
783-1188.pdf - South Dakota Public Utilities Commission
406
Direct Testimony Vance Crocker Before the South Dakota Public Utilities Commission of the State of South Dakota In the Matter of the Application of Black Hills Power, Inc., a South Dakota Corporation For Authority to Increase Rates In South Dakota Docket No. EL14-___ March 31, 2014 000783
-
Upload
khangminh22 -
Category
Documents
-
view
3 -
download
0
Transcript of 783-1188.pdf - South Dakota Public Utilities Commission

Direct Testimony
Vance Crocker
Before the South Dakota Public Utilities Commission
of the State of South Dakota
In the Matter of the Application of
Black Hills Power, Inc., a South Dakota Corporation
For Authority to Increase Rates
In South Dakota
Docket No. EL14-___
March 31, 2014
000783

i
TABLE OF CONTENTS
I. INTRODUCTION AND QUALIFICATIONS ........................................................ 1
II. PURPOSE OF TESTIMONY .................................................................................. 3
III. RATE CASE OVERVIEW ...................................................................................... 3
IV. BUSINESS OVERVIEW OF BLACK HILLS POWER ......................................... 8
V. RELIABILITY AND CUSTOMER SERVICE ..................................................... 12
VII. BLACK HILLS POWER’S WORKFORCE ......................................................... 20
VIII. INTRODUCTION OF WITNESSES ..................................................................... 23
Exhibits
None
000784

1
I. INTRODUCTION AND QUALIFICATIONS 1
Q. PLEASE STATE YOUR NAME AND BUSINESS ADDRESS. 2
A. My name is Vance Crocker. My business address is 409 Deadwood Avenue, 3
Rapid City, South Dakota 57702. 4
Q. BY WHOM ARE YOU EMPLOYED AND IN WHAT CAPACITY? 5
A. I am the Vice President, Electric Operations, for Black Hills Power, Inc. (“Black 6
Hills Power” or the “Company”). 7
Q. FOR WHOM ARE YOU TESTIFYING ON BEHALF OF TODAY? 8
A. I am testifying on behalf of Black Hills Power. 9
Q. BRIEFLY DESCRIBE YOUR EDUCATIONAL AND BUSINESS 10
BACKGROUND. 11
A. I graduated from South Dakota State University, Brookings, South Dakota, in 12
1990 with a Bachelor of Science Degree in Electrical Engineering. I am currently 13
a Registered Professional Engineer in the State of South Dakota. I was hired by 14
Black Hills Power and Light upon graduation and have been employed with the 15
Company since that time. The following is a summary of positions I have held 16
with the Company. 17
From 1990 to 2000, I worked as an Engineer responsible for the planning and 18
design of a wide array of transmission and distribution projects. From 2000 to 19
2005, I was a Transmission Planning Engineer responsible for developing long-20
range transmission plans that ensure reliability of the transmission system. From 21
2005 to 2007, I was the Manager of Transmission Planning and Operations. In this 22
000785

2
role I was responsible for transmission planning and managing the 24/7 Reliability 1
Dispatch Center for Black Hills Power and its sister utility Cheyenne Light, Fuel 2
and Power Company (“Cheyenne Light”). From 2007 to 2011, I was Director, 3
Transmission Services for Black Hills Corporation’s (“BHC”) three electric 4
utilities, Black Hills Power, Cheyenne Light, and Black Hills/Colorado Utility 5
Company, LP. In this role, I was responsible for the transmission planning 6
function and for the 24/7 Reliability Dispatch Center. From 2011 to 2013, I was 7
the General Manager, Black Hills Energy – Kansas Gas. As General Manger, I 8
was responsible for leading and managing Black Hills Energy for the State of 9
Kansas. In 2013, I was named the Vice President of Electric Operations, Black 10
Hills Power. I continue in this role today. 11
Q. PLEASE DESCRIBE YOUR RESPONSIBILITIES AS BLACK HILLS 12
POWER’S VICE PRESIDENT OF OPERATIONS. 13
A. I am responsible for the financial and operational performance of Black Hills 14
Power’s electric operations. I directly oversee operating functions, including 15
electric distribution network operations, maintenance, construction, local customer 16
service, customer relations and community relations. I am indirectly involved in 17
the oversight of certain other functions that are centralized within BHC. Examples 18
of central functions include regulatory and legislative affairs, human resources, IT, 19
and customer service call center functions. 20
000786

3
II. PURPOSE OF TESTIMONY 1
Q. WHAT IS THE PURPOSE OF YOUR TESTIMONY IN THIS 2
PROCEEDING? 3
A. The purpose of my testimony is to provide: 1) an overview of this rate case; 2) an 4
overview of Black Hills Power’s operations and business in South Dakota; 3) a 5
summary of Black Hills Power’s reliability metrics and customer service efforts; 6
4) an overview of the Winter Storm Atlas driven ground patrol program; 5) a 7
discussion regarding Black Hills Power’s workforce; and 6) an introduction of the 8
other witnesses testifying in this proceeding. 9
III. RATE CASE OVERVIEW 10
Q. WHAT ARE THE PRIMARY REASONS FOR THIS RATE CASE? 11
A. There are four primary reasons for this rate case. The first is the request that 12
Cheyenne Prairie Generating Station (“CPGS”) be added to rate base, coinciding 13
with the in-service date of CPGS, and to add certain costs and expenses associated 14
with CPGS as adjustments to the test year. Second, Black Hills Power will make 15
significant investments in capital projects necessary to maintain, improve and 16
replace infrastructure on our system. Third, as a result of the Environmental 17
Protection Agency’s (“EPA”) Area Source Rules, Black Hills Power requests 18
recovery of the costs related to the decommissioning of three of its coal-fired 19
generation facilities. Fourth and finally, Black Hills Power requests recovery of 20
the costs incurred to repair damage and restore service to its customers as a result 21
of Winter Storm Atlas. 22
000787

4
Q. WHAT IS THE AMOUNT OF THE REQUESTED INCREASE IN RATES? 1
A. As illustrated throughout the testimony offered in this docket, Black Hills Power 2
has expended costs to ensure its continued ability to provide safe and reliable 3
service in South Dakota. Black Hills Power requests authority to increase its 4
annual revenue by $14,634,238 to cover the costs incurred since its last rate case. 5
Q. WHAT IS CPGS? 6
A. CPGS, which is located in Cheyenne, Wyoming, will consist of a 95 MW 7
combined-cycle combustion turbine jointly owned by Black Hills Power (55 MW) 8
and its sister utility Cheyenne Light (40 MW) and a 37 MW simple-cycle 9
combustion turbine owned entirely by Cheyenne Light. Construction of CPGS 10
began in April 2013, and is expected to be completed and in-service by October 1, 11
2014. CPGS is described in more detail in the testimony of Mark Lux. 12
Q. WHAT ARE THE CAPITAL EXPENDITURES RELATED TO CPGS? 13
A. The construction of CPGS is in progress as of the date of this application. There is 14
an agreed upon cost cap of $222 million for all of the facilities at CPGS, and 15
construction costs are expected to be at or below this amount. Black Hills Power’s 16
portion of the cost of construction of CPGS is expected to be approximately $93 17
million. 18
Q. BEYOND CPGS, WHAT ARE THE OTHER MAJOR CAPITAL 19
ADDITIONS THAT ARE INCLUDED IN THIS RATE CASE? 20
A. There are a number of capital plant investments that have been made to existing 21
generation since Black Hills Power’s last South Dakota rate case. In particular, 22
000788

5
Black Hills Power has made major capital investments for safety and security, 1
control system upgrades, environmental issues, integrity and reliability, regulatory 2
requirements and facilities. Each of these categories of capital plant investments 3
are discussed in detail in the testimony of Mark Lux. 4
In addition, Black Hills Power has also made capital investments to its distribution 5
assets since its last rate case. For additional discussion regarding these 6
investments, please refer to the testimony of Mike Fredrich. 7
Q. PLEASE EXPLAIN WHY BLACK HILLS POWER PLANS TO 8
DECOMMISSION THREE OF ITS COAL-FIRED GENERATION 9
FACILITIES. 10
A. The EPA enacted the National Emission Standards for Hazardous Air Pollutants 11
for Area Sources: Industrial, Commercial, and Institutional Boilers (“Area Source 12
Rules”), which is designed to reduce emissions of hazardous air pollutants from 13
various small boilers, to include coal-fired units of 25 MW or less. Black Hills 14
Power owns three coal-fired power plants equipped with boilers of 25 MW or less 15
and therefore subject to the Area Source Rules: Neil Simpson I, Osage, and Ben 16
French. The implications of the standards set forth in the Area Source Rules 17
require either the retrofit of expensive new environmental controls on these three 18
facilities or the retirement of the affected units. Black Hills Power has concluded 19
that the most cost effective plan for its customers to achieve EPA compliance was 20
to retire Neil Simpson I, Osage, and Ben French. Decommissioning is discussed 21
in more detail in the testimony of Mark Lux. 22
000789

6
Q. PLEASE EXPLAIN WHY BLACK HILLS POWER IS REQUESTING 1
RECOVERY OF COSTS ASSOCIATED WITH WINTER STORM ATLAS. 2
A. From Thursday, October 3rd through Saturday, October 5th 2013, western South 3
Dakota experienced a severe winter storm that is commonly referred to as Winter 4
Storm Atlas. Winter Storm Atlas has been determined to be the second heaviest 5
snowstorm on record for Rapid City. Heavy snow and high winds caused 6
significant damage to trees and power lines in the affected areas and caused 7
treacherous travel and working conditions. Because the storm occurred in early 8
October all deciduous trees were fully leafed. The combination of the leafed trees, 9
heavy snow and high winds resulted in extensive broken trees that contributed 10
greatly to the damage to Black Hills Power’s facilities throughout its service 11
territory in South Dakota. 12
Black Hills Power considers the outages caused by Winter Storm Atlas to be the 13
worst in the Company’s 130 year history. At the outage peak, approximately 14
41,800 of Black Hills Power’s customers (in excess of 60%) were without power. 15
Internal personnel as well as personnel dispatched from utilities in neighboring 16
states supported Black Hills Power’s restoration effort. These crews averaged 13 17
to 16 hour days with an exemplary safety record during the restoration period. At 18
the height, these restoration efforts were carried out by over 500 employees and 19
contractors. Many of the crews came from other states including North Dakota, 20
Montana, Wyoming, and Colorado. Because Black Hills Power had an 21
appropriate emergency response plan and began executing this plan prior to the 22
000790

7
storm, including timely activation of resources, it was able to restore power to 1
95% of its customers in six days. 2
The volume of personnel, materials and equipment that were mobilized for this 3
storm was unprecedented, and critical to the Company’s success. The resources 4
that were utilized were greatly needed and resulted in power being restored to 5
customers dramatically sooner than otherwise would have been possible. 6
Repairing the substantial and widespread damage was costly, and far exceeded 7
average annual storm-related costs. As a result, Black Hills Power seeks recovery 8
of the associated costs in this proceeding. For additional information regarding 9
the costs attributed to Winter Storm Atlas, please see the testimony of Chris 10
Kilpatrick. 11
Q. WHAT INNOVATIVE MEASURES HAS BLACK HILLS POWER 12
UNDERTAKEN TO MITIGATE INCREASING COSTS AND RATE 13
IMPACT? 14
A. Black Hills Power supported and received approval for the phase in rate plan 15
(“PIPR”) whereby customers would pay construction financing costs during 16
construction instead of adding an allowance for funds used during construction to 17
rate base. The PIPR that accomplished this resulted in savings for Black Hills 18
Power customers. The PIPR also provided that customers pay quarterly increases 19
during the construction of CPGS, which minimizes the customer impact of the 20
new generation going into customer rates on October 1, 2014. 21
000791

8
Q. WHAT OTHER MEASURES WERE UNDERTAKEN BY BLACK HILLS 1
POWER? 2
A. The electricity needs of the customers of Black Hills Power continue to steadily 3
increase. Generation facilities must be built in advance to ensure the continued 4
reliability of service to its customers. At the same time, Black Hills Power must 5
decommission three of its coal-fired generation units. In addressing these issues, 6
Black Hills Power identified the opportunity to partner with its sister utility, 7
Cheyenne Light, in the development and joint ownership of the CPGS. This 8
partnership provides for economies of scale that reduce overall costs, including the 9
joint ownership of assets that benefit both utilities. 10
IV. BUSINESS OVERVIEW OF BLACK HILLS POWER 11
Q. PLEASE BRIEFLY DESCRIBE BLACK HILLS POWER’S HISTORY. 12
A. Black Hills Power and its predecessor companies have been providing electric 13
power to the Black Hills region since 1883, when Pilcher Electric Light Co. was 14
formed by early pioneers in Deadwood, SD. Black Hills Power and Light was 15
formed in 1941 through the purchase and combination of several existing electric 16
utilities throughout the Black Hills. Headquartered in Rapid City, today, Black 17
Hills Power is a wholly owned subsidiary of BHC. 18
Q. PLEASE GIVE A BASIC OVERVIEW OF BLACK HILLS POWER’S 19
BUSINESS OPERATIONS. 20
A. Black Hills Power is a regulated electric utility engaged in the generation, 21
transmission and distribution of electricity to approximately 68,000 customers in 22
000792

9
western South Dakota, northeastern Wyoming, and southeastern Montana. Black 1
Hills Power’s service territory covers approximately 9,300 square miles. The 2
Company has approximately 265 current employees with several open positions, 3
and is further supported by Black Hills Service Company, LLC (“Service 4
Company”) and Black Hills Utility Holdings, Inc. (“Utility Holdings”). 5
Approximately 90 percent of Black Hills Power’s retail electric revenues during 6
the 12 months ending September 30, 2013 were generated in South Dakota. 7
Q. PLEASE DESCRIBE BLACK HILLS POWER’S UTILITY ASSETS. 8
A. The assets utilized by Black Hills Power to provide service to customers fall into 9
three primary classes: Generation (also known as Production), Transmission and 10
Distribution. Each of these asset classes are described in more detail below. 11
Generation Assets 12
Black Hills Power’s current ownership interests in electric generation plants are as 13
follows: 14
Unit
Fuel
Type
Location
Ownership
Interest (%)
Capacity
(MW)
Year
Installed
Osage Coal Osage, WY 100 34.5 1948-
1952
Ben French Coal Rapid City, SD 100 25.0 1960
Neil Simpson I Coal Gillette, WY 100 21.8 1969
Neil Simpson II Coal Gillette, WY 100 90.0 1995
Wyodak Coal Gillette, WY 20 72.4 1978
Wygen III Coal Gillette, WY 52 57.2 2010
Ben French Diesel #1-
5 Oil Rapid City, SD 100 10.0 1965
Ben French CTs
#1-4 Gas/Oil Rapid City, SD 100 80.0
1977-
1979
Neil Simpson CT Gas Gillette, WY 100 40.0 2000
Lange CT Gas Rapid City, SD 100 40.0 2002
000793

10
However, as a result of the newly enacted Area Source Rules, Black Hills Power 1
retired three of its coal-fired generation units, Osage, Ben French, and Neil 2
Simpson I. 3
In addition to the balance of the ownership of the remaining generation facilities, 4
Black Hills Power will also own 58% of a combined cycle unit at CPGS. This 5
unit will be in service on October 1, 2014, and will provide a total of 95 MW of 6
generating capacity, with Black Hills Power owning 55 MW. 7
Transmission Assets 8
Black Hills Power’s electric transmission system is composed of approximately 9
590 miles of high voltage (230 kV) transmission lines and 500 miles of low 10
voltage (69 kV and 47 kV) transmission lines. 11
Black Hills Power also owns 35 percent of a transmission tie that interconnects the 12
Western and Eastern transmission grids, which are independently operated 13
transmission grids serving the western United States and eastern United States, 14
respectively. This transmission tie, which is 65 percent owned by Basin Electric, 15
provides transmission access to both the Western Electricity Coordinating Council 16
region in the West and the Mid-Continent Area Power Pool region in the East. 17
This transmission tie allows Black Hills Power to buy and sell energy on the 18
Eastern grid without having to isolate and physically reconnect load or generation 19
between the two transmission grids. 20
000794

11
Distribution Assets 1
Black Hills Power owns and operates 2,550 line miles of distribution facilities. 2
Additional distribution assets include poles, transformers, meters, and other related 3
equipment. 4
Q. PLEASE PROVIDE A BREAKDOWN OF BLACK HILLS POWER’S 5
CUSTOMER CLASSES AND CUSTOMER COUNTS. 6
A. From October 2012 through September 2013, Black Hills Power provided service 7
to the following average number of retail customers in South Dakota by customer 8
class. 9
South Dakota Retail Customers 10
Residential 52,450 11
Small General Service 11,886 12
Large General Service 505 13
Lighting 647 14
Total 65,487 15
Q. WHAT ARE BLACK HILLS POWER’S HIGHEST SUMMER AND 16
WINTER PEAK LOADS? 17
A. Black Hills Power’s all-time peak load of 452 megawatts was reached in July, 18
2011, and a winter peak load of 408 megawatts was reached in January, 2011. 19
000795

12
Q. PLEASE IDENTIFY BLACK HILLS POWER’S LONG TERM 1
WHOLESALE CONTRACTS. 2
A. Black Hills Power has long term agreements to serve Sheridan, Wyoming (through 3
Montana-Dakota Utilities Company) and the Municipal Energy Agency of 4
Nebraska, also known as MEAN. 5
V. RELIABILITY AND CUSTOMER SERVICE 6
Q. PLEASE DESCRIBE HOW BLACK HILLS POWER MEASURES 7
RELIABILITY OF ITS DELIVERY SYSTEM. 8
A. Black Hills Power utilizes generally accepted reliability indices, as defined by the 9
Institute of Electrical and Electronic Engineers (“IEEE”) in its standard number 10
1366-2003, “Guide for Electric Power Distribution Reliability Indices.” Generally 11
speaking, the most often used performance measurement for a sustained 12
interruption is the System Average Interruption Duration Index (“SAIDI”). SAIDI 13
measures the duration of an interruption for an “average time” customers are 14
interrupted during a given time period. Other standard measures are utilized to 15
help target expenditures for capital improvements to improve reliability measures. 16
Q. PLEASE DESCRIBE BLACK HILLS POWER’S HISTORICAL 17
RELIABILITY PERFORMANCE. 18
A. Black Hills Power participates in an annual reliability benchmarking study 19
conducted by IEEE. Among the 60 participating utilities, Black Hills Power 20
consistently ranks as one of the top 25 percent most reliable companies. The 21
000796

13
following table sets forth a summary of Black Hills Power’s performance relative 1
to the IEEE benchmark survey for the years 2009, 2010, 2011, and 2012. 2
SAIDI Performance 3
(Average annual customer outage duration in minutes) 4
2009 2010 2011 2012 5
Black Hills Power 69.9 76.1 85.9 72.6 6
IEEE Top Quartile 81.2 89.5 100.7 93.1 7
At the time of this filing, 2013 survey data is not yet available from IEEE. 8
Based on 2012 data, Black Hills Power customers had, on average, power 9
available 99.99 percent of the time. 10
Q. WHAT EMPHASIS DOES BLACK HILLS POWER PLACE ON 11
CUSTOMER SERVICE SATISFACTION LEVELS? 12
A. Customer service has been and remains a very high priority for Black Hills Power, 13
and for all employees within the Black Hills Power utility. Company and 14
departmental goals include a customer satisfaction component. 15
Q. DOES BLACK HILLS POWER CONSISTENTLY MEASURE CUSTOMER 16
SERVICE AND SATISFACTION LEVELS? 17
A. Yes. Black Hills Power believes that its focus on customer service is reflected 18
well in its ability to maintain a high level of customer satisfaction, as demonstrated 19
by the results of surveys completed by J.D. Powers and Associates. For each set 20
of results (conducted approximately each quarter), Black Hills Power’s customer 21
satisfaction scores have consistently exceeded the average of Midwest utilities 22
000797

14
participating in the surveys. The following table sets forth a summary of Black 1
Hills Power’s performance relative to other midsize Midwest utilities participating 2
in JD Power surveys for the years 2010, 2011, 2012 and 2013. 3
JD Power Overall Customer Satisfaction Index 4
2010 2011 2012 2013 5
Black Hills Power 601 637 644 671 6
Midwest Region 637 618 627 639 7
Q. PLEASE DISCUSS BLACK HILLS POWER’S CONSOLIDATION OF ITS 8
CUSTOMER SERVICE AND LINE OPERATION DEPARTMENTS AT 9
SEVERAL LOCATIONS. 10
A. Black Hills Power consolidated its customer service and line operation 11
departments at several offices to adapt to changing customer needs, including 12
customers’ preference to use more technology and more convenient payment 13
options when doing business with the Company. As a result of these changing 14
trends, the Company has experienced a 45% decrease in walk-in traffic in recent 15
years, while online interactions have increased by 40%. 16
To better serve the current customer preferences and reduce costs for all 17
customers, the Company implemented a new customer service model on February 18
3, 2014. As part of the new model, three regional customer service and operations 19
centers will be utilized to offer expanded services in South Dakota. These 20
regional centers are located in Sturgis and Spearfish to serve the Northern Hills 21
region, and Custer to serve the Southern Hills region. The Rapid City Service 22
000798

15
Center will continue to serve the Rapid City area. Offices in Deadwood and Hot 1
Springs were closed to walk-in customer service traffic, but continue to serve as 2
operations centers. Offices in Newell and Belle Fourche were closed. The new 3
regional model continues to offer walk-in payment options for those customers 4
preferring this method, and provides for an increased focus on delivering a wider 5
variety of services to customers. 6
Q. PLEASE DESCRIBE BLACK HILLS POWER’S ENHANCED AND 7
EXPANDED CUSTOMER SERVICE MODEL. 8
A. As a result of its conversion to the CIS+ information system that is now common 9
to the regulated utilities of BHC, Black Hills Power is able to provide call center 10
customer service support 24 hours a day, 7 days a week in the case of electric 11
emergencies. General customer support through the Call Centers is provided 6 12
days a week from 7am-8pm Monday through Friday and 8am to 5pm on Saturday, 13
mountain time. In addition, business process initiatives have been put into place 14
to improve customer service as well as efficiencies. For example, additional 15
payment options are available through our electronic bill presentment software and 16
mobile application or Quick Response code (QR) for customers wishing to pay 17
their bill via their smart phone. An improved interactive response system provides 18
self-service options for customers who do business with the Company, including 19
the ability to make payment arrangements, set up their accounts on budget billing, 20
initiate payments and report service interruptions. With the installation of 21
Automated Meter Infrastructure, Black Hills Power customers can view their 22
000799

16
monthly, weekly and daily electric usage patterns from our website as well as 1
service interruption updates. Black Hills Power has also initiated outage and other 2
Company news on social media. The website has been redesigned to offer 3
customers the ability to access their account information from various electronic 4
devices including tablets and smart phones. Finally, Black Hills Power continues 5
to provide and enhance energy efficiency programs to assist customers with 6
managing their energy bill. 7
Q. HOW DOES BLACK HILLS POWER DEMONSTRATE ITS 8
COMMITMENT TO THE COMMUNITIES AND CUSTOMERS IT 9
SERVES? 10
A. As a community partner, Black Hills Power remains active in numerous civic and 11
community matters and economic development efforts. Black Hills Power has 12
been involved in a broad range of projects to improve its local communities. In 13
Black Hills Power’s South Dakota service area, some examples of this 14
involvement include participation in local Community United Way campaigns, 15
annual participation in the United Way Day of Caring, board involvement on 16
numerous community and civic organizations, extensive involvement in Chamber 17
of Commerce and economic development in the communities served by the 18
Company, Power of Trees tree planting programs, and participation in numerous 19
K-12 safety education and career development programs. 20
000800

17
Q. DOES BLACK HILLS POWER PROVIDE ENERGY EFFICIENCY 1
INCENTIVES TO ITS CUSTOMERS? 2
A. Yes. Black Hills Power provides various Energy Efficiency incentives to its 3
customers in South Dakota. For example, the Company offers rebates for energy 4
efficient water heaters and heat pumps. Additional programs include home energy 5
audits, refrigerator recycling, residential home weatherization, commercial and 6
industrial rebates, program training and marketing and reporting services. 7
Q. DOES BLACK HILLS POWER SUPPORT COMMUNITY PROGRAMS 8
FOR ENERGY ASSISTANCE? 9
A. Yes. Black Hills Power supports community programs for energy assistance 10
primarily through our Black Hills Cares program and the Walk for Warmth 11
program. Our Black Hills Cares program offers customers and employees several 12
options to donate to the Black Hills Cares fund, and all customer contributions are 13
matched by Black Hills Power dollar for dollar. The Walk for Warmth program is 14
an annual walk initiated by Black Hills Power where all entry fees and donations 15
directly support the Black Hills Cares program and all funds are matched dollar 16
for dollar by Black Hills Power. The 2014 Walk for Warmth raised over $20,000 17
for this important program. Funds from the Black Hills Cares program are 18
administered for those in need by Church Response, the Salvation Army and the 19
Ministerial Association. 20
000801

18
VI. GROUND PATROL PROGRAM 1
Q. PLEASE EXPLAIN WHY BLACK HILLS POWER IS PERFORMING A 2
GROUND PATROL OF ITS ENTIRE DISTRIBUTION SYSTEM IN 3
SOUTH DAKOTA. 4
A. As indicated above, the Black Hills Region experienced a devastating winter storm 5
in October of 2013. The combination of the leafed trees, heavy snow, and high 6
winds resulted in extensive broken trees that contributed greatly to the damage to 7
Black Hills Power’s facilities throughout its service territory in South Dakota. 8
Although significant efforts to repair facilities and address vegetation were 9
undertaken in conjunction with the restoration efforts that followed the storm, 10
Black Hills Power continues to discover damaged vegetation and facilities today. 11
In order to identify latent defects and to ensure a safe, reliable system, the 12
Company has determined that it is prudent to perform a system wide ground patrol 13
of the electrical system that is located in the Black Hills region. 14
Q. WHAT DOES A GROUND PATROL ENTAIL? 15
A. A ground patrol consists of a visual inspection of a power line and supporting 16
infrastructure performed by someone either on foot or in a vehicle. Individuals 17
performing ground patrols are trained to spot potential defects or other concerns 18
that may impact the ability to safely and reliably deliver power to customers. 19
000802

19
Q. HOW DOES BLACK HILLS POWER PLAN TO ACCOMPLISH THIS 1
TASK? 2
A. The Company has retained DCP Consulting to perform the majority of the ground 3
patrol efforts within Black Hills communities. Black Hills Power employees will 4
perform ground patrols in remote areas of the Black Hills and on the majority of 5
the 69kV system. Black Hills Power plans to have the majority of the ground 6
patrols completed by June of 2014. 7
Q. WHAT ARE THE COSTS ASSOCIATED WITH THIS PROJECT? 8
A. Black Hills Power estimates that the project will cost approximately $1.1 million. 9
For information regarding the costs contained within this estimate and the 10
proposed treatment of those costs, please refer to the testimony of Jon Thurber and 11
Chris Kilpatrick. 12
Q. WHAT MEASURES HAS BLACK HILLS POWER TAKEN TO 13
MITIGATE THE COSTS ASSOCIATED WITH THIS PROJECT? 14
A. Black Hills Power developed a scope of work for the ground patrol project and 15
solicited bids from multiple qualified vendors. The low bidder was selected for 16
the project. Training was held with both employees and the contractor to ensure 17
each inspector understood the scope of work and the process for reporting 18
potential issues. An electronic database was created to improve efficiency with 19
tracking items identified in the patrol and the associated repairs. 20
000803

20
VII. BLACK HILLS POWER’S WORKFORCE 1
Q. PLEASE DESCRIBE BLACK HILLS POWER’S CURRENT 2
WORKFORCE. 3
A. As stated above, Black Hills Power currently employs approximately 265 people 4
with several open positions. In addition, employees of Service Company and 5
Utility Holdings perform specific functions for Black Hills Power. 6
Q. DO YOU FORESEE ANY CHANGES TO BLACK HILLS POWER’S 7
WORKFORCE IN THE NEAR TERM? 8
A. Yes. The average age of Black Hills Power’s employees is 47.1 years. Over the 9
next 8 years, approximately 31% of Black Hills Power’s current workforce will 10
reach the age of 62, which has been the historical average age of retirement at 11
Black Hills Power and its parent, BHC. 12
Q. DOES THIS CAUSE ANY CONCERN? 13
A. Absolutely. Our people are our best assets. A talent shortage within our 14
organization impairs our ability to provide safe, reliable service to our customers. 15
The impending retirements are a concern not only from a headcount perspective, 16
but from a knowledge and experience standpoint. Black Hills Power understands 17
that over the next eight years, employees representing a combined 1,713 years of 18
work experience are expected to retire. This represents approximately 50% of total 19
years of experience. Black Hills Power has not experienced this significant type of 20
loss of experience in its history. Not having replacements ready for our retiring 21
employees could put Black Hills Power at risk by placing undue strain on our 22
000804

21
remaining employees, who must train replacements as well as complete their own 1
duties. 2
Q. WHAT STEPS HAVE THE COMPANY TAKEN TO ADDRESS THIS 3
CONCERN? 4
A. Black Hills Power completed a strategic workforce planning process that evaluates 5
workforce demographics, tenure, experience and skill capabilities as well as 6
industry trends and risks. As a result of this process, the Company has retained 7
employees that were employed at the retired Neil Simpson I facility. Also as a 8
result of this process, the Company has identified a total of 72 potential 9
retirements between now and the end of 2021 and is therefore seeking to add 10
several positions through its proposed FutureTrack Workforce Development 11
Program. For additional information on these topics, please refer to the testimony 12
of Chris Kilpatrick and Jennifer Landis. 13
Q. WHAT OPERATIONS POSITIONS ARE INCLUDED IN BLACK HILLS 14
POWER’S FUTURETRACK WORKFORCE DEVELOPMENT 15
PROGRAM? 16
A. Constructions representatives, electricians, meter mechanics and line mechanics 17
are the four operations positions that are included in the FutureTrack Workforce 18
Development Program. 19
Q. PLEASE EXPLAIN WHY THESE POSITIONS ARE INCLUDED. 20
A. In the next eight years, Black Hills Power expects 3 construction representatives, 5 21
electricians, 3 meter mechanics and 13 line mechanics to retire. Based on the 22
000805

22
Company’s experience, it takes approximately 2 years to fully train a construction 1
representative, 4 years to fully train an electrician, 2 years to fully train a meter 2
mechanic and 4 years to fully train a line mechanic. Due to the lengthy training 3
periods and the expected shortage of skilled candidates, these four operations 4
positions are included in the Black Hills Power FutureTrack Workforce 5
Development Program. 6
Q. HOW PRODUCTIVE ARE THE INDIVIDUALS WHO ARE TRAINING 7
FOR THESE POSITIONS? 8
A. Based on the Company’s experience, a construction representative is 50 percent 9
productive after 12 months of training, and able to work independently after 2 10
years of training; an electrician is 75% percent productive after 3 years of training, 11
and able to work independently after 4 years of training; a meter mechanic is 25% 12
productive after 6 months of training and able to work independently after 2 years 13
of training; and a line mechanic is 75 percent productive after 3 years of training, 14
and able to work independently after 4 years of training. Jennifer Landis 15
discusses how these productively metrics are applied to determine what portion of 16
a particular position is charged to the FutureTrack Workforce Development 17
Program regulatory asset. 18
000806

23
VIII. INTRODUCTION OF WITNESSES 1
Q. PLEASE INTRODUCE BLACK HILLS POWER’S OTHER WITNESSES 2
IN THIS PROCEEDING. 3
A. The other witnesses providing written direct testimony and exhibits, and the 4
subject matter of each, are listed below: 5
Kyle D. White, Vice President of Regulatory Affairs 6
Mr. White discusses the corporate structure of Black Hills Power and its parent 7
company, BHC. He discusses the class cost of service and proposed rates. He 8
also discusses the Statement R coal pricing and presents the business case for 9
utility-owned generation. Lastly, he supports the decision to construct CPGS. 10
Jill S. Tietjen, President and CEO of Technically Speaking, Inc. 11
Ms. Tietjen demonstrates the need for a new resource on the Black Hills Power 12
system in the 2014 timeframe. She discusses the 2011 Integrated Resource Plan 13
that was conducted to determine how Black Hills Power’s resource need should be 14
fulfilled. She discusses the CPGS as the resource to be installed in 2014. 15
Mark Lux, Vice President and General Manager, Regulated and Non-16
Regulated Generation 17
Mr. Lux describes CPGS and its construction costs, plant operations and 18
maintenance. He provides an overview of the major capital plant investments that 19
are included in this rate case and defines major maintenance. He discusses the 20
decommissioning of the Neil Simpson I, Osage, and Ben French coal-fired 21
generation facilities. He summarizes the Neil Simpson Complex common asset 22
000807

24
treatment and addresses plans for the Neil Simpson labor force. Lastly, Mr. Lux 1
addresses the generation related positions that are included in the FutureTrack 2
Workforce Development Program. 3
Kent J. Kopetzky, Senior Manager, Gas Supply Services 4
Mr. Kopetzky describes the natural gas supply, pipeline capacity, and other fuel 5
cost for CPGS. 6
Mike Fredrich, Director Engineering Services 7
Mr. Fredrich describes Black Hills Power’s service territory. He summarizes 8
major capital distribution investments. He also discusses Black Hills Power’s 9
LIDAR project. 10
Jennifer Landis, Director Corporate Human Resources and Talent 11
Management 12
Ms. Landis describes the FutureTrack Workforce Development Program for Black 13
Hills Power. 14
Laura A. Patterson, Director of Compensation, Benefits, and Human 15
Resources Information Services 16
Ms. Patterson describes the compensation and benefits philosophy of Black Hills 17
Power. 18
Jon Thurber, Manager - Regulatory Affairs 19
Mr. Thurber supports and explains the revenue requirement model for Black Hills 20
Power and discusses the test year rate base and income statement, describes the 21
appropriate adjustments to the test year rate base, revenues and operating 22
000808

25
expenses, including any known and measurable or contracted for adjustments, and 1
supports the requested revenue increase. 2
Christopher J. Kilpatrick, Director Regulatory 3
Mr. Kilpatrick supports Black Hills Power’s revenue requirement. He discusses 4
the Phase In Plan Rate revenue. He addresses the CPGS pipeline cost allocations. 5
He summarizes the proposed changes to the Energy Cost Adjustment. He 6
addresses the treatment of the decommissioning and Winter Storm Atlas regulator 7
assets. Lastly, he discusses the Cost Allocation Manuals. 8
Charles R. Gray, Manager – Regulatory Affairs 9
Mr. Gray provides the proof of test year revenues and billing determinants for 10
Black Hills Power. Mr. Gray also discusses the jurisdictional cost of service. 11
John J. Spanos, Vice President of Gannett Fleming 12
Mr. Spanos supports Black Hills Power’s proposed depreciation expense rates. 13
Brian G. Iverson, Vice President, Treasurer 14
Mr. Iverson certifies the books and records of Black Hills Power and the use of the 15
FERC uniform system of accounts. In addition, Mr. Iverson discusses the 16
corporate finance philosophy of Black Hills Power, the proposed capital structure, 17
long term debt and the cost of equity and debt financing activity. 18
Dr. William E. Avera of FINCAP, Inc. 19
Dr. Avera presents his independent assessment of the fair and reasonable rate of 20
return on equity for Black Hills Power and Black Hills Power’s requested capital 21
structure. 22
000809

26
Q. DOES THIS CONCLUDE YOUR DIRECT TESTIMONY? 1
A. Yes, it does. 2
000810

Direct Testimony and Exhibits
Kyle D. White
Before the South Dakota Public Utilities Commission
of the State of South Dakota
In the Matter of the Application of
Black Hills Power, Inc., a South Dakota Corporation
For Authority to Increase Rates
In South Dakota
Docket No. EL14-___
March 31, 2014
000811

i
TABLE OF CONTENTS
I. INTRODUCTION AND QUALIFICATIONS ............................................ 1
II. PURPOSE OF TESTIMONY ....................................................................... 2
III. BLACK HILLS CORPORATION OVERVIEW ......................................... 2
IV. CLASS COST OF SERVICE ....................................................................... 4
V. PROPOSED RATES .................................................................................... 6
VI. PROPOSED CHANGES TO TARIFFS ..................................................... 10
VII. STATEMENT R COAL PRICING ............................................................ 12
VIII. BUSINESS CASE FOR UTILITY OWNED GENERATION .................. 13
IX. SUPPORT FOR THE DECISION TO CONSTRUCT CPGS ................... 15
Exhibits
Exhibit KDW-1
Exhibit KDW-2
Black Hills Corporation Organizational Chart
Black Hills Corporation Subsidiary List
000812

1
I. INTRODUCTION AND QUALIFICATIONS 1
Q. PLEASE STATE YOUR NAME AND BUSINESS ADDRESS. 2
A. Kyle D. White, 625 Ninth Street, P.O. Box 1400, Rapid City, South Dakota. 3
Q. BY WHOM ARE YOU EMPLOYED AND IN WHAT CAPACITY? 4
A. I am currently employed by Black Hills Service Company (“Service Company”), a 5
wholly-owned subsidiary of Black Hills Corporation (“BHC”), as Vice President 6
of Regulatory Affairs. My areas of responsibility include regulatory affairs for the 7
regulated electric utility subsidiaries of BHC. 8
Q. FOR WHOM ARE YOU TESTIFYING ON BEHALF OF TODAY? 9
A. I am testifying on behalf of Black Hills Power, Inc. (“Black Hills Power” or 10
“Company”). 11
Q. PLEASE DESCRIBE YOUR EDUCATIONAL AND BUSINESS 12
BACKGROUND. 13
A. I graduated with honors from the University of South Dakota in May of 1982 with 14
a Bachelor of Science degree in Business Administration, majoring in 15
management. In August of 1989, I graduated with a Masters degree in Business 16
Administration, also from the University of South Dakota. I have been employed 17
by BHC in rate, marketing and resource planning related work since July of 1982 18
and have been in my present position since August of 2012. For much of my 19
career, I was responsible for the preparation of rate studies and other filings for 20
Black Hills Power. In addition to on-the-job training, I have attended numerous 21
000813

2
seminars, trade association meetings, and regulatory conferences covering a 1
variety of utility-related subjects. 2
Q. HAVE YOU PREVIOUSLY TESTIFIED BEFORE THIS COMMISSION? 3
A. Yes. 4
II. PURPOSE OF TESTIMONY 5
Q. WHAT IS THE PURPOSE OF YOUR TESTIMONY? 6
A. The purpose of my testimony is to provide an overview of BHC’s subsidiary 7
structure. I also discuss the class cost of service and the proposed rates. In 8
addition, I discuss the Statement R coal pricing and present the business case for 9
utility-owned generation. Lastly, I support the decision to construct Cheyenne 10
Prairie Generating Station (“CPGS”). 11
III. BLACK HILLS CORPORATION OVERVIEW 12
Q. PLEASE GIVE A BASIC OVERVIEW OF BHC AND ITS SUBSIDIARIES. 13
A. BHC is a diversified energy company that is headquartered in Rapid City, South 14
Dakota with a 130 year history. BHC operates as a “holding company” under the 15
Public Utility Holding Company Act of 2005. It operates in the United States with 16
two major business groups: 1) Utilities – which deliver retail electric and natural 17
gas service, and 2) Non-regulated Energy – which is involved in various wholesale 18
energy businesses. 19
000814

3
Q. WHAT IS THE RELATIONSHIP BETWEEN BHC AND BLACK HILLS 1
POWER? 2
A. Black Hills Power is a wholly-owned subsidiary of BHC. Black Hills Power is a 3
component of BHC’s Utilities Business Segment. Attached as Exhibit KDW-1, is 4
the organization chart for BHC and its subsidiaries. Also, attached as Exhibit 5
KDW-2, is the listing of subsidiaries and the classification of those subsidiaries 6
into the two major business groups – Utilities and Non-regulated Energy. 7
Q. WHAT OTHER UTILITIES ARE OWNED BY BHC? 8
A. As shown on Exhibit KDW-2, Black Hills Power’s sister electric utilities include 9
Cheyenne Light, Fuel and Power Company (“Cheyenne Light”), which operates in 10
the City of Cheyenne, Wyoming and portions of Laramie County; and Black 11
Hills/Colorado Electric Utility Company, which operates in the Pueblo area of 12
Colorado. In addition, BHC owns gas distribution utilities operating in Colorado, 13
Nebraska, Iowa, Kansas, and Wyoming. These utilities conduct business under 14
the assumed names of Black Hills Energy and Cheyenne Light. 15
Q. WHAT ARE THE COMPANIES INCLUDED IN THE NON-REGULATED 16
ENERGY GROUP OF BHC? 17
A. BHC’s Non-regulated Energy businesses include: Wyodak Resources 18
Development Corporation (“Wyodak Resources”), which is engaged in coal 19
production and sales; Black Hills Exploration and Production, Inc., which is 20
engaged in oil and natural gas production; and Black Hills Electric Generation, 21
LLC and its subsidiaries, which are engaged in independent power production. 22
000815

4
IV. CLASS COST OF SERVICE 1
Q. HAVE YOU REVIEWED THE RESULTS OF THE CLASS COST OF 2
SERVICE PREPARED BY MR. GRAY? 3
A. Yes, I have. 4
Q. WHAT DID YOU DETERMINE? 5
A. Material differences now exist in the revenue increases required for each class to 6
pay its allocated cost of service. These increases are larger for some classes than is 7
warranted at this time. This result is different than occurred in Black Hills Power’s 8
last application for an increase in base rates which the Commission considered in 9
2013. The Class Cost of Service Model (“CCOS”) is provided as Statement O of 10
Exhibit 4. 11
Q. DO YOU HAVE AN OPINION AS TO WHY THIS HAS OCCURRED? 12
A. Yes, this is the first class cost of service study since load research data became 13
available from the Company’s Advanced Metering Infrastructure (AMI) and the 14
recently installed Meter Data Management System (MDMS). Prior to this study, 15
the Company either borrowed load research data from other utilities and made 16
adjustments to it for perceived differences or utilized old information under the 17
presumption that load characteristics by class had not materially changed. As a 18
result of the availability of nearly census hourly load data for all of Black Hills 19
Power’s retail customers, we now have precise data we can use for determining 20
class capacity allocators. However, this data is for one summer peak season only. 21
Additional years of load measurements would help increase the Company’s 22
000816

5
confidence that the reported load data represents a “typical” or “normal” 1
consumption of customers within each class. 2
Q. WHAT IS BLACK HILLS POWER’S RATE DESIGN PHILOSOPHY? 3
A. Black Hills Power’s primary principle for rate design is the creation of fair and 4
consistent rates. The rate design is intended to balance the revenue responsibilities 5
of Black Hills Power’s customers with the right of the Company to recover the 6
reasonable costs incurred to provide service to its customers. 7
Black Hills Power recognizes that the process of adopting and applying a specific 8
rate design requires judgment, and is a complex and somewhat iterative process. 9
The Company understands that preparing and proposing a rate design that is 10
consistent with this philosophy involves various overlapping and sometime 11
conflicting considerations. 12
Q. WHAT ARE THOSE CONSIDERATIONS? 13
A. The rate design considerations include, but are not limited to, the following: 14
(1) collection of Black Hills Power’s total annual revenue requirement and the 15
allocation of those revenues to each customer class to recover costs from 16
those customers that cause those costs to be incurred; 17
(2) recognition of the cost to serve, as reflected by a class cost of service study 18
that attributes costs to the different classes of customers based on how those 19
customers cause costs to be incurred; 20
(3) encouragement of the optimum use of supply sources by promoting 21
desirable and discouraging undesirable load characteristics; 22
000817

6
(4) recognition of the value of service considering the nature and level of 1
competition and the degree of price sensitivity in each rate class; 2
(5) avoidance of undue discrimination between customer classes and individual 3
customers within each class; 4
(6) history of rates, including trends in the level of charges and stability of the 5
rates; 6
(7) rate structures and terms and conditions of service which are easy to 7
administer and be understood by customers; 8
(8) consideration of the rates and practices of other utilities having similar 9
types of load and service conditions; and 10
(9) redesign of rates and services to reflect industry movement when 11
appropriate. 12
V. PROPOSED RATES 13
Q. HOW HAS THE ADDITION OF AMI DATA CHANGED THE 14
ALLOCATION OF COSTS TO THE VARIOUS CUSTOMER CLASSES? 15
A. Black Hills Power can now utilize more complete customer and system data 16
through its AMI meters and MDMS information systems that was not previously 17
available. Now that Black Hills Power can obtain and analyze this specific 18
customer class data, it can better identify methodologies and class demands to 19
fairly allocate the costs of providing service. In addition, Black Hills Power can 20
determine how the costs to be allocated will impact the different customer classes. 21
000818

7
Upon reviewing the more complete data in this case, Black Hills Power 1
determined that a reallocation of certain costs from one customer class to another 2
is necessary. However, because the Company has information from the AMI and 3
MDMS data collection, Black Hills Power recognizes that it must apply 4
gradualism in the reassignment of costs. Accordingly, the proposed allocation of 5
costs moves toward a full cost of service approach yet recognizes that the shift of 6
costs must be done in a transitional manner to avoid significant and sudden 7
impacts to customers. 8
Q. IS THE COMPANY PROPOSING THAT RATES BE APPROVED FOR 9
EACH CUSTOMER CLASS TO RECOVER ITS ALLOCATED COST OF 10
SERVICE? 11
A. No. While the cost-based rates would allocate the revenue requirement needed to 12
each customer class to recover each class’ current cost causation, the Company 13
does not propose to move rates to fully cost-based rates. Doing so would produce 14
greater customer impacts to certain classes than the Company believes is 15
appropriate and acceptable. 16
Q. HOW DID THE COMPANY DETERMINE THE PROPOSED CLASS 17
REVENUE RESPONSIBILITY? 18
A. The primary guide for the proposed class revenue responsibility is the class cost of 19
service study. Moderation, gradualism, and rate stability were also considered by 20
comparing class costs as a percentage increase from the present rate levels, 21
relative to the proposed overall 9.27 percent increase to revenues. While the total 22
000819

8
overall revenue increase is 9.27 percent, the results of the class cost of service 1
study shows various rate changes should rates be set to match the study results for 2
each individual customer class. 3
Q. WHY DID BLACK HILLS POWER CHOOSE GRADUALISM? 4
A. With the variance in the allocated class percentages as compared to the overall 5
percentage increase, Black Hills Power chose to exercise caution and developed 6
rates that begin the move toward cost based rates while acknowledging the history 7
of the relationship of the rates, including trends in the level of charges and stability 8
and predictability of rates. The Company seeks to avoid undue discrimination 9
between customer classes and similarly situated individual customers within each 10
class. Black Hills Power must also be cognizant of customer reactions to a move 11
to fully cost-based rates. 12
By employing the practice of gradualism when changing rates, significant rate 13
shifts can be minimized by moving a rate class to its full cost of service rates 14
through smaller step changes over time, as opposed to one large jump to full cost 15
of service. The proposed rates allow the Company to move all classes toward cost 16
based rates in moderation. This moderation is expected to require future 17
reallocations of required revenues to each customer class to appropriately recover 18
utility costs from those customer classes that are shown to cause those costs to be 19
incurred by Black Hills Power. 20
000820

9
Q. PLEASE EXPLAIN HOW THE CLASS REVENUE RESPONSIBILITIES 1
WERE DEVELOPED. 2
A. Due to the newness of the shown inequities between the expected returns between 3
the five customer classes under current rates, the Company proposes to increase 4
the charges for all classes consistent with certain constraints. Under the proposed 5
rate design, no customer class will receive an increase which is less than 75 6
percent of the overall revenue increase. Also, no customer class will experience 7
an increase greater than 120 percent of the overall increase for all customers. The 8
boundaries for acceptable percentage increases then become approximately 7 9
percent and 12 percent. This proposed class revenue allocation provides an 10
appropriate and reasoned movement of rates to class cost levels to maintain 11
accurate and equitable pricing while being tempered by moderation. The 12
moderation in this proposal also recognizes the overall level of the proposed 13
increase. 14
Using the proposed class revenues and applying rate design factors mentioned 15
above, Black Hills Power developed appropriate base rate charges. These charges 16
are necessary to allow Black Hills Power the opportunity to recover, from each 17
class, the currently appropriate class revenue requirement and the total annual 18
revenue requirement as applied for by the Company. 19
000821

10
Q. ARE THERE OTHER REASONS WHY NOW IS NOT THE 1
APPROPRIATE TIME TO MOVE TO FULLY COST-BASED RATES? 2
A. Yes. With the electric utility industry on the verge of fully deploying AMI, there 3
will likely be innovations in how customer groupings are determined, along with 4
an increased utilization of rate designs applicable to load data rich metering. Rates 5
which may see increased application include demand rates, time of use rates and 6
peak control rates. Rather than subjecting customers to the impact of full cost of 7
service rates today and then coming forward in a few years with another major 8
change, Black Hills Power would prefer to wait to see what develops. 9
Q. DO YOU BELIEVE THAT THE RATES AND CHARGES PROPOSED BY 10
THE COMPANY WILL RESULT IN JUST AND REASONABLE RATES? 11
A. Yes. With my years of experience in rate making and my understanding of the 12
situation presented today, I believe that the Company’s proposal is fair and will 13
result in just and reasonable rates. 14
VI. PROPOSED CHANGES TO TARIFFS 15
Q. HAS THE COMPANY MADE CHANGES TO THE APPLICABILITY 16
PROVISIONS OF ITS RESIDENTIAL TARIFFS IN RESPONSE TO 17
INCREASING INTEREST NATIONALLY IN CUSTOMER-OWNED 18
BEHIND THE METER DISTRIBUTED GENERATION? 19
A. Yes. 20
000822

11
Q. PLEASE PROVIDE THE REASONS FOR THIS CHANGE IN 1
APPROACH? 2
A. Nationally, customers are showing a growing interest in utilizing distributed self-3
generation for meeting portions of the electricity they require within their homes. 4
Due to traditional approaches for pricing residential electric service, these 5
customers are often receiving more savings incentive for their self-generation than 6
is appropriate for the costs the utility saves by not fully serving them. 7
Additionally, because residential charges frequently have not been set to match 8
costs, the utility also fails to recover the real cost to serve the partially self-9
generating residential customers. These unbilled costs then must be paid by all 10
other residential customers. Black Hills Power is fortunate that for over three 11
decades it has offered the Residential Demand Service rate which has the 12
appropriate pricing that can be used for this type of application. 13
Q. WHAT CHANGES HAVE BEEN MADE TO THE RESIDENTIAL 14
TARIFFS? 15
A. Language has been added to the APPLICABLE section of the Residential Demand 16
Service tariff to specify that residential partial requirements service will only be 17
available under this rate schedule. The Residential Service tariff and the Total-18
Electric Residential Service will be available for all-requirements service only. 19
Black Hills Power has some residential customers that have generation 20
interconnection agreements related to their service requirements. For these 21
customers the Residential Demand Service schedule includes language whereby 22
000823

12
they can remain on the rate schedule applicable at the time when their agreement 1
became effective for the term of the agreement or through September 30, 2024, 2
which ever period is shorter. By making the changes at this time, this 3
grandfathering provision would only apply to about a dozen customers. The result 4
is that Black Hills Power’s customers will have appropriate price signals should 5
they consider investing in distributed generation for meeting some of the 6
electricity requirements for their homes. 7
VII. STATEMENT R COAL PRICING 8
Q. PLEASE EXPLAIN THE COAL SUPPLY ARRANGEMENT FOR BLACK 9
HILLS POWER’S COAL FIRED POWER PLANTS. 10
A. Black Hills Power has a Coal Supply Agreement with Wyodak Resources to 11
provide coal to the Company’s coal-fired power plants. The pricing for the Coal 12
Supply Agreement is based on what the Company refers to as ‘Statement R’ 13
pricing because it has historically corresponded to the Statement in the rate case 14
application that details the coal price calculation for coal purchased from the 15
Company’s affiliate. Under this methodology, Black Hills Power’s coal costs are 16
determined by calculating the amount that allows Wyodak Resources to recover its 17
cost of service related to the coal sales to Black Hills Power, plus a return on 18
investment. That return is the average interest rate for new, long-term A-rated 19
utility bonds issued during the calendar year for which the calculation is being 20
made, plus four hundred basis points. This is a utility type rate of return 21
methodology. This methodology has been presented and accepted by this 22
000824

13
Commission previously for Black Hills Power for decades. In addition, this 1
pricing methodology has been accepted by third parties with ownership interests at 2
the Gillette Energy Complex such as the City of Gillette and Montana Dakota 3
Utilities Co. 4
Q. DO BLACK HILLS POWER’S CUSTOMERS BENEFIT FROM THE 5
EXISTENCE OF THE COAL SUPPLY AGREEMENT? 6
A. Yes. The coal supply arrangement is beneficial to Black Hills Power’s customers 7
for several reasons. All remaining coal-fired power plants are mine-mouth 8
facilities, which eliminate almost all transportation costs. In addition, the Coal 9
Supply Agreement is a long term supply agreement, providing coal for the life of 10
the facilities. 11
VIII. BUSINESS CASE FOR UTILITY OWNED GENERATION 12
Q. ARE THERE BENEFITS OF UTILITY OWNED GENERATION? 13
A. Yes. In the three decades that I have worked in the utility industry, I have seen the 14
results of both long-term power purchase relationships and utility-owned 15
generation. I have come to strongly believe that the best resource acquisition for 16
meeting the majority of customer electricity requirements is to own and control 17
generation. There are several benefits to utility ownership including the 18
following: 19
Typically utility owned generation provides more price stability for 20
customers over the long term than power purchase agreements (“PPA”) that 21
have shorter terms than the expected useful life of the generation. By 22
000825

14
owning and controlling generation, Black Hills Power can protect 1
customers from market forces that may drive prices up when the utility is 2
seeking new supply to replace a PPA that is expiring. Frequently PPA 3
suppliers seek renewal prices that are higher than what the underlying 4
generation assets would allow under cost-based regulation. It can be said 5
that under twenty year PPAs, the customers often pay for the supplier’s 6
generation facilities more than once. Also, constructing and owning 7
generation gives Black Hills Power customers the security of supply and 8
the cost benefits of long-lived and depreciating assets. With utility-owned 9
generation, the rate base declines over time while PPAs typically have 10
lower cost at the beginning, but rise over the term of the agreement. 11
The utility has an obligation to provide customers with reliable service; 12
therefore, it has no motivation to let demand outpace supply, which 13
increases the cost of generation and ultimately the cost to customers. In 14
other words, utilities are paid for their actual cost of providing the 15
generation while independent power producers generally are providing 16
power at the market price which may be affected by the laws of supply and 17
demand. 18
The utility’s profits on generation come in the authorized return on equity 19
on the actual capital invested in the generating resource. This return is 20
typically less than that required by a competitive non-regulated entity. 21
Since independent power producers may charge market-based rates under a 22
000826

15
tariff on file with the Federal Energy Regulatory Commission (“FERC”), 1
the only limit on the size of that return is the market value for purchased 2
power. 3
Utility ownership of capacity provides operational benefits and security and 4
will result in a more financially sound utility, which benefits customers. 5
These benefits include outage management, dispatch, ramp rates, unit 6
commitments and capital additions for increased efficiency and life 7
extension, and also compliance with new regulations. Often PPAs limit the 8
flexibility the utility has in utilizing the resource to meet changing 9
operating conditions. 10
IX. SUPPORT FOR THE DECISION TO CONSTRUCT CPGS 11
Q. PLEASE PROVIDE A SUMMARY OF THE DECISION TO CONSTRUCT 12
CPGS. 13
A. In 2011, Cheyenne Light recognized that it would need new electric resources to 14
offset load growth and the expiration of long-term PPAs. As a consequence, 15
Cheyenne Light completed an integrated resource plan (“IRP”) that identified a 16
capacity deficit of 93 MW in 2014 and exceeding 150 MW by the end of the 20-17
year plan. Consistent with the IRP, Cheyenne Light filed an Application for a 18
Certificate of Public Convenience and Necessity on August 1, 2011 with the 19
Wyoming Public Service Commission to construct three combustion turbine 20
generators (“CTG”) on a site in Cheyenne, Wyoming. 21
000827

16
At the same time, Black Hills Power began work on an IRP to identify the future 1
needs of its customers. The future resource needs of Black Hills Power were 2
driven primarily by the impact of environmental regulatory requirements on its 3
existing generating facilities. Based on regulatory requirements and economics, 4
the Black Hills Power IRP identified that the Ben French, Neil Simpson I, and 5
Osage coal-fired units owned by Black Hills Power will be retired in 2014. In 6
addition, certain PPAs of Black Hills Power will terminate over the 20-year IRP 7
planning horizon. 8
The preferred plan identified in the Black Hills Power IRP included the conversion 9
of a CTG to combined cycle (“CC”) operation, in the 2014 time frame. As a result 10
of the preferred plan in Black Hills Power’s IRP, consideration was given to 11
whether siting a CC resource in Cheyenne would present an opportunity for both 12
Black Hills Power and Cheyenne Light. 13
To assess the benefits and risks of a jointly-owned CC unit, Black Hills Power and 14
Cheyenne Light undertook additional analysis and modeling to determine the 15
financial impact on the completed resource plans. The result of the analysis 16
indicated that a jointly-owned CC unit, one CTG owned by Cheyenne Light, and 17
additional firm market purchases resulted in lower present value of revenue 18
requirements than the resource scenario identified in Cheyenne Light’s original 19
IRP. 20
000828

17
Q. WHY DOES BLACK HILLS POWER BELIEVE A CC IS THE 1
APPROPRIATE GENERATION RESOURCE FOR ITS CUSTOMERS? 2
A. Black Hills Power believes that the increased initial capital cost per kW of a CC, 3
as compared to CTGs, will be offset by the benefits associated with a more fuel 4
efficient CC. The advantages of a CC include operation at a lower heat rate, lower 5
environmental emissions, and reduced exposure to future environmental mandates 6
or taxes. In addition, Black Hills Power believes that it is in the best interest of 7
customers to build and own generation rather than relying on PPAs. Therefore, 8
Black Hills Power believes that the construction of the jointly owned CC will 9
provide reliable electricity to its customers for years to come and mitigate the risk 10
of economy energy not being available in the market. 11
Q. WHY DID BLACK HILLS POWER ELECT TO CONSTRUCT A NEW 12
GENERATION FACILITY IN CHEYENNE WYOMING? 13
A. The Cheyenne, Wyoming location was chosen for CPGS because it provides an 14
adequate and efficient water supply, an abundant natural gas supply, and access to 15
available electric transmission. 16
Q. HAS THE SOUTH DAKOTA PUBLIC UTILITIES COMMISSION 17
(“COMMISSION”) HAD AN OPPORTUNITY TO CONSIDER ANY 18
FILINGS RELATED TO CPGS? 19
A. Yes. Pursuant to S.D.C.L. §§ 49-34A-73 to 78, Black Hills Power filed an 20
Application for the Phase In of Rates Regarding CPGS Construction Financing 21
Costs with the Commission on December 17, 2012, Docket EL12-062. On 22
000829
18
September 19, 2013, the Commission approved the phase in plan rate for CPGS 1
through a Decision and Order Granting Joint Motions for Approval of Settlement 2
Agreement and Settlement Stipulation. 3
Q. DID BLACK HILLS POWER OBTAIN A CERTIFICATE OF PUBLIC 4
CONVENIENCE AND NECESSITY FOR CPGS FROM THE WYOMING 5
PUBLIC SERVICE COMMISSION? 6
A. Yes. Black Hills Power and Cheyenne Light filed a Joint Application for a 7
Certificate of Public Convenience and Necessity (“CPCN”) on November 1, 2011, 8
which was approved by the Wyoming Public Service Commission by a 9
Memorandum Decision dated January 8, 2013, in Docket Nos. 20002-81-EA-11 10
and 20003-113-EA-11 (Record No. 13007). 11
Q. DOES THIS CONCLUDE YOUR TESTIMONY? 12
A. Yes. 13
000830

CHEYENNE LIGHT, FUEL ANDPOWER COMPANY
BLACK HILLS NON-REGULATEDHOLDINGS, LLC BLACK HILLS POWER, INC. BLACK HILLS UTILITY
HOLDINGS, INC.
BLACK HILLS EXPLORATIONAND PRODUCTION, INC.
WYODAK RESOURCESDEVELOPMENT CORP.
BLACK HILLS ELECTRICGENERATION, LLC
BLACK HILLS SERVICECOMPANY, LLC
BLACK HILLS CORPORATION
BLACK HILLS/COLORADOELECTRIC UTILITY
COMPANY, LP
BLACK HILLS/COLORADO UTILITY
COMPANY II, LLC
BLACK HILLS/IOWAGAS UTILITY
COMPANY, LLC
BLACK HILLS/KANSAS GAS UTILITY
COMPANY, LLC
BLACK HILLS/NEBRASKA GAS UTILITY
COMPANY, LLC
BLACK HILLS/COLORADO UTILITY
COMPANY, LLC
BLACK HILLS/COLORADOGAS UTILITY
COMPANY, LP
Doing business as BLACK HILLS ENERGY
000831
mtoney
Typewritten Text
Exhibit KDW-1 Black Hills Corporation Organizational Chart
mtoney
Typewritten Text
mtoney
Typewritten Text
mtoney
Typewritten Text
mtoney
Typewritten Text
mtoney
Typewritten Text
mtoney
Typewritten Text
mtoney
Typewritten Text
mtoney
Typewritten Text
mtoney
Typewritten Text
mtoney
Typewritten Text
mtoney
Typewritten Text
mtoney
Typewritten Text
mtoney
Typewritten Text
mtoney
Typewritten Text

BLACK HILLS NON-REGULATEDHOLDINGS, LLC
WYODAK RESOURCESDEVELOPMENT CORP.
BLACK HILLS CORPORATION
BLACK HILLS CABRESTO
PIPELINE, LLC
BLACK HILLS ELECTRICGENERATION, LLC
BLACK HILLSMIDSTREAM, LLC
BLACK HILLS GASRESOURCES, INC.
BLACK HILLS GASHOLDINGS CORP.
BLACK HILLS PLATEAU
PRODUCTION, LLC
MALLON OIL COMPANY, SUCURSAL
COSTA RICA
BLACK HILLSWYOMING, LLC
BLACK HILLS COLORADO IPP,
LLC
GENERATION DEVELOPMENTCOMPANY, LLC
BLACK HILLS EXPLORATIONAND PRODUCTION, INC.
000832

000833
mtoney
Typewritten Text
mtoney
Typewritten Text
Exhibit KDW-2 Black Hills Corporation Subsidiary List
mtoney
Typewritten Text
mtoney
Typewritten Text

Direct Testimony and Exhibits
Jill S. Tietjen
Before the South Dakota Public Utilities Commission
of the State of South Dakota
In the Matter of the Application of
Black Hills Power, Inc., a South Dakota Corporation
For Authority to Increase Rates
in South Dakota
Docket No. EL14-___
March 31, 2014
000834

i
TABLE OF CONTENTS
I. INTRODUCTION & QUALIFICATIONS .............................................................. 1
II. PURPOSE OF TESTIMONY ................................................................................... 2
III. NEED FOR RESOURCES ....................................................................................... 3
IV. BLACK HILLS POWER’S INTEGRATED RESOURCE PLAN ........................... 6
V. SELECTION OF CPGS .......................................................................................... 13
EXHIBITS
Exhibit JST-1 Jill Tietjen Qualifications
Exhibit JST-2 Black Hills Power 2011 Integrated Resource Plan
000835

1
I. INTRODUCTION & QUALIFICATIONS 1
Q. PLEASE STATE YOUR NAME AND BUSINESS ADDRESS. 2
A. My name is Jill S. Tietjen. My business address is 8547 E. Arapahoe Road, PMB 3
J189, Greenwood Village, Colorado. 4
Q. BY WHOM ARE YOU EMPLOYED AND WHAT IS YOUR POSITION? 5
A. I am the President and CEO of Technically Speaking, Inc., a firm that provides 6
engineering consulting services. I have held this position since the firm was 7
incorporated in August of 2005. Previously, I was self-employed as an 8
engineering consultant. 9
Q. PLEASE DESCRIBE YOUR EDUCATIONAL AND WORK 10
BACKGROUND. 11
A. I graduated from the University of Virginia with a B.S. in Applied Mathematics 12
(minor in Electrical Engineering) in 1976. I began my career with Duke Power 13
Company and spent five years as a Planning Engineer in the System Planning 14
Department (1976-1981). While at Duke Power Company, I earned my MBA 15
from the University of North Carolina at Charlotte in 1979. I subsequently joined 16
Mobil Oil Corporation’s Mining and Coal Division where I worked from 1981-17
1984 as a planning analyst. I became a registered professional engineer in 18
Colorado in 1982. I joined Stone & Webster Management Consultants in 1984 19
and by the time I left in 1992 had progressed to Assistant Vice President. I served 20
as Principal and leader of the utility planning practice at Hagler Bailly Consulting 21
during 1992-1995. In 1995, I rejoined Stone & Webster Management Consultants 22
000836

2
as an Assistant Vice President and office manager for the Denver office, a position 1
that I served in through 1997. Since 1997, I have been on staff at the University of 2
Colorado at Boulder. From 1997-2005, I was also self-employed as an 3
engineering consultant. Also in 1997, I was elected as an outside director on the 4
Board of Directors of Georgia Transmission Corporation and still serve in that 5
capacity. In 2010, I was elected as an outside director for Merrick & Company of 6
Aurora, Colorado. My resume, testimony listing, and publications listing are 7
attached to my testimony as Exhibit JST-1. 8
Q. HAVE YOU TESTIFIED PREVIOUSLY IN PROCEEDINGS BEFORE 9
REGULATORY COMMISSIONS? 10
A. Yes. I have testified before regulatory commissions in South Dakota, Wyoming, 11
Colorado, Illinois, Kansas, Kentucky, Maine, Missouri, and Ohio. I have testified 12
on behalf of Black Hills Corporation subsidiaries in South Dakota, Wyoming and 13
Colorado. 14
Q. FOR WHOM ARE YOU TESTIFYING ON BEHALF OF TODAY? 15
A. I am testifying on behalf of Black Hills Power, Inc. (Black Hills Power). 16
II. PURPOSE OF TESTIMONY 17
Q. WHAT IS THE PURPOSE OF YOUR TESTIMONY? 18
A. I demonstrate the need for a new resource on the Black Hills Power system in the 19
2014 timeframe. I discuss Black Hills Power’s 2011 Integrated Resource Plan 20
(BHP IRP) that was conducted to determine how that resource need should be 21
fulfilled. I then discuss the selection of the Cheyenne Prairie Generating Station 22
000837

3
(CPGS) as the resource that should be installed in 2014 and the associated 1
rationale. 2
III. NEED FOR RESOURCES 3
Q. PLEASE DESCRIBE THE FACTORS AFFECTING THE NEED FOR NEW 4
RESOURCES ON THE BLACK HILLS POWER SYSTEM. 5
A. Two primary factors are driving the need for new resources on the Black Hills 6
Power system. The first is regulations promulgated by the Environmental 7
Protection Agency (EPA) and the resulting retirements of several of Black Hills 8
Power’s older coal-fired generating units. The second is the expiration of the 9
Reserve Capacity and Integration Agreement (RCIA) between Black Hills Power 10
and PacifiCorp. 11
Q. HOW DID BLACK HILLS POWER EVALUATE THE COST OF 12
RETROFITTING THE POWER PLANTS THAT DO NOT COMPLY 13
WITH THE NEW EPA NATIONAL EMISSION STANDARDS FOR 14
HAZARDOUS AIR POLLUTANTS FOR AREA SOURCES: 15
INDUSTRIAL, COMMERCIAL AND INSTITUTIONAL BOILERS (AREA 16
SOURCE RULES)? 17
A. Black Hills Power contracted with an engineering firm, CH2M HILL, to perform 18
an analysis on several of its smaller coal-fired generating units. The analysis 19
provided an estimate of the capital cost to add emission controls to these units to 20
meet the existing and future air pollution control requirements. These 21
requirements would entail the addition of emission controls, installation of 22
000838

4
monitoring equipment, restrictions on the quality of coal received and adherence 1
to new operating parameters established during the compliance test. The units 2
evaluated were Neil Simpson Unit 1; Osage Units 1, 2, and 3; and Ben French 3
Unit 1, which are all coal-fired units. After reviewing the study results, including 4
life extension costs, Black Hills Corporation made the decision to retire (and 5
replace) the Neil Simpson 1, Osage 1-3 and Ben French 1 units because that 6
option was more cost effective than retrofitting the units. Ben French, Osage 1-3, 7
and Neil Simpson 1 were officially retired in March of 2014. With these 8
retirements, Black Hills Power’s generation capacity was reduced by 71 MW. 9
Q. WHEN DID THE RCIA EXPIRE AND WHAT IS THE RESULT OF THAT 10
EXPIRATION? 11
A. The RCIA expired June 30, 2012. Under the RCIA, Black Hills Power could 12
count the Ben French combustion turbine (CT) capacity as 100 MW. This was 13
important because the output from Black Hills Power’s older coal-fired generating 14
units is reduced at higher ambient temperatures. Those higher temperatures occur 15
in the summer months of June, July, and August, and coincide with Black Hills 16
Power’s peak load periods. The RCIA allowed Black Hills Power the right to call 17
on PacifiCorp for any of the 100 MW that could not be generated by the Ben 18
French CTs. After termination of the RCIA, the Ben French CTs are rated at 72 19
MW in the summer. This means that the termination of the RCIA has led to a total 20
of 28 MW of capacity that could no longer be counted as Black Hills Power 21
000839

5
resources available to meet the summer peak demand. This loss of 28 MW of 1
capacity began July 1, 2012. 2
Q. IN TOTAL, HOW MUCH NET SUMMER CAPACITY WILL BLACK 3
HILLS POWER HAVE RETIRED OR OTHERWISE LOST BETWEEN 4
2011 AND 2014? 5
A. Black Hills Power will have lost 99 MW of net summer capacity, calculated as 6
follows: 7
RCIA expiration 28 MW 8
Osage retirement 33 MW 9
Ben French retirement 22 MW 10
Neil Simpson 1 retirement 16 MW 11
TOTAL 99 MW 12
Q. PLEASE DESCRIBE HOW TO FIND THIS 99 MW DECREASE IN 13
RESOURCES IN THE BHP IRP. 14
A. The Load and Resource Balance provided as Appendix B in the BHP IRP reflects 15
the 28 MW loss due to the expiration of the RCIA and the retirements of Ben 16
French 1 (22 MW) and Neil Simpson 1 (16 MW). A discussion of the retirement 17
of the Osage units (33 MW) is contained in Section 6.2 of the BHP IRP. Because 18
the Osage units were in cold storage at the time the BHP IRP was conducted (and 19
not expected to be reactivated before their 2014 retirement), those 33 MW of 20
capacity are not reflected as available either in Table 6-1 or Appendix B of the 21
BHP IRP. 22
000840

6
Q. WHAT PERCENTAGE OF BLACK HILLS POWER’S PEAK DEMAND IS 1
REPRESENTED BY THIS 99 MW OF CAPACITY LOSSES FROM 2012 2
THROUGH 2014? 3
A. In the BHP IRP, Black Hills Power’s peak demand in 2014 is estimated to be 430 4
MW (see Table 4-1 of the BHP IRP). Thus, the loss of 99 MW represented 23% 5
of Black Hills Power’s 2014 projected peak summer demand. 6
IV. BLACK HILLS POWER’S INTEGRATED RESOURCE PLAN 7
Q. PLEASE DESCRIBE THE BHP IRP. 8
A. The BHP IRP examined the period 2011-2030 and determined the appropriate 9
resources to fill resource needs over that 20-year period. A load forecast of 10
projected peak demands and annual energy consumption was developed. 11
Appropriate assumptions were made for the wide variety of parameters required to 12
model the operation of the generating units. Characteristics required to model all 13
existing resources were confirmed. The analysis considered a range of 14
conventional supply-side resources as well as renewable resources with modeling 15
and operational parameters developed for each. The computer modeling that was 16
conducted consisted of capacity expansion, production costing, sensitivity, and 17
risk analysis. Ventyx, a leading integrated resource planning vendor, performed 18
the computer modeling. The BHP IRP is provided as Exhibit JST-2 to my 19
testimony. 20
000841

7
Q. WHAT CATEGORIES OF ASSUMPTIONS UNDERLIE THE 1
PREPARATION OF AN IRP? 2
A. In addition to the load forecast, assumptions are needed for fuel prices, financial 3
parameters, capital cost of generation resources, the level of reserves required, 4
plant operational parameters, and the market price of energy. Assumptions must 5
also be made for the demand-side management programs put in place during the 6
planning period and their peak demand and annual energy impact. 7
Q. PLEASE DESCRIBE THE PRICE FORECASTS USED FOR FUEL COSTS 8
IN THE BHP IRP. 9
A. Black Hills Power used a coal price forecast that reflects the cost as of May 2011 10
incurred for fuel delivered to its coal-fired power plants. The coal prices were 11
then escalated to result in the forecast to match the Ventyx reference case, with 12
annual coal escalation averaging about 3% per year. Natural gas price forecasts 13
were developed from Ventyx’s WECC 2011 Spring Reference Case Henry Hub 14
forecast. The Henry Hub values were adjusted for transportation costs to more 15
accurately reflect the price of natural gas as delivered to Black Hills Power’s 16
generating facilities. 17
Q. PLEASE DESCRIBE THE ASSUMPTIONS USED FOR THE MARKET 18
PRICE OF ENERGY. 19
A. Electricity price estimates for the Wyoming region were derived from Ventyx’s 20
2011 Spring Reference Case and are the basis on which Black Hills Power’s 21
market transactions were priced. Values were developed for four differing 22
000842

8
scenarios that require correlation between natural gas prices and market prices – 1
base, environmental, low gas, and high gas. 2
Q. PLEASE DESCRIBE THE FINANCIAL PARAMETER ASSUMPTIONS 3
USED FOR THIS IRP. 4
A. Assumptions were required for various financial parameters, including the 5
discount rate, the capital structure, and the levelized fixed charge rates for each of 6
the resource alternatives. The assumptions used for the BHP IRP are shown on 7
Table 3-3. 8
Q. PLEASE DESCRIBE THE CAPITAL COSTS OF GENERATION 9
RESOURCE ASSUMPTIONS. 10
A. Black Hills Power used the Ventyx 2011 Spring Reference Case assumptions for 11
capital costs of a variety of generation resources (shown in Tables 6-3 through 6-12
8). These assumptions include the direct capital costs of coal, a variety of natural 13
gas-fired configurations and renewable generation that are non-site specific. This 14
means that the costs for transmission interconnection, gas fuel supply system 15
installation and ancillary equipment were not included in the capital cost 16
assumptions. 17
Q. WHAT LEVEL OF PLANNING RESERVE MARGIN WAS USED FOR 18
THE BHP IRP AND HOW WAS THIS LEVEL DETERMINED? 19
A. Black Hills Power assumed a planning reserve margin of 15% over projected peak 20
demand for this analysis. It was anticipated that the level of reserve margin 21
000843

9
required by Black Hills Power will not change during the entire 20-year planning 1
horizon evaluated in the BHP IRP. 2
Q. PLEASE DESCRIBE THE DEMAND-SIDE MANAGEMENT 3
ASSUMPTIONS USED FOR THE BHP IRP. 4
A. The Black Hills Power Demand-Side Management programs as defined in SD 5
PUC Docket #EL11-002 and approved by the Commission were assumed to be 6
implemented. Those programs and the associated savings in demand and energy 7
are reflected in Section 5.0 of the BHP IRP. 8
Q. PLEASE DESCRIBE THE RANGE OF NEW CONVENTIONAL 9
RESOURCES EXAMINED IN THE COURSE OF PREPARING THE BHP 10
IRP. 11
A. Conventional resources examined in the BHP IRP include coal-fired capacity, 12
natural gas-fired simple cycle and combined cycle combustion turbines, the 13
purchase of a portion of an existing unit, and firm market purchases. 14
Q. PLEASE DESCRIBE THE RENEWABLE RESOURCES EXAMINED IN 15
THE COURSE OF PREPARING THE BHP IRP. 16
A. The renewable resources examined were wind and solar photovoltaics. 17
Q. PLEASE DESCRIBE THE PROCESS USED TO DETERMINE THE LOAD 18
FORECAST AND THE RESULTS. 19
A. Ventyx developed a load forecast for Black Hills Power by trending historical 20
peak demands and annual energy and modifying the results for expected load 21
additions in 2012 through 2016. The trended growth for Black Hills Power is 22
000844

10
1.0% for both peak demand and annual energy as shown on Table 4-1 of the BHP 1
IRP. These growth rates do not reflect any significant increases in loads for major 2
industrial customers on the Black Hills Power system as no significant increases 3
were expected at the time the BHP IRP was prepared. As set forth in the BHP 4
IRP, loads for major industrial customers are expected to trend forward without 5
significant decreases or increases throughout the planning horizon. 6
Q. HOW DOES THE LOAD FORECAST DETERMINE CAPACITY 7
REQUIREMENTS FOR BLACK HILLS POWER? 8
A. Black Hills Power must maintain sufficient capacity to support peak load 9
requirements plus planning reserves. Black Hills Power has a legal obligation to 10
serve the needs of its customers – as those needs exist today and as they grow over 11
time. The first year that Black Hills Power has a capacity deficit is 2014 as shown 12
on Figure ES-1. 13
Q. PLEASE BRIEFLY EXPLAIN CAPACITY EXPANSION MODELING. 14
A. Capacity expansion modeling is a process used to determine the appropriate type, 15
size, and timing for economic resource additions for utilities. The utility’s existing 16
generation resources and future resource alternatives are inputted into a capacity 17
expansion model with a forecasted load and other appropriate parameters over the 18
entire planning horizon. The model simulates utility operation, serves the 19
forecasted load with the utility’s existing resources, and economically “selects” 20
additional resources from the list of available resource alternatives subject to the 21
planning constraints. The typical criterion for evaluation is the expected present 22
000845

11
value of revenue requirements (PVRR). Capacity expansion plans are developed 1
for scenarios that vary the assumptions in order to simulate changing market and 2
load conditions. 3
Q. PLEASE BRIEFLY EXPLAIN PRODUCTION COSTING MODELING. 4
A. Production cost modeling is a process used to forecast system costs over a 5
specified planning horizon. A production cost model includes an hourly dispatch 6
model, with a load forecast and fixed resources to serve that load. The model 7
simulates a load every hour, then economically serves that load with the available 8
resources, and captures the associated cost. 9
Q. WHAT SCENARIOS WERE EXAMINED IN THE BHP IRP? 10
A. As described in Section 7.1 of the BHP IRP, scenarios examined included base, 11
environmental, high gas, low gas, high load, low load, step load, Gillette Top 12
Load, Base with No Firm Market, and No Combined Cycle Conversion Option. 13
What this means is that alternative expansion plans were developed for each 14
scenario, costs were determined for each scenario, and a risk assessment was 15
conducted for each scenario. The resulting optimal expansion plans for each 16
scenario are reflected on Table 7-2 of the BHP IRP. A conversion of a 17
combustion turbine to combined cycle operation was selected as the resource 18
choice for 2014 for each scenario except the scenario in which that resource option 19
was specifically excluded (which is reflected in the BHP IRP as the “No CC Conv 20
Option”). 21
000846

12
Q. HOW DOES THE 2011 LOAD FORECAST COMPARE TO ACTUALLY 1
EXPERIENCED LOADS IN THE 2011-2013 TIME FRAME? 2
A. The 2011 peak demand of 452 MW and the 2012 peak demand of 449 MW 3
reached levels that were forecast for the 2017-2018 time frame in the BHP IRP. 4
The 2013 peak demand experienced was lower than forecast in the BHP IRP. 5
Q. IN WHAT YEAR DID THE BHP IRP FIRST SHOW A CAPACITY 6
DEFICIT? 7
A. The first year to show a capacity deficit in the BHP IRP is 2014. This capacity 8
deficit is shown graphically in Figure ES-1 on page ES-5 of the BHP IRP. 9
Q. WHAT GENERATION RESOURCE WAS SELECTED IN THE BHP IRP 10
TO MEET THE 2014 RESOURCE NEED. 11
A. The resource shown to meet Black Hills Power’s 2014 need in the BHP IRP is the 12
conversion of a combustion turbine unit to combined cycle operation. This 13
resource selection results in the addition of 55 MW to the Black Hills Power 14
system. Thus, in order to satisfy reserve margin requirements, the BHP IRP 15
further shows that Black Hills Power would purchase 25 MW of firm power in 16
2014. Note that as discussed previously in my testimony, 99 MW of resources are 17
no longer available due to retirements and contract expiration. The BHP IRP 18
selects 80 MW of resources in 2014 (less than 99 MW) to meet reserve margin 19
criteria and serve load. 20
000847

13
V. SELECTION OF CPGS 1
Q. DO YOU BELIEVE THAT THE BHP IRP SELECTED A RESOURCE 2
LIKE OR SIMILAR TO CPGS? 3
A. Yes. The BHP IRP selected a 2014 resource that was the conversion of a simple 4
cycle combustion turbine to combined cycle operation, resulting in the addition of 5
55 MW to the Black Hills Power system, plus the procurement of 25 MW of firm 6
market power. As stated in the Executive Summary and the Action Plan of the 7
BHP IRP, Black Hills Power’s 2014 resource would be procured by “Purchase or 8
otherwise obtain a simple cycle combustion turbine to be converted to combined 9
cycle operation in 2014.” The BHP IRP does not specify location or size of that 10
simple cycle combustion turbine other than that it supports a 55 MW addition 11
when converted to combined cycle operation. 12
Q. DO YOU THINK THAT A SIMPLE CYCLE COMBUSTION TURBINE 13
CONVERTED TO COMBINED CYCLE OPERATION IN CHEYENNE, 14
WYOMING IS WHAT WAS INTENDED BY THE BHP IRP? 15
A. Yes. I think it is one of several choices available to Black Hills Power. I believe 16
that an IRP identifies the type of resource that makes the most economic sense to 17
add for any given capacity deficit. I further believe that it is up to the utility to 18
make the business decision based on the business case that makes the most sense 19
for that utility’s customers. In this instance, an opportunity existed for synergies 20
with a capacity need demonstrated by an affiliate of Black Hills Power – 21
000848

14
Cheyenne Light, Fuel & Power. In my opinion, Black Hills Power properly took 1
advantage of those synergies to construct CPGS. 2
Q. DOES THIS CONCLUDE YOUR TESTIMONY? 3
A. Yes, it does. 4
000849

JILL S. TIETJEN
An electrical engineer experienced in electric utility and related planning processes and analyses,
primarily in the areas of generation, transmission, and fuels. Experienced expert witness.
EMPLOYMENT CHRONOLOGY
1997-present Technically Speaking, Inc. (and predecessor organizations), President and
CEO
2001-present University of Colorado at Boulder, Various Titles
2003-2005 Senior Management Consultant, R.W. Beck
2001-2008 Senior Engineer, McNeil Technologies
1997-2000 University of Colorado at Boulder
Director, Women in Engineering Program and Independent Consultant
1995-1997 Stone & Webster Management Consultants, Inc.
Assistant Vice President
1992-1995 Principal, Hagler Bailly Consulting (Previously RCG/Hagler Bailly)
1984-1992 Stone & Webster Management Consultants, Inc.
Assistant Vice President
1981-1984 Mobil Oil Corporation, Planning Analyst, Mining and Coal Division
1976-1981 Duke Power Company, Planning Engineer
CONSULTING ASSIGNMENTS
Examined the process used by Big Rivers Electric Corporation to determine that a scrubber should be
installed at Henderson Station Two. Expert witness before the Kentucky Public Service Commission.
Managed several projects relating to the efficiency of qualified facilities. One project involved
preparation of an affidavit in a Federal Energy Regulatory Commission hearing. Managed an appraisal
of an IPP in bankruptcy.
Evaluated fuel contracts - primarily coal and petroleum coke - associated with cogeneration projects
in various states. Evaluated steam and power sales contracts as well as operational aspects, avoided cost
projections, and transmission issues of projects. Prepared feasibility studies and financial viability
analysis.
Managed competitive bidding solicitations for supply-side and/or renewable resources. Projects
included RFP and PPA development and evaluations of bids. Clients: Northern States Power; The
Empire District Electric Company; San Diego Gas & Electric; SaskPower; Southwestern Public Service;
and Cheyenne Light, Fuel & Power. Independent Evaluator for Southern California Edison and Pacific
Gas & Electric RFOs.
Investigated the competitive market price for the sale of power from coal-fired, geothermal, and
hydroelectric power plants. Performed earnings value evaluations for appraisal evaluations.
Prepared testimony or affidavits for cases before the Federal Energy Regulatory Commission and
before regulatory agencies in the states of Colorado, Illinois, Kansas, Kentucky, Maine, Missouri, Ohio,
South Dakota, and Wyoming. Topics have included fuel procurement practices, policies, and procedures;
integrated resource planning; nonutility generation markets; economic dispatch practices; avoided costs;
fuel and purchased power expenses; and electric system reliability.
Project manager of integrated resource planning studies for Bangor Hydro-Electric, Black Hills
Power, and the Empire District Electric Company. Efforts supported with testimony filed in multiple
jurisdictions. Authored Integrated Resource Plans for Black Hills Corporation (2005, 2007, 2008) and
The Empire District Electric Company (2006, 2007).
EXHIBIT JST-1
Jill Tietjen Qualifications

Jill S. Tietjen
Page 2 of 5
Managed fuel practices and policies audits of utilities. Participated in a management audit
investigating issues of generation planning. Participated in evaluations of system dispatch practices and
procedures.
Served as advisor to the Iowa Utilities Board on a priori ratemaking principles for utility construction
of electric power generation in Iowa.
Served as project manager for assessment of alternative wind technologies for a Midwestern utility.
Examined the feasibility and economics of biomass generation for a sawmill in Wyoming, an electric
utility in Arizona, a reservation in Minnesota, and a public utilities district in California.
Project manager and expert witness for a proceeding in Illinois with regard to a reliability rule
proposed by the staff of the Illinois Commerce Commission.
AFFILIATIONS
Society of Women Engineers – 1991-92 National President, Fellow.
Georgia Transmission Corporation, Board of Directors, 1997 – present.
Merrick & Company, Board of Directors, 2010 – present, Vice Chair 2013 – present.
National Women’s Hall of Fame, Board of Directors, 2009 – present, President 2014 – present.
Colorado State Board of Registration for Professional Engineers and Professional Land Surveyors,
1996-2004, Chair, 2001-2003.
Institute of Electrical and Electronics Engineers, Power Engineering Society, Senior Member.
International Women’s Forum (Colorado), Board of Directors, 1998 – 2000.
Rocky Mountain Electrical League Board of Directors, 1994-2002; President, 1999-2000.
Rocky Mountain Electrical League Foundation Board of Directors, 1999-2006, Chair, 2002-2005.
Girl Scouts – Mile Hi Council Board of Directors, 1999-2007, Chair, 2003-2007.
Board of Trustees, Arapahoe Library District, 1995-2000, President, 1997 – 1999.
Women in Engineering Programs & Advocates Network, Board of Directors, 1995 – 2001.
Leadership Denver 1996.
HONORS
1990 Certificate of Honor, Colorado Engineering Council. 1991 John E. Daly Award for Consulting
Excellence, Stone & Webster Management Consultants. Soroptomist International Women of
Distinction Award, 1995. Woman of Distinction, Mile Hi Girl Scouts Council, 1997. IEEE Spectrum
Advisor of the Year, 2000. Presidential Citation Award, Professional Land Surveyors of Colorado, 2000,
Woman in Technology Award from the Women’s Foundation of Colorado, Subaru, and News4, 2001.
Distinguished Service Award, Society of Women Engineers, 2002. Horizon Award, Outstanding
Professional, The Partnership to Advance Science, Engineering, and Technology, 2003. Colorado
Women’s Leadership Coalition, 2004 Woman Leader of Excellence. Virginia Engineering Foundation,
2004, Distinguished Alumni Award. Tau Beta Pi, 2004 Distinguished Alumna Award. One of 50 2004
Trendsetters, Public Works Magazine. University of Colorado at Boulder, Distinguished Engineering
Alumni Award, 2005. University of Virginia, Distinguished Alumna, 2007. Athena Award Finalist,
Colorado Women’s Chamber of Commerce, 2009, 2010. Colorado Women’s Hall of Fame, 2010.
EDUCATION AND OTHER
University of Virginia, B.S., Applied Mathematics with a minor in Electrical Engineering, 1976.
(Tau Beta Pi, Virginia Alpha).
University of North Carolina at Charlotte, M.B.A., 1979.
Registered Professional Engineer, Colorado.
3/2014
Exhibit JST-1 000851
JILL S. TIETJEN
Books/Reports/Articles/Speeches
Known as Karen Jill Stein 1954-1976
Known as Jill S. Baylor May 1976-August 1996
Books
1. Quoted in Members of the Club: The Coming of Age of Executive Women. 1993. Dawn-Marie Driscoll
and Carol R. Goldberg. New York: The Free Press, A Division of Macmillan, Inc.
2. She Does Math! Real-Life Problems from Women on the Job (contributing author). 1995. M. Parker, ed.
Washington, DC: The Mathematical Association of America.
3. Keys to Engineering Success. 2001. Jill S. Tietjen, Kristy A. Schloss, et. al. Upper Saddle River, New
Jersey: Prentice Hall. [Brief review in SWE: Magazine of the Society of Women Engineers,
March/April 2001, p. 4.]
4. Setting the Record Straight: An Introduction to the History and Evolution of Women’s Professional
Achievement. 2001. Betty Reynolds, Ph.D. and Jill S. Tietjen, P.E. Denver, Colorado: White Apple
Press.
5. Setting the Record Straight: The History and Evolution of Women’s Professional Achievement in
Engineering. 2001. Betty Reynolds, Ph.D. and Jill S. Tietjen, P.E. Denver, Colorado: White Apple
Press.
6. Setting the Record Straight: The History and Evolution of Women’s Professional Achievement in
Accounting. 2005. Betty Reynolds, Ph.D. and Jill S. Tietjen, P.E. Denver, Colorado: White Apple
Press.
7. Profiled and Pictured in Changing Our World: True Stories of Women Engineers. 2006. Sybil E. Hatch.
Reston, Virginia: ASCE Press.
8. Technical Consultant, Hedy Lamarr and a Secret Communication System. 2007. Trina Robbins.
Mankato, Minnesota. Capstone Press.
9. Her Story: A Timeline of the Women Who Changed America. 2008. Charlotte S. Waisman, Ph.D. and
Jill S. Tietjen, P.E. New York, New York. HarperCollins.
10. Keys to Engineering Success (Chinese language version). 2008. Jill S. Tietjen, Kristy A. Schloss, et.al.
Pearson Education, Prentice Hall.
11. Paper (written with Betty Reynolds) titled “Women Engineers Bridging the Gap” reprinted in an
anthology titled Women in Engineering: Pioneers and Trailblazers. 2009. Margaret E. Layne, PE,
editor. Reston, Virginia. American Society of Civil Engineers Press.
12. Profiled in Stuck: 12 Steps Up the Leadership Ladder. 2010. Sandra Ford Walston. Charleston, South
Carolina.
13. Her Story: A Timeline of the Women Who Changed America. 2013 (Paperback and Ebook). Charlotte S.
Waisman, Ph.D. and Jill S. Tietjen, P.E. New York, New York. William Morrow.
Technical Reports
1. RDI’s Outlook for Power in the U.S. (contributing author), Resource Data International, 1998.
2. Outlook for Power in North America, 1999 Annual Edition (contributing author), Resource Data
International, 2000.
3. Electric Transmission: Pathway To Power, Financial Times Energy, 2000.
4. Quoted and pictured in the Executive Summary, Women In Technology Report, Status of Women and
Girls in Colorado, Women’s Foundation of Colorado, 2001.
Exhibit JST-1 000852

Jill S. Tietjen
Page 2 of 4
5. Fuel From the Sky: Solar Power’s Potential for Western Energy Supply (technical writer), National
Renewable Energy Laboratory, NREL/BK-550-32160, July 2002.
6. Using the Fundamentals of Engineering (FE) Examination to Assess Academic Programs, (with Walter
LeFevre, John Steadman, Kenneth White and David Whitman), National Council of Examiners for
Engineering and Surveying, 2005.
Articles (Technical)
1. “Transmission Loss Evaluation for Electric Systems” (with Martin W. Gustafson). IEEE 87 SM 467-4,
IEEE Transactions on Power Systems, 3(3):1026-1032.
2. “Considerations in the Formation of Power Pooling Arrangements” (with Leslie A. Buttorff). 1987.
Public Utilities Fortnightly, November 26.
3. “The Equivalent Hours Loss Factor Revisited” (with Martin W. Gustafson and Steven S. Mulnix). IEEE
88 WM 166-1, IEEE Transactions on Power Systems, 3(4):1502-1507.
4. “Operational Losses Savings Attributable to Load Management” (with Martin W. Gustafson). IEEE 88
SM 659-5, IEEE Transactions on Power Systems, 4(1):229-235.
5. “Approximating the System Losses Equation” (with Martin W. Gustafson). 1989. IEEE 89 WM 146-2 —
PWRS, IEEE Transactions on Power Systems, 4(3):850-855.
6. “Power-System Loss Calculations Are Updated” (with Martin W. Gustafson). 1989. Transmission and
Distribution, November.
7. “Acid Rain Impacts on Utility Plans for Plant Life Extension.” 1990. Public Utilities Fortnightly, March.
8. “Making New Rules” (with Michael T. Burr, et al.). 1991. Independent Energy, July/August.
9. “The Fair Access Debate.” 1991. Independent Energy. September.
10. “Direct Water Heater Load Control — Estimating Program Effectiveness Using an Engineering Model”
(with Martin W. Gustafson and Gary Epstein). February 1993. IEEE 92 WM 130-5 — PWRS, IEEE
Transactions on Power Systems, 8(1):137-143.
11. Discussion for “Bulk Transmission System Loss Analysis.” Nadira, Wu, Maratukulam, Weber, and
Thomas (with Martin W. Gustafson). May 1993. IEEE 92 WM 097-6 — PWRS, IEEE Transactions on
Power Systems, 8(2):414.
12. “Estimating Air Conditioning Load Control Effectiveness Using an Engineering Model” (with Martin W.
Gustafson and Gary Epstein). August 1993. IEEE 92 SM 420-0 PWRS, IEEE Transactions on Power
Systems, 8(3):972-978.
13. “Communicating the Value of Dispatchability for Nonutility Generation Projects” (with D. Cotcher, K.D.
Krauss, and D. Logan). January 1995. IEEE 95 WM 123-0 — PWRS, IEEE Transactions on Power
Systems.
14. “The perils of power lines: aging infrastructure, aging workforce,” Licensure Exchange, National
Council of Examiner for Engineering and Surveying, April 2006, pp. 7-8.
15. “Pumped Storage Hydro,” The Encyclopedia of Energy Engineering, Capehart, Barney, Editor, Taylor &
Francis Group, LLC, 2007. Updated 2014.
16. “Coal Supply,” The Encyclopedia of Energy Engineering, Capehart, Barney, Editor, Taylor & Francis
Group, LLC, 2007. Updated 2014.
17. “Generation,” The Encyclopedia of Energy Engineering, Capehart, Barney, Editor, Taylor & Francis
Group, LLC, 2007. Updated 2014.
18. “Is There Power in Your Future?” U.Va. Engineer, Spring 2007, University of Virginia, p. 17.
19. “”Coal Supply in the U.S. – Surface Mining, The Encyclopedia of Energy Engineering, Capehart,
Barney, Editor, Taylor & Francis Group, LLC, 2011.
20. “The Interaction of Pumped Storage Hydro and Renewable Energy Resources, The Encyclopedia of
Environmental Management, Sven Erik Jorgenson, Editor, Taylor & Francis Group, LLC, 2013.
Exhibit JST-1
000853

Jill S. Tietjen
Page 3 of 4
Conference Papers (Technical)
1. “Power by Wire — Expectations and Realities,” Proceedings of the Sixth Annual Coal Market Strategies
Conference — Dynamics of Utility Coal Use, 2:1-21, Denver, CO, November 1-3, 1988. (Awarded one
of 10 best papers for 1988 for Stone & Webster employees.)
2. “Wheeling — Issues and Challenges,” Proceedings of the 1989 Electric Utility Business Environment
Conference and Exhibition, 101-115, Denver, CO, sponsored by Electric Utilities Consultants, Inc. and
RCG/Hagler Bailly, Inc., March 28-30, 1989.
3. “Air Quality Concerns: Impacts on Utility Plans for Life Extension of Coal-Fired Power Plants,”
Proceedings of the Seventh Annual Coal Market Strategies Conference — Utility Coal Use, Acid Rain,
and Other Uncertainties, 3:1-16, Denver, CO, sponsored by Edison Electric Institute Western Coal
Council, October 26, 1989. (Awarded one of 10 best papers for 1989 for Stone & Webster employees.)
4. “Transmission Pricing Policies and Access,” Proceedings of the 1990 Electric Utility Business
Environment Conference and Exhibition, 49-55, Denver, CO, sponsored by Electric Utilities Consultants,
Inc. and RCG/Hagler Bailly, Inc., March 7-9, 1990.
5. “Analyzing Utility System Losses.” Presented at the T&D World Expo ‘90, March 1990.
6. “Future Electric Generation: Clean Air At What Cost?” Proceedings of the Fifteenth Annual Conference
— Issues in Gas, Electricity, and Telecommunications, 5, July 18-20, 1990. (Awarded one of 10 best
papers for 1990 for Stone & Webster employees.)
7. “Transmission Access: Who Pays and How?” Proceedings of the Transmission & Wheeling Conference,
61-70, Denver, CO, sponsored by Electric Utilities Consultants, Inc. and Stone & Webster Management
Consultants, Inc., November 8-9, 1990.
8. “Open Access.” 1990. Power-Gen ‘90. November.
9. “Plant Life Management Option Selection Decision Methodology” (with David S. Galpin and Roger L.
Johnson). 1990. Power-Gen ‘90. December.
10. “Why Inter-Area Electric Transmission?” (with Fred E. Depenbrock), Proceedings of the American
Power Conference, Volume 53-I, 588-591, Chicago, IL, sponsored by the Illinois Institute of Technology,
April 1991.
11. “Decision Methodology for Plant Life Management Option Selection” (with David S. Galpin and Roger
L. Johnson), Proceedings of the American Power Conference, Volume 53-I, 485-491, Chicago, IL,
sponsored by the Illinois Institute of Technology, April 1991. (Awarded one of 10 best papers for 1991
for Stone & Webster employees.)
12. “Transmission Access: Technical and Political Implications” (with Glenn A. Davidson), Proceedings of
the 2nd Annual Transmission & Wheeling Conference, 127-134, Denver, CO, sponsored by Electric
Utilities Consultants, Inc. and Stone & Webster Management Consultants, Inc., November 21-22, 1991.
13. “New Transmission Lines: Do We Really Need Them?” (with Glenn A. Davidson). Presented at the
Strategic Utility Planning Conference, June 25-26, 1992. (Awarded one of 10 best papers for 1992 for
Stone & Webster employees.)
14. “Licensing a Coal-Fired Power Plant in the 1990s — A Utility’s Success Story” (with Tom Ohlmacher,
Douglas M. Logan, Ludwig Funke, and Scott Carpenter). 1993. Power-Gen ‘93.
15. “Uncertainty Analysis Without Tears” (with Douglas M. Logan). Proceedings of EPRI’s Ninth Electric
Utility Forecasting Symposium, September 8-10, 1993.
16. “Modeling Renewable Energy Resources in Utility Planning Models” (with Douglas M. Logan, Alan
Taylor, and Peter Lilienthal), Proceedings of the National Regulatory Conference on Renewable Energy,
315-329, Savannah, GA, sponsored by the National Association of Regulatory Utility Commissioners,
October 3-6, 1993.
17. “Load Forecasting: Ensuring a Solid Foundation for Integrated Resource Planning” (with Douglas M.
Logan and Chris Neil), Proceedings of the Electric Systems Planning and Operations Conference, 1-10,
Denver, CO, sponsored by Electric Utilities Consultants, Inc., November 11-13, 1993.
Exhibit JST-1
000854

Jill S. Tietjen
Page 4 of 4
18. “Where and Why Coal Will Remain the Big Player,” Proceedings of the Natural Gas and Electric Power
Industries Conference, Washington, D.C., sponsored by The Institute of Gas Technology, November 11-
13, 1996.
19. “The Chicken or the Egg: Renewables and Transmission,” The Fourth Annual Comprehensive
Conference on Electric Energy Markets, Regulation and Investment, Law Seminars International,
Washington, DC, March 4, 2008.
Technical Presentations
1. “The Mechanical Performance of Polyglycolic Acid Sutures.” Presented to the Virginia Academy of
Science, May 1975.
2. “Mechanical Performance of Surgical Sutures.” Presented at the American Society of Mechanical
Engineers Regional Student Conference, March 1976. (Awarded second place.)
3. “How to Evaluate Utility Staff Resource Plans” (with Martin W. Gustafson). Presented to the California
Municipal Utilities Association, February 1987.
4. “Geothermal Project Development and Management Market Analysis,” (with Leslie A. Buttorff),
presented to the Geothermal Resources Council as part of a short course, Sparks, NV, October 9-10,
1987.
5. “Transmission Access and Wheeling.” Presented at the Rocky Mountain Electrical League Spring
Conference, May 1990.
6. “Engineering and Rate Making Fundamentals,” Power Transmission: Access, Pricing and Regulation,
San Francisco, CA, presented to Infocast, Inc., September 23, 1991.
7. “Coal Issues and Electric Fuel Management.” Stone & Webster Management Consultants’ annual Utility
Management Development Program, Annual lecture, 1986-1992.
8. “Natural Gas and Coal: Competition or Cooperation?” Presented at Denver Coal Club. February 11,
1993.
9. “Where are We and How Did We Get There?” 32nd
Annual Paul D. Scholz Symposium on Technology
and Its Role in Society, University of Iowa, Iowa City, Iowa, April 5, 2001.
10. “What is Happening in California?” Englewood (Colorado) Lions Club, Englewood, CO, June 19, 2001.
11. Transmission 101: Understanding the Grid,” Coal Market Strategies 2001 – Fueling the Nation’s Energy
Needs: Bridging the Barriers to Future Coal-fired Power,” San Antonio, Texas, October 15-17,. 2001.
12. “Powering Our Future,” Boulder Rotary Club, Boulder, CO, January 4, 2002.
13. “Electrical Power in 2004 and Beyond, Sharkey, Howes & Javer, Inc., Denver, CO, May 12, 2004.
14. “Blackouts, Wind Turbines and Coal: Where is the Power in Your Future?” IEEE and SWE, Clemson
University, Clemson, SC, October 6, 2004.
15. “Integrated Resource Planning in the 21st Century” (with Jacqueline C. Sargent), Rocky Mountain
Electrical League 2005 Spring Conference, Albuquerque, NM, May 16, 2005.
16. “Small is Profitable: Distributed Generation and the Aging Electric Infrastructure in the U.S.,” (with
Kitty Wang), Society of Women Engineers National Conference, Anaheim, California, November 4,
2005.
17. Panel Member, Environment and Sustainability, University of Virginia Women in Leadership
Conference, Charlottesville, Virginia, September 26, 2008.
18. “Fitting Wind into Utility Resource Portfolios,” Women of Wind Energy, Denver, Colorado, June 9,
2010.
19. “Resource Planning for an Aging Coal Fleet,” RMEL Fall Convention, Marana, Arizona, September 8-
10, 2013.
3/19/14
Exhibit JST-1
000855

2011-2030 Integrated Resource Plan for
Black Hills Power
2011
Exhibit JST2
Black Hills Power 2011 Integrated
Resource Plan
000856

Black Hills Power 2011 IRP i
Table of Contents ES.0 Executive Summary ..........................................................................................ES-1 ES.1 Summary ..................................................................................................ES-1 ES.2 Action Plan...............................................................................................ES-1 ES.3 Company Background..............................................................................ES-2 ES.4 The Planning Environment.......................................................................ES-3 ES.5 Assumptions .............................................................................................ES-4 ES.6 Demand-Side Management ......................................................................ES-4 ES.7 Supply-Side Resources.............................................................................ES-4 ES.8 Resource Need Assessment......................................................................ES-4 ES.9 Resource Evaluation.................................................................................ES-5 ES.10 Risk Analysis..........................................................................................ES-6 ES.11 Conclusion..............................................................................................ES-9 1.0 Introduction................................................................................................................1 1.1 Background.......................................................................................................1 1.2 Objectives .........................................................................................................3 1.3 IRP Process .......................................................................................................3 2.0 Planning Environment ...............................................................................................4 2.1 The Future of Coal-Fired Generation ...............................................................4 2.1.1 Climate Change Legislation..................................................................5 2.1.2 Carbon Capture and Sequestration Technologies .................................6 2.1.3 Environmental Regulatory Requirements.............................................6 2.2 Grid Modernization....................................................................................................9 2.3 Plug-in Hybrid Electric Vehicles ......................................................................9 2.4 Renewable Energy Standards .........................................................................10 2.4.1 South Dakota.......................................................................................10 2.4.2 Montana ..............................................................................................10 3.0 Assumptions.............................................................................................................12 3.1 Coal Price Forecasts........................................................................................12 3.2 Natural Gas Price Forecasts ............................................................................13 3.3 Market Price Forecasts....................................................................................14 3.4 Financial Parameters.......................................................................................14 3.5 Planning Reserves...........................................................................................15 3.6 Emissions Costs ..............................................................................................15 4.0 Load Forecast...........................................................................................................17 5.0 Demand-Side Management......................................................................................20 5.1 Residential Water Heating ..............................................................................20 5.2 Residential Refrigerator Recycling.................................................................20 5.3 Residential Heat Pumps ..................................................................................20 5.4 School-Based Energy Education.....................................................................21
Exhibit JST 2
000857

Black Hills Power 2011 IRP ii
5.5 Residential Audits...........................................................................................21 5.6 Weatherization Team......................................................................................21 5.7 Commercial and Industrial Prescriptive and Custom Rebates........................21 6.0 Supply-Side Resources ............................................................................................24 6.1 Existing Resources..........................................................................................24 6.2 Existing Unit Retirements and Upgrades........................................................24 6.3 New Conventional Resources .........................................................................25 6.3.1 Coal .....................................................................................................26 6.3.2 Combined Cycle..................................................................................26 6.3.3 Combustion Turbine ...........................................................................26 6.3.4 Existing Unit Purchase........................................................................27 6.4 New Renewable Resources.............................................................................28 6.4.1 Photovoltaic ........................................................................................28 6.4.2 Wind....................................................................................................29 7.0 Resource Need Assessment .....................................................................................30 7.1 Analysis...........................................................................................................32 8.0 Risk Analysis ...........................................................................................................37 8.1 Stochastic Analysis .........................................................................................37 8.2 Risk Profiles....................................................................................................38 8.3 Sensitivity Drivers ..........................................................................................40 8.4 Comparison to 2005 and 2007 IRP.................................................................41 9.0 Conclusions and Recommendations ........................................................................43 9.1 Action Plan......................................................................................................43 Appendix A – Software Used in the Analysis ................................................................44 A.1 Markets Module .............................................................................................44 A.2 Portfolio Module ............................................................................................46 A.3 Capacity Expansion Module ..........................................................................46 A.4 Financial Module ...........................................................................................47 A.5 Risk Module...................................................................................................48 Appendix B – Black Hills Power – Load and Resource Balance – Preferred Plan ........49 Appendix C – Carbon Capture and Sequestration Technologies....................................50 Appendix D – Grid Modernization .................................................................................51 Abbreviations..................................................................................................................53
Exhibit JST-2
000858

Black Hills Power 2011 IRP iii
List of Tables
Table ES-1. Ranges for Selected Uncertainty Variables ........................................ES-7 Table 3-1. Coal Price Forecast....................................................................................12 Table 3-2. Monthly Henry Hub Natural Gas Prices ($/MMBtu)................................13 Table 3-3. Financial Parameters .................................................................................14 Table 3-4. Carbon Tax Assumptions (Environmental Scenarios Only) .....................16 Table 4-1. BHP Peak Demand and Energy Forecast 2011-2030................................17 Table 4-2. Load Forecast Comparison........................................................................19 Table 5-1. DSM Program Portfolio – Year 1..............................................................22 Table 5-2. DSM Program Portfolio – Year 2..............................................................22 Table 5-3. DSM Program Portfolio – Year 3..............................................................23 Table 5-4. Program Budgets .......................................................................................23 Table 6-1. BHP Existing Resources............................................................................24 Table 6-2. Existing Unit Upgrades Performance Parameters .....................................25 Table 6-3. Coal-Fired Power Plant Performance Parameters .....................................26 Table 6-4. Combined Cycle Power Plant Performance Parameters ...........................27 Table 6-5. Combustion Turbine Power Plant Performance Parameters .....................27 Table 6-6. Existing Unit Purchase Performance Parameters ......................................28 Table 6-7. PV Performance Parameters......................................................................28 Table 6-8. Wind Performance Parameters ..................................................................29 Table 7-1. Black Hills Power – Load and Resource Balance (2011-2015) ................32 Table 7-2. Optimal Expansion Plans ..........................................................................34 Table 8-1. Range for Selected Uncertainty Variables ................................................38 Table 8-2. Preferred Plan Resource Comparison........................................................42 Table B-1. Black Hills Power – Load and Resource Balance – Preferred Plan .........49
Exhibit JST-2
000859

Black Hills Power 2011 IRP iv
List of Figures
Figure ES-1. Black Hills Power Load and Resource Summary .............................ES-5 Figure ES-2. Deterministic PVRR for Scenarios....................................................ES-6 Figure ES-3. Scenarios – Risk Profiles (2011-2030)..............................................ES-8 Figure ES-4. Preferred Plan – Resource Additions ................................................ES-9 Figure 2-1. Possible Timeline for Environmental Regulatory Requirements for the Utility Industry...................................................................................................8 Figure 3-1. Henry Hub Natural Gas Prices.................................................................13 Figure 3-2. Reference Case – On-Peak Electricity Prices – Wyoming Region..........14 Figure 4-1. Black Hills Power – 7-Year Historical and 20-Year Forecasted Peak.....18 Figure 4-2. Black Hills Power – 7-Year Historical and 20-Year Forecasted Energy.18 Figure 7-1. Black Hills Power Load and Resource Summary ....................................31 Figure 7-2. 20 Year Deterministic PVRR for Scenarios.............................................35 Figure 7-3. 30 Year Deterministic PVRR for Scenarios…………………………….36 Figure 8-1. Scenarios – Risk Profiles (2011-2030) ....................................................39 Figure 8-2. Preferred Plan – Resource Additions .......................................................40 Figure 8-3. Base Plan – Tornado Chart (2011-2030) .................................................41 Figure A-1. Sample Topology ....................................................................................44 Figure A-2. MRX Decision Basis...............................................................................45 Figure A-3. Sample Reports .......................................................................................47 Figure A-4. Overview of Process................................................................................48
Exhibit JST-2
000860

Black Hills Power 2011 IRP ES-1
ES.0 Executive Summary ES.1 Summary The 2011 Black Hills Power (BHP) integrated resource plan (IRP) was completed to provide a road map for defining the appropriate generation system upgrades, modifications, and additions required to ensure reliable and economic service to BHP’s customers now and for the future. The IRP examined the needs of those customers with a consideration of existing demand-side and future supply-side resources, including renewable energy and purchased power. Key elements of the IRP include an evaluation of the current and expected future resource planning environment, identification of resource needs for the next 20 years through a comprehensive resource need assessment process, and an action plan that identifies the steps required to implement a preferred portfolio of incremental resources to meet the forecasted need. Development of the IRP involved consideration of cost, risk, uncertainty, supply reliability, and public policy. As a result, the preferred plan reflects energy efficiency and demand-side management goals, the effect of environmental regulations, gas-fired combined-cycle combustion turbine technology and firm market purchases. The preferred plan meets the objectives of the company to:
Ensure a reasonable level of price stability for its customers Generate and provide reliable and economic electricity service while complying
with all environmental standards Manage and minimize risk Continually evaluate renewables for our energy supply portfolio, being mindful of
the impact on customer rates. In preparing this IRP, BHP conformed to the Wyoming Public Service Commission Guidelines Regarding Electric IRPs, including hosting a stakeholder meeting on Monday, May 16, 2011, in Rapid City, South Dakota. The comments and feedback provided during the meeting were incorporated in the IRP analysis, as appropriate. None of the comments or feedback had a material impact on the IRP process or final results. ES.2 Action Plan BHP’s action plan listed below provides a template for the actions that should be taken over the next several years. BHP should continue to monitor market conditions and regulatory developments so that the items in the action plan can be adapted to address actual conditions as they occur. BHP’s plan is as follows:
In the near term, continue to purchase a firm 6 x 16 (6 days each week, 16 hours each day) product during the summer months to provide for the summer capacity shortfall.
Exhibit JST-2
000861

Black Hills Power 2011 IRP ES-2
Purchase or otherwise obtain a simple cycle combustion turbine to be converted to combined cycle operation in 2014.
Seek opportunities to develop economic renewable resources – particularly wind and solar.
Actively review development of load growth opportunities in the service territory. Monitor transmission developments in the Western U.S.
ES.3 Company Background BHP serves approximately 68,000 customers in 25 communities located in Western South Dakota, Northern Wyoming, and Southeastern Montana. In 2010, BHP sold more than 3,315 GWh of electricity through retail sales, contract wholesales sales and off-system wholesales sales. On January 31, 2011, BHP’s system recorded an all-time winter system peak of 408 MW and on July 19, 2011, hit an all-time summer system peak of 452 MW. BHP currently meets electric demand through purchases from the open market, power purchase agreements (PPA) and generation assets. BHP’s power delivery system consists of approximately 565 miles of transmission lines (greater than 69 kV) and 2,930 miles of distribution lines (69 kV or lower). BHP also owns 35% of a DC transmission tie that interconnects the Western and Eastern transmission grids, which are independently-operated transmission grids. This transmission tie provides transmission access to both the Western Electricity Coordinating Council (WECC) region in the West and the Mid-Continent Area Power Pool (MAPP) region in the East. BHP has firm point-to-point transmission access to deliver up to 50 MW of power on PacifiCorp’s transmission system to wholesale customers in the Western region through 2023. BHP also has firm network transmission access to deliver power on PacifiCorp’s system to Sheridan, Wyoming to serve its power sales contract with Montana-Dakota Utilities (MDU). In addition, BHP has entered into four long-term power sales agreements:
an agreement with MDU to supply energy needs above their Wygen III ownership share, and replace their Wygen III ownership share when Wygen III is operating at a reduced capacity or off line
an agreement with the City of Gillette to dispatch the City’s 23% of Wygen III’s net generating capacity and their operating component of spinning reserves
a unit contingent agreement that supplies a decreasing amount of energy and capacity to Municipal Energy Agency of Nebraska (MEAN) under a contract that expires in 2023
a five-year power purchase agreement (PPA) with MEAN for the purchase of 5 MW of unit-contingent capacity from Neil Simpson II and 5 MW of unit-contingent capacity from Wygen III.
Exhibit JST-2
000862

Black Hills Power 2011 IRP ES-3
BHP’s future resource need has historically been evaluated in conjunction with its Black Hills Corporation affiliate Cheyenne Light, Fuel & Power (Cheyenne Light). In 2005, BHP and Cheyenne Light completed a joint resource plan included in a Certificate of Public Convenience and Necessity (CPCN) before the Wyoming Public Service Commission (WPSC) for the construction of the coal-fired Wygen II unit. The need for Wygen II was deemed necessary to serve Cheyenne Light’s load, and is a Cheyenne Light rate-based resource. In 2007, BHP and Cheyenne Light completed a joint resource plan included in a CPCN before the WPSC for the construction of the coal-fired Wygen III unit. The need for Wygen III was deemed necessary to serve BHP’s load, and is a BHP rate-based resource. BHP’s 2011 IRP is the first plan since the mid-1990s that exclusively analyzes the future resource needs of BHP’s customers. ES.4 The Planning Environment Planning for future generating resources in the electric utility industry involves the consideration and evaluation of many uncertainties. Those uncertainties have increased in number and magnitude over the last several decades. BHP has considered the impacts of uncertainties that include the future of coal-fired generation, grid modernization, plug-in hybrid electric vehicles, and renewable energy standards. The uncertainties regarding the future of coal-fired generation include climate change legislation, carbon capture and sequestration technologies, and other environmental regulatory requirements. Changes in the market that could result from the construction of new transmission also need to be monitored. The Environmental Protection Agency (EPA) issued National Emission Standards for Hazardous Air Pollutants for Area Sources: Industrial, Commercial and Institutional Boilers (herein “Area Source Rules”), on March 21, 2011 with an effective date of May 20, 2011. The deadline to comply with these rules is March 21, 2014. This rule provided for hazardous air pollutant-related emission limits and monitoring requirements for area sources of hazardous air pollutants. BHP is evaluating the impact of the rules on its existing generating facilities. The Area Source Rules as issued have a significant impact on our Neil Simpson I, Osage and Ben French coal-fired facilities, which have collectively provided approximately 71 MW summer of summer capacity. The regulation has prompted BHP to perform an engineering evaluation to determine economic viability of continued operations of these units. Based on the evaluations completed, the cost associated with complying with the Area Source Rules and other environmental regulations may lead to retirement of these units prior to March 21, 2014. Wyoming does not currently have a renewable energy standard. South Dakota has adopted a renewable portfolio objective that encourages utilities to generate, or cause to be generated, at least 10% of their retail electricity supply from renewable energy sources by 2015. Absent a specific renewable energy mandate in Wyoming or South Dakota, our current strategy is to prudently incorporate renewable energy into our resource supply, seeking to minimize associated rate increases for our utility customers.
Exhibit JST-2
000863

Black Hills Power 2011 IRP ES-4
ES.5 Assumptions A wide variety of data assumptions must be made for IRP modeling. A 20-year planning horizon was used as the basis for the modeling assumptions. Other key assumptions include the load forecast, coal price forecasts, natural gas price forecasts, market price forecasts, financial parameters, planning reserves, and emissions costs. ES.6 Demand-Side Management BHP’s demand-side management programs as defined in Docket # EL11-002 were approved by the South Dakota Public Utilities Commission (SDPUC) on June 28, 2011. The plan includes residential and commercial programs for energy efficiency. The residential electric portfolio offers opportunities to save energy with water heating, refrigerator recycling, heat pumps, and school-based energy efficiency. This portfolio also offers energy audits and weatherization programs. The commercial electric portfolio provides both a prescriptive rebate program and a custom rebate program. ES.7 Supply-Side Resources The resources currently available to BHP to meet customer obligations include coal-fired units, natural gas-fired units, diesel-fired units, and long-term PPAs. The following are the long-term PPAs and generation assets presently used to meet BHP’s customer capacity needs.
Pacificorp PPA, referred to as Colstrip, expiring in 2023, with a total net capacity of 50 MW
Happy Jack and Silver Sage Wind Farm PPAs expiring in 2028 and 2029, respectively, for a total accredited capacity of 3.5 MW
Five coal-fired power plants with a total net capacity of 280 MW One diesel station with a net capacity of 10 MW Three natural gas-fired combustion turbine stations with a combined net capacity
of 178 MW As part of the IRP modeling, both conventional and renewable resources were considered to replace any retiring units or expiring PPAs and to provide for future load growth. Conventional resources included coal, natural gas-fired combined cycle units (CC), natural gas-fired combustion turbines (SC or CT), firm market power, conversions of existing combustion turbines to combined cycle units, upgrades to existing units, and existing generation purchases. The renewable resources considered included solar and wind. ES.8 Resource Need Assessment The EPA Area Source Rules have an impact on BHP’s Ben French, Neil Simpson 1, and Osage coal-fired generation units. Currently, the Osage units are in cold storage based on economics and are not included as part of BHP’s available resources, but Ben French and
Exhibit JST-2
000864

Black Hills Power 2011 IRP ES-5
Neil Simpson are in operation and relied upon for system capacity. BHP’s future resource need is based on the upgrade or replacement of the Ben French and Neil Simpson 1 units. In addition, the Reserve Capacity Integration Agreement (RCIA) with PacifiCorp terminates in 2012 which results in the effective loss of 28 MW of summer capacity. The PPAs with PacifiCorp, Happy Jack, and Silver Sage all terminate over the planning horizon for a loss of 53.5 MW of accredited capacity. As resources retire or existing PPAs terminate, other resources will be required to enable BHP to meets its obligations to serve the electricity needs of its customers. The totality of the requirements for new resources, incorporating the need for a minimum planning reserve margin of 15% and reflecting that BHP has no committed resources (resources that are planned and/or under construction but are not currently operational) in its generation portfolio, is shown on Figure ES-1. The capacity deficit in any year is reflected as the distance between the line labeled “Peak Demand Plus 15% Reserves” and the top of the shaded block for “Existing Resources”. BHP’s capacity deficit in 2014 is approximately 66 MW and reaches approximately 225 MW by the end of the planning horizon.
Figure ES-1 Black Hills Power Load and Resource Summary
0
100
200
300
400
500
600
700
2011 2012 2013 2014 2015 2016 2017 2018 2019 2020 2021 2022 2023 2024 2025 2026 2027 2028 2029 2030
Year
MW
Existing Resources
Peak Demand Plus 15% Reserves
Capacity Deficit
ES.9 Resource Evaluation The process used to determine the preferred resource portfolio for BHP began by identifying ten scenarios, also referred to as plans, to run through the Capacity Expansion
Exhibit JST-2
000865

Black Hills Power 2011 IRP ES-6
module.1 These scenarios were determined to measure risk associated with some of the modeling assumptions and to capture some potential load additions above what is forecast in a typical year. Each capacity expansion model scenario selected an economic resource portfolio to serve the load subject to the assumptions of that scenario. The resource portfolios were each run through a production cost model, and were modeled with the base case scenario assumptions to determine the relative present value of revenue requirements (PVRR). The PVRR for all ten scenarios when run on a deterministic basis (each scenario run using the base case assumptions) are shown on Figure ES-2.
Figure ES-2 Deterministic PVRR for Scenarios
$1,400
$1,500
$1,600
$1,700
$1,800
$1,900
$2,000
Mil
lio
n $
20 Year PVRR
ES.10 Risk Analysis Utilities must plan for future customer needs for electricity in an environment of significant uncertainty. Thus, the analysis conducted for this IRP examined uncertainty under a variety of possible future conditions. Analyses conducted to quantify the risk associated with the various scenarios included stochastic analysis, and specific examination of 1) the effects of a step load increase in the BHP demand for electricity, and 2) the effects of not having a market available for economy interchange on the base plan. Ventyx is a leading provider of software, data and advisory services to several industries, including utility companies. Ventyx has developed utility specific software to assist
1 Specific details for each scenario are provided in Section 7.1 of this report.
Exhibit JST-2
000866

Black Hills Power 2011 IRP ES-7
utilities in evaluating generation resource needs and was retained by BHP to assist in the IRP process. Ventyx’s Strategic Planning model uses a structural approach to forecasting prices that captures the uncertainties in demand, fuel prices, supply and costs. The uncertainties examined in this IRP included those reflected in Table ES-1 which shows the minimum and maximum values used for selected uncertainty values.
Table ES-1 Ranges for Selected Uncertainty Variables
Variable Minimum Maximum Mid-Term Peak 0.87 1.11 Mid-Term Energy 0.90 1.09 Long-Term Demand 0.85 1.12 Mid-Term Gas 0.70 2.60 Oil Price 0.85 1.18 Long-Term Gas 0.79 1.23 Coal Unit Availability 0.88 1.11 Gas Unit Availability 0.80 1.16 Pulverized Coal Capital Costs 1.00 1.15 Combustion Turbine Capital Costs 1.00 1.10 Combined Cycle Capital Costs 1.00 1.10 Wind Capital Costs 0.90 1.10 Source: Ventyx Cumulative probability distributions, also known as risk profiles, provide the ability to visually assess the risks associated with a decision under uncertainty. These risk profiles are one of the results of the stochastic analysis conducted by Ventyx for BHP. The risk profiles for the scenarios examined with the exception of the step load scenarios are shown on Figure ES-3.
Exhibit JST-2
000867

Black Hills Power 2011 IRP ES-8
Figure ES-3 Scenarios – Risk Profiles (2011-2030)
0%
10%
20%
30%
40%
50%
60%
70%
80%
90%
100%
$1,550 $1,650 $1,750 $1,850
Cu
mu
lati
ve P
rob
abili
ty
Present Value of Revenue Requirements (Millions $)
Risk Profiles
Base Plan Environmental Plan High Gas Low Gas
High Load Low Load Base-No Firm Market No CC Conversion
Figure ES-3 shows that with the exception of the low gas and the environmental scenarios, the risk profile for the base plan is to the left and lower than any other case. The base plan resource portfolio includes the conversion of an existing simple cycle gas turbine to a combined cycle unit in 2014 and firm capacity in all of the years 2011-2023. Because of capacity additions in the later years of the base plan (referred to as end effects) that do not occur in the environmental scenario, the base plan’s risk profile is somewhat higher than the risk profile for the environmental scenario for the 20 years of the planning horizon. Any decision for resources at the end of the planning horizon is many years in the future, and will be evaluated in a future resource plan. Thus the base plan has been selected as the preferred plan. The resource portfolio for the preferred plan is shown in Figure ES-4.
Exhibit JST-2
000868

Black Hills Power 2011 IRP ES-9
Figure ES-4
Preferred PlanResource Additions
0
25
50
75
100
125
150
175
2011
2012
2013
2014
2015
2016
2017
2018
2019
2020
2021
2022
2023
2024
2025
2026
2027
2028
2029
2030
MW
CC Conversion
Coal
Simple Cycle
Firm Capacity
ES.11 Conclusion This IRP provides a road map to define the system upgrades, modifications, and additions that are required to ensure reliable and economic service to BHP’s customers now and into the future. The resources selected in the preferred plan balance cost with the need to mitigate risk and provide for operational flexibility for BHP. BHP’s preferred portfolio addresses the generation needs of its customer over the short term – the next 5 years - through the implementation of energy efficiency and demand-side management goals, installation of gas-fired combined-cycle combustion turbine technology and firm market purchases. The preferred plan, when adjusted for end effects, is the least cost plan and has low risk associated with future uncertainty. This plan also provides BHP with an efficient combined cycle gas turbine. The need for resources in the longer term will be re-examined in future IRPs.
Exhibit JST-2
000869

Black Hills Power 2011 IRP ES-10
The preferred plan meets the objectives of the company to:
Ensure a reasonable level of price stability for its customers Generate and provide reliable and economic electricity service while complying
with all environmental standards Manage and minimize risk Continually evaluate renewables for our energy supply portfolio, being mindful of
the impact on customer rates.
Exhibit JST-2
000870

Black Hills Power 2011 IRP 1
1.0 Introduction 1.1 Background Black Hills Power (BHP) serves 68,000 customers in 25 communities located in Western South Dakota, Northern Wyoming, and Southeastern Montana. In 2010, BHP sold more than 3,315 GWh of electricity through retail sales, contract wholesales sales and off-system wholesale sales. BHP currently meets electric demand through purchases from the open market and from the following power purchase agreements (PPA) and generation assets:
PacifiCorp PPA expiring in 2023, which provides for the purchase of 50 MW of coal-fired baseload power;
Reserve Capacity Integration Agreement (RCIA) with PacifiCorp expiring in 2012, which makes available 100 MW of reserve capacity in connection with the utilization of the Ben French CT units;
Cheyenne Light and BHP’s Generation Dispatch Agreement that requires BHP to purchase all of Cheyenne Light’s excess energy (Cheyenne Put);
Happy Jack and Silver Sage Wind Farm PPAs expiring in 2028 and 2029, respectively, for an accredited capacity of 3.5 MW
Five coal-fired power plants with a total net capacity of 280 MW One diesel station with a net capacity of 10 MW Three natural gas-fired combustion turbine stations with a combined net capacity
of 178 MW BHP’s power delivery system consists of approximately 565 miles of transmission lines (greater than 69 kV) and 2,930 miles of distribution lines (69 kV or lower). Black Hills Power also owns 35% of a DC transmission tie that interconnects the Western and Eastern transmission grids, which are independently-operated transmission grids. This transmission tie provides transmission access to both the Western Electricity Coordinating Council (WECC) region in the West and the Mid-Continent Area Power Pool (MAPP) region in the East. BHP has firm point-to-point transmission access to deliver up to 50 MW of power on PacifiCorp’s transmission system to wholesale customers in the Western region through 2023. BHP also has firm network transmission access to deliver power on PacifiCorp’s system to Sheridan, Wyoming to serve its power sales contract with Montana-Dakota Utilities (MDU) through 2017, with the right to renew pursuant to the terms of PacifiCorp’s transmission tariff. In addition, BHP has entered into four long-term power sales agreements:
In conjunction with MDU’s April 2009 purchase of a 25% ownership interest in Wygen III, an agreement to supply 74 MW of capacity and energy through 2016 was modified. Sales to MDU have been integrated into Black Hills Power’s control area and are considered part of its firm native load. Capacity from the
Exhibit JST-2
000871

Black Hills Power 2011 IRP 2
Wygen III unit is deemed to supply a portion of the required 74 MW. During periods of reduced production at Wygen III, or during periods when Wygen III is off-line, MDU will be provided with 25 MW from BHP’s other generation facilities or from system purchases with reimbursement of costs by MDU;
BHP’s agreement with the City of Gillette is to dispatch the City’s 23% of Wygen III’s net generating capacity for the life of the plant. Upon the City of Gillette’s July 2010 purchase of a 23% ownership interest in Wygen III, a seven-year PPA with the City of Gillette that went into effect in April 2010, was terminated. The City of Gillette’s 23 MW of Wygen III capacity has been integrated into BHP’s control area and is considered part of its firm native load. During periods of reduced production at Wygen III, or during periods when Wygen III is off line, BHP will provide the City of Gillette with its first 23 MW from BHP’s other generation facilities or from system purchases with reimbursement of costs by the City of Gillette. Under this agreement, BHP will also provide the City of Gillette its operating component of spinning reserves;
BHP has entered into an agreement to supply 20 MW of energy and capacity to Municipal Energy Agency of Nebraska (MEAN). This contract is unit-contingent based on the availability of the Neil Simpson II and Wygen III plants, with capacity purchases decreasing to 15 MW in 2018, 12 MW in 2020 and 10 MW in 2022. This contract expires in 2023.
BHP’s five-year PPA with MEAN which commenced in May 2010 whereby MEAN will purchase 5 MW of unit-contingent capacity from Neil Simpson II and 5 MW of unit-contingent capacity from Wygen III.
BHP’s future resource need has historically been evaluated in conjunction with its Black Hills Corporation affiliate Cheyenne Light, Fuel & Power (Cheyenne Light). In 2005, BHP and Cheyenne Light completed a joint resource plan included in a Certificate of Public Convenience and Necessity (CPCN) before the Wyoming Public Service Commission (WPSC) for the construction of the coal-fired Wygen II unit. The need for Wygen II was deemed necessary to serve Cheyenne Light’s load, and is a Cheyenne Light rate-based resource. In 2007, BHP and Cheyenne Light completed a joint resource plan included in a CPCN before the WPSC for the construction of the coal-fired Wygen III unit. The need for Wygen III was deemed necessary to serve BHP’s load, and is a BHP rate-based resource. BHP’s 2011 IRP is the first plan since the mid-1990s that exclusively analyzes the future resource needs of BHP’s customers. Since the 2007 IRP was completed, several important changes have occurred in the electric utility industry:
While natural gas prices continue to be volatile, the recent emergence of shale gas has introduced relative stability into natural gas pricing. However, there is much for the industry to learn with respect to the future of shale gas production and its expected influence on future natural gas pricing.
Just a few years ago, the enactment of carbon cap and trade or a similar carbon reduction program appeared imminent; in mid 2011 that no longer appears to be
Exhibit JST-2
000872

Black Hills Power 2011 IRP 3
the case. Such enactment is exceedingly dependent on politics and the development of laws and public policy in Washington, DC.
Clean Air, boiler Maximum Achievable Control Technology (MACT) and other regulations promulgated by the Environmental Protection Agency (EPA), are expected to cause the retirement of small coal-fired units on the BHP system. Other small coal-fired units around the country are also being affected.
The effects of the earthquake and tsunami in Japan in March 2011 are expected to impact market prices for electricity over the planning horizon and eventually impact the operation of existing and planned nuclear units in the U.S.
1.2 Objectives The IRP was completed to provide a road map for defining the appropriate system upgrades, modifications, and additions required to ensure reliable and economic electric service to BHP’s customers now and for the future. This IRP addresses resource needs for BHP for the planning horizon of 2011-2030. The IRP examined the needs of those customers with a thorough consideration of generation resources, including renewable energy and short-term purchased power. Prudent utility practices were employed in the preparation of the IRP and a full range of practical resource alternatives, including renewables, were evaluated. Comprehensive modeling was undertaken using Ventyx Capacity Expansion and Strategic Planning powered by MIDAS Gold® software modules (see Appendix A). The Ventyx modeling included 1) optimization of resource selection using linear programming techniques, 2) in-depth modeling of resource portfolios using production costing models, and 3) risk analysis using stochastic techniques. The preferred plan meets the objectives of the company to:
Ensure a reasonable level of price stability for its customers Generate and provide reliable and economic electricity service while complying
with all environmental standards Manage and minimize risk Continually evaluate renewables for our energy supply portfolio, being mindful of
the impact on customer rates. 1.3 IRP Process In preparing this IRP, BHP conformed to the Wyoming Public Service Commission Guidelines Regarding Electric IRPs, including hosting a stakeholder meeting on Monday, May 16, 2011, in Rapid City, South Dakota. The comments and feedback provided during the meeting were incorporated in the IRP analysis, as appropriate. None of the comments or feedback had a material impact on the IRP process or final results.
Exhibit JST-2
000873

Black Hills Power 2011 IRP 4
2.0 Planning Environment Planning for future generating resources in the electric utility industry involves the consideration and evaluation of many uncertainties. Those uncertainties have increased in number and magnitude over the last several decades. BHP has considered the impacts of uncertainties that include the future of coal-fired generation, grid modernization, plug-in hybrid electric vehicles, and renewable energy standards. The future of coal-fired generation discussion touches on climate change legislation, carbon capture and sequestration technologies, and environmental regulatory requirements. 2.1 The Future of Coal-Fired Generation For many years, most of the baseload energy need in this country has been provided by coal-fired generation. As a fuel, coal has many merits:
it is dense (meaning it has a high heating value in a compressed space) there are extensive and efficient supply chains that have been built over its many
years of use it is relatively low cost and has experienced much less price volatility than other
fuels, particularly natural gas. Coal is also quite abundant in this country and in Wyoming (the estimated supply is measured in hundreds of years), helping to ensure national energy security. Over the years, Black Hills Corporation (BHC) has implemented cutting edge technologies for its coal-fired power plants. Lack of water in the Gillette, Wyoming area led BHP to become a pioneer in the installation and operation of air-cooled condensers. BHP has partnered with Babcock & Wilcox, the Energy & Environmental Research Center of the University of North Dakota, Optimal Air Testing, and the University of Wyoming on studies examining methods of controlling mercury emissions when coal is used as a combustion fuel. BHP was the first adopter of low NOx (nitrogen oxides) burners which were retrofitted on Neil Simpson I in the early 1990s to control nitrous oxide emissions. Since that time Neil Simpson II has been retrofitted with the latest design low NOx burners, and Black Hills Wyoming’s and Cheyenne Light’s coal generating units Wygen I and Wygen II have also been equipped with low NOx burners. In addition, BHP agreed to test burn coal produced by a company that worked on a clean coal process in order to assist in the understanding of the environmental and operational merits of that process. BHC has striven to ensure that its plants use the best available control technologies when constructed and comply with all permit emission limits. These control technologies include Selective Catalytic Reactors (SCR) for NOx control, Spray Dry Absorption (SDA) for SO2 controls, Electrostatic Precipitators (ESP) and fabric filter baghouses for particulate matter control. We are currently testing sorbent injection products (Powder Activated Carbon-PAC/Novinda Sorbent/Calcium Chloride) for mercury and other hazardous air pollutant control at our coal facilities. Control technologies at our new combustion turbine projects will include SCR (NOx control) and Catalytic Oxidation control carbon monoxide (CO) and volatile organic chemical (VOC). Utilizing pipeline quality natural gas will reduce particulate matter, SO2, hazardous air pollutants, and
Exhibit JST-2
000874

Black Hills Power 2011 IRP 5
greenhouse gases in the combustion process as compared to other conventional fuels. These control technologies will enhance the ambient air we breathe, increase visibility (Regional Haze) at our National Parks, reduce Acid Rain (SO2/NOx), ground level Ozone (NOx), and reduce hazardous air pollutants (mercury, other metals and acids). One of the newer issues surrounding coal as a fuel for electricity generation is that it produces more carbon dioxide (CO2) emissions per unit of energy output than any other fuel – about twice as much as natural gas. Today the future of coal-fired generation for electric utilities is significantly uncertain. Coal faces competitive pressure from natural gas in the short term and in the long term from renewable resources or other emerging technologies. But coal plants continue to be built in developing nations particularly China. Some sources report that China is on the average adding one new coal plant per week. It took many decades to build the current infrastructure of coal-fired power plants in the United States, so existing coal-fired generation will continue to be a large producer of energy during the 20-year planning horizon of this IRP and beyond. Carbon capture and sequestration (CCS) has yet to be proven on a commercial scale and may or may not be practical in any given location depending on the geology at the site or cost limitations to deliver it where it could be used. As a result of potential greenhouse gas legislation, this IRP considers environmental costs (which include possible CO2 costs) as a critical uncertain factor. As a result of the uncertainty of the future of coal-fired generation, some alternate plans assume that no future new coal-fired units will be built during the planning horizon. 2.1.1 Climate Change Legislation The effects of greenhouse gases on the atmosphere and on the Earth’s climate have been a subject of debate in the U.S. and worldwide for many years. On May 19, 2010, the National Research Council, an arm of the National Academies, issued three reports that concluded global climate change is occurring and that it is caused in large part by human activities. The reports recommend some form of carbon pricing system as the most cost-effective way to reduce emissions. The reports suggest that cap-and-trade, taxing emissions or some combination of the two could provide the needed incentive to reduce the carbon emissions. The reports further state that major technological and behavioral changes will be required, and that business as usual will not address the climate change issue. Among those changes, the reports recommend the capturing and sequestering of CO2 from power plants and factories as well as scrubbing CO2 directly from the atmosphere. How these reports will be translated into regulation and laws at the local, state and national levels remain to be seen, continuing this uncertainty in the planning period of BHP’s IRP. BHP cannot predict if any particular carbon mitigation strategy will be enacted into law or when such might occur. The Spring 2011 Reference Case from
Exhibit JST-2
000875

Black Hills Power 2011 IRP 6
Ventyx no longer includes carbon costs in its base case. However, BHP did consider levels of potential carbon regulation in the future in its risk analysis of this IRP. 2.1.2 Carbon Capture and Sequestration Technologies2 Carbon capture and sequestration (CCS) technologies are currently being researched and tested in an effort to remove CO2 from the atmosphere. Carbon capture is defined as the separation and entrapment of CO2 from large stationary sources including power plants, cement manufacturing, ammonia production, iron and non-ferrous metal smelters, industrial boilers, refineries, and natural gas wells. Carbon sequestration means the capture and secure storage of CO2 that would otherwise be emitted to or remain in the atmosphere. CO2 can also be removed from the atmosphere through what is termed “enhancing natural sinks” by increasing its uptake in soils and vegetation (reforestation) or in the ocean (iron fertilization). Additional information on CCS is found in Appendix C. With the belief that CO2 will be regulated (either cap and trade or a tax) with an associated requirement to significantly reduce CO2 emissions in the future, CCS will need to be proven as a viable technology in order for coal-fired generation to continue to be a resource option. For purposes of this IRP, BHP assumed CCS has not progressed enough to be a viable alternative for this IRP during the entire twenty-year planning horizon. 2.1.3 Environmental Regulatory Requirements BHP personnel are closely monitoring environmental regulations and requirements to determine what actions need to be undertaken to ensure compliance and to understand the costs associated with that compliance. Among other issues, BHP is currently tracking issues relating to ozone; sulfur dioxide (SO2); nitrogen dioxide (NO2); the boiler Maximum Achievable Control Technology (MACT) rules for both industrial sources and utility boilers; the Clean Air Interstate Rule (CAIR) and its impending replacement rule, the Clean Air Transport Rule (CATR); water; particulate matter, specifically for 2.5 micrometers (PM2.5); the Coal Combustion Residuals (CCR) rule relating to ash; mercury and hazardous air pollutants (Hg/HAPS); and Geenhouse Gases , (see Figure 2-13). The uncertainty related to the myriad of rules expected from the U.S. Environmental Protection Agency (EPA) is large. The American Public Power Association (APPA) projects that the coal-fired power sector will see near-constant retrofits from 2012 through 2018, competition for scarce engineering and construction services and equipment, large-scale unit retirements, possible shortfalls in reserve margin
2 Howard Herzog and Dan Golomb, “Carbon Capture and Storage from Fossil Fuel Use,” as published in the Encyclopedia of Energy, 2004. 3 “Generating Buzz,” Power Engineering, July 2010, p. 80.
Exhibit JST-2
000876

Black Hills Power 2011 IRP 7
requirements, an increase in natural gas generation, and a worrisome chance that financial resources could be misallocated and investments left stranded.4 APPA believes that the EPA hopes to force closure of 50% of the fleet of coal-fired generating units in the U.S. in the next 10 years which would reduce the CO2 emissions by a commensurate 50%. The cost of such a transition is in the hundreds of billions of dollars.5 The EPA issued National Emission Standards for Hazardous Air Pollutants for Area Sources: Industrial, Commercial and Institutional Boilers (herein “Area Source Rules”), on March 21, 2011 with an effective date of May 20, 2011. The deadline to comply with these rules is March 21, 2014. This rule provides for hazardous air pollutant-related emission limits and monitoring requirements for area sources of hazardous air pollutants. BHP is evaluating the impact of the rules on its existing generating facilities. The area source rules, as issued, have a significant impact on our Neil Simpson I, Osage and Ben French coal-fired facilities. The regulation has prompted BHP to perform engineering evaluations to determine economic viability of continued operations of these units. In our current opinion, the regulations will lead to retirement of these units within three years of the effective date of the final rule. BHP previously placed its Osage 1-3 units in cold storage based on economics. The evaluation of the upgrades necessary to bring Ben French and Neil Simpson 1 into compliance with the Area Source Rules and the cost associated with those upgrades have been completed. If it is determined that upgrading these units is not economically viable then it is probable that the Ben French, Neil Simpson 1, and Osage 1-3 units will be retired in 2014.
4 Eric Wagman, “Expect a Mess as EPA Rules Take Hold,” Power Engineering, July 2010, p. 4. 5 Ibid.
Exhibit ES-2
000877

Black Hills Power 2011 IRP 8
Figure 2-1
Possible Timeline for EnvironmentalRegulatory Requirements for the Utility Industry
Ozone
PM2.5
'08'08 '09'09 '10'10 '11'11 '12'12 '13'13 '14'14 '15'15 '16'16 '17'17
Beginning CAIR Phase I Seasonal NOxCap
HAPs MACT proposed
rule
Beginning CAIR Phase II Seasonal NOx Cap
Revised Ozone NAAQS
Begin CAIR
Phase I Annual
SO2 Cap
-- adapted from Wegman (EPA 2003) Updated 2.15.10
Beginning CAIR Phase II Annual SO2 & NOx Caps
Next PM-2.5
NAAQS Revision
Next Ozone NAAQS Revision
SO2Primary NAAQS
SO2/NO2Secondary
NAAQS
NO2 Primary NAAQS
SO2/NO2
New PM-2.5 NAAQS Designations
CAMR & Delisting Rule vacated
Hg/HAPS
Final EPA Non-attainment
Designations
PM-2.5SIPs due (‘06)
Proposed CAIR Replacement
Rule Expected
HAPS MACT final rule expected
CAIR Vacated
HAPS MACT Compliance 3 yrs
after final rule
CAIR Remanded
CAIR
Begin CAIR
Phase I Annual
NOx Cap
PM-2.5 SIPs due (‘97)
316(b) proposedrule expected
316(b) final ruleexpected
316(b) Compliance3-4 yrs after final rule
Effluent Guidelines
proposed ruleexpected
Water
Effluent GuidelinesFinal rule expected Effluent Guidelines
Compliance 3-5 yrs after final rule
Begin Compliance Requirements
under Final CCB Rule (ground
water monitoring, double monitors, closure, dry ash
conversion)Ash
Proposed Rule for CCBsManagement
Final Rule for CCBsMgmt
Final CAIR Replacement
Rule Expected
Compliance with CAIR
Replacement Rule
CO2
CO2Regulation
Reconsidered Ozone NAAQS
Exhibit JST-2
000878

Black Hills Power 2011 IRP 9
2.2 Grid Modernization Grid modernization, sometimes referred to as “Smart Grid”, is frequently used in discussions among government agencies, equipment manufacturers, and the utility industry. However, the definition of grid modernization varies significantly depending on who is leading the discussion. For BHP’s purposes in preparing this IRP, grid modernization will mean integrating the electrical infrastructure with the communications network. This will lead to an automated electric power system that monitors and controls grid activities, ensuring two-way flow of electricity and information between power plants and consumers – and all points in-between. Additional information on grid modernization can be found in Appendix D. BHP has completed installation of advanced metering infrastructure (AMI) on the majority of its residential and commercial customers. In addition to the AMI meter deployment, BHP is also implementing a Meter Data Management System (MDMS.) The MDMS application will be a core utility business system utilized to collect essential metering information from BHP customers. The MDMS application will help BHP manage customer usage information as we continue to provide reliable and economic service to meet our customers’ needs of today and in the future. The MDMS application is scheduled for completion in 2012. 2.3 Plug-in Hybrid Electric Vehicles Electric vehicles, and their associated battery technology, have been under development for several decades. Today’s hybrid electric vehicles, available for purchase by the mass market and part of the rental car fleets, have significantly advanced the likelihood that such cars can be a commercial success and not just an oddity. The hybrid electric vehicles recharge themselves as they are still fueled by gasoline or similar fuel. The next step in the evolution of personal transportation appears to be plug-in hybrid electric vehicles (PHEV) and plug-in electric vehicles, which are dependent on advances in battery technology. This evolutionary step could have significant impacts on the electric utility industry. PHEVs will require charging, presumably daily. Without grid modernization, the PHEVs could recharge during on-peak periods, thus increasing an electric utility’s load and potentially causing the need for new generating capacity. With grid modernization the plug would know not to begin charging until a utility’s off-peak hours. In addition, PHEVs represent what transmission planners call “mobile loads.” This means that the car might be charged at home, at the office, at the mall, or at other locations. Such flexibility for the customer will require accommodation through the design or redesign of the transmission and distribution systems which have yet to occur on any utility system in the country including BHP’s. No changes to the load forecast or modifications to the transmission and distribution plans are contained in this IRP as would be necessary to accommodate widespread adoption of PHEVs in BHP’s service territory.
Exhibit JST-2
000879

Black Hills Power 2011 IRP 10
2.4 Renewable Energy Standards Wyoming does not currently have a renewable energy standard (RES). South Dakota has adopted a renewable portfolio objective that encourages utilities to generate, or cause to be generated, at least 10% of their retail electricity supply from renewable energy sources by 2015. Absent a specific renewable energy mandate in Wyoming or South Dakota, our current strategy is to prudently incorporate renewable energy into our resource supply, seeking to minimize associated rate increases for our utility customers. Additional information on the RES in South Dakota and Montana are provided below. 2.4.1 South Dakota Renewable Energy Standard6 In February 2008, South Dakota enacted legislation (HB 1123) establishing an objective that 10% of all retail electricity sales in the state be obtained from renewable and recycled energy by 2015. In March 2009, this policy was modified by allowing “conserved energy” to meet the objective. This is a voluntary objective, not a mandatory standard, thus there are no penalties or sanctions for retail providers that fail to meet the goal. Qualifying electricity includes that produced from wind, solar, hydroelectric, biomass (agricultural crops, wastes, and residues; wood and wood wastes; animal and other degradable organic wastes; municipal solid waste; and landfill gas) and geothermal resources, and electricity generated from currently unused waste heat from combustion or another process that does not use an additional combustion process and that is not the result of a system whose primary purpose is the generation of electricity. Hydrogen generated by any of the preceding resources is eligible. In addition to meeting the technology eligibility criteria, electricity must also meet the SDPUC’s rules for tracking, recording and verifying renewable energy credits (RECs). Both in-state and out-of-state facilities are eligible to generate qualifying RECs. Annual reporting to the SDPUC is required. 2.4.2 Montana7 Montana’s renewable portfolio standard (RPS), enacted in April 2005, requires public utilities and competitive electricity suppliers to obtain a percentage of their retail electricity sales from eligible renewable resources according to the following schedule:
5% for compliance years 2008-2009 (1/1/2008 - 12/31/2009) 10% for compliance years 2010-2014 (1/1/2010 - 12/31/2014)
6DSIRE: Database of State Incentives for Renewables & Efficiency, http://www.dsireusa.org/incentives/index.cfm?re=1&ee=1&spv=0&st=0&srp=1&state=SD 7 DSIRE: Database of State Incentives for Renewables & Efficiency, http://www.dsireusa.org/incentives/incentive.cfm?Incentive_Code=MT11R&state=MT&CurrentPageID=1&RE=1&EE=1
Exhibit JST-2
000880

Black Hills Power 2011 IRP 11
15% for compliance year 2015 (1/1/2015 - 12/31/2015) and for each year thereafter
Eligible renewable resources include wind; solar; geothermal; existing hydroelectric projects (10 megawatts or less); certain new hydroelectric projects (up to 15 megawatts installed at an existing reservoir or on an existing irrigation system that did not have hydroelectric generation as of April 16, 2009); landfill or farm-based methane gas; wastewater-treatment gas; low-emission, non-toxic biomass; and fuel cells where hydrogen is produced with renewable fuels. Facilities must begin operation after January 1, 2005, and must either be located in Montana or located in another state and be delivering electricity into Montana. Utilities and competitive suppliers can meet the standard by entering into long-term purchase contracts for electricity bundled with renewable-energy credits (RECs), by purchasing the RECs separately, or by a combination of both. The law includes cost caps that limit the additional cost utilities must pay for renewable energy and allows cost recovery from ratepayers for contracts pre-approved by the Montana Public Service Commission (MPSC).
Exhibit JST-2
000881

Black Hills Power 2011 IRP 12
3.0 Assumptions A wide variety of data assumptions must be made for integrated resource planning (IRP) modeling. Key assumptions described in the following paragraphs were used in the base scenario (scenarios are described in Section 7.1 Analysis). These assumptions include coal price forecasts, natural gas price forecasts, market price forecasts, financial parameters, planning reserves, and emissions costs. The Ventyx 2011 Spring Reference Case for the Western Electricity Coordinating Council (WECC) was used for the long-term natural gas and electric price forecasts. The load and energy forecast is described in its own section of the report that follows this one. 3.1 Coal Price Forecasts BHP used a coal price forecast that reflects the cost incurred at the time of the IRP modeling for fuel from BHP’s coal-fired generating units. These prices as of May 2011 are shown in Table 3-1.
Table 3-1 Coal Price Forecast
Year All Units (Except Ben French) $/MMBtu
Ben French $/MMBtu*
2011 0.878 1.472 2012 0.985 1.588 2013 1.078 1.689 2014 1.131 1.775 2015 1.224 1.884 2016 1.277 1.954 2017 1.424 2.117 2018 1.477 2.188 2019 1.543 2.272 2020 1.610 2.357 2021 1.690 2.455 2022 1.743 2.528 2023 1.783 2.587 2024 1.876 2.700 2025 1.956 2.801 2026 2.022 2.889 2027 2.076 2.963 2028 2.129 3.039 2029 2.182 3.115 2030 2.209 3.165 *Ben French coal forecast includes transportation costs.
Exhibit JST-2
000882

Black Hills Power 2011 IRP 13
3.2 Natural Gas Price Forecasts BHP used the natural gas price forecasts from Ventyx’s WECC 2011 Spring Reference Case. The Henry Hub values were adjusted by the cost of transportation to reflect the price of natural gas as actually delivered to BHP generating facilities. The Henry Hub natural gas prices are shown monthly in Table 3-2, and Figure 3-1
Table 3-2 Monthly Henry Hub Natural Gas Prices ($/MMBtu)
Year Jan Feb Mar Apr May Jun Jul Aug Sep Oct Nov Dec 2011 4.45 4.06 3.93 4.38 4.46 4.53 4.60 4.63 4.64 4.69 4.85 5.08 2012 5.20 5.18 5.11 4.95 4.97 5.00 5.04 5.07 5.08 5.13 5.26 5.47 2013 5.59 5.56 5.47 5.22 5.25 5.28 5.33 5.36 5.38 5.44 5.59 5.82 2014 5.97 5.95 5.85 5.56 5.58 5.61 5.65 5.68 5.70 5.76 5.92 6.17 2015 6.31 6.27 6.15 5.82 5.82 5.84 5.88 5.91 5.92 5.99 6.15 6.41 2016 6.58 6.54 6.40 6.05 6.06 6.08 6.11 6.15 6.16 6.22 6.39 6.67 2017 6.83 6.78 6.64 6.27 6.28 6.29 6.32 6.35 6.35 6.42 6.59 6.87 2018 7.04 6.99 6.83 6.43 6.43 6.45 6.49 6.53 6.54 6.61 6.80 7.09 2019 7.25 7.20 7.05 6.65 6.66 6.68 6.72 6.76 6.77 6.85 7.04 7.34 2020 7.47 7.43 7.28 6.90 6.91 6.94 6.99 7.03 7.05 7.14 7.33 78.63 2021 7.83 7.79 7.65 7.25 7.27 7.30 7.34 7.39 7.41 7.50 7.70 8.02 2022 8.15 8.12 7.98 7.60 7.62 7.66 7.71 7.77 7.80 7.89 8.09 8.41 2023 8.69 8.65 8.49 8.05 8.08 8.11 8.16 8.21 8.23 8.32 8.55 8.90 2024 9.11 9.06 8.89 8.42 8.44 8.47 8.52 8.57 8.59 8.68 8.91 9.28 2025 9.46 9.41 9.23 8.77 8.79 8.82 8.87 8.92 8.94 9.03 9.26 9.63 2026 9.89 9.83 9.64 9.13 9.15 9.17 9.22 9.27 9.28 9.38 9.62 10.02 2027 10.22 10.16 9.96 9.44 9.45 9.48 9.53 9.58 9.59 9.69 9.93 10.33 2028 10.55 10.49 10.29 9.75 9.76 9.79 9.84 9.89 9.90 10.01 10.26 10.67 2029 10.80 10.74 10.56 10.07 10.08 10.12 10.19 10.25 10.29 10.40 10.65 11.04 2030 11.28 11.24 11.07 10.57 10.60 10.65 10.71 10.78 10.81 10.93 11.19 11.60 Source: Ventyx
Figure 3-1 Henry Hub Natural Gas Prices
0.00
2.00
4.00
6.00
8.00
10.00
12.00
14.00
$/M
MBtu
Source: Ventyx
Exhibit JST-2
000883

Black Hills Power 2011 IRP 14
3.3 Market Price Forecasts Electricity price estimates for the Wyoming region were derived from Ventyx’s 2011 Spring Reference Case and are the basis on which BHP’s market transactions were priced. The on-peak electricity prices for Wyoming are shown in Figure 3-2. Values are shown for the four scenarios that require the development of correlated natural gas and market prices – base, environmental, low gas and high gas. The description of these scenarios is found in Section 7.1.
Figure 3-2 Reference Case – On-Peak Electricity Prices – Wyoming Region
0
20
40
60
80
100
120
140
160
180
2011 2014 2017 2020 2023 2026 2029
$/MWh
Base Environmental High Gas Low Gas
3.4 Financial Parameters The financial parameters used in this IRP are summarized in Table 3-3.
Table 3-3 Financial Parameters
Component Annual Rate (%) Interest Rate 6.25 Discount Rate 7.41 Income Tax Rate 35 Rate of Escalation 2.5 Capital Structure Equity 52 Debt 48 Wyoming Property Tax Rate 0.35 Wyoming 20-year Fixed Charge Rate 11.05 Wyoming 30-year Fixed Charge Rate 10.91 Wyoming 50-year Fixed Charge Rate 9.95
Exhibit JST-2
000884

Black Hills Power 2011 IRP 15
A discount rate of 7.41% was used to examine the present value of revenue requirements (PVRR) in this analysis. A levelized fixed charge rate of 9.95% was used for future coal investments, 10.91% for combined cycle investments, 11.05% for solar and wind investments, and 10.91% for peaking investments. Book lives of 50 years were used for coal, 30 years for combined cycle and peaking technology, and 20 years for wind and solar. Tax lives of 20 years were used for coal and combined cycle and peaking technology, 5 year life for solar and wind. A 6.25% short-term debt interest rate was modeled. 3.5 Planning Reserves Planning reserve margin is defined as the additional capacity required in excess of a utility’s peak forecasted demand to ensure resource adequacy for a reliable generation portfolio. Historically around the country, the level of planning reserve margin has generally varied from 15% to 20%. A minimum planning reserve margin of 15% was used in this IRP which is consistent with what other utilities use in the western region and is generally regarded as prudent utility practice. 3.6 Emissions Costs Federal greenhouse gas emission legislation has failed to gain enough support in Congress to become law and, although lawmakers continue to debate this issue, it does not appear that carbon taxes or a CO2 cap and trade mechanism will be enacted in the foreseeable future. As such, no carbon taxes are assumed in Ventyx’s 2011 Spring Reference Case and thus no carbon taxes are assumed to be put in place during the planning horizon for the base scenario assumptions. For the environmental scenarios, the carbon taxes developed by Ventyx, starting in 2015 and shown in Table 3-4, were assumed.
Exhibit JST-2
000885

Black Hills Power 2011 IRP 16
Table 3-4 Carbon Tax Assumption
(Environmental Scenarios Only) Year Carbon Tax ($/ton)2015 15.742016 16.622017 17.542018 18.522019 19.552020 20.642021 21.792022 23.012023 24.302024 25.682025 30.032026 34.952027 37.752028 41.512029 46.362030 54.06
Source: Ventyx
Exhibit JST-2
000886

Black Hills Power 2011 IRP 17
4.0 Load Forecast The load forecast for BHP was developed and includes 23 MW of load from the City of Gillette, Wyoming (COG); and the MDU Sheridan Service Territory (MDU Sheridan). BHP is contractually obligated to serve 23 MW of the COG’s and the MDU’s Sheridan load when Wygen III is not available. The load forecast represents an average annual trended forecast peak and energy growth rate of 1.0% based on seven year historical data. Expected load additions in 2012 through 2016 were also incorporated into the load forecast. The peak demand and energy forecast values are shown in Table 4-1 and Figures 4-1 and 4-2.
Table 4-1 BHP Peak Demand and Energy Forecast 2011-2030
Year Peak Demand (MW)
Growth in Peak
Demand (%)
Annual Energy (MWh)
Growth in Annual
Energy (%)
Load Factor (%)
2011* 408 2,283,465 63.9 2012 414 1.47 2,306,302 1.00 63.6 2013 426 2.91 2,389,303 3.60 64.0 2014 430 0.92 2,412,278 0.96 64.0 2015 442 2.72 2,465,252 2.20 64.0 2016 446 0.94 2,504,224 1.58 64.1 2017 450 0.93 2,529,276 1.00 64.2 2018 455 1.14 2,554,576 1.00 64.1 2019 459 0.91 2,580,134 1.00 64.1 2020 464 1.00 2,605,935 1.00 64.1 2021 468 1.00 2,631,995 1.00 64.1 2022 473 1.00 2,658,315 1.00 64.1 2023 478 1.00 2,684,898 1.00 64.1 2024 483 1.00 2,711,747 1.00 64.1 2025 488 1.00 2,738,864 1.00 64.1 2026 492 1.00 2,766,253 1.00 64.1 2027 497 1.00 2,793,915 1.00 64.1 2028 502 1.00 2,821,855 1.00 64.1 2029 507 1.00 2,850,073 1.00 64.1 2030 512 1.00 2,878,574 1.00 64.1
*A new all-time peak of 452 MW was set in 2011.
The load forecast was adjusted to reflect the achievement of demand-side management programs as well as the energy purchased from Cheyenne Light through the Cheyenne put arrangement for energy from Wygen I. Once the load forecast was complete the forecast Cheyenne put energy from the Cheyenne Light IRP was subtracted from the BHP load forecast.
Exhibit JST-2
000887

Black Hills Power 2011 IRP 18
Figure 4-1 Black Hills Power
7-Year Historical and 20-Year Forecasted Peak
300
350
400
450
500
550
600
650
700
20
04
20
06
20
08
20
10
20
12
20
14
20
16
20
18
20
20
20
22
20
24
20
26
20
28
20
30
An
nu
al P
ea
k (
MW
)
Growth Rate: 1.0%80% Confidence Band: +/- .75%Trended Load Factor: 64.6%
Figure 4-2 Black Hills Power
7-Year Historical and 20-Year Forecasted Energy
1,000,000
1,500,000
2,000,000
2,500,000
3,000,000
3,500,000
4,000,000
20
04
20
06
20
08
20
10
20
12
20
14
20
16
20
18
20
20
20
22
20
24
20
26
20
28
20
30
An
nu
al E
ne
rgy
(M
Wh
)
Growth Rate: 1.0%80% Confidence Band: +/- .75%
Table 4-2 provides a side-by-side comparison of the values projected for peak demand and annual energy in the 2005 IRP, the 2007 IRP, and in the forecast prepared for this 2011 IRP. The forecast from the 2007 IRP reflects a very strong economy and thus a
Exhibit JST-2
000888

Black Hills Power 2011 IRP 19
higher load growth than is seen for the 2011 IRP. This most recent forecast reflects the economic downturn and the resulting effects.
Table 4-2 Load Forecast Comparison
2005 IRP 2007 IRP 2011 IRP Year Peak
Demand Annual Energy
Peak Demand
Annual Energy
Peak Demand
Annual Energy
2005 400 2,109,780 2006 405 2,130,870 2007 410 2,152,190 2008 415 2,173,700 416 2,234,646 2009 420 2,197,600 423 2,266,302 2010 425 2,219,590 429 2,298,835 2011* 430 2,244,020 436 2,331,971 408 2,283,465 2012 435 2,268,700 441 2,366,184 414 2,306,302 2013 441 2,291,380 448 2,399,829 426 2,389,303 2014 446 2,314,370 456 2,434,563 430 2,412,278 2015 451 2,336,550 461 2,469,844 442 2,465,252 2016 456 2,360,610 468 2,506,235 446 2,504,224 2017 475 2,542,090 450 2,529,276 2018 482 2,579,073 455 2,554,576 2019 489 2,616,638 459 2,580,134 2020 497 2,655,348 464 2,605,935 2021 504 2,693,560 468 2,631,995 2022 512 2,732,935 473 2,658,315 2023 518 2,772,932 478 2,684,898 2024 526 2,814,111 483 2,711,747 2025 534 2,854,832 488 2,738,864 2026 543 2,896,755 492 2,766,253 2027 551 2,939,340 497 2,793,915 2028 502 2,821,855 2029 507 2,850,073 2030 512 2,878,574
*A new all-time peak of 452 MW was set in 2011.
Exhibit JST-2
000889

Black Hills Power 2011 IRP 20
5.0 Demand-Side Management BHP’s Demand-Side Management (DSM) programs as defined in Docket # EL11-002 were approved by the South Dakota Public Utilities Commission on June 28, 2011. The plan documented the energy efficiency programs that will be implemented in its service territory. In this section of the IRP report, the DSM and energy efficiency programs that are being implemented for BHP and their effects on peak demand and/or energy are presented. The residential electric portfolio offers customers opportunities to save energy with water heating, refrigerator recycling, heat pumps, and school-based energy efficiency. This portfolio also offers an energy audit program and weatherization teams. The commercial electric portfolio provides both a prescriptive rebate program and a custom rebate program. A brief description of each program is provided below. 5.1 Residential Water Heating This program offers rebates to BHP residential customers when they replace existing electric water heaters with high-efficiency models or when they install high-efficiency electric tank water heaters in new single-family or specific types of multi-family dwellings. The incentive is $75 per water heater. BHP anticipates that 80 water heaters will be replaced in year 1 of the program, 120 water heaters in year 2 and 160 water heaters in year 3. 5.2 Residential Refrigerator Recycling The Refrigerator Recycling Program will encourage residential or small business customers to turn in old inefficient refrigerators. The program’s goal is to remove inefficient refrigerators from the electric system and dispose of them in an environmentally safe and responsible manner. As part of the program, an incentive will be given to the customer. Initially, a $30 payment will be offered per qualifying unit. A contractor will handle scheduling, transportation and disposal. The contractor will also provide nameplate data on units to assist in impact evaluation. Goals of 150 units for year 1, 225 units for year 2 and 300 units for year 3 have been established. 5.3 Residential Heat Pumps This program offers rebates to residential customers for installing new, energy efficient heat pumps in new construction or existing homes. Rebates are also paid for the replacement of existing heat pumps and for replacing an electric furnace with a heat pump. Goals for this program are set at 577 units replaced in year 1, 865 units in year 2 and 1,154 units in year 3.
Exhibit JST-2
000890

Black Hills Power 2011 IRP 21
5.4 School-Based Energy Education This program targets middle school-age children and their households seeking long-term energy savings through enhanced awareness of energy efficiency among students. A specific curriculum has been developed that complements the existing natural science-based education and includes a set of low-cost measures that help ideas and concepts resonate with participating students. Compact fluorescent light bulbs (CFL) will be given to students to install in their homes. A participation goal has been set at 125 students per year. 5.5 Residential Audits This program will provide on-site audits to customers. The objective of the audit program is to provide recommendations to customers about ways they can reduce the energy consumption in their homes and direct installation of low-cost energy savings measures. Audit recommendations may include suggested behavioral changes and suggestions about repairing, upgrading, or replacing larger, relatively expensive equipment or systems. As a part of the free audit, auditors will install or instruct participating customers on how to install a number of low-cost energy-saving measures. BHP expects to provide audits for 200 customers in each year of this 3-year program. 5.6 Weatherization Team This program delivers weatherization measures to the low-income community within the Company’s service territory. A variety of weatherization efforts may be undertaken as part of the program offered to low income residential customers including senior citizens and disabled customers. Eligible participants will be identified through Neighborworks, Inc., Western South Dakota Community Action, and Church Response. BHP expects to provide weatherization assistance for 25 customers in each year of this 3-year program. 5.7 Commercial and Industrial Prescriptive and Custom Rebates This program provides standardized pre-determined rebates to commercial and industrial customers that install, replace or retrofit electric savings measures of pre-qualified performance. These measures include lighting, electric motors, and variable frequency drives. Any energy efficient equipment not covered by the prescriptive component of the rebate program will be eligible for evaluation as a custom rebate. All commercial and industrial customers served by BHP’s standard tariffs are eligible to participate in this program. The projected program participation and impacts for years 1 through 3 of the Energy Efficiency Solutions Plan are shown on Tables 5-1, 5-2 and 5-3. The plan’s budgets for Year 1 through 3 are shown on Table 5-4.
Exhibit JST-2
000891

Black Hills Power 2011 IRP 22
Table 5-1 DSM Program Portfolio – Year 1
Program Name Annual Participation Goal
Demand Savings (kW)
Year 1 – Annual Program Impacts (kWh)
Residential Water Heating 80 8 21,207Residential Refrigerator Recycle 150 30 195,016Residential Heat Pumps 577 535 1,172,664School Based EE 125 1 24,921Residential Audits 200 27 178,157Weatherization Team 25 N/A N/AResidential Total 1,132 601 1,591,966C/I Prescriptive & Custom Rebate 162 136 1,448,261Total C/I 162 136 1,448,261TOTAL 1,294 737 3,040,227
Table 5-2 DSM Program Portfolio – Year 2
Program Name Annual Participation Goal
Demand Savings (kW)
Year 1 – Annual Program Impacts (kWh)
Residential Water Heating 120 12 31,811Residential Refrigerator Recycle 225 45 292,524Residential Heat Pumps 865 802 1,756,665School Based EE 125 1 24,921Residential Audits 200 27 178,157Weatherization Team 25 N/A N/AResidential Total 1,560 901 2,284,078C/I Prescriptive & Custom Rebate 245 205 2,176,632Total C/I 245 205 2,176,632TOTAL 1,805 1,107 4,460,710
Exhibit JST-2
000892

Black Hills Power 2011 IRP 23
Table 5-3 Electric Program Portfolio – Year 3
Program Name Annual Participation Goal
Demand Savings (kW)
Year 1 – Annual Program Impacts (kWh)
Residential Water Heating 160 16 42,415Residential Refrigerator Recycle 300 59 390,031Residential Heat Pumps 1,154 1,074 2,351,228School Based EE 125 1 24,921Residential Audits 200 27 178,157Weatherization Team 25 N/A N/AResidential Total 1,964 1,177 2,986,752C/I Prescriptive & Custom Rebate 326 273 2,900,762Total C/I 326 273 2,900,762TOTAL 2,290 1,450 5,887,514
Table 5-4 Program Budgets
Program Name Year 1 Year 2 Year 3 Residential Water Heating $8,050 $12,075 $16,100Residential Refrigerator Recycling $30,700 $46,050 $61,400Residential Heat Pumps $125,070 $186,863 $252,038School Based Energy Education $5,500 $5,500 $5,500Residential Audits $46,800 $46,800 $46,800Weatherization Team $10,000 $10,000 $10,000TOTAL RESIDENTIAL $226,120 $307,288 $391,838Commercial/Industrial Prescriptive and Custom Rebate
$267,304 $401,813 $535,465
TOTAL C/I $267,304 $401,813 $535,465Cross Program Training, Marketing and Project Management
$100,000 $100,000 $100,000
TOTAL $593,424 $809,100 $1,027,302
Exhibit JST-2
000893

Black Hills Power 2011 IRP 24
6.0 Supply-Side Resources 6.1 Existing Resources The resources available to BHP to meet customer obligations include coal-fired units, natural gas-fired units, diesel-fired units, and long-term power purchase agreements (PPA) as shown in Table 6-1. Resources committed under the current PPAs include coal and wind. The PPA with PacifiCorp, referred to as Colstrip, expires in 2023. The wind PPAs at Happy Jack and Silver Sage expire in 2028 and 2029, respectively. The City of Gillette’s and MDU’s ownership shares in Wygen III are included in BHP’s existing resources to account for the City of Gillette’s and MDU Sheridan’s load being included in BHP’s load forecast.
Table 6-1 BHP Existing Resources
Power Plant Net BHP Capacity (MW)
Fuel Type State Start Date
Ben French 22 Coal SD 1960 Neil Simpson I 16 Coal WY 1969 Neil Simpson II 80 Coal WY 1995 Wyodak 62 Coal WY 1978 Wygen III*** 100 Coal WY 2010 Ben French Diesels 1-5
10 Diesel SD 1965-1977
Ben French CTs 1-4
100* Natural Gas SD 1977-1979
Lange CT 39 Natural Gas SD 2002 Neil Simpson CT 1 39 Natural Gas WY 2000 Long-Term PPAs Capacity Type Start Date End Date PacifiCorp PPA (Colstrip)
50 Firm 1983 2023
Happy Jack 1.5** Wind 2008 2028 Silver Sage 2** Wind 2009 2029 TOTAL 521.5 Notes: *Under terms of the Reserve Capacity Integration Agreement (RCIA) with PacifiCorp, these units are rated at 72 MW total (summer value as of 7/1/2012). **The accredited capacity for each of the wind PPAs (Happy Jack and Silver Sage) is 10% of the total capacity. *** Includes City of Gillette and MDU’s Wygen III ownership. 6.2 Existing Unit Retirements and Upgrades Recently adopted and proposed EPA rules are impacting and will continue to impact BHP’s generating fleet. Of particular note are the Area Source Rules and utility boiler Maximum Achievable Control Technology (MACT) rules. EPA’s final Area Source
Exhibit JST-2
000894

Black Hills Power 2011 IRP 25
Rules went into effect March 21, 2011. These rules affect Ben French 1, Neil Simpson 1 and Osage 1-3. These rules specify limits for mercury emissions and carbon monoxide emissions. The proposed utility boiler MACT rules are scheduled to be finalized in November 2011. These rules will apply to Neil Simpson II, Wygen I, II, and III. The utility MACT rules set limits on emissions of particulate matter, mercury and hydrogen chloride. As a result of the promulgation of these rules, BHP undertook studies, through a consultant, of the costs that would be required for compliance with the Area Source Rules as well as the expected standards for making progress on regional haze. Osage units 1-3 are currently in cold storage based on economics. The costs developed for Osage 1-3 indicated that it is not economically viable to retrofit Osage 1-3. Upgrades for Ben French 1 and Neil Simpson 1 have been modeled as resource options in this IRP. These upgrades include the installation of selective catalytic reduction (SCR), spray dryer absorbers (SDA), and fabric filters. Parameters used to model these upgrades are shown in Table 6-2.
Table 6-2 Existing Unit Upgrades Performance Parameters
Parameter Neil Simpson 1 Upgrade
Ben French 1 Upgrade
Earliest feasible year of installation 2014 2014 Size, MW (net) - summer 18 22 Full load heat rate, Btu/kWh 14,427 13942 SO2 Emission Rate, lb/MMBtu 0.00 0.00 NOx Emission Rate, lb/MMBtu 0.00 0.00 CO2 Emission Rate, lb/MMBtu 292.6 292.6 Fixed O&M, $/kW-year (2010 $) 54.301 111.44 Variable O&M, $/MWh (2010 $) 6.458 11.57 Forced Outage Rate, % 2.00 2.00 Maintenance Outage Rate, % 3.00 3.00 Capital Cost, $/kW (2010 $) 1,000 1,000
If upgrades are not performed for Neil Simpson 1 and Ben French 1, these units as well as Osage 1-3 will retire in 2014. 6.3 New Conventional Resources A variety of conventional supply-side resources were examined and considered in preparing this IRP. These include coal, different configurations of natural gas-fired combined cycle, and several types of natural gas-fired simple cycle combustion turbines. In addition, unit upgrades and conversion from combustion turbine to combined cycle configuration were evaluated. A brief description of each type of resource and the cost and other parameters used for modeling are described below.
Exhibit JST-2
000895

Black Hills Power 2011 IRP 26
6.3.1 Coal New pulverized coal-fired units are assumed to be located in the Gillette, Wyoming area near the Wyodak plant site. Each new unit is rated at 100 MW at the time of the summer system peak. Data used for modeling new coal-fired units are shown in Table 6-3.
Table 6-3 Coal-Fired Power Plant Performance Parameters
Parameter Value Earliest feasible year of installation 2017Size, MW (net) - summer 100Full load heat rate, Btu/kWh 11,500SO2 Emission Rate, lb/MMBtu 0.03NOx Emission Rate, lb/MMBtu 0.05CO2 Emission Rate, lb/MMBtu 210Fixed O&M, $/kW-year (2010 $) 26.95Variable O&M, $/MWh (2010 $) 4.00Forced Outage Rate, % 2.00Maintenance Outage Rate, % 2.00Capital Cost, $/kW (2010 $) 2,627
6.3.2 Combined Cycle Combustion Turbines In a combustion turbine combined cycle facility, the hot exhaust gases from the combustion pass through a heat recovery steam generator (HRSG). The steam generated by the HRSG is expanded through a steam turbine, which, in turn, drives an additional generator. Combustion turbine combined cycle systems typically burn natural gas and are available in a variety of sizes and configurations. The possible conversion of an existing combustion turbine to a combined cycle configuration was included in the options examined for combined cycle facilities due to BHP owning 2 combustion turbines capable of being converted. Parameters used to model several different configurations of combined cycle facility as a resource are shown in Table 6-4. 6.3.3 Simple Cycle Combustion Turbine Combustion turbines typically burn natural gas and/or No. 2 fuel oil and are available in a wide variety of sizes and configurations. Combustion turbines are generally used for peaking and reserve purposes because of their relatively low capital costs, higher full load heat rate, and the higher cost of fuel when compared to conventional baseload capacity. Combustion turbines have the added benefit of providing quick-start capability in certain configurations. Certain combustion turbines can regulate for wind as well. Parameters used to model different configurations of combustion turbines as a resource are shown in Table 6-5.
Exhibit JST-2
000896

Black Hills Power 2011 IRP 27
Table 6-4 Combined Cycle Combustion Turbine Power Plant Performance Parameters
Parameter NS CT Conv to
CC – Air/Water
CC Conversion
1 x 1 with Duct
Firing
2 x 1 3 x 1
Earliest feasible year of installation 2012 2012 2012 2012 2012Size, MW (net) - summer 45/55 55 55.7 91.8 137.4Full load heat rate, Btu/kWh 7,947/7,547 7,947 8,168 7,547 7,562SO2 Emission Rate, lb/MMBtu 0.00 0.00 0.00 0.00 0.00NOx Emission Rate, lb/MMBtu 0.009 0.009 0.01 0.01 0.01CO2 Emission Rate, lb/MMBtu 120 120 117 120 120Fixed O&M, $/kW-year (2010 $) 13.00 13.00 13.00 13.00 13.00Variable O&M, $/MWh (2010 $) 2.15 2.15 2.15 2.15 2.15Forced Outage Rate, % 2.00 2.00 2.00 2.00 2.00Maintenance Outage Rate, % 2.00 2.00 2.00 2.00 2.00Capital Cost, $/kW (2010 $) 1,650 1,300 1,427 1,372 1,179Notes: 1x1 with Duct Firing reflects one combustion turbine and one steam generator 2x1 reflects two combustion turbines feeding one steam generator 3x1 reflects three combustion turbines feeding one steam generator CC conversion represent the incremental net capacity addition of converting a simple cycle to a combined cycle.
Table 6-5
Simple Cycle Combustion Turbine Power Plant Performance Parameters Parameter Small CT Aeroderivative
CT Earliest feasible year of installation 2012 2012 Size, MW (net) - summer 36.2 90 Full load heat rate, Btu/kWh 9,566 9,000 SO2 Emission Rate, lb/MMBtu 0.00 0.00 NOx Emission Rate, lb/MMBtu 0.01 0.03 CO2 Emission Rate, lb/MMBtu 120 120 Fixed O&M, $/kW-year (2010 $) 10.95 10.95 Variable O&M, $/MWh (2010 $) 3.30 3.30 Forced Outage Rate, % 2.00 3.60 Maintenance Outage Rate, % 2.00 4.10 Capital Cost, $/kW (2010 $) 1,016 1,020
6.3.4 Existing Unit Purchase BHP may have an option to purchase a portion of the existing Wygen I coal-fired unit, owned by Black Hills Wyoming and located in Gillette, Wyoming in 2014. To evaluate how such a purchase option would fit in BHP’s resource mix, the purchase was modeled as shown below in Table 6-6.
Exhibit JST-2
000897

Black Hills Power 2011 IRP 28
Table 6-6
Existing Unit Purchase Performance Parameters Parameter Wygen IEarliest feasible year of installation 2014Size, MW (net) - summer 30Full load heat rate, Btu/kWh 11,500SO2 Emission Rate, lb/MMBtu 0.03NOx Emission Rate, lb/MMBtu 0.05CO2 Emission Rate, lb/MMBtu 210Fixed O&M, $/kW-year (2010 $) 108.61Variable O&M, $/MWh (2010 $) 7.71Forced Outage Rate, % 2.00Maintenance Outage Rate, % 2.00Capital Cost, $/kW (2014 $) 2,189
6.4 New Renewable Resources Renewable resources considered in this IRP included solar photovoltaics and wind. 6.4.1 Photovoltaic A 10 MW solar photovoltaic (PV) generation facility was modeled as one of the renewable options during the IRP process. A PV or solar cell is made of semiconducting material, typically wafer-based crystalline silicon technology, configured such that when sunlight hits the cells, the electrons flow through the material and produce electricity. Usually, about 40 solar cells are combined to form a module. Modules can be characterized as flat plate or concentrator systems. About 10 modules make up a flat plate PV array. Approximately 10-20 arrays would be required to provide enough electricity for a typical household. Parameters used to model PV are shown in Table 6-7.
Table 6-7 PV Performance Parameters
Parameter ValueEarliest feasible year of installation 2012Size, MW (net) - summer 10Full load heat rate, Btu/kWh N/ASO2 Emission Rate, lb/MMBtu N/ANOx Emission Rate, lb/MMBtu N/ACO2 Emission Rate, lb/MMBtu N/AFixed O&M, $/kW-year (2010 $) 12.55Variable O&M, $/MWh (2010 $) 0.00Forced Outage Rate, % 0.00Maintenance Outage Rate, % 0.00Capital Cost, $/kW (2010 $) 6,100
Exhibit JST-2
000898

Black Hills Power 2011 IRP 29
6.4.2 Wind Wind turbines use their blades to collect the kinetic energy of the wind. The blades are connected to a drive shaft that turns an electric generator to produce electricity. Wyoming is ranked seventh in terms of wind energy potential among the 50 states – with the possibility to develop 85,000 MW. Parameters used to model wind in this IRP are shown in Table 6-8.
Table 6-8 Wind Performance Parameters
Parameter ValueSize, MW (net) – summer and winter 30Fixed O&M, $/kW-year (2010 $) 29.55Capital Cost, $/kW (2010 $) 1,530
Production Tax Credit of $.022 kWh (2010$) for units on-line before 2020.
Exhibit JST-2
000899

Black Hills Power 2011 IRP 30
7.0 Resource Need Assessment To meet the future needs of the BHP customers, it is necessary to evaluate the impact of several factors:
Reduction of available capacity and energy resources due to unit retirements and expiration of PPAs
Future load growth projections A 15% planning reserve margin over the 20-year horizon.
The Area Source Rules have an impact on BHP’s Ben French, Neil Simpson 1, and Osage coal-fired generation units. Currently, the Osage units are in cold storage and not counted as an existing resource based on economics, but Ben French and Neil Simpson 1 are in operation and relied upon for system capacity. BHP’s future resource need is based on the upgrade or replacement of the Ben French and Neil Simpson 1 units. In addition, the Reserve Capacity Integration Agreement (RCIA) with PacifiCorp terminates which results in the effective loss of 28 MW of summer capacity. The PPAs with PacifiCorp, Happy Jack, and Silver Sage all terminate over the planning horizon for a loss of 53.5 MW of accredited capacity. As resources retire or existing PPAs terminate, other resources will be required to enable BHP to meets its obligations to serve the electricity needs of its customers. BHP developed a load and resource balance to compare its annual peak demand with the annual capability of existing resources. The load and resource balance highlights the year in which forecast load exceeds resources and indicates a need for additional generation. The load forecast used as the basis for BHP’s load and resource balance includes 23 MW of the City of Gillette’s and MDU Sheridan’s load and each entity’s respective ownership share in Wygen III as an available resource. These loads and resources are included in BHP’s load and resource balance because BHP has a contractual obligation to serve these loads when Wygen III is unavailable. The load resource balance also takes into account the planning reserve requirement. The totality of the requirements for new resources, incorporating the need for a minimum planning reserve margin of 15% and reflecting that BHP has no committed resources (resources that are planned and/or under construction but are not currently operational) in its generation portfolio as determined from the load and resource balance, is shown on Figure 7-1. The capacity deficit in any year is reflected as the distance between the line labeled “Peak Demand Plus 15% Reserves” and the top of the shaded block for “Existing Resources”. The capacity deficit reaches approximately 225 MW by the end of the planning horizon.
Exhibit JST-2
000900

Black Hills Power 2011 IRP 31
Figure 7.1 Black Hills Power Load and Resource Summary
0
100
200
300
400
500
600
700
2011 2012 2013 2014 2015 2016 2017 2018 2019 2020 2021 2022 2023 2024 2025 2026 2027 2028 2029 2030
Year
MW
Existing Resources
Peak Demand Plus 15% Reserves
Capacity Deficit
A load and resource balance for 2011 - 2015 is shown in Table 7-1.
Exhibit JST-2
000901

Black Hills Power 2011 IRP 32
Table 7.1
Black Hills Power Load and Resource Balance (2011-2015)
2011 2012 2013 2014 2015 Peak Demand* 408 414 426 430 442 DSM 0 (1) (2) (3) (3) Net Peak Demand 408 413 424 427 439 15% Reserve Margin 61 62 64 64 66 Total Demand (including planning reserves)
469 475 488 491 505
Resources Ben French 1 22 22 22 0 0 Neil Simpson I 16 16 16 0 0 Neil Simpson II 80 80 80 80 80 Wyodak 62 62 62 62 62 Ben French Diesels 10 10 10 10 10 Ben French CTs 1-4 100 72 72 72 72 Lange CT 39 39 39 39 39 Neil Simpson CT1 39 39 39 39 39 Wygen III** 100 100 100 100 100 Total BHP Resources 468 440 440 402 402 Purchases Colstrip 50 50 50 50 50 Happy Jack 1.5 1.5 1.5 1.5 1.5 Silver Sage 2 2 2 2 2 Sales Sales (MEAN) 30 30 30 30 20 Total Resources 491.5 463.5 463.5 425.5 435.5 Reserve Margin** 5.5% -2.8% -5.7% -15.5% -15.8% Notes: *Forecast Peak load includes 23 MW City of Gillette and MDU Sheridan load **Includes City of Gillette’s and MDU’s ownership share ***Reserve margin calculation is in excess of assumed 15% planning reserve margin 7.1 Analysis The process used to determine the preferred resource portfolio for BHP over the planning horizon began by identifying ten scenarios (also referred to as plans) that the Capacity Expansion module uses to derive optimal resource expansion plans The scenarios
Exhibit JST-2
000902

Black Hills Power 2011 IRP 33
include variations in inputs representing the significant sources of portfolio cost variability and risk. These ten scenarios and a brief description of the scenario variables are listed below: 1. Base Scenario
Used assumptions described in Sections 3.0 through 7.0 Colstrip contract modeled at 50 MW through December 2023
Happy Jack expires August 2028 Silver Sage expires September 2029 MEAN contract sale through May 2023 Up to 75 MW firm market purchases in July and August; 6 x 16 product 2. Environmental Scenario Same assumptions as Base Scenario Included CO2 emissions price based on Ventyx’s 2011 Spring Reference Case –
Environmental Case Gas and market prices from Ventyx’s 2011 Spring Reference Case –
Environmental Case 3. High Gas Scenario Same assumptions as Base Scenario Assumed higher gas and market prices than Base Scenario 4. Low Gas Scenario Same assumptions as Base Scenario Assumed lower gas and market prices than Base Scenario 5. High Load Scenario Same assumptions as Base Scenario Assumed a high load forecast 6. Low Load Scenario Same assumptions as Base Scenario Assumed a low load forecast 7. Step Load Scenario Same assumptions as Base Scenario Included a 40 MW load increase in 2015 8. Gillette Top Load Scenario Same assumptions as Base Scenario Included City of Gillette “top load” (load over base 23 MW) Assumed Neil Simpson CT 2 purchased by the City of Gillette; BHP serves City’s
energy requirements 9. Base Scenario with No Firm Market Same assumptions as Base Scenario Assumed no firm market purchases available in July and August 10. No Combined Cycle Conversion Option Same build assumptions as Base Scenario No combined cycle conversion option Capacity expansion modeling results (resource portfolios) for these scenarios are shown in Table 7-2.
Exhibit JST-2
000903

Black Hills Power 2011 IRP 34
Table 7-2 - Optimal Expansion Plans (Source: Ventyx)
YEAR Base Environ mental High Gas Low Gas High Load Low
Load Step Load Top Load
Base No Firm Market
No CC Conv Option
2011
2012 Market 25 MW
Market 25 MW
Market 25 MW
Market 25 MW
Market 25 MW
Market 25 MW
Market 25 MW
Market 25 MW
Market 25 MW
Market 25 MW
2013 Market 25 MW
Market 25 MW
Market 25 MW
Market 25 MW
Market 50 MW
Market 25 MW
Market 25 MW
Market 25 MW
Market 25 MW
Market 25 MW
2014
CC Conv 55 MW Market 25 MW
CC Conv 55 MW Market 25 MW
CC Conv 55 MW Market 25 MW
CC Conv 55 MW Market 25 MW
CC Conv 55MW Market 50 MW
CC Conv 55 MW
CC Conv 55 MW Market 25 MW
CC Conv 55 MW Market 25 MW
CC Conv 55 MW Simple Cycle 36 MW
Simple Cycle 36 MW Market 50 MW
2015 Market 25 MW
Market 25 MW
Market 25 MW
Market 25 MW
Market 50 MW
Simple Cycle 36 MW Market 50 MW
Market 50 MW Market
50 MW
2016 Market 25 MW
Market 25 MW
Market 25 MW
Market 25 MW
Market 50 MW Market
50 MW Market 50 MW Market
50 MW
2017 Market 50 MW
Market 50 MW
Market 50 MW
Market 50 MW
Wygen 1 Purch 30 MW Market 25 MW
Market 25 MW
Market 50 MW
Market 75 MW Market
50 MW
2018 Market 50 MW
Market 50 MW
Market 50 MW
Market 50 MW
Market 50 MW Market
50 MW Market 75 MW Market
50 MW
2019 Market 50 MW
Market 50 MW
Wygen 1 Purch 30 MW Market 25 MW
Market 50 MW
Market 50 MW
Wygen 1 Purch 30 MW
Wygen 1 Purch 30 MW Market 25 MW
Wygen 1 Purch 30 MW Market 50 MW
Wygen 1 Purch 30 MW Market 25 MW
2020 Market 50 MW
Market 50 MW
Market 25 MW
Market 50 MW
Market 50 MW Market
25 MW Market 50 MW Market
25 MW
2021 Market 50 MW
Market 50 MW
Market 25 MW
Market 50 MW
Simple Cycle 36 MW Market 25 MW
Market 25 MW
Market 50 MW Market
25 MW
2022 Market 50 MW
Market 50 MW
Market 25 MW
Market 50 MW
Market 50MW Market
50 MW Market 75 MW Market
50 MW
2023 Market 50 MW
Market 50 MW
Market 25 MW
Market 50 MW
Market 50 MW Market
25 MW Market 75 MW Market
25 MW
2024 Coal 100 MW
2 Simple Cycles 36 MW Wind 30 MW Market 25 MW
Coal 100 MW
2 Simple Cycles 36 MW Market 25 MW
Coal 100 MW
Market 25 MW
Coal 100 MW
Coal 100 MW Market 25 MW
Coal 100 MW
Coal 100 MW
2025 Market 25 MW Market
25 MW Market 25 MW Market
25 MW
2026 Market 25 MW
Market 50 MW Market
50 MW Market 25 MW
Market 25 MW Market
50 MW
2027 Market 25 MW
Market 50 MW Market
50 MW Market 25 MW
Market 25 MW Market
50 MW
2028 Market 25 MW
Wind 30 MW Market 50 MW
Market 50 MW
Market 50 MW
Market 25 MW
Market 25 MW
Market 50 MW Market
25 MW
2029 Market 25 MW
Market 50 MW
Market 50 MW
Market 50 MW
Market 25 MW
Market 25 MW
Market 75 MW Market
25 MW
2030 Simple Cycle 36 MW
2 Simple Cycles 36 MW Wind 30 MW
2 Simple Cycles 36 MW
2 Simple Cycles 36 MW
Simple Cycle 36 MW
Simple Cycle 36 MW
2 Simple Cycles 36 MW
Simple Cycle 36 MW
Each of the resource portfolios was then run through a production cost model, and was modeled with the base case scenario assumptions to determine the relative present value of revenue requirements (PVRR). The PVRR for all of the scenarios when run on a deterministic basis are shown on Figure 7-2.
Exhibit JST-2
000904

Black Hills Power 2011 IRP 35
Figure 7-2
Deterministic PVRR for Scenarios
BHP 2011 IRP 20 Year PVRR
$1,400
$1,500
$1,600
$1,700
$1,800
$1,900
$2,000
Base
Environ
mental
High Gas
Low Gas
High Load
Low Lo
ad
Step Load
Top Lo
ad
No Firm M
arket
No CC Conver
sion
Million
With exception of the environmental and low gas scenario, the base plan has the lowest PVRR. In the environmental scenario, and the low gas scenario, a second simple cycle is added in 2030, the last year of the study. By adding a unit in the last year of the study period the cost associated with the addition are not realized resulting in a lower PVRR and a reduced expected cost based on the stochastic production cost modeling represented in figure 8-1. The concept is known as “end effects” in modeling terms. Figure 7-3 shows the PVRR for all scenarios when run on a 30 year basis to take into account the end effect described above. On a 30 year PVRR the base scenario is the least cost.
Exhibit JST-2
000905

Black Hills Power 2011 IRP 36
Figure 7-3 Deterministic PVRR for Scenarios
BHP 2011 IRP 30 Year PVRR
$1,900
$2,000
$2,100
$2,200
$2,300
$2,400
$2,500
Base
Environ
mental
High Gas
Low Gas
High Load
Low Lo
ad
Step Load
Top Lo
ad
No Firm M
arket
No CC Conver
sion
Million
Exhibit JST-2
000906

Black Hills Power 2011 IRP 37
8.0 Risk Analysis Utilities must plan for future customer needs for electricity in an environment of significant uncertainty. Thus, the analysis conducted for this IRP examined uncertainty under a variety of possible future conditions. Analyses conducted to quantify the risk associated with the various scenarios included stochastic analysis, and specific examination of 1) the effects of a step load increase in the BHP demand for electricity, 2) the effects of not having a capacity market available, and 3) the effects of not having a combined cycle as a resource option on the preferred resource portfolio. 8.1 Stochastic Analysis Ventyx’s Strategic Planning model uses a structural approach to forecasting prices that captures the uncertainties in demand, fuel prices, supply and costs. Regional forward price curves are generated across multiple scenarios using a stratified Monte Carlo sampling program. Scenarios are driven by a wide range of market drivers that take into account statistical distributions, correlations, and volatilities. The market uncertainty drivers developed for the specific Wyoming market prices are also used when evaluating the resource mix. During the evaluations, the prices and associated uncertainties provide sufficient information about the market to allow for proper evaluation of alternatives. For example, high gas prices would generally result in high on-peak prices. The following uncertainties were examined in the IRP and resulted in 50 future scenarios for price development and portfolio evaluation:
Demand o Mid-Term Peak by region o Mid-Term Energy by region o Long-Term Demand (to consider uncertainty in the rate of long-term load
growth) Fuel Prices
o Mid-Term Gas Price o Mid-Term Oil Price o Long-Term Gas, Oil and Coal Price (to consider the price uncertainty in
the long-term supply/demand balance) Emission Prices
o Long-Term SOx, NOx, and CO2 Price Supply
o Mid-Term Coal Unit Availability by region o Mid-Term Nuclear Unit Availability by region o Mid-Term Gas Unit Availability by region o Mid-Term Hydro Output by region
Capital Cost o Long-Term Pulverized Coal Capital Cost o Long-Term Aero, Combustion Turbine and Combined Cycle Capital Cost o Long-Term Wind Capital Cost
Exhibit JST-2
000907

Black Hills Power 2011 IRP 38
The range of values for each of these parameters is developed using either uniform distribution or standard deviations for two related variables that are then correlated. The ranges for some of the variables considered (with 1.0 being the middle) are shown in Table 8-1.
Table 8-1 Ranges for Selected Uncertainty Variables
Variable Minimum Maximum Mid-Term Peak 0.87 1.11 Mid-Term Energy 0.90 1.09 Long-Term Demand 0.85 1.12 Mid-Term Gas 0.70 2.60 Oil Price 0.85 1.18 Long-Term Gas 0.79 1.23 Coal Unit Availability 0.88 1.11 Gas Unit Availability 0.80 1.16 Pulverized Coal Capital Costs 1.00 1.15 Combustion Turbine Capital Costs 1.00 1.10 Combined Cycle Capital Costs 1.00 1.10 Wind Capital Costs 0.90 1.10 Source: Ventyx 8.2 Risk Profiles During the stochastic analysis, the expansion plans optimized for each case remain the same. The analysis examines the cost of each expansion plan assuming 50 different “futures” and tabulates the PVRR expected for each of those 50 futures. A risk profile for each expansion plan is then constructed using all 50 of those “future” PVRR points. Cumulative probability distributions, also known as risk profiles, provide the ability to visually assess the risks associated with a decision under uncertainty. These risk profiles are one of the results of the stochastic analysis conducted by Ventyx for BHP. The risk profiles for the scenarios with the exception of the step load scenarios are shown on Figure 8-1. The step load scenario is not included in figure 8-1 because it has a different load then the other scenarios and is not an accurate comparison.
Exhibit JST-2
000908

Black Hills Power 2011 IRP 39
Figure 8-1 Scenarios – Risk Profiles (2011-2030)
0%
10%
20%
30%
40%
50%
60%
70%
80%
90%
100%
$1,550 $1,650 $1,750 $1,850
Cu
mu
lati
ve P
rob
abili
ty
Present Value of Revenue Requirements (Millions $)
Risk Profiles
Base Plan Environmental Plan High Gas Low Gas
High Load Low Load Base-No Firm Market No CC Conversion
Figure 8-1 shows that with the exception of the low gas and the environmental scenarios, the risk profile for the base plan is to the left and lower than any other case. End effects as discussed in section 7.1 are impacting the risk profiles for the low gas and environmental scenario. The low gas scenario also relies more on market purchases and adds additional market risk not measured in Figure 8-1. Thus the base plan has been selected as the preferred plan. The base plan resource portfolio includes installation of a simple cycle combustion turbine to be converted to a combined cycle unit utilizing an existing simple cycle combustion turbine in 2014 and firm capacity purchases in all of the years 2011-2023. This plan when adjusted for end effects has a low risk profile and expected PVRR value. BHP also benefits from the addition of an efficient combined cycle gas turbine. The resource portfolio for the preferred plan is shown in Figure 8-2. BHP’s full load and resource balance for the preferred plan is shown on Table B-1 in Appendix B.
Exhibit JST-2
000909

Black Hills Power 2011 IRP 40
Figure 8-2 Preferred Plan – Resource Additions
Preferred PlanResource Additions
0
25
50
75
100
125
150
175
2011
2012
2013
2014
2015
2016
2017
2018
2019
2020
2021
2022
2023
2024
2025
2026
2027
2028
2029
2030
MW
CC Conversion
Coal
Simple Cycle
Firm Capacity
8.3 Sensitivity Drivers The magnitude of the influence that any specific driving factor has in determining the PVRR can be represented in what is called a “tornado chart.” The values on this chart are determined through regression analysis and identify the contribution of each variable to the total change in the PVRR. Demand for electricity and natural gas prices are the two primary drivers for the base plan as shown on Figure 8-3. These were also the two primary drivers for all the other scenarios examined in the IRP.
Exhibit JST-2
000910

Black Hills Power 2011 IRP 41
Figure 8-3 Base Plan – Tornado Chart (2011-2030
1,550 1,650 1,750 1,850
LTD Interest
Gas Availability
Coal Availability
Peak
Market Purchased Power
Energy
Gas Price
Demand
Total Base Revenues
Present Value of Revenue Requirements (Millions $)
Base
8.4 Comparison to 2005 and 2007 IRP In accordance with the Wyoming Public Service Commission’s Guidelines Regarding Electric IRPs, for comparison purposes, the load forecast changes between the 2005 IRP, the 2007 IRP and this IRP were shown on Table 4-2. Table 8-2 shows a comparison of the resources in the preferred plan in the 2005 IRP, the resources selected in the 2007 IRP, and the preferred plan resources in the 2011 IRP. Resources selected for the 2005 and 2007 IRP reflect resources required for a combined Cheyenne Light/BHP system.
Exhibit JST-2
000911

Black Hills Power 2011 IRP 42
Table 8-2
Preferred Plan Resource Comparison Year Resources from 2005
IRP (2005-2016) Resources from 2007 IRP (2008-2027)
Resources from 2011 IRP (2011-2030)
2005 2006 2007 2008 Wygen II – 90 MW Wygen II – 90 MW, Happy
Jack – 30 MW 90 MW Wygen II is commercial. Happy Jack is commercial and modeled as an existing PPA
2009 Wygen III – 90 MW, 25 MW of firm market power
Silver Sage Wind is commercial and modeled as an existing 20 MW PPA
2010 Wygen III – 90 MW Wygen III is commercial and modeled as an existing unit.
2011 2012 Wind PPA – 25 MW 25 MW firm market power 2013 Wygen IV – 90 MW, Wind
PPA – 25 MW 25 MW firm market power
2014 55 MW combined cycle ownership share
2015 25 MW firm market power 2016 LAST YEAR OF STUDY 25 MW firm market power 2017 50 MW firm market power 2018 50 MW firm market power 2019 CT – 67 MW 50 MW firm market power 2020 50 MW firm market power 2021 50 MW firm market power 2022 Wind PPA – 25 MW 50 MW firm market power 2023 Biomass – 11 MW 50 MW firm market power 2024 Wygen V – 90 MW 100 MW coal unit 2025 2026 Wind PPA – 25 MW, CT –
42 MW 25 MW firm market power
2027 Wind PPA – 25 MW 25 MW firm market power 2028 25 MW firm market power 2029 25 MW firm market power 2030 36 MW combustion turbine
Exhibit JST-2
000912

Black Hills Power 2011 IRP 43
9.0 Conclusions and Recommendations This IRP was completed to provide a road map to define the system upgrades, modifications, and additions that may be required to ensure reliable and least cost electric service to BHP’s customers now and in the future. A full range of resource alternatives, including renewables, were examined with the emphasis on determining the most robust plan that balances risk, reliability, and cost under a variety of possible future scenarios. BHP’s preferred portfolio addresses the generation needs of its customers over the short-term – the next five years - through the implementation of an energy efficiency program, installation of gas-fired combined-cycle combustion turbine technology and firm market purchases. The preferred plan, when adjusted for end effects, is the least cost plan and has low risk associated with future uncertainty. This plan also provides BHP with an efficient combined cycle gas turbine. In addition, the preferred plan meets BHP’s objectives to:
Ensure a reasonable level of price stability for its customers Generate and provide reliable and economic electricity service while complying
with all environmental standards Manage and minimize risk Continually evaluate renewables for our energy supply portfolio, being mindful of
the impact on customer rates. 9.1 Action Plan An action plan provides a template for the actions that should be taken over the next several years. BHP should continue to monitor market conditions and regulatory developments so that the items in the action plan can be adapted to address actual conditions as they occur. BHP’s plan is as follows:
In the near term, continue to purchase a firm 6 x 16 product (6 days each week, 16 hours each day) during the summer months to provide for the summer capacity shortfall.
Purchase or otherwise obtain a simple cycle combustion turbine to be converted to combined cycle operation in 2014.
Seek opportunities to develop economic renewable resources – particularly wind and solar.
Actively review development of load growth opportunities in the service territory. Monitor transmission developments in the Western U.S.
Exhibit JST-2
000913

Black Hills Power 2011 IRP 44
Appendix A – Software Used in the Analysis Strategic Planning powered by MIDAS Gold® was utilized to measure and analyze the consumer value of competition. Strategic Planning includes multiple modules for an enterprise-wide strategic solution. These modules are:
Markets Portfolio Financial Risk
Strategic Planning is an integrated, fast, multi-scenario zonal market model capable of capturing many aspects of regional electricity market pricing, resource operation, asset and customer value. The markets and portfolio modules are hourly, multi-market, chronologically correct market production modules used to derive market prices, evaluate power contracts, and develop regional or utility-specific resource plans. The financial and risk modules provide full financial results and statements and decision making tools necessary to value customers, portfolios and business unit profitability. A.1 Markets Module Generates zonal electric market price forecasts for single and multi-market systems by hour and chronologically correct for 30 years. Prices may be generated for energy only, bid- or ICAP-based bidding processes. Prices generated reflect trading between transaction groups where transaction group may be best defined as an aggregated collection of control areas where congestion is limited and market prices are similar. Trading is limited by transmission paths and constraints quantities.
Figure A-1 Sample Topology
Source: Ventyx
Exhibit JST-2
000914

Black Hills Power 2011 IRP 45
The database is populated with Ventyx Intelligence – Market Ops information. Operational information provided for over 10,000 generating units.
Load forecasts by zone (where zone may be best defined as utility level) and historical hourly load profiles
Transmission capabilities Coal price forecast by plant with delivery adders from basin Gas price forecast from Henry Hub with basis and delivery adders
When running the simulation in markets module, the main process of the simulation is to determine hourly market prices. Plant outages are based on a unit derate and maintenance outages may be specified as a number of weeks per year or scheduled. The market based resource expansion algorithm builds resources by planning region based on user-defined profitability and/or minimum and maximum reserve margin requirements in determining prices. In addition, strategic retirements are made of non-profitable units based on user-defined parameters.
Figure A-2 MRX Decision Basis
Maximum Reserve
Minimum Reserve
Years2004 200720062005 2008
MRX Additions if no constraints (e.g. “Overbuild”)
MRX Additions if no constraints (e.g. “Underbuild”)
Add
ition
s (M
W)
Source: Ventyx
The markets module simulation process performs the following steps to determine price: Hourly loads are summed for all customers within each Transaction Group.
For each Transaction Group in each hour, all available hydro power is used to meet firm power sales commitments.
For each Transaction Group and Day Type, the model calculates production cost data for each dispatchable thermal unit and develops a dispatch order.
Exhibit JST-2
000915

Black Hills Power 2011 IRP 46
The model calculates a probabilistic supply curve for each Transaction Group considering forced and planned outages.
Depending on the relative sum of marginal energy cost + transmission cost + scarcity cost between regions, the model determines the hourly transactions that would likely occur among Transaction Groups.
The model records and reports details about the generation, emissions, costs, revenues, etc. associated with these hourly transactions.
A.2 Portfolio Module Once the price trajectories have been completed in the markets module, the portfolio module may be used to perform utility or region specific portfolio analyses. Simulation times are faster and it allows for more detailed operational characteristics for a utility specific fleet. The generation fleet is dispatched competitively against pre-solved market prices from the markets module or other external sources. Native load may also be used for non-merchant/regulated entities with a requirement to serve. Operates generation fleet based on unit commitment logic which allows for plant specific parameters of:
Ramp rates Minimum/maximum run times Start up costs
The decision to commit a unit may be based on one day, three day, seven day and month criteria. Forced outages may be based on monte-carlo or frequency duration with the capability to perform detailed maintenance scheduling. Resources may be de-committed based on transmission export constraints. Portfolio module has the capability to operate a generation fleet against single or multiple markets to show interface with other zones. In addition, physical, financial and fuel derivatives with pre-defined or user-defined strike periods, unit contingency, replacement policies, or load following for full requirement contracts are active. A.3 Capacity Expansion Module Capacity Expansion automates screening and evaluation of generation capacity expansion, transmission upgrades, strategic retirement, and other resource alternatives. It is a detailed and fast economic optimization model that simultaneously considers resource expansion investments and external market transactions. With Capacity Expansion, the optimal resource expansion strategy is determined based on an objective function subject to a set of constraints. The typical criterion for evaluation is the expected present value of revenue requirements (PVRR) subject to meeting load plus reserves, and various resource planning constraints. It develops long-term resource
Exhibit JST-2
000916

Black Hills Power 2011 IRP 47
expansion plans with type, size, location, and timing of capital projects over a 30-year horizon. Decisions to build generating units or expand transmission capacity, purchase or sell contracts, or retire generating units are made based on the expected market value (revenue) less costs including both variable and fixed cost components. The model is a mixed integer linear program (MILP) in which the objective is minimization of the sum of the discounted costs of supplying customer loads in each area with load obligations. The model can be used to also represent areas that provide energy and capacity from power stations or contracts, but have no load obligations. The model includes all existing and proposed plants and transmission lines in a utility system. A.4 Financial Module The financial module allows the user the ability to model other financial aspects regarding costs exterior to the operation of units and other valuable information that is necessary to properly evaluate the economics of a generation fleet. The financial module produces bottom-line financial statements to evaluate profitability and earnings impacts.
Figure A-3 Sample Reports
Source: Ventyx
Exhibit JST-2
000917

Black Hills Power 2011 IRP 48
A.5 Risk Module Risk module provides users the capability to perform stochastic analyses on all other modules and review results numerically and graphically. Stochastics may be performed on both production and financial variables providing flexibility not available in other models. Strategic Planning has the functionality of developing probabilistic price series by using a four-factor structural approach to forecast prices that captures the uncertainties in regional electric demand, resources and transmission. Using a Latin Hypercube-based stratified sampling program, Strategic Planning generates regional forward price curves across multiple scenarios. Scenarios are driven by variations in a host of market price “drivers” (e.g. demand, fuel price, availability, hydro year, capital expansion cost, transmission availability, market electricity price, reserve margin, emission price, electricity price and/or weather) and takes into account statistical distributions, correlations, and volatilities for three time periods (i.e. Short-Term hourly, Mid-Term monthly, and Long-Term annual) for each transact group. By allowing these uncertainties to vary over a range of possible values a range or distribution of forecasted prices are developed.
Figure A-4 Overview of Process
Strategic PlanningEnterprise-Wide Portfolio Analysis
Portfolio Simulation
Stochastic Simulation Scenario
Simulation
Market PriceTrajectories
Corporate Finance
Capacity Expansion
Production Statistics
RiskAssessment
FinancialRateMaking
Velocity Suite
Strategic Planning
ChallengeEnterprise-wide solution
Best PracticeStrategic Planningcombines zonal market price trajectories, portfolio analysis, corporate finance, capacity expansion, and risk assessment within a single model.
Strategic Planning
ChallengeEnterprise-wide solution
Best PracticeStrategic Planningcombines zonal market price trajectories, portfolio analysis, corporate finance, capacity expansion, and risk assessment within a single model.
Source: Ventyx
Exhibit JST-2
000918

Black Hills Power 2011 IRP 49
Appendix B
Table B-1
Black Hills PowerLoad and Resource Balance - Preferred Plan
2011 2012 2013 2014 2015 2016 2017 2018 2019 2020 2021 2022 2023 2024 2025 2026 2027 2028 2029 2030Peak Demand* 408 414 426 430 442 446 450 455 459 464 468 473 478 483 488 492 497 502 507 512DSM 0 (1) (2) (3) (3) (3) (3) (3) (3) (3) (3) (3) (3) (3) (3) (3) (3) (3) (3) (3)Net Peak Demand 408 413 424 427 439 443 447 452 456 461 465 470 475 480 485 489 494 499 504 50915% Reserve margin 61 62 64 64 66 66 67 68 68 69 70 71 71 72 73 73 74 75 76 76Total Demand 469 475 488 491 505 509 514 520 524 530 535 541 546 552 558 562 568 574 580 585(including planning reserves)
ResourcesBen French 1 22 22 22 0 0 0 0 0 0 0 0 0 0 0 0 0 0 0 0 0Neil Simpson I 16 16 16 0 0 0 0 0 0 0 0 0 0 0 0 0 0 0 0 0Neil Simpson II 80 80 80 80 80 80 80 80 80 80 80 80 80 80 80 80 80 80 80 80Wyodak 62 62 62 62 62 62 62 62 62 62 62 62 62 62 62 62 62 62 62 62Ben French Diesels 10 10 10 10 10 10 10 10 10 10 10 10 10 10 10 10 10 10 10 10Ben French CTs 1-4 100 72 72 72 72 72 72 72 72 72 72 72 72 72 72 72 72 72 72 72Lange CT 39 39 39 39 39 39 39 39 39 39 39 39 39 39 39 39 39 39 39 39Neil Simpson CT1 39 39 39 39 39 39 39 39 39 39 39 39 39 39 39 39 39 39 39 39Wygen III** 100 100 100 100 100 100 100 100 100 100 100 100 100 100 100 100 100 100 100 100Combined Cycle Conversion 55 55 55 55 55 55 55 55 55 55 55 55 55 55 55 55 55New Coal 100 100 100 100 100 100 100New Combustion Turbine 36
Total BHP Resources 468 440 440 457 457 457 457 457 457 457 457 457 457 557 557 557 557 557 557 593
PurchasesColstrip 50 50 50 50 50 50 50 50 50 50 50 50 50 0 0 0 0 0 0 0Happy Jack 1.5 1.5 1.5 1.5 1.5 1.5 1.5 1.5 1.5 1.5 1.5 1.5 1.5 1.5 1.5 1.5 1.5 1.5 0 0Silver Sage 2 2 2 2 2 2 2 2 2 2 2 2 2 2 2 2 2 2 2 0Capacity 0 25 25 25 25 25 50 50 50 50 50 50 50 0 0 25 25 25 25 0
SalesSales (MEAN) 30 30 30 30 20 20 20 15 15 12 12 10 10 0 0 0 0 0 0 0
Total Resources 491.5 488.5 488.5 505.5 515.5 515.5 540.5 545.5 545.5 548.5 548.5 550.5 550.5 560.5 560.5 585.5 585.5 585.5 584.0 593.0
Reserve Margin*** 5.5% 3.3% 0.2% 3.4% 2.4% 1.4% 5.9% 5.7% 4.6% 4.0% 3.0% 2.1% 0.9% 1.8% 0.6% 4.7% 3.5% 2.3% 0.9% 1.5%
* Peak load includes 23MW COG and MDU Sheridan load** Included COG's and MDU's ownership share***Reserve margin calculation is in excess of assumed 15% planning reserve margin.
Exhibit JST-2
000919

Black Hills Power 2011 IRP 50
Appendix C – Carbon Capture and Sequestration Technologies CO2 capture processes fall into three general categories: (1) flue gas separation, (2) oxy-fuel combustion in power plants, and (3) pre-combustion separation. Each process has associated economic (cost) and energy (kWh) penalties. For flue gas separation, the capture process is typically based on chemical absorption where the CO2 is absorbed in a liquid solvent by formation of a chemically bonded compound. The captured CO2 is used for various industrial and commercial processes such as the production of urea, foam blowing, carbonated beverages, and dry ice production. Other processes being examined for CO2 capture from the flue gas include membrane separation, cryogenic fractionation, and adsorption using molecular sieves. An alternative to flue gas separation is to burn the fossil fuel in pure or enriched oxygen. The flue gas will then contain mostly CO2 and water vapor. The water vapor can be condensed and the CO2 can be compressed and piped directly to a storage site. Whereas for flue gas separation, the separation took place after combustion, now the separation occurs in the intake air where oxygen and nitrogen need to be separated. The air separation unit alone can impose a 15% efficiency penalty. Pilot scale studies have indicated that this method of carbon capture can be retrofitted on existing pulverized coal units. Pre-combustion capture is usually applied in coal gasification combined cycle power plants. The process involves gasifying the coal to produce a synthetic gas. That gas reacts with water to produce CO2 and hydrogen fuel. The hydrogen fuel is used in the turbine to produce electricity and the CO2 is captured. Once the CO2 is captured, it must be stored in a manner in which it will not be emitted back into the atmosphere. Such storage needs to be: 1) long in duration, preferably hundreds to thousands of years, 2) at minimal cost including transportation to the storage site, 3) with no risk of accident, 4) with minimal environmental impact, and 5) without violating any national or international laws or regulations. Potential storage media include geologic sinks and the deep ocean. Geologic sinks include deep saline formations – subterranean and sub-seabed, depleted oil and gas reservoirs, enhanced oil recovery, and unminable coal seams. Deep ocean storage includes direct injection into the water column at intermediate or deep depths.
Exhibit JST-2
000920

Black Hills Power 2011 IRP 51
Appendix D – Grid Modernization
Grid modernization is expected to facilitate:8
improved electricity flows from power plants to consumers consumer interaction with the grid improved response to power demand reduced incidence of generation resource outages more consistent and reliable power quality increased reliability and security more efficient overall operation
Some of the technologies that will be required in order for the U.S. to realize this vision for grid modernization include:9
AMI meters for advanced measurement Integrated two-way communications Active customer interface including home area networks with in-home displays Meter data management system Distribution management system with advanced and ubiquitous sensors Distribution geographical information system Substation automation including sensors to monitor transformers, relays, digital
fault recorders, breakers, and station batteries Advanced protection and control schemes Advanced grid control devices
The enhancements of the electricity infrastructure in this manner are expected to lead to many benefits including active management and control of electricity generation, transmission, distribution and usage in real time; an optimal balance between supply and demand; reduced numbers of outages; more consistent and reliable power quality; increased reliability and security; and more efficient overall operation, among others.10
Reduced incidence of outages. Grids in the future will rely on embedded automation and control devices. Thus energy producers and the operators of the transmission and distribution systems will be able to anticipate, detect, and respond to system problems more quickly than is possible with the technology in place currently.
8 “Smart Grid basics,” www.smartgrid.gov/basics. “Wotruba, Bill, “Enabling the Smart Grid,” Power Engineering, May 2010, p. 52. 9 Joe Miller, Horizon Energy Group, “The Smart Grid – How do we get there?” http://www.smartgridnews.com/artman/publish/Business_Strategy_News/The_Smart_Grid_How_Do_We_Get_There-452.html. 10 “Smart Grid basics,” www.smartgrid.gov/basics. “Wotruba, Bill, “Enabling the Smart Grid,” Power Engineering, May 2010, p. 52.
Exhibit JST-2
000921

Black Hills Power 2011 IRP 52
More consistent and reliable power quality. When supply and demand are more optimally balanced, operation will be leaner and more efficient which in turn leads to higher levels of customer service.
Increased reliability and security. With the capabilities of the enhanced communication system and associated real-time monitoring, power companies will have increased visibility of the entire generation, transmission, and distribution systems and thus an increased ability to resist both physical threats and cyber attacks. Operations that are networked tend to have increased reliability and reduced expensive downtime. Grid modernization may also increase redundancy, in turn leading to fewer service disruptions.
More efficient overall operation. Grid modernization should reduce bottlenecks and relieve grid congestion. Fewer outages and less congestion should lead to lower costs to customers and, potentially, fewer emissions.
Exhibit JST-2
000922

Black Hills Power 2011 IRP 53
Abbreviations
AMI – Advanced Metering Infrastructure APPA – American Public Power Association BHC – Black Hills Corporation BHP – Black Hills Power Btu – British Thermal Unit C/I – Commercial/Industrial CAIR – Clean Air Interstate Rule CAMR – Clean Air Mercury Rule CATR – Clean Air Transport Rule CC – Combined Cycle CCB – Coal Combustion By-products CCR – Coal Combustion Residuals CCS – Carbon Capture and Sequestration CFL – Compact fluorescent lamp CO – Carbon Monoxide CO2 – Carbon Dioxide COG-City of Gillette CPCN – Certificate of Public Convenience and Necessity CT – Combustion Turbine DF – Duct Firing DSM – Demand-Side Management EE – Energy Education EPA – Environmental Protection Agency FERC – Federal Energy Regulatory Commission HAPS – Hazardous Air Pollutants Hg – Mercury HRSG – Heat Recovery Steam Generator IGCC – Integrated Gasification Combined Cycle IRP – Integrated Resource Planning or Integrated Resource Plan kW – Kilowatt kWh – Kilowatthour MACT – Maximum Achievable Control Technology MAPP – Mid-Continent Area Power Pool MDMS – Meter Data Management System MDU – Montana-Dakota Utilities MEAN – Municipal Energy Agency of Nebraska MILP – Mixed Integer Linear Programming MMBtu – Millions of British Thermal Units MPSC – Montana Public Service Commission MW - Megawatt MWh - Megawatthour NAAQS – National Ambient Air Quality Standards NO2 – Nitrogen Dioxide
Exhibit JST-2
000923

Black Hills Power 2011 IRP 54
NOx – Nitrogen Oxides O&M – Operating and Maintenance costs PAC – Power Activated Carbon PHEV – Plug-in Hybrid Electric Vehicles PM2.5 – Particulate Matter PPA – Power Purchase Agreement PV – Photovoltaics PVRR – Present Value of Revenue Requirements RCIA – Reserve Capacity Integration Agreement REC – Renewable Energy Credit RES – Renewable Energy Standard RFP – Request for Proposals RPS – Renewable Portfolio Standard SCR – Selective Catalytic Reduction SDA – Spray Dryer Absorber SDPUC – South Dakota Public Utilities Commission SIP – State Implementation Plan SO2 – Sulfur Dioxide TRC – Total Resource Cost test TWh – Terrawatthour VOC – Volatile Organic Chemical WECC – Western Electricity Coordinating Council WPSC – Wyoming Public Service Commission
Exhibit JST-2
000924

Direct Testimony
Mark Lux
Before the South Dakota Public Utilities Commission
of the State of South Dakota
In the Matter of the Application of
Black Hills Power, Inc., a South Dakota Corporation
For Authority to Increase Rates
In South Dakota
Docket No. EL14-___
March 31, 2014
000925

i
TABLE OF CONTENTS
I. INTRODUCTION AND QUALIFICATIONS ......................................................... 1
II. CPGS OVERVIEW ................................................................................................... 2
III. CPGS COST OF CONSTRUCTION ........................................................................ 5
IV. STATUS OF CPGS CONSTRUCTION ................................................................... 9
V. OPERATIONS AND MAINTENANCE COSTS FOR CPGS. ................................ 9
VI. CPGS PLANT OPERATIONS ............................................................................... 10
VII. OTHER CAPITAL PLANT INVESTMENTS ....................................................... 11
VIII. DEFINITION OF MAJOR MAINTENANCE ...................................................... 14
IX. DECOMMISSIONING ........................................................................................... 15
X. THE NEIL SIMPSON COMPLEX AND ASSOCIATED COMMON ASSETS . 19
XI. LABOR FORCE ...................................................................................................... 21
XII. CONCLUSION ....................................................................................................... 23
Exhibits
None
000926

1
I. INTRODUCTION AND QUALIFICATIONS 1
Q. WHAT IS YOUR NAME AND BUSINESS ADDRESS? 2
A. My name is Mark Lux. My business address is 625 Ninth Street, P.O. Box 1400, 3
Rapid City, South Dakota, 57701. 4
Q. BY WHOM ARE YOU EMPLOYED AND IN WHAT CAPACITY? 5
A. I am currently employed by Black Hills Service Company (“Service Company”), a 6
wholly-owned subsidiary of Black Hills Corporation (“BHC”), as Vice President 7
and General Manager, Regulated and Non-Regulated Generation. In that role, I 8
am responsible for the operation and construction of the electrical power 9
generation and coal mining assets owned by BHC subsidiaries, including Black 10
Hills Power, Inc. (“Black Hills Power” or the “Company”). 11
Q. ON WHOSE BEHALF ARE YOU APPEARING IN THIS APPLICATION? 12
A. I am appearing on behalf of Black Hills Power. 13
Q. PLEASE DESCRIBE YOUR PROFESSIONAL EXPERIENCE. 14
A. I received a Bachelor of Science degree with honors in Mechanical Engineering 15
from the South Dakota School of Mines and Technology in 1987. I have more 16
than 25 years of experience working in the mining and electrical power industry, 17
in both nuclear and fossil fuel power generation, including operating experience 18
and power plant construction experience. I have been and continue to be involved 19
in the development, engineering, construction and commissioning of the natural 20
gas-fired Cheyenne Prairie Generating Station (“CPGS”), as well as the other 21
natural gas and coal-fired power plants owned by subsidiaries of BHC. 22
000927

2
Q. WHAT IS THE PURPOSE OF YOUR TESTIMONY? 1
A. The purpose of my testimony is to discuss CPGS, and the construction, operation 2
and maintenance costs for CPGS. In addition, I discuss the other major capital 3
plant investments of Black Hills Power that are included in this rate case. I 4
provide the revised definition of major maintenance that has been adopted by 5
Black Hills Power. I discuss the decommissioning of three of Black Hills Power’s 6
coal-fired generation facilities: Neil Simpson I, Osage, and Ben French. I discuss 7
common assets at the Neil Simpson Complex. Lastly, I provide information 8
regarding the Neil Simpson employee work force. 9
II. CPGS OVERVIEW 10
Q. PLEASE DESCRIBE CPGS. 11
A. CPGS is an electric generating plant that will provide a total of 132 MW. CPGS is 12
located on the southeast side of the City of Cheyenne, Wyoming. The power plant 13
includes: a gas-fired combustion turbine generator (37 MW), a combined cycle 14
generator (95 MW), a natural gas supply pipeline, an electric transmission line, 15
ancillary equipment, land and buildings, and a substation. CPGS has adequate and 16
efficient water supply, an abundant natural gas supply, and access to available 17
electric transmission. 18
000928

3
Q. HAS THE SOUTH DAKOTA PUBLIC UTILITIES COMMISSION 1
(“COMMISSION”) HAD AN OPPORTUNITY TO CONSIDER ANY 2
FILINGS RELATED TO CPGS? 3
A. Yes. Black Hills Power filed an Application for the Phase In of Rates Regarding 4
CPGS Construction Financing Costs with the Commission on December 17, 2012, 5
Docket No. EL12-062. On September 19, 2013, the Commission approved the 6
phase in plan rate for CPGS pursuant to a Decision and Order Granting Joint 7
Motions for Approval of Settlement Agreement and Settlement Stipulation. 8
Q. DID THE WYOMING PUBLIC SERVICE COMMISSION APPROVE A 9
CERTIFICATE OF PUBLIC CONVENIENCE AND NECESSITY FOR 10
CPGS? 11
A. Yes. Black Hills Power and its sister utility Cheyenne Light, Fuel and Power 12
Company (“Cheyenne Light”) filed a Joint Application for a Certificate of Public 13
Convenience and Necessity (“CPCN”) on November 1, 2011, which was approved 14
by the Wyoming Public Service Commission by a Memorandum Decision dated 15
January 8, 2013, in Docket Nos. 20002-81-EA-11 and 20003-113-EA-11 (Record 16
No. 13007) (“CPCN Docket”). 17
Q. PLEASE DESCRIBE YOUR ROLE IN THE CPGS PROJECT. 18
A. I am responsible for supporting the overall project development and management 19
of the construction of the CPGS power plant. In that role, I oversee the 20
preparation of plans and specifications, oversee the competitive bid process, 21
manage the selection and sourcing of equipment, and manage the construction 22
000929

4
project. I also supported the process by which the air permit and the industrial 1
siting permit were obtained. In addition, I supported the efforts to obtain the 2
CPCN from the Wyoming Public Service Commission. 3
Q. WHAT ARE THE MAJOR COMPONENTS OF CPGS? 4
A. There are five major components of CPGS, as follows: 5
1. A combined cycle (95 MW) jointly owned by Cheyenne Light (42%) and 6
Black Hills Power (58%) that includes two combustion turbine generators, 7
two heat recovery steam generators and one steam turbine generator. 8
2. One natural gas-fired combustion turbine generator (37 MW) to be wholly 9
owned by Cheyenne Light. 10
3. Ancillary equipment, land and buildings, a substation, and other such assets 11
jointly owned by Cheyenne Light (58%) and Black Hills Power (42%). 12
4. A 10.5 mile long, high pressure natural gas supply pipeline owned by 13
Cheyenne Light. 14
5. An electric transmission line, owned by Cheyenne Light, interconnecting 15
the combined cycle and the combustion turbine generator to Cheyenne 16
Light’s existing 115 kV transmission system. 17
Q. PLEASE DESCRIBE THE CPGS GAS PIPELINE. 18
A. Black Hills Power and Cheyenne Light are constructing a 12 inch diameter high 19
pressure natural gas transmission pipeline (“CPGS Pipeline”). It is approximately 20
ten and one-half miles in length. It will connect CPGS to the Southern Star 21
Central Gas Pipeline (“Southern Star”). It originates at an interconnection with 22
000930

5
Southern Star at a point just north of the Wyoming – Colorado State line and east 1
of Highway 85. 2
Black Hills Power will have 42% of the CPGS Pipeline capacity. Cheyenne Light 3
will have the remaining 58% of the CPGS Pipeline capacity. Cheyenne Light’s 4
natural gas utility will own, operate and maintain the CPGS Pipeline. The 5
testimony of Kent Kopetzky provides further information regarding the pipeline 6
transportation capacity and natural gas supply for CPGS. The testimony of Chris 7
Kilpatrick addresses allocation of the costs for the CPGS Pipeline. 8
Q. PLEASE DESCRIBE HOW CPGS WILL INTERCONNECT WITH 9
CHEYENNE LIGHT’S 115 kV TRANSMISSION SYSTEM. 10
A. CPGS will interconnect to Cheyenne Light’s 115 kV transmission system at a new 11
115 kV substation located at the project site. The 115 kV substation is being 12
constructed to initially accommodate a double circuit 115 kV transmission line and 13
two 115/13.8 kV GSU transformers. 14
III. CPGS COST OF CONSTRUCTION 15
Q. IS THERE A PRICE CAP FOR THE CONSTRUCTION COSTS FOR 16
CPGS? 17
A. Pursuant to a settlement between Black Hills Power, Cheyenne Light, and the 18
Wyoming Office of Consumer Advocate in the CPCN Docket, a price cap of $222 19
million dollars was established for CPGS. 20
000931

6
Q. DO YOU ANTICIPATE THAT THE ACTUAL CONSTRUCTION COST 1
OF CPGS WILL BE AT OR BELOW THE PRICE CAP OF $222 2
MILLION? 3
A. Yes. 4
Q. PLEASE DISCUSS THE COST OF THE CPGS PIPELINE. 5
A. Cheyenne Light has contracted with a third party to build the CPGS Pipeline and 6
the Southern Star interconnection, at a cost of approximately $9 million. For 7
information regarding allocation of costs, please see the testimony of Christopher 8
Kilpatrick. 9
Q. HOW CONFIDENT ARE YOU IN THE ABOVE CONSTRUCTION COST 10
ESTIMATES? 11
A. I am very confident in these estimates because nearly all of the contracts entered 12
into for the construction of the CPGS plant are fixed price contracts. In addition, I 13
am confident in the anticipated costs because of our experience in constructing 14
other power plants owned by Black Hills Power and other subsidiaries of BHC. 15
Q. ARE THERE ANY SPARE PARTS FOR CPGS? 16
A. Yes. There is $1,029,000 in spare parts allocated to Black Hills Power and 17
included in the Revenue Requirement Model. See Schedule F-4 of Section 4 for a 18
complete listing. 19
000932

7
Q. WHY DOES THE COMPANY NEED AN INVENTORY OF SPARE PARTS 1
FOR CPGS? 2
A. The spare parts are based on the critical need of CPGS to have these items on 3
hand, in accordance with prudent utility practice, thereby reducing the amount of 4
lost production time. The amount of spare parts set forth in Schedule F-4 of 5
Section 4 is appropriate, based on my experience and falls within the industry 6
standard of two percent of the total investment capital. 7
Q. WHO HAS MANAGED THE CONSTRUCTION OF THE CPGS POWER 8
PLANT? 9
A. Black Hills Power and Cheyenne Light have used an owners’ self-build approach 10
regarding the management of the construction of CPGS, rather than contracting 11
with a third party to engineer, procure, and construct the facility. 12
Q. DESCRIBE THE PROCESS BY WHICH THE COMPANY SECURED 13
CONTRACTS FOR THE CONSTRUCTION OF CPGS. 14
A. At the time the Company was preparing for the construction of CPGS, the United 15
States economy was just starting to recover from a recession. As a result, the 16
Company believed that it was in a position to favorably negotiate the price of the 17
significant components. The Company determined that it was important to secure 18
fixed priced contracts for all direct costs that were based on competitive bid 19
pricing. To obtain the benefits of competitive bidding in light of the recession, the 20
Company began by securing fixed price contracts from some key vendors and 21
subcontractors. Locking in these key contracts at this early stage allowed the 22
000933

8
Company to insure that the construction process could proceed in a timely manner 1
with secured but reasonably priced resources. After these key contracts were 2
secured, the remainder of the project was secured through competitively bid fixed 3
price contracts. 4
In summary, the CPGS project strategy involved securing key contracts early to 5
establish a reliable schedule and reduce price risk, and then subsequently securing 6
competitively bid fixed priced contracts for the remainder of the project. 7
Q. EXPLAIN HOW THE COMPETITIVE BID PROCESS WORKED. 8
A. The Company hired Kuljian as the engineer of record for CPGS. Kuljian prepared 9
the specifications for the plant. After the Company reviewed and approved these 10
specifications, Kuljian prepared requests for proposals that were submitted to 11
various potential vendors. Kuljian reviewed the bid proposals submitted by the 12
vendors and made recommendations to the Company. The Company also 13
reviewed the bid proposals and ultimately accepted the successful bid proposals. 14
Q. WERE ALL SUCCESSFUL BIDDERS REQUIRED TO PROVIDE 15
SECURITY FOR THEIR PERFORMANCE? 16
A. Yes, all successful bidders for major construction and major process equipment 17
were required to provide security for their performance. 18
000934

9
IV. STATUS OF CPGS CONSTRUCTION 1
Q. PLEASE GENERALLY DESCRIBE THE CURRENT STATUS AND 2
EXPECTED COMPLETION OF THE CONSTRUCTION OF CPGS. 3
A. At this time, construction is on schedule. Black Hills Power anticipates that 4
construction of CPGS will be complete and the plant will be operational by 5
October 1, 2014. All of the major project equipment has been delivered to the 6
CPGS site. In general terms, as of mid-March, 2014, the construction phase was 7
approximately 64% complete and the total project (which includes engineering, 8
procurement, construction and commissioning) was considered to be 9
approximately 85% complete. 10
V. OPERATIONS AND MAINTENANCE COSTS FOR CPGS. 11
Q. WHAT ARE THE ESTIMATED ANNUAL OPERATING AND 12
MAINTENANCE COSTS FOR CPGS AND HOW DID YOU ARRIVE AT 13
THIS FORECAST? 14
A. Black Hills Power estimates its total annual operation and maintenance costs for 15
CPGS to be approximately $2.78 million. The forecast was done at the Federal 16
Energy Regulatory Commission (“FERC”) account level and is included as 17
Schedule H-15 of Section 4. This forecast utilizes the historical and budget 18
information for an existing combined cycle and similar projects that are also 19
operated by Service Company, with appropriate adjustments for labor, various 20
consumables, and other costs. 21
000935

10
Q. WHAT EXPENSES ARE INCLUDED IN THE OPERATIONS AND 1
MAINTENANCE COST FIGURE? 2
A. The estimated total annual operation and maintenance costs for CPGS includes 3
primarily: i) the cost of labor to operate the plant; ii) the consumables; and iii) 4
maintenance and repairs. The estimate does not include the cost of the fuel for the 5
CPGS plant. 6
Q. HOW DID THE COMPANY ESTIMATE THE COST OF LABOR TO 7
OPERATE THE PLANT? 8
A. The estimated cost of labor to operate the plant is a function of how much CPGS 9
will run. It is expected that CPGS will need to be staffed twenty four hours per 10
day, and seven days per week. Accordingly, CPGS will have eighteen full time 11
equivalent employees. 12
VI. CPGS PLANT OPERATIONS 13
Q. WHO WILL OPERATE CPGS? 14
A. Service Company will be responsible for the operation of CPGS. 15
Q. WHAT ARE THE ADVANTAGES OF THE COMBINED CYCLE UNIT 16
THAT IS PART OF CPGS? 17
A. A combined cycle unit, which is an intermediate resource, provides a number of 18
advantages and benefits to Black Hills Power and Cheyenne Light. Specifically, i) 19
it operates at a lower heat rate than a combustion turbine generator; ii) it lowers 20
environmental emissions; iii) it reduces utility exposure to future environmental 21
mandates or taxes; iv) it reduces reliance on the energy markets; v) it creates 22
000936

11
diversification of the generation resource mix for both Black Hills Power and 1
Cheyenne Light; and vi) it can provide economical system and wind regulation. 2
Q. PLEASE EXPLAIN THE AIR QUALITY CONTROLS EMPLOYED AT 3
CPGS. 4
A. CPGS employs state of the art air quality control technology. Once CPGS 5
commences operation, it will likely be the cleanest operating power plant in 6
Wyoming and one of the cleanest operating natural gas-fired plants in the nation. 7
To the best of my knowledge, this is the first power project where this vendor of 8
the natural gas turbines guaranteed the CO2 emission performance of the 9
combustion turbines. 10
VII. OTHER CAPITAL PLANT INVESTMENTS 11
Q. HAS BLACK HILLS POWER MADE CAPITAL INVESTMENTS OTHER 12
THAN CPGS? 13
A. Yes. Black Hills Power has made a number of capital investments in its existing 14
generation facilities which are listed in Schedule D-10 of Section 4 and are 15
expected to be in service on or before September 30, 2014. 16
Q. PLEASE DESCRIBE THE MAJOR PLANT CAPITAL INVESTMENTS 17
BLACK HILLS POWER IS INCLUDING IN THIS RATE CASE. 18
A. There are several categories of major capital investments to existing generation 19
that are included in this rate case. The categories, associated approximate costs, 20
and more specific examples are as follows: 21
000937

12
1. $0.3 million allocated to Safety and Security Projects. Within this category 1
are projects including the purchase of a man lift crane to ensure that 2
elevated security areas at the Neil Simpson Complex have access for 3
operations and maintenance to perform work, and alteration of the main 4
entrance to the Neil Simpson Complex to provide a means to safely and 5
securely manage the access point to the property. 6
2. $2.1 million allocated to Control Systems projects. The majority of the 7
projects that fall within this category relate to efforts that were undertaken 8
to address obsolete controls for production equipment. 9
3. $6 million allocated to Environmental Projects. Examples of projects 10
contained within this category are installation of an enclosure around the 11
Wygen III reagent preparation area to allow for increased personal safety 12
and equipment reliability, end of life replacement of a catalyst removal 13
system for Wygen III, addition of a hydrated lime injection system for early 14
removal of SO2 upon firing Wygen III, installation of a new air quality 15
control system to meet the Environmental Protection Agency (“EPA”) 16
MATS rules at Wyodak, and conversion of the Neil Simpson II startup fuel 17
from fuel oil to natural gas to improve emission performance. 18
4. $3.5 million allocated to Equipment Reliability projects that individually 19
exceed $100,000 in costs. Included in this category are projects involving 20
replacement of boiler water wall tubes due to fireside corrosion inherent 21
with low NOx burner characteristics, the addition of a portable conveyor for 22
000938

13
the coal handling system to provide a redundant or back-up should the 1
existing system fail, and replacement of the furnace water wall panel on 2
Wygen III to address fire side corrosion. 3
5. $1.1 million allocated to Regulation Requirements. Examples of projects 4
included in this category are installation of a buffer around the Wygen II 5
and III storm water pond to satisfy a state mandate for facilities located near 6
wetlands, extending the concrete apron around the areas of ash haulers, and 7
installation of a dust control containment system to satisfy a new OSHA 8
dust standard. 9
6. $0.4 million allocated to Facilities. Included within this category are 10
HVAC upgrades at the Neil Simpson Complex and procurement of a large 11
forklift for inventory maintenance support at the Neil Simpson Complex. 12
Q. PLEASE BRIEFLY DESCRIBE YOUR INVOLVEMENT WITH THE 13
AFOREMENTIONED PROJECTS. 14
A. My responsibility includes project approvals to ensure projects are prudent and 15
cost effective. 16
Q. WERE THESE CAPITAL INVESTMENTS PRUDENTLY 17
UNDERTAKEN? 18
A. Yes. The capital investments are necessary to continue to provide safe and 19
reliable service to Black Hills Power’s customers. 20
000939

14
VIII. DEFINITION OF MAJOR MAINTENANCE 1
Q. PLEASE DEFINE MAJOR MAINTENANCE. 2
A. Any time Black Hills Power opens its turbine generators the associated work is 3
considered major maintenance. 4
Q. PLEASE DESCRIBE HOW MAJOR MAINTENANCE HAS 5
HISTORICALLY BEEN ADDRESSED BY BLACK HILLS POWER. 6
A. Historically, Black Hills Power has scheduled major maintenance work for its 7
coal-fired generation units on an eight year cycle. 8
Q. DOES BLACK HILLS POWER PLAN TO ALTER ITS MAJOR 9
MAINTENANCE CYCLE FREQUENCY? 10
A. Yes. Black Hills Power plans to perform major maintenance work every four 11
years. 12
Q. WILL THE SAME MAJOR MAINTENANCE CYCLE FREQUENCY 13
APPLY TO THE CPGS GENERATION UNITS? 14
A. No. Black Hills Power’s coal-fired generation units are run consistently and 15
therefore a major maintenance schedule is easily determined. Conversely, the 16
combined cycle unit located at CPGS is an intermediate generation unit. Because 17
run time for the combined cycle is undetermined, major maintenance will be 18
scheduled to occur when the unit has exceeded the recommended amount of run 19
time hours. 20
000940

15
Q. WILL THE CHANGE IN THE MAJOR MAINTENANCE SCHEDULE 1
RESULT IN INCREASED COSTS TO CUSTOMERS? 2
A. No, the change in schedule for major maintenance activities will not increase costs 3
to customers. The allocation of major maintenance costs is discussed in more 4
detail in the testimony of Chris Kilpatrick. 5
IX. DECOMMISSIONING 6
Q. PLEASE GENERALLY DESCRIBE BLACK HILLS POWER’S NEIL 7
SIMPSON I, OSAGE, AND BEN FRENCH COAL-FIRED GENERATION 8
FACILITIES. 9
A. Neil Simpson I (21.8 MW) is located in Campbell County, Wyoming and has been 10
in service since 1969. Osage (three boilers with a total of 34.5 MW) is located in 11
Weston County, Wyoming. The last of the three boilers located at this facility 12
was placed in service in 1952. Ben French (25 MW) is located in Pennington 13
County, South Dakota, and has been in service since 1960. Each of these three 14
facilities includes a coal-fired boiler with a capacity of 25 MW or less. 15
Q. HAS THE EPA ADOPTED REGULATIONS THAT IMPACT NEIL 16
SIMPSON I, OSAGE, AND BEN FRENCH? 17
A. Yes, the EPA issued the National Emission Standards for Hazardous Air 18
Pollutants for Area Sources: Industrial, Commercial, and Institutional Boilers 19
(“Area Source Rules”). The Area Source Rules are designed to reduce emissions 20
of hazardous air pollutants from various small boilers, to include coal-fired units 21
of 25 MW or less. 22
000941

16
Q. WHAT ARE THE IMPLICATIONS OF THE AREA SOURCE RULES? 1
A. The rules implement: (1) new emission requirements for mercury and carbon 2
monoxide; (2) work practice standards addressing startup and shutdown and 3
energy assessments; (3) operating restrictions defining mercury sorbent injection 4
rates and coal quality; (4) continuous monitoring; and (5) compliance testing. The 5
deadline for compliance with the Area Source Rules is March 21, 2014. In order 6
for Black Hills Power to comply with the Area Source rules, it is required to 7
either: (1) retrofit these three affected facilities with expensive new environmental 8
controls; or (2) retire Neil Simpson I, Osage, and Ben French. 9
Q. HAS BLACK HILLS POWER MADE A DETERMINATION REGARDING 10
COMPLIANCE WITH THE AREA SOURCE RULES? 11
A. Yes. As a result of the costs involved to retrofit these units, the need for life 12
extension upgrades if the units were to continue to operate, and the likelihood of 13
additional future EPA regulations that would affect the continued operation of 14
these facilities; Black Hills Power concluded that the most cost effective plan for 15
EPA compliance is to retire Neil Simpson I, Osage, and Ben French no later than 16
March 21, 2014. 17
Q. PLEASE DESCRIBE YOUR ROLE IN THE DECOMMISSIONING OF 18
NEIL SIMPSON I, OSAGE, AND BEN FRENCH. 19
A. I am responsible for supporting the overall project development and management 20
of the decommissioning of these facilities. In this role, I oversee preparations of 21
000942

17
plans and specifications, the competitive bid process, selection of the 1
decommissioning contractor, and management of the decommissioning process. 2
Q. HOW HAS BLACK HILLS POWER PREPARED FOR THE 3
DECOMMISSIONING OF THESE FACILITIES? 4
A. Black Hills Power retained Environmental Resources Management (“ERM”) to 5
conduct Environmental Site Assessments (“ESA”) at all three facilities. Based 6
upon the data obtained during the site visits, review of publicly available 7
information sources, and interviews with persons familiar with the sites, ERM 8
identified the environmental conditions that need to be addressed through 9
abatement or removal. 10
The Company also retained Black & Veatch, a global engineering, consulting, and 11
construction company, to consult on preparation of the Request for Proposal 12
(“RFP”) for the decommissioning work and the overall decommissioning process. 13
An RFP was issued in March of 2013. In response, vendors submitted proposals 14
through a competitive bidding process. Black Hills Power subsequently selected 15
Independence Excavating, LLC (“IX”) to decommission these facilities, as it had 16
submitted the lowest cost proposal that met the technical specification of the RFP. 17
Q. WHAT ARE THE FORECASTED COSTS ASSOCIATED WITH 18
DECOMMISSIONING THESE FACILITIES? 19
A. The following table provides a summary of estimated decommissioning costs by 20
plant: 21
000943

18
Generation
Unit
Demolition
&
Abatement
Bid
Salvage
Value
Credit
RFP
Lump
Sum Bid
Environmental
Assessments /
Other Costs
Total
Decommissioning
Budget
Osage 3,296,300 (573,000) 2,723,300 1,228,436 $ 3,951,736
Neil Simpson
I 2,315,000 (420,000) 1,895,000 1,080,413 $ 2,975,413
Ben French 2,709,000 (420,000) 2,289,000 1,670,606 $ 3,959,606
Q. PLEASE EXPLAIN WHAT IS INCLUDED IN THE COLUMN ENTITLED 1
ENVIRONMENTAL ASSESSMENTS / OTHER COSTS. 2
A. The Environmental Assessments / Other Costs column above includes the cost of 3
performing the individual ESA at each of the three facilities. This section includes 4
the cost of retaining the professionals to conduct the assessments as well as costs 5
associated with well closure, waste disposal, asbestos abatement and bonding. 6
Two ESAs were conducted to research and analyze any potential liabilities from 7
an environmental impact perspective. Additionally, this category of costs includes 8
site management during decommissioning, and indirect costs such as insurance 9
and permits required throughout the decommissioning progress. 10
Q. HOW CONFIDENT IS BLACK HILLS POWER IN THE FORECASTED 11
DECOMMISSIONING COSTS? 12
A. Black Hills Power is very confident in these costs because the decommissioning 13
contract is a fixed price contract. 14
Q. PLEASE DISCUSS THE DECOMMISSIONING SCHEDULE. 15
A. Decommissioning efforts at the Osage facility are scheduled to begin in August of 16
2014, with a target date for completion of April of 2015. Decommissioning 17
000944

19
efforts at the Neil Simpson I facility are scheduled to begin in November of 2014 1
and estimated to be completed in June of 2015. Finally, decommissioning efforts 2
at the Ben French facility are scheduled to begin in January of 2015 and estimated 3
to conclude in September of 2015. 4
X. THE NEIL SIMPSON COMPLEX AND ASSOCIATED 5
COMMON ASSETS 6
Q. WHAT FACILITIES ARE LOCATED AT THE NEIL SIMPSON 7
COMPLEX? 8
A. The following generation facilities are located in Gillette, Wyoming at the Neil 9
Simpson Complex: Wygen III, Neil Simpson II, Wyodak, and the Neil Simpson 10
CT. 11
Q. WHAT PERCENTAGE OF OWNERSHIP DOES BLACK HILLS POWER 12
HAVE IN EACH OF THESE FACILITIES? 13
A. Black Hills Power owns 52% of Wygen III, 100% of Neil Simpson II, 20% of 14
Wyodak, and 100% of the Neil Simpson CT. 15
Q. PLEASE DESCRIBE THE COAL STOCKPILE ITEM AT THE NEIL 16
SIMPSON COMPLEX (“NEIL SIMPSON COMPLEX”) LISTED ON 17
SCHEDULE F-1, LINE 31. 18
A. The coal plants at the Neil Simpson Complex are directly adjacent to the Wyodak 19
Mine. The coal is crushed in a secondary crusher building and then this mine-20
mouth coal is fed through a single conveyor belt system. This system is 21
maintained and operates very reliably. However, the reliance on a single non-22
000945

20
redundant source of coal to these facilities is a risk to the plant operations. This 1
risk has been evaluated and based on the potential for interruption of the supply of 2
coal to all the coal plants at the Neil Simpson Complex, the single secondary 3
crusher building and conveyor belt system is identified as a significant risk. 4
Although the Company has limited coal storage available, an event causing major 5
damage to the coal supply system could prevent the operation of all the power 6
plants at the Neil Simpson Complex and pose risk to the ability to adequately 7
supply power to customers. Therefore, the decision was made to stockpile coal at 8
the Neil Simpson Complex. 9
Q. IS THE NEIL SIMPSON COMPLEX COAL STOCKPILE ADJUSTMENT 10
PRUDENT AND NECESSARY? 11
A. Yes, the back-up coal supply system project and adding a coal stock pile to 12
inventory is prudent to ensure reliable power supply to customers. 13
Q. HAS BLACK HILLS POWER MADE OTHER INVESTMENTS IN THE 14
COMMON ASSETS AT THE NEIL SIMPSON COMPLEX? 15
A. Yes. The post test year Neil Simpson Complex common asset additions are set 16
forth on Schedule D-10, lines 26-40, 44. The Neil Simpson Complex Shared 17
Facilities adjustment has been updated to reflect these additions on Schedule H-10. 18
000946

21
XI. LABOR FORCE 1
Q. ONCE OPERATIONS ARE COMPLETELY SUSPENDED AT NEIL 2
SIMPSON I, WILL BLACK HILLS POWER REALIZE A DECREASE IN 3
LABOR FORCE? 4
A. No. There are currently eight full time equivalent employees allocated to Neil 5
Simpson I. These employees have been retained by Black Hills Power as part of 6
its strategic workforce planning efforts. As operations at Neil Simpson I moved 7
toward suspension, these employees assigned part of their time to the common 8
Neil Simpson Complex facilities and also direct charged specific entities such as 9
Cheyenne Light and Black Hills Wyoming. Once suspension of operations is 10
complete, these employees will be transitioned to fill eight open positions at the 11
Neil Simpson Complex. 12
Q. DOES THE RETENTION OF THE NEIL SIMPSON I EMPLOYEES 13
ELIMINATE THE NEED TO INCLUDE GENERATION EMPLOYEES IN 14
BLACK HILLS POWER’S FUTURETRACK WORKFORCE 15
DEVELOPMENT PROGRAM? 16
A. No. The retention of the Neil Simpson I employees merely addresses open 17
positions that exist today. A need will still exist to hire and train individuals to fill 18
positions that will be left vacant following future retirements. As a consequence, 19
there are a number of generation positions included in Black Hills Power’s 20
FutureTrack Workforce Development Program. 21
000947

22
Q. WHAT GENERATION POSITIONS ARE INCLUDED IN BLACK HILLS 1
POWER’S FUTURETRACK WORKFORCE DEVELOPMENT 2
PROGRAM? 3
A. Instrument technicians, plant unit operators, and plant maintenance operators are 4
the three generation positions that are included in the Program. 5
Q. PLEASE EXPLAIN WHY THESE POSITIONS ARE INCLUDED. 6
A. In the next eight years, Black Hills Power expects 7 instrument technicians, 4 7
plant maintenance operators, and 14 unit operators to retire. Based upon the 8
Company’s experience, it takes approximately 3 years to train an instrument 9
technician and 1.5 years to train a plant maintenance operator to the level 10
necessary for him/her to work independently and be considered as a candidate for 11
a plant unit operator. Plant maintenance operators provide the pool of available 12
candidates for unit operator positions. Once employed as a unit operator, it takes 13
an additional 1.5 years before this category of employee is able to work 14
independently. Due to the lengthy training periods and the shortage of skilled 15
candidates, these three generation positions are included in the Black Hills 16
Power’s FutureTrack Workforce Development Program. 17
Q. HOW PRODUCTIVE ARE THE INDIVIDUALS WHO ARE TRAINING 18
FOR THESE POSITIONS? 19
A. Based upon the Company’s experience, an instrument technician is approximately 20
50 percent productive after 2 years of training, and able to work independently 21
after 3 years of training; a plant maintenance operator is approximately 50 percent 22
000948

23
productive after 1 year of training, and able to work independently after 18 months 1
of training; and a fully trained plant maintenance operator is approximately 50 2
percent productive as a unit operator after 1 year and able to work independently 3
after 1.5 years of training. Jennifer Landis discusses how these productivity 4
metrics are applied to determine what percentage of a particular position is 5
charged to the Black Hills Power’s FutureTrack Workforce Development Program 6
regulatory asset. 7
XII. CONCLUSION 8
Q. PLEASE EVALUATE BLACK HILLS POWER’S GENERATION 9
RESOURCES. 10
A. Once CPGS is in-service, Black Hills Power will have a balanced portfolio of 11
geographically diverse modern coal and gas-fired generation that represents one of 12
the newest fleets of generation resources in the United States. Black Hills Power’s 13
generation resources should provide its customers with reliable and economical 14
energy for a very long period of time. 15
Q. DOES THIS CONCLUDE YOUR TESTIMONY? 16
A. Yes, it does. 17
000949

Direct Testimony
Kent J. Kopetzky
Before the South Dakota Public Utilities Commission
of the State of South Dakota
In the Matter of the Application of
Black Hills Power, Inc., a South Dakota Corporation
For Authority to Increase Rates
in South Dakota
Docket No. EL14-___
March 31, 2014
000950

i
TABLE OF CONTENTS
I. INTRODUCTION AND QUALIFICATIONS ......................................................... 1
II. PURPOSE OF TESTIMONY .................................................................................... 2
III. CPGS GAS SUPPLY ................................................................................................. 3
IV. SOUTHERN STAR TRANSPORTATION AGREEMENTS .................................. 6
V. OTHER GAS SUPPLY ARRANGEMENTS ........................................................... 8
VI. CONCLUSION .......................................................................................................... 9
Exhibits
None
000951

1
I. INTRODUCTION AND QUALIFICATIONS 1
Q. PLEASE STATE YOUR NAME AND BUSINESS ADDRESS. 2
A. My name is Kent J. Kopetzky. My business address is 1102 East 1st Street, 3
Papillion, NE, 68046. 4
Q. BY WHOM ARE YOU EMPLOYED AND IN WHAT CAPACITY? 5
A. I am currently employed as Senior Manager, Gas Supply Services for Black Hills 6
Utility Holdings, Inc., (“BHUH”), which is a wholly-owned subsidiary of Black 7
Hills Corporation (“BHC”). Gas Supply Services is a department within BHUH. 8
Gas Supply Services is responsible for providing natural gas to regulated utility 9
business units of BHC, including Black Hills Power (“Black Hills Power” or 10
“Company”). 11
Q. ON WHOSE BEHALF ARE YOU TESTIFYING IN THIS DOCKET? 12
A. I am testifying on behalf of Black Hills Power. 13
Q. PLEASE OUTLINE YOUR EDUCATIONAL BACKGROUND. 14
A. I obtained a Bachelor of Journalism degree in Broadcasting from the University of 15
Nebraska-Lincoln in 1993. I have attended several utility industry conferences 16
and workshops throughout my career in the utility industry. In addition to that 17
ongoing work-specific education, I have also attended numerous conferences, 18
meetings, and informal training sessions provided by interstate pipelines and 19
natural gas suppliers providing natural gas products or services to the Company, 20
and I was selected to be a member of the Gas Buyers Panel at the 2011 21
Midcontinent LDC Gas Forum. 22
000952

2
Q. PLEASE DESCRIBE YOUR WORK EXPERIENCE. 1
A. I joined BHUH as Manager, Gas Supply Services on July 16, 2008, and was 2
appointed Senior Manager, Gas Supply, in September 2012. Prior to joining BHC, 3
I served in multiple gas supply positions with Aquila, Inc. and its predecessor 4
companies. For example, in 2006, I was appointed by Aquila, Inc. as Manager, 5
Gas Supply Services. 6
I also served as a regulatory analyst in various positions, including preparation of 7
gas supply cost adjustment compliance filings. I have over fifteen (15) years of 8
experience in the utility industry with the majority of that experience in the area of 9
procuring and managing natural gas supply, interstate transportation, and storage 10
of natural gas for both natural gas and electric utilities. I coordinate my activities 11
and responsibilities with other Gas Supply Services staff, including our portfolio 12
and natural gas dispatching managers, to provide the Company’s regulated utilities 13
and their customers with reliable sources of natural gas. 14
Specifically, my work experience covers pipeline nominations, daily and monthly 15
gas purchasing, and the development and support of natural gas requirements of 16
natural gas fired power plants for BHC’s regulated utilities. 17
II. PURPOSE OF TESTIMONY 18
Q. WHAT IS THE PURPOSE OF YOUR DIRECT TESTIMONY? 19
A. I will discuss the natural gas supply, pipeline capacity, and other fuel cost for the 20
Cheyenne Prairie Generating Station project (hereafter “Cheyenne Prairie 21
Generating Station” or “CPGS”). Gas Supply Services is responsible for 22
000953

3
arranging and managing the gas supply and pipeline capacity needed by the CPGS 1
facilities. 2
The CPGS facilities are being constructed near Cheyenne, Wyoming to provide 3
electricity to customers of Cheyenne Light, Fuel and Power Company (“Cheyenne 4
Light”) and Black Hills Power. This testimony will describe the actions taken by 5
Black Hills Power or Gas Supply Services to ensure that natural gas is available at 6
the CPGS facilities on those days when it is economical to generate electricity at 7
CPGS for the customers of Black Hills Power and will address and support the 8
natural gas fuel costs associated with generating that electricity. 9
Q. DID YOU PREPARE ANY EXHIBITS IN SUPPORT OF YOUR DIRECT 10
TESTIMONY? 11
A. No. 12
III. CPGS GAS SUPPLY 13
Q. WHAT RECENT ACTIONS WERE UNDERTAKEN TO SERVE CPGS 14
WITH NATURAL GAS? 15
A. Upon direction from Black Hills Power and Cheyenne Light, Fuel and Power 16
Company (“Cheyenne Light”), Gas Supply Services solicited construction and 17
transportation offers from multiple interstate natural gas transportation pipelines as 18
part of Black Hills Power’s natural gas supply planning for CPGS. Three bids 19
were received in response to the solicitation. After further evaluation of the costs 20
and benefits included within the various bids, Southern Star Central Gas Pipeline 21
(“Southern Star”) was selected as the interstate pipeline transportation provider for 22
000954

4
CPGS. Southern Star built interconnecting facilities and a four mile lateral from 1
its Rawlins-Hesston line in Colorado to an interconnection point with the 2
Company’s CPGS Pipeline1, just north of the Wyoming – Colorado state line. 3
Pursuant to a Certificate of Public Convenience and Necessity (“CPCN”) granted 4
by the Wyoming Public Service Commission in Docket Nos. 20002-81-EA-11 and 5
20003-113-EA-11 (Record No. 13007), Cheyenne Light and Black Hills Power 6
are constructing the CPGS Pipeline, which originates at the Southern Star 7
interconnection point just north of the Wyoming – Colorado State line and East of 8
HWY 85 running to the North to CPGS. 9
Q. WHICH NATURAL GAS SUPPLIERS WILL PROVIDE THE GAS 10
SUPPLY THROUGH SOUTHERN STAR AND THE CPGS PIPELINE? 11
A. There are currently no gas supply transactions in effect for gas supply through 12
Southern Star and the CPGS Pipeline. Gas Supply Services will procure gas 13
supplies in the future from a variety of natural gas suppliers as requested or as 14
needed by Black Hills Power (i.e., electric generation or natural gas service) or 15
Cheyenne Light. 16
Gas Supply Services has previously entered into industry-standard natural gas 17
supply agreements with various natural gas suppliers (e.g., North American 18
Energy Standards Board Agreement or NAESB). When Generation Dispatch and 19
Power Marketing Department (“GDPM”), acting as agent for Black Hills Power or 20
1 The CPGS Pipeline is a high pressure natural gas pipeline that is approximately ten and one-half (10.5)
miles in length and twelve (12”) inches in diameter that connects Southern Star to CPGS.
000955

5
Cheyenne Light determines that a package of gas supply is needed to provide 1
natural gas to CPGS, then Gas Supply Services will enter into specific 2
negotiations with an existing supplier and thereafter execute a “Transaction 3
Confirmation” with that natural gas supplier to deliver the package of natural gas 4
at a receipt point on Southern Star in the agreed-upon quantities and at the agreed-5
upon price. 6
Gas Supply Services, acting as agent for Black Hills Power or Cheyenne Light 7
will enter into additional NAESB agreements if needed to obtain gas supply from 8
a particular natural gas supplier with which it does not already have an existing 9
contractual relationship. The NAESB does not require any minimum 10
consumption, and Gas Supply Services acting as agent for either Black Hills 11
Power or Cheyenne Light will enter into specific gas supply transactions as 12
identified by GDPM acting as agent for CPGS when gas is needed for CPGS. 13
The primary receipt point on Cheyenne Light’s Firm Transportation agreement 14
with Southern Star is Echo Springs, a Rockies point upstream of the CPGS 15
interconnection which has historically enjoyed strong liquidity. Therefore, Gas 16
Supply Services, as agent, will procure supply on a seasonal, monthly, and daily 17
basis from reputable suppliers as needed for Black Hills Power at CPGS to 18
generate power for its electric customers, or for Cheyenne Light at CPGS to 19
generate power for its electric customers. 20
000956

6
Q. WHEN WILL NATURAL GAS BE AVAILABLE AT CPGS? 1
A. As discussed in more detail below, the contract for firm interstate natural gas 2
pipeline transportation capacity on Southern Star begins on October 1, 2014. 3
CPGS Pipeline and Southern Star construction is expected to be completed prior to 4
the start of CPGS testing in the summer of 2014. Thus, in addition to firm 5
interstate transportation capacity, Cheyenne Light also entered into an interruptible 6
interstate transportation capacity agreement with Southern Star for deliveries prior 7
to October 1, 2014. That agreement does not require any minimum quantity use 8
so it is available to be used as needed. As noted above, natural gas supply 9
commodity is readily available on Southern Star. Thus, Gas Supply Services 10
acting on behalf of either Black Hills Power or Cheyenne Light can enter into gas 11
supply transactions for amounts needed to commence at that same time in the 12
amounts identified by managers of CPGS. 13
IV. SOUTHERN STAR TRANSPORTATION AGREEMENTS 14
Q. WHAT ARE THE TERMS FOR THE INTERSTATE PIPELINE 15
TRANSPORTATION AGREEMENT WITH SOUTHERN STAR? 16
A. The interstate pipeline Firm Transportation Agreement is between Cheyenne Light 17
and Southern Star. The Firm Transportation Agreement and the Interruptible 18
Transportation agreements with Southern Star are standard Southern Star tariff 19
agreements. The rates, terms, and conditions of service under those interstate 20
transportation agreements are regulated by the Federal Energy Regulatory 21
Commission (“FERC”). The Firm Transportation Agreement is a maximum tariff 22
000957

7
rate agreement for 10,000 Dth per day. The Interruptible Transportation 1
Agreement is at a discounted rate. The Firm Transportation Agreement 2
commences on October 1, 2014 and will continue for seven years and seven 3
months, expiring May 1, 2022, with a right of first refusal option to extend the 4
term. The Interruptible Transportation Agreement goes into effect January 1, 5
2014 and therefore will be available for use during testing at CPGS. 6
Q. HOW WILL THE INTERSTATE PIPELINE TRANSPORTATION 7
CAPACITY AND GAS SUPPLY REQUIREMENTS BE MANAGED? 8
A. Gas Supply Services, as agent for Black Hills Power and Cheyenne Light, will 9
manage the use of the Southern Star interstate transportation capacity, and will 10
enter into an Asset Management Agreement (“AMA”), interstate pipeline 11
transportation capacity release agreements, Inter-Corporate Services, Agency, or 12
make other arrangements with Black Hills Power and Cheyenne Light to fully 13
manage this interstate pipeline transportation capacity on behalf of Black Hills 14
Power and Cheyenne Light. Under similar agreements, Gas Supply Services will 15
also manage the procurement of natural gas supply for Black Hills Power and 16
Cheyenne Light, creating separate natural gas pools for each entity to ensure that 17
each entity is allocated the appropriate commodity costs. 18
Q. IS THE LEVEL OF FIRM INTERSTATE PIPELINE CAPACITY 19
ADEQUATE? 20
A. Yes. However, as noted above, in addition to the interstate pipeline Firm 21
Transportation Agreement, Gas Supply Services acting on behalf of Black Hills 22
000958

8
Power and Cheyenne Light has arranged for a discounted Interruptible 1
Transportation contract if CPGS consumes more than 10,000 Dth of natural gas in 2
a given day. As noted above, Gas Supply Services will obtain transportation for 3
Black Hills Power through an AMA, or obtain interruptible transportation in Black 4
Hills Power’s name as appropriate or necessary. 5
V. OTHER GAS SUPPLY ARRANGEMENTS 6
Q. WILL HEDGES OR OTHER FINANCIAL DERIVATIVE 7
ARRANGEMENTS BE USED? 8
A. Hedges and other financial derivatives will be used if market conditions indicate 9
that it would be prudent to enter into such arrangements. 10
Q. WILL STORAGE BE ACQUIRED FOR CPGS? 11
A. There are several reasons why storage will not be purchased for CPGS at this time. 12
Unlike many other pipelines, Southern Star does not currently charge daily out-of-13
balance fees, so storage is not needed to avoid daily balancing penalties. Also, as 14
noted earlier, the primary receipt point on the Firm Transportation contract has 15
historically been very liquid so supply should be easily attained. Finally, Southern 16
Star currently has virtually no open storage capacity. 17
Q. WILL BLACK HILLS POWER PURCHASE NATURAL GAS SUPPLY 18
FOR CPGS THAT IS PRODUCED LOCALLY? 19
A. No. Currently, the natural gas obtained for use at CPGS will be obtained through 20
Southern Star. 21
000959

9
VI. CONCLUSION 1
Q. DOES THIS CONCLUDE YOUR TESTIMONY? 2
A. Yes. 3
000960

Direct Testimony and Exhibit
Michael J. Fredrich
Before the South Dakota Public Utilities Commission
of the State of South Dakota
In the Matter of the Application of
Black Hills Power, Inc., a South Dakota Corporation
For Authority to Increase Rates
in South Dakota
Docket No. EL14-___
March 31, 2014
000961

i
TABLE OF CONTENTS
I. INTRODUCTION AND QUALIFICATIONS .................................................. 1
II. PURPOSE OF TESTIMONY ............................................................................. 3
III. DISTRIBUTION GROWTH & RELIABILITY ................................................ 3
IV. MAJOR CAPITAL DISTRIBUTION INVESTMENTS ................................... 6
V. LIDAR PROJECT .............................................................................................. 8
Exhibits
Exhibit MJF - 1 – Diagram of the BHP 230 & 69 kV transmission system
000962

1
I. INTRODUCTION AND QUALIFICATIONS 1
Q. PLEASE STATE YOUR NAME AND BUSINESS ADDRESS. 2
A. My name is Michael J. Fredrich. My business address is 409 Deadwood 3
Avenue, P.O. Box 1400, Rapid City, South Dakota, 57701. 4
Q. BY WHOM ARE YOU EMPLOYED AND IN WHAT CAPACITY? 5
A. I am employed by Black Hills Utility Holdings Company (“BHUH”) as 6
Director, Engineering Services. 7
Q. FOR WHOM ARE YOU TESTIFYING ON BEHALF OF TODAY? 8
A. I am testifying on behalf of Black Hills Power, Inc. (“Black Hills Power” or 9
the “Company”). 10
Q. PLEASE DESCRIBE YOUR EDUCATION AND BUSINESS 11
BACKGROUND. 12
A. I graduated from the South Dakota School of Mines and Technology with a 13
Bachelor of Science Degree in Electrical Engineering in 1981. Following 14
graduation, I accepted a position with Black Hills Corporation (“BHC”). Since 15
that time, I have held a variety of engineering related roles. 16
From 1981 through 1986, I served as an electrical engineer in the Power 17
Resources Department where I was responsible for the operation and 18
maintenance of the generation and transmission protective relaying systems. 19
From 1987 to 1988, I served as the Substation Maintenance Supervisor for 20
Black Hills Power’s Electric Operations Department. From 1989 to 1991, I 21
000963

2
served as the System Protection and Studies Engineer for the Black Hills 1
Power System Engineering Department, where I performed system study work 2
associated with the operational and planning requirements associated with the 3
Black Hills Power 230 kV and 69 kV transmission networks. From 1991 to 4
2000, I was the Manager for Planning and Coordination for Black Hills Power. 5
I was responsible for the development of operating and infrastructure plans 6
associated with maintaining the adequacy and reliability of all 230 kV and 69 7
kV transmission electrical facilities. From 2000 to 2005, I was the Director of 8
Transmission for Black Hills Power with responsibility for the entire 9
transmission network, including transmission planning, transmission contracts, 10
and Federal Energy Regulatory Commission (“FERC”) tariff administration. 11
From 2005 to 2008, I was the Director of System Operations and Maintenance, 12
Engineering, and Transmission for Black Hills Power. I was responsible for 13
the operation and maintenance of the transmission network, including electrical 14
maintenance, the 24 hour System Control Dispatch Center, all transmission 15
planning activities, transmission contract administration, and FERC Open 16
Access Transmission Tariff administration. I also had management 17
responsibility over the Black Hills Power Engineering Department, which was 18
responsible for the design and construction of the transmission and distribution 19
networks of Black Hills Power. In 2008, I was named Director, Engineering 20
Services. I continue in this role today. 21
000964

3
Q. WHAT ARE YOUR PRIMARY RESPONSIBILITIES IN YOUR 1
CURRENT POSITION? 2
A. As Director, Engineering Services, I currently manage and oversee the 3
engineering, design, construction, operation, and maintenance functions 4
associated with the major transmission and distribution networks of all three 5
electric utilities currently under BHC, those entities being Black Hills Power, 6
Cheyenne Light, Fuel & Power Company, and Black Hills/Colorado Electric 7
Utility Company. I also have responsibility for the metering services, 8
distribution planning, Geographic Information Systems electronic mapping, 9
and drafting support services for these organizations. 10
II. PURPOSE OF TESTIMONY 11
Q. WHAT IS THE PURPOSE OF YOUR TESTIMONY? 12
A. The purpose of my testimony is to provide the Commission with a brief 13
description of the Black Hills Power service territory and electrical network, a 14
summary of the major capital distribution investments that are included in this 15
rate case, and an overview of Black Hills Power’s LIDAR project. 16
III. DISTRIBUTION GROWTH & RELIABILITY 17
Q. PLEASE DESCRIBE THE GEOGRAPHIC AREA OF BLACK HILLS 18
POWER’S SERVICE TERRITORY. 19
A. Black Hills Power’s service territory is located in the northeastern part of 20
Wyoming, the western part of South Dakota (primarily the Black Hills of 21
000965

4
South Dakota), and a portion of southeastern Montana. (See Exhibit MJF - 1 – 1
Diagram of the BHP 230 & 69 kV transmission system). Please refer to the 2
testimony of Vance Crocker for additional detail regarding Black Hills Power’s 3
service territory and business operations. 4
Q. PLEASE DESCRIBE THE METHODS THE COMPANY USES TO 5
DETERMINE WHEN RELIABILITY AND GROWTH INVESTMENTS 6
ARE APPROPRIATE OR REQUIRED. 7
A. Black Hills Power performs numerous power flow and voltage profile analyses 8
on the Company’s electrical transmission and distribution networks to 9
determine the overall capability of the existing electric facilities to serve the 10
projected customer peak loads during a typical near and long term planning 11
cycle. It is through these planning studies that Black Hills Power is able to 12
identify specific limitations associated with the existing transmission and 13
distribution facilities that may prevent the Company from providing safe and 14
reliable service to the Company’s existing customers. It is also through this 15
planning process that Black Hills Power will review, consider, and analyze 16
specific system additions and improvements required to meet existing 17
customer loads as well as the projected future customer loads. Black Hills 18
Power has developed a detailed set of distribution planning standards and 19
technical study criteria that it utilizes to evaluate and determine the best 20
solutions required to meet load serving requirements of customers. 21
000966

5
Q. PLEASE DESCRIBE THE TYPES OF INVESTMENTS NECESSARY 1
TO MAINTAIN RELIABILITY OF THE DISTRIBUTION SYSTEM. 2
A. The types of investments associated with maintaining the reliability and 3
integrity of the distribution and 69kV sub-transmission networks that have 4
typically been considered in the Company’s planning studies have been the 5
following: 6
* Rebuilding of existing 69kV lines 7
* Upgrading of substation equipment 8
* New substation additions 9
* Rebuilding of distribution feeders 10
* New 69kV sub-transmission lines 11
* New distribution feeder circuits 12
* Voltage conversions 13
* Replacement of aged or damaged infrastructure 14
As potential projects are evaluated to address specific integrity, reliability, and 15
growth requirements, Black Hills Power considers the cost benefit associated 16
with the alternatives that may have been identified as reasonable solutions to a 17
respective project. Black Hills Power takes into consideration a number of 18
planning and economic variables as it reviews and evaluates a given project to 19
consider reasonable cost alternatives for providing service to its customers. 20
000967

6
IV. MAJOR CAPITAL DISTRIBUTION INVESTMENTS 1
Q. PLEASE IDENTIFY THE COMPANY’S RECENT MAJOR CAPITAL 2
DISTRIBUTION INVESTMENTS. 3
A. The following provides a brief description of some of the major distribution 4
capital investments that have been required to address various reliability and 5
long term growth issues and that are included as part of this rate case. 6
a. The East Meade Substation Project. 7
The East Meade Substation Project consists of the construction of a 10.5/12/14 8
MVA – 69/12.4 kV substation and associated switchgear located in the 9
southeastern part of Rapid City. This substation addition and associated 10
distribution tie lines are required to support the loads currently served from the 11
existing Robbinsdale Substation. 12
This project is necessary because the load service capability of the Robbinsdale 13
Substation has reached its maximum capacity. The Robbinsdale Substation 14
property site location is not conducive to physical expansion that would allow 15
a larger transformer. The existing Robbinsdale Substation property site is also 16
bordered by a drainage aqueduct on two sides of the property, which again 17
poses various limitations to our ability to expand this location. Also, the 18
ability to install additional distribution switchgear and associated distribution 19
feeder exits was prohibited due to the geographical location of this substation. 20
000968

7
The East Meade Substation location is outside of this residential area and will 1
provide adequate access to the area distribution network. This new location 2
will allow critical distribution ties to be constructed that will support the loads 3
currently served from the Robbinsdale Substation. The additional transformer 4
capacity at the East Meade Substation will also allow additional load support 5
for loads served from adjacent substations during certain operating conditions 6
and when back up support is needed during outage events. The location and 7
capacity of the East Meade Substation will also provide additional system 8
capacity and operating options to serve potential load growth in the 9
southeastern portion of Black Hills Power’s Rapid City service area. 10
The projected in service date for this project is September 30, 2014. 11
b. Neil Simpson Controls Project. 12
This project is associated with the decommissioning of the Neil Simpson I 13
facility. This particular project will facilitate the relocation of all the control 14
and protective relaying equipment required for the Neil Simpson 69 kV 15
substation. This equipment is currently located within the physical confines of 16
the Neil Simpson I power plant. The new control house will be located outside 17
of the existing plant and be located near the 69 kV substation. The costs of this 18
project include the installation of a new substation control building and the 19
installation of new control and protective relaying equipment for the Neil 20
Simpson 69 kV substation. The initial relocation of the existing controls from 21
000969

8
their power plant location into the new control building is anticipated to start in 1
April 2014 and is currently scheduled to be completed by the end of May 2014. 2
c. Jackson Boulevard 69 kV Relocation Project. 3
This project is associated with a major South Dakota Department of 4
Transportation road expansion/rebuild along Jackson Boulevard in Rapid City. 5
This project will require Black Hills Power to relocate and rebuild 6
approximately 3000 feet of existing single pole 69kV lines with 12.47 kV 7
underbuild. This project is expected to be completed in July 2014. 8
d. Rapid City Cemetery Transformer Replacement. 9
The Rapid City Cemetery Transformer Replacement project involves 10
replacement of the smaller of the two existing transformers (10.5 MVA) at this 11
location so that both transformers have the same 14 MVA rating. Replacement 12
is necessary because the smaller 10.5 MVA transformer can no longer support 13
the summer peak loads in this area. This upgrade is also required to address 14
system outages and reliability situations. The projected in service date for this 15
project is late April 2014. 16
V. LIDAR PROJECT 17
Q. WHAT IS LIDAR? 18
A. LIDAR (Light Detection and Ranging) is a remote sensing technology that 19
measures distance by illuminating a target with a laser and analyzing the 20
reflected light. LIDAR surveys are performed by attaching the LIDAR device 21
000970

9
to an aircraft used to fly along the right-of-ways of the electric transmission 1
and distribution facilities. The LIDAR imaging, coupled with high-resolution 2
cameras, measures the distances between the particular facility, the ground, 3
vegetation and other objects or structures within the vicinity of the facility. 4
Q. WHAT ARE THE BENEFITS OF LIDAR IMAGING? 5
A. LIDAR provides an economically appropriate imaging tool for areas with 6
rough terrain and significant vegetation, such as the Black Hills. In particular, 7
LIDAR imaging will provide Black Hills Power another tool to more 8
accurately identify hazard trees and vegetation. LIDAR imaging will also 9
assist Black Hills Power in measuring the distance between its power lines and 10
the ground. As a consequence, Black Hills Power will be able to address 11
inadequate clearances in a timely manner and therefore minimize line de-12
ratings caused by clearance issues. 13
Q. DOES THE NORTH AMERICAN ELECTRIC RELIABILITY 14
CORPRATION (“NERC”) RECOMMEND LIDAR IMAGING ON 15
BHP’S 230 kV TRANSMISSION LINES? 16
A. Under NERC’s facility rating reliability standard FAC-008, Black Hills Power 17
is required to ensure that the facility ratings used in the reliable planning and 18
operation of the Bulk Electric System are determined based on technically 19
sound principles. Black Hills Power’s 230kV transmission facilities fall under 20
the definition of Bulk Electric System. As Black Hills Power continues to meet 21
000971

10
these facility rating requirements, it will utilize LIDAR surveys of its 230kV 1
transmission facilities to validate and ensure it is maintaining the proper 2
clearances so that it does not have to derate the loading on any of its facilities. 3
In addition, Black Hills Power will also utilize these LIDAR surveys to better 4
ensure compliance with the clearance requirements associated with NERC’s 5
Vegetation Management reliability standard FAC-003. The LIDAR technology 6
and survey results will provide Black Hills Power with the most economical 7
means of collecting electronic data on our facilities to perform these 8
assessments. 9
Q. IS BLACK HILLS POWER PROPOSING TO PERFORM A LIDAR 10
ANALYSIS OF ITS ENTIRE TRANSMISSION SYSTEM? 11
A. Yes. Black Hills Power plans to perform LIDAR imaging of all of its 230 kV 12
and 69 kV facilities. This project will be started in 2014 after all snow is gone 13
in the area and deciduous trees are fully leafed. Black Hills Power will hire an 14
independent contractor to perform the LIDAR imaging. Based upon past 15
experience of BHC, the cost estimate for this project is approximately 16
$800,000 for the 69 kV system. 17
Q. DOES THIS CONCLUDE YOUR TESTIMONY? 18
A. Yes, it does. 19
000972

000973
mtoney
Typewritten Text
mtoney
Typewritten Text
Exhibit MJF-1 Diagram of the BHP 230 & 69 kV transmission system
mtoney
Typewritten Text
mtoney
Typewritten Text
mtoney
Typewritten Text
mtoney
Typewritten Text
mtoney
Typewritten Text

Direct Testimony and Exhibits Jennifer C. Landis
Before the South Dakota Public Utilities Commission of the State of South Dakota
In the Matter of the Application of Black Hills Power, Inc., a South Dakota Corporation
For Authority to Increase Rates In South Dakota
Docket No. EL14-___
March 31, 2014
000974

i
TABLE OF CONTENTS
I. INTRODUCTION AND QUALIFICATIONS ............................................ 1
II. INDUSTRY WORKFORCE CONCERNS .................................................. 2
III. BLACK HILLS POWER’S WORKFORCE ................................................ 4
IV. FUTURETRACK WORKFORCE DEVELOPMENT PROGRAM ............ 6
Exhibits
Exhibit JCL-1: FutureTrack Workforce Development Program Description
Exhibit JCL-2 BHP FutureTrack Workforce Revenue Requirements
000975

1
I. INTRODUCTION AND QUALIFICATIONS 1
Q. PLEASE STATE YOUR NAME AND BUSINESS ADDRESS. 2
A. My name is Jennifer C. Landis. My business address is 625 Ninth Street, Rapid 3
City, South Dakota 57701. 4
Q. BY WHOM ARE YOU EMPLOYED AND IN WHAT CAPACITY? 5
A. I am employed by Black Hills Service Company (“Service Company”), a wholly-6
owned subsidiary of Black Hills Corporation (“BHC”), as the Director, Corporate 7
Human Resources and Talent Management. 8
Q. FOR WHOM ARE YOU TESTIFYING ON BEHALF OF TODAY? 9
A. I am testifying on behalf of Black Hills Power, Inc. (“Black Hills Power” or 10
“Company”). 11
Q. PLEASE BRIEFLY SUMMARIZE YOUR ACADEMIC AND 12
PROFESSIONAL BACKGROUND? 13
A. I have a Bachelors Degree in Applied Management and a Masters Degree in 14
Global Human Resources Development. I have over 18 years of experience in 15
adult learning and development and 9 years in human resources with 16
specializations in strategic workforce planning, leadership and employee 17
development, succession planning, employee engagement, performance 18
management, and project management. I am certified by the Human Capital 19
Institute in Strategic Workforce Planning. I belong to several professional human 20
resource organizations and speak publicly on human resources topics at 21
association and industry conferences. 22
000976

2
Q. WHAT IS THE PURPOSE OF YOUR TESTIMONY? 1
A. The purpose of my testimony is to provide: 1) a discussion regarding current 2
industry workforce concerns; 2) an overview of Black Hills Power’s current 3
workforce; and 3) an explanation of the proposed FutureTrack Workforce 4
Development Program, a recruitment and training program to address pending 5
retirements. 6
II. INDUSTRY WORKFORCE CONCERNS 7
Q. PLEASE DESCRIBE THE CHALLENGES THE UTILITY INDUSTRY AS 8
A WHOLE IS EXPERIENCING WITH ITS WORKFORCE 9
REQUIREMENTS. 10
A. The utility industry is uniquely faced with an aging workforce and a scarcity of 11
talent, especially technical talent. According to the 2013 Center for Energy 12
Workforce Development (“CEWD”) Gaps in the Energy Workforce Survey, the 13
utility industry will likely replace up to 55% of its workforce due to retirement and 14
attrition within the next 10 years. This impending wave of retirements, coupled 15
with a decrease in the number of workers entering the industry, is well 16
documented in several industry studies and white papers by the National 17
Regulatory Research Institute, the California Public Utilities Commission, and the 18
U.S. Department of Labor. 19
000977

3
Q. ARE THERE ANY POSITION SPECIFIC STATISTICS THAT SUPPORT 1
THIS CONCERN? 2
A. Yes. The CEWD study highlights line mechanics, technicians, plant operators, and 3
engineers, and presents findings that 36% of these workers may be lost between 4
2013 and 2017 through attrition and retirement. In addition to the number of 5
employees leaving the job market, other industry data demonstrates an alarming 6
lack of candidates available to fill these openings. For example, the table below 7
provides nationwide data regarding the number of active candidates and job 8
openings for a number of typical utility jobs: 9
Position Active Candidates in US Job Postings in US
Instrument Controls Technician 6,116 candidates 6,654 open jobs Lineman (Line Mechanic) 2,380 candidates 6,622 open jobs Plant Maintenance Operator 7,936 candidates 12,483 open jobs Substation Electrician 1,682 candidates 2,188 open jobs Unit Operator 3,089 candidates 4,405 open jobs
These statistics illustrate the challenges the industry is facing with respect to 10
filling critical role vacancies. 11
Q. ARE LOCAL UTILITIES ALSO EXPERIENCING A SHORTAGE OF 12
ELIGIBLE CANDIDATES TO FILL CRITICAL POSITIONS? 13
A. Yes. According to statewide industry data, there were zero substation electricians 14
seeking employment in South Dakota from January 2012 to December 2013, but 15
there were 8 openings. During the same period, there were 35 line mechanics 16
seeking South Dakota employment, with 30 job postings. In the power generation 17
000978

4
field, there were only 45 plant maintenance operators seeking employment in 1
Wyoming, with 232 job openings. There were 70 unit operators also looking for 2
work in Wyoming, with 146 job openings. Lastly, there were 19 instrument 3
control technicians searching for Wyoming employment and 32 job openings. 4
III. BLACK HILLS POWER’S WORKFORCE 5
Q. IS BLACK HILLS POWER FACING THE SAME CHALLENGES AS THE 6
UTILITY INDUSTRY REGARDING IMPENDING RETIREMENTS? 7
A. Yes. As of January 31, 2014, Black Hills Power employed approximately 265 8
people. Over the next 8 years, approximately 31% of Black Hills Power’s current 9
workforce will reach the age of 62, which has been the historical average age of 10
retirement of employees at Black Hills Power and its parent, BHC. 11
Q. DOES THE IMPENDING WORKFORCE LOSS CAUSE ANY CONCERN? 12
A. Yes. The magnitude of impending retirements causes the Company great concern. 13
The employees expected to retire in the next eight years represent over 50% of 14
total years of experience with the Company. Many of the roles most critical to 15
Black Hills Power operations have a particularly high retirement risk. The 16
following table illustrates this point. 17
000979

5
Position 2013
Headcount
Expected Retirements Over 8 Years
Expected Retirement
Percent Construction Representative 7 3 42.9% Electrician 8 5 62.5% Line Mechanic 43 13 30.2% Unit Operator 24 14 58.3% Instrument Technician 13 7 53.8% Energy Services Technician 4 2 50.0% Plant Maintenance Operator 40 4 10.0% Meter Technician 6 3 50.0%
The impending loss of critical institutional knowledge, especially in jobs that have 1
significant technical skills requirements, presents a risk to the Company and its 2
ability to continue to efficiently provide safe and reliable service. 3
Q. WHAT STEPS HAS BLACK HILLS POWER UNDERTAKEN TO 4
ADDRESS THESE CONCERNS IN THE PAST? 5
A. BHC has implemented strategic workforce planning processes and practices at 6
each of its utility business units, including Black Hills Power. The strategic 7
workforce planning process includes an examination of the current workforce 8
demographics, projections of potential losses due to employee retirement over the 9
next 5 to 8 years, and a thorough discussion of the skills and knowledge that will 10
be needed to serve our customers. Through this process, Black Hills Power has 11
identified specific areas of risk due to an alarming shortage of workers possessing 12
specialized skills and gaps in unique organizational and systems knowledge. 13
000980

6
Q. WHAT STEPS ARE BLACK HILLS POWER CURRENTLY TAKING TO 1
ADDRESS THIS CRITICAL WORKFORCE ISSUE? 2
A. Building on efforts already underway at Black Hills Power, the company has 3
created a comprehensive strategic workforce planning program – the FutureTrack 4
Workforce Development Program – which will involve the hiring, training, and 5
preparation of new workers to perform the specialized and critical work necessary 6
to continue providing Black Hills Power’s customers and communities with the 7
safe and reliable service they depend upon. This is a company-wide initiative that 8
BHC will implement at each of its utility subsidiaries. 9
IV. FUTURETRACK WORKFORCE DEVELOPMENT PROGRAM 10
Q. PLEASE PROVIDE A GENERAL OVERVIEW OF THE FUTURETRACK 11
WORKFORCE DEVELOPMENT PROGRAM. 12
A. The primary function of the FutureTrack Workforce Development Program is 13
to recruit talent within critical areas to complete the advanced training necessary to 14
fill the highly skilled positions upon retirement of existing employees. The 15
training provided to employees hired into the FutureTrack program will be flexible 16
and innovatively tailored to the education and experience level of the individual 17
employee. Most of the training will occur on the job and under very close 18
supervision. Some positions will require bookwork, classroom based training, and 19
examinations. In addition, potential candidates may be offered a scholarship, 20
covering tuition, books, and tools, to a South Dakota vocational school to receive 21
training necessary to meet minimum qualifications for FutureTrack positions. A 22
000981

7
program description is included in Exhibit JCL-1. 1
Q. PLEASE EXPLAIN WHY BLACK HILLS POWER NEEDS TO HIRE IN 2
ADVANCE OF RETIREMENTS. 3
A. Black Hills Power relies on skilled labor to safely and reliably deliver electricity to 4
its customers. These roles are technically complex and take years of study and 5
application before competence is achieved. The learning period for these jobs far 6
exceeds the typical amount of notice Black Hills Power would receive from 7
employees giving notice of their intent to retire. To keep up with the loss of talent 8
caused by retirements, Black Hills Power must begin training and hiring 9
replacement workers well in advance of expected retirements. Given the scarcity 10
of qualified replacements, Black Hills Power will not be able to meet its workforce 11
demands by hiring off the street or from within the industry, as it has in the past. 12
Q. WHAT POSITIONS HAVE BEEN IDENTIFIED FOR INCLUSION IN THE 13
PROGRAM? 14
A. The FutureTrack program includes line mechanics, sub-station electricians, 15
construction representatives, energy services technicians, meter technicians, unit 16
operators, plant maintenance operators, instrument and controls technicians, and 17
information technology developers. Also included in the program is a category of 18
positions called operations support and management roles. This group of positions 19
is included due to the nature of the skills, knowledge, and advanced training 20
necessary for success in these roles. Roles included in the other support and 21
management category include: operations management, GIS analysts, systems 22
000982

8
operators, system operations analysts, energy services representatives, and 1
generation dispatch/power marketing roles. 2
Q. WHY WERE THESE POSITIONS SELECTED FOR INCLUSION? 3
A. The positions selected for inclusion will have the following characteristics: the 4
role is critical to Black Hills Power operations; the role requires unique or 5
specialized skills and knowledge with a minimum requirement of six months 6
advanced training to achieve competence; the role is difficult to fill or requires a 7
unique or specialized skill set; and the role has incumbent employees who will 8
reach age 62 within the next 4-8 years. 9
Q. HOW DID BLACK HILLS POWER FORECAST ITS WORKFORCE 10
NEEDS? 11
A. Black Hills Power's workforce was assessed to determine retirement risk by job 12
function and/or position. The determining factor was employee age. Historical 13
retirement data demonstrates that long-tenured, pension eligible employees retire 14
almost exactly at age 62. Once the retirement risk was determined for each job 15
function, interviews were conducted with Black Hills Power business unit 16
managers and human resource support staff, and collective bargaining unit 17
agreements were consulted. 18
Q. DESCRIBE THE TYPICAL EXPERIENCE PROFILE OF A 19
FUTURETRACK EMPLOYEE? 20
A. There is no typical experience profile. The FutureTrack program will recruit both 21
inexperienced and partially qualified workers. One focus of the FutureTrack 22
000983

9
program will be to identify and recruit high school students during their junior or 1
senior year of high school. These students will receive scholarships to a South 2
Dakota vocational school appropriate for the position they are selected to fill. The 3
program will also target re-training more mature workers who are interested in 4
entering the utility industry (e.g., former military personnel returning to South 5
Dakota). 6
Q. PLEASE EXPLAIN WHY A SCHOLARSHIP COMPONENT IS 7
INCLUDED IN THE PROGRAM. 8
A. Many of the jobs in the FutureTrack program require technical school certificates 9
or college degrees for consideration. Additionally, the majority of skilled utility 10
workers are approaching retirement. A different approach is necessary to attract 11
the sufficient numbers of people from the next generation to work in the utility 12
industry. The intent is to create South Dakota training for South Dakota residents 13
to fill South Dakota jobs. 14
Q. PLEASE EXPLAIN HOW THE SCHOLARSHIP COMPONENT OF THE 15
PROGRAM WILL BE IMPLEMENTED. 16
A. Of the FutureTrack jobs that require technical school certificates or college 17
degrees, roughly 50% of the FutureTrack positions expected to be filled over an 18
eight year period will receive scholarships. Technical school scholarships will 19
include tuition, books, and tools (as applicable). Recipients of full scholarships, 20
for example, will be asked to sign a letter of intent to work for Black Hills Power 21
upon graduation, with the stipulation that if the recipient decides not to work for 22
000984

10
Black Hills Power for at least two years, the recipient must repay Black Hills 1
Power the sum of their scholarship. For positions requiring a college degree, a 2
scholarship will be offered to support the last year of the degree. The same letter 3
of intent with the payback stipulation will be used. These scholarships will send 4
South Dakota residents to South Dakota schools to prepare for South Dakota jobs 5
at Black Hills Power. 6
Q. ARE YOU AWARE OF ANY OTHER COMPANIES THAT ARE 7
OFFERING SCHOLARSHIPS TO POTENTIAL EMPLOYEES? 8
A. Yes. Approximately 25 companies are working with Mitchell Technical Institute 9
(“MTI”) to provide scholarships for MTI students that require employment with 10
the sponsoring company following graduation. These scholarships require the 11
recipient to work for the sponsoring company for a pre-determined number of 12
years. 13
Q. WHAT ARE THE OVERALL COSTS TO CUSTOMERS ASSOCIATED 14
WITH THE FUTURETRACK WORKFORCE DEVELOPMENT 15
PROGRAM? 16
A. The anticipated total annual cost to customers for the program is $721,861 for 17
each of the next eight years. This includes costs associated with labor and 18
benefits, scholarships, relocation, and training as shown in the table below. As 19
described in the testimony of Chris Kilpatrick, Black Hills Power is requesting 20
that expenditures for the program that exceed $721,861 annually over each of the 21
next eight years be recorded in a regulatory asset. If in any of the eight years the 22
000985

11
annual expenditures are less than $721,861, the amount of the difference will be 1
credited to customers through the regulatory asset. For additional information 2
regarding the requested treatment of these costs, please refer to the testimony of 3
Chris Kilpatrick. 4
Expense Type Estimated Annual Cost Labor & Benefits $652,200 Relocation $31,400 Scholarships $21,200 Training $17,100
Total $721,900 Q. PLEASE PROVIDE AN EXAMPLE OF HOW THE COSTS FOR ONE 5
FUTURETRACK EMPLOYEE WOULD FLOW THROUGH THE 6
PROGRAM. 7
A. The table below shows the progression of a newly recruited high school student 8
into the FutureTrack program and follows his or her progress through the entire 9
training period. 10
000986

12
Year Expense Type
Regulatory Account
Cost BHP Cost Notes
0 Scholarship to Mitchell Technical Institute's Power Line Construction & Maintenance Program
$13,400 Scholarship covers tution, books, fees, and tools for the 2 semester program
1 Relocation cost $5,000 Training Cost (IBEW course work)
$1,110 Covers IBEW's line mechanic certification course
Labor & Benefits $78,741 2 Training Cost (IBEW
course work) $1,110 Covers IBEW's line
mechanic certification course
Labor & Benefits $90,799 3 Labor & Benefits $51,706 $54,181 Employee is able to begin
working independently in year 3; costs are shared by BHP
4 Labor & Benefits $109,060 Employee transitions out of FutureTrack program and replaces a retiring BHP line mechanic
Not all FutureTrack employees will receive scholarships or relocation. This 1
example shows how all elements of the program, if used and necessary, are 2
applied. A complete description of the developed revenue requirement for the 3
FutureTrack program is included as Exhibit JCL-2. 4
000987

13
Q. IS A FUTURETRACK EMPLOYEE’S COMPENSATION CHARGED TO 1
THE FUTURETRACK REGULATORY ACCOUNT DURING THE 2
ENTIRE TRAINING PERIOD? 3
A. Employee compensation costs are fully charged to the regulatory asset during the 4
initial training period, the length of which varies for each position. Once the 5
employee begins to gain competence and can begin to do some independent work, 6
however, the costs begin to shift from the regulatory account to Black Hills Power 7
capital and operations and maintenance accounts. As described in the testimony 8
of Vance Crocker and Mark Lux, productivity metrics were developed for 9
individual FutureTrack positions. These metrics are applied to estimate the 10
percentage and timing of moving compensation expenses from the regulatory 11
asset to Black Hills Power. By the end of the training period, the entire 12
compensation cost is covered by Black Hills Power and the employee will 13
transition into regular full-time employment as another employee is retiring. 14
Please refer to the testimony provided by Vance Crocker and Mark Lux for more 15
information regarding transitioning employees from a training role into an active 16
employment role. 17
Q. HOW DOES BLACK HILLS POWER PLAN TO TRACK THE COSTS 18
ASSOCIATED WITH THE FUTURETRACK WORKFORCE 19
DEVELOPMENT PROGRAM? 20
A. Each FutureTrack employee-in-training will be tracked using a custom field in 21
our human resources management system. FutureTrack has accounts created to 22
000988

14
allow our financial systems to capture and report all expenses associated with the 1
labor, benefits, relocation, scholarship, and training of FutureTrack employees. 2
Q. WHAT ARE THE BENEFITS OF THE FUTURETRACK PROGRAM FOR 3
CUSTOMERS? 4
A. Black Hills Power’s employees are the most important element of the Company’s 5
ability to meet its obligation to serve. Given the certainty of upcoming retirements, 6
and the dramatic shortage of qualified utility-industry job applicants, innovative 7
solutions are required. By training and preparing workers in advance of retirement, 8
long-tenured and experienced workers are given the time and opportunity to 9
transfer their knowledge of the job, the customers, the company culture, and the 10
skills they’ve honed over their 30-plus years in a specialized role with Black Hills 11
Power. This knowledge transfer over time translates to increased understanding, 12
compliance, safety, and overall performance. It creates a deeper sense of 13
engagement and integration into the workgroup and Company for both the retiring 14
worker and the FutureTrack employee-in-training, which decreases turnover, 15
increases retention, and improves efficiency, system safety, and reliability. 16
Combined, these benefits decrease unnecessary costs due to preventable incidents, 17
inefficiencies, and knowledge loss. The FutureTrack program is good for our 18
customers, our communities, and for Black Hills Power. 19
Q. DOES THIS CONCLUDE YOUR TESTIMONY? 20
A. Yes. 21
000989

BHP Rate Case Exhibit: FutureTrack Workforce Development Program
The Purpose: This program is being created to offset the large number of retirements exiting
Black Hills Power’s workforce over the next eight years by training and preparing new workers
to perform the specialized and critical work necessary to continue providing the safe, reliable
service Black Hills Power’s customers depend upon.
Forecasting Workforce Needs: All positions at Black Hills Power were evaluated to identify
the utility’s most critical workforce needs. Positions were reviewed to determine: 1) if unique or
specialized skills and knowledge are required to perform the job safetly; 2) if the position is
critical to operations or directly supports critical operations; 3) if retirement within the role’s
current incumbents creates risk to the utility’s ability to provide safe, reliable service; 4) if there
is at least a 6 month training time required to reach full productivity/competence before the
employee can work independently; and 5) if there is limited availability to find replacement
workers in the labor pool/external market.
Positions included in the FutureTrack Workforce Development Program (FutureTrack) are
critical. Workforce needs created through the loss of experienced workers through retirements
must be managed proactively and prudently.
FutureTrack Positions:
Applying the criteria listed above resulted in the following positions inclusion in the FutureTrack
Workforce Development Program:
1. Line Mechanics
2. Electricians
3. Construction Representatives
4. Energy Services Technicians
5. Meter Technicians
6. Unit Operators
7. Plant Maintenance Operators
8. Instrument and Controls Techs
9. Information Technology Developers
10. Other Operations Support and Management Roles: This group of roles was included due
to the nature of the skills and knowledge required; however, there is not currently a need
to hire duplicate staff in these areas. Should there be unexpected retirements or a change
in business needs that would put safe, reliable service at risk, duplicate hires would need
to be made in these positions.
o Operations Management
o GIS Analysts
o Systems Operators and System Operations Analysts
Exhibit JCL-1
FutureTrack Workforce
Development Program
Description
000990

o Energy Services Representatives
o Generation Dispatch/Power Marketing roles
Participant Criteria & Selection: Any candidate who applies for and meets the minimum
qualifications for a posted FutureTrack postion will be considered for employment under the
program. Minimum qualifications will vary based on the posted position's requirements.
Program Length: The length of the FutureTrack program depends on the job an employee-in-
training is hired into and the experience that individual brings with them into the job. The least
amount of time an employee-in-training will spend in the program is 6 months and the greatest is
4 years.
Program Components: The FutureTrack program includes some scholarships and relocation,
onboarding, and training (classroom and on-the-job) for employees in the program.
Scholarships: Many of the jobs in the FutureTrack program require technical school or
college degrees. To fill these jobs, scholarships have been included in the FutureTrack
program. These scholarships will send South Dakota residents to South Dakota schools to
prepare for South Dakota jobs at Black Hills Power.
Relocation: In some cases, relocation may be necessary. The FutureTrack program
includes limited relocation dollars to assist employees-in-training to relocate themselves
and their families to/near Black Hills Power service areas.
Onboarding: All FutureTrack employees will go through a comprehensive onboarding
program. The onboarding program will include all elements traditionally covered with
Black Hills Power employees, but will also contain additional material about their
responsibilities as FutureTrack employees-in-training.
Training: The specific training requirements vary for each position in the FutureTrack
program. Many of the positions are tied to apprenticeships, while others require
specialized training of a different variety. Because many of the individuals historically
hired into Black Hills Power positions have had prior utility experience, it is anticipated
that additional training will likely be needed to support FutureTrack employees-in-
training who will bring little to no prior utility experience.
Tracking & Reporting: All activities associated with the FutureTrack program will be recorded
and reported to the commission annually.
Estimated Total Program Cost:
Cost to Customers: The anticipated total annual cost to customers for the program is
$721,900. This includes costs associated with labor and benefits, scholarships, relocation,
and training.
000991

Productivity Adjustments: As FutureTrack employees-in-training gain the knowledge
and experience needed to work productively, their labor and benefit costs will be shared
and eventually transferred fully to Black Hills Power. Each position in the FutureTrack
program has a different training timeline and productivity curve, which was used to
determine the amount of the cost sharing between customers and Black Hills Power.
Program Expense True-Up: Retirement decisions are highly personal and workers may
decide to alter their retirement plans to either work longer or retire sooner. Because of
this, the cost of the program is expected to fluctuate over time. In addition to reporting
the program’s staus to the commission annually, we recommend a true-up audit be
performed in 5 years. Any expenses planned for but not realized will be returned to Black
Hills Power customers. Likewise, any reasonable and documented expenses that exceed
the approved FutureTrack regulatory account will be brought before the commission for
reimbursement.
000992

Exhibit JCL-2BHP Future Track Workforce
Revenue RequirementsPage 1 of 2
1 SD Construction Non Union $ 46,240 69% $ 78,145 100% $78,145 $156,291 2.0 $78,145 $5,000 2345
6SD Electrician BHP Local 1250 $ 40,149 58% $ 63,436 100% $63,436 $190,308 3.0 $63,436 $8,500
7891011
12SD Line Mechanic BHP Local 1250 $ 42,386 58% $ 66,970 100% $66,970 $200,910 3.0 $66,970 $2,213
1314151617
18WY/SD Unit Operators BHP Local 1250 $ 44,351 58% $ 70,075 38% $26,628 $40,000 1.5 $20,000 $760
1920212223 WY Instrument Non Union $ 48,932 69% $ 82,695 38% $31,424 $94,273 3.0 $31,424 $4,180 2425262728
29SD Energy Services
TechsBHP Local 1250 $ 36,478 58% $ 57,635 100% $57,635 $57,635 1.0 $57,635 $2,000
303132
33WY Plant
Maintenance BHP Local 1250 $ 29,321 58% $ 46,328 38% $17,605 $26,407 1.5 $13,203 $760
34353637
38SD Information
Technology Non Union $ 32,526 65% $ 53,668 21% $11,270 $11,270 1.0 $11,270 $1,575
394041
42SD Meter
TechniciansBHP Local 1250 $ 48,336 58% $ 76,370.90 100% $76,371 $152,742 2.0 $76,371 $6,000
4344454647 Other Positions $ 45,760 65% $ 75,504.00 30% $22,651 $22,651 1.0 $22,651 $1,540 484950
Black Hills Power - Strategic Workforce Planning Hire Ahead Program
Line No.
BHP Ownership %
/ CAM %State Job Function Bargaining
Unit
Avg Annual Wage Adj for Productivity
Loading Less Compensated
Absences
Fully Loaded Annual Salary
SWP Program Avg Annual Labor Cost
Total Labor Cost of SWP Advanced
Hire
Average Annual Cost of SWP
Advanced Hire
Training & Transition
Period Req'd (in yrs)
Training Cost per Hire Ahead
000993
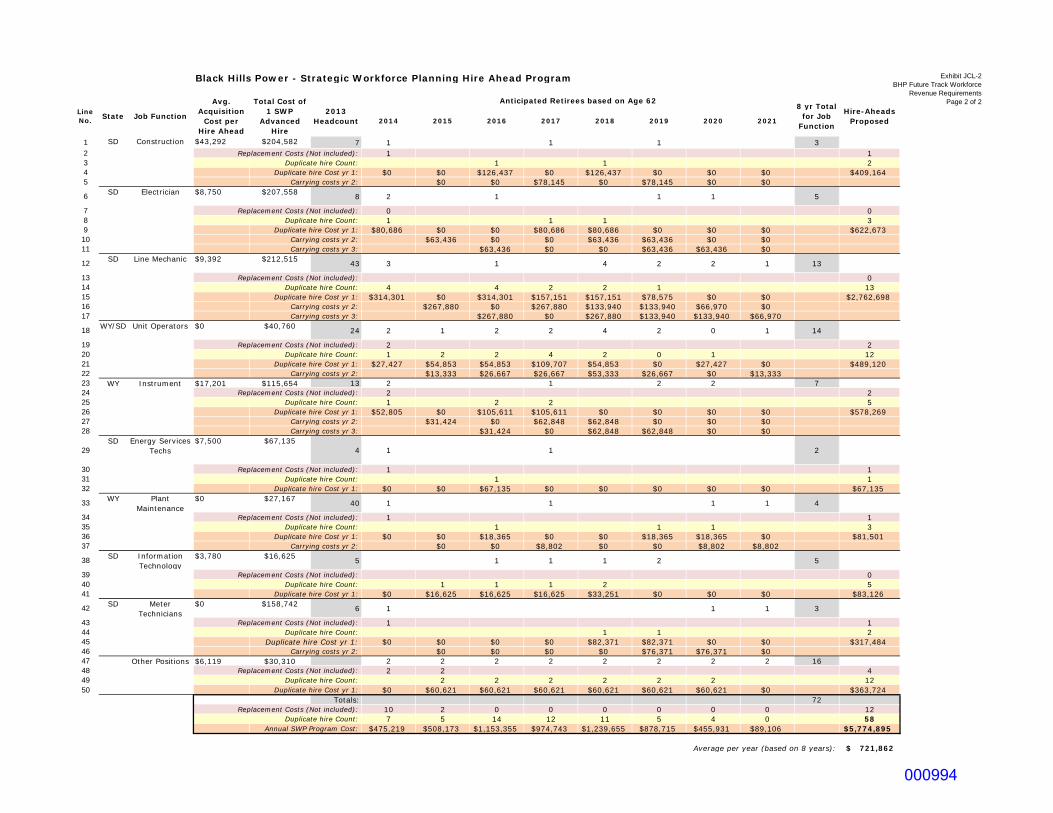
Exhibit JCL-2BHP Future Track Workforce
Revenue RequirementsPage 2 of 2
1 SD Construction 2345
6SD Electrician
7891011
12SD Line Mechanic
1314151617
18WY/SD Unit Operators
1920212223 WY Instrument 2425262728
29SD Energy Services
Techs
303132
33WY Plant
Maintenance 34353637
38SD Information
Technology 394041
42SD Meter
Technicians4344454647 Other Positions484950
Line No. State Job Function
Black Hills Power - Strategic Workforce Planning Hire Ahead Program
2014 2015 2016 2017 2018 2019 2020 2021
$43,292 $204,582 7 1 1 1 3Replacement Costs (Not included): 1 1
Duplicate hire Count: 1 1 2Duplicate hire Cost yr 1: $0 $0 $126,437 $0 $126,437 $0 $0 $0 $409,164
Carrying costs yr 2: $0 $0 $78,145 $0 $78,145 $0 $0$8,750 $207,558 8 2 1 1 1 5
Replacement Costs (Not included): 0 0Duplicate hire Count: 1 1 1 3
Duplicate hire Cost yr 1: $80,686 $0 $0 $80,686 $80,686 $0 $0 $0 $622,673Carrying costs yr 2: $63,436 $0 $0 $63,436 $63,436 $0 $0Carrying costs yr 3: $63,436 $0 $0 $63,436 $63,436 $0
$9,392 $212,515 43 3 1 4 2 2 1 13
Replacement Costs (Not included): 0Duplicate hire Count: 4 4 2 2 1 13
Duplicate hire Cost yr 1: $314,301 $0 $314,301 $157,151 $157,151 $78,575 $0 $0 $2,762,698Carrying costs yr 2: $267,880 $0 $267,880 $133,940 $133,940 $66,970 $0Carrying costs yr 3: $267,880 $0 $267,880 $133,940 $133,940 $66,970
$0 $40,760 24 2 1 2 2 4 2 0 1 14
Replacement Costs (Not included): 2 2Duplicate hire Count: 1 2 2 4 2 0 1 12
Duplicate hire Cost yr 1: $27,427 $54,853 $54,853 $109,707 $54,853 $0 $27,427 $0 $489,120Carrying costs yr 2: $13,333 $26,667 $26,667 $53,333 $26,667 $0 $13,333
$17,201 $115,654 13 2 1 2 2 7Replacement Costs (Not included): 2 2
Duplicate hire Count: 1 2 2 5Duplicate hire Cost yr 1: $52,805 $0 $105,611 $105,611 $0 $0 $0 $0 $578,269
Carrying costs yr 2: $31,424 $0 $62,848 $62,848 $0 $0 $0Carrying costs yr 3: $31,424 $0 $62,848 $62,848 $0 $0
$7,500 $67,1354 1 1 2
Replacement Costs (Not included): 1 1Duplicate hire Count: 1 1
Duplicate hire Cost yr 1: $0 $0 $67,135 $0 $0 $0 $0 $0 $67,135$0 $27,167 40 1 1 1 1 4
Replacement Costs (Not included): 1 1Duplicate hire Count: 1 1 1 3
Duplicate hire Cost yr 1: $0 $0 $18,365 $0 $0 $18,365 $18,365 $0 $81,501Carrying costs yr 2: $0 $0 $8,802 $0 $0 $8,802 $8,802
$3,780 $16,625 5 1 1 1 2 5
Replacement Costs (Not included): 0Duplicate hire Count: 1 1 1 2 5
Duplicate hire Cost yr 1: $0 $16,625 $16,625 $16,625 $33,251 $0 $0 $0 $83,126$0 $158,742 6 1 1 1 3
Replacement Costs (Not included): 1 1Duplicate hire Count: 1 1 2
Duplicate hire Cost yr 1: $0 $0 $0 $0 $82,371 $82,371 $0 $0 $317,484Carrying costs yr 2: $0 $0 $0 $0 $76,371 $76,371 $0
$6,119 $30,310 2 2 2 2 2 2 2 2 16Replacement Costs (Not included): 2 2 4
Duplicate hire Count: 2 2 2 2 2 2 12Duplicate hire Cost yr 1: $0 $60,621 $60,621 $60,621 $60,621 $60,621 $60,621 $0 $363,724
Totals: 72Replacement Costs (Not included): 10 2 0 0 0 0 0 0 12
Duplicate hire Count: 7 5 14 12 11 5 4 0 58Annual SWP Program Cost: $475,219 $508,173 $1,153,355 $974,743 $1,239,655 $878,715 $455,931 $89,106 $5,774,895
Average per year (based on 8 years): 721,862$
2013 Headcount
Anticipated Retirees based on Age 62Total Cost of 1 SWP
Advanced Hire
Hire-Aheads Proposed
8 yr Total for Job
Function
Avg. Acquisition
Cost per Hire Ahead
000994

Direct Testimony
Laura A. Patterson
Before the South Dakota Public Utilities Commission
of the State of South Dakota
In the Matter of the Application of
Black Hills Power, Inc., a South Dakota Corporation
For Authority to Increase Rates
In South Dakota
Docket No. EL14-___
March 31, 2014
000995

i
TABLE OF CONTENTS
I. INTRODUCTION AND QUALIFICATIONS ............................................ 1
II. COMPENSATION PHILOSOPHY AND PROGRAMS ............................ 4
III. COMPANY ANNUAL INCENTIVE PLAN ............................................... 8
IV. COMPANY LONG-TERM INCENTIVE PROGRAM ............................. 14
V. INDUSTRY COMPENSATION COMPARISONS .................................. 15
VI. COMPANY RECOVERY OF EMPLOYEE COMPENSATION
EXPENSES ................................................................................................. 17
VII. COMPANY BENEFITS AND PERIODIC REVIEW ............................... 20
VIII. ADJUSTMENTS DUE TO SUSPENSION OF CERTAIN
OPERATIONS ............................................................................................ 22
Exhibits
None
000996

1
I. INTRODUCTION AND QUALIFICATIONS 1
Q. PLEASE STATE YOUR NAME AND BUSINESS ADDRESS. 2
A. My name is Laura A. Patterson and my business address is 625 9th Street (4th 3
Floor), Rapid City, South Dakota 57701. 4
Q. BY WHOM ARE YOU EMPLOYED AND IN WHAT CAPACITY? 5
A. I am employed by Black Hills Service Company, (“Service Company”), a wholly-6
owned subsidiary of Black Hills Corporation (“BHC”), as the Director of 7
Compensation, Benefits and Human Resources Information Systems (“HRIS”). In 8
my position, I am responsible for partnering with business leaders to design and 9
execute compensation and benefits strategies and plans. I also provide input 10
related to strategic planning, implementation and administration of compensation 11
and benefits programs, executive plans, equity programs, non-qualified plans and 12
other initiatives. My responsibilities also cover employees working for Black Hills 13
Power, Inc. (“Black Hills Power” or the “Company”). 14
Q. PLEASE BRIEFLY SUMMARIZE YOUR ACADEMIC AND 15
PROFESSIONAL BACKGROUND? 16
A. I have more than 23 years of experience in compensation and benefits, with 17
responsibilities including the development, management, administration and 18
regulatory compliance of such plans. I began my current position as Director of 19
Compensation, Benefits and HRIS for BHC in April 2009. Prior to this position, I 20
spent 6 years as Director of Compensation, Benefits and HRIS and 2 years as 21
Employee Benefits Manager, for PNM Resources, Inc. (PNMR), where I was 22
000997

2
responsible for managing and administrating all compensation and benefit 1
programs for PNMR, its subsidiaries and for its joint venture business with 2
Cascade Investments, Optim Energy. Prior to working for PNMR, I was employed 3
as a Tax Manager and Human Capital Consultant for four years at Arthur 4
Andersen, a global tax and consulting firm. In this position, I worked with 5
organizations to identify, analyze and apply regulatory rules that govern structure, 6
compliance, and administration of employee benefit plans. Prior to Arthur 7
Andersen, I was employed as a Trust Officer at Mercantile Trust Company from 8
1995 to 1999 with responsibilities for managing and administration of profit 9
sharing, 401(k), and pension purchase retirement plans sponsored by a wide range 10
of clients. I have a Bachelor of Business Administration degree from the 11
University of Iowa. 12
Q. HAVE YOU PROVIDED TESTIMONY IN REGULATORY 13
PROCEEDINGS PRIOR TO THIS CASE? 14
A. Yes. I have previously testified in New Mexico PRC Case No. 06-00210-UT, a 15
gas rate case, in New Mexico PRC Case No. 07-00077-UT, an electric rate case, in 16
Texas PUC Case Docket No. 36025, an electric rate case, in Nebraska PUC Case 17
Docket No. NG-0061, a gas rate case, and in Colorado PUC Case Docket No. 11-18
AL-382E, an electric rate case. I have also submitted testimony in Black Hills 19
Power’s last rate application with the South Dakota PUC, Docket No. EL 12-061. 20
Finally, I testified on behalf of Cheyenne Light before the Commission in 21
Cheyenne Light’s 2009 and 2011 electric and natural gas rate proceedings. 22
000998

3
Q. DESCRIBE YOUR PROFESSIONAL ASSOCIATIONS. 1
A. I served on the Corporate Board of Directors of the International Foundation of 2
Employee Benefit Plans and currently serve on the Employee Benefits Committee 3
for the U.S. Chamber of Commerce. I am also a Certified Retirement Services 4
Professional. 5
Q. ON WHOSE BEHALF ARE YOU TESTIFYING? 6
A. Black Hills Power. 7
Q. WHAT IS THE PURPOSE OF YOUR TESTIMONY? 8
A. I describe and support the general compensation program for BHC employees, 9
and particularly the employees of Black Hills Power, including the variable 10
compensation program and the equity compensation program. I explain why 11
these programs and their associated costs are reasonable and necessary to attract, 12
motivate and retain well qualified and competent employees to support utility 13
operations. Black Hills Power employees, both non-union and union, participate 14
in the compensation and benefit plans sponsored by BHC. 15
I also describe and support the general benefits programs and policies for BHC 16
employees, particularly the employees of Black Hills Power, including the health, 17
welfare and retirement benefits, and explain why those programs and their 18
associated costs are reasonable and necessary. 19
My testimony specifically supports employee compensation related adjustments, 20
including base salary, variable compensation, equity compensation, retiree 21
healthcare, pension plan, pooled medical, and 401(k) plan, that are part of the 22
000999

4
overall benefits adjustment. Finally, my testimony will explain the adjustments 1
related to personnel due to the suspension of operations at certain facilities. 2
II. COMPENSATION PHILOSOPHY AND PROGRAMS 3
Q. WHAT IS BHC’S GENERAL COMPENSATION PHILOSOPHY? 4
A. BHC’s long-term success depends on operational excellence, providing reliable 5
products and services to our customers, and investing wisely to ensure present 6
and future strength. BHC’s strength allows us to invest in our utility infrastructure 7
and systems to improve the safe, reliable and affordable service our customers 8
and communities depend on. To consistently achieve these outcomes, BHC must 9
attract, motivate and retain employees to achieve appropriate business results. For 10
these reasons, BHC promotes a compensation program that supports the overall 11
operational excellence and customer service objectives, based on principles 12
designed to: 13
• attract, motivate, retain and encourage the development of highly qualified 14
employees; 15
• provide compensation that is competitive; 16
• promote the relationship between pay and performance; 17
• promote overall performance that is linked to our customers and 18
shareholders; and 19
• recognize and reward individual performance appropriately. 20
001000

5
All compensation programs are designed to be strategically aligned, externally 1
competitive, internally equitable, personally motivating, cost effective and legally 2
compliant. 3
Q. PLEASE DESCRIBE BHC’S COMPENSATION PROGRAMS. 4
A. There are two primary components to the compensation program – Base Salary 5
and Variable Pay programs. 6
Base Salary: Base salary represents the fixed portion of an employee’s total 7
cash compensation opportunity. Base salary compensation is determined by 8
the market value of the job, the experience level of the employee, and 9
specific performance standards and competencies. Base salaries are 10
reviewed on an annual basis and merit salary increases are based on 11
individual performance and contributions. Base rates of pay for Black Hills 12
Power’s union employees are established under the terms of the collective 13
bargaining agreement with the International Brotherhood of Electrical 14
Workers (“IBEW”) Local 1250. 15
Variable Pay: Variable Pay is pay that is “at risk” and is not fixed or 16
guaranteed. Variable Pay is only earned and awarded based on 17
achievements against specific performance-based goals. All BHC 18
employees (non-union and union) participate in the Annual Incentive Plan 19
(AIP) which is described in detail later in this testimony. 20
001001

6
Q. PLEASE EXPLAIN BHC’S PHILOSOPHY ON BASE PAY 1
COMPENSATION. 2
A. Base pay is intended to reflect the median of the market for similar positions in 3
similar companies. Overall, our goal is to target direct compensation (base salary 4
and variable pay / annual incentives) at the median of the appropriate market when 5
our operating results approximate average in relation to our peers. 6
There are twenty-three (23) pay grades which are used for all non-executive, non-7
union jobs. Each grade has a minimum, midpoint, and a maximum pay level. This 8
means that the pay ranges within the grades are competitive with what other 9
companies pay for similar positions. All jobs are compared to the market, where 10
data exists, and placed in the grade where the midpoint of the range is closest to 11
the average market rate for that job. In 2009, Towers Watson conducted an 12
independent market review of the BHC’s positions and benchmarked each 13
position. Each position was placed in the appropriate salary grade, reflecting the 14
market median values. Subsequent to the Towers Watson study, the BHC Human 15
Resources Compensation Department periodically reviews each position in the 16
company and compares it to credible market survey data to ensure that current 17
compensation remains within the competitive range. 18
Market rates are determined by utilizing compensation survey data where 19
companies report actual compensation paid to employees by position. The survey 20
most widely used by BHC is from Towers Watson, as they are recognized 21
nationally as the leader in the energy services / utility market place. 22
001002

7
Q. IN ADDITION TO THE TOWERS SURVEY, ARE THERE ANY OTHER 1
SURVEYS THAT BHC UTILIZES TO ENSURE THAT ITS OVERALL 2
COMPENSATION IS COMPETITIVE IN COMPARISON WITH OTHER 3
COMPANIES? 4
A. Yes. BHC also utilizes surveys conducted by Aon Hewitt, Mercer, the Edison 5
Electric Institute (EEI), ECI, the EAPDIS LLC, Ed Powell, and other surveys, 6
including several specific to wages by state. The surveys provide compensation 7
and other data for each position by company size, revenue, and number of 8
employees so that BHC can match each of its positions to positions in the market 9
that are most similar in duties and most similar for the company size/revenue. 10
Q. HOW DO THE COMPANY’S COMPENSATION STRATEGIES 11
COMPARE TO THE CURRENT MARKET? 12
A. The BHC Compensation Department reviews the pay structure annually to see 13
how the structure and pay practices reflect the market. As of October 21, 2013, the 14
average base pay for non-union employees of Black Hills Power was 95% of the 15
market median, indicating Black Hills Power employees’ base pay rates were 16
lower than the market median. Compensation is considered to be competitive to 17
the market at a range of 95% to 105% of the market median, so compensation for 18
Black Hills Power is at the lower end of this range. 19
Q. DOES BHC HAVE A VARIABLE COMPENSATION COMPONENT OF 20
ITS TOTAL COMPENSATION PHILOSOPHY? 21
A. Yes. The Black Hills Corporation Annual Incentive Plan (the "AIP" or the "Plan") 22
001003

8
is designed to motivate and reward employees for achieving and exceeding goals 1
that benefit our customers and our shareholders. The AIP is designed to reward 2
eligible employees, including both non-union and union employees of Black Hills 3
Power, who contribute to the success of the BHC and/or their assigned Business 4
Unit; reward employees who contribute to the quality of service provided to 5
customers including, but not limited to, the provision of safe, reliable and 6
affordable service; motivate work performance and behavior that supports the 7
Corporation's financial and non-financial goals and increase the employee's 8
understanding of the Corporation's business objectives and performance. 9
III. COMPANY ANNUAL INCENTIVE PLAN 10
Q. PLEASE DESCRIBE BHC’S ANNUAL INCENTIVE PLAN. 11
A. The purpose of BHC’s AIP is to promote BHC’s pay for performance philosophy, 12
to provide competitive incentive opportunities that are consistent with other 13
companies in the industry, and to focus employees on important performance 14
objectives. The AIP is an important component of the total pay package necessary 15
to ensure BHC is competitive with market practices for employees. In addition, 16
the AIP directly links pay with performance, and therefore total compensation 17
expense varies with BHC’s performance on measures important to the customers, 18
and provides a tool to align employees’ interests with customer and community 19
interests. 20
001004

9
Q. WHO IS ELIGIBLE TO PARTICIPATE IN THE AIP? 1
A. All regular full-time and part-time employees, both union and non-union, who are 2
hired and working by October 1 of the plan year are eligible to participate in the 3
Plan for that plan year. Part-time employees who work a minimum of 20 hours 4
per week are eligible for a pro-rata award based on their actual wages for hours 5
worked. Pro-rata awards for the number of months actively employed at each 6
eligibility level during the plan year will also be paid to Participants who are hired, 7
promoted, retire or have other job changes during the year. 8
Q. WHAT PERFORMANCE GOALS ARE MEASURED UNDER THE AIP? 9
A. An eligible employee can earn an incentive award based on that employee’s 10
performance toward goals designed to achieve business unit operational 11
performance targets. The components of the incentive award for the test year were 12
as follows: 13
An employee could qualify for up to 50% of the maximum possible award 14
for goals tied to customer satisfaction, cost control, safety, reliability, 15
operations efficiency, expense reductions and other operational measures; 16
An employee could qualify for up to 25% of the maximum possible award 17
for the achievement of direct business unit operating income goals, 18
including initiatives on cost control, continuous improvement and 19
improvements in operations efficiencies; and 20
An employee could qualify for up to 25% of the maximum possible award 21
if BHC realizes established earnings per share (“EPS”) targets. 22
001005

10
Each goal is measured independently. Goal performance that meets or exceeds the 1
threshold level will be used to calculate the incentive award. Achievement of 2
financial results is not a condition to award incentive for achievement of other 3
goals. An employee can earn from 0 to 1.50 times the target percentage incentive 4
based on achievement against each of the AIP goals. Performance below 5
threshold results in a zero payout for the associated goal. Achievement of a goal’s 6
“target” performance results in a payout of 100% of the payment relative to that 7
goal. There is also a Maximum payout, which means that if performance exceeds 8
target, no more than 1.50 times the target payment will be made relative to that 9
goal. 10
Q. HOW DOES THE AIP PROVIDE VALUE TO CUSTOMERS? 11
A. The AIP provides direct and indirect value to customers in a number of different 12
ways. For example, AIP goals are aligned with BHC’s high-level objectives and 13
strategic framework. Business unit goals are primarily designed to improve the 14
performance of utility operations by focusing on improvements to operational 15
excellence, safety, reliability, and customer satisfaction. Examples of Black Hills 16
Power’s business unit goals include: 17
• Continuous improvement in results from customer satisfaction surveys. 18
These results are measured each quarter. 19
• Service reliability metrics. 20
• Increase in number of completed service orders per day. 21
• Reduction in labor cost per service order. 22
001006

11
• Reductions in O&M expense resulting from Continuous (Process) 1
Improvement projects. 2
• Reduction in number of lost time accidents, preventable vehicle accidents, 3
and OSHA recordable accidents. 4
BHC must maintain a skilled and motivated workforce in order to provide safe, 5
reliable and affordable service and products. To do so, it is important to pay our 6
employees at rates competitive to rates paid by similar utilities and other 7
companies with which we compete for employees. Because the actual base 8
salaries for Black Hills Power’s employees fall somewhat below the market 9
median levels, total compensation would be significantly less competitive without 10
the incentive plan component. An employee’s total cash earnings potential (base 11
salary plus AIP incentive award) depends on both competitive base salary and on a 12
competitive AIP incentive compensation opportunity awarded for the achievement 13
of key operating and strategic goals. 14
Q. HOW WOULD AVERAGE BASE SALARIES BE AFFECTED IF AIP 15
INCENTIVES WERE ELIMINATED? 16
A. If BHC did not offer employees the opportunity to earn AIP incentive 17
compensation, BHC would need to make-up the difference by increasing base 18
salaries in at least an equivalent amount, which would result in higher fixed costs 19
for salaries and benefits. An alternative to variable compensation would be for 20
BHC to raise all employees base pay to reflect the median variable compensation 21
earnings provided by other utilities. While this would provide a competitive total 22
001007

12
compensation rate that is “fixed and measurable”, it would de-link those costs with 1
customer performance measures and increase overall costs as many of our benefits 2
are also tied to base pay rates. 3
Q. DO YOU BELIEVE THAT THE AIP IS AN IMPORTANT ELEMENT OF 4
EMPLOYEE RETENTION? 5
A. Yes. If BHC were to eliminate its variable pay program and did not replace that 6
compensation with base pay, employees would be much less likely to stay with 7
BHC because their total compensation would significantly lag what other utilities 8
were paying for the same positions. Coupling this risk with the loss of experience 9
that Black Hills Power will realize over the next eight years due to retirements, 10
results in a significant and immediate business risk. 11
Q. ONE OF THE INCENTIVE GOALS UNDER THE AIP RELATES TO THE 12
COMPANY’S OPERATING INCOME OR EARNINGS PER SHARE 13
(“EPS”) PERFORMANCE. DO CUSTOMERS BENEFIT FROM 14
COMPANY EPS PERFORMANCE IN LINE WITH INCENTIVE PLAN 15
TARGETS? 16
A. Yes. Earnings Per Share is an easily recognized benchmark for successful and 17
productive companies that are meeting their customers’ needs. They provide 18
company-wide objective measures of performance that cannot reasonably be 19
separated from customer interest. Both shareholders and customers benefit from 20
strong EPS performance - - they are not mutually exclusive. Two primary drivers 21
of EPS are expense management and debt costs. Customers benefit from receiving 22
001008

13
service from a company that is able to effectively manage its costs. When the 1
Company is managing its costs, rate cases are less frequent. When a rate case is 2
required, the requested increase is less than would otherwise be required. 3
Q. DO INDIVIDUAL EMPLOYEES CONTRIBUTE TO THE COMPANY’S 4
EPS PERFORMANCE? 5
A. Yes. Each employee primarily contributes to the financial success of the Company 6
through the prudent actions he or she takes to control costs, work efficiently, and 7
drive operational excellence. By setting an EPS target, and monitoring company 8
performance against the target throughout the year, employees receive immediate 9
feedback regarding performance. Providing incentive compensation related to 10
meeting financial performance drives employees to cost-conscious behavior that is 11
beneficial to customers. 12
Q. HOW ELSE DO CUSTOMERS BENEFIT FROM A STRONG EPS 13
RECORD? 14
A. As described in the Direct Testimony of Brian G. Iverson, Black Hills Power must 15
maintain financial integrity to access capital at reasonable costs. A strong 16
financial position provides the financial flexibility necessary to meet the ongoing 17
demand for utility services. Credit ratings agencies compare quantitative 18
measures of a company’s financial performance, including EPS, to determine a 19
company’s credit ratings. These ratings have a direct impact on the cost of 20
Company’s debt, both for acquiring debt and refinancing higher cost debt, which 21
directly impact customer rates. Through strong EPS performance, the Company is 22
001009

14
able to maintain or even improve its credit ratings, resulting in a lower cost of debt 1
for customers. Because Company earnings are such an important consideration in 2
rating agency evaluations of the Company, it is critical that employees receive 3
incentives to maintain strong financial performance, which ultimately results in 4
lower costs for customers. 5
IV. COMPANY LONG-TERM INCENTIVE PROGRAM 6
Q. PLEASE DESCRIBE BHC’S LONG-TERM INCENTIVE PROGRAM. 7
A. The Company provides a long-term incentive program on a limited basis to key 8
employees who are responsible for various aspects of management and business 9
results. These long-term incentives include restricted stock and performance share 10
awards. Restricted stock is granted to key employees and vests ratably over a 3-11
year period. The purpose of the 3-year vesting period for both the restricted stock 12
and the performance shares is to get retention of key employees. 13
Performance shares, if any, are based on achievement against established criteria 14
measured over a 3-year period and are made at the conclusion of that 3-year 15
period. The performance share component measures relative performance of 16
BHC against other utilities - - it is about operational performance and metrics. 17
BHC focuses on top quartile performance in all areas and performs at this level on 18
a sustained basis. This operational excellence is recognized by the market and 19
using performance measures to compare BHC to its peers provides focus for key 20
employees in these areas. This operational excellence also results in lower costs to 21
customers in very direct ways. For example, BHC’s continued high performance 22
001010

15
for power plant availability is recognized by the market with higher stock 1
performance, but impacts the customers directly through lower cost of service, 2
high reliability, and high customer satisfaction. 3
Both forms of equity grants under the long-term incentive program are intended to 4
provide participants with incentives for excellent performance, to promote 5
teamwork and to motivate, retain and attract the services of participants who make 6
significant contributions to the success of the company and its operational goals. 7
V. INDUSTRY COMPENSATION COMPARISONS 8
Q. DO OTHER COMPANIES IN THE UTILITY INDUSTRY USE 9
COMPARABLE VARIABLE AND LONG-TERM COMPENSATION 10
MECHANISMS? 11
A. Yes. Other utilities do provide incentive or variable compensation as part of their 12
compensation packages, as do companies in other industries. Other utilities also 13
provide key employees with long-term incentives designed to retain these key 14
employees and to motivate them to achieve operational and strategic goals. 15
Without similar annual and long-term plans, BHC’s total compensation package 16
would not be competitive with other utilities and BHC would be at risk for 17
retention of its key employees. 18
Q. ARE YOU AWARE OF ANY STUDIES THAT SUPPORT THIS 19
CONCLUSION? 20
A. Yes. Aon Hewitt Associates, an international business consulting firm that 21
specializes in compensation issues, conducted a survey of broad-based variable 22
001011
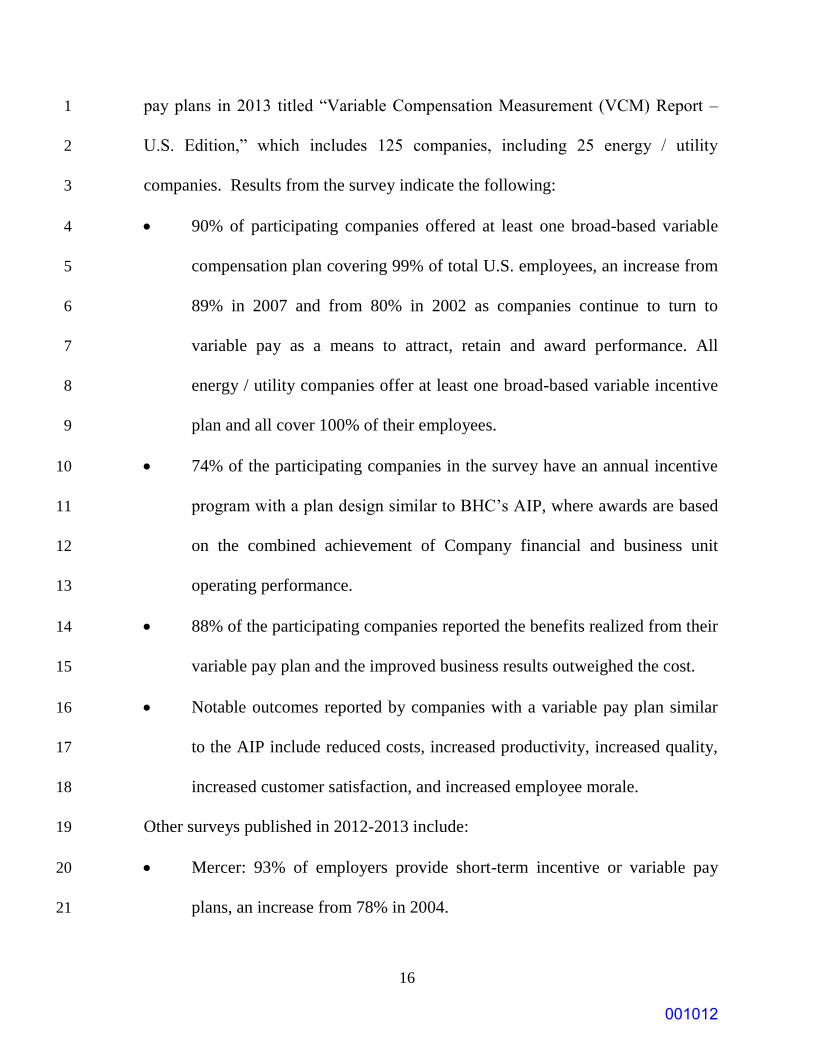
16
pay plans in 2013 titled “Variable Compensation Measurement (VCM) Report – 1
U.S. Edition,” which includes 125 companies, including 25 energy / utility 2
companies. Results from the survey indicate the following: 3
90% of participating companies offered at least one broad-based variable 4
compensation plan covering 99% of total U.S. employees, an increase from 5
89% in 2007 and from 80% in 2002 as companies continue to turn to 6
variable pay as a means to attract, retain and award performance. All 7
energy / utility companies offer at least one broad-based variable incentive 8
plan and all cover 100% of their employees. 9
74% of the participating companies in the survey have an annual incentive 10
program with a plan design similar to BHC’s AIP, where awards are based 11
on the combined achievement of Company financial and business unit 12
operating performance. 13
88% of the participating companies reported the benefits realized from their 14
variable pay plan and the improved business results outweighed the cost. 15
Notable outcomes reported by companies with a variable pay plan similar 16
to the AIP include reduced costs, increased productivity, increased quality, 17
increased customer satisfaction, and increased employee morale. 18
Other surveys published in 2012-2013 include: 19
Mercer: 93% of employers provide short-term incentive or variable pay 20
plans, an increase from 78% in 2004. 21
001012

17
World at Work: 84% of employers provide short-term incentive or variable 1
pay plans, an increase from 77% in 2004. Of those providing a short-term 2
incentive plan, 98% of hourly employees (average payout was 5%) and 3
100% of salaried employees (average payout was 12%) are eligible under 4
the plan. 5
Buck Consulting: 87% of utilities in the survey provide a short-term 6
incentive plan to all employees. 7
Kenexa: 88.5% of energy and utility companies in the survey provide a 8
short-term incentive plan to all employees. 9
Q. HOW DOES BHC MAKE IMPROVEMENTS TO ITS AIP? 10
A. Through its annual strategic and operational planning process, BHC routinely 11
evaluates the effectiveness of the plan in meeting its goals. These goals are 12
modified and continually refined to drive continued operational excellence and 13
performance improvements. BHC also continuously evaluates the AIP design to 14
ensure that it remains competitive and comparable to other utilities. 15
VI. COMPANY RECOVERY OF EMPLOYEE 16
COMPENSATION EXPENSES 17
Q. SHOULD THE COMPENSATION MERIT INCREASE BE APPROVED? 18
A. Yes. Recovering the actual amount of employee compensation expense is 19
necessary to attract and retain the high quality of employees that are needed to 20
serve the customers of Black Hills Power. Under existing economic conditions, 21
independent surveys reflected that more than 97% of US-based companies will 22
001013

18
award merit pay increases during 2014, with an average budget of 3% to 4%. 1
Non-union employee pay changes are effective each March, with the most recent 2
increase effective March 4, 2013 and the next scheduled merit increase to be 3
effective March 3, 2014. The company has a non-union merit increase budget for 4
2014 of 3.50%. The union salary increases for the period April 1, 2013 through 5
March 30, 2014 range from 3.0% to 3.5% by position and the wage increase will 6
be 3.25% effective April 1, 2014. Increases in employee compensation are known 7
and measurable, and these increases in employee compensation are supported by 8
extensive reviews of competitive market data. 9
Without merit increases, BHC would further lag the median pay for these 10
positions, significantly increasing retention and performance risk, and the 11
company will incur higher costs for turnover and related issues. A summary of 12
independent surveys regarding merit pay follows: 13
Mercer: The survey of 634 employers reflects that energy and utility 14
employers plan to provide merit increases to employees in 2014, with an 15
average budgeted increase ranging from 3.0% to 4.0%. 16
Aon Hewitt: The 2013-2014 survey of 1,096 employers reflects planned 17
2014 merit increases, with an average budget of 3.1%. The energy and 18
utility employers in the survey reflect a merit budget average of 3.7%. 19
Towers Watson: The 2013-2014 survey of 633 employers reflects planned 20
2014 merit increases, with an average budget of 3.1%. This survey does 21
not reflect utility specific information. 22
001014

19
World at Work: The 2013-2014 survey of 1,834 employers reflects a 3.1% 1
merit increase budget average for 2014 across all industries. The average 2
merit increase budgets for energy and utility companies average up to 3
4.1%. 4
Simply put, the merit increases and the union wage increases will be incurred, and 5
the overall compensation to Black Hills Power employees is fair and competitive 6
as tested against prevailing market comparisons. 7
Q. SHOULD THE COMPENSATION INCREASE BE APPROVED FOR 8
UNION EMPLOYEES? 9
A. Recovering the actual amount of employee compensation expense is necessary – 10
as described above – to attract and retain the high quality of employees that are 11
needed to serve the customers of Black Hills Power. 12
The ratified contract between Black Hills Power and the IBEW Local 1250 Local 13
Bargaining Unit requires an increase in union employee compensation of 3.0% to 14
3.5% depending on job classification effective April 1, 2013; and an increase of 15
3.25% effective April 1, 2014. Black Hills Power’s union employees also 16
participate in the AIP under the terms of the contract. Accordingly, the April 1, 17
2014 rate increase of 3.25% and AIP compensation for union employees is 18
representative of the amount that Black Hills Power will be obligated to pay while 19
its rates will be in effect. Black Hills Power’s union employee compensation 20
adjustment qualifies as a known and measurable change over the four-year 21
contract. 22
001015

20
VII. COMPANY BENEFITS AND PERIODIC REVIEW 1
Q. PLEASE DESCRIBE THE BENEFIT PLANS THAT BHC PROVIDES TO 2
ITS BLACK HILLS POWER EMPLOYEES? 3
A. BHC offers a combination of company-provided and voluntary benefits. 4
Employees are enrolled in certain company-provided benefits automatically and 5
BHC pays the costs (for example, short-term and long-term disability benefits). 6
Employees choose whether or not to participate in the voluntary benefits and they 7
pay a portion or all of the costs. These company-provided and voluntary benefit 8
programs consist of: (1) medical, dental and vision plans, (2) flexible spending 9
accounts, (3) life insurance and accidental death and dismemberment insurance, 10
(4) paid time off, (5) retirement, and (6) other benefits including educational 11
assistance, holidays and other time away from work, business travel accident 12
insurance, rewards & recognition and wellness programs. 13
Q. WHAT BENCHMARKING HAS BEEN CONDUCTED TO EVALUATE 14
COST/PERFORMANCE LEVELS? 15
A. BHC solicits a number of independent reviews from external organizations and 16
consulting firms such as Towers Watson, Aon Hewitt, Mercer, etc. These reviews 17
cover a wide range of compensation and benefit program designs and costs 18
including compensation and benefit programs, HR function administrative 19
expenses, and market data for positions. BHC compares its benefit programs and 20
costs with companies from the utility sector and from general industry to ensure 21
the company can attract and retain employees with the necessary skills. BHC 22
001016

21
utilizes multiple nationally recognized third-party surveys and also conducts 1
customized surveys where appropriate and necessary. These benchmarking 2
surveys allow BHC to evaluate the competitiveness and efficiencies of its benefit 3
programs and costs compared to other companies in the market. If a program does 4
not meet performance, cost or efficiency expectations, it is reviewed to determine 5
the root cause and the options or alternatives available. BHC closely monitors 6
market practices and benchmark data for costs to maintain competitive and cost 7
effective programs. 8
Q. WHAT TYPE OF OVERSIGHT IS IN PLACE TO ENSURE THAT BHC’S 9
COMPENSATION AND BENEFIT PROGRAMS ARE THOSE THAT ARE 10
MOST BENEFICIAL FOR THE SUPPORT OF THE OPERATING 11
COMPANIES’ UTILITY SERVICE? 12
A. The BHC Human Resources Department, in partnership with the business unit 13
leaders and company management, develop annual budgets and long-range plans 14
(5 years), including compensation, benefit and other programs supporting the 15
business’ goals and objectives. HR and key operating personnel manage these 16
budgets and review all programs for effectiveness, cost and any proposed 17
modifications. All costs are modeled to determine impacts to cost and are 18
benchmarked against the market parameters to ensure competitiveness, cost 19
effectiveness, and reasonableness. 20
001017

22
Q. ARE YOU AWARE OF OTHER STATE COMMISSIONS THAT HAVE 1
APPROVED THE EMPLOYEE COMPENSATION AND BENEFIT 2
STRUCTURE PROPOSED IN THIS PROCEEDING? 3
A. Yes. Through rate case settlements and contested proceedings, commissions in 4
Nebraska, Iowa, Wyoming and Colorado in both gas and electric rate cases have 5
approved this employee compensation and benefit structure. BHC places emphasis 6
on maintaining a common employee compensation structure and program. The 7
same is true for its proposal related to its employees living in or supporting our 8
Black Hills Power customers. 9
VIII. ADJUSTMENTS DUE TO SUSPENSION OF 10
CERTAIN OPERATIONS 11
Q. HAS BLACK HILLS POWER SUSPENDED OPERATIONS AT ANY OF 12
ITS FACILITIES? 13
A. Yes, Black Hills Power placed its Osage and Ben French facilities into economic 14
shutdown. Black Hills Power has suspended operations at its Neil Simpson I 15
facility. As indicated in the testimony of both Vance Crocker and Mark Lux, these 16
three facilities will be decommissioned as a result of the EPA’s National Emission 17
Standards for Hazardous Air Pollutants for Area Sources: Industrial, Commercial 18
and Institutional Boilers. 19
001018

23
Q. WHAT ADJUSTMENTS WERE MADE RELATED TO PERSONNEL DUE 1
TO THE SUSPENSION OF OPERATIONS AT THESE FACILITIES? 2
A. Adjustments have not been made for the employees that were employed at Osage 3
and Ben French when those facilities were placed into economic shutdown. The 4
affected employees retired, took alternate positions with the Company, or left the 5
Company. Black Hills Power has had a labor reduction due to the suspension of 6
operations at Neil Simpson I. However, these employees were retained by Black 7
Hills Power as part of its strategic workforce planning. 8
More specifically the Neil Simpson I employees have been retained and are 9
assigning part of their time to the common Neil Simpson complex facilities. 10
These employees also direct charge other specific units, such as Cheyenne Light 11
and Black Hills Wyoming, and common facilities for work performed at those 12
facilities. Retention of these critical skills is necessary to ensure the continued 13
provision of safe, reliable and cost-effective service to customers. 14
Q. DOES THIS CONCLUDE YOUR TESTIMONY? 15
A. Yes. 16
001019

Direct Testimony
Jon Thurber
Before the South Dakota Public Utilities Commission
of the State of South Dakota
In the Matter of the Application of
Black Hills Power, Inc., a South Dakota Corporation
For Authority to Increase Rates
in South Dakota
Docket No. EL14-___
March 31, 2014
001020

i
TABLE OF CONTENTS
I. INTRODUCTION & QUALIFICATIONS ............................................................. 1
II. PURPOSE OF TESTIMONY .................................................................................. 2
III. REVENUE REQUIREMENT MODEL OVERVIEW ............................................ 2
IV. RATE BASE ............................................................................................................ 5
V. ADJUSTMENTS TO THE OPERATING EXPENSES ........................................ 16
VI. ADDITIONAL CHANGES TO THE OPERATING EXPENSES........................ 23
VII. ADJUSTMENTS TO THE OPERATING REVENUES ....................................... 26
VIII. SUMMARY OF THE MODEL ............................................................................. 27
Exhibits
None
001021

1
I. INTRODUCTION & QUALIFICATIONS 1
Q. PLEASE STATE YOUR NAME AND BUSINESS ADDRESS. 2
A. My name is Jon Thurber, 625 Ninth Street, P.O. Box 1400, Rapid City, South 3
Dakota 57701. 4
Q. BY WHOM ARE YOU EMPLOYED AND IN WHAT CAPACITY? 5
A. I am employed by Black Hills Utilities Holdings, Inc. (“Utility Holdings”), a 6
wholly-owned subsidiary of Black Hills Corporation (“BHC”). I am Manager of 7
Regulatory Affairs for Black Hills Power, Inc. (“Black Hills Power” or the 8
“Company”). I am responsible for leading all aspects of the regulatory process for 9
Black Hills Power. 10
Q. FOR WHOM ARE YOU TESTIFYING ON BEHALF TODAY? 11
A. I am testifying on behalf of Black Hills Power. 12
Q. PLEASE DESCRIBE YOUR EDUCATIONAL AND BUSINESS 13
BACKGROUND. 14
A. I graduated summa cum laude from the University of Wisconsin – Stevens Point, 15
with a Bachelors of Science Degree in Managerial Accounting, Computer 16
Information Systems, Business Administration and Mathematics. My work 17
experience includes working for the South Dakota Public Utilities Commission 18
(“Commission”) as a Utility Analyst from July 2008 through March 2013. At the 19
South Dakota PUC, my responsibilities included analyzing and testifying on 20
ratemaking matters arising in rate proceedings involving electric and gas utilities. 21
I began my career with Utility Holdings in April 2013 as Manager of Rates. In 22
001022

2
February of 2014, I accepted the position of Manager of Regulatory Affairs for 1
Black Hills Power. 2
Q. HAVE YOU PREVIOUSLY TESTIFIED BEFORE THIS COMMISSION? 3
A. Yes. 4
II. PURPOSE OF TESTIMONY 5
Q. WHAT IS THE PURPOSE OF YOUR DIRECT TESTIMONY? 6
A. The purpose of my testimony is to present and explain the Revenue Requirement 7
Model (the “Model”) that supports this rate case filing. The Model is presented in 8
Volume 1 of Black Hills Power’s Application, as Section 4, Statements A through 9
R and supporting Schedules, and with Workpapers included as Section 5. In my 10
testimony, I describe the adjustments to certain utility costs, and I support the 11
revenue requirement. 12
III. REVENUE REQUIREMENT MODEL OVERVIEW 13
Q. PLEASE DESCRIBE YOUR ROLE IN PREPARING THE MODEL. 14
A. My role was to directly supervise the preparation of the per books and pro forma 15
information, including the Statements and supporting Schedules and Workpapers. 16
Q. IS THE REVENUE REQUIREMENT MODEL FILED IN THIS CASE 17
CONSISTENT WITH THE MODEL USED IN BLACK HILLS POWER’S 18
2012 RATE CASE? 19
A. Yes, the models are consistent. 20
001023

3
Q. WHAT HAS BLACK HILLS POWER USED FOR A TEST YEAR IN THIS 1
FILING? 2
A. Black Hills Power is utilizing a twelve month test year based on historical data, 3
ending September 30, 2013, as adjusted with known and measurable changes. 4
Q. WHAT STATEMENTS HAVE YOU INCLUDED IN THIS FILING? 5
A. The following is a list of the Statements provided in the Application: 6
A. Balance Sheet 7
B. Income Statement 8
C. Statement of Retained Earnings 9
D. Utility Plant in Service 10
E. Accumulated Depreciation 11
F. Working Capital 12
G. Cost of Capital 13
H. Operation and Maintenance Expense 14
I. Operating Revenues 15
J. Depreciation Expense 16
K. Income Taxes 17
L. Taxes Other Than Income 18
M. Overall Revenue Requirement 19
N. Allocated Cost of Service by Jurisdiction 20
O. Allocated Cost of Service by SD Customer Class 21
P. Energy Cost Adjustment Factors 22
001024

4
Q. Description of Utility Operations 1
R. Coal Supply Pricing Methodology 2
Q. WHAT SCHEDULES HAVE BEEN INCLUDED IN THE FILING? 3
A. Schedules have been included, where applicable, to provide supporting 4
documentation and calculations for the Statements listed above. For example, 5
Schedules H-1 through H-21 support Statement H, Operation and Maintenance 6
Expense. These Schedules detail the expense adjustments that have been made 7
and summarized in Statement H. 8
Q. HAVE WORKPAPERS BEEN INCLUDED IN THE FILING? 9
A. Yes, Workpapers have been included in Volume 1 as supporting documentation 10
for the Statements listed above. For example, Workpaper 1 supports the energy 11
allocation incorporated in Statement N, Allocated Cost of Service by Jurisdiction. 12
Q. PLEASE EXPLAIN HOW THE REVENUE REQUIREMENT WAS 13
DEVELOPED. 14
A. The starting point to determine the revenue requirement is the per books financial 15
statements for the test year, kept and recorded in the normal course of business, in 16
compliance with FERC rules and regulations. Adjustments for known and 17
measurable items were then made to the per books financial statements to 18
determine the pro forma costs and revenue requirement. 19
Q. WHAT ADJUSTMENTS WILL BE MADE TO THE TEST YEAR? 20
A. Black Hills Power is incorporating pro forma adjustments to the test year that are 21
known and measurable and relate to investments that will be used and useful prior 22
001025

5
to new rates going into effect. Known and measurable adjustments to the per 1
books financial statements include: 1) additional rate base that will be used to 2
serve customers at the time the new rates go into effect including, but not limited 3
to, the addition of the Cheyenne Prairie Generating Station (“CPGS”); and 2) 4
adjusting revenues and expenses for operational changes. 5
Q. PLEASE SUMMARIZE THE SIGNIFICANT ADJUSTMENTS THAT 6
HAVE BEEN MADE TO BLACK HILLS POWER’S MODEL. 7
A. Adjustments have been made for rate base in Statements D, E, and F, and on 8
Schedules M-1 and M-2. Expense adjustments have been included in Statements 9
H, J, K, and L. Revenue adjustments are included in Statement I. The most 10
significant known and measurable adjustment relates to CPGS. The adjustment 11
includes additions to rate base, as well as changes to the cost of service expenses 12
to reflect projected increases in operation and maintenance costs for a full year of 13
operations. 14
IV. RATE BASE 15
Q. PLEASE DESCRIBE RATE BASE. 16
A. Rate base is the value established by a regulatory authority, upon which a utility is 17
allowed to earn a specified rate of return as shown on Statement M. Rate base 18
begins with the thirteen month average amount of all fixed asset accounts for 19
Black Hills Power as of September 30, 2013, as shown on Statement D, Page 2, 20
reduced by accumulated depreciation as shown on Statement E, Page 1. 21
Additional rate base is then added to reflect expected capital additions from 22
001026

6
September 30, 2013, through the effective date of this rate case as shown on 1
Statement D, Page 2. Additional depreciation expense is also included, along with 2
a corresponding increase in accumulated depreciation, thereby decreasing rate 3
base. Rate base also includes a component of working capital as shown on 4
Statement F. The final component of rate base is the other rate base reductions, 5
such as deferred federal income taxes, as those reductions relate to the timing 6
difference of book depreciation and tax depreciation expense. These amounts can 7
be found on Schedules M-1 and M-2. 8
Q. ARE YOU REQUESTING CONSTRUCTION WORK IN PROGRESS AS 9
PART OF RATE BASE? 10
A. No. The only plant investment in rate base will be that which is used and useful 11
prior to rates going into effect. 12
A. PLANT IN SERVICE 13
Q. PLEASE DESCRIBE THE ADJUSTMENT FOR CPGS. 14
A. Schedule D-11 shows the capital costs associated with CPGS. The adjustment for 15
CPGS construction costs was prepared using the actual cost incurred as of 16
December 31, 2013, together with the projected remaining costs to complete the 17
project. Since CPGS is jointly owned by Black Hills Power and its sister company 18
Cheyenne Light, Fuel and Power Company (“Cheyenne Light”), the adjustment 19
only reflects Black Hills Power’s ownership percentage. A more detailed 20
explanation of these costs is included in Mark Lux’s testimony. 21
001027

7
Q. IS THE COMPANY PROPOSING ANY ADDITIONAL ADJUSTMENTS 1
FOR PLANT ADDITIONS? 2
A. Yes, there are other known and measurable adjustments for plant investments that 3
will be used and useful prior to rates going into effect. Schedule D-10 provides a 4
detailed list of production, sub-transmission, distribution, and general plant 5
additions that will serve customers prior to October 1, 2014. The major plant 6
additions are further discussed in the testimony of Mark Lux and Mike Fredrich. 7
Q. PLEASE EXPLAIN WHY THE COMPANY IS REQUESTING COST 8
RECOVERY OF PLANT INVESTMENTS THAT WILL BE PLACED IN-9
SERVICE PRIOR TO OCTOBER 1, 2014. 10
A. The Commission has historically issued its final decision within six to twelve 11
months from the date the rate case was filed. The Company assumes that this 12
docket will be processed within approximately six months, and is requesting cost 13
recovery of capital projects that are expected to be placed in service when final 14
rates go into effect. If this docket takes longer than six months to process, the 15
Company requests the opportunity to supplement this filing with additional capital 16
projects that are used and useful prior to final rates going into effect. 17
Q. IS THE COMPANY REFLECTING ANY ADJUSTMENTS FOR PLANT 18
RETIREMENTS? 19
A. Yes. The Ben French, Neil Simpson I, and Osage power plants were retired on or 20
before March 21, 2014, to comply with the Environmental Protection Agency 21
(“EPA”) Area Source Rules. The facilities will no longer be providing power or 22
001028

8
capacity for customers when rates go into effect from this proceeding, and should 1
not be included in plant in service. The plant adjustment is reflected on Statement 2
D, page 2, and the corresponding rate base adjustments are made to accumulated 3
depreciation on Statement E, page 1, working capital on Schedule F-1, and 4
accumulated deferred income taxes on Schedule M-2. The net book value and 5
associated inventory for the three units were transferred to a regulatory asset as 6
reflected in Schedule J-2. 7
B. TRANSMISSION FACILITY ADJUSTMENT CLAUSE 8
Q. IS THE COMPANY PROPOSING TO SHIFT COST RECOVERY OF SUB-9
TRANSMISSION ASSETS FROM THE TRANSMISSION FACILITY 10
ADJUSTMENT (“TFA”) RIDER TO BASE RATES? 11
A. Yes. Black Hills Power is requesting to move from the TFA to base rates all sub-12
transmission assets that are placed in-service prior to final rates going into effect. 13
In Docket EL14-013, the Company requested cost recovery through the TFA of 14
two 69 kV line rebuild projects, Custer to Hot Springs and Lookout to Sundance 15
Hill, that are expected to be placed in-service prior to September 30, 2014. The 16
recovery of these two projects and related expenses are included in the Company’s 17
base rate request in this docket. 18
Q. WHEN WILL THE TFA RATE BE ADJUSTED TO REFLECT THIS 19
SHIFT IN COST RECOVERY? 20
A. The Company will make its annual TFA filing by February 15, 2015, to reflect the 21
Commission’s decision regarding these assets. 22
001029

9
C. WORKING CAPITAL 1
Q. HOW WAS WORKING CAPITAL CALCULATED AND INCLUDED IN 2
RATE BASE? 3
A. Working Capital is shown on Statement F. The first component is cash working 4
capital as determined by a lead/lag study. The other components are materials and 5
supplies and prepaid expenses using a thirteen month average on balances as of 6
September 30, 2013, with known and measurable adjustments. The final adjusted 7
Working Capital balance of $17,824,269, as shown on Statement F, is included as 8
part of rate base. 9
Q. DESCRIBE HOW THE CASH WORKING CAPITAL AMOUNT WAS 10
DETERMINED. 11
A. The Company prepared a per books and an as adjusted Cash Working Capital 12
(“CWC”) amount for this rate case. The per books CWC is located on Schedule 13
F-3, page 1 and the as adjusted CWC is on Schedule F-3, page 2. The as adjusted 14
CWC amount is used as a component of rate base. The per books and as adjusted 15
CWC amounts were determined by preparing a Lead/Lag Study. 16
Q. HOW DOES A LEAD/LAG STUDY MEASURE THE AMOUNT OF CASH 17
REQUIRED FOR OPERATING EXPENSE? 18
A. A lead/lag study measures the difference between: (1) the time a service is 19
rendered and billed until the time revenues for that service are received (“lag”) and 20
(2) the time that services, materials, etc., are obtained/used and the time 21
expenditures for those services are made (“lead”). The applicable lead period for 22
001030

10
each major category of expense is compared to the revenue lag period. The 1
difference between those periods, expressed in days, multiplied by the average 2
daily operating expense, yields the amount of CWC requirement. 3
Q. HOW WAS THE EXPENSE LEAD DAYS CALCULATED ON SCHEDULE 4
F-3? 5
A. The expense lead days are the actual days between when a service is received and 6
when payment is made for those services. To determine the expense lead days for 7
each expense category, Black Hills Power reviewed a sample of invoices paid 8
from that category and determined the average number of days it took to pay each 9
of those invoices. The expense per day is calculated by taking the total expense 10
per category divided by the number of days in the year. Finally, that expense per 11
day for each category is multiplied by the expense lead days for that category to 12
determine the expense dollar days for each category. Line 41 of Schedule F-3, 13
page 2 contains the combined total of the expense dollar days and the combined 14
total of the expense per day for all the expense categories. On Schedule F-3, the 15
total in column (d) was divided by the total in column (b), resulting in the expense 16
lead days of 43.34, which is shown on line 44. 17
Q. CAN YOU DESCRIBE HOW THE REVENUE LAG DAYS WERE 18
CALCULATED? 19
A. The midpoint of service for each revenue month during the test year was first 20
determined by dividing the total days of the year by 12 and then by 2. Then the 21
amount of lag days between when the meter is read and when the customer is 22
001031

11
billed, was determined by using the Company’s billing system and calculating that 1
amount on a monthly basis. The monthly results are then averaged to arrive at an 2
annual average. Next, the average number of days between billing and receipt of 3
payment was determined. This was done by using the Company’s billing system, 4
calculating that amount on a monthly basis and then averaging the monthly results 5
to arrive at an annual average. Finally, the sum of the results discussed above 6
were added together to determine the total revenue lag days 7
of 33.98, as shown on Schedule F-3, line 43. 8
Q. WHAT WAS THE RESULT OF THE LEAD/LAG STUDY? 9
A. The results of the lead/lag study demonstrate that, in aggregate, customers have 10
supplied funds to the utility to pay for expenses prior to the utility paying for the 11
same expenses. As a result, a rate base reduction was included in the 12
determination of total rate base. 13
Q. WHAT AMOUNT OF CASH WORKING CAPITAL WAS DETERMINED? 14
A. The final cash working capital adjusted balance developed from the lead/lag study 15
is ($5,839,251). The adjusted balance of cash working capital is used as a 16
component of rate base. 17
Q. EXPLAIN THE KNOWN AND MEASURABLE ADJUSTMENT MADE TO 18
FUEL STOCKS. 19
A. The adjustment reflects a new coal stockpile at the Neil Simpson Complex 20
associated with the Coal Redundancy project. This stockpile provides 21
approximately 5 to 7 days of coal for generation in the event of a major 22
001032

12
malfunction with mining operations. This inventory should allow adequate time to 1
implement back up plans to ensure the continuous delivery of coal. These costs 2
are supported through the testimony of Mark Lux. 3
Q. EXPLAIN THE KNOWN AND MEASURABLE ADJUSTMENTS MADE 4
TO MATERIALS AND SUPPLIES. 5
A. Several adjustments were made to materials and supplies as summarized on 6
Statement F, line 5. The individual adjustments are itemized on Schedule F-1 and 7
Schedule F-4. 8
Schedule F-1, Row 29: Row 29 reflects a spare transformer rebuild that was 9
received in November 2013. This spare transformer is for the Neil Simpson II 10
power plant. In case of a transformer failure, the spare transformer will allow 11
more timely restoration of service. 12
Schedule F-1, Row 30: Row 30 reflects spare fan motors for the coal units at the 13
Neil Simpson Complex. The motors are critical to the operation of the units that 14
have no back-up or redundancy. A typical motor failure would result in a major 15
outage of many weeks to months. The fan motors are uniquely designed for each 16
generation unit, so there is no “off the shelf” availability from manufacturers. The 17
lead time for ordering a replacement motor is approximately 36 weeks. 18
Schedule F-1, Rows 32 – 34: Rows 32 through 34 remove the inventory from the 19
test year associated with the Ben French, Osage, and Neil Simpson I power plants. 20
These plants were retired on or before March 21, 2014, as the most cost effective 21
plan for EPA compliance, and the associated inventory will no longer be needed 22
001033

13
for the operation of the plants. The cost of the inventory at these plants will be 1
transferred to the regulatory asset established for decommissioning these units. 2
Schedule F-4: This schedule reflects Black Hills Power’s ownership percentage 3
of critical spare parts needed at CPGS to reduce the amount of lost production 4
time. The plant operations department provided the current market prices for each 5
item of equipment. These costs are supported through the testimony of Mark Lux. 6
D. OTHER RATE BASE REDUCTIONS 7
Q. WHAT OTHER REDUCTIONS TO RATE BASE WERE MADE? 8
A. Deferred federal income taxes related primarily to accelerated depreciation, cash 9
received for customer deposits, advances for construction, and also pension related 10
costs are included as reductions to rate base, as shown on Schedule M-1 and M-2. 11
Q. ARE THESE OTHER REDUCTIONS TO RATE BASE CONSISTENT 12
WITH THE COMPANY’S LAST RATE CASE? 13
A. Yes, we used a consistent approach and accounts to reduce rate base. 14
Q. WHAT OTHER ADJUSTMENTS DID YOU MAKE TO REDUCE RATE 15
BASE? 16
A. As shown on Statement E page 1, the Company also made an adjustment to reduce 17
rate base for additional accumulated depreciation expense. This adjustment 18
increases accumulated depreciation to reflect one-half of the annual depreciation 19
expense associated with new assets summarized on Statement D, Page 2 and the 20
new depreciation rates on Statement J. 21
001034

14
Q. WERE PRO FORMA ADJUSTMENTS MADE TO OTHER RATE BASE 1
REDUCTIONS? 2
A. Yes. Schedule M-1 provides for an adjustment that reflects the thirteen month 3
average on balances as of September 30, 2013, for Other Regulatory Assets (182), 4
Deferred Income Tax Asset (190), Customer Advances for Construction (252), 5
Other Regulatory Liabilities (253 and 254), Deferred Tax – Accelerated 6
Depreciation (282), and Deferred Income Tax Liability (283) accounts. Consistent 7
with prior rate cases, an adjustment was made for deferred taxes related to the 8
accelerated depreciation for the pro forma capital additions to be placed in service 9
prior to the effective date of the new rates resulting from this rate case. The 10
Company has once again elected bonus depreciation rates for assets that were 11
eligible. This calculation is shown on Schedule M-2 and includes an offset for a 12
Net Operating Loss (“NOL”) adjustment. This NOL is created since there is not 13
enough taxable income to use the entire bonus depreciation. In other words, the 14
Company is not able to receive the cash benefit for the bonus depreciation tax 15
deduction; therefore a tax asset is created for this timing difference. 16
001035

15
E. DECOMMISSIONING AND WINTER STORM ATLAS 1
REGULATORY ASSETS 2
Q. DID THE COMMISSION ISSUE AN ACCOUNTING ORDER TO 3
ESTABLISH REGULATORY ASSETS FOR THE WINTER STORM 4
ATLAS COSTS AND COSTS ASSOCIATED WITH DECOMMISSIONING 5
THE NEIL SIMPSON I, OSAGE, AND BEN FRENCH POWER PLANTS? 6
A. Yes. On January 9, 2014, in Docket EL 13-036, the Commission issued an Order 7
Approving Deferred Accounting For Storm Damage Costs (associated with Winter 8
Storm Atlas) and Transfer of Remaining Plant Balance for soon to be 9
Decommissioned Plants to a Regulatory. 10
Q. EXPLAIN THE RATE BASE ADJUSTMENTS FOR WINTER STORM 11
ATLAS AND DECOMMISSIONING REGULATORY ASSET. 12
A. The rate base adjustments for the decommissioning and Winter Storm Atlas 13
regulatory assets are reflected on Schedule J-2 and J-3, respectively. The 14
adjustments reflect the unamortized balance to be included in rate base until fully 15
amortized. An adjustment to the operating income statement is being made to 16
recognize a full year of amortization expense. Therefore, the amount of rate base 17
being included in the test year is reduced by the accumulated amortization for a 18
full year. 19
001036

16
V. ADJUSTMENTS TO THE OPERATING EXPENSES 1
Q. PLEASE DEFINE OPERATING EXPENSES. 2
A. Total operating expenses are costs incurred by the Company in order to supply 3
electricity to the customers of Black Hills Power. In the development of the 4
revenue requirement, these operating costs are passed on to customers dollar for 5
dollar; that is, without Black Hills Power earning any net income on those 6
expenses. Expenses are reflected in the following statements: 7
1) Statement H shows the operating and maintenance expenses in detail by 8
FERC account. 9
2) Statement J is the calculation of depreciation and amortization expense. 10
3) Statement K shows the calculation of federal income tax expense. 11
4) Statement L calculates taxes other than federal income taxes - such as 12
federal payroll taxes. 13
5) All of the Statements are summarized on Statement M to show the per 14
books and the pro forma rate of return. 15
Q. PLEASE EXPLAIN THE ADJUSTMENTS FOR THE EXPENSES ON 16
STATEMENT H. 17
A. Several adjustments were made to the expenses as shown on Statement H, 18
columns (b) – (s). Statement H starts with the per books information for the 19
twelve months ending September 30, 2013, by FERC account number. Each 20
adjustment has a column on this page and a supporting Schedule to show how the 21
adjustment was determined. 22
001037

17
Adjustment (b): The adjustment of $1,688,744 on Schedule H-1 represents the 1
actual and projected wage increases and changes in personnel. These amounts are 2
calculated using an average of union negotiated wage increases and expected non-3
union wage increases, together with the costs associated with open vacancies and 4
additional employees needed for operations. The labor costs associated with Neil 5
Simpson I personnel who will have part of their time charged to power plants not 6
owned by Black Hills Power at the Neil Simpson Complex have been removed 7
from the test year. Please refer to the testimony of Laura A. Patterson and Jennifer 8
Landis for a further description of the compensation program for Black Hills 9
Power employees, FutureTrack Workforce Development Program, and personnel 10
changes at Ben French, Osage, and Neil Simpson I. 11
Adjustment (c): Schedule H-5 contains the corporate costs charged to Black 12
Hills Power from Utility Holdings for the twelve months ending September 30, 13
2013. This amount is then adjusted to reflect the allocation of Utility Holdings 14
costs to Black Hills Power after CPGS is placed in service on October 1, 2014. 15
The adjustment is an increase of $2,303,019 to the operating expenses. These 16
expenses are a combination of direct and indirect charges without any additional 17
fees. The allocation methods for indirect charges are described in the Utility 18
Holdings Cost Allocation Manual, which is included as an Exhibit to the direct 19
testimony of Christopher J. Kilpatrick. 20
Adjustment (d): Schedule H-6 represents the cost increases to provide retiree 21
healthcare, medical costs for employees, pension plan premiums, and the 22
001038

18
employer portion of the 401(k). The adjusted FAS 87 pension plan expense 1
reflects the most recent five year average. The annual pension expense has ranged 2
between $976,122 and $3,251,072 from 2010 through 2014, and the annual 3
percent change has ranged between a 64% decrease and a 79% increase. The 4
Company proposes to normalize pension expenses because these expenses 5
fluctuate widely from year to year. These pro forma amounts are compared to the 6
test year expense, and the difference is an increase to operating expenses of 7
$334,319. 8
Adjustment (e): Schedule H-7 provides the calculation to normalize bad debt 9
expense using a three year historical period. The average net write-offs during that 10
three year period was then divided by the average billed revenues to determine the 11
average uncollectable expense for the Company. This average rate was then 12
applied to the projected new revenue amount to determine the expected bad debt 13
expense. This was compared to the actual test year amount and a decrease to 14
operating expenses of $20,937 was then included as an adjustment. 15
Adjustment (f): Schedule H-8 provides for Black Hills Power’s costs related to 16
generation dispatch and scheduling. These costs are in accordance with the 17
Generation Dispatch and Energy Agreement effective July 1, 2012, that has been 18
filed with the FERC. This agreement allocates costs to the parties contracting for 19
services based on the total capacity of each company. Based on the current 20
Generation Dispatch and Scheduling costs, the expense adjustment is $107,964. 21
001039

19
Adjustment (g): Schedule H-9 removes all the costs that are collected through 1
the Energy Cost Adjustment (“ECA”) from the test year. The Commission 2
approved separating the ECA costs from base rates in Black Hills Power’s last rate 3
case, Docket EL12-061. The adjustment decreases operating expenses by 4
$51,252,370. 5
Adjustment (h): Schedule H-10 shows Black Hills Power’s pro forma 6
adjustments for the Neil Simpson Complex Shared Facilities Agreement. Total 7
expenses are provided along with the calculation of Black Hills Power’s share of 8
these expenses based on pooled expensed net capacity allocators. This adjustment 9
reflects the retirement of Neil Simpson I on or before March 21, 2014. These 10
2014 revenue and expense amounts are compared to the per book amounts with 11
the difference representing the adjustment. 12
Adjustment (i): Schedule H-11 represents the removal of costs associated with 13
unallowable advertising. The adjustment eliminates costs associated with brand 14
and image advertisements, and sponsorship of community organizations. The 15
advertising included in the cost of service are those designed to promote safety, 16
inform and educate consumers on the utility’s financial services, and disseminate 17
information on a utility’s corporate affairs to its owners. The adjustment 18
decreases operating expense by $262,517. 19
Adjustment (j): The adjustments in Schedule H-12 relate to Power Marketing 20
activities of Black Hills Power. Adjustments made represent costs for energy sold 21
by Power Marketing for marketing purposes which are not used to serve Black 22
001040

20
Hills Power’s load and thus, not included in the cost of service. The total expense 1
that is eliminated from the test year is $28,035,682. 2
Adjustment (k): Schedule H-13 is a detailed listing of outside consulting costs 3
related to this rate case and certain consulting costs associated with the 2012 rate 4
case and phase in plan rate dockets. The Settlement Stipulation (“Stipulation”) 5
approved in Docket EL12-061 allows for the rate case costs incurred in Dockets 6
EL12-061 and EL12-062 in excess of $261,813 to be recovered in this case. The 7
Company proposes amortizing these costs over a three year period with the 8
unamortized amount included in rate base. 9
Adjustment (l): Schedule H-14 adjusts test year vegetation management 10
expenses to reflect the amount approved in the Stipulation in Docket EL12-061. 11
The settlement establishes the annual vegetation management expense included in 12
base rates, and this adjustment reduces the test year amount in accordance with the 13
Stipulation. The adjustment reduces operating expenses by $401,420. 14
Adjustment (m): Schedule H-15 provides a detailed listing by FERC account of 15
projected expense amounts to operate and maintain CPGS during a normal year. 16
The adjustment is $2,781,469 for Black Hills Power’s ownership percentage of 17
CPGS. This adjustment is covered in more detail in the testimony of Mark Lux. 18
Adjustment (n): Schedule H-16 reflects the removal of severance expense during 19
the test year for Ben French plant employees. The employee severance expense 20
associated with the Ben French plant reflects a non-recurring event that needs to 21
001041

21
be removed from the test year to emulate normal, ongoing conditions. The total 1
expenses eliminated were $180,861. 2
Adjustment (o): Schedule H-17 reflects Black Hills Power’s allocation of 3
expenses related to the operation and maintenance of Neil Simpson Complex 4
(“NSC”) common steam facilities. The NSC common steam facility expense is 5
allocated based on capacity at the complex and Black Hills Power is responsible 6
for the capacity associated with Neil Simpson II and its ownership percentage of 7
Wygen III. The allocations reflect the retirement of Neil Simpson I, and the costs 8
are based on the 2014 amounts. This was compared to the actual test year amount 9
and an increase to operating expenses of $324,962 was then included as an 10
adjustment. The employee retention efforts associated with this adjustment are 11
addressed in the testimony of Laura A. Patterson. 12
Adjustment (p): Schedule H-18 adjusts for the removal of operating and 13
maintenance expenses related to the discontinuance of operations at the Ben 14
French, Osage, and Neil Simpson I power plants. The primary contributors to the 15
expense reduction are fuel costs, fuel transportation costs, employee benefits costs, 16
and materials used in the operation of the plants. The test year labor costs at the 17
three plants are adjusted in Schedule H-1. The net adjustment reduces operating 18
expenses by $3,753,186. 19
Adjustment (q): Schedule H-19 reflects the annual test year expense associated 20
with BHC’s FutureTrack Workforce Development Program. For additional 21
information on the program and the Company’s ratemaking proposal, please refer 22
001042

22
to the testimony of Laura A. Patterson, Jennifer Landis, and Christopher J. 1
Kilpatrick. The adjustment increases operating expenses by $721,861. 2
Adjustment (r): Schedule H-20 adjusts for Black Hills Power’s LIDAR surveying 3
project on its 69 kV transmission system. The project cost is shared with the joint 4
owners of the transmission system, and Black Hills Power’s share is amortized 5
over five years to correspond with the expected frequency of the survey. The 6
Company requests the unamortized amount be included in rate base. The LIDAR 7
surveying project is further discussed in the testimony of Mike Fredrich. The 8
adjustment increases operating expenses by $136,920. 9
Adjustment (s): Schedule H-21 reflects the cost reductions as a result of Black 10
Hills Power’s customer service model changes. Black Hills Power completed a 11
thorough review of its customer service model. The study found that most 12
customers prefer self-service options via Black Hills Power’s website or other 13
automated services. Walk-in traffic has declined 45% since 2008 and that trend is 14
expected to continue. Customers are adopting electronic payment options which 15
will require Black Hills Power to better align its resource to provide support for 16
these business channels. As a result, the Belle Fourche and Newell customer and 17
electric operation services will be consolidated and moved to Spearfish and 18
Sturgis, respectively. The new customer service strategy will allow Black Hills 19
Power to provide better service at a lower cost to customers. The adjustment 20
removes the salaries and benefits associated with three customer service 21
001043

23
representatives from the test year, and also eliminates the Belle Fourche and 1
Newell facility costs. The net effect reduces operating expenses by $215,934. 2
Q. PLEASE EXPLAIN HOW THE EXPENSES ASSOCIATED WITH THE 3
TRANSMISSION FACILITIES THAT CONNECT CPGS TO CHEYENNE 4
LIGHT’S 115 kV SYSTEM ARE INCORPORATED IN THE COST OF 5
SERVICE. 6
A. The CPGS transmission facilities are owned by Cheyenne Light, and Black Hills 7
Power will be a transmission customer. The transmission expense will be based 8
on the revenue requirement associated with the CPGS transmission assets and 9
allocated to Black Hills Power to reflect its ownership percentage of CPGS. The 10
expense will be recorded to FERC Account 565 and recovered from customers 11
through the Energy Cost Adjustment. 12
VI. ADDITIONAL CHANGES TO THE OPERATING EXPENSES 13
Q. WHAT ADDITIONAL ADJUSTMENTS DID YOU MAKE TO THE 14
OPERATING EXPENSES? 15
A. The depreciation expense was adjusted, as shown on Statement J, to account for 16
the new depreciation rates as established in the depreciation study completed by 17
Gannett Fleming in November 2013. We also calculated the depreciation expense 18
for CPGS and other subsequent plant additions for a full year of operation. The 19
retirements of the Ben French, Neil Simpson I, and Osage power plants are 20
reflected by removing each plant’s test year depreciation expense from the cost of 21
service. The net result of these adjustments is an increase to depreciation expense 22
001044

24
of $3,584,757. The depreciation study is discussed in the testimony of John J. 1
Spanos and the study is provided as Exhibit JJS-2. 2
Q. HOW ARE THE DEPRECIATION ADJUSTMENTS CALCULATED ON 3
STATEMENT J? 4
A. The depreciation adjustment is calculated by using the new depreciation rates, as 5
determined by our depreciation study, multiplied by the adjusted plant in service. 6
The adjusted expense is then compared to the per books amount for the test year 7
and the difference is recorded on Statement M as the adjusted depreciation 8
expense and an increase in accumulated depreciation. 9
Q. EXPLAIN THE ADJUSTMENT FOR THE AMORTIZATION OF THE 10
DECOMMISSIONING REGULATORY ASSET. 11
A. Black Hills Power is proposing to amortize the costs associated with the retirement 12
and decommissioning of Neil Simpson I, Ben French, and Osage over five years. 13
Schedule J-2 provides the calculation of the $3,472,714 increase to amortization 14
expense. Please refer to the testimony of Mark Lux and Christopher J. Kilpatrick 15
for a further description of the decommissioning costs and associated 16
amortization. 17
Q. EXPLAIN THE ADJUSTMENT FOR THE AMORTIZATION OF THE 18
WINTER STORM ATLAS REGULATORY ASSET. 19
A. Please refer to Vance Crocker’s testimony for a description of the Winter Storm 20
Atlas and line inspection costs. The Winter Storm Atlas damage costs include 21
actual expenses through December 31, 2013, and estimated costs through the end 22
001045

25
of February 2014. The line inspection costs include contract labor costs for the 1
inspection and an estimate for repair costs. Since the need for a system wide line 2
inspection is driven by Winter Storm Atlas, the Company proposes to include the 3
line inspection costs in the Winter Storm Atlas amortization. Black Hills Power is 4
proposing to amortize these costs over five years. Schedule J-3 provides the 5
calculation of the $827,702 increase to amortization expense. 6
Q. PLEASE EXPLAIN THE REMAINING CHANGES TO OPERATING 7
EXPENSES. 8
A. On Statement L, additional payroll taxes were calculated based on the known and 9
measurable adjustments described on Schedule H-1. The net payroll change was 10
multiplied by the federal and state payroll tax rates to determine the adjustment of 11
$22,257 to payroll taxes as shown on Schedule L-1. 12
Q. PLEASE EXPLAIN THE ADJUSTMENT TO THE SOUTH DAKOTA PUC 13
TAX. 14
A. The adjustment is based on the South Dakota pro forma retail revenue adjustments 15
and the additional revenue requirement for South Dakota, multiplied by the gross 16
receipts tax, resulting in an additional cost shown on Statement L. 17
Q. HOW IS THE FEDERAL INCOME TAX CALCULATED? 18
A. Federal income taxes are calculated based on the adjusted rate base amount on 19
Statement M and Statement G debt and equity ratios. As shown on Statement K, 20
the adjusted operating income before tax amount from Statement M, column (e), is 21
then reduced by the adjusted interest expense as provided on Statement K, page 3. 22
001046

26
This taxable income is multiplied by the federal income tax rate. This amount is 1
adjusted for the permanent tax differences found on Statement K, Page 1, line 16, 2
and tax additions and deductions found on Statement K, Page 2, lines 58 through 3
67, for the adjusted federal income tax expense. 4
VII. ADJUSTMENTS TO THE OPERATING REVENUES 5
Q. WHERE DO YOU GET THE PER BOOKS REVENUE ON STATEMENT I, 6
PAGE 1? 7
A. The per books revenue is from the billing system for the customers of Black Hills 8
Power for the test year ended September 30, 2013. 9
Q. PLEASE DESCRIBE THE ADJUSTMENTS MADE TO SOUTH DAKOTA 10
RETAIL REVENUE? 11
A. There are four adjustments to South Dakota retail revenue. First, the Phase In Plan 12
Rate Rider revenue is adjusted as reflected on Schedule I-2 and discussed in 13
Christopher J. Kilpatrick’s testimony. Second, residential retail sales were 14
affected by weather. Therefore, it was necessary to normalize sales to reflect 15
revenue based on normal weather. Third, an adjustment is made to annualize the 16
rate increase in Docket EL12-061 that was effective during the test period. The 17
annualization properly calculates pro forma revenues as if the rates had been in 18
effect for the entire test period. Please refer to the testimony of Charles Gray for 19
further discussion on the weather normalization adjustment and the Docket EL12-20
061 rate annualization adjustment. Fourth, revenue associated with the ECA was 21
removed from retail revenues as reflected on Statement I, Page 4. This relates to 22
001047

27
the matching principle as delivered energy costs were also eliminated in Schedule 1
H-9. 2
Q. PLEASE DESCRIBE THE ADJUSTMENT TO OTHER NON-FIRM 3
REVENUE ON STATEMENT I, PAGE 1. 4
A. The other non-firm revenue adjustment represents the removal of revenue 5
associated with Power Marketing. The removal of expenses associated with 6
Power Marketing is shown on Schedule H-12. 7
Q. PLEASE DESCRIBE THE ADJUSTMENT TO CITY OF GILLETTE 8
REVENUE. 9
A. The City of Gillette revenue was removed as it relates to replacement energy. The 10
associated costs are included in the Power Marketing adjustment on Schedule H-11
12. 12
Q. PLEASE EXPLAIN THE ADJUSTMENT TO RENT FROM ELECTRIC 13
PROPERTY. 14
A. The revenue from rental of electric property is increased to reflect the Neil 15
Simpson Complex Shared Facilities adjustment as shown on Schedule H-10. 16
VIII. SUMMARY OF THE MODEL 17
Q. WHAT IS THE REQUESTED AMOUNT OF THE SOUTH DAKOTA 18
INCREASE IN ELECTRIC BASE RATES? 19
A. Black Hills Power is seeking to increase its electric base rates to recover 20
$14,634,238 in additional annual revenues, or an increase of 9.27%. This increase 21
is calculated based on Black Hills Power’s pro forma revenue requirement using a 22
001048

28
test year of the twelve months ending September 30, 2013. This revenue 1
requirement is based on the jurisdictional allocation prepared on Schedule N-1. 2
Q. DOES THE MODEL RESULT IN A JUST AND REASONABLE REVENUE 3
REQUIREMENT? 4
A. Yes. The Model uses the per books financial statements for the test year ending 5
September 30, 2013, which contains known and measurable adjustments. The 6
effect is a straight-forward application supporting the requested increase in base 7
rates. 8
Q. DOES THIS CONCLUDE YOUR TESTIMONY? 9
A. Yes, it does. 10
001049

Direct Testimony and Exhibits
Christopher J. Kilpatrick
Before the South Dakota Public Utilities Commission
of the State of South Dakota
In the Matter of the Application of
Black Hills Power, Inc., a South Dakota Corporation
For Authority to Increase Rates
In South Dakota
Docket No. EL14-___
March 31, 2014
001050

i
TABLE OF CONTENTS
I. INTRODUCTION AND QUALIFICATIONS ........................................................ 1
II. PURPOSE OF TESTIMONY .................................................................................. 2
III. PHASE IN PLAN RATE REVENUE ...................................................................... 3
IV. CPGS PIPELINE COST ALLOCATION ................................................................ 4
V. ENERGY COST ADJUSTMENT (“ECA”) ............................................................ 5
VI. DECOMMISSIONING REGULATORY ASSET ................................................. 11
VII. WINTER STORM ATLAS REGULATORY ASSET .......................................... 14
VIII. FUTURETRACK WORKFORCE DEVELOPMENT PROGRAM ..................... 16
IX. CORPORATE COST ALLOCATIONS ................................................................ 18
X. CONCLUSION ...................................................................................................... 20
Exhibits
Exhibit CJK-1 Fuel and Purchase Power Adjustment Example
Exhibit CJK-2 Fuel and Purchase Power Adjustment Tariff Pages
Exhibit CJK-3 Request for Accounting Order – Winter Storm Atlas
Exhibit CJK-4 Request for Accounting Order - FutureTrack
Exhibit CJK-5 Service Company Service Agreement
Exhibit CJK-6 Utility Holdings Service Agreement
Exhibit CJK-7 Cost Allocation Manual (CAM) – Service Company
Exhibit CJK-8 Cost Allocation Manual (CAM) – Utility Holdings
001051

1
I. INTRODUCTION AND QUALIFICATIONS 1
Q. PLEASE STATE YOUR NAME AND BUSINESS ADDRESS. 2
A. My name is Christopher J. Kilpatrick. My business address is 625 Ninth Street, 3
P.O. Box 1400, Rapid City, South Dakota 57701. 4
Q. BY WHOM ARE YOU EMPLOYED AND IN WHAT CAPACITY? 5
A. I am currently employed by Black Hills Utility Holdings, Inc. (“Utility 6
Holdings”), a wholly-owned subsidiary of Black Hills Corporation (“BHC”), as 7
the Director of Regulatory. 8
Q. ON WHOSE BEHALF ARE YOU APPEARING ON IN THIS 9
APPLICATION? 10
A. I am testifying on behalf of Black Hills Power, Inc., (“Black Hills Power” or the 11
“Company”). 12
Q. PLEASE DESCRIBE YOUR EDUCATIONAL AND BUSINESS 13
BACKGROUND. 14
A. I am a graduate of Mount Marty College in Yankton, South Dakota, with a 15
Bachelor of Arts Degree in Accounting. I am a Certified Public Accountant 16
(“CPA”), a member of the American Institute of Certified Public Accountants, and 17
a member of the South Dakota CPA Society. My work experience includes 18
working for two public accounting firms from 1994 through 1999. The first was 19
Wohlenberg, Ritzman, and Co., located in Yankton, South Dakota, and the second 20
was Ketel Thorstenson, LLP, located in Rapid City, South Dakota. 21
001052

2
I began my career with BHC in January 2000 in the internal audit department. In 1
August of 2003, I became the controller of Black Hills FiberCom until February 2
2005, when I accepted the position of Director of Accounting – Retail Operations. 3
In August 2008, I was offered and accepted the position of Director of Rates. In 4
2011, I accepted an expanded role, responsible for both electric rates and resource 5
planning. In 2013, BHC reorganized its Resource Planning department and I am 6
now the Director of Regulatory. 7
Q. BRIEFLY DEFINE YOUR DUTIES AND RESPONSIBILITIES. 8
A. I am responsible for the revenue requirement calculation and rate design for 9
BHC’s utility subsidiaries. 10
II. PURPOSE OF TESTIMONY 11
Q. WHAT IS THE PURPOSE OF YOUR TESTIMONY? 12
A. The purpose of my testimony is to support the revenue requirement in this 13
proceeding. In particular, I describe: 1) the Phase In Plan Rate (“PIPR”) revenue; 14
2) the Cheyenne Prairie Generating Station (“CPGS”) pipeline cost allocations; 3) 15
the proposed changes to the Energy Cost Adjustment (“ECA”); 4) the regulatory 16
asset for decommissioning costs and the proposed amortization of those costs; 5) 17
the regulatory asset for Winter Storm Atlas and the proposed amortization of those 18
costs; and 6) the proposed regulatory asset for the FutureTrack Workforce 19
Development program. In addition, I describe the Company’s Cost Allocation 20
Manuals with Black Hills Service Company, LLC (“Service Company”) and 21
Utility Holdings. 22
001053

3
III. PHASE IN PLAN RATE REVENUE 1
Q. PLEASE DESCRIBE THE PIPR. 2
A. The PIPR is the recovery mechanism established by the South Dakota Public 3
Utilities Commission (“Commission”) in Docket No. EL12-062. The purpose of 4
the PIPR is to recover the actual construction financing costs related to CPGS 5
before the facility is included in rate base, thereby avoiding Allowance for Funds 6
Used During Construction (“AFUDC”). The rate base with the PIPR is $9.5 7
million less than the rate base that would exist if AFUDC was included. The PIPR 8
also results in a gradual increase in customer rates through a small increase each 9
quarter. 10
Q. WHAT IS THE PURPOSE OF THE ADJUSTMENT ON SCHEDULE I-2? 11
A. The adjustment on Schedule I-2 estimates monthly financing costs collected 12
through the PIPR and annualizes the last five months to properly reflect what 13
customers rates will be prior to new rates going into effect. This amount is then 14
compared to the PIPR revenue collected during the test year and the difference is 15
the resulting adjustment, included on Statement I Page 1 (line 4), which increases 16
operating revenue. 17
Q. WHY IS THIS ADJUSTMENT NECESSARY? 18
A. This adjustment is necessary to properly reflect the full benefit of the PIPR. The 19
PIPR is gradually increasing customers’ rates each quarter, and this increase in 20
rates through the PIPR needs to be reflected as an adjustment to operating revenue. 21
The adjustment on Statement I, page 1, reduces the overall increase necessary 22
001054

4
when CPGS is placed into service and thereby properly matches what customers 1
are paying in September and appropriately reduces the revenue deficiency. This 2
adjustment is consistent with the design of the PIPR and the desire to help 3
customers adjust to the new rates that will become effective on October 1, 2014. 4
IV. CPGS PIPELINE COST ALLOCATION 5
Q. PLEASE DESCRIBE THE CPGS PIPELINE. 6
A. The CPGS Pipeline is a high pressure natural gas pipeline that is approximately 7
ten and one-half (10.5) miles in length and is twelve (12) inches in diameter. This 8
pipeline connects Southern Star Central Gas Pipeline (located near the 9
Wyoming/Colorado border) to CPGS. The CPGS Pipeline will be wholly owned 10
and operated by Cheyenne Light, Fuel and Power Company’s (“Cheyenne Light”) 11
gas utility division. The CPGS Pipeline is discussed at length in the testimony of 12
Kent Kopetzky. 13
Q. HOW ARE COSTS ALLOCATED BETWEEN BLACK HILLS POWER 14
AND CHEYENNE LIGHT? 15
A. The contribution in aid of construction for the CPGS Pipeline is calculated based 16
upon Black Hills Power’s share of CPGS, which is (42%). This payment is shown 17
on Schedule D-3, Line 15. 18
001055

5
V. ENERGY COST ADJUSTMENT (“ECA”) 1
Q. PLEASE DESCRIBE THE ECA. 2
A. The ECA consists of two adjustment clauses. The first adjustment clause is the 3
Fuel and Purchased Power Adjustment (“FPPA”). The second adjustment clause is 4
the Transmission Cost Adjustment (“TCA”). 5
Q. IS THE COMPANY PROPOSING CHANGES TO THE ECA? 6
A. Yes. Black Hills Power is proposing changes to the FPPA clause contained within 7
the ECA. 8
Q. PLEASE GENERALLY DESCRIBE THE CURRENT FPPA 9
CALCULATION. 10
A. The FPPA is the mechanism Black Hills Power utilizes to recover the costs 11
associated with fuel, fuel handling, purchase power, and other related costs (the 12
“Annual System Fuel and Purchased Power Costs”). To calculate the current 13
FPPA, the Annual System Fuel and Purchase Power costs are reduced through a 14
sharing mechanism called the Power Marketing Operating Income credit. This 15
Sharing mechanism equates to 65% of Black Hills Power’s Power Marketing 16
Operating Income. The current minimum Power Marketing Operating Income 17
credit is $2 million. The current FPPA is set forth in Tariff Sheets 1-4, Section 18
3C. 19
001056

6
Q. WHAT CHANGES TO THE FPPA ARE BEING PROPOSED IN THIS 1
CASE? 2
A. The Company is proposing four changes to the FPPA. The first change is the 3
inclusion of any difference in ad valorem or property taxes, from what is reflected 4
in base rates, in the FPPA. Second, in Docket No. EL12-062, the Company 5
agreed to begin providing its customers a credit for 100% of its wholesale contract 6
revenue on October 1, 2014. The Company is proposing the mechanism to provide 7
this credit through the FPPA. Third, the Company proposes the elimination of the 8
Power Marketing Credit minimum. Finally, the Company proposes that 100% of 9
the costs related to short-term planning reserve capacity purchases and sales be 10
recovered through the FPPA. 11
Q. DOES BLACK HILLS POWER PROPOSE CHANGING THE BASE 12
ENERGY COST PER KWH IN THIS RATE CASE APPLICATION? 13
A. No. The base unit cost was set in Docket No. EL09-018 at $0.0146/kWh and 14
Black Hills Power does not propose it be changed. Each annual filing determines 15
an increase or decrease from the base cost per kWh. 16
Q. PLEASE EXPLAIN THE CHANGE THE COMPANY IS PROPOSING 17
REGARDING AD VALOREM OR PROPERTY TAXES. 18
A. Pursuant to S.D.C.L. § 49-34A-25, the Company is entitled to recover ad valorem 19
or property taxes. Black Hills Power proposes including in the FPPA any property 20
tax amount that deviates from the amount included in base rates. This inclusion is 21
shown on Statement P, page 1, line 19 and illustrated in Exhibit CJK-1. 22
001057

7
Q. WHY IS BLACK HILLS POWER PROPOSING INCLUDING CHANGES 1
TO PROPERTY TAXES IN THE FPPA? 2
A. The Company is making this proposal to provide rate mitigation for its customers. 3
Black Hills Power anticipates its property taxes will increase when CPGS is 4
placed in service. If the Company’s proposal is approved, the property tax 5
increase associated with CPGS will not be included in base rates in October of 6
2014. Instead, the increase will be deferred until the Company makes its FPPA 7
filing in April of 2015. 8
Q. HOW IS BLACK HILLS POWER CREDITING LONG TERM 9
WHOLESALE CONTRACT REVENUE TO CUSTOMERS? 10
A. The Company is including a credit for long term wholesale contract revenue in 11
base rates. Any incremental change in the annual long term wholesale contract 12
revenue will flow through the FPPA. An example of the proposed FPPA 13
calculation is set forth in Exhibit CJK-1. Exhibit CJK-2 contains the proposed 14
FPPA tariff sheets that are also included in tariff Section 3C, Sheets 12 through 15
15. 16
Q. DOES THIS PROPOSAL PROVIDE CUSTOMERS A 100% CREDIT OF 17
THE REVENUES FROM LONG-TERM WHOLESALE CONTRACTS? 18
A. Yes. Customers receive 100% of the revenues from the long-term wholesale 19
contracts, of one year or more, through the annual FPPA filings. 20
001058

8
Q. WHY IS THE COMPANY CREDITING BASE RATES INSTEAD OF 1
FLOWING THE CREDIT ENTIRELY THROUGH THE FPPA? 2
A. Customers will realize the long term wholesale contract revenue credit sooner 3
under this proposal. In particular, new base rates will become effective on 4
October 1, 2014. As reflected on Statement P, page 1, line 27, a $19,288,845 long 5
term wholesale contract revenue credit is reflected in base rates. If the credit 6
flowed entirely through the FPPA, customers would not realize the credit until the 7
Company makes its FPPA filing in April of 2015. 8
Q. PLEASE EXPLAIN THE CHANGE THE COMPANY IS PROPOSING TO 9
THE POWER MARKETING CREDIT. 10
A. The Company proposes eliminating the existing Power Marketing Credit 11
minimum. Elimination of this minimum credit is appropriate because the 12
Company’s generation resource mix is changing significantly from what it was 13
when the minimum credit was established in 2010. In particular, the Company has 14
retired three of its coal-fired generation facilities. This decrease in base load coal 15
facilities reduces the amount of low cost energy the Company has available to 16
market. As a consequence, the Company’s ability to make short-term market 17
sales, i.e. create Power Marketing Operating Income, is greatly reduced. 18
Elimination of the Power Marketing Credit minimum is justified due to the 19
significant change in the generation resource mix and the fact that 100% of long-20
term wholesale revenues are now credited to customers. 21
001059

9
Q. IS THE COMPANY PROPOSING ANY OTHER CHANGES TO THE 1
FPPA? 2
A. Yes. The Company proposes that 100% of the costs and revenues related to short-3
term planning reserve capacity purchases be recovered through the FPPA. 4
Q. WHAT IS CONSIDERED A “SHORT-TERM” PLANNING RESERVE 5
CAPACITY PURCHASE FOR THE PURPOSES OF THIS PROPOSAL? 6
A. A “short-term” planning reserve capacity purchase is an agreement to purchase 7
capacity for a period of 31 days or less. 8
Q. UNDER WHAT CIRCUMSTANCES DO YOU EXPECT THAT BLACK 9
HILLS POWER MAY NEED TO PURCHASE SHORT-TERM PLANNING 10
RESERVE CAPACITY? 11
A. Under normal operations, Black Hills Power’s system provides sufficient capacity 12
to ensure that peak customer loads will be reliably and economically met. This is 13
achieved through, among other things, forecasting peak customer demand, and 14
maintaining sufficient resources to meet the forecasted demand plus a capacity 15
reserve margin. On occasion, however, Black Hills Power may experience an 16
unexpected plant outage or other contingency that would cause its allocated 17
resources to fall below the forecasted demand plus the reserve margin. In those 18
circumstances, Black Hills Power will seek to make a short-term reserve capacity 19
purchase to ensure that customers receive continuous reliable service. 20
001060

10
Q. WHY IS THE COMPANY MAKING THIS PROPOSAL AT THIS TIME? 1
A. Historically, there has been no market for short-term capacity purchases available 2
to serve Black Hills Power’s customers. Therefore, in the event that Black Hills 3
Power has needed additional resources due to an unexpected contingency, Black 4
Hills Power has been required to purchase firm energy. Through collaboration 5
with South Dakota Public Utilities Commission Staff, a group of Black Hills 6
Power’s industrial customers, and the Wyoming Office of Consumer Advocate, 7
Black Hills Power and Cheyenne Light developed a Planning Reserve Capacity 8
Agreement. The agreement allows Black Hills Power and Cheyenne Light to 9
share firm capacity to cover short term contingencies, when it is available and an 10
economic benefit for both parties to do so. The agreement should reduce Black 11
Hills Power’s reliance on more expensive firm energy purchases, and also create 12
opportunities to make short-term capacity sales. There is not presently a 13
mechanism, however, for Black Hills Power to either recover the costs of 14
purchases under the agreement, or credit customers for the revenues received 15
under the agreement. Therefore, the Company is proposing that the cost for 16
purchases and credit for sales be addressed through the FPPA. 17
Q. WHEN WILL THE PROPOSED REVISIONS TO THE FPPA BECOME 18
EFFECTIVE? 19
A. If approved, the proposed revisions to the FPPA calculation will become effective 20
on October 1, 2014. 21
001061

11
Q. WHEN WILL THE CURRENT FPPA CALCULATION BE 1
DISCONTINUED? 2
A. The current FPPA is calculated in tariff Section 3C, Sheets 1-4, and is in effect 3
until September 30, 2014. The current FPPA calculation will be used for costs 4
incurred by the Company through September 30, 2014. After this date, the new 5
proposed FPPA calculation will become effective. Based on the current annual 6
filing methodology, the FPPA filing that would occur in April 2015 would use two 7
different FPPA calculations to establish the ECA rate that would be charged or 8
refunded to customers. The filing in April 2015 would use the current FPPA 9
calculation for April through September of 2014, and the proposed FPPA 10
calculation from October 2014 through March of 2015. 11
VI. DECOMMISSIONING REGULATORY ASSET 12
Q. DOES BLACK HILLS POWER’S PLAN TO DECOMMISSION ITS BEN 13
FRENCH, NEIL SIMPSON I, AND OSAGE FACILITIES IMPACT THE 14
REVENUE REQUIREMENT? 15
A. Yes. The costs associated with decommissioning the above facilities result in an 16
increase to rate base of approximately $13.9 million. Schedule J-2 of the revenue 17
requirement lists the estimated Regulatory Asset for the Amortization of 18
Decommissioning costs. The total amount, less an adjustment for the first year of 19
recovery, is carried forward to Statement M, line 27, Other Rate Base Reductions, 20
as an increase to rate base. Please refer to the testimony of Mark Lux for 21
additional details regarding decommissioning. 22
001062

12
Q. HAVE THESE FACILITIES BEEN REMOVED FROM PLANT-IN-1
SERVICE? 2
A. Yes. The retirement of Ben French, Neil Simpson I and Osage is reflected on 3
Statement D page 2 (column d) of the revenue requirement, in the amount of 4
$54,755,892. The adjustment for the elimination of operations and maintenance 5
expense related to the three facilities is in Schedule H-18. 6
Q. PLEASE DESCRIBE THE TREATMENT OF THE COSTS TO 7
DECOMMISSION NEIL SIMPSON I, OSAGE AND BEN FRENCH. 8
A. These facilities are scheduled to be decommissioned, demolished, and remediated 9
by mid-2015. In Docket No. EL13-036, Black Hills Power received permission 10
from the Commission to establish a regulatory asset for the cost of 11
decommissioning. This unamortized regulatory asset, with adjustments, is 12
calculated and adjusted for on Schedule J-2. In particular, line 6 represents the 13
sum of the production plant estimated regulatory asset, which is approximately 14
$17,400,000 or approximately $3.5 million of annual amortization expense. 15
Q. OVER WHAT TIME PERIOD IS BLACK HILLS POWER REQUESTING 16
RECOVERY OF THE COSTS CONTAINED WITHIN THIS 17
REGULATORY ASSET? 18
A. Black Hills Power is requesting recovery of the regulatory asset over a five year 19
period commencing in 2015. This time period provides a balance between the 20
amount of time required to minimize impact to customers and matching the 21
001063

13
expense as best as possible with the customers who have utilized the assets being 1
retired. 2
Q. HOW DID YOU ARRIVE AT THE PROPOSED AMORTIZATION 3
PERIOD FOR DECOMMISSIONING COSTS? 4
A. The proposed amortization period achieves an annual amortization expense that is 5
approximately equivalent to the annual amount that it would cost to continue to 6
operate these facilities. In particular, Table 1 below illustrates recent annual 7
operating costs for these facilities, not including fuel. 8
Table 1. Summary of Annual Plant Costs if not decommissioned (Excluding
Fuel)
(a)
(b)
(c)
Operating Costs
Depreciation
Total
Excluding Fuel
Costs
Costs
Neil Simpson I
$1,436,035
$777,866
$2,213,901
Ben French
2,037,564
416,024
2,453,588
Osage
465,658
465,658
Totals
$3,473,599
$1,659,548
$5,133,147
The above annual operating costs are approximately $1.7 million more than the 9
$3.5 million proposed total amortization amount set forth in Schedule J-2 of the 10
revenue requirement. 11
001064

14
Q. WHY HAS THE AMOUNT FOR OBSOLETE INVENTORY BEEN 1
INCLUDED ON SCHEDULE J-2? 2
A. The decommissioning of Osage, Ben French and Neil Simpson I includes the sale 3
of obsolete inventory at each facility. The winning bid for the decommissioning 4
contract includes a credit to the Company for these sales. The estimated 5
decommissioning costs, as shown in column (g) on Schedule J-2, includes a lump 6
sum credit for the remaining inventory at each facility. Thus, the lump sum credit 7
reduces the total decommissioning costs of the facilities. The contractor selected 8
to decommission the units is responsible for the removal and sale of the remaining 9
inventory. The inventory has been assigned to each unit and has been removed 10
from rate base on Schedule F-1. 11
Q. HOW DOES THE ESTABLISHMENT OF A REGULATORY ASSET 12
BENEFIT CUSTOMERS? 13
A. A regulatory asset will allow for the recovery of these costs over a number of 14
years. This will minimize the increase that will impact customer rates as a result 15
of this rate case proceeding. 16
VII. WINTER STORM ATLAS REGULATORY ASSET 17
Q. HAS THE COMMISSION PREVIOUSLY CONSIDERED A FILING 18
RELATED TO THE COSTS ASSOCIATED WITH WINTER STORM 19
ATLAS? 20
A. Yes. The Commission granted Black Hills Power the authority to establish a 21
regulatory asset in Docket No. EL13-036. This regulatory asset includes the 22
001065

15
incremental storm related costs for Winter Storm Atlas. For additional discussion 1
regarding Winter Storm Atlas, please refer to the testimony of Vance Crocker. 2
Q. WHAT COSTS WERE INCLUDED IN THE REGULATORY ASSET 3
WHEN IT WAS APPROVED? 4
A. At the time Black Hills Power’s Application in EL13-036 was approved, storm 5
costs included in the regulatory asset were approximately $2.7 million. 6
Q. IS BLACK HILLS POWER REQUESTING ADDITIONAL COSTS BE 7
ADDED TO THIS REGULATORY ASSET? 8
A. Yes. Black Hills Power estimates there are approximately $0.3 million in 9
additional Winter Storm Atlas costs that should be added to the regulatory asset 10
for costs paid during January and February of 2014. These costs were not 11
included in the accounting order for the regulatory asset because not all invoices 12
had been received at the time the docket was finalized. 13
In addition, Black Hills Power requests the authority to include the costs of 14
conducting a line patrol of its 69 kV system in the Winter Storm Atlas regulatory 15
asset. Schedule J-3 details the estimated costs associated with the line patrol, 16
referred to as 2014 BHP SD System Inspection Costs, in the amount of $1.14 17
million. For additional information regarding the line patrol project, please refer 18
to the testimony of Vance Crocker. Please also refer to Exhibit CJK-3 for the 19
Request for Accounting Order for these additional costs. 20
001066

16
Q. WHAT IS THE TOTAL PROPOSED VALUE OF THE WINTER STORM 1
ATLAS REGULATORY ASSET? 2
A. The total proposed value of the Winter Storm Atlas regulatory asset is 3
approximately $4.14 million. The total unamortized regulatory asset requested for 4
Winter Storm Atlas, shown on Schedule J-3, is approximately $3.31 million. 5
Black Hills Power proposes amortizing $4.14 million over a five year period, for 6
an annual amortization expense of approximately $827,700. 7
VIII. FUTURETRACK WORKFORCE DEVELOPMENT PROGRAM 8
Q. HOW DOES BLACK HILLS POWER PLAN TO TREAT THE COSTS 9
ASSOCIATED WITH THE FUTURETRACK WORKFORCE 10
DEVELOPMENT PROGRAM DESCRIBED IN THE TESTIMONY OF 11
JENNIFER LANDIS? 12
A. Schedule H-19 of the revenue requirement model, Section 4, includes a total 13
Company annual expense for the FutureTrack Workforce Development Program 14
in the amount of $721,861, for the test year ended September 30, 2013. The 15
Company is requesting that the Commission approve an accounting order to create 16
a regulatory asset for any expenses that deviate from the annual expense included 17
in rate base. The Request for Accounting Order for the FutureTrack Program is 18
contained in Exhibit CJK-4. If in any of the eight years the annual expenditures 19
are less than the amount in base rates, the amount of the difference will be credited 20
to customers through the regulatory asset. In particular, Black Hills Power is 21
001067

17
requesting that expenditures for the program that exceed the amount in base rates 1
annually over each of the next eight years be recorded in a regulatory asset. 2
Q. UNDER THE COMPANY’S PROPOSAL, HOW WILL THE 3
FUTURETRACK REGULATORY ASSET BE TREATED AT THE END OF 4
THE EIGHT YEAR PERIOD? 5
A. The Company requests that at the end of the eight year period, the balance in the 6
regulatory asset be amortized over the next three years in order to recover costs 7
from customers who directly benefit from the program. The Company also 8
requests that the balance of the regulatory asset be recovered through a tariff or 9
rate increase to be determined prior to year eight. 10
Q. HOW DO CUSTOMERS BENEFIT FROM THIS PROPOSAL? 11
A. Customers benefit from this program because costs are spread over a period of 12
time. Additionally, this program will help ensure Black Hills Power’s continued 13
ability to safely and reliably deliver electricity. 14
Q. PLEASE DESCRIBE HOW THE COMPANY PLANS TO REPORT THE 15
ANNUAL COSTS ASSOCIATED WITH THE FUTURETRACK 16
WORKFORCE DEVELOPMENT PROGRAM? 17
A. Black Hills Power proposes an annual filing requirement that will report the 18
annual expenditures and the status of the program. 19
001068

18
IX. CORPORATE COST ALLOCATIONS 1
Q. DOES BLACK HILLS POWER RECEIVE SERVICES FROM OTHER 2
CORPORATE ENTITIES? 3
A. Black Hills Power obtains services from Service Company and Utility Holdings, 4
which are subsidiaries of BHC. 5
Q. WHAT TYPES OF SERVICES DOES BLACK HILLS POWER RECEIVE 6
FROM SERVICE COMPANY AND UTILITY HOLDINGS? 7
A. Service Company provides central services such as human resources, legal, 8
finance, and generating plant operations to Black Hills Power. Utility Holdings 9
provides services to Black Hills Power that are primarily related to customer 10
service, billing and information technology. 11
Q. HOW DOES BLACK HILLS POWER BENEFIT FROM THE SERVICES 12
OF SERVICE COMPANY AND UTILITY HOLDINGS? 13
A. The services provided by Service Company and Utility Holdings avoid the 14
duplication of these business functions by each of the regulated and non-regulated 15
business units of BHC, including Black Hills Power. This business arrangement 16
creates efficiencies compared to stand-alone business functions at each separate 17
business unit. 18
Q. ARE THESE SERVICES PROVIDED UNDER A WRITTEN 19
AGREEMENT? 20
A. Yes, Black Hills Power has Service Agreements with Service Company and 21
Utility Holdings. Both Service Company and Utility Holdings provide their 22
001069

19
services at cost to Black Hills Power and other BHC affiliates through direct 1
charges and indirect charges. Expenses for support services are charged to Black 2
Hills Power on a monthly basis pursuant to the Service Agreements. A copy of 3
the Service Company Service Agreement is attached to my testimony as Exhibit 4
CJK-5. A copy of the Utility Holdings Service Agreement is attached as 5
Exhibit CJK-6. 6
Q. IS THE PROPOSED METHOD OF CORPORATE COSTS 7
ALLOCATIONS CONSISTENT WITH HOW SIMILAR ALLOCATIONS 8
WERE HANDLED IN PAST RATE CASE? 9
A. Yes. Black Hills Power is allocating corporate costs based on the Cost Allocation 10
Manuals (CAM). The CAMs for Service Company and Utility Holdings are 11
provided as Exhibit CJK-7 and Exhibit CJK-8. These CAMs are generally 12
consistent with the last rate case for the Company in 2012 with a few updates to 13
the descriptions to departments or other clarifying items. 14
Q. DO THESE ALLOCATIONS OF INDIRECT COSTS RESULT IN A FAIR 15
AND EQUITABLE COST BEING BILLED TO BLACK HILLS POWER? 16
A. Yes. The methods used by Service Company and Utility Holdings were 17
established by reviewing relevant cost factors and are consistent with industry 18
practice in allocating common costs. In addition, services that are identified to a 19
specific project or company are directly billed to that project or company. The 20
combination of assigning direct costs for identifiable expenses and allocation of 21
indirect costs fairly and accurately represents Black Hills Power’s share of the 22
001070

20
costs of Service Company and Utility Holdings in the provision of services to 1
Black Hills Power. 2
X. CONCLUSION 3
Q. DOES THE REVENUE REQUIREMENT RESULT IN A JUST AND 4
REASONABLE REVENUE REQUIREMENT? 5
A. Yes. The revenue requirement uses the per books financial statements for the test 6
year ending September 30, 2013, which contains known and measurable 7
adjustments. The effect is a straight-forward application supporting the requested 8
increase in base rates. 9
Q. DOES THIS CONCLUDE YOUR TESTIMONY? 10
A. Yes, it does. 11
001071

Exhibit CJK-1
(1) (2) (3)Amounts
Amounts Included in theLine FERC Included in FPPA FilingNo. Acct. # Rate Case Reference Base Rates in April 2015
1 501 Fuel and Fuel Handling Stmt H; lns 3-7 -$ 9,000,000$ (a)2 502 Reagent Costs (Lime; Ammonia; Mercury Sorbent) Stmt H; ln 8 - 1,200,000 (a)3 555 Purchase Power Stmt H; ln 45 - 5,800,000 (a)4 547 Fuel - Other Plant (Delivered Natural Gas Cost) Stmt H; ln 27 - 3,000,000 (a)5 Power Marketing Operating Income Stmt I pg 1; ln 9 & Sched H-12 - (750,000) (b)6 Annual System FPP Costs that would be reported on Section No 3C, Sheet 12, Line 1 18,250,000 78 408 Property Taxes Stmt P pg 1; ln 19 4,049,818 500,000 (c)9 447 Sales for Resale (Long-Term Wholesale Contracts) Stmt P pg 1; ln 27 19,288,845 700,000 (d)
10 Incremental South Dakota Jurisdictional Costs reported on Section 3C, Sheet 12, Line 10 1,200,000 1112 Note (a) These amounts represent 100% of those costs passed through to customers in the April 2015 filing from13 October 1, 2014 through March 31, 2015.14 Note (b) This amount represents 65% of the total Power Marketing Operating Income from October 1, 201415 through March 31, 2015.16 Note (c) This amount will represent the difference from the amount included in base rates to the actual amount17 from October 1, 2014 through March 31, 2015 (prorated for the six month time period).18 Note (d) This amount will represent the difference from the amount included in base rates to the actual amount19 from October 1, 2014 through March 31, 2015 (prorated for the six month time period). A positive20 amount here would represent lower revenue as compared to the amount in base rates and a negative21 amount here would represent higher revenue as compared to the amount in base rates. Long-Term22 Wholesale contracts are defined as one year or longer.2324 Overall Note: The amounts listed in Column (3) are for illustration purposes only.
Black Hills PowerFuel and Purchase Power Adjustment Example
For Rates Effective on October 1, 2014
001072

Date Filed: March 31, 2014 By: Chris Kilpatrick Effective Date: October 1, 2014 Docket: EL14- Director of Rates
Black Hills Power, Inc. Rapid City, South Dakota
SOUTH DAKOTA ELECTRIC RATE BOOK FUEL AND PURCHASED POWER ADJUSTMENT Section No. 3C Fifth Revised Sheet No. 12 Page 1 of 4 Cancels Fourth Revised Sheet No. 12
FUEL AND PURCHASED POWER ADJUSTMENT APPLICABLE This Fuel and Purchased Power Adjustment (FPPA) applies to all rate schedules for all classes of service authorized by the South Dakota Public Utilities Commission (Commission). The FPPA shall be calculated annually based on actual system costs for Fuel and Purchased Power (FPP) for the twelve months of April through March as compared to the base year FPP costs, and shall include an over-or-under recovery from prior years’ adjustments through the Balancing Account. Black Hills Power, Inc. (the Company) will update and make a FPPA filing with the Commission on an annual basis no later than May 10th. For the Twelve months FUEL AND PURCHASED POWER ADJUSTMENT CALCULATION ended
1. Annual System FPP Costs $ 2. Annual Retail Energy Sales kWh 3. FPP Cost / kWh (Line 1 ÷ Line 2) $ /kWh 4. Approved Base FPP Costs $ 0.0146 /kWh 5. FPP Cost / kWh Difference (Line 3 – Line 4) $ /kWh 6. Total FPP Change from Base (Line 2 x Line 5) $ 7. South Dakota Annual Retail Energy Sales kWh 8. Total SD (Refund)/Charge (Line 5 x Line 7) $ 9. SD Balancing Account (+/-) $ 10. Incremental SD Jurisdictional Costs $ 11 Rate Case True-up Items $ 12. Net SD Amount to (Refund)/Charge (Line 8 through Line 11) $ 13. Projected South Dakota Retail Energy Sales kWh 14. SD FPPA (Line 12 ÷ Line 13) $ /kWh
(N)
EXHIBIT CJK-2
001073

Date Filed: March 31, 2014 By: Chris Kilpatrick Effective Date: October 1, 2014 Docket: EL14- Director of Rates
Black Hills Power, Inc. Rapid City, South Dakota
SOUTH DAKOTA ELECTRIC RATE BOOK
FUEL AND PURCHASED POWER ADJUSTMENT Section No. 3C First Revised Sheet No. 13 Page 2 of 4 Cancels Original Sheet No. 13
FUEL AND PURCHASED POWER ADJUSTMENT
ANNUAL SYSTEM FUEL AND PURCHASED POWER (FPP) COSTS (Line 1) FPP Costs include all purchased power; fuel consumed for plant generation, including but not limited to coal, fuel oil and natural gas; plus costs for certain re-agents used in conjunction with fuel consumed for plant generation less costs associated with Power Marketing; and a sharing of Power Marketing Operating Income. The Annual System FPP Costs shall be calculated on an annual basis using the total of:
a. Total fuel costs of the Company’s generation for items listed in the Federal Energy Regulatory Commission’s (FERC) Accounts: 501 for Fuel and 547 for Other Power Production, as well as any other costs of fuel consumed to generate electricity not listed in these two accounts. The base price for coal, included in this cost, is determined in accordance with the methodology set forth in the Statement R of the Company’s 2006 rate application Docket No. EL06-019;
b. The costs of re-agents necessary to use in conjunction with fuel consumed for plant generation. This includes lime and the associated freight, ammonia and other chemicals.
c. The costs of all energy or short term capacity purchases listed under FERC account 555; d. Less, Ninety percent (90%) of the share of margin generated by the sale of Renewable
Energy Credits;
e. Less, FPP used for Power Marketing Sales; and
f. Less a share of Power Marketing Operating Income as described below. POWER MARKETING OPERATING INCOME (PMOI)
As an incentive to provide the lowest cost FPP to customers, Power Marketing revenues and expenses will be included in the Fuel and Purchase Power Adjustment clause as follows:
a. Power Marketing Sales revenues are defined as short-term (generally less than one year) energy or capacity sales to wholesale customers and sales of emission allowances.
b. The Company’s long-term (generally one year or longer) customer obligations will be served
with the lowest cost resources during each hour that the Company engages in Power Marketing Sales except for the following: 1) Any renewable resource energy; and 2) Specific energy or capacity blocks, up to 75MW, purchased to cover capacity needs for 3 weeks or more [but not to exceed 6 months] in length. For these two situations, the cost of capacity or energy shall be directly assigned to the Company’s long-term customers. Any remaining resources may be scheduled for, and if scheduled will be charged to, Power Marketing Sales as the costs of goods sold.
c. Fifty percent (50%) of the base salary and benefit costs of the Company’s generation
dispatch and power marketing personnel shall be included as a power marketing expense
(N)
EXHIBIT CJK-2
001074

Date Filed: March 31, 2014 By: Chris Kilpatrick Effective Date : October 1, 2014 Docket: EL14- Director of Rates
Black Hills Power, Inc. Rapid City, South Dakota
SOUTH DAKOTA ELECTRIC RATE BOOK
FUEL AND PURCHASED POWER ADJUSTMENT Section No. 3C
Second Revised Sheet No. 14 Page 3 of 4 Cancels First Revised Sheet No. 14
FUEL AND PURCHASED POWER ADJUSTMENT POWER MARKETING OPERATING INCOME (Continued)
d. Any transmission expense incurred to facilitate Power Marketing Sales shall be included as an expense.
e. Bonuses payable to the Company’s generation dispatch and power marketing personnel as a
result of Power Marketing Sales shall be included as an expense. f. Any specifically identified expenses associated with Power Marketing Sales, such as legal
expense or bad debt expense, shall be included as an expense.
SHARING OF POWER MARKETING OPERATING INCOME The calculated Pre-Tax PMOI will be multiplied by 65% to determine the amount of the credit to be applied as a reduction to the FPP costs. ANNUAL RETAIL ENERGY SALES (Line 2) Annual Retail Energy Sales are the total sales of Electricity, for retail customers.
BASE FPP COSTS (Line 4) The Base FPP Costs are as approved by the Commission in Docket No. EL09-018.
SOUTH DAKOTA ANNUAL RETAIL ENERGY SALES (Line 7) The South Dakota Annual Retail Energy Sales are the total South Dakota retail energy kilowatt hour sales for the previous period for all classes of service authorized by the Commission. SD BALANCING ACCOUNT (Line 9) This Balancing Account amount on Line 9 (positive or negative) is the amount from the previous filing (SD Net Amount to (Refund)/Charge) less the actual FPPA amount (Refunded) or Charged for the period, adjusted for applicable interest. The Balancing Account shall have interest applied or credited monthly at the annual rate of seven percent (7%). The FPPA (Refund)/Charge will be applied monthly to the Balancing Account, first to the interest balance, and thereafter to the principal amount. INCREMENTAL SD JURISDICTIONAL COSTS (Line 10) These costs represent the difference of the actual ad valorem and wholesale contract revenue as compared to the amount in base rates as approved in Docket No. EL14-___, Statement P, page 1, lines 19 and 27.
(N)
EXHIBIT CJK-2
001075

Date Filed: March 31, 2014 By: Chris Kilpatrick Effective Date : October 1, 2014 Docket: EL14- Director of Rates
Black Hills Power, Inc. Rapid City, South Dakota
SOUTH DAKOTA ELECTRIC RATE BOOK
FUEL AND PURCHASED POWER ADJUSTMENT Section No. 3C Second Revised Sheet No. 15 Page 4 of 4 Cancels First Revised Sheet No. 15
FUEL AND PURCHASED POWER ADJUSTMENT
RATE CASE TRUE-UP ITEMS (Line 11) The Rate Case True-up Items adjustment includes items that need to be charged or (refunded) to customers as a result of rate case items to be handled outside of the general rate case. These items are handled in the time period required per the outcome of each case. The total dollar amount may reflect items from various cases. NET SD AMOUNT TO (REFUND)/CHARGE (Line 12) The net amount to refund or charge customers is the South Dakota’s share of the total Net FPP costs adjusted by the Balancing Account (Line 8 through Line 11). PROJECTED SOUTH DAKOTA RETAIL ENERGY SALES (Line 13) These are the kilowatt hours of retail sales projected for the State of South Dakota for the period that the FPPA (Line 14) will be in effect. SD FUEL AND PURCHASED POWER ADJUSTMENT (Line 14) The FPPA on Line 14 shall be included in the Company’s annual Energy Cost Adjustment and shall be applied to all rate schedules in all classes of service authorized by the Commission.
EFFECTIVE DATE The FPPA will be updated and filed annually with the effective date of June 1st.
(N)
EXHIBIT CJK-2
001076

EXHIBIT CJK-3
REQUEST FOR ACCOUNTING AUTHORITY ORDER
ALLOWING BLACK HILLS POWER TO INCLUDE ADDITIONAL COSTS IN THE
REGULATORY ASSET APPROVED IN DOCKET NO. EL 13-036
Black Hills Power, Inc. (“Black Hills Power” or the “Company”) requests that the South Dakota
Public Utilities Commission (“Commission”) approve an accounting authority order permitting
Black Hills Power to include additional costs in the regulatory asset approved in Docket No. EL
13-036. Black Hills Power requests this accounting authority order be approved if the pending
rate case is not resolved prior to December 31, 2014.
1) On January 9, 2014, the Commission granted Black Hills Power the authority to
establish a regulatory asset in Docket No. EL13-036 for the incremental costs
incurred in relation to Winter Storm Atlas. When the regulatory asset was
approved, Black Hills Power had paid incremental costs in the amount of $2.5
million as of November 30, 2013.
2) All storm related invoices had not been received when the regulatory asset was
approved. Black Hills Power has an additional $0.5 million in associated costs
since the approval and requests that these costs be included in the regulatory asset.
3) Black Hills Power has also determined that it is necessary to conduct a ground
patrol of its Black Hills communities to identify any latent damage caused by
Winter Storm Atlas. Black Hills Power estimates that the costs associated with
001077

this ground patrol project will be approximately $1.142 million. Black Hills
Power requests that this amount also be included in the regulatory asset.
4) The Company requests that it receive a yearly rate of return on the balance in the
Winter Storm Atlas regulatory asset. The rate of return will be equal to the rate of
return approved by the Commission in this rate case.
If the Commission approves Black Hills Power’s request, Black Hills Power will hold its
deferred costs in Account No. 182.3, Other Regulatory Assets, until consideration of cost
recovery occurs in the base rate proceedings. Permitting this treatment will allow Black Hills
Power to make appropriate adjustments on its books for the regulatory asset and prevent it from
having to record Winter Storm Atlas related incremental costs as expenses on its books in a
condensed time period.
001078

EXHIBIT CJK-4
REQUEST FOR ACCOUNTING AUTHORITY ORDER
ALLOWING BLACK HILLS POWER TO USE DEFERRED ACCOUNTING FOR COSTS
ASSOCIATED WITH THE FUTURETRACK WORKFORCE DEVELOPMENT PROGRAM
THAT DEVIATE FROM THE ASSOCIATED COSTS INCLUDED IN BASE RATES
Black Hills Power, Inc. (“Black Hills Power” or the “Company”) requests that the South Dakota
Public Utilities Commission (“Commission”) approve an accounting authority order permitting
Black Hills Power to use deferred accounting for costs associated with the FutureTrack
Workforce Development Program that deviate from the associated costs included in base rates.
1) Black Hills Power has requested that the Commission approve the inclusion of
$675,845 in base rates over the next eight years for the FutureTrack Workforce
Development Program. Provided the Commission approves this amount, Black
Hills Power proposes that any deviation from this amount be recorded in a
regulatory asset.
2) The Company requests that it receive a yearly rate of return on the balance in the
FutureTrack Workforce Development Program regulatory asset. The rate of
return will be equal to the rate of return approved by the Commission in this rate
case.
3) An annual report to the Commission will be provided to demonstrate the actual
costs incurred and progress of the overall program.
001079

4) The Company requests that at the end of the eight year period, the balance in the
regulatory asset be amortized over the next three year period.
5) The Company requests that the recovery of the FutureTrack Regulatory Asset
commence in year nine in the form of a tariff or rate increase to be approved by
the Commission prior to year eight.
001080

Line FERC Schedule N-1 SDNo. Acct. # Description Reference Amount Alloction Amount
1 Salaries and Benefit Expenses2 502 Steam Plant Operation 61,140$ DPROD 54,923$ 34 512 Steam Plant Boilers Maintenance 82,471 DPROD 74,085 56 580 Distribution Supervision 77,834 SALWAGDO 72,694 78 593 Distribution Overhead Line Maintenance 345,337 OHDIST 327,569 9
10 908 Customer Assistance 99,223 CUSTASST 95,369 1112 920 Administration 55,856 SALWAGES 51,205 1314 Annual Strategic Workforce Planning Expense Sum(Ln. 2:Ln. 12) 721,861$ 675,845$
1516 Note: The annual FutureTrack Workforce Development Program expense equals one-eighth of the total cost needed17 over the next eight years to cover the significant loss of employees related to the baby boomer generation retiring18 from the company.
BLACK HILLS POWER, INC.FUTURETRACK WORKFORCE DEVELOPMENT PROGRAMFor the Pro Forma Test Year Ended September 30, 2013
001081

001082
mtoney
Typewritten Text
Exhibit CJK-5 Service Company Service Agreement
mtoney
Typewritten Text
mtoney
Typewritten Text
mtoney
Typewritten Text
mtoney
Typewritten Text

001083

001084

001085

001086

001087
mtoney
Typewritten Text
Exhibit CJK-6 Utility Holdings Service Agreement

001088

001089

001090

001091

Black Hills Service Company
Cost Allocation Manual
Effective Date: July 14, 2008
Amended: January 1, 2010
Amended: August 1, 2010
Amended: December 1, 2013
001092
mtoney
Typewritten Text
mtoney
Typewritten Text
mtoney
Typewritten Text
Exhibit CJK-7 Service Company Cost Allocation Manual
mtoney
Typewritten Text
mtoney
Typewritten Text
mtoney
Typewritten Text
mtoney
Typewritten Text
mtoney
Typewritten Text
mtoney
Typewritten Text
mtoney
Typewritten Text
mtoney
Typewritten Text
mtoney
Typewritten Text
mtoney
Typewritten Text

2
Black Hills Service Company Cost Allocation Manual
Table of Contents
Introduction ..................................................................................................................................... 3
Service Company Organization ...................................................................................................... 3
Direct Costs versus Indirect Costs .................................................................................................. 4
Transaction Coding ......................................................................................................................... 5
General Ledger Business Unit (GLBU): ..................................................................................... 6
Operating Unit (OpUnit): ............................................................................................................ 6
Department (Dept): ..................................................................................................................... 7
Account (Acct) ............................................................................................................................ 7
Resource:..................................................................................................................................... 8
Product: ....................................................................................................................................... 8
Work Order: ................................................................................................................................ 8
Timekeeping ................................................................................................................................... 9
Loadings .......................................................................................................................................... 9
Allocation Factors ......................................................................................................................... 10
Changing Allocation Factors ........................................................................................................ 11
Subsidiary Payment for Direct and Indirect Charges ................................................................... 11
Allocating Fixed Assets ................................................................................................................ 12
Appendix 1 – BHSC Departments ................................................................................................ 13
Appendix 2 – Allocation Factors .................................................................................................. 21
001093

3
Introduction
The purpose of this cost allocation manual is to document the allocation processes of Black Hills Service Company, from recording the original transaction through the allocation of costs to Black Hills Corporation subsidiaries. Various topics to be addressed include the organization of the Service Company, the recording of transactions, calculating and assigning allocation factors, and recording allocation transactions. Black Hills Service Company (the Service Company) was formed on December 30, 2004, and was fully implemented and operational as of January 1, 2006. The Service Company was formed as required by the Public Utility Holding Company Act of 1935, which was administered by the Securities and Exchange Commission (SEC). Service companies were required of all registered holding companies under this law. Service companies coordinate corporate support functions and distribute costs to registered holding company subsidiaries using pre-defined allocation methodologies that had to be approved by the SEC. Black Hills Corporation became a registered holding company at the end of 2004, and through a transition period and various amendments to the registered holding company filings, established the date of January 1, 2006 to fully implement the Service Company. In August of 2005, this law was repealed and replaced by the Public Utility Holding Company Act of 2005, which is administered by the Federal Energy Regulatory Commission (FERC). This new law was effective in February of 2006. Although certain administrative and reporting requirements changed as a result of the repeal, Black Hills Corporation did not change its implementation plan. The Service Company is a wholly owned subsidiary of Black Hills Corporation (the Holding Company), and is a separate legal entity. The majority of operations and all employees were transferred out of the Holding Company on the effective date of implementation. The only transactions that remain at the Holding Company are transactions pertaining to long-term debt and related deferred finance costs, corporate credit facility and related deferred finance costs, and the administration of money pool transactions for both the utility money pool and the non-utility money pool. In addition, as will be discussed in greater detail later, certain corporate costs are charged directly to the Holding Company. The most notable of these types of costs are corporate development project costs.
Service Company Organization
The Service Company is organized into operating departments based upon the services that those departments provide to Black Hills Corporation subsidiaries. A list of each
001094
4
department, as well as a brief description of the services they provide, is attached as Appendix 1.
Direct Costs versus Indirect Costs
A key issue in distributing Service Company costs is distinguishing between direct costs and indirect costs. The account coding will change depending on whether the cost is a direct or indirect cost. Below is a summary of each of these types of costs and examples of these costs. Direct costs are those costs that are specifically associated with an identified subsidiary. This means that it is known exactly to which subsidiary these costs relate. Here are some examples:
A Payroll Processor is processing the payroll for Black Hills Power. The labor costs incurred in processing payroll are specifically associated with an identified subsidiary. Therefore, this would be a direct cost.
An Internal Auditor travels to Denver to complete audits for Colorado Independent Power Production and Black Hills Exploration and Production. The time associated with completing the audits would be charged to each company based on the time worked for each specific company project. The travel expenses should be split equally or on a pro rata share based on days worked. The Human Resources department incurs costs to bring an employment candidate on-site to Gillette for an interview with Wyodak Resources. These travel costs incurred in bringing the employee in for the interview are specifically associated with an identified subsidiary. Therefore, this would be a direct cost.
A Help Desk technician orders a replacement computer monitor for an employee at Black Hills Power. This hardware cost incurred is specifically associated with an identified subsidiary. Therefore, this would be a direct cost.
Indirect costs are those costs that are not associated with an identified subsidiary. This means that the costs indirectly support all companies or directly support the operation of the Service Company. In other words, costs that would be directly charged to the Service Company using the definition and examples above would be classified as indirect costs. Here are some examples:
The Internal Audit department is completing a BHC consolidated financial statement audit. Since all entities indirectly affect the financial statements of BHC consolidated, this charge would be considered an indirect cost.
An Environmental representative attends an industry training event). This charge cannot be directly attributable to any specifically identified company; therefore, this charge would be considered an indirect cost
001095

5
A Help Desk technician orders a replacement computer monitor for an employee of the Service Company. This hardware cost incurred is specifically associated with the Service Company. Therefore, this would be an indirect cost.
It is important to consider two things when determining if a cost is a direct cost or an indirect cost: (1) Can the costs that are coded to a specific company or group of companies be substantiated; and (2) Can it be substantiated that a utility-based entity is not subsidizing the operations of non-utility based company with the time and expenses that have been charged to them. A certain level of judgment will be involved when deciding whether a particular cost should be directly charged or indirectly allocated. There are certain costs that will always be considered either direct or indirect costs. Below is a list of significant Service Company expenses that follow these rules: Always considered direct costs:
Capitalized costs for non-BHSC projects (including capitalized labor) Corporate development project costs Retiree healthcare costs
Always considered indirect costs:
Board of Directors’ fees and expenses General Office rent Depreciation of BHSC assets Directors’ and officers’ insurance Investor relations expenses Shareholder expenses Intercompany interest expense and income
Transaction Coding
The Service Company uses an accounting software system to accumulate and distribute both direct costs and indirect costs. It is important to have costs properly classified as direct or indirect. Direct costs will be directly charged to the subsidiaries, while indirect costs will be allocated to the subsidiaries using pre-defined allocation factors. Below is a description of the coding.
001096

6
General Ledger Business Unit (GLBU):
Five (5) character numeric field.
The GLBU field is used to identify the company that will be receiving the charges.
The GLBU field is required on all accounting transactions.
The GLBU field will default when the Operating Unit (OpUnit) is entered.
Operating Unit (OpUnit):
Six (6) character numeric field.
The OpUnit field is used to identify the account code block as either a direct cost
or an indirect cost.
If the cost is a direct cost, the OpUnit field will be populated using the OpUnit
code for the company being directly charged.
If the cost is an indirect cost, the OpUnit field will be populated using one of the
BHSC OpUnit’s. Indirect costs also include costs directly related to the Service
Company.
separate fields, each representing an important characteristic of the underlying transaction.
_______ -- _________ -- __________ -- _________ -- ________ -- _________
GL BU OpUnit Dept. Acct. Resource Product
_______ -- _________ -- __________ -- _________ -- ________ -- _________
GL BU OpUnit Dept. Acct. Resource Product
001097

7
Department (Dept):
Four (4) character numeric field.
The Dept field is used to identify where the cost(s) originated.
The Dept field is required on all income statement and capital transactions.
Every department is assigned to a GLBU.
Account (Acct)
Six (6) character numeric field.
The Account field is required on all accounting transactions.
All companies will generally use the same Chart of Accounts although some
values will be specific to certain companies.
_______ -- _________ -- __________ -- _________ -- ________ -- _________
GL BU OpUnit Dept. Acct. Resource Product
_______ -- _________ -- __________ -- _________ -- ________ -- _________
GL BU OpUnit Dept. Acct. Resource Product
001098

8
Resource:
Four (4) character numeric field.
A Resource is used to identify types of costs.
The Resource field is required on all income statement and capital accounting
transactions.
Product:
Three (3) character numeric field.
A Product code is used to identify business lines.
Work Order:
Eight (8) character numeric field.
_______ -- _________ -- __________ -- _________ -- ________ -- _________
GL BU OpUnit Dept. Acct Resource Product
_______ -- _________ -- __________ -- _________ -- ________ -- _________
GL BU OpUnit Dept. Acct Resource Product
_______ -- _________ -- ________ -- ________ -- ________ -- ________ -- _________
GL BU OpUnit Dept. Acct Resource Product Work Order
001099

9
Represents the collection of costs to allow the monitoring of a job or group of
costs.
The Work Order field is required on all construction work in progress transactions
Timekeeping
All Service Company employees are required to complete a timesheet for each two week pay period. Timesheets of appropriate employees must be approved by a supervisor. Employees must complete the code block, as previously discussed, for each time record. The timesheet will default the department and resource. However, the employee is responsible for providing the remainder of the code block. Employees are encouraged to enter their time in one half hour increments, although they may use smaller increments if they so choose.
Loadings
Certain benefits that are provided to employees become an inherent cost of labor. To account for these benefits and allow for them to be charged to the appropriate subsidiary, they become part of a loading rate that is added on to each payroll dollar. The loading rates are calculated at the beginning of the year based on budgeted benefit expenses and budgeted labor. Benefit costs and loading ratesare reviewed, and updated as needed. Below is a list of components of the loading rates: General labor loadings:
Compensated Absences: including but not limited to PTO, Holiday, Jury duty, Funeral pay, United Way day, Short-term Disability and Annual Physical appointment.
Payroll Taxes: including but not limited to FICA, FUTA SUTA and city taxes Employee Benefits: including but not limited to health and medical, 401K match
and fees, Pension, Retiree healthcare and associated fees and Pension audit fees
Incentives: including but not limited to Non-officer incentive plans, Restricted Stock and Stock Option expense
Supplemental loadings:
Officer short term incentive plans Officer supplemental retirement Officer performance plan
001100

10
Loadings calculated on payroll are based on estimated benefit costs, therefore, differences between actual benefits will be inherent to this process. After the difference is calculated and reviewed for reasonableness, it is recorded to a separate department, and indirectly allocated to Black Hills Corporation subsidiaries.
Allocation Factors
As previously stated, Service Company costs are either directly charged to a subsidiary, or indirectly allocated when the cost is not associated with a specific subsidiary. Indirect costs are allocated using one of several pre-defined allocation factors. Each department has been assigned one of these allocation factors. All indirect costs of that department are then allocated using that factor. When determining which allocation factor should be assigned to each department, a factor is selected based on the specific cost driver of that department. For instance, the expenses incurred by a Human Resources department are primarily related to their support of all company employees. In this example, the cost driver for the Human Resources department indirect costs is employees. Therefore, their indirect costs will be allocated based upon the Employee Ratio. For certain departments, a specific cost driver may not be clearly identifiable or the driver may not be cost effective to compute on a continuing basis. In these instances, a three-pronged general allocation factor is used, which is referred to as the Blended Ratio. This ratio equally weights three different general ratios: Gross Margin, Asset Cost (limited to gross PP&E), and Payroll Dollars. These factors were chosen to be included in the Blended Ratio because they best allocate costs based on the diverse nature of BHC operations. In addition, some departments utilize a Holding Company Blended Ratio. The difference between the Blended Ratio and the Holding Company Blended Ratio is that the Holding Company Blended Ratio allocates a percentage of costs to BHC Holding Company. For example, the Corporate Governance department will allocate indirect costs using the Holding Company Blended Ratio because certain costs incurred, such as New York Stock Exchange fees and Board of Directors costs, relate to both the Holding Company and the subsidiary companies. One additional item to note is that pooled benefits, primarily health care costs, are allocated differently due to the pooling method for benefits such as self-insured health care. Black Hills Corporation has chosen to pool certain benefit costs and spread the risk amongst all subsidiaries equally. All pooled benefit costs of BHC are paid by the Service Company and allocated to subsidiaries based on employee counts. Appendix 2 includes a list of all allocation factors, including a brief description of the factor, the basis for the calculation of the factor, and the departments to which that
001101

11
factor has been assigned. Asset factors and employee count factors are calculated as of period-end dates, while revenue and expense factors are calculated for twelve months ended as of period-end dates.
Changing Allocation Factors
Allocation factors are set at the first of the year, based upon financial information from the prior year ending December 31st. Assets, utility assets, employee counts, and power generation capacity are based on values as of the previous period ending December 31st. Gross margin, utility gross margin, payroll dollars, and utility payroll dollars are based on values for the 12 months ended December 31st. Certain events may occur during the year that are deemed to be significant to Black Hills Corporation that will require corresponding adjustments be made to the allocation factors. Examples of these types of events include acquisitions, divestitures, new generation, significant change in asset base, significant staffing changes or new, significant revenue streams. When these events occur, indirect allocation factors will be adjusted. When adjusting allocation factors, it is the policy of the Service Company to not recalculate all allocation factors. Rather, allocation factors will be adjusted with pro forma adjustments for the subsidiary with a significant change in a specific allocation factor base. For example, if an acquisition occurs during the middle of the year, pro forma values will be loaded. Asset values at the time of the acquisition would be used, as well as pro forma gross margin and payroll dollars for a 12 month period. It should be noted that estimations may be required, especially when significant additions or changes are expected as a result of the acquisition. It should also be noted that asset values, gross margin, and payroll dollars for the other companies will not be changed. However, the ratios will change because the base against which the ratios are calculated will change. Subsidiary companies would see decreased ratio values with acquisitions, and increased ratio values with divestitures. Changes will be effective as of the beginning of the month following the significant event, and will apply to all transactions for the month.
Subsidiary Payment for Direct and Indirect Charges
It is the policy of the Service Company to insure payments are made by the subsidiary companies for direct and indirect charges. All payments for direct and indirect charges must be remitted to the Service Company by the end of the following month. The
001102

12
Service Company will monitor payments received during the month to insure that all subsidiary companies make payment in a timely manner.
Allocating Fixed Assets
The Service Company maintains certain fixed assets that are used by and benefit multiple Black Hills Corporation subsidiaries. These fixed assets primarily consist of computer hardware and software that form the corporate-wide information technology network. Because these fixed assets support multiple Black Hills Corporation subsidiaries, they are allocated to the appropriate subsidiaries monthly as part of the month-end close process, along with the allocation of these assets’ accumulated depreciation. Construction Work in Process balances are not allocated. Allocated assets and accumulated depreciation are maintained in separate general ledger accounts at the subsidiary level so that they are not intermingled with regular subsidiary fixed assets, and for ease of reconciliation. The allocation factor used for fixed assets and accumulated depreciation is the Blended Ratio, except as otherwise noted. Depreciation expense is also allocated using the Blended Ratio.
001103

13
Appendix 1 – BHSC Departments
The following departments are included in BHSC as of 01/01/2013 and are subject
to changes as required to support evolving business requirements.
SC-ACCOUNTING SYSTEMS (4700)
Description: Maintains the corporate- wide accounting systems of Black Hills Corporation, most notably the general ledger and financial statement preparation systems. (Blended)
SC-DISBURSEMENTS (4701)
Description: Processes payments to vendors and prepares 1099s and applicable documentation for the majority of Black Hills Corporation subsidiaries. Also, processes payroll including but not limited to time reporting, calculation of salaries and wages, payroll tax reporting and compliance reports for Black Hills Corporation and its subsidiaries. (Blended)
SC-CORP DEVELOPMENT (4702)
Description: Facilitates the development of the corporate strategy, prepares strategic plans, and evaluates potential business opportunities. Department also assists various subsidiaries with financial analysis and special projects. (HoldCo Blended)
SC-CORP GOV AND SHAREHOLDER SERV (4703)
Description: Develops and enforces corporate governance policies and procedures in accordance with applicable laws and regulations. Provides oversight of compliance with Securities and Exchange Commission rules and regulations. Oversees the administrative duties to the Board of Directors. Provides various recordkeeping and administrative services related to shareholder services. Assists in the administration of equity-based compensation plans. (HoldCo Blended)
SC-TAX (4704)
Description: Prepares quarterly and annual tax provisions of all Black Hills Corporation subsidiaries. Maintains and reconciles all current and deferred income tax general ledger accounts. Prepares tax filings and ensures compliance with applicable laws and regulations. Oversees various tax planning projects. (Blended)
SC-CREDIT AND RISK (4705)
001104

14
Description: Provides risk management, risk evaluation, and risk analysis services. Provides support to the Executive Risk Committee. Evaluates contract risks. (Blended)
SC-LEGAL - CORPORATE (4706)
Description: Provides legal counsel and services related to general business operations, including labor and employment law, finance, litigation, contracts, utility rates and regulation, financial reporting, Securities and Exchange Commission, Federal Energy Regulatory Commission and other state and federal compliance, environmental matters, real estate and other legal matters. Oversees the hiring and administration of external counsel. Provides legal support to various corporate development projects. (Blended)
SC-CORPORATE AFFAIRS (4708)
Description: Provides oversight to Public Relations, Marketing, Governmental Affairs, Regulatory Affairs and Regulatory Services/Resource Planning for all Black Hills Corporation and its subsidiaries. (Blended)
SC-ENVIRONMENTAL SERVICES (4709)
Description: Establishes policies and procedures for compliance with environmental laws and regulations. Researches emerging environmental issues and monitors compliance with environmental requirements. Oversees environmental clean-up projects. Obtains permits to support the business operations of Black Hills Corporation and its subsidiaries. (Asset)
SC-EXECUTIVE MGMT (4710)
Description: Provides overall oversight of Black Hills Corporation and its subsidiaries. Provides the Board of Directors information for decision making purposes. (HoldCo Blended)
SC-SAFETY (4711)
Description: Develops and implements safety planning activities and provides employee safety education. Administers the corporate safety program. Assists with compliance with DOT, OSHA, and MSHA regulations. (Employee)
SC-FINANCE AND TREASURY (4712)
Description: Coordinates activities related to securities issuance, including maintaining relationships with financial institutions, debt holders, rating agencies, equity analysts and equity investors. Performs accounting, cash management, debt compliance, and
001105

15
investing activities. Monitors capital markets to support financial planning for all subsidiaries. Oversees the administration of corporate pension and 401(k) plans. (HoldCo Blended)
SC-FINANCIAL REPORTING (4713)
Description: Oversees the corporate consolidation of subsidiary financial statements. Prepares monthly internal financial reports for management. Prepares quarterly and annual financial reports to the Securities and Exchange Commission, financial statements to banks and quarterly and annual financial statements filed wtih FERC. Researches emerging accounting issues and assists with the compliance of new accounting rules and regulations. (HoldCo Blended)
SC-BUDGET AND FORECAST (4714)
Description: Oversees the accumulation of subsidiary financial budgets and forecasts. Provides the consolidation of the corporate wide- budget and forecast. Guides the preparation of strategic plans. (Blended)
SC-GENERAL ACCOUNTING (4715)
Description: Provides management and administrative support for accounting and finance functions of the Company's regulated and non-regulated businesses including external audit coordination. (Blended)
SC-ACCOUNTING-CENTRAL SERVICES (4716)
Description: Maintains the accounting records for Black Hills Service Company and Black Hills Corporation. Provides oversight of Accounts Payable, Payroll, and Property Accounting departments. (Blended)
SC-ACCOUNTING-GENERATION SERV (4717)
Description: Provides general ledger accounting to non-regulated generation facilities and accounting support to all generation facilities. (Generation Capacity)
SC-HUMAN RESOURCES CORP (4718)
Description: Provides general Human Resources support services through the administration of policies for all facets of Human Resources, including employee relations, labor relations, talent management, recruiting and employment staffing, compensation and benefits administration and state/federal regulation compliance. (Employee)
001106

16
SC-HUMAN RESOURCES REGULATED (4720)
Description: Provides general Human Resources support services to the subsidiaries through the administration of policies and labor contracts for all facets of Human Resources, including employee relations, labor relations, talent management, recruiting and employment staffing, compensation and benefits administration. (Employee)
SC-COMPENSATION AND BENEFITS (4721)
Description: Administers policies related to compensation and benefits. Oversees the self-insured medical benefits plans and other pooled benefits and provides support to the third party administrators of the plans. (Employee)
SC-ORGANIZATIONAL DEVELOPMENT AND TRAINING (4722)
Description: Provides for employee and leadership development, succession planning, performance management, goal alignment, employee engagement, strategic workforce planning, talent assessment and general HR support for Black Hills Corporation and its subsidiaries. (Employee)
SC-ENGINEERING ROTATION PROGRAM (4723)
Description: Provides a rotation program to develop staff for critical need areas within Black Hills Corporation and its subsidiaries. (Blended)
SC-INSURANCE (4724)
Description: Facilitates physical risk management strategies through the purchase and evaluation of various types of insurance coverage. Provides claims management services. (Blended)
SC-INTERNAL AUDIT (4725)
Description: Reviews internal controls and procedures to ensure assets are safeguarded and transactions are properly authorized and recorded. Oversees the Sarbanes Oxley compliance efforts. (Blended)
SC-IN-HOUSE CREATIVE SOLUTIONS (4726)
001107

17
Description: Provides program for effective, measured, and coordinated advertising. Manages, develops and implements communication channels to maintain effective communications with stakeholders. Designs and develops communication materials. (Blended)
SC-POWER DELIVERY MGMT (4728)
Description: Performs resource planning, power delivery management, strategic planning, and construction management for the corporation’s power generation assets.
(Generation Capacity)
SC-PROPERTY ACCOUNTING (4729)
Description: Maintains the accounting records for property, plant and equipment for the majority of subsidiaries of the corporation. Assists in compliance with regulatory accounting requirements as it relates to property. Prepares various operating and financial reports for management. (Asset)
SC-RECORDS MGMT (4730)
Description: Administers and maintains the records retention policies and procedures of the corporation. Manages and maintains the content management software. (Blended)
SC-SUPPLY CHAIN MGMT (4731)
Description: Develops strategies and provides general oversight to Facilities, Contract Management, Strategic Sourcing, Procurement, Fleet Services, Materials Management and Supplier Diversity departments. (Blended)
SC-CONTRACTS MGMT (4732)
Description: Manages contracts, including drafting, negotiating, reviewing and interpreting contracts. (Blended)
SC-STRATEGIC SOURCING (4733)
Description: Executes the procurement process including, purchasing activities, managing vendor relationships, and issue resolution and tracking and expediting orders. (Blended)
SC-FLEET SERV (4734)
Description: Manages fleet expense cards, fleet contracts, vehicle purchasing, replacement, disposal, licensing/registration and titling. Advises on vehicle maintenance and repairs, alternative fuel selections and implementations. (Blended)
001108

18
SC-FACILITIES (4736)
Description: Provides facility, construction, and real estate management services for corporate-wide facilities. Supports disaster recovery and business continuation planning. (Blended)
SC-GOVERNMENTAL AFFAIRS (4741)
Description: Advances corporate objectives by initiating, influencing, monitoring, and researching government legislation and policies. Acts as a liaison with legislators and other governmental officials. Maintains relationships with federal, state and other governmental bodies. (Blended)
SC-IT ADMINISTRATION (4742)
Description: Provides guidance, governance, and strategic planning to the overall information technology operations. (Blended)
SC-IT BUSINESS APPLICATIONS-FIN AND HR SYSTMS (4743)
Description: Manages, maintains, and enhances the financial and human resource related business applications of the company. (Blended)
SC-IT BUSINESS APPLICATIONS-REGULATED (4744)
Description: Manages, maintains, and enhances business applications within the utility companies. (Utility Blended)
SC-IT BUSINESS APPLICATIONS-WEB SERV SUPP (4745)
Description: Manages, maintains, and enhances the web-based service business applications of the company. (Blended)
SC-IT BUSINESS APPLICATIONS-WHOLESALE AND ENTERPRISE (4746)
Description: Manages, maintains, and enhances the wholesale and enterprise-wide business applications of the company. (Blended)
SC-IT INFRASTRUCTURE SERV (4747)
Description: Manages, maintains, and enhances data center operations, infrastructure servers, storage, system software, enterprise architecture, and corporate databases. (Blended)
SC-IT COMMUNICATIONS (4748)
001109

19
Description: Manages and supports the data and voice communication needs for the company. Provides telecommunication expense management services. (Blended)
SC-IT USER SERVICES (4749)
Description: Provides technology support services for the company, including field services. (Blended)
SC-IT COMPLIANCE (4751)
Description: Responsible for internal and external audit compliance, disaster recovery, change management and legal compliance related to technology. (Blended)
SC-MATERIALS MGMT (4752)
Description: Manages inventory, obsolescence and scrap. Ensure availability of proper materials. Pull, restock and stage materials. (Blended)
SC-CONTINIOUS IMPROVEMENT (4753)
Description: Helps identify solutions to improve work processes, maximize business performance and add value for customers and stakeholders. (Blended)
SC-GENERATION PLANT OPERATIONS (4754)
Description: Operates and manages the generation for BHCOE and BHCIPP. (NamePlate Generation Capacity)
SC-IT HELPDESK / TECHNOLOGY INTEGRATION (4755)
Description: Provides IT telephone support, technology training and technology integration services. (Blended Ratio)
SC-CPGS PLANT OPERATIONS (4756)
Description: Operates and manages the new generation for the Cheyenne Prairie Generation Station. (NamePlate Generation Capacity)
SC-PROCUREMENT (4760)
Description: Executes the procurement process including, purchasing activities, managing vendor relationships, and issue resolution and tracking and expediting orders. (Blended)
SC – ASSET BLENDED (4793)
Description: Records depreciation for the Service Company assets. (Blended)
001110

20
SC-BENEFIT POOLED (4794)
Description: Records pooled benefit costs, primarily related to health and welfare for Black Hills Corporation and its subsidiaries. (Employee)
SC-ACCOUNTING ACCRUAL ENTRIES (4795)
Description: Records accrual of certain charges not related to specific departments or not significant enough to allocate to each department. (Blended)
SC-BENEFITS LOADING (4796)
Description: Records overhead benefit costs loaded to labor costs (Blended)
001111

21
Appendix 2 – Allocation Factors
Asset Cost Ratio – Based on the total cost of assets as of December 31 for the prior year, the numerator of which is for an applicable BHC subsidiary and the denominator of which is for all applicable BHC subsidiaries. Assets are limited to property, plant, and equipment, and include construction or work in process. Assets are also reported at their FERC value, meaning that assets for the utility subsidiaries will not include any adjustments that are required to bring their FERC financial statements into compliance with GAAP. FERC requires that acquired fixed assets be recorded at their gross value with accumulated depreciation, while GAAP requires that acquired fixed assets be recorded at their net book value. An adjustment journal entry is used to eliminate the gross-up of cost and accumulated depreciation for preparation of GAAP financial statements, but this adjustment is not factored into the calculation of the Asset Cost Ratio.
The Environmental Services and Property Accounting departments utilize this ratio, and it is a component in the Blended Ratio and the Holding Company Blended Ratio.
Gross Margin Ratio – Based on the total gross margin for the prior year ending December 31, the numerator of which is for an applicable BHC subsidiary and the denominator of which is for all applicable BHC subsidiaries. Gross margin is defined as revenue less cost of sales. Certain intercompany transactions may be excluded from gross margin if they would not have occurred if the revenue relationship was with a third party instead of a related party.
No departments utilize this ratio, but it is a component in the Blended Ratio and the Holding Company Blended Ratio.
Payroll Dollars Ratio – Based on the total payroll dollars for the prior year ending December 31, the numerator of which is for an applicable BHC subsidiary and the denominator of which is for all applicable BHC subsidiaries. Payroll dollars include all bonuses and compensation paid to employees, but do not include items that are only included on an employee’s W-2 for gross-up and income tax purposes, such as life insurance premiums over $50,000.
No departments utilize this ratio, but it is a component in the Blended Ratio and the Holding Company Blended Ratio.
Blended Ratio – A composite ratio comprised of an average of the Asset Cost Ratio, the Payroll Dollars Ratio, and the Gross Margin Ratio. These factors are equally weighted. This factor is sometimes referred to as the general allocation factor.
Departments that utilize this ratio include Accounting Systems, Accounts Payable, Tax, Credit and Risk, General Accounting, Insurance, Internal Audit, Legal, Corporate Affairs, Budget and Forecast, General Accounting, Accounting-Central Services, Engineering
001112

22
Rotation Program, Insurance, Internal Audit, In-House Creative Solutions, Records Management, Supply Chain Management, Contract Management, Strategic Sourcing, Fleet Services, Facilities, Governmental Affairs, Information Technology Administration, Information Technology Business Applications Wholesale and Enterprise, Information Technology Business Applications Web Service Support, Information Technology Business Applications Financial and HR Systems, Information Technology Infrastructure Services, Information Technology Communications, Information Technology User Services, Corporate Security, Information Technology Compliance, Materials Management, Continuous Improvement, Information Technology Helpdesk / Technology Integration, Procurement, Assets Blended, Accounting Accruals, Benefits and BHSC portion of the Rapid City Plant Street Facility, Midlands Data Facility and Bellevue Data Center Facility.
Holding Company Blended Ratio – 5% of costs allocated to the Holding Company, with the remaining 95% of costs allocated using a composite ratio comprised of an average of the Asset Cost Ratio, the Payroll Dollars Ratio, and the Gross Margin Ratio. These factors are equally weighted.
Departments that utilize this ratio include Corporate Development, Corporate Governance and Shareholder Services, Executive Management, Finance and Treasury and Financial Reporting.
Employee Ratio – Based on the number of employees at the end of the prior year ending December 31, the numerator of which is for an applicable BHC subsidiary and the denominator of which is for all applicable BHC subsidiaries.
Departments that utilize this ratio include Safety, Human Resources Corp., Human Resources Regulated, Compensation and Benefits, Organizational Development and Training, and Payroll. Health and welfare costs for BHC will be in a pool and allocated to subsidiaries based on the Employee Ratio.
Power Generation Capacity Ratio – Based on the total power generation capacity at the end of the prior year ending December 31, the numerator of which is for an applicable BHC subsidiary and the denominator of which is for all applicable BHC subsidiaries. Power generation includes capacity in service and capacity under construction.
Departments that use this ratio include Power Delivery Management and Accounting-Generation Services. Utility Asset Cost Ratio – Based on the total cost of utility assets as of December 31 for the prior year, the numerator of which is for an applicable BHC utility subsidiary and the denominator of which is for all applicable BHC utility subsidiaries. Utility assets are limited to property, plant, and equipment, and include construction or work in process. Assets are also reported at their FERC value, meaning that assets for the utility subsidiaries will not include any adjustments that are required to bring their FERC
001113

23
financial statements into compliance with GAAP. FERC requires that acquired fixed assets be recorded at their gross value with accumulated depreciation, while GAAP requires that acquired fixed assets be recorded at their net book value. An adjustment journal entry is used to eliminate the gross-up of cost and accumulated depreciation for preparation of GAAP financial statements, but this adjustment is not factored into the calculation of the Utility Asset Cost Ratio. No departments utilize this ratio, but it is a component in the Utility Blended Ratio Utility Employee Ratio – Based on the number of utility employees at the end of the prior year ending December 31, the numerator of which is for an applicable BHC utility subsidiary and the denominator of which is for all applicable BHC utility subsidiaries.
No departments currently utilize this ratio. Utility Gross Margin Ratio – Based on the total utility gross margin for the prior year ending December 31, the numerator of which is for an applicable BHC utility subsidiary and the denominator of which is for all applicable BHC utility subsidiaries. Utility gross margin is defined as revenue less cost of sales. Certain intercompany transaction may be excluded from utility gross margin if they would not have occurred if the revenue relationship was with a third party instead of a related party. No departments utilize this ratio, but it is a component in the Utility Blended Ratio. Utility Payroll Dollars Ratio – Based on the total utility payroll dollars for the prior year ending December 31, the numerator of which is for an applicable BHC utility subsidiary and the denominator of which is for all applicable BHC utility subsidiaries. Utility payroll dollars include all bonuses and compensation paid to employees, but do not include items that are only included on an employee’s W-2 for gross-up and income tax purposes, such as life insurance premiums over $50,000. No departments utilize this ratio, but it is a component in the Utility Blended Ratio. Utility Blended Ratio – A composite ratio comprised of an average of the Utility Asset Cost Ratio, the Utility Payroll Dollars Ratio, and the Utility Gross Margin Ratio. These factors are equally weighted. The IT Business Applications Regulated department utilizes this ratio. Nameplate Generation Capacity Ratio – Based on the total facility’s power generation capacity at the end of the prior year ending December 31, the numerator of which is for an applicable BHC subsidiary and the denominator of which is for all applicable BHC subsidiaries. Nameplate generation includes capacity in service and capacity under construction at the facility.
001114

24
The Generation Plant Operations and CPGS Plant Operations departments utilize this ratio. (should the Generation Plant Operations department be re-named to PAGS Plant Operations? If so, this will need to be updated in multiple places. Square Footage Ratio – The total square footage of a given facility, the numerator of which is for an applicable BHC subsidiary and the denominator of which is for all applicable BHC subsidiaries. The Rapid City Plant Street Facility and the Denver Office Facility utilize this ratio.
001115

______________________________________________________________________________
Black Hills Utility Holdings, Inc.
Cost Allocation Manual
______________________________________________________________________________
Effective Date: July 14, 2008
Amended: August 1, 2009
Amended: January 1, 2011
Amended: January 1, 2012
Amended: January 1, 2013
Amended: December 1, 2013
001116
mtoney
Typewritten Text
Exhibit CJK-8 Utility Holdings Cost Allocation Manual

2
Black Hills Utility Holdings, Inc. Cost Allocation Manual
Table of Contents
Introduction ................................................................................................................................................... 3
BHUH Organization ..................................................................................................................................... 3
Direct Costs versus Indirect Costs ................................................................................................................ 3
Transaction Coding ....................................................................................................................................... 5
General Ledger Business Unit .................................................................................................................. 5
Operating Unit .......................................................................................................................................... 6
Department (“Dept.”) ................................................................................................................................ 6
Account (“Acct.”) ..................................................................................................................................... 7
Resource .................................................................................................................................................... 7
Product ...................................................................................................................................................... 8
Work Order ............................................................................................................................................... 8
Timekeeping ................................................................................................................................................. 8
Loadings ........................................................................................................................................................ 9
Allocation Ratios .......................................................................................................................................... 9
Changing Allocation Ratios ........................................................................................................................ 10
Subsidiary Payment for Direct and Indirect Charges .................................................................................. 11
Allocating Fixed Assets .............................................................................................................................. 11
Allocating Capitalized Inventory ................................................................................................................ 12
Appendix 1- BHUH Departments ............................................................................................................... 13
Appendix 2- Allocation Ratios ................................................................................................................... 19
001117

3
Introduction
The purpose of this cost allocation manual is to document the allocation processes of Black Hills Utility
Holdings, Inc. (“BHUH”), from recording the original transaction through the allocation of costs to
entities receiving services from BHUH. Various topics to be addressed include the organization of
BHUH, the recording of transactions, calculating and assigning allocation ratios, and recording allocation
transactions.
BHUH began formal operations in July 2008. The company was formed in anticipation of the purchase
of certain gas and electric utility operating companies from Aquila, Inc. BHUH is a wholly owned
subsidiary of Black Hills Corporation (“BHC”). BHUH is the parent company of each of the five
acquired Aquila operating companies. In addition, BHUH also supports the operations of the five
acquired Aquila operating companies and other utility and utility like operating companies, together the
“operating companies”. These costs are allocated to the operating companies requesting service using
formal cost allocation methodologies. Departments that provide support services to the five acquired
Aquila operating companies as well as other Black Hills Corporation subsidiaries are held at Black Hills
Service Company, LLC (“BHSC”). BHSC cost allocation methodologies are discussed in a separate cost
allocation manual.
BHUH Organization
BHUH is organized into departments based upon the services that those departments provide to the
operating companies. A list of each department, as well as a brief description of the services they
provide, is attached hereto as Appendix 1.
Direct Costs versus Indirect Costs
A key issue in distributing BHUH costs is distinguishing between direct costs and indirect costs. The
account coding will change depending on whether the cost is a direct or indirect cost. Below is a
summary of each of these types of costs and examples of these costs.
Direct costs are those costs that are specifically associated with an identified operating company. This
means that it is known exactly to which operating company these costs relate. Here are some examples:
001118

4
Advertising is prepared for a new customer information and instructional advertising campaign in
the state of Nebraska. The advertising costs incurred are specifically associated with an identified
operating company. Therefore, this would be a direct cost.
The Vice President of Utilities attends a meeting on the proposed budget for the state of Iowa.
The labor costs incurred in attending this meeting are specifically associated with an identified
operating company. Therefore, this would be a direct cost.
A trainer from Gas Engineering travels to various Black Hills Kansas Gas field offices to conduct
training. These travel costs are specifically associated with an identified operating company.
Therefore, this would be a direct cost.
Indirect costs are those costs that are not associated with an identified operating company. This means
that the costs indirectly support all companies or directly support the operation of BHUH. In other words,
costs that would be directly charged to BHUH using the definition and examples above would be
classified as indirect costs. Here are some examples:
Advertising is prepared for all customers to inform them of changes to electronic payment
processes. These advertising costs incurred apply to all operating companies. Therefore, this
would be an indirect cost.
The Vice President of Utilities attends a meeting to present the consolidated budget for all gas
utilities to the Board of Directors. The labor costs incurred in attending this meeting are not
specifically associated with an identified operating company. Therefore, this would be an
indirect cost.
A trainer from Gas Engineering travels to Rapid City to present a training program to operating
company executives. These travel costs are specifically associated with BHUH. Therefore, this
would be an indirect cost.
It is important when determining if a cost is a direct cost or an indirect cost to consider two things: (1)
Can the costs coded to a specific operating company or group of operating companies be substantiated,
and (2) Can it be substantiated that a utility-based subsidiary is not subsidizing the operations of a non-
utility based subsidiary with the time and expenses that have been charged to them. A certain level of
judgment will be involved when deciding whether a particular cost should be directly charged or
indirectly allocated.
There are certain costs that will always be considered either direct or indirect costs. Below is a list of
significant BHUH expenses that follow these rules:
001119

5
Always considered direct costs:
Capitalized costs for non-BHUH projects (including capitalized labor)
Retiree healthcare costs
Always considered indirect costs:
Depreciation of BHUH and BHSC assets
Intercompany interest expense and income related to the BHUH balance payable or receivable
from the Utility Money Pool
Transaction Coding
The Holding Company uses an accounting software system to accumulate and distribute both direct costs and indirect costs. It is important to have costs properly classified as direct or indirect. Direct costs will be directly charged to the subsidiaries, while indirect costs will be allocated to the subsidiaries using pre-defined allocation factors. Below is a description of the coding.
General Ledger Business Unit (“GLBU”):
Five (5) character numeric field.
The GLBU field is used to identify the company that will be receiving the charges, either as a
direct cost or an indirect cost.
The GLBU field is required to be populated on all accounting transactions
The GLBU field will default based on the operating unit (Op Unit), as described below.
separate fields, each representing an important characteristic of the underlying transaction.
_______ -- _________ -- __________ -- _________ -- ________ -- _________
GL BU OpUnit Dept. Acct. Resource Product
001120

6
Operating Unit (“OpUnit”):
Six (6) character numeric field.
The Op Unit field is used to identify the account code block as either a direct cost or an indirect
cost.
If the cost is a direct cost, the Op Unit field will be populated using an Op Unit at the specific
GLBU being charged.
The Op Unit field will be populated using one of the BHUH Op Units for indirect costs. Indirect
costs also include costs from other areas of the company that are directly related to the Utility
Holding Company.
Department (“Dept.”):
Four (4) character numeric field
The department field is used to identify where the cost(s) originated
The department field is required on all income statement and capital transactions
Every department is assigned to a GLBU
_______ -- _________ -- __________ -- _________ -- ________ -- _________
GL BU OpUnit Dept. Acct. Resource Product
_______ -- _________ -- __________ -- _________ -- ________ -- _________
GL BU OpUnit Dept. Acct. Resource Product
001121

7
Account (“Acct.”):
Six (6) character numeric field
The account field is required on all accounting transactions
All companies will generally use the same Chart of Accounts although some values will be specific to
certain companies.
Resource:
Four (4) character numeric field
A Resource is used to identify types of costs
The resource field is required for all income statement and capital accounting transactions
_______ -- _________ -- __________ -- _________ -- ________ -- _________
GL BU OpUnit Dept. Acct. Resource Product
_______ -- _________ -- __________ -- _________ -- ________ -- _________
GL BU OpUnit Dept. Acct Resource Product
001122

8
Product:
Three (3) character numeric field
A Product is used to identify business lines
Examples of the product line include electric, gas, and non-regulated
Work Order:
Eight (8) character numeric field
Represents the collection of costs to allow the monitoring of a job or group of costs
The work order field is required on all construction work in progress transactions
Timekeeping
All BHUH employees are required to complete a timesheet for each two week pay period. Timesheets of appropriate employees must be approved by a supervisor.
Employees must complete the coding string, as previously discussed, for each time record. The timesheet
will default the department and resource. However, the employee is responsible for providing the
_______ -- _________ -- __________ -- _________ -- ________ -- _________
GL BU OpUnit Dept. Acct Resource Product
_______ -- _________ -- ________ -- ________ -- ________ -- ________ -- _________
GL BU OpUnit Dept. Acct Resource Product Work Order
001123

9
remainder of the code block. Employees are encouraged to enter their time in one half hour increments,
although they may use smaller increments if they so choose.
Loadings
Certain benefits that are provided to employees become an inherent cost of labor. To account for these
benefits and allow for them to be charged to the appropriate subsidiary, they become part of a loading rate
that is added on to each payroll dollar.
The loading rates are calculated at the beginning of the year based on budgeted benefit expenses and
budgeted labor. Benefit costs and loading rates are reviewed, and updated as needed. Below is a list of
components of the loading rates:
General loadings:
Compensated Absences: including but not limited to PTO (Paid Time Off), Holiday, Jury duty,
Funeral pay, United Way day, Short-term Disability and Annual Physical appointment.
Payroll Taxes: including but not limited to FICA, FUTA SUTA and city taxes.
Employee Benefits: including but not limited to health and medical, 401K match and fees,
Pension, Retiree healthcare and associated fees and Pension audit fees.
Incentives: including but not limited to Non-officer incentive plans, Restricted Stock and Stock
Option expense.
Loadings calculated on payroll are based on estimated benefit costs, therefore, differences between actual
benefits will be inherent to this process. After the difference is calculated and reviewed for
reasonableness, it is recorded to a separate department, and indirectly allocated to Black Hills Corporation
subsidiaries.
Allocation Ratios
As previously stated, BHUH costs are either directly charged to an operating company, or indirectly
allocated when the cost is not associated with a specific operating company. Indirect costs are allocated
001124

10
out using one of several pre-defined allocation ratios. Each department has been assigned one of these
allocation ratios. All indirect costs of that department are then allocated using that ratio. When
determining which allocation ratio should be assigned to each department, a ratio was selected based on
the specific cost driver of that department. For instance, the expenses incurred by the Customer Service -
Rapid City department are primarily related to the support of all utility customers. In this example, the
cost driver for the Customer Service - Rapid City department indirect costs is the number of customers.
Therefore, the indirect costs will be allocated based upon the Customer Count Ratio.
When determining how the assigned ratio should be applied, consideration is given to the operating
companies or segments that are supported by the department. For instance, the Appliance Technical
Training department was determined to have a cost driver of number of Service Guard customers.
Therefore, the indirect costs will be allocated based on the Customer Count Ratio using Service Guard
customers whereas the Customer Service – Rapid City department used in the previous example would be
allocated based on the Customer Count Ratio using Regulated Utility customers.
For certain departments, a specific cost driver may not be clearly identifiable or the driver may not be cost
effective to compute on a continuing basis. In these instances, a three-pronged general allocation ratio is
used. This ratio equally weights three different general ratios: Gross Margin, Asset Cost, and Payroll
Dollars. These ratios were chosen to be included in the Blended Allocator Ratio because they best
allocate costs based on the diverse nature of BHUH operations.
A list of all allocation ratios, including a brief description of the ratio, the basis for the calculation of the
ratio, and the department to which that ratio has been assigned, is attached hereto as Appendix 2.
Changing Allocation Ratios
Allocation ratios are set at the first of the year, based upon financial information from the prior year
ending December 31st. The ratios for Asset Cost and Customer Count are based on values as of the
previous period ending December 31st. The ratios for Gross Margin, Payroll Dollars, are based on values
for the 12 months ended December 31st.
Certain events may occur during the year that are deemed to be significant to BHUH that will require
corresponding adjustments be made to the allocation ratios. Examples of these types of events include
acquisitions, divestitures, new generation, significant change in asset base, significant staffing changes or
new, significant revenue streams.
001125

11
When these events occur, indirect allocation ratios will be adjusted. When adjusting allocation ratios, it is
the policy of BHUH to not recalculate all allocation ratios. Rather, allocation ratios will be adjusted with
pro forma adjustments for the subsidiary with a significant change in a specific allocation ratio base. For
example, if an acquisition occurs during the middle of the year, pro forma values will be loaded. Asset
values at the time of the acquisition would be used, as well as pro forma gross margin and payroll dollars
for a 12 month period. It should be noted that estimations may be required, especially when significant
additions or changes are expected as a result of the acquisition.
It should also be noted that asset values, gross margin, and payroll dollars for the other companies will
not be changed. However, the ratios will change because the base against which the ratios are calculated
will change. Operating companies would normally see decreased ratio values with acquisitions, and
increased ratio values with divestitures. Changes will be effective as of the beginning of the month
following the significant event, and will apply to all transactions for the month.
.
Subsidiary Payment for Direct and Indirect Charges
It is the policy of BHUH to insure payments are made by the subsidiary companies for direct and indirect
charges. All payments for direct and indirect charges must be remitted to BHUH by the end of the
following month. BHUH will monitor payments received during the month to insure that all subsidiary
companies make payment in a timely manner.
Allocating Fixed Assets
BHUH maintains certain fixed assets that are used by and benefit all operating companies. These fixed
assets primarily consist of computer hardware and software and shared office facilities. Because these
fixed assets support all operating companies, they are allocated monthly as part of the month-end close
process, along with the allocation of these assets’ accumulated depreciation. Construction Work in
Process balances are not allocated.
001126

12
Allocated assets and accumulated depreciation are maintained in separate general ledger accounts at the
subsidiary level so they are not intermingled with regular subsidiary fixed assets, and for ease of
reconciliation.
The allocation ratio used to allocate assets and accumulated depreciation will vary depending on the type
of asset being allocated, and will be based on the function the asset is serving. For instance, customer
service software is allocated based on the Customer Count Ratio, while general office space is allocated
using the Blended Allocator Ratio.
Allocating Capitalized Inventory
The gas and electric meter shops are BHUH departments serving the utility operating companies. As
meters are purchased, they are recorded as capitalized inventory (charged to plant-in-service) by BHUH,
as the meters are issued out of inventory to the specific operating company those assets are transferred
from BHUH to the specific utility operating companies. All unassigned gas and electric meter investment
and accumulated depreciation reserve is held at BHUH, and is allocated to the applicable utilities
monthly. The Customer Count Ratio is used for this allocation.
001127

13
Appendix 1- BHUH Departments
UHC-GSS ADMINISTRATION (2301)
Description: Provides for the development and execution of the gas supply portfolio plans for all gas
distribution operating companies and regulated power plants fueled by natural gas. This plan includes
purchasing strategies for the commodity and optimization and procurement of pipeline capacity and
services. (Customer Count Ratio)
UHC-ASSETS-LINCOLN CCTR/CAD (4247)
Description: The assets invested for the Computer Aided Dispatch system for Black Hills Energy. This
includes capitalized and centrally located hardware and software costs to service multiple utilities.
Depreciation expense and maintenance expense on this group of assets is also charged from here.
(Customer Count Ratio)
UHC-ASSETS-FAME (4251)
Description: The assets invested for the Facilitated Asset Mapping Enterprise system for Black Hills
Energy. This includes capitalized and centrally located hardware and software costs to serve multiple
utilities. Depreciation expense on this group of assets is also charged from here. (Customer Count Ratio)
UHC-ASSETS-WORK MGMT (4257)
Description: The assets invested for the Work Management system for Black Hills Energy. This includes
capitalized and centrally located hardware and software costs to serve multiple utilities. Depreciation
expense on this group of assets is also charged from here. (Customer Count Ratio)
UHC-ASSETS-REG GENERATION (4258)
Description: The assets for electric utilities specifically. This includes capitalized and centrally located
hardware and software costs to serve multiple electric utilities. Depreciation expense on this group of
assets is also charged from here. (Customer-Regulated)
UHC-BENEFITS LOADINGS (4470)
Description: Utilized for charging out benefits, including medical costs, to the operating departments.
Provided that all labor is loaded with overhead loadings, only the residual charges are to the operating
companies. (Blended)
UHC-ACCOUNTING ACCRUAL ENTRIES (4474)
Description: Created to facilitate the accrual of certain charges not related to specific departments.
(Blended)
001128

14
UHC-ASSETS-BLENDED-ALL (4478)
Description: The assets invested and centrally located for gas and electric operating companies where the
Blended Ratio is determined to be the best form of allocation. Depreciation expense on this group of
assets is also charged from here. (Blended)
UHC-ASSETS-BLENDED-ELECTRIC (4479)
Description: The assets invested and centrally located for electric operating companies where the Blended
Ratio is determined to be the best form of allocation. Depreciation expense on this group of assets is also
charged from here. (Blended)
UHC-ASSETS-BLENDED-GAS (4480)
Description: The assets invested and centrally located for gas operating companies where the Blended
Ratio is determined to be the best form of allocation. Depreciation expense on this group of assets is also
charged from here. (Blended)
UHC-ASSETS-BLENDED-CUSTOMERS (4481)
Description: The assets invested and centrally located for gas and electric companies where the Customer
Ratio is determined to be the best form of allocation. Depreciation expense on this group of assets is also
charged from here. (Customer Count Ratio)
UHC-DESIGN ENGINEERING GAS (5105)
Description: Provides engineering support of gas transmission and distribution facilities including
planning, monitoring, and analyses. (Customer-Regulated)
UHC-STANDARDS AND COMPLIANCE GAS (5106)
Description: Responsible for implementing and reporting DOT regulatory requirements, maintaining
standards, and supporting GIS Smallworld mapping. (Customer-Regulated)
UHC-TRANSMISSION PLANNING (5107)
Description: Performs near and long-term (1-20 year) transmission planning to determine cost-effective
transmission additions needed to reliably serve projected customer load. Performs studies in support of
large customer requests and the FERC Tariff; and supports operational studies for planned outages.
Provides support in meeting compliance with NERC Standards; and represents the corporation in regional
and sub-regional planning groups. (Transmission)
UHC-NERC COMPLIANCE (5108)
Description: Develops, coordinates and oversees the Electric Utilities Group’s compliance with
mandatory North American Electric Reliability Corporation (NERC) Reliability Standards, which
standards are enforceable through financial sanctions and are intended to ensure a reliable Bulk Electric
System. (Transmission)
001129

15
UHC-FERC TARRIFF AND COMPLIANCE (5109)
Description: Develops, coordinates, and oversees the Electric Utilities Group’s compliance with the
Federal Energy Regulatory Commission (FERC) requirements pertaining to electric transmission; and
administers the Company’s Open Access Transmission Tariff (OATT) and Open Access Same-time
Information System (OASIS).Administration of the Tariff, which outlines the “rules of the road” for
transmission providers, the rates we charge, and the procedures and timelines in addressing customer
requests (new load, new generators, or other requests to wheel power across the system). (Transmission)
UHC-T AND D RELIABILITY CTR (5110)
Description: Operates the Company’s transmission and distribution systems on a 24/7 basis; and plans
and directs switching and outage restoration efforts for both emergency and planned outages.
(Transmission)
UHC-NERC TRANSMISSION AND TECH SUPPORT (5111)
Description: Develops, coordinates and oversees the technical support piece of the Electric Utilities
Group’s compliance with mandatory North American Electric Reliability Corporation (NERC) Reliability
Standards, which standards are enforceable through financial sanctions and are intended to ensure a
reliable Bulk Electric System. (Transmission)
UHC-TRANSMISSION SERVICES MGMT (5112)
Description: For all three electric utilities (BHP, CLFP and Colorado Electric), Transmission Services
directs the 24/7 Reliability Centers in Rapid City and Pueblo, Transmission Planning, NERC Compliance,
FERC Compliance, and Transmission Tariff Administration. (Transmission)
UHC-ELEC ENGINEERING SERV (5120)
Description: Engineering Services supports transmission and distribution activities within the Electric
Utilities group including engineering, distribution planning, T and D asset management, metering,
substation maintenance, Vegetation Management, GIS/drafting and outage management systems.
Provides Director level support to GIS support functions as defined in Dept. 5305 for both the electric and
gas network operations. (Blended)
UHC-PWR SUPPLY AND RENEWABLES (5121)
Description: Provides for the planning, development, and management of power supply and renewable
strategies for electric operating companies. (Blended)
UHC-ELECTRIC REGULATORY SERV (5122)
Description: Supports and manages all electric regulatory filings, rate cases, and regulatory issues.
(Blended)
001130

16
UHC-Technical Training(5254)
Description: Provides technical training support for gas and electric utilities. (Customer-Regulated)
UHC-GIS SUPPORT (5305)
Description: Researches, builds and implements utility software solutions for the benefit of electric and
gas network operations. This department supports Smallworld GIS, STORMS work management,
PowerOn outage management, Korterra line locates, and GTViewer mobile maps. (Customer Count
Ratio)
UHC-GAS METERING SERV (5490)
Description: Manages and provides gas measurement support to field operations located in gas service
states. (Customer-Regulated)
UHC-UTILITY FINANCIAL MGMT (5668)
Description: Assists in the compliance with regulatory and operating unit business strategy from a
financial perspective. Responsible for preparation of all phases of the financial planning process including
budgets, forecasts and strategic plans. Prepares various operating and financial reports for management.
(Blended)
UHC-UTILITY ACCOUNTING (5670)
Description: Responsible for closing the general ledger for the utilities on a monthly basis and assists in
the compliance of all accounting rules and regulations. Prepares various operating and financial reports
for utility financial management. Assists the utility financial management team with monthly analysis.
(Blended)
UHC-EXEC MGMT-CUST SERV (5674)
Description: Provides general direction and supervision of customer service activities. Encourages the
safe, efficient and economical use of the utilities services. (Customer Count Ratio)
UHC-EXEC MGMT-UTILITIES (5682)
Description: Provides guidance, direction and management to overall utility operations and support
services. (Blended)
UHC-MARKETING (5688)
Description: Provides business and planning services, including marketing. Searches for competitive
business opportunities and energy solutions (Blended)
UHC-EXTERNAL AFFAIRS (5690)
Description: Aligns business objectives with the integrated communications provided to our stakeholders.
Including: media relations, coordination of community involvement programs, developing and managing
001131

17
a consistent communications program, and leading economic development for community growth
(Customer Count Ratio)
UHC-Electric Meter Services (5691)
Description: Manages and provides electric measurement support to field operations located in electric
service states. Also manages AMI system for all electric entities. (Customer-Regulated)
UHC-CUSTOMER SERV-LINCOLN (5701)
Description: Answers and resolves customer inquiries, requests for services, for both regulated and non-
regulated customers. (Customer Count Ratio)
UHC-CUSTOMER ACCT SERV-OMAHA (5702)
Description: Assists customers with billing, payment and collection issues. (Customer Count Ratio)
UHC-CUSTOMER SERV SUPP (5703)
Description: Provides support to customer services areas through customer information system project
management and process control for customer information system changes, revenue assurance analysis,
quality analysis, training, and customer and community communication. (Customer Count Ratio)
UHC-CUSTOMER ACCT SERV-RC (5704)
Description: Assists customers with billing, payment and collection issues. (Customer Count Ratio)
UHC-CUSTOMER SERV-RC (5705)
Description: Answers and resolves customer inquiries and requests for services, for both regulated and
non-regulated customers. (Customer Count Ratio)
UHC-LARGE VOLUME BILLING (5706)
Description: Manages and maintains regulated and non-regulated sales and billing of gas to large volume
customers. (Customer Count Ratio)
UHC CS CTR SUPPORT (5707)
Description: Provides direct support to the operations of the two customer service centers in Lincoln and
Rapid City. Provides analysis on employee staffing, monitoring service metrics, projects, and planning.
(Customer Count Ratio)
UHC-BILL PRINT AND LOCKBOX (5711)
Description: Prepares prints, inserts and mails regulated and non-regulated letters and bills for BHC
utility customers. Processes payments for regulated and non-regulated services mailed back to BHC by
utility customers. (Customer Count Ratio)
001132

18
UHC-BILL PROCESSING (5712)
Description: Outside services, supplies and postage expenses required for billing, correspondence,
remittance, credit and collection services related to BHC utility customers. (Customer Count Ratio)
UHC-FIELD RESOURCE CTR-LINCOLN (5715)
Description: Plans work, and schedules and dispatches premise service activities to both regulated and
non-regulated customers. (Customer Count Ratio)
UHC-FIELD RESOURCE CTR-RC (5717)
Description: Plans work, and schedules and dispatches premise service activities to both regulated and
non-regulated customers. (Customer Count Ratio)
UHC-SERV GUARD MARKETING (6005)
Description: Provides and manages product development for consumer marketing with the primary focus
on Service Guard (appliance options) a non-regulated business for utility/regulated customers.
(Customers-Service Guard)
UHC Gas Engineering Management (6183)
Description: Provides management support to gas engineering and metering activities with emphasis on
reliability, customer service, compliance and safety. (Blended)
UHC-TECHNICAL TRN-APPLIANCE (6331)
Description: Designs and implements safety programs and incentives, incident investigation, hazard
identification and problem solving, and appliance repair technical skill training, program development
and administration of technical-related training for our front-line utility employees supporting Service
Guard. (Customers-Service Guard)
UHC-GAS REGULATORY SERV (6372)
Description: Supports and manages all gas regulatory filings, rate cases, and regulatory issues. (Blended)
UHC-ENERGY SERVICES (6373)
Description: Supports the energy efficiency programs across the utilities supported by BHUC (Customer
Count Ratio)
CATCH-ALL
Description: Departments at Black Hills Corporation that are not specifically listed in the CAM or
included in the master allocation design that charge BHUH will be allocated using the Blended Allocator
Ratio.
001133

19
Appendix 2- Allocation Ratios
Any asset ratios and employee and customer count ratios are calculated as of period-end dates, while
revenue and expense ratios are calculated for twelve months ended as of period-end dates.
Asset Cost Ratio – Based on the total cost of assets as of December 31 for the prior year, the
numerator of which is for an applicable operating company and the denominator of which is all
applicable operating companies. Assets are limited to property, plant, and equipment, and include
construction or work in process. Assets are also reported at their FERC value, meaning that assets
for the utility subsidiaries will not include any elimination that are done to bring their FERC
financial statements into compliance with GAAP. FERC requires that acquired fixed assets be
recorded at their gross value with accumulated depreciation, while GAAP requires acquired fixed
assets be recorded at their net value. An elimination journal entry is used to eliminate the gross-
up for preparation of GAAP financial statements, but this elimination journal entry is not factored
into the calculation of the Asset Cost Ratio.
No departments utilize this ratio, but it is a component in the Blended Ratio.
Gross Margin Ratio – Based on the total gross margin for the prior year ending December 31, the
numerator of which is for an applicable operating company and the denominator of which is for
all applicable operating companies. Gross margin is defined as revenue less cost of sales.
No departments utilize this ratio, but it is a component in the Blended Ratio.
Payroll Dollar Ratio –Based on the total payroll dollars for the prior year ending December 31,
the numerator of which is for an applicable operating company and the denominator of which is
for all applicable operating companies. Payroll dollars include all bonuses and compensation
paid to employees, but do not include items that are only included on an employee’s W-2 for
gross-up and income tax purposes, such as life insurance premiums of $50,000.
No departments utilize this ratio, but it is a component in the Blended Ratio.
001134

20
Blended Ratio – A composite ratio comprised of an average of the Asset Cost Ratio, Payroll
Dollar Ratio and the Gross Margin Ratio. These factors are equally weighted. This factor is
sometimes referred to as the general allocation factor.
Departments that utilize this ratio include BHUH benefits loading, retiree, BHUH accounting
accruals, all blended assets, electric blended assets, gas blended assets, electric engineering
services, electric regulatory services, utility margin accounting, utility financial management,
utility accounting, utility operations management, utility market services, power supply and
renewables, and gas regulatory services.
Any department at Black Hills Corp that appropriately charges a BHUH operating unit but is not
part of the predefined allocation design will also utilize the Blended Allocator Ratio. For example
if a BHSC IT department provides maintenance on the SCADA system supporting the regulated
electric companies they would charge BHUH operating unit 201900 and these costs would be
allocated using the Blended Ratio across the regulated electric companies.
Customer Count Ratio – Based on the number of customers at the end of the prior year ending
December 31, the numerator of which is for an applicable operating company and the
denominator of which is for all applicable operating companies.
There are currently several variations of the Customer Count ratio that are specific to the type of
customers that are appropriate to the department for which charges are being allocated. For
example a department that supports gas engineering would be allocated based on gas customers
only whereas a general customer service department would be allocated based on total customers.
As of December 31, 2012 BHUH is utilizing the following customer counts to calculate customer
count ratios additional variations may be added if additional product lines are added or in the
event that additional segmentation of customers are deemed appropriate to most effectively
allocate costs from a specific department
Regulated Electric Customers
Regulated Gas Customers
Non-Regulated Customers
001135

21
Total Customers
Departments that utilize this ratio include gas supply services administration, computer aided
dispatch, FAME assets, general assets, work management assets, regulated generation assets,
customer blended assets, electric AMI blended assets, gas engineering services, GIS support,
general meter shop, customer service management, Lincoln customer service center, Omaha
customer account services, Rapid City customer service support, Rapid City customer account
services, Rapid City customer service center, large volume billing, customer service center
support, bill processing, Lincoln field resource center, Rapid City field resource center, service
guard marketing, lockbox & bill-print, and appliance technical training.
Transmission Ratio – Based on a simple average of a multiple of cross-sectional drivers for the
transmission function that includes customer counts, peak load, number of substations, number of
feeders, number of distribution and transmission miles, and number of remote terminal units. The
numerator of which is for an applicable operating company and the denominator of which is for
all applicable operating companies.
The departments that utilize this ratio include transmission planning, NERC compliance, FERC
tariff and compliance, transmission and distribution reliability, NERC transmission and tech
support, and transmission service management.
001136

Direct Testimony and Exhibits
Charles R. Gray
Before the South Dakota Public Utilities Commission of
the State of South Dakota
In the Matter of the Application of
Black Hills Power, Inc., a South Dakota Corporation
For an Increase in Electric Rates
In South Dakota
Docket No. EL14-
March 31, 2014
001137

i
TABLE OF CONTENTS
I. INTRODUCTION AND QUALIFICATIONS ..................................................... 1
II. PURPOSE OF TESTIMONY AND EXHIBITS ................................................... 2
III. BILLING DETERMINANTS AND PROOF OF REVENUE .............................. 3
IV. PRO FORMA REVENUE ADJUSTMENTS ....................................................... 6
V. OVERVIEW OF RATE DESIGN ....................................................................... 11
VI. JURISDICTIONAL COST OF SERVICE STUDY ............................................ 12
VII. CLASS COST OF SERVICE STUDY ................................................................ 14
VIII. PROPOSED RATES ................................................................................................... 36
IX. PROPOSED CHANGES TO TARIFFS .............................................................. 39
X. PROPOSED TARIFFS ........................................................................................ 41
XI. CONCLUSION .................................................................................................... 41
Exhibits
Exhibit CRG-1 Test Year Billing Determinants
Exhibit CRG-2 Weather Normalization Adjustment
Exhibit CRG-3 Industrial Contract Service Accrual Adjustment
Exhibit CRG-4 Docket EL12-061 Rate Annualization Adjustment
Exhibit CRG-5 PIPR Rider Revenue Adjustment
Exhibit CRG-6 Pro Forma Billing Determinants on Current Rates
Exhibit CRG-7 PIPR & EIA Roll-In Adjustment
Exhibit CRG-8 Pro Forma Billing Determinants on Proposed Rates
001138

1
I. INTRODUCTION AND QUALIFICATIONS 1
Q. PLEASE STATE YOUR NAME AND BUSINESS ADDRESS. 2
A. My name is Charles R. Gray. My business address is 105 South Victoria Avenue, 3
Pueblo, Colorado. 4
Q. BY WHOM ARE YOU EMPLOYED AND IN WHAT CAPACITY? 5
A. I am employed by Black Hills Utility Holdings, Inc., a wholly-owned subsidiary 6
of Black Hills Corporation (“BHC”). I am a Manager of Regulatory Affairs in the 7
Regulatory Department. 8
Q. ON WHOSE BEHALF ARE YOU TESTIFYING IN THIS DOCKET? 9
A. I am testifying on behalf of Black Hills Power, Inc., (“Black Hills Power”, or the 10
“Company”). 11
Q. PLEASE OUTLINE YOUR EDUCATIONAL BACKGROUND. 12
A. I attended Central Missouri State University in Warrensburg, Missouri, from 13
which I received a Bachelor of Science-Education Degree. I also attended 14
Longview Community College in Kansas City, Missouri, from which I received an 15
Associates of Arts-Accounting degree. I have also attended many industry 16
conferences and workshops throughout my 28 year career in the utility industry. 17
Q. PLEASE DESCRIBE YOUR WORK EXPERIENCE. 18
A. In 1986, I began working for Missouri Public Service, a division of UtiliCorp 19
United, Inc. (predecessor-in-interest to Aquila, Inc.) (“Aquila”), and held positions 20
within the Accounting Department. My responsibilities included direct 21
001139

2
responsibility for the monthly billing of Missouri Public Service’s Large Volume 1
billing accounts, as well as preparation of financial and regulatory reports, 2
monthly accounting journal entries and budgeting. In 1995, I joined Aquila’s 3
Regulatory Department as a Rates Analyst. I was promoted to Senior Rates 4
Analyst in 2000. Following the sale of certain Aquila electric and gas properties 5
to BHC, I accepted a position as Senior Regulatory Analyst located in Pueblo, 6
Colorado. In 2013, I was promoted to Manager - Regulatory Affairs. Specifically, 7
I am responsible for compiling and reviewing financial and customer billing 8
information. I conduct analyses and prepare work papers and other supporting 9
documents for various filings with regulatory agencies in several jurisdictions. I 10
participate in the preparation of class cost of service studies, prepare rate design 11
and develop tariffs. 12
II. PURPOSE OF TESTIMONY AND EXHIBITS 13
Q. WHAT IS THE PURPOSE OF YOUR TESTIMONY? 14
A. The purpose of my testimony is to provide a proof of test year revenue and billing 15
determinants for Black Hills Power. I also provide revenue adjustments to the test 16
year and the pro forma billing determinants priced out on the current and proposed 17
rates. In addition, my testimony describes the jurisdictional cost of service study 18
and the customer class cost of service study for the revenue requirement described 19
in Jon Thurber’s testimony. Finally, I discuss the principles used for rate design 20
and sponsor the customer rate updates to the rate schedule tariffs. 21
001140

3
Q. ARE YOU SPONSORING ANY EXHIBITS IN THIS PROCEEDING? 1
A. Yes. I am sponsoring the following exhibits: 2
Exhibit CRG-1 – Test Year Billing Determinants 3
Exhibit CRG-2 – Weather Normalization Adjustment 4
Exhibit CRG-3 – Industrial Contract Service Accrual Adjustment 5
Exhibit CRG-4 – Docket EL12-061 Rate Annualization Adjustment 6
Exhibit CRG-5 – PIPR Rider Revenue Adjustment 7
Exhibit CRG-6 – Pro Forma Billing Determinants on Current Rates 8
Exhibit CRG-7 – PIPR & EIA Roll-In Adjustment 9
Exhibit CRG-8 – Pro Forma Billing Determinants on Proposed Rates 10
Q. PLEASE DESCRIBE YOUR ROLE IN PREPARING THE EXHIBITS. 11
A. My role was to prepare the supporting exhibits listed above. 12
III. BILLING DETERMINANTS AND PROOF OF REVENUE 13
Q. PLEASE EXPLAIN THE PURPOSE OF EXHIBIT CRG-1. 14
A. The purpose of Exhibit CRG-1 is to price out the individual billing determinants 15
using existing rates for the test year ended September 30, 2013 by rate schedule. 16
This process is necessary for the proof of test year revenue using the current rates. 17
The base rate revenue generated from Black Hills Power service is normally 18
classified as a customer charge, demand/capacity charge or an energy charge. In 19
addition to these normal billing charges, Black Hills Power’s electric service 20
revenues are also generated within the Cost Adjustment Summary by the Base 21
001141

4
Costs, the Fuel and Purchased Power Adjustment (“FPPA”), Environmental 1
Improvement Adjustment (“EIA”), Transmission Cost Adjustment (“TCA”), 2
Energy Efficiency Solutions Adjustment (“EESA”) along with rate schedule 3
minimum monthly charges, equipment rental/lease fees, and the Phase in Plan 4
Rate (“PIPR”) rider. 5
Q. ARE THERE ANY BILLING CHARGES EXCLUDED FROM EXHIBIT 6
CRG-1? 7
A. Yes. The revenue shown on Exhibit CRG-1 does not include sales taxes or 8
franchise fees. 9
Q. PLEASE EXPLAIN HOW YOU DERIVED THE BILLING 10
DETERMINANTS SHOWN ON EXHIBIT CRG-1? 11
A. I compiled the test year billing determinants by rate identification (“rate ID”) from 12
data recorded in the Company’s Customer Information System (“CIS+”). This 13
data was compiled from a total company level as well as individual customer 14
billing records from CIS+ by month. From these sources, I cross checked the 15
billing information to the income statement. The revenue for each rate ID was then 16
grouped to the specific rate schedule. 17
Q. DOES THE CIS+ BILLING SYSTEM ASSIGN ONLY ONE RATE ID 18
NUMBER FOR EACH TARIFF RATE SCHEDULE? 19
A. No. There can be multiple rate IDs within the CIS+ billing system for a specific 20
rate schedule. The rate ID is used internally by the billing system to designate the 21
001142

5
proper rate component values to apply to a customer’s billed electricity usage 1
during the process of calculating a customer’s bill. 2
As an example, Black Hills Power has a Residential Demand Service (Optional) 3
tariff schedule but the tariff schedule has two rate ID’s associated with it. The 4
Residential Demand Service tariff, Schedule RD, uses rate ID SD714 for the 5
normal residential demand service accounts and SD716 for the Maximum Value 6
Option Residential Demand Service accounts. 7
In total, the CIS+ billing system currently uses thirty (30) rate ID’s for metered 8
electrical service and another seven (7) rate IDs for the unmetered street lighting 9
and outdoor area lighting options available to customers. 10
Q. PLEASE DISCUSS THE FORMAT USED ON EXHIBIT CRG-1. 11
A. Exhibit CRG-1 lists each rate schedule by name and rate ID. The test year billing 12
determinants are shown by revenue type along with the charge per unit and the 13
total test year dollars billed by rate component. The various revenue components 14
are summed and shown in total at the end of each rate section. This total is the 15
total revenue for each rate ID. The schedule shows the unmetered usage billed and 16
the revenue generated by each lighting schedule. 17
001143

6
Q. DOES ANALYSIS OF TEST YEAR BILLING DETERMINANTS ALLOW 1
ONE TO REACH ANY CONCLUSIONS CONCERNING BILLED 2
REVENUE? 3
A. Yes. The analysis demonstrates that billed revenues used by Black Hills Power in 4
its rate application are accurately reflected in the per books revenue presented in 5
the filing. 6
IV. PRO FORMA REVENUE ADJUSTMENTS 7
Q. ARE YOU RESPONSIBLE FOR ANY REVENUE ADJUSTMENTS? 8
A. Yes. I have calculated four revenue adjustments that have been incorporated into 9
the overall revenue requirement. The electric revenue adjustments are: 10
Exhibit CRG-2 – Weather Normalization Adjustment 11
Exhibit CRG-3 – Industrial Contract Service Accrual Adjustment 12
Exhibit CRG-4 – Docket EL12-061 Rate Annualization Adjustment 13
Exhibit CRG-5 – PIPR Rider Revenue Adjustment 14
Q. WHAT IS THE PURPOSE OF THE EXHIBIT CRG-2 WEATHER 15
NORMALIZATION ADJUSTMENT? 16
A. Exhibit CRG-2 is a known and measurable adjustment to Black Hills Power’s test 17
year revenues. The adjustment is necessary to reflect the expected level of 18
residential usage under normal weather conditions. 19
001144

7
Q. HOW WAS THE RESIDENTIAL WEATHER NORMALIZATION 1
ADJUSTMENT CALCULATED? 2
A. Black Hills Power began its analysis by comparing the monthly cooling degree 3
day (“CDD”) levels for the 30 year average CDD provided by the National 4
Oceanic Atmospheric Administration (“NOAA”) against the actual monthly CDDs 5
during the test year for the city of Rapid City, South Dakota. The thirty-year 6
average normal CDDs for Rapid City is 598 CDDs. During the summer of 2013 7
test year, Rapid City experienced 724 CDDs, which is approximately 21% warmer 8
than normal conditions. 9
The next step in the analysis was to determine an appropriate level of base 10
monthly sales volumes. In the analysis, Black Hills Power averaged the actual 11
usage per customer for the months of April, May and October for the last nine 12
years. Those three shoulder months have virtually no CDDs therefore it was 13
appropriate to average the usage per customer for those three shoulder months 14
over this historical period. The averaging of customer usage from those months 15
resulted in an appropriate level of non-weather sensitive sales to compare against 16
the weather sensitive sales volumes. Black Hills Power then backed out the non-17
weather sensitive sales from the actual test year residential sales to determine the 18
cooling sensitive sales volumes. 19
The monthly volume variance of the weather normalized sales was then priced by 20
applying the regular residential base energy charge of $0.08755/kWh. The 21
001145

8
residential weather adjustment resulted in a pro forma reduction of residential 1
sales volumes of 7,363,852 kWh and a pro forma reduction of residential revenue 2
of $644,705. 3
Q. WHAT IS THE PURPOSE OF THE EXHIBIT CRG-3 INDUSTRIAL 4
CONTRACT SERVICE ACCRUAL ADJUSTMENT? 5
A. Exhibit CRG-3 is a known and measurable adjustment to the test year revenues for 6
three customers. The test year usage and revenues for these customers are 7
adjusted to achieve proper matching between test year revenues and expenses for 8
the period of time in which the new rates become effective. 9
For example, the bill generated for September 2013 usage (Sept. 1-Sept. 30 meter 10
read dates) is not produced until early October 2013. That billing information will 11
be recorded as October 2013 usage and revenue in the billing system when 100% 12
of the usage and revenue occurred in the previous month of September. Due to the 13
mismatch between the billing system and the per-books financial information this 14
adjustment properly aligns the billing system and the financial system. 15
Q. WHAT IS THE PURPOSE OF THE EXHIBIT CRG-4 DOCKET EL12-061 16
RATE ANNUALIZATION ADJUSTMENT? 17
A. Exhibit CRG-4 is a known and measurable adjustment to Black Hills Power South 18
Dakota retail revenues to properly reflect the new rates that became effective 19
during the test year. 20
001146

9
Black Hills Power implemented approved rates in Docket No. EL 12-061 with an 1
effective date of October 1, 2013. As these new rates were implemented 2
following the end of the test year, this adjustment prices out the adjusted billing 3
determinants on current rates and therefore properly reflects the proper level of 4
revenue to be received from customers based on the recently approved rates. The 5
revenue adjustment increases the per books revenues by $7,000,205. 6
Q. PLEASE DESCRIBE EXHIBIT CRG-5 PIPR RIDER REVENUE 7
ADJUSTMENT. 8
A. Exhibit CRG-5 reflects the revenue adjustment as calculated in Schedule I-2 and 9
allocates the additional revenue to each customer class. The additional revenue of 10
$4,751,938 is allocated to each customer class consistent with the decision in 11
EL12-062. 12
Q. WHAT WAS THE NEXT STEP IN YOUR ANALYSIS OF THE 13
REVENUE? 14
A. The next step is to remove the Base Costs for each rate ID. Removing this 15
revenue matches the energy expense adjustments as discussed in the testimony of 16
Jon Thurber and allows these revenues and costs to be accounted for in the Energy 17
Cost Adjustment (“ECA”). The next step in reconciling the customer revenue is to 18
prove the above adjustments all flow into each customer class by rate ID. This is 19
proven out in Exhibit CRG-6 that shows the adjusted billing determinants on 20
current rates reconciling to Statement I, pg. 1, column (c), line 3, within $2,102. 21
001147

10
Q. DID BLACK HILLS POWER ROLL ANY RATE RIDER CHARGES INTO 1
THE BASE RATE CHARGES? 2
A. Yes. Black Hills Power rolled its Environmental Improvement Adjustment 3
(“EIA”) and the Phase In Plan Rate (“PIPR”) into base rates. These revenues are 4
shown by rate ID in Exhibit CRG-6. 5
The PIPR Rider revenue was rolled into the demand charge rate for the rate 6
schedules that meter and bill a monthly capacity charge. Similarly, the PIPR Rider 7
revenue was rolled into the energy charge if the rate schedule only bills on energy 8
usage. The EIA was rolled into the energy charge for all rate schedules to follow 9
the current collection method of a per kWh charge. Exhibit CRG-7 shows the new 10
rates by rate ID following these adjustments and the final revenue amount still 11
reconciles to Statement I, pg. 1, column (c), line 3 within $2,193. 12
Q. WHY ROLL THE RIDER REVENUES INTO THE APPLICABLE BASE 13
CHARGES? 14
A. These riders were for investments that are or have been moved into rate base. For 15
example, the PIPR Rider is to recover the construction financing costs during 16
construction and once the plant is placed into service, the cost recovery for CPGS 17
will be handled through base rates. 18
001148

11
Q. WHAT IS THE PURPOSE OF EXHIBIT CRG-8? 1
A. The purpose of Exhibit CRG-8 is to provide a proof of revenue based on proposed 2
base rates to recover the additional revenue needed as supported by Section 4, 3
Statement N-1. 4
V. OVERVIEW OF RATE DESIGN 5
Q. WHAT STEPS DID THE COMPANY FOLLOW TO DESIGN RATES? 6
A. The first step is to determine the overall cost of service. The overall cost of 7
service is also commonly referred to as the revenue requirement. The next step is 8
to determine the jurisdictional cost of service. Then Black Hills Power performs 9
a class cost of service study in order to allocate the costs across the rate classes 10
based on cost causation and service type. Finally, based on the results of the 11
jurisdictional and class cost of service studies, revenue targets and rate elements 12
are calculated and then modified where necessary to meet the rate design 13
objectives. 14
Q. ARE BLACK HILLS POWER’S CURRENT RATE DESIGN AND RATE 15
STRUCTURES APPROPRIATE? 16
A. Yes. Black Hills Power has worked over time to design rates that are easy for 17
customers to understand, have been accepted by customers, and provide for ease 18
of administration. In addition, Black Hills Power rates are structured to provide 19
appropriate price signals to customers to encourage optimum use of supply 20
sources by promoting desirable load characteristics. Black Hills Power is 21
001149

12
proposing to modify several rate structures to further provide more appropriate 1
price signals and simplify tariffs for ease of administration. Those modifications 2
are discussed later in my testimony covering the proposed tariffs. 3
Q. WHAT SCHEDULES SUPPORT BLACK HILLS POWER’S RATE 4
DESIGN STEPS? 5
A. The pro forma cost of service study by jurisdiction is provided in Schedule N-1 6
and Statement N for the per books. The cost of service study is supported by 7
Schedule O-1 for the pro forma and Statement O for the per books. Based on the 8
results of the jurisdictional and class cost of service studies, the rate design for 9
each tariff schedule is provided in Exhibit CRG-8. 10
VI. JURISDICTIONAL COST OF SERVICE STUDY 11
Q. WHAT IS THE PURPOSE OF THE JURISDICTIONAL COST OF 12
SERVICE STUDY? 13
A. The purpose of the jurisdictional cost of service study is to allocate costs among 14
the various jurisdictions in which Black Hills Power operates, including South 15
Dakota, Wyoming, Montana, and Federal Energy Regulatory Commission 16
(“FERC”). The jurisdictional cost of service establishes the revenues needed from 17
South Dakota retail customers to recover the Company’s reasonable return on rate 18
base, as well as operational and maintenance, depreciation, and tax expenses. 19
001150

13
Q. PLEASE DESCRIBE THE STEPS INVOLVED IN CONDUCTING A 1
JURISDICTIONAL COST OF SERVICE STUDY. 2
A. The steps involved in conducting a jurisdictional cost of service study are similar 3
to the class cost of service study. An allocation percentage is used to allocate rate 4
base and costs based on the main driver of the rate base or expense. For example, 5
production facilities are allocated based on demand since generation is built to 6
handle specific demands of Black Hills Power’s customers. This methodology 7
conforms to general cost causation rate making principles. Consistent allocation 8
methodologies are used between the jurisdictional and class cost of service studies 9
whenever possible and appropriate. The FERC jurisdictional investments and 10
costs are primarily directly assigned based on the approved annual formula rate 11
methodology in accordance with Black Hills Power’s FERC Joint Open Access 12
Transmission Tariff for the 230 kV Common Use System. 13
Q. ARE THE JURISDICTIONAL ALLOCATION METHODOLOGIES 14
CONSISTENT WITH BLACK HILLS POWER’S PREVIOUS RATE CASE 15
IN SOUTH DAKOTA? 16
A. Yes, the current jurisdictional cost of service study is consistent with the previous 17
rate case in South Dakota. 18
001151

14
VII. CLASS COST OF SERVICE STUDY 1
A. Overview of Class Cost of Service Study 2
Q. WHAT IS THE PURPOSE OF THE CLASS COST OF SERVICE STUDY? 3
A. A Class Cost of Service Study (“CCOSS”) is performed to determine the revenue 4
requirement for each class of customers. This is accomplished by assigning, or 5
allocating, the detailed components of the revenue requirement to individual 6
customer classes using allocation factors that reflect the nature of the particular 7
cost component being allocated. The total cost of service is distributed among the 8
various customer classes in such a manner that the sum of the customer class 9
revenue requirements equals the South Dakota jurisdictional revenue requirement. 10
This type of cost of service study is generally referred to as a "fully distributed" 11
cost of service study since all company costs that make up the revenue 12
requirement are allocated to customer classes. 13
Q. WHY ARE COSTS ALLOCATED TO CUSTOMER CLASSES? 14
A. Costs are allocated to customer classes in order to provide customer class revenue 15
guidelines for rate design purposes. In addition, the CCOSS results provide 16
information regarding the level of classified component costs per unit (e.g., 17
demand cost per kW or kVA, energy costs per kWh, and customer costs per 18
customer per month) which is useful in the design of rates. 19
001152

15
Q. PLEASE DESCRIBE THE STEPS INVOLVED IN CONDUCTING A 1
CCOSS. 2
A. There are three steps involved in conducting a CCOSS - functionalization, 3
classification, and allocation. Functionalization identifies the operational source 4
where the costs are incurred, either directly or indirectly, with respect to the 5
physical process of providing service. For example, the costs of generating units 6
and purchased power (production function) are identified separately from costs 7
associated with transmission lines (transmission function) which are, in turn, 8
segregated from the costs of the distribution system (distribution function). 9
The next step in conducting a CCOSS, classification, refers to the separation of 10
costs according to the usage characteristic that drives the cost – e.g., demand, 11
energy and customer-related costs. Demand costs are costs that arise as a result of 12
the rate of power consumption over a short period of time (usually 15 minutes to 13
one hour). Energy costs are those costs that result from the volume of energy 14
supplied over time. Customer costs are costs that vary as a function of the number 15
of system customers. 16
The final step in conducting a CCOSS is allocation. Allocation is the process of 17
using customer class metrics, along with the knowledge that certain costs are 18
incurred exclusively for the benefit of specific identifiable customers, to allocate 19
or assign the specific cost components that have been functionalized and classified 20
to individual customer classes. Customer class information such as annual energy 21
001153

16
use, class demand at time of system peak, weighted meter costs, and customer 1
counts are employed to calculate class allocation factors. 2
Q. PLEASE DESCRIBE THE PROCESS OF COST FUNCTIONALIZATION 3
EMPLOYED IN THE CCOSS. 4
A. Once all the individual cost components representing the total revenue 5
requirement have been collected for the CCOSS the components are separated 6
according to the function or physical service they provide. These functions are: 7
Production – costs associated with the production of energy and capacity, 8
including purchased power; 9
Transmission – costs associated with the high voltage system that transports 10
the power to load centers; 11
Distribution – costs associated with distributing the energy from the 12
transmission system to the end users; 13
Customer Service – costs associated with providing service to the customer 14
–e.g., service drops, metering, billing, the customer-related portion of 15
transformers and conductors, and similar costs; and 16
Administrative and General – common costs, such as management, 17
buildings, software, support services, and similar indirect costs that are 18
incurred to support the other functions of electric service. 19
001154

17
Q. PLEASE DESCRIBE THE PROCESS OF COST CLASSIFICATION 1
EMPLOYED IN THE CCOSS. 2
A. Cost classification is the process of further categorizing the functionalized costs 3
according to the cost driving characteristic of the utility service being provided. 4
The three principal cost classifications are demand-related costs, energy-related 5
costs and customer-related costs. 6
Demand-related costs are those fixed costs that are related to the kilowatt ("kW") 7
demand that the customers place on the system at any point in time. These costs 8
vary with the maximum demand imposed on the various components (facilities) of 9
the power system by customers. Energy-related costs are those costs that are 10
related to the kilowatt-hours ("kWh") of energy that the customer utilizes over 11
time. These costs, such as fuel, vary with the overall quantity of energy. 12
Customer-related costs are those costs incurred as a result of the number of 13
customers on the system. These costs, such as meters and billing, are incurred to 14
serve individual customers. 15
As described later in my testimony, operating and accounting data are used to 16
develop allocation factors that link cost causation factors (demand, energy and 17
customers) to the costs that comprise Black Hills Power's revenue requirement. 18
These allocation factors are calculated as percentages and applied to specific costs 19
and rate base items to derive the cost of service for each customer class. 20
001155

18
Q. ONCE THE COSTS ARE FUNCTIONALIZED AND CLASSIFIED, WHAT 1
IS THE NEXT STEP IN THE PROCESS OF CALCULATING THE CLASS 2
COST OF SERVICE? 3
A. After the functionalization and classification steps, class responsibility for each 4
cost is determined using the allocation factors referred to above. Each identifiable 5
element of the revenue requirement is allocated to each customer class on the basis 6
of imposed demand (using either average and excess ("A&E") or a calculated 7
maximum demand), energy at the generation source (after accounting for line and 8
transformer losses), or number of customers served (weighted by the appropriate 9
weighting factor to recognize differences in types of customers and their impacts 10
upon the system). These allocations are then summarized within the cost of 11
service model. 12
Q. PLEASE DESCRIBE THE LAYOUT AND OPERATION OF THE CLASS 13
COST OF SERVICE MODELS IN THIS FILING. 14
A. The CCOSS provided as Statement O - Per Books Class Cost of Service Study and 15
Schedule O-1 - Pro Forma Class Cost of Service Study are organized as a cost 16
matrix. Each row of the model identifies a particular detailed component of the 17
total cost to provide service. The columns on Schedule O-1 consist of the 18
allocation of costs to each customer class. The development of the costs of 19
serving each customer class begins with the allocation of revenues, and continues 20
with the allocation of operating expenses, taxes, rate base and the computation of 21
001156

19
labor and other allocators. 1
Q. PLEASE DESCRIBE THE OUTPUT OF THE COST OF SERVICE 2
MODELS IN THIS FILING. 3
A. Page 1 of the CCOSS summarizes the allocated components of the revenue 4
requirement and presents the rate of return by customer class at present rates. As 5
indicated by this summary, the present rates charged to some classes produce a 6
rate of return for that class that is below the system average rate of return while the 7
present rates charged to other classes produce a higher than system average rate of 8
return. The rate of return at present rates is also shown as a ratio of each classes 9
return to the system return, which is referred to in the CCOSS as the "Index Rate 10
of Return". An Index Rate of Return of 1.00 means that the class’ return is the 11
same as the system return. An Index Rate of Return of less than 1.00 means that 12
the class’ return is less than the system return. Conversely, an Index Rate of 13
Return of greater than 1.00 means that the class’ return is greater than the system 14
return. 15
Page 2 of the CCOSS summarizes the allocated components of the revenue 16
requirement and presents the rates of return by customer class at Black Hills 17
Power’s requested rate of return of 8.48%. The results summarized on this page 18
set forth the revenue requirements for each class. 19
Page 3 of the CCOSS presents the rate of return by customer class at Black Hills 20
Power proposed rates. 21
001157

20
Pages 4 through 10 of the CCOSS set forth in Schedule O-1 provide the allocation 1
of rate base to customer classes. The allocations of gross plant in service are 2
provided on pages 4 through 6. The allocations of accumulated depreciation are 3
provided on page 7. Additions and deductions to rate base are provided on page 8 4
along with the summary of rate base by customer class. Pages 9 and 10 include 5
line item detail for the Addition to Rate Base item Cash Working Capital. 6
Allocated Operating Revenues are provided on page 11 of Schedule O-1. The 7
allocation of operation and maintenance expense by account is set forth on pages 8
12 through 15. Page 16 provides the detailed allocation of depreciation expense 9
by account to each customer class. Taxes Other than Income Taxes are allocated 10
to customer classes on page 17. The components of Income Taxes and the 11
calculation of Income Taxes by customer class are provided on pages 18 and 19 of 12
Schedule O-1. Note that Income Taxes are not directly allocated to each customer 13
class, but rather the components used to calculate income taxes are allocated to 14
each customer class instead. These allocated income tax components are then 15
used to calculate the Income Tax liability for each class based upon the allocated 16
tax components. 17
The remaining pages of the CCOSS provide the information employed to develop 18
the allocation factors employed in the cost of service study. Page 20 details the 19
development of the salaries and wages allocation factors used in the study. 20
Finally, pages 21 through 35 provide the detailed information used to develop the 21
001158

21
other allocation factors employed in the CCOSS. These allocation factors consist 1
of both externally and internally developed allocation factors. Externally 2
developed allocation ratios reflect customer class metrics such as A&E and 3
calculated maximum demand at various voltage levels, energy sales, and as 4
measured at both the generation level and at the meter (i.e., with and without line 5
and transformer losses), and number of customers by voltage level. Externally 6
developed allocation factors are developed outside of the cost of service study and 7
then input into the study. In contrast, internally developed allocation factors are 8
calculated within the cost of service study using previously allocated cost 9
components to derive factors that reflect the combined impacts of multiple cost 10
drivers. 11
Q. IN YOUR OPINION, ARE THE COST OF SERVICE STUDIES 12
TRANSPARENT AND VERIFIABLE? 13
A. Yes, I believe the cost of service studies are transparent and verifiable. The 14
jurisdictional cost of service and the CCOSS submitted in Statement N, Schedule 15
N-1, Statement O, and Schedule O-1, provide complete detail as to each allocation 16
made on an account-by-account basis. In addition, cross-references to supporting 17
schedules are provided on all summary pages. Every calculation made in the 18
model can be readily verified by Commission Staff and other parties to the case. 19
The cost of service model used by Black Hills Power in this filing is subject to 20
protective restrictions since its internal computations are confidential trade secrets 21
001159

22
of Management Applications Consulting, Inc. The Company will provide a 1
working model of its licensed cost of service studies to Staff and any intervenors 2
upon execution of the necessary confidentiality agreements. 3
B. Cost Allocations 4
Q. PLEASE DESCRIBE THE ALLOCATION OF POWER SUPPLY 5
RESOURCES IN THIS CURRENT RATE CASE. 6
A. In this filing, Black Hills Power continues to use the A&E allocation method for 7
power supply capacity costs. The A&E allocation is consistent with the approach 8
used in previous rate cases. This methodology reasonably and justly represents 9
the factors that affect Black Hills Power's demand-related supply costs. 10
Q. PLEASE DESCRIBE THE A&E CAPACITY ALLOCATION 11
METHODOLOGY. 12
A. The A&E allocation methodology has two distinct components to its calculations 13
of responsibility for the system peak demand of 302 MW. The system peak 14
demand for the test period occurred on August 27, 2013. First, each customer 15
class is allocated its average kW demand during the test year. Average kW 16
demand is determined by taking the total kilowatt hour sales for the class, plus 17
associated energy losses, divided by the number of hours within the test period. In 18
this case, the number of hours used was 8,760, which is 365 x 24 hours. The 19
second component of the A&E demand allocation, allocates the remaining system 20
peak demand (excess demand) not allocated by the sum of the individual class 21
001160

23
average demands. The excess demand is allocated based upon the relationship of 1
the individual class non-coincident peak demand determined for the test period. 2
The result of this approach is that customer classes with lower load factors are 3
responsible for a greater percentage of the excess demand, whereas customers with 4
higher load factors are responsible for a greater percentage of the average demand. 5
This approach has the tendency to recognize that systems are made up of both base 6
load resources and peaking resources, and that the load factors associated with 7
each class of customer allows system planners to acquire various mixes of 8
resources. 9
Q. WHY WAS THE A&E CAPACITY ALLOCATION METHOD SELECTED 10
FOR THIS RATE CASE? 11
A. The A&E capacity allocation method has been used by the Company and 12
approved by the Commission in all of its previous rate case proceedings in South 13
Dakota. Therefore, the results of this method are consistent with past cost 14
allocation and the rate design provided for in the Company’s rate schedules. The 15
A&E allocator is also recognized by the National Association of Regulatory 16
Utility Commissioners (“NARUC”) as an acceptable capacity allocation 17
methodology in the Electric Utility Cost Allocation Manual (“Manual”). Finally, 18
Black Hills Power’s system, with similar summer and winter peaks, should use a 19
methodology that recognizes both the need to plan for base load resources and the 20
need to acquire peaking resources. The A&E methodology fits this need. 21
001161

24
Q. PLEASE DESCRIBE THE PROPOSED ALLOCATION OF 1
TRANSMISSION COSTS. 2
A. Over 96% of Black Hills Power’s transmission system and related costs are 3
allocated to the FERC jurisdiction for the 230 kV Common Use System that is 4
owned and operated by Black Hills Power, Basin Electric Power Cooperative, and 5
Powder River Energy Corporation. The characteristics of the remaining 6
transmission system, to be first allocated to the state jurisdictions and then South 7
Dakota customers, are more closely related to the distribution system. For 8
example, some of the substation assets that provide step down transformation from 9
transmission to distribution service remain to be allocated. Due to the nature of 10
these assets and related costs, the Company proposes to use the Calculated 11
Maximum Demand, or Non Coincident Peak (“NCP”), allocation methodology. 12
This is consistent with the methodology used to allocate certain distribution assets 13
and related costs as provided further in my testimony below. 14
Q. WHAT IS THE RECOMMENDATION IN THE CURRENT CASE 15
REGARDING THE CLASSIFICATION AND ALLOCATION OF 16
DISTRIBUTION ACCOUNTS 364 THROUGH 368? 17
A. The Company recommends classifying these distribution accounts as demand and 18
using the NCP allocation methodology. Several approaches were considered 19
when determining the demand and customer classification of these accounts, such 20
as the Minimum-Size Method and the Minimum-Intercept Approach that are 21
001162

25
provided in NARUC’s Manual. However, the evaluation of these methods on 1
page 95 of the Manual identifies issues in each of the methods. Due to the 2
potential misclassification or misallocation to customer classes from these 3
shortcomings associated with employing these classification methods, the 4
Company elected to classify these accounts as demand. Since local area loads are 5
the major factors in sizing distribution equipment, the customer class non-6
coincident demand is used to allocate the distribution accounts. This classification 7
and allocation of these distribution accounts is consistent with Black Hills Power’s 8
previous rate cases. 9
Q. DO THE ALLOCATIONS OF DISTRIBUTION PLANT IN THE CCOSS 10
RECOGNIZE DIFFERENCES BETWEEN PRIMARY AND SECONDARY 11
FACILITIES? 12
A. Yes, as indicated on page 5 of Schedule O-1, Accounts 364 through 367 recognize 13
that some distribution customers are served from the primary voltage system and 14
other distribution customers are served at secondary voltage. This differentiation 15
by voltage level allows secondary costs to be allocated only to secondary 16
customers. 17
Q. HOW ARE THE REMAINING DISTRIBUTION PLANT ACCOUNTS 18
ALLOCATED TO CUSTOMER CLASSES? 19
A. Account 369 - Services includes customer-related costs that are allocated to 20
classes on the basis of weighted class NCP demands. Account 370 - Meters is 21
001163

26
allocated to classes on the basis of the number of customers weighted by the 1
relative cost of a meter for that class. The remaining plant accounts, Account 371 2
- Installations on customer premises and Account 373 - Street lighting and signal 3
systems are exclusively used for lighting services of Black Hills Power. 4
Therefore, these accounts are directly assigned to the Lighting class as a whole. 5
Q. BRIEFLY DESCRIBE THE ALLOCATION OF GENERAL PLANT. 6
A. General Plant does not readily fall into a demand, energy, or customer 7
classification because general plant reflects indirect common costs necessary to 8
operate a utility system. Generally speaking, general plant consists of plant and 9
equipment necessary to support overall organization personnel. In performing a 10
CCOSS, Operation and Maintenance ("O&M") expenses for production, 11
transmission, distribution, customer accounting and customer information have 12
already been functionalized, classified and allocated to classes. As a result, the 13
level of wages and salaries recorded in the O&M expense accounts is known and 14
allocation factors are developed using this information. In summary, general plant 15
is allocated on the basis of the prior assignment of distribution wages and salaries 16
by operation and maintenance expense accounts. This method is recognized by 17
NARUC in its Manual (page 105). 18
001164

27
Q. HOW ARE THE REMAINING RATE BASE ITEMS ALLOCATED TO 1
CLASSES? 2
A. Accumulated depreciation is allocated to classes based upon the prior allocation of 3
related plant accounts. Additions and deductions from rate base are allocated 4
using the most appropriate allocation factors for the items being assigned. For 5
example, cash working capital is allocated to classes on the basis of an analysis of 6
specific components on pages 9 and 10 of the CCOSS that encompass the leads 7
and lags of expenses; fuel inventory is allocated based upon the allocation of fuel 8
expense; materials and supplies inventory is allocated to customer classes on the 9
basis of total plant in service; prepayments are allocated on the basis of previously 10
allocated O&M expenses excluding fuel and purchased power; customer advances 11
for construction are allocated based upon a direct assignment; and regulatory 12
assets, regulatory liabilities, and deferred taxes are allocated based on salary and 13
wages, total plant, or customer based on the nature of the specific accounts. 14
Q. HOW ARE OPERATING REVENUES ALLOCATED? 15
A. Sales of electricity are recorded by customer class and are, therefore, directly 16
assigned. Account 450 - Forfeited Discounts are allocated on the basis of expense 17
Account 904 - Uncollectible Accounts. Miscellaneous service revenues are 18
allocated on the basis of distribution plant. Rent from electric property is allocated 19
on the basis of previously allocated transmission and distribution plant in service. 20
The allocations of operating revenues are set forth on page 11 of the CCOSS. 21
001165

28
Q. PLEASE DESCRIBE THE ALLOCATION OF POWER PRODUCTION 1
EXPENSE AND OTHER POWER SUPPLY EXPENSES. 2
A. Accounts 501 - Fuel and 547 - Other Power Generation Fuel are eliminated from 3
the revenue requirement as provided in the testimony of Jon Thurber. All other 4
power production expenses other than supervision and engineering accounts are 5
allocated on the basis of the production allocation factor which, as explained 6
above, is calculated on the basis of the A&E allocation methodology. Supervision 7
and engineering accounts are allocated based upon the allocation of wages and 8
salaries recorded in the related series of accounts. For example, Account 500 - 9
Supervision and Engineering (steam production operation) is allocated on the basis 10
of the allocation of wages and salaries allocated in Accounts 501 through 506; 11
Account 510 - Supervision and Engineering (steam production maintenance) is 12
allocated on the basis of the allocation of wages and salaries allocated in Accounts 13
511 through 514; Account 546 - Supervision and Engineering (other power 14
generation operation) is allocated on the basis of the allocation of wages and 15
salaries allocated in Accounts 547 through 549; and Account 551 - Supervision 16
and Engineering (other power generation maintenance) is allocated on the basis of 17
the allocation of wages and salaries allocated in accounts 552 through 556. 18
Finally, the energy component of purchased power is removed from the revenue 19
requirement and discussed further in Jon Thurber’s testimony, while the demand 20
001166

29
portion of the purchased power bill and other power supply expenses are allocated 1
using the demand-related production allocation factor discussed above. 2
Q. PLEASE DESCRIBE THE ALLOCATION OF TRANSMISSION 3
EXPENSES. 4
A. For this CCOSS, the expenses booked in most O&M expense accounts are related 5
to a specific property account that has already been allocated to the FERC 6
jurisdiction. In addition, the Transmission of Electricity by Others (Account 565) 7
is completely removed for Base Costs as further explained in Jon Thurber’s 8
testimony. For these reasons, all transmission costs except for the Supervision and 9
Engineering accounts (Accounts 560 and 568) are allocated on the basis of total 10
allocated transmission plant. Transmission Supervision and Engineering expenses 11
are allocated on the basis of the sum of the allocation of wages and salaries in the 12
related series of accounts in the same manner as production expenses. 13
Q. PLEASE DESCRIBE THE ALLOCATION OF DISTRIBUTION 14
EXPENSES. 15
A. Similar to the transmission plant related O&M expenses, the distribution O&M 16
expenses are allocated based on the distribution plant allocator. For example, 17
overhead line operation expense and maintenance expense are allocated on the 18
basis of the allocation of overhead lines; street light related expenses are allocated 19
on the basis of the allocation of street lights; transformer maintenance expense is 20
allocated on the basis of the allocation of transformers; and so forth. Similarly, 21
001167

30
distribution supervision and engineering expenses are allocated on the basis of the 1
summed allocation of the wage and salary components among the allocated series 2
of expense accounts. Accounts 581 - Load Dispatching, 588 – Miscellaneous 3
Operation Expenses, 589 - Rents, and 598 - Miscellaneous Maintenance Expense 4
are allocated on the basis of total distribution plant. 5
Q. PLEASE DESCRIBE THE ALLOCATION OF CUSTOMER ACCOUNTS 6
EXPENSES AND CUSTOMER SERVICE EXPENSES. 7
A. These accounts are customer-related accounts that are allocated on the basis of the 8
number of bills or number of customers. Account 904 - Uncollectible Accounts 9
are allocated on the basis of customer account write-offs during the test period. 10
Supervision expenses are allocated based upon the allocated wages and salaries of 11
the related series of accounts. 12
Q. PLEASE DESCRIBE THE ALLOCATION OF ADMINISTRATIVE AND 13
GENERAL ("A&G") EXPENSES. 14
A. A large portion of A&G activities support the functions and activities carried out 15
by Black Hills Power employees. Therefore, many A&G expense accounts are 16
allocated on the basis of allocated wages and salaries for all other accounts. 17
Property insurance is allocated on the basis of total plant in service. Regulatory 18
commission expense is allocated on claimed revenues. Rents and Maintenance of 19
General Plant are allocated on General Plant. 20
001168

31
Q. PLEASE DESCRIBE THE ALLOCATION OF DEPRECIATION 1
EXPENSE. 2
A. In a manner similar to accumulated depreciation, depreciation expense by account 3
is allocated on the basis of the associated plant. 4
Q. PLEASE DESCRIBE THE ALLOCATION OF TAXES OTHER THAN 5
INCOME TAXES. 6
A. Taxes other than income taxes are allocated based upon the most appropriate 7
allocation. For example, FICA and federal and state unemployment taxes are 8
allocated on the basis of total allocated wages and salaries. South Dakota Public 9
Utilities Commission taxes are allocated on the basis of claimed revenues, and 10
property taxes are allocated on the basis of the total plant in service. 11
Q. PLEASE DESCRIBE THE ALLOCATION OF INCOME TAXES. 12
A. As previously stated, income taxes are not directly allocated to customer classes. 13
Instead, the components used to calculate income taxes are allocated to each 14
customer class. These allocated income tax components are then used to calculate 15
the income tax liability for each customer class based upon the allocated tax 16
components. The detailed computation of federal income taxes are set forth on 17
pages 18 and 19 of the CCOSS provided in Schedule O-1. 18
001169

32
C. Overview of Class Load Data 1
Q. WHAT DATA WAS USED TO DEVELOP THE CUSTOMER CLASS 2
DEMAND ALLOCATORS AND DESCRIBE YOUR ROLE IN THE 3
PREPARATION OF THE ALLOCATORS? 4
A. Black Hills Power retained a load research consultant to develop customer class 5
load shapes which were then used in the allocation process of demand related 6
costs in the CCOSS. The consultant was provided the same monthly billing 7
determinants used in Exhibit CRG-1. He was also provided with test year hourly 8
interval data by rate for virtually all customers from their AMI meter. Several of 9
the largest customers are currently billing on non-AMI meters, so customer hourly 10
interval data from the recording demand meters was utilized. For non-metered 11
services, street and private area lighting, the consultant created monthly load 12
shapes based on number of nighttime hours of expected lighting usage. 13
Q. WHAT IS THE PURPOSE OF CREATING CUSTOMER CLASS LOAD 14
SHAPES? 15
A. Customer class load shapes are used in creating demand allocators for use in the 16
CCOSS to assign costs to the various customer classes. This load shape 17
information is not available from data collected in the routine billing of customers, 18
so historically, the load shape was estimated based on samples drawn from classes 19
of customers. With the availability of AMI information for almost all customers, 20
sampling is no longer necessary, as hourly information is available by rate. 21
001170

33
Q. HOW WERE THE CUSTOMER CLASS LOAD SHAPES CREATED? 1
A. Load shapes were created using the data provided. For the customer classes with 2
AMI data, we multiplied each hour, typically by rate, by the ratio of the billed 3
kWh to the sum of the annual hourly values available from AMI. This is the form 4
of a Combined Ratio Estimator – one of the industry standard methods of 5
estimation – and has the effect of raising or lowering the entire shape so it exactly 6
reflects the billed kWh used for creating billing determinants. 7
Q. HOW WAS THE DEMAND INFORMATION USED? 8
A. The demand information developed from Black Hills Power’s data was used to 9
create allocators by dividing each customer class demand estimate by the sum of 10
the customer class demand estimates such that the sum of the results equals 1. 11
These allocations are illustrated in Schedule O-1. 12
Q. CAN THE CUSTOMER CLASS LOAD SHAPES, DEMAND ESTIMATES 13
AND DEMAND ALLOCATORS THAT YOU DEVELOPED BE USED 14
RELIABLY IN THE CCOSS? 15
A. Yes. The customer class load shapes, demand estimates and demand allocators 16
have been developed, are reasonable and can be reliably used in Schedule O-1, to 17
assign costs to the various customer classes. The demand estimates were modified 18
by loss factors to account for the line losses between generation stations and the 19
retail meters where the load shape data is collected. The demand allocators were 20
all developed using industry standard methods. 21
001171

34
D. Results of Study 1
Q. PLEASE SUMMARIZE THE RESULTS OF THE CCOSS. 2
A. As the results of the CCOSS indicate, moving the current customer class rates of 3
return produced at present rates to the system return of 8.48% would require large 4
increases to the base rates for three of the five customer classes and a smaller 5
increase to one customer class and reduction to base rates for two customer 6
classes. In order for each customer class to produce the system rate of return of 7
8.48%, this requires increases to Residential rates by 19.26%, General Service 8
Large/Industrial Contract by 15.44%, and 3.45% to the Water Pumping/Irrigation 9
class. This also requires a reduction of General Service rates by 6.37%, and 10
Lighting Service rates by 15.74%. 11
Q. WHAT CONCLUSIONS HAVE YOU REACHED REGARDING THE 12
RESULTS OF THE COST OF SERVICE STUDIES? 13
A. The methods and procedures applied in the jurisdictional and CCOSS are 14
consistent with traditional rate making principles employed by the electric utility 15
industry and Black Hills Power. In addition, the results of these cost of service 16
studies justly and reasonably reflect the cost to serve the various customer classes 17
for Black Hills Power and the results provide a sound basis for designing just and 18
reasonable rates for each of its customer classes. Black Hills Power also 19
recognizes the significant increases the CCOSS developed for both of the smallest 20
customers, the residential customer class, as well as our largest customers, the 21
001172

35
Industrial Contract Service customer class. As previously mentioned, our rate 1
design philosophy must consider the history of rates, including trends in the level 2
of charges and stability of the rates as well as the degree of price sensitivity in 3
each customer class. 4
The direct testimony of Kyle White provides a method to move to cost-based 5
rates. In particular, he discusses the concept of gradualism, so that rates are not 6
increased in one step, since certain classes would experience rate shock from the 7
resulting large increase in a single customer class and reallocation of costs 8
reflected in a single move to full cost of service rates. 9
In class cost of service modeling, a complete elimination of all inter-class 10
subsidies can often have significant adverse implications on a given customer 11
class. By employing the concept of gradualism, significant rate shifts, for the 12
Residential and General Service Large/Industrial Contract Service customer 13
classes in this case, are minimized by moving all customer classes to the full cost 14
of service rates over several smaller steps as opposed to one leap to full cost of 15
service. 16
Q. WILL ALL CUSTOMERS IN A CUSTOMER CLASS RECEIVE THE 17
SAME PERCENTAGE CHANGE FROM CURRENT RATES? 18
A. No. The proposed percentage change for a customer class will more closely follow 19
the revenue requirement indicated by the CCOSS for each particular Rate ID while 20
following the gradual move to full cost of service. However, within a rate class, 21
001173

36
the study may have identified certain subclasses that may need a different 1
percentage. So the change from current rates might go up more for one subclass 2
and less of an increase for another, while the customer class still receives the total 3
required customer class increase. 4
Q. HOW WERE THE PERCENTAGE INCREASES APPLIED TO THE 5
PROPOSED CUSTOMER RATES? 6
A. Generally, increases were applied across all rates for each rate schedule. Some of 7
the customer charges are rounded to the closest 5 or 10 cents after being raised the 8
class percentage increase required. In addition, for some customer classes, the 9
increase is assigned more to the demand charge, if the CCOSS supported such 10
charge, rather than the energy charge in order to incent customers to achieve 11
higher load factors. The proposed rates will allow Black Hills Power the 12
opportunity to collect the revenue requirement level derived by Schedule N-1. 13
VIII. PROPOSED RATES 14
Q. DISCUSS THE PURPOSE OF EXHIBIT CRG-8. 15
A. The purpose of Exhibit CRG-8 - Pro Forma Billing Determinants on Proposed 16
Rates is to price out the pro forma billing determinants using rates that align with 17
costs caused by each customer class and the appropriate revenues collected by 18
customer class while implementing the rate shock mitigation plan offered in the 19
testimony of Kyle White. 20
001174

37
The Pro Forma CCOSS is provided as Schedule O-1. The pro forma billing 1
determinants provided in Exhibit CRG-8 are also carried over to Section 3 2
Revenue Comparison. 3
Q. DISCUSS THE PROCESS YOU USED IN DEVELOPING THE BASE 4
RATES SHOWN ON EXHIBIT CRG-8. 5
A. The CCOSS is the guide in developing the proposed rates. Black Hills Power used 6
the same billing determinants as provided in Exhibit CRG-7. That is, Black Hills 7
Power used the same number of customer bills, same monthly billed kW demand 8
and the same kWh consumption for each individual rate schedule. The total 9
electric revenue deficiency of $14,634,238 causes an overall deficiency of 9.27% 10
of current base revenues. An across the board rate increase of 9.27% would 11
provide Black Hills Power the opportunity to reach its total South Dakota revenue 12
requirement of $138,803,591 as shown on Schedule N-1, Page 2, Column (c), Line 13
73. 14
Q. PLEASE EXPLAIN HOW THE ALLOCATION PROPOSAL WAS 15
DEVELOPED FOR EACH CLASS. 16
A. The Company’s customer class allocation proposal sets upper and lower limits to 17
each customer class’s contribution to the overall South Dakota revenue deficiency. 18
The rate shock mitigation plan set the upper limit on any type of class of 19
customers at 120% of the overall base revenue deficiency percentage. The lower 20
limit is set at 75% of the overall base revenue percentage increase. All customer 21
001175

38
classes will see some level of increase, the CCOSS results will define the level 1
each customer class will contribute to the overall revenue deficiency. This 2
proposal provides a significant movement of rates toward full class cost of service 3
levels while maintaining accurate and equitable pricing, tempered by moderation. 4
The moderation in this proposal also recognizes the overall level of the proposed 5
increase. 6
Using the proposed customer class revenues and applying rate design factors 7
mentioned herein, Black Hills Power developed appropriate base rate charges. 8
These charges are necessary to allow the Company the opportunity to recover, 9
from each class, the appropriate class revenue requirement and the total annual 10
revenue requirement proposed. 11
Q. WHAT IS YOUR CONCLUSION CONCERNING THE ADDITIONAL 12
REVENUE REQUIREMENT REQUEST OF $ 14,634,238? 13
A. Black Hills Power’s analysis demonstrates that Exhibit CRG-8 pro forma billing 14
determinants priced out on the increased base rate charges provided in proposed 15
rate schedule tariffs will allow the Company the opportunity to recover the 16
revenue requirement proposed by Black Hills Power in this rate application. 17
001176
39
IX. PROPOSED CHANGES TO TARIFFS 1
Q. ARE ANY RATE STRUCTURES ON EXISTING TARIFFS BEING 2
MODIFIED OR ELIMINATED? 3
A. Yes. Black Hills Power has reviewed its tariffs and has proposed several 4
refinements to the General Service, General Service-Large and Forest Products 5
Service tariff options. The current rate structures for these tariffs have multiple 6
billing steps based on differing levels in the demand charge and also in the energy 7
charge. Our proposal is to reduce the number of steps from three to two in order to 8
allow for a more simplified bill calculation as well as the elimination of some 9
inter-class subsidies from the larger users to the smaller users on the same tariff. 10
Additionally, the enhanced capabilities of the AMI meters provide Black Hills 11
Power with complete and accurate demand readings from all of its General Service 12
customers not possible with the prior General Service meters used for billing. The 13
history behind the first demand billing bucket, 0 – 5 kW, originated out of the 14
smaller General Service customers having a non-demand watt hour meter. Their 15
previous electric meter did not register demand, only kilowatt hours consumed, the 16
same as with regular residential meters. As evidenced on Exhibit CRG-6, Pro 17
Forma billing determinants on current rates, almost 30% of the total kW measured 18
for General Service (Rate ID SD720) currently goes uncharged. To recover the 19
appropriate demand dollars, a larger charge per billed kW is necessary to achieve 20
the desired revenues. With the roll out of the new AMI meters, all customer 21
001177

40
meters now register both energy (kWh) and demand (kW) for the billing period. 1
As accurate demand readings are now recorded in the billing system, the actual 2
metered demand for all general service customers can be billed appropriately. The 3
proposed rates have consolidated the 0- 5 kW demand bucket with the 5- 50 kW 4
bucket. In rate design process, by billing for all demand from all General Service 5
customers, the proposed rates offer a lower charge per kW for the customers 6
falling in the 5 -50 kW demand level than might ordinarily occur if the current 7
pricing structure was retained. The over 50 kW bucket is retained for the largest 8
users at this time. Further, the Company is proposing to consolidate the current 9
four step energy charges into a two step energy charge, 0 - 3000 kWh in bucket 10
one and all remaining kWh in bucket two. 11
The General Service-Large tariff will have three step energy charges consolidated 12
to two energy buckets, with the lower pricing applied to energy used with a load 13
factor over 55% at 125 kVA capacity. This provides the pricing incentive for 14
customers to manage their peak demand and improve their load factor. The two 15
step demand charge will remain in place. 16
The modification to the Forest Products Service tariff follows the General Service-17
Large load factor concept. The three step demand charge will be consolidated into 18
a two part demand charge, the first bucket of 0 -5,000 kVA and second bucket of 19
all excess kVA. The three step energy charge calculation will become a two step 20
charge, the first 800,000 kWh in the first bucket and excess kWh in the second 21
001178

41
bucket. These modifications will provide the pricing break at the 55% load factor 1
level similar to the General Service-Large tariff. 2
Black Hills Power believes these modifications will provide appropriate price 3
signals to customers to encourage optimum use of supply sources by promoting 4
desirable load characteristics, provide tariffs that are easy for customers to 5
understand, provide for ease of administration while avoiding undue 6
discrimination between customer classes and individual customers within each 7
class. 8
X. PROPOSED TARIFFS 9
Q. PLEASE DESCRIBE THE PROPOSED TARIFFS. 10
A. The tariff sheets are updated to reflect the new rates provided in Exhibit CRG-8. 11
The tariff sheets have been provided in legislative and non-legislative format in 12
Section 2. 13
XI. CONCLUSION 14
Q. DO THE PROPOSED RATES INCORPORATE THE 15
RECOMMENDATIONS FROM THE CCOSS AND ALLOW BLACK 16
HILLS POWER THE OPPORTUNITY TO COLLECT THE ADDITIONAL 17
REVENUE REQUIREMENT OF $14,634,238? 18
A. Yes. These proposed rates will allow Black Hills Power the opportunity to 19
recover the allowed revenue requirement level. 20
001179

42
In addition, the proposed rates are aligned with the principles of rate design that 1
the Company has used consistently throughout past rate cases. Black Hills Power 2
has presented a reasonable CCOSS, which supports the proposed rate design. 3
Black Hills Power’s proposed rate design is another step toward full cost of 4
service rates for its customers, relying on gradualism to move customers towards 5
that goal. The proposed rate design mitigates rate shock and balances individual 6
customer class revenue requirement recovery impacts with cost based rates. Black 7
Hills Power’s proposed rate design results in just and reasonable rates. 8
Q. DOES THIS CONCLUDE YOUR TESTIMONY? 9
A. Yes. 10
001180

Exhibit CRG-1Test Year Billing Determinants
Row No.
1 Residential Service
2 Section 3, Sheet No. 1 SD710
3
4 Customer Charge
5 All Year Regular Use 505,651 4,295,113$
6
7 Base Costs FPP/Transmsn. 2,144,656$
8 Environ. Improve. Adj 489,327$
9 Phase In Plan Rate 463,882$
10 Energy Efficiency Adjust 279,397$
11
12 Energy Charge
13 All Year All kWh 336,138,965 33,208,722$
14 Total per Tariff sheet 336,138,965 40,881,098$
15
16
17 Residential - Total Electric Service
18 Section 3, Sheet No. 3 SD712
19
20 Customer Charge
21 All Year 80,670 901,885$
22
23 Base Costs FPP/Transmsn. 315,496$
24 Environ. Improve. Adj 146,409$
25 Phase In Plan Rate 87,592$
26 Energy Efficiency Adjust 76,599$
27
28 Energy Charge
29 All Year All kWh 88,905,064 7,138,848$
30 Total per Tariff sheet 88,905,064 8,666,828$
31
32
33 Residential - Demand Service
34 Section 3A, Sheet No. 1 SD714
35
36 Customer Charge
37 All Year 10,198 140,149$
38
39 Capacity Charge (kW) 112,052 775,070$
40
41 Base Costs FPP/Transmsn. 74,412$
42 Environ. Improve. Adj 32,588$
43 Phase In Plan Rate 20,188$
44 Energy Efficiency Adjust 17,150$
45
46 Energy charge
47 All Year All kWh 19,940,176 728,376$
48 Total per Tariff sheet 19,940,176 1,787,933$
49
50
51 Residential - Demand Service (Maximum Value Option)
52 Section 3A, Sheet No. 1 SD716
53
54 Customer Charge
55 All Year 32,737 449,996$
56
57 Capacity Charge (kW) 314,209 2,181,338$
58
59 Base Costs FPP/Transmsn. 258,991$
60 Environ. Improve. Adj 115,856$
61 Phase In Plan Rate 71,202$
62 Energy Efficiency Adjust 60,836$
63
64 Base Rate charge
65 All Year All kWh 70,704,603 2,586,992$
66 Total per Tariff sheet 70,704,603 5,725,211$
67
68
69 Residential - Utility Controlled Service
70 Section 3A, Sheet No. 4 SD717
71
72 Customer Charge
73 All Year 33 224$
74
75 Base Costs FPP/Transmsn. 456$
76 Environ. Improve. Adj 215$
77 Phase In Plan Rate 128$
78 Energy Efficiency Adjust 114$
79
80 Energy Charge
81 All Year All kWh 131,002 6,729$
82 Total per Tariff sheet 131,002 7,866$
83
84
85 Residential - Net Billing - Regular Service
86 Section 3B, Sheet No. 4 (SD710) SD875
87
88 Customer Charge
89 All Year Regular Use 75 644$
Page 1 of 8
001181

Exhibit CRG-1Test Year Billing Determinants
Row No.
90
91 Base Costs FPP/Transmsn. 357$
92 Environ. Improve. Adj 91$
93 Phase In Plan Rate 80$
94 Energy Efficiency Adjust 51$
95
96 Energy Charge
97 All Year All kWh 60,839 6,026$
98 Total per Tariff sheet 60,839 7,249$
99
100
101 Residential - Net Billing - Total Electric
102 Section 3B, Sheet No. 4 (SD712) SD876
103
104 Customer Charge
105 All Year Regular Use 24 269$
106
107 Base Costs FPP/Transmsn. 71$
108 Environ. Improve. Adj 30$
109 Phase In Plan Rate 20$
110 Energy Efficiency Adjust 16$
111
112 Energy Charge
113 All Year All kWh 18,621 1,492$
114 Total per Tariff sheet 18,621 1,898$
115
116
117 Residential - Net Billing - Demand - Max Value
118 Section 3B, Sheet No. 1 (SD716) SD887
119
120 Customer Charge
121 All Year 12 147$
122
123 Capacity Charge (kW) 119 818$
124
125 Base Costs FPP/Transmsn. 117$
126 Environ. Improve. Adj 32$
127 Phase In Plan Rate 28$
128 Energy Efficiency Adjust 18$
129
130 Base Rate charge
131 All Year All kWh 21,270 744$
132 Total per Tariff sheet 21,270 1,904$
133
134
135
136 Small General Service - Total Electric (No Demand)
137 Section 3, Sheet No.9 SD703
138
139 Customer Charge
140 All Year 158 2,602$
141
142 Base Costs FPP/Transmsn. -$
143 Environ. Improve. Adj 119$
144 Phase In Plan Rate -$
145 Energy Efficiency Adjust 41$
146
147 Energy Charge
148 All Year First 6000 kWh's 64,143 4,766$
149 All Year All additional kW - -$
150 Total per Tariff sheet 64,143 7,529$
151
152
153 SGS - Athletic Fields (off-peak)
154 Section 3, Sheet No.7 SD718
155
156 Customer Charge
157 All Year 533 6,146$
158
159 Base Costs FPP/Transmsn. 6,374$
160 Environ. Improve. Adj 1,149$
161 Phase In Plan Rate 1,725$
162 Energy Efficiency Adjust 549$
163
164 Energy Charge
165 All Year First 1,000 kWh 254,738 27,565$
166 All Year Next 2,000 kwh 238,550 22,043$
167 All Year Next 12,000 kWh 206,488 16,631$
168 All Year All additional kWh 67,200 4,015$
169 Total per Tariff sheet 766,976 86,196$
170
171
172 SGS - Demand Not Billed (off-peak)
173 Section 3, Sheet No.7 SD719
174
175 Customer Charge
176 All Year 4,134 45,475$
177
178 Minimum Bill -$
179
Page 2 of 8
001182

Exhibit CRG-1Test Year Billing Determinants
Row No.
180 Base Costs FPP/Transmsn. -$
181 Environ. Improve. Adj 2,779$
182 Phase In Plan Rate 0$
183 Energy Efficiency Adjust 970$
184
185 Energy Charge
186 All Year First 1,000 kWh 1,112,279 123,018$
187 All Year Next 2,000 kwh 94,285 9,033$
188 All Year Next 12,000 kWh 1,128 96$
189 All Year All additional kWh - -$
190 Total per Tariff sheet 1,207,692 181,370$
191
192
193 Small General Service
194 Section 3, Sheet No.7 SD720
195
196 Customer Charge
197 All Year 124,047 1,427,551$
198
199 Capacity Charge
200 All Year First 5 kW 401,125 -$
201 All Year Next 45 kW 756,976 5,160,634$
202 All Year Additional kW 226,023 1,456,187$
203
204 Minimum Bill 1,353$
205
206 Base Costs FPP/Transmsn. 2,211,448$
207 Environ. Improve. Adj 610,922$
208 Phase In Plan Rate 568,571$
209 Energy Efficiency Adjust 254,851$
210
211 Energy Charge
212 All Year First 1,000 kWh 72,860,730 7,922,233$
213 All Year Next 2,000 kwh 71,093,438 6,621,352$
214 All Year Next 12,000 kWh 132,786,844 10,823,702$
215 All Year All additional kWh 76,531,080 4,970,891$
216 Total per Tariff sheet 353,272,092 42,029,694$
217
218
219 Small General Service - Total Electric
220 Section 3, Sheet No.9 SD723
221
222 Customer Charge
223 All Year 10,421 180,463$
224
225 Capacity Charge
226 All Year First 5 kW 44,210 -$
227 All Year Next 45 kW 98,812 612,616$
228 All Year Additional kW 20,720 117,951$
229
230 Base Costs FPP/Transmsn. 198,757$
231 Environ. Improve. Adj 69,361$
232 Phase In Plan Rate 55,207$
233 Energy Efficiency Adjust 28,028$
234
235 Energy Management Fee (864)$
236
237 Energy Charge
238 All Year First 6,000 kWh 23,032,373 1,641,028$
239 All Year All additional kWh 15,056,977 996,043$
240 Total per Tariff sheet 38,089,350 3,898,590$
241
242
243 Irrigation Pumping
244 Section 3, Sheet No. 19 SD726
245
246 Capacity Charge
247 Per season per horsepower of connected load 1,371 20,587$
248
249 Base Costs FPP/Transmsn. 11,839$
250 Environ. Improve. Adj 1,023$
251 Phase In Plan Rate 2,394$
252 Energy Efficiency Adjust 551$
253
254 Energy Charge
255 All Year All kWh 887,365 61,207$
256 Total per Tariff sheet 887,365 97,602$
257
258
259 Small General Service - Utility Controlled Service
260 Section 3A, Sheet No. 11 SD727
261
262 Customer Charge
263 All Year 282 1,757$
264
265 Base Costs FPP/Transmsn. 7,919$
266 Environ. Improve. Adj 4,739$
267 Phase In Plan Rate 2,008$
268 Energy Efficiency Adjust 1,802$
269 Energy Charge
Page 3 of 8
001183

Exhibit CRG-1Test Year Billing Determinants
Row No.
270 All Year All kWh 2,375,455 121,333$
271 Total per Tariff sheet 2,375,455 139,558$
272
273
274 Traffic Signals
275 Section 3, Sheet No. 26 SD742
276
277 Customer Charge 1,765 14,699$
278
279 Base Costs FPP/Transmsn. 3,632$
280 Environ. Improve. Adj 1,340$
281 Phase In Plan Rate 868$
282 Energy Efficiency Adjust 519$
283
284 Base Rate charge
285 All Year All kWh 706,762 53,087$
286 Total per Tariff sheet 706,762 74,146$
287
288
289 Municipal Pumping
290 Section 3, Sheet No. 24 SD743
291
292 Customer Charge
293 Winter 11/1 to 5/31 Regular Use 668 11,026$
294 Summer 6/1 to 10/31 Regular Use 502 9,031$
295
296 Capacity Charge
297 Winter 11/1 to 5/31 Per kW 20,037 81,751$
298 Summer 6/1 to 10/31 Per kW 47,767 228,655$
299
300 Base Costs FPP/Transmsn. 163,790$
301 Environ. Improve. Adj 38,802$
302 Phase In Plan Rate 41,424$
303 Energy Efficiency Adjust 16,619$
304 Energy Charge
305 Winter 10/1 to 5/31 All kWh 11,715,085 708,763$
306 Summer 6/1 to 9/30 All kWh 11,658,031 594,918$
307 Total per Tariff sheet 23,373,116 1,894,777$
308
309
310 Small Interruptible General Service
311 Section 3A, Sheet No. 18 SD750
312
313 Customer Charge
314 All Year 50 564$
315
316 Capacity Charge (kW) 3,447 2,752$
317
318 Base Costs FPP/Transmsn. 2,208$
319 Environ. Improve. Adj 285$
320 Phase In Plan Rate 511$
321 Energy Efficiency Adjust 144$
322 Base Rate charge
323 All Year All kWh 211,580 9,256$
324 Total per Tariff sheet 211,580 15,720$
325
326
327 Energy Storage
328 Section 3A, Sheet No. 6 SD755
329
330 Customer Charge
331 All Year 242 2,884$
332
333 Capacity Charge (kW)
334 All Year On-Peak 14,720 118,257$
335 All Year Off-Peak 29,386 -$
336
337 Base Costs FPP/Transmsn. 24,879$
338 Environ. Improve. Adj 7,982$
339 Phase In Plan Rate 6,626$
340 Energy Efficiency Adjust 3,504$
341
342 Energy Charge (kWh)
343 All Year On-Peak 2,032,274 97,494$
344 All Year Off-Peak 2,768,305 74,664$
345 Total per Tariff sheet 4,800,579 336,291$
346
347
348 SGS - Special Events
349 Section 3, Sheet No.7 SD770
350
351 Customer Charge
352 All Year 1,281 15,552$
353
354 Capacity Charge
355 All Year First 5 kW 1,871 -$
356 All Year Next 45 kW 4,044 31,414$
357 All Year Additional kW 1,412 10,548$
358
359 Base Costs FPP/Transmsn. 16,690$
Page 4 of 8
001184

Exhibit CRG-1Test Year Billing Determinants
Row No.
360 Environ. Improve. Adj 529$
361 Phase In Plan Rate 2,649$
362 Energy Efficiency Adjust 361$
363
364 Energy Charge
365 All Year First 1,000 kWh 269,419 28,184$
366 All Year Next 2,000 kwh 221,930 19,165$
367 All Year Next 12,000 kWh 293,432 21,447$
368 All Year All additional kWh 34,520 1,891$
369 819,301 148,431$
370
371
372 SGS - Net Billing (SD720)
373 Section 3B, Sheet No.4 SD878
374
375 Customer Charge
376 All Year 97 1,119$
377
378 Capacity Charge
379 All Year First 5 kW 327 -$
380 All Year Next 45 kW 459 3,028$
381 All Year Additional kW 14 84$
382
383 Base Costs FPP/Transmsn. 479$
384 Environ. Improve. Adj 193$
385 Phase In Plan Rate 131$
386 Energy Efficiency Adjust 75$
387
388 Energy Charge
389 All Year First 1,000 kWh 45,368 4,928$
390 All Year Next 2,000 kwh 46,071 4,315$
391 All Year Next 12,000 kWh 10,900 812$
392 All Year All additional kWh - -$
393 Total per Tariff sheet 102,339 15,164$
394
395
396
397
398 General Service Large - Secondary Service
399 Section 3, Sheet No.11 SD721
400
401 Capacity Charge
402 All Year On-Peak - First 125 kVa 1,230 1,514,152$
403 All Year On-Peak - Each Addl kVA 137,527 1,088,720$
404 All Year Off-Peak - >250 kVA - no charge - -$
405 All Year Off-Peak - 1.5x Billing Capacity - -$
406
407 Base Costs FPP/Transmsn. 780,373$
408 Environ. Improve. Adj 149,519$
409 Phase In Plan Rate 147,486$
410 Energy Efficiency Adjust 90,819$
411
412 Substation Lease -$
413
414 Energy Charge
415 All Year First 50,000 kWh 56,128,845 2,988,050$
416 All Year Next 450,000 kwh 41,544,430 2,102,990$
417 All Year All additional kWh 379,700 12,834$
418 Total per Tariff sheet 98,052,975 8,874,943$
419
420
421 General Service Large - Primary Service
422 Section 3, Sheet No.11 SD721
423
424 Capacity Charge
425 All Year On-Peak - First 125 kVa 60 73,100$
426 All Year On-Peak - Each Addl kVA 52,650 414,530$
427 All Year Off-Peak - >250 kVA - no charge - -$
428 All Year Off-Peak - 1.5x Billing Capacity - -$
429
430 Base Costs FPP/Transmsn. -$
431 Environ. Improve. Adj -$
432 Phase In Plan Rate -$
433 Energy Efficiency Adjust -$
434
435 Substation Lease (10,876)$
436
437 Energy Charge
438 All Year First 50,000 kWh 3,000,000 161,095$
439 All Year Next 450,000 kwh 9,704,042 505,622$
440 All Year All additional kWh 14,898,000 709,249$
441 Total per Tariff sheet 27,602,042 1,852,720$
442
443
444 General Service Large - Large Demand Curtailable Service (Closed)
445 Section 3A, Sheet No. 13 SD722
446
447 Capacity Charge
448 All Year Per kVA 2,902 36,769$
449
450 Base Costs FPP/Transmsn. 5,403$
451 Environ. Improve. Adj 1,241$
Page 5 of 8
001185

Exhibit CRG-1Test Year Billing Determinants
Row No.
452 Phase In Plan Rate 1,096$
453 Energy Efficiency Adjust 725$
454
455 Curtailable Load Credit 2,902 (20,130)$
456 Energy Charge
457 All Year All kWh 998,721 39,987$
458 Total per Tariff sheet 998,721 65,091$
459
460
461 General Service Large - Secondary Service - Combined Billing
462 Section 3, Sheet No. 33 SD752
463
464 Service Charge
465 Per Location 1,732 157,206$
466
467 Capacity Charge
468 All Year First 125 kVa 499 615,967$
469 All Year Each Addl kVA 360,830 2,849,522$
470
471 Base Costs FPP/Transmsn. 902,145$
472 Environ. Improve. Adj 186,336$
473 Phase In Plan Rate 174,778$
474 Energy Efficiency Adjust 111,255$
475
476 Phone Charge/Equipment Rental 4,019$
477
478 Energy Charge
479 All Year First 50,000 kWh 24,779,800 1,309,826$
480 All Year Next 450,000 kwh 90,013,259 4,642,855$
481 All Year All additional kWh 39,078,591 1,859,299$
482 Total per Tariff sheet 153,871,650 12,813,208$
483
484
485 General Service Large - Secondary Service - Combined Billing
486 Section 3, Sheet No. 33487
488 Service Charge
489 Per Location
490
491 Capacity Charge
492 All Year First 125 kVa
493 All Year Each Addl kVA
494
495 Base Costs FPP/Transmsn.
496 Environ. Improve. Adj
497 Phase In Plan Rate
498 Energy Efficiency Adjust
499
500 Phone Charge/Equipment Rental
501
502 Energy Charge
503 All Year First 50,000 kWh
504 All Year Next 450,000 kwh
505 All Year All additional kWh
506 Total per Tariff sheet
507
508
509 Large Power Contract Service - Secondary Service - Combined Billing
510 Section 3, Sheet No. 31 Special Contract
511
512 Service Charge
513 Flat Monthly Charge
514
515 Capacity Charge
516 All Year Peak Monthly kVa
517 All Year Billed Contract kVA
518
519 Base Costs FPP/Transmsn.
520 Environ. Improve. Adj
521 Phase In Plan Rate
522 Energy Efficiency Adjust
523
524 Phone Charge/Equipment Rental
525
526 Energy Charge
527 All Year First 3,000,000 kWh
528 All Year All additional kWh
529 Total per Tariff sheet
530
531
532
533
534
535 Special Contract - Industrial 69 kV Service
536 Section 3, Sheet No. 14
537
538 Capacity Charge
539 All Year On Peak
540
541 Base Costs FPP/Transmsn.
542 Environ. Improve. Adj
543 Phase In Plan Rate
Page 6 of 8
001186

Exhibit CRG-1Test Year Billing Determinants
Row No.
544 Energy Efficiency Adjust
545
546 Energy Charge
547 All Year All kWh @ 69 kV Service
548 Total per Tariff sheet
549
550
551 Special Contract - Forest Products - Industrial Primary
552 Section 3, Sheet No. 36
553
554 Capacity Charge
555 All Year First 2,000 kVA
556 All Year Next 3,000 kVA
557 All Year Each Additional kVA
558
559 Base Costs FPP/Transmsn.
560 Environ. Improve. Adj
561 Phase In Plan Rate
562 Energy Efficiency Adjust
563
564 Energy Charge
565 All Year First 800,000 kWh
566 All Year First 1,200,000 kWh
567 All Year Each Additional kWh
568 Total per Tariff sheet
569
570
571 Special Contract - Forest Products - Industrial Secondary
572 Section 3, Sheet No. 36
573
574 Capacity Charge
575 All Year First 2,000 kVA
576 All Year Next 3,000 kVA
577 All Year Each Additional kVA
578
579 Base Costs FPP/Transmsn.
580 Environ. Improve. Adj
581 Phase In Plan Rate
582 Energy Efficiency Adjust
583
584 Energy Charge
585 All Year First 800,000 kWh
586 All Year First 1,200,000 kWh
587 All Year Each Additional kWh
588 Total per Tariff sheet
589
590
591 Special Contract - General Service Large 69 kV Service
592 Section 3, Sheet No.11593
594 Capacity Charge
595 All Year On-Peak - First 125 kVA
596 All Year On-Peak - Each Addl kVA
597
598 Base Costs FPP/Transmsn.
599 Environ. Improve. Adj
600 Phase In Plan Rate
601 Energy Efficiency Adjust
602 Substation Lease
603
604 Energy Charge
605 All Year First 50,000 kWh
606 All Year Next 450,000 kwh
607 All Year All additional kWh
608 Total per Tariff sheet
609
610
611 Special Contract - Forest Products - Industrial Primary
612 Section 3, Sheet No. 36
613
614 Capacity Charge
615 All Year First 2,000 kVA
616 All Year Next 3,000 kVA
617 All Year Each Additional kVA
618
619 Base Costs FPP/Transmsn.
620 Environ. Improve. Adj
621 Phase In Plan Rate
622 Energy Efficiency Adjust
623
624 Energy Charge
625 All Year First 800,000 kWh
626 All Year First 1,200,000 kWh
627 All Year Each Additional kWh
628 Total per Tariff sheet
629
630
631
632
633 Private or Public Area Lighting Service - Standard
634 Section 3, Sheet No. 16 SDA24
635
Page 7 of 8
001187

Exhibit CRG-1Test Year Billing Determinants
Row No.
636 Base Costs FPP/Transmsn. 15,469$
637 Environ. Improve. Adj 5,927$
638 Phase In Plan Rate 3,576$
639 Energy Efficiency Adjust 2,254$
640
641 Base Rate charge
642 All Year All kWh 3,077,091 391,862$
643 Total per Tariff sheet 3,077,091 419,088$
644
645
646 Private or Public Area Lighting Service - Flood Lighting
647 Section 3, Sheet No. 16 SDB24
648
649 Base Costs FPP/Transmsn. 3,370$
650 Environ. Improve. Adj 1,435$
651 Phase In Plan Rate 795$
652 Energy Efficiency Adjust 539$
653
654 Base Rate charge
655 All Year All kWh 729,344 133,811$
656 Total per Tariff sheet 729,344 139,950$
657
658
659 Private or Public Area Lighting Service - Customer Owned
660 Section 3, Sheet No. 17 SDC24
661
662 Base Costs FPP/Transmsn. 680$
663 Environ. Improve. Adj 250$
664 Phase In Plan Rate 154$
665 Energy Efficiency Adjust 95$
666
667 Base Rate charge
668 All Year All kWh 131,472 8,520$
669 Total per Tariff sheet 131,472 9,700$
670
671
672 Customer Owned Street Lighting - Energy Only
673 Section 3, Sheet No. 22 SD741
674
675 Base Costs FPP/Transmsn. 27,353$
676 Environ. Improve. Adj 11,495$
677 Phase In Plan Rate 6,354$
678 Energy Efficiency Adjust 4,337$
679
680 Base Rate charge
681 All Year All kWh 5,872,811 369,911$
682 Total per Tariff sheet 5,872,811 419,449$
683
684
685 Company Owned Street Lighting
686 Section 3, Sheet No. 22 SD840
687
688 Base Costs FPP/Transmsn. 16,712$
689 Environ. Improve. Adj 6,998$
690 Phase In Plan Rate 3,866$
691 Energy Efficiency Adjust 2,641$
692
693 Base Rate charge
694 All Year All kWh 3,577,040 724,322$
695 Total per Tariff sheet 3,577,040 754,539$
696
697
698 Customer Owned Street Lighting - Energy and Maintenance
699 Section 3, Sheet No. 22 SD841
700
701 Base Costs FPP/Transmsn. 575$
702 Environ. Improve. Adj 220$
703 Phase In Plan Rate 130$
704 Energy Efficiency Adjust 82$
705
706 Base Rate charge
707 All Year All kWh 114,226 9,693$
708 Total per Tariff sheet 114,226 10,701$
709
710
711
712 Rental
713 Section 3, Sheet No. 22 SD798/SD799
714
715 Capacity Charge 240$
716 Equip. Rental Charge 600$
717 Facilities/Rental Charge 54,007$
718 Miscellaneous Fee's 4,096$
719
720
721 Total per Tariff sheet - 58,943$
722
723
724
725 TOTAL RATES 1,483,797,944 146,724,130$
Page 8 of 8
001188