before the public utilities commission
222
BEFORE THE PUBLIC UTILITIES COMMISSION OF THE STATE OF CALIFORNIA Application of Pacific Gas and Electric Company for Authority, Among Other Things, to Increase Rates and Charges for Electric and Gas Service Effective on January 1, 2020. (U 39 M) Application No. 18-12-009 (Filed: December 13, 2018) (NOT CONSOLIDATED) Application of Pacific Gas and Electric Company (U 39 M) to Submit Its 2020 Risk Assessment and Mitigation Phase Report. Application No. 20-06-012 (Filed June 30, 2020) (NOT CONSOLIDATED) Application of Pacific Gas and Electric Company (U 39 M) for Authority, Among Other Things, to Increase Rates and Charges for Electric and Gas Service Effective on January 1, 2023 Application No. 21-06-021 (Filed June 30, 2021) PACIFIC GAS AND ELECTRIC COMPANY’S (U39M) 2021 RISK SPENDING ACCOUNTABILITY REPORT Dated: March 31, 2022 MARY A. GANDESBERY PETER OUBORG Pacific Gas and Electric Company 77 Beale Street San Francisco, CA 94105 Telephone: (415) 238-7987 Facsimile: (415) 973-5520 E-Mail: [email protected] Attorneys for PACIFIC GAS AND ELECTRIC COMPANY
-
Upload
khangminh22 -
Category
Documents
-
view
3 -
download
0
Transcript of before the public utilities commission

BEFORE THE PUBLIC UTILITIES COMMISSION OF THE STATE OF CALIFORNIA
Application of Pacific Gas and Electric Company for Authority, Among Other Things, to Increase Rates and Charges for Electric and Gas Service Effective on January 1, 2020.
(U 39 M)
Application No. 18-12-009 (Filed: December 13, 2018)
(NOT CONSOLIDATED)
Application of Pacific Gas and Electric Company (U 39 M) to Submit Its 2020 Risk Assessment and Mitigation Phase Report.
Application No. 20-06-012 (Filed June 30, 2020)
(NOT CONSOLIDATED)
Application of Pacific Gas and Electric Company (U 39 M) for Authority, Among Other Things, to Increase Rates and Charges for Electric and Gas Service Effective on January 1, 2023
Application No. 21-06-021 (Filed June 30, 2021)
PACIFIC GAS AND ELECTRIC COMPANY’S (U39M) 2021 RISK SPENDING ACCOUNTABILITY REPORT
Dated: March 31, 2022
MARY A. GANDESBERY PETER OUBORG
Pacific Gas and Electric Company 77 Beale Street San Francisco, CA 94105 Telephone: (415) 238-7987 Facsimile: (415) 973-5520 E-Mail: [email protected]
Attorneys for PACIFIC GAS AND ELECTRIC COMPANY

- 1 -
BEFORE THE PUBLIC UTILITIES COMMISSION OF THE STATE OF CALIFORNIA
Application of Pacific Gas and Electric Company for Authority, Among Other Things, to Increase Rates and Charges for Electric and Gas Service Effective on January 1, 2020.
(U 39 M)
Application No. 18-12-009 (Filed: December 13, 2018)
(NOT CONSOLIDATED)
Application of Pacific Gas and Electric Company (U 39 M) to Submit Its 2020 Risk Assessment and Mitigation Phase Report.
Application No. 20-06-012 (Filed June 30, 2020)
(NOT CONSOLIDATED)
Application of Pacific Gas and Electric Company (U 39 M) for Authority, Among Other Things, to Increase Rates and Charges for Electric and Gas Service Effective on January 1, 2023
Application No. 21-06-021 (Filed June 30, 2021)
PACIFIC GAS AND ELECTRIC COMPANY’S (U39M) 2021 RISK SPENDING ACCOUNTABILITY REPORT
Pacific Gas and Electric Company (PG&E) submits its 2021 Risk Spending
Accountability Report in Compliance with the Phase Two Decision Adopting Risk Spending
Accountability Report Requirements And Safety Performance Metrics For Investor-Owned
Utilities And Adopting A Safety Model Approach For Small And Multi-Jurisdictional Utilities,
Decision (D.) 19-04-020 (“Decision”). This 2021 Report covers spend authorized in the Test
Year 2020 General Rate Case (“GRC”) cycle for activities that address safety, reliability, and/or
maintenance, consistent with Public Utilities Code Section 591. This report is timely filed in
accordance with Table 5 of the Decision.
Pursuant to the Decision, PG&E is incorporating new requirements in this annual Risk
Spending Accountability Report (“RSAR”).1 The Decision requires the list of programs that are
related to safety, reliability, or maintenance “be separated into risk mitigation programs
1 Decision, Ordering Paragraph (OP) 9.

- 2 -
identified in the risk assessment and mitigation phase (RAMP).”2 PG&E’s first RAMP, filed in
2017, is the foundation for PG&E’s 2020 GRC for the years 2020-2022.
The Decision contains new variance thresholds for the investor-owned utilities, with an
option for PG&E to continue to follow its prior reporting thresholds.3 PG&E in this RSAR has
elected to follow the reporting requirements in the Decision.
As directed in the Decision, PG&E notifies parties that they are permitted to file
comments in the GRC proceeding where PG&E’s 2021 funding was authorized (A.18-12-009)
and Risk Assessment Mitigation Phase proceeding (A. 20-06-012) with copies of the comments
emailed to Energy Division’s Tariff Unit ([email protected]). Any comments should
clearly identify the RSAR on which they are commenting. Energy Division shall serve an
Annual Schedule that will include the deadlines for parties to file comments for each utility’s
RSAR by April 11, 2022.
PG&E’s 2021 RSAR is provided as Attachment A.
Dated: March 31, 2022
Respectfully Submitted,
Pacific Gas and Electric Company
By: /s/ Peter Ouborg PETER OUBORG
Pacific Gas and Electric Company 77 Beale Street San Francisco, CA 94105 Telephone: (415) 238-7987 Facsimile: (415) 973-5520 E-Mail: [email protected]
Attorney for PACIFIC GAS AND ELECTRIC COMPANY
2 D.19-04-020, Attachment 2, p. 1.3 Decision, p. 41, fn. 75.

PACIFIC GAS AND ELECTRIC COMPANY
ATTACHMENT A
PACIFIC GAS AND ELECTRIC COMPANY’S (U39M) 2021 RISK SPENDING ACCOUNTABILITY REPORT

PACIFIC GAS AND ELECTRIC COMPANY
2021 RISK SPENDING ACCOUNTABILITY REPORT IN COMPLIANCE WITH CALIFORNIA PUBLIC UTILITIES COMMISSION
DECISION 19-04-020
MARCH 31, 2022

-i-
PACIFIC GAS AND ELECTRIC COMPANY 2021 RISK SPENDING ACCOUNTABILITY REPORT
IN COMPLIANCE WITH CALIFORNIA PUBLIC UTILITIES COMMISSION DECISION 19-04-020
MARCH 31, 2022
TABLE OF CONTENTS
Section Title
1 INTRODUCTION AND OVERVIEW
2 GAS DISTRIBUTION IMPUTED ADOPTED VS. RECORDED COMPARISON
3 ELECTRIC DISTRIBUTION IMPUTED ADOPTED VS. RECORDED COMPARISON
4 ENERGY SUPPLY IMPUTED ADOPTED VS. RECORDED COMPARISON
5 CUSTOMER CARE IMPUTED ADOPTED VS. RECORDED COMPARISON
6 SHARED SERVICES/INFORMATION TECHNOLOGY IMPUTED ADOPTED VS. RECORDED COMPARISON
7 COST RECOVERY: BALANCING AND MEMORANDUM ACCOUNTS
Appendix A 2020 GRC IMPUTED REGULATORY VALUES METHODOLOGY
Appendix B 2020-2022 IMPUTED REGULATORY VALUES BY LINE OF BUSINESS

PACIFIC GAS AND ELECTRIC COMPANY
SECTION 1
INTRODUCTION AND OVERVIEW

1-i
PACIFIC GAS AND ELECTRIC COMPANY SECTION 1
INTRODUCTION AND OVERVIEW
TABLE OF CONTENTS
A. Introduction ....................................................................................................... 1-1
B. 2021 Expense and Capital Comparison of Imputed Adopted andRecorded Costs Summary ............................................................................... 1-3
1. Expense ..................................................................................................... 1-4
2. Capital ........................................................................................................ 1-4
C. Summary Tables .............................................................................................. 1-4
D. 2021 Imputed vs. Recorded Comparison by LOB ............................................ 1-5
1. Gas Distribution ......................................................................................... 1-6
2. Electric Distribution .................................................................................... 1-6
3. Energy Supply ............................................................................................ 1-7
a. Energy Policy and Procurement .......................................................... 1-7
b. Nuclear Generation ............................................................................. 1-7
c. Power Generation ................................................................................ 1-8
4. Customer Care ........................................................................................... 1-9
5. Shared Services/IT .................................................................................. 1-10
6. Corporate Services .................................................................................. 1-10
7. Human Resources ................................................................................... 1-11

1-1
PACIFIC GAS AND ELECTRIC COMPANY 1
SECTION 1 2
INTRODUCTION AND OVERVIEW 3
A. Introduction4
Pacific Gas and Electric Company (PG&E or the Company) submits its 2021 5
Risk Spending Accountability Report (RSAR) in compliance with the Phase Two 6
Decision Adopting Risk Spending Accountability Report Requirements and 7
Safety Performance Metrics for Investor-Owned Utilities and Adopting a Safety 8
Model Approach for Small and Multi-Jurisdictional Utilities, Decision 9
(D.) 19-04-020 (the Decision). 10
This report is organized as follows: 11
The Introduction and Overview section of this report (Section 1) provides an 12
overview of PG&E’s 2020 General Rate Case (GRC) 2021 imputed adopted 13
costs and recorded costs for Gas Distribution, Electric Distribution, Energy 14
Supply, Customer Care, Shared Services/Information Technology (IT), 15
Corporate Services, and Human Resources for the year 2021. 16
Sections 2 through 6 contain detailed comparisons of PG&E’s 2021 imputed 17
adopted and recorded costs by line of business (LOB).1 Specifically, Sections 2 18
through 6 contain: 19
1) PG&E’s imputed adopted and recorded costs/units for 2021, by Major Work20
Category (MWC) and/or Maintenance Activity Type (MAT) Code (where21
applicable) for Gas Distribution,2 Electric Distribution, Energy Supply,22
Customer Care, and Shared Services/IT.23
2) Variance explanations for:24
a) Imputed adopted versus recorded costs/units for 2021 by MWC and/or25
MAT for safety, reliability, and maintenance work subject to the following26
thresholds.327
1 Corporate Services do not have costs that meet the variance explanation requirements. 2 Gas Transmission and Storage assets were not in the 2020 GRC. These assets are
included in the GRC beginning in the year 2023 and will be included in this report for the 2023 cycle.
3 D.19-04-020, Table 4, p. 43.

1-2
• Expense: A variance of at least $10 million, or a percentage1
variance of at least 20 percent subject to a minimum variance of2
$5 million;3
• Capital: A variance of at least $20 million, or a percentage variance4
of at least 20 percent subject to a minimum variance of $10 million;5
and6
• Units: A variance of at least 20 percent of work units performed.47
Section 7 discusses the cost recovery of expenditures that flow through 8
balancing or memorandum accounts. 9
The Decision requires the list of programs that are related to safety, 10
reliability, or maintenance to “be separated into risk mitigation programs 11
identified in the Risk Assessment And Mitigation Phase (RAMP).”5 PG&E’s 12
2017 RAMP supported PG&E’s 2020 GRC. The data provided in this RSAR is 13
organized by RAMP Risk, RAMP mitigation, RAMP control and Non-RAMP 14
spending on safety, reliability and maintenance programs. The RAMP risks, 15
mitigations, and controls included in this report are those presented in PG&E’s 16
2020 GRC, which updated the 2017 RAMP analysis. 17
A few clarifying notes for reviewers on PG&E’s RAMP presentation. 18
Programs that are labeled as “SRM Total (Non-RAMP)” represent programs that 19
have no RAMP risk mitigations. Spending for new RAMP risk mitigation 20
activities identified after PG&E’s 2020 GRC submission that are safety, 21
reliability, and maintenance activities are included in the “Post 2020 GRC 22
Mitigations” category. 23
In its review letter of PG&E’s 2019 RSAR6 Energy Division (ED) requested 24
“PG&E provide in its next RSAR for 2020 the most recent risk spend efficiencies 25
in accordance with the method adopted in D.18-12-014, Phase Two Decision 26
Adopting Safety Model Assessment Proceeding Settlement Agreement With 27
Modifications, or other measure of prioritization, and descriptions of how 28
changes in priority occurred that led to shifting funds between programs.” PG&E 29
4 D.19-04-020, p. 54, Ordering Paragraph (OP) 11.5 D.19-04-020, Attachment 2, p. 1, p. 36. D.21-11-009 expanded this requirement to
include both RAMP mitigations and controls, p. 15.6 November 13, 2020 (revised December 15, 2020) letter from ED Director, Edward
Randolph, to PG&E’s Vice President of Regulatory Affairs, Robert Kenney, p. 11.

1-3
did not prioritize funding of 2021 work and activities with the use of RSEs. 1
However, as part of the LOB budget proposal process described below, some 2
LOBs use the RSE’s as a data point in their budget proposal process. PG&E’s 3
2021 planning year enterprise budget planning process required each LOB or 4
department to prepare a bottoms up risk-informed budget proposal. These 5
bottoms-up forecasts reflect the investment and resource plans created by each 6
LOB with input from its investment planning team, asset and risk managers, 7
engineering, LOB leadership, and other subject matter experts. In addition, 8
PG&E includes further details regarding change in priority that led to a shifting of 9
funds between programs in its variance explanations where applicable. 10
B. 2021 Expense and Capital Comparison of Imputed Adopted and11
Recorded Costs Summary12
This report provides a summary of PG&E’s 2021 actual expense and capital 13
expenditures7 compared to imputed adopted costs derived from the 14
Commission’s decision on PG&E’s 2020 GRC (2020 GRC Decision).8 This 15
report includes expenditures of the core LOB (Electric Distribution, Gas 16
Distribution and Energy Supply) and support organizations (Customer Care, 17
Shared Services, IT, and Corporate Services). PG&E’s 2020 GRC is for the 18
years 2020 through 2022. 19
This report complies with D.19-04-020 OP 8 and ED’s most recent 20
guidance.9 While this report presents certain LOB expenditures, it is not 21
representative of total Company expenditures. Specifically, this report does not 22
include Electric Transmission costs, Gas Transmission & Storage costs, 23
expenditures on companywide items, including liability insurance premiums that 24
were higher than amounts adopted in the 2020 GRC, and does not include 25
emergency response and restoration costs that are recorded in the Catastrophic 26
Event Memorandum Account. Costs that are recorded in non-GRC 27
memorandum accounts included in this report are those that are recorded in the 28
7 Data is as of January 14, 2022. The imputed values do not reflect any reorganizations. The recorded values do reflect any reorganizations and these reorganizations are explained in the variance explanations.
8 D.20-12-005.9 July 9, 2021 letter from ED Director, Edward Randolph, to PG&E’s Vice President of
Regulatory Affairs, Robert Kenney.

1-4
Fire Risk Mitigation Memorandum Account (FRMMA) and the Wildfire Mitigation 1
Plan Memorandum Account (WMPMA) because these costs and activities align 2
with costs and activities in PG&E’s 2020 GRC. 3
1. Expense4
PG&E’s 2021 LOB expense spending exceeded imputed adopted 5
values by $1,684.1 million. The increase was primarily attributable to 6
routine and enhance vegetation management (EVM), tree mortality work, 7
costs associated with responding to major emergencies, and additional 8
wildfire risk mitigation work which included: enhanced inspections and 9
associated repairs, Enhanced Powerline Safety Settings (EPSS), and Public 10
Safety Power Shutoff (PSPS) event activities within Electric Distribution. 11
These increases were partially offset by lower levels of spending in Shared 12
Services and IT. Spending reductions for Shared Services and IT were 13
primarily due to a change in IT’s overhead allocation cost pool which 14
reduced recorded costs without impacting public or employee safety and 15
reliability. Spending reductions for Corporate Real Estate Strategy and 16
Service (CRESS) were primarily attributable to a reduction in building 17
maintenance activities. 18
2. Capital19
In 2021, PG&E’s capital spending exceeded imputed adopted values by 20
$1,244.4 million. The increase was primarily attributable to additional 21
spending in Electric Distribution related to pole replacements and equipment 22
replacements associated with enhanced wildfire inspections, new business 23
connections, and major emergency, and additional spending in Shared 24
Services on CRESS investments to prepare the new Oakland Headquarters 25
for ownership and occupancy starting in April 2022. The increases were 26
partially offset by lower spending in Energy Supply, Corporate Services, and 27
Human Resources. 28
C. Summary Tables29
PG&E’s methodology to derive its imputed adopted costs from the 30
2020 GRC Decision is described in Appendix A: 2021 GRC Imputed Regulatory 31
Values Methodology. The tables below summarize PG&E’s 2021 spending by 32
expense and capital by LOB. 33

1-5
TABLE 1-1 2021 IMPUTED ADOPTED VS. ACTUAL EXPENSE BY LOB
(MILLIONS OF DOLLARS)
TABLE 1-2 2021 IMPUTED ADOPTED VS. ACTUAL CAPITAL BY LOB
(MILLIONS OF DOLLARS)
D. 2021 Imputed vs. Recorded Comparison by LOB1
The significant drivers of the differences between 2021 imputed adopted 2
and recorded costs for each LOB are summarized below. 3
IT costs attributable to the LOBs at issue in this report are presented in a 4
decentralized fashion, meaning LOB-specific IT program costs are included with 5
the costs of the LOBs that initiated the programs. 6
Line
No. LOB
2021 Imputed Adopted
Costs (A)
2021 Actual Costs
(B)
2021 Cost Difference
(B-A)
2021 Cost Percent Change
(%)(B-A)/A
1 Gas Distribution 379,327.8 399,549.7 20,221.9 5.3%2 Electric Distribution 1,033,834.8 2,643,983.8 1,610,149.0 155.7%3 Energy Supply 586,258.8 593,891.2 7,632.4 1.3%4 Customer Care 285,463.4 337,489.8 52,026.4 18.2%5 Shared Services/IT 558,153.5 513,627.3 (44,526.3) -8.0%6 Corporate Services 172,794.2 210,508.4 37,714.2 21.8%7 Human Resources 80,417.6 81,306.4 888.9 1.1%8 Total 3,096,250.1 4,780,356.7 1,684,106.6 54.4%
Line
No. LOB
2021 Imputed Adopted
Costs (A)
2021 Actual Costs
(B)
2021 Cost Difference
(B-A)
2021 Cost Percent Change
(%)(B-A)/A
1 Gas Distribution 1,102,045.0 1,224,647.8 122,602.9 11.1%2 Electric Distribution 2,626,180.4 3,463,922.6 837,742.3 31.9%3 Energy Supply 285,333.7 274,328.6 (11,005.1) -3.9%4 Customer Care 142,859.0 180,254.7 37,395.7 26.2%5 Shared Services/IT 434,070.6 701,423.7 267,353.1 61.6%6 Corporate Services 8,124.4 216.5 (7,907.8) -97.3%7 Human Resources 3,434.0 1,651.1 (1,782.8) -51.9%8 Total 4,602,047.0 5,846,445.1 1,244,398.1 27.0%

1-6
1. Gas Distribution 1
Expense: Gas Distribution’s total recorded expenses in 2021 exceeded 2
imputed adopted values by $20.2 million or 5.3 percent. For safety, 3
reliability, and maintenance work, 2021 recorded expenses exceeded 4
imputed adopted values by $32.7 million, or 10.4 percent.10 The increases 5
were primarily attributable to: (1) distribution main leak repairs performed 6
based on higher leak find rates, (2) higher costs in service leak repairs, and 7
(3) more Picarro leak surveys completed based on the compliance leak 8
plan. 9
Capital: Gas Distribution’s total 2021 recorded capital expenditures 10
exceeded imputed adopted values by $122.6 million, or 11.1 percent. For 11
safety, reliability, and maintenance work, 2021 recorded capital 12
expenditures exceeded imputed adopted values by $99.5 million, or 13
10.8 percent. The increases were primarily attributable to: (1) higher unit 14
costs for gas regulator station rebuilds, and (2) a higher volume of pipe 15
replacement work completed. 16
2. Electric Distribution 17
Expense: Electric Distribution’s total recorded expenses in 2021 18
exceeded imputed adopted values by $1,610.1 million or 155.7 percent. For 19
safety, reliability and maintenance work, 2021 recorded expenses exceeded 20
imputed adopted values by $1,593.9 million or 162.5 percent. The 21
increases were primarily attributable to: (1) additional trees being worked 22
and higher costs for routine and EVM driven by Senate Bill 247 prevailing 23
wage requirements, (2) wildfire mitigation work not forecast in the 2020 GRC 24
which included enhanced inspections and associated repairs and EPSS, 25
(3) tree mortality work not forecast in the 2020 GRC and included to the 26
Vegetation Management Balancing Account per D.20-12-005, (4) costs for 27
executing PSPS events not forecast in the 2020 GRC; and (5) costs 28
associated with responding to major emergencies. Other increase drivers 29
include costs for PG&E’s pole loading program and the 2018 Field Meter 30
Operations (FMO) transfer. 31
10 MWC Operational Management (OM) is included as a maintenance activity in
accordance with ED’s February 12, 2019 letter to PG&E. Gas Distribution does not consider MWC OM as safety, reliability, and maintenance work.

1-7
Capital: Electric Distribution’s total recorded capital expenditures in 1
2021 exceeded imputed adopted values by $837.7 million or 31.9 percent. 2
For safety, reliability and maintenance work, 2021 recorded capital 3
expenditures exceeded imputed adopted values by $647.4 million or 4
32.6 percent. The primary drivers of the increase were: (1) an increased 5
number of pole replacements with higher unit costs; (2) equipment 6
replacements identified through enhanced inspections in High Fire Threat 7
District (HFTD) areas; (3) costs associated with responding to routine and 8
major emergencies; (4) completion of additional distribution line capacity 9
projects; and (5) an increased number of sectionalizing devices installed to 10
reduce PSPS impacts. There were also increased expenditures for 11
substation equipment replacement, which included costs to pursue the next 12
phase of switchgear projects at several substations and continuation of 13
costs for key substation transformer replacement work, technology to 14
support wildfire mitigation work not forecast in the 2020 GRC, and costs 15
associated with the 2018 FMO transfer. The increases were partially offset 16
by reductions in overhead system hardening HFTD areas due to a 17
realignment of work consistent with improved risk modelling. 18
3. Energy Supply19
This section includes costs associated with Energy Policy and 20
Procurement, Nuclear Generation, and Power Generation other than power 21
purchase agreement and fuel costs. 22
a. Energy Policy and Procurement23
The Energy Policy and Procurement Department does not have 24
safety, reliability, or maintenance related work. Therefore, no additional 25
information is provided for this department. 26
b. Nuclear Generation27
Expense: Nuclear Generation’s total recorded expenses in 2021 28
were below imputed adopted values by $29.3 million or 8.6 percent. For 29
safety, reliability and maintenance work, 2021 recorded expenses were 30
below imputed adopted values by $33.1 million or 11.2 percent. The 31
decrease in spending is spread across several MWCs but is primarily 32
driven by the GRC imputed adopted costs of the second refueling 33

1-8
outage being levelized over the 3-year GRC period (2020-2022). The 1
GRC imputed adopted levelized amount is approximately $15 million 2
annually. The actual costs for this outage will be recorded in 2022 when 3
the outage is scheduled. 4
Capital: Nuclear Generation’s total 2021 recorded capital 5
expenditures exceeded imputed adopted values by $17.7 million or 6
68.6 percent. For safety, reliability and maintenance work, 2021 7
recorded capital expenditures exceeded imputed adopted by 8
$15.5 million or 74.1 percent. The primary driver for the increase is an 9
emergent project to replace the main generator stator core cooling water 10
manifold piping. 11
c. Power Generation 12
Expense: Power Generation’s total expenses in 2021 exceeded 13
imputed adopted by $34.5 million or 16.8 percent. For safety, reliability 14
and maintenance work, 2021 recorded expenses exceeded imputed 15
adopted values by $39.3 million or 21.6 percent. The increase drivers 16
are primarily attributable to: (1) the Long-Term Service Agreement 17
costs, which are levelized in the imputed adopted value; however, the 18
outage work associated with these costs only occurs on a periodic basis 19
once every 4 to 5 years depending on operating profile and did occur in 20
2021 at Colusa Generating Station; (2) rescheduling of the 21
Lake Almanor Prattville Intake dredging project from 2019 to 2021; 22
(3) emergent costs related to achieving full compliance for all risks at 23
Level 3 per PG&E's Compliance Maturity Model; (4) an emergent hydro 24
system-wide powerhouse safety mitigation program to mitigate safety 25
risks resulting from dropped objects from heights (e.g. tools from 26
scaffolding); (5) emergent costs related to a fatality investigation; 27
(6) costs related to accelerating guidance document completion to meet 28
Level 3 compliance deadline; (7) emergent physical security and 29
cybersecurity costs at our FERC-regulated facilities to comply with new 30
FERC regulations; and (8) emergent costs related to new California 31
Independent System Operator telemetry requirements at PG&E-owned 32
powerhouses. 33

1-9
Capital: Power Generation’s total 2021 recorded capital 1
expenditures were below the imputed adopted values by $21.6 million or 2
8.8 percent. For safety, reliability and maintenance work, 2021 recorded 3
capital expenditures were below the imputed adopted values by 4
$17.1 million or 7.2 percent. The decrease drivers are primarily 5
attributable to: (1) a delay in the regulatory process related to FERC 6
operating license renewals for the McCloud-Pit license and the 7
Rock Creek-Cresta license; (2) PG&E’s decision to surrender the 8
Potter Valley license rather than continue through the relicensing 9
process which reduced licensing costs; and (3) less work scheduled in 10
2021 for spillway work due to the refinement of project scope and 11
schedule. 12
4. Customer Care13
Expense: Customer Care’s total recorded expenses in 2021 were 14
above imputed adopted values by $52 million or 18.2 percent. For safety, 15
reliability, and maintenance work, 2021 recorded expenses were above 16
imputed adopted values by $15.5 million or 9.6 percent. The increases were 17
primarily attributable to: (1) PSPS planning and readiness activities 18
recorded to the WMBA and WMPMA; (2) Increased customer demand for 19
non-tariffed products and services; and (3) Marketing and Communications’ 20
recorded costs to the WMPMA for PSPS and wildfire customer 21
communications are now reflected in Customer Care since Marketing and 22
Communications was reorganized from Corporate Services to Customer 23
Care in 2021. 24
Capital: Customer Care’s total 2021 recorded capital expenditures 25
exceeded imputed adopted values by $37.4 million or 26.2 percent. For 26
safety, reliability, and maintenance work, 2021 recorded capital 27
expenditures were above imputed adopted values by $3.4 million or 28
2.6 percent. The increase in spending is primarily attributable to Customer 29
Care technology projects and materials costs related to the corrective 30
maintenance of gas modules. 31

1-10
5. Shared Services/IT 1
Expense: Shared Services and IT’s total recorded expenses in 2021 2
were below imputed adopted values by $44.5 million or 8 percent. The 3
decrease was primarily attributable to a change in IT’s overhead allocation 4
cost pool which did not impact safety, reliability or maintenance. The 5
underspend above is partially offset by overspend in Transportation 6
Services on Fleet Maintenance support for Electric and Gas Distribution and 7
Security on physical controls that improved or maintained safety, reliability 8
or maintenance, e.g., enterprise guard services, corporate security support, 9
and an increase in security investigations. 10
Capital: Shared Services and IT’s total 2021 recorded capital 11
expenditures exceeded imputed adopted by $267.4 million or 61.6 percent. 12
The increase was primarily attributable to an increase in CRESS 13
investments to prepare the new Oakland Headquarters for ownership and 14
occupancy starting in April 2022. These activities included Seismic Safety, 15
Tenant Improvements, Furniture, and IT Infrastructure and Security 16
upgrades. Other major expenditures included purchasing the Fairfield Data 17
Center building and property as a strategic investment to reduce Operating 18
Expenses (lease costs); and project delivery costs for the Sacramento 19
Area – T-Line Fabrication Shop which increased from the prior GRC 20
forecast as a result of supply chain issues that caused an unplanned 21
increase in material expenditures. In addition to the increase discussed 22
above, IT exceeded imputed adopted by delivering various technology 23
solutions that served to either improve or maintain safety, reliability or 24
maintenance, e.g., continued investments in asset lifecycle programs for 25
telecom network infrastructure, data center infrastructure and supporting 26
systems, and end-user devices. 27
6. Corporate Services 28
The Corporate Services total expenses do not include any safety, 29
reliability, or maintenance work as defined in D.19-04-020.11 Therefore, no 30
additional information is provided for this organization. However, Marketing 31
and Communications recorded costs in 2021 to the WMPMA associated 32
11 D.19-04-020, Attachment 2, p. 3.

1-11
with PSPS and wildfire customer communications. Marketing and 1
Communications was reorganized from Corporate Services to Customer 2
Care in 2021 so its 2021 recorded costs are now reflected in Customer 3
Care. 4
7. Human Resources5
Expense: Human Resources total recorded expenses in 2021 were 6
below imputed adopted values by $0.9 million or 1.1 percent. For safety, 7
reliability, and maintenance work within PG&E Academy, 2021 recorded 8
expenses were above imputed adopted values by $4.3 million or 12 percent. 9
The majority of the increase is due to Electric and Gas Curriculum 10
Development and Training Delivery.12 11
Capital: Human Resources total 2021 recorded capital expenditures 12
were below imputed adopted values by $1.8 million or 51.9 percent. The 13
majority of the underspend is related to IT projects. 14
12 PG&E Academy expenditures include amounts recorded in the Wildfire MitigationBalancing Account.

PACIFIC GAS AND ELECTRIC COMPANY
SECTION 2
GAS DISTRIBUTION
IMPUTED ADOPTED VS. RECORDED COMPARISON

2-i
PACIFIC GAS AND ELECTRIC COMPANY SECTION 2
GAS DISTRIBUTION IMPUTED ADOPTED VS. RECORDED COMPARISON
TABLE OF CONTENTS
A. Introduction ....................................................................................................... 2-1
B. Comparison Summary Tables .......................................................................... 2-2
C. MWC Descriptions – Expense .......................................................................... 2-3
D. MWC Descriptions – Capital ........................................................................... 2-10
E. Comparison by MAT for Safety, Reliability, and Maintenance Work Tables ... 2-13
F. MAT Descriptions for Safety, Reliability, and Maintenance Work –Expense ......................................................................................................... 2-25
G. MAT Descriptions for Safety and Reliability Work – Capital ........................... 2-43

2-1
PACIFIC GAS AND ELECTRIC COMPANY 1
SECTION 2 2
GAS DISTRIBUTION 3
IMPUTED ADOPTED VS. RECORDED COMPARISON 4
A. Introduction5
This section includes the following information for the Gas Distribution line of 6
business (LOB): a comparison of the total 2021 imputed adopted spend to the 7
actual spend, Major Work Category (MWC) descriptions, and for those programs 8
that are related to safety, reliability, or maintenance the 2021 imputed adopted 9
spend vs. actual spend comparison details, Maintenance Activity Type (MAT) 10
descriptions, and variance explanations. In addition, per Decision 19-04-020, 11
the MWC and MAT descriptions include how each program relates to safety, 12
reliability, or maintenance. 13

2-2
B. Comparison Summary Tables1
TABLE 2-1 GAS DISTRIBUTION 2021 EXPENSE COMPARISON SUMMARY
(THOUSANDS OF DOLLARS)
LineNo. MWC Description MWC
2021 Imputed Adopted
Costs (A)
2021 Actual Costs
(B)
2021 Cost Difference
(B-A)1 Support AB 17,700.0 1,114.8 (16,585.2)2 Provide Field Service DD 44,902.5 48,130.7 3,228.23 Leak Survey DE 25,002.3 33,348.1 8,345.84 Locate and Mark DF 45,210.9 40,672.5 (4,538.3)5 Cathodic Protection DG 20,726.7 21,093.0 366.36 Curriculum Development/Gas Qualifications DN 4,901.2 780.6 (4,120.6)7 Meter Protection EX 8,452.1 7,555.5 (896.6)8 Operate Gas Distribution System FG 9,246.1 8,693.2 (552.9)9 Gas Preventive Maintenance FH 23,110.7 24,458.6 1,347.9
10 Gas Corrective Maintenance FI/LW (a) 61,968.4 94,324.7 32,356.311 Gas Mapping GF 4,399.8 4,559.6 159.812 Gas Distribution Planning & Operations Engineering GG 6,456.4 8,464.2 2,007.9
13Natural Gas Fueling Facilities Operation and Maintenance (O&M) GM 3,870.0 3,529.5 (340.4)
14 Gas Research, Development, and Demonstration GZ 3,487.7 3,581.3 93.615 Gas Meter Maintenance HY 1,868.7 2,543.4 674.816 Gas Distribution Integrity Management Program (DIMP) JQ 42,526.3 34,358.9 (8,167.4)17 Information Technology JV 12,853.1 9,318.9 (3,534.1)18 Gas Expense Work at the Request of Others (WRO) LK 6,129.2 6,758.4 629.219 Operational Management OM 17,529.5 16,206.0 (1,323.5)20 Operational Support OS 18,986.3 30,052.7 11,066.421 Total (b) 379,327.8 399,549.7 20,221.9
(a) In 2021, approximately $114.8 under Leak Abatement MWC LW was realigned to MWC FI as a result of acorrection to the 2020 recorded data.(b) In addition to the MWCs listed above, approximately $4.9 was recorded in MWC BC in 2021.

2-3
TABLE 2-2 GAS DISTRIBUTION 2021 CAPITAL COMPARISON SUMMARY
(THOUSANDS OF DOLLARS)
C. MWC Descriptions – Expense1
MWC AB – Support – Encompasses miscellaneous gas distribution costs 2
not aligned with other MWCs or MAT, including, but not limited to: 3
(1) Miscellaneous expenses such as industry association dues and4
miscellaneous contract spend; and (2) Collection point for zero sum allocation 5
LineNo. MWC Description MWC
2021 Imputed Adopted
Costs (A)
2021 Actual Costs (a)
(B)
2021 Cost Difference
(B-A)1 Tools and Equipment 05 3,415.8 14,704.1 11,288.32 Gas Pipeline Replacement Program 14 528,982.5 571,710.9 42,728.43 Miscellaneous Capital 21 0.0 (299.6) (299.6)4 Gas Meter Protection 27 17,263.0 2,915.2 (14,347.8)5 Gas Distribution Customer Connects 29 88,189.7 96,327.7 8,138.06 Build IT Applications & Infrastructure 2F 11,455.3 17,423.8 5,968.57 High Pressure Regulator (HPR) Program 2K 60,424.9 61,010.9 586.18 NGV - Station Infrastructure 31 4,163.0 6,957.1 2,794.19 Gas Distribution Capacity 47 39,835.1 45,313.7 5,478.6
10 Gas Distribution Control Operations Assets 4A 30,460.9 30,336.7 (124.2)11 Gas Distribution Reliability 50/3P 235,934.7 292,430.3 56,495.612 Gas Capital WRO 51 79,033.6 78,299.6 (734.0)13 Gas Distribution Emergency Response 52 902.0 2,868.5 1,966.514 Install New Gas Meters 74 1,984.5 5,913.6 3,929.115 Manage Buildings 78 0.0 7.2 7.216 Total 1,102,045.0 1,224,647.8 122,602.9
(a) Approximately $(1,271.8) under MWC 12 was realigned to Gas Transmission as a result of a correctionto the 2021 recorded data.

2-4
type work such as Standard Cost Variance (SCV),1 Blanket Purchase Orders 1
and Working Stock. 2
This MWC does not relate directly to safety and/or reliability and/or 3
maintenance. 4
MWC DD – Provide Field Service – Includes customer generated requests 5
for service that require site visit by field technician, as well as immediate 6
response standby costs. Service requests include investigating reports of 7
possible gas leaks, carbon monoxide monitoring, customer requests for 8
stop/starts of gas service, appliance pilot relights, appliance adjustment and 9
safety checks. 10
This MWC relates to safety and/or reliability and/or maintenance as it 11
includes customer generated requests for service that require site visit by field 12
technician to address issues such as possible gas leaks or safety checks. 13
MWC DE –Leak Survey – Includes periodic or routine leak surveys 14
performed by Pacific Gas and Electric Company (PG&E) on its distribution 15
system that are necessary to comply with pipeline safety regulations. MWC DE 16
also includes special leak surveys conducted by PG&E on its gas distribution 17
system that are outside of the routine leak survey schedule for either operating 18
reasons or to assess the integrity of the pipe. 19
This MWC relates to safety and/or reliability and/or maintenance as it 20
includes periodic or routine leak surveys performed by PG&E on its distribution 21
system that are necessary to comply with pipeline safety regulations. 22
MWC DF – Locate and Mark – Includes the work necessary to comply with 23
federal pipeline safety regulations and state law that requires PG&E to belong to 24
1 SCV represents the difference between actual costs incurred and the amount charged
out by employees at a predetermined rate (i.e., standard cost). Costs charged out are calculated using productive hours multiplied by a planned standard hourly rate. When results match initial estimates, SCV should be minimal. That said, while initial estimates do factor in external factors (e.g., extreme weather) based on historical data, actual results inevitably vary resulting in a SCV. The following is a simplified example of the standard cost calculation and how SCVs occur. Based on the historic pattern of Team A’s productivity and anticipated workload, it is projected that Team A will have a monthly cost of $100,000 for 10 employees and will perform 1,000 hours of work in a month. The resulting standard rate for Team A is $100 per hour ($100,000/1,000 hours). If Team A completes 1,000 hours of work in the month according to plan, Team A will have a zero SCV. However, if Team A does not complete all the planned work, e.g., due to unanticipated bad weather, and only completes 950 hours of work, Team A will have an unfavorable SCV of $5,000 (50 hours × $100 per hour).

2-5
and share the costs of operating the regional “one-call” notification systems. 1
Builders, contractors, and others planning to excavate use these systems to 2
notify underground facility owners, like PG&E, of their intent to excavate. PG&E 3
then provides the excavators with information about the location of its 4
underground facilities by visiting the work site and placing color-coded surface 5
markings to show the location of pipes and wires. Excavation activities that are 6
within specified distances of high priority facilities require field meets or standby. 7
This MWC relates to safety and/or reliability and/or maintenance as it 8
includes the work necessary to comply with federal pipeline safety regulations 9
and state law that requires PG&E to belong to, respond to notifications, and 10
share the costs of operating the regional “one-call” notification systems. 11
MWC DG – Cathodic Protection (CP) – Includes work related to mitigating 12
the effects of corrosion on metallic gas distribution pipelines. Corrosion of gas 13
piping systems can cause leaks and other potential safety hazards. In the case 14
of steel gas lines, the pipe is coated or wrapped before installation, followed by 15
the application of CP through the use of either an impressed system or galvanic 16
anodes as required by federal pipeline safety regulations. The CP system 17
requires continual monitoring on regular intervals to ensure that adequate levels 18
of current are maintained. Maintenance tasks include monitoring CP levels on 19
metallic pipe by taking required pipe to soil reads and reading rectifiers to verify 20
correct operation. If the CP system is found to read below protected levels, 21
corrective action is taken by troubleshooting the CP systems to identify the 22
location of the problem (e.g., electrically shorted meters, underground electrical 23
contacts with other metallic structures, electrical interference, malfunctioning 24
impressed current system, or depleted galvanic anodes). Appropriate corrective 25
action is subsequently performed to restore the CP system to satisfactory 26
protection levels. 27
This MWC relates to safety and/or reliability and/or maintenance as it 28
includes work related to mitigating the effects of corrosion on metallic gas 29
distribution pipelines. Corrosion of gas piping systems can cause leaks and 30
other potential safety hazards. 31
MWC DN – Curriculum Development/Gas Qualifications – The Gas 32
Qualifications program creates new and revises existing training materials 33
ensuring that the Gas Operations (GO) workforce is competent, safe, and 34

2-6
qualified and includes costs associated with field employee operator 1
qualifications. It does not include curriculum development, the general 2
maintenance, or delivery of training materials. 3
This MWC does not relate directly to safety and/or reliability and/or 4
maintenance. 5
MWC EX – Meter Protection – Includes efforts to ensure that gas meter 6
locations that do not conform to current PG&E standards and/or federal pipeline 7
safety regulations are addressed. The program focuses on two types of 8
non-conforming meter locations: those with inadequate protection from potential 9
damage by vehicles; and those with inaccessible service or shutoff valves. The 10
work to correct these non-conforming facilities generally involves one of 11
three work activities: installing barrier posts, installing a new valve or relocating 12
the meter set. 13
This MWC relates to safety and/or reliability and/or maintenance as it 14
includes efforts to ensure that gas meter locations that do not conform to current 15
PG&E standards and/or federal pipeline safety regulations are addressed. The 16
Meter Protection Program (MPP) focuses on two types of non-conforming meter 17
locations: those with inadequate protection from potential damage by vehicles; 18
and those with inaccessible service or shutoff valves. 19
MWC FG – Operate Gas Distribution System – Includes a broad range of 20
operations which include monitoring system pressures and flows, checking 21
odorant intensity levels for leak detection, operating valves, regulator stations, 22
and changing pressure recorder charts. Additionally, this program includes 23
occasional manual operations to provide necessary capacity during peak 24
demand periods in the morning (e.g., using a Compressed Natural Gas (CNG) 25
or Liquefied Natural Gas natural gas tanker to inject gas, manually opening 26
separation valves to redirect gas, or manually bypassing regulator station 27
equipment to flow more gas). 28
This MWC relates to safety and/or reliability and/or maintenance as it 29
includes a broad range of operations to keep the system safe, such as 30
monitoring the system pressures and flows, checking odorant intensity levels for 31
leak detection; operating valves and regulator stations, and changing pressure 32
recorder charts. 33

2-7
MWC FH – Gas Preventive Maintenance – Includes work to comply with 1
pipeline safety regulations that require PG&E to conduct periodic inspection and 2
maintenance on its gas distribution system. Preventive maintenance work 3
includes regulator station maintenance, maintenance on mains and services, 4
distribution valve replacement, service valve replacement, atmospheric 5
corrosion (AC) inspections, and overall gas maintenance support. 6
This MWC relates to safety and/or reliability and/or maintenance as it 7
includes work to comply with pipeline safety regulations that require PG&E to 8
conduct periodic inspection and maintenance on its gas distribution system. 9
MWC FI – Gas Corrective Maintenance – Includes work to repair or 10
replace damaged or failed gas facilities. In many cases, the need for such 11
restoration is identified during the preventive maintenance activities described in 12
MWC FH. Corrective maintenance includes leak repair, dig-in repair, CP 13
restoration, regulator station repair, and distribution valve repair. Below ground 14
Grade 3 leak repairs are recorded under MWC LW – Leak Abatement. 15
This MWC relates to safety and/or reliability and/or maintenance as it 16
includes work to repair or replace damaged or failed gas facilities. 17
MWC GF – Gas Mapping – Encompasses tracking the size, material type, 18
location, configuration, and other essential information needed to 19
identify thousands of miles of underground gas main and millions of gas 20
services. Gas Mapping updates and maintains the gas distribution system maps 21
and records. 22
This MWC relates to safety and/or reliability and/or maintenance as it 23
involves tracking the size, material type, location, configuration, and other 24
essential information needed to identify gas main and services. 25
MWC GG – Gas Distribution Planning and Operations Engineering – 26
Includes local gas planning engineers modeling the gas distribution system to 27
ensure a safe, reliable, and cost-effective supply of natural gas to customers and 28
to ensure that the system can accommodate future load growth. By simulating 29
changes in load demand, engineers use modeling to identify potential 30
constraints in the system to support service reliability. 31
This MWC relates to safety and/or reliability and/or maintenance as it 32
includes local gas planning engineers modeling the gas distribution system to 33

2-8
ensure a safe, reliable, and cost-effective supply of natural gas to customers and 1
to ensure that the system can accommodate future load growth. 2
MWC GM – Natural Gas Fueling Facilities Operation and Maintenance 3
(O&M) – Includes the work required to maintain and operate existing CNG 4
fueling facilities. PG&E operates Natural Gas Vehicles (NGV) and 5
has thousands of third-party customers vehicles that use the natural gas fueling 6
facilities. PG&E’s network of natural gas fueling stations also serves as a back 7
up to customer owned CNG fueling stations that are not available due to 8
breakdowns or maintenance. 9
This MWC relates to safety and/or reliability and/or maintenance as it 10
includes the work required to maintain and operate existing natural gas fueling 11
facilities. 12
MWC GZ – Gas Research, Development, and Demonstration – Includes 13
work in targeted areas of gas distribution. The objectives of gas distribution 14
research, development and demonstration are to explore new opportunities, 15
concepts, and technologies to continue to provide safe and reliable service to 16
customers at a lower cost, where possible. 17
This MWC does not relate directly to safety and/or reliability and/or 18
maintenance. 19
MWC HY – Gas Meter Maintenance – The meter set is defined as the 20
facilities between the shut-off valve (i.e., service valve and inlet valve) and 21
service tee or meter outlet valve. 22
Maintenance includes: 23
• Corrective Maintenance work performed on meter sets greater than24
1,000 cubic feet per hour (cfh) and less than or equal to 1,000 cfh. Outlet25
Valve greater than or equal to 2 inches in diameter and less than 2 inches in26
diameter.27
• Preventive Maintenance work performed on meter sets greater than28
1,000 cfh. Preventive maintenance work includes: Differential Pressure29
Tests, Regulator A Inspections, Pressure Verification, Electronic Corrector30
Maintenance, Turbine Spin Test, Delta A Turbine and Ultra-Sonic Diagnostic31
Testing.32

2-9
This MWC relates to safety and/or reliability and/or maintenance as it 1
includes corrective and preventative maintenance work performed on meter 2
sets. 3
MWC JQ – Gas Distribution Integrity Management Program (DIMP) – 4
This program is mandated by Federal regulations and includes efforts to 5
enhance gas distribution system safety by identifying risks to the gas distribution 6
system and addressing those risks. The types of work in this MWC include 7
development and improvements in the following areas: DIMP Program, 8
preventative maintenance, DIMP leak surveys, operator qualifications, training, 9
and programs including the Cross Bore Inspection Program, and Plastics 10
Program. 11
This MWC relates to safety and/or reliability and/or maintenance as it 12
includes efforts to enhance gas distribution system safety by identifying risks to 13
the gas distribution system and addressing those risks. 14
MWC JV – Information Technology (IT) – Includes costs for ongoing 15
maintenance, operations and repair for PG&E’s IT applications, systems, and 16
infrastructure. 17
This MWC was not presented in the 2020 General Rate Case (GRC) as 18
related directly to safety and/or reliability and/or maintenance. However, certain 19
projects within this MWC provide support for safety and/or reliability and/or 20
maintenance projects. 21
MWC LK – Gas Expense Work Requested by Others (WRO) – 22
Encompasses work required by tariff, third-party requests, and franchise 23
compliance, including: 24
• Gas main relocations and rearrangement of gas facilities initiated by25
customers due to overbuilds (billable to the customer);26
• Raise gas valve frame and covers to grade;27
• Gas service cutout at property line;28
• Provide temporary gas service that is not expected to last more than 1 year29
(Rule 13) (applicant pays for installation and removal costs); and30
• Complete additional work above normal level of mark and locate activities as31
needed for third-party work. Work will normally be done at applicant’s32
expense unless done to comply with city or county franchise agreements.33

2-10
This MWC does not relate directly to safety and/or reliability and/or 1
maintenance. 2
MWC OM – Operational Management – Includes labor and 3
employee-related costs to provide supervision and management support. 4
MWC OM also includes costs incurred by the administrative staff working for the 5
Supervisors/Managers. 6
This MWC is included as a maintenance activity in accordance with Energy 7
Division’s February 12, 2019 letter to PG&E. Gas Distribution does not consider 8
MWC OM as related directly to safety and/or reliability and/or maintenance work. 9
MWC OS – Operational Support – Includes labor and employee-related 10
costs to provide services and support that are unrelated to supervision and 11
management. One example is Investment Planning that supports the LOB. 12
This MWC does not relate directly to safety and/or reliability and/or 13
maintenance. 14
D. MWC Descriptions – Capital 15
MWC 05 – Tools and Equipment – Includes the costs of miscellaneous 16
tools and equipment. Regular expenditures are necessary to replace damaged, 17
worn out, or obsolete tools and to ensure specialized tools are available to 18
perform testing and other functions. 19
This MWC does not relate directly to safety and/or reliability and/or 20
maintenance. 21
MWC 14 – Gas Pipeline Replacement Program (GPRP) – Primarily 22
encompasses three gas distribution asset replacement programs: (1) the 23
GPRP; (2) Copper Service Replacement Program (CSRP); and (3) Plastic Pipe 24
Replacement Program. The GPRP targets cast iron and pre-1940 steel gas 25
mains. PG&E uses age, materials, seismic factors, and gas leaks to identify and 26
prioritize gas mains for replacement. In addition to gas main replacement, the 27
program includes related service replacement because copper services were 28
determined to have a similar relative risk as compared to GPRP pipe. 29
Subsequently, plastic pipe replacement was included in MWC 14 because of an 30
increase in the relative risk of vintage plastic material such as Aldyl-A. 31
This MWC relates to safety and/or reliability and/or maintenance as it 32
includes gas distribution pipe replacement and service replacement programs 33
for safety and reliability reasons. 34

2-11
MWC 21 – Miscellaneous Capital – This MWC is typically used for 1
planning purposes and accounting adjustments. 2
This MWC does not relate directly to safety and/or reliability and/or 3
maintenance. 4
MWC 27 – Gas Meter Protection – Includes efforts to ensure that gas 5
meter locations that do not conform to current PG&E standards and/or federal 6
pipeline safety regulations are addressed. The program focuses on two types of 7
non-conforming meter locations: those with inadequate protection from potential 8
damage by vehicles; and those with inaccessible service or shutoff valves. The 9
work to correct these non-conforming facilities generally involves one of 10
three work activities: installing barrier posts, installing a new valve or relocating 11
the meter set. 12
This MWC relates to safety and/or reliability and/or maintenance as it 13
includes efforts to ensure that gas meter locations that do not conform to current 14
PG&E standards and/or federal pipeline safety regulations are addressed. The 15
program focuses on two types of non-conforming meter locations: those with 16
inadequate protection from potential damage by vehicles; and those with 17
inaccessible service or shutoff valves. 18
MWC 29 – Gas Distribution Customer Connections – Includes building 19
new gas distribution systems to provide service to new customers and the costs 20
of regulators purchased for emergency response, regulator change outs, and 21
system upgrades. 22
This MWC does not relate directly to safety and/or reliability and/or 23
maintenance. 24
MWC 31 – NGV Station Infrastructure – Includes keeping PG&E’s natural 25
gas fueling infrastructure safe and in compliance for PG&E’s fleet and 26
customers. This work includes: (1) CP and underground corrosion protection; 27
(2) upgrading stations to better serve the vehicles being produced in the market28
today; (3) increasing the reliability of stations; (4) security monitoring as required 29
at some public access stations; and (5) remote monitoring of stations. 30
This MWC relates to safety and/or reliability and/or maintenance as it 31
includes capital work to keep PG&E’s natural gas fueling infrastructure safe. 32
MWC 47 – Gas Distribution Capacity – Includes capacity additions to 33
meet load growth by reinforcing the existing gas systems. 34

2-12
This MWC relates to safety and/or reliability and/or maintenance as it 1
includes capacity additions to meet load growth. 2
MWC 50 – Gas Distribution Reliability – Includes installation or 3
replacement of gas facilities to: improve system safety and reliability, replace 4
aging facilities, and maintain compliance with pipeline safety regulations. 5
Facilities replaced include mains, services, regulator stations, CP equipment, 6
and remote CP monitoring equipment. Below ground Grade 3 leak repairs are 7
recorded under MWC 3P – Leak Abatement. 8
This MWC relates to safety and/or reliability and/or maintenance as it 9
includes installation or replacement of gas facilities to improve system safety 10
and reliability, replace aging facilities, and maintain compliance with pipeline 11
safety regulations. 12
MWC 51 – Gas Capital WRO – Includes relocating gas distribution main 13
and service facilities at the request of a governmental agency or other third 14
parties (e.g., customers and developers). This work could be due to road 15
widening, street improvements, sewer improvements and other similar work. 16
This MWC does not relate directly to safety and/or reliability and/or 17
maintenance. 18
MWC 52 – Gas Distribution Emergency Response – Includes work and 19
materials required to replace damaged or failed facilities including replacement 20
of mains and services due to gas dig-ins and external forces such as landslides 21
and earthquakes. 22
This MWC relates to safety and/or reliability and/or maintenance as it 23
includes work and materials required to replace damaged or failed facilities. 24
MWC 74 – Install New Gas Meters – Includes regulator replacement labor 25
to remove and install new regulators and meters and regulators for new 26
business connections and labor to install. The meter set is defined as the 27
facilities between the shut-off valve (i.e., service valve and inlet valve) and 28
service tee or meter outlet valve. Maintenance includes: (1) Compliance – 29
Scheduled Meter Change Outs less than or equal 1,000 cfh; (2) Compliance – 30
Periodic Meter Change outs, every 10 years (PMC) greater than 1,000 cfh; 31
(3) Corrective Maintenance work with replacement of meter performed on meter32
sets less than or equal to 1,000 cfh and greater than 1,000 cfh; Meter outlet 33
valve greater than or equal to 2 inches diameter; (4) Meter removal (retire) less 34

2-13
than or equal to 1,000 cfh and greater than 1,000 cfh; (5) New Business less 1
than 400 cfh and 400 - 1,000 cfh; (6) Capital projects (i.e., Replacement); and 2
(7) SmartMeter™ gas module replacements. 3
This MWC relates to safety and/or reliability and/or maintenance as it 4
includes regulator replacement labor to remove and install new regulators and 5
meters. 6
MWC 78 – Manage Buildings – Includes capital buildings projects 7
(i.e., facility upgrades/improvements as well as new construction) for GO. 8
This MWC does not relate directly to safety and/or reliability and/or 9
maintenance. 10
MWC 2F – Build IT Applications and Infrastructure – Includes the costs 11
to design, develop and enhance applications, systems, and infrastructure 12
technology solutions. 13
This MWC was not presented in the 2020 GRC as related directly to safety 14
and/or reliability and/or maintenance. However, certain projects within this MWC 15
provide support for safety and/or reliability and/or maintenance projects. 16
MWC 2K – High Pressure Regulator (HPR) Program – Includes the 17
replacement of gas HPRs or the reconstruction of gas distribution systems to 18
eliminate the need for HPRs. 19
This MWC relates to safety and/or reliability and/or maintenance as it 20
includes the replacement of gas customer HPR or the reconstruction of gas 21
distribution systems to eliminate the need for HPRs. 22
MWC 4A – Gas Distribution Control Operations Assets – Includes costs 23
associated with the installation of Supervisory Control and Data Acquisition 24
(SCADA) devices, electronic recorders (ERX), and associated field equipment. 25
MWC 4A captures costs associated with the development of software tools to 26
support the collection, retention, and presentation of data related to the Control 27
Center as well as support telecommunication radio system assets to monitor and 28
control the gas distribution network. 29
This MWC relates to safety and/or reliability and/or maintenance as it 30
includes costs to support the collection, retention, and presentation of data 31
related to the Control Center as well as support costs for telecommunication 32
radio system assets to monitor and control the gas distribution network. 33
E. Comparison by MAT for Safety, Reliability, and Maintenance Work Tables 34

2-14
TABLE 2-3 GAS DISTRIBUTION 2021 EXPENSE COMPARISON BY MAT FOR SAFETY, RELIABILITY, AND MAINTENANCE WORK
(THOUSANDS OF DOLLARS)
LineNo. MWC MWC Name MAT MAT Name RAMP Risk Name
RAMP Mitigation and/or Control Name
2020 GRC Testimony Reference
2021 Imputed Adopted
Costs (A)
2021 Actual Costs
(B)
2021 Cost Difference
(B-A)
2021 Cost Percent Change
(%)(B-A)/A
2021 Imputed Adopted
Units (C)
2021 Actual Units(D)
2021 Unit Difference
(D-C)
2021 Unit Percent Change
(%)(D-C)/C
Spending Variance
Explanation Required
(Y/N)
Percentage Variance
Explanation Required
Unit Variance Explanation
Required (Y/N) Cost Variance Explanation Unit Variance Explanation
1 DD Provide Field Service DDA Field Services: Other SRM Total (Non RAMP) SRM Total (Non RAMP)Exhibit (PG&E-3), Chapter 6 0.0 161.1 161.1 100.0% N/A N/A N/A N/A NO NO NO Below variance threshold. Below variance threshold.
2 DD Provide Field Service DDD Pilot Relight SRM Total (Non RAMP) SRM Total (Non RAMP)Exhibit (PG&E-3), Chapter 6 12,897.7 10,112.6 (2,785.1) -21.6% 177,773 119,293 (58,480) -32.9% NO NO YES Below variance threshold.
Actual units were lower than imputed units due to a reduction in customer demand.
3 DD Provide Field Service DDE Appliance Adjs SRM Total (Non RAMP) SRM Total (Non RAMP)Exhibit (PG&E-3), Chapter 6 988.5 969.9 (18.6) -1.9% 12,947 10,230 (2,717) -21.0% NO NO YES Below variance threshold.
Actual units were lower than imputed units due to a reduction in customer demand.
4 DD Provide Field Service DDF Gas Fumigation Activity SRM Total (Non RAMP) SRM Total (Non RAMP)Exhibit (PG&E-3), Chapter 6 3,039.4 3,191.1 151.6 5.0% 37,538 30,743 (6,795) -18.1% NO NO NO Below variance threshold. Below variance threshold.
5 DD Provide Field Service DDG Gas Leaks & Emergencies SRM Total (Non RAMP) SRM Total (Non RAMP)Exhibit (PG&E-3), Chapter 6 18,119.4 27,108.2 8,988.8 49.6% 166,790 133,412 (33,378) -20.0% NO YES YES
Program expenses exceeded imputed regulatory values due to an accounting change that began recording immediate response (IR) standby time to orders directly under this MAT. Previously these charges were allocated across multiple MATs.
Actual units were lower than imputed units due to a reduction in customer demand.
6 DD Provide Field Service DDK Gas Start SRM Total (Non RAMP) SRM Total (Non RAMP)Exhibit (PG&E-3), Chapter 6 5,361.9 3,726.5 (1,635.4) -30.5% 55,581 33,131 (22,450) -40.4% NO NO YES Below variance threshold.
Actual units were lower than imputed units due to a reduction in customer demand.
7 DD Provide Field Service DDL Gas Stop SRM Total (Non RAMP) SRM Total (Non RAMP)Exhibit (PG&E-3), Chapter 6 4,495.6 2,861.3 (1,634.3) -36.4% 97,018 42,702 (54,316) -56.0% NO NO YES Below variance threshold.
Actual units were lower than imputed units due to a reduction in customer demand. In addition, a moratorium was in place in 2021 on Gas Shut Offs for no payments.
8 DE Leak Survey DEA Leak Survey SRM Total (Non RAMP) SRM Total (Non RAMP)Exhibit (PG&E-3), Chapter 8 7,926.3 8,880.4 954.0 12.0% 543,301 421,715 (121,586) -22.4% NO NO YES Below variance threshold.
Actual units were lower than imputed units as result of MAT DEA units shifting over to MAT DEF in an effort to utilize advanced mobile leak detection technology with Picarro. In addition, when an annual leak survey was scheduled in the same month as a scheduled three-year comprehensive survey, those MAT DEA units were captured as part of MAT DEF.
9 DE Leak Survey DEA Leak Survey
Measurement and Control Failure - Release of Gas with Ignition at M&C Facility
C5-D – Leak Management - D
Exhibit (PG&E-3), Chapter 8 7,926.3 8,880.4 954.0 12.0% 543,301 421,715 (121,586) -22.4% N/A N/A N/A N/A N/A
10 DE Leak Survey DEA Leak Survey
Release of Gas with Ignition on Distribution Facilities (non-Cross Bore) C4 – Leak Management
Exhibit (PG&E-3), Chapter 8 7,926.3 8,880.4 954.0 12.0% 543,301 421,715 (121,586) -22.4% N/A N/A N/A N/A N/A
11 DE Leak Survey DEB Special Leak Survey SRM Total (Non RAMP) SRM Total (Non RAMP)Exhibit (PG&E-3), Chapter 8 5,902.2 2,361.2 (3,541.0) -60.0% N/A N/A N/A N/A NO NO NO Below variance threshold. Below variance threshold.
12 DE Leak Survey DEB Special Leak Survey
Measurement and Control Failure - Release of Gas with Ignition at M&C Facility
C5-D – Leak Management - D
Exhibit (PG&E-3), Chapter 8 5,902.2 2,361.2 (3,541.0) -60.0% N/A N/A N/A N/A N/A N/A N/A N/A N/A
13 DE Leak Survey DEB Special Leak Survey
Release of Gas with Ignition on Distribution Facilities (non-Cross Bore) C4 – Leak Management
Exhibit (PG&E-3), Chapter 8 5,902.2 2,361.2 (3,541.0) -60.0% N/A N/A N/A N/A N/A N/A N/A N/A N/A
14 DE Leak Survey DEC Leak Downgrade No Repair SRM Total (Non RAMP) SRM Total (Non RAMP)Exhibit (PG&E-3), Chapter 8 2,081.3 3,445.1 1,363.8 65.5% 6,951 8,999 2,048 29.5% NO NO YES Below variance threshold.
Actual units were higher than imputed units due to the adoption of Leak Abatement Best Practice (BP) 21 which states that Utilities shall repair leaks as soon as reasonably possible after discovery, but in no event, more than three years after discovery. Utilities may make reasonable exceptions for leaks that are costly to repair relative to the estimated size of the leak. 2,000 grade below ground three leaks were scheduled for repair in 2021 in the leak repair MATs, however, when Grade 3 leaks are found, they have a very small percentage of gas and are subject to downgrade with no repair. As a result, a number of additional units were recorded in this MAT.
15 DE Leak Survey DEC Leak Downgrade No Repair
Measurement and Control Failure - Release of Gas with Ignition at M&C Facility
C5-D – Leak Management - D
Exhibit (PG&E-3), Chapter 8 2,081.3 3,445.1 1,363.8 65.5% 6,951 8,999 2,048 29.5% N/A N/A N/A N/A N/A
16 DE Leak Survey DEC Leak Downgrade No Repair
Release of Gas with Ignition on Distribution Facilities (non-Cross Bore) C4 – Leak Management
Exhibit (PG&E-3), Chapter 8 2,081.3 3,445.1 1,363.8 65.5% 6,951 8,999 2,048 29.5% N/A N/A N/A N/A N/A
17 DE Leak Survey DED Leak Rechecks SRM Total (Non RAMP) SRM Total (Non RAMP)Exhibit (PG&E-3), Chapter 8 1,588.4 1,422.0 (166.4) -10.5% 21,430 36,552 15,122 70.6% NO NO YES Below variance threshold.
Actual units were higher than imputed units due to: 1) an IT enhancement introduced to make leak rechecks viewable and workable electronically. This allowed leak surveyors to recheck a leak anytime they were in the area without being dependant on a printed map, allowing work bundling for efficiency, and 2) a process improvement and increased focus on procedure adherance from the Leak Cancelation Desk. This team added a leak repair location photo review to their review protocol to ensure the subsequent recheck was perfomed at the right location, yieldeding an additional 1,118 rechecks.

2-15
TABLE 2-3 GAS DISTRIBUTION 2021 EXPENSE COMPARISON BY MAT FOR SAFETY, RELIABILITY, AND MAINTENANCE WORK
(THOUSANDS OF DOLLARS) (CONTINUED)
LineNo. MWC MWC Name MAT MAT Name RAMP Risk Name
RAMP Mitigation and/or Control Name
2020 GRC Testimony Reference
2021 Imputed Adopted
Costs (A)
2021 Actual Costs
(B)
2021 Cost Difference
(B-A)
2021 Cost Percent Change
(%)(B-A)/A
2021 Imputed Adopted
Units (C)
2021 Actual Units(D)
2021 Unit Difference
(D-C)
2021 Unit Percent Change
(%)(D-C)/C
Spending Variance
Explanation Required
(Y/N)
Percentage Variance
Explanation Required
Unit Variance Explanation
Required (Y/N) Cost Variance Explanation Unit Variance Explanation
18 DE Leak Survey DED Leak Rechecks
Measurement and Control Failure - Release of Gas with Ignition at M&C Facility
C5-D – Leak Management - D
Exhibit (PG&E-3), Chapter 8 1,588.4 1,422.0 (166.4) -10.5% 21,430 36,552 15,122 70.6% N/A N/A N/A N/A N/A
19 DE Leak Survey DED Leak Rechecks
Release of Gas with Ignition on Distribution Facilities (non-Cross Bore) C4 – Leak Management
Exhibit (PG&E-3), Chapter 8 1,588.4 1,422.0 (166.4) -10.5% 21,430 36,552 15,122 70.6% N/A N/A N/A N/A N/A
20 DE Leak Survey DEE Customer Calls SRM Total (Non RAMP) SRM Total (Non RAMP)Exhibit (PG&E-3), Chapter 8 557.5 276.2 (281.3) -50.5% 3,624 3,766 142 3.9% NO NO NO Below variance threshold. Below variance threshold.
21 DE Leak Survey DEE Customer Calls
Measurement and Control Failure - Release of Gas with Ignition at M&C Facility
C5-D – Leak Management - D
Exhibit (PG&E-3), Chapter 8 557.5 276.2 (281.3) -50.5% 3,624 3,766 142 3.9% N/A N/A N/A N/A N/A
22 DE Leak Survey DEE Customer Calls
Release of Gas with Ignition on Distribution Facilities (non-Cross Bore) C4 – Leak Management
Exhibit (PG&E-3), Chapter 8 557.5 276.2 (281.3) -50.5% 3,624 3,766 142 3.9% N/A N/A N/A N/A N/A
23 DE Leak Survey DEF Picarro Leak Survey SRM Total (Non RAMP) SRM Total (Non RAMP)Exhibit (PG&E-3), Chapter 8 6,215.5 11,541.9 5,326.3 85.7% 663,997 947,602 283,605 42.7% NO YES YES
Program expenses exceeded imputed regulatory values due to anticipated efficiencies included in the 2020 GRC that did not materialize.
Actual units were higher than imputed units due to more leak surveys completed using Picarro technology based on the compliance leak survey plan. See MAT DEA explanation above.
24 DE Leak Survey DEF Picarro Leak Survey
Measurement and Control Failure - Release of Gas with Ignition at M&C Facility
C5-D – Leak Management - D
Exhibit (PG&E-3), Chapter 8 6,215.5 11,541.9 5,326.3 85.7% 663,997 947,602 283,605 42.7% N/A N/A N/A N/A N/A
25 DE Leak Survey DEF Picarro Leak Survey
Release of Gas with Ignition on Distribution Facilities (non-Cross Bore) C4 – Leak Management
Exhibit (PG&E-3), Chapter 8 6,215.5 11,541.9 5,326.3 85.7% 663,997 947,602 283,605 42.7% N/A N/A N/A N/A N/A
26 DE Leak Survey DEG Picarro Special Survey SRM Total (Non RAMP) SRM Total (Non RAMP)Exhibit (PG&E-3), Chapter 8 1.6 0.0 (1.6) -100.0% N/A N/A N/A N/A NO NO NO Below variance threshold. Below variance threshold.
27 DE Leak Survey DEG Picarro Special Survey
Measurement and Control Failure - Release of Gas with Ignition at M&C Facility
C5-D – Leak Management - D
Exhibit (PG&E-3), Chapter 8 1.6 0.0 (1.6) -100.0% N/A N/A N/A N/A N/A N/A N/A N/A N/A
28 DE Leak Survey DEG Picarro Special Survey
Release of Gas with Ignition on Distribution Facilities (non-Cross Bore) C4 – Leak Management
Exhibit (PG&E-3), Chapter 8 1.6 0.0 (1.6) -100.0% N/A N/A N/A N/A N/A N/A N/A N/A N/A
29 DE Leak Survey DEH Gas Capacity Uprates SRM Total (Non RAMP) SRM Total (Non RAMP)Exhibit (PG&E-3), Chapter 8 0.0 2,596.5 2,596.5 100.0% N/A N/A N/A N/A NO NO NO Below variance threshold. Below variance threshold.
30 DE Leak Survey DE# Leak Survey Support SRM Total (Non RAMP) SRM Total (Non RAMP)Exhibit (PG&E-3), Chapter 8 729.5 2,824.9 2,095.4 287.2% N/A N/A N/A N/A NO NO NO Below variance threshold. Below variance threshold.
31 DF Locate and Mark DFA Locate and Mark SRM Total (Non RAMP) SRM Total (Non RAMP)Exhibit (PG&E-3), Chapter 6 42,463.1 38,099.3 (4,363.8) -10.3% 722,584 608,866 (113,718) -15.7% NO NO NO Below variance threshold. Below variance threshold.
32 DF Locate and Mark DFA Locate and Mark
Release of Gas with Ignition on Distribution Facilities (non-Cross Bore) C5 – Locate & Mark
Exhibit (PG&E-3), Chapter 6 42,463.1 38,099.3 (4,363.8) -10.3% 722,584 608,866 (113,718) -15.7% N/A N/A N/A N/A N/A
33 DF Locate and Mark DFB Locate and Mark - Standby SRM Total (Non RAMP) SRM Total (Non RAMP)Exhibit (PG&E-3), Chapter 6 1,805.3 560.3 (1,245.0) -69.0% 3,919 682 (3,237) -82.6% NO NO YES Below variance threshold.
Program recorded units were less than imputed units due to Gas Resource Specialists performing quality field observations to further reduce and/or eliminate standbys for work that is not in conflict with PG&E's critical facilities. In addition, the new Ticket Management System (Locate App) continued to enhance the onsite Field Meet criteria for locators in the field by adding additional questions to ask excavators while onsite. The added criteria enable better onsite Field Meetings to occur with excavators; thus, improving the ability to relocate excavations away from critical facilities to further reduce the need for standbys. In addition, PG&E experienced a lower demand for standbys in 2021.
34 DF Locate and Mark DFB Locate and Mark - Standby
Release of Gas with Ignition on Distribution Facilities (non-Cross Bore) C5 – Locate & Mark
Exhibit (PG&E-3), Chapter 6 1,805.3 560.3 (1,245.0) -69.0% 3,919 682 (3,237) -82.6% N/A N/A N/A N/A N/A
35 DF Locate and Mark DF# Locate and Mark, Other SRM Total (Non RAMP) SRM Total (Non RAMP)Exhibit (PG&E-3), Chapter 6 942.5 2,012.9 1,070.4 113.6% N/A N/A N/A N/A NO NO NO Below variance threshold. Below variance threshold.
36 DG Cathodic Protection DGACathodic Protection - Monitoring SRM Total (Non RAMP) SRM Total (Non RAMP)
Exhibit (PG&E-3), Chapter 7 2,845.1 4,301.6 1,456.6 51.2% 76,818 89,706 12,888 16.8% NO NO NO Below variance threshold. Below variance threshold.
37 DG Cathodic Protection DGACathodic Protection - Monitoring
Release of Gas with Ignition on Distribution Facilities (non-Cross Bore) C2 – Corrosion Control
Exhibit (PG&E-3), Chapter 7 2,845.1 4,301.6 1,456.6 51.2% 76,818 89,706 12,888 16.8% N/A N/A N/A N/A N/A

2-16
TABLE 2-3 GAS DISTRIBUTION 2021 EXPENSE COMPARISON BY MAT FOR SAFETY, RELIABILITY, AND MAINTENANCE WORK
(THOUSANDS OF DOLLARS) (CONTINUED)
LineNo. MWC MWC Name MAT MAT Name RAMP Risk Name
RAMP Mitigation and/or Control Name
2020 GRC Testimony Reference
2021 Imputed Adopted
Costs (A)
2021 Actual Costs
(B)
2021 Cost Difference
(B-A)
2021 Cost Percent Change
(%)(B-A)/A
2021 Imputed Adopted
Units (C)
2021 Actual Units(D)
2021 Unit Difference
(D-C)
2021 Unit Percent Change
(%)(D-C)/C
Spending Variance
Explanation Required
(Y/N)
Percentage Variance
Explanation Required
Unit Variance Explanation
Required (Y/N) Cost Variance Explanation Unit Variance Explanation
38 DG Cathodic Protection DGBCathodic Protection - Troubleshoot SRM Total (Non RAMP) SRM Total (Non RAMP)
Exhibit (PG&E-3), Chapter 7 4,367.8 4,843.7 475.9 10.9% 6,000 10,976 4,976 82.9% NO NO YES Below variance threshold.
Actual units were higher than imputed units due to findings of the Enhanced Cathodic Protection Survey Program (MAT DGD) and the Electrically Connected Isolated Steel Program (MAT DGE) that required troubleshooting. This is a workstream with regulatory compliance requirements.
39 DG Cathodic Protection DGBCathodic Protection - Troubleshoot
Release of Gas with Ignition on Distribution Facilities (non-Cross Bore) C2 – Corrosion Control
Exhibit (PG&E-3), Chapter 7 4,367.8 4,843.7 475.9 10.9% 6,000 10,976 4,976 82.9% N/A N/A N/A N/A N/A
40 DG Cathodic Protection DGCCathodic Protection - Rectifier Maintenance SRM Total (Non RAMP) SRM Total (Non RAMP)
Exhibit (PG&E-3), Chapter 7 487.0 661.1 174.1 35.7% 3,953 4,119 166 4.2% NO NO NO Below variance threshold. Below variance threshold.
41 DG Cathodic Protection DGCCathodic Protection - Rectifier Maintenance
Release of Gas with Ignition on Distribution Facilities (non-Cross Bore) C2 – Corrosion Control
Exhibit (PG&E-3), Chapter 7 487.0 661.1 174.1 35.7% 3,953 4,119 166 4.2% N/A N/A N/A N/A N/A
42 DG Cathodic Protection DGD (a)Cathodic Protection - Enhanced Survey SRM Total (Non RAMP) SRM Total (Non RAMP)
Exhibit (PG&E-3), Chapter 7 6,440.1 5,585.5 (854.6) -13.3% N/A N/A N/A N/A NO NO NO Below variance threshold. Below variance threshold.
43 DG Cathodic Protection DGD (a)Cathodic Protection - Enhanced Survey
Release of Gas with Ignition on Distribution Facilities (non-Cross Bore)
M3 – Enhanced CP Survey and Unprotected Main Evaluation
Exhibit (PG&E-3), Chapter 7 6,440.1 5,585.5 (854.6) -13.3% N/A N/A N/A N/A N/A N/A N/A N/A N/A
44 DG Cathodic Protection DGE (b)Electrically Connected Isolated Steel (EC‐ISSP) SRM Total (Non RAMP) SRM Total (Non RAMP)
Exhibit (PG&E-3), Chapter 7 2,827.3 4,087.7 1,260.5 44.6% N/A N/A N/A N/A NO NO NO Below variance threshold. Below variance threshold.
45 DG Cathodic Protection DGE (b) EC‐ISSP
Release of Gas with Ignition on Distribution Facilities (non-Cross Bore) M4 - EC-ISSP
Exhibit (PG&E-3), Chapter 7 2,827.3 4,087.7 1,260.5 44.6% N/A N/A N/A N/A N/A N/A N/A N/A N/A
46 DG Cathodic Protection DGG Install Casing Test Stations SRM Total (Non RAMP) SRM Total (Non RAMP)Exhibit (PG&E-3), Chapter 7 808.3 1,186.1 377.7 46.7% 360 29 (331) -91.9% NO NO YES Below variance threshold.
Actual units were lower than imputed units due to an increase in realized unit cost for the Casing Test Station program. The increased costs were driven by the need to utilize contractors for this work and higher construction costs driven by municipalities not allowing installation of test stations within roadways (using lower cost keyhole methods).
47 DG Cathodic Protection DGHCasing Short Mitigations Less Than 100 Feet SRM Total (Non RAMP) SRM Total (Non RAMP)
Exhibit (PG&E-3), Chapter 7 2,944.6 427.3 (2,517.3) -85.5% 83 1 (82) -98.8% NO NO YES Below variance threshold.
Actual units were lower than imputed units due to the decision to prioritize capital casing mitigation (greater than 100 feet) over expense casing migitation (less than 100 feet). The prioritization was made in 2020 and was based on the following: 1) mitigation of longer casings provides a greater per unit risk reduction to the gas distribution system; 2) the find rate of contacted expense casings (less than 100 feet) waslower than forecast; and 3) a shortage of work crews due to the COVID-19 pandemic.
48 DG Cathodic Protection DGICasing Monitoring Without Lead SRM Total (Non RAMP) SRM Total (Non RAMP)
Exhibit (PG&E-3), Chapter 7 6.5 0.0 (6.5) -100.0% 32 2 (30) -93.8% NO NO YES Below variance threshold.
Actual units were lower than imputed units as PG&E transitioned this type of specialized testing to routine work performed by Corrosion Mechanics under MAT DGA (Cathodic Protection Monitoring) in 2021.
49 EX Meter Protection EXA MPP Inspections SRM Total (Non RAMP) SRM Total (Non RAMP)Exhibit (PG&E-3), Chapter 4 0.2 0.0 (0.2) -100.0% N/A N/A N/A N/A NO NO NO Below variance threshold. Below variance threshold.
50 EX Meter Protection EXB MPP Protections SRM Total (Non RAMP) SRM Total (Non RAMP)Exhibit (PG&E-3), Chapter 4 8,427.6 7,555.5 (872.0) -10.3% 9,079 9,192 113 1% NO NO NO Below variance threshold. Below variance threshold.
51 EX Meter Protection EXC MPP - Service Valves SRM Total (Non RAMP) SRM Total (Non RAMP)Exhibit (PG&E-3), Chapter 4 24.3 0.0 (24.3) -100% N/A N/A N/A N/A NO NO NO Below variance threshold. Below variance threshold.
52 FGOperate Gas Distribution System FGA
Gas Distribution Control Center Operations SRM Total (Non RAMP) SRM Total (Non RAMP)
Exhibit (PG&E-3), Chapter 9 7,910.5 7,661.7 (248.8) -3.1% N/A N/A N/A N/A NO NO NO Below variance threshold. Below variance threshold.
53 FGOperate Gas Distribution System FGB
Operate Distribution Mains and Services SRM Total (Non RAMP) SRM Total (Non RAMP)
Exhibit (PG&E-3), Chapter 9 1,083.1 829.0 (254.1) -23.5% N/A N/A N/A N/A NO NO NO Below variance threshold. Below variance threshold.
54 FGOperate Gas Distribution System FGC
Operate Distribution Regulator General SRM Total (Non RAMP) SRM Total (Non RAMP)
Exhibit (PG&E-3), Chapter 9 252.5 202.5 (50.0) -19.8% N/A N/A N/A N/A NO NO NO Below variance threshold. Below variance threshold.
55 FH Gas Preventive Maintenance FHAPreventative Maintenance, Mains SRM Total (Non RAMP) SRM Total (Non RAMP)
Exhibit (PG&E-3), Chapter 6 1,234.6 1,153.0 (81.6) -6.6% 265 414 149 56.2% NO NO YES Below variance threshold.
Actual units were higher than imputed units due to additional volume of work identified in 2021.
56 FH Gas Preventive Maintenance FHAPreventative Maintenance, Mains
Measurement and Control Failure - Release of Gas with Ignition Downstream
C3 – Preventative Maintenance
Exhibit (PG&E-3), Chapter 6 1,234.6 1,153.0 (81.6) -6.6% 265 414 149 56.2% N/A N/A N/A N/A N/A
57 FH Gas Preventive Maintenance FHAPreventative Maintenance, Mains
Measurement and Control Failure - Release of Gas with Ignition at M&C Facility
C6 – Preventative Maintenance
Exhibit (PG&E-3), Chapter 6 1,234.6 1,153.0 (81.6) -6.6% 265 414 149 56.2% N/A N/A N/A N/A N/A
58 FH Gas Preventive Maintenance FHAPreventative Maintenance, Mains
Release of Gas with Ignition on Distribution Facilities (non-Cross Bore)
C7 – Preventative Maintenance
Exhibit (PG&E-3), Chapter 6 1,234.6 1,153.0 (81.6) -6.6% 265 414 149 56.2% N/A N/A N/A N/A N/A

2-17
TABLE 2-3 GAS DISTRIBUTION 2021 EXPENSE COMPARISON BY MAT FOR SAFETY, RELIABILITY, AND MAINTENANCE WORK
(THOUSANDS OF DOLLARS) (CONTINUED)
LineNo. MWC MWC Name MAT MAT Name RAMP Risk Name
RAMP Mitigation and/or Control Name
2020 GRC Testimony Reference
2021 Imputed Adopted
Costs (A)
2021 Actual Costs
(B)
2021 Cost Difference
(B-A)
2021 Cost Percent Change
(%)(B-A)/A
2021 Imputed Adopted
Units (C)
2021 Actual Units(D)
2021 Unit Difference
(D-C)
2021 Unit Percent Change
(%)(D-C)/C
Spending Variance
Explanation Required
(Y/N)
Percentage Variance
Explanation Required
Unit Variance Explanation
Required (Y/N) Cost Variance Explanation Unit Variance Explanation
59 FH Gas Preventive Maintenance FHB (c)Preventative Maintenance, Regulator Station SRM Total (Non RAMP) SRM Total (Non RAMP)
Exhibit (PG&E-3), Chapter 6 3,329.5 4,056.2 726.7 21.8% N/A N/A N/A N/A NO NO NO Below variance threshold. Below variance threshold.
60 FH Gas Preventive Maintenance FHB (c)Preventative Maintenance, Regulator Station
Measurement and Control Failure - Release of Gas with Ignition Downstream
C3 – Preventative Maintenance
Exhibit (PG&E-3), Chapter 6 3,329.5 4,056.2 726.7 21.8% N/A N/A N/A N/A N/A N/A N/A N/A N/A
61 FH Gas Preventive Maintenance FHB (c)Preventative Maintenance, Regulator Station
Measurement and Control Failure - Release of Gas with Ignition at M&C Facility
C6 – Preventative Maintenance
Exhibit (PG&E-3), Chapter 6 3,329.5 4,056.2 726.7 21.8% N/A N/A N/A N/A N/A N/A N/A N/A N/A
62 FH Gas Preventive Maintenance FHB (c)Preventative Maintenance, Regulator Station
Release of Gas with Ignition on Distribution Facilities (non-Cross Bore)
C7 – Preventative Maintenance
Exhibit (PG&E-3), Chapter 6 3,329.5 4,056.2 726.7 21.8% N/A N/A N/A N/A N/A N/A N/A N/A N/A
63 FH Gas Preventive Maintenance FHC (c)Preventative Maintenance, Farm Tap SRM Total (Non RAMP) SRM Total (Non RAMP)
Exhibit (PG&E-3), Chapter 6 261.2 228.2 (33.0) -12.6% N/A N/A N/A N/A NO NO NO Below variance threshold. Below variance threshold.
64 FH Gas Preventive Maintenance FHC (c)Preventative Maintenance, Farm Tap
Measurement and Control Failure - Release of Gas with Ignition Downstream
C3 – Preventative Maintenance
Exhibit (PG&E-3), Chapter 6 261.2 228.2 (33.0) -12.6% N/A N/A N/A N/A N/A N/A N/A N/A N/A
65 FH Gas Preventive Maintenance FHC (c)Preventative Maintenance, Farm Tap
Measurement and Control Failure - Release of Gas with Ignition at M&C Facility
C6 – Preventative Maintenance
Exhibit (PG&E-3), Chapter 6 261.2 228.2 (33.0) -12.6% N/A N/A N/A N/A N/A N/A N/A N/A N/A
66 FH Gas Preventive Maintenance FHC (c)Preventative Maintenance, Farm Tap
Release of Gas with Ignition on Distribution Facilities (non-Cross Bore)
C7 – Preventative Maintenance
Exhibit (PG&E-3), Chapter 6 261.2 228.2 (33.0) -12.6% N/A N/A N/A N/A N/A N/A N/A N/A N/A
67 FH Gas Preventive Maintenance FHEPreventative Maintenance, Services SRM Total (Non RAMP) SRM Total (Non RAMP)
Exhibit (PG&E-3), Chapter 6 3,787.2 4,101.6 314.5 8.3% 2,458 2,540 82 3.3% NO NO NO Below variance threshold. Below variance threshold.
68 FH Gas Preventive Maintenance FHEPreventative Maintenance, Services
Measurement and Control Failure - Release of Gas with Ignition Downstream
C3 – Preventative Maintenance
Exhibit (PG&E-3), Chapter 6 3,787.2 4,101.6 314.5 8.3% 2,458 2,540 82 3.3% N/A N/A N/A N/A N/A
69 FH Gas Preventive Maintenance FHEPreventative Maintenance, Services
Measurement and Control Failure - Release of Gas with Ignition at M&C Facility
C6 – Preventative Maintenance
Exhibit (PG&E-3), Chapter 6 3,787.2 4,101.6 314.5 8.3% 2,458 2,540 82 3.3% N/A N/A N/A N/A N/A
70 FH Gas Preventive Maintenance FHEPreventative Maintenance, Services
Release of Gas with Ignition on Distribution Facilities (non-Cross Bore)
C7 – Preventative Maintenance
Exhibit (PG&E-3), Chapter 6 3,787.2 4,101.6 314.5 8.3% 2,458 2,540 82 3.3% N/A N/A N/A N/A N/A
71 FH Gas Preventive Maintenance FHG (c)Preventative Maintenance, Valves SRM Total (Non RAMP) SRM Total (Non RAMP)
Exhibit (PG&E-3), Chapter 6 1,737.4 1,578.2 (159.2) -9.2% N/A N/A N/A N/A NO NO NO Below variance threshold. Below variance threshold.
72 FH Gas Preventive Maintenance FHG (c)Preventative Maintenance, Valves
Measurement and Control Failure - Release of Gas with Ignition Downstream
C3 – Preventative Maintenance
Exhibit (PG&E-3), Chapter 6 1,737.4 1,578.2 (159.2) -9.2% N/A N/A N/A N/A N/A N/A N/A N/A N/A
73 FH Gas Preventive Maintenance FHG (c)Preventative Maintenance, Valves
Measurement and Control Failure - Release of Gas with Ignition at M&C Facility
C6 – Preventative Maintenance
Exhibit (PG&E-3), Chapter 6 1,737.4 1,578.2 (159.2) -9.2% N/A N/A N/A N/A N/A N/A N/A N/A N/A
74 FH Gas Preventive Maintenance FHG (c)Preventative Maintenance, Valves
Release of Gas with Ignition on Distribution Facilities (non-Cross Bore)
C7 – Preventative Maintenance
Exhibit (PG&E-3), Chapter 6 1,737.4 1,578.2 (159.2) -9.2% N/A N/A N/A N/A N/A N/A N/A N/A N/A
75 FH Gas Preventive Maintenance FHICorrective Maintenance, Service Valves SRM Total (Non RAMP) SRM Total (Non RAMP)
Exhibit (PG&E-3), Chapter 6 2,300.5 1,740.8 (559.7) -24.3% 18,417 24,340 5,923 32.2% NO NO YES Below variance threshold.
Actual units were higher than imputed units due to more units completed by Field Service than planned on top of the units completed by Maintenance and Construction (M&C).
76 FH Gas Preventive Maintenance FHICorrective Maintenance, Service Valves
Release of Gas with Ignition on Distribution Facilities (non-Cross Bore)
C1 – Corrective Maintenance
Exhibit (PG&E-3), Chapter 6 2,300.5 1,740.8 (559.7) -24.3% 18,417 24,340 5,923 32.2% N/A N/A N/A N/A N/A
77 FH Gas Preventive Maintenance FHICorrective Maintenance, Service Valves
Measurement and Control Failure - Release of Gas with Ignition at M&C Facility
C1 – Corrective Maintenance
Exhibit (PG&E-3), Chapter 6 2,300.5 1,740.8 (559.7) -24.3% 18,417.0 24,340.0 5,923.0 32.2% N/A N/A N/A N/A N/A
78 FH Gas Preventive Maintenance FHICorrective Maintenance, Service Valves
Measurement and Control Failure - Release of Gas with Ignition Downstream
C1 – Corrective Maintenance
Exhibit (PG&E-3), Chapter 6 2,300.5 1,740.8 (559.7) -24.3% 18,417.0 24,340.0 5,923.0 32.2% N/A N/A N/A N/A N/A
79 FH Gas Preventive Maintenance FHJ Gas Non-Recurring Projects SRM Total (Non RAMP) SRM Total (Non RAMP)Exhibit (PG&E-3), Chapter 6 2,938.6 2,294.2 (644.5) -21.9% N/A N/A N/A N/A NO NO NO Below variance threshold. Below variance threshold.
80 FH Gas Preventive Maintenance FHKAtmospheric Corrosion Monitoring SRM Total (Non RAMP) SRM Total (Non RAMP)
Exhibit (PG&E-3), Chapter 7 1,064.2 146.2 (918.0) -86.3% N/A N/A N/A N/A NO NO NO Below variance threshold. Below variance threshold.
81 FH Gas Preventive Maintenance FHLAtmospheric Corrosion Main Repairs SRM Total (Non RAMP) SRM Total (Non RAMP)
Exhibit (PG&E-3), Chapter 7 252.0 1,023.3 771.3 306.1% 100 81 (19) -19.0% NO NO NO Below variance threshold. Below variance threshold.

2-18
TABLE 2-3 GAS DISTRIBUTION 2021 EXPENSE COMPARISON BY MAT FOR SAFETY, RELIABILITY, AND MAINTENANCE WORK
(THOUSANDS OF DOLLARS) (CONTINUED)
LineNo. MWC MWC Name MAT MAT Name RAMP Risk Name
RAMP Mitigation and/or Control Name
2020 GRC Testimony Reference
2021 Imputed Adopted
Costs (A)
2021 Actual Costs
(B)
2021 Cost Difference
(B-A)
2021 Cost Percent Change
(%)(B-A)/A
2021 Imputed Adopted
Units (C)
2021 Actual Units(D)
2021 Unit Difference
(D-C)
2021 Unit Percent Change
(%)(D-C)/C
Spending Variance
Explanation Required
(Y/N)
Percentage Variance
Explanation Required
Unit Variance Explanation
Required (Y/N) Cost Variance Explanation Unit Variance Explanation
82 FH Gas Preventive Maintenance FHMAtmospheric Corrosion Service Repairs SRM Total (Non RAMP) SRM Total (Non RAMP)
Exhibit (PG&E-3), Chapter 7 412.2 3,997.1 3,585.0 869.8% 550 25,947 25,397 4617.6% NO NO YES Below variance threshold.
Actual units were higher than imputed units due to PG&E's implementation of PHMSA guidance on atmospheric corrosion control of metallic piping in soil interface areas (i.e. risers). Distribution meter set risers are now managed in the same manner as the balance of transmission and distribution risers, resulting in the need to mitigate riser wrap damage identified during inspections. Implementation of this guidance is driving the additional mitigation units.
83 FH Gas Preventive Maintenance FHNAtmospheric Corrosion Regulator Station Repair SRM Total (Non RAMP) SRM Total (Non RAMP)
Exhibit (PG&E-3), Chapter 7 594.0 1,077.0 483.0 81.3% 34 45 11 32.4% NO NO YES Below variance threshold.
Actual units were higher than imputed units due to find rates during atmospheric corrosion inspections. This is a compliance workstream.
84 FH Gas Preventive Maintenance FHO(c)SCADA Preventative Maintenance SRM Total (Non RAMP) SRM Total (Non RAMP)
Exhibit (PG&E-3), Chapter 6 427.8 991.2 563.5 131.7% N/A N/A N/A N/A NO NO NO Below variance threshold. Below variance threshold.
85 FH Gas Preventive Maintenance FHO(c)SCADA Preventative Maintenance
Measurement and Control Failure - Release of Gas with Ignition Downstream
C3 – Preventative Maintenance
Exhibit (PG&E-3), Chapter 6 427.8 991.2 563.5 131.7% N/A N/A N/A N/A N/A N/A N/A N/A N/A
86 FH Gas Preventive Maintenance FHO(c)SCADA Preventative Maintenance
Measurement and Control Failure - Release of Gas with Ignition at M&C Facility
C6 – Preventative Maintenance
Exhibit (PG&E-3), Chapter 6 427.8 991.2 563.5 131.7% N/A N/A N/A N/A N/A N/A N/A N/A N/A
87 FH Gas Preventive Maintenance FHO(c)SCADA Preventative Maintenance
Release of Gas with Ignition on Distribution Facilities (non-Cross Bore)
C7 – Preventative Maintenance
Exhibit (PG&E-3), Chapter 6 427.8 991.2 563.5 131.7% N/A N/A N/A N/A N/A N/A N/A N/A N/A
88 FH Gas Preventive Maintenance FHP(c)SCADA Corrective Maintenance SRM Total (Non RAMP) SRM Total (Non RAMP)
Exhibit (PG&E-3), Chapter 6 341.5 708.5 367.0 107.5% N/A N/A N/A N/A NO NO NO Below variance threshold. Below variance threshold.
89 FH Gas Preventive Maintenance FHP(c)SCADA Corrective Maintenance
Measurement and Control Failure - Release of Gas with Ignition Downstream
C1 – Corrective Maintenance
Exhibit (PG&E-3), Chapter 6 341.5 708.5 367.0 107.5% N/A N/A N/A N/A N/A N/A N/A N/A N/A
90 FH Gas Preventive Maintenance FHP(c)SCADA Corrective Maintenance
Measurement and Control Failure - Release of Gas with Ignition at M&C Facility
C1 – Corrective Maintenance
Exhibit (PG&E-3), Chapter 6 341.5 708.5 367.0 107.5% N/A N/A N/A N/A N/A N/A N/A N/A N/A
91 FH Gas Preventive Maintenance FHP(c)SCADA Corrective Maintenance
Release of Gas with Ignition on Distribution Facilities (non-Cross Bore)
C1 – Corrective Maintenance
Exhibit (PG&E-3), Chapter 6 341.5 708.5 367.0 107.5% N/A N/A N/A N/A N/A N/A N/A N/A N/A
92 FH Gas Preventive Maintenance FHQGD Overpressure Protection Enhancements SRM Total (Non RAMP) SRM Total (Non RAMP)
Exhibit (PG&E-3), Chapter 5 3,250.2 714.7 (2,535.6) -78.0% N/A N/A N/A N/A NO NO NO Below variance threshold. Below variance threshold.
93 FH Gas Preventive Maintenance FHQGD Overpressure Protection Enhancements
Measurement and Control Failure - Release of Gas with Ignition Downstream
M4 – Station OPP Enhancements
Exhibit (PG&E-3), Chapter 5 3,250.2 714.7 (2,535.6) -78.0% N/A N/A N/A N/A N/A N/A N/A N/A N/A
94 FH Gas Preventive Maintenance FHR Distribution Pipeline Markers SRM Total (Non RAMP) SRM Total (Non RAMP) N/A 0.0 262.4 262.4 100.0% N/A N/A N/A N/A NO NO NO Below variance threshold. Below variance threshold.
95 FH Gas Preventive Maintenance FH#Preventative Maintenance,Other SRM Total (Non RAMP) SRM Total (Non RAMP)
Exhibit (PG&E-3), Chapter 6 1,179.9 385.9 (794.0) -67.3% N/A N/A N/A N/A NO NO NO Below variance threshold. Below variance threshold.
96 FI Gas Corrective Maintenance FIB(c)Corrective Maintenance, Regulator Station SRM Total (Non RAMP) SRM Total (Non RAMP)
Exhibit (PG&E-3), Chapter 6 4,675.6 2,706.7 (1,968.9) -42.1% N/A N/A N/A N/A NO NO NO Below variance threshold. Below variance threshold.
97 FI Gas Corrective Maintenance FIB(c)Corrective Maintenance, Regulator Station
Measurement and Control Failure - Release of Gas with Ignition Downstream
C1 – Corrective Maintenance
Exhibit (PG&E-3), Chapter 6 4,675.6 2,706.7 (1,968.9) -42.1% N/A N/A N/A N/A N/A N/A N/A N/A N/A
98 FI Gas Corrective Maintenance FIB(c)Corrective Maintenance, Regulator Station
Measurement and Control Failure - Release of Gas with Ignition at M&C Facility
C1 – Corrective Maintenance
Exhibit (PG&E-3), Chapter 6 4,675.6 2,706.7 (1,968.9) -42.1% N/A N/A N/A N/A N/A N/A N/A N/A N/A
99 FI Gas Corrective Maintenance FIB(c)Corrective Maintenance, Regulator Station
Release of Gas with Ignition on Distribution Facilities (non-Cross Bore)
C1 – Corrective Maintenance
Exhibit (PG&E-3), Chapter 6 4,675.6 2,706.7 (1,968.9) -42.1% N/A N/A N/A N/A N/A N/A N/A N/A N/A
100 FI Gas Corrective Maintenance FIC(c)Corrective Maintenance, Farm Tap SRM Total (Non RAMP) SRM Total (Non RAMP)
Exhibit (PG&E-3), Chapter 6 168.4 402.7 234.3 139.1% N/A N/A N/A N/A NO NO NO Below variance threshold. Below variance threshold.
101 FI Gas Corrective Maintenance FIC(c)Corrective Maintenance, Farm Tap
Measurement and Control Failure - Release of Gas with Ignition Downstream
C1 – Corrective Maintenance
Exhibit (PG&E-3), Chapter 6 168.4 402.7 234.3 139.1% N/A N/A N/A N/A N/A N/A N/A N/A N/A
102 FI Gas Corrective Maintenance FIC(c)Corrective Maintenance, Farm Tap
Measurement and Control Failure - Release of Gas with Ignition at M&C Facility
C1 – Corrective Maintenance
Exhibit (PG&E-3), Chapter 6 168.4 402.7 234.3 139.1% N/A N/A N/A N/A N/A N/A N/A N/A N/A
103 FI Gas Corrective Maintenance FIC(c)Corrective Maintenance, Farm Tap
Release of Gas with Ignition on Distribution Facilities (non-Cross Bore)
C1 – Corrective Maintenance
Exhibit (PG&E-3), Chapter 6 168.4 402.7 234.3 139.1% N/A N/A N/A N/A N/A N/A N/A N/A N/A
104 FI Gas Corrective Maintenance FIF(c)Corrective Maintenance, Farm Tap SRM Total (Non RAMP) SRM Total (Non RAMP)
Exhibit (PG&E-3), Chapter 6 608.3 458.0 (150.3) -24.7% N/A N/A N/A N/A NO NO NO Below variance threshold. Below variance threshold.

2-19
TABLE 2-3 GAS DISTRIBUTION 2021 EXPENSE COMPARISON BY MAT FOR SAFETY, RELIABILITY, AND MAINTENANCE WORK
(THOUSANDS OF DOLLARS) (CONTINUED)
LineNo. MWC MWC Name MAT MAT Name RAMP Risk Name
RAMP Mitigation and/or Control Name
2020 GRC Testimony Reference
2021 Imputed Adopted
Costs (A)
2021 Actual Costs
(B)
2021 Cost Difference
(B-A)
2021 Cost Percent Change
(%)(B-A)/A
2021 Imputed Adopted
Units (C)
2021 Actual Units(D)
2021 Unit Difference
(D-C)
2021 Unit Percent Change
(%)(D-C)/C
Spending Variance
Explanation Required
(Y/N)
Percentage Variance
Explanation Required
Unit Variance Explanation
Required (Y/N) Cost Variance Explanation Unit Variance Explanation
105 FI Gas Corrective Maintenance FIF(c)Corrective Maintenance, Farm Tap
Measurement and Control Failure - Release of Gas with Ignition Downstream
C1 – Corrective Maintenance
Exhibit (PG&E-3), Chapter 6 608.3 458.0 (150.3) -24.7% N/A N/A N/A N/A N/A N/A N/A N/A N/A
106 FI Gas Corrective Maintenance FIF(c)Corrective Maintenance, Farm Tap
Measurement and Control Failure - Release of Gas with Ignition at M&C Facility
C1 – Corrective Maintenance
Exhibit (PG&E-3), Chapter 6 608.3 458.0 (150.3) -24.7% N/A N/A N/A N/A N/A N/A N/A N/A N/A
107 FI Gas Corrective Maintenance FIF(c)Corrective Maintenance, Farm Tap
Release of Gas with Ignition on Distribution Facilities (non-Cross Bore)
C1 – Corrective Maintenance
Exhibit (PG&E-3), Chapter 6 608.3 458.0 (150.3) -24.7% N/A N/A N/A N/A N/A N/A N/A N/A N/A
108 FI Gas Corrective Maintenance FIG/LWG(d)Corrective Maintenance Main Leak SRM Total (Non RAMP) SRM Total (Non RAMP)
Exhibit (PG&E-3), Chapter 8 20,331.3 33,469.4 13,138.1 64.6% 3,059 3,719 660 21.6% YES YES YES
Program costs exceeded imputed regulatory values because of increased unit costs and because more units were completed. Unit costs were higher due to increases in labor, paving, permitting, and traffic control costs.
Actual units were higher than imputed units due to higher leak find rates for main leak repairs.
109 FI Gas Corrective Maintenance FIG/LWG(d)Corrective Maintenance Main Leak
Measurement and Control Failure - Release of Gas with Ignition at M&C Facility
C5-D – Leak Management - D
Exhibit (PG&E-3), Chapter 8 20,331.3 33,469.4 13,138.1 64.6% 3,059 3,719 660 21.6% N/A N/A N/A N/A N/A
110 FI Gas Corrective Maintenance FIG/LWG(d)Corrective Maintenance Main Leak
Release of Gas with Ignition on Distribution Facilities (non-Cross Bore) C4 – Leak Management
Exhibit (PG&E-3), Chapter 8 20,331.3 33,469.4 13,138.1 64.6% 3,059 3,719 660 21.6% N/A N/A N/A N/A N/A
111 FI Gas Corrective Maintenance FIHCorrective Maintenance Service Leak, Above Ground SRM Total (Non RAMP) SRM Total (Non RAMP)
Exhibit (PG&E-3), Chapter 8 5,879.4 3,234.1 (2,645.3) -45.0% 25,087 6,147 (18,940) -75.5% NO NO YES Below variance threshold.
Actual units were lower than imputed as a result of changes to Leak Grading Procedure TD-4110P-09 that shifted above ground riser thread gradable leaks to MAT FIS as non-gradable leaks.
112 FI Gas Corrective Maintenance FIHCorrective Maintenance Service Leak, Above Ground
Measurement and Control Failure - Release of Gas with Ignition at M&C Facility
C5-D – Leak Management - D
Exhibit (PG&E-3), Chapter 8 5,879.4 3,234.1 (2,645.3) -45.0% 25,087 6,147 (18,940) -75.5% N/A N/A N/A N/A N/A
113 FI Gas Corrective Maintenance FIHCorrective Maintenance Service Leak, Above Ground
Release of Gas with Ignition on Distribution Facilities (non-Cross Bore) C4 – Leak Management
Exhibit (PG&E-3), Chapter 8 5,879.4 3,234.1 (2,645.3) -45.0% 25,087 6,147 (18,940) -75.5% N/A N/A N/A N/A N/A
114 FI Gas Corrective Maintenance FIICorrective Maintenance Cathodic Protection SRM Total (Non RAMP) SRM Total (Non RAMP)
Exhibit (PG&E-3), Chapter 7 3,024.0 7,721.5 4,697.4 155.3% 1,701 3,812 2,111 124.1% NO NO YES Below variance threshold.
Actual units were higher than imputed units due to findings of the Enhanced Cathodic Protection Survey Program (MAT DGD) and the Electrically Connected Isolated Steel Program (MAT DGE) that required troubleshooting. This is a workstream with regulatory compliance requirements.
115 FI Gas Corrective Maintenance FIJCorrective Maintenance Main Dig‐in SRM Total (Non RAMP) SRM Total (Non RAMP)
Exhibit (PG&E-3), Chapter 8 950.8 1,202.5 251.7 26.5% 255 211 (44) -17.3% NO NO NO Below variance threshold. Below variance threshold.
116 FI Gas Corrective Maintenance FIJCorrective Maintenance Main Dig‐in
Measurement and Control Failure - Release of Gas with Ignition at M&C Facility
C5-D – Leak Management - D
Exhibit (PG&E-3), Chapter 8 950.8 1,202.5 251.7 26.5% 255 211 (44) -17.3% N/A N/A N/A N/A N/A
117 FI Gas Corrective Maintenance FIJCorrective Maintenance Main Dig‐in
Release of Gas with Ignition on Distribution Facilities (non-Cross Bore) C4 – Leak Management
Exhibit (PG&E-3), Chapter 8 950.8 1,202.5 251.7 26.5% 255 211 (44) -17.3% N/A N/A N/A N/A N/A
118 FI Gas Corrective Maintenance FIKCorrective Maintenance Service Dig‐in SRM Total (Non RAMP) SRM Total (Non RAMP)
Exhibit (PG&E-3), Chapter 8 578.1 1,629.3 1,051.2 181.8% 1,504 1,569 65 4.3% NO NO NO Below variance threshold. Below variance threshold.
119 FI Gas Corrective Maintenance FIKCorrective Maintenance Service Dig‐in
Measurement and Control Failure - Release of Gas with Ignition at M&C Facility
C5-D – Leak Management - D
Exhibit (PG&E-3), Chapter 8 578.1 1,629.3 1,051.2 181.8% 1,504 1,569 65 4.3% N/A N/A N/A N/A N/A
120 FI Gas Corrective Maintenance FIKCorrective Maintenance Service Dig‐in
Release of Gas with Ignition on Distribution Facilities (non-Cross Bore) C4 – Leak Management
Exhibit (PG&E-3), Chapter 8 578.1 1,629.3 1,051.2 181.8% 1,504 1,569 65 4.3% N/A N/A N/A N/A N/A
121 FI Gas Corrective Maintenance FIM Major Event SRM Total (Non RAMP) SRM Total (Non RAMP)Exhibit (PG&E-3), Chapter 8 0.0 6.4 6.4 100.0% N/A N/A N/A N/A NO NO NO Below variance threshold. Below variance threshold.
122 FI Gas Corrective Maintenance FIO Encroachment SRM Total (Non RAMP) SRM Total (Non RAMP)Exhibit (PG&E-3), Chapter 4 611.9 1,161.8 549.9 89.9% 62 89 27 43.5% NO NO YES Below variance threshold.
Actual units were higher than imputed units due to a higher find rate than forecast in the 2020 GRC. This is demand driven work.
123 FI Gas Corrective Maintenance FIO Encroachment
Release of Gas with Ignition on Distribution Facilities (non-Cross Bore)
C1 – Corrective Maintenance
Exhibit (PG&E-3), Chapter 4 611.9 1,161.8 549.9 89.9% 62 89 27 43.5% N/A N/A N/A N/A N/A
124 FI Gas Corrective MaintenanceFIP/ LWH
(d)
Corrective Maintenance Service Leak Repair, Below Ground SRM Total (Non RAMP) SRM Total (Non RAMP)
Exhibit (PG&E-3), Chapter 8 14,343.1 26,237.9 11,894.8 82.9% 5,419 5,604 185 3.4% YES YES NO
Actual costs exceeded imputed values because of increased unit cost and more units completed. Unit costs were higher due to increases in labor, paving, permitting, and traffic control costs. Below variance threshold.
125 FI Gas Corrective MaintenanceFIP/ LWH
(d)
Corrective Maintenance Service Leak Repair, Below Ground
Measurement and Control Failure - Release of Gas with Ignition at M&C Facility
C5-D – Leak Management - D
Exhibit (PG&E-3), Chapter 8 14,343.1 26,237.9 11,894.8 82.9% 5,419 5,604 185 3.4% N/A N/A N/A N/A N/A

2-20
TABLE 2-3 GAS DISTRIBUTION 2021 EXPENSE COMPARISON BY MAT FOR SAFETY, RELIABILITY, AND MAINTENANCE WORK
(THOUSANDS OF DOLLARS) (CONTINUED)
LineNo. MWC MWC Name MAT MAT Name RAMP Risk Name
RAMP Mitigation and/or Control Name
2020 GRC Testimony Reference
2021 Imputed Adopted
Costs (A)
2021 Actual Costs
(B)
2021 Cost Difference
(B-A)
2021 Cost Percent Change
(%)(B-A)/A
2021 Imputed Adopted
Units (C)
2021 Actual Units(D)
2021 Unit Difference
(D-C)
2021 Unit Percent Change
(%)(D-C)/C
Spending Variance
Explanation Required
(Y/N)
Percentage Variance
Explanation Required
Unit Variance Explanation
Required (Y/N) Cost Variance Explanation Unit Variance Explanation
126 FI Gas Corrective MaintenanceFIP/ LWH
(d)
Corrective Maintenance Service Leak Repair, Below Ground
Release of Gas with Ignition on Distribution Facilities (non-Cross Bore) C4 – Leak Management
Exhibit (PG&E-3), Chapter 8 14,343.1 26,237.9 11,894.8 82.9% 5,419 5,604 185 3.4% N/A N/A N/A N/A N/A
127 FI Gas Corrective Maintenance FIQAtmospheric Corrosion Monitoring SRM Total (Non RAMP) SRM Total (Non RAMP)
Exhibit (PG&E-3), Chapter 7 2,118.6 4,766.3 2,647.7 125.0% 200,000 62,144 (137,856) -68.9% NO NO YES Below variance threshold.
Actual units were below imputed units due to regular planned Atmospheric Corrosion (AC inspections) on gas meters being captured as a part of performing the 3-year comprehensive leak survey under MAT DEA or MAT DEF. The 2021 units for MAT FIQ include Cant Get Ins (CGI's) only.
128 FI Gas Corrective Maintenance FIRTee-Cap Replacement Program SRM Total (Non RAMP) SRM Total (Non RAMP)
Exhibit (PG&E-3), Chapter 4 2,126.2 1,592.1 (534.0) -25.1% 1,165 817 (348) -29.9% NO NO YES Below variance threshold.
Actual units were below imputed units due to execution crews being deployed to emergency fire support therfore causing delays in the ability to excecute planned units.
129 FI Gas Corrective Maintenance FIS Leak Survey Meter Repair SRM Total (Non RAMP) SRM Total (Non RAMP)Exhibit (PG&E-3), Chapter 6 5,237.5 7,626.6 2,389.0 45.6% 64,978 68,382 3,404 5.2% NO NO NO Below variance threshold. Below variance threshold.
130 FI Gas Corrective Maintenance FI# Corrective Maintenance, Other SRM Total (Non RAMP) SRM Total (Non RAMP)Exhibit (PG&E-3), Chapter 8 1,315.2 2,109.4 794.2 60.4% N/A N/A N/A N/A NO NO NO Below variance threshold. Below variance threshold.
131 GF Gas Mapping GFO Mapping Support SRM Total (Non RAMP) SRM Total (Non RAMP)Exhibit (PG&E-3), Chapter 11 4,399.8 4,559.6 159.8 3.6% N/A N/A N/A N/A NO NO NO Below variance threshold. Below variance threshold.
132 GGGas Distribution Planning & Operations Engineering GGA Gas System Planning SRM Total (Non RAMP) SRM Total (Non RAMP)
Exhibit (PG&E-3), Chapter 9 4,808.5 6,239.5 1,431.0 29.8% N/A N/A N/A N/A NO NO NO Below variance threshold. Below variance threshold.
133 GGGas Distribution Planning & Operations Engineering GG#
Gas Distribution Portfolio Management and Engineering SRM Total (Non RAMP) SRM Total (Non RAMP)
Exhibit (PG&E-3), Chapter 9 1,647.8 2,224.7 576.9 35.0% N/A N/A N/A N/A NO NO NO Below variance threshold. Below variance threshold.
134 GMNatural Gas Fueling Facilities O&M GMC CNG Stations Expense SRM Total (Non RAMP) SRM Total (Non RAMP)
Exhibit (PG&E-3), Chapter 5 (MWC Level) 3,859.4 3,529.5 (329.9) -8.5% N/A N/A N/A N/A NO NO NO Below variance threshold. Below variance threshold.
135 GMNatural Gas Fueling Facilities O&M GM# CNG Stations Expense, Other SRM Total (Non RAMP) SRM Total (Non RAMP)
Exhibit (PG&E-3), Chapter 5 (MWC Level) 10.5 0.0 (10.5) -100.0% N/A N/A N/A N/A NO NO NO Below variance threshold. Below variance threshold.
136 HY Gas Meter Maintenance HYIGas Meter Atmospheric Corrosion SRM Total (Non RAMP) SRM Total (Non RAMP)
Exhibit (PG&E-3), Chapter 6 1,868.7 2,543.4 674.8 36.1% 40,000 38,567 (1,433) -3.6% NO NO NO Below variance threshold. Below variance threshold.
137 JQ Gas DIMP JQA(e) DIMP Leak Survey SRM Total (Non RAMP) SRM Total (Non RAMP)Exhibit (PG&E-3), Chapter 4 684.3 1,036.8 352.5 51.5% 54,500 65,489 10,989 20.2% NO NO YES Below variance threshold.
Actual units were higher than imputed units due to the extended DIMP leak survey performed in 2021 which added on an additional 6,981 services and 273,582 feet of main.
138 JQ Gas DIMP JQA(e) DIMP Leak Survey
Release of Gas with Ignition on Distribution Facilities (non-Cross Bore) C3 – DIMP Leak Survey
Exhibit (PG&E-3), Chapter 4 684.3 1,036.8 352.5 51.5% 54,500 65,489 10,989 20.2% N/A N/A N/A N/A N/A
139 JQ Gas DIMP JQC Damage Prevention SRM Total (Non RAMP) SRM Total (Non RAMP)Exhibit (PG&E-3), Chapter 6 2,538.3 3,127.9 589.6 23.2% N/A N/A N/A N/A NO NO NO Below variance threshold. Below variance threshold.
140 JQ Gas DIMP JQC Damage Prevention
Release of Gas with Ignition on Distribution Facilities (non-Cross Bore)
C8 – Public Awareness Program
Exhibit (PG&E-3), Chapter 6 2,538.3 3,127.9 589.6 23.2% N/A N/A N/A N/A N/A N/A N/A N/A N/A
141 JQ Gas DIMP JQD DIMP Emergent Work SRM Total (Non RAMP) SRM Total (Non RAMP)Exhibit (PG&E-3), Chapter 4 3,046.9 2,048.9 (998.0) -32.8% N/A N/A N/A N/A NO NO NO Below variance threshold. Below variance threshold.
142 JQ Gas DIMP JQD DIMP Emergent Work
Release of Gas with Ignition on Distribution Facilities (non-Cross Bore)
M1A– DIMP Emergent Work
Exhibit (PG&E-3), Chapter 4 1,511.5 646.2 (865.3) -57.2% N/A N/A N/A N/A N/A N/A N/A N/A N/A
143 JQ Gas DIMP JQE Plastic Program SRM Total (Non RAMP) SRM Total (Non RAMP)Exhibit (PG&E-3), Chapter 4 319.5 150.9 (168.6) -52.8% N/A N/A N/A N/A NO NO NO Below variance threshold. Below variance threshold.
144 JQ Gas DIMP JQG Fitting Mitigation Program SRM Total (Non RAMP) SRM Total (Non RAMP)Exhibit (PG&E-3), Chapter 4 1,018.2 1,314.0 295.7 29.0% N/A N/A N/A N/A NO NO NO Below variance threshold. Below variance threshold.
145 JQ Gas DIMP JQK Cross Bore Program SRM Total (Non RAMP) SRM Total (Non RAMP)Exhibit (PG&E-3), Chapter 4 30,585.0 26,538.1 (4,046.9) -13.2% 35,140 28,293 (6,847) -19.5% NO NO NO Below variance threshold. Below variance threshold.
146 JQ Gas DIMP JQK Cross Bore Program
Release of Gas with Ignition on Distribution Facilities (Cross-Bore)
M1A – Cross Bore Program
Exhibit (PG&E-3), Chapter 4 30,585.0 26,538.1 (4,046.9) -13.2% 35,140 28,293 (6,847) -19.5% N/A N/A N/A N/A N/A
147 JQ Gas DIMP JQL DIMP Program Management SRM Total (Non RAMP) SRM Total (Non RAMP)Exhibit (PG&E-3), Chapter 4 4,334.0 142.3 (4,191.7) -96.7% N/A N/A N/A N/A NO NO NO Below variance threshold. Below variance threshold.
148 JQ Gas DIMP JQ# DIMP, Other SRM Total (Non RAMP) SRM Total (Non RAMP)Exhibit (PG&E-3), Chapter 4 0.0 0.03 0.03 100.0% N/A N/A N/A N/A NO NO NO Below variance threshold. Below variance threshold.
149 OM Operational Management OM# Operational Management cost SRM Total (Non RAMP) SRM Total (Non RAMP)Exhibit (PG&E-3), Chapter 11 17,529.5 16,206.0 (1,323.5) -7.6% N/A N/A N/A N/A NO NO NO Below variance threshold. Below variance threshold.
(a) Cathodic Protection MAT DGD is non-unitized, however, survey mileage is tracked to indicate overall program progress. Survey findings may lead to additional work in MAT DGB or MAT FII.
(e) Actual units reflect a count of services surveyed in 2021 only and do not include miles of main surveyed. Given the combination of units MAT JQA has shifted to a non-unitized MAT.
(b) Cathodic Protection MAT DGE is a non-unitized MAT, however service risers surveyed are tracked to indicate overall program progress. Survey findings may lead to additional work in MAT DGB or MAT FII.
(d) Includes below ground grade 3 leak repairs recorded under Leak Abatement MWC LW.(c) The forecast for these MAT was non-unitized in the 2020 GRC, and therefore, PG&E does not have imputed adopted units. A count of the operations completed is captured in SAP, however, the operations do not equate to units because they encompass a variety of different O&M activities.

2-21
TABLE 2-4 GAS DISTRIBUTION 2021 CAPITAL COMPARISON BY MAT FOR SAFETY, RELIABILITY, AND MAINTENANCE WORK
(THOUSANDS OF DOLLARS)
LineNo. MWC MWC Name MAT MAT Name RAMP Risk Name
RAMP Mitigation and/or Control Name
2020 GRC Testimony Reference
2021 Imputed Adopted
Costs (A)
2021 Actual Costs
(B)
2021 Cost Difference
(B-A)
2021 Cost Percent Change
(%)(B-A)/A
2021 Imputed Adopted
Units (C)
2021 Actual Units(D)
2021 Unit Difference
(D-C)
2021 Unit Percent Change
(%)(D-C)/C
Spending Variance
Explanation Required
(Y/N)
Percentage Variance
Explanation Required
Unit Variance Explanation
Required (Y/N) Cost Variance Explanation Unit Variance Explanation
1 14G Dist Pipeline Repl Program 14A
Gas Pipeline Replacement Program SRM Total (Non RAMP) SRM Total (Non RAMP)
Exhibit (PG&E-3), Chapter 4 126,063.2 155,832.5 29,769.3 23.6% 182,489 194,697 12,208 6.7% YES YES NO
Program expenditures exceeded imputed regulatory values due to capital projects being pulled forward from 2022 to 2021 based on readiness, which also resulted in projects in higher costing divisions being completed sooner than the 2020 GRC forecast plan. Below variance threshold.
2 14G Dist Pipeline Repl Program 14A
Gas Pipeline Replacement Program
Release of Gas with Ignition on Distribution Facilities (Cross-Bore)
C1 - Cross Bore Prevention Program
Exhibit (PG&E-3), Chapter 4 126,063.2 155,832.5 29,769.3 23.6% 182,489 194,697 12,208 6.7% N/A N/A N/A N/A N/A
3 14G Dist Pipeline Repl Program 14A
Gas Pipeline Replacement Program
Release of Gas with Ignition on Distribution Facilities (non-Cross Bore)
C6 – Pipeline Replacement Program
Exhibit (PG&E-3), Chapter 4 126,063.2 155,832.5 29,769.3 23.6% 182,489 194,697 12,208 6.7% N/A N/A N/A N/A N/A
4 14G Dist Pipeline Repl Program 14B Copper Service Replacements SRM Total (Non RAMP) SRM Total (Non RAMP)
Exhibit (PG&E-3), Chapter 4 0.0 10,632.0 10,632.0 100.0% 0 205 205 100% NO YES YES
Program expenditures exceeded imputed regulatory values because there was no forecast provided in the 2020 GRC for MAT 14B since the Copper Services Program was expected to be complete in 2019. Through a records review post 2020 GRC filling, additional Copper Services were discovered that required replacement. Reprioritization of other programs was required to fund this work.
Actual units were higher than imputed units because there was no forecast provided in the 2020 GRC for MAT 14B since the Copper Services Program was expected to be complete in 2019. Through a records review post 2020 GRC filling, additional Copper Services were discovered that required replacement. Reprioritization of other programs was required to fund this work.
5 14G Dist Pipeline Repl Program 14D Plastic Pipe Replacement SRM Total (Non RAMP) SRM Total (Non RAMP)
Exhibit (PG&E-3), Chapter 4 402,919.3 405,246.4 2,327.1 0.6% 723,358 719,508 (3,850) -0.5% NO NO NO
Below variance threshold. Below variance threshold.
6 14G Dist Pipeline Repl Program 14D Plastic Pipe Replacement
Release of Gas with Ignition on Distribution Facilities (Cross-Bore)
C1 - Cross Bore Prevention Program
Exhibit (PG&E-3), Chapter 4 402,919.3 405,246.4 2,327.1 0.6% 723,358.0 719,508.0 (3,850.0) -0.5% N/A N/A N/A N/A N/A
7 14G Dist Pipeline Repl Program 14D Plastic Pipe Replacement
Release of Gas with Ignition on Distribution Facilities (non-Cross Bore)
C6 – Pipeline Replacement Program
Exhibit (PG&E-3), Chapter 4 402,919.3 405,246.4 2,327.1 0.6% 723,358.0 719,508.0 (3,850.0) -0.5% N/A N/A N/A N/A N/A
8 27Gas Meter Protection-Capital 27A Meter Protection-Capital SRM Total (Non RAMP) SRM Total (Non RAMP)
Exhibit (PG&E-3), Chapter 4 17,263.0 2,915.2 (14,347.8) -83.1% 592 90 (502) -84.8% NO YES YES
Program expenditures were below imputed regulatory values due to less units being performed. See unit variance explanation.
Actual units were below imputed units due to a lower capital conversion rate from expense Meter Protection MAT EXB work materializing than was forecast in the 2020 GRC.
9 2K HPR Program 2K HPR Program SRM Total (Non RAMP) SRM Total (Non RAMP)
Exhibit (PG&E-3), Chapter 5 (MWC Level) 60,424.9 61,010.9 586.1 1.0% 336 302 (34) -10.1% NO NO NO
The 2020 GRC forecast for HPR Replacement was at the MWC level. The total imputed adopted cost for MWC 2K is $60,424.9 as compared to the total actual cost of $61,010.9, which is below the variance threshold. Actual costs by MAT are as follows: 2KA - $16,086.9, 2KB - $5,913.4, and 2KC - $39,010.6. Costs are in thousands.
The 2020 GRC forecast for HPR Replacement was at the MWC level. The total imputed units for MWC 2K are 336 as compared to the total actual units of 302, which is below the variance threshold. Actual units by MAT are as follows: 2KA - 52, 2KB - 15, and 2KC - 235.
10 2K HPR Program 2K HPR Program
Measurement and Control Failure - Release of Gas with Ignition Downstream
M2A – HPR Replacement
Exhibit (PG&E-3), Chapter 5 (MWC Level) 60,424.9 61,010.9 586.1 1.0% 336 302 (34) -10.1% N/A N/A N/A N/A N/A
11 31 NGV - Station Infrastructure 31A CNG Stations SRM Total (Non RAMP) SRM Total (Non RAMP)Exhibit (PG&E-3), Chapter 5 4,163.0 6,957.1 2,794.1 67.1% N/A N/A N/A N/A NO NO NO Below variance threshold. Below variance threshold.
12 47 Gas Distribution Capacity 47B Gas Capacity, Mains SRM Total (Non RAMP) SRM Total (Non RAMP)Exhibit (PG&E-3), Chapter 9 31,458.9 35,979.8 4,520.8 14.4% 49,098 48,818 (280) -0.6% NO NO NO Below variance threshold. Below variance threshold.
13 47 Gas Distribution Capacity 47CGas Capacity, Regulator Station SRM Total (Non RAMP) SRM Total (Non RAMP)
Exhibit (PG&E-3), Chapter 9 7,588.5 8,940.3 1,351.8 17.8% 6 3 (3) -50.0% NO NO YES Below variance threshold.
Actual units were below the imputed units due to lower materialization of system capacity load than forecast. As a result, fewer regulator stations were installed than forecast.
14 47 Gas Distribution Capacity 47DGas Capacity, Replace Regulator Station Component SRM Total (Non RAMP) SRM Total (Non RAMP)
Exhibit (PG&E-3), Chapter 9 494.3 441.0 (53.3) -10.8% 10 0 (10) -100.0% NO NO YES Below variance threshold.
Actual units were below imputed units due to: 1) supply-chain material delays, 2) permitting challenges, and 3) resource unavailability.
15 47 Gas Distribution Capacity 47FGas Capacity, Other Enhancements SRM Total (Non RAMP) SRM Total (Non RAMP)
Exhibit (PG&E-3), Chapter 9 293.3 9.2 (284.1) -96.9% N/A N/A N/A N/A NO NO NO Below variance threshold. Below variance threshold.
16 47 Gas Distribution Capacity 47# Capacity, Other SRM Total (Non RAMP) SRM Total (Non RAMP)Exhibit (PG&E-3), Chapter 9 0.0 (56.6) (56.6) 100.0% N/A N/A N/A N/A NO NO NO Below variance threshold. Below variance threshold.
17 4A(a)Gas Distribution Control Operations Assets 4AA
Regulator Station Monitor and Control, Type 1 SRM Total (Non RAMP) SRM Total (Non RAMP)
Exhibit (PG&E-3), Chapter 9 0.0 28.0 28.0 100.0% N/A N/A N/A N/A NO NO NO Below variance threshold. Below variance threshold.

2-22
TABLE 2-4 GAS DISTRIBUTION 2021 CAPITAL COMPARISON BY MAT FOR SAFETY, RELIABILITY, AND MAINTENANCE WORK
(THOUSANDS OF DOLLARS) (CONTINUED)
LineNo. MWC MWC Name MAT MAT Name RAMP Risk Name
RAMP Mitigation and/or Control Name
2020 GRC Testimony Reference
2021 Imputed Adopted
Costs (A)
2021 Actual Costs
(B)
2021 Cost Difference
(B-A)
2021 Cost Percent Change
(%)(B-A)/A
2021 Imputed Adopted
Units (C)
2021 Actual Units(D)
2021 Unit Difference
(D-C)
2021 Unit Percent Change
(%)(D-C)/C
Spending Variance
Explanation Required
(Y/N)
Percentage Variance
Explanation Required
Unit Variance Explanation
Required (Y/N) Cost Variance Explanation Unit Variance Explanation
18 4A(a)Gas Distribution Control Operations Assets 4AA
Regulator Station Monitor and Control, Type 1
Measurement and Control Failure - Release of Gas with Ignition Downstream
M3-D – SCADA Visibility - D
Exhibit (PG&E-3), Chapter 9 0.0 28.0 28.0 100.0% N/A N/A N/A N/A N/A N/A N/A N/A N/A
19 4A(a)Gas Distribution Control Operations Assets 4AA
Regulator Station Monitor and Control, Type 1
Measurement and Control Failure - Release of Gas with Ignition at M&C Facility
M5-D – SCADA Visibility - D
Exhibit (PG&E-3), Chapter 9 0.0 28.0 28.0 100.0% N/A N/A N/A N/A N/A N/A N/A N/A N/A
20 4A(a)Gas Distribution Control Operations Assets 4AB
Regulator Station Monitoring, Type 3 SRM Total (Non RAMP) SRM Total (Non RAMP)
Exhibit (PG&E-3), Chapter 9 5,621.8 22.2 (5,599.6) -99.6% 0 0 0 0 NO NO NO Below variance threshold. Below variance threshold.
21 4A(a)Gas Distribution Control Operations Assets 4AB
Regulator Station Monitoring, Type 3
Measurement and Control Failure - Release of Gas with Ignition Downstream
M3-D – SCADA Visibility - D
Exhibit (PG&E-3), Chapter 9 5,621.8 22.2 (5,599.6) (1.0) 0 0 0 0 N/A N/A N/A N/A N/A
22 4A(a)Gas Distribution Control Operations Assets 4AB
Regulator Station Monitoring, Type 3
Measurement and Control Failure - Release of Gas with Ignition at M&C Facility
M5-D – SCADA Visibility - D
Exhibit (PG&E-3), Chapter 9 5,621.8 22.2 (5,599.6) (1.0) 0 0 0 0 N/A N/A N/A N/A N/A
23 4A(a)Gas Distribution Control Operations Assets 4AC Real Time PSI Monitor, Type 4 SRM Total (Non RAMP) SRM Total (Non RAMP)
Exhibit (PG&E-3), Chapter 9 2,584.0 10.4 (2,573.7) -99.6% 0 0 0 0 NO NO NO Below variance threshold. Below variance threshold.
24 4A(a)Gas Distribution Control Operations Assets 4AC Real Time PSI Monitor, Type 4
Measurement and Control Failure - Release of Gas with Ignition Downstream
M3-D – SCADA Visibility - D
Exhibit (PG&E-3), Chapter 9 2,584.0 10.4 (2,573.7) -99.6% 0 0 0 0 N/A N/A N/A N/A N/A
25 4A(a)Gas Distribution Control Operations Assets 4AC Real Time PSI Monitor, Type 4
Measurement and Control Failure - Release of Gas with Ignition at M&C Facility
M5-D – SCADA Visibility - D
Exhibit (PG&E-3), Chapter 9 2,584.0 10.4 (2,573.7) -99.6% 0 0 0 0 N/A N/A N/A N/A N/A
26 4A(a)Gas Distribution Control Operations Assets 4AF
ERX Pressure Monitoring, Type 6 SRM Total (Non RAMP) SRM Total (Non RAMP)
Exhibit (PG&E-3), Chapter 9 879.9 840.6 (39.3) -4.5% 29 30 1 3.4% NO NO NO Below variance threshold. Below variance threshold.
27 4A(a)Gas Distribution Control Operations Assets 4AF
ERX Pressure Monitoring, Type 6
Measurement and Control Failure - Release of Gas with Ignition Downstream
M3-D – SCADA Visibility - D
Exhibit (PG&E-3), Chapter 9 879.9 840.6 (39.3) -4.5% 29 30 1 3.4% N/A N/A N/A N/A N/A
28 4A(a)Gas Distribution Control Operations Assets 4AF
ERX Pressure Monitoring, Type 6
Measurement and Control Failure - Release of Gas with Ignition at M&C Facility
M5-D – SCADA Visibility - D
Exhibit (PG&E-3), Chapter 9 879.9 840.6 (39.3) -4.5% 29 30 1 3.4% N/A N/A N/A N/A N/A
29 4A(a)Gas Distribution Control Operations Assets 4AK
Regulator Station Monitoring Single No Flow, Type 3 SRM Total (Non RAMP) SRM Total (Non RAMP)
Exhibit (PG&E-3), Chapter 9 4,913.5 (15.5) (4,929.0) -100.3% 0 0 0 0 NO NO NO Below variance threshold. Below variance threshold.
30 4A(a)Gas Distribution Control Operations Assets 4AK
Regulator Station Monitoring Single No Flow, Type 3
Measurement and Control Failure - Release of Gas with Ignition Downstream
M3-D – SCADA Visibility - D
Exhibit (PG&E-3), Chapter 9 4,913.5 (15.5) (4,929.0) -100.3% 0 0 0 0 N/A N/A N/A N/A N/A
31 4A(a)Gas Distribution Control Operations Assets 4AK
Regulator Station Monitoring Single No Flow, Type 3
Measurement and Control Failure - Release of Gas with Ignition at M&C Facility
M5-D – SCADA Visibility - D
Exhibit (PG&E-3), Chapter 9 4,913.5 (15.5) (4,929.0) -100.3% 0 0 0 0 N/A N/A N/A N/A N/A
32 4A(a)Gas Distribution Control Operations Assets 4AL
Regulator Station Monitoring Dual Flow, Type 3 SRM Total (Non RAMP) SRM Total (Non RAMP)
Exhibit (PG&E-3), Chapter 9 8,915.8 26.1 (8,889.7) -99.7% 0 0 0 0 NO NO NO Below variance threshold. Below variance threshold.
33 4A(a)Gas Distribution Control Operations Assets 4AL
Regulator Station Monitoring Dual Flow, Type 3
Measurement and Control Failure - Release of Gas with Ignition Downstream
M3-D – SCADA Visibility - D
Exhibit (PG&E-3), Chapter 9 8,915.8 26.1 (8,889.7) -99.7% 0 0 0 0 N/A N/A N/A N/A N/A
34 4A(a)Gas Distribution Control Operations Assets 4AL
Regulator Station Monitoring Dual Flow, Type 3
Measurement and Control Failure - Release of Gas with Ignition at M&C Facility
M5-D – SCADA Visibility - D
Exhibit (PG&E-3), Chapter 9 8,915.8 26.1 (8,889.7) -99.7% 0 0 0 0 N/A N/A N/A N/A N/A
35 4A(a)Gas Distribution Control Operations Assets 4AM
Reg Stat Mntr Dual No Flow Type 3 SRM Total (Non RAMP) SRM Total (Non RAMP)
Exhibit (PG&E-3), Chapter 9 7,040.7 28,942.2 21,901.5 311.1% 122 111 (11) -9.0% YES YES NO
The 2020 GRC presented the recorded and forecast costs formerly shown under 10 separate MATs (4AA, 4AB, 4AC, 4AE, 4AH, 4AI, 4AJ, 4AK, 4AL, and 4AM) under a single MAT 4AM. The consolidated imputed adopted costs for these MATs is $29,075.9 as compared to the total 2021 actuals of $29,013.4, the difference of which is below the variance threshold. Costs are in thousands. Below variance threshold.

2-23
TABLE 2-4 GAS DISTRIBUTION 2021 CAPITAL COMPARISON BY MAT FOR SAFETY, RELIABILITY, AND MAINTENANCE WORK
(THOUSANDS OF DOLLARS) (CONTINUED)
LineNo. MWC MWC Name MAT MAT Name RAMP Risk Name
RAMP Mitigation and/or Control Name
2020 GRC Testimony Reference
2021 Imputed Adopted
Costs (A)
2021 Actual Costs
(B)
2021 Cost Difference
(B-A)
2021 Cost Percent Change
(%)(B-A)/A
2021 Imputed Adopted
Units (C)
2021 Actual Units(D)
2021 Unit Difference
(D-C)
2021 Unit Percent Change
(%)(D-C)/C
Spending Variance
Explanation Required
(Y/N)
Percentage Variance
Explanation Required
Unit Variance Explanation
Required (Y/N) Cost Variance Explanation Unit Variance Explanation
36 4A(a)Gas Distribution Control Operations Assets 4AM
Reg Stat Mntr Dual No Flow Type 3
Measurement and Control Failure - Release of Gas with Ignition Downstream
M3-D – SCADA Visibility - D
Exhibit (PG&E-3), Chapter 9 7,040.7 28,942.2 21,901.5 311.1% 122 111 (11) -9.0% N/A N/A N/A N/A N/A
37 4A(a)Gas Distribution Control Operations Assets 4AM
Reg Stat Mntr Dual No Flow Type 3
Measurement and Control Failure - Release of Gas with Ignition at M&C Facility
M5-D – SCADA Visibility - D
Exhibit (PG&E-3), Chapter 9 7,040.7 28,942.2 21,901.5 311.1% 122.0 111.0 (11.0) -9.0% N/A N/A N/A N/A N/A
38 4A(a)Gas Distribution Control Operations Assets 4A# SCADA Support SRM Total (Non RAMP) SRM Total (Non RAMP)
Exhibit (PG&E-3), Chapter 9 505.1 482.7 (22.5) -4.4% N/A N/A N/A N/A NO NO NO Below variance threshold. Below variance threshold.
39 4A(a)Gas Distribution Control Operations Assets 4A# SCADA Support
Measurement and Control Failure - Release of Gas with Ignition Downstream
M3-D – SCADA Visibility - D
Exhibit (PG&E-3), Chapter 9 505.1 482.7 (22.5) -4.4% N/A N/A N/A N/A N/A N/A N/A N/A N/A
40 4A(a)Gas Distribution Control Operations Assets 4A# SCADA Support
Measurement and Control Failure - Release of Gas with Ignition at M&C Facility
M5-D – SCADA Visibility - D
Exhibit (PG&E-3), Chapter 9 505.1 482.7 (22.5) -4.4% N/A N/A N/A N/A N/A N/A N/A N/A N/A
41 50 Gas Dist Reliability General 50A Reliability Main Replacement SRM Total (Non RAMP) SRM Total (Non RAMP)Exhibit (PG&E-3), Chapter 4 47,372.9 63,310.3 15,937.4 33.6% 78,210 95,857 17,647 22.6% NO YES YES
Program expenditures exceeded imputed regulatory values due to capital projects being pulled forward from 2022 to 2021 based on readiness, which also resulted in projects in higher costing divisions being completed sooner than the 2020 GRC forecast plan.
Actual units were higher than imputed units due to: 1) the execution of capital projects pulled forward from 2022 to 2021 based on readiness, and 2) more field identified work than historically experienced.
42 50 Gas Dist Reliability General 50A Reliability Main Replacement
Release of Gas with Ignition on Distribution Facilities (Cross-Bore)
C1 - Cross Bore Prevention Program
Exhibit (PG&E-3), Chapter 4 47,372.9 63,310.3 15,937.4 33.6% 78,210 95,857 17,647 22.6% N/A N/A N/A N/A N/A
43 50 Gas Dist Reliability General 50A Reliability Main Replacement
Release of Gas with Ignition on Distribution Facilities (non-Cross Bore)
C6 – Pipeline Replacement Program
Exhibit (PG&E-3), Chapter 4 47,372.9 63,310.3 15,937.4 33.6% 78,210 95,857 17,647 22.6% N/A N/A N/A
44 50 Gas Dist Reliability General 50BReliability Service Replacement SRM Total (Non RAMP) SRM Total (Non RAMP)
Exhibit (PG&E-3), Chapter 4 9,991.2 18,476.8 8,485.6 84.9% 494 669 175 35.4% NO NO YES Below variance threshold.
Actual units were higher than imputed units due to resource availability and support which allowed for the execution of additional capital work.
45 50 Gas Dist Reliability General 50C Gas Regulator Station Rebuild SRM Total (Non RAMP) SRM Total (Non RAMP)Exhibit (PG&E-3), Chapter 5 41,735.2 76,659.7 34,924.4 83.7% 33 28 (5) -15.2% YES YES NO
Program expenditures exceeded imputed regulatory values due to higher unit costs than forecast in the 2020 GRC. The imputed unit cost was lower than the previous 4-year historical unit costs and does not incorporate higher contractor and vendor costs (for example construction costs), increased labor costs (for example construction inspection costs), and material costs. Below variance threshold.
46 51 Gas Dist Reliability General 50C Gas Regulator Station Rebuild
Measurement and Control Failure - Release of Gas with Ignition Downstream
C5 – Regulator Station Replacement
Exhibit (PG&E-3), Chapter 5 41,735.2 76,659.7 34,924.4 83.7% 33.0 28.0 (5.0) -15.2% N/A N/A N/A N/A N/A
47 52 Gas Dist Reliability General 50C Gas Regulator Station Rebuild
Measurement and Control Failure - Release of Gas with Ignition at M&C Facility
C8 – Regulator Station Replacement
Exhibit (PG&E-3), Chapter 5 41,735.2 76,659.7 34,924.4 83.7% 33.0 28.0 (5.0) -15.2% N/A N/A N/A N/A N/A
48 53 Gas Dist Reliability General50D/
50Q(b)Cathodic Protection Casing Mitigation SRM Total (Non RAMP) SRM Total (Non RAMP)
Exhibit (PG&E-3), Chapter 7 9,866.3 12,287.5 2,421.2 24.5% 72 126 54 75.0% NO NO YES Below variance threshold.
Actual units were higher than imputed units due to the mix of required and compliance work in this MAT. The 2021 actual units consist of 75 rectifier replacements, 3 atmospheric corrosion span mitigations, 7 RMU replacements, and 41 casing mitigations.
49 50 Gas Dist Reliability General 50EReliability Gas Valve Replacement SRM Total (Non RAMP) SRM Total (Non RAMP)
Exhibit (PG&E-3), Chapter 4 13,705.7 11,837.6 (1,868.1) -13.6% 197 203 6 3.0% NO NO NO Below variance threshold. Below variance threshold.
50 50 Gas Dist Reliability General 50EReliability Gas Valve Replacement
Release of Gas with Ignition on Distribution Facilities (non-Cross Bore)
M2 – New Valve Installations
Exhibit (PG&E-3), Chapter 4 6,940.0 7,937.5 997.5 14.4% 100 131 31 31.0% N/A N/A N/A N/A N/A
51 50 Gas Dist Reliability General 50FReliability Gas Other Equipment Replacement SRM Total (Non RAMP) SRM Total (Non RAMP)
Exhibit (PG&E-3), Chapter 4 974.0 474.5 (499.5) -51.3% N/A N/A N/A N/A NO NO NO Below variance threshold. Below variance threshold.

2-24
TABLE 2-4 GAS DISTRIBUTION 2021 CAPITAL COMPARISON BY MAT FOR SAFETY, RELIABILITY, AND MAINTENANCE WORK
(THOUSANDS OF DOLLARS) (CONTINUED)
LineNo. MWC MWC Name MAT MAT Name RAMP Risk Name
RAMP Mitigation and/or Control Name
2020 GRC Testimony Reference
2021 Imputed Adopted
Costs (A)
2021 Actual Costs
(B)
2021 Cost Difference
(B-A)
2021 Cost Percent Change
(%)(B-A)/A
2021 Imputed Adopted
Units (C)
2021 Actual Units(D)
2021 Unit Difference
(D-C)
2021 Unit Percent Change
(%)(D-C)/C
Spending Variance
Explanation Required
(Y/N)
Percentage Variance
Explanation Required
Unit Variance Explanation
Required (Y/N) Cost Variance Explanation Unit Variance Explanation
52 50 Gas Dist Reliability General50G/
3PB (c)Leak Management ‐ Simple Service Replacement SRM Total (Non RAMP) SRM Total (Non RAMP)
Exhibit (PG&E-3), Chapter 8 26,513.4 22,075.5 (4,438.0) -16.7% 1,650 1,278 (372) -22.5% NO NO YES Below variance threshold.
Actual units were below imputed values because less actual service replacements materialized than expected. The forecast was based on an average conversion rate from a below ground leak to a full service replacement. In most instances, it is not known if the service will be replaced until the leak is exposed and the source is determined to be on the service.
53 50 Gas Dist Reliability General 50HReliability, Cut‐Off Idle Gas Service SRM Total (Non RAMP) SRM Total (Non RAMP)
Exhibit (PG&E-3), Chapter 4 4,942.2 5,366.5 424.3 8.6% 566 418 (148) -26.1% NO NO YES Below variance threshold.
Actual units were lower than imputed units due to less stubs identified in the field for excavation and removal than forecast. This is a demand driven program.
54 50 Gas Dist Reliability General 50I Improve Reliability Deactivation SRM Total (Non RAMP) SRM Total (Non RAMP)Exhibit (PG&E-3), Chapter 4 12,239.6 6,317.2 (5,922.4) -48.4% N/A N/A N/A N/A NO NO NO Below variance threshold. Below variance threshold.
55 50 Gas Dist Reliability General 50J Encroachment SRM Total (Non RAMP) SRM Total (Non RAMP)Exhibit (PG&E-3), Chapter 4 19,268.6 13,942.7 (5,325.9) -27.6% 739 398 (341) -46.1% NO NO YES Below variance threshold.
Actual units were lower than imputed units due to a lower find rate materializing than forecast. This program is demand driven.
56 50 Gas Dist Reliability General 50KEmergent Leaking Main Replace SRM Total (Non RAMP) SRM Total (Non RAMP)
Exhibit (PG&E-3), Chapter 8 6,802.7 4,268.1 (2,534.6) -37.3% 11,291 4,216 (7,075) -62.7% NO NO YES Below variance threshold.
Actual units were lower than imputed units due to less actual emergent main replacements materializing than what was forecast. MAT 50K is leak main replacement greater than 100 feet. The units are captured in 1 foot increments, therefore, on an annual basis the total units captured depend on the size of the project and total footage replaced. As projects are identified, they are reviewed by engineering and DIMP to review current main replacement projects and a determination is made on approving the projects.
57 50 Gas Dist Reliability General 50LGas Regulator Station Component Rebuilds SRM Total (Non RAMP) SRM Total (Non RAMP)
Exhibit (PG&E-3), Chapter 5 12,266.8 15,023.3 2,756.4 22.5% 148 129 (19) -12.8% NO NO NO Below variance threshold. Below variance threshold.
58 50 Gas Dist Reliability General 50LGas Regulator Station Component Rebuilds
Measurement and Control Failure - Release of Gas with Ignition at M&C Facility
C7 – Regulator Station Component Replacement
Exhibit (PG&E-3), Chapter 5 12,266.8 15,023.3 2,756.4 22.5% 148.0 129.0 (19.0) -12.8% N/A N/A N/A N/A N/A
59 50 Gas Dist Reliability General 50LGas Regulator Station Component Rebuilds
Measurement and Control Failure - Release of Gas with Ignition Downstream
C4 – Regulator Station Component Replacement
Exhibit (PG&E-3), Chapter 5 12,266.8 15,023.3 2,756.4 22.5% 148.0 129.0 (19.0) -12.8% N/A N/A N/A N/A N/A
60 50 Gas Dist Reliability General50M/
3PC (c)Leak Management – Complex Service Replacements SRM Total (Non RAMP) SRM Total (Non RAMP)
Exhibit (PG&E-3), Chapter 8 7,354.4 1,014.6 (6,339.8) -86.2% 453 37 (416) -91.8% NO NO YES Below variance threshold.
Actual units were lower than imputed units because less actual service replacements materialized than expected. The forecast was based on an average conversion rate from a below ground leak to a full service replacement. In most instances, it is not known if the service will be replaced until the leak is exposed and the source is determined to be on the service.
61 50 Gas Dist Reliability General 50N GD Over Pressure Protection SRM Total (Non RAMP) SRM Total (Non RAMP)Exhibit (PG&E-3), Chapter 5 13,982.5 21,761.3 7,778.8 55.6% 197 250 53 26.9% NO NO YES Below variance threshold.
Actual units were higher than imputed units due to carryover work completed from prior years.
62 50 Gas Dist Reliability General 50N GD Over Pressure Protection
Measurement and Control Failure - Release of Gas with Ignition Downstream
M4 – Station OPP Enhancements
Exhibit (PG&E-3), Chapter 5 13,982.5 21,761.3 7,778.8 55.6% 197 250 53.0 26.9% N/A N/A N/A N/A N/A
63 50 Gas Dist Reliability General 50PCathodic Protection System New/Replace SRM Total (Non RAMP) SRM Total (Non RAMP)
Exhibit (PG&E-3), Chapter 7 8,919.1 19,614.8 10,695.7 119.9% 115 85 (30) -26.1% NO YES YES
Program expenditures exceeded imputed regulatory values due to higher unit costs than forecast in the 2020 GRC. The higher costs are primarily associated with the conversion of this workstream to contractors. Contractors performing the drilling must hold a California drilling license in accordance with State regulations.
Actual units are below imputed units due to annual fluctuations in the actual number of ground bed replacements required to maintain compliance.
64 52Gas Distribution Emergency Response 52B
Emergency Response to Dig Ins, Services SRM Total (Non RAMP) SRM Total (Non RAMP)
Exhibit (PG&E-3), Chapter 8 127.3 2,362.6 2,235.3 1756.2% 203 164 (39) -19.2% NO NO NO Below variance threshold. Below variance threshold.
65 52Gas Distribution Emergency Response 52C
Emergency Response to Dig Ins, Mains SRM Total (Non RAMP) SRM Total (Non RAMP)
Exhibit (PG&E-3), Chapter 8 774.7 505.9 (268.8) -34.7% 988 914 (75) -7.5% NO NO NO Below variance threshold. Below variance threshold.
66 74 Install New Gas Meters 74A Gas Regulator Replacement SRM Total (Non RAMP) SRM Total (Non RAMP)Exhibit (PG&E-3), Chapter 6 1,984.5 5,913.6 3,929.1 198.0% 6,289 19,854 13,565 215.7% NO NO YES Below variance threshold.
Actual units were higher than imputed units due to increased demand of regulator replacements.
(c) Includes below ground grade 3 leak repairs recorded under Leak Abatement MWC 3P.
(a) PG&E does not allocate the costs of the SCADA mitigations among the Measurement and Control risks they support because the costs cannot be allocated in a meaningful way. To monitor and operate the gas system and mitigate potentially abnormal conditions, Gas Control Center (GCC) personnel must be able to view pressure and flow data from key locations within the gas system. Typically, these locations are atregulator stations, where supply enters the downstream and pressure is highest, and at the historic or modeled points of lowest pressure. Due to their importance in operating the system, regulator stations may have multiple SCADA devices, one immediately upstream of, downstream of, and inside the station. SCADA devices provide the required visibility to GCC personnel.
(b) Casing mitigation work was forecast under MAT 50D in the 2020 GRC. PG&E created MAT 50Q in 2020 to record costs associated with casing mitigations and is presenting 2021 casing mitigations recorded to MAT 50Q in the same row for consistency with the 2020 GRC.

2-25
F. MAT Descriptions for Safety, Reliability, and Maintenance Work – Expense 1
For descriptions of how the following Gas Distribution expense programs 2
relate to safety, reliability, or maintenance, please see the MAT descriptions 3
which explain the type of work associated with each MAT below. 4
MAT DDA –Field Service, Other – Other Support costs for Field Services. 5
This is a non-unitized MAT. 6
This MAT relates to safety and/or reliability and/or maintenance as it 7
involves other support costs for MWC DD Provide Field Services. 8
MAT DDD – Pilot Relight – Seasonal and other gas pilot relight activities at 9
customer’s request. Does not include: (1) relight for GPRP; (2) “off by crew” 10
relights; and (3) service restoration following a major gas event. Unit of measure 11
is number of service tickets. 12
This program relates to safety and/or reliability and/or maintenance as it 13
involves seasonal and other gas pilot relight activities at a customer’s request. 14
MAT DDE – Appliance Adjustments – Includes input, primary air, cleaning 15
burner or pilot, safety checks and energy cost inquiries. Unit of measure is 16
number of service tickets. 17
This program relates to safety and/or reliability and/or maintenance as it 18
includes input, primary air, cleaning burner or pilot, safety checks and energy 19
cost inquiries. 20
MAT DDF – Gas Fumigation – Gas starts/stops to facilitate fumigation work 21
at customer premise. Unit of measure is number of service tickets. 22
This program relates to safety and/or reliability and/or maintenance as it 23
involves gas starts/stops to facilitate fumigation work at a customer premise. 24
MAT DDG – Gas Leaks and Emergencies – Responding to 25
customer-reported gas emergencies, includes high/low pressure, leaks, fires, 26
explosions, carbon monoxide investigations, etc. on the customer’s side of the 27
gas meter. Includes flame pack call-out initiated by Gas Field Service where no 28
leak is found on the distribution service or main. Does not include: (1) leak 29
survey generated non-hazardous leak repairs at meter; (2) leak survey initiated 30
hazardous gas leak repair at the meter set; (3) gas dig-in response or stand-by, 31
company or non-company equipment; (4) repair or replacement of gas valve; 32
(5) replacement of gas regulators; (6) meter replacement; and (7) leaks on33
distribution main or service. Unit of measure is number of service tickets. 34

2-26
This program relates to safety and/or reliability and/or maintenance as it 1
involves responding to customer reported gas emergencies, including high/low 2
pressure, leaks, fires, explosions, carbon monoxide investigations, etc. on the 3
customer’s side of the gas meter. 4
MAT DDK – Gas Start – Turn-on (start) gas service at customer’s request 5
using routine change of account process. Requires site visit and manual 6
operation. Does not include: (1) company-generated field credit activity; and 7
(2) New Business generated customer connects. Unit of measure is number of8
service tickets. 9
This program relates to safety and/or reliability and/or maintenance as it 10
involves turning-on (starting) gas service at customer’s request. 11
MAT DDL – Gas Stop – Turn-off (stop) gas service at customer’s request 12
using routine change of account process. Requires site visit and manual 13
operation. Does not include: (1) company-generated field credit activity; and 14
(2) gas disconnect and removal for obsolete facilities. Unit of measure is15
number of service tickets. 16
This program relates to safety and/or reliability and/or maintenance as it 17
involves turning-off (stopping) gas service at customer’s request. 18
MAT DEA – Leak Survey – Perform compliance foot and mobile surveys of 19
distribution mains and services only. Includes cost of equipment calibration, 20
e.g., flame pack units. Also includes AC Inspections of exposed mains, exposed21
services, service risers, and meter sets being conducted in the course of the 22
leak survey. Does not include Grade 1 leak standby unless the surveyor is 23
actively helping with the repair (i.e., bar-hole pinpointing, digging etc.). Unit of 24
measure is services surveyed. 25
This program relates to safety and/or reliability and/or maintenance as it 26
involves performing compliance foot and mobile gas leak surveys of distribution 27
mains and services. It also includes AC Inspections of exposed mains, exposed 28
services, service risers, and meter sets being conducted in the course of the 29
leak survey. 30

2-27
MAT DEB – Special Leak Survey – Perform special (non-compliance) foot 1
and mobile leak survey of distribution mains and services, by special request 2
(city paving, customer callout, emergencies, engineering, and risk mitigation). 3
Includes calibration of the instruments associated to this work. It does not 4
include costs to investigate leaks found at or downstream of the service valve. 5
This is a non-unitized program. 6
This program relates to safety and/or reliability and/or maintenance as it 7
involves special (non-compliance) foot and mobile leak survey of distribution 8
mains and services, by special request (city paving, customer callout, 9
emergencies, engineering, and risk mitigation). It also includes calibration of the 10
instruments associated to this work. 11
MAT DEC – Leak Downgrade, No Repair – Includes instances where a 12
repairable leak (Grade 1, 2, or 3)2 is downgraded to a non-hazardous leak 13
(Grade 3) that does not require repair, the leak is not found (Grade 0) or leak is 14
due to non-PG&E gas. Unit of measure is services surveyed. 15
This program relates to safety and/or reliability and/or maintenance as it 16
includes instances where a repairable leaks (Grade 1, 2 ,or 3) are downgraded 17
to a non-hazardous leak (Grade 3) that do not require repair, instances where 18
the leak is not found (Grade 0) or the leak is due to non-PG&E gas. 19
MAT DED – Leak Rechecks – Includes routine above and below ground 20
Grade 3 and 2 leak rechecks, follow-up Grade 0 rechecks, and/or post-repair 21
rechecks. Unit of measure is number of rechecks performed. 22
This program relates to safety and/or reliability and/or maintenance as it 23
includes routine above and below ground Grade 3 and 2 leak rechecks, 24
follow-up Grade 0 rechecks, and/or post-repair rechecks. 25
MAT DEE – Customer Calls – Survey/Investigation of leaks found on the 26
distribution system where investigation is initiated by customer odor complaint. 27
Does not include: (1) leak repair (pinpointing, digging, etc.), (2) distribution 28
assets, (3) investigation of customer odor complaint where leak is found on the 29
2 Grade 1 leaks (also referred to as “hazardous” leaks) represent existing or probable hazards to persons or property and require immediate repair or continuous action until conditions are no longer hazardous. Grade 2 leaks are non-hazardous to persons or property at the time of detection, but still require a scheduled repair because they present probable future hazards. Grade 3 leaks are non-hazardous at the time of detection and can reasonably be expected to remain non-hazardous.

2-28
customer side of the service valve (4) leak repair (no meter exchange/rebuild). 1
Unit of measure is number of customer calls. 2
This program relates to safety and/or reliability and/or maintenance as it 3
involves survey and/or investigation of leaks found on the distribution system 4
where the investigation is initiated by a customer odor complaint. 5
MAT DEF – Picarro Leak Survey – Includes: (1) use of Picarro Surveyor 6
to perform compliance leak survey (drive) of distribution mains and services 7
only, (2) perform foot survey of leak indication search areas (LISA) and Gap 8
Survey (foot survey performed for service & mains not in the field of view of 9
Picarro surveyor); and (3) Field of View Survey (five feet from building survey 10
sweep). Does not include: If the surveyor is actively helping with the repair 11
(i.e., bar-hole pinpointing, digging etc.). Unit of measure is services surveyed. 12
This program relates to safety and/or reliability and/or maintenance as it 13
includes: (1) Use of Picarro Surveyor to perform compliance leak survey (drive) 14
of distribution mains and services only (2) Perform foot survey of LISA and Gap 15
Survey (foot survey performed for service & mains not in the field of view of 16
Picarro surveyor) and (3) Field of View Survey (five feet from building survey 17
sweep). 18
MAT DEG – Picarro Special Survey – Previously included: (1) use of 19
Picarro Surveyor to perform special (non-compliance) leak survey of distribution 20
mains and services, by special request (city paving, customer callout, 21
emergencies); (2) foot survey of LISA and Gap Survey (foot survey performed 22
for service and mains not in the field of view of Picarro surveyor); and 23
(3) calibration of the instruments associated to this work.24
This MAT is no longer in use, see MAT DEB Special Leak Survey.25
MAT DEH – Gas Capacity Uprates – Involves expense work to upgrade26
existing distribution systems to a higher Maximum Allowable Operating Pressure 27
(MAOP) for the primary purpose of creating new capacity. This is a non-unitized 28
MAT. 29
This program relates to safety and/or reliability as it involves expense work 30
to upgrade existing distribution systems to a higher MAOP for the primary 31
purpose of creating new capacity. 32
MAT DE# – Leak Survey Support – Support costs for Leak Survey. This is 33
a non-unitized MAT. 34

2-29
This MAT relates to safety and/or reliability and/or maintenance as it 1
includes other support costs such as labor and other support for MWC DE Leak 2
Survey. 3
MAT DFA – Locate and Mark – Locate and Mark underground Gas and 4
Electric Distribution facilities per Underground Service Alert (USA) requests. 5
Preparation of maps, process tickets, and perform administrative work, and Gas 6
and Electric damage prevention activities. Also includes USA delineation 7
marking and calibration/repair of equipment. Does not include locate and mark 8
for Gas and Electric Transmission. Unit of measure is number of USA tickets 9
worked. 10
This program relates to safety and/or reliability and/or maintenance as it 11
involves locating and marking underground Gas and Electric Distribution 12
facilities per USA requests and additional damage prevention activities like 13
preparation of maps, processing tickets, and calibration/repair of equipment. 14
MAT DFB – Locate and Mark, Standby – Includes observation of work 15
performed within five feet of a gas or electric transmission facility or for 16
excavation activity within close proximity of a critical distribution facility. Unit of 17
measure is number of sites requiring a standby. 18
This program relates to safety and/or reliability and/or maintenance as it 19
includes observation of work performed within five feet of a gas or electric 20
transmission facility or for excavation activity within close proximity of a critical 21
distribution facility. 22
MAT DF# – Locate and Mark, Other – Support costs for Locate and Mark, 23
including membership costs for USA. This is a non-unitized MAT. 24
This MAT relates to safety and/or reliability and/or maintenance as it 25
includes support costs for MWC DF Locate and Mark. 26
MAT DGA – CP: Monitoring – Include all types of pipe-to-soil reads, 27
including isolated steel, rectifier reads, and remote monitoring. Also includes 28
remote rectifier monitoring unit communication and software costs, and electric 29
utility costs for rectifiers. Unit of measure is number of monitoring points read. 30
This program relates to safety and/or reliability and/or maintenance as it 31
includes all types of pipe-to-soil reads (which provides information about the CP 32
levels on the pipeline), including isolated steel, rectifier reads, and remote 33

2-30
monitoring. Also includes remote rectifier monitoring unit communication and 1
software costs, and electric utility costs for rectifiers. 2
MAT DGB – CP: Troubleshooting – Includes troubleshooting and 3
identification of problems with down Cathodic Protection Areas (CPA) and 4
performing any remedial actions. Unit of measure is number of CPA’s 5
troubleshot. 6
This program relates to safety and/or reliability and/or maintenance as it 7
includes troubleshooting and identification of problems with down CPA and 8
performance of any remedial actions. 9
MAT DGC – CP: Rectifier Maintenance – Perform rectifier maintenance 10
and associated costs. Unit of measure is number of rectifiers maintained. 11
This program relates to safety and/or reliability and/or maintenance as it 12
involves performing rectifier maintenance. 13
MAT DGD – CP: Enhanced Survey – Conduct enhanced CP survey and 14
associated activities. This is a non-unitized program. 15
This program relates to safety and/or reliability and/or maintenance as it 16
involves conducting enhanced CP survey and associated activities. 17
MAT DGE – Electrically Connected Isolated Steel Services– Identify and 18
evaluate electrically connected isolated steel services and associated activities. 19
This is a non-unitized program. 20
This program relates to safety and/or reliability and/or maintenance as it 21
involves identifying and evaluating electrically connected isolated steel services 22
and associated activities. 23
MAT DGG – Installing Casing Test Stations – Install casing test stations. 24
Unit of measure is number of casings mitigated. 25
This program relates to safety and/or reliability and/or maintenance as it 26
involves installing casing test stations. 27
MAT DGH – Casing Short Mitigation Less Than 100 Feet – Clear casing 28
shorts or replace cased pipe less than 100 feet in length. Unit of measure is 29
number of casings mitigated. 30
This program relates to safety and/or reliability and/or maintenance as it 31
involves clearing casing shorts or replacing cased pipe less than 100 feet in 32
length. 33

2-31
MAT DGI – Casing Monitoring Without Lead – Annual casing monitoring 1
for casings without leads. Unit of measure is number of casings monitored. 2
This program relates to safety and/or reliability and/or maintenance as it 3
involves annual casing monitoring for casings without leads. 4
MAT EXA – MPP Inspections – Previously included inspecting the MPP 5
database or performing a special survey to identify the need for Barrier Posts or 6
Service Valves. As part of the transition of the MPP to ongoing maintenance, 7
this MAT is no longer in use. 8
MAT EXB – MPP Protections – Includes installing barrier posts in order to 9
protect above ground gas facilities (meters and risers) from damage by vehicles. 10
Does not include: relocation requiring re-running the service from the main, 11
which is under MWC 27. Unit of measure is number of locations. 12
This program relates to safety and/or reliability as it involves installing barrier 13
posts in order to protect above ground gas facilities (meters and risers) from 14
damage by vehicles. 15
MAT EXC – MPP Service Valves – Previously included the installation of a 16
new service valve or the relocation of an existing service valve if the property 17
does not have an accessible service valve (for emergency response). As part of 18
the transition of the MPP to ongoing maintenance, this MAT is no longer in use. 19
MAT FGA – Gas Distribution Control Center (GDCC) Operations – 20
Includes gas control personnel, contractor support, increased main Remote 21
Terminal Unit (RTU) and ERXs, apprentice training program, damage 22
prevention, abnormal conditions, emergency response, compliance, systems 23
operations, data collection, clearance process and benchmarking. This is a 24
non-unitized MAT. 25
This program relates to safety and/or reliability and/or maintenance as it 26
includes gas control personnel, contractor support, increased main RTU and 27
ERXs, apprentice training program, damage prevention, abnormal conditions, 28
emergency response, compliance, systems operations, data collection, 29
clearance process and benchmarking. 30
MAT FGB – Operate Distribution Mains and Services – Includes: 31
changing winter and station pressure recorder charts (including downloading 32
ERX), performing instrument calibrations (test equipment, gauges, portable 33
pressure recorders, etc.) operating valves (including changes in emergency 34

2-32
zones), removing distribution system pipeline liquids and monitoring system 1
pressure. Does not include: calibration of Distribution Regulator Station 2
mechanical pressure recorders during station maintenance or distribution 3
SCADA, including ERX calibrations. This is a non-unitized program. 4
This program relates to safety and/or reliability and/or maintenance as it 5
includes changing winter and station pressure recorder charts (including 6
downloading ERX), performing instrument calibrations (test equipment, gauges, 7
portable pressure recorders, etc.) operating valves (including changes in 8
emergency zones), removing distribution system pipeline liquids and monitoring 9
system pressure. 10
MAT FGC – Operate Distribution Regulator General – Control the supply 11
and flow of gas through the distribution system via direction from the GDCC, 12
adjust and change Distribution Regulator Station pressure set points, maintain 13
station pressure in conjunction with winter or planned operational clearances. 14
This is a non-unitized program. 15
This program relates to safety and/or reliability and/or maintenance as it 16
involves controlling the supply and flow of gas through the distribution system 17
via direction from the GDCC, adjusting and changing Distribution Regulator 18
Station pressure set points, and maintaining station pressure in conjunction with 19
winter or planned operational clearances. 20
MAT FHA – Preventative Maintenance, Gas Mains – Includes: 21
(1) non-leak repairs to distribution gas mains; (2) rewrap, lower, or paint gas22
distribution mains; (3) replace cover; protect shallow pipe; (4) replace/repair pipe 23
hangars; (5) replace/relocate less than 100 feet of gas distribution main; 24
(6) identify pipe; and (7) install Electrolytic Test Station (ETS) for the purpose of25
locating the main. Does not include: (1) main leak repairs; (2) any work related 26
to gas transmission; (3) any work caused by work or alteration by a customer or 27
third party; (4) pothole gas facilities for potential conflicts with third-party work; 28
(5) third-party damage; (6) AC; (7) install ETS for purposes of corrosion29
prevention; (8) fire valve repair or replacement; (9) main or service alterations 30
due to “sewer cross-bores”; and (10) any corrective work related to sunk 31
trenches or sunk bell holes. Unit of measure is feet of main maintained. 32
This program relates to safety and/or reliability and/or maintenance as it 33
includes: (1) non-leak repairs to distribution gas mains; (2) rewrapping, 34

2-33
lowering, or painting gas distribution mains; (3) replacing cover or protecting 1
shallow pipe; (4) replacing/repairing pipe hangars; (5) replacing/relocating 2
greater than 100 feet of gas distribution main; (6) identifying pipe; and 3
(7) installing ETS for the purpose of locating the main.4
MAT FHB – Preventative Maintenance, Gas Regulator Station – Includes5
scheduled preventative maintenance inspections on distribution regulator 6
stations, required maintenance work for all associated equipment inside the 7
district regulator station, and vault dewatering. Does not include: (1) repairs to 8
inlet and outlet fire valves with a pressure greater than 60 pounds per square 9
inch gauge; (2) SCADA calibration of GDCC RTUs and ERXs installed at a 10
regulator station; and (3) calibration of pressure recorders for planning “winter 11
chart” applications (non-GDCC). This is a non-unitized MAT. 12
This program relates to safety and/or reliability and/or maintenance as it 13
includes scheduled preventative maintenance inspections on distribution 14
regulator stations. 15
MAT FHC – Preventative Maintenance, Gas Farm Tap – Performing 16
atmospheric inspections on customer HPR sets, including Class “A” inspections. 17
This is a non-unitized program. 18
This program relates to safety and/or reliability and/or maintenance as it 19
involves performing atmospheric inspections on customer HPR sets, including 20
Class “A” inspections. 21
MAT FHE – Preventative Maintenance, Gas Services – Includes: 22
(1) repair non-leaking gas distribution services; (2) riser replacement; (3) rewrap,23
lower, or paint gas distribution services; (4) clear and/or repair plugged services; 24
(5) replace cover or protect shallow pipe; (6) repair, replace, relocate, or cut-off25
less than a full service; (7) repair, replace curb valves less than 2 inches; 26
(8) investigate idle gas stub service cut-offs; (9) install ETS for the purpose of27
locating the service; (10) installation of excess flow valve (EFV) (when not 28
related to leak repair); (11) repairing inoperative bypass valves including 29
exposing buried/inaccessible bypass valves and raising the riser; and 30
(12) repairing non-gradable leaks on buried valves that require riser31
replacement. Does not include: (1) stub or service cut-off; (2) any work caused 32
by work or alteration by a customer or third party; (3) third-party damage; (4) AC; 33
(5) service valve replacement; (6) work above the service valve; (7) install ETS34

2-34
for the purpose of corrosion prevention; (8) service leak repairs; (9) main or 1
service alterations due to “sewer cross-bores”; and (10) any corrective work 2
related to sunk trenches or sunk bell holes. Unit of measure is number of 3
services repaired. 4
This program relates to safety and/or reliability and/or maintenance as it 5
includes: (1) repairing non-leaking gas distribution services; (2) riser 6
replacement; (3) rewrapping, lowering, or painting gas distribution services; 7
(4) clearing and/or repairing plugged services; (5) replacing cover; protecting8
shallow pipe; (6) repairing, replacing, relocating, or cutting-off less than a full 9
service; (7) repairing or replacing curb valves less than 2 inches; 10
(8) investigating idle gas stub service cut-offs; (9) installing ETS for the purpose11
of locating the service; and (10) installation of EFV (when not related to leak 12
repair).. 13
MAT FHG – Preventative Maintenance, Gas Valves – Perform scheduled 14
inspections and operation checks of emergency, curb, and sectionalizing valves. 15
This is a non-unitized MAT. 16
This program relates to safety and/or reliability and/or maintenance as it 17
involves performing Class “A” inspections and operation checks of emergency, 18
curb, and sectionalizing valves. 19
MAT FHI – Corrective Maintenance, Gas Service Valves – Includes repair 20
or replace inoperative service valves less than 2 inches which involves exposing 21
buried/inaccessible service valves and raising the riser and relocation of an 22
existing service valve less than 2 inches. Does not include: (1) valves greater 23
than or equal to 2 inches; (2) work above the service valve; (3) encroachment 24
related work; (4) installation or relocation of an existing service valve less than 25
2 inches that results in re-running the entire service from the main; and (5) repair 26
or replace curb valves less than 2 inches. Unit of measure is number of valves 27
replaced. 28
This program relates to safety and/or reliability and/or maintenance as it 29
involves repairing or replacing inoperative service valves less than 2 inches. 30
MAT FHJ – Gas Non-Recurring Projects – One-time non-recurring 31
maintenance projects. This is a non-unitized MAT. 32
This program relates to safety and/or reliability and/or maintenance as it 33
includes one-time non-recurring maintenance projects. 34

2-35
MAT FHK – AC Monitoring – Inspect atmospherically exposed gas mains 1
and services, for AC. This is a non-unitized MAT. 2
This program relates to safety and/or reliability and/or maintenance as it 3
involves inspecting atmospherically exposed gas mains and services, for AC. 4
MAT FHL – AC Main Repairs – Perform expense repair of AC on mains. 5
Unit of measure is number of spans repaired. 6
This program relates to safety and/or reliability and/or maintenance as it 7
involves performing expense repairs of AC on mains. 8
MAT FHM – AC Service Repairs – Expense repairs of AC on services to 9
below stopcock. Does not include: AC repairs of customer gas regulators, 10
HPRs, and meter sets. Unit of measure is number of services repaired. 11
This program relates to safety and/or reliability and/or maintenance as it 12
involves expense repairs of AC on services to below the stopcock. 13
MAT FHN – AC Distribution Regulator Station Repair – Expense repairs 14
of AC on distribution district regulator stations. Unit of measure is number of 15
regulator stations mitigated. 16
This program relates to safety and/or reliability and/or maintenance as it 17
involves expense repairs of AC on distribution district regulator stations. 18
MAT FHO – Preventative Maintenance SCADA – SCADA preventive 19
maintenance to RTU, SCADA Transmitters and ERXs. Activities may include 20
normal operation checks, input/output checks, check/set power supply and other 21
activities. 22
This program relates to safety and/or reliability and/or maintenance as it 23
involves performing SCADA Preventive Maintenance to RTUs, SCADA 24
Transmitters and ERXs. 25
MAT FHP – Corrective Maintenance SCADA – SCADA corrective 26
maintenance to RTUs, SCADA Transmitters, ERXs, as well as GDCC RTUs and 27
GDCC ERXs. Activities may include response and investigation of SCADA 28
alarms at the request of the control center and maintenance or repair of failed or 29
inoperative electronic permanent pressure recorder at a regulator station. This is 30
a non-unitized MAT. 31
This program relates to safety and/or reliability and/or maintenance as it 32
involves performing SCADA Corrective Maintenance to RTUs, SCADA 33

2-36
Transmitters and ERXs. It also includes SCADA corrective maintenance of 1
GDCC RTUs and GDCC ERXs. 2
MAT FHQ – Over Pressure Protection (OPP) Enhancements – Includes: 3
installation of pilot filters, system planning studies to identify the most effective 4
secondary OPP option, revision of standard and procedures, program 5
management for developing and maintaining the over pressure elimination plan 6
and pilot studies on new equipment technologies for applicability to the PG&E 7
system. This is a non-unitized MAT. 8
This program relates to safety and/or reliability and/or maintenance as it 9
includes installation of pilot filters, system planning studies to identify the most 10
effective secondary OPP option, revision of standard and procedures, program 11
management for developing and maintaining the over pressure elimination plan, 12
and pilot studies on new equipment technologies for applicability to the PG&E 13
system. 14
MAT FHR – Distribution Pipeline Markers – Perform patrols on distribution 15
mains. This is a non-unitized MAT. 16
This MAT relates to safety and/or reliability and/or maintenance as it 17
includes performing patrols on distribution mains. 18
MAT FH# – Preventative Maintenance, Other – Includes field support 19
costs. This is a non-unitized MAT. 20
This MAT relates to safety and/or reliability and/or maintenance as it 21
includes compliance support costs for MWC FH Preventative Maintenance. 22
MAT FIB – Corrective Maintenance, Gas Regulator Station – Maintain 23
and repair failed or inoperative distribution district regulation equipment. Does 24
not include: repair of SCADA equipment at a district regulator station; corrective 25
paint work; or repairs for vault lids or station fencing. This is a non-unitized 26
MAT. 27
This program relates to safety and/or reliability and/or maintenance as it 28
involves maintaining and repairing failed or inoperative distribution district 29
regulation equipment. 30
MAT FIC – Corrective Maintenance, Gas Farm Tap – Perform repairs on 31
customer HPR sets. This is a non-unitized MAT. 32
This program relates to safety and/or reliability and/or maintenance as it 33
involves performing repairs on customer HPR sets. 34

2-37
MAT FIF – Corrective Maintenance, Gas Main Valves – Includes: 1
(1) replace valves less than 2 inches; (2) repair all distribution main valves;2
(3) repair/seal vaults and lids; and (4) raise vaults and lids unless due to WRO3
(especially street repaving). This is a non-unitized MAT. 4
This program relates to safety and/or reliability and/or maintenance as it 5
includes: (1) replacing valves less than 2 inches; (2) repairing distribution main 6
valves; (3) repairing and/or sealing vaults and lids; and (4) raising vaults and lids 7
(non WRO work). 8
MAT FIG –Main Leak Repair – Expense repair of non-dig-in leaks less than 9
100 feet on any distribution main and appurtenances (flanges, valves, etc.). 10
Includes leak pinpointing. Includes repair of service leak by replacing a portion 11
of main (100 feet or less). Includes repair of leak on existing cut-off service tee 12
(24 inches or less). Does not include: If a suspected leak is excavated and 13
downgraded to a 3 or 0 that won’t be repaired, non-PG&E gas, and if service tee 14
is cut off within 12 inches of main and no service exists. Below ground Grade 3 15
leak repairs are recorded under Leak Abatement MAT LWG. Unit of measure is 16
number of main leaks repaired. 17
This program relates to safety and/or reliability and/or maintenance as it 18
involves expense repairs of non-dig-in leaks less than 100 feet on any 19
distribution main and appurtenances (flanges, valves, etc.). It includes leak 20
pinpointing, repair of service leak by replacing a portion of main (100 feet or 21
less), and repair of leak on existing cut-off service tee (24 inches or less). 22
MAT FIH – Gas Service Leak Repair, Above Ground – Leak pin-pointing 23
and repair of non-dig-in leaks below the service valve on the above ground 24
portion of the service. Does not include: If a suspected leak is excavated and 25
downgraded to a 3 or 0 that won’t be repaired, or non-PG&E gas. Unit of 26
measure is number of service leak repairs (above ground). 27
This program relates to safety and/or reliability and/or maintenance as it 28
includes leak pin-pointing and repair of non-dig-in leaks below the service valve 29
on the above ground portion of the service. 30
MAT FII – Corrective Maintenance, CP – Includes: repair existing anodes 31
or rectifiers; dig up gas facilities to install insulating material; install new anodes 32
on isolated steel as necessary; install an ETS; restore a down CPA without 33

2-38
replacing capital plant. Does not include: any CP remediation or restoration 1
activities. Unit of measure is number of corrosion tags cleared. 2
This program relates to safety and/or reliability and/or maintenance as it 3
includes: (1) repairing existing anodes or rectifiers; (2) digging up gas facilities 4
to install insulating material; (3) installing new anodes on isolated steel as 5
necessary; (4) installing an ETS; and (5) restoring a down CP Area without 6
replacing capital plant. 7
MAT FIJ – Main Dig-In Repair – Expense repair of dig-in leaks and other 8
third-party damage to any distribution main and appurtenances (flanges, valves, 9
etc.). Unit of measure is number of main dig-ins repaired. 10
This program relates to safety and/or reliability and/or maintenance as it 11
involves expense repairs of dig-in leaks and other third-party damage to any 12
distribution main and appurtenances (flanges, valves, etc.). 13
MAT FIK – Service Dig-In Repair – Expense repair of dig-in leaks and 14
other third-party damage to any service (including curb valves). Unit of measure 15
is number of service dig-ins repaired. 16
This program relates to safety and/or reliability and/or maintenance as it 17
involves expense repairs of dig-in leaks and other third-party damage to any 18
service (including curb valves). 19
MAT FIM –Major Event – Includes gas major events and also emergencies. 20
This is a non-unitized MAT. 21
This program relates to safety and/or reliability and/or maintenance as it 22
involves work in response to gas major events and emergencies. 23
MAT FIO – Encroachment Program (formerly Overbuild) – Relocation of 24
partial gas service and/or main (less than 100 feet) due to encroachment 25
condition. Unit of measure is number of services repaired. 26
This program relates to safety and/or reliability and/or maintenance as it 27
involves the relocation of a partial gas service and/or main (less than 100 feet) 28
due to encroachment conditions. 29
MAT FIP – Service Leak Repair, Below Ground – Leak pinpointing and 30
repair of non-dig in leak on below ground section of any service (includes curb 31
valves) from tee to where riser breaks ground. Includes: (1) above ground leak 32
that requires below ground repair (i.e., must replace section of below ground 33
pipe or riser); and (2) riser replacement including section of below ground 34

2-39
service. Does not include if a suspected leak is excavated and downgraded to a 1
3 or 0 or non-PG&E gas. Below ground Grade 3 leak repairs are recorded 2
under Leak Abatement MAT LWH. Unit of measure is number of service leak 3
repairs (below ground). 4
This program relates to safety and/or reliability and/or maintenance as it 5
involves leak pinpointing and repair of non-dig in leak on below ground section 6
of any service (includes curb valves) from tees to where risers breaks ground. It 7
includes: (1) above ground leak that requires below ground repair (i.e., must 8
replace section of below ground pipe or riser); and (2) riser replacement 9
including section of below ground service. 10
MAT FIQ – AC Monitoring – Inspect atmospherically risers, customer gas 11
regulators (including HPRs), and meter sets for AC where not completed by 12
routine leak survey work. Unit of measure is number of locations inspected. 13
This program relates to safety and/or reliability and/or maintenance as it 14
involves inspecting atmospherically risers, customer gas regulators (including 15
HPRs), and meter sets for AC where not completed by routine leak survey work. 16
MAT FIR – Tee-Cap Replacement Program – Projects specified by the 17
plastic tee cap repair team to lower risks in the plastic system. Unit of measure 18
is number of tee caps replaced. 19
This program relates to safety and/or reliability and/or maintenance as it 20
involves projects specified by the plastic tee cap repair team to lower risks in the 21
plastic system. 22
MAT FIS – Leak Survey Meter Repair – Scheduled repair of 23
non-hazardous gas leaks at the meter set. Does not include: (1) hazardous gas 24
leak repair at the meter set initiated by Leak Survey; (2) customer generated 25
field orders for gas leak investigation; (3) repair or replacement of gas valve; 26
(4) replacement of gas regulators; (5) meter replacement; and (6) leak surveys27
performed by Leak Surveyors. Unit of measure is number of meters repaired. 28
This program relates to safety and/or reliability and/or maintenance as it 29
involves scheduled repair of non-hazardous gas leaks at the meter set. 30
MAT FI# – Gas Corrective Maintenance, Other – This includes support 31
costs for Gas Corrective Maintenance including leak repair support. This is a 32
non-unitized MAT. 33

2-40
This MAT relates to safety and/or reliability and/or maintenance as it 1
includes support costs for MWC FI Gas Corrective Maintenance. 2
MAT GFO – Mapping Support – Includes: (1) distribution mapping 3
activities not directly charged to orders such as posting obsolete orders, 4
delineations, data management non-posting and map reprographics, 5
annexations, posting corrections, operating maps and diagrams, asset registry 6
and request for work, Corrective Action Program (CAP) mapping and information 7
and data requests; and (2) special distribution mapping projects. This is a 8
non-unitized MAT. 9
This program relates to safety and/or reliability and/or maintenance as it 10
includes: (1) distribution mapping activities not directly charged to orders such 11
as posting obsolete orders, delineations, data management non-posting and 12
map reprographics, annexations, posting corrections, operating maps and 13
diagrams, asset registry and request for work, CAP mapping and information 14
and data requests; and (2) special distribution mapping projects. 15
MAT GGA – Gas System Planning – Perform hydraulic analysis on gas 16
distribution systems to support operations and long-term design. Build and 17
maintain computer models of the gas distribution system. This is a non-unitized 18
MAT. 19
This program relates to safety and/or reliability and/or maintenance as it 20
involves performing hydraulic analysis on gas distribution systems to support 21
operations and long-term design. It also includes building and maintaining 22
computer models of the gas distribution system. 23
MAT GG# – Gas Distribution Portfolio Management and Engineering – 24
Preliminary engineering prior to determining the type of work (install vs. repair) 25
to be performed, such as, defining economic alternatives, field checking of asset 26
conditions, approximate scope/cost of work, and economic analysis. This is a 27
non-unitized MAT. 28
This MAT relates to safety and/or reliability and/or maintenance as it 29
includes support costs for MWC GG Gas Mapping. 30
MAT GMC – CNG Station Expense – Corrective and Preventative 31
Maintenance on CNG Stations. This is a non-unitized MAT. 32
This program relates to safety and/or reliability and/or maintenance as it 33
involves maintenance and operating expenditure for CNG Stations. 34

2-41
MAT GM# – CNG Station, Other – Includes other support costs related to 1
CNG maintenance. This is a non-unitized MAT. 2
For how this MAT relates to safety and/or reliability and/or maintenance see 3
MWC GM Natural Gas Fueling Facilities O&M. 4
MAT HYI – Meter Set AC Remediation – Perform remediation of AC on 5
customer gas meters and regulators as identified through AC inspection. Does 6
not include: (1) AC inspection; (2) AC repair on HPRs; (3) AC repair on 7
distribution mains, services, valves, etc.; (4) meter replacement; and 8
(5) regulator replacement. Unit of measure is number of meters repaired.9
This program relates to safety and/or reliability and/or maintenance as it10
involves performing remediation of AC on customer gas meters and regulators 11
as identified through AC inspection. 12
MAT JQA – DIMP Leak Survey – Leak Survey enhancements. This is a 13
non-unitized MAT.3 14
This program relates to safety and/or reliability and/or maintenance as it 15
involves system integrity leak surveys. 16
MAT JQC – Damage Prevention Dig-In Reduction Team (DiRT) – Costs 17
associated with the DiRT. The costs include investigations of dig-ins, 18
documentation of damage incidents, 811 outreach and education, 19
811 Ambassador program management and response and other damage 20
prevention activities by DiRT Members. These damage prevention activities 21
include: field contacts at excavation sites, follow-up on reports of unsafe 22
excavation activities and meetings with excavators. Also, costs associated with 23
the ticket management system (i.e., licensing fees, data storage and required 24
formatting changes). This is a non-unitized MAT. 25
See MWC DF Locate and Mark for how this MAT relates to safety and/or 26
reliability and/or maintenance. 27
MAT JQD – DIMP Emergent Work – Emergent work associated with 28
operational events and risk mitigation activities identified by the DIMP. This is a 29
non-unitized program. 30
3 Actual units in Table 2-3 reflect a count of services surveyed in 2021 only and do not include miles of main surveyed. Given the combination of units MAT JQA has shifted to a non-unitized MAT.
2-42
This program relates to safety and/or reliability as it manages and executes 1
the DIMP emergent work. 2
MAT JQE – Plastic Program – Supports the selection, testing and 3
development of plastic materials, tools, and associated construction methods for 4
use on the distribution system. Also includes: laboratory testing, sample 5
material, and prototype tools and equipment purchases. This is a non-unitized 6
MAT. 7
This program relates to safety and/or reliability and/or maintenance as it 8
oversees selection, testing and development of plastic materials, tools, and 9
associated construction methods for use on the PG&E distribution system. It 10
also includes laboratory testing, sample material, and prototype tools and 11
equipment purchases. 12
MAT JQG – Mechanical Fitting Replacement Program – Replacement 13
program for removal of mechanical fittings with known failures. Includes removal 14
of compression style mechanical fittings with risk of corrosion and leak. This 15
MAT is non-unitized. 16
This program relates to safety and/or reliability as it replaces mechanical 17
fittings with known failures, including the removal of compression style mechanical 18
fittings with risk of corrosion and leaks. 19
MAT JQK – Cross Bore Program – Includes: research of records, create 20
and execute legacy storm and sewer inspections, and repair costs to remove 21
legacy cross bores. It does not include replacement of gas pipe beyond the 22
cross bore segment. Unit of measure is number of inspections. 23
This program relates to safety and/or reliability as it involves conducting 24
storm and sewer inspections, repair costs to remediate cross bores, and records 25
research. 26
MAT JQL – DIMP Program Management – Costs for DIMP staff. This is a 27
non-unitized MAT. 28
This program relates to safety and/or reliability and/or maintenance as it 29
involves costs for DIMP staff. 30
MAT JQ# – DIMP, Other – Other support costs for DIMP. This is a 31
non-unitized MAT. 32
See MWC JQ DIMP for how this program relates to safety and/or reliability 33
and/or maintenance. 34

2-43
MWC OM – Operational Management – includes labor and 1
employee-related costs to provide supervision and management support. 2
MWC OM also includes costs incurred by the administrative staff working for the 3
Supervisors/Managers. This is a non-unitized MWC. 4
MWC OM is included as a maintenance activity in accordance with Energy 5
Division’s February 12, 2019 letter to PG&E. Gas Distribution does not consider 6
MWC OM as related directly to safety and/or reliability and/or maintenance work. 7
G. MAT Descriptions for Safety and Reliability Work – Capital8
For descriptions of how the following Gas Distribution capital programs 9
relate to safety, reliability, or maintenance, please see the MAT descriptions 10
which explain the type of work associated with each MAT below. 11
MAT 14A – GPRP – Replace main and services qualifying for replacement 12
under the GPRP. Does not include: deactivation with no capital main 13
installation less than 100 feet. Unit of measure is feet of main installed. 14
This program relates to safety and/or reliability as it involves replacing main 15
and services qualifying for replacement under the GPRP. 16
MAT 14B – Copper Service Replacement – Replace copper services 17
identified under the CSRP. Unit of measure is number of services replaced. 18
This program relates to safety and/or reliability and/or maintenance as it 19
involves replacing copper services identified under the CSRP. 20
MAT 14D – Plastic Pipe Replacement– Replace main and services 21
qualifying for replacement under the Plastic Pipeline Replacement Program. 22
Does not include: deactivation with no capital main installation less than 23
100 feet. Unit of measure is feet of main installed. 24
This program relates to safety and/or reliability and/or maintenance as it 25
involves replacing main and services qualifying for replacement under the 26
Plastic Pipeline Replacement Program. 27
MAT 27A – Meter Protection-Capital – Includes: (1) meters that cannot be 28
adequately protected by barrier posts and require relocation with re-running the 29
service from the main; and (2) services with inaccessible service valves that 30
require re-running the service from the main. Does not include: minor 31
relocations or service valve installations that do not require re-running the 32
service from the main. Unit of measure is number of services corrected. 33

2-44
This program relates to safety and/or reliability and/or maintenance as it 1
includes: (1) meters that cannot be adequately protected by barrier posts and 2
require relocation with re-running the service from the main, and (2) services 3
with inaccessible service valves that require re-running the service from the 4
main. 5
MAT 31A – CNG Stations – Capital work on CNG stations. This MAT is 6
non-unitized. 7
This program relates to safety and/or reliability and/or maintenance as it 8
involves capital work to replace obsolete equipment that no longer can meet the 9
demands of the station, or is not in acceptable working condition. 10
MAT 4AA – Regulator Station Monitoring and Control, SCADA Type 1 – 11
HPR Station Monitoring and Control. Includes upstream, midstream, and 12
downstream pressure, differential pressure, flow and shut-off control. This MAT 13
is non-unitized. 14
This program relates to safety and/or reliability and/or maintenance as it 15
involves HPR Station monitoring and control (single run). It includes upstream, 16
midstream, and downstream pressure, differential pressure, flow and shut off 17
control. 18
MAT 4AB – Regulator Station Monitoring, SCADA Type 3 – HPR Station 19
Monitoring-Single Run: Includes upstream, midstream, and downstream 20
pressure, differential pressure and flow. Unit of measure is RTUs installed. 21
This program relates to safety and/or reliability and/or maintenance as it 22
involves HPR Station monitoring (single run). It includes upstream, midstream, 23
and downstream pressure, differential pressure and flow. 24
MAT 4AC – Real-Time PSI Monitor, SCADA Type 4 – HPR Station 25
Monitoring: Includes upstream and downstream pressure. Unit of measure is 26
RTUs installed. 27
This program relates to safety and/or reliability and/or maintenance as it 28
involves HPR Station monitoring. It includes upstream and downstream 29
pressure. 30
MAT 4AF – ERX Pressure Monitoring, SCADA Type 6 – Includes 31
regulator station, Hydraulically Independent System (HIS) pipeline or valve 32
pressure, and ERX pressure monitoring. Unit of measure is number of 33
electronic pressure recorders. 34

2-45
This program relates to safety, reliability, and compliance as it involves 1
electronic recorder pressure monitoring. It includes regulator stations, HIS 2
pipeline or valve pressure. 3
MAT 4AK – Regulator Station Monitoring Single No Flow, Type 3 – High 4
and low pressure regulator station monitoring-single run: includes upstream, 5
midstream, and downstream pressure, differential pressure (high pressure only) 6
and vault water level (low pressure only). Also high and low pressure regulator 7
station monitoring and control-dual run: includes upstream, midstream and 8
downstream pressure, differential pressure (high pressure only), vault water 9
level (low pressure only) and shut-off control. Unit of measure is RTUs installed. 10
This program relates to safety and/or reliability and/or maintenance as it 11
involves high and low pressure regulator station monitoring. It includes: 12
upstream, midstream, and downstream pressure, differential pressure (high 13
pressure only), vault water level (low pressure only) and shut-off control. 14
MAT 4AL – Regulator Station Monitoring Dual Flow, SCADA Type 3 – 15
HPR station monitoring-dual run: Includes upstream, midstream, and 16
downstream pressure; differential pressure; and flow. Unit of measure is RTUs 17
installed. 18
This program relates to safety and/or reliability and/or maintenance as it 19
involves HPR station monitoring (dual run). It includes: upstream, midstream, 20
and downstream pressure, differential pressure, and flow. 21
MAT 4AM – Regulator Station Monitoring Dual No Flow, SCADA 22
Type 3 – High and low regulator station monitoring-dual run: includes upstream, 23
midstream, downstream pressure, differential pressure (high pressure only), and 24
vault water level (low pressure only). Unit of measure is RTUs installed. 25
This program relates to safety and/or reliability and/or maintenance as it 26
involves high and low pressure regulator station monitoring (dual run). It 27
includes upstream, midstream, downstream pressure, differential pressure (high 28
pressure only), and vault water level (low pressure only). 29
MAT 4A# – SCADA Support – Includes other support costs related to Gas 30
Distribution Control Operations. This is a non-unitized MAT. 31
See MWC 4A Gas Distribution Control Operations Assets for how this MAT 32
relates to safety and/or reliability and/or maintenance. 33

2-46
MAT 47B – Gas Capacity, Mains – Installation of gas main to provide 1
additional capacity. The primary unit of measure is feet of main. 2
This program relates to safety and/or reliability and/or maintenance as it 3
involves installation of gas main to provide additional capacity. 4
MAT 47C – Gas Capacity, Regulator Station – Installation of new district 5
regulator station to provide additional capacity (including cost to install SCADA). 6
The primary unit of measure is total number of regulator stations addressed. 7
This program relates to safety and/or reliability and/or maintenance as it 8
involves installation of new district regulator station to provide additional capacity 9
(including cost to install SCADA). 10
MAT 47D – Gas Capacity, Replace Regulator Station Component – 11
Install or replace gas regulation equipment at an existing district regulator station 12
to provide additional capacity. Includes valves, filters, regulators, and other 13
capital equipment within the station. The primary unit of measure is number of 14
regulator station components. 15
This program relates to safety and/or reliability and/or maintenance as it 16
involves installation or replace gas regulation equipment at an existing district 17
regulator station to provide additional capacity. 18
MAT 47F – Gas Capacity, Other Enhancements – Install or replace facility 19
for capacity. This MAT is non-unitized. 20
This program relates to safety and/or reliability and/or maintenance as it 21
involves installing or replacing a facility for capacity. 22
MAT 47# – Gas Capacity, Other – Other Gas Capacity costs. This MAT is 23
non-unitized. 24
See MWC 47 Gas Distribution Capacity for how this MAT relates to safety 25
and/or reliability and/or maintenance. 26
MAT 50A – Reliability Main Replacement – Replace/install greater than or 27
equal to 100 feet of gas distribution main due to deterioration or reduced 28
reliability, and includes non-leak replacements driven by corrosion. Does not 29
include: deactivation of main, shallow mains and services, and if the condition 30
was caused by work or alteration by a customer/third party. Unit of measure is 31
feet of main installed. 32

2-47
This program relates to safety and/or reliability and/or maintenance as it 1
involves replacing and/or installing greater than or equal to 100 feet of gas 2
distribution main due to deterioration or reduced reliability. 3
MAT 50B – Reliability Service Replacement – Includes: (1) replace entire 4
service due to deterioration or reduced reliability including non-leak 5
replacements driven by corrosion; and (2) re-establishing an existing electronic 6
recorder to a service that is being replaced. Does not include: capital service 7
leak repairs, opportunistic service replacements, idle stub cut-offs, shallow 8
services, if the condition was caused by work or alteration by a customer/third 9
party, or new installations of ERXs. Unit of measure is number of services 10
replaced. 11
This program relates to safety and/or reliability and/or maintenance as it 12
includes replacing an entire service due to deterioration or reduced reliability. 13
MAT 50C – Gas Regulator Station Rebuild – Includes: replacement of an 14
entire district regulator station (existing pilot operated station and HPR Type 15
stations with regulation 1 inch and above) due to deterioration or reduced 16
reliability. Does not include replacement of HPRs. Unit of measure: number of 17
regulator stations addressed. 18
This program relates to safety and/or reliability and/or maintenance as it 19
includes replacement of an entire district regulator station (existing pilot operated 20
station and HPR Type stations with regulation 1 inch and above) due to 21
deterioration or reduced reliability. 22
MAT 50D/50Q – CP Casing mitigation – Includes: For ETS greater than or 23
equal to five stations at a single location the following – rectifier replacement, 24
including inserts or new installations, pipe coating greater than or equal to 25
100 feet, Remote Monitoring Units (RMU), and casing remediation greater than 26
100 feet. This may involve replacing end seals, removing segments of the 27
casing, replacing link seals and insulation spacers, flushing and draining 28
casings, repairing coatings, and gelling the casing after site restoration. Does 29
not include: impressed current anodes (deep or shallow bed) and CP systems 30
for ETS less than five stations at a single location. Units of measure include 31
RMUs, Casing Mitigation, and CP Systems. 32
This program relates to safety and/or reliability and/or maintenance as it 33
includes for ETS greater than or equal to five stations at a single location the 34

2-48
following: rectifier replacement, including inserts or new installations, pipe 1
coating greater than or equal to 100 feet, RMUs, and casing remediation. 2
MAT 50E – Reliability Gas Valve Replacement – Includes: replace/install 3
gas distribution valves greater or equal to 2 inches (e.g., emergency shutdown, 4
riser valves 2 inches or greater, and therm billing area valves). Does not include 5
station fire valve or block valve replacement. Unit of measure is number of 6
valves installed. 7
This program relates to safety and/or reliability and/or maintenance as it 8
includes replacing or installing gas distribution valves greater or equal to 9
2 inches (e.g., emergency shutdown, riser valves 2 inches or greater, and therm 10
billing area valves). 11
MAT 50F – Reliability Gas Other Equipment Replacement – Includes: 12
replace/install/deactivate other units of gas capital (e.g., permanent pressure 13
recorders, new pits/vaults, and all deactivation-only jobs for CP systems). Does 14
not include partial pit/vault rebuilds and/or lids only. This is a non-unitized MAT. 15
This program relates to safety and/or reliability and/or maintenance as it 16
includes: (1) replacing, installing, or deactivating other units of gas capital; 17
(2) permanent pressure recorders and new pits or vaults; and (3) all18
deactivation-only jobs for CP systems. 19
MAT 50G – Leak Management – Simple Service Replacement – 20
Replace/deactivate entire or stub services due to leaks, not due to idle facilities 21
or “dig-ins.” Below ground Grade 3 leak replacements are recorded under Leak 22
Abatement MAT 3PB. Unit of measure is number of services replaced. 23
This program relates to safety and/or reliability and/or maintenance as it 24
includes replacement or deactivation of an entire stub or stub service due to 25
leaks that are not due to idle facilities or dig-ins. 26
MAT 50H – Reliability, Cut-Off Idle Gas Service – Remove/deactivate 27
entire or stub services due to idle facilities and not due to leaks, overbuilds, 28
“dig-ins,” or demolitions. Does not include capital work for demolition. Unit of 29
measure is cut off idle services. 30
This program relates to safety and/or reliability and/or maintenance as it 31
involves removal or deactivation of an entire service or stub services due to idle 32
facilities and not due to leaks, overbuilds, dig-ins, or demolitions. 33

2-49
MAT 50I – Improve Reliability – Deactivation – Deactivate gas mains (and 1
the associated services), regulator stations, or valves. Does not include new 2
mains limited to less than 100 feet; those with greater than or equal to 100 feet 3
or gas service deactivations with no main deactivation. This program is 4
non-unitized. 5
This program relates to safety and/or reliability and/or maintenance as it 6
involves deactivation of gas main (and the associated services), regulator 7
stations, or valves. 8
MAT 50J – Encroachment Program – Relocation/rearrangement of gas 9
main (greater than 100 continuous feet) and/or complete gas service 10
replacement to clear encroachment conflicts. Does not include customer 11
requested relocations to clear encroachment. Unit of measure is number of 12
services replaced. 13
This program relates to safety and/or reliability and/or maintenance as it 14
involves relocation or rearrangement of a gas main (greater than 100 continuous 15
feet) and/or complete gas service replacement to clear encroachment conflicts. 16
MAT 50K – Emergent Leaking Main Replacement – Replace/install 17
greater than or equal to 100 feet of gas distribution main due to leaks. Does not 18
include: Deactivation of main only jobs. Unit of measure is feet of main 19
installed. 20
This program relates to safety and/or reliability and/or maintenance as it 21
involves replacement or installation of greater than or equal to 100 feet of gas 22
distribution main due to leaks. 23
MAT 50L – Gas Regulator Station Component Rebuilds – Replacement 24
of regulator station component due to deterioration or reduced reliability. 25
Includes valves (both upstream and downstream fire valves and block valves), 26
filters, regulators, and other capital equipment within the station. Unit of 27
measure is number of regulator station components replaced within a station. 28
This program relates to safety and/or reliability and/or maintenance as it 29
involves replacement of regulator station component due to deterioration or 30
reduced reliability. It includes valves (both upstream and downstream fire valves 31
and block valves), filters, regulators, and other capital equipment within the 32
station. 33

2-50
MAT 50M – Leak Management – Complex Service Replacements – 1
Replace/deactivate entire or stub complex services due to leaks, not due to idle 2
facilities or “dig-ins.” Also includes large commercial meter sets, and any 3
complex load calculations that require Gas Distribution Engineering and Design. 4
Below ground Grade 3 leak replacements are recorded under Leak Abatement 5
MAT 3PC. Unit of measure is number of services replaced. 6
This program relates to safety and/or reliability and/or maintenance as it 7
involves replacement or deactivation of an entire or stub complex services due 8
to leaks not due to idle facilities or dig-ins. It also includes large commercial 9
meter sets, and any complex load calculations that require Gas Distribution 10
Engineering and Design. 11
MAT 50N – GD Overpressure Protection Enhancements – Includes: 12
installation of filters and separators at strategic locations within the system to 13
reduce the likelihood of debris and liquids from entering the system and 14
impacting pilot-operated regulators and monitors; and installation of secondary 15
OPP devices at stations with pilot-operated regulators and monitors. These 16
additional devices may include slam shuts valves, monitor valves, relief valves, 17
or alternate technologies to prevent overpressure events from occurring; and 18
installation of pressure transmitters system wide for enhanced visibility and 19
removal or installation of additional MAOP separation valves. Unit of measure is 20
total number of regulator stations addressed. 21
This program relates to safety and/or reliability and/or maintenance as it 22
includes the installation of secondary OPP devices at pilot-operated regulator 23
stations. These additional devices may include slam shuts devices, monitor 24
valves, relief valves, or alternate technologies to prevent overpressure 25
events from occurring; and installation of pressure transmitters system wide 26
for enhanced visibility and removal or installation of additional MAOP 27
separation valves. 28
MAT 50P – CP System – New/Replace – Installation of impressed current 29
ground bed, deep or shallow. Unit of measure is number of CP systems 30
installed. 31
This program relates to safety and/or reliability and/or maintenance as it 32
involves installation of impressed current ground bed, deep or shallow. 33

2-51
MAT 52B – Emergency Response to Dig-Ins, Services – 1
Replace/deactivate entire or stub services due to “dig-in,” outside forces, or 2
third-party damage. Also, includes service cut-offs due to emergencies 3
(e.g., due to fire). Unit of measure is number of services replaced. 4
This program relates to safety and/or reliability and/or maintenance as it 5
involves replacing or deactivating an entire service or stub services due to 6
“dig-ins,” outside forces, or third-party damage. It also includes service cut-offs 7
due to emergencies (e.g., due to fire). 8
MAT 52C – Emergency Response to Dig-Ins, Mains – Replace greater 9
than or equal to 100 feet gas distribution main due to dig-in or damage by 10
outside forces or third party. Deactivate greater than or equal to 1-foot gas 11
distribution main due to dig-in or damage by outside forces. Unit of measure is 12
feet of main replaced. 13
This program relates to safety and/or reliability and/or maintenance as it 14
involves replacing greater than or equal to 100 feet gas distribution main due to 15
dig-ins, damage by outside forces, or third parties. It also includes deactivations 16
of greater than or equal to 1-foot gas distribution main due to dig-ins or damage 17
by outside forces. 18
MAT 74A – Gas Regulator Replacement – Labor to replace failed or 19
deteriorating residential and non-residential regulators while performing routine 20
maintenance or other field activity. Includes targeted regulator replacement 21
programs and filter replacement with regulator replacement for large meter work 22
2 inches and greater. Does not include: (1) regulator replacement in 23
conjunction with a meter set, (2) the cost of the regulator; (3) HPR replacement; 24
(4) distribution district regulation equipment; and (5) replacement of strainer.25
Unit of measure is number of regulators. 26
This program relates to safety and/or reliability and/or maintenance as it 27
involves labor to replace failed or deteriorating residential and non-residential 28
regulators while performing routine maintenance or other field activity. It 29
includes targeted regulator replacement programs and filter replacement with 30
regulator replacement for large meter work 2 inches and greater. 31

PACIFIC GAS AND ELECTRIC COMPANY
SECTION 3
ELECTRIC DISTRIBUTION
IMPUTED ADOPTED VS. RECORDED COMPARISON

3-i
PACIFIC GAS AND ELECTRIC COMPANY SECTION 3
ELECTRIC DISTRIBUTION IMPUTED ADOPTED VS. RECORDED COMPARISON
TABLE OF CONTENTS
A. Introduction ....................................................................................................... 3-1
B. Comparison Summary Tables .......................................................................... 3-2
C. Comparison by MAT Code for Safety, Reliability, and Maintenance WorkTables ............................................................................................................... 3-4
D. MWC Descriptions – Expense ........................................................................ 3-23
E. MWC Descriptions – Capital ........................................................................... 3-31
F. MAT Code Descriptions – Expense ................................................................ 3-38
G. New MAT Code Descriptions – Expense ........................................................ 3-54
H. MAT Code Descriptions – Capital................................................................... 3-54
I. New MAT Code Descriptions – Capital .......................................................... 3-72
J. Electric Distribution Supplemental Reporting ................................................. 3-73

3-1
PACIFIC GAS AND ELECTRIC COMPANY 1
SECTION 3 2
ELECTRIC DISTRIBUTION 3
IMPUTED ADOPTED VS. RECORDED COMPARISON 4
A. Introduction5
This section includes the following information for the Electric Distribution 6
line of business: a comparison of the total 2021 imputed adopted spend vs. the 7
actual spend. This section also includes, for programs that are related to safety, 8
reliability, or maintenance, the Major Work Category (MWC)/Maintenance 9
Activity Type (MAT) Code descriptions, imputed adopted vs. actual cost 10
comparison details and variance explanations. As required by Decision 11
(D.) 19-04-020,1 the MWC/MAT Code descriptions include a discussion of how12
each program/project relates to safety, reliability, or maintenance. Also included 13
in this section are supplemental reporting on certain units of work, progress on 14
the nonexempt surge-arrester replacement program, and age data of Pacific 15
Gas and Electric Company’s (PG&E or the Company) distribution poles. 16
1 Attachment 2, p. 9.

3-2
B. Comparison Summary Tables1
TABLE 3-1 ELECTRIC DISTRIBUTION 2021 EXPENSE COMPARISON SUMMARY
(THOUSANDS OF DOLLARS)
Line No. MWC Description MWC
2021 Imputed Adopted Costs
(A)
2021 Actual Costs
(B)
2021 Cost Difference
(B-A)1 Support and Emergency Preparedness and Response
(EP&R)AB 68,665.4 210,906.2 142,240.8
2 Read & Investigate Meters AR 0.0 9,398.0 9,398.03 Electric Distribution Operation Activities BA 21,993.4 33,452.0 11,458.74 Perform Reimbursable Work for Others BC 0.0 86.3 86.35 Electric Distribution Patrols and Inspections BF 33,969.3 150,535.0 116,565.76 Electric Distribution Routine Emergency BH 58,922.5 92,047.0 33,124.47 Maintenance of Other Equip BK 1,707.0 2,098.4 391.48 Customer Field Service Work DD 20,997.2 25,253.4 4,256.19 Manage Service Inquiries EV 13,031.9 16,480.9 3,449.110 Electric Operations Work Requested by Others (WRO) EW 9,403.7 14,443.1 5,039.511 Change/Maintenance Used Electric Meter EY 0.0 6,550.7 6,550.712 Electric Distribution Engineering and Planning FZ 17,477.6 18,466.8 989.313 Poles – Intrusive Inspection/Test and Treat Program GA 13,930.1 36,355.5 22,425.414 Operate and Maintain Substations GC 29,890.5 50,571.6 20,681.115 Electric Distribution Mapping GE 6,031.6 16,688.1 10,656.516 Electric Distribution Operational Technology HG 11,158.6 7,249.9 (3,908.7)17 Vegetation Management Balancing Account HN (a) 252,197.3 682,524.8 430,327.518 Distribution Automation & Protection Support HX 2,099.7 2,452.2 352.519 Perform Gas Meter Maintenance HY 0.0 558.0 558.020 Electric Distribution Major Emergency IF 34,647.9 146,946.2 112,298.321 Various Balancing and Memorandum Accounts IG (a) 350,616.5 945,649.4 595,032.922 Streetlight Support IS 1,107.8 664.5 (443.3)23 Collect Revenue IU 0.0 1,855.6 1,855.624 Maintain IT Applications & Infrastructure JV 5,361.2 2,300.6 (3,060.6)25 Preventive Maintenance and Equipment Repair,
Overhead (OH)KA 33,279.0 107,738.1 74,459.1
26 Preventive Maintenance and Equipment Repair,Underground (UG)
KB 12,835.6 20,421.2 7,585.7
27 Preventive Maintenance and Equipment Repair, Network
KC 4,130.7 4,560.9 430.228 Operational Management OM 7,428.7 19,297.9 11,869.229 Operational Support OS 22,951.6 18,431.5 (4,520.1)30 Total 1,033,834.8 2,643,983.8 1,610,149.0
Notes: (a) The 2020 GRC adopted amounts for PG&E's Vegetation Management Program, including both Routine VegetationManagement (MWC HN) and Enhanced Vegetation Management (MAT IGJ), were adopted in MWC HN. In this reportPG&E is showing the imputed adopted portion to where the activity is recorded.

3-3
TABLE 3-2 ELECTRIC DISTRIBUTION 2021 CAPITAL COMPARISON SUMMARY
(THOUSANDS OF DOLLARS)
Line No. MWC Description MWC
2021 Imputed Adopted Costs
(A)
2021 Actual Costs
(B)
2021 Cost Difference
(B-A)1 Tools & Equipment 05 7,815.6 6,573.7 (1,241.9)2 Electric Distribution Line and Equipment Capacity 06 91,882.8 157,046.1 65,163.33 Electric Distribution Install/Replace Overhead Poles 07 109,236.7 414,827.4 305,590.84 Electric Distribution Overhead Asset Replacement 08 876,247.7 349,304.5 (526,943.2)5 Electric Distribution Automation & Protection 09 35,557.2 33,098.7 (2,458.5)6 Electric Distribution Work Requested by Others (WRO)
General10 142,156.7 170,163.8 28,007.0
7 Electric Distribution Customer Connects 16 463,208.0 622,050.1 158,842.08 Electric Distribution Routine Emergency 17 188,416.2 274,632.6 86,216.49 Miscellaneous Capital and Emergency Preparedness &
Response21 (30,126.1) 29,034.0 59,160.1
10 Corporate Real Estate 23 0.0 266.5 266.511 Install New Electric Meters 25 0.0 28,508.2 28,508.212 Electric Distribution Preventive Maintenance Overhead 2A 198,580.5 430,241.5 231,661.013 Electric Distribution Preventive Maintenance
Underground2B 59,397.3 83,906.3 24,509.0
14 Electric Distribution Preventive Maintenance Network 2C 20,019.2 21,820.9 1,801.715 Build IT Applications & Infrastructure 2F 17,393.8 66,989.1 49,595.416 Electric Distribution WRO Rule 20A 30 34,312.0 37,818.2 3,506.217 Energy Storage Capital 3R 0.0 284.0 284.018 Electric Distribution Substation Capacity 46 58,316.9 54,215.9 (4,101.0)19 Electric Distribution Substation Replace Other
Equipment48 53,475.0 69,653.4 16,178.4
20 Electric Distribution Reliability Circuit/Zone 49 35,419.4 88,129.7 52,710.421 Electric Distribution Substation Transformer
Replacements54 5,660.1 37,733.7 32,073.6
22 Electric Distribution Underground (UG) AssetReplacements
56 101,386.5 106,439.6 5,053.0
23 Electric Distribution Substation Safety and Security 58 4,733.1 3,121.8 (1,611.3)24 Electric Distribution Substation Emergency
Replacement59 64,283.6 109,649.7 45,366.1
25 Electric Operations Control Center Facility andOperations Technology
63 32,251.7 69,014.4 36,762.6
26 Install New Gas Meters 74 0.0 39,771.7 39,771.727 Electric Distribution Major Emergency 95 56,556.5 159,627.3 103,070.828 Total 2,626,180.4 3,463,922.6 837,742.3

3-4
C. Comparison by MAT Code for Safety, Reliability, and Maintenance Work Tables 1
TABLE 3-3 ELECTRIC DISTRIBUTION 2021 EXPENSE COMPARISON BY MAT CODE FOR SAFETY, RELIABILITY, AND MAINTENANCE WORK
(THOUSANDS OF DOLLARS)
Line No. MWC MWC Name MAT MAT Name RAMP Risk Name
RAMP Control/Mitigation Name
2020 GRC Testimony Reference
2021 Imputed Adopted Costs
(A) 2021 Actual Costs
(B)
2021 Cost Difference
(B-A)
2021 Cost Percent Change
(%)(B-A)/A
2021 Imputed Adopted
Units (C)
2021 Actual Units(D)
2021 Unit Difference
(D-C)
2021 Unit Percent Change
(%)(D-C)/C
Spending Variance
Explanation Required
(Y/N)
Percentage Variance
Explanation Required
(Y/N)
Unit Variance Explanation
Required (Y/N) Cost Variance Explanation Unit Variance Explanation
1 AB Support and EP&R # Not assigned SRM Total SRM Total 4-18 $ 18,212.7 $ 98,057.4 $ 79,844.6 438.4% N/A N/A N/A N/A YES YES N/A Program expenses exceeded imputed regulatory values due to higher miscellaneous recurring costs and miscellaneous contract and consulting costs from incremental work beyond historic spend (e.g. Electric Asset Excellence Program and PAS 55 certification), higher Applied Technology Services (ATS) spend because of special projects related to wildfire risk, and the expansion of functions and headcount in the Regulatory Compliance and Quality Assurance group. In addition, costs for the CWSP PMO were higher than forecasted, and there Post 2020 GRC Mitigation costs for management support and quality assurance for wildfire risk mitigation work not forecast in the 2020 GRC.
N/A
2 AB Support and EP&R # Not assigned RAMP Risk: DOCP Mitigation
M3 - Additional Public Awareness Outreach
4-18 $ 44.7 $ - $ (44.7) -100.0% N/A N/A N/A N/A N/A N/A N/A N/A N/A
3 AB Support and EP&R # Not assigned RAMP Risk: DOCP Control
C1 - Public Awareness Programs
4-18 $ 271.9 $ 260.0 $ (11.9) -4.4% N/A N/A N/A N/A N/A N/A N/A N/A N/A
4 AB Support and EP&R # Not assigned RAMP Risk: WF Mitigation
M12 - Wildfire System Hardening
4-9 $ - $ 89.3 $ 89.3 100.0% N/A N/A N/A N/A N/A N/A N/A N/A N/A
5 AB Support and EP&R # Not assigned RAMP Risk: WF Mitigation
M28 - CWSP Program Management Office
4-18 $ 8,480.7 $ 15,818.4 $ 7,337.7 86.5% N/A N/A N/A N/A N/A N/A N/A N/A N/A
6 AB Support and EP&R # Not assigned RAMP Risk: WF Mitigation
Post 2020 GRC Mitigations N/A $ - $ 46,420.6 $ 46,420.6 100.0% N/A N/A N/A N/A N/A N/A N/A N/A N/A
7 AB Support and EP&R # Not assigned SRM (Non-RAMP) SRM (Non-RAMP) 4-18 $ 9,415.4 $ 35,469.1 $ 26,053.7 276.7% N/A N/A N/A N/A N/A N/A N/A N/A N/A
8 AB Support and EP&R AB6 EP&R Expense SRM Total SRM Total 4-3 $ 50,452.7 $ 112,670.3 $ 62,217.6 123.3% 180 153 (27) -15.0% YES YES NO Program expenses exceeded imputed regulatory values due to PSPS events. The majority of the PSPS program costs were not forecast in the 2020 GRC filing since it was a new program and lacked sufficient detail to forecast at the time of filing. The 2020 GRC forecast and 2021 imputed amount included only the customer outreach component of the PSPS program.
Below variance threshold
9 AB Support and EP&R AB6 EP&R Expense RAMP Risk: WF Mitigation
M13 - Public Safety Power Shutoff
4-3 $ 6,305.8 $ 70,792.8 $ 64,486.9 1022.7% N/A N/A N/A N/A N/A N/A N/A N/A N/A
10 AB Support and EP&R AB6 EP&R Expense RAMP Risk: WF Mitigation
M18 - Wildfire Safety Operations Center
4-3 $ 6,211.0 $ 4,847.4 $ (1,363.6) -22.0% N/A N/A N/A N/A N/A N/A N/A N/A N/A
11 AB Support and EP&R AB6 EP&R Expense RAMP Risk: WF Mitigation
M19 - Expanded Weather Station Deployment
4-3 $ 577.9 $ 145.2 $ (432.7) -74.9% N/A N/A N/A N/A N/A N/A N/A N/A N/A
12 AB Support and EP&R AB6 EP&R Expense RAMP Risk: WF Mitigation
M20 - SOPP Model Automation
4-3 $ 302.7 $ 1,976.9 $ 1,674.2 553.1% N/A N/A N/A N/A N/A N/A N/A N/A N/A
13 AB Support and EP&R AB6 EP&R Expense RAMP Risk: WF Mitigation
M21 - Advanced Fire Modeling 4-3 $ 1,194.3 $ 4,833.2 $ 3,638.8 304.7% N/A N/A N/A N/A N/A N/A N/A N/A N/A
14 AB Support and EP&R AB6 EP&R Expense RAMP Risk: WF Mitigation
M22 - Wildfire Cameras 4-3 $ 14,860.6 $ 8,050.8 $ (6,809.8) -45.8% 180 153 (27) -15.0% N/A N/A N/A N/A N/A
15 AB Support and EP&R AB6 EP&R Expense RAMP Risk: WF Mitigation
M23 - Satellite Fire Detection System
4-3 $ 302.7 $ 195.2 $ (107.5) -35.5% N/A N/A N/A N/A N/A N/A N/A N/A N/A
16 AB Support and EP&R AB6 EP&R Expense RAMP Risk: WF Mitigation
M24 - Enhanced Wire Down Detection
4-3 $ 220.2 $ - $ (220.2) -100.0% N/A N/A N/A N/A N/A N/A N/A N/A N/A
17 AB Support and EP&R AB6 EP&R Expense RAMP Risk: WF Mitigation
M25 - Wildfire and Infrastructure Protection Teams
4-3 $ 13,788.3 $ 17,112.0 $ 3,323.7 24.1% N/A N/A N/A N/A N/A N/A N/A N/A N/A
18 AB Support and EP&R AB6 EP&R Expense RAMP Risk: WF Mitigation
Post 2020 GRC Mitigations N/A $ - $ 52.1 $ 52.1 100.0% N/A N/A N/A N/A N/A N/A N/A N/A N/A

3-5
TABLE 3-3 ELECTRIC DISTRIBUTION 2021 EXPENSE COMPARISON BY MAT CODE FOR SAFETY, RELIABILITY, AND MAINTENANCE WORK
(THOUSANDS OF DOLLARS) (CONTINUED)
Line No. MWC MWC Name MAT MAT Name RAMP Risk Name
RAMP Control/Mitigation Name
2020 GRC Testimony Reference
2021 Imputed Adopted Costs
(A) 2021 Actual Costs
(B)
2021 Cost Difference
(B-A)
2021 Cost Percent Change
(%)(B-A)/A
2021 Imputed Adopted
Units (C)
2021 Actual Units(D)
2021 Unit Difference
(D-C)
2021 Unit Percent Change
(%)(D-C)/C
Spending Variance
Explanation Required
(Y/N)
Percentage Variance
Explanation Required
(Y/N)
Unit Variance Explanation
Required (Y/N) Cost Variance Explanation Unit Variance Explanation
19 AB Support and EP&R AB6 EP&R Expense SRM (Non-RAMP) SRM (Non-RAMP) 4-3 $ 6,689.2 $ 4,664.7 $ (2,024.5) -30.3% N/A N/A N/A N/A N/A N/A N/A N/A N/A
20 AR Read & Investigate Meters
N/A Not assigned SRM Total (Non-RAMP)
SRM Total (Non-RAMP) 6-6 $ - $ 9,398.0 $ 9,398.0 100.0% N/A N/A N/A N/A NO YES N/A Program expenses exceeded imputed regulatory values due to transfer of this program from Customer Care to Electric Distribution in 2018.
N/A
21 BA Electric Distribution Operation Activities
# Not assigned SRM Total (Non-RAMP)
SRM Total (Non-RAMP) 4-5 $ - $ 0.2 $ 0.2 100.0% N/A N/A N/A N/A NO NO N/A Below variance threshold N/A
22 BA Electric Distribution Operation Activities
BAF General Operations SRM Total SRM Total 4-5 $ 21,993.4 $ 29,929.4 $ 7,936.1 36.1% N/A N/A N/A N/A NO YES N/A Program expenses exceeded imputed regulatory values due to increased workload from compliance, system hardening and new business work, and wildfire mitigation work to support EPSS.
N/A
23 BA Electric Distribution Operation Activities
BAF General Operations RAMP Risk: WF Mitigation
Post 2020 GRC Mitigations N/A $ - $ 5,660.5 $ 5,660.5 100.0% N/A N/A N/A N/A NO NO N/A N/A N/A
24 BA Electric Distribution Operation Activities
BAF General Operations SRM (Non-RAMP) SRM (Non-RAMP) 4-5 $ 21,993.4 $ 24,268.9 $ 2,275.6 10.3% N/A N/A N/A N/A NO NO N/A N/A N/A
25 BA Electric Distribution Operation Activities
BAH FLISR Maintenance SRM Total (Non-RAMP)
SRM Total (Non-RAMP) 4-5 $ - $ 3,522.3 $ 3,522.3 100.0% N/A N/A N/A N/A NO NO N/A Below variance threshold N/A
26 BC Perform Reimbursable Work for Others
# Not assigned SRM Total (Non-RAMP)
SRM Total (Non-RAMP) 4-5 $ - $ 86.3 $ 86.3 100.0% N/A N/A N/A N/A NO NO N/A Below variance threshold N/A
27 BF Electric Distribution Patrols and Inspections
BF3 UG BART Cable Test/Insp
SRM Total (Non-RAMP)
SRM Total (Non-RAMP) 4-6 $ 40.9 $ 20.2 $ (20.7) -50.7% N/A N/A N/A N/A NO NO N/A Below variance threshold N/A
28 BF Electric Distribution Patrols and Inspections
BF4 UG Auto Transfer Switch Test/Insp
SRM Total (Non-RAMP)
SRM Total (Non-RAMP) 4-6 $ 100.5 $ 67.0 $ (33.5) -33.3% N/A N/A N/A N/A NO NO N/A Below variance threshold N/A
29 BF Electric Distribution Patrols and Inspections
BFA OH Poles Patrolled SRM Total SRM Total 4-6 $ 4,931.0 $ 6,079.2 $ 1,148.2 23.3% 1,502,599 1,328,943 (173,656) -11.6% NO NO NO Below variance threshold Below variance threshold
30 BF Electric Distribution Patrols and Inspections
BFA OH Poles Patrolled RAMP Risk: WF Control / DOCP Control
C1 - OH Patrols and Inspections / C6 - OH Patrols and Inspections
4-6 $ 4,931.0 $ 6,079.2 $ 1,148.1 23.3% 1,502,599 1,328,943 (173,656) -11.6% N/A N/A N/A N/A N/A
31 BF Electric Distribution Patrols and Inspections
BFB OH Poles Inspected SRM Total SRM Total 4-6 $ 13,637.0 $ 95,920.6 $ 82,283.6 603.4% 493,600 988,718 495,118 100.3% YES YES YES Program expenses exceeded imputed regulatory values due to increased number and cost of inspections, driven by new enhanced inspection process, and increased inspections in the high fire threat areas.
Actual units exceeded imputed regulatory units due to increased number of inspections, driven by new enhanced inspection process, and increased inspections in the high fire threat areas.
32 BF Electric Distribution Patrols and Inspections
BFB OH Poles Inspected RAMP Risk: WF Control / DOCP Control
C1 - OH Patrols and Inspections / C6 - OH Patrols and Inspections
4-6 $ 13,637.0 $ 95,920.6 $ 82,283.6 603.4% 493,600 988,718 495,118 100.3% N/A N/A N/A N/A N/A
33 BF Electric Distribution Patrols and Inspections
BFC OH Infrared Inspections
SRM Total SRM Total 4-6 $ 2,249.4 $ 2,118.1 $ (131.3) -5.8% N/A N/A N/A N/A NO NO N/A Below variance threshold N/A
34 BF Electric Distribution Patrols and Inspections
BFC OH Infrared Inspections
RAMP Risk: WF Control / DOCP Control
C1 - OH Patrols and Inspections / C7 - Overhead Infrared Inspections
4-6 $ 2,249.4 $ 2,118.1 $ (131.3) -5.8% N/A N/A N/A N/A N/A N/A N/A N/A N/A
35 BF Electric Distribution Patrols and Inspections
BFD UG Enclosures Patrolled
SRM Total (Non-RAMP)
SRM Total (Non-RAMP) 4-6 $ 1,012.0 $ 2,447.3 $ 1,435.3 141.8% 184,104 260,741 76,637 41.6% NO NO YES Below variance threshold Actual units exceeded imputed regulatory units due to increased number of patrols, driven by new requirements in the high fire threat areas.
36 BF Electric Distribution Patrols and Inspections
BFE UG Infrared Inspections
SRM Total (Non-RAMP)
SRM Total (Non-RAMP) 4-6 $ 5,379.1 $ 12,968.7 $ 7,589.6 141.1% 60,956 179,574 118,618 194.6% NO YES YES Program expenses exceeded imputed regulatory values due to decision to move padmount equipment back to a 3 year inspection cycle instead of 5 year per GO 165.
Actual units exceeded imputed regulatory units due to increased number of inspections, driven by padmount equipment moved back to a 3 year inspection cycle instead of 5 year cycle per GO 165.
37 BF Electric Distribution Patrols and Inspections
BFF UG Line Equipment Insp/Test
SRM Total (Non-RAMP)
SRM Total (Non-RAMP) 4-6 $ 574.0 $ 557.7 $ (16.2) -2.8% 2,415 2,254 (161) -6.7% NO NO NO Below variance threshold Below variance threshold
38 BF Electric Distribution Patrols and Inspections
BFG OH Line Equipment Insp/Test
SRM Total SRM Total 4-6 $ 2,816.0 $ 2,836.1 $ 20.1 0.7% 24,288 24,424 136 0.6% NO NO NO Below variance threshold Below variance threshold

3-6
TABLE 3-3 ELECTRIC DISTRIBUTION 2021 EXPENSE COMPARISON BY MAT CODE FOR SAFETY, RELIABILITY, AND MAINTENANCE WORK
(THOUSANDS OF DOLLARS) (CONTINUED)
Line No. MWC MWC Name MAT MAT Name RAMP Risk Name
RAMP Control/Mitigation Name
2020 GRC Testimony Reference
2021 Imputed Adopted Costs
(A) 2021 Actual Costs
(B)
2021 Cost Difference
(B-A)
2021 Cost Percent Change
(%)(B-A)/A
2021 Imputed Adopted
Units (C)
2021 Actual Units(D)
2021 Unit Difference
(D-C)
2021 Unit Percent Change
(%)(D-C)/C
Spending Variance
Explanation Required
(Y/N)
Percentage Variance
Explanation Required
(Y/N)
Unit Variance Explanation
Required (Y/N) Cost Variance Explanation Unit Variance Explanation
39 BF Electric Distribution Patrols and Inspections
BFG OH Line Equipment Insp/Test
RAMP Risk: WF Control / DOCP Control
C1 - OH Patrols and Inspections / C6 - OH Patrols and Inspections
4-6 $ 2,816.0 $ 2,836.1 $ 20.1 0.7% 24,288 24,424 136 0.6% N/A N/A N/A N/A N/A
40 BF Electric Distribution Patrols and Inspections
BFH Inspection Projects SRM Total SRM Total 4-6 $ 2,797.4 $ 27,309.1 $ 24,511.7 876.2% N/A N/A N/A N/A YES YES N/A Program expenses exceeded imputed regulatory values due to increased contractor spend for inspections, and enhanced inspections support costs.
N/A
41 BF Electric Distribution Patrols and Inspections
BFH Inspection Projects RAMP Risk: WF Control / DOCP Control
C1 - OH Patrols and Inspections / C6 - OH Patrols and Inspections
4-6 $ 2,797.4 $ 27,309.1 $ 24,511.7 876.2% N/A N/A N/A N/A N/A N/A N/A N/A N/A
42 BF Electric Distribution Patrols and Inspections
BFJ OH Patrol ORT Post Outage
SRM Total (Non-RAMP)
SRM Total (Non-RAMP) 4-6 $ 432.0 $ 128.2 $ (303.8) -70.3% N/A N/A N/A N/A NO NO N/A Below variance threshold N/A
43 BF Electric Distribution Patrols and Inspections
BFL SB WF Patrols SRM Total SRM Total 4-6 $ - $ 0.2 $ 0.2 100.0% N/A N/A N/A N/A NO NO N/A Below variance threshold N/A
44 BF Electric Distribution Patrols and Inspections
BFL SB WF Patrols RAMP Risk: WF Control / DOCP Control
C1 - OH Patrols and Inspections / C6 - OH Patrols and Inspections
4-6 $ - $ 0.2 $ 0.2 100.0% N/A N/A N/A N/A N/A N/A N/A N/A N/A
45 BH Electric Distribution Routine Emergency
N/A Not assigned SRM Total SRM Total 4-6 $ 58,922.5 $ 92,047.0 $ 33,124.4 56.2% N/A N/A N/A N/A YES YES N/A Program expenses exceeded imputed regulatory values due to higher than forecast volume of emergency events, driving higher overall contract spend, higher estimating over head costs, and higher labor charges. Additional expense include costs for EPSS post-outage patrols.
N/A
46 BH Electric Distribution Routine Emergency
N/A Not assigned RAMP Risk: WF Mitigation
Post 2020 GRC Mitigations N/A $ - $ 12,657.7 $ 12,657.7 100.0% N/A N/A N/A N/A N/A N/A N/A N/A N/A
47 BH Electric Distribution Routine Emergency
N/A Not assigned SRM (Non-RAMP) SRM (Non-RAMP) 4-6 $ 58,922.5 $ 79,389.2 $ 20,466.7 34.7% N/A N/A N/A N/A N/A N/A N/A N/A N/A
48 BK Maintenance of Other Equip
BKA Line Equipment Overhauls (Emeryville)
SRM Total (Non-RAMP)
SRM Total (Non-RAMP) 4-6 $ 1,235.6 $ 1,800.2 $ 564.6 45.7% 1,175 971 (204) -17.4% NO NO NO Below variance threshold Below variance threshold
49 BK Maintenance of Other Equip
BKJ Line Equipment Overhauls (Division Up/Down Labor) (Emeryville)
SRM Total (Non-RAMP)
SRM Total (Non-RAMP) 4-6 $ 408.2 $ 177.9 $ (230.4) -56.4% 89 17 (72) -80.9% NO NO YES Below variance threshold Actual units were lower than imputed regulatory units due to a combination of demand from the field for overhauled equipment, manufacturer availability, and work priorities. Field demand for Regulators was low and new Regulators were available for purchase. Field demand for transformers was high and manufacturer availability was negatively impacted by supply chain issues.
50 BK Maintenance of Other Equip
BKK Equip Warranty Repair (Emeryville)
SRM Total (Non-RAMP)
SRM Total (Non-RAMP) 4-6 $ 63.2 $ 120.3 $ 57.1 90.4% N/A N/A N/A N/A NO NO N/A Below variance threshold N/A
51 DD Customer Field Service Work
# Not assigned SRM Total (Non-RAMP)
SRM Total (Non-RAMP) 4-5 $ 5,974.5 $ 6,488.0 $ 513.5 8.6% N/A N/A N/A N/A NO NO N/A Below variance threshold N/A
52 DD Customer Field Service Work
DDC Electric Start/Stop SRM Total (Non-RAMP)
SRM Total (Non-RAMP) 4-5 $ - $ 349.2 $ 349.2 100.0% N/A N/A N/A N/A NO NO N/A Below variance threshold N/A
53 DD Customer Field Service Work
DDH Electric Trouble Customer Equipment
SRM Total (Non-RAMP)
SRM Total (Non-RAMP) 4-5 $ 5,941.6 $ 5,386.2 $ (555.4) -9.3% 47,535 29,982 (17,553) -36.9% NO NO YES Below variance threshold Actual units were lower than imputed regulatory units due to fewer outages caused by customer equipment in 2021. This is demand driven work and has many variables (customers equipment condition, business activity, weather, activation of emergency center), and PG&E responded to outages as they occurred.
54 DD Customer Field Service Work
DDJ Swing Service, Disconnects/Reconnects
SRM Total (Non-RAMP)
SRM Total (Non-RAMP) 4-5 $ 9,081.1 $ 13,029.9 $ 3,948.8 43.5% 80,818 86,950 6,132 7.6% NO NO NO Below variance threshold Below variance threshold
55 EY Change/Maintenance Used Electric Meter
N/A Not assigned SRM Total (Non-RAMP)
SRM Total (Non-RAMP) 6-6 $ - $ 6,550.7 $ 6,550.7 100.0% N/A N/A N/A N/A NO YES N/A Program expenses exceeded imputed regulatory values due to transfer of this program from Customer Care to Electric Distribution in 2018.
N/A

3-7
TABLE 3-3 ELECTRIC DISTRIBUTION 2021 EXPENSE COMPARISON BY MAT CODE FOR SAFETY, RELIABILITY, AND MAINTENANCE WORK
(THOUSANDS OF DOLLARS) (CONTINUED)
Line No. MWC MWC Name MAT MAT Name RAMP Risk Name
RAMP Control/Mitigation Name
2020 GRC Testimony Reference
2021 Imputed Adopted Costs
(A) 2021 Actual Costs
(B)
2021 Cost Difference
(B-A)
2021 Cost Percent Change
(%)(B-A)/A
2021 Imputed Adopted
Units (C)
2021 Actual Units(D)
2021 Unit Difference
(D-C)
2021 Unit Percent Change
(%)(D-C)/C
Spending Variance
Explanation Required
(Y/N)
Percentage Variance
Explanation Required
(Y/N)
Unit Variance Explanation
Required (Y/N) Cost Variance Explanation Unit Variance Explanation
56 FZ Electric Distribution Engineering and Planning
FZA General Engineering SRM Total SRM Total 4-14 $ 14,837.3 $ 13,567.7 $ (1,269.6) -8.6% N/A N/A N/A N/A NO NO N/A Below variance threshold N/A
57 FZ Electric Distribution Engineering and Planning
FZA General Engineering RAMP Risk: DOCP Control
C10 - Annual Protection Reviews
4-14 $ 14,837.3 $ 11,239.7 $ (3,597.6) -24.2% N/A N/A N/A N/A N/A N/A N/A N/A N/A
58 FZ Electric Distribution Engineering and Planning
FZA General Engineering RAMP Risk: WF Mitigation
Post 2020 GRC Mitigations N/A $ - $ 2,328.0 $ 2,328.0 100.0% N/A N/A N/A N/A N/A N/A N/A N/A N/A
59 FZ Electric Distribution Engineering and Planning
FZB Voltage Complaints Investigations
SRM Total (Non-RAMP)
SRM Total (Non-RAMP) 4-14 $ 607.0 $ 1,610.8 $ 1,003.8 165.4% N/A N/A N/A N/A NO NO N/A Below variance threshold N/A
60 FZ Electric Distribution Engineering and Planning
FZC Transformer Reports Manage
SRM Total (Non-RAMP)
SRM Total (Non-RAMP) 4-14 $ 14.4 $ 37.1 $ 22.6 156.6% N/A N/A N/A N/A NO NO N/A Below variance threshold N/A
61 FZ Electric Distribution Engineering and Planning
FZD Field Work Plan SRM Total (Non-RAMP)
SRM Total (Non-RAMP) 4-14 $ 591.1 $ 115.3 $ (475.8) -80.5% N/A N/A N/A N/A NO NO N/A Below variance threshold N/A
62 FZ Electric Distribution Engineering and Planning
FZE Troublemen Field Work
SRM Total SRM Total 4-14 $ 1,427.7 $ 3,136.0 $ 1,708.3 119.7% N/A N/A N/A N/A NO NO N/A Below variance threshold N/A
63 FZ Electric Distribution Engineering and Planning
FZE Troublemen Field Work
RAMP Risk: WF Mitigation
Post 2020 GRC Mitigations N/A $ - $ 650.6 $ 650.6 100.0% N/A N/A N/A N/A NO NO N/A N/A N/A
64 FZ Electric Distribution Engineering and Planning
FZE Troublemen Field Work
SRM (Non-RAMP) SRM (Non-RAMP) 4-14 $ 1,427.7 $ 2,485.4 $ 1,057.7 74.1% N/A N/A N/A N/A NO NO N/A N/A N/A
65 GA Poles – Intrusive Inspection/Test and Treat Program
# Not assigned SRM Total (Non-RAMP)
SRM Total (Non-RAMP) 4-8 $ (4,294.3) $ (5,301.0) $ (1,006.6) 23.4% N/A N/A N/A N/A NO NO N/A Below variance threshold N/A
66 GA Poles – Intrusive Inspection/Test and Treat Program
GAA Intrusive Inspection Program
SRM Total SRM Total 4-8 $ 12,751.8 $ 17,628.5 $ 4,876.8 38.2% 246,252 217,211 (29,041) -11.8% NO NO NO Below variance threshold Below variance threshold
67 GA Poles – Intrusive Inspection/Test and Treat Program
GAA Intrusive Inspection Program
RAMP Risk: WF Control
C9 - Deteriorated Pole Replacement
4-8 $ 12,751.8 $ 17,628.5 $ 4,876.8 38.2% 246,252 217,211 (29,041) -11.8% NO NO NO N/A N/A
68 GA Poles – Intrusive Inspection/Test and Treat Program
GAB Pole Joint Util Maint Reimbursement
SRM Total (Non-RAMP)
SRM Total (Non-RAMP) 4-8 $ - $ 84.2 $ 84.2 100.0% N/A N/A N/A N/A NO NO N/A Below variance threshold N/A
69 GA Poles – Intrusive Inspection/Test and Treat Program
GAC Pole Analyze Loading SRM Total (Non-RAMP)
SRM Total (Non-RAMP) 4-8 $ - $ 20,874.1 $ 20,874.1 100.0% N/A N/A N/A N/A YES YES N/A Program expenses exceeded imputed regulatory values due to the implementation of new pole loading program not included in the 2020 GRC, which incorporates wind loading into pole loading calculations.
N/A
70 GA Poles – Intrusive Inspection/Test and Treat Program
GAD Pole Restoration Program
SRM Total (Non-RAMP)
SRM Total (Non-RAMP) 4-8 $ 5,026.7 $ 2,800.1 $ (2,226.5) -44.3% 5,464 3,371 (2,093) -38.3% NO NO YES Below variance threshold Actual units were lower than imputed regulatory units due to pole reinforcements being demand-driven work. In 2021, PG&E identified less poles to be reinforced in 2021 than originally forecast.
71 GA Poles – Intrusive Inspection/Test and Treat Program
GAF Telco Engr Review Non-Reimbursed
SRM Total (Non-RAMP)
SRM Total (Non-RAMP) 4-8 $ 167.3 $ - $ (167.3) -100.0% N/A N/A N/A N/A NO NO N/A Below variance threshold N/A
72 GA Poles – Intrusive Inspection/Test and Treat Program
GAH Pole Joint Util Maint Non-Reim
SRM Total (Non-RAMP)
SRM Total (Non-RAMP) 4-8 $ 278.8 $ 278.2 $ (0.6) -0.2% N/A N/A N/A N/A NO NO N/A Below variance threshold N/A
73 GC Operate and Maintain Substations
GC1 ED Substation Engineering Maintenance Support
SRM Total (Non-RAMP)
SRM Total (Non-RAMP) 4-12 $ 4,610.3 $ 5,801.8 $ 1,191.5 25.8% N/A N/A N/A N/A NO NO N/A Below variance threshold N/A
74 GC Operate and Maintain Substations
GC2 ED Substation Major Emergency Corrective Maintenance
SRM Total (Non-RAMP)
SRM Total (Non-RAMP) 4-12 $ 4,825.0 $ 5,351.6 $ 526.7 10.9% N/A N/A N/A N/A NO NO N/A Below variance threshold N/A
75 GC Operate and Maintain Substations
GC5 ED Substation Major Emergency Corrective Maintenance
SRM Total (Non-RAMP)
SRM Total (Non-RAMP) 4-12 $ - $ 3,251.8 $ 3,251.8 100.0% N/A N/A N/A N/A NO NO N/A Below variance threshold N/A

3-8
TABLE 3-3 ELECTRIC DISTRIBUTION 2021 EXPENSE COMPARISON BY MAT CODE FOR SAFETY, RELIABILITY, AND MAINTENANCE WORK
(THOUSANDS OF DOLLARS) (CONTINUED)
Line No. MWC MWC Name MAT MAT Name RAMP Risk Name
RAMP Control/Mitigation Name
2020 GRC Testimony Reference
2021 Imputed Adopted Costs
(A) 2021 Actual Costs
(B)
2021 Cost Difference
(B-A)
2021 Cost Percent Change
(%)(B-A)/A
2021 Imputed Adopted
Units (C)
2021 Actual Units(D)
2021 Unit Difference
(D-C)
2021 Unit Percent Change
(%)(D-C)/C
Spending Variance
Explanation Required
(Y/N)
Percentage Variance
Explanation Required
(Y/N)
Unit Variance Explanation
Required (Y/N) Cost Variance Explanation Unit Variance Explanation
76 GC Operate and Maintain Substations
GCA ED Substation: TXfmr - Preventive Maintenance
SRM Total (Non-RAMP)
SRM Total (Non-RAMP) 4-12 $ 901.4 $ 928.3 $ 27.0 3.0% 4,311 4,302 (9) -0.2% NO NO NO Below variance threshold Below variance threshold
77 GC Operate and Maintain Substations
GCB ED Substation: Breaker - Preventive Maintenance
SRM Total (Non-RAMP)
SRM Total (Non-RAMP) 4-12 $ 761.6 $ 780.7 $ 19.0 2.5% 1,791 1,279 (512) -28.6% NO NO YES Below variance threshold Actual units were lower than imputed regulatory units due to fewer breaker units requiring preventive maintenance. The GCB preventive maintenance tags are dispatched based on static counter operation data. When counter operations are recorded in SAP, the exercise requirement detailed in the maintenance standard is satisfied.
78 GC Operate and Maintain Substations
GCC ED Substation: Relay - Preventive Maintenance
SRM Total (Non-RAMP)
SRM Total (Non-RAMP) 4-12 $ 2,221.1 $ 2,509.6 $ 288.6 13.0% 1,177 1,213 36 3.1% NO NO NO Below variance threshold Below variance threshold
79 GC Operate and Maintain Substations
GCD ED Substation: Inspections
SRM Total (Non-RAMP)
SRM Total (Non-RAMP) 4-12 $ 2,624.1 $ 3,159.7 $ 535.6 20.4% 8,002 6,916 (1,086) -13.6% NO NO NO Below variance threshold Below variance threshold
80 GC Operate and Maintain Substations
GCE ED Substation: General station Preventive Maintenance
SRM Total (Non-RAMP)
SRM Total (Non-RAMP) 4-12 $ 448.4 $ 547.4 $ 99.0 22.1% 1,014 1,460 446 44.0% NO NO YES Below variance threshold Actual units exceeded imputed regulatory units primarily driven by an increase in infrared inspections triggered by condition.
81 GC Operate and Maintain Substations
GCF ED Substation: Batteries - Preventive Maintenance
SRM Total (Non-RAMP)
SRM Total (Non-RAMP) 4-12 $ 305.9 $ 468.1 $ 162.3 53.1% 646 622 (24) -3.7% NO NO NO Below variance threshold Below variance threshold
82 GC Operate and Maintain Substations
GCG ED Substation Vegetation Management
SRM Total SRM Total 4-12 $ 1,518.0 $ 9,733.7 $ 8,215.8 541.2% N/A N/A N/A N/A NO YES N/A Program expenses exceeded imputed regulatory values due to an expansion of vegetation management activities to achieve defensible space and other clearance activities in HFTD areas.
N/A
83 GC Operate and Maintain Substations
GCG ED Substation Vegetation Management
RAMP Risk: WF Control / DOCP Control
C2 - Vegetation Management / C2 - Vegetation Management
4-12 $ 1,518.0 $ 9,733.7 $ 8,215.8 541.2% N/A N/A N/A N/A N/A N/A N/A N/A N/A
84 GC Operate and Maintain Substations
GCH ED Substation Building Maintenance
SRM Total (Non-RAMP)
SRM Total (Non-RAMP) 4-12 $ 976.1 $ 2,684.4 $ 1,708.3 175.0% N/A N/A N/A N/A NO NO N/A Below variance threshold N/A
85 GC Operate and Maintain Substations
GCI ED Substation: Switches Preventive Maintenance
SRM Total (Non-RAMP)
SRM Total (Non-RAMP) 4-12 $ 62.9 $ 134.5 $ 71.7 114.0% 91 101 10 11.0% NO NO NO Below variance threshold Below variance threshold
86 GC Operate and Maintain Substations
GCJ ED Substation: Corrective (T80)
SRM Total (Non-RAMP)
SRM Total (Non-RAMP) 4-12 $ 7,656.4 $ 11,998.4 $ 4,342.0 56.7% 7,469 5,442 (2,027) -27.1% NO NO YES Below variance threshold Actual units were lower than imputed regulatory units due to fewer issues identified than planned in substations. This reduction is in part attributed to corrective repairs made because of Enhanced Inspection findings under MAT code GC2 that would have been identified under GCJ. In addition, there is overall variability in corrective work.
87 GC Operate and Maintain Substations
GCM ED Substation Breaker Mechanism Services
SRM Total (Non-RAMP)
SRM Total (Non-RAMP) 4-12 $ 844.0 $ 1,594.8 $ 750.8 89.0% 441 748 307 69.6% NO NO YES Below variance threshold Actual units exceeded imputed regulatory units due to additional condition driven mechanism services.
88 GC Operate and Maintain Substations
GCO ED Substation Transformer Overhaul Inspections
SRM Total (Non-RAMP)
SRM Total (Non-RAMP) 4-12 $ 1,522.8 $ 891.8 $ (631.0) -41.4% 160 74 (86) -53.8% NO NO YES Below variance threshold Actual units were lower than imputed regulatory units due to fewer transformer overhauls triggered based on condition.
89 GC Operate and Maintain Substations
GCS ED Substation CKSW MOAS Mechanism Services
SRM Total (Non-RAMP)
SRM Total (Non-RAMP) 4-12 $ 119.2 $ 221.4 $ 102.2 85.7% 49 79 30 61.2% NO NO YES Below variance threshold Actual units exceeded imputed regulatory units due to additional condition driven mechanism services.
90 GC Operate and Maintain Substations
GCV ED Substation Breaker Overhauls
SRM Total (Non-RAMP)
SRM Total (Non-RAMP) 4-12 $ 85.2 $ 41.3 $ (43.9) -51.5% 17 10 (7) -41.2% NO NO YES Below variance threshold Actual units were lower than imputed regulatory units due to fewer breaker overhauls triggered based on condition.
91 GC Operate and Maintain Substations
GCW ED Substation Station Washes
SRM Total (Non-RAMP)
SRM Total (Non-RAMP) 4-12 $ 408.2 $ 472.1 $ 63.9 15.7% 444 390 (54) -12.2% NO NO NO Below variance threshold Below variance threshold

3-9
TABLE 3-3 ELECTRIC DISTRIBUTION 2021 EXPENSE COMPARISON BY MAT CODE FOR SAFETY, RELIABILITY, AND MAINTENANCE WORK
(THOUSANDS OF DOLLARS) (CONTINUED)
Line No. MWC MWC Name MAT MAT Name RAMP Risk Name
RAMP Control/Mitigation Name
2020 GRC Testimony Reference
2021 Imputed Adopted Costs
(A) 2021 Actual Costs
(B)
2021 Cost Difference
(B-A)
2021 Cost Percent Change
(%)(B-A)/A
2021 Imputed Adopted
Units (C)
2021 Actual Units(D)
2021 Unit Difference
(D-C)
2021 Unit Percent Change
(%)(D-C)/C
Spending Variance
Explanation Required
(Y/N)
Percentage Variance
Explanation Required
(Y/N)
Unit Variance Explanation
Required (Y/N) Cost Variance Explanation Unit Variance Explanation
92 GE Electric Distribution Mapping
GEO Mapping SRM Total (Non-RAMP)
SRM Total (Non-RAMP) 4-18 $ 6,031.6 $ 12,334.1 $ 6,302.5 104.5% N/A N/A N/A N/A NO YES N/A Program expenses exceeded imputed regulatory values due to: (1) expenses to develop and implement PG&E’s Asset Data Management Plan, data management standards, tools, analytic products, and data quality improvement projects, and (2) wildfire-related expenses from programs created to improve wildfire related data, develop wildfire analytic products and respond to wildfire related data requirements including the Wildfire Safety Division GIS Data Standard.
N/A
93 GE Electric Distribution Mapping
GEP Records Management SRM Total (Non-RAMP)
SRM Total (Non-RAMP) 4-18 $ - $ 4,354.0 $ 4,354.0 100.0% N/A N/A N/A N/A NO NO N/A Below variance threshold N/A
94 HG Electric Distribution Operational Technology
# Not assigned SRM Total SRM Total 4-5, 4-19 $ 11,158.6 $ 61.1 $ (11,097.5) -99.5% N/A N/A N/A N/A YES YES N/A Program expenses were below imputed regulatory values because work was recorded in new MAT codes HGC and HGD. Actual 2021 costs across both HGC and HGD were less than the Imputed Adopted 2021 cost in HG# because costs within the ADMS program were more capital intensive than anticipated.
N/A
95 HG Electric Distribution Operational Technology
# Not assigned RAMP Risk: WF Mitigation
M15 - Automation and Protection
4-5 $ 357.7 $ 58.8 $ (298.9) -83.6% N/A N/A N/A N/A N/A N/A N/A N/A N/A
96 HG Electric Distribution Operational Technology
# Not assigned SRM (Non-RAMP) SRM (Non-RAMP) 4-5 $ 10,801.0 $ 2.3 $ (10,798.7) -100.0% N/A N/A N/A N/A N/A N/A N/A N/A N/A
97 HG Electric Distribution Operational Technology
HGC ADMS Development SRM Total (Non-RAMP)
SRM Total (Non-RAMP) 4-19 $ - $ 2,939.3 $ 2,939.3 100.0% N/A N/A N/A N/A NO NO N/A Below variance threshold N/A
98 HG Electric Distribution Operational Technology
HGD Distribution Operational Technology
SRM Total (Non-RAMP)
SRM Total (Non-RAMP) 4-5 $ - $ 4,249.5 $ 4,249.5 100.0% N/A N/A N/A N/A NO NO N/A Below variance threshold N/A
99 HN Vegetation Management Balancing Account
HN (a)
Tree Trim - Routine SRM Total SRM Total 4-7 $ 252,197.3 $ 682,524.8 $ 430,327.5 170.6% N/A N/A N/A N/A YES YES N/A Program expenses exceeded imputed regulatory values due to PG&E contractors conducting more work on tree bundles than planned caused primarily by extreme drought and fire season conditions. Other factors contributing to higher costs include Senate Bill 247, transitioning contractor workers to internal employees, unionization of inspection workforce, enhanced contractor safety requirements and increased safety oversight.
N/A
100 HN Vegetation Management Balancing Account
HN (a)
Tree Trim - Routine RAMP Risk: WF Control / DOCP Control
C2 - Vegetation Management / C2 - Vegetation Management
4-7 $ 251,056.7 $ 682,058.0 $ 431,001.3 171.7% N/A N/A N/A N/A N/A N/A N/A N/A N/A
101 HN Vegetation Management Balancing Account
HN (a)
Tree Trim - Routine RAMP Risk: WF Control / DOCP Control
C2 - Vegetation Management / C1 - Public Awareness Program
4-7 $ 1,140.6 $ 466.8 $ (673.9) -59.1% N/A N/A N/A N/A N/A N/A N/A N/A N/A
102 HX Distribution Automation & Protection Support
N/A Not assigned SRM Total (Non-RAMP)
SRM Total (Non-RAMP) 4-10 $ 2,099.7 $ 2,452.2 $ 352.5 16.8% N/A N/A N/A N/A NO NO N/A Below variance threshold N/A
103 HY Perform Gas Meter Maintenance
N/A Not assigned SRM Total (Non-RAMP)
SRM Total (Non-RAMP) 6-6 $ - $ 558.0 $ 558.0 100.0% N/A N/A N/A N/A NO NO N/A Below variance threshold N/A
104 IF Electric Distribution Major Emergency
N/A Not assigned SRM Total (Non-RAMP)
SRM Total (Non-RAMP) 4-4 $ 34,647.9 $ 146,946.2 $ 112,298.3 324.1% N/A N/A N/A N/A YES YES N/A Program expenses exceeded imputed regulatory values due to large weather events that took place in 2021. This program utilizes a 5 year average to forecast, however in 2021 the events that took place were larger than anything seen in the past 5 years. Hence the variance reflects the impacts of these storms.
N/A

3-10
TABLE 3-3 ELECTRIC DISTRIBUTION 2021 EXPENSE COMPARISON BY MAT CODE FOR SAFETY, RELIABILITY, AND MAINTENANCE WORK
(THOUSANDS OF DOLLARS) (CONTINUED)
Line No. MWC MWC Name MAT MAT Name RAMP Risk Name
RAMP Control/Mitigation Name
2020 GRC Testimony Reference
2021 Imputed Adopted Costs
(A) 2021 Actual Costs
(B)
2021 Cost Difference
(B-A)
2021 Cost Percent Change
(%)(B-A)/A
2021 Imputed Adopted
Units (C)
2021 Actual Units(D)
2021 Unit Difference
(D-C)
2021 Unit Percent Change
(%)(D-C)/C
Spending Variance
Explanation Required
(Y/N)
Percentage Variance
Explanation Required
(Y/N)
Unit Variance Explanation
Required (Y/N) Cost Variance Explanation Unit Variance Explanation
105 IG Various Balancing and Memorandum Accounts
# Not assigned SRM Total SRM Total N/A $ - $ 87,983.3 $ 87,983.3 100.0% N/A N/A N/A N/A YES YES N/A Program expenses exceeded imputed regulatory values (which was not forecast as a part of the 2020 GRC and thus did not have an imputed value) due to activities needed to deliver technology solutions (IT Asset Risk Program, Data Enablement Program) that support wildfire mitigation efforts as well as incremental IT Operations and Maintenance costs (labor and contracts) resulting from the solutions delivered as part of the technology project investments. Program expenses also include costs for temporary generation and other support for PSPS events.
N/A
106 IG Various Balancing and Memorandum Accounts
# Not assigned RAMP Risk: WF Mitigation
M13 - Public Safety Power Shutoff
4-3 $ - $ 10,814.4 $ 10,814.4 100.0% N/A N/A N/A N/A N/A N/A N/A N/A N/A
107 IG Various Balancing and Memorandum Accounts
# Not assigned RAMP Risk: WF Mitigation
M18 - Wildfire Safety Operations Center
4-3 $ - $ (0.6) $ (0.6) -100.0% N/A N/A N/A N/A N/A N/A N/A N/A N/A
108 IG Various Balancing and Memorandum Accounts
# Not assigned RAMP Risk: WF Mitigation
M24 - Enhanced Wire Down Detection
4-3 $ - $ 2.2 $ 2.2 100.0% N/A N/A N/A N/A N/A N/A N/A N/A N/A
109 IG Various Balancing and Memorandum Accounts
# Not assigned RAMP Risk: WF Mitigation
Post 2020 GRC Mitigations: IT Decentralized Wildfire
N/A $ - $ 33,823.0 $ 33,823.0 100.0% N/A N/A N/A N/A N/A N/A N/A N/A N/A
110 IG Various Balancing and Memorandum Accounts
# Not assigned RAMP Risk: WF Mitigation
Post 2020 GRC Mitigations N/A $ - $ 43,344.0 $ 43,344.0 100.0% N/A N/A N/A N/A N/A N/A N/A N/A N/A
111 IG Various Balancing and Memorandum Accounts
IGI Dead and Dying Trees SRM Total SRM Total 4-7 $ - $ 87,022.4 $ 87,022.4 100.0% N/A N/A N/A N/A YES YES N/A Program expenses exceeded imputed regulatory values due to costs for Tree Mortality work which were previously recovered in CEMA moving to the VMBA. No forecast for Tree Mortality work was included in the 2020 GRC.
N/A
112 IG Various Balancing and Memorandum Accounts
IGI Dead and Dying Trees RAMP Risk: WF Control / DOCP Control
C3 - Catastrophic Event Memorandum Account - Vegetation Management / C3 - Catastrophic Event Memorandum Account - Vegetation Management
4-7 $ - $ 87,022.4 $ 87,022.4 100.0% N/A N/A N/A N/A N/A N/A N/A N/A N/A
113 IG Various Balancing and Memorandum Accounts
IGJ (a)
Enhanced Vegetation Management
SRM Total SRM Total 4-7 $ 350,616.5 $ 770,434.5 $ 419,818.0 119.7% N/A N/A N/A N/A YES YES N/A Program expenses exceeded imputed regulatory values for Enhanced VM due to completing more work than forecast. PG&E patrolled and inventoried more miles of trees than planned caused primarily by extreme drought and fire season conditions along with increased use of the Tree Assessment Tool. Other contributing factors included Senate Bill 247, higher contractor costs and increased costs for wood management.
N/A
114 IG Various Balancing and Memorandum Accounts
IGJ (a)
Enhanced Vegetation Management
RAMP Risk: WF Mitigation / DOCP Mitigation
M16 - Enhanced VM M8- Enhanced VM Fuel Reduction
4-7 $ 350,616.5 $ 770,434.5 $ 419,818.0 119.7% N/A N/A N/A N/A N/A N/A N/A N/A N/A
115 IS Streetlight Support N/A Not assigned SRM Total (Non-RAMP)
SRM Total (Non-RAMP) 4-18 $ 1,107.8 $ 664.5 $ (443.3) -40.0% N/A N/A N/A N/A NO NO N/A Below variance threshold N/A
116 IU Collect Revenue N/A Not assigned SRM Total (Non-RAMP)
SRM Total (Non-RAMP) 6-6 $ - $ 1,855.6 $ 1,855.6 100.0% N/A N/A N/A N/A NO NO N/A Below variance threshold N/A
117 JV Maintain IT Applications & Infrastructure
N/A Not assigned SRM Total (Non-RAMP)
SRM Total (Non-RAMP) 4-15 $ 5,361.2 $ 2,300.6 $ (3,060.6) -57.1% N/A N/A N/A N/A NO NO N/A Below variance threshold N/A
118 KA Preventive Maintenance and Equipment Repair, OH
# Not assigned SRM Total (Non-RAMP)
SRM Total (Non-RAMP) 4-6 $ 741.8 $ 318.3 $ (423.5) -57.1% N/A N/A N/A N/A NO NO N/A Below variance threshold N/A

3-11
TABLE 3-3 ELECTRIC DISTRIBUTION 2021 EXPENSE COMPARISON BY MAT CODE FOR SAFETY, RELIABILITY, AND MAINTENANCE WORK
(THOUSANDS OF DOLLARS) (CONTINUED)
Line No. MWC MWC Name MAT MAT Name RAMP Risk Name
RAMP Control/Mitigation Name
2020 GRC Testimony Reference
2021 Imputed Adopted Costs
(A) 2021 Actual Costs
(B)
2021 Cost Difference
(B-A)
2021 Cost Percent Change
(%)(B-A)/A
2021 Imputed Adopted
Units (C)
2021 Actual Units(D)
2021 Unit Difference
(D-C)
2021 Unit Percent Change
(%)(D-C)/C
Spending Variance
Explanation Required
(Y/N)
Percentage Variance
Explanation Required
(Y/N)
Unit Variance Explanation
Required (Y/N) Cost Variance Explanation Unit Variance Explanation
119 KA Preventive Maintenance and Equipment Repair, OH
KAA OH General CM Tag SRM Total SRM Total 4-6 $ 19,074.5 $ 89,786.3 $ 70,711.8 370.7% 31,412 37,211 5,799 18.5% YES YES NO Program expenses exceeded imputed regulatory values due to higher unit costs, as limited resources were available which required contractor resources to complete tasks. Also, more tags were completed to address Wildfire Risk.
Below variance threshold
120 KA Preventive Maintenance and Equipment Repair, OH
KAA OH General CM Tag RAMP Risk: WF Control / DOCP Control
C8 - OH Equipment Replacement / C4 - OH ED Preventive Maintenance
4-6 $ 19,074.5 $ 89,786.3 $ 70,711.8 370.7% 31,412 37,211 5,799 18.5% N/A N/A N/A N/A N/A
121 KA Preventive Maintenance and Equipment Repair, OH
KAC Bird Safe Retrofit SRM Total SRM Total 4-6 $ 758.4 $ 956.6 $ 198.3 26.1% 1,013 591 (422) -41.7% NO NO YES Below variance threshold Actual units were lower than imputed regulatory units due to fewer units required due to work completed in other programs that included bird mitigation, such as system hardening, including tree wire projects, and pole replacement in raptor concentration zones.
122 KA Preventive Maintenance and Equipment Repair, OH
KAC Bird Safe Retrofit RAMP Risk: WF Control /DOCP Control
C6 - Animal Abatement / C4 - OH ED Preventive Maintenance
4-6 $ 758.4 $ 956.6 $ 198.3 26.1% 1,013 591 (422) -41.7% N/A N/A N/A N/A N/A
123 KA Preventive Maintenance and Equipment Repair, OH
KAD Bird Safe Retrofit Annual
SRM Total SRM Total 4-6 $ 748.6 $ 569.4 $ (179.2) -23.9% 1,000 223 (777) -77.7% NO NO YES Below variance threshold Actual units were lower than imputed regulatory units due to fewer units required due to work completed in other programs that included bird mitigation, such as system hardening, including tree wire projects, and pole replacement in raptor concentration zones.
124 KA Preventive Maintenance and Equipment Repair, OH
KAD Bird Safe Retrofit Annual
RAMP Risk: WF Control / DOCP Control
C6 - Animal Abatement / C4 - OH ED Preventive Maintenance
4-6 $ 748.6 $ 569.4 $ (179.2) -23.9% 1,000 223 (777) -77.7% N/A N/A N/A N/A N/A
125 KA Preventive Maintenance and Equipment Repair, OH
KAF OH COE CM Tag SRM Total SRM Total 4-6 $ 7,347.2 $ 7,786.8 $ 439.7 6.0% 1,419 1,358 (61) -4.3% NO NO NO Below variance threshold Below variance threshold
126 KA Preventive Maintenance and Equipment Repair, OH
KAF OH COE CM Tag RAMP Risk: WF Control
C8 - OH Equipment Replacement
4-6 $ 7,347.2 $ 7,786.8 $ 439.7 6.0% 1,419 1,358 (61) -4.3% N/A N/A N/A N/A N/A
127 KA Preventive Maintenance and Equipment Repair, OH
KAH Streetlights Replace Burnouts
SRM Total (Non-RAMP)
SRM Total (Non-RAMP) 4-6 $ 2,232.5 $ 1,662.7 $ (569.8) -25.5% 14,702 7,085 (7,617) -51.8% NO NO YES Below variance threshold Actual units were lower than imputed regulatory units due to less than expected burnouts of streetlights as a results of previous conversions to LEDs.
128 KA Preventive Maintenance and Equipment Repair, OH
KAK RTVI Invest/Repair SRM Total (Non-RAMP)
SRM Total (Non-RAMP) 4-6 $ 109.0 $ 77.6 $ (31.4) -28.8% 144 128 (16) -11.1% NO NO NO Below variance threshold Below variance threshold
129 KA Preventive Maintenance and Equipment Repair, OH
KAM Insulators Washing SRM Total (Non-RAMP)
SRM Total (Non-RAMP) 4-6 $ 211.6 $ 246.5 $ 34.8 16.5% N/A N/A N/A N/A NO NO N/A Below variance threshold N/A
130 KA Preventive Maintenance and Equipment Repair, OH
KAO Idle Facilities Invest - Svc Planning
SRM Total (Non-RAMP)
SRM Total (Non-RAMP) 4-6 $ 183.6 $ 1,857.0 $ 1,673.4 911.5% N/A N/A N/A N/A NO NO N/A Below variance threshold N/A
131 KA Preventive Maintenance and Equipment Repair, OH
KAP OH Expense Projects SRM Total (Non-RAMP)
SRM Total (Non-RAMP) 4-6 $ - $ 2,497.8 $ 2,497.8 100.0% N/A N/A N/A N/A NO NO N/A Below variance threshold N/A
132 KA Preventive Maintenance and Equipment Repair, OH
KAQ Wood Pole Bridge Bonding
SRM Total SRM Total 4-6 $ 27.9 $ 77.0 $ 49.1 176.4% N/A N/A N/A N/A NO NO N/A Below variance threshold N/A

3-12
TABLE 3-3 ELECTRIC DISTRIBUTION 2021 EXPENSE COMPARISON BY MAT CODE FOR SAFETY, RELIABILITY, AND MAINTENANCE WORK
(THOUSANDS OF DOLLARS) (CONTINUED)
Line No. MWC MWC Name MAT MAT Name RAMP Risk Name
RAMP Control/Mitigation Name
2020 GRC Testimony Reference
2021 Imputed Adopted Costs
(A) 2021 Actual Costs
(B)
2021 Cost Difference
(B-A)
2021 Cost Percent Change
(%)(B-A)/A
2021 Imputed Adopted
Units (C)
2021 Actual Units(D)
2021 Unit Difference
(D-C)
2021 Unit Percent Change
(%)(D-C)/C
Spending Variance
Explanation Required
(Y/N)
Percentage Variance
Explanation Required
(Y/N)
Unit Variance Explanation
Required (Y/N) Cost Variance Explanation Unit Variance Explanation
133 KA Preventive Maintenance and Equipment Repair, OH
KAQ Wood Pole Bridge Bonding
RAMP Risk: WF Control
C10 - Wood Pole Bridging 4-6 $ 27.9 $ 77.0 $ 49.1 176.4% N/A N/A N/A N/A N/A N/A N/A N/A N/A
134 KA Preventive Maintenance and Equipment Repair, OH
KAS FAS Overhead Expense
SRM Total (Non-RAMP)
SRM Total (Non-RAMP) 4-6 $ 1,844.0 $ 1,902.1 $ 58.1 3.2% 10,333 9,938 (395) -3.8% NO NO NO Below variance threshold Below variance threshold
135 KB Preventive Maintenance and Equipment Repair, UG
# Not assigned SRM Total (Non-RAMP)
SRM Total (Non-RAMP) 4-6 $ 659.8 $ 86.4 $ (573.5) -86.9% N/A N/A N/A N/A NO NO N/A Below variance threshold N/A
136 KB Preventive Maintenance and Equipment Repair, UG
KBA UG General Corrective Maintenance (CM) Tag
SRM Total (Non-RAMP)
SRM Total (Non-RAMP) 4-6 $ 11,058.8 $ 18,813.9 $ 7,755.1 70.1% 6,188 5,345 (843) -13.6% NO YES NO Program expenses exceeded imputed regulatory values due to higher unit costs, as limited resources were available which required contractor resources to complete tasks.
Below variance threshold
137 KB Preventive Maintenance and Equipment Repair, UG
KBC UG COE CM Tag SRM Total (Non-RAMP)
SRM Total (Non-RAMP) 4-6 $ 874.5 $ 1,353.5 $ 479.0 54.8% 248 145 (103) -41.5% NO NO YES Below variance threshold Actual units were lower than imputed regulatory units due to prioritization of resources to Tier 2 and Tier 3 HFTD area repairs and replacement work.
138 KB Preventive Maintenance and Equipment Repair, UG
KBD Nitrogen Cylinders CM SRM Total (Non-RAMP)
SRM Total (Non-RAMP) 4-6 $ 21.9 $ 10.0 $ (11.9) -54.4% N/A N/A N/A N/A NO NO N/A Below variance threshold N/A
139 KB Preventive Maintenance and Equipment Repair, UG
KBE BART Cable Repair SRM Total (Non-RAMP)
SRM Total (Non-RAMP) 4-6 $ 61.4 $ 8.6 $ (52.8) -86.1% N/A N/A N/A N/A NO NO N/A Below variance threshold N/A
140 KB Preventive Maintenance and Equipment Repair, UG
KBP UG Expense Projects SRM Total (Non-RAMP)
SRM Total (Non-RAMP) 4-6 $ 159.1 $ 148.9 $ (10.2) -6.4% N/A N/A N/A N/A NO NO N/A Below variance threshold N/A
141 KC Preventive Maintenance and Equipment Repair, Network
KCA Network Equip CM Notifications
SRM Total (Non-RAMP)
SRM Total (Non-RAMP) 4-6 $ 157.8 $ 184.7 $ 26.9 17.0% 75 46 (29) -38.7% NO NO YES Below variance threshold Actual units were lower than imputed regulatory units due to lower number of units of network equipment identified as needing preventive repair in order to maintain a safe and reliable distribution network system.
142 KC Preventive Maintenance and Equipment Repair, Network
KCB Network Oil Repl & 60Day F/U
SRM Total (Non-RAMP)
SRM Total (Non-RAMP) 4-6 $ 32.3 $ 100.5 $ 68.2 210.9% 27 176 149 551.9% NO NO YES Below variance threshold Actual units exceeded imputed regulatory units due to increased oil replacement activities related to transformer retrofits.
143 KC Preventive Maintenance and Equipment Repair, Network
KCC Network Vault CM Notifications
SRM Total (Non-RAMP)
SRM Total (Non-RAMP) 4-6 $ 163.9 $ 92.4 $ (71.5) -43.6% 79 10 (69) -87.3% NO NO YES Below variance threshold Actual units were lower than imputed regulatory units due to decreased number of troubled units reported and repaired to correct problems.
144 KC Preventive Maintenance and Equipment Repair, Network
KCD Network Xfmr Preventive Maintenance/Restore
SRM Total (Non-RAMP)
SRM Total (Non-RAMP) 4-6 $ 2,545.8 $ 2,795.2 $ 249.3 9.8% 3,618 3,540 (78) -2.2% NO NO NO Below variance threshold Below variance threshold
145 KC Preventive Maintenance and Equipment Repair, Network
KCE Network Protector Preventive Maintenance
SRM Total (Non-RAMP)
SRM Total (Non-RAMP) 4-6 $ 628.7 $ 714.6 $ 85.9 13.7% 390 468 78 20.0% NO NO NO Below variance threshold Below variance threshold
146 KC Preventive Maintenance and Equipment Repair, Network
KCF Fiber/SCADA Comm Repair
SRM Total (Non-RAMP)
SRM Total (Non-RAMP) 4-6 $ 602.1 $ 673.4 $ 71.4 11.9% N/A N/A N/A N/A NO NO N/A Below variance threshold N/A
Notes: (a) The 2020 GRC adopted amounts for PG&E's Vegetation Management Program, including both Routine Vegetation Management (MWC HN) and Enhanced Vegetation Management (MAT IGJ), were adopted in MWC HN. In this report PG&E is showing the imputed adopted portion to where the activity is recorded.

3-13
TABLE 3-4 ELECTRIC DISTRIBUTION 2021 CAPITAL COMPARISON BY MAT CODE FOR SAFETY, RELIABILITY, AND MAINTENANCE WORK
(THOUSANDS OF DOLLARS)
Line No. MWC MWC Name MAT MAT Name RAMP Risk Name
RAMP Control/Mitigation Name
2020 GRC Testimony Reference
2021 Imputed Adopted Costs
(A) 2021 Actual Costs
(B)
2021 Cost Difference
(B-A)
2021 Cost Percent Change
(%)(B-A)/A
2021 Imputed Adopted
Units (C)
2021 Actual Units(D)
2021 Unit Difference
(D-C)
2021 Unit Percent Change
(%)(D-C)/C
Spending Variance
Explanation Required
(Y/N)
Percentage Variance
Explanation Required
(Y/N)
Unit Variance Explanation
Required (Y/N) Cost Variance Explanation Unit Variance Explanation
1 05 Tools & Equipment N/A Not assigned SRM Total (Non-RAMP)
SRM Total (Non-RAMP) 4-18 $ 7,815.6 $ 6,573.7 $ (1,241.9) -15.9% N/A N/A N/A N/A NO NO N/A Below variance threshold N/A
2 06 Electric Distribution Line and Equipment Capacity
# Not assigned SRM Total (Non-RAMP)
SRM Total (Non-RAMP) 4-13 $ 7,200.5 $ 10,434.2 $ 3,233.7 44.9% N/A N/A N/A N/A NO NO N/A Below variance threshold N/A
3 06 Electric Distribution Line and Equipment Capacity
06A Fdr Prj Assoc w/Subst Capacity
SRM Total (Non-RAMP)
SRM Total (Non-RAMP) 4-13 $ 6,659.3 $ 35,916.7 $ 29,257.4 439.4% N/A N/A N/A N/A YES YES N/A Program expenditures exceeded imputed regulatory values due to completion in 2021 of capacity projects from previous years that were rescheduled due to emergency repair and wildfire hardening work.
N/A
4 06 Electric Distribution Line and Equipment Capacity
06B Transformer Repl Overloaded
SRM Total (Non-RAMP)
SRM Total (Non-RAMP) 4-13 $ 681.7 $ 1,535.5 $ 853.8 125.2% 49 34 (15) -30.6% NO NO YES Below variance threshold Actual units were lower than imputed regulatory units due to less overhead transformer replacement work as a consequence of work deferral and resource constraints owing to focus on wildfire mitigation and maintenance work.
5 06 Electric Distribution Line and Equipment Capacity
06D Circuits Reinforce-DP Managed
SRM Total SRM Total 4-13 $ 3,512.9 $ 2,485.9 $ (1,027.0) -29.2% N/A N/A N/A N/A NO NO N/A Below variance threshold N/A
6 06 Electric Distribution Line and Equipment Capacity
06D Circuits Reinforce-DP Managed
RAMP Risk: DOCP Control
C11 - ED Line and Equipment Capacity
4-13 $ 3,512.9 $ 2,485.9 $ (1,027.0) -29.2% N/A N/A N/A N/A N/A N/A N/A N/A N/A
7 06 Electric Distribution Line and Equipment Capacity
06E Circuits Reinforce-PS Managed
SRM Total SRM Total 4-13 $ 18,950.5 $ 21,412.4 $ 2,461.9 13.0% N/A N/A N/A N/A NO NO N/A Below variance threshold N/A
8 06 Electric Distribution Line and Equipment Capacity
06E Circuits Reinforce-PS Managed
RAMP Risk: DOCP Control
C11 - ED Line and Equipment Capacity
4-13 $ 18,950.5 $ 21,412.4 $ 2,461.9 13.0% N/A N/A N/A N/A N/A N/A N/A N/A N/A
9 06 Electric Distribution Line and Equipment Capacity
06G Voltage Correct Secondary
SRM Total (Non-RAMP)
SRM Total (Non-RAMP) 4-13 $ 3,294.8 $ 4,139.4 $ 844.6 25.6% N/A N/A N/A N/A NO NO N/A Below variance threshold N/A
10 06 Electric Distribution Line and Equipment Capacity
06H Dist Line New Business Performance
SRM Total (Non-RAMP)
SRM Total (Non-RAMP) 4-13 $ 45,521.4 $ 74,289.7 $ 28,768.3 63.2% N/A N/A N/A N/A YES YES N/A Program expenditures exceeded imputed regulatory values due to completion in 2021 of capacity projects from previous years that were rescheduled due to emergency repair and wildfire hardening work as well as an increase in the number of new business applications for service that required capacity work to serve these loads.
N/A
11 06 Electric Distribution Line and Equipment Capacity
06I Operational Capacity Proj
SRM Total (Non-RAMP)
SRM Total (Non-RAMP) 4-13 $ 3,575.1 $ 6,075.5 $ 2,500.4 69.9% N/A N/A N/A N/A NO NO N/A Below variance threshold N/A
12 06 Electric Distribution Line and Equipment Capacity
06K Power Factor Management
SRM Total (Non-RAMP)
SRM Total (Non-RAMP) 4-13 $ 1,129.3 $ 281.9 $ (847.4) -75.0% N/A N/A N/A N/A NO NO N/A Below variance threshold N/A
13 06 Electric Distribution Line and Equipment Capacity
06P Enable DG Dist Line SRM Total (Non-RAMP)
SRM Total (Non-RAMP) 4-13 $ 1,357.4 $ 474.9 $ (882.4) -65.0% N/A N/A N/A N/A NO NO N/A Below variance threshold N/A
14 07 Electric Distribution Install/Replace Overhead Poles
# Not assigned SRM Total (Non-RAMP)
SRM Total (Non-RAMP) 4-8 $ - $ 3,070.9 $ 3,070.9 100.0% N/A N/A N/A N/A NO NO N/A Below variance threshold N/A
15 07 Electric Distribution Install/Replace Overhead Poles
07A Tree Connect VM Assessments
SRM Total (Non-RAMP)
SRM Total (Non-RAMP) 4-8 $ - $ 768.0 $ 768.0 100.0% N/A N/A N/A N/A NO NO N/A Below variance threshold N/A
16 07 Electric Distribution Install/Replace Overhead Poles
07C Special Criteria Pole Replace
SRM Total (Non-RAMP)
SRM Total (Non-RAMP) 4-8 $ - $ 11,721.3 $ 11,721.3 100.0% 0 397 397 100.0% NO YES YES Program expenditures exceeded imputed regulatory values due to implementation of new tree attachment program not included in the 2020 GRC, which installs new clearance poles and transfers PG&E distribution facilities from the declining tree to the new pole.
Actual units were higher than imputed regulatory units due to implementation of new tree attachment program not included in the 2020 GRC, which installs new clearance poles and transfers PG&E distribution facilities from the declining tree to the new pole.
17 07 Electric Distribution Install/Replace Overhead Poles
07D Pole Replacement SRM Total SRM Total 4-8 $ 109,236.7 $ 379,165.6 $ 269,929.0 247.1% 7,779 15,584 7,805 100.3% YES YES YES Program expenditures exceeded imputed regulatory values due to higher volume of deteriorated units identified during the 2019 WSIP and 2020 enhanced inspections, and higher unit costs for pole replacements. The additional units identified were in HFTDs and the program was expanded to increase replacements in efforts to reduce overall system risk.
Actual units were higher than imputed regulatory units due to higher volume of deteriorated units identified during the 2019 WSIP and 2020 enhanced inspections. The additional units identified were in HFTDs and the program was expanded to increase replacements in efforts to reduce overall system risk.

3-14
TABLE 3-4 ELECTRIC DISTRIBUTION 2021 CAPITAL COMPARISON BY MAT CODE FOR SAFETY, RELIABILITY, AND MAINTENANCE WORK
(THOUSANDS OF DOLLARS) (CONTINUED)
Line No. MWC MWC Name MAT MAT Name RAMP Risk Name
RAMP Control/Mitigation Name
2020 GRC Testimony Reference
2021 Imputed Adopted Costs
(A) 2021 Actual Costs
(B)
2021 Cost Difference
(B-A)
2021 Cost Percent Change
(%)(B-A)/A
2021 Imputed Adopted
Units (C)
2021 Actual Units(D)
2021 Unit Difference
(D-C)
2021 Unit Percent Change
(%)(D-C)/C
Spending Variance
Explanation Required
(Y/N)
Percentage Variance
Explanation Required
(Y/N)
Unit Variance Explanation
Required (Y/N) Cost Variance Explanation Unit Variance Explanation
18 07 Electric Distribution Install/Replace Overhead Poles
07D Pole Replacement RAMP Risk: WF Control
C9 - Deteriorated Pole Replacement
4-8 $ 109,236.7 $ 379,165.6 $ 269,929.0 247.1% 7,779 15,584 7,805 100.3% N/A N/A N/A N/A N/A
19 07 Electric Distribution Install/Replace Overhead Poles
07G Pole Joint Util Telco Reimb
SRM Total (Non-RAMP)
SRM Total (Non-RAMP) 4-8 $ - $ 40.1 $ 40.1 100.0% N/A N/A N/A N/A NO NO N/A Below variance threshold N/A
20 07 Electric Distribution Install/Replace Overhead Poles
07L Steel Lattice Structures
SRM Total SRM Total 4-8 $ - $ 657.4 $ 657.4 100.0% 0 1 1 100.0% NO NO YES Below variance threshold Actual units were higher than imputed regulatory units due to no work forecast for steel lattice structures in the 2020 GRC.
21 07 Electric Distribution Install/Replace Overhead Poles
07L Steel Lattice Structures
RAMP Risk: WF Control
C9 - Deteriorated Pole Replacement
4-8 $ - $ 657.4 $ 657.4 100.0% 0 1 1 100.0% N/A N/A N/A N/A N/A
22 07 Electric Distribution Install/Replace Overhead Poles
07O Overloaded Pole Replacements
SRM Total SRM Total 4-8 $ - $ 19,404.2 $ 19,404.2 100.0% 0 563 563 100.0% NO YES YES Program expenditures exceeded imputed regulatory values due to the forecast for overloaded poles being in MAT 07D in the 2020 GRC.
Actual units were higher than imputed regulatory units due to the forecast for overloaded poles being in MAT 07D in the 2020 GRC. In addition, actual units were higher than imputed regulatory units due to higher volume of overloaded units identified during the 2019 WSIP and 2020 enhanced inspections. The additional units identified were in HFTDs and the program was expanded to increase replacements in efforts to reduce overall system risk.
23 07 Electric Distribution Install/Replace Overhead Poles
07O Overloaded Pole Replacements
RAMP Risk: WF Control
C9 - Deteriorated Pole Replacement
4-8 $ - $ 19,404.2 $ 19,404.2 100.0% 0 563 563 100.0% N/A N/A N/A N/A N/A
24 08 Electric Distribution Overhead Asset Replacement
# Not assigned SRM Total (Non-RAMP)
SRM Total (Non-RAMP) 4-9 $ - $ (487.8) $ (487.8) -100.0% N/A N/A N/A N/A NO NO N/A Below variance threshold N/A
25 08 Electric Distribution Overhead Asset Replacement
08D Do Not Use - Cornerstone
SRM Total (Non-RAMP)
SRM Total (Non-RAMP) 4-9 $ - $ 1.2 $ 1.2 100.0% N/A N/A N/A N/A NO NO N/A Below variance threshold N/A
26 08 Electric Distribution Overhead Asset Replacement
08E Do Not Use - Cornerstone DA Control Upgrade
SRM Total (Non-RAMP)
SRM Total (Non-RAMP) 4-9 $ - $ (0.7) $ (0.7) -100.0% N/A N/A N/A N/A NO NO N/A Below variance threshold N/A
27 08 Electric Distribution Overhead Asset Replacement
08J Repl Deteriorated OH Conductor
SRM Total SRM Total 4-9 $ 52,956.9 $ 29,869.8 $ (23,087.1) -43.6% 97 34 (63) -64.9% YES YES YES Program expenditures were below imputed regulatory values due to lower units executed.
Actual units were lower than imputed regulatory units due to supporting higher risk and higher priority work such as System Hardening, WSIP tags, pole replacement, and PSPS that shifted out conductor replacements.
28 08 Electric Distribution Overhead Asset Replacement
08J Repl Deteriorated OH Conductor
RAMP Risk: WF Control /DOCP Control
C5 - OH Conductor Replacement / C5 - OH Conductor Replacement
4-9 $ 52,956.9 $ 29,869.8 $ (23,087.1) -43.6% 97 34 (63) -64.9% N/A N/A N/A N/A N/A
29 08 Electric Distribution Overhead Asset Replacement
08S Replace Obsolete OH Switches
SRM Total (Non-RAMP)
SRM Total (Non-RAMP) 4-9 $ 1,123.8 $ 426.0 $ (697.8) -62.1% 30 6 (24) -80.0% NO NO YES Below variance threshold Actual units were lower than imputed regulatory units due to supporting higher risk and higher priority work such as System Hardening, WSIP tags, pole replacement, and PSPS that shifted out switch replacements.
30 08 Electric Distribution Overhead Asset Replacement
08W System Hardening Wildfire Resiliency projects
SRM Total SRM Total 4-9 $ 822,167.0 $ 319,496.0 $ (502,671.0) -61.1% 358 242 (117) -32.5% YES YES YES Program expenditures were below imputed regulatory values due to improvements in modeling tool, data, and understanding of fire risks leading to shift in thinking about where to target system hardening resources. PG&E changed course, stopped previously selected projects, and started different projects that are in alignment with updated risk model. The miles targeted in 2021 represent a greater risk reduction value than previously planned work plan. PG&E used 2021 to rebuild our pipeline of projects in alignment with the new risk model that are identified, vetted, designed, and permitted for future construction.
Actual units were lower than imputed units due to improvements in modeling tool, data, and understanding of fire risks leading to shift in thinking about where to target system hardening resources. PG&E changed course, stopped previously selected projects, and started different projects that are in alignment with updated risk model. The miles targeted in 2021 represent a greater risk reduction value than previously planned work plan.

3-15
TABLE 3-4 ELECTRIC DISTRIBUTION 2021 CAPITAL COMPARISON BY MAT CODE FOR SAFETY, RELIABILITY, AND MAINTENANCE WORK
(THOUSANDS OF DOLLARS) (CONTINUED)
Line No. MWC MWC Name MAT MAT Name RAMP Risk Name
RAMP Control/Mitigation Name
2020 GRC Testimony Reference
2021 Imputed Adopted Costs
(A) 2021 Actual Costs
(B)
2021 Cost Difference
(B-A)
2021 Cost Percent Change
(%)(B-A)/A
2021 Imputed Adopted
Units (C)
2021 Actual Units(D)
2021 Unit Difference
(D-C)
2021 Unit Percent Change
(%)(D-C)/C
Spending Variance
Explanation Required
(Y/N)
Percentage Variance
Explanation Required
(Y/N)
Unit Variance Explanation
Required (Y/N) Cost Variance Explanation Unit Variance Explanation
31 08 Electric Distribution Overhead Asset Replacement
08W System Hardening Wildfire Resiliency projects
RAMP Risk: WF Control / DOCP Control
C5 - OH Conductor Replacement/C5 - Overhead Conductor Replacement
4-9 $ - $ 10.1 $ 10.1 100.0% N/A N/A N/A N/A N/A N/A N/A N/A N/A
32 08 Electric Distribution Overhead Asset Replacement
08W System Hardening Wildfire Resiliency projects
RAMP Risk: WF Mitigation
M12 - Wildfire System Hardening
4-9 $ 822,167.0 $ 319,485.9 $ (502,681.1) -61.1% 358 242 (117) -32.5% N/A N/A N/A N/A N/A
33 09 Electric Distribution Automation & Protection
09A/49A (a)
ED Line SCADA Install/Replace
SRM Total SRM Total 4-10 $ 5,664.9 $ (250.7) $ (5,915.7) -104.4% N/A N/A N/A N/A NO NO N/A Below variance threshold N/A
34 09 Electric Distribution Automation & Protection
09A/49A (a)
ED Line SCADA Install/Replace
RAMP Risk: WF Control / DOCP Control
C7 - Protective Equipment / C9 - Supervisory Control and Data Acquisition
4-10 $ 5,664.9 $ (250.7) $ (5,915.7) -104.4% N/A N/A N/A N/A N/A N/A N/A N/A N/A
35 09 Electric Distribution Automation & Protection
09B ED Sub SCADA/RTU Replace
SRM Total SRM Total 4-10 $ 22,893.3 $ 15,823.4 $ (7,069.9) -30.9% N/A N/A N/A N/A NO NO N/A Below variance threshold N/A
36 09 Electric Distribution Automation & Protection
09B ED Sub SCADA/RTU Replace
RAMP Risk: DOCP Control
C9 - Supervisory Control and Data Acquisition
4-10 $ 22,893.3 $ 15,823.4 $ (7,069.9) -30.9% N/A N/A N/A N/A N/A N/A N/A N/A N/A
37 09 Electric Distribution Automation & Protection
09D ED Sub SCADA/RTU Install
SRM Total SRM Total 4-10 $ 2,352.7 $ 4,846.7 $ 2,493.9 106.0% N/A N/A N/A N/A NO NO N/A Below variance threshold N/A
38 09 Electric Distribution Automation & Protection
09D ED Sub SCADA/RTU Install
RAMP Risk: DOCP Control
C9 - Supervisory Control and Data Acquisition
4-10 $ 2,352.7 $ 4,846.7 $ 2,493.9 106.0% N/A N/A N/A N/A N/A N/A N/A N/A N/A
39 09 Electric Distribution Automation & Protection
09E ED Sub Protect Relay Install/Replace
SRM Total SRM Total 4-10 $ 3,453.6 $ 1,448.8 $ (2,004.8) -58.1% N/A N/A N/A N/A NO NO N/A Below variance threshold N/A
40 09 Electric Distribution Automation & Protection
09E ED Sub Protect Relay Install/Replace
RAMP Risk: DOCP Control
C9 - Supervisory Control and Data Acquisition
4-10 $ 3,453.6 $ 1,448.8 $ (2,004.8) -58.1% N/A N/A N/A N/A N/A N/A N/A N/A N/A
41 09 Electric Distribution Automation & Protection
09F ED Sub SCADA Emergency Replace
SRM Total SRM Total 4-10 $ 1,192.6 $ 11,230.6 $ 10,038.0 841.7% N/A N/A N/A N/A NO YES N/A Program expenditures exceeded imputed regulatory values due to an increase in the volume of automation equipment and protective relays failing in-service under emergency conditions driving higher overall costs.
N/A
42 09 Electric Distribution Automation & Protection
09F ED Sub SCADA Emergency Replace
RAMP Risk: DOCP Control
C9 - Supervisory Control and Data Acquisition
4-10 $ 1,192.6 $ 11,230.6 $ 10,038.0 841.7% N/A N/A N/A N/A N/A N/A N/A N/A N/A
43 17 Electric Distribution Routine Emergency
N/A Not assigned SRM Total (Non-RAMP)
SRM Total (Non-RAMP) 4-4 $ 188,416.2 $ 274,632.6 $ 86,216.4 45.8% N/A N/A N/A N/A YES YES N/A Program expenditures exceeded imputed regulatory values due to higher than forecast volume of emergency events, driving higher overall contract spend, higher estimating over head costs, and higher labor charges.
N/A
44 21 Miscellaneous Capital and EP&R
N/A Not assigned SRM Total SRM Total 4-3, 4-18 $ (30,126.1) $ 29,034.0 $ 59,160.1 -196.4% N/A N/A N/A N/A YES YES N/A Program expenditures exceeded imputed regulatory values due to the inclusion of capital efficiencies in MWC 21 in the 2020 GRC that did not materialize in MWC 21. Any efficiencies achieved would be captured in the MWCs impacted by the process change. The recorded costs in MWC 21 represent the costs for miscellaneous support capital, Emergency Preparedness & Response work, Federal Land Authorization, specific wildfire mitigations, and costs for new wildfire mitigations identified since the 2020 GRC was filed, inclding the Distribution, Transmission, and Substation Fire Action Schema and Technology (DTS FAST) pilot.
N/A
45 21 Miscellaneous Capital and EP&R
N/A Not assigned SRM (Non-RAMP) Miscellaneous Capital 4-18 $ (38,347.1) $ 10,816.6 $ 49,163.7 -128.2% N/A N/A N/A N/A N/A N/A N/A N/A N/A
46 21 Miscellaneous Capital and EP&R
N/A Not assigned SRM (Non-RAMP) EP&R Capital 4-3 $ 1,213.3 $ 898.4 $ (315.0) -26.0% N/A N/A N/A N/A N/A N/A N/A N/A N/A
47 21 Miscellaneous Capital and EP&R
N/A Not assigned RAMP Risk: WF Mitigation
M13 - Public Safety Power Shutoff
4-3 $ - $ 1,361.8 $ 1,361.8 100.0% N/A N/A N/A N/A N/A N/A N/A N/A N/A

3-16
TABLE 3-4 ELECTRIC DISTRIBUTION 2021 CAPITAL COMPARISON BY MAT CODE FOR SAFETY, RELIABILITY, AND MAINTENANCE WORK
(THOUSANDS OF DOLLARS) (CONTINUED)
Line No. MWC MWC Name MAT MAT Name RAMP Risk Name
RAMP Control/Mitigation Name
2020 GRC Testimony Reference
2021 Imputed Adopted Costs
(A) 2021 Actual Costs
(B)
2021 Cost Difference
(B-A)
2021 Cost Percent Change
(%)(B-A)/A
2021 Imputed Adopted
Units (C)
2021 Actual Units(D)
2021 Unit Difference
(D-C)
2021 Unit Percent Change
(%)(D-C)/C
Spending Variance
Explanation Required
(Y/N)
Percentage Variance
Explanation Required
(Y/N)
Unit Variance Explanation
Required (Y/N) Cost Variance Explanation Unit Variance Explanation
48 21 Miscellaneous Capital and EP&R
N/A Not assigned RAMP Risk: WF Mitigation
M18 - Wildfire Safety Operations Center
4-3 $ - $ 140.6 $ 140.6 100.0% N/A N/A N/A N/A N/A N/A N/A N/A N/A
49 21 Miscellaneous Capital and EP&R
N/A Not assigned RAMP Risk: WF Mitigation
M19 - Expanded Weather Station Deployment
4-3 $ 6,438.0 $ 7,719.8 $ 1,281.8 19.9% 300 308 8 2.7% N/A N/A N/A N/A N/A
50 21 Miscellaneous Capital and EP&R
N/A Not assigned RAMP Risk: WF Mitigation
M20 - SOPP Model Automation
4-3 $ - $ 975.1 $ 975.1 100.0% N/A N/A N/A N/A N/A N/A N/A N/A N/A
51 21 Miscellaneous Capital and EP&R
N/A Not assigned RAMP Risk: WF Mitigation
M21 - Advanced Fire Modeling 4-3 $ - $ 14.0 $ 14.0 100.0% N/A N/A N/A N/A N/A N/A N/A N/A N/A
52 21 Miscellaneous Capital and EP&R
N/A Not assigned RAMP Risk: WF Mitigation
M24 - Enhanced Wire Down Detection
4-3 $ - $ 607.7 $ 607.7 100.0% N/A N/A N/A N/A N/A N/A N/A N/A N/A
53 21 Miscellaneous Capital and EP&R
N/A Not assigned RAMP Risk: WF Mitigation
M25 - Wildfire and Infrastructure Protection Teams
4-3 $ - $ 58.5 $ 58.5 100.0% N/A N/A N/A N/A N/A N/A N/A N/A N/A
54 21 Miscellaneous Capital and EP&R
N/A Not assigned RAMP Risk: WF Mitigation
M28 - CWSP Program Management Office
4-3 $ 569.5 $ 0.3 $ (569.2) -99.9% N/A N/A N/A N/A N/A N/A N/A N/A N/A
55 21 Miscellaneous Capital and EP&R
N/A Not assigned RAMP Risk: WF Mitigation
Post 2020 GRC Mitigations N/A $ - $ 6,441.2 $ 6,441.2 100.0% N/A N/A N/A N/A N/A N/A N/A N/A N/A
56 23 Implement Real Estate Strategy
23C Implement Workplace Strategy
SRM Total SRM Total N/A $ - $ 266.5 $ 266.5 100.0% N/A N/A N/A N/A NO NO N/A Below variance threshold N/A
57 23 Implement Real Estate Strategy
23C Implement Workplace Strategy
RAMP Risk: WF Mitigation
Post 2020 GRC Mitigations N/A $ - $ 266.5 $ 266.5 100.0% N/A N/A N/A N/A N/A N/A N/A N/A N/A
58 25 Install New Electric Meters
N/A Not assigned SRM Total (Non-RAMP)
SRM Total (Non-RAMP) 6-6 $ - $ 28,508.2 $ 28,508.2 100.0% N/A N/A N/A N/A YES YES N/A Program expenditures exceeded imputed regulatory values due to transfer of this program from Customer Care to Electric Distribution in 2018 after the 2020 GRC financials submission.
N/A
59 2A Electric Distribution Preventive Maintenance OH
# Not assigned SRM Total (Non-RAMP)
SRM Total (Non-RAMP) 4-6 $ - $ (214.1) $ (214.1) -100.0% N/A N/A N/A N/A NO NO N/A Below variance threshold N/A
60 2A Electric Distribution Preventive Maintenance OH
2AA OH General Replace SRM Total SRM Total 4-6 $ 60,078.4 $ 261,997.7 $ 201,919.3 336.1% 12,135 20,340 8,205 67.6% YES YES YES Program expenditures exceeded imputed regulatory values due to higher volume of work completed and greater use of contractors as work volume exceeded capacity of internal resources.
Actual units were higher than imputed regulatory units due to change in strategy in Q2 last year to focus on wildfire risk. More high fire risk tags completed.
61 2A Electric Distribution Preventive Maintenance OH
2AA OH General Replace RAMP Risk: WF Control / DOCP Control
C8 - OH Equipment Replacement/C4 - Overhead Equip ED Prev Maint
4-6 $ 60,078.4 $ 261,997.7 $ 201,919.3 336.1% 12,135 20,340 8,205 67.6% N/A N/A N/A N/A N/A
62 2A Electric Distribution Preventive Maintenance OH
2AB Bird Safe Install/Replacement
SRM Total SRM Total 4-6 $ 3,166.7 $ 3,130.6 $ (36.0) -1.1% 1,209 822 (387) -32.0% NO NO YES Below variance threshold Actual units were lower than imputed regulatory units due to fewer units required due to work completed in other programs that included bird mitigation, such as system hardening, including tree wire projects, and pole replacement in raptor concentration zones.
63 2A Electric Distribution Preventive Maintenance OH
2AB Bird Safe Install/Replacement
RAMP Risk: WF Control / DOCP Control
C6 - Animal Abatement/C4 - Overhead Equip ED Prev Maint
4-6 $ 3,166.7 $ 3,130.6 $ (36.0) -1.1% 1,209 822 (387) -32.0% N/A N/A N/A N/A N/A
64 2A Electric Distribution Preventive Maintenance OH
2AC Bird Safe Install/Replace Annual
SRM Total SRM Total 4-6 $ 2,596.3 $ 2,466.5 $ (129.8) -5.0% 989 470 (519) -52.5% NO NO YES Below variance threshold Actual units were lower than imputed regulatory units due to fewer units required due to work completed in other programs that included bird mitigation, such as system hardening, including tree wire projects, and pole replacement in raptor concentration zones.
65 2A Electric Distribution Preventive Maintenance OH
2AC Bird Safe Install/Replace Annual
RAMP Risk: WF Control / DOCP Control
C6 - Animal Abatement/C4 - Overhead Equip ED Prev Maint
4-6 $ 2,596.3 $ 2,466.5 $ (129.8) -5.0% 989 470 (519) -52.5% N/A N/A N/A N/A N/A

3-17
TABLE 3-4 ELECTRIC DISTRIBUTION 2021 CAPITAL COMPARISON BY MAT CODE FOR SAFETY, RELIABILITY, AND MAINTENANCE WORK
(THOUSANDS OF DOLLARS) (CONTINUED)
Line No. MWC MWC Name MAT MAT Name RAMP Risk Name
RAMP Control/Mitigation Name
2020 GRC Testimony Reference
2021 Imputed Adopted Costs
(A) 2021 Actual Costs
(B)
2021 Cost Difference
(B-A)
2021 Cost Percent Change
(%)(B-A)/A
2021 Imputed Adopted
Units (C)
2021 Actual Units(D)
2021 Unit Difference
(D-C)
2021 Unit Percent Change
(%)(D-C)/C
Spending Variance
Explanation Required
(Y/N)
Percentage Variance
Explanation Required
(Y/N)
Unit Variance Explanation
Required (Y/N) Cost Variance Explanation Unit Variance Explanation
66 2A Electric Distribution Preventive Maintenance OH
2AE OH COE Replace SRM Total SRM Total 4-6 $ 32,042.3 $ 58,058.9 $ 26,016.7 81.2% 1,463 1,365 (98) -6.7% YES YES NO Program expenditures exceeded imputed regulatory values due to greater use of contractors as work volume exceeded capacity of internal resources.
Below variance threshold
67 2A Electric Distribution Preventive Maintenance OH
2AE OH COE Replace RAMP Risk: WF Control
C8 - OH Equipment Replacement
4-6 $ 32,042.3 $ 58,058.9 $ 26,016.7 81.2% 1,463 1,365 (98) -6.7% N/A N/A N/A N/A N/A
68 2A Electric Distribution Preventive Maintenance OH
2AF OH Idle Facility Remove
SRM Total SRM Total 4-6 $ 10,669.1 $ 15,249.6 $ 4,580.5 42.9% 2,347 1,714 (633) -27.0% NO NO YES Below variance threshold Actual units were lower than imputed regulatory units due to change in strategy in Q2 last year to focus on wildfire risk and complete high fire risk work in MAT 2AA.
69 2A Electric Distribution Preventive Maintenance OH
2AF OH Idle Facility Remove
RAMP Risk: WF Control / DOCP Control
C8 - OH Equipment Replacement/C4 - Overhead Equip ED Prev Maint
4-6 $ 10,669.1 $ 15,249.6 $ 4,580.5 42.9% 2,347 1,714 (633) -27.0% N/A N/A N/A N/A N/A
70 2A Electric Distribution Preventive Maintenance OH
2AG SF Series Streetlights SRM Total (Non-RAMP)
SRM Total (Non-RAMP) 4-6 $ - $ 24.4 $ 24.4 100.0% N/A N/A N/A N/A NO NO N/A Below variance threshold N/A
71 2A Electric Distribution Preventive Maintenance OH
2AH LED Streetlights SRM Total (Non-RAMP)
SRM Total (Non-RAMP) 4-6 $ - $ 1,115.6 $ 1,115.6 100.0% N/A N/A N/A N/A NO NO N/A Below variance threshold N/A
72 2A Electric Distribution Preventive Maintenance OH
2AI SF Historical Streetlights
SRM Total (Non-RAMP)
SRM Total (Non-RAMP) 4-6 $ - $ 74.4 $ 74.4 100.0% N/A N/A N/A N/A NO NO N/A Below variance threshold N/A
73 2A Electric Distribution Preventive Maintenance OH
2AP OH Capital Projects SRM Total SRM Total 4-6 $ 13,838.5 $ 13,340.1 $ (498.4) -3.6% 625 1,429 804 128.6% NO NO YES Below variance threshold Actual units were higher than imputed regulatory units due to increase in scope of program in 2021. The scope of the program was expanded to expedite the replacement of non-exempt fuses (which are located in HFTD areas) to mitigation ignition risks.
74 2A Electric Distribution Preventive Maintenance OH
2AP OH Capital Projects - Non-exempt fuse replacement
RAMP Risk: WF Control
C4 - Non-Exempt Equipment Replacement
4-6 $ 535.2 $ - $ (535.2) -100.0% N/A N/A N/A N/A N/A N/A N/A N/A N/A
75 2A Electric Distribution Preventive Maintenance OH
2AP OH Capital Projects - Non-exempt fuse replacement
RAMP Risk: WF Control / DOCP Control
C8 - Overhead Equipment Replacement / C4 - Overhead Equipment ED Preventive Maintenance
4-6 $ 7,878.2 $ 2,044.9 $ (5,833.2) -74.0% N/A N/A N/A N/A N/A N/A N/A N/A N/A
76 2A Electric Distribution Preventive Maintenance OH
2AP OH Capital Projects - Non-exempt fuse replacement
RAMP Risk: WF Mitigation
M12 - Wildfire System Hardening
4-6 $ 5,425.2 $ 11,295.2 $ 5,870.0 108.2% 625 1,429 804 128.6% N/A N/A N/A N/A N/A
77 2A Electric Distribution Preventive Maintenance OH
2AQ Ceramic Post Insulators
SRM Total SRM Total 4-6 $ - $ 705.6 $ 705.6 100.0% N/A N/A N/A N/A NO NO N/A Below variance threshold N/A
78 2A Electric Distribution Preventive Maintenance OH
2AQ Ceramic Post Insulators
RAMP Risk: WF Control / DOCP Control
C8 - OH Equipment Replacement/C4 - Overhead Equip ED Prev Maint
4-6 $ - $ 705.6 $ 705.6 100.0% N/A N/A N/A N/A N/A N/A N/A N/A N/A
79 2A Electric Distribution Preventive Maintenance OH
2AR Surge Arrester Replacement
SRM Total SRM Total 4-6 $ 75,432.6 $ 74,190.9 $ (1,241.6) -1.6% 19,340 15,465 (3,875) -20.0% NO NO YES Below variance threshold Actual units were lower than imputed units due to limitations in field variables concerning contractors performing work and change in strategy to prioritize work on more difficult units in Tier 2 and 3 HFTD areas.
80 2A Electric Distribution Preventive Maintenance OH
2AR Surge Arrester Replacement
RAMP Risk: WF Mitigation
M5 - Non Exempt Surge Arrester Replacement Program
4-6 $ 75,432.6 $ 74,190.9 $ (1,241.6) -1.6% 19,340 15,465 (3,875) -20.0% N/A N/A N/A N/A N/A
81 2A Electric Distribution Preventive Maintenance OH
2AS FAS Overhead Capital SRM Total (Non-RAMP)
SRM Total (Non-RAMP) 4-6 $ 756.7 $ 101.4 $ (655.3) -86.6% 2,325 1,106 (1,219) -52.4% NO NO YES Below variance threshold Actual units were lower than imputed regulatory units due to change in strategy in Q2 last year to focus on wildfire risk and complete high fire risk work in MAT 2AA.
82 2B Electric Distribution Preventive Maintenance UG
# Not assigned SRM Total (Non-RAMP)
SRM Total (Non-RAMP) 4-6 $ 3,092.8 $ (110.3) $ (3,203.1) -103.6% N/A N/A N/A N/A NO NO N/A Below variance threshold N/A

3-18
TABLE 3-4 ELECTRIC DISTRIBUTION 2021 CAPITAL COMPARISON BY MAT CODE FOR SAFETY, RELIABILITY, AND MAINTENANCE WORK
(THOUSANDS OF DOLLARS) (CONTINUED)
Line No. MWC MWC Name MAT MAT Name RAMP Risk Name
RAMP Control/Mitigation Name
2020 GRC Testimony Reference
2021 Imputed Adopted Costs
(A) 2021 Actual Costs
(B)
2021 Cost Difference
(B-A)
2021 Cost Percent Change
(%)(B-A)/A
2021 Imputed Adopted
Units (C)
2021 Actual Units(D)
2021 Unit Difference
(D-C)
2021 Unit Percent Change
(%)(D-C)/C
Spending Variance
Explanation Required
(Y/N)
Percentage Variance
Explanation Required
(Y/N)
Unit Variance Explanation
Required (Y/N) Cost Variance Explanation Unit Variance Explanation
83 2B Electric Distribution Preventive Maintenance UG
2BA UG General Replace SRM Total (Non-RAMP)
SRM Total (Non-RAMP) 4-6 $ 46,434.6 $ 72,974.8 $ 26,540.2 57.2% 2,551 2,892 341 13.4% YES YES NO Program expenditures exceeded imputed regulatory values due to greater use of contractors as work volume exceeded capacity of internal resources.
Below variance threshold
84 2B Electric Distribution Preventive Maintenance UG
2BB Fault Indicator Replacements
SRM Total (Non-RAMP)
SRM Total (Non-RAMP) 4-6 $ 1,171.3 $ 813.2 $ (358.1) -30.6% 3,791 2,740 (1,051) -27.7% NO NO YES Below variance threshold Actual units were lower than imputed regulatory units due to change in strategy in Q2 last year to focus on wildfire risk and complete high fire risk overhead maintenance work.
85 2B Electric Distribution Preventive Maintenance UG
2BD UG COE Replace SRM Total (Non-RAMP)
SRM Total (Non-RAMP) 4-6 $ 5,915.1 $ 9,441.0 $ 3,525.9 59.6% 145 95 (50) -34.5% NO NO YES Below variance threshold Actual units were lower than imputed regulatory units due to change in strategy in Q2 last year to focus on wildfire risk and complete high fire risk overhead maintenance work.
86 2B Electric Distribution Preventive Maintenance UG
2BF UG Idle Facility Remove
SRM Total (Non-RAMP)
SRM Total (Non-RAMP) 4-6 $ 194.2 $ 95.2 $ (99.0) -51.0% 17 3 (14) -82.4% NO NO YES Below variance threshold Actual units were lower than imputed regulatory units due to change in strategy in Q2 last year to focus on wildfire risk and complete high fire risk overhead maintenance work.
87 2B Electric Distribution Preventive Maintenance UG
2BP UG Capital Projects SRM Total (Non-RAMP)
SRM Total (Non-RAMP) 4-6 $ 2,589.3 $ 692.5 $ (1,896.9) -73.3% 0 2 2 100.0% NO NO YES Below variance threshold Actual units were higher than imputed regulatory units due to change in strategy in Q2 last year to focus on Wildfire Risk. More high fire risk tags completed.
88 2C Electric Distribution Preventive Maintenance Network
# Not assigned SRM Total (Non-RAMP)
SRM Total (Non-RAMP) 4-6 $ - $ 25.6 $ 25.6 100.0% N/A N/A N/A N/A NO NO N/A Below variance threshold N/A
89 2C Electric Distribution Preventive Maintenance Network
2CA NP Relay Replacement
SRM Total (Non-RAMP)
SRM Total (Non-RAMP) 4-6 $ 232.6 $ 92.6 $ (140.0) -60.2% 20 17 (3) -15.0% NO NO NO Below variance threshold Below variance threshold
90 2C Electric Distribution Preventive Maintenance Network
2CB Fiber/SCADA Communication Replace
SRM Total (Non-RAMP)
SRM Total (Non-RAMP) 4-6 $ 145.7 $ 19.0 $ (126.7) -87.0% N/A N/A N/A N/A NO NO N/A Below variance threshold N/A
91 2C Electric Distribution Preventive Maintenance Network
2CC Network Transformer & Protector Replace
SRM Total (Non-RAMP)
SRM Total (Non-RAMP) 4-6 $ 5,284.8 $ 4,942.7 $ (342.1) -6.5% 25 42 17 68.0% NO NO YES Below variance threshold Actual units were higher than imputed regulatory units due to additional units identified for replacement based on condition. Additional units were identified via inspection, dissolved gas analysis (DGA), and in the course of normal work.
92 2C Electric Distribution Preventive Maintenance Network
2CD Venting Manhole Covers Replace
SRM Total (Non-RAMP)
SRM Total (Non-RAMP) 4-6 $ 5,569.9 $ 5,057.1 $ (512.9) -9.2% 593 513 (80) -13.5% NO NO NO Below variance threshold Below variance threshold
93 2C Electric Distribution Preventive Maintenance Network
2CE SCADA Communications Upgrd
SRM Total (Non-RAMP)
SRM Total (Non-RAMP) 4-6 $ 8,786.1 $ 11,683.9 $ 2,897.8 33.0% N/A N/A N/A N/A NO NO N/A Below variance threshold N/A
94 2F Build IT Applications & Infrastructure
N/A Not assigned SRM Total SRM Total 4-15 $ 17,393.8 $ 66,989.1 $ 49,595.4 285.1% N/A N/A N/A N/A YES YES N/A Program expenditures exceeded imputed regulatory values due to technology investments made in support of wildfire mitigation efforts (IT PSPS Program, IT Asset Risk Program, Data Enablement).
N/A
95 2F Build IT Applications & Infrastructure
N/A Not assigned RAMP Risk: WF Mitigation
Post 2020 GRC Mitigations N/A $ 17,393.8 $ 66,989.1 $ 49,595.4 285.1% N/A N/A N/A N/A N/A N/A N/A N/A N/A
96 3R Energy Storage Capital N/A Not assigned SRM Total (Non-RAMP)
SRM Total (Non-RAMP) N/A $ - $ 284.0 $ 284.0 100.0% N/A N/A N/A N/A NO NO N/A Below variance threshold N/A
97 46 Electric Distribution Substation Capacity
46A ED Substation General install/Replace
SRM Total (Non-RAMP)
SRM Total (Non-RAMP) 4-13 $ 32,525.3 $ 9,603.0 $ (22,922.3) -70.5% N/A N/A N/A N/A YES YES N/A Program expenditures were below imputed regulatory values due to a cancellation of the Llagas energy storage project.
N/A
98 46 Electric Distribution Substation Capacity
46F ED Substation Emergency and Operational Capacity
SRM Total (Non-RAMP)
SRM Total (Non-RAMP) 4-13 $ 5,121.5 $ 17,398.6 $ 12,277.1 239.7% N/A N/A N/A N/A NO YES N/A Program expenditures exceeded imputed regulatory values due to completion in 2021 of capacity projects from previous years that were rescheduled due to emergency repair and wildfire hardening work.
N/A

3-19
TABLE 3-4 ELECTRIC DISTRIBUTION 2021 CAPITAL COMPARISON BY MAT CODE FOR SAFETY, RELIABILITY, AND MAINTENANCE WORK
(THOUSANDS OF DOLLARS) (CONTINUED)
Line No. MWC MWC Name MAT MAT Name RAMP Risk Name
RAMP Control/Mitigation Name
2020 GRC Testimony Reference
2021 Imputed Adopted Costs
(A) 2021 Actual Costs
(B)
2021 Cost Difference
(B-A)
2021 Cost Percent Change
(%)(B-A)/A
2021 Imputed Adopted
Units (C)
2021 Actual Units(D)
2021 Unit Difference
(D-C)
2021 Unit Percent Change
(%)(D-C)/C
Spending Variance
Explanation Required
(Y/N)
Percentage Variance
Explanation Required
(Y/N)
Unit Variance Explanation
Required (Y/N) Cost Variance Explanation Unit Variance Explanation
99 46 Electric Distribution Substation Capacity
46H ED Substation New Bus Related Capacity
SRM Total (Non-RAMP)
SRM Total (Non-RAMP) 4-13 $ 17,471.2 $ 27,207.7 $ 9,736.5 55.7% N/A N/A N/A N/A NO NO N/A Below variance threshold N/A
100 46 Electric Distribution Substation Capacity
46N ED Substation Land Purchase New Sub
SRM Total (Non-RAMP)
SRM Total (Non-RAMP) 4-13 $ 843.5 $ 6.5 $ (837.0) -99.2% N/A N/A N/A N/A NO NO N/A Below variance threshold N/A
101 46 Electric Distribution Substation Capacity
46T ED Substation Support Transmission or Substation Related work
SRM Total (Non-RAMP)
SRM Total (Non-RAMP) 4-13 $ 2,355.4 $ - $ (2,355.4) -100.0% N/A N/A N/A N/A NO NO N/A Below variance threshold N/A
102 48 Electric Distribution Substation Replace Other Equipment
48A Replace ED Substation Other Equipment
SRM Total (Non-RAMP)
SRM Total (Non-RAMP) 4-12 $ 7,346.4 $ 4,985.2 $ (2,361.2) -32.1% N/A N/A N/A N/A NO NO N/A Below variance threshold N/A
103 48 Electric Distribution Substation Replace Other Equipment
48C Replace ED Substation Batteries
SRM Total (Non-RAMP)
SRM Total (Non-RAMP) 4-12 $ 2,257.5 $ 466.3 $ (1,791.2) -79.3% 10 2 (8) -80.0% NO NO YES Below variance threshold Actual units were lower than imputed regulatory units due to a decision to defer proactive battery replacements to fund other higher priority work in MWC 48, such as critical switchgear replacement work in the 2020 GRC period. Deferral of these proactive replacements does not compromise safety or reliability.
104 48 Electric Distribution Substation Replace Other Equipment
48D Replace ED Substation Breakers
SRM Total (Non-RAMP)
SRM Total (Non-RAMP) 4-12 $ 7,481.5 $ 6,564.6 $ (917.0) -12.3% N/A N/A N/A N/A NO NO N/A Below variance threshold N/A
105 48 Electric Distribution Substation Replace Other Equipment
48E Replace ED Substation Switches
SRM Total (Non-RAMP)
SRM Total (Non-RAMP) 4-12 $ 1,437.4 $ 815.2 $ (622.2) -43.3% N/A N/A N/A N/A NO NO N/A Below variance threshold N/A
106 48 Electric Distribution Substation Replace Other Equipment
48F Replace ED Substation Switchgear
SRM Total (Non-RAMP)
SRM Total (Non-RAMP) 4-12 $ 21,156.4 $ 31,757.2 $ 10,600.8 50.1% N/A N/A N/A N/A NO YES N/A Program expenditures exceeded imputed regulatory values primarily because costs related to the Larkin switchgear replacement project that had been forecast for prior years instead fell in 2021. Carry over activities included deferred materials purchases. These purchases included supplier and PG&E issues related to COVID-19 execution impacts that resulted in higher expenditures.
N/A
107 48 Electric Distribution Substation Replace Other Equipment
48H Replace ED Substation Civil Structures
SRM Total (Non-RAMP)
SRM Total (Non-RAMP) 4-12 $ 2,045.3 $ 1,264.6 $ (780.7) -38.2% N/A N/A N/A N/A NO NO N/A Below variance threshold N/A
108 48 Electric Distribution Substation Replace Other Equipment
48L Dist Line Work Support Substation
SRM Total (Non-RAMP)
SRM Total (Non-RAMP) 4-12 $ 7,109.6 $ 19,052.3 $ 11,942.7 168.0% N/A N/A N/A N/A NO YES N/A Program expenditures exceeded imputed regulatory values due to a higher volume of distribution line work required to support various transformer, switchgear, and emergency replacement projects. In addition, carry over costs from prior years related to COVID-19 impacts resulted in higher expenses.
N/A
109 48 Electric Distribution Substation Replace Other Equipment
48N ED Substation Insulators
SRM Total (Non-RAMP)
SRM Total (Non-RAMP) 4-12 $ 2,255.3 $ 8.9 $ (2,246.3) -99.6% N/A N/A N/A N/A NO NO N/A Below variance threshold N/A
110 48 Electric Distribution Substation Replace Other Equipment
48X ED Substation Animal Abatement
SRM Total (Non-RAMP)
SRM Total (Non-RAMP) 4-12 $ 2,385.6 $ 4,739.2 $ 2,353.6 98.7% 10 12 2 20.0% NO NO NO Below variance threshold Below variance threshold
111 49 Electric Distribution Reliability Circuit/Zone
# Not assigned SRM Total (Non-RAMP)
SRM Total (Non-RAMP) 4-9 $ 4,430.9 $ 14,961.1 $ 10,530.1 237.7% N/A N/A N/A N/A NO YES N/A Program expenditures exceeded imputed regulatory values due to higher volume of line recloser and automatic switch purchases.
N/A
112 49 Electric Distribution Reliability Circuit/Zone
49A/09A (a)
Distribution Line Automation
SRM Total SRM Total 4-9 $ - $ 8,220.3 $ 8,220.3 100.0% N/A N/A N/A N/A NO NO N/A Below variance threshold N/A
113 49 Electric Distribution Reliability Circuit/Zone
49A/09A (a)
Distribution Line Automation
RAMP Risk: WF Mitigation / DOCP Control
M15 - Automation and Protection / C9 - Supervisory Control and Data Acquisition
4-9 $ - $ 8,220.3 $ 8,220.3 100.0% N/A N/A N/A N/A N/A N/A N/A N/A N/A
114 49 Electric Distribution Reliability Circuit/Zone
49B Recl Ctrls Install/Replace
SRM Total SRM Total 4-9 $ - $ 23.9 $ 23.9 100.0% N/A N/A N/A N/A NO NO N/A Below variance threshold N/A
115 49 Electric Distribution Reliability Circuit/Zone
49B Recl Ctrls Install/Replace
RAMP Risk: WF Control
C7 - Protective Equipment 4-9 $ - $ 23.9 $ 23.9 100.0% N/A N/A N/A N/A N/A N/A N/A N/A N/A

3-20
TABLE 3-4 ELECTRIC DISTRIBUTION 2021 CAPITAL COMPARISON BY MAT CODE FOR SAFETY, RELIABILITY, AND MAINTENANCE WORK
(THOUSANDS OF DOLLARS) (CONTINUED)
Line No. MWC MWC Name MAT MAT Name RAMP Risk Name
RAMP Control/Mitigation Name
2020 GRC Testimony Reference
2021 Imputed Adopted Costs
(A) 2021 Actual Costs
(B)
2021 Cost Difference
(B-A)
2021 Cost Percent Change
(%)(B-A)/A
2021 Imputed Adopted
Units (C)
2021 Actual Units(D)
2021 Unit Difference
(D-C)
2021 Unit Percent Change
(%)(D-C)/C
Spending Variance
Explanation Required
(Y/N)
Percentage Variance
Explanation Required
(Y/N)
Unit Variance Explanation
Required (Y/N) Cost Variance Explanation Unit Variance Explanation
116 49 Electric Distribution Reliability Circuit/Zone
49C OH Fuses Install/Replace
SRM Total (Non-RAMP)
SRM Total (Non-RAMP) 4-9 $ 1,094.6 $ 686.6 $ (408.0) -37.3% 99 97 (2) -2.0% NO NO NO Below variance threshold Below variance threshold
117 49 Electric Distribution Reliability Circuit/Zone
49D OH Recl/Sect/Swch Install/Replace
SRM Total SRM Total 4-9 $ - $ 537.9 $ 537.9 100.0% 0 4 4 100.0% NO NO YES Below variance threshold Actual units were higher than imputed regulatory units due to no forecast in the 2020 GRC for this work.
118 49 Electric Distribution Reliability Circuit/Zone
49D OH Recl/Sect/Swch Install/Replace
RAMP Risk: WF Control
C7 - Protective Equipment 4-9 $ - $ 537.9 $ 537.9 100.0% 0 4 4 100.0% N/A N/A N/A N/A N/A
119 49 Electric Distribution Reliability Circuit/Zone
49E General Install/Replace Circuit/Zone
SRM Total SRM Total 4-9 $ - $ 200.8 $ 200.8 100.0% N/A N/A N/A N/A NO NO N/A Below variance threshold N/A
120 49 Electric Distribution Reliability Circuit/Zone
49E General Install/Replace Circuit/Zone
RAMP Risk: WF Control / DOCP Control
C7 - Protective Equipment / C8 - Targeted Circuits Program
4-9 $ - $ 200.8 $ 200.8 100.0% N/A N/A N/A N/A N/A N/A N/A N/A N/A
121 49 Electric Distribution Reliability Circuit/Zone
49F UG Fuses Install/Replace
SRM Total (Non-RAMP)
SRM Total (Non-RAMP) 4-9 $ - $ 151.8 $ 151.8 100.0% 0 1 1 100.0% NO NO YES Below variance threshold Actual units were higher than imputed regulatory units due to no forecast in the 2020 GRC for this work.
122 49 Electric Distribution Reliability Circuit/Zone
49G UG Recl/Sect/Swch Install/Replace
SRM Total (Non-RAMP)
SRM Total (Non-RAMP) 4-9 $ - $ 293.2 $ 293.2 100.0% 0 4 4 100.0% NO NO YES Below variance threshold Actual units were higher than imputed regulatory units due to no forecast in the 2020 GRC for this work.
123 49 Electric Distribution Reliability Circuit/Zone
49H PSPS Sect Device Install/Replace
SRM Total SRM Total 4-9 $ 5,425.0 $ 29,276.5 $ 23,851.5 439.7% 75 269 194 258.7% YES YES YES Program expenditures exceeded imputed regulatory values due to installing additional sectionalizing devices to support the ability to segment distribution circuits near the HFTDboundary to reduce the impact and scope of PSPS events. In addition, working near the HFTD boundary involves increased construction complexities.
Actual units were higher than imputed regulatory units due to installing additional sectionalizing devices to support the ability to segment distribution circuits near the HFTD boundary to reduce the impact and scope of PSPS events.
124 49 Electric Distribution Reliability Circuit/Zone
49H PSPS Sect Device Install/Replace
RAMP Risk: WF Mitigation
M15 - Automation and Protection
4-9 $ 5,425.0 $ 29,276.5 $ 23,851.5 439.7% 75 269 194 258.7% N/A N/A N/A N/A N/A
125 49 Electric Distribution Reliability Circuit/Zone
49I OH Fault lndicator/Line Sensor Install/Replace
SRM Total SRM Total 4-9 $ - $ 8,597.0 $ 8,597.0 100.0% 0 397 397 100.0% NO NO YES Below variance threshold Actual units were higher than imputed regulatory units due to being added as part of CWSP/WMP program.
126 49 Electric Distribution Reliability Circuit/Zone
49I OH Fault lndicator/Line Sensor Install/Replace
RAMP Risk: DOCP Control
C8 - Targeted Circuits Program 4-9 $ - $ 53.4 $ 53.4 100.0% N/A N/A N/A N/A N/A N/A N/A N/A N/A
127 49 Electric Distribution Reliability Circuit/Zone
49I OH Fault lndicator/Line Sensor Install/Replace
RAMP Risk: WF Mitigation
Post 2020 GRC Mitigations 4-9 $ - $ 8,543.6 $ 8,543.6 100.0% 0 397 397 100.0% N/A N/A N/A N/A N/A
128 49 Electric Distribution Reliability Circuit/Zone
49M PIH / Microgrids: non-gen
SRM Total SRM Total 4-9 $ 13,187.8 $ 13,746.9 $ 559.1 4.2% 12 5 (7) -58.3% NO NO YES Below variance threshold Actual units were lower than imputed adopted units due to successful pilot phase and successive phases of the program presenting opportunities to build larger sites and enhance grid hardening beyond what was initially envisioned in 2018, which reduced the actual units relative to the imputed adopted.
129 49 Electric Distribution Reliability Circuit/Zone
49M PIH / Microgrids: non-gen
RAMP Risk: WF Mitigation
M10 - Resiliance Zones 4-9 $ 13,187.8 $ 13,746.9 $ 559.1 4.2% 12 5 (7) -58.3% N/A N/A N/A N/A N/A
130 49 Electric Distribution Reliability Circuit/Zone
49R Grid Mod Tech SRM Total SRM Total N/A $ - $ (2,022.4) $ (2,022.4) -100.0% N/A N/A N/A N/A NO NO N/A Below variance threshold N/A
131 49 Electric Distribution Reliability Circuit/Zone
49R Grid Mod Tech RAMP Risk: WF Mitigation
Post 2020 GRC Mitigations N/A $ - $ (2,022.4) $ (2,022.4) -100.0% N/A N/A N/A N/A N/A N/A N/A N/A N/A
132 49 Electric Distribution Reliability Circuit/Zone
49S Elect Reliability Inst FLISR
SRM Total SRM Total 4-9 $ 2,182.9 $ 4,093.7 $ 1,910.8 87.5% 8 11 3 37.5% NO NO YES Below variance threshold Actual units were higher than imputed regulatory units due to the completion of 2020 projects, that ended up carrying over into 2021, due to higher competing priorities using same limited construction resources in 2020.
133 49 Electric Distribution Reliability Circuit/Zone
49S Elect Reliability Inst FLISR
RAMP Risk: WF Control
C7 - Protective Equipment 4-9 $ 2,182.9 $ 4,093.7 $ 1,910.8 87.5% 8 11 3 37.5% N/A N/A N/A N/A N/A
134 49 Electric Distribution Reliability Circuit/Zone
49T D-TripSaverII Cutout-MountedLR
SRM Total SRM Total 4-9 $ 3,311.1 $ 6,684.8 $ 3,373.7 101.9% 187 109 (78) -41.7% NO NO YES Below variance threshold Actual units were lower than imputed regulatory units due to the change from TripSaver installation to the more complex FuseSaver installation reduced the amount of units installed.
135 49 Electric Distribution Reliability Circuit/Zone
49T D-TripSaverII Cutout-MountedLR
RAMP Risk: WF Mitigation
M15 - Automation and Protection
4-9 $ 2,214.6 $ 6,461.0 $ 4,246.4 191.7% N/A N/A N/A N/A N/A N/A N/A N/A N/A

3-21
TABLE 3-4 ELECTRIC DISTRIBUTION 2021 CAPITAL COMPARISON BY MAT CODE FOR SAFETY, RELIABILITY, AND MAINTENANCE WORK
(THOUSANDS OF DOLLARS) (CONTINUED)
Line No. MWC MWC Name MAT MAT Name RAMP Risk Name
RAMP Control/Mitigation Name
2020 GRC Testimony Reference
2021 Imputed Adopted Costs
(A) 2021 Actual Costs
(B)
2021 Cost Difference
(B-A)
2021 Cost Percent Change
(%)(B-A)/A
2021 Imputed Adopted
Units (C)
2021 Actual Units(D)
2021 Unit Difference
(D-C)
2021 Unit Percent Change
(%)(D-C)/C
Spending Variance
Explanation Required
(Y/N)
Percentage Variance
Explanation Required
(Y/N)
Unit Variance Explanation
Required (Y/N) Cost Variance Explanation Unit Variance Explanation
136 49 Electric Distribution Reliability Circuit/Zone
49T D-TripSaverII Cutout-MountedLR
SRM (Non-RAMP) SRM (Non-RAMP) 4-9 $ 1,096.5 $ 223.8 $ (872.7) -79.6% N/A N/A N/A N/A N/A N/A N/A N/A N/A
137 49 Electric Distribution Reliability Circuit/Zone
49X Emerging Dist Rel Improvements
SRM Total SRM Total 4-9 $ 5,787.0 $ 2,677.5 $ (3,109.5) -53.7% N/A N/A N/A N/A NO NO N/A Below variance threshold N/A
138 49 Electric Distribution Reliability Circuit/Zone
49X Emerging Dist Rel Improvements
RAMP Risk: WF Control /DOCP Control
C7 - Protective Equipment / C8 - Targeted Circuits Program
4-9 $ 5,787.0 $ 2,677.5 $ (3,109.5) -53.7% N/A N/A N/A N/A N/A N/A N/A N/A N/A
139 54 Electric Distribution Substation Transformer Replacements
54A ED Substation Replace Transformer
SRM Total (Non-RAMP)
SRM Total (Non-RAMP) 4-12 $ 5,660.1 $ 37,706.8 $ 32,046.7 566.2% N/A N/A N/A N/A YES YES N/A Program expenditures exceeded imputed regulatory values due to a decision to continue in-flight transformer replacements not identified in the 2020 GRC forecast.
N/A
140 54 Electric Distribution Substation Transformer Replacements
54L ED Substation Life Extension Transformer
SRM Total (Non-RAMP)
SRM Total (Non-RAMP) 4-12 $ - $ 26.9 $ 26.9 100.0% N/A N/A N/A N/A NO NO N/A Below variance threshold N/A
141 56 Electric Distribution Underground (UG) AssetReplacements
# Not assigned SRM Total (Non-RAMP)
SRM Total (Non-RAMP) 4-11 $ - $ 204.7 $ 204.7 100.0% N/A N/A N/A N/A NO NO N/A Below variance threshold N/A
142 56 Electric Distribution Underground (UG) AssetReplacements
56A UG Cable Other Replace
SRM Total (Non-RAMP)
SRM Total (Non-RAMP) 4-11 $ 33,503.8 $ 24,664.2 $ (8,839.6) -26.4% 20 8 (12) -60.0% NO NO YES Below variance threshold Actual units were lower than imputed regulatory units due to other higher priority work of LBOR switches and temperature alarm devices.
143 56 Electric Distribution Underground (UG) AssetReplacements
56B UG Cable Inject SRM Total (Non-RAMP)
SRM Total (Non-RAMP) 4-11 $ 3,312.4 $ 12.4 $ (3,300.0) -99.6% N/A N/A N/A N/A NO NO N/A Below variance threshold N/A
144 56 Electric Distribution Underground (UG) AssetReplacements
56C UG Cable COE Replace
SRM Total (Non-RAMP)
SRM Total (Non-RAMP) 4-11 $ 33,407.4 $ 26,990.9 $ (6,416.5) -19.2% 221 108 (113) -51.1% NO NO YES Below variance threshold Actual units were lower than imputed regulatory units due to other higher priority work of LBOR switches and temperature alarm devices.
145 56 Electric Distribution Underground (UG) AssetReplacements
56D TGRAM/TGRAL Switch Replacement
SRM Total (Non-RAMP)
SRM Total (Non-RAMP) 4-11 $ - $ (243.8) $ (243.8) -100.0% 0 3 3 100.0% NO NO YES Below variance threshold Actual units were higher than imputed regulatory units due to identification of newly discovered units requiring replacements.
146 56 Electric Distribution Underground (UG) AssetReplacements
56N Network Cable Replacement
SRM Total (Non-RAMP)
SRM Total (Non-RAMP) 4-11 $ 24,502.9 $ 28,134.1 $ 3,631.2 14.8% N/A N/A N/A N/A NO NO N/A Below variance threshold N/A
147 56 Electric Distribution Underground (UG) AssetReplacements
56S Replace Obsolete UG Switches
SRM Total (Non-RAMP)
SRM Total (Non-RAMP) 4-11 $ 6,660.0 $ 14,052.4 $ 7,392.4 111.0% 64 88 24 37.5% NO NO YES Below variance threshold Actual units were higher than imputed regulatory units due to completion of additional LBOR switch replacements to meet the 2020 GRC settlement agreement compliance requirement.
148 56 Electric Distribution Underground (UG) AssetReplacements
56T Install Temperature Indicator
SRM Total (Non-RAMP)
SRM Total (Non-RAMP) 4-11 $ - $ 12,624.6 $ 12,624.6 100.0% 0 458 458 100.0% NO YES YES Program expenditures exceeded imputed regulatory values because this is a new program initiated after the 2020 GRC was filed to install temperature sensors to monitor underground equipment.
Actual units were higher than imputed regulatory units because this is a new program initiated after the 2020 GRC was filed to install temperature sensors to monitor underground equipment.
149 58 Electric Distribution Substation Safety and Security
58A ED Substation Safety&Envir&Fire Protect
SRM Total (Non-RAMP)
SRM Total (Non-RAMP) 4-12 $ 2,285.3 $ 108.0 $ (2,177.3) -95.3% N/A N/A N/A N/A NO NO N/A Below variance threshold N/A
150 58 Electric Distribution Substation Safety and Security
58B Replace Dist Sub Civil Structures
SRM Total (Non-RAMP)
SRM Total (Non-RAMP) 4-12 $ - $ 205.2 $ 205.2 100.0% N/A N/A N/A N/A NO NO N/A Below variance threshold N/A
151 58 Electric Distribution Substation Safety and Security
58C Replace Dist Sub Misc Equip
SRM Total (Non-RAMP)
SRM Total (Non-RAMP) 4-12 $ - $ 5.9 $ 5.9 100.0% N/A N/A N/A N/A NO NO N/A Below variance threshold N/A
152 58 Electric Distribution Substation Safety and Security
58S ED Substation Security Upgrades
SRM Total (Non-RAMP)
SRM Total (Non-RAMP) 4-12 $ 2,447.8 $ 2,802.7 $ 354.9 14.5% N/A N/A N/A N/A NO NO N/A Below variance threshold N/A

3-22
TABLE 3-4 ELECTRIC DISTRIBUTION 2021 CAPITAL COMPARISON BY MAT CODE FOR SAFETY, RELIABILITY, AND MAINTENANCE WORK
(THOUSANDS OF DOLLARS) (CONTINUED)
Line No. MWC MWC Name MAT MAT Name RAMP Risk Name
RAMP Control/Mitigation Name
2020 GRC Testimony Reference
2021 Imputed Adopted Costs
(A) 2021 Actual Costs
(B)
2021 Cost Difference
(B-A)
2021 Cost Percent Change
(%)(B-A)/A
2021 Imputed Adopted
Units (C)
2021 Actual Units(D)
2021 Unit Difference
(D-C)
2021 Unit Percent Change
(%)(D-C)/C
Spending Variance
Explanation Required
(Y/N)
Percentage Variance
Explanation Required
(Y/N)
Unit Variance Explanation
Required (Y/N) Cost Variance Explanation Unit Variance Explanation
153 59 Electric Distribution Substation Emergency Replacement
N/A Not assigned SRM Total (Non-RAMP)
SRM Total (Non-RAMP) 4-12 $ 64,283.6 $ 109,649.7 $ 45,366.1 70.6% N/A N/A N/A N/A YES YES N/A Program expenditures exceeded imputed regulatory values due to a higher volume of Just-In-Time (JIT) transformer and minor equipment, as well as various other equipment replacements identified through wildfire inspections. The 2020 GRC forecast planned for only emergency support, whereas the actual expenses were higher for the additional JIT work identified. Overall there were also more in-flight project costs that were multi-year efforts
N/A
154 63 Electric Operations Control Center Facility andOperations Technology
63C Dist Ctrl Sys/Fac Install/Replace
SRM Total (Non-RAMP)
SRM Total (Non-RAMP) 4-19 $ 32,251.7 $ 67,387.7 $ 35,136.0 108.9% N/A N/A N/A N/A YES YES N/A Program expenditures exceeded imputed regulatory values due to higher than anticipated contract and internal labor costs for ADMS SCADA replacement, including work associated with Network Model Build, Application Build, and Application Testing. Additionally, IT infrastructure costs were higher than initially forecasted.
N/A
155 63 Electric Operations Control Center Facility andOperations Technology
63D Distribution Operational Tech
SRM Total (Non-RAMP)
SRM Total (Non-RAMP) 4-5 $ - $ 1,626.6 $ 1,626.6 100.0% N/A N/A N/A N/A NO NO N/A Below variance threshold N/A
156 74 Install New Gas Meters N/A Not assigned SRM Total (Non-RAMP)
SRM Total (Non-RAMP) 6-6 $ - $ 39,771.7 $ 39,771.7 100.0% N/A N/A N/A N/A YES YES N/A Program expenditures exceeded imputed regulatory values due to transfer of this program from Customer Care to Electric Distribution in 2018 after the 2020 GRC forecast submission.
N/A
157 95 Electric Distribution Major Emergency
N/A Not assigned SRM Total (Non-RAMP)
SRM Total (Non-RAMP) 4-4 $ 56,556.5 $ 159,627.3 $ 103,070.8 182.2% N/A N/A N/A N/A YES YES N/A Program expenditures exceeded imputed regulatory values due to large weather events that took place in 2021. This program utilizes a 5 year average to forecast, however in 2021 the events that took place were larger than anything seen in the past 5 years. Hence the variance reflects the impacts of these weather events.
N/A
(a) Amounts forecast and authorized in MAT 09A in the 2020 GRC are now recorded in MAT 49A.

3-23
D. MWC Descriptions – Expense1
MWC AB – Support and Emergency Preparedness and Response 2
(EP&R) – Includes general support of the electric distribution system, including 3
performance improvement initiatives, interdepartmental meter costs, consulting 4
fees, and several smaller projects such as the Electric Magnetic Fields (EMF) 5
Program. In addition, MWC AB captures standard cost variance of multiple 6
electric distribution workgroups in Electric Operations (EO) and a forecast offset 7
for productivity improvements. This MWC also includes costs for PG&E’s EP&R 8
organization, recorded in MAT code AB6. This program relates to safety, 9
reliability, or maintenance because the initiatives are for emergency 10
preparedness for all employees. Employees are trained to respond to the 11
Emergency Operations Center (EOC) activations during emergencies, and 12
specifically how to perform their function within the Incident Command Structure 13
organization. This also includes the Public Safety Power Shutoffs (PSPS) event 14
cost and PSPS program recorded in MAT AB6. This will also include wildfire 15
situational awareness related programs including the Wildfire Safety Operations 16
Center (WSOC)/(will be) All-Hazards Center, Safety and Infrastructure 17
Protection Team (SIPT), Meteorology-related projects (including Advanced Fire 18
Modeling), and wildfire cameras. These activities are for the purpose of 19
responding to emergencies in safe manner and timely restoring customer 20
service to minimize reliability impacts. In addition, this MWC includes Public 21
Awareness Outreach, the Advanced Technology Services (ATS) organization 22
responsible for equipment testing and calibration and coordinating the EMF 23
Program, and the Regulatory Compliance & Quality Assurance (QA) 24
organization. 25
MWC AR – Read and Investigate Meters ‒ Includes activities for field 26
resources performing manual meter reading activities, and the systems, 27
administration, and clerical support necessary to effectively perform these 28
activities. This program relates to safety, reliability, or maintenance because it 29
supports the proper functioning of PG&E’s metering infrastructure necessary to 30
reliably deliver timely and accurate customer billing. 31
MWC BA – Electric Distribution Operation Activities – Includes electric 32
Distribution Control Center (DCC) and field operations, including work performed 33
by Distribution Operators (DO) and engineers. This work includes operating 34

3-24
switches to transfer load between circuits, isolating customer services or 1
deenergizing sections of line during planned construction or maintenance, and 2
reconfiguring circuits to mitigate unplanned situations such as dig-ins, car pole 3
accidents, and storms. This program relates to safety, reliability, or maintenance 4
because the costs are incurred for timely response and restoration during 5
emergencies and power outages and to develop and execute switching to 6
reduce customer impacts from planned work. 7
MWC BC – Perform Reimbursable Work for Others – Includes costs and 8
the reimbursable expenses incurred to provide mutual assistance support to 9
other utilities. This program relates to safety, reliability, or maintenance because 10
it concerns timely restoring power following outages. 11
MWC BF – EO Patrols/Inspections – Includes patrols and inspections of 12
overhead (OH) and underground (UG) electric distribution facilities per General 13
Order (GO) 165; patrols and inspections of OH facilities in wildfire areas; infrared 14
inspections; testing and inspections of OH and UG line equipment; special 15
patrols and inspections; and other work associated with electric distribution 16
system maintenance. This program relates to safety, reliability, or maintenance 17
because it proactively identifies assets needing repair or replacement and 18
generates corrective work orders for future work planning. 19
MWC BH – Electric Distribution Routine Emergency – Includes repair or 20
replacement of Electric Distribution OH or UG infrastructure that are an imminent 21
hazard or have caused an outage during normal Level 1 conditions. This 22
includes routine emergency response work, as well as work issued using 23
PG&E’s Field Automation System (FAS) for either emergency response or 24
system reliability, e.g., arcing wire, wire down, patrol on lines before 25
re-energizing due to fast tripping settings on devices to mitigate fire risk. This 26
also includes costs associated with Enhanced Powerline Safety Settings (EPSS) 27
to mitigate wildfire ignition risk. This program relates to safety, reliability, or 28
maintenance because it concerns timely restoring power following outages, 29
investigating voltage or power quality complaints, and putting an imminent 30
hazard in a safe condition. 31
MWC BK – Maintenance of Other Equipment – Includes repair of 32
specialized equipment, such as transformers, voltage regulators, circuit 33
reclosers, capacitor banks and line switches, as well as equipment repair 34

3-25
activities at the Emeryville repair facility. This program relates to safety and 1
reliability because it involves overhauling, repairing, and testing distribution line 2
equipment. Units which cannot be safely restored are taken out of service and 3
disposed of properly. 4
MWC DD – Customer Field Service Work – Includes Electric Distribution’s 5
portion of customer-generated field service activities, specifically start/stop 6
service requests and other customer-generated electric field service requests. 7
Beginning in 2018, this work includes activities for electric turn-ons and shut-offs 8
initiated by customers, which are mainly performed by electric meter technicians 9
and meter maintenance person resources at commercial and agricultural 10
customer premises. This program relates to safety, reliability, or maintenance 11
because it supports the proper functioning of PG&E’s metering infrastructure. 12
MWC EV – New Customer Connection Service Inquiry Activities – 13
Includes processing customer requests related to new business or increased 14
connection capacity (added load) on existing services. PG&E is required by its 15
approved electric tariff and franchise agreements to perform this work. This 16
program does not relate to safety, reliability, or maintenance because it is 17
customer-driven work. 18
MWC EW – EO Work Requested by Others (WRO) – Encompasses work 19
required by tariff, third-party requests and franchise compliance, including: 20
• Relocations: Non-plant related relocations of electric facilities; Land21
Department right-of-way record research requested by third parties that are22
not project specific; and local division office WRO service inquiries not23
requiring Land Department involvement. (WRO related to gas service has24
moved to MWC LK in Gas Operations.)25
• Generation Interconnection Services: Managing the electric interconnection26
process for the California Public Utilities Commission (CPUC or27
Commission) and Federal Energy Regulatory Commission jurisdictional28
customer generation projects connected at the electric distribution service29
level from receipt of the interconnection inquiry through the in-service date30
of the new generation facility and continuing through billing, settlements and31
refunds.32
• Pre-Parallel Inspections: On-site inspections of electric distribution voltage33
interconnections that are funded via Electric Tariff Rule 21. Pre-parallel34

3-26
inspections are performed for safe and reliable operation of customer-owned 1
generators paralleled with PG&E’s grid. 2
This program does not relate to safety, reliability, or maintenance because it 3
is customer, or other third-party driven work. 4
MWC EY – Change/Maintenance Used Electric Meter – Includes the 5
costs of meter activities associated with electric meter preventive maintenance, 6
electric meter Corrective Maintenance (CM), meter programming, meter network 7
maintenance, electric meter accuracy testing, and the associated staff support 8
necessary to effectively perform these activities. This program relates to safety, 9
reliability, or maintenance because it supports the proper functioning of PG&E’s 10
metering infrastructure necessary to reliably deliver timely and accurate 11
customer billing. 12
MWC FZ – Electric Distribution Engineering and Planning – Supports 13
many programs that require engineering and planning services, including the 14
Electric Distribution Capacity, Electric Distribution Reliability, and UG Asset 15
Management programs. This program also supports performing diagnostics on 16
data from automated field equipment to support the DCCs; investigating 17
secondary voltage complaints that Troublemen cannot resolve on the first visit; 18
and operational field work that electric planning personnel initiate, such as phase 19
balancing and replacing fuses that are projected to be overloaded. This 20
program relates to safety, reliability, or maintenance because it includes the 21
electrical engineering and planning services work necessary for a variety of 22
asset management activities. 23
MWC GA – Poles – Intrusive Inspection/Test and Treat Program – 24
Includes activities to assess the condition of the lower section of wood poles and 25
preserve the poles’ wood strength through the application of chemicals and 26
restoration of poles as warranted. This program also includes coordinating the 27
billing of joint owners and tenants for their share of costs for work performed on 28
jointly owned or leased facilities. In addition, this program includes analyzing 29
poles for overload conditions and ensuring poles meet the strength and loading 30
requirements of GO 95. This program relates to safety, reliability, or 31
maintenance because the costs are incurred to determine whether poles are in 32
good condition to prevent premature failure. 33

3-27
MWC GC – Electric Distribution Substations Operate and Maintain 1
Assets – Includes operations, preventive maintenance and CM of electric 2
distribution substation assets. 3
• Preventive maintenance includes: Substation facility and Equipment4
Inspections (EI); diagnostic testing; overhauls; washing insulators;5
maintenance of mobile and Capitalized Emergency Material equipment;6
maintaining station logs.7
• CM includes: Restoration and repair of failed equipment; switching and8
restoring service to customers; mobile substation and mobile transformer9
installation costs; and relocation of emergency and surplus equipment.10
• Operations in a substation include: Activities associated with providing safe11
working conditions for employees; calibrating and adjusting substation12
equipment; building maintenance, miscellaneous activities such as yard13
repairs, janitorial work and landscaping, vegetation management (VM),14
rental contracts, and system-funded expense projects, such as transformer15
relocations.16
This program relates to safety, reliability, or maintenance because it targets17
the operation, preventive and CM of substation equipment and identifies any 18
abnormalities in the equipment’s intended function. 19
MWC GE – Electric Distribution Mapping – Includes providing timely and 20
accurate data and spatial information for PG&E’s electric system that supports 21
construction, engineering, estimating, operational, restoration, inspection, and 22
maintenance activities. This program includes data management activities 23
covering the full lifecycle of data: ingestion, storage, access, controls, 24
governance, quality, meta-data, usage, security, retention and disposal of data. 25
This program relates to safety, reliability, or maintenance because it enables the 26
accurate collection and effective management of records related to field assets. 27
It also enables access and use of the data to inform risk management decisions. 28
These records are crucial to determine that field assets are safely, and reliably 29
operated and necessary maintenance is performed in a timely fashion. 30
MWC HG – Electric Distribution Operations Technology – Covers 31
technical support for Electric Distribution Operations, including but not limited to 32
operational and development support for various control center applications, 33
licenses, tools, Integrated Grid Platform (IGP) applications, including the 34

3-28
implementation of an Advanced Distribution Management System (ADMS). This 1
program relates to reliability and safety due to its critical association with 2
advanced outage management applications including instantaneous fault 3
location, automated switching recommendations, enhanced cybersecurity and 4
supports operator awareness of real-time (RT)circuit conditions. 5
MWC HN – Vegetation Management Balancing Account (VMBA) – 6
Includes costs necessary to support and execute patrolling, inspecting and 7
maintaining clearances of vegetation along PG&E’s OH high voltage electric 8
distribution lines. The program covers routine tree trimming and removal, 9
vegetation control, contractor quality control, environmental compliance and 10
public education, and fire risk reduction work. This program relates to safety 11
and reliability by managing the vegetation adjacent to powerlines to reduce the 12
risk of vegetation contact with the electric distribution equipment. 13
MWC HX – EO Automation/Supervisory Control and Data Acquisition 14
(SCADA), Protection Support – Includes engineering and technical support for 15
automation and protection equipment. Also includes the service and software 16
costs associated with electric distribution SCADA software. Engineering support 17
consists of three components: (1) Automation Engineering support; 18
(2) Protection Engineering support; and (3) SCADA Specialist support. This19
program relates to safety, reliability, or maintenance because it includes 20
engineering support for the maintenance and operation of automation and 21
protection equipment. 22
MWC HY – Perform Gas Meter Maintenance – Includes the costs of meter 23
activities associated with gas meter/AMI SmartMeter™ module maintenance 24
that does not result in meter/module exchanges, meter/module communication 25
trouble-shooting, programming, and repairs. This program relates to safety, 26
reliability, or maintenance because it supports the proper functioning of PG&E’s 27
metering infrastructure necessary to reliably deliver timely and accurate 28
customer billing. 29
MWC IF – Electric Distribution Major Emergency – Includes response 30
work to significant OH or UG outages and/or imminent hazard to PG&E’s electric 31
distribution facilities that requires a division Operations Emergency Center 32
(OEC) activation and is consistent with PG&E’s Major Emergency Balancing 33
Account (MEBA) Criteria Guidance Document. Beginning in 2014, these costs 34

3-29
are included in the two-way MEBA authorized by D.14-08-032. This program 1
relates to safety, reliability, or maintenance because the costs incurred are for 2
timely restoring power following an outage. 3
MWC IG – Fire Risk Mitigation Memorandum Account (FRMMA), 4
Wildfire Mitigation Plan Memorandum Account (WMPMA), VMBA, and Rule 5
20A Balancing Account Expense: 6
• FRMMA – Includes costs incurred for wildfire risk mitigation work that is not7
otherwise recovered in PG&E’s adopted revenue requirements. PG&E will8
determine the incrementality of these amounts to the Company’s revenue9
requirement when it applies for cost recovery;10
• WMPMA – Includes costs incurred to implement PG&E’s approved Wildfire11
Mitigation Plan that are not otherwise recovered in PG&E’s adopted revenue12
requirement. PG&E will determine the incrementality of these amounts to13
the Company’s revenue requirement when it applies for cost recovery;14
• VMBA – Includes enhanced vegetation management (EVM). In addition,15
records costs for Tree Mortality and Fire Risk Reduction work, previously16
recorded in CEMA, in the new VMBA; and17
• Rule 20A Balancing Account Expense – Includes costs associated with the18
Rule 20A Audit and Rule 20 Guidebook ordered by D.1803022, and19
expense amounts for cancelled projects.20
This program relates to safety, reliability, or maintenance because the21
memorandum accounts, excluding Rule 20A, track work to implement safety 22
prevention measures, system reliability risk reductions, and mandated 23
maintenance improvements to address wildfire risk. 24
This also includes PSPS event activities and costs, and PSPS non-event 25
preparation and programs, and costs associated with EPSS to mitigate wildfire 26
ignition risk. 27
MWC IS – Streetlight Support – Includes work in support of streetlight 28
inventory and LS-2 Streetlight Audit Services, and the Light Emitting Diode 29
(LED) and other streetlight programs. This program relates to safety, reliability, 30
or maintenance for the successful inventory of streetlights necessary for ongoing 31
maintenance and safe operations. 32
MWC IU – Collect Revenue – Meter activities that are focused on the 33
detection, investigation, and resolution of customer energy theft. This includes 34

3-30
the costs of field employees, systems and staff support necessary to effectively 1
perform these activities. This program relates to safety, reliability, or 2
maintenance because it supports the proper functioning of PG&E’s metering 3
infrastructure and seeks to identify and address potential safety issues created 4
by PG&E’s customers. 5
MWC JV – Maintain Information Technology (IT) Applications and 6
Infrastructure – Includes costs for ongoing maintenance, operations and repair 7
for PG&E’s IT applications, systems and infrastructure. This program relates to 8
safety, reliability, or maintenance by maintaining the IT solutions that provide 9
PG&E’s field and office employees with the tools needed for them to perform 10
their job in a safe and efficient manner. These tools are intended to provide 11
up-to-date, complete, and accurate information to enable coordination of work 12
and asset data across all work streams to enhance grid safety and operational 13
efficiency. The areas covered by this MWC include asset design, asset 14
management, and work management. 15
MWC KA – Preventive Maintenance and Equipment Repair, OH – 16
Includes repair of OH facilities; repair of OH Critical Operating Equipment 17
(COE); repair of streetlights and group streetlight replacements; repair of OH 18
facilities to address migratory bird requirements; investigation and response to 19
Radio and Television Interference (RTVI) inquiries; washing insulators; 20
investigation of idle facilities; wood pole bridge bonding; and other OH 21
maintenance work. This program relates to safety, reliability, or maintenance 22
because it addresses non-conforming equipment identified by preventative 23
maintenance programs such as inspections and patrols, as well as internal 24
operational processes (e.g., equipment testing). 25
MWC KB – Preventive Maintenance and Equipment Repair, UG – 26
Includes repair of UG facilities; repair of UG COE; grounding WYE (three-phase 27
star configuration) transformers; and other UG line maintenance work. This 28
program relates to safety, reliability, or maintenance because it addresses 29
non-conforming equipment identified by preventative maintenance programs 30
such as inspections and patrols, as well as internal operational processes 31
(e.g., equipment testing). 32
MWC KC – Preventive Maintenance and Equipment Repair, Network – 33
Includes repair of network facilities; repair of network equipment, repair of 34

3-31
network SCADA equipment, testing and overhaul of Network Protectors (NP), 1
transformer oil sampling; and other miscellaneous network maintenance work. 2
This program relates to safety, reliability, or maintenance because it addresses 3
the maintenance and repair of the equipment necessary and fundamental to 4
maintaining a safe and reliable distribution network system. 5
MWC OM – Operational Management – Includes labor- and 6
employee-related costs to provide supervision and management support. 7
MWC OM also includes costs incurred by the administrative staff working for the 8
Supervisors/Managers. This program is not directly related to safety, reliability, 9
or maintenance because this MWC represents PG&E operational management 10
staff necessary to direct field execution of work on PG&E assets. 11
MWC OS – Operational Support – Includes labor- and employee-related 12
costs that provide services and support that are unrelated to supervision and 13
management. This program is not directly related to safety, reliability, or 14
maintenance because this MWC represents PG&E operational support staff 15
necessary to plan and coordinate field execution of work on PG&E assets, 16
develop asset family strategies and standards, and drive necessary process 17
coordination and improvement efforts. 18
E. MWC Descriptions – Capital19
MWC 05 – Tools and Equipment – Includes the costs of miscellaneous 20
tools and equipment, ATS tools, and of overdrawn materials. ATS tools include 21
the cost of laboratory and test equipment used for field work or in ATS 22
laboratories. In the 2017 General Rate Case (GRC), this MWC also included 23
PG&E’s forecast for an offset for capital- related productivity improvements. 24
Beginning in 2018, this category includes tools and equipment necessary to 25
perform all field metering, meter maintenance, meter repair, and accuracy 26
testing activities. This program relates to safety, reliability, or maintenance 27
because it includes funds for the purchase of necessary tools to be used in the 28
safe execution of work by field personnel. 29
MWC 06 – Electric Distribution Line and Equipment Capacity – Includes 30
capacity expansion work outside a substation necessary to correct specific 31
capacity deficiencies or overload conditions on electric distribution lines and 32
equipment. This work includes replacing/upgrading conductors and devices 33
along with installing capacitors, switches or other equipment; establishing new 34

3-32
circuit outlets; converting circuit line sections to a higher operating voltage; and 1
reconfiguring primary electric distribution circuits to redistribute loading. This 2
program relates to safety, reliability, or maintenance because it corrects 3
overloads on distribution equipment, mitigating the risk of equipment failure due 4
to overloads. 5
MWC 07 – Electric Distribution Install/Replace OH Poles – Includes the 6
replacement of poles to support safety and reliability of the electric distribution 7
system. This program relates to safety, reliability, or maintenance because it 8
actively works to determine whether poles are in good condition so as to prevent 9
premature failure. This program enhances overall system safety by replacing 10
poles identified as overloaded or nearing the end of their in-service life, prior to 11
premature failure. 12
MWC 08 – Electric Distribution Reliability Base – OH Asset 13
Replacement – Includes rebuilding and reframing OH electric distribution lines 14
(including the installation of covered wire and non-wood electric distribution 15
poles, and conversion of overhead to underground); and performing other 16
reliability and system hardening improvement work such as replacing annealed 17
OH conductors and obsolete switches. This program relates to safety, reliability, 18
or maintenance because it directly funds projects designed to replace OH 19
equipment and rebuild electric distribution lines in high fire threat districts 20
(HFTD) as part of PG&E’s Community Wildfire Safety Program (CWSP). 21
MWC 09 – Electric Distribution Automation and Protection – Covers 22
investments in field automation and protection devices including installing or 23
replacing substation Remote Terminal Units (RTU); installing or replacing 24
SCADA peripherals; replacing obsolete protection equipment, primarily relays, in 25
electric distribution substations; replacing automation or protection equipment 26
due to unanticipated failure; and continuing the Fire Risk Management initiative 27
that allows remote operation of reclose relays on certain circuit breakers and line 28
reclosers to reduce the likelihood of wildland and urban fires. This program 29
relates to safety, reliability, or maintenance because it directly funds projects 30
which support the automation of substation equipment and electric distribution 31
protective devices. 32
MWC 10 – Electric Distribution WRO General – Includes relocating 33
electric distribution facilities at the request of a governmental agency or other 34

3-33
third parties (e.g., customers and developers) and conversion of OH electric 1
facilities to UG under Tariff Rule 20B and Rule 20C. This work is mandated by 2
PG&E’s electric tariff and franchise agreements. This program does not relate 3
to safety, reliability, or maintenance because it is third-party driven work. 4
MWC 16 – Electric Distribution Customer Connections – Includes 5
building new UG and OH primary electric distribution systems, and the 6
associated secondary systems and services to both residential and 7
nonresidential customers. PG&E is required by its approved electric tariff and 8
franchise agreements to perform this work. Additionally, included within this 9
MWC are all purchases for distribution transformers for use in all types of capital 10
work. This program does not relate to safety, reliability, or maintenance 11
because it is customer-driven work. 12
MWC 17 – Electric Distribution Routine Emergency – Includes activities 13
related to the replacement of capital-related Electric Distribution infrastructure, in 14
response to (1) a customer outage or an unsafe condition requiring immediate 15
response and standby, and (2) trouble man assessment activities and switching 16
of the system’s configuration in response to OH and UG outages occurring 17
during normal Level 1 conditions. This program relates to safety, reliability or 18
maintenance because it concerns timely restoring power following an outage 19
and putting an imminent hazard in a safe condition. 20
MWC 21 – Miscellaneous Capital and EP&R – Includes costs to build 21
critical infrastructure required for response to catastrophic emergencies and fire 22
related situational awareness tools and resources. This includes costs for 23
EOCs, basecamps, facility upgrades, communications and data infrastructure 24
improvements, and natural disaster models. Beginning in 2016, this MWC may 25
include an offset for capital related productivity improvements and work 26
execution risk. This program relates to safety, reliability, or maintenance 27
because work in this program is critical to effective emergency response and 28
supporting the CWSP Management Office. MWC 21 also include miscellaneous 29
capital expenses such as ATS lab safety and reliability upgrades. 30
MWC 23 – Implement Real Estate Strategy – includes the costs for new 31
buildings and yards, including the purchase of land and the purchase and 32
installation of furniture, office equipment, and IT Infrastructure, as well as the 33
costs to improve building environmental sustainability, to implement workplace 34

3-34
strategy, and to optimize the real estate portfolio. This work moved to Corporate 1
Real Estate in 2016, however some residual costs were in Electric Distribution 2
for 2021. 3
MWC 25 – Install New Electric Meters – Includes labor necessary to 4
perform electric meter installations, exchanges, removals, and retirements. This 5
program relates to safety, reliability, or maintenance because it supports the 6
proper functioning of PG&E’s metering infrastructure necessary to reliably 7
deliver timely and accurate customer billing. 8
MWC 2A – Electric Distribution Preventive Maintenance (EDPM), OH – 9
Includes replacing deteriorated OH facilities on a planned basis where it is not 10
cost effective to repair those facilities. This work is like the work performed in 11
MWC KA, but includes replacing equipment, rather than repair and 12
maintenance. Typical equipment replacements include corroded transformers, 13
deteriorated cross-arms, inoperative line switches, and other OH electric 14
distribution facilities. This equipment is replaced in kind in most cases; however, 15
upgrades may be required where necessary to meet current operating 16
conditions, technology, and safety standards. Work also includes replacing 17
PG&E-owned, non-decorative High- Pressure- Sodium Vapor streetlights with 18
LED streetlights and non-exempt surge arrester replacements. This program 19
relates to safety, reliability, or maintenance because it addresses 20
non-conforming equipment identified by preventative maintenance programs 21
such as inspections and patrols, as well as internal operational processes 22
(e.g., equipment testing). In addition, the streetlight replacements address 23
certain assets (i.e., San Francisco Regulated Output Streetlights) that will 24
improve illumination, increasing safety. 25
MWC 2B – EDPM, UG – Includes replacing deteriorated UG facilities on a 26
planned basis where it is not cost effective to repair those facilities. This work is 27
like the work performed in MWC KB, but includes replacing equipment, rather 28
than repair and maintenance. Typical equipment replacements include corroded 29
transformers, inoperative switches, damaged UG enclosures and other UG 30
electric distribution facilities. Equipment is replaced in kind in most cases; 31
however, upgrades are required where necessary to meet current operating 32
conditions, technology, and safety standards. This program relates to safety, 33
reliability, or maintenance because it addresses non-conforming equipment 34

3-35
identified by preventative maintenance programs such as inspections and 1
patrols, as well as internal operational processes (e.g., equipment testing). 2
MWC 2C – EDPM, Network – Includes replacing deteriorated network 3
facilities on a planned basis where it is not cost effective to repair those facilities. 4
This work is similar to the work performed in MWC KC, but includes replacing 5
equipment, rather than repair and maintenance. Typical equipment 6
replacements include corroded transformers, inoperative switches, and other 7
network distribution facilities. Equipment is replaced in kind in most cases; 8
however, upgrades are required where the equipment must meet current 9
operating conditions, technology, and safety standards. Additional work 10
includes safety improvement programs such as High-Rise Building Transformer 11
Replacements, new monitoring system installation and the Manhole Cover 12
Replacement Program. This program relates to safety, reliability, or 13
maintenance because it addresses the replacement of faulty network equipment 14
identified by the preventative maintenance program in addition to the planned 15
new equipment upgrade, which is fundamental to maintaining a safe and reliable 16
distribution network system. 17
MWC 2F – Build IT Applications and Infrastructure – Includes the costs 18
to design, develop and enhance applications, systems and infrastructure 19
technology solutions. This program relates to safety, reliability, or maintenance 20
by developing and deploying IT solutions that provide PG&E’s field and office 21
employees with the tools needed for them to perform their job in a safe and 22
efficient manner. These tools are intended to provide up-to-date, complete, and 23
accurate information to enable coordination of work and asset data across all 24
work streams to enhance grid safety and operational efficiency. The areas 25
covered by this MWC include asset design, asset management and work 26
management. 27
MWC 30 – Electric Distribution WRO – Rule 20A – Conversion of existing 28
OH electric distribution facilities to UG facilities. To qualify under the Rule 20A 29
Tariff, a project must meet certain criteria including being in the general public 30
interest and having sufficient work credits to convert the facilities. Beginning in 31
2017, these costs are included in the one-way Rule 20A balancing account 32
authorized by D.17-05-013. This program does not relate to safety, reliability, or 33
maintenance because it is customer driven work. 34

3-36
MWC 3R – Energy Storage Capital—Includes the capital costs to install 1
new or replace existing energy storage equipment or components to support 2
energy storage activities. This MWC relates to safety, reliability, or maintenance 3
because the costs are associated with installing/replacing energy storage 4
equipment that is consistent with keeping the energy storage facilities reliable. 5
MWC 46 – Electric Distribution Substation Capacity – Includes capacity 6
work within substations including new substations, increased capacity at existing 7
substations, and work on feeders/breakers within a substation. This program 8
relates to safety, reliability, or maintenance because it corrects overloads on 9
substation equipment, mitigating the risk of equipment failure due to overloads. 10
MWC 48 – Electric Distribution Substation Replace Other Equipment – 11
Includes all major and minor substation equipment replacements not included in 12
MWC 54 (Transformer Program). Specific sub-programs include: (1) Ancillary 13
Substation Equipment Replacement; (2) Ground Grid Replacement; (3) Circuit 14
Breaker Replacement; (4) Switch Replacement; (5) Battery Replacement; 15
(6) Civil Structure Replacement; (7) Switchgear Replacement; (8) Yard16
Improvements; (9) Animal Abatement; and (10) Transformer Bushings. This 17
program relates to safety and reliability because it targets proactive replacement 18
of substation equipment that is crucial to maintaining substation reliability. 19
MWC 49 – Electric Distribution Circuit/Zone Reliability Program – 20
Includes various circuit reliability improvement work to address repeat outages 21
and customer service-level complaints. This program also includes the 22
purchase of line reclosers (revolving stock), the installation of Fault Location, 23
Isolation, and Service Restoration (FLISR) systems, and the targeted circuit 24
initiative which addresses the least reliable circuits and typically involves a 25
mixture of installing new fuses, reclosers, fault indicators and animal and bird 26
guards, reframing poles to increase phase separation, and repairing or replacing 27
existing equipment. This program relates to safety, reliability, or maintenance 28
because it directly supports the implementation of targeted capital projects 29
designed to improve electric service reliability and address customer outage 30
complaints. 31
MWC 54 – Electric Distribution Substation Transformer 32
Replacements – Includes maintaining or improving substation reliability by 33
replacing transformers that have the highest risk of failure. This MWC also 34

3-37
includes maintaining an adequate supply of emergency transformer stock and 1
mobile transformers for emergency response. This program relates to reliability 2
because it is the proactive planned replacement of substation transformers in 3
order to improve substation reliability and prevent transformer failures. 4
MWC 56 – Electric Distribution UG Asset Replacements – Includes 5
reliability related replacement of primary electric distribution cables (includes 6
tie-cables), primary and secondary Network Cables, non-emergency related 7
failed primary electric distribution cables, Transfer Ground Rocker Arm 8
Main(TGRAM)/Transfer Ground Rocker Arm Line (TGRAL) switches, Load 9
Break Oil Rotary (LBOR) switches, and replacement of failed primary electric 10
distribution cables. Program also includes performing cable rejuvenation 11
(injection) and testing. This program relates to safety, reliability, or maintenance 12
because it addresses assets that have deteriorated and/or are experiencing 13
failures, some of which may pose safety risk to employees and public if they fail. 14
MWC 58 – Electric Distribution Substation Safety and Security – 15
Includes substation security, seismic, and fire protection and suppression work. 16
Also encompasses miscellaneous, unforeseen, short lead-time and emergency 17
environmental work (e.g., removal of an old asbestos panel in a control room 18
that requires special handling). This program relates to safety and reliability 19
because it targets work that prevents potential hazards within the substation. 20
MWC 59 – Electric Distribution Substation Emergency Replacements – 21
Includes replacements for substation equipment that fails or is forced out of 22
service, as well as an emergency supply of transformers and other equipment to 23
replace failed equipment. This program relates to reliability because it targets 24
the replacement of substation assets that have failed or are expected to fail 25
imminently. 26
MWC 63 – EO Control Center Operational Technology – Covers ongoing 27
capital improvements and enhancements to the operational technology used in 28
the DCCs, technology and systems for these facilities, including IGP 29
applications such as ADMS. This includes operational technology costs to 30
design, develop and enhance legacy and future applications, system and 31
infrastructure technology solutions. This program relates to reliability and safety 32
due to its critical association with advanced outage management applications 33
including instantaneous fault location, automated switching recommendations, 34

3-38
enhanced cybersecurity and supports operator awareness of RT circuit 1
conditions. 2
MWC 74 – Install New Gas Meters – Includes labor necessary to perform 3
SmartMeter AMI module installations, exchanges, removals and retirements. 4
This program relates to safety, reliability, or maintenance because accurate 5
customer usage data must be recorded and delivered to the PG&E billing 6
systems on a reliable and timely basis. 7
MWC 95 – Electric Distribution Major Emergency – Includes response to 8
significant OH or UG outages and/or imminent hazard to PG&E’s electric 9
distribution facilities that requires division OEC activation and is consistent with 10
PG&E’s MEBA Criteria Guidance Document. Beginning in 2014, these costs are 11
included in the two-way MEBA authorized by D.14-08-032. This program relates 12
to safety, reliability, or maintenance because the costs incurred are for timely 13
response and restoration following power outages. 14
F. MAT Code Descriptions – Expense15
MAT AB6 – EP&R – EP&R expense cost. This program relates to safety, 16
reliability, or maintenance because this work drives the company emergency 17
response plan for customer safety, and timely outage restoration. This also 18
includes the PSPS PMO organization. This will also include WF situational 19
awareness related programs including the WSOC, SIPT, Meteorology-related 20
projects (including AFM), and wildfire cameras. 21
MAT BAF – General Operations – DO manage and control the electric 22
distribution system. Activities include monitoring the distribution system; 23
performing system configuration changes, such as switching and circuit 24
reconfiguration; and processing switching applications for work that enables 25
construction to maintain and improve electric distribution system infrastructure. 26
This program relates to safety, reliability, or maintenance because the costs are 27
incurred for timely response and restoration during emergencies and power 28
outages. 29
MAT BAH – Power Quality and Distribution Operations Engineers 30
Support – Respond to customer voltage complaints, assess and identify 31
potential overloading and providing guidance to Distribution System Operators 32
regarding load transfers and circuit reconfigurations. This program relates to 33

3-39
safety, reliability, or maintenance because the costs are incurred for timely 1
response and restoration during emergencies and power outages. 2
MAT BF3 – UG Bay Area Rapid Transit (BART) Cable 3
Testing/Inspections – Annual UG inspections/testing of 34.5 kilovolts (kV) 4
BART Cable for compliance with Utility Standard TD-2302S. This program 5
relates to safety, reliability, or maintenance because the costs are incurred to 6
proactively identify UG BART cable assets needing repair or replacement and 7
generates corrective work orders for future work planning. 8
MAT BF4 – UG Auto Transfer Switch Testing/Inspections – Annual UG 9
inspections/testing of individual electronic-component style and microprocessor 10
style Auto-Transfer Switches (ATS) for compliance with Utility 11
Standard TD-2302S. This program relates to safety, reliability, or maintenance 12
because it proactively identifies UG ATS assets needing repair or replacement 13
and generates corrective work orders for future work planning. 14
MAT BFA – OH Poles Patrolled – Visual patrol of OH electric distribution 15
facilities to identify obvious structural problems or hazards for compliance with 16
GO 165 and the EDPM Manual. Patrolled facilities include primary, secondary, 17
and service, and other associated electric distribution facilities from the 18
substation, including poles within the substation fence, to the end of the line. 19
Towers supporting only electric distribution facilities are included in the OH 20
patrol. Patrols can be performed from a vehicle, on foot, or by helicopter. Units 21
measured: Number of poles patrolled. This program relates to safety, reliability, 22
or maintenance because it proactively identifies OH assets needing immediate 23
repair or replacement. 24
MAT BFB – OH Poles Inspected – Detailed inspection of OH electric 25
distribution facilities to examine and record abnormal conditions that will 26
adversely impact safety or reliability for compliance with GO 165 and the EDPM 27
Manual. Inspected facilities include PG&E solely-and jointly-owned distribution 28
poles, including all equipment and facilities on the pole; primary and secondary 29
risers and services; primary and secondary conductor; transmission poles with 30
electric distribution under build; electric distribution towers and lattices; 31
streetlights on PG&E solely owned or joint pole distribution poles; and primary 32
metering. Units measured: Number of poles inspected. This program relates to 33
safety, reliability, or maintenance because it proactively identifies OH assets 34

3-40
needing repair or replacement and generates corrective work orders for future 1
work planning. 2
MAT BFC – OH Infrared Inspections – Infrared inspection of OH electric 3
distribution facilities to identify pending failure of equipment. Work includes 4
contractor-performed reliability work and internal-performed ad hoc requests. 5
This program relates to safety, reliability, or maintenance because it proactively 6
identifies OH assets needing repair or replacement and generates corrective 7
work orders for future work planning. 8
MAT BFD – UG Enclosures Patrolled – Visual patrol of UG electric 9
distribution facilities to identify obvious structural problems or hazards for 10
compliance with GO 165 and the EDPM Manual. Patrolled facilities include 11
pad-mounted equipment, primary enclosures, and visible secondary enclosures 12
outside the substation fence to the end of the line. An UG patrol may be 13
performed by walking or driving. Units measured: Number of enclosures 14
patrolled. This program relates to safety, reliability, or maintenance because it 15
proactively identifies UG assets needing repair or replacement. 16
MAT BFE – UG Infrared Inspections – Detailed inspection of UG electric 17
distribution facilities to examine and record abnormal conditions that will 18
adversely impact safety or reliability for compliance with GO 165 and the EDPM 19
Manual. Inspected facilities include pad-mounted facilities; all UG equipment, 20
conductors, splices, and elbows within primary enclosures; primary metering that 21
includes all visible, primary cable up to termination point plus the primary 22
metering facilities. An infrared inspection must be performed in conjunction with 23
UG inspections. Units measured: Number of enclosures inspected. This 24
program relates to safety, reliability, or maintenance because it proactively 25
identifies UG assets needing repair or replacement and generates corrective 26
work orders for future work planning. 27
MAT BFF – UG Line Equipment Inspected and Tested – Annual 28
inspections of UG electric distribution line equipment for compliance with Utility 29
Standard TD-2302S. Facility inspections only include manholes with special 30
equipment (i.e., oil-filled equipment). 34.5 kV BART Cable Inspections and ATS 31
Inspections are performed and tracked in MATs BF3 and BF4, respectively. 32
Units measured: Number of UG line equipment inspected and tested. This 33
program relates to safety, reliability, or maintenance because it proactively 34

3-41
identifies assets needing repair or replacement and generates corrective work 1
orders for future work planning. 2
MAT BFG – OH Line Equipment Inspected and Tested – Annual 3
inspections/testing of OH, pad-mounted, and UG electric distribution line 4
equipment for compliance with Utility Standard TD-2302S. Facilities include 5
capacitors, regulators, reclosers, and SCADA operated switches, interrupters, 6
and sectionalizers. Units measured: Number of OH line equipment inspected 7
and tested. This program relates to safety, reliability, or maintenance because it 8
proactively identifies assets needing repair or replacement and generates 9
corrective work orders for future work planning. 10
MAT BFH – CPUC QA Electric Distribution Maintenance Audits – 11
Support of annual GO 165 audits, QA Electric Distribution Audits and ad hoc 12
requests throughout the year. This MAT also includes miscellaneous special 13
projects as requested by Asset Strategy. Projects include inspections or patrols 14
of equipment determined to present safety related conditions. Some projects 15
are multi-year while others are single year. Other projects are related to 16
re-inspections or re-patrols as needed as a result of work verifications and is 17
required by GO 165. Other funding in this MAT is related to UG inspection 18
sticker costs required as part of the UG inspections. This program relates to 19
safety, reliability, or maintenance because it proactively identifies assets needing 20
repair or replacement and generates corrective work orders for future work 21
planning. 22
MAT BFJ – OH Patrol Outage Review Team (ORT) Post Outage – For 23
requested post-outage patrols as an action from an ORT meeting. Work scope 24
(including the area to be patrolled and the volume of poles and enclosures) must 25
be identified during the ORT meeting. This includes UG Infrared requests. This 26
program relates to safety, reliability, or maintenance because it identifies assets 27
needing repair or replacement and generates corrective work orders for future 28
work planning. 29
MAT BFL – Santa Barbara Wildfire Poles Patrolled – Annual patrols of 30
OH electric distribution facilities in Santa Barbara County wildfire-risk areas. 31
Work is performed in two divisions (Los Padres and Kern) in PG&E territory in 32
Santa Barbara County. Units measured: Number of poles patrolled. This 33
program relates to safety, reliability, or maintenance because the costs are 34

3-42
incurred to patrol specific areas within Santa Barbara County wildfire-risk areas, 1
now managed as part of BFA. 2
MAT BKA – Line Equipment Overhauls (Emeryville) – For Emeryville’s 3
use only of scheduled transformer repair. Units measured: Number of 4
equipment overhauls. This program relates to safety, reliability, or maintenance 5
because it involves the overhaul, repair, and testing of all distribution line 6
equipment at the Emeryville Repair facility. 7
MAT BKJ – Line Equipment Overhauls (Division Up/Down Labor) 8
(Emeryville) – For Emeryville’s use only of scheduled equipment overhauls of 9
electrical distribution equipment: regulators, auto boosters, and reclosers. Units 10
measured: Number of equipment overhauls. This program relates to safety, 11
reliability, or maintenance because it involves the overhaul, repair, and testing of 12
all distribution line equipment at the Emeryville Repair facility. 13
MAT BKK – Equipment Warranty Repair (Emeryville) – For Emeryville’s 14
use only of scheduled equipment warranty repairs. This program relates to 15
safety, reliability, or maintenance because the equipment is repaired or replaced 16
under the manufacturer’s warranty period, at the Emeryville Repair facility. 17
MAT DD# – Customer Field Service Work – Covers Electric Distribution’s 18
portion of customer-generated field service activities, specifically start/stop 19
service requests, emergency response and other customer-generated electric 20
field service requests. The primary work includes addressing partial and 21
complete outages related to customer equipment; transfers of service; electric 22
service upgrades; and temporary disconnections or reconnections of service. 23
This work was previously included in MWC BA. This program relates to safety, 24
reliability, or maintenance as the costs are incurred for timely response, repair, 25
and service per customer requests. 26
MAT DDC – Electric Start/Stop – Includes activities for electric service 27
turn-ons and shut-offs initiated by customers, which are mainly performed by 28
Field Metering resources at commercial, industrial and agricultural customer 29
premises. This program relates to safety, reliability, or maintenance because 30
electric service is either established or terminated based on customer request. 31
MAT DDH – Electric Trouble Customer Equipment – Part outs or 32
complete outs related to customer equipment. Part outs occur when a customer 33
is only receiving energy to a portion of their home or business (e.g., burnt out 34

3-43
fuses, customer wiring, service connection at the weather-head, etc.). Units 1
measured: Number of outages. This program relates to safety, reliability, or 2
maintenance because the costs are incurred for timely response, repair, and 3
service per customer requests. 4
MAT DDJ – Swing Service, Disconnects/Reconnects – (1) Swing service: 5
transfer of service from old location to new, using existing wire; (2) Service 6
upgrades; (3) Temporary service disconnect, such as a temporary disconnects 7
at a customer’s request to enable tree trimming, weather-head or panel work; 8
and (4) Reconnect service due to disconnects for items such as tree trimming, 9
panel or weather-head work by customer, etc. Units measured: Number of 10
swings/upgrades/disconnects/reconnects. This program relates to safety, 11
reliability, or maintenance because the costs are incurred for timely response, 12
repair, and service per customer requests. 13
MAT FZA – General Engineering – Work primarily covers electric 14
distribution engineering and planning services labor, which includes wires down 15
investigations. This includes costs associated with new OH fault indicators or 16
distribution line monitoring systems and/or line sensors to improve reliability. 17
This also includes costs associated with EPSS to mitigate wildfire ignition risk. 18
This program relates to safety, reliability, or maintenance because it directly 19
provides funding to support the electrical engineering work necessary to create 20
the various capital and expense related improvement projects. 21
MAT FZB – Voltage Complaints Investigations – Used for investigating 22
secondary voltage complaints that Troublemen cannot resolve on the first visit, 23
and the setting of recording volt meters for these voltage complaints. This 24
program relates to safety, reliability, or maintenance because it directly provides 25
funding to address voltage issues on distribution circuits to support safe and 26
reliable operation of customer equipment. 27
MAT FZC – Transformer Reports Manage – Used for investigating 28
overloaded and idle transformers. This program relates to safety, reliability, or 29
maintenance because it directly provides funding to address overloaded 30
transformers and mitigate risks of equipment failure caused by overloads. 31
MAT FZD – Field Work Plan – Used for supporting operational field work 32
that engineering personnel initiate, such as phase balancing, and replacing 33
fuses that are projected to be overloaded. This program relates to safety, 34

3-44
reliability, or maintenance because it directly provides funding to support the 1
field work necessary to solve overload and imbalance issues, thereby mitigating 2
equipment failure caused by overloads and outages caused by load imbalance. 3
MAT FZE – Troublemen Field Work – Field Personnel performing 4
seasonal, permanent and emergency load transfer field switching, change 5
settings related to seasonal capacitors, or perform special load/voltage 6
readings/setting changes when specifically requested by the Electric Distribution 7
Engineers and directed by the DCC Operator. This includes costs associated 8
with EPSS to mitigate wildfire ignition risk. This program relates to safety, 9
reliability, or maintenance because it directly provides funding to support the 10
field work necessary to resolve voltage issues and provide proper device 11
protection for reliability. 12
MAT GAA – Intrusive Inspection Program – Intrusive testing and 13
treatment of wood poles. Compliance inspection program for GO 95 and 14
GO 165. Units measured: Number of inspections. This program relates to 15
safety, reliability, or maintenance because the costs are incurred to determine 16
that poles are in good condition to prevent premature failure. In addition, this 17
program satisfies the safety and maintenance requirements of GO 95 and 165. 18
MAT GAB – Pole Joint Utilities Maintenance Reimbursement – Engineer 19
review of pole attachment requests submitted by third-party utilities. Units 20
Measured: Number of poles. This program relates to safety, reliability, or 21
maintenance because it actively works to determine that poles are in good 22
condition to prevent premature failure. In addition, this program satisfies the 23
safety requirements by ensuring poles meet the strength and loading 24
requirements of GO 95. 25
MAT GAC – Pole Analyze Loading – Engineer review and analysis of 26
distribution wood pole loading for an overload condition. If the pole is 27
determined to not be overloaded, then assessment and analysis remains in 28
MAT GAC. However, if the pole is determined to be overloaded, then the MAT 29
changes to 07O to replace the pole. Units Measured: Number of poles. This 30
program relates to safety, reliability, or maintenance because it actively works to 31
determine that poles are in good condition to prevent premature failure. In 32
addition, this program satisfies the safety requirements by ensuring poles meet 33
the strength and loading requirements of GO 95. 34

3-45
MAT GAD – Pole Restoration Program – Reinforce deteriorated, decayed 1
or damaged poles with steel trusses. This program typically follows one year 2
behind Pole Test and Treat program and restores poles to original design 3
strength. Units measured: Number of reinforcements. This program relates to 4
safety, reliability, or maintenance because the costs are incurred to determine 5
that poles are in good condition to prevent premature failure. In addition, this 6
program satisfies the safety and maintenance requirements of GOs 95 and 165. 7
MAT GAF – Joint Utilities Telecom Engineer Review Non-reimbursed – 8
Telecommunications engineer pole attachment request review for jointly owned 9
wood poles. Units Measured: Number of poles. This program relates to safety, 10
reliability, or maintenance because it actively works to determine that poles are 11
in good condition to prevent premature failure. In addition, this program satisfies 12
the safety requirements by ensuring poles meet the strength and loading 13
requirements of GO 95. 14
MAT GAH – Joint Utilities Maintenance Non-reimbursed – Includes 15
PG&E’s membership share of the operating costs and participation in the 16
Northern California Joint Pole Association and the Joint Pole Database 17
maintenance costs for continued operation. This program relates to safety, 18
reliability, or maintenance because the costs are incurred to determine that 19
poles are in good condition to prevent premature failure. In addition, this 20
program enables communication with other utilities, to determine that poles meet 21
the safety, strength and loading requirements of GO 95. 22
MAT GC1 – Electric Distribution Substation: Engineering Maintenance 23
Support – Distribution substation costs in engineering and other maintenance 24
support. This program relates to safety, reliability, or maintenance because it 25
includes substation support activities for the maintenance and operation of 26
substation equipment. 27
MAT GC2 – Electric Distribution Substation: Major Emergency CM – 28
Distribution substation costs from major emergencies and emergent work. This 29
also includes costs associated with EPSS to mitigate wildfire ignition risk. This 30
program relates to safety, reliability, or maintenance because it addresses 31
emergencies and emergent maintenance work to prevent imminent failures. 32
MAT GCA – Electric Distribution Substation: Transformer Preventive 33
Maintenance – Distribution substation costs for transformers, regulators, and 34

3-46
Load Tap Changer (LTC) Oil Tests. Units measured: Number of oil tests 1
performed. This program relates to safety, reliability, or maintenance because it 2
monitors Transformer and LTC condition and identifies any abnormalities that 3
may lead to a potential mis-operation of the transformer. 4
MAT GCB – Electric Distribution Substation: Circuit Breaker 5
Preventive Maintenance – Distribution substation costs for breaker exercises. 6
Units measured: Number of circuit breakers exercised. This program relates to 7
safety, reliability, or maintenance because it confirms functional operation of the 8
circuit breaker. 9
MAT GCC – Electric Distribution Substation: Relay Preventive 10
Maintenance – Distribution substation costs for relay functional tests. Units 11
measured: Number of relay scheme tests. This program relates to safety, 12
reliability, or maintenance because it inspects the relay schemes and tests the 13
condition of the relay to prevent mis-operation. 14
MAT GCD – Electric Distribution Substation: Inspections – Distribution 15
substation costs for recurring station inspection of equipment. Units measured: 16
Number of substation inspections. This program relates to safety, reliability, or 17
maintenance because inspections such as EI, Security Check, Environmental 18
Check, and Load Data Collection are performed within the substation. 19
MAT GCE – Electric Distribution Substation: General Station 20
Preventive Maintenance – Distribution substation costs for preventive 21
maintenance tasks on variety of other types of substation equipment. Units 22
measured: Number of tasks. This program relates to safety, reliability, or 23
maintenance because tests are performed on minor substation equipment 24
(e.g., hot washes, mobile exercises, fire system tests, etc.) not specifically 25
captured under other specified maintenance programs to inspect and identify 26
any abnormalities. 27
MAT GCF – Electric Distribution Substation: Battery Preventive 28
Maintenance – Distribution substation costs for battery tests. Units measured: 29
Number of batteries. This program relates to safety, reliability, or maintenance 30
because inspections, tests (e.g., resistance and discharge tests) are performed 31
on batteries to identify any abnormalities and determine the batteries can 32
perform as designed. 33

3-47
MAT GCG – Electric Distribution Substation: VM – Distribution 1
substation costs in VM to manage vegetation and other property issues in and 2
around the substation. Routine vegetation control, rodent control, transient 3
encampment clean-up, mowing and other fuel reduction type work for 4
compliance with local laws and administration of the program. This program 5
relates to safety, reliability, or maintenance because it involves maintaining 6
property in and around the substation. 7
MAT GCH – Electric Distribution Substation: Building Maintenance – 8
Distribution substation costs for substation facility/building and yard work such 9
as repair to breaches in station fences, roof leaks, plumbing repairs, station 10
security such as lighting and card readers, etc. This program relates to safety, 11
reliability, or maintenance because it involves maintaining substation facilities 12
and buildings. 13
MAT GCI – Electric Distribution Substation: Switch Preventive 14
Maintenance – Distribution substation costs for switch diagnostic/performance 15
tests. Units measured: Number of switches. This program relates to safety, 16
reliability, or maintenance because diagnostic testing and infrared inspections 17
are performed on switches to identify any abnormal conditions. 18
MAT GCJ – Electric Distribution Substation: Corrective (T80) – 19
Distribution substation costs for various substation equipment corrective 20
repair work. This program relates to safety, reliability, or maintenance because 21
it involves the corrective repairs of substation equipment that are identified 22
during inspections or test of substation equipment. 23
MAT GCM – Electric Distribution Substation: Circuit Breaker 24
Mechanism Services – Distribution substation costs for breaker mechanism 25
services, including required breaker oil and gas analysis. Units measured: 26
Number of breakers. This program relates to safety, reliability, or maintenance 27
because it involves the mechanism service of the circuit breaker to determine 28
whether it is operating as needed. 29
MAT GCO – Electric Distribution Substation: Transformer Overhaul 30
Inspections – Distribution substation costs for transformer/regulator LTC 31
overhaul inspections. Units measured: Number of transformer overhaul 32
inspections. This program relates to safety, reliability, or maintenance because 33

3-48
it involves the overhaul inspection of transformer and regulator LTC to detect 1
deterioration or abnormal conditions. 2
MAT GCS – Electric Distribution Substation: Circuit Switcher & 3
Motor-Operated Air Switch (MOAS) Mechanism Services – Distribution 4
substation costs for circuit switcher and MOAS mechanism services. Units 5
measured: Number of circuit switcher and MOAS. This program relates to 6
safety, reliability, or maintenance because it involves mechanism service related 7
specifically to the performance of circuit switches and MOAS (e.g., performing 8
open and closing operations manually and/or under remote test conditions). 9
MAT GCV – Electric Distribution Substation: Circuit Breaker 10
Overhauls – Distribution substation costs for circuit breaker overhauls. Units 11
measured: Number of circuit breaker overhauls. This program relates to safety, 12
reliability, or maintenance because it involves the circuit breaker overhaul which 13
includes a detailed list of maintenance tasks to determine the circuit breaker is 14
operating as designed. 15
MAT GCW – Electric Distribution Substation: Station Washes – 16
Distribution substation costs for station insulator washing. This program relates 17
to safety, reliability, or maintenance because it involves washing insulators to 18
prevent contamination accumulation that may result in a flashover. 19
MAT GEO – Mapping – Electric Distribution Mapping includes activities 20
such as annexations (city/county boundary and tax changes) and delineations 21
(internal mapping information to external agencies, e.g., engineering firms, other 22
utilities). This MAT also includes Enterprise Records and Information 23
Management (ERIM) work described in MAT Gas Emergency Preparedness 24
(GEP). This program relates to safety, reliability, or maintenance because the 25
costs are incurred for the accurate collection of records related to field assets. 26
These records are necessary to determine that field assets are safely, and 27
reliably operated and necessary maintenance is performed in a timely fashion. 28
MAT GEP – Records Management – Records and Information 29
Management labor for full-time employees in execution of the following projects: 30
Field Asset Inventory, Field Records Inventory, Convert Paper Records and 31
Migrate Electronic Records, as well as ongoing business process reviews, 32
change management, process mapping and implementation of ERIM Program 33
policies and standards. This program relates to safety, reliability, or 34

3-49
maintenance because this work involves a detailed review and validation of 1
Electric field asset data. This information is critical to informing risk-reduction 2
planning activities and safely operating the system on a day-to-day basis. 3
MAT HGC – ADMS Development – Funds the ADMS. Used to track 4
expense associated to the multi-year grid modernization effort to consolidate 5
distribution operational technology platforms into a single platform. This 6
program relates to safety, wildfire mitigation, reliability, or maintenance because 7
it enables outage management applications that include instantaneous fault 8
location, automated switching recommendations and promotes operator 9
awareness of RT circuit conditions. This project directly supports DCC 10
operations. 11
MAT HGD – Distribution Operational Technology – DCC Systems, 12
installation and replacement. Used to track expense improvements and 13
enhancements at the DCCs. This program relates to safety, wildfire mitigation, 14
reliability and maintenance by supporting the development and daily operation of 15
RT applications/tools that are used to safely operate and maintain distribution 16
reliability. 17
MAT IGI – Dead and Dying Trees – Reduce risk associated with increased 18
tree mortality due to prolonged drought and bark beetle infestation within 19
PG&E’s service territory. Targeted removal of dead and dying trees as well as 20
certain species that pose an increased potential risk of falling into power lines. 21
Includes costs for enhanced vegetation inspection and mitigation, Urban Wild 22
Land tree work, wood management, aerial (smoke) patrol and fire safe council 23
fuel reduction program to help prevent wildfires and protect communities. Units 24
measured: Number of trees. This program relates to safety, reliability, or 25
maintenance because it addresses wildfire risk. 26
MAT IGJ – EVM – EVM work is intended to reduce wildfire risk in high fire 27
threat areas. EVM meets standards requiring creating clearances of 12 feet or 28
more at time of trim to ensure compliance until the next inspection. The program 29
covers pre-inspections, tree trims and removals, work validation through QA and 30
quality control, targeted species work, and fuel reduction. Units measured: 31
Miles completed. This program relates to safety, reliability, or maintenance 32
because it addresses wildfire risk. 33

3-50
MAT KAA – OH General CM Tag – Repair OH facilities or replace 1
individual components that are not an imminent hazard and have not caused an 2
outage. Facilities include connectors, insulators, low conductors, leaning poles, 3
slack guys, etc. Repair, replace, or install grounds, moldings, leaking bushings, 4
and related work on all OH transformers and equipment associated with 5
transformers. Units measured: Number of notifications. This program relates to 6
safety, reliability, or maintenance because it addresses non-conforming 7
equipment identified by preventative maintenance programs such as inspections 8
and patrols, as well as internal operational processes. 9
MAT KAC – Bird Safe Retrofit – Repair, replace, or install bird-guard 10
materials such as insulated jumpers, bushing covers, line covers, or perching 11
platforms on incident and/or adjacent poles for bird safety, per U.S. Fish and 12
Wildlife Service (USFWS) requirements and Utility Operating Standard 13
TD-2321S. Units measured: Number of notifications. This program relates to 14
safety and reliability by mitigating outages due to bird incidents. 15
MAT KAD – Bird Safe Retrofit Annual – Install bird-guard materials such 16
as jumper covers, bushing covers, perch guards, or perching platforms on poles 17
identified in the Annual Pole Retrofit Program for bird safety, per USFWS 18
requirements and Utility Operating Standard TD-2321S. Units measured: 19
Number of notifications. This program relates to safety, reliability, or 20
maintenance due to PG&E’s commitment made to USFWS to retrofit poles in 21
raptor concentration zones to mitigate bird-related outages. 22
MAT KAF – OH COE CM Tag – Also includes ordering batteries for work in 23
MAT BFG. Units measured: Number of notifications. This program relates to 24
safety, reliability, or maintenance because it addresses non-conforming 25
equipment identified by preventative maintenance programs such as battery and 26
equipment testing, as well as internal operational processes. 27
MAT KAH – Streetlight Replace Burnouts – Repair or replace lamps, 28
photocells, and related items associated with nonoperating streetlights. If the 29
street light head needs replacement, the time and material to replace the head is 30
charged to 2AA. If the burnout is caused by a secondary UG failure, the time 31
and material to make the repair is charged to 2BA. Units measured: Number of 32
burnout repairs. This program relates to safety, reliability, or maintenance 33

3-51
because it addresses non-conforming equipment identified by customer call-ins 1
and preventative maintenance programs such as Troublemen patrols. 2
MAT KAK – RTVI Investigations/Repairs – Investigation of RTVI where 3
cause is linked to Company equipment. Units measured: Number of 4
investigations. This program relates to safety because it addresses potential 5
non-conformances identified by customers. 6
MAT KAM – Insulator Washing – Washing pole-mounted insulators. This 7
program relates to safety, reliability, or maintenance because it prevents pole 8
top ignitions. 9
MAT KAO – Idle Facilities Investigations Service Planning – 10
Investigation by Service planning to assess whether identified idle facilities have 11
a foreseeable future use. This program relates to safety and maintenance 12
because it identifies whether idle facilities should be removed. If an idle facility 13
is confirmed, the removal work will fall under MAT codes 2AF and 2BF. 14
MAT KAP – OH Expense Projects – Projects for the replacement of OH 15
electric facilities that are not an imminent hazard and have not caused an 16
outage. Includes pre-planned projects such as actuator board replacements. 17
This program relates to safety and reliability because it mitigates the risk of 18
equipment failure from identified Material Problem Reporting (i.e., all material 19
and/or equipment found as defective, failed, or not meeting PG&E 20
requirements). 21
MAT KAQ – Wood Pole Bridge Bonding - Wood Pole Bonding 22
maintenance activity where an existing wood pole supporting both electric 23
transmission and distribution line facilities is retrofitted with grounding protection 24
to prevent fires that can occur at the location on the pole where the electric 25
distribution cross arm is bolted to the pole. This program relates to safety, 26
reliability, or maintenance because it serves to prevent ignitions. 27
MAT KAS – FAS OH Expense – FAS OH expense is work that is identified 28
during a field job and completed by a single Troubleman. This program relates 29
to safety, reliability, or maintenance because it addresses non-conforming 30
conditions identified by preventative maintenance programs such as Troublemen 31
patrols. 32
MAT KB# – Not assigned – Transformer labor reclassification costs 33
incurred when a transformer is refurbished and reused instead of being replaced 34

3-52
with a new unit. Additionally, this MAT includes costs for sand, gravel, spoils 1
and other oil-filled equipment used on a variety of UG jobs. This MAT is used 2
for compliance with Generally Accepted Accounting Principles (GAAP) 3
standards and is not directly related to safety, reliability or maintenance. 4
MAT KBA – UG General CM Tag – Repair UG facilities (including UG 5
infrared tags) or replace individual components that are not an imminent hazard 6
and have not caused an outage. Includes cleaning enclosures, re-securing 7
equipment, resurfacing lids, and tagging; repairing, replacing, or installing 8
grounds, moldings, leaking bushings; and completing related work on all 9
UG transformers and equipment associated with transformers. This program 10
relates to safety, reliability, or maintenance because it addresses 11
non-conforming equipment identified by preventative maintenance programs 12
such as inspections and patrols, as well as internal operational processes. 13
MAT KBC – UG COE CM Tag – Repair of UG COE. This program relates 14
to reliability and maintenance because it identifies certain asset life 15
replacements (e.g., UG Cable Testing). 16
MAT KBD – Nitrogen Cylinders CM – Replacement of Nitrogen Cylinders 17
(San Francisco and East Bay division only annual nitrogen-cylinder 18
replacements). This program relates to safety, reliability, and maintenance 19
because it maintains sufficient nitrogen levels in cables where leaking naturally 20
occurs. 21
MAT KBE – BART Cable Repair – Repair of 34.5 kV BART Cable issues 22
identified during annual inspections/testing performed under MAT BF3. This 23
program relates to safety, reliability, and maintenance because it checks 24
whether cables are in proper operating condition, remediating problems caused 25
by leaks, corrosion, movement of support tracks, gas pressure, etc. 26
MAT KBP – UG Expense Projects – Projects for the replacement of UG 27
electric facilities that are not an imminent hazard and have not caused an 28
outage. This program relates to safety because it addresses WYE (three-phase 29
star configuration) transformer grounding configurations. 30
MAT KBQ – Elbow/Splices Replace – Costs in this category are for special 31
splicing projects performed to fix portions of cable rather than replacing the 32
entire cable. This program relates to reliability and maintenance because it 33
addresses cable outages to major customers. 34

3-53
MAT KCA – Network Equipment CM Notifications – Repairs related to 1
network transformers and NPs. Does not include oil replacement work. Units 2
measured: Number of notifications. This program relates to safety, reliability, or 3
maintenance because it addresses problems found on the network equipment 4
and repairs made to correct those problems in order to maintain a safe and 5
reliable distribution network system. 6
MAT KCB – Network Transformer Oil Replacement and 60-Day 7
Follow Up Notifications – Replacement of oil in network primary termination 8
chambers or network ground switches. Includes resample of network 9
transformer oil. Units measured: Number of oil replacements. This program 10
relates to safety, reliability, or maintenance because it addresses issues 11
identified in sample oil during laboratory testing. The replacement of the oil at 12
the network transformer chamber is needed to maintain safe operation. 13
MAT KCC – Network Vault CM Notifications – Vault environmental 14
cleanup. Excludes work associated with network transformers and NPs. Units 15
measured: Number of vault cleanups. This program relates to safety, reliability, 16
or maintenance because it addresses hazardous conditions identified in the 17
vaults. The cleanup is for the safety and health of personnel working inside the 18
vault. 19
MAT KCD – Network Transformer Preventive Maintenance/Restore 20
Notifications – Annual maintenance on network transformers and associated 21
oil-filled chambers. Includes oil sampling on all chambers and pressure testing 22
of units. Units measured: Number of oil samplings. This program relates to 23
safety, reliability, or maintenance because it addresses the maintenance of 24
network transformers for safe and reliable operation. 25
MAT KCE – NP Preventive Maintenance Notifications – Routine 26
maintenance of NPs conducted once every three years (triennial). Excludes 27
repairs costing more than $500 or requiring greater than one hour that are 28
covered by MAT category KCA. Units measured: Number of protector 29
maintenance tags. This program relates to safety, reliability, or maintenance 30
because it addresses the maintenance of NPs for safe and reliable operation. 31
MAT KCF – Fiber Optic/SCADA Communications Repair Notifications – 32
Repair of existing network SCADA and fiber optics systems. Includes 33
communication. This program relates to safety, reliability, or maintenance 34

3-54
because it addresses the problems found on the existing network SCADA and 1
fiber optics systems and repairs made to correct the problems as needed for 2
safe and reliable operation. 3
G. New MAT Code Descriptions – Expense4
None. 5
H. MAT Code Descriptions – Capital6
MAT 06# – Line Voltage Regulator Revolving Stock – Purchase of Line 7
Voltage Regulator Revolving Stock. This program relates to safety, reliability, or 8
maintenance because it corrects voltage issues on distribution circuits to support 9
safe and reliable operation of customer equipment. 10
MAT 06A – Feeder Projects Associated with Substation Capacity – 11
Includes installation and replacement of UG cable and OH conductor associated 12
with a new substation transformer and feeder. This program relates to safety, 13
reliability, or maintenance because it prevents overloads on substation 14
equipment, mitigating the risk of equipment failure due to overloads. 15
MAT 06B – Transformer Replace Overloaded – Replacement of 16
transformers identified through overload reports using SmartMeter data, 17
recorded high oil temperature indicators, or multiple thermal protective device 18
operations during peak load periods. This does not include replacement of 19
transformers identified via the new business, WRO or any other process. Units 20
measured: Number of transformers. This program relates to safety, reliability, 21
or maintenance by replacing transformers identified as overloaded, thereby 22
mitigating the risk of transformer failure due to overloads. 23
MAT 06D – Circuits Reinforce – Distribution Planning (DP) Managed – 24
Installation of new OH and UG facilities or reconductoring of existing facilities 25
with larger wire to meet capacity needs or voltage support. These upgrades are 26
performed to address one of the following possible scenarios: (1) Line Capacity 27
Overload; (2) Under or Over-Voltage Conditions; (3) Operational or Emergency 28
Capacity; and (4) Future UG Facilities in Joint Trench Projects. This MAT 29
covers circuit reinforcement projects managed by DP. This program relates to 30
safety, reliability, or maintenance by replacing distribution equipment that is 31
either presently overloaded or forecast to be overloaded, mitigating the risk of 32
equipment failure due to overloads. 33

3-55
MAT 06E – Circuits Reinforce – Project Services (PS) Managed – 1
Installation of new OH and UG facilities or reconductoring of existing facilities 2
with larger wire to meet capacity needs or voltage support. These upgrades are 3
performed to address one of the following possible scenarios: (1) Line Capacity 4
Overload; (2) Under or Over-Voltage Conditions; (3) Operational or Emergency 5
Capacity; and (4) Future UG Facilities in Joint Trench Projects. This MAT 6
covers circuit reinforcement projects managed by PS. This program relates to 7
safety, reliability, or maintenance by correcting overloads on distribution 8
equipment caused by load growth, mitigating the risk of equipment failure due to 9
overloads. 10
MAT 06G – Voltage Correct Secondary – Includes adding or upgrading: 11
(1) existing transformers; (2) secondary distribution conductors; and/or12
(3) secondary service wires to comply with the voltage requirements of Electric13
Rule 2. This program relates to safety, reliability, or maintenance by correcting 14
secondary voltage issues to support safe and reliable operation of customer 15
equipment. 16
MAT 06H – Electric Distribution Line New Business Performance – 17
Includes projects identified to address capacity deficiencies related to specific 18
New Business customer’s demand increase. This program relates to safety, 19
reliability, or maintenance by correcting overloads on distribution equipment 20
caused by addition of new customer loads, mitigating the risk of equipment 21
failure due to overloads. 22
MAT 06I – Electric Distribution Line Operational Capacity Projects – 23
Includes OH or UG new facilities or reconductoring of existing facilities with large 24
wire to improve reliability, as well as increase emergency and operational 25
capability of the system. This program relates to safety, reliability, or 26
maintenance because it improves the ability to reconfigure the distribution 27
system, reducing the number of customers impacted by outages and reducing 28
outage restoration times. 29
MAT 06K – Power Factor Management – Includes installing SCADA 30
controls on strategically located electric distribution capacitor banks to allow 31
control setting changes remotely for better power factor management, as well as 32
increased voltage and reactive power support of the system. This program 33
relates to safety, reliability, or maintenance by enabling RT control over power 34

3-56
factor correction equipment, and RT solving of voltage issues in order to support 1
safe and reliable operation of customer equipment. 2
MAT 06P – Enable Distributed Generation Electric Distribution Line – 3
Includes installing SCADA controls on strategically located electric distribution 4
regulator banks to allow control setting changes remotely for better control of 5
two-way power flow. This program relates to safety, reliability, or maintenance 6
by enabling RT control over voltage correction equipment, and RT solving of 7
voltage issues to support safe and reliable operation of customer equipment. 8
MAT 07C – Special Criteria Pole Replacement – Replace all tree 9
connections in the system. Tree connections are defined as a dead, dying or 10
living tree that is being used as a utility power pole. Units measured: Number of 11
trees. This program relates to safety, reliability, or maintenance because it 12
actively works to identify trees being used as utility power poles. In addition, this 13
program enhances overall system safety by replacing the trees with poles, prior 14
to failure. 15
MAT 07D – Pole Replacement – Replace poles identified as 16
deteriorated/damaged and requiring replacement. Units measured: Number of 17
poles. This program relates to safety, reliability, or maintenance because it 18
actively works to determine whether poles are in good condition to prevent 19
premature failure. In addition, this program enhances overall system safety by 20
replacing poles identified to be nearing the end of their service life, prior to 21
premature failure. 22
MAT 07G – Pole Joint Utility Telecommunications Reimbursement – 23
Pole/Anchor replacement due to an overloaded condition caused by an owner's 24
tenant. This can be driven by a PG&E tenant or another joint owner's tenant. 25
This work is 100 percent reimbursed and managed by the local 26
telecommunications cable attachment project manager. Project Manager must 27
obtain tenant approval prior to creation of an 07G order. Units Measured: 28
Number of poles. This program relates to safety, reliability, or maintenance 29
because it actively works to determine whether poles are in good condition to 30
prevent premature failure. In addition, this program enhances overall system 31
safety by replacing poles identified as overloaded, prior to premature failure. 32
The program satisfies the safety requirements by determining poles meet the 33
strength and loading requirements of GO 95. 34
3-57
MAT 07L – Steel Lattice Structures – Replacement or repair of steel lattice 1
structures that carry electric distribution conductor across the Delta to meet 2
various local and state agencies’ (San Joaquin, Contra Costa, Alameda, Solano, 3
and Yolo Counties) Navigable Waterway height clearance requirements. Units 4
measured: Number of structures. This program relates to safety, reliability, or 5
maintenance because it actively works to determine whether structures are in 6
good condition to prevent premature failure. In addition, this program enhances 7
overall system safety by replacing structures identified to be nearing the end of 8
their service life, prior to premature failure. 9
MAT 07O – Overloaded Pole Replacements – Replace poles identified as 10
overloaded (additional load applied to the pole beyond what it is designed to 11
hold) and requiring replacement. Units measured: Number of poles. This 12
program relates to safety, reliability, or maintenance because it actively works to 13
determine whether poles are in good condition to prevent premature failure. In 14
addition, this program enhances overall system safety by replacing poles 15
identified as overloaded, prior to premature failure. The program satisfies safety 16
requirements by ensuring poles meet the strength and loading requirements of 17
GO 95. 18
MAT 08D – Do Not Use – Cornerstone – Costs for work related to PG&E’s 19
Cornerstone reliability program. The MAT code is no longer in use, but some 20
costs still settle to Cornerstone project orders. The program relates to safety, 21
reliability or maintenance because the Cornerstone program objective was to 22
improve reliability. 23
MAT 08F – Do Not Use – Cornerstone DA Control Upgrade – Costs for 24
work related to PG&E’s Cornerstone reliability program. The MAT code is no 25
longer in use, but some costs still settle to Cornerstone project orders. The 26
program relates to safety, reliability or maintenance because the Cornerstone 27
program objective was to improve reliability. 28
MAT 08J – Replace Deteriorated OH Conductor – Targeted replacement 29
of primary OH conductor in non-HFTDs deemed deteriorated through processes: 30
(1) post wire-down investigation, (2) outage review/safety team31
recommendation, or (3) to proactively address elevated rates of wires down to 32
improve safety, reliability, and integrity. Starting in 2018, MAT 08J also includes 33
PG&E’s Wires-Down Program, which addresses conductors that fail and result 34

3-58
in a contact with the ground, or other object. Units measured: Number of feet 1
replaced, which is converted to miles. This program relates to safety, reliability, 2
or maintenance because it mitigates the risk of primary OH conductor failure 3
resulting in a potential wire-down event. 4
MAT 08S – Replace Obsolete OH Switches – Replace “grasshopper” OH 5
switches, installed between 1950 and 1970, minimizing potential safety issues 6
and improve reliability during routine and emergency switching operations. Units 7
measured: Number of switches. This program relates to safety, reliability, or 8
maintenance because it replaces obsolete switches that have limited to 9
load-break capabilities. 10
MAT 08W – Wires Down Generated Projects and System Hardening 11
Wildfire Resiliency Projects – Performing targeted HFTDs site specific primary 12
conductor replacement, secondary conductor replacement, conversion of 13
overhead to underground, replacement of non-exempt equipment, replacement 14
of OH electric distribution line transformers, replacement of existing wood poles 15
with more resilient poles, upgrades to electrical protective devices and systems 16
through equipment replacements and device programming. Prior to 2018, this 17
MAT was used for OH conductor replacements associated with PG&E’s 18
wires-down program; this work has been moved to MAT 08J. Units measured: 19
Number of circuit miles. This program relates directly to safety, reliability, and 20
maintenance because the work can be initiated based on: (1) deteriorated 21
conductor identification, (2) fire-risk ignition modeling, (3) bundling of electric 22
corrective tags identified as part of the WSIP, or (4) PSPS mitigation; and is 23
completed in compliance with PG&E’s Fire Rebuild Design Guidance for 24
System Hardening. 25
MAT 09A – Electric Distribution Line SCADA Install/Replace – This 26
includes the DA Initiative, installing new RTUs to improve visibility, reliability, and 27
operations, and continuing to upgrade and replace obsolete, deficient, and failed 28
automation and protection equipment. This program relates to safety, reliability, 29
or maintenance because it supports the installation of electric distribution line 30
equipment to remotely isolate electric lines and quickly de-energize facilities to 31
address urgent safety issues such as wire down events. 32
MAT 09B – Electric Distribution Substation SCADA/RTU Replace – 33
Replace obsolete SCADA/RTUs in electric distribution substations to provide 34

3-59
visibility and remote controllability to Operations. This program relates to safety, 1
reliability, or maintenance because the work targets proactive replacements of 2
SCADA systems in distribution substations that possess obsolete SCADA and 3
protective relay assets, which, if failed, would jeopardize PG&E’s ability to 4
operate the electric facility remotely and properly gather data for system 5
operators. 6
MAT 09D – Electric Distribution Substation SCADA/RTU Install – 7
Install additional SCADA/RTU in electric distribution substations to provide 8
visibility and remote controllability to Operations. This program relates to safety, 9
reliability, or maintenance because SCADA technology provides the ability for 10
remote DO to operate relays and quickly deenergize downed lines and 11
equipment in support of wildfire risk management. In addition, operational 12
improvements are gained through remotely switching substation equipment, 13
obtaining RT information about the condition of the system, and providing 14
historical data to examine line loading trends, forecast future loading, and 15
perform outage investigations. 16
MAT 09E – Electric Distribution Substation Protective Relay 17
Install/Replace – Install and replace protective relays in electric distribution 18
substations to maintain optimal system protection and reliability. This program 19
relates to safety, reliability, or maintenance because it covers the proactive 20
replacement of aging substation protective relays. These relays serve the 21
purpose of tripping substation circuit breakers when faults are detected, such as 22
in cases of wires down resulting in over-current events, protecting power 23
equipment from catastrophic failure and increasing public safety. 24
MAT 09F – Electric Distribution Substation SCADA Emergency 25
Replace – Miscellaneous and emergency replacement projects initiated and 26
funded by System Automation & Protection program. This program relates to 27
safety, reliability, or maintenance because it covers in-service failures of 28
substation SCADA equipment and protective relays, as well as emergency 29
replacements of equipment whose risk of failure is imminent, which, if failed, 30
would jeopardize PG&E’s ability to remotely operate the electric facility safely. 31

3-60
MAT 21A/21# – EP&R Capital – 1
Capital work and projects supporting EP&R focused on: 2
• Addressing one of PG&E’s top 3 enterprise risks—a catastrophic emergency3
incident such as a major earthquake or fire that could affect one or more4
areas of PG&E’s service territory;5
• Providing additional fire mitigation actions as precautionary measures to6
reduce the risk of future wildfire ignitions, including timely detection of7
wildfires;8
• Developing corporate emergency strategy, preparedness, response, and9
business continuity policies and procedures for gas, electric, and generation;10
and11
• Undertaking key technology projects that support PG&E’s emergency12
preparedness to improve public and system safety, employee safety,13
reliability, and work efficiency.14
This program relates to safety, reliability, or maintenance because it15
addresses catastrophic emergency incidents, fire mitigations, and corporate 16
emergency strategy. 17
MAT 2AA – OH General Replacement – Replace deteriorated OH facilities 18
that are not an imminent hazard and have not caused an outage. Facilities 19
include crossarms, leaking transformers, and conductor. Units measured: 20
Number of notifications. This program relates to safety, reliability, or 21
maintenance because it addresses a non-conformance identified by preventative 22
maintenance programs such as inspections and patrols, as well as internal 23
operational processes. 24
MAT 2AB – Bird Safe Install/Replacement – Capital modification work and 25
retrofits to distribution poles and/or adjacent poles in order to address bird-safety 26
incidents, per USFWS requirements and Utility Operating Standard TD-2321S. 27
Units measured: Number of notifications. This program relates to safety and 28
reliability by mitigating outages due to bird incidents. 29
MAT 2AC – Bird Safe Install/Replacement Annual – Capital modification 30
work made to distribution poles as part of the annual pole retrofit program to 31
address bird-safety issues, per USFWS requirements and Utility Operating 32
Standard TD-2321S. Units measured: Number of notifications. This program 33
relates to safety, reliability, or maintenance due to PG&E’s commitment made to 34

3-61
USFWS to retrofit poles in raptor concentration zones to mitigate bird-related 1
outages. 2
MAT 2AE – OH COE Replacement – Replace OH equipment classified as 3
COE. Units measured: Number of notifications. This program relates to safety, 4
reliability, or maintenance because it addresses non-conforming equipment 5
identified by preventative maintenance programs such as equipment testing, as 6
well as internal operational processes. 7
MAT 2AF – OH Idle Facility Remove – Removal of OH Idle Facilities that 8
have no likely foreseeable future use. Units measured: Number of facilities. 9
This program relates to safety and maintenance because it removes equipment 10
no longer in use and therefore no longer requiring maintenance. 11
MAT 2AG – San Francisco Series Streetlights – Replacement of the RO 12
streetlights, also referred to as constant-current streetlight systems, owned and 13
operated by PG&E in San Francisco. This project will replace the existing RO 14
loops with the type of streetlight circuits used elsewhere is PG&E’s system. This 15
program relates to safety and maintenance because it provides illumination for 16
pedestrian and vehicular traffic. 17
MAT 2AH – LED Streetlights – Replacement of PG&E-owned and 18
maintained decorative streetlights (LS-1) with more efficient, longer-life LED 19
fixtures and new photo controllers. Units measured: Number of streetlights. 20
This program relates to safety and maintenance because it provides longer-life 21
streetlights and better illumination for pedestrian and vehicular traffic. 22
MAT 2AI – San Francisco Historical Streetlights – Replacement or 23
refurbishment of cast-iron decorative streetlights in the Golden Triangle/Union 24
Square area of San Francisco that have been found to have corroded steel 25
support poles. This program relates to safety and maintenance because it 26
provides illumination for pedestrian and vehicular traffic. 27
MAT 2AP – OH Capital Projects – Major OH projects, defined as jobs 28
costing more than $10,000 per location. This program relates to safety and 29
maintenance because it includes replacement of non-exempt fuses with exempt 30
fuses for wildfire mitigation in HFTD areas. 31
MAT 2AQ – Ceramic Post Insulators – Replacement of ceramic post 32
insulators that were manufactured in or prior to 1972 and are currently installed 33

3-62
on PG&E poles. This program relates to safety, reliability, and maintenance 1
because it replaces ceramic post insulators prior to failure. 2
MAT 2AR – Surge Arrester Replacement – Replacement of current 3
(non-exempt) surge arresters with exempt surge arresters to reduce fire risk 4
from electric distribution operations. Non-exempt surge arresters are OH 5
electric distribution equipment that have the potential to expel hot or molten 6
material upon normal operation, leading to an increased risk of wildfire. Units 7
measured: Number of replacements. This program relates to safety and 8
maintenance because it includes replacing equipment to mitigate wildfire risk 9
and correcting common grounding issues that pose a safety risk. 10
MAT 2AS – FAS OH Capital – FAS OH capital is work that is identified 11
during a field job and completed by a single Troubleman. The work could 12
involve either replacing or installing OH facilities: Electric distribution 13
conductors, components, structures, and associated equipment constructed 14
above ground level. Units measured: Number of notifications. This program 15
relates to safety, reliability, or maintenance because it addresses 16
non-conforming conductors, components, structures, and associated equipment 17
identified by Troublemen. 18
MAT 2B# – Not assigned – Sand, gravel, spoils and oil-filled equipment 19
used on a variety of UG jobs. This program relates to safety, reliability, or 20
maintenance because this material is used on UG work associated with safety, 21
reliability and maintenance. 22
MAT 2BA – UG General Replacement – Replace deteriorated UG facilities 23
that are not an imminent hazard and have not caused an outage. Facilities 24
include deteriorated transformers, conduits, enclosures, pads, and idle 25
equipment. Units measured: Number of notifications. This program relates to 26
safety, reliability, or maintenance because it addresses non-conforming facilities 27
identified by preventative maintenance programs such as inspections and 28
patrols, as well as internal operational processes. 29
MAT 2BB – Fault Indicator Replacements – Replace deteriorated fault 30
indicators that are not an imminent hazard and have not caused an outage. 31
Units measured: Number of fault indicators. This program relates to reliability 32
because in the event of an outage it helps sectionalize the outage area. 33

3-63
MAT 2BD – UG COE Replacement – Replace UG equipment determined 1
COE by the division operators, Maintenance and Construction, and restoration, 2
and validated by Distribution Engineers. Units measured: Number of 3
notifications. This program relates to reliability and maintenance because it 4
identifies certain asset replacements. 5
MAT 2BF – UG Idle Facility Remove – Removal of UG Idle Facilities that 6
do not to have a likely use in the foreseeable future. This program relates to 7
safety and maintenance because it removes equipment no longer in use and no 8
longer requiring maintenance. 9
MAT 2BP – UG Capital Projects – Major UG projects, defined as jobs 10
costing more than $100,000 per location. This program relates to safety, 11
reliability, or maintenance because it addresses non-conforming equipment 12
identified by preventative maintenance programs such as inspections and 13
patrols, as well as internal operational processes. 14
MAT 2CA – NP Relay Replacement – Replacement of an NP relay as part 15
of planned replacement program. Units measured: Number of replacements. 16
This program relates to safety, reliability, or maintenance because it addresses 17
the replacement of any inoperable NP relays to maintain a safe and reliable 18
distribution network system. 19
MAT 2CB – Fiber/SCADA Communication Replace – Installation of new 20
network monitoring systems for the distribution networks, including sensor 21
installation, communications, fiber optic replacement and programming activities. 22
Includes any upgrade/replacement work to the existing network SCADA systems 23
for reliable operations until new SCADA systems are installed (not part of the 24
new monitoring system as part of MAT 2CE). This program relates to safety, 25
reliability, or maintenance because it addresses the replacement of any 26
inoperable existing SCADA system and related components, including fiber 27
optics, to maintain a safe and reliable distribution network system. 28
MAT 2CC – Network Transformer and Protector Replace – Planned 29
replacement of electric distribution network transformers, including those with 30
deteriorated oil condition or high-rise locations. Units measured: Number of 31
replacements. This program relates to safety, reliability, or maintenance 32
because it addresses the replacement of both network transformer and NP 33

3-64
including high rise location to maintain a safe and reliable distribution network 1
system. 2
MAT 2CD – Venting Manhole Covers Replacement – Replacement of 3
existing manhole covers on the electric distribution network and distribution 4
radial systems with venting manhole covers. Units measured: Number of 5
replacements. This program relates to safety, reliability, or maintenance 6
because it addresses public safety in the event of an electrical failure in an UG 7
vault and the possible ejection of the manhole cover. 8
MAT 2CE – Network SCADA Communications Upgrade – Installation of 9
new network SCADA monitoring systems for the electric distribution networks, 10
including sensor installation, communications, fiber optic replacement and 11
programming activities. This program relates to safety, reliability, or 12
maintenance because the new safety monitoring system provides information to 13
help prevent in-service failure of the monitored equipment in the distribution 14
network system. 15
MAT 46A – Electric Distribution Substation General Install/Replace – 16
Projects to support general electric distribution substation capacity increases for 17
banks, bus, feeders, or other substation components that do not fall into one of 18
the other MWC 46 MATs. This program relates to safety, reliability, or 19
maintenance because it creates additional substation capacity in order to 20
prevent overloads on substation equipment, mitigating the risk of equipment 21
failure due to overloads. 22
MAT 46F – Electric Distribution Substation Emergency and Operational 23
Capacity – Projects identified in this MAT increase electric distribution capacity 24
by upgrading banks, bus, feeders, or other substation components to improve 25
reliability by providing emergency capacity and/or operational flexibility at the 26
bank and feeder level. This program relates to safety, reliability, or maintenance 27
because it improves the ability to reconfigure the distribution system, reducing 28
the number of customers impacted by outages and reducing outage restoration 29
times. 30
MAT 46H – Electric Distribution Substation New Business Related 31
Capacity – These projects are like other projects under MWC 46; however, 32
these projects have been identified to address capacity deficiencies for specific 33
New Business customers’ demand increase. This program relates to safety, 34

3-65
reliability, or maintenance because it creates additional substation capacity in 1
order to serve new customer loads, mitigating the risk of equipment failure due 2
to overloads. 3
MAT 46N – Electric Distribution Substation Land Purchase New 4
Substation – Includes projects to increase area electric distribution substation 5
capacity by siting, permitting, and constructing new substations. This program 6
relates to safety, reliability, or maintenance because it works towards siting a 7
new substation that adds additional substation capacity in order to prevent 8
overloads on substation equipment, mitigating the risk of equipment failure due 9
to overloads. 10
MAT 46T – Electric Distribution Substation Support Transmission or 11
Substation Related Work – Projects identified in this MAT replace or relocate 12
electric distribution substation equipment to support a related Transmission bus 13
reconfiguration or voltage conversion or Substation condition-based replacement 14
projects. This program relates to safety, reliability, or maintenance because it 15
supports work that creates additional transmission capacity to mitigate the risk of 16
equipment failure due to overloads. It also supports proactive substation 17
replacement work intended to prevent failures and maintain reliability. 18
MAT 48A – Replace Electric Distribution Substation Other Equipment – 19
Replace other electric distribution substation equipment, such as ancillary 20
equipment, ground grids, etc. Includes replacement projects with complex or 21
wide-ranging scope of work that include various equipment types. This program 22
relates to safety and reliability because it involves the replacement of various 23
substation equipment (e.g., ancillary equipment, ground grid upgrade, etc.) not 24
specifically captured under other specified programs under MWC 48 to maintain 25
reliability. 26
MAT 48C – Replace Electric Distribution Substation Batteries – Replace 27
battery system at electric distribution substation. Units measured: Number of 28
batteries. This program relates to reliability because it targets the replacement 29
of substation batteries to minimize reliability risk due to battery failures. 30
MAT 48D – Replace Electric Distribution Substation Breakers – Replace 31
electric distribution substation circuit breakers. This program relates to reliability 32
because it involves the proactive planned replacement of circuit breakers aimed 33
to prevent failures and maintain reliability. 34

3-66
MAT 48E – Replace Electric Distribution Substation Switches – Replace 1
electric distribution substation disconnect switches. This program relates to 2
reliability because it targets the replacement of switches to maintain reliability. 3
MAT 48F – Replace Electric Distribution Substation Switchgear – 4
Replace electric distribution substation switchgear equipment. This program 5
relates to reliability because it targets the replacement of switchgear to improve 6
reliability. 7
MAT 48H – Replace Electric Distribution Substation Civil Structures – 8
Replace civil structures (structures, foundation, etc.) that are electric distribution 9
substation assets. This program relates to safety and reliability because it 10
replaces civil structures to prevent interruption of service and to mitigate safety 11
hazard to personnel. 12
MAT 48L – Electric Distribution Line Work Support Substation – 13
Includes work required on electric distribution lines associated with substation 14
equipment replacement work. This program relates to reliability because it 15
retrofits distribution lines and associated equipment work in conjunction with 16
distribution work (e.g., cutovers – 4 kV to 12 kV, switchgear and transformer 17
replacement, etc.). 18
MAT 48N – Electric Distribution Substation Insulators – Replacement of 19
electric distribution insulators that have reached end-of-life. This program 20
relates to reliability because it targets the replacement of insulators to minimize 21
equipment damages leading to sustained outages. 22
MAT 48X – Electric Distribution Substation Animal Abatement – Animal 23
abatement program retroactively mitigates substations to prevent animal 24
contacts. Units measured: Number of substations mitigated. This program 25
relates to reliability because it involves the abatement of substation assets to 26
prevent equipment damage and customer outages due to animal contacts. 27
MAT 49# – Line Reclosers Revolving Stock – Purchase Line Reclosers 28
Revolving Stock. This program relates to safety, reliability, or maintenance 29
because it provides a centralized inventory of equipment to support various 30
safety and reliability programs such as PG&E’s PSPS Program, targeted electric 31
reliability improvements, and distribution line automation. 32
MAT 49A – Distribution Line Automation – Replace Automation/SCADA 33
equipment includes Reclosers, OH, Pad-mounted, or Subsurface Switches, may 34

3-67
include deficient communication equipment. This program relates to safety, 1
wildfire mitigation, reliability, or maintenance because it supports the installation 2
of electric distribution line equipment to remotely isolate electric lines and quickly 3
de-energize facilities to address urgent safety issues such as wire down events. 4
MAT 49B – Recloser Asset Replacement – Strategic upgrade of reclosers 5
(units in-service, not deteriorated or damaged), may include recloser 6
replacement, minor communication, or other minor upgrades to expand or 7
improve SCADA coverage and improve reliability. Units measured: Number of 8
reclosers. This program relates to safety, reliability, or maintenance because it 9
provides replacement electronic recloser controls or recloser to improve the 10
functionality of distribution line protective devices. 11
MAT 49C – OH Fuses Install/Replace – Install new OH Fuses to improve 12
reliability. Units measured: Number of fuses. This program relates to safety, 13
reliability, or maintenance because it provides funding to support the installation 14
of devices to quickly de-energize faulted lines and improve electric reliability to 15
customers. 16
MAT 49D – Recloser/Switch/Disconnect Install/Replace – Install new 17
Reclosers, OH Switches or solid blade disconnects to improve reliability. Units 18
measured: Number of devices. This program relates to safety, reliability, or 19
maintenance because it directly funds the installation of electrical equipment 20
designed to isolate faulted lines and improve electric service reliability to 21
customers. 22
MAT 49E – General Installations/Replace Circuits/Zone – Line work that 23
typically includes reliability work, such as protective devices, reframing lines, 24
installing tree wire, etc.: Targeted Circuit Program, as well as system or 25
city/community programs to improve reliability. Units measured: Number of 26
circuits. This program relates to safety, reliability, or maintenance because it 27
directly funds the installation of various electrical equipment designed to isolate 28
faulted lines, prevent electrical outages, and improve electric service reliability to 29
customers. 30
MAT 49F – UG Fuses Install/Replace – Install or replace UG fuses to 31
improve reliability. Units measured: Number of fuses. This program relates to 32
safety, reliability, or maintenance because it directly funds the installation of 33

3-68
various electrical UG equipment designed to isolate faulted lines, limit the scope 1
of electrical outages, and improve electric service reliability to customers. 2
MAT 49G – UG Recloser/Sectionalizers/Switch Install/Replace – Install 3
or replace UG interrupters to improve reliability. Units measured: Number of 4
devices. This program relates to safety, reliability, or maintenance because it 5
directly funds the installation of various electrical UG equipment designed to 6
isolate faulted lines, limit the scope of electrical outages, and improve electric 7
service reliability to customers. 8
MAT 49H – PSPS Sectionalizer Device Install/Replace – Install or replace 9
distribution PSPS sectionalizing devices. Units measured: Number of devices. 10
This program relates to safety and reliability because it directly funds the 11
installation of automated electrical equipment designed to isolate faulted lines, 12
limit line reclosing, and facilitate the remote opening and closing of switches 13
necessary to efficiently implement PSPS. 14
MAT 49I – OH Fault Indicators/Line Sensors Install/Replace – Install new 15
OH fault indicators or distribution line monitoring systems and/or line sensors to 16
improve reliability. Units measured: Number of devices. This program relates 17
to safety, reliability, or maintenance because it provides funding to support the 18
installation of devices which assist with quickly identifying faulted lines leading to 19
improved electric reliability to customers. 20
MAT 49M – Resilience Zones – Build resilience zones around Pre-Installed 21
Interconnection Hubs (PIH)—permanent, “plug and play” infrastructure enabling 22
temporary generation to connect to the electric distribution grid at 23
pre-determined locations. Generally, PIHs will consist of a transformer and 24
associated interconnection equipment, ground grid, and grid isolation and 25
protection devices. This program relates to safety and reliability because it 26
improves public safety through wildfire prevention, limits the number of 27
customers impacted by PSPS outage events, and reduces the unplanned 28
outage frequency and duration. 29
MAT 49R – Grid Modernization Technology – This includes projects and 30
programs that install new and advancing technologies on the distribution 31
system. These technologies are designed to enhance standard protection and 32
controls and identify problems that traditional systems did not detect. This 33
program relates to safety, wildfire mitigation, reliability, or maintenance because 34

3-69
it supports reducing risk and improving overall safety. Initial projects will install 1
Rapid Earth Fault Current Limiter (REFCL) on circuits within the Tier 2 and 3 2
HFTD areas to reduce the risk of ignition from a wire down conditions. 3
MAT 49S – Electric Reliability Install FLISR Systems – The FLISR 4
automation system reduces the effect of outages to customers by quickly 5
opening and closing automated switches. This is the same automation work 6
done previously under the Cornerstone project. Units measured: Number of 7
circuits. This program relates to safety, reliability, or maintenance because it 8
directly funds the installation of various electrical equipment designed to isolate 9
faulted lines, limit the scope of electrical outages, and improve electric service 10
reliability. 11
MAT 49T – Single Phase Line Recloser – Install single unit (per phase) 12
recloser. Units measured: Number of locations. This program relates to safety, 13
reliability, or maintenance because it directly funds the installation of electrical 14
OH equipment designed to isolate faulted lines, limit the scope of electrical 15
outages, improve electric service reliability, and gang tripping or remote 16
functionality to increase public safety. 17
MAT 49X – Emerging Electric Distribution Reliability Improvements – 18
Emergent Reliability projects focused on addressing localized reliability issues 19
not covered by broad, system-wide reliability programs. This program relates to 20
safety, reliability, or maintenance because it directly funds the installation of 21
various electrical equipment designed to isolate faulted lines, limit the scope of 22
electrical outages, and improve electric service reliability. 23
MAT 54A – Electric Distribution Substation – Replace Transformer – 24
Replace Electric Distribution Substation Transformers to maintain and improve 25
substation reliability. This program relates to reliability, because it involves the 26
proactive planned replacement of substation transformers to improve substation 27
reliability and prevent transformer failures. 28
MAT 56A – Reliability Related Cable Replacement – Capital work 29
associated with UG primary cable systems, including replacement of UG cables 30
and associated components. Units measured: Number of miles. This program 31
relates to safety and reliability. Program replaces UG cables in areas that have 32
experienced two or more cable failures within five years. Many of these cables 33
are unjacketed High Molecular Weight Polyethene (HMWPE) or Cross-Linked 34

3-70
Polyethylene (XLPE) cables that have been evaluated through cable testing or 1
cable rejuvenation (MAT 56B program) and showed signs of insulation and/or 2
concentric neutral deterioration, some of which had complete neutral breaks. 3
MAT 56B – Cable Rejuvenation and Testing – Rejuvenation (injection) of 4
primary UG cables to restore insulation integrity with goal of extending operating 5
life. Testing involves applying voltage signals to cable to evaluate its operating 6
condition, typically using partial discharge. Units measured: Number of miles. 7
Both rejuvenation and testing involve performing neutral assessment of the 8
cables. Sections not injectable or do not pass testing are targeted for cable 9
replacement under MAT 56A. This program relates to safety and reliability 10
because it evaluates the condition (concentric neutral and insulation 11
deterioration) of some of HMWPE and XLPE UG cables, in areas that have 12
experienced two or more failures within five years, which are then prioritized for 13
replacement under MAT 56A. 14
MAT 56C – COE Cable Replacement –Replacement of failed primary UG 15
loop cable sections noted on the COE list. Units measured: Number of projects. 16
This program relates to reliability or maintenance because it replaces sections of 17
cables that have failed and are out of operation. 18
MAT 56D – TGRAM/TGRAL) Switch Replacement – Replacement of UG 19
TGRAM/TGRAL switches. Units measured: Number of replacements. This 20
program relates to safety and reliability because it replaces switches that have 21
been in service since the 1950s and 1960s, and for which the insulating oil to 22
make or break load cannot be properly tested and is considered suspect. 23
MAT 56N – Network Cable Replacement – Systematic replacement of 24
network cable assets in San Francisco and Oakland. The work involves 25
replacing primary and secondary cables and installing new equipment. This 26
program relates to safety, reliability, or maintenance because the network cable 27
system is in urban areas where the public potentially could be near energized 28
equipment. These factors require a safety driver to minimize in-service failure; a 29
reliability driver to minimize service outages impacting customers; and a 30
maintenance driver to execute a consistent asset-management strategy for the 31
safety and operating performance of the system to balance risk, performance, 32
and cost. 33

3-71
MAT 56S – LBOR Switch Replacements – Proactive replacement of UG 1
oil-filled switches whose condition warrants replacement in order to avoid 2
potential failures. Units measured: Number of replacements. This program 3
relates to safety and reliability because it focuses on the replacement of 4
subsurface switches that have been in service for more than 45 years, and for 5
which the quantity of the insulating oil is considered suspect. 6
MAT 56T – Temperature Alarm Devices– Install Distribution Temperature 7
Monitor, otherwise known as Temperature Alarm Devices, for Subsurface 8
Distribution Assets (Subsurface Transformers, LBOR Switches and 600 amp 9
Switches). This program relates to safety and reliability because it installs 10
temperature indicators to safely and proactively replace UG assets that are 11
continuously running above allowable temperature or exhibiting thermal runaway 12
conditions (very quick temperature rises). 13
MAT 58A – Electric Distribution Substation Safety, Environmental, Fire 14
Protection – Replace or install fire protection in electric distribution substation 15
assets. This program relates to safety and reliability because it involves the 16
installation and/or upgrades of fire suppression systems which minimizes the 17
probability of fire occurrences that could lead to interruption of service and/or 18
property loss. 19
MAT 58B – Replace Electric Distribution Substation Civil Structures – 20
Replace civil structures in electric distribution substation assets. This program 21
relates to safety and reliability because it replaces civil structures to prevent 22
safety risk to employees or public, and/or interruption of service. 23
MAT 58C – Replace Distribution Substation Miscellaneous 24
Equipment – Distribution Substation miscellaneous equipment replacements. 25
This program relates to safety, reliability, or maintenance because it provides for 26
replacement of distribution substation miscellaneous equipment. 27
MAT 58S – Electric Distribution Substation Security Upgrades – 28
Replace, upgrade or install security in electric distribution substation assets. 29
This program relates to safety and reliability because it installs, upgrades or 30
replaces security systems (physical or technology) to provide safety to 31
employees and prevent vandalism. 32
MAT 63C – ADMS Development – Funds the ADMS. Used to track capital 33
associated to the multi-year grid modernization effort to consolidate distribution 34

3-72
operational technology platforms into a single platform. This program relates to 1
safety, wildfire mitigation, reliability, or maintenance because it enables outage 2
management applications that include instantaneous fault location, automated 3
switching recommendations and promotes operator awareness of RT circuit 4
conditions. This project directly supports DCC operations. 5
MAT 63D – Distribution Operational Technology – DCC Systems, 6
Equipment/Hardware installations and replacement. Used to track capital 7
improvements and enhancements at the DCC. This program relates to safety, 8
wildfire mitigation, reliability, and maintenance by supporting the development 9
and daily operation of RT applications/tools that are used to safely operate and 10
maintain distribution reliability. 11
I. New MAT Code Descriptions – Capital12
MAT 07A – Tree Connect VM Assessments – Assess tree connections in 13
the system. Tree conditions are defined as a dead, dying or living tree that is 14
being used as a utility power pole. VM Certified Personnel are dispatched to the 15
field to assess the tree condition and provide a recommended Priority for 16
remediation. Remediation of tree connections includes installation of a new 17
clearance pole and transfer of PG&E facilities from the tree to the new clearance 18
pole. Remediation is performed in MAT 07C. MAT 07A is for the VM Certified 19
Personnel assessment of the tree only. Units measured: Number of trees. This 20
program relates to safety, reliability, or maintenance because it actively works to 21
identify trees being used as utility power poles. 22
MAT 54L – Transformer Life Extension – Program is a cost-effective 23
mitigation measure to extend the useful service life of the power transformer and 24
maintain system reliability, with limited impact to planned major replacement 25
projects. This program relates to safety, reliability, and maintenance because it 26
reconditions power transformers, restoring integrity, until planned replacement 27
can take place. 28
MAT 23C – Implement Workforce Strategy – includes the costs to 29
implement workforce strategy. This program relates to safety, reliability and 30
maintenance because it enables workforce strategy items such as the Wildfire 31
Risk Command Center. 32

3-73
J. Electric Distribution Supplemental Reporting1
TABLE 3-5 ELECTRIC DISTRIBUTION 2021 UNIT REPORT
Line No. Description
2021 Actual Units
1 Wood Poles replaced through Pole Replacement and other Company programs 35,583
2 Stand-alone circuit breakers replaced or installed across all Company programs 44
3 Miles of Paper Insulated Lead Sheath Cable (PILC) replaced across all Company programs 6.87
4 Miles of HMWPE cable, respectively, replaced across all Company programs 28.94
5 Miles of HMWPE cable, respectively, rejuvenated across all Company programs 0.0
6 Miles of OH conductor replaced or installed across all Company programs 419.76
7 Grasshopper switches replaced across all Company programs 7
8 FLISR installations in the Reliability Program 11
9 OH fuse installations across all Company programs 87
TABLE 3-6 ELECTRIC DISTRIBUTION 2021 SURGE ARRESTER PROGRESS REPORT
(THOUSANDS OF NOMINAL DOLLARS)
Line No. Description Amount
1 Capital (MAT 2AR) Total Program Spend: $74,191
2 Units Completed 15,465
3 Locations in PG&E’s survey identified as not requiring work: 3,497

3-74
TABLE 3-7 ELECTRIC DISTRIBUTION WOOD POLE COUNT BY AGE
Line No.
Wood Pole Count by Age
Age (Years) Number of
Poles
1 1-5 129,582 2 6-10 114,844 3 11-15 82,953 4 16-20 83,495 5 21-25 124,011 6 26-30 111,533 7 31-35 155,233 8 36-40 161,860 9 41-45 168,858 10 46-50 188,748 11 51-55 150,364 12 56-60 168,501 13 61-65 193,623 14 66-70 169,170 15 71-75 121,818 16 76-80 47,778 17 81-85 11,175 18 86-90 5,177 19 91-95 4,025 20 96-100 890 21 Unavailable 83,452
22 Total 2,277,090
The Oil-Filled Transformers in High-Rise Replacement program, projected to 1
be completed in 2021, was completed on February 10, 2022 under work 2
performed in MAT 2CC. As required by the 2020 GRC Settlement, PG&E is 3
notifying the Commission, in this Risk Spending Accountability Report, that the 4
2021 planned completion date was exceeded due to manufacturer production 5
delays and product quality issues. See GRC Settlement, Section 2.3.6.3. 6

PACIFIC GAS AND ELECTRIC COMPANY
SECTION 4
ENERGY SUPPLY IMPUTED ADOPTED VS.
RECORDED COMPARISON

4-i
PACIFIC GAS AND ELECTRIC COMPANY SECTION 4
ENERGY SUPPLY IMPUTED ADOPTED VS. RECORDED COMPARISON
TABLE OF CONTENTS
A. Introduction ....................................................................................................... 4-1
B. Nuclear Generation Comparison Summary Tables .......................................... 4-1
C. Nuclear Generation Comparison by MWC Code for Safety, Reliability,and Maintenance Work Tables ......................................................................... 4-2
D. Nuclear Generation MWC Descriptions – Expense .......................................... 4-4
E. Nuclear Generation MWC Descriptions – Capital ............................................. 4-6
F. Power Generation Comparison Summary Tables ............................................ 4-7
G. Power Generation Comparison by MWC Code for Safety, Reliability, andMaintenance Work Tables ................................................................................ 4-8
H. Power Generation MWC Descriptions – Expense .......................................... 4-11
I. Power Generation MWC Descriptions – Capital ............................................. 4-14
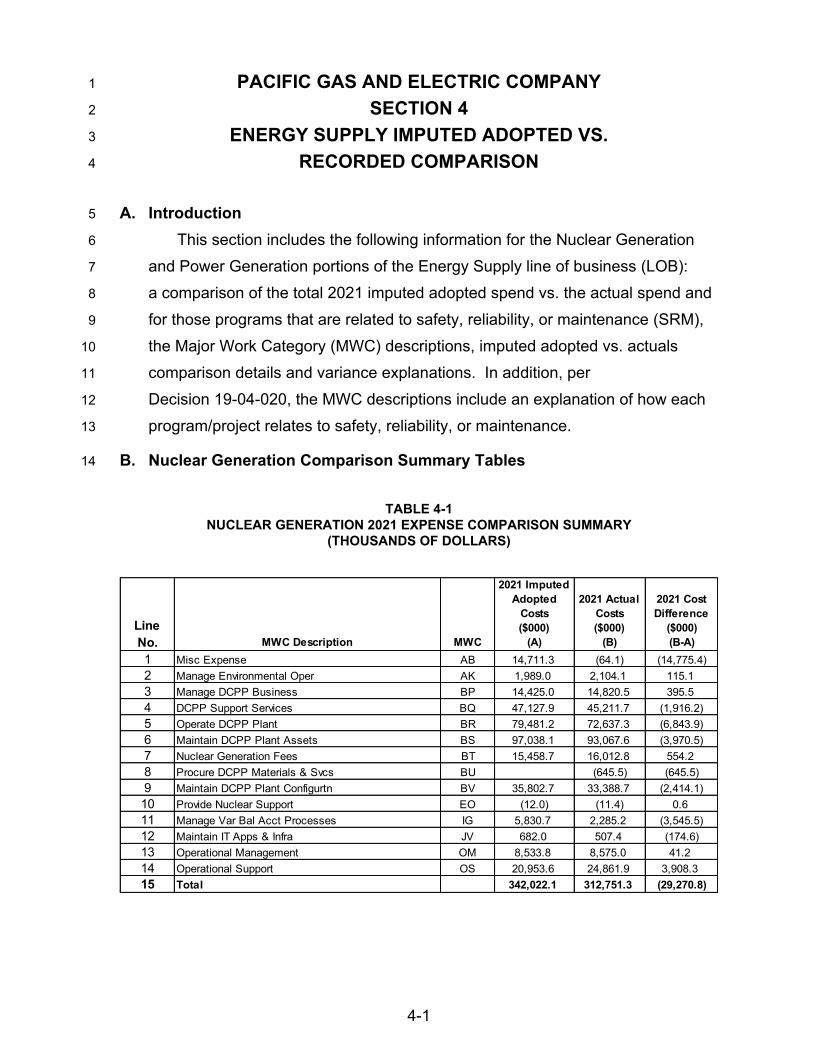
4-1
PACIFIC GAS AND ELECTRIC COMPANY 1
SECTION 4 2
ENERGY SUPPLY IMPUTED ADOPTED VS. 3
RECORDED COMPARISON 4
A. Introduction5
This section includes the following information for the Nuclear Generation 6
and Power Generation portions of the Energy Supply line of business (LOB): 7
a comparison of the total 2021 imputed adopted spend vs. the actual spend and 8
for those programs that are related to safety, reliability, or maintenance (SRM), 9
the Major Work Category (MWC) descriptions, imputed adopted vs. actuals 10
comparison details and variance explanations. In addition, per 11
Decision 19-04-020, the MWC descriptions include an explanation of how each 12
program/project relates to safety, reliability, or maintenance. 13
B. Nuclear Generation Comparison Summary Tables14
TABLE 4-1 NUCLEAR GENERATION 2021 EXPENSE COMPARISON SUMMARY
(THOUSANDS OF DOLLARS)
LineNo. MWC Description MWC
2021 Imputed Adopted
Costs ($000)
(A)
2021 Actual Costs($000)
(B)
2021 Cost Difference
($000)(B-A)
1 Misc Expense AB 14,711.3 (64.1) (14,775.4)2 Manage Environmental Oper AK 1,989.0 2,104.1 115.13 Manage DCPP Business BP 14,425.0 14,820.5 395.54 DCPP Support Services BQ 47,127.9 45,211.7 (1,916.2)5 Operate DCPP Plant BR 79,481.2 72,637.3 (6,843.9)6 Maintain DCPP Plant Assets BS 97,038.1 93,067.6 (3,970.5)7 Nuclear Generation Fees BT 15,458.7 16,012.8 554.28 Procure DCPP Materials & Svcs BU (645.5) (645.5)9 Maintain DCPP Plant Configurtn BV 35,802.7 33,388.7 (2,414.1)10 Provide Nuclear Support EO (12.0) (11.4) 0.611 Manage Var Bal Acct Processes IG 5,830.7 2,285.2 (3,545.5)12 Maintain IT Apps & Infra JV 682.0 507.4 (174.6)13 Operational Management OM 8,533.8 8,575.0 41.214 Operational Support OS 20,953.6 24,861.9 3,908.315 Total 342,022.1 312,751.3 (29,270.8)

4-2
TABLE 4-2 NUCLEAR GENERATION 2021 CAPITAL COMPARISON SUMMARY
(THOUSANDS OF DOLLARS)
C. Nuclear Generation Comparison by MWC Code for Safety, Reliability, and 1
Maintenance Work Tables 2
LineNo. MWC Description MWC
2021 Imputed Adopted Costs
($000)(A)
2021 Actual Costs($000)
(B)
2021 Cost Difference
($000)(B-A)
1 Office Furniture & Equipment 03 31.2 0.0 (31.2)2 Tools & Equipment 05 475.0 1,174.4 699.33 DCPP Capital 20 20,972.5 36,557.7 15,585.24 Build IT Apps & Infra 2F 4,295.0 5,761.0 1,466.05 Nuclear Safety and Security 3I 0.0 (46.3) (46.3)6 Total 25,773.8 43,446.9 17,673.1

TABLE 4-3 NUCLEAR GENERATION 2021 EXPENSE COMPARISON BY MWC FOR SAFETY, RELIABILITY, AND MAINTENANCE WORK
(THOUSANDS OF DOLLARS)
TABLE 4-4 NUCLEAR GENERATION 2021 CAPITAL COMPARISON BY MWC FOR SAFETY, RELIABILITY, AND MAINTENANCE WORK
(THOUSANDS OF DOLLARS)
LineNo. MWC MWC Name RAMP Risk Name RAMP Mitigation Name
2020 GRC Testimony Reference
2021 Imputed Adopted
Costs ($000)
(A)
2021 Actual Costs($000)
(B)
2021 Cost Difference
($000)(B-A)
2021 Cost Percent Change
(%)(B-A)/A
Spending Variance
Explanation Required
(Y/N)
Percentage Variance
Explanation Required
(Y/N) Cost Variance Explanation
1 AB Misc Expense SRM Total (Non-RAMP) SRM Total (Non-RAMP)Exhibit (PG&E-5), pp. 3-56 to 3-57 14,711.3 (64.1) (14,775.4) -100.4% YES YES
Program expenses were below imputed regulatory values due to the GRC imputed adopted costs of the second refueling outage being levelized over the 3-year GRC period (2020-2022). The GRC imputed adopted levelized amount of approximately $15M annual. The actual costs for this outage will be recorded in 2022 when the outage is scheduled.
2 BQ DCPP Support Services Core Damaging EventSecurity from External and Internal Threats, and Emergency Response
Exhibit (PG&E-5), pp. 3-59 to 3-60 47,127.9 45,211.7 (1,916.2) -4.1% NO NO Below variance threshold.
3 BP Manage DCPP Business Core Damaging Event Independent Oversight and TrainingExhibit (PG&E-5), pp. 3-58 to 3-59 14,425.0 14,820.5 395.5 2.7% NO NO Below variance threshold.
4 BR Operate DCPP Plant Core Damaging Event Operating the Facility Within RequirementsExhibit (PG&E-5), pp. 3-60 to 3-61 79,481.2 72,637.3 (6,843.9) -8.6% NO NO Below variance threshold.
5 BSMaintain DCPP Plant Assets Core Damaging Event Maintaining the Systems
Exhibit (PG&E-5),pp. 3-62 to 3-64 97,038.1 93,067.6 (3,970.5) -4.1% NO NO Below variance threshold.
6 BVMaintain DCPP Plant Configurtn Core Damaging Event Plant and System Configuaration Control
Exhibit (PG&E-5), pp. 3-65 to 3-66 35,802.7 33,388.7 (2,414.1) -6.7% NO NO Below variance threshold.
7 IGManage Var Bal Acct Processes Core Damaging Event
Regulatory Required Improvements and Ongoing Seismic Evaluations
Exhibit (PG&E-5), pp. 3-68 to 3-70 5,830.7 2,285.2 (3,545.5) -60.8% NO NO Below variance threshold.
LineNo. MWC MWC Name RAMP Risk Name RAMP Mitigation Name
2020 GRC Testimony Reference
2021 Imputed Adopted
Costs ($000)
(A)
2021 Actual Costs($000)
(B)
2021 Cost Difference
($000)(B-A)
2021 Cost Percent Change
(%)(B-A)/A
Spending Variance
Explanation Required
(Y/N)
Percentage Variance
Explanation Required
(Y/N) Cost Variance Explanation
1 20 DCPP Capital SRM Total (Non-RAMP) SRM Total (Non-RAMP)
Exhibit (PG&E-5), pp. 3-49 to 3-56 20,972.5 36,557.7 15,585.2 74.3% NO YES
Program expenses were above imputed adopted costs due primarily to an emergent project to replace the Main Generator Stator Core Cooling Water Manifold Piping.
2 3I Nuclear Safety and Security SRM Total (Non-RAMP) SRM Total (Non-RAMP)
Exhibit (PG&E-5), pp. 3-49 to 3-56 0.0 (46.3) (46.3) 100.0% NO NO Below variance threshold.
4-3

4-4
D. Nuclear Generation MWC Descriptions – Expense1
MWC AB – Support – Includes miscellaneous support cost from both within 2
and outside of Nuclear Generation. Also, used for General Rate Case imputed 3
adopted for levelizing the cost of nuclear refueling outages when two outages 4
are forecast to occur in a single year. Refueling outage recorded costs are 5
recorded in other MWCs as appropriate. This MWC relates to safety, reliability, 6
or maintenance because the costs are associated with levelizing the cost of 7
nuclear refueling outages when two outages are forecast to occur in a single 8
year, consistent with keeping the generation facilities reliable. 9
MWC AK – Manage Environmental Operations – Includes managing the 10
environmental protection programs mandated by federal, state, and local 11
regulations. This MWC is not related to safety, reliability, and/or maintenance. 12
MWC BP – Manage Diablo Canyon Nuclear Power Plant (DCPP) 13
Business – Includes: (1) all activities associated with representing Pacific Gas 14
and Electric Company (PG&E) and providing technical input to committees, 15
owners groups, industry, professional and trade associations that support 16
electric utilities; (2) dues to the Institute of Nuclear Power Operators, Nuclear 17
Energy Institute, Strategic Teaming and Resource Sharing, and Diablo Canyon 18
Independent Safety Committee; (3) land management activities; and (4) planned 19
emergent work funding for the entire Nuclear Generation organization. This 20
MWC relates to safety, reliability, or maintenance because the costs are 21
associated with the above programs, consistent with keeping the generation 22
facility safe and reliable. 23
MWC BQ – DCPP Loss Prevention – Includes support for the 24
management and implementation of the Security, Industrial Safety and Health, 25
Emergency Preparedness and Fire Protection programs. This MWC relates to 26
safety, reliability, or maintenance because the costs are associated with 27
Security, Industrial Safety and Health, Emergency Preparedness and Fire 28
Protection programs, consistent with keeping the generation facility safe. 29
MWC BR – Operate DCPP Plant – Includes all activities to operate the 30
plant, radiation control, monitoring of plant chemistry, managing radioactive 31
waste and hazardous waste generation, nuclear fuel movement, and reactor 32
physics testing. This MWC relates to safety, reliability, or maintenance because 33

4-5
the costs are associated with the above programs, consistent with keeping the 1
generation facility safe and reliable. 2
MWC BS – Maintain DCPP Plant Assets – Includes all preventative and 3
corrective maintenance activities for systems, structures, and components at the 4
plant. This MWC relates to safety, reliability, or maintenance because the costs 5
are associated with maintaining generation equipment. 6
MWC BT – Nuclear Generation Fees – Includes Nuclear Regulatory 7
Commission (NRC) license fees and supporting contracts to conduct training 8
programs for license and non-license operator, maintenance, engineering, and 9
all general employee training development and delivery. This MWC is not 10
related to safety, reliability, and/or maintenance. 11
MWC BU – Procure DCPP Materials & Services – Includes cost for 12
under/over clearing of material burden. This MWC is not related to safety, 13
reliability, and/or maintenance. 14
MWC BV – Maintain DCPP Plant Configuration – Includes design 15
engineering, system engineering, component engineering, reactor engineering, 16
in service testing and inspection, reliability engineering, and fire protection 17
engineering. This MWC relates to safety, reliability, or maintenance because the 18
costs are associated with the above programs, consistent with keeping the 19
generation facility safe and reliable. 20
MWC CR – Manage Waste Disposal and Transportation – Includes cost 21
for disposal and transportation of site hazardous waste. This MWC is not 22
related to safety, reliability, and/or maintenance. 23
MWC EO – Provide Nuclear Support – Includes cost for plant support 24
provided by PG&E’s Corporate Support organizations such as security and 25
communications. This MWC is not related to safety, reliability, and/or 26
maintenance. 27
MWC IG – Manage Balancing Account Processes – Includes costs 28
subject to the 2-way balancing account established for Nuclear Safety and 29
Security regulatory mandated projects. This MWC relates to safety, reliability, or 30
maintenance because the costs are associated with nuclear safety and security, 31
consistent with keeping the generation facility safe. 32
MWC JV – Maintain Applications and Infrastructure – Includes costs for 33
ongoing maintenance, operations and repair for PG&E’s Information Technology 34

4-6
(IT) applications, systems and infrastructure. This MWC is not related to safety, 1
reliability, and/or maintenance. 2
MWC OM – Operational Management – Includes labor- and 3
employee-related costs to provide supervision and management support. 4
MWC OM also includes costs incurred by the administrative staff working for the 5
supervisors/managers. This MWC is not related to safety, reliability, and/or 6
maintenance. 7
MWC OS – Operational Support – Includes labor- and employee-related 8
costs to provide services and support that are unrelated to supervision and 9
management. Examples include Business Finance and Sourcing that support 10
the LOBs. This MWC is not related to safety, reliability, and/or maintenance. 11
E. Nuclear Generation MWC Descriptions – Capital12
MWC 03 – Office Furniture and Equipment – Includes capital costs to 13
replace office furniture and equipment. This MWC is not related to safety, 14
reliability, and/or maintenance. 15
MWC 04 – Fleet/Auto Equipment – Includes replacement of station 16
fleet/auto equipment which has been in use longer than their useful life. This 17
MWC is not related to safety, reliability, and/or maintenance. 18
MWC 05 – Tools and Equipment – Includes replacement of tools and shop 19
equipment. This MWC is not related to safety, reliability, and/or maintenance. 20
MWC 20 – DCPP Capital Projects – Includes replacement of capital 21
structures, systems and components that no longer can be maintained to safely 22
and reliably operate and protect the plant. There are three major drivers to 23
these replacements: (1) reliability has degraded to cause replacement to be 24
needed; (2) obsolete replacement material, not allowing proper maintenance to 25
continue; and (3) regulatory driven NRC requirements. This MWC relates to 26
safety, reliability, or maintenance because the costs are associated with the 27
replacement of capital structures, systems and components that no longer can 28
be maintained to safely and reliably operate and protect the plant. 29
MWC 2F – Build Applications and Infrastructure – Includes the costs to 30
design, develop and enhance applications, systems and infrastructure 31
technology solutions. This MWC is not related to safety, reliability, and/or 32
maintenance. 33

4-7
MWC 3I – Nuclear Safety and Security – Includes DCPP capital projects 1
subject to the 2-way balancing account established for Nuclear Safety and 2
Security regulatory-mandated projects. This MWC relates to safety, reliability, or 3
maintenance because the costs are associated with Nuclear Safety and Security 4
regulatory-mandated projects. 5
F. Power Generation Comparison Summary Tables6
TABLE 4-5 POWER GENERATION 2021 EXPENSE COMPARISON SUMMARY
(THOUSANDS OF DOLLARS)
LineNo. MWC Description MWC
2021 Imputed Adopted Costs
($000)(A)
2021 Actual Costs($000)
(B)
2021 Cost Difference
($000)(B-A)
1 Misc Expense AB 6,521.5 5,135.3 (1,386.1)2 Manage Environmental Oper AK 3,732.7 3,334.0 (398.8)3 Maint Resv,Dams&Waterways AX 24,291.7 30,700.9 6,409.34 Habitat and Species Protection AY 140.8 76.6 (64.1)5 Perf Reimburs Wk for Oth BC 26.5 (82.6) (109.0)6 Manage Property & Bldgs EP 1,015.2 1,286.9 271.77 Implement Environment Projects ES 54.1 0.0 (54.1)8 Manage Var Bal Acct Processes IG 5,397.4 22,127.1 16,729.79 Maintain IT Apps & Infra JV 492.0 360.8 (131.2)10 Operate Hydro Generation KG 31,674.4 42,122.7 10,448.211 Maint Hydro Generating Equip KH 21,976.0 19,520.9 (2,455.0)12 Maint Hydro Bldg,Grnd,Infrast KI 9,078.9 10,426.4 1,347.513 License Compliance Hydro Gen KJ 37,483.6 22,972.1 (14,511.5)14 Operate Fossil Generation KK 13,175.7 15,440.6 2,264.915 Maint Fossil Generating Equip KL 31,586.0 53,886.8 22,300.816 Maint Fossil Bldg,Grnd,Infrast KM 2,995.4 2,302.7 (692.7)17 Operate Alternative Gen KQ 846.8 882.4 35.618 Maint AltGen Generating Equip KR 3,397.6 807.3 (2,590.3)19 Maint AltGen Bldg,Grnd,Infrast KS 515.9 657.4 141.620 Operational Management OM 3,675.1 3,414.1 (261.0)21 Operational Support OS 7,470.8 4,715.0 (2,755.8)28 Total 205,547.9 240,087.5 34,539.6

4-8
TABLE 4-6 POWER GENERATION 2021 CAPITAL COMPARISON SUMMARY
(THOUSANDS OF DOLLARS)
G. Power Generation Comparison by MWC Code for Safety, Reliability, and 1
Maintenance Work Tables 2
LineNo. MWC Description MWC
2021 Imputed Adopted Costs
($000)(A)
2021 Actual Costs($000)
(B)
2021 Cost Difference
($000)(B-A)
1 Office Furniture & Equipment 3 15.7 0.0 (15.7)2 Tools & Equipment 05 1,058.2 2,317.1 1,258.93 Relicensing Hydro Gen 11 211.6 523.9 312.34 Implement Environment Projects 12 1,510.6 24.1 (1,486.5)5 Build IT Apps & Infra 2F 6,432.1 1,906.7 (4,525.4)6 Instl/Rpl for Hydro Safety&Reg 2L 29,012.1 27,218.8 (1,793.3)7 Instal/Repl Hydro Gneratng Eqp 2M 106,675.8 114,433.6 7,757.88 Instal/Repl Resv,Dams&Waterway 2N 59,695.4 27,576.2 (32,119.1)9 Instl/Repl Hydr BldgGrndInfrst 2P 3,918.7 19,556.7 15,638.010 Instl/Rpl for Fosil Safety&Reg 2R 0.0 18.0 18.011 Instal/Repl Fosil Gneratng Eqp 2S 5,081.1 13,689.7 8,608.612 Instl/Repl Fosl BldgGrndInfrst 2T 0.0 845.0 845.013 Instl/Rpl for AltGen Safty&Reg 3A 24.3 0.0 (24.3)14 Instal/Repl AltGen GneratngEqp 3B 688.1 27.8 (660.3)15 Hydroelec Lic & Lic Conditions 3H 32,109.9 16,695.9 (15,414.0)16 Total 246,433.5 224,833.6 (21,599.9)

4-9
TABLE 4-7 POWER GENERATION 2021 EXPENSE COMPARISON BY MWC FOR SAFETY, RELIABILITY, AND MAINTENANCE WORK
(THOUSANDS OF DOLLARS)
LineNo. MWC MWC Name RAMP Risk Name RAMP Mitigation Name
2020 GRC Testimony Reference
2021 Imputed Adopted
Costs ($000)
(A)
2021 Actual Costs($000)
(B)
2021 Cost Difference
($000)(B-A)
2021 Cost Percent Change
(%)(B-A)/A
Spending Variance
Explanation Required
(Y/N)
Spending Percentage
Variance Explanation
Required (Y/N) Cost Variance Explanation
1 AX Maint Resv,Dams&Waterways SRM Total SRM TotalExhibit (PG&E-5), p. 4-103 24,291.7 30,700.9 6,409.3 26.4% NO YES
Program expenses were above imputed adopted values due to two key drivers, including (1) rescheduling of the Lake Almanor Prattville Intake dredging project from 2019 to 2021 due to project reprioritization; and (2) forecast higher spend in 2021 than 2020 in MWC AX. Because PG&E did not provide forecasts for expense beyond 2020 in the GRC, yearly variances in MWC spend were not conveyed. Since expense imputed values in attrition years are based on test year forecasts, the MWC AX imputed value for 2021 was below PG&E's forecast. The higher program expenses were partially offset by the reclassification to MWC IG of recorded spend exceeding $4 million for the spillway assessment program (see variance explanation for MWC IG).
2 AX Maint Resv,Dams&Waterways Hydro System Safety C1 - Dam Safety ProgramExhibit (PG&E-5), p. 2-6 276.2 1,055.1 778.9 282.0% N/A N/A N/A
3 AX Maint Resv,Dams&Waterways Hydro System SafetyM1 - Internal Erosion Mitigation
Exhibit (PG&E-5), p. 2-17 0.0 88.0 88.0 N/A N/A N/A N/A
4 AX Maint Resv,Dams&Waterways Hydro System Safety M2 - Spillway RemediationExhibit (PG&E-5), p. 2-17 0.0 357.3 357.3 N/A N/A N/A N/A
5 AX Maint Resv,Dams&Waterways Hydro System Safety M4 - LLO RefurbishmentExhibit (PG&E-5), p. 2-17 0.0 126.7 126.7 N/A N/A N/A N/A
6 BC Perf Reimburs Wk for Oth SRM Total (Non-RAMP) SRM Total (Non-RAMP)Exhibit (PG&E-5), p. 4-103 26.5 (82.6) (109.0) -412.1% NO NO Below variance threshold.
7 IG Manage Var Bal Acct Processes SRM Total SRM TotalExhibit (PG&E-5), p. 4-103 5,397.4 22,127.1 16,729.7 310.0% YES YES
Program expenses were above imputed adopted values due to the approval of the expansion of the two-way hydro licensing balancing account in the GRC 2020 decision (D.20-12-005), which now permits recovery through the hydro licensing balancing account of: (1) FERC and DSOD fees, and (2) programmatic spend for projects arising from the 2017 spillway assessment recommendations originating from the Oroville spillway incident. The costs of FERC fees and DSOD fees, cumulatively exceeding $11 million in 2021, have been moved from MWC KJ to MWC IG. The costs of the spillway assessment programmatic spend, cumulatively exceeding $4 million in 2021, have been moved from MWC AX to MWC IG.
8 IG Manage Var Bal Acct Processes Hydro System Safety C1 - Dam Safety ProgramExhibit (PG&E-5), p. 2-6 0.0 59.5 59.5 N/A N/A N/A N/A
9 IG Manage Var Bal Acct Processes Hydro System Safety M2 - Spillway RemediationExhibit (PG&E-5), p. 2-17 0.0 4,398.9 4,398.9 N/A N/A N/A N/A
10 KG Operate Hydro Generation SRM Total (Non-RAMP) SRM Total (Non-RAMP)Exhibit (PG&E-5), p. 4-103 31,674.4 42,122.7 10,448.2 33.0% YES YES
Program expenses were above imputed adopted values due to several key drivers, including (1) emergent costs related to achieving full compliance for all risks at Level 3 per PG&E's Compliance Maturity Model; (2) an emergent hydro system-wide powerhouse safety mitigation program to mitigate safety risks resulting from dropped objects from heights (e.g. tools from scaffolding); (3) emergent costs related to the fatality investigation of a PG&E employee on a company-owned road; (4) costs related to accelerating guidance document completion to meet Level 3 compliance deadline; (5) emergent physical security and cybersecurity costs at our FERC-regulated facilities to meet new regulations from FERC; and (6) emergent costs related to new CAISO telemetry requirements at PG&E-owned powerhouses.
11 KH Maint Hydro Generating Equip SRM Total (Non-RAMP) SRM Total (Non-RAMP)Exhibit (PG&E-5), p. 4-103 21,976.0 19,520.9 (2,455.0) -11.2% NO NO Below variance threshold.
12 KI Maint Hydro Bldg,Grnd,Infrast SRM Total (Non-RAMP) SRM Total (Non-RAMP)Exhibit (PG&E-5), p. 4-103 9,078.9 10,426.4 1,347.5 14.8% NO NO Below variance threshold.
13 KJ License Compliance Hydro Gen SRM Total (Non-RAMP) SRM TotalExhibit (PG&E-5), p. 4-103 37,483.6 22,972.1 (14,511.5) -38.7% YES YES
Program expenses were below imputed adopted values due to approval of the expansion of the two-way hydro licensing balancing account in the GRC 2020 decision (D.20-12-005) which now permits the FERC and DSOD fees to be recovered through the hydro licensing balancing account. The costs of FERC fees and DSOD fees, cumulatively exceeding $11 million in 2021, have been moved from MWC KJ to MWC IG.
14 KJ License Compliance Hydro Gen Hydro System Safety C1 - Dam Safety ProgramExhibit (PG&E-5), p. 2-6 6,521.1 8,444.1 1,923.0 29.5% N/A N/A N/A
15 KK Operate Fossil Generation SRM Total (Non-RAMP) SRM Total (Non-RAMP)Exhibit (PG&E-5), p. 5-63 13,175.7 15,440.6 2,264.9 17.2% NO NO Below variance threshold.
16 KL Maint Fossil Generating Equip SRM Total (Non-RAMP) SRM Total (Non-RAMP)Exhibit (PG&E-5), p. 5-63 31,586.0 53,886.8 22,300.8 70.6% YES YES
Program expenses were above imputed adopted values due to the Long-Term Service Agreement costs, which are levelized in the imputed adopted value; however, the outage work associated with these costs only occurs on a periodic basis once every 4 to 5 years depending on operating profile and did occur in 2021 at Colusa Generating Station.
17 KM Maint Fossil Bldg,Grnd,Infrast SRM Total (Non-RAMP) SRM Total (Non-RAMP)Exhibit (PG&E-5), p. 5-63 2,995.4 2,302.7 (692.7) -23.1% NO NO Below variance threshold.
18 KQ Operate Alternative Gen SRM Total (Non-RAMP) SRM Total (Non-RAMP)Exhibit (PG&E-5), p. 5-63 846.8 882.4 35.6 4.2% NO NO Below variance threshold.
19 KR Maint AltGen Generating Equip SRM Total (Non-RAMP) SRM Total (Non-RAMP)Exhibit (PG&E-5), p. 5-63 3,397.6 807.3 (2,590.3) -76.2% NO NO Below variance threshold.
20 KS Maint AltGen Bldg,Grnd,Infrast SRM Total (Non-RAMP) SRM Total (Non-RAMP)Exhibit (PG&E-5), p. 5-63 515.9 657.4 141.6 27.4% NO NO Below variance threshold.

4-10
TABLE 4-8 POWER GENERATION 2021 CAPITAL COMPARISON BY MWC FOR SAFETY, RELIABILITY, AND MAINTENANCE WORK
(THOUSANDS OF DOLLARS)
LineNo. MWC MWC Name RAMP Risk Name
RAMP Mitigation Name
2020 GRCTestimony Reference
2021 Imputed Adopted Costs
($000)(A)
2021 Actual Costs($000)
(B)
2021 Cost Difference
($000)(B-A)
2021 Cost Percent Change
(%)(B-A)/A
Spending Variance
Explanation Required
(Y/N)
Spending Percentage
Variance Explanation
Required (Y/N) Cost Variance Explanation
1 2L Instl/Rpl for Hydro Safety&Reg SRM Total SRM TotalExhibit (PG&E-5), p. 4-104 29,012.1 27,218.8 (1,793.3) -6.2% NO NO Below variance threshold.
2 2L Instl/Rpl for Hydro Safety&Reg Hydro System SafetyM1 - Internal Erosion Mitigation
Exhibit (PG&E-5), p. 2-16 16,568.1 12,241.4 (4,326.7) -26.1% N/A N/A N/A
3 2L Instl/Rpl for Hydro Safety&Reg Hydro System SafetyM2 - Spillway Remediation
Exhibit (PG&E-5), p. 2-16 0.0 966.1 966.1 N/A N/A N/A N/A
4 2L Instl/Rpl for Hydro Safety&Reg Hydro System Safety M3 - Seismic RetrofitExhibit (PG&E-5), p. 2-16 48.7 1,606.5 1,557.8 3196.8% N/A N/A N/A
5 2L Instl/Rpl for Hydro Safety&Reg Hydro System Safety M4 - LLO RefurbishmentExhibit (PG&E-5), p. 2-16 1,949.2 1,670.1 (279.1) -14.3% N/A N/A N/A
6 2M Instal/Repl Hydro Gneratng Eqp SRM Total (Non-RAMP) SRM Total (Non-RAMP)Exhibit (PG&E-5), p. 4-104 106,675.8 114,433.6 7,757.8 7.3% NO NO Below variance threshold.
7 2NInstal/Repl Resv,Dams&Waterway SRM Total SRM Total
Exhibit (PG&E-5), p. 4-104 59,695.4 27,576.2 (32,119.1) -53.8% YES YES
Program expenses were below imputed adopted values due to approval of the expansion of the two-way hydro licensing balancing account in the 2020 GRC decision (D.20-12-005) which now permits the programmatic spend for projects arising from the 2017 spillway assessment recommendations originating from the Oroville spillway incident to be recovered through the hydro licensing balancing account. The spillway assessment recommendation programmatic costs, exceeding $30 million in the 2021 forecast of the 2020 GRC, have been moved to MWC 3H.
8 2NInstal/Repl Resv,Dams&Waterway Hydro System Safety
M1 - Internal Erosion Mitigation
Exhibit (PG&E-5), p. 2-16 682.2 500.2 (182.1) -26.7% N/A N/A N/A
9 2NInstal/Repl Resv,Dams&Waterway Hydro System Safety
M2 - Spillway Remediation
Exhibit (PG&E-5), p. 2-16 0.0 0.0 0.0 N/A N/A N/A N/A
10 2NInstal/Repl Resv,Dams&Waterway Hydro System Safety M4 - LLO Refurbishment
Exhibit (PG&E-5), p. 2-16 0.0 1,727.9 1,727.9 N/A N/A N/A N/A
11 2P Instl/Repl Hydr BldgGrndInfrst SRM Total (Non-RAMP) SRM Total (Non-RAMP)Exhibit (PG&E-5), p. 4-104 3,918.7 19,556.7 15,638.0 399.1% NO YES
Program expenses were above imputed adopted values due to two key drivers. The first is emergent costs related to upgrading the Pit 3 powerhouse crane to support planned improvement projects. A third party assessment revealed deficiencies in the safe operability of the crane. The second driver is the Pit 5 powerhouse access road bridge installation, which was pulled forward a year from a forecast year of 2022 in the 2020 GRC forecast. The bridge installation work was necessary to prevent the tributary from overtopping the road and flooding Pit 5 Powerhouse during large storm events or high precipitation years, as has occurred several times in the past.
12 2R Instl/Rpl for Fosil Safety&Reg SRM Total (Non-RAMP) SRM Total (Non-RAMP)Exhibit (PG&E-5), p. 5-65 0.0 18.0 18.0 100.0% NO NO Below variance threshold.
13 2S Instal/Repl Fosil Gneratng Eqp SRM Total (Non-RAMP) SRM Total (Non-RAMP)Exhibit (PG&E-5), p. 5-65 5,081.1 13,689.7 8,608.6 169.4% NO NO Below variance threshold.
14 2T Instl/Repl Fosl BldgGrndInfrst SRM Total (Non-RAMP) SRM Total (Non-RAMP)Exhibit (PG&E-5), p. 5-65 0.0 845.0 845.0 100.0% NO NO Below variance threshold.
15 3A Instl/Rpl for AltGen Safty&Reg SRM Total (Non-RAMP) SRM Total (Non-RAMP)Exhibit (PG&E-5), p. 5-65 24.3 0.0 (24.3) -100.0% NO NO Below variance threshold.
16 3B Instal/Repl AltGen GneratngEqp SRM Total (Non-RAMP) SRM Total (Non-RAMP)Exhibit (PG&E-5), p. 5-65 688.1 27.8 (660.3) -96.0% NO NO Below variance threshold.
17 3H Hydroelec Lic & Lic Conditions SRM Total SRM TotalExhibit (PG&E-5), p. 4-104 32,109.9 16,695.9 (15,414.0) -48.0% NO YES
Program expenses were below imputed adopted due to two key drivers: (1) a delay in the regulatory process related to FERC operating license renewals for the McCloud-Pit license and the Rock Creek-Cresta license. Delays in license renewals create delays in the forecasted start date of the capital work required as part of the new operating license; and (2) PG&E's decision to surrender the Potter Valley license rather than continue through the relicensing process as the license was uneconomic to our customers. Forecast relicensing costs were not incurred. The lower program expenses were partially offset by recorded spend of $3 million for the spillway assessment program (see variance explanation for MWC 2N). Due to the short timeline between the spillway assessment recommendations resulting from the 2017 Oroville spillway incident and the forecast due date for the 2020 GRC submittal, many of the projects envisioned for the spillway assessment work were at early stages of project identification, schedule and cost estimating. In the time since the 2020 GRC submittal, PG&E has refined its forecasts and effectively scheduled less work in 2021 and more in future years.
18 3H Hydroelec Lic & Lic Conditions Hydro System SafetyM2 - Spillway Remediation
Exhibit (PG&E-5), p. 2-16 0.0 2,847.7 2,847.7 N/A N/A N/A N/A

4-11
H. Power Generation MWC Descriptions – Expense 1
MWC AB – Business/Miscellaneous Expense – Includes costs associated 2
with efficiency savings, Land Conservation Commitment, Contracts and 3
Consulting Services, and miscellaneous support costs. This MWC is not related 4
to safety, reliability, and/or maintenance. 5
MWC AK – Manage Environmental Operations – Includes costs 6
associated with managing environmental operations. This MWC is not related to 7
safety, reliability, and/or maintenance. 8
MWC AX – Maintain Hydro Reservoirs, Dams & Waterways – Includes 9
costs associated with maintenance of hydroelectric reservoirs, dams, and water 10
conveyance systems. These maintenance activities also ensure safety through 11
routine and preventive maintenance. This MWC relates to safety, reliability, or 12
maintenance because the costs are associated with maintaining the hydro dams 13
and water conveyance systems. 14
MWC AY – Habitat and Species Protection – Includes compliance with 15
regulations to protect endangered species and sensitive habitats as part of 16
PG&E’s broader Environmental Stewardship Program. This MWC is not related 17
to safety, reliability, and/or maintenance. 18
MWC BC – Perform Reimbursable Work for Others – Includes costs 19
associated with managing the irrigation district contracts and the reimbursable 20
expenses incurred to perform maintenance on behalf of the irrigation districts. 21
Also includes reimbursable work for other third parties. This MWC relates to 22
safety, reliability, or maintenance because the costs are associated with 23
performing maintenance work for third parties. 24
MWC EP – Manage Property & Buildings – Includes costs associated with 25
managing land rights and property leases in support of the operation of hydro 26
power plants. This MWC is not related to safety, reliability, and/or maintenance. 27
MWC ES – Implement Environmental Projects – Includes costs 28
associated with the implementing environmental projects and programs. This 29
MWC is not related to safety, reliability, and/or maintenance. 30
MWC IG – Balancing Account – Regulatory Compliance Hydro Electric 31
Generation – includes costs assigned to the Hydro Licensing Balancing Account 32
(HLBA). This MWC includes: (1) costs to maintain Federal Energy Regulatory 33
Commission (FERC) license compliance to support hydroelectric generation 34

4-12
activities for licenses received after January 1, 2014; (2) regulatory fees; 1
(3) costs associated with implementation of the Crane Valley Recreation2
Settlement Agreement; and (4) costs associated with work required because of 3
the 2017 Oroville spillway incident. This MWC relates to safety, reliability, or 4
maintenance because the costs are associated with regulatory compliance that 5
often includes safety and/or reliability related expenditures. Please see 6
Section 7, SRM Programs Balancing and Memorandum Account Cost Recovery. 7
MWC IG – Wildfire Mitigation Plan Memorandum Account (WMPMA) – 8
Includes costs for which PG&E is seeking recovery through WMPMA. This 9
MWC relates to safety, reliability, or maintenance because the costs are 10
associated with clearing a defensible space around the generation facilities. 11
MWC JV – Maintain Applications and Infrastructure – Includes costs for 12
ongoing maintenance, operations and repair for PG&E’s IT applications, 13
systems and infrastructure. This MWC is not related to safety, reliability, and/or 14
maintenance. 15
MWC KG – Operate Hydro Electric Generation – Includes costs to 16
operate hydroelectric power generating stations and associated facilities. This 17
MWC relates to safety, reliability, or maintenance because the costs are 18
associated with operating the hydro facilities safely and reliably. 19
MWC KH – Maintain Hydro Electric Generating Equipment – Includes 20
costs to maintain generating equipment or components to support hydroelectric 21
generation activities. This MWC relates to safety, reliability, or maintenance 22
because the costs are associated with maintaining generation equipment. 23
MWC KI – Maintain Hydro Electric Generation Buildings, Grounds & 24
Infrastructure – Includes costs to maintain buildings, grounds and infrastructure 25
to support hydroelectric generation activities, including roads and bridges. This 26
MWC relates to safety, reliability, or maintenance because the costs are 27
associated with maintaining buildings, grounds and infrastructure. 28
MWC KJ – Regulatory Compliance Hydro Electric Generation – Includes 29
costs to maintain FERC license compliance to support hydroelectric generation 30
activities for licenses received prior to January 1, 2014. This MWC relates to 31
safety, reliability, or maintenance because the costs are associated with 32
regulatory compliance that often includes safety and/or reliability related 33
expenditures. 34

4-13
MWC KK – Operate Fossil Generation – Includes costs to operate fossil 1
power generating stations. This MWC relates to safety, reliability, or 2
maintenance because the costs are associated with operating the fossil facilities 3
safely and reliably. 4
MWC KL – Maintain Fossil Generating Equipment – Includes costs to 5
maintain fossil power generating station equipment. This MWC relates to safety, 6
reliability, or maintenance because the costs are associated with maintaining 7
generation equipment. 8
MWC KM – Maintain Fossil Generation Buildings, Grounds & 9
Infrastructure – Includes costs to maintain buildings, grounds and infrastructure 10
on the plant site to support fossil generation activities, including buildings and 11
facilities, roadways, landscaping, retaining walls, fencing, and yard lighting 12
systems. This MWC relates to safety, reliability, or maintenance because the 13
costs are associated with maintaining buildings, grounds and infrastructure. 14
MWC KQ – Operate Alternative Generation – Includes costs to operate 15
alternative generation sites. This MWC relates to safety, reliability, or 16
maintenance because the costs are associated with safely and reliably operating 17
the other generation facilities. 18
MWC KR – Maintain Alternative Generation Generating Equipment – 19
Includes costs to maintain alternative power generating station equipment. This 20
MWC relates to safety, reliability, or maintenance because the costs are 21
associated with maintaining generation equipment. 22
MWC KS – Maintain Alternative Generation Building, Ground, 23
Infrastructure – Includes costs to maintain photovoltaic and fuel cell generation 24
common facilities. This MWC relates to safety, reliability, or maintenance 25
because the costs are associated with maintaining buildings, grounds and 26
infrastructure. 27
MWC OM – Operational Management – Includes labor and employee 28
related costs to provide supervision and management support. MWC OM also 29
includes costs incurred by the administrative staff working for the 30
supervisors/managers. This MWC is not related to safety, reliability, and/or 31
maintenance. 32
MWC OS – Operational Support – Includes labor and employee related 33
costs to provide services and support that are unrelated to supervision and 34

4-14
management. Examples include Business Finance and Sourcing that support 1
the LOBs. This MWC is not related to safety, reliability, and/or maintenance. 2
MWC ZC – Corporate Items – Includes enterprise-level expenses and 3
revenues that are planned and managed separately from Business Unit budgets. 4
Examples include environmental liabilities, insurance, workers’ compensation. 5
This MWC is not related to safety, reliability, and/or maintenance. 6
I. Power Generation MWC Descriptions – Capital7
MWC 01 – IT Computing Equipment – Includes capital costs to replace 8
computing equipment. This MWC is not related to safety, reliability, and/or 9
maintenance. 10
MWC 03 – Office Furniture & Equipment – Includes capital costs to 11
replace office furniture and equipment. This MWC is not related to safety, 12
reliability, and/or maintenance. 13
MWC 05 – Tools & Equipment – Includes purchase of tools and equipment 14
required to perform various functions to maintain the safety and reliability of 15
fossil and hydro electric generation operations. This MWC is not related to 16
safety, reliability, and/or maintenance. 17
MWC 11 – Relicensing and License Compliance Hydro Electric 18
Generation – Includes costs for complying with the conditions required by 19
FERC licenses received prior to January 1, 2014, and other compliance work 20
generally related to facility safety. This MWC is not related to safety, reliability, 21
and/or maintenance. 22
MWC 12 – Implement Environmental Projects – Includes costs for capital 23
projects to comply with water and air quality regulations and various oil spill 24
prevention projects. This MWC is not related to safety, reliability, and/or 25
maintenance. 26
MWC 2F – Build Applications and Infrastructure – Includes the costs to 27
design, develop and enhance applications, systems and infrastructure 28
technology solutions. This MWC is not related to safety, reliability, and/or 29
maintenance. 30
MWC 2L – Install/Replace for Hydro Electric Generation Safety & 31
Regulatory Requirements – Includes capital costs primarily related to 32
employee or public safety and regulatory requirements that are not connected 33

4-15
with relicensing for hydroelectric generation. This MWC relates to safety, 1
reliability, or maintenance because the costs are associated with hydro safety. 2
MWC 2M – Install/Replace Hydro Electric Generating Equipment – 3
Includes capital costs to install/replace generating equipment or components to 4
support hydroelectric generation activities. This MWC relates to safety, 5
reliability, or maintenance because the costs are associated with 6
installing/replacing generating equipment that is consistent with keeping the 7
generation facilities reliable. 8
MWC 2N – Install/Replace Reservoirs, Dams & Waterways – Includes 9
capital costs to support the operation of reservoirs, dams and waterways. This 10
MWC relates to safety, reliability, or maintenance because the costs are 11
associated with installing/replacing equipment related to dams and water 12
conveyance systems for safe and reliable operations. 13
MWC 2P – Install/Replace Hydro Electric Generation Buildings, 14
Grounds & Infrastructure – Includes capital costs to install/replace buildings, 15
grounds and infrastructure to support hydroelectric generation activities, 16
including roads and bridges. This MWC relates to safety, reliability, or 17
maintenance because the costs are associated with installing/replacing hydro 18
buildings, grounds, and infrastructure to operate the generation facilities in a 19
safe and reliable manner. 20
MWC 2R – Install/Replace Fossil Generating Safety & Regulatory 21
Requirements – Includes capital costs primarily related to employee safety or 22
regulatory requirements for fossil generation. This MWC relates to safety, 23
reliability, or maintenance because the costs are associated with fossil safety. 24
MWC 2S – Install/Replace Fossil Generating Equipment – Includes 25
capital costs to install new or replace existing generating equipment or 26
components to support fossil generation activities. This MWC relates to safety, 27
reliability, or maintenance because the costs are associated with 28
installing/replacing generating equipment that is consistent with keeping the 29
generation facilities reliable. 30
MWC 2T – Install/Replace Fossil Generation Buildings, Grounds & 31
Infrastructure – Includes capital costs to install or replace new buildings, 32
grounds and infrastructure on the plant site to support fossil generation activities. 33
This MWC relates to safety, reliability, or maintenance because the costs are 34

4-16
associated with installing/replacing fossil buildings, grounds, and infrastructure 1
to operate the generation facilities in a safe and reliable manner. 2
MWC 3A – Install/Replace Alternative Fossil Generation Safety and 3
Regulation – Includes capital costs associated with the installation and/or 4
replacement of safety equipment for alternative generation. This MWC relates 5
to safety, reliability, or maintenance because the costs are associated with 6
alternative generation safety. 7
MWC 3B – Install/Replace Alternative Generation Equipment – Includes 8
capital costs associated with the installation of solar photovoltaic generation 9
equipment. This MWC relates to safety, reliability, or maintenance because the 10
costs are associated with installing/replacing generating equipment that is 11
consistent with keeping the generation facilities reliable. 12
MWC 3H – Balancing Account – Relicensing Hydro Electric 13
Generation – Includes costs assigned to the HLBA. This MWC includes: 14
(1) costs for relicensing existing FERC licenses; obtaining major license15
amendments; surrendering licenses for facilities that are no longer economic; 16
complying with the conditions required by existing and newly issued FERC 17
licenses and major license amendments; and anticipated to be required by 18
pending new FERC licenses for licenses. This includes costs for all pending 19
licenses as of January 1, 2014, and new licenses applied for after 20
January 1, 2014. This MWC also includes the costs associated with work 21
required because of the 2017 Oroville spillway incident. This MWC relates to 22
safety, reliability, and/or maintenance because some costs are associated with 23
spillway work that will be required because of the Oroville spillway incident. 24
Please see Section 7, SRM Programs Balancing and Memorandum Account 25
Cost Recovery. 26

PACIFIC GAS AND ELECTRIC COMPANY
SECTION 5
CUSTOMER CARE
IMPUTED ADOPTED VS.
RECORDED COMPARISON

5-i
PACIFIC GAS AND ELECTRIC COMPANY SECTION 5
CUSTOMER CARE IMPUTED ADOPTED VS.
RECORDED COMPARISON
TABLE OF CONTENTS
A. Introduction ....................................................................................................... 5-1
B. Comparison Summary Tables .......................................................................... 5-2
C. Comparison by MWC for Safety, Reliability, and Maintenance Work ............... 5-3
D. MWC Descriptions – Expense .......................................................................... 5-6
E. MWC Descriptions – Capital ............................................................................. 5-9

5-1
PACIFIC GAS AND ELECTRIC COMPANY 1
SECTION 5 2
CUSTOMER CARE 3
IMPUTED ADOPTED VS. 4
RECORDED COMPARISON 5
A. Introduction6
This section includes the following information for the Customer Care line of 7
business: a comparison of the total 2021 imputed adopted spend vs. the actual 8
spend and for those programs that are related to safety, reliability, or 9
maintenance the Major Work Category (MWC) descriptions, imputed adopted 10
vs. actuals comparison details and variance explanations. The MWC 11
descriptions are based on Pacific Gas and Electric Company’s (PG&E or the 12
Company) 2020 Spending Accountability Report. In addition, per 13
Decision 19-04-020 the MWC descriptions include how each program/project 14
relates to safety, reliability, or maintenance. 15

5-2
B. Comparison Summary Tables1
TABLE 5-1 CUSTOMER CARE 2021 EXPENSE COMPARISON SUMMARY
(THOUSANDS OF DOLLARS)
LineNo. MWC Description MWC
2021 Imputed Adopted
Costs ($000)
(A)
2021 Actual Costs($000)
(B)
2021 Cost Difference
($000)(B-A)
1 Misc Expense AB 0.0 (59.6) (59.6)2 Read & Investigate Meters AR 11,121.8 (1,176.7) (12,298.5)3 Provide Field Service DD 707.8 0.0 (707.8)4 Manage Customer Inquiries DK 62,352.4 57,946.1 (4,406.3)5 Develop New Revenue EL 25,118.8 58,293.3 33,174.66 Change/Maint Used Elec Meter EY 9,061.8 994.0 (8,067.8)7 Manage Var Cust Care Processes EZ 40,470.8 41,473.7 1,002.98 Spc A&G/Oth Csts-Bud Dept FA 0.0 103.6 103.69 Retain & Grow Customers FK 903.4 616.1 (287.2)
10 Manage Energy Efficiency-NonBA GM 8,831.1 8,594.6 (236.5)11 Change/Maint Used Gas Meters HY 6,837.7 6,418.7 (419.0)12 Manage Var Bal Acct Processes IG1 0.0 50,802.1 50,802.113 Bill Customers IS 56,613.6 52,290.4 (4,323.1)14 Manage Credit IT 15,653.4 8,169.1 (7,484.3)15 Collect Revenue IU 21,713.8 11,545.0 (10,168.9)16 Provide Account Services IV 17,671.0 15,839.6 (1,831.4)17 Maintain IT Apps & Infra JV 3,826.6 11,873.3 8,046.718 Prov Advertising Svcs LB 0.0 3,574.9 3,574.919 Prov Corporate Communication LI 0.0 935.5 935.520 Prov Corp Affairs Svcs LJ 0.0 5,966.7 5,966.721 Operational Management OM 4,262.1 3,289.3 (972.8)22 Operational Support OS 317.3 0.0 (317.3)23 Total 285,463.4 337,489.8 52,026.4
1 Includes recorded costs by Marketing and Communications for PSPS and w ildfire customer communications that w ere recorded to the WMPMA. Those recorded costs are now reflected in Customer Care since Marketing and Communications w as reorganized from Corporate Services to Customer Care in 2021.

5-3
TABLE 5-2 CUSTOMER CARE 2021 CAPITAL COMPARISON SUMMARY
(THOUSANDS OF DOLLARS)
C. Comparison by MWC for Safety, Reliability, and Maintenance Work 1
LineNo. MWC Description MWC
2021 Imputed Adopted
Costs ($000)
(A)
2021 Actual Costs($000)
(B)
2021 Cost Difference
($000)(B-A)
1 Tools & Equipment 05 255.0 79.7 (175.3)2 Misc Capital 21 500.0 5,348.1 4,848.13 Install New Electric Meters 25 54,010.8 27,878.6 (26,132.2)4 EV - Station Infrastructure 28 3,523.2 2,311.8 (1,211.4)5 Build IT Apps & Infra 2F 7,852.2 43,103.4 35,251.26 Install New Gas Meters 74 76,717.9 101,533.2 24,815.37 Total 142,859.0 180,254.7 37,395.7

TABLE 5-3 CUSTOMER CARE 2021 EXPENSE COMPARISON BY MWC FOR SAFETY, RELIABILITY, AND MAINTENANCE WORK
(THOUSANDS OF DOLLARS)
LineNo. MWC MWC Name RAMP Risk Name RAMP Mitigation
Name
2020 GRC Testimony Reference
2021 Imputed Adopted
Costs ($000)
(A)
2021 Actual Costs($000)
(B)
2021 Cost Difference
($000)(B-A)
2021 Cost Percent Change
(%)(B-A)/A
Spending Variance
Explanation Required
(Y/N)
Percentage Variance
Explanation Required
(Y/N)
Cost Variance Explanation
1 AR Read & Investigate MetersExhibit (PG&E-6), Chapter 6 11,121.8 (1,176.7) (12,298.5) -110.6% YES YES
2021 actual costs were below 2021 imputed adopted costs due to the transfer of Field Meter Operations (FMO) to Electric Operations (EO) and Gas Operations (GO) in 2018.
FMO was included in Customer Care's 2020 GRC Exhibit since the decision to transfer FMO to EO and GO was made after PG&E finalized its 2020 GRC forecast.
2 DD Provide Field ServiceExhibit (PG&E-6), Chapter 6 707.8 0.0 (707.8) -100.0% NO NO Below threshold variance.
3 DK Manage Customer InquiriesExhibit (PG&E-6), Chapter 4 62,352.4 57,946.1 (4,406.3) -7.1% NO NO Below threshold variance.
4 EY Change/Maint Used Elec MeterExhibit (PG&E-6), Chapter 6 9,061.8 994.0 (8,067.8) -89.0% NO YES
2021 actual costs were below 2021 imputed adopted costs due to the transfer of Field Meter Operations (FMO) to Electric Operations (EO) and Gas Operations (GO) in 2018.
FMO was included in Customer Care's 2020 GRC Exhibit since the decision to transfer FMO to EO and GO was made after PG&E finalized its 2020 GRC forecast.
5 EZ Manage Var Cust Care Processes
Exhibit (PG&E-6), All Chapters Except Chapter 10 40,470.8 41,473.7 1,002.9 2.5% NO NO Below threshold variance.
6 GM Manage Energy Efficiency-NonBAExhibit (PG&E-6), Chapter 3 8,831.1 8,594.6 (236.5) -2.7% NO NO Below threshold variance.
7 HY Change/Maint Used Gas MetersExhibit (PG&E-6), Chapter 6 6,837.7 6,418.7 (419.0) -6.1% NO NO Below threshold variance.
8 IG Manage Var Bal Acct Processes
Exhibit (PG&E-6) Chapter 2;Exhibit (PG&E-9) Chapter 8 - WMBA and WMPMA 0.0 50,802.1 50,802.1 100.0% YES YES
2021 actual costs were primarily attributable to Customer Care PSPS planning and readiness activities such as customer outreach and education, and customer resiliency and support programs. 2021 actual costs also include Marketing and Communications' costs for PSPS and wildfire customer communications reflected in Customer Care since Marketing and Communications was reorganized from Corporate Services to Customer Care in 2021.
9 IU Collect Revenue
Exhibit (PG&E-6), Chapters 5, 6, and 7 21,713.8 11,545.0 (10,168.9) -46.8% YES YES
2021 actual costs were below 2021 imputed adopted costs primarily due to the ongoing temporary closure, since March 2020, of all 65 Customer Service Offices for health and safety precautions in response to the COVID-19 pandemic.
SRM Total (Non-Ramp)
5-4

TABLE 5-4 CUSTOMER CARE 2021 CAPITAL COMPARISON BY MWC FOR SAFETY, RELIABILITY, AND MAINTENANCE WORK
(THOUSANDS OF DOLLARS)
LineNo. MWC MWC Name RAMP Risk Name RAMP Mitigation
Name
2020 GRC Testimony Reference
2021 Imputed Adopted
Costs ($000)
(A)
2021 Actual Costs($000)
(B)
2021 Cost Difference
($000)(B-A)
2021 Cost Percent Change
(%)(B-A)/A
Spending Variance
Explanation Required
(Y/N)
Percentage Variance
Explanation Required
(Y/N)
Cost Variance Explanation
1 05 Tools & EquipmentExhibit (PG&E-6), Chapter 6 255.0 79.7 (175.3) -68.7% NO NO Below threshold variance.
2 21 Misc EquipmentExhibit (PG&E-6), Chapter 6 500.0 5,348.1 4,848.1 969.6% NO NO Below threshold variance.
3 25 Install New Electric MetersExhibit (PG&E-6), Chapter 6 54,010.8 27,878.6 (26,132.2) -48.4% YES YES
2021 actual costs were below 2021 imputed adopted costs due to the transfer of Field Meter Operations (FMO) to Electric Operations (EO) and Gas Operations (GO) in 2018.
FMO was included in Customer Care's 2020 GRC Exhibit since the decision to transfer FMO to EO and GO was made after PG&E finalized its 2020 GRC forecast.
4 74 Install New Gas MetersExhibit (PG&E-6), Chapter 6 76,717.9 101,533.2 24,815.3 32.3% YES YES
2021 actual costs were above 2021 imputed adopted costs primarily due to materials costs related to the corrective maintenance of gas modules.
SRM Total (Non-Ramp)
5-5

5-6
D. MWC Descriptions – Expense 1
MWC AB – Miscellaneous Expense – Includes costs associated with work 2
considered administrative and general in nature (i.e., benefiting the entire 3
corporation and not just one functional area). This program does not relate to 4
safety, reliability, or maintenance. 5
MWC AR – Read and Investigate Meters – Includes activities for dedicated 6
meter readers, other field resources performing manual meter reading activities, 7
and the systems, administration and clerical support necessary to effectively 8
perform these activities. This program relates to safety, reliability, or 9
maintenance because it supports the proper functioning of PG&E’s 10
metering infrastructure. 11
MWC DD – Provide Field Services – Includes customer generated 12
requests for service that require site visit by field technician, such as 13
investigating reports of possible gas leaks, carbon monoxide monitoring, 14
customer requests for stop/starts of gas service, appliance pilot relights, and 15
appliance adjustment and safety checks. This program relates to safety, 16
reliability, or maintenance because it supports the proper functioning of PG&E’s 17
metering infrastructure. 18
MWC DK – Manage Customer Inquiries – Includes expenses incurred in 19
operating the Company’s four Contact Centers (CC), which handle 20
approximately 20 million calls per year, with approximately 7 million of these 21
handled by a customer service representative, costs associated with PG&E’s 22
Customer Relations department, and expenses to address customer inquiries at 23
the local offices, and various non-cash receiving front counter activities. This 24
program relates to safety, reliability, or maintenance in PG&E’s CCs because 25
the CCs support customer calls on safety and reliability issues. 26
MWC EL – Develop New Revenue – Covers work in support of the 27
New Revenue Development team on streetlight light emitting diode turnkey 28
work, wireless telecommunications and fiber optics attachments on PG&E 29
assets, and various other services based on secondary use of PG&E assets. 30
This program does not relate to safety, reliability, or maintenance. 31
MWC EY – Change/Maint Used Electric Meter – Includes activities such 32
as electric meter preventive maintenance, electric meter corrective maintenance, 33
meter programming, meter network maintenance, electric meter accuracy 34
5-7
testing, and the associated staff support necessary to effectively perform these 1
activities. This program relates to safety, reliability, or maintenance because it 2
supports the proper functioning of PG&E’s metering infrastructure. 3
MWC EZ – Manage Var Cust Care Processes – Covers customer 4
satisfaction surveys, customer service, customer experience, program 5
implementation and outreach, rate education and outreach, rate tools, 6
correspondence management and literature fulfillment, customer facing check 7
and letter generation and delivery, and tariff, risk, compliance, and privacy 8
support. Also includes activities primarily associated with SmartMeter™ Opt-Out 9
Program oversight and supplemental utility meter engineering support. This 10
program relates to safety, reliability, or maintenance because it supports the 11
proper functioning of PG&E’s metering infrastructure. 12
MWC FK – Retain and Grow Customers – Covers responding to economic 13
development inquiries, providing detailed analyses of service options desired by 14
customers, and providing detailed explanations of special rate components. 15
MWC FK also includes “below the line” (BTL) activities related to public power 16
and Community Choice Aggregation issues. BTL costs are not included in this 17
report. This program does not relate to safety, reliability, or maintenance. 18
MWC GM – Manage Energy Efficiency-NonBA – Covers required safety 19
and compliance work associated with Low Income Energy Efficiency direct 20
installation measures, including Natural Gas Appliance Testing. This MWC also 21
covers support required for Cooling Centers and guiding and adhering to policy 22
related to electric vehicles (EV), introducing new services that benefit EV 23
customers, and for minimal market readiness activities for EVs. This program 24
relates to safety, reliability, or maintenance because it involves in-home 25
appliance safety checks and support for Cooling Centers to support customer 26
safety during hot summer days. 27
MWC HY – Change/Maint Used Gas Meters – Covers gas meter 28
maintenance activities that do not result in new meter exchanges, including 29
meter tests, minimal regulator maintenance, meter/module communication 30
trouble-shooting, and meter/module repairs. This program relates to safety, 31
reliability, or maintenance because it supports the proper functioning of PG&E’s 32
metering infrastructure. 33

5-8
MWC IG – Manage Var Bal Acct Processes – This program relates to 1
safety, reliability, or maintenance because it includes expenses for the new 2
Portable Battery Program which provides no-cost backup portable batteries for 3
eligible income-qualified customers who live in high fire-threat districts and are 4
enrolled in the Medical Baseline program. 5
MWC IS – Bill Customers – Includes expenses incurred to print, insert, and 6
mail over 52 million customer bills annually; provide electronic bills to customers, 7
bill complex commercial and industrial accounts, including the growing number 8
of Net Energy Metering accounts; calculate and remit franchise fees and taxes; 9
perform user acceptance testing of the customer billing system to ensure billing 10
accuracy; and verify and/or resolve billing issues. Also covers work in support of 11
streetlight inventory and discontinuing service/investigations situations of 12
metered commodity usage with no customer service agreement (e.g., broken 13
lock). This program does not relate to safety, reliability, or maintenance. 14
MWC IT – Manage Credit – Covers expenses incurred to perform credit risk 15
management for retail customers; delinquent account follow-ups and post 16
account closure collections; open account collections on high dollar accounts; 17
balance transfers for closed accounts, fraud verification; and costs related to 18
notifying customers of past due amounts, as well as discontinuing and 19
reconnecting service for non-payment. MWC IT also includes external collection 20
agency costs. This program does not relate to safety, reliability, or maintenance. 21
MWC IU – Collect Revenue – Covers expenses incurred to process energy 22
payments received through the United States mail and in local offices, as well as 23
vendor transaction fees for online energy payments. MWC IU also includes 24
expenses to manage customer payment inquiries and cash refunds. This 25
program relates to safety, reliability, or maintenance because it also supports 26
activities focused on the detection, investigation, and resolution of customer 27
energy theft. 28
MWC IV – Provide Account Services – Covers the costs of labor, 29
materials, and other expenses incurred in responding to customer inquiries, 30
primarily for non-residential customers, regarding contracts, credit, billing and 31
accounting, collections and complaints; providing outage information; providing 32
retail interconnection information; and responding to customer needs of Energy 33

5-9
Service Providers and Core Transport Agents. This program does not relate to 1
safety, reliability, or maintenance. 2
MWC JV – Maintain Information Technology (IT) Apps and Infra – 3
Includes costs for ongoing maintenance, operations, and repair for PG&E’s IT 4
applications, systems, and infrastructure. 5
This program does not relate to safety, reliability, or maintenance. 6
MWC OM – Operational Management – Includes labor and employee 7
related costs to provide supervision and management support. MWC OM also 8
includes costs incurred by the administrative staff working for the supervisors 9
and managers. This program does not relate to safety, reliability, or 10
maintenance. 11
MWC OS – Operational Support – Includes labor and employee related 12
costs to provide services and support that are unrelated to supervision and 13
management. This program does not relate to safety, reliability, or maintenance. 14
E. MWC Descriptions – Capital 15
MWC 05 – Tools and Equipment – Includes tools and equipment used by 16
field technicians and meter repair facilities to perform field metering and meter 17
repair activities. This program relates to safety, reliability, or maintenance 18
because it supports the proper functioning of PG&E’s metering infrastructure. 19
MWC 21 – Miscellaneous Capital – Includes various capital equipment. 20
This program relates to safety, reliability, or maintenance because it supports 21
the proper functioning of PG&E’s metering infrastructure. 22
MWC 25 – Install New Electric Meters – Includes new electric meter 23
purchases for new customer growth, replacement of failed units, and the 24
associated installation labor necessary to perform electric meter installations, 25
exchanges, removals, and retirements. This program relates to safety, 26
reliability, or maintenance because it supports the proper functioning of PG&E’s 27
metering infrastructure. 28
MWC 28 – EV – Station Infrastructure – Includes the cost of EV charging 29
infrastructure for PG&E-owned vehicles. This program does not relate to safety, 30
reliability, or maintenance. 31
MWC 2F – Build IT Apps & Infra – Includes the costs to design, develop, 32
and enhance applications, systems, and IT solutions. 33
This program does not relate to safety, reliability, or maintenance. 34

5-10
MWC 74 – Install New Gas Meters – Includes new gas meter and module 1
purchases for new customer growth, replacement of failed units, and the 2
associated installation labor necessary to perform gas meter and module 3
installations, exchanges, removals and retirements. This program relates to 4
safety, reliability, or maintenance because it supports the proper functioning of 5
PG&E’s metering infrastructure. 6

PACIFIC GAS AND ELECTRIC COMPANY
SECTION 6
SHARED SERVICES/INFORMATION TECHNOLOGY IMPUTED
ADOPTED VS. RECORDED COMPARISON

6-i
PACIFIC GAS AND ELECTRIC COMPANY SECTION 6
SHARED SERVICES/INFORMATION TECHNOLOGY IMPUTED ADOPTED VS. RECORDED COMPARISON
TABLE OF CONTENTS
A. Introduction ....................................................................................................... 6-1
B. Comparison Summary Tables .......................................................................... 6-2
C. Comparison by MWC for Safety, Reliability, and Maintenance Work Tables ............................................................................................................... 6-4
D. MWC Descriptions – Expense .......................................................................... 6-5
E. MWC Descriptions – Capital ............................................................................. 6-9
6-1
PACIFIC GAS AND ELECTRIC COMPANY 1
SECTION 6 2
SHARED SERVICES/INFORMATION TECHNOLOGY IMPUTED 3
ADOPTED VS. RECORDED COMPARISON 4
A. Introduction 5
This section includes the following information for the Shared 6
Services/Information Technology (IT) lines of business: a comparison of the 7
total 2021 imputed adopted spend vs. the actual spend and for those programs 8
that are related to safety, reliability, or maintenance, the Major Work Category 9
(MWC) descriptions, imputed adopted vs. actuals comparison details and 10
variance explanations. The MWC descriptions are based on Pacific Gas and 11
Electric Company’s (PG&E or the Company) 2020 Spending Accountability 12
Report. In addition, per Decision 19-04-020, the MWC descriptions explain how 13
each program/project relates to safety, reliability, or maintenance. 14

6-2
B. Comparison Summary Tables 1
TABLE 6-1 SHARED SERVICES/IT 2021 EXPENSE COMPARISON SUMMARY
(THOUSANDS OF DOLLARS)
LineNo. MWC Description MWC
2021 Imputed Adopted
Costs (A)
2021 Actual Costs
(B)
2021 Cost Difference
(B-A)1 Habitat and Species Protection AY 150.9 76.5 (74.4)2 Implement Environment Projects ES 712.0 810.8 98.83 Implement RealEstate Strategy JH 8,378.8 5,127.1 (3,251.7)4 Maint Buildings BI 4,088.4 973.6 (3,114.8)5 Maintain IT Apps & Infra JV 37,743.9 32,242.0 (5,501.9)6 Manage DCPP Business BP 5,507.4 1,393.5 (4,113.9)7 Manage Environ Remed (Earning) JK 2,032.9 5,040.5 3,007.68 Manage Environmental Oper AK 8,474.8 6,612.3 (1,862.5)9 Manage Land Services JE 3,545.7 3,342.6 (203.1)
10 Manage Property & Bldgs EP 109,403.9 112,190.7 2,786.811 Manage Var Bal Acct Processes IG 0.0 1,887.1 1,887.112 Misc Expense AB 210,001.1 246,751.2 36,750.113 Mnge Waste Disp & Transp CR 2,244.6 1,801.1 (443.5)14 Operational Management OM 1,722.1 737.1 (985.0)15 Operational Support OS 7,322.5 18,678.1 11,355.616 Procure Materials & Services (b) JL 17,063.9 18,652.2 1,588.317 Prov Human Resource Svcs KX 5,986.4 9,075.8 3,089.418 Prov Regulation Svcs KY 1,512.6 350.6 (1,162.0)19 Prov Risk/Security Svcs KZ 15,421.4 26,302.5 10,881.120 Safety Engineering & OSHA Cmpl FL 17,953.4 6,776.2 (11,177.1)21 Shared Services Sub-Total 459,266.6 498,821.4 39,554.9
22 Fleet Capitalization AB (92,662.2) (128,326.0) (35,663.8)23 Building Services Capitalization (a) EP (67,372.1) (63,109.3) 4,262.724 Shared Services Total 299,232.3 307,386.1 8,153.8
25 Maintain IT Apps & Infra JV 293,513.4 292,616.2 (897.2)26 Misc Expense AB 0.0 134.0 134.027 Operational Management OM 536.5 456.0 (80.4)28 Operational Support OS 639.6 5,532.6 4,893.129 Information Technology Sub-Total 294,689.4 298,738.9 4,049.5
30 End User Services Capitalization AB (35,768.2) (92,497.7) (56,729.5)31 Information Technology Total 258,921.2 206,241.2 (52,680.1)
32 Shared Services/Information Technology Total 558,153.5 513,627.3 (44,526.3)
Notes:(a) The 2020 GRC adopted amounts for PG&E's Building Services Capitalization credit was originally adopted in MWC AB.
In this report, PG&E has aligned the imputed adopted amount with where the work is recorded (MWC EP).
(b) MWC JL includes recorded costs from the Sourcing department for wildfire contract support recorded in both the WMPMA/FRMMA and the WMBA.

6-3
TABLE 6-2 SHARED SERVICES/IT 2021 CAPITAL COMPARISON SUMMARY
(THOUSANDS OF DOLLARS)
LineNo. MWC Description MWC
2021 Imputed Adopted
Costs (A)
2021 Actual Costs
(B)
2021 Cost Difference
(B-A)1 Build IT Apps & Infra 2F 25,151.2 38,309.4 13,158.32 Fleet / Auto Equip (a) 04 28,674.4 65,164.8 36,490.53 Implement Environment Projects 12 5,979.0 6,591.5 612.54 Implement RealEstate Strategy 23 92,473.3 283,222.6 190,749.35 Maintain Buildings 22 82,820.3 23,948.3 (58,872.0)6 Misc Capital 21 579.1 821.5 242.37 Security Install/Replace 3N 17,318.1 5,862.9 (11,455.2)8 Tools & Equipment 05 1,823.9 2,432.7 608.8
9 Shared Services Total 254,819.3 426,353.8 171,534.6
10 Build IT Apps & Infra 2F 179,251.4 275,069.9 95,818.511 Information Technology Total 179,251.4 275,069.9 95,818.5
12 Shared Services/Information Technology Total 434,070.6 701,423.7 267,353.1
Notes:(a) MWC 04 includes recorded costs from the Transportation Services department for wildfire Temporary Generation equipment for use during PSPS recorded in the WMBA.

C. Comparison by MWC for Safety, Reliability, and Maintenance Work Tables 1
TABLE 6-3 CORPORATE REAL ESTATE 2020 EXPENSE COMPARISON BY MWC FOR SAFETY, RELIABILITY, AND MAINTENANCE WORK
(THOUSANDS OF DOLLARS)
TABLE 6-4 CORPORATE REAL ESTATE 2020 CAPITAL COMPARISON BY MWC FOR SAFETY, RELIABILITY, AND MAINTENANCE WORK
(THOUSANDS OF DOLLARS)
LineNo. MWC MWC Name RAMP Risk Name
RAMP Mitigation
Name
2020 GRC Testimony Reference
2021 Imputed Adopted
Costs (A)
2021 Actual Costs
(B)
2021 Cost Difference
(B-A)
2021 Cost Percent Change
(%)(B-A)/A
Spending Variance
Explanation Required
(Y/N)
Percentage Variance
Explanation Required
(Y/N) Cost Variance Explanation
1 BI Maint Buildings SRM Total (Non-RAMP)SRM Total (NonRAMP)
Exhibit (PG&E-7), Chapter 5 4,088.4 973.6 (3,114.8) -76.2% NO NO Below variance threshold.
2 JH Implement RealEstate Strategy SRM Total (Non-RAMP)SRM Total (NonRAMP)
Exhibit (PG&E-7), Chapter 5 8,378.8 5,127.1 (3,251.7) -38.8% NO NO Below variance threshold.
LineNo. MWC MWC Name RAMP Risk Name
RAMP Mitigation
Name
2020 GRC Testimony Reference
2021 Imputed Adopted
Costs (A)
2021 Actual Costs
(B)
2021 Cost Difference
(B-A)
2021 Cost Percent Change
(%)(B-A)/A
Spending Variance
Explanation Required
(Y/N)
Percentage Variance
Explanation Required
(Y/N) Cost Variance Explanation
1 22 Maintain Buildings SRM Total (Non-RAMP)SRM Total (Non-RAMP)
Exhibit (PG&E-7), Chapter 5 82,820.3 23,948.3 (58,872.0) -71.1% YES YES
Decrease due to the consolidation of the Facility Asset Upkeep Program into MWC 23.
2 23 Implement RealEstate StrategySRM Total (Non-RAMP)SRM Total (NonRAMP)
Exhibit (PG&E-7), Chapter 5 92,473.3 283,222.6 190,749.3 206.3% YES YES
Increase was primarily due to efforts to prepare the new Oakland Headquarters building for ownership and occupancy starting in April 2022. These activities included Seismic Safety, Tenant Improvements, Furniture, and IT Infrastructure and Security upgrades. Other major expenditures in this MWC included purchasing the Fairfield Data Center building and property as a strategic investment to reduce Operating Expenses (lease costs); and project delivery costs for the Sacramento Area - T-Line Fab Shop which increased from the prior GRC forecast as a result of supply chain issues that caused an unplanned increase in material expenditures.
6-4

6-5
D. MWC Descriptions – Expense 1
MWC AB – Support – Includes costs associated with climate protection and 2
other environmental leadership initiatives. MWC AB also includes standard cost 3
variances for Shared Services departments that charge out their costs to other 4
organizations and miscellaneous support costs. In addition, this MWC 5
addresses costs related to PG&E’s heavy-lift helicopters that provide both 6
service restoration and California Department of Forestry and Fire Protection 7
(CAL FIRE) use for emergency response during fire season. This program does 8
relate to safety, reliability, and maintenance as it supports wildfire mitigations by 9
improving wildfire response capabilities and potentially reducing wildfire 10
consequences to PG&E and public infrastructure. 11
MWC AK – Manage Environmental Operations – Includes costs for 12
environmental compliance support, permits and day-to-day costs that are part of 13
facility environmental operations. MWC AK also includes routine environmental 14
work, including the labor costs of environmental professionals and facility 15
personnel who perform environmental compliance tasks (e.g., inspections, 16
compliance assessments, corrective actions, and hazardous waste 17
management). This program does not relate to safety, reliability, or 18
maintenance. 19
MWC AY – Habitat and Species Protection – Includes compliance with 20
regulations to protect endangered species and sensitive habitats as part of 21
PG&E’s broader Environmental Stewardship Program. The Environmental 22
Stewardship Program covers initiatives to support habitat and species 23
protection, Safe Harbor Agreement, avian protection, land stewardship and 24
conservation partnerships. MWC AY includes labor and expense associated 25
with administration of the different programs. This program does not relate to 26
safety, reliability, or maintenance. 27
MWC BI – Maintain Buildings – Includes costs to repair and maintain base 28
building to extend the life of building components, correct building component 29
deficiencies, improve equipment operating efficiencies, and increase the 30
operating reliability of buildings and yards. This program relates to safety, 31
reliability, or maintenance because the facilities are required to support PG&E’s 32
safe and reliable delivery of energy and the funding is for maintenance of the 33
buildings and related seismic safety. 34
6-6
MWC BP – Manage DCPP Business – Includes costs of aircraft services 1
that have been moved from the Nuclear Generation line of business. This 2
program relates to safety, reliability, or maintenance because heavy-lift 3
helicopters, fixed wing aircraft and unmanned aerial vehicles (UAV) or drones 4
are all used in support of wildfire mitigation strategies. 5
MWC CR – Manage Waste Disposal & Transportation – Includes costs of 6
transportation and disposal of hazardous and other regulated wastes in 7
accordance with federal and state laws and regulations. This program does not 8
relate to safety, reliability, or maintenance. 9
MWC EP – Manage Property and Buildings – Includes costs to operate, 10
maintain, and repair PG&E’s facilities and shared conference center space. This 11
program does not relate to safety, reliability, or maintenance. 12
MWC ES – Implement Environment Projects – Includes costs associated 13
with repairing, replacing, or upgrading equipment to comply with environmental 14
regulations. This program does not relate to safety, reliability, or maintenance. 15
MWC FA/FL – Safety Engineering & OSHA Compliance – Includes costs 16
of the Safety Engineering & Health Services department which provides overall 17
direction and implementation of the Company’s occupational safety and health 18
programs. MWC FL also includes costs for the development and integration 19
of safety and health solutions supporting the goal of eliminating employee 20
injuries. This program is for employee safety. 21
MWC IG – Manage Various Balancing Account Processes – Includes 22
expense costs for various balancing and memorandum accounts: 23
• Fire Risk Mitigation Memorandum Account – Includes costs incurred for 24
wildfire risk mitigation which were not included in PG&E’s 2020 Wildfire 25
Mitigation Plan (WMP) and not associated with wildfire mitigations described 26
in PG&E’s 2020 General Rate Case (GRC) that are recorded in the Wildfire 27
Mitigation Balancing Account (WMBA). PG&E will determine the 28
incrementality of these amounts to the Company’s revenue requirement 29
when it applies for cost recovery. 30
• Wildfire Mitigation Plan Memorandum Account – Includes costs incurred to 31
implement PG&E’s approved WMP that are not associated with wildfire 32
mitigations described in PG&E’s 2020 GRC that are recorded in the WMBA. 33

6-7
PG&E will determine the incrementality of these amounts to the Company’s 1
revenue requirement when it applies for cost recovery. 2
This program relates to safety, reliability, or maintenance because the 3
memorandum and balancing accounts track work to address wildfire risk. In 4
Shared Services, specific investments include Enterprise Health and Safety’s 5
purchase of employee personal protective equipment for the protection from 6
wildfire smoke inhalation; Corporate Real Estate Strategy and Services’ ongoing 7
efforts on the Emergency Generation Enhancement Project; and Land and 8
Environmental Management’s work with U.S. Forest Service (USFS) to perform 9
hazardous fuel reduction work on USFS lands with a focus on areas near PG&E 10
distribution facilities. 11
MWC JE – Manage Land Services – Includes costs to establish policies 12
and provide support for the management and protection of the Company’s land 13
and land rights in support of PG&E’s utility operations. MWC JE also includes 14
costs to manage the Company’s timberlands to achieve optimal revenues while 15
maintaining and/or enhancing timberland values. This program does not relate 16
to safety, reliability, or maintenance. 17
MWC JH – Real Estate Strategy and Transactions – Includes costs for 18
long-term real estate strategy development, space demand forecasting and 19
planning and lease administration and transaction management. This program 20
relates to safety, reliability, or maintenance because it supports seismic safety 21
as it relates to Customer Service Office (CSO) relocations. 22
MWC JK – Manage Environmental Remediation-Earnings – Includes 23
costs for the clean-up of contaminated sites which are not recovered through the 24
Hazardous Substance Mechanism, decommissioning accounts, or at 25
shareholder expense. These include internal labor and expenses associated 26
with management and support of the site remediation as well as contractor and 27
legal fees. This program does not relate to safety, reliability, or maintenance. 28
MWC JL – Procure Materials & Services – Includes costs to procure 29
goods and services, including implementing programs to improve organizational 30
effectiveness, developing supplier alliances, and maintaining and promoting a 31
diverse supplier base. This program does relate to safety and reliability because 32
it supports establishing contracts for Wildfire System Hardening, the Wildfire 33

6-8
Program Management Office and unit pricing other contract support services for 1
Wildfire hardening efforts. 2
MWC JV – Maintain Applications and Infrastructure – Includes costs for 3
ongoing maintenance, operations and repair for PG&E’s IT applications, 4
systems, and infrastructure. In addition, cybersecurity ongoing maintenance and 5
operations as well as project costs are addressed. This program does relate to 6
safety, reliability, or maintenance because it contains both controls and 7
mitigations for the Cyber Attack Risk Assessment and Mitigation Phase (RAMP) 8
risk. 9
MWC KX – Provide Human Resource Services – Represents costs for the 10
Integrated Disability Management program and support as well as services 11
provided by Human Resources. This program does not relate to safety, 12
reliability, or maintenance. 13
MWC KY – Provide Regulations Services – Includes costs for regulatory 14
services and support. This program does not relate to safety, reliability, or 15
maintenance. 16
MWC KZ – Provide Risk and Security Services – Includes support for 17
corporate security, enterprise risk management (ERM), internal audit, and 18
insurance functions. In Shared Services, this work is Corporate Security and 19
ERM expense costs. Corporate Security includes guard services, investigations 20
and investigators, executive protection, access control, physical security testing, 21
video monitoring security facilities, and maintenance of security equipment. This 22
program does relate to safety, reliability, or maintenance because it contains 23
mitigations for the Insider Threat RAMP risk. 24
MWC OM – Operational Management –Includes labor and employee 25
related costs to provide supervision and management support. MWC OM also 26
includes costs incurred by the administrative staff working for the 27
supervisors/managers. This program does not relate to safety, reliability, or 28
maintenance. 29
MWC OS – Operational Support –Includes labor and employee related 30
costs to provide services and support that are unrelated to supervision and 31
management. Examples include Business Finance and Sourcing that support 32
the lines of business. This program does not relate to safety, reliability, or 33
maintenance. 34

6-9
E. MWC Descriptions – Capital 1
MWC 04 – Fleet/Automotive Equipment – Includes acquisition of vehicles, 2
power-operated and off-road equipment, and trailers needed to respond to 3
customer service requests and the myriad of maintenance and construction 4
needs of the Company. This program does relate to safety and reliability 5
because it contains costs for the purchase of Temporary Generation equipment 6
in support of Public Safety Power Shutoff events. 7
MWC 05 – Tools & Equipment – Includes purchase of tools and equipment 8
required to perform various functions, including fleet repairs, warehouse 9
operations, etc. This program does not relate to safety, reliability, or 10
maintenance. 11
MWC 12 – Implement Environment Projects – Includes costs associated 12
with repairing, replacing, or upgrading equipment and facilities to comply with 13
environmental regulations. This program does not relate to safety, reliability, or 14
maintenance. 15
MWC 21 – Purchase/Install – Other Capital – Includes costs related to the 16
miscellaneous purchase of capital and/or the disposition and sale of PG&E’s 17
surplus, obsolete or damaged assets. In addition, this MWC addresses costs 18
related to PG&E’s heavy-lift helicopters that provide both service restoration and 19
California Department of Forestry and Fire Protection (CAL FIRE) use for 20
emergency response during fire season. This program does relate to safety, 21
reliability, and maintenance as it supports wildfire mitigations by improving 22
wildfire response capabilities and potentially reducing wildfire consequences to 23
PG&E and public infrastructure. 24
MWC 22 – Maintain Buildings – Includes the costs to replace and 25
construct base buildings, to extend the life of building components, correct 26
building component deficiencies, improve equipment operating efficiencies, 27
replace failed or functionally obsolete building components, and increase the 28
operating reliability of buildings and yards. This includes furniture, office 29
equipment, and IT Infrastructure for buildings. This program relates to safety, 30
reliability, or maintenance because the facilities are required to support PG&E’s 31
safe and reliable delivery of energy and the funding is for maintenance of the 32
buildings and related seismic safety. 33

6-10
MWC 23 – Implement Real Estate Strategy – Includes the costs for new 1
buildings and yards, including the purchase of land and the purchase and 2
installation of furniture, office equipment, and IT Infrastructure, as well as the 3
costs to improve building environmental sustainability, to implement workplace 4
strategy, and to optimize the real estate portfolio. This program relates to safety, 5
reliability, or maintenance because it supports seismic safety as it relates to 6
CSO relocations and wildfire mitigations. 7
MWC 2F – Build Applications and Infrastructure – Includes the costs to 8
design, develop and enhance applications, systems, and infrastructure 9
technology solutions. In addition, costs for Cybersecurity projects are 10
addressed. This program does relate to safety, reliability, or maintenance 11
because it contains mitigations for the Cyber Attack RAMP risk. 12
MWC 3N – Install/Replace Security Assets – Includes the costs to design, 13
build, install, and replace Corporate Security assets. This program does relate 14
to safety, reliability, or maintenance because it contains mitigations for the 15
Insider Threat RAMP risk. 16

PACIFIC GAS AND ELECTRIC COMPANY
SECTION 7
COST RECOVERY:
BALANCING AND MEMORANDUM ACCOUNTS

7-i
PACIFIC GAS AND ELECTRIC COMPANY SECTION 7
COST RECOVERY: BALANCING AND MEMORANDUM ACCOUNTS
TABLE OF CONTENTS
A. Introduction ....................................................................................................... 7-1
B. Gas Distribution ................................................................................................ 7-2
C. Electric Distribution ........................................................................................... 7-3
D. Energy Supply: Nuclear Generation ................................................................ 7-7
E. Energy Supply: Power Generation .................................................................. 7-8
F. Customer Care ............................................................................................... 7-10
G. Shared Services ............................................................................................. 7-11

7-1
PACIFIC GAS AND ELECTRIC COMPANY 1
SECTION 7 2
COST RECOVERY: 3
BALANCING AND MEMORANDUM ACCOUNTS 4
A. Introduction 5
This section includes the balancing and memorandum accounts associated 6
with actual expenditures for programs identified as related to safety, reliability, or 7
maintenance in Pacific Gas and Electric Company’s (PG&E) 2021 Risk 8
Spending Accountability Report (RSAR), “where any portion of the program was 9
tracked in a balancing account or memorandum account.”1 The tables below 10
identify which of these programs had expenditures that were recorded to a 11
balancing or memorandum account by Major Work Category (MWC), the name 12
of the account, the purpose of that account from the Preliminary Statement, and 13
the year-end balance.2,314
1 D.19-04-020, p. 37. 2 As noted in the Introduction Section 1, Information Technology (IT) and Corporate Real
Estate (CRE) costs attributable to the Line of Business (LOB) at issue in this report are presented in a decentralized fashion, meaning LOB-specific IT and CRE program costs are included within the LOBs that initiated the programs.
3 Data is as of January 14, 2022.
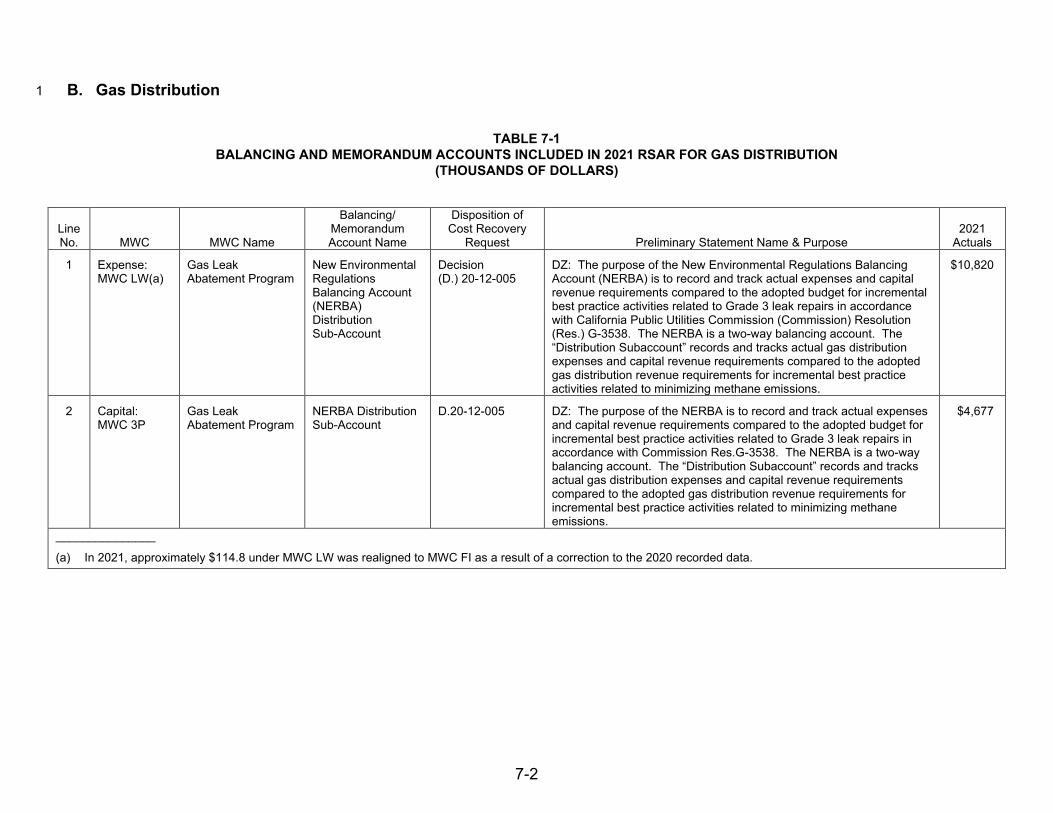
B. Gas Distribution1
TABLE 7-1 BALANCING AND MEMORANDUM ACCOUNTS INCLUDED IN 2021 RSAR FOR GAS DISTRIBUTION
(THOUSANDS OF DOLLARS)
Line No. MWC MWC Name
Balancing/ Memorandum Account Name
Disposition of Cost Recovery
Request Preliminary Statement Name & Purpose 2021
Actuals
1 Expense: MWC LW(a)
Gas Leak Abatement Program
New Environmental Regulations Balancing Account (NERBA) Distribution Sub-Account
Decision (D.) 20-12-005
DZ: The purpose of the New Environmental Regulations Balancing Account (NERBA) is to record and track actual expenses and capital revenue requirements compared to the adopted budget for incremental best practice activities related to Grade 3 leak repairs in accordance with California Public Utilities Commission (Commission) Resolution (Res.) G-3538. The NERBA is a two-way balancing account. The “Distribution Subaccount” records and tracks actual gas distribution expenses and capital revenue requirements compared to the adopted gas distribution revenue requirements for incremental best practice activities related to minimizing methane emissions.
$10,820
2 Capital: MWC 3P
Gas Leak Abatement Program
NERBA Distribution Sub-Account
D.20-12-005 DZ: The purpose of the NERBA is to record and track actual expenses and capital revenue requirements compared to the adopted budget for incremental best practice activities related to Grade 3 leak repairs in accordance with Commission Res.G-3538. The NERBA is a two-way balancing account. The “Distribution Subaccount” records and tracks actual gas distribution expenses and capital revenue requirements compared to the adopted gas distribution revenue requirements for incremental best practice activities related to minimizing methane emissions.
$4,677
_______________
(a) In 2021, approximately $114.8 under MWC LW was realigned to MWC FI as a result of a correction to the 2020 recorded data.
7-2

C. Electric Distribution1
TABLE 7-2 BALANCING AND MEMORANDUM ACCOUNTS INCLUDED IN 2021 RSAR FOR ELECTRIC DISTRIBUTION
(THOUSANDS OF DOLLARS)
Line No. MWC MWC Name
Balancing/ Memorandum Account Name
Disposition of Cost Recovery
Request Preliminary Statement Name & Purpose 2021
Actuals
1 Expense: MWC HN
Vegetation Management Balancing Account (VMBA)
VMBA D.20-12-005 BU: The purpose of the VMBA is to record the difference between the actual Routine and Enhanced Vegetation Management (EVM) expenses and amounts adopted in PG&E’s General Rate Case (GRC) or other base revenue proceeding. The VMBA was created in compliance with D.00-02-046. In D.20-12-005, the Commission authorized PG&E to modify the VMBA to be atwo-way balancing account, with a reasonableness review requirement forspending above 120 percent of adopted amounts (reasonableness threshold).In D.20-12-005, the Commission also required PG&E to track actual costsrelated to tree mortality work for which there is currently no adopted amount.PG&E may amend the VMBA to include additional Vegetation Management(VM) programs.
This account is comprised of two subaccounts:
The Main Account tracks actual Routine and EVM expenses up to 120 percent of adopted amounts. Undercollections in the Main Account will be determined through the Distribution Revenue Adjustment Mechanism (DRAM) in the Annual Electric True-Up (AET), or through another Tier 2 Advice Letter (AL) as authorized by the Commission. Overcollections will be returned to customers through a regularly scheduled AET or other rate change AL at the end of the rate case cycle or as otherwise authorized by the Commission.
The Reasonableness Review Subaccount tracks spending above the reasonableness threshold and actual tree mortality costs, for which there is currently no adopted amount.
PG&E may file a separate application seeking approval of any costs in the Reasonableness Review Subaccount—where actual costs exceed 120 percent of the adopted amount. Upon approval, amounts will be transferred to the DRAM or the Portfolio Allocation Balancing Account for recovery from customers.
$682,525
2 Expense: MWC Information Governance (IG)
Manage Var Bal Acct Processes
$857,457
7-3

TABLE 7-2 BALANCING AND MEMORANDUM ACCOUNTS INCLUDED IN 2021 RSAR FOR ELECTRIC DISTRIBUTION
(CONTINUED) (THOUSANDS OF DOLLARS)
Line No. MWC MWC Name
Balancing/Memorandum Account
Name
Disposition of Cost Recovery
Request Preliminary Statement Name & Purpose 2021
Actuals
3 Expense: MWC IF
Electric Distribution Major Emergency
Major Emergency Balancing Account (MEBA)
D.20-12-005 GJ: The purpose of the MEBA is to recover actual expenses and capital revenue requirements resulting from responding to major emergencies and catastrophic events not eligible for recovery through the Catastrophic Event Memorandum Account (CEMA). In some cases, costs relating to major emergencies that are found by the Commission not to be eligible for recovery through the CEMA process may be recoverable through the MEBA. The MEBA is a two-way balancing account in which PG&E records the difference between actual and adopted expenses and capital revenue requirements.
$146,946
4 Capital: MWC 95
Electric Distribution Major Emergency
$159,627
5 Expense: Wildfire Mitigation Balancing Account (WMBA)
D.20-12-005 IO: PURPOSE: The purpose of the Wildfire Mitigation Balancing Account – Electric (WMBA-E) is to track actual expenses and capital expenditures against adopted amounts and to record associated expenses and capital revenue requirements for fire risk mitigation work, allocated to the electric distribution and generation functions. These costs include, but are not limited to, expenses and the revenue requirements associated with capital expenditures for: advanced system hardening and resiliency; expanded automation and protection; improved wildfire detection; and enhanced operational practices including work related to Public Safety Power Shutoff (PSPS) events. Costs recorded to the WMBA-E do not include costs recovered through the CEMA, the Fire Risk Mitigation Memorandum Account (FRMMA) or the Wildfire Mitigation Plan Memorandum Account (WMPMA).
The WMBA is a two-way balancing account, with a reasonableness review requirement for spending above 115 percent of expense and capital expenditure adopted amounts (reasonableness threshold). Any such amounts are tracked separately for subsequent review and approval by the Commission.
$123,861
6 AB Support and Emergency Preparedness and Response (EP&R)
7 IG
Manage Var Bal Acct Processes
$10,816
8 HG Electric Distribution Operational Technology
$59
9 Capital: $319,486
10 08 Electric Distribution Overhead (OH) Asset Replacement
11 09 Electric Distribution Automation and Protection
$(11)
12 21 Miscellaneous Capital and EP&R
$10,878
13 2A Electric Distribution Preventive Maintenance Overhead
$85,486
7-4

TABLE 7-2 BALANCING AND MEMORANDUM ACCOUNTS INCLUDED IN 2021 RSAR FOR ELECTRIC DISTRIBUTION
(CONTINUED) (THOUSANDS OF DOLLARS)
Line No. MWC MWC Name
Balancing/ Memorandum Account Name
Disposition of Cost Recovery
Request Preliminary Statement Name & Purpose 2021
Actuals
14 49 Electric Distribution Reliability Circuit/Zone
$57,778
15 Expense: FRMMA
WMPMA
Disposition Letter Dated March 12, 2019
HQ: The purpose of the FRMMA is to record, pursuant to Public Utilities Code (Pub. Util. Code) Section 8386.4 (b)(1), incremental costs of fire risk mitigation work that is not otherwise recovered in PG&E’s adopted revenue requirements. Such costs shall include, but are not limited to, expense and capital expenditures for: advanced system hardening and resiliency; expanded automation and protection; improved wildfire detection; enhanced event response capacity, and VM activities. Costs recorded to the FRMMA will not include costs approved for recovery in PG&E GRCs or recovered through PG&E’s CEMA, Fire Hazard Prevention Memorandum Account (FHPMA) or other cost recovery mechanisms including the memorandum account approved as part of PG&E’s Wildfire Mitigation Plan (WMP) (Pub. Util. Code Section 8386.4 (a)).
HX: The purpose of the WMPMA is to record, pursuant to Senate Bill (SB) 901 (Pub. Util. Code Section 8386.4 (a)) and the WMP (also known as the Wildfire Safety Plan) approved by the Commission, incremental costs incurred to implement an approved WMP that are not otherwise recovered in PG&E’s adopted revenue requirements. Such costs may include expense and capital expenditures for activities including but not limited to: operational practices, inspection programs, system hardening, EVM, enhanced situational awareness, PSPS, and alternative technologies. Costs recorded to the WMPMA will not include costs approved for recovery in PG&E GRCs or recovered through PG&E’s CEMA, FHPMA, FRMMA, or other cost recovery mechanisms.
16 AB Support and EP&R $46,473
17 BA Electric Distribution Operation Activities
$5,660
18 BF Electric Operations Patrols/Inspections
$61,086
19 BH Electric Distribution Routine Emergency
$13,864
20 FZ Electric Distribution Engineering and Planning
$2,979
21 GA Poles – Intrusive Inspection/Test and Treat Program
$23,463
22 GC Electric Distribution Substations Operate and Maintain Assets
$9,111
23 GE Electric Distribution Mapping
$6,435
24 IG Manage Var Bal Acct Processes
$77,167
25 KA Preventive Maintenance and Equipment Repair
$67,542
26 Capital:
27 07 Electric Distribution Install/Replace OH Poles
$341,915
7-5

TABLE 7-2 BALANCING AND MEMORANDUM ACCOUNTS INCLUDED IN 2021 RSAR FOR ELECTRIC DISTRIBUTION
(CONTINUED) (THOUSANDS OF DOLLARS)
Line No. MWC MWC Name
Balancing/ Memorandum Account Name
Disposition of Cost Recovery
Request Preliminary Statement Name & Purpose 2021
Actuals
28 09 Electric Distribution Automation & Protection
$2,764
29 17 Electric Distribution Routine Emergency
$10,500
30 21 Miscellaneous Capital and Emergency Preparedness & Response
$6,441
31 23 Implement Real Estate Strategy
$266
32 2A Electric Distribution Preventive Maintenance Overhead
$130,831
33 2F Build IT Applications and Infrastructure
IT: $39,424
34 48 Electric Distribution Substation Replace Other Equipment
$4,176
35 49 Electric Distribution Circuit/Zone Reliability Program
$6,998
36 59 Electric Distribution Substation Emergency Replacements
$7,962
7-6

D. Energy Supply: Nuclear Generation1
TABLE 7-3 BALANCING AND MEMORANDUM ACCOUNTS INCLUDED IN 2021 RSAR FOR NUCLEAR GENERATION
(THOUSANDS OF DOLLARS)
Line No. MWC MWC Name
Balancing/ Memorandum Account Name
Disposition of Cost Recovery Request Preliminary Statement
2021 Actuals
1 Expense: MWC IG
Manage Var Bal Acct Processes
Nuclear Regulatory Commission Rulemaking Balancing Account (NRCRBA)
D.14-08-032 GM: The purpose of the NRCRBA is to recover actual expenses for complying with existing, emerging or evolving Nuclear Regulatory Commission regulations, rulemakings, orders, bulletins and/or generic letters, and the Code of Federal Regulations (CFR) 10-50-54F – Conditions of Licenses at Diablo Canyon. Specifically, the NRCRBA tracks and adjusts for the difference in expenses based on actual versus adopted costs.
$2,282
2 Expense: MWC IG
Manage Var Bal Acct Processes
Department of Energy Litigation BA (DOELBA)
D.14-08-032 The purpose of the DOELBA is to recover actual expenses for litigation costs related to the spent fuel storage from the Department of Energy
$3
3 Capital: MWC 3I
Nuclear Safety and Security
NRCRBA D.14-08-032 GM: The purpose of the NRCRBA is to recover actual expenses for complying with existing, emerging or evolving Nuclear Regulatory Commission regulations, rulemakings, orders, bulletins and/or generic letters, and the CFRs 10-50-54F – Conditions of Licenses at Diablo Canyon. Specifically, the NRCRBA tracks and adjusts for the difference in expenses based on actual versus adopted costs.
$(46)
7-7

E. Energy Supply: Power Generation1
TABLE 7-4 BALANCING AND MEMORANDUM ACCOUNTS INCLUDED IN 2021 RSAR FOR POWER GENERATION
(THOUSANDS OF DOLLARS)
Line No. MWC MWC Name
Balancing/ Memorandum Account Name
Disposition of Cost Recovery
Request Preliminary Statement 2021
Actuals
1 Expense: MWC IG
Manage Var Bal Acct Processes
Hydro Licensing Balancing Account (HLBA)
D.20-12-005 GL: The purpose of the HLBA is to recover actual expenses and capital revenue requirements based on actual capital expenditures related to Federal Energy Regulatory Commission (FERC) hydro licensing activities, which include, but are not limited to, renewing, amending, surrendering, decommissioning, compliance requirements, FERC and California Division of Safety of Dams (DSOD) regulatory fees, costs associated with implementation of the Crane Valley Recreation Settlement Agreement (SA), and costs associated with work required as a result of the 2017 Oroville Dam incident. Specifically, the HLBA tracks and adjusts for the difference in actual and adopted expenses and capital revenue requirements associated with relicensing and amending/modifying licenses issued on or after January 1, 2012, including costs associated with implementing and complying with new license conditions or requirements resulting from renewed, modified, or amended licenses.
$16,996
2 Expense: MWC IG
Manage Var Bal Acct Processes
FRMMA and WMPMA
Disposition Letter Dated March 12, 2019
HQ: The purpose of the FRMMA is to record, pursuant to Pub. Util. Code Section 8386.4 (b)(1) incremental cost of fire risk mitigation work that is not otherwise recovered in PG&E’s adopted revenue requirements. Such costs shall include, but are not limited to, expense and capital expenditures for: advanced system hardening and resiliency; expanded automation and protection; improved wildfire detection; enhanced event response capacity, and VM activities. Costs recorded to the FRMMA will not include costs approved for recovery in PG&E GRCs or recovered through PG&E’s CEMA, FHPMA or other cost recovery mechanisms including the memorandum account approved as part of PG&E’s annual WMP, as set forth in Pub. Util. Code Section 8386.4 (a).
$5,131
7-8

TABLE 7-4 BALANCING AND MEMORANDUM ACCOUNTS INCLUDED IN 2021 RSAR FOR POWER GENERATION
(CONTINUED) (THOUSANDS OF DOLLARS)
Line No. MWC MWC Name
Balancing/ Memorandum Account Name
Disposition of Cost Recovery
Request Preliminary Statement 2021
Actuals
HX: The purpose of the WMPMA is to record, pursuant to Pub. Util. Code Section 8386.4 (a) and the WMP approved by the Commission, incremental costs incurred to implement an approved WMP that are not otherwise recovered in PG&E’s adopted revenue requirements. Such costs may include expense and capital expenditures for activities including but not limited to: operational practices, inspection programs, system hardening, EVM, enhanced situational awareness, PSPS, and alternative technologies. Costs recorded to the WMPMA will not include costs approved for recovery in PG&E GRCs or recovered through PG&E’s CEMA, FHPMA, FRMMA, or other cost recovery mechanisms.
3 Capital: MWC 3H
Hydroelectric License and License Conditions
HLBA D.20-12-005 GL: The purpose of the HLBA is to recover actual expenses and capital revenue requirements based on actual capital expenditures related to FERC hydro licensing activities, which include, but are not limited to, renewing, amending, surrendering, decommissioning, compliance requirements, FERC and California DSOD regulatory fees, costs associated with implementation of the Crane Valley Recreation SA, and costs associated with work required as a result of the 2017 Oroville Dam incident. Specifically, the HLBA tracks and adjusts for the difference in actual and adopted expenses and capital revenue requirements associated with relicensing and amending/modifying licenses issued on or after January 1, 2012, including costs associated with implementing and complying with new license conditions or requirements resulting from renewed, modified, or amended licenses.
$16,696
4 Capital: MWC 2L
Instl/Rpl for Hydro Safety and Reg
FRMMA Disposition Letter Dated March 12, 2019
HQ: The purpose of the FRMMA is to record, pursuant to Pub. Util. Code Section 8386.4 (b)(1) incremental cost of fire risk mitigation work that is not otherwise recovered in PG&E’s adopted revenue requirements. Such costs shall include, but are not limited to, expense and capital expenditures for: advanced system hardening and resiliency; expanded automation and protection; improved wildfire detection; enhanced event response capacity, and VM activities. Costs recorded to the FRMMA will not include costs approved for recovery in PG&E GRCs or recovered through PG&E’s CEMA, FHPMA or other cost recovery mechanisms including the memorandum account approved as part of PG&E’s annual WMP, as set forth in Pub. Util. Code Section 8386.4 (a).
$469
7-9

F. Customer Care1
TABLE 7-5 BALANCING AND MEMORANDUM ACCOUNTS INCLUDED IN 2021 RSAR FOR CUSTOMER CARE
(THOUSANDS OF DOLLARS)
Line No. MWC MWC Name
Balancing/ Memorandum Account Name
Disposition of Cost Recovery
Request Preliminary Statement 2021
Actuals
1 Expense: MWC IG
Manage Var Bal Acct Processes
WMPMA Disposition Letter Dated March 12, 2019
HX: The purpose of the WMPMA is to record, pursuant to SB 901 (Pub. Util. Code Section 8386.4 (a)) and the Wildfire Mitigation Plan (also known as the Wildfire Safety Plan) approved by the Commission, incremental costs incurred to implement an approved wildfire mitigation plan that are not otherwise recovered in PG&E’s adopted revenue requirements. Such costs may include expense and capital expenditures for activities including but not limited to: operational practices, inspection programs, system hardening, enhanced vegetation management, enhanced situational awareness, PSPS, and alternative technologies. Costs recorded to the WMPMA will not include costs approved for recovery in PG&E GRCs or recovered through PG&E’s CEMA, Fire Hazard Prevention Memorandum Account (FHPMA), FRMMA, or other cost recovery mechanisms.
$26,620
2 Expense: MWC IG
Manage Var Bal Acct Processes
WMBA D.20-12-005 IO: The purpose of the WMBA-E is to track actual expenses and capital expenditures against adopted amounts and to record associated expenses and capital revenue requirements for fire risk mitigation work, allocated to the electric distribution and generation functions. These costs include, but are not limited to, expenses and the revenue requirements associated with capital expenditures for: advanced system hardening and resiliency; expanded automation and protection; improved wildfire detection; and enhanced operational practices including work related to PSPS events. Costs recorded to the WMBA-E do not include costs recovered through the CEMA, the FRMMA or the WMPMA.
$24,181
3 Expense: MWC EZ
Manage Var Cust Care Processes
CDGSWMA Res.E-5030 October 24, 2019
IC: The purpose of the California Distributed Generation Statistics (DG Stats) Website Memorandum Account (CDGSWMA) is to track and record incremental costs for work performed by the DG Stats contractor for the three-year period of January 1, 2020 to December 31, 2022, which may not exceed PG&E’s proportion, defined as 43.7% of $990,000 or $432,630.
$130
7-10

G. Shared Services1
TABLE 7-6 BALANCING AND MEMORANDUM ACCOUNTS INCLUDED IN 2021 RSAR FOR SHARED SERVICES
(THOUSANDS OF DOLLARS)
Line No. MWC MWC Name
Balancing/ Memorandum Account Name
Disposition of Cost Recovery
Request Preliminary Statement 2021
Actuals
1 Expense: MWC IG
Manage Var Bal Acct Processes
FRMMA/WMPMA Disposition Letter Dated March 12, 2019
HQ: The purpose of the FRMMA is to record, pursuant to Pub. Util. Code Section 8386.4 (b)(1), incremental costs of fire risk mitigation work that is not otherwise recovered in PG&E’s adopted revenue requirements. Such costs shall include, but are not limited to, expense and capital expenditures for: advanced system hardening and resiliency; expanded automation and protection; improved wildfire detection; enhanced event response capacity, and VM activities. Costs recorded to the FRMMA will not include costs approved for recovery in PG&E GRCs or recovered through PG&E’s CEMA, FHPMA or other cost recovery mechanisms including the memorandum account approved as part of PG&E’s WMP (Pub. Util. Code Section 8386.4 (a)).
HX: The purpose of the WMPMA is to record, pursuant to SB 901 (Pub. Util. Code Section 8386.4 (a)) and the WMP (also known as the Wildfire Safety Plan) approved by the Commission, incremental costs incurred to implement an approved WMP that are not otherwise recovered in PG&E’s adopted revenue requirements. Such costs may include expense and capital expenditures for activities including but not limited to: operational practices, inspection programs, system hardening, EVM, enhanced situational awareness, PSPS, and alternative technologies. Costs recorded to the WMPMA will not include costs approved for recovery in PG&E GRCs or recovered through PG&E’s CEMA, FHPMA, FRMMA, or other cost recovery mechanisms.
$1,887
2 Expense: MWC JL
Procure Materials and Services
FRMMA/WMPMA $1,341
3 Capital: MWC 23
Implement Real Estate Strategy
FRMMA/WMPMA $40,249
7-11

TABLE 7-6 BALANCING AND MEMORANDUM ACCOUNTS INCLUDED IN 2021 RSAR FOR SHARED SERVICES
(CONTINUED) (THOUSANDS OF DOLLARS)
Line No. MWC MWC Name
Balancing/ Memorandum Account Name
Disposition of Cost Recovery
Request Preliminary Statement 2021
Actuals
4 Expense: MWC AB
Miscellaneous Expense
WMBA D.20-12-005 IO: PURPOSE: The purpose of the WMBA-E is to track actual expenses and capital expenditures against adopted amounts and to record associated expenses and capital revenue requirements for fire risk mitigation work, allocated to the electric distribution and generation functions. These costs include, but are not limited to, expenses and the revenue requirements associated with capital expenditures for: advanced system hardening and resiliency; expanded automation and protection; improved wildfire detection; and enhanced operational practices including work related to PSPS events. Costs recorded to the WMBA-E do not include costs recovered through the CEMA, the FRMMA or the WMPMA.
The WMBA is a two-way balancing account, with a reasonableness review requirement for spending above 115 percent of expense and capital expenditure adopted amounts (reasonableness threshold). Any such amounts are tracked separately for subsequent review and approval by the Commission.
Shared Services (Aviation):
$3,349
5 Expense: MWC JL
Procure Materials and Services
$509
6 Capital: MWC 04
Fleet/Automotive Equipment
Shared Services (Transportation):
$461
7-12

PACIFIC GAS AND ELECTRIC COMPANY
APPENDIX A
2020 GRC IMPUTED REGULATORY VALUES METHODOLOGY

AppA-i
PACIFIC GAS AND ELECTRIC COMPANY APPENDIX A
2020 GRC IMPUTED REGULATORY VALUES METHODOLOGY
TABLE OF CONTENTS
A. Introduction .......................................................................................................... 1
1. 2020 Test Year ............................................................................................. 1
2. 2021 to 2022 Post-Test Year ........................................................................ 2
3. Imputation Methodology (MAT Level for Electric Distribution and Gas Distribution) ................................................................................................... 4
4. Units of Work Imputation for Gas and Electric Distribution ............................ 4
5. Risk Assessment and Mitigation Phase (RAMP) Regulatory Values Imputation ..................................................................................................... 5

AppA-1
PACIFIC GAS AND ELECTRIC COMPANY 1
APPENDIX A 2
2020 GRC IMPUTED REGULATORY VALUES METHODOLOGY 3
A. Introduction 4
On December 20, 2019, Pacific Gas and Electric Company (PG&E) and 5
other settling parties (collectively, Settling Parties) filed a Settlement Agreement 6
with the California Public Utilities Commission (CPUC). The Settlement 7
Agreement resolved all issues raised by the Settling Parties in PG&E’s test 8
year 2020 General Rate Case (GRC), Application 18-12-009. On December 11, 9
2020, the CPUC issued Decision (D. or the decision) 20-12-005 in PG&E's 2020 10
GRC, adopting most provisions in the Settlement Agreement, with certain 11
modifications, and adopting base revenue requirements for the 2020-2022 GRC 12
period. 13
The section below describes the methodology used by PG&E to develop 14
expense and capital regulatory values (i.e., imputed adopted amounts). 15
1. 2020 Test Year 16
The decision adopted 2020 test year operations and maintenance 17
(O&M) and Administrative and General (A&G) expense values at the Major 18
Work Category (MWC) and/or Organizational level, and capital expenditure 19
values at the MWC level as specified in the Settlement Agreement. The 20
adopted test year expense and capital costs at the MWC and/or 21
Organizational levels are included in the Settlement Agreement, 22
Appendix B. 23
The Settlement Agreement had reductions for certain A&G costs 24
including Short Term Incentive Plan reduction of $88 million for 2020.1 The 25
capitalized portion of all A&G reduction is $33 million. The $33 million 26
reduction was then applied to capital expenditures as specified in the 27
Settlement Agreement Appendix B proportionately to derive the 2020 test 28
year imputed adopted capital expenditures. The capitalized A&G reduction 29
was not applied to items with specific forecast called out in the Settlement 30
1 See Settlement Agreement of the 2020 GRC, Article 2, Section 2.8.2.

AppA-2
Agreement, specifically, System Hardening in Electric Distribution and 1
Plastic Pipe Replacement in Gas Distribution. 2
2. 2021 to 2022 Post-Test Year 3
The decision adopted 2021 and 2022 revenue requirements based on 4
the attrition increases of 3.5 percent and 3.9 percent, respectively, included 5
in the Settlement Agreement for the post-test years. The Settlement 6
Agreement did not provide specific MWC values for 2021 and 2022 except 7
for certain specific programs in O&M and capital expenditures such as 8
System Hardening, Plastic Pipe Replacement and customer care 9
stipulation2 of the Salesforce Phase II and III project. 10
To develop imputed regulatory values for 2021 and 2022 that conform to 11
the decision revenue requirement increase, PG&E used a 3-step process: 12
(1) derive the capital additions assumed in the rate base and capital revenue 13
requirement approved in Appendix E of the decision (2) break down 14
expense related revenue requirement approved in Appendix E of the 15
decision to expense amounts at the 2020 GRC exhibit-level by MWC 16
(3) calculate the capital expenditures using the capital additions derived 17
from step 1. 18
Step 1: PG&E used the decision Results of Operations (RO) model to 19
derive the net capital additions that supported the capital revenue 20
requirement increase in the Appendix E of the decision. The decision RO 21
model provides net capital additions at the GRC exhibit and MWC level. 22
Step 2: PG&E determined the expense revenue requirement increase 23
for 2021 and 2022 from Appendix E of the Settlement Agreement. To 24
develop the expense imputed values for 2021, PG&E used the composite 25
escalation rates incorporated in the Settlement RO model to escalate the 26
2020 expense settlement amounts to 2021 by MWC and Maintenance 27
Activity Type (MAT) code or by corporate services department, with the 28
exception of any post-test year amounts specified in the Settlement 29
Agreement or specific Line of Business forecast items accepted as part of 30
the Settlement. For 2022, PG&E calculated the expense by MWC and MAT 31
2 HE 98: Stipulation Between PG&E and The Utility Reform Network Regarding
Salesforce 2 and 3 Project, p. 3.

AppA-3
code or by corporate services department by escalating the non-labor 1
component amount from 2021 to 2022 using the non-labor escalation rate, 2
while the labor component amount was held constant to 2021 to be 3
consistent with the decision RO calculation, with the exception of the 4
post-test year Settlement adjustments approved in the decision. The labor 5
escalation rates are provided in Exhibit (PG&E-8)3 and non-labor escalation 6
rates are from Global Insights, which are included in the decision RO model 7
calculation. 8
Step 3: To convert the decision capital additions to capital expenditure 9
imputed values for 2021 and 2022, PG&E first identified the 2021 and 2022 10
bottom-up capital expenditure forecast for Diablo Canyon, Hydro 11
Generation, Corporate Real Estate, System Hardening and the Gas 12
Distribution Plastic Pipe Replacement program as agreed in the Settlement 13
Agreement and calculated in the decision RO model. 14
For the other non bottom-up capital expenditure forecast programs for 15
2021 and 2022, the decision RO model applied Global Insights escalation 16
factors to escalate the 2020 settlement capital additions amounts to 2021 17
then to 2022. When a capital project becomes operational or used and 18
useful, inception-to-date capital expenditures are converted to capital 19
additions, which become part of rate base and start earning a capital 20
revenue requirement. The ratio of test year capital additions to test year 21
capital expenditures settlement amounts are calculated at the PG&E exhibit, 22
chapter and MWC level. This settlement ratio is then applied to the 2021 23
and 2022 capital additions to calculate the 2021 and 2022 capital 24
expenditures by exhibit, chapter and MWC. The 2021 and 2022 total 25
derived capital expenditure amount based on this described methodology 26
was compared to the PG&E’s bottom-up forecast for 2021, 2022 and the 27
final imputed adopted was capped at PG&E’s bottom-up forecast for 2021 28
and 2022. 29
3 See 2020 GRC D.20-12-005 of PG&E, HR Section 11.1.1

AppA-4
3. Imputation Methodology (MAT Level for Electric Distribution and Gas 1
Distribution) 2
To impute regulatory values at the MAT code level, PG&E applied 3
program specific MAT code adjustments to PG&E’s forecast for the test 4
year, as appropriate, based on the specification described in the decision, 5
Joint Comparison Exhibit and/or Settlement Agreement. For any 6
adjustments that were not specifically identified at the MAT code level, 7
PG&E prorated the adjustments to PG&E’s forecast by MWC to all MAT 8
codes, as applicable, using the MAT code to MWC ratios from PG&E’s 9
Application forecast. 10
4. Units of Work Imputation for Gas and Electric Distribution 11
To impute the adopted MAT code units of work for 2020, PG&E divided 12
the 2020 imputed MAT code values by the specific unit cost forecast 13
included in opening testimony or updated in the Joint Comparison Exhibits 14
and the Settlement Agreement, as applicable. MAT code labor was 15
adjusted for the change in labor escalation factors from the initial application 16
forecast to reflect the labor escalation factors update included in the 17
Settlement and decision RO model calculation. The reduction in labor 18
resulted in a change in the unit costs. 19
To impute the adopted units of work for 2021 and 2022, PG&E 20
escalated the 2020 unit cost to 2021 then to 2022 based on the composite 21
escalation rates in the decision RO Model. The imputed 2021 and 2022 22
units of work were then calculated as the imputed MAT code values divided 23
by the escalated unit cost. 24
Gas Distribution Exceptions: The exceptions to the above-described 25
units of work imputation methodology are the imputed regulatory volume of 26
inspections for the Gas Distribution Cross Bore Program (MAT JQK) and 27
Plastic Pipe Replacement Program (MAT 14D). For MAT JQK, per the 28
Settlement Agreement, PG&E has the flexibility to perform more or less 29
inspections than the forecast volume for this program. Each year the total 30
volume of recorded inspections will be compared to: (1) the recorded 31
volume of unable-to-access (UTA) inspections, and (2) the calculated 32
volume of non-UTA inspections using the formula adopted in the Settlement 33

AppA-5
Agreement: Non-UTA Units = (Target $ - (UTA Unit Cost X UTA 1
Units))/Non-UTA Unit Cost. Per Section 2.2.2 of the Settlement Agreement, 2
PG&E will replace 115, 137, 165 miles of plastic pipe under MAT 14D in 3
2020, 2021, and 2022 respectively. 4
Electric Distribution Exceptions: The exceptions for Electric 5
Distribution units imputation are for capital MATs (08W, 2AR, 2AP, 49T) that 6
are related to PG&E’s community Wildfire safety program. For the wildfire 7
related work, the decision approved specific post-test year forecasts. 8
Accordingly, the 2021 and 2022 imputed units for the wildfire program 9
related MATs were based on the PG&E updated forecast units as submitted 10
in PG&E’s Rebuttal Testimony4 Chapter 2A Table 2A-2. 11
5. Risk Assessment and Mitigation Phase (RAMP) Regulatory Values 12
Imputation 13
The imputed regulatory values by Risk Mitigation or Control were 14
developed in alignment with PG&E’s forecast.5 For 2020, PG&E applied 15
any specific Risk Mitigation or Control settlement adjustments to PG&E’s 16
forecast, as appropriate. For any settlement adjustments that were not 17
specifically identified, PG&E applied the settlement reductions at the MWC, 18
MAT or Department levels proportionally to all Risk Mitigations or Controls 19
based on the weighting of the RAMP forecast against the total MWC, MAT 20
or Department forecast. 21
Imputed regulatory values for 2021-2022 were developed using the 22
same methods described in the 2021-2022 Regulatory Values (Post-Test 23
Years) section for consistency to the overall GRC imputation. 24
Gas Distribution Expense RAMP: For Gas Distribution MAT codes 25
that were linked to a single Risk Mitigation or Control, the total MAT code 26
imputed amount was assigned to the specific Risk Mitigation or Control. 27
The exception is MAT Code JQD, which is based on Exhibit (PG&E-4), 28
Chapter 3, Table 4-6. When several MAT codes were linked to a 29
combination of Risk Mitigation or Controls and forecasts are provided in 30
4 Exhibit (PG&E-30) Revised Rebuttal Testimony. 5 GRC-2020-PhI_DR_ED_003-Q02Atch1 and GRC-2020-PhI_DR_ED_003-Q02Atch2.

AppA-6
aggregate, the associated aggregate MAT code imputed values were 1
assigned to the combination of Risk Mitigation or Risk Controls. 2
The imputed units for Risk Mitigations or Controls were developed using 3
the same methodology described under “Units of Work Imputation for Gas 4
and Electric Distribution”. 5
Gas Distribution Capital RAMP: For Gas Distribution capital, all Risk 6
Mitigations or Controls except for Mitigation 2 (New Valve installations in 7
MAT 50E) corresponded to 100 percent of specific MAT codes. The 8
imputed regulatory values at MAT level were directly applied to the specific 9
Risk Mitigations or Controls. For Mitigation 2, MAT 50E work associated 10
with RAMP was imputed based on Exhibit (PG&E-3) Table 4-5 line 1 and 11
adjusted for capitalized A&G reductions from the settlement. 12
The imputed units for Risk Mitigations or Controls were developed using 13
the same methodology described under “Units of Work Imputation for Gas 14
and Electric Distribution”. 15
Electric Distribution Expense RAMP: The imputed regulatory values 16
for Electric Distribution Risk Mitigations or Controls were developed using 17
the same methodology described under Gas Distribution Expense RAMP. 18
Electric Distribution had additional instances when one single MAT code had 19
multiple risk mitigations or controls. In these instances, the imputed 20
amounts were developed proportionately based on the forecast weighting of 21
the specific planning orders. Specifically, for Vegetation Management (VM) 22
program, PG&E applied the specific settlement reductions to MAT code HN# 23
and mitigations M16 – Enhanced VM/M8 – Enhance VM Fuel Reduction. 24
The imputed units for Risk Mitigations or Controls were developed using 25
the same methodology described under “Units of Work Imputation for Gas 26
and Electric Distribution”. 27
Electric Distribution Capital RAMP: For Electric distribution capital, all 28
MAT codes except for MAT 21# (Miscellaneous capital) and MAT 2AP 29
(Overhead Capital Projects) were linked to one Risk Mitigation or Control. 30
The imputed regulatory values at MAT level were assigned to specific Risk 31
Mitigations or Controls. For MAT 21# and MAT 2AP, PG&E identified 32

AppA-7
specific mitigation and controls related planning orders from PG&E’s 1
forecast to develop the imputed values for each Risk Mitigation or Control. 2
The imputed units for Risk Mitigations or Controls were developed using 3
the same methodology described under “Units of Work Imputation for Gas 4
and Electric Distribution.” MAT 2AP and 21# were not unitized and hence 5
did not have unit cost or units for the respective risk mitigations or controls. 6

PACIFIC GAS AND ELECTRIC COMPANY
APPENDIX B
2020-2022 IMPUTED REGULATORY VALUES BY
LINE OF BUSINESS

AppB-1
PACIFIC GAS AND ELECTRIC COMPANY 1
APPENDIX B 2
2020-2022 IMPUTED REGULATORY VALUES BY 3
LINE OF BUSINESS 4
2020 GRC BUSINESS UNIT EXPENSE IMPUTED ADOPTED REGULATORY VALUES (THOUSANDS OF NOMINAL DOLLARS)

AppB-2
2020 GRC BUSINESS UNIT EXPENSE IMPUTED ADOPTED REGULATORY VALUES (THOUSANDS OF NOMINAL DOLLARS)
(CONTINUED)

AppB-3
2020 GRC BUSINESS UNIT EXPENSE IMPUTED ADOPTED REGULATORY VALUES (THOUSANDS OF NOMINAL DOLLARS)
(CONTINUED)

AppB-4
2020 GRC BUSINESS UNIT EXPENSE IMPUTED ADOPTED REGULATORY VALUES (THOUSANDS OF NOMINAL DOLLARS)
(CONTINUED)

AppB-5
2020 GRC CORPORATE SERVICES EXPENSE IMPUTED ADOPTED REGULATORY VALUES (THOUSANDS OF NOMINAL DOLLARS)

AppB-6
2020 GRC BUSINESS UNIT CAPITAL IMPUTED ADOPTED REGULATORY VALUES (THOUSANDS OF NOMINAL DOLLARS)

AppB-7
2020 GRC BUSINESS UNIT CAPITAL IMPUTED ADOPTED REGULATORY VALUES (THOUSANDS OF NOMINAL DOLLARS)
(CONTINUED)

AppB-8
2020 GRC BUSINESS UNIT CAPITAL IMPUTED ADOPTED REGULATORY VALUES (THOUSANDS OF NOMINAL DOLLARS)
(CONTINUED)