public utilities - 2023 budget proposal
104
PUBLIC UTILITIES 2023 BUDGET PROPOSAL March 24, 2022 WATER – SEWER – STORMWATER – STREET LIGHTING ENTERPRISE FUNDS SERVING OUR COMMUNITY, PROTECTING OUR ENVIRONMENT
-
Upload
khangminh22 -
Category
Documents
-
view
0 -
download
0
Transcript of public utilities - 2023 budget proposal

PUBLIC UTILITIES 2023 BUDGET PROPOSAL
March 24,
2022
WATER – SEWER – STORMWATER – STREET LIGHTING
ENTERPRISE FUNDS SERVING OUR COMMUNITY, PROTECTING OUR ENVIRONMENT


Table of Contents BUDGET SUMMARY FISCAL YEAR 2022-2023 ................................................................................... 1
WATER UTILITY ENTERPRISE FUND ................................................................................................. 5
WATER INFRASTRUCTURE BACKGROUND ............................................................................................... 5 WATER UTILITY BUDGET HIGHLIGHTS FOR FY 2023 ............................................................................. 5
SEWER UTILITY ENTERPRISE FUND ...................................................................................................9 SEWER INFRASTRUCTURE BACKGROUND ..................................................................................................9 SEWER UTILITY BUDGET HIGHLIGHTS FOR FY 2023 .............................................................................10
STORMWATER UTILITY ENTERPRISE FUND ............................................................................... ..14 STORMWATER INFRASTRUCTURE BACKGROUND ...................................................................................14 STORMWATER UTILITY BUDGET HIGHLIGHTS FOR FY 2023 .................................................................14
STREET LIGHTING UTILITY ENTERPRISE FUND...........................................................................17
STREET LIGHTING INFRASTRUCTURE BACKGROUND .............................................................................17 STREET LIGHTING UTILITY BUDGET HIGHLIGHTS FOR FY 2023 ..........................................................18
COMBINED UTILITIES- BUDGET SUMMARY AND CASH FLOW ...............................................21 WATER UTILITY- BUDGET SUMMARY AND CASH FLOW ..........................................................27 SEWER UTILITY- BUDGET SUMMARY AND CASH FLOW ...........................................................41 STORMWATER UTILITY- BUDGET SUMMARY AND CASH FLOW ............................................51 STREET LIGHTING UTILITY- BUDGET SUMMARY AND CASH FLOW ....................................57 APPENDIX A: RATE CHANGE COMPARISONS AND CUSTOMER IMPACTS ...........................61 APPENDIX B: SUPPLEMENTAL INFORMATION .............................................................................75 APPENDIX C: FINANCIAL CAPABILITY ASSESSMENT.................................................................95

BUDGET SUMMARY FISCAL YEAR 2022-2023
Salt Lake City Department of Public Utilities (SLCDPU) is pleased to present its recommended budget for fiscal year 2022-2023 (FY 2023). The FY 2023 budget includes funding for operations, maintenance, and capital investments in the water, sewer, stormwater, and street lighting utilities. SLCDPU operates each of its utilities as separate enterprise funds.
SLCDPU’s proposed FY 2023 budget continues planned capital projects that have been anticipated over the previous several years. Of note, the FY 2023 budget includes significant continuing work to rebuild the City’s Water Reclamation Facility (WRF) to meet nutrient requirements and continues to address other aging water, sewer, and stormwater infrastructure. The budget also reflects the enhancement of operational programs to meet more stringent regulatory requirements for drinking water, wastewater, and stormwater, including programs related to the federal revised Lead and Copper Rule and the implementation of new requirements of the City’s Municipal Separate Storm Sewer System (MS4) Permit.
SLCDPU’s budget aligns with Mayor Mendenhall’s 2022 Plan goals for growth, environmental stewardship and resiliency, community engagement, and support for our workforce. The budget includes funding for specific actions in the Mayor’s 2022 Plan to 1) complete a comprehensive review and update to the water, sewer, and stormwater ratestructures; 2) complete a comprehensive update to the City’s Watershed Management Plan;and 3) implementation of the new Street Light Master Plan. Mayor Mendenhall has alsorequested a three-year budget outlook from City departments; SLCDPU’s FY 2023 budgetincludes our customary five-year budget outlook.
The proposed budget and the five-year outlook acknowledge and incorporate our long-term financing plan and certain economic realities:
• Previous years’ projections for the need to raise water, sewer, and stormwater ratesby 15% in FY 2023 to fund ongoing rehabilitation and replacement of aginginfrastructure and meet more stringent regulatory requirements are being followedin our FY 2023 budget. The five-year budget outlook includes additional rateincreases in future years;
• There are expected revenue impacts of anticipated persistent drought, primarily tothe water fund;
• SLCDPU expects significant impact of inflationary pressures on project costs,necessitating a combination of capital improvement reprioritization, increasedbonding for the WRF, and identifying and applying for federal and state grants;
• SLCDPU will need to begin bringing salaries for eligible positions identified in therecent non-represented employee compensation study to mid-point;
• SLCDPU will need to continuously evaluate the impact of water, sewer,stormwater, and street lighting rates on our community through rate studies andcommunity financial capability analyses; and
1

• Ongoing customer assistance program support is likely needed as the communitycontinues to recover from COVID impacts and deals with record inflation rates.
SLCDPU is actively seeking grants and federal financing to support our work, reduce reliance on debt, and reduce rate burdens. With the passage of the Bipartisan Infrastructure Law (BIL) in November 2021, the US Environmental Protection Agency will be investing nationally $50 billion in water and wastewater infrastructure in annual tranches of funding through 2026. The BIL funding will be allocated to states based on existing Drinking Water State Revolving Fund (DWSRF) and Clean Water State Revolving Fund (CWSRF) allocation formulas. Each state will administer a mix of grants and loans using this funding through their DWSRF and CWSRF programs. SLCDPU is working to identify eligibility requirements and will likely apply for low interest loans or grants available through this funding over the next five years. SLCDPU has also applied for a $52.4 million federal grant under the Building Resilient Infrastructure and Communities (BRIC) program administered through the Federal Emergency Management Agency (FEMA) to rebuild the City Creek Water Treatment Plant. We are waiting to know whether our application is successful.
While our success in receiving BIL and BRIC funding are not known at budget time, and therefore not included in our proposed budget, it should be noted that SLCDPU’s budget does reflect revenue associated with a $4 million grant from City and State ARPA allotments to construct a flood plain and stormwater project benefitting the City’s Granary District. The budget also includes the ongoing low interest WIFIA (Water Infrastructure Finance and Innovation Act) loan for the new WRF. It is estimated that the WIFIA loan will save ratepayers $100 million for the life of the project as compared to traditional revenue bonding.
Summary of Expenditures and Revenues The total proposed FY 2023 budget is $414,498,942, a 28.61 % decrease from the FY 2022 amended budget of $580,608,656. The FY 2022 adopted budget was adjusted for FY 2021 carryover encumbrances for open contracts, purchase orders, and amendments. Those changes are reflected in the amended budget amount. The proposed operating budget of $122,794,572 is $4,955,637 or 4.20% higher than the current year amended budget. The increase includes seven proposed new employees, and a 4.5% increase to accommodate employee compensation and benefit changes. Amounts paid to other departments for IMS charges, administrative service fees, payment in lieu of taxes, and risk management is projected to increase by $1,355,505. Operational costs also reflect a $509,070 increase to be paid to the Metropolitan Water District of Salt Lake and Sandy (MWDSLS) pursuant to their projected increased operational and capital needs.
The proposed capital budget for FY 2023 is $261,074,907. Debt service is anticipated to be $30,629,463, including the cost of new debt planned to be issued during June 2022.
Funding for capital projects in FY 2023 will be generated through rate revenue, bond proceeds from Series 2020 and 2022 issues, and a federal loan. SLCDPU plans to use its WIFIA loan under to finance $125,965,000 of the new WRF in FY 2023.
2

There are proposed rate increases for the water, sewer, and stormwater utilities. This includes a 15% increase in water, an 15% increase in sewer, and a 15% increase in stormwater rates. Appendix A includes a summary of expected customer rate impacts. SLCDPU’s total anticipated revenues for FY 2023 are $413,124,942, a decrease of $167,483,714. SLCDPU intends to transfer $90,618,712 from reserves utilizing debt funds.
Utility Funds FY 2023
Operations Capital Debt Fund Totals
Water 82,371,819 44,282,943 6,098,053 132,752,815 Sewer 27,315,112 207,189,964 21,409,504 255,914,580 Storm 9,783,401 7,362,000 1,554,321 18,699,722 Street 3,324,240 2,240,000 193,585 5,757,825 Total 122,794,572$ 261,074,907$ 29,255,463$ 413,124,942$
Summary of Utilities Fund Budgets
Major Expenditure Categories
Adopted Budget 2021-2022
Amended Budget 2021-2022
Proposed Budget 2022-
Difference Percent Change
Personal Services 45,615,184 46,354,529 49,027,442 2,672,913 5.77%Materials and Supplies 7,735,360 7,743,896 8,737,209 993,313 12.83%Charges for Services 61,240,035 63,740,510 65,029,921 1,289,411 2.02%Debt Service 23,185,287 23,185,287 29,255,463 6,070,176 26.18%Capital Outlay 6,167,835 7,090,761 8,235,997 1,145,236 16.15%Capital Improvements 276,506,326 432,493,673 252,838,910 (179,654,763) -41.54%Total 420,450,027$ 580,608,656$ 413,124,942$ (167,483,714)$ -28.85%
Proposed Department of Public Utilities Expenditures for FY 2022-23
Revenue Adopted Budget 2021-2022
Amended Budget 2021-2022
Proposed Budget 2022-
Difference Percent Change
Operating Sales 158,309,402 158,309,402 181,503,255 23,193,853 14.65%Interest 728,700 728,700 1,927,748 1,199,048 164.55%Permits 267,500 267,500 267,500 - 0.00%Interfund Charges 2,966,142 2,966,142 3,171,284 205,142 6.92%Other Revenues 2,087,930 2,087,930 2,153,330 65,400 3.13%Impact Fees 3,595,670 3,595,670 3,831,670 236,000 6.56%Contributions 3,426,443 3,426,443 3,686,443 260,000 7.59%Bond/Loan Proceeds 249,883,000 249,883,000 125,965,000 (123,918,000) -49.59%From (To) Reserves (784,760) 159,343,869 90,618,712 (68,725,157) -43.13%Total 420,480,027$ 580,608,656$ 413,124,942$ (167,483,714)$ -28.85%
Projected Department of Public Utilities Revenues for FY 2022-23
3

Summary of Additional Proposed Positions The proposed budget includes the addition of seven (7) new full time equivalent (FTE) positions. These recommended positions are identified to assist SLCDPU in meeting regulatory and programmatic requirements, expand the safety program, and supporting the economic and geographic growth within our service area. SLCDPU currently has 470.50 FTEs and is proposing the following positions to meet identified needs.
Administration Water Sewer Stormwater Street Lighting TotalSAFETY INSPECTOR 1.00 - - - 1.00
1.00 GIS and IT Systems
GIS TECHNICIAN I 0.50 0.30 0.20 - 1.00 1.00
Water QualityLEAD AND COPPER TECHNICIAN 2.00 - - - 2.00
2.00 Finance
ACCOUNTANT III 1.00 - - - 1.00 1.00
Engineering ENGINEERING TECHNICIAN V 0.80 0.70 0.50 - 2.00
2.00
Total New FTEs 5.30 1.00 0.70 - 7.00
Proposed Personnel Adjustments FY 2022-2023
4

Water Utility Enterprise Fund Water Infrastructure Background
The Salt Lake City water system is one of the oldest and largest systems west of the Mississippi River with over 1,127 miles of 12-inch or smaller distribution lines, and more than 190 miles of large transmission mains for a total asset inventory of 1,318 miles of pipe with over fifty pressure zones. The service area covers the Salt Lake City corporate boundaries as well as the east side of the Salt Lake Valley to the mouth of Little Cottonwood Canyon—a total of 141 square miles. This includes water supply to portions of other incorporated cities such as Mill Creek, Cottonwood Heights, Holladay, and small portions of Murray, Midvale, and South Salt Lake Cities. SLCDPU’s asset management program includes personnel and systems to assess the condition of the large water transmission mains, distribution mains, treatment and pumping plants, reservoirs, tanks, wells, canals, and other infrastructure to assure repair and replacement is completed with minimal impact to the public. Addressing aging water infrastructure through rehabilitation and replacement is a priority and is the primary reason behind gradual rate increases planned for the next few years in the water utility. For instance, each of SLCDPU’s three water treatment plants were originally constructed in the 1950’s and have undergone numerous upgrades. Based on recent condition assessments, SLCDPU is preparing a strategy to replace these treatment plants in future years to ensure this critical infrastructure remains viable for the long-term protection of public health and can better withstand major seismic events. There is also a continual need to repair and replace pipe segments to maintain water service and reduce emergency repair costs and impacts to the public.
Water Utility Budget Highlights for FY 2023 Anticipated Revenues The long-term impacts of the COVID-19 pandemic continue to be evaluated. During the past two years, patterns of water use have been altered. Due to current and anticipated drought responses leading to reduced water consumption, we are conservatively estimating revenues. SLCDPU intends to issue revenue bonds of $68,380,000 in June 2022 designated for water. Additional bonding of $147,821,000 is anticipated from FY 2024 to FY 2027 meet water utility capital project objectives. The revenue budget is proposed to decrease by $41,3573,241 or 23.75% from the FY 2022 budget. The proposed water utility budget for FY 2023 by major category is as follows:
5

Operating Sales: Revenue is expected to be 14.98% more than FY 2022 budgeted levels. The proposed budget is based on modeling done on 10-year water sales. The forecast anticipates a less than average consumption from the average.
Interfund Charges: The water utility is reimbursed by sewer, stormwater, street lighting, refuse, and the Hive program for services related to billing. Related revenue is anticipated to increase based on actual costs. Impact Fees: No change in anticipated. Bond Proceeds: No series bonds are anticipated to be issued during FY 2023. Reserve Funds: SLCDPU plans to use $26,030,447 of reserve funds to balance the capital and operational needs. Budgeted use of reserve funds is $27,532,101 less than the FY 2022 amended budget or a decrease of 51.40% Proposed Expenditures The water utility’s FY 2023 budget includes an increase of $1,461,257 in personal services. The increase in personal services is attributed to the addition of 5.30 FTEs and a 4.5% increase to accommodate employee compensation and benefit changes. The new FTEs requested will support the SLCDPU’s administration, finance, engineering, GIS and IT, and water quality divisions to meet regulatory requirements and support continued economic activity. Metropolitan Water District of Salt Lake and Sandy (MWDSLS) is projecting to increase the current price levels for water for FY 2023 without increases to operational or assessment charges. A 3% increase is included in this budget. Pursuant to SLCDPU’s recent water supply and demand planning, the FY 2023 budget includes a scheduled payment for the Central Utah Project Utah Lake System (ULS) petition for 3,100-acre feet of new water resources. The MWDSLS payment for the ULS petition of $844,223 is passed through to SLCDPU and is reflected in the SLCDPU FY 2023 proposed budget.
Revenue Adopted Budget 2021-2022
Amended Budget 2021-2022
Proposed Budget 2022-2023
Difference Percent Change
Operating Sales 85,462,346 85,462,346 98,266,900 12,804,554 14.98%Interest 398,000 398,000 883,164 485,164 121.90%Interfund Charges 2,966,142 2,966,142 3,171,284 205,142 6.92%Other Revenues 1,836,730 1,836,730 1,836,730 - 0.00%Impact Fees 1,784,670 1,784,670 1,784,670 - 0.00%Contributions 1,953,620 1,953,620 2,153,620 200,000 10.24%Bond Proceeds 26,146,000 26,146,000 - (26,146,000) From (To) Reserves 6,818,047 53,562,548 24,656,447 (28,906,101) -53.97%Total 127,365,555$ 174,110,056$ 132,752,815$ (41,357,241)$ -23.75%
Projected Water Revenues for FY 2022-23
6

SLCDPU plans to invest $38,989,000 in capital improvements for water utility infrastructure in FY 2023. The capital improvement program includes a prioritized balance of needed improvements to treatment plants, water lines, meter replacements, pump stations, wells, and other infrastructure. Certain water main replacements are being performed in conjunction with the General Fund bonded street repair projects. With construction costs escalating, SLCDPU is cautiously resuming its plans for gradual rate increases and investment into aging infrastructure this year. The expenditure budget for the water utility is proposed to decrease $41,357,241 or 23.75% from the FY 2022 amended budget. The proposed budget for FY 2023 by major category is as follows:
Personal Services: Employee related costs are estimated to increase $1,461,257 or 5.09%. The water utility budget anticipates an increase of 5.30 FTEs. The FY 2023 budget includes a 4.5% increase to accommodate employee compensation and benefit changes.
Charges for Services: The proposed budget for charges and services will decrease $140,684 or 0.30%. Debt Service: In compliance with current bond issues and in anticipation of the Series 2022 debt, the budget for debt services is projected to increase by $1,331,124. Capital Outlay: The proposed budget for capital outlay for FY 2023 includes $1,500,000 dedicated to the City’s watershed purchase account, $250,000 for water right and company purchases, $250,000 for water stock purchases, $150,000 for additional land purchases, $1,489,523 for 20 vehicles, $425,500 for field equipment, $250,000 for telemetering equipment, $180,000 for treatment plant equipment, $607,000 for office furniture and equipment, and $191,920 for other non-motive equipment. Capital Improvements: The proposed capital improvement budget for FY 2023 is $38,989,000. A detailed list of capital improvement projects is included in the cash flow summaries for the water utility. A capital project summary by facility type is as follows:
Major Expenditure Categories
Adopted Budget 2021-2022
Amended Budget 2021-2022
Proposed Budget 2022-2023
Difference Percent Change
Personal Services 28,272,052 28,732,768 30,194,025 1,461,257 5.09%Materials and Supplies 4,839,903 4,848,439 5,259,214 410,775 8.47%Charges for Services 45,263,836 47,059,264 46,918,580 (140,684) -0.30%Debt Service 4,766,929 4,766,929 6,098,053 1,331,124 27.92%Capital Outlay 4,622,835 5,128,961 5,293,943 164,982 3.22%Capital Improvements 39,600,000 83,573,695 38,989,000 (44,584,695) -53.35%Total 127,365,555$ 174,110,056$ 132,752,815$ (41,357,241)$ -23.75%
Proposed Water Expenditures for FY 2022-23
7

Type of Project Proposed Budget 2022-2023
Treatment Plants 9,200,000 Water Service Connections 6,600,000 Pumping Plant Upgrades 50,000 Reservoirs 3,535,000 Water Mains and Hydrants 16,893,000 Wells 996,000 Culverts, Flumes, and Bridges 1,615,000 Landscaping 100,000 Total 2022-2023 CIP 38,989,000$
Proposed Water Capital Improvement Program for FY 2022-23
8

Sewer Utility Enterprise Fund Sewer Infrastructure Background The City’s Water Reclamation Facility (WRF) was constructed in 1965 and has undergone numerous upgrades since. Nutrient removal regulations adopted by the Utah Department of Environmental Quality (UDEQ) in 2015 require a new sewage treatment process. After much study, SLCDPU determined that the WRF has reached the end of its useful life and adapting the 55-year-old facility to meet the new nutrient removal requirements is not feasible. A new WRF is currently under construction, to be completed to meet UDEQ’s nutrient compliance date of January 1, 2025. SLCDPU has been implementing a financing strategy of gradual rate increases revenue bonding and a low interest federal loan for the replacement of the WRF. Cost escalations have resulted in increasing the projected cost of the new WRF to $802,855,409, requiring additional financing strategies to be implemented, primarily additional revenue bonds to pay for the project increases. The sewer collection system (654 miles of pipeline, and several pump stations) is a very challenging environment; hydrogen sulfide gases, sediment, roots and other factors affect the competency of the collection lines. SLCDPU’s asset management program includes personnel and systems to assess the condition of the sewer collection system, pump stations, and other infrastructure to assure repair and replacement is completed with minimal impact to the public. More than 38% of the sewer collection system is greater than 80 years old. SLCDPU is expanding capacity of the sewer collection system, in large part to meet growth requirements related to the new State Correctional Facility, the Airport expansion, and new development occurring in the Northwest Quadrant of Salt Lake City.
9

Sewer Utility Budget Highlights for FY 2023 Total project costs for the WRF reconstruction were anticipated to be $711,653,000 in 2020. The estimated project cost to completion is now $802,855,409. Construction began in FY 2020 and SLCDPU has expended approximately $116.6 million to date on this project. Current financing for the new WRF is anticipated to be accomplished using a combination of revenue bonds, user rates, and a federal loan through the Water Infrastructure Finance and Innovation Act (WIFIA). The loan will provide up to 49% of the anticipated cost of the new WRF as submitted in 2020 ($711,725,000). The interest rate at loan closing in 2020 was extremely favorable at 1.34%. This is expected to save SLCDPU’s ratepayers more than $100 million over the life of the project compared to revenue bonds. Debt plans have been revised due to increased estimated project costs.
A proposed 15% rate increase is anticipated to generate an additional $8,705,063 in sewer fees. Proposed sales revenues are based on the best estimates available. The additional revenue is required for the sewer utility to meet its capital and operations objectives. Rate increases in future years are also anticipated at this time.
SLCDPU planned bond issuance for FY 2022 has been revised upward from $123,687,000 to $281,425,195. Changes to construction costs and schedule as well as market conditions were considered in the timing and amount of the bond issue Additional bonded debt of $146,250,000 is anticipated from FY 2024 to FY 2026 to meet capital objectives, primarily the reconstruction of the WRF. It is anticipated that WIFIA loan proceeds of $209,670,000 will be utilized during the same period. Debt will be used in conjunction with rate increases to blend pay as you go and borrowing strategies. The proposed debt is for a 30-year term creating intergenerational equity payback on the new WRF facility. The City’s professional financial advisors have been involved in the process to measure debt service
FY WIFIA Bonds Total2021-2022 13,000,000 280,000,000 293,000,000 2022-2023 125,965,000 - 125,965,000 2023-2024 158,517,000 5,100,000 163,617,000 2024-2025 48,456,000 48,000,000 96,456,000 2025-2026 2,697,000 47,250,000 49,947,000 2026-2027 - - - Total 348,635,000$ 380,350,000$ 728,985,000$
Sewer Planned Debt
10

and ratios to comply with external rating agency standards. SLCDPU intends to maintain its AAA rating to limit costs of borrowing. The total revenue budget is expected to decrease by $120,728,405 or 32.05% to $255,914,580 from the FY 2021 amended budget. The proposed budget for FY 2023 by major category is as follows:
Sewer service fees: Sewer service fees are expected to increase $8,705,063 or 15.00%. AWC information was utilized to determine a reasonably anticipated sales base, and then applied the 15% rate increase. The proposed increase is approximately $6.16 per month for the representative resident, assuming winter water use of eight CCF. Winter water use of eight CCF is conservative as some of our residents use less than eight CCF during the winter months. The additional revenue from rates is required for the sewer utility to meet is capital and operations objectives while balancing debt. Interest Income: Interest earnings are expected to increase due to Series 2022 bond proceeds. Permit Fees: No change is anticipated. Other Revenues: Increased to reflect estimate based on historical collections. Impact Fees: No change is anticipated. Bond / Note Proceeds: No bond issue is anticipated in FY 2023. The budget anticipates utilizing $125,965,000 in WIFIA loan proceeds. Contribution: No change in anticipated. Reserve Funds: Unspent bond proceeds of $59,283,673 will be transferred from reserves for use on the WRF project. Proposed Expenditures The proposed sewer budget for FY 2023 includes $205,884,910 in planned projects. Of this amount $175,322,910 is designated for the new WRF, $3,417,000 for the existing WRF, and $24,385,000 for improvements to the sewer collections system. Select sewer
RevenueAdopted Budget 2021-
2022Amended Budget
2021-2022Proposed Budget
2022-2023Difference
Percent Change
Operating Sales 58,034,937 58,034,937 66,740,000 8,705,063 15.00%Interest 171,000 171,000 947,084 776,084 453.85%Permits 267,500 267,500 267,500 - 0.00%Other Revenues 154,500 154,500 188,500 34,000 22.01%Bond/ Loan Proceeds 217,577,000 217,577,000 125,965,000 (91,612,000) -42.11%Impact Fees 1,422,000 1,422,000 1,422,000 - 0.00%Contribution 1,100,823 1,100,823 1,100,823 - 0.00%From (To) Reserves (10,513,964) 97,915,225 59,283,673 (38,631,552) -39.45%Total 268,213,796$ 376,642,985$ 255,914,580$ (120,728,405)$ -32.05%
Projected Sewer Revenues for FY 2022-23
11

collection line replacements are being performed in conjunction with the City’s general obligation bonded street repair projects. The sewer utility’s FY 2023 budget proposes a decrease of $120,728,405 or 32.05% from the FY 2022 amended budget. The proposed budget for FY 2023 by major category is as follows:
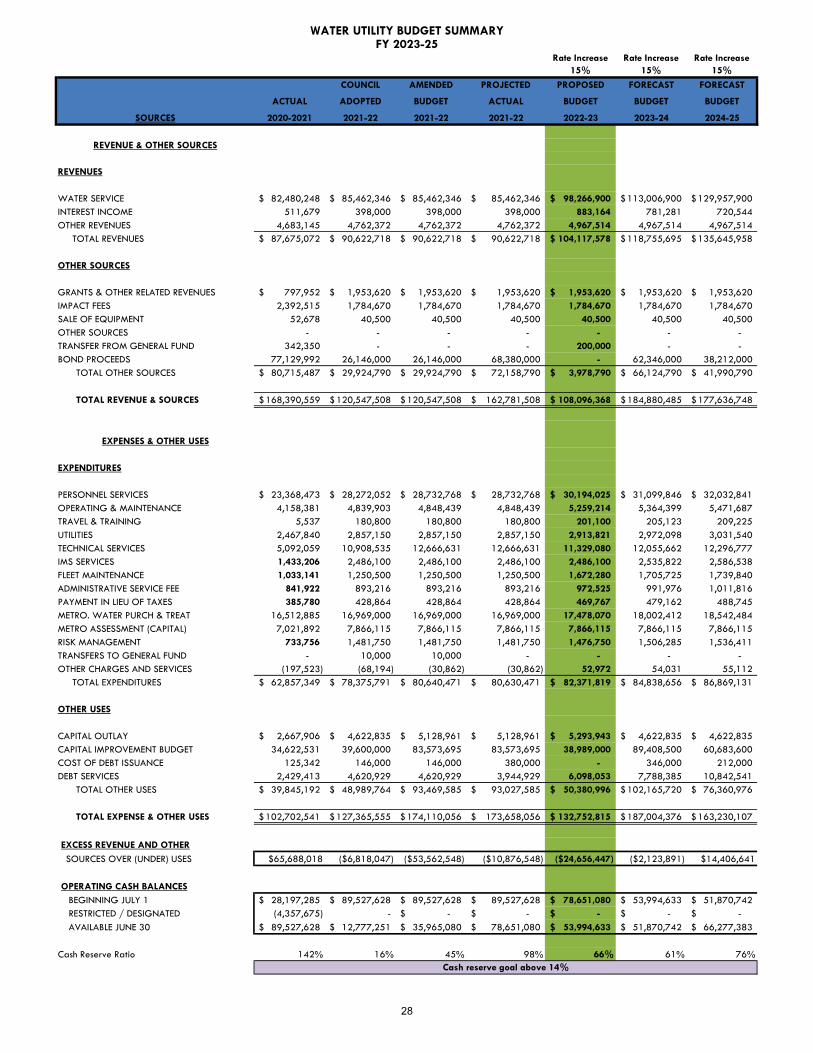
Personal Services: Employee related costs are estimated to increase $805,886 or 6.19%. The sewer utility budget anticipates an increase of one FTE. The FY 2023 budget includes a 4.5% increase to accommodate employee compensation and benefit changes. Materials & Supplies: The sewer utility’s budget for this category increases by $508,749. The increase is attributed increasing costs of supplies including chemical purchases. Charges for Services: Increases in professional and contractual services and increased sludge management fees represent the largest portion of the budget increase in this category. Debt Service: The annual debt service budget is expected to increase by $4,933,154 in FY 2023. The increase is attributed to payments on existing debt and includes interest payments for the Series 2022 debt. Capital Outlay: The proposed capital outlay budget for FY 2023 includes $849,054 for vehicles and trucks, $96,000 for field maintenance equipment, $45,000 for treatment plant equipment, $240,000 for office furniture and equipment, and $75,000 for other non-motive equipment. Capital Improvements: The proposed capital improvement budget for FY 2023 is $205,884,910, a decrease of $128,051,337 from the current year amended budget. A detailed list of capital improvement projects is included in the cash flow summary for the sewer utility. A capital project summary by facility type is as follows:
Major Expenditure Categories
Adopted Budget 2021-2022
Amended Budget 2021-2022
Proposed Budget 2022-2023
DifferencePercent Change
Personal Services 12,799,959 13,021,785 13,827,671 805,886 6.19%Materials and Supplies 2,656,055 2,656,055 3,164,804 508,749 19.15%Charges for Services 8,818,606 9,103,614 10,322,637 1,219,023 13.39%Debt Service 16,476,350 16,476,350 21,409,504 4,933,154 29.94%Capital Outlay 1,327,000 1,448,934 1,305,054 (143,880) -9.93%Capital Improvements 226,135,826 333,936,247 205,884,910 (128,051,337) -38.35%Total 268,213,796$ 376,642,985$ 255,914,580$ (120,728,405)$ -32.05%
Proposed Sewer Expenditures for FY 2022-23
12

Proposed Budget 2022-2023
178,739,910 24,385,000
2,760,000 205,884,910$
Proposed Sewer Capital Improvement Program for FY 2022-23
Type of Project
WRFCollection SystemLift StationsTotal 2022-2023 CIP
13

Stormwater Utility Enterprise Fund Stormwater Infrastructure Background The City’s stormwater system includes 350 miles of stormwater collection lines, 76 miles of canals and drainage ditches, 32 miles of open channel creeks and rivers, culverts, 27 lift stations, and 63 detention basins. These systems must be maintained to prevent flooding and to meet the water quality requirements in the Municipal Separate Storm Sewer System (MS4) permit. SLCDPU is also responsible for all city facilities meeting MS4 requirements. A new MS4 was issued to the City in June 2021, with resulting new requirements to implement in FY 2023. A Drainage Master Plan was completed in 1993. The FY 2023 budget includes the continuation of on update of the Drainage Master Plan to include water quality and climate change issues, such as storm intensification, in addition to traditional conveyance. Stormwater Utility Budget Highlights for FY 2023 Anticipated Revenues SLCDPU is proposing a rate increase of 15% in FY 2023. Rate increases between 5% and 10% are anticipated in future years through FY 2026 in order to maintain and rehabilitate infrastructure and meet more stringent water quality requirements. The planned bond issuance during FY 2022 will be deferred to FY 2024. This timing was adjusted to match the capital needs of the stormwater utility. The revenue budget is proposed to decrease by $5,432,246 or 22.51% from the FY 2022 amended budget. The proposed revenue budget for FY 2023 by major category is as follows:
Operating Sales: Revenue is expected to increase by approximately 15%.
Revenue Adopted Budget 2021-2022
Amended Budget 2021-2022
Proposed Budget 2022-2023
Difference Percent Change
Operating Sales 10,714,550 10,714,550 12,321,733 1,607,183 15.00%Interest 119,200 119,200 75,000 (44,200) -37.08%Other Revenues 64,000 64,000 103,000 39,000 60.94%Impact Fees 389,000 389,000 625,000 236,000 60.67%Contributions 352,000 352,000 352,000 - 0.00%Bond Proceeds 6,160,000 6,160,000 - (6,160,000) From (To) Reserves 1,402,263 6,333,218 5,222,989 (1,110,229) -17.53%Total 19,201,013$ 24,131,968$ 18,699,722$ (5,432,246)$ -22.51%
Projected Storm Revenues for FY 2022-23
14

Interest Income: Interest earnings are expected to decrease due to spending of bond proceeds. Other Revenues: Increased based on historical collections. Contributions: No change is anticipated. Impact Fees: Increased based on historical collections. Reserve Funds: Reserves of $5,222,989 will be utilized for stormwater system improvements. These funds will come from the Series 2020 Bond proceeds. Proposed Expenditures The stormwater utility’s FY 2023 budget proposes capitalizing $5,725,000 to renovate portions of the stormwater collection system. A portion of the stormwater system improvements are being performed in conjunction with the general obligation bonded street repair projects. The FY 2023 capital improvements budget includes continued funding for this cooperative work. The expenditure budget for the stormwater utility is proposed to decrease $5,432,246 or 22.51%. The proposed budget for fiscal year FY 2023 by major category is as follows:
Personal Services: Employee related costs are estimated to increase $377,466 or 8.91%. The stormwater utility budget anticipates an increase of 0.70 FTEs. The FY 2023 budget includes a 4.5% increase to accommodate employee compensation and benefit changes. Materials and Supplies: The increase is due to increased parts and maintenance supply costs. Charges for Services: Other professional services and fleet costs are anticipated to increase in FY 2023. Debt Service: The budget decreases due to the deferral of the budgeted 2022 bond issue. Capital Outlay: The proposed capital outlay budget for FY 2023 includes $890,000 for vehicles, $456,000 for field maintenance equipment, $131,000 for other non-motive equipment, $160,000 for office furniture and equipment. Capital Improvements: The proposed capital improvement budget for FY 2023 is $5,725,500, a decrease of $7,002,316 from the FY 2022 amended budget. A detailed list
Major Expenditure Categories
Adopted Budget 2021-2022
Amended Budget 2021-2022
Proposed Budget 2022-2023
Difference Percent Change
Personal Services 4,215,783 4,235,488 4,612,954 377,466 8.91%Materials and Supplies 232,408 232,408 306,197 73,789 31.75%Charges for Services 4,255,851 4,675,419 4,864,250 188,831 4.04%Debt Service 1,748,471 1,748,471 1,554,321 (194,150) -11.10%Capital Outlay 218,000 512,866 1,637,000 1,124,134 219.19%Capital Improvements 8,530,500 12,727,316 5,725,000 (7,002,316) -55.02%Total 19,201,013$ 24,131,968$ 18,699,722$ (5,432,246)$ -22.51%
Proposed Storm Expenditures for FY 2022-23
15

of capital improvement projects is provided in the cash flow summary for the stormwater utility. The capital project summary by facility types are as follows:
Proposed Budget 2022-2023
4,875,000 750,000 100,000
5,725,000$
Lift StationsLandscapingTotal 2022-2023 CIP
Proposed Storm Capital Improvement Program for FY 2022-23
Type of Project
Lines and Riparian Corridor Projects
16

Street Lighting Utility Enterprise Fund Street Lighting Infrastructure Background SLCDPU has updated the City’s Street Lighting Master Plan, which balances safety, character, responsibility to public health and the environment, and equity using a series of plan guideposts for evaluating the illuminated environment and the technical elements of a streetlighting system. SLCDPU anticipates revising the street lighting cost of service and rate study, as well as preparing a programmatic and systematic approach to implementation of the 2020 master plan. Of the 15,820 lights that the City maintains, 9,814 lights or 62% are now considered to be energy efficient. The FY 2023 budget funds implementation of the new 2020 Street Lighting Master Plan, as well as the continued conversion to high efficiency lights.
17

Street Lighting Utility Budget Highlights for FY 2023 Anticipated Revenues No rate changes are proposed in the FY 2023 budget. The base lighting rates were established in 2013 at $3.73 per month for an average residential customer, or Equivalent Residential Unit (ERU), and are expected to remain unchanged for this fiscal year. Rates for enhanced tiers are Tier 1 $5.67, Tier 2 $15.94, and Tier 3 $43.82. Continuation of the private lights program is proposed in the FY 2023 budget. The program includes a $20,000 transfer from the General Fund and indicates the on-going desire of the City to provide a matching support to reduce the capital costs to neighborhoods installing private street lighting. SLCDPU administers this program. The budget anticipates transfers from the General Fund associated with three prior fiscal years. The revenue budget is proposed to increase by $34,178 from the FY 2022 budget. The proposed budget for FY 2023 by major category is as follows:
Operating Sales: Rate changes are not proposed thus this category is not expected to change significantly. The FY 2023 budget is based on actual sales revenue from FY 2021. Interest Income: Interest earnings budget was revised based on a review of historical and current year earnings. The decrease is also associated with declining cash balances. Other Revenues: The decrease is based on 5-year historical data. General Fund Contributions: FY 2023 reflects prior year funds not received from General Fund. Reserve Funds: The FY 2023 budget anticipates using $1,455,603 from the utility’s reserve funds.
RevenueAdopted Budget
2021-2022Amended Budget
2021-2022Proposed Budget
2022-2023Difference
Percent Change
Operating Sales 4,097,569 4,097,569 4,174,622 77,053 1.88%Interest 40,500 40,500 22,500 (18,000) -44.44%Other Revenues 32,700 32,700 25,100 (7,600) -23.24%General Fund Contributions 20,000 20,000 80,000 60,000 300.00%From (To) Reserves 1,508,894 1,532,878 1,455,603 (77,275) -5.04%Total 5,699,663$ 5,723,647$ 5,757,825$ 34,178$ 0.60%
Projected Street Lighting Revenues for FY 2022-23
18

Proposed Expenditures Street lighting capital improvements totaling $2,240,000 are planned in the FY 2023 budget. The Street Lighting Capital Program focuses on high efficiency and system upgrades in neighborhood, arterial and collector streets per the new 2020 Street Lighting Master Plan. This includes replacement of outdated induction lighting with LED and replacement of cactus poles. The expenditure budget for the street lighting utility is proposed to increase $34,178 or 0.60% from the FY 2022 amended budget. The proposed budget for FY 2023 by major category is as follows:
Personal Services: Employee related costs are estimated to increase $28,304 or 7.77%. The FY 2023 budget includes a 4.5% increase to accommodate employee compensation and benefit changes. Charges for Services: The proposed budget for charges and services increases $22,241 or 0.77% in FY 2023. Debt Service: In compliance with the outstanding Series 2017 Bond, budgeted debt service payments will increase slightly from FY 2022. Capital Equipment: No expenditures of capital equipment are planned. Capital Improvements: The proposed capital improvement budget for FY 2023 is $2,240,000, a decrease of $16,414 from the FY 2022 amended budget. A capital projects summary by facility type is as follows for base lighting and all enhanced tiers:
Major Expenditure Categories
Adopted Budget 2021-2022
Amended Budget 2021-2022
Proposed Budget 2022-2023
DifferencePercent Change
Personal Services 327,390 364,488 392,792 28,304 7.77%Materials and Supplies 6,994 6,994 6,994 - 0.00%Charges for Services 2,901,742 2,902,213 2,924,454 22,241 0.77%Debt Service 193,537 193,537 193,585 48 0.02%Capital Improvements 2,240,000 2,256,415 2,240,000 (16,415) -0.73%Total 5,669,663$ 5,723,647$ 5,757,825$ 34,178$ 0.60%
Proposed Street Lighting Expenditures for FY 2022-23
Proposed Budget 2022-2023
2,240,000 2,240,000.00$
System upgrades for high efficiency and uniformity - Base Tiers 1-3Total 2022-2023 CIP
Type of Project
Proposed Street Lighting Capital Improvement Program for FY 2022-23
19

This page left intentionally blank.
20

Combined Utilities- Budget Summary and Cash Flow
21

COUNCIL AMENDED PROJECTED PROPOSED PROPOSED PROPOSEDACTUAL ADOPTED BUDGET ACTUAL BUDGET BUDGET BUDGET
SOURCES 2020-21 2021-22 2021-22 2021-22 2022-23 2023-24 2024-2025
REVENUE & OTHER SOURCES
REVENUES
WATER SERVICE 82,480,248$ 85,462,346$ 85,462,346$ 85,462,346$ 98,266,900$ 113,006,900$ 129,957,900$ SEWER SERVICE 51,516,383 58,034,937 58,034,937 58,034,937 66,740,000 73,414,000 80,755,000 STORM WATER FEES 10,922,225 10,714,550 10,714,550 10,714,550 12,321,733 13,553,906 14,909,297 STREET LIGHTING FEES 4,350,116 4,097,569 4,097,569 4,097,569 4,174,622 4,592,084 5,051,292 UTILITY SERVICE REVENUE 149,268,972 158,309,402 158,309,402 158,309,402 181,503,255 204,566,890 230,673,489
INTEREST INCOME 1,093,683 728,700 728,700 689,610 1,927,748 917,094 860,399 OTHER REVENUES 5,358,388 5,237,231 5,237,231 5,250,796 5,476,614 5,481,373 5,481,373
TOTAL REVENUES 155,721,043$ 164,275,333$ 164,275,333$ 164,249,808$ 188,907,617$ 210,965,357$ 237,015,261$
OTHER SOURCES
GRANTS & OTHER RELATED REVENUES 1,449,241$ 3,434,284$ 3,434,284$ 3,406,443$ 3,431,443$ 3,431,443$ 7,431,443$ IMPACT FEES 6,415,863$ 3,595,670 3,595,670$ 4,714,045$ 3,831,670$ 3,831,670$ 3,831,670$ SALE OF EQUIPMENT 92,451 56,500$ 56,500 139,125 90,500 90,500 90,500 BOND PROCEEDS 197,939,471 155,993,000 155,993,000 349,805,195 - 118,659,000 86,480,000 WIFIA LOAN - 93,890,000 93,890,000 13,000,000 125,965,000 158,517,000 48,456,000 TRANSFERS FROM GENERAL FUND 343,850 20,000 20,000 20,000 280,000 20,000 20,000
TOTAL OTHER SOURCES 206,240,876$ 256,989,454$ 256,989,454$ 371,084,808$ 133,598,613$ 284,549,613$ 146,309,613$
TOTAL REVENUE & OTHER SOURCES 361,961,919$ 421,264,787$ 421,264,787$ 535,334,616$ 322,506,230$ 495,514,970$ 383,324,874$
EXPENSES & OTHER USES
EXPENDITURES
PERSONNEL SERVICES 36,996,997$ 45,645,184$ 46,354,529$ 46,354,529$ 49,027,442$ 50,676,116$ 52,392,161$ OPERATING & MAINTENANCE 5,525,465 7,735,360 7,743,896 7,743,896 8,737,209 8,911,952 9,090,195 TRAVEL & TRAINING 13,886 298,005 298,005 298,005 332,355 339,003 345,782 UTILITIES 3,931,050 5,172,058 5,172,058 5,172,058 5,142,123 5,244,965 5,349,863 TECHNICAL SERVICES 8,462,875 16,530,731 18,941,186 18,933,245 17,921,211 18,779,636 19,155,232 IMS SERVICES 2,541,765 4,332,073 4,332,073 4,332,073 4,412,313 4,500,560 4,590,572 FLEET MAINTENANCE 1,556,995 2,005,500 2,005,500 2,005,500 2,511,625 2,561,857 2,613,094 ADMINISTRATIVE SERVICE FEE 1,473,935 1,600,416 1,600,416 1,600,416 1,760,460 1,795,671 1,831,585 PAYMENT IN LIEU OF TAXES 1,393,358 1,413,775 1,456,244 1,456,244 1,638,918 1,671,697 1,705,132 METRO. WATER PURCH & TREAT 16,512,885 16,969,000 16,969,000 16,969,000 17,478,070 18,002,412 18,542,484 METRO ASSESSMENT (CAPITAL) 7,021,892 7,866,115 7,866,115 7,866,115 7,866,115 7,866,115 7,866,115 RISK MANAGEMENT 893,535 1,759,300 1,759,300 1,759,300 1,764,407 1,799,695 1,835,689 TRANSFERS TO GENERAL FUND - 14,000 21,941 4,000 - - - OTHER CHARGES AND SERVICES 412,772 840,575 880,185 877,907 1,513,837 1,544,113 1,574,999 BILLING COST 1,502,572 1,618,882 1,618,882 1,618,882 1,618,882 1,651,259 1,684,284 NEW PLANT O&M COSTS - - - - 250,000 252,500 255,025 PUBLIC SERVICES / STREET SWEEPING 236,000 819,605 819,605 819,605 819,605 819,605 819,605
TOTAL EXPENDITURES 88,475,982$ 114,620,579$ 117,838,935$ 117,810,775$ 122,794,572$ 126,417,156$ 129,651,817$
OTHER USES
CAPITAL OUTLAY 3,686,129$ 6,167,835$ 7,090,761$ 7,090,761$ 8,235,997$ 6,122,835$ 6,122,835$ CAPITAL IMPROVEMENT BUDGET 121,366,326 276,506,326 432,493,673 432,493,673 252,838,910 332,800,925 191,895,318 COST OF DEBT ISSUANCE 384,989 867,200 867,200 1,941,000 - 659,000 480,000 DEBT SERVICES 16,586,495 22,318,087 22,318,087 18,395,087 29,255,463 32,442,570 43,346,640
TOTAL OTHER USES 142,023,939$ 305,859,448$ 462,769,721$ 459,920,521$ 290,330,370$ 372,025,330$ 241,844,793$
TOTAL EXPENSE & OTHER USES 230,499,921$ 420,480,027$ 580,608,656$ 577,731,296$ 413,124,942$ 498,442,486$ 371,496,610$
EXCESS REVENUE AND OTHER
SOURCES OVER (UNDER) USES 131,461,998$ 784,760$ (159,343,869)$ (42,396,680)$ (90,618,712)$ (2,927,516)$ 11,828,264$
OPERATING CASH BALANCES
BEGINNING JULY 1 72,333,355$ 198,868,125$ 198,868,125$ 198,868,125$ 156,471,445$ 65,852,733$ 62,925,217$ RESTRICTED / DESIGNATED (4,927,228) - - - - - - ENDING JUNE 30 198,868,125$ 199,652,885$ 39,524,256$ 156,471,445$ 65,852,733$ 62,925,217$ 74,753,481$
Cash Reserve Ratio 225% 174% 34% 133% 54% 50% 58%
PUBLIC UTILITIESWATER, SEWER, STORMWATER, AND STREET LIGHTING COMBINED BUDGET SUMMARY
Cash reserve goal above 14%
Combined Rate Increase 15%
Combined Rate Increase 13%
Combined Rate Increase 13%
FY 2023-2025
22

PUBLIC UTILITIESCOMBINED WATER, SEWER, STORMWATER, AND STREET LIGHTING CASH FLOW
FY 2023 BUDGET AND FY 2024-2027 FORECASTACTUAL PROJECTED BUDGET BUDGET BUDGET BUDGET BUDGET
YEAR YEAR YEAR YEAR YEAR YEAR YEAR2020-2021 2021-2022 2022-2023 2023-2024 2024-2025 2025-2026 2026-2027
REVENUEWATER SALES 82,480,248$ 85,462,346$ 98,266,900$ 113,006,900$ 129,957,900$ 145,552,800$ 160,108,100$ SEWER CHARGES 51,516,383 58,034,937 66,740,000 73,414,000 80,755,000 88,831,000 97,714,000 STORMWATER FEES 10,889,575 10,714,550 12,321,733 13,553,906 14,909,297 15,654,762 15,654,762 STREET LIGHTING FEES 4,350,116 4,097,569 4,174,622 4,592,084 5,051,292 5,556,421 6,112,063
TOTAL SERVICES FEES AND CHARGES 149,236,322$ 158,309,402$ 181,503,255$ 204,566,890$ 230,673,489$ 255,594,983$ 279,588,925$
OTHER INCOME 5,392,538$ 5,250,796$ 5,476,614$ 5,481,373$ 5,481,373$ 5,481,373$ 5,483,173$ INTEREST INCOME 1,093,683 689,610 1,927,748 917,094 860,399 1,048,743 1,299,577
TOTAL OPERATING INCOME 155,722,543$ 164,249,808$ 188,907,617$ 210,965,357$ 237,015,261$ 262,125,099$ 286,371,675$
OPERATING EXPENDITURESOPERATING EXPENDITURES (88,475,982)$ (117,810,775)$ (122,794,572)$ (126,417,156)$ (129,651,817)$ (132,981,533)$ (139,411,858)$
NET INCOME EXCLUDING DEP. 67,246,561$ 46,439,033$ 66,113,045$ 84,548,201$ 107,363,444$ 129,143,566$ 146,959,817$
OTHER INCOME & EXPENSEWIFIA LOAN -$ 13,000,000$ 125,965,000$ 158,517,000$ 48,456,000$ 2,697,000$ -$ NET BOND PROCEEDS 197,554,482 347,864,195 - 118,000,000 86,000,000 77,250,000 23,000,000 BIC Borrowed 384,989 1,941,000 - 659,000 480,000 432,000 129,000 BIC Paid (384,989) (1,941,000) - (659,000) (480,000) (432,000) (129,000) IMPACT FEES 6,415,863 4,714,045 3,831,670 3,831,670 3,831,670 3,831,670 3,831,670 OTHER CONTRIBUTIONS 1,791,591 3,426,443 3,711,443 3,451,443 7,451,443 4,034,620 4,034,620 SALE OF EQUIPMENT 92,451 139,125 90,500 90,500 90,500 90,500 90,500 CAPITAL OUTLAY (3,191,423) (5,440,761) (6,085,997) (3,972,835) (3,972,835) (3,972,835) (3,972,835) WATERSHED PURCHASES (494,706) (1,650,000) (2,150,000) (2,150,000) (2,150,000) (2,150,000) (2,150,000) STATE LOAN DEBT SERVICE (2,125,000) - - - - - - WIFIA LOAN REPAYMENT - - - - - - - DEBT SERVICE (14,461,495) (18,395,087) (18,236,569) (18,310,445) (18,418,527) (18,415,120) (17,912,085) NEW DEBT SERVICE - - (11,018,894) (14,132,125) (24,928,113) (27,427,680) (31,796,927)
OTHER INCOME & EXPENSE 185,581,763$ 343,657,960$ 96,107,153$ 245,325,208$ 96,360,138$ 35,938,155$ (24,875,057)$
CAPITAL GENEARATIONGENERATED FOR CAPITAL 252,828,324$ 390,096,993$ 162,220,198$ 329,873,409$ 203,723,582$ 165,081,721$ 122,084,760$
CAPITAL IMPROVEMENTSCAPITAL IMPROVEMENTS (121,366,326)$ (432,493,673)$ (252,838,910)$ (332,800,925)$ (191,895,318)$ (142,524,677)$ (187,512,411)$
OPERATING CASH BALANCESBEGINING CASH BALANCE 72,333,355$ 198,868,125$ 156,471,445$ 65,852,733$ 62,925,217$ 74,753,481$ 97,310,525$ CASH INCREASE/(DECREASE) 131,461,998 (42,396,680) (90,618,712) (2,927,516) 11,828,264 22,557,044 (65,427,651) RESTRICTED / DESIGNATED (4,927,228) - - - - - -
ENDING BALANCES 198,868,125$ 156,471,445$ 65,852,733$ 62,925,217$ 74,753,481$ 97,310,525$ 31,882,874$
CASH RESERVE RATIO 224.8% 132.8% 53.6% 49.8% 57.7% 73.2% 22.9%DEBT SERVICE COVERAGE 4.05 2.52 2.26 2.61 2.48 2.82 2.96 % CHANGE RESIDENTIAL UTILITY BILL* 10.2% 14.3% 13.2% 13.2% 11.0% 9.3%DEBT SERVICE % OF GROSS OPERATING REVENUE 9.2% 11.1% 15.5% 15.3% 17.9% 17.4% 17.3%RESIDENTIAL UTILITY BILL 72.93 80.37 91.88 103.96 117.69 130.58 142.77
* Residential Utility Bill assumes annual water consumption of 255 ccf/12 months, 4 ccf monthly of sewer, 1 Stormwater ERU (.25 acres) monthly, and 1 Street Lighting ERU (75 feet) monthly.
23

DESCRIPTION OF SERVICES
JUNE 30, 2021 ACTUALS WATER
JUNE 30, 2021 ACTUALS
SEWER
JUNE 30, 2021 ACTUALS STORM
JUNE 30, 2021 ACTUALS
STREET LIGHT
JUNE 30, 2021 ACTUALS TOTALS
FY 2021/2022 BUDGET
FY 2022/2023 PROPOSED
BUDGET
ADMINISTRATIVE SERVICE FEES (GENERAL FUND)HUMAN RESOURCES x 260,794$ 141,668$ 45,724$ 8,382$ 456,568$ 495,746$ 545,320$ CITY ATTORNEY x 120,382 65,394 21,105 3,868 210,749 228,835 251,718 ACCOUNTING/FINANCE x 164,239 89,218 28,795 5,278 287,530 312,203 343,424 PURCHASING & CONTRACTS x 84,934 46,138 14,891 2,729 148,692 161,452 177,597 CITY RECORDERS x 59,094 32,101 10,360 1,899 103,454 112,333 123,566 PROPERTY MANAGEMENT x - - - - - - - BUDGET AND POLICY x 51,803 28,141 9,082 1,665 90,691 98,474 108,321 TREASURER'S OFFICE (CASH MGT.) x 45,013 24,452 7,892 1,446 78,803 85,565 94,122 DIST EMG PREP COSTS x 54,741 29,736 9,597 1,759 95,833 104,057 114,463 CITY COUNCIL x - - - - - - - MAYOR x - - - - - - - COMMUNITY AFFAIRS x 922 501 162 30 1,615 1,753 1,928
TOTAL ADMINISTRATIVE FEES 841,922$ 457,351$ 147,607$ 27,055$ 1,473,935$ 1,600,416$ 1,760,458$
TAX OR FEE AUTHORIZEDPAYMENT IN LIEU-OF-TAXES (GENERAL FUND) 385,780$ 809,149$ 124,259$ 74,170$ 1,393,358$ 1,413,775$ 1,638,918$ FRANCHISE FEES (GENERAL FUND) 2,979,466 3,214,238 668,259 - 5,006,310 7,808,965 8,449,515
TOTAL TAX OR FEE AUTHORIZED 3,365,246$ 4,023,387$ 792,518$ 74,170$ 6,399,668$ 9,222,740$ 10,088,433$
INTERNAL SERVICE FUND SERVICESFLEET MGT. SERVICES 1,033,140$ 332,753$ 191,101$ -$ 1,556,994$ 2,005,500$ 2,251,575$ CITY DATA PROCESSING (IMS) 1,433,206 647,925 460,634 - 2,541,765 2,549,085 2,629,325 WORK DAY ALLOCATION - - - - - 1,782,988 1,782,988 RISK MGT. ADMININSTRATIVE FEES (GOV. IMMUNITY) x 219,969 26,547 74 - 246,590 272,250 272,252 RISK MANAGEMENT PREMIUMS & CHARGES 513,787 93,977 39,181 - 646,945 1,676,550 1,680,004
TOTAL INTERNAL SERVICE FUND SERVICES 3,200,102$ 1,101,202$ 690,990$ -$ 4,992,294$ 8,286,373$ 8,616,144$
SPECIAL ASSOCIATED CHARGES (INDIRECT BENEFIT)WORK DAY (Allocation) - - - - - STREET SWEEPING - - 236,000 - 236,000 819,605 819,605
TOTAL SPECIAL ASSOCIATED CHARGES -$ -$ 236,000$ -$ 236,000$ 819,605$ 819,605$
TOTAL FEES, TAXES AND CHARGES 7,407,270$ 5,581,940$ 1,867,115$ 101,225$ 14,957,550$ 19,929,134$ 21,284,639$
PUBLIC UTILITIESFEES AND CHARGES PAID TO THE GENERAL FUND
FOR SERVICES RENDERED
OR COLLECTED BY CITY ORDINANCE
24

Division Cost Center Study or Project Description Lighting Water Sewer Storm TotalAdministration 5100200 Great Salt Lake Basin Study - Year 1 25,000 25,000 Administration 5103000 Special Consultant - Emergency Preparedness Plan 15,000 15,000 Administration 5103700 Public Engagement - Rate Study 30,000 30,000 Administration 5100200 Special Consultant NAWC and DNR Cloud Seeding 80,000 80,000 Administration 5100200 Special Consultant - University of Utah Climate Study 95,000 95,000 Administration 4848000 Implementation plan, and Misc. Needs 90,000 90,000 Administration 4848000 Engagement 80,000 80,000 Administration 4848000 Rate Study 50,000 50,000 Administration 5100200 Special Consultant - Measurement and Device Study 50,000 50,000 Administration 5100200 Water Supply and Demand Study - Update 50,000 50,000 Administration 4848000 Smart Cities Plan-Contribution 40,000 40,000 Administration 5100200 Sustainability Opportunities Study for Public Utilities 50,000 50,000 Engineering 5101300 AMP for Storage Reservoirs 135,000 135,000 Engineering 5210400 Jacobs Program Support - Operations share 300,000 300,000 Engineering 5210400 Sewer Master Plan Update - initiation 100,000 100,000 Engineering 5310300 Storm Water Master Plan 350,000 350,000 Engineering 5310300 Jacobs Program Support - Operations share 75,000 75,000 Engineering 5101300 Jacobs Program Support - Operations share 300,000 300,000 Engineering 5101300 Well Siting Study 285,000 285,000 Finance 5310500 Energy Retro-Commissioning Study - Sustainability Opportunities 35,000 35,000 Finance 5103200 Special Consultant 500,000 500,000 Finance 5211700 Energy Retro-Commissioning Study - Sustainability Opportunities 55,000 55,000 Finance 5103200 Diversity, Equity, and Inclusion Plan Facilitator 48,000 48,000 Finance 5211700 Diversity, Equity, and Inclusion Plan Facilitator 20,250 20,250 Finance 5310500 Diversity, Equity, and Inclusion Plan Facilitator 6,750 6,750 Finance 5103200 Utility Rate Study 287,500 287,500 Finance 5211700 Utility Rate Study 172,500 172,500 Finance 5310500 Utility Rate Study 115,000 115,000 Finance 5211700 Sampling in support of rate study 150,000 150,000 Finance 5103200 Space Needs Assessment 125,000 125,000 Finance 5211700 Space Needs Assessment 62,500 62,500 Finance 5310500 Space Needs Assessment 62,500 62,500 GIS 5101600 Special Consultant 37,500 37,500 Maintenance 5100100 Site Cleanup 60,000 60,000 Maintenance 5100300 Consultants - Wells 100,000 100,000 Maintenance 5100100 Geotech Consultants 50,000 50,000 Reclamation 5211300 Wasatch Front Water Quality Council (WFWQC) 150,000 150,000 Water Quality 5101800 Public Relations 8,000 8,000 Water Quality 5101800 Utah State University Canal Analysis 35,300 35,300 Water Quality 5101800 Water Quality Analysis-Various 70,000 70,000 Water Quality 5100600 Watershed Management Plan 50,000 50,000 Water Quality 5100600 Misc Needs 10,000 10,000 Water Quality 5100600 PR Keep it Pure Campaign-Continuous work 40,000 40,000 Water Quality 5310700 Various regulatory reports - permit compliance Stormwater 20,000 20,000 Water Quality 5100600 PMAA Remediation and Restoration Design 500,000 500,000 Water Quality 5310700 IWM-Plan and Planning Documents 150,000 150,000 Water Quality 5101000 Lead &Copper Support 250,000 250,000 Water Quality 5100600 Watershed Management Plan-Stakeholder and public engagement 50,000 50,000
260,000 3,336,300 1,010,250 814,250 5,420,800
Public Utilities Proposed Consulting Studies for FY 2022-2023
25

26

Water Utility- Budget Summary and Cash Flow
27
COUNCIL AMENDED PROJECTED PROPOSED FORECAST FORECAST
ACTUAL ADOPTED BUDGET ACTUAL BUDGET BUDGET BUDGET
SOURCES 2020-2021 2021-22 2021-22 2021-22 2022-23 2023-24 2024-25
REVENUE & OTHER SOURCES
REVENUES
WATER SERVICE 82,480,248$ 85,462,346$ 85,462,346$ 85,462,346$ 98,266,900$ 113,006,900$ 129,957,900$ INTEREST INCOME 511,679 398,000 398,000 398,000 883,164 781,281 720,544 OTHER REVENUES 4,683,145 4,762,372 4,762,372 4,762,372 4,967,514 4,967,514 4,967,514
TOTAL REVENUES 87,675,072$ 90,622,718$ 90,622,718$ 90,622,718$ 104,117,578$ 118,755,695$ 135,645,958$
OTHER SOURCES
GRANTS & OTHER RELATED REVENUES 797,952$ 1,953,620$ 1,953,620$ 1,953,620$ 1,953,620$ 1,953,620$ 1,953,620$ IMPACT FEES 2,392,515 1,784,670 1,784,670 1,784,670 1,784,670 1,784,670 1,784,670 SALE OF EQUIPMENT 52,678 40,500 40,500 40,500 40,500 40,500 40,500 OTHER SOURCES - - - - - - - TRANSFER FROM GENERAL FUND 342,350 - - - 200,000 - - BOND PROCEEDS 77,129,992 26,146,000 26,146,000 68,380,000 - 62,346,000 38,212,000
TOTAL OTHER SOURCES 80,715,487$ 29,924,790$ 29,924,790$ 72,158,790$ 3,978,790$ 66,124,790$ 41,990,790$
TOTAL REVENUE & SOURCES 168,390,559$ 120,547,508$ 120,547,508$ 162,781,508$ 108,096,368$ 184,880,485$ 177,636,748$
EXPENSES & OTHER USES
EXPENDITURES
PERSONNEL SERVICES 23,368,473$ 28,272,052$ 28,732,768$ 28,732,768$ 30,194,025$ 31,099,846$ 32,032,841$ OPERATING & MAINTENANCE 4,158,381 4,839,903 4,848,439 4,848,439 5,259,214 5,364,399 5,471,687 TRAVEL & TRAINING 5,537 180,800 180,800 180,800 201,100 205,123 209,225 UTILITIES 2,467,840 2,857,150 2,857,150 2,857,150 2,913,821 2,972,098 3,031,540 TECHNICAL SERVICES 5,092,059 10,908,535 12,666,631 12,666,631 11,329,080 12,055,662 12,296,777 IMS SERVICES 1,433,206 2,486,100 2,486,100 2,486,100 2,486,100 2,535,822 2,586,538 FLEET MAINTENANCE 1,033,141 1,250,500 1,250,500 1,250,500 1,672,280 1,705,725 1,739,840 ADMINISTRATIVE SERVICE FEE 841,922 893,216 893,216 893,216 972,525 991,976 1,011,816 PAYMENT IN LIEU OF TAXES 385,780 428,864 428,864 428,864 469,767 479,162 488,745 METRO. WATER PURCH & TREAT 16,512,885 16,969,000 16,969,000 16,969,000 17,478,070 18,002,412 18,542,484 METRO ASSESSMENT (CAPITAL) 7,021,892 7,866,115 7,866,115 7,866,115 7,866,115 7,866,115 7,866,115 RISK MANAGEMENT 733,756 1,481,750 1,481,750 1,481,750 1,476,750 1,506,285 1,536,411 TRANSFERS TO GENERAL FUND - 10,000 10,000 - - - - OTHER CHARGES AND SERVICES (197,523) (68,194) (30,862) (30,862) 52,972 54,031 55,112
TOTAL EXPENDITURES 62,857,349$ 78,375,791$ 80,640,471$ 80,630,471$ 82,371,819$ 84,838,656$ 86,869,131$
OTHER USES
CAPITAL OUTLAY 2,667,906$ 4,622,835$ 5,128,961$ 5,128,961$ 5,293,943$ 4,622,835$ 4,622,835$ CAPITAL IMPROVEMENT BUDGET 34,622,531 39,600,000 83,573,695 83,573,695 38,989,000 89,408,500 60,683,600 COST OF DEBT ISSUANCE 125,342 146,000 146,000 380,000 - 346,000 212,000 DEBT SERVICES 2,429,413 4,620,929 4,620,929 3,944,929 6,098,053 7,788,385 10,842,541
TOTAL OTHER USES 39,845,192$ 48,989,764$ 93,469,585$ 93,027,585$ 50,380,996$ 102,165,720$ 76,360,976$
TOTAL EXPENSE & OTHER USES 102,702,541$ 127,365,555$ 174,110,056$ 173,658,056$ 132,752,815$ 187,004,376$ 163,230,107$
EXCESS REVENUE AND OTHER
SOURCES OVER (UNDER) USES $65,688,018 ($6,818,047) ($53,562,548) ($10,876,548) ($24,656,447) ($2,123,891) $14,406,641
OPERATING CASH BALANCES
BEGINNING JULY 1 28,197,285$ 89,527,628$ 89,527,628$ 89,527,628$ 78,651,080$ 53,994,633$ 51,870,742$ RESTRICTED / DESIGNATED (4,357,675) - -$ -$ -$ -$ -$
AVAILABLE JUNE 30 89,527,628$ 12,777,251$ 35,965,080$ 78,651,080$ 53,994,633$ 51,870,742$ 66,277,383$
Cash Reserve Ratio 142% 16% 45% 98% 66% 61% 76%
WATER UTILITY BUDGET SUMMARYFY 2023-25
Rate Increase 15%
Rate Increase 15%
Rate Increase 15%
Cash reserve goal above 14%
28

WATER UTILITY CASH FLOW FY 2023 BUDGET / FY 2024‐2027 FORECAST
ACTUAL PROJECTED BUDGET BUDGET BUDGET BUDGET BUDGETYEAR YEAR YEAR YEAR YEAR YEAR YEAR
2020-2021 2021-2022 2022-2023 2023-2024 2024-2025 2025-2026 2026-2027REVENUEWATER SALES 82,480,248$ 85,462,346$ 98,266,900$ 113,006,900$ 129,957,900$ 145,552,800$ 160,108,100 OTHER INCOME 4,683,145 4,762,372 4,967,514 4,967,514 4,967,514 4,967,514 4,967,514INTEREST INCOME 511,679 398,000 883,164 781,281 720,544 907,516 1,112,657
OPERATING INCOME 87,675,072$ 90,622,718$ 104,117,578$ 118,755,695$ 135,645,958$ 151,427,830$ 166,188,271
OPERATING EXPENDITURES METROPOLITAN WATER ASSESSMENT (7,021,892)$ (7,866,115)$ (7,866,115)$ (7,866,115)$ (7,866,115)$ (7,866,115)$ (7,866,115)METROPOLITAN WATER PURCHASES (16,512,885) (16,969,000) (17,478,070) (17,827,631) (17,483,044) (17,832,705) (18,189,359.00) OPERATING EXPENDITURES (39,322,572) (55,795,356) (57,027,634) (59,144,910) (61,519,972) (63,256,124) (65,042,173)
TOTAL OPERATING EXPENSES (62,857,349)$ (80,630,471)$ (82,371,819)$ (84,838,656)$ (86,869,131)$ (88,954,944)$ (91,097,647)$
NET INCOME EXCLUDING DEP. 24,817,723$ 9,992,247$ 21,745,759$ 33,917,039$ 48,776,827$ 62,472,886$ 75,090,624
OTHER INCOME & EXPENSE NET BOND PROCEEDS 77,004,650$ 68,000,000$ -$ 62,000,000$ 38,000,000$ 24,000,000$ 23,000,000BIC Borrowed 125,342 380,000 - 346,000 212,000 134,000 129,000BIC Paid (125,342) (380,000) - (346,000) (212,000) (134,000) (129,000)SHORT TERM FINANCING - - - - - - IMPACT FEES 2,392,515 1,784,670 1,784,670 1,784,670 1,784,670 1,784,670 1,784,670OTHER CONTRIBUTIONS 1,140,302 1,953,620 2,153,620 1,953,620 1,953,620 1,953,620 1,953,620SALE OF EQUIPMENT 52,678 40,500 40,500 40,500 40,500 40,500 40,500CAPITAL OUTLAY (2,173,200) (3,478,961) (3,143,943) (2,472,835) (2,472,835) (2,472,835) (2,472,835)WATERSHED AND WATER RIGHTS PURCHASES (494,706) (1,650,000) (2,150,000) (2,150,000) (2,150,000) (2,150,000) (2,150,000)DEBT SERVICE (2,429,413) (3,944,929) (3,944,053) (3,997,385) (4,076,541) (4,076,541) (4,076,142)NEW DEBT SERVICE - - (2,154,000) (3,791,000) (6,766,000) (7,601,000) (9,835,000)
OTHER INCOME & EXPENSE 75,492,826$ 62,704,900$ (7,413,206)$ 53,367,570$ 26,313,414$ 11,478,414$ 8,244,813
CAPITAL GENERATIONGENERATED FOR CAPITAL 100,310,549$ 72,697,147$ 14,332,553$ 87,284,609$ 75,090,241$ 73,951,300$ 83,335,437
CAPITAL IMPROVEMENTSCAPITAL IMPROVEMENTS (34,622,531)$ (83,573,695)$ (38,989,000)$ (89,408,500)$ (60,683,600)$ (57,315,400)$ (141,417,005)
OPERATING CASH BALANCESBEGINING CASH BALANCE 28,197,285$ 89,527,628$ 78,651,080$ 53,994,633$ 51,870,742$ 66,277,383$ 82,913,283CASH INCREASE/(DECREASE) 65,688,018 (10,876,548) (24,656,447) (2,123,891) 14,406,641 16,635,900 (58,081,568)RESTRICTED / DESIGNATED (4,357,675) - - - - -
ENDING CASH 89,527,628$ 78,651,080$ 53,994,633$ 51,870,742$ 66,277,383$ 82,913,283$ 24,831,715
DEBT SERVICE COVERAGE 10.22 2.53 3.57 4.35 4.50 5.35 5.40RATE CHANGE 0% 8% 15% 15% 15% 12% 10%Cash Reserve Ratio (Total Cash) 142% 98% 66% 61% 76% 93% 27%
DEBT SERVICE % OF GROSS OPERATING REVENUE 3% 4% 6% 6% 8% 8% 8%MONTHLY RESIDENTIAL BILL (255 ccf annually/12 mos.) 46.41 50.15 57.68 66.34 76.30 85.46 94.01
29

WATER UTILITY CIP BUDGETFive Year Projected Budget 2023-2027
COST CENTER
PROJECT NUMBER
CAP REQUEST NUMBER
PROJECT DESCRIPTION
CR
ITIC
ALI
TY
RA
TIN
G
CO
ND
ITIO
N
RA
TIN
G PAST BUDGET YEAR
2021-2022
BUDGET YEAR 2022-2023 2023-2024 2024-2025 2025-2026 2026-2027 DELAYED
51-01301- 2720.10 MAINTENANCE & REPAIR SHOPS01401 2015-0460 DISTRIBUTION AND ELECTRICAL BARN 4 4 850,000
CAMPUS 5 5 37,000,000 75,000,000 03201 512185 FUEL PUMP AWNINGS 5 0 250,000
TOTAL MAINTENANCE & REPAIR SHOPS -$ -$ -$ -$ -$ 37,000,000$ 76,100,000$ - - -
51-01301- 2720.30 TREATMENT PLANTS 01301 2021-1090 FY 22/23 WATER PLANTS CAPITAL PROJECT SUPPORT 4/5 4/5 650,000 1,000,000 500,000 350,000 350,000 01301 2020-1168 FY 22/23 WATER PLANTS COMPLIANCE PROJECTS 5 1 1,000,000 4,000,000 2,000,000 2,000,000 2,000,000 7,000,000
Shared for all WTPs Total 1,650,000 5,000,000 2,500,000 2,350,000 2,350,000 7,000,000
CITY CREEK00701 512260079 2017-2043 TREATMENT PLANT UPGRADES 5 5 1,450,000 1,750,000 2,000,000 300,000 4,500,000 00701 512260089 2021-1019 CITY CREEK TREATMENT PLANT UPGRADES - PACKAGE 1 5 0 00701 2021-1092 CITY CREEK TREATMENT PLANT UPGRADES - PACKAGE 2 5 4 6,000,000 3,000,000 00701 2021-1078 CITY CREEK TREATMENT PLANT UPGRADES - PACKAGE 4 5 0 6,000,000 00701 2021-1095 CITY CREEK TREATMENT PLANT UPGRADES - PACKAGE 3 4 5 37,500,000 00701 512260084 CITY CREEK TREATMENT PLANT UPGRADES - PUBLIC ENGAGEMENT 5 0 300,000 300,000 300,000 300,000 300,000 900,000 00701 2021-1077 City Creek WTP ADVANCED TREATMENT 4 0 5,000,000 00701 512260081 SCADA SYSTEM UPGRADES 5 5 250,000
TOTAL CITY CREEK 2,000,000$ 2,050,000$ 8,300,000$ 9,600,000$ 300,000$ -$ 47,900,000$ -
PARLEY'S 00801 512450090 PARLEYS ENTRANCE GATE REPLACEMENT 5 1 300,000 300,000 . 00801 512450088 2020-1183 PARLEYS WTP - RAW WATER INTAKE & PRIORITY IMPROVEMENTS II 5 4 1,058,000 700,000 12,000,000 4,000,000 00801 PARLEYS WTP - BUILDING IMPROVEMENTS 4 5 200,000 00801 2016-0867 PARLEYS WTP ROOF REPLACEMENT 4 5 2,000,000 00801 2021-1053 PARLEYS WTP ACCESS CONTROL IMPROVEMENTS 4 0 500,000 00801 2021-1016 PARLEYS WTP BACKWASH TANK IMPROVEMENTS 4 3 500,000 00801 2021-1097 PARLEYS WTP REBUILD - ALTERNATIVES ANALYSIS 4 0 300,000 00801 2020-1182 PARLEYS WTP FILTER REHAB 4 4 1,500,000 15,000,000 00801 2020-1179 PARLEYS WTP NEW CHEMICAL FACILITIES 5 4 1,400,000 14,000,000 00801 2020-1181 Parleys WTP - New Electrical FACILITIES 5 4 10,000,000 00801 2020-1190 PARLEYS WTP - FILTER & OPERATIONS BLDG REBUILD & RESERVOIR 4 4 75,000,000 00801 2020-1184 PARLEYS WTP STILLING TOWER AND BASIN REBUILD 5 4 1,875,000 00801 2020-1180 PARLEYS WTP - CLARIFIER & CLARIFIER PUMP STATION REBUILD 4 4 3,000,000 00801 2020-1189 PARLEYS WTP PAC STORAGE & FEED 3 0 1,500,000
TOTAL PARLEY'S 1,358,000$ 1,200,000$ 14,750,000$ 4,300,000$ 1,500,000$ 16,400,000$ 106,375,000$ -
BIG COTTONWOOD00901 512627474 2020-1032 BIG COTTONWOOD WTP REBUILD (ENGINEERING) 4 4 2,200,000 4,000,000 8,500,000 2,500,000 1,200,000 1,500,000 11,350,000 00901 2020-1134 BCWTP REBUILD - CM/GC (Design Phase) 5 4 12,000,000 60,000,000 108,000,000 00901 2020-1135 BCWTP REBUILD - RAW WATER PUMP STATION 5 4 12,000,000 00901 512627479 2020-1075 BIG COTTONWOOD WTP REBUILD - PUBLIC ENGAGEMENT 5 4 300,000 300,000 300,000 300,000 300,000 300,000 300,000
TOTAL BIG COTTONWOOD 2,500,000$ 4,300,000$ 20,800,000$ 2,800,000$ 13,500,000$ 61,800,000$ 119,650,000$ -
TOTAL TREATMENT PLANTS 5,858,000$ 9,200,000$ 48,850,000$ 19,200,000$ 17,650,000$ 80,550,000$ 280,925,000$
51-01301- 2720.35 PUMPING PLANTS AND PUMP HOUSES 01301 2021-1103 EMIGRATION PUMP STATION DRAIN FIELD 5 5 50,000 01301 513416364 2016-1282 BONNEVILLE AND EAST BENCH PUMP STATION - PUMP UPGRADES 5 501301 513505271 2015-0378 UPLAND DR PROJECT 4 501301 513800033 2015-0555 3900 SOUTH BIRCH DRIVE VALVE VAULT 4 401301 513416359 2016-0888 3900 SOUTH PUMP STATION 4 4
30

WATER UTILITY CIP BUDGETFive Year Projected Budget 2023-2027
COST CENTER
PROJECT NUMBER
CAP REQUEST NUMBER
PROJECT DESCRIPTION
CR
ITIC
ALI
TY
RA
TIN
G
CO
ND
ITIO
N
RA
TIN
G PAST BUDGET YEAR
2021-2022
BUDGET YEAR 2022-2023 2023-2024 2024-2025 2025-2026 2026-2027 DELAYED
01301 3900 SOUTH PUMP STATION PHASE 2 - 3900 SOUTH PUMP STATION & EDWARDS DRIVE 4 4 4,000,000 01301 3900 SOUTH PUMP STATION PHASE 3 - SUPPLY AND HIGH PRESSURE PIPELINES 4 4 6,000,000 01301 3900 SOUTH PUMP STATION PHASE 4 - PUMP STATION CONNECTIONS 4 4 1,500,000 01301 513416366 2015-0531 GOLDEN HILLS PUMP STATION 3 5 200,000 01301 513416367 2016-1208 5TH AND U PUMP STATION IMPROVEMENTS 4 4 1,300,000 01301 513416361 2015-0563 OAKHILLS PUMP STATION - MCC - VFD - PUMP UPGRADE 3 3 1,500,000 01301 513416376 2016-0937 ENSIGN DOWNS PS VFD 3 3 50,000 01301 513416336 2015-0428 MP 3.12 B - 7800 SOUTH AUXILIARY POWER 3 3 305,000 01301 2016-1179 300 EAST PUMP STATION BACKUP POWER 3 3 700,000 01301 2016-1180 3300 SOUTH BOOSTER PUMP STATION BACKUP POWER 3 3 400,000 01301 2016-1181 KENTON DRIVE PUMP STATION BACKUP POWER 3 3 400,000 01301 2016-1183 VIRGINIA AND MILLCREEK PUMP STATION BACKUP POWER 3 3 400,000 01301 2016-1184 EASTWOOD PUMP STATION BACKUP POWER 3 3 400,000 01301 2016-1185 MILLCREEK PUMP STATION BACKUP POWER 3 3 400,000 01301 2016-1186 39TH AND BIRCH PUMP STATION BACKUP POWER 3 3 400,000 01301 2016-1187 CANYON COVE PUMP STATION BACKUP POWER 3 3 400,000 01301 2016-1188 7800 SOUTH PUMP STATION BACKUP POWER 3 3 400,000 01301 2016-1189 GOLDEN HILLS PUMP STATION BACKUP POWER 3 3 400,000 01301 2016-1190 CARRIGAN COVE PUMP STATION BACKUP POWER 3 3 400,000 01301 2016-1173 NORTH BENCH PUMP STATION BACKUP POWER 3 3 400,000 01301 2016-1175 UNIVERSITY PUMP STATION BACKUP POWER 3 3 400,000 01301 2016-1176 RESEARCH PARK PUMP STATION BACKUP POWER 3 3 400,000 01301 2016-1177 OAK HILLS PUMP STATION BACKUP POWER 3 3 500,000 01301 2016-1178 BONNEVILLE PUMP STATION BACKUP POWER 3 3 400,000 01301 2016-1191 3900 SOUTH BOOSTER PUMP STATION BACKUP POWER 3 3 400,000 01301 2016-1192 6200 SOUTH IRRIGATION PUMP STATION BACKUP POWER 3 3 500,000 01301 2016-1193 EMIGRATION PUMP STATION BACKUP POWER 3 3 400,000 01301 2016-1223 5TH AVE AND U ST PUMP STATION VFD'S 3 3 200,000 01301 2016-1224 ARLINGTON HILLS PUMP STATION VFD'S 3 3 200,000 01301 2016-1225 NORTH BENCH PUMP STATION VFD'S 3 3 200,000 01301 2016-1226 5TH AVE AND U ST PUMP STATION PIPING 3 3 200,000 01301 2017-2009 REPAIR AND LINE OF UNIVERSITY DRAIN LINE 2 3 10,000 01301 2015-0517 4500 SOUTH PUMP STATION BLACK TOP 1 3 25,000 01301 2015-0522 RECURRING PUMP STATION REPAIR FUND 3 0 200,000 01301 513416329 2015-0169 UV UPGRADE 6200 SOUTH PUMP STATION 1 2 300,000 01301 2016-1194 ENSIGN DOWNS PUMP STATION BACKUP POWER 3 0 400,000 01301 2015-0172 MP 3.8C - VICTORY ROAD - ENSIGN DOWNS PHASE II - PROPERTY PURCHASE - IF 4 0 500,000 01301 2015-0173 4500 SOUTH PUMP STATION (BACK UP) 5 0 1,500,000
TOTAL PUMPING PLANTS AND PUMP HOUSES 1,550,000$ 50,000$ 6,100,000$ 8,705,000$ 2,700,000$ -$ 7,635,000$ -
51-01301- 2730.02 CULVERTS FLUMES & BRIDGES01301 5129264 JSL CANAL CONDUIT REPLACEMENT - SUGARHOUSE 5 5 150,000 01301 512900272 2015-0432 VARIOUS CANAL IMPROVEMENTS 5 5 25,000 25,000 25,000 25,000 01301 512900273 2016-0737 IRRIGATION SCADA IMPROVEMENTS 5 5 20,000 20,000 20,000 20,000 01301 2016-0816 ROCKHOUSE DUMP - INTAKE IMPROVEMENT 5 4 78,500 01301 513000034 2016-0858 FLUME FROM DOUBLE BARRELS TO RAILROAD TRACKS 4 4 1,000,000 1,500,000 01301 5129246 2015-0158 REPLACE FLUME/AUTO DUMP AND JSL CANAL ENCLOSURE @ MILLCREEK 4 4 468,000 01301 512900274 2017-2076 HEADGATE REHABILITATION 18/19 4 4 20,000 20,000 20,000 01301 513000026 2015-0161 E JORDAN TOWER - IMPROVED ACCESS 3 5 150,000 01301 512900278 2016-1167 6200 SOUTH LIFT STATION WEIR PROTECTION 3 5 250,000 01301 5129231 2015-0152 JSL CANAL - 1750 S EMIGRATION DIVERSION STRUCTURE REBUILD 4 3 50,000 290,000 01301 5129233 2015-0604 JSL 3800 S REHAB FLOOR AND LEAKAGE 3 4 18,000 997,000 01301 5129251 2015-0151 JSL ENCLOSURE FROM 1300 EAST TO MILLCREEK 3 3 997,000 01301 5129249 2015-0149 NEW IRRIGATION CONDUIT ON HARVARD AVENUE 4 0 50,000 402,000 1,300,000 01301 513000038 2016-0865 OIL SEPARATORS AND DRAINAGE SYSTEM FOR THE ARTESIAN SHOP 4 0 1,200,000 01301 2016-1165 LOW FLOW CHANNEL AT SPENCER'S POND ( BIG COTTONWOOD CREEK) 4 0 300,000 01301 5129232 2015-0602 JSL CANAL – MODIFY BIG SPILL TO HANDLE TEMPORARY PUMP 2 2 82,000 1,000,000 01301 2016-0749 J&SL DIVERSION STRUCTURE AT 2700 SOUTH 2 0 2,000,000
31

WATER UTILITY CIP BUDGETFive Year Projected Budget 2023-2027
COST CENTER
PROJECT NUMBER
CAP REQUEST NUMBER
PROJECT DESCRIPTION
CR
ITIC
ALI
TY
RA
TIN
G
CO
ND
ITIO
N
RA
TIN
G PAST BUDGET YEAR
2021-2022
BUDGET YEAR 2022-2023 2023-2024 2024-2025 2025-2026 2026-2027 DELAYED
01301 5129242 2015-0153 PIPING DITCH ON JSL, OSAGE ORANGE AVENUE TO LINCOLN LANE 1 0 17,000 01301 2015-0160 DESPAIN IRRIGATION SYSTEM IMPROVEMENTS 3 3 406,000 01301 2015-0603 JSL CANAL/JORDAN RIVER STABILIZATION AT EAST JORDAN DUMP 4 4 500,000 01301 2018-1019 14600 SO. CANAL OVER FLOW STRUTURE 3 3 300,000 01301 2018-1080 3900SO STORM DRAIN OVER FLOW 2 4 50,000 01301 2018-1082 LITTLE TANNER PIPE PROJECT 2 0 50,000
TOTAL CULVERTS FLUMES & BRIDGES 1,533,000$ 1,615,000$ 1,395,500$ 1,490,000$ 1,397,000$ 45,000$ 6,770,000$
51-01301- 2730.04 DEEP PUMP WELLS 01301 2019-1184 BRINTON SPRINGS WELL IMPROVEMENTS 5 4 405,000 486,000 01301 51322336 2015-0171 WELL TREATMENT PROJECT - 1500 EAST WELL 5 4 425,000 510,000 100,000 01301 513223429 R20-0295 WELL SANITARY SURVEY DEFICIENCIES 800,000 01301 2019-1185 EDGEWOOD WELL IMPROVEMENTS 400,000 01301 2019-1186 ELLISON WELL IMPROVEMENTS 400,000 01301 2019-1187 FONTAIN BLEU WELL IMPROVEMENTS 400,000 01301 5132245 2015-0429 WELL ASSESSMENT AND UPGRADES 5 5 200,000 200,000 200,000 01301 5132270 2015-0430 WELL BUILDING STRUCTURE UPGRADES 5 5 100,000 100,000 100,000 01301 DESIGN FOR NEW WELL SOURCE 250,000 01301 2016-0820 DYERS INN 4 401301 2017-2071 DYER'S INN WELL FLUSH LINE 4 401301 2016-0911 1300 E WELL CHLORINATION 3 4 400,000 01301 5132255 2015-0571 ARTESIAN WELL 2 REHAB 4 0 250,000 01301 5132249 2015-0565 19TH AND 27TH SOUTH WELL - VFD 3 0 60,000 01301 5132246 2015-0570 TREATMENT OF PCE AT WELLS 3 0 12,000,000 01301 5132241 2015-0569 RED BUTTE 2 0 2,500,000 01301 2018-1091 VAN WINKLE PROPERTY FENCE 1 5 20,000
TOTAL DEEP PUMP WELLS 1,630,000$ 996,000$ 1,520,000$ 300,000$ 300,000$ -$ 15,560,000$ -
51-01301- 2730.06 STORAGE RESERVOIRS MOUNTAIN DELL DAM
01301 5134458 2015-0155 REHABILITATION OF MOUNTAIN DELL DAM 5 401301 5124512 2015-0209 REPLACE VALVES ON MT. DELL DAM 4 4 320,000 01301 5124509 2015-0451 STAIRS MT DELL DAM 2 3 75,000 01301 512700015 2018-1106 MOUNTAIN DELL DAM SPILLWAY REHABILITATION 5 4 600,000 500,000 01301 512700023 R20-0237 MOUNTAIN DELL DAM REHABILITATION - REVEGATATION OF DISTURBED AREAS 4 5 250,000 01301 512700022 R20-0197 MOUNTAIN DELL DAM REHABILITATION - RESERVOIR WATER MANAGEMENT 5 4 100,000 01301 REHABILITATION OF MOUNTAIN DELL DAM -LOWER DAM WATERPROOFING 5 4 500,000 01301 REHABILITATION OF MOUNTAIN DELL DAM- CONCRETE REPAIRS AND MONITORING 5 4 250,000 750,000
TOTAL MOUNTAIN DELL 1,420,000$ 675,000$ 500,000$ 750,000$ -$ -$ -$
LITTLE DELL DAM01301 5134468 2015-0607 LITTLE DELL RESTORE PARLEY’S DIVERSION EXTERIOR COATING 4 4 40,000 01301 5134478 2015-0164 LITTLE DELL DAM - INSTALL NEW DRAINS ON THE PORTAL 3 3 60,000 27,000 01301 2016-1278 SECURITY CAMERAS AT LITTLE DELL 3 3 50,000 50,000 01301 5134457 2015-0166 NEW STAFF GAGE AT LITTLE DELL DAM 3 3 175,000 153,000 01301 2020-1007/8 LITTLE DELL PENSTOCK AND DIVERSION WINTERIZATION 4 4 150,000 01301 2018-1108 LITTLE DELL DAM STAFF GAUGE 3 0 175,000 01301 LITTLE DELL DAM - ADIT PIPE COATING REPAIRS 5 4 40,000 160,000 01301 LITTLE DELL DAM - PORTAL WALL REPAIRS 5 4 100,000 01301 LITTLE DELL DAM - BULKHEAD GATE EVALUATION AND REPAIR 5 5 20,000 01301 LITTLE DELL DAM - NEW ENTRANCE SECURITY GATE 5 3 40,000
TOTAL LITTLE DELL 60,000$ 450,000$ 325,000$ -$ -$ -$ 435,000$
PARLEYS CANYON01301 5134476 CHEVRON OIL SPILL PROTECTION PROJECT01301 2015-0208 CONDUIT FROM DAM TO OLD ICB TO PLANT 2 2 20,000 01301 5134466 2015-0156 PARLEY'S CANYON HYDROPOWER PROJECT 1 0 1,100,000 01301 2018-1034 SPILL PROTECTION PROJECT - I-80 AT LAMB'S CANYON 5 0 240,000
32

WATER UTILITY CIP BUDGETFive Year Projected Budget 2023-2027
COST CENTER
PROJECT NUMBER
CAP REQUEST NUMBER
PROJECT DESCRIPTION
CR
ITIC
ALI
TY
RA
TIN
G
CO
ND
ITIO
N
RA
TIN
G PAST BUDGET YEAR
2021-2022
BUDGET YEAR 2022-2023 2023-2024 2024-2025 2025-2026 2026-2027 DELAYED
01301 512700011 2018-1103 PARLEYS CANYON CONDUIT AND FIBER INSTALLATION 4 0 100,000 TOTAL PARLEYS CANYON -$ -$ -$ -$ -$ -$ 1,460,000$
RED PINE DAM01301 5134455 2015-0167 RED PINE DAM REHABILITATION 5 4 - 100,000 1,000,000
TOTAL RED PINE DAM -$ -$ 100,000$ 1,000,000$ -$ -$ -$
CECRET DAM01301 512700005 2016-1272 CECRET DAM REHABILITATION - DESIGN 4 3 2,000,000 2,000,000
2018-1109 CECRET LAKE FLOW METER AND TELEMETRY 4 0 60,000 CECRET DAM REHABILITATION - OUTLET WORKS 4 4 50,000
TOTAL CECRET DAM -$ -$ -$ 110,000$ 2,000,000$ -$ 2,000,000$
LAKE MARY DAM 01301 512700016 2018-1100 LAKE MARY DAM CREST REHABILITATION 5 5 90,000 100,000 01301 512700013 2018-1102 TWIN LAKE AND LAKE MARY OUTLET CHANNEL IMPROVEMENTS 5 5 50,000 100,000 01301 2018-1105 TWIN LAKES AND LAKE MARY LOG BOOMS 3 5 10,000 01301 TWIN LAKES DAM - GATE REPAIRS 1,000,000 500,000
TOTAL LAKE MARY DAM 150,000$ 1,000,000$ 600,000$ 100,000$ -$ -$ -$
TWIN LAKES DAM01301 2018-1101 TWIN LAKES DAM GAUGE RELOCATION 3 4 50,000 20,000 01301 512700012 2018-1104 TWIN LAKES DAM DRAIN CLEANOUT INSTALLATION 4 5 40,000
TWIN LAKES DAM - GATE REPAIRS 20,000 TOTAL TWIN LAKES 20,000$ -$ 50,000$ 60,000$ -$ -$ -$
RED BUTTE DAM01301 512700003 2017-2079 REPAIRS AND IMPROVEMENTS TO RED BUTTTE DAM ROAD 3 4 20,000
TOTAL RED BUTTE DAM -$ -$ -$ -$ -$ -$ 20,000$
TOTAL STORAGE RESERVOIRS 1,650,000$ 2,125,000$ 1,575,000$ 2,020,000$ 2,000,000$ -$ 3,915,000$ - -
51-01301- 2730.07 DISTRIBUTION RESERVOIRS 01301 513444164 2017-2067 MARCUS RESERVOIR TANK UPGRADES 5 5 1,000,000 01301 513444166 2015-0573 AM - TANK AND RESERVOIR INSPECTIONS AND REPAIRS 5 5 100,000 80,000 100,000 100,000 100,000 100,000 100,000 01301 5134507 2016-1171 FORT DOUGLAS IMPROVEMENTS/EXPANSION 5 401301 513444159 2015-0174 MILITARY RESERVOIR REPAIR 5 3 11,020,000 01301 513444168 2017-2111 TANNER RESERVOIR ROOF REPLACEMENT/FULL REPLACEMENT 4 4 450,000 3,000,000 01301 513444715 2015-0719 DISTRIBUTION TANK AND RESERVOIR PAVING 4 4 80,000 80,000 01301 513444180 2016-0753 BASKIN OVERFLOW/DRAIN GOOSENECK BOX 4 4 100,000 01301 2017-2061 TETON TANKS SLOPE STABILIZATION 4 3 50,000 01301 513444174 2015-0525 PERRY HOLLOW TANK 2 5 400,000 570,000 01301 5134471 2015-0459 TANK PAINTING AND CORROSION CONTROL 3 3 100,000 80,000 100,000 100,000 01301 2016-0935 ENSIGN DOWNS OVERFLOW 3 3 150,000 01301 2015-0516 MOUNT OLYMPUS TANKS & PUMP STATION BLACKTOP 2 4 25,000 01301 2015-0499 RAINER TANK 2 2 280,000 01301 2016-0917 ENSIGN DOWNS LOWER RESERVOIR MODIFICATIONS 2 2 200,000 01301 2015-0520 NORTH BENCH TANK ROAD 1 3 45,000 01301 2015-0526 VICTORY ROAD 1 3 22,000 01301 2016-0754 CAPITOL HILLS TANKS - TRUCK ACCESS 3 0 200,000 01301 2015-0528 NEFFS CANYON TANK 1 3 55,000 01301 2015-0529 EMIGRATION TANK UPGRADES 1 2 60,000 01301 2015-0530 TETON TANK UPGRADES 1 2 35,000 01301 2017-2010 COVE TANK STABILIZATION PROJECT 2 3 200,000 01301 2017-2012 TELFORD FENCE 3 0 30,000 01301 2017-2013 EAST BENCH TANKS DRAIN LINE GOOSENECK 1 3 25,000 01301 2017-2059 VICTORY ROAD TANK OVERFLOW DRAIN 4 4 50,000 01301 2017-2064 CARRIGAN COVE TANK POWER 2 3 50,000 01301 2017-2112 GRANITE OAKS/TELFORD RESERVOIR REPAIRS 3 3 50,000
33

WATER UTILITY CIP BUDGETFive Year Projected Budget 2023-2027
COST CENTER
PROJECT NUMBER
CAP REQUEST NUMBER
PROJECT DESCRIPTION
CR
ITIC
ALI
TY
RA
TIN
G
CO
ND
ITIO
N
RA
TIN
G PAST BUDGET YEAR
2021-2022
BUDGET YEAR 2022-2023 2023-2024 2024-2025 2025-2026 2026-2027 DELAYED
01301 2017-2118 GRANITE OAKS ACCESS ROAD 1 4 100,000 01301 513444181 2018-1023 BASKIN RESERVOIR EFFLUENT PIPE 4 4 500,000 01301 513444172 2018-1024 BASKIN ROOF REPLACEMENT 5 5 2,000,000 01301 2018-1031 MILITARY RESERVOIR - JOINT SEALANT REPAIR 5 4 20,000 01301 2018-1032 MILITARY RESERVOIR - REPAIR INLET/OUTLET PIPE 5 4 50,000 01301 2018-1033 MILITARY RESERVOIR CONDITION ASSESSMENT 5 4 20,000 01301 513444179 2020-1094 MCINITIRE RESERVOIR ROOF DEFICIENCY STRUCTURAL ASSESSMENT 5 4 700,000 50,000 01301 2018-1092 FENCE 300 EAST GORDON LANE 1 4
TOTAL DISTRIBUTION RESERVOIRS 2,350,000$ 1,410,000$ 4,190,000$ 2,335,000$ 100,000$ 100,000$ 12,287,000$ -
51-01301- 2730.08 DISTRIBUTION MAINS & HYDRANTS
CITY, COUNTY, STATE AND MISC. DRIVEN PROJECTS01301 513505425 2020-1066 2100 SOUTH - HIGHLAND TO YUMA 1,200,000 01301 513505272 2016-1233 WATER MAIN REPLACEMENT - 900 SOUTH 5 501301 513505273 2016-0744 1300 EAST - WATER LINE 3 4 2,200,000 01301 513505312 2015-0431 CITY/COUNTY/STATE DRIVEN PROJECTS 5 5 250,000 200,000 250,000 250,000 250,000 250,000 01301 2016-1264 NW QUADRANT (DEVELOPMENT) PIPE UPSIZE 5 5 1,400,000 01301 513600099 2017-2056 ENERGY EFFICIENCY/RENEWABLE ENERGY CAPITAL IMPROVEMENTS 5 5 1,500,000 01301 ROADWAY BOND WATERLINE PROJECT CONTINGENCY 250,000 50,000 01301 513505308 2015-0398 UPPER CONDUIT METER REPLACEMENT 4 501301 514400106 2018-1081 STATE IPS RESOLUTIONS 4 4 200,000 200,000 01301 513505412 2019-1096 900 SOUTH - 900 WEST TO 900 EAST01301 513505410 2019-1097 300 WEST - 900 SOUTH TO 2100 SOUTH 1,300,000 01301 1100 EAST HIGHLAND , RAMONA TO WARNOCK01301 LOCAL STREETS DISTRICT 4 & 701301 1100 EAST - 900 SOUTH TO RAMONA 400,000 4,500,000 01301 W TEMPLE - NORTH TEMPLE TO 400 SOUTH 800,000 01301 LOCAL STREETS 3 & 6 200,000 01301 VIRGINIA STREET - SOUTH TEMPLE TO 11TH AVE 100,000 01301 1300 EAST - 2100 SOUTH TO 3000 SOUTH 700,000 01301 513505409 2018-1079 2100 SOUTH - 700 EAST TO 1700 EAST 3 4 1,800,000 01301 LOCAL STREETS DISTRICT 1, 4 & 5 200,000 01301 GLADIOLA STREET - 900 SOUTH TO CALIFORNIA 50,000 01301 300 WEST - 400 SOUTH TO 900 SOUTH 2,000,000 01301 WAKARA WAY - FOOTHILL DRIVE TO CHIPETA WAY 150,000
TOTAL CITY, COUNTY, STATE AND MISC. DRIVEN PROJECTS 3,400,000$ 4,750,000$ 2,250,000$ 2,250,000$ 250,000$ 450,000$ 7,300,000$ -
WATER MAIN MISCELLANEOUS PROJECTS 01301 TASK 1 PROGRAM MANAGMENT SERVICES (Jacobs) 360,000 01301 TASK 7 WATER DISTRIBUTION CAPITAL PROJECT DELIVERY 500,000 01301 513505490 EMERGENCY REPAIRS 500,000 200,000 500,000 500,000 500,000 500,000 01301 514500020 2015-0491 REGULATOR REPLACEMENT 5 5 200,000 200,000 200,000 200,000 300,000 300,000 01301 513302118 2015-0493 NEW MAINLINE VALVES - COUNTY 5 5 135,000 108,000 135,000 135,000 138,000 138,000 03301 513505311 2015-0489 NEW WATER LINES - CONTRIBUTIONS BY DEVELOPERS 5 5 50,000 500,000 500,000 500,000 500,000 500,000 01301 513505310 2015-0490 FIRE HYDRANT REPLACEMENTS 5 5 250,000 200,000 250,000 250,000 400,000 400,000 01301 513505309 2015-0492 NEW MAINLINE VALVES - CITY 5 5 250,000 200,000 250,000 250,000 262,000 262,000 01301 512800041 2019-1183 NEW PRV AT 3300 S HIGHLAND DR - E6-R5101301 514500019 2016-0961 4TH AND A PRV 4 501301 2016-0958 10TH AND B PRV 3 4 225,000 01301 2019-1190 BIG COTTONWOOD CONDUIT PIPE INSPECTION 300,000 01301 2016-0751 RECONNECTION OF 1700 SOUTH AND FOOTHILL UTILITIES 2 4 20,000 01301 513505407 2020-1031 UPPER CONDUIT REPAIR DESIGN 1,008,000 01301 513505476 2020-1109 UPPER CONDUIT REPAIR CONSTRUCTION 2,225,000 2,808,000 1,293,600 6,222,000 6,222,000 5,000,000 01301 513600098 2017-2072 SAMPLING TAPS 3 3 10,000 01301 2016-0923 SAM PARK INLET VAULT 3 3 35,000 01301 2016-0959 10TH AND E PRV 3 3 210,000 01301 2016-0960 8TH AND L PRV 3 3 210,000 01301 2016-0914 CONNECTIONS AT RR 4 0 440,000
34

WATER UTILITY CIP BUDGETFive Year Projected Budget 2023-2027
COST CENTER
PROJECT NUMBER
CAP REQUEST NUMBER
PROJECT DESCRIPTION
CR
ITIC
ALI
TY
RA
TIN
G
CO
ND
ITIO
N
RA
TIN
G PAST BUDGET YEAR
2021-2022
BUDGET YEAR 2022-2023 2023-2024 2024-2025 2025-2026 2026-2027 DELAYED
01301 513600103 CORROSION CONTROL PROGRAM01301 2020-1071 CORROSION PROGRAM RETROFITTING 80,000 80,000 100,000 100,000 01301 514500023 2021-1049 C12-R15 PRV REPLACEMENT 5 4 250,000 01301 514506 R19-0114 1000 EAST 500 SOUTH PRV01301 513505206 R20-0245 STATE ST/NORTH TEMPLE RECONNECT MAIN 5 5 1,600,000 01301 2020-1003 TRANSMISSION LINE VALVE REPLACEMENT ALONG 500 S 4 4 210,000
TOTAL WATER MAIN MISCELLANEOUS PROJECTS 4,243,000$ 4,493,000$ 5,158,000$ 3,508,600$ 8,667,000$ 8,422,000$ 5,680,000$ -
WATER MAIN REPLACEMENTS 01301 FY 21/22 WATER MAIN REPLACEMENT 5 4 2,300,000 01301 FY 22/23 WATER MAIN REPLACEMENT - INDIANA AVE 2,300,000 01301 FY 23/24 WATER MAIN REPLACEMENT 2,000,000 01301 FY 24/25 WATER MAIN REPLACEMENT 4,000,000 01301 FY 25/26 WATER MAIN REPLACEMENT 7,000,000 01301 FY 26/27 WATER MAIN REPLACEMENT 8,000,000 01301 513302134 2019-1170 VINE STREET WATER MAIN REPLACEMENT01301 513302017 2015-0618 900 EAST AND 5600 SOUTH WATER MAIN REPLACEMENT 5 5 2,000,000 01301 513505484 2016-0921 BACKFEED FOR UTAH STATE CAPITOL 5 4 60,000 01301 513505193 2015-0235 BECK STREET - 1805 NORTH TO 1180 NORTH 4 5 1,247,000 01301 513302138 2019-1109 OLYMPIC WAY & SOVEREIGN WAY 4 5 1,600,000 01301 513505133 2015-0624 1700 SOUTH - 1000 EAST TO 1100 EAST 4 501301 2016-1230 17TH AND FOOTHILL TELEMETRY AND POWER 4 501301 2015-0255 REDWOOD ROAD - 500 SOUTH TO 1050 SOUTH 4 501301 513505212 2015-0253 PLEASANT VALLEY LINE 4 5 653,000 01301 2015-0254 CITY CREEK HIGHLINE 4 5 460,000 01301 2015-0554 SOUTH TEMPLE 1000 W.(GADSBY LINE) 5 301301 513505198 2015-0237 GREGSON AVENUE - 2465 EAST TO 2700 EAST 4 4 80,000 01301 513302089 2015-0238 2300 EAST - 6200 SOUTH TO 6400 SOUTH 4 4 268,000 01301 513505202 2015-0246 420 N MAIN STREET - 1" SERVICE REPLACEMENT - MAIN ST TO WALL ST 4 4 64,000 01301 513505125 2015-0260 WEST TEMPLE - 500 SOUTH TO 800 SOUTH (EAST SIDE) 4 4 469,000 01301 513505127 2015-0262 1000 WEST - 1400 TO 1700 SOUTH WATER MAIN REPLACEMENT 4 4 1,200,000 560,000 01301 2017-2022 2880 SOUTH WATER MAIN REPLACEMENT 4 4 260,000 01301 513505197 2015-0236 800 SOUTH - 1200 EAST TO 1220 EAST 3 5 134,000 01301 513302039 2015-0613 OAK CREEK DRIVE - 8200 SOUTH TO END OF LINE 3 5 300,000 01301 513302045 2015-0616 MARDONNA WAY (3545 S) - SUNILAND DRIVE TO MILLSTREAM DRIVE 3 5 153,000 01301 513505128 2015-0620 WILTON WAY WATER MAIN REPLACEMENT 3 5 374,000 01301 513505129 2015-0621 1700 SOUTH - FOOTHILL TO WASATCH WATER MAIN REPLACEMENTS 3 5 257,000 01301 513505132 2015-0622 MILTON AVENUE (1595 SOUTH) - 1100 EAST TO 1200 EAST 3 5 179,000 01301 2017-2066 2700 E DEAD-END CONNECTION 3 5 20,000 01301 2016-0738 RELOCATE 12" CIP MAIN FROM UNDER HOUSE (EAST BENCH SUCTION LINE) 5 2 255,000 01301 513302090 2015-0239 COBBLECREST RD - 6380 S TO 2300 E; HAUN AVE - 2300 E TO COBBLECREST 4 3 411,000 01301 2015-0232 NORTH TEMPLE - 1800 WEST TO REDWOOD ROAD 4 3 156,200 01301 513505155 2015-0241 WESTMINSTER AVENUE - LAURELHURST (2550 EAST) TO FOOTHILL BOULEVARD (2600 EAST 4 3 90,000 01301 513302038 2015-0258 BISCAYNE DR (2975 E) - BENGAL BLVD TO OAKVIEW CIR 4 3 158,000 01301 513505122 2015-0550 DUPONT AVE (1335 N) - AMERICAN BEAUTY DR TO 990 W 4 3 115,000 01301 2016-1228 REPLACE PRV'S - R11 AND R12 4 3 400,000 01301 513505205 2015-0249 SCOTT AVENUE - 700 EAST TO SCOTT PARK LANE 3 4 105,000 01301 2015-0400 R37. MAYWOOD REGULATOR 3 4 150,000 01301 513505134 2015-0625 BRYAN AVENUE (1565 SOUTH) - 900 EAST TO 1000 EAST 3 4 172,000 01301 2016-0889 CR1 PRV 3 4 225,000 01301 2016-0890 CR2 PRV 3 4 225,000 01301 2016-0891 HYDRANT 3300 SOUTH 750 EAST E3-5H 3 4 40,000 01301 2016-0901 PRV E3-R49 REPLACEMENT 3 4 220,000 01301 2016-0910 HIGHLAND DRIVE REGULATORS 3 4 1,300,000 01301 2016-0912 R73 REPLACEMENT 3 4 200,000 01301 2016-0913 CUP REGULATORS 3 4 300,000 01301 2016-0918 2300 EAST - CLAYBOURNE TO 3300 SOUTH 3 4 200,000 01301 2016-0934 PRV AT 17TH 3 4 210,000 01301 2016-1169 J STREET PIPELINE AND PRV REPLACEMENT 3 4 300,000 01301 2016-1273 NEW WATER MAIN - 1000 EAST 3 4 300,000
35

WATER UTILITY CIP BUDGETFive Year Projected Budget 2023-2027
COST CENTER
PROJECT NUMBER
CAP REQUEST NUMBER
PROJECT DESCRIPTION
CR
ITIC
ALI
TY
RA
TIN
G
CO
ND
ITIO
N
RA
TIN
G PAST BUDGET YEAR
2021-2022
BUDGET YEAR 2022-2023 2023-2024 2024-2025 2025-2026 2026-2027 DELAYED
01301 2017-2062 ROXBURY PRV C46-R66 3 4 150,000 01301 2017-2065 CAMILLE ST. DEAD-END CONNECTION 3 4 20,000 01301 2016-1283 SUICIDE ROCK RUNAROUND 2 5 25,000 01301 513302117 2017-2069 CAP STUB AT 6200 SOUTH HOLLADAY BOULEVARD 3 301301 513505124 2015-0619 BUCCANEER DRIVE WATER MAIN REPLACEMENT 3 3 151,000 01301 2016-0748 WATER VALVE REPLACEMENT PROJECT #3 2 4 100,000 01301 513505199 2015-0242 700 EAST - DRIGGS AVE (2370 S) TO WARNOCK AVE (2470 S) 1 5 257,000 01301 2015-0256 900 EAST HILLVIEW (4060 SOUTH) - REPLACE DIP MAIN UNDER SEWER 1 5 36,000 01301 2016-0756 300 WEST - 700 S TO 800 S 1 5 175,000 01301 2016-0892 KEARNS LINE REPLACEMENT 3 3 8,000,000 01301 2016-0900 R48 VALVE 3 3 220,000 01301 2016-0906 6-INCH ON 9TH 3 3 450,000 01301 2016-0915 SMITHS CONNECTION 3 3 70,000 01301 2016-0916 COUNTRY CLUB PRV 3 3 250,000 01301 2016-0933 MAYWOOD 6-INCH 3 3 220,000 01301 2016-0936 16-INCH VALVE VAULT 3 3 65,000 01301 2016-1222 PRV REPLACEMENT - A8-14 3 3 200,000 01301 2016-1231 NEW PRV - R73 3 3 200,000 01301 2016-1232 NEW PRV - R74 3 3 200,000 01301 2016-1235 POWER AT EMIGRATION TUNNEL 3 3 100,000 01301 2015-0399 RESEARCH PARK UPGRADE 5 0 410,000 01301 2016-0919 INSERTA VALVES 5 0 50,000 01301 2017-1299 EDWARD DRIVE REGULATED IMPROVEMENTS 5 0 500,000 01301 2017-2068 INDIAN ROCK PRESSURE ZONE REDUNDANT FEED 5 0 250,000 01301 2017-2070 HIGHLAND DR WATER MAIN - 6200 S TO DIAMOND HILLS LN 3 2 250,000 01301 513302046 2015-0615 SUNILAND DRIVE (3550 E) - MILLSTREAM LANE TO END OF SUNILAND CIRCLE 3 2 149,000 01301 2015-0426 FORT UNION AND HIGHLAND AVE INTERSECTION 2 3 302,500 01301 2017-2011 900 EAST FROM VAN WINKLE TO 5600 SOUTH 2 3 100,000 01301 513505204 2015-0248 500 SOUTH - 2130 WEST TO ORANGE STREET 4 0 315,000 01301 513302021 2015-0250 6200 SOUTH - 2900 EAST TO 3000 EAST 4 0 350,000 01301 513302058 2015-0544 SHORT HILLS DR (3375 E) - 8220 SOUTH TO 8315 SOUTH 4 0 55,000 01301 2015-0397 SUICIDE ROCK VAULT 2 2 100,000 01301 2016-0925 2700 E CONNECTION 2 2 60,000 01301 2015-0480 1700 EAST FROM FT UNION BLVD (6935 S) TO 7080 SOUTH 1 3 360,000 01301 513302059 2015-0548 3900 SOUTH - 900 EAST TO 940 EAST 3 0 130,000 01301 2015-0586 PARLEY'S CANYON BLVD 1700 EAST TO 1800 EAST 3 0 181,000 01301 513505166 2015-0626 400 EAST - 1497 SOUTH TO 1530 SOUTH 3 0 37,000 01301 513505167 2015-0627 1400 EAST - GILMER AVENUE TO YALE AVENUE 3 0 32,000 01301 2016-0957 MORRIS PUMP STATION 3 0 600,000 01301 2016-1168 KEARNS VALVE 3 0 30,000 01301 2015-0413 700 NORTH 8" AC 2 1 115,000 01301 2015-0641 LITTLE COTTONWOOD CREEK CEMENT CAP 4" 1 2 35,000 01301 2015-0407 2200 WEST WATER MAIN EXTENSION 1 0 255,000 01301 513505450 2019-1182 SOUTH TEMPLE WATER MAIN - 1000 W TO JORDAN RIVER 5 5 916,000 01301 2018-1096 CHEYENNE STREET WATER LINE REPLACEMENT 3 4 50,000 01301 2016-0856 7000 SOUTH SAND TRAP AND SCREEN REMOVAL 5 5 50,000 01301 2018-1041 UPPER BOUNDARY SPRINGS EFFLUENT LINE REPLACEMENT FROM SPRING BOX TO TANK 4 5 500,000 01301 513505409 2018-1079 2100 SOUTH, 700 EAST TO 1300 EAST, WATER LINE REPLACEMENT 3 401301 2018-1089 EAST BENCH SUCTION LINE RELOCATION 4 2 96,400 01301 2019-1132 EAST PLACE WATER MAIN REPLACEMENT 85,000 01301 2019-1125 OLYMPUS DRIVE WATER MAIN REPLACEMENT 725,000 01301 513505126 2019-1111 1400 SOUTH WATER LINE 900-1000 WEST 350,000
TOTAL WATER MAIN REPLACEMENTS 4,876,000$ 3,850,000$ 4,220,000$ 4,725,000$ 7,401,400$ 8,000,000$ 26,725,700$ -
MASTER PLAN PROJECTS01301 513416337 2015-0629 MP3.16 - NORTH BENCH PUMP STATION 5 5 300,000 3,000,000 01301 513505088 2015-0217 CITY CREEK TREATMENT LINE TO MORRIS RESERVOIR 5 4 5,500,000 01301 513302020 2015-0230 3RD EAST PHASE II - MARCUS TO ARTESIAN BASIN 4 4 5,500,000 3,500,000 01301 51360062 2015-0632 MP2.3 - WASTEWATER REUSE 4 3 23,000,000
36

WATER UTILITY CIP BUDGETFive Year Projected Budget 2023-2027
COST CENTER
PROJECT NUMBER
CAP REQUEST NUMBER
PROJECT DESCRIPTION
CR
ITIC
ALI
TY
RA
TIN
G
CO
ND
ITIO
N
RA
TIN
G PAST BUDGET YEAR
2021-2022
BUDGET YEAR 2022-2023 2023-2024 2024-2025 2025-2026 2026-2027 DELAYED
01301 513505116 2015-0633 MILLCREEK TREATMENT PLANT LINE - TANK TO WASATCH BLVD (24") 4 3 750,000 01301 513416327 2015-0218 MP 3.5B - 16" PIPELINE ON NEWPORT WAY/NANTUCKET DRIVE 4 2 394,000 01301 513302063 2015-0224 MP 3.5A - 12" PIPELINE ON HIGHLAND DR (6200 S HIGH ZONE) 3 3 317,000 01301 2015-0229 MP 3.17 - 8" LOOP AT 2200 WEST/2200 NORTH 5 0 948,000 01301 513505159 2015-0222 MP3.14 - AUXILIARY POWER - GOLDEN HILLS 5 0 45,000 01301 513505168 CAPITOL HILL TO ENSIGN DOWNS PIPELINE 4 0 5,000,000 01301 513302062 2015-0219 MP3.9 - NEW PUMP STATION - TETON TO MT. OLYMPUS/4500 SOUTH HIGH - IF 4 0 695,000 01301 513302061 2015-0220 MP3.6B - 12" PIPELINE ON BRIGHTON WAY 4 0 200,000 01301 513505117 2015-0221 MP3.5C - 16" PIPELINE ON BENGAL BOULEVARD 4 0 1,134,000 01301 513505098 2015-0225 MP3.1A - EAST-WEST CONVEYANCE LINE - PARK RESERVOIR TO SUGARHOUSE PARK 4 0 55,000,000 01301 2015-0231 MP 3.8C - VICTORY ROAD - ENSIGN DOWNS PHASE II - IF 4 0 2,250,000 01301 5134493 2015-0634 MP3.1B - EAST WEST CONVEYANCE LINE - SUGARHOUSE PARK TO 900 WEST 4 0 5,000,000 10,000,000 10,000,000 25,000,000 01301 5134464 2015-0227 MP3.7 - ADD THROTTLING CONTROL VALVE INTO WILSON RESERVOIR 3 0 150,000 01301 2015-0538 MP 3.12A - 7800 SOUTH PRESSURE ZONE - 4.3 MG RESERVOIR 2 0 3,000,000 01301 51360060 2015-0636 MP2.1 - DEVELOP ADDITIONAL GROUND WATER SOURCES 2 0 18,000,000 01301 513505169 2015-0630 MP2.2 - ADDITIONAL SURFACE WATER DEVELOPMENT 2 0 12,000,000 01301 51360061 2015-0635 MP3.1C - EAST WEST CONVEYANCE LINE - 900 WEST TO 3400 WEST (PHASE 3) 1 0 75,000,000 01301 2015-0631 MILLCREEK WATER TREATMENT FACILITY 1 0 80,000,000 01301 UPDATE WATER MASTER PLAN 400,000
TOTAL MASTER PLAN PROJECTS 5,500,000$ 3,800,000$ 8,000,000$ 10,000,000$ 10,000,000$ -$ 308,783,000$ -
TOTAL DISTRIBUTION MAINS & HYDRANTS 18,019,000$ 16,893,000$ 19,628,000$ 20,483,600$ 26,318,400$ 16,872,000$ 348,488,700$ -
2730.09 WATER SERVICE CONNECTIONS01701 513900126 2015-0494 SERVICE LINE REPAIR/REPLACEMENTS 5 5 1,500,000 1,800,000 1,500,000 1,500,000 1,800,000 1,800,000 03301 513900125 2015-0495 NEW SERVICE CONNECTIONS 5 5 400,000 400,000 400,000 400,000 400,000 400,000 03301 NEW SERVICE CONNECTIONS-DEVELOPERS 5 5 450,000 500,000 450,000 450,000 450,000 450,005 02201 513900124 2015-0496 LARGE METER REPLACEMENTS 5 5 400,000 400,000 400,000 400,000 400,000 400,000 02601 513900123 2015-0498 METER REPLACEMENT PROGRAM 5 5 200,000 400,000 200,000 200,000 200,000 200,000 02601 513900120 AMI TOWERS - CITY 4 002601 513900121 2017-2122 AMI TOWERS - COUNTY 4 002601 513900122 2017-2126 AMI METER REPLACEMENT PROGRAM 1 0 2,500,000 3,100,000 2,700,000 2,700,000 3,100,000 3,100,000 01701 REVISED LEAD AND COPPER RULE COMPLIANCE 500,000 500,000 500,000 500,000 01701 513900132 2020-1034 REPLACE METER VAULT AND 4" METER W/BY-PASS
TOTAL WATER SERVICE CONNECTIONS 5,450,000$ 6,600,000$ 6,150,000$ 6,150,000$ 6,850,000$ 6,850,005$ -$ -
2730.20 LANDSCAPING
WATERSHED00601 5122672 2017-1295 RECREATION AREA PICNIC TABLE REPLACEMENT 5 500601 5122673 2015-0670 ACCESSIBILITY UPGRADES TO WATERSHED RECREATION FACILITIES 5 000601 512627466 2017-2032 SILVER LAKE RESTROOM DEMOLISH AND REPLACE 5 500601 512627463 2017-1296 BIG COTTONWOOD CANYON PARK & RIDE RESTROOM REBUILD 5 5 500,000 00601 512300064 R19-0115 CITY CREEK ROADWAY ASPHALT 5 5 100,000 03201 51360014 2015-0519 WEST TEMPLE CAMPUS - CONSERVATION IMPROVEMENTS 2 4 100,000 00601 2018-1028 CITY CREEK CANYON ROAD RECONSTRUCTION 5 5 3,000,000 00601 CITY CREEK WATER SYSTEM TO SITES 23 THROUGH 30 500,000 03601 RESTORE TWO SITES 100,000 03601 900 SOUTH LANDSCAPING PROJECT - Cost share Stormwater 68,000
TOTAL LANDSCAPING 68,000$ 100,000$ -$ -$ -$ -$ 4,200,000$ - - - -
TOTAL CAPITAL IMPROVEMENTS 38,108,000$ 38,989,000$ 89,408,500$ 60,683,600$ 57,315,400$ 141,417,005$ 756,890,700$
37

Cost Center Object Code Asset Description Budget Year 2022-23
275010 AUTOMOBILES & TRUCKS Amount5100101 3/4 ton pickup w/winch - F350 Supercab (replaces 2008 GMC) 47,000.00 5100101 1/4 ton pickup/Chevy Colorado (replaces 2008 GMC Canyon) 42,000.00 5100101 1 ton flatbed w/plow - F350 (replaces 2001 Ford F550 4X4) 50,000.00 5100601 Ford F550 (replaces 2006 Ford F450) 50,000.00 5101001 1/4 ton pickup/Chevy Colorado - New Lead and Copper 35,000.00 5101301 Chevy Colorado or similar mid size 4 X 4 with bed cover and lights 35,000.00 5101301 Chevy Colorado or similar mid size 4 X 4 with bed cover and lights 35,000.00 5101401 Ford F550 4X4 Dump Body (replaces 2008 GMC3500 dump body) 63,000.00 5101501 Ford Escape (replaces 2009 Ford Escape) 26,000.00 5101701 Freightliner M2 V&H ( replaces 2010 International V&H) 175,000.00 5101701 Freightliner M2 V&H ( replaces 2010 International V&H) 175,000.00 5101701 Freightliner M2 V&H ( replaces 2010 International V&H) 175,000.00 5101701 1/4 ton pickup/Chevy Colorado (replaces 2008 GMC Canyon) 34,000.00 5101701 Freightliner 114 SD (replaces 2008 Mack Dump Truck) 160,000.00 5101701 Freightliner 114 SD (replaces 2010 International Dump Truck) 160,000.00 5102301 Ford F350 w/utility bed/fuel tank (replaces 2010 3/4 ton GMC) 63,000.00 5102401 Chevy 3500 w/utility walk in bed ( replaces 2009 GMC 3500 w/utility bed) 51,000.00 5102501 Ford F350 w/utility ( replaces 2008 Chevy 3500 w/utility bed) 47,000.00 5102601 1/4 ton V6 4X4 pickup Extended cab, light bar, cover (replaces 2009 GMC Canyon) 40,523.00 5103001 Ford Escape (replaces 2009 Ford Escape) 26,000.00
1,489,523.00$
276030 TELEMETERING EQUIPMENT Amount5100201 Hydrology Measurement System Replacement/Rebuild - irrigation and streams 200,000.00 5101501 Miscellaneous Water Telemetry Equipment 50,000.00
250,000.00$
275030 FIELD MAINTENACE EQUIPMENT5100101 CAT Backhoe replacement program 9,000.00 5100101 Valor 60TS Trailer -New 45,000.00
WATER UTILITY CAPITAL PURCHASESProjected Budget 2022-23
38

5100101 Chipper - 12 EPC drum style (replaces Vermeer chipper) 30,000.00 5100101 John Deere 4066R Compact Tractor ( replaces John Deere unit) 85,000.00 5100101 John Deere HX Rotary Mower - New 10,500.00 5100101 Rom Ecofit 0280606 - skid mounted - New 67,000.00 5100101 MSAHD 12-3 rock separator - midsize adjustable - new 25,000.00 5101201 UTV and miscellaneous equipment - New 30,000.00 5100601 Polaris Titan - replaces Snowpro M800 16,000.00 5100601 Polaris Titan - replaces Snowpro M800 16,000.00 5101701 Case Hammer Hoe attachment - New 20,000.00 5101701 CAT Backhoe replacement program - 8 units 72,000.00
425,500.00$
276090 OTHER NON-MOTIVE EQUIPMENT5100101 Verisight Pro Push Camera system 10,000.00 5100601 Plow 8,000.00 5100601 Skid sprayer - weeds 8,500.00 5100601 Salter 8,000.00 5100601 Tilt trailer - transport tractor and requested skid loader 10,000.00 5101401 Western 8' Striker Stainless Steel electric spreader (replaces Buyers 2011) 5,500.00 5101401 Western MVP3 8'6" Snow plow (replaces Western 2013) 6,300.00 5101501 Replacement UPS 50,000.00 5101601 New Access points /updated licensing - 12 14,400.00 5101601 Drone software 15,000.00 5101601 Replacement server - SharePoint 20,000.00 5101601 Loggers - leak detection 10,500.00 5101601 Stethophone - leak finders - 3 8,400.00 5102601 Vehicle Gateway base station - drive by technology 17,320.00
191,920.00$
276050 OFFICE FURNITURE AND EQUIPMENT5101601 Replacement of Sharp Copier/Scanner/Printer in Reagan Building 7,000.00 5103201 Replacement - radio system 600,000.00
607,000.00$
39

276020 TREATMENT PLANT EQUIPMENT5100701 Emergency equipment replacement (i.e. pumps, etc) 60,000.00 5100801 Plant equipment, emergency (ie: pumps, etc) 60,000.00 5100901 Emergency plant equipment (i.e. pumps) 60,000.00
180,000.00$
271030 WATER RIGHTS & SUPPLY5103301 Water rights and companies 250,000.00 5103301 Water stock 250,000.00
500,000.00$
271010 LAND5103301 Non-project and canals 150,000.00 5103301 Watershed Land 1,500,000.00
1,650,000.00$
Total 5,293,943.00$
40

Sewer Utility- Budget Summary and Cash Flow
41

COUNCIL AMENDED PROJECTED PROPOSED FORECAST FORECASTACTUAL ADOPTED BUDGET ACTUAL BUDGET BUDGET BUDGET
SOURCES 2020-2021 2021-22 2021-22 2021-22 2022-23 2023-24 2024-25
REVENUE & OTHER SOURCES
REVENUES
SEWER SERVICE 51,516,383$ 58,034,937$ 58,034,937$ 58,034,937$ 66,740,000$ 73,414,000 80,755,000$ OTHER REVENUES 596,965 406,000 406,000 406,000 406,000 406,000 406,000 INTEREST INCOME 438,896 171,000 171,000 171,000 947,084 59,064 59,953
TOTAL REVENUES 52,552,244 58,611,937 58,611,937 58,611,937 68,093,084 73,879,064 81,220,953
OTHER SOURCES
IMPACT FEES 3,094,964.0 1,422,000.0 1,422,000.0 2,264,352.0 1,422,000.0 1,422,000.0 1,422,000.0 GRANTS & OTHER RELATED REVENUES 651,289.0 1,100,823.0 1,100,823.0 1,100,823.0 1,100,823.0 1,100,823.0 1,100,823.0 SALE OF EQUIPMENT 29,838.0 16,000.0 16,000.0 98,625.0 50,000.0 50,000.0 50,000.0 WIFIA LOAN - 93,890,000.0 93,890,000.0 13,000,000.0 125,965,000 158,517,000 48,456,000 NON BOND FINANCING - - - - - - - BOND PROCEEDS 106,285,000.0 123,687,000.0 123,687,000.0 281,425,195.0 - 51,285,000.0 48,268,000.0
TOTAL OTHER SOURCES 110,061,091 220,115,823 220,115,823 297,888,995 128,537,823 212,374,823 99,296,823
TOTAL REVENUE & OTHER SOURCES 162,613,335$ 278,727,760$ 278,727,760$ 356,500,932$ 196,630,907$ 286,253,887 180,517,776$
EXPENSES & OTHER USES
EXPENDITURES
PERSONNEL SERVICES 10,317,141$ 12,799,959$ 13,021,785$ 13,021,785$ 13,827,671 14,380,778 14,956,009$ OPERATING & MAINTENANCE 1,173,611 2,656,055 2,656,055 2,656,055 3,164,804 3,228,098 3,292,660 TRAVEL & TRAINING 7,804 90,590 90,590 90,590 99,990 101,990 104,029 UTILITIES 607,869 1,039,090 1,039,090 1,039,090 1,045,184 1,066,087 1,087,407 TECHNICAL SERVICES 700,810 2,710,769 2,987,836 2,979,895 3,214,691 3,278,985 3,344,564 IMS SERVICES 647,925 1,040,533 1,040,533 1,040,533 1,040,533 1,061,344 1,082,571 FLEET MAINTENANCE 332,753 541,000 541,000 541,000 522,130 532,573 543,224 ADMINISTRATIVE SERVICE FEE 457,351 494,400 494,400 494,400 538,300 549,066 560,047 PAYMENT IN LIEU OF TAXES 809,149 851,386 851,386 851,386 1,001,995 1,022,035 1,042,476 BILLING COST 827,634 949,872 949,872 949,872 949,872 968,869 988,246 RISK MANAGEMENT 120,524 224,450 224,450 224,450 228,402 232,970 237,629 TRANSFERS TO GENERAL FUND - - 7,941 - - - - NEW PLANT O&M COSTS - - - - 250,000 252,500 255,025 OTHER CHARGES AND SERVICES 544,736 876,516 876,516 876,516 1,431,540 1,460,170 1,489,374
TOTAL EXPENDITURES 16,547,307$ 24,274,620$ 24,781,454$ 24,765,572$ 27,315,112$ 28,135,465 28,983,261$
OTHER USES
CAPITAL OUTLAY 924,777$ 1,327,000$ 1,448,934$ 1,448,934$ 1,305,054$ 1,000,000 1,000,000$ CAPITAL IMPROVEMENT BUDGET 82,153,930 226,135,826 333,936,247 333,936,247 205,884,910 234,047,425 117,811,718 COST OF DEBT ISSUANCE 236,077 687,000 687,000 1,561,000 - 285,000 268,000 DEBT SERVICES 12,716,763 15,789,350 15,789,350 12,542,350 21,409,504 22,812,369 30,688,195
TOTAL OTHER USES 96,031,547$ 243,939,176$ 351,861,531$ 349,488,531$ 228,599,468$ 258,144,794 149,767,913$
TOTAL EXPENSE & OTHER USES 112,578,854$ 268,213,796$ 376,642,985$ 374,254,103$ 255,914,580$ 286,280,259 178,751,174$
EXCESS REVENUE AND OTHERSOURCES OVER (UNDER) USES 50,034,481$ 10,513,964$ (97,915,225)$ (17,753,171)$ (59,283,673)$ (26,372) 1,766,602$
OPERATING CASH BALANCESBEGINNING JULY 1 30,581,040$ 80,892,100$ 80,892,100$ 80,892,100$ 63,138,929$ 3,855,256 3,828,884$ RESTRICTED / DESIGNATED 276,579$ -$ -$ -$ -$ 0 -$ AVAILABLE JUNE 30 80,892,100$ 91,406,064$ (17,023,125)$ 63,138,929$ 3,855,256$ 3,828,884 5,595,486$
Cash Reserve Ratio 489% 377% -69% 255% 14% 14% 19%Cash reserve goal above 14%
Rate Increase 15% Rate Increase 15% Rate Increase 10%
SEWER UTILITY BUDGET SUMMARYFY 2023-25
42

SEWER UTILITY CASH FLOW FY 2023 BUDGET / FY 2024-2027 FORECAST
ACTUAL PROJECTED BUDGET BUDGET BUDGET BUDGET BUDGETYEAR YEAR YEAR YEAR YEAR YEAR YEAR
2020-2021 2021-2022 2022-2023 2023-24 2024-25 2025-26 2026-27REVENUE
SEWER SALES 51,516,383$ 58,034,937$ 66,740,000$ 73,414,000$ 80,755,000$ 88,831,000$ 97,714,000$
OTHER INCOME 596,965 406,000 406,000 406,000 406,000 406,000 406,000
INTEREST INCOME 438,896 171,000 947,084 59,064 59,953 87,788 146,099
OPERATING INCOME 52,552,244$ 58,611,937$ 68,093,084$ 73,879,064 81,220,953$ 89,324,788$ 98,266,099$
OPERATING EXPENSES
NEW PLANT O&M COSTS -$ (250,000)$ (252,500) (255,025)$ (257,575)$ (3,262,727)$ OPERATING EXPENSES (16,547,307) (24,765,572) (27,065,112) (27,882,965) (28,728,236) (29,601,916) (30,505,037)
TOTAL OPERATING EXPENSE (16,547,307)$ (24,765,572)$ (27,315,112)$ (28,135,465) (28,983,261)$ (29,859,491)$ (33,767,764)$
NET INCOME EXCLUDING DEP. 36,004,937$ 33,846,365$ 40,777,972$ 45,743,599 52,237,692$ 59,465,297$ 64,498,335$
OTHER INCOME & EXPENSE
IMPACT FEES 3,094,964$ 2,264,352$ 1,422,000$ 1,422,000 1,422,000$ 1,422,000$ 1,422,000$
WIFIA LOAN 13,000,000 125,965,000 158,517,000 48,456,000 2,697,000 NET BOND PROCEEDS 106,048,923 279,864,195 51,000,000 48,000,000 47,250,000 - ISSUE COSTS (PROCEEDS) 236,077 1,561,000 - 285,000 268,000 264,000 -
ISSUE COSTS (EXP) (236,077) (1,561,000) - (285,000) (268,000) (264,000) -
OTHER CONTRIBUTIONS 651,289 1,100,823 1,100,823 1,100,823 1,100,823 1,684,000 1,684,000
SALE OF EQUIPMENT 29,838 98,625 50,000 50,000 50,000 50,000 50,000
CAPITAL OUTLAY (924,777) (1,448,934) (1,305,054) (1,000,000) (1,000,000) (1,000,000) (1,000,000)
STATE LOAN DEBT REPAYMENT (2,125,000) - - - - - -
WIFIA LOAN REPAYMENT - - - - - -
NEW DEBT SERVICE - - (8,864,894) (10,211,125) (18,006,113) (19,514,680) (21,495,927)
DEBT SERVICE (10,591,763) (12,542,350) (12,544,610) (12,601,244) (12,682,082) (12,679,577) (12,469,035)
OTHER INCOME & EXPENSE 96,183,474$ 282,336,711$ 105,823,265$ 188,277,454 67,340,628$ 19,908,743$ (31,808,962)$
CAPITAL GENERATION
GENERATED FOR CAPITAL 132,188,411$ 316,183,076$ 146,601,237$ 234,021,053 119,578,320$ 79,374,040$ 32,689,373$
CAPITAL IMPROVEMENTS
CAPITAL IMPROVEMENTS (82,153,930)$ (333,936,247)$ (205,884,910)$ (234,047,425) (117,811,718)$ (75,579,277)$ (37,815,406)$
BEGINING CASH BALANCE 30,581,040$ 80,892,100$ 63,138,929$ 3,855,256 3,828,884$ 5,595,486$ 9,390,249$
CASH INCREASE/(DECREASE) 50,034,481$ (17,753,171)$ (59,283,673)$ (26,372) 1,766,602$ 3,794,763$ (5,126,033)$
RESTRICTED/DESIGNATED 276,579$ -$ -$ - -$ -$ -$
ENDING BALANCE 80,892,100$ 63,138,929$ 3,855,256$ 3,828,884 5,595,486$ 9,390,249$ 4,264,216$
Debt Service Coverage 2.83 2.70 1.90 2.01 1.70 1.85 1.90
RATE CHANGE 18% 18% 15% 10% 10% 10% 10%
Cash Reserve Ratio 487% 255% 14% 14% 19% 31% 13%
DEBT SERVICE % OF GROSS OPERATING REVENUE 20% 21% 31% 31% 38% 36% 35%
MONTHLY RESIDENTIAL UTILITY BILL AT 4 CCF 17.36 20.52 23.60 25.96 28.56 31.42 34.56
MONTHLY RESIDENTIAL UTILITY BILL AT 8 CCF 34.72 41.04 47.20 51.92 57.11 62.82 69.10
43

SEWER UTILITY CIP BUDGETFive Year Projected Budget 2023‐2027
COST CENTER
PROJECT NUMBER
CAP REQUEST NUMBER
PROJECT DESCRIPTION
CR
ITIC
ALI
TY
RA
TIN
G
CO
ND
ITIO
N
RA
TIN
G PAST BUDGET YEAR
2021-22
BUDGET YEAR 2022-23 2023-24 2024-25 2025-26 2026-27 2027-28 DELAYED
2720.10 MAINTENANCE & REPAIR SHOPS - 2720.102019-1041 LIFT STATION STORAGE FACILITY 5 0 200,000 600,000
NEW SLCDPU CAMPUS 5 5 8,000,000 8,000,000 2021-1051 Collections WRF Receiving Pad 4 5 60,000 330,000 3,300,000
TOTAL MAINTENANCE & REPAIR SHOPS - 2720.10 0 0 0 8,200,000 60,000 930,000 0 11,300,000
52-10101 2720.05 LIFT STATIONS - 2720.05
LIFT STATION ASSET MANAGEMENT PROGRAM10101 2019-1046 LIFT STATION SCOPING and ASSET MANAGEMENT PRIORITIZATION 2 1 500,000
LIFT STATION RENEWAL/REPLACEMENT PROGRAM10101 2021-1087 FY 22/23 ANNUAL PUMP REPLACEMENT (VARIOUS) 5 5 25,000 25,000 25,000 25,000 25,000 25,000 25,000 10101 524907101 2017-1301 5300 WEST LIFT STATION (SS17) CAPACITY IMPROVEMENTS 4 5 2,500,000 2,500,000 10101 2015-0264 SOUTH LIFT STATION (SS05) 3 2 700,000 10101 524907104 2015-0417 INDUSTRIAL LIFT STATION REHAB & PIPING UPGRADES (SS21) 4 5 60,00010101 524907098 2015-0267 NEW ROSE PARK LIFT STATION REPLACEMENT (SS02) 4 5 40,00010101 524907105 2015-0268 500 W LIFT STATION WET WELL IMPROVEMENTS (SS28) 4 5 ---10101 2015-0270 WESTPOINTE LIFT STATION WET WELL IMPROVEMENTS (SS 33) 2 2 550,000 10101 524907100 2015-0272 900 NORTH LIFT STATION WET WELL IMPROVEMENTS 4 5 60,000 40,000 10101 2017-2008 Billy Mitchell (SS16) Capacity Upgrades 3 5 120,000 250,000 2,000,000 10101 524907107 2020-1036 1700 NORTH LIFT STATION ELECTRICAL IMPROVEMENTS 4 5 ---10101 2020-1063 Amelia Earhart LS Rehab 3 3 550,000 10101 2020-1062 Concord LS Improvements 3 2 700,000 10101 2020-1060 California Place LS Improvements 3 3 339,900 10101 2020-1064 Morton Lift Station Rehabilitation 3 3 500,000 10101 2020-1061 West LS Improvements 3 2 300,000 10101 2020-1070 North LS (SS04) Rehabilitation 3 3 350,000 10101 2020-1078 600 N LS Rehab 3 3 350,000 10101 2020-1079 Nin Tech LS Rehabilitation 3 4 350,000 10101 2021-1024 500 S PS Biofilter Make-up Water 2 1 100,000 10101 2021-1109 Industrial LS Alternatives Evaluation 4 5 75,000 10101 2021-1136 Industrial LS Improvements 4 5 2,500,000
TOTAL LIFT STATIONS - 2720.05 2,685,000 2,760,000 2,775,000 2,025,000 25,000 25,000 525,000 4,789,900
52-11201 2720.30 TREATMENT PLANTS11201 524905347 2015-0640 FACILITY BUILDING PAINTING (CORROSION PROTECTION PROGRAM) 5 5 100,000 500,000 11201 524905338 2017-2093 INFLUENT SCREEN (S) REPLACE/RETROFIT 5 511201 524905336 EXISTING FACILITES CONDITION ASSESSMENT/PRE-DESIGN 511201 525400075 SOUTH RAS SKIMMER RELOCATION 411201 52540066 WETLANDS RESTORATION PROJECT 411201 524905342 PROCESS CONTROL LAB ROOM 411201 2016-1275 WASHER COMPACTOR FOR PRIMARY SLUDGE 4 011201 525400074 2017-2088 SCADA INSTRUMENTATION CONTROL IMPROVEMENTS 5 511201 524905330 2015-0707 CHLORINE BUILDING ALARM SYSTEM 511201 524905283 R19-0167 SCADA PHASE III FOLLOW-UP SERVICES 5 511201 524905280 2015-0710 REPLACEMENT OF MCC2A AT THE PRE-SEDIMENTATION BUILDING - CONSTRUCTION 511201 52540053 2015-0708 ATMOSPHERIC MONITORING REPLACEMENT PROGRAM 5 511201 52540064 VFD REPLACEMENT 511201 52540052 2015-0500 TRICKLING FILTER REHABILITATION 5 511201 52540067 TRICKLIKNG FILTER PUMPS INSPECTION & RECONDITIONING11201 524905345 2015-0502 CAPITAL ASSET REHABILITATION AND UPGRADES 5 5 1,300,000 1,300,000 1,300,000 1,300,000 1,300,000 11201 2016-1133 REHAB OF VERTICAL TURBINE PUMPS 4 4 400,000 11201 524905344 2017-2089 HVAC REPLACEMENTS 3 3 25,000 25,000 25,000 25,000 25,000 11201 524905341 HVAC IMPROVEMENTS AT PRE-SEDIMENTATION11201 2016-1281 COGEN ENGINE OVERHAUL 700,000 11201 524905352 2018-1052 SLC WRF HEADWORKS GATE REPLACEMENT 5 511201 524905355 2016-1160 UPGRADE EMERGENCY GENERATORS AT PUMP STATION 4 511201 524905365 2018-1072 SLC WRF INFLUENT PUMP MOTOR REBUILD 5 411201 524905366 2018-1071 SLC WRF INFLUENT PUMP REBUILD 5 411201 524905367 2018-1068 SLC WRF BIO GAS HEAT EXCHANGER 4 411201 524905363 2018-1066 SLC WRF PUMP PLANT EXTERIOR LIGHTING 4 511201 524905359 R19-0040 NEW WRF COMPUTERIZED MAINTENANCE MANAGEMENT SYSTEM
44

SEWER UTILITY CIP BUDGETFive Year Projected Budget 2023‐2027
COST CENTER
PROJECT NUMBER
CAP REQUEST NUMBER
PROJECT DESCRIPTION
CR
ITIC
ALI
TY
RA
TIN
G
CO
ND
ITIO
N
RA
TIN
G PAST BUDGET YEAR
2021-22
BUDGET YEAR 2022-23 2023-24 2024-25 2025-26 2026-27 2027-28 DELAYED
11201 524905370 2019-1143 SLCWRF MAIN PLANT PLC UPGRADES11201 524905358 R18-0065 INTEGRATION FOR VFD REPLACEMENTS11201 524905356 R18-0066 SLC WRF WORK ORDER SYSTEM11201 524905360 R19-0046 TEMPORARY DEWATERING 300,000
2021-1070 SLCWRF - Lab HVAC Replacement and Relocate 4 4 150,000 2021-1071 SLCWRF - Redwood Campus Civil Work 1 1 75,000 2021-1093 SLCWRF - Plant Wide Breaker PM 5 5 230,000 2021-1100 SLCWRF - Boiler Redundancy Upgrades (Digesters) 2 2 75,000 2022-1001 SLCWRF - 5th Rotary Drum Thickener (TWAS) 2 2 2,100,000 2021-1102 SLCWRF - Digester #4 Mixer 4 4 1,075,000 2015-0500 Trickling Filter Rehabilitation 4 4 75,000 2021-1133 SLCWRF - Digester Mixers Platform Upgrade 3 3 100,000 2021-1134 SLCWRF - Screw Press Scaffolding (Temp Dewatering) 3 3 65,000 2021-1135 SLCWRF - Rotary Drum Replacements (TWAS) 4 4 247,000
1,725,000 3,417,000 3,425,000 2,025,000 0 0 0 2,225,000
NEW WATER RECLAMATION FACILITY11201 524905339 2017-2051 New WRF - CM/GC Services (CM/GC Preconstruction Services)11201 525400068 2017-2050 New WRF - Professional Design Services (Design Services - AECOM) 8,250,904 5,200,000 5,400,000 2,450,000 1,200,000 604,975 11201 524905271 Program Management (Jacobs) 2,500,000 3,000,000 3,000,000 2,200,000 1,500,000 594,529 11201 524905337 2017-2052 New WRF - Water Renew Public Outreach (Public Engagement -WF&Co) 144,000 114,000 120,000 120,000 120,000 59,421 11201 524905362 2019-1054 New WRF - Visual Documentation Services for Construction (Project Documentation - MultiVista) 96,000 102,000 81,202 64,944 64,944 32,556 11201 524905368 2019-1131 Salt Lake City Water Reclamation Facility LEED Leed Commissioning Agent (Leed Commissioning -ETC) 22,000 108,000 11201 524905359 R19-0040 New WRF- Computerized Maintenance Management System (CMMS -NexGen)11201 524905271 2017-2054 New WRF - Piloting and Demonstration Testing (BNR Demonstration Facility) 1,636,364 11201 524905271 Permitting 3,750,000 11201 524905271 Easements 1,200,000 11201 524905271 2015-0505 New WRF - Core - Design Build Reclamation Facility (Construction - Based off BODR) 164,943,912 159,428,253 188,352,567 80,306,942 40,505,245 9,893,925 11201 524905271 Contingency 6,777,647 6,777,647 6,777,647 3,388,824 4,473,079
Financing costs 701,009 701,009 701,009 701,009
TOTAL NEW WATER RECLAMATION FACILITY 189,320,826 175,322,910 204,432,425 89,231,718 48,564,277 11,185,406 - 108,000
TOTAL TREATMENT PLANTS (WATER RECLAMATION FACILITY) 191,045,826 178,739,910 207,857,425 91,256,718 48,564,277 11,185,406 0 2,333,000
TOTAL BUILDINGS 193,730,826 181,499,910 210,632,425 101,481,718 48,649,277 12,140,406 525,000 18,422,900
52-10401 2730.14 COLLECTION LINES
COLLECTION SYSTEM ASSET MANAGEMENT PROGRAM10401 2020-1154 1200 WEST TRUNK LINE CONDITION ASSESSMENT/ PROJECT PRE-DESIGN 5 2 600,000 600,000 10401 2015-0664 SIPHON INSPECTION PROJECT 3 3 200,000 200,000 10401 2015-0645 COLLECTION SYSTEM PROJECT DEVELOPMENT CAP SCOPING 2 2 300,000 10401 2020-1155 BECK STREET TRUNK LINE CONDITION ASSESSMENT/PRE-DESIGN 5 2 600,000 10401 2020-1156 ORANGE STREET TRUNK LINE CONDITION ASSESSMENT/PROJECT PRE-DESIGN 4 4 430,000 10401 2019-1115 Wastewater Masterplan 5 4 1,200,000
0 0 0 430,000 200,000 600,000 600,000 2,300,000
FLOW MONITORING/I&I PROGRAM10401 2015-0652 EAST SIDE INFLOW AND INFILTRATION STUDY 3 5 300,000 10401 2015-0651 ANNUAL HYDRAULIC MODEL CALIBRATION 4 3 150,000 150,000 10401 2017-2078 VARIOUS BASIN INFLOW TESTING 4 4 250,000 10401 2018-1029 BASIN 11 I&I 3 4 250,000
0 0 0 0 150,000 800,000 0 150,000
CITY, COUNTY, STATE AND MISC. DRIVEN PROJECTS10401 2015-0484 ANNUAL MISC. PUBLIC SERVICES PROJECTS 5 5 200,000 200,000 200,000 200,000 200,000 200,000 200,000 200,000 10401 525002988 R20-0213 500 SOUTH FM DISCHARGE BIOTOWER PRE-DESIGN 4 0 ---10401 2019-1126 500 SOUTH FM DISCHARGE BIOTOWER 4 0 150,000 1,300,000 10401 2019-1127 ORANGE STREET LOCATION 4 BIOTOWER 2 0 2,840,000 10401 2021-1082 ORANGE STREET LOCATION 5 BIOTOWER 2 0 2,640,000 10401 525002942 2019-1091 800 WEST 600 S to 800 S 5 5 ---10401 525002861 R19-0018 300 W (900 S TO 2100 S) Spot Repairs and Sewer Rehabilitation Project 5 5 ---10401 525002982 2019-1018 Roadway Bond 2021: 900 East from Hollywood to 2700 South 5 5 ---
45

SEWER UTILITY CIP BUDGETFive Year Projected Budget 2023‐2027
COST CENTER
PROJECT NUMBER
CAP REQUEST NUMBER
PROJECT DESCRIPTION
CR
ITIC
ALI
TY
RA
TIN
G
CO
ND
ITIO
N
RA
TIN
G PAST BUDGET YEAR
2021-22
BUDGET YEAR 2022-23 2023-24 2024-25 2025-26 2026-27 2027-28 DELAYED
10401 525002980 2019-1038 Roadway Bond 2021: 100 S from 900 East to North Campus Drive 5 5 ---10401 525002985 2019-1066 1700 East 12-inch Sewer - 1700 South to 2700 South Roadway 5 5 ---10401 525002979 2019-1072 CITY WIDE SEWER IMPROVEMENTS AND PRESERVATION 2020/2021 5 5 ---10401 2019-1068 200 SOUTH - 400 WEST TO 900 EAST, PHASE 1 4 4 2,500,000 75,000 10401 2019-1073 CITY WIDE SEWER IMPROVEMENTS AND PRESERVATION 2021/2022 4 4 800,000 40,000 10401 2019-1071 1100 EAST TO HIGHLAND - ROMONA AVE TO WARNOCK AVENUE 4 4 200,000 10401 2019-1070 1100 EAST - 900 SOUTH TO RAMONA AVE 5 5 750,000 10401 2019-1078 1300 EAST - 2100 SOUTH TO CITY BOUNDARY 5 5 600,000 10401 2019-1074 CITY WIDE SEWER IMPROVEMENTS AND PRESERVATION 2022/2023 5 5 500,000 10401 2020-1106 VIRGINA STREET - SOUTH TEMPLE TO 11TH AVE 4 5 300,000 10401 2020-1107 300 NORTH - 300 WEST TO 1000 WEST 5 5 800,000 10401 2019-1075 CITY WIDE SEWER IMPROVEMENTS AND PRESERVATION 2023/2024 5 4 500,000 10401 525002978 2019-1065 900 South - 900 West to 300 West & West Temple to 900 East 5 510401 2019-1081 2100 SOUTH - 700 EAST TO HIGHLAND DRIVE 5 5 800,000 10401 2019-1174 CITY WIDE SEWER IMPROVEMENTS AND PRESERVATION 2024/2025 5 5 500,000 10401 525002865 R19-0016 City Wide Street Improvements Spot Repairs and Sewer Rehabilitation Project 5 5 450,000 10401 2020-1053 SLCo Surplus Inspection Reporting 5 4 150,000 200,000 10401 525003028 2020-1086 SR-186 (400 S) -- State Street to 1300 E Sewer Rehab (UDOT) 4 5 40,000 350,000 10401 525003003 2020-1097 Foothill Dr -- 2100 E to Stringham Sewer Rehab 4 5 350,00010401 525003026 2020-1098 State Street -- 1700 S to 400 S Sewer Rehab 4 5 40,000 400,000 10401 525003018 2017-2016 630 South State Street East Side (Life on State) 4 5 150,00010401 2020-1169 SLCo Surplus Canal Certification Project 5 4 1,000,000 3,000,000 10401 2021-1132 Downtown Local Area Study 3 4 250,000 10401 2021-1002 700 North Sewer Rehabilitation 4 5 200,000 1,700,000
4,080,000 6,615,000 2,650,000 400,000 4,900,000 200,000 200,000 6,130,000
PIPE RENEWAL & REPLACEMENT PROGRAM10401 2015-0486 1% PER YEAR SEWER REHABILITATION/SYSTEM RENEWAL 5 5 3,000,000 2,500,000 5,500,000 4,500,000 4,500,000 3,400,000 10401 2015-0722 TESORO SEWER TRUNK LINE REHABILITATION 5 4 6,000,000 10401 2016-0897 1200 W Trunk Line Rehabilitation - West Temple 5 5 7,000,000 10401 2021-1084 1200 W Trunk Line Rehabilitation - 1300 S 5 4 6,000,000 10401 2016-0902 800 S AND 1100 E LATERAL CONNECTIONS AND UPSTREAM INFILTRATION 3 4 350,000 10401 2015-0727 300 W - 550 S TO 600 S 3 3 250,000 10401 2016-0895 ELGIN AVE SEWER REPLACEMENT 3 4 50,000 350,000 10401 2015-0318 700 SOUTH - 3750 WEST TO IRON ROSE PLACE (3830 W) 4 4 650,000 10401 525002835 2016-0873 DOOLEY COURT 3 5 150,000 60,000 10401 525002851 R18-0027 1200 WEST TRUNK LINE REHABILITATION PROJECT 5 5 75,000 32,000,000 10401 525003010 2020-1009 BECK STREET TRUNK LINE REHABILITATION PROJECT 5 5 10,000,000 2,000,000 8,000,000 6,000,000 10401 525002981 2016-1125 CIPP SEWER ON 650 EAST SIXTEENTH AVE 3 5 80,00010401 525002983 2016-1128 CIPP SEWER ON NORTHCREST DR BETWEEN I STREET AND ALOHA RD 3 5 50,00010401 525002984 2016-1130 CIPP SEWER ON C STREET BETWEEN TENTH AVE AND ELEVENTH AVE 3 5 130,00010401 525002943 2016-1141 CIPP SEWER ON J STREET BETWEEN EIGHTH AVE AND NINTH AVE 3 5 40,00010401 525002944 2016-1143 CIPP SEWER ON A STREET FROM SIXTH AVE TO SEVENTH AVE 3 5 50,00010401 525002945 2016-1146 CIPP SEWER AT 2930 EAST OQUIRRH DR 3 5 160,00010401 525002946 2016-1147 CIPP SEWER ON 2725 EAST ST MARY'S WAY 3 5 280,00010401 525002947 2016-1148 CIPP SEWER AT 3050 EAST SHERWOOD DR 3 5 50,00010401 525002948 2016-1150 CIPP SEWER ON 1470 SOUTH CANTERBURY DR 3 5 50,00010401 525002949 2016-1151 CIPP SEWER ON 1515 SOUTH DEVONSHIRE DR 3 5 65,00010401 525002950 2016-1182 CIPP SEWER ON EMERSON AVE FROM 2300 EAST TO FOOTHILL 3 5 35,00010401 525002951 2016-1170 CIPP SEWER BETWEEN 1811 SOUTH FOOTHILL AND 1845 SOUTH FOOTHILL DR 3 5 300,00010401 525002952 2016-1243 CIPP SEWER ON 2100 SOUTH BETWEEN MCCLELLAND ST AND 1100 EAST 3 5 45,00010401 525002953 2016-1196 CIPP SEWER FROM 2400 EAST KENSINGTON AVE TO 2440 EAST KENSINGTON AVE 3 5 80,00010401 525002954 2016-1199 CIPP SEWER ON 800 EAST FROM PARKWAY AVE TO FAIRMONT CIR 3 5 230,00010401 525002955 2016-1205 CIPP SEWER ON 600 WEST BETWEEN 100 SOUTH AND 200 SOUTH 3 5 60,00010401 525002956 2016-1210 CIPP SEWER ON KENDEN DR AND SCENIC DR 3 5 35,00010401 525002957 2016-1211 CIPP SEWER AT PARLEYS WAY AND MAYWOOD DR 3 5 45,00010401 525002958 2016-1217 CIPP SEWER ON GARFIELD AVE FROM 2130 EAST GARFIELD TO CONNER ST 3 5 35,00010401 525002960 2016-1220 CIPP SEWER ON HANNIBAL ST FROM WILMINGTON AVE TO PARLEYS CANYON BL 3 5 100,00010401 525002962 2016-1221 CIPP SEWER SUGAR HOUSE PARK (1630 E 2100 S) 3 5 300,00010401 525002959 2016-1237 CIPP SEWER ON CLAYBOURNE AVE FROM 1300 EAST TO ALDEN ST 3 5 70,000 10401 525002964 2016-1238 CIPP SEWER ON 1000 EAST BETWEEN 2700 SOUTH AND 2800 SOUTH 3 5 50,000 10401 2016-1240 CIPP SEWER ON MCCLELLAND ST AT CRANDAL AVE 3 5 35,000 10401 525002967 2016-1254 CIPP SEWER 745 SOUTH GUARDSMAN WAY 3 5 50,000 10401 2015-0683 8TH AVE - FROM M ST TO L ST 3 4 22,000 10401 525002961 2016-0872 800 W 100 N TO 100 S BOTH SIDES 3 5 200,000 10401 525002969 2016-0907 600 W 300 - 400 N EAST SIDE 3 5 160,000
46

SEWER UTILITY CIP BUDGETFive Year Projected Budget 2023‐2027
COST CENTER
PROJECT NUMBER
CAP REQUEST NUMBER
PROJECT DESCRIPTION
CR
ITIC
ALI
TY
RA
TIN
G
CO
ND
ITIO
N
RA
TIN
G PAST BUDGET YEAR
2021-22
BUDGET YEAR 2022-23 2023-24 2024-25 2025-26 2026-27 2027-28 DELAYED
10401 2016-0963 CIPP SEWER LINE PROJECT FROM 1038 EAST NORTH BONNEVILLE DR TO 760 NORTH NORTHLAND DR 3 4 25,000 10401 2016-0836 2600 E BLAINE AVE TO FOOTHILL 2 5 100,000 10401 525002965 2016-0740 SOUTH TEMPLE FROM 1410 EAST TO 1380 EAST 3 5 25,000 10401 525002446 2016-0896 700 WEST FROM 250 NORTH TO 300 NORTH 4 5 55,000 10401 525002973 2016-0970 CIPP SEWER LINE FROM 300 WEST TO 260 WEST ON REED AVE 3 5 70,000 10401 2016-0972 CIPP SEWER VIRGINIA ST FROM MH 22062 TO POPPERTON WAY 3 4 25,000 10401 525002972 2016-0975 CIPP SEWER IN INTERNATIONAL CENTER ON NEIL ARMSTRONG ROAD 3 5 110,000 10401 2016-0976 CIPP SEWER ON DONNER WAY AND DONNER CIRCLE 3 4 20,000 10401 2016-0978 CIPP SEWER ON OAK HILLS WAY 3 4 66,000 10401 2016-0984 CIPP SEWER ON WILTON WAY TO SHERWOOD DR 3 4 110,000 10401 525002968 2016-0985 CIPP SEWER ON ROXBURY ROAD 3 5 ---10401 525002970 2016-0986 CIPP SEWER ON APACHE CIRCLE 3 5 70,000 10401 2016-0996 CIPP SEWER 1700 SOUTH AND FOOTHILL DR 3 4 85,000 10401 525002976 2016-1022 CIPP SEWER ON BRYAN AVE FROM 1000 EAST TO 1100 EAST 3 5 55,000 10401 525002977 2016-1023 CIPP SEWER ON 1200 EAST FROM WOOD AVE TO MILTON AVE 3 5 150,000 10401 2016-1025 CIPP SEWER 1700 SOUTH 2100 EAST 3 4 50,000 10401 2016-1029 CIPP SEWER ON 1100 EAST FROM MICHIGAN AVE TO HERBERT AVE 3 5 90,000 10401 2016-1034 CIPP SEWER ON WHITLOCK AVE FROM HIGHLAND DR TO DOUGLAS ST 3 4 40,000 10401 2016-1037 CIPP SEWER ON HOLLYWOOD AVE BETWEEN 1800 EAST AND 1900 EAST 3 3 55,000 10401 2016-1043 CIPP SEWER ON 200 EAST AND 100 SOUTH 3 5 200,000 10401 2016-1045 CIPP SEWER ON WEST TEMPLE BETWEEN SOUTH TEMPLE AND 100 SOUTH 3 5 200,000 10401 2016-1046 CIPP SEWER ON 100 SOUTH STATE STREET 3 5 250,000 10401 2016-1060 CIPP SEWER ON 800 EAST FROM SIMPSON AVE TO WILMINGTON AVE 3 5 200,000 10401 2016-1061 CIPP SEWER ON THIRD AVE FROM O ST TO P ST 3 4 70,000 10401 2016-1074 CIPP SEWER ON SOUTH TEMPLE FROM P ST TO Q ST 3 5 900,000 10401 2016-1076 CIPP SEWER ON 900 EAST FROM SOUTH TEMPLE TO 100 SOUTH 3 4 40,000 10401 2016-1079 CIPP SEWER ON 200 SOUTH 1300 EAST TO UNIVERSITY 3 4 40,000 10401 2016-1082 CIPP SEWER ON LINDEN AVE AND 1000 EAST 3 5 40,000 10401 2016-1083 CIPP SEWER ON 900 EAST BETWEEN 300 SOUTH AND 400 SOUTH 3 4 400,000 10401 2016-1084 CIPP SEWER ON GILMER DR 3 4 80,000 10401 2016-1085 CIPP SEWER ON 1900 EAST FROM HERBERT AVE TO YALE AVE 3 5 60,000 10401 525003022 2016-1087 1700 SOUTH AND 1700 EAST SEWER REHAB 3 4 225,000 75,000 10401 2016-1088 CIPP SEWER ON FAYETTE AVE AND WEST TEMPLE 3 5 50,000 10401 2016-1109 CIPP SEWER ON ELY PL AND 700 EAST 3 510401 2016-1010 CIPP SEWER ON 1000 EAST FROM SOUTH TEMPLE TO 100 SOUTH 3 4 55,000 10401 2016-1111 CIPP SEWER ON 200 EAST FROM 250 SOUTH TO 300 SOUTH 3 5 200,000 10401 2016-1115 CIPP SEWER ON 200 NORTH BETWEEN WEST TEMPLE AND ALMOND ST 3 4 110,000 10401 2016-1122 CIPP SEWER ON EDGEHILL ROAD AND LITTLE VALLEY ROAD 3 5 35,000 10401 2016-1124 CIPP SEWER ON NORTHMONT WAY AND EIGHTEENTH AVE 3 5 60,000 10401 2016-1126 CIPP SEWER ON TERRACE HILLS DR BETWEEN NORTHCREST DR AND NORTH BONNEVILLE 3 5 90,000 10401 2016-1132 CIPP SEWER ON NINTH AVE BETWEEN K STREET AND L STREET 3 4 70,000 10401 2016-1140 CIPP SEWER ON DORCHESTER DR FROM BRAEWICK RD TO SANDRUN RD 3 5 70,000 10401 2016-1142 CIPP SEWER ON B STREET FROM SIXTH AVE TO SEVENTH AVE 3 5 300,000 10401 2016-1145 CIPP SEWER ON DONNER WAY FROM THACKERAY PL TO SHAKESPEARE PL 3 5 40,000 10401 2016-1152 CIPP SEWER ON KENSINGTON AVE AND BEACON DR 3 4 100,000 10401 2016-1153 CIPP SEWER ON CANTERBURY DR FROM LANCASTER DR TO WILTON WAY 3 5 70,000 10401 2016-1156 CIPP SEWER ON UTE DR FROM INDIAN HILL CIRCLE TO EAGLE WAY 3 4 60,000 10401 2016-1157 CIPP SEWER ON COMANCHE DR AND EAGLE WAY 3 5 15,000 10401 2016-1158 CIPP SEWER ON WASATCH DR BETWEEN 1700 SOUTH AND SKYLINE DR 3 5 150,000 10401 2016-1172 CIPP SEWER FROM 1911 SOUTH FOOTHILL TO 1975 SOUTH FOOTHILL 3 4 19,000 10401 2016-1198 CIPP SEWER ON BLAINE AVE AND TEXAS ST 3 5 90,000 10401 2016-1207 CIPP SEWER ON INDUSTRIAL AVE AND 1700 SOUTH 3 5 15,000 10401 2016-1209 CIPP SEWER ON 2300 EAST BETWEEN CLUBHOUSE DR AND MAYWOOD DR 3 5 30,000 10401 2016-1212 CIPP SEWER FROM 2526 EAST COMMONWEALTH TO WYOMING ST 3 5 35,000 10401 2016-1213 CIPP SEWER ON 2000 EAST BETWEEN WILSON AVE AND DOWNINGTOWN AVE 3 5 60,000 10401 2016-1214 CIPP SEWER FROM 1838 EAST DOWNINGTOWN AVE TO 1800 EAST 3 5 70,000 10401 2016-1215 CIPP SEWER ON 2100 EAST FROM WILSON AVE TO DOWNINGTOWN AVE 3 4 25,000 10401 2016-1229 CIPP SEWER ON GLENMARE ST BETWEEN STRATFORD AVE AND 2700 SOUTH 3 5 19,000 10401 2016-1241 CIPP SEWER ON HUDSON AVE BETWEEN HIGHLAND DRIVE AND 1400 EAST 3 5 100,000 10401 2016-1242 CIPP SEWER ON SYLVAN AVE BETWEEN 1900 EAST AND 2000 EAST 3 4 40,000 10401 2016-1245 CIPP SEWER ON THIRD AVE AT CANYON ROAD 3 5 80,000 10401 525003041 2016-1246 Sewer Rehab State Street -- NT to 300 N 3 5 ---10401 2016-1248 CIPP SEWER ON C STREET BETWEEN FIFTH AVE AND SIXTH AVE 3 5 180,000 10401 2016-1256 CIPP SEWER ON UNIVERSITY BLVD (500 S) FROM 1500 EAST TO GUARDSMAN WAY 3 4 70,000 10401 2015-0309 500 SOUTH - 3415 WEST TO 3600 WEST 3 3 224,000 10401 2016-0821 ELGIN AVE 1000 E - 950 E 2 4 250,000 10401 2016-0967 8-IN CIPP SEWER LINE FROM CAMBRIDGE WAY TO 1330 EAST PERRYS HOLLOW 3 4 80,000
47

SEWER UTILITY CIP BUDGETFive Year Projected Budget 2023‐2027
COST CENTER
PROJECT NUMBER
CAP REQUEST NUMBER
PROJECT DESCRIPTION
CR
ITIC
ALI
TY
RA
TIN
G
CO
ND
ITIO
N
RA
TIN
G PAST BUDGET YEAR
2021-22
BUDGET YEAR 2022-23 2023-24 2024-25 2025-26 2026-27 2027-28 DELAYED
10401 2016-0974 CIPP SEWER ON 1500 WEST FROM TALISMAN DR TO 895 NORTH 3 4 100,000 10401 2016-0977 CIPP SEWER BONNEVILLE DR 3 3 70,000 10401 2016-0982 CIPP SEWER AT ST MARY'S WAY AND OQUIRRH DRIVE 3 4 110,000 10401 2016-1006 CIPP SEWER ON 4TH AVE FROM VIRGINIA ST TO U ST 3 5 55,000 10401 2016-1007 CIPP SEWER ON FORT DOUGLAS CIRCLE 3 5 30,000 10401 2016-1053 CIPP SEWER ON KRISTIANNA CIR AND VIRGINIA ST 3 5 120,000 10401 2016-1054 CIPP SEWER ON ROUNDTOFT DR TO EAST CAPITOL BLVD 3 5 80,000 10401 2016-1062 CIPP SEWER ON SECOND AVE FROM L STREET TO M STREET 3 5 40,000 10401 2016-1127 CIPP SEWER ON 550 EAST NORTHHILLS DR 3 5 100,000 10401 2016-0969 CIPP SEWER LINE ON 300 WEST FROM 400 NORTH TO BISHOP PL 3 4 25,000 10401 2016-1066 CIPP SEWER ON M STREET BETWEEN FIRST AND SECOND AVE 3 5 260,000 10401 2016-0870 Easement North of Oquirrh Dr 3 4 50,000 10401 2017-2021 800 South 1200 East 2 5 80,000 10401 2017-1302 LEARNED AVE 1034 TO 1000 WEST 3 5 100,000 10401 2017-2023 400 East 2100 ‐ 1700 South 4 5 500,000 10401 525002922 2017-2040 1210 WEST PACIFIC AVE 3 5 ---10401 2017-2036 350 West 600 South North Side 4 5 150,000 10401 2017-2037 1000 East Logan Ave 3 5 110,000 10401 2017-2038 700 to 800 West 300 North North Side 3 5 300,000 10401 2017-2041 420 South 700 West 2 5 50,000 10401 2017-2047 994 South Oak Hills 3 4 150,000 10401 2017-2123 4200 West North Temple 4 5 500,000 10401 525002923 2018-1046 YALE AVE - 100 E to 200 E 3 5 --- 80,000 10401 525002925 2019-1061 1300 S - LAIRD DRIVE 3 5 --- 50,000 10401 2018-1001 190 East Social Hall 1 5 250,000 10401 2018-1008 CIPP on South Temple Between A and B Street 3 5 25,000 10401 2018-1009 CIPP on Q street from 4th ave to South Temple Including side shots 3 5 400,000 10401 2018-1010 CIPP on 3rd ave from C Street to E Street 2 5 90,000 10401 2018-1011 CIPP on 100 south from 750 ‐ 800 West 2 5 75,000 10401 2018-1012 Spot Repair on Wasatch Drive at 1758 South 3 5 25,000 10401 2018-1021 Foothill Drive 1300‐1000 South 4 5 200,000 10401 2018-1022 500 South, Main Street to State Street 1 2 40,000 10401 2018-1027 845 West 200 South 2 5 350,000 10401 2018-1039 900 East 100 ‐ 200 South East Side 2 4 65,000 10401 2018-1042 100 South 800 ‐ 700 East south side 3 4 65,000 10401 2018-1086 18th Ave 630 ‐ 724 East 2 5 800,000 10401 2018-1087 Laird Ave 1300 ‐ 1100 East 2 4 120,000 10401 2018-1088 400 South State to main North Side with Side Street 3 5 120,000 10401 2018-1097 CIPP State St and 500 S to 200 E and 100 S 4 4 2,000,000 10401 2018-1111 North Temple (from Main to West Temple) Capacity Project 4 4 600,000 10401 2019-1017 Downington Ave and 2500 East 3 3 60,000 10401 2019-1051 Harvard Ave ‐ Major St to Main St 4 5 150,000 10401 2019-1058 CIPP on M Street 1st ‐ 4th ave 3 4 500,000 10401 2019-1059 CIPP 800 West 500 to 600 North 3 5 500,000 10401 2019-1063 200 S Sewer Realignment 4 3 250,000 10401 2019-1064 300 West ‐ 500 South to 2100 South Roadway 4 5 2,800,000 10401 2019-1069 400 S 1000 W Sewer Replacement 3 4 450,000 10401 2019-1104 280 South 300 West 3 5 120,000 10401 2019-1139 Fulton Sewer Extension 1 0 680,000 10401 2019-1156 Pioneer Side Sewer Relocation 4 3 300,000 10401 2019-1180 600 South ‐ MH 21371‐MH 03058 4 5 100,000 60,000 10401 2020-1174 Pipe Replacement 200 S 900 W 4 5 500,000 10401 2020-1045 900 E Main Extension 1 3 300,000 10401 2020-1175 Blanchard Pipe Rehab and Replacement 3 4 350,000 10401 2021-1012 Dupont Sewer Rehab 4 5 75,000 10401 2021-1001 200 E Sewer Rehabilitation 4 5 260,000 10401 2021-1009 Emery Sewer Rehab 4 5 200,00010401 2021-1040 900 South 1300 East Sewer Line Rehab 3 4 105,000
POINT REPAIR PROGRAM (VARIOUS LOCATIONS)10401 Emergent Operational Support Project(s) 3 5 500,000 500,000 500,000 500,000 500,000 10401 FY 2022/2023 Emergent Operational Support Project 5 5 500,000 10401 2021-1034 North Temple 1000 West Point Repair 2 5 65,000 10401 2021-1054 Grounding Rod Point Repair(s) 3 4 100,000
TOTAL COLLECTION LINES 2,445,000 560,000 12,805,000 13,000,000 14,050,000 13,350,000 5,000,000 70,035,000
48

SEWER UTILITY CIP BUDGETFive Year Projected Budget 2023‐2027
COST CENTER
PROJECT NUMBER
CAP REQUEST NUMBER
PROJECT DESCRIPTION
CR
ITIC
ALI
TY
RA
TIN
G
CO
ND
ITIO
N
RA
TIN
G PAST BUDGET YEAR
2021-22
BUDGET YEAR 2022-23 2023-24 2024-25 2025-26 2026-27 2027-28 DELAYED
MAINTENANCE ACCESS REHAB PROGRAM (VARIOUS LOCATIONS)10401 MAINTENANCE ACCESS REHAB PROGRAM (VARIOUS LOCATIONS) 5 5 500,000 500,000 500,000 1,000,000 10401 525002875 2015-0478 FY 2019-2020 Manhole Rehab Program (Various Locations) 4 5 ---10401 2021-1018 500 S Surplus Siphon Rehabilitation 4 4 750,000 10401 2021-1050 Facility ID 21309 Replacement 3 4 170,000
0 0 500,000 0 500,000 500,000 0 1,920,000
OTHER PROJECTS10401 CONTRIBUTIONS BY DEVELOPERS 5 5 500,000 500,000 500,000 500,000 500,000 500,000 500,000 10401 2021-1045 FY 21/22 Collection System Capital Project Support 4 4 600,00010401 2021-1129 FY 22/23 Collection System Capital Project Support 4 4 650,000 10401 525003006 R-20-0277 01WW - Construction Management Support Services 5 0 200,00010401 TASK 1 PROGRAM MANAGMENT SERVICES (Jacobs) 360,000
1,300,000 1,510,000 500,000 500,000 500,000 500,000 500,000 0 MASTER PLAN IMPLEMENTATION PROGRAM
10401 525002850 2016-0926 MP11 - State Street 500 South Diversion Improvement 5 5 ---10401 2016-0950 MP13 - BECK STREET TRUNK REPLACEMENT FROM 500 SOUTH AND STATE STREET TO 700 SOUTH AN 5 3 20,000,000 10401 525002878 R19-0079 1800 North Sewer Realignment, Phase 1 - Inverted Siphon 5 5 8,100,000 500,000 10401 525002879 R19-0082 1800 North Sewer Realignment, Phase 2 - Trunk Sewer 5 5 8,250,000 14,500,000 1,500,000 10401 525002915 R19-0084 1800 North Sewer Realignment, Phase 3 - Rehabilitation 5 5 4,000,000 10401 525002631 2015-0280 ORANGE STREET - PHASE IV - INDIANA TO 1500 SOUTH 5 4 1,200,000 9,500,000 10401 52490787 2015-0269 MP12D - 700 SOUTH LIFT STATION (SS 10) 5 4 ---10401 2016-0929 MP16 - 600 WEST AND 700 SOUTH TO 500 WEST AND 800 SOUTH 5 5 30,000 2,500,000 10401 2016-0931 MP17B - MAIN STREET FROM 800 SOUTH TO 900 SOUTH 5 5 30,000 1,750,000 10401 2016-0940 MP19 - FOLSOM AVENUE FROM 500 WEST TO 1000 WEST 5 5 30,000 13,500,000 10401 2016-0941 MP20 - 700 WEST FROM 900 SOUTH TO 600 SOUTH 5 4 30,000 5,500,000 10401 2016-0942 MP21 - 100 SOUTH AND 300 WEST DIVERSION 5 4 360,000 10401 2015-0322 MP28 - NORTH TEMPLE - AIRPORT TO ORANGE STREET 4 4 16,250,000 10401 2016-0949 MP26 - SOUTH TEMPLE AND 400 WEST DIVERSION 4 4 40,000 250,000 10401 2016-0943 MP22 - PIONEER ROAD FROM CALIFORNIA AVENUE TO 1500 SOUTH 4 4 40,000 9,000,000 10401 2016-0947 MP24 - 400 SOUTH FROM 300 WEST TO 600 WEST 4 3 3,000,000 10401 2016-0953 MP31 - 600 SOUTH FROM 800 WEST TO 900 WEST 4 3 2,000,000 10401 2016-0952 MP30 - 200 EAST FROM 300 SOUTH TO 500 SOUTH 4 4 350,000 4,000,000 10401 2016-0946 MP23 - Parallel 1000 West Trunk 4 3 25,000,000 10401 2016-1195 MP29 - BECK STREET TRUCK REPLACEMENT FROM 200 SOUTH AND 300 WEST TO STATE STREET AND 4 3 16,000,000 10401 2016-0841 500 S. PUMP AND THIRD FORCE MAIN INSTALLATION 5 1 18,000,000 10401 2016-0954 MP32 - 700 WEST FROM 700 SOUTH TO 500 SOUTH (EAST SIDE OF I-15) 4 3 40,000 3,000,000 10401 2015-0660 SATELLITE TREATMENT PLANT 5 0 405,500,000 10401 2016-0948 MP25 - Centennial Lift Station Discharge 1 0 3,400,000 10401 2019-1123 700 S. PUMP AND THIRD FORCE MAIN INSTALLATION 5 2 20,000,000 10401 525003027 2019-1085 2300 E/WILMINGTON AVE/YUMA ST UPSIZING PROJECT 5 4 80,000 350,000 3,500,000 10401 525003004 2019-1086 EMERY STREET UPSIZING PROJECT 4 5 --- 700,000 10401 525002924 2015-0483 Land Easement for 500 South MP Project to Orange Street 5 4 200,000 10401 2016-0842 MP12B&C - 500 South Capacity Upgrades (3400 West to Orange Street) 5 4 1,500,000 15,000,000 10401 525002940 2019-1082 2100 S CAPACITY UPGRADE PROJECT 5 5 7,750,000 500,000 10401 2019-1105 SOUTH TEMPLE UPSIZING PROJECT 5 5 250,000 2,000,000 10401 2019-1116 Gladiola Street Capacity Project 2 0 4,000,000 10401 2019-1117 Amelia Earhart Dr/Jimmy Doolittle Rd Upsizing Project 3 3 2,000,000 10401 2019-1118 2100 S Upsizing Project 3 3 1,500,000 10401 2019-1119 California Ave Upsizing Project 3 3 660,000 10401 2019-1120 South Temple/200 E Upsizing Project 3 3 225,000 600,000 10401 2019-1121 700 S Upsizing Project 3 2 2,000,000 10401 2019-1122 N Wall St Upsizing Project 3 2 500,000 10401 2020-1044 MP8B – 3230 West Capacity Upgrades 4 2 4,000,000
Total improvements other than buildings 32,005,000 24,385,000 23,415,000 16,330,000 26,930,000 25,675,000 25,300,000 660,805,000
Total CIP 225,735,826 205,884,910 234,047,425 117,811,718 75,579,277 37,815,406 25,825,000 679,227,900
49
Cost Center Object Code Asset Description Budget Year 2022-23
275010 Automobiles & Trucks Amount5210101 Ford F550 4X4 w/ Dump bed (replaces 2001 Ford F550) 63,000.00 5210601 Chevy 3500 (replaces International 4900) 64,000.00 5210601 Electric vehicle/Hybrid (replaces 2013 GMC Terrain) 35,000.00 5210601 Ford F450 (replaces 2014 Freightliner Sprinter) 228,053.67 5210601 Chevy 2500 HD 4 door 4X4 (replaces 2013 Toyota Tacoma) 52,000.00 5210601 Freightliner 114 (replaces 2009 International 7600 4X4) 365,000.00 5211201 Club Cart/Golf Cart - New 21,000.00 5211201 Club Cart/Golf Cart - New 21,000.00
849,053.67$
275030 FIELD MAINTENACE EQUIPMENT Amount5210601 Toro CM 1248Y-SD cement mixer - replaces existing unit 12,000.00 5210601 SPMI roll off tub -22'X40 yard - replaces existing solution 10,000.00 5210601 CAT Backhoe replacement program 9,000.00 5211201 Toyota forklift - replace 1999 Daewoo at WRF storehouse 65,000.00
96,000.00$
276020 TREATMENT PLANT EQUIPMENT5211201 Aeration basin drainage pump 45,000.00
45,000.00$
276050 OFFICE FURNITURE AND EQUIPMENT5211701 Replacement - Radio System 240,000.00
240,000.00$
276090 OTHER NON-MOTIVE EQUIPMENT5211201 HVAC upgrades - 3 units 75,000.00
75,000.00$
Total 1,305,053.67$
SEWER UTILITY CAPITAL PURCHASESProjected Budget 2022-23
50

Stormwater Utility- Budget Summary and Cash Flow
51

COUNCIL AMENDED PROJECTED PROPOSED FORECAST FORECASTACTUAL ADOPTED BUDGET ACTUAL BUDGET BUDGET BUDGET
SOURCES 2020-21 2021-22 2021-22 2021-22 2022-23 2023-24 2024-25
REVENUE & OTHER SOURCES
REVENUES
STORM WATER FEES 10,922,225$ 10,714,550$ 10,714,550$ 10,714,550$ 12,321,733$ 13,553,906$ 14,909,297$ INTEREST INCOME 105,061 119,200 119,200 96,203 75,000 36,249 39,402 OTHER REVENUES 78,078 64,000 64,000 82,324 103,000 103,000 103,000 TOTAL REVENUES 11,105,364$ 10,897,750$ 10,897,750$ 10,893,077$ 12,499,733$ 13,693,155$ 15,051,699$
OTHER SOURCES
GRANTS & OTHER RELATED REVENUES -$ 352,000$ 352,000$ 352,000$ $ 352,000 352,000$ 4,352,000$ SALE OF EQUIPMENT 9,935 - - - - COUNTY FLOOD CONTROL - - - - - - - IMPACT FEES 928,384 389,000 389,000 665,023 625,000 625,000 625,000 BOND PROCEEDS 14,524,479 6,160,000 6,160,000 - - 5,028,000 - TOTAL OTHER SOURCES 15,462,798$ 6,901,000$ 6,901,000$ 1,017,023$ 977,000$ 6,005,000$ 4,977,000$
TOTAL REVENUE & OTHER SOURCES 26,568,162$ 17,798,750$ 17,798,750$ 11,910,100$ 13,476,733$ 19,698,155$ 20,028,699$
EXPENSES & OTHER USES
EXPENDITURES
PERSONNEL SERVICES 3,041,941$ 4,215,783$ 4,235,488$ 4,235,488$ $ 4,612,954 4,797,472$ 4,989,371$ OPERATING & MAINTENANCE 193,434 232,408 232,408 232,408 306,197 312,321 318,568 TRAVEL & TRAINING 330 23,615 23,615 23,615 28,265 28,830 29,406 UTILITIES 167,325 264,318 264,318 264,318 271,118 276,540 282,070 TECHNICAL SERVICES 390,674 1,083,723 1,501,013 1,501,013 1,443,940 1,472,819 1,502,277 PUBLIC SERVICES / STREET SWEEPING 236,000 819,605 819,605 819,605 819,605 819,605 819,605 IMS SERVICES 460,634 802,400 802,400 802,400 882,640 900,293 918,299 FLEET MAINTENANCE 191,101 214,000 214,000 214,000 317,215 323,559 330,030 ADMINISTRATIVE SERVICE FEE 147,607 164,800 164,800 164,800 197,375 201,323 205,349 PAYMENT IN LIEU OF TAXES 124,259 133,525 133,525 133,525 149,450 152,439 155,488 BILLING COST 674,938 669,010 669,010 669,010 669,010 682,390 696,038 RISK MANAGEMENT 39,255 52,100 52,100 52,100 58,255 59,420 60,608 TRANSFERS TO GENERAL FUND - 4,000 4,000 4,000 - - - OTHER CHARGES AND SERVICES 63,205 24,755 27,033 24,755 27,377 27,925 28,484 TOTAL EXPENDITURES 5,730,703$ 8,704,042$ 9,143,315$ 9,141,037$ 9,783,401$ 10,054,936$ 10,335,593$
OTHER USES
CAPITAL OUTLAY 93,446$ 218,000$ 512,866$ 512,866$ $ 1,637,000 500,000$ 500,000$ CAPITAL IMPROVEMENT BUDGET 3,925,293 8,530,500 12,727,316 12,727,316 5,725,000 7,105,000 11,160,000 COST OF DEBT ISSUANCE 23,570 34,200 34,200 - - 28,000 - DEBT SERVICES 1,268,215 1,714,271 1,714,271 1,714,271 1,554,321 1,648,254 1,622,376
TOTAL OTHER USES 5,310,524$ 10,496,971$ 14,988,653$ 14,954,453$ 8,916,321$ 9,281,254$ 13,282,376$
TOTAL EXPENSE & OTHER USES 11,041,227$ 19,201,013$ 24,131,968$ 24,095,490$ 18,699,722$ 19,336,190$ 23,617,969$
EXCESS REVENUE AND OTHERSOURCES OVER (UNDER) USES 15,526,935$ (1,402,263)$ (6,333,218)$ (12,185,390)$ $ (5,222,989) 361,965$ (3,589,270)$
OPERATING CASH BALANCESBEGINNING JULY 1 7,504,567$ 22,185,370$ 22,185,370$ 22,185,370$ $ 9,999,980 4,776,991$ 5,138,956$ RESTRICTED / DESIGNATED (846,132)$ -$ -$ -$ $ - -$ -$ AVAILABLE JUNE 30 22,185,370$ 20,783,107$ 15,852,152$ 9,999,980$ $ 4,776,991 5,138,956$ 1,549,686$
Cash Reserve Ratio 387% 173% 109% 49% 51% 15%Cash reserve goal above 14%
Rate increase 15% Rate increase 10% Rate increase 10%
STORMWATER UTILITY BUDGET SUMMARYFY 2023-2025
52

STORMWATER UTILITY CASH FLOW FY 2023 BUDGET / FY 2024-2027 FORECAST
ACTUAL PROJECTED BUDGET BUDGET BUDGET BUDGET BUDGETYEAR YEAR YEAR YEAR YEAR YEAR YEAR
2020-2021 2021-2022 2022-2023 2023-2024 2024-2025 2025-2026 2026-2027REVENUESTORMWATER CHARGES 10,889,575$ 10,714,550$ 12,321,733$ 13,553,906$ 14,909,297$ 15,654,762$ 15,654,762$ OTHER INCOME 110,728 82,324 103,000 103,000 103,000 103,000 103,000 INTEREST INCOME 105,061 96,203 75,000 36,249 39,402 12,939 31,821
OPERATING INCOME 11,105,364$ 10,893,077$ 12,499,733$ 13,693,155$ 15,051,699$ 15,770,701$ 15,789,583$
OPERATING EXPENDITURESOPERATING EXPENDITURES (5,730,703)$ (9,141,037)$ (9,783,401)$ (10,054,936)$ (10,335,593)$ (10,625,699)$ (10,925,599)$
NET INCOME EXCLUDING DEP. 5,374,661$ 1,752,040$ 2,716,332$ 3,638,219$ 4,716,106$ 5,145,002$ 4,863,984$
OTHER INCOME & EXPENSEIMPACT FEES 928,384$ 665,023$ 625,000$ 625,000$ 625,000$ 625,000$ 625,000$ NET BOND PROCEEDS 14,500,909 - - 5,000,000 6,000,000 - COST OF ISSUANCE (PROCEEDS) 23,570 - - 28,000 - 34,000 - COST OF ISSUANCE (EXP.) (23,570) - - (28,000) - (34,000) - OTHER CONTRIBUTIONS - 352,000 352,000 352,000 4,352,000 352,000 352,000 SALE OF EQUIPMENT 9,935 - - - - - - CAPITAL OUTLAY (93,446) (512,866) (1,637,000) (500,000) (500,000) (500,000) (500,000) SHORT-TERM DEBT - - - - - - - DEBT SERVICE (NEW) - - - (130,000) (156,000) (312,000) (466,000) DEBT SERVICE (1,268,215)$ (1,714,271)$ (1,554,321)$ (1,518,254)$ (1,466,376)$ (1,465,499)$ (1,173,465)$
OTHER INCOME & EXPENSE 14,077,567$ (1,210,114)$ (2,214,321)$ 3,828,746$ 2,854,624$ 4,699,501$ (1,162,465)$
CAPITAL GENERATIONGENERATED FOR CAPITAL 19,452,228$ 541,926$ 502,011$ 7,466,965$ 7,570,730$ 9,844,503$ 3,701,519$
CAPITAL IMPROVEMENTSCAPITAL IMPROVEMENTS (3,925,293)$ (12,727,316)$ (5,725,000)$ (7,105,000)$ (11,160,000)$ (7,390,000)$ (6,040,000)$
BEGINING CASH BALANCE 7,504,567$ 22,185,370$ 9,999,980$ 4,776,991$ 5,138,956$ 1,549,686$ 4,004,189$ CASH INCREASE/(DECREASE) 15,526,935$ (12,185,390)$ (5,222,989)$ 361,965$ (3,589,270)$ 2,454,503$ (2,338,481)$ RESTRICTED/DESIGNATED (846,132)$ -$ -$ -$ -$ -$ ENDING CASH AVAILABLE 22,185,370$ 9,999,980$ 4,776,991$ 5,138,956$ 1,549,686$ 4,004,189$ 1,665,708$
Cash Reserve Ratio 402% 109% 49% 51% 15% 38% 15%DEBT SERVICE COVERAGE 4.24 1.02 1.75 2.21 2.91 2.89 2.97RATE CHANGE 0% 10% 15% 10% 10% 5% 0%Revenue 26,568,162 11,910,100 13,476,733 19,698,155 20,028,699 22,781,701 16,766,583DEBT SERVICE % OF GROSS OPERATING REVENUE 11% 16% 12% 12% 11% 11% 10%RESIDENTIAL BILL FOR 1 ERU (or .25 acre) 5.43 5.97 6.87 7.56 8.32 8.74 8.74
53

STORMWATER CIP BUDGETProjected Budget 2023‐2029
COST CENTER
OBJECT CODE /
PROJECT NUMBER
CAP REQUEST NUMBER PROJECT DESCRIPTION
CR
ITIC
ALI
TY R
ATI
NG
CO
ND
ITIO
N R
ATI
NG
PAST BUDGET
YEAR 2021-22
2022-23 2023-24 2024-25 2025-26 2026-27 2027-28 2028-29 DELAYED
53-10301 2720.05 LIFT STATIONS 10301 2021-1113 VARIOUS PUMP STATIONS 5 5 100,000 100,000 200,000 200,00010301 53471040 SWEDE TOWN LIFT STATION 4 0 700,000 200,000 1,200,00010301 2020-1144 NORTHWEST DRAIN LIFT STATION RECONSTRUCTION 5 5 550,000 3,500,000
700,000$ 750,000$ 1,200,000$ 3,500,000$ 100,000$ 100,000$ 200,000$ 200,000$ -$
53-10301 2730.20 DETENTION BASINS 10301 534720008 2021-1110 VARIOUS DETENTION BASINS 5 5 50,000 50,000 50,000 50,000 50,000 50,00010301 2021-1065 GRANARY DISTRICT FLOODPLAIN MITIGATION AND RE-MAPPING 5 5 50,000 365,000 3,500,000
100,000$ -$ 415,000$ 3,500,000$ 50,000$ 50,000$ 50,000$ 50,000$ -$
53-10301 2730.12 COLLECTION MAINS10301 534701097 2021-1111 VARIOUS COLLECTION MAINS 5 5 130,000 300,000 300,000 300,000 300,00010301 53470970 2016-0853 DITCH BANK EROSION PROTECTION - 600 NORTH 550 WEST 4 4 35,000 275,00010301 2021-1056 LOCAL STORM DRAIN IMPROVEMENTS 4 4 200,000 200,000 200,000 200,000 200,000 200,000 200,00010301 2021-1112 NORTHWEST DRAIN BYPASS TO JORDAN RIVER 5 0 150,000 1,650,00010301 2022-1006 STORM DRAIN REHAB - EMIGRATION CREEK AND 1700 S 5 5 310,00010301 53470974 ORANGE STREET STORM DRAIN - NORTH TEMPLE TO I-80 5 0 500,00010301 2017-2034 RED BUTTE CREEK CULVERT AT 900 SOUTH - LINER 5 4 300,00010301 534701029 PIPE REPLACEMENT AT 746 SOUTH ELIZABETH AND 750 S 1100 E 3 5 180,00010301 53470988 7200 WEST AND NORTH TEMPLE CULVERT REPLACEMENT AND CANAL REH 4 4 250,00010301 53470994 CITY DRAIN CROSSING AT HUNTER STABLES 4 3 250,00010301 534701035 2019-1110 SOUTH TEMPLE - R STREET TO 800 EAST STORM DRAIN ASSESSMENT AND 4 5 550,00010301 53470882 2017-2101 LEE DRAIN - PIPE OPEN CHANNEL WEST OF PIONEER ROAD 5 4 895,00010301 534701096 2015-0142 MIDDLE BRIGHTON RAILROAD CULVERT REHABILITATION 5 4 40,00010301 534700998 2016-0746 ABANDONMENT OF STORMWATER DITCH FROM WARM SPRINGS ROAD TO 4 4 350,00010301 534701095 2015-0131 REPAIR OUTLETS ON THE LEE DRAIN AT 4800 WEST 3 4 21,00010301 534701000 2016-0750 1700 SOUTH STORM DRAIN, FROM 2100 EAST TO EMIGRATION CREEK 3 0 2,200,000
4,221,000$ 935,000$ 200,000$ 200,000$ 2,150,000$ 500,000$ 500,000$ 500,000$ 1,480,000$
53-10301 2730.12 CITY, COUNTY, STATE AND MISC. DRIVEN PROJECTS10301 2021-1130 TASK 1 PROGRAM MANAGEMENT SERVICES (JACOBS) 3 3 150,000 180,000 250,00010301 2021-1128 STORMWATER SYSTEM CAPITAL PROJECT SUPPORT 3 3 100,00010301 2021-1114 STORM DRAIN CITY/COUNTY/STATE PROJECTS 5 5 150,000 150,000 150,000 150,000 150,000 150,000 1,250,000 1,250,00010301 2022-1009 ROADWAY RECONSTRUCTION PRELIMINARY DESIGN ASSESSMENTS 5 5 140,000 140,000 140,000 140,000 140,000 140,000 140,00010301 534701051 2021-1115 SURPLUS CANAL ENCROACHMENT AND PERMITTING 5 5 50,000 50,00010301 2019-1010 1100 EAST HIGHLAND - RAMONA TO WARNOCK 4 3 1,300,00010301 2020-1131 1100 EAST - 900 SOUTH TO RAMONA 4 3 400,00010301 2020-1133 LOCAL STREETS FY23 3 5 200,00010301 2020-1132 300 NORTH - 300 WEST TO 1000 WEST 4 3 40,000 400,00010301 2020-1137 VIRGINIA STREET - SOUTH TEMPLE TO 11TH AVE 4 3 50,000 500,00010301 2020-1139 1300 EAST - 2100 SOUTH TO 3000 SOUTH 5 3 120,000 1,200,00010301 2020-1138 W TEMPLE - NORTH TEMPLE TO 400 SOUTH 3 5 60,000 600,00010301 2020-1140 LOCAL STREETS FY24 3 5 200,00010301 2020-1141 2100 SOUTH - 700 EAST TO 1700 EAST 4 5 80,000 800,00010301 2020-1142 1700 EAST - 1700 SOUTH TO 2700 SOUTH 4 4 70,000 700,00010301 2020-1143 LOCAL STREETS DISTRICT FY25 3 5 200,00010301 900 WEST - NORTH TEMPLE TO 600 NORTH 4 4 50,000 500,00010301 LOCAL STREETS FY26 4 4 20,000 200,00010301 700 NORTH - REDWOOD ROAD TO 2200 WEST 4 4 50,000 500,00010301 LOCAL STREETS FY27 4 4 50,000 500,00010301 534701028 2019-0118 900 SOUTH - 900 WEST TO 300 WEST, WEST TEMPLE TO 900 EAST 5 3 1,122,50010301 534701061 2019-1005 200 SOUTH - 400 WEST TO 900 EAST 4 3 500,00010301 534701092 2020-1130 LOCAL STREETS DISTRICTS FY22 3 5 200,000
2,172,500$ 2,790,000$ 3,590,000$ 2,060,000$ 1,090,000$ 1,290,000$ 1,390,000$ 1,390,000$ -$
53-10301 2730.12 PUBLIC UTILITY DEFINED PROJECTS10301 2021-1116 VARIOUS PUBLIC UTILITY DEFINED PROJECTS 5 5 50,000 50,000 50,000 50,000 50,000 50,000 50,000 50,00010301 2021-1117 CLEANOUT BOX REHABILITATION 4 5 100,000 100,000 100,000 100,000 100,000 100,000 100,000 100,000
54

STORMWATER CIP BUDGETProjected Budget 2023‐2029
COST CENTER
OBJECT CODE /
PROJECT NUMBER
CAP REQUEST NUMBER PROJECT DESCRIPTION
CR
ITIC
ALI
TY R
ATI
NG
CO
ND
ITIO
N R
ATI
NG
PAST BUDGET
YEAR 2021-22
2022-23 2023-24 2024-25 2025-26 2026-27 2027-28 2028-29 DELAYED
10301 2021-1118 STORMWATER QUALITY - RETROFITS 4 4 169,000 100,000 100,000 100,000 100,000 100,000 100,000 100,00010301 2021-1119 DITCH RECONSTRUCTION AND PHRAGMITE CONTROL 3 5 50,000 50,000 50,000 50,000 50,000 50,000 50,000 50,00010301 2021-1120 UNDERDRAIN AND SPRING LINE REPLACEMENTS 3 5 100,000 100,000 100,000 100,000 100,000 100,000
369,000$ 300,000$ 400,000$ 400,000$ 400,000$ 400,000$ 400,000$ 400,000$ -$
53-10301 2730.12 RIPARIAN CORRIDOR PROJECTS10301 VARIOUS RIPARIAN CORRIDOR PROJECTS 5 5 200,000 250,000 450,000 450,000 450,000 450,000 450,00010301 2022-1007 EMIGRATION CREEK - 1700 S OUTLET PROTECTION 5 5 250,00010301 534700012 2020-1023 RIPARIAN CORRIDOR ASSESSMENT 5 5 50,000
250,000$ 250,000$ 250,000$ 450,000$ 450,000$ 450,000$ 450,000$ 450,000$ -$
53-10301 2730.12 LOCAL AREA PROJECTS ( * WORK BY CITY CREWS)10301 2021-1121 VARIOUS LOCAL AREA PROJECTS 5 5 100,000 100,000 100,000 100,000 100,000 100,000 100,000 100,00010301 2021-1122 AVENUE CROSSWALKS / SID STREETS - DIPSTONE REPLACEMENT 3 4 50,000 50,000 50,000 50,000 50,000 50,000 50,000 50,00010301 2021-1123 AVENUE CROSSWALKS AND ADA RAMPS 3 0 50,000 50,000 50,000 50,000 50,000 50,000 50,000 50,00010301 2021-1124 CONTRIBUTIONS BY DEVELOPERS 3 0 400,000 400,000 400,000 400,000 400,000 400,000 400,000 400,000
600,000$ 600,000$ 600,000$ 600,000$ 600,000$ 600,000$ 600,000$ 600,000$ -$
53-10301 2730.12 MASTER PLAN PROJECTS10301 VARIOUS MASTER PLAN PROJECTS 5 5 400,000 400,000 2,500,000 2,500,000 2,500,000 2,500,000
-$ -$ 400,000$ 400,000$ 2,500,000$ 2,500,000$ 2,500,000$ 2,500,000$ -$
53-10301 2730.20 LANDSCAPING 10301 2021-1125 VARIOUS LANDSCAPING PROJECTS 5 5 50,000 50,000 50,000 50,000 50,000 150,000 150,000 150,00010301 53470934 NORTHWEST OIL DRAIN 5 5 50,000
50,000$ 100,000$ 50,000$ 50,000$ 50,000$ 150,000$ 150,000$ 150,000$ -$
TOTAL CAPITAL IMPROVEMENTS 8,462,500$ 5,725,000$ 7,105,000$ 11,160,000$ 7,390,000$ 6,040,000$ 6,240,000$ 6,240,000$ 1,480,000$
55

Cost Center Object Code Asset Description Budget Year 2022-23
275010 MOTIVE REPLACEMENT AUTOS & TRUCKS Amount5310201 Freightliner - new 3rd dump truck 175,000.00 5310201 International - new haul existing lowboy trailer; driver tests 110,000.00 5310201 Vactor - replacement of 2009 unit 560,000.00 5310201 Ford 350 extended cab with winch - replacement of 2005 unit 45,000.00
890,000.00$
275030 FIELD MAINTENACE EQUIPMENT Amount5310201 CAT Backhoe replacement program 9,000.00 5310201 John Deere 190 GW wheeled excavator - new 235,000.00 5310201 Gorman Rupp 4" pump - new trailer mounted 55,000.00 5310201 Gorman Rupp 6" pump - new trailer mounted 55,000.00 5310201 Ventura Lachlan - new mower attachment 35,000.00 5310201 Rom Ecofit cleaning machine - new - for use in small areas 67,000.00
456,000.00$
276090 OTHER NON-MOTIVE EQUIPMENT5310201 Verisight Pro Push Camera System - add to new camera truck and crew 10,000.00 5310201 Toro CM958H-S concrete mixer - new 6,000.00 5310201 Multiquip MC84SH8 concrete mixer - new 6,000.00 5310201 Cirsafulli Pump parts 10,000.00 5310201 Sonetics Apex 3 Series APX377 headphones - safety vactor/drag machine ops 29,000.00 5310901 Survey equipment - data collector and antenna - new 70,000.00
131,000.00$ 276050 OFFICE FURNITURE AND EQUIPMENT
5310501 Replacement - Radio System 160,000.00
160,000.00$
Total 1,637,000.00$
STORMWATER UTILITY CAPITAL PURCHASESProjected Budget 2022-23
56

Street Lighting Utility- Budget Summary and Cash Flow
57

COUNCIL AMENDED PROJECTED PROPOSED FORECAST FORECASTACTUAL ADOPTED BUDGET ACTUAL BUDGET BUDGET BUDGET
SOURCES 2020-21 2021-22 2021-22 2021-22 2022-23 2023-24 2024-25
REVENUE & OTHER SOURCES
REVENUES
STREET LIGHTING FEES 4,350,116$ 4,097,569$ 4,097,569$ 4,097,569$ 4,174,622$ 4,592,084$ 5,051,292$ INTEREST INCOME 38,047 40,500 40,500 24,407 22,500 40,500 40,500 OTHER REVENUES 200 4,859 4,859 100 100 4,859 4,859 TOTAL REVENUES 4,388,363$ 4,142,928$ 4,142,928$ 4,122,076$ 4,197,222$ 4,637,443$ 5,096,651$
OTHER SOURCES
GRANTS & OTHER RELATED REVENUES -$ 27,841$ 27,841$ -$ 25,000$ 25,000$ 25,000$ TRANSFERS FROM GENERAL FUND 1,500 20,000 20,000 20,000 80,000 20,000 20,000 IMPACT FEES - - - - - - - BOND PROCEEDS - - - - - - - TOTAL OTHER SOURCES 1,500$ 47,841$ 47,841$ 20,000$ 105,000$ 45,000$ 45,000$
TOTAL REVENUE & SOURCES 4,389,863$ 4,190,769$ 4,190,769$ 4,142,076$ 4,302,222$ 4,682,443$ 5,141,651$
EXPENSES & OTHER USES
EXPENDITURES
PERSONNEL SERVICES 269,442$ 357,390 364,488$ 364,488$ 392,792$ 398,020$ 413,940$ OPERATING & MAINTENANCE 39 6,994$ 6,994 6,994 6,994 7,134 7,280 TRAVEL & TRAINING 215 3,000 3,000 3,000 3,000 3,060 3,122 UTILITIES 688,016 1,011,500 1,011,500 1,011,500 912,000 930,240 948,846 TECHNICAL SERVICES 2,279,332 1,827,704 1,785,706 1,785,706 1,933,500 1,972,170 2,011,614 IMS SERVICES - 3,040 3,040 3,040 3,040 3,101 3,164 FLEET MAINTENANCE - - - - - - - ADMINISTRATIVE SERVICE FEE 27,055 48,000 48,000 48,000 52,260 53,306 54,373 PAYMENT IN LIEU OF TAXES 74,170 - 42,469 42,469 17,706 18,061 18,423 RISK MANAGEMENT - 1,000 1,000 1,000 1,000 1,020 1,041 TRANSFERS TO GENERAL FUND - - - - - - - OTHER CHARGES AND SERVICES 2,354 7,498 7,498 7,498 1,948 1,987 2,029 TOTAL EXPENDITURES 3,340,623$ 3,266,126$ 3,273,695$ 3,273,695$ 3,324,240$ 3,388,099$ 3,463,832$
OTHER USES
CAPITAL OUTLAY -$ - -$ -$ -$ -$ -$ CAPITAL IMPROVEMENT BUDGET 664,572 2,240,000 2,256,415 2,256,415 2,240,000 2,240,000 2,240,000 DEBT SERVICES 172,104 193,537 193,537 193,537 193,585 193,562 193,528
TOTAL OTHER USES 836,676$ 2,433,537$ 2,449,952$ 2,449,952$ 2,433,585$ 2,433,562$ 2,433,528$
TOTAL EXPENSE & OTHER USES 4,177,299$ 5,699,663$ 5,723,647$ 5,723,647$ 5,757,825$ 5,821,661$ 5,897,360$
EXCESS REVENUE AND OTHER SOURCES OVER (UNDER) USES 212,564$ (1,508,894)$ (1,532,878)$ (1,581,571)$ $ (1,455,603) (1,139,218)$ (755,709)$
OPERATING CASH BALANCES BEGINNING JULY 1 6,050,463$ 6,263,027$ 6,263,027$ 6,263,027$ $ 4,681,456 3,225,853$ 2,086,635$ RESTRICTED / DESIGNATED -$ -$ -$ $ - -$ -$ AVAILABLE JUNE 30 6,263,027$ 4,754,133$ 4,730,149$ 4,681,456$ $ 3,225,853 2,086,635$ 1,330,926$
CASH RESERVE RATIO 187% 146% 144% 143% 97% 62% 38%Cash reserve goal above 14%
STREET LIGHTING UTILITY BUDGET SUMMARYFY 2023-2025
Rate Increase 10%
Rate Increase 10%
58

STREET LIGHTING UTILITY CASH FLOW FY 2023 BUDGET / FY 2024-2027 FORECAST
ACTUAL PROJECTED BUDGET BUDGET BUDGET BUDGET BUDGETYEAR YEAR YEAR YEAR YEAR YEAR YEAR
2020-2021 2021-2022 2022-2023 2023-2024 2024-2025 2025-2026 2026-2027REVENUESTREET LIGHTING SALES 4,350,116$ 4,097,569$ 4,174,622$ 4,592,084$ 5,051,292$ 5,556,421$ 6,112,063$ OTHER INCOME 1,700 100 100 4,859 4,859 4,859 6,659 INTEREST INCOME 38,047 24,407 22,500 40,500 40,500 40,500 9,000
OPERATING INCOME 4,389,863$ 4,122,076$ 4,197,222$ 4,637,443$ 5,096,651$ 5,601,780$ 6,127,722$
OPERATING EXPENSESOPERATING EXPENSES (3,340,623)$ (3,273,695)$ (3,324,240)$ (3,388,099)$ (3,463,832)$ (3,541,399)$ (3,620,848)$
NET INCOME EXCLUDING DEP. 1,049,240$ 848,381$ 872,982$ 1,249,344$ 1,632,819$ 2,060,381$ 2,506,874$
OTHER INCOME & EXPENSEBOND PROCEEDS -$ -$ -$ -$ -$ -$ -$ OTHER CONTRIBUTIONS - 20,000 105,000 45,000 45,000 45,000 45,000 CAPITAL OUTLAY - - - - - - - DEBT SERVICE (172,104) (193,537) (193,585) (193,562) (193,528) (193,503) (193,443)
OTHER INCOME & EXPENSE (172,104)$ (173,537)$ (88,585)$ (148,562)$ (148,528)$ (148,503)$ (148,443)$
CAPITAL GENERATIONGENERATED FOR CAPITAL 877,136$ 674,844$ 784,397$ 1,100,782$ 1,484,291$ 1,911,878$ 2,358,431$
CAPITAL IMPROVEMENTSCAPITAL IMPROVEMENTS (664,572)$ (2,256,415)$ (2,240,000)$ (2,240,000)$ (2,240,000)$ (2,240,000)$ (2,240,000)$
OPERATING CASH BALANCESBEGINING CASH BALANCE 6,050,463$ 6,263,027$ 4,681,456$ 3,225,853$ 2,086,635$ 1,330,926$ 1,002,804$ CASH INCREASE/(DECREASE) 212,564 (1,581,571) (1,455,603) (1,139,218) (755,709) (328,122) 118,431 RESTRICTED/DESIGNATED - - - - - - -
ENDING BALANCE 6,263,027$ 4,681,456$ 3,225,853$ 2,086,635$ 1,330,926$ 1,002,804$ 1,121,235$ Cash Reserve Ratio 187% 143% 97% 62% 38% 28% 31%Debt Service Coverage 6.10 4.38 4.51 6.45 8.44 10.65 12.96 RATE CHANGE 0% 0% 0% 10% 10% 10% 10%DEBT SERVICE % OF GROSS OP. REV. 3.9% 4.7% 4.6% 4.2% 3.8% 3.5% 3.2%RESIDENTIAL BILL OF 1 ERU (or 75 ft) 3.73 3.73 3.73 4.10 4.51 4.96 5.46
59

STREET LIGHTING UTIITY CIP BUDGETFive Year Projected Budget 2023-2027
COST CENTER
PROJECT NUMBER PROJECT DESCRIPTION
PROGRAM MANAGER
PROJECTED ESTIMATE`
BUDGET YEAR 2021-2022
PAST BUDGET YEAR
2021-2022BUDGET YEAR
2022-23
2023-2024
2024-2025
2025-2026
2026-2027
2027-2028
2028-2029
DELAYED
48-48001 2730.80 Base Level Projects 2,000,000$ 1,900,000$ 1,900,000$ 1,900,000$ 1,900,000$ 1,900,000$ 1,900,000$ Lighting Controls 50,000$ 50,000$ 50,000$ 50,000$ 50,000$ 50,000$ Master Plan Projects 50,000$ 50,000$ 50,000$ 50,000$ 50,000$ 50,000$ New SLCDPU Campus
48-48101 2730.80 TIER 1 Projects 20,000$ 50,000$ 50,000$ 50,000$ 50,000$ 50,000$ 50,000$ 48-48201 2730.80 TIER 2 Projects 20,000$ 40,000$ 40,000$ 40,000$ 40,000$ 40,000$ 40,000$ 48-48301 2730.80 TIER 3 Projects 200,000$ 150,000$ 150,000$ 150,000$ 150,000$ 150,000$ 150,000$
NUMBER OF PROJECTS xx 8 6 6 6 6 6 6TOTAL CAPITAL IMPROVEMENTS -$ 2,240,000$ 2,240,000$ 2,240,000$ 2,240,000$ 2,240,000$ 2,240,000$ 2,240,000$ ‐$ ‐$
60

APPENDIX A: Rate Change Comparisons and Customer Impacts
61

Water Rate Change Comparisons
Meter 2022 2023
Size (inches)
Current Rate
Proposed Rate
$ %
3/4 10.03 11.54 1.51 15.05%1 13.12 15.09 1.97 15.02%
1 1/2 20.84 23.97 3.13 15.02%2 30.12 34.64 4.52 15.01%3 54.83 63.06 8.23 15.01%4 82.62 95.02 12.40 15.01%6 159.88 183.87 23.99 15.01%8 252.56 290.45 37.89 15.00%
10 654.23 752.37 98.14 15.00%
Meter 2022 2023
Size (inches)
Current Rate
Proposed Rate
$ %
3/4 13.54 15.58 2.04 15.07%1 17.71 20.37 2.66 15.02%
1 1/2 28.13 32.36 4.23 15.04%2 40.66 46.76 6.10 15.00%3 74.02 85.13 11.11 15.01%4 111.54 128.28 16.74 15.01%6 215.84 248.22 32.38 15.00%8 340.96 392.11 51.15 15.00%
10 883.21 1,015.70 132.49 15.00%
Comparison of Monthly Water Base Rate Options for City Customers
Current to Proposed
Comparison of Monthly Water Base Rate Options for County Customers
Current to Proposed
62

2022 2023Flat Rate or
BlockCurrent Rate
per ccfProposed
Rate per ccf$ %
Flat Rate 1.48 1.71 0.23 15.54%
Block 1 1.48 1.71 0.23 15.54%Block 2 2.02 2.33 0.31 15.35%Block 3 2.80 3.22 0.42 15.00%Block 4 2.99 3.44 0.45 15.05%
2022 2023Flat Rate or
BlockCurrent Rate
per ccfProposed
Rate per ccf$ %
Flat Rate 2.00 2.31 0.31 15.50%
Block 1 2.00 2.31 0.31 15.50%Block 2 2.73 3.15 0.42 15.38%Block 3 3.78 4.35 0.57 15.08%Block 4 4.04 4.64 0.60 14.85%
Block CurrentFlat Rate All UsageBlock 1 1 - 10 ccfBlock 2 11 - 30 ccfBlock 3 31 - 60 ccfBlock 4 >61 ccf
Summer Rate Structure ( April - October)
Rate Structure
Summer Rate Structure ( April - October)
Winter Rate Structure (November - March)
Comparison of Water Monthly Usage Rate Options for City Residential Customers
Current to Proposed
Comparison of Water Monthly Usage Rate Options for County Residential Customers
Current to Proposed
Winter Rate Structure (November - March)
63

2022 2023Flat Rate or
BlockCurrent Rate
per ccfProposed
Rate per ccf$ %
Flat Rate 1.61 1.86 0.25 15.5%
Block 1 1.61 1.86 0.25 15.5%Block 2 2.21 2.55 0.34 15.4%Block 3 3.07 3.54 0.47 15.3%Block 4 3.26 3.75 0.49 15.0%
2022 2023Flat Rate or
BlockCurrent Rate
per ccfProposed
Rate per ccf$ %
Flat Rate 2.17 2.51 0.34 15.7%
Block 1 2.17 2.51 0.34 15.7%Block 2 2.98 3.44 0.46 15.5%Block 3 4.14 4.78 0.64 15.4%Block 4 4.40 5.06 0.66 15.1%
Block CurrentFlat Rate All UsageBlock 1 0-AWCBlock 2 AWC-300%Block 3 300%-600%Block 4 >600%
*CII= Commercial, Industrial, and Institutional *AWC = Average Winter Consumption. “AWC-300%” means usage greater than a customer’s AWC and less than or equal to 300% of the customer’s AWC
Current to Proposed
Winter Rate Structure (November - March)
Summer Rate Structure ( April - October)
Rate Structure
Winter Rate Structure (November - March)
Summer Rate Structure ( April - October)
Comparison of Monthly Usage Rate Options for County CII Customers
Comparison of Monthly Usage Rate Options for City CII Customers
Current to Proposed
64

2022 2023Flat Rate or
BlockCurrent Rate
per ccfProposed
Rate per ccf$ %
Flat Rate 1.94 2.23 0.29 15.00%
Block 1 1.94 2.23 0.29 15.00%Block 2 2.70 3.11 0.41 15.19%Block 3 2.87 3.30 0.43 14.98%
2022 2023Flat Rate or
BlockCurrent Rate
per ccfProposed
Rate per ccf$ %
Flat Rate 2.62 3.01 0.39 14.96%
Block 1 2.62 3.01 0.39 14.96%Block 2 3.65 4.20 0.55 15.07%Block 3 3.87 4.46 0.59 15.25%
Block CurrentFlat Rate All Usage
Block 1
1CCF-Target Budget
Block 2
Target Budget up to
300% of Target Budget
Block 3
Over 300% of Target Budget
Comparison of Water Monthly Usage Rate Options for City Irrigation Customers
Current to Proposed
* "Target budget" means the estimated amount of water consumed per acre, as established by the Public Utilities Director or his/her designee each year for customer based on factors including, but not limited to, evapotranspiration, and considering efficient water practices. A different target budget is established for each month of the irrigation season.
Current to Proposed
Winter Rate Structure (November - March)
Summer Rate Structure ( April - October)
Winter Rate Structure (November - March)
Summer Rate Structure ( April - October)
Comparison of Water Monthly Usage Rate Options for County Irrigation Customers
Rate Structure
65

Proposed Water Rate Change Customer Impacts
2022 2023
Account TypeAnnual Usage
Meter Size
Current Rate
Proposed Rate$
Change%
ChangeResidential Minimum Use 72 ccf 3/4 226.92 261.60 34.68 15.28%Residential Low Use 96 ccf 3/4 262.44 302.64 40.20 15.32%Residential Medium Use 255 ccf 3/4 601.80 693.75 91.95 15.28%Residential High Use 838 ccf 1 2,182.24 2,512.74 330.50 15.14%
Industrial Use 96,476 ccf 2 167,877.40 193,879.08 26,001.68 15.49%
Commercial Use 11,597 ccf 2 19,701.73 22,755.59 3,053.86 15.50%
2022 2023
Account TypeMonthlyUsage
Meter Size
Current Rate
Proposed Rate
$ Change
% Change
Residential Minimum Use 6 ccf 3/4 18.91 21.80 2.89 15.28%Residential Low Use 8 ccf 3/4 21.87 25.22 3.35 15.32%Residential Medium Use 21 ccf 3/4 50.15 57.81 7.66 15.28%Residential High Use 70 ccf 1 181.85 209.40 27.54 15.14%
Industrial Use 8,040 ccf 2 13,989.78 16,156.59 2,166.81 15.49%
Commercial Use 966 ccf 2 1,641.81 1,896.30 254.49 15.50%
Water Rate Change Annual Impact on Select City Customers
Water Rate Change Monthly Impact on Select City Customers
66

2022 2023
Account TypeAnnual Usage
Meter Size
Current Rate
Proposed Rate
$ Change
% Change
Residential Minimum Use 72 ccf 3/4 306.34 353.16 46.82 15.28%Residential Low Use 96 ccf 3/4 354.29 408.56 54.27 15.32%Residential Medium Use 255 ccf 3/4 812.43 936.56 124.13 15.28%Residential High Use 838 ccf 1 2,946.02 3,392.20 446.18 15.14%
Industrial Use 96,476 ccf 2 226,634.49 261,736.76 35,102.27 15.49%
Commercial Use 11,597 ccf 2 26,597.34 30,720.04 4,122.71 15.50%
2021 2022
Account TypeMonthlyUsage
Meter Size
Current Rate
Proposed Rate
$ Change
% Change
Residential Minimum Use 6 ccf 3/4 25.53 29.43 3.90 15.28%Residential Low Use 8 ccf 3/4 29.52 34.05 4.52 15.32%Residential Medium Use 21 ccf 3/4 67.70 78.05 10.34 15.28%Residential High Use 70 ccf 1 245.50 282.68 37.18 15.14%
Industrial Use 8,040 ccf 2 18,886.21 21,811.40 2,925.19 15.49%
Commercial Use 966 ccf 2 2,216.44 2,560.00 343.56 15.50%
Water Rate Change
Water Rate Change Monthly Impact on Select County Customers
Annual Impact on Select County Customers
67

Sewer Rate Change Comparisons
68

2022 2023
Class Current RateProposed
Rate$ %
1 5.13 5.90 0.77 15.0%2 6.66 7.66 1.00 15.0%3 9.00 10.35 1.35 15.0%4 11.31 13.01 1.70 15.0%5 13.55 15.59 2.04 15.1%6 15.85 18.23 2.38 15.0%7
BlockBOD Strength
mg/lTSS Strength
mg/l
1 0-300 0-3002 300-600 300-6003 600-900 600-9004 900-1200 900-12005 1200-1500 1200-15006 1500-1800 1500-18007 >1800 >1800
*Current Minimum charge is $10.26. Proposed minimum charge is $11.80
Class Structure
Special Rate by Customer
Total Sewer Rate Per CCF
Current to Proposed
69

Proposed Sewer Rate Change Customer Impacts
2022 2023
Account TypeAnnualized
Average Winter Water Usage (CCF)
Current Rate Proposed Rate $ Changes % Change
Residential Minimum Use 24 ccf 123.12 141.60 18.48 15.01%
Residential Low Use 48 ccf 246.24 283.20 36.96 15.01%
Residential Medium Use 96 ccf 492.48 566.40 73.92 15.01%
Residential High Use 180 ccf 923.40 1,062.00 138.60 15.01%
Industrial 2,4 24,168 ccf 327,476.40 376,779.12 49,302.72 15.06%
Commercial 2,1 408 ccf 6,466.80 7,437.84 971.04 15.02%
*Industrial & Commercial charges are calculated based on flow rate, BOD and TSS
2022 2023
Account TypeAnnualized
Average Winter Water Usage (CCF)
Current Rate Proposed Rate $ Changes % Change
Residential Minimum Use 2 ccf 10.26 11.80 1.54 15.01%
Residential Low Use 4 ccf 20.52 23.60 3.08 15.01%
Residential Medium Use 8 ccf 41.04 47.20 6.16 15.01%
Residential High Use 15 ccf 76.95 88.50 11.55 15.01%
Industrial 2, 4 2,014 ccf 27,289.70 31,398.26 4,108.56 15.06%
Commercial 2,1 34 ccf 538.90 619.82 80.92 15.02%
*Industrial & Commercial charges are calculated based on flow rate, BOD and TSS
Monthly Impact on Select City CustomersSewer Rate Change
Sewer Rate Change Annual Impact on Select City Customers
70

Stormwater Rate Change Comparisons
2022 2023
Account Type ERUs Current RateProposed
Rate$ %
Single and Duplex <.25 Acre
All ERU 5.98 6.88 0.90 15.05%
Single and Duplex >.25 Acre
All ERU 8.36 9.62 1.26 15.07%
Triplex and Fourplex All ERU 11.96 13.76 1.80 15.05%
All other Parcels Per ERU 5.98 6.88 0.90 15.05%
Comparison of Monthly Stormwater Rate Changes
Changes Current to Proposed
*1 ERU = 1 residential property or 75 feet of street frontage for non-residential properties
71

Proposed Stormwater Rate Change Customer Impacts
2022 2023
Account Type ERUs Current RateProposed
Rate$ %
Residential less than .25 Acre
Any ERU 71.76 82.56 10.80 15.05%
Residential more than .25 Acre
Any ERU 100.32 115.44 15.12 15.07%
Industrial* 300 ERU 1,794.00 2,064.00 270.00 15.05%
Commercial 120 ERU 717.60 825.60 108.00 15.05%
2022 2023
Account Type ERUs Current RateProposed
Rate$ %
Residential less than .25 Acre
Any ERU 5.98 6.88 0.90 15.05%
Residential more than .25 Acre
Any ERU 8.36 9.62 1.26 15.07%
Industrial 25 ERU 149.50 172.00 22.50 15.05%
Commercial 10 ERU 59.80 68.80 9.00 15.05%
Changes Current to Proposed
Changes Current to Proposed
Monthly Impact on Select City Customers
Annual Impact on Select City CustomersStormwater Rate Change
Stormwater Rate Change
72

2022 2023
Account Type FundAnnual Usage
Meter SizeCurrent Rate
Proposed Rate
$ Change
% Change
Water 72 ccf 3/4 226.92 260.88 33.96 14.97%
Sewer Class 1-1 24 ccf Combined Fee 123.12 141.60 18.48 15.01%
Storm Single and Duplex <.25 Acre Flat Fee 71.76 82.56 10.80 15.05%
Street Lighting Base Flat Fee 44.76 44.76 - 0.00%Total 466.56 529.80 63.24 13.55%
Water 96 ccf 3/4 262.44 301.68 39.24 14.95%
Sewer Class 1-1 48 ccf Combined Fee 246.24 283.20 36.96 0.1501
Storm Single and Duplex <.25 Acre Flat Fee 71.76 82.56 10.80 15.05%
Street Lighting Group 1 Flat Fee 68.04 68.04 - 0.00%Total 648.48 735.48 87.00 13.42%
Water 255 ccf 3/4 684.96 787.20 102.24 14.93%
Sewer Class 1-1 96 ccf Combined Fee 492.48 566.40 73.92 15.01%
Storm Single and Duplex >.25 Acre Flat Fee 100.32 115.32 15.00 14.95%
Street Lighting Group 2 Flat Fee 68.04 68.04 - 0.00%Total 1,345.80 1,536.96 191.16 14.20%
Water 838 ccf 1 2,186.64 2,513.86 327.22 14.96%
Sewer Class 1-1 180 ccf Combined Fee 923.40 1,062.00 138.60 15.01%
Storm Single and Duplex >.25 Acre Flat Fee 100.32 115.32 15.00 14.95%
Street Lighting Group 2 Flat Fee 191.28 191.28 - 0.00%Total 3,401.64 3,882.46 480.82 14.13%
* Sewer is based on prior year average winter water consumption
Residential Medium Use
Residential High Use
Residential Low Use
SELECT CITY CUSTOMERSCombined Rate Change
ANNUAL Impact on Select City Residential Customers
Residential Minimum Use
73

2022 2023
Account Type FundMonthly Usage
Meter SizeCurrent Rate
Proposed Rate
$ Change
% Change
Water 6 ccf 3/4 18.91 21.74 2.83 14.97%
Sewer Class 1-1 2 ccf Combined Fee 10.26 11.80 1.58 15.01%
Storm Single and Duplex <.25 Acre Flat Fee 5.98 6.88 0.55 15.05%
Street Lighting Base Flat Fee 3.73 3.73 - 0.00%Total 38.88 44.15 4.96 13.55%
Water 8 ccf 3/4 21.87 25.14 3.27 14.95%
Sewer Class 1-1 4 ccf Combined Fee 20.52 23.60 3.16 15.01%
Storm Single and Duplex <.25 Acre Flat Fee 5.98 6.88 0.55 15.05%
Street Lighting Group 1 Flat Fee 5.67 5.67 - 0.00%Total 54.04 61.29 6.98 13.42%
Water 21 ccf 3/4 57.08 65.60 8.52 14.93%
Sewer Class 1-1 8 ccf Combined Fee 41.04 47.20 6.32 15.01%
Storm Single and Duplex >.25 Acre Flat Fee 8.36 9.61 0.76 14.95%
Street Lighting Group 2 Flat Fee 5.67 5.67 - 0.00%Total 112.15 128.08 15.60 14.20%
Water 70 ccf 1 182.22 209.49 27.27 14.96%
Sewer Class 1-1 15 ccf Combined Fee 76.95 88.50 11.85 15.01%
Storm Single and Duplex >.25 Acre Flat Fee 8.36 9.61 0.76 14.95%
Street Lighting Group 2 Flat Fee 15.94 15.94 - 0.00%Total 283.47 323.54 39.88 14.13%
* Sewer is based on prior year average winter water consumption
Residential Minimum Use
Residential Low Use
Residential Medium Use
Residential High Use
SELECT CITY CUSTOMERSCombined Rate Change
AVERAGE MONTHLY Impact on Select City Customers
74
APPENDIX B: Supplemental Information
75

Water Rates Compared With Nearby States
Cities compared with 7,480 gallons per month and 24,000 gallons summer usage
Based on eight months Winter and four months Summer usage
Comparison of AVERAGE
Recognizable Cities in Western States MONTHLY
RANKING City, State CHARGES
1 FLAGSTAFF, ARIZONA $132.66
2 CHEYENNE, WYOMING $74.18
3 BOISE, IDAHO $74.03
4 DENVER, COLORADO $60.25
5 HENDERSEN, NEVADA $57.22
6 PHOENIX, ARIZONA $55.37
7 RENO, NEVEDA $52.42
8 LAS VEGAS, NEVADA $46.99
SALT LAKE CITY, UTAH (Proposed) 15% $46.32
9 SALT LAKE CITY, UTAH (Current) $40.16
76

SEWER RATES COMPARED WITH NEARBY STATES
COMPARISON OF
RECOGNIZABLE CITIES IN WESTERN STATES
CITY, STATE
1 RENO, NV $50.26
2 SALT LAKE CITY (PROPOSED) 47.21
3 BOISE, ID ** 46.72
4 SALT LAKE CITY (CURRENT) 41.05
5 PLEASANT GROVE 40.43
6 CHEYENNE, WY ** 32.37
11 LAS VEGAS, NV *** 21.50
7 FLAGSTAFF, AZ 32.01
9 HENDERSON, NV 26.30
10 PHOENIX, AZ 25.18
11 LAS VEGAS, NV *** 21.50
* ANNUAL COST BASED ON 12 MONTHS @ 5,984 GALLONS PER MONTH AVERAGE WINTER WATER CONSUMPTION.
** INCLUDES MONTHLY BASE RATE
*** $4.66 MONTLY BASE FEE, $16.84/0-5000 GALLONS, $16.00/5,000+ GALLONS
AVERAGE
MONTHLY
CHARGESRANKING
77

SEWER RATES COMPARED WITH LOCAL CITIES
1 CITY OF SOUTH SALT LAKE 0.00 9.00 $646.27
2 MURRAY CITY 9.73 6.86 609.36
3 SALT LAKE CITY, UT (PROPOSED) 0.00 7.89 566.57
4 SALT LAKE CITY, UT (CURRENT) 0.00 6.86 492.60
5 WEST JORDAN CITY 22.00 2.05 411.21
6 ODGEN CITY 32.78 0.00 393.36
7 KEARNS IMPROVEMENT DISTRICT 25.59 1.20 393.25
8 MAGNA CITY **** 29.81 0.00 357.72
9 SOUTH VALLEY SEWER DISTRICT 25.00 0.00 300.00
10 MIDVALLEY IMPROVEMENT DISTRICT 24.50 0.00 294.00
11 GRANGER - HUNTER IMPROVEMENT DISTRICT 15.50 1.50 293.71
12 MT OLYMPUS IMPROVEMENT DISTRICT 22.00 0.00 264.00
13 COTTONWOOD IMPROVEMENT DISTRICT 20.00 0.00 240.00
14 SOUTH DAVIS SEWER DISTRICT 19.00 0.00 228.00
15 TAYLORSVILLE - BENNION IMPROVEMENT DISTRICT 11.15 0.00 133.80
* ANNUAL COST BASED ON 12 MONTHS @ 5,984 GALLONS PER MONTH AVERAGE WINTER WATER CONSUMPTION.
** INCLUDES MONTHLY BASE RATE
*** $4.66 MONTLY BASE FEE, $16.84/0-5000 GALLONS, $16.00/5,000+ GALLONS
**** $29.81 MONTHLY MIN, INCLUDES - 0 to 8,009 AVERAGE GALLONS
RANKING CITY OR DISTRICT
RATE
MONTHLY
RATE PER
1,000 GALS
ANNUAL FEES
SEWER *
78

STORMWATER RATES CCOMPARED WITH LOCAL CITIES
CURRENT
RANKING CITY NAME RATE
1 PLEASANT GROVE $14.41
2 PROVO 10.75
3 DRAPER CITY 9.00
4 OGDEN CITY 8.47
5 TAYLORSVILLE CITY * 7.60
6 OREM 7.35
7 SOUTH JORDAN CITY 7.15
8 BOUNTIFUL CITY 7.00
9 MURRAY CITY 6.30
10 SALT LAKE CITY (PROPOSED) 6.24
11 WEST JORDAN CITY 6.04
12 AMERICAN FORK 6.00
13 SANDY CITY 6.00
14 SALT LAKE CITY (CURRENT) 5.43
79

Public Utilities Department
Local Area Water Rate Comparison - February 2022
(Highest to Lowest Ranking)
MONTHLY MINIMUM RATE OVER MONTHLY WINTER @ SUMMER @ TOTAL TOTAL YEARLY TAX
MINIMUM ALLOWANCE MINIMUM PER FLOURIDE 7,480 GAL 23,936 GAL WINTER SUMMER ON $200,000 TOTAL
RANKING CITY OR DISTRICT NAME CHARGE IN GALLONS ALLOWANCE GALLONS CHARGE PER MONTH PER MONTH CHARGES* CHARGES* PROPERTY CHARGES
1 PARK CITY - GRADUATED RATES (1) 53.63 0 6.68 - 11.27 1,000 113.59 294.84 908.73 1179.35 2088.08
2 SALT LAKE CITY - OUTSIDE OF CITY (Proposed) 15.57 0 2.30 - 4.35 748 38.58 110.08 308.64 440.32 748.96
3 PLEASANT GROVE - GRADUATED RATES (6) 24.32 5,000 2.95 - 6.26 1,000 31.64 116.51 253.09 466.04 719.13
4 AMERICAN FORK - GRADUATED RATES (2) 16.17 3,000 3.52 - 4.96 1,000 33.01 113.53 264.04 454.13 718.17
5 DRAPER CITY - GRADUATED RATES (3) 20.25 0 2.05 - 3.71 1,000 39.08 97.00 312.65 388.01 700.66
6 SOUTH JORDAN CITY - GRADUATED RATES (4) 30.00 0 2.00 - 2.50 1,000 45.33 84.09 362.64 336.36 699.00
7 WEST JORDAN CITY (11) 20.00 0 2.25 - 3.85 1,000 37.50 98.35 300.02 393.41 693.43
8 SALT LAKE CITY - OUTSIDE OF CITY 13.54 0 2.00 - 3.78 748 33.54 95.70 268.32 382.80 651.12
9 RIVERTON CITY - GRADUATED RATES (5) 3.50 0 3.76 - 3.91 1,000 32.00 96.34 255.97 385.36 641.33
10 MAGNA - GRADUATED RATES (10) 18.10 6,000 2.08 - 2.65 1,000 1.02 22.20 57.91 177.59 231.64 207.29 616.52
11 KEARNS IMPROVEMENT DIST-GRADUATED RATES (9) 12.08 0 2.42 - 3.04 1,000 30.18 78.65 241.45 314.58 45.23 601.27
12 SANDY CITY - OUTSIDE OF CITY (8) 19.95 0 1.80 - 2.75 1,000 34.82 80.07 278.56 320.30 598.86
13 OGDEN CITY - GRADUATED RATES (7) 16.02 0 1.81 - 7.24 1,000 31.04 86.72 248.31 346.87 595.18
14 SALT LAKE CITY - INSIDE OF CITY (Proposed) 11.53 0 1.71 - 3.22 748 28.55 81.68 229.12 326.72 31.79 587.63
15 SANDY CITY - INSIDE OF CITY (12) 14.43 0 1.64 - 2.53 1,000 28.01 69.65 224.12 278.59 32.67 535.38
16 SALT LAKE CITY - INSIDE OF CITY (13) 10.03 0 1.48 - 2.80 748 24.83 70.83 198.64 283.32 31.79 513.75
17 GRANGER - HUNTER IMPROVEMENT DISTRICT (14) 13.00 0 1.77 - 2.20 1,000 26.30 60.25 210.42 241.00 24.75 476.16
18 BOUNTIFUL CITY - RESIDENTIAL HIGH ELEVATION 23.57 5,000 1.98 1,000 28.48 61.06 227.84 244.25 472.10
19 CITY OF SOUTH SALT LAKE 21.00 5,000 2.25 1,000 26.58 63.61 212.64 254.42 467.06
20 PROVO 18.59 0 1.01 - 1.67 1,000 26.14 58.56 209.16 234.25 443.41
21 MURRAY CITY - GRADUATED RATES (16) 12.51 0 1.19 - 1.75 748 24.91 58.76 199.28 235.04 434.32
22 BOUNTIFUL CITY - RESIDENTIAL LOW ELEVATION 21.39 5,000 1.79 1,000 25.83 55.29 206.63 221.14 427.78
23 OREM - GRADUATED RATES (17) 20.20 0 0.83 - 1.46 1,000 26.41 48.22 211.27 192.87 404.13
24 TAYLORSVILLE/BENNION IMPROVEMENT DISTRICT (15) 9.00 0 1.43 - 1.87 1,000 20.35 51.12 162.78 204.48 6.16 373.42
25 JVWCD (18) 3.00 0 1.51 - 3.36 1,000 14.29 52.77 114.36 211.10 40.26 365.72
80

Public Utilities Department Local Area Water Rate Comparison - February 2022
Continued(Highest to Lowest Ranking)
CALCULATION OF COMPARISONS
* BASED ON EIGHT MONTHS WINTER AND FOUR MONTHS SUMMER
(1) RATES ARE $6.68/THOUSAND FOR 0-5,000 GALLONS, $10.71/THOUSAND FOR 5,001-15,000 GALLONS, & $11.27/THOUSAND FOR 15,001-25,000 GALLONS
(2) RATES ARE $16.17 FOR 0-3,000 GALLONS, $3.52/THOUSAND FOR 3,001-6,000 GALLONS, $4.24/THOUSAND FOR 6,000-9,000 GAL & $4.96/THOUSAND OVER 9,000 GALLONS
(3) RATES ARE $2.05/THOUSAND FOR 0-5,000 GALLONS, $3.46/THOUSAND FOR 5,001-20,000 GALLONS, & $3.71/THOUSAND FOR 20,001-50,000 GALLONS
(4) RATES ARE $2.00/THOUSAND FOR 0-6,000 GALLONS, $2.25/THOUSAND FOR 6,001-17,000 GALLLONS & $2.50/THOUSAND FOR 17,001 - 42,000 GALLONS
(5) RATES ARE $3.76 FOR 0-5,000 GALLONS & $3.91/THOUSAND OVER 5,000 GALLONS
(6) RATES ARE $24.32 FOR 0-5,000 GALLONS, $2.95/THOUSAND FOR 5,001-10,000 GALLONS, $4.30/THOUSAND FOR 10,001-15,000 GALLONS & $6.26/THOUSAND OVER 15,000 GALLONS
(7) RATES ARE $1.81/THOUSAND FOR 0-6,000 GALLONS, 2.81/THOUSAND FOR 6,001-12,000 GALLONS & $7.24/THOUSAND FOR 12,001-36,000 GALLONS
(8) RATES ARE $1.80/THOUSAND FOR 0-6,000 GALLONS & $2.75/THOUSAND FOR 6,001-40,000 GALLONS
(9) RATES ARE $2.42/THOUSAND FOR 0-10,000 GALLONS & $3.04/THOUSAND FOR 10,001-25,000 GALLONS
(10) RATES ARE $2.08/THOUSAND FOR 0-6,000 GALLONS, $2.33/THOUSAND FOR 6,001-18,000 GALLONS, & $2.65/THOUSAND FOR 18,000 - 35,000 GALLONS
(11) RATES ARE $2.25/THOUSAND FOR 0-5,000 GALLONS, $3.65/THOUSAND FOR 5,001-20,000 GALLONS, & $3.85/THOUSAND FOR 20,001-50,000 GALLONS
(12) RATES ARE $1.64 FOR 0-6,000 GALLONS, $2.53/THOUSAND FOR 6,001-40,000 GALLONS
(13) INCLUDES METROPOLITAN WATER PROPERTY TAX
(14) RATES ARE $1.77/THOUSAND FOR 0-7,000 GALLONS, $1.90/THOUSAND FOR 7,001-15,000 GALLONS & $2.20/THOUSAND FOR OVER 15,000 GALLONS
(15) RATES ARE $1.43/THOUSAND FOR 0-6,000 GALLONS & $1.87/THOUSAND FOR 6,001-25,000 GALLONS
(16) RATES ARE $1.19/HUNDRED FOR 0-8 HCF, $1.44/HUNDRED FOR 9-25 HCF & $1.75/HUNDRED FOR 26-49 HCF
(17) RATES ARE $.83/THOUSAND FOR 0-11,000 GALLONS, $1.46/THOUSAND FOR 11,001-34,000 GALLONS
(18) RATES ARE $1.51/THOUSAND FOR 0-9,000 GALLONS, $2.36/THOUSAND FOR 9,001-23,000 GALLONS, & $3.36/THOUSAND FOR 23,001-53,000 GALLONS
81

AVERAGE MONTHLY BILL COMPARISON-COMBINEDRESIDENTIAL CLASS
SLC Rates Current – Other City Rates as of March 2021 (5,800 gallons Consumption and 4,000 Flows)
$16.21$38.26
$42.74$43.70$45.75
20.82$52.71
$53.62$53.83
$56.34$57.73$57.99
$58.20$58.40$59.79
$61.24$62.08$62.72$63.96
$66.27$66.35
$66.65$71.45
$74.17$77.21$77.53
$80.79$91.84
$94.34$101.94
$103.43$103.94
$104.00$108.94
$119.54$144.01
$158.09
$0 $20 $40 $60 $80 $100 $120 $140 $160 $180
Memphis, TN
Phoenix, AZ
Millwaukee, WI
Amarillo, TX
Salt Lake City, UT - Current
Dallas, TX
El Paso, TX
Las Vegas, NV
Albuquerque, NM
Salt Lake City, UT - Proposed
Oklahoma City, OK
Abilene, TX
Round Rock, TX
Arlington, TX
Fort Worth, TX
Cedar Park, TX
Georgetown, TX
Charlotte, NC
Philadelphia, PA
Houston, TX
San Antonio, TX
Tucson, AZ
Lubbock, TX
Asheville, NC
Los Angeles, CA
Louisville, KY
Austin, TX
East Bay MUD/Oakland, CA
San Marcos, TX
Kyle, TX
Corpus Christi, TX
Pflugerville, TX
San Diego, CA
Atlanta, GA
Portland, OR
Seattle, WA
San Francisco, CA
82

0.00% 0.50% 1.00% 1.50% 2.00% 2.50%
Seattle, WAPortland, OR
Tucson, AZAtlanta, GA
Kyle, TXSan Diego, CA
San Francisco, CAPflugerville, TX
EB MUD/Oakland, CAAsheville, NC
Corpus Christi, TXLos Angeles, CA
Louisville, KYOklahoma City, OK
Fort Worth, TXLubbock, TXAlbiene, TX
Milwaukee, WISan Antonio, TX
Austin, TXAlburquerque, NM
Georgetown, TXArlington, TX
San Marcos, TXHouston, TX
Charlotte, NCRound Rock, TX
Dallas, TXSalt Lake City, UT - proposed
Amarillo, TXPhoenix, AZ
Philadelphia, PAEl Paso, TX
Cedar Park, TXLas Vegas, NVMemphis, TN
Salt Lake City, UT - current
4.06%2.56%2.53%
2.38%2.38%
2.34%2.27%
2.25%1.90%
1.80%1.73%
1.70%1.63%1.62%
1.47%1.46%
1.41%1.25%
1.23%1.22%1.21%1.21%
1.17%1.09%1.08%1.08%
1.06%0.97%
0.95%0.95%0.94%
0.88%0.87%0.86%
0.79%0.77%
0.67%
Residential Water & Wastewater BillPercent of Median Household Income
(Austin Average Consumption & Flows as of March 2021 )
The percentage of median household income was calculated by taking the results of each individual city’s bill based on that city’s rates and the usage of the Austin average consumption and flows. From those results, we divide the annual amount by the individual city’s 10 year average median income.
Median Income source: www.deptofnumbers.com/income/us/l
83

PUBLIC UTILITIES OPERATING REVENUE
$0
$20
$40
$60
$80
$100
$120
10 11 12 13 14 15 16 17 18 19 20 21 22 23
WATER SEWER STORM STREETLIGHTS
Mill
ion
s
84

PUBLIC UTILITIES OPERATING REVENUE
$0
$20
$40
$60
$80
$100
$120
$140
$160
$180
$200
10 11 12 13 14 15 16 17 18 19 20 21 22 23
WATER SEWER STORM STREETLIGHTS
Mill
ion
s
85

WATER UTILITY OPERATING COSTS
$0
$10
$20
$30
$40
$50
$60
$70
$80
$90
20
11
20
12
20
13
20
14
20
15
20
16
20
17
20
18
20
19
20
20
20
21
20
22
20
23
Millio
ns
Metro Assessment
Lieu of Tax Fee
City Admin. Fees
Water Purchases
O & M
Charges &Services
Salaries
86

SEWER UTILITY OPERATING COSTS
$0
$5
$10
$15
$20
$25
$30
20
10
20
11
20
12
20
13
20
14
20
15
20
16
20
17
20
18
20
19
20
20
20
21
20
22
20
23
Million
s
City Admin.Fees
Lieu of Tax Fee
Payment forCity Services
O & M
Charges &Services
Salaries
87

STORM WATER UTILITY OPERATING COSTS
$0
$2
$4
$6
$8
$10
$12
20
10
20
11
20
12
20
13
20
14
20
15
20
16
20
17
20
18
20
19
20
20
20
21
20
22
20
23
Million
s
AdmistrativeService Fee
Payment forCity Services
Payment in Lieuof Taxes
Street Sweeping
Operating &MaintenanceSupply
Charges andServices
88

STREET LIGHTING UTILITY OPERATING COSTS
$0.0
$0.5
$1.0
$1.5
$2.0
$2.5
$3.0
$3.5
20
10
20
11
20
12
20
13
20
14
20
15
20
16
20
17
20
18
20
19
20
20
20
21
20
22
20
23
Million
s
AdministrativeService Fee
ElectricalPower
Operating &Maintenance
Charges andServices
PersonalServices
89

Public Utilities Proposed Debt Service Schedule and Metropolitan Water Assessment
$0
$10
$20
$30
$40
$50
$60
21 22 23 24 25 26 27
Mill
ion
s
METRO Series 2009 Series 2010 Series 2011 Series 2012 Series 2017
Series 2020 Series 2022 Series 2024 Series 2025 Series 2026 Series 2027
Years
Public Utilities Proposed Debt Service Schedule and Metropolitan Water Assessment
90

20,000
22,500
25,000
27,500
30,000
32,500
35,000
37,500
2011 2012 2013 2014 2015 2016 2017 2018 2019 2020 2021 2022 2023
Budgeted
91

0
50
100
150
200
250
300
350
0 5 10 15 20 25 30 35 40 45 50
Per
Ca
pit
a W
ate
r U
se (
gp
cd)
Years Beyond 2000 Bench Mark
Figure 1 - Salt Lake City Conservation TrendDocumentation of Conservation Performance
Metropolitan Water District of Salt Lake & Sandy
Metered Per Capita Water Use
ULS Conservation Goal
(12.5% reduction by 2020,
25% reduction by 2050)
Trend Line of Actual Conservation
State Conservation Goal
(25% reduction by 2025)
92

Proposed Personnel Adjustments FY 22/23
TOTAL 51 - WATER 52 - SEWER 53 - STORM
WATER48 - STREET LIGHTING
Prior FY Ending FTE Balances by Fund 470.50 298.66 127.80 41.32 2.72
NEW POSITIONS REQUESTED FOR FY 22/23:
1) SAFETY INSPECTOR 1.00 1.00
2) GIS TECHNICIAN I 1.00 0.50 0.30 0.20
3) ACCOUNTANT III 1.00 1.00
4) LEAD AND COPPER TECHNICIAN 2.00 2.00
5) ENGINEER TECHNICIAN V 2.00 0.80 0.70 0.50
Total Requested Full Time Employee’s 7.00 5.30 1.00 0.70
TOTAL FTE’S WITH NEW POSITIONS ADDED 477.50 303.96 128.80 42.02 2.72
Changes made to Seasonal Employee’s (0.50) (2.00) 0.30 1.20
Totals with Seasonal Positions 477.00 301.96 129.10 43.22 2.72
Changes made to FTE’S 0.00 0.70 (0.40) (0.30)
Agency Totals for FY 2022/2023 477.00 302.66 128.70 42.92 2.72
93

Public Utilities Number of Employees By Fund By Fiscal Year
Year 93 94 95 96 97 98 99 00 01 02 03 04 05 06 07 08 09 10 11 12 13 14 15 16 17 18 19 20 21 22 23
Water & Sewer 372 368 365 372 380 376 377 373 372 372 370 369 364 363 363 360 360 360 362 363 365 367 369 372 373 377 388 401 410 427 431
Storm Water 18 21 28 28 31 30 29 29 29 28 28 27 27 27 27 27 27 28 28 28 29 29 29 30 31 32 33 35 36 41 43
Street Lighting 3 3 3 3 2 2 2 2 3 2 3 3
# of Water Connections 8
6,3
60
86
,66
5
87
,23
3
85
,51
4
89
,19
1
90
,39
3
89
,77
6
80
,21
8
90
,76
6
91
,28
3
81
,75
1
92
,95
5
92
,34
4
90
,74
8
90
,91
2
90
,92
0
90
,97
6
90
,95
8
90
,62
4
90
,25
1
90
,34
9
90
,43
5
90
,45
1
91
,46
7
91
,54
5
91
,80
2
92
,02
6
92
,28
3
92
,46
6
92
,50
0
92
,50
0
350
370
390
410
430
450
470
490
93 94 95 96 97 98 99 00 01 02 03 04 05 06 07 08 09 10 11 12 13 14 15 16 17 18 19 20 21 22 23
# O
F EM
PLO
YEES
YEAR
94

APPENDIX C: Financial Capability Assessment
95

96

Financial Capability Assessment
Phase I Report – Executive Summary
December 20, 2021
Salt Lake City Department of Public Utilities
97

Executive Summary The Salt Lake City Department of Public Utilities (SLCDPU) has a long-standing commitment to providing affordable service to its customers. This study has been developed as part of the continuing efforts of the Department to understand the impact of its rates and charges on its customers and address any hardships posed on customers as a result of income limitations and impacts of environmental justice and social equity considerations. The study takes advantage of new metrics and approaches that have been identified in recent water-wastewater industry association studies and a new pre-publication guidance on financial capability released by the United States Environmental Protection Agency (EPA). The development of these new approaches and more robust methods and metrics supports SLCDPU’s interest to continuously improve its understanding of the affordability of its services and the impacts of its charges on the range of demographic groups within its customer base. The utility intends to use the findings from this study to support a variety of its activities, including scheduling of projects, support to rate setting and customer assistance program efforts, and more broadly to support its outreach and engagement with customers and environmental justice and social value initiatives.
Scope for Phase I Study
A pre-publication edition of a new guidance on Financial Capability Analysis was issued by the EPA in January 2021 (EPA Guidance). SLCDPU identified that quite a few of the metrics identified in this new guidance are relevant to the SLCDPU study, particularly in light of the multiple intended uses for the study. From the relevant metrics, a subset was identified for development during Phase I of the study in light of schedule and budget constraints. The priority metrics addressed during Phase I include the following:
The “Alternative 1” metrics on financial capability and residential impact in the guidance were selectedfor development because they provide important service-area-level insights into the overall financialcondition of the service area and the impacts of paying for SLCDPU’s services on its residentialcustomers.
Several discretionary community-specific supplemental metrics were selected for development duringPhase I because they help provide a complete picture of the cumulative effect of utility systemrevenue requirements by including costs such as asset management costs and the costs associatedwith customer assistance programs.
In addition, several metrics were identified by SLCDPU to address the numerous types of customerswho may have special circumstances that would amplify potential hardships from an equityperspective when needing to pay for utility service, including re-entry citizens, multigenerationalhouseholds, and refugee citizens.
The final category of metrics selected for development during Phase I consists of several of the itemsin the EPA Guidance that are identified as potential supplemental considerations related to scheduledevelopment. These include discharges to sensitive areas, use impairment, and environmental justice.The first items are included in part because they are being explored in an integrated resource planningstudy currently in development by the utility, but also because there are relevant considerations inthese two areas known to the utility. The environmental justice factor is included because of thepriority given to this issue by SLCDPU, as indicated earlier. It was also deemed useful to develop theEJSCREEN tool recommended by EPA as a mechanism for evaluating environmental justice in theguidance, as a way to help inform future evaluation of financial impacts of utility charges in prioritysub-geographies within the service area that are likely to have the possibility of more-than-typicalhardships related to environmental justice and social value considerations.
98

Key Findings
Key findings for the metrics selected for development during Phase I include the following:
For the metrics related to impacts on residential customers for the SLCDPU service area as a whole, the overall assessment is that impacts fall within the Low Burden category, but with some of the individual metrics, such as lowest quintile residential indicator, falling in the mid-range impact category.
For example, Figures 1 and 2 below show the Residential Indicator, which shows the burden that SLCDPU’s wastewater charges impose on a household with a median income for the community and the Lowest Quintile Residential Indicator, which shows the burden the wastewater charges impose on households with income within the lowest quintile within the service area. As shown in the figures, for the Residential Indicator, SLCDPU’s charges fall within the low impact range defined in the EPA guidance document; for the Lowest Quintile Indicator, SLCDPU’s charges fall within the mid-range of impacts.
Figures 1 and 2. Residential Indicator and Lowest Quintile Residential Indicator Results for SLCDPU
The Phase I work that analyzed the impacts of the full range of utility-related costs, including wastewater, drinking water, stormwater program costs, plus asset management needs and costs related to customer assistance programs, suggests that the full, cumulative burden of full costs to customers over time will increase and will likely affect the overall affordability of service picture for SLCDPU.
Preliminary work to gather data for several special categories of customers that may have enhanced environmental justice-related challenges, including re-entry citizens and multigeneration households, proved challenging. Given the potential significance of the impacts on these customers, further work beyond the Phase I study is warranted.
Use of EJSCREEN, a screening tool developed by EPA to support initial environmental justice analyses by highlighting geographic areas that may have higher environmental burdens and vulnerable populations, identified the following:
– There are a number of sub-geographies within the SLCDPU service area where there are concentrations of demographic characteristics, such as low-income, that create the possibility of greater burden in terms of financial and social equity hardship of paying for water, wastewater, and stormwater service than indicated in the service-area results indicated above.
99

For example, Figure 3 is a map generated for the EJSCREEN analysis that presents the demographic index, which is the average of two demographic indicators: percent low-income and percent minority. As shown in the legend, the census block groups in the SLCDPU service area are shown in relation to the State of Utah percentiles. For the purposes of the EJSCREEN analysis, a census block group greater than 80th percentile is an area that may warrant further consideration, analysis, or outreach. As shown in the figure, there are a number of neighborhoods in the service area above 80th percentile, including Rose Park, Fairpark and Poplar Grove.
Figure 3. EJSCREEN Demographic Index for SLCDPU service area
– There are a number of sub-geographies within the SLCDPU service area where there are concentrations of physical characteristics, such as proximity to Superfund sites, that create the possibility of greater burden in terms environmental justice and social equity hardship impacts on residents who live there.
Consistent with the opening allowed in the EPA Guidance, work conducted to date as part of the integrated resource planning efforts at SLCDPU suggests that environmental factors, including use impairment, public health, and discharges to sensitive areas, are indeed important factors that should be taken into consideration when prioritizing the timing for capital investments by the utility. This is the case from both SLCDPU’s priorities and goals as a proactive environmental agency and may also be important considerations the utility might advance during schedule negotiations for investments with state and federal regulators, as allowed and invited by the EPA Guidance.
100

Suggested Uses for the Phase I Findings
It is recommended that the findings of the Phase I studies be shared in summary form with the Mayor’s office and City Finance Department, as envisioned during the Phase I kickoff meeting. The findings reported in this report may provide useful context for City policy and program development related to affordability and environmental justice, particularly when viewed in the context of other City programs and tax and fee burdens that affect residents of the service area.
Recommendations for Follow -up Analysis
It is recommended that SLCDPU consider following up the research and analysis developed for this Phase I study with additional work in light of opportunities to build upon the Phase I work. Potential Phase II efforts could include the following:
Follow up with More Detailed Studies for Metrics Covered in Phase I.
– Development of the residential indicator impacts from Alternative 1 in the EPA Guidance for theneighborhoods identified through the EJSCREEN analysis as likely having the most significantlikelihood of environmental justice impacts and financial burden to customers greater than theimpacts identified in Phase I for the service area as a whole.
– Further efforts be made to gather information on re-entry citizens, multigeneration householdsand other customer types that may experience greater-than-typical environmental justiceimpacts.
– Given the high-level findings in Phase I that the cumulative costs of the full cost of service, whichincludes asset management and customer assistance costs, may pose significant additionalchallenges over time, it is recommended that follow-up work be conducted to understand thoseimpacts more fully.
Development of other metrics from the EPA Guidance that were identified as relevant for the SLCDPU context, but which were excluded from development during Phase I as a result of schedule andresource constraints.
101