Understanding regional variation in entrepreneurial activity and entrepreneurial attitude in Europe
Upload
khangminh22Category
view
0download
0
1
CAPSTONE CASE 1: ECO-PRODUCTS, INC.
End-of-Case Assignments: Suggested Discussions and Analyses
A. Describe Eco-Products’ early history (1990 through 2003). Would you view the firm
during that period as being a life-style business, an entrepreneurial venture, or? Why?
Steve Savage and his father founded the company in 1990 with the intent to provide eco-friendly paper and janitorial supplies. They chose to locate the business in Boulder, Colorado, a community known for its support of environmental initiatives and natural products. However, consumers were slow to adopt eco-friendly products. Margins were low and salaries were small. Friends and family supplied funds for business operations. This early history was suggestive of a life-style business.
B. Discuss Eco-Products’ revenue growth-based “business model” that evolved over the
2004 through early 2008 period in terms of (a) production versus distribution, (b)
product line development, (c) branding, etc.
The company remained a local marketer of green janitorial paper and building supplies until 2004 when the company was set on a new course with both business supply and building supply divisions. The management team was expanded and sales in the business supply division grew rapidly as a result of a focus on brand and Internet strategies.
a) In 2004-05 Eco-Products remained primarily a distributor of eco-friendly products such as biodegradable disposable drinking cups, etc. that were purchased from a variety of manufacturers. As the business focus shifted from retail sales to wholesale distribution, pressure increased to produce their own brand of eco-friendly products. Product suppliers were selected in China and Taiwan.
b) Steve Savage emphasized the development of a signature Eco-Products line from a Polylactide (PLA) resin from renewable resources such as corn and sugarcane. This allowed the firm to offer a full, uniquely designed line of environmentally friendly products. However, lead times were long since orders from the Asian original equipment manufacturers took from 7 to 12 weeks to be filed.
c) As wholesale distribution grew, existing product manufacturers restricted Eco-Products’ ability to sell many products in the wholesale marketplace. After identifying Asian manufacturers, the “Eco-Products” branded line of compostable cups and food containers hit the market in March, 2007.
C. What is the size of the domestic and global markets for foodservice disposable
packaging? Who are the major competitors producing/selling environmentally-friendly
food service products. What intellectual property or competitive advantages does Eco-
Products, Inc. possess?
Entrepreneurial Finance 6th Edition Leach Solutions ManualFull Download: http://alibabadownload.com/product/entrepreneurial-finance-6th-edition-leach-solutions-manual/
This sample only, Download all chapters at: alibabadownload.com

Capstone Case 1: Eco-Products, Inc.
The global food service disposable industry produces an estimated $30 billion in sales annually. Biodegradable products represented the fastest growing segment of the industry and had sales estimated to exceed $700 million in 2008. Eco-Products previously carried the Fabri-Kal, International Paper, and Georgia Pacific paper product lines. These firms became direct competitors when Econ-Products decided to produce its own eco-friendly products line. It is difficult to produce intellectual property or competitive advantages in an industry where product production technology is reasonable simple and where there are several major competitors. Eco-Products had an available Asian production source for producing products from a PLA resin, as well as their own “brand” of compostable products.
D. Exhibits 2 and 3 present Eco-Products’ financial statement information for 2005, 2006,
and 2007. Prepare a ratio analysis of the firm’s financial performance over the 2005-07
period.
Note: the financial statements for 2005 and 2006 were unaudited. For 2007, the
income statement and statement of cash flow were “reviewed” while the balance
sheet was “audited.” As a result, some discrepancies exist when trying to reconcile changes in some of the numbers across financial statements. Students should understand that it is not uncommon for small, closely-held firms not to have their financial statements professionally “audited” by a Certified Public Accountant (CPA). Note: we are using end-of-year balance sheet items (rather than averages) in order to have three comparison years and to recognize that the firm’s business model (from a retailer of products manufactured by others to a manufacturer/wholesaler of eco-friendly products. 2005 COGS/Revenues = 2,584,326/3,649,799 = .708 = 70.8% 2006 COGS/Revenues = 3,684,492/5,751,787 = .641 = 64.1% 2007 COGS/Revenues = 7,726,455/10,867,104 = .711 = 71.1% 2005 Gross Profit Margin = 1,065,473/3,649,799 = .292 = 29.2% 2006 Gross Profit Margin = 2,067,295/5,751,787 = .359 = 35.9%% 2007 Gross Profit Margin = 3,140,649/10,867,104 = .289 = 28.9% 2005 Operating Profit Margin = 239,519/3,649,799 = .066 = 6.6% 2006 Operating Profit Margin = 98,333/5,751,787 = .017 = 1.7% 2007 Operating Profit Margin = 128,443/10,867,104 = .012 = 1.2% 2005 Net Profit Margin = 237,336/3,649,799 = .065 = 6.5% 2006 Net Profit Margin = 41,946/5,751,787 = .007 = 0.7% 2007 Net Profit Margin = -36,199/10,867,104 = -.003 = -0.3% 2005 Sales to Total Assets = 3,649,799/795,465 = 4.588 times 2006 Sales to Total Assets = 5,751,787/2,103,478 = 2.734 times 2007 Sales to Total Assets = 10,867,104/5,647,015 = 1.924 times

Capstone Case 1: Eco-Products, Inc.
2005 Return on Assets = 237,336/795,465 = .298 = 29.8% 2006 Return on Assets = 41,946/2,103,478 = .020 = 2.0% 2007 Return on Assets = -36,199/5,647,015 = -.006 = -0.6% 2005 Total Debt to Total Assets = 435,696/795,465 = .548 = 54.8% 2006 Total Debt to Total Assets = 1,781,218/2,103,478 = .847 = 84.7% 2007 Total Debt to Total Assets = 4,111,887/5,647,015 = .728 = 72.8% 2005 Return on Equity = 237,336/359,769 = .660 = 66.0% 2006 Return on Equity = 41,946/322,260 = .130 = 13.0% 2007 Return on Equity = -36,199/1,535,128 = -.024 = -2.4% As Eco-products moved from being a distributor/retailer of other manufacturers’ products to producing/wholesaling its own products, its profit margins declined from 2005 to 2007. In fact, the firm had a net loss in 2007 due in large part to the nearly $200,000 (actually $186,726) in interest expense associated with the obtaining of a line of credit which was $2,843,242 at the end of December, 2007. As sales “ramp up” in the future, it is important to “spread” the “fixed” and “semi-fixed” operating expenses in order to improve the operating profit margin and the firm’s value.
An accompanying Excel spreadsheet provides the following ratio calculations for
2007 and 2008 (data were not available until 2009).
Selected Ratios: 2007 2008
GOGS/Revenues 71.1% 75.7%
Gross Profit Margin 28.9% 24.3%
Operating Profit Margin 1.2% 3.2%
Net Profit Margin -0.3% 1.6%
Sales or Revenues/Total Assets 1.924 1.819
Return on Assets -0.6% 2.8%
Total Debt to Total Assets 72.8% 71.2%
Return on Equity -2.4% 9.9%
E. Exhibit 4 presents Eco-Products’ Statement of Cash Flows for 2007. Was the firm
building or burning cash in its operating activities? When also considering cash flows
from investing activities, was Eco Products in a net cash build or burn position in 2007?
In Chapters 4 and 6 we discussed the preparation of the Statement of Cash Flows. We use the indirect method which begins with an accounting period’s (usually one year) net income (or loss) and adds back non-cash deductions (depreciation and amortization). We then adjust these income statement amounts by changes (between last year and this year) in non-interest bearing working capital accounts shown on the balance sheet to get net cash flow from operations. We also calculate cash flows from investing activities and

Capstone Case 1: Eco-Products, Inc.
cash flows from financing activities. In actual practice, accountants use the direct method for preparing the statement of cash flows which aggregates all individual transactions made throughout the year that impact accounting cash flows. Thus, because of the lack of detail, the indirect method for preparing the statement of cash flows is sometimes difficult to exactly reconcile with the more detailed results provided from the direct method. Also, as noted in the prior question, only the 2007 balance sheet was audited. Other financial statements were only “reviewed by a CPA firm. This makes it more difficult to separately prepare (using the indirect method) a statement of cash flows for Eco-Products for 2007. While many of the changes in balance sheet accounts between 2006 and 2007 match with the amounts presented in the consolidated statements of cash flow in Exhibit 4, others do not. Thus, for this question we suggest that students concentrate on Exhibit 4 to determine the extent to which Eco-Products was building or burning cash in 2007. In Chapter 4 we presented a short method for determining whether a firm had been building or burning cash. The short method sums the net cash used in operating activities and the net cash used in investing activities. 2007 Cash Build/Burn = net cash used in operating activities + net cash used in investing activities = -2,891,887 + -356,745 = -3,248,632 Thus Eco-Products had a cash burn of over $3 million in 2007.
A more detailed method for estimating cash build or burn was provided in Chapter 5. Cash Build = Net Sales – Increase in Receivables = 10,867,104 – 965,683 = 9,901,421 Cash Burn = Income Statement-Based Operating, Interest, and Tax Expenses + Increase in Inventories - (Changes in Payables and Accrued Liabilities) + Capital Expenditures Note: there may be deferred income taxes as well as changes in other less common current asset and current liability accounts (as shown in Exhibit 4) that must be accounted for in determining net cash used in operating activities. These include prepaid expenses and other assets, income tax receivable, deposits, other current liabilities, deferred lease liability, and deferred revenue and are considered below. Cash Burn = 10,786,740 [i.e., 7,726,455 + 1,822,206 +1,102,437 + 187,918 (interest & other expenses) + -23,276 - 29,000 (deferred income tax)] + 1,553,188 + 664,003 (i.e., 589,743 + 64,260 + 10,000)
- 84,156 (44,800 + 39,356) - 126,467 (i.e., 3,966 + 16,913 + 105,588)
+ 356,745

Capstone Case 1: Eco-Products, Inc.
= 13,150,053 Net Cash Burn = Cash Burn – Cash Build = 13,150,053 – 9,901,421 = 3,248,632
F. Describe the early rounds of financing that occurred from Eco-Products’ inception in
1990 through 2006. Beginning in 2007, the need for external financing began
increasing. Describe the sources, amounts, and types of financing obtained during
2007and the early part of 2008.
Exhibit 5 in the case summarizes previous rounds of financing. Eco-Products was started with $8,000 in seed money in 1990. Additional equity investments from the founders, family, friends, and employees for purchase of inventory and to support the building supply division occurred in 1995, 1999, and 2003. As sales began increasing rapidly in 2007, there was a need to finance more working capital, particularly inventory. In 2007, $220,000 was raised from 14 investors which included friends, family, and angels. An additional $2.5 million was raised from 30 angel investors in late 2007 and during the spring of 2008 through a private placement memorandum. Excerpts from the memorandum are shown in Appendix A.
G. In mid-2007, Eco-Products’ management prepared a five-year (2007-2011) projection of
revenues and expenses (see Exhibit 1). What annual rates of growth were projected for
net sales? Make a “back-of-the-envelope” estimate of the amounts of additional assets
needed to support the sales forecasts. How might these assets be financed? Prepare a
“rough” estimate of the possible size of external financing needed to support these sales
projections.
First, let’s review recent actual sales growth rates: Year Sales/Revenues Percent Increase 2005 $3,649,799 2006 $5,751,787 57.6% 2007 $10,867,104 88.9% Financial Projections (made in mid-2007) in Thousands of Dollars: Change Year Sales/Revenues in Sales Percent Increase 2007 $9,200 2008 22,000 $12,800 139.1% 2009 38,000 16,000 72.7 2010 55,000 17,000 44.7 2011 78,000 23,000 41.8
Capstone Case 1: Eco-Products, Inc.
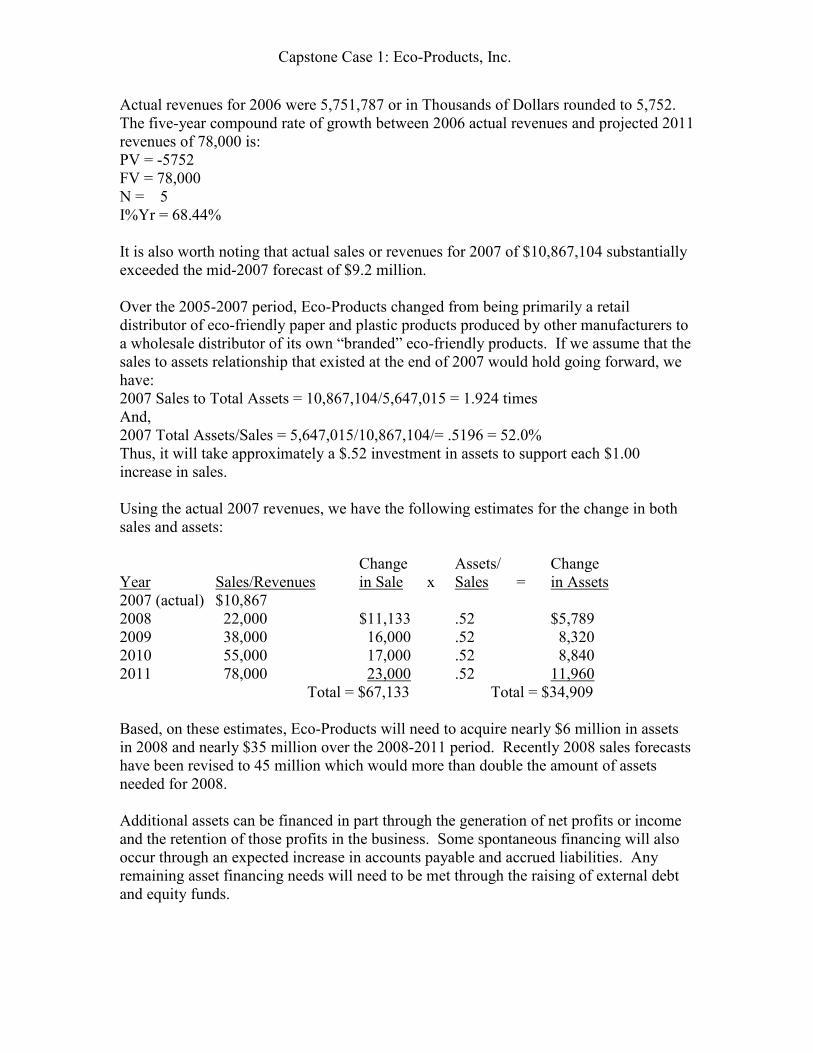
Actual revenues for 2006 were 5,751,787 or in Thousands of Dollars rounded to 5,752. The five-year compound rate of growth between 2006 actual revenues and projected 2011 revenues of 78,000 is: PV = -5752 FV = 78,000 N = 5 I%Yr = 68.44% It is also worth noting that actual sales or revenues for 2007 of $10,867,104 substantially exceeded the mid-2007 forecast of $9.2 million. Over the 2005-2007 period, Eco-Products changed from being primarily a retail distributor of eco-friendly paper and plastic products produced by other manufacturers to a wholesale distributor of its own “branded” eco-friendly products. If we assume that the sales to assets relationship that existed at the end of 2007 would hold going forward, we have: 2007 Sales to Total Assets = 10,867,104/5,647,015 = 1.924 times And, 2007 Total Assets/Sales = 5,647,015/10,867,104/= .5196 = 52.0% Thus, it will take approximately a $.52 investment in assets to support each $1.00 increase in sales. Using the actual 2007 revenues, we have the following estimates for the change in both sales and assets: Change Assets/ Change Year Sales/Revenues in Sale x Sales = in Assets 2007 (actual) $10,867 2008 22,000 $11,133 .52 $5,789 2009 38,000 16,000 .52 8,320 2010 55,000 17,000 .52 8,840 2011 78,000 23,000 .52 11,960 Total = $67,133 Total = $34,909 Based, on these estimates, Eco-Products will need to acquire nearly $6 million in assets in 2008 and nearly $35 million over the 2008-2011 period. Recently 2008 sales forecasts have been revised to 45 million which would more than double the amount of assets needed for 2008. Additional assets can be financed in part through the generation of net profits or income and the retention of those profits in the business. Some spontaneous financing will also occur through an expected increase in accounts payable and accrued liabilities. Any remaining asset financing needs will need to be met through the raising of external debt and equity funds.

Capstone Case 1: Eco-Products, Inc.
In Chapter 6, we introduced a basic additional funds needed (AFN) equation which can provide a quick “back-of-the-envelope” estimate of future external financing needs. AFN = (Total Assets/Sales)(Change in Sales) – (Accounts Payable + Accrued Liabilities)/(Change in Sales) – (Next Year’s Sales)(Net Income/Net Sales)(Retention Rate) 2007 Total Assets/Sales = 5,647,015/10,867,104 = .5196 = .520 (rounded) 2007 (Accounts Payables & Accrued Expenses)/Sales = 568,131/10,867,104 = .052 2007 Net Income/Sales = -36,199/10,867,104 = -.003 Note: Eco-Products must return to profitability in order to finance its sales growth and to add to firm value. Exhibit 1 projects an EBITDA/Sales margin of 8.5%. A net profit margin of 4.25% (8.5% x .50) might be achievable and is used here for illustrative purposes. A 100% retention rate also is assumed. Two AFN estimates are prepared for 2008:
1) 2008 sales estimate (in $ Thousands) made in mid-2007 = $22,000; with a change of $11,133 ($22,000 - $10,867)
2) 2008 sales estimate (in $ Thousands) made in early-2008 = $45,000; with a change of $34,133 ($45,000 - $10,867)
1) 2008 AFN for Sales of $22,000 = .520(11,133) - .052(11,133) –
22,000(.0425)(1.00) = 5,789 – 579 – 935 = 4,275
2) 2008 AFN for Sales of $45,000 = .520(34,133) - .052(34,133) – 45,000(.0425)(1.00) = 17,749 – 1,775 – 1,913 = 14,061
The 2008 AFN ranges from $4.275 million for $22 million in sales to $14.061 million for $45 million in sales or revenues. The large AFN estimates are due in large part to working capital needs primarily in the form of higher accounts receivable and inventory. The amount of funds tied up in inventory is problematic due to supply chain lead times and supplier terms (see Figure 2). Furthermore, relatively little supplier financing is provided and the business does not generate large profit margins. As a result, Eco-Products will likely need to improve its supply chain model.
Note: An accompanying Excel spreadsheet provides basic financial statement
projections for 2008 for three different revenue projections. The results follow.

Capstone Case 1: Eco-Products, Inc.
Eco-Products, Inc.
Financial Statements and Projections Forecast Basis: Mid-2007 Moderate Early-2008
[Dollars] Actual Percent of Forecast Forecast Forecast
Income Statements 2007 2007 Revenues (Sales) 2008 2008 2008
Net Revenues 10,867,104 Estimated Amounts 22,000,000 35,000,000 45,000,000
Cost of Goods Sold 7,726,455 0.711 x sales forecast 15,642,000 24,885,000 31,995,000
Gross Profit 3,140,649 6,358,000 10,115,000 13,005,000
Operating Expenses
Bad Debt 141 0.000 x sales forecast 0 0 0
Depreciation and Amortization 87,563 0.008 x sales forecast 176,000 280,000 360,000
Employee Benefits 114,011 0.010 x sales forecast 220,000 350,000 450,000
General and Administrative 494,061 0.045 x sales forecast 990,000 1,575,000 2,025,000
Payroll Taxes 117,557 0.011 x sales forecast 242,000 385,000 495,000
Occupancy Expense 349,668 0.032 x sales forecast 704,000 1,120,000 1,440,000
Repairs and Maintenance 27,140 0.002 x sales forecast 44,000 70,000 90,000
Salaries and Wages 1,778,282 *0.123 x sales forecast 2,706,000 4,305,000 5,535,000
Selling and Marketing Expenses 43,783 *0.016 x sales forecast 352,000 560,000 720,000
Total Operating Expenses 3,012,206 5,434,000 8,645,000 11,115,000
Operating Profit 128,443 924,000 1,470,000 1,890,000
Other Income and (Expenses)
Interest Expense -186,726 *(0.009) x sales forecast (198,000) (315,000) (405,000)
Other Income 0 0.000 x sales forecast - - -
Other Expense -1,192 (0.001) x sales forecast (22,000) (35,000) (45,000)
Net Other Income & (Expenses) -187,918 -220,000 -350,000 -450,000
Net Income (Loss) Before Taxes -59,475 704,000 1,120,000 1,440,000
Provision for Income Taxes
Estimated Taxes *Assumes 35% Tax Rate (246,400) (392,000) (504,000)
Current Tax Benefit 52,276
Deferred Tax Expense -29,000
Total Provision of Income Taxes 23,276 -246,400 -392,000 -504,000
Net Income (Loss) -36,199 457,600 728,000 936,000 Balance Sheets Actual Percent Forecast Forecast Forecast
Assets 2007 of Sales 2008 2008 2008
Current Assets
Cash 51,667 0.5% 0.005 x sales forecast 104,598 166,405 213,950
Accounts Receivable, Net 1,330,562 12.2% 0.122 x sales forecast 2,684,000 4,270,000 5,490,000
Prepaid Expenses & Other Cur. Assets 728,776 6.7% 0.067 x sales forecast 1,474,000 2,345,000 3,015,000
Income Tax Receivable 54,506 0.5% 0.005 x sales forecast 110,000 175,000 225,000
Inventory 2,415,916 22.2% 0.222 x sales forecast 4,884,000 7,770,000 9,990,000
Deferred Income Tax Asset 42,000 0.4% Held Constant 42,000 42,000 42,000
Total Current Assets 4,623,427 42.5% 9,298,598 14,768,405 18,975,950
Property and Equipment
Machinery and Equipment 641,773 5.9% *0.039 x sales forecast 858,000 1,365,000 1,755,000
Building Improvements 479,481 4.4% *0.029 x sales forecast 638,000 1,015,000 1,305,000
Vehicles 228,448 2.1% *0.014 x sales forecast 308,000 490,000 630,000
Total Property and Equipment 1,349,702 12.4% 1,804,000 2,870,000 3,690,000
Less Accumulated Depreciation -360,304 -3.3% *(0.022) x sales forecast -484,000 -770,000 -990,000
Net Property and Equipment 989,398 9.1% 1,320,000 2,100,000 2,700,000
Intangible Assets
Trademarks 20,800 0.2% 0.002 x sales forecast 44,000 70,000 90,000
Other Intangible Assets 5,440 0.1% 0.001 x sales forecast 22,000 35,000 45,000
Total Intangible Assets 26,240 0.2% 0.002 x sales forecast 44,000 70,000 90,000
Less Accumulated Amortization -2,050 0.0% 0.000 x sales forecast 0 0 0
Net Intangible Assets 24,190 0.2% 44,000 70,000 90,000
Other Assets
Deposits 10,000 0.1% 0.001 x sales forecast 22,000 35,000 45,000
Total Assets 5,647,015 52.0% 10,684,598 16,973,405 21,810,950

Capstone Case 1: Eco-Products, Inc.
Actual Percent Forecast Forecast Forecast
Liabilities and Equity 2007 of Sales 2008 2008 2008
Current Liabilities
Accounts Payable & Accrued Expenses 568,131 5.2% 0.052 x sales forecast 1,144,000 1,820,000 2,340,000
Accrued Payroll & Payroll Taxes 6,712 0.1% 0.001 x sales forecast 22,000 35,000 45,000
Accrued Vacation 39,865 0.4% 0.004 x sales forecast 88,000 140,000 180,000
Lines of Credit 2,843,242 26.2% *0.262 x sales forecast 5,764,000 9,170,000 11,790,000
Current Portion of Long-Term Debt 39,356 0.4% 0.004 x sales forecast 88,000 140,000 180,000
Current Portion of Capital Leases 37,919 0.3% 0.003 x sales forecast 66,000 105,000 135,000
Deferred Revenue 105,588 1.0% Held Constant 105,588 105,588 105,588
Loan from Stockholder 93,394 0.9% Held Constant 93,394 93,394 93,394
Other Current Liabilities 21,523 0.2% 0.002 x sales forecast 44,000 70,000 90,000
Total Current Liabilities 3,755,730 34.6% 7,414,982 11,678,982 14,958,982
Deferred Income Tax Liability 54,000 0.5% 0.005 x sales forecast 110,000 175,000 225,000
Deferred Lease Liability 36,383 0.3% 0.052 x sales forecast 66,000 105,000 135,000
Long-Term Capital Leases, Net of Current Por. 141,228 1.3% Held Constant 141,228 141,228 141,228
Long-term Debt, Net of Current Portion 124,546 1.1% Held Constant 124,546 124,546 124,546
Total Liabilities 4,111,887 37.8% 7,856,756 12,224,756 15,584,756
Stockholders' Equity
Common Stock, $.001 Par Value
50,000,000 Shares Authorized
16,935,000 Shares Issued & Outstanding 156,300 1.4% Held Constant 156,300 156,300 156,300
Preferred Stock, $.001 Par Value
1,750,000 Shares Authorized
1,366,666 Shares Issued & Outstanding 0 Held Constant 0 0 0
Additional Paid-In-Capital 1,269,908 11.7% Held Constant 1,269,908 1,269,908 1,269,908
Retained Earnings 108,920 1.0% [+2008 Net Income] 566,520 836,920 1,044,920
Total Stockholders' Equity 1,535,128 14.1% 1,992,728 2,263,128 2,471,128
*Additional Financing Needed 0 835,114 2,485,521 3,755,066
Total Liabilities & Stockholders' Equity 5,647,015 52.0% 10,684,598 16,973,405 21,810,950
Notes on Projected Financial Statements
Income Statement:
*Salaries and Wages--reduced by 25% from the 16.4% 2007 relationship to reflect expected economies
*Selling and Marketing Expenses--increased 4 times the .4% 2007 relationship to reflect the need for higher expenditures
*Interest Expense was projected at one-half the 2007 percent of sales rate due to a likely slower growth rate for interest-bearing debt
*Assumes 35% Tax Rate for 2008 projections (Deferred Taxes were not projected due to insufficient data)
Balance Sheet:
*Property and Equipment was reduced to two-thirds of 2007 rate due to production being outsourced
*Lines of Credit were increased with sales under the assumption they would be available to finance working capital
*Additional Financing Needed is the amount of long-term debt and equity funds needed to finance projected sales growth
Note: Actual 2008 operating results are presented in the Epilogue (What Happened)
at the end of this teaching note:
2008 Actual Sales/Revenues: $34,378,138 (well below the early 2008 estimate of $45
million due to a slowing economy, greater competition, and supply chain issues)
2008 Net Income: $538,344 (resulting in a 1.6% net profit margin)
2008 Year-end Inventory: $12,222,801 (excess inventory was produced in
anticipation of higher sales which did not materialize)
H. Eco-Products’ management developed a Confidential Private Placement Memorandum
(PPM) dated October 16, 2007 in an attempt to raise $3,500,000. Appendix A contains
excerpts from the PPM.

Capstone Case 1: Eco-Products, Inc.
1. What is meant by a Regulation D offering? What is an accredited investor and how
many investors can participate in the PPM? [You may wish to review materials from
Chapter 8 and its appendices when answering these PPM-related questions.]
Regulation D (or Reg D) is a registration that offers a safe harbor from registration of securities with the SEC. Due to uncertainty about what constitutes a nonpublic offering, the SEC provided some “safe-harbor” conditions that will result in guaranteed exemption as a private placement.
An “accredited investor” was first defined under the Securities Act of 1933 and Section 4(6) provided that there is no limit to the number of accredited investors so long as the offering amount does not exceed $5 million. The definition of an “accredited investor” was expanded to include eight categories of accredited investors under Rule 501 of Regulation D (see Chapter 8, Appendix B). Banks, private business development companies, and other specified organizations are considered to be accredited investors. Directors, executive officers, or general partners of the issuer of the securities being offered or sold are considered to be accredited investors. A natural person with individual net worth (or joint net worth with that person’s spouse) exceeding $1,000,000 is deemed an accredited investors. Also, a natural person who had individual income in excess of $200,000 in each of the two most recent years (or $300,000 of joint income with one’s spouse) and who has a reasonable expectation of the same income level in the current year also is considered to be an accredited investor.
There is no limit as to the number of investors (accredited or unaccredited) under Reg D: Rule 504 which has an offering limit of $1 million. Under Reg D: Rule 505 (offering limit of $5 million) and Reg D: Rule 506 (no offering limit) there may be a maximum of 35 unaccredited investors but no limit on the number of accredited investors.
2. Considering the planned use of proceeds, discuss the pros and cons of trying to raise
$3,500,000 in increments as small as $50,000 each.
A $3.5 million private placement memorandum fall under Reg D: Rule 505 which has a $5 million offering limit in a 12-month period. While there is no limit on the number of accredited investors, there is a limit of 35 unaccredited investors. At the extreme, raising $3.5 million all in minimum $50 thousand amounts would require 70 different investors. At this minimum amount, only $1.75 million could be generated from the maximum 35 unaccredited investors (i.e., 35 x $50 thousand). Raising funds in small amounts requires more time, effort, and cost. Since there is a need to quickly build up working capital, particularly inventory, raising funds in relatively small amounts over an extended period of time could impede the firm’s ability to grow its sales.

Capstone Case 1: Eco-Products, Inc.
3. Summarize the risk factors listed by management in the Private Placement
Memorandum. Which factors do you believe are the most crucial in determining the
future success of Eco-Products?
Appendix A provides excerpts for Eco-Products 2007 Private Placement Memorandum. Risk factors include: a) Need for new product development b) Being subject to patent infringement laws c) Reliance on importing products from overseas suppliers d) Competition will continue to increase e) Supply could be constrained by raw material availability f) Subject to federal and state, as well as foreign, regulations g) Subject to product liability claims h) Need to hire and retain skilled personnel i) Need to successfully manage growth j) Impact by general economic conditions k) Restrictions on the transferability of, and no pubic market, for firm’s stock l) Determination of offering price was arbitrarily determined by current owners m) No expectation to pay dividends in foreseeable future
Supply chain-related risks (availability to obtain raw materials and reliance on importing products from overseas suppliers), the need for new product development, and increasing competition clearly will be important if Eco-Products is able to achieve profitable sales growth and added to firm value in the future. Of course, the ability to avoid/manage the other risk factors listed by management also will have a major impact on the firm’s future success.
I. Identify and discuss the factors and developments that led to the previously unexpected
revenue growth during the first-half of 2008 by Eco-Products. Is such growth likely to be
sustainable in the near future? What possible developments might interrupt or change
this rapid rate of sales growth?
In mid-2007, management forecasted full-year 2007 sales to be $9.2 million with a sales forecast of $22 million for 2008 (refer to Exhibit 1). Then, the “perfect storm” hit. Oil prices spiked to new heights and general awareness of environmental issues intensified. Orders for products made from renewable resources skyrocketed and Eco-Products experienced large and sudden increases in sales. In early 2008, forecasted 2008 full-year sales were increased to $45 million. The ability to meet and maintain such growth targets would depend on consumer demand for eco-friendly products, the ability to fulfill orders given the firm’s long inventory cycle, how competitors (particularly some very large firms) will react, and overall economic conditions. Actual 2008 sales were a little under $35 million (see the Epilogue, What Happened, at the end of this teaching note). This over $10 million short-fall in sales from the early

Capstone Case 1: Eco-Products, Inc.
2008 forecast of $45 million was associated with a decline in economic activity (recession), increased competition, and a supply chain problem that made it difficult to first avoid stocking out of inventory and then accumulating excess inventory. By the end of 2008, inventory had increased to more than $12 million compared to $2.4 million at the end of 2007.
J. Explain Eco-Products’ supply chain model that existed in early 2008. Describe the
strengths and weaknesses of such a model from an operations viewpoint. What are the
implications of this supply chain model on Eco-Products working capital financing needs
and its cash conversion cycle?
The supply chain model used by Eco-Products resulted in a long inventory cycle (for a relatively simple production process). Raw materials were often purchased in the U.S. or from suppliers in other countries, shipped to manufacturers in Asia, with the final products being shipped back for sale in the U.S. This long inventory cycle tied up cash and made it difficult to stock adequate inventory in some time periods, or produce excess inventory at other times. A long supply chain cycle involves larger asset financing requirements, particularly in the form of inventory. As shown below, both assets to sales and inventory to sales increased dramatically as the firm changed from a seller of products manufactured by other firms to a business model whereby Eco-Products became a manufacturer and wholesaler of eco-friendly products. 2005 Total Assets/Sales = 795,465/3,649,799 = .2179 = 21.8% 2006 Total Assets/Sales = 2,103,478/5,751,787 = .3657 = 36.6% 2007 Total Assets/Sales = 5,647,015/10,867,104 = .5196 = 52.0% 2005 Inventory/Sales = 361,906/3,649,799 = .0992 = 9.2% 2006 Inventory/Sales = 862,728/5,751,787 = .1499 = 15.0% 2007 Inventory/Sales = 2,415,916/10,867,104 = .2223 = 22.2% Actual 2008 Results: 2008 Total Assets/Sales = 18,903,838/34,378,138 = .5499 = 55.0% 2008 Inventory/Sales = 12,222,801/34,378,138 = .3555 = 35.6% Total assets to sales increased from 52.0% for 2007 to 55.0% in 2008. Of course, the primary reason for the need to finance more assets relative to sales was due to the increase in the inventory to sales ratio which increased from 22.2% in 2007 to 35.6% in 2008. The inability to efficiently manage inventory levels was due, at least in part, to the supply chain model being employed by Eco-Products. An examination of the Cash Conversion Cycle (CCC) also helps illustrate the working capital problem faced by Eco-Products. CCC Calculations:

Capstone Case 1: Eco-Products, Inc.
Inventory-to-Sale Conversion Period (Inv. CP): 2005 Inv. CP = 361,906/(2,584,326/365) = 361,906/7,080.4 = 51.1 days 2006 Inv. CP = 862,728/(3,684,492/365) = 862,728/10,094.5 = 85.5 days 2007 Inv. CP = 2,415,916/(7,726,455/365) = 2,415,916/21,168.4 = 114.1 days Sale-to-Cash Conversion Period (Rec. CP): 2005 Rec. CP = 101,690/(3,649,799/365) = 101,690/9,999.5 = 10.2 days 2006 Rec. CP = 862,728/(5,751,787/365) = 862,728/15,758.3 = 54.8 days 2007 Rec. CP = 1,330,562/(10,867,104/365) = 1,330,562/29,772.9 = 44.7 days Purchase-to-Payment Conversion Period (Pmt. CP): 2005 Pmt. CP = 123,429/(2,584,326/365) = 123,429/7,080.4 = 17.4 days 2006 Pmt. CP = 526,555/(3,684,492/365) = 526,555/10,094.5 = 52.2 days 2007 Pmt. CP = 568,131/(7,726,455/365) = 568,131/21,168.4 = 26.8 days Cash Conversion Cycle (CCC): 2005 CCC = 51.1 days + 10.2 days – 17.4 days = 43.9 days 2006 CCC = 85.5 days + 54.8 days – 52.2 days = 88.1 days 2007 CCC = 114.1 days + 44.7 days – 26.8 days = 132.0 days
The dramatic increase in the cash conversion cycle from 43.9 days in 2005 to 132.0 days in 2007 reflects the change in the firm’ business model from a seller of products manufactured by other firms to a manufacturer/wholesaler of eco-friendly products, as well as the firm’s supply chain model which resulted in a long inventory conversion period which was 114.1 days in 2007. Dividing 365 days by 114.1 days results in an inventory turnover of 3.2 times per year. This is a very low turnover for products that require very short production times.
For reference, the actual CCC calculations for 2008 were as follows:
2008 Inv. CP = 12,222,801/(26,041,166/365) = 12,222,801/71,345.7 = 171.3 days 2008 Rec. CP = 3,109,920/(34,378,138/365) = 3,109,920/94,186.7 = 33.0 days 2008 Pmt. CP = 3,804,210/(26,041,166/365) = 3,804,210/71,345.7 = 53.3 days 2008 CCC= 171.3 days + 33.0 days – 53.3 days = 151.0 days This further increase in the CCC meant that even more financing was required to support the actual 2008 sales.
An accompanying Excel spreadsheet provides the following ratio calculations for
2007 and 2008 (data not available until 2009).
Cash Conversion Cycle (in Days): 2007 2008
Inventory-to-Sale Conversion Period 114.1 171.3
Sale-to-Cash Conversion Period 44.7 33.0
Purchase-to-Payment Conversion Period 26.8 53.3
Cash Conversion Cycle 132.0 151.0
Capstone Case 1: Eco-Products, Inc.
K. In mid-2008, Eco-Products management sought to quickly (hopefully) raise an additional
$2 million in external financing through a single private equity investment. The term
sheet prepared by Greenmont Capital is presented in Appendix B.
1. After considering a number of possible private equity investors, Greenmont Capital
was selected by Eco-Products’ management. Discuss the pros and cons of selecting a
small locally-based private equity firm relative to a larger private equity investor?
Large private equity firms have large amounts of funds to invest and will have a portfolio of several projects being simultaneously financed. Large private equity firms also usually can move quickly in providing funds to specific ventures and are likely to have broad industry and managerial expertise to offer in support of the venture’s management team. However, given multiple investments, their working arrangements with a specific venture may be more impersonal.
A small private equity firm will invest in fewer ventures and thus can devote more specific focus on understanding the business model of each of their venture investments. While a small private equity firm may have limited overall industry and managerial expertise, they will concentrate their investments in industries and firms they know and understand. However, small private equity firms likely will have smaller amounts to invest and may take longer to raise funds from their investors. As a result, ventures needing large amounts of immediate financial capital may be hindered if they try to work with a small private equity firm.
2. Review the investment terms presented in Appendix B and comment on any factors in
the term sheet that might be “deal breakers.” If you were representing Eco-Products
top management, which terms might you want deleted or modified from the term
sheet? Now, if you were representing Greenmont Capital, which terms would be
important in protecting its investment capital?
It might be helpful to first review Chapter 11, Figure 11.6 which provides a list of “Typical Issues Addressed in a Term Sheet.’ A term sheet should summarize the proposed principal terms with respect to a specific financing vehicle to be used to finance a venture. Included should be an identification of the issuer, the investor(s), the type of security being used, the price of the security being offered, and the amount of financing to be raised and an agreed to ownership position. In the proposed term sheet shown in Appendix B, Eco-Products is issuing Series A Convertible Preferred Stock (initially convertible on a 1:1 basis into shares of the company’s common stock) at a price of $1.50 per share to Greenmont Capital Partners. A total of $2 million will be raised in exchange for a 7.8% ownership

Capstone Case 1: Eco-Products, Inc.
position on a fully-diluted basis (including shares reserved for any employee option pool including additional warrants being offered to Greenmont). The proposed terms of the Series A Preferred Stock are spelled out in Appendix B and include: dividends, liquidation preference, conversion, automatic conversion, anti-dilution provisions, voting rights, board of directors, board meetings, protective provisions, information rights, registration rights, right of participation, purchase agreement, employee pool, stock vesting, restrictions on sales, co-sale agreement, and employment agreements.
The term sheet also addresses “other matters” that include: confidentiality, indemnification, legal fees and expenses, and conditions precedent to financing. A possible “deal breaker” would be the number of warrants being offered to Greenmont Partners in the term sheet proposal. The July 18, 2008 term sheet proposal provides for Greenmont to receive 1.5 million shares of Series A Convertible Preferred Stock initially convertible on a 1:1 basis into shares of Eco-Products common stock. The term sheet proposal also provides for a 25% warrant coverage (i.e., warrants to purchase additional Series A Preferred Shares at an exercise price of $1.50 per share). This would amount to 333,333 warrants ($1.5 million shares times .25) which potentially dilutes Eco-Products equity ownership. Eco-Products likely would want the proposed “warrants” provision to be modified downwards or even deleted. Eco-Products also may want to modify downwards the proposed “dividends” provision for the Series A Preferred Stock which provides for cumulative dividends of 8% of the original purchase price per annum.
Greenmont Capital, in an effort to protect its investment capital, would want to maintain the warrants provision. Anti-dilution provisions also are very important since additional equity capital will be needed to finance Eco-Products growth and this capital is likely to come from other private equity investors.
3. Some analysts employ a relative value method that uses multiples from comparable
firms to estimate the value of a target venture. Exhibit 9 contains enterprise value-to-
sales information for a number of possible comparable firms for the purpose of
valuing Eco-Products. Estimate the enterprise value of Eco-Products. What portion
of equity ownership should Eco- Products be willing to give up for the $2 million
Greenmont Capital investment?
Although Eco-Products had been in business since 1990, its business model changed between 2005 and 2007. Eco-Products became a manufacturer and wholesaler of eco-friendly products at a time when oil prices were at record highs and concern about the environment reached new heights. Sales grew rapidly in 2007. However, the firm operated at a loss in 2007. Thus, by 2008 Eco-Products possessed characteristics of a high sales growth venture that needed to still find a way to produce bottom line profitability and ultimately free cash flows for the equity investors. When trying to value such a venture, analysts may differ widely as to what they believe are reasonable values.
Capstone Case 1: Eco-Products, Inc.
As discussed in the text, ventures may be valued using a discounted cash flow (DCF) method (see Chapters 9 and 13), a venture capitalist (VC) short-cut method (see Chapter 10), or a relative valuation method (see Chapter 14). Analysts often attempt to value a firm on the basis of its top line (sales), its rough cash flow (as reflected in EBITDA), and/or its bottom line (net income). Here we concentrate on examining the relative valuation data provided by Greenmont Capital Partners in Exhibit 9 which included financial information on 7 “possible” transactions. Five of the transactions occurred While some analysts might argue for including all available transactions, a case could be made for including the five transactions that occurred during 2007 and which may be more representative of the valuation multiples that prevailed in mid-2008. The Insulair acquisition was in July, 2006 and had an enterprise value to revenue multiple that was several times higher than any of the other transactions. The Newspring acquisition occurred in March, 2005 and thus was over three years prior to the current mid-2008 valuation date. The average enterprise value to revenue multiple for the Tendercare International, Waddington, Van Houtte, Matrix Packaging, and Prairie Packaging transactions was 1.55 times. Unfortunately, no information was available for EBITDA (except for the dated Newspring transaction) or net income multiples. As noted in the case, sales estimates changed rapidly in the case. Eco-Products management in mid-2007 had forecasted 2008 sales to be $22 million. By early 2008, the 2008 sales estimates were revised upwards to $45 million. Trailing twelve months revenues for the twelve months ended in June, 2008 were $19.7 million. Exhibit 8 shows quarterly revenues increasing rapidly over the past three quarters with revenues amounting to almost $13.5 million for the first-half of 2008. Thus, to reach the $45 million in forecasted sales for all of 2008, the second-half of the year sales would need to be $31.50 million. However, as Eco-Products entered the second-half of 2008, there was reason for some concern due to an inventory-related problem and the fact that consumer spending and overall economic activity were slowing considerably. A range of possible values for Eco-Products using an enterprise value to sales multiple of 1.55 might be: Sales or Rev. x Multiple = Value 12-Month Trailing Sales $19.7 million 1.55 $30.535 million
Management’s Forecast $45.0 million 1.55 $69.750 million
Actual 2008 Results $34.4 million 1.55 $53.320 million
At the end of 2007, Eco-Products had a line of credit outstanding of $2,843,242, long-term debt (including the current portion) of $164,411, and long-term capital leases (including the current portion) of $215,530 for an interest-bearing debt plus capital leases

Capstone Case 1: Eco-Products, Inc.
total of $3,223,183 or approximately $3.2 million rounded. Thus, the enterprise values shown above should be reduced by about $3.2 million each. The equity value using trailing sales would be $27.3 million while the equity value using management’s $45 million sales forecast would be about $66.5 million. Furthermore, it was likely that even more interest-bearing debt was outstanding as of mid-2009. For example, the $4 million line-of-credit (of which $2.8 million was outstanding at the end of 2007) was increased to $8 million on July 1. Larger interest-bearing debt obligations would have further reduced the equity value of the firm.
Note: As can be seen from the actual 2008 results, the lines of credit at the end of
2008 amounted to slightly more than $8 million, long-term debt (including the
current portion) was nearly $.5 million, and long-term capital leases (including the
current portion) was nearly $.3 million. Thus, the total interest-bearing debt plus
long-term capital leases amounted to approximately $8.8 million.
In the proposed term sheet (see Appendix B), Greenmont Partners valued Eco-Products equity at $29.6 million as of mid-2008. This amount was about $2.3 million more than the equity value of $27.3 million (30.5 million - $3.2 million) estimated based on 12-month trailing sales. Greenmont Partners’ post-money ownership (including shares reserved for the employee option pool but not the warrants to be issued to Greenmont) can be estimated as: $2,000,000/($29,587,500 + $2,000,000) = $2,000,000/$31,587,500 = 6.33% Or, using pre-money and post-money shares the calculations would be: Pre-money shares (fully diluted to account for the employee option pool) = $29,587,500/$1.50 = 19,725,000 shares Shares issued to Greenmont = $2,000,000/$1.50 = 1,333,333 Post-money shares = 19,725,000 + 1,333,333 = 21,058,333 Greenmont Partners’ ownership = (1,333,333 shares)/(21,058,333 shares) = 6.33% Of course, the potential dilution impact of the 333,333 (1,333,333 x .25) warrants to be issued to Greenmont also need to be taken into consideration in determining Greenmont’s ownership percentage on a fully diluted basis. Greenmont’s potential total shares = 1,333,333 + 333,333 = 1,666,666 Total post-money fully-diluted shares = 21,058,333 + 333,333 = 21,391,666 Greenmont’s ownership position on a fully-diluted basis = 1,666,666 shares/21,391,666 shares = .0779 = 7.8% rounded
As noted in the following epilogue, Greenmont Partners negotiated a larger
percentage ownership as Eco-Products struggled to meet its revenue targets due to
inventory-related problems and the rapidly slowing economy during the last-half of
2008. According to the 2008 balance sheet, 1,366,666 shares of preferred stock were
actually issued to Greenmont, instead of the previously negotiated 1,333,333 shares
Capstone Case 1: Eco-Products, Inc.
(an increase of 33,333 shares). Adding the 333,333 warrants resulted in Greenmont
Partners having potential 1,699,999 fully-diluted shares.
EPILOGUE: What Happened
Finance deal. Steve Savage and Greenmont Capital Partners signed a $2 million Series A investment round on July 1, 2008. Greenmont’s valuation was not the highest of those Savage received, but it was close. Savage chose Greenmont over others because the valuation was fair and provided the intangible benefits of a strategic partnership, and the Greenmont team was beset with industry veterans. Greenmont’s terms sheet contained what Savage considered were standard provisions and covenants and negotiations went smoothly. Ellie’s Organic Home Center, the retail operation, was the main sticking point for Greenmont because they felt the retail operation distracted from the company’s core competencies. The valuation excluded Ellie’s and the terms contained a provision preempting any activity involving “the investment of funds in Ellie’s Organic Home Center in excess of $200,000 beyond its current approved operating budget.” Recession. Following the investment, Eco-Products struggled to meet revenue targets. Prior to the Greenmont deal, Eco-Products had never been accountable to outside investors for its performance and, at that time, introducing new products impeded accurate sales forecasts. The company faltered when a recession hit the market in late 2008 and sales slumped by as much as 30% industry wide. Greenmont ended up with nearly 8% of Eco-Products, shares fully diluted including an employee pool, up from its original 6.3% share prior to adding the 333,333 warrants as part of the deal. Savage continued to believe he made the right decision, regardless of these difficulties, but “I should have kept the PPM going,” he stated. Recovery. Eco-Products overcame the decline in spending that most consumer good companies and manufacturers experienced beginning in the fall of 2008. The 2008 financial statements are given in Exhibits 1 and 2.One year later Eco-Products’ “GreenStripe” product line was being sold through than 450 distributors and the company launched a retail product line. In June of 2009, Savage resigned as CEO. The company replaced its CEO-Founder with an executive accomplished in growing established companies, the former CEO of Corporate Express who took that company from $50 million to $5 billion in revenue. Savage became Executive Chairman and looked to planned to conduct another round of private equity financing, this time for $5 million to operations. He stated:
This $5 million in financial capital is more than enough unless the core business
really takes off, or the new products lines really take off, or an attractive merger
and acquisition comes along. Then that money could go up in smoke. I figure a pre-
valuation equity stake of $9.5 million and still in the single-digits. I hope to give
myself and some others that have been part of the five previous rounds an
opportunity to take money off the table. I never have….and I hold 9 million of the
21 million shares.
Capstone Case 1: Eco-Products, Inc.
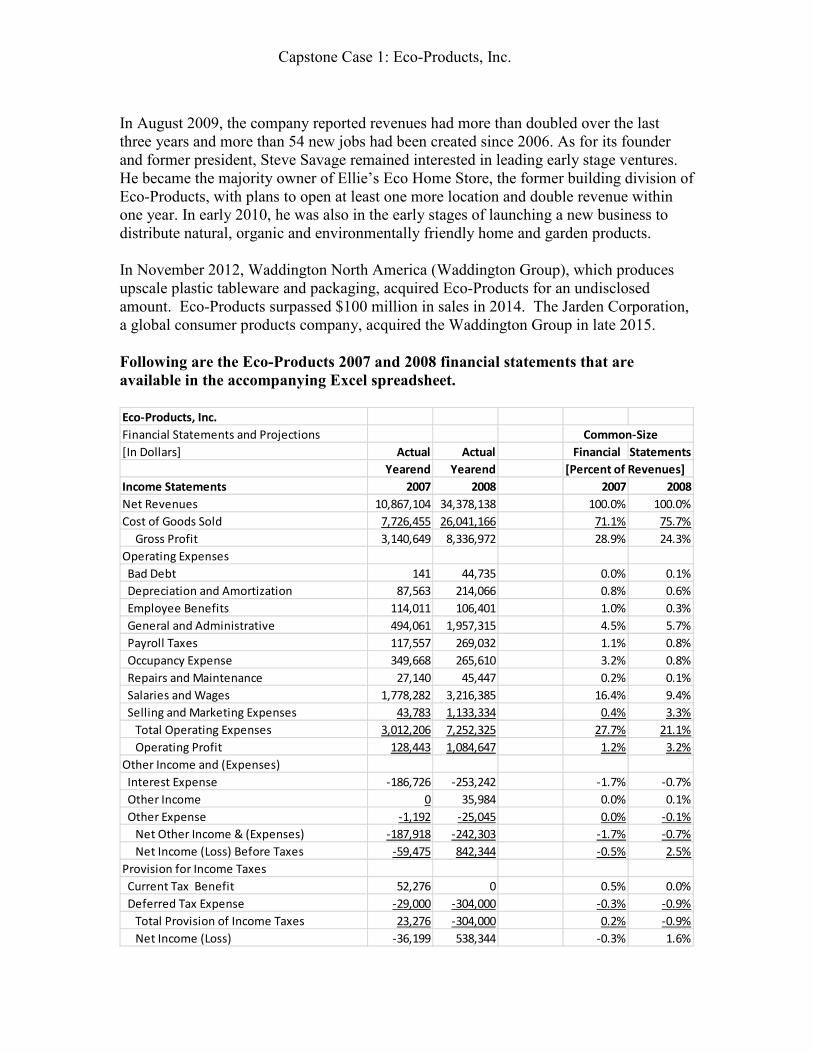
In August 2009, the company reported revenues had more than doubled over the last three years and more than 54 new jobs had been created since 2006. As for its founder and former president, Steve Savage remained interested in leading early stage ventures. He became the majority owner of Ellie’s Eco Home Store, the former building division of Eco-Products, with plans to open at least one more location and double revenue within one year. In early 2010, he was also in the early stages of launching a new business to distribute natural, organic and environmentally friendly home and garden products. In November 2012, Waddington North America (Waddington Group), which produces upscale plastic tableware and packaging, acquired Eco-Products for an undisclosed amount. Eco-Products surpassed $100 million in sales in 2014. The Jarden Corporation, a global consumer products company, acquired the Waddington Group in late 2015.
Following are the Eco-Products 2007 and 2008 financial statements that are
available in the accompanying Excel spreadsheet. Eco-Products, Inc.
Financial Statements and Projections Common-Size
[In Dollars] Actual Actual Financial Statements
Yearend Yearend [Percent of Revenues]
Income Statements 2007 2008 2007 2008
Net Revenues 10,867,104 34,378,138 100.0% 100.0%
Cost of Goods Sold 7,726,455 26,041,166 71.1% 75.7%
Gross Profit 3,140,649 8,336,972 28.9% 24.3%
Operating Expenses
Bad Debt 141 44,735 0.0% 0.1%
Depreciation and Amortization 87,563 214,066 0.8% 0.6%
Employee Benefits 114,011 106,401 1.0% 0.3%
General and Administrative 494,061 1,957,315 4.5% 5.7%
Payroll Taxes 117,557 269,032 1.1% 0.8%
Occupancy Expense 349,668 265,610 3.2% 0.8%
Repairs and Maintenance 27,140 45,447 0.2% 0.1%
Salaries and Wages 1,778,282 3,216,385 16.4% 9.4%
Selling and Marketing Expenses 43,783 1,133,334 0.4% 3.3%
Total Operating Expenses 3,012,206 7,252,325 27.7% 21.1%
Operating Profit 128,443 1,084,647 1.2% 3.2%
Other Income and (Expenses)
Interest Expense -186,726 -253,242 -1.7% -0.7%
Other Income 0 35,984 0.0% 0.1%
Other Expense -1,192 -25,045 0.0% -0.1%
Net Other Income & (Expenses) -187,918 -242,303 -1.7% -0.7%
Net Income (Loss) Before Taxes -59,475 842,344 -0.5% 2.5%
Provision for Income Taxes
Current Tax Benefit 52,276 0 0.5% 0.0%
Deferred Tax Expense -29,000 -304,000 -0.3% -0.9%
Total Provision of Income Taxes 23,276 -304,000 0.2% -0.9%
Net Income (Loss) -36,199 538,344 -0.3% 1.6%

Capstone Case 1: Eco-Products, Inc.
[Percent of Total Assets]
Balance Sheets 2007 2008 2007 2008
Assets
Current Assets
Cash 51,667 235,618 0.9% 1.2%
Accounts Receivable, Net 1,330,562 3,109,920 23.6% 16.5%
Prepaid Expenses & Other Cur. Assets 728,776 1,010,028 12.9% 5.3%
Income Tax Receivable 54,506 193,148 1.0% 1.0%
Inventory 2,415,916 12,222,801 42.8% 64.7%
Deferred Income Tax Asset 42,000 127,000 0.7% 0.7%
Total Current Assets 4,623,427 16,898,515 81.9% 89.4%
Property and Equipment
Machinery and Equipment 641,773 1,161,317 11.4% 6.1%
Building Improvements 479,481 983,396 8.5% 5.2%
Vehicles 228,448 299,178 4.0% 1.6%
Total Property and Equipment 1,349,702 2,443,891 23.9% 12.9%
Less Accumulated Depreciation -360,304 -571,166 -6.4% -3.0%
Net Property and Equipment 989,398 1,872,725 17.5% 9.9%
Intangible Assets
Trademarks 20,800 21,564 0.4% 0.1%
Other Intangible Assets 5,440 84,920 0.1% 0.4%
Total Intangible Assets 26,240 106,484 0.5% 0.6%
Less Accumulated Amortization -2,050 -5,254 0.0% 0.0%
Net Intangible Assets 24,190 101,230 0.4% 0.5%
Other Assets
Deposits 10,000 31,368 0.2% 0.2%
Total Assets 5,647,015 18,903,838 100.0% 100.0%

Capstone Case 1: Eco-Products, Inc.
2007 2008 2007 2008
Liabilities and Equity
Current Liabilities
Accounts Payable & Accrued Expenses 568,131 3,804,210 10.1% 20.1%
Accrued Payroll & Payroll Taxes 6,712 253,094 0.1% 1.3%
Accrued Vacation 39,356 84,755 0.7% 0.4%
Lines of Credit 2,843,242 8,043,568 50.3% 42.5%
Current Portion of Long-Term Debt 39,865 166,310 0.7% 0.9%
Current Portion of Capital Leases 37,919 88,856 0.7% 0.5%
Deferred Revenue 105,588 43,975 1.9% 0.2%
Loan from Stockholder 93,394 28,825 1.7% 0.2%
Other Current Liabilities 21,523 0 0.4% 0.0%
Total Current Liabilities 3,755,730 12,513,593 66.5% 66.2%
Deferred Income Tax Liability 54,000 443,000 1.0% 2.3%
Deferred Lease Liability 36,383 0 0.6% 0.0%
Long-Term Capital Leases, Net of Current Por. 141,228 201,299 2.5% 1.1%
Long-term Debt, Net of Current Portion 124,546 293,474 2.2% 1.6%
Total Liabilities 4,111,887 13,451,366 72.8% 71.2%
Stockholders' Equity
Common Stock, $.001 Par Value
50,000,000 Shares Authorized
16,935,000 Shares Issued & Outstanding 156,300 169,350 2.8% 0.9%
Preferred Stock, $.001 Par Value
1,750,000 Shares Authorized
1,366,666 Shares Issued & Outstanding 0 13,667 0.0% 0.1%
Additional Paid-In-Capital 1,269,908 4,622,191 22.5% 24.5%
Retained Earnings 108,920 647,264 1.9% 3.4%
Total Stockholders' Equity 1,535,128 5,452,472 27.2% 28.8%
Total Liabilities & Stockholders' Equity 5,647,015 18,903,838 100.0% 100.0%

17
Chapter 2
DEVELOPING THE BUSINESS IDEA
FOCUS
In this chapter we examine how one can move from an idea to a determination of the feasibility of the related business opportunity. We present an opportunity screening system to aid in determining whether an idea should be discarded or pursued. We conclude the chapter with an overview of a business plan.
LEARNING OBJECTIVES
1. Describe the process of moving from an idea to a business model/plan. 2. Understand the components of a sound business model. 3. Identify some of the best practices for high growth, high performance firms. 4. Understand the importance of timing in venture success. 5. Describe the use of a Strength-Weakness-Opportunity-Threats (SWOT) analysis as an
initial “litmus test.” 6. Identify the types of questions that a reasonable feasibility assessment addresses. 7. Identify quantitative criteria that assist in assessing a new venture’s feasibility and its
ability to attract external financing. 8. Describe the primary components of a typical business plan.
CHAPTER OUTLINE
2.1 PROCESS FOR INDENTIFYING BUSINESS OPPORTUNITIES 2.2 TO BE SUCCESSFUL YOU MUST HAVE A SOUND BUSINESS MODEL
A. Component1: The Business Model must Generate Revenues B. Component 2: The Business Model must Make Profits C. Component 3: The Business Model must Produce Free Cash Flows
2.3 LEARN FROM THE BEST PRACTICES OF SUCCESSFUL ENTREPRENEURIAL VENTURES
A. Best Marketing Practices B. Best Financial Practices C. Best Management Practices D. Best Production or Operations Practices are also Important
2.4 TIME-TO-MARKET AND OTHER TIMING IMPLICATIONS 2.5 INITIAL “LITMUS TEST” FOR EVALUATING THE BUSINESS FEASIBILITY OF
AN IDEA 2.6 SCREENING VENTURE OPPORTUNITIES
A. An Interview with the Founder (Entrepreneur) and Management Team: Qualitative Screening
B. Scoring a Prospective New Venture: Quantitative Screening C. Industry/Market Considerations D. Pricing/Profitability Considerations

Chapter 2: Developing the Business Idea 18
E. Financial/Harvest Considerations F. Management Team Considerations G. Opportunity-Screening Caveats
2.7 KEY ELEMENTS OF A BUSINESS PLAN A. Cover Page, Confidentiality Statement, and Table of Contents B. Executive Summary C. Business Description D. Marketing Plan and Strategy E. Operations and Support F. Management Team G. Financial Plans and Projections H. Risks and Opportunities I. Business Plan Appendix
SUMMARY APPENDIX A: Applying the VOS IndicatorTM: An Example CSC Profile Market Opportunity Products Management Team CSC Assessment
DISCUSSION QUESTIONS AND ANSWERS
1. How do we know whether an idea has the potential to become a viable business opportunity?
The answer is that we don’t know with absolute certainty. While there is no infallible screening process, there are tools and techniques that can help examine similarities between a new idea and previously successful ventures.
2. Identify three types of startup firms.
Salary-replacement firms are firms that provide their owners with income levels comparable to what they could have earned working for much larger firms.
Lifestyle firms are firms that allow owners to pursue specific lifestyles while being paid for doing what they like to do.
Entrepreneurial ventures are entrepreneurial firms that are flows and performance oriented as reflected in rapid value creation over time.
3. Briefly describe the process involved in moving from an idea to a business model/plan.
Refer to Figure 2.1 “From Entrepreneurial Opportunities to New Businesses, Products, or Services.” Start with “ideas,” then assess the “feasibility” (finding an unfilled need), and then develop a “business model/plan.”

Chapter 2: Developing the Business Idea 19
4. What are the components of a sound business model?
The components of a sound business model are the abilities to generate revenues, create a profit, and produce free cash flow. These components must be achieved within a reasonable time frame as the venture progresses through the early stages of its life cycle.
5. Describe the differences between entrepreneurial ventures and other entrepreneurial firms.
Entrepreneurial ventures are entrepreneurial firms that are flows and performance oriented as reflected in rapid value creation over time. Such ventures strive for high growth in revenues, profits, and cash flows. In contrast, some small businesses may have some of the trauma and rewards of the entrepreneurial lifestyle, but remain centered on a small-scale format with limited growth and employment opportunities.
6. Identify some of the best marketing and management practices of high growth, high
performance firms.
Successful high-growth, high-performance firms typically sell high quality products or provide high quality services. Such firms also generally develop and introduce new products or services considered the top or best in their industries; they are product and service innovation leaders. Their products typically command higher prices and profit margins. In summary, these firms’ “marketing profiles” are characterized by high quality, innovative leadership, and pricing power.
Best management practices include: (1) assemble a management team that is balanced in
both functional area coverage and industry/market knowledge, (2) employ a decision-making style that is viewed as being collaborative, (3) identify and develop functional area managers that support entrepreneurial endeavors, and (4) assemble a board of directors that is balanced in terms of internal and external members.
7. Describe and discuss some of the best financial practices of high growth, high performance
firms. Why is it also important to consider production or operations practices?
High-growth, high-performance firms consider their financial practices as important as their marketing and operating functions. To this end, they plan for future growth and unexpected contingencies that may develop as the firm operates. They prepare realistic monthly financial plans for at least the coming year, and also may prepare annual financial plans for the next three to five years. As rapid growth typically requires multiple rounds of financing, successful ventures anticipate financing needs in advance and seek to obtain financing commitments before the funds are actually needed. Financing sources that allow, whenever possible, the entrepreneur to maintain control over the firm, are highly desirable. Successful high growth firms devote the necessary resources and effort to manage the firm’s assets, financial resources, and operating performance efficiently and effectively. They also develop preliminary harvest or exit strategies and may indicate potential liquidity events in their business plans.
Chapter 2: Developing the Business Idea 20
It is the production or operations area that carries the responsibility of delivering high-quality products or services on time. Customers want their products or services delivered when they are promised. Thus, the production or operations area is equally important to successful high-growth, high-performance firms.
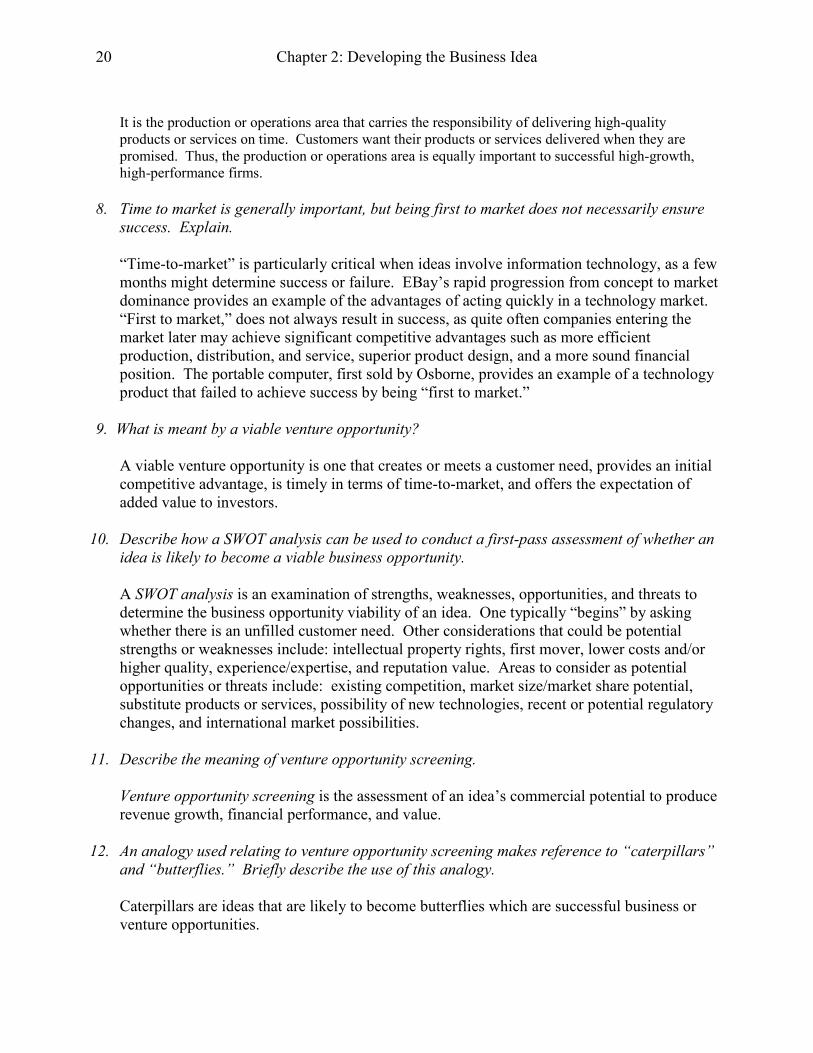
8. Time to market is generally important, but being first to market does not necessarily ensure
success. Explain.
“Time-to-market” is particularly critical when ideas involve information technology, as a few months might determine success or failure. EBay’s rapid progression from concept to market dominance provides an example of the advantages of acting quickly in a technology market. “First to market,” does not always result in success, as quite often companies entering the market later may achieve significant competitive advantages such as more efficient production, distribution, and service, superior product design, and a more sound financial position. The portable computer, first sold by Osborne, provides an example of a technology product that failed to achieve success by being “first to market.”
9. What is meant by a viable venture opportunity?
A viable venture opportunity is one that creates or meets a customer need, provides an initial competitive advantage, is timely in terms of time-to-market, and offers the expectation of added value to investors.
10. Describe how a SWOT analysis can be used to conduct a first-pass assessment of whether an
idea is likely to become a viable business opportunity.
A SWOT analysis is an examination of strengths, weaknesses, opportunities, and threats to determine the business opportunity viability of an idea. One typically “begins” by asking whether there is an unfilled customer need. Other considerations that could be potential strengths or weaknesses include: intellectual property rights, first mover, lower costs and/or higher quality, experience/expertise, and reputation value. Areas to consider as potential opportunities or threats include: existing competition, market size/market share potential, substitute products or services, possibility of new technologies, recent or potential regulatory changes, and international market possibilities.
11. Describe the meaning of venture opportunity screening.
Venture opportunity screening is the assessment of an idea’s commercial potential to produce revenue growth, financial performance, and value.
12. An analogy used relating to venture opportunity screening makes reference to “caterpillars”
and “butterflies.” Briefly describe the use of this analogy.
Caterpillars are ideas that are likely to become butterflies which are successful business or venture opportunities.
Chapter 2: Developing the Business Idea 21
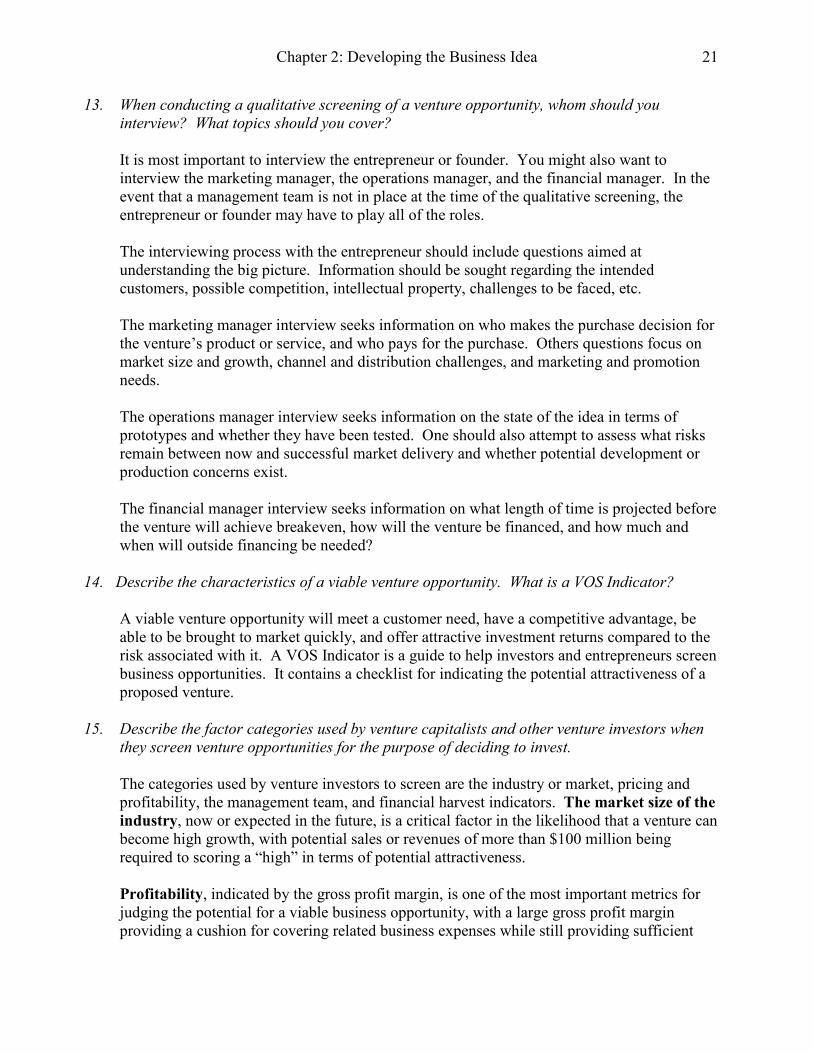
13. When conducting a qualitative screening of a venture opportunity, whom should you
interview? What topics should you cover?
It is most important to interview the entrepreneur or founder. You might also want to interview the marketing manager, the operations manager, and the financial manager. In the event that a management team is not in place at the time of the qualitative screening, the entrepreneur or founder may have to play all of the roles. The interviewing process with the entrepreneur should include questions aimed at understanding the big picture. Information should be sought regarding the intended customers, possible competition, intellectual property, challenges to be faced, etc. The marketing manager interview seeks information on who makes the purchase decision for the venture’s product or service, and who pays for the purchase. Others questions focus on market size and growth, channel and distribution challenges, and marketing and promotion needs. The operations manager interview seeks information on the state of the idea in terms of prototypes and whether they have been tested. One should also attempt to assess what risks remain between now and successful market delivery and whether potential development or production concerns exist. The financial manager interview seeks information on what length of time is projected before the venture will achieve breakeven, how will the venture be financed, and how much and when will outside financing be needed?
14. Describe the characteristics of a viable venture opportunity. What is a VOS Indicator?
A viable venture opportunity will meet a customer need, have a competitive advantage, be able to be brought to market quickly, and offer attractive investment returns compared to the risk associated with it. A VOS Indicator is a guide to help investors and entrepreneurs screen business opportunities. It contains a checklist for indicating the potential attractiveness of a proposed venture.
15. Describe the factor categories used by venture capitalists and other venture investors when
they screen venture opportunities for the purpose of deciding to invest.
The categories used by venture investors to screen are the industry or market, pricing and profitability, the management team, and financial harvest indicators. The market size of the
industry, now or expected in the future, is a critical factor in the likelihood that a venture can become high growth, with potential sales or revenues of more than $100 million being required to scoring a “high” in terms of potential attractiveness.
Profitability, indicated by the gross profit margin, is one of the most important metrics for judging the potential for a viable business opportunity, with a large gross profit margin providing a cushion for covering related business expenses while still providing sufficient
Chapter 2: Developing the Business Idea 22
return for investors. In general, a gross profit margin greater than 50 percent indicates that a venture has the potential to be a high growth, high performance opportunity. The net profit margin may also be used to evaluate ventures, with after-tax greater margins greater than 20 percent suggesting the potential for a high growth, high performance venture. Venture screening usually begins with an assessment of the management team’s experience and expertise, with a high score being given to a management team having both expertise and experience in the proposed business opportunity’s industry or market. Finally, venture investors give high scores to entrepreneurs who have given some thought in relation to providing investors with an exit from their venture investment. Financial harvest indicators such as operating cash flow breakeven, free cash flow to equity, and internal rate of return (IRR) provide indications that a venture will be able to achieve an exit strategy, and returns to investors, in an acceptably short period of time.
16. Describe return on assets (ROA). What are the two major components of the ROA model?
The return on assets is a metric calculated by dividing the venture’s net after-tax profit by its venture total assets and it represents a measure of the firm’s performance relative to its invested assets. The return on assets measure can also be viewed in terms of the return on
assets (ROA) model that expresses the return on assets as the product of the net profit margin and the assets turnover metrics or ratios. This relationship is depicted as follows:
Return on Assets = Net Profit Margin x Assets Turnover
This also can be represented as: Net Profit/Total Assets = Net Profit/Revenues x Revenues/Total Assets.
Thus, the ROA of a venture is equal to its profit margin times its asset intensity.
17. How do asset intensity and asset turnover differ? What is implied by a high asset intensity?
Asset intensity is calculated as total assets divided by total revenues. Asset turnover is calculated as revenues divided by total assets. Asset intensity is the reciprocal of asset turnover and asset turnover is the reciprocal of asset intensity.
A high asset intensity implies a large investment in fixed assets and/or net working capital is
needed to support revenue growth. A high asset intensity also usually requires large amounts of external financial capital in order to support revenue growth.
18. How do the concepts of operating cash flow and free cash flow to equity differ?
Operating cash flow is a measure of the cash generated by the daily operations of selling the company’s product or service; it represents the figure that remains after the cost of goods sold and other business expenses (primarily general and administrative expenses along with

Chapter 2: Developing the Business Idea 23
marketing expenses or “SG&A”) are subtracted from revenues. It approximates the operating cash flows over a specified time period, such as a year.
Free cash flow to equity is the cash available to the entrepreneur and venture investors after operating cash outflows, financing and tax cash flows, required investment in assets needed to sustain the venture’s growth, and net increases in debt capital. Free cash flow to equity is calculated as the venture’s revenues minus operating expenses, minus financing costs and tax payments, after adjustment for changes in net working capital (NWC), physical capital expenditures (CAPEX) needed to sustain and grow the venture, and net additional debt issues to support the venture’s growth. In short: Free cash flow to equity =
net profit + depreciation charges - NWC – CAPEX + net new debt.
19. What is a business plan? Why is it important to prepare a business plan?
A business plan is a written document that describes the proposed venture in terms of the product or service opportunity, current resources, and financial projections. More formal business plan development is common in ventures moving from the development stage to the startup stage. The process of business planning is beneficial to the entrepreneur, who must be the first to believe the plan is reasonable. The entrepreneur must be convinced that starting this business is the right thing to do personally and professionally; the business plan reflects the excitement, opportunity, and reasonableness of the business idea to the members of the management team, potential investors, and other stakeholders.
20. What are the major elements of a typical business plan?
A typical business plan contains, in its Introduction, a cover page, confidentiality statement,
table of contents, and executive summary. The Business Description section presents some of the considerations related to the venture opportunity-screening phase on industry/market factors. The Marketing Plan and Strategy section addresses the target market and customers, competition and market share, pricing strategy, and promotion and distribution. The Operations and Support section discusses how production methods or services will be delivered. The Management Team section presents the experience and expertise characteristics of the management team. In the Financial Plans and Projections, the business plan typically includes financial projections in the form of income statements, balance sheets, and statements of cash flows. These projections provide the basis for how the venture is expected to start up and operate over the next several years. The business plan should include a discussion of possible Problems or Risks.
The Appendix should contain the detailed assumptions underlying the projected financial statements in the Financial Plans and Projections section. It should also include a timeline with milestones indicating the amount and size of expected financing needs.
21. What are real options? What types of real option opportunities are available to
entrepreneurs?
Chapter 2: Developing the Business Idea 24
Real options are real or non-financial options available to a venture’s managers as the venture progresses through its life cycle. Examples of real options include growth options, flexibility options, learning options, and even exit options. Growth options represent the possibility that, if the venture’s market begins to grow rapidly, an initial toehold position in a scalable technology or service may provide a platform for quick expansion to capture market share. Flexibility or learning options may develop when an investment in new technology has multiple potential applications and revenue streams. Exit options relate to the venture’s ability to provide a return in a variety of ways other than remaining as a free-standing venture. The venture’s intellectual property can be licensed or purchased by other firms, the venture can be absorbed into another public or private entity or the venture can remain independent and use its cash flow to provide a return for the investors.
22. From the Headlines—Diluting the Angels’ Share: Briefly describe how the idea of a
shortened aging process can be the basis of financial profitability for Cleveland Whiskey.
Answers will vary: The barrel-aging process is extraordinarily time consuming, placing a
large gap between when money is invested in an inventory and when that inventory is released to be sold. As with any business, in the whiskey business, time is money. The possibility of decreasing the barrel-aging time from 10 years to a few weeks represents a potentially disruptive technological improvement that can save a significant amount of the financing and storage costs for producing “aged” whiskies. Until other distillers have adopted such techniques, Cleveland may have an ability to sell its whiskey at prices driven primarily by those who have to invest in their products for 10 years prior to realizing cash flows. This effectively increases the profitability of Cleveland Whiskey relative to other whiskeys (by decreasing the financial carrying and storage costs for the inventory).
INTERNET ACTIVITIES
1. Access the Inc. magazine Web site at www.inc.com. Identify a list of recent articles that
relate to how business opportunities are evaluated by venture investors and/or articles
discussing why venture investors chose not to invest in potential business opportunities.
Web-researched results vary due to constant updating of the related web sites.
2. Access the Center for Business Planning Web site at www.businessplans.org. The site
provides examples of business plans prepared by MBA students from top business schools
and presented to panels of investors at recent Moot Corp. competitions hosted by the
University of Texas at Austin. Review one of the business plans. Write a brief summary
comparing the segments or elements included in the business plan to the key elements of a
typical business plan presented in the chapter.
Web-researched results vary due to constant updating of the related web sites.
Chapter 2: Developing the Business Idea 25
3. Access the Center for business Planning Web site at: www.businessplans.org. Find the
reference to PlanWrite which is designed to help an entrepreneur to create a business plan.
Identify and briefly describe what this software product provides.
Web-researched results vary due to constant updating of the related web sites.
EXERCISES/PROBLEMS AND ANSWERS
1. [Basic Financial Ratios] A venture recorded revenues of $1 million last year and net profit
of $100,000. Total assets were $800,000 at the end of last year.
A. Calculate the venture’s net profit margin.
Net Profit Margin: net profit/revenues = $100,000/$1,000,000 = 10.0%
B. Calculate the venture’s asset turnover.
Asset Turnover: revenues/total assets = $1,000,000/$800,000 = 1.25 times
C. Calculate the venture’s return on total assets.
Return on Total Assets: net profit/total assets = $100,000/$800,000 = 12.5%
2. [Financial Ratios and Performance] Following is financial information for three ventures:
Venture XX Venture YY Venture ZZ
After-tax Profit Margins 5% 15% 25%
Asset Turnover 2.0 times 1.0 times 3.0 times
A. Calculate the return on assets (ROA) for each firm.
Venture XX: 5% x 2.0 = 10% Venture YY: 15% x 1.0 = 15% Venture ZZ: 25% x 3.0 = 75%
B. Which venture is indicative of a strong entrepreneurial venture opportunity?
Venture ZZ seems to represent a strong entrepreneurial venture opportunity based on a very high return on assets financial measure.
C. Which venture seems to be more of a commodity type business?
Venture XX seems to be more of a commodity type of business as indicated by a relatively low return on assets.
D. How would you place these three ventures on a graph similar to Figure 2.10?

Chapter 2: Developing the Business Idea 26
Venture ZZ would be a Case 1 type of venture opportunity (very high profit margin). However, Venture ZZ’s also high turnover would place the venture above the ROA curve (with an ROA of 75% as calculated in Part A.). Venture XX would be a Case 2 type of venture opportunity (low profit margin with a moderate asset turnover) resulting in a ROA of 10% (see Part A). Venture YY would fall between the other two ventures (a relatively high profit margin and a low asset turnover ratio) resulting in an ROA of 15% (see Part A).
E. Use the information in Figure 2.9 relating to pricing/profitability, and “score” each
venture in terms of potential attractiveness.
Pricing/Profitability Venture XX Venture YY Venture ZZ Gross margins NA NA NA After-tax margins 1 2 3 Asset intensity 2 2 2 Return on assets 2 2 3
Total points 5 6 8 3. [Revenues, Costs, and Profits] In early 2013, Jennifer (Jen) Liu and Larry Mestas founded
Jen and Larry’s Frozen Yogurt Company, which was based on the idea of applying the
microbrew or microbatch strategy to the production and sale of frozen yogurt. They began
producing small quantities of unique flavors and blends in limited editions. Revenues were
$600,000 in 2013 and were estimated at $1.2 million in 2014. Because Jen and Larry were
selling premium frozen yogurt containing premium ingredients, each small cup of yogurt sold
for $3 and the cost of producing the frozen yogurt averaged $1.50 per cup. Other expenses
plus taxes averaged an additional $1 per cup of frozen yogurt in 2013 and were estimated at
$1.20 per cup in 2014.
A. Determine the number of cups of frozen yogurt sold each year.
Revenue = Price per unit x units sold, and Revenue / Price per unit = units sold:
Units Sold for 2013 = 600,000/3 = 200,000 units Units Sold for 2014 = 1,200,000/3 = 400,000 units
B. Estimate the dollar amounts of gross profit and net profit for Jen and Larry’s venture in
2013 and 2014.
2013 2014
Revenue $ 600,000 $ 1,200,000 COGS (Units x COGS per Unit) 300,000 600,000 Gross Profit 300,000 600,000 OE + Tax 200,000 480,000 Net Profit $100,000 $120,000

Chapter 2: Developing the Business Idea 27
C. Calculate the gross profit margins and net profit margins in 2013 and 2014.
Gross Profit Margin = Gross Profit/Revenues Net Profit Margin = Net Profit/Revenues Gross Profit Margin in 2013 = Gross Profit/Sales = 300,000/600,000 = 50% Net Profit Margin in 2013 = Net Profit/Sales = 100,000/600,000 = 16.7% Gross Profit Margin in 2014 = Gross Profit/Sales = 600,000/1,200,000 = 50% Net Profit Margin in 2014 = Net Profit/Sales = 120,000/1,200,000 = 10%
D. Briefly describe what has occurred between the two years.
The gross profit margins are the same in the two years because the “cost of goods sold per unit” stays the same. However, 2014’s net profit margin declines because of the increase in the other expenses category.
4. [Returns on Assets] Jen and Larry’s frozen yogurt venture described in Problem 3 required
some investment in bricks and mortar. Initial specialty equipment and the renovation of an
old warehouse building in Lower Downtown, referred to as LoDo, cost $450,000 at the
beginning of 2013. At the same time, $50,000 was invested in inventories. In early 2014, an
additional $100,000 was spent on equipment to support the increased frozen yogurt sales in
2014. Use information from Problem 3 and this problem to answer the following questions.
A. Calculate the return on assets in both 2013 and 2014.
Total Assets 2013 = Warehouse + Inventory = $450,000 + $50,000 = $500,000 Total Assets 2014 = Warehouse + Inventory + Additional Capital Expenditure
= $450,000 + $50,000 + $100,000 = $600,000 Return on Assets (ROA) = Net Profit/Total Assets ROA for 2013 = 100,000/500,000 = 20% ROA for 2014 = 120,000/600,000 = 20%
B. Calculate the asset intensity or asset turnover ratios for 2013 and 2014.
Asset Intensity = Total Assets/Revenues Asset Intensity Ratio for 2013 = 500,000/600,000 = .80 Asset Intensity Ratio for 2014 = 600,000/1,200,000 = .50 Assets Turnover = Revenues/Total Assets Asset Turnover Ratio for 2013 = 600,000/500,000 = 1.20 Asset Turnover Ratio for 2014 = 1,200,000/600,000 = 2.00
C. Apply the ROA Business Model to Jen and Larry’s frozen yogurt venture.
ROA Business Model = Net Profit Margin x Asset Turnover Ratio

Chapter 2: Developing the Business Idea 28
ROA for 2013 = 16.67% x 1.2 = 20% ROA for 2014 = 10% x 2.0 = 20%
D. Briefly describe what has occurred between the two years.
The Returns on Assets were the same in the two years because the company’s Net Profit Margins went down due to the increased operation expenses while Asset Intensity went up due to additional capital expenditure on equipment.
E. Show how you would position Jen and Larry’s frozen yogurt venture in terms of the
relationship between net profit margins and asset turnovers depicted in Figure 2.10.
In relation to Figure 2.10, one should position Jen and Larry’s frozen yogurt venture in Case 1 where the company has high profit margin and low assets turnover.
In Case 2, companies compete on price, have very low profit margin and high assets turnover. If the company is incapable of becoming a market leader, it will be squeezed out as the industry grows.
5. [VOS IndicatorTM Screening] Jen Liu and Larry Mestas are seeking venture investors to help
fund the expected growth in their Frozen Yogurt venture described in Problems 3 and 4. Use
the VOS Indicator guidelines presented in Figures 2.8 and 2.9 to score Jen and Larry’s frozen yogurt venture in terms of the items in the pricing/profitability factor category.
Comment on the likely attractiveness of this business opportunity to venture investors.
Gross Margin: 50%, 50% (“High”) After-Tax Margin: 16.7%, 10% (“Average”) Asset Intensity: 1.2, 2 (“Average”) ROA: 20%, 20% (“Average”)
This is an “Average” opportunity.
6. [Ethical Issues] Assume that you have just “run-out-of-money” and are unable to move your
“idea” from its development stage to production and the startup stage. However, you remain
convinced that with a reasonable amount of additional financial capital you will be a successful
entrepreneur. While your expectations are low, you are meeting with a loan officer of the local
bank in the hope that you can get a personal loan in order to continue your venture.
A. As you are about to enter the bank, you see a bank money bag lying on the street. No one is
around to claim the bag. What would you do?
Many entrepreneurs state that high ethical standards are one of a venture’s most important assets and are critical to long-term success and value. High ethical standards involve following laws, regulations, and treating others honestly and fairly. The money, if any, in the money bag does not belong to you—it is someone else’s property. Most people would agree that you should turn the money bag in to the bank immediately.
Chapter 2: Developing the Business Idea 29
It is possible, but should not be expected and thus should not be part of your decision, that your high ethical standards might have an indirect impact on your being able to obtain a personal loan from the bank to continue your venture.
B. Now, let’s assume that what you found lying on the street was a $100 bill. The thought
crosses your mind that it would be nice to take your significant other out for a nice dinner—
something that you have not had for several months. What would you do?
Unless you see someone drop the $100 bill it will be very difficult to identify the owner of the bill. However, the money does not belong to you. Most people would agree that you should not just “pocket” the $100 bill but should make an attempt to find its owner. Since you are outside the bank, you might enter the bank, indicate that you found a $100 bill outside the bank, and enquire whether someone has reported losing a $100 bill.
C. Now, instead of $100 you “find” a $1 bill on the street. The thought crosses your mind that
you could buy a lottery ticket with the dollar. Winning the lottery would certainly solve all
your financing needs to start and run your venture. What would you do?
When the amount of money “found” is very small, such as $1, people often behave differently than when the amount of money is large. First, it is virtually impossible to identify the owner unless you saw a specific person drop the $1 bill. Second, the time and energy involved in trying to find the rightful owner likely will outweigh the value of the money. Again, the money is not rightfully yours. Most people would probably say that if you can’t immediately identify the rightful owner, the $1 becomes “yours.”
It is up to you to decide whether keeping the $1 bill jeopardizes your own personal high ethical standards. Purchasing a lottery ticket with the dollar represents another personal decision.
SUPPLEMENTAL EXERCISES/PROBLEMS AND ANSWERS
[Note: These activities are for readers with an existing understanding of financial statements (i.e., income statements and balance sheets). For other readers, these exercises/problems can be worked after covering Chapter 4.] 7. [Revenues, Profits, and Assets] Refer to the information on the three ventures in Problem 2.
A. If each venture had net sales of $10 million, calculate the dollar amount of net profit and
total assets for Venture XX, Venture YY, and Venture ZZ.
Net Profit Total Assets Venture XX $10,000,000 x .05 = $500,000 $10,000,000/2.0 = $5,000,000
Venture YY $10,000,000 x .25 = $2,500,000 $10,000,000/3.0 = $3,333,333 Venture ZZ $10,000,000 x .15 = $1,500,000 $10,000,000/1.0 = $10,000,000

Chapter 2: Developing the Business Idea 30
B. Which venture would have the largest dollar amount of net profit?
Venture YY would have the largest net profit at $2,500,000.
C. Which venture would have to largest dollar amount of total assets?
Venture ZZ would have the largest total assets at $10,000,000.
8. [Ratio Calculations from Financial Statements] Ricardo Martinez has prepared the
following financial statement projections as part of his business plan for starting the
Martinez Products Corporation. The venture is to manufacture and sell electronic
components that make standard overhead projectors “smart.” In essence, through voice
commands a projector can be turned on or off, and the brightness of the projection altered.
This will allow the user to avoid audience annoyances associated with a bright projection
light during periods when no overhead transparency is being used. Venture investors usually
screen prospective venture opportunities in terms of projected profitability and financial
performance.
A. Use the following projected financial statements for Martinez Products and calculate
financial ratios showing the venture’s projected: (a) gross profit margin, (b) net profit
margin, (c) asset intensity, and (d) return on assets.
Gross Profit Margin = Gross Profit/Sales = 100,000/200,000 = 50% Net Profit Margin = Net Income/Sales = 15,000/200,000 = 7.5% Asset Intensity = Total Assets/Sales = 100,000/200,000 = .50 Asset Turnover = Sales/Total Assets = 200,000/100,000 = 2.0 Alternatively, 1/(Asset Intensity) = Asset Turnover. Thus, 1/.50 = 2.0 Return on Assets = Net Income/Total Assets = 15,000/100,000 = 15%
B. The ratios calculated in Part A are found in the venture opportunity screening guide
discussed in the chapter. Rate the potential attractiveness of the Martinez Products
venture using the guidelines for the pricing/profitability factor category for the VOS
Indicator.
The VOS Indicator shows that three of the pricing/profitability indicators are average while after-tax margins are low in attractiveness. The scoring suggests a low-to-average appraisal of this venture opportunity.
__________________________________ Martinez Products Corporation Projected Income Statement for Year 1 __________________________________ Sales $200,000 Cost of goods sold -100,000 Gross profit 100,000 Operating expenses -75,000
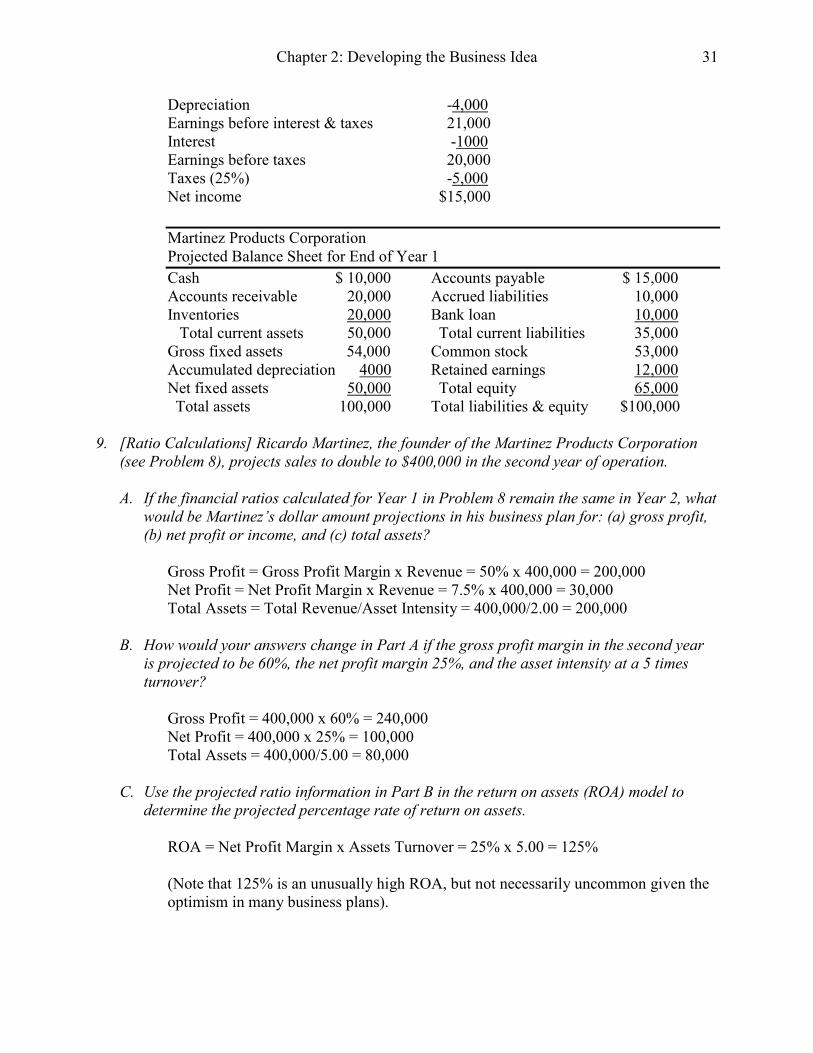
Chapter 2: Developing the Business Idea 31
Depreciation -4,000 Earnings before interest & taxes 21,000 Interest -1000 Earnings before taxes 20,000 Taxes (25%) -5,000 Net income $15,000
Martinez Products Corporation Projected Balance Sheet for End of Year 1
Cash $ 10,000 Accounts payable $ 15,000 Accounts receivable 20,000 Accrued liabilities 10,000 Inventories 20,000 Bank loan 10,000 Total current assets 50,000 Total current liabilities 35,000 Gross fixed assets 54,000 Common stock 53,000 Accumulated depreciation 4000 Retained earnings 12,000 Net fixed assets 50,000 Total equity 65,000 Total assets 100,000 Total liabilities & equity $100,000
9. [Ratio Calculations] Ricardo Martinez, the founder of the Martinez Products Corporation
(see Problem 8), projects sales to double to $400,000 in the second year of operation.
A. If the financial ratios calculated for Year 1 in Problem 8 remain the same in Year 2, what
would be Martinez’s dollar amount projections in his business plan for: (a) gross profit,
(b) net profit or income, and (c) total assets?
Gross Profit = Gross Profit Margin x Revenue = 50% x 400,000 = 200,000 Net Profit = Net Profit Margin x Revenue = 7.5% x 400,000 = 30,000 Total Assets = Total Revenue/Asset Intensity = 400,000/2.00 = 200,000
B. How would your answers change in Part A if the gross profit margin in the second year
is projected to be 60%, the net profit margin 25%, and the asset intensity at a 5 times
turnover?
Gross Profit = 400,000 x 60% = 240,000 Net Profit = 400,000 x 25% = 100,000 Total Assets = 400,000/5.00 = 80,000
C. Use the projected ratio information in Part B in the return on assets (ROA) model to
determine the projected percentage rate of return on assets.
ROA = Net Profit Margin x Assets Turnover = 25% x 5.00 = 125% (Note that 125% is an unusually high ROA, but not necessarily uncommon given the optimism in many business plans).

Chapter 2: Developing the Business Idea 32
MINI CASE: LEARNRITE.COM CORPORATION
LearnRite.com offers e-commerce service for children’s “edutainment” products and services. The word edutainment is used to describe software that combines “educational” and “entertainment” components. Valuable product information and detailed editorial comments are combined with a wide selection of products for purchase to help families make their kids’ edutainment decisions. A team of leading educators and journalists provide editorial comments on the products sold by the firm. LearnRite targets highly educated, convenience oriented, and value conscience families with children under the age of 12, estimated to be about 35 percent of Internet users.
The firm’s warehouse-distribution model results in higher net margins, as well as greater selection and convenience for customers, when compared to traditional retailers. Gross profit margins are expected to average about 30 percent each year. Because of relatively high marketing expenditures aimed at gaining market share, the firm is expected to suffer net losses for two years. Marketing and other operating expenses are estimated to be $3 million in 2017 and $5 million in 2018, respectively. However, during the third year operating cash flow breakeven should be reached. Net profit margins are expected to average 10 percent per year beginning in year 3. Investment in bricks and mortar is largely in the form of warehouse facilities and a computer system to handle orders and facilitate the distribution of inventories. After considering the investment in inventories, the asset intensity or turnover is expected to average about two times per year. LearnRite estimates that venture investors should earn about a 40 percent average annual compound rate of return and sees an opportunity for a possible initial public offering in about six years. If industry consolidation occurs, a merger might occur even sooner. The management team is headed by Srikant Kapoor who serves as President of LearnRite.com and who personally controls about 35 percent of the ownership of the firm. Mr. Kapoor has more than twelve years experience in high-tech industries including previous positions with US West and Microsoft. He holds a B.S. degree in electrical engineering from an Indian technology institute and an MBA from a major U.S. university. Sean Davidson, Director of Technology has more than ten years of experience in software development and integration. Walter Vu has almost ten years of experience in sales and business development in the software industry including positions at Claris and Maxis. Mitch Feldman, Director of Marketing, was responsible for six years for the marketing communications function and the Internet operations of a large software company. Management strives for continual improvement in ease of user interface, personalized services, and amount of information supplied to customers. The total market for children’s entertainment is estimated to be $35 billion annually. Toys account for about $20 billion in annual spending. Summer camps are estimated to generate $6 billion annually. This is followed by children’s videos and video games at $4 billion each. Children’s software sales currently generates about $1 billion per year in revenues and industry sales are expected to grow at a 30 percent annual rate over the next several years.
LearnRite has made the following five-year revenue projections:
Year 2017 2018 2019 2020 2021 Revenues ($M) $1.0 $9.6 $30.1 $67.8 $121.4

Chapter 2: Developing the Business Idea 33
A. Project industry sales for children’s software through the year 2021based on the information
provided above.
2017 Market for Children’s Entertainment: Toys $20 billion Summer camps 6 billion Children’s videos/games 4 billion Children’s software sales 1 billion Miscellaneous 4 billion Total Market $35 billion Children’s Software Sales Growing at 30% annually: Year 2018 Sales = Year 2017 Sales x 1.30; and so forth. Industry Year Forecasted Sales 2017 $1.00 billion 2018 1.30 billion 2019 1.69 billion 2020 2.20 billion 2021 2.86 billion
B. Calculate the year-to-year annual sales growth rates for LearnRite. [Optional: Estimate the
compound growth rate over the 2017 through 2021 time period using a financial calculator
or computer software program.]
Growth Rate = [(Next Year Sales – Current Year Sales)/Current Year Sales] x 100 LearnRite Year Forecasted Sales Sales Growth Rate 2017 $1.00 million 2018 9.60 million 860% 2019 30.10 million 214% 2020 67.80 million 125% 2021 121.40 million 79% Arithmetic average = (860% + 214% + 125% + 79%)/4 = 320%
Compound average (using a financial calculator and point-to-point estimate between 2017 and 2021) = 232%
[Enter: present value = -1.00; future value = 121.40; number of periods = 4; then solve for %i] Geometric average = [(1 + 860) x (1 + 214) x (1 + 125) x (1 + 79)]1/4 = 208%
C. Estimate LearnRite’s expected market share in each year based on the above data.
Note: use data for the kid’s software industry from (A) and for LearnRite from (B). Percent of

Chapter 2: Developing the Business Idea 34
Year Industry Sales 2017 0.1% 2018 0.7% 2019 1.8% 2020 3.1% 2021 4.2%
D. Estimate the firm’s net income (loss) in each of the five years.
Year Net Income (Loss) 2017 $-2.70 million 2018 -2.12 million 2019 3.01 million 2020 6.78 million 2021 12.14 million Year 2017: Gross profit is $0.30 million ($1.0 million sales x .30 margin) less marketing expenses of $3 million produces a loss of $2.70 million Year 2018: Gross profit is $2.88 million ($9.6 million sales x .30 margin) less marketing expenses of $5 million produces a loss of $2.12 million Years 2019-2021: Net profit is 10% of that year’s forecasted sales
E. Estimate the firm’s return on assets beginning when the net or after-tax income is expected
to be positive.
Millions of Dollars: Return Year Net Income / Forecasted Assets = on Assets 2017 $-2.70 / $0.50 = -540.0% 2018 -2.12 / 4.80 = -44.2% 2019 3.01 / 15.05 = 20.0% 2020 6.78 / 33.90 = 20.0% 2021 12.14 / 60.70 = 20.0% Note: Since the asset intensity or turnover is 2.00, total assets will be one-half of forecasted sales. Alternatively, return on assets = net profit margin (10.0%) times asset turnover (2.0 times) = 20.0%
F. Score LearnRite’s venture investor attractiveness in terms of the Industry/Market Factor
Category using the VOS Indicator guide and criteria set out in Figures 2.8 and 2.9. If you believe there are insufficient data, indicate that decision with an “N/A.”
Industry/Market Score Market Size Potential: kid’s software sales = $1 billion High Venture Growth Rate: greater than 30% annually High Market Share (Year 3): 1.8% of industry sales Low Entry Barriers: possible timing barriers Average

Chapter 2: Developing the Business Idea 35
G. Score LearnRite’s venture investor attractiveness in terms of pricing/profitability factors.
Follow the instructions in Part F.
Pricing/Profitability Score Gross Margins: 30% margins are estimated Average After-Tax Margins: 10% margins are estimated Average Asset Intensity: 2.0 asset turnovers are estimated Average Return on Assets: 20% returns are estimated Average
H. Score LearnRite’s venture investor attractiveness in terms of financial/harvest factors.
Follow the instructions in Part F.
Financial/Harvest Score Cash Flow Breakeven: estimated to occur in Year 3 Average Rates of Return: 20% investor returns are estimated Average IPO Potential: estimated in Year 6 Low Founder’s Control: 35% ownership by founder Average
I. “Score” LearnRite’s venture investor attractiveness in terms of management team factors.
Follow the instructions in Part F.
Management Team Score Experience/Expertise: very good in software/tech industries High Functional Areas: good except for finance Average Flexibility/Adaptability: experience suggests flexibility Average Entrepreneurial Focus: startup risks accepted by founder/team Average
J. Determine overall total points and an average score for LearnRite as was done for the
Companion Systems Corporation in the Appendix. Items where information is judged to be
lacking and an NA is used should be excluded when calculating an average score.
The “labels” assigned in (F) through (I) for LearnRite can be summarized as follows: Category Number x Points Per = Total Points High 3 3 9 Average 11 2 22 Low 2 1 2 Totals 16 33 Average score = 33/16 = 2.06
K. Provide a brief written summary indicating how you feel about LearnRite.com as a
business opportunity.
Chapter 2: Developing the Business Idea 36
We have “scored” each of the 16 items. Of course, it could be argued that adequate information might be lacking for one or more of the items and an NA could have been assigned until the information was acquired. However, even after substantial due diligence efforts are completed, scoring “judgments” will still have to be made. [We note that differences in industry knowledge, attitudes towards risk preferences, etc. might lead individual instructors and/or students to “score” certain items differently than we have. Such differences in opinion should help enliven the discussion of the mini case and provide recognition that deciding to become an entrepreneur is not for everyone.] We have assigned “average” scores to about two-thirds of the items, which accounts for a score around 2. Of course, it is important we recognize that the venture opportunity-screening guide we are employing is very demanding due to its focus on venture investor expectations. While an idea/opportunity with an average score (1.67 to 2.33) may find it somewhat difficult to attract venture capital, it may still constitute a viable business opportunity. The risks associated with the LearnRite venture are potentially high, but the rewards are also potentially large. As a result, LearnRite could be very successful and generate substantial wealth for the founder and the management team.
Entrepreneurial Finance 6th Edition Leach Solutions ManualFull Download: http://alibabadownload.com/product/entrepreneurial-finance-6th-edition-leach-solutions-manual/
This sample only, Download all chapters at: alibabadownload.com
Copyright © 2022 FDOKUMEN