A novel sequential heap leach process for treating crushed ...
Upload
khangminh22Category
view
3download
0
1
Faculty of Science and Engineering
Western Australian School of Mines: Minerals, Energy and Chemical Engineering
Manganese Removal from Sulfuric Acid Leach Solutions of Nickel Laterite
Ores
Daryl Corbin Gaw
This thesis is presented for the Degree of
Master of Philosophy (Mining and Metallurgical Engineering)
of
Curtin University
July 2020
brought to you by COREView metadata, citation and similar papers at core.ac.uk
provided by espace@Curtin

i
DECLARATION
To the best of my knowledge and belief this thesis contains no material previously
published by any other person except where due acknowledgement has been made.
This thesis contains no material which has been accepted for the award of any other
degree or diploma in any university.
________________________
Daryl Corbin Gaw
Date: July 2020

ii
ABSTRACT
The growing demand for nickel since the 1950s and the dwindling nickel sulphide
resources have resulted in an increasing need to process nickel laterite ores as an
alternative source. Currently, pressure acid leaching (PAL) is the most widely used
leaching technique for these ores. It involves leaching the ore with sulfuric acid at
high temperature (250 oC) yielding high nickel and cobalt dissolution (>95%) but also
substantial co-dissolution of other components of the ore, and thus generating a
highly contaminated pregnant leach solution (PLS). Among the contaminants,
manganese constitutes the bulk of the impurities in the PLS after iron, together with
aluminium and chromium, has been removed and therefore affects the efficiency of
the downstream processing, whether intermediate precipitation, mixed hydroxide
precipitation (MHP) or mixed sulphide precipitation (MSP), or direct solvent
extraction (DSX) is chosen as the purifying technique. These purification techniques
have proven to be unsuccessful in separating manganese from nickel and cobalt,
owing to its co-precipitation in intermediate precipitation or co-extraction in DSX.
Moreover, intermediate nickel and cobalt products, which can either be as mixed
sulfides or mixed hydroxides coming from intermediate precipitation, require further
processing through consecutive re-leaching and solvent extraction steps before
nickel and cobalt can be recovered as final saleable products and therefore increasing
the operational costs associated to processing nickel laterite ores. Clearly, removing
manganese prior to the purifying step would enhance the efficiency of the step
regardless of the route taken and hence, this proposed study.
The purpose of the present work was to explore the removal of manganese(II) from
the PLS generated from PAL of nickel laterite ores by oxidative precipitation with
potassium permanganate. In pursuing this aim, screening experiments using
unreplicated full factorial design were performed to determine the variables that
significantly affect the oxidative precipitation of manganese(II) using synthetic
partially neutralised and post-partially neutralised PLS. Afterwards, the variables
determined to have a significant effect on the oxidative precipitation of

iii
manganese(II) by potassium permanganate were optimised before further applying
the technique to actual partially neutralised and post-partially neutralised PLS.
The results of the screening experiments revealed that pH and molar ratio between
moles of permanganate ion and total moles of iron(II) and manganese(II) (denoted as
mol MnO4–: total mol Fe(II) and Mn(II)) for partially neutralised PLS and between
moles of permanganate ion and moles of manganese(II) (denoted as mol MnO4–:mol
Mn(II)) for post-partially neutralised PLS significantly affect the oxidative
precipitation of manganese(II). Optimisation experiments using synthetic PLS
revealed that the oxidative precipitation of manganese(II) can be carried out in acidic
conditions, specifically at a pH less than or equal to pH 4. The results also showed
that the amount of precipitated manganese(II) increased with an increase in molar
ratio. For a partially neutralised PLS, pH 3 and a stoichiometric molar ratio of 0.50
were found to be optimum where the amount of precipitated manganese(II) was 85%
with minimal losses for nickel(II) and cobalt(II) at 2% and 7%, respectively. As for the
optimisation experiments using post-partially neutralised PLS, a pH maintained
between pH 1.66 and pH 1.71 and molar ratio of less than or equal to 0.70 were
optimum. The amount of precipitated manganese(II) was nearly 100% with losses of
nickel(II) between 3% and 10% while for cobalt(II), it was between 50% and 60%.
Application of the optimised pH and molar ratio for the oxidative precipitation of
manganese(II) from actual partially neutralised and post-partially neutralised PLS
resulted in nearly 100% of precipitated manganese(II). Nickel(II) losses were
approximately 27% while for cobalt(II), it was approximately 50% for the actual
partially neutralised PLS. As for the actual post-partially neutralised, nickel(II) losses
were approximately between 3% and 10% while for cobalt(II), it was approximately
between 43% and 54%. Based on these results, it can be concluded that the right
combination of pH and molar ratio is important in order to achieve maximum removal
of manganese(II) with minimum nickel(II) and cobalt(II) losses.

iv
ACKNOWLEDGEMENTS
I would like to express my deepest gratitude to my supervisor, Associate Professor
Don Ibana, for his constant guidance and support throughout the project. I would
also like to thank my co-supervisors, Associate Professor Richard Browner and Dr.
Richard Alorro for sharing their valuable inputs and suggestions in helping me
improve this thesis.
Many thanks go to the library staff, Teresa and Mieke, for their significant help in
searching for hard to find literature for this project. I also wish to express my
gratitude to the laboratory technicians, Mujesira, Anusha, and Sheree, for assisting
me in all of my laboratory and analytical equipment needs throughout the project. A
very special gratitude goes out to Connie for going above and beyond her role as a
student experience and wellbeing coordinator. Thank you for always lending an ear
and for helping me understand myself more especially during the challenging times
of this project.
I would also like to thank Zela, Ndisha, and April, my fellow higher degree by research
(HDR) students in the WA School of Mines, Curtin University, for all the technical and
non-technical discussions we often had both in and out of the HDR office. I sincerely
thank the Mariano, Calderon, Alorro, Sollitt, and Palomaria families in Kalgoorlie.
Being miles away from my family, their friendship, company, and support means so
much to me.
I am also grateful to the Australia Awards Scholarships (AAS) for the financial support
and for giving me the opportunity to pursue postgraduate studies in Australia. To the
people behind AAS in the Philippines, Enna, Nayra, Milalin, and Majen, thank you for
your constant support, encouragement, and prayers.
Finally, I express my very profound gratitude to my parents, Jeffrey and Helen, and
to my siblings, Bernice, Bettina, and Derrick, for providing me with all the support and
encouragement despite being away from them while I finish this project. This
accomplishment would not have been possible without them. Thank you.

v
TABLE OF CONTENTS
Declaration .................................................................................................................... i
Abstract ........................................................................................................................ ii
Acknowledgements ..................................................................................................... iv
Table of Contents ......................................................................................................... v
List of Tables ................................................................................................................vii
List of Figures ............................................................................................................. viii
Chapter 1 ...................................................................................................................... 1
Introduction ................................................................................................................. 1
1.1 Background of the Study ................................................................................... 1
1.2 Overview of Occurrence and Characteristics of Nickel Laterite Ores ............... 2
1.3 Processing Routes for Nickel Laterite Ores ....................................................... 4
1.4 Purification of the Pregnant Leach Solution from Pressure Acid Leaching ...... 8
1.4.1 Intermediate Precipitation ............................................................................ 9
1.4.2 Direct Solvent Extraction ............................................................................. 11
1.5 Statement of the Problem .............................................................................. 12
1.6 Aim and Scope of the Study ............................................................................ 12
1.7 Significance of the Study ................................................................................. 13
Chapter 2 .................................................................................................................... 14
Review of Studies on the Removal of Manganese by Oxidative Precipitation .......... 14
2.1 Manganese in Nickel Laterite Ores and their PAL Leach Solutions ................ 14
2.2 Manganese as an Impurity and its Oxidation States and Stability in Acidic Leach Solutions .......................................................................................................... 16
2.3 Removal of Manganese from Acidic Leach Solutions by Oxidative Precipitation ............................................................................................................... 20
2.4 Oxidants for the Oxidative Precipitation of Manganese ..................................... 22
2.4.1 Potassium Permanganate as Oxidant ............................................................... 23
2.5 Variables Influencing the Oxidative Precipitation of Manganese(II) by Potassium Permanganate ............................................................................................................ 24
2.5.1 Influence of pH .................................................................................................. 24
2.5.2 Influence of Oxidant Amount ............................................................................ 26
vi
2.7 Summary of the Review ....................................................................................... 28
Chapter 3 .................................................................................................................... 30
Materials and Methods .............................................................................................. 30
3.1 Reagents .......................................................................................................... 30
3.2 Test Solutions ...................................................................................................... 30
3.3 Preparation of Synthetic and Actual Pregnant Leach Solutions ..................... 31
3.4 Experimental Design ....................................................................................... 32
3.5 Experimental Set-up for the Oxidative Precipitation Test Procedure ............ 37
3.6 Oxidative Precipitation Test Procedure .......................................................... 38
3.7 Assay of Metals ............................................................................................... 38
Chapter 4 .................................................................................................................... 39
Results and Discussion ............................................................................................... 39
4.1 Screening of Effects of Experimental Variables on the Oxidative Precipitation of Manganese(II) ........................................................................................................ 39
4.1.1 Synthetic Partially Neutralised PLS as Feed Solution in Determining Effects of Experimental Variables on Oxidative Precipitation of Manganese(II) .................. 41
4.1.2 Synthetic Post-Partially Neutralised PLS as Feed Solution in Determining the Effects of Experimental Variables on the Oxidative Precipitation of Manganese(II) ............................................................................................................ 48
4.2 Optimisation of Variables with Significant Effect on Oxidative Precipitation of Manganese(II) ............................................................................................................ 57
4.2.1 Effect of pH on Oxidative Precipitation of Manganese(II) .......................... 57
4.2.2 Effect of Molar Ratio on Oxidative Precipitation of Manganese(II) ............ 59
4.3 Application of Optimised Values on Oxidative Precipitation of Manganese(II) from Actual PLS .......................................................................................................... 64
4.3.1 Actual Partially Neutralised PLS as Feed Solution for the Application of Optimised Values on Oxidative Precipitation of Manganese(II) ................................ 66
4.3.2 Actual Post-Partially Neutralised PLS as Feed Solution for the Application of Optimised Values on Oxidative Precipitation of Manganese(II) ................................ 68
Chapter 5 .................................................................................................................... 71
Conclusions and Recommendations .......................................................................... 71
References .................................................................................................................. 75
vii
LIST OF TABLES
Table 1. Chemical Composition Ranges (%) of Nickel Laterite Ores (Alcock 1988). .... 4 Table 2. Nickel Content in Significant Minerals of Nickel Laterite Ores (Alcock 1988).
........................................................................................................................ 4 Table 3. General formulae of different manganese-bearing minerals in nickel laterite
ores. ............................................................................................................. 14 Table 4. Elemental compositions (%) of nickel laterite ores used in different nickel
laterite operations. ...................................................................................... 15 Table 5. Elemental compositions (g/L) of PAL-generated PLS from Moa Bay, Murrin
Murrin, and Ravensthorpe nickel laterite operations. ................................ 16 Table 6. Reagents used in the experimental work. .................................................... 30 Table 7. Typical compositions of synthetic feed solution. ......................................... 32 Table 8. Typical compositions of actual PLS............................................................... 32 Table 9. Variables and selected levels in unreplicated 24 full factorial design. ......... 34 Table 10. Experimental matrix of unreplicated 24 full factorial design. .................... 34 Table 11. Experimental plan and responses of unreplicated 24 full factorial design
using a partially neutralised PLS as feed. ..................................................... 40 Table 12. Experimental plan and responses of unreplicated 24 full factorial design
using a post-partially neutralised PLS as feed. ............................................ 41 Table 13. Standard deviation (SD) of the mean of precipitated metal ions (%) in the
actual partially neutralised PLS. ................................................................... 66 Table 14. Standard deviation (SD) of the mean of precipitated metal ions (%) in the
actual post-partially neutralised PLS ........................................................... 68

viii
LIST OF FIGURES
Figure 1. World distribution of nickel laterite ore resources by country (Brand et al. 1998). ............................................................................................................. 2
Figure 2. Typical nickel laterite ore profiles in dry and humid climates (Alcock 1988)......................................................................................................................... 3
Figure 3. Generalised flowsheet for the pyrometallurgical route. .............................. 5
Figure 4. Generalised flowsheet for the hydrometallurgical route. ............................ 6
Figure 5. Potential–pH equilibrium (Pourbaix) diagram for the system of manganese–water, at 25 oC, considering β-MnO2 (Pourbaix 1966). Encircled numbers in the diagram represent the equilibria between two manganese species while molar concentration is represented by its respective base-10 power in the diagram, −6, −4, −2, and 0. .......................................................................... 18
Figure 6. Potential–pH equilibrium (Pourbaix) diagram for the system of nickel–water, at 25 oC (Pourbaix 1966). Encircled numbers in the diagram represent the equilibria between two nickel species while molar concentration is represented by its respective base-10 power in the diagram, −6, −4, −2, and 0. .................................................................................................................. 21
Figure 7. Potential-pH equilibrium (Pourbaix) diagram for the system of cobalt-water, at 25 oC (Pourbaix 1966). Encircled numbers in the diagram represent the equilibria between two cobalt species while molar concentration is represented by its respective base-10 power in the diagram, −6, −4, −2, and 0. .................................................................................................................. 22
Figure 8. Experimental set-up for the oxidative precipitation tests. ......................... 37
Figure 9. Normal probability plot of the main and interaction effects for the precipitation of manganese(II) (%) from a synthetic partially neutralised PLS (α = 0.05). ..................................................................................................... 42
Figure 10. Normal probability plot of the main and interaction effects for the precipitation of iron(II) (%) from a synthetic partially neutralised PLS (α = 0.05). ............................................................................................................ 43
Figure 11. Interaction plot between temperature (A) and pH (C) with respect to the mean of precipitated iron(II) (%) where −1.0 and 1.0 represent the low level and high levels of the variables used in the experimental plan (Table 11). 45
Figure 12. Interaction plot between molar ratio (B) and pH (C) with respect to the mean of precipitated iron(II) (%) where −1.0 and 1.0 represent the low level and high levels of the variables used in the experimental plan (Table 11). 45

ix
Figure 13. Normal probability plot of the main and interaction effects for the
precipitation of nickel(II) (%) from a synthetic partially neutralised PLS (α = 0.05). ............................................................................................................ 47
Figure 14. Normal probability plot of the main and interaction effects for the
precipitation of cobalt(II) (%) from a synthetic partially neutralised PLS (α = 0.05). ............................................................................................................ 47
Figure 15. Normal probability plot of the main and interaction effects for the
precipitation of manganese(II) (%) from a synthetic post-partially neutralised PLS (α = 0.05). .............................................................................................. 48
Figure 16. Interaction plot between temperature (A) and molar ratio (B) with respect
to the mean of precipitated manganese(II) (%) where −1.0 and 1.0represent the low level and high levels of the variables used in the experimental plan (Table 12). .................................................................................................... 50
Figure 17. Normal probability plot of the main and interaction effects for the
precipitation of nickel(II) (%) from a synthetic post-partially neutralised PLS (α = 0.05). ..................................................................................................... 51
Figure 18. Normal probability plot of the main and interaction effects for the
precipitation of cobalt(II) (%) from a synthetic post-partially neutralised PLS (α = 0.05). ..................................................................................................... 52
Figure 19. Interaction plot between temperature (A) and molar ratio (B) with respect
to the mean of precipitated cobalt(II) (%) where −1.0 and 1.0 represents the low level and high levels of the variables used in the experimental plan (Table 12). .................................................................................................... 53
Figure 20. Interaction plot between temperature (A) and pH (C) with respect to the
mean of precipitated cobalt(II) (%) where −1.0 and 1.0 represents the low level and high levels of the variables used in the experimental plan (Table 12). ............................................................................................................... 54
Figure 21. Interaction plot between molar ratio (B) and agitation speed (D) with
respect to the mean of precipitated cobalt(II) (%) where −1.0 and 1.0 represents the low level and high levels of the variables used in the experimental plan (Table 12). ...................................................................... 56
Figure 22. Interaction plot between pH (C) and agitation speed (D) with respect to the
mean of precipitated cobalt(II) (%) where −1.0 and 1.0 represents the low level and high levels of the variables used in the experimental plan (Table 12). ............................................................................................................... 56

x
Figure 23. The effect of pH on the amount of precipitated metals ions (%) from synthetic partially neutralised PLS. Initial pH = 2.12–2.15; ambient T = 23.9–26.0 ᵒC; agitation speed = 50 rpm; molar ratio = 0.5 (stoichiometric); t = 1 h....................................................................................................................... 58
Figure 24. The effect of molar ratio on the amount of precipitated metal ions (%) from synthetic partially neutralised PLS. pH = 3.00; ambient T = 24.3–26.1 ᵒC; agitation speed = 50 rpm; t = 1 h. ................................................................ 60
Figure 25. The effect of molar ratio on the amount of precipitated metal ions (%) from synthetic post-partially neutralised PLS. Unadjusted pH = 1.66–1.71; ambient T = 18.5–23.0 ᵒC; agitation speed = 50 rpm; t = 1 h. ..................... 62
Figure 26. Mean of precipitated metal ions (%) from an actual partially neutralised PLS. Conditions: pH = 3.00; ambient T = 23.3–26.9 ᵒC; agitation speed = 50 rpm; molar ratio = 0.50 (stoichiometric) and 0.53 (105% of stoichiometric); t = 1 h. ............................................................................................................. 67
Figure 27. Mean of precipitated metal ions (%) from an actual post-partially neutralised PLS. Conditions: Unadjusted pH = 1.87–1.91; ambient T = 21.2–22.9 ᵒC; agitation speed = 50 rpm; molar ratio = 0.67 (stoichiometric) and 0.70 (105% of stoichiometric); t = 1 h. ......................................................... 69

1
Chapter 1
INTRODUCTION
1.1 Background of the Study
The global production of nickel has been increasing by approximately four percent
per annum since the 1950s (Dalvi et al. 2004, Goonan et al. 2017). This is owing to
nickel’s industrially desirable properties, mainly corrosion resistance, heat resistance,
elasticity, and hardness, and hence its increasing industrial use in building and
construction, transportation, and electronics, to name a few. According to Mudd
(2010), approximately 58% of nickel’s end use application is in stainless steel
production while the rest is used for nickel-based alloys, casting and alloy steels,
electroplating, and rechargeable batteries. Except for stainless steel production, all
these applications require high purity nickel. The growing demand for nickel drives
the need to improve existing processes as well as develop new processes that can
maximise the nickel that can be obtained from its ores.
Nickel ores can either be sulfidic or lateritic. Approximately 70% of the nickel ore
deposits are lateritic while the rest are sulfidic. Traditionally, nickel sulfide ores have
been the source of nickel since they are amenable to beneficiation by concentrating
the valuable metals and rejecting the gangue in the ore, and this accounts for
approximately 60% of the total global nickel production (Dalvi et al. 2004, Kyle 2010,
Mudd 2010). As a result, nickel sulfide ore resources are being consumed and thus
the need to process nickel laterite ores has been increasing. By increasing the global
production coming from nickel laterite ores, it can help sustain the increasing
demand for nickel. In 2009, the shift to processing nickel laterite ores resulted in an
increase in its global proportion by 54% and the growth is projected to increase close
to 72% by the year 2022 (Oxley et al. 2016).
Unlike nickel sulfide ores that can directly be beneficiated by conventional methods,
such as flotation, before further extracting the valuable metals, nickel laterite ores
are of lower grade and not amenable to beneficiation. The concentrations of the

2
valuable metals in nickel laterite ores—nickel and cobalt—relative to the impurities
are much lower and their minerals have similar properties to those of the gangue,
making their separation difficult (Dalvi et al. 2004, Kyle 2010). Moreover, in these
ores, the nickel is primarily associated in the goethite (80%) phase and no free nickel
mineral is present in the ore (Zhu et al. 2012). Hence, upgrading of the ore is difficult
(Quast et al. 2015). It follows that the bulk of the ore, including the impurities, needs
to be processed and consequently, can be more expensive and complex to do than
those that can be upgraded, such as the nickel sulfide ores.
1.2 Overview of Occurrence and Characteristics of Nickel Laterite Ores
Nickel laterite ores are mostly distributed in tropical and subtropical regions around
the world, such as Australia, New Caledonia, Philippines, and Indonesia, as shown in
Figure 1 (Brand et al. 1998).
Figure 1. World distribution of nickel laterite ore resources by country (Brand et al. 1998). Content is removed due to copyright restrictions.
The formation of nickel laterite ores is a result of chemical weathering through the
natural leaching of peridotite, which consists mainly of the mineral olivine or its
hydrated derivative, serpentine (Golightly 1979, Alcock 1988). As peridotite
undergoes weathering, the presence of water in the ground, which is usually affected
by the frequency and amount of rainfall, allows the movement of soluble elements

3
from peridotite that results in the development of different nickel laterite ore
profiles. As such, the profile developed in dryer climate will be different from those
in humid climate due to the difference in the frequency and amount of rainfall. Figure
2 shows three types of nickel laterite ore profiles based on dryer and humid climatic
conditions. Each profile is further classified into three distinct zones from bottom to
top. The bottom zone is classified as the saprolite zone while the middle and top
zones are nontronite zone and limonite zone, respectively.
Figure 2. Typical nickel laterite ore profiles in dry and humid climates (Alcock 1988). Content is removed due to copyright restrictions.
The saprolite and nontronite zones develop in dryer climatic conditions as opposed
to the limonite zone, which develops in humid climatic conditions. The saprolite zone
is enriched in soluble elements, such as nickel and magnesium, that decrease as it
moves up the profile towards the limonite zone, which contains mostly insoluble
elements, primarily iron together with aluminium and chromium. The silica-enriched
nontronite zone only develops when the water circulation is sporadic during
weathering in areas of dryer climatic conditions and it is said to be non-economic
when compared with the composition of the saprolite zone (Alcock 1988). Elias
(2002) also highlighted in his study that the composition and development of a nickel
4
laterite profile into the different zones during weathering can vary from one deposit
to another or even within the same deposit due to varying climatic and geological
factors. Clearly, having the right understanding of both the occurrence and
characteristics of nickel laterite ores, including the different minerals associated with
the valuable metals, has a significant implication for the selection of the most suitable
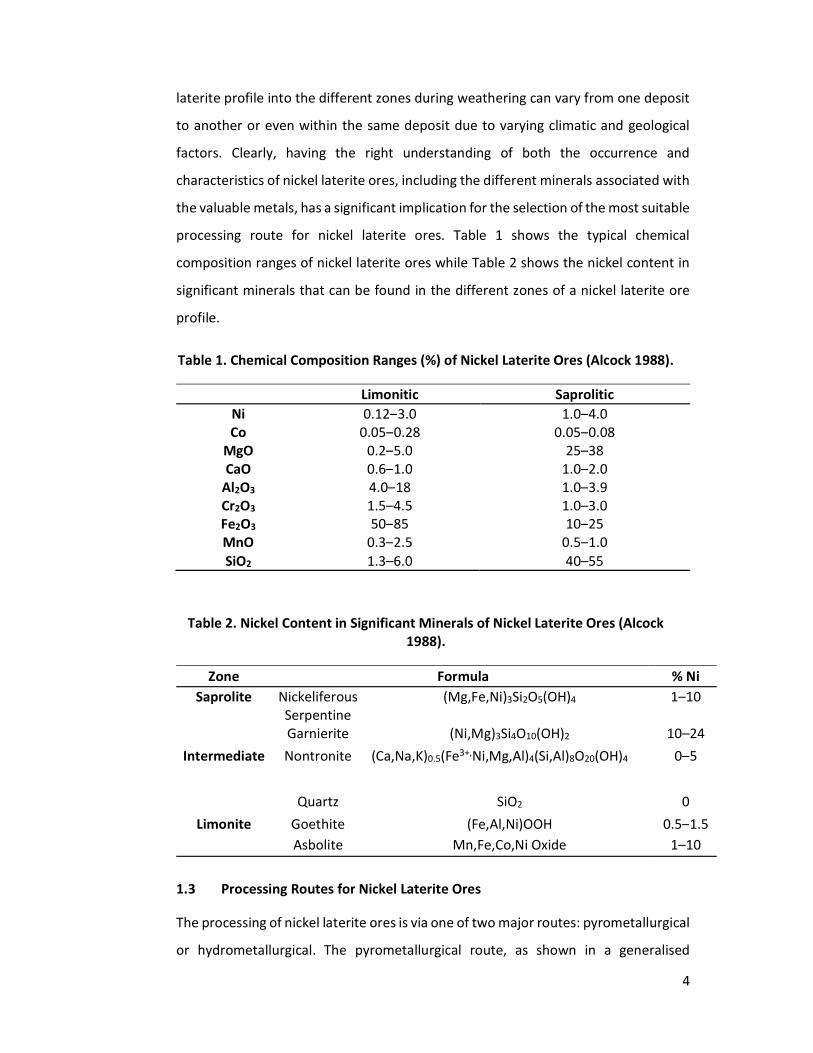
processing route for nickel laterite ores. Table 1 shows the typical chemical
composition ranges of nickel laterite ores while Table 2 shows the nickel content in
significant minerals that can be found in the different zones of a nickel laterite ore
profile.
Table 1. Chemical Composition Ranges (%) of Nickel Laterite Ores (Alcock 1988).
Limonitic Saprolitic Ni 0.12–3.0 1.0–4.0 Co 0.05–0.28 0.05–0.08
MgO 0.2–5.0 25–38 CaO 0.6–1.0 1.0–2.0
Al2O3 4.0–18 1.0–3.9 Cr2O3 1.5–4.5 1.0–3.0 Fe2O3 50–85 10–25 MnO 0.3–2.5 0.5–1.0 SiO2 1.3–6.0 40–55
Table 2. Nickel Content in Significant Minerals of Nickel Laterite Ores (Alcock 1988).
Zone Formula % Ni Saprolite Nickeliferous
Serpentine (Mg,Fe,Ni)3Si2O5(OH)4 1–10
Garnierite (Ni,Mg)3Si4O10(OH)2 10–24 Intermediate Nontronite (Ca,Na,K)0.5(Fe3+,Ni,Mg,Al)4(Si,Al)8O20(OH)4 0–5
Quartz SiO2 0 Limonite Goethite (Fe,Al,Ni)OOH 0.5–1.5
Asbolite Mn,Fe,Co,Ni Oxide 1–10
1.3 Processing Routes for Nickel Laterite Ores
The processing of nickel laterite ores is via one of two major routes: pyrometallurgical
or hydrometallurgical. The pyrometallurgical route, as shown in a generalised

5
flowsheet in Figure 3, which is suitable for saprolitic ores, is carried out in a series of
steps by drying, heating, reducing, and smelting of the ore before the final recovery
of the valuable metals (Alcock 1988, Davis 2000, Dalvi et al. 2004, Kyle 2010).
However, the pyrometallurgical route produces only either ferronickel or nickel
matte. Ferronickel or nickel matte are only suitable if the end use application does
not require high purity nickel, such as in stainless steel production. Moreover, cobalt
as a by-product cannot be separated if this route is chosen.
Figure 3. Generalised flowsheet for the pyrometallurgical route.
Alternatively, if the aim is to produce high purity nickel from nickel laterite ores that
is suitable for end use application, such as in battery manufacturing and metal
plating, the only option available is the hydrometallurgical route. The
hydrometallurgical route, as shown in a generalised flowsheet in Figure 4, which is
suitable for limonitic ores, is carried out by leaching the ore, partially neutralising the

6
pregnant leach solution (PLS), and purifying the PLS by removing any remaining
undesirable major impurities before further recovering the valuable metals. One
advantage of this route over the pyrometallurgical route is the separation of cobalt
as a valuable by-product (Alcock 1988, Davis 2000, Dalvi et al. 2004, Kyle 2010). This
advantage will enable the maximisation of returns through the hydrometallurgical
route. As a result of the accompanying advantage in choosing the hydrometallurgical
route, it has been apparent that there is an upward trend in the development of
nickel laterite ore processing projects since the 1990s focusing towards increasing
the global hydrometallurgical capacity (Dalvi et al. 2004). Currently, there are three
available leaching processes under the hydrometallurgical route, and these are the
Caron process, pressure acid leaching (PAL), and atmospheric leaching (AL) (Dalvi et
al. 2004, Kyle 2010).
Figure 4. Generalised flowsheet for the hydrometallurgical route.
The Caron process, which was developed during the 1920s and commercialised in the
early 1940s (Caron 1950), involves consecutive energy-intensive drying and reductive

7
roasting of limonite ore (Fe content >40%) followed by atmospheric ammoniacal
leaching of the nickel and cobalt. Although this process is reasonably selective in
leaching nickel and cobalt from the ore and it allows recycling of excess ammonia,
lowering its consumption, the dissolutions of nickel and cobalt are less than 90% and
60%, respectively (Crundwell et al. 2011). The overall low recovery of the Caron
process is due to the low dissolution of nickel and cobalt in the reduced ore. During
the reductive roasting step, the ore is only partially reduced to convert portions of
nickel and cobalt into free metals while the rest remains bound in the iron matrix
(Chander and Sharma 1981, Valix and Cheung 2002, Kyle 2010, Senanayake et al.
2010). Because of the issues underlying the dissolution of nickel and cobalt from the
reduced ore, the commercial application of the Caron process is waning.
The PAL process, which was first commercially used in the late 1950s (Carlson and
Simons 1960), involves leaching the ore with sulfuric acid (H2SO4) in a titanium-lined
autoclave at 250 oC. Unlike the Caron process, this process does not require the
drying and reductive roasting of the ore, thereby eliminating the cost of two
energy-intensive processes. Additionally, the dissolution of both nickel and cobalt is
greater than 95% while the precipitation reactions involved in the process allow the
removal of significant amounts of co-dissolved iron and the regeneration of the
initially consumed sulfuric acid, as shown in Equations 1-1 to 1-3.
Hematite: Fe2(SO4)3 + 3 H2O → Fe2O3(s) + 3 H2SO4 (1-1)
Jarosite: 1.5 Fe2(SO4)3 + 7 H2O → (H3O)Fe3(SO4)2(OH)6(s) + 2.5 H2SO4 (1-2)
Alunite: 1.5 Al2(SO4)3 + 7 H2O → (H3O)Al3(SO4)2(OH)6(s) + 2.5 H2SO4 (1-3)
The higher dissolution of the valuable metals that is achievable using PAL is a distinct
advantage over the Caron process. The PAL-generated PLS, however, has much more
impurities than that of Caron’s owing to the higher solubilities of magnesium,
calcium, manganese, aluminium, and chromium in acidic media, which can affect the
downstream purification process, resulting in additional cost (Georgiou and
Papangelakis 1998, Whittington and Muir 2000, Kyle 2010, Ucyildiz and Girgin 2017).

8
Atmospheric leaching (AL), which was adopted by BHP Billiton in the early 2000s as
part of its Ravensthorpe nickel project, involves leaching the ore with sulfuric acid at
temperatures between 90 oC to 100 oC in an open vessel. Operating at lower
temperatures does not necessarily reduce the energy cost of processing the ore
because it also reduces the leaching kinetics and thereby requiring longer residence
time. Consequently, the resulting PLS is contaminated with highly soluble iron that
further affects the downstream processing (McDonald and Whittington 2008, Kyle
2010). High concentration of soluble iron is present in the AL-generated PLS due to
the absence of iron hydrolysis that occurs in PAL at high operating temperature (250 oC). The occurrence of iron hydrolysis in PAL allows the bulk of the dissolved iron to
precipitate right after dissolution as opposed to AL. The differences between the
concentration of soluble iron in AL and PAL are reported by the studies of Liu et al.
(2004) and White et al. (2006). In the study completed by Liu et al. (2004), the
resulting AL-generated PLS from a limonitic nickel laterite ore contained as high as 80
g/L of iron. In contrast, White et al. (2006) observed that using PAL on a limonitic
nickel laterite ore only resulted in an iron concentration of 2.2 g/L. Therefore, the
presence of considerable amounts of soluble iron in AL-generated PLS compared to
PAL-generated PLS will make the subsequent downstream purification process
challenging.
1.4 Purification of the Pregnant Leach Solution from Pressure Acid Leaching
After leaching the ore, the PAL-generated PLS is partially neutralised in order to
remove largely the remaining iron, aluminium, and chromium that are present in the
solution. The resulting PLS will further undergo a purification step before recovering
nickel and cobalt as separate products. The purification of the PLS is necessary in
order to separate nickel and cobalt from each other and any remaining impurities,
particularly manganese, which can range between 1 g/L and 3 g/L (Cheng and Urbani
2005). Purification of the PAL-generated PLS is carried out through either
intermediate precipitation or direct solvent extraction (DSX). Mixed sulfide
precipitation (MSP) and mixed hydroxide precipitation (MHP) are two processes
available under intermediate precipitation, which produces an intermediate product
of mixed nickel and cobalt precipitate. The intermediate product needs to undergo

9
further processing through consecutive re-leaching and solvent extraction steps to
recover nickel and cobalt as high purity products. Conversely, DSX does not involve
producing an intermediate product of mixed nickel and cobalt, but instead, it
separates nickel and cobalt directly from the partially neutralised PLS through
consecutive solvent extraction steps.
1.4.1 Intermediate Precipitation
Intermediate precipitation has been widely used in various nickel laterite operations,
such as Moa Bay (Carlson and Simons 1960), Murrin Murrin (Motteram et al. 1996),
Cawse (Kyle and Furfaro 1997, Mason et al. 1997, Grassi et al. 2000, White 2009),
Ravensthorpe (White et al. 2006, White 2009), Coral Bay (Llerin et al. 2011), and
Taganito (Shibayama et al. 2016), to further purify the PAL-generated PLS after the
partial neutralisation step. Precipitation allows the separation of nickel and cobalt as
intermediate products from any remaining major impurity, which in this case is
manganese. Precipitation in the said operations is carried out through the addition
of a suitable reagent to form an intermediate product of mixed nickel and cobalt
precipitate.
Mixed sulfide precipitation (MSP) was first applied in the nickel laterite operation in
Moa Bay (Carlson and Simons 1960) and later on in Murrin Murrin (Motteram et al.
1996), Coral Bay (Llerin et al. 2011), and Taganito (Shibayama et al. 2016) using
hydrogen sulfide. The PAL-generated PLS undergoes partial neutralisation to
precipitate iron, chromium, and aluminium using coral mud (Moa Bay), calcrete
(Murrin-Murrin) or limestone (Coral Bay and Taganito) by gradually increasing the
pH. In-between washing in a counter current decantation (CCD) is carried out before
hydrogen sulfide (H2S) gas is introduced to the solution to induce sulfide precipitation
of nickel and cobalt (Carlson and Simons 1960, Motteram et al. 1996, Llerin et al.
2011, Shibayama et al. 2016). The application of MSP has proven to be selective in
separating nickel and cobalt over the impurities associated with them in the PAL-
generated feed, which includes manganese. Fundamentally, the solubility product
constant of manganese sulfide is greater than nickel sulfide and cobalt sulfide. This
suggests that it is unlikely for manganese to co-precipitate with the intermediate

10
products of nickel and cobalt and therefore avoiding any contamination. In the
mentioned operations (Carlson and Simons 1960, Motteram et al. 1996, Llerin et al.
2011, Shibayama et al. 2016), sulfide precipitation precipitates up to 99% of nickel
and cobalt from the PLS as metal sulfides while impurities such as manganese that
are more soluble than nickel and cobalt in the presence of sulfide ions remain
dissolved in the solution. However, the application of MSP can only be carried out at
elevated pressure and temperature, which would require the use of
high-specification equipment, such as brick-lined pressure vessels (White 2009).
Additionally, there are risks in using hydrogen sulfide due to its toxicity and therefore
requires proper use, handling, and control of the reagent in a pressurised vessel,
which would demand highly trained personnel (Dickson 2000, Willis 2007, Kyle 2010),
making sulfide precipitation less attractive. The intermediate product coming from
MSP would still require re-leaching and solvent extraction to ultimately recover nickel
and cobalt. Despite the advantages of using MSP, it has not been adopted as the main
purification process in nickel laterite operations due to the drawbacks mentioned.
Mixed hydroxide precipitation (MHP) was first applied in Cawse (Kyle and Furfaro
1997, Mason et al. 1997, Grassi et al. 2000, White 2009) and later in Ravensthorpe
(White et al. 2006, White 2009) nickel laterite operations for the purification of the
PAL-generated PLS. After the ore undergoes PAL, the PLS is partially neutralised using
limestone to raise the pH before proceeding to the CCD. At this stage, most of the
ferric ions would precipitate, leaving manganese as the main impurity in the solution
and some ferrous ion, which are subsequently removed after the CCD. After the
removal of the remaining ferrous ion, the solution is subjected to hydroxide
precipitation using magnesia (MgO) to precipitate nickel and cobalt (Kyle and Furfaro
1997, Mason et al. 1997, Grassi et al. 2000, White 2009). The application of MHP can
be carried out in atmospheric pressure using standard equipment, such as open top
tanks and agitators (White 2009), which can be advantageous when compared with
MSP. However, the use of MHP in Cawse and Ravensthorpe operation was found to
be challenging due to its poor selectivity in separating nickel and cobalt from
manganese. The poor selectivity of the process was attributed to the co-precipitation
of manganese together with nickel and cobalt, which affects the purity and grade of

11
the intermediate product (Kyle and Furfaro 1997, Grassi et al. 2000, White et al.
2006). Analysis of the intermediate product of mixed nickel-cobalt hydroxide
precipitate contained as high as 12% manganese (Kyle and Furfaro 1997); therefore,
the precipitate needs to undergo consecutive re-leaching and solvent extraction
steps similar to MSP in order to separate nickel and cobalt as pure saleable products.
Fundamentally, since the solubility product constants of nickel hydroxide and cobalt
hydroxide are close to that of manganese hydroxide, the probability of manganese
co-precipitating is high. Therefore, removing manganese prior to the precipitation of
nickel and cobalt as MHP would substantially enhance the efficiency of the process
and reduce the potential contamination of the intermediate products.
1.4.2 Direct Solvent Extraction
DSX involves the use of organic extractants to separate nickel and cobalt directly from
the PAL-generated PLS. The commercial application of the process was pioneered in
the Bulong nickel laterite operation. In this process, the neutralised PAL-generated
PLS is first fed into the cobalt extraction circuit (CoSX) with a dialkyl phosphinic acid,
Cyanex 272, as the extractant. Cobalt, together with the impurities such as zinc, iron,
copper, and manganese, is extracted leaving the nickel in the raffinate, which is then
fed to the nickel extraction circuit (NiSX) where nickel is extracted with a neodecanoic
acid, Versatic 10. The extracted nickel is then stripped with barren electrolyte from
the tank house, which is then fed back for the electrowinning of nickel (Griffin 2000,
O'Callaghan 2003, Donegan 2006). Meanwhile, the cobalt together with the co-
extracted impurities is stripped and put through a separate purifying stream, which
involves precipitation, re-leaching, and solvent extraction to separate the cobalt from
all the co-extracted impurity metals (Griffin 2000, Donegan 2006). Manganese is the
major impurity and constitutes the bulk of the PLS. Moreover, when manganese is
entrained in the organic solution used in solvent extraction, there is a possibility that
it will be transferred to the loaded nickel electrolyte and oxidise to a higher oxidation
state during the electrowinning step (Cheng et al. 2000). Clearly, removing
manganese prior to CoSX would considerably enhance the efficiency of the whole
DSX process.
12
1.5 Statement of the Problem
Although the Caron process is a well proven technology and AL provides lower
operating costs and uses less expensive equipment compared with PAL, the latter has
a distinct advantage as it allows higher nickel and cobalt dissolution and with much
lower impurities in the PLS than AL. PAL therefore provides opportunity to maximise
the recoveries of these metals from nickel laterite ores, which are abundant. One of
its major drawbacks, however, is the large amount of manganese in the PLS, which
remains even after the partial neutralisation step. An effective technique of removing
this metal from the post-partially neutralised PLS or, better, if in conjunction with the
partial neutralisation step, is therefore highly desirable as it would make the purifying
step much more efficient, whether it is carried out by intermediate precipitation
(MHP or MSP) or DSX. In order to find a solution in solving the problem, it has been
postulated by D.C. Ibana (2017, May) in a personal communication that the removal
of manganese(II) from PAL-generated PLS may be achieved through oxidative
precipitation using potassium permanganate, which will not introduce any new ions
to the highly contaminated PLS, and if successful, it may allow the recovery of
manganese as a valuable by product1.
1.6 Aim and Scope of the Study
This project was aimed to explore the removal of manganese from partially
neutralised and post-partially neutralised PLS of nickel laterites ores as manganese
dioxide by oxidative precipitation with potassium permanganate as a method of
purifying the PLS with regard to this impurity. Specifically, it was aimed to:
1. review the aqueous chemistry of the manganous and permanganate
ions, including their redox reaction;
2. determine the variables that significantly affect the oxidative
precipitation of manganese;
1 D. C. Ibana, Associate Professor, Curtin University – Western Australian School of Mines, Personal Communications, May 2017

13
3. optimise the variables with significant effects determined in the
previous step by applying the technique using synthetic PLS, both
partially neutralised and post-partially neutralised; and
4. apply the optimised variables using actual PLS, both partially neutralised
and post-partially neutralised.
1.7 Significance of the Study
This project will contribute to the much-needed development of knowledge in the
field of process metallurgy of nickel laterite ores, which is quite new, and will benefit
the fledgling nickel laterite industry including researches in the field. If successful, a
commercial application is within easy reach as Australia has the world's largest
economic nickel resource (25%) where 69% occur as nickel laterite ores and thus, a
major beneficiary of the work (Geoscience Australia 2012, McRae 2018). In addition,
several countries in the region, including Papua New Guinea, New Caledonia,
Indonesia and the Philippines, also host large deposits of nickel laterite ores and
should therefore benefit from this work. This resource is also plentiful in South
America, Europe, and Africa. Advances in its processing therefore is truly of global
interest.
14
Chapter 2
REVIEW OF STUDIES ON THE REMOVAL OF MANGANESE BY
OXIDATIVE PRECIPITATION
2.1 Manganese in Nickel Laterite Ores and their PAL Leach Solutions
Manganese is contained in many minerals that are often found in nickel laterite ores.
Among these are asbolane, chalcophanite, cryptomelane, ernienickelite,
lithiophorite, and todorokite (Brand et al. 1998), where the general formulae
representing these minerals are shown in Table 3. Depending on the ore, nickel and
cobalt are often associated with some of the manganese-bearing minerals in Table 3.
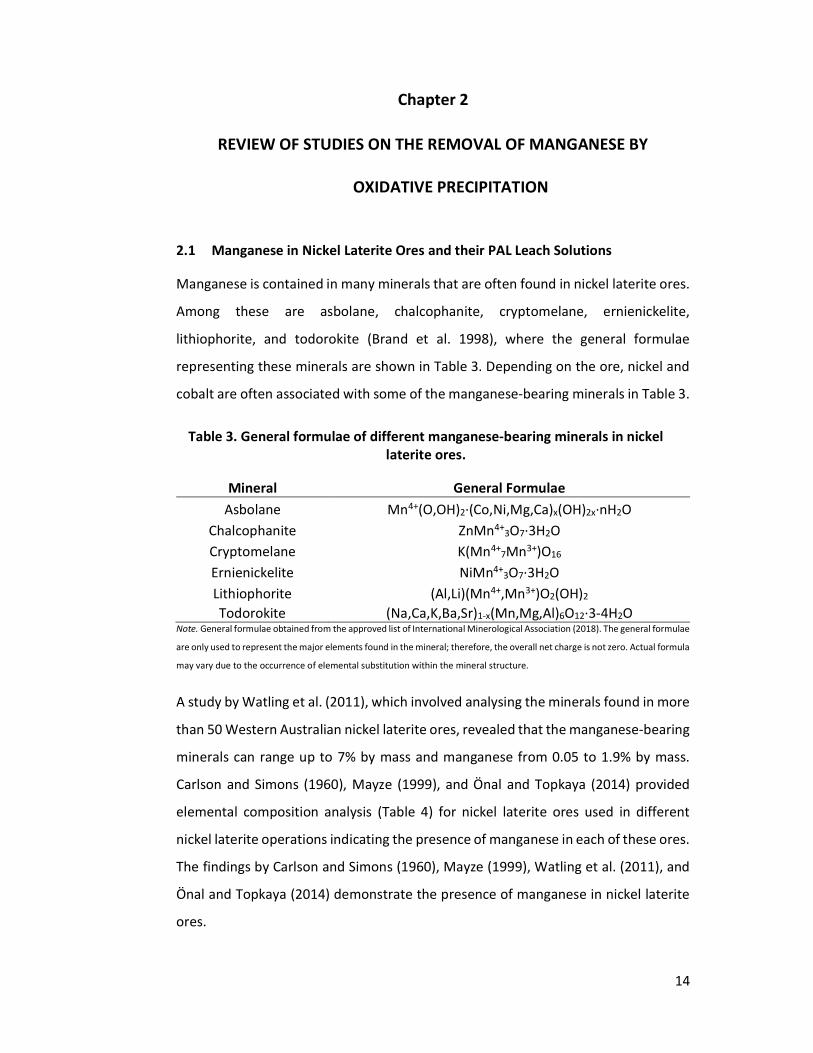
Table 3. General formulae of different manganese‐bearing minerals in nickel laterite ores.
Mineral General Formulae Asbolane Mn4+(O,OH)2·(Co,Ni,Mg,Ca)x(OH)2x·nH2O
Chalcophanite ZnMn4+3O7·3H2O Cryptomelane K(Mn4+
7Mn3+)O16 Ernienickelite NiMn4+
3O7·3H2O Lithiophorite (Al,Li)(Mn4+,Mn3+)O2(OH)2 Todorokite (Na,Ca,K,Ba,Sr)1-x(Mn,Mg,Al)6O12·3-4H2O
Note. General formulae obtained from the approved list of International Minerological Association (2018). The general formulae
are only used to represent the major elements found in the mineral; therefore, the overall net charge is not zero. Actual formula
may vary due to the occurrence of elemental substitution within the mineral structure.
A study by Watling et al. (2011), which involved analysing the minerals found in more
than 50 Western Australian nickel laterite ores, revealed that the manganese-bearing
minerals can range up to 7% by mass and manganese from 0.05 to 1.9% by mass.
Carlson and Simons (1960), Mayze (1999), and Önal and Topkaya (2014) provided
elemental composition analysis (Table 4) for nickel laterite ores used in different
nickel laterite operations indicating the presence of manganese in each of these ores.
The findings by Carlson and Simons (1960), Mayze (1999), Watling et al. (2011), and
Önal and Topkaya (2014) demonstrate the presence of manganese in nickel laterite
ores.

15
Table 4. Elemental compositions (%) of nickel laterite ores used in different nickel laterite operations.
Element Operations
Bulong Cawse Murrin Murrin Caldag Moa Bay Ni 1.11 1 1.24 1.215 1.35 Co 0.08 0.07 0.09 0.078 0.146 Fe 20.80 18 22 32.7 47.5 Mg 4.62 1.58 4 1.62 1 Al 2.75 1.71 2.5 1.66 4.5
Mn 0.36 0.17 0.40 0.349 0.76 Cr 0.60 0.92 0.88 1.01 2.01 Ca 0.03 0.03 0.53 0.60 na
na, not available. Note.Data for Bulong, Cawse, and Murrin Murrin from Mayze (1999), for Caldag from Önal and Topkaya (2014),
and for Moa Bay from Carlson and Simons (1960).
No studies on the solubility of specific manganese-bearing minerals in nickel laterite
ores during the PAL process were found in literature. However, there have been
studies by several authors on the leaching behaviour of metals in nickel laterite ores
during PAL. It has been reported (Georgiou and Papangelakis 2009, Guo et al. 2011,
Önal and Topkaya 2014, Ucyildiz and Girgin 2017) that the leaching of nickel and
cobalt from the ore can be greater than 90% and the co-leaching of manganese is up
to 90%. The leaching behaviour of metals is attributed to the operating parameters
used in PAL, such as acid to ore ratio, temperature, and leaching time, which not only
favour the dissolution of nickel and cobalt from nickel laterite ores, but also other
metals including manganese (Georgiou and Papangelakis 2009, Guo et al. 2011, Önal
and Topkaya 2014, Ucyildiz and Girgin 2017). The dissolution in sulfuric acid of the
minerals found in nickel laterite ores can be represented by the simplified equation
shown in Equation 2-1, where MmOn represents the metal oxide of minerals in nickel
laterite ores that reacts with the proton (H+) released from the acid, including those
bearing nickel, cobalt, and manganese, m and n are stoichiometric coefficient, and z
is the valency of the metal M.
MmOn + 2n H+ → m Mz+ + n H2O (2-1)
The elemental composition of PLS from PAL (Table 5) is indicative of the solubility of
the manganese-bearing minerals due to the presence of manganese in the PLS.

16
Clearly, processing nickel laterite ores using sulfuric acid in PAL will generate a PLS
containing large amounts of impurities including manganese, which needs to be
removed prior to the downstream processing.
Table 5. Elemental compositions (g/L) of PAL‐generated PLS from Moa Bay, Murrin Murrin, and Ravensthorpe nickel laterite operations.
Element Operations
Moa Bay Murrin Murrin Ravensthorpe Ni 5.95 5.02 11.80 Co 0.64 0.37 0.41 Mn 1.98 1.62 2.20 Fe 0.80 1.53 2.20 Mg 2.76 17.2 21.0 Al 2.30 1.63 0.055 Cr 0.30 0.10 0.020
Note.Data for Moa Bay from Carlson and Simons (1960), for Murrin Murrin from Motteram et al. (1996), and for Ravensthorpe
from White et al. (2006).
In summary, the presence of manganese in PAL-generated PLS from nickel laterite
ores is due to the dissolution of manganese-bearing minerals, which is attributed to
the operating parameters used in PAL. The removal of manganese as an impurity is
therefore particularly important in order to avoid affecting the efficiency of the
downstream processing.
2.2 Manganese as an Impurity and its Oxidation States and Stability in Acidic Leach Solutions
After leaching the ore, the major impurities present in the PAL-generated PLS that
can form insoluble hydroxides are removed by different nickel laterite operations
through partial neutralisation by using alkaline reagents, such as limestone (Kyle and
Furfaro 1997, Mason et al. 1997, Grassi et al. 2000, O'Callaghan 2003, White et al.
2006, Llerin et al. 2011, Shibayama et al. 2016), coral mud (Carlson and Simons 1960),
and calcrete (Motteram et al. 1996), in order to adjust the pH to between 2.4 and
5.0. Partial neutralisation of the PLS causes iron, aluminium, and chromium to
precipitate out of the solution as hydroxides; therefore, leaving manganese as the
main impurity in the PLS, which can affect the downstream processing. A few studies
report that manganese can either co-precipitate with nickel and cobalt as a hydroxide
17
during the intermediate precipitation step (Grassi et al. 2000, Oustadakis et al. 2006,
Oustadakis et al. 2007) or oxidise to a higher oxidation state during the
electrowinning step (Cheng et al. 2000, Donegan 2006) when present in sulfate leach
solutions during the downstream processing. The co-precipitation of manganese with
nickel and cobalt as a mixed hydroxide will require additional re-leaching and solvent
extraction steps in order to separate nickel and cobalt as final products (Grassi et al.
2000, Oustadakis et al. 2006, Oustadakis et al. 2007) while the oxidation of
manganese to a higher oxidation state in the electrowinning step will lead to the
potential degradation of the organic when the spent electrolyte is recycled back to
the solvent extraction circuit (Cheng et al. 2000, Donegan 2006). The likely reason for
the co-precipitation or oxidation of manganese to occur during the downstream
processing is due to the existence of manganese in different oxidation states and its
stability in acidic leach solutions.
Manganese, which can exist as either dissolved or solid species, exhibits different
oxidation states depending on the redox potential and pH of the solution. Figure 5
shows a diagram of the electrochemical stability for the different redox species of
manganese. The diagram (Figure 5) identifies specific conditions where different
redox species of manganese are stable at molar concentrations of 10−6, 10−4, 10−2,
and 100. Each molar concentration is represented by its respective base-10 power in
the diagram, −6, −4, −2, and 0. The lines with encircled numbers in the diagram
represent the equilibria between two manganese species. Horizontal lines represent
pure redox reactions or reactions that are independent of pH, while vertical lines
represent acid–base reactions, which are independent of the potential. Diagonal lines
represent a combination of both redox and acid–base reactions, which depends on
both the redox potential and pH of the solution.

18
Figure 5. Potential–pH equilibrium (Pourbaix) diagram for the system of manganese–water, at 25 oC, considering β‐MnO2 (Pourbaix 1966). Encircled numbers in the diagram represent the equilibria between two manganese species while molar concentration is represented by its respective base‐10
power in the diagram, −6, −4, −2, and 0. Content is removed due to copyright restrictions.
The oxidation states of known dissolved species of manganese include +2, +3, +6, and
+7. In highly acidic conditions (~ pH 2) within the stability region of water, which
match PAL-generated PLS, only manganous ions (Mn2+) exist as stable dissolved
species. In contrast, +3, +6, and +7 oxidation states are unstable in highly acidic
conditions. Manganic ion (Mn3+) disproportionates into Mn2+ and MnO2, as shown in
Equation 2-2, while for the +6 oxidation state, manganate ion (MnO42−), it reduces to

19
Mn2+, as shown in Equation 2-3. In the case of the +7 oxidation state, permanganate
ion (MnO4−), which is the highest oxidation state of manganese and a strong oxidising
agent, is unstable and reacts with water to form manganese dioxide (MnO2), as
shown in Equation 2-4. Thus, Mn3+, MnO42−, and MnO4− are unlikely to exist as stable
dissolved species in PAL-generated PLS.
2 Mn(aq)3+ + 2 H2O ↔ Mn(aq)
2+ + MnO2(s) + 4 H(aq)+ (2-2)
MnO4(aq)2- + 8 H(aq)
+ + 4 e- ↔ Mn(aq)2+ + 4 H2O (2-3)
4 MnO4(aq) - + 2 H2O ↔ 4 MnO2(s) + 4 OH(aq)
- + 3 O2 (g) (2-4)
The only solid species of manganese that can exist in highly acidic condition is
manganese dioxide (MnO2), which is the +4 oxidation state of manganese after
undergoing hydrolysis. Manganese dioxide (MnO2) is a dark brown to black solid
substance, which can be either anhydrous or hydrous (Pourbaix 1966). In highly acidic
conditions, manganese dioxide (MnO2) can either form from the oxidation of Mn2+
(Equation 2-5) or reduction of MnO4− (Equation 2-6).
Mn(aq)2+ + 2 H2O ↔ MnO2(s) + 4 H+ + 2 e- (2-5)
MnO4(aq)- + 4 H+ + 3 e- ↔ MnO2(s) + 2 H2O (2-6)
Other solid species of manganese, such as Mn(OH)2, Mn2O3, and Mn3O4, are not
stable under highly acidic conditions. Each will dissociate to form manganous ion
(Mn2+), as shown in Equations 2-7 to 2-9.
Mn(OH)2(s) ↔ Mn(aq)2+ + 2 OH- (2-7)
Mn2O3(s) + 6 H+ + 2 e- ↔ 2 Mn(aq)2+ + 3 H2O (2-8)
Mn3O4(s) + 8 H+ + 2 e- ↔ 3 Mn(aq)2+ + 4 H2O (2-9)
20
Manganese remains as the main impurity in the PLS even after the partial
neutralisation step. The presence of manganese in the PLS can affect the efficiency
of the downstream processing due to its stability in highly acidic conditions and at
the same time its existence in different oxidation states; therefore, the removal of
manganese will be beneficial to the process.
2.3 Removal of Manganese from Acidic Leach Solutions by Oxidative Precipitation
Oxidative precipitation of Mn2+ in an aqueous solution at highly acidic conditions (~
pH 2) involves the use of a strong oxidising reagent, which must have a standard
reduction potential higher than 1.23 V (redox couple Mn4+/Mn2+) that will result in
the in-situ formation of a higher oxidation state manganese, Mn4+, which undergoes
hydrolysis to form manganese dioxide (MnO2) (Equation 2-5). Manganese has
different oxidation states (Section 2.2) where the stability is dependent on the pH
and potential of the solution. In multi-component solutions such as PAL-generated
PLS, one important consideration in the application of oxidative precipitation is to
ensure that Ni2+ and Co2+ will not oxidise together with Mn2+. Careful examination of
the potential–pH equilibrium (Pourbaix) diagram of manganese (Figure 5) in
comparison with those of nickel (Figure 6) and cobalt (Figure 7) shows that at highly
acidic conditions, there is a firm thermodynamic basis for the selective precipitation
of manganese compared with nickel and cobalt at a high solution potential (e.g. pH 2
and Eϴ = 1.23 V) where Mn2+ oxidises to form MnO2 while nickel and cobalt remain in
the +2 oxidation state and soluble in solution. This is a clear indication that it can be
possible to oxidise manganese by oxidative precipitation, even in the presence of
nickel and cobalt at highly acidic conditions.

21
Figure 6. Potential–pH equilibrium (Pourbaix) diagram for the system of nickel–water, at 25 oC (Pourbaix 1966). Encircled numbers in the diagram represent the equilibria between two nickel species while molar concentration is represented
by its respective base‐10 power in the diagram, −6, −4, −2, and 0. Content is removed due to copyright restrictions.

22
Figure 7. Potential‐pH equilibrium (Pourbaix) diagram for the system of cobalt‐water, at 25 oC (Pourbaix 1966). Encircled numbers in the diagram represent the equilibria between two cobalt species while molar concentration is represented
by its respective base‐10 power in the diagram, −6, −4, −2, and 0. Content is removed due to copyright restrictions.
2.4 Oxidants for the Oxidative Precipitation of Manganese
Oxidative precipitation has proven to be effective for the removal of manganese
using various oxidants (Zhang and Cheng 2007). Since MnO2 is a strong oxidant with
a standard reduction potential (Eϴ) of 1.23 V, it would need a stronger oxidant in
order to oxidise Mn2+ to MnO2. Various oxidants that have been applied in the

23
oxidation of Mn2+ are ozone (O3), Caro’s acid (H2SO5), and peroxydisulfuric acid
(H2S2O8), hypochlorite (ClO−), and chlorate (ClO3−) (Zhang and Cheng 2007). These
oxidants have either high cost, are highly corrosive resulting in difficulty with control
and handling (Zhang and Cheng 2007), or introduce foreign ions that are undesirable
and may form toxic by-products; therefore, their use in the oxidative precipitation of
Mn2+ from PAL-generated PLS can be challenging and unattractive. A few low-cost
oxidants are available for the oxidative precipitation of manganese and these include
sulfur dioxide and oxygen (SO2/O2) gas mixture and potassium permanganate
(KMnO4). However, even if using SO2/O2 mixture is low cost, the downside of using
the gas mixture is its dependence on the mass transfer and diffusion of the gases to
the solution during oxidation, which is affected by the ratio between the dissolved
S4+ species coming from SO2 to the dissolved O2 (Zhang et al. 2010). Gas dispersion
and flow rate would also be critical as O2 is less soluble than SO2, making it difficult
to maintain oxidising conditions in the solution. In order to effectively oxidise
manganese using an SO2/O2 mixture, an optimum ratio between SO2 and O2 must be
maintained with proper dispersion so as not to limit the rate of manganese oxidation
(Zhang et al. 2010). The difficulty in using and handling SO2/O2 gas mixture will only
add to the already challenging purification step of existing nickel laterite operations.
This would leave potassium permanganate as a possible option for the oxidative
precipitation of manganese from acidic leach solutions. Other than being low cost,
another advantage of potassium permanganate is that it has been widely used in
water treatment (Environmental Protection Agency 1999) and at the same time it will
not introduce any new ions to the highly contaminated PLS.
2.4.1 Potassium Permanganate as Oxidant
Most studies conducted on the oxidative precipitation of manganese using potassium
permanganate focused on applications used for water treatment and industrial waste
solutions, such as those from mineral processing. There is limited information
available on applications in solutions similar to PAL-generated PLS.
The literature review revealed no studies on the application of potassium
permanganate (KMnO4) to PAL-generated PLS. Potassium permanganate is widely

24
used in water treatment for the oxidation of iron and manganese as well as other
compounds that affect the taste and odour of water (Environmental Protection
Agency 1999). The net ionic reaction for the oxidative precipitation of Mn2+ with
permanganate (MnO4-) is shown in Equation 2-26, which shows that Mn2+ will
precipitate as MnO2 in the presence of MnO4−.
3 Mn(aq)2+ + 2 MnO4(aq)
- + 2 H2O ↔ 5 MnO2(s) + 4 H+ (2-26)
2.5 Variables Influencing the Oxidative Precipitation of Manganese(II) by Potassium Permanganate
The oxidative precipitation of Mn2+ using potassium permanganate is influenced by
pH (Adams 1960, Phatai et al. 2010, Freitas et al. 2013, Elsheikh et al. 2017) and
oxidant amount (Adams 1960, Heviankova and Bestova 2007, Phatai et al. 2010,
Freitas et al. 2013, Phatai et al. 2014, Macingova et al. 2016, Elsheikh et al. 2017).
Much of the current literature using potassium permanganate for the oxidative
precipitation of manganese concerns water treatment, but it has been applied as well
to acid mine water, which is sometimes known as acid mine drainage (AMD). The aim
in the oxidative precipitation of manganese from either raw water or acid mine water
is to ensure that the concentration of manganese will be within the acceptable limit
set by various international legislation. For instance, raw water should have less than
0.10 mg/L of manganese based on global standards (Phatai et al. 2014), while for acid
mine water, it should be less than 1.0 mg/L, as in the case of Brazilian legislation
(Freitas et al. 2013). If the present study could achieve a comparable concentration
of manganese close to the acceptable limit in either raw water (<0.10 mg/L) or acid
mine water (<1.0 mg/L), it will be low enough so as to not to affect the efficiency of
downstream processing of PAL-generated PLS.
2.5.1 Influence of pH
It is known that the oxidative precipitation of manganese is influenced by changes in
pH of the solution (Figure 5). In addition, changing the pH of the solution can cause a
change in the standard reduction potential (Eϴ) of permanganate when potassium
permanganate is used as an oxidant. At highly acidic conditions, permanganate has a

25
standard reduction potential (Eϴ) of 1.51 V and as the pH changes to basic conditions,
Eϴ decreases to 0.59 V. At basic conditions, manganese does not only form MnO2 but
can also form other stable solid species, such as Mn2O3, Mn3O4, and Mn(OH)2, even
at a low solution potential.
Studies investigating the influence of pH on the oxidative precipitation of manganese
using potassium permanganate are mostly found for water treatment (Adams 1960,
Phatai et al. 2010, Elsheikh et al. 2017), but it has also been applied for the treatment
of AMD (Freitas et al. 2013). A study on the oxidative precipitation of manganese
from raw water by Adams (1960) showed that soluble manganese in high
concentrations can rapidly and completely oxidise at a high pH range. The pH range
required to completely oxidise less than 0.5 mg/L of manganese is between pH 7.2
and pH 7.4, but as the concentration of manganese increases to between 2 and 4
mg/L, the pH range for effective manganese oxidation was between pH 8.0 and pH
8.3.
A similar study investigating the influence of pH on the oxidative precipitation of
manganese from MnSO4 solutions (90 – 150 mg/L Mn2+) and actual AMD solutions at
pH 3, 5, and 7 was carried out by Freitas et al. (2013) as well as from synthetic ground
water at pH 8 to 9 by Phatai et al. (2010) and at pH 7 to 9 by Elsheikh et al. (2017).
Freitas et al. (2013) reported nearly complete removal of manganese to less than 0.1
mg/L of the acceptable limit from MnSO4 solutions at pH 5 and 7 while at pH 3, the
concentration remained at 0.3 mg/L. The increase in manganese removal was
attributed to the increase in the Mn2+ oxidation rate as the pH increases (Van
Benschoten et al. 1992, Freitas et al. 2013). In addition, the same trend was observed
by Freitas et al. (2013) using actual AMD solutions. In one of the solutions (102.6 mg/L
Mn, 2.8 mg/L Fe, 3.2 mg/L Zn, 9.5 mg/L U, 251.9 mg/L Ca, 194.8 mg/L Al, and 65.2
mg/L F−), almost complete removal of manganese (99.7%) was obtained at pH 7 while
only 85.4% at pH 3 (Freitas et al. 2013). The results in the investigation of Elsheikh et
al. (2017) and Phatai et al. (2010) using synthetic ground water were also consistent
with the trend, despite using different test solutions and pH ranges. Manganese
removal increased from 75% to 85% (Elsheikh et al. 2017) and from 80% to almost
complete removal (Phatai et al. 2010) when the pH was increased from pH 8 to 9.

26
Clearly, operating at basic conditions will be beneficial in enhancing the oxidative
precipitation of manganese. However, what is not yet clear is the influence of pH on
the oxidative precipitation of manganese when a solution is maintained at highly
acidic conditions, as in the case of PAL-generated PLS. The reason for this is that
operating at basic conditions will not be beneficial when applied to PAL-generated
PLS due to the possibility for nickel and cobalt to co-precipitate with manganese by
forming metal hydroxides. Raising the pH to basic conditions will promote the
precipitation of nickel and cobalt as metal hydroxides due to the decrease in the
solubility of nickel hydroxide and cobalt hydroxide. It is for this reason that, in the
present study, it is of interest to determine whether the oxidative precipitation of
manganese from PAL-generated PLS using potassium permanganate will still be an
effective technique to selectively separate manganese from nickel and cobalt by
taking into consideration the firm thermodynamic basis for the oxidative
precipitation of manganese based on potential–pH equilibrium (Pourbaix) diagram of
the manganese–water system (Figure 5) at highly acidic pH conditions.
2.5.2 Influence of Oxidant Amount
Another variable that is known to have an influence on the oxidative precipitation of
manganese is the amount of potassium permanganate used since it will affect the
availability of permanganate ion (MnO4−) needed for the oxidative precipitation of
Mn2+ (Equation 2-26). The stoichiometric amount of MnO4− required to completely
oxidise manganese is 2:3 (Equation 2-26). Therefore, for 1 mg (1.82 x 10⁻⁵ mol) of
manganese to completely oxidise, it will require 1.92 mg (1.21 x 10⁻⁵ mol) of
potassium permanganate. Several studies have investigated the influence of
potassium permanganate amount on the oxidative precipitation of manganese from
water treatment (Phatai et al. 2014, Elsheikh et al. 2017) and acid mine water
treatment (Heviankova and Bestova 2007, Macingova et al. 2016).
A study by Phatai et al. (2014) on the oxidative precipitation of manganese and iron
from synthetic groundwater using potassium permanganate investigated the
influence of the amount of potassium permanganate in single (Mn = 0.314 mg/L ) and
dual (Mn = 0.314 mg/L and Fe = 0.048 mg/L) metal systems at pH 8. The

27
stoichiometric amount of potassium permanganate required on the oxidative
precipitation of the single component system was 0.603 mg/L while for dual
component system, it was 0.648 mg/L (Phatai et al. 2014). Phatai et al. (2014)
reported that for the single component system, the removal of manganese increased
from 84.6% to 92.2% when the amount of potassium permanganate was increased
from 0.603 mg/L to 0.648 mg/L. The result was attributed by Phatai et al. (2014), to
the increase in conversion of Mn2+ to MnO2 when higher amount (0.648 mg/L) of
potassium permanganate was used instead of 0.603 mg/L to oxidise 0.314 mg/L of
manganese. The ratio of reacting MnO4− to Mn2+ will increase as more potassium
permanganate is added to the solution. A comparable trend was also reported by
Phatai et al. (2014) in the dual component system. Phatai et al. (2014) noted that the
result was higher in the dual component system compared with the single
component system due to the precipitation of iron as Fe(OH)3, which provided
surface for the autocatalytic oxidation of Mn2+, and therefore enhancing the
oxidative precipitation of Mn2+.
In the same vein, Elsheikh et al. (2017), in their study on the oxidative precipitation
of iron (1.50 mg/L) and manganese (1.0 mg/L) from a simulated groundwater at pH
7, yielded the same increasing trend. As the potassium permanganate amount
increased from 1 mg/L to 3 mg/L, which was near the theoretical stoichiometric
amount, the oxidative precipitation of manganese increased from 50% to 80%. The
removal, however, started to decrease to approximately 70% when the amount was
increased to 4 mg/L, which is roughly 1.2 times the theoretical stoichiometric amount
required. The drop in the amount of manganese precipitated was consistent with
Equation 2-27, where reduction of permanganate resulted in the generation of Mn2+,
which was also the reason attributed by Elsheikh et al. (2017) for the decrease in
oxidative precipitation of manganese; therefore, this suggests that the amount of
potassium permanganate must carefully be considered in order to ensure the
complete oxidative precipitation of Mn2+ while avoiding the generation of additional
Mn2+ due to the reduction of permanganate. In the potassium permanganate
amounts investigated, up to 97% iron removal was consistently attained by Elsheikh
et al. (2017).

28
MnO4(aq)- + 8 H(aq)
+ + 5 e- ↔ Mn(aq)2+ + 4 H2O (2-27)
Studies by Heviankova and Bestova (2007) and Macingova et al. (2016) also
investigated the influence of the amount of potassium permanganate, but for the
oxidative precipitation of manganese from acid mine water. In the studies by
Heviankova and Bestova (2007) and Macingova et al. (2016) on the oxidative
precipitation of manganese from acid mine water containing 5.33 mg/L of Mn2+ and
16.50 mg/L of Mn2+, respectively, at pH 7, they observed that there was a limit to the
amount of potassium permanganate that could effectively oxidise Mn2+. Beyond the
limit, the complete oxidative precipitation of Mn2+ was affected due to the
generation of Mn2+, which is supported by the observation of Elsheikh et al. (2017)
using simulated groundwater. Although the observations by Heviankova and Bestova
(2007) and Macingova et al. (2016) using acid mine water were consistent with those
observed by Elsheikh et al. (2017) for groundwater, the values reported for the
limiting amount of potassium permanganate varied. The amounts of potassium
permanganate reported by Macingova et al. (2016) and Elsheikh et al. (2017) were
only stoichiometric while in the case of Heviankova and Bestova (2007), the limiting
value was 1.2 times the stoichiometric amount. The differences in the reported
values of the various authors may be attributed to the presence of different metal
components that were present together with manganese in the feed solutions used.
It is for this reason that the present study will determine the amount of potassium
permanganate that will be needed to ensure the complete oxidative precipitation of
manganese from PAL-generated PLS.
2.7 Summary of the Review
The major findings of this review may be summarised as follows:
The dissolution of manganese-bearing minerals in nickel laterite ores is
attributed to the operating parameters used in PAL, which results in a large
amount of manganese in PAL-generated PLS.
At highly acidic conditions (~pH 2), manganese can exist either as
manganese(II) or manganese dioxide (MnO2).

29
Potassium permanganate, SO2/O2 gas mixture, ozone, Caro’s acid, and
peroxydisulfuric acid are strong oxidants available for the oxidative
precipitation of manganese(II). Among the available oxidants, however,
SO2/O2 gas mixture and potassium permanganate are the options available as
inexpensive oxidants compared with ozone, Caro’s acid, and peroxydisulfuric
acid.
Between SO2/O2 gas mixture and potassium permanganate, the latter
provides more interest to test the suitability of the technique using PAL-
generated PLS compared with the former, which is sensitive to mass transfer,
diffusion, gas dispersion, and flow rate that would require higher operational
costs due to the need to constantly control different variables.
Two of the critical variables that have an influence on the oxidative
precipitation of manganese(II) by potassium permanganate are pH and
amount of potassium permanganate. Operating at pH greater than seven (pH
>7) will enhance the oxidative precipitation of manganese(II) by increasing the
oxidation rate and promote, not only the formation of MnO2 but also those
of Mn2O3, Mn3O4, and Mn(OH)2. The amount of potassium permanganate
influences the oxidative precipitation of manganese(II) by increasing the
conversion of manganese(II) to MnO2 due to an increase in the ratio of
available MnO4− that reacts with manganese(II). It was concluded, therefore,
that a need exists to determine whether the oxidative precipitation of
manganese(II) from PAL-generated PLS using potassium permanganate will
still be an effective technique to selectively separate manganese(II) from
nickel(II) and cobalt(II) while the pH is at highly acidic conditions and at the
same time determine the amount of potassium permanganate needed to
ensure the complete oxidative precipitation of manganese(II) from PAL-
generated PLS.
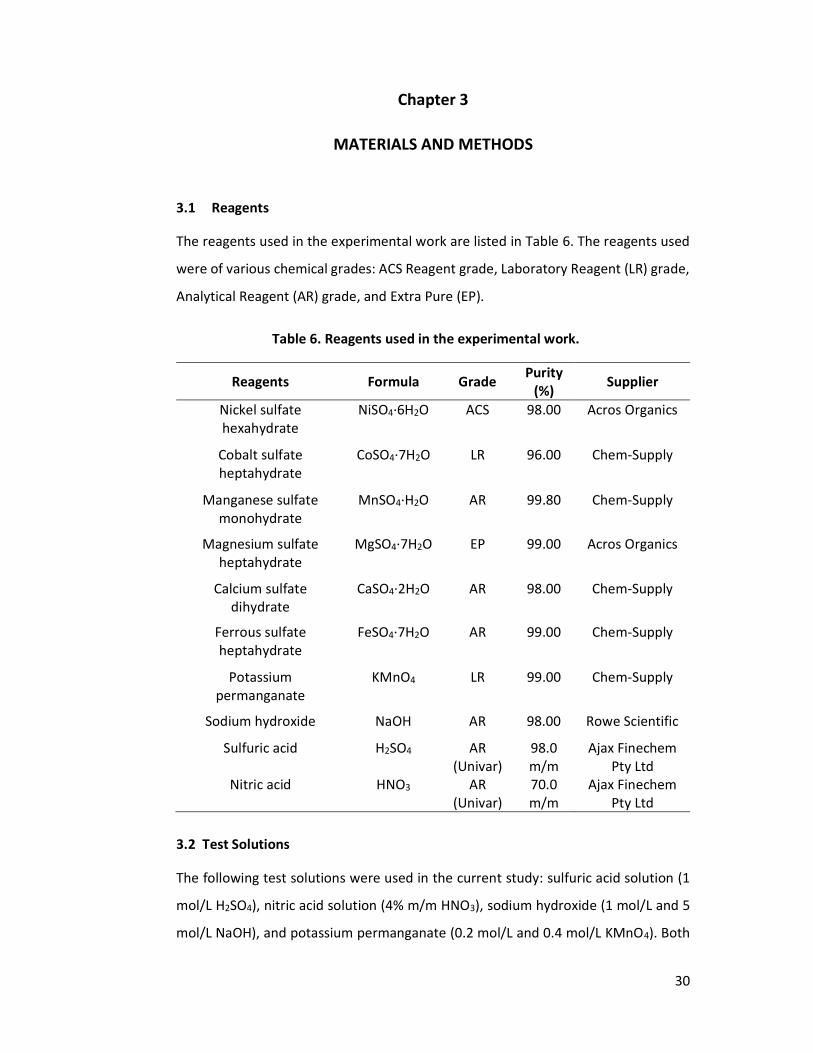
30
Chapter 3
MATERIALS AND METHODS
3.1 Reagents
The reagents used in the experimental work are listed in Table 6. The reagents used
were of various chemical grades: ACS Reagent grade, Laboratory Reagent (LR) grade,
Analytical Reagent (AR) grade, and Extra Pure (EP).
Table 6. Reagents used in the experimental work.
Reagents Formula Grade Purity (%)
Supplier
Nickel sulfate hexahydrate
NiSO4·6H2O ACS 98.00 Acros Organics
Cobalt sulfate heptahydrate
CoSO4·7H2O LR 96.00 Chem-Supply
Manganese sulfate monohydrate
MnSO4·H2O AR 99.80 Chem-Supply
Magnesium sulfate heptahydrate
MgSO4·7H2O EP 99.00 Acros Organics
Calcium sulfate dihydrate
CaSO4·2H2O AR 98.00 Chem-Supply
Ferrous sulfate heptahydrate
FeSO4·7H2O AR 99.00 Chem-Supply
Potassium permanganate
KMnO4 LR 99.00 Chem-Supply
Sodium hydroxide NaOH AR 98.00 Rowe Scientific
Sulfuric acid H2SO4 AR (Univar)
98.0 m/m
Ajax Finechem Pty Ltd
Nitric acid HNO3 AR (Univar)
70.0 m/m
Ajax Finechem Pty Ltd
3.2 Test Solutions
The following test solutions were used in the current study: sulfuric acid solution (1
mol/L H2SO4), nitric acid solution (4% m/m HNO3), sodium hydroxide (1 mol/L and 5
mol/L NaOH), and potassium permanganate (0.2 mol/L and 0.4 mol/L KMnO4). Both

31
the sulfuric acid and nitric acid solutions were prepared by dilution from
concentrated reagents using deionised (DI) water following standard procedures.
Sodium hydroxide and potassium permanganate were prepared by dissolving the
pellets and crystals, respectively, in a sufficient amount of deionised water to ensure
complete dissolution before the volumetric flasks were filled to the mark.
3.3 Preparation of Synthetic and Actual Pregnant Leach Solutions
Synthetic pregnant leach solutions (PLS) that simulated those produced from the
pressure acid leaching (PAL) process in terms of the concentration of the major
elements both at the partial neutralisation and post-partial neutralisation steps were
prepared by dissolving the respective sulfate salts of the metals in a minimum
amount of deionised water until the salts were completely dissolved. The volume was
then adjusted to nearly that of the volumetric flask but still allowing the adjustment
of the pH of the solution to approximately pH 2 by adding sulfuric acid (1 mol/L) and
then made to the volume using deionised water. Typical elemental compositions of
the synthetic solutions prepared to simulate the PLS solutions, both partially
neutralised and post-partially neutralised, are shown in Table 7 . The former refers to
the solution that still contains residual iron, mainly iron(II), after the removal of
iron(III) during the first iron removal step. The latter refers to the solution after all
iron has been removed by oxidising the iron(II) to iron(III) before precipitating by
adjusting the pH to approximately pH 3.5. The major impurities in the synthetic
partially neutralised PLS were manganese(II) and iron(II), which simulated the
composition of the PLS after the removal of iron(III), aluminium(III), and
chromium(III). In the case of the synthetic post-partially neutralised PLS, the solution
simulated an iron-free solution where only manganese(II) remained as the major
impurity.
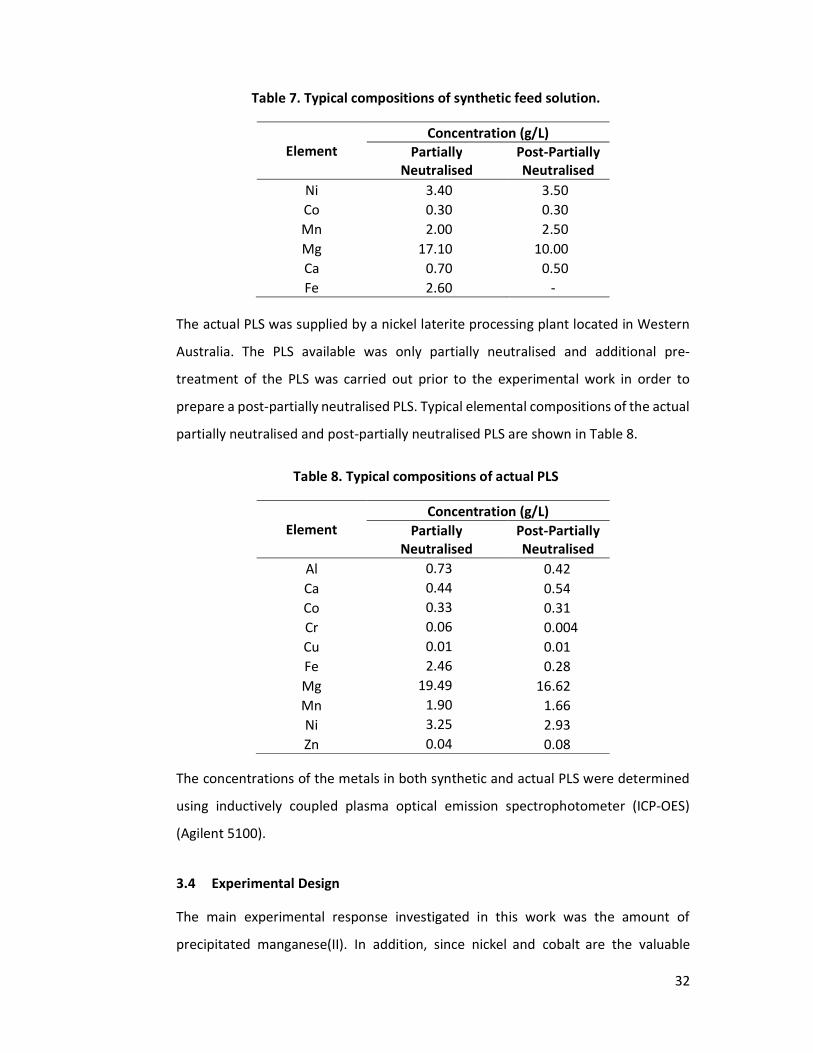
32
Table 7. Typical compositions of synthetic feed solution.
Element Concentration (g/L)
Partially Neutralised
Post‐Partially Neutralised
Ni 3.40 3.50 Co 0.30 0.30 Mn 2.00 2.50 Mg 17.10 10.00 Ca 0.70 0.50 Fe 2.60 -
The actual PLS was supplied by a nickel laterite processing plant located in Western
Australia. The PLS available was only partially neutralised and additional pre-
treatment of the PLS was carried out prior to the experimental work in order to
prepare a post-partially neutralised PLS. Typical elemental compositions of the actual
partially neutralised and post-partially neutralised PLS are shown in Table 8.
Table 8. Typical compositions of actual PLS
Element Concentration (g/L)
Partially Neutralised
Post‐Partially Neutralised
Al 0.73 0.42 Ca 0.44 0.54 Co 0.33 0.31 Cr 0.06 0.004 Cu 0.01 0.01 Fe 2.46 0.28 Mg 19.49 16.62 Mn 1.90 1.66 Ni 3.25 2.93 Zn 0.04 0.08
The concentrations of the metals in both synthetic and actual PLS were determined
using inductively coupled plasma optical emission spectrophotometer (ICP-OES)
(Agilent 5100).
3.4 Experimental Design
The main experimental response investigated in this work was the amount of
precipitated manganese(II). In addition, since nickel and cobalt are the valuable

33
products, their responses were also included. In case of the partially neutralised PLS,
the amount of precipitated iron(II) was also investigated since the residual iron(II)
that is present together with manganese(II) in the PLS will readily oxidise and be
removed along with manganese(II). The reason for the oxidation is that, besides
MnO2 (Equation 3-1), the standard reduction potential (Eϴ) for the redox couple
Fe(III)/Fe(II) (Equation 3-2) is also lower than that of MnO4–; therefore, in the
presence of MnO4–, which has an Eϴ of 1.69 V (Equation 2-6), Equation 3-1 and
Equation 3-2 will proceed in the reverse direction (i.e. Fe2+ to Fe3+ and Mn2+ to MnO2).
However, due to the much lower Eϴ of Fe3+ compared with MnO2, the reverse of
Equation 3-2 will proceed first before the reverse of Equation 3-1.
MnO2(s) + 4 H+ + 2 e– ↔ Mn(aq)2+ + 2 H2O Eθ = 1.23 V (3-1)
Fe(aq)3+ + e– ↔ Fe(aq)
2+ + 2 H2O Eθ = 0.77 V (3-2)
Screening experiments were performed using an unreplicated full factorial design to
evaluate the variables that may have significant effects on the responses (amount of
precipitated metal ions) investigated in the current study. The advantage of using
unreplicated full factorial design over one-variable-at-a-time (OVAT) for screening
experiments is that it allows the determination of the main effects of each variable
to the response as well as any interaction effects that may exist among the various
variables using a fixed number of experimental runs even with limited resources and
time. The variables, which often affect chemical reactions, chosen for investigation
that may influence the oxidative precipitation of manganese(II) were temperature,
molar ratio, pH, and agitation speed. The variables investigated for the oxidative
precipitation experiments were evaluated at two levels: low (–1) and high (+1). The
levels used for each variable are detailed in Table 9. These levels were then
systematically changed for each experimental run of the unreplicated full factorial
design by following the experimental design matrix shown in Table 10.
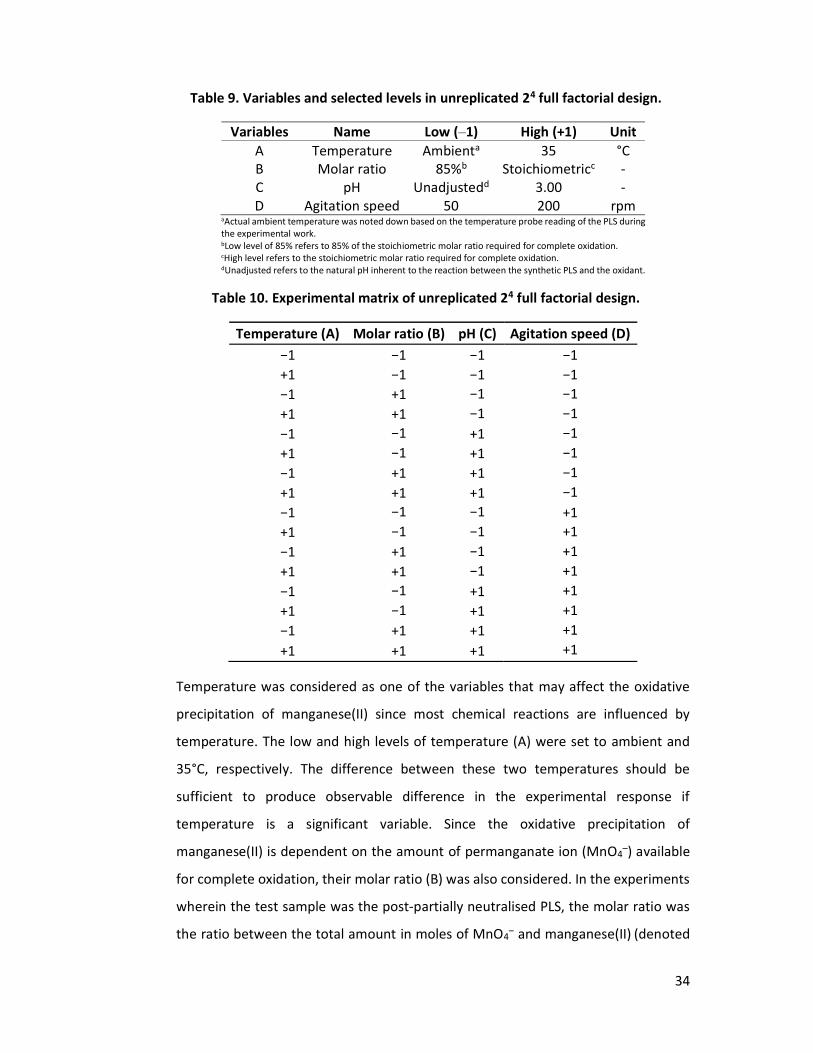
34
Table 9. Variables and selected levels in unreplicated 24 full factorial design.
Variables Name Low (–1) High (+1) Unit A Temperature Ambienta 35 °C B Molar ratio 85%b Stoichiometricc - C pH Unadjustedd 3.00 - D Agitation speed 50 200 rpm
aActual ambient temperature was noted down based on the temperature probe reading of the PLS during the experimental work. bLow level of 85% refers to 85% of the stoichiometric molar ratio required for complete oxidation. cHigh level refers to the stoichiometric molar ratio required for complete oxidation. dUnadjusted refers to the natural pH inherent to the reaction between the synthetic PLS and the oxidant.
Table 10. Experimental matrix of unreplicated 24 full factorial design.
Temperature (A) Molar ratio (B) pH (C) Agitation speed (D) −1 −1 −1 −1+1 −1 −1 −1−1 +1 −1 −1+1 +1 −1 −1−1 −1 +1 −1+1 −1 +1 −1−1 +1 +1 −1+1 +1 +1 −1−1 −1 −1 +1+1 −1 −1 +1−1 +1 −1 +1+1 +1 −1 +1−1 −1 +1 +1+1 −1 +1 +1−1 +1 +1 +1+1 +1 +1 +1
Temperature was considered as one of the variables that may affect the oxidative
precipitation of manganese(II) since most chemical reactions are influenced by
temperature. The low and high levels of temperature (A) were set to ambient and
35°C, respectively. The difference between these two temperatures should be
sufficient to produce observable difference in the experimental response if
temperature is a significant variable. Since the oxidative precipitation of
manganese(II) is dependent on the amount of permanganate ion (MnO4–) available
for complete oxidation, their molar ratio (B) was also considered. In the experiments
wherein the test sample was the post-partially neutralised PLS, the molar ratio was
the ratio between the total amount in moles of MnO4– and manganese(II) (denoted

35
as mol MnO4–: mol Mn(II)). The low and high levels were set to 0.57 and 0.67,
respectively. The high level was maintained at the stoichiometric molar ratio
between MnO4– (2 mol) and manganese(II) (3 mol) based on Equation 2-26, while the
low level was 85% of the high level molar ratio to produce an observable difference
in the experimental response. In the case of partially neutralised PLS, this ratio,
however, incorporated the amount in moles of iron(II) together with the amount in
moles of manganese(II) (denoted as mol MnO4–: total mol Fe(II) and Mn(II)) to take
into consideration the oxidation of iron(II) (Equation 3-3) before manganese(II) due
to a much lower standard reduction potential (Eϴ). The low and high levels were set
to 0.43 and 0.50, respectively. The high level was the stoichiometric molar ratio
between the total moles of MnO4– (3 mol) required to completely oxidise the total
moles of iron(II) and manganese(II) (6 mol) based on Equation 2-26 and Equation 3-3
with the overall equation shown in Equation 3-4, while the low level was 85% of the
high level molar ratio.
3 Fe(aq)2+ + MnO4(aq)
– + 4 H+ ↔ 3 Fe(aq)3+ + MnO2(s) + 2 H2O (3-3)
3 Fe(aq)2+ + 3 Mn(aq)
2+ + 3 MnO4(aq)– ↔ 3 Fe(aq)
3+ + 6 MnO2(s) (3-4)
Another variable considered was pH as it has an influence in most redox reactions
and this can be seen in the potential–pH equilibrium (Pourbaix) diagram for the
manganese–water system (Figure 5). The low level of pH (C) was the natural pH of
the solution, meaning no pH adjustment was carried out during the experiment while
the high level was set at pH 3, which was a convenient pH to operate at for the
oxidative precipitation of manganese(II) as it avoided the precipitation of nickel(II)
and cobalt(II). Lastly, agitation speed (D) was considered to ensure homogeneous
mixing of the solution during the experimental work. The low and high levels used for
agitation speed were set to 50 and 200 rpm, respectively, and these values ensured
that there was still noticeable mixing of the solution while the experiment was
performed. The effect of agitation in nucleation and particle size, however, was not
investigated, but may be relevant during the characterisation of the precipitate in
future studies. Prior to the implementation of the unreplicated full factorial design

36
for the screening experiments, an exploratory experiment was conducted using a
constantly agitated (50 rpm) synthetic post-partially neutralised PLS at ambient
temperature (19.5 oC). The pH of the solution was not adjusted throughout the
experiment and the amount of potassium permanganate used was at stoichiometric
molar ratio (0.67). Samples for assay were taken at 1 and 2 hours. The results
indicated that only 1.51% (from 96.88% to 98.39%) additional manganese(II) was
precipitated in the second hour but at the expense of losing 28.57% (from 4.56% to
33.13%) additional nickel(II) and 17.82% (from 48.79% to 66.61%) additional
cobalt(II). Because of the increased losses of nickel(II) and cobalt(II) over time,
subsequent experiments were limited to 1 hour.
An unreplicated full factorial design is a saturated experimental design. This means
that only the main and interaction effects as well as the general mean can be
estimated. There are no degrees of freedom left in a saturated experimental design
to estimate the experimental error. A workaround in this limitation is to analyse the
unreplicated full factorial design on the assumption of the sparsity-of-effects
principle and then plot the estimated effects in a normal probability plot (Daniel
1959, Montgomery 2013). The sparsity-of-effects principle states that main effects
(single variable) and low-order interaction effects (two-variable) are dominant in a
factorial design and any higher order interactions (three-variable and up) are
negligible (Montgomery 2013). The normal probability plot will assist in screening the
variables that may have significant effect on the responses being investigated.
Negligible or not significant effects are normally distributed and will fall along the
normal distribution line in the normal probability plot. In contrast, significant effects
are not normally distributed and will fall outside the normal distribution line. In order
to generate normal probability plots, the data gathered were encoded in Minitab®
18 and the significance of the variables was tested against a significance level (α) of
0.05. The significance of the variables was examined from the normal probability
plots before further experimental work was carried out to optimise the variables
using the OVAT approach. Afterwards, the optimum values determined from the
OVAT approach were applied to an actual PLS as test solution.

37
3.5 Experimental Set‐up for the Oxidative Precipitation Test Procedure
All oxidative precipitation tests were performed inside a fume hood to control any
exposure to hazardous substances produced during the experiment. The tests were
carried out in a 150 mL five-neck glass flask (Pine Research RRPG022) immersed in a
water bath. Heating and agitating for the experiment were facilitated using a hotplate
with magnetic stirrer (VELP Scientifica AREX heating and magnetic stirrer F20500163).
The temperature of the PLS was monitored using a temperature probe connected to
a pH meter to ensure that the temperature throughout the experiment was
maintained within the required operating temperature of the experimental run.
Additionally, the pH of the PLS was monitored using a pH meter equipped with pH
probe (TPS WP-80 pH meter, Ionode IJ44 pH probe). A 50 mL burette was used for
the addition of the potassium permanganate (KMnO4). Figure 8 shows the
experimental set-up used in the experimental work.
Figure 8. Experimental set‐up for the oxidative precipitation tests.

38
3.6 Oxidative Precipitation Test Procedure
Oxidative precipitation tests were conducted using the experimental set-up
described in Section 3.5. The tests were carried out by transferring 50 mL of the PLS
into a constantly agitated 150 mL five-neck glass flask. The temperature of the PLS
inside the five-neck glass flask was adjusted using a water bath until thermal
equilibrium was reached. The temperature of the PLS was constantly monitored using
the temperature probe and to ensure that the required temperature was maintained,
the temperature controller of the hot plate was manually adjusted. Potassium
permanganate (KMnO4) was then added in a drop-wise manner using the 50 mL
burette to minimise any local concentration effect in the feed solution. Afterwards,
the pH of the solution was adjusted by adding sodium hydroxide until the desired
equilibrium pH was reached and monitored using the pH meter with the addition of
sodium hydroxide as required to maintain a constant pH value. The same test
procedure was performed for the experimental work using the OVAT approach for
the optimisation of the variables that were identified to be significantly affecting the
oxidative precipitation of manganese(II).
3.7 Assay of Metals
The concentrations of the metal ions in the solution were analysed using ICP-OES.
The samples (10 mL) for assay were collected during the oxidative precipitation tests,
vacuum filtered (5.5 cm no. 1 Whatman qualitative filter paper) and then diluted with
nitric acid (4% m/m) to quench the reaction and prevent further precipitation. The
addition of nitric acid also ensured that the samples had the same acid matrix as the
ICP-OES calibration standards during analysis. No washing of the solids produced
from the vacuum filtered 10 mL samples were carried out as it was observed that the
amounts of solids were very small.

39
Chapter 4
RESULTS AND DISCUSSION
4.1 Screening of Effects of Experimental Variables on the Oxidative Precipitation of Manganese(II)
An unreplicated 24 full factorial design (Section 3.4) was implemented in order to
screen the main and interaction effects of the four selected variables in the oxidative
precipitation of manganese(II) from partially neutralised and post-partially
neutralised PLS. The four variables selected were temperature (A), molar ratio (B), pH
(C), and agitation speed (D). A set of oxidative precipitation experiments was carried
out following the experimental procedure outlined in Section 3.6. Synthetic solutions
simulating partially neutralised and post-partially neutralised PLS with typical
concentrations enumerated in Section 3.3 were used for the oxidative precipitation
experiments instead of an actual PLS since the elemental compositions of synthetic
solutions were better defined. Moreover, using a synthetic PLS enabled a
straightforward identification of the significant variables that may affect the oxidative
precipitation of manganese in the absence of any unassayed components that might
be present in an actual PLS.
The operating conditions for each experimental run were defined using the selected
levels and experimental matrix described in Section 3.4. The experimental plan as
well as the percent precipitated metal ions for the partially neutralised and post-
partially neutralised PLS are shown in Table 11 and Table 12, respectively. The
percent of precipitated metal ions were calculated from the initial minus the final
metal ion concentration after the dilution effect had been factored in due to the
addition of the reagents.

40
Table 11. Experimental plan and responses of unreplicated 24 full factorial design using a partially neutralised PLS as feed.
Temperature (°C)
Molar ratioa pH
Agitation speed (rpm)
Precipitated Metal Ions (%)
A B C D Mn Fe Ni Co Ambientb 0.43 Unadjustedc 50 75.64 61.21 1.03 5.00
35 0.43 Unadjusted 50 74.80 63.29 0.27 4.29 Ambient 0.50 Unadjusted 50 86.44 63.88 6.93 11.01
35 0.50 Unadjusted 50 83.20 64.55 0.00 4.42 Ambient 0.43 3 50 77.38 98.98 3.10 7.72
35 0.43 3 50 76.07 99.51 0.00 3.82 Ambient 0.50 3 50 84.96 99.33 1.18 6.62
35 0.50 3 50 85.54 99.73 1.76 9.28 Ambient 0.43 Unadjusted 200 76.44 60.41 0.83 4.59
35 0.43 Unadjusted 200 74.86 62.65 0.01 4.15 Ambient 0.50 Unadjusted 200 83.57 62.97 0.00 3.15
35 0.50 Unadjusted 200 84.42 66.72 6.90 11.95 Ambient 0.43 3 200 75.13 99.01 0.00 2.50
35 0.43 3 200 75.67 99.66 0.00 2.58 Ambient 0.50 3 200 84.78 99.66 1.04 6.74
35 0.50 3 200 85.82 99.66 2.20 9.29 aMolar ratio for a partially neutralised PLS is denoted as mol MnO4–: total mol Fe(II) and Mn(II); bAmbient temperature range =
23.9–26.7 oC ;cUnadjusted pH range = 1.71–1.85

41
Table 12. Experimental plan and responses of unreplicated 24 full factorial design using a post‐partially neutralised PLS as feed.
Temperature (°C)
Molar ratioa pH
Agitation speed (rpm)
Precipitated Metal Ions (%)
A B C D Mn Ni Co Ambientb 0.57 Unadjustedc 50 96.60 5.02 41.05
35 0.57 Unadjusted 50 94.86 9.18 44.53 Ambient 0.67 Unadjusted 50 99.32 9.71 60.14
35 0.67 Unadjusted 50 99.45 16.42 67.13 Ambient 0.57 3 50 97.36 8.01 63.98
35 0.57 3 50 96.07 12.91 62.31 Ambient 0.67 3 50 99.76 18.39 84.20
35 0.67 3 50 99.83 14.79 87.20 Ambient 0.57 Unadjusted 200 96.01 9.66 43.59
35 0.57 Unadjusted 200 95.53 16.01 48.22 Ambient 0.67 Unadjusted 200 99.80 16.52 61.72
35 0.67 Unadjusted 200 99.30 13.80 67.30 Ambient 0.57 3 200 97.51 13.88 65.14
35 0.57 3 200 96.08 13.68 62.74 Ambient 0.67 3 200 99.73 19.31 81.34
35 0.67 3 200 99.75 19.54 85.77 aMolar ratio for a post-partially neutralised PLS is denoted as mol MnO4–:mol Mn(II); bAmbient temperature range = 19.0–
24.5 oC ;cUnadjusted pH range = 1.65–1.71
4.1.1 Synthetic Partially Neutralised PLS as Feed Solution in Determining Effects of Experimental Variables on Oxidative Precipitation of Manganese(II)
The effects of the variables were estimated by constructing normal probability plots
for the precipitated metals (%) of manganese(II) and iron(II) versus standardized
effects, as shown in Figures 9 and 10, respectively. On these plots, a significant effect
is indicated by a square while a nonsignificant effect is indicated by a circle.

42
Figure 9. Normal probability plot of the main and interaction effects for the precipitation of manganese(II) (%) from a synthetic partially neutralised PLS (α =
0.05).
Figure 9 shows that the effect of molar ratio (B) on the precipitation of manganese(II)
was significant. The significance of the effect of molar ratio (B) with a standardized
effect (SE) of 17.664 was probably owing to the change in the number of moles of
manganese(II) that underwent oxidative precipitation produced by the change in
molar ratio, which manifested in the amount of precipitated manganese(II).
Increasing the molar ratio will cause an increase in available MnO4– that is being
consumed for the oxidative precipitation of manganese(II) and therefore resulting in
an increase in amount of precipitated manganese(II).
20151050
99
95
90
80
70
605040
30
20
10
5
1
Standardized Effect
Nor
mal
% P
roba
bilit
y (M
n)
Not SignificantSignificant
CD
BDBC
AD
AC
AB
D
C
B
A

43
Figure 10. Normal probability plot of the main and interaction effects for the precipitation of iron(II) (%) from a synthetic partially neutralised PLS (α = 0.05).
In the case of the precipitation of iron(II), Figure 10 shows that the effects of
temperature (A), molar ratio (B), and pH (C) as well as the interaction effects between
temperature and pH (AC) and molar ratio and pH (BC) were significant. The
significance of the effect of temperature (A) with SE of 3.757 was probably owing to
the considerable difference in the change in solubility of the iron compound
produced by the change in temperature, which manifested in the amount of
precipitated iron(II). The solubility of most insoluble compounds such as ferric
hydroxide tends to change as temperature changes, which can be predicted by the
Second Law of Thermodynamics. The Second Law of Thermodynamics predicts that
changing the temperature allows insoluble substances to shift towards a more
disorientated state by increasing the average velocity of the particles in order to
achieve thermal equilibrium of the system. The significance of the effect of molar
ratio (B) (SE = 4.291) was probably owing to the change in the number of moles of
iron(II) that underwent oxidative precipitation produced by the change in molar ratio,
which manifested in the amount of precipitated iron(II). Increasing the molar ratio
caused an increase in the available MnO4–consumed for the oxidation of iron(II) to
iron(III), which then precipitated to form ferric hydroxide. The significance of the
10896847260483624120
99
95
90
80
70
60
5040
30
20
10
5
1
Standardized Effect
Nor
mal
% P
roba
bilit
y (F
e)
Not SignificantSignificant
CDBD
BC
AD
AC
AB
D
C
B
A

44
effect of pH (C) was also evident in Figure 10. Among the effects that were significant,
it had the largest standardized effect (SE) of 105.60. A possible explanation for the
significance in the effect of pH (C) is the dependence of iron precipitation on pH as in
the case of ferric hydroxide. It can be seen in Equation 4-1 that an increase in
concentration of the hydroxide ion during pH adjustment will result in the shift of the
reaction forward to form ferric hydroxide following Le Chatelier's principle.
Fe(aq)3+ + 3 OH(aq)
- ↔ Fe(OH)3(s) (4-1)
The effects of the interaction between temperature and pH (AC) and molar ratio and
pH (BC) were also identified as significant based on Figure 10. However, the
significance of the interaction effects AC and BC had the smallest SE among the
effects that were significant since the points are relatively close to the normal
probability line. The SE of AC was −2.607 while the SE of BC was −3.400. This
suggested that the interaction effects had a smaller influence in the amount of
precipitated iron(II) than the individual effects.
The effect of interactions AC and BC was further evident when the interaction plots
were constructed, as shown in Figures 11 and 12, respectively. An interaction plot
shows the impact of the interacting variables to the response being investigated. The
more parallel the lines in an interaction plot, the less the interaction between the two
variables.

45
Figure 11. Interaction plot between temperature (A) and pH (C) with respect to the mean of precipitated iron(II) (%) where −1.0 and 1.0 represent the low level
and high levels of the variables used in the experimental plan (Table 11).
Figure 12. Interaction plot between molar ratio (B) and pH (C) with respect to the mean of precipitated iron(II) (%) where −1.0 and 1.0 represent the low level
and high levels of the variables used in the experimental plan (Table 11).
In the case of either Figure 11 or Figure 12, the lines were relatively parallel to each
other with only a slight increase in the solid line, which means that the interaction
between temperature and pH (AC) and molar ratio and pH (BC) was weak and
1.0-1.0
100
90
80
70
60
Temperature
Mea
n of
Pre
cipi
tate
d Fe
(%)
-1.01.0
pH
1.0-1.0
100
90
80
70
60
Molar ratio
Mea
n of
Pre
cipi
tate
d Fe
(%)
-1.01.0
pH

46
therefore, their significance in the precipitation of iron(II) can be considered to be
negligible. A possible reason for the interaction between temperature and pH (AC) is
due to the influence of the temperature on the pH. A change in temperature alters
the activity of all the ions in the solution. An increase in temperature will increase the
activity of hydrogen ion and cause the pH to decrease. The decrease in pH will result
in an increase in pOH and decrease the activity of hydroxide ion; therefore, it hinders
iron precipitation (Equation 4-1). The interaction between molar ratio and pH (BC),
indicated that the effect of pH (C) on the amount of iron(II) precipitated was
influenced by the molar ratio (B). For iron(II) to precipitate as ferric hydroxide upon
pH adjustment, all iron(II) in the partially neutralised PLS must first be oxidised to
iron(III) with enough MnO4−.
No significant effects were shown in the normal probability plot for precipitated (%)
nickel(II) (Figure 13) and cobalt(II) (Figure 14). Any losses in nickel(II) and cobalt(II)
were probably due to the occurrence of co-precipitation, which usually occurs when
the solution is multi-component. This can either be due to inclusion, occlusion, or
surface adsorption in the precipitate formed (Harvey 2000). However, another
mechanism may have occurred, which requires further studies to confirm the reason
behind the losses in nickel(II) and cobalt(II).
Taking into consideration the magnitude of the SE among the significant main and
interaction effects, it was determined that for a synthetic partially neutralised PLS,
molar ratio (B) had the largest SE for the precipitation of manganese(II) while pH (C)
had the largest SE for the precipitation of iron(II); therefore, OVAT tests concentrated
on the optimisation of molar ratio (B) and pH (C). The results are discussed in Section
4.2.

47
Figure 13. Normal probability plot of the main and interaction effects for the precipitation of nickel(II) (%) from a synthetic partially neutralised PLS (α =
0.05).
Figure 14. Normal probability plot of the main and interaction effects for the precipitation of cobalt(II) (%) from a synthetic partially neutralised PLS (α =
0.05).
3210-1-2-3
99
95
90
80
70
60
5040
30
20
10
5
1
Standardized Effect
Nor
mal
% P
roba
bilit
y (N
i)
Not SignificantSignificant
CD
BD
BC
AD
AC
AB
D
C
B
A
3210-1-2-3
99
95
90
80
70
60
5040
30
20
10
5
1
Standardized Effect
Nor
mal
% P
roba
bilit
y (C
o)
Not SignificantSignificant
CD
BDBC
AD
AC
AB
D
C
B
A
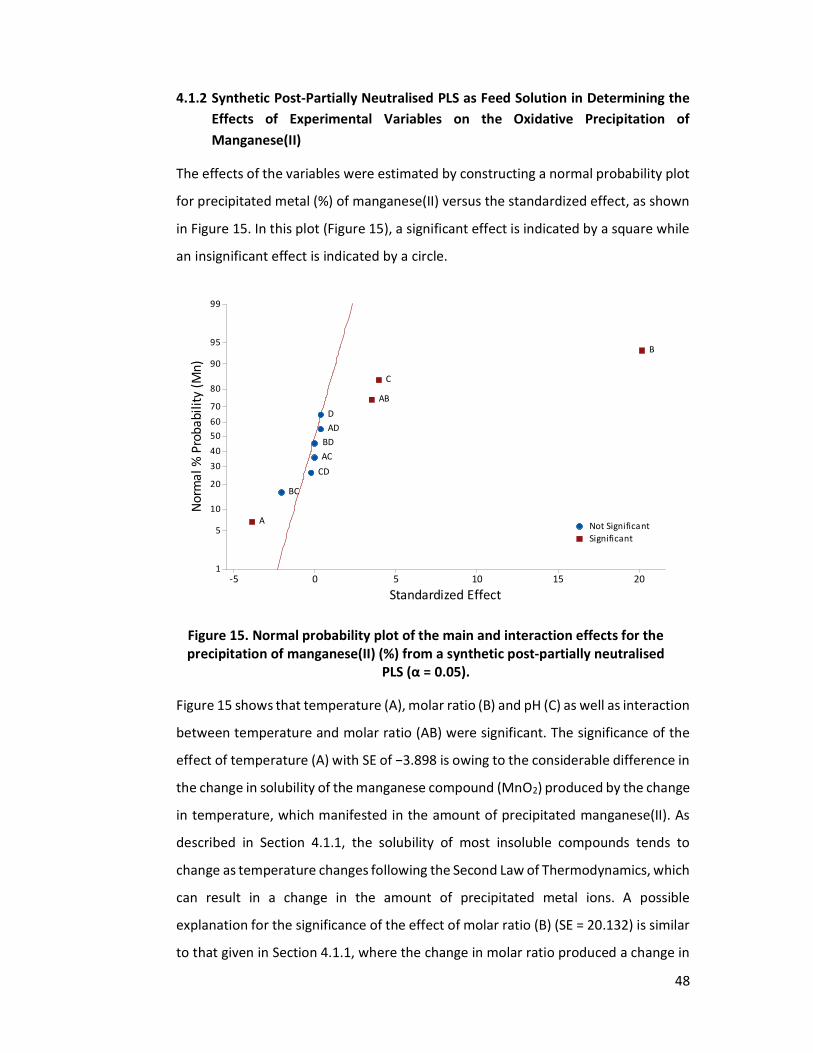
48
4.1.2 Synthetic Post‐Partially Neutralised PLS as Feed Solution in Determining the Effects of Experimental Variables on the Oxidative Precipitation of Manganese(II)
The effects of the variables were estimated by constructing a normal probability plot
for precipitated metal (%) of manganese(II) versus the standardized effect, as shown
in Figure 15. In this plot (Figure 15), a significant effect is indicated by a square while
an insignificant effect is indicated by a circle.
Figure 15. Normal probability plot of the main and interaction effects for the precipitation of manganese(II) (%) from a synthetic post‐partially neutralised
PLS (α = 0.05).
Figure 15 shows that temperature (A), molar ratio (B) and pH (C) as well as interaction
between temperature and molar ratio (AB) were significant. The significance of the
effect of temperature (A) with SE of −3.898 is owing to the considerable difference in
the change in solubility of the manganese compound (MnO2) produced by the change
in temperature, which manifested in the amount of precipitated manganese(II). As
described in Section 4.1.1, the solubility of most insoluble compounds tends to
change as temperature changes following the Second Law of Thermodynamics, which
can result in a change in the amount of precipitated metal ions. A possible
explanation for the significance of the effect of molar ratio (B) (SE = 20.132) is similar
to that given in Section 4.1.1, where the change in molar ratio produced a change in
20151050-5
99
95
90
80
70
6050
40
30
20
10
5
1
Standardized Effect
Nor
mal
% P
roba
bilit
y (M
n)
Not SignificantSignificant
CD
BD
BC
AD
AC
AB
D
C
B
A

49
the number of moles of manganese(II) that underwent oxidative precipitation, which
manifested in the amount of precipitated manganese(II). Increasing the molar ratio
resulted in an increase in available MnO4− that was consumed for the oxidative
precipitation of manganese(II) (Equation 2-26) from the synthetic post-partially
neutralised PLS and therefore resulting in an increase in amount of precipitated
manganese(II). The effect of pH (C) (SE = 3.901) was also significant, as can be seen in
Figure 15. This result may be explained by the influence of pH (C) on the oxidative
precipitation of manganese(II), which can be seen in the potential–pH equilibrium
(Pourbaix) diagram (Figure 5) for the manganese–water system. Although MnO2 can
readily form at highly acidic conditions, increasing the pH results in an increase in the
oxidation rate of manganese(II) (Van Benschoten et al. 1992, Freitas et al. 2013) and
may result in the formation of other insoluble manganese compounds, such as
Mn2O3, Mn3O4, and Mn(OH)2.
The effect of the interaction between temperature and molar ratio (AB) (SE = 3.478)
was also identified to be significant, based on the data of Figure 15. This may indicate
that the effect of molar ratio (B) on the precipitation of manganese(II) is influenced
by temperature (A). It is possible that the interaction between temperature and
molar ratio (AB) is due to the change in the number of moles of manganese(II) that
underwent oxidative precipitation produced by the change in molar ratio and since
temperature (A) affects the solubility of the insoluble manganese compound (MnO2),
as in the case of the individual effect, its interaction with molar ratio (B) manifested
through considerable changes in the amount of precipitated manganese(II).
The effect of interaction AB was further evident when the interaction plot was
constructed, as shown in Figure 16. It can be seen in Figure 16 that changes in
temperature only occurred in instances when the molar ratio was at the low level. At
a high level of molar ratio, the mean of precipitated manganese(II) was relatively
constant as the temperature changed, which may be beneficial since the amount of
precipitated manganese(II) was at a maximum. This suggested that the individual
effect of molar ratio is stronger compared with the interaction effect between
temperature and molar ratio at the high-level molar ratio. By operating at high-level

50
molar ratio, the interaction effect will be minimised while the amount of precipitated
manganese(II) is maximised.
Figure 16. Interaction plot between temperature (A) and molar ratio (B) with respect to the mean of precipitated manganese(II) (%) where −1.0 and 1.0represent the low level and high levels of the variables used in the
experimental plan (Table 12).
In the case of the precipitation of nickel(II), Figure 17 shows that the effects of molar
ratio (B) and agitation speed (D) were significant. The significance of the effect of
molar ratio (B) (SE = 3.982) suggests that nickel(II) may have also undergone
precipitation as the molar ratio (B) changed, which manifested in the amount of
precipitated nickel(II). However, this finding was unexpected since, based on the
potential–pH equilibrium (Pourbaix) diagram (Figure 6) for the nickel–water system,
nickel should remain soluble under the conditions used for the present study. A
possible reason for this is that the solution behaviour being multi-component
contains different interacting ions that may have caused nickel(II) to co-precipitate
due to the changes in molar ratio and therefore causing a considerable difference in
the amount of precipitated nickel(II). As for the significance of the effect of agitation
speed (D) (SE = 2.776), it is possible that the change in agitation speed produced a
change in the collision frequency between the different ions in the solution, which
affected the precipitation mechanism (Misra 2016), resulting in a change in the
1.0-1.0
100
99
98
97
96
Temperature
Mea
n of
Pre
cipi
tate
d M
n (%
) -1.01.0
RatioMolar

51
amount of precipitated nickel(II). Misra (2016) reported that agitation affected the
nucleation, growth, and agglomeration of solids formed during precipitation and may
also lead to attrition and breakage of the solids when the agitation speed is high.
Figure 17. Normal probability plot of the main and interaction effects for the precipitation of nickel(II) (%) from a synthetic post‐partially neutralised PLS (α =
0.05).
Figure 18 shows that the effects of temperature (A), molar ratio (B), and pH (C) as
well as the interactions effects between temperature and molar ratio (AB),
temperature and pH (AC), molar ratio and agitation speed (BD), and pH and agitation
(CD) were significant for the precipitation of cobalt(II). The significance of the effect
of temperature (A) with SE of 6.215 was possibly due to the considerable difference
in the change in solubility of the cobalt compound produced by the change in
temperature, which manifested in the amount of precipitated cobalt(II). However, it
is not clear what cobalt compound formed and may require further investigation to
be undertaken to examine the precipitate since this is beyond the scope of the
present work. Similarly, the reason behind the significance of the effect of molar ratio
(B) with SE of 42.193 is also not clear at this point. Based on the potential–pH
equilibrium (Pourbaix) diagram (Figure 7) for the cobalt–water system, cobalt should
remain soluble under the conditions used for the present study. However, the
43210-1-2-3
99
95
90
80
70
6050
40
30
20
10
5
1
Standardized Effect
Nor
mal
% P
roba
bilit
y (N
i)
Not SignificantSignificant
CDBD
BC
AD
AC
AB
D
C
B
A

52
significance of molar ratio (B) suggests that cobalt(II) may have also undergone
precipitation as the molar ratio (B) changed. A possible explanation for this may be
similar to that for nickel(II), where the multi-component behaviour of the solution
and the interaction between the different ions may have driven the co-precipitation
of cobalt(II) to occur during the oxidative precipitation of manganese(II) due to the
changes in molar ratio. Further studies may need to be undertaken to understand the
mechanism by which molar ratio affects the precipitation of cobalt(II) during the
oxidative precipitation of manganese(II) by potassium permanganate. In the case of
the effect of pH (C) (SE = 41.098), its significance was probably owing to the
dependence of different cobalt compounds on pH, as what can be seen from the
potential–pH equilibrium (Pourbaix) diagram (Figure 7) for the cobalt–water system.
Increases in pH can enhance the precipitation of cobalt(II), which may result in the
formation of insoluble cobalt compounds such as Co(OH)3, Co3O4, and Co(OH)2.
Figure 18. Normal probability plot of the main and interaction effects for the precipitation of cobalt(II) (%) from a synthetic post‐partially neutralised PLS (α =
0.05).
The effects of the interaction between temperature and molar ratio (AB) (SE = 4.127),
temperature and pH (AC) (SE = −4.477), molar ratio and agitation speed (BD) (SE =
403020100
99
95
90
80
70
60
5040
30
20
10
5
1
Standardized Effect
Nor
mal
% P
roba
bilit
y (C
o)
Not SignificantSignificant
CD
BD
BC
AD
AC
AB
D
C
B
A
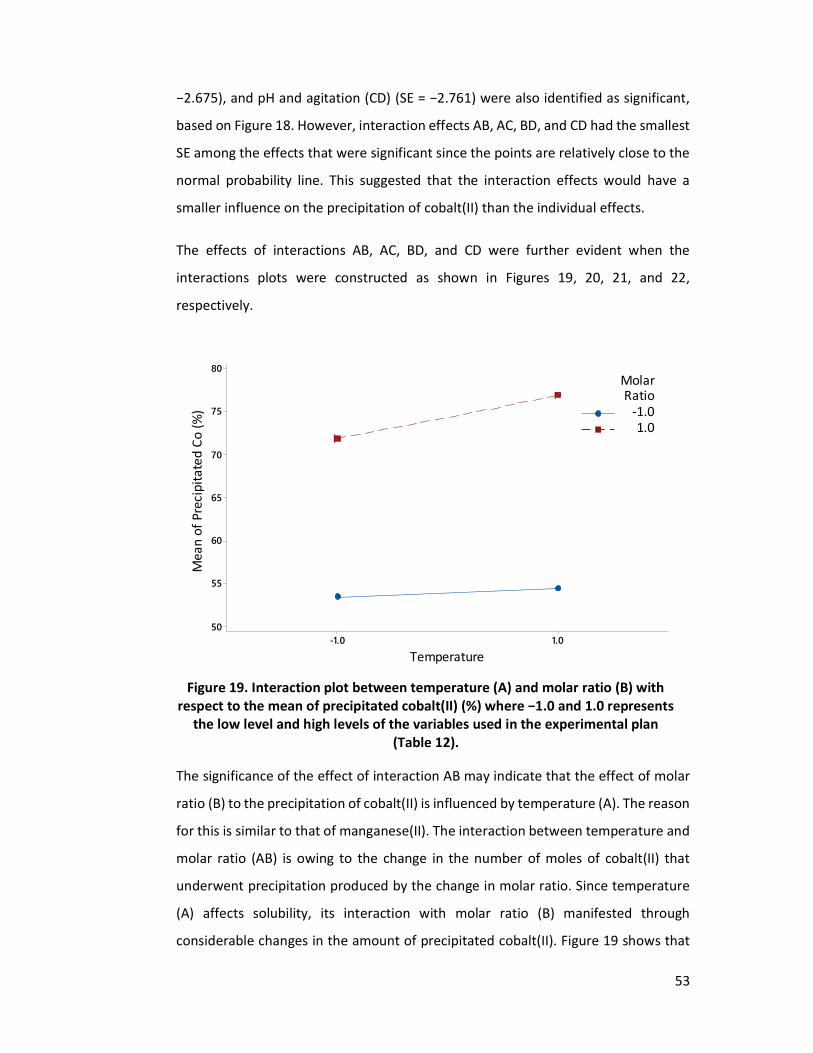
53
−2.675), and pH and agitation (CD) (SE = −2.761) were also identified as significant,
based on Figure 18. However, interaction effects AB, AC, BD, and CD had the smallest
SE among the effects that were significant since the points are relatively close to the
normal probability line. This suggested that the interaction effects would have a
smaller influence on the precipitation of cobalt(II) than the individual effects.
The effects of interactions AB, AC, BD, and CD were further evident when the
interactions plots were constructed as shown in Figures 19, 20, 21, and 22,
respectively.
Figure 19. Interaction plot between temperature (A) and molar ratio (B) with respect to the mean of precipitated cobalt(II) (%) where −1.0 and 1.0 represents
the low level and high levels of the variables used in the experimental plan (Table 12).
The significance of the effect of interaction AB may indicate that the effect of molar
ratio (B) to the precipitation of cobalt(II) is influenced by temperature (A). The reason
for this is similar to that of manganese(II). The interaction between temperature and
molar ratio (AB) is owing to the change in the number of moles of cobalt(II) that
underwent precipitation produced by the change in molar ratio. Since temperature
(A) affects solubility, its interaction with molar ratio (B) manifested through
considerable changes in the amount of precipitated cobalt(II). Figure 19 shows that
1.0-1.0
80
75
70
65
60
55
50
Temperature
Mea
n of
Pre
cipi
tate
d Co
(%) -1.01.0
RatioMolar

54
at the high level of molar ratio, there was an increase in the amount of mean
precipitated cobalt(II) as temperature changed from low to high level. It can also be
seen that at the low level of molar ratio, the mean of precipitated cobalt(II) was
relatively constant. Since the interaction was only evident at a high-level molar ratio,
this is probably the reason why the SE for the effect of interaction AB was small and
may indicate that there is a weak interaction between temperature and molar ratio
and therefore, its significance in the precipitation of cobalt(II) can be considered to
be negligible.
Turning now to the significance of the effect of AC, Figure 20 indicates that the effect
of pH (C) on the precipitation of cobalt(II) is influenced by temperature (A). The
significance of effect AC can be explained by the fact that temperature has an
influence on pH. A change in temperature will alter the activity of all the ions in the
solution. An increase in temperature will increase the activity of hydrogen ions and
cause the pH to decrease; therefore, it may cause some changes in the precipitation
of cobalt(II).
Figure 20. Interaction plot between temperature (A) and pH (C) with respect to the mean of precipitated cobalt(II) (%) where −1.0 and 1.0 represents the low level and high levels of the variables used in the experimental plan (Table 12).
Figure 20 shows that at the low level of pH, there was an increase in the amount of
mean precipitated cobalt(II) as temperature changed from low to high level. The
1.0-1.0
75
70
65
60
55
50
Temperature
Mea
n of
Pre
cipi
tate
d Co
(%)
-1.01.0
pH

55
amount of mean precipitated cobalt(II), however, remained relatively constant when
the pH was at the high level as temperature changed from low to high level, which is
probably the reason why the SE for the effect of interaction AC on the precipitation
of cobalt(II) was small and may indicate a weak interaction between temperature and
pH and therefore, its significance in the precipitation of cobalt(II) can also be
considered to be negligible.
The lines in either Figure 21 or Figure 22, respectively, were relatively parallel to each
other with only a slight decrease in the solid line at the low level of either molar ratio
for interaction effect BD or pH for interaction effect CD. This indicated that the
interaction between molar ratio and agitation speed (BD) and pH and agitation speed
(CD) was weak and therefore, their significance in the precipitation of cobalt(II) can
be considered to be negligible. It was also evident from Figures 21 and 22 that the
agitation speed did not cause much change in the mean of precipitated cobalt(II).
The change in the mean of precipitated cobalt(II) was primarily influenced by either
molar ratio or pH, which suggested that the individual effects were strong compared
with the interaction effects. The interaction of agitation speed to either molar ratio
or pH may possibly due to a similar reason as discussed in the earlier portion of
Section 4.1.2 concerning nickel(II).

56
Figure 21. Interaction plot between molar ratio (B) and agitation speed (D) with respect to the mean of precipitated cobalt(II) (%) where −1.0 and 1.0 represents
the low level and high levels of the variables used in the experimental plan (Table 12).
Figure 22. Interaction plot between pH (C) and agitation speed (D) with respect to the mean of precipitated cobalt(II) (%) where −1.0 and 1.0 represents the low level and high levels of the variables used in the experimental plan (Table 12).
Taking into consideration the magnitude of the SE among the significant main and
interaction effects on the oxidative precipitation of manganese(II), it was determined
1.0-1.0
75
70
65
60
55
50
Molar ratio
Mea
n of
Pre
cipi
tate
d Co
(%) -1.0
1.0
SpeedAgitation
1.0-1.0
75
70
65
60
55
pH
Mea
n of
Pre
cipi
taed
Co
(%) -1.0
1.0
SpeedAgitation

57
that for a synthetic post-partially neutralised PLS, molar ratio (B) had the largest SE
for the precipitation of manganese(II); therefore, OVAT tests concentrated on the
optimisation of molar ratio (B). The results are discussed in Section 4.2. Significant
effects for the precipitation of either nickel(II) and cobalt(II) were not considered for
the OVAT tests since the aim of the current study was focused on optimising the
variables that had significant effect on the oxidative precipitation of manganese(II).
4.2 Optimisation of Variables with Significant Effect on Oxidative Precipitation of Manganese(II)
Optimisation experiments using synthetic partially neutralised and post-partially
neutralised PLS were carried out using the same experimental procedure outlined in
Section 3.6. As determined from the screening experiments (Section 4.1.1) using
partially neutralised PLS as test solution, molar ratio (B) and pH (C) were considered
for optimisation using the OVAT approach since both variables had the largest
standardized effect in comparison with all the other variables with significant effect.
In the case of the post-partially neutralised PLS, it was determined from the screening
experiments (Section 4.1.2) that molar ratio (B) had the largest standardized effect in
comparison with all the other variables with significant effect on the precipitation of
manganese(II) and it was considered for optimisation using the OVAT approach. The
variations of molar ratio (B) and pH (C) were investigated in separate sets of
experiments to explore whether higher amounts of manganese(II) could be
precipitated. Optimisation of pH (C) was only applicable to synthetic partially
neutralised PLS due to the presence of iron(II), which required pH adjustment for its
oxidative precipitation.
4.2.1 Effect of pH on Oxidative Precipitation of Manganese(II)
The effect of pH on the oxidative precipitation of manganese(II) was examined by
varying the pH in the range of 1.77 to 4.0. Afterwards, the amount of precipitated
metal ions (%) was plotted against pH to observe any trend. Similar to Section 4.1,
the percent of precipitated metal ions were calculated from the initial minus the final
metal ion concentration after the dilution effect had been factored in due to the

58
addition of the reagents. Figure 23 shows the effect of pH on the amount of
precipitated metals ions (%).
Figure 23. The effect of pH on the amount of precipitated metals ions (%) from synthetic partially neutralised PLS. Initial pH = 2.12–2.15; ambient T = 23.9–26.0
ᵒC; agitation speed = 50 rpm; molar ratio = 0.5 (stoichiometric); t = 1 h.
From the data in Figure 23, there was an increasing trend in the amount of
precipitated manganese(II), iron(II), nickel(II), and cobalt(II) (%) as the pH increased.
The increase in the amount of precipitated manganese(II) was observed when the pH
was greater than or equal to 3 (pH ≥ 3). This suggested that operating at a higher pH
will enhance the oxidative precipitation of manganese(II) that will result in an
increase in the amount of precipitated manganese(II). A possible explanation for this
increase is the tendency for manganese(II) to form other stable solid species such as
Mn2O3, Mn3O4, and Mn(OH)2 when operating at higher pH conditions, as can be seen
in the potential–pH equilibrium (Pourbaix) diagram for the manganese–water system
(Figure 5). Additionally, the result is consistent with the trend reported in earlier
studies on the oxidative precipitation of manganese(II) for water treatment (Adams
1960, Phatai et al. 2010, Elsheikh et al. 2017) and acid mine water treatment (Freitas
et al. 2013) despite using different manganese-containing solutions and operating at
different pH conditions (neutral to basic conditions). A similar trend was also
observed with the amount of precipitated iron(II) (%). The trend can be attributed to
the fact that the precipitation of ferric hydroxide would require the adjustment of pH
to greater than 2 (pH > 2). Operating at a higher pH (pH > 2), however, was
0%
20%
40%
60%
80%
100%
1.5 2.0 2.5 3.0 3.5 4.0 4.5 5.0
Prec
ipita
ted
Met
al Io
ns (%
)
pH
Mn
Fe
Ni
Co

59
unfavourable to nickel(II) and cobalt(II) due to the increase in their precipitation
(Figure 23). It is possible that the increase was due to the co-precipitation (Harvey
2000) of nickel(II) and cobalt(II) either as nickel hydroxide or cobalt hydroxide as the
pH increases or a different mechanism that requires further investigation in order to
confirm this observation.
An issue that may arise from the increase in the amount of precipitated nickel(II) and
cobalt(II) was that there will be losses of the valuable metals that goes together with
the manganese precipitate (MnO2). Given these considerations, the most appropriate
approach is to minimise the losses of nickel(II) and cobalt(II) by operating at the
minimum pH needed to maximise both iron(II) and manganese(II) precipitation,
which was at pH 3. At a pH of 3, iron(II) precipitation was complete while
manganese(II) precipitation was close to 85%. Moreover, at this pH, the amounts of
nickel(II) and cobalt(II) precipitated were close to 2% and 7%, respectively. However,
if the desire is to push the amount of precipitated manganese(II) beyond 85% by
operating at pH greater than 3 (pH > 3), it would be at the expense of losing nickel(II)
and cobalt(II), which reached as high as 28% and 43%, respectively.
Taken together, these results suggest that the oxidative precipitation of
manganese(II) can be carried out in acidic conditions, but can be enhanced at a pH >
3, which is beneficial for the oxidative precipitation of iron(II) when present together
with manganese(II) in the partially neutralised PLS. However, inevitable losses in
nickel(II) and cobalt(II) was observed at a pH >3. Hence, the pH value applied on the
oxidative precipitation of manganese(II) from an actual partially neutralised PLS was
3 to ensure the precipitation of the oxidized iron(II) before manganese(II). The results
of the experiments are discussed in Section 4.3. As for nickel(II) and cobalt(II), further
study needs to be conducted in order to understand the mechanism by which the
ions are affected by pH control during the oxidative precipitation of manganese(II) in
a partially neutralised PLS.
4.2.2 Effect of Molar Ratio on Oxidative Precipitation of Manganese(II)
The molar ratios used in the experimental work were at 85% (0.43), 100% (0.50),
105% (0.53), and 115% (0.58) of the stoichiometric ratio (0.50) in order to observe

60
the effect of molar ratio on the oxidative precipitation of manganese(II). Afterwards,
the amount of precipitated metal ions (%) was plotted against molar ratio to observe
any trend. The percent of precipitated metal ions were calculated from the initial
minus the final metal ion concentration after the dilution effect had been factored in
due to the addition of the reagents. Figure 24 shows the effect of molar ratio on the
amount of precipitated metal ions (%).
Figure 24. The effect of molar ratio on the amount of precipitated metal ions (%) from synthetic partially neutralised PLS. pH = 3.00; ambient T = 24.3–26.1
ᵒC; agitation speed = 50 rpm; t = 1 h.
From the data in Figure 24, the amount of precipitated iron(II) (%) was relatively
complete and constant at the molar ratios (0.43, 0.50, 0.53, and 0.58) investigated,
indicating that there was sufficient available permanganate ion (MnO4−) to ensure
the complete oxidative precipitation of the iron(II) in the solution. This result may be
attributed to the fact that any iron(II) present in the partially neutralised PLS will
preferentially be oxidised by the available MnO4− before manganese(II) due to a much
lower standard reduction potential (Eϴ) (Section 3.4). In contrast, the result was not
the same for the amount of precipitated manganese(II). Figure 24 shows that the
amount of precipitated manganese(II) increased with increasing molar ratio. A
possible explanation for this result is that by increasing the molar ratio, there was an
increase in the available MnO4− that reacted not only with iron(II), but also with
manganese(II); therefore, resulting in more manganese(II) being oxidised. This
increasing trend in the amount of precipitated manganese(II) is consistent with
0%
20%
40%
60%
80%
100%
0.40 0.45 0.50 0.55 0.60 0.65
Prec
ipita
ted
Met
al Io
ns (%
)
Molar Ratio
Mn
Fe
Ni
Co

61
previous studies on the oxidative precipitation of manganese(II) reported by Phatai
et al. (2014) and Elsheikh et al. (2017) using synthetic groundwater and Heviankova
and Bestova (2007) and Macingova et al. (2016) using acid mine water despite using
different manganese-containing solutions and operating at different pH conditions
(neutral to basic conditions) in comparison with the present study. However, it should
be noted down that although the trend of the present study is consistent with those
reported from previous studies, the amount of potassium permanganate consumed
for the oxidative precipitation of manganese(II) differed from that of the various
authors (Heviankova and Bestova 2007, Phatai et al. 2014, Macingova et al. 2016,
Elsheikh et al. 2017) mentioned. The difference in the amount of potassium
permanganate used by various authors is probably owing to the dissimilar
composition of the test solution used, which may have resulted in different solution
behaviour and interaction among the metal ions in the solution that caused some
interference in the oxidative precipitation by KMnO4.
It is also apparent from Figure 24 that there was an increase in the amount of
precipitated nickel(II) and cobalt(II) as the molar ratio increased to greater than 0.50.
Operating at molar ratios greater than 0.50 showed complete oxidative precipitation
of manganese(II), but the downside of this is that nickel(II) and cobalt(II) were lost in
the manganese precipitate due to the observed increase in amount of precipitated
nickel(II) and cobalt(II). Although it was observed from the potential–pH equilibrium
(Pourbaix) diagram (Figure 6 and Figure 7) that it is unlikely for nickel(II) and cobalt(II)
to undergo oxidative precipitation at the conditions used for the present study, it is
possible that the increase is due to the co-precipitation (Harvey 2000) of nickel(II) and
cobalt(II). The co-precipitation mechanism whether by inclusion, occlusion, or surface
adsorption (Harvey 2000), however, is not clear at this point and may require further
investigation to understand the mechanism in which nickel(II) and cobalt(II) co-
precipitates during the oxidative precipitation of manganese(II). Additionally, a
different mechanism may have also occurred other than co-precipitation that
requires further investigation in order to confirm this observation. Given these
considerations, the most probable approach to minimise the losses in nickel(II) and
cobalt(II) is to operate at stoichiometric molar ratio (0.50) while maximising the

62
precipitation of iron(II) and manganese(II). At stoichiometric molar ratio, iron(II)
precipitation was complete while manganese(II) was close to 85%. Moreover, the
amounts of precipitated nickel(II) and cobalt(II) were close to 2% and 7%,
respectively. However, if the desire is to obtain higher amounts of precipitated
iron(II) and manganese(II), using 5% more of stoichiometric molar ratio (0.53)
resulted in the complete precipitation of both iron(II) and manganese(II) at the
expense of higher nickel(II) and cobalt(II) losses. At a molar ratio of 0.53, the amounts
of precipitated nickel(II) and cobalt(II) were close to 20% and 30%, respectively.
Turning now to the effect of molar ratio on the oxidative precipitation of
manganese(II) from synthetic post-partially neutralised, the molar ratios used in the
experimental work were at 85% (0.57), 100% (0.67), 105% (0.70), and 115% (0.77) of
the stoichiometric ratio (0.67). The amount of precipitated metal ions (%) was plotted
against molar ratio to observe any trend. Figure 25 shows that there was an increase
in the amount of precipitated manganese(II) (%) from a molar ratio of 0.57 to 0.70,
but a slight decrease was observed at 0.77.
Figure 25. The effect of molar ratio on the amount of precipitated metal ions (%) from synthetic post‐partially neutralised PLS. Unadjusted pH = 1.66–1.71;
ambient T = 18.5–23.0 ᵒC; agitation speed = 50 rpm; t = 1 h.
A possible explanation for the increase in the amount of precipitated manganese(II)
from 0.57 to 0.70 is due to the increase in the available permanganate ion (MnO4−)
and therefore, resulting in more manganese(II) being oxidised and then precipitated
0%
20%
40%
60%
80%
100%
0.55 0.60 0.65 0.70 0.75 0.80
Prec
ipita
ted
Met
al Io
ns (%
)
Molar ratio
Mn
Ni
Co

63
from the solution. This finding was in agreement with the results obtained using
partially neutralised PLS, where an increase in molar ratio also resulted in an increase
in amount of precipitated manganese(II). However, it should be noted down that the
presence of iron(II) in the partially neutralised PLS as opposed to that of a post-
partially neutralised PLS would require more permanganate ion to oxidise iron(II)
before manganese(II). The increase in the amount of precipitated manganese(II) as
the molar ratio increased is also consistent with previous studies on the oxidative
precipitation of manganese(II) reported by Phatai et al. (2014) and Elsheikh et al.
(2017) using synthetic groundwater and Heviankova and Bestova (2007) and
Macingova et al. (2016) using acid mine water despite using different manganese-
containing solutions and operating at different pH conditions (neutral to basic
conditions) in comparison with the present study. Turning now to the slight decrease
in the amount of precipitated manganese(II) observed at a molar ratio of 0.77, there
was probably an overdose of permanganate ion in the solution, which may have
generated additional manganese(II) according to Equation 4-1. This was not observed
from the results obtained from the experimental work using partially neutralised PLS,
which indicated that the presence of iron(II) possibly caused some interference
during the oxidative precipitation of manganese(II) that prevents the generation of
additional manganese(II) when there is an overdose of permanganate ion in the
solution.
MnO4(aq)- + 8 H(aq)
+ + 5 e- ↔ Mn(aq)2+ + 4 H2O (4-1)
In the case of either the amount of precipitated nickel(II) or cobalt(II), Figure 25 shows
a relatively similar trend except that the percent of precipitated cobalt(II) was at a
higher range in comparison with nickel(II). This result was contrary to the results
obtained from nickel(II) and cobalt(II) in Figure 24 especially with the amount of
precipitated cobalt(II), which was already high even at low molar ratio. The reason
for this is not clear at this point but it may have something to do with the multi-
component behaviour of the solution, which have caused the variability in the
amount of precipitated nickel(II) and cobalt(II) due to a similar reason as discussed in
the earlier portion of Section 4.2.2 for Figure 24. Given these considerations, the most
probable approach is to operate at a molar ratio where the generation of additional
64
manganese(II) from permanganate will be avoided. In the case of the present study,
this would be less than or equal to a molar ratio of 0.70.
Overall, the results for both partially neutralised and post-partially neutralised PLS
indicated that an increase in molar ratio resulted in an increase in the amount of
precipitated manganese(II). However, special care should be taken into consideration
for choosing the amount of potassium permanganate to ensure that the ratio of
available MnO4− will be sufficient for the oxidative precipitation of manganese(II)
from a multi-component solution and to avoid the overdose of permanganate ion,
which can lead to the generation of additional manganese(II). For a partially
neutralised PLS, the amount of precipitated manganese(II) increased at a molar ratio
greater than the stoichiometric molar ratio (>0.50) before reaching a relatively
constant value close to 100%. As for a post-partially neutralised PLS, the optimum
value obtained was at a stoichiometric ratio less than or equal to 105% of the
stoichiometric molar ratio (≤0.70) where the amount of precipitated manganese(II)
was close to 100%. However, in the case of either the partially neutralised or post-
partially neutralised PLS, inevitable losses in nickel(II) and cobalt(II) were observed in
the results. Hence, the molar ratio applied on the oxidative precipitation of
manganese(II) from either an actual partially neutralised or post-partially neutralised
was limited to stoichiometric molar ratio and 105% of stoichiometric molar ratio. The
results obtained are discussed in Section 4.3.
4.3 Application of Optimised Values on Oxidative Precipitation of Manganese(II) from Actual PLS
The oxidative precipitation experiments using actual partially neutralised and post-
partially neutralised PLS were carried out using the same experimental procedure
outlined in Section 3.6. As determined from the optimisation experiments using
synthetic partially neutralised PLS, the optimum value obtained for pH was 3 (Section
4.2.1) while for molar ratio, it was at stoichiometric molar ratio (0.50) (Section 4.2.2).
However, since the amount of precipitated manganese(II) at 0.50 was only 85%,
experiments using 105% of the stoichiometric molar ratio (0.53) were also carried out
even at the expense of losses in nickel(II) and cobalt(II) to test whether a higher

65
amount of manganese(II) would precipitate from an actual partially neutralised PLS.
Application of the technique using molar ratios of 0.50 and 0.53, both maintained at
pH 3, were investigated in separate sets of experiments. In the case of the post-
partially neutralised PLS, it was determined from the optimisation experiments that
the optimum value for molar ratio should be less than or equal to 0.70 (Section 4.5.1)
to avoid the overdose of permanganate ion, which can lead to the generation of
additional manganese(II). Hence, the values chosen were stoichiometric molar ratio
(0.67) and 105% of the stoichiometric molar ratio (0.70) since it was at these values
that the amount of precipitated manganese(II) was relatively constant based on the
OVAT experiment. The application of the technique using molar ratios of 0.67 and
0.70 was also investigated in separate sets of experiments. In either the actual
partially neutralised or post-partially neutralised PLS, each set of experiments was
conducted twice to test the repeatability of the results when applied to the actual
PLS.
Repeatability of the results was examined by constructing a bar chart of the mean of
precipitated metal ions (%) against the metal ions in the actual PLS. Error bars for
each metal ion were also included to represent the standard deviation (SD) of the
mean of precipitated metal ions (%). Data that are narrowly clustered around the
mean will have a small SD while data that are broadly dispersed around the mean will
have a large SD. In the case of the present study, a SD of less than or equal to 10%
(SD 10%) was considered to be practically acceptable for the application of the
technique using an actual PLS. The acceptability of the SDs, however, may vary
depending on the willingness of the nickel laterite processing operations to tolerate
any variation in the results on the basis of their desired final product as well as the
variability in the composition of the actual PLS they use. Moreover, the number of
results taken for the repeatability test was based on the practicality of the procedure
and the availability of an appropriate measurement system at the time the present
study was conducted.
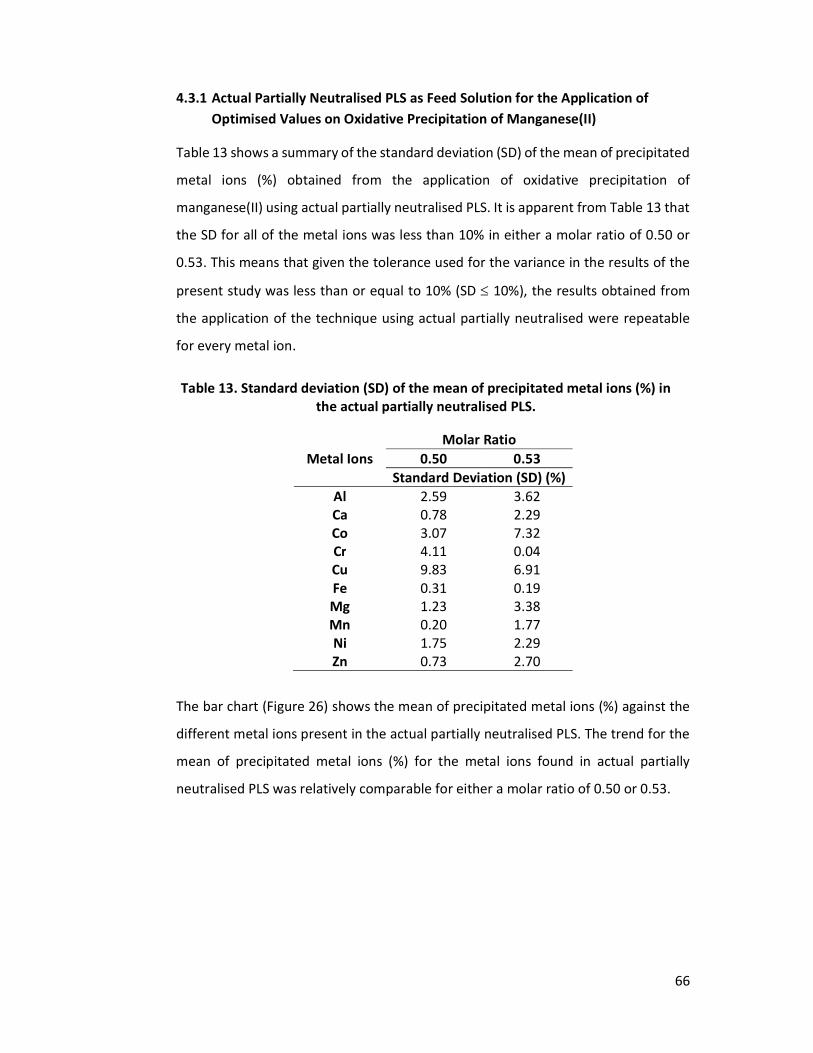
66
4.3.1 Actual Partially Neutralised PLS as Feed Solution for the Application of Optimised Values on Oxidative Precipitation of Manganese(II)
Table 13 shows a summary of the standard deviation (SD) of the mean of precipitated
metal ions (%) obtained from the application of oxidative precipitation of
manganese(II) using actual partially neutralised PLS. It is apparent from Table 13 that
the SD for all of the metal ions was less than 10% in either a molar ratio of 0.50 or
0.53. This means that given the tolerance used for the variance in the results of the
present study was less than or equal to 10% (SD 10%), the results obtained from
the application of the technique using actual partially neutralised were repeatable
for every metal ion.
Table 13. Standard deviation (SD) of the mean of precipitated metal ions (%) in the actual partially neutralised PLS.
Metal Ions Molar Ratio
0.50 0.53 Standard Deviation (SD) (%)
Al 2.59 3.62 Ca 0.78 2.29 Co 3.07 7.32 Cr 4.11 0.04 Cu 9.83 6.91 Fe 0.31 0.19 Mg 1.23 3.38 Mn 0.20 1.77 Ni 1.75 2.29 Zn 0.73 2.70
The bar chart (Figure 26) shows the mean of precipitated metal ions (%) against the
different metal ions present in the actual partially neutralised PLS. The trend for the
mean of precipitated metal ions (%) for the metal ions found in actual partially
neutralised PLS was relatively comparable for either a molar ratio of 0.50 or 0.53.
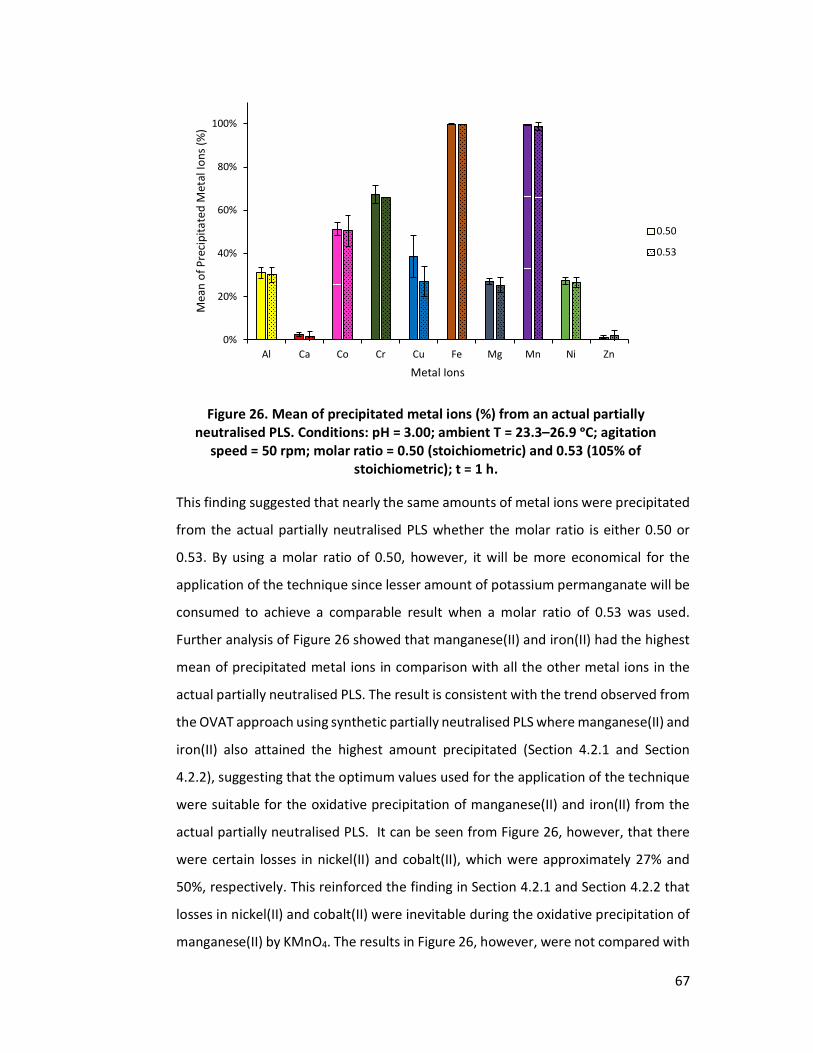
67
Figure 26. Mean of precipitated metal ions (%) from an actual partially neutralised PLS. Conditions: pH = 3.00; ambient T = 23.3–26.9 ᵒC; agitation
speed = 50 rpm; molar ratio = 0.50 (stoichiometric) and 0.53 (105% of stoichiometric); t = 1 h.
This finding suggested that nearly the same amounts of metal ions were precipitated
from the actual partially neutralised PLS whether the molar ratio is either 0.50 or
0.53. By using a molar ratio of 0.50, however, it will be more economical for the
application of the technique since lesser amount of potassium permanganate will be
consumed to achieve a comparable result when a molar ratio of 0.53 was used.
Further analysis of Figure 26 showed that manganese(II) and iron(II) had the highest
mean of precipitated metal ions in comparison with all the other metal ions in the
actual partially neutralised PLS. The result is consistent with the trend observed from
the OVAT approach using synthetic partially neutralised PLS where manganese(II) and
iron(II) also attained the highest amount precipitated (Section 4.2.1 and Section
4.2.2), suggesting that the optimum values used for the application of the technique
were suitable for the oxidative precipitation of manganese(II) and iron(II) from the
actual partially neutralised PLS. It can be seen from Figure 26, however, that there
were certain losses in nickel(II) and cobalt(II), which were approximately 27% and
50%, respectively. This reinforced the finding in Section 4.2.1 and Section 4.2.2 that
losses in nickel(II) and cobalt(II) were inevitable during the oxidative precipitation of
manganese(II) by KMnO4. The results in Figure 26, however, were not compared with
0%
20%
40%
60%
80%
100%
Al Ca Co Cr Cu Fe Mg Mn Ni Zn
Mea
n of
Pre
cipi
tate
d M
etal
Ions
(%)
Metal Ions
0.50
0.53

68
standard precipitation curves as a function of pH for the reason it was only limited to
metal hydroxides, sulfides, arsenates, and phosphates and does not include the
possible compounds that can form during the oxidative precipitation by potassium
permanganate. Characterisation of the precipitate still needs to be carried out in
future studies before the results can be compared with standard precipitation curves.
4.3.2 Actual Post‐Partially Neutralised PLS as Feed Solution for the Application of Optimised Values on Oxidative Precipitation of Manganese(II)
Table 14 shows the summary of the standard deviation (SD) of the mean of
precipitated metal ions (%) obtained from the application of oxidative precipitation
of manganese(II) using actual post-partially neutralised PLS. It is apparent from Table
14 that majority of the metal ions had a SD of less than 10% in either a molar ratio of
0.67 or 0.70. Table 14, however, shows that the SD of chromium(III) slightly exceeded
10% at a molar ratio of 0.67 while copper(II) had a large SD at both a molar ratio of
0.67 and 0.70. A possible reason for this may be due to the very low concentrations
of chromium(III) (0.004 g/L) and copper(II) (0.01 g/L) in the actual post-partially
neutralised PLS where co-precipitation occurred, which resulted in variable amounts
of precipitated chromium(III) and copper(II).
Table 14. Standard deviation (SD) of the mean of precipitated metal ions (%) in the actual post‐partially neutralised PLS
Metal Ions Molar Ratio
0.67 0.70 Standard Deviation (SD) (%)
Al 2.56 2.46 Ca 5.23 3.50 Co 7.41 0.77 Cr 10.13 2.33 Cu 26.08 45.82 Fe 4.87 0.20 Mg 2.79 1.67 Mn 2.28 0.00 Ni 4.69 0.43 Zn 9.02 2.92

69
The bar chart (Figure 27) shows the mean of precipitated metal ions (%) against the
different metal ions present in the actual post-partially neutralised PLS. The trend for
the mean of precipitated metal ions (%) for the metal ions found in the actual post-
partially neutralised PLS was relatively similar for either a molar ratio of 0.67 or 0.70.
Figure 27. Mean of precipitated metal ions (%) from an actual post‐partially neutralised PLS. Conditions: Unadjusted pH = 1.87–1.91; ambient T = 21.2–22.9 ᵒC; agitation speed = 50 rpm; molar ratio = 0.67 (stoichiometric) and 0.70 (105%
of stoichiometric); t = 1 h.
However, although the trend was similar for both of the molar ratios, there was a
slight increase in the mean of precipitated metal ions (%) in most of the metal ions
when a molar ratio of 0.70 was used. It is possible that the increase in the available
permanganate ion (MnO4−) did not just result in the oxidative precipitation of
manganese(II), but also the co-precipitation of other metal ions in the actual post-
partially neutralised PLS. In addition, a comparison between the results from both
the actual partially neutralised and post-partially neutralised PLS showed a dissimilar
trend. A possible reason for this is due to the presence of considerable amount of
iron(II) (2.46 g/L) in the actual partially neutralised PLS as opposed to the negligible
amount of iron(II) (0.28 g/L) in the actual post-partially neutralised PLS. The
considerable amount of iron(II) in the actual partially neutralised PLS can interfere
with the oxidative precipitation of manganese(II) as what have been observed from
0%
20%
40%
60%
80%
100%
Al Ca Co Cr Cu Fe Mg Mn Ni Zn
Mea
n of
Pre
cipi
tate
d M
etal
Ions
(%)
Metal Ions
0.67
0.70

70
the results of the optimisation experiments (Section 4.2). In the case of nickel(II) and
cobalt(II), it can be seen from Figure 27 that there were also certain losses in nickel(II)
and cobalt(II), which was similar to the observation in Section 4.3.1 for actual partially
neutralised PLS. This suggested that regardless of whether the actual PLS was
partially neutralised or post-partially neutralised, losses in nickel(II) and cobalt(II)
would be inevitable during the oxidative precipitation of manganese(II) by KMnO4.
With a similar reason as Figure 26, the results shown in Figure 27 were not compared
with standard precipitation curves.
Despite the results showing slight increase in the mean of precipitated metal ions (%)
for most of the metal species, using a molar ratio of 0.67 would still be more
economical for the application of the technique since lesser amount of potassium
permanganate will be consumed at only a marginal difference in the mean of
precipitated manganese(II) between a molar ratio of 0.67 and 0.70. In addition, lower
amounts of nickel(II) and cobalt(II) were lost in the precipitate when a molar ratio of
0.67 was used, which were approximately 3% and 43%, respectively.

71
Chapter 5
CONCLUSIONS AND RECOMMENDATIONS
The growing demand for nickel since the 1950s and the dwindling nickel sulfide ore
resources have resulted in increasing interest in processing nickel laterite ores as an
alternative source. Nickel laterite ores are processed via a hydrometallurgical route
if the aim is to produce high purity nickel. There are three available leaching
processes under the hydrometallurgical route, and these are the Caron process,
pressure acid leaching (PAL), and atmospheric leaching (AL). Among the available
three leaching processes, the most widely used for nickel laterite ores is PAL since it
can yield high nickel and cobalt dissolutions (>95%). However, substantial co-
dissolutions of other components of the ore occurs during PAL that results in a highly
contaminated pregnant leach solution (PLS).
The PAL-generated PLS is partially neutralised to largely remove the remaining iron,
aluminium, and chromium in the solution. Afterwards, the resulting solution will
undergo further purification since large amounts of manganese, which can affect the
efficiency of the downstream processing, still remain as the major impurity in the
PAL-generated PLS even after the solution has been partially neutralised. Current
purification techniques for PAL-generated PLS are carried out through either
intermediate precipitation (MHP or MSP) or direct solvent extraction (DSX). These
purification techniques, however, have proven to be unsuccessful in separating
manganese from nickel and cobalt due to either co-precipitation as a hydroxide in
intermediate precipitation or co-extraction in DSX where it can potentially oxidise
during the electrowinning step and may degrade the organic when the spent
electrolyte is recycled back to the solvent extraction. Moreover, the intermediate
products (mixed hydroxides or mixed sulfides) coming from intermediate
precipitation will require further processing using consecutive re-leaching and
solvent extraction steps before nickel and cobalt can be recovered as final saleable
products and therefore increasing the operational costs associated with processing
nickel laterite ores.

72
The present study attempted to address the issue concerning manganese(II) by
exploring the removal of manganese(II) from the PLS generated from PAL of nickel
laterite ores by oxidative precipitation with potassium permanganate. As postulated
by D.C. Ibana in a personal communication (Section 1.5), the removal of
manganese(II) from PAL-generated PLS can be achieved through oxidative
precipitation by potassium permanganate without introducing any new ions to the
highly contaminated PLS. This study set out to determine the variables that
significantly affect the oxidative precipitation of manganese(II) by potassium
permanganate, optimise the determined variables by applying the technique using
synthetic partially and post-partially neutralised PLS, and then apply the optimised
variables using actual partially and post-partially neutralised PLS.
The literature review revealed that most studies on the oxidative precipitation of
manganese(II) by potassium permanganate were for treatment of water and acid
mine water, which was usually carried out at basic pH conditions. There is, however,
a firm thermodynamic basis to test the application of oxidative precipitation of
manganese(II) from PAL-generated PLS in highly acidic conditions, which will produce
manganese dioxide (MnO2), based on the potential–pH equilibrium (Pourbaix)
diagram of manganese–water system (Figure 5). Aside from the influence of pH,
another variable found in the literature that has an influence on the oxidative
precipitation of manganese(II) is the amount of potassium permanganate. The
amount of potassium permanganate affects the ratio between moles of
permanganate ion and total moles of iron(II) and manganese(II) (denoted as mol
MnO4–: total mol Fe(II) and Mn(II)) for partially neutralised PLS and between moles
of permanganate ion and moles of manganese(II) (denoted as mol MnO4–:mol Mn(II))
for post-partially neutralised PLS. The amount must carefully be determined to
ensure that sufficient MnO4− is available for the complete oxidative precipitation of
manganese(II) from PAL-generated PLS and to avoid the generation of manganese(II)
due to the reduction of MnO4− when there is an overdose of potassium
permanganate. Given these considerations, an experimental program involving
bench-scale experimental work was developed and implemented to explore and
evaluate the viability of the proposed oxidative precipitation technique.

73
The main findings of the research work may be summarised as follows:
Screening experiments using unreplicated full factorial design revealed that
molar ratio (B) significantly affected the oxidative precipitation of
manganese(II) from either the partially neutralised or post-partially
neutralised PLS. This was evident in the normal probability plot of the main
and interaction effects for precipitated manganese(II) (%) since molar ratio
had the largest standardized effect (SE) compared with all the other variables
investigated. Additionally, pH was also considered for the oxidative
precipitation of manganese(II) from the partially neutralised PLS due to the
presence of iron(II) in the solution, which would oxidise before manganese(II).
The screening experiments revealed that pH (C) significantly affected the
oxidative precipitation of iron(II), as evident in the normal probability plot of
the main and interaction effects for precipitated iron(II) (%).
Optimisation experiments using OVAT for the effect of pH revealed that the
oxidative precipitation of manganese(II) can be carried out in acidic
conditions, which was at a pH less than or equal to 4.0 (pH ≤ 4). It was found
that a pH of 3 was optimum since appreciable amounts of nickel(II) and
cobalt(II) were lost in the precipitate at pH > 3. This was evident in the plot of
amount of precipitated metal ions (%) versus pH. In the case of the
optimisation of the effect of molar ratio, the amount of manganese(II)
precipitation increases with an increase in molar ratio and it was evident with
the plot of amount of precipitated metal ions (%) versus molar ratio.
Results from optimisation experiments using partially neutralised PLS
revealed that a pH of 3 and a stoichiometric molar ratio of 0.50 were found to
be optimum, where the amount of precipitated manganese(II) was 85% with
minimal losses for nickel(II) and cobalt(II) at 2% and 7%, respectively.
Results from optimisation experiments using post-partially neutralised PLS
revealed that when pH was maintained between pH 1.66 and pH 1.71 and
molar ratio was less than or equal to 0.70, the amount of precipitated

74
manganese(II) was nearly 100% with losses of nickel(II) between 3% and 10%
while for cobalt(II), losses were between 50% and 60%.
Application of the optimised pH and molar ratio for the oxidative precipitation
of manganese(II) from actual partially neutralised and post-partially
neutralised PLS resulted in nearly 100% of precipitated manganese(II).
Nickel(II) losses were approximately 27% while for cobalt(II), they were
approximately 50% for the actual partially neutralised PLS. As for the actual
post-partially neutralised, nickel(II) losses were approximately between 3%
and 10% while for cobalt(II), they were approximately between 43% and 54%.
This was evident with the bar chart for the mean of precipitated metal ions
(%) versus metal ions in the actual PLS.
The findings of this work have contributed significantly to understanding the
oxidative precipitation of manganese(II) from PAL-generated PLS using potassium
permanganate. However, opportunities for further research that were outside the
scope of the present study might explore the following:
Investigate the mechanism by which nickel(II) and cobalt(II) partake on the
oxidative precipitation of manganese(II) by potassium permanganate from
either a partially neutralised or post-partially neutralised PLS by conducting
kinetic and chemical speciation experiments.
Characterise the precipitate by analysing the filtrate products from either the
partially neutralised or post-partially neutralised PLS by conducting chemical
composition, morphology, and minerology analysis.

75
REFERENCES
Adams, R. B. (1960) Manganese removal by oxidation with potassium permanganate. Journal of the American Water Works Association, 52(2), pp. 219–228.
Alcock, R. A. (1988) The character and occurrence of primary resources available to
the nickel industry. In Tyroler, G. P. and Landolt, C. A. Extractive metallurgy of nickel & cobalt : proceedings of a symposium at the 117th TMS Annual Meeting,Phoenix, Arizona: The Metallurgical Society. pp. 67–89.
Brand, N. W., Butt, C. R. M. and Elias, M. (1998) Nickel laterites: classification and
features. AGSO Journal of Australian Geology & Geophysics, 17(4), pp. 81–88. Carlson, E. T. and Simons, C. S. (1960) Acid leaching Moa Bay’s nickel. Journal of
Metals, 12(3), pp. 206–213. Caron, M. H. (1950) Fundamental and practical factors in ammonia leaching of nickel
and cobalt ores. Journal of Metals, 2(1), pp. 67–90. Chander, S. and Sharma, V. N. (1981) Reduction roasting/ammonia leaching of
nickeliferous laterites. Hydrometallurgy, 7(4), pp. 315–327. Cheng, C. and Urbani, M. D. (2005) The recovery of nickel and cobalt from leach
solutions by solvent extraction: Process overview, recent research and development. pp. 503–526.
Cheng, C. Y., Hughes, C. A., Barnard, K. R. and Larcombe, K. (2000) Manganese in
copper solvent extraction and electrowinning. Hydrometallurgy, 58(2), pp. 135–150.
Crundwell, F. K., Moats, M. S., Ramachandran, V., Robinson, T. G. and Davenport, W.
G. (2011) Appendix B - Caron Process for Processing Nickel Laterites. In Crundwell, F. K., Moats, M. S., Ramachandran, V., Robinson, T. G. and Davenport, W. G. Extractive Metallurgy of Nickel, Cobalt and Platinum Group Metals,Oxford: Elsevier. pp. 553–558.
Dalvi, A. D., Bacon, W. G. and Osborne, R. C. (2004) The past and the future of nickel
laterites. In Paper Presented to the TMS 2004 133rd Annual Meeting & Exhibition Charlotte, North Carolina.
Daniel, C. (1959) Use of half-normal plots in interpreting factorial two-level
experiments. Technometrics, 1(4), pp. 311–341. Davis, J. R. (2000) Introduction to nickel and nickel alloys. In Nickel, Cobalt, and their
Alloys,United States of America: ASM International. pp. 3–6.

76
Dickson, P. (2000) The recovery of nickel from PAL discharge liquors. In ALTA 2000, Perth, Western Australia: ALTA Metallurgical Services.
Donegan, S. (2006) Direct solvent extraction of nickel at Bulong operations. Minerals Engineering, 19(12), pp. 1234–1245.
Elias, M. (2002) Nickel laterite deposits-geological overview, resources and exploitation. Giant ore deposits: Characteristics, genesis and exploration. CODES Special Publication, 4, pp. 205–220.
Elsheikh, M., Guirguis, H. and Fathy, A. (2017) Removal of iron and manganese from groundwater: a study of using potassium permanganate and sedimentation. In Paper Presented to the The 3rd International Conference on Buildings, Construction and Environmental Engineering, Sharm el-Shiekh, Egypt.
Environmental Protection Agency (1999) Alternative disinfectants and oxidants guidance manual, Washington, D.C: U.S. Environmental Protection Agency, Office of Water.
Freitas, R. M., Perilli, T. A. G. and Ladeira, A. C. Q. (2013) Oxidative precipitation of manganese from acid mine drainage by potassium permanganate. Journal of Chemistry, 2013, pp. 1–8.
Georgiou, D. and Papangelakis, V. G. (1998) Sulphuric acid pressure leaching of a limonitic laterite: chemistry and kinetics. Hydrometallurgy, 49(1–2), pp. 23–46.
Georgiou, D. and Papangelakis, V. G. (2009) Behaviour of cobalt during sulphuric acid pressure leaching of a limonitic laterite. Hydrometallurgy, 100(1), pp. 35–40.
Geoscience Australia (2012) Nickel resources and potential of Australia, Available: http://d28rz98at9flks.cloudfront.net/81581/81581.pdf [Accessed February 27 2018].
Golightly, J. P. (1979) Nickeliferous laterites: a general description. In Evans, D. J. I., Shoemaker, R. S. and Veltman, H. International Laterite Symposium,New York: Society of Mining Engineers of AIME.
Goonan, T. G., Kuck, P. H. and Schnebele, E. K. (2017) Historical statistics for mineral and material commodities in the United States, Available: https://minerals.usgs.gov/minerals/pubs/historical-statistics/ [Accessed 5 May 2017].
Grassi, R., White, D. and Kindred, T. (2000) Cawse nickel operations process description and production ramp up. In ALTA 2000, Perth, Western Australia: ALTA Metallurgical Services.

77
Griffin, A. (2000) Bulong nickel operations post commissioning. In ALTA 2000, Perth, Western Australia: ALTA Metallurgical Services.
Guo, X.-y., Shi, W.-t., Li, D. and Tian, Q.-h. (2011) Leaching behavior of metals from
limonitic laterite ore by high pressure acid leaching. Transactions of Nonferrous Metals Society of China, 21(1), pp. 191–195.
Harvey, D. (2000) Gravimetric method analysis. In Modern Analytical
Chemistry,United States of America: The McGraw-Hill Companies, Inc. pp. 235–239.
Heviankova, S. and Bestova, I. (2007) Removal of manganese from acid mine water.
Journal of Mining and Metallurgy, 43 A, pp. 43–52. International Minerological Association (2018) The New IMA List of Minerals – A Work
in Progress, Available: http://nrmima.nrm.se//IMA_Master_List_%282018-03%29.pdf [Accessed May 28 2018].
Kyle, J. (2010) Nickel laterite processing technologies – where to next? In Paper
Presented to the ALTA 2010 Nickel/Cobalt/Copper Conference, Perth, Western Australia.
Kyle, J. H. and Furfaro, D. (1997) The Cawse nickel/cobalt laterite project metallurgical
process development. Hydrometallurgy and refining of nickel and cobalt, 1, pp. 379–389.
Liu, H., Gillaspie, J., Lewis, C., Neudorf, D. and Barnett, S. (2004) Atmospheric leaching
of laterites with iron precipitation as goethite. In Paper Presented to the International Laterite Nickel Symposium - 2004, Charlotte, North Carolina.
Llerin, J. E., Nishikawa, I. and Kawata, M. (2011) Coral Bay nickel HPAL plant expansion
project. In ALTA 2011, Perth, Western Australia: ALTA Metallurgical Services. Macingova, E., Ubaldini, S. and Luptakova, A. (2016) Study of manganese removal in
the process of mine water remediation. Journal of the Polish Mineral Engineering Society, 1(37), pp. 121–127.
Mason, P. G., Groutsch, J. V. and Mayze, R. S. (1997) Process development and plant
design for the Cawse nickel project. In ALTA 1997, Blackburn South, Victoria: ALTA Metallurgical Services.
Mayze, R. (1999) An engineering comparison of the three treatment flowsheets in
WA nickel laterite projects. In ALTA 1999, Perth, Western Australia: ALTA Metallurgical Services.

78
McDonald, R. G. and Whittington, B. I. (2008) Atmospheric acid leaching of nickel laterites review: Part I. Sulphuric acid technologies. Hydrometallurgy, 91(1), pp. 35–55.
McRae, M. E. (2018) Mineral commodity summaries - nickel, Available: https://minerals.usgs.gov/minerals/pubs/commodity/nickel/mcs-2018-nicke.pdf [Accessed February 27 2018].
Misra, C. (2016) Agitation effects in precipitation. In Donaldson, D. and Raahauge, B. E. Essential Readings in Light Metals: Volume 1 Alumina and Bauxite,Cham:Springer International Publishing. pp. 541–549.
Montgomery, D. C. (2013) The 2^k factorial design. In Design and Analysis of Experiments: Hoboken, NJ : John Wiley & Sons, Inc. pp. 255–260.
Motteram, G., Ryan, M., Berezowsky, R. and Raudsepp, R. (1996) Murrin Murrin nickel/cobalt project : Project development overview. In ALTA 1996, Perth, Western Australia: ALTA Metallurgical Services.
Mudd, G. M. (2010) Global trends and environmental issues in nickel mining: Sulfides versus laterites. Ore Geology Reviews, 38(1), pp. 9–26.
O'Callaghan, J. (2003) Process improvement at Bulong Operations Pty Ltd. In ALTA 2003, Perth, Western Australia: ALTA Metallurgical Services.
Önal, M. A. R. and Topkaya, Y. A. (2014) Pressure acid leaching of Çaldağ lateritic nickel ore: An alternative to heap leaching. Hydrometallurgy, 142, pp. 98–107.
Oustadakis, P., Agatzini-Leonardou, S. and Tsakiridis, P. E. (2006) Nickel and cobalt precipitation from sulphate leach liquor using MgO pulp as neutralizing agent. Minerals Engineering, 19(11), pp. 1204–1211.
Oustadakis, P., Agatzini-Leonardou, S. and Tsakiridis, P. E. (2007) Bulk precipitation of nickel and cobalt from sulphate leach liquor by CaO pulp. Mineral Processing and Extractive Metallurgy, 116(4), pp. 245–250.
Oxley, A., Smith, M. E. and Caceres, O. (2016) Why heap leach nickel laterites? Minerals Engineering, 88, pp. 53–60.
Phatai, P., Wittayakun, J., Chen, W.-H., Futalan, C. M., Grisdanurak, N. and Kan, C.-C. (2014) Removal of manganese(II) and iron(II) from synthetic groundwater using potassium permanganate. Desalination and Water Treatment, 52(31–33), pp. 5942–5951.

79
Phatai, P., Wittayakun, J., Grisdanurak, N., Chen, W. H., Wan, M. W. and Kan, C. C. (2010) Removal of manganese ions from synthetic groundwater by oxidation using KMnO4 and the characterization of produced MnO2 particles. Water Science and Technology, 62(8), pp. 1719–1726.
Pourbaix, M. (1966) Atlas of Electrochemical Equilibria in Aqueous Solutions 1st
English ed., Oxford : Brussels: Oxford : Pergamon ; Brussels : CEBELCOR. Quast, K., Connor, J. N., Skinner, W., Robinson, D. J. and Addai-Mensah, J. (2015)
Preconcentration strategies in the processing of nickel laterite ores part 1: Literature review. Minerals Engineering, 79, pp. 261–268.
Senanayake, G., Senaputra, A. and Nicol, M. J. (2010) Effect of thiosulfate, sulfide,
copper(II), cobalt(II)/(III) and iron oxides on the ammoniacal carbonate leaching of nickel and ferronickel in the Caron process. Hydrometallurgy, 105(1), pp. 60–68.
Shibayama, K., Yokogawa, T., Sato, H., Enomoto, M., Nakai, O., Ito, T., Mizuno, F. and
Hattori, Y. (2016) Taganito HPAL plant project. Minerals Engineering, 88, pp. 61–65.
Ucyildiz, A. and Girgin, I. (2017) High pressure sulphuric acid leaching of lateritic nickel
ore. Physicochemical Problems of Mineral Processing, 53(1), pp. 475–488. Valix, M. and Cheung, W. H. (2002) Study of phase transformation of laterite ores at
high temperature. Minerals Engineering, 15(8), pp. 607–612. Van Benschoten, J. E., Lin, W. and Knocke, W. R. (1992) Kinetic modeling of
manganese(II) oxidation by chlorine dioxide and potassium permanganate. Environmental Science and Technology, 26(7), pp. 1327–1333.
Watling, H. R., Elliot, A. D., Fletcher, H. M., Robinson, D. J. and Sully, D. M. (2011) Ore
mineralogy of nickel laterites: Controls on processing characteristics under simulated heap-leach conditions. Australian Journal of Earth Sciences, 58(7), pp. 725–744.
White, D. T. (2009) Commercial development of the magnesia mixed hydroxide
process for recovery of nickel and cobalt from laterite leach solutions. In Budac, J. J., Fraser, R., Mihaylov, I., Papangelakis, V. G. and Robinson, D. J. Conference of Metallurgists,Sudbury, Ontario, Canada: Canadian Institute of Mining, Metallurgy and Petroleum. pp. 351–367.
White, D. T., Miller, M. J. and Napier, A. C. (2006) Impurity disposition and control in
the Ravensthorpe acid leaching process. In Iron Control Technologies: 3rd International Symposium on Iron Control in Hydrometallurgy,Montreal, Canada: Canadian Institute of Mining, Metallurgy and Petroleum. pp. 591–609.

80
Whittington, B. I. and Muir, D. (2000) Pressure acid leaching of nickel laterites: A review. Mineral Processing and Extractive Metallurgy Review, 21(6), pp. 527–599.
Willis, B. (2007) Downstream processing options for nickel laterite heap leach liquors. In ALTA 2007, Perth, Western Australia: ALTA Metallurgical Services.
Zhang, W. and Cheng, C. Y. (2007) Manganese metallurgy review. Part II: Manganese separation and recovery from solution. Hydrometallurgy, 89(3–4), pp. 160–177.
Zhang, W., Cheng, C. Y. and Pranolo, Y. (2010) Investigation of methods for removal and recovery of manganese in hydrometallurgical processes. Hydrometallurgy, 101(1–2), pp. 58–63.
Zhu, D.-Q., Cui, Y., Pan, J., Hapugoda, S. and Vining, K. (2012) Mineralogy and crystal chemistry of a low grade nickel laterite ore. Transactions of Nonferrous Metals Society of China (English Edition), 22(4), pp. 907–916.
Every reasonable effort has been made to acknowledge the owners of copyright
material. I would be pleased to hear from any copyright owner who has been omitted
or incorrectly acknowledged.
Copyright © 2022 FDOKUMEN