SEI GLOBAL ASSETS FUND PLC Annual Report and Audited ...
214
SEI GLOBAL ASSETS FUND PLC Annual Report and Audited Financial Statements for the financial year ended 30 June 2020 DocuSign Envelope ID: 2646536F-BB10-4779-844A-39205D22F4E0
-
Upload
khangminh22 -
Category
Documents
-
view
0 -
download
0
Transcript of SEI GLOBAL ASSETS FUND PLC Annual Report and Audited ...

SEI GLOBAL ASSETS FUND PLC
Annual Report and Audited Financial Statements for the financial year ended 30 June 2020
DocuSign Envelope ID: 2646536F-BB10-4779-844A-39205D22F4E0
SEI Global Assets Fund plc Annual Report and Audited Financial Statements for the financial year ended 30 June 2020 CONTENTS PAGE
Directory 4 General Information 5
Directors’ Report 7 Report of the Depositary to the Shareholders 11 Independent Auditors’ Report 12 Investment Adviser’s Reports The SEI Defensive Fund 14
The SEI Conservative Fund 16
The SEI Moderate Fund 18
The SEI Core Fund 20
The SEI Balanced Fund 22
The SEI Growth Fund 24
The SEI Aggressive Fund 26
The SEI Global Conservative Fund 28
The SEI Global Moderate Fund 30
The SEI Global Core Fund 32
The SEI Global Balanced Fund 34
The SEI Global Growth Fund 36
The SEI Global Aggressive Fund 38
The SEI Euro Conservative Fund 40
The SEI Euro Moderate Fund 42
The SEI Euro Core Fund 44
The SEI Euro Balanced Fund 46
The SEI Euro Growth Fund 48
The SEI Euro Aggressive Fund 50
Financial Statements
Portfolio of Investments
The SEI Defensive Fund 53
The SEI Conservative Fund 58
The SEI Moderate Fund 63
The SEI Core Fund 68
The SEI Balanced Fund 70
The SEI Growth Fund 72
The SEI Aggressive Fund 74
The SEI Global Conservative Fund 75
The SEI Global Moderate Fund 80
The SEI Global Core Fund 85
The SEI Global Balanced Fund 87
The SEI Global Growth Fund 89
The SEI Global Aggressive Fund 91
The SEI Euro Conservative Fund 92
The SEI Euro Moderate Fund 97
The SEI Euro Core Fund 102
The SEI Euro Balanced Fund 104
The SEI Euro Growth Fund 106
The SEI Euro Aggressive Fund 108
Income Statement 114 Statement of Financial Position 121
2
DocuSign Envelope ID: 2646536F-BB10-4779-844A-39205D22F4E0
SEI Global Assets Fund plc Annual Report and Audited Financial Statements for the financial year ended 30 June 2020 CONTENTS (continued) PAGE Statement of Changes in Net Assets Attributable to Redeemable Participating Shareholders 132 Notes to the Financial Statements 142 Appendix I – Global Exposure and Leverage (Unaudited) 167 Appendix II – Remuneration Disclosures (Unaudited) 171 Appendix III – Statement of Changes in Composition of Portfolio (Unaudited) 172 Appendix IV – Securities Financing Transactions Regulation (Unaudited) 206
3
DocuSign Envelope ID: 2646536F-BB10-4779-844A-39205D22F4E0
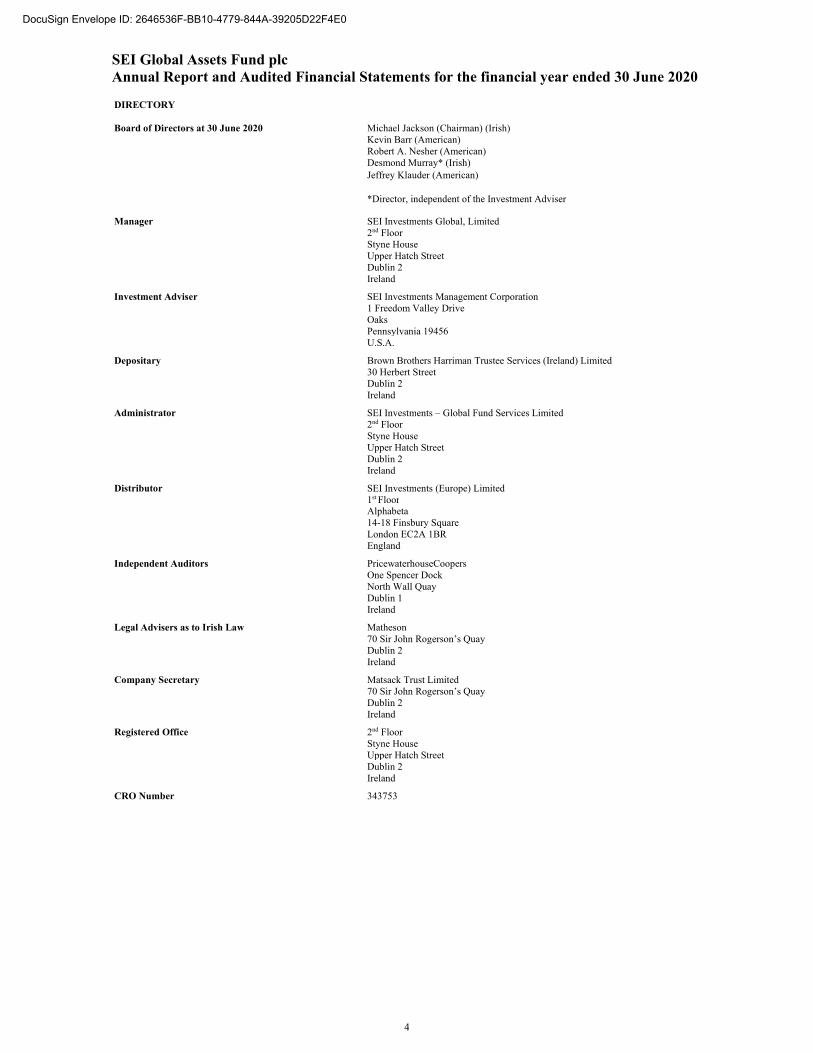
SEI Global Assets Fund plc Annual Report and Audited Financial Statements for the financial year ended 30 June 2020 DIRECTORY
Board of Directors at 30 June 2020
Michael Jackson (Chairman) (Irish)
Kevin Barr (American) Robert A. Nesher (American) Desmond Murray* (Irish) Jeffrey Klauder (American)
*Director, independent of the Investment Adviser
Manager SEI Investments Global, Limited 2nd Floor Styne House Upper Hatch Street Dublin 2 Ireland
Investment Adviser SEI Investments Management Corporation 1 Freedom Valley Drive Oaks Pennsylvania 19456 U.S.A.
Depositary Brown Brothers Harriman Trustee Services (Ireland) Limited 30 Herbert Street Dublin 2 Ireland
Administrator SEI Investments – Global Fund Services Limited 2nd Floor Styne House Upper Hatch Street Dublin 2 Ireland
Distributor SEI Investments (Europe) Limited 1st Floor Alphabeta 14-18 Finsbury Square London EC2A 1BR England
Independent Auditors PricewaterhouseCoopers One Spencer Dock North Wall Quay Dublin 1 Ireland
Legal Advisers as to Irish Law Matheson 70 Sir John Rogerson’s Quay Dublin 2 Ireland
Company Secretary Matsack Trust Limited 70 Sir John Rogerson’s Quay Dublin 2 Ireland
Registered Office 2nd Floor Styne House Upper Hatch Street Dublin 2 Ireland
CRO Number 343753
4
DocuSign Envelope ID: 2646536F-BB10-4779-844A-39205D22F4E0
SEI Global Assets Fund plc Annual Report and Audited Financial Statements for the financial year ended 30 June 2020
GENERAL INFORMATION
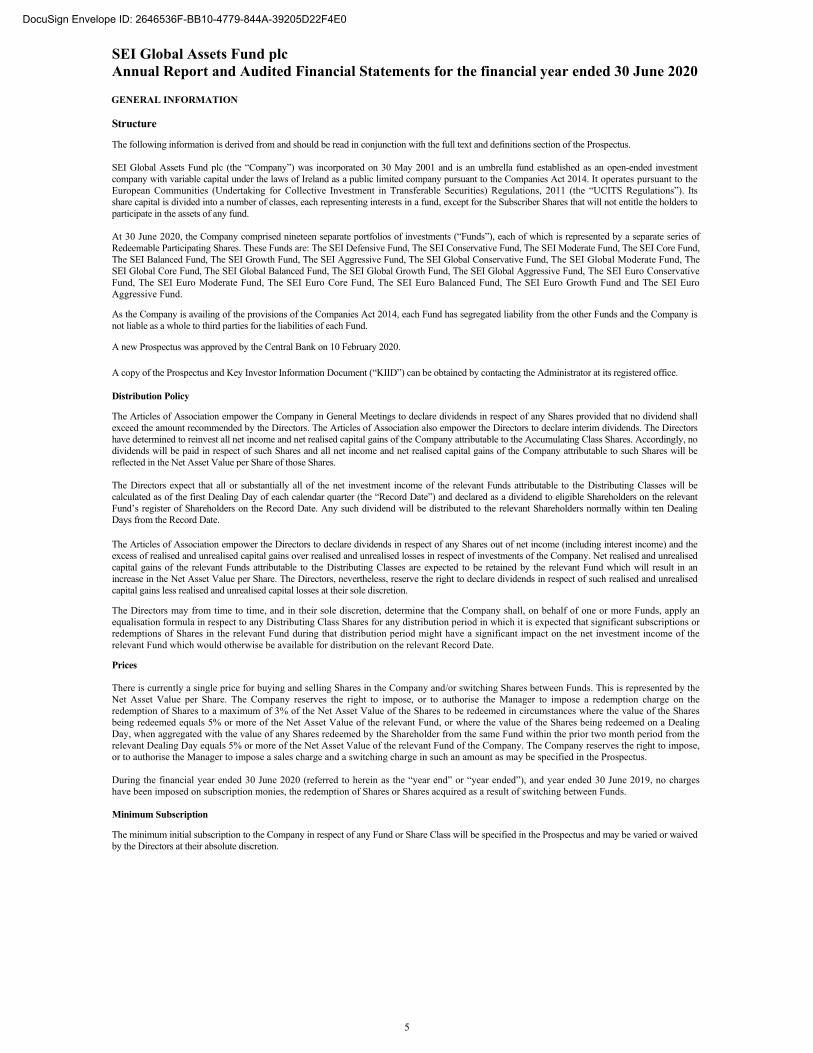
Structure
The following information is derived from and should be read in conjunction with the full text and definitions section of the Prospectus.
SEI Global Assets Fund plc (the “Company”) was incorporated on 30 May 2001 and is an umbrella fund established as an open-ended investment company with variable capital under the laws of Ireland as a public limited company pursuant to the Companies Act 2014. It operates pursuant to the European Communities (Undertaking for Collective Investment in Transferable Securities) Regulations, 2011 (the “UCITS Regulations”). Its share capital is divided into a number of classes, each representing interests in a fund, except for the Subscriber Shares that will not entitle the holders to participate in the assets of any fund.
At 30 June 2020, the Company comprised nineteen separate portfolios of investments (“Funds”), each of which is represented by a separate series of Redeemable Participating Shares. These Funds are: The SEI Defensive Fund, The SEI Conservative Fund, The SEI Moderate Fund, The SEI Core Fund, The SEI Balanced Fund, The SEI Growth Fund, The SEI Aggressive Fund, The SEI Global Conservative Fund, The SEI Global Moderate Fund, The SEI Global Core Fund, The SEI Global Balanced Fund, The SEI Global Growth Fund, The SEI Global Aggressive Fund, The SEI Euro Conservative Fund, The SEI Euro Moderate Fund, The SEI Euro Core Fund, The SEI Euro Balanced Fund, The SEI Euro Growth Fund and The SEI Euro Aggressive Fund.
As the Company is availing of the provisions of the Companies Act 2014, each Fund has segregated liability from the other Funds and the Company is not liable as a whole to third parties for the liabilities of each Fund.
A new Prospectus was approved by the Central Bank on 10 February 2020.
A copy of the Prospectus and Key Investor Information Document (“KIID”) can be obtained by contacting the Administrator at its registered office.
Distribution Policy
The Articles of Association empower the Company in General Meetings to declare dividends in respect of any Shares provided that no dividend shall exceed the amount recommended by the Directors. The Articles of Association also empower the Directors to declare interim dividends. The Directors have determined to reinvest all net income and net realised capital gains of the Company attributable to the Accumulating Class Shares. Accordingly, no dividends will be paid in respect of such Shares and all net income and net realised capital gains of the Company attributable to such Shares will be reflected in the Net Asset Value per Share of those Shares.
The Directors expect that all or substantially all of the net investment income of the relevant Funds attributable to the Distributing Classes will be calculated as of the first Dealing Day of each calendar quarter (the “Record Date”) and declared as a dividend to eligible Shareholders on the relevant Fund’s register of Shareholders on the Record Date. Any such dividend will be distributed to the relevant Shareholders normally within ten Dealing Days from the Record Date.
The Articles of Association empower the Directors to declare dividends in respect of any Shares out of net income (including interest income) and the excess of realised and unrealised capital gains over realised and unrealised losses in respect of investments of the Company. Net realised and unrealised capital gains of the relevant Funds attributable to the Distributing Classes are expected to be retained by the relevant Fund which will result in an increase in the Net Asset Value per Share. The Directors, nevertheless, reserve the right to declare dividends in respect of such realised and unrealised capital gains less realised and unrealised capital losses at their sole discretion.
The Directors may from time to time, and in their sole discretion, determine that the Company shall, on behalf of one or more Funds, apply an equalisation formula in respect to any Distributing Class Shares for any distribution period in which it is expected that significant subscriptions or redemptions of Shares in the relevant Fund during that distribution period might have a significant impact on the net investment income of the relevant Fund which would otherwise be available for distribution on the relevant Record Date.
Prices
There is currently a single price for buying and selling Shares in the Company and/or switching Shares between Funds. This is represented by the Net Asset Value per Share. The Company reserves the right to impose, or to authorise the Manager to impose a redemption charge on the redemption of Shares to a maximum of 3% of the Net Asset Value of the Shares to be redeemed in circumstances where the value of the Shares being redeemed equals 5% or more of the Net Asset Value of the relevant Fund, or where the value of the Shares being redeemed on a Dealing Day, when aggregated with the value of any Shares redeemed by the Shareholder from the same Fund within the prior two month period from the relevant Dealing Day equals 5% or more of the Net Asset Value of the relevant Fund of the Company. The Company reserves the right to impose, or to authorise the Manager to impose a sales charge and a switching charge in such an amount as may be specified in the Prospectus. During the financial year ended 30 June 2020 (referred to herein as the “year end” or “year ended”), and year ended 30 June 2019, no charges have been imposed on subscription monies, the redemption of Shares or Shares acquired as a result of switching between Funds. Minimum Subscription
The minimum initial subscription to the Company in respect of any Fund or Share Class will be specified in the Prospectus and may be varied or waived by the Directors at their absolute discretion.
5
DocuSign Envelope ID: 2646536F-BB10-4779-844A-39205D22F4E0
SEI Global Assets Fund plc Annual Report and Audited Financial Statements for the financial year ended 30 June 2020
GENERAL INFORMATION (continued) Dealing A Dealing Day is:
(i) every Business Day, except for 24 December; (ii) and/or such other days as the Directors may from time to time determine in relation to any particular Fund and notify in advance to the relevant
Shareholders;
provided always that there shall be at least one Dealing Day for each Fund per fortnight.
A Business Day is defined as any day on which banks in Dublin or London are open for normal banking business, excluding Saturdays and Sundays and such other day or days as may be determined by the Directors. If the aggregate redemption requests on any Dealing Day equal or exceed 10% or more of the outstanding Shares of any Series in issue or deemed to be in issue, the Directors may elect to restrict the total number of Shares to be redeemed to 10% of the outstanding Shares in issue in that Series on that Dealing Day, in which case all redemption requests will be reduced pro rata to the size of the request. The balance of the Shares in respect of which redemption requests have been received shall be redeemed on the next succeeding Dealing Day, subject to the same 10% restriction, and in priority to redemption requests received in respect of next Dealing Day.
6
DocuSign Envelope ID: 2646536F-BB10-4779-844A-39205D22F4E0
SEI Global Assets Fund plc Annual Report and Audited Financial Statements for the financial year ended 30 June 2020 DIRECTORS’ REPORT Statement of Directors’ Responsibilities The Directors are responsible for preparing the annual report and the financial statements in accordance with applicable Irish Law and Generally Accepted Accounting Practice in Ireland including the accounting standards issued by the Financial Reporting Council and published by the Institute of Chartered Accountants in Ireland. Under Irish law, the Directors shall not approve the financial statements unless they are satisfied that they give a true and fair view of the Company’s assets, liabilities and financial position as at the end of the financial year and the profit or loss of the Company for the financial year. In preparing these financial statements, the Directors are required to: select suitable accounting policies and then apply them consistently; make judgements and estimates that are reasonable and prudent; state whether the financial statements have been prepared in accordance with applicable accounting standards and identify the standards in
question, subject to any material departures from those standards being disclosed and explained in the Notes to the financial statements; and prepare the financial statements on the going concern basis unless it is inappropriate to presume that the company will continue in business.
The Directors are responsible for keeping adequate accounting records that are sufficient to: correctly record and explain the transactions of the company; enable, at any time, the assets, liabilities, financial position and profit or loss of the company to be determined with reasonable accuracy; and enable the Directors to ensure that the financial statements comply with the Companies Act 2014 and enable those financial statements to be
audited.
The Directors are also responsible for safeguarding the assets of the Company and hence for taking reasonable steps for the prevention and detection of fraud and other irregularities.
The Directors submit their annual report together with the audited financial statements for the year ended 30 June 2020 and comparatives for the year ended 30 June 2019. Directors’ Compliance Statement
It is the policy of the Company to comply with its relevant obligations (as defined in the Companies Act 2014). As required by Section 225(2) of the Companies Act 2014, the Directors acknowledge that they are responsible for securing the Company’s compliance with the relevant obligations. The Directors have drawn up a compliance policy statement as defined in Section 225(3)(a) of the Companies Act 2014 which refers to the arrangements and structures that are in place and which are, in the Directors’ opinion, designed to secure material compliance with the Company’s relevant obligations. In discharging their responsibilities under Section 225, the Directors relied upon, among other things, the services provided, advice and/or representations from third parties whom the Directors believe have the requisite knowledge and experience in order to secure material compliance with the Company’s relevant obligations.
In accordance with Section 225(3) (c) the Directors can confirm a review occurred during the financial year of the structures and arrangements that are in place to comply with the relevant obligations.
Statement of Relevant Audit Information The Directors in office at the date of this report have each confirmed that: As far as they are aware, there is no relevant audit information of which the Company’s auditor is unaware; and They have taken all the steps that they ought to have taken as a Director in order to make themselves aware of any relevant audit
information and to establish that the Company’s auditor is aware of that information.
Audit Committee
The Board of Directors decided it was not necessary to constitute an audit committee given the frequency of the meetings of the Board of Directors throughout the year and given the size of the Board of Directors.
Accounting Records
The measures taken by the Directors to secure compliance with the Company’s obligation to keep adequate accounting records are the use of appropriate systems and procedures and employment of competent persons. The accounting records are kept at 2nd Floor, Styne House, Upper Hatch Street, Dublin 2, Ireland.
7
DocuSign Envelope ID: 2646536F-BB10-4779-844A-39205D22F4E0
SEI Global Assets Fund plc Annual Report and Audited Financial Statements for the financial year ended 30 June 2020 DIRECTORS’ REPORT (continued) Accounting Records (continued) The financial statements are published on the www.seic.com website. The Directors, together with the Manager and the Investment Adviser are responsible for the maintenance and integrity of the financial information included on this website. Legislation governing the presentation and dissemination of the financial statements may differ from legislation in other jurisdictions. Directors The names of persons who served as Directors at any time during the year ended 30 June 2020 are set out below: Kevin Barr (American) Michael Jackson (Irish) Desmond Murray* (Irish) Robert A. Nesher (American) Jeffrey Klauder (American)
*Director, independent of the Investment Adviser. Information about Director’s Remuneration is presented in Note 9 in the Notes to the Financial Statements. Directors’ and Company Secretary’s Interests in Shares and Contracts
None of the Directors or the Company Secretary, at the date of this report, holds or held, on the date of his appointment or at any time during the year ended 30 June 2020, any beneficial interest in the Shares of the Company.
Michael Jackson is the managing partner in the firm of Matheson, who act as legal advisers to the Company. During the year ended 30 June 2020, Matheson were paid fees of US$68,343 (30 June 2019: US$39,580) for services to the Company.
Transactions Involving Directors Apart from the matter above, the Board of Directors is not aware of any contracts or arrangements of any significance in relation to the business of the Company in which the Directors had any interest as defined in Section 309 of the Companies Act 2014 at any time during the year ended 30 June 2020.
Results, Activities and Future Developments
The results of operations are set out in the Income Statement. A detailed review of activities and further developments is contained in the Investment Adviser’s Reports.
Risk Management Objectives and Policies The main risks arising from the Company’s financial instruments are market risk (including price risk, currency risk and interest rate risk), credit risk and liquidity risk as set out in Note 12 in the Notes to the Financial Statements.
Dividends The dividends for the year are set out in Note 4 in the Notes to the Financial Statements.
Efficient Portfolio Management
The Company may employ techniques and instruments relating to transferable securities and/or other financial instruments under the conditions and within the limits laid down by the Central Bank, provided that such instruments are used for efficient portfolio management. Techniques and instruments including futures contracts, forward foreign currency contracts, options and swaps utilised for the purposes of efficient portfolio management may only be used in accordance with the investment objectives and policies of the relevant Fund. Any technique or instrument must be one which is reasonably believed by the managers to be economically appropriate to the efficient portfolio management of the relevant Fund. Forward foreign currency contracts open at 30 June 2020 are disclosed as part of the Portfolio of Investments.
The Directors of the Company have elected to co-manage assets of certain Funds within the Company. In such cases, assets of different Funds are managed in common. The assets which are co-managed shall be referred to as a “pool” notwithstanding that such pools are used solely for internal management purposes. The pools do not constitute separate legal entities and are not directly accessible to investors. Each of the comanaged Funds shall be allocated an appropriate portion of a pool’s specific assets. The entitlements of each participating Fund to the co-managed assets apply to each and every line of the investments of each pool. As at 30 June 2020, SEI Global Assets Fund plc co-managed the assets of all the Funds (with the exception of The SEI Core Fund, The SEI Balanced Fund, The SEI Growth Fund, The SEI Aggressive Fund, The SEI Global Core Fund, The SEI Global Balanced Fund, The SEI Global Growth Fund, The SEI Global Aggressive Fund, The SEI Euro Core Fund, The SEI Euro Balanced Fund and The SEI Euro Growth Fund) utilising the following pools overleaf:
8
DocuSign Envelope ID: 2646536F-BB10-4779-844A-39205D22F4E0
SEI Global Assets Fund plc Annual Report and Audited Financial Statements for the financial year ended 30 June 2020
DIRECTORS’ REPORT (continued)
Efficient Portfolio Management (continued) Fund Name Pool The SEI Defensive Fund The SEI Managed Volatility Pool The SEI Conservative Fund The SEI Managed Volatility Pool The SEI Moderate Fund The SEI Managed Volatility Pool The SEI Global Conservative Fund The SEI Managed Volatility Pool The SEI Global Moderate Fund The SEI Managed Volatility Pool The SEI Euro Conservative Fund The SEI Managed Volatility Pool The SEI Euro Moderate Fund The SEI Managed Volatility Pool The SEI Euro Aggressive Fund The SEI Acadian European Equity (Ex-U.K.) Pool Investments can be held in the pool and also directly in the Funds. See portfolio of investments for further details. Portfolio Managers
No changes in Portfolio Managers occurred during the year ended 30 June 2020. Corporate Governance Statement
The Board of Directors (the “Board”) of the Company is responsible for the effective, prudent and ethical oversight of the Company and is ultimately responsible for ensuring that risk and compliance is properly managed in the Company. The Board of the Company shall strive to ensure that the Company is run in compliance with the Companies Act 2014, and the UCITS Regulations issued by the Central Bank and other rules which are of relevance to their position as Directors. The Board has adopted the voluntary Irish Funds (IF) Corporate Governance Code for Irish domiciled Collective Investment Schemes and Management Companies, issued 14 December 2011 (the “Code”) with effect from 29 November 2012. The Board has reviewed and assessed the measures included in the Code and considers its corporate governance practices and procedures since the adoption of the Code as consistent with it. The Board has assessed the measures included in the Code as being consistent with its corporate governance practices and procedures for the financial year. Each of the services providers engaged by the Company is subject to their own corporate governance requirements. Connected Persons In compliance with the UCITS Regulations, the Directors confirm that for the year ended 30 June 2020, all transactions carried out with connected persons were on an arms length basis and in the best interests of Shareholders. Significant Events Affecting the Company During the Year A new Prospectus was approved by the Central Bank on 10 February 2020. As at 11 March 2020 the COVID-19 outbreak was declared a pandemic by the World Health Organization. The situation is dynamic with various cities and countries around the world responding in different ways to address the outbreak. The rapid development and fluidity of this situation precludes any prediction as its ultimate impact, which may have a continued adverse impact on economic and market conditions and trigger a period of global economic slowdown. There were no other significant events affecting the Company during the year. Post Balance Sheet Events On 1 September 2020, there was a redemption in the SEI Global Aggressive Fund, which was over 90% of the USD Wealth B share class. There were no significant events affecting the Company since the year end.
9
DocuSign Envelope ID: 2646536F-BB10-4779-844A-39205D22F4E0
DocuSign Envelope ID: 2646536F-BB10-4779-844A-39205D22F4E0
11
DocuSign Envelope ID: 2646536F-BB10-4779-844A-39205D22F4E0
SEI Global Assets Fund plc Annual Report and Audited Financial Statements for the financial year ended 30 June 2020
REPORT OF THE DEPOSITARY TO THE SHAREHOLDERS
acity as Depositary to the Company.
This report including the opinion has been prepared for and solely for the Shareholders in the Company as a body, in accordance with Part 5 of the European Communities (Undertakings for Collective Investment in Transfera
pose or to any other person to whom this report is shown.
Responsibilities of the Depositary
Our duties and responsibilities are outlined in Part 5 of the UCITS Regulations. One of those duties is to enquire into the conduct of the Company in each annual accounting period and report thereon to the Shareholders.
Our report shall Memorandum and Articles of Association and the UCITS Regulations. It is the overall responsibility of the Company to comply with these provisions. If the Company has not so complied, we as Depositary must state why this is the case and outline the steps which we have taken to rectify the situation.
Basis of Depositary Opinion
The Depositary conducts such reviews as it, in its reasonable opinion, considers necessary in order to comply with its duties as outlined in Part 5 of the UCITS Regulations and to ensure that, in all material respects, the Company has been managed (i) in accordance with the limitations imposed on its investment and borrowing powers by the provisions of the Memorandum and Articles of Association and the appropriate regulations and (ii)
Opinion
In our opinion, the Company has been managed during the year, in all material respects:
(i) in accordance with the limitations imposed on the investment and borrowing powers of the Company by the Memorandum & Articles of Association and by the UCITS Regulations ; and
(ii) otherwise in accordance with the provisions of the Memorandum & Articles of Association, the UCITS Regulations and the Central Bank UCITS Regulations.
Brown Brothers Harriman Trustee Services (Ireland) Limited 30 Herbert Street Dublin 2 Ireland
22 October 2020
SEI Global Assets Fund plc Annual Report and Audited Financial Statements for the financial year ended 30 June 2020 INDEPENDENT AUDITORS' REPORT TO THE MEMBERS OF SEI GLOBAL ASSETS FUND PLC
Report on the audit of the financial statements
Opinion
In our opinion, SEI Global Assets Fund plc’s financial statements:
give a true and fair view of the Company’s and Funds’ assets, liabilities and financial position as at 30 June 2020 and of their results for the year then ended;
have been properly prepared in accordance with Generally Accepted Accounting Practice in Ireland (accounting standards issued by the Financial Reporting Council of the UK, including Financial Reporting Standard 102 “The Financial Reporting Standard applicable in the UK and Republic of Ireland” and Irish law); and
have been properly prepared in accordance with the requirements of the Companies Act 2014 and the European Communities (Undertakings for Collective Investment in Transferable Securities) Regulations 2011 (as amended).
We have audited the financial statements, included within the Annual Report and Audited Financial Statements, which comprise:
the Statement of Financial Position as at 30 June 2020;
the Income Statement for the year then ended;
the Statement of Changes in Net Assets Attributable to Redeemable Participating Shareholders for the year then ended;
the Portfolio of Investments for each of the Funds as at 30 June 2020; and
the notes to the Audited Financial Statements for the Company and for each of its Funds, which include a description of the significant accounting policies.
Basis for opinion
We conducted our audit in accordance with International Standards on Auditing (Ireland) (“ISAs (Ireland)”) and applicable law.
Our responsibilities under ISAs (Ireland) are further described in the Auditors’ responsibilities for the audit of the financial statements section of our report. We believe that the audit evidence we have obtained is sufficient and appropriate to provide a basis for our opinion.
Independence
We remained independent of the Company in accordance with the ethical requirements that are relevant to our audit of the financial statements in Ireland, which includes IAASA’s Ethical Standard, and we have fulfilled our other ethical responsibilities in accordance with these requirements.
Conclusions relating to going concern
We have nothing to report in respect of the following matters in relation to which ISAs (Ireland) require us to report to you where:
the directors’ use of the going concern basis of accounting in the preparation of the financial statements is not appropriate; or the directors have not disclosed in the financial statements any identified material uncertainties that may cast significant doubt about the
Company’s and Funds’ ability to continue to adopt the going concern basis of accounting for a period of at least twelve months from the date when the financial statements are authorised for issue.
However, because not all future events or conditions can be predicted, this statement is not a guarantee as to the Company’s and Funds’ ability to continue as going concerns.
Reporting on other information
The other information comprises all of the information in the Annual Report and Audited Financial Statements other than the financial statements and our auditors’ report thereon. The directors are responsible for the other information. Our opinion on the financial statements does not cover the other information and, accordingly, we do not express an audit opinion or, except to the extent otherwise explicitly stated in this report, any form of assurance thereon. In connection with our audit of the financial statements, our responsibility is to read the other information and, in doing so, consider whether the other information is materially inconsistent with the financial statements or our knowledge obtained in the audit, or otherwise appears to be materially misstated. If we identify an apparent material inconsistency or material misstatement, we are required to perform procedures to conclude whether there is a material misstatement of the financial statements or a material misstatement of the other information. If, based on the work we have performed, we conclude that there is a material misstatement of this other information, we are required to report that fact. We have nothing to report based on these responsibilities. With respect to the Directors’ Report, we also considered whether the disclosures required by the Companies Act 2014 have been included. Based on the responsibilities described above and our work undertaken in the course of the audit, ISAs (Ireland) and the Companies Act 2014 require us to also report certain opinions and matters as described below:
In our opinion, based on the work undertaken in the course of the audit, the information given in the Directors’ Report for the year ended 30 June 2020 is consistent with the financial statements and has been prepared in accordance with applicable legal requirements.
Based on our knowledge and understanding of the Company and its environment obtained in the course of the audit, we have not identified any material misstatements in the Directors’ Report.
12
DocuSign Envelope ID: 2646536F-BB10-4779-844A-39205D22F4E0
SEI Global Assets Fund plc Annual Report and Audited Financial Statements for the financial year ended 30 June 2020 INDEPENDENT AUDITORS' REPORT TO THE MEMBERS OF SEI GLOBAL ASSETS FUND PLC (continued)
Report on the audit of the financial statements (continued)
Responsibilities for the financial statements and the audit
Responsibilities of the directors for the financial statements
As explained more fully in the Statement of Directors’ Responsibilities set out on page 7, the directors are responsible for the preparation of the financial statements in accordance with the applicable framework and for being satisfied that they give a true and fair view.
The directors are also responsible for such internal control as they determine is necessary to enable the preparation of financial statements that are free from material misstatement, whether due to fraud or error.
In preparing the financial statements, the directors are responsible for assessing the Company’s and Funds’ ability to continue as going concerns, disclosing as applicable, matters related to going concern and using the going concern basis of accounting unless the directors either intend to liquidate the Company or to cease operations, or have no realistic alternative but to do so.
Auditors’ responsibilities for the audit of the financial statements
Our objectives are to obtain reasonable assurance about whether the financial statements as a whole are free from material misstatement, whether due to fraud or error, and to issue an auditors’ report that includes our opinion. Reasonable assurance is a high level of assurance, but is not a guarantee that an audit conducted in accordance with ISAs (Ireland) will always detect a material misstatement when it exists. Misstatements can arise from fraud or error and are considered material if, individually or in the aggregate, they could reasonably be expected to influence the economic decisions of users taken on the basis of these financial statements.
A further description of our responsibilities for the audit of the financial statements is located on the IAASA website at:
https://www.iaasa.ie/getmedia/b2389013-1cf6-458b-9b8f-a98202dc9c3a/Description_of_auditors_responsibilities_for_audit.pdf.
This description forms part of our auditors’ report.
Use of this report
This report, including the opinions, has been prepared for and only for the Company’s members as a body in accordance with section 391 of the Companies Act 2014 and for no other purpose. We do not, in giving these opinions, accept or assume responsibility for any other purpose or to any other person to whom this report is shown or into whose hands it may come save where expressly agreed by our prior consent in writing.
Other required reporting
Companies Act 2014 opinions on other matters
We have obtained all the information and explanations which we consider necessary for the purposes of our audit.
In our opinion the accounting records of the Company were sufficient to permit the financial statements to be readily and properly
audited.
The financial statements are in agreement with the accounting records.
Companies Act 2014 exception reporting
Directors’ remuneration and transactions
Under the Companies Act 2014 we are required to report to you if, in our opinion, the disclosures of directors’ remuneration and transactions specified by sections 305 to 312 of that Act have not been made. We have no exceptions to report arising from this responsibility.
Vincent MacMahon for and on behalf of PricewaterhouseCoopers Chartered Accountants and Statutory Audit Firm Dublin 22 October 2020
13
DocuSign Envelope ID: 2646536F-BB10-4779-844A-39205D22F4E0
SEI Global Assets Fund plc Annual Report and Audited Financial Statements for the financial year ended 30 June 2020 THE SEI DEFENSIVE FUND – INVESTMENT ADVISER’S REPORT The SEI Defensive Fund is comprised of eight classes of Shares. The Fund was launched on 19 February 2010. The functional currency of The SEI Defensive Fund is British Pound Sterling (GBP). Objective The investment objective of The SEI Defensive Fund aims to protect against the risk of a significant loss of capital while providing an opportunity for income and capital growth. Market Commentary The 12-month period ending 30 June 2020 saw strong returns in the equity markets over the final half of 2019, only to give up all of that return and more in the first quarter of 2020. Global economic growth remained low, yet stable, going into 2020 until panic set in over the spread of COVID-19. Equity returns rebounded after the market drop, but still finished below their peaks from earlier in the year. Despite tension around a U.S./China trade deal and ongoing Brexit concerns in late 2019, the lingering effects of COVID-19 demanded plenty of attention from investors. The pace of interest-rate cuts by the U.S. Federal Reserve (Fed) mostly followed market projections, with the Fed cutting rates three times in 2019. As the Fed cut, the back end of the curve also moved higher as expectations for additional moves decreased and inflation increased. This helped steepen the U.S. yield curve after inverting earlier in the year. Once COVID-19 made its way to the U.S., the Treasury curve bull steepened; the Fed cut rates to 0% and implemented a series of programmes, reminiscent of some of the actions taken during the great financial crisis, to address the impact of illiquidity in different markets affected by a lack of large buyers and market makers. In September, the European Central Bank (ECB) decreased the interest rate on its deposit facility by 10 basis points. Christine Lagarde was named to succeed Mario Draghi as ECB president at the end of October 2019. The ECB restarted its asset purchase programme in November with a monthly pace of €20 billion. The ECB stated it intends to continue to fully reinvest the principal payments from maturing securities purchased under the programme. In response to COVID-19, the ECB announced €750 billion in stimulus through its Pandemic Emergency Purchase Programme (PEPP). The PEPP aims to lower borrowing costs and increase lending in the euro area, and the amount of stimulus is now up to €1350 billion. Oil prices stayed range-bound in 2019 with significant geopolitical events occurring, such as the disruption of Saudi Arabian wells due to attacks. In early 2020, Saudi Arabia and Russia could not agree on oil output and started a price war. This price war, on top of the sinking demand due to the health pandemic, led to cratering oil prices. COVID-19 drove a massive selloff in commodities; the broad asset class recovered some over the final three months of the period although the rebound was nowhere near as strong as for equities. Brexit concerns alleviated as Boris Johnson’s Conservative Party did well in the December elections. The British pound strengthened against the U.S. dollar by over 4% during the final six months of 2019. However, Brexit concerns lingered over the second half of the fiscal year, and sterling depreciated against the U.S. dollar by over 6%. The MSCI United Kingdom Index was up 3% over the last six months of 2019, but the index sold off over 19% in 2020 and finished down over 15% for the full reporting period. U.S. equities were the best-performing global market during all of 2019 and the first half of 2020. The technology sector continued to dominate, and Alphabet, Amazon, Apple, Facebook and Microsoft made up roughly one-fourth of the market capitalisation of the S&P 500 Index at the end of the fiscal year. Over the last six months, the MSCI Europe, Australasia and Far East (EAFE) Index was down over 12%, the MSCI Emerging Markets Index was down over 10%, and the S&P 500 index was down by about 4%. Led by the dovish tone of global central banks and the continued strength of other risk assets, global high-yield bonds outperformed global Treasury bonds during the fiscal year; most forms of credit performed well in the “risk-on” environment over the first half of the reporting period. Global growth expectations stayed flat at a slightly positive rate, which also helped steepen yield curves. Across the globe, central banks offered more monetary stimulus in response to COVID-19. Global fixed income, as measured by the Bloomberg Barclays Global Aggregate Index, climbed over 4% over the 12 months. U.S. high-yield, as measured by the ICE BofA U.S. High Yield Constrained Index, dropped about 1%. Additionally, emerging-market debt performed well over the period; the JP Morgan Emerging Markets Bond Index (EMBI) Global Diversified Index, which tracks emerging-market debt denominated in external currencies (such as the U.S. dollar), returned almost 6%. Performance For the 12-month reporting period ending at 30 June 2020, the Fund’s GBP Wealth A Distributing shares returned 0.18%. Fund Attribution Fund performance was marginally positive during the annual period ending 30 June 2020. After a positive second half of 2019, equity performance suffered in the first half of 2020 due to the global COVID-19 pandemic and cratering oil prices. Specifically for UK equities, ongoing Brexit tensions heavily contributed to negative performance. The greatest detractor in the Fund was The SEI Global Managed Volatility Fund. Commodities also underperformed as energy prices fell due to the pandemic. The SEI UK Core Fixed Interest Fund was the largest contributor to Fund performance. Investors sought “safe-haven” assets and flocked to core fixed income as COVID-19 and Brexit concerns rose. The SEI Global Short Duration Bond Fund and The SEI Global Short Term Bond Fund also performed well during the period. From an active allocation perspective, the Fund closed its overweight to The SEI Emerging Markets Debt Fund relative to an underweight in The SEI High Yield Fixed Income Fund; the position marginally detracted from performance during the reporting period. Also, the Fund closed an overweight to commodities through a decrease in cash and cash equivalents; this exposure also detracted from performance over the fiscal year. July 2020
14
DocuSign Envelope ID: 2646536F-BB10-4779-844A-39205D22F4E0

SEI Global Assets Fund plc Annual Report and Audited Financial Statements for the financial year ended 30 June 2020 THE SEI DEFENSIVE FUND – INVESTMENT ADVISER’S REPORT (continued) Performance
Sterling Sterling Sterling Wealth A Sterling Sterling Investor Institutional Distributing Institutional Institutional Distributing Distributing Class C Class Class Class Class GBP GBP GBP GBP GBP
Opening Net Asset Value per share 11.19 12.07 12.13 10.52 10.34 Distribution rate per share 0.09 0.00 0.00 0.11 0.13 Closing Net Asset Value per share 11.12 12.09 12.22 10.43 10.28 Closing Net Asset Value plus distribution rate per share 11.21 12.09 12.22 10.54 10.41 Class return for the year/period 0.18% 0.17% 0.74% 0.19% 0.68%
Sterling Wealth A Sterling Sterling Accumulating Institutional Institutional Class D Class E Class GBP GBP GBP
Opening Net Asset Value per share 10.41 10.12 10.14 Distribution rate per share 0.00 0.00 0.00 Closing Net Asset Value per share 10.43 10.16 10.18 Closing Net Asset Value plus distribution rate per share 10.43 10.16 10.18 Class return for the year/period 0.19% 0.40% 0.39%
15
DocuSign Envelope ID: 2646536F-BB10-4779-844A-39205D22F4E0
SEI Global Assets Fund plc Annual Report and Audited Financial Statements for the financial year ended 30 June 2020 THE SEI CONSERVATIVE FUND – INVESTMENT ADVISER’S REPORT The SEI Conservative Fund is comprised of six classes of Shares. The Fund was launched on 19 February 2010. The functional currency of The SEI Conservative Fund is British Pound Sterling (GBP). Objective The investment objective of The SEI Conservative Fund aims to protect against the risk of a significant loss of capital and provide the opportunity for a conservative level of capital growth and income. Market Commentary The 12-month period ending 30 June 2020 saw strong returns in the equity markets over the final half of 2019, only to give up all of that return and more in the first quarter of 2020. Global economic growth remained low, yet stable, going into 2020 until panic set in over the spread of COVID-19. Equity returns rebounded after the market drop, but still finished below their peaks from earlier in the year. Despite tension around a U.S./China trade deal and ongoing Brexit concerns in late 2019, the lingering effects of COVID-19 demanded plenty of attention from investors. The pace of interest-rate cuts by the U.S. Federal Reserve (Fed) mostly followed market projections, with the Fed cutting rates three times in 2019. As the Fed cut, the back end of the curve also moved higher as expectations for additional moves decreased and inflation increased. This helped steepen the U.S. yield curve after inverting earlier in the year. Once COVID-19 made its way to the U.S., the Treasury curve bull steepened; the Fed cut rates to 0% and implemented a series of programmes, reminiscent of some of the actions taken during the great financial crisis, to address the impact of illiquidity in different markets affected by a lack of large buyers and market makers. In September, the European Central Bank (ECB) decreased the interest rate on its deposit facility by 10 basis points. Christine Lagarde was named to succeed Mario Draghi as ECB president at the end of October 2019. The ECB restarted its asset purchase programme in November with a monthly pace of €20 billion. The ECB stated it intends to continue to fully reinvest the principal payments from maturing securities purchased under the programme. In response to COVID-19, the ECB announced €750 billion in stimulus through its Pandemic Emergency Purchase Programme (PEPP). The PEPP aims to lower borrowing costs and increase lending in the euro area, and the amount of stimulus is now up to €1350 billion. Oil prices stayed range-bound in 2019 with significant geopolitical events occurring, such as the disruption of Saudi Arabian wells due to attacks. In early 2020, Saudi Arabia and Russia could not agree on oil output and started a price war. This price war, on top of the sinking demand due to the health pandemic, led to cratering oil prices. COVID-19 drove a massive selloff in commodities; the broad asset class recovered some over the final three months of the period although the rebound was nowhere near as strong as for equities. Brexit concerns alleviated as Boris Johnson’s Conservative Party did well in the December elections. The British pound strengthened against the U.S. dollar by over 4% during the final six months of 2019. However, Brexit concerns lingered over the second half of the fiscal year, and sterling depreciated against the U.S. dollar by over 6%. The MSCI United Kingdom Index was up 3% over the last six months of 2019, but the index sold off over 19% in 2020 and finished down over 15% for the full reporting period. U.S. equities were the best-performing global market during all of 2019 and the first half of 2020. The technology sector continued to dominate, and Alphabet, Amazon, Apple, Facebook and Microsoft made up roughly one-fourth of the market capitalisation of the S&P 500 Index at the end of the fiscal year. Over the last six months, the MSCI Europe, Australasia and Far East (EAFE) Index was down over 12%, the MSCI Emerging Markets Index was down over 10%, and the S&P 500 index was down by about 4%. Led by the dovish tone of global central banks and the continued strength of other risk assets, global high-yield bonds outperformed global Treasury bonds during the fiscal year; most forms of credit performed well in the “risk-on” environment over the first half of the reporting period. Global growth expectations stayed flat at a slightly positive rate, which also helped steepen yield curves. Across the globe, central banks offered more monetary stimulus in response to COVID-19. Global fixed income, as measured by the Bloomberg Barclays Global Aggregate Index, climbed over 4% over the 12 months. U.S. high-yield, as measured by the ICE BofA U.S. High Yield Constrained Index, dropped about 1%. Additionally, emerging-market debt performed well over the period; the JP Morgan Emerging Markets Bond Index (EMBI) Global Diversified Index, which tracks emerging-market debt denominated in external currencies (such as the U.S. dollar), returned almost 6%. Performance For the 12-month reporting period ending at 30 June 2020, the Fund’s GBP Wealth A Distributing shares returned -0.88%. Fund Attribution Fund performance was negative during the annual period ending 30 June 2020. After a positive second half of 2019, equity performance suffered in the first half of 2020 due to the global COVID-19 pandemic and cratering oil prices. Specifically for UK equities, ongoing Brexit tensions heavily contributed to negative performance. The greatest detractor in the Fund was The SEI Global Managed Volatility Fund. Commodities also underperformed as energy prices fell due to the pandemic. The SEI UK Core Fixed Interest Fund and The SEI UK Index-Linked Fixed Interest Fund were the largest contributors to Fund performance. Investors sought “safe-haven” assets and flocked to core fixed income and inflation-linked bonds as COVID-19 and Brexit concerns rose. July 2020
16
DocuSign Envelope ID: 2646536F-BB10-4779-844A-39205D22F4E0
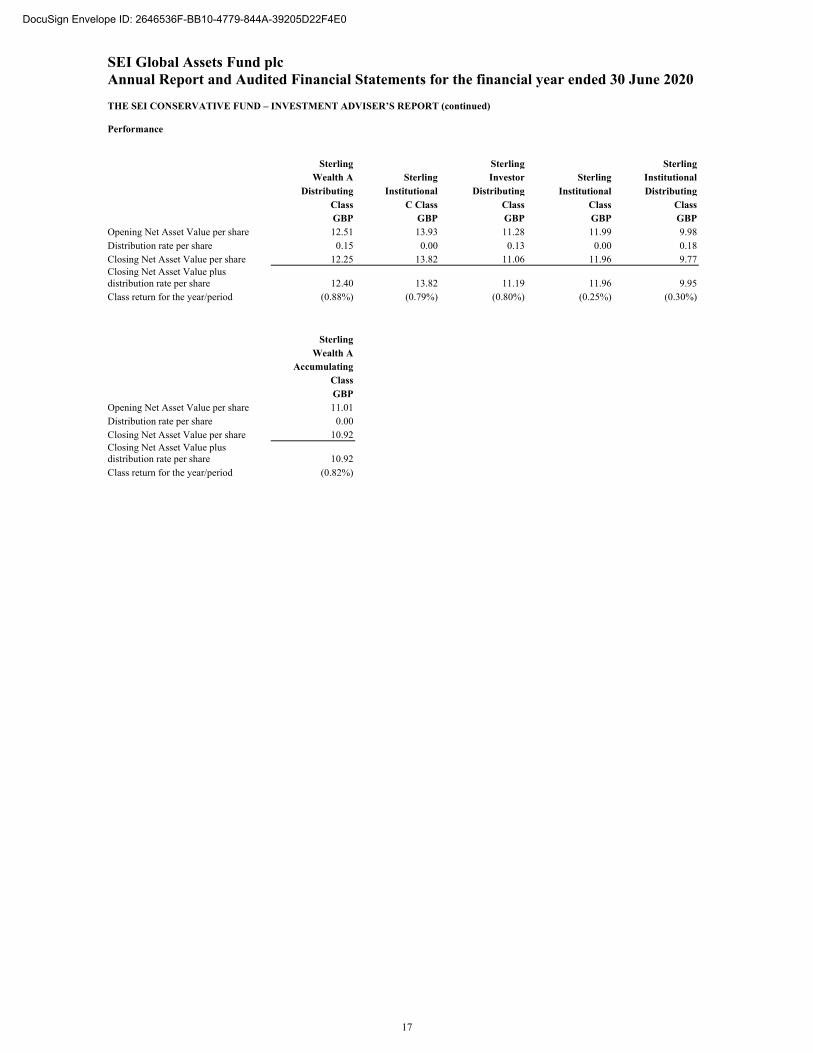
SEI Global Assets Fund plc Annual Report and Audited Financial Statements for the financial year ended 30 June 2020 THE SEI CONSERVATIVE FUND – INVESTMENT ADVISER’S REPORT (continued) Performance
Sterling Sterling Sterling Wealth A Sterling Investor Sterling Institutional Distributing Institutional Distributing Institutional Distributing Class C Class Class Class Class GBP GBP GBP GBP GBP
Opening Net Asset Value per share 12.51 13.93 11.28 11.99 9.98 Distribution rate per share 0.15 0.00 0.13 0.00 0.18 Closing Net Asset Value per share 12.25 13.82 11.06 11.96 9.77 Closing Net Asset Value plus distribution rate per share 12.40 13.82 11.19 11.96 9.95 Class return for the year/period (0.88%) (0.79%) (0.80%) (0.25%) (0.30%)
Sterling Wealth A Accumulating Class GBP
Opening Net Asset Value per share 11.01 Distribution rate per share 0.00 Closing Net Asset Value per share 10.92 Closing Net Asset Value plus distribution rate per share 10.92 Class return for the year/period (0.82%)
17
DocuSign Envelope ID: 2646536F-BB10-4779-844A-39205D22F4E0
SEI Global Assets Fund plc Annual Report and Audited Financial Statements for the financial year ended 30 June 2020 THE SEI MODERATE FUND – INVESTMENT ADVISER’S REPORT The SEI Moderate Fund is comprised of nine classes of Shares. The Fund was launched on 19 February 2010. The functional currency of The SEI Moderate Fund is British Pound Sterling (GBP). Objective The investment objective of The SEI Moderate Fund is to provide the opportunity for a moderate level of capital growth and income while lowering the risk of a significant loss of capital. Market Commentary The 12-month period ending 30 June 2020 saw strong returns in the equity markets over the final half of 2019, only to give up all of that return and more in the first quarter of 2020. Global economic growth remained low, yet stable, going into 2020 until panic set in over the spread of COVID-19. Equity returns rebounded after the market drop, but still finished below their peaks from earlier in the year. Despite tension around a U.S./China trade deal and ongoing Brexit concerns in late 2019, the lingering effects of COVID-19 demanded plenty of attention from investors. The pace of interest-rate cuts by the U.S. Federal Reserve (Fed) mostly followed market projections, with the Fed cutting rates three times in 2019. As the Fed cut, the back end of the curve also moved higher as expectations for additional moves decreased and inflation increased. This helped steepen the U.S. yield curve after inverting earlier in the year. Once COVID-19 made its way to the U.S., the Treasury curve bull steepened; the Fed cut rates to 0% and implemented a series of programmes, reminiscent of some of the actions taken during the great financial crisis, to address the impact of illiquidity in different markets affected by a lack of large buyers and market makers. In September, the European Central Bank (ECB) decreased the interest rate on its deposit facility by 10 basis points. Christine Lagarde was named to succeed Mario Draghi as ECB president at the end of October 2019. The ECB restarted its asset purchase programme in November with a monthly pace of €20 billion. The ECB stated it intends to continue to fully reinvest the principal payments from maturing securities purchased under the programme. In response to COVID-19, the ECB announced €750 billion in stimulus through its Pandemic Emergency Purchase Programme (PEPP). The PEPP aims to lower borrowing costs and increase lending in the euro area, and the amount of stimulus is now up to €1350 billion. Oil prices stayed range-bound in 2019 with significant geopolitical events occurring, such as the disruption of Saudi Arabian wells due to attacks. In early 2020, Saudi Arabia and Russia could not agree on oil output and started a price war. This price war, on top of the sinking demand due to the health pandemic, led to cratering oil prices. COVID-19 drove a massive selloff in commodities; the broad asset class recovered some over the final three months of the period although the rebound was nowhere near as strong as for equities. Brexit concerns alleviated as Boris Johnson’s Conservative Party did well in the December elections. The British pound strengthened against the U.S. dollar by over 4% during the final six months of 2019. However, Brexit concerns lingered over the second half of the fiscal year, and sterling depreciated against the U.S. dollar by over 6%. The MSCI United Kingdom Index was up 3% over the last six months of 2019, but the index sold off over 19% in 2020 and finished down over 15% for the full reporting period. U.S. equities were the best-performing global market during all of 2019 and the first half of 2020. The technology sector continued to dominate, and Alphabet, Amazon, Apple, Facebook and Microsoft made up roughly one-fourth of the market capitalisation of the S&P 500 Index at the end of the fiscal year. Over the last six months, the MSCI Europe, Australasia and Far East (EAFE) Index was down over 12%, the MSCI Emerging Markets Index was down over 10%, and the S&P 500 index was down by about 4%. Led by the dovish tone of global central banks and the continued strength of other risk assets, global high-yield bonds outperformed global Treasury bonds during the fiscal year; most forms of credit performed well in the “risk-on” environment over the first half of the reporting period. Global growth expectations stayed flat at a slightly positive rate, which also helped steepen yield curves. Across the globe, central banks offered more monetary stimulus in response to COVID-19. Global fixed income, as measured by the Bloomberg Barclays Global Aggregate Index, climbed over 4% over the 12 months. U.S. high-yield, as measured by the ICE BofA U.S. High Yield Constrained Index, dropped about 1%. Additionally, emerging-market debt performed well over the period; the JP Morgan Emerging Markets Bond Index (EMBI) Global Diversified Index, which tracks emerging-market debt denominated in external currencies (such as the U.S. dollar), returned almost 6%. Performance For the 12-month reporting period ending at 30 June 2020, the Fund’s GBP Wealth A Distributing shares returned -2.30%. Fund Attribution Fund performance was negative during the annual period ending 30 June 2020. After a positive second half of 2019, equity performance suffered in the first half of 2020 due to the global COVID-19 pandemic and cratering oil prices. Specifically for UK equities, ongoing Brexit tensions heavily contributed to negative performance. The greatest detractor in the Fund was The SEI Global Managed Volatility Fund. Commodities also underperformed as energy prices fell due to the pandemic. The SEI UK Core Fixed Interest Fund was the largest contributor to Fund performance. Investors sought “safe-haven” assets and flocked to core fixed income as COVID-19 and Brexit concerns rose. The SEI UK Index-Linked Fixed Interest Fund, The SEI Global Short Duration Bond Fund and The SEI Global Short Term Bond Fund also performed well during the period. From an active allocation perspective, the Fund closed its overweight to The SEI Emerging Markets Debt Fund relative to an underweight in The SEI High Yield Fixed Income Fund; the position marginally detracted from performance during the reporting period. Also, the Fund closed an overweight to commodities through a decrease in cash and cash equivalents; this exposure also detracted from performance over the fiscal year. July 2020
18
DocuSign Envelope ID: 2646536F-BB10-4779-844A-39205D22F4E0
SEI Global Assets Fund plc Annual Report and Audited Financial Statements for the financial year ended 30 June 2020 THE SEI MODERATE FUND – INVESTMENT ADVISER’S REPORT (continued) Performance
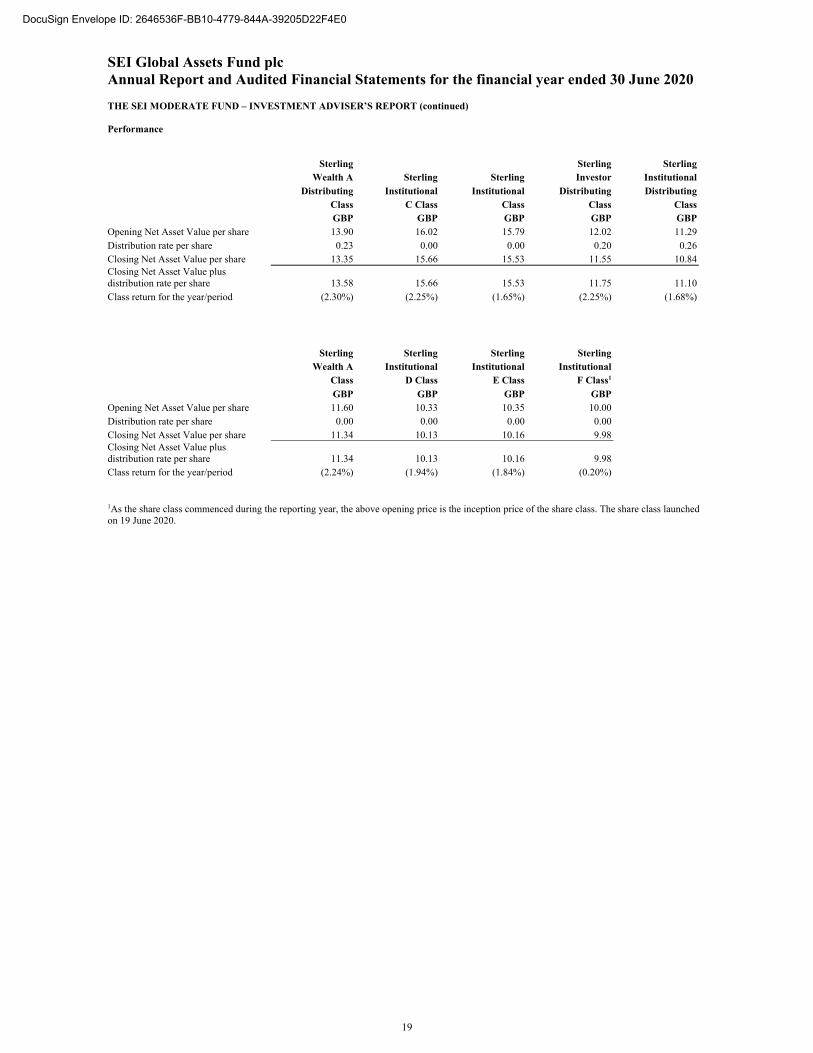
Sterling Sterling Sterling Wealth A Sterling Sterling Investor Institutional Distributing Institutional Institutional Distributing Distributing Class C Class Class Class Class GBP GBP GBP GBP GBP
Opening Net Asset Value per share 13.90 16.02 15.79 12.02 11.29 Distribution rate per share 0.23 0.00 0.00 0.20 0.26 Closing Net Asset Value per share 13.35 15.66 15.53 11.55 10.84 Closing Net Asset Value plus distribution rate per share 13.58 15.66 15.53 11.75 11.10 Class return for the year/period (2.30%) (2.25%) (1.65%) (2.25%) (1.68%)
Sterling Sterling Sterling Sterling Wealth A Institutional Institutional Institutional Class D Class E Class F Class1 GBP GBP GBP GBP
Opening Net Asset Value per share 11.60 10.33 10.35 10.00 Distribution rate per share 0.00 0.00 0.00 0.00 Closing Net Asset Value per share 11.34 10.13 10.16 9.98 Closing Net Asset Value plus distribution rate per share 11.34 10.13 10.16 9.98 Class return for the year/period (2.24%) (1.94%) (1.84%) (0.20%)
1As the share class commenced during the reporting year, the above opening price is the inception price of the share class. The share class launched on 19 June 2020.
19
DocuSign Envelope ID: 2646536F-BB10-4779-844A-39205D22F4E0

SEI Global Assets Fund plc Annual Report and Audited Financial Statements for the financial year ended 30 June 2020 THE SEI CORE FUND – INVESTMENT ADVISER’S REPORT The SEI Core Fund is comprised of nine classes of Shares. The Fund was launched on 19 February 2010. The functional currency of The SEI Core Fund is British Pound Sterling (GBP). Objective The investment objective of The SEI Core Fund is to provide the opportunity for capital growth and income in line with global equity and fixed income markets whilst seeking to manage the respective risks. Market Commentary The 12-month period ending 30 June 2020 saw strong returns in the equity markets over the final half of 2019, only to give up all of that return and more in the first quarter of 2020. Global economic growth remained low, yet stable, going into 2020 until panic set in over the spread of COVID-19. Equity returns rebounded after the market drop, but still finished below their peaks from earlier in the year. Despite tension around a U.S./China trade deal and ongoing Brexit concerns in late 2019, the lingering effects of COVID-19 demanded plenty of attention from investors. The pace of interest-rate cuts by the U.S. Federal Reserve (Fed) mostly followed market projections, with the Fed cutting rates three times in 2019. As the Fed cut, the back end of the curve also moved higher as expectations for additional moves decreased and inflation increased. This helped steepen the U.S. yield curve after inverting earlier in the year. Once COVID-19 made its way to the U.S., the Treasury curve bull steepened; the Fed cut rates to 0% and implemented a series of programmes, reminiscent of some of the actions taken during the great financial crisis, to address the impact of illiquidity in different markets affected by a lack of large buyers and market makers. In September, the European Central Bank (ECB) decreased the interest rate on its deposit facility by 10 basis points. Christine Lagarde was named to succeed Mario Draghi as ECB president at the end of October 2019. The ECB restarted its asset purchase programme in November with a monthly pace of €20 billion. The ECB stated it intends to continue to fully reinvest the principal payments from maturing securities purchased under the programme. In response to COVID-19, the ECB announced €750 billion in stimulus through its Pandemic Emergency Purchase Programme (PEPP). The PEPP aims to lower borrowing costs and increase lending in the euro area, and the amount of stimulus is now up to €1350 billion. Oil prices stayed range-bound in 2019 with significant geopolitical events occurring, such as the disruption of Saudi Arabian wells due to attacks. In early 2020, Saudi Arabia and Russia could not agree on oil output and started a price war. This price war, on top of the sinking demand due to the health pandemic, led to cratering oil prices. COVID-19 drove a massive selloff in commodities; the broad asset class recovered some over the final three months of the period although the rebound was nowhere near as strong as for equities. Brexit concerns alleviated as Boris Johnson’s Conservative Party did well in the December elections. The British pound strengthened against the U.S. dollar by over 4% during the final six months of 2019. However, Brexit concerns lingered over the second half of the fiscal year, and sterling depreciated against the U.S. dollar by over 6%. The MSCI United Kingdom Index was up 3% over the last six months of 2019, but the index sold off over 19% in 2020 and finished down over 15% for the full reporting period. U.S. equities were the best-performing global market during all of 2019 and the first half of 2020. The technology sector continued to dominate, and Alphabet, Amazon, Apple, Facebook and Microsoft made up roughly one-fourth of the market capitalisation of the S&P 500 Index at the end of the fiscal year. Over the last six months, the MSCI Europe, Australasia and Far East (EAFE) Index was down over 12%, the MSCI Emerging Markets Index was down over 10%, and the S&P 500 index was down by about 4%. Led by the dovish tone of global central banks and the continued strength of other risk assets, global high-yield bonds outperformed global Treasury bonds during the fiscal year; most forms of credit performed well in the “risk-on” environment over the first half of the reporting period. Global growth expectations stayed flat at a slightly positive rate, which also helped steepen yield curves. Across the globe, central banks offered more monetary stimulus in response to COVID-19. Global fixed income, as measured by the Bloomberg Barclays Global Aggregate Index, climbed over 4% over the 12 months. U.S. high-yield, as measured by the ICE BofA U.S. High Yield Constrained Index, dropped about 1%. Additionally, emerging-market debt performed well over the period; the JP Morgan Emerging Markets Bond Index (EMBI) Global Diversified Index, which tracks emerging-market debt denominated in external currencies (such as the U.S. dollar), returned almost 6%. Performance For the 12-month reporting period ending at 30 June 2020, the Fund’s GBP Wealth A Distributing shares returned -1.77%. Fund Attribution Fund performance was negative during the annual period ending 30 June 2020. After a positive second half of 2019, equity performance suffered in the first half of 2020 due to the global COVID-19 pandemic and cratering oil prices. Specifically for UK equities, ongoing Brexit tensions heavily contributed to negative performance. The greatest detractor in the Fund was The SEI UK Equity Fund. Commodities also underperformed as energy prices fell due to the pandemic. The SEI UK Core Fixed Interest Fund and The SEI UK Index-Linked Fixed Interest Fund were the largest contributors to Fund performance. Investors sought “safe-haven” assets and flocked to core fixed income and inflation-linked bonds as COVID-19 and Brexit concerns rose. The SEI Global Short Duration Bond Fund, The SEI Global Short Term Bond Fund and The SEI UK Credit Fixed Interest Fund contributed as well. July 2020
20
DocuSign Envelope ID: 2646536F-BB10-4779-844A-39205D22F4E0

SEI Global Assets Fund plc Annual Report and Audited Financial Statements for the financial year ended 30 June 2020 THE SEI CORE FUND – INVESTMENT ADVISER’S REPORT (continued) Performance
Sterling Sterling Sterling Wealth A Sterling Sterling Investor Institutional Distributing Institutional Institutional Distributing Distributing Class C Class Class Class Class GBP GBP GBP GBP GBP
Opening Net Asset Value per share 15.79 18.07 17.85 13.00 11.76 Distribution rate per share 0.28 0.00 0.00 0.23 0.09 Closing Net Asset Value per share 15.23 17.78 17.67 12.54 11.55 Closing Net Asset Value plus distribution rate per share 15.51 17.78 17.67 12.77 11.64 Class return for the year/period (1.77%) (1.60%) (1.01%) (1.77%) (1.02%)
Sterling Wealth A Sterling Sterling Sterling Accumulating Institutional Institutional Institutional Class D Class E Class F Class1 GBP GBP GBP GBP
Opening Net Asset Value per share 12.31 10.22 10.24 10.00 Distribution rate per share 0.00 0.00 0.00 0.00 Closing Net Asset Value per share 12.10 10.08 10.13 9.97 Closing Net Asset Value plus distribution rate per share 12.10 10.08 10.13 9.97 Class return for the year/period (1.71%) (1.37%) (1.07%) (0.30%)
1As the share class commenced during the reporting year, the above opening price is the inception price of the share class. The share class launched on 19 June 2020.
21
DocuSign Envelope ID: 2646536F-BB10-4779-844A-39205D22F4E0
SEI Global Assets Fund plc Annual Report and Audited Financial Statements for the financial year ended 30 June 2020 THE SEI BALANCED FUND – INVESTMENT ADVISER’S REPORT The SEI Balanced Fund is comprised of six classes of Shares. The Fund was launched on 19 February 2010. The functional currency of The SEI Balanced Fund is British Pound Sterling (GBP). Objective The investment objective of The SEI Balanced Fund is to provide capital growth and income in line with global equity and fixed income markets whilst seeking to manage the respective risks. Market Commentary The 12-month period ending 30 June 2020 saw strong returns in the equity markets over the final half of 2019, only to give up all of that return and more in the first quarter of 2020. Global economic growth remained low, yet stable, going into 2020 until panic set in over the spread of COVID-19. Equity returns rebounded after the market drop, but still finished below their peaks from earlier in the year. Despite tension around a U.S./China trade deal and ongoing Brexit concerns in late 2019, the lingering effects of COVID-19 demanded plenty of attention from investors. The pace of interest-rate cuts by the U.S. Federal Reserve (Fed) mostly followed market projections, with the Fed cutting rates three times in 2019. As the Fed cut, the back end of the curve also moved higher as expectations for additional moves decreased and inflation increased. This helped steepen the U.S. yield curve after inverting earlier in the year. Once COVID-19 made its way to the U.S., the Treasury curve bull steepened; the Fed cut rates to 0% and implemented a series of programmes, reminiscent of some of the actions taken during the great financial crisis, to address the impact of illiquidity in different markets affected by a lack of large buyers and market makers. In September, the European Central Bank (ECB) decreased the interest rate on its deposit facility by 10 basis points. Christine Lagarde was named to succeed Mario Draghi as ECB president at the end of October 2019. The ECB restarted its asset purchase programme in November with a monthly pace of €20 billion. The ECB stated it intends to continue to fully reinvest the principal payments from maturing securities purchased under the programme. In response to COVID-19, the ECB announced €750 billion in stimulus through its Pandemic Emergency Purchase Programme (PEPP). The PEPP aims to lower borrowing costs and increase lending in the euro area, and the amount of stimulus is now up to €1350 billion. Oil prices stayed range-bound in 2019 with significant geopolitical events occurring, such as the disruption of Saudi Arabian wells due to attacks. In early 2020, Saudi Arabia and Russia could not agree on oil output and started a price war. This price war, on top of the sinking demand due to the health pandemic, led to cratering oil prices. COVID-19 drove a massive selloff in commodities; the broad asset class recovered some over the final three months of the period although the rebound was nowhere near as strong as for equities. Brexit concerns alleviated as Boris Johnson’s Conservative Party did well in the December elections. The British pound strengthened against the U.S. dollar by over 4% during the final six months of 2019. However, Brexit concerns lingered over the second half of the fiscal year, and sterling depreciated against the U.S. dollar by over 6%. The MSCI United Kingdom Index was up 3% over the last six months of 2019, but the index sold off over 19% in 2020 and finished down over 15% for the full reporting period. U.S. equities were the best-performing global market during all of 2019 and the first half of 2020. The technology sector continued to dominate, and Alphabet, Amazon, Apple, Facebook and Microsoft made up roughly one-fourth of the market capitalisation of the S&P 500 Index at the end of the fiscal year. Over the last six months, the MSCI Europe, Australasia and Far East (EAFE) Index was down over 12%, the MSCI Emerging Markets Index was down over 10%, and the S&P 500 index was down by about 4%. Led by the dovish tone of global central banks and the continued strength of other risk assets, global high-yield bonds outperformed global Treasury bonds during the fiscal year; most forms of credit performed well in the “risk-on” environment over the first half of the reporting period. Global growth expectations stayed flat at a slightly positive rate, which also helped steepen yield curves. Across the globe, central banks offered more monetary stimulus in response to COVID-19. Global fixed income, as measured by the Bloomberg Barclays Global Aggregate Index, climbed over 4% over the 12 months. U.S. high-yield, as measured by the ICE BofA U.S. High Yield Constrained Index, dropped about 1%. Additionally, emerging-market debt performed well over the period; the JP Morgan Emerging Markets Bond Index (EMBI) Global Diversified Index, which tracks emerging-market debt denominated in external currencies (such as the U.S. dollar), returned almost 6%. Performance For the 12-month reporting period ending at 30 June 2020, the Fund’s GBP Wealth A Distributing shares returned -2.85%. Fund Attribution Fund performance was negative during the annual period ending 30 June 2020. After a positive second half of 2019, equity performance suffered in the first half of 2020 due to the global COVID-19 pandemic and cratering oil prices. The greatest detractor in the Fund was The SEIUK Equity Fund as ongoing Brexit tensions heavily contributed to negative returns. The SEI UK Core Fixed Interest Fund and The SEI UK Index-Linked Fixed Interest Fund were the largest contributors to Fund performance. Investors sought “safe-haven” assets and flocked to core fixed income and inflation-linked bonds as COVID-19 and Brexit concerns rose. The SEI Dynamic Asset Allocation Fund also performed well and profited as its gold exposure benefitted from the rise in gold prices as pandemic uncertainty escalated. July 2020
22
DocuSign Envelope ID: 2646536F-BB10-4779-844A-39205D22F4E0
SEI Global Assets Fund plc Annual Report and Audited Financial Statements for the financial year ended 30 June 2020 THE SEI BALANCED FUND – INVESTMENT ADVISER’S REPORT (continued) Performance
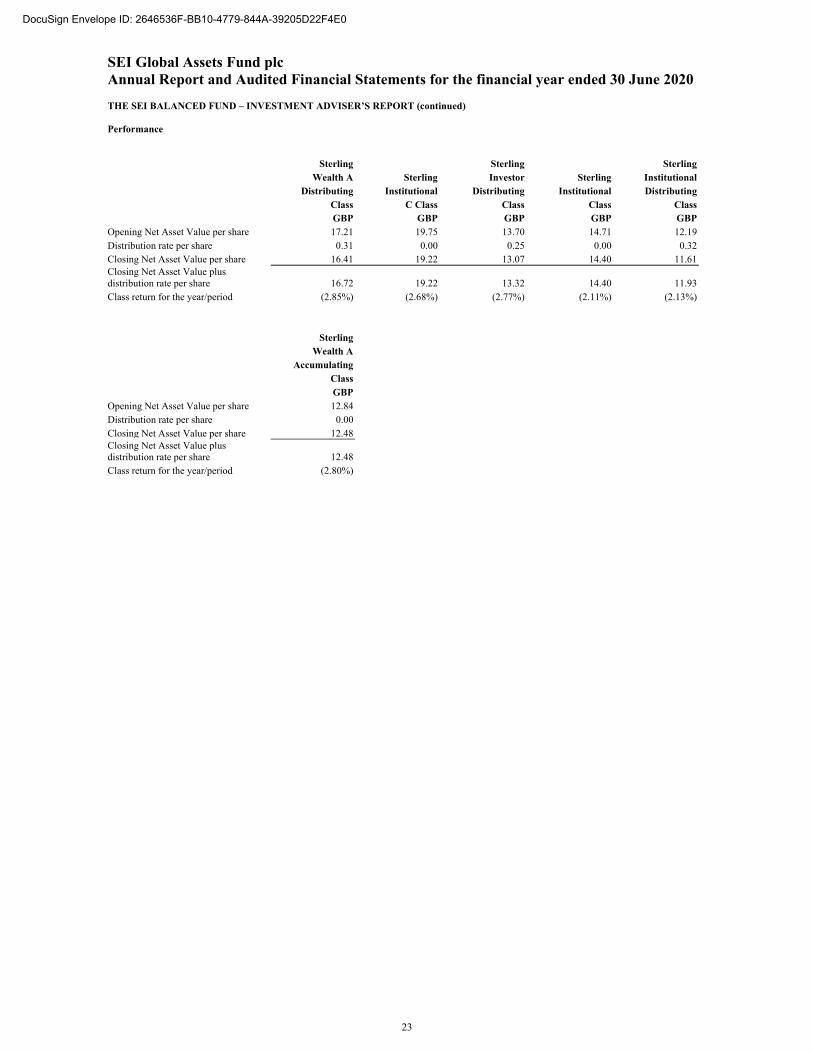
Sterling Sterling Sterling Wealth A Sterling Investor Sterling Institutional Distributing Institutional Distributing Institutional Distributing Class C Class Class Class Class GBP GBP GBP GBP GBP
Opening Net Asset Value per share 17.21 19.75 13.70 14.71 12.19 Distribution rate per share 0.31 0.00 0.25 0.00 0.32 Closing Net Asset Value per share 16.41 19.22 13.07 14.40 11.61 Closing Net Asset Value plus distribution rate per share 16.72 19.22 13.32 14.40 11.93 Class return for the year/period (2.85%) (2.68%) (2.77%) (2.11%) (2.13%)
Sterling Wealth A Accumulating Class GBP
Opening Net Asset Value per share 12.84 Distribution rate per share 0.00 Closing Net Asset Value per share 12.48 Closing Net Asset Value plus distribution rate per share 12.48 Class return for the year/period (2.80%)
23
DocuSign Envelope ID: 2646536F-BB10-4779-844A-39205D22F4E0
SEI Global Assets Fund plc Annual Report and Audited Financial Statements for the financial year ended 30 June 2020 THE SEI GROWTH FUND – INVESTMENT ADVISER’S REPORT The SEI Growth Fund is comprised of eight classes of Shares. The Fund was launched on 19 February 2010. The functional currency of The SEI Growth Fund is British Pound Sterling (GBP). Objective The investment objective of The SEI Growth Fund is to provide capital growth and risk exposure predominantly in line with global equity markets. Market Commentary The 12-month period ending 30 June 2020 saw strong returns in the equity markets over the final half of 2019, only to give up all of that return and more in the first quarter of 2020. Global economic growth remained low, yet stable, going into 2020 until panic set in over the spread of COVID-19. Equity returns rebounded after the market drop, but still finished below their peaks from earlier in the year. Despite tension around a U.S./China trade deal and ongoing Brexit concerns in late 2019, the lingering effects of COVID-19 demanded plenty of attention from investors. The pace of interest-rate cuts by the U.S. Federal Reserve (Fed) mostly followed market projections, with the Fed cutting rates three times in 2019. As the Fed cut, the back end of the curve also moved higher as expectations for additional moves decreased and inflation increased. This helped steepen the U.S. yield curve after inverting earlier in the year. Once COVID-19 made its way to the U.S., the Treasury curve bull steepened; the Fed cut rates to 0% and implemented a series of programmes, reminiscent of some of the actions taken during the great financial crisis, to address the impact of illiquidity in different markets affected by a lack of large buyers and market makers. In September, the European Central Bank (ECB) decreased the interest rate on its deposit facility by 10 basis points. Christine Lagarde was named to succeed Mario Draghi as ECB president at the end of October 2019. The ECB restarted its asset purchase programme in November with a monthly pace of €20 billion. The ECB stated it intends to continue to fully reinvest the principal payments from maturing securities purchased under the programme. In response to COVID-19, the ECB announced €750 billion in stimulus through its Pandemic Emergency Purchase Programme (PEPP). The PEPP aims to lower borrowing costs and increase lending in the euro area, and the amount of stimulus is now up to €1350 billion. Oil prices stayed range-bound in 2019 with significant geopolitical events occurring, such as the disruption of Saudi Arabian wells due to attacks. In early 2020, Saudi Arabia and Russia could not agree on oil output and started a price war. This price war, on top of the sinking demand due to the health pandemic, led to cratering oil prices. COVID-19 drove a massive selloff in commodities; the broad asset class recovered some over the final three months of the period although the rebound was nowhere near as strong as for equities. Brexit concerns alleviated as Boris Johnson’s Conservative Party did well in the December elections. The British pound strengthened against the U.S. dollar by over 4% during the final six months of 2019. However, Brexit concerns lingered over the second half of the fiscal year, and sterling depreciated against the U.S. dollar by over 6%. The MSCI United Kingdom Index was up 3% over the last six months of 2019, but the index sold off over 19% in 2020 and finished down over 15% for the full reporting period. U.S. equities were the best-performing global market during all of 2019 and the first half of 2020. The technology sector continued to dominate, and Alphabet, Amazon, Apple, Facebook and Microsoft made up roughly one-fourth of the market capitalisation of the S&P 500 Index at the end of the fiscal year. Over the last six months, the MSCI Europe, Australasia and Far East (EAFE) Index was down over 12%, the MSCI Emerging Markets Index was down over 10%, and the S&P 500 index was down by about 4%. Led by the dovish tone of global central banks and the continued strength of other risk assets, global high-yield bonds outperformed global Treasury bonds during the fiscal year; most forms of credit performed well in the “risk-on” environment over the first half of the reporting period. Global growth expectations stayed flat at a slightly positive rate, which also helped steepen yield curves. Across the globe, central banks offered more monetary stimulus in response to COVID-19. Global fixed income, as measured by the Bloomberg Barclays Global Aggregate Index, climbed over 4% over the 12 months. U.S. high-yield, as measured by the ICE BofA U.S. High Yield Constrained Index, dropped about 1%. Additionally, emerging-market debt performed well over the period; the JP Morgan Emerging Markets Bond Index (EMBI) Global Diversified Index, which tracks emerging-market debt denominated in external currencies (such as the U.S. dollar), returned almost 6%. Performance For the 12-month reporting period ending at 30 June 2020, the Fund’s GBP Wealth A Distributing shares returned -3.54%. Fund Attribution Fund performance was negative during the annual period ending 30 June 2020. After a positive second half of 2019, equity performance suffered in the first half of 2020 due to the global COVID-19 pandemic and cratering oil prices. Specifically for UK equities, ongoing Brexit tensions heavily contributed to negative performance. The greatest detractor in the Fund was The SEI UK Equity Fund. The SEI Dynamic Asset Allocation Fund performed well and profited as its gold exposure benefitted from the rise in gold prices as pandemic uncertainty escalated. The SEI Factor Allocation U.S. Equity Fund also contributed as U.S. technology stocks surged after the COVID-19 market correction. July 2020
24
DocuSign Envelope ID: 2646536F-BB10-4779-844A-39205D22F4E0

SEI Global Assets Fund plc Annual Report and Audited Financial Statements for the financial year ended 30 June 2020 THE SEI GROWTH FUND – INVESTMENT ADVISER’S REPORT (continued) Performance
Sterling Sterling Sterling Wealth A Sterling Sterling Investor Institutional Distributing Institutional Institutional Distributing Distributing Class C Class Class Class Class GBP GBP GBP GBP GBP
Opening Net Asset Value per share 18.64 21.45 21.24 14.49 12.66 Distribution rate per share 0.35 0.00 0.00 0.27 0.35 Closing Net Asset Value per share 17.63 20.72 20.65 13.70 11.96 Closing Net Asset Value plus distribution rate per share 17.98 20.72 20.65 13.97 12.31 Class return for the year/period (3.54%) (3.40%) (2.78%) (3.59%) (2.76%)
Sterling Wealth A Sterling Sterling Accumulating Institutional Institutional Class D Class E Class GBP GBP GBP
Opening Net Asset Value per share 13.45 10.12 10.13 Distribution rate per share 0.00 0.00 0.00 Closing Net Asset Value per share 12.96 9.80 9.83 Closing Net Asset Value plus distribution rate per share 12.96 9.80 9.83 Class return for the year/period (3.64%) (3.16%) (2.96%)
25
DocuSign Envelope ID: 2646536F-BB10-4779-844A-39205D22F4E0
SEI Global Assets Fund plc Annual Report and Audited Financial Statements for the financial year ended 30 June 2020 THE SEI AGGRESSIVE FUND – INVESTMENT ADVISER’S REPORT The SEI Aggressive Fund is comprised of eight classes of Shares. The Fund was launched on 19 February 2010. The functional currency of The SEI Aggressive Fund is British Pound Sterling (GBP). Objective The investment objective of The SEI Aggressive Fund is to provide capital growth and risk exposure in line with global equity markets. Market Commentary The 12-month period ending 30 June 2020 saw strong returns in the equity markets over the final half of 2019, only to give up all of that return and more in the first quarter of 2020. Global economic growth remained low, yet stable, going into 2020 until panic set in over the spread of COVID-19. Equity returns rebounded after the market drop, but still finished below their peaks from earlier in the year. Despite tension around a U.S./China trade deal and ongoing Brexit concerns in late 2019, the lingering effects of COVID-19 demanded plenty of attention from investors. The pace of interest-rate cuts by the U.S. Federal Reserve (Fed) mostly followed market projections, with the Fed cutting rates three times in 2019. As the Fed cut, the back end of the curve also moved higher as expectations for additional moves decreased and inflation increased. This helped steepen the U.S. yield curve after inverting earlier in the year. Once COVID-19 made its way to the U.S., the Treasury curve bull steepened; the Fed cut rates to 0% and implemented a series of programmes, reminiscent of some of the actions taken during the great financial crisis, to address the impact of illiquidity in different markets affected by a lack of large buyers and market makers. In September, the European Central Bank (ECB) decreased the interest rate on its deposit facility by 10 basis points. Christine Lagarde was named to succeed Mario Draghi as ECB president at the end of October 2019. The ECB restarted its asset purchase programme in November with a monthly pace of €20 billion. The ECB stated it intends to continue to fully reinvest the principal payments from maturing securities purchased under the programme. In response to COVID-19, the ECB announced €750 billion in stimulus through its Pandemic Emergency Purchase Programme (PEPP). The PEPP aims to lower borrowing costs and increase lending in the euro area, and the amount of stimulus is now up to €1350 billion. Oil prices stayed range-bound in 2019 with significant geopolitical events occurring, such as the disruption of Saudi Arabian wells due to attacks. In early 2020, Saudi Arabia and Russia could not agree on oil output and started a price war. This price war, on top of the sinking demand due to the health pandemic, led to cratering oil prices. COVID-19 drove a massive selloff in commodities; the broad asset class recovered some over the final three months of the period although the rebound was nowhere near as strong as for equities. Brexit concerns alleviated as Boris Johnson’s Conservative Party did well in the December elections. The British pound strengthened against the U.S. dollar by over 4% during the final six months of 2019. However, Brexit concerns lingered over the second half of the fiscal year, and sterling depreciated against the U.S. dollar by over 6%. The MSCI United Kingdom Index was up 3% over the last six months of 2019, but the index sold off over 19% in 2020 and finished down over 15% for the full reporting period. U.S. equities were the best-performing global market during all of 2019 and the first half of 2020. The technology sector continued to dominate, and Alphabet, Amazon, Apple, Facebook and Microsoft made up roughly one-fourth of the market capitalisation of the S&P 500 Index at the end of the fiscal year. Over the last six months, the MSCI Europe, Australasia and Far East (EAFE) Index was down over 12%, the MSCI Emerging Markets Index was down over 10%, and the S&P 500 index was down by about 4%. Led by the dovish tone of global central banks and the continued strength of other risk assets, global high-yield bonds outperformed global Treasury bonds during the fiscal year; most forms of credit performed well in the “risk-on” environment over the first half of the reporting period. Global growth expectations stayed flat at a slightly positive rate, which also helped steepen yield curves. Across the globe, central banks offered more monetary stimulus in response to COVID-19. Global fixed income, as measured by the Bloomberg Barclays Global Aggregate Index, climbed over 4% over the 12 months. U.S. high-yield, as measured by the ICE BofA U.S. High Yield Constrained Index, dropped about 1%. Additionally, emerging-market debt performed well over the period; the JP Morgan Emerging Markets Bond Index (EMBI) Global Diversified Index, which tracks emerging-market debt denominated in external currencies (such as the U.S. dollar), returned almost 6%. Performance For the 12-month reporting period ending at 30 June 2020, the Fund’s GBP Wealth A Distributing shares returned -4.49%. Fund Attribution Fund performance was negative during the annual period ending 30 June 2020. After a positive second half of 2019, equity performance suffered in the first half of 2020 due to the global COVID-19 pandemic and cratering oil prices. The greatest detractor in the Fund was The SEI UK Equity Fund as ongoing Brexit tensions heavily contributed to negative returns. The SEI Dynamic Asset Allocation Fund performed well and profited as its gold exposure benefitted from the rise in gold prices as pandemic uncertainty escalated. The SEI Factor Allocation U.S. Equity Fund also contributed as U.S. technology stocks surged after the COVID-19 market correction. July 2020
26
DocuSign Envelope ID: 2646536F-BB10-4779-844A-39205D22F4E0
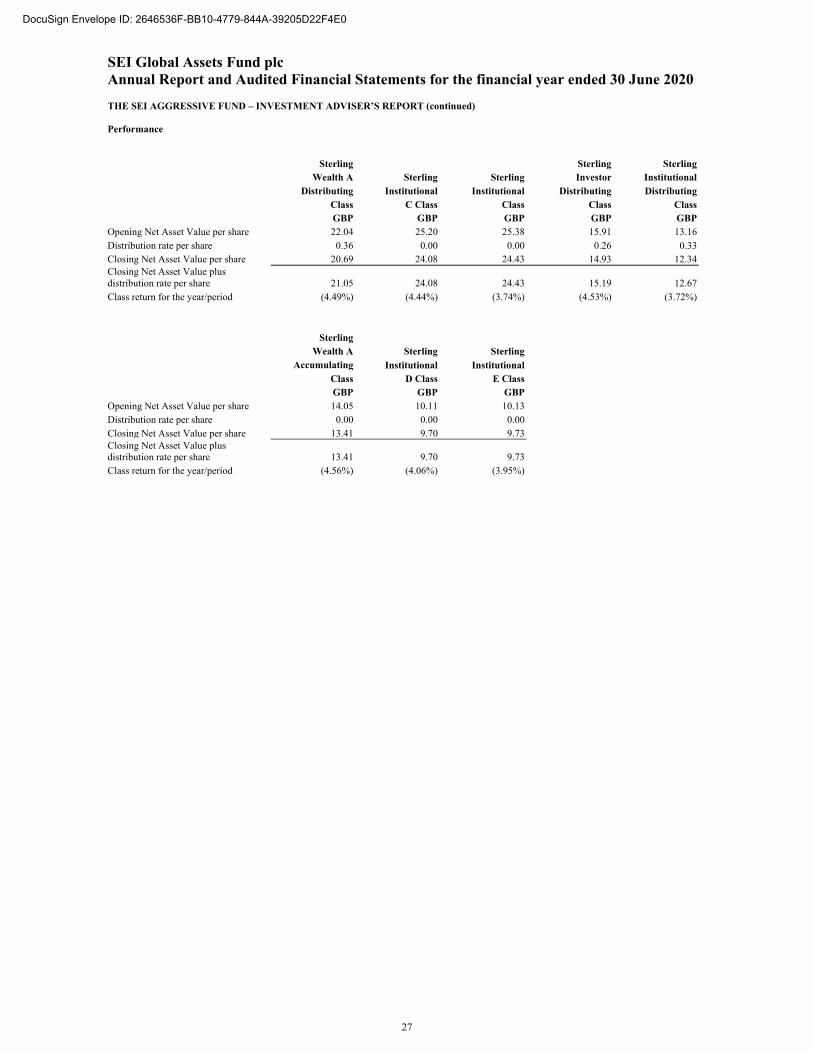
SEI Global Assets Fund plc Annual Report and Audited Financial Statements for the financial year ended 30 June 2020 THE SEI AGGRESSIVE FUND – INVESTMENT ADVISER’S REPORT (continued) Performance
Sterling Sterling Sterling Wealth A Sterling Sterling Investor Institutional Distributing Institutional Institutional Distributing Distributing Class C Class Class Class Class GBP GBP GBP GBP GBP
Opening Net Asset Value per share 22.04 25.20 25.38 15.91 13.16 Distribution rate per share 0.36 0.00 0.00 0.26 0.33 Closing Net Asset Value per share 20.69 24.08 24.43 14.93 12.34 Closing Net Asset Value plus distribution rate per share 21.05 24.08 24.43 15.19 12.67 Class return for the year/period (4.49%) (4.44%) (3.74%) (4.53%) (3.72%)
Sterling Wealth A Sterling Sterling Accumulating Institutional Institutional Class D Class E Class GBP GBP GBP
Opening Net Asset Value per share 14.05 10.11 10.13 Distribution rate per share 0.00 0.00 0.00 Closing Net Asset Value per share 13.41 9.70 9.73 Closing Net Asset Value plus distribution rate per share 13.41 9.70 9.73 Class return for the year/period (4.56%) (4.06%) (3.95%)
27
DocuSign Envelope ID: 2646536F-BB10-4779-844A-39205D22F4E0

SEI Global Assets Fund plc Annual Report and Audited Financial Statements for the financial year ended 30 June 2020 THE SEI GLOBAL CONSERVATIVE FUND – INVESTMENT ADVISER’S REPORT The SEI Global Conservative Fund is comprised of five classes of Shares. The Fund was launched on 28 February 2011. The functional currency of The SEI Global Conservative Fund is U.S. Dollar (US$). Objective The investment objective of The SEI Global Conservative Fund aims to protect against the risk of loss of capital while providing the opportunity for capital growth and income. Market Commentary The 12-month period ending 30 June 2020 saw strong returns in the equity markets over the final half of 2019, only to give up all of that return and more in the first quarter of 2020. Global economic growth remained low, yet stable, going into 2020 until panic set in over the spread of COVID-19. Equity returns rebounded after the market drop, but still finished below their peaks from earlier in the year. Despite tension around a U.S./China trade deal and ongoing Brexit concerns in late 2019, the lingering effects of COVID-19 demanded plenty of attention from investors. The pace of interest-rate cuts by the U.S. Federal Reserve (Fed) mostly followed market projections, with the Fed cutting rates three times in 2019. As the Fed cut, the back end of the curve also moved higher as expectations for additional moves decreased and inflation increased. This helped steepen the U.S. yield curve after inverting earlier in the year. Once COVID-19 made its way to the U.S., the Treasury curve bull steepened; the Fed cut rates to 0% and implemented a series of programmes, reminiscent of some of the actions taken during the great financial crisis, to address the impact of illiquidity in different markets affected by a lack of large buyers and market makers. In September, the European Central Bank (ECB) decreased the interest rate on its deposit facility by 10 basis points. Christine Lagarde was named to succeed Mario Draghi as ECB president at the end of October 2019. The ECB restarted its asset purchase programme in November with a monthly pace of €20 billion. The ECB stated it intends to continue to fully reinvest the principal payments from maturing securities purchased under the programme. In response to COVID-19, the ECB announced €750 billion in stimulus through its Pandemic Emergency Purchase Programme (PEPP). The PEPP aims to lower borrowing costs and increase lending in the euro area, and the amount of stimulus is now up to €1350 billion. Oil prices stayed range-bound in 2019 with significant geopolitical events occurring, such as the disruption of Saudi Arabian wells due to attacks. In early 2020, Saudi Arabia and Russia could not agree on oil output and started a price war. This price war, on top of the sinking demand due to the health pandemic, led to cratering oil prices. COVID-19 drove a massive selloff in commodities; the broad asset class recovered some over the final three months of the period although the rebound was nowhere near as strong as for equities. Brexit concerns alleviated as Boris Johnson’s Conservative Party did well in the December elections. The British pound strengthened against the U.S. dollar by over 4% during the final six months of 2019. However, Brexit concerns lingered over the second half of the fiscal year, and sterling depreciated against the U.S. dollar by over 6%. The MSCI United Kingdom Index was up 3% over the last six months of 2019, but the index sold off over 19% in 2020 and finished down over 15% for the full reporting period. U.S. equities were the best-performing global market during all of 2019 and the first half of 2020. The technology sector continued to dominate, and Alphabet, Amazon, Apple, Facebook and Microsoft made up roughly one-fourth of the market capitalisation of the S&P 500 Index at the end of the fiscal year. Over the last six months, the MSCI Europe, Australasia and Far East (EAFE) Index was down over 12%, the MSCI Emerging Markets Index was down over 10%, and the S&P 500 index was down by about 4%. Led by the dovish tone of global central banks and the continued strength of other risk assets, global high-yield bonds outperformed global Treasury bonds during the fiscal year; most forms of credit performed well in the “risk-on” environment over the first half of the reporting period. Global growth expectations stayed flat at a slightly positive rate, which also helped steepen yield curves. Across the globe, central banks offered more monetary stimulus in response to COVID-19. Global fixed income, as measured by the Bloomberg Barclays Global Aggregate Index, climbed over 4% over the 12 months. U.S. high-yield, as measured by the ICE BofA U.S. High Yield Constrained Index, dropped about 1%. Additionally, emerging-market debt performed well over the period; the JP Morgan Emerging Markets Bond Index (EMBI) Global Diversified Index, which tracks emerging-market debt denominated in external currencies (such as the U.S. dollar), returned almost 6%. Performance For the 12-month reporting period ending at 30 June 2020, the Fund’s USD Institutional shares returned -0.23%. Fund Attribution Fund performance was negative during the annual period ending 30 June 2020. After a strong second half of 2019, equity performance suffered in the first half of 2020 due to the global COVID-19 pandemic and cratering oil prices. The largest detractor in this fund was The SEI Global Managed Volatility Fund. Commodities were another detractor as prices got crushed in response to COVID-19. The best performers during the period were hedged global credit, treasury and short duration securities as investors sought lower risk assets given the future uncertainty of the global economy. All fixed income contributed positively during the period except for U.S. High Yield and The SEI Emerging Market Debt. From an active allocation perspective, the Fund closed its overweight to The SEI Emerging Markets Debt Fund relative to an underweight in The SEI High Yield Fixed Income Fund; the position marginally detracted from performance. Also, the Fund closed an overweight to commodities through a decrease in cash and cash equivalents; this exposure detracted from performance over the fiscal year. July 2020
28
DocuSign Envelope ID: 2646536F-BB10-4779-844A-39205D22F4E0

SEI Global Assets Fund plc Annual Report and Audited Financial Statements for the financial year ended 30 June 2020 THE SEI GLOBAL CONSERVATIVE FUND – INVESTMENT ADVISER’S REPORT (continued) Performance
U.S.$ U.S.$ U.S.$ U.S.$ Wealth B Institutional U.S.$ Wealth B Institutional Distributing Distributing Wealth A Class Class Class Class Class USD USD USD USD USD
Opening Net Asset Value per share 12.13 13.29 11.29 10.76 10.50 Distribution rate per share 0.00 0.00 0.08 0.19 0.00 Closing Net Asset Value per share 11.96 13.26 11.06 10.54 10.42 Closing Net Asset Value plus distribution rate per share 11.96 13.26 11.14 10.73 10.42
Class return for the year/period (1.40%) (0.23%) (1.33%) (0.28%) (0.76%)
29
DocuSign Envelope ID: 2646536F-BB10-4779-844A-39205D22F4E0
SEI Global Assets Fund plc Annual Report and Audited Financial Statements for the financial year ended 30 June 2020 THE SEI GLOBAL MODERATE FUND – INVESTMENT ADVISER’S REPORT The SEI Global Moderate Fund is comprised of six classes of Shares. The Fund was launched on 28 August 2018. The functional currency of The SEI Global Moderate Fund is U.S. Dollar (US$). Objective The investment objective of The SEI Global Moderate Fund is to provide the opportunity for a moderate level of capital growth and income while lowering the risk of a significant loss of capital. Market Commentary The 12-month period ending 30 June 2020 saw strong returns in the equity markets over the final half of 2019, only to give up all of that return and more in the first quarter of 2020. Global economic growth remained low, yet stable, going into 2020 until panic set in over the spread of COVID-19. Equity returns rebounded after the market drop, but still finished below their peaks from earlier in the year. Despite tension around a U.S./China trade deal and ongoing Brexit concerns in late 2019, the lingering effects of COVID-19 demanded plenty of attention from investors. The pace of interest-rate cuts by the U.S. Federal Reserve (Fed) mostly followed market projections, with the Fed cutting rates three times in 2019. As the Fed cut, the back end of the curve also moved higher as expectations for additional moves decreased and inflation increased. This helped steepen the U.S. yield curve after inverting earlier in the year. Once COVID-19 made its way to the U.S., the Treasury curve bull steepened; the Fed cut rates to 0% and implemented a series of programmes, reminiscent of some of the actions taken during the great financial crisis, to address the impact of illiquidity in different markets affected by a lack of large buyers and market makers. In September, the European Central Bank (ECB) decreased the interest rate on its deposit facility by 10 basis points. Christine Lagarde was named to succeed Mario Draghi as ECB president at the end of October 2019. The ECB restarted its asset purchase programme in November with a monthly pace of €20 billion. The ECB stated it intends to continue to fully reinvest the principal payments from maturing securities purchased under the programme. In response to COVID-19, the ECB announced €750 billion in stimulus through its Pandemic Emergency Purchase Programme (PEPP). The PEPP aims to lower borrowing costs and increase lending in the euro area, and the amount of stimulus is now up to €1350 billion. Oil prices stayed range-bound in 2019 with significant geopolitical events occurring, such as the disruption of Saudi Arabian wells due to attacks. In early 2020, Saudi Arabia and Russia could not agree on oil output and started a price war. This price war, on top of the sinking demand due to the health pandemic, led to cratering oil prices. COVID-19 drove a massive selloff in commodities; the broad asset class recovered some over the final three months of the period although the rebound was nowhere near as strong as for equities. Brexit concerns alleviated as Boris Johnson’s Conservative Party did well in the December elections. The British pound strengthened against the U.S. dollar by over 4% during the final six months of 2019. However, Brexit concerns lingered over the second half of the fiscal year, and sterling depreciated against the U.S. dollar by over 6%. The MSCI United Kingdom Index was up 3% over the last six months of 2019, but the index sold off over 19% in 2020 and finished down over 15% for the full reporting period. U.S. equities were the best-performing global market during all of 2019 and the first half of 2020. The technology sector continued to dominate, and Alphabet, Amazon, Apple, Facebook and Microsoft made up roughly one-fourth of the market capitalisation of the S&P 500 Index at the end of the fiscal year. Over the last six months, the MSCI Europe, Australasia and Far East (EAFE) Index was down over 12%, the MSCI Emerging Markets Index was down over 10%, and the S&P 500 index was down by about 4%. Led by the dovish tone of global central banks and the continued strength of other risk assets, global high-yield bonds outperformed global Treasury bonds during the fiscal year; most forms of credit performed well in the “risk-on” environment over the first half of the reporting period. Global growth expectations stayed flat at a slightly positive rate, which also helped steepen yield curves. Across the globe, central banks offered more monetary stimulus in response to COVID-19. Global fixed income, as measured by the Bloomberg Barclays Global Aggregate Index, climbed over 4% over the 12 months. U.S. high-yield, as measured by the ICE BofA U.S. High Yield Constrained Index, dropped about 1%. Additionally, emerging-market debt performed well over the period; the JP Morgan Emerging Markets Bond Index (EMBI) Global Diversified Index, which tracks emerging-market debt denominated in external currencies (such as the U.S. dollar), returned almost 6%. Performance For the 12-month reporting period ending at 30 June 2020, the Fund’s USD Institutional shares returned -0.78%. Fund Attribution Fund performance was negative during the annual period ending 30 June 2020. After a strong second half of 2019, equity performance suffered in the first half of 2020 due to the global COVID-19 pandemic and cratering oil prices. The largest detractor in this fund was The SEI Global Managed Volatility Fund. Commodities were another detractor as prices sold off in response to COVID-19. The best performers during the period were hedged global credit, treasury and short duration securities as investors sought lower risk assets given the future uncertainty of the global economy. All fixed income contributed positively during the period except for U.S. High Yield and The SEI Emerging Market Debt. From an active allocation perspective, the Fund closed its overweight to The SEI Emerging Markets Debt Fund relative to an underweight in The SEI High Yield Fixed Income Fund; the position marginally detracted from performance. Also, the Fund closed an overweight to commodities through a decrease in cash and cash equivalents; this exposure detracted from performance over the fiscal year. July 2020
30
DocuSign Envelope ID: 2646536F-BB10-4779-844A-39205D22F4E0
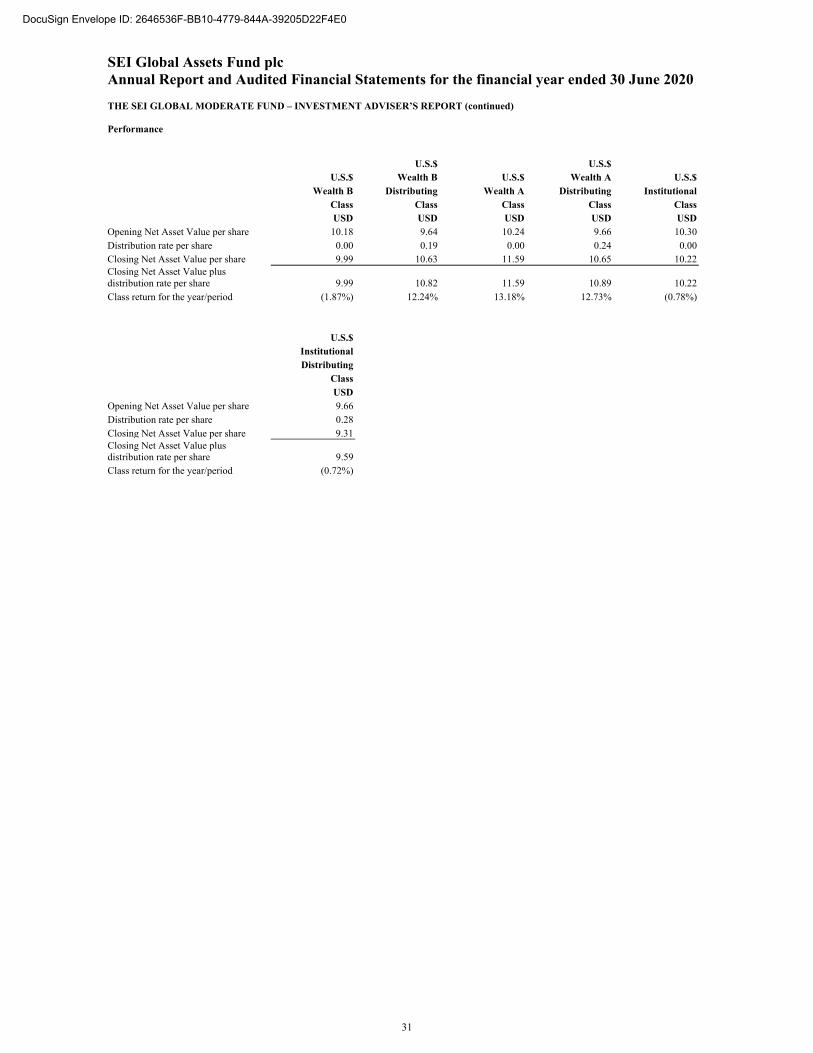
SEI Global Assets Fund plc Annual Report and Audited Financial Statements for the financial year ended 30 June 2020 THE SEI GLOBAL MODERATE FUND – INVESTMENT ADVISER’S REPORT (continued) Performance
U.S.$ U.S.$ U.S.$ Wealth B U.S.$ Wealth A U.S.$ Wealth B Distributing Wealth A Distributing Institutional Class Class Class Class Class USD USD USD USD USD
Opening Net Asset Value per share 10.18 9.64 10.24 9.66 10.30 Distribution rate per share 0.00 0.19 0.00 0.24 0.00 Closing Net Asset Value per share 9.99 10.63 11.59 10.65 10.22 Closing Net Asset Value plus distribution rate per share 9.99 10.82 11.59 10.89 10.22 Class return for the year/period (1.87%) 12.24% 13.18% 12.73% (0.78%)
U.S.$ Institutional Distributing Class USD
Opening Net Asset Value per share 9.66 Distribution rate per share 0.28 Closing Net Asset Value per share 9.31 Closing Net Asset Value plus distribution rate per share 9.59 Class return for the year/period (0.72%)
31
DocuSign Envelope ID: 2646536F-BB10-4779-844A-39205D22F4E0

SEI Global Assets Fund plc Annual Report and Audited Financial Statements for the financial year ended 30 June 2020 THE SEI GLOBAL CORE FUND – INVESTMENT ADVISER’S REPORT The SEI Global Core Fund is comprised of five classes of Shares. The Fund was launched on 28 February 2011. The functional currency of The SEI Global Core Fund is U.S. Dollar (US$). Objective The investment objective of The SEI Global Core Fund is to provide the opportunity for capital growth and income in line with global equity and fixed income markets whilst seeking to manage the respective risks. Market Commentary The 12-month period ending 30 June 2020 saw strong returns in the equity markets over the final half of 2019, only to give up all of that return and more in the first quarter of 2020. Global economic growth remained low, yet stable, going into 2020 until panic set in over the spread of COVID-19. Equity returns rebounded after the market drop, but still finished below their peaks from earlier in the year. Despite tension around a U.S./China trade deal and ongoing Brexit concerns in late 2019, the lingering effects of COVID-19 demanded plenty of attention from investors. The pace of interest-rate cuts by the U.S. Federal Reserve (Fed) mostly followed market projections, with the Fed cutting rates three times in 2019. As the Fed cut, the back end of the curve also moved higher as expectations for additional moves decreased and inflation increased. This helped steepen the U.S. yield curve after inverting earlier in the year. Once COVID-19 made its way to the U.S., the Treasury curve bull steepened; the Fed cut rates to 0% and implemented a series of programmes, reminiscent of some of the actions taken during the great financial crisis, to address the impact of illiquidity in different markets affected by a lack of large buyers and market makers. In September, the European Central Bank (ECB) decreased the interest rate on its deposit facility by 10 basis points. Christine Lagarde was named to succeed Mario Draghi as ECB president at the end of October 2019. The ECB restarted its asset purchase programme in November with a monthly pace of €20 billion. The ECB stated it intends to continue to fully reinvest the principal payments from maturing securities purchased under the programme. In response to COVID-19, the ECB announced €750 billion in stimulus through its Pandemic Emergency Purchase Programme (PEPP). The PEPP aims to lower borrowing costs and increase lending in the euro area, and the amount of stimulus is now up to €1350 billion. Oil prices stayed range-bound in 2019 with significant geopolitical events occurring, such as the disruption of Saudi Arabian wells due to attacks. In early 2020, Saudi Arabia and Russia could not agree on oil output and started a price war. This price war, on top of the sinking demand due to the health pandemic, led to cratering oil prices. COVID-19 drove a massive selloff in commodities; the broad asset class recovered some over the final three months of the period although the rebound was nowhere near as strong as for equities. Brexit concerns alleviated as Boris Johnson’s Conservative Party did well in the December elections. The British pound strengthened against the U.S. dollar by over 4% during the final six months of 2019. However, Brexit concerns lingered over the second half of the fiscal year, and sterling depreciated against the U.S. dollar by over 6%. The MSCI United Kingdom Index was up 3% over the last six months of 2019, but the index sold off over 19% in 2020 and finished down over 15% for the full reporting period. U.S. equities were the best-performing global market during all of 2019 and the first half of 2020. The technology sector continued to dominate, and Alphabet, Amazon, Apple, Facebook and Microsoft made up roughly one-fourth of the market capitalisation of the S&P 500 Index at the end of the fiscal year. Over the last six months, the MSCI Europe, Australasia and Far East (EAFE) Index was down over 12%, the MSCI Emerging Markets Index was down over 10%, and the S&P 500 index was down by about 4%. Led by the dovish tone of global central banks and the continued strength of other risk assets, global high-yield bonds outperformed global Treasury bonds during the fiscal year; most forms of credit performed well in the “risk-on” environment over the first half of the reporting period. Global growth expectations stayed flat at a slightly positive rate, which also helped steepen yield curves. Across the globe, central banks offered more monetary stimulus in response to COVID-19. Global fixed income, as measured by the Bloomberg Barclays Global Aggregate Index, climbed over 4% over the 12 months. U.S. high-yield, as measured by the ICE BofA U.S. High Yield Constrained Index, dropped about 1%. Additionally, emerging-market debt performed well over the period; the JP Morgan Emerging Markets Bond Index (EMBI) Global Diversified Index, which tracks emerging-market debt denominated in external currencies (such as the U.S. dollar), returned almost 6%. Performance For the 12-month reporting period ending at 30 June 2020, the Fund’s USD Institutional shares returned -0.39%. Fund Attribution Fund performance was negative during the annual period ending 30 June 2020. After a positive second half of 2019, equity performance suffered in the first half of 2020 due to the global COVID-19 pandemic and cratering oil prices. The greatest detractor in the Fund was The SEI Global Equity Fund. Commodities also underperformed as energy prices fell due to the pandemic. The SEI Global Equity Fund, The SEI UK Equity Fund and The SEI Global Managed Volatility Fund were also negative during the reporting period. The best performers during the period were The SEI Global Fixed Income Fund and The SEI Global Short Term Bond Fund. Investors sought “safe-haven” assets and flocked to core fixed income as COVID-19 and Brexit concerns rose. The Fund’s allocation to the Schroders Global Inflation Linked Bond Fund and The SEI Global Dynamic Asset Allocation Fund were also positive. July 2020
32
DocuSign Envelope ID: 2646536F-BB10-4779-844A-39205D22F4E0
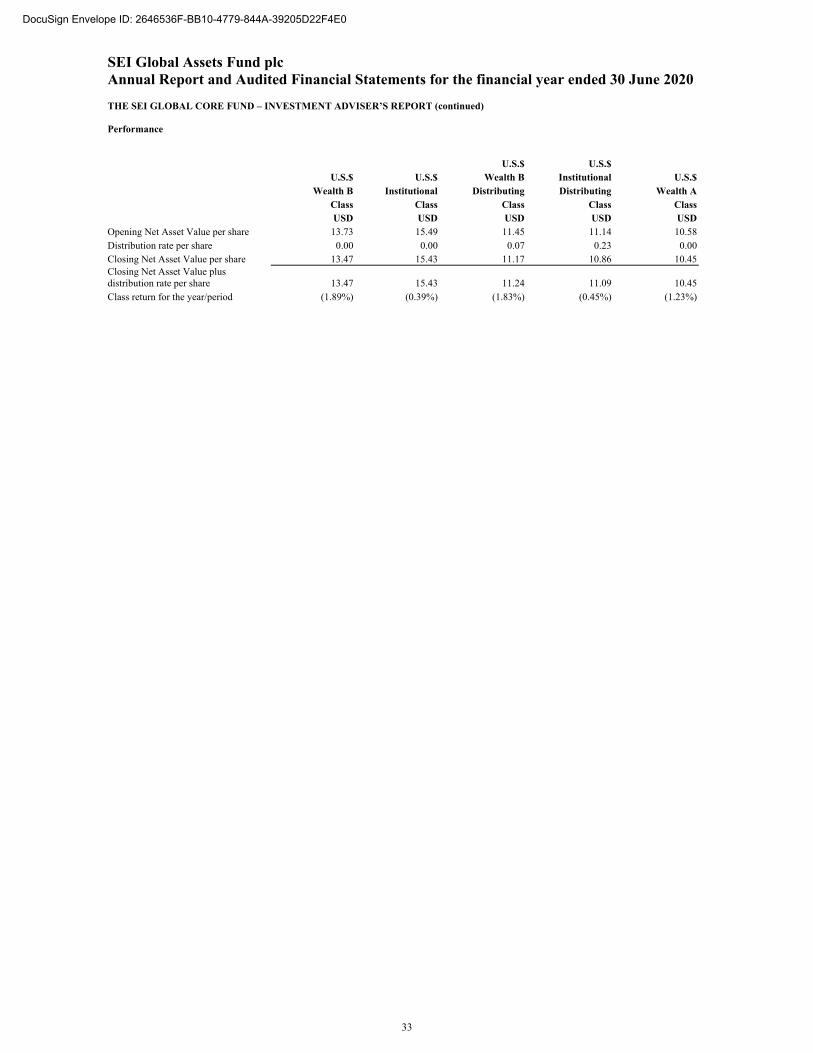
SEI Global Assets Fund plc Annual Report and Audited Financial Statements for the financial year ended 30 June 2020 THE SEI GLOBAL CORE FUND – INVESTMENT ADVISER’S REPORT (continued) Performance
U.S.$ U.S.$ U.S.$ U.S.$ Wealth B Institutional U.S.$ Wealth B Institutional Distributing Distributing Wealth A Class Class Class Class Class USD USD USD USD USD
Opening Net Asset Value per share 13.73 15.49 11.45 11.14 10.58 Distribution rate per share 0.00 0.00 0.07 0.23 0.00 Closing Net Asset Value per share 13.47 15.43 11.17 10.86 10.45 Closing Net Asset Value plus distribution rate per share 13.47 15.43 11.24 11.09 10.45 Class return for the year/period (1.89%) (0.39%) (1.83%) (0.45%) (1.23%)
33
DocuSign Envelope ID: 2646536F-BB10-4779-844A-39205D22F4E0
SEI Global Assets Fund plc Annual Report and Audited Financial Statements for the financial year ended 30 June 2020 THE SEI GLOBAL BALANCED FUND – INVESTMENT ADVISER’S REPORT The SEI Global Balanced Fund is comprised of five classes of Shares. The Fund was launched on 28 February 2011. The functional currency of The SEI Global Balanced Fund is U.S. Dollar (US$). Objective The investment objective of The SEI Global Balanced Fund is to provide capital growth and income in line with global equity and fixed income markets whilst seeking to manage the respective risks. Market Commentary The 12-month period ending 30 June 2020 saw strong returns in the equity markets over the final half of 2019, only to give up all of that return and more in the first quarter of 2020. Global economic growth remained low, yet stable, going into 2020 until panic set in over the spread of COVID-19. Equity returns rebounded after the market drop, but still finished below their peaks from earlier in the year. Despite tension around a U.S./China trade deal and ongoing Brexit concerns in late 2019, the lingering effects of COVID-19 demanded plenty of attention from investors. The pace of interest-rate cuts by the U.S. Federal Reserve (Fed) mostly followed market projections, with the Fed cutting rates three times in 2019. As the Fed cut, the back end of the curve also moved higher as expectations for additional moves decreased and inflation increased. This helped steepen the U.S. yield curve after inverting earlier in the year. Once COVID-19 made its way to the U.S., the Treasury curve bull steepened; the Fed cut rates to 0% and implemented a series of programmes, reminiscent of some of the actions taken during the great financial crisis, to address the impact of illiquidity in different markets affected by a lack of large buyers and market makers. In September, the European Central Bank (ECB) decreased the interest rate on its deposit facility by 10 basis points. Christine Lagarde was named to succeed Mario Draghi as ECB president at the end of October 2019. The ECB restarted its asset purchase programme in November with a monthly pace of €20 billion. The ECB stated it intends to continue to fully reinvest the principal payments from maturing securities purchased under the programme. In response to COVID-19, the ECB announced €750 billion in stimulus through its Pandemic Emergency Purchase Programme (PEPP). The PEPP aims to lower borrowing costs and increase lending in the euro area, and the amount of stimulus is now up to €1350 billion. Oil prices stayed range-bound in 2019 with significant geopolitical events occurring, such as the disruption of Saudi Arabian wells due to attacks. In early 2020, Saudi Arabia and Russia could not agree on oil output and started a price war. This price war, on top of the sinking demand due to the health pandemic, led to cratering oil prices. COVID-19 drove a massive selloff in commodities; the broad asset class recovered some over the final three months of the period although the rebound was nowhere near as strong as for equities. Brexit concerns alleviated as Boris Johnson’s Conservative Party did well in the December elections. The British pound strengthened against the U.S. dollar by over 4% during the final six months of 2019. However, Brexit concerns lingered over the second half of the fiscal year, and sterling depreciated against the U.S. dollar by over 6%. The MSCI United Kingdom Index was up 3% over the last six months of 2019, but the index sold off over 19% in 2020 and finished down over 15% for the full reporting period. U.S. equities were the best-performing global market during all of 2019 and the first half of 2020. The technology sector continued to dominate, and Alphabet, Amazon, Apple, Facebook and Microsoft made up roughly one-fourth of the market capitalisation of the S&P 500 Index at the end of the fiscal year. Over the last six months, the MSCI Europe, Australasia and Far East (EAFE) Index was down over 12%, the MSCI Emerging Markets Index was down over 10%, and the S&P 500 index was down by about 4%. Led by the dovish tone of global central banks and the continued strength of other risk assets, global high-yield bonds outperformed global Treasury bonds during the fiscal year; most forms of credit performed well in the “risk-on” environment over the first half of the reporting period. Global growth expectations stayed flat at a slightly positive rate, which also helped steepen yield curves. Across the globe, central banks offered more monetary stimulus in response to COVID-19. Global fixed income, as measured by the Bloomberg Barclays Global Aggregate Index, climbed over 4% over the 12 months. U.S. high-yield, as measured by the ICE BofA U.S. High Yield Constrained Index, dropped about 1%. Additionally, emerging-market debt performed well over the period; the JP Morgan Emerging Markets Bond Index (EMBI) Global Diversified Index, which tracks emerging-market debt denominated in external currencies (such as the U.S. dollar), returned almost 6%. Performance For the 12-month reporting period ending at 30 June 2020, the Fund’s USD Institutional shares returned -1.16%. Fund Attribution Fund performance was negative during the annual period ending 30 June 2020. After a positive second half of 2019, equity performance suffered in the first half of 2020 due to the global COVID-19 pandemic and cratering oil prices. The greatest detractor in the Fund was The SEI Global Equity Fund. Commodities also underperformed as energy prices fell due to the pandemic. The best performers during the period was The SEI Global Fixed Income Fund. Investors sought “safe-haven” assets as COVID-19 and Brexit concerns rose. The Fund’s allocation to the Schroders Global Inflation Linked Bond Fund also contributed. The SEI Dynamic Asset Allocation Fund performed well and profited as its gold exposure benefitted from the rise in gold prices as pandemic uncertainty escalated. July 2020
34
DocuSign Envelope ID: 2646536F-BB10-4779-844A-39205D22F4E0

SEI Global Assets Fund plc Annual Report and Audited Financial Statements for the financial year ended 30 June 2020 THE SEI GLOBAL BALANCED FUND – INVESTMENT ADVISER’S REPORT (continued) Performance
U.S.$ U.S.$ U.S.$ U.S.$ Wealth B Institutional U.S.$ Wealth B Institutional Distributing Distributing Wealth A Class Class Class Class Class USD USD USD USD USD
Opening Net Asset Value per share 14.37 16.35 11.75 11.36 10.59 Distribution rate per share 0.00 0.00 0.13 0.24 0.00 Closing Net Asset Value per share 13.98 16.16 11.30 10.98 10.38 Closing Net Asset Value plus distribution rate per share 13.98 16.16 11.43 11.22 10.38
Class return for the year/period (2.71%) (1.16%) (2.72%) (1.23%) (1.98%)
35
DocuSign Envelope ID: 2646536F-BB10-4779-844A-39205D22F4E0

SEI Global Assets Fund plc Annual Report and Audited Financial Statements for the financial year ended 30 June 2020 THE SEI GLOBAL GROWTH FUND – INVESTMENT ADVISER’S REPORT The SEI Global Growth Fund is comprised of five classes of Shares. The Fund was launched on 28 February 2011. The functional currency of The SEI Global Growth Fund is U.S. Dollar (US$). Objective The investment objective of The SEI Global Growth Fund is to provide capital growth and risk exposure predominantly in line with global equity markets. Market Commentary The 12-month period ending 30 June 2020 saw strong returns in the equity markets over the final half of 2019, only to give up all of that return and more in the first quarter of 2020. Global economic growth remained low, yet stable, going into 2020 until panic set in over the spread of COVID-19. Equity returns rebounded after the market drop, but still finished below their peaks from earlier in the year. Despite tension around a U.S./China trade deal and ongoing Brexit concerns in late 2019, the lingering effects of COVID-19 demanded plenty of attention from investors. The pace of interest-rate cuts by the U.S. Federal Reserve (Fed) mostly followed market projections, with the Fed cutting rates three times in 2019. As the Fed cut, the back end of the curve also moved higher as expectations for additional moves decreased and inflation increased. This helped steepen the U.S. yield curve after inverting earlier in the year. Once COVID-19 made its way to the U.S., the Treasury curve bull steepened; the Fed cut rates to 0% and implemented a series of programmes, reminiscent of some of the actions taken during the great financial crisis, to address the impact of illiquidity in different markets affected by a lack of large buyers and market makers. In September, the European Central Bank (ECB) decreased the interest rate on its deposit facility by 10 basis points. Christine Lagarde was named to succeed Mario Draghi as ECB president at the end of October 2019. The ECB restarted its asset purchase programme in November with a monthly pace of €20 billion. The ECB stated it intends to continue to fully reinvest the principal payments from maturing securities purchased under the programme. In response to COVID-19, the ECB announced €750 billion in stimulus through its Pandemic Emergency Purchase Programme (PEPP). The PEPP aims to lower borrowing costs and increase lending in the euro area, and the amount of stimulus is now up to €1350 billion. Oil prices stayed range-bound in 2019 with significant geopolitical events occurring, such as the disruption of Saudi Arabian wells due to attacks. In early 2020, Saudi Arabia and Russia could not agree on oil output and started a price war. This price war, on top of the sinking demand due to the health pandemic, led to cratering oil prices. COVID-19 drove a massive selloff in commodities; the broad asset class recovered some over the final three months of the period although the rebound was nowhere near as strong as for equities. Brexit concerns alleviated as Boris Johnson’s Conservative Party did well in the December elections. The British pound strengthened against the U.S. dollar by over 4% during the final six months of 2019. However, Brexit concerns lingered over the second half of the fiscal year, and sterling depreciated against the U.S. dollar by over 6%. The MSCI United Kingdom Index was up 3% over the last six months of 2019, but the index sold off over 19% in 2020 and finished down over 15% for the full reporting period. U.S. equities were the best-performing global market during all of 2019 and the first half of 2020. The technology sector continued to dominate, and Alphabet, Amazon, Apple, Facebook and Microsoft made up roughly one-fourth of the market capitalisation of the S&P 500 Index at the end of the fiscal year. Over the last six months, the MSCI Europe, Australasia and Far East (EAFE) Index was down over 12%, the MSCI Emerging Markets Index was down over 10%, and the S&P 500 index was down by about 4%. Led by the dovish tone of global central banks and the continued strength of other risk assets, global high-yield bonds outperformed global Treasury bonds during the fiscal year; most forms of credit performed well in the “risk-on” environment over the first half of the reporting period. Global growth expectations stayed flat at a slightly positive rate, which also helped steepen yield curves. Across the globe, central banks offered more monetary stimulus in response to COVID-19. Global fixed income, as measured by the Bloomberg Barclays Global Aggregate Index, climbed over 4% over the 12 months. U.S. high-yield, as measured by the ICE BofA U.S. High Yield Constrained Index, dropped about 1%. Additionally, emerging-market debt performed well over the period; the JP Morgan Emerging Markets Bond Index (EMBI) Global Diversified Index, which tracks emerging-market debt denominated in external currencies (such as the U.S. dollar), returned almost 6%. Performance For the 12-month reporting period ending at 30 June 2020, the Fund’s USD Institutional shares returned -2.40%. Fund Attribution Fund performance was negative during the annual period ending 30 June 2020. After a positive second half of 2019, equity performance suffered in the first half of 2020 due to the global COVID-19 pandemic and cratering oil prices. The largest detractors in the Fund were The SEI Global Equity Fund, The SEI European Equity ex-UK Fund, The SEI UK Equity Fund and The SEI Global Managed Volatility Fund. Commodities also underperformed as energy prices fell due to the pandemic. The best performers during the period were The SEI Global Fixed Income Fund and the Fund’s allocation to the Schroders Global Inflation Linked Bond Fund. Investors sought “safe-haven” assets as COVID-19 and Brexit concerns rose. The SEI Dynamic Asset Allocation Fund performed well and profited as its gold exposure benefitted from the rise in gold prices as pandemic uncertainty escalated. July 2020
36
DocuSign Envelope ID: 2646536F-BB10-4779-844A-39205D22F4E0

SEI Global Assets Fund plc Annual Report and Audited Financial Statements for the financial year ended 30 June 2020 THE SEI GLOBAL GROWTH FUND – INVESTMENT ADVISER’S REPORT (continued) Performance
U.S.$ U.S.$ U.S.$ U.S.$ Wealth B Institutional U.S.$ Wealth B Institutional Distributing Distributing Wealth A Class Class Class Class Class USD USD USD USD USD
Opening Net Asset Value per share 14.86 17.05 11.91 11.52 10.57 Distribution rate per share 0.00 0.00 0.06 0.25 0.00 Closing Net Asset Value per share 14.27 16.64 11.37 11.00 10.23 Closing Net Asset Value plus distribution rate per share 14.27 16.64 11.43 11.25 10.23
Class return for the year/period (3.97%) (2.40%) (4.03%) (2.34%) (3.22%)
37
DocuSign Envelope ID: 2646536F-BB10-4779-844A-39205D22F4E0

SEI Global Assets Fund plc Annual Report and Audited Financial Statements for the financial year ended 30 June 2020 THE SEI GLOBAL AGGRESSIVE FUND – INVESTMENT ADVISER’S REPORT The SEI Global Aggressive Fund is comprised of five classes of Shares. The Fund was launched on 28 February 2011. The functional currency of The SEI Global Aggressive Fund is U.S. Dollar (US$). Objective The investment objective of The SEI Global Aggressive Fund is to provide capital growth and risk in line with global equity markets. Market Commentary The 12-month period ending 30 June 2020 saw strong returns in the equity markets over the final half of 2019, only to give up all of that return and more in the first quarter of 2020. Global economic growth remained low, yet stable, going into 2020 until panic set in over the spread of COVID-19. Equity returns rebounded after the market drop, but still finished below their peaks from earlier in the year. Despite tension around a U.S./China trade deal and ongoing Brexit concerns in late 2019, the lingering effects of COVID-19 demanded plenty of attention from investors. The pace of interest-rate cuts by the U.S. Federal Reserve (Fed) mostly followed market projections, with the Fed cutting rates three times in 2019. As the Fed cut, the back end of the curve also moved higher as expectations for additional moves decreased and inflation increased. This helped steepen the U.S. yield curve after inverting earlier in the year. Once COVID-19 made its way to the U.S., the Treasury curve bull steepened; the Fed cut rates to 0% and implemented a series of programmes, reminiscent of some of the actions taken during the great financial crisis, to address the impact of illiquidity in different markets affected by a lack of large buyers and market makers. In September, the European Central Bank (ECB) decreased the interest rate on its deposit facility by 10 basis points. Christine Lagarde was named to succeed Mario Draghi as ECB president at the end of October 2019. The ECB restarted its asset purchase programme in November with a monthly pace of €20 billion. The ECB stated it intends to continue to fully reinvest the principal payments from maturing securities purchased under the programme. In response to COVID-19, the ECB announced €750 billion in stimulus through its Pandemic Emergency Purchase Programme (PEPP). The PEPP aims to lower borrowing costs and increase lending in the euro area, and the amount of stimulus is now up to €1350 billion. Oil prices stayed range-bound in 2019 with significant geopolitical events occurring, such as the disruption of Saudi Arabian wells due to attacks. In early 2020, Saudi Arabia and Russia could not agree on oil output and started a price war. This price war, on top of the sinking demand due to the health pandemic, led to cratering oil prices. COVID-19 drove a massive selloff in commodities; the broad asset class recovered some over the final three months of the period although the rebound was nowhere near as strong as for equities. Brexit concerns alleviated as Boris Johnson’s Conservative Party did well in the December elections. The British pound strengthened against the U.S. dollar by over 4% during the final six months of 2019. However, Brexit concerns lingered over the second half of the fiscal year, and sterling depreciated against the U.S. dollar by over 6%. The MSCI United Kingdom Index was up 3% over the last six months of 2019, but the index sold off over 19% in 2020 and finished down over 15% for the full reporting period. U.S. equities were the best-performing global market during all of 2019 and the first half of 2020. The technology sector continued to dominate, and Alphabet, Amazon, Apple, Facebook and Microsoft made up roughly one-fourth of the market capitalisation of the S&P 500 Index at the end of the fiscal year. Over the last six months, the MSCI Europe, Australasia and Far East (EAFE) Index was down over 12%, the MSCI Emerging Markets Index was down over 10%, and the S&P 500 index was down by about 4%. Led by the dovish tone of global central banks and the continued strength of other risk assets, global high-yield bonds outperformed global Treasury bonds during the fiscal year; most forms of credit performed well in the “risk-on” environment over the first half of the reporting period. Global growth expectations stayed flat at a slightly positive rate, which also helped steepen yield curves. Across the globe, central banks offered more monetary stimulus in response to COVID-19. Global fixed income, as measured by the Bloomberg Barclays Global Aggregate Index, climbed over 4% over the 12 months. U.S. high-yield, as measured by the ICE BofA U.S. High Yield Constrained Index, dropped about 1%. Additionally, emerging-market debt performed well over the period; the JP Morgan Emerging Markets Bond Index (EMBI) Global Diversified Index, which tracks emerging-market debt denominated in external currencies (such as the U.S. dollar), returned almost 6%. Performance For the 12-month reporting period ending at 30 June 2020, the Fund’s USD Institutional shares returned -3.39%. Fund Attribution Fund performance was negative during the annual period ending 30 June 2020. After a positive second half of 2019, equity performance suffered in the first half of 2020 due to the global COVID-19 pandemic and cratering oil prices. The greatest detractor in the Fund was The SEI Global Equity Fund. All fund returns with the exception of The SEI Dynamic Asset Allocation Fund, The SEI Factor Allocation U.S. Equity Fund and The SEI U.S. Large Companies Fund detracted during the reporting period. The best performer during the period was The SEI Dynamic Asset Allocation Fund as gold prices rose due to the uncertainty of the pandemic. The SEI Factor Allocation U.S. Equity Fund and The SEI U.S. Large Companies Fund both contributed as U.S. technology stocks surged after the COVID-19 market correction. July 2020
38
DocuSign Envelope ID: 2646536F-BB10-4779-844A-39205D22F4E0

SEI Global Assets Fund plc Annual Report and Audited Financial Statements for the financial year ended 30 June 2020
THE SEI GLOBAL AGGRESSIVE FUND – INVESTMENT ADVISER’S REPORT (continued)
Performance
U.S.$ U.S.$ U.S.$ U.S.$ Wealth B Institutional U.S.$ Wealth B Institutional Distributing Distributing Wealth A Class Class Class Class Class USD USD USD USD USD
Opening Net Asset Value per share 15.54 17.98 12.60 11.99 10.66 Distribution rate per share 0.00 0.00 0.08 0.22 0.00 Closing Net Asset Value per share 14.74 17.37 11.88 11.36 10.21 Closing Net Asset Value plus distribution rate per share 14.74 17.37 11.96 11.58 10.21
Class return for the year/period (5.15%) (3.39%) (5.08%) (3.42%) (4.22%)
39
DocuSign Envelope ID: 2646536F-BB10-4779-844A-39205D22F4E0
SEI Global Assets Fund plc Annual Report and Audited Financial Statements for the financial year ended 30 June 2020 THE SEI EURO CONSERVATIVE FUND – INVESTMENT ADVISER’S REPORT The SEI Euro Conservative Fund is comprised of four classes of Shares. The Fund was launched on 29 September 2017. The functional currency of The SEI Euro Conservative Fund is Euro (EUR). Objective The investment objective of The SEI Euro Conservative Fund aims to protect against the risk of loss of capital while providing the opportunity for capital growth and income. Market Commentary The 12-month period ending 30 June 2020 saw strong returns in the equity markets over the final half of 2019, only to give up all of that return and more in the first quarter of 2020. Global economic growth remained low, yet stable, going into 2020 until panic set in over the spread of COVID-19. Equity returns rebounded after the market drop, but still finished below their peaks from earlier in the year. Despite tension around a U.S./China trade deal and ongoing Brexit concerns in late 2019, the lingering effects of COVID-19 demanded plenty of attention from investors. The pace of interest-rate cuts by the U.S. Federal Reserve (Fed) mostly followed market projections, with the Fed cutting rates three times in 2019. As the Fed cut, the back end of the curve also moved higher as expectations for additional moves decreased and inflation increased. This helped steepen the U.S. yield curve after inverting earlier in the year. Once COVID-19 made its way to the U.S., the Treasury curve bull steepened; the Fed cut rates to 0% and implemented a series of programmes, reminiscent of some of the actions taken during the great financial crisis, to address the impact of illiquidity in different markets affected by a lack of large buyers and market makers. In September, the European Central Bank (ECB) decreased the interest rate on its deposit facility by 10 basis points. Christine Lagarde was named to succeed Mario Draghi as ECB president at the end of October 2019. The ECB restarted its asset purchase programme in November with a monthly pace of €20 billion. The ECB stated it intends to continue to fully reinvest the principal payments from maturing securities purchased under the programme. In response to COVID-19, the ECB announced €750 billion in stimulus through its Pandemic Emergency Purchase Programme (PEPP). The PEPP aims to lower borrowing costs and increase lending in the euro area, and the amount of stimulus is now up to €1350 billion. Oil prices stayed range-bound in 2019 with significant geopolitical events occurring, such as the disruption of Saudi Arabian wells due to attacks. In early 2020, Saudi Arabia and Russia could not agree on oil output and started a price war. This price war, on top of the sinking demand due to the health pandemic, led to cratering oil prices. COVID-19 drove a massive selloff in commodities; the broad asset class recovered some over the final three months of the period although the rebound was nowhere near as strong as for equities. Brexit concerns alleviated as Boris Johnson’s Conservative Party did well in the December elections. The British pound strengthened against the U.S. dollar by over 4% during the final six months of 2019. However, Brexit concerns lingered over the second half of the fiscal year, and sterling depreciated against the U.S. dollar by over 6%. The MSCI United Kingdom Index was up 3% over the last six months of 2019, but the index sold off over 19% in 2020 and finished down over 15% for the full reporting period. U.S. equities were the best-performing global market during all of 2019 and the first half of 2020. The technology sector continued to dominate, and Alphabet, Amazon, Apple, Facebook and Microsoft made up roughly one-fourth of the market capitalisation of the S&P 500 Index at the end of the fiscal year. Over the last six months, the MSCI Europe, Australasia and Far East (EAFE) Index was down over 12%, the MSCI Emerging Markets Index was down over 10%, and the S&P 500 index was down by about 4%. Led by the dovish tone of global central banks and the continued strength of other risk assets, global high-yield bonds outperformed global Treasury bonds during the fiscal year; most forms of credit performed well in the “risk-on” environment over the first half of the reporting period. Global growth expectations stayed flat at a slightly positive rate, which also helped steepen yield curves. Across the globe, central banks offered more monetary stimulus in response to COVID-19. Global fixed income, as measured by the Bloomberg Barclays Global Aggregate Index, climbed over 4% over the 12 months. U.S. high-yield, as measured by the ICE BofA U.S. High Yield Constrained Index, dropped about 1%. Additionally, emerging-market debt performed well over the period; the JP Morgan Emerging Markets Bond Index (EMBI) Global Diversified Index, which tracks emerging-market debt denominated in external currencies (such as the U.S. dollar), returned almost 6%. Performance For the 12-month reporting period ending at 30 June 2020, the Fund’s EUR Wealth C Accumulating shares returned -3.35%. Fund Attribution Fund performance was negative during the annual period ending 30 June 2020. After a positive second half of 2019, equity performance suffered in the first half of 2020 due to the global COVID-19 pandemic and cratering oil prices. The largest detractors in the Fund were its commodities exposure, which underperformed as energy prices fell due to the pandemic, and The SEI Global Managed Volatility Fund. The three largest contributors to this fund were The SEI Global Fixed Income Fund, The SEI Global Short Duration Bond Fund and The SEI Global Short Term Bond Fund. Investors sought “safe-haven” assets as COVID-19 and Brexit concerns rose. From an active allocation perspective, the Fund closed its overweight to The SEI Emerging Markets Debt Fund relative to an underweight in The SEI High Yield Fixed Income Fund; the position marginally detracted from performance during the reporting period. Also, the Fund closed an overweight to commodities through a decrease in cash and cash equivalents; this exposure also detracted from performance over the fiscal year. July 2020
40
DocuSign Envelope ID: 2646536F-BB10-4779-844A-39205D22F4E0

SEI Global Assets Fund plc Annual Report and Audited Financial Statements for the financial year ended 30 June 2020
THE SEI EURO CONSERVATIVE FUND – INVESTMENT ADVISER’S REPORT (continued)
Performance
Euro Euro Euro Euro Wealth C Wealth C Wealth A Institutional Accumulating Distributing Accumulating Accumulating Class Class Class Class EUR EUR EUR EUR
Opening Net Asset Value per share 10.15 10.16 10.24 10.26 Distribution rate per share 0.00 0.00 0.00 0.00 Closing Net Asset Value per share 9.81 9.81 10.03 10.12 Closing Net Asset Value plus distribution rate per share 9.81 9.81 10.03 10.12 Class return for the year/period (3.35%) (3.44%) (2.05%) (1.36%)
41
DocuSign Envelope ID: 2646536F-BB10-4779-844A-39205D22F4E0
SEI Global Assets Fund plc Annual Report and Audited Financial Statements for the financial year ended 30 June 2020 THE SEI EURO MODERATE FUND – INVESTMENT ADVISER’S REPORT The SEI Euro Moderate Fund is comprised of four classes of Shares. The Fund was launched on 29 September 2017. The functional currency of The SEI Euro Moderate Fund is Euro (EUR). Objective The investment objective of The SEI Euro Moderate Fund is to provide the opportunity for a moderate level of capital growth and income while lowering the risk of a significant loss of capital. Market Commentary The 12-month period ending 30 June 2020 saw strong returns in the equity markets over the final half of 2019, only to give up all of that return and more in the first quarter of 2020. Global economic growth remained low, yet stable, going into 2020 until panic set in over the spread of COVID-19. Equity returns rebounded after the market drop, but still finished below their peaks from earlier in the year. Despite tension around a U.S./China trade deal and ongoing Brexit concerns in late 2019, the lingering effects of COVID-19 demanded plenty of attention from investors. The pace of interest-rate cuts by the U.S. Federal Reserve (Fed) mostly followed market projections, with the Fed cutting rates three times in 2019. As the Fed cut, the back end of the curve also moved higher as expectations for additional moves decreased and inflation increased. This helped steepen the U.S. yield curve after inverting earlier in the year. Once COVID-19 made its way to the U.S., the Treasury curve bull steepened; the Fed cut rates to 0% and implemented a series of programmes, reminiscent of some of the actions taken during the great financial crisis, to address the impact of illiquidity in different markets affected by a lack of large buyers and market makers. In September, the European Central Bank (ECB) decreased the interest rate on its deposit facility by 10 basis points. Christine Lagarde was named to succeed Mario Draghi as ECB president at the end of October 2019. The ECB restarted its asset purchase programme in November with a monthly pace of €20 billion. The ECB stated it intends to continue to fully reinvest the principal payments from maturing securities purchased under the programme. In response to COVID-19, the ECB announced €750 billion in stimulus through its Pandemic Emergency Purchase Programme (PEPP). The PEPP aims to lower borrowing costs and increase lending in the euro area, and the amount of stimulus is now up to €1350 billion. Oil prices stayed range-bound in 2019 with significant geopolitical events occurring, such as the disruption of Saudi Arabian wells due to attacks. In early 2020, Saudi Arabia and Russia could not agree on oil output and started a price war. This price war, on top of the sinking demand due to the health pandemic, led to cratering oil prices. COVID-19 drove a massive selloff in commodities; the broad asset class recovered some over the final three months of the period although the rebound was nowhere near as strong as for equities. Brexit concerns alleviated as Boris Johnson’s Conservative Party did well in the December elections. The British pound strengthened against the U.S. dollar by over 4% during the final six months of 2019. However, Brexit concerns lingered over the second half of the fiscal year, and sterling depreciated against the U.S. dollar by over 6%. The MSCI United Kingdom Index was up 3% over the last six months of 2019, but the index sold off over 19% in 2020 and finished down over 15% for the full reporting period. U.S. equities were the best-performing global market during all of 2019 and the first half of 2020. The technology sector continued to dominate, and Alphabet, Amazon, Apple, Facebook and Microsoft made up roughly one-fourth of the market capitalisation of the S&P 500 Index at the end of the fiscal year. Over the last six months, the MSCI Europe, Australasia and Far East (EAFE) Index was down over 12%, the MSCI Emerging Markets Index was down over 10%, and the S&P 500 index was down by about 4%. Led by the dovish tone of global central banks and the continued strength of other risk assets, global high-yield bonds outperformed global Treasury bonds during the fiscal year; most forms of credit performed well in the “risk-on” environment over the first half of the reporting period. Global growth expectations stayed flat at a slightly positive rate, which also helped steepen yield curves. Across the globe, central banks offered more monetary stimulus in response to COVID-19. Global fixed income, as measured by the Bloomberg Barclays Global Aggregate Index, climbed over 4% over the 12 months. U.S. high-yield, as measured by the ICE BofA U.S. High Yield Constrained Index, dropped about 1%. Additionally, emerging-market debt performed well over the period; the JP Morgan Emerging Markets Bond Index (EMBI) Global Diversified Index, which tracks emerging-market debt denominated in external currencies (such as the U.S. dollar), returned almost 6%. Performance For the 12-month reporting period ending at 30 June 2020, the Fund’s EUR Wealth C shares returned -4.31%. Fund Attribution Fund performance was negative during the annual period ending 30 June 2020. After a positive second half of 2019, equity performance suffered in the first half of 2020 due to the global COVID-19 pandemic and cratering oil prices. The largest detractors in the Fund were its commodities exposure, which underperformed as energy prices fell due to the pandemic, and The SEI Global Managed Volatility Fund. The SEI European ex-UK Equity Fund, The SEI High Yield Fixed Income Fund and The SEI Emerging Markets Debt Fund also detracted. The SEI Global Fixed Income Fund and The SEI Global Short Term Bond Fund were the largest contributors during the period. Investors sought “safe-haven” assets as COVID-19 and Brexit concerns rose. From an active allocation perspective, the Fund closed its overweight to The SEI Emerging Markets Debt Fund relative to an underweight in The SEI High Yield Fixed Income Fund; the position marginally detracted from performance during the reporting period. Also, the Fund closed an overweight to commodities through a decrease in cash and cash equivalents; this exposure also detracted from performance over the fiscal year. July 2020
42
DocuSign Envelope ID: 2646536F-BB10-4779-844A-39205D22F4E0

SEI Global Assets Fund plc Annual Report and Audited Financial Statements for the financial year ended 30 June 2020 THE SEI EURO MODERATE FUND – INVESTMENT ADVISER’S REPORT (continued) Performance
Euro Euro Euro Euro Wealth C Wealth C Wealth A Institutional Accumulating Distributing Accumulating Accumulating Class Class Class Class EUR EUR EUR EUR
Opening Net Asset Value per share 10.21 10.21 10.33 10.35 Distribution rate per share 0.00 0.00 0.00 0.00 Closing Net Asset Value per share 9.77 9.77 10.04 10.11 Closing Net Asset Value plus distribution rate per share 9.77 9.77 10.04 10.11
Class return for the year/period (4.31%) (4.31%) (2.81%) (2.32%)
43
DocuSign Envelope ID: 2646536F-BB10-4779-844A-39205D22F4E0

SEI Global Assets Fund plc Annual Report and Audited Financial Statements for the financial year ended 30 June 2020 THE SEI EURO CORE FUND – INVESTMENT ADVISER’S REPORT The SEI Euro Core Fund is comprised of four classes of Shares. The Fund was launched on 29 September 2017. The functional currency of The SEI Euro Core Fund is Euro (EUR). Objective The investment objective of The SEI Euro Core Fund is to provide the opportunity for capital growth and income in line with global equity and fixed income markets whilst seeking to manage the respective risks. Market Commentary The 12-month period ending 30 June 2020 saw strong returns in the equity markets over the final half of 2019, only to give up all of that return and more in the first quarter of 2020. Global economic growth remained low, yet stable, going into 2020 until panic set in over the spread of COVID-19. Equity returns rebounded after the market drop, but still finished below their peaks from earlier in the year. Despite tension around a U.S./China trade deal and ongoing Brexit concerns in late 2019, the lingering effects of COVID-19 demanded plenty of attention from investors. The pace of interest-rate cuts by the U.S. Federal Reserve (Fed) mostly followed market projections, with the Fed cutting rates three times in 2019. As the Fed cut, the back end of the curve also moved higher as expectations for additional moves decreased and inflation increased. This helped steepen the U.S. yield curve after inverting earlier in the year. Once COVID-19 made its way to the U.S., the Treasury curve bull steepened; the Fed cut rates to 0% and implemented a series of programmes, reminiscent of some of the actions taken during the great financial crisis, to address the impact of illiquidity in different markets affected by a lack of large buyers and market makers. In September, the European Central Bank (ECB) decreased the interest rate on its deposit facility by 10 basis points. Christine Lagarde was named to succeed Mario Draghi as ECB president at the end of October 2019. The ECB restarted its asset purchase programme in November with a monthly pace of €20 billion. The ECB stated it intends to continue to fully reinvest the principal payments from maturing securities purchased under the programme. In response to COVID-19, the ECB announced €750 billion in stimulus through its Pandemic Emergency Purchase Programme (PEPP). The PEPP aims to lower borrowing costs and increase lending in the euro area, and the amount of stimulus is now up to €1350 billion. Oil prices stayed range-bound in 2019 with significant geopolitical events occurring, such as the disruption of Saudi Arabian wells due to attacks. In early 2020, Saudi Arabia and Russia could not agree on oil output and started a price war. This price war, on top of the sinking demand due to the health pandemic, led to cratering oil prices. COVID-19 drove a massive selloff in commodities; the broad asset class recovered some over the final three months of the period although the rebound was nowhere near as strong as for equities. Brexit concerns alleviated as Boris Johnson’s Conservative Party did well in the December elections. The British pound strengthened against the U.S. dollar by over 4% during the final six months of 2019. However, Brexit concerns lingered over the second half of the fiscal year, and sterling depreciated against the U.S. dollar by over 6%. The MSCI United Kingdom Index was up 3% over the last six months of 2019, but the index sold off over 19% in 2020 and finished down over 15% for the full reporting period. U.S. equities were the best-performing global market during all of 2019 and the first half of 2020. The technology sector continued to dominate, and Alphabet, Amazon, Apple, Facebook and Microsoft made up roughly one-fourth of the market capitalisation of the S&P 500 Index at the end of the fiscal year. Over the last six months, the MSCI Europe, Australasia and Far East (EAFE) Index was down over 12%, the MSCI Emerging Markets Index was down over 10%, and the S&P 500 index was down by about 4%. Led by the dovish tone of global central banks and the continued strength of other risk assets, global high-yield bonds outperformed global Treasury bonds during the fiscal year; most forms of credit performed well in the “risk-on” environment over the first half of the reporting period. Global growth expectations stayed flat at a slightly positive rate, which also helped steepen yield curves. Across the globe, central banks offered more monetary stimulus in response to COVID-19. Global fixed income, as measured by the Bloomberg Barclays Global Aggregate Index, climbed over 4% over the 12 months. U.S. high-yield, as measured by the ICE BofA U.S. High Yield Constrained Index, dropped about 1%. Additionally, emerging-market debt performed well over the period; the JP Morgan Emerging Markets Bond Index (EMBI) Global Diversified Index, which tracks emerging-market debt denominated in external currencies (such as the U.S. dollar), returned almost 6%. Performance For the 12-month reporting period ending at 30 June 2020, the Fund’s EUR Wealth C shares returned -3.42%. Fund Attribution Fund performance was negative during the annual period ending 30 June 2020. After a positive second half of 2019, equity performance suffered in the first half of 2020 due to the global COVID-19 pandemic and cratering oil prices. The largest detractors in the Fund were its commodities exposure, which underperformed as energy prices fell due to the pandemic, and The SEI Global Managed Volatility Fund. The SEI UK Equity Fund, The SEI European ex-UK Equity Fund, The SEI U.S. Small Companies Fund, and The SEI High Yield Fixed Income Fund were also negative. The largest contributors were The SEI Global Short Duration Bond Fund, The SEI Global Short Term Bond Fund and The SEI Global Fixed Income Fund. Investors sought “safe-haven” assets as COVID-19 and Brexit concerns rose. The SEI UK Core Fixed Interest Fund also contributed positively for the same reason. The SEI Dynamic Asset Allocation Fund performed well and profited as its gold exposure benefitted from the rise in gold prices as pandemic uncertainty escalated. July 2020
44
DocuSign Envelope ID: 2646536F-BB10-4779-844A-39205D22F4E0

SEI Global Assets Fund plc Annual Report and Audited Financial Statements for the financial year ended 30 June 2020 THE SEI EURO CORE FUND – INVESTMENT ADVISER’S REPORT (continued) Performance
Euro Euro Euro Euro Wealth C Wealth C Wealth A Institutional Accumulating Distributing Accumulating Accumulating Class Class Class Class EUR EUR EUR EUR
Opening Net Asset Value per share 10.24 10.24 10.22 10.26 Distribution rate per share 0.00 0.00 0.00 0.00 Closing Net Asset Value per share 9.89 9.89 10.03 10.13 Closing Net Asset Value plus distribution rate per share 9.89 9.89 10.03 10.13
Class return for the year/period (3.42%) (3.42%) (1.86%) (1.27%)
45
DocuSign Envelope ID: 2646536F-BB10-4779-844A-39205D22F4E0
SEI Global Assets Fund plc Annual Report and Audited Financial Statements for the financial year ended 30 June 2020 THE SEI EURO BALANCED FUND – INVESTMENT ADVISER’S REPORT The SEI Euro Balanced Fund is comprised of four classes of Shares. The Fund was launched on 29 September 2017. The functional currency of The SEI Euro Balanced Fund is Euro (EUR). Objective The investment objective of The SEI Euro Balanced Fund is to provide capital growth and income in line with global equity and fixed income markets whilst seeking to manage the respective risks. Market Commentary The 12-month period ending 30 June 2020 saw strong returns in the equity markets over the final half of 2019, only to give up all of that return and more in the first quarter of 2020. Global economic growth remained low, yet stable, going into 2020 until panic set in over the spread of COVID-19. Equity returns rebounded after the market drop, but still finished below their peaks from earlier in the year. Despite tension around a U.S./China trade deal and ongoing Brexit concerns in late 2019, the lingering effects of COVID-19 demanded plenty of attention from investors. The pace of interest-rate cuts by the U.S. Federal Reserve (Fed) mostly followed market projections, with the Fed cutting rates three times in 2019. As the Fed cut, the back end of the curve also moved higher as expectations for additional moves decreased and inflation increased. This helped steepen the U.S. yield curve after inverting earlier in the year. Once COVID-19 made its way to the U.S., the Treasury curve bull steepened; the Fed cut rates to 0% and implemented a series of programmes, reminiscent of some of the actions taken during the great financial crisis, to address the impact of illiquidity in different markets affected by a lack of large buyers and market makers. In September, the European Central Bank (ECB) decreased the interest rate on its deposit facility by 10 basis points. Christine Lagarde was named to succeed Mario Draghi as ECB president at the end of October 2019. The ECB restarted its asset purchase programme in November with a monthly pace of €20 billion. The ECB stated it intends to continue to fully reinvest the principal payments from maturing securities purchased under the programme. In response to COVID-19, the ECB announced €750 billion in stimulus through its Pandemic Emergency Purchase Programme (PEPP). The PEPP aims to lower borrowing costs and increase lending in the euro area, and the amount of stimulus is now up to €1350 billion. Oil prices stayed range-bound in 2019 with significant geopolitical events occurring, such as the disruption of Saudi Arabian wells due to attacks. In early 2020, Saudi Arabia and Russia could not agree on oil output and started a price war. This price war, on top of the sinking demand due to the health pandemic, led to cratering oil prices. COVID-19 drove a massive selloff in commodities; the broad asset class recovered some over the final three months of the period although the rebound was nowhere near as strong as for equities. Brexit concerns alleviated as Boris Johnson’s Conservative Party did well in the December elections. The British pound strengthened against the U.S. dollar by over 4% during the final six months of 2019. However, Brexit concerns lingered over the second half of the fiscal year, and sterling depreciated against the U.S. dollar by over 6%. The MSCI United Kingdom Index was up 3% over the last six months of 2019, but the index sold off over 19% in 2020 and finished down over 15% for the full reporting period. U.S. equities were the best-performing global market during all of 2019 and the first half of 2020. The technology sector continued to dominate, and Alphabet, Amazon, Apple, Facebook and Microsoft made up roughly one-fourth of the market capitalisation of the S&P 500 Index at the end of the fiscal year. Over the last six months, the MSCI Europe, Australasia and Far East (EAFE) Index was down over 12%, the MSCI Emerging Markets Index was down over 10%, and the S&P 500 index was down by about 4%. Led by the dovish tone of global central banks and the continued strength of other risk assets, global high-yield bonds outperformed global Treasury bonds during the fiscal year; most forms of credit performed well in the “risk-on” environment over the first half of the reporting period. Global growth expectations stayed flat at a slightly positive rate, which also helped steepen yield curves. Across the globe, central banks offered more monetary stimulus in response to COVID-19. Global fixed income, as measured by the Bloomberg Barclays Global Aggregate Index, climbed over 4% over the 12 months. U.S. high-yield, as measured by the ICE BofA U.S. High Yield Constrained Index, dropped about 1%. Additionally, emerging-market debt performed well over the period; the JP Morgan Emerging Markets Bond Index (EMBI) Global Diversified Index, which tracks emerging-market debt denominated in external currencies (such as the U.S. dollar), returned almost 6%. Performance For the 12-month reporting period ending at 30 June 2020, the Fund’s EUR Wealth C shares returned -3.63%. Fund Attribution Fund performance was negative during the annual period ending 30 June 2020. After a positive second half of 2019, equity performance suffered in the first half of 2020 due to the global COVID-19 pandemic and cratering oil prices. The largest detractor in the Fund was its commodities exposure, which lagged other asset classes as energy prices got crushed due to COVID-19. The SEI Global Equity Fund, The SEI UK Equity Fund, The SEI European ex-UK Equity Fund, The SEI U.S. Small Companies Fund and The SEI Global Managed Volatility Fund all detracted as well. The SEI Dynamic Asset Allocation Fund performed well and profited as its gold exposure benefitted from the rise in gold prices as pandemic uncertainty escalated. The SEI Factor Allocation U.S. Equity Fund also contributed as U.S. technology stocks surged after the COVID-19 market correction. July 2020
46
DocuSign Envelope ID: 2646536F-BB10-4779-844A-39205D22F4E0

SEI Global Assets Fund plc Annual Report and Audited Financial Statements for the financial year ended 30 June 2020 THE SEI EURO BALANCED FUND – INVESTMENT ADVISER’S REPORT (continued) Performance
Euro Euro Euro Euro Wealth C Wealth C Wealth A Institutional Accumulating Distributing Accumulating Accumulating Class Class Class Class EUR EUR EUR EUR
Opening Net Asset Value per share 10.20 9.98 10.21 10.24 Distribution rate per share 0.00 0.06 0.00 0.00 Closing Net Asset Value per share 9.83 9.55 9.99 10.10 Closing Net Asset Value plus distribution rate per share 9.83 9.61 9.99 10.10
Class return for the year/period (3.63%) (3.71%) (2.15%) (1.37%)
47
DocuSign Envelope ID: 2646536F-BB10-4779-844A-39205D22F4E0
SEI Global Assets Fund plc Annual Report and Audited Financial Statements for the financial year ended 30 June 2020 THE SEI EURO GROWTH FUND – INVESTMENT ADVISER’S REPORT The SEI Euro Growth Fund is comprised of four classes of Shares. The Fund was launched on 29 September 2017. The functional currency of The SEI Euro Growth Fund is Euro (EUR). Objective The investment objective of The SEI Euro Growth Fund is to provide capital growth and risk exposure predominantly in line with global equity markets. Market Commentary The 12-month period ending 30 June 2020 saw strong returns in the equity markets over the final half of 2019, only to give up all of that return and more in the first quarter of 2020. Global economic growth remained low, yet stable, going into 2020 until panic set in over the spread of COVID-19. Equity returns rebounded after the market drop, but still finished below their peaks from earlier in the year. Despite tension around a U.S./China trade deal and ongoing Brexit concerns in late 2019, the lingering effects of COVID-19 demanded plenty of attention from investors. The pace of interest-rate cuts by the U.S. Federal Reserve (Fed) mostly followed market projections, with the Fed cutting rates three times in 2019. As the Fed cut, the back end of the curve also moved higher as expectations for additional moves decreased and inflation increased. This helped steepen the U.S. yield curve after inverting earlier in the year. Once COVID-19 made its way to the U.S., the Treasury curve bull steepened; the Fed cut rates to 0% and implemented a series of programmes, reminiscent of some of the actions taken during the great financial crisis, to address the impact of illiquidity in different markets affected by a lack of large buyers and market makers. In September, the European Central Bank (ECB) decreased the interest rate on its deposit facility by 10 basis points. Christine Lagarde was named to succeed Mario Draghi as ECB president at the end of October 2019. The ECB restarted its asset purchase programme in November with a monthly pace of €20 billion. The ECB stated it intends to continue to fully reinvest the principal payments from maturing securities purchased under the programme. In response to COVID-19, the ECB announced €750 billion in stimulus through its Pandemic Emergency Purchase Programme (PEPP). The PEPP aims to lower borrowing costs and increase lending in the euro area, and the amount of stimulus is now up to €1350 billion. Oil prices stayed range-bound in 2019 with significant geopolitical events occurring, such as the disruption of Saudi Arabian wells due to attacks. In early 2020, Saudi Arabia and Russia could not agree on oil output and started a price war. This price war, on top of the sinking demand due to the health pandemic, led to cratering oil prices. COVID-19 drove a massive selloff in commodities; the broad asset class recovered some over the final three months of the period although the rebound was nowhere near as strong as for equities. Brexit concerns alleviated as Boris Johnson’s Conservative Party did well in the December elections. The British pound strengthened against the U.S. dollar by over 4% during the final six months of 2019. However, Brexit concerns lingered over the second half of the fiscal year, and sterling depreciated against the U.S. dollar by over 6%. The MSCI United Kingdom Index was up 3% over the last six months of 2019, but the index sold off over 19% in 2020 and finished down over 15% for the full reporting period. U.S. equities were the best-performing global market during all of 2019 and the first half of 2020. The technology sector continued to dominate, and Alphabet, Amazon, Apple, Facebook and Microsoft made up roughly one-fourth of the market capitalisation of the S&P 500 Index at the end of the fiscal year. Over the last six months, the MSCI Europe, Australasia and Far East (EAFE) Index was down over 12%, the MSCI Emerging Markets Index was down over 10%, and the S&P 500 index was down by about 4%. Led by the dovish tone of global central banks and the continued strength of other risk assets, global high-yield bonds outperformed global Treasury bonds during the fiscal year; most forms of credit performed well in the “risk-on” environment over the first half of the reporting period. Global growth expectations stayed flat at a slightly positive rate, which also helped steepen yield curves. Across the globe, central banks offered more monetary stimulus in response to COVID-19. Global fixed income, as measured by the Bloomberg Barclays Global Aggregate Index, climbed over 4% over the 12 months. U.S. high-yield, as measured by the ICE BofA U.S. High Yield Constrained Index, dropped about 1%. Additionally, emerging-market debt performed well over the period; the JP Morgan Emerging Markets Bond Index (EMBI) Global Diversified Index, which tracks emerging-market debt denominated in external currencies (such as the U.S. dollar), returned almost 6%. Performance For the 12-month reporting period ending at 30 June 2020, the Fund’s EUR Wealth C shares returned -2.81%. Fund Attribution Fund performance was negative during the annual period ending 30 June 2020. After a positive second half of 2019, equity performance suffered in the first half of 2020 due to the global COVID-19 pandemic and cratering oil prices. The greatest detractors in the Fund were The SEI Global Equity Fund and The SEI European ex-UK Equity Fund. The SEI UK Equity Fund, The SEI U.S. Small Companies Fund and The SEI Global Managed Volatility Fund were also negative during the reporting period. The largest contributors were The SEI Factor Allocation U.S. Equity Fund and The SEI Dynamic Asset Allocation Fund. The SEI Dynamic Asset Allocation Fund performed well and profited as its gold exposure benefitted from the rise in gold prices as pandemic uncertainty escalated. The SEI Factor Allocation U.S. Equity Fund also contributed as U.S. technology stocks surged after the COVID-19 market correction. The portion of the Fund allocated to Schroders Global Inflation Linked Bond Fund was also positive. July 2020
48
DocuSign Envelope ID: 2646536F-BB10-4779-844A-39205D22F4E0

SEI Global Assets Fund plc Annual Report and Audited Financial Statements for the financial year ended 30 June 2020 THE SEI EURO GROWTH FUND – INVESTMENT ADVISER’S REPORT (continued) Performance
Euro Euro Euro Euro Wealth C Wealth C Wealth A Institutional Accumulating Distributing Accumulating Accumulating Class Class Class Class EUR EUR EUR EUR
Opening Net Asset Value per share 10.33 10.33 10.25 10.26 Distribution rate per share 0.00 0.00 0.00 0.00 Closing Net Asset Value per share 10.04 10.03 10.12 10.12 Closing Net Asset Value plus distribution rate per share 10.04 10.03 10.12 10.12
Class return for the year/period (2.81%) (2.90%) (1.27%) (1.36%)
49
DocuSign Envelope ID: 2646536F-BB10-4779-844A-39205D22F4E0
SEI Global Assets Fund plc Annual Report and Audited Financial Statements for the financial year ended 30 June 2020 THE SEI EURO AGGRESSIVE FUND – INVESTMENT ADVISER’S REPORT The SEI Euro Aggressive Fund is comprised of four classes of Shares. The Fund was launched on 29 September 2017. The functional currency of The Euro Aggressive Fund is Euro (EUR). Objective The investment objective of The SEI Euro Aggressive Fund is to provide capital growth and risk in line with global equity markets. Market Commentary The 12-month period ending 30 June 2020 saw strong returns in the equity markets over the final half of 2019, only to give up all of that return and more in the first quarter of 2020. Global economic growth remained low, yet stable, going into 2020 until panic set in over the spread of COVID-19. Equity returns rebounded after the market drop, but still finished below their peaks from earlier in the year. Despite tension around a U.S./China trade deal and ongoing Brexit concerns in late 2019, the lingering effects of COVID-19 demanded plenty of attention from investors. The pace of interest-rate cuts by the U.S. Federal Reserve (Fed) mostly followed market projections, with the Fed cutting rates three times in 2019. As the Fed cut, the back end of the curve also moved higher as expectations for additional moves decreased and inflation increased. This helped steepen the U.S. yield curve after inverting earlier in the year. Once COVID-19 made its way to the U.S., the Treasury curve bull steepened; the Fed cut rates to 0% and implemented a series of programmes, reminiscent of some of the actions taken during the great financial crisis, to address the impact of illiquidity in different markets affected by a lack of large buyers and market makers. In September, the European Central Bank (ECB) decreased the interest rate on its deposit facility by 10 basis points. Christine Lagarde was named to succeed Mario Draghi as ECB president at the end of October 2019. The ECB restarted its asset purchase programme in November with a monthly pace of €20 billion. The ECB stated it intends to continue to fully reinvest the principal payments from maturing securities purchased under the programme. In response to COVID-19, the ECB announced €750 billion in stimulus through its Pandemic Emergency Purchase Programme (PEPP). The PEPP aims to lower borrowing costs and increase lending in the euro area, and the amount of stimulus is now up to €1350 billion. Oil prices stayed range-bound in 2019 with significant geopolitical events occurring, such as the disruption of Saudi Arabian wells due to attacks. In early 2020, Saudi Arabia and Russia could not agree on oil output and started a price war. This price war, on top of the sinking demand due to the health pandemic, led to cratering oil prices. COVID-19 drove a massive selloff in commodities; the broad asset class recovered some over the final three months of the period although the rebound was nowhere near as strong as for equities. Brexit concerns alleviated as Boris Johnson’s Conservative Party did well in the December elections. The British pound strengthened against the U.S. dollar by over 4% during the final six months of 2019. However, Brexit concerns lingered over the second half of the fiscal year, and sterling depreciated against the U.S. dollar by over 6%. The MSCI United Kingdom Index was up 3% over the last six months of 2019, but the index sold off over 19% in 2020 and finished down over 15% for the full reporting period. U.S. equities were the best-performing global market during all of 2019 and the first half of 2020. The technology sector continued to dominate, and Alphabet, Amazon, Apple, Facebook and Microsoft made up roughly one-fourth of the market capitalisation of the S&P 500 Index at the end of the fiscal year. Over the last six months, the MSCI Europe, Australasia and Far East (EAFE) Index was down over 12%, the MSCI Emerging Markets Index was down over 10%, and the S&P 500 index was down by about 4%. Led by the dovish tone of global central banks and the continued strength of other risk assets, global high-yield bonds outperformed global Treasury bonds during the fiscal year; most forms of credit performed well in the “risk-on” environment over the first half of the reporting period. Global growth expectations stayed flat at a slightly positive rate, which also helped steepen yield curves. Across the globe, central banks offered more monetary stimulus in response to COVID-19. Global fixed income, as measured by the Bloomberg Barclays Global Aggregate Index, climbed over 4% over the 12 months. U.S. high-yield, as measured by the ICE BofA U.S. High Yield Constrained Index, dropped about 1%. Additionally, emerging-market debt performed well over the period; the JP Morgan Emerging Markets Bond Index (EMBI) Global Diversified Index, which tracks emerging-market debt denominated in external currencies (such as the U.S. dollar), returned almost 6%. Performance For the 12-month reporting period ending at 30 June 2020, the Fund’s EUR Wealth C shares returned -3.26%. Fund Attribution Fund performance was negative during the annual period ending 30 June 2020. After a positive second half of 2019, equity performance suffered in the first half of 2020 due to the global COVID-19 pandemic and cratering oil prices. The greatest detractor in the Fund was The SEI Global Equity Fund. The SEI UK Equity Fund, The SEI European ex-UK Equity Fund and The SEI U.S. Small Companies Fund were also negative during the reporting period. The largest contributors were The SEI Factor Allocation U.S. Equity Fund and The SEI Dynamic Asset Allocation Fund. The SEI Factor Allocation U.S. Equity Fund contributed as U.S. technology stocks surged after the COVID-19 market correction. The SEI Dynamic Asset Allocation Fund performed well and profited as its gold exposure benefitted from the rise in gold prices as pandemic uncertainty escalated. July 2020
50
DocuSign Envelope ID: 2646536F-BB10-4779-844A-39205D22F4E0
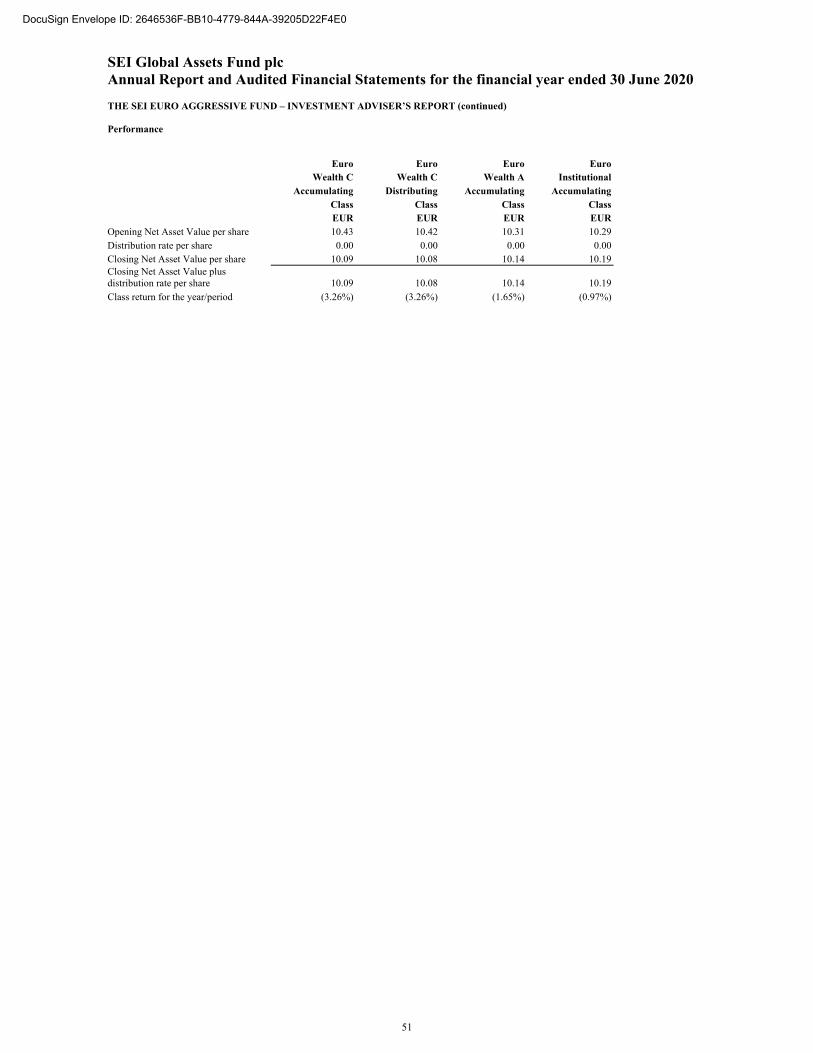
SEI Global Assets Fund plc Annual Report and Audited Financial Statements for the financial year ended 30 June 2020 THE SEI EURO AGGRESSIVE FUND – INVESTMENT ADVISER’S REPORT (continued) Performance
Euro Euro Euro Euro Wealth C Wealth C Wealth A Institutional Accumulating Distributing Accumulating Accumulating Class Class Class Class EUR EUR EUR EUR
Opening Net Asset Value per share 10.43 10.42 10.31 10.29 Distribution rate per share 0.00 0.00 0.00 0.00 Closing Net Asset Value per share 10.09 10.08 10.14 10.19 Closing Net Asset Value plus distribution rate per share 10.09 10.08 10.14 10.19
Class return for the year/period (3.26%) (3.26%) (1.65%) (0.97%)
51
DocuSign Envelope ID: 2646536F-BB10-4779-844A-39205D22F4E0
SEI Global Assets Fund plc Annual Report and Audited Financial Statements for the financial year ended 30 June 2020 INVESTMENT ADVISER’S REPORT (continued) Important Information: The opinions and views contained in this document are solely those of SEI and are subject to change; descriptions relating to organisational structure, teams and investment processes herein may differ significantly from those prescribed by underlying managers regarding their own investment houses and investments. Past performance is not a guarantee of future performance. Investment in the range of SEI’s Funds is intended as a long-term investment. The value of an investment and any income from it can go down as well as up. Investors may not get back the original amount invested. Additionally, this investment may not be suitable for everyone. If you should have any doubt whether it is suitable for you, you should obtain expert advice. No offer of any security is made hereby. Recipients of this information who intend to apply for Shares in any SEI Fund are reminded that any such application may be made solely on the basis of the information contained in the Prospectus. This material represents an assessment of the market environment at a specific point in time and is not intended to be a forecast of future events, or a guarantee of future results. This information should not be relied upon by the reader as research or investment advice regarding the Funds or any stock in particular, nor should it be construed as a recommendation to purchase or sell a security, including futures contracts. If the investment is withdrawn in the early years it may not return the full amount invested. In addition to the normal risks associated with equity investing, international investments may involve risk of capital loss from unfavourable fluctuation in currency values, from differences in generally accepted accounting principles or from economic or political instability in other nations. Narrowly focused investments and smaller companies typically exhibit higher volatility. Products of companies in which technology funds invest may be subject to severe competition and rapid obsolescence. SEI Funds may use derivative instruments such as futures, forward currency contracts, options, swaps, contracts for difference, credit derivatives, caps and floors. These instruments may be used for hedging purposes and/or investment purposes.
While considerable care has been taken to ensure the information contained within this document is accurate and up-to-date, no warranty is given as to the accuracy or completeness of any information and no liability is accepted for any errors or omissions in such information or any action taken on the basis of this information. This information is issued by SEI Investments (Europe) Limited, 1st Floor, Alphabeta, 14-18 Finsbury Square, London EC2A 1BR which is authorised and regulated by the Financial Conduct Authority. Please refer to our latest Full Prospectus (which includes information in relation to the use of derivatives and the risks associated with the use of derivative instruments), Key Investor Information Document (“KIID”) and latest Annual or Interim Reports for more information on our Funds. This information can be obtained by contacting your Financial Adviser or using the contact details shown above.
52
DocuSign Envelope ID: 2646536F-BB10-4779-844A-39205D22F4E0
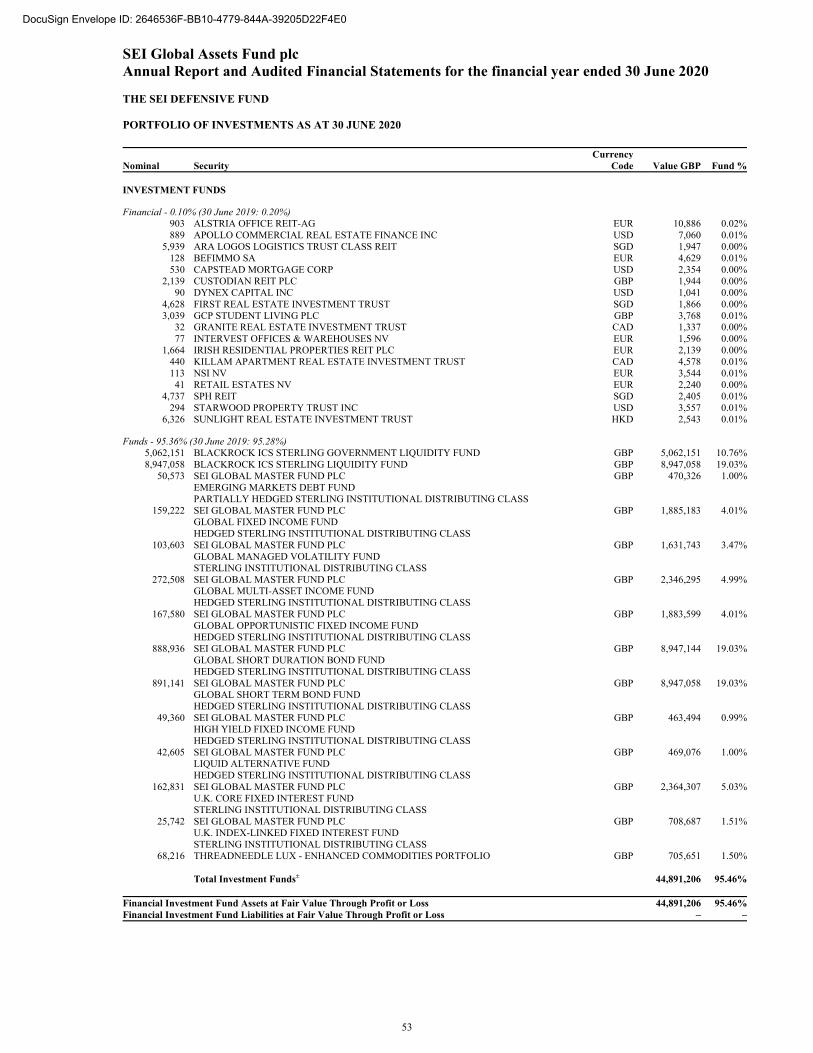
SEI Global Assets Fund plc Annual Report and Audited Financial Statements for the financial year ended 30 June 2020 THE SEI DEFENSIVE FUND PORTFOLIO OF INVESTMENTS AS AT 30 JUNE 2020
Nominal Security Currency
Code Value GBP Fund % INVESTMENT FUNDS
Financial - 0.10% (30 June 2019: 0.20%) 903 ALSTRIA OFFICE REIT-AG EUR 10,886 0.02%889 APOLLO COMMERCIAL REAL ESTATE FINANCE INC USD 7,060 0.01%
5,939 ARA LOGOS LOGISTICS TRUST CLASS REIT SGD 1,947 0.00%128 BEFIMMO SA EUR 4,629 0.01%530 CAPSTEAD MORTGAGE CORP USD 2,354 0.00%
2,139 CUSTODIAN REIT PLC GBP 1,944 0.00%90 DYNEX CAPITAL INC USD 1,041 0.00%
4,628 FIRST REAL ESTATE INVESTMENT TRUST SGD 1,866 0.00%3,039 GCP STUDENT LIVING PLC GBP 3,768 0.01%
32 GRANITE REAL ESTATE INVESTMENT TRUST CAD 1,337 0.00%77 INTERVEST OFFICES & WAREHOUSES NV EUR 1,596 0.00%
1,664 IRISH RESIDENTIAL PROPERTIES REIT PLC EUR 2,139 0.00%440 KILLAM APARTMENT REAL ESTATE INVESTMENT TRUST CAD 4,578 0.01%113 NSI NV EUR 3,544 0.01%
41 RETAIL ESTATES NV EUR 2,240 0.00%4,737 SPH REIT SGD 2,405 0.01%
294 STARWOOD PROPERTY TRUST INC USD 3,557 0.01%6,326 SUNLIGHT REAL ESTATE INVESTMENT TRUST HKD 2,543 0.01%
Funds - 95.36% (30 June 2019: 95.28%) 5,062,151 BLACKROCK ICS STERLING GOVERNMENT LIQUIDITY FUND GBP 5,062,151 10.76%8,947,058 BLACKROCK ICS STERLING LIQUIDITY FUND GBP 8,947,058 19.03%
50,573 SEI GLOBAL MASTER FUND PLC GBP 470,326 1.00% EMERGING MARKETS DEBT FUND PARTIALLY HEDGED STERLING INSTITUTIONAL DISTRIBUTING CLASS
159,222 SEI GLOBAL MASTER FUND PLC GBP 1,885,183 4.01% GLOBAL FIXED INCOME FUND HEDGED STERLING INSTITUTIONAL DISTRIBUTING CLASS
103,603 SEI GLOBAL MASTER FUND PLC GBP 1,631,743 3.47% GLOBAL MANAGED VOLATILITY FUND STERLING INSTITUTIONAL DISTRIBUTING CLASS
272,508 SEI GLOBAL MASTER FUND PLC GBP 2,346,295 4.99% GLOBAL MULTI-ASSET INCOME FUND HEDGED STERLING INSTITUTIONAL DISTRIBUTING CLASS
167,580 SEI GLOBAL MASTER FUND PLC GBP 1,883,599 4.01% GLOBAL OPPORTUNISTIC FIXED INCOME FUND HEDGED STERLING INSTITUTIONAL DISTRIBUTING CLASS
888,936 SEI GLOBAL MASTER FUND PLC GBP 8,947,144 19.03% GLOBAL SHORT DURATION BOND FUND HEDGED STERLING INSTITUTIONAL DISTRIBUTING CLASS
891,141 SEI GLOBAL MASTER FUND PLC GBP 8,947,058 19.03% GLOBAL SHORT TERM BOND FUND HEDGED STERLING INSTITUTIONAL DISTRIBUTING CLASS
49,360 SEI GLOBAL MASTER FUND PLC GBP 463,494 0.99% HIGH YIELD FIXED INCOME FUND HEDGED STERLING INSTITUTIONAL DISTRIBUTING CLASS
42,605 SEI GLOBAL MASTER FUND PLC GBP 469,076 1.00% LIQUID ALTERNATIVE FUND HEDGED STERLING INSTITUTIONAL DISTRIBUTING CLASS
162,831 SEI GLOBAL MASTER FUND PLC GBP 2,364,307 5.03% U.K. CORE FIXED INTEREST FUND STERLING INSTITUTIONAL DISTRIBUTING CLASS
25,742 SEI GLOBAL MASTER FUND PLC GBP 708,687 1.51% U.K. INDEX-LINKED FIXED INTEREST FUND STERLING INSTITUTIONAL DISTRIBUTING CLASS
68,216 THREADNEEDLE LUX - ENHANCED COMMODITIES PORTFOLIO GBP 705,651 1.50% Total Investment Funds± 44,891,206 95.46% Financial Investment Fund Assets at Fair Value Through Profit or Loss 44,891,206 95.46%Financial Investment Fund Liabilities at Fair Value Through Profit or Loss – –
53
DocuSign Envelope ID: 2646536F-BB10-4779-844A-39205D22F4E0

SEI Global Assets Fund plc Annual Report and Audited Financial Statements for the financial year ended 30 June 2020 THE SEI DEFENSIVE FUND PORTFOLIO OF INVESTMENTS AS AT 30 JUNE 2020 (continued)
Nominal Security Currency
Code Value GBP Fund % EQUITIES
Agriculture - 0.10% (30 June 2019: 0.10%) 122 HOKUTO CORP JPY 1,857 0.00%404 SCANDINAVIAN TOBACCO GROUP A/S 144A DKK 4,823 0.01%742 SWEDISH MATCH AB SEK 42,196 0.09%
Basic Materials - 0.09% (30 June 2019: 0.03%) 104 KAISER ALUMINUM CORP USD 6,212 0.01%639 KEMIRA OYJ EUR 6,656 0.01%427 RELIANCE STEEL & ALUMINUM CO USD 32,817 0.07%
Beverages - 0.00% (30 June 2019: 0.00%) 48 DYDO GROUP HOLDINGS INC JPY 1,757 0.00%
106 KEY COFFEE INC JPY 1,828 0.00%
Biotechnology - 0.16% (30 June 2019: 0.00%) 100 AMGEN INC USD 19,058 0.04%142 BIOGEN INC USD 30,738 0.07%248 UNITED THERAPEUTICS CORP USD 24,327 0.05%
Commercial Services - 0.00% (30 June 2019: 0.01%) 1,658 SIA ENGINEERING CO LTD SGD 1,894 0.00%
Communications - 0.62% (30 June 2019: 0.32%) 880 AT&T INC USD 21,540 0.05%922 BCE INC CAD 31,004 0.07%
19,543 HKT TRUST & HKT LTD CLASS MISCELLA HKD 23,142 0.05%9,474 HUTCHISON TELECOMMUNICATIONS HONG KONG HOLDINGS LTD HKD 1,217 0.00%
160 METROPOLE TELEVISION SA EUR 1,458 0.00%18,622 NETLINK NBN TRUST SGD 10,479 0.02%
913 NTT DOCOMO INC JPY 19,732 0.04%791 OMNICOM GROUP INC USD 34,947 0.07%
28,241 PCCW LTD HKD 13,034 0.03%39 QUEBECOR INC CLASS B CAD 674 0.00%
3,585 SES SA CLASS A EUR 19,812 0.04%21,818 SINGAPORE TELECOMMUNICATIONS LTD SGD 31,138 0.07%2,231 SMARTONE TELECOMMUNICATIONS HOLDINGS LTD HKD 967 0.00%3,894 STARHUB LTD SGD 2,937 0.01%
88 SWISSCOM AG CHF 37,255 0.08%1,005 TELEKOM AUSTRIA AG CLASS A EUR 5,618 0.01%
860 VERIZON COMMUNICATIONS INC USD 38,389 0.08%
Cosmetics/Personal Care - 0.17% (30 June 2019: 0.07%) 632 COLGATE-PALMOLIVE CO USD 37,470 0.08%72 EARTH CORP JPY 4,460 0.01%
405 PROCTER & GAMBLE CO USD 39,148 0.08%
Distribution/Wholesale - 0.09% (30 June 2019: 0.01%) 159 D'IETEREN SA/NV EUR 7,104 0.02%
27 ITOCHU-SHOKUHIN CO LTD JPY 1,051 0.00%1,521 LKQ CORP USD 32,256 0.07%
Entertainment - 0.00% (30 June 2019: 0.01%) 345 BORUSSIA DORTMUND GMBH & CO KGAA EUR 1,813 0.00%
72 MARS GROUP HOLDINGS CORP JPY 883 0.00%
Financial - 0.35% (30 June 2019: 0.91%) 194 ABC ARBITRAGE EUR 1,206 0.00%946 AGEAS SA/NV EUR 27,109 0.06%
48 AMERICAN NATIONAL INSURANCE CO USD 2,810 0.01%7,499 ASCOTT RESIDENCE TRUST SGD 4,351 0.01%1,309 CAPITOL FEDERAL FINANCIAL INC USD 11,662 0.03%
79 CORESTATE CAPITAL HOLDING SA EUR 1,282 0.00%177 EHIME BANK LTD JPY 1,544 0.00%118 GIMV NV EUR 5,472 0.01%577 GLOBE LIFE INC USD 34,645 0.07%
54
DocuSign Envelope ID: 2646536F-BB10-4779-844A-39205D22F4E0
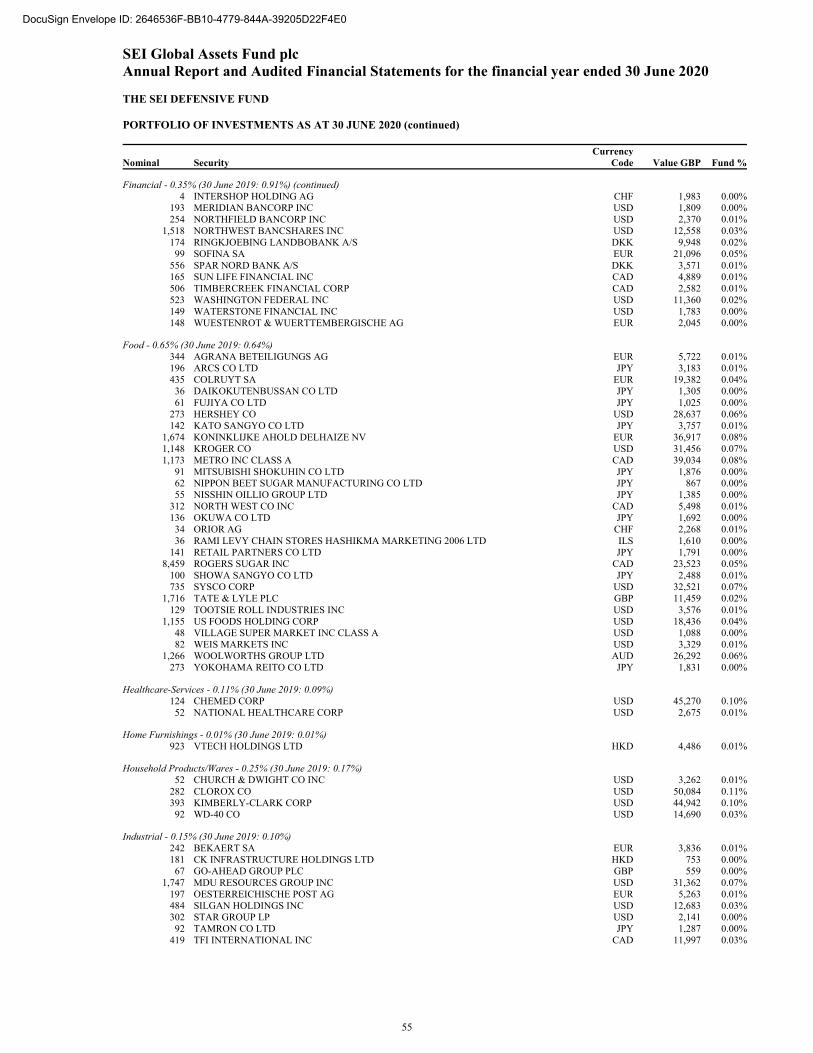
SEI Global Assets Fund plc Annual Report and Audited Financial Statements for the financial year ended 30 June 2020 THE SEI DEFENSIVE FUND PORTFOLIO OF INVESTMENTS AS AT 30 JUNE 2020 (continued)
Nominal Security Currency
Code Value GBP Fund %
Financial - 0.35% (30 June 2019: 0.91%) (continued) 4 INTERSHOP HOLDING AG CHF 1,983 0.00%
193 MERIDIAN BANCORP INC USD 1,809 0.00%254 NORTHFIELD BANCORP INC USD 2,370 0.01%
1,518 NORTHWEST BANCSHARES INC USD 12,558 0.03%174 RINGKJOEBING LANDBOBANK A/S DKK 9,948 0.02%99 SOFINA SA EUR 21,096 0.05%
556 SPAR NORD BANK A/S DKK 3,571 0.01%165 SUN LIFE FINANCIAL INC CAD 4,889 0.01%506 TIMBERCREEK FINANCIAL CORP CAD 2,582 0.01%523 WASHINGTON FEDERAL INC USD 11,360 0.02%149 WATERSTONE FINANCIAL INC USD 1,783 0.00%148 WUESTENROT & WUERTTEMBERGISCHE AG EUR 2,045 0.00%
Food - 0.65% (30 June 2019: 0.64%) 344 AGRANA BETEILIGUNGS AG EUR 5,722 0.01%196 ARCS CO LTD JPY 3,183 0.01%435 COLRUYT SA EUR 19,382 0.04%
36 DAIKOKUTENBUSSAN CO LTD JPY 1,305 0.00%61 FUJIYA CO LTD JPY 1,025 0.00%
273 HERSHEY CO USD 28,637 0.06%142 KATO SANGYO CO LTD JPY 3,757 0.01%
1,674 KONINKLIJKE AHOLD DELHAIZE NV EUR 36,917 0.08%1,148 KROGER CO USD 31,456 0.07%1,173 METRO INC CLASS A CAD 39,034 0.08%
91 MITSUBISHI SHOKUHIN CO LTD JPY 1,876 0.00%62 NIPPON BEET SUGAR MANUFACTURING CO LTD JPY 867 0.00%55 NISSHIN OILLIO GROUP LTD JPY 1,385 0.00%
312 NORTH WEST CO INC CAD 5,498 0.01%136 OKUWA CO LTD JPY 1,692 0.00%
34 ORIOR AG CHF 2,268 0.01%36 RAMI LEVY CHAIN STORES HASHIKMA MARKETING 2006 LTD ILS 1,610 0.00%
141 RETAIL PARTNERS CO LTD JPY 1,791 0.00%8,459 ROGERS SUGAR INC CAD 23,523 0.05%
100 SHOWA SANGYO CO LTD JPY 2,488 0.01%735 SYSCO CORP USD 32,521 0.07%
1,716 TATE & LYLE PLC GBP 11,459 0.02%129 TOOTSIE ROLL INDUSTRIES INC USD 3,576 0.01%
1,155 US FOODS HOLDING CORP USD 18,436 0.04%48 VILLAGE SUPER MARKET INC CLASS A USD 1,088 0.00%82 WEIS MARKETS INC USD 3,329 0.01%
1,266 WOOLWORTHS GROUP LTD AUD 26,292 0.06%273 YOKOHAMA REITO CO LTD JPY 1,831 0.00%
Healthcare-Services - 0.11% (30 June 2019: 0.09%) 124 CHEMED CORP USD 45,270 0.10%
52 NATIONAL HEALTHCARE CORP USD 2,675 0.01%
Home Furnishings - 0.01% (30 June 2019: 0.01%) 923 VTECH HOLDINGS LTD HKD 4,486 0.01%
Household Products/Wares - 0.25% (30 June 2019: 0.17%) 52 CHURCH & DWIGHT CO INC USD 3,262 0.01%
282 CLOROX CO USD 50,084 0.11%393 KIMBERLY-CLARK CORP USD 44,942 0.10%92 WD-40 CO USD 14,690 0.03%
Industrial - 0.15% (30 June 2019: 0.10%) 242 BEKAERT SA EUR 3,836 0.01%181 CK INFRASTRUCTURE HOLDINGS LTD HKD 753 0.00%67 GO-AHEAD GROUP PLC GBP 559 0.00%
1,747 MDU RESOURCES GROUP INC USD 31,362 0.07%197 OESTERREICHISCHE POST AG EUR 5,263 0.01%484 SILGAN HOLDINGS INC USD 12,683 0.03%302 STAR GROUP LP USD 2,141 0.00%
92 TAMRON CO LTD JPY 1,287 0.00%419 TFI INTERNATIONAL INC CAD 11,997 0.03%
55
DocuSign Envelope ID: 2646536F-BB10-4779-844A-39205D22F4E0
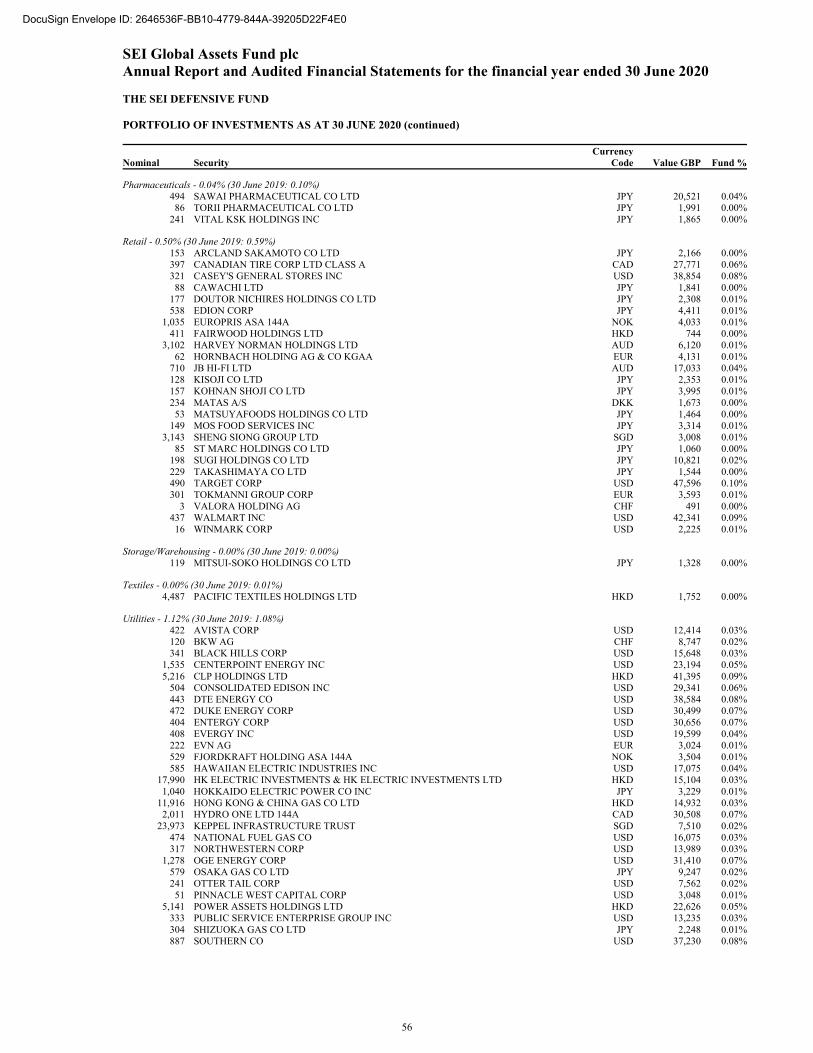
SEI Global Assets Fund plc Annual Report and Audited Financial Statements for the financial year ended 30 June 2020 THE SEI DEFENSIVE FUND PORTFOLIO OF INVESTMENTS AS AT 30 JUNE 2020 (continued)
Nominal Security Currency
Code Value GBP Fund %
Pharmaceuticals - 0.04% (30 June 2019: 0.10%) 494 SAWAI PHARMACEUTICAL CO LTD JPY 20,521 0.04%86 TORII PHARMACEUTICAL CO LTD JPY 1,991 0.00%
241 VITAL KSK HOLDINGS INC JPY 1,865 0.00%
Retail - 0.50% (30 June 2019: 0.59%) 153 ARCLAND SAKAMOTO CO LTD JPY 2,166 0.00%397 CANADIAN TIRE CORP LTD CLASS A CAD 27,771 0.06%321 CASEY'S GENERAL STORES INC USD 38,854 0.08%88 CAWACHI LTD JPY 1,841 0.00%
177 DOUTOR NICHIRES HOLDINGS CO LTD JPY 2,308 0.01%538 EDION CORP JPY 4,411 0.01%
1,035 EUROPRIS ASA 144A NOK 4,033 0.01%411 FAIRWOOD HOLDINGS LTD HKD 744 0.00%
3,102 HARVEY NORMAN HOLDINGS LTD AUD 6,120 0.01%62 HORNBACH HOLDING AG & CO KGAA EUR 4,131 0.01%
710 JB HI-FI LTD AUD 17,033 0.04%128 KISOJI CO LTD JPY 2,353 0.01%157 KOHNAN SHOJI CO LTD JPY 3,995 0.01%234 MATAS A/S DKK 1,673 0.00%
53 MATSUYAFOODS HOLDINGS CO LTD JPY 1,464 0.00%149 MOS FOOD SERVICES INC JPY 3,314 0.01%
3,143 SHENG SIONG GROUP LTD SGD 3,008 0.01%85 ST MARC HOLDINGS CO LTD JPY 1,060 0.00%
198 SUGI HOLDINGS CO LTD JPY 10,821 0.02%229 TAKASHIMAYA CO LTD JPY 1,544 0.00%490 TARGET CORP USD 47,596 0.10%301 TOKMANNI GROUP CORP EUR 3,593 0.01%
3 VALORA HOLDING AG CHF 491 0.00%437 WALMART INC USD 42,341 0.09%
16 WINMARK CORP USD 2,225 0.01%
Storage/Warehousing - 0.00% (30 June 2019: 0.00%) 119 MITSUI-SOKO HOLDINGS CO LTD JPY 1,328 0.00%
Textiles - 0.00% (30 June 2019: 0.01%) 4,487 PACIFIC TEXTILES HOLDINGS LTD HKD 1,752 0.00%
Utilities - 1.12% (30 June 2019: 1.08%) 422 AVISTA CORP USD 12,414 0.03%120 BKW AG CHF 8,747 0.02%341 BLACK HILLS CORP USD 15,648 0.03%
1,535 CENTERPOINT ENERGY INC USD 23,194 0.05%5,216 CLP HOLDINGS LTD HKD 41,395 0.09%
504 CONSOLIDATED EDISON INC USD 29,341 0.06%443 DTE ENERGY CO USD 38,584 0.08%472 DUKE ENERGY CORP USD 30,499 0.07%404 ENTERGY CORP USD 30,656 0.07%408 EVERGY INC USD 19,599 0.04%222 EVN AG EUR 3,024 0.01%529 FJORDKRAFT HOLDING ASA 144A NOK 3,504 0.01%585 HAWAIIAN ELECTRIC INDUSTRIES INC USD 17,075 0.04%
17,990 HK ELECTRIC INVESTMENTS & HK ELECTRIC INVESTMENTS LTD HKD 15,104 0.03%1,040 HOKKAIDO ELECTRIC POWER CO INC JPY 3,229 0.01%
11,916 HONG KONG & CHINA GAS CO LTD HKD 14,932 0.03%2,011 HYDRO ONE LTD 144A CAD 30,508 0.07%
23,973 KEPPEL INFRASTRUCTURE TRUST SGD 7,510 0.02%474 NATIONAL FUEL GAS CO USD 16,075 0.03%317 NORTHWESTERN CORP USD 13,989 0.03%
1,278 OGE ENERGY CORP USD 31,410 0.07%579 OSAKA GAS CO LTD JPY 9,247 0.02%241 OTTER TAIL CORP USD 7,562 0.02%
51 PINNACLE WEST CAPITAL CORP USD 3,048 0.01%5,141 POWER ASSETS HOLDINGS LTD HKD 22,626 0.05%
333 PUBLIC SERVICE ENTERPRISE GROUP INC USD 13,235 0.03%304 SHIZUOKA GAS CO LTD JPY 2,248 0.01%887 SOUTHERN CO USD 37,230 0.08%
56
DocuSign Envelope ID: 2646536F-BB10-4779-844A-39205D22F4E0
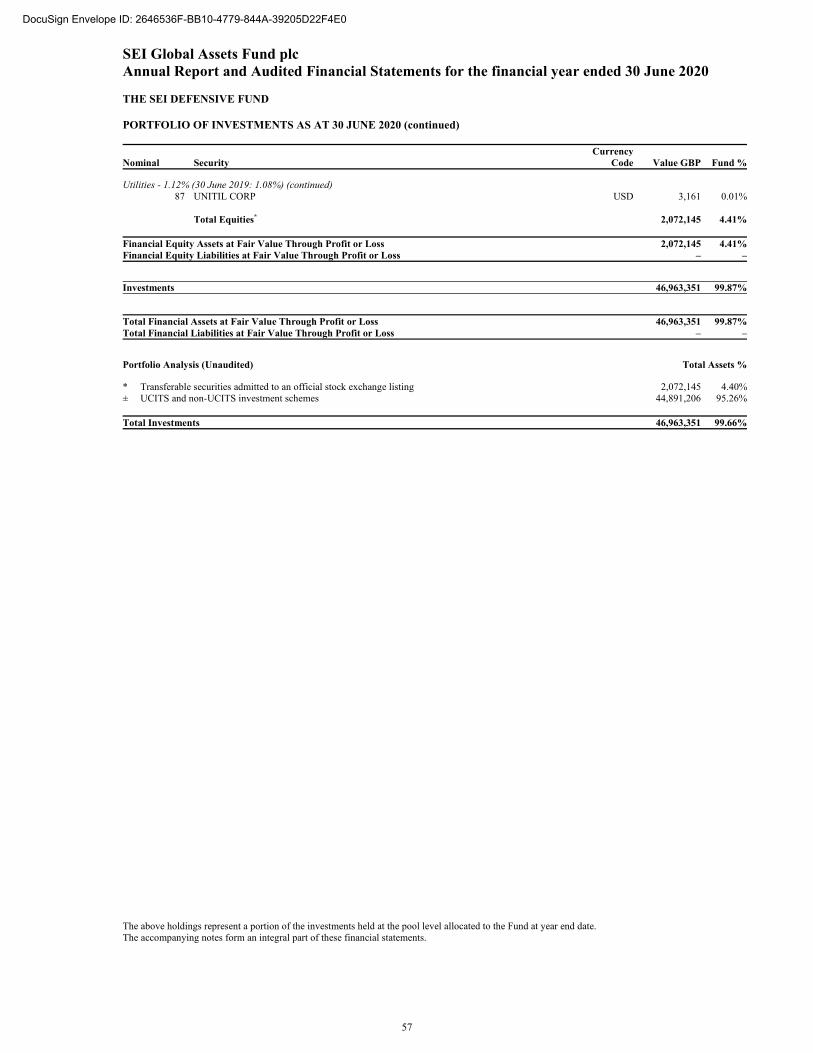
SEI Global Assets Fund plc Annual Report and Audited Financial Statements for the financial year ended 30 June 2020 THE SEI DEFENSIVE FUND PORTFOLIO OF INVESTMENTS AS AT 30 JUNE 2020 (continued)
Nominal Security Currency
Code Value GBP Fund %
Utilities - 1.12% (30 June 2019: 1.08%) (continued) 87 UNITIL CORP USD 3,161 0.01%
Total Equities* 2,072,145 4.41% Financial Equity Assets at Fair Value Through Profit or Loss 2,072,145 4.41%Financial Equity Liabilities at Fair Value Through Profit or Loss – –
Investments 46,963,351 99.87%
Total Financial Assets at Fair Value Through Profit or Loss 46,963,351 99.87%Total Financial Liabilities at Fair Value Through Profit or Loss – –
Portfolio Analysis (Unaudited) Total Assets % * Transferable securities admitted to an official stock exchange listing 2,072,145 4.40%± UCITS and non-UCITS investment schemes 44,891,206 95.26% Total Investments 46,963,351 99.66%
The above holdings represent a portion of the investments held at the pool level allocated to the Fund at year end date. The accompanying notes form an integral part of these financial statements.
57
DocuSign Envelope ID: 2646536F-BB10-4779-844A-39205D22F4E0
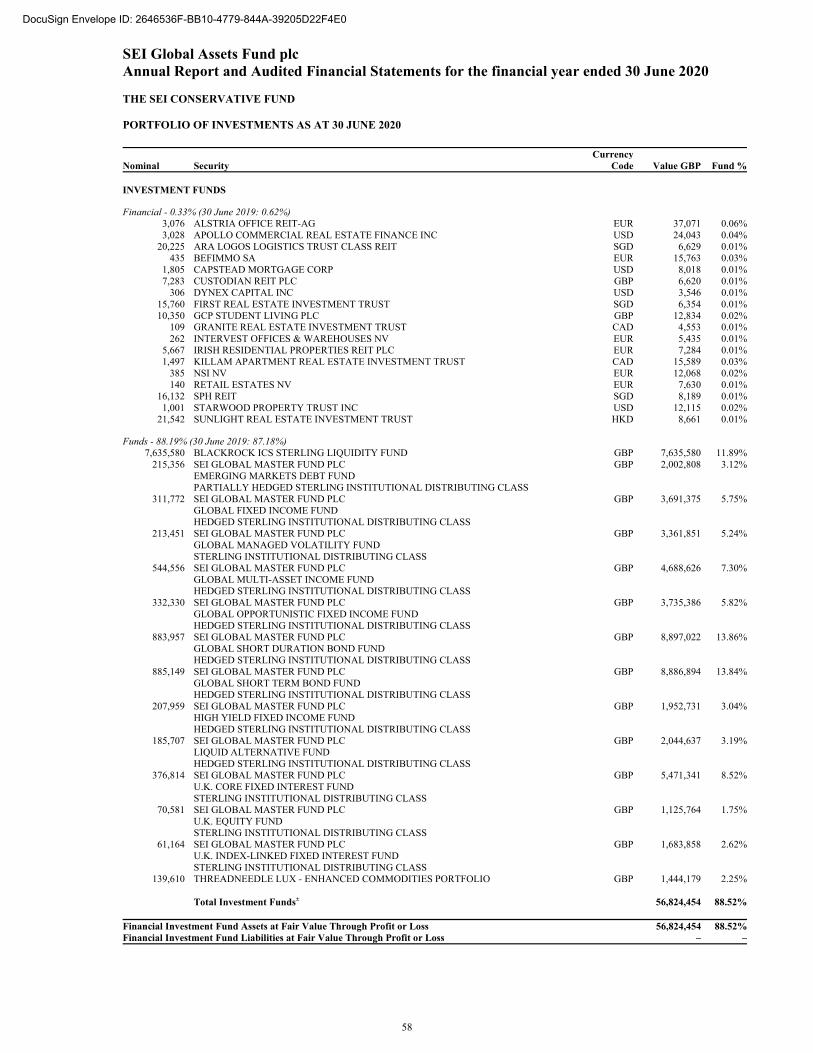
SEI Global Assets Fund plc Annual Report and Audited Financial Statements for the financial year ended 30 June 2020 THE SEI CONSERVATIVE FUND PORTFOLIO OF INVESTMENTS AS AT 30 JUNE 2020
Nominal Security Currency
Code Value GBP Fund % INVESTMENT FUNDS
Financial - 0.33% (30 June 2019: 0.62%) 3,076 ALSTRIA OFFICE REIT-AG EUR 37,071 0.06%3,028 APOLLO COMMERCIAL REAL ESTATE FINANCE INC USD 24,043 0.04%
20,225 ARA LOGOS LOGISTICS TRUST CLASS REIT SGD 6,629 0.01%435 BEFIMMO SA EUR 15,763 0.03%
1,805 CAPSTEAD MORTGAGE CORP USD 8,018 0.01%7,283 CUSTODIAN REIT PLC GBP 6,620 0.01%
306 DYNEX CAPITAL INC USD 3,546 0.01%15,760 FIRST REAL ESTATE INVESTMENT TRUST SGD 6,354 0.01%10,350 GCP STUDENT LIVING PLC GBP 12,834 0.02%
109 GRANITE REAL ESTATE INVESTMENT TRUST CAD 4,553 0.01%262 INTERVEST OFFICES & WAREHOUSES NV EUR 5,435 0.01%
5,667 IRISH RESIDENTIAL PROPERTIES REIT PLC EUR 7,284 0.01%1,497 KILLAM APARTMENT REAL ESTATE INVESTMENT TRUST CAD 15,589 0.03%
385 NSI NV EUR 12,068 0.02%140 RETAIL ESTATES NV EUR 7,630 0.01%
16,132 SPH REIT SGD 8,189 0.01%1,001 STARWOOD PROPERTY TRUST INC USD 12,115 0.02%
21,542 SUNLIGHT REAL ESTATE INVESTMENT TRUST HKD 8,661 0.01%
Funds - 88.19% (30 June 2019: 87.18%) 7,635,580 BLACKROCK ICS STERLING LIQUIDITY FUND GBP 7,635,580 11.89%
215,356 SEI GLOBAL MASTER FUND PLC GBP 2,002,808 3.12% EMERGING MARKETS DEBT FUND PARTIALLY HEDGED STERLING INSTITUTIONAL DISTRIBUTING CLASS
311,772 SEI GLOBAL MASTER FUND PLC GBP 3,691,375 5.75% GLOBAL FIXED INCOME FUND HEDGED STERLING INSTITUTIONAL DISTRIBUTING CLASS
213,451 SEI GLOBAL MASTER FUND PLC GBP 3,361,851 5.24% GLOBAL MANAGED VOLATILITY FUND STERLING INSTITUTIONAL DISTRIBUTING CLASS
544,556 SEI GLOBAL MASTER FUND PLC GBP 4,688,626 7.30% GLOBAL MULTI-ASSET INCOME FUND HEDGED STERLING INSTITUTIONAL DISTRIBUTING CLASS
332,330 SEI GLOBAL MASTER FUND PLC GBP 3,735,386 5.82% GLOBAL OPPORTUNISTIC FIXED INCOME FUND HEDGED STERLING INSTITUTIONAL DISTRIBUTING CLASS
883,957 SEI GLOBAL MASTER FUND PLC GBP 8,897,022 13.86% GLOBAL SHORT DURATION BOND FUND HEDGED STERLING INSTITUTIONAL DISTRIBUTING CLASS
885,149 SEI GLOBAL MASTER FUND PLC GBP 8,886,894 13.84% GLOBAL SHORT TERM BOND FUND HEDGED STERLING INSTITUTIONAL DISTRIBUTING CLASS
207,959 SEI GLOBAL MASTER FUND PLC GBP 1,952,731 3.04% HIGH YIELD FIXED INCOME FUND HEDGED STERLING INSTITUTIONAL DISTRIBUTING CLASS
185,707 SEI GLOBAL MASTER FUND PLC GBP 2,044,637 3.19% LIQUID ALTERNATIVE FUND HEDGED STERLING INSTITUTIONAL DISTRIBUTING CLASS
376,814 SEI GLOBAL MASTER FUND PLC GBP 5,471,341 8.52% U.K. CORE FIXED INTEREST FUND STERLING INSTITUTIONAL DISTRIBUTING CLASS
70,581 SEI GLOBAL MASTER FUND PLC GBP 1,125,764 1.75% U.K. EQUITY FUND STERLING INSTITUTIONAL DISTRIBUTING CLASS
61,164 SEI GLOBAL MASTER FUND PLC GBP 1,683,858 2.62% U.K. INDEX-LINKED FIXED INTEREST FUND STERLING INSTITUTIONAL DISTRIBUTING CLASS
139,610 THREADNEEDLE LUX - ENHANCED COMMODITIES PORTFOLIO GBP 1,444,179 2.25% Total Investment Funds± 56,824,454 88.52% Financial Investment Fund Assets at Fair Value Through Profit or Loss 56,824,454 88.52%Financial Investment Fund Liabilities at Fair Value Through Profit or Loss – –
58
DocuSign Envelope ID: 2646536F-BB10-4779-844A-39205D22F4E0
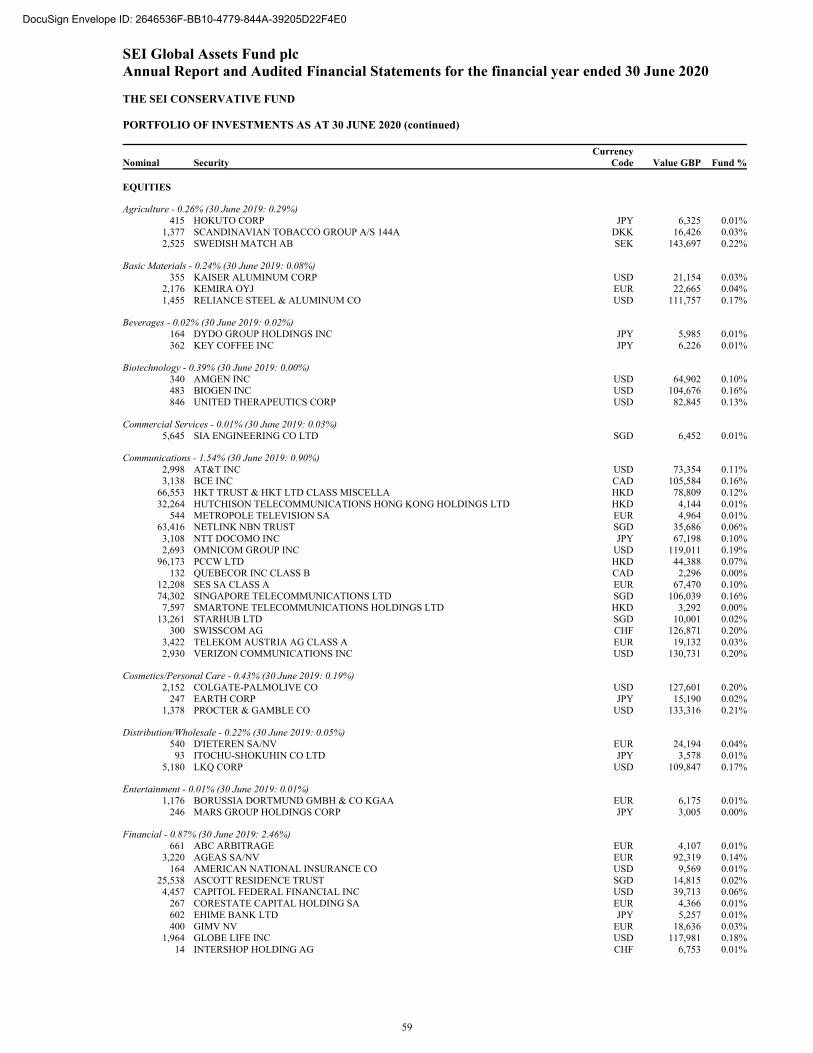
SEI Global Assets Fund plc Annual Report and Audited Financial Statements for the financial year ended 30 June 2020 THE SEI CONSERVATIVE FUND PORTFOLIO OF INVESTMENTS AS AT 30 JUNE 2020 (continued)
Nominal Security Currency
Code Value GBP Fund % EQUITIES
Agriculture - 0.26% (30 June 2019: 0.29%) 415 HOKUTO CORP JPY 6,325 0.01%
1,377 SCANDINAVIAN TOBACCO GROUP A/S 144A DKK 16,426 0.03%2,525 SWEDISH MATCH AB SEK 143,697 0.22%
Basic Materials - 0.24% (30 June 2019: 0.08%) 355 KAISER ALUMINUM CORP USD 21,154 0.03%
2,176 KEMIRA OYJ EUR 22,665 0.04%1,455 RELIANCE STEEL & ALUMINUM CO USD 111,757 0.17%
Beverages - 0.02% (30 June 2019: 0.02%) 164 DYDO GROUP HOLDINGS INC JPY 5,985 0.01%362 KEY COFFEE INC JPY 6,226 0.01%
Biotechnology - 0.39% (30 June 2019: 0.00%) 340 AMGEN INC USD 64,902 0.10%483 BIOGEN INC USD 104,676 0.16%846 UNITED THERAPEUTICS CORP USD 82,845 0.13%
Commercial Services - 0.01% (30 June 2019: 0.03%) 5,645 SIA ENGINEERING CO LTD SGD 6,452 0.01%
Communications - 1.54% (30 June 2019: 0.90%) 2,998 AT&T INC USD 73,354 0.11%3,138 BCE INC CAD 105,584 0.16%
66,553 HKT TRUST & HKT LTD CLASS MISCELLA HKD 78,809 0.12%32,264 HUTCHISON TELECOMMUNICATIONS HONG KONG HOLDINGS LTD HKD 4,144 0.01%
544 METROPOLE TELEVISION SA EUR 4,964 0.01%63,416 NETLINK NBN TRUST SGD 35,686 0.06%
3,108 NTT DOCOMO INC JPY 67,198 0.10%2,693 OMNICOM GROUP INC USD 119,011 0.19%
96,173 PCCW LTD HKD 44,388 0.07%132 QUEBECOR INC CLASS B CAD 2,296 0.00%
12,208 SES SA CLASS A EUR 67,470 0.10%74,302 SINGAPORE TELECOMMUNICATIONS LTD SGD 106,039 0.16%7,597 SMARTONE TELECOMMUNICATIONS HOLDINGS LTD HKD 3,292 0.00%
13,261 STARHUB LTD SGD 10,001 0.02%300 SWISSCOM AG CHF 126,871 0.20%
3,422 TELEKOM AUSTRIA AG CLASS A EUR 19,132 0.03%2,930 VERIZON COMMUNICATIONS INC USD 130,731 0.20%
Cosmetics/Personal Care - 0.43% (30 June 2019: 0.19%) 2,152 COLGATE-PALMOLIVE CO USD 127,601 0.20%
247 EARTH CORP JPY 15,190 0.02%1,378 PROCTER & GAMBLE CO USD 133,316 0.21%
Distribution/Wholesale - 0.22% (30 June 2019: 0.05%) 540 D'IETEREN SA/NV EUR 24,194 0.04%
93 ITOCHU-SHOKUHIN CO LTD JPY 3,578 0.01%5,180 LKQ CORP USD 109,847 0.17%
Entertainment - 0.01% (30 June 2019: 0.01%) 1,176 BORUSSIA DORTMUND GMBH & CO KGAA EUR 6,175 0.01%
246 MARS GROUP HOLDINGS CORP JPY 3,005 0.00%
Financial - 0.87% (30 June 2019: 2.46%) 661 ABC ARBITRAGE EUR 4,107 0.01%
3,220 AGEAS SA/NV EUR 92,319 0.14%164 AMERICAN NATIONAL INSURANCE CO USD 9,569 0.01%
25,538 ASCOTT RESIDENCE TRUST SGD 14,815 0.02%4,457 CAPITOL FEDERAL FINANCIAL INC USD 39,713 0.06%
267 CORESTATE CAPITAL HOLDING SA EUR 4,366 0.01%602 EHIME BANK LTD JPY 5,257 0.01%400 GIMV NV EUR 18,636 0.03%
1,964 GLOBE LIFE INC USD 117,981 0.18%14 INTERSHOP HOLDING AG CHF 6,753 0.01%
59
DocuSign Envelope ID: 2646536F-BB10-4779-844A-39205D22F4E0
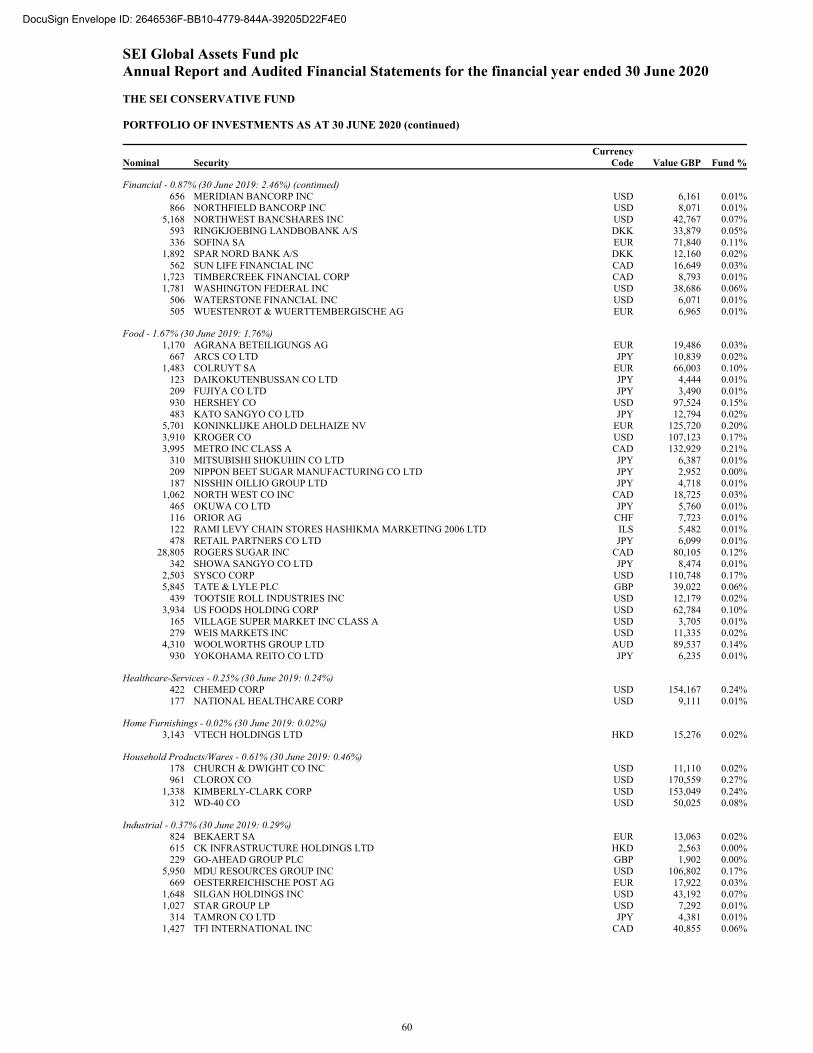
SEI Global Assets Fund plc Annual Report and Audited Financial Statements for the financial year ended 30 June 2020 THE SEI CONSERVATIVE FUND PORTFOLIO OF INVESTMENTS AS AT 30 JUNE 2020 (continued)
Nominal Security Currency
Code Value GBP Fund %
Financial - 0.87% (30 June 2019: 2.46%) (continued) 656 MERIDIAN BANCORP INC USD 6,161 0.01%866 NORTHFIELD BANCORP INC USD 8,071 0.01%
5,168 NORTHWEST BANCSHARES INC USD 42,767 0.07%593 RINGKJOEBING LANDBOBANK A/S DKK 33,879 0.05%336 SOFINA SA EUR 71,840 0.11%
1,892 SPAR NORD BANK A/S DKK 12,160 0.02%562 SUN LIFE FINANCIAL INC CAD 16,649 0.03%
1,723 TIMBERCREEK FINANCIAL CORP CAD 8,793 0.01%1,781 WASHINGTON FEDERAL INC USD 38,686 0.06%
506 WATERSTONE FINANCIAL INC USD 6,071 0.01%505 WUESTENROT & WUERTTEMBERGISCHE AG EUR 6,965 0.01%
Food - 1.67% (30 June 2019: 1.76%) 1,170 AGRANA BETEILIGUNGS AG EUR 19,486 0.03%
667 ARCS CO LTD JPY 10,839 0.02%1,483 COLRUYT SA EUR 66,003 0.10%
123 DAIKOKUTENBUSSAN CO LTD JPY 4,444 0.01%209 FUJIYA CO LTD JPY 3,490 0.01%930 HERSHEY CO USD 97,524 0.15%483 KATO SANGYO CO LTD JPY 12,794 0.02%
5,701 KONINKLIJKE AHOLD DELHAIZE NV EUR 125,720 0.20%3,910 KROGER CO USD 107,123 0.17%3,995 METRO INC CLASS A CAD 132,929 0.21%
310 MITSUBISHI SHOKUHIN CO LTD JPY 6,387 0.01%209 NIPPON BEET SUGAR MANUFACTURING CO LTD JPY 2,952 0.00%187 NISSHIN OILLIO GROUP LTD JPY 4,718 0.01%
1,062 NORTH WEST CO INC CAD 18,725 0.03%465 OKUWA CO LTD JPY 5,760 0.01%116 ORIOR AG CHF 7,723 0.01%122 RAMI LEVY CHAIN STORES HASHIKMA MARKETING 2006 LTD ILS 5,482 0.01%478 RETAIL PARTNERS CO LTD JPY 6,099 0.01%
28,805 ROGERS SUGAR INC CAD 80,105 0.12%342 SHOWA SANGYO CO LTD JPY 8,474 0.01%
2,503 SYSCO CORP USD 110,748 0.17%5,845 TATE & LYLE PLC GBP 39,022 0.06%
439 TOOTSIE ROLL INDUSTRIES INC USD 12,179 0.02%3,934 US FOODS HOLDING CORP USD 62,784 0.10%
165 VILLAGE SUPER MARKET INC CLASS A USD 3,705 0.01%279 WEIS MARKETS INC USD 11,335 0.02%
4,310 WOOLWORTHS GROUP LTD AUD 89,537 0.14%930 YOKOHAMA REITO CO LTD JPY 6,235 0.01%
Healthcare-Services - 0.25% (30 June 2019: 0.24%) 422 CHEMED CORP USD 154,167 0.24%177 NATIONAL HEALTHCARE CORP USD 9,111 0.01%
Home Furnishings - 0.02% (30 June 2019: 0.02%) 3,143 VTECH HOLDINGS LTD HKD 15,276 0.02%
Household Products/Wares - 0.61% (30 June 2019: 0.46%) 178 CHURCH & DWIGHT CO INC USD 11,110 0.02%961 CLOROX CO USD 170,559 0.27%
1,338 KIMBERLY-CLARK CORP USD 153,049 0.24%312 WD-40 CO USD 50,025 0.08%
Industrial - 0.37% (30 June 2019: 0.29%) 824 BEKAERT SA EUR 13,063 0.02%615 CK INFRASTRUCTURE HOLDINGS LTD HKD 2,563 0.00%229 GO-AHEAD GROUP PLC GBP 1,902 0.00%
5,950 MDU RESOURCES GROUP INC USD 106,802 0.17%669 OESTERREICHISCHE POST AG EUR 17,922 0.03%
1,648 SILGAN HOLDINGS INC USD 43,192 0.07%1,027 STAR GROUP LP USD 7,292 0.01%
314 TAMRON CO LTD JPY 4,381 0.01%1,427 TFI INTERNATIONAL INC CAD 40,855 0.06%
60
DocuSign Envelope ID: 2646536F-BB10-4779-844A-39205D22F4E0
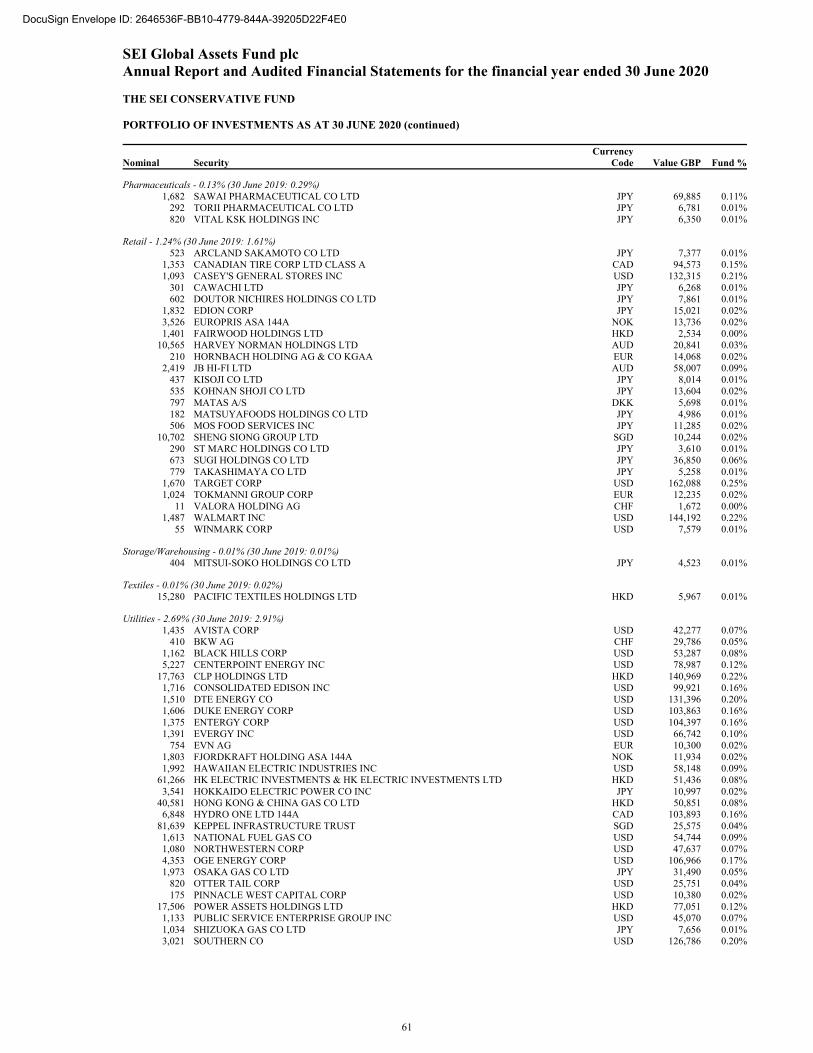
SEI Global Assets Fund plc Annual Report and Audited Financial Statements for the financial year ended 30 June 2020 THE SEI CONSERVATIVE FUND PORTFOLIO OF INVESTMENTS AS AT 30 JUNE 2020 (continued)
Nominal Security Currency
Code Value GBP Fund %
Pharmaceuticals - 0.13% (30 June 2019: 0.29%) 1,682 SAWAI PHARMACEUTICAL CO LTD JPY 69,885 0.11%
292 TORII PHARMACEUTICAL CO LTD JPY 6,781 0.01%820 VITAL KSK HOLDINGS INC JPY 6,350 0.01%
Retail - 1.24% (30 June 2019: 1.61%) 523 ARCLAND SAKAMOTO CO LTD JPY 7,377 0.01%
1,353 CANADIAN TIRE CORP LTD CLASS A CAD 94,573 0.15%1,093 CASEY'S GENERAL STORES INC USD 132,315 0.21%
301 CAWACHI LTD JPY 6,268 0.01%602 DOUTOR NICHIRES HOLDINGS CO LTD JPY 7,861 0.01%
1,832 EDION CORP JPY 15,021 0.02%3,526 EUROPRIS ASA 144A NOK 13,736 0.02%1,401 FAIRWOOD HOLDINGS LTD HKD 2,534 0.00%
10,565 HARVEY NORMAN HOLDINGS LTD AUD 20,841 0.03%210 HORNBACH HOLDING AG & CO KGAA EUR 14,068 0.02%
2,419 JB HI-FI LTD AUD 58,007 0.09%437 KISOJI CO LTD JPY 8,014 0.01%535 KOHNAN SHOJI CO LTD JPY 13,604 0.02%797 MATAS A/S DKK 5,698 0.01%182 MATSUYAFOODS HOLDINGS CO LTD JPY 4,986 0.01%506 MOS FOOD SERVICES INC JPY 11,285 0.02%
10,702 SHENG SIONG GROUP LTD SGD 10,244 0.02%290 ST MARC HOLDINGS CO LTD JPY 3,610 0.01%673 SUGI HOLDINGS CO LTD JPY 36,850 0.06%779 TAKASHIMAYA CO LTD JPY 5,258 0.01%
1,670 TARGET CORP USD 162,088 0.25%1,024 TOKMANNI GROUP CORP EUR 12,235 0.02%
11 VALORA HOLDING AG CHF 1,672 0.00%1,487 WALMART INC USD 144,192 0.22%
55 WINMARK CORP USD 7,579 0.01%
Storage/Warehousing - 0.01% (30 June 2019: 0.01%) 404 MITSUI-SOKO HOLDINGS CO LTD JPY 4,523 0.01%
Textiles - 0.01% (30 June 2019: 0.02%) 15,280 PACIFIC TEXTILES HOLDINGS LTD HKD 5,967 0.01%
Utilities - 2.69% (30 June 2019: 2.91%) 1,435 AVISTA CORP USD 42,277 0.07%
410 BKW AG CHF 29,786 0.05%1,162 BLACK HILLS CORP USD 53,287 0.08%5,227 CENTERPOINT ENERGY INC USD 78,987 0.12%
17,763 CLP HOLDINGS LTD HKD 140,969 0.22%1,716 CONSOLIDATED EDISON INC USD 99,921 0.16%1,510 DTE ENERGY CO USD 131,396 0.20%1,606 DUKE ENERGY CORP USD 103,863 0.16%1,375 ENTERGY CORP USD 104,397 0.16%1,391 EVERGY INC USD 66,742 0.10%
754 EVN AG EUR 10,300 0.02%1,803 FJORDKRAFT HOLDING ASA 144A NOK 11,934 0.02%1,992 HAWAIIAN ELECTRIC INDUSTRIES INC USD 58,148 0.09%
61,266 HK ELECTRIC INVESTMENTS & HK ELECTRIC INVESTMENTS LTD HKD 51,436 0.08%3,541 HOKKAIDO ELECTRIC POWER CO INC JPY 10,997 0.02%
40,581 HONG KONG & CHINA GAS CO LTD HKD 50,851 0.08%6,848 HYDRO ONE LTD 144A CAD 103,893 0.16%
81,639 KEPPEL INFRASTRUCTURE TRUST SGD 25,575 0.04%1,613 NATIONAL FUEL GAS CO USD 54,744 0.09%1,080 NORTHWESTERN CORP USD 47,637 0.07%4,353 OGE ENERGY CORP USD 106,966 0.17%1,973 OSAKA GAS CO LTD JPY 31,490 0.05%
820 OTTER TAIL CORP USD 25,751 0.04%175 PINNACLE WEST CAPITAL CORP USD 10,380 0.02%
17,506 POWER ASSETS HOLDINGS LTD HKD 77,051 0.12%1,133 PUBLIC SERVICE ENTERPRISE GROUP INC USD 45,070 0.07%1,034 SHIZUOKA GAS CO LTD JPY 7,656 0.01%3,021 SOUTHERN CO USD 126,786 0.20%
61
DocuSign Envelope ID: 2646536F-BB10-4779-844A-39205D22F4E0

SEI Global Assets Fund plc Annual Report and Audited Financial Statements for the financial year ended 30 June 2020 THE SEI CONSERVATIVE FUND PORTFOLIO OF INVESTMENTS AS AT 30 JUNE 2020 (continued)
Nominal Security Currency
Code Value GBP Fund %
Utilities - 2.69% (30 June 2019: 2.91%) (continued) 297 UNITIL CORP USD 10,766 0.02%
Total Equities* 7,056,613 10.99% Financial Equity Assets at Fair Value Through Profit or Loss 7,056,613 10.99%Financial Equity Liabilities at Fair Value Through Profit or Loss – –
Investments 63,881,067 99.51%
Total Financial Assets at Fair Value Through Profit or Loss 63,881,067 99.51%Total Financial Liabilities at Fair Value Through Profit or Loss – –
Portfolio Analysis (Unaudited) Total Assets % * Transferable securities admitted to an official stock exchange listing 7,056,613 10.96%± UCITS and non-UCITS investment schemes 56,824,454 88.29% Total Investments 63,881,067 99.25%
The above holdings represent a portion of the investments held at the pool level allocated to the Fund at year end date. The accompanying notes form an integral part of these financial statements.
62
DocuSign Envelope ID: 2646536F-BB10-4779-844A-39205D22F4E0
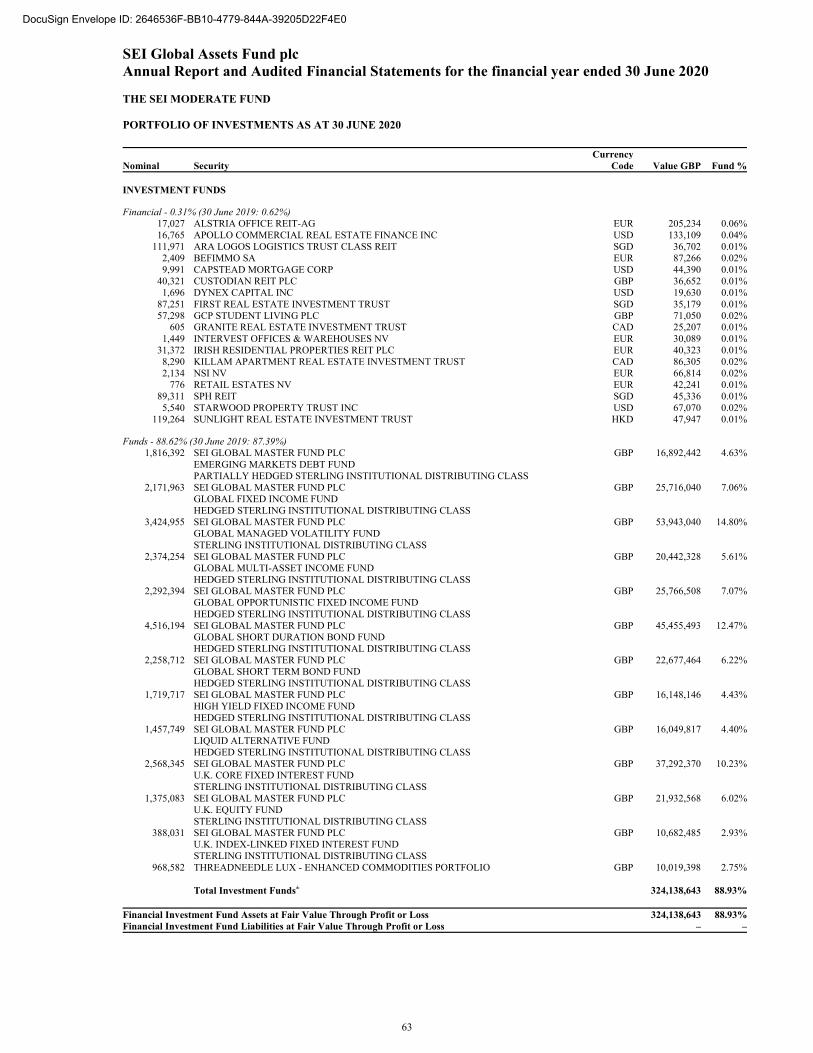
SEI Global Assets Fund plc Annual Report and Audited Financial Statements for the financial year ended 30 June 2020 THE SEI MODERATE FUND PORTFOLIO OF INVESTMENTS AS AT 30 JUNE 2020
Nominal Security Currency
Code Value GBP Fund % INVESTMENT FUNDS
Financial - 0.31% (30 June 2019: 0.62%) 17,027 ALSTRIA OFFICE REIT-AG EUR 205,234 0.06%16,765 APOLLO COMMERCIAL REAL ESTATE FINANCE INC USD 133,109 0.04%
111,971 ARA LOGOS LOGISTICS TRUST CLASS REIT SGD 36,702 0.01%2,409 BEFIMMO SA EUR 87,266 0.02%9,991 CAPSTEAD MORTGAGE CORP USD 44,390 0.01%
40,321 CUSTODIAN REIT PLC GBP 36,652 0.01%1,696 DYNEX CAPITAL INC USD 19,630 0.01%
87,251 FIRST REAL ESTATE INVESTMENT TRUST SGD 35,179 0.01%57,298 GCP STUDENT LIVING PLC GBP 71,050 0.02%
605 GRANITE REAL ESTATE INVESTMENT TRUST CAD 25,207 0.01%1,449 INTERVEST OFFICES & WAREHOUSES NV EUR 30,089 0.01%
31,372 IRISH RESIDENTIAL PROPERTIES REIT PLC EUR 40,323 0.01%8,290 KILLAM APARTMENT REAL ESTATE INVESTMENT TRUST CAD 86,305 0.02%2,134 NSI NV EUR 66,814 0.02%
776 RETAIL ESTATES NV EUR 42,241 0.01%89,311 SPH REIT SGD 45,336 0.01%
5,540 STARWOOD PROPERTY TRUST INC USD 67,070 0.02%119,264 SUNLIGHT REAL ESTATE INVESTMENT TRUST HKD 47,947 0.01%
Funds - 88.62% (30 June 2019: 87.39%) 1,816,392 SEI GLOBAL MASTER FUND PLC GBP 16,892,442 4.63%
EMERGING MARKETS DEBT FUND PARTIALLY HEDGED STERLING INSTITUTIONAL DISTRIBUTING CLASS
2,171,963 SEI GLOBAL MASTER FUND PLC GBP 25,716,040 7.06% GLOBAL FIXED INCOME FUND HEDGED STERLING INSTITUTIONAL DISTRIBUTING CLASS
3,424,955 SEI GLOBAL MASTER FUND PLC GBP 53,943,040 14.80% GLOBAL MANAGED VOLATILITY FUND STERLING INSTITUTIONAL DISTRIBUTING CLASS
2,374,254 SEI GLOBAL MASTER FUND PLC GBP 20,442,328 5.61% GLOBAL MULTI-ASSET INCOME FUND HEDGED STERLING INSTITUTIONAL DISTRIBUTING CLASS
2,292,394 SEI GLOBAL MASTER FUND PLC GBP 25,766,508 7.07% GLOBAL OPPORTUNISTIC FIXED INCOME FUND HEDGED STERLING INSTITUTIONAL DISTRIBUTING CLASS
4,516,194 SEI GLOBAL MASTER FUND PLC GBP 45,455,493 12.47% GLOBAL SHORT DURATION BOND FUND HEDGED STERLING INSTITUTIONAL DISTRIBUTING CLASS
2,258,712 SEI GLOBAL MASTER FUND PLC GBP 22,677,464 6.22% GLOBAL SHORT TERM BOND FUND HEDGED STERLING INSTITUTIONAL DISTRIBUTING CLASS
1,719,717 SEI GLOBAL MASTER FUND PLC GBP 16,148,146 4.43% HIGH YIELD FIXED INCOME FUND HEDGED STERLING INSTITUTIONAL DISTRIBUTING CLASS
1,457,749 SEI GLOBAL MASTER FUND PLC GBP 16,049,817 4.40% LIQUID ALTERNATIVE FUND HEDGED STERLING INSTITUTIONAL DISTRIBUTING CLASS
2,568,345 SEI GLOBAL MASTER FUND PLC GBP 37,292,370 10.23% U.K. CORE FIXED INTEREST FUND STERLING INSTITUTIONAL DISTRIBUTING CLASS
1,375,083 SEI GLOBAL MASTER FUND PLC GBP 21,932,568 6.02% U.K. EQUITY FUND STERLING INSTITUTIONAL DISTRIBUTING CLASS
388,031 SEI GLOBAL MASTER FUND PLC GBP 10,682,485 2.93% U.K. INDEX-LINKED FIXED INTEREST FUND STERLING INSTITUTIONAL DISTRIBUTING CLASS
968,582 THREADNEEDLE LUX - ENHANCED COMMODITIES PORTFOLIO GBP 10,019,398 2.75% Total Investment Funds± 324,138,643 88.93% Financial Investment Fund Assets at Fair Value Through Profit or Loss 324,138,643 88.93%Financial Investment Fund Liabilities at Fair Value Through Profit or Loss – –
63
DocuSign Envelope ID: 2646536F-BB10-4779-844A-39205D22F4E0

SEI Global Assets Fund plc Annual Report and Audited Financial Statements for the financial year ended 30 June 2020 THE SEI MODERATE FUND PORTFOLIO OF INVESTMENTS AS AT 30 JUNE 2020 (continued)
Nominal Security Currency
Code Value GBP Fund % EQUITIES
Agriculture - 0.25% (30 June 2019: 0.29%) 2,299 HOKUTO CORP JPY 35,016 0.01%7,624 SCANDINAVIAN TOBACCO GROUP A/S 144A DKK 90,937 0.02%
13,982 SWEDISH MATCH AB SEK 795,541 0.22%
Basic Materials - 0.23% (30 June 2019: 0.08%) 1,966 KAISER ALUMINUM CORP USD 117,115 0.03%
12,046 KEMIRA OYJ EUR 125,479 0.03%8,053 RELIANCE STEEL & ALUMINUM CO USD 618,712 0.17%
Beverages - 0.02% (30 June 2019: 0.02%) 906 DYDO GROUP HOLDINGS INC JPY 33,132 0.01%
2,006 KEY COFFEE INC JPY 34,469 0.01%
Biotechnology - 0.39% (30 June 2019: 0.00%) 1,882 AMGEN INC USD 359,314 0.10%2,676 BIOGEN INC USD 579,510 0.16%4,684 UNITED THERAPEUTICS CORP USD 458,648 0.13%
Commercial Services - 0.01% (30 June 2019: 0.03%) 31,252 SIA ENGINEERING CO LTD SGD 35,717 0.01%
Communications - 1.50% (30 June 2019: 0.90%) 16,599 AT&T INC USD 406,107 0.11%17,374 BCE INC CAD 584,539 0.16%
368,454 HKT TRUST & HKT LTD CLASS MISCELLA HKD 436,307 0.12%178,621 HUTCHISON TELECOMMUNICATIONS HONG KONG HOLDINGS LTD HKD 22,942 0.01%
3,012 METROPOLE TELEVISION SA EUR 27,485 0.01%351,085 NETLINK NBN TRUST SGD 197,568 0.05%17,207 NTT DOCOMO INC JPY 372,024 0.10%14,910 OMNICOM GROUP INC USD 658,874 0.18%
532,435 PCCW LTD HKD 245,745 0.07%733 QUEBECOR INC CLASS B CAD 12,712 0.00%
67,587 SES SA CLASS A EUR 373,531 0.10%411,351 SINGAPORE TELECOMMUNICATIONS LTD SGD 587,057 0.16%42,060 SMARTONE TELECOMMUNICATIONS HOLDINGS LTD HKD 18,227 0.00%73,416 STARHUB LTD SGD 55,369 0.01%
1,658 SWISSCOM AG CHF 702,389 0.19%18,947 TELEKOM AUSTRIA AG CLASS A EUR 105,918 0.03%16,221 VERIZON COMMUNICATIONS INC USD 723,760 0.20%
Cosmetics/Personal Care - 0.41% (30 June 2019: 0.19%) 11,915 COLGATE-PALMOLIVE CO USD 706,432 0.19%1,365 EARTH CORP JPY 84,093 0.02%7,627 PROCTER & GAMBLE CO USD 738,069 0.20%
Distribution/Wholesale - 0.22% (30 June 2019: 0.05%) 2,989 D'IETEREN SA/NV EUR 133,942 0.04%
515 ITOCHU-SHOKUHIN CO LTD JPY 19,807 0.01%28,680 LKQ CORP USD 608,140 0.17%
Entertainment - 0.01% (30 June 2019: 0.02%) 6,513 BORUSSIA DORTMUND GMBH & CO KGAA EUR 34,189 0.01%1,362 MARS GROUP HOLDINGS CORP JPY 16,638 0.00%
Financial - 0.85% (30 June 2019: 2.45%) 3,657 ABC ARBITRAGE EUR 22,739 0.01%
17,827 AGEAS SA/NV EUR 511,102 0.14%908 AMERICAN NATIONAL INSURANCE CO USD 52,976 0.01%
141,383 ASCOTT RESIDENCE TRUST SGD 82,022 0.02%24,674 CAPITOL FEDERAL FINANCIAL INC USD 219,861 0.06%1,480 CORESTATE CAPITAL HOLDING SA EUR 24,169 0.01%3,330 EHIME BANK LTD JPY 29,105 0.01%2,217 GIMV NV EUR 103,174 0.03%
10,872 GLOBE LIFE INC USD 653,174 0.18%77 INTERSHOP HOLDING AG CHF 37,387 0.01%
64
DocuSign Envelope ID: 2646536F-BB10-4779-844A-39205D22F4E0
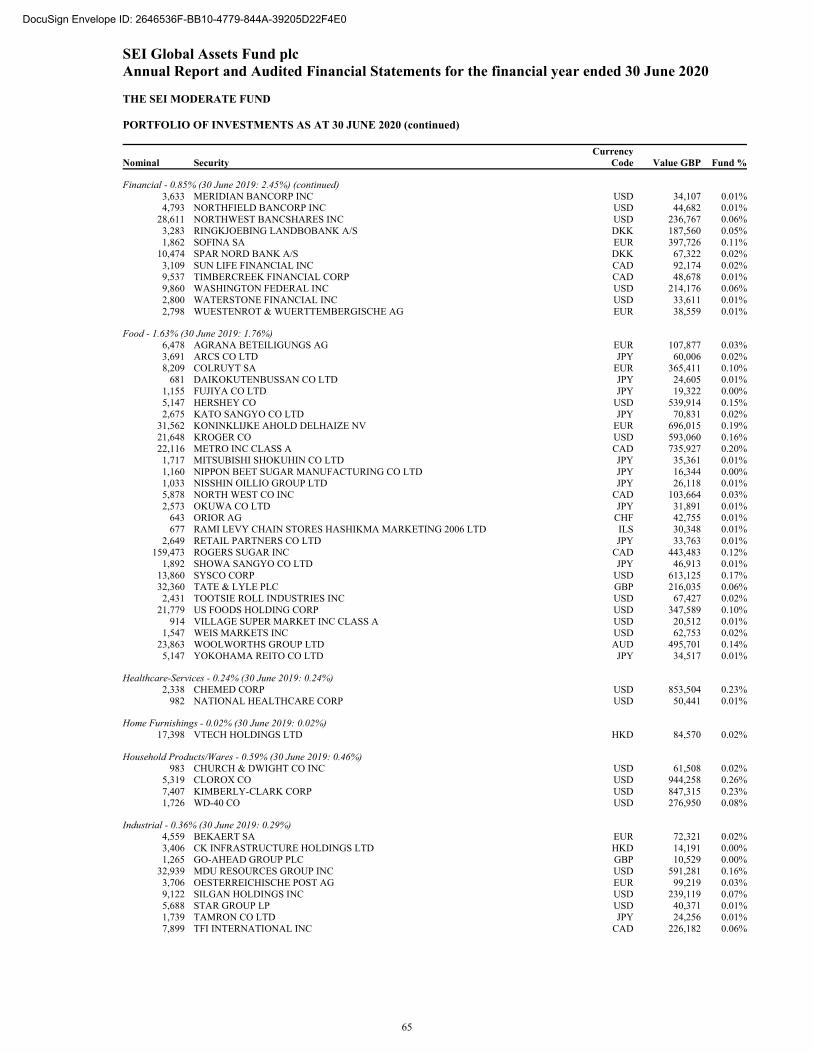
SEI Global Assets Fund plc Annual Report and Audited Financial Statements for the financial year ended 30 June 2020 THE SEI MODERATE FUND PORTFOLIO OF INVESTMENTS AS AT 30 JUNE 2020 (continued)
Nominal Security Currency
Code Value GBP Fund %
Financial - 0.85% (30 June 2019: 2.45%) (continued) 3,633 MERIDIAN BANCORP INC USD 34,107 0.01%4,793 NORTHFIELD BANCORP INC USD 44,682 0.01%
28,611 NORTHWEST BANCSHARES INC USD 236,767 0.06%3,283 RINGKJOEBING LANDBOBANK A/S DKK 187,560 0.05%1,862 SOFINA SA EUR 397,726 0.11%
10,474 SPAR NORD BANK A/S DKK 67,322 0.02%3,109 SUN LIFE FINANCIAL INC CAD 92,174 0.02%9,537 TIMBERCREEK FINANCIAL CORP CAD 48,678 0.01%9,860 WASHINGTON FEDERAL INC USD 214,176 0.06%2,800 WATERSTONE FINANCIAL INC USD 33,611 0.01%2,798 WUESTENROT & WUERTTEMBERGISCHE AG EUR 38,559 0.01%
Food - 1.63% (30 June 2019: 1.76%) 6,478 AGRANA BETEILIGUNGS AG EUR 107,877 0.03%3,691 ARCS CO LTD JPY 60,006 0.02%8,209 COLRUYT SA EUR 365,411 0.10%
681 DAIKOKUTENBUSSAN CO LTD JPY 24,605 0.01%1,155 FUJIYA CO LTD JPY 19,322 0.00%5,147 HERSHEY CO USD 539,914 0.15%2,675 KATO SANGYO CO LTD JPY 70,831 0.02%
31,562 KONINKLIJKE AHOLD DELHAIZE NV EUR 696,015 0.19%21,648 KROGER CO USD 593,060 0.16%22,116 METRO INC CLASS A CAD 735,927 0.20%1,717 MITSUBISHI SHOKUHIN CO LTD JPY 35,361 0.01%1,160 NIPPON BEET SUGAR MANUFACTURING CO LTD JPY 16,344 0.00%1,033 NISSHIN OILLIO GROUP LTD JPY 26,118 0.01%5,878 NORTH WEST CO INC CAD 103,664 0.03%2,573 OKUWA CO LTD JPY 31,891 0.01%
643 ORIOR AG CHF 42,755 0.01%677 RAMI LEVY CHAIN STORES HASHIKMA MARKETING 2006 LTD ILS 30,348 0.01%
2,649 RETAIL PARTNERS CO LTD JPY 33,763 0.01%159,473 ROGERS SUGAR INC CAD 443,483 0.12%
1,892 SHOWA SANGYO CO LTD JPY 46,913 0.01%13,860 SYSCO CORP USD 613,125 0.17%32,360 TATE & LYLE PLC GBP 216,035 0.06%
2,431 TOOTSIE ROLL INDUSTRIES INC USD 67,427 0.02%21,779 US FOODS HOLDING CORP USD 347,589 0.10%
914 VILLAGE SUPER MARKET INC CLASS A USD 20,512 0.01%1,547 WEIS MARKETS INC USD 62,753 0.02%
23,863 WOOLWORTHS GROUP LTD AUD 495,701 0.14%5,147 YOKOHAMA REITO CO LTD JPY 34,517 0.01%
Healthcare-Services - 0.24% (30 June 2019: 0.24%) 2,338 CHEMED CORP USD 853,504 0.23%
982 NATIONAL HEALTHCARE CORP USD 50,441 0.01%
Home Furnishings - 0.02% (30 June 2019: 0.02%) 17,398 VTECH HOLDINGS LTD HKD 84,570 0.02%
Household Products/Wares - 0.59% (30 June 2019: 0.46%) 983 CHURCH & DWIGHT CO INC USD 61,508 0.02%
5,319 CLOROX CO USD 944,258 0.26%7,407 KIMBERLY-CLARK CORP USD 847,315 0.23%1,726 WD-40 CO USD 276,950 0.08%
Industrial - 0.36% (30 June 2019: 0.29%) 4,559 BEKAERT SA EUR 72,321 0.02%3,406 CK INFRASTRUCTURE HOLDINGS LTD HKD 14,191 0.00%1,265 GO-AHEAD GROUP PLC GBP 10,529 0.00%
32,939 MDU RESOURCES GROUP INC USD 591,281 0.16%3,706 OESTERREICHISCHE POST AG EUR 99,219 0.03%9,122 SILGAN HOLDINGS INC USD 239,119 0.07%5,688 STAR GROUP LP USD 40,371 0.01%1,739 TAMRON CO LTD JPY 24,256 0.01%7,899 TFI INTERNATIONAL INC CAD 226,182 0.06%
65
DocuSign Envelope ID: 2646536F-BB10-4779-844A-39205D22F4E0
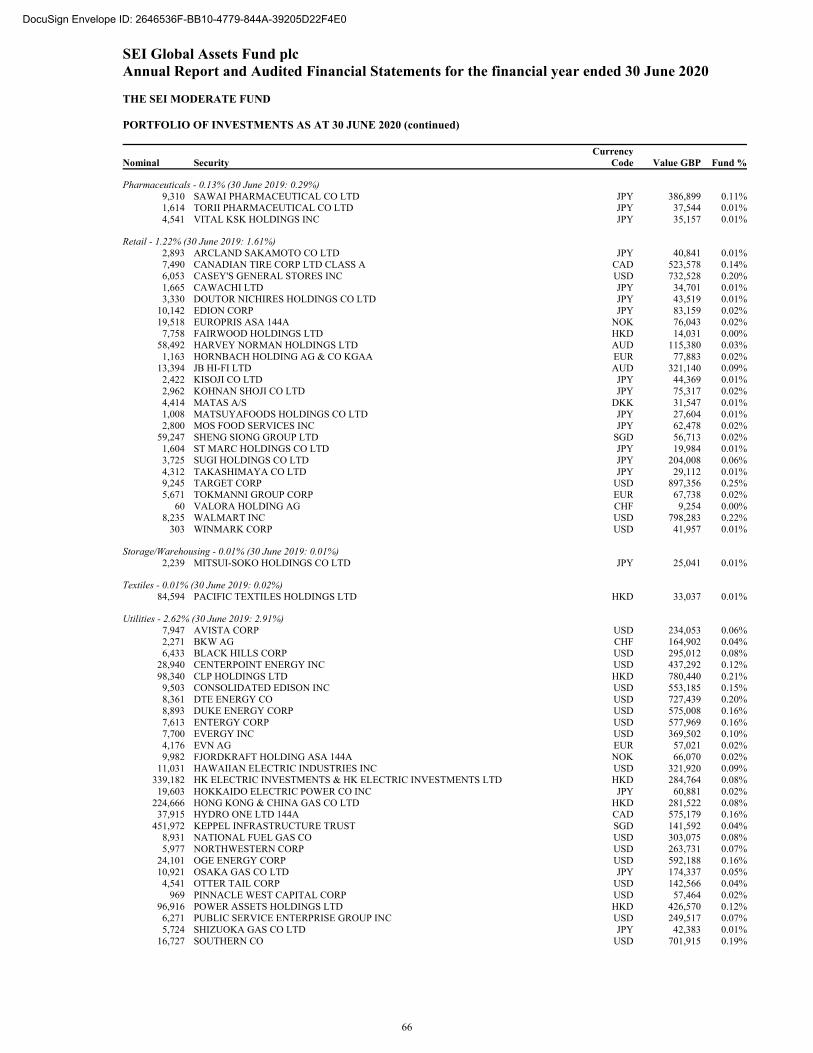
SEI Global Assets Fund plc Annual Report and Audited Financial Statements for the financial year ended 30 June 2020 THE SEI MODERATE FUND PORTFOLIO OF INVESTMENTS AS AT 30 JUNE 2020 (continued)
Nominal Security Currency
Code Value GBP Fund %
Pharmaceuticals - 0.13% (30 June 2019: 0.29%) 9,310 SAWAI PHARMACEUTICAL CO LTD JPY 386,899 0.11%1,614 TORII PHARMACEUTICAL CO LTD JPY 37,544 0.01%4,541 VITAL KSK HOLDINGS INC JPY 35,157 0.01%
Retail - 1.22% (30 June 2019: 1.61%) 2,893 ARCLAND SAKAMOTO CO LTD JPY 40,841 0.01%7,490 CANADIAN TIRE CORP LTD CLASS A CAD 523,578 0.14%6,053 CASEY'S GENERAL STORES INC USD 732,528 0.20%1,665 CAWACHI LTD JPY 34,701 0.01%3,330 DOUTOR NICHIRES HOLDINGS CO LTD JPY 43,519 0.01%
10,142 EDION CORP JPY 83,159 0.02%19,518 EUROPRIS ASA 144A NOK 76,043 0.02%
7,758 FAIRWOOD HOLDINGS LTD HKD 14,031 0.00%58,492 HARVEY NORMAN HOLDINGS LTD AUD 115,380 0.03%1,163 HORNBACH HOLDING AG & CO KGAA EUR 77,883 0.02%
13,394 JB HI-FI LTD AUD 321,140 0.09%2,422 KISOJI CO LTD JPY 44,369 0.01%2,962 KOHNAN SHOJI CO LTD JPY 75,317 0.02%4,414 MATAS A/S DKK 31,547 0.01%1,008 MATSUYAFOODS HOLDINGS CO LTD JPY 27,604 0.01%2,800 MOS FOOD SERVICES INC JPY 62,478 0.02%
59,247 SHENG SIONG GROUP LTD SGD 56,713 0.02%1,604 ST MARC HOLDINGS CO LTD JPY 19,984 0.01%3,725 SUGI HOLDINGS CO LTD JPY 204,008 0.06%4,312 TAKASHIMAYA CO LTD JPY 29,112 0.01%9,245 TARGET CORP USD 897,356 0.25%5,671 TOKMANNI GROUP CORP EUR 67,738 0.02%
60 VALORA HOLDING AG CHF 9,254 0.00%8,235 WALMART INC USD 798,283 0.22%
303 WINMARK CORP USD 41,957 0.01%
Storage/Warehousing - 0.01% (30 June 2019: 0.01%) 2,239 MITSUI-SOKO HOLDINGS CO LTD JPY 25,041 0.01%
Textiles - 0.01% (30 June 2019: 0.02%) 84,594 PACIFIC TEXTILES HOLDINGS LTD HKD 33,037 0.01%
Utilities - 2.62% (30 June 2019: 2.91%) 7,947 AVISTA CORP USD 234,053 0.06%2,271 BKW AG CHF 164,902 0.04%6,433 BLACK HILLS CORP USD 295,012 0.08%
28,940 CENTERPOINT ENERGY INC USD 437,292 0.12%98,340 CLP HOLDINGS LTD HKD 780,440 0.21%
9,503 CONSOLIDATED EDISON INC USD 553,185 0.15%8,361 DTE ENERGY CO USD 727,439 0.20%8,893 DUKE ENERGY CORP USD 575,008 0.16%7,613 ENTERGY CORP USD 577,969 0.16%7,700 EVERGY INC USD 369,502 0.10%4,176 EVN AG EUR 57,021 0.02%9,982 FJORDKRAFT HOLDING ASA 144A NOK 66,070 0.02%
11,031 HAWAIIAN ELECTRIC INDUSTRIES INC USD 321,920 0.09%339,182 HK ELECTRIC INVESTMENTS & HK ELECTRIC INVESTMENTS LTD HKD 284,764 0.08%19,603 HOKKAIDO ELECTRIC POWER CO INC JPY 60,881 0.02%
224,666 HONG KONG & CHINA GAS CO LTD HKD 281,522 0.08%37,915 HYDRO ONE LTD 144A CAD 575,179 0.16%
451,972 KEPPEL INFRASTRUCTURE TRUST SGD 141,592 0.04%8,931 NATIONAL FUEL GAS CO USD 303,075 0.08%5,977 NORTHWESTERN CORP USD 263,731 0.07%
24,101 OGE ENERGY CORP USD 592,188 0.16%10,921 OSAKA GAS CO LTD JPY 174,337 0.05%
4,541 OTTER TAIL CORP USD 142,566 0.04%969 PINNACLE WEST CAPITAL CORP USD 57,464 0.02%
96,916 POWER ASSETS HOLDINGS LTD HKD 426,570 0.12%6,271 PUBLIC SERVICE ENTERPRISE GROUP INC USD 249,517 0.07%5,724 SHIZUOKA GAS CO LTD JPY 42,383 0.01%
16,727 SOUTHERN CO USD 701,915 0.19%
66
DocuSign Envelope ID: 2646536F-BB10-4779-844A-39205D22F4E0
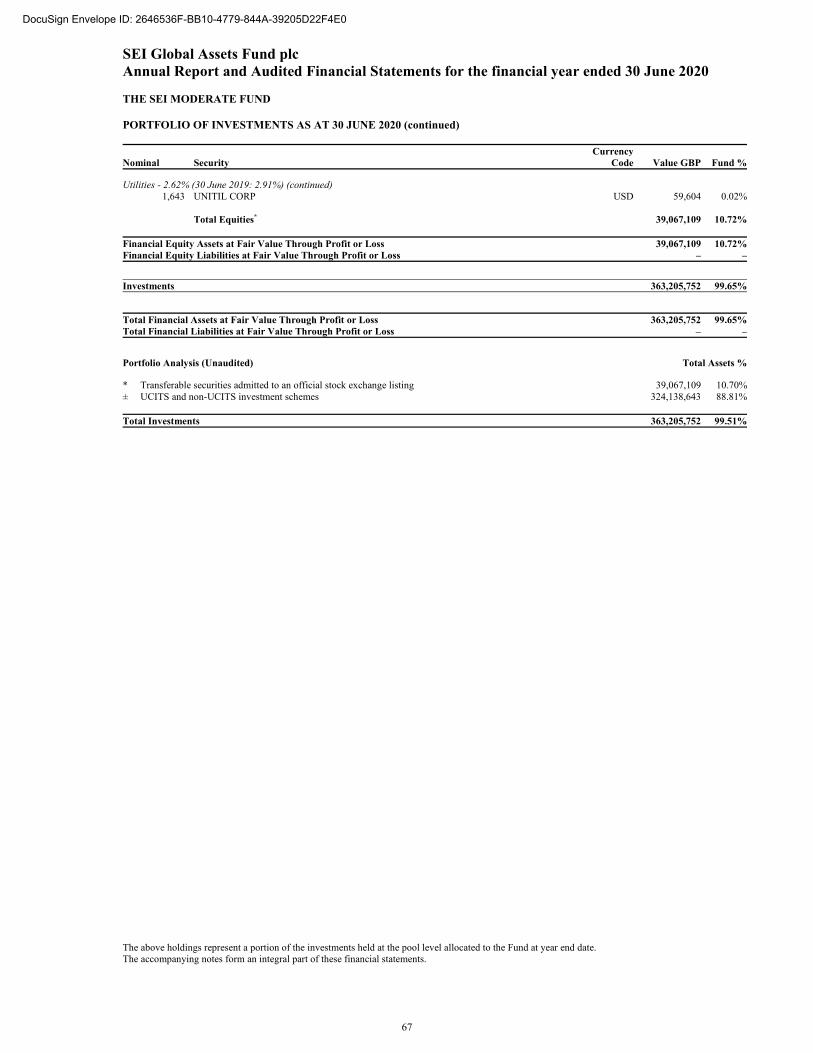
SEI Global Assets Fund plc Annual Report and Audited Financial Statements for the financial year ended 30 June 2020 THE SEI MODERATE FUND PORTFOLIO OF INVESTMENTS AS AT 30 JUNE 2020 (continued)
Nominal Security Currency
Code Value GBP Fund %
Utilities - 2.62% (30 June 2019: 2.91%) (continued) 1,643 UNITIL CORP USD 59,604 0.02%
Total Equities* 39,067,109 10.72% Financial Equity Assets at Fair Value Through Profit or Loss 39,067,109 10.72%Financial Equity Liabilities at Fair Value Through Profit or Loss – –
Investments 363,205,752 99.65%
Total Financial Assets at Fair Value Through Profit or Loss 363,205,752 99.65%Total Financial Liabilities at Fair Value Through Profit or Loss – –
Portfolio Analysis (Unaudited) Total Assets % * Transferable securities admitted to an official stock exchange listing 39,067,109 10.70%± UCITS and non-UCITS investment schemes 324,138,643 88.81% Total Investments 363,205,752 99.51%
The above holdings represent a portion of the investments held at the pool level allocated to the Fund at year end date. The accompanying notes form an integral part of these financial statements.
67
DocuSign Envelope ID: 2646536F-BB10-4779-844A-39205D22F4E0
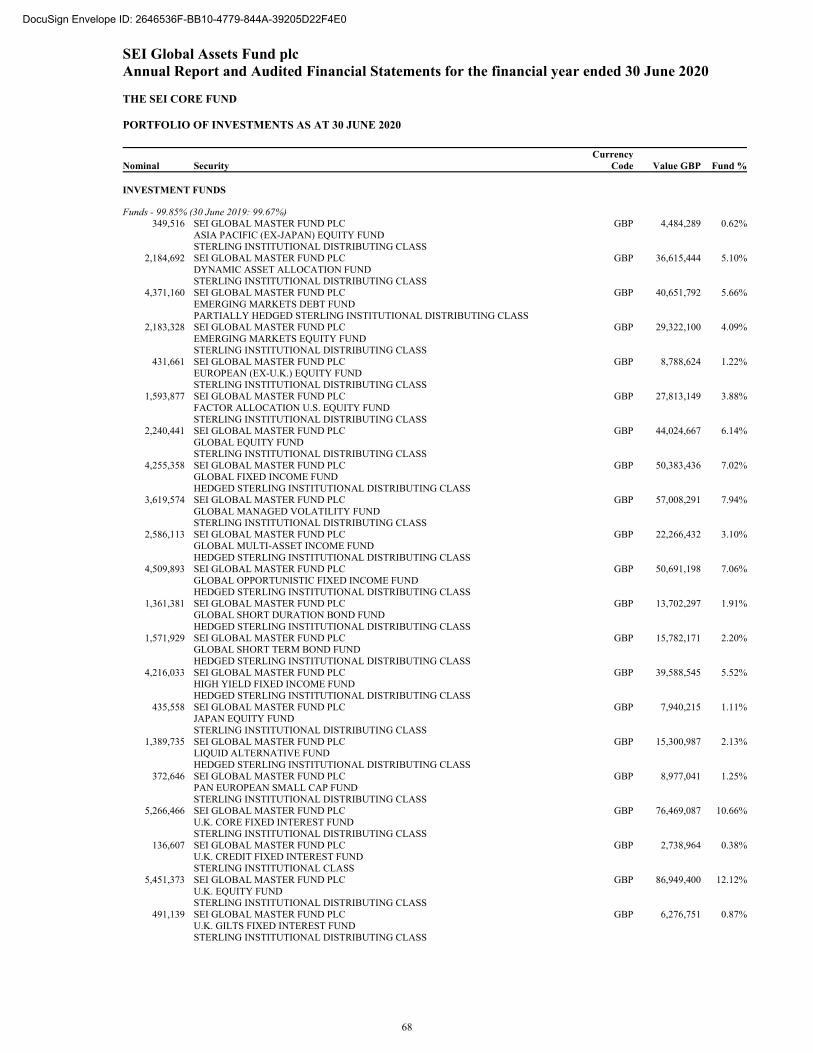
SEI Global Assets Fund plc Annual Report and Audited Financial Statements for the financial year ended 30 June 2020 THE SEI CORE FUND PORTFOLIO OF INVESTMENTS AS AT 30 JUNE 2020
Nominal Security Currency
Code Value GBP Fund % INVESTMENT FUNDS
Funds - 99.85% (30 June 2019: 99.67%) 349,516 SEI GLOBAL MASTER FUND PLC GBP 4,484,289 0.62%
ASIA PACIFIC (EX-JAPAN) EQUITY FUND STERLING INSTITUTIONAL DISTRIBUTING CLASS
2,184,692 SEI GLOBAL MASTER FUND PLC GBP 36,615,444 5.10% DYNAMIC ASSET ALLOCATION FUND STERLING INSTITUTIONAL DISTRIBUTING CLASS
4,371,160 SEI GLOBAL MASTER FUND PLC GBP 40,651,792 5.66% EMERGING MARKETS DEBT FUND PARTIALLY HEDGED STERLING INSTITUTIONAL DISTRIBUTING CLASS
2,183,328 SEI GLOBAL MASTER FUND PLC GBP 29,322,100 4.09% EMERGING MARKETS EQUITY FUND STERLING INSTITUTIONAL DISTRIBUTING CLASS
431,661 SEI GLOBAL MASTER FUND PLC GBP 8,788,624 1.22% EUROPEAN (EX-U.K.) EQUITY FUND STERLING INSTITUTIONAL DISTRIBUTING CLASS
1,593,877 SEI GLOBAL MASTER FUND PLC GBP 27,813,149 3.88% FACTOR ALLOCATION U.S. EQUITY FUND STERLING INSTITUTIONAL DISTRIBUTING CLASS
2,240,441 SEI GLOBAL MASTER FUND PLC GBP 44,024,667 6.14% GLOBAL EQUITY FUND STERLING INSTITUTIONAL DISTRIBUTING CLASS
4,255,358 SEI GLOBAL MASTER FUND PLC GBP 50,383,436 7.02% GLOBAL FIXED INCOME FUND HEDGED STERLING INSTITUTIONAL DISTRIBUTING CLASS
3,619,574 SEI GLOBAL MASTER FUND PLC GBP 57,008,291 7.94% GLOBAL MANAGED VOLATILITY FUND STERLING INSTITUTIONAL DISTRIBUTING CLASS
2,586,113 SEI GLOBAL MASTER FUND PLC GBP 22,266,432 3.10% GLOBAL MULTI-ASSET INCOME FUND HEDGED STERLING INSTITUTIONAL DISTRIBUTING CLASS
4,509,893 SEI GLOBAL MASTER FUND PLC GBP 50,691,198 7.06% GLOBAL OPPORTUNISTIC FIXED INCOME FUND HEDGED STERLING INSTITUTIONAL DISTRIBUTING CLASS
1,361,381 SEI GLOBAL MASTER FUND PLC GBP 13,702,297 1.91% GLOBAL SHORT DURATION BOND FUND HEDGED STERLING INSTITUTIONAL DISTRIBUTING CLASS
1,571,929 SEI GLOBAL MASTER FUND PLC GBP 15,782,171 2.20% GLOBAL SHORT TERM BOND FUND HEDGED STERLING INSTITUTIONAL DISTRIBUTING CLASS
4,216,033 SEI GLOBAL MASTER FUND PLC GBP 39,588,545 5.52% HIGH YIELD FIXED INCOME FUND HEDGED STERLING INSTITUTIONAL DISTRIBUTING CLASS
435,558 SEI GLOBAL MASTER FUND PLC GBP 7,940,215 1.11% JAPAN EQUITY FUND STERLING INSTITUTIONAL DISTRIBUTING CLASS
1,389,735 SEI GLOBAL MASTER FUND PLC GBP 15,300,987 2.13% LIQUID ALTERNATIVE FUND HEDGED STERLING INSTITUTIONAL DISTRIBUTING CLASS
372,646 SEI GLOBAL MASTER FUND PLC GBP 8,977,041 1.25% PAN EUROPEAN SMALL CAP FUND STERLING INSTITUTIONAL DISTRIBUTING CLASS
5,266,466 SEI GLOBAL MASTER FUND PLC GBP 76,469,087 10.66% U.K. CORE FIXED INTEREST FUND STERLING INSTITUTIONAL DISTRIBUTING CLASS
136,607 SEI GLOBAL MASTER FUND PLC GBP 2,738,964 0.38% U.K. CREDIT FIXED INTEREST FUND STERLING INSTITUTIONAL CLASS
5,451,373 SEI GLOBAL MASTER FUND PLC GBP 86,949,400 12.12% U.K. EQUITY FUND STERLING INSTITUTIONAL DISTRIBUTING CLASS
491,139 SEI GLOBAL MASTER FUND PLC GBP 6,276,751 0.87% U.K. GILTS FIXED INTEREST FUND STERLING INSTITUTIONAL DISTRIBUTING CLASS
68
DocuSign Envelope ID: 2646536F-BB10-4779-844A-39205D22F4E0
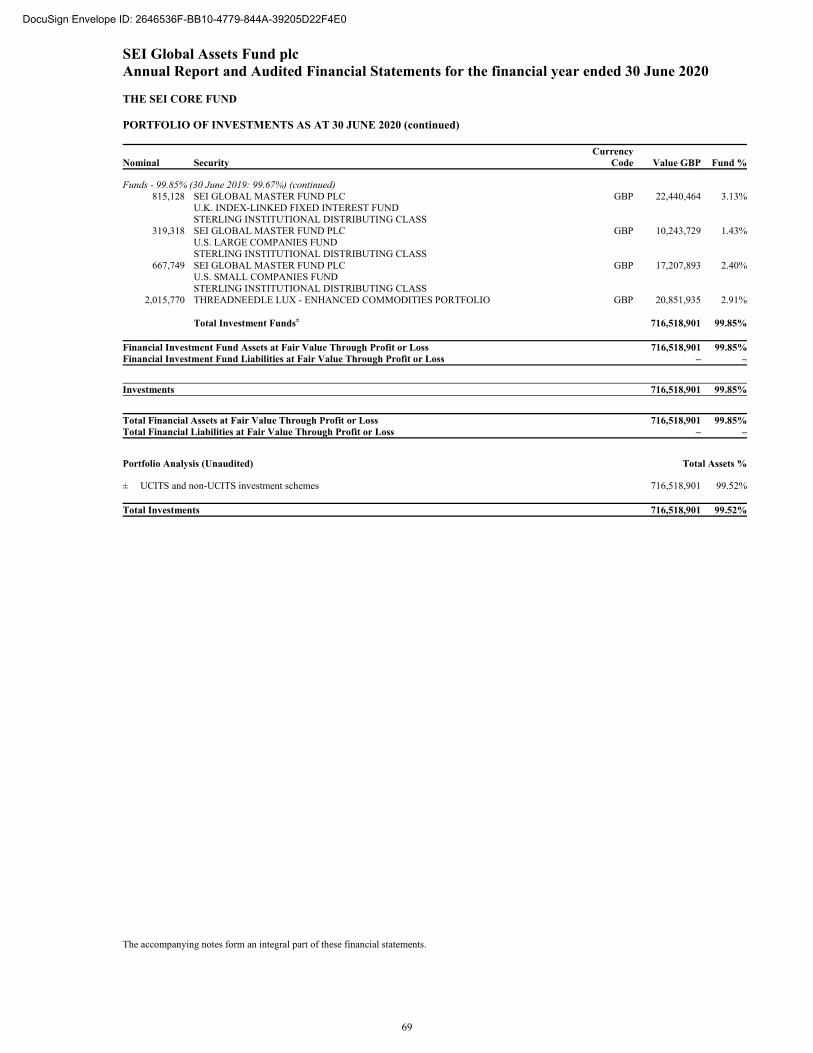
SEI Global Assets Fund plc Annual Report and Audited Financial Statements for the financial year ended 30 June 2020 THE SEI CORE FUND PORTFOLIO OF INVESTMENTS AS AT 30 JUNE 2020 (continued)
Nominal Security Currency
Code Value GBP Fund %
Funds - 99.85% (30 June 2019: 99.67%) (continued) 815,128 SEI GLOBAL MASTER FUND PLC GBP 22,440,464 3.13%
U.K. INDEX-LINKED FIXED INTEREST FUND STERLING INSTITUTIONAL DISTRIBUTING CLASS
319,318 SEI GLOBAL MASTER FUND PLC GBP 10,243,729 1.43% U.S. LARGE COMPANIES FUND STERLING INSTITUTIONAL DISTRIBUTING CLASS
667,749 SEI GLOBAL MASTER FUND PLC GBP 17,207,893 2.40% U.S. SMALL COMPANIES FUND STERLING INSTITUTIONAL DISTRIBUTING CLASS
2,015,770 THREADNEEDLE LUX - ENHANCED COMMODITIES PORTFOLIO GBP 20,851,935 2.91% Total Investment Funds± 716,518,901 99.85% Financial Investment Fund Assets at Fair Value Through Profit or Loss 716,518,901 99.85%Financial Investment Fund Liabilities at Fair Value Through Profit or Loss – –
Investments 716,518,901 99.85%
Total Financial Assets at Fair Value Through Profit or Loss 716,518,901 99.85%Total Financial Liabilities at Fair Value Through Profit or Loss – –
Portfolio Analysis (Unaudited) Total Assets % ± UCITS and non-UCITS investment schemes 716,518,901 99.52% Total Investments 716,518,901 99.52%
The accompanying notes form an integral part of these financial statements.
69
DocuSign Envelope ID: 2646536F-BB10-4779-844A-39205D22F4E0
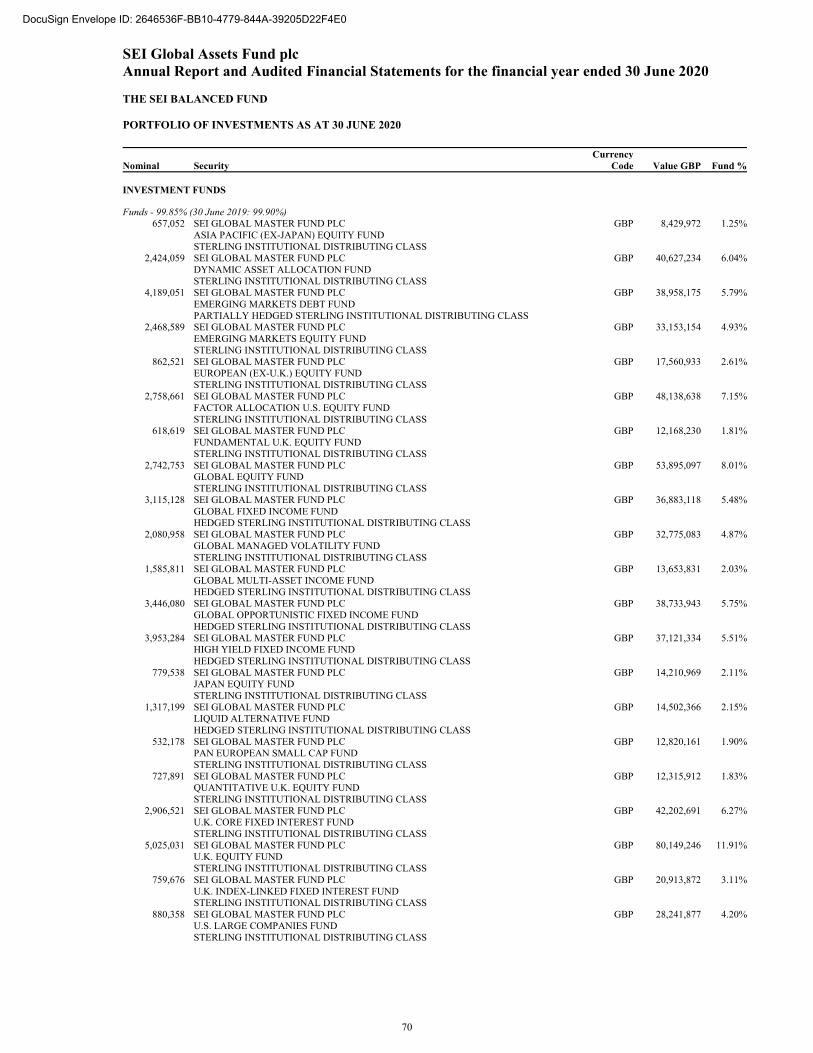
SEI Global Assets Fund plc Annual Report and Audited Financial Statements for the financial year ended 30 June 2020 THE SEI BALANCED FUND PORTFOLIO OF INVESTMENTS AS AT 30 JUNE 2020
Nominal Security Currency
Code Value GBP Fund % INVESTMENT FUNDS
Funds - 99.85% (30 June 2019: 99.90%) 657,052 SEI GLOBAL MASTER FUND PLC GBP 8,429,972 1.25%
ASIA PACIFIC (EX-JAPAN) EQUITY FUND STERLING INSTITUTIONAL DISTRIBUTING CLASS
2,424,059 SEI GLOBAL MASTER FUND PLC GBP 40,627,234 6.04% DYNAMIC ASSET ALLOCATION FUND STERLING INSTITUTIONAL DISTRIBUTING CLASS
4,189,051 SEI GLOBAL MASTER FUND PLC GBP 38,958,175 5.79% EMERGING MARKETS DEBT FUND PARTIALLY HEDGED STERLING INSTITUTIONAL DISTRIBUTING CLASS
2,468,589 SEI GLOBAL MASTER FUND PLC GBP 33,153,154 4.93% EMERGING MARKETS EQUITY FUND STERLING INSTITUTIONAL DISTRIBUTING CLASS
862,521 SEI GLOBAL MASTER FUND PLC GBP 17,560,933 2.61% EUROPEAN (EX-U.K.) EQUITY FUND STERLING INSTITUTIONAL DISTRIBUTING CLASS
2,758,661 SEI GLOBAL MASTER FUND PLC GBP 48,138,638 7.15% FACTOR ALLOCATION U.S. EQUITY FUND STERLING INSTITUTIONAL DISTRIBUTING CLASS
618,619 SEI GLOBAL MASTER FUND PLC GBP 12,168,230 1.81% FUNDAMENTAL U.K. EQUITY FUND STERLING INSTITUTIONAL DISTRIBUTING CLASS
2,742,753 SEI GLOBAL MASTER FUND PLC GBP 53,895,097 8.01% GLOBAL EQUITY FUND STERLING INSTITUTIONAL DISTRIBUTING CLASS
3,115,128 SEI GLOBAL MASTER FUND PLC GBP 36,883,118 5.48% GLOBAL FIXED INCOME FUND HEDGED STERLING INSTITUTIONAL DISTRIBUTING CLASS
2,080,958 SEI GLOBAL MASTER FUND PLC GBP 32,775,083 4.87% GLOBAL MANAGED VOLATILITY FUND STERLING INSTITUTIONAL DISTRIBUTING CLASS
1,585,811 SEI GLOBAL MASTER FUND PLC GBP 13,653,831 2.03% GLOBAL MULTI-ASSET INCOME FUND HEDGED STERLING INSTITUTIONAL DISTRIBUTING CLASS
3,446,080 SEI GLOBAL MASTER FUND PLC GBP 38,733,943 5.75% GLOBAL OPPORTUNISTIC FIXED INCOME FUND HEDGED STERLING INSTITUTIONAL DISTRIBUTING CLASS
3,953,284 SEI GLOBAL MASTER FUND PLC GBP 37,121,334 5.51% HIGH YIELD FIXED INCOME FUND HEDGED STERLING INSTITUTIONAL DISTRIBUTING CLASS
779,538 SEI GLOBAL MASTER FUND PLC GBP 14,210,969 2.11% JAPAN EQUITY FUND STERLING INSTITUTIONAL DISTRIBUTING CLASS
1,317,199 SEI GLOBAL MASTER FUND PLC GBP 14,502,366 2.15% LIQUID ALTERNATIVE FUND HEDGED STERLING INSTITUTIONAL DISTRIBUTING CLASS
532,178 SEI GLOBAL MASTER FUND PLC GBP 12,820,161 1.90% PAN EUROPEAN SMALL CAP FUND STERLING INSTITUTIONAL DISTRIBUTING CLASS
727,891 SEI GLOBAL MASTER FUND PLC GBP 12,315,912 1.83% QUANTITATIVE U.K. EQUITY FUND STERLING INSTITUTIONAL DISTRIBUTING CLASS
2,906,521 SEI GLOBAL MASTER FUND PLC GBP 42,202,691 6.27% U.K. CORE FIXED INTEREST FUND STERLING INSTITUTIONAL DISTRIBUTING CLASS
5,025,031 SEI GLOBAL MASTER FUND PLC GBP 80,149,246 11.91% U.K. EQUITY FUND STERLING INSTITUTIONAL DISTRIBUTING CLASS
759,676 SEI GLOBAL MASTER FUND PLC GBP 20,913,872 3.11% U.K. INDEX-LINKED FIXED INTEREST FUND STERLING INSTITUTIONAL DISTRIBUTING CLASS
880,358 SEI GLOBAL MASTER FUND PLC GBP 28,241,877 4.20% U.S. LARGE COMPANIES FUND STERLING INSTITUTIONAL DISTRIBUTING CLASS
70
DocuSign Envelope ID: 2646536F-BB10-4779-844A-39205D22F4E0
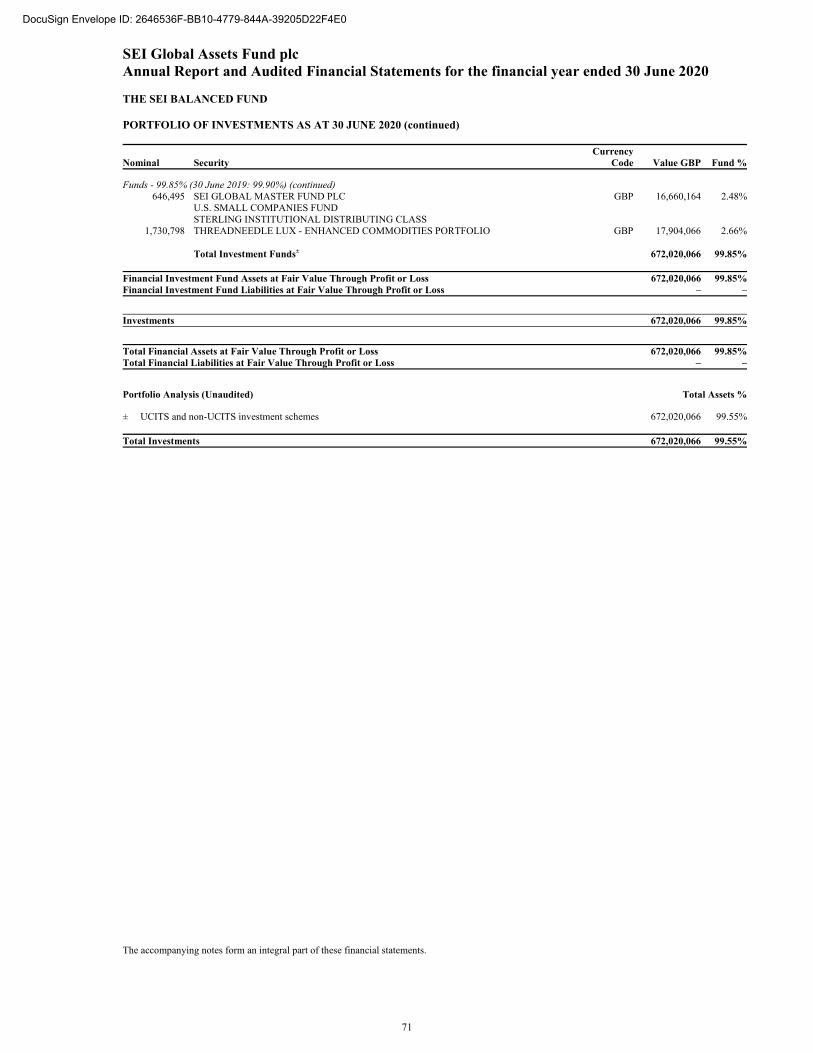
SEI Global Assets Fund plc Annual Report and Audited Financial Statements for the financial year ended 30 June 2020 THE SEI BALANCED FUND PORTFOLIO OF INVESTMENTS AS AT 30 JUNE 2020 (continued)
Nominal Security Currency
Code Value GBP Fund %
Funds - 99.85% (30 June 2019: 99.90%) (continued) 646,495 SEI GLOBAL MASTER FUND PLC GBP 16,660,164 2.48%
U.S. SMALL COMPANIES FUND STERLING INSTITUTIONAL DISTRIBUTING CLASS
1,730,798 THREADNEEDLE LUX - ENHANCED COMMODITIES PORTFOLIO GBP 17,904,066 2.66% Total Investment Funds± 672,020,066 99.85% Financial Investment Fund Assets at Fair Value Through Profit or Loss 672,020,066 99.85%Financial Investment Fund Liabilities at Fair Value Through Profit or Loss – –
Investments 672,020,066 99.85%
Total Financial Assets at Fair Value Through Profit or Loss 672,020,066 99.85%Total Financial Liabilities at Fair Value Through Profit or Loss – –
Portfolio Analysis (Unaudited) Total Assets % ± UCITS and non-UCITS investment schemes 672,020,066 99.55% Total Investments 672,020,066 99.55%
The accompanying notes form an integral part of these financial statements.
71
DocuSign Envelope ID: 2646536F-BB10-4779-844A-39205D22F4E0
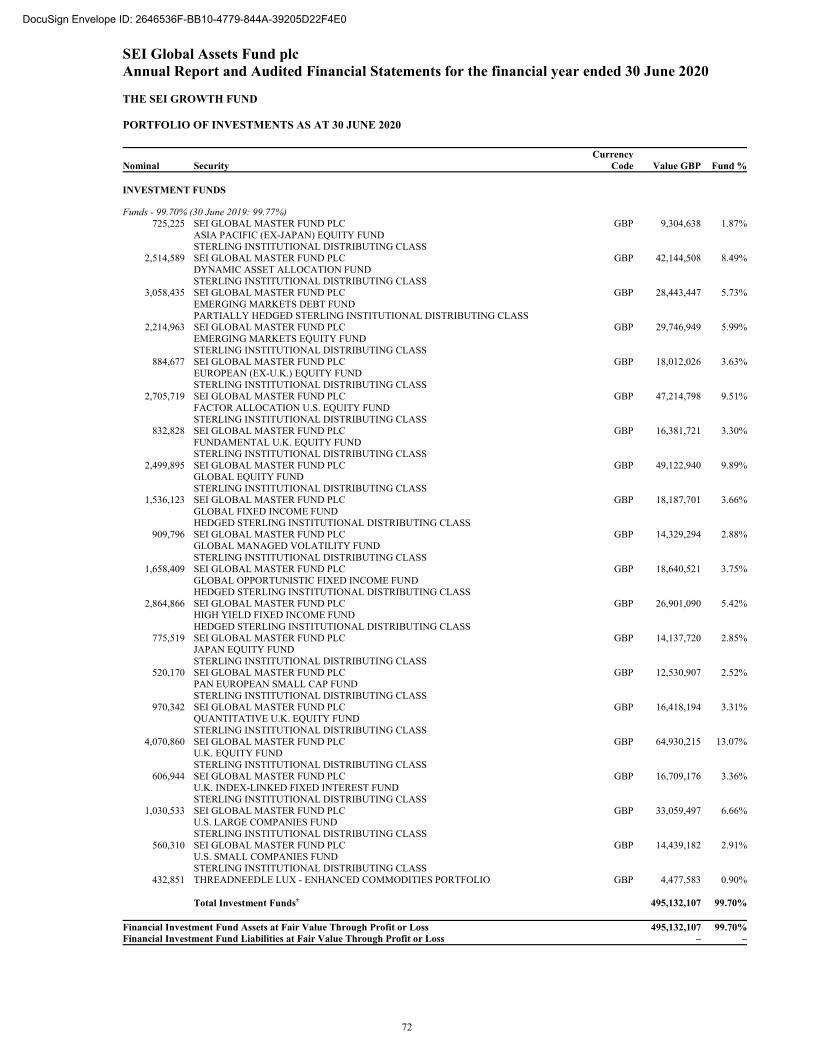
SEI Global Assets Fund plc Annual Report and Audited Financial Statements for the financial year ended 30 June 2020 THE SEI GROWTH FUND PORTFOLIO OF INVESTMENTS AS AT 30 JUNE 2020
Nominal Security Currency
Code Value GBP Fund % INVESTMENT FUNDS
Funds - 99.70% (30 June 2019: 99.77%) 725,225 SEI GLOBAL MASTER FUND PLC GBP 9,304,638 1.87%
ASIA PACIFIC (EX-JAPAN) EQUITY FUND STERLING INSTITUTIONAL DISTRIBUTING CLASS
2,514,589 SEI GLOBAL MASTER FUND PLC GBP 42,144,508 8.49% DYNAMIC ASSET ALLOCATION FUND STERLING INSTITUTIONAL DISTRIBUTING CLASS
3,058,435 SEI GLOBAL MASTER FUND PLC GBP 28,443,447 5.73% EMERGING MARKETS DEBT FUND PARTIALLY HEDGED STERLING INSTITUTIONAL DISTRIBUTING CLASS
2,214,963 SEI GLOBAL MASTER FUND PLC GBP 29,746,949 5.99% EMERGING MARKETS EQUITY FUND STERLING INSTITUTIONAL DISTRIBUTING CLASS
884,677 SEI GLOBAL MASTER FUND PLC GBP 18,012,026 3.63% EUROPEAN (EX-U.K.) EQUITY FUND STERLING INSTITUTIONAL DISTRIBUTING CLASS
2,705,719 SEI GLOBAL MASTER FUND PLC GBP 47,214,798 9.51% FACTOR ALLOCATION U.S. EQUITY FUND STERLING INSTITUTIONAL DISTRIBUTING CLASS
832,828 SEI GLOBAL MASTER FUND PLC GBP 16,381,721 3.30% FUNDAMENTAL U.K. EQUITY FUND STERLING INSTITUTIONAL DISTRIBUTING CLASS
2,499,895 SEI GLOBAL MASTER FUND PLC GBP 49,122,940 9.89% GLOBAL EQUITY FUND STERLING INSTITUTIONAL DISTRIBUTING CLASS
1,536,123 SEI GLOBAL MASTER FUND PLC GBP 18,187,701 3.66% GLOBAL FIXED INCOME FUND HEDGED STERLING INSTITUTIONAL DISTRIBUTING CLASS
909,796 SEI GLOBAL MASTER FUND PLC GBP 14,329,294 2.88% GLOBAL MANAGED VOLATILITY FUND STERLING INSTITUTIONAL DISTRIBUTING CLASS
1,658,409 SEI GLOBAL MASTER FUND PLC GBP 18,640,521 3.75% GLOBAL OPPORTUNISTIC FIXED INCOME FUND HEDGED STERLING INSTITUTIONAL DISTRIBUTING CLASS
2,864,866 SEI GLOBAL MASTER FUND PLC GBP 26,901,090 5.42% HIGH YIELD FIXED INCOME FUND HEDGED STERLING INSTITUTIONAL DISTRIBUTING CLASS
775,519 SEI GLOBAL MASTER FUND PLC GBP 14,137,720 2.85% JAPAN EQUITY FUND STERLING INSTITUTIONAL DISTRIBUTING CLASS
520,170 SEI GLOBAL MASTER FUND PLC GBP 12,530,907 2.52% PAN EUROPEAN SMALL CAP FUND STERLING INSTITUTIONAL DISTRIBUTING CLASS
970,342 SEI GLOBAL MASTER FUND PLC GBP 16,418,194 3.31% QUANTITATIVE U.K. EQUITY FUND STERLING INSTITUTIONAL DISTRIBUTING CLASS
4,070,860 SEI GLOBAL MASTER FUND PLC GBP 64,930,215 13.07% U.K. EQUITY FUND STERLING INSTITUTIONAL DISTRIBUTING CLASS
606,944 SEI GLOBAL MASTER FUND PLC GBP 16,709,176 3.36% U.K. INDEX-LINKED FIXED INTEREST FUND STERLING INSTITUTIONAL DISTRIBUTING CLASS
1,030,533 SEI GLOBAL MASTER FUND PLC GBP 33,059,497 6.66% U.S. LARGE COMPANIES FUND STERLING INSTITUTIONAL DISTRIBUTING CLASS
560,310 SEI GLOBAL MASTER FUND PLC GBP 14,439,182 2.91% U.S. SMALL COMPANIES FUND STERLING INSTITUTIONAL DISTRIBUTING CLASS
432,851 THREADNEEDLE LUX - ENHANCED COMMODITIES PORTFOLIO GBP 4,477,583 0.90% Total Investment Funds± 495,132,107 99.70% Financial Investment Fund Assets at Fair Value Through Profit or Loss 495,132,107 99.70%Financial Investment Fund Liabilities at Fair Value Through Profit or Loss – –
72
DocuSign Envelope ID: 2646536F-BB10-4779-844A-39205D22F4E0
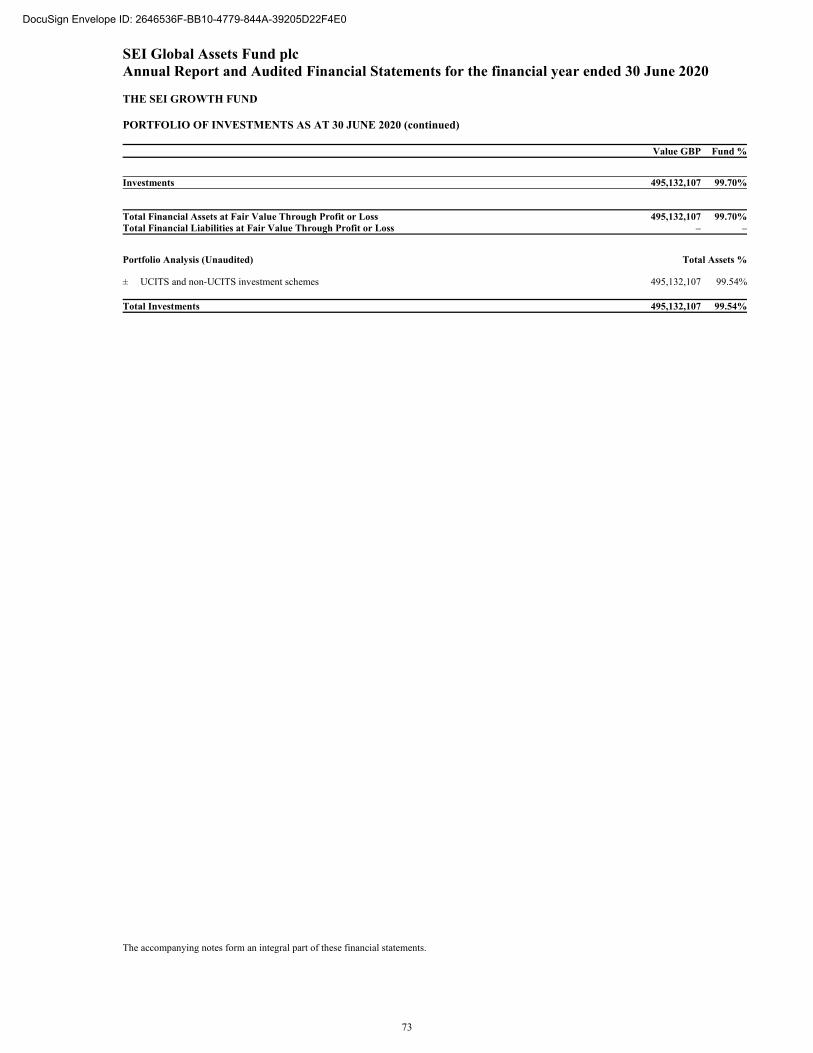
SEI Global Assets Fund plc Annual Report and Audited Financial Statements for the financial year ended 30 June 2020 THE SEI GROWTH FUND PORTFOLIO OF INVESTMENTS AS AT 30 JUNE 2020 (continued)
Value GBP Fund %
Investments 495,132,107 99.70%
Total Financial Assets at Fair Value Through Profit or Loss 495,132,107 99.70%Total Financial Liabilities at Fair Value Through Profit or Loss – –
Portfolio Analysis (Unaudited) Total Assets % ± UCITS and non-UCITS investment schemes 495,132,107 99.54% Total Investments 495,132,107 99.54%
The accompanying notes form an integral part of these financial statements.
73
DocuSign Envelope ID: 2646536F-BB10-4779-844A-39205D22F4E0
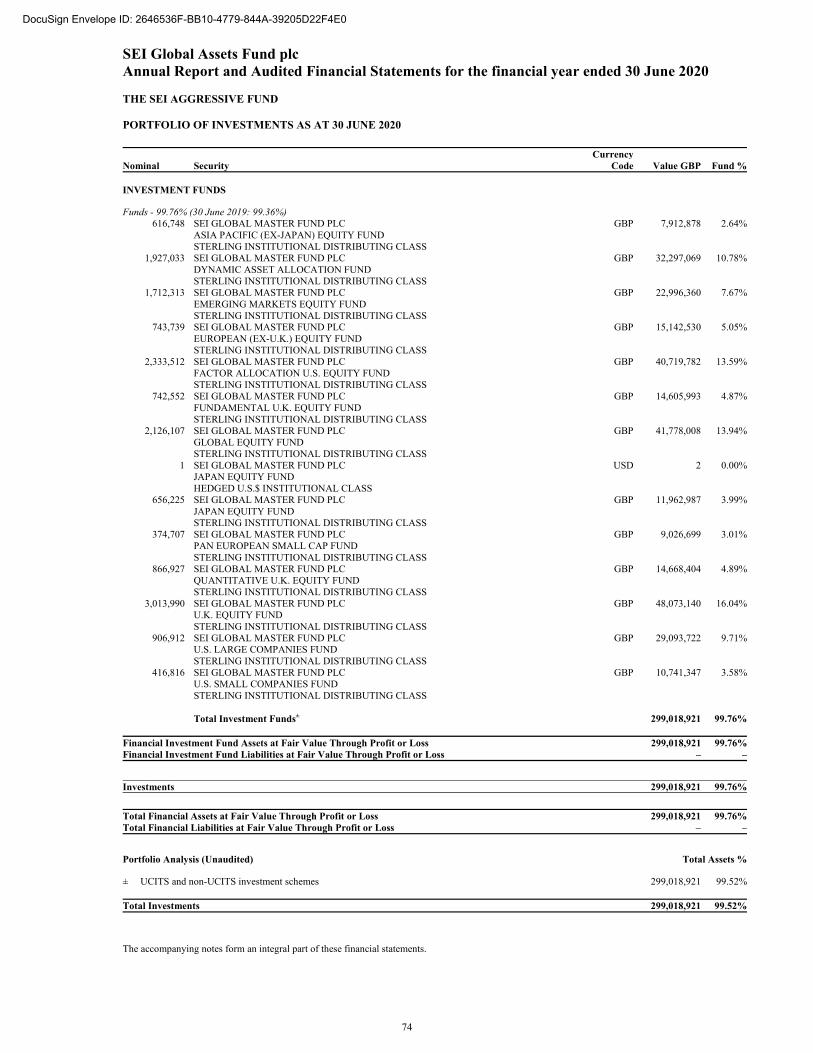
SEI Global Assets Fund plc Annual Report and Audited Financial Statements for the financial year ended 30 June 2020 THE SEI AGGRESSIVE FUND PORTFOLIO OF INVESTMENTS AS AT 30 JUNE 2020
Nominal Security Currency
Code Value GBP Fund % INVESTMENT FUNDS
Funds - 99.76% (30 June 2019: 99.36%) 616,748 SEI GLOBAL MASTER FUND PLC GBP 7,912,878 2.64%
ASIA PACIFIC (EX-JAPAN) EQUITY FUND STERLING INSTITUTIONAL DISTRIBUTING CLASS
1,927,033 SEI GLOBAL MASTER FUND PLC GBP 32,297,069 10.78% DYNAMIC ASSET ALLOCATION FUND STERLING INSTITUTIONAL DISTRIBUTING CLASS
1,712,313 SEI GLOBAL MASTER FUND PLC GBP 22,996,360 7.67% EMERGING MARKETS EQUITY FUND STERLING INSTITUTIONAL DISTRIBUTING CLASS
743,739 SEI GLOBAL MASTER FUND PLC GBP 15,142,530 5.05% EUROPEAN (EX-U.K.) EQUITY FUND STERLING INSTITUTIONAL DISTRIBUTING CLASS
2,333,512 SEI GLOBAL MASTER FUND PLC GBP 40,719,782 13.59% FACTOR ALLOCATION U.S. EQUITY FUND STERLING INSTITUTIONAL DISTRIBUTING CLASS
742,552 SEI GLOBAL MASTER FUND PLC GBP 14,605,993 4.87% FUNDAMENTAL U.K. EQUITY FUND STERLING INSTITUTIONAL DISTRIBUTING CLASS
2,126,107 SEI GLOBAL MASTER FUND PLC GBP 41,778,008 13.94% GLOBAL EQUITY FUND STERLING INSTITUTIONAL DISTRIBUTING CLASS
1 SEI GLOBAL MASTER FUND PLC USD 2 0.00% JAPAN EQUITY FUND HEDGED U.S.$ INSTITUTIONAL CLASS
656,225 SEI GLOBAL MASTER FUND PLC GBP 11,962,987 3.99% JAPAN EQUITY FUND STERLING INSTITUTIONAL DISTRIBUTING CLASS
374,707 SEI GLOBAL MASTER FUND PLC GBP 9,026,699 3.01% PAN EUROPEAN SMALL CAP FUND STERLING INSTITUTIONAL DISTRIBUTING CLASS
866,927 SEI GLOBAL MASTER FUND PLC GBP 14,668,404 4.89% QUANTITATIVE U.K. EQUITY FUND STERLING INSTITUTIONAL DISTRIBUTING CLASS
3,013,990 SEI GLOBAL MASTER FUND PLC GBP 48,073,140 16.04% U.K. EQUITY FUND STERLING INSTITUTIONAL DISTRIBUTING CLASS
906,912 SEI GLOBAL MASTER FUND PLC GBP 29,093,722 9.71% U.S. LARGE COMPANIES FUND STERLING INSTITUTIONAL DISTRIBUTING CLASS
416,816 SEI GLOBAL MASTER FUND PLC GBP 10,741,347 3.58% U.S. SMALL COMPANIES FUND STERLING INSTITUTIONAL DISTRIBUTING CLASS
Total Investment Funds± 299,018,921 99.76% Financial Investment Fund Assets at Fair Value Through Profit or Loss 299,018,921 99.76%Financial Investment Fund Liabilities at Fair Value Through Profit or Loss – –
Investments 299,018,921 99.76% Total Financial Assets at Fair Value Through Profit or Loss 299,018,921 99.76%Total Financial Liabilities at Fair Value Through Profit or Loss – –
Portfolio Analysis (Unaudited) Total Assets % ± UCITS and non-UCITS investment schemes 299,018,921 99.52% Total Investments 299,018,921 99.52%
The accompanying notes form an integral part of these financial statements.
74
DocuSign Envelope ID: 2646536F-BB10-4779-844A-39205D22F4E0
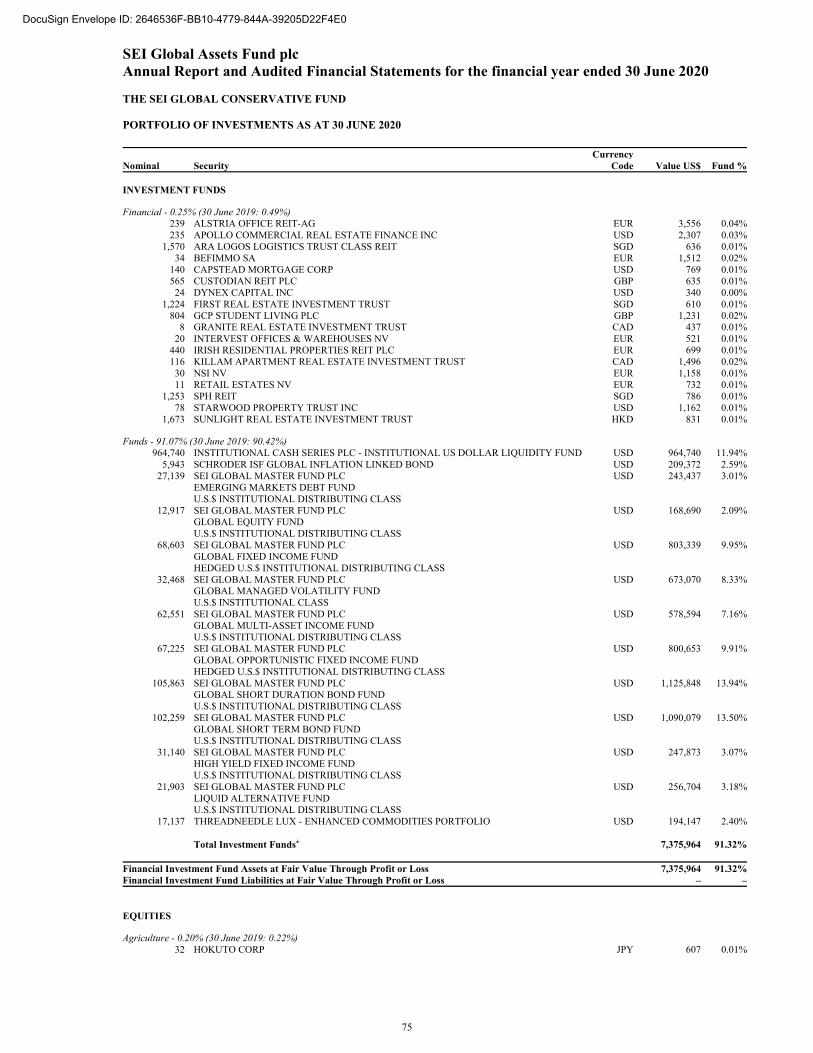
SEI Global Assets Fund plc Annual Report and Audited Financial Statements for the financial year ended 30 June 2020 THE SEI GLOBAL CONSERVATIVE FUND PORTFOLIO OF INVESTMENTS AS AT 30 JUNE 2020
Nominal Security Currency
Code Value US$ Fund % INVESTMENT FUNDS
Financial - 0.25% (30 June 2019: 0.49%) 239 ALSTRIA OFFICE REIT-AG EUR 3,556 0.04%235 APOLLO COMMERCIAL REAL ESTATE FINANCE INC USD 2,307 0.03%
1,570 ARA LOGOS LOGISTICS TRUST CLASS REIT SGD 636 0.01%34 BEFIMMO SA EUR 1,512 0.02%
140 CAPSTEAD MORTGAGE CORP USD 769 0.01%565 CUSTODIAN REIT PLC GBP 635 0.01%24 DYNEX CAPITAL INC USD 340 0.00%
1,224 FIRST REAL ESTATE INVESTMENT TRUST SGD 610 0.01%804 GCP STUDENT LIVING PLC GBP 1,231 0.02%
8 GRANITE REAL ESTATE INVESTMENT TRUST CAD 437 0.01%20 INTERVEST OFFICES & WAREHOUSES NV EUR 521 0.01%
440 IRISH RESIDENTIAL PROPERTIES REIT PLC EUR 699 0.01%116 KILLAM APARTMENT REAL ESTATE INVESTMENT TRUST CAD 1,496 0.02%30 NSI NV EUR 1,158 0.01%11 RETAIL ESTATES NV EUR 732 0.01%
1,253 SPH REIT SGD 786 0.01%78 STARWOOD PROPERTY TRUST INC USD 1,162 0.01%
1,673 SUNLIGHT REAL ESTATE INVESTMENT TRUST HKD 831 0.01%
Funds - 91.07% (30 June 2019: 90.42%) 964,740 INSTITUTIONAL CASH SERIES PLC - INSTITUTIONAL US DOLLAR LIQUIDITY FUND USD 964,740 11.94%
5,943 SCHRODER ISF GLOBAL INFLATION LINKED BOND USD 209,372 2.59%27,139 SEI GLOBAL MASTER FUND PLC USD 243,437 3.01%
EMERGING MARKETS DEBT FUND U.S.$ INSTITUTIONAL DISTRIBUTING CLASS
12,917 SEI GLOBAL MASTER FUND PLC USD 168,690 2.09% GLOBAL EQUITY FUND U.S.$ INSTITUTIONAL DISTRIBUTING CLASS
68,603 SEI GLOBAL MASTER FUND PLC USD 803,339 9.95% GLOBAL FIXED INCOME FUND HEDGED U.S.$ INSTITUTIONAL DISTRIBUTING CLASS
32,468 SEI GLOBAL MASTER FUND PLC USD 673,070 8.33% GLOBAL MANAGED VOLATILITY FUND U.S.$ INSTITUTIONAL CLASS
62,551 SEI GLOBAL MASTER FUND PLC USD 578,594 7.16% GLOBAL MULTI-ASSET INCOME FUND U.S.$ INSTITUTIONAL DISTRIBUTING CLASS
67,225 SEI GLOBAL MASTER FUND PLC USD 800,653 9.91% GLOBAL OPPORTUNISTIC FIXED INCOME FUND HEDGED U.S.$ INSTITUTIONAL DISTRIBUTING CLASS
105,863 SEI GLOBAL MASTER FUND PLC USD 1,125,848 13.94% GLOBAL SHORT DURATION BOND FUND U.S.$ INSTITUTIONAL DISTRIBUTING CLASS
102,259 SEI GLOBAL MASTER FUND PLC USD 1,090,079 13.50% GLOBAL SHORT TERM BOND FUND U.S.$ INSTITUTIONAL DISTRIBUTING CLASS
31,140 SEI GLOBAL MASTER FUND PLC USD 247,873 3.07% HIGH YIELD FIXED INCOME FUND U.S.$ INSTITUTIONAL DISTRIBUTING CLASS
21,903 SEI GLOBAL MASTER FUND PLC USD 256,704 3.18% LIQUID ALTERNATIVE FUND U.S.$ INSTITUTIONAL DISTRIBUTING CLASS
17,137 THREADNEEDLE LUX - ENHANCED COMMODITIES PORTFOLIO USD 194,147 2.40% Total Investment Funds± 7,375,964 91.32% Financial Investment Fund Assets at Fair Value Through Profit or Loss 7,375,964 91.32%Financial Investment Fund Liabilities at Fair Value Through Profit or Loss – – EQUITIES
Agriculture - 0.20% (30 June 2019: 0.22%) 32 HOKUTO CORP JPY 607 0.01%
75
DocuSign Envelope ID: 2646536F-BB10-4779-844A-39205D22F4E0
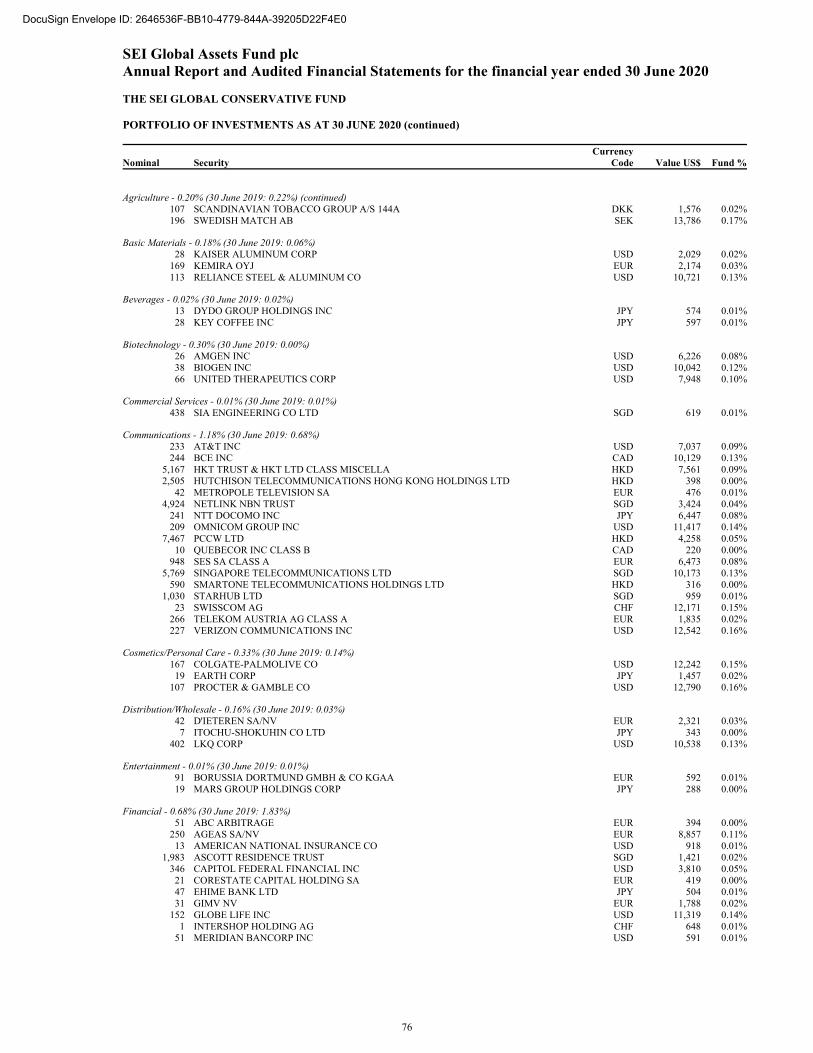
SEI Global Assets Fund plc Annual Report and Audited Financial Statements for the financial year ended 30 June 2020 THE SEI GLOBAL CONSERVATIVE FUND PORTFOLIO OF INVESTMENTS AS AT 30 JUNE 2020 (continued)
Nominal Security Currency
Code Value US$ Fund %
Agriculture - 0.20% (30 June 2019: 0.22%) (continued) 107 SCANDINAVIAN TOBACCO GROUP A/S 144A DKK 1,576 0.02%196 SWEDISH MATCH AB SEK 13,786 0.17%
Basic Materials - 0.18% (30 June 2019: 0.06%) 28 KAISER ALUMINUM CORP USD 2,029 0.02%
169 KEMIRA OYJ EUR 2,174 0.03%113 RELIANCE STEEL & ALUMINUM CO USD 10,721 0.13%
Beverages - 0.02% (30 June 2019: 0.02%) 13 DYDO GROUP HOLDINGS INC JPY 574 0.01%28 KEY COFFEE INC JPY 597 0.01%
Biotechnology - 0.30% (30 June 2019: 0.00%) 26 AMGEN INC USD 6,226 0.08%38 BIOGEN INC USD 10,042 0.12%66 UNITED THERAPEUTICS CORP USD 7,948 0.10%
Commercial Services - 0.01% (30 June 2019: 0.01%) 438 SIA ENGINEERING CO LTD SGD 619 0.01%
Communications - 1.18% (30 June 2019: 0.68%) 233 AT&T INC USD 7,037 0.09%244 BCE INC CAD 10,129 0.13%
5,167 HKT TRUST & HKT LTD CLASS MISCELLA HKD 7,561 0.09%2,505 HUTCHISON TELECOMMUNICATIONS HONG KONG HOLDINGS LTD HKD 398 0.00%
42 METROPOLE TELEVISION SA EUR 476 0.01%4,924 NETLINK NBN TRUST SGD 3,424 0.04%
241 NTT DOCOMO INC JPY 6,447 0.08%209 OMNICOM GROUP INC USD 11,417 0.14%
7,467 PCCW LTD HKD 4,258 0.05%10 QUEBECOR INC CLASS B CAD 220 0.00%
948 SES SA CLASS A EUR 6,473 0.08%5,769 SINGAPORE TELECOMMUNICATIONS LTD SGD 10,173 0.13%
590 SMARTONE TELECOMMUNICATIONS HOLDINGS LTD HKD 316 0.00%1,030 STARHUB LTD SGD 959 0.01%
23 SWISSCOM AG CHF 12,171 0.15%266 TELEKOM AUSTRIA AG CLASS A EUR 1,835 0.02%227 VERIZON COMMUNICATIONS INC USD 12,542 0.16%
Cosmetics/Personal Care - 0.33% (30 June 2019: 0.14%) 167 COLGATE-PALMOLIVE CO USD 12,242 0.15%19 EARTH CORP JPY 1,457 0.02%
107 PROCTER & GAMBLE CO USD 12,790 0.16%
Distribution/Wholesale - 0.16% (30 June 2019: 0.03%) 42 D'IETEREN SA/NV EUR 2,321 0.03%7 ITOCHU-SHOKUHIN CO LTD JPY 343 0.00%
402 LKQ CORP USD 10,538 0.13%
Entertainment - 0.01% (30 June 2019: 0.01%) 91 BORUSSIA DORTMUND GMBH & CO KGAA EUR 592 0.01%19 MARS GROUP HOLDINGS CORP JPY 288 0.00%
Financial - 0.68% (30 June 2019: 1.83%) 51 ABC ARBITRAGE EUR 394 0.00%
250 AGEAS SA/NV EUR 8,857 0.11%13 AMERICAN NATIONAL INSURANCE CO USD 918 0.01%
1,983 ASCOTT RESIDENCE TRUST SGD 1,421 0.02%346 CAPITOL FEDERAL FINANCIAL INC USD 3,810 0.05%21 CORESTATE CAPITAL HOLDING SA EUR 419 0.00%47 EHIME BANK LTD JPY 504 0.01%31 GIMV NV EUR 1,788 0.02%
152 GLOBE LIFE INC USD 11,319 0.14%1 INTERSHOP HOLDING AG CHF 648 0.01%
51 MERIDIAN BANCORP INC USD 591 0.01%
76
DocuSign Envelope ID: 2646536F-BB10-4779-844A-39205D22F4E0

SEI Global Assets Fund plc Annual Report and Audited Financial Statements for the financial year ended 30 June 2020 THE SEI GLOBAL CONSERVATIVE FUND PORTFOLIO OF INVESTMENTS AS AT 30 JUNE 2020 (continued)
Nominal Security Currency
Code Value US$ Fund %
Financial - 0.68% (30 June 2019: 1.83%) (continued) 67 NORTHFIELD BANCORP INC USD 774 0.01%
401 NORTHWEST BANCSHARES INC USD 4,103 0.05%46 RINGKJOEBING LANDBOBANK A/S DKK 3,250 0.04%26 SOFINA SA EUR 6,892 0.09%
147 SPAR NORD BANK A/S DKK 1,167 0.01%44 SUN LIFE FINANCIAL INC CAD 1,597 0.02%
134 TIMBERCREEK FINANCIAL CORP CAD 844 0.01%138 WASHINGTON FEDERAL INC USD 3,711 0.05%39 WATERSTONE FINANCIAL INC USD 582 0.01%39 WUESTENROT & WUERTTEMBERGISCHE AG EUR 668 0.01%
Food - 1.27% (30 June 2019: 1.31%) 91 AGRANA BETEILIGUNGS AG EUR 1,869 0.02%52 ARCS CO LTD JPY 1,040 0.01%
115 COLRUYT SA EUR 6,332 0.08%10 DAIKOKUTENBUSSAN CO LTD JPY 426 0.01%16 FUJIYA CO LTD JPY 335 0.00%72 HERSHEY CO USD 9,356 0.12%38 KATO SANGYO CO LTD JPY 1,227 0.02%
443 KONINKLIJKE AHOLD DELHAIZE NV EUR 12,061 0.15%304 KROGER CO USD 10,277 0.13%310 METRO INC CLASS A CAD 12,753 0.16%24 MITSUBISHI SHOKUHIN CO LTD JPY 613 0.01%16 NIPPON BEET SUGAR MANUFACTURING CO LTD JPY 283 0.00%14 NISSHIN OILLIO GROUP LTD JPY 453 0.01%82 NORTH WEST CO INC CAD 1,796 0.02%36 OKUWA CO LTD JPY 553 0.01%9 ORIOR AG CHF 741 0.01%9 RAMI LEVY CHAIN STORES HASHIKMA MARKETING 2006 LTD ILS 526 0.01%
37 RETAIL PARTNERS CO LTD JPY 585 0.01%2,237 ROGERS SUGAR INC CAD 7,685 0.09%
27 SHOWA SANGYO CO LTD JPY 813 0.01%194 SYSCO CORP USD 10,625 0.13%454 TATE & LYLE PLC GBP 3,744 0.05%
34 TOOTSIE ROLL INDUSTRIES INC USD 1,168 0.01%305 US FOODS HOLDING CORP USD 6,023 0.07%13 VILLAGE SUPER MARKET INC CLASS A USD 355 0.00%22 WEIS MARKETS INC USD 1,087 0.01%
335 WOOLWORTHS GROUP LTD AUD 8,590 0.11%72 YOKOHAMA REITO CO LTD JPY 598 0.01%
Healthcare-Services - 0.19% (30 June 2019: 0.18%) 33 CHEMED CORP USD 14,790 0.18%14 NATIONAL HEALTHCARE CORP USD 874 0.01%
Home Furnishings - 0.02% (30 June 2019: 0.01%) 244 VTECH HOLDINGS LTD HKD 1,466 0.02%
Household Products/Wares - 0.45% (30 June 2019: 0.36%) 14 CHURCH & DWIGHT CO INC USD 1,066 0.01%75 CLOROX CO USD 16,363 0.20%
104 KIMBERLY-CLARK CORP USD 14,683 0.18%24 WD-40 CO USD 4,799 0.06%
Industrial - 0.29% (30 June 2019: 0.21%) 64 BEKAERT SA EUR 1,253 0.02%48 CK INFRASTRUCTURE HOLDINGS LTD HKD 246 0.00%18 GO-AHEAD GROUP PLC GBP 182 0.00%
462 MDU RESOURCES GROUP INC USD 10,246 0.13%52 OESTERREICHISCHE POST AG EUR 1,719 0.02%
128 SILGAN HOLDINGS INC USD 4,144 0.05%80 STAR GROUP LP USD 700 0.01%24 TAMRON CO LTD JPY 420 0.01%
111 TFI INTERNATIONAL INC CAD 3,919 0.05%
77
DocuSign Envelope ID: 2646536F-BB10-4779-844A-39205D22F4E0
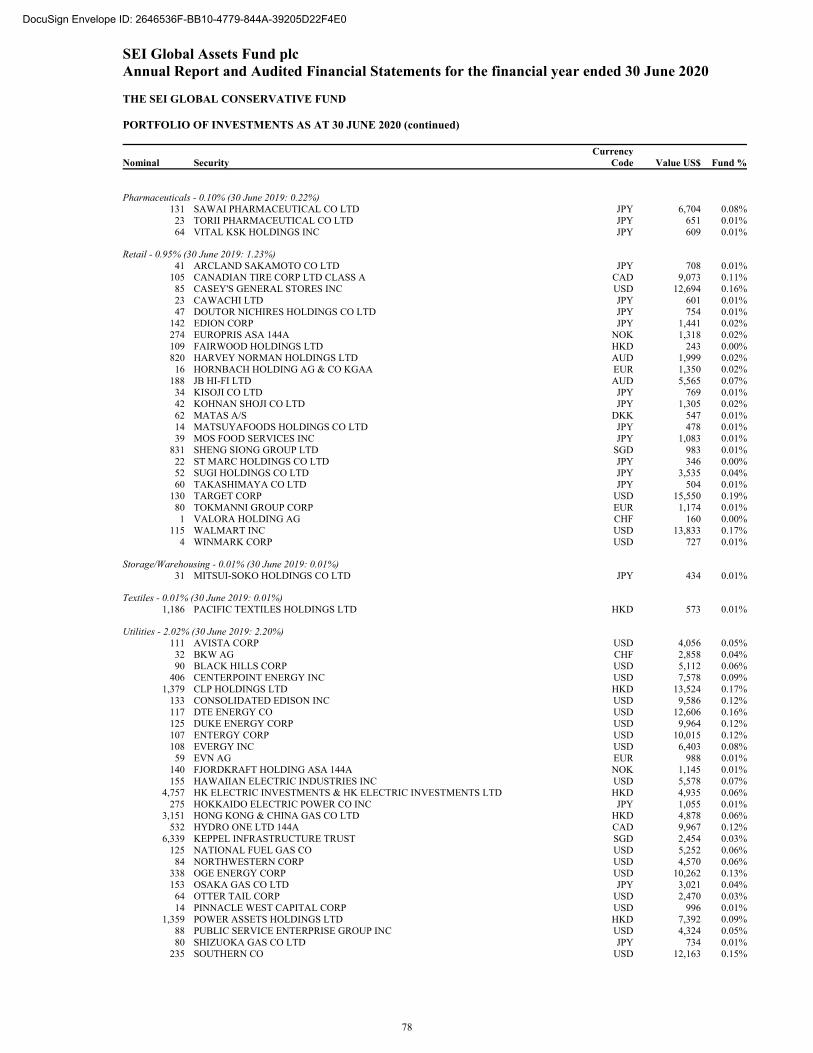
SEI Global Assets Fund plc Annual Report and Audited Financial Statements for the financial year ended 30 June 2020 THE SEI GLOBAL CONSERVATIVE FUND PORTFOLIO OF INVESTMENTS AS AT 30 JUNE 2020 (continued)
Nominal Security Currency
Code Value US$ Fund %
Pharmaceuticals - 0.10% (30 June 2019: 0.22%) 131 SAWAI PHARMACEUTICAL CO LTD JPY 6,704 0.08%23 TORII PHARMACEUTICAL CO LTD JPY 651 0.01%64 VITAL KSK HOLDINGS INC JPY 609 0.01%
Retail - 0.95% (30 June 2019: 1.23%) 41 ARCLAND SAKAMOTO CO LTD JPY 708 0.01%
105 CANADIAN TIRE CORP LTD CLASS A CAD 9,073 0.11%85 CASEY'S GENERAL STORES INC USD 12,694 0.16%23 CAWACHI LTD JPY 601 0.01%47 DOUTOR NICHIRES HOLDINGS CO LTD JPY 754 0.01%
142 EDION CORP JPY 1,441 0.02%274 EUROPRIS ASA 144A NOK 1,318 0.02%109 FAIRWOOD HOLDINGS LTD HKD 243 0.00%820 HARVEY NORMAN HOLDINGS LTD AUD 1,999 0.02%16 HORNBACH HOLDING AG & CO KGAA EUR 1,350 0.02%
188 JB HI-FI LTD AUD 5,565 0.07%34 KISOJI CO LTD JPY 769 0.01%42 KOHNAN SHOJI CO LTD JPY 1,305 0.02%62 MATAS A/S DKK 547 0.01%14 MATSUYAFOODS HOLDINGS CO LTD JPY 478 0.01%39 MOS FOOD SERVICES INC JPY 1,083 0.01%
831 SHENG SIONG GROUP LTD SGD 983 0.01%22 ST MARC HOLDINGS CO LTD JPY 346 0.00%52 SUGI HOLDINGS CO LTD JPY 3,535 0.04%60 TAKASHIMAYA CO LTD JPY 504 0.01%
130 TARGET CORP USD 15,550 0.19%80 TOKMANNI GROUP CORP EUR 1,174 0.01%1 VALORA HOLDING AG CHF 160 0.00%
115 WALMART INC USD 13,833 0.17%4 WINMARK CORP USD 727 0.01%
Storage/Warehousing - 0.01% (30 June 2019: 0.01%) 31 MITSUI-SOKO HOLDINGS CO LTD JPY 434 0.01%
Textiles - 0.01% (30 June 2019: 0.01%) 1,186 PACIFIC TEXTILES HOLDINGS LTD HKD 573 0.01%
Utilities - 2.02% (30 June 2019: 2.20%) 111 AVISTA CORP USD 4,056 0.05%
32 BKW AG CHF 2,858 0.04%90 BLACK HILLS CORP USD 5,112 0.06%
406 CENTERPOINT ENERGY INC USD 7,578 0.09%1,379 CLP HOLDINGS LTD HKD 13,524 0.17%
133 CONSOLIDATED EDISON INC USD 9,586 0.12%117 DTE ENERGY CO USD 12,606 0.16%125 DUKE ENERGY CORP USD 9,964 0.12%107 ENTERGY CORP USD 10,015 0.12%108 EVERGY INC USD 6,403 0.08%
59 EVN AG EUR 988 0.01%140 FJORDKRAFT HOLDING ASA 144A NOK 1,145 0.01%155 HAWAIIAN ELECTRIC INDUSTRIES INC USD 5,578 0.07%
4,757 HK ELECTRIC INVESTMENTS & HK ELECTRIC INVESTMENTS LTD HKD 4,935 0.06%275 HOKKAIDO ELECTRIC POWER CO INC JPY 1,055 0.01%
3,151 HONG KONG & CHINA GAS CO LTD HKD 4,878 0.06%532 HYDRO ONE LTD 144A CAD 9,967 0.12%
6,339 KEPPEL INFRASTRUCTURE TRUST SGD 2,454 0.03%125 NATIONAL FUEL GAS CO USD 5,252 0.06%
84 NORTHWESTERN CORP USD 4,570 0.06%338 OGE ENERGY CORP USD 10,262 0.13%153 OSAKA GAS CO LTD JPY 3,021 0.04%
64 OTTER TAIL CORP USD 2,470 0.03%14 PINNACLE WEST CAPITAL CORP USD 996 0.01%
1,359 POWER ASSETS HOLDINGS LTD HKD 7,392 0.09%88 PUBLIC SERVICE ENTERPRISE GROUP INC USD 4,324 0.05%80 SHIZUOKA GAS CO LTD JPY 734 0.01%
235 SOUTHERN CO USD 12,163 0.15%
78
DocuSign Envelope ID: 2646536F-BB10-4779-844A-39205D22F4E0
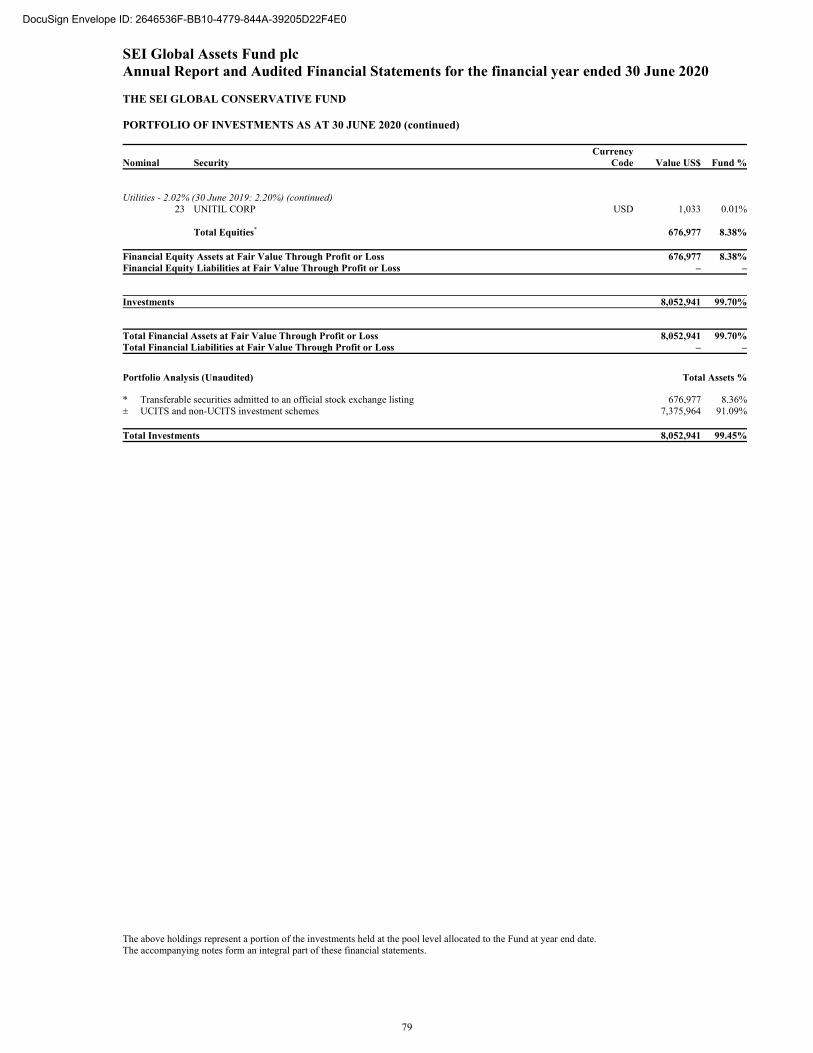
SEI Global Assets Fund plc Annual Report and Audited Financial Statements for the financial year ended 30 June 2020 THE SEI GLOBAL CONSERVATIVE FUND PORTFOLIO OF INVESTMENTS AS AT 30 JUNE 2020 (continued)
Nominal Security Currency
Code Value US$ Fund %
Utilities - 2.02% (30 June 2019: 2.20%) (continued) 23 UNITIL CORP USD 1,033 0.01%
Total Equities* 676,977 8.38% Financial Equity Assets at Fair Value Through Profit or Loss 676,977 8.38%Financial Equity Liabilities at Fair Value Through Profit or Loss – –
Investments 8,052,941 99.70%
Total Financial Assets at Fair Value Through Profit or Loss 8,052,941 99.70%Total Financial Liabilities at Fair Value Through Profit or Loss – –
Portfolio Analysis (Unaudited) Total Assets % * Transferable securities admitted to an official stock exchange listing 676,977 8.36%± UCITS and non-UCITS investment schemes 7,375,964 91.09% Total Investments 8,052,941 99.45%
The above holdings represent a portion of the investments held at the pool level allocated to the Fund at year end date. The accompanying notes form an integral part of these financial statements.
79
DocuSign Envelope ID: 2646536F-BB10-4779-844A-39205D22F4E0
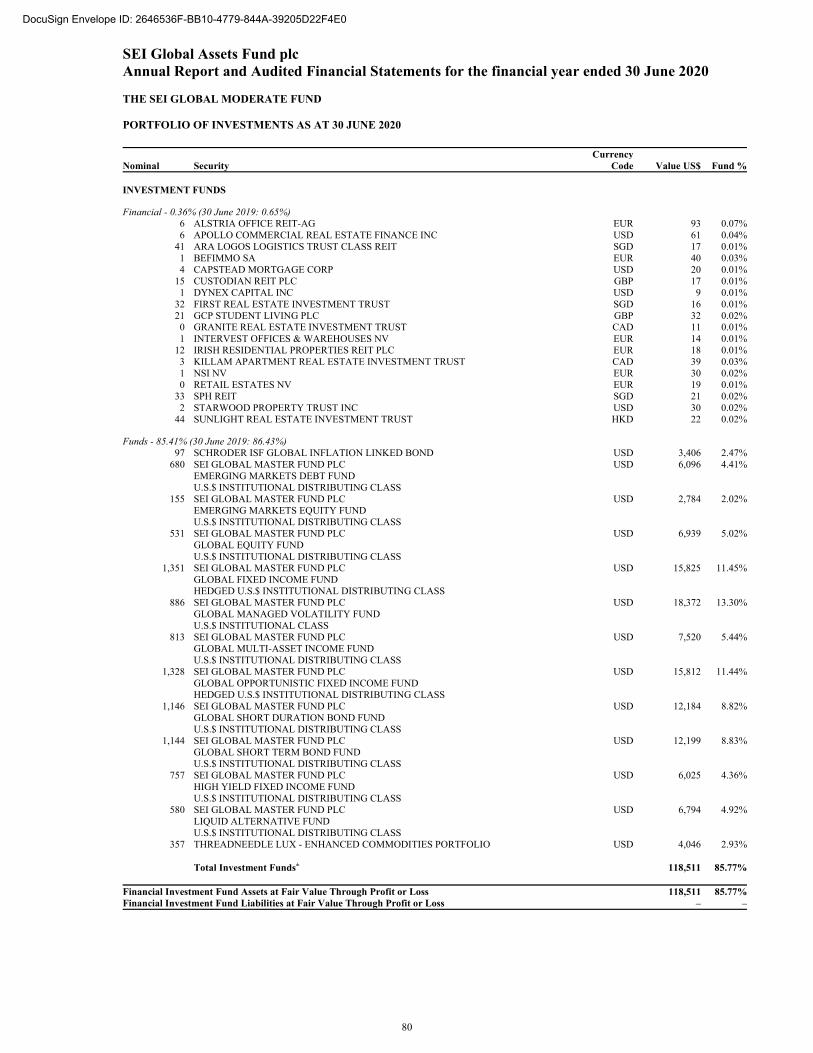
SEI Global Assets Fund plc Annual Report and Audited Financial Statements for the financial year ended 30 June 2020 THE SEI GLOBAL MODERATE FUND PORTFOLIO OF INVESTMENTS AS AT 30 JUNE 2020
Nominal Security Currency
Code Value US$ Fund % INVESTMENT FUNDS
Financial - 0.36% (30 June 2019: 0.65%) 6 ALSTRIA OFFICE REIT-AG EUR 93 0.07%6 APOLLO COMMERCIAL REAL ESTATE FINANCE INC USD 61 0.04%
41 ARA LOGOS LOGISTICS TRUST CLASS REIT SGD 17 0.01%1 BEFIMMO SA EUR 40 0.03%4 CAPSTEAD MORTGAGE CORP USD 20 0.01%
15 CUSTODIAN REIT PLC GBP 17 0.01%1 DYNEX CAPITAL INC USD 9 0.01%
32 FIRST REAL ESTATE INVESTMENT TRUST SGD 16 0.01%21 GCP STUDENT LIVING PLC GBP 32 0.02%0 GRANITE REAL ESTATE INVESTMENT TRUST CAD 11 0.01%1 INTERVEST OFFICES & WAREHOUSES NV EUR 14 0.01%
12 IRISH RESIDENTIAL PROPERTIES REIT PLC EUR 18 0.01%3 KILLAM APARTMENT REAL ESTATE INVESTMENT TRUST CAD 39 0.03%1 NSI NV EUR 30 0.02%0 RETAIL ESTATES NV EUR 19 0.01%
33 SPH REIT SGD 21 0.02%2 STARWOOD PROPERTY TRUST INC USD 30 0.02%
44 SUNLIGHT REAL ESTATE INVESTMENT TRUST HKD 22 0.02%
Funds - 85.41% (30 June 2019: 86.43%) 97 SCHRODER ISF GLOBAL INFLATION LINKED BOND USD 3,406 2.47%
680 SEI GLOBAL MASTER FUND PLC USD 6,096 4.41% EMERGING MARKETS DEBT FUND U.S.$ INSTITUTIONAL DISTRIBUTING CLASS
155 SEI GLOBAL MASTER FUND PLC USD 2,784 2.02% EMERGING MARKETS EQUITY FUND U.S.$ INSTITUTIONAL DISTRIBUTING CLASS
531 SEI GLOBAL MASTER FUND PLC USD 6,939 5.02% GLOBAL EQUITY FUND U.S.$ INSTITUTIONAL DISTRIBUTING CLASS
1,351 SEI GLOBAL MASTER FUND PLC USD 15,825 11.45% GLOBAL FIXED INCOME FUND HEDGED U.S.$ INSTITUTIONAL DISTRIBUTING CLASS
886 SEI GLOBAL MASTER FUND PLC USD 18,372 13.30% GLOBAL MANAGED VOLATILITY FUND U.S.$ INSTITUTIONAL CLASS
813 SEI GLOBAL MASTER FUND PLC USD 7,520 5.44% GLOBAL MULTI-ASSET INCOME FUND U.S.$ INSTITUTIONAL DISTRIBUTING CLASS
1,328 SEI GLOBAL MASTER FUND PLC USD 15,812 11.44% GLOBAL OPPORTUNISTIC FIXED INCOME FUND HEDGED U.S.$ INSTITUTIONAL DISTRIBUTING CLASS
1,146 SEI GLOBAL MASTER FUND PLC USD 12,184 8.82% GLOBAL SHORT DURATION BOND FUND U.S.$ INSTITUTIONAL DISTRIBUTING CLASS
1,144 SEI GLOBAL MASTER FUND PLC USD 12,199 8.83% GLOBAL SHORT TERM BOND FUND U.S.$ INSTITUTIONAL DISTRIBUTING CLASS
757 SEI GLOBAL MASTER FUND PLC USD 6,025 4.36% HIGH YIELD FIXED INCOME FUND U.S.$ INSTITUTIONAL DISTRIBUTING CLASS
580 SEI GLOBAL MASTER FUND PLC USD 6,794 4.92% LIQUID ALTERNATIVE FUND U.S.$ INSTITUTIONAL DISTRIBUTING CLASS
357 THREADNEEDLE LUX - ENHANCED COMMODITIES PORTFOLIO USD 4,046 2.93% Total Investment Funds± 118,511 85.77% Financial Investment Fund Assets at Fair Value Through Profit or Loss 118,511 85.77%Financial Investment Fund Liabilities at Fair Value Through Profit or Loss – –
80
DocuSign Envelope ID: 2646536F-BB10-4779-844A-39205D22F4E0
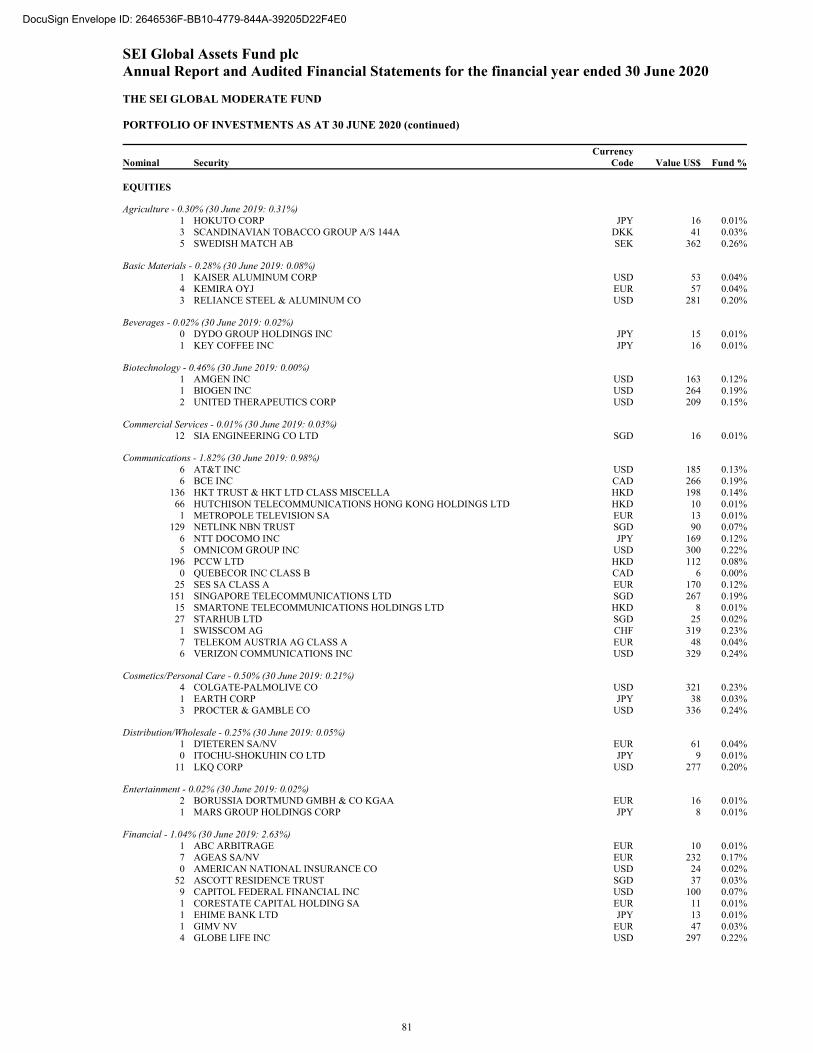
SEI Global Assets Fund plc Annual Report and Audited Financial Statements for the financial year ended 30 June 2020 THE SEI GLOBAL MODERATE FUND PORTFOLIO OF INVESTMENTS AS AT 30 JUNE 2020 (continued)
Nominal Security Currency
Code Value US$ Fund % EQUITIES
Agriculture - 0.30% (30 June 2019: 0.31%) 1 HOKUTO CORP JPY 16 0.01%3 SCANDINAVIAN TOBACCO GROUP A/S 144A DKK 41 0.03%5 SWEDISH MATCH AB SEK 362 0.26%
Basic Materials - 0.28% (30 June 2019: 0.08%) 1 KAISER ALUMINUM CORP USD 53 0.04%4 KEMIRA OYJ EUR 57 0.04%3 RELIANCE STEEL & ALUMINUM CO USD 281 0.20%
Beverages - 0.02% (30 June 2019: 0.02%) 0 DYDO GROUP HOLDINGS INC JPY 15 0.01%1 KEY COFFEE INC JPY 16 0.01%
Biotechnology - 0.46% (30 June 2019: 0.00%) 1 AMGEN INC USD 163 0.12%1 BIOGEN INC USD 264 0.19%2 UNITED THERAPEUTICS CORP USD 209 0.15%
Commercial Services - 0.01% (30 June 2019: 0.03%) 12 SIA ENGINEERING CO LTD SGD 16 0.01%
Communications - 1.82% (30 June 2019: 0.98%) 6 AT&T INC USD 185 0.13%6 BCE INC CAD 266 0.19%
136 HKT TRUST & HKT LTD CLASS MISCELLA HKD 198 0.14%66 HUTCHISON TELECOMMUNICATIONS HONG KONG HOLDINGS LTD HKD 10 0.01%1 METROPOLE TELEVISION SA EUR 13 0.01%
129 NETLINK NBN TRUST SGD 90 0.07%6 NTT DOCOMO INC JPY 169 0.12%5 OMNICOM GROUP INC USD 300 0.22%
196 PCCW LTD HKD 112 0.08%0 QUEBECOR INC CLASS B CAD 6 0.00%
25 SES SA CLASS A EUR 170 0.12%151 SINGAPORE TELECOMMUNICATIONS LTD SGD 267 0.19%15 SMARTONE TELECOMMUNICATIONS HOLDINGS LTD HKD 8 0.01%27 STARHUB LTD SGD 25 0.02%1 SWISSCOM AG CHF 319 0.23%7 TELEKOM AUSTRIA AG CLASS A EUR 48 0.04%6 VERIZON COMMUNICATIONS INC USD 329 0.24%
Cosmetics/Personal Care - 0.50% (30 June 2019: 0.21%) 4 COLGATE-PALMOLIVE CO USD 321 0.23%1 EARTH CORP JPY 38 0.03%3 PROCTER & GAMBLE CO USD 336 0.24%
Distribution/Wholesale - 0.25% (30 June 2019: 0.05%) 1 D'IETEREN SA/NV EUR 61 0.04%0 ITOCHU-SHOKUHIN CO LTD JPY 9 0.01%
11 LKQ CORP USD 277 0.20%
Entertainment - 0.02% (30 June 2019: 0.02%) 2 BORUSSIA DORTMUND GMBH & CO KGAA EUR 16 0.01%1 MARS GROUP HOLDINGS CORP JPY 8 0.01%
Financial - 1.04% (30 June 2019: 2.63%) 1 ABC ARBITRAGE EUR 10 0.01%7 AGEAS SA/NV EUR 232 0.17%0 AMERICAN NATIONAL INSURANCE CO USD 24 0.02%
52 ASCOTT RESIDENCE TRUST SGD 37 0.03%9 CAPITOL FEDERAL FINANCIAL INC USD 100 0.07%1 CORESTATE CAPITAL HOLDING SA EUR 11 0.01%1 EHIME BANK LTD JPY 13 0.01%1 GIMV NV EUR 47 0.03%4 GLOBE LIFE INC USD 297 0.22%
81
DocuSign Envelope ID: 2646536F-BB10-4779-844A-39205D22F4E0

SEI Global Assets Fund plc Annual Report and Audited Financial Statements for the financial year ended 30 June 2020 THE SEI GLOBAL MODERATE FUND PORTFOLIO OF INVESTMENTS AS AT 30 JUNE 2020 (continued)
Nominal Security Currency
Code Value US$ Fund %
Financial - 1.04% (30 June 2019: 2.63%) (continued) 0 INTERSHOP HOLDING AG CHF 17 0.01%1 MERIDIAN BANCORP INC USD 16 0.01%2 NORTHFIELD BANCORP INC USD 20 0.02%
11 NORTHWEST BANCSHARES INC USD 108 0.08%1 RINGKJOEBING LANDBOBANK A/S DKK 85 0.06%1 SOFINA SA EUR 181 0.13%4 SPAR NORD BANK A/S DKK 31 0.02%1 SUN LIFE FINANCIAL INC CAD 42 0.03%4 TIMBERCREEK FINANCIAL CORP CAD 22 0.02%4 WASHINGTON FEDERAL INC USD 97 0.07%1 WATERSTONE FINANCIAL INC USD 15 0.01%1 WUESTENROT & WUERTTEMBERGISCHE AG EUR 18 0.01%
Food - 1.94% (30 June 2019: 1.90%) 2 AGRANA BETEILIGUNGS AG EUR 49 0.04%1 ARCS CO LTD JPY 27 0.02%3 COLRUYT SA EUR 166 0.12%0 DAIKOKUTENBUSSAN CO LTD JPY 11 0.01%0 FUJIYA CO LTD JPY 9 0.01%2 HERSHEY CO USD 246 0.18%1 KATO SANGYO CO LTD JPY 32 0.02%
12 KONINKLIJKE AHOLD DELHAIZE NV EUR 317 0.23%8 KROGER CO USD 270 0.20%8 METRO INC CLASS A CAD 335 0.24%1 MITSUBISHI SHOKUHIN CO LTD JPY 16 0.01%0 NIPPON BEET SUGAR MANUFACTURING CO LTD JPY 7 0.01%0 NISSHIN OILLIO GROUP LTD JPY 12 0.01%2 NORTH WEST CO INC CAD 47 0.03%1 OKUWA CO LTD JPY 15 0.01%0 ORIOR AG CHF 19 0.01%0 RAMI LEVY CHAIN STORES HASHIKMA MARKETING 2006 LTD ILS 14 0.01%1 RETAIL PARTNERS CO LTD JPY 15 0.01%
59 ROGERS SUGAR INC CAD 202 0.15%1 SHOWA SANGYO CO LTD JPY 21 0.02%5 SYSCO CORP USD 279 0.20%
12 TATE & LYLE PLC GBP 98 0.07%1 TOOTSIE ROLL INDUSTRIES INC USD 31 0.02%8 US FOODS HOLDING CORP USD 158 0.11%0 VILLAGE SUPER MARKET INC CLASS A USD 9 0.01%1 WEIS MARKETS INC USD 29 0.02%9 WOOLWORTHS GROUP LTD AUD 225 0.16%2 YOKOHAMA REITO CO LTD JPY 16 0.01%
Healthcare-Services - 0.30% (30 June 2019: 0.25%) 1 CHEMED CORP USD 388 0.28%0 NATIONAL HEALTHCARE CORP USD 23 0.02%
Home Furnishings - 0.03% (30 June 2019: 0.02%) 6 VTECH HOLDINGS LTD HKD 39 0.03%
Household Products/Wares - 0.70% (30 June 2019: 0.51%) 0 CHURCH & DWIGHT CO INC USD 28 0.02%2 CLOROX CO USD 430 0.31%3 KIMBERLY-CLARK CORP USD 385 0.28%1 WD-40 CO USD 126 0.09%
Industrial - 0.42% (30 June 2019: 0.31%) 2 BEKAERT SA EUR 33 0.02%1 CK INFRASTRUCTURE HOLDINGS LTD HKD 6 0.01%0 GO-AHEAD GROUP PLC GBP 5 0.00%
12 MDU RESOURCES GROUP INC USD 269 0.19%1 OESTERREICHISCHE POST AG EUR 45 0.03%3 SILGAN HOLDINGS INC USD 109 0.08%2 STAR GROUP LP USD 18 0.01%1 TAMRON CO LTD JPY 11 0.01%3 TFI INTERNATIONAL INC CAD 103 0.07%
82
DocuSign Envelope ID: 2646536F-BB10-4779-844A-39205D22F4E0

SEI Global Assets Fund plc Annual Report and Audited Financial Statements for the financial year ended 30 June 2020 THE SEI GLOBAL MODERATE FUND PORTFOLIO OF INVESTMENTS AS AT 30 JUNE 2020 (continued)
Nominal Security Currency
Code Value US$ Fund %
Pharmaceuticals - 0.15% (30 June 2019: 0.30%) 3 SAWAI PHARMACEUTICAL CO LTD JPY 176 0.13%1 TORII PHARMACEUTICAL CO LTD JPY 17 0.01%2 VITAL KSK HOLDINGS INC JPY 16 0.01%
Retail - 1.46% (30 June 2019: 1.75%) 1 ARCLAND SAKAMOTO CO LTD JPY 19 0.01%3 CANADIAN TIRE CORP LTD CLASS A CAD 238 0.17%2 CASEY'S GENERAL STORES INC USD 333 0.24%1 CAWACHI LTD JPY 16 0.01%1 DOUTOR NICHIRES HOLDINGS CO LTD JPY 20 0.01%4 EDION CORP JPY 38 0.03%7 EUROPRIS ASA 144A NOK 35 0.03%3 FAIRWOOD HOLDINGS LTD HKD 6 0.00%
22 HARVEY NORMAN HOLDINGS LTD AUD 53 0.04%0 HORNBACH HOLDING AG & CO KGAA EUR 35 0.03%5 JB HI-FI LTD AUD 146 0.11%1 KISOJI CO LTD JPY 20 0.01%1 KOHNAN SHOJI CO LTD JPY 34 0.03%2 MATAS A/S DKK 14 0.01%0 MATSUYAFOODS HOLDINGS CO LTD JPY 13 0.01%1 MOS FOOD SERVICES INC JPY 28 0.02%
22 SHENG SIONG GROUP LTD SGD 26 0.02%1 ST MARC HOLDINGS CO LTD JPY 9 0.01%1 SUGI HOLDINGS CO LTD JPY 93 0.07%2 TAKASHIMAYA CO LTD JPY 13 0.01%3 TARGET CORP USD 408 0.30%2 TOKMANNI GROUP CORP EUR 31 0.02%0 VALORA HOLDING AG CHF 4 0.00%3 WALMART INC USD 363 0.26%0 WINMARK CORP USD 19 0.01%
Storage/Warehousing - 0.01% (30 June 2019: 0.01%) 1 MITSUI-SOKO HOLDINGS CO LTD JPY 11 0.01%
Textiles - 0.01% (30 June 2019: 0.02%) 31 PACIFIC TEXTILES HOLDINGS LTD HKD 15 0.01%
Utilities - 3.14% (30 June 2019: 3.15%) 3 AVISTA CORP USD 106 0.08%1 BKW AG CHF 75 0.05%2 BLACK HILLS CORP USD 134 0.10%
11 CENTERPOINT ENERGY INC USD 199 0.14%36 CLP HOLDINGS LTD HKD 355 0.26%3 CONSOLIDATED EDISON INC USD 252 0.18%3 DTE ENERGY CO USD 331 0.24%3 DUKE ENERGY CORP USD 262 0.19%3 ENTERGY CORP USD 263 0.19%3 EVERGY INC USD 168 0.12%2 EVN AG EUR 26 0.02%4 FJORDKRAFT HOLDING ASA 144A NOK 30 0.02%4 HAWAIIAN ELECTRIC INDUSTRIES INC USD 146 0.11%
125 HK ELECTRIC INVESTMENTS & HK ELECTRIC INVESTMENTS LTD HKD 130 0.09%7 HOKKAIDO ELECTRIC POWER CO INC JPY 28 0.02%
83 HONG KONG & CHINA GAS CO LTD HKD 128 0.09%14 HYDRO ONE LTD 144A CAD 262 0.19%
166 KEPPEL INFRASTRUCTURE TRUST SGD 64 0.05%3 NATIONAL FUEL GAS CO USD 138 0.10%2 NORTHWESTERN CORP USD 120 0.09%9 OGE ENERGY CORP USD 269 0.20%4 OSAKA GAS CO LTD JPY 79 0.06%2 OTTER TAIL CORP USD 65 0.05%0 PINNACLE WEST CAPITAL CORP USD 26 0.02%
36 POWER ASSETS HOLDINGS LTD HKD 194 0.14%2 PUBLIC SERVICE ENTERPRISE GROUP INC USD 114 0.08%2 SHIZUOKA GAS CO LTD JPY 19 0.01%6 SOUTHERN CO USD 319 0.23%
83
DocuSign Envelope ID: 2646536F-BB10-4779-844A-39205D22F4E0
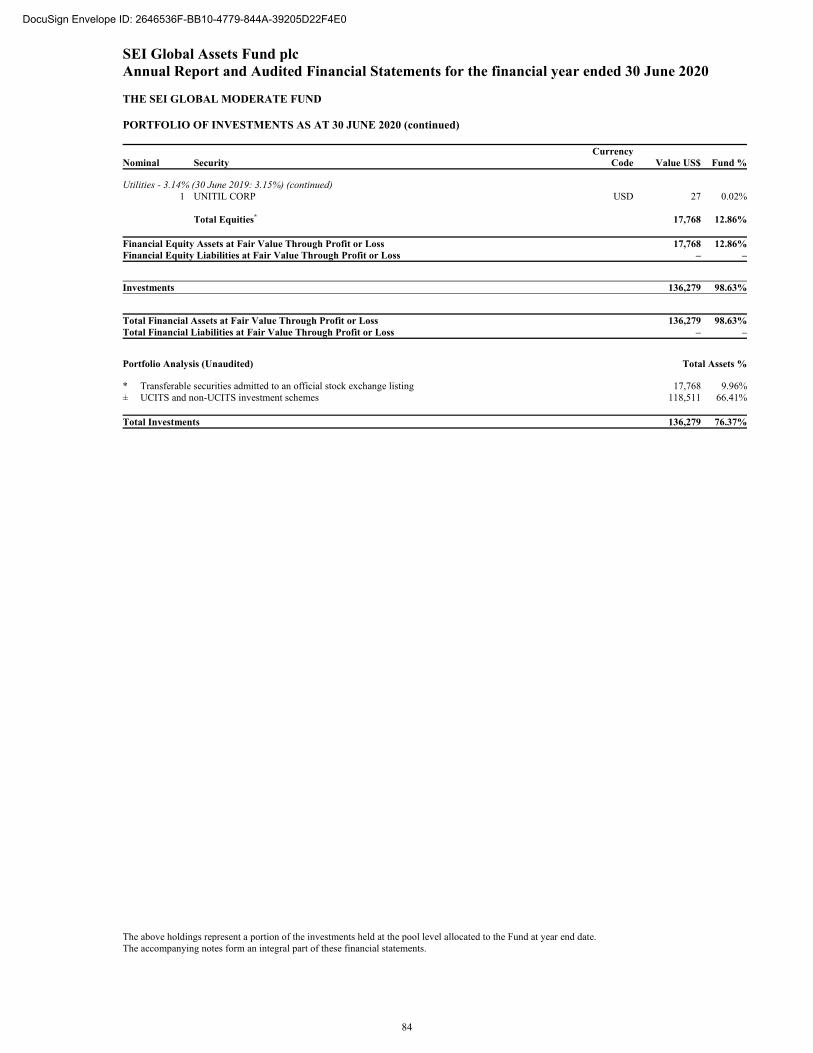
SEI Global Assets Fund plc Annual Report and Audited Financial Statements for the financial year ended 30 June 2020 THE SEI GLOBAL MODERATE FUND PORTFOLIO OF INVESTMENTS AS AT 30 JUNE 2020 (continued)
Nominal Security Currency
Code Value US$ Fund %
Utilities - 3.14% (30 June 2019: 3.15%) (continued) 1 UNITIL CORP USD 27 0.02%
Total Equities* 17,768 12.86% Financial Equity Assets at Fair Value Through Profit or Loss 17,768 12.86%Financial Equity Liabilities at Fair Value Through Profit or Loss – –
Investments 136,279 98.63%
Total Financial Assets at Fair Value Through Profit or Loss 136,279 98.63%Total Financial Liabilities at Fair Value Through Profit or Loss – –
Portfolio Analysis (Unaudited) Total Assets % * Transferable securities admitted to an official stock exchange listing 17,768 9.96%± UCITS and non-UCITS investment schemes 118,511 66.41% Total Investments 136,279 76.37%
The above holdings represent a portion of the investments held at the pool level allocated to the Fund at year end date. The accompanying notes form an integral part of these financial statements.
84
DocuSign Envelope ID: 2646536F-BB10-4779-844A-39205D22F4E0
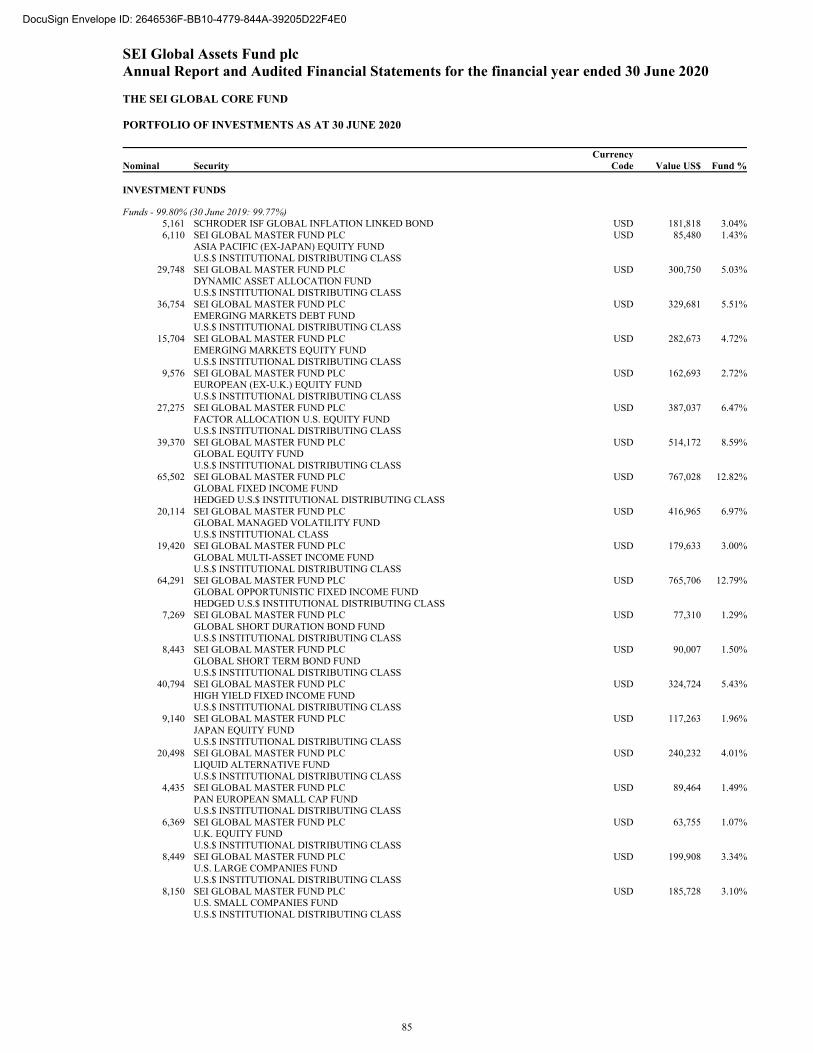
SEI Global Assets Fund plc Annual Report and Audited Financial Statements for the financial year ended 30 June 2020 THE SEI GLOBAL CORE FUND PORTFOLIO OF INVESTMENTS AS AT 30 JUNE 2020
Nominal Security Currency
Code Value US$ Fund % INVESTMENT FUNDS
Funds - 99.80% (30 June 2019: 99.77%) 5,161 SCHRODER ISF GLOBAL INFLATION LINKED BOND USD 181,818 3.04%6,110 SEI GLOBAL MASTER FUND PLC USD 85,480 1.43%
ASIA PACIFIC (EX-JAPAN) EQUITY FUND U.S.$ INSTITUTIONAL DISTRIBUTING CLASS
29,748 SEI GLOBAL MASTER FUND PLC USD 300,750 5.03% DYNAMIC ASSET ALLOCATION FUND U.S.$ INSTITUTIONAL DISTRIBUTING CLASS
36,754 SEI GLOBAL MASTER FUND PLC USD 329,681 5.51% EMERGING MARKETS DEBT FUND U.S.$ INSTITUTIONAL DISTRIBUTING CLASS
15,704 SEI GLOBAL MASTER FUND PLC USD 282,673 4.72% EMERGING MARKETS EQUITY FUND U.S.$ INSTITUTIONAL DISTRIBUTING CLASS
9,576 SEI GLOBAL MASTER FUND PLC USD 162,693 2.72% EUROPEAN (EX-U.K.) EQUITY FUND U.S.$ INSTITUTIONAL DISTRIBUTING CLASS
27,275 SEI GLOBAL MASTER FUND PLC USD 387,037 6.47% FACTOR ALLOCATION U.S. EQUITY FUND U.S.$ INSTITUTIONAL DISTRIBUTING CLASS
39,370 SEI GLOBAL MASTER FUND PLC USD 514,172 8.59% GLOBAL EQUITY FUND U.S.$ INSTITUTIONAL DISTRIBUTING CLASS
65,502 SEI GLOBAL MASTER FUND PLC USD 767,028 12.82% GLOBAL FIXED INCOME FUND HEDGED U.S.$ INSTITUTIONAL DISTRIBUTING CLASS
20,114 SEI GLOBAL MASTER FUND PLC USD 416,965 6.97% GLOBAL MANAGED VOLATILITY FUND U.S.$ INSTITUTIONAL CLASS
19,420 SEI GLOBAL MASTER FUND PLC USD 179,633 3.00% GLOBAL MULTI-ASSET INCOME FUND U.S.$ INSTITUTIONAL DISTRIBUTING CLASS
64,291 SEI GLOBAL MASTER FUND PLC USD 765,706 12.79% GLOBAL OPPORTUNISTIC FIXED INCOME FUND HEDGED U.S.$ INSTITUTIONAL DISTRIBUTING CLASS
7,269 SEI GLOBAL MASTER FUND PLC USD 77,310 1.29% GLOBAL SHORT DURATION BOND FUND U.S.$ INSTITUTIONAL DISTRIBUTING CLASS
8,443 SEI GLOBAL MASTER FUND PLC USD 90,007 1.50% GLOBAL SHORT TERM BOND FUND U.S.$ INSTITUTIONAL DISTRIBUTING CLASS
40,794 SEI GLOBAL MASTER FUND PLC USD 324,724 5.43% HIGH YIELD FIXED INCOME FUND U.S.$ INSTITUTIONAL DISTRIBUTING CLASS
9,140 SEI GLOBAL MASTER FUND PLC USD 117,263 1.96% JAPAN EQUITY FUND U.S.$ INSTITUTIONAL DISTRIBUTING CLASS
20,498 SEI GLOBAL MASTER FUND PLC USD 240,232 4.01% LIQUID ALTERNATIVE FUND U.S.$ INSTITUTIONAL DISTRIBUTING CLASS
4,435 SEI GLOBAL MASTER FUND PLC USD 89,464 1.49% PAN EUROPEAN SMALL CAP FUND U.S.$ INSTITUTIONAL DISTRIBUTING CLASS
6,369 SEI GLOBAL MASTER FUND PLC USD 63,755 1.07% U.K. EQUITY FUND U.S.$ INSTITUTIONAL DISTRIBUTING CLASS
8,449 SEI GLOBAL MASTER FUND PLC USD 199,908 3.34% U.S. LARGE COMPANIES FUND U.S.$ INSTITUTIONAL DISTRIBUTING CLASS
8,150 SEI GLOBAL MASTER FUND PLC USD 185,728 3.10% U.S. SMALL COMPANIES FUND U.S.$ INSTITUTIONAL DISTRIBUTING CLASS
85
DocuSign Envelope ID: 2646536F-BB10-4779-844A-39205D22F4E0
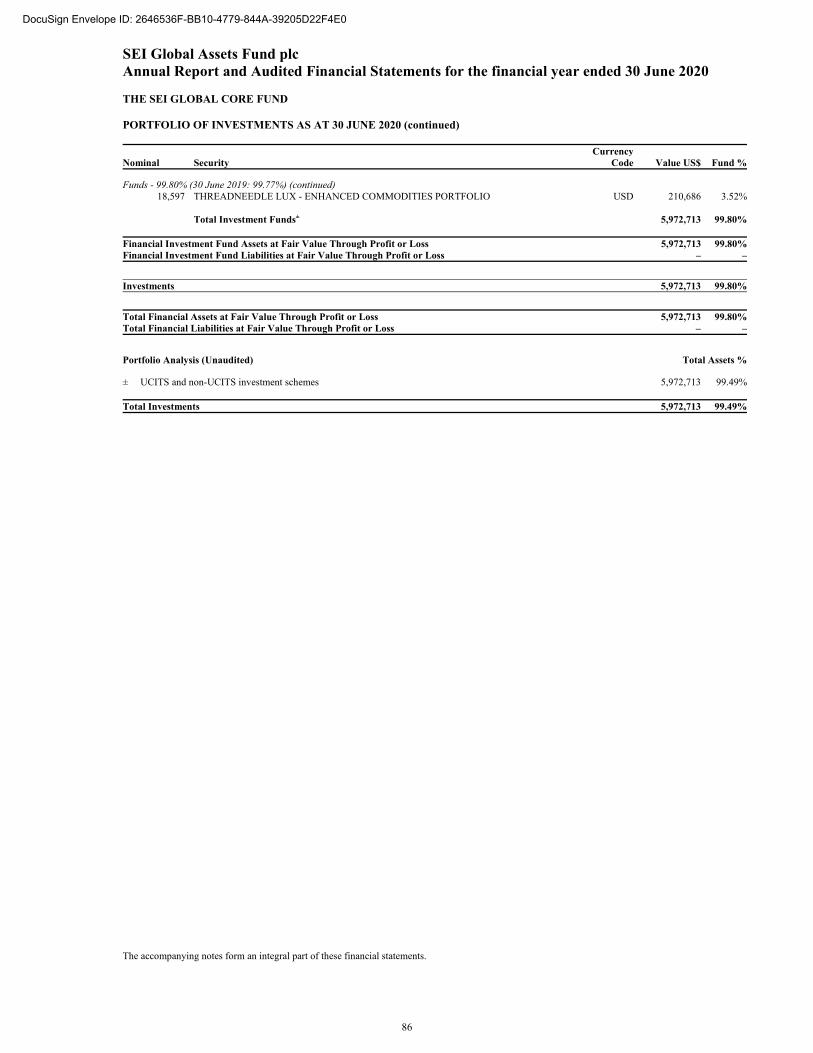
SEI Global Assets Fund plc Annual Report and Audited Financial Statements for the financial year ended 30 June 2020 THE SEI GLOBAL CORE FUND PORTFOLIO OF INVESTMENTS AS AT 30 JUNE 2020 (continued)
Nominal Security Currency
Code Value US$ Fund %
Funds - 99.80% (30 June 2019: 99.77%) (continued) 18,597 THREADNEEDLE LUX - ENHANCED COMMODITIES PORTFOLIO USD 210,686 3.52%
Total Investment Funds± 5,972,713 99.80% Financial Investment Fund Assets at Fair Value Through Profit or Loss 5,972,713 99.80%Financial Investment Fund Liabilities at Fair Value Through Profit or Loss – –
Investments 5,972,713 99.80%
Total Financial Assets at Fair Value Through Profit or Loss 5,972,713 99.80%Total Financial Liabilities at Fair Value Through Profit or Loss – –
Portfolio Analysis (Unaudited) Total Assets % ± UCITS and non-UCITS investment schemes 5,972,713 99.49% Total Investments 5,972,713 99.49%
The accompanying notes form an integral part of these financial statements.
86
DocuSign Envelope ID: 2646536F-BB10-4779-844A-39205D22F4E0
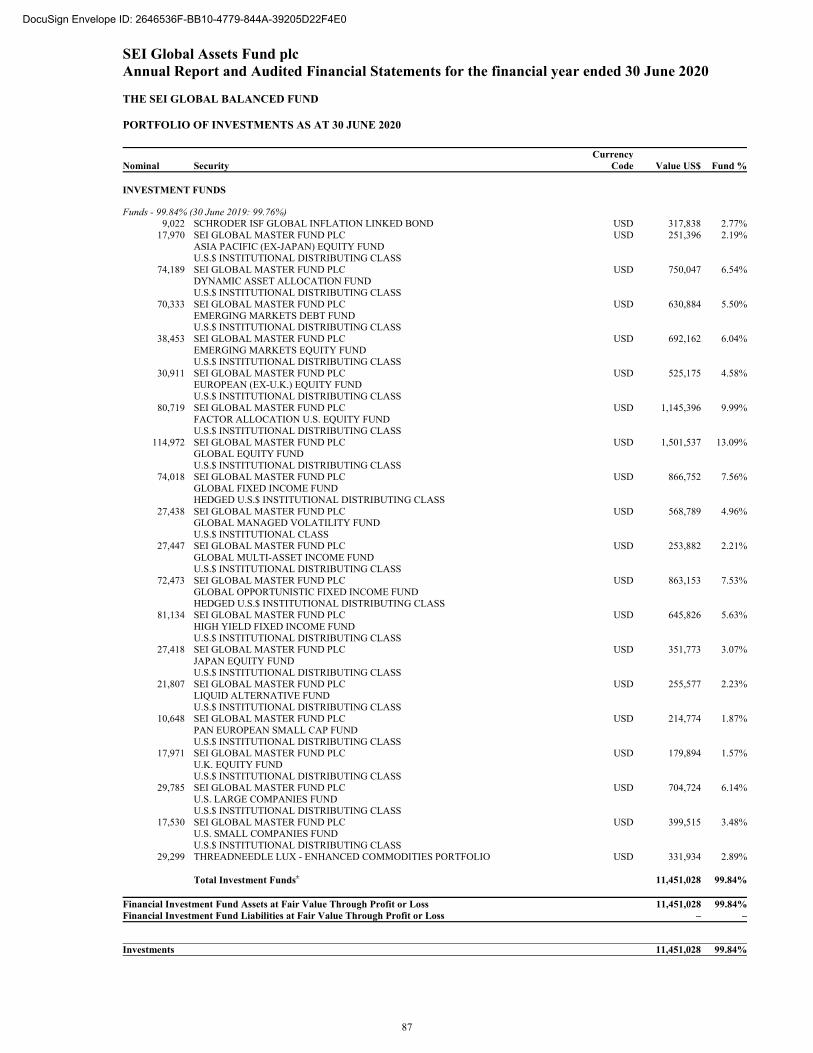
SEI Global Assets Fund plc Annual Report and Audited Financial Statements for the financial year ended 30 June 2020 THE SEI GLOBAL BALANCED FUND PORTFOLIO OF INVESTMENTS AS AT 30 JUNE 2020
Nominal Security Currency
Code Value US$ Fund % INVESTMENT FUNDS
Funds - 99.84% (30 June 2019: 99.76%) 9,022 SCHRODER ISF GLOBAL INFLATION LINKED BOND USD 317,838 2.77%
17,970 SEI GLOBAL MASTER FUND PLC USD 251,396 2.19% ASIA PACIFIC (EX-JAPAN) EQUITY FUND U.S.$ INSTITUTIONAL DISTRIBUTING CLASS
74,189 SEI GLOBAL MASTER FUND PLC USD 750,047 6.54% DYNAMIC ASSET ALLOCATION FUND U.S.$ INSTITUTIONAL DISTRIBUTING CLASS
70,333 SEI GLOBAL MASTER FUND PLC USD 630,884 5.50% EMERGING MARKETS DEBT FUND U.S.$ INSTITUTIONAL DISTRIBUTING CLASS
38,453 SEI GLOBAL MASTER FUND PLC USD 692,162 6.04% EMERGING MARKETS EQUITY FUND U.S.$ INSTITUTIONAL DISTRIBUTING CLASS
30,911 SEI GLOBAL MASTER FUND PLC USD 525,175 4.58% EUROPEAN (EX-U.K.) EQUITY FUND U.S.$ INSTITUTIONAL DISTRIBUTING CLASS
80,719 SEI GLOBAL MASTER FUND PLC USD 1,145,396 9.99% FACTOR ALLOCATION U.S. EQUITY FUND U.S.$ INSTITUTIONAL DISTRIBUTING CLASS
114,972 SEI GLOBAL MASTER FUND PLC USD 1,501,537 13.09% GLOBAL EQUITY FUND U.S.$ INSTITUTIONAL DISTRIBUTING CLASS
74,018 SEI GLOBAL MASTER FUND PLC USD 866,752 7.56% GLOBAL FIXED INCOME FUND HEDGED U.S.$ INSTITUTIONAL DISTRIBUTING CLASS
27,438 SEI GLOBAL MASTER FUND PLC USD 568,789 4.96% GLOBAL MANAGED VOLATILITY FUND U.S.$ INSTITUTIONAL CLASS
27,447 SEI GLOBAL MASTER FUND PLC USD 253,882 2.21% GLOBAL MULTI-ASSET INCOME FUND U.S.$ INSTITUTIONAL DISTRIBUTING CLASS
72,473 SEI GLOBAL MASTER FUND PLC USD 863,153 7.53% GLOBAL OPPORTUNISTIC FIXED INCOME FUND HEDGED U.S.$ INSTITUTIONAL DISTRIBUTING CLASS
81,134 SEI GLOBAL MASTER FUND PLC USD 645,826 5.63% HIGH YIELD FIXED INCOME FUND U.S.$ INSTITUTIONAL DISTRIBUTING CLASS
27,418 SEI GLOBAL MASTER FUND PLC USD 351,773 3.07% JAPAN EQUITY FUND U.S.$ INSTITUTIONAL DISTRIBUTING CLASS
21,807 SEI GLOBAL MASTER FUND PLC USD 255,577 2.23% LIQUID ALTERNATIVE FUND U.S.$ INSTITUTIONAL DISTRIBUTING CLASS
10,648 SEI GLOBAL MASTER FUND PLC USD 214,774 1.87% PAN EUROPEAN SMALL CAP FUND U.S.$ INSTITUTIONAL DISTRIBUTING CLASS
17,971 SEI GLOBAL MASTER FUND PLC USD 179,894 1.57% U.K. EQUITY FUND U.S.$ INSTITUTIONAL DISTRIBUTING CLASS
29,785 SEI GLOBAL MASTER FUND PLC USD 704,724 6.14% U.S. LARGE COMPANIES FUND U.S.$ INSTITUTIONAL DISTRIBUTING CLASS
17,530 SEI GLOBAL MASTER FUND PLC USD 399,515 3.48% U.S. SMALL COMPANIES FUND U.S.$ INSTITUTIONAL DISTRIBUTING CLASS
29,299 THREADNEEDLE LUX - ENHANCED COMMODITIES PORTFOLIO USD 331,934 2.89% Total Investment Funds± 11,451,028 99.84% Financial Investment Fund Assets at Fair Value Through Profit or Loss 11,451,028 99.84%Financial Investment Fund Liabilities at Fair Value Through Profit or Loss – –
Investments 11,451,028 99.84%
87
DocuSign Envelope ID: 2646536F-BB10-4779-844A-39205D22F4E0
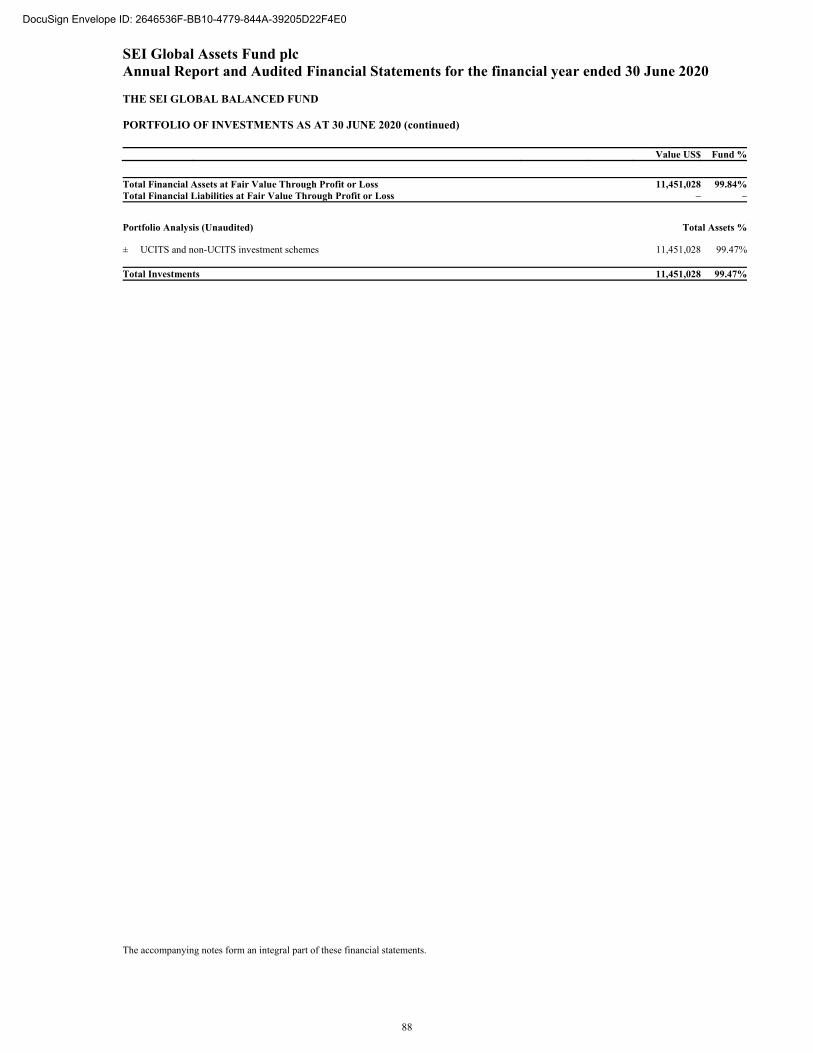
SEI Global Assets Fund plc Annual Report and Audited Financial Statements for the financial year ended 30 June 2020 THE SEI GLOBAL BALANCED FUND PORTFOLIO OF INVESTMENTS AS AT 30 JUNE 2020 (continued)
Value US$ Fund %
Total Financial Assets at Fair Value Through Profit or Loss 11,451,028 99.84%Total Financial Liabilities at Fair Value Through Profit or Loss – –
Portfolio Analysis (Unaudited) Total Assets % ± UCITS and non-UCITS investment schemes 11,451,028 99.47% Total Investments 11,451,028 99.47%
The accompanying notes form an integral part of these financial statements.
88
DocuSign Envelope ID: 2646536F-BB10-4779-844A-39205D22F4E0
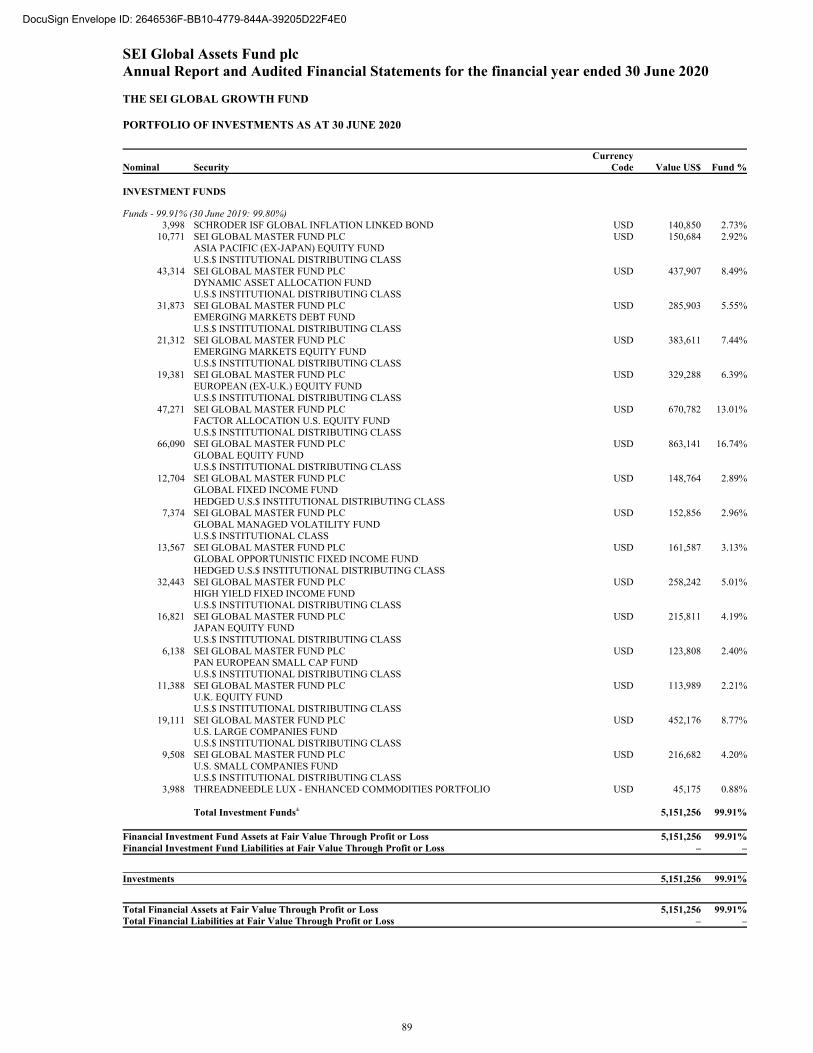
SEI Global Assets Fund plc Annual Report and Audited Financial Statements for the financial year ended 30 June 2020 THE SEI GLOBAL GROWTH FUND PORTFOLIO OF INVESTMENTS AS AT 30 JUNE 2020
Nominal Security Currency
Code Value US$ Fund % INVESTMENT FUNDS
Funds - 99.91% (30 June 2019: 99.80%) 3,998 SCHRODER ISF GLOBAL INFLATION LINKED BOND USD 140,850 2.73%
10,771 SEI GLOBAL MASTER FUND PLC USD 150,684 2.92% ASIA PACIFIC (EX-JAPAN) EQUITY FUND U.S.$ INSTITUTIONAL DISTRIBUTING CLASS
43,314 SEI GLOBAL MASTER FUND PLC USD 437,907 8.49% DYNAMIC ASSET ALLOCATION FUND U.S.$ INSTITUTIONAL DISTRIBUTING CLASS
31,873 SEI GLOBAL MASTER FUND PLC USD 285,903 5.55% EMERGING MARKETS DEBT FUND U.S.$ INSTITUTIONAL DISTRIBUTING CLASS
21,312 SEI GLOBAL MASTER FUND PLC USD 383,611 7.44% EMERGING MARKETS EQUITY FUND U.S.$ INSTITUTIONAL DISTRIBUTING CLASS
19,381 SEI GLOBAL MASTER FUND PLC USD 329,288 6.39% EUROPEAN (EX-U.K.) EQUITY FUND U.S.$ INSTITUTIONAL DISTRIBUTING CLASS
47,271 SEI GLOBAL MASTER FUND PLC USD 670,782 13.01% FACTOR ALLOCATION U.S. EQUITY FUND U.S.$ INSTITUTIONAL DISTRIBUTING CLASS
66,090 SEI GLOBAL MASTER FUND PLC USD 863,141 16.74% GLOBAL EQUITY FUND U.S.$ INSTITUTIONAL DISTRIBUTING CLASS
12,704 SEI GLOBAL MASTER FUND PLC USD 148,764 2.89% GLOBAL FIXED INCOME FUND HEDGED U.S.$ INSTITUTIONAL DISTRIBUTING CLASS
7,374 SEI GLOBAL MASTER FUND PLC USD 152,856 2.96% GLOBAL MANAGED VOLATILITY FUND U.S.$ INSTITUTIONAL CLASS
13,567 SEI GLOBAL MASTER FUND PLC USD 161,587 3.13% GLOBAL OPPORTUNISTIC FIXED INCOME FUND HEDGED U.S.$ INSTITUTIONAL DISTRIBUTING CLASS
32,443 SEI GLOBAL MASTER FUND PLC USD 258,242 5.01% HIGH YIELD FIXED INCOME FUND U.S.$ INSTITUTIONAL DISTRIBUTING CLASS
16,821 SEI GLOBAL MASTER FUND PLC USD 215,811 4.19% JAPAN EQUITY FUND U.S.$ INSTITUTIONAL DISTRIBUTING CLASS
6,138 SEI GLOBAL MASTER FUND PLC USD 123,808 2.40% PAN EUROPEAN SMALL CAP FUND U.S.$ INSTITUTIONAL DISTRIBUTING CLASS
11,388 SEI GLOBAL MASTER FUND PLC USD 113,989 2.21% U.K. EQUITY FUND U.S.$ INSTITUTIONAL DISTRIBUTING CLASS
19,111 SEI GLOBAL MASTER FUND PLC USD 452,176 8.77% U.S. LARGE COMPANIES FUND U.S.$ INSTITUTIONAL DISTRIBUTING CLASS
9,508 SEI GLOBAL MASTER FUND PLC USD 216,682 4.20% U.S. SMALL COMPANIES FUND U.S.$ INSTITUTIONAL DISTRIBUTING CLASS
3,988 THREADNEEDLE LUX - ENHANCED COMMODITIES PORTFOLIO USD 45,175 0.88% Total Investment Funds± 5,151,256 99.91% Financial Investment Fund Assets at Fair Value Through Profit or Loss 5,151,256 99.91%Financial Investment Fund Liabilities at Fair Value Through Profit or Loss – –
Investments 5,151,256 99.91%
Total Financial Assets at Fair Value Through Profit or Loss 5,151,256 99.91%Total Financial Liabilities at Fair Value Through Profit or Loss – –
89
DocuSign Envelope ID: 2646536F-BB10-4779-844A-39205D22F4E0

SEI Global Assets Fund plc Annual Report and Audited Financial Statements for the financial year ended 30 June 2020 THE SEI GLOBAL GROWTH FUND PORTFOLIO OF INVESTMENTS AS AT 30 JUNE 2020 (continued)
Portfolio Analysis (Unaudited) Total Assets % ± UCITS and non-UCITS investment schemes 5,151,256 99.53% Total Investments 5,151,256 99.53%
The accompanying notes form an integral part of these financial statements.
90
DocuSign Envelope ID: 2646536F-BB10-4779-844A-39205D22F4E0
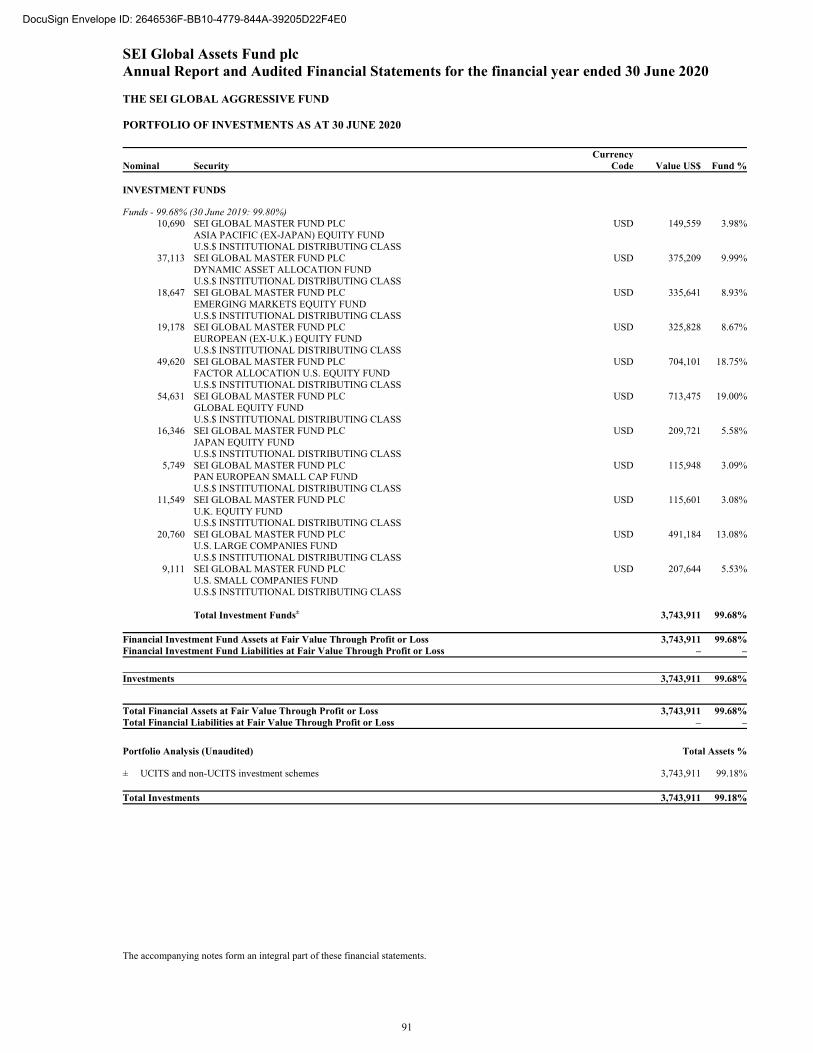
SEI Global Assets Fund plc Annual Report and Audited Financial Statements for the financial year ended 30 June 2020 THE SEI GLOBAL AGGRESSIVE FUND PORTFOLIO OF INVESTMENTS AS AT 30 JUNE 2020
Nominal Security Currency
Code Value US$ Fund % INVESTMENT FUNDS
Funds - 99.68% (30 June 2019: 99.80%) 10,690 SEI GLOBAL MASTER FUND PLC USD 149,559 3.98%
ASIA PACIFIC (EX-JAPAN) EQUITY FUND U.S.$ INSTITUTIONAL DISTRIBUTING CLASS
37,113 SEI GLOBAL MASTER FUND PLC USD 375,209 9.99% DYNAMIC ASSET ALLOCATION FUND U.S.$ INSTITUTIONAL DISTRIBUTING CLASS
18,647 SEI GLOBAL MASTER FUND PLC USD 335,641 8.93% EMERGING MARKETS EQUITY FUND U.S.$ INSTITUTIONAL DISTRIBUTING CLASS
19,178 SEI GLOBAL MASTER FUND PLC USD 325,828 8.67% EUROPEAN (EX-U.K.) EQUITY FUND U.S.$ INSTITUTIONAL DISTRIBUTING CLASS
49,620 SEI GLOBAL MASTER FUND PLC USD 704,101 18.75% FACTOR ALLOCATION U.S. EQUITY FUND U.S.$ INSTITUTIONAL DISTRIBUTING CLASS
54,631 SEI GLOBAL MASTER FUND PLC USD 713,475 19.00% GLOBAL EQUITY FUND U.S.$ INSTITUTIONAL DISTRIBUTING CLASS
16,346 SEI GLOBAL MASTER FUND PLC USD 209,721 5.58% JAPAN EQUITY FUND U.S.$ INSTITUTIONAL DISTRIBUTING CLASS
5,749 SEI GLOBAL MASTER FUND PLC USD 115,948 3.09% PAN EUROPEAN SMALL CAP FUND U.S.$ INSTITUTIONAL DISTRIBUTING CLASS
11,549 SEI GLOBAL MASTER FUND PLC USD 115,601 3.08% U.K. EQUITY FUND U.S.$ INSTITUTIONAL DISTRIBUTING CLASS
20,760 SEI GLOBAL MASTER FUND PLC USD 491,184 13.08% U.S. LARGE COMPANIES FUND U.S.$ INSTITUTIONAL DISTRIBUTING CLASS
9,111 SEI GLOBAL MASTER FUND PLC USD 207,644 5.53% U.S. SMALL COMPANIES FUND U.S.$ INSTITUTIONAL DISTRIBUTING CLASS
Total Investment Funds± 3,743,911 99.68% Financial Investment Fund Assets at Fair Value Through Profit or Loss 3,743,911 99.68%Financial Investment Fund Liabilities at Fair Value Through Profit or Loss – –
Investments 3,743,911 99.68%
Total Financial Assets at Fair Value Through Profit or Loss 3,743,911 99.68%Total Financial Liabilities at Fair Value Through Profit or Loss – –
Portfolio Analysis (Unaudited) Total Assets % ± UCITS and non-UCITS investment schemes 3,743,911 99.18% Total Investments 3,743,911 99.18%
The accompanying notes form an integral part of these financial statements.
91
DocuSign Envelope ID: 2646536F-BB10-4779-844A-39205D22F4E0
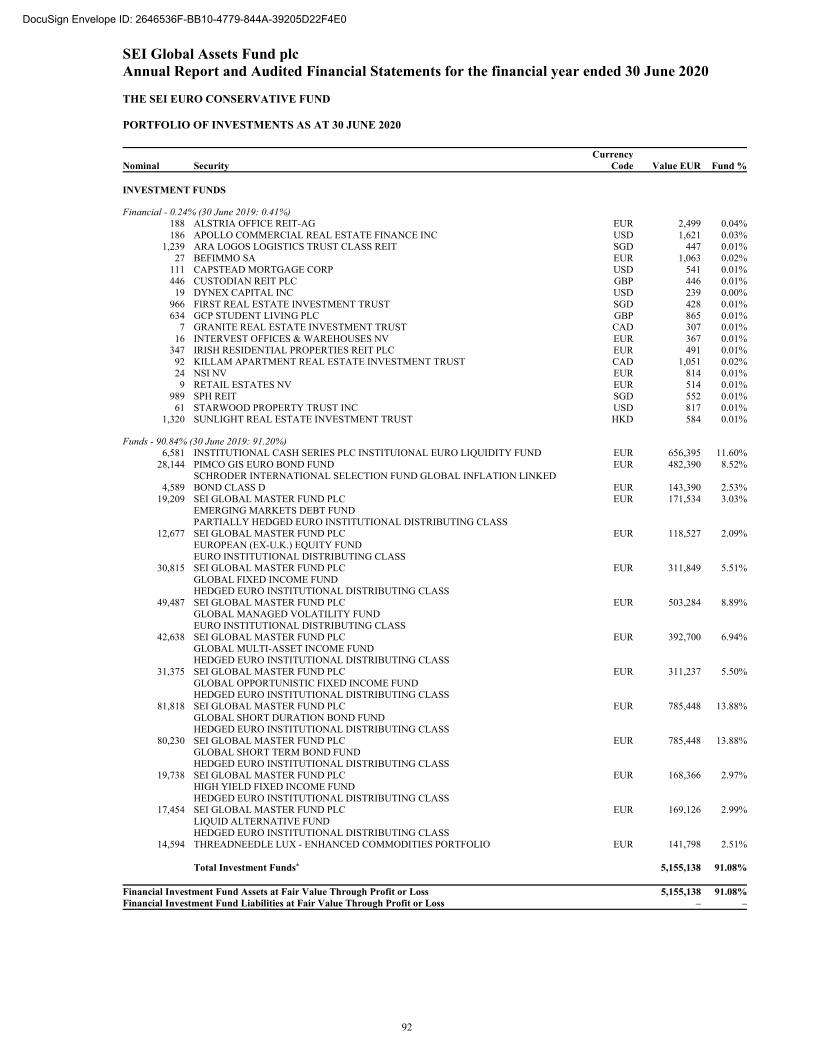
SEI Global Assets Fund plc Annual Report and Audited Financial Statements for the financial year ended 30 June 2020 THE SEI EURO CONSERVATIVE FUND PORTFOLIO OF INVESTMENTS AS AT 30 JUNE 2020
Nominal Security Currency
Code Value EUR Fund % INVESTMENT FUNDS
Financial - 0.24% (30 June 2019: 0.41%) 188 ALSTRIA OFFICE REIT-AG EUR 2,499 0.04%186 APOLLO COMMERCIAL REAL ESTATE FINANCE INC USD 1,621 0.03%
1,239 ARA LOGOS LOGISTICS TRUST CLASS REIT SGD 447 0.01%27 BEFIMMO SA EUR 1,063 0.02%
111 CAPSTEAD MORTGAGE CORP USD 541 0.01%446 CUSTODIAN REIT PLC GBP 446 0.01%19 DYNEX CAPITAL INC USD 239 0.00%
966 FIRST REAL ESTATE INVESTMENT TRUST SGD 428 0.01%634 GCP STUDENT LIVING PLC GBP 865 0.01%
7 GRANITE REAL ESTATE INVESTMENT TRUST CAD 307 0.01%16 INTERVEST OFFICES & WAREHOUSES NV EUR 367 0.01%
347 IRISH RESIDENTIAL PROPERTIES REIT PLC EUR 491 0.01%92 KILLAM APARTMENT REAL ESTATE INVESTMENT TRUST CAD 1,051 0.02%24 NSI NV EUR 814 0.01%9 RETAIL ESTATES NV EUR 514 0.01%
989 SPH REIT SGD 552 0.01%61 STARWOOD PROPERTY TRUST INC USD 817 0.01%
1,320 SUNLIGHT REAL ESTATE INVESTMENT TRUST HKD 584 0.01%
Funds - 90.84% (30 June 2019: 91.20%) 6,581 INSTITUTIONAL CASH SERIES PLC INSTITUIONAL EURO LIQUIDITY FUND EUR 656,395 11.60%
28,144 PIMCO GIS EURO BOND FUND EUR 482,390 8.52%
4,589 SCHRODER INTERNATIONAL SELECTION FUND GLOBAL INFLATION LINKED BOND CLASS D EUR 143,390 2.53%
19,209 SEI GLOBAL MASTER FUND PLC EUR 171,534 3.03% EMERGING MARKETS DEBT FUND PARTIALLY HEDGED EURO INSTITUTIONAL DISTRIBUTING CLASS
12,677 SEI GLOBAL MASTER FUND PLC EUR 118,527 2.09% EUROPEAN (EX-U.K.) EQUITY FUND EURO INSTITUTIONAL DISTRIBUTING CLASS
30,815 SEI GLOBAL MASTER FUND PLC EUR 311,849 5.51% GLOBAL FIXED INCOME FUND HEDGED EURO INSTITUTIONAL DISTRIBUTING CLASS
49,487 SEI GLOBAL MASTER FUND PLC EUR 503,284 8.89% GLOBAL MANAGED VOLATILITY FUND EURO INSTITUTIONAL DISTRIBUTING CLASS
42,638 SEI GLOBAL MASTER FUND PLC EUR 392,700 6.94% GLOBAL MULTI-ASSET INCOME FUND HEDGED EURO INSTITUTIONAL DISTRIBUTING CLASS
31,375 SEI GLOBAL MASTER FUND PLC EUR 311,237 5.50% GLOBAL OPPORTUNISTIC FIXED INCOME FUND HEDGED EURO INSTITUTIONAL DISTRIBUTING CLASS
81,818 SEI GLOBAL MASTER FUND PLC EUR 785,448 13.88% GLOBAL SHORT DURATION BOND FUND HEDGED EURO INSTITUTIONAL DISTRIBUTING CLASS
80,230 SEI GLOBAL MASTER FUND PLC EUR 785,448 13.88% GLOBAL SHORT TERM BOND FUND HEDGED EURO INSTITUTIONAL DISTRIBUTING CLASS
19,738 SEI GLOBAL MASTER FUND PLC EUR 168,366 2.97% HIGH YIELD FIXED INCOME FUND HEDGED EURO INSTITUTIONAL DISTRIBUTING CLASS
17,454 SEI GLOBAL MASTER FUND PLC EUR 169,126 2.99% LIQUID ALTERNATIVE FUND HEDGED EURO INSTITUTIONAL DISTRIBUTING CLASS
14,594 THREADNEEDLE LUX - ENHANCED COMMODITIES PORTFOLIO EUR 141,798 2.51% Total Investment Funds± 5,155,138 91.08% Financial Investment Fund Assets at Fair Value Through Profit or Loss 5,155,138 91.08%Financial Investment Fund Liabilities at Fair Value Through Profit or Loss – –
92
DocuSign Envelope ID: 2646536F-BB10-4779-844A-39205D22F4E0

SEI Global Assets Fund plc Annual Report and Audited Financial Statements for the financial year ended 30 June 2020 THE SEI EURO CONSERVATIVE FUND PORTFOLIO OF INVESTMENTS AS AT 30 JUNE 2020 (continued)
Nominal Security Currency
Code Value EUR Fund % EQUITIES
Agriculture - 0.20% (30 June 2019: 0.19%) 25 HOKUTO CORP JPY 426 0.01%84 SCANDINAVIAN TOBACCO GROUP A/S 144A DKK 1,107 0.02%
155 SWEDISH MATCH AB SEK 9,688 0.17%
Basic Materials - 0.18% (30 June 2019: 0.06%) 22 KAISER ALUMINUM CORP USD 1,426 0.02%
133 KEMIRA OYJ EUR 1,528 0.03%89 RELIANCE STEEL & ALUMINUM CO USD 7,534 0.13%
Beverages - 0.02% (30 June 2019: 0.02%) 10 DYDO GROUP HOLDINGS INC JPY 403 0.01%22 KEY COFFEE INC JPY 420 0.01%
Biotechnology - 0.30% (30 June 2019: 0.00%) 21 AMGEN INC USD 4,376 0.08%30 BIOGEN INC USD 7,057 0.12%52 UNITED THERAPEUTICS CORP USD 5,585 0.10%
Commercial Services - 0.01% (30 June 2019: 0.01%) 346 SIA ENGINEERING CO LTD SGD 435 0.01%
Communications - 1.18% (30 June 2019: 0.62%) 184 AT&T INC USD 4,945 0.09%192 BCE INC CAD 7,118 0.13%
4,078 HKT TRUST & HKT LTD CLASS MISCELLA HKD 5,313 0.09%1,977 HUTCHISON TELECOMMUNICATIONS HONG KONG HOLDINGS LTD HKD 279 0.00%
33 METROPOLE TELEVISION SA EUR 335 0.01%3,886 NETLINK NBN TRUST SGD 2,406 0.04%
190 NTT DOCOMO INC JPY 4,530 0.08%165 OMNICOM GROUP INC USD 8,023 0.14%
5,894 PCCW LTD HKD 2,993 0.05%8 QUEBECOR INC CLASS B CAD 155 0.00%
748 SES SA CLASS A EUR 4,549 0.08%4,553 SINGAPORE TELECOMMUNICATIONS LTD SGD 7,149 0.13%
466 SMARTONE TELECOMMUNICATIONS HOLDINGS LTD HKD 222 0.00%813 STARHUB LTD SGD 674 0.01%
18 SWISSCOM AG CHF 8,553 0.15%210 TELEKOM AUSTRIA AG CLASS A EUR 1,290 0.02%180 VERIZON COMMUNICATIONS INC USD 8,814 0.16%
Cosmetics/Personal Care - 0.33% (30 June 2019: 0.13%) 132 COLGATE-PALMOLIVE CO USD 8,603 0.15%15 EARTH CORP JPY 1,024 0.02%84 PROCTER & GAMBLE CO USD 8,988 0.16%
Distribution/Wholesale - 0.16% (30 June 2019: 0.03%) 33 D'IETEREN SA/NV EUR 1,631 0.03%6 ITOCHU-SHOKUHIN CO LTD JPY 241 0.00%
317 LKQ CORP USD 7,406 0.13%
Entertainment - 0.01% (30 June 2019: 0.01%) 72 BORUSSIA DORTMUND GMBH & CO KGAA EUR 416 0.01%15 MARS GROUP HOLDINGS CORP JPY 203 0.00%
Financial - 0.69% (30 June 2019: 1.71%) 40 ABC ARBITRAGE EUR 277 0.00%
197 AGEAS SA/NV EUR 6,224 0.11%10 AMERICAN NATIONAL INSURANCE CO USD 645 0.01%
1,565 ASCOTT RESIDENCE TRUST SGD 999 0.02%273 CAPITOL FEDERAL FINANCIAL INC USD 2,677 0.05%16 CORESTATE CAPITAL HOLDING SA EUR 294 0.01%37 EHIME BANK LTD JPY 354 0.01%25 GIMV NV EUR 1,256 0.02%
120 GLOBE LIFE INC USD 7,954 0.14%1 INTERSHOP HOLDING AG CHF 455 0.01%
93
DocuSign Envelope ID: 2646536F-BB10-4779-844A-39205D22F4E0

SEI Global Assets Fund plc Annual Report and Audited Financial Statements for the financial year ended 30 June 2020 THE SEI EURO CONSERVATIVE FUND PORTFOLIO OF INVESTMENTS AS AT 30 JUNE 2020 (continued)
Nominal Security Currency
Code Value EUR Fund %
Financial - 0.69% (30 June 2019: 1.71%) (continued) 40 MERIDIAN BANCORP INC USD 415 0.01%53 NORTHFIELD BANCORP INC USD 544 0.01%
317 NORTHWEST BANCSHARES INC USD 2,883 0.05%36 RINGKJOEBING LANDBOBANK A/S DKK 2,284 0.04%21 SOFINA SA EUR 4,843 0.09%
116 SPAR NORD BANK A/S DKK 820 0.01%34 SUN LIFE FINANCIAL INC CAD 1,122 0.02%
106 TIMBERCREEK FINANCIAL CORP CAD 593 0.01%109 WASHINGTON FEDERAL INC USD 2,608 0.05%31 WATERSTONE FINANCIAL INC USD 409 0.01%31 WUESTENROT & WUERTTEMBERGISCHE AG EUR 470 0.01%
Food - 1.28% (30 June 2019: 1.23%) 72 AGRANA BETEILIGUNGS AG EUR 1,314 0.02%41 ARCS CO LTD JPY 731 0.01%91 COLRUYT SA EUR 4,450 0.08%8 DAIKOKUTENBUSSAN CO LTD JPY 300 0.01%
13 FUJIYA CO LTD JPY 235 0.00%57 HERSHEY CO USD 6,575 0.12%30 KATO SANGYO CO LTD JPY 863 0.02%
349 KONINKLIJKE AHOLD DELHAIZE NV EUR 8,476 0.15%240 KROGER CO USD 7,222 0.13%245 METRO INC CLASS A CAD 8,962 0.16%19 MITSUBISHI SHOKUHIN CO LTD JPY 431 0.01%13 NIPPON BEET SUGAR MANUFACTURING CO LTD JPY 199 0.00%11 NISSHIN OILLIO GROUP LTD JPY 318 0.01%65 NORTH WEST CO INC CAD 1,262 0.02%28 OKUWA CO LTD JPY 388 0.01%7 ORIOR AG CHF 521 0.01%7 RAMI LEVY CHAIN STORES HASHIKMA MARKETING 2006 LTD ILS 370 0.01%
29 RETAIL PARTNERS CO LTD JPY 411 0.01%1,765 ROGERS SUGAR INC CAD 5,400 0.10%
21 SHOWA SANGYO CO LTD JPY 571 0.01%153 SYSCO CORP USD 7,466 0.13%358 TATE & LYLE PLC GBP 2,631 0.05%
27 TOOTSIE ROLL INDUSTRIES INC USD 821 0.01%241 US FOODS HOLDING CORP USD 4,233 0.07%10 VILLAGE SUPER MARKET INC CLASS A USD 250 0.00%17 WEIS MARKETS INC USD 764 0.01%
264 WOOLWORTHS GROUP LTD AUD 6,036 0.11%57 YOKOHAMA REITO CO LTD JPY 420 0.01%
Healthcare-Services - 0.19% (30 June 2019: 0.17%) 26 CHEMED CORP USD 10,393 0.18%11 NATIONAL HEALTHCARE CORP USD 614 0.01%
Home Furnishings - 0.02% (30 June 2019: 0.01%) 193 VTECH HOLDINGS LTD HKD 1,030 0.02%
Household Products/Wares - 0.45% (30 June 2019: 0.33%) 11 CHURCH & DWIGHT CO INC USD 749 0.01%59 CLOROX CO USD 11,499 0.20%82 KIMBERLY-CLARK CORP USD 10,318 0.18%19 WD-40 CO USD 3,373 0.06%
Industrial - 0.29% (30 June 2019: 0.19%) 50 BEKAERT SA EUR 881 0.02%38 CK INFRASTRUCTURE HOLDINGS LTD HKD 173 0.00%14 GO-AHEAD GROUP PLC GBP 128 0.00%
365 MDU RESOURCES GROUP INC USD 7,200 0.13%41 OESTERREICHISCHE POST AG EUR 1,208 0.02%
101 SILGAN HOLDINGS INC USD 2,912 0.05%63 STAR GROUP LP USD 492 0.01%19 TAMRON CO LTD JPY 295 0.01%87 TFI INTERNATIONAL INC CAD 2,754 0.05%
94
DocuSign Envelope ID: 2646536F-BB10-4779-844A-39205D22F4E0
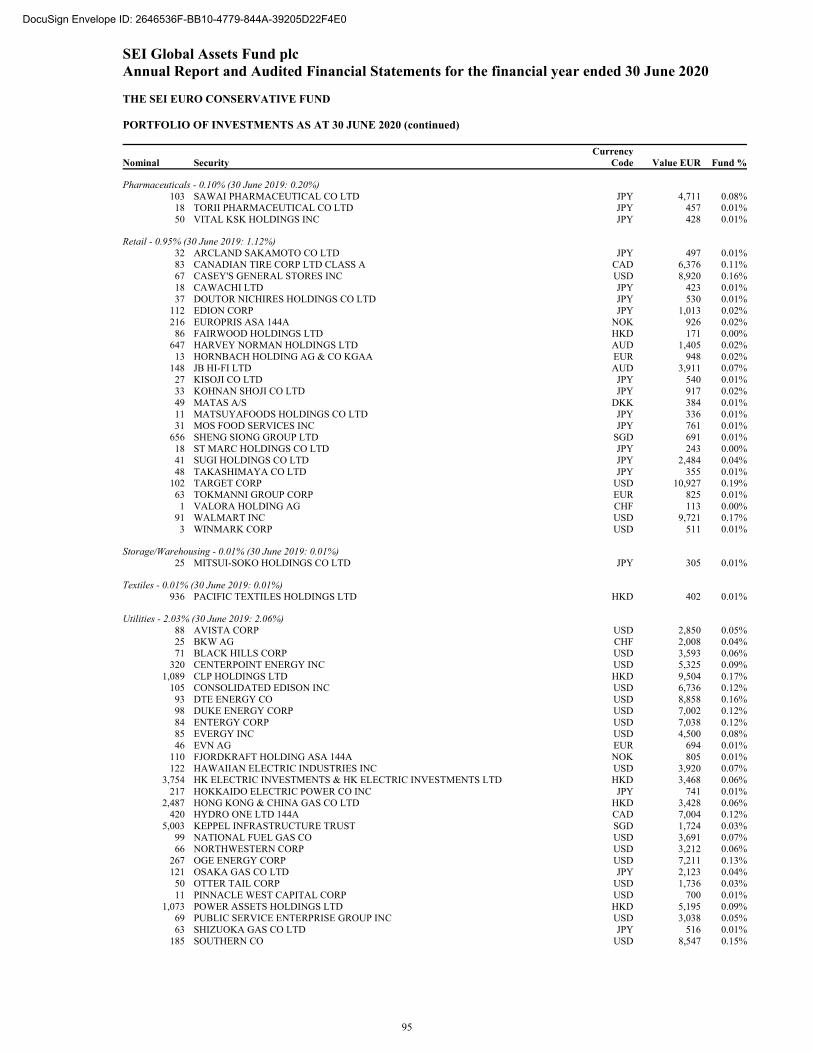
SEI Global Assets Fund plc Annual Report and Audited Financial Statements for the financial year ended 30 June 2020 THE SEI EURO CONSERVATIVE FUND PORTFOLIO OF INVESTMENTS AS AT 30 JUNE 2020 (continued)
Nominal Security Currency
Code Value EUR Fund %
Pharmaceuticals - 0.10% (30 June 2019: 0.20%) 103 SAWAI PHARMACEUTICAL CO LTD JPY 4,711 0.08%18 TORII PHARMACEUTICAL CO LTD JPY 457 0.01%50 VITAL KSK HOLDINGS INC JPY 428 0.01%
Retail - 0.95% (30 June 2019: 1.12%) 32 ARCLAND SAKAMOTO CO LTD JPY 497 0.01%83 CANADIAN TIRE CORP LTD CLASS A CAD 6,376 0.11%67 CASEY'S GENERAL STORES INC USD 8,920 0.16%18 CAWACHI LTD JPY 423 0.01%37 DOUTOR NICHIRES HOLDINGS CO LTD JPY 530 0.01%
112 EDION CORP JPY 1,013 0.02%216 EUROPRIS ASA 144A NOK 926 0.02%
86 FAIRWOOD HOLDINGS LTD HKD 171 0.00%647 HARVEY NORMAN HOLDINGS LTD AUD 1,405 0.02%13 HORNBACH HOLDING AG & CO KGAA EUR 948 0.02%
148 JB HI-FI LTD AUD 3,911 0.07%27 KISOJI CO LTD JPY 540 0.01%33 KOHNAN SHOJI CO LTD JPY 917 0.02%49 MATAS A/S DKK 384 0.01%11 MATSUYAFOODS HOLDINGS CO LTD JPY 336 0.01%31 MOS FOOD SERVICES INC JPY 761 0.01%
656 SHENG SIONG GROUP LTD SGD 691 0.01%18 ST MARC HOLDINGS CO LTD JPY 243 0.00%41 SUGI HOLDINGS CO LTD JPY 2,484 0.04%48 TAKASHIMAYA CO LTD JPY 355 0.01%
102 TARGET CORP USD 10,927 0.19%63 TOKMANNI GROUP CORP EUR 825 0.01%1 VALORA HOLDING AG CHF 113 0.00%
91 WALMART INC USD 9,721 0.17%3 WINMARK CORP USD 511 0.01%
Storage/Warehousing - 0.01% (30 June 2019: 0.01%) 25 MITSUI-SOKO HOLDINGS CO LTD JPY 305 0.01%
Textiles - 0.01% (30 June 2019: 0.01%) 936 PACIFIC TEXTILES HOLDINGS LTD HKD 402 0.01%
Utilities - 2.03% (30 June 2019: 2.06%) 88 AVISTA CORP USD 2,850 0.05%25 BKW AG CHF 2,008 0.04%71 BLACK HILLS CORP USD 3,593 0.06%
320 CENTERPOINT ENERGY INC USD 5,325 0.09%1,089 CLP HOLDINGS LTD HKD 9,504 0.17%
105 CONSOLIDATED EDISON INC USD 6,736 0.12%93 DTE ENERGY CO USD 8,858 0.16%98 DUKE ENERGY CORP USD 7,002 0.12%84 ENTERGY CORP USD 7,038 0.12%85 EVERGY INC USD 4,500 0.08%46 EVN AG EUR 694 0.01%
110 FJORDKRAFT HOLDING ASA 144A NOK 805 0.01%122 HAWAIIAN ELECTRIC INDUSTRIES INC USD 3,920 0.07%
3,754 HK ELECTRIC INVESTMENTS & HK ELECTRIC INVESTMENTS LTD HKD 3,468 0.06%217 HOKKAIDO ELECTRIC POWER CO INC JPY 741 0.01%
2,487 HONG KONG & CHINA GAS CO LTD HKD 3,428 0.06%420 HYDRO ONE LTD 144A CAD 7,004 0.12%
5,003 KEPPEL INFRASTRUCTURE TRUST SGD 1,724 0.03%99 NATIONAL FUEL GAS CO USD 3,691 0.07%66 NORTHWESTERN CORP USD 3,212 0.06%
267 OGE ENERGY CORP USD 7,211 0.13%121 OSAKA GAS CO LTD JPY 2,123 0.04%
50 OTTER TAIL CORP USD 1,736 0.03%11 PINNACLE WEST CAPITAL CORP USD 700 0.01%
1,073 POWER ASSETS HOLDINGS LTD HKD 5,195 0.09%69 PUBLIC SERVICE ENTERPRISE GROUP INC USD 3,038 0.05%63 SHIZUOKA GAS CO LTD JPY 516 0.01%
185 SOUTHERN CO USD 8,547 0.15%
95
DocuSign Envelope ID: 2646536F-BB10-4779-844A-39205D22F4E0
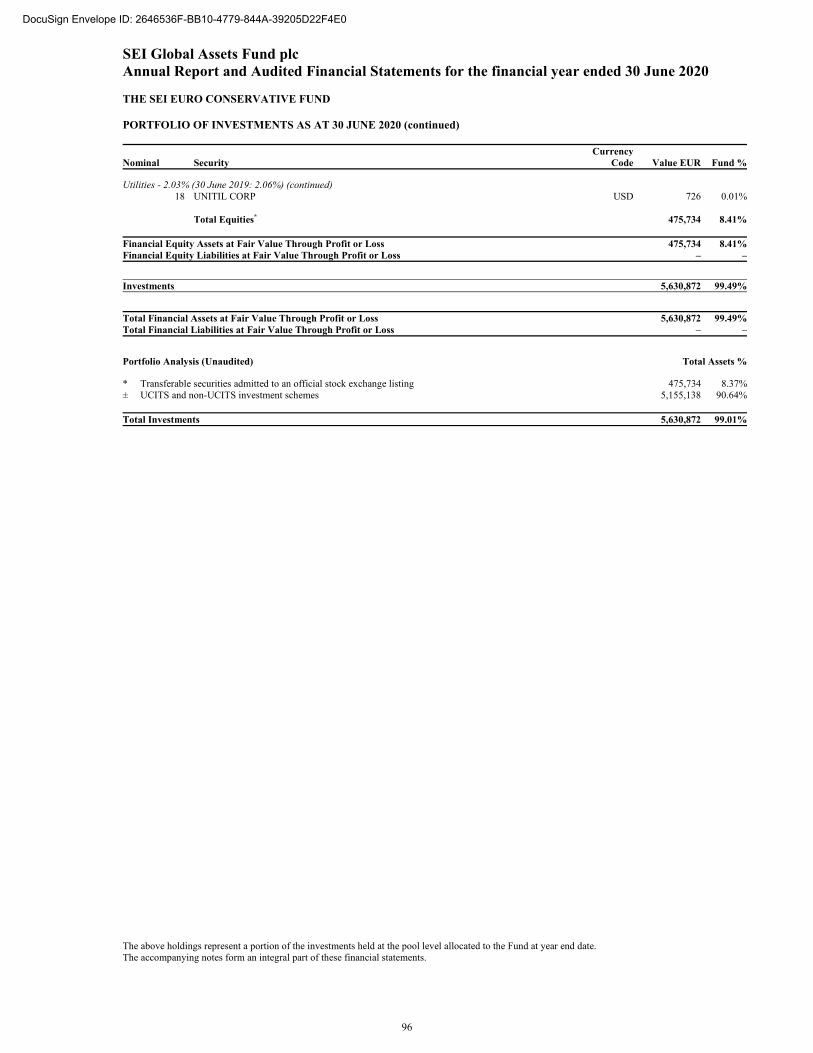
SEI Global Assets Fund plc Annual Report and Audited Financial Statements for the financial year ended 30 June 2020 THE SEI EURO CONSERVATIVE FUND PORTFOLIO OF INVESTMENTS AS AT 30 JUNE 2020 (continued)
Nominal Security Currency
Code Value EUR Fund %
Utilities - 2.03% (30 June 2019: 2.06%) (continued) 18 UNITIL CORP USD 726 0.01%
Total Equities* 475,734 8.41% Financial Equity Assets at Fair Value Through Profit or Loss 475,734 8.41%Financial Equity Liabilities at Fair Value Through Profit or Loss – –
Investments 5,630,872 99.49%
Total Financial Assets at Fair Value Through Profit or Loss 5,630,872 99.49%Total Financial Liabilities at Fair Value Through Profit or Loss – –
Portfolio Analysis (Unaudited) Total Assets % * Transferable securities admitted to an official stock exchange listing 475,734 8.37%± UCITS and non-UCITS investment schemes 5,155,138 90.64% Total Investments 5,630,872 99.01%
The above holdings represent a portion of the investments held at the pool level allocated to the Fund at year end date. The accompanying notes form an integral part of these financial statements.
96
DocuSign Envelope ID: 2646536F-BB10-4779-844A-39205D22F4E0
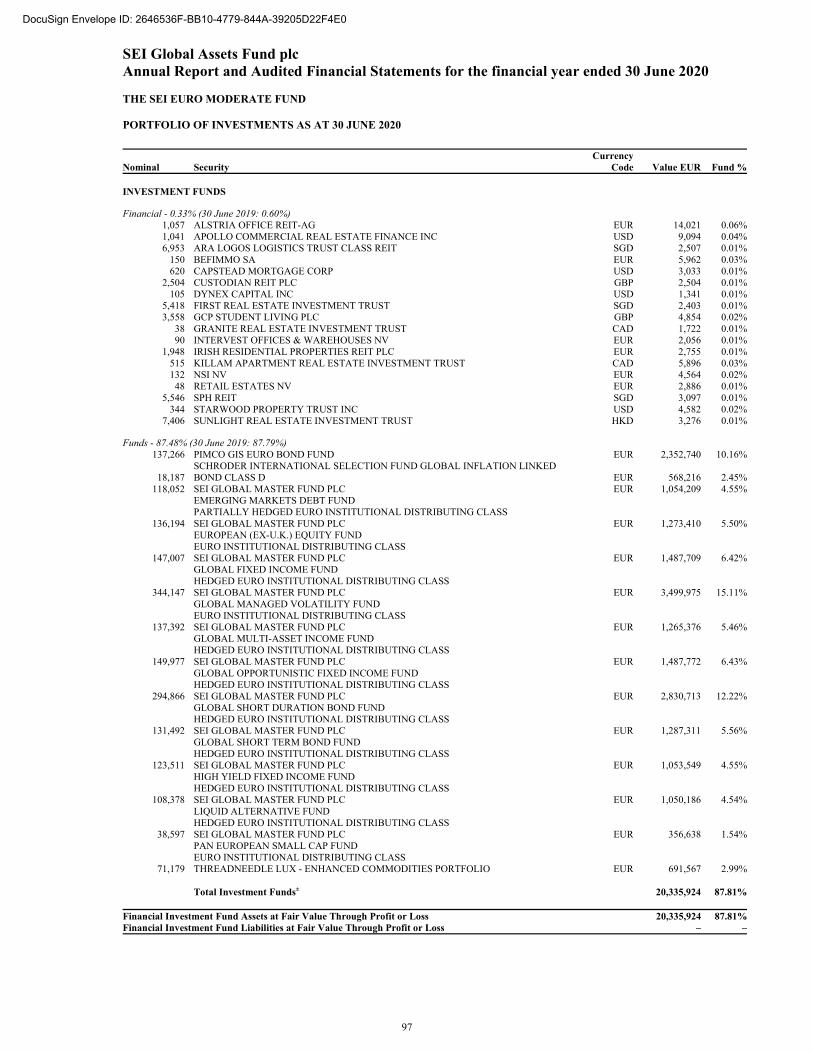
SEI Global Assets Fund plc Annual Report and Audited Financial Statements for the financial year ended 30 June 2020 THE SEI EURO MODERATE FUND PORTFOLIO OF INVESTMENTS AS AT 30 JUNE 2020
Nominal Security Currency
Code Value EUR Fund % INVESTMENT FUNDS
Financial - 0.33% (30 June 2019: 0.60%) 1,057 ALSTRIA OFFICE REIT-AG EUR 14,021 0.06%1,041 APOLLO COMMERCIAL REAL ESTATE FINANCE INC USD 9,094 0.04%6,953 ARA LOGOS LOGISTICS TRUST CLASS REIT SGD 2,507 0.01%
150 BEFIMMO SA EUR 5,962 0.03%620 CAPSTEAD MORTGAGE CORP USD 3,033 0.01%
2,504 CUSTODIAN REIT PLC GBP 2,504 0.01%105 DYNEX CAPITAL INC USD 1,341 0.01%
5,418 FIRST REAL ESTATE INVESTMENT TRUST SGD 2,403 0.01%3,558 GCP STUDENT LIVING PLC GBP 4,854 0.02%
38 GRANITE REAL ESTATE INVESTMENT TRUST CAD 1,722 0.01%90 INTERVEST OFFICES & WAREHOUSES NV EUR 2,056 0.01%
1,948 IRISH RESIDENTIAL PROPERTIES REIT PLC EUR 2,755 0.01%515 KILLAM APARTMENT REAL ESTATE INVESTMENT TRUST CAD 5,896 0.03%132 NSI NV EUR 4,564 0.02%
48 RETAIL ESTATES NV EUR 2,886 0.01%5,546 SPH REIT SGD 3,097 0.01%
344 STARWOOD PROPERTY TRUST INC USD 4,582 0.02%7,406 SUNLIGHT REAL ESTATE INVESTMENT TRUST HKD 3,276 0.01%
Funds - 87.48% (30 June 2019: 87.79%) 137,266 PIMCO GIS EURO BOND FUND EUR 2,352,740 10.16%
18,187 SCHRODER INTERNATIONAL SELECTION FUND GLOBAL INFLATION LINKED BOND CLASS D EUR 568,216 2.45%
118,052 SEI GLOBAL MASTER FUND PLC EUR 1,054,209 4.55% EMERGING MARKETS DEBT FUND PARTIALLY HEDGED EURO INSTITUTIONAL DISTRIBUTING CLASS
136,194 SEI GLOBAL MASTER FUND PLC EUR 1,273,410 5.50% EUROPEAN (EX-U.K.) EQUITY FUND EURO INSTITUTIONAL DISTRIBUTING CLASS
147,007 SEI GLOBAL MASTER FUND PLC EUR 1,487,709 6.42% GLOBAL FIXED INCOME FUND HEDGED EURO INSTITUTIONAL DISTRIBUTING CLASS
344,147 SEI GLOBAL MASTER FUND PLC EUR 3,499,975 15.11% GLOBAL MANAGED VOLATILITY FUND EURO INSTITUTIONAL DISTRIBUTING CLASS
137,392 SEI GLOBAL MASTER FUND PLC EUR 1,265,376 5.46% GLOBAL MULTI-ASSET INCOME FUND HEDGED EURO INSTITUTIONAL DISTRIBUTING CLASS
149,977 SEI GLOBAL MASTER FUND PLC EUR 1,487,772 6.43% GLOBAL OPPORTUNISTIC FIXED INCOME FUND HEDGED EURO INSTITUTIONAL DISTRIBUTING CLASS
294,866 SEI GLOBAL MASTER FUND PLC EUR 2,830,713 12.22% GLOBAL SHORT DURATION BOND FUND HEDGED EURO INSTITUTIONAL DISTRIBUTING CLASS
131,492 SEI GLOBAL MASTER FUND PLC EUR 1,287,311 5.56% GLOBAL SHORT TERM BOND FUND HEDGED EURO INSTITUTIONAL DISTRIBUTING CLASS
123,511 SEI GLOBAL MASTER FUND PLC EUR 1,053,549 4.55% HIGH YIELD FIXED INCOME FUND HEDGED EURO INSTITUTIONAL DISTRIBUTING CLASS
108,378 SEI GLOBAL MASTER FUND PLC EUR 1,050,186 4.54% LIQUID ALTERNATIVE FUND HEDGED EURO INSTITUTIONAL DISTRIBUTING CLASS
38,597 SEI GLOBAL MASTER FUND PLC EUR 356,638 1.54% PAN EUROPEAN SMALL CAP FUND EURO INSTITUTIONAL DISTRIBUTING CLASS
71,179 THREADNEEDLE LUX - ENHANCED COMMODITIES PORTFOLIO EUR 691,567 2.99% Total Investment Funds± 20,335,924 87.81% Financial Investment Fund Assets at Fair Value Through Profit or Loss 20,335,924 87.81%Financial Investment Fund Liabilities at Fair Value Through Profit or Loss – –
97
DocuSign Envelope ID: 2646536F-BB10-4779-844A-39205D22F4E0

SEI Global Assets Fund plc Annual Report and Audited Financial Statements for the financial year ended 30 June 2020 THE SEI EURO MODERATE FUND PORTFOLIO OF INVESTMENTS AS AT 30 JUNE 2020 (continued)
Nominal Security Currency
Code Value EUR Fund % EQUITIES
Agriculture - 0.27% (30 June 2019: 0.27%) 143 HOKUTO CORP JPY 2,392 0.01%473 SCANDINAVIAN TOBACCO GROUP A/S 144A DKK 6,213 0.03%868 SWEDISH MATCH AB SEK 54,349 0.23%
Basic Materials - 0.25% (30 June 2019: 0.08%) 122 KAISER ALUMINUM CORP USD 8,001 0.03%748 KEMIRA OYJ EUR 8,572 0.04%500 RELIANCE STEEL & ALUMINUM CO USD 42,269 0.18%
Beverages - 0.02% (30 June 2019: 0.02%) 56 DYDO GROUP HOLDINGS INC JPY 2,264 0.01%
125 KEY COFFEE INC JPY 2,355 0.01%
Biotechnology - 0.42% (30 June 2019: 0.00%) 117 AMGEN INC USD 24,547 0.11%166 BIOGEN INC USD 39,591 0.17%291 UNITED THERAPEUTICS CORP USD 31,334 0.14%
Commercial Services - 0.01% (30 June 2019: 0.03%) 1,941 SIA ENGINEERING CO LTD SGD 2,440 0.01%
Communications - 1.63% (30 June 2019: 0.86%) 1,031 AT&T INC USD 27,744 0.12%1,079 BCE INC CAD 39,934 0.17%
22,881 HKT TRUST & HKT LTD CLASS MISCELLA HKD 29,807 0.13%11,092 HUTCHISON TELECOMMUNICATIONS HONG KONG HOLDINGS LTD HKD 1,567 0.01%
187 METROPOLE TELEVISION SA EUR 1,878 0.01%21,802 NETLINK NBN TRUST SGD 13,497 0.06%
1,069 NTT DOCOMO INC JPY 25,416 0.11%926 OMNICOM GROUP INC USD 45,013 0.19%
33,064 PCCW LTD HKD 16,789 0.07%46 QUEBECOR INC CLASS B CAD 869 0.00%
4,197 SES SA CLASS A EUR 25,519 0.11%25,545 SINGAPORE TELECOMMUNICATIONS LTD SGD 40,106 0.17%2,612 SMARTONE TELECOMMUNICATIONS HOLDINGS LTD HKD 1,245 0.01%4,559 STARHUB LTD SGD 3,783 0.02%
103 SWISSCOM AG CHF 47,985 0.21%1,177 TELEKOM AUSTRIA AG CLASS A EUR 7,236 0.03%1,007 VERIZON COMMUNICATIONS INC USD 49,445 0.21%
Cosmetics/Personal Care - 0.45% (30 June 2019: 0.18%) 740 COLGATE-PALMOLIVE CO USD 48,262 0.21%85 EARTH CORP JPY 5,745 0.02%
474 PROCTER & GAMBLE CO USD 50,423 0.22%
Distribution/Wholesale - 0.23% (30 June 2019: 0.04%) 186 D'IETEREN SA/NV EUR 9,151 0.04%
32 ITOCHU-SHOKUHIN CO LTD JPY 1,353 0.01%1,781 LKQ CORP USD 41,547 0.18%
Entertainment - 0.02% (30 June 2019: 0.02%) 404 BORUSSIA DORTMUND GMBH & CO KGAA EUR 2,336 0.01%
85 MARS GROUP HOLDINGS CORP JPY 1,137 0.01%
Financial - 0.93% (30 June 2019: 2.31%) 227 ABC ARBITRAGE EUR 1,553 0.01%
1,107 AGEAS SA/NV EUR 34,917 0.15%56 AMERICAN NATIONAL INSURANCE CO USD 3,619 0.02%
8,780 ASCOTT RESIDENCE TRUST SGD 5,604 0.02%1,532 CAPITOL FEDERAL FINANCIAL INC USD 15,020 0.07%
92 CORESTATE CAPITAL HOLDING SA EUR 1,651 0.01%207 EHIME BANK LTD JPY 1,988 0.01%138 GIMV NV EUR 7,049 0.03%675 GLOBE LIFE INC USD 44,623 0.19%
5 INTERSHOP HOLDING AG CHF 2,554 0.01%
98
DocuSign Envelope ID: 2646536F-BB10-4779-844A-39205D22F4E0
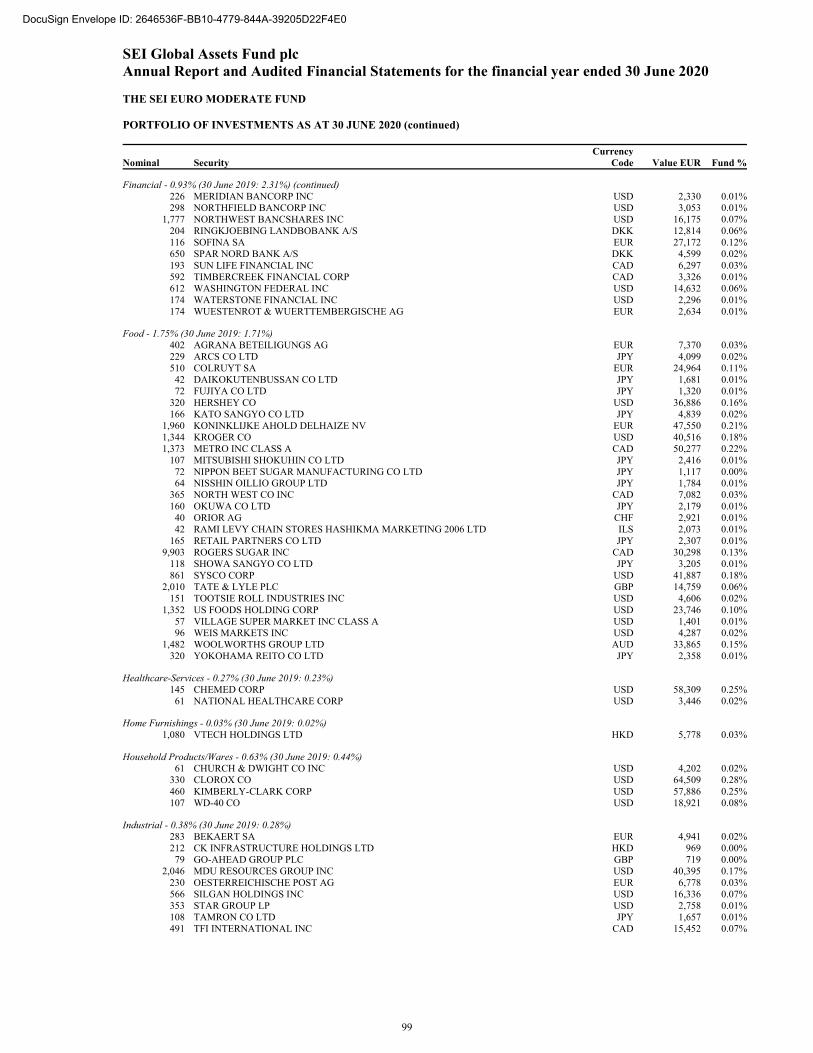
SEI Global Assets Fund plc Annual Report and Audited Financial Statements for the financial year ended 30 June 2020 THE SEI EURO MODERATE FUND PORTFOLIO OF INVESTMENTS AS AT 30 JUNE 2020 (continued)
Nominal Security Currency
Code Value EUR Fund %
Financial - 0.93% (30 June 2019: 2.31%) (continued) 226 MERIDIAN BANCORP INC USD 2,330 0.01%298 NORTHFIELD BANCORP INC USD 3,053 0.01%
1,777 NORTHWEST BANCSHARES INC USD 16,175 0.07%204 RINGKJOEBING LANDBOBANK A/S DKK 12,814 0.06%116 SOFINA SA EUR 27,172 0.12%650 SPAR NORD BANK A/S DKK 4,599 0.02%193 SUN LIFE FINANCIAL INC CAD 6,297 0.03%592 TIMBERCREEK FINANCIAL CORP CAD 3,326 0.01%612 WASHINGTON FEDERAL INC USD 14,632 0.06%174 WATERSTONE FINANCIAL INC USD 2,296 0.01%174 WUESTENROT & WUERTTEMBERGISCHE AG EUR 2,634 0.01%
Food - 1.75% (30 June 2019: 1.71%) 402 AGRANA BETEILIGUNGS AG EUR 7,370 0.03%229 ARCS CO LTD JPY 4,099 0.02%510 COLRUYT SA EUR 24,964 0.11%
42 DAIKOKUTENBUSSAN CO LTD JPY 1,681 0.01%72 FUJIYA CO LTD JPY 1,320 0.01%
320 HERSHEY CO USD 36,886 0.16%166 KATO SANGYO CO LTD JPY 4,839 0.02%
1,960 KONINKLIJKE AHOLD DELHAIZE NV EUR 47,550 0.21%1,344 KROGER CO USD 40,516 0.18%1,373 METRO INC CLASS A CAD 50,277 0.22%
107 MITSUBISHI SHOKUHIN CO LTD JPY 2,416 0.01%72 NIPPON BEET SUGAR MANUFACTURING CO LTD JPY 1,117 0.00%64 NISSHIN OILLIO GROUP LTD JPY 1,784 0.01%
365 NORTH WEST CO INC CAD 7,082 0.03%160 OKUWA CO LTD JPY 2,179 0.01%
40 ORIOR AG CHF 2,921 0.01%42 RAMI LEVY CHAIN STORES HASHIKMA MARKETING 2006 LTD ILS 2,073 0.01%
165 RETAIL PARTNERS CO LTD JPY 2,307 0.01%9,903 ROGERS SUGAR INC CAD 30,298 0.13%
118 SHOWA SANGYO CO LTD JPY 3,205 0.01%861 SYSCO CORP USD 41,887 0.18%
2,010 TATE & LYLE PLC GBP 14,759 0.06%151 TOOTSIE ROLL INDUSTRIES INC USD 4,606 0.02%
1,352 US FOODS HOLDING CORP USD 23,746 0.10%57 VILLAGE SUPER MARKET INC CLASS A USD 1,401 0.01%96 WEIS MARKETS INC USD 4,287 0.02%
1,482 WOOLWORTHS GROUP LTD AUD 33,865 0.15%320 YOKOHAMA REITO CO LTD JPY 2,358 0.01%
Healthcare-Services - 0.27% (30 June 2019: 0.23%) 145 CHEMED CORP USD 58,309 0.25%
61 NATIONAL HEALTHCARE CORP USD 3,446 0.02%
Home Furnishings - 0.03% (30 June 2019: 0.02%) 1,080 VTECH HOLDINGS LTD HKD 5,778 0.03%
Household Products/Wares - 0.63% (30 June 2019: 0.44%) 61 CHURCH & DWIGHT CO INC USD 4,202 0.02%
330 CLOROX CO USD 64,509 0.28%460 KIMBERLY-CLARK CORP USD 57,886 0.25%107 WD-40 CO USD 18,921 0.08%
Industrial - 0.38% (30 June 2019: 0.28%) 283 BEKAERT SA EUR 4,941 0.02%212 CK INFRASTRUCTURE HOLDINGS LTD HKD 969 0.00%79 GO-AHEAD GROUP PLC GBP 719 0.00%
2,046 MDU RESOURCES GROUP INC USD 40,395 0.17%230 OESTERREICHISCHE POST AG EUR 6,778 0.03%566 SILGAN HOLDINGS INC USD 16,336 0.07%353 STAR GROUP LP USD 2,758 0.01%108 TAMRON CO LTD JPY 1,657 0.01%491 TFI INTERNATIONAL INC CAD 15,452 0.07%
99
DocuSign Envelope ID: 2646536F-BB10-4779-844A-39205D22F4E0

SEI Global Assets Fund plc Annual Report and Audited Financial Statements for the financial year ended 30 June 2020 THE SEI EURO MODERATE FUND PORTFOLIO OF INVESTMENTS AS AT 30 JUNE 2020 (continued)
Nominal Security Currency
Code Value EUR Fund %
Pharmaceuticals - 0.13% (30 June 2019: 0.28%) 578 SAWAI PHARMACEUTICAL CO LTD JPY 26,432 0.11%100 TORII PHARMACEUTICAL CO LTD JPY 2,565 0.01%282 VITAL KSK HOLDINGS INC JPY 2,402 0.01%
Retail - 1.28% (30 June 2019: 1.55%) 180 ARCLAND SAKAMOTO CO LTD JPY 2,790 0.01%465 CANADIAN TIRE CORP LTD CLASS A CAD 35,769 0.15%376 CASEY'S GENERAL STORES INC USD 50,044 0.22%103 CAWACHI LTD JPY 2,371 0.01%207 DOUTOR NICHIRES HOLDINGS CO LTD JPY 2,973 0.01%630 EDION CORP JPY 5,681 0.02%
1,212 EUROPRIS ASA 144A NOK 5,195 0.02%482 FAIRWOOD HOLDINGS LTD HKD 959 0.00%
3,632 HARVEY NORMAN HOLDINGS LTD AUD 7,882 0.03%72 HORNBACH HOLDING AG & CO KGAA EUR 5,321 0.02%
832 JB HI-FI LTD AUD 21,939 0.09%150 KISOJI CO LTD JPY 3,031 0.01%184 KOHNAN SHOJI CO LTD JPY 5,145 0.02%274 MATAS A/S DKK 2,155 0.01%
63 MATSUYAFOODS HOLDINGS CO LTD JPY 1,886 0.01%174 MOS FOOD SERVICES INC JPY 4,268 0.02%
3,679 SHENG SIONG GROUP LTD SGD 3,875 0.02%100 ST MARC HOLDINGS CO LTD JPY 1,365 0.01%231 SUGI HOLDINGS CO LTD JPY 13,937 0.06%268 TAKASHIMAYA CO LTD JPY 1,989 0.01%574 TARGET CORP USD 61,305 0.26%352 TOKMANNI GROUP CORP EUR 4,628 0.02%
4 VALORA HOLDING AG CHF 632 0.00%511 WALMART INC USD 54,537 0.24%
19 WINMARK CORP USD 2,866 0.01%
Storage/Warehousing - 0.01% (30 June 2019: 0.01%) 139 MITSUI-SOKO HOLDINGS CO LTD JPY 1,711 0.01%
Textiles - 0.01% (30 June 2019: 0.01%) 5,253 PACIFIC TEXTILES HOLDINGS LTD HKD 2,257 0.01%
Utilities - 2.81% (30 June 2019: 2.76%) 494 AVISTA CORP USD 15,990 0.07%141 BKW AG CHF 11,266 0.05%400 BLACK HILLS CORP USD 20,154 0.09%
1,797 CENTERPOINT ENERGY INC USD 29,875 0.13%6,107 CLP HOLDINGS LTD HKD 53,318 0.23%
590 CONSOLIDATED EDISON INC USD 37,792 0.16%519 DTE ENERGY CO USD 49,697 0.21%552 DUKE ENERGY CORP USD 39,283 0.17%473 ENTERGY CORP USD 39,485 0.17%478 EVERGY INC USD 25,243 0.11%259 EVN AG EUR 3,896 0.02%620 FJORDKRAFT HOLDING ASA 144A NOK 4,514 0.02%685 HAWAIIAN ELECTRIC INDUSTRIES INC USD 21,993 0.10%
21,063 HK ELECTRIC INVESTMENTS & HK ELECTRIC INVESTMENTS LTD HKD 19,454 0.08%1,217 HOKKAIDO ELECTRIC POWER CO INC JPY 4,159 0.02%
13,952 HONG KONG & CHINA GAS CO LTD HKD 19,233 0.08%2,354 HYDRO ONE LTD 144A CAD 39,295 0.17%
28,067 KEPPEL INFRASTRUCTURE TRUST SGD 9,673 0.04%555 NATIONAL FUEL GAS CO USD 20,705 0.09%371 NORTHWESTERN CORP USD 18,017 0.08%
1,497 OGE ENERGY CORP USD 40,457 0.17%678 OSAKA GAS CO LTD JPY 11,910 0.05%282 OTTER TAIL CORP USD 9,740 0.04%
60 PINNACLE WEST CAPITAL CORP USD 3,926 0.02%6,019 POWER ASSETS HOLDINGS LTD HKD 29,142 0.13%
389 PUBLIC SERVICE ENTERPRISE GROUP INC USD 17,046 0.07%355 SHIZUOKA GAS CO LTD JPY 2,896 0.01%
1,039 SOUTHERN CO USD 47,953 0.21%
100
DocuSign Envelope ID: 2646536F-BB10-4779-844A-39205D22F4E0
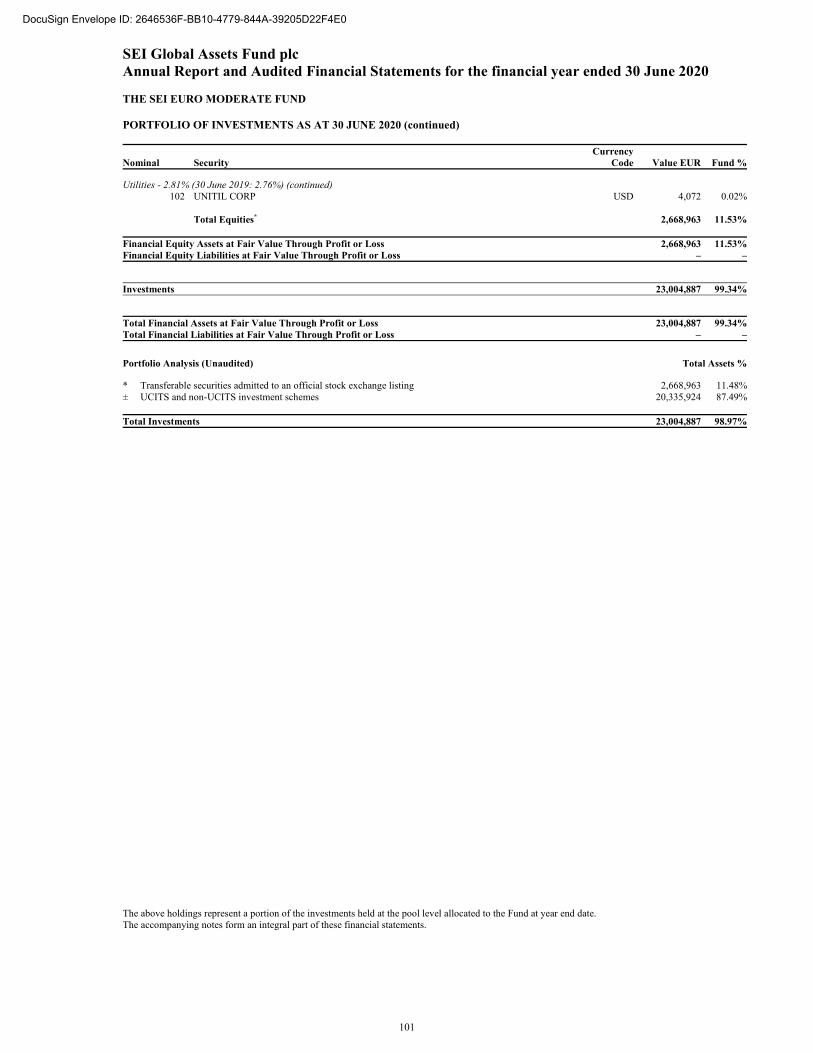
SEI Global Assets Fund plc Annual Report and Audited Financial Statements for the financial year ended 30 June 2020 THE SEI EURO MODERATE FUND PORTFOLIO OF INVESTMENTS AS AT 30 JUNE 2020 (continued)
Nominal Security Currency
Code Value EUR Fund %
Utilities - 2.81% (30 June 2019: 2.76%) (continued) 102 UNITIL CORP USD 4,072 0.02%
Total Equities* 2,668,963 11.53% Financial Equity Assets at Fair Value Through Profit or Loss 2,668,963 11.53%Financial Equity Liabilities at Fair Value Through Profit or Loss – –
Investments 23,004,887 99.34%
Total Financial Assets at Fair Value Through Profit or Loss 23,004,887 99.34%Total Financial Liabilities at Fair Value Through Profit or Loss – –
Portfolio Analysis (Unaudited) Total Assets % * Transferable securities admitted to an official stock exchange listing 2,668,963 11.48%± UCITS and non-UCITS investment schemes 20,335,924 87.49% Total Investments 23,004,887 98.97%
The above holdings represent a portion of the investments held at the pool level allocated to the Fund at year end date. The accompanying notes form an integral part of these financial statements.
101
DocuSign Envelope ID: 2646536F-BB10-4779-844A-39205D22F4E0
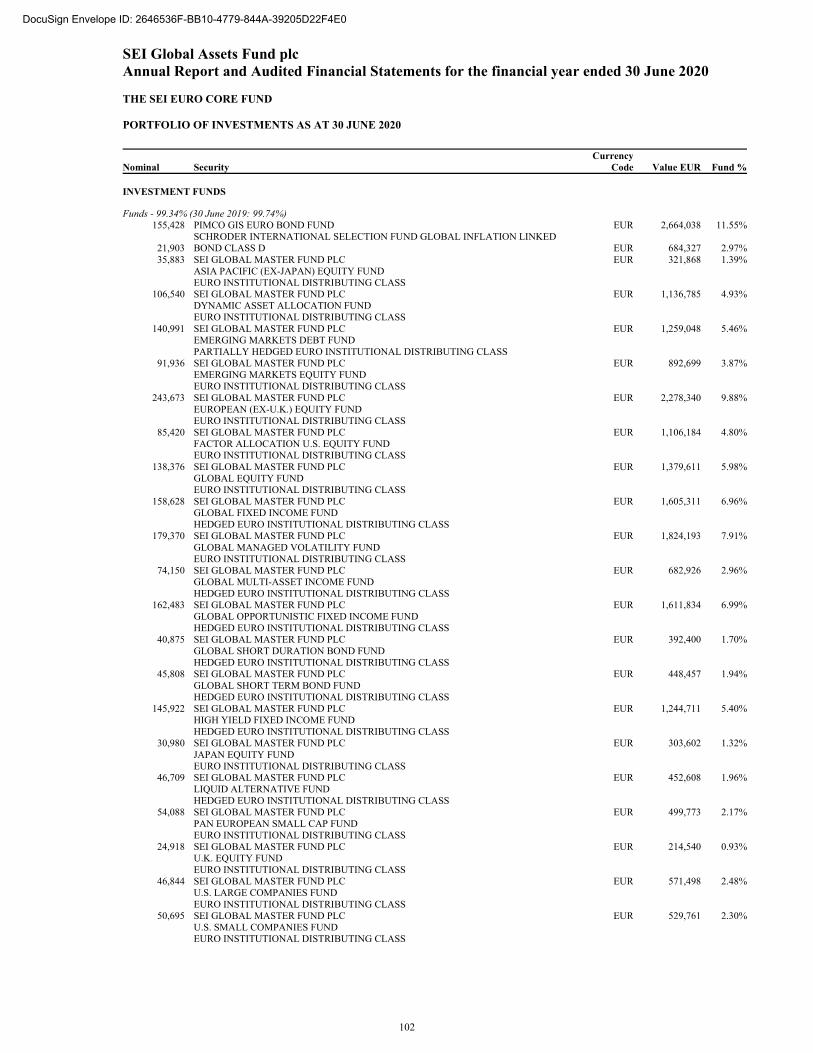
SEI Global Assets Fund plc Annual Report and Audited Financial Statements for the financial year ended 30 June 2020 THE SEI EURO CORE FUND PORTFOLIO OF INVESTMENTS AS AT 30 JUNE 2020
Nominal Security Currency
Code Value EUR Fund % INVESTMENT FUNDS
Funds - 99.34% (30 June 2019: 99.74%) 155,428 PIMCO GIS EURO BOND FUND EUR 2,664,038 11.55%
21,903 SCHRODER INTERNATIONAL SELECTION FUND GLOBAL INFLATION LINKED BOND CLASS D EUR 684,327 2.97%
35,883 SEI GLOBAL MASTER FUND PLC EUR 321,868 1.39% ASIA PACIFIC (EX-JAPAN) EQUITY FUND EURO INSTITUTIONAL DISTRIBUTING CLASS
106,540 SEI GLOBAL MASTER FUND PLC EUR 1,136,785 4.93% DYNAMIC ASSET ALLOCATION FUND EURO INSTITUTIONAL DISTRIBUTING CLASS
140,991 SEI GLOBAL MASTER FUND PLC EUR 1,259,048 5.46% EMERGING MARKETS DEBT FUND PARTIALLY HEDGED EURO INSTITUTIONAL DISTRIBUTING CLASS
91,936 SEI GLOBAL MASTER FUND PLC EUR 892,699 3.87% EMERGING MARKETS EQUITY FUND EURO INSTITUTIONAL DISTRIBUTING CLASS
243,673 SEI GLOBAL MASTER FUND PLC EUR 2,278,340 9.88% EUROPEAN (EX-U.K.) EQUITY FUND EURO INSTITUTIONAL DISTRIBUTING CLASS
85,420 SEI GLOBAL MASTER FUND PLC EUR 1,106,184 4.80% FACTOR ALLOCATION U.S. EQUITY FUND EURO INSTITUTIONAL DISTRIBUTING CLASS
138,376 SEI GLOBAL MASTER FUND PLC EUR 1,379,611 5.98% GLOBAL EQUITY FUND EURO INSTITUTIONAL DISTRIBUTING CLASS
158,628 SEI GLOBAL MASTER FUND PLC EUR 1,605,311 6.96% GLOBAL FIXED INCOME FUND HEDGED EURO INSTITUTIONAL DISTRIBUTING CLASS
179,370 SEI GLOBAL MASTER FUND PLC EUR 1,824,193 7.91% GLOBAL MANAGED VOLATILITY FUND EURO INSTITUTIONAL DISTRIBUTING CLASS
74,150 SEI GLOBAL MASTER FUND PLC EUR 682,926 2.96% GLOBAL MULTI-ASSET INCOME FUND HEDGED EURO INSTITUTIONAL DISTRIBUTING CLASS
162,483 SEI GLOBAL MASTER FUND PLC EUR 1,611,834 6.99% GLOBAL OPPORTUNISTIC FIXED INCOME FUND HEDGED EURO INSTITUTIONAL DISTRIBUTING CLASS
40,875 SEI GLOBAL MASTER FUND PLC EUR 392,400 1.70% GLOBAL SHORT DURATION BOND FUND HEDGED EURO INSTITUTIONAL DISTRIBUTING CLASS
45,808 SEI GLOBAL MASTER FUND PLC EUR 448,457 1.94% GLOBAL SHORT TERM BOND FUND HEDGED EURO INSTITUTIONAL DISTRIBUTING CLASS
145,922 SEI GLOBAL MASTER FUND PLC EUR 1,244,711 5.40% HIGH YIELD FIXED INCOME FUND HEDGED EURO INSTITUTIONAL DISTRIBUTING CLASS
30,980 SEI GLOBAL MASTER FUND PLC EUR 303,602 1.32% JAPAN EQUITY FUND EURO INSTITUTIONAL DISTRIBUTING CLASS
46,709 SEI GLOBAL MASTER FUND PLC EUR 452,608 1.96% LIQUID ALTERNATIVE FUND HEDGED EURO INSTITUTIONAL DISTRIBUTING CLASS
54,088 SEI GLOBAL MASTER FUND PLC EUR 499,773 2.17% PAN EUROPEAN SMALL CAP FUND EURO INSTITUTIONAL DISTRIBUTING CLASS
24,918 SEI GLOBAL MASTER FUND PLC EUR 214,540 0.93% U.K. EQUITY FUND EURO INSTITUTIONAL DISTRIBUTING CLASS
46,844 SEI GLOBAL MASTER FUND PLC EUR 571,498 2.48% U.S. LARGE COMPANIES FUND EURO INSTITUTIONAL DISTRIBUTING CLASS
50,695 SEI GLOBAL MASTER FUND PLC EUR 529,761 2.30% U.S. SMALL COMPANIES FUND EURO INSTITUTIONAL DISTRIBUTING CLASS
102
DocuSign Envelope ID: 2646536F-BB10-4779-844A-39205D22F4E0
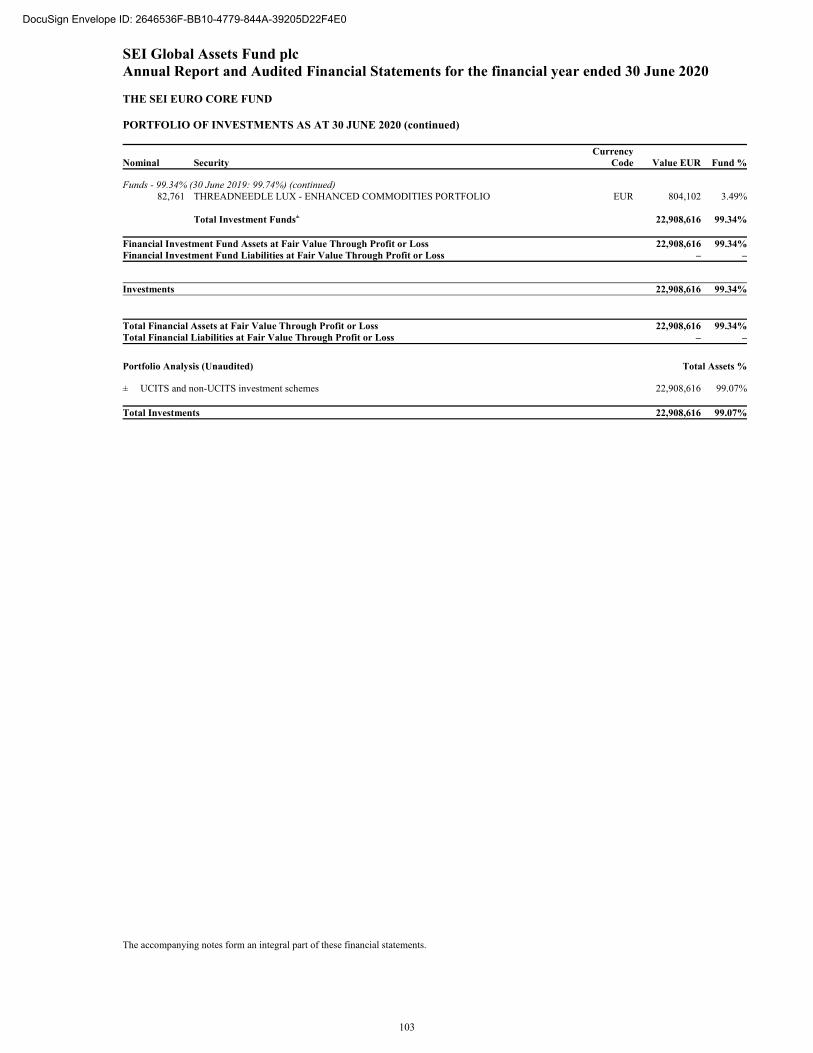
SEI Global Assets Fund plc Annual Report and Audited Financial Statements for the financial year ended 30 June 2020 THE SEI EURO CORE FUND PORTFOLIO OF INVESTMENTS AS AT 30 JUNE 2020 (continued)
Nominal Security Currency
Code Value EUR Fund %
Funds - 99.34% (30 June 2019: 99.74%) (continued) 82,761 THREADNEEDLE LUX - ENHANCED COMMODITIES PORTFOLIO EUR 804,102 3.49%
Total Investment Funds± 22,908,616 99.34% Financial Investment Fund Assets at Fair Value Through Profit or Loss 22,908,616 99.34%Financial Investment Fund Liabilities at Fair Value Through Profit or Loss – –
Investments 22,908,616 99.34%
Total Financial Assets at Fair Value Through Profit or Loss 22,908,616 99.34%Total Financial Liabilities at Fair Value Through Profit or Loss – –
Portfolio Analysis (Unaudited) Total Assets % ± UCITS and non-UCITS investment schemes 22,908,616 99.07% Total Investments 22,908,616 99.07%
The accompanying notes form an integral part of these financial statements.
103
DocuSign Envelope ID: 2646536F-BB10-4779-844A-39205D22F4E0
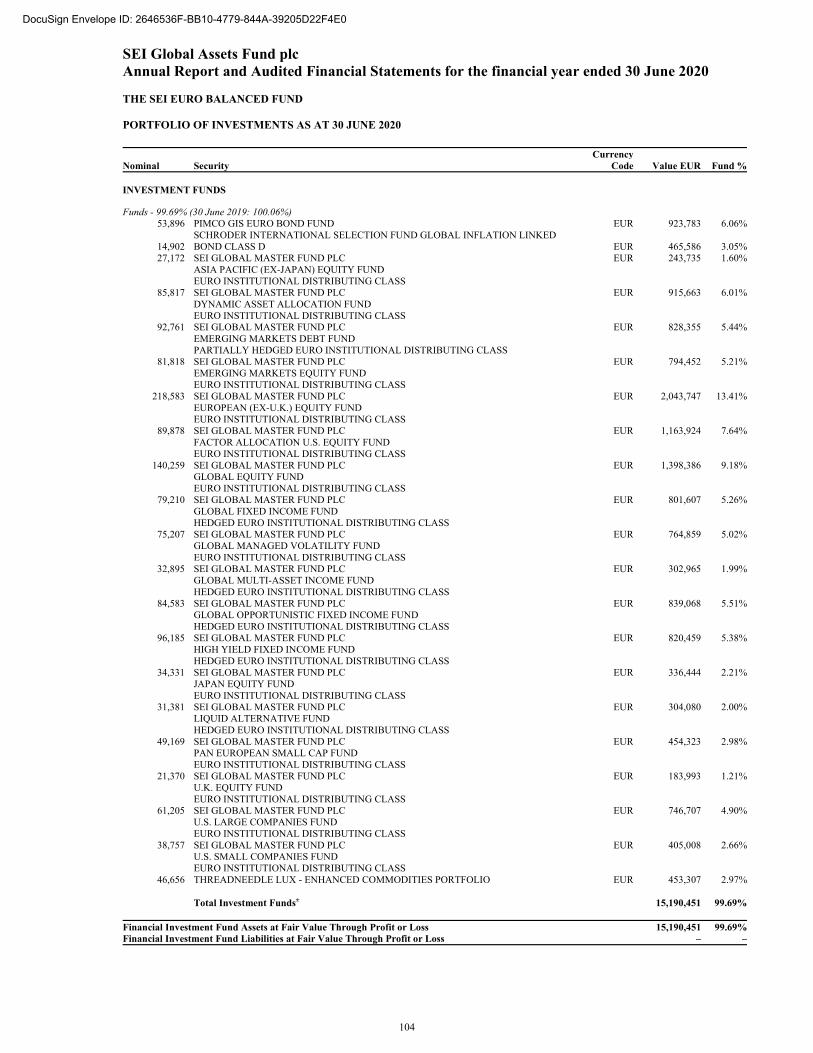
SEI Global Assets Fund plc Annual Report and Audited Financial Statements for the financial year ended 30 June 2020 THE SEI EURO BALANCED FUND PORTFOLIO OF INVESTMENTS AS AT 30 JUNE 2020
Nominal Security Currency
Code Value EUR Fund % INVESTMENT FUNDS
Funds - 99.69% (30 June 2019: 100.06%) 53,896 PIMCO GIS EURO BOND FUND EUR 923,783 6.06%
14,902 SCHRODER INTERNATIONAL SELECTION FUND GLOBAL INFLATION LINKED BOND CLASS D EUR 465,586 3.05%
27,172 SEI GLOBAL MASTER FUND PLC EUR 243,735 1.60% ASIA PACIFIC (EX-JAPAN) EQUITY FUND EURO INSTITUTIONAL DISTRIBUTING CLASS
85,817 SEI GLOBAL MASTER FUND PLC EUR 915,663 6.01% DYNAMIC ASSET ALLOCATION FUND EURO INSTITUTIONAL DISTRIBUTING CLASS
92,761 SEI GLOBAL MASTER FUND PLC EUR 828,355 5.44% EMERGING MARKETS DEBT FUND PARTIALLY HEDGED EURO INSTITUTIONAL DISTRIBUTING CLASS
81,818 SEI GLOBAL MASTER FUND PLC EUR 794,452 5.21% EMERGING MARKETS EQUITY FUND EURO INSTITUTIONAL DISTRIBUTING CLASS
218,583 SEI GLOBAL MASTER FUND PLC EUR 2,043,747 13.41% EUROPEAN (EX-U.K.) EQUITY FUND EURO INSTITUTIONAL DISTRIBUTING CLASS
89,878 SEI GLOBAL MASTER FUND PLC EUR 1,163,924 7.64% FACTOR ALLOCATION U.S. EQUITY FUND EURO INSTITUTIONAL DISTRIBUTING CLASS
140,259 SEI GLOBAL MASTER FUND PLC EUR 1,398,386 9.18% GLOBAL EQUITY FUND EURO INSTITUTIONAL DISTRIBUTING CLASS
79,210 SEI GLOBAL MASTER FUND PLC EUR 801,607 5.26% GLOBAL FIXED INCOME FUND HEDGED EURO INSTITUTIONAL DISTRIBUTING CLASS
75,207 SEI GLOBAL MASTER FUND PLC EUR 764,859 5.02% GLOBAL MANAGED VOLATILITY FUND EURO INSTITUTIONAL DISTRIBUTING CLASS
32,895 SEI GLOBAL MASTER FUND PLC EUR 302,965 1.99% GLOBAL MULTI-ASSET INCOME FUND HEDGED EURO INSTITUTIONAL DISTRIBUTING CLASS
84,583 SEI GLOBAL MASTER FUND PLC EUR 839,068 5.51% GLOBAL OPPORTUNISTIC FIXED INCOME FUND HEDGED EURO INSTITUTIONAL DISTRIBUTING CLASS
96,185 SEI GLOBAL MASTER FUND PLC EUR 820,459 5.38% HIGH YIELD FIXED INCOME FUND HEDGED EURO INSTITUTIONAL DISTRIBUTING CLASS
34,331 SEI GLOBAL MASTER FUND PLC EUR 336,444 2.21% JAPAN EQUITY FUND EURO INSTITUTIONAL DISTRIBUTING CLASS
31,381 SEI GLOBAL MASTER FUND PLC EUR 304,080 2.00% LIQUID ALTERNATIVE FUND HEDGED EURO INSTITUTIONAL DISTRIBUTING CLASS
49,169 SEI GLOBAL MASTER FUND PLC EUR 454,323 2.98% PAN EUROPEAN SMALL CAP FUND EURO INSTITUTIONAL DISTRIBUTING CLASS
21,370 SEI GLOBAL MASTER FUND PLC EUR 183,993 1.21% U.K. EQUITY FUND EURO INSTITUTIONAL DISTRIBUTING CLASS
61,205 SEI GLOBAL MASTER FUND PLC EUR 746,707 4.90% U.S. LARGE COMPANIES FUND EURO INSTITUTIONAL DISTRIBUTING CLASS
38,757 SEI GLOBAL MASTER FUND PLC EUR 405,008 2.66% U.S. SMALL COMPANIES FUND EURO INSTITUTIONAL DISTRIBUTING CLASS
46,656 THREADNEEDLE LUX - ENHANCED COMMODITIES PORTFOLIO EUR 453,307 2.97% Total Investment Funds± 15,190,451 99.69% Financial Investment Fund Assets at Fair Value Through Profit or Loss 15,190,451 99.69%Financial Investment Fund Liabilities at Fair Value Through Profit or Loss – –
104
DocuSign Envelope ID: 2646536F-BB10-4779-844A-39205D22F4E0
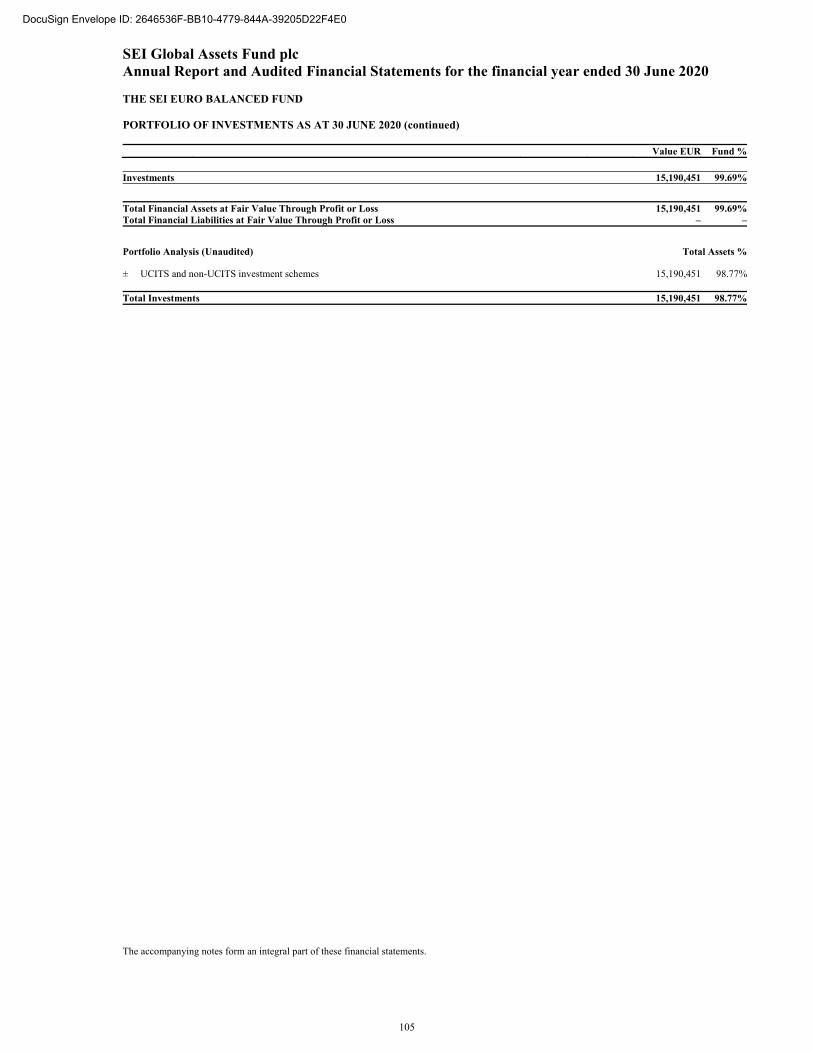
SEI Global Assets Fund plc Annual Report and Audited Financial Statements for the financial year ended 30 June 2020 THE SEI EURO BALANCED FUND PORTFOLIO OF INVESTMENTS AS AT 30 JUNE 2020 (continued)
Value EUR Fund %
Investments 15,190,451 99.69%
Total Financial Assets at Fair Value Through Profit or Loss 15,190,451 99.69%Total Financial Liabilities at Fair Value Through Profit or Loss – –
Portfolio Analysis (Unaudited) Total Assets % ± UCITS and non-UCITS investment schemes 15,190,451 98.77% Total Investments 15,190,451 98.77%
The accompanying notes form an integral part of these financial statements.
105
DocuSign Envelope ID: 2646536F-BB10-4779-844A-39205D22F4E0
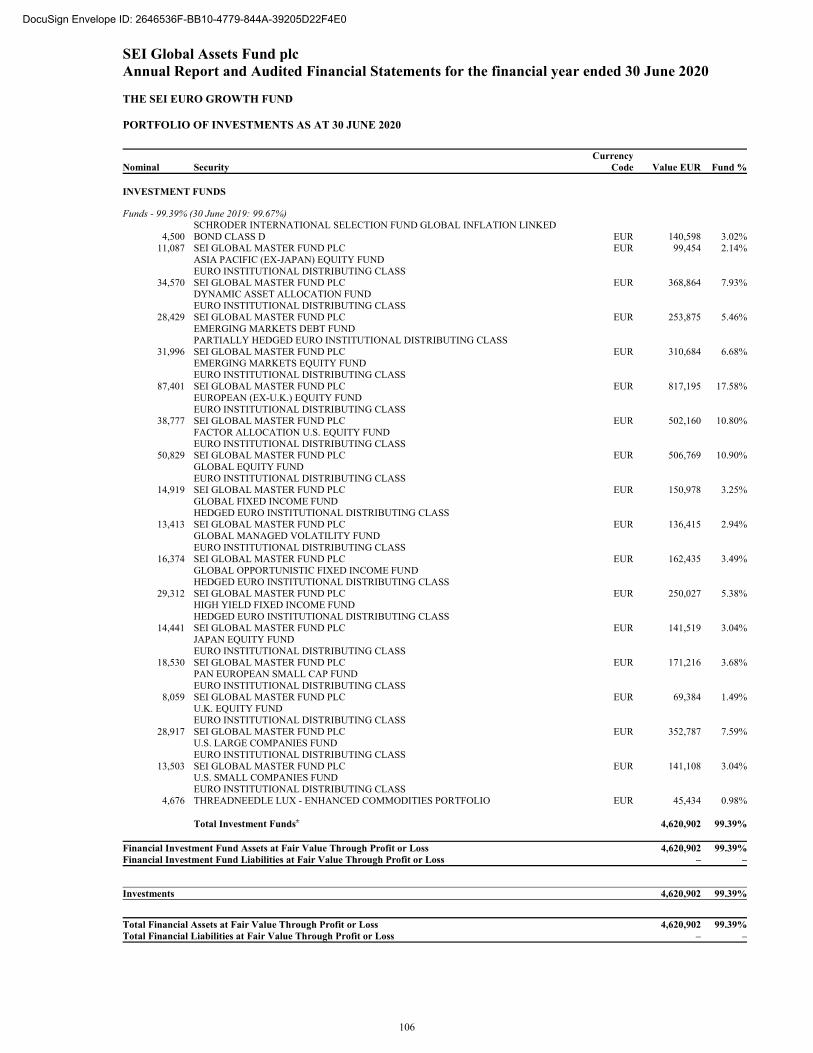
SEI Global Assets Fund plc Annual Report and Audited Financial Statements for the financial year ended 30 June 2020 THE SEI EURO GROWTH FUND PORTFOLIO OF INVESTMENTS AS AT 30 JUNE 2020
Nominal Security Currency
Code Value EUR Fund % INVESTMENT FUNDS
Funds - 99.39% (30 June 2019: 99.67%)
4,500 SCHRODER INTERNATIONAL SELECTION FUND GLOBAL INFLATION LINKED BOND CLASS D EUR 140,598 3.02%
11,087 SEI GLOBAL MASTER FUND PLC EUR 99,454 2.14% ASIA PACIFIC (EX-JAPAN) EQUITY FUND EURO INSTITUTIONAL DISTRIBUTING CLASS
34,570 SEI GLOBAL MASTER FUND PLC EUR 368,864 7.93% DYNAMIC ASSET ALLOCATION FUND EURO INSTITUTIONAL DISTRIBUTING CLASS
28,429 SEI GLOBAL MASTER FUND PLC EUR 253,875 5.46% EMERGING MARKETS DEBT FUND PARTIALLY HEDGED EURO INSTITUTIONAL DISTRIBUTING CLASS
31,996 SEI GLOBAL MASTER FUND PLC EUR 310,684 6.68% EMERGING MARKETS EQUITY FUND EURO INSTITUTIONAL DISTRIBUTING CLASS
87,401 SEI GLOBAL MASTER FUND PLC EUR 817,195 17.58% EUROPEAN (EX-U.K.) EQUITY FUND EURO INSTITUTIONAL DISTRIBUTING CLASS
38,777 SEI GLOBAL MASTER FUND PLC EUR 502,160 10.80% FACTOR ALLOCATION U.S. EQUITY FUND EURO INSTITUTIONAL DISTRIBUTING CLASS
50,829 SEI GLOBAL MASTER FUND PLC EUR 506,769 10.90% GLOBAL EQUITY FUND EURO INSTITUTIONAL DISTRIBUTING CLASS
14,919 SEI GLOBAL MASTER FUND PLC EUR 150,978 3.25% GLOBAL FIXED INCOME FUND HEDGED EURO INSTITUTIONAL DISTRIBUTING CLASS
13,413 SEI GLOBAL MASTER FUND PLC EUR 136,415 2.94% GLOBAL MANAGED VOLATILITY FUND EURO INSTITUTIONAL DISTRIBUTING CLASS
16,374 SEI GLOBAL MASTER FUND PLC EUR 162,435 3.49% GLOBAL OPPORTUNISTIC FIXED INCOME FUND HEDGED EURO INSTITUTIONAL DISTRIBUTING CLASS
29,312 SEI GLOBAL MASTER FUND PLC EUR 250,027 5.38% HIGH YIELD FIXED INCOME FUND HEDGED EURO INSTITUTIONAL DISTRIBUTING CLASS
14,441 SEI GLOBAL MASTER FUND PLC EUR 141,519 3.04% JAPAN EQUITY FUND EURO INSTITUTIONAL DISTRIBUTING CLASS
18,530 SEI GLOBAL MASTER FUND PLC EUR 171,216 3.68% PAN EUROPEAN SMALL CAP FUND EURO INSTITUTIONAL DISTRIBUTING CLASS
8,059 SEI GLOBAL MASTER FUND PLC EUR 69,384 1.49% U.K. EQUITY FUND EURO INSTITUTIONAL DISTRIBUTING CLASS
28,917 SEI GLOBAL MASTER FUND PLC EUR 352,787 7.59% U.S. LARGE COMPANIES FUND EURO INSTITUTIONAL DISTRIBUTING CLASS
13,503 SEI GLOBAL MASTER FUND PLC EUR 141,108 3.04% U.S. SMALL COMPANIES FUND EURO INSTITUTIONAL DISTRIBUTING CLASS
4,676 THREADNEEDLE LUX - ENHANCED COMMODITIES PORTFOLIO EUR 45,434 0.98% Total Investment Funds± 4,620,902 99.39% Financial Investment Fund Assets at Fair Value Through Profit or Loss 4,620,902 99.39%Financial Investment Fund Liabilities at Fair Value Through Profit or Loss – –
Investments 4,620,902 99.39%
Total Financial Assets at Fair Value Through Profit or Loss 4,620,902 99.39%Total Financial Liabilities at Fair Value Through Profit or Loss – –
106
DocuSign Envelope ID: 2646536F-BB10-4779-844A-39205D22F4E0
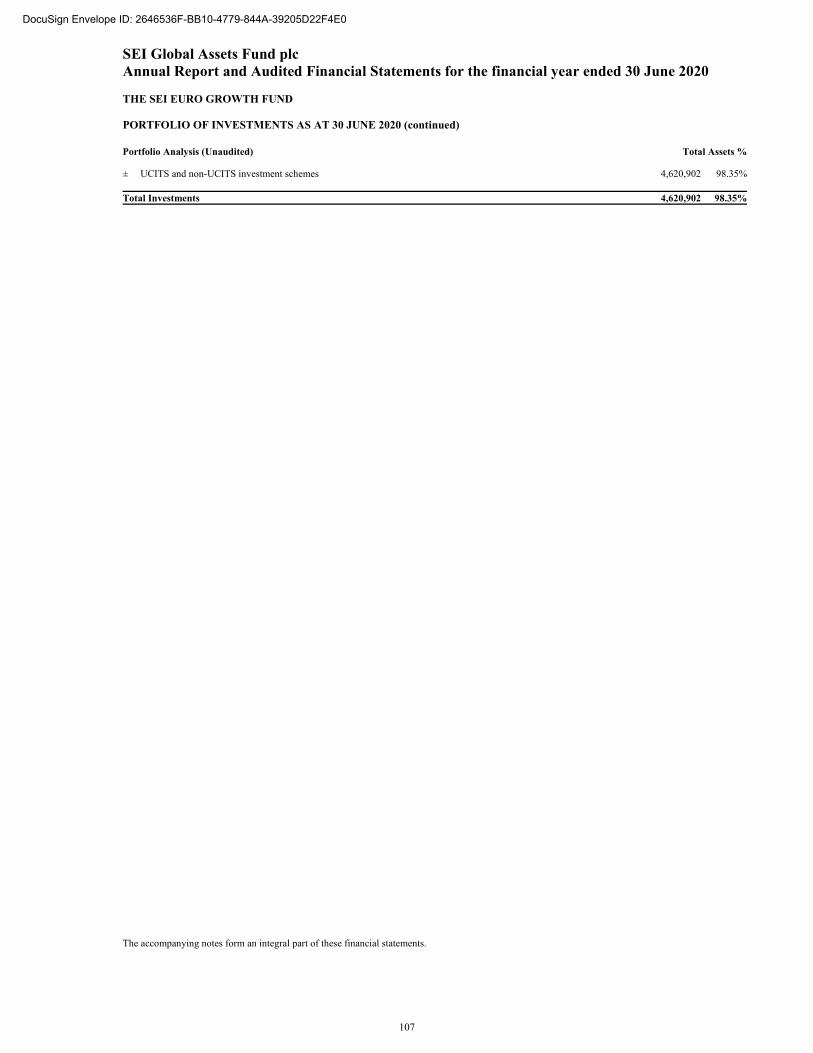
SEI Global Assets Fund plc Annual Report and Audited Financial Statements for the financial year ended 30 June 2020 THE SEI EURO GROWTH FUND PORTFOLIO OF INVESTMENTS AS AT 30 JUNE 2020 (continued)
Portfolio Analysis (Unaudited) Total Assets % ± UCITS and non-UCITS investment schemes 4,620,902 98.35% Total Investments 4,620,902 98.35%
The accompanying notes form an integral part of these financial statements.
107
DocuSign Envelope ID: 2646536F-BB10-4779-844A-39205D22F4E0
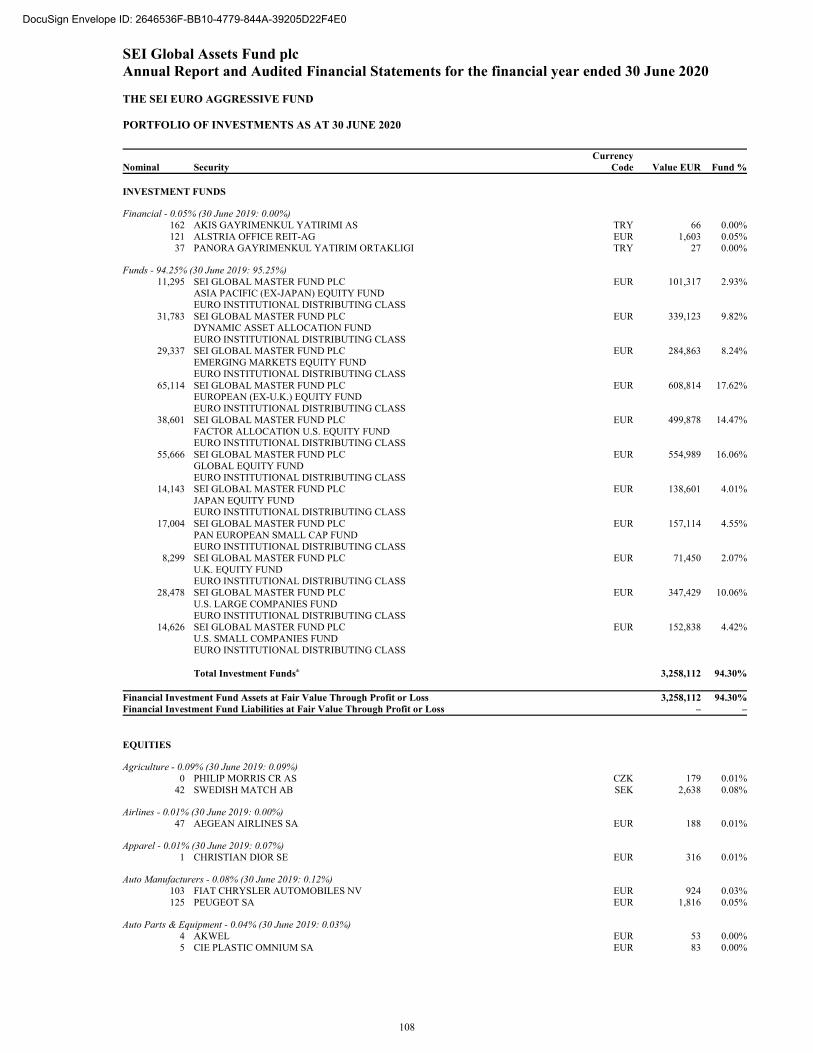
SEI Global Assets Fund plc Annual Report and Audited Financial Statements for the financial year ended 30 June 2020 THE SEI EURO AGGRESSIVE FUND PORTFOLIO OF INVESTMENTS AS AT 30 JUNE 2020
Nominal Security Currency
Code Value EUR Fund % INVESTMENT FUNDS
Financial - 0.05% (30 June 2019: 0.00%) 162 AKIS GAYRIMENKUL YATIRIMI AS TRY 66 0.00%121 ALSTRIA OFFICE REIT-AG EUR 1,603 0.05%
37 PANORA GAYRIMENKUL YATIRIM ORTAKLIGI TRY 27 0.00%
Funds - 94.25% (30 June 2019: 95.25%) 11,295 SEI GLOBAL MASTER FUND PLC EUR 101,317 2.93%
ASIA PACIFIC (EX-JAPAN) EQUITY FUND EURO INSTITUTIONAL DISTRIBUTING CLASS
31,783 SEI GLOBAL MASTER FUND PLC EUR 339,123 9.82% DYNAMIC ASSET ALLOCATION FUND EURO INSTITUTIONAL DISTRIBUTING CLASS
29,337 SEI GLOBAL MASTER FUND PLC EUR 284,863 8.24% EMERGING MARKETS EQUITY FUND EURO INSTITUTIONAL DISTRIBUTING CLASS
65,114 SEI GLOBAL MASTER FUND PLC EUR 608,814 17.62% EUROPEAN (EX-U.K.) EQUITY FUND EURO INSTITUTIONAL DISTRIBUTING CLASS
38,601 SEI GLOBAL MASTER FUND PLC EUR 499,878 14.47% FACTOR ALLOCATION U.S. EQUITY FUND EURO INSTITUTIONAL DISTRIBUTING CLASS
55,666 SEI GLOBAL MASTER FUND PLC EUR 554,989 16.06% GLOBAL EQUITY FUND EURO INSTITUTIONAL DISTRIBUTING CLASS
14,143 SEI GLOBAL MASTER FUND PLC EUR 138,601 4.01% JAPAN EQUITY FUND EURO INSTITUTIONAL DISTRIBUTING CLASS
17,004 SEI GLOBAL MASTER FUND PLC EUR 157,114 4.55% PAN EUROPEAN SMALL CAP FUND EURO INSTITUTIONAL DISTRIBUTING CLASS
8,299 SEI GLOBAL MASTER FUND PLC EUR 71,450 2.07% U.K. EQUITY FUND EURO INSTITUTIONAL DISTRIBUTING CLASS
28,478 SEI GLOBAL MASTER FUND PLC EUR 347,429 10.06% U.S. LARGE COMPANIES FUND EURO INSTITUTIONAL DISTRIBUTING CLASS
14,626 SEI GLOBAL MASTER FUND PLC EUR 152,838 4.42% U.S. SMALL COMPANIES FUND EURO INSTITUTIONAL DISTRIBUTING CLASS
Total Investment Funds± 3,258,112 94.30% Financial Investment Fund Assets at Fair Value Through Profit or Loss 3,258,112 94.30%Financial Investment Fund Liabilities at Fair Value Through Profit or Loss – – EQUITIES
Agriculture - 0.09% (30 June 2019: 0.09%) 0 PHILIP MORRIS CR AS CZK 179 0.01%
42 SWEDISH MATCH AB SEK 2,638 0.08%
Airlines - 0.01% (30 June 2019: 0.00%) 47 AEGEAN AIRLINES SA EUR 188 0.01%
Apparel - 0.01% (30 June 2019: 0.07%) 1 CHRISTIAN DIOR SE EUR 316 0.01%
Auto Manufacturers - 0.08% (30 June 2019: 0.12%) 103 FIAT CHRYSLER AUTOMOBILES NV EUR 924 0.03%125 PEUGEOT SA EUR 1,816 0.05%
Auto Parts & Equipment - 0.04% (30 June 2019: 0.03%) 4 AKWEL EUR 53 0.00%5 CIE PLASTIC OMNIUM SA EUR 83 0.00%
108
DocuSign Envelope ID: 2646536F-BB10-4779-844A-39205D22F4E0
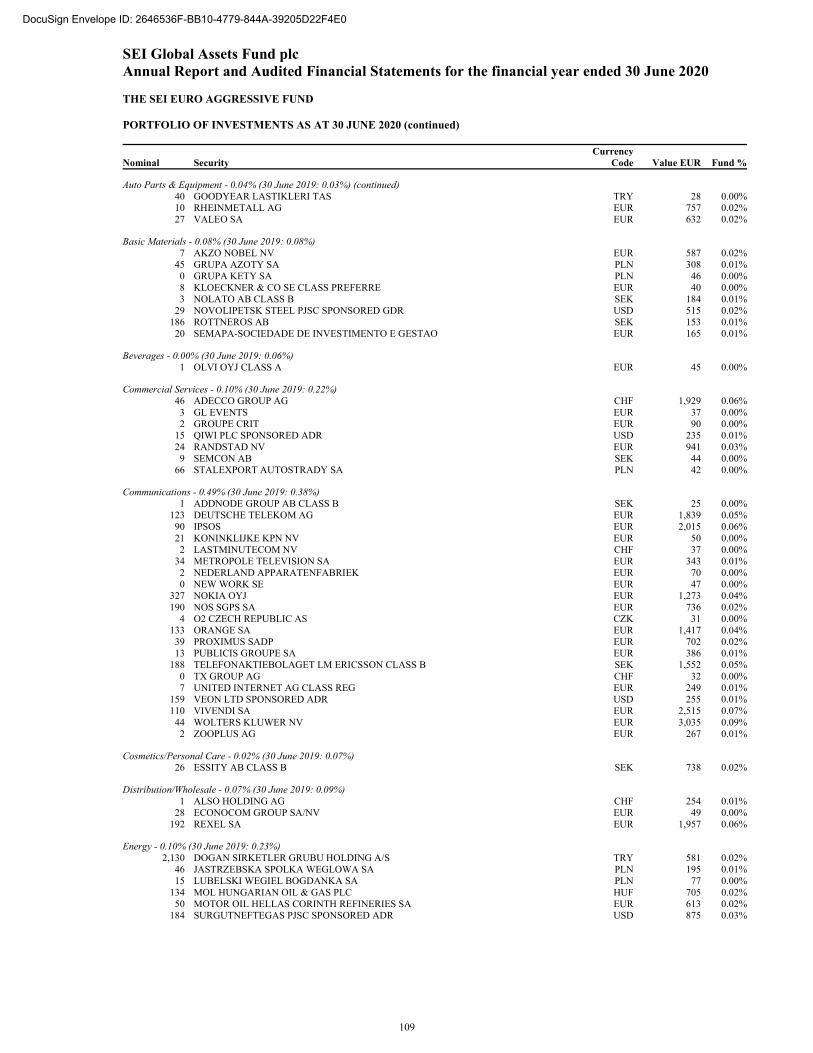
SEI Global Assets Fund plc Annual Report and Audited Financial Statements for the financial year ended 30 June 2020 THE SEI EURO AGGRESSIVE FUND PORTFOLIO OF INVESTMENTS AS AT 30 JUNE 2020 (continued)
Nominal Security Currency
Code Value EUR Fund %
Auto Parts & Equipment - 0.04% (30 June 2019: 0.03%) (continued) 40 GOODYEAR LASTIKLERI TAS TRY 28 0.00%10 RHEINMETALL AG EUR 757 0.02%27 VALEO SA EUR 632 0.02%
Basic Materials - 0.08% (30 June 2019: 0.08%) 7 AKZO NOBEL NV EUR 587 0.02%
45 GRUPA AZOTY SA PLN 308 0.01%0 GRUPA KETY SA PLN 46 0.00%8 KLOECKNER & CO SE CLASS PREFERRE EUR 40 0.00%3 NOLATO AB CLASS B SEK 184 0.01%
29 NOVOLIPETSK STEEL PJSC SPONSORED GDR USD 515 0.02%186 ROTTNEROS AB SEK 153 0.01%
20 SEMAPA-SOCIEDADE DE INVESTIMENTO E GESTAO EUR 165 0.01%
Beverages - 0.00% (30 June 2019: 0.06%) 1 OLVI OYJ CLASS A EUR 45 0.00%
Commercial Services - 0.10% (30 June 2019: 0.22%) 46 ADECCO GROUP AG CHF 1,929 0.06%3 GL EVENTS EUR 37 0.00%2 GROUPE CRIT EUR 90 0.00%
15 QIWI PLC SPONSORED ADR USD 235 0.01%24 RANDSTAD NV EUR 941 0.03%9 SEMCON AB SEK 44 0.00%
66 STALEXPORT AUTOSTRADY SA PLN 42 0.00%
Communications - 0.49% (30 June 2019: 0.38%) 1 ADDNODE GROUP AB CLASS B SEK 25 0.00%
123 DEUTSCHE TELEKOM AG EUR 1,839 0.05%90 IPSOS EUR 2,015 0.06%21 KONINKLIJKE KPN NV EUR 50 0.00%2 LASTMINUTECOM NV CHF 37 0.00%
34 METROPOLE TELEVISION SA EUR 343 0.01%2 NEDERLAND APPARATENFABRIEK EUR 70 0.00%0 NEW WORK SE EUR 47 0.00%
327 NOKIA OYJ EUR 1,273 0.04%190 NOS SGPS SA EUR 736 0.02%
4 O2 CZECH REPUBLIC AS CZK 31 0.00%133 ORANGE SA EUR 1,417 0.04%
39 PROXIMUS SADP EUR 702 0.02%13 PUBLICIS GROUPE SA EUR 386 0.01%
188 TELEFONAKTIEBOLAGET LM ERICSSON CLASS B SEK 1,552 0.05%0 TX GROUP AG CHF 32 0.00%7 UNITED INTERNET AG CLASS REG EUR 249 0.01%
159 VEON LTD SPONSORED ADR USD 255 0.01%110 VIVENDI SA EUR 2,515 0.07%
44 WOLTERS KLUWER NV EUR 3,035 0.09%2 ZOOPLUS AG EUR 267 0.01%
Cosmetics/Personal Care - 0.02% (30 June 2019: 0.07%) 26 ESSITY AB CLASS B SEK 738 0.02%
Distribution/Wholesale - 0.07% (30 June 2019: 0.09%) 1 ALSO HOLDING AG CHF 254 0.01%
28 ECONOCOM GROUP SA/NV EUR 49 0.00%192 REXEL SA EUR 1,957 0.06%
Energy - 0.10% (30 June 2019: 0.23%) 2,130 DOGAN SIRKETLER GRUBU HOLDING A/S TRY 581 0.02%
46 JASTRZEBSKA SPOLKA WEGLOWA SA PLN 195 0.01%15 LUBELSKI WEGIEL BOGDANKA SA PLN 77 0.00%
134 MOL HUNGARIAN OIL & GAS PLC HUF 705 0.02%50 MOTOR OIL HELLAS CORINTH REFINERIES SA EUR 613 0.02%
184 SURGUTNEFTEGAS PJSC SPONSORED ADR USD 875 0.03%
109
DocuSign Envelope ID: 2646536F-BB10-4779-844A-39205D22F4E0
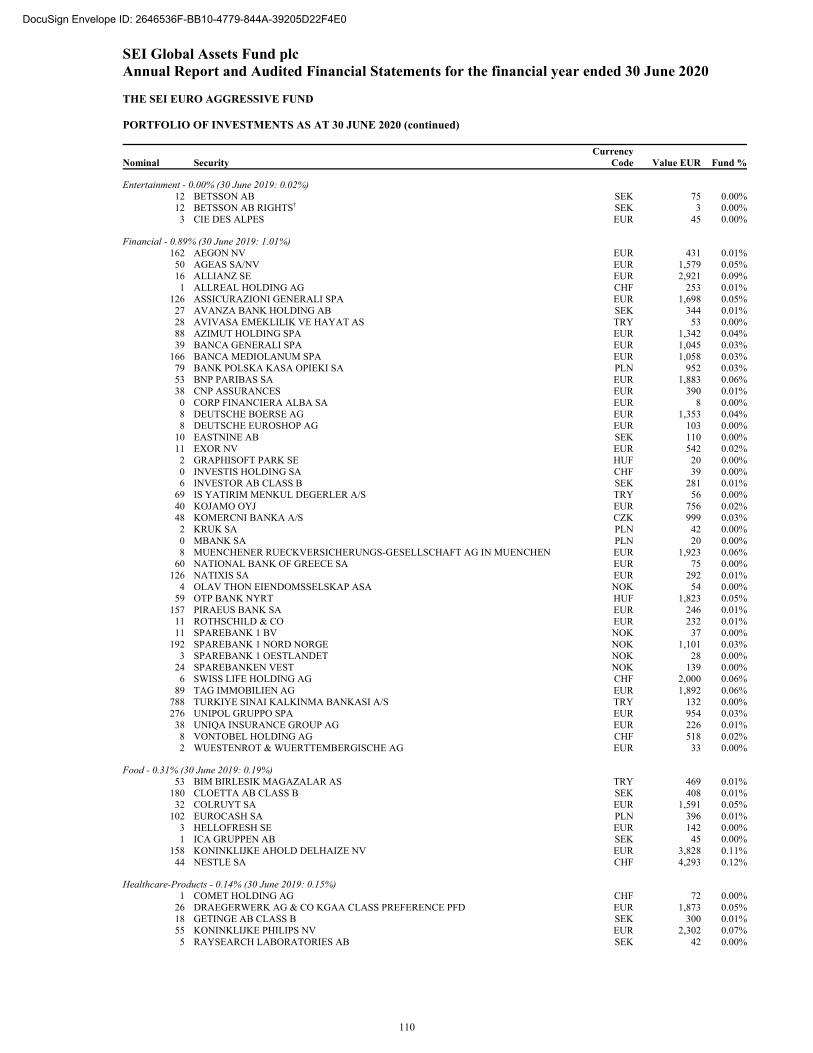
SEI Global Assets Fund plc Annual Report and Audited Financial Statements for the financial year ended 30 June 2020 THE SEI EURO AGGRESSIVE FUND PORTFOLIO OF INVESTMENTS AS AT 30 JUNE 2020 (continued)
Nominal Security Currency
Code Value EUR Fund %
Entertainment - 0.00% (30 June 2019: 0.02%) 12 BETSSON AB SEK 75 0.00%12 BETSSON AB RIGHTS† SEK 3 0.00%3 CIE DES ALPES EUR 45 0.00%
Financial - 0.89% (30 June 2019: 1.01%) 162 AEGON NV EUR 431 0.01%
50 AGEAS SA/NV EUR 1,579 0.05%16 ALLIANZ SE EUR 2,921 0.09%1 ALLREAL HOLDING AG CHF 253 0.01%
126 ASSICURAZIONI GENERALI SPA EUR 1,698 0.05%27 AVANZA BANK HOLDING AB SEK 344 0.01%28 AVIVASA EMEKLILIK VE HAYAT AS TRY 53 0.00%88 AZIMUT HOLDING SPA EUR 1,342 0.04%39 BANCA GENERALI SPA EUR 1,045 0.03%
166 BANCA MEDIOLANUM SPA EUR 1,058 0.03%79 BANK POLSKA KASA OPIEKI SA PLN 952 0.03%53 BNP PARIBAS SA EUR 1,883 0.06%38 CNP ASSURANCES EUR 390 0.01%0 CORP FINANCIERA ALBA SA EUR 8 0.00%8 DEUTSCHE BOERSE AG EUR 1,353 0.04%8 DEUTSCHE EUROSHOP AG EUR 103 0.00%
10 EASTNINE AB SEK 110 0.00%11 EXOR NV EUR 542 0.02%2 GRAPHISOFT PARK SE HUF 20 0.00%0 INVESTIS HOLDING SA CHF 39 0.00%6 INVESTOR AB CLASS B SEK 281 0.01%
69 IS YATIRIM MENKUL DEGERLER A/S TRY 56 0.00%40 KOJAMO OYJ EUR 756 0.02%48 KOMERCNI BANKA A/S CZK 999 0.03%2 KRUK SA PLN 42 0.00%0 MBANK SA PLN 20 0.00%8 MUENCHENER RUECKVERSICHERUNGS-GESELLSCHAFT AG IN MUENCHEN EUR 1,923 0.06%
60 NATIONAL BANK OF GREECE SA EUR 75 0.00%126 NATIXIS SA EUR 292 0.01%
4 OLAV THON EIENDOMSSELSKAP ASA NOK 54 0.00%59 OTP BANK NYRT HUF 1,823 0.05%
157 PIRAEUS BANK SA EUR 246 0.01%11 ROTHSCHILD & CO EUR 232 0.01%11 SPAREBANK 1 BV NOK 37 0.00%
192 SPAREBANK 1 NORD NORGE NOK 1,101 0.03%3 SPAREBANK 1 OESTLANDET NOK 28 0.00%
24 SPAREBANKEN VEST NOK 139 0.00%6 SWISS LIFE HOLDING AG CHF 2,000 0.06%
89 TAG IMMOBILIEN AG EUR 1,892 0.06%788 TURKIYE SINAI KALKINMA BANKASI A/S TRY 132 0.00%276 UNIPOL GRUPPO SPA EUR 954 0.03%
38 UNIQA INSURANCE GROUP AG EUR 226 0.01%8 VONTOBEL HOLDING AG CHF 518 0.02%2 WUESTENROT & WUERTTEMBERGISCHE AG EUR 33 0.00%
Food - 0.31% (30 June 2019: 0.19%) 53 BIM BIRLESIK MAGAZALAR AS TRY 469 0.01%
180 CLOETTA AB CLASS B SEK 408 0.01%32 COLRUYT SA EUR 1,591 0.05%
102 EUROCASH SA PLN 396 0.01%3 HELLOFRESH SE EUR 142 0.00%1 ICA GRUPPEN AB SEK 45 0.00%
158 KONINKLIJKE AHOLD DELHAIZE NV EUR 3,828 0.11%44 NESTLE SA CHF 4,293 0.12%
Healthcare-Products - 0.14% (30 June 2019: 0.15%) 1 COMET HOLDING AG CHF 72 0.00%
26 DRAEGERWERK AG & CO KGAA CLASS PREFERENCE PFD EUR 1,873 0.05%18 GETINGE AB CLASS B SEK 300 0.01%55 KONINKLIJKE PHILIPS NV EUR 2,302 0.07%5 RAYSEARCH LABORATORIES AB SEK 42 0.00%
110
DocuSign Envelope ID: 2646536F-BB10-4779-844A-39205D22F4E0
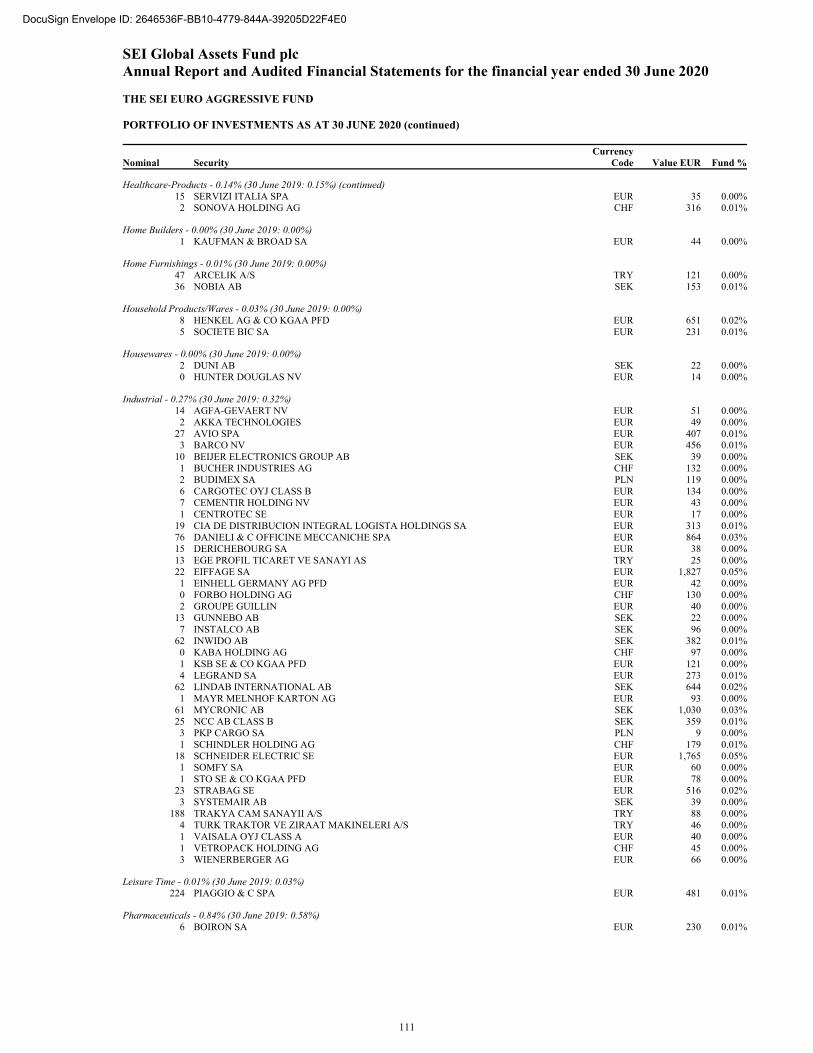
SEI Global Assets Fund plc Annual Report and Audited Financial Statements for the financial year ended 30 June 2020 THE SEI EURO AGGRESSIVE FUND PORTFOLIO OF INVESTMENTS AS AT 30 JUNE 2020 (continued)
Nominal Security Currency
Code Value EUR Fund %
Healthcare-Products - 0.14% (30 June 2019: 0.15%) (continued) 15 SERVIZI ITALIA SPA EUR 35 0.00%2 SONOVA HOLDING AG CHF 316 0.01%
Home Builders - 0.00% (30 June 2019: 0.00%) 1 KAUFMAN & BROAD SA EUR 44 0.00%
Home Furnishings - 0.01% (30 June 2019: 0.00%) 47 ARCELIK A/S TRY 121 0.00%36 NOBIA AB SEK 153 0.01%
Household Products/Wares - 0.03% (30 June 2019: 0.00%) 8 HENKEL AG & CO KGAA PFD EUR 651 0.02%5 SOCIETE BIC SA EUR 231 0.01%
Housewares - 0.00% (30 June 2019: 0.00%) 2 DUNI AB SEK 22 0.00%0 HUNTER DOUGLAS NV EUR 14 0.00%
Industrial - 0.27% (30 June 2019: 0.32%) 14 AGFA-GEVAERT NV EUR 51 0.00%2 AKKA TECHNOLOGIES EUR 49 0.00%
27 AVIO SPA EUR 407 0.01%3 BARCO NV EUR 456 0.01%
10 BEIJER ELECTRONICS GROUP AB SEK 39 0.00%1 BUCHER INDUSTRIES AG CHF 132 0.00%2 BUDIMEX SA PLN 119 0.00%6 CARGOTEC OYJ CLASS B EUR 134 0.00%7 CEMENTIR HOLDING NV EUR 43 0.00%1 CENTROTEC SE EUR 17 0.00%
19 CIA DE DISTRIBUCION INTEGRAL LOGISTA HOLDINGS SA EUR 313 0.01%76 DANIELI & C OFFICINE MECCANICHE SPA EUR 864 0.03%15 DERICHEBOURG SA EUR 38 0.00%13 EGE PROFIL TICARET VE SANAYI AS TRY 25 0.00%22 EIFFAGE SA EUR 1,827 0.05%1 EINHELL GERMANY AG PFD EUR 42 0.00%0 FORBO HOLDING AG CHF 130 0.00%2 GROUPE GUILLIN EUR 40 0.00%
13 GUNNEBO AB SEK 22 0.00%7 INSTALCO AB SEK 96 0.00%
62 INWIDO AB SEK 382 0.01%0 KABA HOLDING AG CHF 97 0.00%1 KSB SE & CO KGAA PFD EUR 121 0.00%4 LEGRAND SA EUR 273 0.01%
62 LINDAB INTERNATIONAL AB SEK 644 0.02%1 MAYR MELNHOF KARTON AG EUR 93 0.00%
61 MYCRONIC AB SEK 1,030 0.03%25 NCC AB CLASS B SEK 359 0.01%3 PKP CARGO SA PLN 9 0.00%1 SCHINDLER HOLDING AG CHF 179 0.01%
18 SCHNEIDER ELECTRIC SE EUR 1,765 0.05%1 SOMFY SA EUR 60 0.00%1 STO SE & CO KGAA PFD EUR 78 0.00%
23 STRABAG SE EUR 516 0.02%3 SYSTEMAIR AB SEK 39 0.00%
188 TRAKYA CAM SANAYII A/S TRY 88 0.00%4 TURK TRAKTOR VE ZIRAAT MAKINELERI A/S TRY 46 0.00%1 VAISALA OYJ CLASS A EUR 40 0.00%1 VETROPACK HOLDING AG CHF 45 0.00%3 WIENERBERGER AG EUR 66 0.00%
Leisure Time - 0.01% (30 June 2019: 0.03%) 224 PIAGGIO & C SPA EUR 481 0.01%
Pharmaceuticals - 0.84% (30 June 2019: 0.58%) 6 BOIRON SA EUR 230 0.01%
111
DocuSign Envelope ID: 2646536F-BB10-4779-844A-39205D22F4E0
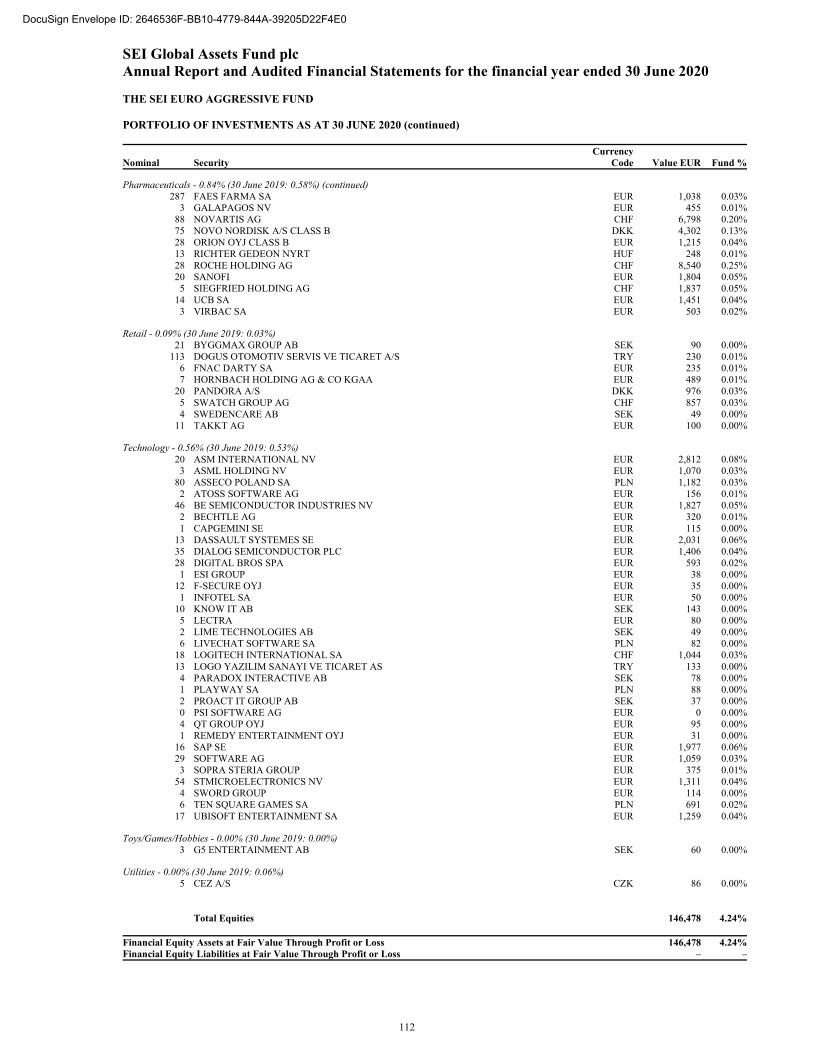
SEI Global Assets Fund plc Annual Report and Audited Financial Statements for the financial year ended 30 June 2020 THE SEI EURO AGGRESSIVE FUND PORTFOLIO OF INVESTMENTS AS AT 30 JUNE 2020 (continued)
Nominal Security Currency
Code Value EUR Fund %
Pharmaceuticals - 0.84% (30 June 2019: 0.58%) (continued) 287 FAES FARMA SA EUR 1,038 0.03%
3 GALAPAGOS NV EUR 455 0.01%88 NOVARTIS AG CHF 6,798 0.20%75 NOVO NORDISK A/S CLASS B DKK 4,302 0.13%28 ORION OYJ CLASS B EUR 1,215 0.04%13 RICHTER GEDEON NYRT HUF 248 0.01%28 ROCHE HOLDING AG CHF 8,540 0.25%20 SANOFI EUR 1,804 0.05%5 SIEGFRIED HOLDING AG CHF 1,837 0.05%
14 UCB SA EUR 1,451 0.04%3 VIRBAC SA EUR 503 0.02%
Retail - 0.09% (30 June 2019: 0.03%) 21 BYGGMAX GROUP AB SEK 90 0.00%
113 DOGUS OTOMOTIV SERVIS VE TICARET A/S TRY 230 0.01%6 FNAC DARTY SA EUR 235 0.01%7 HORNBACH HOLDING AG & CO KGAA EUR 489 0.01%
20 PANDORA A/S DKK 976 0.03%5 SWATCH GROUP AG CHF 857 0.03%4 SWEDENCARE AB SEK 49 0.00%
11 TAKKT AG EUR 100 0.00%
Technology - 0.56% (30 June 2019: 0.53%) 20 ASM INTERNATIONAL NV EUR 2,812 0.08%3 ASML HOLDING NV EUR 1,070 0.03%
80 ASSECO POLAND SA PLN 1,182 0.03%2 ATOSS SOFTWARE AG EUR 156 0.01%
46 BE SEMICONDUCTOR INDUSTRIES NV EUR 1,827 0.05%2 BECHTLE AG EUR 320 0.01%1 CAPGEMINI SE EUR 115 0.00%
13 DASSAULT SYSTEMES SE EUR 2,031 0.06%35 DIALOG SEMICONDUCTOR PLC EUR 1,406 0.04%28 DIGITAL BROS SPA EUR 593 0.02%1 ESI GROUP EUR 38 0.00%
12 F-SECURE OYJ EUR 35 0.00%1 INFOTEL SA EUR 50 0.00%
10 KNOW IT AB SEK 143 0.00%5 LECTRA EUR 80 0.00%2 LIME TECHNOLOGIES AB SEK 49 0.00%6 LIVECHAT SOFTWARE SA PLN 82 0.00%
18 LOGITECH INTERNATIONAL SA CHF 1,044 0.03%13 LOGO YAZILIM SANAYI VE TICARET AS TRY 133 0.00%4 PARADOX INTERACTIVE AB SEK 78 0.00%1 PLAYWAY SA PLN 88 0.00%2 PROACT IT GROUP AB SEK 37 0.00%0 PSI SOFTWARE AG EUR 0 0.00%4 QT GROUP OYJ EUR 95 0.00%1 REMEDY ENTERTAINMENT OYJ EUR 31 0.00%
16 SAP SE EUR 1,977 0.06%29 SOFTWARE AG EUR 1,059 0.03%3 SOPRA STERIA GROUP EUR 375 0.01%
54 STMICROELECTRONICS NV EUR 1,311 0.04%4 SWORD GROUP EUR 114 0.00%6 TEN SQUARE GAMES SA PLN 691 0.02%
17 UBISOFT ENTERTAINMENT SA EUR 1,259 0.04%
Toys/Games/Hobbies - 0.00% (30 June 2019: 0.00%) 3 G5 ENTERTAINMENT AB SEK 60 0.00%
Utilities - 0.00% (30 June 2019: 0.06%) 5 CEZ A/S CZK 86 0.00%
Total Equities 146,478 4.24% Financial Equity Assets at Fair Value Through Profit or Loss 146,478 4.24%Financial Equity Liabilities at Fair Value Through Profit or Loss – –
112
DocuSign Envelope ID: 2646536F-BB10-4779-844A-39205D22F4E0
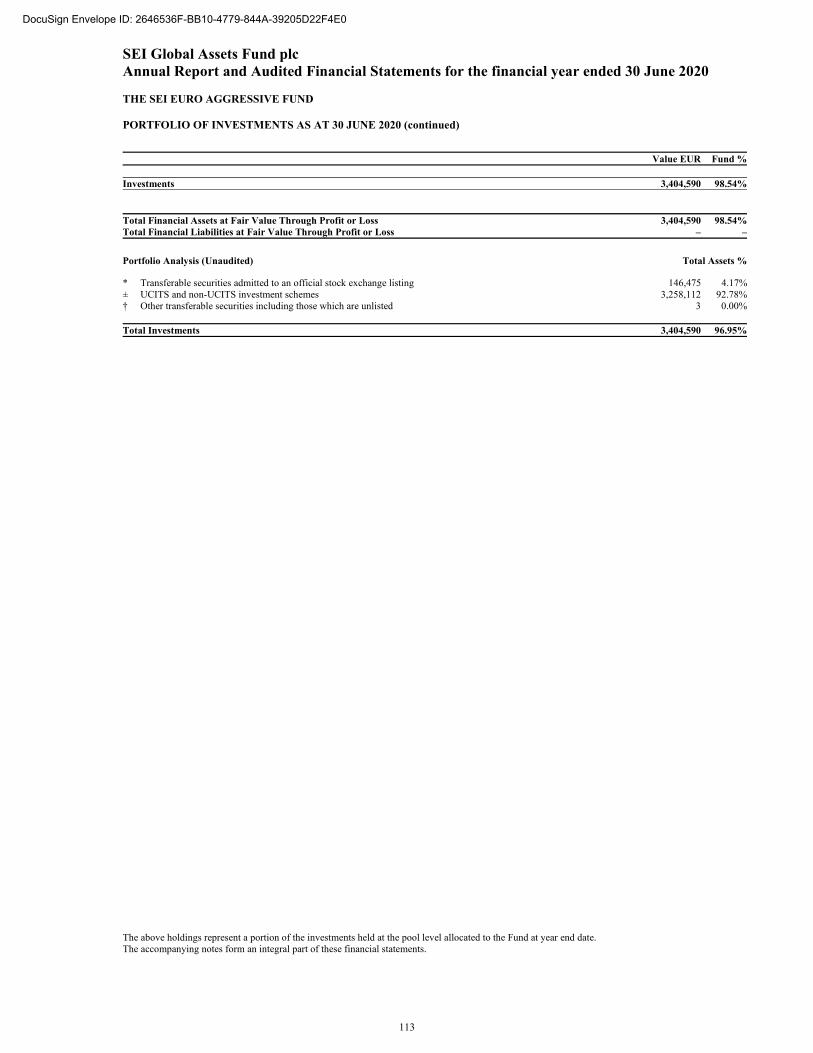
SEI Global Assets Fund plc Annual Report and Audited Financial Statements for the financial year ended 30 June 2020 THE SEI EURO AGGRESSIVE FUND PORTFOLIO OF INVESTMENTS AS AT 30 JUNE 2020 (continued)
Value EUR Fund % Investments 3,404,590 98.54%
Total Financial Assets at Fair Value Through Profit or Loss 3,404,590 98.54%Total Financial Liabilities at Fair Value Through Profit or Loss – –
Portfolio Analysis (Unaudited) Total Assets % * Transferable securities admitted to an official stock exchange listing 146,475 4.17%± UCITS and non-UCITS investment schemes 3,258,112 92.78%† Other transferable securities including those which are unlisted 3 0.00% Total Investments 3,404,590 96.95%
The above holdings represent a portion of the investments held at the pool level allocated to the Fund at year end date. The accompanying notes form an integral part of these financial statements.
113
DocuSign Envelope ID: 2646536F-BB10-4779-844A-39205D22F4E0
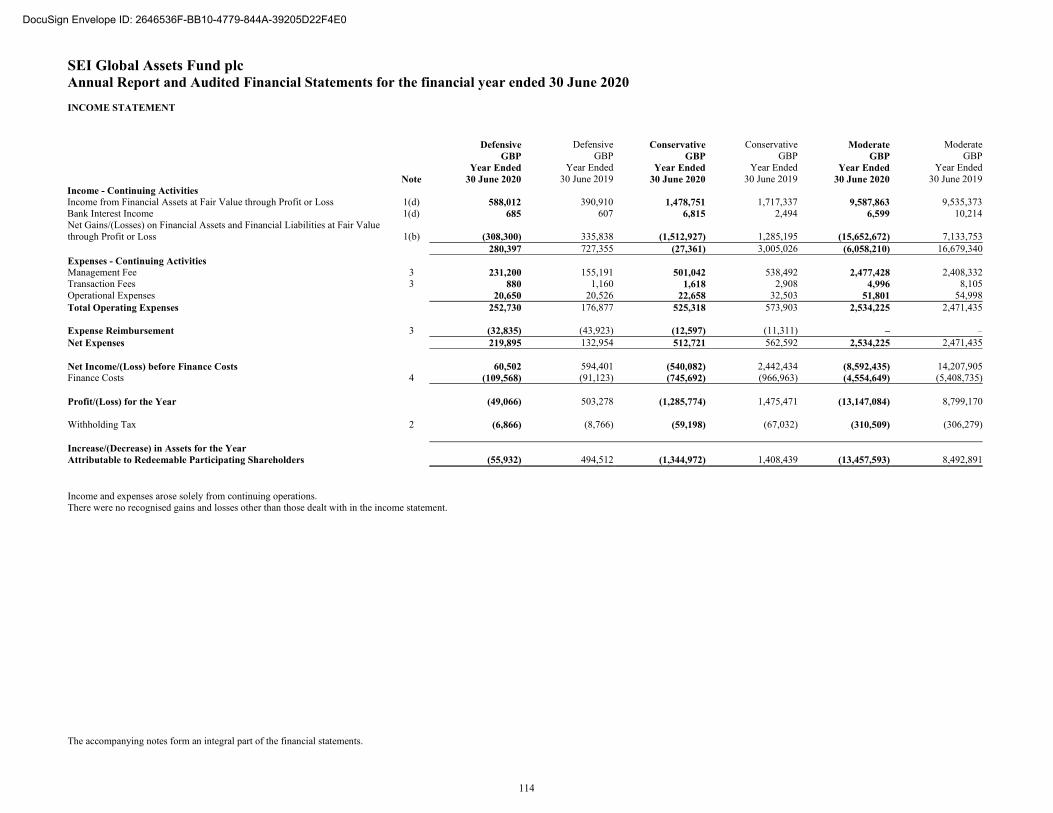
SEI Global Assets Fund plc Annual Report and Audited Financial Statements for the financial year ended 30 June 2020 INCOME STATEMENT
The accompanying notes form an integral part of the financial statements.
DefensiveGBP
Year Ended
DefensiveGBP
Year Ended
ConservativeGBP
Year Ended
ConservativeGBP
Year Ended
Moderate GBP
Year Ended
ModerateGBP
Year Ended Note 30 June 2020 30 June 2019 30 June 2020 30 June 2019 30 June 2020 30 June 2019Income - Continuing Activities Income from Financial Assets at Fair Value through Profit or Loss 1(d) 588,012 390,910 1,478,751 1,717,337 9,587,863 9,535,373Bank Interest Income 1(d) 685 607 6,815 2,494 6,599 10,214Net Gains/(Losses) on Financial Assets and Financial Liabilities at Fair Value through Profit or Loss 1(b) (308,300) 335,838 (1,512,927) 1,285,195 (15,652,672) 7,133,753 280,397 727,355 (27,361) 3,005,026 (6,058,210) 16,679,340Expenses - Continuing Activities Management Fee 3 231,200 155,191 501,042 538,492 2,477,428 2,408,332Transaction Fees 3 880 1,160 1,618 2,908 4,996 8,105Operational Expenses 20,650 20,526 22,658 32,503 51,801 54,998Total Operating Expenses 252,730 176,877 525,318 573,903 2,534,225 2,471,435 Expense Reimbursement 3 (32,835) (43,923) (12,597) (11,311) – –Net Expenses 219,895 132,954 512,721 562,592 2,534,225 2,471,435 Net Income/(Loss) before Finance Costs 60,502 594,401 (540,082) 2,442,434 (8,592,435) 14,207,905Finance Costs 4 (109,568) (91,123) (745,692) (966,963) (4,554,649) (5,408,735) Profit/(Loss) for the Year (49,066) 503,278 (1,285,774) 1,475,471 (13,147,084) 8,799,170 Withholding Tax 2 (6,866) (8,766) (59,198) (67,032) (310,509) (306,279) Increase/(Decrease) in Assets for the Year Attributable to Redeemable Participating Shareholders (55,932) 494,512 (1,344,972) 1,408,439 (13,457,593) 8,492,891 Income and expenses arose solely from continuing operations. There were no recognised gains and losses other than those dealt with in the income statement.
114
DocuSign Envelope ID: 2646536F-BB10-4779-844A-39205D22F4E0
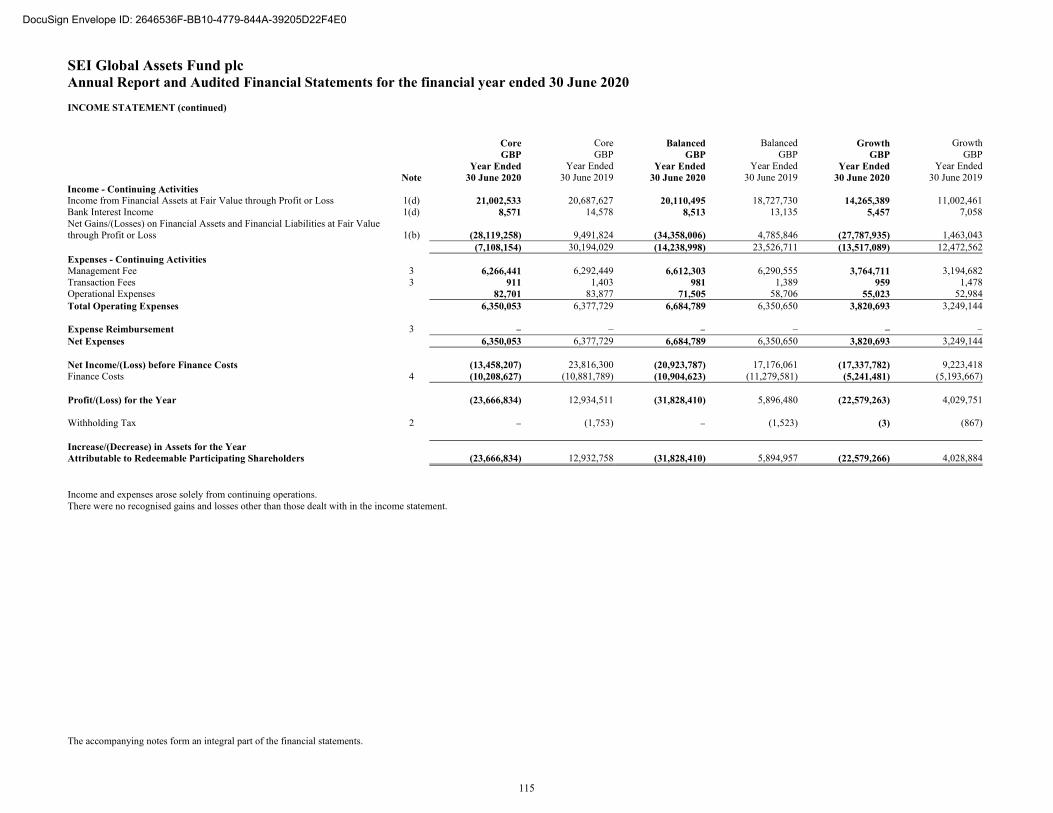
SEI Global Assets Fund plc Annual Report and Audited Financial Statements for the financial year ended 30 June 2020 INCOME STATEMENT (continued)
The accompanying notes form an integral part of the financial statements.
CoreGBP
Year Ended
CoreGBP
Year Ended
BalancedGBP
Year Ended
BalancedGBP
Year Ended
Growth GBP
Year Ended
GrowthGBP
Year Ended Note 30 June 2020 30 June 2019 30 June 2020 30 June 2019 30 June 2020 30 June 2019Income - Continuing Activities Income from Financial Assets at Fair Value through Profit or Loss 1(d) 21,002,533 20,687,627 20,110,495 18,727,730 14,265,389 11,002,461Bank Interest Income 1(d) 8,571 14,578 8,513 13,135 5,457 7,058Net Gains/(Losses) on Financial Assets and Financial Liabilities at Fair Value through Profit or Loss 1(b) (28,119,258) 9,491,824 (34,358,006) 4,785,846 (27,787,935) 1,463,043 (7,108,154) 30,194,029 (14,238,998) 23,526,711 (13,517,089) 12,472,562Expenses - Continuing Activities Management Fee 3 6,266,441 6,292,449 6,612,303 6,290,555 3,764,711 3,194,682Transaction Fees 3 911 1,403 981 1,389 959 1,478Operational Expenses 82,701 83,877 71,505 58,706 55,023 52,984Total Operating Expenses 6,350,053 6,377,729 6,684,789 6,350,650 3,820,693 3,249,144 Expense Reimbursement 3 – – – – – –Net Expenses 6,350,053 6,377,729 6,684,789 6,350,650 3,820,693 3,249,144 Net Income/(Loss) before Finance Costs (13,458,207) 23,816,300 (20,923,787) 17,176,061 (17,337,782) 9,223,418Finance Costs 4 (10,208,627) (10,881,789) (10,904,623) (11,279,581) (5,241,481) (5,193,667) Profit/(Loss) for the Year (23,666,834) 12,934,511 (31,828,410) 5,896,480 (22,579,263) 4,029,751 Withholding Tax 2 – (1,753) – (1,523) (3) (867) Increase/(Decrease) in Assets for the Year Attributable to Redeemable Participating Shareholders (23,666,834) 12,932,758 (31,828,410) 5,894,957 (22,579,266) 4,028,884 Income and expenses arose solely from continuing operations. There were no recognised gains and losses other than those dealt with in the income statement.
115
DocuSign Envelope ID: 2646536F-BB10-4779-844A-39205D22F4E0
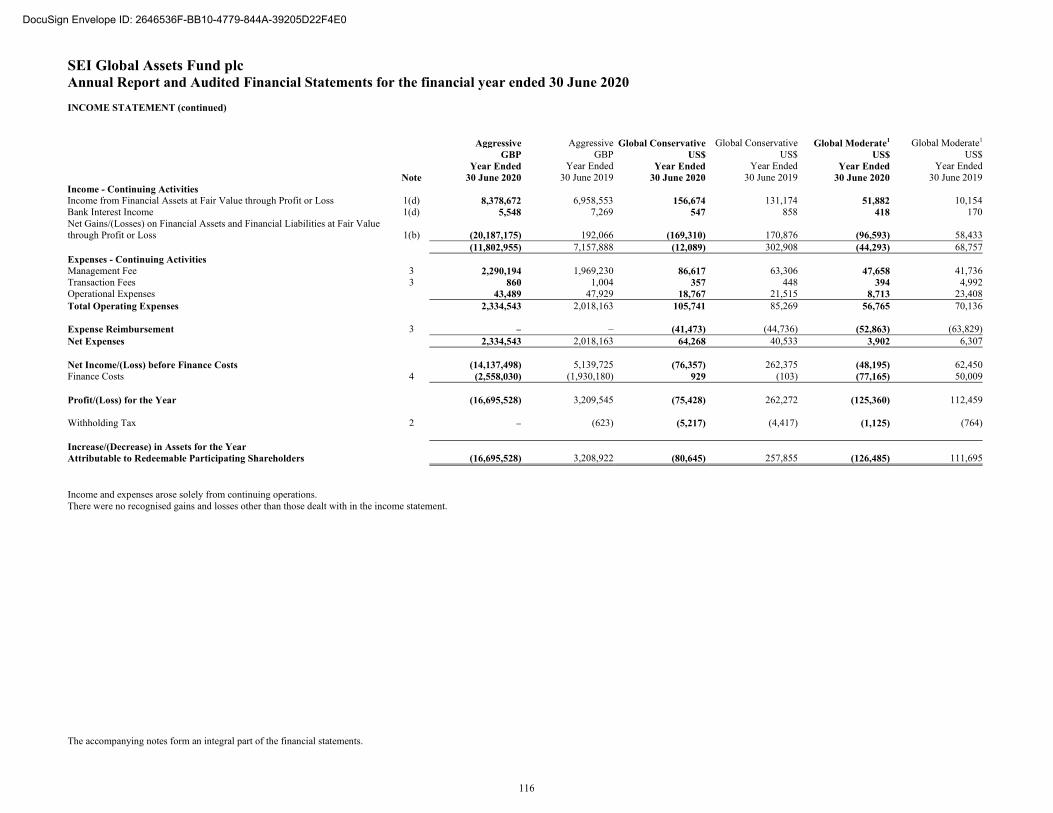
SEI Global Assets Fund plc Annual Report and Audited Financial Statements for the financial year ended 30 June 2020 INCOME STATEMENT (continued)
The accompanying notes form an integral part of the financial statements.
AggressiveGBP
Year Ended
AggressiveGBP
Year Ended
Global ConservativeUS$
Year Ended
Global ConservativeUS$
Year Ended
Global Moderate1 US$
Year Ended
Global Moderate1
US$Year Ended
Note 30 June 2020 30 June 2019 30 June 2020 30 June 2019 30 June 2020 30 June 2019Income - Continuing Activities Income from Financial Assets at Fair Value through Profit or Loss 1(d) 8,378,672 6,958,553 156,674 131,174 51,882 10,154Bank Interest Income 1(d) 5,548 7,269 547 858 418 170Net Gains/(Losses) on Financial Assets and Financial Liabilities at Fair Value through Profit or Loss 1(b) (20,187,175) 192,066 (169,310) 170,876 (96,593) 58,433 (11,802,955) 7,157,888 (12,089) 302,908 (44,293) 68,757Expenses - Continuing Activities Management Fee 3 2,290,194 1,969,230 86,617 63,306 47,658 41,736Transaction Fees 3 860 1,004 357 448 394 4,992Operational Expenses 43,489 47,929 18,767 21,515 8,713 23,408Total Operating Expenses 2,334,543 2,018,163 105,741 85,269 56,765 70,136 Expense Reimbursement 3 – – (41,473) (44,736) (52,863) (63,829)Net Expenses 2,334,543 2,018,163 64,268 40,533 3,902 6,307 Net Income/(Loss) before Finance Costs (14,137,498) 5,139,725 (76,357) 262,375 (48,195) 62,450Finance Costs 4 (2,558,030) (1,930,180) 929 (103) (77,165) 50,009 Profit/(Loss) for the Year (16,695,528) 3,209,545 (75,428) 262,272 (125,360) 112,459 Withholding Tax 2 – (623) (5,217) (4,417) (1,125) (764) Increase/(Decrease) in Assets for the Year Attributable to Redeemable Participating Shareholders (16,695,528) 3,208,922 (80,645) 257,855 (126,485) 111,695 Income and expenses arose solely from continuing operations. There were no recognised gains and losses other than those dealt with in the income statement.
116
DocuSign Envelope ID: 2646536F-BB10-4779-844A-39205D22F4E0
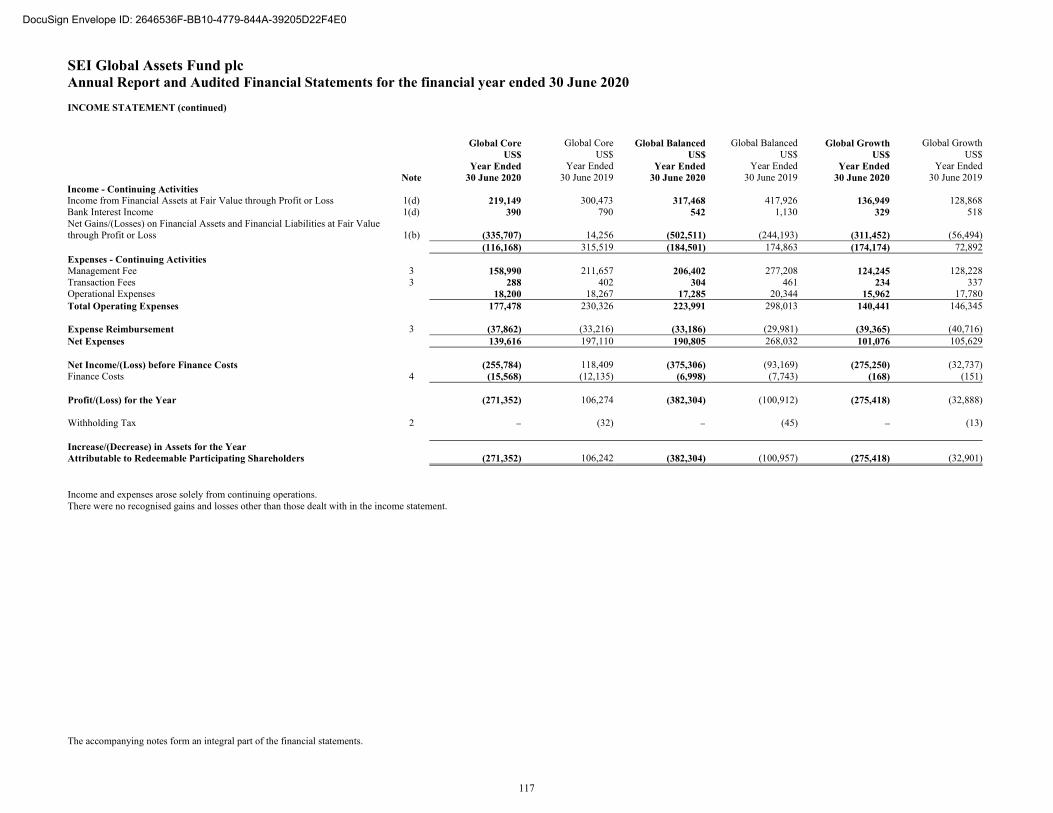
SEI Global Assets Fund plc Annual Report and Audited Financial Statements for the financial year ended 30 June 2020 INCOME STATEMENT (continued)
The accompanying notes form an integral part of the financial statements.
Global CoreUS$
Year Ended
Global CoreUS$
Year Ended
Global BalancedUS$
Year Ended
Global BalancedUS$
Year Ended
Global Growth US$
Year Ended
Global GrowthUS$
Year Ended Note 30 June 2020 30 June 2019 30 June 2020 30 June 2019 30 June 2020 30 June 2019Income - Continuing Activities Income from Financial Assets at Fair Value through Profit or Loss 1(d) 219,149 300,473 317,468 417,926 136,949 128,868Bank Interest Income 1(d) 390 790 542 1,130 329 518Net Gains/(Losses) on Financial Assets and Financial Liabilities at Fair Value through Profit or Loss 1(b) (335,707) 14,256 (502,511) (244,193) (311,452) (56,494) (116,168) 315,519 (184,501) 174,863 (174,174) 72,892Expenses - Continuing Activities Management Fee 3 158,990 211,657 206,402 277,208 124,245 128,228Transaction Fees 3 288 402 304 461 234 337Operational Expenses 18,200 18,267 17,285 20,344 15,962 17,780Total Operating Expenses 177,478 230,326 223,991 298,013 140,441 146,345 Expense Reimbursement 3 (37,862) (33,216) (33,186) (29,981) (39,365) (40,716)Net Expenses 139,616 197,110 190,805 268,032 101,076 105,629 Net Income/(Loss) before Finance Costs (255,784) 118,409 (375,306) (93,169) (275,250) (32,737)Finance Costs 4 (15,568) (12,135) (6,998) (7,743) (168) (151) Profit/(Loss) for the Year (271,352) 106,274 (382,304) (100,912) (275,418) (32,888) Withholding Tax 2 – (32) – (45) – (13) Increase/(Decrease) in Assets for the Year Attributable to Redeemable Participating Shareholders (271,352) 106,242 (382,304) (100,957) (275,418) (32,901) Income and expenses arose solely from continuing operations. There were no recognised gains and losses other than those dealt with in the income statement.
117
DocuSign Envelope ID: 2646536F-BB10-4779-844A-39205D22F4E0
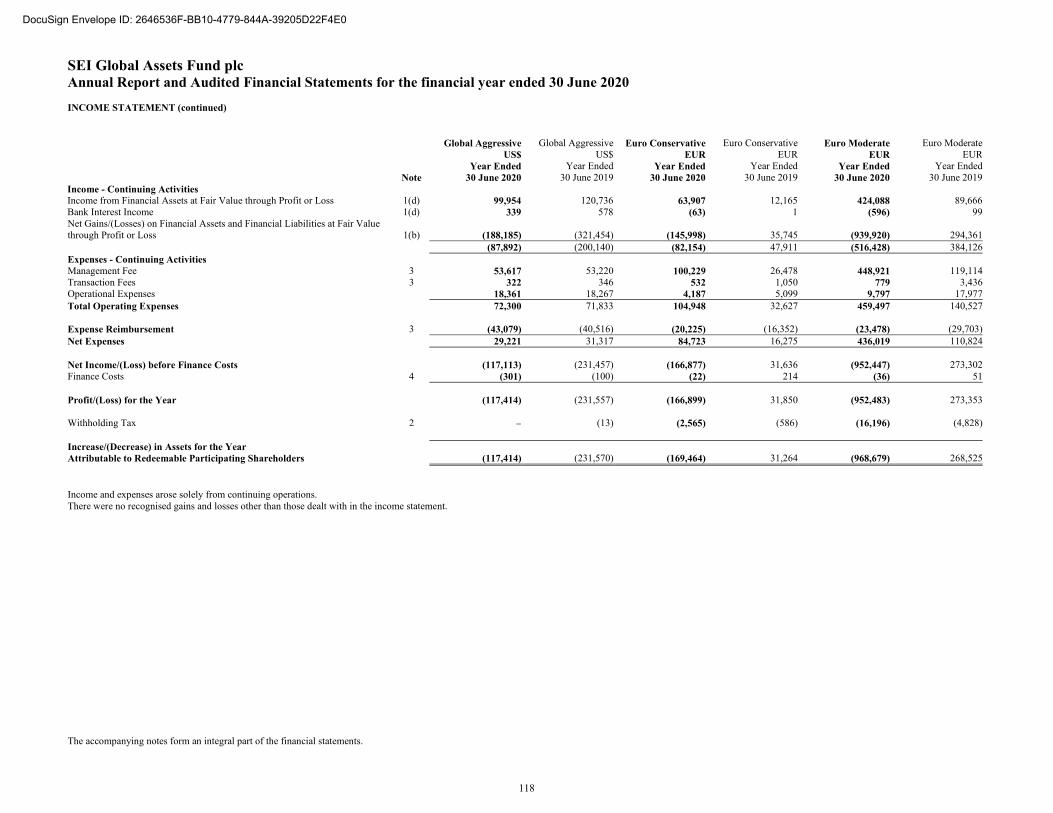
SEI Global Assets Fund plc Annual Report and Audited Financial Statements for the financial year ended 30 June 2020 INCOME STATEMENT (continued)
The accompanying notes form an integral part of the financial statements.
Global AggressiveUS$
Year Ended
Global AggressiveUS$
Year Ended
Euro ConservativeEUR
Year Ended
Euro ConservativeEUR
Year Ended
Euro Moderate EUR
Year Ended
Euro ModerateEUR
Year Ended Note 30 June 2020 30 June 2019 30 June 2020 30 June 2019 30 June 2020 30 June 2019Income - Continuing Activities Income from Financial Assets at Fair Value through Profit or Loss 1(d) 99,954 120,736 63,907 12,165 424,088 89,666Bank Interest Income 1(d) 339 578 (63) 1 (596) 99Net Gains/(Losses) on Financial Assets and Financial Liabilities at Fair Value through Profit or Loss 1(b) (188,185) (321,454) (145,998) 35,745 (939,920) 294,361 (87,892) (200,140) (82,154) 47,911 (516,428) 384,126Expenses - Continuing Activities Management Fee 3 53,617 53,220 100,229 26,478 448,921 119,114Transaction Fees 3 322 346 532 1,050 779 3,436Operational Expenses 18,361 18,267 4,187 5,099 9,797 17,977Total Operating Expenses 72,300 71,833 104,948 32,627 459,497 140,527 Expense Reimbursement 3 (43,079) (40,516) (20,225) (16,352) (23,478) (29,703)Net Expenses 29,221 31,317 84,723 16,275 436,019 110,824 Net Income/(Loss) before Finance Costs (117,113) (231,457) (166,877) 31,636 (952,447) 273,302Finance Costs 4 (301) (100) (22) 214 (36) 51 Profit/(Loss) for the Year (117,414) (231,557) (166,899) 31,850 (952,483) 273,353 Withholding Tax 2 – (13) (2,565) (586) (16,196) (4,828) Increase/(Decrease) in Assets for the Year Attributable to Redeemable Participating Shareholders (117,414) (231,570) (169,464) 31,264 (968,679) 268,525 Income and expenses arose solely from continuing operations. There were no recognised gains and losses other than those dealt with in the income statement.
118
DocuSign Envelope ID: 2646536F-BB10-4779-844A-39205D22F4E0
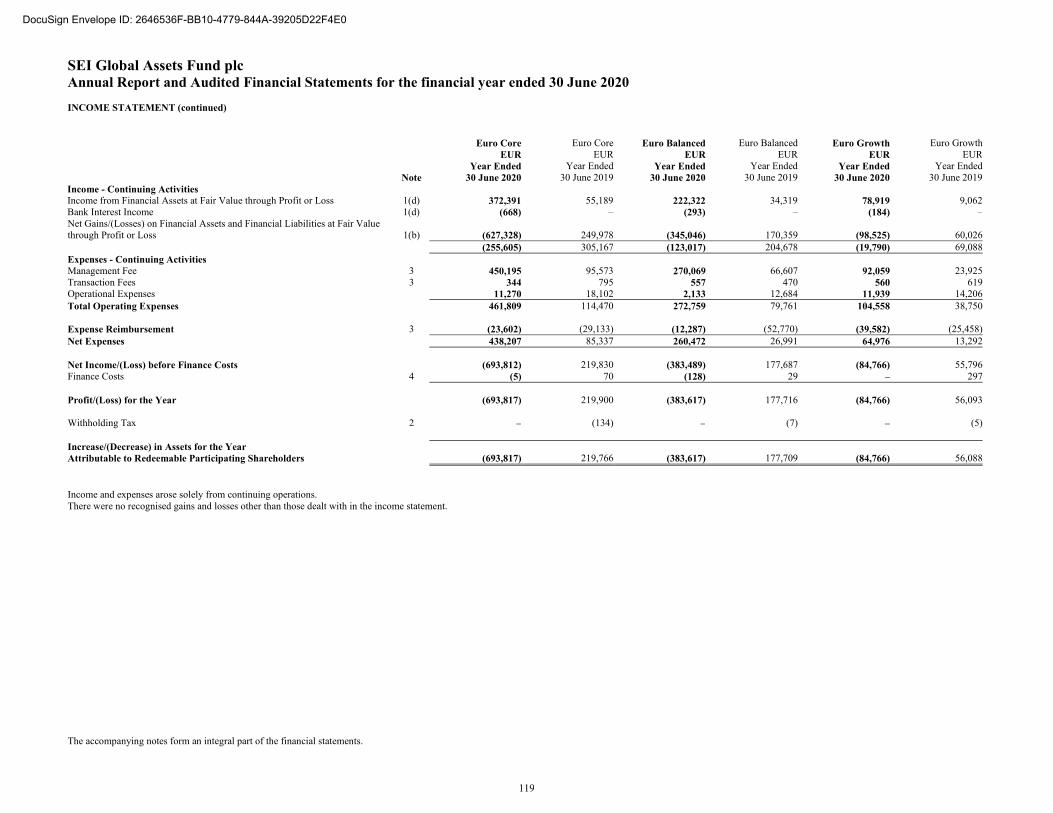
SEI Global Assets Fund plc Annual Report and Audited Financial Statements for the financial year ended 30 June 2020 INCOME STATEMENT (continued)
The accompanying notes form an integral part of the financial statements.
Euro CoreEUR
Year Ended
Euro CoreEUR
Year Ended
Euro Balanced EUR
Year Ended
Euro Balanced EUR
Year Ended
Euro Growth EUR
Year Ended
Euro GrowthEUR
Year Ended Note 30 June 2020 30 June 2019 30 June 2020 30 June 2019 30 June 2020 30 June 2019Income - Continuing Activities Income from Financial Assets at Fair Value through Profit or Loss 1(d) 372,391 55,189 222,322 34,319 78,919 9,062Bank Interest Income 1(d) (668) – (293) – (184) –Net Gains/(Losses) on Financial Assets and Financial Liabilities at Fair Value through Profit or Loss 1(b) (627,328) 249,978 (345,046) 170,359 (98,525) 60,026 (255,605) 305,167 (123,017) 204,678 (19,790) 69,088Expenses - Continuing Activities Management Fee 3 450,195 95,573 270,069 66,607 92,059 23,925Transaction Fees 3 344 795 557 470 560 619Operational Expenses 11,270 18,102 2,133 12,684 11,939 14,206Total Operating Expenses 461,809 114,470 272,759 79,761 104,558 38,750 Expense Reimbursement 3 (23,602) (29,133) (12,287) (52,770) (39,582) (25,458)Net Expenses 438,207 85,337 260,472 26,991 64,976 13,292 Net Income/(Loss) before Finance Costs (693,812) 219,830 (383,489) 177,687 (84,766) 55,796Finance Costs 4 (5) 70 (128) 29 – 297 Profit/(Loss) for the Year (693,817) 219,900 (383,617) 177,716 (84,766) 56,093 Withholding Tax 2 – (134) – (7) – (5) Increase/(Decrease) in Assets for the Year Attributable to Redeemable Participating Shareholders (693,817) 219,766 (383,617) 177,709 (84,766) 56,088 Income and expenses arose solely from continuing operations. There were no recognised gains and losses other than those dealt with in the income statement.
119
DocuSign Envelope ID: 2646536F-BB10-4779-844A-39205D22F4E0
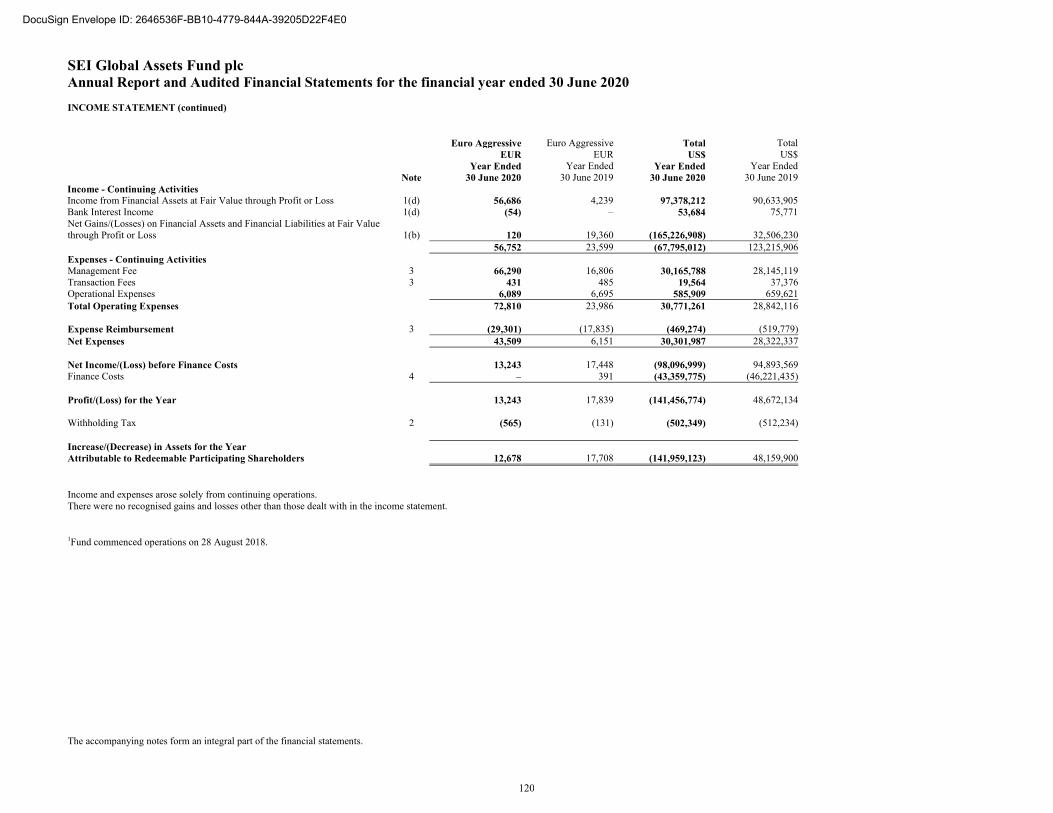
SEI Global Assets Fund plc Annual Report and Audited Financial Statements for the financial year ended 30 June 2020 INCOME STATEMENT (continued)
The accompanying notes form an integral part of the financial statements.
Euro AggressiveEUR
Year Ended
Euro AggressiveEUR
Year Ended
TotalUS$
Year Ended
TotalUS$
Year Ended Note 30 June 2020 30 June 2019 30 June 2020 30 June 2019Income - Continuing Activities Income from Financial Assets at Fair Value through Profit or Loss 1(d) 56,686 4,239 97,378,212 90,633,905Bank Interest Income 1(d) (54) – 53,684 75,771Net Gains/(Losses) on Financial Assets and Financial Liabilities at Fair Value through Profit or Loss 1(b) 120 19,360 (165,226,908) 32,506,230 56,752 23,599 (67,795,012) 123,215,906Expenses - Continuing Activities Management Fee 3 66,290 16,806 30,165,788 28,145,119Transaction Fees 3 431 485 19,564 37,376Operational Expenses 6,089 6,695 585,909 659,621Total Operating Expenses 72,810 23,986 30,771,261 28,842,116 Expense Reimbursement 3 (29,301) (17,835) (469,274) (519,779)Net Expenses 43,509 6,151 30,301,987 28,322,337 Net Income/(Loss) before Finance Costs 13,243 17,448 (98,096,999) 94,893,569Finance Costs 4 – 391 (43,359,775) (46,221,435) Profit/(Loss) for the Year 13,243 17,839 (141,456,774) 48,672,134 Withholding Tax 2 (565) (131) (502,349) (512,234) Increase/(Decrease) in Assets for the Year Attributable to Redeemable Participating Shareholders 12,678 17,708 (141,959,123) 48,159,900 Income and expenses arose solely from continuing operations. There were no recognised gains and losses other than those dealt with in the income statement.
1Fund commenced operations on 28 August 2018.
120
DocuSign Envelope ID: 2646536F-BB10-4779-844A-39205D22F4E0

SEI Global Assets Fund plc Annual Report and Audited Financial Statements for the financial year ended 30 June 2020 STATEMENT OF FINANCIAL POSITION
The accompanying notes form an integral part of the financial statements.
Defensive Defensive Conservative Conservative Moderate Moderate GBP GBP GBP GBP GBP GBP As at As at As at As at As at As at Note 30 June 2020 30 June 2019 30 June 2020 30 June 2019 30 June 2020 30 June 2019Current Assets Financial Assets at Fair Value through Profit or Loss 1(b) 46,963,351 30,539,433 63,881,067 75,452,977 363,205,752 354,932,194Cash at Bank 6 138,324 36,016 180,881 295,485 1,535,595 1,223,987Receivable for Investments Sold 3 8,115 182,739 54,505 17 259,771Receivable for Shares Created 19,180 262,301 103,233 148,650 171,942 499,800Accrued Income Receivable 4,093 1,923 13,940 13,044 77,117 61,234Other Assets 1,582 3,694 292 1,455 1,285 1,289Total Assets 47,126,533 30,851,482 64,362,152 75,966,116 364,991,708 356,978,275 Liabilities Due Within One Year Payable for Investments Purchased – 173,162 – 73,259 – 343,906Payable for Shares Redeemed 53,061 34,885 97,737 50,614 262,040 705,057Accrued Expenses Payable and Other Payables 47,108 37,229 65,403 65,924 254,621 230,967Total Liabilities (excluding Net Assets Attributable to Redeemable Participating Shareholders) 100,169 245,276 163,140 189,797 516,661 1,279,930 Net Assets Attributable to Redeemable Participating Shareholders (for Financial Reporting purposes) 47,026,364 30,606,206 64,199,012 75,776,319 364,475,047 355,698,345Adjustments for Organisational Expenses – – – – – –Net Assets Attributable to Redeemable Participating Shareholders (at Last Traded Market Prices) 47,026,364 30,606,206 64,199,012 75,776,319 364,475,047 355,698,345
121
DocuSign Envelope ID: 2646536F-BB10-4779-844A-39205D22F4E0
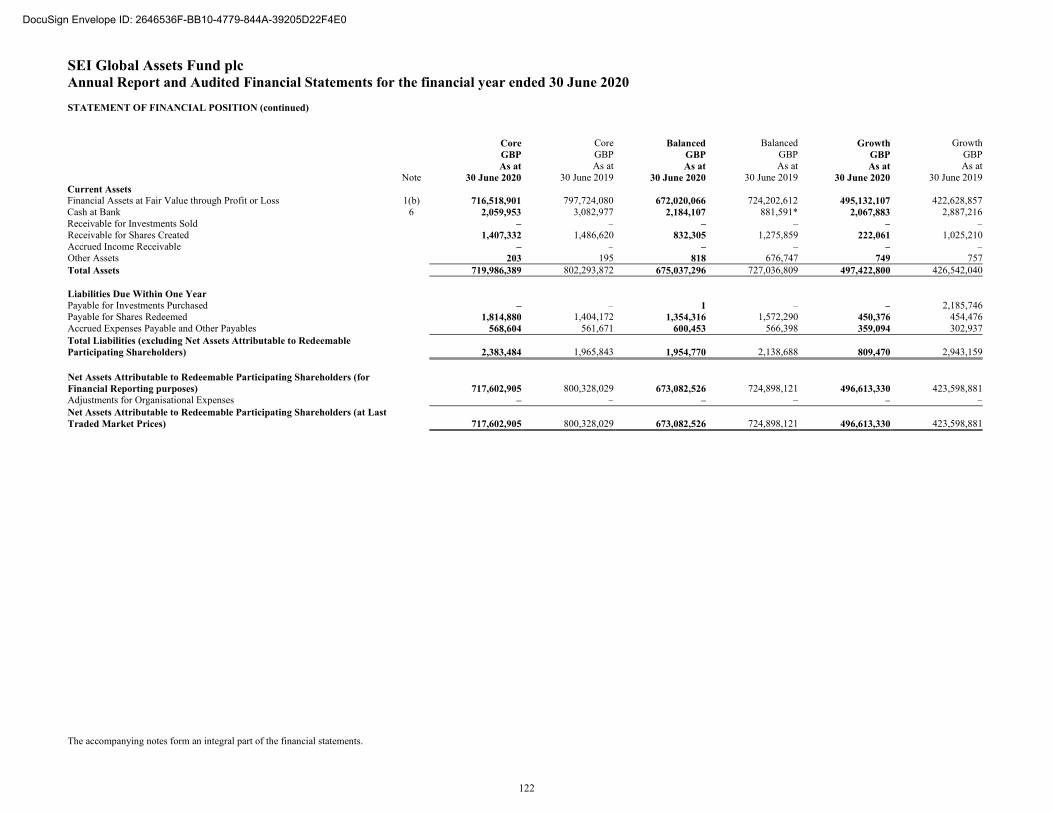
SEI Global Assets Fund plc Annual Report and Audited Financial Statements for the financial year ended 30 June 2020 STATEMENT OF FINANCIAL POSITION (continued)
The accompanying notes form an integral part of the financial statements.
Core Core Balanced Balanced Growth Growth GBP GBP GBP GBP GBP GBP As at As at As at As at As at As at Note 30 June 2020 30 June 2019 30 June 2020 30 June 2019 30 June 2020 30 June 2019Current Assets Financial Assets at Fair Value through Profit or Loss 1(b) 716,518,901 797,724,080 672,020,066 724,202,612 495,132,107 422,628,857Cash at Bank 6 2,059,953 3,082,977 2,184,107 881,591* 2,067,883 2,887,216Receivable for Investments Sold – – – – – –Receivable for Shares Created 1,407,332 1,486,620 832,305 1,275,859 222,061 1,025,210Accrued Income Receivable – – – – – –Other Assets 203 195 818 676,747 749 757Total Assets 719,986,389 802,293,872 675,037,296 727,036,809 497,422,800 426,542,040 Liabilities Due Within One Year Payable for Investments Purchased – – 1 – – 2,185,746Payable for Shares Redeemed 1,814,880 1,404,172 1,354,316 1,572,290 450,376 454,476Accrued Expenses Payable and Other Payables 568,604 561,671 600,453 566,398 359,094 302,937Total Liabilities (excluding Net Assets Attributable to Redeemable Participating Shareholders) 2,383,484 1,965,843 1,954,770 2,138,688 809,470 2,943,159 Net Assets Attributable to Redeemable Participating Shareholders (for Financial Reporting purposes) 717,602,905 800,328,029 673,082,526 724,898,121 496,613,330 423,598,881Adjustments for Organisational Expenses – – – – – –Net Assets Attributable to Redeemable Participating Shareholders (at Last Traded Market Prices) 717,602,905 800,328,029 673,082,526 724,898,121 496,613,330 423,598,881
122
DocuSign Envelope ID: 2646536F-BB10-4779-844A-39205D22F4E0
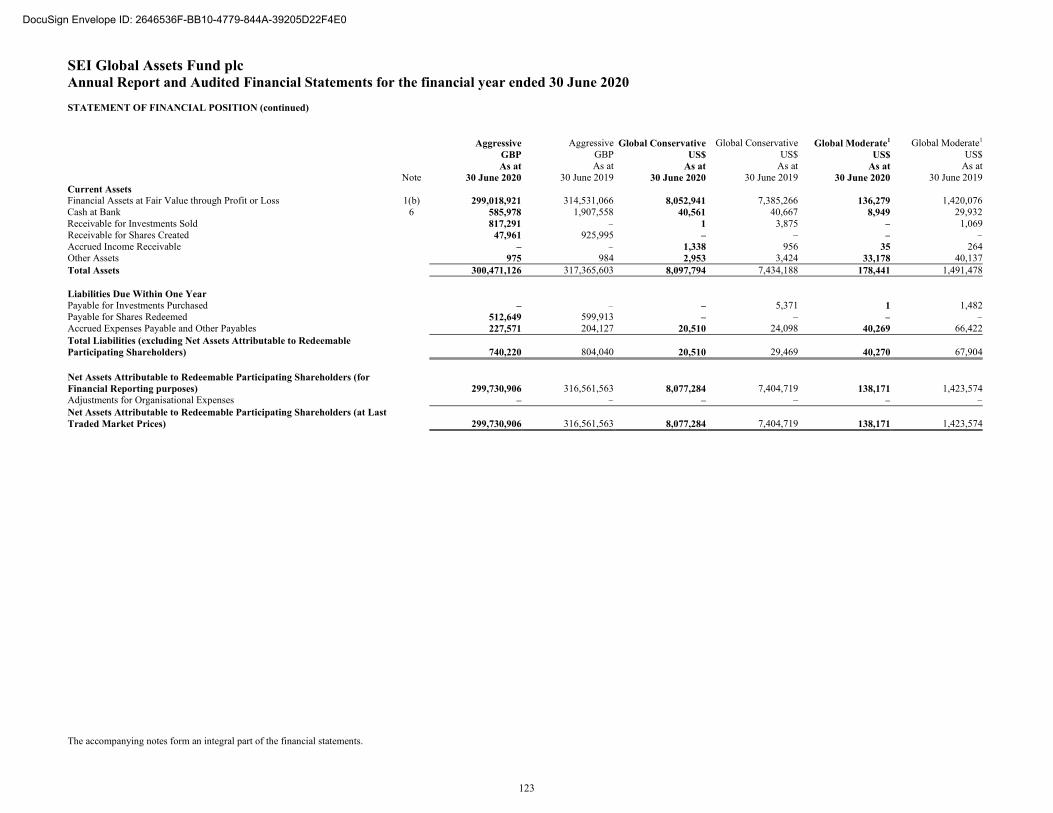
SEI Global Assets Fund plc Annual Report and Audited Financial Statements for the financial year ended 30 June 2020 STATEMENT OF FINANCIAL POSITION (continued)
The accompanying notes form an integral part of the financial statements.
Aggressive Aggressive Global Conservative Global Conservative Global Moderate1 Global Moderate1
GBP GBP US$ US$ US$ US$ As at As at As at As at As at As at Note 30 June 2020 30 June 2019 30 June 2020 30 June 2019 30 June 2020 30 June 2019Current Assets Financial Assets at Fair Value through Profit or Loss 1(b) 299,018,921 314,531,066 8,052,941 7,385,266 136,279 1,420,076Cash at Bank 6 585,978 1,907,558 40,561 40,667 8,949 29,932Receivable for Investments Sold 817,291 – 1 3,875 – 1,069Receivable for Shares Created 47,961 925,995 – – – –Accrued Income Receivable – – 1,338 956 35 264Other Assets 975 984 2,953 3,424 33,178 40,137Total Assets 300,471,126 317,365,603 8,097,794 7,434,188 178,441 1,491,478 Liabilities Due Within One Year Payable for Investments Purchased – – – 5,371 1 1,482Payable for Shares Redeemed 512,649 599,913 – – – –Accrued Expenses Payable and Other Payables 227,571 204,127 20,510 24,098 40,269 66,422Total Liabilities (excluding Net Assets Attributable to Redeemable Participating Shareholders) 740,220 804,040 20,510 29,469 40,270 67,904 Net Assets Attributable to Redeemable Participating Shareholders (for Financial Reporting purposes) 299,730,906 316,561,563 8,077,284 7,404,719 138,171 1,423,574Adjustments for Organisational Expenses – – – – – –Net Assets Attributable to Redeemable Participating Shareholders (at Last Traded Market Prices) 299,730,906 316,561,563 8,077,284 7,404,719 138,171 1,423,574
123
DocuSign Envelope ID: 2646536F-BB10-4779-844A-39205D22F4E0
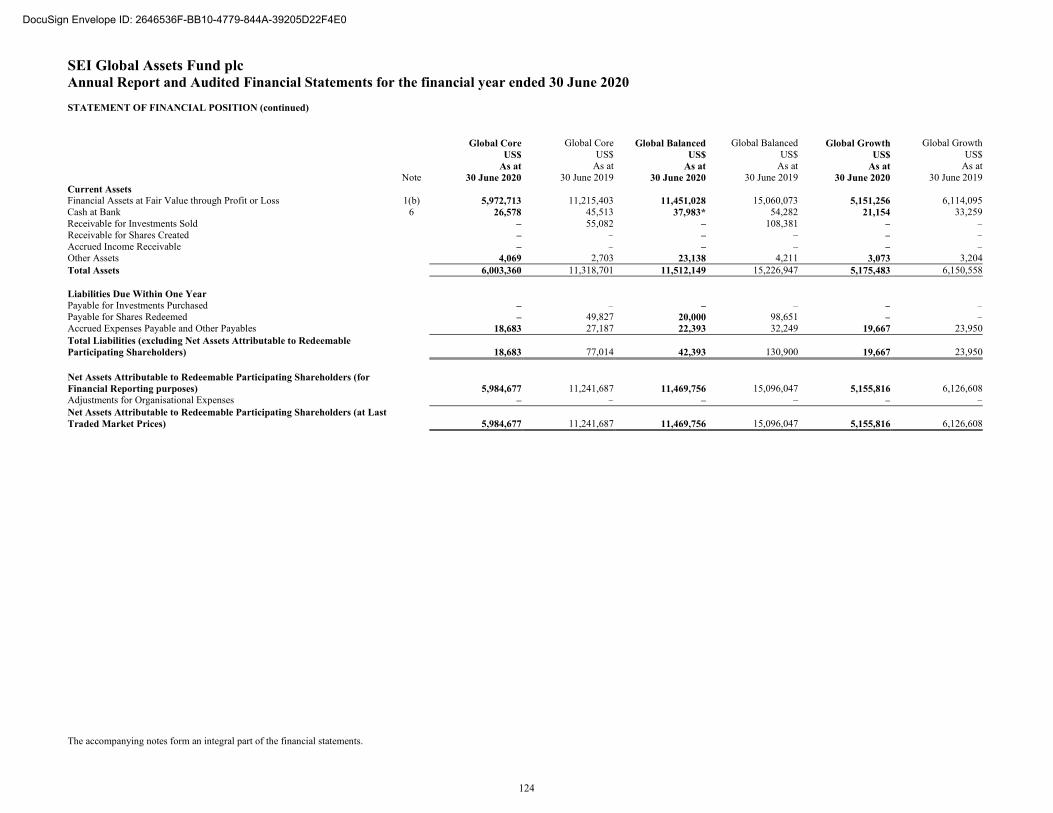
SEI Global Assets Fund plc Annual Report and Audited Financial Statements for the financial year ended 30 June 2020 STATEMENT OF FINANCIAL POSITION (continued)
The accompanying notes form an integral part of the financial statements.
Global Core Global Core Global Balanced Global Balanced Global Growth Global Growth US$ US$ US$ US$ US$ US$ As at As at As at As at As at As at Note 30 June 2020 30 June 2019 30 June 2020 30 June 2019 30 June 2020 30 June 2019Current Assets Financial Assets at Fair Value through Profit or Loss 1(b) 5,972,713 11,215,403 11,451,028 15,060,073 5,151,256 6,114,095Cash at Bank 6 26,578 45,513 37,983* 54,282 21,154 33,259Receivable for Investments Sold – 55,082 – 108,381 – –Receivable for Shares Created – – – – – –Accrued Income Receivable – – – – – –Other Assets 4,069 2,703 23,138 4,211 3,073 3,204Total Assets 6,003,360 11,318,701 11,512,149 15,226,947 5,175,483 6,150,558 Liabilities Due Within One Year Payable for Investments Purchased – – – – – –Payable for Shares Redeemed – 49,827 20,000 98,651 – –Accrued Expenses Payable and Other Payables 18,683 27,187 22,393 32,249 19,667 23,950Total Liabilities (excluding Net Assets Attributable to Redeemable Participating Shareholders) 18,683 77,014 42,393 130,900 19,667 23,950 Net Assets Attributable to Redeemable Participating Shareholders (for Financial Reporting purposes) 5,984,677 11,241,687 11,469,756 15,096,047 5,155,816 6,126,608Adjustments for Organisational Expenses – – – – – –Net Assets Attributable to Redeemable Participating Shareholders (at Last Traded Market Prices) 5,984,677 11,241,687 11,469,756 15,096,047 5,155,816 6,126,608
124
DocuSign Envelope ID: 2646536F-BB10-4779-844A-39205D22F4E0
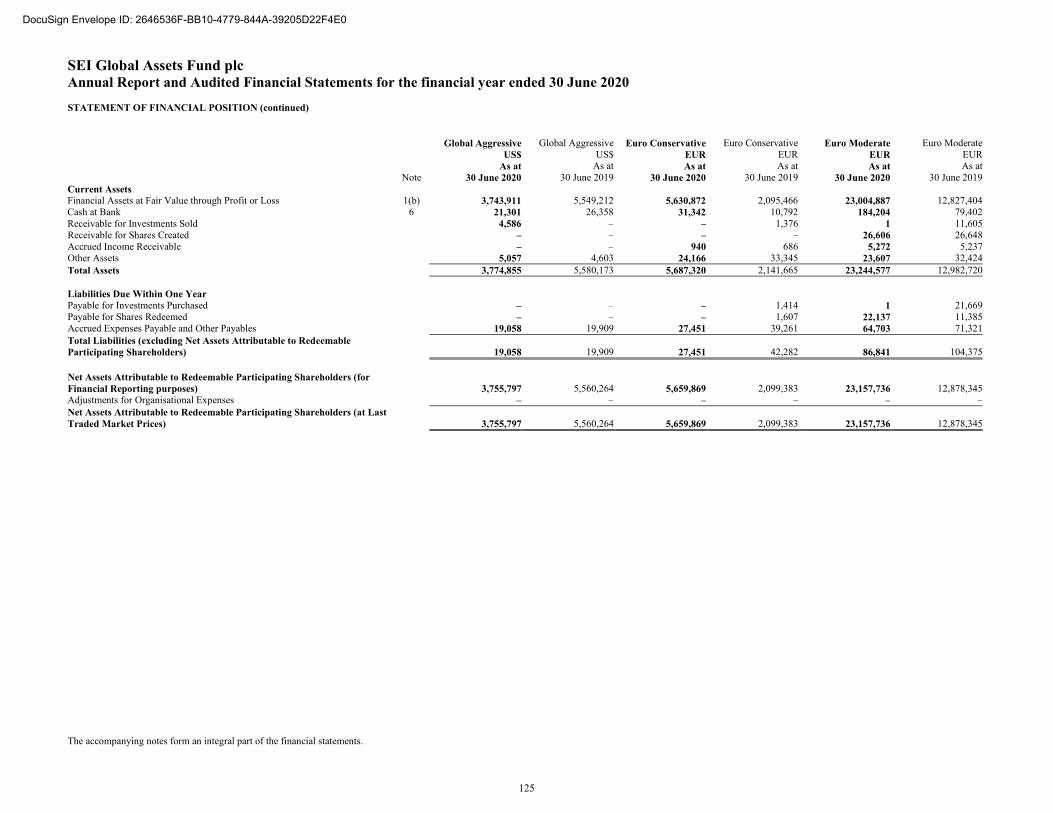
SEI Global Assets Fund plc Annual Report and Audited Financial Statements for the financial year ended 30 June 2020 STATEMENT OF FINANCIAL POSITION (continued)
The accompanying notes form an integral part of the financial statements.
Global Aggressive Global Aggressive Euro Conservative Euro Conservative Euro Moderate Euro Moderate US$ US$ EUR EUR EUR EUR As at As at As at As at As at As at Note 30 June 2020 30 June 2019 30 June 2020 30 June 2019 30 June 2020 30 June 2019Current Assets Financial Assets at Fair Value through Profit or Loss 1(b) 3,743,911 5,549,212 5,630,872 2,095,466 23,004,887 12,827,404Cash at Bank 6 21,301 26,358 31,342 10,792 184,204 79,402Receivable for Investments Sold 4,586 – – 1,376 1 11,605Receivable for Shares Created – – – – 26,606 26,648Accrued Income Receivable – – 940 686 5,272 5,237Other Assets 5,057 4,603 24,166 33,345 23,607 32,424Total Assets 3,774,855 5,580,173 5,687,320 2,141,665 23,244,577 12,982,720 Liabilities Due Within One Year Payable for Investments Purchased – – – 1,414 1 21,669Payable for Shares Redeemed – – – 1,607 22,137 11,385Accrued Expenses Payable and Other Payables 19,058 19,909 27,451 39,261 64,703 71,321Total Liabilities (excluding Net Assets Attributable to Redeemable Participating Shareholders) 19,058 19,909 27,451 42,282 86,841 104,375 Net Assets Attributable to Redeemable Participating Shareholders (for Financial Reporting purposes) 3,755,797 5,560,264 5,659,869 2,099,383 23,157,736 12,878,345Adjustments for Organisational Expenses – – – – – –Net Assets Attributable to Redeemable Participating Shareholders (at Last Traded Market Prices) 3,755,797 5,560,264 5,659,869 2,099,383 23,157,736 12,878,345
125
DocuSign Envelope ID: 2646536F-BB10-4779-844A-39205D22F4E0
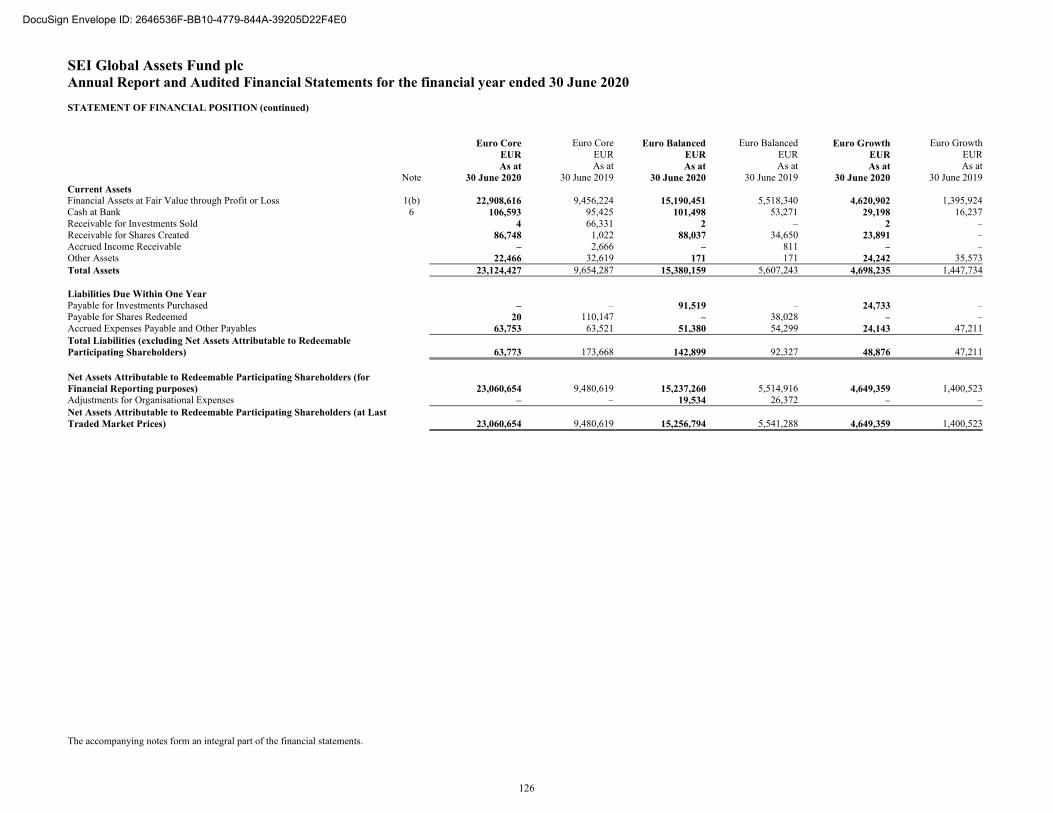
SEI Global Assets Fund plc Annual Report and Audited Financial Statements for the financial year ended 30 June 2020 STATEMENT OF FINANCIAL POSITION (continued)
The accompanying notes form an integral part of the financial statements.
Euro Core Euro Core Euro Balanced Euro Balanced Euro Growth Euro Growth EUR EUR EUR EUR EUR EUR As at As at As at As at As at As at Note 30 June 2020 30 June 2019 30 June 2020 30 June 2019 30 June 2020 30 June 2019Current Assets Financial Assets at Fair Value through Profit or Loss 1(b) 22,908,616 9,456,224 15,190,451 5,518,340 4,620,902 1,395,924Cash at Bank 6 106,593 95,425 101,498 53,271 29,198 16,237Receivable for Investments Sold 4 66,331 2 – 2 –Receivable for Shares Created 86,748 1,022 88,037 34,650 23,891 –Accrued Income Receivable – 2,666 – 811 – –Other Assets 22,466 32,619 171 171 24,242 35,573Total Assets 23,124,427 9,654,287 15,380,159 5,607,243 4,698,235 1,447,734 Liabilities Due Within One Year Payable for Investments Purchased – – 91,519 – 24,733 –Payable for Shares Redeemed 20 110,147 – 38,028 – –Accrued Expenses Payable and Other Payables 63,753 63,521 51,380 54,299 24,143 47,211Total Liabilities (excluding Net Assets Attributable to Redeemable Participating Shareholders) 63,773 173,668 142,899 92,327 48,876 47,211 Net Assets Attributable to Redeemable Participating Shareholders (for Financial Reporting purposes) 23,060,654 9,480,619 15,237,260 5,514,916 4,649,359 1,400,523Adjustments for Organisational Expenses – – 19,534 26,372 – –Net Assets Attributable to Redeemable Participating Shareholders (at Last Traded Market Prices) 23,060,654 9,480,619 15,256,794 5,541,288 4,649,359 1,400,523
126
DocuSign Envelope ID: 2646536F-BB10-4779-844A-39205D22F4E0
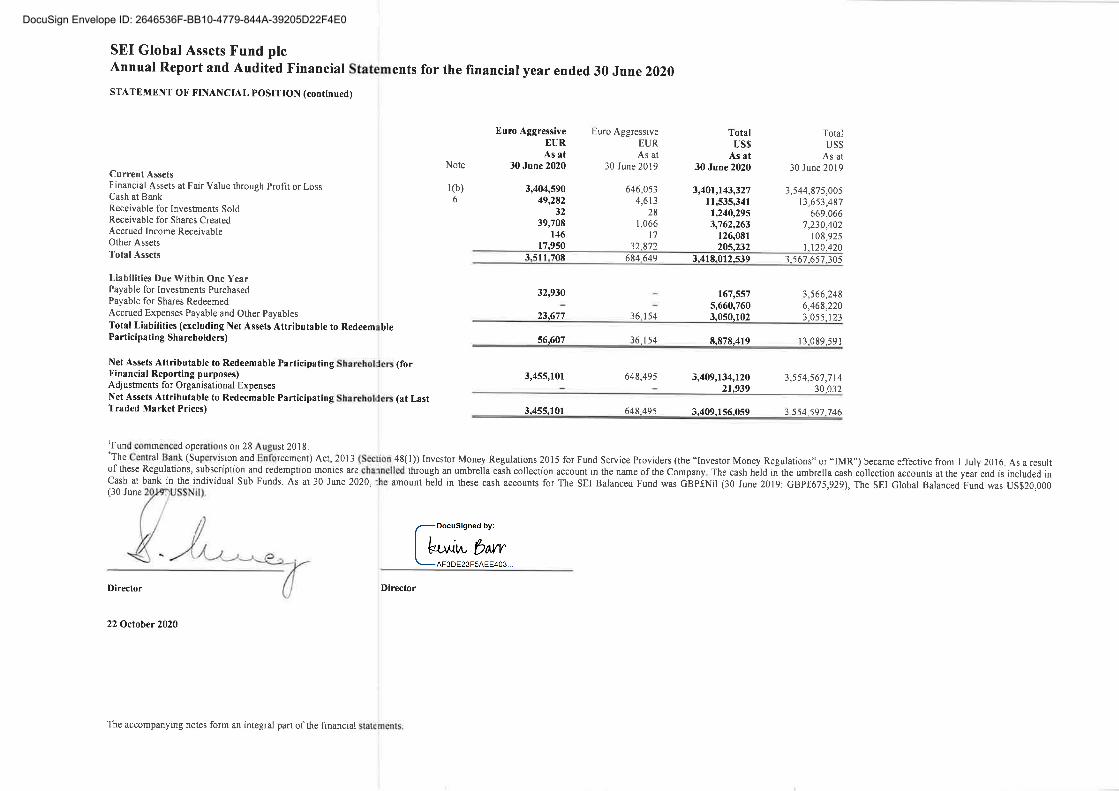
DocuSign Envelope ID: 2646536F-BB10-4779-844A-39205D22F4E0
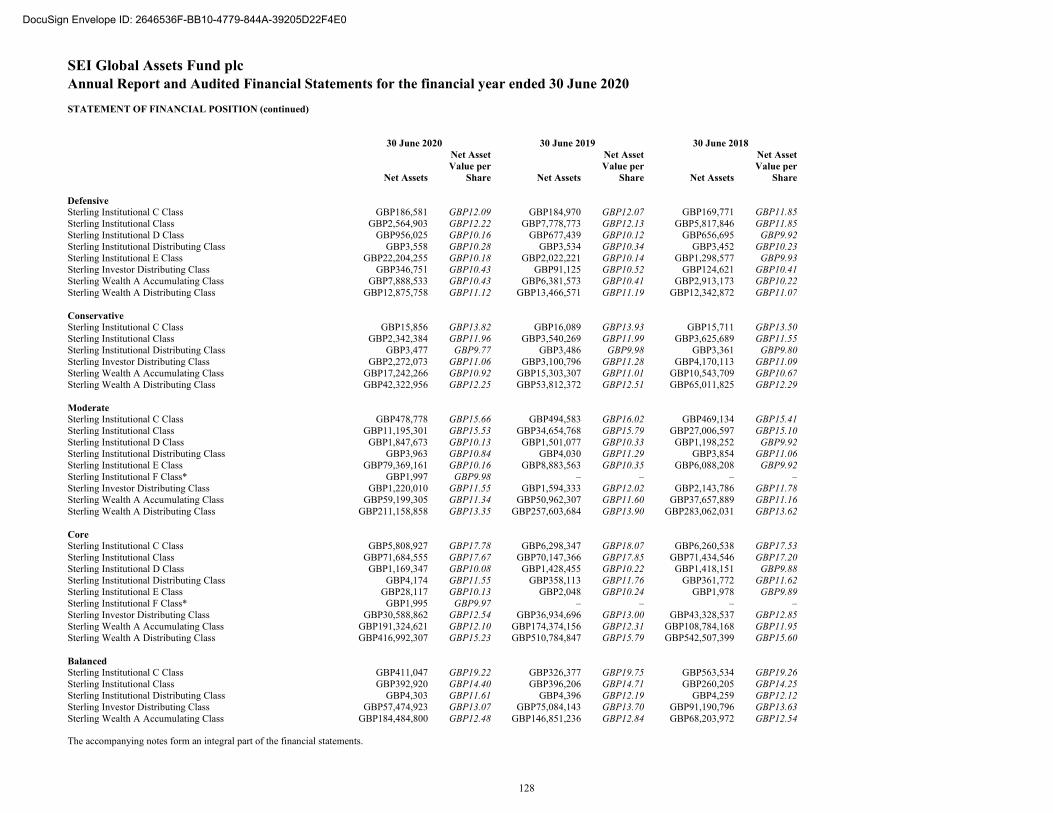
SEI Global Assets Fund plc Annual Report and Audited Financial Statements for the financial year ended 30 June 2020 STATEMENT OF FINANCIAL POSITION (continued)
The accompanying notes form an integral part of the financial statements.
30 June 2020 30 June 2019 30 June 2018
Net Assets
Net AssetValue per
Share Net Assets
Net AssetValue per
Share Net Assets
Net AssetValue per
Share Defensive Sterling Institutional C Class GBP186,581 GBP12.09 GBP184,970 GBP12.07 GBP169,771 GBP11.85Sterling Institutional Class GBP2,564,903 GBP12.22 GBP7,778,773 GBP12.13 GBP5,817,846 GBP11.85Sterling Institutional D Class GBP956,025 GBP10.16 GBP677,439 GBP10.12 GBP656,695 GBP9.92Sterling Institutional Distributing Class GBP3,558 GBP10.28 GBP3,534 GBP10.34 GBP3,452 GBP10.23Sterling Institutional E Class GBP22,204,255 GBP10.18 GBP2,022,221 GBP10.14 GBP1,298,577 GBP9.93Sterling Investor Distributing Class GBP346,751 GBP10.43 GBP91,125 GBP10.52 GBP124,621 GBP10.41Sterling Wealth A Accumulating Class GBP7,888,533 GBP10.43 GBP6,381,573 GBP10.41 GBP2,913,173 GBP10.22Sterling Wealth A Distributing Class GBP12,875,758 GBP11.12 GBP13,466,571 GBP11.19 GBP12,342,872 GBP11.07 Conservative Sterling Institutional C Class GBP15,856 GBP13.82 GBP16,089 GBP13.93 GBP15,711 GBP13.50Sterling Institutional Class GBP2,342,384 GBP11.96 GBP3,540,269 GBP11.99 GBP3,625,689 GBP11.55Sterling Institutional Distributing Class GBP3,477 GBP9.77 GBP3,486 GBP9.98 GBP3,361 GBP9.80Sterling Investor Distributing Class GBP2,272,073 GBP11.06 GBP3,100,796 GBP11.28 GBP4,170,113 GBP11.09Sterling Wealth A Accumulating Class GBP17,242,266 GBP10.92 GBP15,303,307 GBP11.01 GBP10,543,709 GBP10.67Sterling Wealth A Distributing Class GBP42,322,956 GBP12.25 GBP53,812,372 GBP12.51 GBP65,011,825 GBP12.29 Moderate Sterling Institutional C Class GBP478,778 GBP15.66 GBP494,583 GBP16.02 GBP469,134 GBP15.41Sterling Institutional Class GBP11,195,301 GBP15.53 GBP34,654,768 GBP15.79 GBP27,006,597 GBP15.10Sterling Institutional D Class GBP1,847,673 GBP10.13 GBP1,501,077 GBP10.33 GBP1,198,252 GBP9.92Sterling Institutional Distributing Class GBP3,963 GBP10.84 GBP4,030 GBP11.29 GBP3,854 GBP11.06Sterling Institutional E Class GBP79,369,161 GBP10.16 GBP8,883,563 GBP10.35 GBP6,088,208 GBP9.92Sterling Institutional F Class* GBP1,997 GBP9.98 – – – –Sterling Investor Distributing Class GBP1,220,010 GBP11.55 GBP1,594,333 GBP12.02 GBP2,143,786 GBP11.78Sterling Wealth A Accumulating Class GBP59,199,305 GBP11.34 GBP50,962,307 GBP11.60 GBP37,657,889 GBP11.16Sterling Wealth A Distributing Class GBP211,158,858 GBP13.35 GBP257,603,684 GBP13.90 GBP283,062,031 GBP13.62 Core Sterling Institutional C Class GBP5,808,927 GBP17.78 GBP6,298,347 GBP18.07 GBP6,260,538 GBP17.53Sterling Institutional Class GBP71,684,555 GBP17.67 GBP70,147,366 GBP17.85 GBP71,434,546 GBP17.20Sterling Institutional D Class GBP1,169,347 GBP10.08 GBP1,428,455 GBP10.22 GBP1,418,151 GBP9.88Sterling Institutional Distributing Class GBP4,174 GBP11.55 GBP358,113 GBP11.76 GBP361,772 GBP11.62Sterling Institutional E Class GBP28,117 GBP10.13 GBP2,048 GBP10.24 GBP1,978 GBP9.89Sterling Institutional F Class* GBP1,995 GBP9.97 – – – –Sterling Investor Distributing Class GBP30,588,862 GBP12.54 GBP36,934,696 GBP13.00 GBP43,328,537 GBP12.85Sterling Wealth A Accumulating Class GBP191,324,621 GBP12.10 GBP174,374,156 GBP12.31 GBP108,784,168 GBP11.95Sterling Wealth A Distributing Class GBP416,992,307 GBP15.23 GBP510,784,847 GBP15.79 GBP542,507,399 GBP15.60 Balanced Sterling Institutional C Class GBP411,047 GBP19.22 GBP326,377 GBP19.75 GBP563,534 GBP19.26Sterling Institutional Class GBP392,920 GBP14.40 GBP396,206 GBP14.71 GBP260,205 GBP14.25Sterling Institutional Distributing Class GBP4,303 GBP11.61 GBP4,396 GBP12.19 GBP4,259 GBP12.12Sterling Investor Distributing Class GBP57,474,923 GBP13.07 GBP75,084,143 GBP13.70 GBP91,190,796 GBP13.63Sterling Wealth A Accumulating Class GBP184,484,800 GBP12.48 GBP146,851,236 GBP12.84 GBP68,203,972 GBP12.54
128
DocuSign Envelope ID: 2646536F-BB10-4779-844A-39205D22F4E0
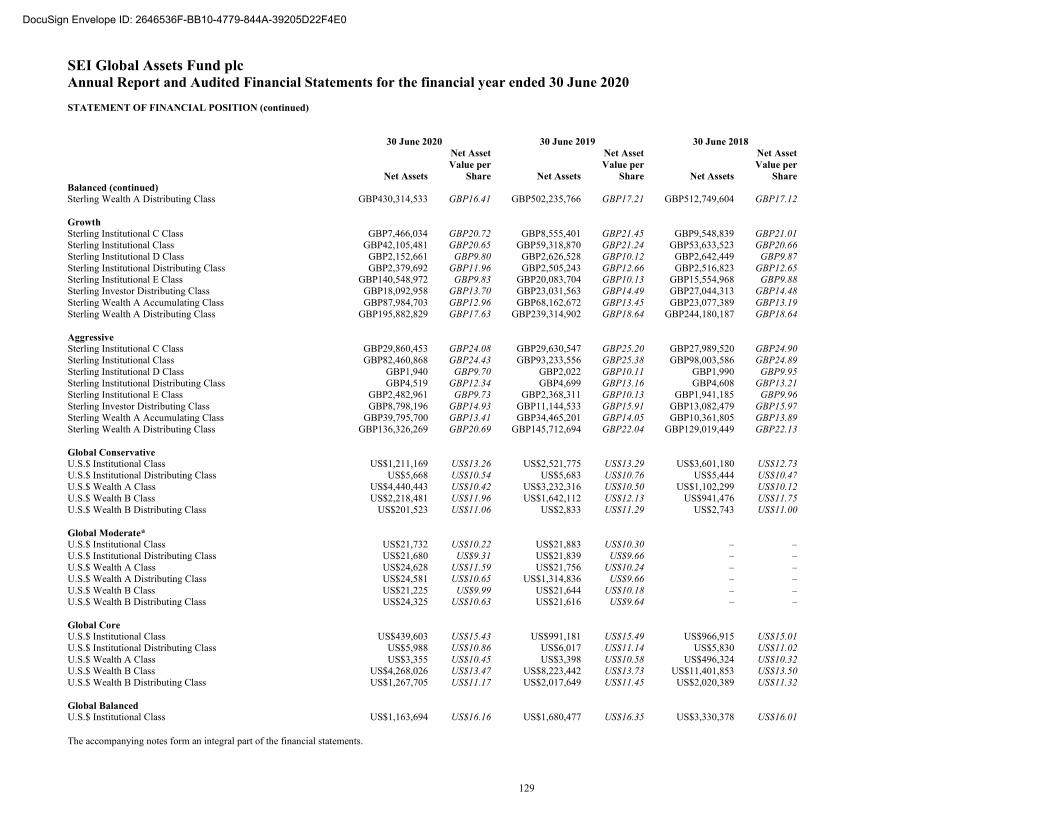
SEI Global Assets Fund plc Annual Report and Audited Financial Statements for the financial year ended 30 June 2020 STATEMENT OF FINANCIAL POSITION (continued)
The accompanying notes form an integral part of the financial statements.
30 June 2020 30 June 2019 30 June 2018
Net Assets
Net AssetValue per
Share Net Assets
Net AssetValue per
Share Net Assets
Net AssetValue per
ShareBalanced (continued) Sterling Wealth A Distributing Class GBP430,314,533 GBP16.41 GBP502,235,766 GBP17.21 GBP512,749,604 GBP17.12 Growth Sterling Institutional C Class GBP7,466,034 GBP20.72 GBP8,555,401 GBP21.45 GBP9,548,839 GBP21.01Sterling Institutional Class GBP42,105,481 GBP20.65 GBP59,318,870 GBP21.24 GBP53,633,523 GBP20.66Sterling Institutional D Class GBP2,152,661 GBP9.80 GBP2,626,528 GBP10.12 GBP2,642,449 GBP9.87Sterling Institutional Distributing Class GBP2,379,692 GBP11.96 GBP2,505,243 GBP12.66 GBP2,516,823 GBP12.65Sterling Institutional E Class GBP140,548,972 GBP9.83 GBP20,083,704 GBP10.13 GBP15,554,968 GBP9.88Sterling Investor Distributing Class GBP18,092,958 GBP13.70 GBP23,031,563 GBP14.49 GBP27,044,313 GBP14.48Sterling Wealth A Accumulating Class GBP87,984,703 GBP12.96 GBP68,162,672 GBP13.45 GBP23,077,389 GBP13.19Sterling Wealth A Distributing Class GBP195,882,829 GBP17.63 GBP239,314,902 GBP18.64 GBP244,180,187 GBP18.64 Aggressive Sterling Institutional C Class GBP29,860,453 GBP24.08 GBP29,630,547 GBP25.20 GBP27,989,520 GBP24.90Sterling Institutional Class GBP82,460,868 GBP24.43 GBP93,233,556 GBP25.38 GBP98,003,586 GBP24.89Sterling Institutional D Class GBP1,940 GBP9.70 GBP2,022 GBP10.11 GBP1,990 GBP9.95Sterling Institutional Distributing Class GBP4,519 GBP12.34 GBP4,699 GBP13.16 GBP4,608 GBP13.21Sterling Institutional E Class GBP2,482,961 GBP9.73 GBP2,368,311 GBP10.13 GBP1,941,185 GBP9.96Sterling Investor Distributing Class GBP8,798,196 GBP14.93 GBP11,144,533 GBP15.91 GBP13,082,479 GBP15.97Sterling Wealth A Accumulating Class GBP39,795,700 GBP13.41 GBP34,465,201 GBP14.05 GBP10,361,805 GBP13.89Sterling Wealth A Distributing Class GBP136,326,269 GBP20.69 GBP145,712,694 GBP22.04 GBP129,019,449 GBP22.13 Global Conservative U.S.$ Institutional Class US$1,211,169 US$13.26 US$2,521,775 US$13.29 US$3,601,180 US$12.73U.S.$ Institutional Distributing Class US$5,668 US$10.54 US$5,683 US$10.76 US$5,444 US$10.47U.S.$ Wealth A Class US$4,440,443 US$10.42 US$3,232,316 US$10.50 US$1,102,299 US$10.12U.S.$ Wealth B Class US$2,218,481 US$11.96 US$1,642,112 US$12.13 US$941,476 US$11.75U.S.$ Wealth B Distributing Class US$201,523 US$11.06 US$2,833 US$11.29 US$2,743 US$11.00 Global Moderate* U.S.$ Institutional Class US$21,732 US$10.22 US$21,883 US$10.30 – –U.S.$ Institutional Distributing Class US$21,680 US$9.31 US$21,839 US$9.66 – –U.S.$ Wealth A Class US$24,628 US$11.59 US$21,756 US$10.24 – –U.S.$ Wealth A Distributing Class US$24,581 US$10.65 US$1,314,836 US$9.66 – –U.S.$ Wealth B Class US$21,225 US$9.99 US$21,644 US$10.18 – –U.S.$ Wealth B Distributing Class US$24,325 US$10.63 US$21,616 US$9.64 – – Global Core U.S.$ Institutional Class US$439,603 US$15.43 US$991,181 US$15.49 US$966,915 US$15.01U.S.$ Institutional Distributing Class US$5,988 US$10.86 US$6,017 US$11.14 US$5,830 US$11.02U.S.$ Wealth A Class US$3,355 US$10.45 US$3,398 US$10.58 US$496,324 US$10.32U.S.$ Wealth B Class US$4,268,026 US$13.47 US$8,223,442 US$13.73 US$11,401,853 US$13.50U.S.$ Wealth B Distributing Class US$1,267,705 US$11.17 US$2,017,649 US$11.45 US$2,020,389 US$11.32 Global Balanced U.S.$ Institutional Class US$1,163,694 US$16.16 US$1,680,477 US$16.35 US$3,330,378 US$16.01
129
DocuSign Envelope ID: 2646536F-BB10-4779-844A-39205D22F4E0
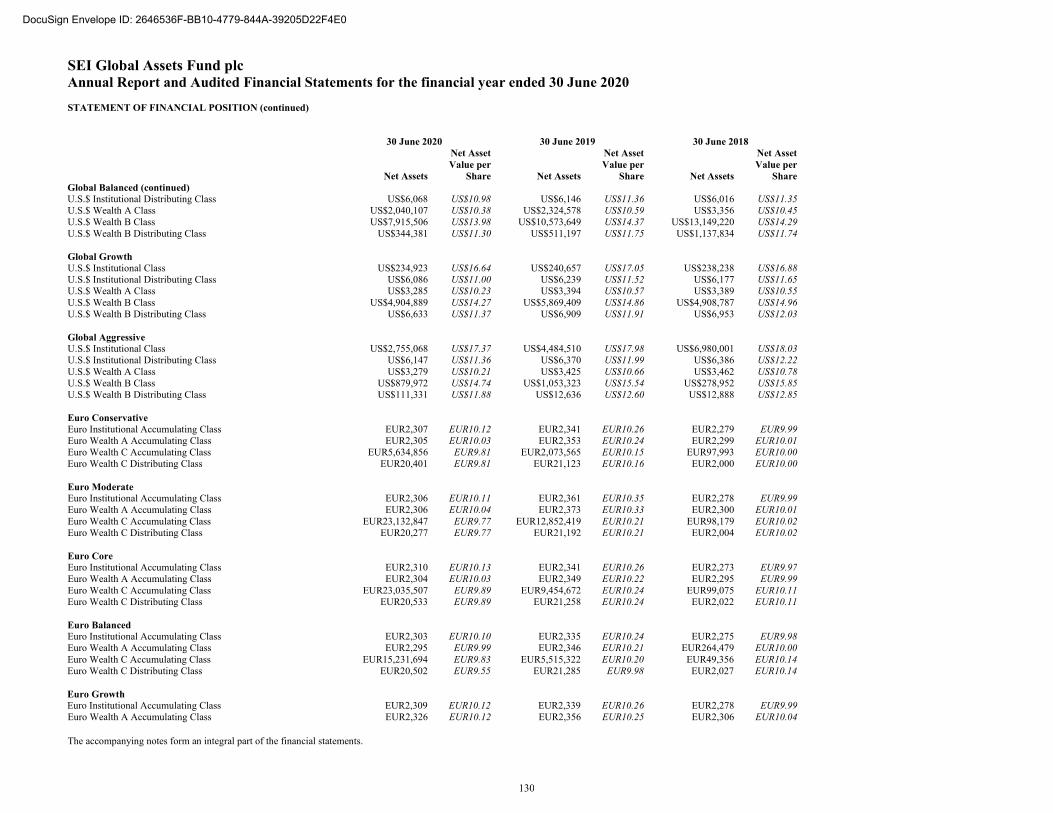
SEI Global Assets Fund plc Annual Report and Audited Financial Statements for the financial year ended 30 June 2020 STATEMENT OF FINANCIAL POSITION (continued)
The accompanying notes form an integral part of the financial statements.
30 June 2020 30 June 2019 30 June 2018
Net Assets
Net AssetValue per
Share Net Assets
Net AssetValue per
Share Net Assets
Net AssetValue per
ShareGlobal Balanced (continued) U.S.$ Institutional Distributing Class US$6,068 US$10.98 US$6,146 US$11.36 US$6,016 US$11.35U.S.$ Wealth A Class US$2,040,107 US$10.38 US$2,324,578 US$10.59 US$3,356 US$10.45U.S.$ Wealth B Class US$7,915,506 US$13.98 US$10,573,649 US$14.37 US$13,149,220 US$14.29U.S.$ Wealth B Distributing Class US$344,381 US$11.30 US$511,197 US$11.75 US$1,137,834 US$11.74 Global Growth U.S.$ Institutional Class US$234,923 US$16.64 US$240,657 US$17.05 US$238,238 US$16.88U.S.$ Institutional Distributing Class US$6,086 US$11.00 US$6,239 US$11.52 US$6,177 US$11.65U.S.$ Wealth A Class US$3,285 US$10.23 US$3,394 US$10.57 US$3,389 US$10.55U.S.$ Wealth B Class US$4,904,889 US$14.27 US$5,869,409 US$14.86 US$4,908,787 US$14.96U.S.$ Wealth B Distributing Class US$6,633 US$11.37 US$6,909 US$11.91 US$6,953 US$12.03 Global Aggressive U.S.$ Institutional Class US$2,755,068 US$17.37 US$4,484,510 US$17.98 US$6,980,001 US$18.03U.S.$ Institutional Distributing Class US$6,147 US$11.36 US$6,370 US$11.99 US$6,386 US$12.22U.S.$ Wealth A Class US$3,279 US$10.21 US$3,425 US$10.66 US$3,462 US$10.78U.S.$ Wealth B Class US$879,972 US$14.74 US$1,053,323 US$15.54 US$278,952 US$15.85U.S.$ Wealth B Distributing Class US$111,331 US$11.88 US$12,636 US$12.60 US$12,888 US$12.85 Euro Conservative Euro Institutional Accumulating Class EUR2,307 EUR10.12 EUR2,341 EUR10.26 EUR2,279 EUR9.99Euro Wealth A Accumulating Class EUR2,305 EUR10.03 EUR2,353 EUR10.24 EUR2,299 EUR10.01Euro Wealth C Accumulating Class EUR5,634,856 EUR9.81 EUR2,073,565 EUR10.15 EUR97,993 EUR10.00Euro Wealth C Distributing Class EUR20,401 EUR9.81 EUR21,123 EUR10.16 EUR2,000 EUR10.00 Euro Moderate Euro Institutional Accumulating Class EUR2,306 EUR10.11 EUR2,361 EUR10.35 EUR2,278 EUR9.99Euro Wealth A Accumulating Class EUR2,306 EUR10.04 EUR2,373 EUR10.33 EUR2,300 EUR10.01Euro Wealth C Accumulating Class EUR23,132,847 EUR9.77 EUR12,852,419 EUR10.21 EUR98,179 EUR10.02Euro Wealth C Distributing Class EUR20,277 EUR9.77 EUR21,192 EUR10.21 EUR2,004 EUR10.02 Euro Core Euro Institutional Accumulating Class EUR2,310 EUR10.13 EUR2,341 EUR10.26 EUR2,273 EUR9.97Euro Wealth A Accumulating Class EUR2,304 EUR10.03 EUR2,349 EUR10.22 EUR2,295 EUR9.99Euro Wealth C Accumulating Class EUR23,035,507 EUR9.89 EUR9,454,672 EUR10.24 EUR99,075 EUR10.11Euro Wealth C Distributing Class EUR20,533 EUR9.89 EUR21,258 EUR10.24 EUR2,022 EUR10.11 Euro Balanced Euro Institutional Accumulating Class EUR2,303 EUR10.10 EUR2,335 EUR10.24 EUR2,275 EUR9.98Euro Wealth A Accumulating Class EUR2,295 EUR9.99 EUR2,346 EUR10.21 EUR264,479 EUR10.00Euro Wealth C Accumulating Class EUR15,231,694 EUR9.83 EUR5,515,322 EUR10.20 EUR49,356 EUR10.14Euro Wealth C Distributing Class EUR20,502 EUR9.55 EUR21,285 EUR9.98 EUR2,027 EUR10.14 Euro Growth Euro Institutional Accumulating Class EUR2,309 EUR10.12 EUR2,339 EUR10.26 EUR2,278 EUR9.99Euro Wealth A Accumulating Class EUR2,326 EUR10.12 EUR2,356 EUR10.25 EUR2,306 EUR10.04
130
DocuSign Envelope ID: 2646536F-BB10-4779-844A-39205D22F4E0
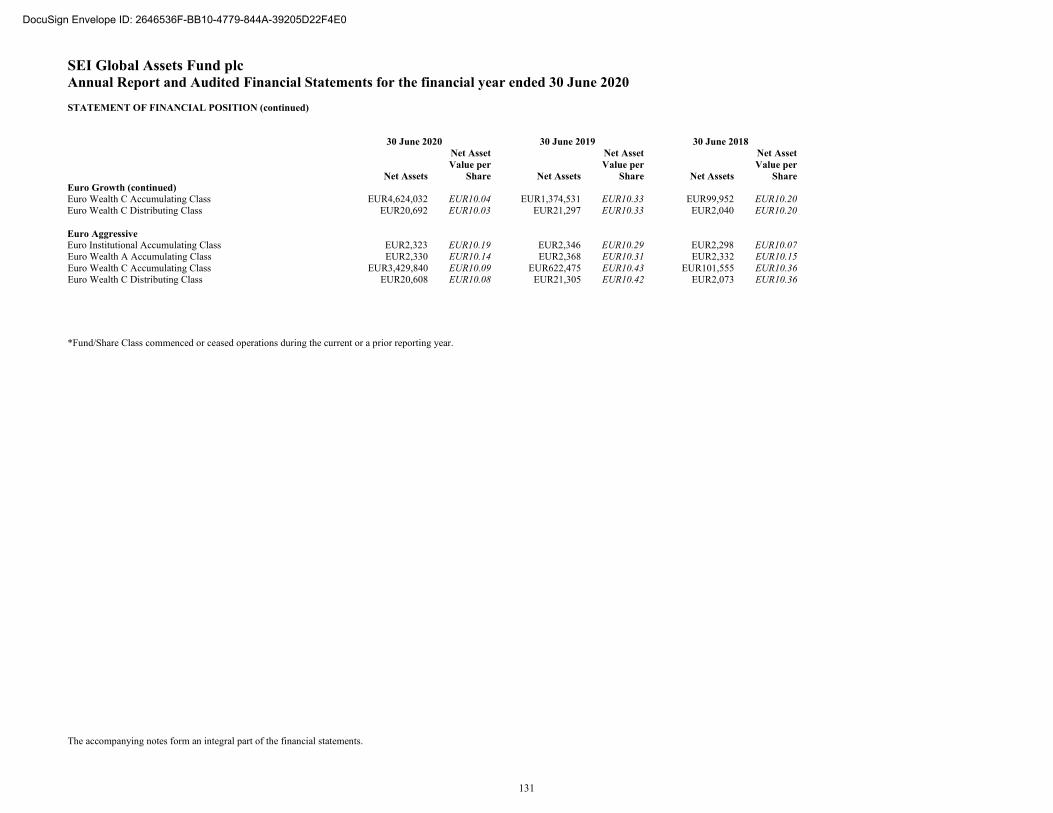
SEI Global Assets Fund plc Annual Report and Audited Financial Statements for the financial year ended 30 June 2020 STATEMENT OF FINANCIAL POSITION (continued)
The accompanying notes form an integral part of the financial statements.
30 June 2020 30 June 2019 30 June 2018
Net Assets
Net AssetValue per
Share Net Assets
Net AssetValue per
Share Net Assets
Net AssetValue per
ShareEuro Growth (continued) Euro Wealth C Accumulating Class EUR4,624,032 EUR10.04 EUR1,374,531 EUR10.33 EUR99,952 EUR10.20Euro Wealth C Distributing Class EUR20,692 EUR10.03 EUR21,297 EUR10.33 EUR2,040 EUR10.20 Euro Aggressive Euro Institutional Accumulating Class EUR2,323 EUR10.19 EUR2,346 EUR10.29 EUR2,298 EUR10.07Euro Wealth A Accumulating Class EUR2,330 EUR10.14 EUR2,368 EUR10.31 EUR2,332 EUR10.15Euro Wealth C Accumulating Class EUR3,429,840 EUR10.09 EUR622,475 EUR10.43 EUR101,555 EUR10.36Euro Wealth C Distributing Class EUR20,608 EUR10.08 EUR21,305 EUR10.42 EUR2,073 EUR10.36
*Fund/Share Class commenced or ceased operations during the current or a prior reporting year.
131
DocuSign Envelope ID: 2646536F-BB10-4779-844A-39205D22F4E0
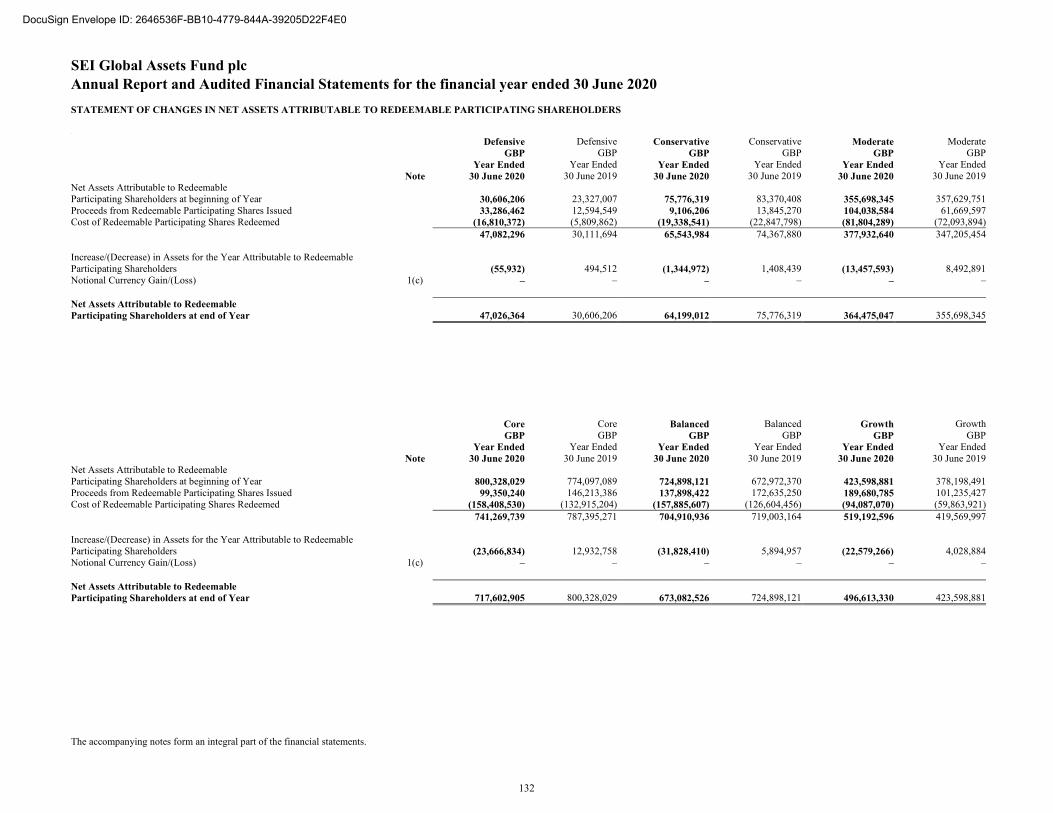
SEI Global Assets Fund plc Annual Report and Audited Financial Statements for the financial year ended 30 June 2020 STATEMENT OF CHANGES IN NET ASSETS ATTRIBUTABLE TO REDEEMABLE PARTICIPATING SHAREHOLDERS
The accompanying notes form an integral part of the financial statements.
v
Defensive GBP
Year Ended
DefensiveGBP
Year Ended
ConservativeGBP
Year Ended
Conservative GBP
Year Ended
ModerateGBP
Year Ended
ModerateGBP
Year Ended Note 30 June 2020 30 June 2019 30 June 2020 30 June 2019 30 June 2020 30 June 2019Net Assets Attributable to Redeemable Participating Shareholders at beginning of Year 30,606,206 23,327,007 75,776,319 83,370,408 355,698,345 357,629,751Proceeds from Redeemable Participating Shares Issued 33,286,462 12,594,549 9,106,206 13,845,270 104,038,584 61,669,597Cost of Redeemable Participating Shares Redeemed (16,810,372) (5,809,862) (19,338,541) (22,847,798) (81,804,289) (72,093,894) 47,082,296 30,111,694 65,543,984 74,367,880 377,932,640 347,205,454 Increase/(Decrease) in Assets for the Year Attributable to Redeemable Participating Shareholders (55,932) 494,512 (1,344,972) 1,408,439 (13,457,593) 8,492,891Notional Currency Gain/(Loss) 1(c) – – – – – – Net Assets Attributable to Redeemable Participating Shareholders at end of Year 47,026,364 30,606,206 64,199,012 75,776,319 364,475,047 355,698,345
Core GBP
Year Ended
CoreGBP
Year Ended
BalancedGBP
Year Ended
Balanced GBP
Year Ended
GrowthGBP
Year Ended
GrowthGBP
Year Ended Note 30 June 2020 30 June 2019 30 June 2020 30 June 2019 30 June 2020 30 June 2019Net Assets Attributable to Redeemable Participating Shareholders at beginning of Year 800,328,029 774,097,089 724,898,121 672,972,370 423,598,881 378,198,491Proceeds from Redeemable Participating Shares Issued 99,350,240 146,213,386 137,898,422 172,635,250 189,680,785 101,235,427Cost of Redeemable Participating Shares Redeemed (158,408,530) (132,915,204) (157,885,607) (126,604,456) (94,087,070) (59,863,921) 741,269,739 787,395,271 704,910,936 719,003,164 519,192,596 419,569,997 Increase/(Decrease) in Assets for the Year Attributable to Redeemable Participating Shareholders (23,666,834) 12,932,758 (31,828,410) 5,894,957 (22,579,266) 4,028,884Notional Currency Gain/(Loss) 1(c) – – – – – – Net Assets Attributable to Redeemable Participating Shareholders at end of Year 717,602,905 800,328,029 673,082,526 724,898,121 496,613,330 423,598,881
132
DocuSign Envelope ID: 2646536F-BB10-4779-844A-39205D22F4E0
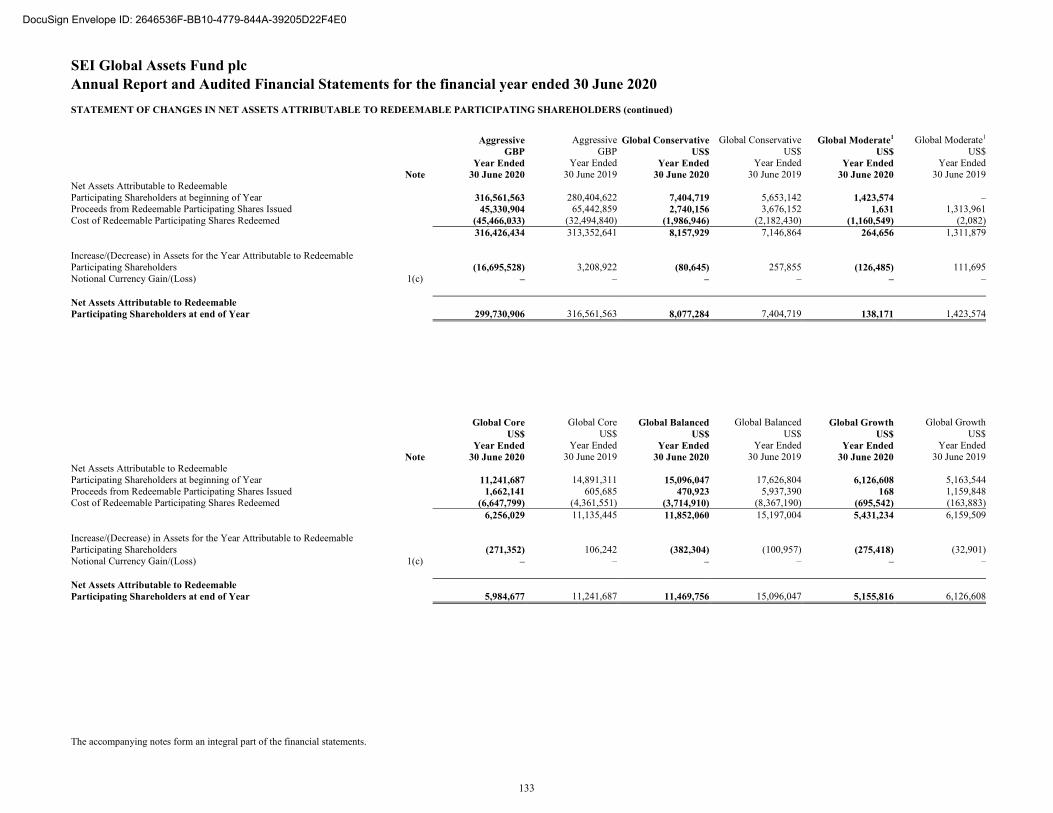
SEI Global Assets Fund plc Annual Report and Audited Financial Statements for the financial year ended 30 June 2020 STATEMENT OF CHANGES IN NET ASSETS ATTRIBUTABLE TO REDEEMABLE PARTICIPATING SHAREHOLDERS (continued)
The accompanying notes form an integral part of the financial statements.
Aggressive GBP
Year Ended
AggressiveGBP
Year Ended
Global ConservativeUS$
Year Ended
Global Conservative US$
Year Ended
Global Moderate1
US$Year Ended
Global Moderate1
US$Year Ended
Note 30 June 2020 30 June 2019 30 June 2020 30 June 2019 30 June 2020 30 June 2019Net Assets Attributable to Redeemable Participating Shareholders at beginning of Year 316,561,563 280,404,622 7,404,719 5,653,142 1,423,574 –Proceeds from Redeemable Participating Shares Issued 45,330,904 65,442,859 2,740,156 3,676,152 1,631 1,313,961Cost of Redeemable Participating Shares Redeemed (45,466,033) (32,494,840) (1,986,946) (2,182,430) (1,160,549) (2,082) 316,426,434 313,352,641 8,157,929 7,146,864 264,656 1,311,879 Increase/(Decrease) in Assets for the Year Attributable to Redeemable Participating Shareholders (16,695,528) 3,208,922 (80,645) 257,855 (126,485) 111,695Notional Currency Gain/(Loss) 1(c) – – – – – – Net Assets Attributable to Redeemable Participating Shareholders at end of Year 299,730,906 316,561,563 8,077,284 7,404,719 138,171 1,423,574
Global Core US$
Year Ended
Global CoreUS$
Year Ended
Global BalancedUS$
Year Ended
Global Balanced US$
Year Ended
Global GrowthUS$
Year Ended
Global GrowthUS$
Year Ended Note 30 June 2020 30 June 2019 30 June 2020 30 June 2019 30 June 2020 30 June 2019Net Assets Attributable to Redeemable Participating Shareholders at beginning of Year 11,241,687 14,891,311 15,096,047 17,626,804 6,126,608 5,163,544Proceeds from Redeemable Participating Shares Issued 1,662,141 605,685 470,923 5,937,390 168 1,159,848Cost of Redeemable Participating Shares Redeemed (6,647,799) (4,361,551) (3,714,910) (8,367,190) (695,542) (163,883) 6,256,029 11,135,445 11,852,060 15,197,004 5,431,234 6,159,509 Increase/(Decrease) in Assets for the Year Attributable to Redeemable Participating Shareholders (271,352) 106,242 (382,304) (100,957) (275,418) (32,901)Notional Currency Gain/(Loss) 1(c) – – – – – – Net Assets Attributable to Redeemable Participating Shareholders at end of Year 5,984,677 11,241,687 11,469,756 15,096,047 5,155,816 6,126,608
133
DocuSign Envelope ID: 2646536F-BB10-4779-844A-39205D22F4E0
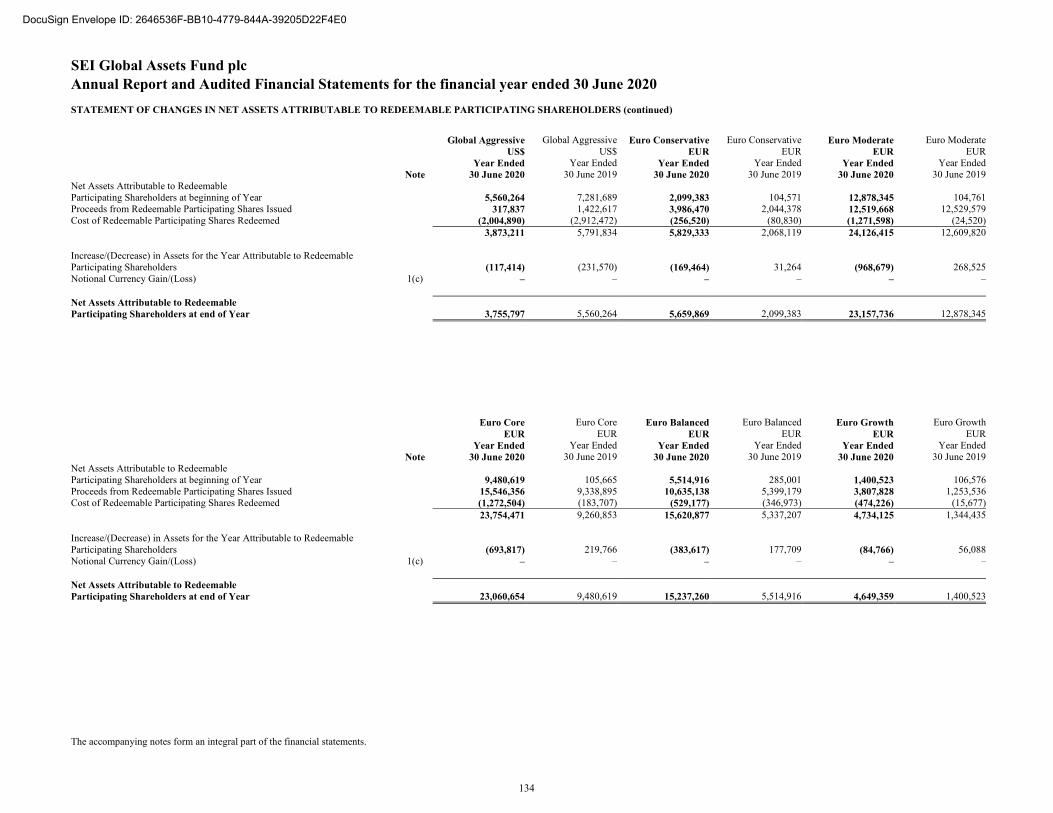
SEI Global Assets Fund plc Annual Report and Audited Financial Statements for the financial year ended 30 June 2020 STATEMENT OF CHANGES IN NET ASSETS ATTRIBUTABLE TO REDEEMABLE PARTICIPATING SHAREHOLDERS (continued)
The accompanying notes form an integral part of the financial statements.
Global Aggressive US$
Year Ended
Global AggressiveUS$
Year Ended
Euro ConservativeEUR
Year Ended
Euro Conservative EUR
Year Ended
Euro ModerateEUR
Year Ended
Euro ModerateEUR
Year Ended Note 30 June 2020 30 June 2019 30 June 2020 30 June 2019 30 June 2020 30 June 2019Net Assets Attributable to Redeemable Participating Shareholders at beginning of Year 5,560,264 7,281,689 2,099,383 104,571 12,878,345 104,761Proceeds from Redeemable Participating Shares Issued 317,837 1,422,617 3,986,470 2,044,378 12,519,668 12,529,579Cost of Redeemable Participating Shares Redeemed (2,004,890) (2,912,472) (256,520) (80,830) (1,271,598) (24,520) 3,873,211 5,791,834 5,829,333 2,068,119 24,126,415 12,609,820 Increase/(Decrease) in Assets for the Year Attributable to Redeemable Participating Shareholders (117,414) (231,570) (169,464) 31,264 (968,679) 268,525Notional Currency Gain/(Loss) 1(c) – – – – – – Net Assets Attributable to Redeemable Participating Shareholders at end of Year 3,755,797 5,560,264 5,659,869 2,099,383 23,157,736 12,878,345
Euro Core EUR
Year Ended
Euro CoreEUR
Year Ended
Euro Balanced EUR
Year Ended
Euro Balanced EUR
Year Ended
Euro GrowthEUR
Year Ended
Euro GrowthEUR
Year Ended Note 30 June 2020 30 June 2019 30 June 2020 30 June 2019 30 June 2020 30 June 2019Net Assets Attributable to Redeemable Participating Shareholders at beginning of Year 9,480,619 105,665 5,514,916 285,001 1,400,523 106,576Proceeds from Redeemable Participating Shares Issued 15,546,356 9,338,895 10,635,138 5,399,179 3,807,828 1,253,536Cost of Redeemable Participating Shares Redeemed (1,272,504) (183,707) (529,177) (346,973) (474,226) (15,677) 23,754,471 9,260,853 15,620,877 5,337,207 4,734,125 1,344,435 Increase/(Decrease) in Assets for the Year Attributable to Redeemable Participating Shareholders (693,817) 219,766 (383,617) 177,709 (84,766) 56,088Notional Currency Gain/(Loss) 1(c) – – – – – – Net Assets Attributable to Redeemable Participating Shareholders at end of Year 23,060,654 9,480,619 15,237,260 5,514,916 4,649,359 1,400,523
134
DocuSign Envelope ID: 2646536F-BB10-4779-844A-39205D22F4E0
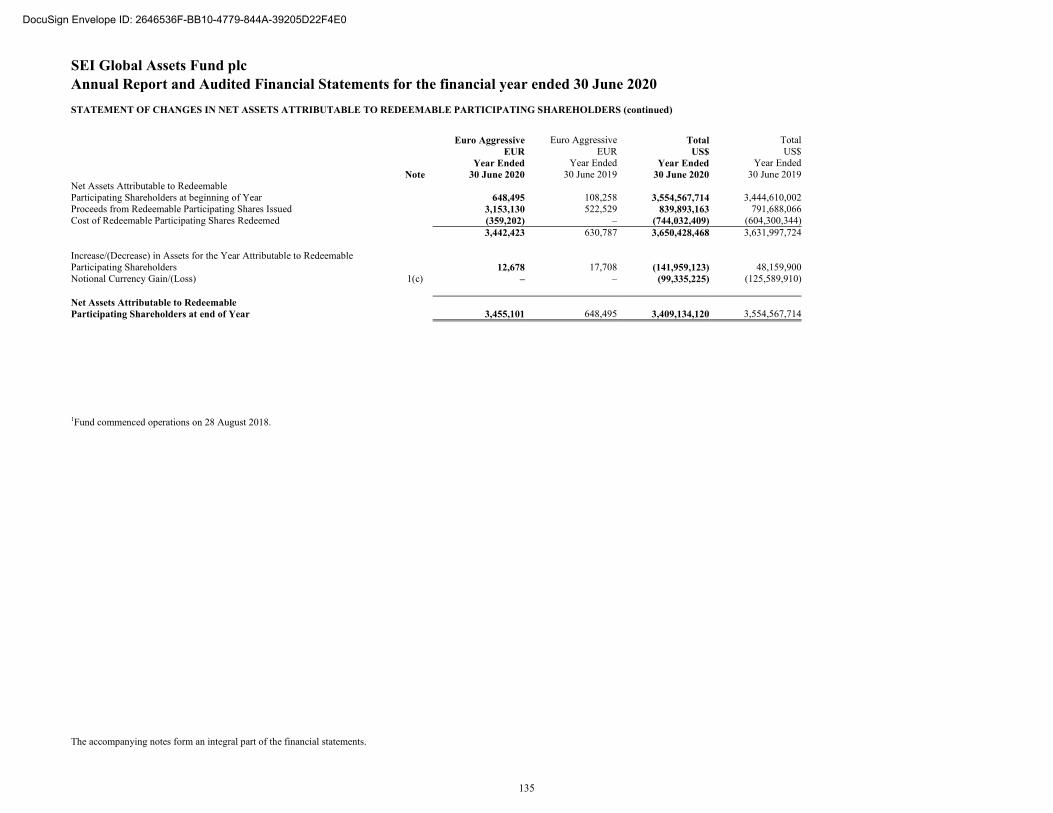
SEI Global Assets Fund plc Annual Report and Audited Financial Statements for the financial year ended 30 June 2020 STATEMENT OF CHANGES IN NET ASSETS ATTRIBUTABLE TO REDEEMABLE PARTICIPATING SHAREHOLDERS (continued)
The accompanying notes form an integral part of the financial statements.
Euro Aggressive EUR
Year Ended
Euro AggressiveEUR
Year Ended
TotalUS$
Year Ended
Total US$
Year Ended Note 30 June 2020 30 June 2019 30 June 2020 30 June 2019 Net Assets Attributable to Redeemable Participating Shareholders at beginning of Year 648,495 108,258 3,554,567,714 3,444,610,002 Proceeds from Redeemable Participating Shares Issued 3,153,130 522,529 839,893,163 791,688,066 Cost of Redeemable Participating Shares Redeemed (359,202) – (744,032,409) (604,300,344) 3,442,423 630,787 3,650,428,468 3,631,997,724 Increase/(Decrease) in Assets for the Year Attributable to Redeemable Participating Shareholders 12,678 17,708 (141,959,123) 48,159,900 Notional Currency Gain/(Loss) 1(c) – – (99,335,225) (125,589,910) Net Assets Attributable to Redeemable Participating Shareholders at end of Year 3,455,101 648,495 3,409,134,120 3,554,567,714
1Fund commenced operations on 28 August 2018.
135
DocuSign Envelope ID: 2646536F-BB10-4779-844A-39205D22F4E0
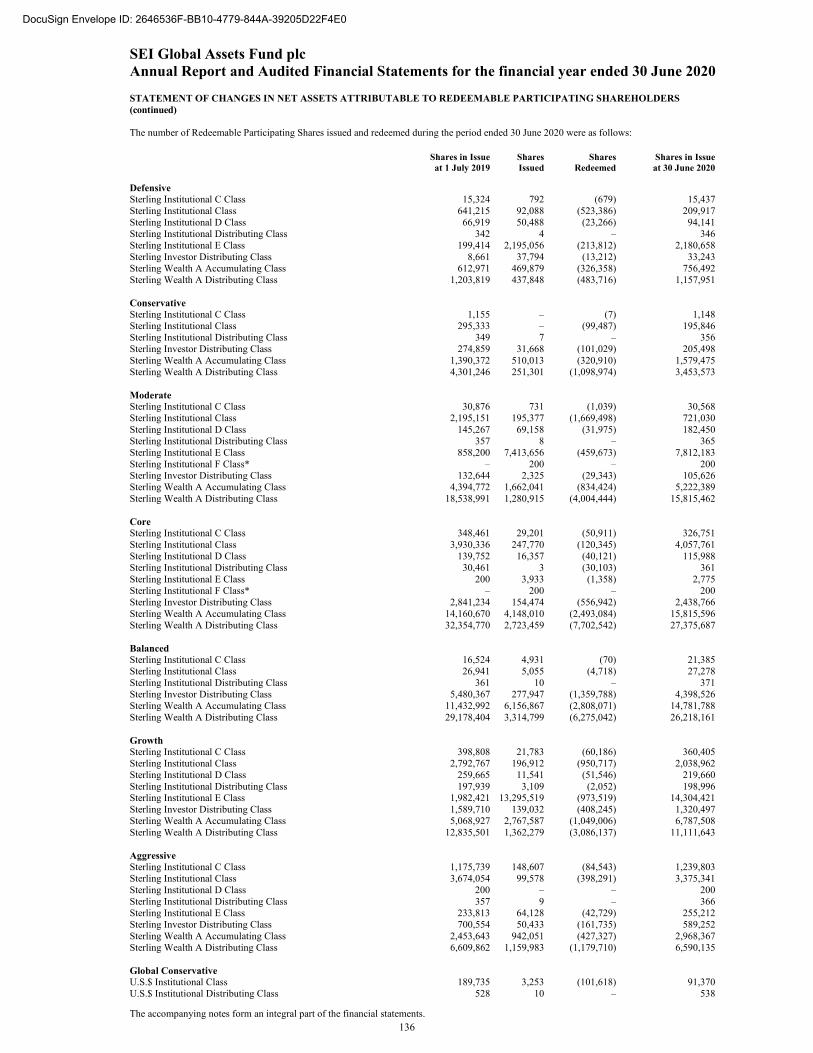
SEI Global Assets Fund plc Annual Report and Audited Financial Statements for the financial year ended 30 June 2020
STATEMENT OF CHANGES IN NET ASSETS ATTRIBUTABLE TO REDEEMABLE PARTICIPATING SHAREHOLDERS (continued)
The accompanying notes form an integral part of the financial statements.
The number of Redeemable Participating Shares issued and redeemed during the period ended 30 June 2020 were as follows:
Shares in Issueat 1 July 2019
SharesIssued
SharesRedeemed
Shares in Issueat 30 June 2020
Defensive Sterling Institutional C Class 15,324 792 (679) 15,437Sterling Institutional Class 641,215 92,088 (523,386) 209,917Sterling Institutional D Class 66,919 50,488 (23,266) 94,141Sterling Institutional Distributing Class 342 4 – 346Sterling Institutional E Class 199,414 2,195,056 (213,812) 2,180,658Sterling Investor Distributing Class 8,661 37,794 (13,212) 33,243Sterling Wealth A Accumulating Class 612,971 469,879 (326,358) 756,492Sterling Wealth A Distributing Class 1,203,819 437,848 (483,716) 1,157,951 Conservative Sterling Institutional C Class 1,155 – (7) 1,148Sterling Institutional Class 295,333 – (99,487) 195,846Sterling Institutional Distributing Class 349 7 – 356Sterling Investor Distributing Class 274,859 31,668 (101,029) 205,498Sterling Wealth A Accumulating Class 1,390,372 510,013 (320,910) 1,579,475Sterling Wealth A Distributing Class 4,301,246 251,301 (1,098,974) 3,453,573 Moderate Sterling Institutional C Class 30,876 731 (1,039) 30,568Sterling Institutional Class 2,195,151 195,377 (1,669,498) 721,030Sterling Institutional D Class 145,267 69,158 (31,975) 182,450Sterling Institutional Distributing Class 357 8 – 365Sterling Institutional E Class 858,200 7,413,656 (459,673) 7,812,183Sterling Institutional F Class* – 200 – 200Sterling Investor Distributing Class 132,644 2,325 (29,343) 105,626Sterling Wealth A Accumulating Class 4,394,772 1,662,041 (834,424) 5,222,389Sterling Wealth A Distributing Class 18,538,991 1,280,915 (4,004,444) 15,815,462 Core Sterling Institutional C Class 348,461 29,201 (50,911) 326,751Sterling Institutional Class 3,930,336 247,770 (120,345) 4,057,761Sterling Institutional D Class 139,752 16,357 (40,121) 115,988Sterling Institutional Distributing Class 30,461 3 (30,103) 361Sterling Institutional E Class 200 3,933 (1,358) 2,775Sterling Institutional F Class* – 200 – 200Sterling Investor Distributing Class 2,841,234 154,474 (556,942) 2,438,766Sterling Wealth A Accumulating Class 14,160,670 4,148,010 (2,493,084) 15,815,596Sterling Wealth A Distributing Class 32,354,770 2,723,459 (7,702,542) 27,375,687 Balanced Sterling Institutional C Class 16,524 4,931 (70) 21,385Sterling Institutional Class 26,941 5,055 (4,718) 27,278Sterling Institutional Distributing Class 361 10 – 371Sterling Investor Distributing Class 5,480,367 277,947 (1,359,788) 4,398,526Sterling Wealth A Accumulating Class 11,432,992 6,156,867 (2,808,071) 14,781,788Sterling Wealth A Distributing Class 29,178,404 3,314,799 (6,275,042) 26,218,161 Growth Sterling Institutional C Class 398,808 21,783 (60,186) 360,405Sterling Institutional Class 2,792,767 196,912 (950,717) 2,038,962Sterling Institutional D Class 259,665 11,541 (51,546) 219,660Sterling Institutional Distributing Class 197,939 3,109 (2,052) 198,996Sterling Institutional E Class 1,982,421 13,295,519 (973,519) 14,304,421Sterling Investor Distributing Class 1,589,710 139,032 (408,245) 1,320,497Sterling Wealth A Accumulating Class 5,068,927 2,767,587 (1,049,006) 6,787,508Sterling Wealth A Distributing Class 12,835,501 1,362,279 (3,086,137) 11,111,643 Aggressive Sterling Institutional C Class 1,175,739 148,607 (84,543) 1,239,803Sterling Institutional Class 3,674,054 99,578 (398,291) 3,375,341Sterling Institutional D Class 200 – – 200Sterling Institutional Distributing Class 357 9 – 366Sterling Institutional E Class 233,813 64,128 (42,729) 255,212Sterling Investor Distributing Class 700,554 50,433 (161,735) 589,252Sterling Wealth A Accumulating Class 2,453,643 942,051 (427,327) 2,968,367Sterling Wealth A Distributing Class 6,609,862 1,159,983 (1,179,710) 6,590,135 Global Conservative U.S.$ Institutional Class 189,735 3,253 (101,618) 91,370U.S.$ Institutional Distributing Class 528 10 – 538
136
DocuSign Envelope ID: 2646536F-BB10-4779-844A-39205D22F4E0
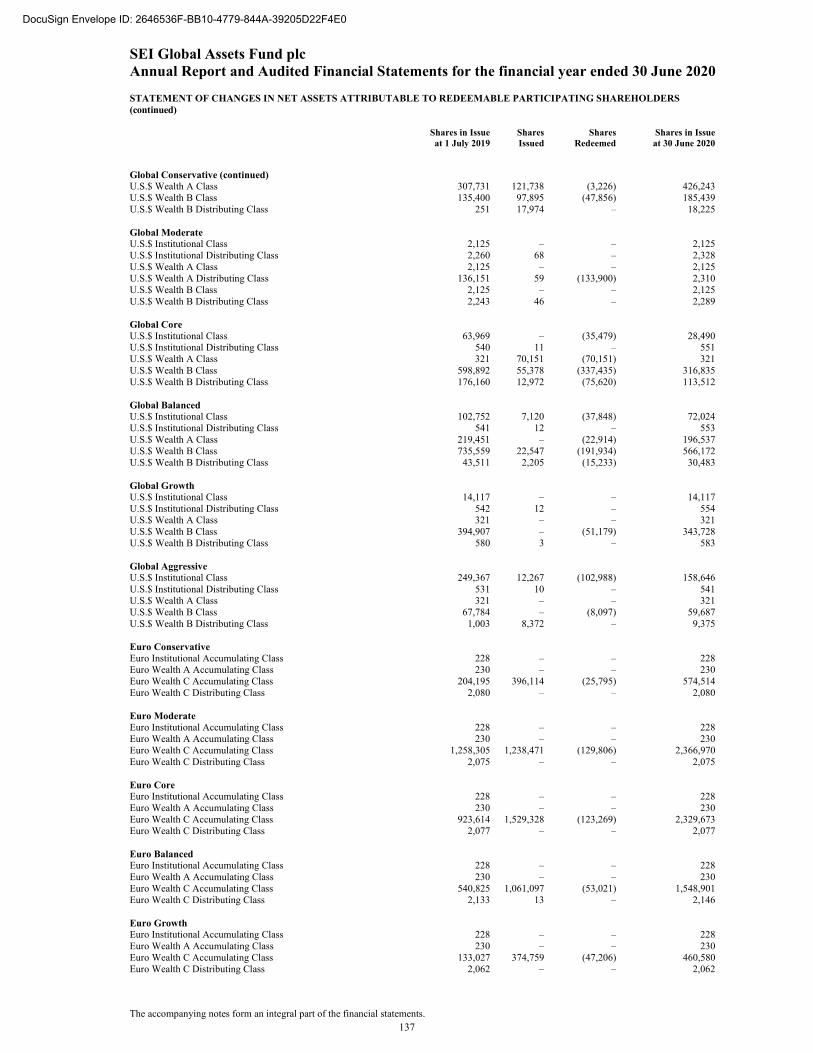
SEI Global Assets Fund plc Annual Report and Audited Financial Statements for the financial year ended 30 June 2020
STATEMENT OF CHANGES IN NET ASSETS ATTRIBUTABLE TO REDEEMABLE PARTICIPATING SHAREHOLDERS (continued)
The accompanying notes form an integral part of the financial statements.
Shares in Issueat 1 July 2019
SharesIssued
SharesRedeemed
Shares in Issueat 30 June 2020
Global Conservative (continued) U.S.$ Wealth A Class 307,731 121,738 (3,226) 426,243U.S.$ Wealth B Class 135,400 97,895 (47,856) 185,439U.S.$ Wealth B Distributing Class 251 17,974 – 18,225 Global Moderate U.S.$ Institutional Class 2,125 – – 2,125U.S.$ Institutional Distributing Class 2,260 68 – 2,328U.S.$ Wealth A Class 2,125 – – 2,125U.S.$ Wealth A Distributing Class 136,151 59 (133,900) 2,310U.S.$ Wealth B Class 2,125 – – 2,125U.S.$ Wealth B Distributing Class 2,243 46 – 2,289 Global Core U.S.$ Institutional Class 63,969 – (35,479) 28,490U.S.$ Institutional Distributing Class 540 11 – 551U.S.$ Wealth A Class 321 70,151 (70,151) 321U.S.$ Wealth B Class 598,892 55,378 (337,435) 316,835U.S.$ Wealth B Distributing Class 176,160 12,972 (75,620) 113,512 Global Balanced U.S.$ Institutional Class 102,752 7,120 (37,848) 72,024U.S.$ Institutional Distributing Class 541 12 – 553U.S.$ Wealth A Class 219,451 – (22,914) 196,537U.S.$ Wealth B Class 735,559 22,547 (191,934) 566,172U.S.$ Wealth B Distributing Class 43,511 2,205 (15,233) 30,483 Global Growth U.S.$ Institutional Class 14,117 – – 14,117U.S.$ Institutional Distributing Class 542 12 – 554U.S.$ Wealth A Class 321 – – 321U.S.$ Wealth B Class 394,907 – (51,179) 343,728U.S.$ Wealth B Distributing Class 580 3 – 583 Global Aggressive U.S.$ Institutional Class 249,367 12,267 (102,988) 158,646U.S.$ Institutional Distributing Class 531 10 – 541U.S.$ Wealth A Class 321 – – 321U.S.$ Wealth B Class 67,784 – (8,097) 59,687U.S.$ Wealth B Distributing Class 1,003 8,372 – 9,375 Euro Conservative Euro Institutional Accumulating Class 228 – – 228Euro Wealth A Accumulating Class 230 – – 230Euro Wealth C Accumulating Class 204,195 396,114 (25,795) 574,514Euro Wealth C Distributing Class 2,080 – – 2,080 Euro Moderate Euro Institutional Accumulating Class 228 – – 228Euro Wealth A Accumulating Class 230 – – 230Euro Wealth C Accumulating Class 1,258,305 1,238,471 (129,806) 2,366,970Euro Wealth C Distributing Class 2,075 – – 2,075 Euro Core Euro Institutional Accumulating Class 228 – – 228Euro Wealth A Accumulating Class 230 – – 230Euro Wealth C Accumulating Class 923,614 1,529,328 (123,269) 2,329,673Euro Wealth C Distributing Class 2,077 – – 2,077 Euro Balanced Euro Institutional Accumulating Class 228 – – 228Euro Wealth A Accumulating Class 230 – – 230Euro Wealth C Accumulating Class 540,825 1,061,097 (53,021) 1,548,901Euro Wealth C Distributing Class 2,133 13 – 2,146 Euro Growth Euro Institutional Accumulating Class 228 – – 228Euro Wealth A Accumulating Class 230 – – 230Euro Wealth C Accumulating Class 133,027 374,759 (47,206) 460,580Euro Wealth C Distributing Class 2,062 – – 2,062
137
DocuSign Envelope ID: 2646536F-BB10-4779-844A-39205D22F4E0
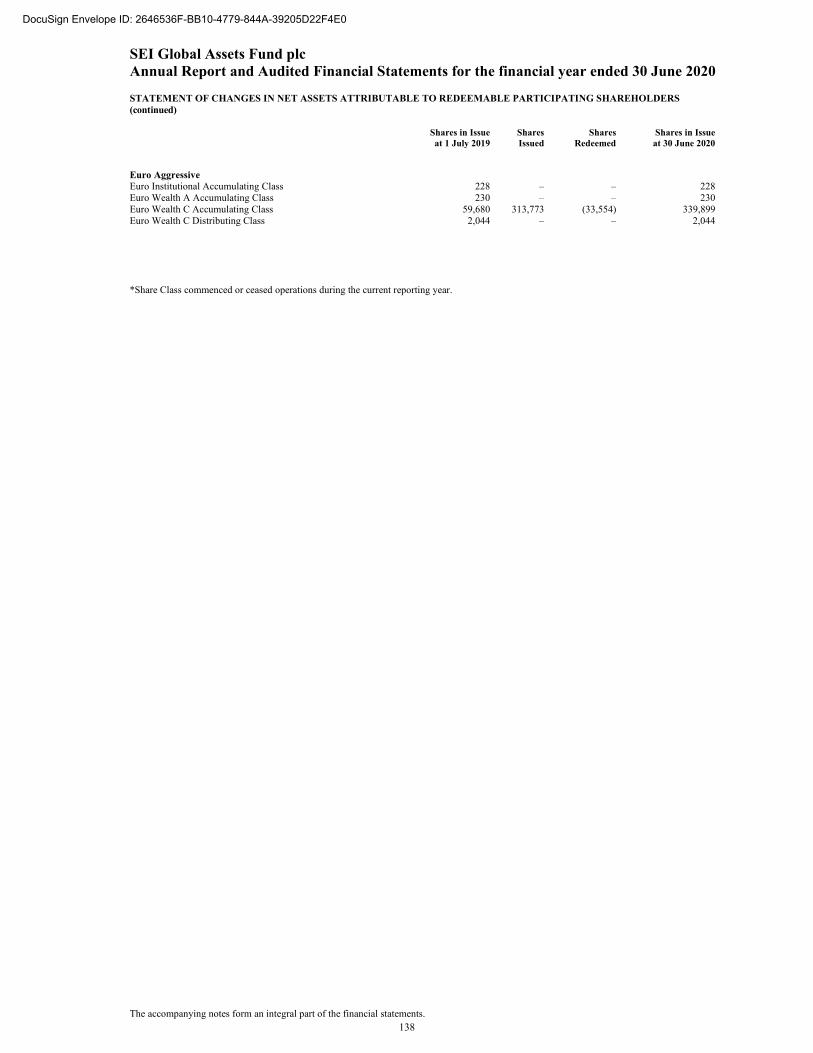
SEI Global Assets Fund plc Annual Report and Audited Financial Statements for the financial year ended 30 June 2020
STATEMENT OF CHANGES IN NET ASSETS ATTRIBUTABLE TO REDEEMABLE PARTICIPATING SHAREHOLDERS (continued)
The accompanying notes form an integral part of the financial statements.
Shares in Issueat 1 July 2019
SharesIssued
SharesRedeemed
Shares in Issueat 30 June 2020
Euro Aggressive Euro Institutional Accumulating Class 228 – – 228Euro Wealth A Accumulating Class 230 – – 230Euro Wealth C Accumulating Class 59,680 313,773 (33,554) 339,899Euro Wealth C Distributing Class 2,044 – – 2,044 *Share Class commenced or ceased operations during the current reporting year.
138
DocuSign Envelope ID: 2646536F-BB10-4779-844A-39205D22F4E0
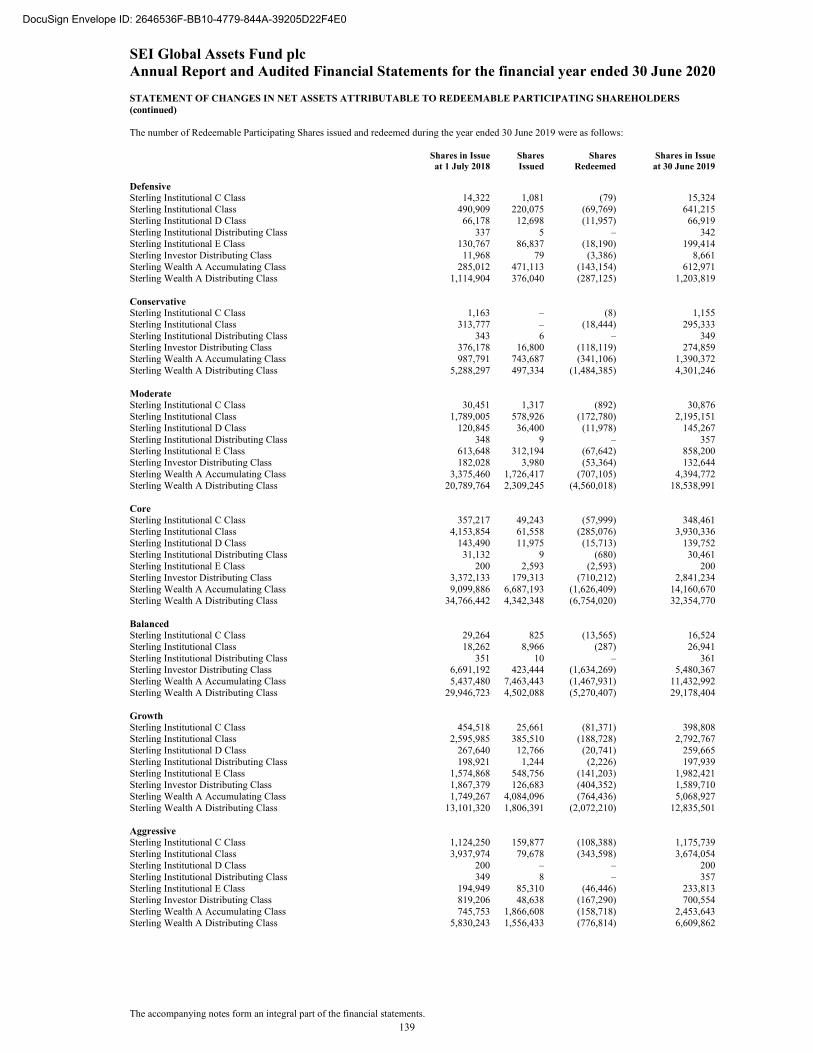
SEI Global Assets Fund plc Annual Report and Audited Financial Statements for the financial year ended 30 June 2020
STATEMENT OF CHANGES IN NET ASSETS ATTRIBUTABLE TO REDEEMABLE PARTICIPATING SHAREHOLDERS (continued)
The accompanying notes form an integral part of the financial statements.
The number of Redeemable Participating Shares issued and redeemed during the year ended 30 June 2019 were as follows:
Shares in Issueat 1 July 2018
SharesIssued
SharesRedeemed
Shares in Issueat 30 June 2019
Defensive Sterling Institutional C Class 14,322 1,081 (79) 15,324Sterling Institutional Class 490,909 220,075 (69,769) 641,215Sterling Institutional D Class 66,178 12,698 (11,957) 66,919Sterling Institutional Distributing Class 337 5 – 342Sterling Institutional E Class 130,767 86,837 (18,190) 199,414Sterling Investor Distributing Class 11,968 79 (3,386) 8,661Sterling Wealth A Accumulating Class 285,012 471,113 (143,154) 612,971Sterling Wealth A Distributing Class 1,114,904 376,040 (287,125) 1,203,819 Conservative Sterling Institutional C Class 1,163 – (8) 1,155Sterling Institutional Class 313,777 – (18,444) 295,333Sterling Institutional Distributing Class 343 6 – 349Sterling Investor Distributing Class 376,178 16,800 (118,119) 274,859Sterling Wealth A Accumulating Class 987,791 743,687 (341,106) 1,390,372Sterling Wealth A Distributing Class 5,288,297 497,334 (1,484,385) 4,301,246 Moderate Sterling Institutional C Class 30,451 1,317 (892) 30,876Sterling Institutional Class 1,789,005 578,926 (172,780) 2,195,151Sterling Institutional D Class 120,845 36,400 (11,978) 145,267Sterling Institutional Distributing Class 348 9 – 357Sterling Institutional E Class 613,648 312,194 (67,642) 858,200Sterling Investor Distributing Class 182,028 3,980 (53,364) 132,644Sterling Wealth A Accumulating Class 3,375,460 1,726,417 (707,105) 4,394,772Sterling Wealth A Distributing Class 20,789,764 2,309,245 (4,560,018) 18,538,991 Core Sterling Institutional C Class 357,217 49,243 (57,999) 348,461Sterling Institutional Class 4,153,854 61,558 (285,076) 3,930,336Sterling Institutional D Class 143,490 11,975 (15,713) 139,752Sterling Institutional Distributing Class 31,132 9 (680) 30,461Sterling Institutional E Class 200 2,593 (2,593) 200Sterling Investor Distributing Class 3,372,133 179,313 (710,212) 2,841,234Sterling Wealth A Accumulating Class 9,099,886 6,687,193 (1,626,409) 14,160,670Sterling Wealth A Distributing Class 34,766,442 4,342,348 (6,754,020) 32,354,770 Balanced Sterling Institutional C Class 29,264 825 (13,565) 16,524Sterling Institutional Class 18,262 8,966 (287) 26,941Sterling Institutional Distributing Class 351 10 – 361Sterling Investor Distributing Class 6,691,192 423,444 (1,634,269) 5,480,367Sterling Wealth A Accumulating Class 5,437,480 7,463,443 (1,467,931) 11,432,992Sterling Wealth A Distributing Class 29,946,723 4,502,088 (5,270,407) 29,178,404 Growth Sterling Institutional C Class 454,518 25,661 (81,371) 398,808Sterling Institutional Class 2,595,985 385,510 (188,728) 2,792,767Sterling Institutional D Class 267,640 12,766 (20,741) 259,665Sterling Institutional Distributing Class 198,921 1,244 (2,226) 197,939Sterling Institutional E Class 1,574,868 548,756 (141,203) 1,982,421Sterling Investor Distributing Class 1,867,379 126,683 (404,352) 1,589,710Sterling Wealth A Accumulating Class 1,749,267 4,084,096 (764,436) 5,068,927Sterling Wealth A Distributing Class 13,101,320 1,806,391 (2,072,210) 12,835,501 Aggressive Sterling Institutional C Class 1,124,250 159,877 (108,388) 1,175,739Sterling Institutional Class 3,937,974 79,678 (343,598) 3,674,054Sterling Institutional D Class 200 – – 200Sterling Institutional Distributing Class 349 8 – 357Sterling Institutional E Class 194,949 85,310 (46,446) 233,813Sterling Investor Distributing Class 819,206 48,638 (167,290) 700,554Sterling Wealth A Accumulating Class 745,753 1,866,608 (158,718) 2,453,643Sterling Wealth A Distributing Class 5,830,243 1,556,433 (776,814) 6,609,862
139
DocuSign Envelope ID: 2646536F-BB10-4779-844A-39205D22F4E0
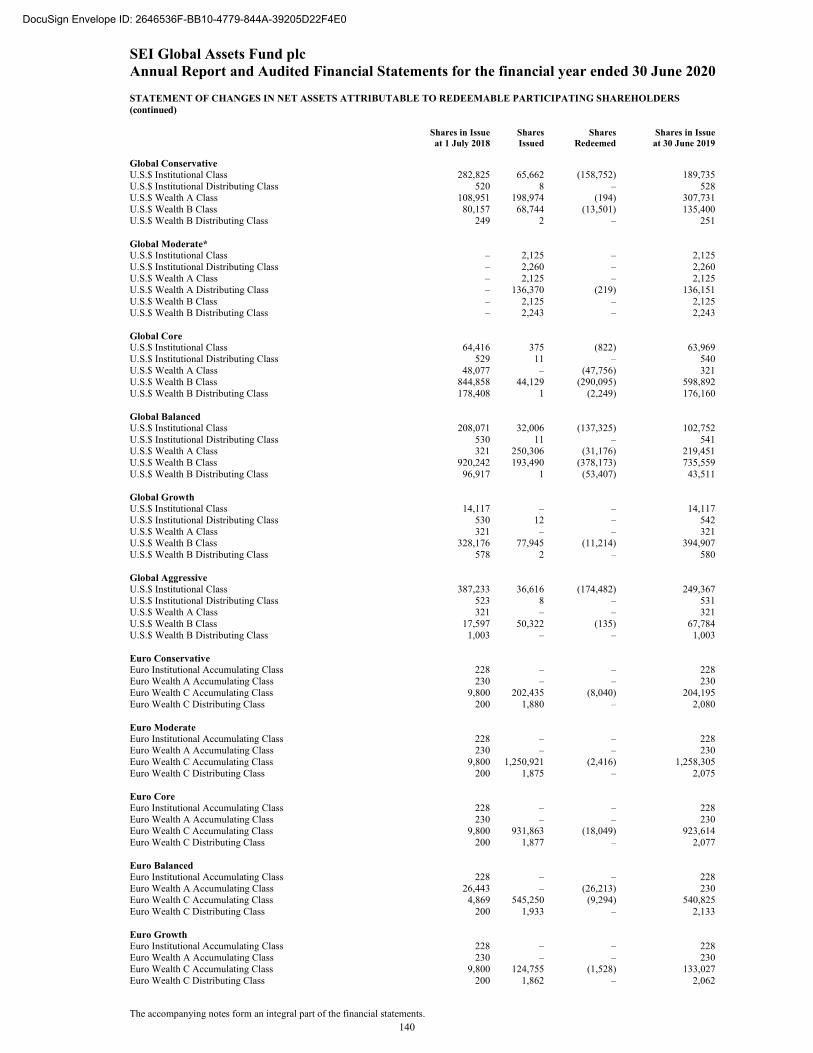
SEI Global Assets Fund plc Annual Report and Audited Financial Statements for the financial year ended 30 June 2020
STATEMENT OF CHANGES IN NET ASSETS ATTRIBUTABLE TO REDEEMABLE PARTICIPATING SHAREHOLDERS (continued)
The accompanying notes form an integral part of the financial statements.
Shares in Issueat 1 July 2018
SharesIssued
SharesRedeemed
Shares in Issueat 30 June 2019
Global Conservative U.S.$ Institutional Class 282,825 65,662 (158,752) 189,735U.S.$ Institutional Distributing Class 520 8 – 528U.S.$ Wealth A Class 108,951 198,974 (194) 307,731U.S.$ Wealth B Class 80,157 68,744 (13,501) 135,400U.S.$ Wealth B Distributing Class 249 2 – 251 Global Moderate* U.S.$ Institutional Class – 2,125 – 2,125U.S.$ Institutional Distributing Class – 2,260 – 2,260U.S.$ Wealth A Class – 2,125 – 2,125U.S.$ Wealth A Distributing Class – 136,370 (219) 136,151U.S.$ Wealth B Class – 2,125 – 2,125U.S.$ Wealth B Distributing Class – 2,243 – 2,243 Global Core U.S.$ Institutional Class 64,416 375 (822) 63,969U.S.$ Institutional Distributing Class 529 11 – 540U.S.$ Wealth A Class 48,077 – (47,756) 321U.S.$ Wealth B Class 844,858 44,129 (290,095) 598,892U.S.$ Wealth B Distributing Class 178,408 1 (2,249) 176,160 Global Balanced U.S.$ Institutional Class 208,071 32,006 (137,325) 102,752U.S.$ Institutional Distributing Class 530 11 – 541U.S.$ Wealth A Class 321 250,306 (31,176) 219,451U.S.$ Wealth B Class 920,242 193,490 (378,173) 735,559U.S.$ Wealth B Distributing Class 96,917 1 (53,407) 43,511 Global Growth U.S.$ Institutional Class 14,117 – – 14,117U.S.$ Institutional Distributing Class 530 12 – 542U.S.$ Wealth A Class 321 – – 321U.S.$ Wealth B Class 328,176 77,945 (11,214) 394,907U.S.$ Wealth B Distributing Class 578 2 – 580 Global Aggressive U.S.$ Institutional Class 387,233 36,616 (174,482) 249,367U.S.$ Institutional Distributing Class 523 8 – 531U.S.$ Wealth A Class 321 – – 321U.S.$ Wealth B Class 17,597 50,322 (135) 67,784U.S.$ Wealth B Distributing Class 1,003 – – 1,003 Euro Conservative Euro Institutional Accumulating Class 228 – – 228Euro Wealth A Accumulating Class 230 – – 230Euro Wealth C Accumulating Class 9,800 202,435 (8,040) 204,195Euro Wealth C Distributing Class 200 1,880 – 2,080 Euro Moderate Euro Institutional Accumulating Class 228 – – 228Euro Wealth A Accumulating Class 230 – – 230Euro Wealth C Accumulating Class 9,800 1,250,921 (2,416) 1,258,305Euro Wealth C Distributing Class 200 1,875 – 2,075 Euro Core Euro Institutional Accumulating Class 228 – – 228Euro Wealth A Accumulating Class 230 – – 230Euro Wealth C Accumulating Class 9,800 931,863 (18,049) 923,614Euro Wealth C Distributing Class 200 1,877 – 2,077 Euro Balanced Euro Institutional Accumulating Class 228 – – 228Euro Wealth A Accumulating Class 26,443 – (26,213) 230Euro Wealth C Accumulating Class 4,869 545,250 (9,294) 540,825Euro Wealth C Distributing Class 200 1,933 – 2,133 Euro Growth Euro Institutional Accumulating Class 228 – – 228Euro Wealth A Accumulating Class 230 – – 230Euro Wealth C Accumulating Class 9,800 124,755 (1,528) 133,027Euro Wealth C Distributing Class 200 1,862 – 2,062
140
DocuSign Envelope ID: 2646536F-BB10-4779-844A-39205D22F4E0
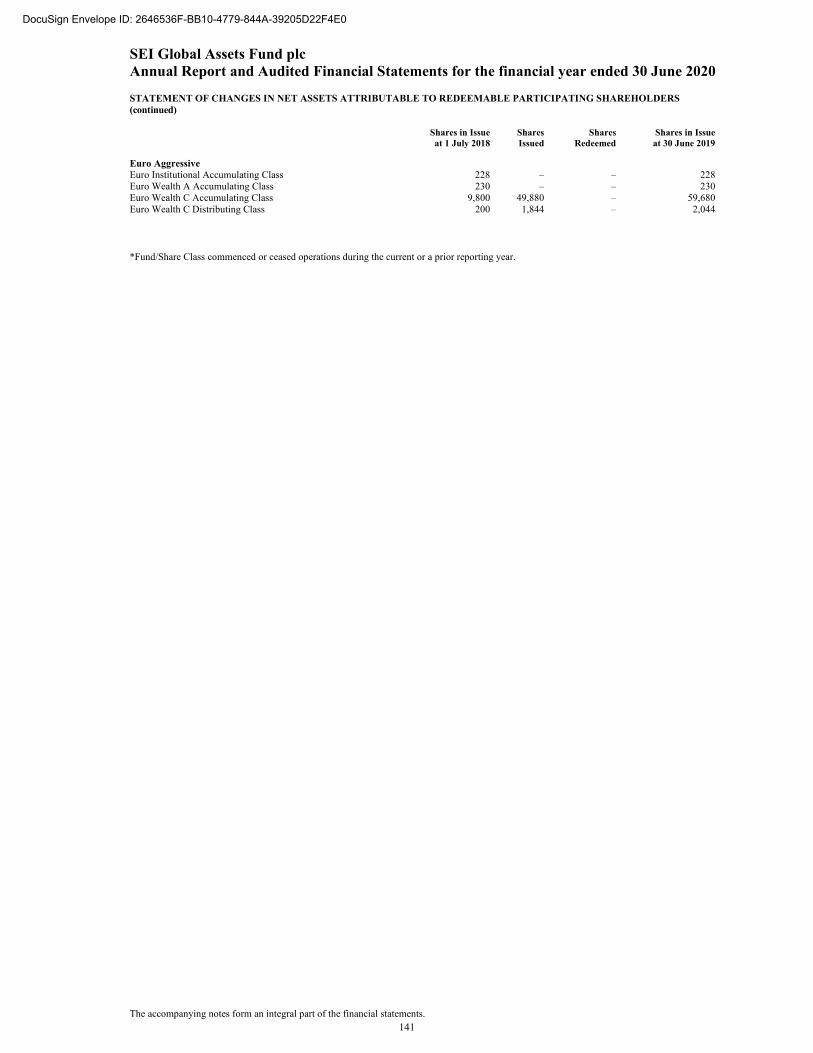
SEI Global Assets Fund plc Annual Report and Audited Financial Statements for the financial year ended 30 June 2020
STATEMENT OF CHANGES IN NET ASSETS ATTRIBUTABLE TO REDEEMABLE PARTICIPATING SHAREHOLDERS (continued)
The accompanying notes form an integral part of the financial statements.
Shares in Issueat 1 July 2018
SharesIssued
SharesRedeemed
Shares in Issueat 30 June 2019
Euro Aggressive Euro Institutional Accumulating Class 228 – – 228Euro Wealth A Accumulating Class 230 – – 230Euro Wealth C Accumulating Class 9,800 49,880 – 59,680Euro Wealth C Distributing Class 200 1,844 – 2,044
*Fund/Share Class commenced or ceased operations during the current or a prior reporting year.
141
DocuSign Envelope ID: 2646536F-BB10-4779-844A-39205D22F4E0
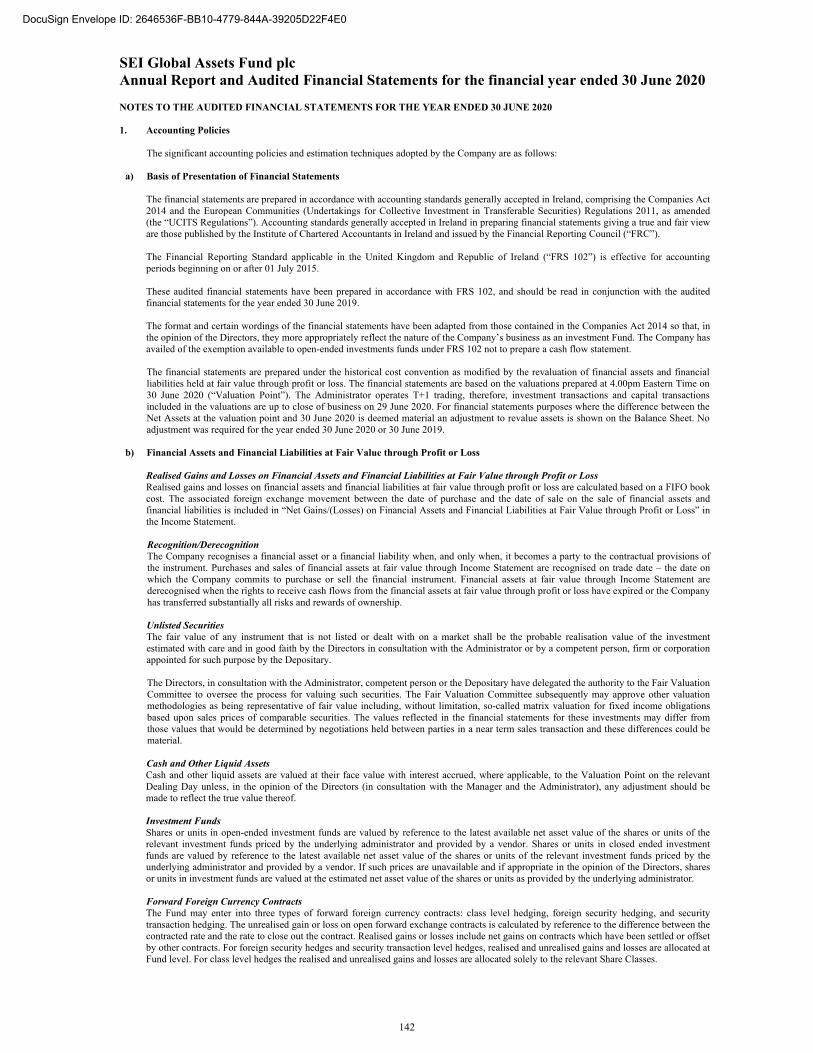
SEI Global Assets Fund plc Annual Report and Audited Financial Statements for the financial year ended 30 June 2020
NOTES TO THE AUDITED FINANCIAL STATEMENTS FOR THE YEAR ENDED 30 JUNE 2020
1. Accounting Policies The significant accounting policies and estimation techniques adopted by the Company are as follows:
a) Basis of Presentation of Financial Statements The financial statements are prepared in accordance with accounting standards generally accepted in Ireland, comprising the Companies Act 2014 and the European Communities (Undertakings for Collective Investment in Transferable Securities) Regulations 2011, as amended (the “UCITS Regulations”). Accounting standards generally accepted in Ireland in preparing financial statements giving a true and fair view are those published by the Institute of Chartered Accountants in Ireland and issued by the Financial Reporting Council (“FRC”). The Financial Reporting Standard applicable in the United Kingdom and Republic of Ireland (“FRS 102”) is effective for accounting periods beginning on or after 01 July 2015. These audited financial statements have been prepared in accordance with FRS 102, and should be read in conjunction with the audited financial statements for the year ended 30 June 2019. The format and certain wordings of the financial statements have been adapted from those contained in the Companies Act 2014 so that, in the opinion of the Directors, they more appropriately reflect the nature of the Company’s business as an investment Fund. The Company has availed of the exemption available to open-ended investments funds under FRS 102 not to prepare a cash flow statement. The financial statements are prepared under the historical cost convention as modified by the revaluation of financial assets and financial liabilities held at fair value through profit or loss. The financial statements are based on the valuations prepared at 4.00pm Eastern Time on 30 June 2020 (“Valuation Point”). The Administrator operates T+1 trading, therefore, investment transactions and capital transactions included in the valuations are up to close of business on 29 June 2020. For financial statements purposes where the difference between the Net Assets at the valuation point and 30 June 2020 is deemed material an adjustment to revalue assets is shown on the Balance Sheet. No adjustment was required for the year ended 30 June 2020 or 30 June 2019.
b) Financial Assets and Financial Liabilities at Fair Value through Profit or Loss
Realised Gains and Losses on Financial Assets and Financial Liabilities at Fair Value through Profit or Loss Realised gains and losses on financial assets and financial liabilities at fair value through profit or loss are calculated based on a FIFO book cost. The associated foreign exchange movement between the date of purchase and the date of sale on the sale of financial assets and financial liabilities is included in “Net Gains/(Losses) on Financial Assets and Financial Liabilities at Fair Value through Profit or Loss” in the Income Statement. Recognition/Derecognition The Company recognises a financial asset or a financial liability when, and only when, it becomes a party to the contractual provisions of the instrument. Purchases and sales of financial assets at fair value through Income Statement are recognised on trade date – the date on which the Company commits to purchase or sell the financial instrument. Financial assets at fair value through Income Statement are derecognised when the rights to receive cash flows from the financial assets at fair value through profit or loss have expired or the Company has transferred substantially all risks and rewards of ownership.
Unlisted Securities The fair value of any instrument that is not listed or dealt with on a market shall be the probable realisation value of the investment estimated with care and in good faith by the Directors in consultation with the Administrator or by a competent person, firm or corporation appointed for such purpose by the Depositary. The Directors, in consultation with the Administrator, competent person or the Depositary have delegated the authority to the Fair Valuation Committee to oversee the process for valuing such securities. The Fair Valuation Committee subsequently may approve other valuation methodologies as being representative of fair value including, without limitation, so-called matrix valuation for fixed income obligations based upon sales prices of comparable securities. The values reflected in the financial statements for these investments may differ from those values that would be determined by negotiations held between parties in a near term sales transaction and these differences could be material.
Cash and Other Liquid Assets Cash and other liquid assets are valued at their face value with interest accrued, where applicable, to the Valuation Point on the relevant Dealing Day unless, in the opinion of the Directors (in consultation with the Manager and the Administrator), any adjustment should be made to reflect the true value thereof. Investment Funds Shares or units in open-ended investment funds are valued by reference to the latest available net asset value of the shares or units of the relevant investment funds priced by the underlying administrator and provided by a vendor. Shares or units in closed ended investment funds are valued by reference to the latest available net asset value of the shares or units of the relevant investment funds priced by the underlying administrator and provided by a vendor. If such prices are unavailable and if appropriate in the opinion of the Directors, shares or units in investment funds are valued at the estimated net asset value of the shares or units as provided by the underlying administrator.
Forward Foreign Currency Contracts The Fund may enter into three types of forward foreign currency contracts: class level hedging, foreign security hedging, and security transaction hedging. The unrealised gain or loss on open forward exchange contracts is calculated by reference to the difference between the contracted rate and the rate to close out the contract. Realised gains or losses include net gains on contracts which have been settled or offset by other contracts. For foreign security hedges and security transaction level hedges, realised and unrealised gains and losses are allocated at Fund level. For class level hedges the realised and unrealised gains and losses are allocated solely to the relevant Share Classes.
142
DocuSign Envelope ID: 2646536F-BB10-4779-844A-39205D22F4E0
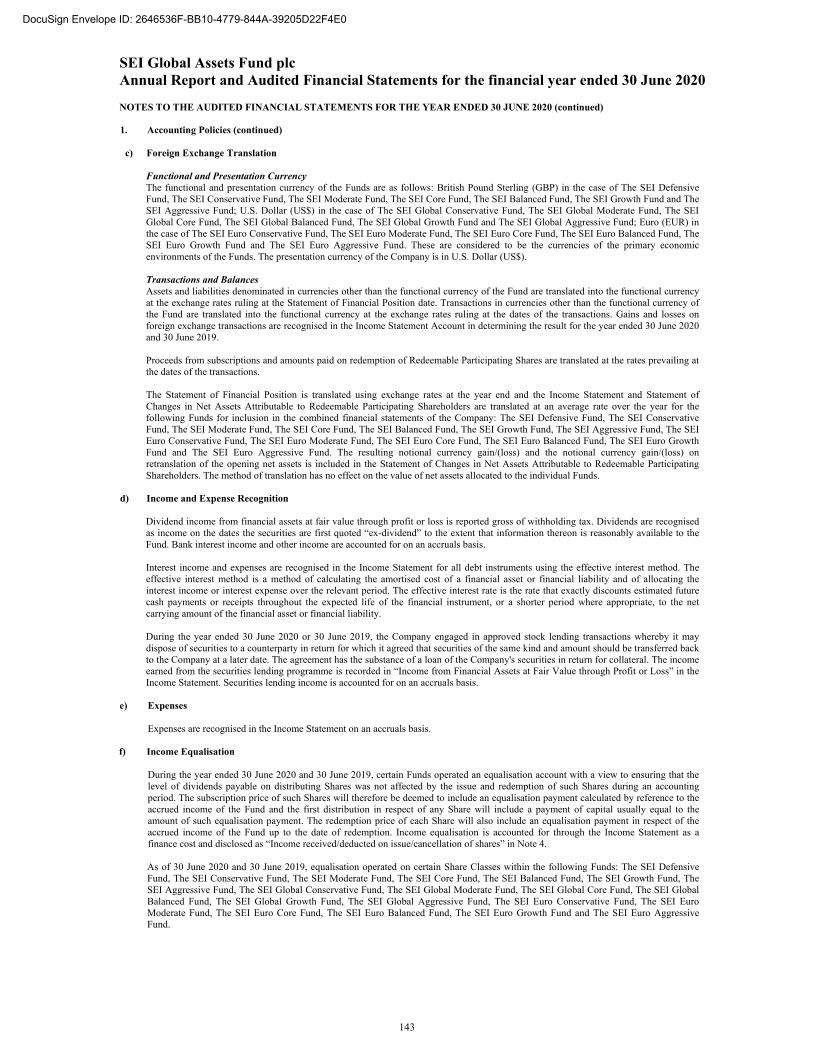
SEI Global Assets Fund plc Annual Report and Audited Financial Statements for the financial year ended 30 June 2020
NOTES TO THE AUDITED FINANCIAL STATEMENTS FOR THE YEAR ENDED 30 JUNE 2020 (continued)
1. Accounting Policies (continued)
c) Foreign Exchange Translation Functional and Presentation Currency The functional and presentation currency of the Funds are as follows: British Pound Sterling (GBP) in the case of The SEI Defensive Fund, The SEI Conservative Fund, The SEI Moderate Fund, The SEI Core Fund, The SEI Balanced Fund, The SEI Growth Fund and The SEI Aggressive Fund; U.S. Dollar (US$) in the case of The SEI Global Conservative Fund, The SEI Global Moderate Fund, The SEI Global Core Fund, The SEI Global Balanced Fund, The SEI Global Growth Fund and The SEI Global Aggressive Fund; Euro (EUR) in the case of The SEI Euro Conservative Fund, The SEI Euro Moderate Fund, The SEI Euro Core Fund, The SEI Euro Balanced Fund, The SEI Euro Growth Fund and The SEI Euro Aggressive Fund. These are considered to be the currencies of the primary economic environments of the Funds. The presentation currency of the Company is in U.S. Dollar (US$). Transactions and Balances Assets and liabilities denominated in currencies other than the functional currency of the Fund are translated into the functional currency at the exchange rates ruling at the Statement of Financial Position date. Transactions in currencies other than the functional currency of the Fund are translated into the functional currency at the exchange rates ruling at the dates of the transactions. Gains and losses on foreign exchange transactions are recognised in the Income Statement Account in determining the result for the year ended 30 June 2020 and 30 June 2019. Proceeds from subscriptions and amounts paid on redemption of Redeemable Participating Shares are translated at the rates prevailing at the dates of the transactions. The Statement of Financial Position is translated using exchange rates at the year end and the Income Statement and Statement of Changes in Net Assets Attributable to Redeemable Participating Shareholders are translated at an average rate over the year for the following Funds for inclusion in the combined financial statements of the Company: The SEI Defensive Fund, The SEI Conservative Fund, The SEI Moderate Fund, The SEI Core Fund, The SEI Balanced Fund, The SEI Growth Fund, The SEI Aggressive Fund, The SEI Euro Conservative Fund, The SEI Euro Moderate Fund, The SEI Euro Core Fund, The SEI Euro Balanced Fund, The SEI Euro Growth Fund and The SEI Euro Aggressive Fund. The resulting notional currency gain/(loss) and the notional currency gain/(loss) on retranslation of the opening net assets is included in the Statement of Changes in Net Assets Attributable to Redeemable Participating Shareholders. The method of translation has no effect on the value of net assets allocated to the individual Funds.
d) Income and Expense Recognition
Dividend income from financial assets at fair value through profit or loss is reported gross of withholding tax. Dividends are recognised as income on the dates the securities are first quoted “ex-dividend” to the extent that information thereon is reasonably available to the Fund. Bank interest income and other income are accounted for on an accruals basis. Interest income and expenses are recognised in the Income Statement for all debt instruments using the effective interest method. The effective interest method is a method of calculating the amortised cost of a financial asset or financial liability and of allocating the interest income or interest expense over the relevant period. The effective interest rate is the rate that exactly discounts estimated future cash payments or receipts throughout the expected life of the financial instrument, or a shorter period where appropriate, to the net carrying amount of the financial asset or financial liability. During the year ended 30 June 2020 or 30 June 2019, the Company engaged in approved stock lending transactions whereby it may dispose of securities to a counterparty in return for which it agreed that securities of the same kind and amount should be transferred back to the Company at a later date. The agreement has the substance of a loan of the Company's securities in return for collateral. The income earned from the securities lending programme is recorded in “Income from Financial Assets at Fair Value through Profit or Loss” in the Income Statement. Securities lending income is accounted for on an accruals basis.
e) Expenses Expenses are recognised in the Income Statement on an accruals basis.
f) Income Equalisation
During the year ended 30 June 2020 and 30 June 2019, certain Funds operated an equalisation account with a view to ensuring that the level of dividends payable on distributing Shares was not affected by the issue and redemption of such Shares during an accounting period. The subscription price of such Shares will therefore be deemed to include an equalisation payment calculated by reference to the accrued income of the Fund and the first distribution in respect of any Share will include a payment of capital usually equal to the amount of such equalisation payment. The redemption price of each Share will also include an equalisation payment in respect of the accrued income of the Fund up to the date of redemption. Income equalisation is accounted for through the Income Statement as a finance cost and disclosed as “Income received/deducted on issue/cancellation of shares” in Note 4.
As of 30 June 2020 and 30 June 2019, equalisation operated on certain Share Classes within the following Funds: The SEI Defensive Fund, The SEI Conservative Fund, The SEI Moderate Fund, The SEI Core Fund, The SEI Balanced Fund, The SEI Growth Fund, The SEI Aggressive Fund, The SEI Global Conservative Fund, The SEI Global Moderate Fund, The SEI Global Core Fund, The SEI Global Balanced Fund, The SEI Global Growth Fund, The SEI Global Aggressive Fund, The SEI Euro Conservative Fund, The SEI Euro Moderate Fund, The SEI Euro Core Fund, The SEI Euro Balanced Fund, The SEI Euro Growth Fund and The SEI Euro Aggressive Fund.
143
DocuSign Envelope ID: 2646536F-BB10-4779-844A-39205D22F4E0
SEI Global Assets Fund plc Annual Report and Audited Financial Statements for the financial year ended 30 June 2020
NOTES TO THE AUDITED FINANCIAL STATEMENTS FOR THE YEAR ENDED 30 JUNE 2020 (continued)
1. Accounting Policies (continued) g) Collateral
Securitised collateral which is provided to the broker (if any) is annotated on the relevant security in the Portfolio of Investments. Securitised collateral which is provided to the Fund (if any) is disclosed in Note 8. Cash collateral which is provided to the broker is recorded as an asset to the Fund and included under “Cash Collateral”, and is valued at its fair value. Cash received as collateral is recorded as an asset on the Statement of Financial Position and is valued at its fair value. Cash collateral held is unrestricted and held in a segregated account in the individual Fund’s name. A related liability to repay the collateral is recorded as a liability on the Statement of Financial Position under “Cash Collateral Payable” and is also valued at its fair value and disclosed in Note 8. All types of collateral are treated in line with the reporting requirements of FRS 102 and are governed by the terms and conditions of individual ISDA Master Agreements.
h) Distribution Policy
The distributions on the distributing Shares are recognised in the Income Statement as Finance Costs when they are appropriately authorised and no longer at the discretion of the Company.
i) Transaction Costs
Transaction costs are the costs incurred in the acquisition, issue or disposal of financial assets and liabilities. Transaction costs include fees and commissions paid to agents, advisers, brokers and dealers, levies by regulatory agencies and securities exchanges, and transfer taxes and duties. Transaction costs do not include debt premiums or discounts, financing costs or internal administrative or holding costs. Transaction costs are disclosed in Note 3 and are recognised on the Income Statement in “Net Gains/(Losses) on Financial Assets and Financial Liabilities at Fair Value through Profit or Loss”. Transaction fees on trades charged by the Depositary are recognised on the Income Statement as “Transaction Fees” under “Expenses”.
2. Taxation
Under current law and practice the Company qualifies as an investment undertaking as defined in Section 739B of the Taxes Consolidation Act, 1997, as amended. On that basis, it is not chargeable to Irish tax on its income or gains.
However, Irish tax may arise on the happening of a “chargeable event”. A chargeable event includes any distribution payments to Shareholders, any encashment, redemption, cancellation or transfer of shares and the holding of shares at the end of each eight year period beginning with the acquisition of such shares.
No Irish tax will arise on the Fund in respect of chargeable events in respect of:
(i) a Shareholder who is neither Irish resident nor ordinarily resident in Ireland for tax purposes, at the time of the chargeable event,
provided appropriate valid declarations in accordance with the provisions of the Taxes Consolidation Act, 1997, as amended, are held by the Fund or the Fund has been authorised by the Irish Revenue to make gross payments in the absence of appropriate declarations; and
(ii) certain exempted Irish tax resident shareholders who have provided the Fund with the necessary signed statutory declarations.
Dividends, interest and capital gains (if any) received on investments made by the Fund may be subject to taxes imposed by the country from which the investment income/gains are received and such taxes may not be recoverable by the Fund or its Shareholders.
Withholding Tax disclosed on the Income Statement includes tax credits and tax reclaims. 3. Fees and Expenses
SEI Investments Global, Limited and SEI Investments – Global Fund Services Limited, have been appointed as Manager and Administrator respectively, to provide the Company with management and administrative services. For these services, the Manager receives advisory, administration and depositary fees from the Company in respect of the Funds and Classes at the rates specified below. The Funds are not subject to any investment advisory fees for their investments in SEI Global Master Fund plc and SEI Global Investments Funds plc Share Classes. The Manager is responsible for paying out of these fees, the fees and expenses of the Investment Adviser, the Administrator, the Depositary and the Distributor. The Investment Adviser is responsible for paying the Portfolio Managers. The Company also reimburses the Depositary for reasonable out-of-pocket expenses, fees, transaction fees on trades and customary agents’ charges paid by the Depositary to any sub-custodian appointed with the consent of the Company which will be charged at normal commercial rates. The Manager is also entitled to reimbursement of all out-of-pocket expenses, incurred for the benefit of the Company. These transaction fees are disclosed in the Income Statement.
144
DocuSign Envelope ID: 2646536F-BB10-4779-844A-39205D22F4E0
SEI Global Assets Fund plc Annual Report and Audited Financial Statements for the financial year ended 30 June 2020
NOTES TO THE AUDITED FINANCIAL STATEMENTS FOR THE YEAR ENDED 30 JUNE 2020 (continued)
3. Fees and Expenses (continued) Administration and Depositary Fees Certain Share Classes pay only administration and depositary fees to the Manager. Advisory fees are paid by the underlying shareholders. The U.S.$ Institutional Class, U.S.$ Institutional Distributing Class, Sterling Institutional Class, Sterling Institutional Distributing Class and Euro Institutional Accumulating Class pay administration and depositary fees to the Manager up to the following rates (in basis points):
U.S.$ Institutional Class U.S.$ Institutional Distributing Class The SEI Global Conservative Fund 20 20 The SEI Global Moderate Fund1 20 20 The SEI Global Core Fund 20 20 The SEI Global Balanced Fund 20 20 The SEI Global Growth Fund 20 20 The SEI Global Aggressive Fund 20 20 Sterling Institutional Class Sterling Institutional Distributing Class The SEI Defensive Fund 15 15 The SEI Conservative Fund 15 15 The SEI Moderate Fund 15 15 The SEI Core Fund 15 15 The SEI Balanced Fund 15 15 The SEI Growth Fund 15 15 The SEI Aggressive Fund 15 15
Euro Institutional Accumulating Class
The SEI Euro Conservative Fund 20 The SEI Euro Moderate Fund 20 The SEI Euro Core Fund 20 The SEI Euro Balanced Fund 20 The SEI Euro Growth Fund 20 The SEI Euro Aggressive Fund 20
1 Fund commenced operations on 28 August 2018.
Advisory/Administration/Depositary Fees The Sterling Wealth A Accumulating Class, Sterling Wealth A Distributing Class, Sterling Institutional C Class, Sterling Investor Distributing Class, U.S.$ Wealth B Class, U.S.$ Wealth B Distributing Class, Euro Wealth A Accumulating Class, Euro Wealth C Accumulating Class, Euro Wealth C Distributing Class, U.S.$ Wealth A Class, Sterling Institutional D Class, Sterling Institutional E Class and Sterling Institutional F Class pay advisory, administration and depositary fees to the Manager up to the following rates (in basis points):
145
DocuSign Envelope ID: 2646536F-BB10-4779-844A-39205D22F4E0
SEI Global Assets Fund plc Annual Report and Audited Financial Statements for the financial year ended 30 June 2020
NOTES TO THE AUDITED FINANCIAL STATEMENTS FOR THE YEAR ENDED 30 JUNE 2020 (continued)
3. Fees and Expenses (continued) Advisory/Administration/Depositary Fees (continued)
Sterling Wealth Sterling Wealth Sterling A Accumulating A Distributing Institutional C Class Class Class
The SEI Defensive Fund 65 65 68 The SEI Conservative Fund 75 75 73 The SEI Moderate Fund 80 80 73 The SEI Core Fund 95 95 78 The SEI Balanced Fund 100 100 80 The SEI Growth Fund 105 105 83 The SEI Aggressive Fund 105 105 88
Sterling Investor U.S.$ Wealth B U.S.$ Wealth B Distributing Class Class Distributing Class The SEI Defensive Fund 65 - - The SEI Conservative Fund 75 - - The SEI Moderate Fund 80 - - The SEI Core Fund 90 - - The SEI Balanced Fund 95 - - The SEI Growth Fund 98 - - The SEI Aggressive Fund 100 - - The SEI Global Conservative Fund - 130 130 The SEI Global Moderate Fund1 - 145 145 The SEI Global Core Fund - 165 165 The SEI Global Balanced Fund - 175 175 The SEI Global Growth Fund - 185 185 The SEI Global Aggressive Fund - 195 195
Euro Wealth A
Accumulating Class
Euro Wealth C Accumulating
Class
Euro Wealth C Distributing
Class The SEI Euro Conservative Fund 80 220 220 The SEI Euro Moderate Fund 85 240 240 The SEI Euro Core Fund 100 245 245 The SEI Euro Balanced Fund 105 255 255 The SEI Euro Growth Fund 110 265 265 The SEI Euro Aggressive Fund 110 275 275
Sterling U.S.$ Wealth A U.S.$ Wealth A Institutional D Class Distributing Class Class The SEI Defensive Fund - - 50 The SEI Moderate Fund - - 50 The SEI Core Fund - - 50 The SEI Growth Fund - - 50 The SEI Aggressive Fund - - 50 The SEI Global Conservative Fund 75 - - The SEI Global Moderate Fund1 90 90 - The SEI Global Core Fund 95 - - The SEI Global Balanced Fund 100 - - The SEI Global Growth Fund 105 - - The SEI Global Aggressive Fund 105 - -
Sterling Sterling Institutional E Institutional F Class Class The SEI Defensive Fund 38 - The SEI Moderate Fund 38 30 The SEI Core Fund 38 30 The SEI Growth Fund 38 - The SEI Aggressive Fund 38 -
1 Fund commenced operations on 28 August 2018 The Manager has agreed to reimburse the Company for certain other expenses incurred because of the cap. During the year ended 30 June 2020, the Manager charged fees amounting to US$30,165,788 (30 June 2019: US$28,145,119) of which US$469,274 (30 June 2019: US$519,779) was reimbursed from the Investment Advisory Fee.
146
DocuSign Envelope ID: 2646536F-BB10-4779-844A-39205D22F4E0
SEI Global Assets Fund plc Annual Report and Audited Financial Statements for the financial year ended 30 June 2020
NOTES TO THE AUDITED FINANCIAL STATEMENTS FOR THE YEAR ENDED 30 JUNE 2020 (continued)
3. Fees and Expenses (continued)
Auditors Fees The charges (exclusive of VAT) for work carried out for the Company by its statutory audit firm, PricewaterhouseCoopers, for the years ended 30 June 2020 and 30 June 2019 were as follows:
Year Ended Year Ended 30 June 2020* 30 June 2019** EUR EUR
Audit of financial statements 139,500 139,500 Other assurance services - - Tax advisory services 76,260 76,260 Other non audit services 24,800 15,615 240,560 231,375 *Based on estimated amounts **Based on actual amounts Transaction Costs Transaction costs incurred in the acquisition or disposal of financial assets and liabilities for the year ended 30 June 2020 and 30 June 2019 were as follows:
Year ended Year ended Fund Name 30 June 2020 30 June 2019 The SEI Defensive Fund GBP708 GBP544 The SEI Conservative Fund GBP2,956 GBP4,288 The SEI Moderate Fund GBP15,445 GBP19,477 The SEI Core Fund - - The SEI Balanced Fund GBP1 - The SEI Growth Fund - - The SEI Aggressive Fund - - The SEI Global Conservative Fund USD254 US$291 The SEI Global Moderate Fund1 USD50 US$36 The SEI Global Core Fund - - The SEI Global Balanced Fund - - The SEI Global Growth Fund - - The SEI Global Aggressive Fund - - The SEI Euro Conservative Fund EUR122 EUR30 The SEI Euro Moderate Fund EUR774 EUR220 The SEI Euro Core Fund - - The SEI Euro Balanced Fund - EUR2 The SEI Euro Growth Fund - - The SEI Euro Aggressive Fund EUR82 EUR19 1 Fund commenced operations on 28 August 2018.
These transaction costs are recognised in the Income Statement in “Net Gains/(Losses) on Financial Assets and Financial Liabilities at Fair Value through Profit or Loss”. Transaction fees on trades charged by the Depositary are recognised on the Income Statement as “Transaction Fees” under “Expenses”. The Funds will only invest in classes of SEI Global Master Fund plc or SEI Global Investment Fund plc that are not subject to any investment advisory fee. Where the Funds invest in other (non SEI) investment funds; such investments may be subject to management fees which are generally not expected to exceed 2% of the assets of the relevant investment funds per annum. Organisational Expenses The Company’s initial establishment and organisational expenses (including, without limitation, expenses relating to the drafting of the Prospectus and Supplements, the authorisation of the Company by the Central Bank, the negotiation and preparation of the material contracts referred to herein, printing and translating the Prospectus and the Supplements and the fees and expenses of its professional advisers) are being borne by the Company and amounted to approximately US$300,000. Such expenses will be amortised over the first five accounting periods of the Company, unless otherwise determined by the Directors. In accordance with the Prospectus dated 10 February 2020, the Net Asset Value reported each month reflects these organisational expenses amortised over a period of sixty months. Consequently, in the current period amounts totalling EUR6,837 (30 June 2019: EUR6,763) for the SEI Euro Balanced Fund were amortised. However, for financial reporting purposes, as at 30 June 2020, organisational expenses totalling EUR26,372 (30 June 2019: EUR33,135) have been charged to the Income Statement of SEI Euro Balanced Fund.
147
DocuSign Envelope ID: 2646536F-BB10-4779-844A-39205D22F4E0
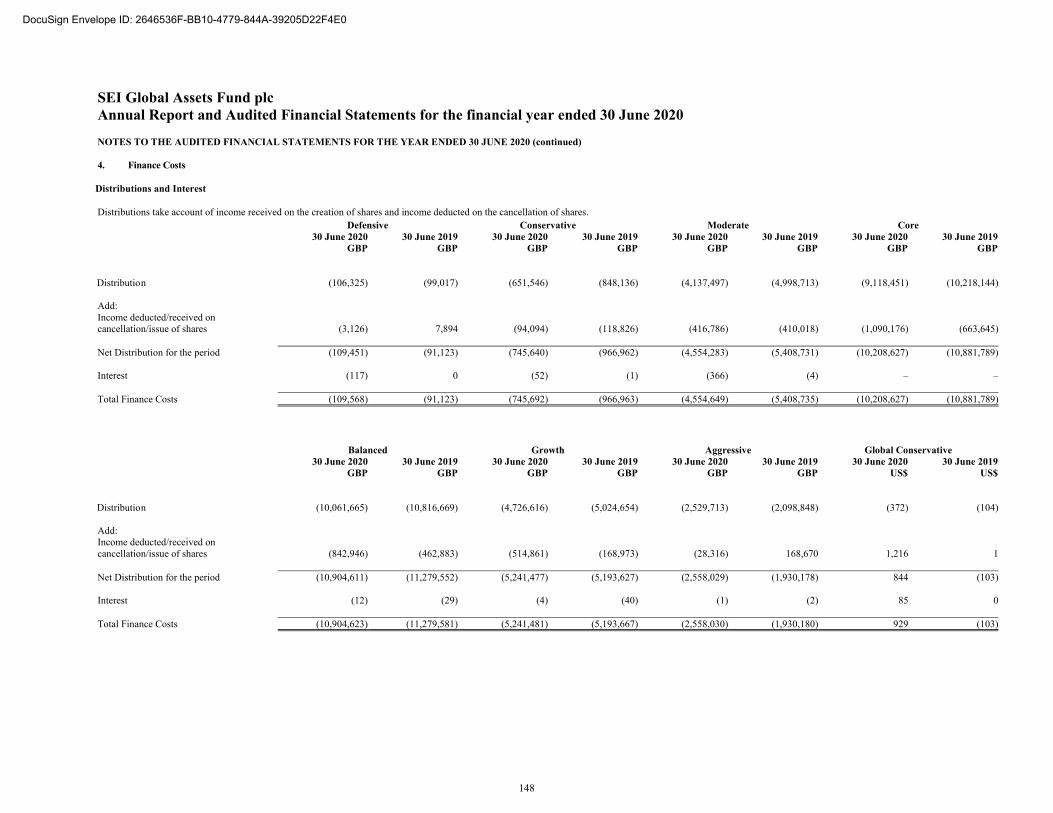
SEI Global Assets Fund plc Annual Report and Audited Financial Statements for the financial year ended 30 June 2020
NOTES TO THE AUDITED FINANCIAL STATEMENTS FOR THE YEAR ENDED 30 JUNE 2020 (continued)
4. Finance Costs Distributions and Interest Distributions take account of income received on the creation of shares and income deducted on the cancellation of shares.
Defensive Conservative Moderate Core
30 June 2020
GBP30 June 2019
GBP30 June 2020
GBP30 June 2019
GBP30 June 2020
GBP30 June 2019
GBP30 June 2020
GBP30 June 2019
GBP Distribution (106,325) (99,017) (651,546) (848,136) (4,137,497) (4,998,713) (9,118,451) (10,218,144) Add: Income deducted/received on cancellation/issue of shares (3,126) 7,894 (94,094) (118,826) (416,786) (410,018) (1,090,176) (663,645) Net Distribution for the period (109,451) (91,123) (745,640) (966,962) (4,554,283) (5,408,731) (10,208,627) (10,881,789) Interest (117) 0 (52) (1) (366) (4) – – Total Finance Costs (109,568) (91,123) (745,692) (966,963) (4,554,649) (5,408,735) (10,208,627) (10,881,789)
Balanced Growth Aggressive Global Conservative
30 June 2020
GBP30 June 2019
GBP30 June 2020
GBP30 June 2019
GBP30 June 2020
GBP30 June 2019
GBP30 June 2020
US$30 June 2019
US$ Distribution (10,061,665) (10,816,669) (4,726,616) (5,024,654) (2,529,713) (2,098,848) (372) (104) Add: Income deducted/received on cancellation/issue of shares (842,946) (462,883) (514,861) (168,973) (28,316) 168,670 1,216 1 Net Distribution for the period (10,904,611) (11,279,552) (5,241,477) (5,193,627) (2,558,029) (1,930,178) 844 (103) Interest (12) (29) (4) (40) (1) (2) 85 0 Total Finance Costs (10,904,623) (11,279,581) (5,241,481) (5,193,667) (2,558,030) (1,930,180) 929 (103)
148
DocuSign Envelope ID: 2646536F-BB10-4779-844A-39205D22F4E0
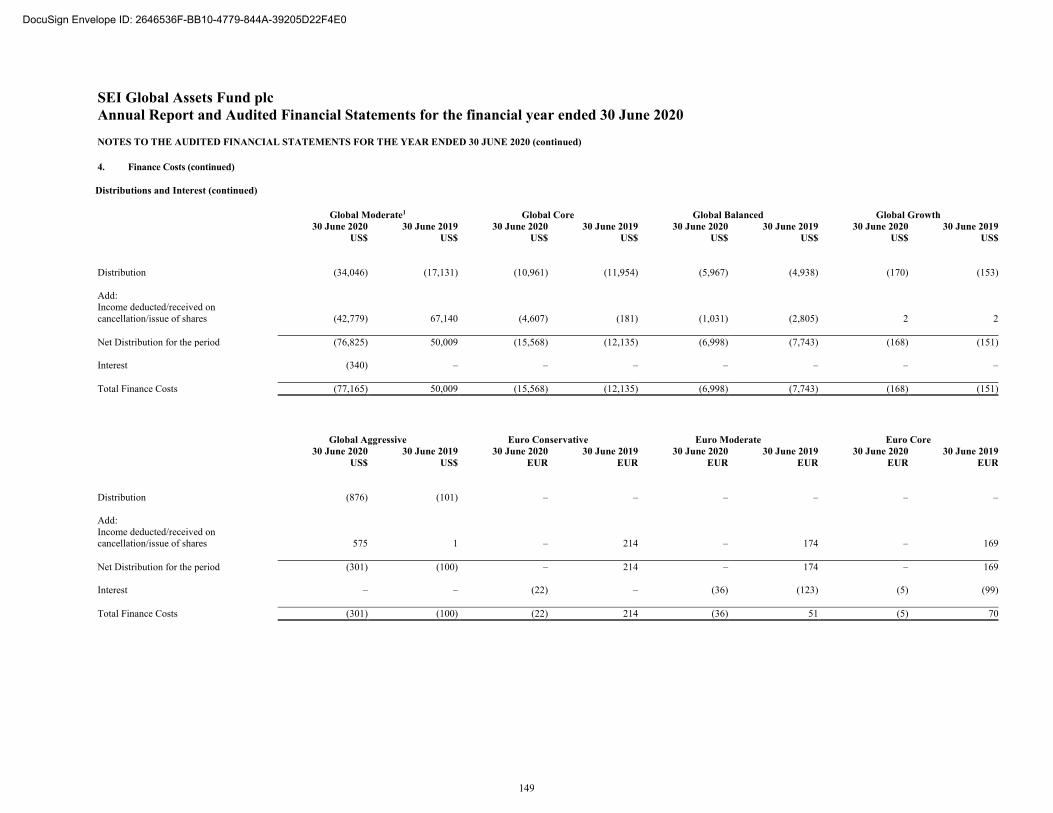
SEI Global Assets Fund plc Annual Report and Audited Financial Statements for the financial year ended 30 June 2020
NOTES TO THE AUDITED FINANCIAL STATEMENTS FOR THE YEAR ENDED 30 JUNE 2020 (continued)
4. Finance Costs (continued) Distributions and Interest (continued)
Global Moderate1 Global Core Global Balanced Global Growth
30 June 2020
US$30 June 2019
US$30 June 2020
US$30 June 2019
US$30 June 2020
US$30 June 2019
US$30 June 2020
US$30 June 2019
US$ Distribution (34,046) (17,131) (10,961) (11,954) (5,967) (4,938) (170) (153) Add: Income deducted/received on cancellation/issue of shares (42,779) 67,140 (4,607) (181) (1,031) (2,805) 2 2 Net Distribution for the period (76,825) 50,009 (15,568) (12,135) (6,998) (7,743) (168) (151) Interest (340) – – – – – – – Total Finance Costs (77,165) 50,009 (15,568) (12,135) (6,998) (7,743) (168) (151)
Global Aggressive Euro Conservative Euro Moderate Euro Core
30 June 2020
US$30 June 2019
US$30 June 2020
EUR30 June 2019
EUR30 June 2020
EUR30 June 2019
EUR30 June 2020
EUR30 June 2019
EUR Distribution (876) (101) – – – – – – Add: Income deducted/received on cancellation/issue of shares 575 1 – 214 – 174 – 169 Net Distribution for the period (301) (100) – 214 – 174 – 169 Interest – – (22) – (36) (123) (5) (99) Total Finance Costs (301) (100) (22) 214 (36) 51 (5) 70
149
DocuSign Envelope ID: 2646536F-BB10-4779-844A-39205D22F4E0
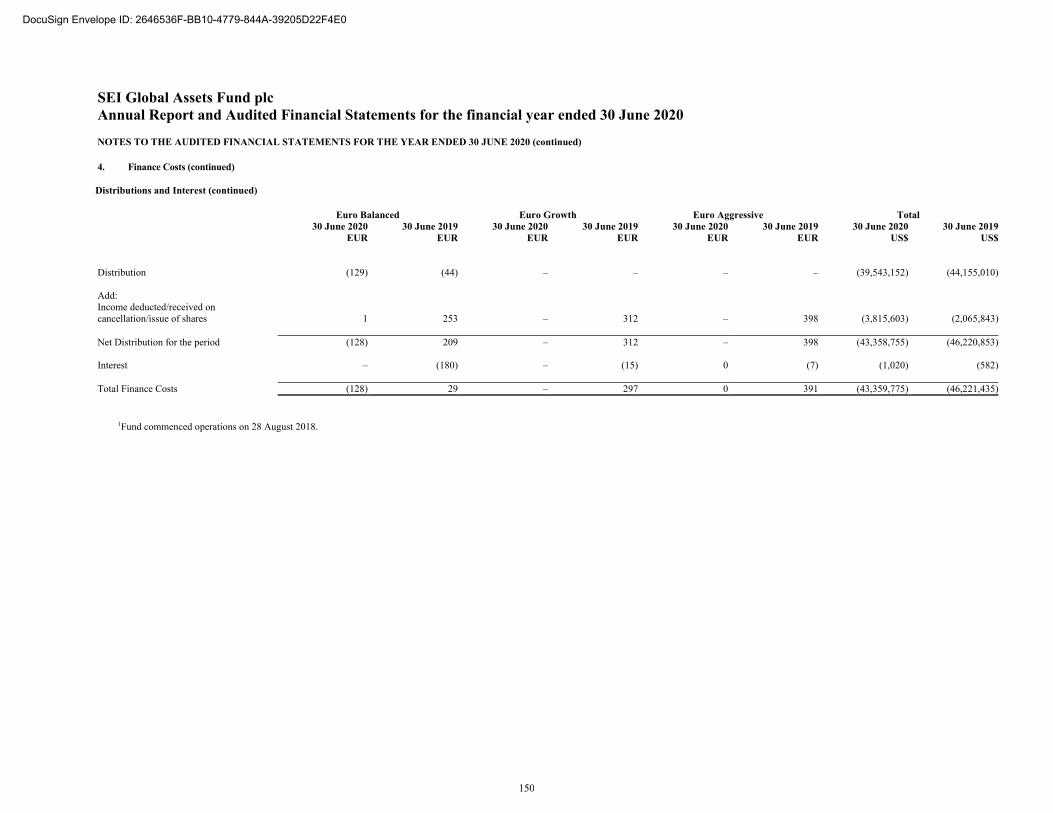
SEI Global Assets Fund plc Annual Report and Audited Financial Statements for the financial year ended 30 June 2020
NOTES TO THE AUDITED FINANCIAL STATEMENTS FOR THE YEAR ENDED 30 JUNE 2020 (continued)
4. Finance Costs (continued) Distributions and Interest (continued)
Euro Balanced Euro Growth Euro Aggressive Total
30 June 2020
EUR30 June 2019
EUR30 June 2020
EUR30 June 2019
EUR30 June 2020
EUR30 June 2019
EUR30 June 2020
US$30 June 2019
US$ Distribution (129) (44) – – – – (39,543,152) (44,155,010) Add: Income deducted/received on cancellation/issue of shares 1 253 – 312 – 398 (3,815,603) (2,065,843) Net Distribution for the period (128) 209 – 312 – 398 (43,358,755) (46,220,853) Interest – (180) – (15) 0 (7) (1,020) (582) Total Finance Costs (128) 29 – 297 0 391 (43,359,775) (46,221,435)
1Fund commenced operations on 28 August 2018.
150
DocuSign Envelope ID: 2646536F-BB10-4779-844A-39205D22F4E0
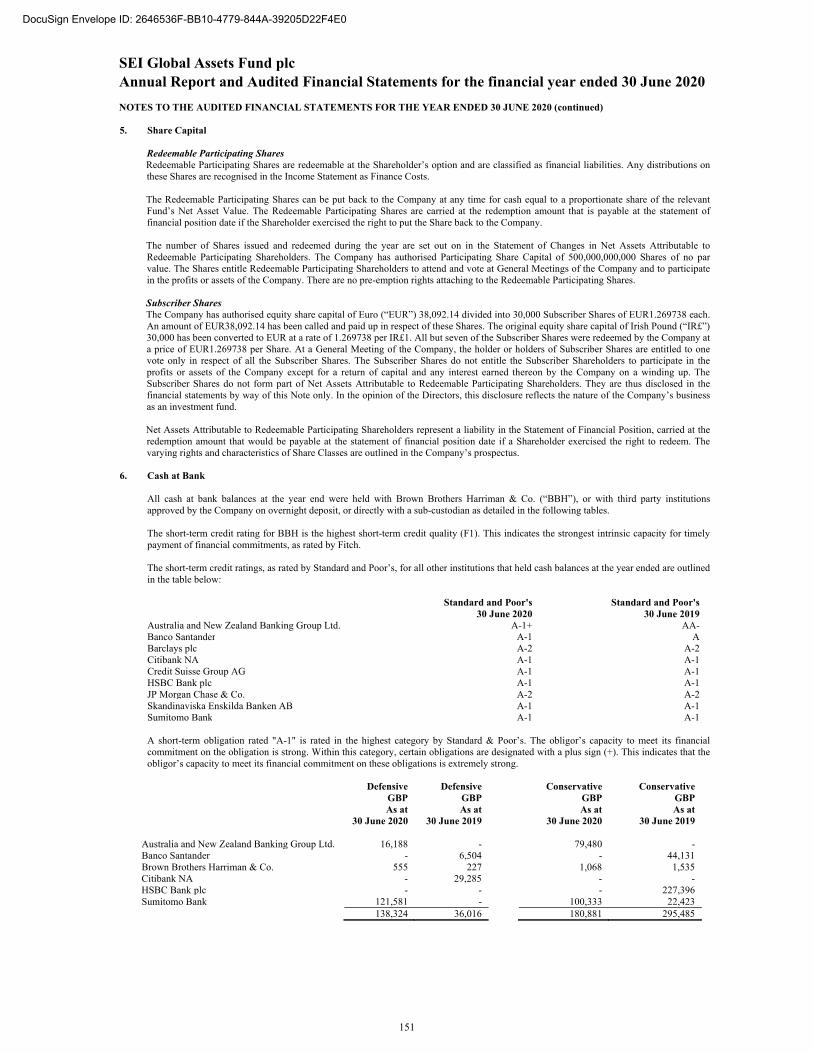
SEI Global Assets Fund plc
Annual Report and Audited Financial Statements for the financial year ended 30 June 2020 NOTES TO THE AUDITED FINANCIAL STATEMENTS FOR THE YEAR ENDED 30 JUNE 2020 (continued)
5. Share Capital
Redeemable Participating Shares Redeemable Participating Shares are redeemable at the Shareholder’s option and are classified as financial liabilities. Any distributions on these Shares are recognised in the Income Statement as Finance Costs. The Redeemable Participating Shares can be put back to the Company at any time for cash equal to a proportionate share of the relevant Fund’s Net Asset Value. The Redeemable Participating Shares are carried at the redemption amount that is payable at the statement of financial position date if the Shareholder exercised the right to put the Share back to the Company. The number of Shares issued and redeemed during the year are set out on in the Statement of Changes in Net Assets Attributable to Redeemable Participating Shareholders. The Company has authorised Participating Share Capital of 500,000,000,000 Shares of no par value. The Shares entitle Redeemable Participating Shareholders to attend and vote at General Meetings of the Company and to participate in the profits or assets of the Company. There are no pre-emption rights attaching to the Redeemable Participating Shares. Subscriber Shares The Company has authorised equity share capital of Euro (“EUR”) 38,092.14 divided into 30,000 Subscriber Shares of EUR1.269738 each. An amount of EUR38,092.14 has been called and paid up in respect of these Shares. The original equity share capital of Irish Pound (“IR£”) 30,000 has been converted to EUR at a rate of 1.269738 per IR£1. All but seven of the Subscriber Shares were redeemed by the Company at a price of EUR1.269738 per Share. At a General Meeting of the Company, the holder or holders of Subscriber Shares are entitled to one vote only in respect of all the Subscriber Shares. The Subscriber Shares do not entitle the Subscriber Shareholders to participate in the profits or assets of the Company except for a return of capital and any interest earned thereon by the Company on a winding up. The Subscriber Shares do not form part of Net Assets Attributable to Redeemable Participating Shareholders. They are thus disclosed in the financial statements by way of this Note only. In the opinion of the Directors, this disclosure reflects the nature of the Company’s business as an investment fund. Net Assets Attributable to Redeemable Participating Shareholders represent a liability in the Statement of Financial Position, carried at the redemption amount that would be payable at the statement of financial position date if a Shareholder exercised the right to redeem. The varying rights and characteristics of Share Classes are outlined in the Company’s prospectus.
6. Cash at Bank
All cash at bank balances at the year end were held with Brown Brothers Harriman & Co. (“BBH”), or with third party institutions approved by the Company on overnight deposit, or directly with a sub-custodian as detailed in the following tables. The short-term credit rating for BBH is the highest short-term credit quality (F1). This indicates the strongest intrinsic capacity for timely payment of financial commitments, as rated by Fitch. The short-term credit ratings, as rated by Standard and Poor’s, for all other institutions that held cash balances at the year ended are outlined in the table below:
Standard and Poor's Standard and Poor's 30 June 2020 30 June 2019
Australia and New Zealand Banking Group Ltd. A-1+ AA- Banco Santander A-1 A Barclays plc A-2 A-2 Citibank NA A-1 A-1 Credit Suisse Group AG A-1 A-1 HSBC Bank plc A-1 A-1 JP Morgan Chase & Co. A-2 A-2 Skandinaviska Enskilda Banken AB A-1 A-1 Sumitomo Bank A-1 A-1 A short-term obligation rated "A-1" is rated in the highest category by Standard & Poor’s. The obligor’s capacity to meet its financial commitment on the obligation is strong. Within this category, certain obligations are designated with a plus sign (+). This indicates that the obligor’s capacity to meet its financial commitment on these obligations is extremely strong.
Defensive Defensive Conservative Conservative GBP GBP GBP GBP As at As at As at As at 30 June 2020 30 June 2019 30 June 2020 30 June 2019
Australia and New Zealand Banking Group Ltd. 16,188 - 79,480 - Banco Santander - 6,504 - 44,131 Brown Brothers Harriman & Co. 555 227 1,068 1,535 Citibank NA - 29,285 - - HSBC Bank plc - - - 227,396 Sumitomo Bank 121,581 - 100,333 22,423
138,324 36,016 180,881 295,485
151
DocuSign Envelope ID: 2646536F-BB10-4779-844A-39205D22F4E0
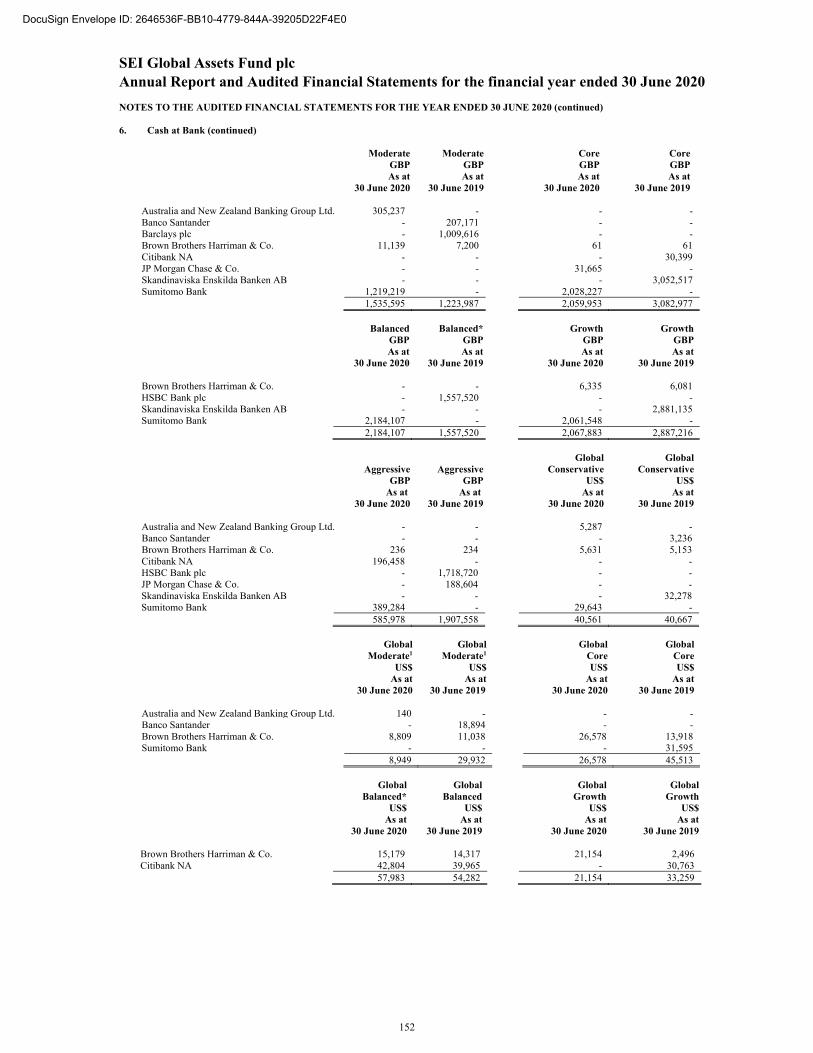
SEI Global Assets Fund plc
Annual Report and Audited Financial Statements for the financial year ended 30 June 2020 NOTES TO THE AUDITED FINANCIAL STATEMENTS FOR THE YEAR ENDED 30 JUNE 2020 (continued)
6. Cash at Bank (continued)
Moderate Moderate Core Core GBP GBP GBP GBP As at As at As at As at 30 June 2020 30 June 2019 30 June 2020 30 June 2019 Australia and New Zealand Banking Group Ltd. 305,237 - - - Banco Santander - 207,171 - - Barclays plc - 1,009,616 - - Brown Brothers Harriman & Co. 11,139 7,200 61 61 Citibank NA - - - 30,399 JP Morgan Chase & Co. - - 31,665 - Skandinaviska Enskilda Banken AB - - - 3,052,517 Sumitomo Bank 1,219,219 - 2,028,227 - 1,535,595 1,223,987 2,059,953 3,082,977
Balanced Balanced* Growth Growth GBP GBP GBP GBP As at As at As at As at 30 June 2020 30 June 2019 30 June 2020 30 June 2019 Brown Brothers Harriman & Co. - - 6,335 6,081 HSBC Bank plc - 1,557,520 - - Skandinaviska Enskilda Banken AB - - - 2,881,135 Sumitomo Bank 2,184,107 - 2,061,548 -
2,184,107 1,557,520 2,067,883 2,887,216
Global Global Aggressive Aggressive Conservative Conservative GBP GBP US$ US$ As at As at As at As at 30 June 2020 30 June 2019 30 June 2020 30 June 2019 Australia and New Zealand Banking Group Ltd. - - 5,287 - Banco Santander - - - 3,236 Brown Brothers Harriman & Co. 236 234 5,631 5,153 Citibank NA 196,458 - - - HSBC Bank plc - 1,718,720 - - JP Morgan Chase & Co. - 188,604 - - Skandinaviska Enskilda Banken AB - - - 32,278 Sumitomo Bank 389,284 - 29,643 -
585,978 1,907,558 40,561 40,667
Global Global Global Global Moderate1 Moderate1 Core Core US$ US$ US$ US$ As at As at As at As at 30 June 2020 30 June 2019 30 June 2020 30 June 2019 Australia and New Zealand Banking Group Ltd. 140 - - - Banco Santander - 18,894 - - Brown Brothers Harriman & Co. 8,809 11,038 26,578 13,918 Sumitomo Bank - - - 31,595
8,949 29,932 26,578 45,513
Global Global Global Global Balanced* Balanced Growth Growth US$ US$ US$ US$ As at As at As at As at 30 June 2020 30 June 2019 30 June 2020 30 June 2019
Brown Brothers Harriman & Co. 15,179 14,317 21,154 2,496 Citibank NA 42,804 39,965 - 30,763
57,983 54,282 21,154 33,259
152
DocuSign Envelope ID: 2646536F-BB10-4779-844A-39205D22F4E0
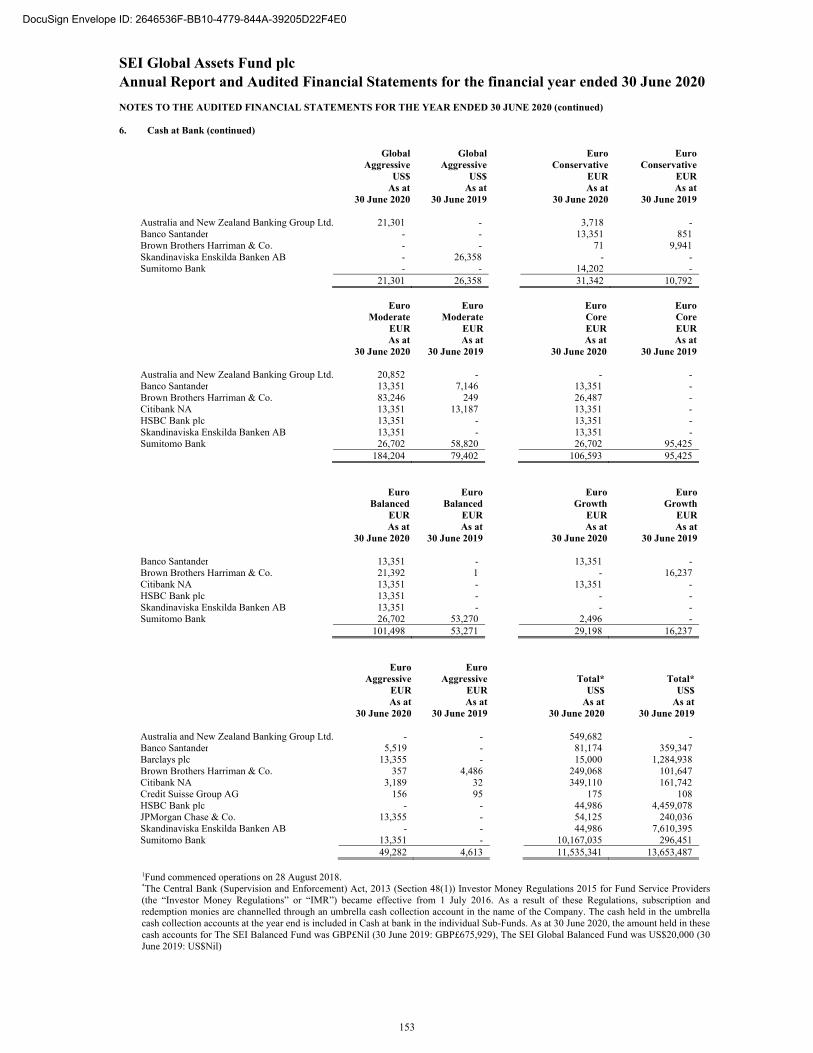
SEI Global Assets Fund plc
Annual Report and Audited Financial Statements for the financial year ended 30 June 2020 NOTES TO THE AUDITED FINANCIAL STATEMENTS FOR THE YEAR ENDED 30 JUNE 2020 (continued)
6. Cash at Bank (continued)
Global Global Euro Euro Aggressive Aggressive Conservative Conservative
US$ US$ EUR EUR As at As at As at As at 30 June 2020 30 June 2019 30 June 2020 30 June 2019
Australia and New Zealand Banking Group Ltd. 21,301 - 3,718 - Banco Santander - - 13,351 851 Brown Brothers Harriman & Co. - - 71 9,941 Skandinaviska Enskilda Banken AB - 26,358 - - Sumitomo Bank - - 14,202 -
21,301 26,358 31,342 10,792
Euro Euro Euro Euro Moderate Moderate Core Core
EUR EUR EUR EUR As at As at As at As at 30 June 2020 30 June 2019 30 June 2020 30 June 2019
Australia and New Zealand Banking Group Ltd. 20,852 - - - Banco Santander 13,351 7,146 13,351 - Brown Brothers Harriman & Co. 83,246 249 26,487 - Citibank NA 13,351 13,187 13,351 - HSBC Bank plc 13,351 - 13,351 - Skandinaviska Enskilda Banken AB 13,351 - 13,351 - Sumitomo Bank 26,702 58,820 26,702 95,425
184,204 79,402 106,593 95,425
Euro Euro Euro Euro Balanced Balanced Growth Growth
EUR EUR EUR EUR As at As at As at As at 30 June 2020 30 June 2019 30 June 2020 30 June 2019
Banco Santander 13,351 - 13,351 - Brown Brothers Harriman & Co. 21,392 1 - 16,237 Citibank NA 13,351 - 13,351 - HSBC Bank plc 13,351 - - - Skandinaviska Enskilda Banken AB 13,351 - - - Sumitomo Bank 26,702 53,270 2,496 -
101,498 53,271 29,198 16,237
Euro Euro Aggressive Aggressive Total* Total* EUR EUR US$ US$ As at As at As at As at 30 June 2020 30 June 2019 30 June 2020 30 June 2019
Australia and New Zealand Banking Group Ltd. - - 549,682 - Banco Santander 5,519 - 81,174 359,347 Barclays plc 13,355 - 15,000 1,284,938 Brown Brothers Harriman & Co. 357 4,486 249,068 101,647 Citibank NA 3,189 32 349,110 161,742 Credit Suisse Group AG 156 95 175 108 HSBC Bank plc - - 44,986 4,459,078 JPMorgan Chase & Co. 13,355 - 54,125 240,036 Skandinaviska Enskilda Banken AB - - 44,986 7,610,395 Sumitomo Bank 13,351 - 10,167,035 296,451
49,282 4,613 11,535,341 13,653,487
1Fund commenced operations on 28 August 2018. *The Central Bank (Supervision and Enforcement) Act, 2013 (Section 48(1)) Investor Money Regulations 2015 for Fund Service Providers (the “Investor Money Regulations” or “IMR”) became effective from 1 July 2016. As a result of these Regulations, subscription and redemption monies are channelled through an umbrella cash collection account in the name of the Company. The cash held in the umbrella cash collection accounts at the year end is included in Cash at bank in the individual Sub-Funds. As at 30 June 2020, the amount held in these cash accounts for The SEI Balanced Fund was GBP£Nil (30 June 2019: GBP£675,929), The SEI Global Balanced Fund was US$20,000 (30 June 2019: US$Nil)
153
DocuSign Envelope ID: 2646536F-BB10-4779-844A-39205D22F4E0
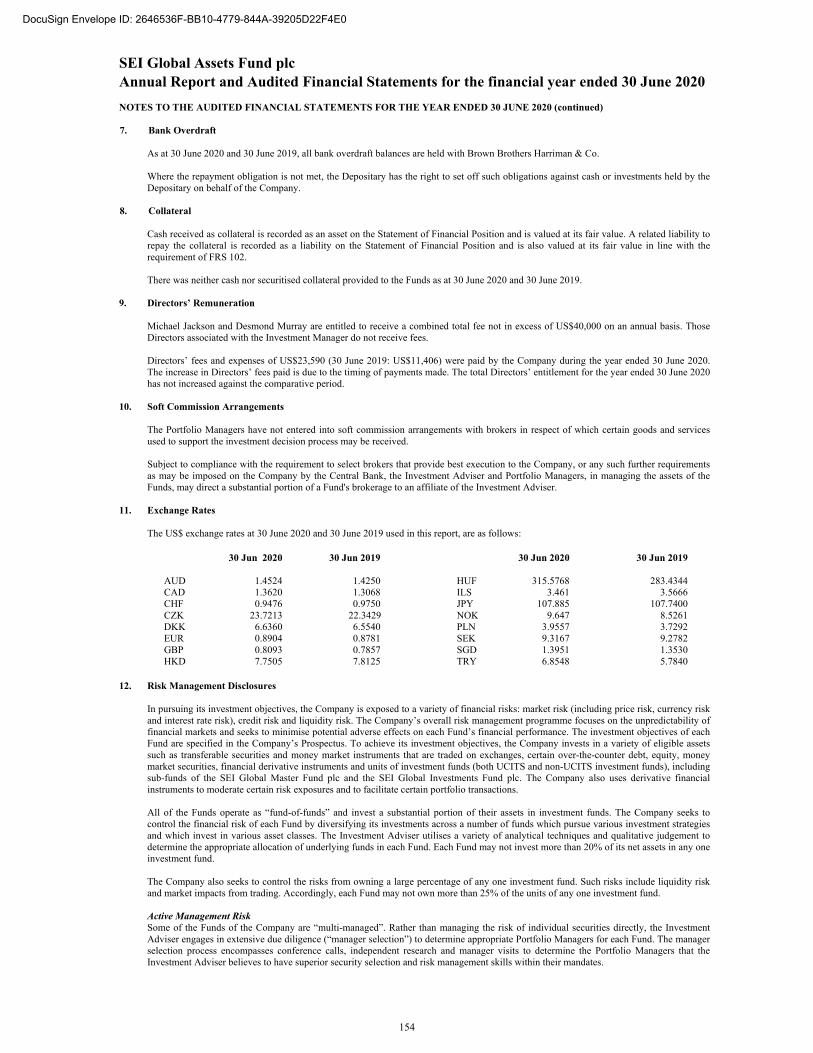
SEI Global Assets Fund plc
Annual Report and Audited Financial Statements for the financial year ended 30 June 2020 NOTES TO THE AUDITED FINANCIAL STATEMENTS FOR THE YEAR ENDED 30 JUNE 2020 (continued)
7. Bank Overdraft
As at 30 June 2020 and 30 June 2019, all bank overdraft balances are held with Brown Brothers Harriman & Co. Where the repayment obligation is not met, the Depositary has the right to set off such obligations against cash or investments held by the Depositary on behalf of the Company.
8. Collateral
Cash received as collateral is recorded as an asset on the Statement of Financial Position and is valued at its fair value. A related liability to repay the collateral is recorded as a liability on the Statement of Financial Position and is also valued at its fair value in line with the requirement of FRS 102.
There was neither cash nor securitised collateral provided to the Funds as at 30 June 2020 and 30 June 2019.
9. Directors’ Remuneration
Michael Jackson and Desmond Murray are entitled to receive a combined total fee not in excess of US$40,000 on an annual basis. Those Directors associated with the Investment Manager do not receive fees. Directors’ fees and expenses of US$23,590 (30 June 2019: US$11,406) were paid by the Company during the year ended 30 June 2020. The increase in Directors’ fees paid is due to the timing of payments made. The total Directors’ entitlement for the year ended 30 June 2020 has not increased against the comparative period.
10. Soft Commission Arrangements
The Portfolio Managers have not entered into soft commission arrangements with brokers in respect of which certain goods and services used to support the investment decision process may be received. Subject to compliance with the requirement to select brokers that provide best execution to the Company, or any such further requirements as may be imposed on the Company by the Central Bank, the Investment Adviser and Portfolio Managers, in managing the assets of the Funds, may direct a substantial portion of a Fund's brokerage to an affiliate of the Investment Adviser.
11. Exchange Rates
The US$ exchange rates at 30 June 2020 and 30 June 2019 used in this report, are as follows:
30 Jun 2020 30 Jun 2019 30 Jun 2020 30 Jun 2019
AUD 1.4524 1.4250 HUF 315.5768 283.4344 CAD 1.3620 1.3068 ILS 3.461 3.5666 CHF 0.9476 0.9750 JPY 107.885 107.7400 CZK 23.7213 22.3429 NOK 9.647 8.5261 DKK 6.6360 6.5540 PLN 3.9557 3.7292 EUR 0.8904 0.8781 SEK 9.3167 9.2782 GBP 0.8093 0.7857 SGD 1.3951 1.3530 HKD 7.7505 7.8125 TRY 6.8548 5.7840
12. Risk Management Disclosures
In pursuing its investment objectives, the Company is exposed to a variety of financial risks: market risk (including price risk, currency risk and interest rate risk), credit risk and liquidity risk. The Company’s overall risk management programme focuses on the unpredictability of financial markets and seeks to minimise potential adverse effects on each Fund’s financial performance. The investment objectives of each Fund are specified in the Company’s Prospectus. To achieve its investment objectives, the Company invests in a variety of eligible assets such as transferable securities and money market instruments that are traded on exchanges, certain over-the-counter debt, equity, money market securities, financial derivative instruments and units of investment funds (both UCITS and non-UCITS investment funds), including sub-funds of the SEI Global Master Fund plc and the SEI Global Investments Fund plc. The Company also uses derivative financial instruments to moderate certain risk exposures and to facilitate certain portfolio transactions. All of the Funds operate as “fund-of-funds” and invest a substantial portion of their assets in investment funds. The Company seeks to control the financial risk of each Fund by diversifying its investments across a number of funds which pursue various investment strategies and which invest in various asset classes. The Investment Adviser utilises a variety of analytical techniques and qualitative judgement to determine the appropriate allocation of underlying funds in each Fund. Each Fund may not invest more than 20% of its net assets in any one investment fund. The Company also seeks to control the risks from owning a large percentage of any one investment fund. Such risks include liquidity risk and market impacts from trading. Accordingly, each Fund may not own more than 25% of the units of any one investment fund. Active Management Risk Some of the Funds of the Company are “multi-managed”. Rather than managing the risk of individual securities directly, the Investment Adviser engages in extensive due diligence (“manager selection”) to determine appropriate Portfolio Managers for each Fund. The manager selection process encompasses conference calls, independent research and manager visits to determine the Portfolio Managers that the Investment Adviser believes to have superior security selection and risk management skills within their mandates.
154
DocuSign Envelope ID: 2646536F-BB10-4779-844A-39205D22F4E0
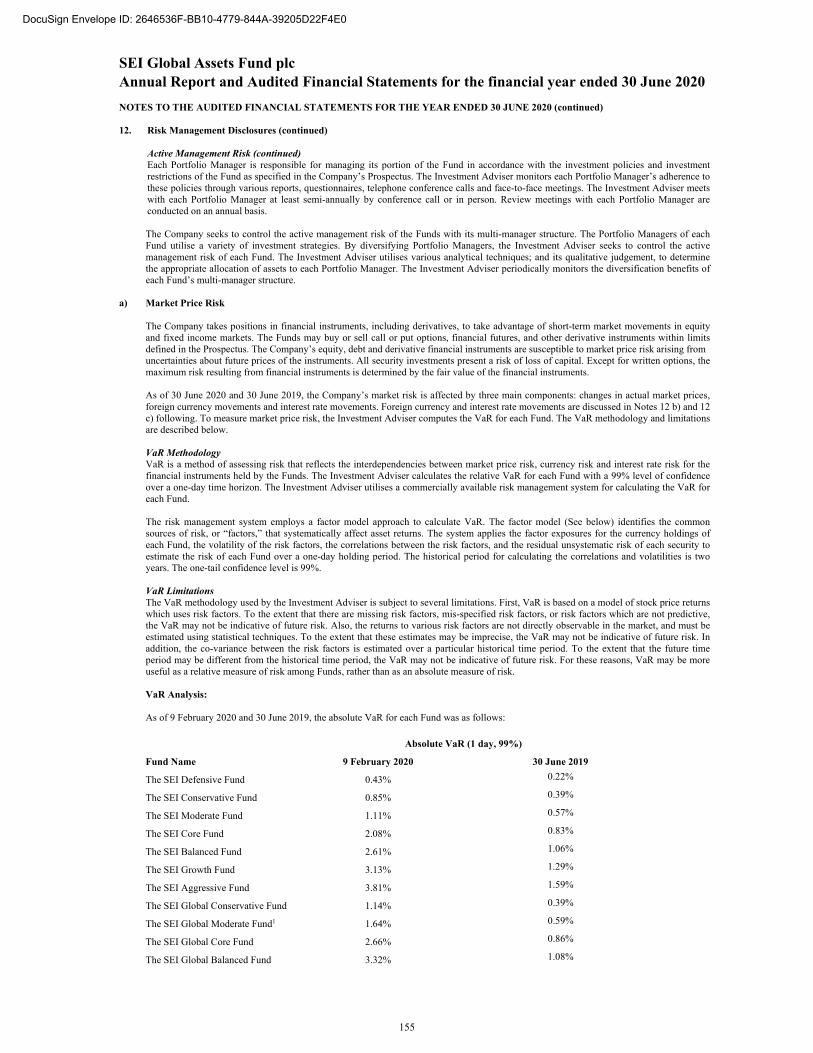
SEI Global Assets Fund plc
Annual Report and Audited Financial Statements for the financial year ended 30 June 2020 NOTES TO THE AUDITED FINANCIAL STATEMENTS FOR THE YEAR ENDED 30 JUNE 2020 (continued)
12. Risk Management Disclosures (continued)
Active Management Risk (continued) Each Portfolio Manager is responsible for managing its portion of the Fund in accordance with the investment policies and investment restrictions of the Fund as specified in the Company’s Prospectus. The Investment Adviser monitors each Portfolio Manager’s adherence to these policies through various reports, questionnaires, telephone conference calls and face-to-face meetings. The Investment Adviser meets with each Portfolio Manager at least semi-annually by conference call or in person. Review meetings with each Portfolio Manager are conducted on an annual basis. The Company seeks to control the active management risk of the Funds with its multi-manager structure. The Portfolio Managers of each Fund utilise a variety of investment strategies. By diversifying Portfolio Managers, the Investment Adviser seeks to control the active management risk of each Fund. The Investment Adviser utilises various analytical techniques; and its qualitative judgement, to determine the appropriate allocation of assets to each Portfolio Manager. The Investment Adviser periodically monitors the diversification benefits of each Fund’s multi-manager structure.
a) Market Price Risk
The Company takes positions in financial instruments, including derivatives, to take advantage of short-term market movements in equity and fixed income markets. The Funds may buy or sell call or put options, financial futures, and other derivative instruments within limits defined in the Prospectus. The Company’s equity, debt and derivative financial instruments are susceptible to market price risk arising from uncertainties about future prices of the instruments. All security investments present a risk of loss of capital. Except for written options, the maximum risk resulting from financial instruments is determined by the fair value of the financial instruments. As of 30 June 2020 and 30 June 2019, the Company’s market risk is affected by three main components: changes in actual market prices, foreign currency movements and interest rate movements. Foreign currency and interest rate movements are discussed in Notes 12 b) and 12 c) following. To measure market price risk, the Investment Adviser computes the VaR for each Fund. The VaR methodology and limitations are described below. VaR Methodology VaR is a method of assessing risk that reflects the interdependencies between market price risk, currency risk and interest rate risk for the financial instruments held by the Funds. The Investment Adviser calculates the relative VaR for each Fund with a 99% level of confidence over a one-day time horizon. The Investment Adviser utilises a commercially available risk management system for calculating the VaR for each Fund.
The risk management system employs a factor model approach to calculate VaR. The factor model (See below) identifies the common sources of risk, or “factors,” that systematically affect asset returns. The system applies the factor exposures for the currency holdings of each Fund, the volatility of the risk factors, the correlations between the risk factors, and the residual unsystematic risk of each security to estimate the risk of each Fund over a one-day holding period. The historical period for calculating the correlations and volatilities is two years. The one-tail confidence level is 99%. VaR Limitations The VaR methodology used by the Investment Adviser is subject to several limitations. First, VaR is based on a model of stock price returns which uses risk factors. To the extent that there are missing risk factors, mis-specified risk factors, or risk factors which are not predictive, the VaR may not be indicative of future risk. Also, the returns to various risk factors are not directly observable in the market, and must be estimated using statistical techniques. To the extent that these estimates may be imprecise, the VaR may not be indicative of future risk. In addition, the co-variance between the risk factors is estimated over a particular historical time period. To the extent that the future time period may be different from the historical time period, the VaR may not be indicative of future risk. For these reasons, VaR may be more useful as a relative measure of risk among Funds, rather than as an absolute measure of risk. VaR Analysis: As of 9 February 2020 and 30 June 2019, the absolute VaR for each Fund was as follows:
Absolute VaR (1 day, 99%)
Fund Name 9 February 2020 30 June 2019
The SEI Defensive Fund 0.43% 0.22%
The SEI Conservative Fund 0.85% 0.39%
The SEI Moderate Fund 1.11% 0.57%
The SEI Core Fund 2.08% 0.83%
The SEI Balanced Fund 2.61% 1.06%
The SEI Growth Fund 3.13% 1.29%
The SEI Aggressive Fund 3.81% 1.59%
The SEI Global Conservative Fund 1.14% 0.39%
The SEI Global Moderate Fund1 1.64% 0.59%
The SEI Global Core Fund 2.66% 0.86%
The SEI Global Balanced Fund 3.32% 1.08%
155
DocuSign Envelope ID: 2646536F-BB10-4779-844A-39205D22F4E0
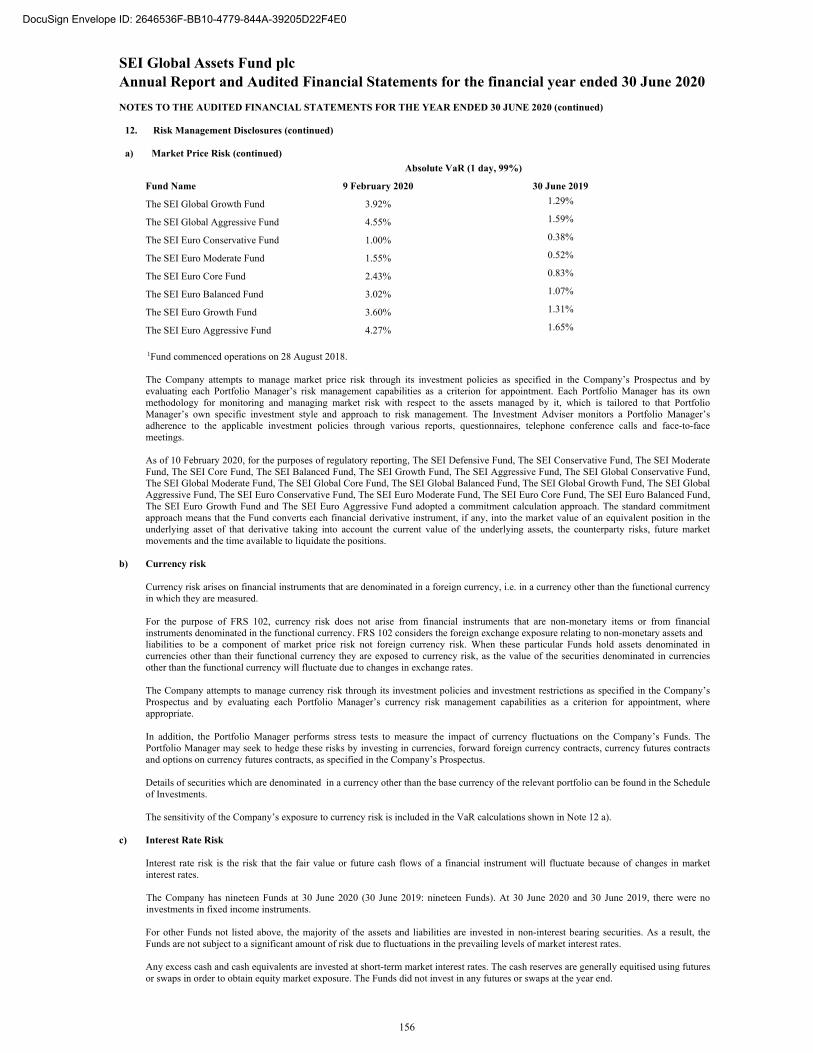
SEI Global Assets Fund plc
Annual Report and Audited Financial Statements for the financial year ended 30 June 2020 NOTES TO THE AUDITED FINANCIAL STATEMENTS FOR THE YEAR ENDED 30 JUNE 2020 (continued)
12. Risk Management Disclosures (continued) a) Market Price Risk (continued) Absolute VaR (1 day, 99%)
Fund Name 9 February 2020 30 June 2019
The SEI Global Growth Fund 3.92% 1.29%
The SEI Global Aggressive Fund 4.55% 1.59%
The SEI Euro Conservative Fund 1.00% 0.38%
The SEI Euro Moderate Fund 1.55% 0.52%
The SEI Euro Core Fund 2.43% 0.83%
The SEI Euro Balanced Fund 3.02% 1.07%
The SEI Euro Growth Fund 3.60% 1.31%
The SEI Euro Aggressive Fund 4.27% 1.65%
1Fund commenced operations on 28 August 2018.
The Company attempts to manage market price risk through its investment policies as specified in the Company’s Prospectus and by evaluating each Portfolio Manager’s risk management capabilities as a criterion for appointment. Each Portfolio Manager has its own methodology for monitoring and managing market risk with respect to the assets managed by it, which is tailored to that Portfolio Manager’s own specific investment style and approach to risk management. The Investment Adviser monitors a Portfolio Manager’s adherence to the applicable investment policies through various reports, questionnaires, telephone conference calls and face-to-face meetings. As of 10 February 2020, for the purposes of regulatory reporting, The SEI Defensive Fund, The SEI Conservative Fund, The SEI Moderate Fund, The SEI Core Fund, The SEI Balanced Fund, The SEI Growth Fund, The SEI Aggressive Fund, The SEI Global Conservative Fund, The SEI Global Moderate Fund, The SEI Global Core Fund, The SEI Global Balanced Fund, The SEI Global Growth Fund, The SEI Global Aggressive Fund, The SEI Euro Conservative Fund, The SEI Euro Moderate Fund, The SEI Euro Core Fund, The SEI Euro Balanced Fund, The SEI Euro Growth Fund and The SEI Euro Aggressive Fund adopted a commitment calculation approach. The standard commitment approach means that the Fund converts each financial derivative instrument, if any, into the market value of an equivalent position in the underlying asset of that derivative taking into account the current value of the underlying assets, the counterparty risks, future market movements and the time available to liquidate the positions.
b) Currency risk
Currency risk arises on financial instruments that are denominated in a foreign currency, i.e. in a currency other than the functional currency in which they are measured.
For the purpose of FRS 102, currency risk does not arise from financial instruments that are non-monetary items or from financial instruments denominated in the functional currency. FRS 102 considers the foreign exchange exposure relating to non-monetary assets and liabilities to be a component of market price risk not foreign currency risk. When these particular Funds hold assets denominated in currencies other than their functional currency they are exposed to currency risk, as the value of the securities denominated in currencies other than the functional currency will fluctuate due to changes in exchange rates. The Company attempts to manage currency risk through its investment policies and investment restrictions as specified in the Company’s Prospectus and by evaluating each Portfolio Manager’s currency risk management capabilities as a criterion for appointment, where appropriate. In addition, the Portfolio Manager performs stress tests to measure the impact of currency fluctuations on the Company’s Funds. The Portfolio Manager may seek to hedge these risks by investing in currencies, forward foreign currency contracts, currency futures contracts and options on currency futures contracts, as specified in the Company’s Prospectus. Details of securities which are denominated in a currency other than the base currency of the relevant portfolio can be found in the Schedule of Investments.
The sensitivity of the Company’s exposure to currency risk is included in the VaR calculations shown in Note 12 a).
c) Interest Rate Risk
Interest rate risk is the risk that the fair value or future cash flows of a financial instrument will fluctuate because of changes in market interest rates. The Company has nineteen Funds at 30 June 2020 (30 June 2019: nineteen Funds). At 30 June 2020 and 30 June 2019, there were no investments in fixed income instruments. For other Funds not listed above, the majority of the assets and liabilities are invested in non-interest bearing securities. As a result, the Funds are not subject to a significant amount of risk due to fluctuations in the prevailing levels of market interest rates. Any excess cash and cash equivalents are invested at short-term market interest rates. The cash reserves are generally equitised using futures or swaps in order to obtain equity market exposure. The Funds did not invest in any futures or swaps at the year end.
156
DocuSign Envelope ID: 2646536F-BB10-4779-844A-39205D22F4E0
SEI Global Assets Fund plc
Annual Report and Audited Financial Statements for the financial year ended 30 June 2020 NOTES TO THE AUDITED FINANCIAL STATEMENTS FOR THE YEAR ENDED 30 JUNE 2020 (continued)
12. Risk Management Disclosures (continued)
c) Interest Rate Risk (continued)
The Company attempts to manage interest rate risk through its investment policies and investment restrictions as specified in the Company’s Prospectus and by evaluating each Portfolio Manager’s interest rate risk management capabilities as a criterion for appointment, where appropriate. In addition, the Portfolio Manager performs stress tests to measure the impact of changes in interest rates on the Company’s Funds. The Portfolio Manager may seek to reduce these risks by modifying the allocation of capital to Portfolio Managers within each Fund. The sensitivity of the Company’s exposure to interest rate risk is included in the overall VaR calculations shown in Note 12 a).
d) Credit Risk Credit risk is the risk that the counterparty to a transaction or an issuer of a financial instrument will cause a financial loss to a Fund by failing to repay an obligation which may arise by purchasing debt instruments, placing deposits, and entering into derivative contracts. Credit risk is generally more significant for those Funds that invest primarily in debt instruments, or that use derivative contracts to a material degree. The Fund may have exposure to credit risk through its investments in other investment funds which themselves have credit risk exposure.
Cash balances held at 30 June 2020 and 30 June 2019 are detailed in Note 6. The short-term credit ratings for all of the institutions are listed in Note 6.
The counterparty to all derivatives held at 30 June 2020 is Brown Brothers Harriman & Co. (“BBH”). The short-term credit rating for BBH is the highest short term credit quality (F1). This indicates the strongest intrinsic capacity for timely payment of financial commitments, as rated by Fitch. For cash accounts, funds which are deposited are liabilities of the banks, thus creating a debtor-creditor relationship between the bank and the Company. Cash accounts opened on the books of BBH are obligations of BBH while cash accounts opened on the books of a sub-custodian or a broker (collectively “agency accounts”) are obligations of the agent. For safekeeping of security assets, BBH’s policy is to maintain segregated client security accounts on its books and on the books of its sub-custodians. Accordingly, while BBH is responsible for exercising reasonable care in the administration of agency cash accounts, it is not liable for their repayment in the event the sub-custodian, by reason of its bankruptcy, insolvency or otherwise, fails to make repayment. BBH performs both initial and ongoing due diligence on the sub-depositaries in its global custody network. Such reviews include an assessment of the sub-depositary’s financial strength and general reputation and standing and, at a minimum, meet the due diligence requirements established by applicable law. The financial analysis is focused on the sub-custodian bank’s capital adequacy, asset quality, financial flexibility and strength, management expertise, earnings, and liquidity as key indicators of its financial standing in the market. These reviews are not audits.
The Company may invest in debt instruments that may receive a credit rating from a well-known rating agency, or if unrated, may be assigned a credit rating using an approach which is consistent with that used by rating agencies. As at 30 June 2019 there are no investments in debt instruments. At 30 June 2020 for The SEI Defensive Fund, The SEI Conservative Fund, The SEI Moderate Fund, The SEI Core Fund, The SEI Balanced Fund, The SEI Growth Fund, The SEI Aggressive Fund, The SEI Global Conservative Fund, The SEI Global Moderate, The SEI Global Core Fund, The SEI Global Balanced Fund, The SEI Global Growth Fund, The SEI Global Aggressive Fund, The SEI Euro Conservative Fund, The SEI Euro Moderate Fund, The SEI Euro Core Fund, The SEI Euro Balanced Fund, The SEI Euro Growth Fund and The SEI Euro Aggressive Fund, the majority of the financial assets are non-interest bearing equity securities. The Fund has limited exposure to credit risk through its investments in other investment funds, which themselves may have credit risk exposure. All broker transactions in listed securities are settled upon delivery to the Company’s Depositary. The risk of default is considered minimal, as delivery of securities sold is only made once the Company’s Depositary has received payment from the broker. Payment to a broker is made on a purchase once the securities have been received by the Company’s Depositary. The trade will fail if either party fails to meet its obligation. The Funds limit their exposure to credit losses on derivative instruments by limiting their exposure to counterparties in accordance with the investment restrictions specified in the Company’s Prospectus. Counterparties must be subject to prudential supervision and meet certain requirements as specified by the Central Bank. The Investment Adviser requires each Portfolio Manager to complete a quarterly questionnaire to verify compliance with the investment restrictions on counterparties. The Funds also limit their exposure to credit losses on derivative instruments by entering into master netting arrangements with counterparties. Master netting arrangements do not result in an offset of Statement of Financial Position assets and liabilities, as transactions are usually settled on a gross basis. However, the credit risk associated with favourable contracts is reduced by a master netting arrangement to the extent that if an event of default occurs, all amounts with the counterparty are terminated and settled on a net basis. A Fund’s overall exposure to credit risk on derivative instruments subject to a master netting arrangement can change substantially within a short period, as it is affected by each transaction subject to the arrangement.
The Company attempts to manage credit risk through its investment policies and investment restrictions as specified in the Company’s Prospectus and by evaluating each Portfolio Manager’s credit analysis capabilities as a criterion for appointment, where appropriate. Each Portfolio Manager that invests in debt instruments or derivative contracts has its own methodology for monitoring and managing credit risk with respect to the assets managed by it, which is tailored to that Portfolio Manager’s own specific investment style and approach to risk management. The Investment Adviser monitors a Portfolio Manager’s adherence to a Fund’s policies and restrictions through various reports, questionnaires, telephone conference calls and on-site meetings.
157
DocuSign Envelope ID: 2646536F-BB10-4779-844A-39205D22F4E0
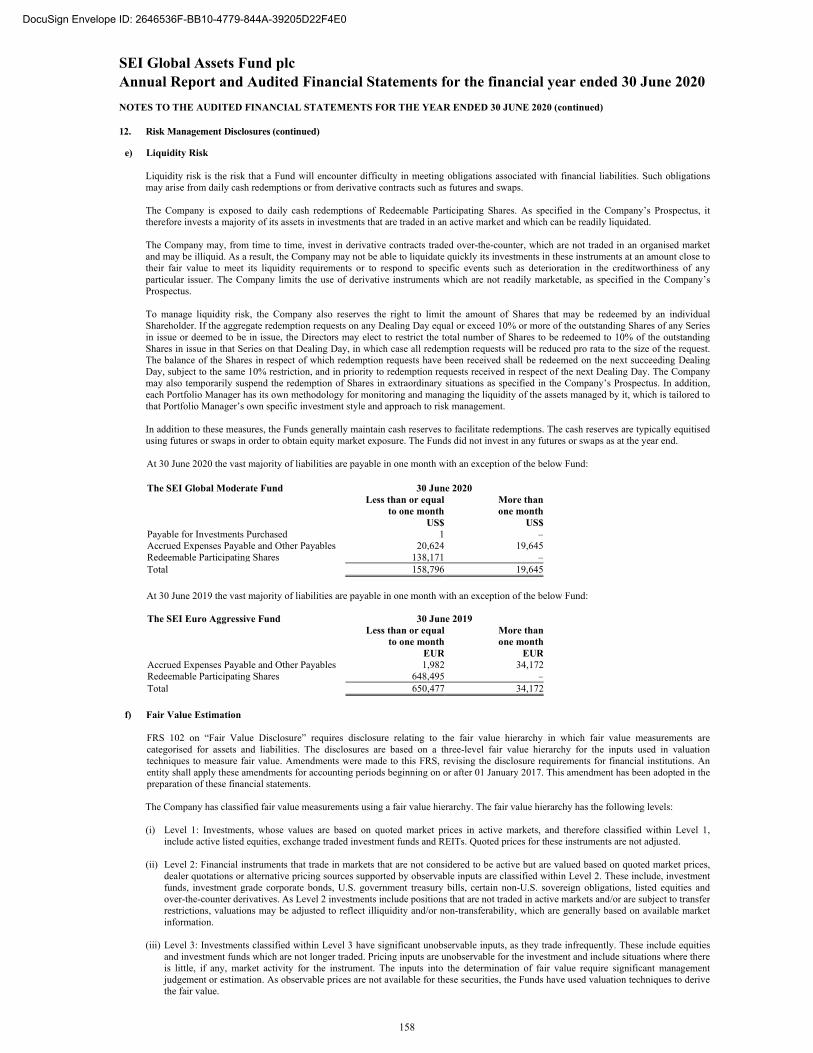
SEI Global Assets Fund plc
Annual Report and Audited Financial Statements for the financial year ended 30 June 2020 NOTES TO THE AUDITED FINANCIAL STATEMENTS FOR THE YEAR ENDED 30 JUNE 2020 (continued)
12. Risk Management Disclosures (continued)
e) Liquidity Risk Liquidity risk is the risk that a Fund will encounter difficulty in meeting obligations associated with financial liabilities. Such obligations may arise from daily cash redemptions or from derivative contracts such as futures and swaps. The Company is exposed to daily cash redemptions of Redeemable Participating Shares. As specified in the Company’s Prospectus, it therefore invests a majority of its assets in investments that are traded in an active market and which can be readily liquidated. The Company may, from time to time, invest in derivative contracts traded over-the-counter, which are not traded in an organised market and may be illiquid. As a result, the Company may not be able to liquidate quickly its investments in these instruments at an amount close to their fair value to meet its liquidity requirements or to respond to specific events such as deterioration in the creditworthiness of any particular issuer. The Company limits the use of derivative instruments which are not readily marketable, as specified in the Company’s Prospectus.
To manage liquidity risk, the Company also reserves the right to limit the amount of Shares that may be redeemed by an individual Shareholder. If the aggregate redemption requests on any Dealing Day equal or exceed 10% or more of the outstanding Shares of any Series in issue or deemed to be in issue, the Directors may elect to restrict the total number of Shares to be redeemed to 10% of the outstanding Shares in issue in that Series on that Dealing Day, in which case all redemption requests will be reduced pro rata to the size of the request. The balance of the Shares in respect of which redemption requests have been received shall be redeemed on the next succeeding Dealing Day, subject to the same 10% restriction, and in priority to redemption requests received in respect of the next Dealing Day. The Company may also temporarily suspend the redemption of Shares in extraordinary situations as specified in the Company’s Prospectus. In addition, each Portfolio Manager has its own methodology for monitoring and managing the liquidity of the assets managed by it, which is tailored to that Portfolio Manager’s own specific investment style and approach to risk management. In addition to these measures, the Funds generally maintain cash reserves to facilitate redemptions. The cash reserves are typically equitised using futures or swaps in order to obtain equity market exposure. The Funds did not invest in any futures or swaps as at the year end. At 30 June 2020 the vast majority of liabilities are payable in one month with an exception of the below Fund:
The SEI Global Moderate Fund 30 June 2020
Less than or equalto one month
US$
More than one month
US$Payable for Investments Purchased 1 –Accrued Expenses Payable and Other Payables 20,624 19,645Redeemable Participating Shares 138,171 –Total 158,796 19,645
At 30 June 2019 the vast majority of liabilities are payable in one month with an exception of the below Fund: The SEI Euro Aggressive Fund 30 June 2019
Less than or equalto one month
EUR
More than one month
EURAccrued Expenses Payable and Other Payables 1,982 34,172Redeemable Participating Shares 648,495 –Total 650,477 34,172
f) Fair Value Estimation
FRS 102 on “Fair Value Disclosure” requires disclosure relating to the fair value hierarchy in which fair value measurements are categorised for assets and liabilities. The disclosures are based on a three-level fair value hierarchy for the inputs used in valuation techniques to measure fair value. Amendments were made to this FRS, revising the disclosure requirements for financial institutions. An entity shall apply these amendments for accounting periods beginning on or after 01 January 2017. This amendment has been adopted in the preparation of these financial statements. The Company has classified fair value measurements using a fair value hierarchy. The fair value hierarchy has the following levels: (i) Level 1: Investments, whose values are based on quoted market prices in active markets, and therefore classified within Level 1,
include active listed equities, exchange traded investment funds and REITs. Quoted prices for these instruments are not adjusted. (ii) Level 2: Financial instruments that trade in markets that are not considered to be active but are valued based on quoted market prices,
dealer quotations or alternative pricing sources supported by observable inputs are classified within Level 2. These include, investment funds, investment grade corporate bonds, U.S. government treasury bills, certain non-U.S. sovereign obligations, listed equities and over-the-counter derivatives. As Level 2 investments include positions that are not traded in active markets and/or are subject to transfer restrictions, valuations may be adjusted to reflect illiquidity and/or non-transferability, which are generally based on available market information.
(iii) Level 3: Investments classified within Level 3 have significant unobservable inputs, as they trade infrequently. These include equities
and investment funds which are not longer traded. Pricing inputs are unobservable for the investment and include situations where there is little, if any, market activity for the instrument. The inputs into the determination of fair value require significant management judgement or estimation. As observable prices are not available for these securities, the Funds have used valuation techniques to derive the fair value.
158
DocuSign Envelope ID: 2646536F-BB10-4779-844A-39205D22F4E0
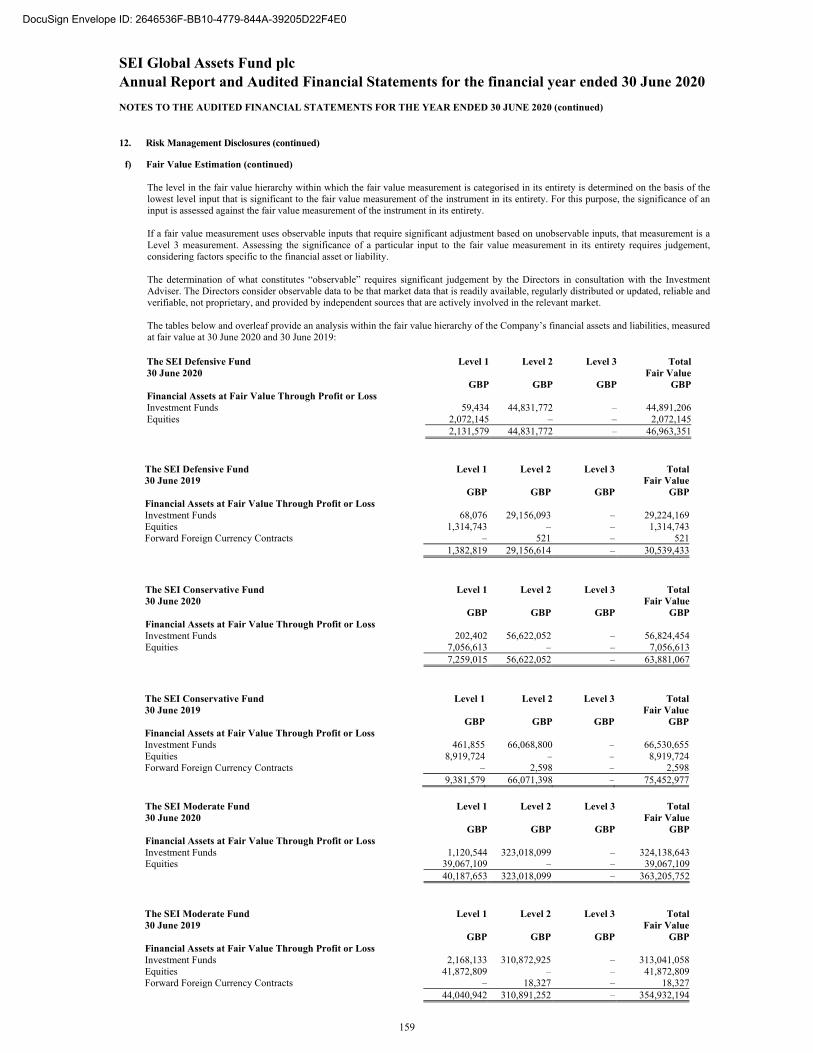
SEI Global Assets Fund plc
Annual Report and Audited Financial Statements for the financial year ended 30 June 2020 NOTES TO THE AUDITED FINANCIAL STATEMENTS FOR THE YEAR ENDED 30 JUNE 2020 (continued)
12. Risk Management Disclosures (continued)
f) Fair Value Estimation (continued)
The level in the fair value hierarchy within which the fair value measurement is categorised in its entirety is determined on the basis of the lowest level input that is significant to the fair value measurement of the instrument in its entirety. For this purpose, the significance of an input is assessed against the fair value measurement of the instrument in its entirety. If a fair value measurement uses observable inputs that require significant adjustment based on unobservable inputs, that measurement is a Level 3 measurement. Assessing the significance of a particular input to the fair value measurement in its entirety requires judgement, considering factors specific to the financial asset or liability. The determination of what constitutes “observable” requires significant judgement by the Directors in consultation with the Investment Adviser. The Directors consider observable data to be that market data that is readily available, regularly distributed or updated, reliable and verifiable, not proprietary, and provided by independent sources that are actively involved in the relevant market.
The tables below and overleaf provide an analysis within the fair value hierarchy of the Company’s financial assets and liabilities, measured at fair value at 30 June 2020 and 30 June 2019:
The SEI Defensive Fund Level 1 Level 2 Level 3 Total30 June 2020 Fair Value
GBP GBP GBP GBPFinancial Assets at Fair Value Through Profit or Loss Investment Funds 59,434 44,831,772 – 44,891,206Equities 2,072,145 – – 2,072,145
2,131,579 44,831,772 – 46,963,351
The SEI Defensive Fund Level 1 Level 2 Level 3 Total30 June 2019 Fair Value
GBP GBP GBP GBPFinancial Assets at Fair Value Through Profit or Loss Investment Funds 68,076 29,156,093 – 29,224,169Equities 1,314,743 – – 1,314,743Forward Foreign Currency Contracts – 521 – 521
1,382,819 29,156,614 – 30,539,433
The SEI Conservative Fund Level 1 Level 2 Level 3 Total30 June 2020 Fair Value
GBP GBP GBP GBPFinancial Assets at Fair Value Through Profit or Loss Investment Funds 202,402 56,622,052 – 56,824,454Equities 7,056,613 – – 7,056,613
7,259,015 56,622,052 – 63,881,067
The SEI Conservative Fund Level 1 Level 2 Level 3 Total30 June 2019 Fair Value
GBP GBP GBP GBPFinancial Assets at Fair Value Through Profit or Loss Investment Funds 461,855 66,068,800 – 66,530,655Equities 8,919,724 – – 8,919,724Forward Foreign Currency Contracts – 2,598 – 2,598
9,381,579 66,071,398 – 75,452,977
The SEI Moderate Fund Level 1 Level 2 Level 3 Total30 June 2020 Fair Value
GBP GBP GBP GBPFinancial Assets at Fair Value Through Profit or Loss Investment Funds 1,120,544 323,018,099 – 324,138,643Equities 39,067,109 – – 39,067,109
40,187,653 323,018,099 – 363,205,752
The SEI Moderate Fund Level 1 Level 2 Level 3 Total30 June 2019 Fair Value
GBP GBP GBP GBPFinancial Assets at Fair Value Through Profit or Loss Investment Funds 2,168,133 310,872,925 – 313,041,058Equities 41,872,809 – – 41,872,809Forward Foreign Currency Contracts – 18,327 – 18,327
44,040,942 310,891,252 – 354,932,194
159
DocuSign Envelope ID: 2646536F-BB10-4779-844A-39205D22F4E0
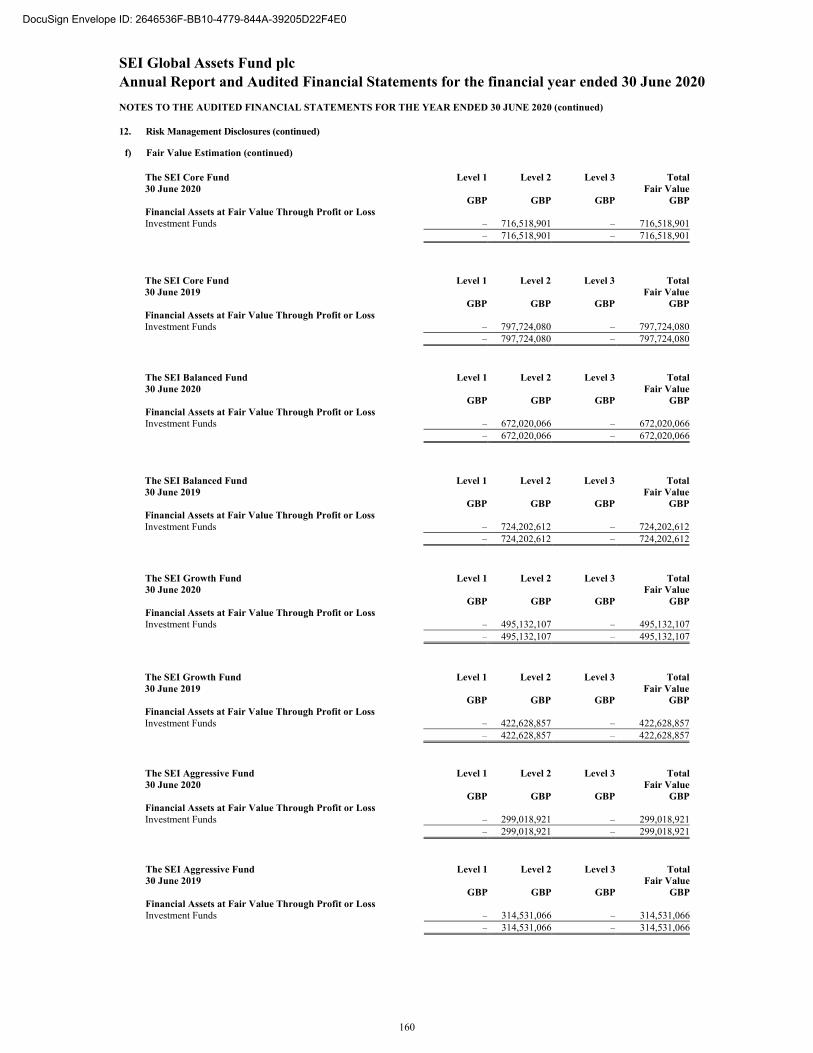
SEI Global Assets Fund plc
Annual Report and Audited Financial Statements for the financial year ended 30 June 2020 NOTES TO THE AUDITED FINANCIAL STATEMENTS FOR THE YEAR ENDED 30 JUNE 2020 (continued)
12. Risk Management Disclosures (continued)
f) Fair Value Estimation (continued)
The SEI Core Fund Level 1 Level 2 Level 3 Total30 June 2020 Fair Value
GBP GBP GBP GBPFinancial Assets at Fair Value Through Profit or Loss Investment Funds – 716,518,901 – 716,518,901
– 716,518,901 – 716,518,901
The SEI Core Fund Level 1 Level 2 Level 3 Total30 June 2019 Fair Value
GBP GBP GBP GBPFinancial Assets at Fair Value Through Profit or Loss Investment Funds – 797,724,080 – 797,724,080
– 797,724,080 – 797,724,080
The SEI Balanced Fund Level 1 Level 2 Level 3 Total30 June 2020 Fair Value
GBP GBP GBP GBPFinancial Assets at Fair Value Through Profit or Loss Investment Funds – 672,020,066 – 672,020,066
– 672,020,066 – 672,020,066
The SEI Balanced Fund Level 1 Level 2 Level 3 Total30 June 2019 Fair Value
GBP GBP GBP GBPFinancial Assets at Fair Value Through Profit or Loss Investment Funds – 724,202,612 – 724,202,612
– 724,202,612 – 724,202,612
The SEI Growth Fund Level 1 Level 2 Level 3 Total30 June 2020 Fair Value
GBP GBP GBP GBPFinancial Assets at Fair Value Through Profit or Loss Investment Funds – 495,132,107 – 495,132,107
– 495,132,107 – 495,132,107
The SEI Growth Fund Level 1 Level 2 Level 3 Total30 June 2019 Fair Value
GBP GBP GBP GBPFinancial Assets at Fair Value Through Profit or Loss Investment Funds – 422,628,857 – 422,628,857
– 422,628,857 – 422,628,857
The SEI Aggressive Fund Level 1 Level 2 Level 3 Total30 June 2020 Fair Value
GBP GBP GBP GBPFinancial Assets at Fair Value Through Profit or Loss Investment Funds – 299,018,921 – 299,018,921
– 299,018,921 – 299,018,921
The SEI Aggressive Fund Level 1 Level 2 Level 3 Total30 June 2019 Fair Value
GBP GBP GBP GBPFinancial Assets at Fair Value Through Profit or Loss Investment Funds – 314,531,066 – 314,531,066
– 314,531,066 – 314,531,066
160
DocuSign Envelope ID: 2646536F-BB10-4779-844A-39205D22F4E0
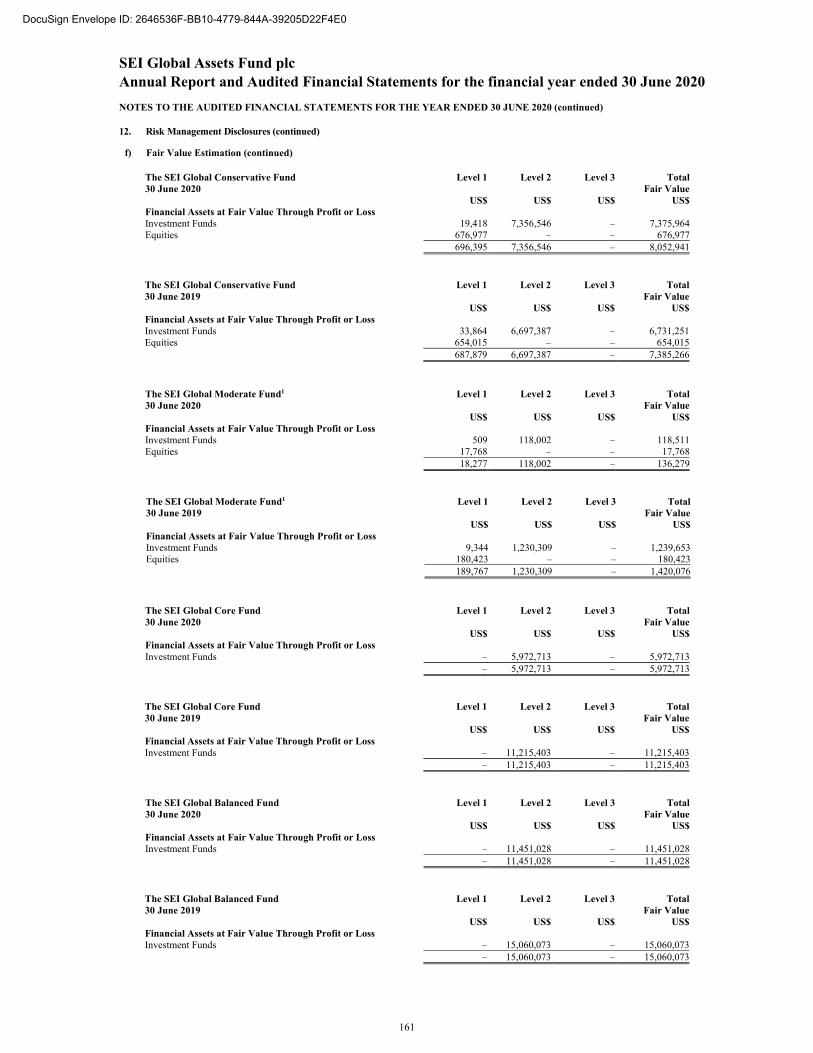
SEI Global Assets Fund plc
Annual Report and Audited Financial Statements for the financial year ended 30 June 2020 NOTES TO THE AUDITED FINANCIAL STATEMENTS FOR THE YEAR ENDED 30 JUNE 2020 (continued)
12. Risk Management Disclosures (continued)
f) Fair Value Estimation (continued)
The SEI Global Conservative Fund Level 1 Level 2 Level 3 Total30 June 2020 Fair Value
US$ US$ US$ US$Financial Assets at Fair Value Through Profit or Loss Investment Funds 19,418 7,356,546 – 7,375,964Equities 676,977 – – 676,977
696,395 7,356,546 – 8,052,941
The SEI Global Conservative Fund Level 1 Level 2 Level 3 Total30 June 2019 Fair Value
US$ US$ US$ US$Financial Assets at Fair Value Through Profit or Loss Investment Funds 33,864 6,697,387 – 6,731,251Equities 654,015 – – 654,015
687,879 6,697,387 – 7,385,266
The SEI Global Moderate Fund1 Level 1 Level 2 Level 3 Total30 June 2020 Fair Value
US$ US$ US$ US$Financial Assets at Fair Value Through Profit or Loss Investment Funds 509 118,002 – 118,511Equities 17,768 – – 17,768
18,277 118,002 – 136,279
The SEI Global Moderate Fund1 Level 1 Level 2 Level 3 Total30 June 2019 Fair Value
US$ US$ US$ US$Financial Assets at Fair Value Through Profit or Loss Investment Funds 9,344 1,230,309 – 1,239,653Equities 180,423 – – 180,423
189,767 1,230,309 – 1,420,076
The SEI Global Core Fund Level 1 Level 2 Level 3 Total30 June 2020 Fair Value
US$ US$ US$ US$Financial Assets at Fair Value Through Profit or Loss Investment Funds – 5,972,713 – 5,972,713
– 5,972,713 – 5,972,713
The SEI Global Core Fund Level 1 Level 2 Level 3 Total30 June 2019 Fair Value
US$ US$ US$ US$Financial Assets at Fair Value Through Profit or Loss Investment Funds – 11,215,403 – 11,215,403
– 11,215,403 – 11,215,403
The SEI Global Balanced Fund Level 1 Level 2 Level 3 Total30 June 2020 Fair Value
US$ US$ US$ US$Financial Assets at Fair Value Through Profit or Loss Investment Funds – 11,451,028 – 11,451,028
– 11,451,028 – 11,451,028
The SEI Global Balanced Fund Level 1 Level 2 Level 3 Total30 June 2019 Fair Value
US$ US$ US$ US$Financial Assets at Fair Value Through Profit or Loss Investment Funds – 15,060,073 – 15,060,073
– 15,060,073 – 15,060,073
161
DocuSign Envelope ID: 2646536F-BB10-4779-844A-39205D22F4E0
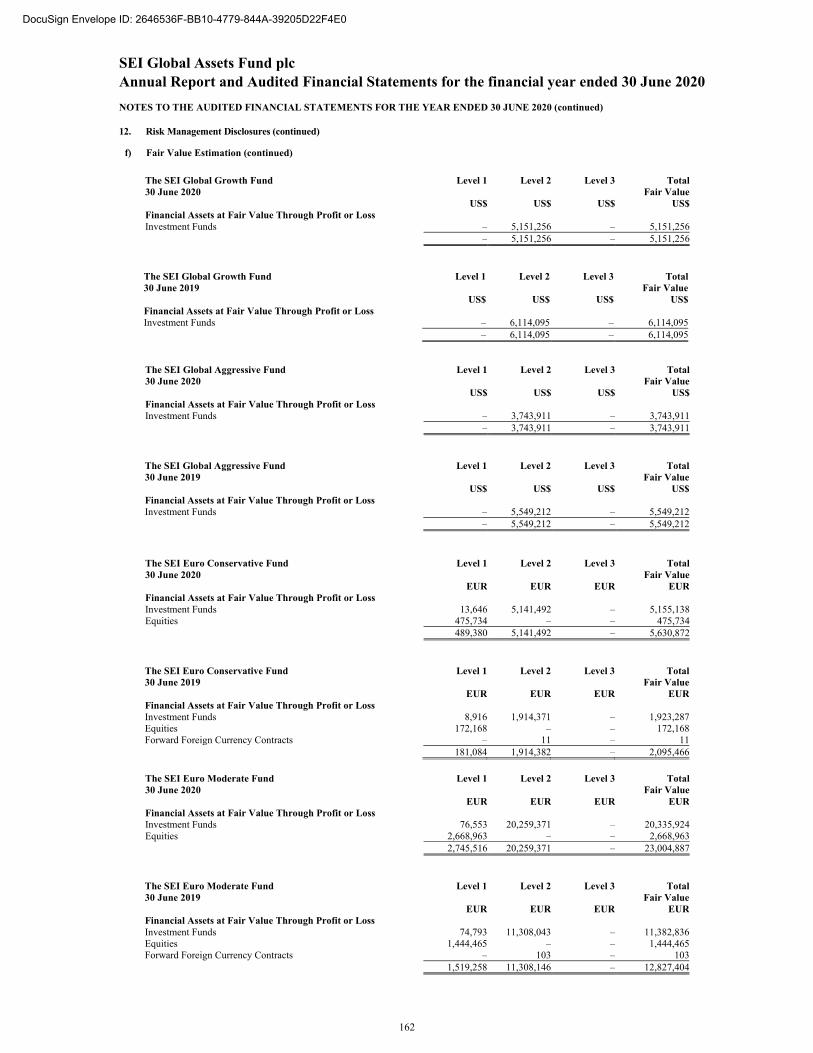
SEI Global Assets Fund plc
Annual Report and Audited Financial Statements for the financial year ended 30 June 2020 NOTES TO THE AUDITED FINANCIAL STATEMENTS FOR THE YEAR ENDED 30 JUNE 2020 (continued)
12. Risk Management Disclosures (continued)
f) Fair Value Estimation (continued)
The SEI Global Growth Fund Level 1 Level 2 Level 3 Total30 June 2020 Fair Value
US$ US$ US$ US$Financial Assets at Fair Value Through Profit or Loss Investment Funds – 5,151,256 – 5,151,256
– 5,151,256 – 5,151,256
The SEI Global Growth Fund Level 1 Level 2 Level 3 Total30 June 2019 Fair Value
US$ US$ US$ US$Financial Assets at Fair Value Through Profit or Loss Investment Funds – 6,114,095 – 6,114,095
– 6,114,095 – 6,114,095
The SEI Global Aggressive Fund Level 1 Level 2 Level 3 Total30 June 2020 Fair Value
US$ US$ US$ US$Financial Assets at Fair Value Through Profit or Loss Investment Funds – 3,743,911 – 3,743,911
– 3,743,911 – 3,743,911
The SEI Global Aggressive Fund Level 1 Level 2 Level 3 Total30 June 2019 Fair Value
US$ US$ US$ US$Financial Assets at Fair Value Through Profit or Loss Investment Funds – 5,549,212 – 5,549,212
– 5,549,212 – 5,549,212
The SEI Euro Conservative Fund Level 1 Level 2 Level 3 Total30 June 2020 Fair Value
EUR EUR EUR EURFinancial Assets at Fair Value Through Profit or Loss Investment Funds 13,646 5,141,492 – 5,155,138Equities 475,734 – – 475,734
489,380 5,141,492 – 5,630,872
The SEI Euro Conservative Fund Level 1 Level 2 Level 3 Total30 June 2019 Fair Value
EUR EUR EUR EURFinancial Assets at Fair Value Through Profit or Loss Investment Funds 8,916 1,914,371 – 1,923,287Equities 172,168 – – 172,168Forward Foreign Currency Contracts – 11 – 11
181,084 1,914,382 – 2,095,466
The SEI Euro Moderate Fund Level 1 Level 2 Level 3 Total30 June 2020 Fair Value
EUR EUR EUR EURFinancial Assets at Fair Value Through Profit or Loss Investment Funds 76,553 20,259,371 – 20,335,924Equities 2,668,963 – – 2,668,963
2,745,516 20,259,371 – 23,004,887
The SEI Euro Moderate Fund Level 1 Level 2 Level 3 Total30 June 2019 Fair Value
EUR EUR EUR EURFinancial Assets at Fair Value Through Profit or Loss Investment Funds 74,793 11,308,043 – 11,382,836Equities 1,444,465 – – 1,444,465Forward Foreign Currency Contracts – 103 – 103
1,519,258 11,308,146 – 12,827,404
162
DocuSign Envelope ID: 2646536F-BB10-4779-844A-39205D22F4E0
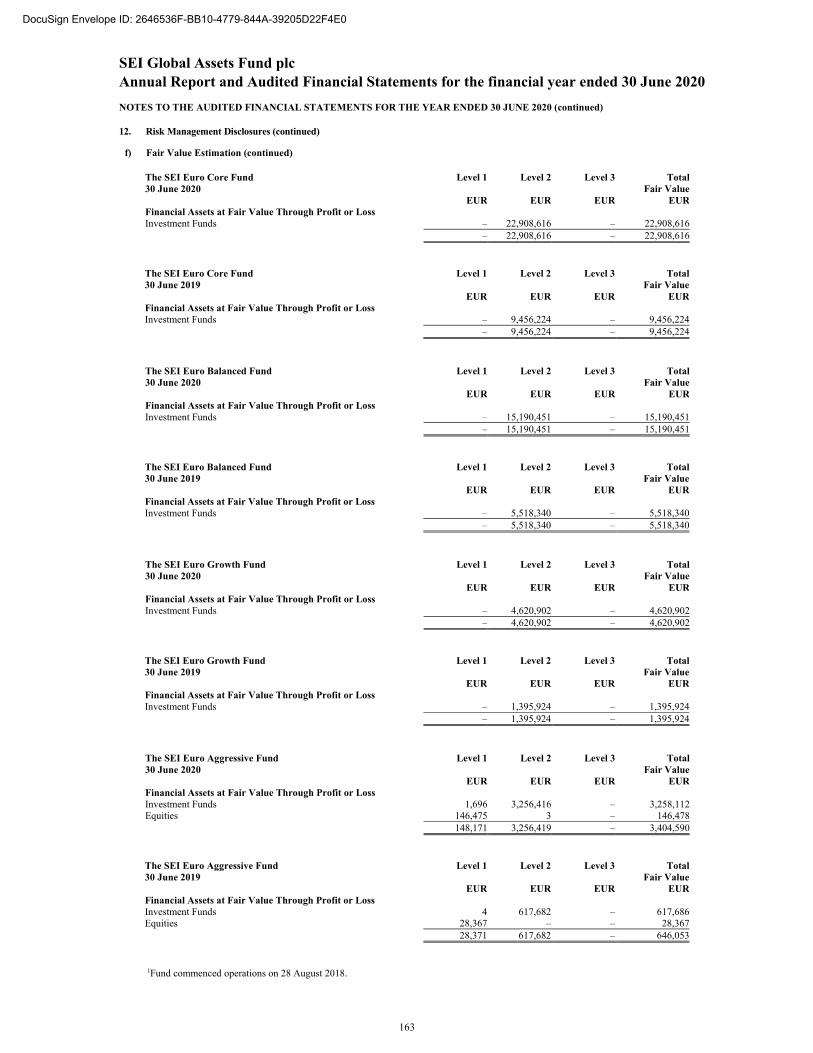
SEI Global Assets Fund plc
Annual Report and Audited Financial Statements for the financial year ended 30 June 2020 NOTES TO THE AUDITED FINANCIAL STATEMENTS FOR THE YEAR ENDED 30 JUNE 2020 (continued)
12. Risk Management Disclosures (continued)
f) Fair Value Estimation (continued)
The SEI Euro Core Fund Level 1 Level 2 Level 3 Total30 June 2020 Fair Value
EUR EUR EUR EURFinancial Assets at Fair Value Through Profit or Loss Investment Funds – 22,908,616 – 22,908,616
– 22,908,616 – 22,908,616
The SEI Euro Core Fund Level 1 Level 2 Level 3 Total30 June 2019 Fair Value
EUR EUR EUR EURFinancial Assets at Fair Value Through Profit or Loss Investment Funds – 9,456,224 – 9,456,224
– 9,456,224 – 9,456,224
The SEI Euro Balanced Fund Level 1 Level 2 Level 3 Total30 June 2020 Fair Value
EUR EUR EUR EURFinancial Assets at Fair Value Through Profit or Loss Investment Funds – 15,190,451 – 15,190,451
– 15,190,451 – 15,190,451
The SEI Euro Balanced Fund Level 1 Level 2 Level 3 Total30 June 2019 Fair Value
EUR EUR EUR EURFinancial Assets at Fair Value Through Profit or Loss Investment Funds – 5,518,340 – 5,518,340
– 5,518,340 – 5,518,340
The SEI Euro Growth Fund Level 1 Level 2 Level 3 Total30 June 2020 Fair Value
EUR EUR EUR EURFinancial Assets at Fair Value Through Profit or Loss Investment Funds – 4,620,902 – 4,620,902
– 4,620,902 – 4,620,902
The SEI Euro Growth Fund Level 1 Level 2 Level 3 Total30 June 2019 Fair Value
EUR EUR EUR EURFinancial Assets at Fair Value Through Profit or Loss Investment Funds – 1,395,924 – 1,395,924
– 1,395,924 – 1,395,924
The SEI Euro Aggressive Fund Level 1 Level 2 Level 3 Total30 June 2020 Fair Value
EUR EUR EUR EURFinancial Assets at Fair Value Through Profit or Loss Investment Funds 1,696 3,256,416 – 3,258,112Equities 146,475 3 – 146,478
148,171 3,256,419 – 3,404,590
The SEI Euro Aggressive Fund Level 1 Level 2 Level 3 Total30 June 2019 Fair Value
EUR EUR EUR EURFinancial Assets at Fair Value Through Profit or Loss Investment Funds 4 617,682 – 617,686Equities 28,367 – – 28,367
28,371 617,682 – 646,053
1Fund commenced operations on 28 August 2018.
163
DocuSign Envelope ID: 2646536F-BB10-4779-844A-39205D22F4E0
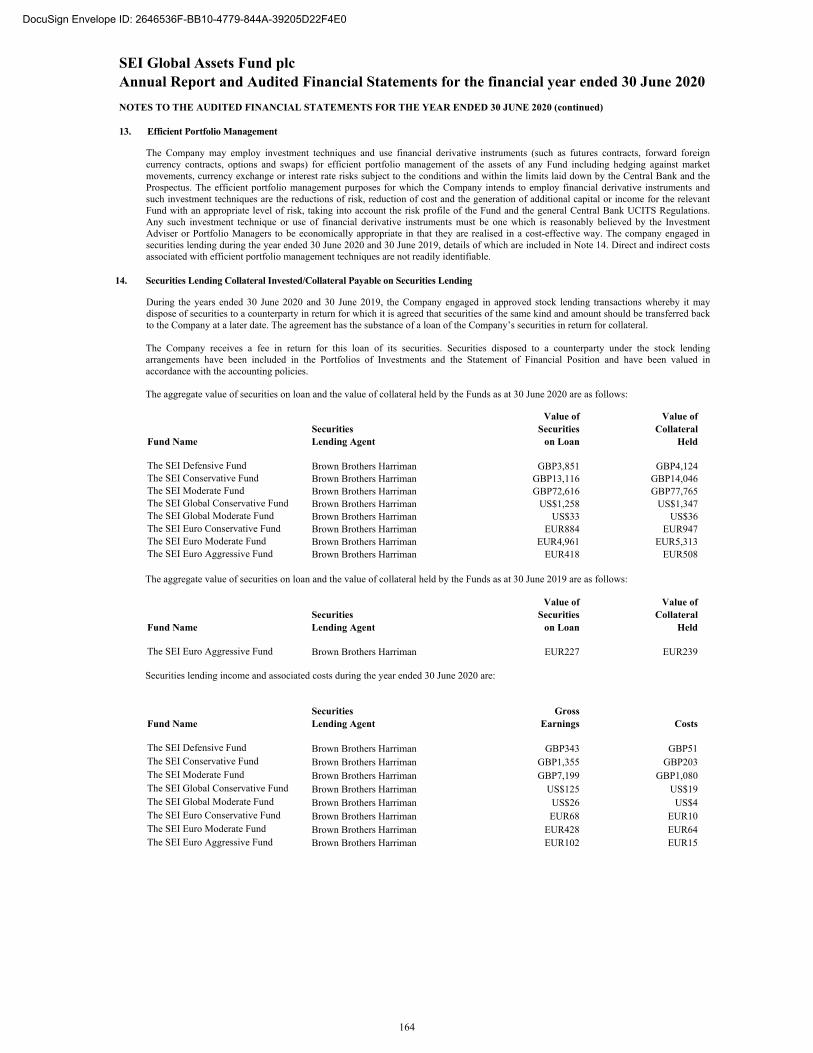
SEI Global Assets Fund plc
Annual Report and Audited Financial Statements for the financial year ended 30 June 2020 NOTES TO THE AUDITED FINANCIAL STATEMENTS FOR THE YEAR ENDED 30 JUNE 2020 (continued)
13. Efficient Portfolio Management
The Company may employ investment techniques and use financial derivative instruments (such as futures contracts, forward foreign currency contracts, options and swaps) for efficient portfolio management of the assets of any Fund including hedging against market movements, currency exchange or interest rate risks subject to the conditions and within the limits laid down by the Central Bank and the Prospectus. The efficient portfolio management purposes for which the Company intends to employ financial derivative instruments and such investment techniques are the reductions of risk, reduction of cost and the generation of additional capital or income for the relevant Fund with an appropriate level of risk, taking into account the risk profile of the Fund and the general Central Bank UCITS Regulations. Any such investment technique or use of financial derivative instruments must be one which is reasonably believed by the Investment Adviser or Portfolio Managers to be economically appropriate in that they are realised in a cost-effective way. The company engaged in securities lending during the year ended 30 June 2020 and 30 June 2019, details of which are included in Note 14. Direct and indirect costs associated with efficient portfolio management techniques are not readily identifiable.
14. Securities Lending Collateral Invested/Collateral Payable on Securities Lending
During the years ended 30 June 2020 and 30 June 2019, the Company engaged in approved stock lending transactions whereby it may dispose of securities to a counterparty in return for which it is agreed that securities of the same kind and amount should be transferred back to the Company at a later date. The agreement has the substance of a loan of the Company’s securities in return for collateral. The Company receives a fee in return for this loan of its securities. Securities disposed to a counterparty under the stock lending arrangements have been included in the Portfolios of Investments and the Statement of Financial Position and have been valued in accordance with the accounting policies. The aggregate value of securities on loan and the value of collateral held by the Funds as at 30 June 2020 are as follows: Value of Value of Securities Securities Collateral Fund Name Lending Agent on Loan Held The SEI Defensive Fund Brown Brothers Harriman GBP3,851 GBP4,124 The SEI Conservative Fund Brown Brothers Harriman GBP13,116 GBP14,046 The SEI Moderate Fund Brown Brothers Harriman GBP72,616 GBP77,765 The SEI Global Conservative Fund Brown Brothers Harriman US$1,258 US$1,347 The SEI Global Moderate Fund Brown Brothers Harriman US$33 US$36 The SEI Euro Conservative Fund Brown Brothers Harriman EUR884 EUR947 The SEI Euro Moderate Fund Brown Brothers Harriman EUR4,961 EUR5,313 The SEI Euro Aggressive Fund Brown Brothers Harriman EUR418 EUR508 The aggregate value of securities on loan and the value of collateral held by the Funds as at 30 June 2019 are as follows: Value of Value of Securities Securities Collateral Fund Name Lending Agent on Loan Held The SEI Euro Aggressive Fund Brown Brothers Harriman EUR227 EUR239 Securities lending income and associated costs during the year ended 30 June 2020 are: Securities Gross Fund Name Lending Agent Earnings Costs The SEI Defensive Fund Brown Brothers Harriman GBP343 GBP51 The SEI Conservative Fund Brown Brothers Harriman GBP1,355 GBP203 The SEI Moderate Fund Brown Brothers Harriman GBP7,199 GBP1,080 The SEI Global Conservative Fund Brown Brothers Harriman US$125 US$19 The SEI Global Moderate Fund Brown Brothers Harriman US$26 US$4 The SEI Euro Conservative Fund Brown Brothers Harriman EUR68 EUR10 The SEI Euro Moderate Fund Brown Brothers Harriman EUR428 EUR64 The SEI Euro Aggressive Fund Brown Brothers Harriman EUR102 EUR15
164
DocuSign Envelope ID: 2646536F-BB10-4779-844A-39205D22F4E0
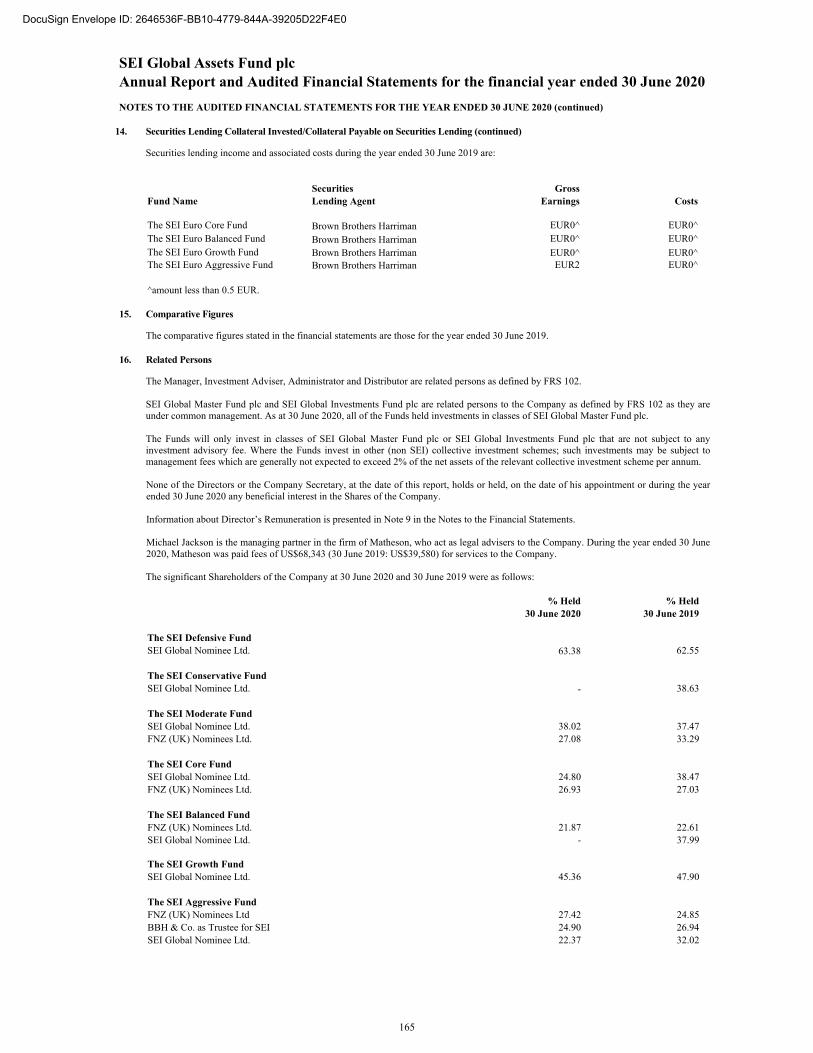
SEI Global Assets Fund plc
Annual Report and Audited Financial Statements for the financial year ended 30 June 2020 NOTES TO THE AUDITED FINANCIAL STATEMENTS FOR THE YEAR ENDED 30 JUNE 2020 (continued)
14. Securities Lending Collateral Invested/Collateral Payable on Securities Lending (continued)
Securities lending income and associated costs during the year ended 30 June 2019 are: Securities Gross Fund Name Lending Agent Earnings Costs The SEI Euro Core Fund Brown Brothers Harriman EUR0^ EUR0^ The SEI Euro Balanced Fund Brown Brothers Harriman EUR0^ EUR0^ The SEI Euro Growth Fund Brown Brothers Harriman EUR0^ EUR0^ The SEI Euro Aggressive Fund Brown Brothers Harriman EUR2 EUR0^ ^amount less than 0.5 EUR.
15. Comparative Figures
The comparative figures stated in the financial statements are those for the year ended 30 June 2019.
16. Related Persons
The Manager, Investment Adviser, Administrator and Distributor are related persons as defined by FRS 102. SEI Global Master Fund plc and SEI Global Investments Fund plc are related persons to the Company as defined by FRS 102 as they are under common management. As at 30 June 2020, all of the Funds held investments in classes of SEI Global Master Fund plc. The Funds will only invest in classes of SEI Global Master Fund plc or SEI Global Investments Fund plc that are not subject to any investment advisory fee. Where the Funds invest in other (non SEI) collective investment schemes; such investments may be subject to management fees which are generally not expected to exceed 2% of the net assets of the relevant collective investment scheme per annum.
None of the Directors or the Company Secretary, at the date of this report, holds or held, on the date of his appointment or during the year ended 30 June 2020 any beneficial interest in the Shares of the Company.
Information about Director’s Remuneration is presented in Note 9 in the Notes to the Financial Statements.
Michael Jackson is the managing partner in the firm of Matheson, who act as legal advisers to the Company. During the year ended 30 June 2020, Matheson was paid fees of US$68,343 (30 June 2019: US$39,580) for services to the Company. The significant Shareholders of the Company at 30 June 2020 and 30 June 2019 were as follows: % Held % Held 30 June 2020 30 June 2019 The SEI Defensive Fund SEI Global Nominee Ltd. 63.38 62.55 The SEI Conservative Fund SEI Global Nominee Ltd. - 38.63 The SEI Moderate Fund SEI Global Nominee Ltd. 38.02 37.47FNZ (UK) Nominees Ltd. 27.08 33.29 The SEI Core Fund SEI Global Nominee Ltd. 24.80 38.47FNZ (UK) Nominees Ltd. 26.93 27.03 The SEI Balanced Fund FNZ (UK) Nominees Ltd. 21.87 22.61SEI Global Nominee Ltd. - 37.99
The SEI Growth Fund SEI Global Nominee Ltd. 45.36 47.90 The SEI Aggressive Fund FNZ (UK) Nominees Ltd 27.42 24.85BBH & Co. as Trustee for SEI 24.90 26.94 SEI Global Nominee Ltd. 22.37 32.02
165
DocuSign Envelope ID: 2646536F-BB10-4779-844A-39205D22F4E0
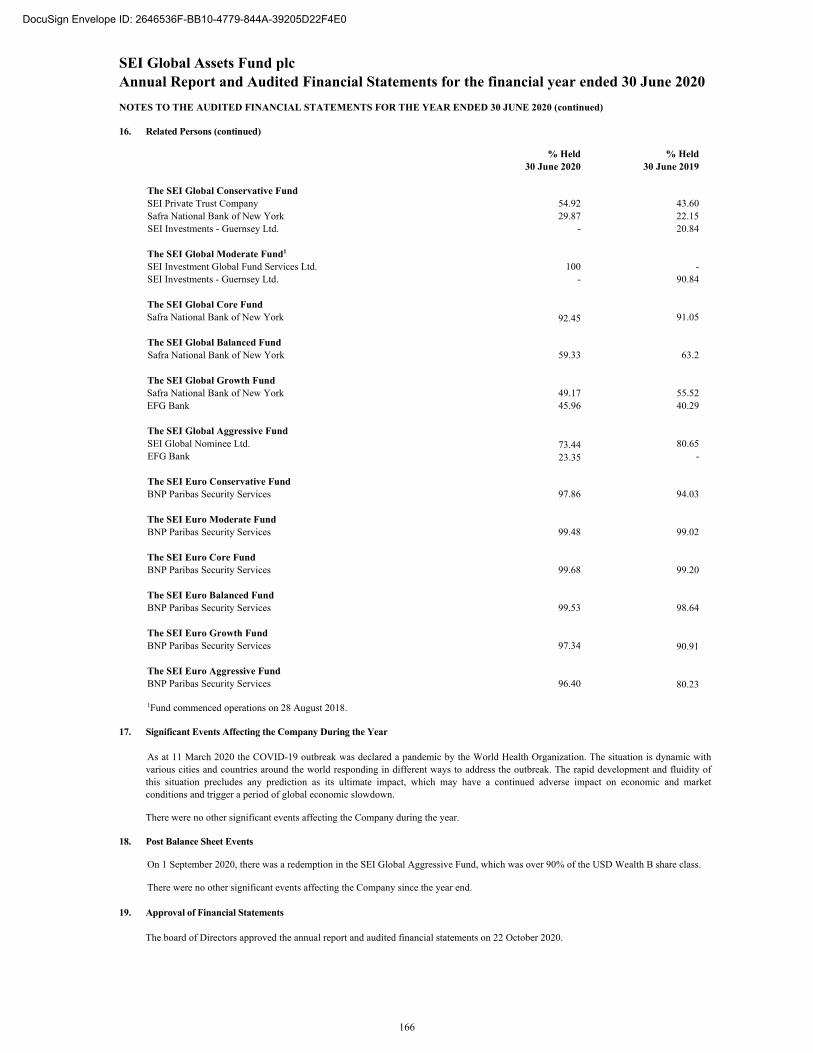
SEI Global Assets Fund plc
Annual Report and Audited Financial Statements for the financial year ended 30 June 2020 NOTES TO THE AUDITED FINANCIAL STATEMENTS FOR THE YEAR ENDED 30 JUNE 2020 (continued)
16. Related Persons (continued)
% Held % Held 30 June 2020 30 June 2019 The SEI Global Conservative Fund SEI Private Trust Company 54.92 43.60Safra National Bank of New York 29.87 22.15 SEI Investments - Guernsey Ltd. - 20.84 The SEI Global Moderate Fund1 SEI Investment Global Fund Services Ltd. 100 -SEI Investments - Guernsey Ltd. - 90.84 The SEI Global Core Fund
Safra National Bank of New York 92.45 91.05 The SEI Global Balanced Fund Safra National Bank of New York 59.33 63.2 The SEI Global Growth Fund
Safra National Bank of New York 49.17 55.52 EFG Bank 45.96 40.29 The SEI Global Aggressive Fund SEI Global Nominee Ltd. 73.44 80.65EFG Bank 23.35 - The SEI Euro Conservative Fund
BNP Paribas Security Services 97.86 94.03 The SEI Euro Moderate Fund
BNP Paribas Security Services 99.48 99.02 The SEI Euro Core Fund
BNP Paribas Security Services 99.68 99.20 The SEI Euro Balanced Fund
BNP Paribas Security Services 99.53 98.64 The SEI Euro Growth Fund
BNP Paribas Security Services 97.34 90.91 The SEI Euro Aggressive Fund
BNP Paribas Security Services 96.40 80.23
1Fund commenced operations on 28 August 2018. 17. Significant Events Affecting the Company During the Year
As at 11 March 2020 the COVID-19 outbreak was declared a pandemic by the World Health Organization. The situation is dynamic with various cities and countries around the world responding in different ways to address the outbreak. The rapid development and fluidity of this situation precludes any prediction as its ultimate impact, which may have a continued adverse impact on economic and market conditions and trigger a period of global economic slowdown.
There were no other significant events affecting the Company during the year.
18. Post Balance Sheet Events
On 1 September 2020, there was a redemption in the SEI Global Aggressive Fund, which was over 90% of the USD Wealth B share class. There were no other significant events affecting the Company since the year end.
19. Approval of Financial Statements
The board of Directors approved the annual report and audited financial statements on 22 October 2020.
166
DocuSign Envelope ID: 2646536F-BB10-4779-844A-39205D22F4E0
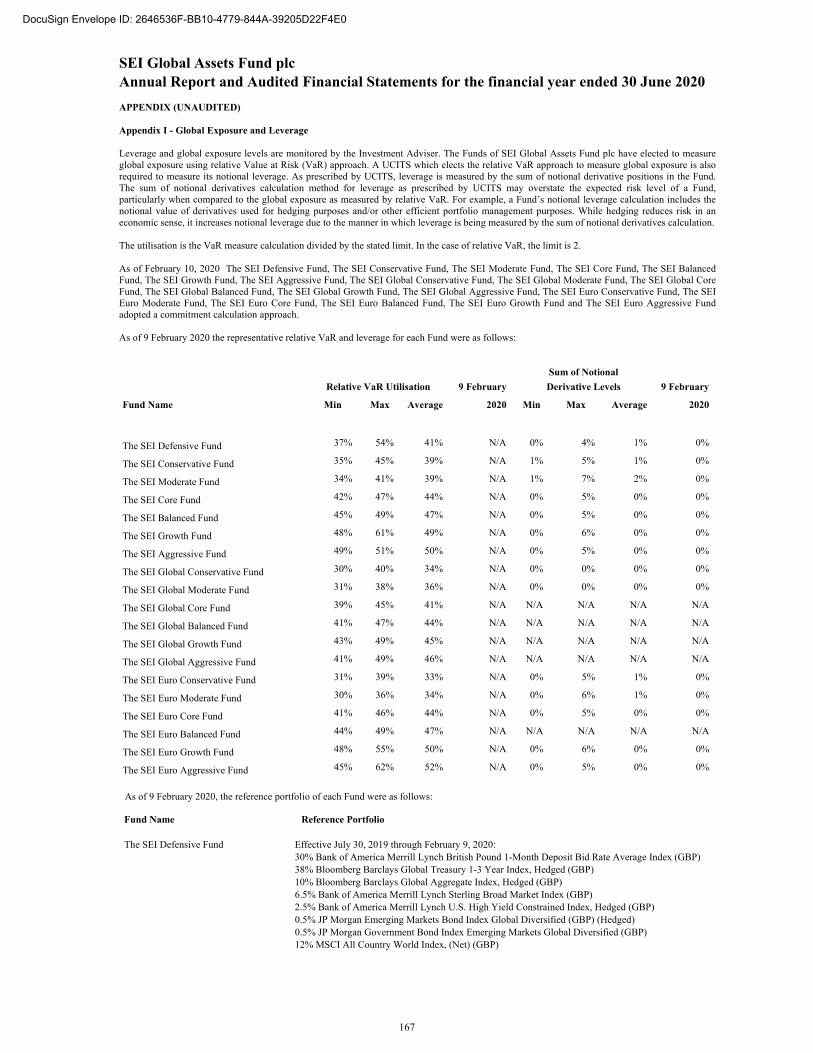
SEI Global Assets Fund plc
Annual Report and Audited Financial Statements for the financial year ended 30 June 2020 APPENDIX (UNAUDITED)
Appendix I - Global Exposure and Leverage
Leverage and global exposure levels are monitored by the Investment Adviser. The Funds of SEI Global Assets Fund plc have elected to measure global exposure using relative Value at Risk (VaR) approach. A UCITS which elects the relative VaR approach to measure global exposure is also required to measure its notional leverage. As prescribed by UCITS, leverage is measured by the sum of notional derivative positions in the Fund. The sum of notional derivatives calculation method for leverage as prescribed by UCITS may overstate the expected risk level of a Fund, particularly when compared to the global exposure as measured by relative VaR. For example, a Fund’s notional leverage calculation includes the notional value of derivatives used for hedging purposes and/or other efficient portfolio management purposes. While hedging reduces risk in an economic sense, it increases notional leverage due to the manner in which leverage is being measured by the sum of notional derivatives calculation. The utilisation is the VaR measure calculation divided by the stated limit. In the case of relative VaR, the limit is 2. As of February 10, 2020 The SEI Defensive Fund, The SEI Conservative Fund, The SEI Moderate Fund, The SEI Core Fund, The SEI Balanced Fund, The SEI Growth Fund, The SEI Aggressive Fund, The SEI Global Conservative Fund, The SEI Global Moderate Fund, The SEI Global Core Fund, The SEI Global Balanced Fund, The SEI Global Growth Fund, The SEI Global Aggressive Fund, The SEI Euro Conservative Fund, The SEI Euro Moderate Fund, The SEI Euro Core Fund, The SEI Euro Balanced Fund, The SEI Euro Growth Fund and The SEI Euro Aggressive Fund adopted a commitment calculation approach. As of 9 February 2020 the representative relative VaR and leverage for each Fund were as follows:
Sum of Notional
Relative VaR Utilisation 9 February Derivative Levels 9 February
Fund Name Min Max Average 2020 Min Max Average 2020
The SEI Defensive Fund 37% 54% 41% N/A 0% 4% 1% 0%
The SEI Conservative Fund 35% 45% 39% N/A 1% 5% 1% 0%
The SEI Moderate Fund 34% 41% 39% N/A 1% 7% 2% 0%
The SEI Core Fund 42% 47% 44% N/A 0% 5% 0% 0%
The SEI Balanced Fund 45% 49% 47% N/A 0% 5% 0% 0%
The SEI Growth Fund 48% 61% 49% N/A 0% 6% 0% 0%
The SEI Aggressive Fund 49% 51% 50% N/A 0% 5% 0% 0%
The SEI Global Conservative Fund 30% 40% 34% N/A 0% 0% 0% 0%
The SEI Global Moderate Fund 31% 38% 36% N/A 0% 0% 0% 0%
The SEI Global Core Fund 39% 45% 41% N/A N/A N/A N/A N/A
The SEI Global Balanced Fund 41% 47% 44% N/A N/A N/A N/A N/A
The SEI Global Growth Fund 43% 49% 45% N/A N/A N/A N/A N/A
The SEI Global Aggressive Fund 41% 49% 46% N/A N/A N/A N/A N/A
The SEI Euro Conservative Fund 31% 39% 33% N/A 0% 5% 1% 0%
The SEI Euro Moderate Fund 30% 36% 34% N/A 0% 6% 1% 0%
The SEI Euro Core Fund 41% 46% 44% N/A 0% 5% 0% 0%
The SEI Euro Balanced Fund 44% 49% 47% N/A N/A N/A N/A N/A
The SEI Euro Growth Fund 48% 55% 50% N/A 0% 6% 0% 0%
The SEI Euro Aggressive Fund 45% 62% 52% N/A 0% 5% 0% 0%
As of 9 February 2020, the reference portfolio of each Fund were as follows:
Fund Name Reference Portfolio The SEI Defensive Fund Effective July 30, 2019 through February 9, 2020: 30% Bank of America Merrill Lynch British Pound 1-Month Deposit Bid Rate Average Index (GBP) 38% Bloomberg Barclays Global Treasury 1-3 Year Index, Hedged (GBP) 10% Bloomberg Barclays Global Aggregate Index, Hedged (GBP) 6.5% Bank of America Merrill Lynch Sterling Broad Market Index (GBP) 2.5% Bank of America Merrill Lynch U.S. High Yield Constrained Index, Hedged (GBP) 0.5% JP Morgan Emerging Markets Bond Index Global Diversified (GBP) (Hedged) 0.5% JP Morgan Government Bond Index Emerging Markets Global Diversified (GBP) 12% MSCI All Country World Index, (Net) (GBP)
167
DocuSign Envelope ID: 2646536F-BB10-4779-844A-39205D22F4E0
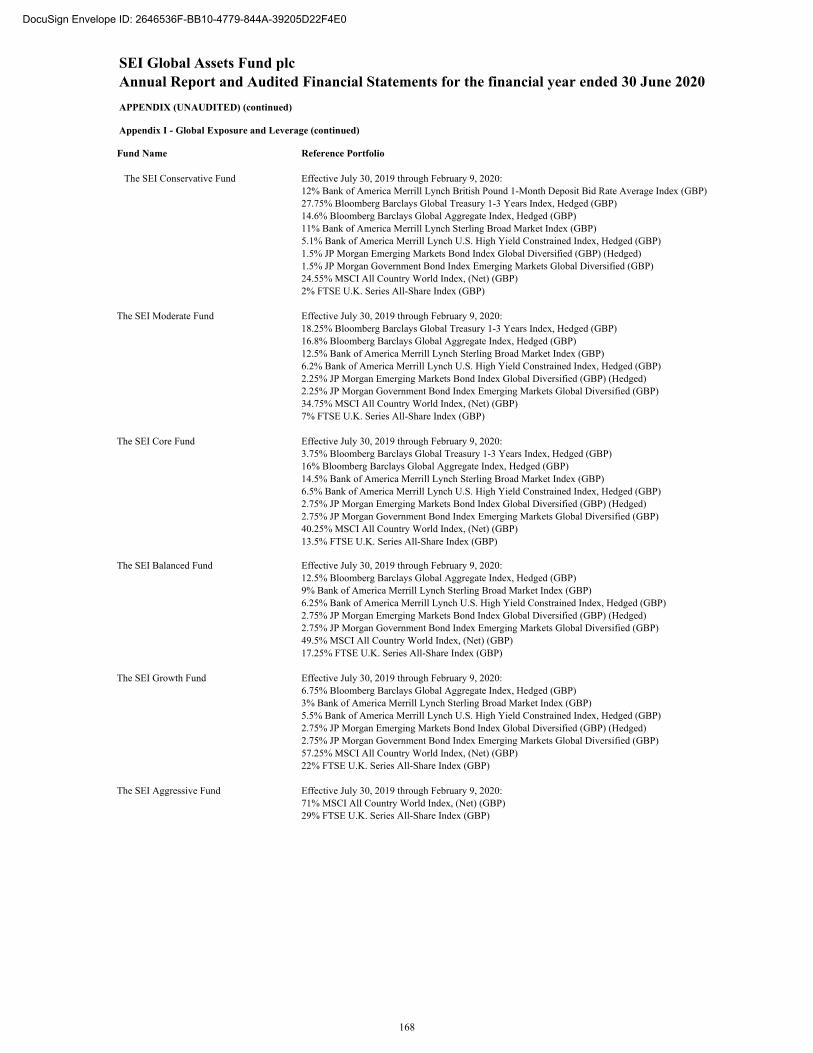
SEI Global Assets Fund plc
Annual Report and Audited Financial Statements for the financial year ended 30 June 2020 APPENDIX (UNAUDITED) (continued)
Appendix I - Global Exposure and Leverage (continued) Fund Name Reference Portfolio
The SEI Conservative Fund Effective July 30, 2019 through February 9, 2020: 12% Bank of America Merrill Lynch British Pound 1-Month Deposit Bid Rate Average Index (GBP) 27.75% Bloomberg Barclays Global Treasury 1-3 Years Index, Hedged (GBP) 14.6% Bloomberg Barclays Global Aggregate Index, Hedged (GBP) 11% Bank of America Merrill Lynch Sterling Broad Market Index (GBP) 5.1% Bank of America Merrill Lynch U.S. High Yield Constrained Index, Hedged (GBP) 1.5% JP Morgan Emerging Markets Bond Index Global Diversified (GBP) (Hedged) 1.5% JP Morgan Government Bond Index Emerging Markets Global Diversified (GBP) 24.55% MSCI All Country World Index, (Net) (GBP) 2% FTSE U.K. Series All-Share Index (GBP)
The SEI Moderate Fund Effective July 30, 2019 through February 9, 2020:
18.25% Bloomberg Barclays Global Treasury 1-3 Years Index, Hedged (GBP) 16.8% Bloomberg Barclays Global Aggregate Index, Hedged (GBP) 12.5% Bank of America Merrill Lynch Sterling Broad Market Index (GBP) 6.2% Bank of America Merrill Lynch U.S. High Yield Constrained Index, Hedged (GBP) 2.25% JP Morgan Emerging Markets Bond Index Global Diversified (GBP) (Hedged) 2.25% JP Morgan Government Bond Index Emerging Markets Global Diversified (GBP) 34.75% MSCI All Country World Index, (Net) (GBP) 7% FTSE U.K. Series All-Share Index (GBP)
The SEI Core Fund Effective July 30, 2019 through February 9, 2020: 3.75% Bloomberg Barclays Global Treasury 1-3 Years Index, Hedged (GBP) 16% Bloomberg Barclays Global Aggregate Index, Hedged (GBP) 14.5% Bank of America Merrill Lynch Sterling Broad Market Index (GBP) 6.5% Bank of America Merrill Lynch U.S. High Yield Constrained Index, Hedged (GBP) 2.75% JP Morgan Emerging Markets Bond Index Global Diversified (GBP) (Hedged) 2.75% JP Morgan Government Bond Index Emerging Markets Global Diversified (GBP) 40.25% MSCI All Country World Index, (Net) (GBP) 13.5% FTSE U.K. Series All-Share Index (GBP)
The SEI Balanced Fund Effective July 30, 2019 through February 9, 2020:
12.5% Bloomberg Barclays Global Aggregate Index, Hedged (GBP) 9% Bank of America Merrill Lynch Sterling Broad Market Index (GBP) 6.25% Bank of America Merrill Lynch U.S. High Yield Constrained Index, Hedged (GBP) 2.75% JP Morgan Emerging Markets Bond Index Global Diversified (GBP) (Hedged) 2.75% JP Morgan Government Bond Index Emerging Markets Global Diversified (GBP) 49.5% MSCI All Country World Index, (Net) (GBP) 17.25% FTSE U.K. Series All-Share Index (GBP)
The SEI Growth Fund Effective July 30, 2019 through February 9, 2020: 6.75% Bloomberg Barclays Global Aggregate Index, Hedged (GBP) 3% Bank of America Merrill Lynch Sterling Broad Market Index (GBP) 5.5% Bank of America Merrill Lynch U.S. High Yield Constrained Index, Hedged (GBP) 2.75% JP Morgan Emerging Markets Bond Index Global Diversified (GBP) (Hedged) 2.75% JP Morgan Government Bond Index Emerging Markets Global Diversified (GBP) 57.25% MSCI All Country World Index, (Net) (GBP) 22% FTSE U.K. Series All-Share Index (GBP)
The SEI Aggressive Fund Effective July 30, 2019 through February 9, 2020:
71% MSCI All Country World Index, (Net) (GBP) 29% FTSE U.K. Series All-Share Index (GBP)
168
DocuSign Envelope ID: 2646536F-BB10-4779-844A-39205D22F4E0
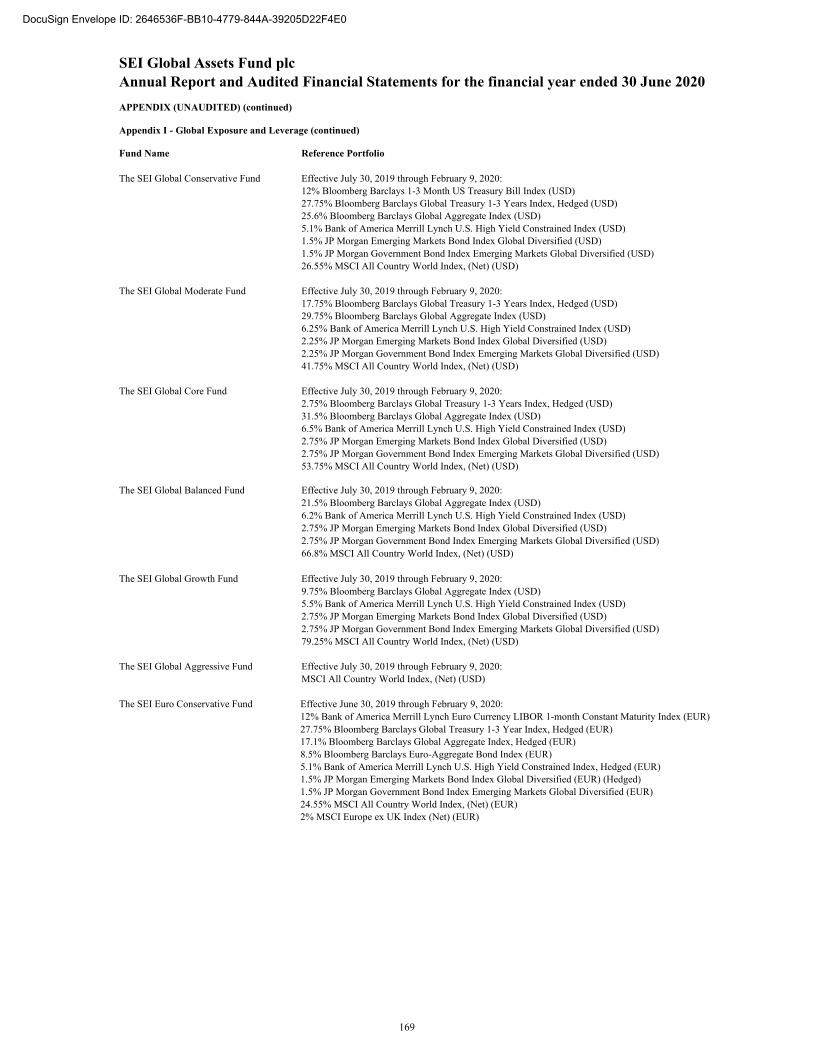
SEI Global Assets Fund plc
Annual Report and Audited Financial Statements for the financial year ended 30 June 2020 APPENDIX (UNAUDITED) (continued)
Appendix I - Global Exposure and Leverage (continued) Fund Name Reference Portfolio
The SEI Global Conservative Fund Effective July 30, 2019 through February 9, 2020:
12% Bloomberg Barclays 1-3 Month US Treasury Bill Index (USD) 27.75% Bloomberg Barclays Global Treasury 1-3 Years Index, Hedged (USD) 25.6% Bloomberg Barclays Global Aggregate Index (USD) 5.1% Bank of America Merrill Lynch U.S. High Yield Constrained Index (USD) 1.5% JP Morgan Emerging Markets Bond Index Global Diversified (USD) 1.5% JP Morgan Government Bond Index Emerging Markets Global Diversified (USD) 26.55% MSCI All Country World Index, (Net) (USD)
The SEI Global Moderate Fund Effective July 30, 2019 through February 9, 2020: 17.75% Bloomberg Barclays Global Treasury 1-3 Years Index, Hedged (USD) 29.75% Bloomberg Barclays Global Aggregate Index (USD) 6.25% Bank of America Merrill Lynch U.S. High Yield Constrained Index (USD) 2.25% JP Morgan Emerging Markets Bond Index Global Diversified (USD) 2.25% JP Morgan Government Bond Index Emerging Markets Global Diversified (USD) 41.75% MSCI All Country World Index, (Net) (USD)
The SEI Global Core Fund Effective July 30, 2019 through February 9, 2020: 2.75% Bloomberg Barclays Global Treasury 1-3 Years Index, Hedged (USD) 31.5% Bloomberg Barclays Global Aggregate Index (USD) 6.5% Bank of America Merrill Lynch U.S. High Yield Constrained Index (USD) 2.75% JP Morgan Emerging Markets Bond Index Global Diversified (USD) 2.75% JP Morgan Government Bond Index Emerging Markets Global Diversified (USD) 53.75% MSCI All Country World Index, (Net) (USD)
The SEI Global Balanced Fund Effective July 30, 2019 through February 9, 2020:
21.5% Bloomberg Barclays Global Aggregate Index (USD) 6.2% Bank of America Merrill Lynch U.S. High Yield Constrained Index (USD) 2.75% JP Morgan Emerging Markets Bond Index Global Diversified (USD) 2.75% JP Morgan Government Bond Index Emerging Markets Global Diversified (USD) 66.8% MSCI All Country World Index, (Net) (USD)
The SEI Global Growth Fund Effective July 30, 2019 through February 9, 2020: 9.75% Bloomberg Barclays Global Aggregate Index (USD) 5.5% Bank of America Merrill Lynch U.S. High Yield Constrained Index (USD) 2.75% JP Morgan Emerging Markets Bond Index Global Diversified (USD) 2.75% JP Morgan Government Bond Index Emerging Markets Global Diversified (USD) 79.25% MSCI All Country World Index, (Net) (USD)
The SEI Global Aggressive Fund Effective July 30, 2019 through February 9, 2020: MSCI All Country World Index, (Net) (USD)
The SEI Euro Conservative Fund Effective June 30, 2019 through February 9, 2020: 12% Bank of America Merrill Lynch Euro Currency LIBOR 1-month Constant Maturity Index (EUR) 27.75% Bloomberg Barclays Global Treasury 1-3 Year Index, Hedged (EUR) 17.1% Bloomberg Barclays Global Aggregate Index, Hedged (EUR) 8.5% Bloomberg Barclays Euro-Aggregate Bond Index (EUR) 5.1% Bank of America Merrill Lynch U.S. High Yield Constrained Index, Hedged (EUR) 1.5% JP Morgan Emerging Markets Bond Index Global Diversified (EUR) (Hedged) 1.5% JP Morgan Government Bond Index Emerging Markets Global Diversified (EUR) 24.55% MSCI All Country World Index, (Net) (EUR) 2% MSCI Europe ex UK Index (Net) (EUR)
169
DocuSign Envelope ID: 2646536F-BB10-4779-844A-39205D22F4E0
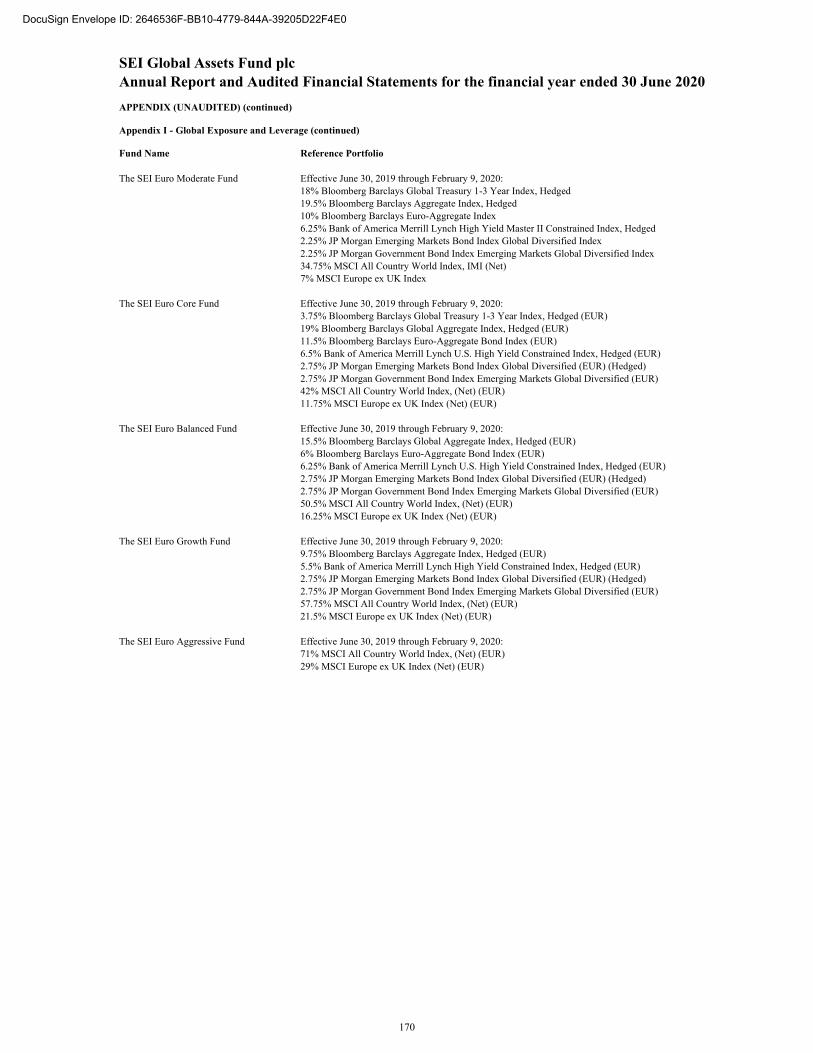
SEI Global Assets Fund plc
Annual Report and Audited Financial Statements for the financial year ended 30 June 2020 APPENDIX (UNAUDITED) (continued)
Appendix I - Global Exposure and Leverage (continued) Fund Name Reference Portfolio
The SEI Euro Moderate Fund Effective June 30, 2019 through February 9, 2020:
18% Bloomberg Barclays Global Treasury 1-3 Year Index, Hedged 19.5% Bloomberg Barclays Aggregate Index, Hedged 10% Bloomberg Barclays Euro-Aggregate Index 6.25% Bank of America Merrill Lynch High Yield Master II Constrained Index, Hedged 2.25% JP Morgan Emerging Markets Bond Index Global Diversified Index 2.25% JP Morgan Government Bond Index Emerging Markets Global Diversified Index 34.75% MSCI All Country World Index, IMI (Net) 7% MSCI Europe ex UK Index
The SEI Euro Core Fund Effective June 30, 2019 through February 9, 2020: 3.75% Bloomberg Barclays Global Treasury 1-3 Year Index, Hedged (EUR) 19% Bloomberg Barclays Global Aggregate Index, Hedged (EUR) 11.5% Bloomberg Barclays Euro-Aggregate Bond Index (EUR) 6.5% Bank of America Merrill Lynch U.S. High Yield Constrained Index, Hedged (EUR) 2.75% JP Morgan Emerging Markets Bond Index Global Diversified (EUR) (Hedged) 2.75% JP Morgan Government Bond Index Emerging Markets Global Diversified (EUR) 42% MSCI All Country World Index, (Net) (EUR) 11.75% MSCI Europe ex UK Index (Net) (EUR)
The SEI Euro Balanced Fund Effective June 30, 2019 through February 9, 2020: 15.5% Bloomberg Barclays Global Aggregate Index, Hedged (EUR) 6% Bloomberg Barclays Euro-Aggregate Bond Index (EUR) 6.25% Bank of America Merrill Lynch U.S. High Yield Constrained Index, Hedged (EUR) 2.75% JP Morgan Emerging Markets Bond Index Global Diversified (EUR) (Hedged) 2.75% JP Morgan Government Bond Index Emerging Markets Global Diversified (EUR) 50.5% MSCI All Country World Index, (Net) (EUR) 16.25% MSCI Europe ex UK Index (Net) (EUR)
The SEI Euro Growth Fund Effective June 30, 2019 through February 9, 2020: 9.75% Bloomberg Barclays Aggregate Index, Hedged (EUR) 5.5% Bank of America Merrill Lynch High Yield Constrained Index, Hedged (EUR) 2.75% JP Morgan Emerging Markets Bond Index Global Diversified (EUR) (Hedged) 2.75% JP Morgan Government Bond Index Emerging Markets Global Diversified (EUR) 57.75% MSCI All Country World Index, (Net) (EUR) 21.5% MSCI Europe ex UK Index (Net) (EUR)
The SEI Euro Aggressive Fund Effective June 30, 2019 through February 9, 2020: 71% MSCI All Country World Index, (Net) (EUR) 29% MSCI Europe ex UK Index (Net) (EUR)
170
DocuSign Envelope ID: 2646536F-BB10-4779-844A-39205D22F4E0
SEI Global Assets Fund plc Annual Report and Audited Financial Statements for the financial year ended 30 June 2020 APPENDIX (UNAUDITED) (continued)
Appendix II - Remuneration Disclosures SEI Investments Global, Limited (the “Management Company”) has implemented a remuneration policy (the “Remuneration Policy”) which is in line with the provisions of the UCITS Regulations and in accordance with the European Securities and Markets Authority Guidelines on Sound Remuneration policies under the UCITS Directive (ESMA/2016/575) (“ESMA Guidelines”). The Remuneration Policy was adopted by the board of directors of the Management Company (the “Board”) on 19 December 2016. The Remuneration Policy is aligned with the business strategy, objectives, values and interests of the Management Company, the Fund and investors in the Fund and the policy includes measures to manage conflicts of interests.
The Management Company is controlled and managed by its Board, but does not currently have any employees. Accordingly, the identified staff for the purpose of the Remuneration Policy are the members of the Board. The Board has adopted the delegation model which leverages off the skills, experience, and knowledge of specialised staff employed by the service providers to the Management Company and the Fund who perform the day-to-day specific functions and are subject to the ongoing supervision and monitoring by the board. The Board considers that the extent of delegation by the Management Company of investment management functions does not exceed, by a substantial margin, the investment management functions performed by the Management Company itself.
The Remuneration Policy is aimed at ensuring that any relevant conflicts of interest can be managed appropriately at all times and sets out practices for those categories of staff, including senior management, risk takers, control functions, and any employees receiving total remuneration that takes them into the same remuneration bracket as senior management and risk takers, whose professional activities have a material impact on the risk profile of the Sub-Funds, that are consistent with and promote sound and effective risk management and do not encourage risk-taking which is inconsistent with the risk profiles of the Sub-Funds.
Variable Remuneration
The directors of the Management Company who are also employees of the SEI group of companies (the “SEI Group”) do not receive any remuneration in respect of their services as directors of the Management Company or the Fund. The other directors receive fixed remuneration in respect of their services which is set at a level determined by the Board as a whole and which is not performance related. The Management Company currently has seven directors of which two are not either employees or consultants of the SEI Group. None of the directors are currently in receipt of variable remuneration in respect of their services as directors of the Management Company or in respect of the Fund managed by the Management Company.
The Board has delegated certain activities in respect of the portfolio management and risk management of the Sub-Funds which it manages to SEI Investments Management Corporation (“SIMC”). In turn SIMC has also sub-delegated certain investment and risk management functions to certain other entities which provide sub-investment management services to the Fund. Where the Management Company has delegated or SIMC has sub-delegated investment management functions the Management Company is required to ensure that either:
(i) The entities to which investment management activities have been delegated are subject to regulatory requirements on remuneration that are equally as effective as those applicable under the UCITS Regulations and the ESMA Guidelines; or
(ii) A determination has been made that pursuant to the principle of proportionality it is appropriate that the entities to which investment management activities have been delegated do not need to adopt remuneration policies consistent with ESMA Guidelines; or
(iii) Appropriate contractual arrangements are put in place with entities to which investment management activities have been delegated in order to ensure that there is no circumvention of the remuneration rules set out in the ESMA Guidelines, subject to the application of the proportionality rules, set out in the ESMA Guidelines.
The ESMA Guidelines provide that when taking measures to comply with the requirements of the UCITS Regulations and the ESMA Guidelines, the Management Company should comply in a way and to the extent that is appropriate to its (a) size; (b) internal organisations; and (c) the nature, scope and complexity of its internal activities. The ESMA Guidelines outline that it is necessary to analyse (a) – (c) together, and not one single element, in isolation, when considering whether an entity may disapply the requirements set out in the UCITS Regulations, on the basis of the proportionality.
As outlined above, SIMC has appointed a number of third party entities to provided investment management and risk management services to the Fund. The Management Company shall ensure that the delegates of SIMC are subject to the requirements of (i), (ii) or (iii) above.
The Management Company does not pay any fixed or variable remuneration to identified staff of SIMC or the third party entities /portfolio managers.
171
DocuSign Envelope ID: 2646536F-BB10-4779-844A-39205D22F4E0
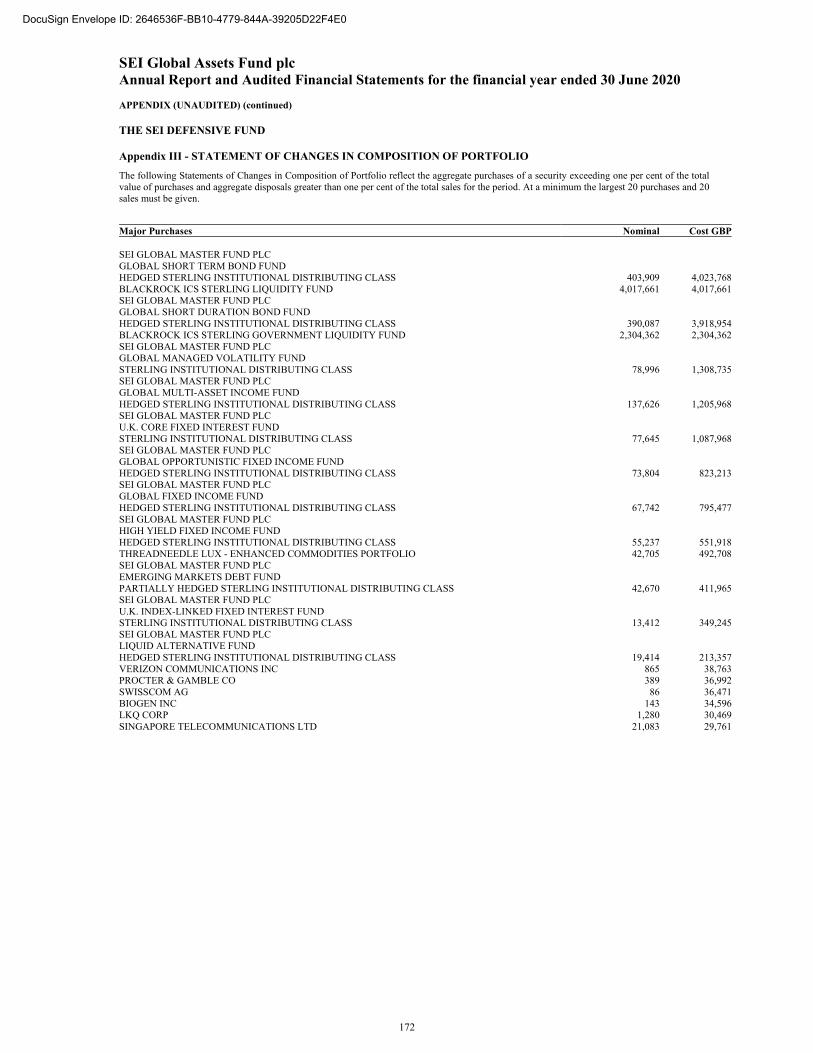
SEI Global Assets Fund plc Annual Report and Audited Financial Statements for the financial year ended 30 June 2020 APPENDIX (UNAUDITED) (continued)
THE SEI DEFENSIVE FUND Appendix III - STATEMENT OF CHANGES IN COMPOSITION OF PORTFOLIO
The following Statements of Changes in Composition of Portfolio reflect the aggregate purchases of a security exceeding one per cent of the total value of purchases and aggregate disposals greater than one per cent of the total sales for the period. At a minimum the largest 20 purchases and 20 sales must be given.
Major Purchases Nominal Cost GBP SEI GLOBAL MASTER FUND PLC GLOBAL SHORT TERM BOND FUND HEDGED STERLING INSTITUTIONAL DISTRIBUTING CLASS 403,909 4,023,768BLACKROCK ICS STERLING LIQUIDITY FUND 4,017,661 4,017,661SEI GLOBAL MASTER FUND PLC GLOBAL SHORT DURATION BOND FUND HEDGED STERLING INSTITUTIONAL DISTRIBUTING CLASS 390,087 3,918,954BLACKROCK ICS STERLING GOVERNMENT LIQUIDITY FUND 2,304,362 2,304,362SEI GLOBAL MASTER FUND PLC GLOBAL MANAGED VOLATILITY FUND STERLING INSTITUTIONAL DISTRIBUTING CLASS 78,996 1,308,735SEI GLOBAL MASTER FUND PLC GLOBAL MULTI-ASSET INCOME FUND HEDGED STERLING INSTITUTIONAL DISTRIBUTING CLASS 137,626 1,205,968SEI GLOBAL MASTER FUND PLC U.K. CORE FIXED INTEREST FUND STERLING INSTITUTIONAL DISTRIBUTING CLASS 77,645 1,087,968SEI GLOBAL MASTER FUND PLC GLOBAL OPPORTUNISTIC FIXED INCOME FUND HEDGED STERLING INSTITUTIONAL DISTRIBUTING CLASS 73,804 823,213SEI GLOBAL MASTER FUND PLC GLOBAL FIXED INCOME FUND HEDGED STERLING INSTITUTIONAL DISTRIBUTING CLASS 67,742 795,477SEI GLOBAL MASTER FUND PLC HIGH YIELD FIXED INCOME FUND HEDGED STERLING INSTITUTIONAL DISTRIBUTING CLASS 55,237 551,918THREADNEEDLE LUX - ENHANCED COMMODITIES PORTFOLIO 42,705 492,708SEI GLOBAL MASTER FUND PLC EMERGING MARKETS DEBT FUND PARTIALLY HEDGED STERLING INSTITUTIONAL DISTRIBUTING CLASS 42,670 411,965SEI GLOBAL MASTER FUND PLC U.K. INDEX-LINKED FIXED INTEREST FUND STERLING INSTITUTIONAL DISTRIBUTING CLASS 13,412 349,245SEI GLOBAL MASTER FUND PLC LIQUID ALTERNATIVE FUND HEDGED STERLING INSTITUTIONAL DISTRIBUTING CLASS 19,414 213,357VERIZON COMMUNICATIONS INC 865 38,763PROCTER & GAMBLE CO 389 36,992SWISSCOM AG 86 36,471BIOGEN INC 143 34,596LKQ CORP 1,280 30,469SINGAPORE TELECOMMUNICATIONS LTD 21,083 29,761
172
DocuSign Envelope ID: 2646536F-BB10-4779-844A-39205D22F4E0
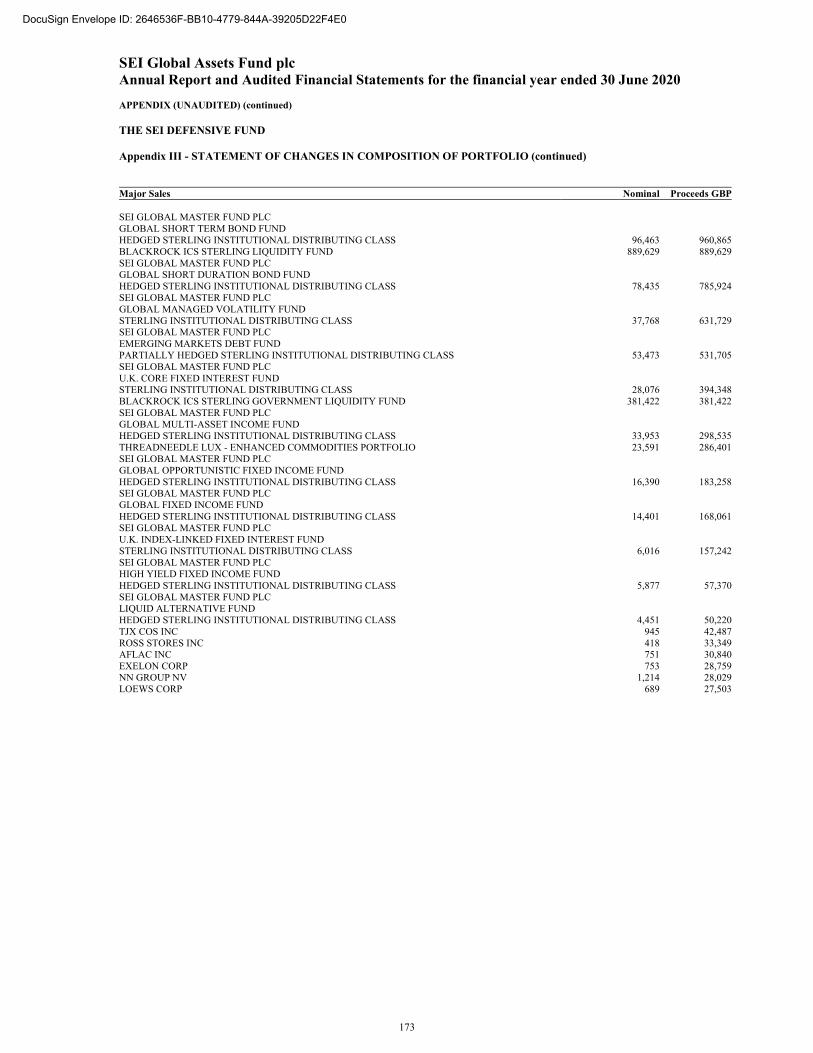
SEI Global Assets Fund plc Annual Report and Audited Financial Statements for the financial year ended 30 June 2020 APPENDIX (UNAUDITED) (continued)
THE SEI DEFENSIVE FUND Appendix III - STATEMENT OF CHANGES IN COMPOSITION OF PORTFOLIO (continued)
Major Sales Nominal Proceeds GBP SEI GLOBAL MASTER FUND PLC GLOBAL SHORT TERM BOND FUND HEDGED STERLING INSTITUTIONAL DISTRIBUTING CLASS 96,463 960,865BLACKROCK ICS STERLING LIQUIDITY FUND 889,629 889,629SEI GLOBAL MASTER FUND PLC GLOBAL SHORT DURATION BOND FUND HEDGED STERLING INSTITUTIONAL DISTRIBUTING CLASS 78,435 785,924SEI GLOBAL MASTER FUND PLC GLOBAL MANAGED VOLATILITY FUND STERLING INSTITUTIONAL DISTRIBUTING CLASS 37,768 631,729SEI GLOBAL MASTER FUND PLC EMERGING MARKETS DEBT FUND PARTIALLY HEDGED STERLING INSTITUTIONAL DISTRIBUTING CLASS 53,473 531,705SEI GLOBAL MASTER FUND PLC U.K. CORE FIXED INTEREST FUND STERLING INSTITUTIONAL DISTRIBUTING CLASS 28,076 394,348BLACKROCK ICS STERLING GOVERNMENT LIQUIDITY FUND 381,422 381,422SEI GLOBAL MASTER FUND PLC GLOBAL MULTI-ASSET INCOME FUND HEDGED STERLING INSTITUTIONAL DISTRIBUTING CLASS 33,953 298,535THREADNEEDLE LUX - ENHANCED COMMODITIES PORTFOLIO 23,591 286,401SEI GLOBAL MASTER FUND PLC GLOBAL OPPORTUNISTIC FIXED INCOME FUND HEDGED STERLING INSTITUTIONAL DISTRIBUTING CLASS 16,390 183,258SEI GLOBAL MASTER FUND PLC GLOBAL FIXED INCOME FUND HEDGED STERLING INSTITUTIONAL DISTRIBUTING CLASS 14,401 168,061SEI GLOBAL MASTER FUND PLC U.K. INDEX-LINKED FIXED INTEREST FUND STERLING INSTITUTIONAL DISTRIBUTING CLASS 6,016 157,242SEI GLOBAL MASTER FUND PLC HIGH YIELD FIXED INCOME FUND HEDGED STERLING INSTITUTIONAL DISTRIBUTING CLASS 5,877 57,370SEI GLOBAL MASTER FUND PLC LIQUID ALTERNATIVE FUND HEDGED STERLING INSTITUTIONAL DISTRIBUTING CLASS 4,451 50,220TJX COS INC 945 42,487ROSS STORES INC 418 33,349AFLAC INC 751 30,840EXELON CORP 753 28,759NN GROUP NV 1,214 28,029LOEWS CORP 689 27,503
173
DocuSign Envelope ID: 2646536F-BB10-4779-844A-39205D22F4E0
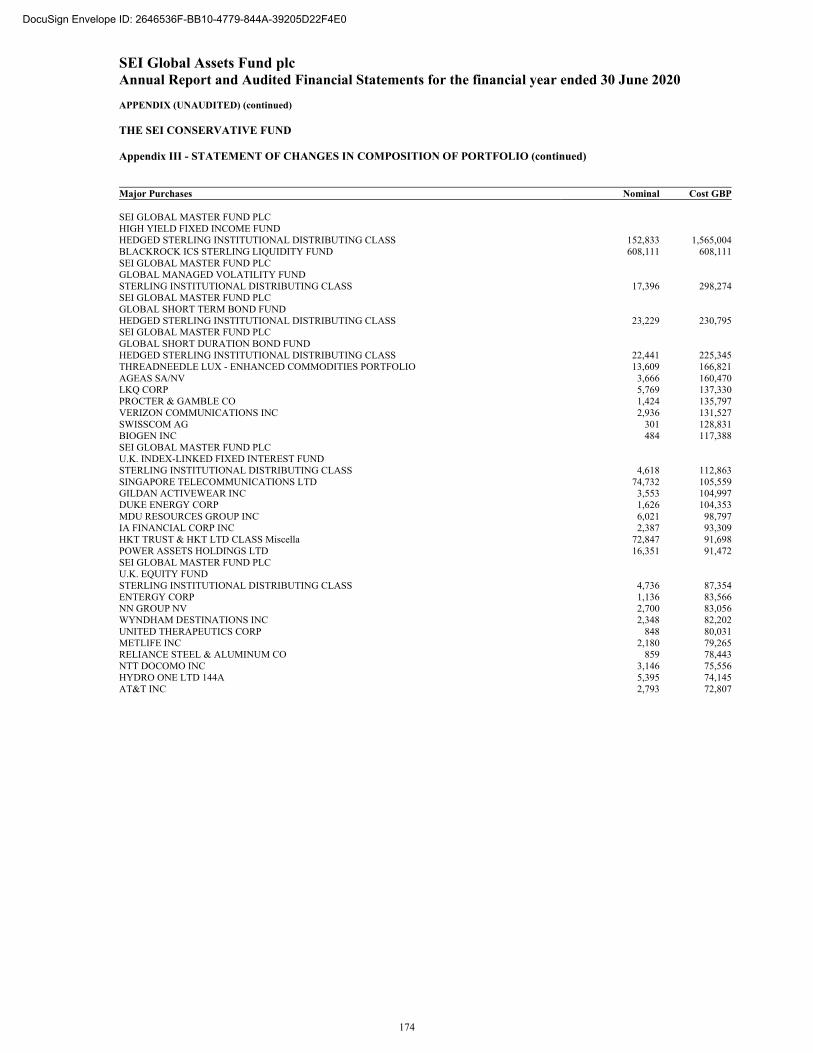
SEI Global Assets Fund plc Annual Report and Audited Financial Statements for the financial year ended 30 June 2020 APPENDIX (UNAUDITED) (continued)
THE SEI CONSERVATIVE FUND Appendix III - STATEMENT OF CHANGES IN COMPOSITION OF PORTFOLIO (continued)
Major Purchases Nominal Cost GBP SEI GLOBAL MASTER FUND PLC HIGH YIELD FIXED INCOME FUND HEDGED STERLING INSTITUTIONAL DISTRIBUTING CLASS 152,833 1,565,004BLACKROCK ICS STERLING LIQUIDITY FUND 608,111 608,111SEI GLOBAL MASTER FUND PLC GLOBAL MANAGED VOLATILITY FUND STERLING INSTITUTIONAL DISTRIBUTING CLASS 17,396 298,274SEI GLOBAL MASTER FUND PLC GLOBAL SHORT TERM BOND FUND HEDGED STERLING INSTITUTIONAL DISTRIBUTING CLASS 23,229 230,795SEI GLOBAL MASTER FUND PLC GLOBAL SHORT DURATION BOND FUND HEDGED STERLING INSTITUTIONAL DISTRIBUTING CLASS 22,441 225,345THREADNEEDLE LUX - ENHANCED COMMODITIES PORTFOLIO 13,609 166,821AGEAS SA/NV 3,666 160,470LKQ CORP 5,769 137,330PROCTER & GAMBLE CO 1,424 135,797VERIZON COMMUNICATIONS INC 2,936 131,527SWISSCOM AG 301 128,831BIOGEN INC 484 117,388SEI GLOBAL MASTER FUND PLC U.K. INDEX-LINKED FIXED INTEREST FUND STERLING INSTITUTIONAL DISTRIBUTING CLASS 4,618 112,863SINGAPORE TELECOMMUNICATIONS LTD 74,732 105,559GILDAN ACTIVEWEAR INC 3,553 104,997DUKE ENERGY CORP 1,626 104,353MDU RESOURCES GROUP INC 6,021 98,797IA FINANCIAL CORP INC 2,387 93,309HKT TRUST & HKT LTD CLASS Miscella 72,847 91,698POWER ASSETS HOLDINGS LTD 16,351 91,472SEI GLOBAL MASTER FUND PLC U.K. EQUITY FUND STERLING INSTITUTIONAL DISTRIBUTING CLASS 4,736 87,354ENTERGY CORP 1,136 83,566NN GROUP NV 2,700 83,056WYNDHAM DESTINATIONS INC 2,348 82,202UNITED THERAPEUTICS CORP 848 80,031METLIFE INC 2,180 79,265RELIANCE STEEL & ALUMINUM CO 859 78,443NTT DOCOMO INC 3,146 75,556HYDRO ONE LTD 144A 5,395 74,145AT&T INC 2,793 72,807
174
DocuSign Envelope ID: 2646536F-BB10-4779-844A-39205D22F4E0
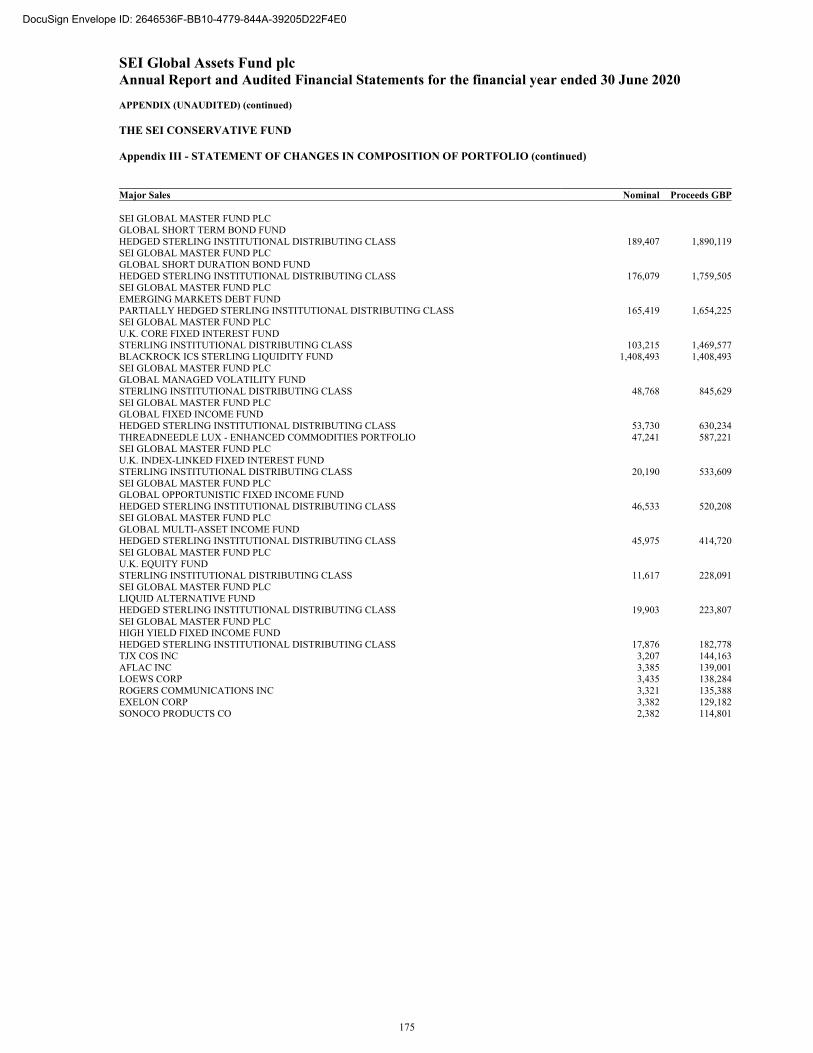
SEI Global Assets Fund plc Annual Report and Audited Financial Statements for the financial year ended 30 June 2020 APPENDIX (UNAUDITED) (continued)
THE SEI CONSERVATIVE FUND Appendix III - STATEMENT OF CHANGES IN COMPOSITION OF PORTFOLIO (continued)
Major Sales Nominal Proceeds GBP SEI GLOBAL MASTER FUND PLC GLOBAL SHORT TERM BOND FUND HEDGED STERLING INSTITUTIONAL DISTRIBUTING CLASS 189,407 1,890,119SEI GLOBAL MASTER FUND PLC GLOBAL SHORT DURATION BOND FUND HEDGED STERLING INSTITUTIONAL DISTRIBUTING CLASS 176,079 1,759,505SEI GLOBAL MASTER FUND PLC EMERGING MARKETS DEBT FUND PARTIALLY HEDGED STERLING INSTITUTIONAL DISTRIBUTING CLASS 165,419 1,654,225SEI GLOBAL MASTER FUND PLC U.K. CORE FIXED INTEREST FUND STERLING INSTITUTIONAL DISTRIBUTING CLASS 103,215 1,469,577BLACKROCK ICS STERLING LIQUIDITY FUND 1,408,493 1,408,493SEI GLOBAL MASTER FUND PLC GLOBAL MANAGED VOLATILITY FUND STERLING INSTITUTIONAL DISTRIBUTING CLASS 48,768 845,629SEI GLOBAL MASTER FUND PLC GLOBAL FIXED INCOME FUND HEDGED STERLING INSTITUTIONAL DISTRIBUTING CLASS 53,730 630,234THREADNEEDLE LUX - ENHANCED COMMODITIES PORTFOLIO 47,241 587,221SEI GLOBAL MASTER FUND PLC U.K. INDEX-LINKED FIXED INTEREST FUND STERLING INSTITUTIONAL DISTRIBUTING CLASS 20,190 533,609SEI GLOBAL MASTER FUND PLC GLOBAL OPPORTUNISTIC FIXED INCOME FUND HEDGED STERLING INSTITUTIONAL DISTRIBUTING CLASS 46,533 520,208SEI GLOBAL MASTER FUND PLC GLOBAL MULTI-ASSET INCOME FUND HEDGED STERLING INSTITUTIONAL DISTRIBUTING CLASS 45,975 414,720SEI GLOBAL MASTER FUND PLC U.K. EQUITY FUND STERLING INSTITUTIONAL DISTRIBUTING CLASS 11,617 228,091SEI GLOBAL MASTER FUND PLC LIQUID ALTERNATIVE FUND HEDGED STERLING INSTITUTIONAL DISTRIBUTING CLASS 19,903 223,807SEI GLOBAL MASTER FUND PLC HIGH YIELD FIXED INCOME FUND HEDGED STERLING INSTITUTIONAL DISTRIBUTING CLASS 17,876 182,778TJX COS INC 3,207 144,163AFLAC INC 3,385 139,001LOEWS CORP 3,435 138,284ROGERS COMMUNICATIONS INC 3,321 135,388EXELON CORP 3,382 129,182SONOCO PRODUCTS CO 2,382 114,801
175
DocuSign Envelope ID: 2646536F-BB10-4779-844A-39205D22F4E0
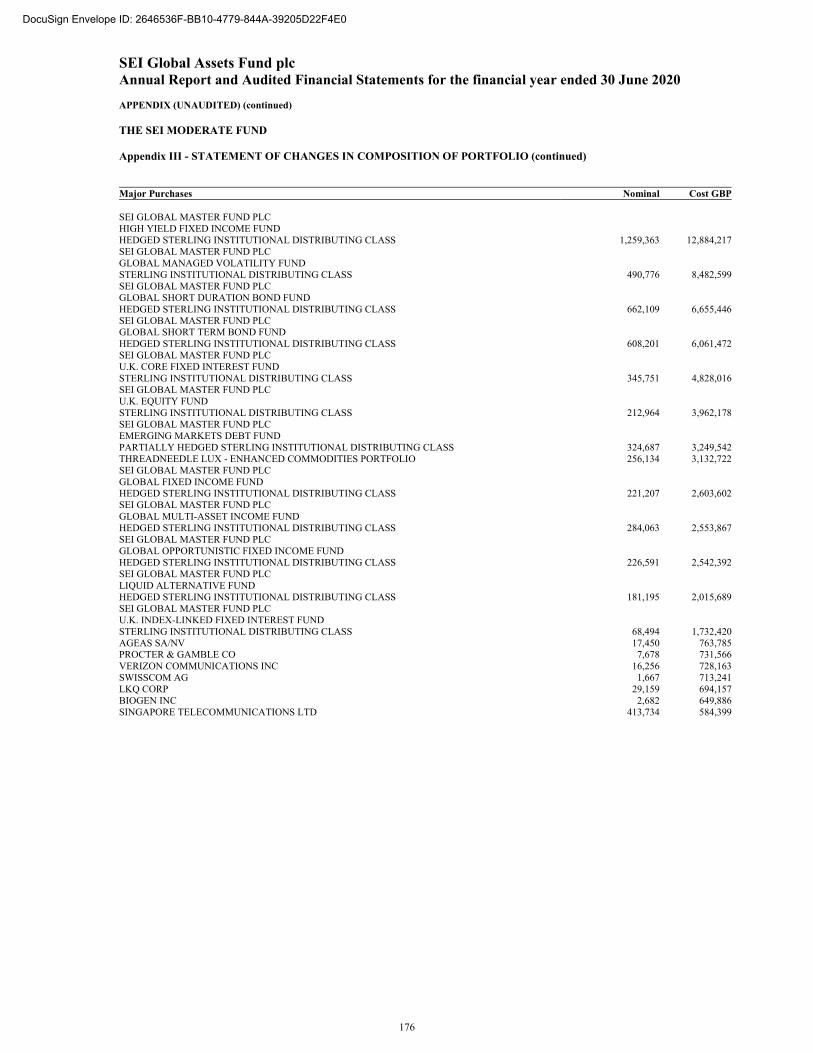
SEI Global Assets Fund plc Annual Report and Audited Financial Statements for the financial year ended 30 June 2020 APPENDIX (UNAUDITED) (continued)
THE SEI MODERATE FUND Appendix III - STATEMENT OF CHANGES IN COMPOSITION OF PORTFOLIO (continued)
Major Purchases Nominal Cost GBP SEI GLOBAL MASTER FUND PLC HIGH YIELD FIXED INCOME FUND HEDGED STERLING INSTITUTIONAL DISTRIBUTING CLASS 1,259,363 12,884,217SEI GLOBAL MASTER FUND PLC GLOBAL MANAGED VOLATILITY FUND STERLING INSTITUTIONAL DISTRIBUTING CLASS 490,776 8,482,599SEI GLOBAL MASTER FUND PLC GLOBAL SHORT DURATION BOND FUND HEDGED STERLING INSTITUTIONAL DISTRIBUTING CLASS 662,109 6,655,446SEI GLOBAL MASTER FUND PLC GLOBAL SHORT TERM BOND FUND HEDGED STERLING INSTITUTIONAL DISTRIBUTING CLASS 608,201 6,061,472SEI GLOBAL MASTER FUND PLC U.K. CORE FIXED INTEREST FUND STERLING INSTITUTIONAL DISTRIBUTING CLASS 345,751 4,828,016SEI GLOBAL MASTER FUND PLC U.K. EQUITY FUND STERLING INSTITUTIONAL DISTRIBUTING CLASS 212,964 3,962,178SEI GLOBAL MASTER FUND PLC EMERGING MARKETS DEBT FUND PARTIALLY HEDGED STERLING INSTITUTIONAL DISTRIBUTING CLASS 324,687 3,249,542THREADNEEDLE LUX - ENHANCED COMMODITIES PORTFOLIO 256,134 3,132,722SEI GLOBAL MASTER FUND PLC GLOBAL FIXED INCOME FUND HEDGED STERLING INSTITUTIONAL DISTRIBUTING CLASS 221,207 2,603,602SEI GLOBAL MASTER FUND PLC GLOBAL MULTI-ASSET INCOME FUND HEDGED STERLING INSTITUTIONAL DISTRIBUTING CLASS 284,063 2,553,867SEI GLOBAL MASTER FUND PLC GLOBAL OPPORTUNISTIC FIXED INCOME FUND HEDGED STERLING INSTITUTIONAL DISTRIBUTING CLASS 226,591 2,542,392SEI GLOBAL MASTER FUND PLC LIQUID ALTERNATIVE FUND HEDGED STERLING INSTITUTIONAL DISTRIBUTING CLASS 181,195 2,015,689SEI GLOBAL MASTER FUND PLC U.K. INDEX-LINKED FIXED INTEREST FUND STERLING INSTITUTIONAL DISTRIBUTING CLASS 68,494 1,732,420AGEAS SA/NV 17,450 763,785PROCTER & GAMBLE CO 7,678 731,566VERIZON COMMUNICATIONS INC 16,256 728,163SWISSCOM AG 1,667 713,241LKQ CORP 29,159 694,157BIOGEN INC 2,682 649,886SINGAPORE TELECOMMUNICATIONS LTD 413,734 584,399
176
DocuSign Envelope ID: 2646536F-BB10-4779-844A-39205D22F4E0
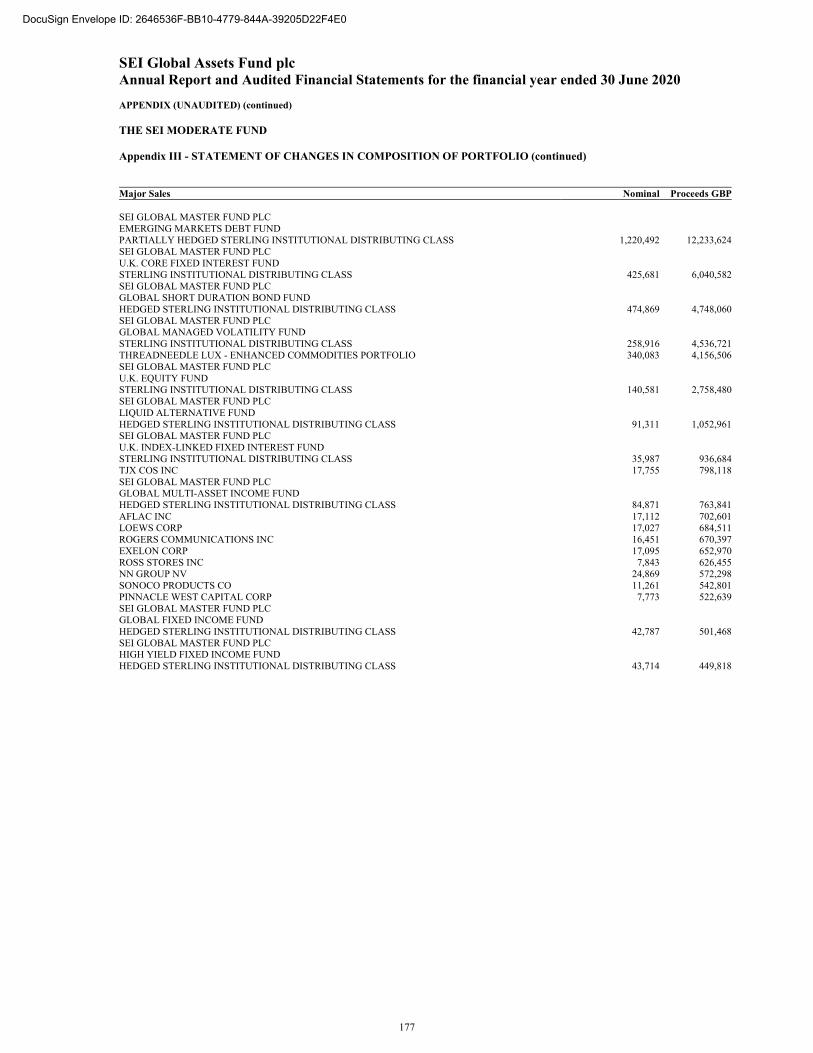
SEI Global Assets Fund plc Annual Report and Audited Financial Statements for the financial year ended 30 June 2020 APPENDIX (UNAUDITED) (continued)
THE SEI MODERATE FUND Appendix III - STATEMENT OF CHANGES IN COMPOSITION OF PORTFOLIO (continued)
Major Sales Nominal Proceeds GBP SEI GLOBAL MASTER FUND PLC EMERGING MARKETS DEBT FUND PARTIALLY HEDGED STERLING INSTITUTIONAL DISTRIBUTING CLASS 1,220,492 12,233,624SEI GLOBAL MASTER FUND PLC U.K. CORE FIXED INTEREST FUND STERLING INSTITUTIONAL DISTRIBUTING CLASS 425,681 6,040,582SEI GLOBAL MASTER FUND PLC GLOBAL SHORT DURATION BOND FUND HEDGED STERLING INSTITUTIONAL DISTRIBUTING CLASS 474,869 4,748,060SEI GLOBAL MASTER FUND PLC GLOBAL MANAGED VOLATILITY FUND STERLING INSTITUTIONAL DISTRIBUTING CLASS 258,916 4,536,721THREADNEEDLE LUX - ENHANCED COMMODITIES PORTFOLIO 340,083 4,156,506SEI GLOBAL MASTER FUND PLC U.K. EQUITY FUND STERLING INSTITUTIONAL DISTRIBUTING CLASS 140,581 2,758,480SEI GLOBAL MASTER FUND PLC LIQUID ALTERNATIVE FUND HEDGED STERLING INSTITUTIONAL DISTRIBUTING CLASS 91,311 1,052,961SEI GLOBAL MASTER FUND PLC U.K. INDEX-LINKED FIXED INTEREST FUND STERLING INSTITUTIONAL DISTRIBUTING CLASS 35,987 936,684TJX COS INC 17,755 798,118SEI GLOBAL MASTER FUND PLC GLOBAL MULTI-ASSET INCOME FUND HEDGED STERLING INSTITUTIONAL DISTRIBUTING CLASS 84,871 763,841AFLAC INC 17,112 702,601LOEWS CORP 17,027 684,511ROGERS COMMUNICATIONS INC 16,451 670,397EXELON CORP 17,095 652,970ROSS STORES INC 7,843 626,455NN GROUP NV 24,869 572,298SONOCO PRODUCTS CO 11,261 542,801PINNACLE WEST CAPITAL CORP 7,773 522,639SEI GLOBAL MASTER FUND PLC GLOBAL FIXED INCOME FUND HEDGED STERLING INSTITUTIONAL DISTRIBUTING CLASS 42,787 501,468SEI GLOBAL MASTER FUND PLC HIGH YIELD FIXED INCOME FUND HEDGED STERLING INSTITUTIONAL DISTRIBUTING CLASS 43,714 449,818
177
DocuSign Envelope ID: 2646536F-BB10-4779-844A-39205D22F4E0
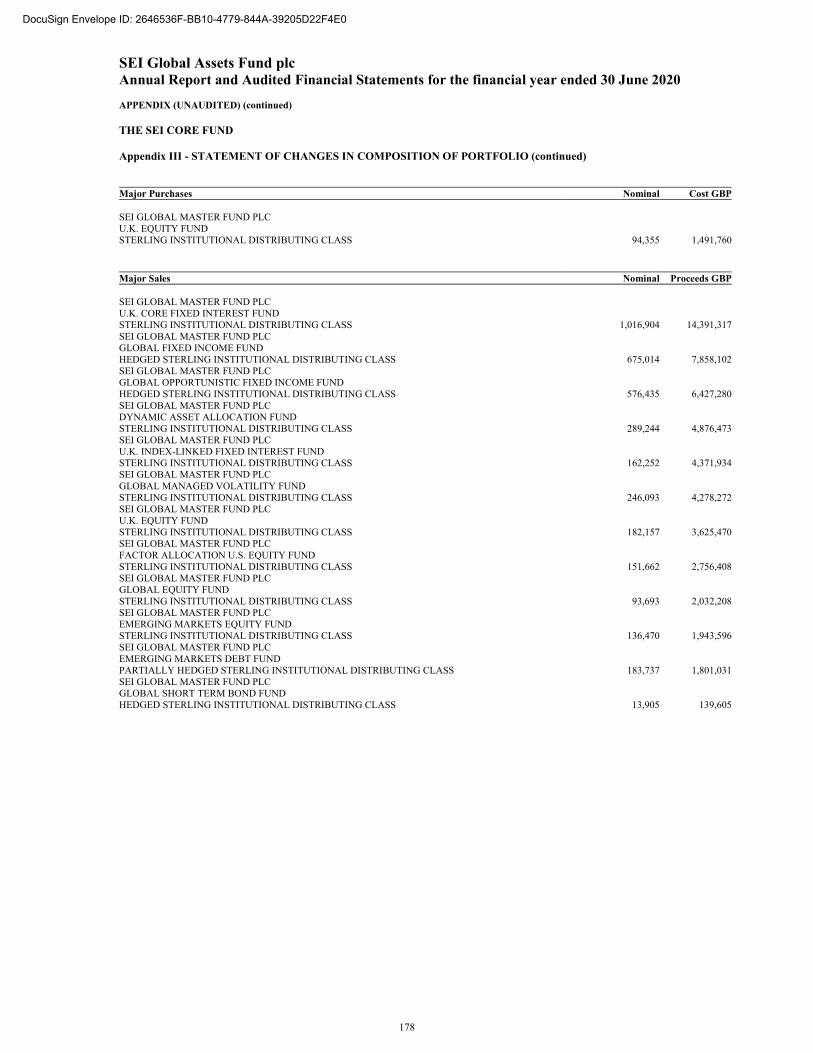
SEI Global Assets Fund plc Annual Report and Audited Financial Statements for the financial year ended 30 June 2020 APPENDIX (UNAUDITED) (continued)
THE SEI CORE FUND Appendix III - STATEMENT OF CHANGES IN COMPOSITION OF PORTFOLIO (continued)
Major Purchases Nominal Cost GBP SEI GLOBAL MASTER FUND PLC U.K. EQUITY FUND STERLING INSTITUTIONAL DISTRIBUTING CLASS 94,355 1,491,760
Major Sales Nominal Proceeds GBP SEI GLOBAL MASTER FUND PLC U.K. CORE FIXED INTEREST FUND STERLING INSTITUTIONAL DISTRIBUTING CLASS 1,016,904 14,391,317SEI GLOBAL MASTER FUND PLC GLOBAL FIXED INCOME FUND HEDGED STERLING INSTITUTIONAL DISTRIBUTING CLASS 675,014 7,858,102SEI GLOBAL MASTER FUND PLC GLOBAL OPPORTUNISTIC FIXED INCOME FUND HEDGED STERLING INSTITUTIONAL DISTRIBUTING CLASS 576,435 6,427,280SEI GLOBAL MASTER FUND PLC DYNAMIC ASSET ALLOCATION FUND STERLING INSTITUTIONAL DISTRIBUTING CLASS 289,244 4,876,473SEI GLOBAL MASTER FUND PLC U.K. INDEX-LINKED FIXED INTEREST FUND STERLING INSTITUTIONAL DISTRIBUTING CLASS 162,252 4,371,934SEI GLOBAL MASTER FUND PLC GLOBAL MANAGED VOLATILITY FUND STERLING INSTITUTIONAL DISTRIBUTING CLASS 246,093 4,278,272SEI GLOBAL MASTER FUND PLC U.K. EQUITY FUND STERLING INSTITUTIONAL DISTRIBUTING CLASS 182,157 3,625,470SEI GLOBAL MASTER FUND PLC FACTOR ALLOCATION U.S. EQUITY FUND STERLING INSTITUTIONAL DISTRIBUTING CLASS 151,662 2,756,408SEI GLOBAL MASTER FUND PLC GLOBAL EQUITY FUND STERLING INSTITUTIONAL DISTRIBUTING CLASS 93,693 2,032,208SEI GLOBAL MASTER FUND PLC EMERGING MARKETS EQUITY FUND STERLING INSTITUTIONAL DISTRIBUTING CLASS 136,470 1,943,596SEI GLOBAL MASTER FUND PLC EMERGING MARKETS DEBT FUND PARTIALLY HEDGED STERLING INSTITUTIONAL DISTRIBUTING CLASS 183,737 1,801,031SEI GLOBAL MASTER FUND PLC GLOBAL SHORT TERM BOND FUND HEDGED STERLING INSTITUTIONAL DISTRIBUTING CLASS 13,905 139,605
178
DocuSign Envelope ID: 2646536F-BB10-4779-844A-39205D22F4E0
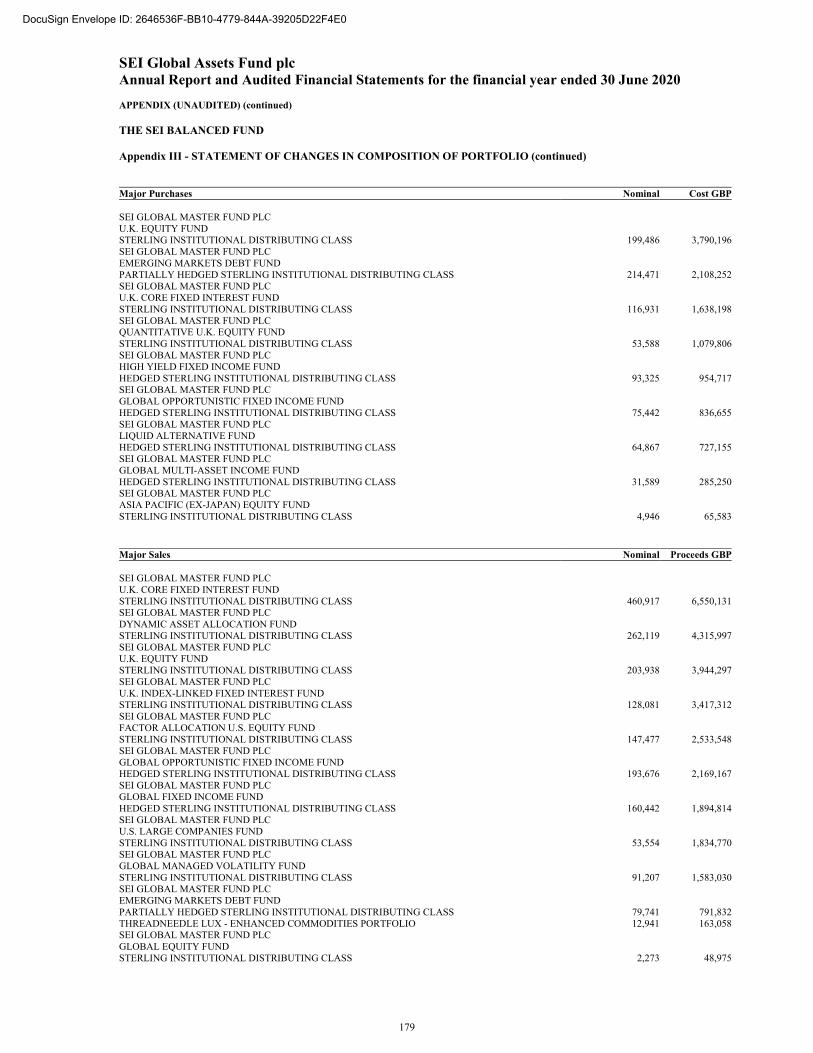
SEI Global Assets Fund plc Annual Report and Audited Financial Statements for the financial year ended 30 June 2020 APPENDIX (UNAUDITED) (continued)
THE SEI BALANCED FUND Appendix III - STATEMENT OF CHANGES IN COMPOSITION OF PORTFOLIO (continued)
Major Purchases Nominal Cost GBP SEI GLOBAL MASTER FUND PLC U.K. EQUITY FUND STERLING INSTITUTIONAL DISTRIBUTING CLASS 199,486 3,790,196SEI GLOBAL MASTER FUND PLC EMERGING MARKETS DEBT FUND PARTIALLY HEDGED STERLING INSTITUTIONAL DISTRIBUTING CLASS 214,471 2,108,252SEI GLOBAL MASTER FUND PLC U.K. CORE FIXED INTEREST FUND STERLING INSTITUTIONAL DISTRIBUTING CLASS 116,931 1,638,198SEI GLOBAL MASTER FUND PLC QUANTITATIVE U.K. EQUITY FUND STERLING INSTITUTIONAL DISTRIBUTING CLASS 53,588 1,079,806SEI GLOBAL MASTER FUND PLC HIGH YIELD FIXED INCOME FUND HEDGED STERLING INSTITUTIONAL DISTRIBUTING CLASS 93,325 954,717SEI GLOBAL MASTER FUND PLC GLOBAL OPPORTUNISTIC FIXED INCOME FUND HEDGED STERLING INSTITUTIONAL DISTRIBUTING CLASS 75,442 836,655SEI GLOBAL MASTER FUND PLC LIQUID ALTERNATIVE FUND HEDGED STERLING INSTITUTIONAL DISTRIBUTING CLASS 64,867 727,155SEI GLOBAL MASTER FUND PLC GLOBAL MULTI-ASSET INCOME FUND HEDGED STERLING INSTITUTIONAL DISTRIBUTING CLASS 31,589 285,250SEI GLOBAL MASTER FUND PLC ASIA PACIFIC (EX-JAPAN) EQUITY FUND STERLING INSTITUTIONAL DISTRIBUTING CLASS 4,946 65,583
Major Sales Nominal Proceeds GBP SEI GLOBAL MASTER FUND PLC U.K. CORE FIXED INTEREST FUND STERLING INSTITUTIONAL DISTRIBUTING CLASS 460,917 6,550,131SEI GLOBAL MASTER FUND PLC DYNAMIC ASSET ALLOCATION FUND STERLING INSTITUTIONAL DISTRIBUTING CLASS 262,119 4,315,997SEI GLOBAL MASTER FUND PLC U.K. EQUITY FUND STERLING INSTITUTIONAL DISTRIBUTING CLASS 203,938 3,944,297SEI GLOBAL MASTER FUND PLC U.K. INDEX-LINKED FIXED INTEREST FUND STERLING INSTITUTIONAL DISTRIBUTING CLASS 128,081 3,417,312SEI GLOBAL MASTER FUND PLC FACTOR ALLOCATION U.S. EQUITY FUND STERLING INSTITUTIONAL DISTRIBUTING CLASS 147,477 2,533,548SEI GLOBAL MASTER FUND PLC GLOBAL OPPORTUNISTIC FIXED INCOME FUND HEDGED STERLING INSTITUTIONAL DISTRIBUTING CLASS 193,676 2,169,167SEI GLOBAL MASTER FUND PLC GLOBAL FIXED INCOME FUND HEDGED STERLING INSTITUTIONAL DISTRIBUTING CLASS 160,442 1,894,814SEI GLOBAL MASTER FUND PLC U.S. LARGE COMPANIES FUND STERLING INSTITUTIONAL DISTRIBUTING CLASS 53,554 1,834,770SEI GLOBAL MASTER FUND PLC GLOBAL MANAGED VOLATILITY FUND STERLING INSTITUTIONAL DISTRIBUTING CLASS 91,207 1,583,030SEI GLOBAL MASTER FUND PLC EMERGING MARKETS DEBT FUND PARTIALLY HEDGED STERLING INSTITUTIONAL DISTRIBUTING CLASS 79,741 791,832THREADNEEDLE LUX - ENHANCED COMMODITIES PORTFOLIO 12,941 163,058SEI GLOBAL MASTER FUND PLC GLOBAL EQUITY FUND STERLING INSTITUTIONAL DISTRIBUTING CLASS 2,273 48,975
179
DocuSign Envelope ID: 2646536F-BB10-4779-844A-39205D22F4E0
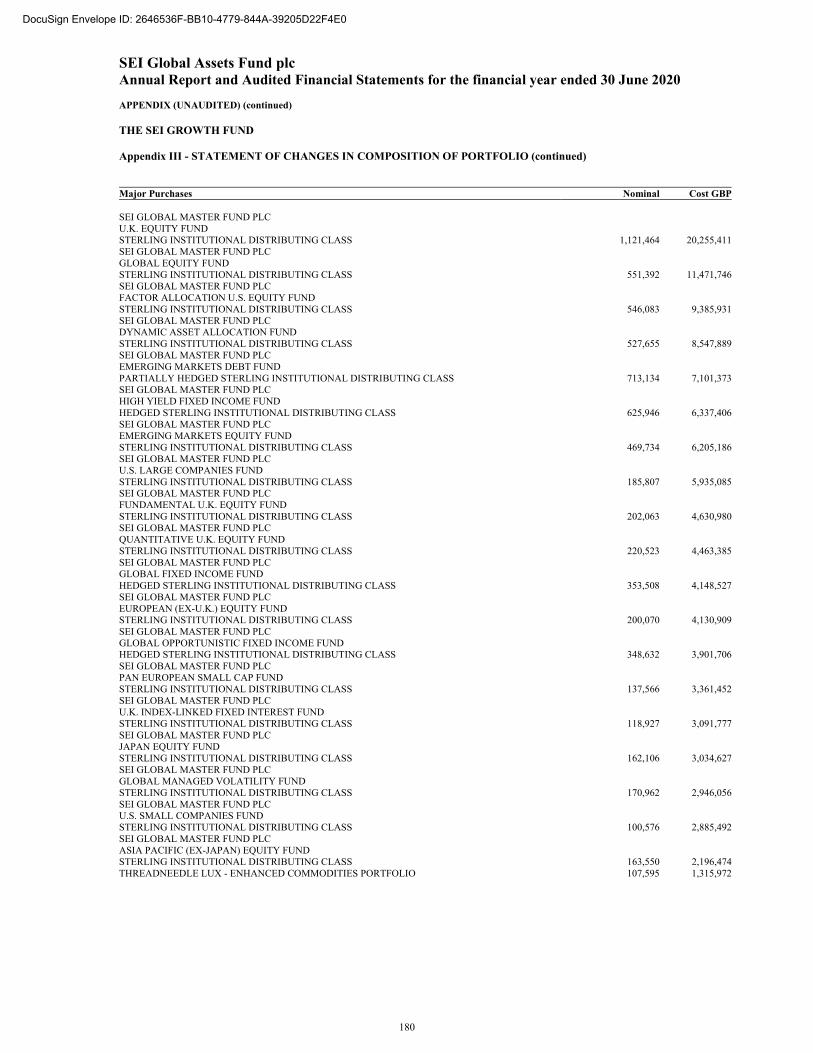
SEI Global Assets Fund plc Annual Report and Audited Financial Statements for the financial year ended 30 June 2020 APPENDIX (UNAUDITED) (continued)
THE SEI GROWTH FUND Appendix III - STATEMENT OF CHANGES IN COMPOSITION OF PORTFOLIO (continued)
Major Purchases Nominal Cost GBP SEI GLOBAL MASTER FUND PLC U.K. EQUITY FUND STERLING INSTITUTIONAL DISTRIBUTING CLASS 1,121,464 20,255,411SEI GLOBAL MASTER FUND PLC GLOBAL EQUITY FUND STERLING INSTITUTIONAL DISTRIBUTING CLASS 551,392 11,471,746SEI GLOBAL MASTER FUND PLC FACTOR ALLOCATION U.S. EQUITY FUND STERLING INSTITUTIONAL DISTRIBUTING CLASS 546,083 9,385,931SEI GLOBAL MASTER FUND PLC DYNAMIC ASSET ALLOCATION FUND STERLING INSTITUTIONAL DISTRIBUTING CLASS 527,655 8,547,889SEI GLOBAL MASTER FUND PLC EMERGING MARKETS DEBT FUND PARTIALLY HEDGED STERLING INSTITUTIONAL DISTRIBUTING CLASS 713,134 7,101,373SEI GLOBAL MASTER FUND PLC HIGH YIELD FIXED INCOME FUND HEDGED STERLING INSTITUTIONAL DISTRIBUTING CLASS 625,946 6,337,406SEI GLOBAL MASTER FUND PLC EMERGING MARKETS EQUITY FUND STERLING INSTITUTIONAL DISTRIBUTING CLASS 469,734 6,205,186SEI GLOBAL MASTER FUND PLC U.S. LARGE COMPANIES FUND STERLING INSTITUTIONAL DISTRIBUTING CLASS 185,807 5,935,085SEI GLOBAL MASTER FUND PLC FUNDAMENTAL U.K. EQUITY FUND STERLING INSTITUTIONAL DISTRIBUTING CLASS 202,063 4,630,980SEI GLOBAL MASTER FUND PLC QUANTITATIVE U.K. EQUITY FUND STERLING INSTITUTIONAL DISTRIBUTING CLASS 220,523 4,463,385SEI GLOBAL MASTER FUND PLC GLOBAL FIXED INCOME FUND HEDGED STERLING INSTITUTIONAL DISTRIBUTING CLASS 353,508 4,148,527SEI GLOBAL MASTER FUND PLC EUROPEAN (EX-U.K.) EQUITY FUND STERLING INSTITUTIONAL DISTRIBUTING CLASS 200,070 4,130,909SEI GLOBAL MASTER FUND PLC GLOBAL OPPORTUNISTIC FIXED INCOME FUND HEDGED STERLING INSTITUTIONAL DISTRIBUTING CLASS 348,632 3,901,706SEI GLOBAL MASTER FUND PLC PAN EUROPEAN SMALL CAP FUND STERLING INSTITUTIONAL DISTRIBUTING CLASS 137,566 3,361,452SEI GLOBAL MASTER FUND PLC U.K. INDEX-LINKED FIXED INTEREST FUND STERLING INSTITUTIONAL DISTRIBUTING CLASS 118,927 3,091,777SEI GLOBAL MASTER FUND PLC JAPAN EQUITY FUND STERLING INSTITUTIONAL DISTRIBUTING CLASS 162,106 3,034,627SEI GLOBAL MASTER FUND PLC GLOBAL MANAGED VOLATILITY FUND STERLING INSTITUTIONAL DISTRIBUTING CLASS 170,962 2,946,056SEI GLOBAL MASTER FUND PLC U.S. SMALL COMPANIES FUND STERLING INSTITUTIONAL DISTRIBUTING CLASS 100,576 2,885,492SEI GLOBAL MASTER FUND PLC ASIA PACIFIC (EX-JAPAN) EQUITY FUND STERLING INSTITUTIONAL DISTRIBUTING CLASS 163,550 2,196,474THREADNEEDLE LUX - ENHANCED COMMODITIES PORTFOLIO 107,595 1,315,972
180
DocuSign Envelope ID: 2646536F-BB10-4779-844A-39205D22F4E0
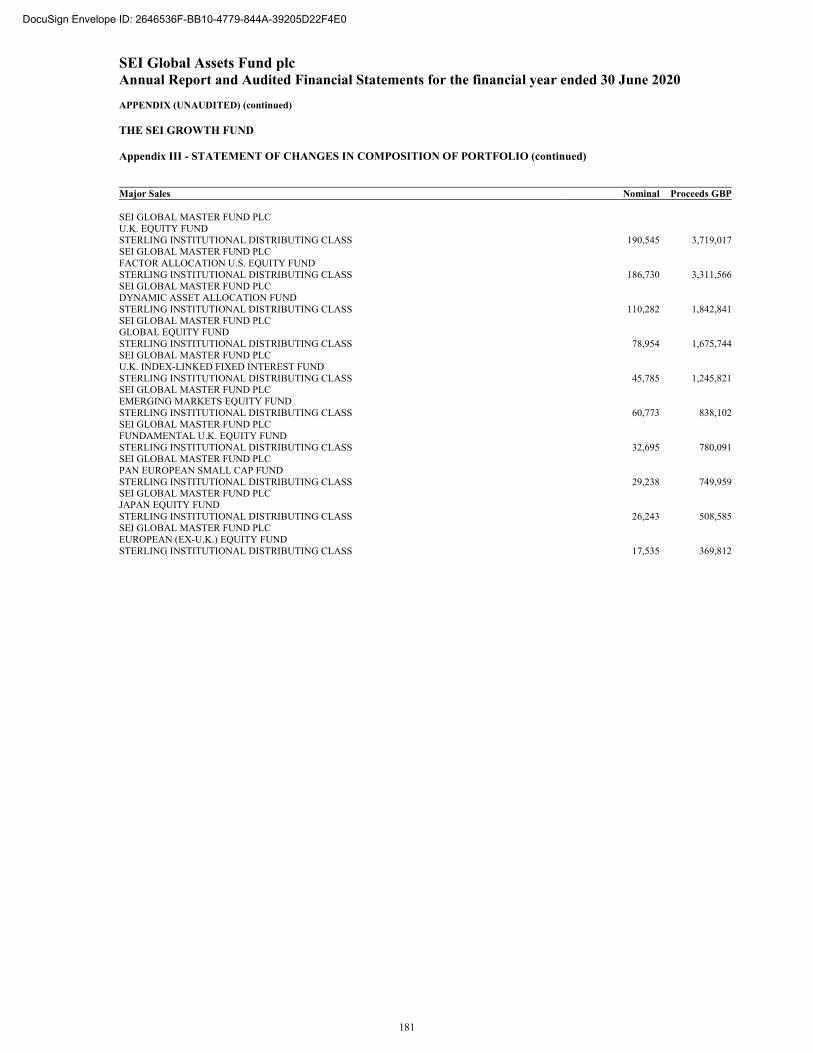
SEI Global Assets Fund plc Annual Report and Audited Financial Statements for the financial year ended 30 June 2020 APPENDIX (UNAUDITED) (continued)
THE SEI GROWTH FUND Appendix III - STATEMENT OF CHANGES IN COMPOSITION OF PORTFOLIO (continued)
Major Sales Nominal Proceeds GBP SEI GLOBAL MASTER FUND PLC U.K. EQUITY FUND STERLING INSTITUTIONAL DISTRIBUTING CLASS 190,545 3,719,017SEI GLOBAL MASTER FUND PLC FACTOR ALLOCATION U.S. EQUITY FUND STERLING INSTITUTIONAL DISTRIBUTING CLASS 186,730 3,311,566SEI GLOBAL MASTER FUND PLC DYNAMIC ASSET ALLOCATION FUND STERLING INSTITUTIONAL DISTRIBUTING CLASS 110,282 1,842,841SEI GLOBAL MASTER FUND PLC GLOBAL EQUITY FUND STERLING INSTITUTIONAL DISTRIBUTING CLASS 78,954 1,675,744SEI GLOBAL MASTER FUND PLC U.K. INDEX-LINKED FIXED INTEREST FUND STERLING INSTITUTIONAL DISTRIBUTING CLASS 45,785 1,245,821SEI GLOBAL MASTER FUND PLC EMERGING MARKETS EQUITY FUND STERLING INSTITUTIONAL DISTRIBUTING CLASS 60,773 838,102SEI GLOBAL MASTER FUND PLC FUNDAMENTAL U.K. EQUITY FUND STERLING INSTITUTIONAL DISTRIBUTING CLASS 32,695 780,091SEI GLOBAL MASTER FUND PLC PAN EUROPEAN SMALL CAP FUND STERLING INSTITUTIONAL DISTRIBUTING CLASS 29,238 749,959SEI GLOBAL MASTER FUND PLC JAPAN EQUITY FUND STERLING INSTITUTIONAL DISTRIBUTING CLASS 26,243 508,585SEI GLOBAL MASTER FUND PLC EUROPEAN (EX-U.K.) EQUITY FUND STERLING INSTITUTIONAL DISTRIBUTING CLASS 17,535 369,812
181
DocuSign Envelope ID: 2646536F-BB10-4779-844A-39205D22F4E0
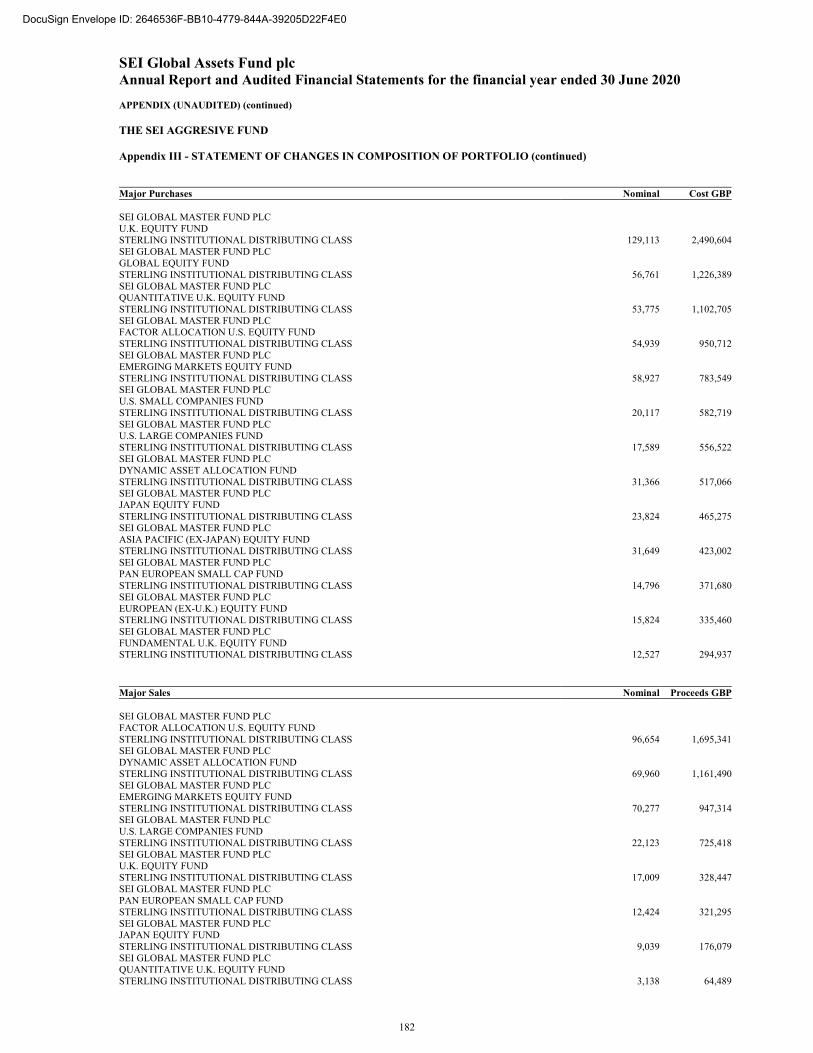
SEI Global Assets Fund plc Annual Report and Audited Financial Statements for the financial year ended 30 June 2020 APPENDIX (UNAUDITED) (continued)
THE SEI AGGRESIVE FUND Appendix III - STATEMENT OF CHANGES IN COMPOSITION OF PORTFOLIO (continued)
Major Purchases Nominal Cost GBP SEI GLOBAL MASTER FUND PLC U.K. EQUITY FUND STERLING INSTITUTIONAL DISTRIBUTING CLASS 129,113 2,490,604SEI GLOBAL MASTER FUND PLC GLOBAL EQUITY FUND STERLING INSTITUTIONAL DISTRIBUTING CLASS 56,761 1,226,389SEI GLOBAL MASTER FUND PLC QUANTITATIVE U.K. EQUITY FUND STERLING INSTITUTIONAL DISTRIBUTING CLASS 53,775 1,102,705SEI GLOBAL MASTER FUND PLC FACTOR ALLOCATION U.S. EQUITY FUND STERLING INSTITUTIONAL DISTRIBUTING CLASS 54,939 950,712SEI GLOBAL MASTER FUND PLC EMERGING MARKETS EQUITY FUND STERLING INSTITUTIONAL DISTRIBUTING CLASS 58,927 783,549SEI GLOBAL MASTER FUND PLC U.S. SMALL COMPANIES FUND STERLING INSTITUTIONAL DISTRIBUTING CLASS 20,117 582,719SEI GLOBAL MASTER FUND PLC U.S. LARGE COMPANIES FUND STERLING INSTITUTIONAL DISTRIBUTING CLASS 17,589 556,522SEI GLOBAL MASTER FUND PLC DYNAMIC ASSET ALLOCATION FUND STERLING INSTITUTIONAL DISTRIBUTING CLASS 31,366 517,066SEI GLOBAL MASTER FUND PLC JAPAN EQUITY FUND STERLING INSTITUTIONAL DISTRIBUTING CLASS 23,824 465,275SEI GLOBAL MASTER FUND PLC ASIA PACIFIC (EX-JAPAN) EQUITY FUND STERLING INSTITUTIONAL DISTRIBUTING CLASS 31,649 423,002SEI GLOBAL MASTER FUND PLC PAN EUROPEAN SMALL CAP FUND STERLING INSTITUTIONAL DISTRIBUTING CLASS 14,796 371,680SEI GLOBAL MASTER FUND PLC EUROPEAN (EX-U.K.) EQUITY FUND STERLING INSTITUTIONAL DISTRIBUTING CLASS 15,824 335,460SEI GLOBAL MASTER FUND PLC FUNDAMENTAL U.K. EQUITY FUND STERLING INSTITUTIONAL DISTRIBUTING CLASS 12,527 294,937
Major Sales Nominal Proceeds GBP SEI GLOBAL MASTER FUND PLC FACTOR ALLOCATION U.S. EQUITY FUND STERLING INSTITUTIONAL DISTRIBUTING CLASS 96,654 1,695,341SEI GLOBAL MASTER FUND PLC DYNAMIC ASSET ALLOCATION FUND STERLING INSTITUTIONAL DISTRIBUTING CLASS 69,960 1,161,490SEI GLOBAL MASTER FUND PLC EMERGING MARKETS EQUITY FUND STERLING INSTITUTIONAL DISTRIBUTING CLASS 70,277 947,314SEI GLOBAL MASTER FUND PLC U.S. LARGE COMPANIES FUND STERLING INSTITUTIONAL DISTRIBUTING CLASS 22,123 725,418SEI GLOBAL MASTER FUND PLC U.K. EQUITY FUND STERLING INSTITUTIONAL DISTRIBUTING CLASS 17,009 328,447SEI GLOBAL MASTER FUND PLC PAN EUROPEAN SMALL CAP FUND STERLING INSTITUTIONAL DISTRIBUTING CLASS 12,424 321,295SEI GLOBAL MASTER FUND PLC JAPAN EQUITY FUND STERLING INSTITUTIONAL DISTRIBUTING CLASS 9,039 176,079SEI GLOBAL MASTER FUND PLC QUANTITATIVE U.K. EQUITY FUND STERLING INSTITUTIONAL DISTRIBUTING CLASS 3,138 64,489
182
DocuSign Envelope ID: 2646536F-BB10-4779-844A-39205D22F4E0
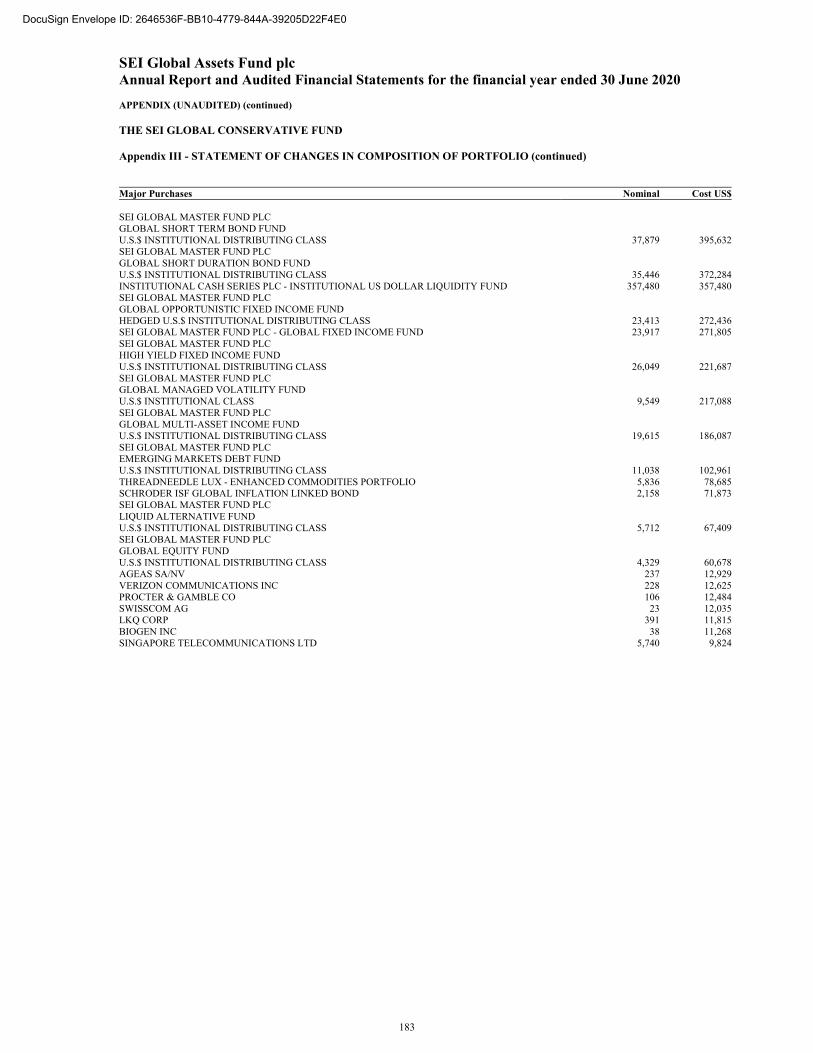
SEI Global Assets Fund plc Annual Report and Audited Financial Statements for the financial year ended 30 June 2020 APPENDIX (UNAUDITED) (continued)
THE SEI GLOBAL CONSERVATIVE FUND Appendix III - STATEMENT OF CHANGES IN COMPOSITION OF PORTFOLIO (continued)
Major Purchases Nominal Cost US$ SEI GLOBAL MASTER FUND PLC GLOBAL SHORT TERM BOND FUND U.S.$ INSTITUTIONAL DISTRIBUTING CLASS 37,879 395,632SEI GLOBAL MASTER FUND PLC GLOBAL SHORT DURATION BOND FUND U.S.$ INSTITUTIONAL DISTRIBUTING CLASS 35,446 372,284INSTITUTIONAL CASH SERIES PLC - INSTITUTIONAL US DOLLAR LIQUIDITY FUND 357,480 357,480SEI GLOBAL MASTER FUND PLC GLOBAL OPPORTUNISTIC FIXED INCOME FUND HEDGED U.S.$ INSTITUTIONAL DISTRIBUTING CLASS 23,413 272,436SEI GLOBAL MASTER FUND PLC - GLOBAL FIXED INCOME FUND 23,917 271,805SEI GLOBAL MASTER FUND PLC HIGH YIELD FIXED INCOME FUND U.S.$ INSTITUTIONAL DISTRIBUTING CLASS 26,049 221,687SEI GLOBAL MASTER FUND PLC GLOBAL MANAGED VOLATILITY FUND U.S.$ INSTITUTIONAL CLASS 9,549 217,088SEI GLOBAL MASTER FUND PLC GLOBAL MULTI-ASSET INCOME FUND U.S.$ INSTITUTIONAL DISTRIBUTING CLASS 19,615 186,087SEI GLOBAL MASTER FUND PLC EMERGING MARKETS DEBT FUND U.S.$ INSTITUTIONAL DISTRIBUTING CLASS 11,038 102,961THREADNEEDLE LUX - ENHANCED COMMODITIES PORTFOLIO 5,836 78,685SCHRODER ISF GLOBAL INFLATION LINKED BOND 2,158 71,873SEI GLOBAL MASTER FUND PLC LIQUID ALTERNATIVE FUND U.S.$ INSTITUTIONAL DISTRIBUTING CLASS 5,712 67,409SEI GLOBAL MASTER FUND PLC GLOBAL EQUITY FUND U.S.$ INSTITUTIONAL DISTRIBUTING CLASS 4,329 60,678AGEAS SA/NV 237 12,929VERIZON COMMUNICATIONS INC 228 12,625PROCTER & GAMBLE CO 106 12,484SWISSCOM AG 23 12,035LKQ CORP 391 11,815BIOGEN INC 38 11,268SINGAPORE TELECOMMUNICATIONS LTD 5,740 9,824
183
DocuSign Envelope ID: 2646536F-BB10-4779-844A-39205D22F4E0
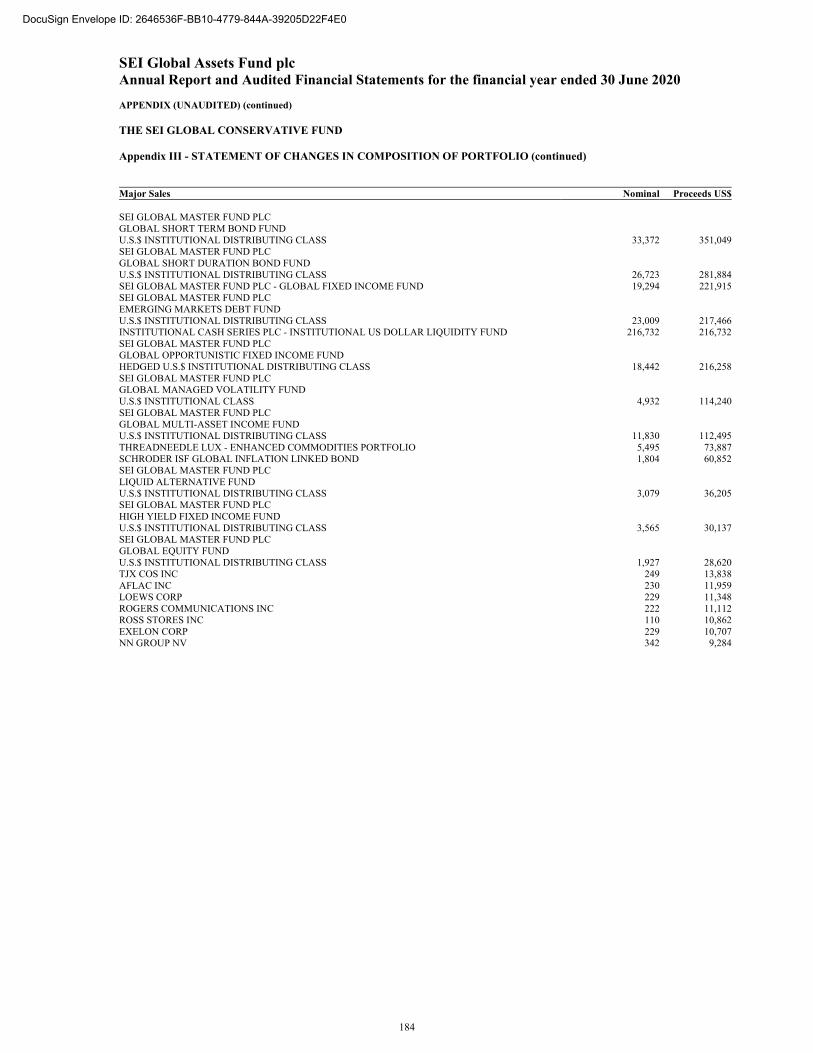
SEI Global Assets Fund plc Annual Report and Audited Financial Statements for the financial year ended 30 June 2020 APPENDIX (UNAUDITED) (continued)
THE SEI GLOBAL CONSERVATIVE FUND Appendix III - STATEMENT OF CHANGES IN COMPOSITION OF PORTFOLIO (continued)
Major Sales Nominal Proceeds US$ SEI GLOBAL MASTER FUND PLC GLOBAL SHORT TERM BOND FUND U.S.$ INSTITUTIONAL DISTRIBUTING CLASS 33,372 351,049SEI GLOBAL MASTER FUND PLC GLOBAL SHORT DURATION BOND FUND U.S.$ INSTITUTIONAL DISTRIBUTING CLASS 26,723 281,884SEI GLOBAL MASTER FUND PLC - GLOBAL FIXED INCOME FUND 19,294 221,915SEI GLOBAL MASTER FUND PLC EMERGING MARKETS DEBT FUND U.S.$ INSTITUTIONAL DISTRIBUTING CLASS 23,009 217,466INSTITUTIONAL CASH SERIES PLC - INSTITUTIONAL US DOLLAR LIQUIDITY FUND 216,732 216,732SEI GLOBAL MASTER FUND PLC GLOBAL OPPORTUNISTIC FIXED INCOME FUND HEDGED U.S.$ INSTITUTIONAL DISTRIBUTING CLASS 18,442 216,258SEI GLOBAL MASTER FUND PLC GLOBAL MANAGED VOLATILITY FUND U.S.$ INSTITUTIONAL CLASS 4,932 114,240SEI GLOBAL MASTER FUND PLC GLOBAL MULTI-ASSET INCOME FUND U.S.$ INSTITUTIONAL DISTRIBUTING CLASS 11,830 112,495THREADNEEDLE LUX - ENHANCED COMMODITIES PORTFOLIO 5,495 73,887SCHRODER ISF GLOBAL INFLATION LINKED BOND 1,804 60,852SEI GLOBAL MASTER FUND PLC LIQUID ALTERNATIVE FUND U.S.$ INSTITUTIONAL DISTRIBUTING CLASS 3,079 36,205SEI GLOBAL MASTER FUND PLC HIGH YIELD FIXED INCOME FUND U.S.$ INSTITUTIONAL DISTRIBUTING CLASS 3,565 30,137SEI GLOBAL MASTER FUND PLC GLOBAL EQUITY FUND U.S.$ INSTITUTIONAL DISTRIBUTING CLASS 1,927 28,620TJX COS INC 249 13,838AFLAC INC 230 11,959LOEWS CORP 229 11,348ROGERS COMMUNICATIONS INC 222 11,112ROSS STORES INC 110 10,862EXELON CORP 229 10,707NN GROUP NV 342 9,284
184
DocuSign Envelope ID: 2646536F-BB10-4779-844A-39205D22F4E0
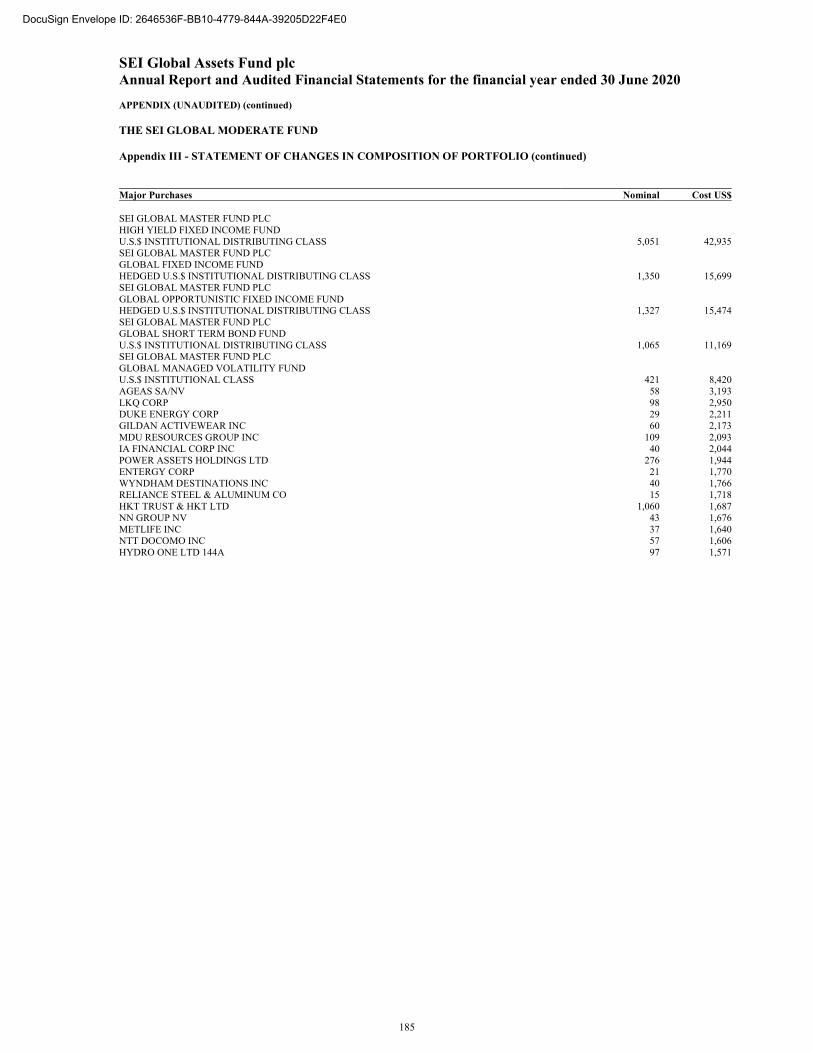
SEI Global Assets Fund plc Annual Report and Audited Financial Statements for the financial year ended 30 June 2020 APPENDIX (UNAUDITED) (continued)
THE SEI GLOBAL MODERATE FUND Appendix III - STATEMENT OF CHANGES IN COMPOSITION OF PORTFOLIO (continued)
Major Purchases Nominal Cost US$ SEI GLOBAL MASTER FUND PLC HIGH YIELD FIXED INCOME FUND U.S.$ INSTITUTIONAL DISTRIBUTING CLASS 5,051 42,935SEI GLOBAL MASTER FUND PLC GLOBAL FIXED INCOME FUND HEDGED U.S.$ INSTITUTIONAL DISTRIBUTING CLASS 1,350 15,699SEI GLOBAL MASTER FUND PLC GLOBAL OPPORTUNISTIC FIXED INCOME FUND HEDGED U.S.$ INSTITUTIONAL DISTRIBUTING CLASS 1,327 15,474SEI GLOBAL MASTER FUND PLC GLOBAL SHORT TERM BOND FUND U.S.$ INSTITUTIONAL DISTRIBUTING CLASS 1,065 11,169SEI GLOBAL MASTER FUND PLC GLOBAL MANAGED VOLATILITY FUND U.S.$ INSTITUTIONAL CLASS 421 8,420AGEAS SA/NV 58 3,193LKQ CORP 98 2,950DUKE ENERGY CORP 29 2,211GILDAN ACTIVEWEAR INC 60 2,173MDU RESOURCES GROUP INC 109 2,093IA FINANCIAL CORP INC 40 2,044POWER ASSETS HOLDINGS LTD 276 1,944ENTERGY CORP 21 1,770WYNDHAM DESTINATIONS INC 40 1,766RELIANCE STEEL & ALUMINUM CO 15 1,718HKT TRUST & HKT LTD 1,060 1,687NN GROUP NV 43 1,676METLIFE INC 37 1,640NTT DOCOMO INC 57 1,606HYDRO ONE LTD 144A 97 1,571
185
DocuSign Envelope ID: 2646536F-BB10-4779-844A-39205D22F4E0
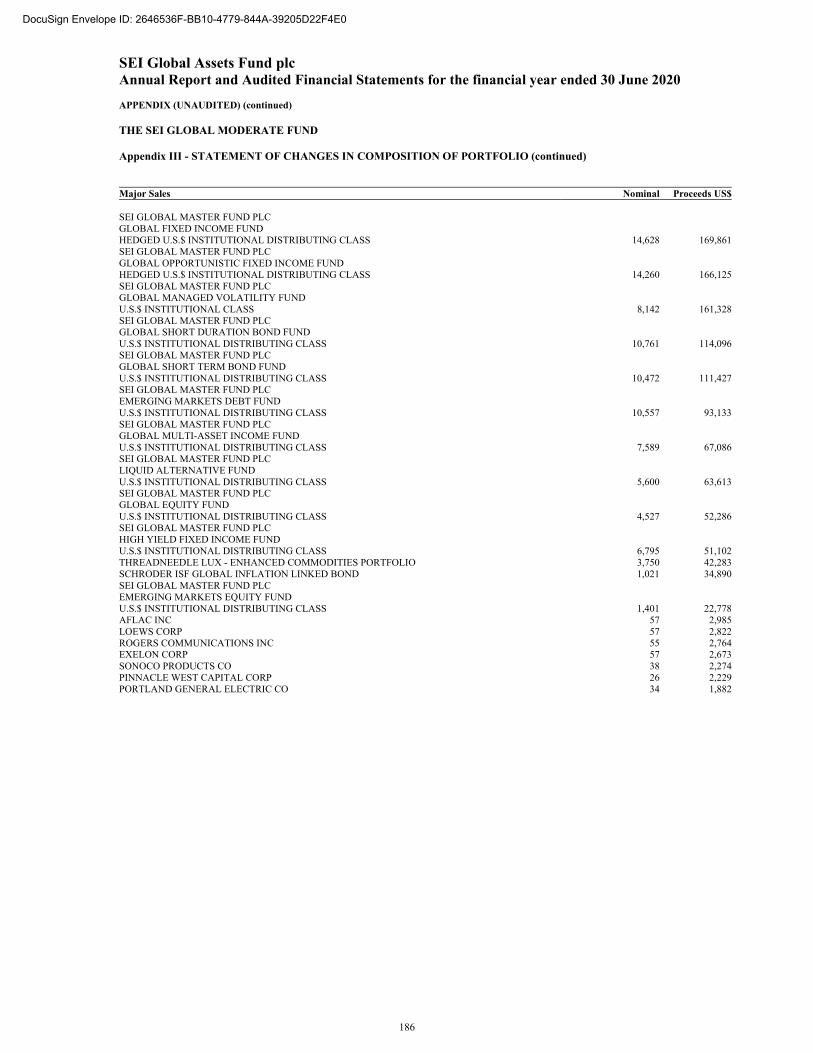
SEI Global Assets Fund plc Annual Report and Audited Financial Statements for the financial year ended 30 June 2020 APPENDIX (UNAUDITED) (continued)
THE SEI GLOBAL MODERATE FUND Appendix III - STATEMENT OF CHANGES IN COMPOSITION OF PORTFOLIO (continued)
Major Sales Nominal Proceeds US$ SEI GLOBAL MASTER FUND PLC GLOBAL FIXED INCOME FUND HEDGED U.S.$ INSTITUTIONAL DISTRIBUTING CLASS 14,628 169,861SEI GLOBAL MASTER FUND PLC GLOBAL OPPORTUNISTIC FIXED INCOME FUND HEDGED U.S.$ INSTITUTIONAL DISTRIBUTING CLASS 14,260 166,125SEI GLOBAL MASTER FUND PLC GLOBAL MANAGED VOLATILITY FUND U.S.$ INSTITUTIONAL CLASS 8,142 161,328SEI GLOBAL MASTER FUND PLC GLOBAL SHORT DURATION BOND FUND U.S.$ INSTITUTIONAL DISTRIBUTING CLASS 10,761 114,096SEI GLOBAL MASTER FUND PLC GLOBAL SHORT TERM BOND FUND U.S.$ INSTITUTIONAL DISTRIBUTING CLASS 10,472 111,427SEI GLOBAL MASTER FUND PLC EMERGING MARKETS DEBT FUND U.S.$ INSTITUTIONAL DISTRIBUTING CLASS 10,557 93,133SEI GLOBAL MASTER FUND PLC GLOBAL MULTI-ASSET INCOME FUND U.S.$ INSTITUTIONAL DISTRIBUTING CLASS 7,589 67,086SEI GLOBAL MASTER FUND PLC LIQUID ALTERNATIVE FUND U.S.$ INSTITUTIONAL DISTRIBUTING CLASS 5,600 63,613SEI GLOBAL MASTER FUND PLC GLOBAL EQUITY FUND U.S.$ INSTITUTIONAL DISTRIBUTING CLASS 4,527 52,286SEI GLOBAL MASTER FUND PLC HIGH YIELD FIXED INCOME FUND U.S.$ INSTITUTIONAL DISTRIBUTING CLASS 6,795 51,102THREADNEEDLE LUX - ENHANCED COMMODITIES PORTFOLIO 3,750 42,283SCHRODER ISF GLOBAL INFLATION LINKED BOND 1,021 34,890SEI GLOBAL MASTER FUND PLC EMERGING MARKETS EQUITY FUND U.S.$ INSTITUTIONAL DISTRIBUTING CLASS 1,401 22,778AFLAC INC 57 2,985LOEWS CORP 57 2,822ROGERS COMMUNICATIONS INC 55 2,764EXELON CORP 57 2,673SONOCO PRODUCTS CO 38 2,274PINNACLE WEST CAPITAL CORP 26 2,229PORTLAND GENERAL ELECTRIC CO 34 1,882
186
DocuSign Envelope ID: 2646536F-BB10-4779-844A-39205D22F4E0
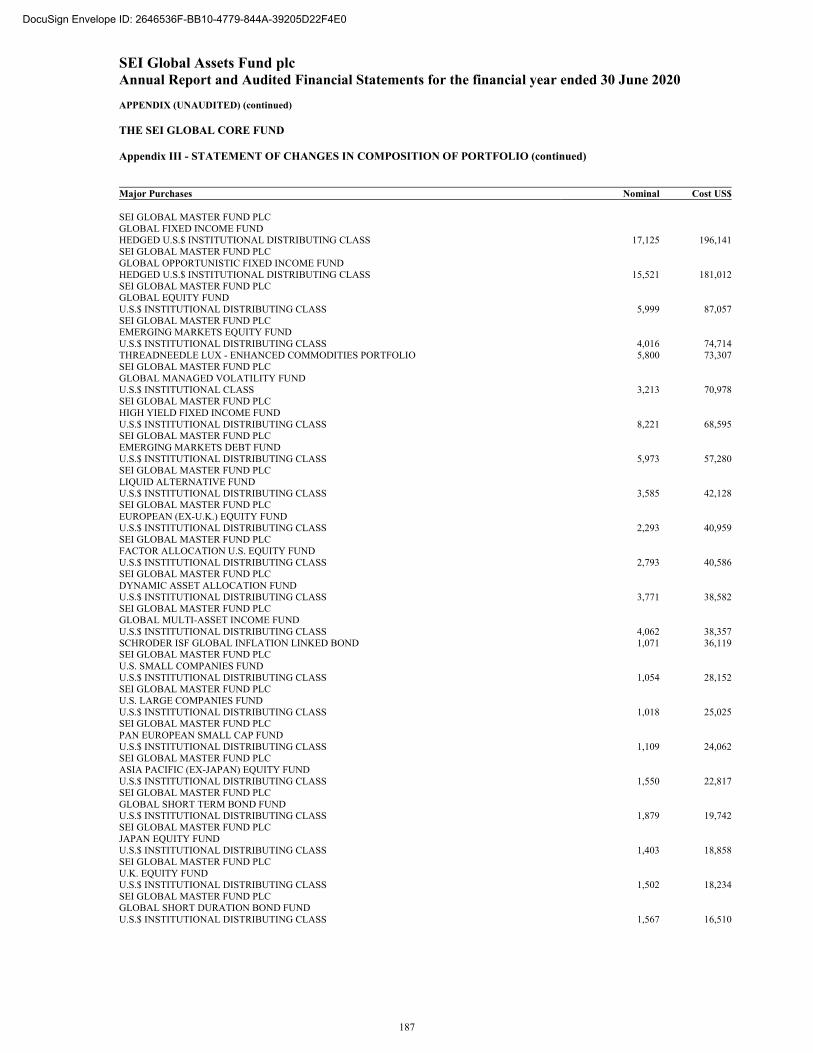
SEI Global Assets Fund plc Annual Report and Audited Financial Statements for the financial year ended 30 June 2020 APPENDIX (UNAUDITED) (continued)
THE SEI GLOBAL CORE FUND Appendix III - STATEMENT OF CHANGES IN COMPOSITION OF PORTFOLIO (continued)
Major Purchases Nominal Cost US$ SEI GLOBAL MASTER FUND PLC GLOBAL FIXED INCOME FUND HEDGED U.S.$ INSTITUTIONAL DISTRIBUTING CLASS 17,125 196,141SEI GLOBAL MASTER FUND PLC GLOBAL OPPORTUNISTIC FIXED INCOME FUND HEDGED U.S.$ INSTITUTIONAL DISTRIBUTING CLASS 15,521 181,012SEI GLOBAL MASTER FUND PLC GLOBAL EQUITY FUND U.S.$ INSTITUTIONAL DISTRIBUTING CLASS 5,999 87,057SEI GLOBAL MASTER FUND PLC EMERGING MARKETS EQUITY FUND U.S.$ INSTITUTIONAL DISTRIBUTING CLASS 4,016 74,714THREADNEEDLE LUX - ENHANCED COMMODITIES PORTFOLIO 5,800 73,307SEI GLOBAL MASTER FUND PLC GLOBAL MANAGED VOLATILITY FUND U.S.$ INSTITUTIONAL CLASS 3,213 70,978SEI GLOBAL MASTER FUND PLC HIGH YIELD FIXED INCOME FUND U.S.$ INSTITUTIONAL DISTRIBUTING CLASS 8,221 68,595SEI GLOBAL MASTER FUND PLC EMERGING MARKETS DEBT FUND U.S.$ INSTITUTIONAL DISTRIBUTING CLASS 5,973 57,280SEI GLOBAL MASTER FUND PLC LIQUID ALTERNATIVE FUND U.S.$ INSTITUTIONAL DISTRIBUTING CLASS 3,585 42,128SEI GLOBAL MASTER FUND PLC EUROPEAN (EX-U.K.) EQUITY FUND U.S.$ INSTITUTIONAL DISTRIBUTING CLASS 2,293 40,959SEI GLOBAL MASTER FUND PLC FACTOR ALLOCATION U.S. EQUITY FUND U.S.$ INSTITUTIONAL DISTRIBUTING CLASS 2,793 40,586SEI GLOBAL MASTER FUND PLC DYNAMIC ASSET ALLOCATION FUND U.S.$ INSTITUTIONAL DISTRIBUTING CLASS 3,771 38,582SEI GLOBAL MASTER FUND PLC GLOBAL MULTI-ASSET INCOME FUND U.S.$ INSTITUTIONAL DISTRIBUTING CLASS 4,062 38,357SCHRODER ISF GLOBAL INFLATION LINKED BOND 1,071 36,119SEI GLOBAL MASTER FUND PLC U.S. SMALL COMPANIES FUND U.S.$ INSTITUTIONAL DISTRIBUTING CLASS 1,054 28,152SEI GLOBAL MASTER FUND PLC U.S. LARGE COMPANIES FUND U.S.$ INSTITUTIONAL DISTRIBUTING CLASS 1,018 25,025SEI GLOBAL MASTER FUND PLC PAN EUROPEAN SMALL CAP FUND U.S.$ INSTITUTIONAL DISTRIBUTING CLASS 1,109 24,062SEI GLOBAL MASTER FUND PLC ASIA PACIFIC (EX-JAPAN) EQUITY FUND U.S.$ INSTITUTIONAL DISTRIBUTING CLASS 1,550 22,817SEI GLOBAL MASTER FUND PLC GLOBAL SHORT TERM BOND FUND U.S.$ INSTITUTIONAL DISTRIBUTING CLASS 1,879 19,742SEI GLOBAL MASTER FUND PLC JAPAN EQUITY FUND U.S.$ INSTITUTIONAL DISTRIBUTING CLASS 1,403 18,858SEI GLOBAL MASTER FUND PLC U.K. EQUITY FUND U.S.$ INSTITUTIONAL DISTRIBUTING CLASS 1,502 18,234SEI GLOBAL MASTER FUND PLC GLOBAL SHORT DURATION BOND FUND U.S.$ INSTITUTIONAL DISTRIBUTING CLASS 1,567 16,510
187
DocuSign Envelope ID: 2646536F-BB10-4779-844A-39205D22F4E0
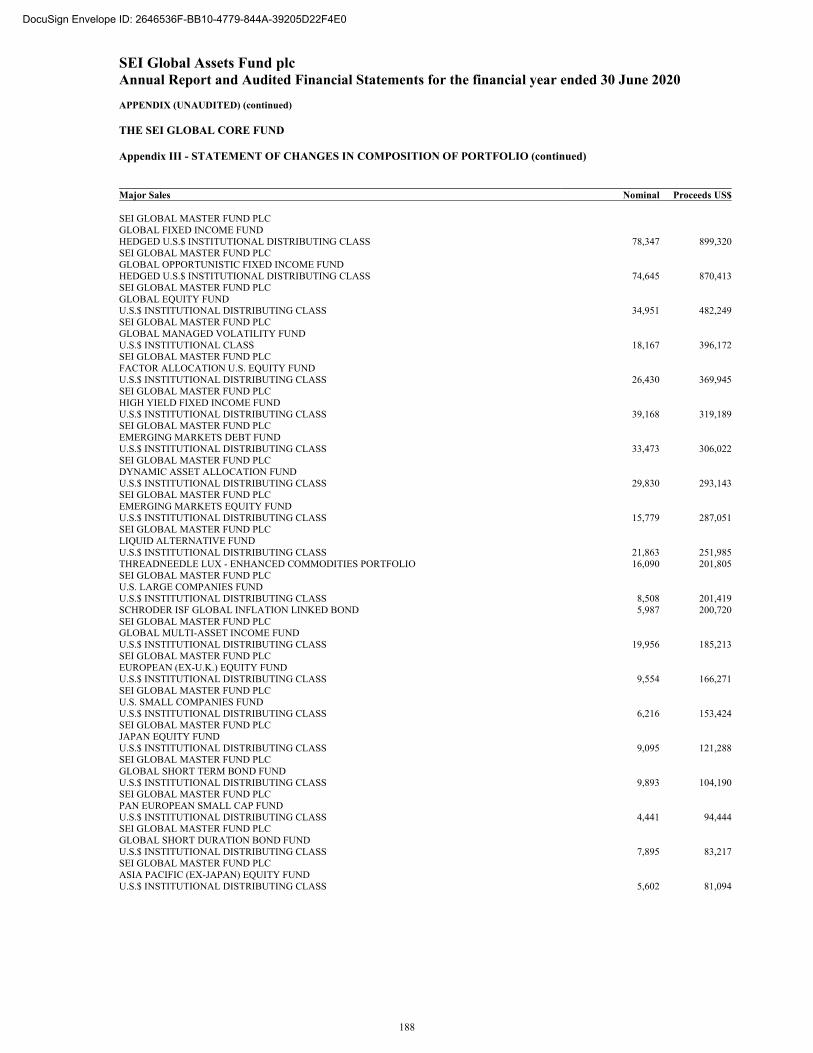
SEI Global Assets Fund plc Annual Report and Audited Financial Statements for the financial year ended 30 June 2020 APPENDIX (UNAUDITED) (continued)
THE SEI GLOBAL CORE FUND Appendix III - STATEMENT OF CHANGES IN COMPOSITION OF PORTFOLIO (continued)
Major Sales Nominal Proceeds US$ SEI GLOBAL MASTER FUND PLC GLOBAL FIXED INCOME FUND HEDGED U.S.$ INSTITUTIONAL DISTRIBUTING CLASS 78,347 899,320SEI GLOBAL MASTER FUND PLC GLOBAL OPPORTUNISTIC FIXED INCOME FUND HEDGED U.S.$ INSTITUTIONAL DISTRIBUTING CLASS 74,645 870,413SEI GLOBAL MASTER FUND PLC GLOBAL EQUITY FUND U.S.$ INSTITUTIONAL DISTRIBUTING CLASS 34,951 482,249SEI GLOBAL MASTER FUND PLC GLOBAL MANAGED VOLATILITY FUND U.S.$ INSTITUTIONAL CLASS 18,167 396,172SEI GLOBAL MASTER FUND PLC FACTOR ALLOCATION U.S. EQUITY FUND U.S.$ INSTITUTIONAL DISTRIBUTING CLASS 26,430 369,945SEI GLOBAL MASTER FUND PLC HIGH YIELD FIXED INCOME FUND U.S.$ INSTITUTIONAL DISTRIBUTING CLASS 39,168 319,189SEI GLOBAL MASTER FUND PLC EMERGING MARKETS DEBT FUND U.S.$ INSTITUTIONAL DISTRIBUTING CLASS 33,473 306,022SEI GLOBAL MASTER FUND PLC DYNAMIC ASSET ALLOCATION FUND U.S.$ INSTITUTIONAL DISTRIBUTING CLASS 29,830 293,143SEI GLOBAL MASTER FUND PLC EMERGING MARKETS EQUITY FUND U.S.$ INSTITUTIONAL DISTRIBUTING CLASS 15,779 287,051SEI GLOBAL MASTER FUND PLC LIQUID ALTERNATIVE FUND U.S.$ INSTITUTIONAL DISTRIBUTING CLASS 21,863 251,985THREADNEEDLE LUX - ENHANCED COMMODITIES PORTFOLIO 16,090 201,805SEI GLOBAL MASTER FUND PLC U.S. LARGE COMPANIES FUND U.S.$ INSTITUTIONAL DISTRIBUTING CLASS 8,508 201,419SCHRODER ISF GLOBAL INFLATION LINKED BOND 5,987 200,720SEI GLOBAL MASTER FUND PLC GLOBAL MULTI-ASSET INCOME FUND U.S.$ INSTITUTIONAL DISTRIBUTING CLASS 19,956 185,213SEI GLOBAL MASTER FUND PLC EUROPEAN (EX-U.K.) EQUITY FUND U.S.$ INSTITUTIONAL DISTRIBUTING CLASS 9,554 166,271SEI GLOBAL MASTER FUND PLC U.S. SMALL COMPANIES FUND U.S.$ INSTITUTIONAL DISTRIBUTING CLASS 6,216 153,424SEI GLOBAL MASTER FUND PLC JAPAN EQUITY FUND U.S.$ INSTITUTIONAL DISTRIBUTING CLASS 9,095 121,288SEI GLOBAL MASTER FUND PLC GLOBAL SHORT TERM BOND FUND U.S.$ INSTITUTIONAL DISTRIBUTING CLASS 9,893 104,190SEI GLOBAL MASTER FUND PLC PAN EUROPEAN SMALL CAP FUND U.S.$ INSTITUTIONAL DISTRIBUTING CLASS 4,441 94,444SEI GLOBAL MASTER FUND PLC GLOBAL SHORT DURATION BOND FUND U.S.$ INSTITUTIONAL DISTRIBUTING CLASS 7,895 83,217SEI GLOBAL MASTER FUND PLC ASIA PACIFIC (EX-JAPAN) EQUITY FUND U.S.$ INSTITUTIONAL DISTRIBUTING CLASS 5,602 81,094
188
DocuSign Envelope ID: 2646536F-BB10-4779-844A-39205D22F4E0
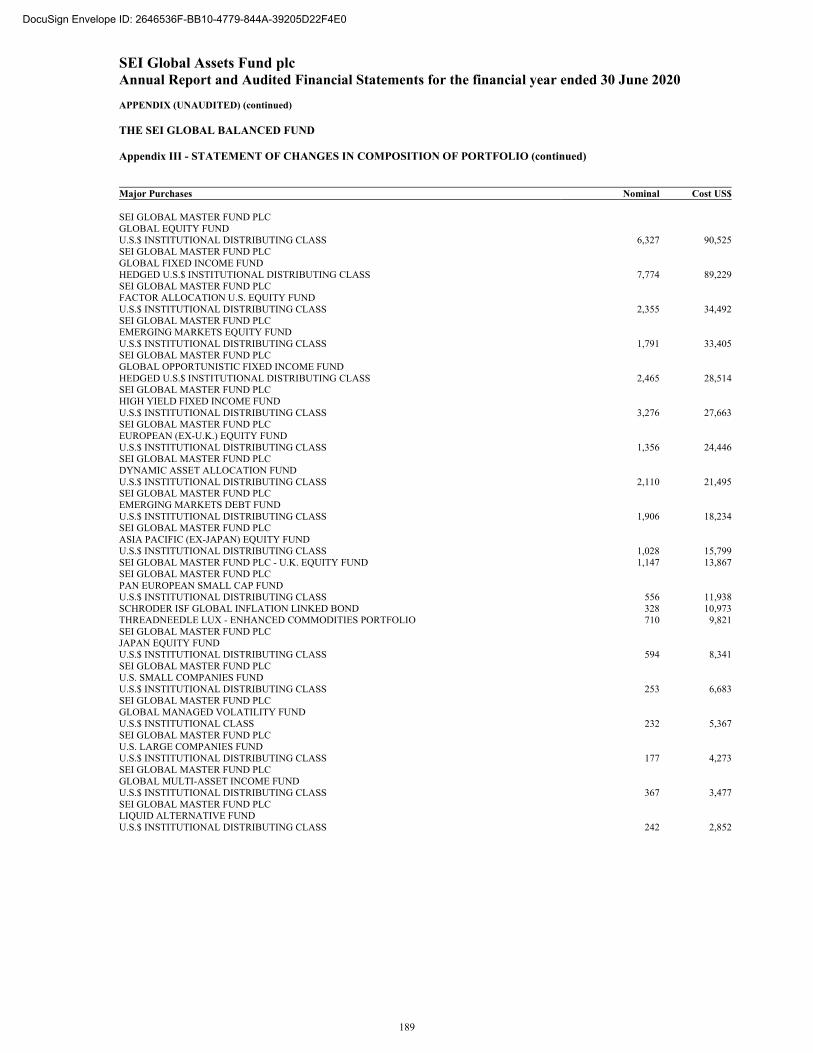
SEI Global Assets Fund plc Annual Report and Audited Financial Statements for the financial year ended 30 June 2020 APPENDIX (UNAUDITED) (continued)
THE SEI GLOBAL BALANCED FUND Appendix III - STATEMENT OF CHANGES IN COMPOSITION OF PORTFOLIO (continued)
Major Purchases Nominal Cost US$ SEI GLOBAL MASTER FUND PLC GLOBAL EQUITY FUND U.S.$ INSTITUTIONAL DISTRIBUTING CLASS 6,327 90,525SEI GLOBAL MASTER FUND PLC GLOBAL FIXED INCOME FUND HEDGED U.S.$ INSTITUTIONAL DISTRIBUTING CLASS 7,774 89,229SEI GLOBAL MASTER FUND PLC FACTOR ALLOCATION U.S. EQUITY FUND U.S.$ INSTITUTIONAL DISTRIBUTING CLASS 2,355 34,492SEI GLOBAL MASTER FUND PLC EMERGING MARKETS EQUITY FUND U.S.$ INSTITUTIONAL DISTRIBUTING CLASS 1,791 33,405SEI GLOBAL MASTER FUND PLC GLOBAL OPPORTUNISTIC FIXED INCOME FUND HEDGED U.S.$ INSTITUTIONAL DISTRIBUTING CLASS 2,465 28,514SEI GLOBAL MASTER FUND PLC HIGH YIELD FIXED INCOME FUND U.S.$ INSTITUTIONAL DISTRIBUTING CLASS 3,276 27,663SEI GLOBAL MASTER FUND PLC EUROPEAN (EX-U.K.) EQUITY FUND U.S.$ INSTITUTIONAL DISTRIBUTING CLASS 1,356 24,446SEI GLOBAL MASTER FUND PLC DYNAMIC ASSET ALLOCATION FUND U.S.$ INSTITUTIONAL DISTRIBUTING CLASS 2,110 21,495SEI GLOBAL MASTER FUND PLC EMERGING MARKETS DEBT FUND U.S.$ INSTITUTIONAL DISTRIBUTING CLASS 1,906 18,234SEI GLOBAL MASTER FUND PLC ASIA PACIFIC (EX-JAPAN) EQUITY FUND U.S.$ INSTITUTIONAL DISTRIBUTING CLASS 1,028 15,799SEI GLOBAL MASTER FUND PLC - U.K. EQUITY FUND 1,147 13,867SEI GLOBAL MASTER FUND PLC PAN EUROPEAN SMALL CAP FUND U.S.$ INSTITUTIONAL DISTRIBUTING CLASS 556 11,938SCHRODER ISF GLOBAL INFLATION LINKED BOND 328 10,973THREADNEEDLE LUX - ENHANCED COMMODITIES PORTFOLIO 710 9,821SEI GLOBAL MASTER FUND PLC JAPAN EQUITY FUND U.S.$ INSTITUTIONAL DISTRIBUTING CLASS 594 8,341SEI GLOBAL MASTER FUND PLC U.S. SMALL COMPANIES FUND U.S.$ INSTITUTIONAL DISTRIBUTING CLASS 253 6,683SEI GLOBAL MASTER FUND PLC GLOBAL MANAGED VOLATILITY FUND U.S.$ INSTITUTIONAL CLASS 232 5,367SEI GLOBAL MASTER FUND PLC U.S. LARGE COMPANIES FUND U.S.$ INSTITUTIONAL DISTRIBUTING CLASS 177 4,273SEI GLOBAL MASTER FUND PLC GLOBAL MULTI-ASSET INCOME FUND U.S.$ INSTITUTIONAL DISTRIBUTING CLASS 367 3,477SEI GLOBAL MASTER FUND PLC LIQUID ALTERNATIVE FUND U.S.$ INSTITUTIONAL DISTRIBUTING CLASS 242 2,852
189
DocuSign Envelope ID: 2646536F-BB10-4779-844A-39205D22F4E0
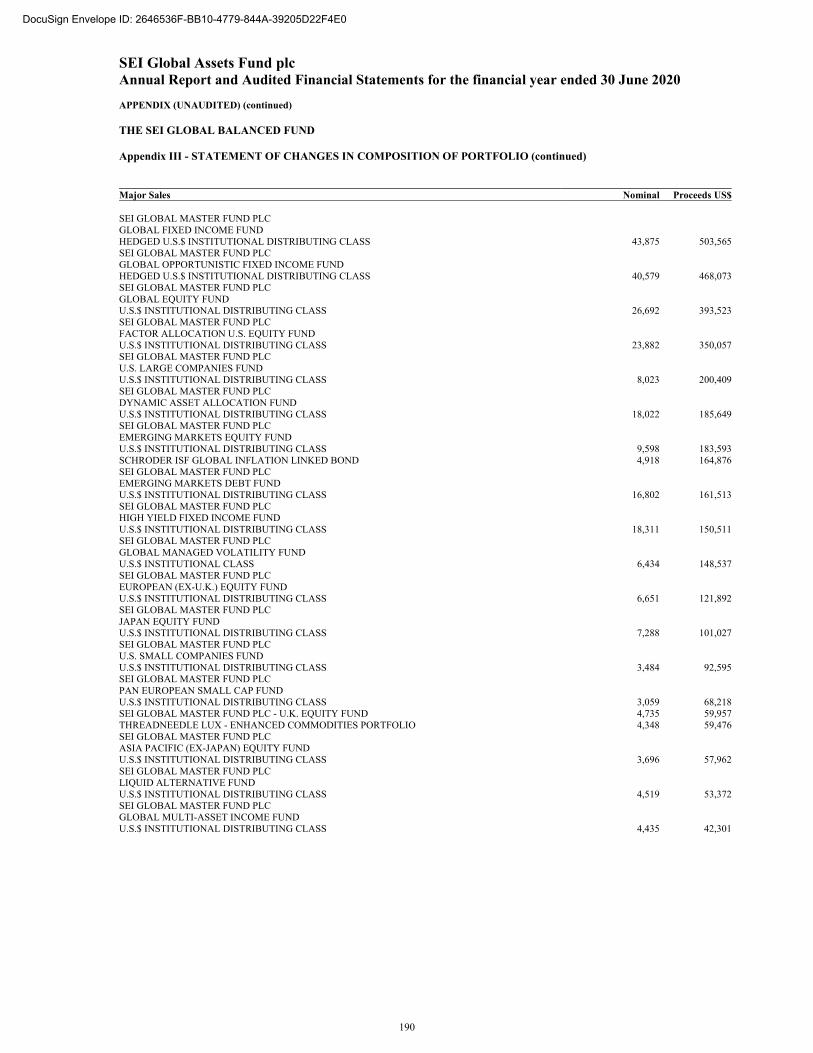
SEI Global Assets Fund plc Annual Report and Audited Financial Statements for the financial year ended 30 June 2020 APPENDIX (UNAUDITED) (continued)
THE SEI GLOBAL BALANCED FUND Appendix III - STATEMENT OF CHANGES IN COMPOSITION OF PORTFOLIO (continued)
Major Sales Nominal Proceeds US$ SEI GLOBAL MASTER FUND PLC GLOBAL FIXED INCOME FUND HEDGED U.S.$ INSTITUTIONAL DISTRIBUTING CLASS 43,875 503,565SEI GLOBAL MASTER FUND PLC GLOBAL OPPORTUNISTIC FIXED INCOME FUND HEDGED U.S.$ INSTITUTIONAL DISTRIBUTING CLASS 40,579 468,073SEI GLOBAL MASTER FUND PLC GLOBAL EQUITY FUND U.S.$ INSTITUTIONAL DISTRIBUTING CLASS 26,692 393,523SEI GLOBAL MASTER FUND PLC FACTOR ALLOCATION U.S. EQUITY FUND U.S.$ INSTITUTIONAL DISTRIBUTING CLASS 23,882 350,057SEI GLOBAL MASTER FUND PLC U.S. LARGE COMPANIES FUND U.S.$ INSTITUTIONAL DISTRIBUTING CLASS 8,023 200,409SEI GLOBAL MASTER FUND PLC DYNAMIC ASSET ALLOCATION FUND U.S.$ INSTITUTIONAL DISTRIBUTING CLASS 18,022 185,649SEI GLOBAL MASTER FUND PLC EMERGING MARKETS EQUITY FUND U.S.$ INSTITUTIONAL DISTRIBUTING CLASS 9,598 183,593SCHRODER ISF GLOBAL INFLATION LINKED BOND 4,918 164,876SEI GLOBAL MASTER FUND PLC EMERGING MARKETS DEBT FUND U.S.$ INSTITUTIONAL DISTRIBUTING CLASS 16,802 161,513SEI GLOBAL MASTER FUND PLC HIGH YIELD FIXED INCOME FUND U.S.$ INSTITUTIONAL DISTRIBUTING CLASS 18,311 150,511SEI GLOBAL MASTER FUND PLC GLOBAL MANAGED VOLATILITY FUND U.S.$ INSTITUTIONAL CLASS 6,434 148,537SEI GLOBAL MASTER FUND PLC EUROPEAN (EX-U.K.) EQUITY FUND U.S.$ INSTITUTIONAL DISTRIBUTING CLASS 6,651 121,892SEI GLOBAL MASTER FUND PLC JAPAN EQUITY FUND U.S.$ INSTITUTIONAL DISTRIBUTING CLASS 7,288 101,027SEI GLOBAL MASTER FUND PLC U.S. SMALL COMPANIES FUND U.S.$ INSTITUTIONAL DISTRIBUTING CLASS 3,484 92,595SEI GLOBAL MASTER FUND PLC PAN EUROPEAN SMALL CAP FUND U.S.$ INSTITUTIONAL DISTRIBUTING CLASS 3,059 68,218SEI GLOBAL MASTER FUND PLC - U.K. EQUITY FUND 4,735 59,957THREADNEEDLE LUX - ENHANCED COMMODITIES PORTFOLIO 4,348 59,476SEI GLOBAL MASTER FUND PLC ASIA PACIFIC (EX-JAPAN) EQUITY FUND U.S.$ INSTITUTIONAL DISTRIBUTING CLASS 3,696 57,962SEI GLOBAL MASTER FUND PLC LIQUID ALTERNATIVE FUND U.S.$ INSTITUTIONAL DISTRIBUTING CLASS 4,519 53,372SEI GLOBAL MASTER FUND PLC GLOBAL MULTI-ASSET INCOME FUND U.S.$ INSTITUTIONAL DISTRIBUTING CLASS 4,435 42,301
190
DocuSign Envelope ID: 2646536F-BB10-4779-844A-39205D22F4E0
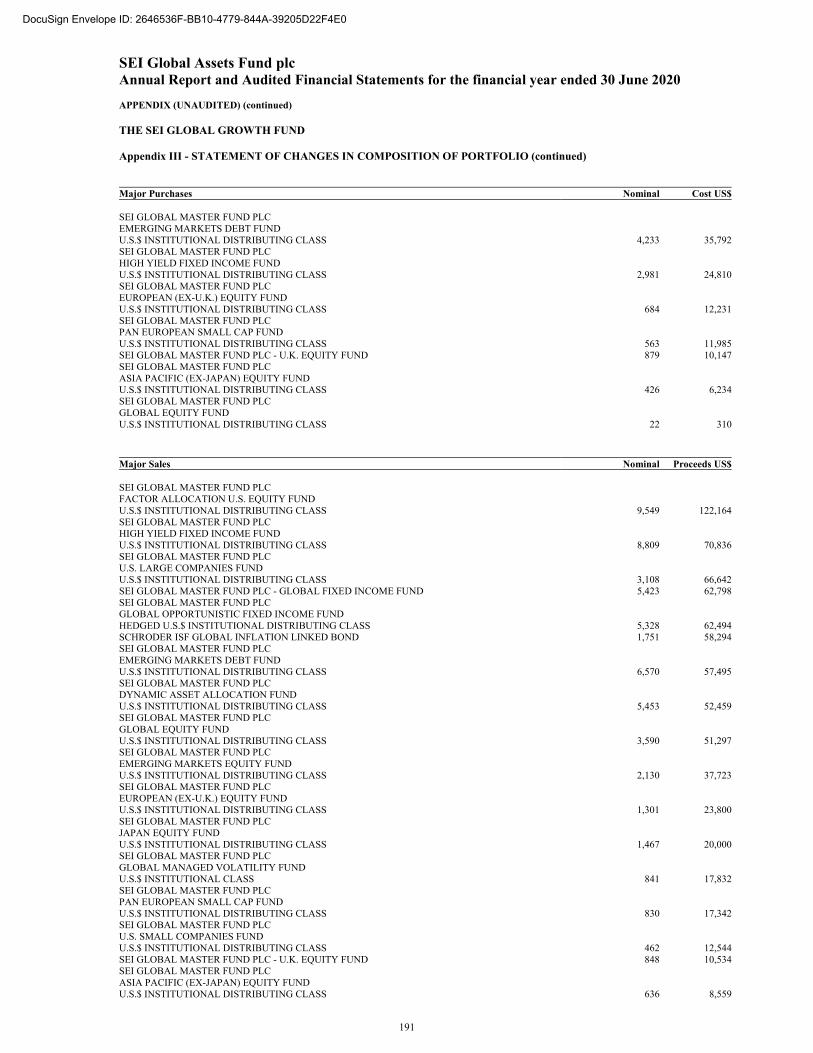
SEI Global Assets Fund plc Annual Report and Audited Financial Statements for the financial year ended 30 June 2020 APPENDIX (UNAUDITED) (continued)
THE SEI GLOBAL GROWTH FUND Appendix III - STATEMENT OF CHANGES IN COMPOSITION OF PORTFOLIO (continued)
Major Purchases Nominal Cost US$ SEI GLOBAL MASTER FUND PLC EMERGING MARKETS DEBT FUND U.S.$ INSTITUTIONAL DISTRIBUTING CLASS 4,233 35,792SEI GLOBAL MASTER FUND PLC HIGH YIELD FIXED INCOME FUND U.S.$ INSTITUTIONAL DISTRIBUTING CLASS 2,981 24,810SEI GLOBAL MASTER FUND PLC EUROPEAN (EX-U.K.) EQUITY FUND U.S.$ INSTITUTIONAL DISTRIBUTING CLASS 684 12,231SEI GLOBAL MASTER FUND PLC PAN EUROPEAN SMALL CAP FUND U.S.$ INSTITUTIONAL DISTRIBUTING CLASS 563 11,985SEI GLOBAL MASTER FUND PLC - U.K. EQUITY FUND 879 10,147SEI GLOBAL MASTER FUND PLC ASIA PACIFIC (EX-JAPAN) EQUITY FUND U.S.$ INSTITUTIONAL DISTRIBUTING CLASS 426 6,234SEI GLOBAL MASTER FUND PLC GLOBAL EQUITY FUND U.S.$ INSTITUTIONAL DISTRIBUTING CLASS 22 310
Major Sales Nominal Proceeds US$ SEI GLOBAL MASTER FUND PLC FACTOR ALLOCATION U.S. EQUITY FUND U.S.$ INSTITUTIONAL DISTRIBUTING CLASS 9,549 122,164SEI GLOBAL MASTER FUND PLC HIGH YIELD FIXED INCOME FUND U.S.$ INSTITUTIONAL DISTRIBUTING CLASS 8,809 70,836SEI GLOBAL MASTER FUND PLC U.S. LARGE COMPANIES FUND U.S.$ INSTITUTIONAL DISTRIBUTING CLASS 3,108 66,642SEI GLOBAL MASTER FUND PLC - GLOBAL FIXED INCOME FUND 5,423 62,798SEI GLOBAL MASTER FUND PLC GLOBAL OPPORTUNISTIC FIXED INCOME FUND HEDGED U.S.$ INSTITUTIONAL DISTRIBUTING CLASS 5,328 62,494SCHRODER ISF GLOBAL INFLATION LINKED BOND 1,751 58,294SEI GLOBAL MASTER FUND PLC EMERGING MARKETS DEBT FUND U.S.$ INSTITUTIONAL DISTRIBUTING CLASS 6,570 57,495SEI GLOBAL MASTER FUND PLC DYNAMIC ASSET ALLOCATION FUND U.S.$ INSTITUTIONAL DISTRIBUTING CLASS 5,453 52,459SEI GLOBAL MASTER FUND PLC GLOBAL EQUITY FUND U.S.$ INSTITUTIONAL DISTRIBUTING CLASS 3,590 51,297SEI GLOBAL MASTER FUND PLC EMERGING MARKETS EQUITY FUND U.S.$ INSTITUTIONAL DISTRIBUTING CLASS 2,130 37,723SEI GLOBAL MASTER FUND PLC EUROPEAN (EX-U.K.) EQUITY FUND U.S.$ INSTITUTIONAL DISTRIBUTING CLASS 1,301 23,800SEI GLOBAL MASTER FUND PLC JAPAN EQUITY FUND U.S.$ INSTITUTIONAL DISTRIBUTING CLASS 1,467 20,000SEI GLOBAL MASTER FUND PLC GLOBAL MANAGED VOLATILITY FUND U.S.$ INSTITUTIONAL CLASS 841 17,832SEI GLOBAL MASTER FUND PLC PAN EUROPEAN SMALL CAP FUND U.S.$ INSTITUTIONAL DISTRIBUTING CLASS 830 17,342SEI GLOBAL MASTER FUND PLC U.S. SMALL COMPANIES FUND U.S.$ INSTITUTIONAL DISTRIBUTING CLASS 462 12,544SEI GLOBAL MASTER FUND PLC - U.K. EQUITY FUND 848 10,534SEI GLOBAL MASTER FUND PLC ASIA PACIFIC (EX-JAPAN) EQUITY FUND U.S.$ INSTITUTIONAL DISTRIBUTING CLASS 636 8,559
191
DocuSign Envelope ID: 2646536F-BB10-4779-844A-39205D22F4E0
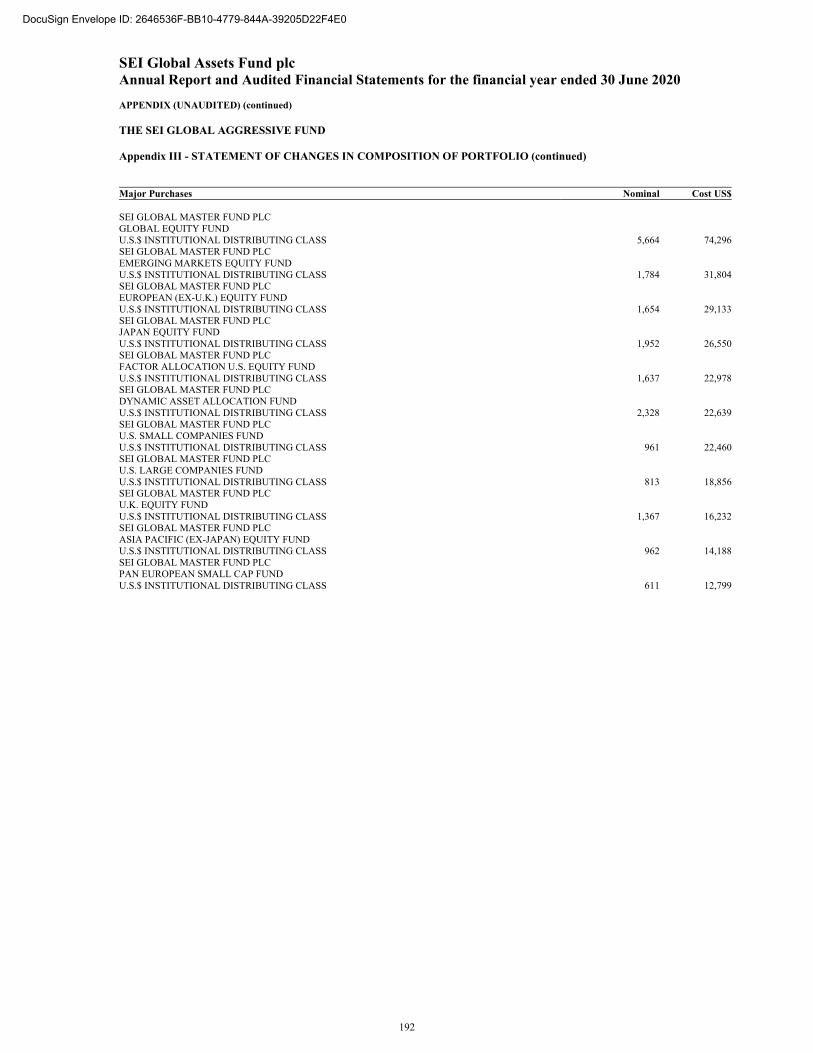
SEI Global Assets Fund plc Annual Report and Audited Financial Statements for the financial year ended 30 June 2020 APPENDIX (UNAUDITED) (continued)
THE SEI GLOBAL AGGRESSIVE FUND Appendix III - STATEMENT OF CHANGES IN COMPOSITION OF PORTFOLIO (continued)
Major Purchases Nominal Cost US$ SEI GLOBAL MASTER FUND PLC GLOBAL EQUITY FUND U.S.$ INSTITUTIONAL DISTRIBUTING CLASS 5,664 74,296SEI GLOBAL MASTER FUND PLC EMERGING MARKETS EQUITY FUND U.S.$ INSTITUTIONAL DISTRIBUTING CLASS 1,784 31,804SEI GLOBAL MASTER FUND PLC EUROPEAN (EX-U.K.) EQUITY FUND U.S.$ INSTITUTIONAL DISTRIBUTING CLASS 1,654 29,133SEI GLOBAL MASTER FUND PLC JAPAN EQUITY FUND U.S.$ INSTITUTIONAL DISTRIBUTING CLASS 1,952 26,550SEI GLOBAL MASTER FUND PLC FACTOR ALLOCATION U.S. EQUITY FUND U.S.$ INSTITUTIONAL DISTRIBUTING CLASS 1,637 22,978SEI GLOBAL MASTER FUND PLC DYNAMIC ASSET ALLOCATION FUND U.S.$ INSTITUTIONAL DISTRIBUTING CLASS 2,328 22,639SEI GLOBAL MASTER FUND PLC U.S. SMALL COMPANIES FUND U.S.$ INSTITUTIONAL DISTRIBUTING CLASS 961 22,460SEI GLOBAL MASTER FUND PLC U.S. LARGE COMPANIES FUND U.S.$ INSTITUTIONAL DISTRIBUTING CLASS 813 18,856SEI GLOBAL MASTER FUND PLC U.K. EQUITY FUND U.S.$ INSTITUTIONAL DISTRIBUTING CLASS 1,367 16,232SEI GLOBAL MASTER FUND PLC ASIA PACIFIC (EX-JAPAN) EQUITY FUND U.S.$ INSTITUTIONAL DISTRIBUTING CLASS 962 14,188SEI GLOBAL MASTER FUND PLC PAN EUROPEAN SMALL CAP FUND U.S.$ INSTITUTIONAL DISTRIBUTING CLASS 611 12,799
192
DocuSign Envelope ID: 2646536F-BB10-4779-844A-39205D22F4E0
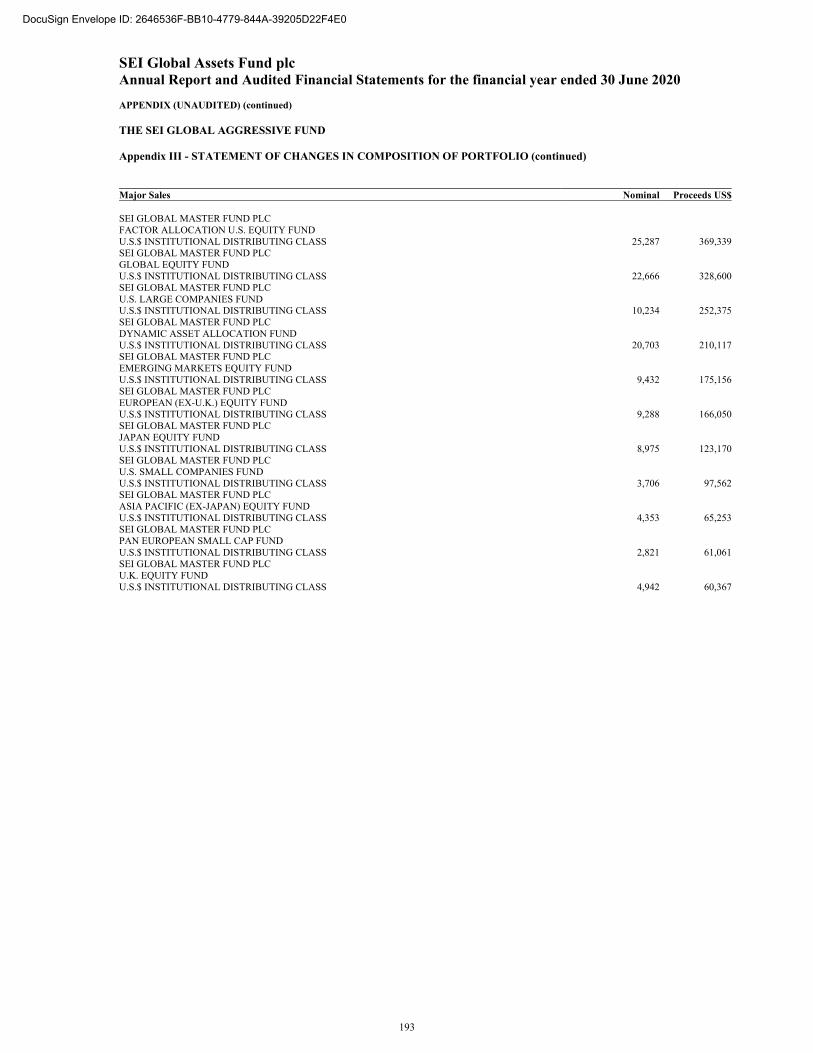
SEI Global Assets Fund plc Annual Report and Audited Financial Statements for the financial year ended 30 June 2020 APPENDIX (UNAUDITED) (continued)
THE SEI GLOBAL AGGRESSIVE FUND Appendix III - STATEMENT OF CHANGES IN COMPOSITION OF PORTFOLIO (continued)
Major Sales Nominal Proceeds US$ SEI GLOBAL MASTER FUND PLC FACTOR ALLOCATION U.S. EQUITY FUND U.S.$ INSTITUTIONAL DISTRIBUTING CLASS 25,287 369,339SEI GLOBAL MASTER FUND PLC GLOBAL EQUITY FUND U.S.$ INSTITUTIONAL DISTRIBUTING CLASS 22,666 328,600SEI GLOBAL MASTER FUND PLC U.S. LARGE COMPANIES FUND U.S.$ INSTITUTIONAL DISTRIBUTING CLASS 10,234 252,375SEI GLOBAL MASTER FUND PLC DYNAMIC ASSET ALLOCATION FUND U.S.$ INSTITUTIONAL DISTRIBUTING CLASS 20,703 210,117SEI GLOBAL MASTER FUND PLC EMERGING MARKETS EQUITY FUND U.S.$ INSTITUTIONAL DISTRIBUTING CLASS 9,432 175,156SEI GLOBAL MASTER FUND PLC EUROPEAN (EX-U.K.) EQUITY FUND U.S.$ INSTITUTIONAL DISTRIBUTING CLASS 9,288 166,050SEI GLOBAL MASTER FUND PLC JAPAN EQUITY FUND U.S.$ INSTITUTIONAL DISTRIBUTING CLASS 8,975 123,170SEI GLOBAL MASTER FUND PLC U.S. SMALL COMPANIES FUND U.S.$ INSTITUTIONAL DISTRIBUTING CLASS 3,706 97,562SEI GLOBAL MASTER FUND PLC ASIA PACIFIC (EX-JAPAN) EQUITY FUND U.S.$ INSTITUTIONAL DISTRIBUTING CLASS 4,353 65,253SEI GLOBAL MASTER FUND PLC PAN EUROPEAN SMALL CAP FUND U.S.$ INSTITUTIONAL DISTRIBUTING CLASS 2,821 61,061SEI GLOBAL MASTER FUND PLC U.K. EQUITY FUND U.S.$ INSTITUTIONAL DISTRIBUTING CLASS 4,942 60,367
193
DocuSign Envelope ID: 2646536F-BB10-4779-844A-39205D22F4E0
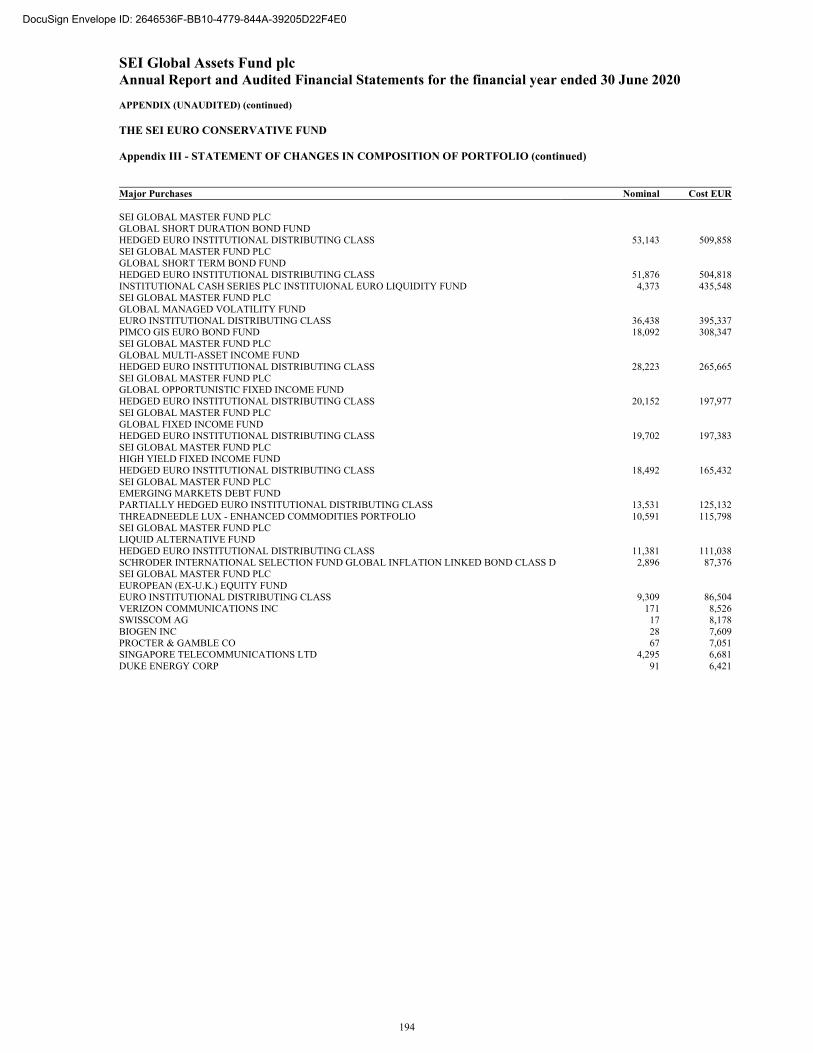
SEI Global Assets Fund plc Annual Report and Audited Financial Statements for the financial year ended 30 June 2020 APPENDIX (UNAUDITED) (continued)
THE SEI EURO CONSERVATIVE FUND Appendix III - STATEMENT OF CHANGES IN COMPOSITION OF PORTFOLIO (continued)
Major Purchases Nominal Cost EUR SEI GLOBAL MASTER FUND PLC GLOBAL SHORT DURATION BOND FUND HEDGED EURO INSTITUTIONAL DISTRIBUTING CLASS 53,143 509,858SEI GLOBAL MASTER FUND PLC GLOBAL SHORT TERM BOND FUND HEDGED EURO INSTITUTIONAL DISTRIBUTING CLASS 51,876 504,818INSTITUTIONAL CASH SERIES PLC INSTITUIONAL EURO LIQUIDITY FUND 4,373 435,548SEI GLOBAL MASTER FUND PLC GLOBAL MANAGED VOLATILITY FUND EURO INSTITUTIONAL DISTRIBUTING CLASS 36,438 395,337PIMCO GIS EURO BOND FUND 18,092 308,347SEI GLOBAL MASTER FUND PLC GLOBAL MULTI-ASSET INCOME FUND HEDGED EURO INSTITUTIONAL DISTRIBUTING CLASS 28,223 265,665SEI GLOBAL MASTER FUND PLC GLOBAL OPPORTUNISTIC FIXED INCOME FUND HEDGED EURO INSTITUTIONAL DISTRIBUTING CLASS 20,152 197,977SEI GLOBAL MASTER FUND PLC GLOBAL FIXED INCOME FUND HEDGED EURO INSTITUTIONAL DISTRIBUTING CLASS 19,702 197,383SEI GLOBAL MASTER FUND PLC HIGH YIELD FIXED INCOME FUND HEDGED EURO INSTITUTIONAL DISTRIBUTING CLASS 18,492 165,432SEI GLOBAL MASTER FUND PLC EMERGING MARKETS DEBT FUND PARTIALLY HEDGED EURO INSTITUTIONAL DISTRIBUTING CLASS 13,531 125,132THREADNEEDLE LUX - ENHANCED COMMODITIES PORTFOLIO 10,591 115,798SEI GLOBAL MASTER FUND PLC LIQUID ALTERNATIVE FUND HEDGED EURO INSTITUTIONAL DISTRIBUTING CLASS 11,381 111,038SCHRODER INTERNATIONAL SELECTION FUND GLOBAL INFLATION LINKED BOND CLASS D 2,896 87,376SEI GLOBAL MASTER FUND PLC EUROPEAN (EX-U.K.) EQUITY FUND EURO INSTITUTIONAL DISTRIBUTING CLASS 9,309 86,504VERIZON COMMUNICATIONS INC 171 8,526SWISSCOM AG 17 8,178BIOGEN INC 28 7,609PROCTER & GAMBLE CO 67 7,051SINGAPORE TELECOMMUNICATIONS LTD 4,295 6,681DUKE ENERGY CORP 91 6,421
194
DocuSign Envelope ID: 2646536F-BB10-4779-844A-39205D22F4E0
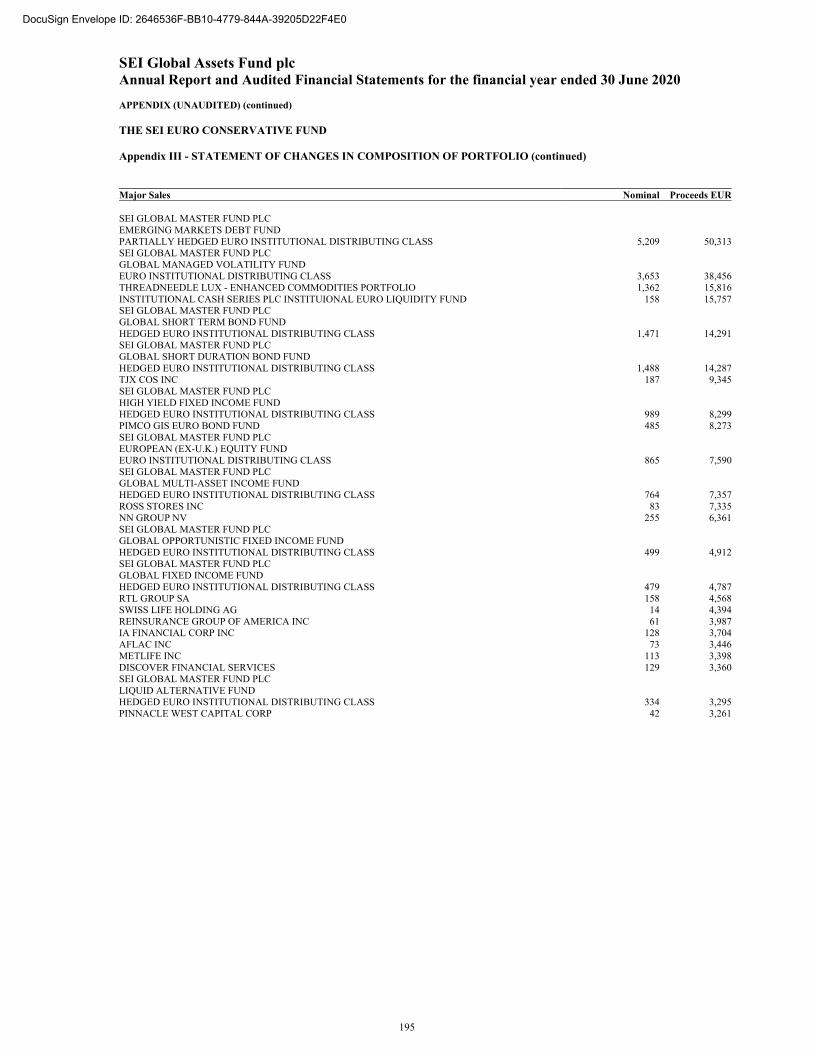
SEI Global Assets Fund plc Annual Report and Audited Financial Statements for the financial year ended 30 June 2020 APPENDIX (UNAUDITED) (continued)
THE SEI EURO CONSERVATIVE FUND Appendix III - STATEMENT OF CHANGES IN COMPOSITION OF PORTFOLIO (continued)
Major Sales Nominal Proceeds EUR SEI GLOBAL MASTER FUND PLC EMERGING MARKETS DEBT FUND PARTIALLY HEDGED EURO INSTITUTIONAL DISTRIBUTING CLASS 5,209 50,313SEI GLOBAL MASTER FUND PLC GLOBAL MANAGED VOLATILITY FUND EURO INSTITUTIONAL DISTRIBUTING CLASS 3,653 38,456THREADNEEDLE LUX - ENHANCED COMMODITIES PORTFOLIO 1,362 15,816INSTITUTIONAL CASH SERIES PLC INSTITUIONAL EURO LIQUIDITY FUND 158 15,757SEI GLOBAL MASTER FUND PLC GLOBAL SHORT TERM BOND FUND HEDGED EURO INSTITUTIONAL DISTRIBUTING CLASS 1,471 14,291SEI GLOBAL MASTER FUND PLC GLOBAL SHORT DURATION BOND FUND HEDGED EURO INSTITUTIONAL DISTRIBUTING CLASS 1,488 14,287TJX COS INC 187 9,345SEI GLOBAL MASTER FUND PLC HIGH YIELD FIXED INCOME FUND HEDGED EURO INSTITUTIONAL DISTRIBUTING CLASS 989 8,299PIMCO GIS EURO BOND FUND 485 8,273SEI GLOBAL MASTER FUND PLC EUROPEAN (EX-U.K.) EQUITY FUND EURO INSTITUTIONAL DISTRIBUTING CLASS 865 7,590SEI GLOBAL MASTER FUND PLC GLOBAL MULTI-ASSET INCOME FUND HEDGED EURO INSTITUTIONAL DISTRIBUTING CLASS 764 7,357ROSS STORES INC 83 7,335NN GROUP NV 255 6,361SEI GLOBAL MASTER FUND PLC GLOBAL OPPORTUNISTIC FIXED INCOME FUND HEDGED EURO INSTITUTIONAL DISTRIBUTING CLASS 499 4,912SEI GLOBAL MASTER FUND PLC GLOBAL FIXED INCOME FUND HEDGED EURO INSTITUTIONAL DISTRIBUTING CLASS 479 4,787RTL GROUP SA 158 4,568SWISS LIFE HOLDING AG 14 4,394REINSURANCE GROUP OF AMERICA INC 61 3,987IA FINANCIAL CORP INC 128 3,704AFLAC INC 73 3,446METLIFE INC 113 3,398DISCOVER FINANCIAL SERVICES 129 3,360SEI GLOBAL MASTER FUND PLC LIQUID ALTERNATIVE FUND HEDGED EURO INSTITUTIONAL DISTRIBUTING CLASS 334 3,295PINNACLE WEST CAPITAL CORP 42 3,261
195
DocuSign Envelope ID: 2646536F-BB10-4779-844A-39205D22F4E0
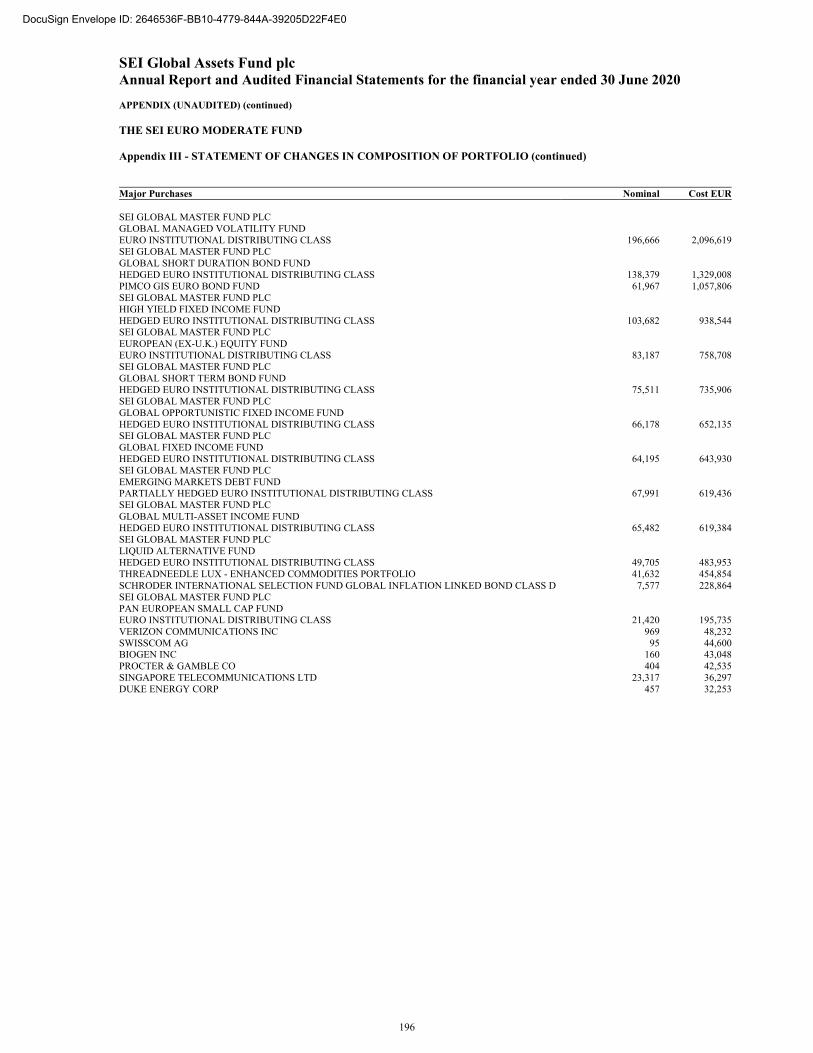
SEI Global Assets Fund plc Annual Report and Audited Financial Statements for the financial year ended 30 June 2020 APPENDIX (UNAUDITED) (continued)
THE SEI EURO MODERATE FUND Appendix III - STATEMENT OF CHANGES IN COMPOSITION OF PORTFOLIO (continued)
Major Purchases Nominal Cost EUR SEI GLOBAL MASTER FUND PLC GLOBAL MANAGED VOLATILITY FUND EURO INSTITUTIONAL DISTRIBUTING CLASS 196,666 2,096,619SEI GLOBAL MASTER FUND PLC GLOBAL SHORT DURATION BOND FUND HEDGED EURO INSTITUTIONAL DISTRIBUTING CLASS 138,379 1,329,008PIMCO GIS EURO BOND FUND 61,967 1,057,806SEI GLOBAL MASTER FUND PLC HIGH YIELD FIXED INCOME FUND HEDGED EURO INSTITUTIONAL DISTRIBUTING CLASS 103,682 938,544SEI GLOBAL MASTER FUND PLC EUROPEAN (EX-U.K.) EQUITY FUND EURO INSTITUTIONAL DISTRIBUTING CLASS 83,187 758,708SEI GLOBAL MASTER FUND PLC GLOBAL SHORT TERM BOND FUND HEDGED EURO INSTITUTIONAL DISTRIBUTING CLASS 75,511 735,906SEI GLOBAL MASTER FUND PLC GLOBAL OPPORTUNISTIC FIXED INCOME FUND HEDGED EURO INSTITUTIONAL DISTRIBUTING CLASS 66,178 652,135SEI GLOBAL MASTER FUND PLC GLOBAL FIXED INCOME FUND HEDGED EURO INSTITUTIONAL DISTRIBUTING CLASS 64,195 643,930SEI GLOBAL MASTER FUND PLC EMERGING MARKETS DEBT FUND PARTIALLY HEDGED EURO INSTITUTIONAL DISTRIBUTING CLASS 67,991 619,436SEI GLOBAL MASTER FUND PLC GLOBAL MULTI-ASSET INCOME FUND HEDGED EURO INSTITUTIONAL DISTRIBUTING CLASS 65,482 619,384SEI GLOBAL MASTER FUND PLC LIQUID ALTERNATIVE FUND HEDGED EURO INSTITUTIONAL DISTRIBUTING CLASS 49,705 483,953THREADNEEDLE LUX - ENHANCED COMMODITIES PORTFOLIO 41,632 454,854SCHRODER INTERNATIONAL SELECTION FUND GLOBAL INFLATION LINKED BOND CLASS D 7,577 228,864SEI GLOBAL MASTER FUND PLC PAN EUROPEAN SMALL CAP FUND EURO INSTITUTIONAL DISTRIBUTING CLASS 21,420 195,735VERIZON COMMUNICATIONS INC 969 48,232SWISSCOM AG 95 44,600BIOGEN INC 160 43,048PROCTER & GAMBLE CO 404 42,535SINGAPORE TELECOMMUNICATIONS LTD 23,317 36,297DUKE ENERGY CORP 457 32,253
196
DocuSign Envelope ID: 2646536F-BB10-4779-844A-39205D22F4E0
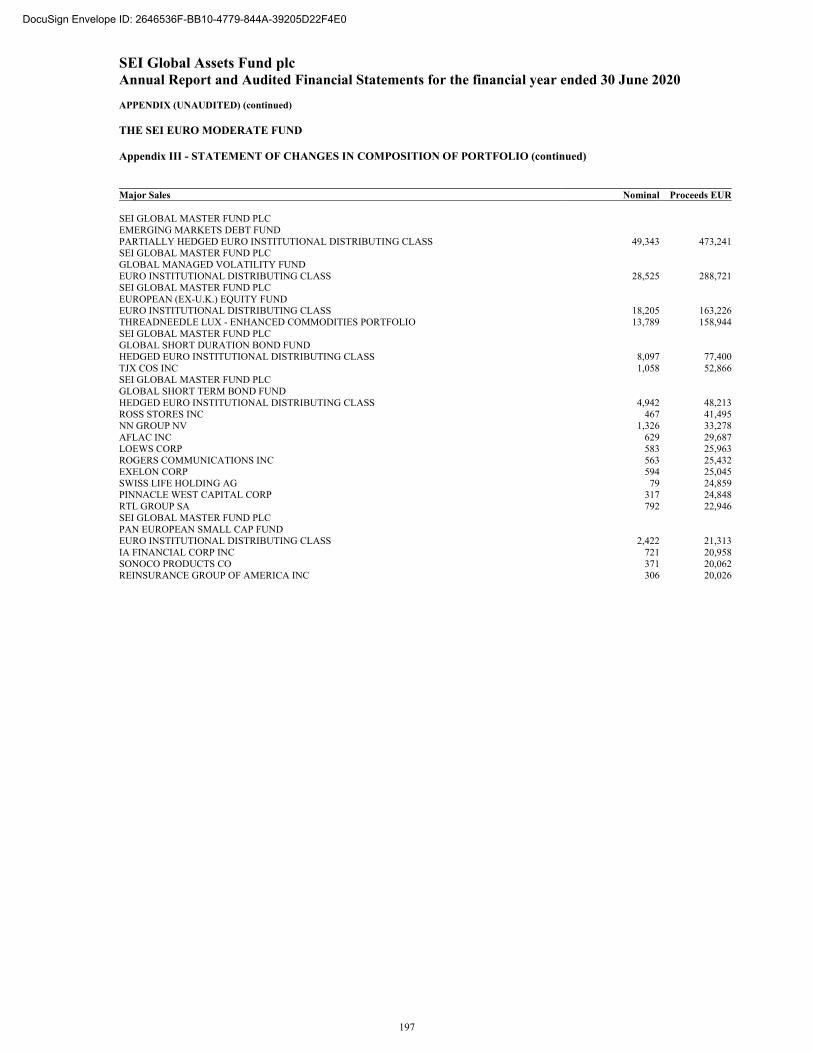
SEI Global Assets Fund plc Annual Report and Audited Financial Statements for the financial year ended 30 June 2020 APPENDIX (UNAUDITED) (continued)
THE SEI EURO MODERATE FUND Appendix III - STATEMENT OF CHANGES IN COMPOSITION OF PORTFOLIO (continued)
Major Sales Nominal Proceeds EUR SEI GLOBAL MASTER FUND PLC EMERGING MARKETS DEBT FUND PARTIALLY HEDGED EURO INSTITUTIONAL DISTRIBUTING CLASS 49,343 473,241SEI GLOBAL MASTER FUND PLC GLOBAL MANAGED VOLATILITY FUND EURO INSTITUTIONAL DISTRIBUTING CLASS 28,525 288,721SEI GLOBAL MASTER FUND PLC EUROPEAN (EX-U.K.) EQUITY FUND EURO INSTITUTIONAL DISTRIBUTING CLASS 18,205 163,226THREADNEEDLE LUX - ENHANCED COMMODITIES PORTFOLIO 13,789 158,944SEI GLOBAL MASTER FUND PLC GLOBAL SHORT DURATION BOND FUND HEDGED EURO INSTITUTIONAL DISTRIBUTING CLASS 8,097 77,400TJX COS INC 1,058 52,866SEI GLOBAL MASTER FUND PLC GLOBAL SHORT TERM BOND FUND HEDGED EURO INSTITUTIONAL DISTRIBUTING CLASS 4,942 48,213ROSS STORES INC 467 41,495NN GROUP NV 1,326 33,278AFLAC INC 629 29,687LOEWS CORP 583 25,963ROGERS COMMUNICATIONS INC 563 25,432EXELON CORP 594 25,045SWISS LIFE HOLDING AG 79 24,859PINNACLE WEST CAPITAL CORP 317 24,848RTL GROUP SA 792 22,946SEI GLOBAL MASTER FUND PLC PAN EUROPEAN SMALL CAP FUND EURO INSTITUTIONAL DISTRIBUTING CLASS 2,422 21,313IA FINANCIAL CORP INC 721 20,958SONOCO PRODUCTS CO 371 20,062REINSURANCE GROUP OF AMERICA INC 306 20,026
197
DocuSign Envelope ID: 2646536F-BB10-4779-844A-39205D22F4E0
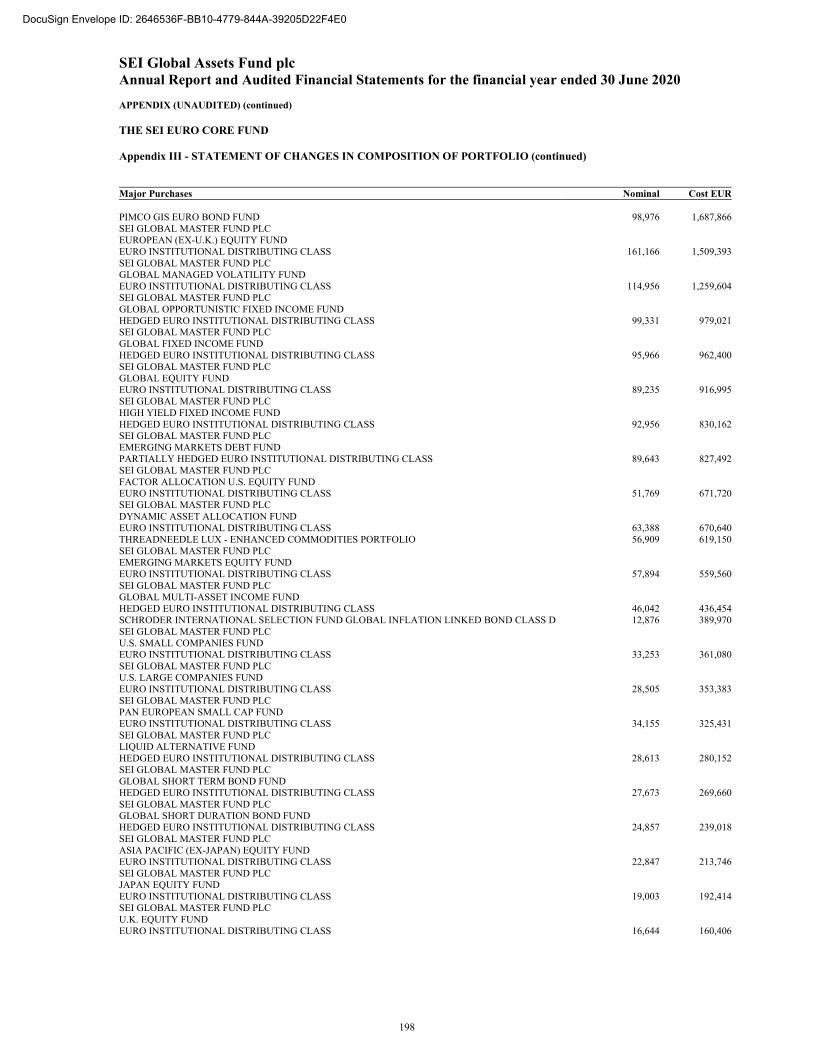
SEI Global Assets Fund plc Annual Report and Audited Financial Statements for the financial year ended 30 June 2020 APPENDIX (UNAUDITED) (continued)
THE SEI EURO CORE FUND Appendix III - STATEMENT OF CHANGES IN COMPOSITION OF PORTFOLIO (continued)
Major Purchases Nominal Cost EUR PIMCO GIS EURO BOND FUND 98,976 1,687,866SEI GLOBAL MASTER FUND PLC EUROPEAN (EX-U.K.) EQUITY FUND EURO INSTITUTIONAL DISTRIBUTING CLASS 161,166 1,509,393SEI GLOBAL MASTER FUND PLC GLOBAL MANAGED VOLATILITY FUND EURO INSTITUTIONAL DISTRIBUTING CLASS 114,956 1,259,604SEI GLOBAL MASTER FUND PLC GLOBAL OPPORTUNISTIC FIXED INCOME FUND HEDGED EURO INSTITUTIONAL DISTRIBUTING CLASS 99,331 979,021SEI GLOBAL MASTER FUND PLC GLOBAL FIXED INCOME FUND HEDGED EURO INSTITUTIONAL DISTRIBUTING CLASS 95,966 962,400SEI GLOBAL MASTER FUND PLC GLOBAL EQUITY FUND EURO INSTITUTIONAL DISTRIBUTING CLASS 89,235 916,995SEI GLOBAL MASTER FUND PLC HIGH YIELD FIXED INCOME FUND HEDGED EURO INSTITUTIONAL DISTRIBUTING CLASS 92,956 830,162SEI GLOBAL MASTER FUND PLC EMERGING MARKETS DEBT FUND PARTIALLY HEDGED EURO INSTITUTIONAL DISTRIBUTING CLASS 89,643 827,492SEI GLOBAL MASTER FUND PLC FACTOR ALLOCATION U.S. EQUITY FUND EURO INSTITUTIONAL DISTRIBUTING CLASS 51,769 671,720SEI GLOBAL MASTER FUND PLC DYNAMIC ASSET ALLOCATION FUND EURO INSTITUTIONAL DISTRIBUTING CLASS 63,388 670,640THREADNEEDLE LUX - ENHANCED COMMODITIES PORTFOLIO 56,909 619,150SEI GLOBAL MASTER FUND PLC EMERGING MARKETS EQUITY FUND EURO INSTITUTIONAL DISTRIBUTING CLASS 57,894 559,560SEI GLOBAL MASTER FUND PLC GLOBAL MULTI-ASSET INCOME FUND HEDGED EURO INSTITUTIONAL DISTRIBUTING CLASS 46,042 436,454SCHRODER INTERNATIONAL SELECTION FUND GLOBAL INFLATION LINKED BOND CLASS D 12,876 389,970SEI GLOBAL MASTER FUND PLC U.S. SMALL COMPANIES FUND EURO INSTITUTIONAL DISTRIBUTING CLASS 33,253 361,080SEI GLOBAL MASTER FUND PLC U.S. LARGE COMPANIES FUND EURO INSTITUTIONAL DISTRIBUTING CLASS 28,505 353,383SEI GLOBAL MASTER FUND PLC PAN EUROPEAN SMALL CAP FUND EURO INSTITUTIONAL DISTRIBUTING CLASS 34,155 325,431SEI GLOBAL MASTER FUND PLC LIQUID ALTERNATIVE FUND HEDGED EURO INSTITUTIONAL DISTRIBUTING CLASS 28,613 280,152SEI GLOBAL MASTER FUND PLC GLOBAL SHORT TERM BOND FUND HEDGED EURO INSTITUTIONAL DISTRIBUTING CLASS 27,673 269,660SEI GLOBAL MASTER FUND PLC GLOBAL SHORT DURATION BOND FUND HEDGED EURO INSTITUTIONAL DISTRIBUTING CLASS 24,857 239,018SEI GLOBAL MASTER FUND PLC ASIA PACIFIC (EX-JAPAN) EQUITY FUND EURO INSTITUTIONAL DISTRIBUTING CLASS 22,847 213,746SEI GLOBAL MASTER FUND PLC JAPAN EQUITY FUND EURO INSTITUTIONAL DISTRIBUTING CLASS 19,003 192,414SEI GLOBAL MASTER FUND PLC U.K. EQUITY FUND EURO INSTITUTIONAL DISTRIBUTING CLASS 16,644 160,406
198
DocuSign Envelope ID: 2646536F-BB10-4779-844A-39205D22F4E0
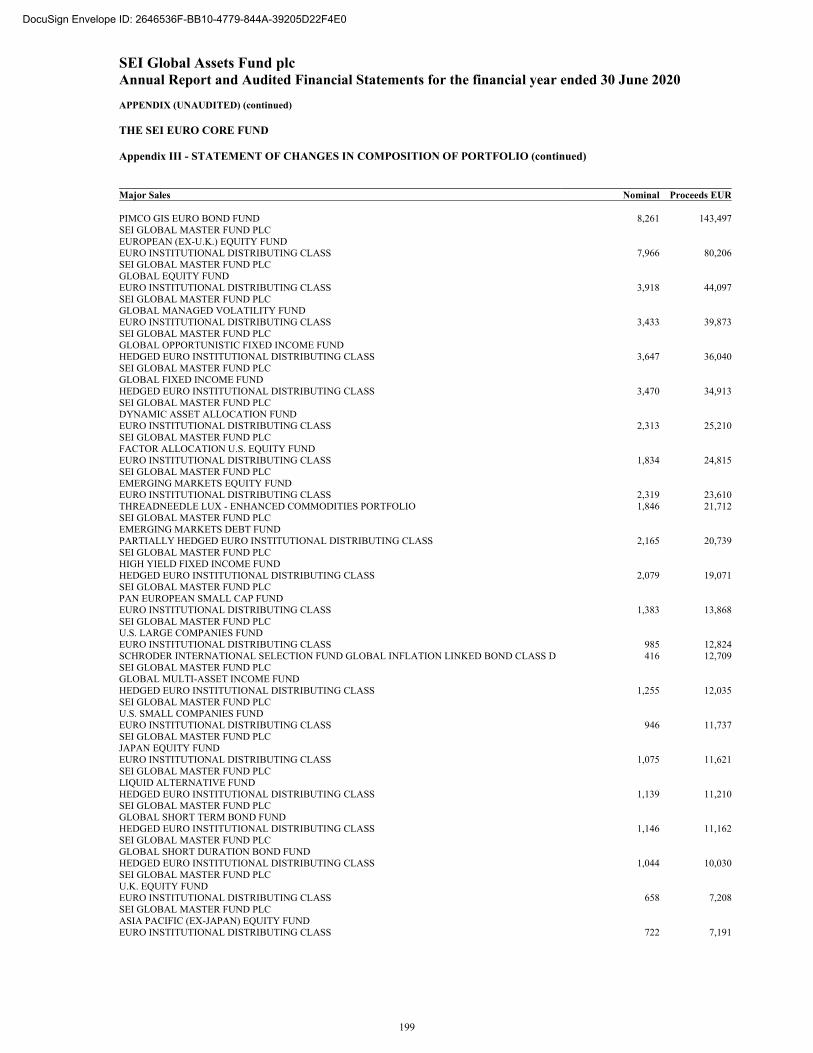
SEI Global Assets Fund plc Annual Report and Audited Financial Statements for the financial year ended 30 June 2020 APPENDIX (UNAUDITED) (continued)
THE SEI EURO CORE FUND Appendix III - STATEMENT OF CHANGES IN COMPOSITION OF PORTFOLIO (continued)
Major Sales Nominal Proceeds EUR PIMCO GIS EURO BOND FUND 8,261 143,497SEI GLOBAL MASTER FUND PLC EUROPEAN (EX-U.K.) EQUITY FUND EURO INSTITUTIONAL DISTRIBUTING CLASS 7,966 80,206SEI GLOBAL MASTER FUND PLC GLOBAL EQUITY FUND EURO INSTITUTIONAL DISTRIBUTING CLASS 3,918 44,097SEI GLOBAL MASTER FUND PLC GLOBAL MANAGED VOLATILITY FUND EURO INSTITUTIONAL DISTRIBUTING CLASS 3,433 39,873SEI GLOBAL MASTER FUND PLC GLOBAL OPPORTUNISTIC FIXED INCOME FUND HEDGED EURO INSTITUTIONAL DISTRIBUTING CLASS 3,647 36,040SEI GLOBAL MASTER FUND PLC GLOBAL FIXED INCOME FUND HEDGED EURO INSTITUTIONAL DISTRIBUTING CLASS 3,470 34,913SEI GLOBAL MASTER FUND PLC DYNAMIC ASSET ALLOCATION FUND EURO INSTITUTIONAL DISTRIBUTING CLASS 2,313 25,210SEI GLOBAL MASTER FUND PLC FACTOR ALLOCATION U.S. EQUITY FUND EURO INSTITUTIONAL DISTRIBUTING CLASS 1,834 24,815SEI GLOBAL MASTER FUND PLC EMERGING MARKETS EQUITY FUND EURO INSTITUTIONAL DISTRIBUTING CLASS 2,319 23,610THREADNEEDLE LUX - ENHANCED COMMODITIES PORTFOLIO 1,846 21,712SEI GLOBAL MASTER FUND PLC EMERGING MARKETS DEBT FUND PARTIALLY HEDGED EURO INSTITUTIONAL DISTRIBUTING CLASS 2,165 20,739SEI GLOBAL MASTER FUND PLC HIGH YIELD FIXED INCOME FUND HEDGED EURO INSTITUTIONAL DISTRIBUTING CLASS 2,079 19,071SEI GLOBAL MASTER FUND PLC PAN EUROPEAN SMALL CAP FUND EURO INSTITUTIONAL DISTRIBUTING CLASS 1,383 13,868SEI GLOBAL MASTER FUND PLC U.S. LARGE COMPANIES FUND EURO INSTITUTIONAL DISTRIBUTING CLASS 985 12,824SCHRODER INTERNATIONAL SELECTION FUND GLOBAL INFLATION LINKED BOND CLASS D 416 12,709SEI GLOBAL MASTER FUND PLC GLOBAL MULTI-ASSET INCOME FUND HEDGED EURO INSTITUTIONAL DISTRIBUTING CLASS 1,255 12,035SEI GLOBAL MASTER FUND PLC U.S. SMALL COMPANIES FUND EURO INSTITUTIONAL DISTRIBUTING CLASS 946 11,737SEI GLOBAL MASTER FUND PLC JAPAN EQUITY FUND EURO INSTITUTIONAL DISTRIBUTING CLASS 1,075 11,621SEI GLOBAL MASTER FUND PLC LIQUID ALTERNATIVE FUND HEDGED EURO INSTITUTIONAL DISTRIBUTING CLASS 1,139 11,210SEI GLOBAL MASTER FUND PLC GLOBAL SHORT TERM BOND FUND HEDGED EURO INSTITUTIONAL DISTRIBUTING CLASS 1,146 11,162SEI GLOBAL MASTER FUND PLC GLOBAL SHORT DURATION BOND FUND HEDGED EURO INSTITUTIONAL DISTRIBUTING CLASS 1,044 10,030SEI GLOBAL MASTER FUND PLC U.K. EQUITY FUND EURO INSTITUTIONAL DISTRIBUTING CLASS 658 7,208SEI GLOBAL MASTER FUND PLC ASIA PACIFIC (EX-JAPAN) EQUITY FUND EURO INSTITUTIONAL DISTRIBUTING CLASS 722 7,191
199
DocuSign Envelope ID: 2646536F-BB10-4779-844A-39205D22F4E0
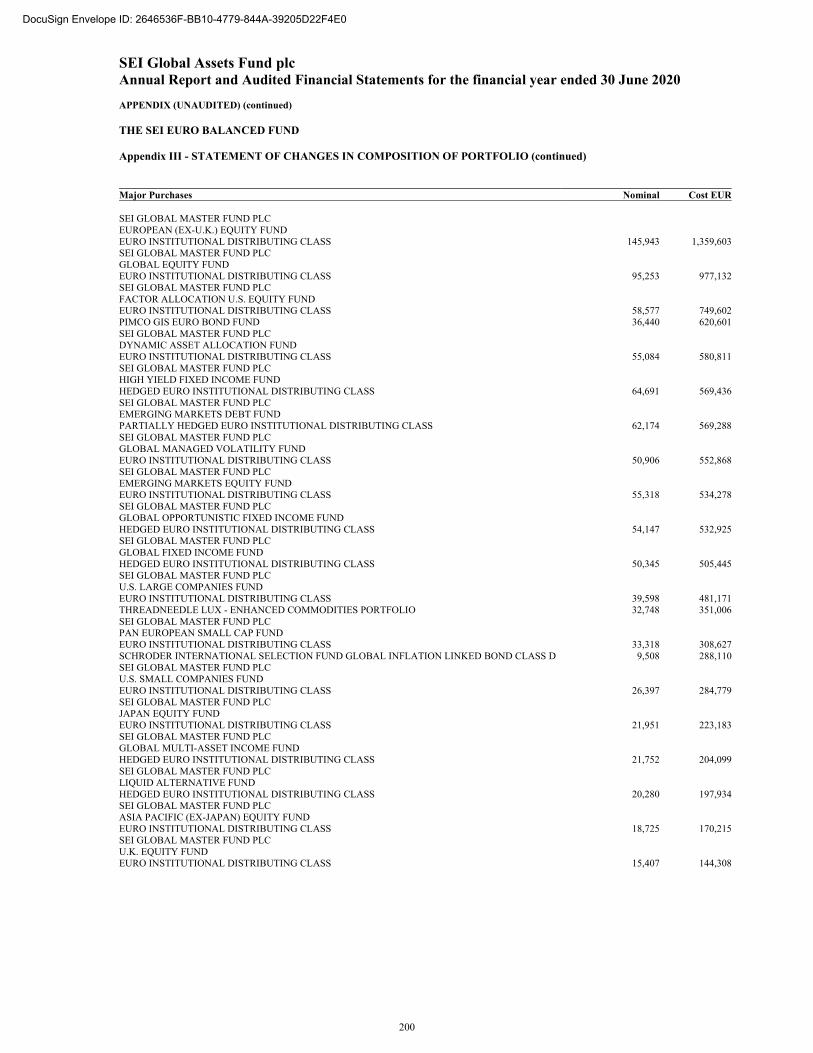
SEI Global Assets Fund plc Annual Report and Audited Financial Statements for the financial year ended 30 June 2020 APPENDIX (UNAUDITED) (continued)
THE SEI EURO BALANCED FUND Appendix III - STATEMENT OF CHANGES IN COMPOSITION OF PORTFOLIO (continued)
Major Purchases Nominal Cost EUR SEI GLOBAL MASTER FUND PLC EUROPEAN (EX-U.K.) EQUITY FUND EURO INSTITUTIONAL DISTRIBUTING CLASS 145,943 1,359,603SEI GLOBAL MASTER FUND PLC GLOBAL EQUITY FUND EURO INSTITUTIONAL DISTRIBUTING CLASS 95,253 977,132SEI GLOBAL MASTER FUND PLC FACTOR ALLOCATION U.S. EQUITY FUND EURO INSTITUTIONAL DISTRIBUTING CLASS 58,577 749,602PIMCO GIS EURO BOND FUND 36,440 620,601SEI GLOBAL MASTER FUND PLC DYNAMIC ASSET ALLOCATION FUND EURO INSTITUTIONAL DISTRIBUTING CLASS 55,084 580,811SEI GLOBAL MASTER FUND PLC HIGH YIELD FIXED INCOME FUND HEDGED EURO INSTITUTIONAL DISTRIBUTING CLASS 64,691 569,436SEI GLOBAL MASTER FUND PLC EMERGING MARKETS DEBT FUND PARTIALLY HEDGED EURO INSTITUTIONAL DISTRIBUTING CLASS 62,174 569,288SEI GLOBAL MASTER FUND PLC GLOBAL MANAGED VOLATILITY FUND EURO INSTITUTIONAL DISTRIBUTING CLASS 50,906 552,868SEI GLOBAL MASTER FUND PLC EMERGING MARKETS EQUITY FUND EURO INSTITUTIONAL DISTRIBUTING CLASS 55,318 534,278SEI GLOBAL MASTER FUND PLC GLOBAL OPPORTUNISTIC FIXED INCOME FUND HEDGED EURO INSTITUTIONAL DISTRIBUTING CLASS 54,147 532,925SEI GLOBAL MASTER FUND PLC GLOBAL FIXED INCOME FUND HEDGED EURO INSTITUTIONAL DISTRIBUTING CLASS 50,345 505,445SEI GLOBAL MASTER FUND PLC U.S. LARGE COMPANIES FUND EURO INSTITUTIONAL DISTRIBUTING CLASS 39,598 481,171THREADNEEDLE LUX - ENHANCED COMMODITIES PORTFOLIO 32,748 351,006SEI GLOBAL MASTER FUND PLC PAN EUROPEAN SMALL CAP FUND EURO INSTITUTIONAL DISTRIBUTING CLASS 33,318 308,627SCHRODER INTERNATIONAL SELECTION FUND GLOBAL INFLATION LINKED BOND CLASS D 9,508 288,110SEI GLOBAL MASTER FUND PLC U.S. SMALL COMPANIES FUND EURO INSTITUTIONAL DISTRIBUTING CLASS 26,397 284,779SEI GLOBAL MASTER FUND PLC JAPAN EQUITY FUND EURO INSTITUTIONAL DISTRIBUTING CLASS 21,951 223,183SEI GLOBAL MASTER FUND PLC GLOBAL MULTI-ASSET INCOME FUND HEDGED EURO INSTITUTIONAL DISTRIBUTING CLASS 21,752 204,099SEI GLOBAL MASTER FUND PLC LIQUID ALTERNATIVE FUND HEDGED EURO INSTITUTIONAL DISTRIBUTING CLASS 20,280 197,934SEI GLOBAL MASTER FUND PLC ASIA PACIFIC (EX-JAPAN) EQUITY FUND EURO INSTITUTIONAL DISTRIBUTING CLASS 18,725 170,215SEI GLOBAL MASTER FUND PLC U.K. EQUITY FUND EURO INSTITUTIONAL DISTRIBUTING CLASS 15,407 144,308
200
DocuSign Envelope ID: 2646536F-BB10-4779-844A-39205D22F4E0
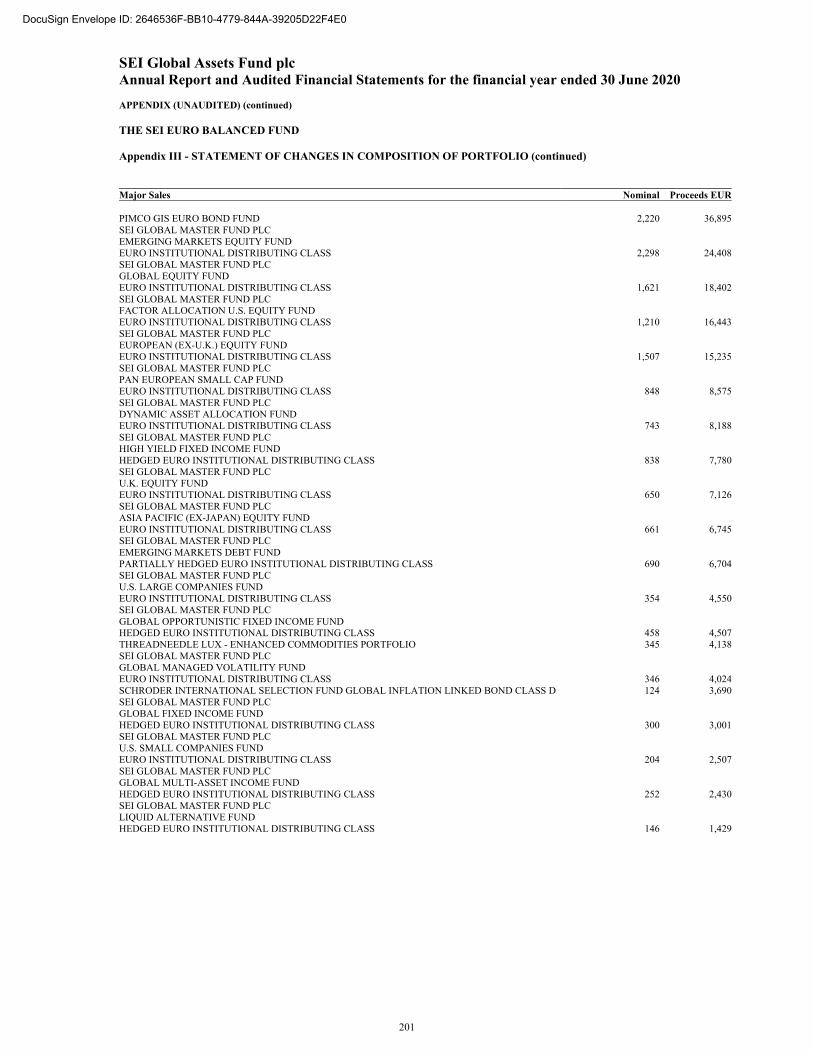
SEI Global Assets Fund plc Annual Report and Audited Financial Statements for the financial year ended 30 June 2020 APPENDIX (UNAUDITED) (continued)
THE SEI EURO BALANCED FUND Appendix III - STATEMENT OF CHANGES IN COMPOSITION OF PORTFOLIO (continued)
Major Sales Nominal Proceeds EUR PIMCO GIS EURO BOND FUND 2,220 36,895SEI GLOBAL MASTER FUND PLC EMERGING MARKETS EQUITY FUND EURO INSTITUTIONAL DISTRIBUTING CLASS 2,298 24,408SEI GLOBAL MASTER FUND PLC GLOBAL EQUITY FUND EURO INSTITUTIONAL DISTRIBUTING CLASS 1,621 18,402SEI GLOBAL MASTER FUND PLC FACTOR ALLOCATION U.S. EQUITY FUND EURO INSTITUTIONAL DISTRIBUTING CLASS 1,210 16,443SEI GLOBAL MASTER FUND PLC EUROPEAN (EX-U.K.) EQUITY FUND EURO INSTITUTIONAL DISTRIBUTING CLASS 1,507 15,235SEI GLOBAL MASTER FUND PLC PAN EUROPEAN SMALL CAP FUND EURO INSTITUTIONAL DISTRIBUTING CLASS 848 8,575SEI GLOBAL MASTER FUND PLC DYNAMIC ASSET ALLOCATION FUND EURO INSTITUTIONAL DISTRIBUTING CLASS 743 8,188SEI GLOBAL MASTER FUND PLC HIGH YIELD FIXED INCOME FUND HEDGED EURO INSTITUTIONAL DISTRIBUTING CLASS 838 7,780SEI GLOBAL MASTER FUND PLC U.K. EQUITY FUND EURO INSTITUTIONAL DISTRIBUTING CLASS 650 7,126SEI GLOBAL MASTER FUND PLC ASIA PACIFIC (EX-JAPAN) EQUITY FUND EURO INSTITUTIONAL DISTRIBUTING CLASS 661 6,745SEI GLOBAL MASTER FUND PLC EMERGING MARKETS DEBT FUND PARTIALLY HEDGED EURO INSTITUTIONAL DISTRIBUTING CLASS 690 6,704SEI GLOBAL MASTER FUND PLC U.S. LARGE COMPANIES FUND EURO INSTITUTIONAL DISTRIBUTING CLASS 354 4,550SEI GLOBAL MASTER FUND PLC GLOBAL OPPORTUNISTIC FIXED INCOME FUND HEDGED EURO INSTITUTIONAL DISTRIBUTING CLASS 458 4,507THREADNEEDLE LUX - ENHANCED COMMODITIES PORTFOLIO 345 4,138SEI GLOBAL MASTER FUND PLC GLOBAL MANAGED VOLATILITY FUND EURO INSTITUTIONAL DISTRIBUTING CLASS 346 4,024SCHRODER INTERNATIONAL SELECTION FUND GLOBAL INFLATION LINKED BOND CLASS D 124 3,690SEI GLOBAL MASTER FUND PLC GLOBAL FIXED INCOME FUND HEDGED EURO INSTITUTIONAL DISTRIBUTING CLASS 300 3,001SEI GLOBAL MASTER FUND PLC U.S. SMALL COMPANIES FUND EURO INSTITUTIONAL DISTRIBUTING CLASS 204 2,507SEI GLOBAL MASTER FUND PLC GLOBAL MULTI-ASSET INCOME FUND HEDGED EURO INSTITUTIONAL DISTRIBUTING CLASS 252 2,430SEI GLOBAL MASTER FUND PLC LIQUID ALTERNATIVE FUND HEDGED EURO INSTITUTIONAL DISTRIBUTING CLASS 146 1,429
201
DocuSign Envelope ID: 2646536F-BB10-4779-844A-39205D22F4E0
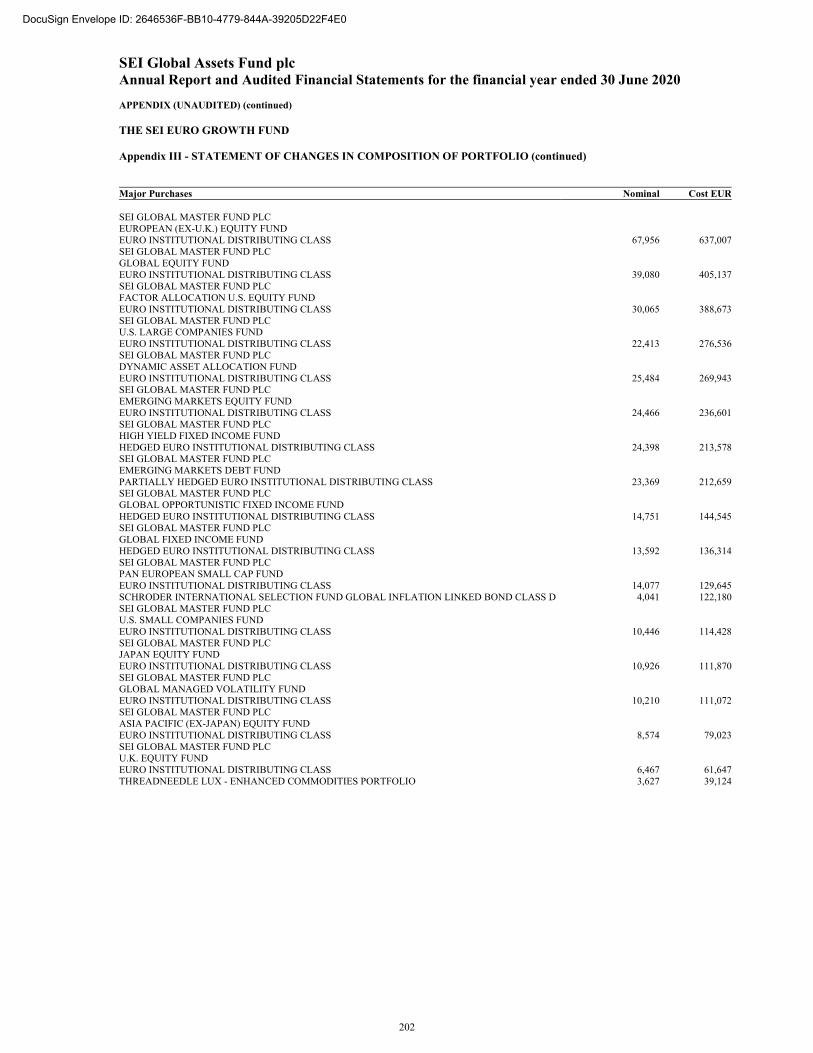
SEI Global Assets Fund plc Annual Report and Audited Financial Statements for the financial year ended 30 June 2020 APPENDIX (UNAUDITED) (continued)
THE SEI EURO GROWTH FUND Appendix III - STATEMENT OF CHANGES IN COMPOSITION OF PORTFOLIO (continued)
Major Purchases Nominal Cost EUR SEI GLOBAL MASTER FUND PLC EUROPEAN (EX-U.K.) EQUITY FUND EURO INSTITUTIONAL DISTRIBUTING CLASS 67,956 637,007SEI GLOBAL MASTER FUND PLC GLOBAL EQUITY FUND EURO INSTITUTIONAL DISTRIBUTING CLASS 39,080 405,137SEI GLOBAL MASTER FUND PLC FACTOR ALLOCATION U.S. EQUITY FUND EURO INSTITUTIONAL DISTRIBUTING CLASS 30,065 388,673SEI GLOBAL MASTER FUND PLC U.S. LARGE COMPANIES FUND EURO INSTITUTIONAL DISTRIBUTING CLASS 22,413 276,536SEI GLOBAL MASTER FUND PLC DYNAMIC ASSET ALLOCATION FUND EURO INSTITUTIONAL DISTRIBUTING CLASS 25,484 269,943SEI GLOBAL MASTER FUND PLC EMERGING MARKETS EQUITY FUND EURO INSTITUTIONAL DISTRIBUTING CLASS 24,466 236,601SEI GLOBAL MASTER FUND PLC HIGH YIELD FIXED INCOME FUND HEDGED EURO INSTITUTIONAL DISTRIBUTING CLASS 24,398 213,578SEI GLOBAL MASTER FUND PLC EMERGING MARKETS DEBT FUND PARTIALLY HEDGED EURO INSTITUTIONAL DISTRIBUTING CLASS 23,369 212,659SEI GLOBAL MASTER FUND PLC GLOBAL OPPORTUNISTIC FIXED INCOME FUND HEDGED EURO INSTITUTIONAL DISTRIBUTING CLASS 14,751 144,545SEI GLOBAL MASTER FUND PLC GLOBAL FIXED INCOME FUND HEDGED EURO INSTITUTIONAL DISTRIBUTING CLASS 13,592 136,314SEI GLOBAL MASTER FUND PLC PAN EUROPEAN SMALL CAP FUND EURO INSTITUTIONAL DISTRIBUTING CLASS 14,077 129,645SCHRODER INTERNATIONAL SELECTION FUND GLOBAL INFLATION LINKED BOND CLASS D 4,041 122,180SEI GLOBAL MASTER FUND PLC U.S. SMALL COMPANIES FUND EURO INSTITUTIONAL DISTRIBUTING CLASS 10,446 114,428SEI GLOBAL MASTER FUND PLC JAPAN EQUITY FUND EURO INSTITUTIONAL DISTRIBUTING CLASS 10,926 111,870SEI GLOBAL MASTER FUND PLC GLOBAL MANAGED VOLATILITY FUND EURO INSTITUTIONAL DISTRIBUTING CLASS 10,210 111,072SEI GLOBAL MASTER FUND PLC ASIA PACIFIC (EX-JAPAN) EQUITY FUND EURO INSTITUTIONAL DISTRIBUTING CLASS 8,574 79,023SEI GLOBAL MASTER FUND PLC U.K. EQUITY FUND EURO INSTITUTIONAL DISTRIBUTING CLASS 6,467 61,647THREADNEEDLE LUX - ENHANCED COMMODITIES PORTFOLIO 3,627 39,124
202
DocuSign Envelope ID: 2646536F-BB10-4779-844A-39205D22F4E0
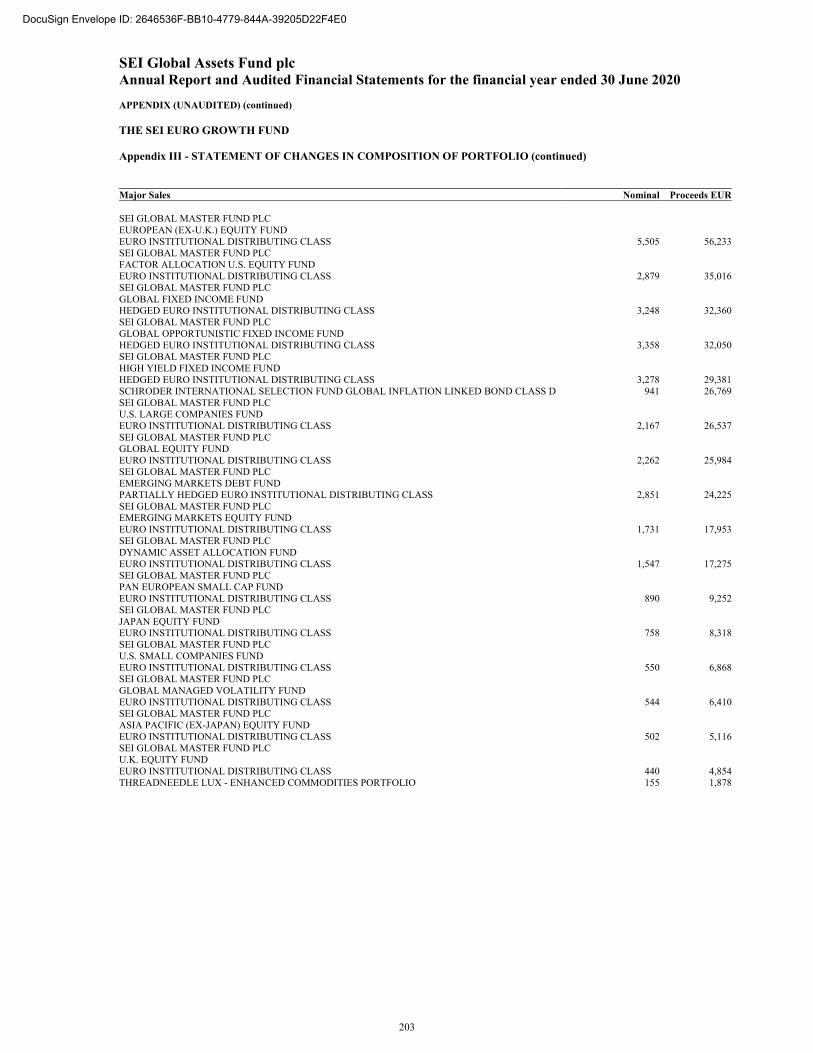
SEI Global Assets Fund plc Annual Report and Audited Financial Statements for the financial year ended 30 June 2020 APPENDIX (UNAUDITED) (continued)
THE SEI EURO GROWTH FUND Appendix III - STATEMENT OF CHANGES IN COMPOSITION OF PORTFOLIO (continued)
Major Sales Nominal Proceeds EUR SEI GLOBAL MASTER FUND PLC EUROPEAN (EX-U.K.) EQUITY FUND EURO INSTITUTIONAL DISTRIBUTING CLASS 5,505 56,233SEI GLOBAL MASTER FUND PLC FACTOR ALLOCATION U.S. EQUITY FUND EURO INSTITUTIONAL DISTRIBUTING CLASS 2,879 35,016SEI GLOBAL MASTER FUND PLC GLOBAL FIXED INCOME FUND HEDGED EURO INSTITUTIONAL DISTRIBUTING CLASS 3,248 32,360SEI GLOBAL MASTER FUND PLC GLOBAL OPPORTUNISTIC FIXED INCOME FUND HEDGED EURO INSTITUTIONAL DISTRIBUTING CLASS 3,358 32,050SEI GLOBAL MASTER FUND PLC HIGH YIELD FIXED INCOME FUND HEDGED EURO INSTITUTIONAL DISTRIBUTING CLASS 3,278 29,381SCHRODER INTERNATIONAL SELECTION FUND GLOBAL INFLATION LINKED BOND CLASS D 941 26,769SEI GLOBAL MASTER FUND PLC U.S. LARGE COMPANIES FUND EURO INSTITUTIONAL DISTRIBUTING CLASS 2,167 26,537SEI GLOBAL MASTER FUND PLC GLOBAL EQUITY FUND EURO INSTITUTIONAL DISTRIBUTING CLASS 2,262 25,984SEI GLOBAL MASTER FUND PLC EMERGING MARKETS DEBT FUND PARTIALLY HEDGED EURO INSTITUTIONAL DISTRIBUTING CLASS 2,851 24,225SEI GLOBAL MASTER FUND PLC EMERGING MARKETS EQUITY FUND EURO INSTITUTIONAL DISTRIBUTING CLASS 1,731 17,953SEI GLOBAL MASTER FUND PLC DYNAMIC ASSET ALLOCATION FUND EURO INSTITUTIONAL DISTRIBUTING CLASS 1,547 17,275SEI GLOBAL MASTER FUND PLC PAN EUROPEAN SMALL CAP FUND EURO INSTITUTIONAL DISTRIBUTING CLASS 890 9,252SEI GLOBAL MASTER FUND PLC JAPAN EQUITY FUND EURO INSTITUTIONAL DISTRIBUTING CLASS 758 8,318SEI GLOBAL MASTER FUND PLC U.S. SMALL COMPANIES FUND EURO INSTITUTIONAL DISTRIBUTING CLASS 550 6,868SEI GLOBAL MASTER FUND PLC GLOBAL MANAGED VOLATILITY FUND EURO INSTITUTIONAL DISTRIBUTING CLASS 544 6,410SEI GLOBAL MASTER FUND PLC ASIA PACIFIC (EX-JAPAN) EQUITY FUND EURO INSTITUTIONAL DISTRIBUTING CLASS 502 5,116SEI GLOBAL MASTER FUND PLC U.K. EQUITY FUND EURO INSTITUTIONAL DISTRIBUTING CLASS 440 4,854THREADNEEDLE LUX - ENHANCED COMMODITIES PORTFOLIO 155 1,878
203
DocuSign Envelope ID: 2646536F-BB10-4779-844A-39205D22F4E0
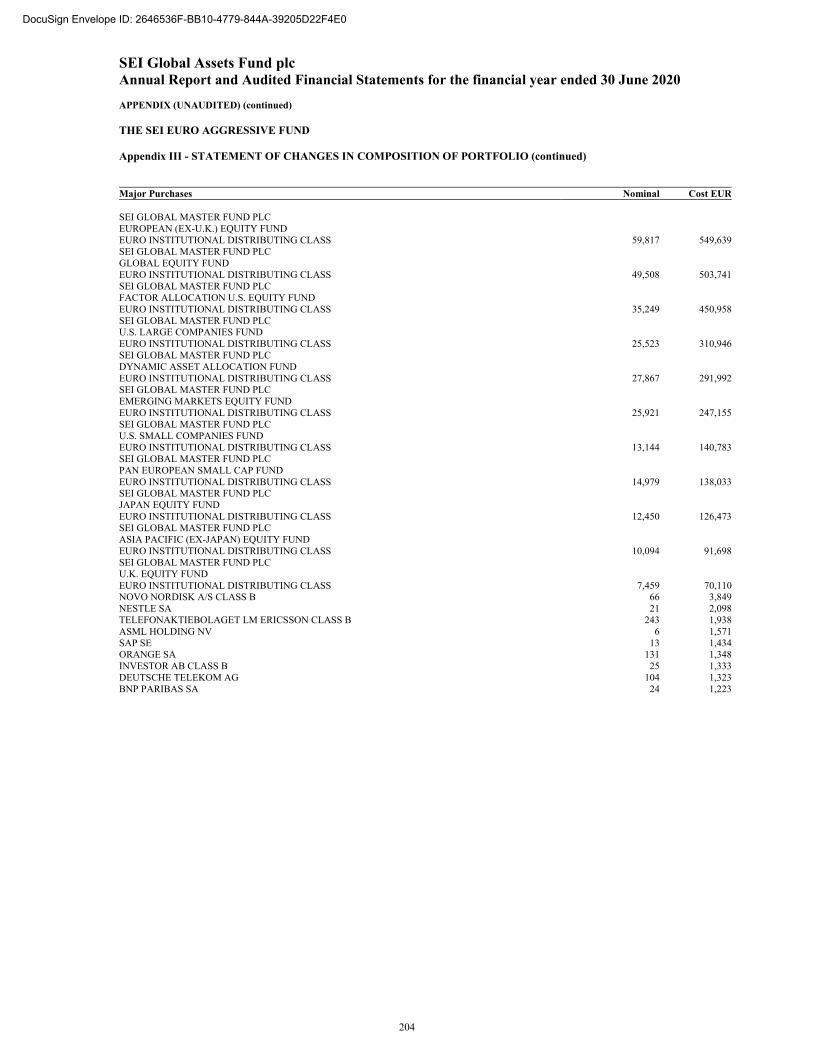
SEI Global Assets Fund plc Annual Report and Audited Financial Statements for the financial year ended 30 June 2020 APPENDIX (UNAUDITED) (continued)
THE SEI EURO AGGRESSIVE FUND Appendix III - STATEMENT OF CHANGES IN COMPOSITION OF PORTFOLIO (continued)
Major Purchases Nominal Cost EUR SEI GLOBAL MASTER FUND PLC EUROPEAN (EX-U.K.) EQUITY FUND EURO INSTITUTIONAL DISTRIBUTING CLASS 59,817 549,639SEI GLOBAL MASTER FUND PLC GLOBAL EQUITY FUND EURO INSTITUTIONAL DISTRIBUTING CLASS 49,508 503,741SEI GLOBAL MASTER FUND PLC FACTOR ALLOCATION U.S. EQUITY FUND EURO INSTITUTIONAL DISTRIBUTING CLASS 35,249 450,958SEI GLOBAL MASTER FUND PLC U.S. LARGE COMPANIES FUND EURO INSTITUTIONAL DISTRIBUTING CLASS 25,523 310,946SEI GLOBAL MASTER FUND PLC DYNAMIC ASSET ALLOCATION FUND EURO INSTITUTIONAL DISTRIBUTING CLASS 27,867 291,992SEI GLOBAL MASTER FUND PLC EMERGING MARKETS EQUITY FUND EURO INSTITUTIONAL DISTRIBUTING CLASS 25,921 247,155SEI GLOBAL MASTER FUND PLC U.S. SMALL COMPANIES FUND EURO INSTITUTIONAL DISTRIBUTING CLASS 13,144 140,783SEI GLOBAL MASTER FUND PLC PAN EUROPEAN SMALL CAP FUND EURO INSTITUTIONAL DISTRIBUTING CLASS 14,979 138,033SEI GLOBAL MASTER FUND PLC JAPAN EQUITY FUND EURO INSTITUTIONAL DISTRIBUTING CLASS 12,450 126,473SEI GLOBAL MASTER FUND PLC ASIA PACIFIC (EX-JAPAN) EQUITY FUND EURO INSTITUTIONAL DISTRIBUTING CLASS 10,094 91,698SEI GLOBAL MASTER FUND PLC U.K. EQUITY FUND EURO INSTITUTIONAL DISTRIBUTING CLASS 7,459 70,110NOVO NORDISK A/S CLASS B 66 3,849NESTLE SA 21 2,098TELEFONAKTIEBOLAGET LM ERICSSON CLASS B 243 1,938ASML HOLDING NV 6 1,571SAP SE 13 1,434ORANGE SA 131 1,348INVESTOR AB CLASS B 25 1,333DEUTSCHE TELEKOM AG 104 1,323BNP PARIBAS SA 24 1,223
204
DocuSign Envelope ID: 2646536F-BB10-4779-844A-39205D22F4E0
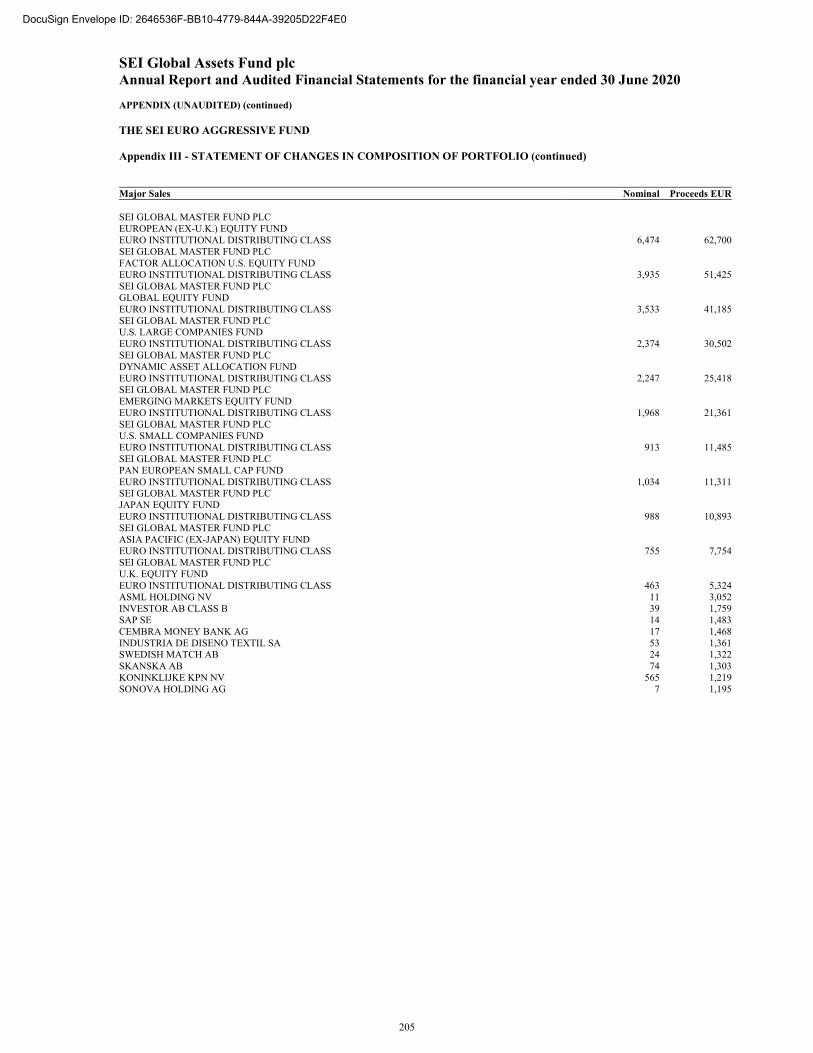
SEI Global Assets Fund plc Annual Report and Audited Financial Statements for the financial year ended 30 June 2020 APPENDIX (UNAUDITED) (continued)
THE SEI EURO AGGRESSIVE FUND Appendix III - STATEMENT OF CHANGES IN COMPOSITION OF PORTFOLIO (continued)
Major Sales Nominal Proceeds EUR SEI GLOBAL MASTER FUND PLC EUROPEAN (EX-U.K.) EQUITY FUND EURO INSTITUTIONAL DISTRIBUTING CLASS 6,474 62,700SEI GLOBAL MASTER FUND PLC FACTOR ALLOCATION U.S. EQUITY FUND EURO INSTITUTIONAL DISTRIBUTING CLASS 3,935 51,425SEI GLOBAL MASTER FUND PLC GLOBAL EQUITY FUND EURO INSTITUTIONAL DISTRIBUTING CLASS 3,533 41,185SEI GLOBAL MASTER FUND PLC U.S. LARGE COMPANIES FUND EURO INSTITUTIONAL DISTRIBUTING CLASS 2,374 30,502SEI GLOBAL MASTER FUND PLC DYNAMIC ASSET ALLOCATION FUND EURO INSTITUTIONAL DISTRIBUTING CLASS 2,247 25,418SEI GLOBAL MASTER FUND PLC EMERGING MARKETS EQUITY FUND EURO INSTITUTIONAL DISTRIBUTING CLASS 1,968 21,361SEI GLOBAL MASTER FUND PLC U.S. SMALL COMPANIES FUND EURO INSTITUTIONAL DISTRIBUTING CLASS 913 11,485SEI GLOBAL MASTER FUND PLC PAN EUROPEAN SMALL CAP FUND EURO INSTITUTIONAL DISTRIBUTING CLASS 1,034 11,311SEI GLOBAL MASTER FUND PLC JAPAN EQUITY FUND EURO INSTITUTIONAL DISTRIBUTING CLASS 988 10,893SEI GLOBAL MASTER FUND PLC ASIA PACIFIC (EX-JAPAN) EQUITY FUND EURO INSTITUTIONAL DISTRIBUTING CLASS 755 7,754SEI GLOBAL MASTER FUND PLC U.K. EQUITY FUND EURO INSTITUTIONAL DISTRIBUTING CLASS 463 5,324ASML HOLDING NV 11 3,052INVESTOR AB CLASS B 39 1,759SAP SE 14 1,483CEMBRA MONEY BANK AG 17 1,468INDUSTRIA DE DISENO TEXTIL SA 53 1,361SWEDISH MATCH AB 24 1,322SKANSKA AB 74 1,303KONINKLIJKE KPN NV 565 1,219SONOVA HOLDING AG 7 1,195
205
DocuSign Envelope ID: 2646536F-BB10-4779-844A-39205D22F4E0
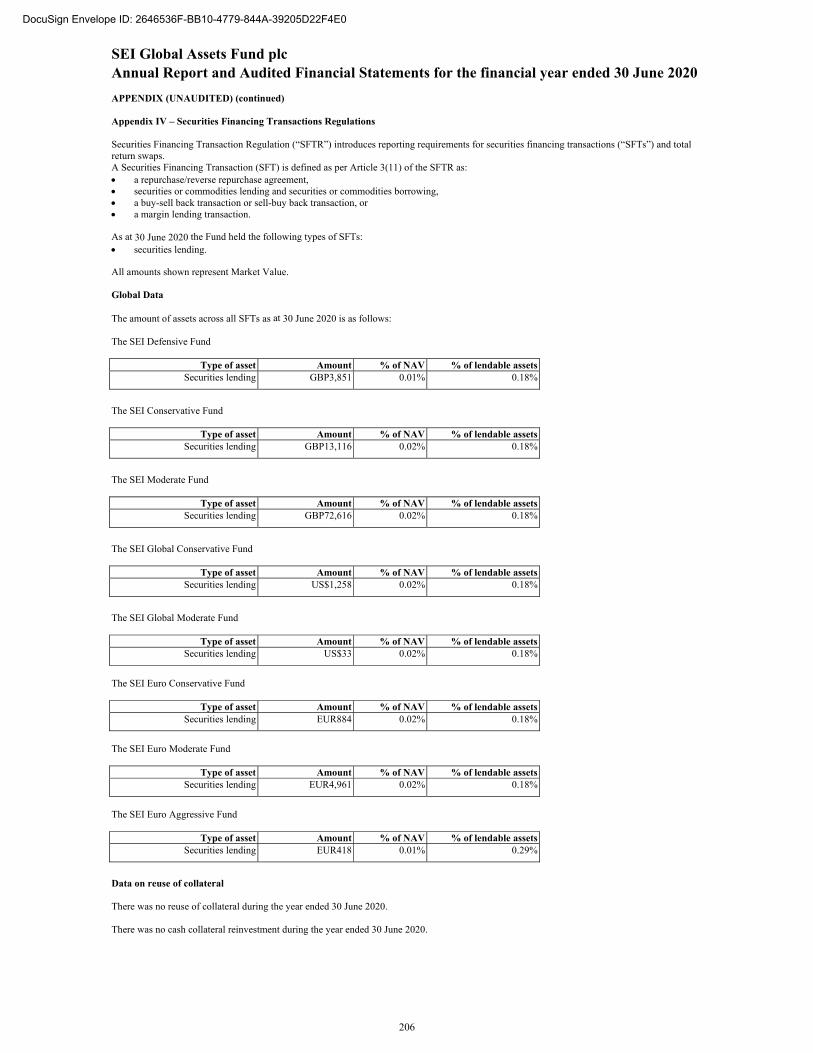
SEI Global Assets Fund plc Annual Report and Audited Financial Statements for the financial year ended 30 June 2020 APPENDIX (UNAUDITED) (continued)
Appendix IV – Securities Financing Transactions Regulations Securities Financing Transaction Regulation (“SFTR”) introduces reporting requirements for securities financing transactions (“SFTs”) and total return swaps. A Securities Financing Transaction (SFT) is defined as per Article 3(11) of the SFTR as: a repurchase/reverse repurchase agreement, securities or commodities lending and securities or commodities borrowing, a buy-sell back transaction or sell-buy back transaction, or a margin lending transaction. As at 30 June 2020 the Fund held the following types of SFTs: securities lending. All amounts shown represent Market Value. Global Data The amount of assets across all SFTs as at 30 June 2020 is as follows: The SEI Defensive Fund
The SEI Conservative Fund
The SEI Moderate Fund
The SEI Global Conservative Fund
The SEI Global Moderate Fund
Type of asset Amount % of NAV % of lendable assets Securities lending US$33 0.02% 0.18%
The SEI Euro Conservative Fund
Type of asset Amount % of NAV % of lendable assets Securities lending EUR884 0.02% 0.18%
The SEI Euro Moderate Fund
Type of asset Amount % of NAV % of lendable assets Securities lending EUR4,961 0.02% 0.18%
The SEI Euro Aggressive Fund
Data on reuse of collateral There was no reuse of collateral during the year ended 30 June 2020. There was no cash collateral reinvestment during the year ended 30 June 2020.
Type of asset Amount % of NAV % of lendable assets Securities lending GBP3,851 0.01% 0.18%
Type of asset Amount % of NAV % of lendable assets Securities lending GBP13,116 0.02% 0.18%
Type of asset Amount % of NAV % of lendable assets Securities lending GBP72,616 0.02% 0.18%
Type of asset Amount % of NAV % of lendable assets Securities lending US$1,258 0.02% 0.18%
Type of asset Amount % of NAV % of lendable assets Securities lending EUR418 0.01% 0.29%
206
DocuSign Envelope ID: 2646536F-BB10-4779-844A-39205D22F4E0
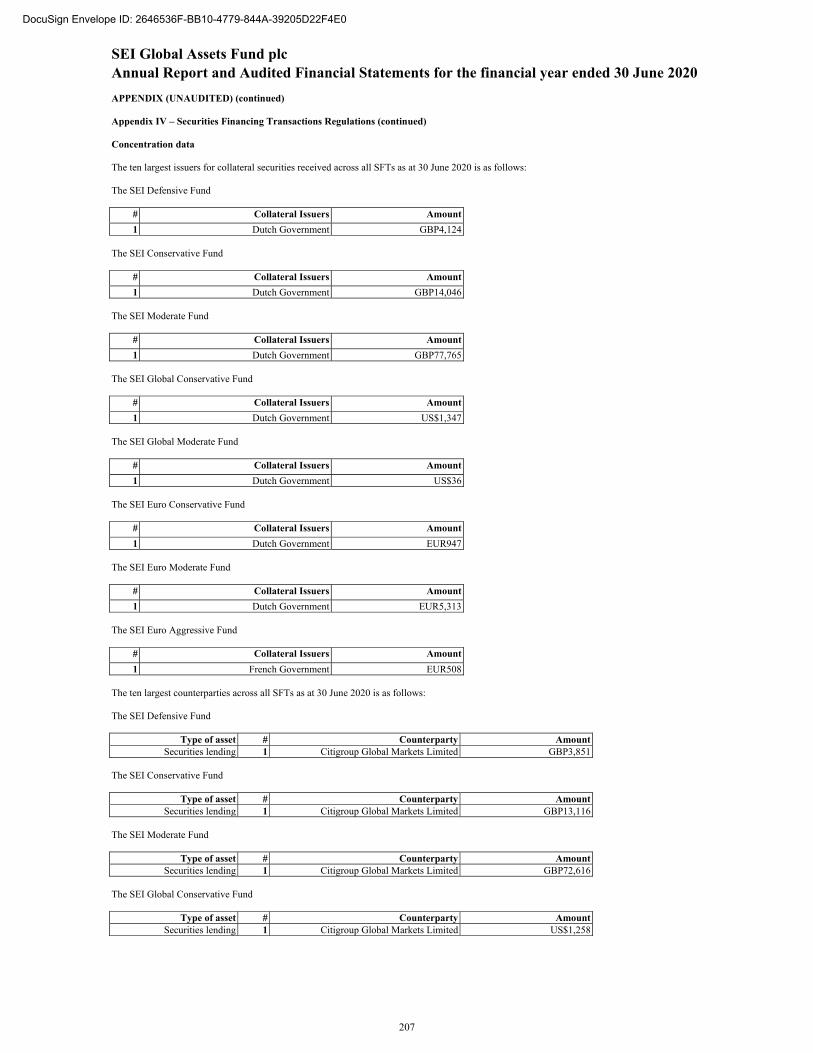
SEI Global Assets Fund plc Annual Report and Audited Financial Statements for the financial year ended 30 June 2020 APPENDIX (UNAUDITED) (continued)
Appendix IV – Securities Financing Transactions Regulations (continued) Concentration data The ten largest issuers for collateral securities received across all SFTs as at 30 June 2020 is as follows: The SEI Defensive Fund
# Collateral Issuers Amount
1 Dutch Government GBP4,124 The SEI Conservative Fund
# Collateral Issuers Amount
1 Dutch Government GBP14,046 The SEI Moderate Fund
# Collateral Issuers Amount
1 Dutch Government GBP77,765 The SEI Global Conservative Fund
# Collateral Issuers Amount
1 Dutch Government US$1,347 The SEI Global Moderate Fund
# Collateral Issuers Amount
1 Dutch Government US$36 The SEI Euro Conservative Fund
# Collateral Issuers Amount
1 Dutch Government EUR947 The SEI Euro Moderate Fund
# Collateral Issuers Amount
1 Dutch Government EUR5,313 The SEI Euro Aggressive Fund
# Collateral Issuers Amount
1 French Government EUR508 The ten largest counterparties across all SFTs as at 30 June 2020 is as follows: The SEI Defensive Fund
Type of asset # Counterparty Amount Securities lending 1 Citigroup Global Markets Limited GBP3,851
The SEI Conservative Fund
Type of asset # Counterparty Amount Securities lending 1 Citigroup Global Markets Limited GBP13,116
The SEI Moderate Fund
Type of asset # Counterparty Amount Securities lending 1 Citigroup Global Markets Limited GBP72,616
The SEI Global Conservative Fund
Type of asset # Counterparty Amount Securities lending 1 Citigroup Global Markets Limited US$1,258
207
DocuSign Envelope ID: 2646536F-BB10-4779-844A-39205D22F4E0
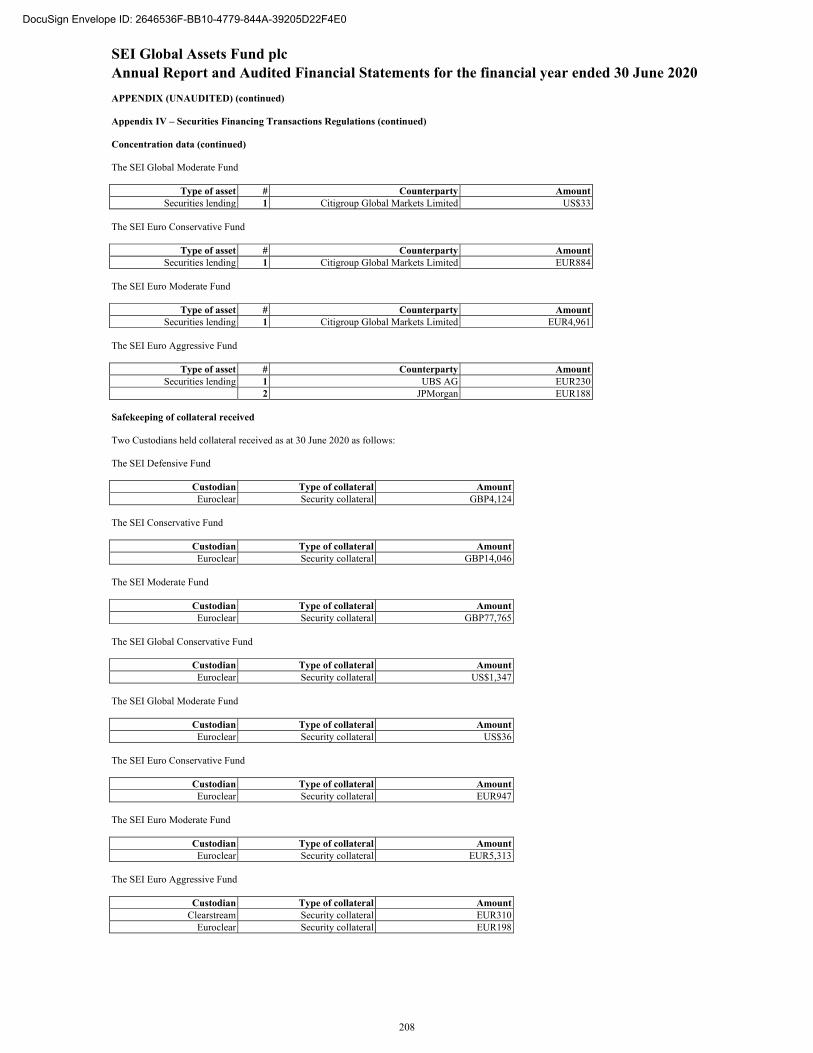
SEI Global Assets Fund plc Annual Report and Audited Financial Statements for the financial year ended 30 June 2020 APPENDIX (UNAUDITED) (continued)
Appendix IV – Securities Financing Transactions Regulations (continued) Concentration data (continued) The SEI Global Moderate Fund
Type of asset # Counterparty Amount Securities lending 1 Citigroup Global Markets Limited US$33
The SEI Euro Conservative Fund
Type of asset # Counterparty Amount Securities lending 1 Citigroup Global Markets Limited EUR884
The SEI Euro Moderate Fund
Type of asset # Counterparty Amount Securities lending 1 Citigroup Global Markets Limited EUR4,961
The SEI Euro Aggressive Fund
Type of asset # Counterparty Amount Securities lending 1 UBS AG EUR230
2 JPMorgan EUR188
Safekeeping of collateral received Two Custodians held collateral received as at 30 June 2020 as follows: The SEI Defensive Fund
Custodian Type of collateral Amount Euroclear Security collateral GBP4,124
The SEI Conservative Fund
Custodian Type of collateral Amount Euroclear Security collateral GBP14,046
The SEI Moderate Fund
Custodian Type of collateral Amount Euroclear Security collateral GBP77,765
The SEI Global Conservative Fund
Custodian Type of collateral Amount Euroclear Security collateral US$1,347
The SEI Global Moderate Fund
Custodian Type of collateral Amount Euroclear Security collateral US$36
The SEI Euro Conservative Fund
Custodian Type of collateral Amount Euroclear Security collateral EUR947
The SEI Euro Moderate Fund
Custodian Type of collateral Amount Euroclear Security collateral EUR5,313
The SEI Euro Aggressive Fund
Custodian Type of collateral Amount Clearstream Security collateral EUR310
Euroclear Security collateral EUR198
208
DocuSign Envelope ID: 2646536F-BB10-4779-844A-39205D22F4E0
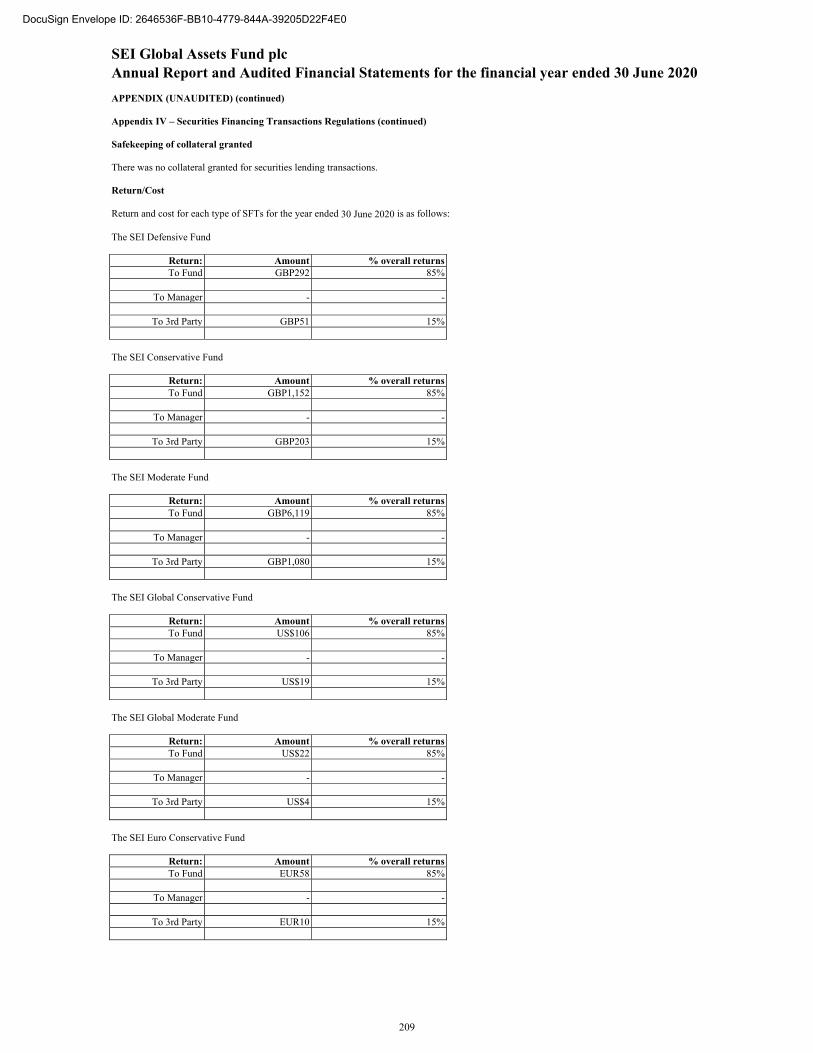
SEI Global Assets Fund plc Annual Report and Audited Financial Statements for the financial year ended 30 June 2020 APPENDIX (UNAUDITED) (continued)
Appendix IV – Securities Financing Transactions Regulations (continued) Safekeeping of collateral granted There was no collateral granted for securities lending transactions. Return/Cost Return and cost for each type of SFTs for the year ended 30 June 2020 is as follows: The SEI Defensive Fund
Return: Amount % overall returns To Fund GBP292 85%
To Manager - -
To 3rd Party GBP51 15%
The SEI Conservative Fund
Return: Amount % overall returns To Fund GBP1,152 85%
To Manager - -
To 3rd Party GBP203 15%
The SEI Moderate Fund
Return: Amount % overall returns To Fund GBP6,119 85%
To Manager - -
To 3rd Party GBP1,080 15%
The SEI Global Conservative Fund
Return: Amount % overall returns To Fund US$106 85%
To Manager - -
To 3rd Party US$19 15%
The SEI Global Moderate Fund
Return: Amount % overall returns To Fund US$22 85%
To Manager - -
To 3rd Party US$4 15%
The SEI Euro Conservative Fund
Return: Amount % overall returns To Fund EUR58 85%
To Manager - -
To 3rd Party EUR10 15%
209
DocuSign Envelope ID: 2646536F-BB10-4779-844A-39205D22F4E0
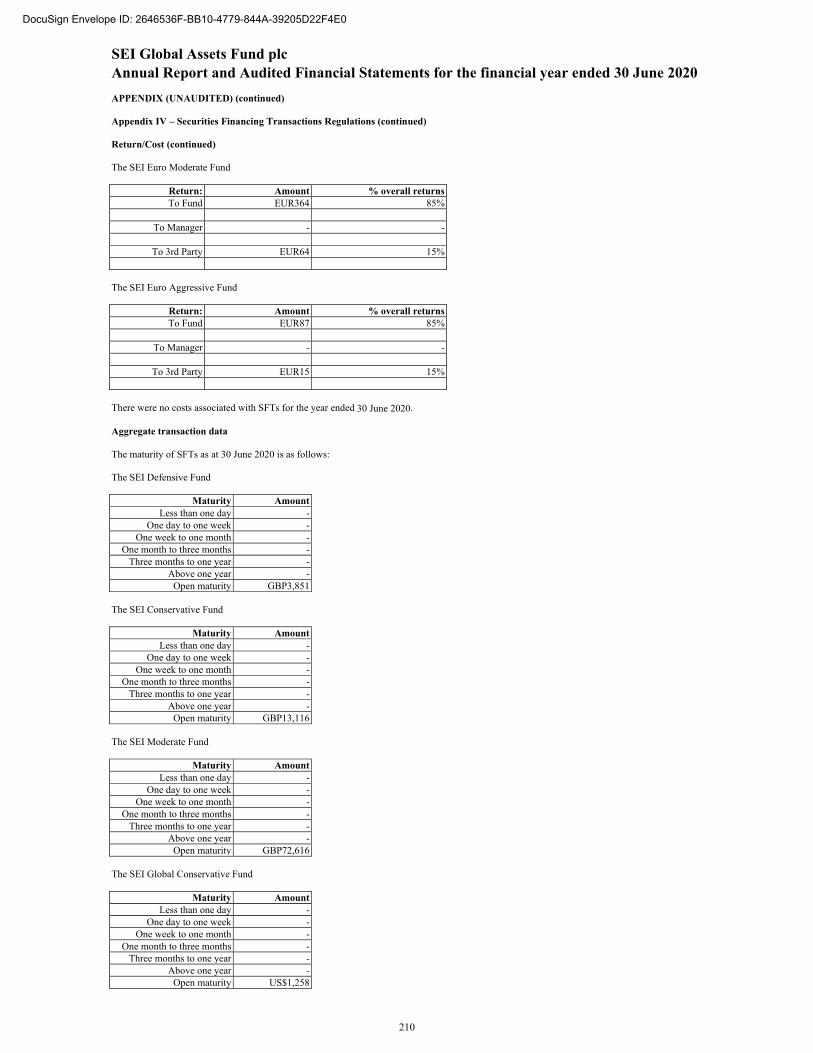
SEI Global Assets Fund plc Annual Report and Audited Financial Statements for the financial year ended 30 June 2020 APPENDIX (UNAUDITED) (continued)
Appendix IV – Securities Financing Transactions Regulations (continued) Return/Cost (continued) The SEI Euro Moderate Fund
Return: Amount % overall returns To Fund EUR364 85%
To Manager - -
To 3rd Party EUR64 15%
The SEI Euro Aggressive Fund
Return: Amount % overall returns To Fund EUR87 85%
To Manager - -
To 3rd Party EUR15 15%
There were no costs associated with SFTs for the year ended 30 June 2020. Aggregate transaction data The maturity of SFTs as at 30 June 2020 is as follows: The SEI Defensive Fund
Maturity Amount Less than one day -
One day to one week - One week to one month -
One month to three months - Three months to one year -
Above one year - Open maturity GBP3,851
The SEI Conservative Fund
Maturity Amount Less than one day -
One day to one week - One week to one month -
One month to three months - Three months to one year -
Above one year - Open maturity GBP13,116
The SEI Moderate Fund
Maturity Amount Less than one day -
One day to one week - One week to one month -
One month to three months - Three months to one year -
Above one year - Open maturity GBP72,616
The SEI Global Conservative Fund
Maturity Amount Less than one day -
One day to one week - One week to one month -
One month to three months - Three months to one year -
Above one year - Open maturity US$1,258
210
DocuSign Envelope ID: 2646536F-BB10-4779-844A-39205D22F4E0
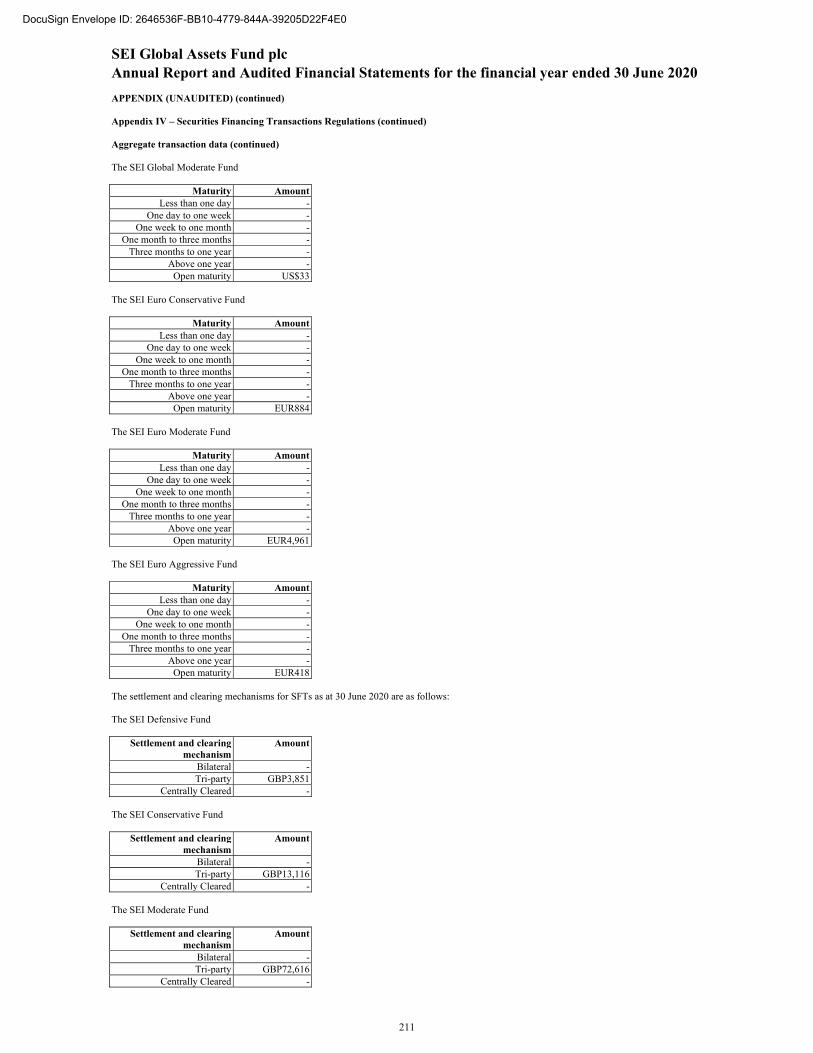
SEI Global Assets Fund plc Annual Report and Audited Financial Statements for the financial year ended 30 June 2020 APPENDIX (UNAUDITED) (continued)
Appendix IV – Securities Financing Transactions Regulations (continued) Aggregate transaction data (continued) The SEI Global Moderate Fund
Maturity Amount Less than one day -
One day to one week - One week to one month -
One month to three months - Three months to one year -
Above one year - Open maturity US$33
The SEI Euro Conservative Fund
Maturity Amount Less than one day -
One day to one week - One week to one month -
One month to three months - Three months to one year -
Above one year - Open maturity EUR884
The SEI Euro Moderate Fund
Maturity Amount Less than one day -
One day to one week - One week to one month -
One month to three months - Three months to one year -
Above one year - Open maturity EUR4,961
The SEI Euro Aggressive Fund
Maturity Amount Less than one day -
One day to one week - One week to one month -
One month to three months - Three months to one year -
Above one year - Open maturity EUR418
The settlement and clearing mechanisms for SFTs as at 30 June 2020 are as follows: The SEI Defensive Fund
Settlement and clearing mechanism
Amount
Bilateral - Tri-party GBP3,851
Centrally Cleared - The SEI Conservative Fund
Settlement and clearing mechanism
Amount
Bilateral - Tri-party GBP13,116
Centrally Cleared - The SEI Moderate Fund
Settlement and clearing mechanism
Amount
Bilateral - Tri-party GBP72,616
Centrally Cleared -
211
DocuSign Envelope ID: 2646536F-BB10-4779-844A-39205D22F4E0
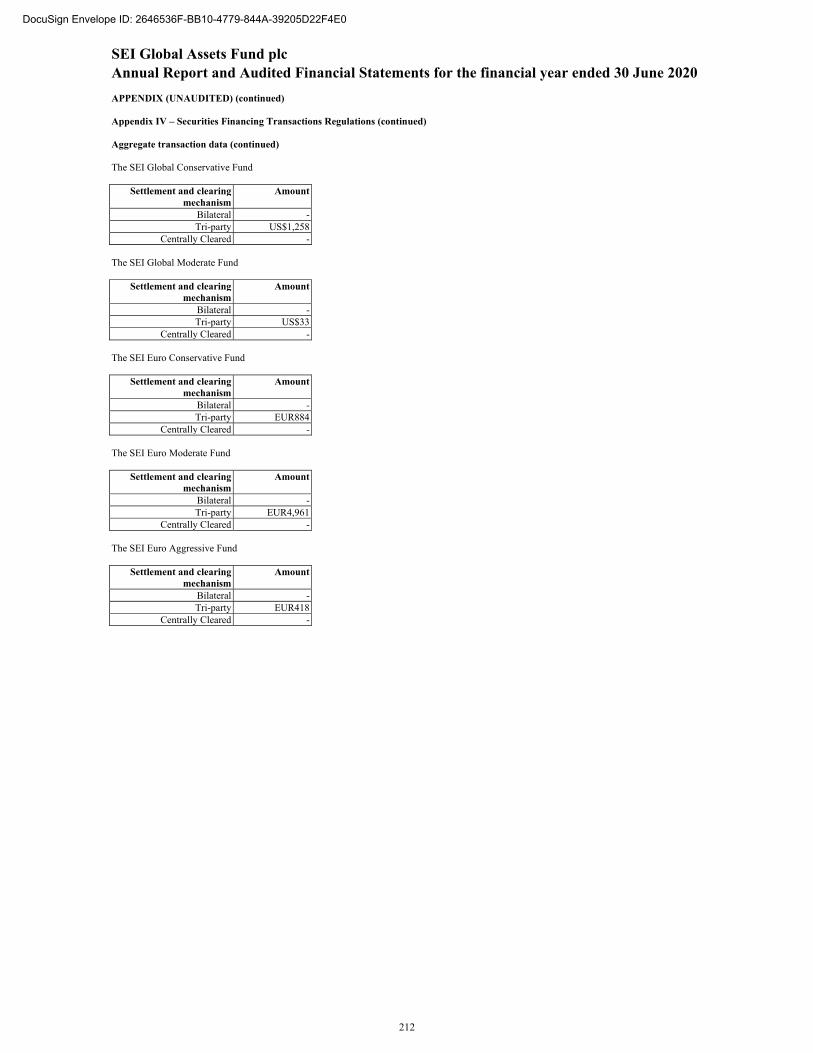
SEI Global Assets Fund plc Annual Report and Audited Financial Statements for the financial year ended 30 June 2020 APPENDIX (UNAUDITED) (continued)
Appendix IV – Securities Financing Transactions Regulations (continued) Aggregate transaction data (continued) The SEI Global Conservative Fund
Settlement and clearing mechanism
Amount
Bilateral - Tri-party US$1,258
Centrally Cleared - The SEI Global Moderate Fund
Settlement and clearing mechanism
Amount
Bilateral - Tri-party US$33
Centrally Cleared - The SEI Euro Conservative Fund
Settlement and clearing mechanism
Amount
Bilateral - Tri-party EUR884
Centrally Cleared - The SEI Euro Moderate Fund
Settlement and clearing mechanism
Amount
Bilateral - Tri-party EUR4,961
Centrally Cleared - The SEI Euro Aggressive Fund
Settlement and clearing mechanism
Amount
Bilateral - Tri-party EUR418
Centrally Cleared -
212
DocuSign Envelope ID: 2646536F-BB10-4779-844A-39205D22F4E0
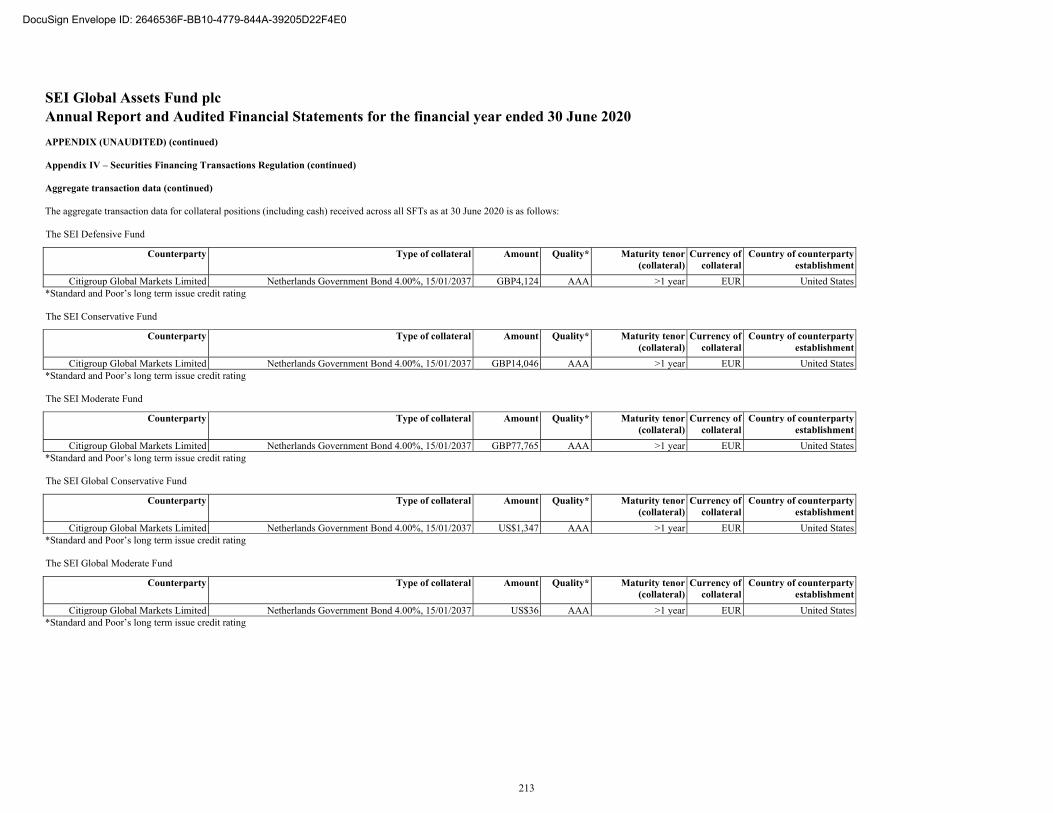
SEI Global Assets Fund plc Annual Report and Audited Financial Statements for the financial year ended 30 June 2020 APPENDIX (UNAUDITED) (continued)
Appendix IV – Securities Financing Transactions Regulation (continued) Aggregate transaction data (continued) The aggregate transaction data for collateral positions (including cash) received across all SFTs as at 30 June 2020 is as follows: The SEI Defensive Fund
Counterparty Type of collateral Amount Quality* Maturity tenor (collateral)
Currency of collateral
Country of counterparty establishment
Citigroup Global Markets Limited Netherlands Government Bond 4.00%, 15/01/2037 GBP4,124 AAA >1 year EUR United States *Standard and Poor’s long term issue credit rating The SEI Conservative Fund
Counterparty Type of collateral Amount Quality* Maturity tenor (collateral)
Currency of collateral
Country of counterparty establishment
Citigroup Global Markets Limited Netherlands Government Bond 4.00%, 15/01/2037 GBP14,046 AAA >1 year EUR United States *Standard and Poor’s long term issue credit rating The SEI Moderate Fund
Counterparty Type of collateral Amount Quality* Maturity tenor (collateral)
Currency of collateral
Country of counterparty establishment
Citigroup Global Markets Limited Netherlands Government Bond 4.00%, 15/01/2037 GBP77,765 AAA >1 year EUR United States *Standard and Poor’s long term issue credit rating The SEI Global Conservative Fund
Counterparty Type of collateral Amount Quality* Maturity tenor (collateral)
Currency of collateral
Country of counterparty establishment
Citigroup Global Markets Limited Netherlands Government Bond 4.00%, 15/01/2037 US$1,347 AAA >1 year EUR United States *Standard and Poor’s long term issue credit rating The SEI Global Moderate Fund
Counterparty Type of collateral Amount Quality* Maturity tenor (collateral)
Currency of collateral
Country of counterparty establishment
Citigroup Global Markets Limited Netherlands Government Bond 4.00%, 15/01/2037 US$36 AAA >1 year EUR United States *Standard and Poor’s long term issue credit rating
213
DocuSign Envelope ID: 2646536F-BB10-4779-844A-39205D22F4E0
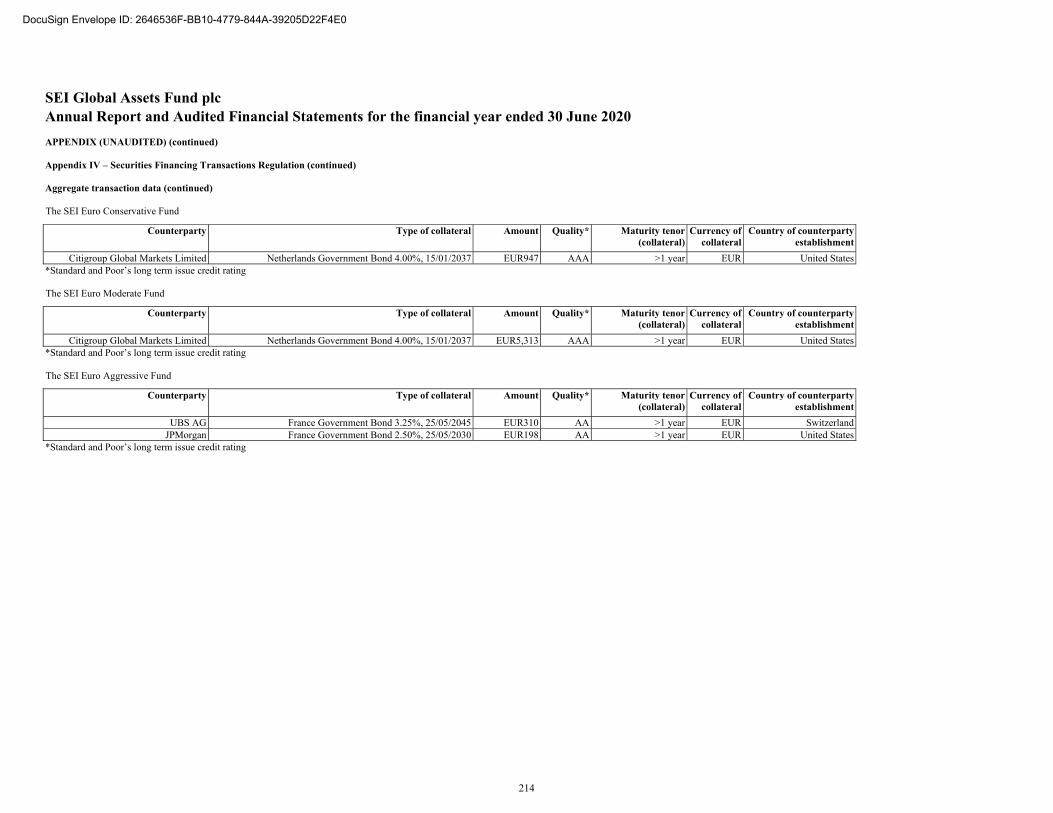
SEI Global Assets Fund plc Annual Report and Audited Financial Statements for the financial year ended 30 June 2020 APPENDIX (UNAUDITED) (continued)
Appendix IV – Securities Financing Transactions Regulation (continued) Aggregate transaction data (continued) The SEI Euro Conservative Fund
Counterparty Type of collateral Amount Quality* Maturity tenor (collateral)
Currency of collateral
Country of counterparty establishment
Citigroup Global Markets Limited Netherlands Government Bond 4.00%, 15/01/2037 EUR947 AAA >1 year EUR United States *Standard and Poor’s long term issue credit rating The SEI Euro Moderate Fund
Counterparty Type of collateral Amount Quality* Maturity tenor (collateral)
Currency of collateral
Country of counterparty establishment
Citigroup Global Markets Limited Netherlands Government Bond 4.00%, 15/01/2037 EUR5,313 AAA >1 year EUR United States *Standard and Poor’s long term issue credit rating The SEI Euro Aggressive Fund
Counterparty Type of collateral Amount Quality* Maturity tenor (collateral)
Currency of collateral
Country of counterparty establishment
UBS AG France Government Bond 3.25%, 25/05/2045 EUR310 AA >1 year EUR Switzerland JPMorgan France Government Bond 2.50%, 25/05/2030 EUR198 AA >1 year EUR United States
*Standard and Poor’s long term issue credit rating
214
DocuSign Envelope ID: 2646536F-BB10-4779-844A-39205D22F4E0