Directors' duties and liabilities in financial distress during ...
Upload
khangminh22Category
view
0download
0
Total Under 10 10 - 50 50 - 100 100 - 1,000 1,000 or over
14,955 6,985 6,460 785 540 185
19,185,717 109,563 1,661,926 979,716 2,639,751 13,794,761
4,971,427 44,969 567,106 424,667 507,490 3,427,195
350,798 6,624 118,437 32,094 58,605 135,038
6,259,130 35,596 434,194 235,098 715,282 4,838,960
602,126 5,923 30,774 9,511 17,788 538,130
48,634 3,022 16,934 5,057 641 22,980
186,760 2,898 240 - 3,358 180,264
366,732 3 13,600 4,454 13,789 334,886
3,178,247 5,096 233,612 172,097 685,276 2,082,166
1,048,553 3,079 97,854 53,526 193,738 700,356
1,234,681 703 58,291 43,850 283,691 848,146
895,013 1,314 77,467 74,721 207,847 533,664
3,823,989 11,355 277,803 106,249 655,310 2,773,272
19,673,327 64,759 1,771,807 669,259 1,449,822 15,717,680
6,834,905 57,646 1,033,233 438,469 992,459 4,313,098
1,730,978 4,207 583,658 169,761 151,752 821,600
571,220 10 62,159 1,899 51,862 455,290
4,532,707 53,429 387,416 266,809 788,845 3,036,208
573,857 632 33,828 10,516 27,897 500,984
188,448 159 27,323 4,473 11,501 144,992
385,409 473 6,505 6,043 16,396 355,992
12,264,565 6,481 704,746 220,274 429,466 10,903,598
9,107,518 32 182,335 68,039 127,769 8,729,343
Stocks 8,555,385 - 143,939 29,501 101,875 8,280,070
Bonds and debentures 198,396 - 7,979 - 8,775 181,642
Other securities 353,737 32 30,417 38,538 17,119 267,631
3,157,047 6,449 522,411 152,235 301,697 2,174,255
36,825 232 18,146 9,895 7,019 1,533
38,895,869 174,554 3,451,879 1,658,870 4,096,592 29,513,974
24,602,558 135,662 5,879,599 945,341 2,543,858 15,098,098
14,035,339 76,695 1,077,561 546,799 2,025,844 10,308,440
293,465 - 51,700 58,127 66,697 116,941
4,350,747 21,649 174,034 142,541 582,048 3,430,475
3,902,955 30,817 395,874 142,140 906,968 2,427,156
1,980,543 5,598 348,321 131,789 149,349 1,345,486
1,922,412 25,219 47,553 10,351 757,619 1,081,670
753,391 116 232,147 12,870 76,689 431,569
4,734,781 24,113 223,806 191,121 393,442 3,902,299
10,567,219 58,967 4,802,038 398,542 518,014 4,789,658
1,121,258 - 14,569 36,457 13,808 1,056,424
7,587,315 58,772 4,757,333 299,705 178,684 2,292,821
3,380,919 43,523 831,239 263,504 130,295 2,112,358
4,206,396 15,249 3,926,094 36,201 48,389 180,463
995,645 - 7,480 54,402 238,402 695,361
863,001 195 22,656 7,978 87,120 745,052
- - - - - -Reserve required by special law
Bonds
Long-term borrowings
Long-term bank borrowings
Long-term other borrowings
Allowance
Other fixed liabilities
Short-term borrowings
Short-term bank borrowings
Short-term other borrowings
Allowance
Other liquid liabilities
Fixed liabilities
Deferred assets
Total assets
Liabilities
Liquid liabilities
Bills payable
Accounts payable
Intangible fixed assets
Intangible fixed assets excluding software
Software
Investments and other assets
Investment securities
Other investments and other assets
Other liquid assets
Fixed assets
Tangible fixed assets
Land
Construction in process
Other tangible fixed assets
Bonds and debentures
Other securities
Inventories
Finished goods and merchandise
Works in process
Raw materials and goods in storage
Liquid assets
Cash and deposits
Bills receivable
Accounts receivable
Securities
Stocks
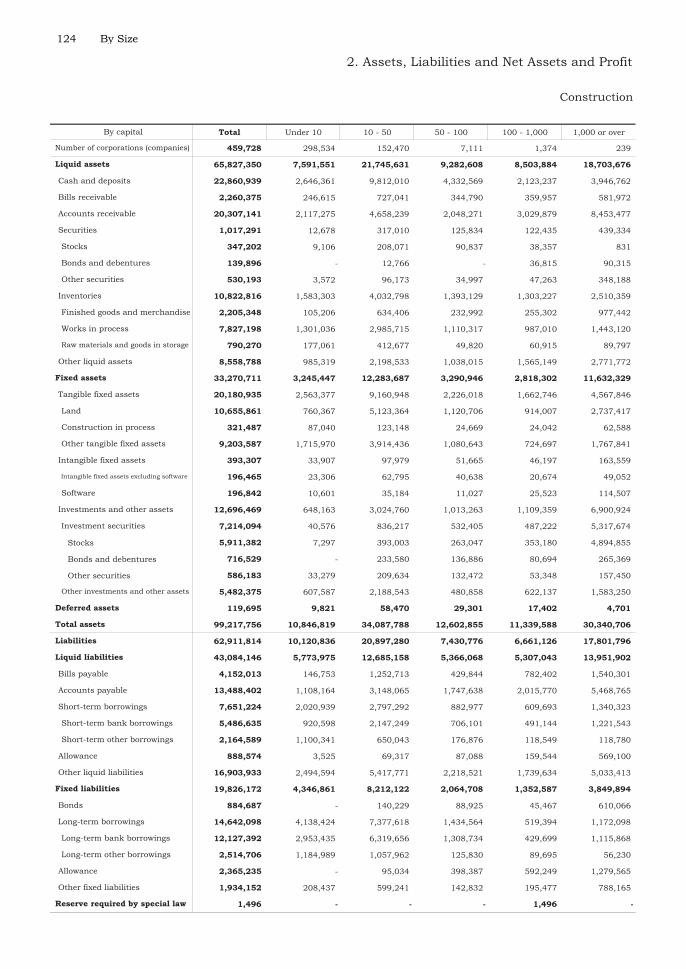
2. Assets, Liabilities and Net Assets and Profit
Information and Communication
By capital
Number of corporations (companies)
104 By Size

(Unit: millions of yen)
Total Under 10 10 - 50 50 - 100 100 - 1,000 1,000 or over
14,293,311 38,892 -2,427,720 713,529 1,552,734 14,415,876
13,217,461 34,724 -2,439,466 713,492 1,508,930 13,399,781
4,459,561 22,066 93,779 54,202 161,104 4,128,410
5,807,446 88 933,204 56,520 413,843 4,403,791
3,381,724 - 102,931 27,256 210,613 3,040,924
2,425,722 88 830,273 29,264 203,230 1,362,867
3,553,986 12,570 -3,418,758 606,385 952,055 5,401,734
205,701 1,969 9,242 9,493 22,228 162,769
3,348,285 10,601 -3,428,000 596,892 929,827 5,238,965
Reserve 4,115,417 22,892 139,348 315,661 809,862 2,827,654
Retained earnings brought forward -767,132 -12,291 -3,567,348 281,231 119,965 2,411,311
-603,532 - -47,691 -3,615 -18,072 -534,154
1,058,505 4,168 11,746 37 43,519 999,035
17,345 - - - 285 17,060
38,895,869 174,554 3,451,879 1,658,870 4,096,592 29,513,974
87,703 961 72,840 6,390 3,877 3,635
2,728,273 - 20,054 22,071 306,520 2,379,628
2,357,412 - 3,456 16,631 147,993 2,189,332
34,487,354 350,819 2,559,478 1,789,344 6,352,960 23,434,753
28,623,308 182,862 1,978,066 1,526,825 5,581,584 19,353,971
4,916,979 169,197 520,674 194,771 395,238 3,637,099
947,067 -1,240 60,738 67,748 376,138 443,683
1,129,673 4,207 56,511 20,483 75,040 973,432
535,738 1,217 41,622 15,645 54,304 422,950
1,541,002 1,750 75,627 72,586 396,874 994,165
992,507 156 21,852 17,489 62,602 890,408
1,193,345 1,839 87,437 10,953 50,673 1,042,443
1,340,164 67 10,042 79,122 408,803 842,130
331,705 1,471 21,673 26,106 103,885 178,570
235,438 - 656 2,282 13,872 218,628
773,021 -1,404 -12,287 50,734 291,046 444,932
168,628 - - - 32,722 135,906
343,481 79 24,945 5,513 113,910 199,034
1,130,895 6,367 58,723 56,739 222,192 786,874
17,255 - 14,474 2,428 332 21
6,232,947 132,485 772,510 474,889 1,502,196 3,350,867
224,811 46,747 107,411 26,234 18,733 25,686
14,403 619 4,995 1,880 2,220 4,689
3,085,006 62,724 447,583 258,867 619,764 1,696,068
826,589 3,545 40,896 53,362 179,500 549,286
674,220 12,157 51,669 41,386 161,459 407,549
223,915 688 61,757 8,452 17,393 135,625
335,423 2,544 32,176 19,351 124,543 156,809
125,428 5,389 27,042 6,061 19,839 67,097
723,152 -1,928 -1,019 59,296 358,745 308,058
32,350 9,525 16,574 2,757 1,900 1,594
733,660 27,622 153,804 75,981 153,543 322,710
By capital
taxes and public charges
Net operating income
Number of directors (persons)
Number of employees (persons)
Directors' bonus
Employees' salaries
Employees' bonus
Welfare expenses
Interest expensesRental or leasing expenses for fixedand liquid assets
Interim dividend
Dividends
Depreciation expenses
Special depreciation expenses
Value added
Directors' remuneration
Special profits
Special losses
Net profits before tax
Income taxes-current
Income taxes-deferred
Net profits for the period
Cost of salesSelling and general administrationexpenses
Operating profits
Non-operating revenues
Non-operating expenses
Ordinary profits
Subscription rights to shares
Liabilities and net assets
Bills receivable discounted outstanding
Accounts receivable from subsidiariesand associates - tradeAccounts payable from subsidiaries andassociates - trade
Sales
Others capital surplus
Earned surplus
Legal retained earnings
Other earned surplus
Treasury stock
Others net assets
Net assets
Shareholders' equity
Capital stock
Capital surplus
Capital reserve
and Loss Table by Sector and by Size (continued)
Electronics Equipment
By Size 105

Total Under 10 10 - 50 50 - 100 100 - 1,000 1,000 or over
15,213 8,365 5,613 609 421 205
34,140,282 147,226 2,049,483 1,470,899 2,629,904 27,842,770
7,518,889 64,599 780,690 407,595 589,810 5,676,195
624,610 10,327 190,906 99,684 75,655 248,038
10,006,792 38,842 477,876 535,196 918,882 8,035,996
3,250,559 1,684 36,171 33,456 21,267 3,157,981
229,125 - 13,036 15,629 9,766 190,694
1,367,726 - 7,821 12,668 6,305 1,340,932
1,653,708 1,684 15,314 5,159 5,196 1,626,355
4,347,210 17,500 336,617 223,487 442,548 3,327,058
1,235,610 8,237 96,092 54,193 98,234 978,854
2,104,352 3,767 158,120 91,158 218,609 1,632,698
1,007,248 5,496 82,405 78,136 125,705 715,506
8,392,222 14,274 227,223 171,481 581,742 7,397,502
37,760,090 148,780 1,633,744 1,210,068 1,809,395 32,958,103
13,609,242 105,978 1,200,042 931,079 1,185,159 10,186,984
4,335,544 39,133 477,524 306,100 327,818 3,184,969
807,507 824 41,837 48,421 90,683 625,742
8,466,191 66,021 680,681 576,558 766,658 6,376,273
420,150 1,259 15,480 6,171 18,778 378,462
107,451 388 13,307 2,263 4,870 86,623
312,699 871 2,173 3,908 13,908 291,839
23,730,698 41,543 418,222 272,818 605,458 22,392,657
19,897,634 6,959 117,246 115,961 373,298 19,284,170
Stocks 16,084,219 4,794 70,607 94,920 321,335 15,592,563
Bonds and debentures 3,430,104 - 3,452 169 22,599 3,403,884
Other securities 383,311 2,165 43,187 20,872 29,364 287,723
3,833,064 34,584 300,976 156,857 232,160 3,108,487
37,514 942 6,496 6,930 6,447 16,699
71,937,886 296,948 3,689,723 2,687,897 4,445,746 60,817,572
33,799,636 305,064 1,989,088 1,601,644 2,521,032 27,382,808
23,907,719 103,574 1,053,775 1,119,269 1,877,436 19,753,665
1,108,206 3,690 159,391 218,318 238,334 488,473
8,722,315 14,184 262,507 379,536 719,781 7,346,307
3,571,426 44,317 285,509 226,391 355,622 2,659,587
2,693,141 16,429 248,376 165,187 226,100 2,037,049
878,285 27,888 37,133 61,204 129,522 622,538
1,685,151 139 25,168 23,535 58,194 1,578,115
8,820,621 41,244 321,200 271,489 505,505 7,681,183
9,891,917 201,490 935,313 482,375 643,596 7,629,143
1,306,934 - 32,148 10,129 20,868 1,243,789
4,581,908 199,683 825,543 419,712 414,959 2,722,011
4,059,044 131,293 705,891 383,948 292,762 2,545,150
522,864 68,390 119,652 35,764 122,197 176,861
2,048,820 - 30,426 30,123 151,180 1,837,091
1,954,255 1,807 47,196 22,411 56,589 1,826,252
- - - - - -Reserve required by special law
Bonds
Long-term borrowings
Long-term bank borrowings
Long-term other borrowings
Allowance
Other fixed liabilities
Short-term borrowings
Short-term bank borrowings
Short-term other borrowings
Allowance
Other liquid liabilities
Fixed liabilities
Deferred assets
Total assets
Liabilities
Liquid liabilities
Bills payable
Accounts payable
Intangible fixed assets
Intangible fixed assets excluding software
Software
Investments and other assets
Investment securities
Other investments and other assets
Other liquid assets
Fixed assets
Tangible fixed assets
Land
Construction in process
Other tangible fixed assets
Bonds and debentures
Other securities
Inventories
Finished goods and merchandise
Works in process
Raw materials and goods in storage
Liquid assets
Cash and deposits
Bills receivable
Accounts receivable
Securities
Stocks
2. Assets, Liabilities and Net Assets and Profit
Transportation
By capital
Number of corporations (companies)
106 By Size

(Unit: millions of yen)
Total Under 10 10 - 50 50 - 100 100 - 1,000 1,000 or over
38,138,250 -8,116 1,700,635 1,086,253 1,924,714 33,434,764
33,974,169 -8,430 1,692,362 1,072,705 1,880,232 29,337,300
4,397,133 29,542 85,296 43,430 133,463 4,105,402
4,848,152 -17,372 66,514 127,972 185,431 4,485,607
4,200,779 - 24,185 31,179 99,298 4,046,117
647,373 -17,372 42,329 96,793 86,133 439,490
27,192,113 -20,600 1,551,366 903,303 1,591,296 23,166,748
512,198 1,580 47,279 15,412 21,379 426,548
26,679,915 -22,180 1,504,087 887,891 1,569,917 22,740,200
Reserve 15,447,485 20,994 839,235 619,734 854,094 13,113,428
Retained earnings brought forward 11,232,430 -43,174 664,852 268,157 715,823 9,626,772
-2,463,229 - -10,814 -2,000 -29,958 -2,420,457
4,157,415 314 8,273 13,548 44,458 4,090,822
6,666 - - - 24 6,642
71,937,886 296,948 3,689,723 2,687,897 4,445,746 60,817,572
36,280 5,889 17,240 7,103 5,765 283
3,997,653 - 95,630 111,561 307,898 3,482,564
2,669,646 - 58,075 105,326 237,601 2,268,644
70,912,542 459,631 4,249,716 3,121,749 5,667,781 57,413,665
59,690,346 258,958 3,688,397 2,817,599 5,013,056 47,912,336
7,654,002 201,221 485,232 237,021 406,083 6,324,445
3,568,194 -548 76,087 67,129 248,642 3,176,884
2,626,904 7,468 65,689 31,858 88,891 2,432,998
501,502 4,575 30,662 18,533 38,343 409,389
5,693,596 2,345 111,114 80,454 299,190 5,200,493
404,893 1,756 14,722 21,746 38,205 328,464
803,461 4,160 30,739 22,736 41,211 704,615
5,295,028 -59 95,097 79,464 296,184 4,824,342
1,246,227 1,063 31,879 26,722 87,254 1,099,309
-28,359 - -1,583 1,412 13,366 -41,554
4,077,160 -1,122 64,801 51,330 195,564 3,766,587
824,475 - 234 1,931 21,569 800,741
1,060,539 2 15,781 11,448 185,587 847,721
1,941,413 12,573 133,801 146,569 180,148 1,468,322
30,533 - 22,299 6,031 2,063 140
12,339,394 204,036 1,103,726 602,155 1,083,680 9,345,797
266,022 57,597 116,408 24,541 22,608 44,868
24,017 252 6,816 3,384 4,822 8,743
5,227,322 113,835 600,166 353,157 496,843 3,663,321
1,534,499 2,405 98,261 80,261 135,300 1,218,272
1,167,052 11,279 98,924 40,702 118,215 897,932
106,164 4,112 15,620 9,135 9,920 67,377
290,185 9,367 56,905 16,811 36,382 170,720
262,103 9,849 50,159 16,170 20,868 165,057
3,462,030 -4,660 60,467 57,994 238,722 3,109,507
37,464 15,274 15,454 2,546 1,954 2,236
1,146,158 57,400 191,414 97,701 134,212 665,431
By capital
taxes and public charges
Net operating income
Number of directors (persons)
Number of employees (persons)
Directors' bonus
Employees' salaries
Employees' bonus
Welfare expenses
Interest expensesRental or leasing expenses for fixedand liquid assets
Interim dividend
Dividends
Depreciation expenses
Special depreciation expenses
Value added
Directors' remuneration
Special profits
Special losses
Net profits before tax
Income taxes-current
Income taxes-deferred
Net profits for the period
Cost of salesSelling and general administrationexpenses
Operating profits
Non-operating revenues
Non-operating expenses
Ordinary profits
Subscription rights to shares
Liabilities and net assets
Bills receivable discounted outstanding
Accounts receivable from subsidiariesand associates - tradeAccounts payable from subsidiaries andassociates - trade
Sales
Others capital surplus
Earned surplus
Legal retained earnings
Other earned surplus
Treasury stock
Others net assets
Net assets
Shareholders' equity
Capital stock
Capital surplus
Capital reserve
and Loss Table by Sector and by Size (continued)
Equipment
By Size 107

Total Under 10 10 - 50 50 - 100 100 - 1,000 1,000 or over
10,447 5,589 3,898 447 344 169
29,315,473 94,236 1,390,937 1,001,920 1,989,654 24,838,726
6,323,332 41,525 461,035 261,810 453,666 5,105,296
488,629 6,378 163,145 53,386 59,174 206,546
8,742,419 23,554 377,860 389,987 799,147 7,151,871
3,135,154 939 12,165 25,895 17,233 3,078,922
218,704 - 6,165 12,841 9,004 190,694
1,278,006 - - 12,668 3,465 1,261,873
1,638,444 939 6,000 386 4,764 1,626,355
2,948,826 9,543 223,109 146,017 291,271 2,278,886
1,149,291 6,798 82,208 45,543 85,282 929,460
1,000,648 1,126 72,465 37,152 99,437 790,468
798,887 1,619 68,436 63,322 106,552 558,958
7,677,113 12,297 153,623 124,825 369,163 7,017,205
34,849,806 108,579 1,206,026 951,592 1,530,836 31,052,773
11,801,959 71,933 873,376 719,944 962,003 9,174,703
3,694,370 24,514 308,661 225,989 247,786 2,887,420
720,320 - 38,939 32,824 84,270 564,287
7,387,269 47,419 525,776 461,131 629,947 5,722,996
385,353 332 13,862 4,815 16,698 349,646
99,758 291 12,076 1,879 4,191 81,321
285,595 41 1,786 2,936 12,507 268,325
22,662,494 36,314 318,788 226,833 552,135 21,528,424
19,307,482 6,780 82,824 103,491 339,136 18,775,251
Stocks 15,549,582 4,732 53,222 85,814 303,251 15,102,563
Bonds and debentures 3,403,890 - 3,452 41 10,110 3,390,287
Other securities 354,010 2,048 26,150 17,636 25,775 282,401
3,355,012 29,534 235,964 123,342 212,999 2,753,173
35,021 918 5,856 6,512 5,367 16,368
64,200,300 203,733 2,602,819 1,960,024 3,525,857 55,907,867
28,959,926 214,575 1,372,878 1,111,740 1,950,513 24,310,220
20,530,116 72,112 733,056 759,259 1,443,086 17,522,603
855,486 2,291 110,669 145,305 190,715 406,506
7,913,834 7,771 202,477 307,627 623,185 6,772,774
2,758,984 33,791 211,491 148,201 278,983 2,086,518
2,280,245 13,306 192,198 97,497 184,326 1,792,918
478,739 20,485 19,293 50,704 94,657 293,600
1,562,278 57 22,878 16,437 43,633 1,479,273
7,439,534 28,202 185,541 141,689 306,570 6,777,532
8,429,810 142,463 639,822 352,481 507,427 6,787,617
1,128,854 - 24,658 10,129 17,402 1,076,665
3,553,218 141,792 550,445 309,416 309,808 2,241,757
3,125,989 86,798 458,853 277,902 236,823 2,065,613
427,229 54,994 91,592 31,514 72,985 176,144
1,906,351 - 24,615 15,818 135,534 1,730,384
1,841,387 671 40,104 17,118 44,683 1,738,811
- - - - - -Reserve required by special law
Bonds
Long-term borrowings
Long-term bank borrowings
Long-term other borrowings
Allowance
Other fixed liabilities
Short-term borrowings
Short-term bank borrowings
Short-term other borrowings
Allowance
Other liquid liabilities
Fixed liabilities
Deferred assets
Total assets
Liabilities
Liquid liabilities
Bills payable
Accounts payable
Intangible fixed assets
Intangible fixed assets excluding software
Software
Investments and other assets
Investment securities
Other investments and other assets
Other liquid assets
Fixed assets
Tangible fixed assets
Land
Construction in process
Other tangible fixed assets
Bonds and debentures
Other securities
Inventories
Finished goods and merchandise
Works in process
Raw materials and goods in storage
Liquid assets
Cash and deposits
Bills receivable
Accounts receivable
Securities
Stocks
2. Assets, Liabilities and Net Assets and Profit
Motor Vehicles,
By capital
Number of corporations (companies)
108 By Size

(Unit: millions of yen)
Total Under 10 10 - 50 50 - 100 100 - 1,000 1,000 or over
35,240,374 -10,842 1,229,941 848,284 1,575,344 31,597,647
31,191,795 -10,842 1,222,864 843,062 1,541,615 27,595,096
3,910,359 19,776 59,941 31,849 114,373 3,684,420
4,420,964 -17,372 54,574 114,402 143,078 4,126,282
3,917,054 - 23,830 28,090 86,239 3,778,895
503,910 -17,372 30,744 86,312 56,839 347,387
25,306,708 -13,246 1,118,050 697,116 1,308,301 22,196,487
478,539 1,322 37,640 13,298 18,714 407,565
24,828,169 -14,568 1,080,410 683,818 1,289,587 21,788,922
Reserve 14,442,684 18,530 617,468 477,498 770,243 12,558,945
Retained earnings brought forward 10,385,485 -33,098 462,942 206,320 519,344 9,229,977
-2,446,236 - -9,701 -305 -24,137 -2,412,093
4,042,391 - 7,077 5,222 33,729 3,996,363
6,188 - - - - 6,188
64,200,300 203,733 2,602,819 1,960,024 3,525,857 55,907,867
26,088 4,037 10,516 5,720 5,532 283
3,705,072 - 82,530 93,707 276,654 3,252,181
2,502,157 - 50,865 67,324 226,227 2,157,741
64,520,772 300,457 3,266,946 2,384,430 4,818,220 53,750,719
54,179,639 171,088 2,871,057 2,156,511 4,270,883 44,710,100
7,015,518 125,972 348,396 182,386 350,321 6,008,443
3,325,615 3,397 47,493 45,533 197,016 3,032,176
2,505,045 5,071 46,809 25,408 79,552 2,348,205
430,946 3,498 19,885 13,654 28,310 365,599
5,399,714 4,970 74,417 57,287 248,258 5,014,782
336,704 1,164 10,235 12,282 35,265 277,758
686,993 164 23,045 12,760 35,555 615,469
5,049,425 5,970 61,607 56,809 247,968 4,677,071
1,161,546 659 23,521 18,957 76,700 1,041,709
-51,857 - -1,898 1,615 6,341 -57,915
3,939,736 5,311 39,984 36,237 164,927 3,693,277
805,471 - 234 1,422 20,302 783,513
1,007,084 2 6,991 7,609 182,156 810,326
1,767,196 8,809 109,802 126,775 157,699 1,364,111
23,601 - 20,291 1,808 1,362 140
11,062,876 136,837 850,696 465,438 900,661 8,709,244
195,233 35,284 85,071 17,839 18,840 38,199
18,933 64 4,915 2,337 4,240 7,377
4,652,483 75,028 473,349 282,077 422,386 3,399,643
1,384,379 1,320 80,399 64,713 112,704 1,125,243
1,022,289 6,791 76,678 28,009 98,798 812,013
85,464 3,195 9,720 6,837 7,409 58,303
235,701 7,865 41,458 12,384 29,364 144,630
228,243 7,088 41,333 12,546 17,313 149,963
3,240,151 202 37,773 38,696 189,607 2,973,873
25,342 9,028 11,100 1,808 1,574 1,832
999,356 42,132 152,901 78,073 114,239 612,011
By capital
taxes and public charges
Net operating income
Number of directors (persons)
Number of employees (persons)
Directors' bonus
Employees' salaries
Employees' bonus
Welfare expenses
Interest expensesRental or leasing expenses for fixedand liquid assets
Interim dividend
Dividends
Depreciation expenses
Special depreciation expenses
Value added
Directors' remuneration
Special profits
Special losses
Net profits before tax
Income taxes-current
Income taxes-deferred
Net profits for the period
Cost of salesSelling and general administrationexpenses
Operating profits
Non-operating revenues
Non-operating expenses
Ordinary profits
Subscription rights to shares
Liabilities and net assets
Bills receivable discounted outstanding
Accounts receivable from subsidiariesand associates - tradeAccounts payable from subsidiaries andassociates - trade
Sales
Others capital surplus
Earned surplus
Legal retained earnings
Other earned surplus
Treasury stock
Others net assets
Net assets
Shareholders' equity
Capital stock
Capital surplus
Capital reserve
and Loss Table by Sector and by Size (continued)
Parts and Accessories
By Size 109

Total Under 10 10 - 50 50 - 100 100 - 1,000 1,000 or over
4,766 2,776 1,715 162 77 36
4,824,809 52,990 658,546 468,979 640,250 3,004,044
1,195,557 23,074 319,655 145,785 136,144 570,899
135,981 3,949 27,761 46,298 16,481 41,492
1,264,373 15,288 100,016 145,209 119,735 884,125
115,405 745 24,006 7,561 4,034 79,059
10,421 - 6,871 2,788 762 -
89,720 - 7,821 - 2,840 79,059
15,264 745 9,314 4,773 432 -
1,398,384 7,957 113,508 77,470 151,277 1,048,172
86,319 1,439 13,884 8,650 12,952 49,394
1,103,704 2,641 85,655 54,006 119,172 842,230
208,361 3,877 13,969 14,814 19,153 156,548
715,109 1,977 73,600 46,656 212,579 380,297
2,910,284 40,201 427,718 258,476 278,559 1,905,330
1,807,283 34,045 326,666 211,135 223,156 1,012,281
641,174 14,619 168,863 80,111 80,032 297,549
87,187 824 2,898 15,597 6,413 61,455
1,078,922 18,602 154,905 115,427 136,711 653,277
34,797 927 1,618 1,356 2,080 28,816
7,693 97 1,231 384 679 5,302
27,104 830 387 972 1,401 23,514
1,068,204 5,229 99,434 45,985 53,323 864,233
590,152 179 34,422 12,470 34,162 508,919
Stocks 534,637 62 17,385 9,106 18,084 490,000
Bonds and debentures 26,214 - - 128 12,489 13,597
Other securities 29,301 117 17,037 3,236 3,589 5,322
478,052 5,050 65,012 33,515 19,161 355,314
2,493 24 640 418 1,080 331
7,737,586 93,215 1,086,904 727,873 919,889 4,909,705
4,839,710 90,489 616,210 489,904 570,519 3,072,588
3,377,603 31,462 320,719 360,010 434,350 2,231,062
252,720 1,399 48,722 73,013 47,619 81,967
808,481 6,413 60,030 71,909 96,596 573,533
812,442 10,526 74,018 78,190 76,639 573,069
412,896 3,123 56,178 67,690 41,774 244,131
399,546 7,403 17,840 10,500 34,865 328,938
122,873 82 2,290 7,098 14,561 98,842
1,381,087 13,042 135,659 129,800 198,935 903,651
1,462,107 59,027 295,491 129,894 136,169 841,526
178,080 - 7,490 - 3,466 167,124
1,028,690 57,891 275,098 110,296 105,151 480,254
933,055 44,495 247,038 106,046 55,939 479,537
95,635 13,396 28,060 4,250 49,212 717
142,469 - 5,811 14,305 15,646 106,707
112,868 1,136 7,092 5,293 11,906 87,441
- - - - - -
Liquid assets
Cash and deposits
Bills receivable
2. Assets, Liabilities and Net Assets and Profit
Miscellaneous Transportation
By capital
Number of corporations (companies)
Accounts receivable
Securities
Stocks
Bonds and debentures
Other securities
Inventories
Finished goods and merchandise
Works in process
Raw materials and goods in storage
Other liquid assets
Fixed assets
Tangible fixed assets
Land
Construction in process
Other tangible fixed assets
Intangible fixed assets
Intangible fixed assets excluding software
Software
Investments and other assets
Investment securities
Other investments and other assets
Deferred assets
Total assets
Liabilities
Liquid liabilities
Bills payable
Accounts payable
Short-term borrowings
Short-term bank borrowings
Short-term other borrowings
Allowance
Other liquid liabilities
Fixed liabilities
Bonds
Long-term borrowings
Long-term bank borrowings
Long-term other borrowings
Allowance
Other fixed liabilities
Reserve required by special law
110 By Size
(Unit: millions of yen)
Total Under 10 10 - 50 50 - 100 100 - 1,000 1,000 or over
2,897,876 2,726 470,694 237,969 349,370 1,837,117
2,782,374 2,412 469,498 229,643 338,617 1,742,204
486,774 9,766 25,355 11,581 19,090 420,982
427,188 - 11,940 13,570 42,353 359,325
283,725 - 355 3,089 13,059 267,222
143,463 - 11,585 10,481 29,294 92,103
1,885,405 -7,354 433,316 206,187 282,995 970,261
33,659 258 9,639 2,114 2,665 18,983
1,851,746 -7,612 423,677 204,073 280,330 951,278
Reserve 1,004,801 2,464 221,767 142,236 83,851 554,483
Retained earnings brought forward 846,945 -10,076 201,910 61,837 196,479 396,795
-16,993 - -1,113 -1,695 -5,821 -8,364
115,024 314 1,196 8,326 10,729 94,459
478 - - - 24 454
7,737,586 93,215 1,086,904 727,873 919,889 4,909,705
10,192 1,852 6,724 1,383 233 -
292,581 - 13,100 17,854 31,244 230,383
167,489 - 7,210 38,002 11,374 110,903
6,391,770 159,174 982,770 737,319 849,561 3,662,946
5,510,707 87,870 817,340 661,088 742,173 3,202,236
638,484 75,249 136,836 54,635 55,762 316,002
242,579 -3,945 28,594 21,596 51,626 144,708
121,859 2,397 18,880 6,450 9,339 84,793
70,556 1,077 10,777 4,879 10,033 43,790
293,882 -2,625 36,697 23,167 50,932 185,711
68,189 592 4,487 9,464 2,940 50,706
116,468 3,996 7,694 9,976 5,656 89,146
245,603 -6,029 33,490 22,655 48,216 147,271
84,681 404 8,358 7,765 10,554 57,600
23,498 - 315 -203 7,025 16,361
137,424 -6,433 24,817 15,093 30,637 73,310
19,004 - - 509 1,267 17,228
53,455 - 8,790 3,839 3,431 37,395
174,217 3,764 23,999 19,794 22,449 104,211
6,932 - 2,008 4,223 701 -
1,276,518 67,199 253,030 136,717 183,019 636,553
70,789 22,313 31,337 6,702 3,768 6,669
5,084 188 1,901 1,047 582 1,366
574,839 38,807 126,817 71,080 74,457 263,678
150,120 1,085 17,862 15,548 22,596 93,029
144,763 4,488 22,246 12,693 19,417 85,919
20,700 917 5,900 2,298 2,511 9,074
54,484 1,502 15,447 4,427 7,018 26,090
33,860 2,761 8,826 3,624 3,555 15,094
221,879 -4,862 22,694 19,298 49,115 135,634
12,122 6,246 4,354 738 380 404
146,802 15,268 38,513 19,628 19,973 53,420
Net assets
Shareholders' equity
By capital
Capital stock
Capital surplus
Capital reserve
and Loss Table by Sector and by Size (continued)
Equipment
Others capital surplus
Earned surplus
Legal retained earnings
Other earned surplus
Treasury stock
Others net assets
Subscription rights to shares
Liabilities and net assets
Bills receivable discounted outstanding
Accounts receivable from subsidiariesand associates - tradeAccounts payable from subsidiaries andassociates - trade
Sales
Cost of salesSelling and general administrationexpenses
Operating profits
Non-operating revenues
Non-operating expenses
Ordinary profits
Special profits
Special losses
Net profits before tax
Income taxes-current
Income taxes-deferred
Net profits for the period
Interim dividend
Dividends
Depreciation expenses
Special depreciation expenses
Value added
Directors' remuneration
taxes and public charges
Net operating income
Number of directors (persons)
Number of employees (persons)
Directors' bonus
Employees' salaries
Employees' bonus
Welfare expenses
Interest expensesRental or leasing expenses for fixedand liquid assets
By Size 111

Total Under 10 10 - 50 50 - 100 100 - 1,000 1,000 or over
61,743 36,356 22,735 1,622 841 189
19,387,145 1,274,540 3,134,961 3,267,276 4,426,001 7,284,367
5,574,857 587,194 1,051,584 944,345 1,244,299 1,747,435
1,551,816 208,385 205,846 395,939 368,332 373,314
5,602,714 300,902 662,138 888,685 1,263,671 2,487,318
617,848 158 119,862 55,461 12,972 429,395
29,233 124 15,832 9,817 3,360 100
173,469 15 101,468 854 4,440 66,692
415,146 19 2,562 44,790 5,172 362,603
3,067,306 127,290 634,128 570,602 702,426 1,032,860
1,673,911 36,157 358,716 321,668 368,521 588,849
598,657 20,353 137,620 101,133 150,208 189,343
794,738 70,780 137,792 147,801 183,697 254,668
2,972,604 50,611 461,403 412,244 834,301 1,214,045
17,158,207 1,255,544 2,410,163 2,491,051 2,446,596 8,554,853
9,281,899 1,050,219 2,059,109 1,579,657 1,610,050 2,982,864
3,359,223 226,487 972,352 554,269 531,830 1,074,285
325,255 33,090 56,318 75,807 52,456 107,584
5,597,421 790,642 1,030,439 949,581 1,025,764 1,800,995
466,357 4,483 15,808 222,584 42,892 180,590
335,315 2,736 11,984 209,921 19,728 90,946
131,042 1,747 3,824 12,663 23,164 89,644
7,409,951 200,842 335,246 688,810 793,654 5,391,399
5,402,197 34,374 105,480 278,188 535,386 4,448,769
Stocks 4,985,665 628 55,474 200,445 408,057 4,321,061
Bonds and debentures 142,458 - 921 15,879 60,583 65,075
Other securities 274,074 33,746 49,085 61,864 66,746 62,633
2,007,754 166,468 229,766 410,622 258,268 942,630
71,054 23,193 8,889 11,695 26,775 502
36,616,406 2,553,277 5,554,013 5,770,022 6,899,372 15,839,722
18,662,869 2,226,881 3,427,963 3,114,837 3,509,450 6,383,738
10,507,997 629,498 1,383,739 1,634,122 2,630,439 4,230,199
1,115,240 29,368 185,217 307,611 276,063 316,981
3,044,305 115,115 352,444 399,097 783,639 1,394,010
3,066,595 267,007 395,688 444,883 1,057,624 901,393
2,135,848 129,751 295,619 309,887 832,810 567,781
930,747 137,256 100,069 134,996 224,814 333,612
303,072 - 33,581 47,180 75,226 147,085
2,978,785 218,008 416,809 435,351 437,887 1,470,730
8,143,827 1,597,383 2,033,179 1,480,715 879,011 2,153,539
426,160 - 13,436 25,497 24,896 362,331
6,002,254 1,548,663 1,957,558 999,778 521,743 974,512
4,709,955 1,207,583 1,610,817 778,958 436,981 675,616
1,292,299 341,080 346,741 220,820 84,762 298,896
1,001,845 8,431 23,214 275,000 226,098 469,102
713,568 40,289 38,971 180,440 106,274 347,594
11,045 - 11,045 - - -Reserve required by special law
Bonds
Long-term borrowings
Long-term bank borrowings
Long-term other borrowings
Allowance
Other fixed liabilities
Short-term borrowings
Short-term bank borrowings
Short-term other borrowings
Allowance
Other liquid liabilities
Fixed liabilities
Deferred assets
Total assets
Liabilities
Liquid liabilities
Bills payable
Accounts payable
Intangible fixed assets
Intangible fixed assets excluding software
Software
Investments and other assets
Investment securities
Other investments and other assets
Other liquid assets
Fixed assets
Tangible fixed assets
Land
Construction in process
Other tangible fixed assets
Bonds and debentures
Other securities
Inventories
Finished goods and merchandise
Works in process
Raw materials and goods in storage
Liquid assets
Cash and deposits
Bills receivable
Accounts receivable
Securities
Stocks
2. Assets, Liabilities and Net Assets and Profit
Miscellaneous Manufacturing
By capital
Number of corporations (companies)
112 By Size

(Unit: millions of yen)
Total Under 10 10 - 50 50 - 100 100 - 1,000 1,000 or over
17,953,537 326,396 2,126,050 2,655,185 3,389,922 9,455,984
17,326,327 326,396 2,120,029 2,648,953 3,324,546 8,906,403
2,176,988 140,628 313,002 117,040 214,777 1,391,541
2,818,917 - 187,344 276,366 496,245 1,858,962
1,721,972 - 86,786 48,119 244,279 1,342,788
1,096,945 - 100,558 228,247 251,966 516,174
13,062,465 185,768 1,656,853 2,361,091 2,650,924 6,207,829
467,241 34,742 208,712 23,277 57,479 143,031
12,595,224 151,026 1,448,141 2,337,814 2,593,445 6,064,798
Reserve 8,230,771 103,150 1,079,514 1,238,383 1,875,883 3,933,841
Retained earnings brought forward 4,364,453 47,876 368,627 1,099,431 717,562 2,130,957
-732,043 - -37,170 -105,544 -37,400 -551,929
619,988 - 3,858 6,232 65,368 544,530
7,222 - 2,163 - 8 5,051
36,616,406 2,553,277 5,554,013 5,770,022 6,899,372 15,839,722
199,846 26,920 78,088 36,851 49,547 8,440
1,347,833 22 54,577 93,621 252,260 947,353
801,570 9,777 59,424 129,390 191,387 411,592
32,618,954 2,398,291 5,513,071 6,708,507 7,160,986 10,838,099
23,801,107 1,300,755 3,975,555 4,990,809 5,771,561 7,762,427
7,047,787 927,309 1,377,165 1,386,725 1,013,829 2,342,759
1,770,060 170,227 160,351 330,973 375,596 732,913
688,180 20,047 88,960 116,869 93,547 368,757
344,403 12,676 56,461 85,909 48,229 141,128
2,113,837 177,598 192,850 361,933 420,914 960,542
237,792 22,417 14,896 28,314 32,617 139,548
597,908 33,256 83,532 149,509 69,310 262,301
1,753,721 166,759 124,214 240,738 384,221 837,789
609,348 87,527 65,879 103,210 149,519 203,213
-18,910 - -185 -7,370 -11,111 -244
1,163,283 79,232 58,520 144,898 245,813 634,820
136,512 - 228 4,553 10,237 121,494
339,670 3,094 9,625 8,651 116,836 201,464
953,044 132,672 130,418 133,658 210,775 345,521
37,415 10,283 2,277 21,285 1,262 2,308
7,838,765 1,200,209 1,486,832 1,337,522 1,463,154 2,351,048
648,455 271,415 257,525 58,705 33,161 27,649
21,959 4,641 6,867 3,500 2,311 4,640
3,392,302 528,900 724,452 605,660 663,508 869,782
703,399 58,181 94,061 131,268 142,485 277,404
729,252 70,264 124,689 114,479 145,374 274,446
106,571 17,439 32,267 19,549 13,995 23,321
367,110 39,914 74,079 66,900 67,574 118,643
206,228 56,667 44,808 26,037 33,145 45,571
1,663,489 152,788 128,084 311,424 361,601 709,592
122,955 57,241 55,993 4,923 3,034 1,764
1,059,532 220,457 273,207 206,620 169,719 189,529
By capital
taxes and public charges
Net operating income
Number of directors (persons)
Number of employees (persons)
Directors' bonus
Employees' salaries
Employees' bonus
Welfare expenses
Interest expensesRental or leasing expenses for fixedand liquid assets
Interim dividend
Dividends
Depreciation expenses
Special depreciation expenses
Value added
Directors' remuneration
Special profits
Special losses
Net profits before tax
Income taxes-current
Income taxes-deferred
Net profits for the period
Cost of salesSelling and general administrationexpenses
Operating profits
Non-operating revenues
Non-operating expenses
Ordinary profits
Subscription rights to shares
Liabilities and net assets
Bills receivable discounted outstanding
Accounts receivable from subsidiariesand associates - tradeAccounts payable from subsidiaries andassociates - trade
Sales
Others capital surplus
Earned surplus
Legal retained earnings
Other earned surplus
Treasury stock
Others net assets
Net assets
Shareholders' equity
Capital stock
Capital surplus
Capital reserve
and Loss Table by Sector and by Size (continued)
Industries
By Size 113
Total Under 10 10 - 50 50 - 100 100 - 1,000 1,000 or over
2,409,751 1,573,173 765,697 49,222 18,594 3,065
495,870,859 42,532,549 133,433,906 64,351,535 82,015,946 173,536,923
148,167,389 19,036,884 53,576,448 22,521,721 17,585,893 35,446,443
14,434,477 595,422 4,491,651 3,021,251 3,478,085 2,848,068
133,341,539 9,255,442 31,584,215 16,167,145 28,637,479 47,697,258
9,526,496 340,418 2,197,186 903,421 1,303,813 4,781,658
2,345,039 121,321 1,345,559 513,511 225,984 138,664
1,462,473 2,092 219,972 108,791 312,183 819,435
5,718,984 217,005 631,655 281,119 765,646 3,823,559
67,201,418 5,936,837 18,396,739 10,308,652 9,997,350 22,561,840
44,473,919 3,971,713 13,214,119 8,120,043 7,184,291 11,983,753
17,484,955 1,379,735 4,103,199 1,791,274 2,303,304 7,907,443
5,242,544 585,389 1,079,421 397,335 509,755 2,670,644
123,199,540 7,367,546 23,187,667 11,429,345 21,013,326 60,201,656
654,038,385 57,994,761 139,782,188 53,026,600 62,215,311 341,019,525
354,487,940 46,991,368 91,874,002 36,523,082 38,785,823 140,313,665
143,228,951 17,025,286 46,186,087 18,171,492 16,457,095 45,388,991
13,146,026 1,447,611 1,908,844 587,706 802,226 8,399,639
198,112,963 28,518,471 43,779,071 17,763,884 21,526,502 86,525,035
14,729,357 464,487 2,225,501 942,956 2,388,053 8,708,360
8,439,055 363,337 1,721,727 645,727 1,267,698 4,440,566
6,290,302 101,150 503,774 297,229 1,120,355 4,267,794
284,821,088 10,538,906 45,682,685 15,560,562 21,041,435 191,997,500
184,466,793 2,685,323 23,332,601 7,438,737 10,665,455 140,344,677
Stocks 168,922,702 2,104,518 17,052,493 4,796,919 8,876,266 136,092,506
Bonds and debentures 4,032,476 15,787 975,518 1,287,623 564,913 1,188,635
Other securities 11,511,615 565,018 5,304,590 1,354,195 1,224,276 3,063,536
100,354,295 7,853,583 22,350,084 8,121,825 10,375,980 51,652,823
1,297,788 230,549 534,537 157,520 237,399 137,783
1,151,207,032 100,757,859 273,750,631 117,535,655 144,468,656 514,694,231
719,488,264 87,306,134 168,197,140 74,229,504 90,717,973 299,037,513
363,114,670 35,493,317 84,443,610 42,861,294 61,126,283 139,190,166
17,484,373 504,768 6,490,033 3,373,357 3,457,338 3,658,877
95,517,216 5,045,494 20,773,550 13,348,258 23,647,370 32,702,544
122,705,650 17,916,768 27,034,858 13,891,443 15,379,181 48,483,400
75,546,650 7,241,629 15,321,558 10,897,343 9,733,191 32,352,929
47,159,000 10,675,139 11,713,300 2,994,100 5,645,990 16,130,471
6,302,418 49,381 1,635,646 638,348 1,540,084 2,438,959
121,105,013 11,976,906 28,509,523 11,609,888 17,102,310 51,906,386
355,898,785 51,791,799 83,751,224 31,365,465 29,590,194 159,400,103
46,104,235 657,666 2,741,475 1,121,672 564,484 41,018,938
235,576,115 44,969,980 70,261,424 22,241,539 17,093,943 81,009,229
186,835,405 31,982,307 52,178,220 18,924,906 12,018,104 71,731,868
48,740,710 12,987,673 18,083,204 3,316,633 5,075,839 9,277,361
25,429,521 105,250 2,134,685 2,250,289 4,695,327 16,243,970
48,788,914 6,058,903 8,613,640 5,751,965 7,236,440 21,127,966
474,809 21,018 2,306 2,745 1,496 447,244Reserve required by special law
Bonds
Long-term borrowings
Long-term bank borrowings
Long-term other borrowings
Allowance
Other fixed liabilities
Short-term borrowings
Short-term bank borrowings
Short-term other borrowings
Allowance
Other liquid liabilities
Fixed liabilities
Deferred assets
Total assets
Liabilities
Liquid liabilities
Bills payable
Accounts payable
Intangible fixed assets
Intangible fixed assets excluding software
Software
Investments and other assets
Investment securities
Other investments and other assets
Other liquid assets
Fixed assets
Tangible fixed assets
Land
Construction in process
Other tangible fixed assets
Bonds and debentures
Other securities
Inventories
Finished goods and merchandise
Works in process
Raw materials and goods in storage
Liquid assets
Cash and deposits
Bills receivable
Accounts receivable
Securities
Stocks
2. Assets, Liabilities and Net Assets and Profit
Non-
By capital
Number of corporations (companies)
114 By Size

(Unit: millions of yen)
Total Under 10 10 - 50 50 - 100 100 - 1,000 1,000 or over
431,718,768 13,451,725 105,553,491 43,306,151 53,750,683 215,656,718
420,882,309 13,463,802 105,186,492 42,558,068 51,937,191 207,736,756
72,968,914 5,325,374 10,924,739 3,376,225 4,451,566 48,891,010
112,000,933 503,471 27,852,662 6,154,762 10,227,734 67,262,304
65,867,951 107,719 13,078,651 3,306,587 4,785,238 44,589,756
46,132,982 395,752 14,774,011 2,848,175 5,442,496 22,672,548
245,984,785 7,693,539 68,143,232 33,607,384 38,376,109 98,164,521
6,481,062 319,744 1,834,043 750,049 1,153,876 2,423,350
239,503,723 7,373,795 66,309,189 32,857,335 37,222,233 95,741,171
Reserve 129,834,528 4,940,338 38,875,976 20,428,170 19,798,181 45,791,863
Retained earnings brought forward 109,669,195 2,433,457 27,433,213 12,429,165 17,424,052 49,949,308
-10,072,323 -58,582 -1,734,141 -580,303 -1,118,218 -6,581,079
10,648,688 -12,077 365,561 744,709 1,808,609 7,741,886
187,771 - 1,438 3,374 4,883 178,076
1,151,207,032 100,757,859 273,750,631 117,535,655 144,468,656 514,694,231
2,012,079 129,374 1,015,789 194,801 326,182 345,933
14,135,805 267,422 2,007,551 1,105,657 4,362,506 6,392,669
15,228,529 192,156 1,202,221 3,617,643 4,999,606 5,216,903
1,033,692,016 107,560,676 288,578,190 128,202,344 191,148,590 318,202,216
760,110,801 59,925,580 204,824,367 99,405,744 151,279,322 244,675,788
234,127,032 46,483,290 76,891,143 24,818,022 33,153,669 52,780,908
39,454,183 1,151,806 6,862,680 3,978,578 6,715,599 20,745,520
15,053,749 1,999,651 3,887,723 1,297,377 1,221,513 6,647,485
9,624,862 1,153,716 2,917,707 839,681 748,180 3,965,578
44,883,070 1,997,741 7,832,696 4,436,274 7,188,932 23,427,427
6,970,188 962,909 1,731,150 627,871 674,083 2,974,175
11,811,561 706,063 3,112,774 979,024 1,034,641 5,979,059
40,041,697 2,254,587 6,451,072 4,085,121 6,828,374 20,422,543
12,258,210 804,668 2,676,390 1,336,940 2,360,513 5,079,699
512,976 29,346 116,304 -18,108 118,239 267,195
27,270,511 1,420,573 3,658,378 2,766,289 4,349,622 15,075,649
3,744,455 1,005 36,198 12,596 616,889 3,077,767
9,175,269 72,330 605,202 515,136 1,718,306 6,264,295
26,582,815 4,367,044 5,822,733 2,368,724 3,190,171 10,834,143
1,198,680 128,162 708,140 182,950 94,525 84,903
216,667,420 31,781,666 65,300,687 24,422,248 35,386,670 59,776,149
20,151,651 9,006,533 8,733,448 1,229,279 760,513 421,878
485,372 55,989 211,299 91,362 72,181 54,541
94,682,399 14,961,083 32,536,938 12,134,385 16,610,990 18,439,003
13,617,984 764,731 3,840,559 1,823,025 3,153,646 4,036,023
14,727,786 1,322,278 4,151,865 1,851,642 3,098,844 4,303,157
5,307,695 858,497 1,542,783 512,120 418,832 1,975,463
24,990,582 3,069,311 6,608,079 2,733,855 4,323,648 8,255,689
8,557,463 1,449,935 2,355,819 580,122 651,249 3,520,338
34,146,488 293,309 5,319,897 3,466,458 6,296,767 18,770,057
4,452,283 2,444,262 1,745,966 157,646 77,158 27,251
31,235,586 6,478,204 11,319,117 3,983,539 4,841,702 4,613,024
By capital
taxes and public charges
Net operating income
Number of directors (persons)
Number of employees (persons)
Directors' bonus
Employees' salaries
Employees' bonus
Welfare expenses
Interest expensesRental or leasing expenses for fixedand liquid assets
Interim dividend
Dividends
Depreciation expenses
Special depreciation expenses
Value added
Directors' remuneration
Special profits
Special losses
Net profits before tax
Income taxes-current
Income taxes-deferred
Net profits for the period
Cost of salesSelling and general administrationexpenses
Operating profits
Non-operating revenues
Non-operating expenses
Ordinary profits
Subscription rights to shares
Liabilities and net assets
Bills receivable discounted outstanding
Accounts receivable from subsidiariesand associates - tradeAccounts payable from subsidiaries andassociates - trade
Sales
Others capital surplus
Earned surplus
Legal retained earnings
Other earned surplus
Treasury stock
Others net assets
Net assets
Shareholders' equity
Capital stock
Capital surplus
Capital reserve
and Loss Table by Sector and by Size (continued)
Manufacturing
By Size 115

Total Under 10 10 - 50 50 - 100 100 - 1,000 1,000 or over
26,809 21,449 4,705 518 133 4
2,323,588 848,275 1,018,995 229,720 200,551 26,047
964,893 453,608 369,675 96,256 40,471 4,883
9,464 - 1,402 3,045 4,990 27
248,090 92,405 62,387 34,141 53,772 5,385
13,684 2,467 6,750 4,159 308 -
10,715 109 6,139 4,159 308 -
- - - - - -
2,969 2,358 611 - - -
737,826 210,699 385,417 55,087 72,466 14,157
426,604 150,681 193,178 39,159 41,756 1,830
206,943 16,220 147,564 9,745 22,264 11,150
104,279 43,798 44,675 6,183 8,446 1,177
349,631 89,096 193,364 37,032 28,544 1,595
2,146,490 569,007 1,042,904 255,137 164,881 114,561
1,815,121 483,445 912,984 199,578 125,204 93,910
423,832 75,638 236,769 57,812 33,957 19,656
52,867 20,578 26,950 1,716 1,413 2,210
1,338,422 387,229 649,265 140,050 89,834 72,044
14,477 5,181 5,863 1,171 1,987 275
11,788 3,974 5,313 921 1,501 79
2,689 1,207 550 250 486 196
316,892 80,381 124,057 54,388 37,690 20,376
103,260 15,371 37,552 24,557 19,461 6,319
Stocks 72,181 4,987 28,255 14,257 19,058 5,624
Bonds and debentures 977 - 282 661 34 -
Other securities 30,102 10,384 9,015 9,639 369 695
213,632 65,010 86,505 29,831 18,229 14,057
7,532 243 5,883 611 769 26
4,477,610 1,417,525 2,067,782 485,468 366,201 140,634
3,368,968 1,319,679 1,433,503 331,484 224,398 59,904
1,527,782 526,842 638,067 175,141 141,368 46,364
23,788 4,784 9,585 3,975 2,765 2,679
322,369 77,754 171,083 27,175 40,952 5,405
705,916 241,068 271,525 108,765 57,504 27,054
512,457 154,499 235,183 80,399 23,479 18,897
193,459 86,569 36,342 28,366 34,025 8,157
4,192 - 247 333 2,056 1,556
471,517 203,236 185,627 34,893 38,091 9,670
1,817,984 771,820 793,251 156,343 83,030 13,540
13,670 - 10,293 - 3,377 -
1,683,878 744,283 722,237 135,861 70,396 11,101
1,244,566 523,717 541,056 115,598 58,750 5,445
439,312 220,566 181,181 20,263 11,646 5,656
19,424 - 6,150 5,243 6,799 1,232
101,012 27,537 54,571 15,239 2,458 1,207
23,202 21,017 2,185 - - -Reserve required by special law
Bonds
Long-term borrowings
Long-term bank borrowings
Long-term other borrowings
Allowance
Other fixed liabilities
Short-term borrowings
Short-term bank borrowings
Short-term other borrowings
Allowance
Other liquid liabilities
Fixed liabilities
Deferred assets
Total assets
Liabilities
Liquid liabilities
Bills payable
Accounts payable
Intangible fixed assets
Intangible fixed assets excluding software
Software
Investments and other assets
Investment securities
Other investments and other assets
Other liquid assets
Fixed assets
Tangible fixed assets
Land
Construction in process
Other tangible fixed assets
Bonds and debentures
Other securities
Inventories
Finished goods and merchandise
Works in process
Raw materials and goods in storage
Liquid assets
Cash and deposits
Bills receivable
Accounts receivable
Securities
Stocks
2. Assets, Liabilities and Net Assets and Profit
Agriculture, Forestry
By capital
Number of corporations (companies)
116 By Size

(Unit: millions of yen)
Total Under 10 10 - 50 50 - 100 100 - 1,000 1,000 or over
1,108,642 97,846 634,279 153,984 141,803 80,730
1,102,159 97,846 630,433 152,329 141,881 79,670
232,001 81,172 71,020 36,084 32,860 10,865
126,652 1,892 39,781 21,375 44,586 19,018
50,035 1,892 17,964 4,857 17,013 8,309
76,617 - 21,817 16,518 27,573 10,709
766,579 14,782 520,585 113,297 65,743 52,172
40,132 1,689 28,396 6,471 2,165 1,411
726,447 13,093 492,189 106,826 63,578 50,761
Reserve 464,876 36,462 282,465 75,294 28,802 41,853
Retained earnings brought forward 261,571 -23,369 209,724 31,532 34,776 8,908
-23,073 - -953 -18,427 -1,308 -2,385
6,453 - 3,846 1,655 -78 1,030
30 - - - - 30
4,477,610 1,417,525 2,067,782 485,468 366,201 140,634
- - - - - -
26,233 - 3,181 5,448 17,426 178
57,065 - 31,862 9,967 15,108 128
3,975,774 1,594,103 1,336,486 422,725 512,947 109,513
2,835,366 937,043 1,027,957 334,307 448,946 87,113
1,156,274 704,988 293,806 84,078 56,243 17,159
-15,866 -47,928 14,723 4,340 7,758 5,241
220,031 126,781 71,018 14,676 5,126 2,430
35,876 11,530 14,951 5,926 2,427 1,042
168,289 67,323 70,790 13,090 10,457 6,629
79,499 55,285 12,522 1,590 6,990 3,112
99,068 59,808 25,465 5,085 7,241 1,469
148,720 62,800 57,847 9,595 10,206 8,272
53,636 19,235 21,869 5,039 4,489 3,004
383 72 131 127 20 33
94,701 43,493 35,847 4,429 5,697 5,235
3,783 - 216 23 3,217 327
7,038 6 518 2,034 1,609 2,871
226,232 88,254 97,262 20,422 11,903 8,391
5,539 - 4,240 34 1,265 -
986,913 544,806 283,076 72,811 56,486 29,734
239,372 182,683 46,018 7,647 2,615 409
1,914 1,262 341 189 106 16
491,918 251,924 156,382 42,280 26,869 14,463
36,967 8,077 13,882 5,973 6,367 2,668
86,118 54,381 18,847 5,907 5,324 1,659
21,354 6,609 10,168 3,019 1,350 208
87,403 56,688 19,194 3,730 3,451 4,340
59,087 37,719 13,689 2,745 3,996 938
-37,220 -54,537 4,555 1,321 6,408 5,033
63,491 50,293 11,050 1,591 502 55
215,357 127,730 56,144 16,387 9,557 5,539
By capital
taxes and public charges
Net operating income
Number of directors (persons)
Number of employees (persons)
Directors' bonus
Employees' salaries
Employees' bonus
Welfare expenses
Interest expensesRental or leasing expenses for fixedand liquid assets
Interim dividend
Dividends
Depreciation expenses
Special depreciation expenses
Value added
Directors' remuneration
Special profits
Special losses
Net profits before tax
Income taxes-current
Income taxes-deferred
Net profits for the period
Cost of salesSelling and general administrationexpenses
Operating profits
Non-operating revenues
Non-operating expenses
Ordinary profits
Subscription rights to shares
Liabilities and net assets
Bills receivable discounted outstanding
Accounts receivable from subsidiariesand associates - tradeAccounts payable from subsidiaries andassociates - trade
Sales
Others capital surplus
Earned surplus
Legal retained earnings
Other earned surplus
Treasury stock
Others net assets
Net assets
Shareholders' equity
Capital stock
Capital surplus
Capital reserve
and Loss Table by Sector and by Size (continued)
and Fisheries
By Size 117

Total Under 10 10 - 50 50 - 100 100 - 1,000 1,000 or over
22,786 18,400 3,831 433 118 4
1,718,564 612,639 790,843 178,385 110,650 26,047
693,253 298,331 283,440 70,465 36,134 4,883
9,372 - 1,324 3,031 4,990 27
189,578 84,339 47,369 27,826 24,659 5,385
4,467 - - 4,159 308 -
4,467 - - 4,159 308 -
- - - - - -
- - - - - -
557,279 161,473 306,860 45,921 28,868 14,157
320,658 113,309 160,661 33,387 11,471 1,830
152,520 16,220 106,319 8,569 10,262 11,150
84,101 31,944 39,880 3,965 7,135 1,177
264,615 68,496 151,850 26,983 15,691 1,595
1,665,893 418,662 793,443 205,333 133,894 114,561
1,467,090 380,315 724,223 159,470 109,172 93,910
344,494 49,994 196,703 46,491 31,650 19,656
43,366 17,986 20,971 1,538 661 2,210
1,079,230 312,335 506,549 111,441 76,861 72,044
8,090 2,146 3,964 387 1,318 275
5,836 939 3,434 296 1,088 79
2,254 1,207 530 91 230 196
190,713 36,201 65,256 45,476 23,404 20,376
54,793 6,189 9,594 21,217 11,474 6,319
Stocks 37,352 3,870 4,543 12,192 11,123 5,624
Bonds and debentures 661 - - 661 - -
Other securities 16,780 2,319 5,051 8,364 351 695
135,920 30,012 55,662 24,259 11,930 14,057
6,330 223 5,287 342 452 26
3,390,787 1,031,524 1,589,573 384,060 244,996 140,634
2,486,149 976,677 1,064,960 256,053 128,555 59,904
1,028,489 354,803 416,688 128,750 81,884 46,364
10,522 - 3,018 3,054 1,771 2,679
239,447 47,864 132,691 22,733 30,754 5,405
491,664 194,083 159,550 79,752 31,225 27,054
359,319 122,490 145,334 56,689 15,909 18,897
132,345 71,593 14,216 23,063 15,316 8,157
3,347 - 227 125 1,439 1,556
283,509 112,856 121,202 23,086 16,695 9,670
1,434,458 600,857 646,087 127,303 46,671 13,540
9,098 - 9,093 - 5 -
1,326,037 575,013 587,726 110,997 41,200 11,101
1,005,207 434,071 436,269 94,759 34,663 5,445
320,830 140,942 151,457 16,238 6,537 5,656
9,760 - 3,191 1,755 3,582 1,232
89,563 25,844 46,077 14,551 1,884 1,207
23,202 21,017 2,185 - - -Reserve required by special law
Bonds
Long-term borrowings
Long-term bank borrowings
Long-term other borrowings
Allowance
Other fixed liabilities
Short-term borrowings
Short-term bank borrowings
Short-term other borrowings
Allowance
Other liquid liabilities
Fixed liabilities
Deferred assets
Total assets
Liabilities
Liquid liabilities
Bills payable
Accounts payable
Intangible fixed assets
Intangible fixed assets excluding software
Software
Investments and other assets
Investment securities
Other investments and other assets
Other liquid assets
Fixed assets
Tangible fixed assets
Land
Construction in process
Other tangible fixed assets
Bonds and debentures
Other securities
Inventories
Finished goods and merchandise
Works in process
Raw materials and goods in storage
Liquid assets
Cash and deposits
Bills receivable
Accounts receivable
Securities
Stocks
2. Assets, Liabilities and Net Assets and Profit
Agriculture
By capital
Number of corporations (companies)
118 By Size
(Unit: millions of yen)
Total Under 10 10 - 50 50 - 100 100 - 1,000 1,000 or over
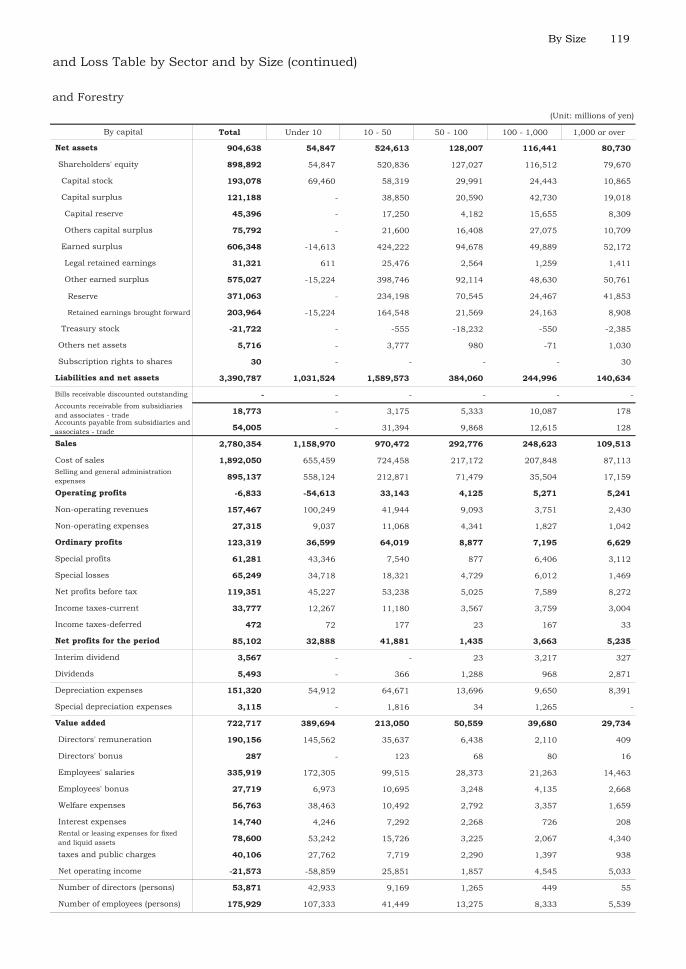
904,638 54,847 524,613 128,007 116,441 80,730
898,892 54,847 520,836 127,027 116,512 79,670
193,078 69,460 58,319 29,991 24,443 10,865
121,188 - 38,850 20,590 42,730 19,018
45,396 - 17,250 4,182 15,655 8,309
75,792 - 21,600 16,408 27,075 10,709
606,348 -14,613 424,222 94,678 49,889 52,172
31,321 611 25,476 2,564 1,259 1,411
575,027 -15,224 398,746 92,114 48,630 50,761
Reserve 371,063 - 234,198 70,545 24,467 41,853
Retained earnings brought forward 203,964 -15,224 164,548 21,569 24,163 8,908
-21,722 - -555 -18,232 -550 -2,385
5,716 - 3,777 980 -71 1,030
30 - - - - 30
3,390,787 1,031,524 1,589,573 384,060 244,996 140,634
- - - - - -
18,773 - 3,175 5,333 10,087 178
54,005 - 31,394 9,868 12,615 128
2,780,354 1,158,970 970,472 292,776 248,623 109,513
1,892,050 655,459 724,458 217,172 207,848 87,113
895,137 558,124 212,871 71,479 35,504 17,159
-6,833 -54,613 33,143 4,125 5,271 5,241
157,467 100,249 41,944 9,093 3,751 2,430
27,315 9,037 11,068 4,341 1,827 1,042
123,319 36,599 64,019 8,877 7,195 6,629
61,281 43,346 7,540 877 6,406 3,112
65,249 34,718 18,321 4,729 6,012 1,469
119,351 45,227 53,238 5,025 7,589 8,272
33,777 12,267 11,180 3,567 3,759 3,004
472 72 177 23 167 33
85,102 32,888 41,881 1,435 3,663 5,235
3,567 - - 23 3,217 327
5,493 - 366 1,288 968 2,871
151,320 54,912 64,671 13,696 9,650 8,391
3,115 - 1,816 34 1,265 -
722,717 389,694 213,050 50,559 39,680 29,734
190,156 145,562 35,637 6,438 2,110 409
287 - 123 68 80 16
335,919 172,305 99,515 28,373 21,263 14,463
27,719 6,973 10,695 3,248 4,135 2,668
56,763 38,463 10,492 2,792 3,357 1,659
14,740 4,246 7,292 2,268 726 208
78,600 53,242 15,726 3,225 2,067 4,340
40,106 27,762 7,719 2,290 1,397 938
-21,573 -58,859 25,851 1,857 4,545 5,033
53,871 42,933 9,169 1,265 449 55
175,929 107,333 41,449 13,275 8,333 5,539
By capital
taxes and public charges
Net operating income
Number of directors (persons)
Number of employees (persons)
Directors' bonus
Employees' salaries
Employees' bonus
Welfare expenses
Interest expensesRental or leasing expenses for fixedand liquid assets
Interim dividend
Dividends
Depreciation expenses
Special depreciation expenses
Value added
Directors' remuneration
Special profits
Special losses
Net profits before tax
Income taxes-current
Income taxes-deferred
Net profits for the period
Cost of salesSelling and general administrationexpenses
Operating profits
Non-operating revenues
Non-operating expenses
Ordinary profits
Subscription rights to shares
Liabilities and net assets
Bills receivable discounted outstanding
Accounts receivable from subsidiariesand associates - tradeAccounts payable from subsidiaries andassociates - trade
Sales
Others capital surplus
Earned surplus
Legal retained earnings
Other earned surplus
Treasury stock
Others net assets
Net assets
Shareholders' equity
Capital stock
Capital surplus
Capital reserve
and Loss Table by Sector and by Size (continued)
and Forestry
By Size 119
Total Under 10 10 - 50 50 - 100 100 - 1,000 1,000 or over
4,023 3,049 874 85 15 -
605,024 235,636 228,152 51,335 89,901 -
271,640 155,277 86,235 25,791 4,337 -
92 - 78 14 - -
58,512 8,066 15,018 6,315 29,113 -
9,217 2,467 6,750 - - -
6,248 109 6,139 - - -
- - - - - -
2,969 2,358 611 - - -
180,547 49,226 78,557 9,166 43,598 -
105,946 37,372 32,517 5,772 30,285 -
54,423 41,245 1,176 12,002 -
20,178 11,854 4,795 2,218 1,311 -
85,016 20,600 41,514 10,049 12,853 -
480,597 150,345 249,461 49,804 30,987 -
348,031 103,130 188,761 40,108 16,032 -
79,338 25,644 40,066 11,321 2,307 -
9,501 2,592 5,979 178 752 -
259,192 74,894 142,716 28,609 12,973 -
6,387 3,035 1,899 784 669 -
5,952 3,035 1,879 625 413 -
435 - 20 159 256 -
126,179 44,180 58,801 8,912 14,286 -
48,467 9,182 27,958 3,340 7,987 -
Stocks 34,829 1,117 23,712 2,065 7,935 -
Bonds and debentures 316 - 282 - 34 -
Other securities 13,322 8,065 3,964 1,275 18 -
77,712 34,998 30,843 5,572 6,299 -
1,202 20 596 269 317 -
1,086,823 386,001 478,209 101,408 121,205 -
882,819 343,002 368,543 75,431 95,843 -
499,293 172,039 221,379 46,391 59,484 -
13,266 4,784 6,567 921 994 -
82,922 29,890 38,392 4,442 10,198 -
214,252 46,985 111,975 29,013 26,279 -
153,138 32,009 89,849 23,710 7,570 -
61,114 14,976 22,126 5,303 18,709 -
845 - 20 208 617 -
188,008 90,380 64,425 11,807 21,396 -
383,526 170,963 147,164 29,040 36,359 -
4,572 - 1,200 - 3,372 -
357,841 169,270 134,511 24,864 29,196 -
239,359 89,646 104,787 20,839 24,087 -
118,482 79,624 29,724 4,025 5,109 -
9,664 - 2,959 3,488 3,217 -
11,449 1,693 8,494 688 574 -
- - - - - -Reserve required by special law
Bonds
Long-term borrowings
Long-term bank borrowings
Long-term other borrowings
Allowance
Other fixed liabilities
Short-term borrowings
Short-term bank borrowings
Short-term other borrowings
Allowance
Other liquid liabilities
Fixed liabilities
Deferred assets
Total assets
Liabilities
Liquid liabilities
Bills payable
Accounts payable
Intangible fixed assets
Intangible fixed assets excluding software
Software
Investments and other assets
Investment securities
Other investments and other assets
Other liquid assets
Fixed assets
Tangible fixed assets
Land
Construction in process
Other tangible fixed assets
Bonds and debentures
Other securities
Inventories
Finished goods and merchandise
Works in process
Raw materials and goods in storage
Liquid assets
Cash and deposits
Bills receivable
Accounts receivable
Securities
Stocks
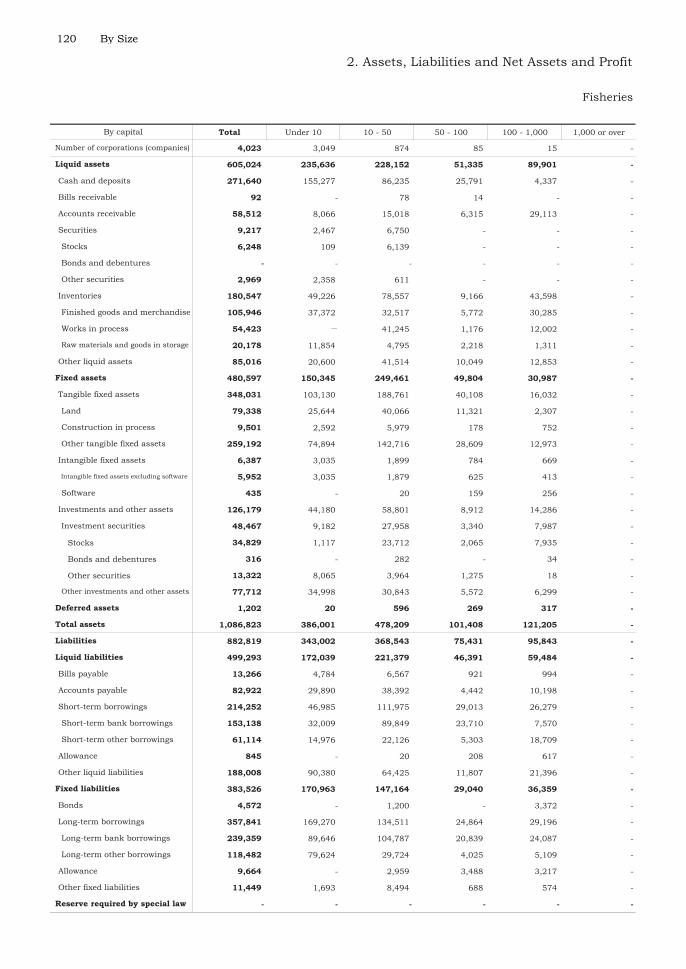
2. Assets, Liabilities and Net Assets and Profit
Fisheries
By capital
Number of corporations (companies)
120 By Size
(Unit: millions of yen)
Total Under 10 10 - 50 50 - 100 100 - 1,000 1,000 or over
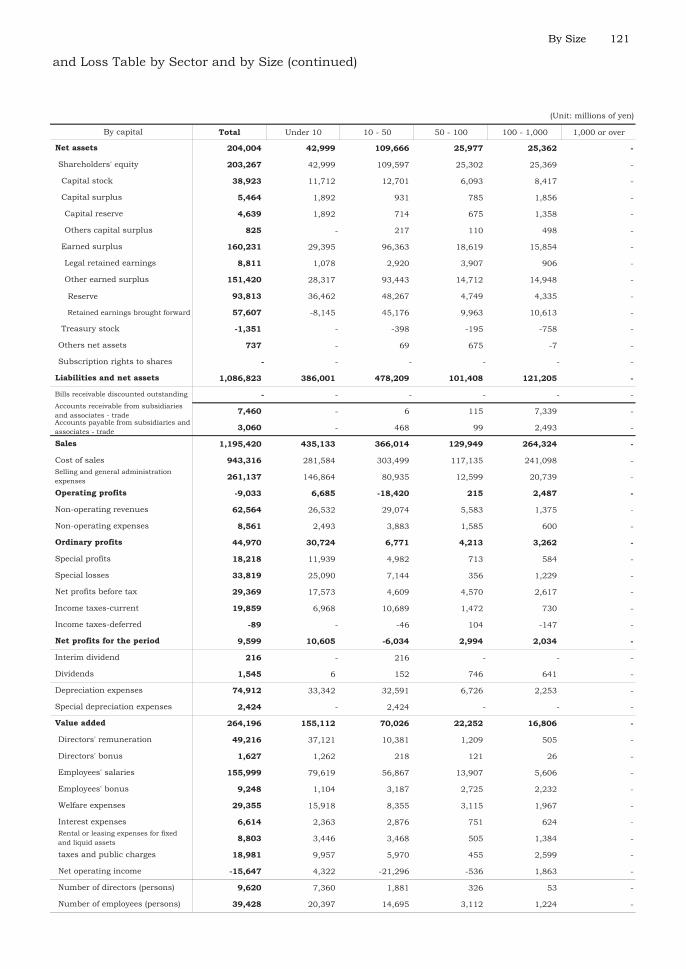
204,004 42,999 109,666 25,977 25,362 -
203,267 42,999 109,597 25,302 25,369 -
38,923 11,712 12,701 6,093 8,417 -
5,464 1,892 931 785 1,856 -
4,639 1,892 714 675 1,358 -
825 - 217 110 498 -
160,231 29,395 96,363 18,619 15,854 -
8,811 1,078 2,920 3,907 906 -
151,420 28,317 93,443 14,712 14,948 -
Reserve 93,813 36,462 48,267 4,749 4,335 -
Retained earnings brought forward 57,607 -8,145 45,176 9,963 10,613 -
-1,351 - -398 -195 -758 -
737 - 69 675 -7 -
- - - - - -
1,086,823 386,001 478,209 101,408 121,205 -
- - - - - -
7,460 - 6 115 7,339 -
3,060 - 468 99 2,493 -
1,195,420 435,133 366,014 129,949 264,324 -
943,316 281,584 303,499 117,135 241,098 -
261,137 146,864 80,935 12,599 20,739 -
-9,033 6,685 -18,420 215 2,487 -
62,564 26,532 29,074 5,583 1,375 -
8,561 2,493 3,883 1,585 600 -
44,970 30,724 6,771 4,213 3,262 -
18,218 11,939 4,982 713 584 -
33,819 25,090 7,144 356 1,229 -
29,369 17,573 4,609 4,570 2,617 -
19,859 6,968 10,689 1,472 730 -
-89 - -46 104 -147 -
9,599 10,605 -6,034 2,994 2,034 -
216 - 216 - - -
1,545 6 152 746 641 -
74,912 33,342 32,591 6,726 2,253 -
2,424 - 2,424 - - -
264,196 155,112 70,026 22,252 16,806 -
49,216 37,121 10,381 1,209 505 -
1,627 1,262 218 121 26 -
155,999 79,619 56,867 13,907 5,606 -
9,248 1,104 3,187 2,725 2,232 -
29,355 15,918 8,355 3,115 1,967 -
6,614 2,363 2,876 751 624 -
8,803 3,446 3,468 505 1,384 -
18,981 9,957 5,970 455 2,599 -
-15,647 4,322 -21,296 -536 1,863 -
9,620 7,360 1,881 326 53 -
39,428 20,397 14,695 3,112 1,224 -
By capital
taxes and public charges
Net operating income
Number of directors (persons)
Number of employees (persons)
Directors' bonus
Employees' salaries
Employees' bonus
Welfare expenses
Interest expensesRental or leasing expenses for fixedand liquid assets
Interim dividend
Dividends
Depreciation expenses
Special depreciation expenses
Value added
Directors' remuneration
Special profits
Special losses
Net profits before tax
Income taxes-current
Income taxes-deferred
Net profits for the period
Cost of salesSelling and general administrationexpenses
Operating profits
Non-operating revenues
Non-operating expenses
Ordinary profits
Subscription rights to shares
Liabilities and net assets
Bills receivable discounted outstanding
Accounts receivable from subsidiariesand associates - tradeAccounts payable from subsidiaries andassociates - trade
Sales
Others capital surplus
Earned surplus
Legal retained earnings
Other earned surplus
Treasury stock
Others net assets
Net assets
Shareholders' equity
Capital stock
Capital surplus
Capital reserve
and Loss Table by Sector and by Size (continued)
By Size 121
Total Under 10 10 - 50 50 - 100 100 - 1,000 1,000 or over
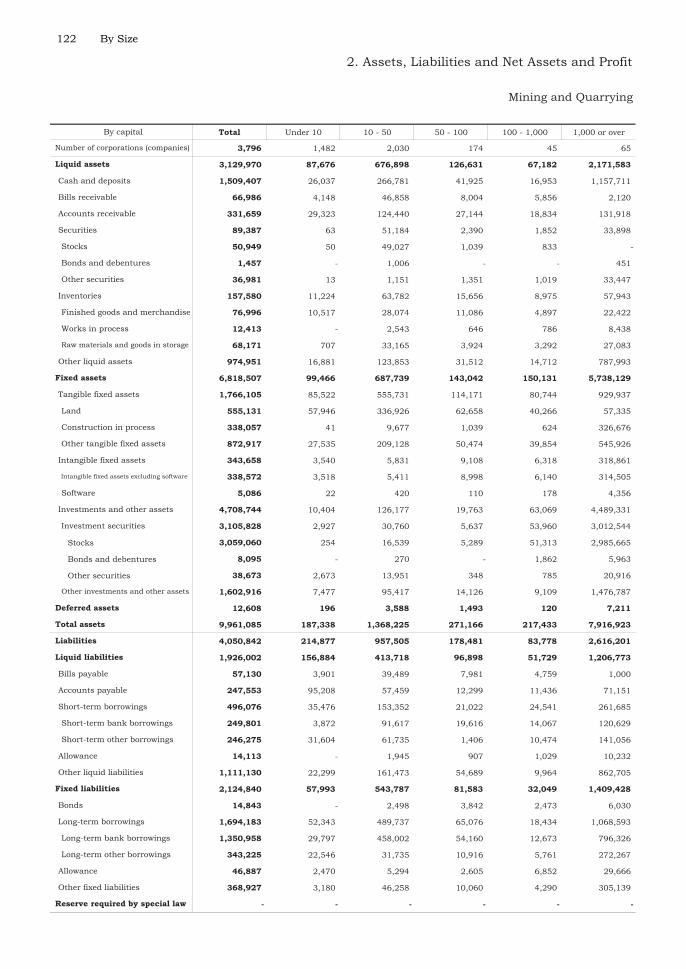
3,796 1,482 2,030 174 45 65
3,129,970 87,676 676,898 126,631 67,182 2,171,583
1,509,407 26,037 266,781 41,925 16,953 1,157,711
66,986 4,148 46,858 8,004 5,856 2,120
331,659 29,323 124,440 27,144 18,834 131,918
89,387 63 51,184 2,390 1,852 33,898
50,949 50 49,027 1,039 833 -
1,457 - 1,006 - - 451
36,981 13 1,151 1,351 1,019 33,447
157,580 11,224 63,782 15,656 8,975 57,943
76,996 10,517 28,074 11,086 4,897 22,422
12,413 - 2,543 646 786 8,438
68,171 707 33,165 3,924 3,292 27,083
974,951 16,881 123,853 31,512 14,712 787,993
6,818,507 99,466 687,739 143,042 150,131 5,738,129
1,766,105 85,522 555,731 114,171 80,744 929,937
555,131 57,946 336,926 62,658 40,266 57,335
338,057 41 9,677 1,039 624 326,676
872,917 27,535 209,128 50,474 39,854 545,926
343,658 3,540 5,831 9,108 6,318 318,861
338,572 3,518 5,411 8,998 6,140 314,505
5,086 22 420 110 178 4,356
4,708,744 10,404 126,177 19,763 63,069 4,489,331
3,105,828 2,927 30,760 5,637 53,960 3,012,544
Stocks 3,059,060 254 16,539 5,289 51,313 2,985,665
Bonds and debentures 8,095 - 270 - 1,862 5,963
Other securities 38,673 2,673 13,951 348 785 20,916
1,602,916 7,477 95,417 14,126 9,109 1,476,787
12,608 196 3,588 1,493 120 7,211
9,961,085 187,338 1,368,225 271,166 217,433 7,916,923
4,050,842 214,877 957,505 178,481 83,778 2,616,201
1,926,002 156,884 413,718 96,898 51,729 1,206,773
57,130 3,901 39,489 7,981 4,759 1,000
247,553 95,208 57,459 12,299 11,436 71,151
496,076 35,476 153,352 21,022 24,541 261,685
249,801 3,872 91,617 19,616 14,067 120,629
246,275 31,604 61,735 1,406 10,474 141,056
14,113 - 1,945 907 1,029 10,232
1,111,130 22,299 161,473 54,689 9,964 862,705
2,124,840 57,993 543,787 81,583 32,049 1,409,428
14,843 - 2,498 3,842 2,473 6,030
1,694,183 52,343 489,737 65,076 18,434 1,068,593
1,350,958 29,797 458,002 54,160 12,673 796,326
343,225 22,546 31,735 10,916 5,761 272,267
46,887 2,470 5,294 2,605 6,852 29,666
368,927 3,180 46,258 10,060 4,290 305,139
- - - - - -Reserve required by special law
Bonds
Long-term borrowings
Long-term bank borrowings
Long-term other borrowings
Allowance
Other fixed liabilities
Short-term borrowings
Short-term bank borrowings
Short-term other borrowings
Allowance
Other liquid liabilities
Fixed liabilities
Deferred assets
Total assets
Liabilities
Liquid liabilities
Bills payable
Accounts payable
Intangible fixed assets
Intangible fixed assets excluding software
Software
Investments and other assets
Investment securities
Other investments and other assets
Other liquid assets
Fixed assets
Tangible fixed assets
Land
Construction in process
Other tangible fixed assets
Bonds and debentures
Other securities
Inventories
Finished goods and merchandise
Works in process
Raw materials and goods in storage
Liquid assets
Cash and deposits
Bills receivable
Accounts receivable
Securities
Stocks
2. Assets, Liabilities and Net Assets and Profit
Mining and Quarrying
By capital
Number of corporations (companies)
122 By Size

(Unit: millions of yen)
Total Under 10 10 - 50 50 - 100 100 - 1,000 1,000 or over
5,910,243 -27,539 410,720 92,685 133,655 5,300,722
5,809,073 -27,486 409,936 92,538 131,404 5,202,681
1,479,737 6,888 33,782 12,578 11,154 1,415,335
3,604,649 223 1,677,081 14,858 47,159 1,865,328
2,657,454 62 827,121 2,857 23,044 1,804,370
947,195 161 849,960 12,001 24,115 60,958
744,673 -34,597 -1,289,967 66,705 73,900 1,928,632
60,775 1,018 12,438 1,593 1,411 44,315
683,898 -35,615 -1,302,405 65,112 72,489 1,884,317
Reserve 1,078,536 6,696 237,841 55,066 48,745 730,188
Retained earnings brought forward -394,638 -42,311 -1,540,246 10,046 23,744 1,154,129
-19,986 - -10,960 -1,603 -809 -6,614
101,170 -53 784 147 2,251 98,041
- - - - - -
9,961,085 187,338 1,368,225 271,166 217,433 7,916,923
28,839 1,881 23,200 1,662 2,096 -
39,187 176 18,733 4,002 6,128 10,148
78,341 - 19,891 1,914 4,420 52,116
3,053,288 159,353 910,878 179,884 117,768 1,685,405
2,036,436 127,216 649,256 139,026 94,265 1,026,673
431,898 35,971 196,022 26,736 17,994 155,175
584,954 -3,834 65,600 14,122 5,509 503,557
168,450 2,631 21,942 3,585 3,121 137,171
189,983 1,788 40,643 1,896 1,846 143,810
563,421 -2,991 46,899 15,811 6,784 496,918
51,045 2,549 31,523 8,045 2,026 6,902
267,809 2,100 21,674 7,986 3,238 232,811
346,657 -2,542 56,748 15,870 5,572 271,009
346,658 699 16,781 4,039 1,530 323,609
-11,438 - -59 -18 -147 -11,214
11,437 -3,241 40,026 11,849 4,189 -41,386
20,779 - - - - 20,779
128,003 - 1,168 723 3,010 123,102
200,919 8,141 42,224 9,456 6,340 134,758
9,658 1,466 6,095 2,097 - -
923,018 33,311 236,485 44,118 24,043 585,061
50,762 11,087 32,023 3,018 1,437 3,197
1,295 - 567 270 159 299
167,820 19,508 90,618 13,155 9,556 34,983
26,216 1,471 11,803 2,028 2,651 8,263
35,073 2,273 17,354 2,720 2,749 9,977
20,887 943 9,755 1,520 478 8,191
29,852 1,296 9,748 7,473 980 10,355
27,046 1,510 8,772 1,332 1,002 14,430
564,067 -4,777 55,845 12,602 5,031 495,366
8,201 2,779 4,657 426 149 190
47,682 7,410 28,944 3,993 2,327 5,008
By capital
taxes and public charges
Net operating income
Number of directors (persons)
Number of employees (persons)
Directors' bonus
Employees' salaries
Employees' bonus
Welfare expenses
Interest expensesRental or leasing expenses for fixedand liquid assets
Interim dividend
Dividends
Depreciation expenses
Special depreciation expenses
Value added
Directors' remuneration
Special profits
Special losses
Net profits before tax
Income taxes-current
Income taxes-deferred
Net profits for the period
Cost of salesSelling and general administrationexpenses
Operating profits
Non-operating revenues
Non-operating expenses
Ordinary profits
Subscription rights to shares
Liabilities and net assets
Bills receivable discounted outstanding
Accounts receivable from subsidiariesand associates - tradeAccounts payable from subsidiaries andassociates - trade
Sales
Others capital surplus
Earned surplus
Legal retained earnings
Other earned surplus
Treasury stock
Others net assets
Net assets
Shareholders' equity
Capital stock
Capital surplus
Capital reserve
and Loss Table by Sector and by Size (continued)
of Stone and Gravel
By Size 123
Total Under 10 10 - 50 50 - 100 100 - 1,000 1,000 or over
459,728 298,534 152,470 7,111 1,374 239
65,827,350 7,591,551 21,745,631 9,282,608 8,503,884 18,703,676
22,860,939 2,646,361 9,812,010 4,332,569 2,123,237 3,946,762
2,260,375 246,615 727,041 344,790 359,957 581,972
20,307,141 2,117,275 4,658,239 2,048,271 3,029,879 8,453,477
1,017,291 12,678 317,010 125,834 122,435 439,334
347,202 9,106 208,071 90,837 38,357 831
139,896 - 12,766 - 36,815 90,315
530,193 3,572 96,173 34,997 47,263 348,188
10,822,816 1,583,303 4,032,798 1,393,129 1,303,227 2,510,359
2,205,348 105,206 634,406 232,992 255,302 977,442
7,827,198 1,301,036 2,985,715 1,110,317 987,010 1,443,120
790,270 177,061 412,677 49,820 60,915 89,797
8,558,788 985,319 2,198,533 1,038,015 1,565,149 2,771,772
33,270,711 3,245,447 12,283,687 3,290,946 2,818,302 11,632,329
20,180,935 2,563,377 9,160,948 2,226,018 1,662,746 4,567,846
10,655,861 760,367 5,123,364 1,120,706 914,007 2,737,417
321,487 87,040 123,148 24,669 24,042 62,588
9,203,587 1,715,970 3,914,436 1,080,643 724,697 1,767,841
393,307 33,907 97,979 51,665 46,197 163,559
196,465 23,306 62,795 40,638 20,674 49,052
196,842 10,601 35,184 11,027 25,523 114,507
12,696,469 648,163 3,024,760 1,013,263 1,109,359 6,900,924
7,214,094 40,576 836,217 532,405 487,222 5,317,674
Stocks 5,911,382 7,297 393,003 263,047 353,180 4,894,855
Bonds and debentures 716,529 - 233,580 136,886 80,694 265,369
Other securities 586,183 33,279 209,634 132,472 53,348 157,450
5,482,375 607,587 2,188,543 480,858 622,137 1,583,250
119,695 9,821 58,470 29,301 17,402 4,701
99,217,756 10,846,819 34,087,788 12,602,855 11,339,588 30,340,706
62,911,814 10,120,836 20,897,280 7,430,776 6,661,126 17,801,796
43,084,146 5,773,975 12,685,158 5,366,068 5,307,043 13,951,902
4,152,013 146,753 1,252,713 429,844 782,402 1,540,301
13,488,402 1,108,164 3,148,065 1,747,638 2,015,770 5,468,765
7,651,224 2,020,939 2,797,292 882,977 609,693 1,340,323
5,486,635 920,598 2,147,249 706,101 491,144 1,221,543
2,164,589 1,100,341 650,043 176,876 118,549 118,780
888,574 3,525 69,317 87,088 159,544 569,100
16,903,933 2,494,594 5,417,771 2,218,521 1,739,634 5,033,413
19,826,172 4,346,861 8,212,122 2,064,708 1,352,587 3,849,894
884,687 - 140,229 88,925 45,467 610,066
14,642,098 4,138,424 7,377,618 1,434,564 519,394 1,172,098
12,127,392 2,953,435 6,319,656 1,308,734 429,699 1,115,868
2,514,706 1,184,989 1,057,962 125,830 89,695 56,230
2,365,235 - 95,034 398,387 592,249 1,279,565
1,934,152 208,437 599,241 142,832 195,477 788,165
1,496 - - - 1,496 -Reserve required by special law
Bonds
Long-term borrowings
Long-term bank borrowings
Long-term other borrowings
Allowance
Other fixed liabilities
Short-term borrowings
Short-term bank borrowings
Short-term other borrowings
Allowance
Other liquid liabilities
Fixed liabilities
Deferred assets
Total assets
Liabilities
Liquid liabilities
Bills payable
Accounts payable
Intangible fixed assets
Intangible fixed assets excluding software
Software
Investments and other assets
Investment securities
Other investments and other assets
Other liquid assets
Fixed assets
Tangible fixed assets
Land
Construction in process
Other tangible fixed assets
Bonds and debentures
Other securities
Inventories
Finished goods and merchandise
Works in process
Raw materials and goods in storage
Liquid assets
Cash and deposits
Bills receivable
Accounts receivable
Securities
Stocks
2. Assets, Liabilities and Net Assets and Profit
Construction
By capital
Number of corporations (companies)
124 By Size

(Unit: millions of yen)
Total Under 10 10 - 50 50 - 100 100 - 1,000 1,000 or over
36,305,942 725,983 13,190,508 5,172,079 4,678,462 12,538,910
34,912,653 724,173 13,132,116 5,165,540 4,624,087 11,266,737
6,356,773 1,093,952 2,372,222 468,276 304,002 2,118,321
2,822,619 -11,245 271,187 266,728 302,354 1,993,595
2,120,476 756 158,553 104,719 161,093 1,695,355
702,143 -12,001 112,634 162,009 141,261 298,240
26,221,510 -326,987 10,603,323 4,476,604 4,055,265 7,413,305
734,377 26,953 273,902 100,790 110,041 222,691
25,487,133 -353,940 10,329,421 4,375,814 3,945,224 7,190,614
Reserve 14,835,310 225,021 5,806,475 1,920,725 2,507,922 4,375,167
Retained earnings brought forward 10,651,823 -578,961 4,522,946 2,455,089 1,437,302 2,815,447
-488,249 -31,547 -114,616 -46,068 -37,534 -258,484
1,390,347 1,810 58,392 6,476 54,361 1,269,308
2,942 - - 63 14 2,865
99,217,756 10,846,819 34,087,788 12,602,855 11,339,588 30,340,706
369,895 81,422 234,801 25,309 19,987 8,376
1,663,986 85,476 103,576 239,886 499,346 735,702
1,050,188 12,152 87,391 57,314 154,089 739,242
122,713,468 19,278,678 43,977,741 13,416,574 15,587,051 30,453,424
98,471,545 12,698,750 34,834,849 11,222,973 13,433,466 26,281,507
19,445,259 6,218,284 7,806,605 1,661,321 1,470,614 2,288,435
4,796,664 361,644 1,336,287 532,280 682,971 1,883,482
1,047,700 171,582 406,229 109,569 77,986 282,334
665,316 126,558 295,130 58,666 43,572 141,390
5,179,048 406,668 1,447,386 583,183 717,385 2,024,426
536,374 105,628 274,003 25,872 27,813 103,058
1,151,109 78,328 642,923 97,513 85,119 247,226
4,564,313 433,968 1,078,466 511,542 660,079 1,880,258
1,527,105 112,454 434,178 181,793 236,461 562,219
58,643 1,376 9,311 -15,176 25,331 37,801
2,978,565 320,138 634,977 344,925 398,287 1,280,238
126,367 2 3,182 159 5,795 117,229
480,604 3,826 34,040 35,157 110,671 296,910
1,610,316 406,854 672,207 172,507 110,355 248,393
300,695 41,205 223,328 29,903 5,563 696
26,263,345 5,694,671 9,705,149 2,302,950 3,003,034 5,557,541
4,057,784 1,933,104 1,810,879 191,704 78,116 43,981
109,476 30,077 54,598 9,854 7,874 7,073
11,511,065 2,493,577 4,600,575 982,070 1,394,569 2,040,274
1,685,642 116,019 472,949 151,811 315,347 629,516
1,982,474 288,011 661,279 159,401 300,173 573,610
372,779 92,169 153,176 38,459 20,712 68,263
1,368,671 234,734 446,033 224,996 184,685 278,223
751,569 237,505 322,549 50,834 39,299 101,382
4,423,885 269,475 1,183,111 493,821 662,259 1,815,219
947,199 533,802 377,906 25,031 7,722 2,738
3,268,116 859,095 1,438,970 276,508 333,012 360,531
By capital
taxes and public charges
Net operating income
Number of directors (persons)
Number of employees (persons)
Directors' bonus
Employees' salaries
Employees' bonus
Welfare expenses
Interest expensesRental or leasing expenses for fixedand liquid assets
Interim dividend
Dividends
Depreciation expenses
Special depreciation expenses
Value added
Directors' remuneration
Special profits
Special losses
Net profits before tax
Income taxes-current
Income taxes-deferred
Net profits for the period
Cost of salesSelling and general administrationexpenses
Operating profits
Non-operating revenues
Non-operating expenses
Ordinary profits
Subscription rights to shares
Liabilities and net assets
Bills receivable discounted outstanding
Accounts receivable from subsidiariesand associates - tradeAccounts payable from subsidiaries andassociates - trade
Sales
Others capital surplus
Earned surplus
Legal retained earnings
Other earned surplus
Treasury stock
Others net assets
Net assets
Shareholders' equity
Capital stock
Capital surplus
Capital reserve
and Loss Table by Sector and by Size (continued)
By Size 125

Total Under 10 10 - 50 50 - 100 100 - 1,000 1,000 or over
3,508 2,790 426 95 142 55
6,046,790 123,828 76,744 41,162 157,401 5,647,655
2,727,631 93,694 43,329 24,689 83,213 2,482,706
1,159 - 305 30 208 616
1,521,171 16,514 11,111 7,084 26,403 1,460,059
246,086 - 36 - - 246,050
36 - 36 - - -
- - - - - -
246,050 - - - - 246,050
602,966 - 798 2,701 8,791 590,676
3,317 - 9 345 1,904 1,059
3,094 - 98 475 719 1,802
596,555 - 691 1,881 6,168 587,815
947,777 13,620 21,165 6,658 38,786 867,548
41,060,544 682,163 429,251 253,903 419,042 39,276,185
32,051,209 665,946 416,647 242,970 363,602 30,362,044
2,542,638 9,917 10,289 2,940 18,330 2,501,162
4,587,194 103,240 31,230 17,198 60,414 4,375,112
24,921,377 552,789 375,128 222,832 284,858 23,485,770
769,159 5,172 3,690 2,633 1,955 755,709
747,173 5,172 3,140 2,557 1,562 734,742
21,986 - 550 76 393 20,967
8,240,176 11,045 8,914 8,300 53,485 8,158,432
2,729,566 - 224 754 33,042 2,695,546
Stocks 2,693,008 - 170 605 25,374 2,666,859
Bonds and debentures 1,204 - - - - 1,204
Other securities 35,354 - 54 149 7,668 27,483
5,510,610 11,045 8,690 7,546 20,443 5,462,886
13,134 1,710 3,763 3,778 2,960 923
47,120,468 807,701 509,758 298,843 579,403 44,924,763
39,437,381 843,994 498,503 296,216 421,634 37,377,034
9,265,257 123,270 113,686 56,705 133,957 8,837,639
2,684 - - - 1,144 1,540
812,185 1,976 2,245 4,156 18,059 785,749
4,433,178 58,535 71,113 45,676 59,759 4,198,095
4,237,388 27,348 33,262 23,658 18,539 4,134,581
195,790 31,187 37,851 22,018 41,220 63,514
30,799 - 304 361 1,221 28,913
3,986,411 62,759 40,024 6,512 53,774 3,823,342
29,998,823 720,724 384,817 239,511 287,677 28,366,094
9,221,048 - 69 133 1,275 9,219,571
12,349,832 641,259 333,793 222,221 251,050 10,901,509
11,947,914 616,354 226,247 122,808 189,064 10,793,441
401,918 24,905 107,546 99,413 61,986 108,068
5,158,047 70 100 90 2,344 5,155,443
3,269,896 79,395 50,855 17,067 33,008 3,089,571
173,301 - - - - 173,301
Short-term other borrowings
Securities
Works in process
Fixed assets
Tangible fixed assets
Stocks
Bonds and debentures
2. Assets, Liabilities and Net Assets and Profit
Production, Transmission and
By capital
Other securities
Investments and other assets
Inventories
Number of corporations (companies)
Liquid assets
Cash and deposits
Bills receivable
Other liquid assets
Land
Construction in process
Other liquid liabilities
Other tangible fixed assets
Other fixed liabilities
Raw materials and goods in storage
Finished goods and merchandise
Reserve required by special law
Liquid liabilities
Long-term other borrowings
Allowance
Long-term borrowings
Long-term bank borrowings
Allowance
Bills payable
Intangible fixed assets
Liabilities
Intangible fixed assets excluding software
Software
Deferred assets
Investment securities
Other investments and other assets
Total assets
Accounts receivable
Bonds
Accounts payable
Short-term borrowings
Short-term bank borrowings
Fixed liabilities
126 By Size

(Unit: millions of yen)
Total Under 10 10 - 50 50 - 100 100 - 1,000 1,000 or over
7,683,087 -36,293 11,255 2,627 157,769 7,547,729
7,608,106 -14,358 14,981 8,829 165,748 7,432,906
4,179,774 6,036 6,803 6,362 41,057 4,119,516
1,544,333 68,884 25,548 1,463 60,119 1,388,319
1,296,264 192 10,584 1,143 59,742 1,224,603
248,069 68,692 14,964 320 377 163,716
2,072,442 -89,278 -17,370 1,009 65,625 2,112,456
539,820 - 75 5 1,225 538,515
1,532,622 -89,278 -17,445 1,004 64,400 1,573,941
Reserve 2,116,315 6,470 2,011 5,407 8,836 2,093,591
Retained earnings brought forward -583,693 -95,748 -19,456 -4,403 55,564 -519,650
-188,443 - - -5 -1,053 -187,385
74,224 -21,935 -3,726 -6,202 -7,988 114,075
757 - - - 9 748
47,120,468 807,701 509,758 298,843 579,403 44,924,763
- - - - - -
56,888 - 190 494 4,853 51,351
60,302 - 517 339 3,086 56,360
20,517,969 144,853 104,904 75,126 277,040 19,916,046
17,161,397 22,864 64,483 56,186 208,777 16,809,087
1,944,055 72,328 21,647 8,287 26,735 1,815,058
1,412,517 49,661 18,774 10,653 41,528 1,291,901
263,701 3,170 2,597 1,517 1,491 254,926
438,793 14,885 5,877 3,822 7,495 406,714
1,237,425 37,946 15,494 8,348 35,524 1,140,113
808,320 9,621 2,827 198 12,536 783,138
997,962 8,113 7,698 244 10,562 971,345
1,047,783 39,454 10,623 8,302 37,498 951,906
139,264 3,908 244 2,698 9,787 122,627
158,561 8,755 5,146 489 -209 144,380
749,958 26,791 5,233 5,115 27,920 684,899
39,960 - 1,179 - 1,241 37,540
94,689 15,489 618 2,845 11,378 64,359
2,110,334 41,073 29,306 16,500 27,266 1,996,189
43,926 8,993 5,027 722 - 29,184
3,996,786 70,120 29,492 13,902 63,226 3,820,046
15,523 6,374 720 483 1,286 6,660
289 - - 33 63 193
910,892 782 1,644 521 9,542 898,403
115,168 - 312 90 1,696 113,070
279,669 217 174 95 1,764 277,419
353,946 13,697 4,762 1,601 6,473 327,413
295,671 5,840 1,300 1,012 3,479 284,040
967,057 7,246 6,568 1,015 3,868 948,360
1,058,571 35,964 14,012 9,052 35,055 964,488
3,199 1,924 417 225 237 396
140,556 577 405 174 2,384 137,016
Distribution of Electricity
By capital
Net operating income
Employees' bonus
Ordinary profits
Selling and general administrationexpenses
Other earned surplus
Capital stock
Subscription rights to shares
Number of employees (persons)
Interest expensesRental or leasing expenses for fixedand liquid assets
Number of directors (persons)
Net profits before tax
Special losses
Sales
Non-operating expenses
Cost of sales
Liabilities and net assets
Accounts receivable from subsidiariesand associates - trade
Others net assets
Earned surplus
and Loss Table by Sector and by Size (continued)
Welfare expenses
Special profits
Employees' salaries
Directors' bonus
Interim dividend
Dividends
Special depreciation expenses
Value added
Directors' remuneration
Operating profits
Net assets
Accounts payable from subsidiaries andassociates - trade
Legal retained earnings
Depreciation expenses
Shareholders' equity
Capital surplus
Bills receivable discounted outstanding
Capital reserve
Others capital surplus
Treasury stock
taxes and public charges
Income taxes-current
Income taxes-deferred
Net profits for the period
Non-operating revenues
By Size 127

Total Under 10 10 - 50 50 - 100 100 - 1,000 1,000 or over
736 314 144 86 157 35
1,363,349 10,461 41,424 53,526 226,342 1,031,596
475,346 5,233 25,154 28,962 97,149 318,848
9,936 - 601 1,308 2,260 5,767
464,401 3,975 8,759 12,026 69,527 370,114
40,678 140 452 260 1,267 38,559
36,459 140 30 60 278 35,951
617 - 299 200 - 118
3,602 - 123 - 989 2,490
124,993 253 986 2,884 10,694 110,176
3,692 124 382 300 2,031 855
2,265 31 36 12 395 1,791
119,036 98 568 2,572 8,268 107,530
247,995 860 5,472 8,086 45,445 188,132
4,774,231 5,612 135,767 111,028 651,840 3,869,984
3,184,708 4,609 125,362 95,248 581,453 2,378,036
563,832 1,341 9,041 17,484 78,623 457,343
175,744 - 751 912 15,651 158,430
2,445,132 3,268 115,570 76,852 487,179 1,762,263
80,054 453 791 868 9,804 68,138
35,869 397 566 350 6,725 27,831
44,185 56 225 518 3,079 40,307
1,509,469 550 9,614 14,912 60,583 1,423,810
972,623 61 3,228 4,072 28,638 936,624
Stocks 964,362 3 1,474 1,470 25,697 935,718
Bonds and debentures 2,610 - 222 1,126 847 415
Other securities 5,651 58 1,532 1,476 2,094 491
536,846 489 6,386 10,840 31,945 487,186
2,435 - 277 252 1,888 18
6,140,015 16,073 177,468 164,806 880,070 4,901,598
3,266,197 13,602 142,856 94,362 467,128 2,548,249
1,267,482 7,635 20,671 36,450 218,400 984,326
8,087 24 924 1,660 5,398 81
205,298 2,200 4,537 8,640 51,211 138,710
246,837 550 10,002 13,546 92,799 129,940
186,034 32 8,547 11,266 82,036 84,153
60,803 518 1,455 2,280 10,763 45,787
37,049 23 202 464 5,604 30,756
770,211 4,838 5,006 12,140 63,388 684,839
1,998,594 5,967 122,064 57,912 248,728 1,563,923
636,146 - 106 566 3,934 631,540
1,073,305 5,552 110,799 48,838 197,811 710,305
971,717 3,739 84,071 42,264 153,640 688,003
101,588 1,813 26,728 6,574 44,171 22,302
225,307 - 2,396 6,280 35,209 181,422
63,836 415 8,763 2,228 11,774 40,656
121 - 121 - - -
Liquid assets
Cash and deposits
Bills receivable
2. Assets, Liabilities and Net Assets and Profit
Production, Transmission
By capital
Number of corporations (companies)
Accounts receivable
Securities
Stocks
Bonds and debentures
Other securities
Inventories
Finished goods and merchandise
Works in process
Raw materials and goods in storage
Other liquid assets
Fixed assets
Tangible fixed assets
Land
Construction in process
Other tangible fixed assets
Intangible fixed assets
Intangible fixed assets excluding software
Software
Investments and other assets
Investment securities
Other investments and other assets
Deferred assets
Total assets
Liabilities
Liquid liabilities
Bills payable
Accounts payable
Short-term borrowings
Short-term bank borrowings
Short-term other borrowings
Allowance
Other liquid liabilities
Fixed liabilities
Bonds
Long-term borrowings
Long-term bank borrowings
Long-term other borrowings
Allowance
Other fixed liabilities
Reserve required by special law
128 By Size

(Unit: millions of yen)
Total Under 10 10 - 50 50 - 100 100 - 1,000 1,000 or over
2,873,818 2,471 34,612 70,444 412,942 2,353,349
2,784,915 2,471 39,496 70,012 407,127 2,265,809
518,735 1,166 3,163 5,840 52,734 455,832
97,302 - 1,141 638 27,183 68,340
91,513 - 324 570 22,611 68,008
5,789 - 817 68 4,572 332
2,178,860 1,360 35,337 63,738 328,207 1,750,218
98,612 23 447 1,104 6,896 90,142
2,080,248 1,337 34,890 62,634 321,311 1,660,076
Reserve 1,250,566 147 22,706 45,498 180,488 1,001,727
Retained earnings brought forward 829,682 1,190 12,184 17,136 140,823 658,349
-9,982 -55 -145 -204 -997 -8,581
88,825 - -4,884 432 5,815 87,462
78 - - - - 78
6,140,015 16,073 177,468 164,806 880,070 4,901,598
- - - - - -
83,806 - 495 2,136 5,314 75,861
23,807 - 316 2,002 6,840 14,649
5,066,616 52,483 74,516 146,670 779,196 4,013,751
3,303,676 34,919 44,654 95,580 533,829 2,594,694
1,333,974 17,149 25,854 45,886 197,277 1,047,808
428,966 415 4,008 5,204 48,090 371,249
64,570 228 1,033 1,204 5,299 56,806
45,960 123 1,696 860 4,680 38,601
447,576 520 3,345 5,548 48,709 389,454
6,386 16 169 234 1,218 4,749
49,093 2 219 378 1,215 47,279
404,869 534 3,295 5,404 48,712 346,924
113,122 100 992 1,668 16,048 94,314
1,839 1 90 116 -152 1,784
289,908 433 2,213 3,620 32,816 250,826
33,572 - 73 92 5,290 28,117
38,246 - 119 392 4,887 32,848
369,231 735 9,047 12,514 77,424 269,511
1,846 - 257 1,086 477 26
994,250 7,783 18,346 28,410 159,781 779,930
16,598 2,121 1,771 2,376 5,668 4,662
911 - 170 206 281 254
215,198 3,628 7,459 10,366 49,725 144,020
79,467 332 1,538 2,948 16,214 58,435
82,735 524 1,501 3,272 15,955 61,483
28,670 101 225 664 2,966 24,714
60,262 409 855 1,552 12,742 44,704
110,113 354 1,044 2,486 11,106 95,123
400,296 314 3,783 4,540 45,124 346,535
2,488 718 428 376 685 281
45,075 1,495 2,147 2,918 12,668 25,847
Net assets
Shareholders' equity
By capital
Capital stock
Capital surplus
Capital reserve
and Loss Table by Sector and by Size (continued)
and Distribution of Gas
Others capital surplus
Earned surplus
Legal retained earnings
Other earned surplus
Treasury stock
Others net assets
Subscription rights to shares
Liabilities and net assets
Bills receivable discounted outstanding
Accounts receivable from subsidiariesand associates - tradeAccounts payable from subsidiaries andassociates - trade
Sales
Cost of salesSelling and general administrationexpenses
Operating profits
Non-operating revenues
Non-operating expenses
Ordinary profits
Special profits
Special losses
Net profits before tax
Income taxes-current
Income taxes-deferred
Net profits for the period
Interim dividend
Dividends
Depreciation expenses
Special depreciation expenses
Value added
Directors' remuneration
taxes and public charges
Net operating income
Number of directors (persons)
Number of employees (persons)
Directors' bonus
Employees' salaries
Employees' bonus
Welfare expenses
Interest expensesRental or leasing expenses for fixedand liquid assets
By Size 129

Total Under 10 10 - 50 50 - 100 100 - 1,000 1,000 or over
111,682 70,259 34,707 3,538 2,740 438
35,411,032 879,509 7,317,192 2,520,212 8,221,473 16,472,646
9,945,638 480,565 2,564,105 1,343,538 2,576,844 2,980,586
160,116 4,256 17,077 33,961 67,975 36,847
12,850,874 292,408 3,165,365 700,986 2,910,366 5,781,749
885,989 1,009 12,460 20,670 214,913 636,937
52,116 1,009 5,688 14,532 11,397 19,490
146,883 - 2,795 554 26,723 116,811
686,990 - 3,977 5,584 176,793 500,636
2,166,457 36,523 670,460 171,318 431,764 856,392
1,073,792 10,834 481,435 90,387 227,881 263,255
671,628 25,636 172,272 74,270 172,210 227,240
421,037 53 16,753 6,661 31,673 365,897
9,401,958 64,748 887,725 249,739 2,019,611 6,180,135
43,930,338 310,204 2,211,544 781,720 6,315,652 34,311,218
19,778,205 98,059 572,227 341,359 2,668,482 16,098,078
3,206,342 933 205,344 107,260 868,594 2,024,211
694,570 - 776 5,034 87,122 601,638
15,877,293 97,126 366,107 229,065 1,712,766 13,472,229
3,691,243 31,588 153,390 81,693 624,224 2,800,348
768,530 625 39,825 15,273 110,791 602,016
2,922,713 30,963 113,565 66,420 513,433 2,198,332
20,460,890 180,557 1,485,927 358,668 3,022,946 15,412,792
12,994,147 7,976 537,114 198,918 1,864,942 10,385,197
Stocks 11,454,755 7,862 109,625 156,840 1,550,591 9,629,837
Bonds and debentures 288,585 - 4,744 10,241 130,125 143,475
Other securities 1,250,807 114 422,745 31,837 184,226 611,885
7,466,743 172,581 948,813 159,750 1,158,004 5,027,595
96,537 18,172 23,212 13,918 34,676 6,559
79,437,907 1,207,885 9,551,948 3,315,850 14,571,801 50,790,423
34,027,735 751,469 5,380,700 1,729,526 6,444,094 19,721,946
20,269,942 442,617 3,931,583 1,130,602 4,101,730 10,663,410
203,544 - 90,100 21,951 41,321 50,172
4,249,181 87,057 975,288 231,291 1,142,088 1,813,457
4,381,508 156,861 944,194 307,262 819,265 2,153,926
1,923,967 54,386 481,713 91,209 264,404 1,032,255
2,457,541 102,475 462,481 216,053 554,861 1,121,671
1,482,894 1,724 824,924 61,010 290,369 304,867
9,952,815 196,975 1,097,077 509,088 1,808,687 6,340,988
13,757,793 308,852 1,449,117 598,924 2,342,364 9,058,536
1,363,828 - 69,017 44,734 27,373 1,222,704
6,930,787 293,458 1,173,899 302,749 702,785 4,457,896
4,446,901 212,342 1,118,013 286,564 404,415 2,425,567
2,483,886 81,116 55,886 16,185 298,370 2,032,329
3,175,115 - 159,904 166,889 1,119,511 1,728,811
2,288,063 15,394 46,297 84,552 492,695 1,649,125
- - - - - -Reserve required by special law
Bonds
Long-term borrowings
Long-term bank borrowings
Long-term other borrowings
Allowance
Other fixed liabilities
Short-term borrowings
Short-term bank borrowings
Short-term other borrowings
Allowance
Other liquid liabilities
Fixed liabilities
Deferred assets
Total assets
Liabilities
Liquid liabilities
Bills payable
Accounts payable
Intangible fixed assets
Intangible fixed assets excluding software
Software
Investments and other assets
Investment securities
Other investments and other assets
Other liquid assets
Fixed assets
Tangible fixed assets
Land
Construction in process
Other tangible fixed assets
Bonds and debentures
Other securities
Inventories
Finished goods and merchandise
Works in process
Raw materials and goods in storage
Liquid assets
Cash and deposits
Bills receivable
Accounts receivable
Securities
Stocks
2. Assets, Liabilities and Net Assets and Profit
Information and
By capital
Number of corporations (companies)
130 By Size

(Unit: millions of yen)
Total Under 10 10 - 50 50 - 100 100 - 1,000 1,000 or over
45,410,172 456,416 4,171,248 1,586,324 8,127,707 31,068,477
44,535,518 455,788 4,159,354 1,577,330 7,742,388 30,600,658
7,207,031 241,215 524,113 239,670 733,641 5,468,392
13,871,854 -7,138 2,165,869 261,765 1,819,593 9,631,765
8,729,244 - 568,994 106,594 497,459 7,556,197
5,142,610 -7,138 1,596,875 155,171 1,322,134 2,075,568
24,636,508 221,711 1,516,415 1,100,913 5,301,709 16,495,760
413,592 1,889 25,233 15,087 113,284 258,099
24,222,916 219,822 1,491,182 1,085,826 5,188,425 16,237,661
Reserve 9,916,089 121,529 938,338 907,329 2,922,516 5,026,377
Retained earnings brought forward 14,306,827 98,293 552,844 178,497 2,265,909 11,211,284
-1,179,875 - -47,043 -25,018 -112,555 -995,259
852,540 628 10,456 8,994 383,928 448,534
22,114 - 1,438 - 1,391 19,285
79,437,907 1,207,885 9,551,948 3,315,850 14,571,801 50,790,423
4,593 - 1,464 - 2,983 146
1,335,459 2,332 84,667 57,660 761,082 429,718
575,661 - 168,159 47,812 181,439 178,251
66,451,013 2,670,773 10,758,216 3,814,917 15,837,677 33,369,430
33,865,981 1,245,322 5,968,471 2,315,037 11,211,690 13,125,461
26,775,597 1,316,514 4,714,123 1,252,893 3,744,406 15,747,661
5,809,435 108,937 75,622 246,987 881,581 4,496,308
636,489 34,149 68,613 42,014 146,199 345,514
434,852 8,237 138,263 14,440 60,173 213,739
6,011,072 134,849 5,972 274,561 967,607 4,628,083
536,133 6,766 28,162 35,479 60,776 404,950
625,132 2,127 128,164 50,736 68,940 375,165
5,922,073 139,488 -94,030 259,304 959,443 4,657,868
1,794,836 33,198 81,008 85,770 339,407 1,255,453
121,691 5,982 20,236 -2,743 24,347 73,869
4,005,546 100,308 -195,274 176,277 595,689 3,328,546
590,867 - 633 - 26,546 563,688
2,795,857 - 39,257 11,942 293,709 2,450,949
3,733,359 32,963 182,805 48,819 470,513 2,998,259
48,102 107 - - 1,642 46,353
22,338,923 1,042,824 4,012,953 1,694,742 5,388,192 10,200,212
1,098,703 363,065 460,132 98,859 123,461 53,186
38,043 - 10,962 11,563 9,146 6,372
8,561,684 394,614 2,350,528 895,305 2,687,395 2,233,842
1,823,007 23,901 388,027 178,778 651,519 580,782
1,625,328 40,049 259,491 148,632 594,624 582,532
185,023 3,112 38,500 9,309 16,939 117,163
1,979,524 94,342 328,684 90,383 372,171 1,093,944
1,403,199 17,916 139,507 24,235 68,295 1,153,246
5,624,412 105,825 37,122 237,678 864,642 4,379,145
191,032 87,048 75,231 12,734 12,310 3,709
1,939,978 124,218 608,760 228,139 570,354 408,507
By capital
taxes and public charges
Net operating income
Number of directors (persons)
Number of employees (persons)
Directors' bonus
Employees' salaries
Employees' bonus
Welfare expenses
Interest expensesRental or leasing expenses for fixedand liquid assets
Interim dividend
Dividends
Depreciation expenses
Special depreciation expenses
Value added
Directors' remuneration
Special profits
Special losses
Net profits before tax
Income taxes-current
Income taxes-deferred
Net profits for the period
Cost of salesSelling and general administrationexpenses
Operating profits
Non-operating revenues
Non-operating expenses
Ordinary profits
Subscription rights to shares
Liabilities and net assets
Bills receivable discounted outstanding
Accounts receivable from subsidiariesand associates - tradeAccounts payable from subsidiaries andassociates - trade
Sales
Others capital surplus
Earned surplus
Legal retained earnings
Other earned surplus
Treasury stock
Others net assets
Net assets
Shareholders' equity
Capital stock
Capital surplus
Capital reserve
and Loss Table by Sector and by Size (continued)
Communications
By Size 131

Total Under 10 10 - 50 50 - 100 100 - 1,000 1,000 or over
79,236 38,314 36,633 2,805 1,206 278
29,624,586 1,955,572 6,776,228 2,651,216 3,116,277 15,125,293
10,870,692 674,387 3,480,430 1,047,091 992,020 4,676,764
381,736 15,905 146,447 76,435 78,068 64,881
8,025,725 434,901 2,050,001 726,089 1,172,216 3,642,518
596,044 4,863 110,562 66,190 37,737 376,692
100,888 3,166 49,195 14,061 14,033 20,433
108,808 - 51,004 1,273 9,255 47,276
386,348 1,697 10,363 50,856 14,449 308,983
3,490,910 24,204 39,152 28,896 68,388 3,330,270
244,964 7,145 15,054 12,135 17,205 193,425
2,897,263 2,132 7,571 976 5,044 2,881,540
348,683 14,927 16,527 15,785 46,139 255,305
6,259,479 801,312 949,636 706,515 767,848 3,034,168
70,174,292 2,314,712 9,500,121 3,954,308 5,911,905 48,493,246
52,729,661 2,078,928 7,300,363 3,090,638 4,781,683 35,478,049
21,630,683 559,000 3,228,491 1,602,674 1,985,014 14,255,504
2,213,314 71,980 201,224 63,405 75,248 1,801,457
28,885,664 1,447,948 3,870,648 1,424,559 2,721,421 19,421,088
1,481,473 9,158 77,791 67,957 115,320 1,211,247
730,667 8,156 55,945 39,687 69,621 557,258
750,806 1,002 21,846 28,270 45,699 653,989
15,963,158 226,626 2,121,967 795,713 1,014,902 11,803,950
7,919,264 14,811 730,497 296,694 444,383 6,432,879
Stocks 7,156,840 14,538 307,855 205,172 372,618 6,256,657
Bonds and debentures 433,820 - 184,729 62,587 21,969 164,535
Other securities 328,604 273 237,913 28,935 49,796 11,687
8,043,894 211,815 1,391,470 499,019 570,519 5,371,071
64,486 1,657 19,819 13,049 23,245 6,716
99,863,364 4,271,941 16,296,168 6,618,573 9,051,427 63,625,255
66,018,021 3,412,677 10,932,849 4,214,334 4,972,935 42,485,226
23,939,897 1,121,277 3,823,545 1,888,602 2,445,044 14,661,429
348,055 6,624 149,048 58,620 98,773 34,990
5,351,329 108,758 1,206,641 466,494 807,168 2,762,268
7,321,219 591,876 895,813 814,526 776,633 4,242,371
4,516,407 167,587 749,855 750,404 556,554 2,292,007
2,804,812 424,289 145,958 64,122 220,079 1,950,364
753,797 19,157 105,412 44,009 92,733 492,486
10,165,497 394,862 1,466,631 504,953 669,737 7,129,314
41,810,129 2,291,400 7,109,304 2,325,680 2,527,891 27,555,854
8,233,666 - 147,968 71,430 32,201 7,982,067
21,646,243 2,006,733 6,119,027 1,886,398 1,473,929 10,160,156
17,911,668 1,720,548 5,249,299 1,687,827 886,563 8,367,431
3,734,575 286,185 869,728 198,571 587,366 1,792,725
6,142,706 73,972 287,491 174,853 558,033 5,048,357
5,787,514 210,695 554,818 192,999 463,728 4,365,274
267,995 - - 52 - 267,943Reserve required by special law
Bonds
Long-term borrowings
Long-term bank borrowings
Long-term other borrowings
Allowance
Other fixed liabilities
Short-term borrowings
Short-term bank borrowings
Short-term other borrowings
Allowance
Other liquid liabilities
Fixed liabilities
Deferred assets
Total assets
Liabilities
Liquid liabilities
Bills payable
Accounts payable
Intangible fixed assets
Intangible fixed assets excluding software
Software
Investments and other assets
Investment securities
Other investments and other assets
Other liquid assets
Fixed assets
Tangible fixed assets
Land
Construction in process
Other tangible fixed assets
Bonds and debentures
Other securities
Inventories
Finished goods and merchandise
Works in process
Raw materials and goods in storage
Liquid assets
Cash and deposits
Bills receivable
Accounts receivable
Securities
Stocks
2. Assets, Liabilities and Net Assets and Profit
Transport and
By capital
Number of corporations (companies)
132 By Size

(Unit: millions of yen)
Total Under 10 10 - 50 50 - 100 100 - 1,000 1,000 or over
33,845,343 859,264 5,363,319 2,404,239 4,078,492 21,140,029
32,641,257 855,120 5,246,535 2,374,512 3,940,403 20,224,687
6,728,092 142,590 572,828 187,166 296,188 5,529,320
6,334,150 238 376,850 78,995 933,199 4,944,868
4,061,748 60 147,964 51,378 610,494 3,251,852
2,272,402 178 228,886 27,617 322,705 1,693,016
20,031,525 712,582 4,432,440 2,117,441 2,733,472 10,035,590
374,233 16,724 75,632 27,829 53,140 200,908
19,657,292 695,858 4,356,808 2,089,612 2,680,332 9,834,682
Reserve 13,081,201 929,577 2,556,977 886,702 1,602,668 7,105,277
Retained earnings brought forward 6,576,091 -233,719 1,799,831 1,202,910 1,077,664 2,729,405
-452,510 -290 -135,583 -9,090 -22,456 -285,091
1,200,054 4,144 116,784 29,727 138,012 911,387
4,032 - - - 77 3,955
99,863,364 4,271,941 16,296,168 6,618,573 9,051,427 63,625,255
69,546 - 61,801 4,172 3,470 103
1,157,497 68,936 326,678 72,963 300,839 388,081
754,955 - 121,281 19,114 185,661 428,899
69,773,616 3,934,685 19,857,317 5,701,267 9,605,277 30,675,070
53,753,031 1,902,250 14,897,918 4,545,652 7,849,070 24,558,141
12,509,930 1,957,221 4,415,780 923,761 1,359,118 3,854,050
3,510,655 75,214 543,619 231,854 397,089 2,262,879
1,046,539 53,874 330,953 57,738 108,638 495,336
734,139 33,851 144,369 48,130 47,546 460,243
3,823,055 95,237 730,203 241,462 458,181 2,297,972
783,537 22,305 129,887 71,309 106,051 453,985
1,751,076 43,906 204,068 48,572 103,539 1,350,991
2,855,516 73,636 656,022 264,199 460,693 1,400,966
1,100,296 19,439 205,069 68,292 152,807 654,689
32,299 4,916 15,469 6,080 1,294 4,540
1,722,921 49,281 435,484 189,827 306,592 741,737
140,071 - 5,807 3,045 11,785 119,434
592,202 4,984 63,320 120,162 80,330 323,406
3,545,389 302,353 733,814 222,322 333,315 1,953,585
130,525 17,431 84,941 20,087 5,945 2,121
24,217,279 1,731,422 6,242,657 2,234,353 2,777,892 11,230,955
839,386 225,712 451,727 71,976 50,740 39,231
20,135 - 9,394 3,352 4,248 3,141
11,809,996 1,097,787 3,839,352 1,313,354 1,380,939 4,178,564
1,768,819 59,194 359,821 137,074 259,632 953,098
2,152,318 128,422 430,358 187,557 288,600 1,117,381
584,939 19,709 74,642 35,030 32,916 422,642
3,351,127 91,854 438,035 239,075 338,558 2,243,605
764,843 53,239 170,351 50,111 58,086 433,056
2,925,716 55,505 468,977 196,824 364,173 1,840,237
162,535 58,364 85,861 10,090 5,583 2,637
3,537,365 386,742 1,277,157 424,244 383,482 1,065,740
By capital
taxes and public charges
Net operating income
Number of directors (persons)
Number of employees (persons)
Directors' bonus
Employees' salaries
Employees' bonus
Welfare expenses
Interest expensesRental or leasing expenses for fixedand liquid assets
Interim dividend
Dividends
Depreciation expenses
Special depreciation expenses
Value added
Directors' remuneration
Special profits
Special losses
Net profits before tax
Income taxes-current
Income taxes-deferred
Net profits for the period
Cost of salesSelling and general administrationexpenses
Operating profits
Non-operating revenues
Non-operating expenses
Ordinary profits
Subscription rights to shares
Liabilities and net assets
Bills receivable discounted outstanding
Accounts receivable from subsidiariesand associates - tradeAccounts payable from subsidiaries andassociates - trade
Sales
Others capital surplus
Earned surplus
Legal retained earnings
Other earned surplus
Treasury stock
Others net assets
Net assets
Shareholders' equity
Capital stock
Capital surplus
Capital reserve
and Loss Table by Sector and by Size (continued)
Postal Activities
By Size 133

Total Under 10 10 - 50 50 - 100 100 - 1,000 1,000 or over
62,655 31,367 28,762 1,857 540 129
13,399,729 971,252 4,911,457 1,822,306 1,335,177 4,359,537
4,915,782 461,129 2,394,975 636,185 372,496 1,050,997
266,894 12,053 104,304 65,879 37,986 46,672
4,492,349 392,566 1,671,127 531,809 572,335 1,324,512
255,439 249 78,007 47,840 22,809 106,534
27,633 141 16,940 6,750 3,491 311
101,461 - 51,004 59 8,306 42,092
126,345 108 10,063 41,031 11,012 64,131
451,341 10,529 21,967 14,738 30,065 374,042
171,230 2,314 8,534 8,578 7,742 144,062
130,400 - 229 383 756 129,032
149,711 8,215 13,204 5,777 21,567 100,948
3,017,924 94,726 641,077 525,855 299,486 1,456,780
46,564,437 1,140,112 6,577,976 2,654,980 3,534,400 32,656,969
37,197,407 987,576 5,461,556 2,134,578 3,127,483 25,486,214
15,143,069 388,050 2,717,455 1,106,743 1,358,115 9,572,706
1,734,358 68,329 97,841 29,712 38,322 1,500,154
20,319,980 531,197 2,646,260 998,123 1,731,046 14,413,354
748,190 8,598 67,482 55,297 56,799 560,014
541,459 7,862 49,408 30,449 37,949 415,791
206,731 736 18,074 24,848 18,850 144,223
8,618,840 143,938 1,048,938 465,105 350,118 6,610,741
4,007,810 1,553 478,643 79,910 156,025 3,291,679
Stocks 3,562,165 1,306 225,386 62,224 130,237 3,143,012
Bonds and debentures 295,000 - 145,489 - 9,457 140,054
Other securities 150,645 247 107,768 17,686 16,331 8,613
4,611,030 142,385 570,295 385,195 194,093 3,319,062
27,887 1,584 7,338 10,435 7,318 1,212
59,992,053 2,112,948 11,496,771 4,487,721 4,876,895 37,017,718
39,918,026 2,107,633 7,769,476 2,912,543 2,801,545 24,326,829
14,449,437 918,143 2,944,826 1,502,225 1,278,709 7,805,534
223,850 6,462 100,866 46,926 47,530 22,066
2,600,344 87,335 955,533 332,993 383,142 841,341
5,496,361 493,370 756,485 727,590 402,879 3,116,037
3,340,540 100,842 655,729 701,474 299,972 1,582,523
2,155,821 392,528 100,756 26,116 102,907 1,533,514
385,538 19,145 53,344 26,204 41,506 245,339
5,743,344 311,831 1,078,598 368,512 403,652 3,580,751
25,200,646 1,189,490 4,824,650 1,410,318 1,522,836 16,253,352
4,731,275 - 124,875 23,935 10,130 4,572,335
13,384,417 962,608 4,154,950 1,244,249 851,122 6,171,488
10,861,505 749,263 3,410,041 1,098,047 415,201 5,188,953
2,522,912 213,345 744,909 146,202 435,921 982,535
2,432,917 34,412 109,136 25,939 340,410 1,923,020
4,652,037 192,470 435,689 116,195 321,174 3,586,509
267,943 - - - - 267,943Reserve required by special law
Bonds
Long-term borrowings
Long-term bank borrowings
Long-term other borrowings
Allowance
Other fixed liabilities
Short-term borrowings
Short-term bank borrowings
Short-term other borrowings
Allowance
Other liquid liabilities
Fixed liabilities
Deferred assets
Total assets
Liabilities
Liquid liabilities
Bills payable
Accounts payable
Intangible fixed assets
Intangible fixed assets excluding software
Software
Investments and other assets
Investment securities
Other investments and other assets
Other liquid assets
Fixed assets
Tangible fixed assets
Land
Construction in process
Other tangible fixed assets
Bonds and debentures
Other securities
Inventories
Finished goods and merchandise
Works in process
Raw materials and goods in storage
Liquid assets
Cash and deposits
Bills receivable
Accounts receivable
Securities
Stocks
2. Assets, Liabilities and Net Assets and Profit
Railway, Road Passenger and
By capital
Number of corporations (companies)
134 By Size
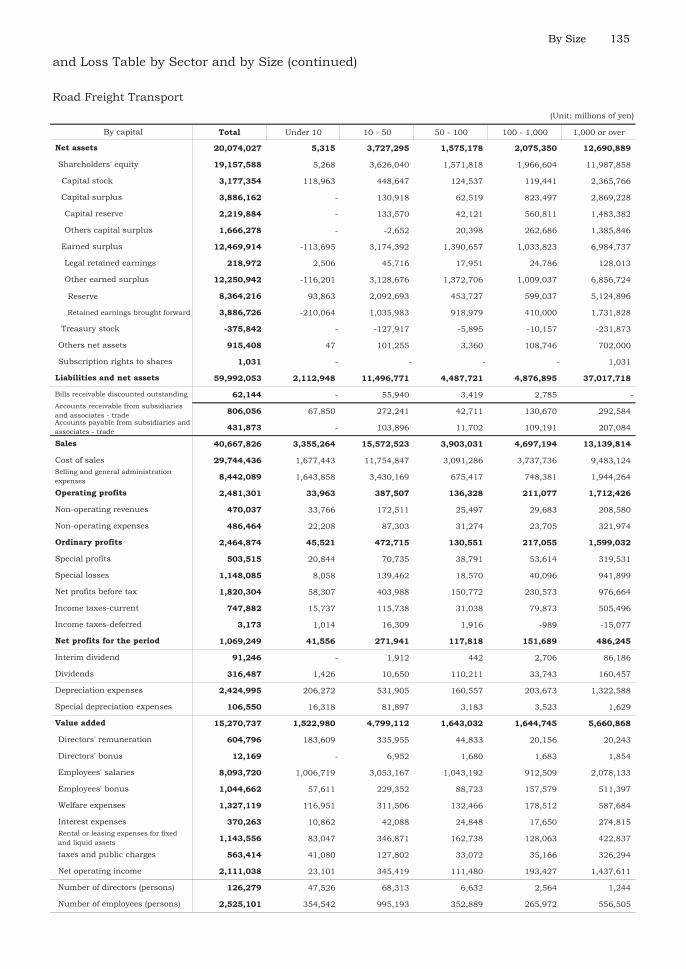
(Unit: millions of yen)
Total Under 10 10 - 50 50 - 100 100 - 1,000 1,000 or over
20,074,027 5,315 3,727,295 1,575,178 2,075,350 12,690,889
19,157,588 5,268 3,626,040 1,571,818 1,966,604 11,987,858
3,177,354 118,963 448,647 124,537 119,441 2,365,766
3,886,162 - 130,918 62,519 823,497 2,869,228
2,219,884 - 133,570 42,121 560,811 1,483,382
1,666,278 - -2,652 20,398 262,686 1,385,846
12,469,914 -113,695 3,174,392 1,390,657 1,033,823 6,984,737
218,972 2,506 45,716 17,951 24,786 128,013
12,250,942 -116,201 3,128,676 1,372,706 1,009,037 6,856,724
Reserve 8,364,216 93,863 2,092,693 453,727 599,037 5,124,896
Retained earnings brought forward 3,886,726 -210,064 1,035,983 918,979 410,000 1,731,828
-375,842 - -127,917 -5,895 -10,157 -231,873
915,408 47 101,255 3,360 108,746 702,000
1,031 - - - - 1,031
59,992,053 2,112,948 11,496,771 4,487,721 4,876,895 37,017,718
62,144 - 55,940 3,419 2,785 -
806,056 67,850 272,241 42,711 130,670 292,584
431,873 - 103,896 11,702 109,191 207,084
40,667,826 3,355,264 15,572,523 3,903,031 4,697,194 13,139,814
29,744,436 1,677,443 11,754,847 3,091,286 3,737,736 9,483,124
8,442,089 1,643,858 3,430,169 675,417 748,381 1,944,264
2,481,301 33,963 387,507 136,328 211,077 1,712,426
470,037 33,766 172,511 25,497 29,683 208,580
486,464 22,208 87,303 31,274 23,705 321,974
2,464,874 45,521 472,715 130,551 217,055 1,599,032
503,515 20,844 70,735 38,791 53,614 319,531
1,148,085 8,058 139,462 18,570 40,096 941,899
1,820,304 58,307 403,988 150,772 230,573 976,664
747,882 15,737 115,738 31,038 79,873 505,496
3,173 1,014 16,309 1,916 -989 -15,077
1,069,249 41,556 271,941 117,818 151,689 486,245
91,246 - 1,912 442 2,706 86,186
316,487 1,426 10,650 110,211 33,743 160,457
2,424,995 206,272 531,905 160,557 203,673 1,322,588
106,550 16,318 81,897 3,183 3,523 1,629
15,270,737 1,522,980 4,799,112 1,643,032 1,644,745 5,660,868
604,796 183,609 335,955 44,833 20,156 20,243
12,169 - 6,952 1,680 1,683 1,854
8,093,720 1,006,719 3,053,167 1,043,192 912,509 2,078,133
1,044,662 57,611 229,352 88,723 157,579 511,397
1,327,119 116,951 311,506 132,466 178,512 587,684
370,263 10,862 42,088 24,848 17,650 274,815
1,143,556 83,047 346,871 162,738 128,063 422,837
563,414 41,080 127,802 33,072 35,166 326,294
2,111,038 23,101 345,419 111,480 193,427 1,437,611
126,279 47,526 68,313 6,632 2,564 1,244
2,525,101 354,542 995,193 352,889 265,972 556,505
By capital
taxes and public charges
Net operating income
Number of directors (persons)
Number of employees (persons)
Directors' bonus
Employees' salaries
Employees' bonus
Welfare expenses
Interest expensesRental or leasing expenses for fixedand liquid assets
Interim dividend
Dividends
Depreciation expenses
Special depreciation expenses
Value added
Directors' remuneration
Special profits
Special losses
Net profits before tax
Income taxes-current
Income taxes-deferred
Net profits for the period
Cost of salesSelling and general administrationexpenses
Operating profits
Non-operating revenues
Non-operating expenses
Ordinary profits
Subscription rights to shares
Liabilities and net assets
Bills receivable discounted outstanding
Accounts receivable from subsidiariesand associates - tradeAccounts payable from subsidiaries andassociates - trade
Sales
Others capital surplus
Earned surplus
Legal retained earnings
Other earned surplus
Treasury stock
Others net assets
Net assets
Shareholders' equity
Capital stock
Capital surplus
Capital reserve
and Loss Table by Sector and by Size (continued)
Road Freight Transport
By Size 135

Total Under 10 10 - 50 50 - 100 100 - 1,000 1,000 or over
4,160 1,630 2,131 207 161 31
3,162,542 182,994 934,825 179,216 480,736 1,384,771
1,505,892 138,594 687,853 83,059 173,170 423,216
38,109 1,090 18,610 1,863 10,286 6,260
563,741 6,976 102,712 47,725 137,272 269,056
73,266 69 20,114 8,843 - 44,240
41,391 - 19,814 1,455 - 20,122
57 - - 57 - -
31,818 69 300 7,331 - 24,118
84,890 2,963 2,036 4,652 12,191 63,048
4,202 877 617 2,093 562 53
636 - - 69 18 549
80,052 2,086 1,419 2,490 11,611 62,446
896,644 33,302 103,500 33,074 147,817 578,951
6,197,442 860,282 1,764,171 203,118 620,083 2,749,788
3,335,508 822,632 1,232,518 131,237 348,396 800,725
406,391 7,092 126,092 31,866 78,000 163,341
132,397 3,651 60,975 2,300 10,942 54,529
2,796,720 811,889 1,045,451 97,071 259,454 582,855
41,637 39 2,323 4,888 5,775 28,612
22,608 39 1,980 4,376 1,700 14,513
19,029 - 343 512 4,075 14,099
2,820,297 37,611 529,330 66,993 265,912 1,920,451
1,243,882 2 206,621 26,962 81,693 928,604
Stocks 1,059,945 - 40,505 19,924 73,071 926,445
Bonds and debentures 39,726 - 39,240 - 6 480
Other securities 144,211 2 126,876 7,038 8,616 1,679
1,576,415 37,609 322,709 40,031 184,219 991,847
3,422 73 582 264 1,344 1,159
9,363,406 1,043,349 2,699,578 382,598 1,102,163 4,135,718
6,664,012 1,038,493 2,101,898 263,360 594,693 2,665,568
2,009,857 119,333 349,376 123,141 323,704 1,094,303
45,824 41 28,075 3,507 8,695 5,506
592,829 4,377 94,265 33,195 127,372 333,620
671,417 76,370 60,601 52,814 109,653 371,979
385,788 57,646 51,272 26,772 70,115 179,983
285,629 18,724 9,329 26,042 39,538 191,996
119,466 12 9,322 1,575 9,505 99,052
580,321 38,533 157,113 32,050 68,479 284,146
4,654,103 919,160 1,752,522 140,167 270,989 1,571,265
383,151 - 17,005 523 1,928 363,695
3,808,520 872,150 1,593,051 119,870 208,306 1,015,143
3,514,065 861,338 1,493,527 77,803 155,989 925,408
294,455 10,812 99,524 42,067 52,317 89,735
271,109 39,560 130,898 13,817 36,764 50,070
191,323 7,450 11,568 5,957 23,991 142,357
52 - - 52 - -Reserve required by special law
Bonds
Long-term borrowings
Long-term bank borrowings
Long-term other borrowings
Allowance
Other fixed liabilities
Short-term borrowings
Short-term bank borrowings
Short-term other borrowings
Allowance
Other liquid liabilities
Fixed liabilities
Deferred assets
Total assets
Liabilities
Liquid liabilities
Bills payable
Accounts payable
Intangible fixed assets
Intangible fixed assets excluding software
Software
Investments and other assets
Investment securities
Other investments and other assets
Other liquid assets
Fixed assets
Tangible fixed assets
Land
Construction in process
Other tangible fixed assets
Bonds and debentures
Other securities
Inventories
Finished goods and merchandise
Works in process
Raw materials and goods in storage
Liquid assets
Cash and deposits
Bills receivable
Accounts receivable
Securities
Stocks
2. Assets, Liabilities and Net Assets and Profit
Water
By capital
Number of corporations (companies)
136 By Size

(Unit: millions of yen)
Total Under 10 10 - 50 50 - 100 100 - 1,000 1,000 or over
2,699,394 4,856 597,680 119,238 507,470 1,470,150
2,623,189 3,082 582,231 119,439 501,559 1,416,878
464,678 5,774 35,959 14,789 45,328 362,828
416,714 178 5,464 2,397 33,029 375,646
331,217 - 1,056 2,064 17,719 310,378
85,497 178 4,408 333 15,310 65,268
1,768,048 -2,870 547,913 103,098 429,220 690,687
47,400 262 6,420 2,179 5,836 32,703
1,720,648 -3,132 541,493 100,919 423,384 657,984
Reserve 985,634 969 203,851 62,204 144,312 574,298
Retained earnings brought forward 735,014 -4,101 337,642 38,715 279,072 83,686
-26,251 - -7,105 -845 -6,018 -12,283
73,431 1,774 15,449 -201 5,834 50,575
2,774 - - - 77 2,697
9,363,406 1,043,349 2,699,578 382,598 1,102,163 4,135,718
2,606 - 1,853 753 - -
140,572 1,086 18,587 6,630 68,356 45,913
95,993 - 8,546 4,629 29,090 53,728
7,718,916 224,351 1,091,236 453,140 1,453,770 4,496,419
6,901,319 51,505 802,620 384,778 1,311,126 4,351,290
684,315 141,729 234,317 55,539 106,698 146,032
133,282 31,117 54,299 12,823 35,946 -903
344,844 9,136 139,315 12,903 37,548 145,942
106,739 7,958 43,858 4,042 8,510 42,371
371,387 32,295 149,756 21,684 64,984 102,668
122,563 142 48,020 10,252 15,431 48,718
437,228 26,522 48,144 9,706 16,056 336,800
56,722 5,915 149,632 22,230 64,359 -185,414
94,338 709 55,665 5,445 18,910 13,609
22,219 3,196 1,659 2,375 -461 15,450
-59,835 2,010 92,308 14,410 45,910 -214,473
15,960 - 1,091 - 532 14,337
85,853 - 35,971 1,782 12,468 35,632
367,726 87,413 165,658 15,841 34,235 64,579
8,503 1,113 - 6,837 61 492
1,162,383 68,030 275,001 75,927 173,743 569,682
67,158 12,177 35,418 5,744 9,105 4,714
1,816 - 979 63 367 407
302,633 17,754 121,229 35,247 66,496 61,907
65,960 493 21,398 7,216 15,897 20,956
69,680 2,942 19,635 8,878 17,560 20,665
145,231 5,345 22,229 1,995 5,189 110,473
501,330 1,178 13,410 5,002 25,600 456,140
20,524 2,369 8,633 954 2,772 5,796
-11,949 25,772 32,070 10,828 30,757 -111,376
10,173 3,346 5,119 621 794 293
66,345 4,890 27,190 7,900 14,658 11,707
By capital
taxes and public charges
Net operating income
Number of directors (persons)
Number of employees (persons)
Directors' bonus
Employees' salaries
Employees' bonus
Welfare expenses
Interest expensesRental or leasing expenses for fixedand liquid assets
Interim dividend
Dividends
Depreciation expenses
Special depreciation expenses
Value added
Directors' remuneration
Special profits
Special losses
Net profits before tax
Income taxes-current
Income taxes-deferred
Net profits for the period
Cost of salesSelling and general administrationexpenses
Operating profits
Non-operating revenues
Non-operating expenses
Ordinary profits
Subscription rights to shares
Liabilities and net assets
Bills receivable discounted outstanding
Accounts receivable from subsidiariesand associates - tradeAccounts payable from subsidiaries andassociates - trade
Sales
Others capital surplus
Earned surplus
Legal retained earnings
Other earned surplus
Treasury stock
Others net assets
Net assets
Shareholders' equity
Capital stock
Capital surplus
Capital reserve
and Loss Table by Sector and by Size (continued)
Transport
By Size 137

Total Under 10 10 - 50 50 - 100 100 - 1,000 1,000 or over
12,421 5,317 5,740 741 505 118
13,062,315 801,326 929,946 649,694 1,300,364 9,380,985
4,449,018 74,664 397,602 327,847 446,354 3,202,551
76,733 2,762 23,533 8,693 29,796 11,949
2,969,635 35,359 276,162 146,555 462,609 2,048,950
267,339 4,545 12,441 9,507 14,928 225,918
31,864 3,025 12,441 5,856 10,542 -
7,290 - - 1,157 949 5,184
228,185 1,520 - 2,494 3,437 220,734
2,954,679 10,712 15,149 9,506 26,132 2,893,180
69,532 3,954 5,903 1,464 8,901 49,310
2,766,227 2,132 7,342 524 4,270 2,751,959
118,920 4,626 1,904 7,518 12,961 91,911
2,344,911 673,284 205,059 147,586 320,545 998,437
17,412,413 314,318 1,157,974 1,096,210 1,757,422 13,086,489
12,196,746 268,720 606,289 824,823 1,305,804 9,191,110
6,081,223 163,858 384,944 464,065 548,899 4,519,457
346,559 - 42,408 31,393 25,984 246,774
5,768,964 104,862 178,937 329,365 730,921 4,424,879
691,646 521 7,986 7,772 52,746 622,621
166,600 255 4,557 4,862 29,972 126,954
525,046 266 3,429 2,910 22,774 495,667
4,524,021 45,077 543,699 263,615 398,872 3,272,758
2,667,572 13,256 45,233 189,822 206,665 2,212,596
Stocks 2,534,730 13,232 41,964 123,024 169,310 2,187,200
Bonds and debentures 99,094 - - 62,587 12,506 24,001
Other securities 33,748 24 3,269 4,211 24,849 1,395
1,856,449 31,821 498,466 73,793 192,207 1,060,162
33,177 - 11,899 2,350 14,583 4,345
30,507,905 1,115,644 2,099,819 1,748,254 3,072,369 22,471,819
19,435,983 266,551 1,061,475 1,038,431 1,576,697 15,492,829
7,480,603 83,801 529,343 263,236 842,631 5,761,592
78,381 121 20,107 8,187 42,548 7,418
2,158,156 17,046 156,843 100,306 296,654 1,587,307
1,153,441 22,136 78,727 34,122 264,101 754,355
790,079 9,099 42,854 22,158 186,467 529,501
363,362 13,037 35,873 11,964 77,634 224,854
248,793 - 42,746 16,230 41,722 148,095
3,841,832 44,498 230,920 104,391 197,606 3,264,417
11,955,380 182,750 532,132 775,195 734,066 9,731,237
3,119,240 - 6,088 46,972 20,143 3,046,037
4,453,306 171,975 371,026 522,279 414,501 2,973,525
3,536,098 109,947 345,731 511,977 315,373 2,253,070
917,208 62,028 25,295 10,302 99,128 720,455
3,438,680 - 47,457 135,097 180,859 3,075,267
944,154 10,775 107,561 70,847 118,563 636,408
- - - - - -Reserve required by special law
Bonds
Long-term borrowings
Long-term bank borrowings
Long-term other borrowings
Allowance
Other fixed liabilities
Short-term borrowings
Short-term bank borrowings
Short-term other borrowings
Allowance
Other liquid liabilities
Fixed liabilities
Deferred assets
Total assets
Liabilities
Liquid liabilities
Bills payable
Accounts payable
Intangible fixed assets
Intangible fixed assets excluding software
Software
Investments and other assets
Investment securities
Other investments and other assets
Other liquid assets
Fixed assets
Tangible fixed assets
Land
Construction in process
Other tangible fixed assets
Bonds and debentures
Other securities
Inventories
Finished goods and merchandise
Works in process
Raw materials and goods in storage
Liquid assets
Cash and deposits
Bills receivable
Accounts receivable
Securities
Stocks
2. Assets, Liabilities and Net Assets and Profit
Miscellaneous
By capital
Number of corporations (companies)
138 By Size

(Unit: millions of yen)
Total Under 10 10 - 50 50 - 100 100 - 1,000 1,000 or over
11,071,922 849,093 1,038,344 709,823 1,495,672 6,978,990
10,860,480 846,770 1,038,264 683,255 1,472,240 6,819,951
3,086,060 17,853 88,222 47,840 131,419 2,800,726
2,031,274 60 240,468 14,079 76,673 1,699,994
1,510,647 60 13,338 7,193 31,964 1,458,092
520,627 - 227,130 6,886 44,709 241,902
5,793,563 829,147 710,135 623,686 1,270,429 2,360,166
107,861 13,956 23,496 7,699 22,518 40,192
5,685,702 815,191 686,639 615,987 1,247,911 2,319,974
Reserve 3,731,351 834,745 260,433 370,771 859,319 1,406,083
Retained earnings brought forward 1,954,351 -19,554 426,206 245,216 388,592 913,891
-50,417 -290 -561 -2,350 -6,281 -40,935
211,215 2,323 80 26,568 23,432 158,812
227 - - - - 227
30,507,905 1,115,644 2,099,819 1,748,254 3,072,369 22,471,819
4,796 - 4,008 - 685 103
210,869 - 35,850 23,622 101,813 49,584
227,089 - 8,839 2,783 47,380 168,087
21,386,874 355,070 3,193,558 1,345,096 3,454,313 13,038,837
17,107,276 173,302 2,340,451 1,069,588 2,800,208 10,723,727
3,383,526 171,634 751,294 192,805 504,039 1,763,754
896,072 10,134 101,813 82,703 150,066 551,356
231,658 10,972 19,127 19,338 41,407 140,814
140,936 3,685 13,208 12,814 15,331 95,898
986,794 17,421 107,732 89,227 176,142 596,272
157,459 1,319 11,132 22,266 37,006 85,736
165,763 9,326 16,462 20,296 47,387 72,292
978,490 9,414 102,402 91,197 165,761 609,716
258,076 2,993 33,666 31,809 54,024 135,584
6,907 706 -2,499 1,789 2,744 4,167
713,507 5,715 71,235 57,599 108,993 469,965
32,865 - 2,804 2,603 8,547 18,911
189,862 3,558 16,699 8,169 34,119 127,317
752,668 8,668 36,251 45,924 95,407 566,418
15,472 - 3,044 10,067 2,361 -
7,784,159 140,412 1,168,544 515,394 959,404 5,000,405
167,432 29,926 80,354 21,399 21,479 14,274
6,150 - 1,463 1,609 2,198 880
3,413,643 73,314 664,956 234,915 401,934 2,038,524
658,197 1,090 109,071 41,135 86,156 420,745
755,519 8,529 99,217 46,213 92,528 509,032
69,445 3,502 10,325 8,187 10,077 37,354
1,706,241 7,629 77,754 71,335 184,895 1,364,628
180,905 9,790 33,916 16,085 20,148 100,966
826,627 6,632 91,488 74,516 139,989 514,002
26,083 7,492 12,429 2,837 2,225 1,100
945,919 27,310 254,774 63,455 102,852 497,528
By capital
taxes and public charges
Net operating income
Number of directors (persons)
Number of employees (persons)
Directors' bonus
Employees' salaries
Employees' bonus
Welfare expenses
Interest expensesRental or leasing expenses for fixedand liquid assets
Interim dividend
Dividends
Depreciation expenses
Special depreciation expenses
Value added
Directors' remuneration
Special profits
Special losses
Net profits before tax
Income taxes-current
Income taxes-deferred
Net profits for the period
Cost of salesSelling and general administrationexpenses
Operating profits
Non-operating revenues
Non-operating expenses
Ordinary profits
Subscription rights to shares
Liabilities and net assets
Bills receivable discounted outstanding
Accounts receivable from subsidiariesand associates - tradeAccounts payable from subsidiaries andassociates - trade
Sales
Others capital surplus
Earned surplus
Legal retained earnings
Other earned surplus
Treasury stock
Others net assets
Net assets
Shareholders' equity
Capital stock
Capital surplus
Capital reserve
and Loss Table by Sector and by Size (continued)
Transport
By Size 139

Total Under 10 10 - 50 50 - 100 100 - 1,000 1,000 or over
633,422 381,443 232,546 13,631 5,018 784
188,333,601 11,832,916 59,337,187 32,872,791 36,907,247 47,383,460
48,023,650 4,378,570 20,803,434 8,794,038 5,663,355 8,384,253
10,776,760 262,817 3,305,376 2,425,985 2,804,697 1,977,885
62,208,750 3,318,194 15,497,044 10,090,510 16,035,798 17,267,204
2,727,862 168,398 679,026 387,566 487,820 1,005,052
759,762 18,836 413,924 248,109 75,152 3,741
335,057 160 32,986 98,657 77,448 125,806
1,633,043 149,402 232,116 40,800 335,220 875,505
34,427,676 2,888,269 10,495,384 6,163,081 6,110,373 8,770,569
32,322,166 2,809,360 9,882,819 5,859,933 5,781,525 7,988,529
803,852 8,082 279,514 97,898 154,457 263,901
1,301,658 70,827 333,051 205,250 174,391 518,139
30,168,903 816,668 8,556,923 5,011,611 5,805,204 9,978,497
125,924,525 7,102,082 39,084,896 16,474,644 16,359,588 46,903,315
67,508,495 5,186,054 24,003,319 11,089,018 10,300,734 16,929,370
32,383,157 2,384,797 12,117,693 5,471,290 4,902,778 7,506,599
1,329,239 197,166 599,110 143,961 156,420 232,582
33,796,099 2,604,091 11,286,516 5,473,767 5,241,536 9,190,189
3,042,255 94,809 942,350 262,706 525,401 1,216,989
1,965,177 69,288 729,184 151,162 303,220 712,323
1,077,078 25,521 213,166 111,544 222,181 504,666
55,373,775 1,821,219 14,139,227 5,122,920 5,533,453 28,756,956
30,573,819 536,801 4,491,298 2,639,161 2,602,496 20,304,063
Stocks 26,670,610 178,911 2,910,608 1,716,668 2,141,693 19,722,730
Bonds and debentures 776,876 15,714 285,861 148,340 139,686 187,275
Other securities 3,126,333 342,176 1,294,829 774,153 321,117 394,058
24,799,956 1,284,418 9,647,929 2,483,759 2,930,957 8,452,893
387,540 57,956 183,350 38,906 82,502 24,826
314,645,666 18,992,954 98,605,433 49,386,341 53,349,337 94,311,601
202,021,995 17,265,866 57,165,150 31,236,614 36,276,939 60,077,426
134,280,338 9,105,235 34,358,936 23,250,832 29,854,084 37,711,251
11,508,277 210,093 4,692,595 2,624,692 2,288,439 1,692,458
57,878,144 2,676,146 12,339,391 9,229,885 16,155,373 17,477,349
35,217,738 4,361,908 10,103,182 7,104,628 5,426,891 8,221,129
24,781,412 2,236,319 7,384,899 5,867,866 3,648,956 5,643,372
10,436,326 2,125,589 2,718,283 1,236,762 1,777,935 2,577,757
1,875,980 4,813 302,595 307,026 605,871 655,675
27,800,199 1,852,275 6,921,173 3,984,601 5,377,510 9,664,640
67,741,657 8,160,631 22,806,214 7,985,782 6,422,855 22,366,175
4,632,159 623,902 325,442 424,555 196,871 3,061,389
50,626,399 7,052,413 19,934,015 5,392,151 3,443,942 14,803,878
41,286,380 4,322,812 15,575,811 4,662,164 2,761,994 13,963,599
9,340,019 2,729,601 4,358,204 729,987 681,948 840,279
4,779,477 6,161 724,536 1,108,632 1,314,865 1,625,283
7,703,622 478,155 1,822,221 1,060,444 1,467,177 2,875,625
- - - - - -Reserve required by special law
Bonds
Long-term borrowings
Long-term bank borrowings
Long-term other borrowings
Allowance
Other fixed liabilities
Short-term borrowings
Short-term bank borrowings
Short-term other borrowings
Allowance
Other liquid liabilities
Fixed liabilities
Deferred assets
Total assets
Liabilities
Liquid liabilities
Bills payable
Accounts payable
Intangible fixed assets
Intangible fixed assets excluding software
Software
Investments and other assets
Investment securities
Other investments and other assets
Other liquid assets
Fixed assets
Tangible fixed assets
Land
Construction in process
Other tangible fixed assets
Bonds and debentures
Other securities
Inventories
Finished goods and merchandise
Works in process
Raw materials and goods in storage
Liquid assets
Cash and deposits
Bills receivable
Accounts receivable
Securities
Stocks
2. Assets, Liabilities and Net Assets and Profit
Wholesale and
By capital
Number of corporations (companies)
140 By Size

(Unit: millions of yen)
Total Under 10 10 - 50 50 - 100 100 - 1,000 1,000 or over
112,623,671 1,727,088 41,440,283 18,149,727 17,072,398 34,234,175
111,011,274 1,733,695 42,180,189 17,799,062 16,636,598 32,661,730
12,619,838 1,313,005 3,197,395 972,285 1,231,676 5,905,477
19,545,761 -42,730 8,507,055 1,599,791 2,267,354 7,214,291
15,360,604 3,984 7,549,233 1,022,204 1,312,690 5,472,493
4,185,157 -46,714 957,822 577,587 954,664 1,741,798
80,499,286 475,843 30,881,303 15,509,170 13,279,887 20,353,083
1,857,608 104,230 539,409 343,180 454,516 416,273
78,641,678 371,613 30,341,894 15,165,990 12,825,371 19,936,810
Reserve 50,301,589 1,263,924 19,714,145 9,777,464 7,408,800 12,137,256
Retained earnings brought forward 28,340,089 -892,311 10,627,749 5,388,526 5,416,571 7,799,554
-1,653,611 -12,423 -405,564 -282,184 -142,319 -811,121
1,588,452 -6,607 -739,906 350,222 434,442 1,550,301
23,945 - - 443 1,358 22,144
314,645,666 18,992,954 98,605,433 49,386,341 53,349,337 94,311,601
1,443,205 19,258 642,201 157,140 289,154 335,452
6,377,819 27,146 644,122 493,892 1,806,581 3,406,078
11,102,556 146,197 544,674 3,282,229 3,961,104 3,168,352
526,380,943 43,364,037 148,255,734 76,866,563 107,082,360 150,812,249
427,612,141 31,949,694 114,798,900 62,593,761 88,839,045 129,430,741
90,577,615 11,410,729 31,190,774 12,906,699 16,121,822 18,947,591
8,191,187 3,614 2,266,060 1,366,103 2,121,493 2,433,917
6,256,503 723,400 1,685,015 587,987 522,554 2,737,547
3,347,546 194,033 969,676 284,232 280,871 1,618,734
11,100,144 532,981 2,981,399 1,669,858 2,363,176 3,552,730
1,549,708 160,188 579,148 205,462 224,064 380,846
2,924,409 199,272 1,093,715 361,759 300,673 968,990
9,725,443 493,897 2,466,832 1,513,561 2,286,567 2,964,586
3,586,740 163,552 1,065,539 544,041 799,985 1,013,623
160,916 925 43,891 15,369 43,689 57,042
5,977,787 329,420 1,357,402 954,151 1,442,893 1,893,921
683,272 - 20,553 5,353 139,139 518,227
2,157,364 6,463 265,113 218,078 569,449 1,098,261
5,098,523 414,531 1,788,354 801,094 793,234 1,301,310
400,913 35,167 231,983 92,313 40,515 935
59,842,287 6,557,527 21,129,382 9,412,936 10,871,054 11,871,388
5,729,149 2,168,644 2,804,747 398,993 243,212 113,553
162,414 10,494 63,245 40,102 34,556 14,017
26,913,594 2,976,494 9,569,089 4,701,783 4,869,368 4,796,860
4,127,329 184,499 1,243,447 788,476 968,776 942,131
4,317,282 252,968 1,369,606 823,039 933,800 937,869
1,148,296 118,338 538,295 155,701 146,423 189,539
8,851,400 734,021 3,140,761 1,138,301 1,503,019 2,335,298
1,549,932 226,793 672,427 156,139 196,830 297,743
7,042,891 -114,724 1,727,765 1,210,402 1,975,070 2,244,378
1,227,965 606,854 543,221 48,103 22,567 7,220
9,349,549 1,614,982 3,335,959 1,477,042 1,490,534 1,431,032
By capital
taxes and public charges
Net operating income
Number of directors (persons)
Number of employees (persons)
Directors' bonus
Employees' salaries
Employees' bonus
Welfare expenses
Interest expensesRental or leasing expenses for fixedand liquid assets
Interim dividend
Dividends
Depreciation expenses
Special depreciation expenses
Value added
Directors' remuneration
Special profits
Special losses
Net profits before tax
Income taxes-current
Income taxes-deferred
Net profits for the period
Cost of salesSelling and general administrationexpenses
Operating profits
Non-operating revenues
Non-operating expenses
Ordinary profits
Subscription rights to shares
Liabilities and net assets
Bills receivable discounted outstanding
Accounts receivable from subsidiariesand associates - tradeAccounts payable from subsidiaries andassociates - trade
Sales
Others capital surplus
Earned surplus
Legal retained earnings
Other earned surplus
Treasury stock
Others net assets
Net assets
Shareholders' equity
Capital stock
Capital surplus
Capital reserve
and Loss Table by Sector and by Size (continued)
Retail Trade
By Size 141

Total Under 10 10 - 50 50 - 100 100 - 1,000 1,000 or over
267,602 123,151 131,399 9,066 3,475 511
129,096,442 4,518,546 38,610,419 21,887,479 27,182,243 36,897,755
32,278,594 1,623,256 14,276,178 6,371,212 3,880,277 6,127,671
9,506,207 184,552 3,164,494 1,930,439 2,338,713 1,888,009
48,327,340 1,594,118 10,908,220 6,526,056 13,302,447 15,996,499
2,298,536 12,008 598,563 371,116 455,264 861,585
699,142 11,812 376,737 242,910 64,526 3,157
321,150 146 32,986 98,657 74,997 114,364
1,278,244 50 188,840 29,549 315,741 744,064
19,883,063 871,681 5,852,688 3,911,839 3,991,696 5,255,159
18,142,635 845,412 5,349,879 3,719,232 3,722,998 4,505,114
743,582 2,115 265,220 88,259 129,147 258,841
996,846 24,154 237,589 104,348 139,551 491,204
16,802,702 232,931 3,810,276 2,776,817 3,213,846 6,768,832
71,325,654 1,996,900 22,424,792 8,900,109 8,566,730 29,437,123
30,256,743 1,599,878 12,499,872 5,341,155 4,820,129 5,995,709
15,485,686 899,553 6,235,734 2,613,961 2,544,873 3,191,565
777,109 46,846 477,872 86,622 85,254 80,515
13,993,948 653,479 5,786,266 2,640,572 2,190,002 2,723,629
1,494,532 14,502 450,896 129,989 331,202 567,943
813,916 9,405 370,780 33,818 164,678 235,235
680,616 5,097 80,116 96,171 166,524 332,708
39,574,379 382,520 9,474,024 3,428,965 3,415,399 22,873,471
25,637,888 48,579 3,300,969 1,969,665 2,007,572 18,311,103
Stocks 22,890,562 17,666 2,145,383 1,196,105 1,683,188 17,848,220
Bonds and debentures 504,020 15,552 97,219 105,488 123,955 161,806
Other securities 2,243,306 15,361 1,058,367 668,072 200,429 301,077
13,936,491 333,941 6,173,055 1,459,300 1,407,827 4,562,368
195,078 31,883 74,006 17,570 54,180 17,439
200,617,174 6,547,329 61,109,217 30,805,158 35,803,153 66,352,317
129,343,786 6,240,475 35,188,335 18,253,653 24,317,547 45,343,776
87,026,001 3,329,215 21,581,802 13,442,263 20,898,904 27,773,817
10,605,215 83,481 4,427,984 2,466,659 2,133,059 1,494,032
40,599,446 1,218,709 7,596,439 4,950,871 12,716,641 14,116,786
19,898,186 1,175,337 6,196,571 3,912,767 3,061,259 5,552,252
15,134,734 760,583 5,249,255 2,959,353 1,970,421 4,195,122
4,763,452 414,754 947,316 953,414 1,090,838 1,357,130
945,883 964 112,335 161,194 342,541 328,849
14,977,271 850,724 3,248,473 1,950,772 2,645,404 6,281,898
42,317,785 2,911,260 13,606,533 4,811,390 3,418,643 17,569,959
3,687,503 251,977 200,634 387,547 121,955 2,725,390
32,200,054 2,601,561 12,266,942 3,067,039 1,809,700 12,454,812
27,515,240 1,795,342 9,946,721 2,566,036 1,362,795 11,844,346
4,684,814 806,219 2,320,221 501,003 446,905 610,466
2,871,264 5,833 322,412 646,387 768,045 1,128,587
3,558,964 51,889 816,545 710,417 718,943 1,261,170
- - - - - -Reserve required by special law
Bonds
Long-term borrowings
Long-term bank borrowings
Long-term other borrowings
Allowance
Other fixed liabilities
Short-term borrowings
Short-term bank borrowings
Short-term other borrowings
Allowance
Other liquid liabilities
Fixed liabilities
Deferred assets
Total assets
Liabilities
Liquid liabilities
Bills payable
Accounts payable
Intangible fixed assets
Intangible fixed assets excluding software
Software
Investments and other assets
Investment securities
Other investments and other assets
Other liquid assets
Fixed assets
Tangible fixed assets
Land
Construction in process
Other tangible fixed assets
Bonds and debentures
Other securities
Inventories
Finished goods and merchandise
Works in process
Raw materials and goods in storage
Liquid assets
Cash and deposits
Bills receivable
Accounts receivable
Securities
Stocks
2. Assets, Liabilities and Net Assets and Profit
Wholesale
By capital
Number of corporations (companies)
142 By Size

(Unit: millions of yen)
Total Under 10 10 - 50 50 - 100 100 - 1,000 1,000 or over
71,273,388 306,854 25,920,882 12,551,505 11,485,606 21,008,541
70,281,076 306,089 26,693,701 12,312,709 11,203,270 19,765,307
7,867,604 419,937 1,864,413 663,017 877,082 4,043,155
12,929,844 1,919 6,278,670 1,135,342 1,090,859 4,423,054
10,830,843 1,537 5,894,364 715,850 656,650 3,562,442
2,099,001 382 384,306 419,492 434,209 860,612
50,391,926 -109,628 18,786,697 10,655,131 9,340,791 11,718,935
1,135,657 36,485 318,936 174,372 277,360 328,504
49,256,269 -146,113 18,467,761 10,480,759 9,063,431 11,390,431
Reserve 31,698,490 276,972 12,023,554 7,211,289 5,288,199 6,898,476
Retained earnings brought forward 17,557,779 -423,085 6,444,207 3,269,470 3,775,232 4,491,955
-908,298 -6,139 -236,079 -140,781 -105,462 -419,837
978,343 765 -772,819 238,796 281,167 1,230,434
13,969 - - - 1,169 12,800
200,617,174 6,547,329 61,109,217 30,805,158 35,803,153 66,352,317
1,397,644 4,913 640,853 152,179 274,066 325,633
5,789,266 24,544 479,898 454,922 1,633,790 3,196,112
7,354,560 15,817 401,114 1,260,972 2,780,528 2,896,129
350,610,005 16,087,603 99,008,229 50,560,006 75,466,146 109,488,021
302,687,941 12,723,632 79,927,048 42,770,546 66,063,855 101,202,860
43,497,455 3,259,157 17,624,597 6,930,257 8,072,920 7,610,524
4,424,609 104,814 1,456,584 859,203 1,329,371 674,637
4,467,244 122,215 1,115,907 425,629 350,339 2,453,154
2,464,195 66,522 570,800 181,577 184,050 1,461,246
6,427,658 160,507 2,001,691 1,103,255 1,495,660 1,666,545
1,034,544 62,057 435,137 137,583 139,166 260,601
1,822,923 135,800 667,181 221,686 177,865 620,391
5,639,279 86,764 1,769,647 1,019,152 1,456,961 1,306,755
2,039,418 57,126 729,068 344,321 499,176 409,727
91,184 541 17,840 13,673 38,480 20,650
3,508,677 29,097 1,022,739 661,158 919,305 876,378
371,291 - 17,963 5,058 65,746 282,524
1,229,116 3,827 164,392 109,928 318,070 632,899
2,426,790 142,830 1,061,120 441,983 351,315 429,542
79,054 32,807 27,320 12,044 5,986 897
28,688,534 2,032,063 11,975,141 4,802,285 5,704,383 4,174,662
2,977,488 695,662 1,757,342 281,540 166,327 76,617
112,926 4,238 47,106 29,891 20,597 11,094
12,264,917 806,586 4,833,196 2,317,578 2,486,223 1,821,334
2,383,678 80,527 675,560 451,916 607,257 568,418
2,353,046 90,415 768,758 449,117 530,687 514,069
662,137 39,528 300,120 94,926 92,533 135,030
3,467,754 159,427 2,116,174 323,914 462,133 406,106
704,116 90,394 320,421 89,126 101,788 102,387
3,762,472 65,286 1,156,464 764,277 1,236,838 539,607
549,344 182,362 313,488 33,277 15,665 4,552
3,476,835 327,687 1,457,601 650,131 643,058 398,358
By capital
taxes and public charges
Net operating income
Number of directors (persons)
Number of employees (persons)
Directors' bonus
Employees' salaries
Employees' bonus
Welfare expenses
Interest expensesRental or leasing expenses for fixedand liquid assets
Interim dividend
Dividends
Depreciation expenses
Special depreciation expenses
Value added
Directors' remuneration
Special profits
Special losses
Net profits before tax
Income taxes-current
Income taxes-deferred
Net profits for the period
Cost of salesSelling and general administrationexpenses
Operating profits
Non-operating revenues
Non-operating expenses
Ordinary profits
Subscription rights to shares
Liabilities and net assets
Bills receivable discounted outstanding
Accounts receivable from subsidiariesand associates - tradeAccounts payable from subsidiaries andassociates - trade
Sales
Others capital surplus
Earned surplus
Legal retained earnings
Other earned surplus
Treasury stock
Others net assets
Net assets
Shareholders' equity
Capital stock
Capital surplus
Capital reserve
and Loss Table by Sector and by Size (continued)
Trade
By Size 143
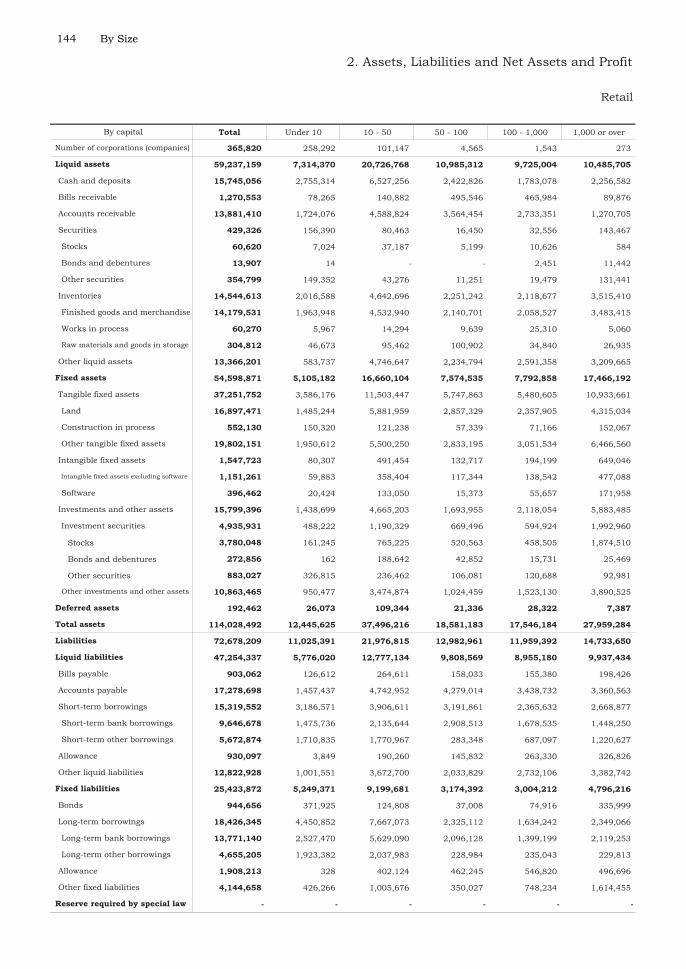
Total Under 10 10 - 50 50 - 100 100 - 1,000 1,000 or over
365,820 258,292 101,147 4,565 1,543 273
59,237,159 7,314,370 20,726,768 10,985,312 9,725,004 10,485,705
15,745,056 2,755,314 6,527,256 2,422,826 1,783,078 2,256,582
1,270,553 78,265 140,882 495,546 465,984 89,876
13,881,410 1,724,076 4,588,824 3,564,454 2,733,351 1,270,705
429,326 156,390 80,463 16,450 32,556 143,467
60,620 7,024 37,187 5,199 10,626 584
13,907 14 - - 2,451 11,442
354,799 149,352 43,276 11,251 19,479 131,441
14,544,613 2,016,588 4,642,696 2,251,242 2,118,677 3,515,410
14,179,531 1,963,948 4,532,940 2,140,701 2,058,527 3,483,415
60,270 5,967 14,294 9,639 25,310 5,060
304,812 46,673 95,462 100,902 34,840 26,935
13,366,201 583,737 4,746,647 2,234,794 2,591,358 3,209,665
54,598,871 5,105,182 16,660,104 7,574,535 7,792,858 17,466,192
37,251,752 3,586,176 11,503,447 5,747,863 5,480,605 10,933,661
16,897,471 1,485,244 5,881,959 2,857,329 2,357,905 4,315,034
552,130 150,320 121,238 57,339 71,166 152,067
19,802,151 1,950,612 5,500,250 2,833,195 3,051,534 6,466,560
1,547,723 80,307 491,454 132,717 194,199 649,046
1,151,261 59,883 358,404 117,344 138,542 477,088
396,462 20,424 133,050 15,373 55,657 171,958
15,799,396 1,438,699 4,665,203 1,693,955 2,118,054 5,883,485
4,935,931 488,222 1,190,329 669,496 594,924 1,992,960
Stocks 3,780,048 161,245 765,225 520,563 458,505 1,874,510
Bonds and debentures 272,856 162 188,642 42,852 15,731 25,469
Other securities 883,027 326,815 236,462 106,081 120,688 92,981
10,863,465 950,477 3,474,874 1,024,459 1,523,130 3,890,525
192,462 26,073 109,344 21,336 28,322 7,387
114,028,492 12,445,625 37,496,216 18,581,183 17,546,184 27,959,284
72,678,209 11,025,391 21,976,815 12,982,961 11,959,392 14,733,650
47,254,337 5,776,020 12,777,134 9,808,569 8,955,180 9,937,434
903,062 126,612 264,611 158,033 155,380 198,426
17,278,698 1,457,437 4,742,952 4,279,014 3,438,732 3,360,563
15,319,552 3,186,571 3,906,611 3,191,861 2,365,632 2,668,877
9,646,678 1,475,736 2,135,644 2,908,513 1,678,535 1,448,250
5,672,874 1,710,835 1,770,967 283,348 687,097 1,220,627
930,097 3,849 190,260 145,832 263,330 326,826
12,822,928 1,001,551 3,672,700 2,033,829 2,732,106 3,382,742
25,423,872 5,249,371 9,199,681 3,174,392 3,004,212 4,796,216
944,656 371,925 124,808 37,008 74,916 335,999
18,426,345 4,450,852 7,667,073 2,325,112 1,634,242 2,349,066
13,771,140 2,527,470 5,629,090 2,096,128 1,399,199 2,119,253
4,655,205 1,923,382 2,037,983 228,984 235,043 229,813
1,908,213 328 402,124 462,245 546,820 496,696
4,144,658 426,266 1,005,676 350,027 748,234 1,614,455
- - - - - -Reserve required by special law
Bonds
Long-term borrowings
Long-term bank borrowings
Long-term other borrowings
Allowance
Other fixed liabilities
Short-term borrowings
Short-term bank borrowings
Short-term other borrowings
Allowance
Other liquid liabilities
Fixed liabilities
Deferred assets
Total assets
Liabilities
Liquid liabilities
Bills payable
Accounts payable
Intangible fixed assets
Intangible fixed assets excluding software
Software
Investments and other assets
Investment securities
Other investments and other assets
Other liquid assets
Fixed assets
Tangible fixed assets
Land
Construction in process
Other tangible fixed assets
Bonds and debentures
Other securities
Inventories
Finished goods and merchandise
Works in process
Raw materials and goods in storage
Liquid assets
Cash and deposits
Bills receivable
Accounts receivable
Securities
Stocks
2. Assets, Liabilities and Net Assets and Profit
Retail
By capital
Number of corporations (companies)
144 By Size

(Unit: millions of yen)
Total Under 10 10 - 50 50 - 100 100 - 1,000 1,000 or over
41,350,283 1,420,234 15,519,401 5,598,222 5,586,792 13,225,634
40,730,198 1,427,606 15,486,488 5,486,353 5,433,328 12,896,423
4,752,234 893,068 1,332,982 309,268 354,594 1,862,322
6,615,917 -44,649 2,228,385 464,449 1,176,495 2,791,237
4,529,761 2,447 1,654,869 306,354 656,040 1,910,051
2,086,156 -47,096 573,516 158,095 520,455 881,186
30,107,360 585,471 12,094,606 4,854,039 3,939,096 8,634,148
721,951 67,745 220,473 168,808 177,156 87,769
29,385,409 517,726 11,874,133 4,685,231 3,761,940 8,546,379
Reserve 18,603,099 986,952 7,690,591 2,566,175 2,120,601 5,238,780
Retained earnings brought forward 10,782,310 -469,226 4,183,542 2,119,056 1,641,339 3,307,599
-745,313 -6,284 -169,485 -141,403 -36,857 -391,284
610,109 -7,372 32,913 111,426 153,275 319,867
9,976 - - 443 189 9,344
114,028,492 12,445,625 37,496,216 18,581,183 17,546,184 27,959,284
45,561 14,345 1,348 4,961 15,088 9,819
588,553 2,602 164,224 38,970 172,791 209,966
3,747,996 130,380 143,560 2,021,257 1,180,576 272,223
175,770,938 27,276,434 49,247,505 26,306,557 31,616,214 41,324,228
124,924,200 19,226,062 34,871,852 19,823,215 22,775,190 28,227,881
47,080,160 8,151,572 13,566,177 5,976,442 8,048,902 11,337,067
3,766,578 -101,200 809,476 506,900 792,122 1,759,280
1,789,259 601,185 569,108 162,358 172,215 284,393
883,351 127,511 398,876 102,655 96,821 157,488
4,672,486 372,474 979,708 566,603 867,516 1,886,185
515,164 98,131 144,011 67,879 84,898 120,245
1,101,486 63,472 426,534 140,073 122,808 348,599
4,086,164 407,133 697,185 494,409 829,606 1,657,831
1,547,322 106,426 336,471 199,720 300,809 603,896
69,732 384 26,051 1,696 5,209 36,392
2,469,110 300,323 334,663 292,993 523,588 1,017,543
311,981 - 2,590 295 73,393 235,703
928,248 2,636 100,721 108,150 251,379 465,362
2,671,733 271,701 727,234 359,111 441,919 871,768
321,859 2,360 204,663 80,269 34,529 38
31,153,753 4,525,464 9,154,241 4,610,651 5,166,671 7,696,726
2,751,661 1,472,982 1,047,405 117,453 76,885 36,936
49,488 6,256 16,139 10,211 13,959 2,923
14,648,677 2,169,908 4,735,893 2,384,205 2,383,145 2,975,526
1,743,651 103,972 567,887 336,560 361,519 373,713
1,964,236 162,553 600,848 373,922 403,113 423,800
486,159 78,810 238,175 60,775 53,890 54,509
5,383,646 574,594 1,024,587 814,387 1,040,886 1,929,192
845,816 136,399 352,006 67,013 95,042 195,356
3,280,419 -180,010 571,301 446,125 738,232 1,704,771
678,621 424,492 229,733 14,826 6,902 2,668
5,872,714 1,287,295 1,878,358 826,911 847,476 1,032,674
By capital
taxes and public charges
Net operating income
Number of directors (persons)
Number of employees (persons)
Directors' bonus
Employees' salaries
Employees' bonus
Welfare expenses
Interest expensesRental or leasing expenses for fixedand liquid assets
Interim dividend
Dividends
Depreciation expenses
Special depreciation expenses
Value added
Directors' remuneration
Special profits
Special losses
Net profits before tax
Income taxes-current
Income taxes-deferred
Net profits for the period
Cost of salesSelling and general administrationexpenses
Operating profits
Non-operating revenues
Non-operating expenses
Ordinary profits
Subscription rights to shares
Liabilities and net assets
Bills receivable discounted outstanding
Accounts receivable from subsidiariesand associates - tradeAccounts payable from subsidiaries andassociates - trade
Sales
Others capital surplus
Earned surplus
Legal retained earnings
Other earned surplus
Treasury stock
Others net assets
Net assets
Shareholders' equity
Capital stock
Capital surplus
Capital reserve
and Loss Table by Sector and by Size (continued)
Trade
By Size 145

Total Under 10 10 - 50 50 - 100 100 - 1,000 1,000 or over
332,412 210,065 110,719 8,472 2,746 410
75,863,971 9,066,606 12,051,088 6,761,845 10,654,314 37,330,118
18,002,346 5,131,545 5,183,178 2,225,038 2,021,687 3,440,898
291,033 5,467 70,700 76,174 63,758 74,934
10,594,200 313,576 866,639 610,544 1,208,309 7,595,132
1,658,527 66,599 654,532 92,488 209,339 635,569
577,518 35,666 410,493 78,249 37,946 15,164
320,273 - 64,002 980 58,965 196,326
760,736 30,933 180,037 13,259 112,428 424,079
11,757,217 903,643 1,646,774 2,039,227 1,445,533 5,722,040
6,842,361 698,942 1,528,930 1,609,425 691,022 2,314,042
4,126,280 - 94,269 409,907 744,373 2,877,731
788,576 204,701 23,575 19,895 10,138 530,267
33,560,648 2,645,776 3,629,265 1,718,374 5,705,688 19,861,545
131,870,053 29,869,582 37,460,635 11,683,938 15,784,479 37,071,419
98,012,456 25,506,111 28,646,092 8,782,828 11,765,215 23,312,210
47,465,437 9,484,533 15,894,475 4,702,004 5,181,621 12,202,804
1,907,957 744,546 222,526 187,260 239,697 513,928
48,639,062 15,277,032 12,529,091 3,893,564 6,343,897 10,595,478
1,676,038 127,680 385,792 164,035 315,497 683,034
1,428,740 115,088 357,313 152,685 269,612 534,042
247,298 12,592 28,479 11,350 45,885 148,992
32,181,559 4,235,791 8,428,751 2,737,075 3,703,767 13,076,175
18,609,371 532,655 5,272,265 1,325,297 1,760,937 9,718,217
Stocks 14,653,432 476,357 3,389,308 1,104,217 1,414,818 8,268,732
Bonds and debentures 226,832 31 16,443 9,454 132,174 68,730
Other securities 3,729,107 56,267 1,866,514 211,626 213,945 1,380,755
13,572,188 3,703,136 3,156,486 1,411,778 1,942,830 3,357,958
185,446 23,152 75,151 38,148 20,074 28,921
207,919,470 38,959,340 49,586,874 18,483,931 26,458,867 74,430,458
150,371,200 31,046,599 34,219,263 12,043,207 17,802,395 55,259,736
58,239,624 8,535,732 11,714,363 4,361,501 8,218,412 25,409,616
531,620 5,398 95,820 79,197 141,564 209,641
3,684,667 71,552 628,396 567,350 817,560 1,599,809
32,591,543 5,815,928 5,989,461 2,760,846 4,870,922 13,154,386
19,241,243 2,929,181 2,220,105 2,186,987 3,425,594 8,479,376
13,350,300 2,886,747 3,769,356 573,859 1,445,328 4,675,010
219,514 250 15,958 29,160 83,665 90,481
21,212,280 2,642,604 4,984,728 924,948 2,304,701 10,355,299
92,131,576 22,510,867 22,504,900 7,681,706 9,583,983 29,850,120
6,434,909 - 1,468,472 387,738 154,900 4,423,799
68,343,485 17,850,970 18,688,686 6,239,811 6,307,530 19,256,488
52,958,822 14,018,942 11,686,529 5,330,258 4,683,239 17,239,854
15,384,663 3,832,028 7,002,157 909,553 1,624,291 2,016,634
827,894 2,811 144,191 121,388 252,787 306,717
16,525,288 4,657,086 2,203,551 932,769 2,868,766 5,863,116
- - - - - -Reserve required by special law
Bonds
Long-term borrowings
Long-term bank borrowings
Long-term other borrowings
Allowance
Other fixed liabilities
Short-term borrowings
Short-term bank borrowings
Short-term other borrowings
Allowance
Other liquid liabilities
Fixed liabilities
Deferred assets
Total assets
Liabilities
Liquid liabilities
Bills payable
Accounts payable
Intangible fixed assets
Intangible fixed assets excluding software
Software
Investments and other assets
Investment securities
Other investments and other assets
Other liquid assets
Fixed assets
Tangible fixed assets
Land
Construction in process
Other tangible fixed assets
Bonds and debentures
Other securities
Inventories
Finished goods and merchandise
Works in process
Raw materials and goods in storage
Liquid assets
Cash and deposits
Bills receivable
Accounts receivable
Securities
Stocks
2. Assets, Liabilities and Net Assets and Profit
Real Estate and Goods
By capital
Number of corporations (companies)
146 By Size
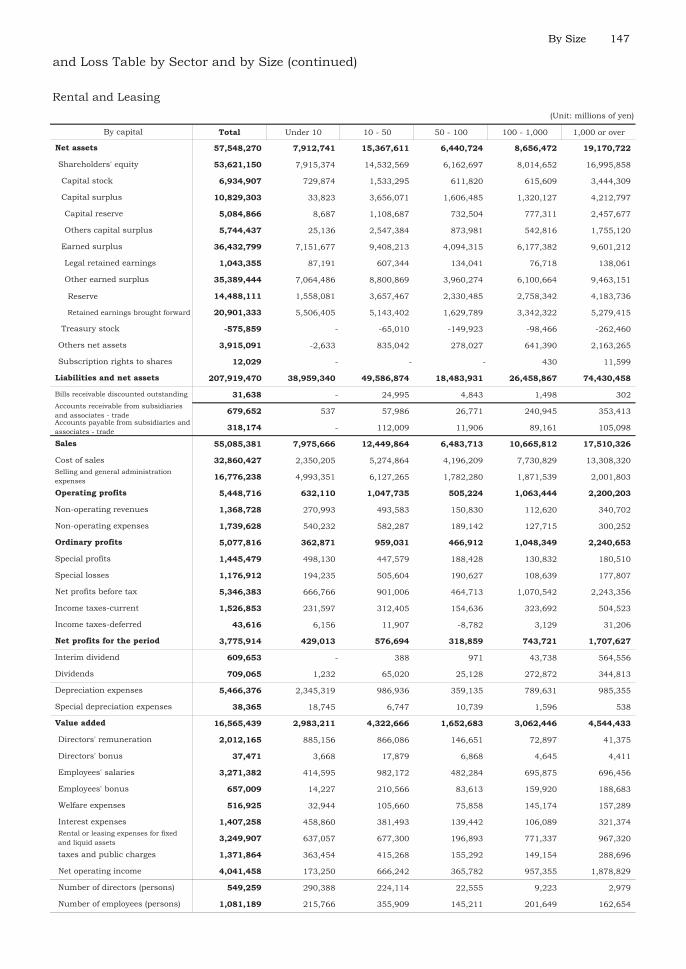
(Unit: millions of yen)
Total Under 10 10 - 50 50 - 100 100 - 1,000 1,000 or over
57,548,270 7,912,741 15,367,611 6,440,724 8,656,472 19,170,722
53,621,150 7,915,374 14,532,569 6,162,697 8,014,652 16,995,858
6,934,907 729,874 1,533,295 611,820 615,609 3,444,309
10,829,303 33,823 3,656,071 1,606,485 1,320,127 4,212,797
5,084,866 8,687 1,108,687 732,504 777,311 2,457,677
5,744,437 25,136 2,547,384 873,981 542,816 1,755,120
36,432,799 7,151,677 9,408,213 4,094,315 6,177,382 9,601,212
1,043,355 87,191 607,344 134,041 76,718 138,061
35,389,444 7,064,486 8,800,869 3,960,274 6,100,664 9,463,151
Reserve 14,488,111 1,558,081 3,657,467 2,330,485 2,758,342 4,183,736
Retained earnings brought forward 20,901,333 5,506,405 5,143,402 1,629,789 3,342,322 5,279,415
-575,859 - -65,010 -149,923 -98,466 -262,460
3,915,091 -2,633 835,042 278,027 641,390 2,163,265
12,029 - - - 430 11,599
207,919,470 38,959,340 49,586,874 18,483,931 26,458,867 74,430,458
31,638 - 24,995 4,843 1,498 302
679,652 537 57,986 26,771 240,945 353,413
318,174 - 112,009 11,906 89,161 105,098
55,085,381 7,975,666 12,449,864 6,483,713 10,665,812 17,510,326
32,860,427 2,350,205 5,274,864 4,196,209 7,730,829 13,308,320
16,776,238 4,993,351 6,127,265 1,782,280 1,871,539 2,001,803
5,448,716 632,110 1,047,735 505,224 1,063,444 2,200,203
1,368,728 270,993 493,583 150,830 112,620 340,702
1,739,628 540,232 582,287 189,142 127,715 300,252
5,077,816 362,871 959,031 466,912 1,048,349 2,240,653
1,445,479 498,130 447,579 188,428 130,832 180,510
1,176,912 194,235 505,604 190,627 108,639 177,807
5,346,383 666,766 901,006 464,713 1,070,542 2,243,356
1,526,853 231,597 312,405 154,636 323,692 504,523
43,616 6,156 11,907 -8,782 3,129 31,206
3,775,914 429,013 576,694 318,859 743,721 1,707,627
609,653 - 388 971 43,738 564,556
709,065 1,232 65,020 25,128 272,872 344,813
5,466,376 2,345,319 986,936 359,135 789,631 985,355
38,365 18,745 6,747 10,739 1,596 538
16,565,439 2,983,211 4,322,666 1,652,683 3,062,446 4,544,433
2,012,165 885,156 866,086 146,651 72,897 41,375
37,471 3,668 17,879 6,868 4,645 4,411
3,271,382 414,595 982,172 482,284 695,875 696,456
657,009 14,227 210,566 83,613 159,920 188,683
516,925 32,944 105,660 75,858 145,174 157,289
1,407,258 458,860 381,493 139,442 106,089 321,374
3,249,907 637,057 677,300 196,893 771,337 967,320
1,371,864 363,454 415,268 155,292 149,154 288,696
4,041,458 173,250 666,242 365,782 957,355 1,878,829
549,259 290,388 224,114 22,555 9,223 2,979
1,081,189 215,766 355,909 145,211 201,649 162,654
By capital
taxes and public charges
Net operating income
Number of directors (persons)
Number of employees (persons)
Directors' bonus
Employees' salaries
Employees' bonus
Welfare expenses
Interest expensesRental or leasing expenses for fixedand liquid assets
Interim dividend
Dividends
Depreciation expenses
Special depreciation expenses
Value added
Directors' remuneration
Special profits
Special losses
Net profits before tax
Income taxes-current
Income taxes-deferred
Net profits for the period
Cost of salesSelling and general administrationexpenses
Operating profits
Non-operating revenues
Non-operating expenses
Ordinary profits
Subscription rights to shares
Liabilities and net assets
Bills receivable discounted outstanding
Accounts receivable from subsidiariesand associates - tradeAccounts payable from subsidiaries andassociates - trade
Sales
Others capital surplus
Earned surplus
Legal retained earnings
Other earned surplus
Treasury stock
Others net assets
Net assets
Shareholders' equity
Capital stock
Capital surplus
Capital reserve
and Loss Table by Sector and by Size (continued)
Rental and Leasing
By Size 147

Total Under 10 10 - 50 50 - 100 100 - 1,000 1,000 or over
315,542 199,907 104,819 7,981 2,494 341
40,525,126 7,703,803 10,168,367 5,001,125 5,840,637 11,811,194
15,440,742 4,803,029 4,706,535 1,915,686 1,831,437 2,184,055
64,165 744 29,724 21,225 11,230 1,242
1,833,389 283,676 697,027 130,561 443,118 279,007
1,176,451 66,570 633,738 87,028 201,359 187,756
543,737 35,666 397,530 78,222 30,937 1,382
163,920 - 63,823 980 58,965 40,152
468,794 30,904 172,385 7,826 111,457 146,222
11,549,640 896,288 1,587,812 1,997,431 1,396,939 5,671,170
6,663,272 691,924 1,479,807 1,576,938 645,969 2,268,634
4,121,694 - 93,269 409,007 743,896 2,875,522
764,674 204,364 14,736 11,486 7,074 527,014
10,460,739 1,653,496 2,513,531 849,194 1,956,554 3,487,964
111,491,077 21,879,848 35,676,101 10,356,728 13,853,979 29,724,421
85,441,760 20,074,742 27,442,626 7,665,149 10,140,930 20,118,313
46,429,210 9,456,094 15,453,572 4,408,287 5,061,034 12,050,223
1,870,987 740,708 210,064 184,309 238,065 497,841
37,141,563 9,877,940 11,778,990 3,072,553 4,841,831 7,570,249
1,487,270 126,661 370,641 149,835 295,402 544,731
1,369,410 114,475 352,713 146,023 265,007 491,192
117,860 12,186 17,928 3,812 30,395 53,539
24,562,047 1,678,445 7,862,834 2,541,744 3,417,647 9,061,377
14,827,522 532,354 4,914,624 1,199,437 1,688,365 6,492,742
Stocks 11,787,068 476,084 3,261,761 987,992 1,349,698 5,711,533
Bonds and debentures 209,175 30 16,086 9,454 132,174 51,431
Other securities 2,831,279 56,240 1,636,777 201,991 206,493 729,778
9,734,525 1,146,091 2,948,210 1,342,307 1,729,282 2,568,635
120,132 8,335 72,449 9,398 17,589 12,361
152,136,335 29,591,986 45,916,917 15,367,251 19,712,205 41,547,976
101,797,048 21,754,887 31,266,679 9,567,436 11,995,608 27,212,438
34,359,235 7,184,044 10,589,459 3,259,745 4,492,856 8,833,131
213,420 5,398 47,516 12,310 81,523 66,673
1,930,523 59,789 470,244 427,741 451,475 521,274
19,876,487 4,677,057 5,368,177 2,182,665 2,225,971 5,422,617
10,478,846 1,806,582 1,936,498 1,727,987 1,661,605 3,346,174
9,397,641 2,870,475 3,431,679 454,678 564,366 2,076,443
147,642 183 14,398 13,950 67,384 51,727
12,191,163 2,441,617 4,689,124 623,079 1,666,503 2,770,840
67,437,813 14,570,843 20,677,220 6,307,691 7,502,752 18,379,307
4,149,372 - 1,453,894 369,672 121,712 2,204,094
50,284,947 12,126,337 17,068,127 5,068,437 4,728,372 11,293,674
36,313,862 8,355,736 10,710,333 4,290,692 3,456,805 9,500,296
13,971,085 3,770,601 6,357,794 777,745 1,271,567 1,793,378
654,678 2,811 138,598 81,358 221,923 209,988
12,348,816 2,441,695 2,016,601 788,224 2,430,745 4,671,551
- - - - - -Reserve required by special law
Bonds
Long-term borrowings
Long-term bank borrowings
Long-term other borrowings
Allowance
Other fixed liabilities
Short-term borrowings
Short-term bank borrowings
Short-term other borrowings
Allowance
Other liquid liabilities
Fixed liabilities
Deferred assets
Total assets
Liabilities
Liquid liabilities
Bills payable
Accounts payable
Intangible fixed assets
Intangible fixed assets excluding software
Software
Investments and other assets
Investment securities
Other investments and other assets
Other liquid assets
Fixed assets
Tangible fixed assets
Land
Construction in process
Other tangible fixed assets
Bonds and debentures
Other securities
Inventories
Finished goods and merchandise
Works in process
Raw materials and goods in storage
Liquid assets
Cash and deposits
Bills receivable
Accounts receivable
Securities
Stocks
2. Assets, Liabilities and Net Assets and Profit
Real
By capital
Number of corporations (companies)
148 By Size

(Unit: millions of yen)
Total Under 10 10 - 50 50 - 100 100 - 1,000 1,000 or over
50,339,287 7,837,099 14,650,238 5,799,815 7,716,597 14,335,538
46,578,457 7,842,527 13,870,332 5,536,805 7,084,155 12,244,638
5,985,793 696,021 1,446,887 578,560 551,168 2,713,157
9,479,514 30,550 3,579,645 1,519,671 1,228,836 3,120,812
4,421,047 8,078 1,105,925 700,453 742,876 1,863,715
5,058,467 22,472 2,473,720 819,218 485,960 1,257,097
31,606,298 7,115,956 8,906,715 3,584,978 5,401,720 6,596,929
986,930 86,689 593,902 129,822 67,422 109,095
30,619,368 7,029,267 8,312,813 3,455,156 5,334,298 6,487,834
Reserve 12,077,399 1,537,969 3,185,746 2,060,101 2,446,430 2,847,153
Retained earnings brought forward 18,541,969 5,491,298 5,127,067 1,395,055 2,887,868 3,640,681
-493,148 - -62,915 -146,404 -97,569 -186,260
3,754,258 -5,428 779,906 263,010 632,012 2,084,758
6,572 - - - 430 6,142
152,136,335 29,591,986 45,916,917 15,367,251 19,712,205 41,547,976
3,304 - 1,207 1,729 66 302
232,564 4 23,134 9,736 149,067 50,623
150,934 - 52,614 1,739 58,392 38,189
39,383,523 6,853,956 10,579,739 4,385,357 7,768,356 9,796,115
21,079,574 1,877,010 4,177,951 2,650,458 5,301,515 7,072,640
13,718,989 4,105,837 5,459,297 1,338,578 1,553,928 1,261,349
4,584,960 871,109 942,491 396,321 912,913 1,462,126
1,108,486 196,788 461,029 133,047 97,912 219,710
1,392,028 300,829 549,733 167,347 116,798 257,321
4,301,418 767,068 853,787 362,021 894,027 1,424,515
949,526 84,368 436,376 168,298 118,986 141,498
981,476 185,631 381,966 164,018 102,713 147,148
4,269,468 665,805 908,197 366,301 910,300 1,418,865
1,270,426 230,408 286,509 117,381 273,135 362,993
16,587 6,132 3,812 -8,187 -1,551 16,381
2,982,455 429,265 617,876 257,107 638,716 1,039,491
546,271 - 388 68 29,976 515,839
503,780 1,232 61,953 14,883 197,246 228,466
2,460,605 657,553 736,822 206,048 348,074 512,108
32,945 18,745 3,809 9,439 414 538
14,069,346 3,108,794 3,829,139 1,161,748 2,638,257 3,331,408
1,886,796 856,084 798,850 134,384 64,695 32,783
33,833 3,668 16,937 6,144 4,237 2,847
2,486,821 365,789 803,084 278,457 573,664 465,827
505,879 9,887 190,045 43,268 129,268 133,411
385,495 26,817 85,704 43,273 124,066 105,635
950,778 213,318 351,198 118,250 86,817 181,195
2,948,194 623,102 610,375 118,805 711,341 884,571
1,237,368 352,338 381,653 141,096 118,073 244,208
3,634,182 657,791 591,293 278,071 826,096 1,280,931
522,123 279,955 210,277 21,044 8,424 2,423
852,362 195,690 293,967 81,369 170,008 111,328
By capital
taxes and public charges
Net operating income
Number of directors (persons)
Number of employees (persons)
Directors' bonus
Employees' salaries
Employees' bonus
Welfare expenses
Interest expensesRental or leasing expenses for fixedand liquid assets
Interim dividend
Dividends
Depreciation expenses
Special depreciation expenses
Value added
Directors' remuneration
Special profits
Special losses
Net profits before tax
Income taxes-current
Income taxes-deferred
Net profits for the period
Cost of salesSelling and general administrationexpenses
Operating profits
Non-operating revenues
Non-operating expenses
Ordinary profits
Subscription rights to shares
Liabilities and net assets
Bills receivable discounted outstanding
Accounts receivable from subsidiariesand associates - tradeAccounts payable from subsidiaries andassociates - trade
Sales
Others capital surplus
Earned surplus
Legal retained earnings
Other earned surplus
Treasury stock
Others net assets
Net assets
Shareholders' equity
Capital stock
Capital surplus
Capital reserve
and Loss Table by Sector and by Size (continued)
Estate
By Size 149

Total Under 10 10 - 50 50 - 100 100 - 1,000 1,000 or over
16,870 10,158 5,900 491 252 69
35,338,845 1,362,803 1,882,721 1,760,720 4,813,677 25,518,924
2,561,604 328,516 476,643 309,352 190,250 1,256,843
226,868 4,723 40,976 54,949 52,528 73,692
8,760,811 29,900 169,612 479,983 765,191 7,316,125
482,076 29 20,794 5,460 7,980 447,813
33,781 - 12,963 27 7,009 13,782
156,353 - 179 - - 156,174
291,942 29 7,652 5,433 971 277,857
207,577 7,355 58,962 41,796 48,594 50,870
179,089 7,018 49,123 32,487 45,053 45,408
4,586 - 1,000 900 477 2,209
23,902 337 8,839 8,409 3,064 3,253
23,099,909 992,280 1,115,734 869,180 3,749,134 16,373,581
20,378,976 7,989,734 1,784,534 1,327,210 1,930,500 7,346,998
12,570,696 5,431,369 1,203,466 1,117,679 1,624,285 3,193,897
1,036,227 28,439 440,903 293,717 120,587 152,581
36,970 3,838 12,462 2,951 1,632 16,087
11,497,499 5,399,092 750,101 821,011 1,502,066 3,025,229
188,768 1,019 15,151 14,200 20,095 138,303
59,330 613 4,600 6,662 4,605 42,850
129,438 406 10,551 7,538 15,490 95,453
7,619,512 2,557,346 565,917 195,331 286,120 4,014,798
3,781,849 301 357,641 125,860 72,572 3,225,475
Stocks 2,866,364 273 127,547 116,225 65,120 2,557,199
Bonds and debentures 17,657 1 357 - - 17,299
Other securities 897,828 27 229,737 9,635 7,452 650,977
3,837,663 2,557,045 208,276 69,471 213,548 789,323
65,314 14,817 2,702 28,750 2,485 16,560
55,783,135 9,367,354 3,669,957 3,116,680 6,746,662 32,882,482
48,574,152 9,291,712 2,952,584 2,475,771 5,806,787 28,047,298
23,880,389 1,351,688 1,124,904 1,101,756 3,725,556 16,576,485
318,200 - 48,304 66,887 60,041 142,968
1,754,144 11,763 158,152 139,609 366,085 1,078,535
12,715,056 1,138,871 621,284 578,181 2,644,951 7,731,769
8,762,397 1,122,599 283,607 459,000 1,763,989 5,133,202
3,952,659 16,272 337,677 119,181 880,962 2,598,567
71,872 67 1,560 15,210 16,281 38,754
9,021,117 200,987 295,604 301,869 638,198 7,584,459
24,693,763 7,940,024 1,827,680 1,374,015 2,081,231 11,470,813
2,285,537 - 14,578 18,066 33,188 2,219,705
18,058,538 5,724,633 1,620,559 1,171,374 1,579,158 7,962,814
16,644,960 5,663,206 976,196 1,039,566 1,226,434 7,739,558
1,413,578 61,427 644,363 131,808 352,724 223,256
173,216 - 5,593 40,030 30,864 96,729
4,176,472 2,215,391 186,950 144,545 438,021 1,191,565
- - - - - -Reserve required by special law
Bonds
Long-term borrowings
Long-term bank borrowings
Long-term other borrowings
Allowance
Other fixed liabilities
Short-term borrowings
Short-term bank borrowings
Short-term other borrowings
Allowance
Other liquid liabilities
Fixed liabilities
Deferred assets
Total assets
Liabilities
Liquid liabilities
Bills payable
Accounts payable
Intangible fixed assets
Intangible fixed assets excluding software
Software
Investments and other assets
Investment securities
Other investments and other assets
Other liquid assets
Fixed assets
Tangible fixed assets
Land
Construction in process
Other tangible fixed assets
Bonds and debentures
Other securities
Inventories
Finished goods and merchandise
Works in process
Raw materials and goods in storage
Liquid assets
Cash and deposits
Bills receivable
Accounts receivable
Securities
Stocks
2. Assets, Liabilities and Net Assets and Profit
Goods Rental
By capital
Number of corporations (companies)
150 By Size

(Unit: millions of yen)
Total Under 10 10 - 50 50 - 100 100 - 1,000 1,000 or over
7,208,983 75,642 717,373 640,909 939,875 4,835,184
7,042,693 72,847 662,237 625,892 930,497 4,751,220
949,114 33,853 86,408 33,260 64,441 731,152
1,349,789 3,273 76,426 86,814 91,291 1,091,985
663,819 609 2,762 32,051 34,435 593,962
685,970 2,664 73,664 54,763 56,856 498,023
4,826,501 35,721 501,498 509,337 775,662 3,004,283
56,425 502 13,442 4,219 9,296 28,966
4,770,076 35,219 488,056 505,118 766,366 2,975,317
Reserve 2,410,712 20,112 471,721 270,384 311,912 1,336,583
Retained earnings brought forward 2,359,364 15,107 16,335 234,734 454,454 1,638,734
-82,711 - -2,095 -3,519 -897 -76,200
160,833 2,795 55,136 15,017 9,378 78,507
5,457 - - - - 5,457
55,783,135 9,367,354 3,669,957 3,116,680 6,746,662 32,882,482
28,334 - 23,788 3,114 1,432 -
447,088 533 34,852 17,035 91,878 302,790
167,240 - 59,395 10,167 30,769 66,909
15,701,858 1,121,710 1,870,125 2,098,356 2,897,456 7,714,211
11,780,853 473,195 1,096,913 1,545,751 2,429,314 6,235,680
3,057,249 887,514 667,968 443,702 317,611 740,454
863,756 -238,999 105,244 108,903 150,531 738,077
260,242 74,205 32,554 17,783 14,708 120,992
347,600 239,403 32,554 21,795 10,917 42,931
776,398 -404,197 105,244 104,891 154,322 816,138
495,953 413,762 11,203 20,130 11,846 39,012
195,436 8,604 123,638 26,609 5,926 30,659
1,076,915 961 -7,191 98,412 160,242 824,491
256,427 1,189 25,896 37,255 50,557 141,530
27,029 24 8,095 -595 4,680 14,825
793,459 -252 -41,182 61,752 105,005 668,136
63,382 - - 903 13,762 48,717
205,285 - 3,067 10,245 75,626 116,347
3,005,771 1,687,766 250,114 153,087 441,557 473,247
5,420 - 2,938 1,300 1,182 -
2,496,093 -125,583 493,527 490,935 424,189 1,213,025
125,369 29,072 67,236 12,267 8,202 8,592
3,638 - 942 724 408 1,564
784,561 48,806 179,088 203,827 122,211 230,629
151,130 4,340 20,521 40,345 30,652 55,272
131,430 6,127 19,956 32,585 21,108 51,654
456,480 245,542 30,295 21,192 19,272 140,179
301,713 13,955 66,925 78,088 59,996 82,749
134,496 11,116 33,615 14,196 31,081 44,488
407,276 -484,541 74,949 87,711 131,259 597,898
27,136 10,433 13,837 1,511 799 556
228,827 20,076 61,942 63,842 31,641 51,326
By capital
taxes and public charges
Net operating income
Number of directors (persons)
Number of employees (persons)
Directors' bonus
Employees' salaries
Employees' bonus
Welfare expenses
Interest expensesRental or leasing expenses for fixedand liquid assets
Interim dividend
Dividends
Depreciation expenses
Special depreciation expenses
Value added
Directors' remuneration
Special profits
Special losses
Net profits before tax
Income taxes-current
Income taxes-deferred
Net profits for the period
Cost of salesSelling and general administrationexpenses
Operating profits
Non-operating revenues
Non-operating expenses
Ordinary profits
Subscription rights to shares
Liabilities and net assets
Bills receivable discounted outstanding
Accounts receivable from subsidiariesand associates - tradeAccounts payable from subsidiaries andassociates - trade
Sales
Others capital surplus
Earned surplus
Legal retained earnings
Other earned surplus
Treasury stock
Others net assets
Net assets
Shareholders' equity
Capital stock
Capital surplus
Capital reserve
and Loss Table by Sector and by Size (continued)
and Leasing
By Size 151

Total Under 10 10 - 50 50 - 100 100 - 1,000 1,000 or over
11,761 6,936 4,198 361 209 57
32,749,352 1,308,161 1,382,998 1,559,646 3,925,814 24,572,733
2,277,409 298,903 351,792 275,272 168,766 1,182,676
195,327 4,683 40,767 51,975 47,859 50,043
8,317,497 18,083 144,793 446,530 566,636 7,141,455
472,285 - 11,231 5,460 7,896 447,698
27,930 - 7,196 27 6,925 13,782
156,238 - 179 - - 156,059
288,117 - 3,856 5,433 971 277,857
152,395 4,383 39,955 30,116 44,075 33,866
127,690 4,276 30,821 21,606 41,006 29,981
3,421 - 1,000 857 383 1,181
21,284 107 8,134 7,653 2,686 2,704
21,334,439 982,109 794,460 750,293 3,090,582 15,716,995
18,330,220 7,905,092 1,571,379 1,007,733 1,165,575 6,680,441
10,817,401 5,388,201 1,036,547 839,100 949,269 2,604,284
882,887 25,811 377,841 246,590 99,117 133,528
30,908 3,050 9,386 2,789 327 15,356
9,903,606 5,359,340 649,320 589,721 849,825 2,455,400
156,832 780 13,517 7,870 13,331 121,334
40,055 406 3,651 3,294 2,088 30,616
116,777 374 9,866 4,576 11,243 90,718
7,355,987 2,516,111 521,315 160,763 202,975 3,954,823
3,730,174 237 345,643 113,282 59,626 3,211,386
Stocks 2,821,284 221 116,463 105,006 53,994 2,545,600
Bonds and debentures 16,533 - 357 - - 16,176
Other securities 892,357 16 228,823 8,276 5,632 649,610
3,625,813 2,515,874 175,672 47,481 143,349 743,437
62,380 14,265 655 28,636 2,288 16,536
51,141,952 9,227,518 2,955,032 2,596,015 5,093,677 31,269,710
44,711,446 9,172,091 2,434,170 2,051,537 4,369,688 26,683,960
21,762,984 1,318,743 1,019,628 832,648 2,887,335 15,704,630
294,188 - 47,863 57,291 53,320 135,714
1,427,702 3,586 131,880 106,802 238,293 947,141
11,290,156 1,122,721 587,903 398,481 2,031,518 7,149,533
7,782,904 1,121,195 259,824 341,984 1,355,969 4,703,932
3,507,252 1,526 328,079 56,497 675,549 2,445,601
55,915 67 321 13,276 8,873 33,378
8,695,023 192,369 251,661 256,798 555,331 7,438,864
22,948,462 7,853,348 1,414,542 1,218,889 1,482,353 10,979,330
2,270,854 - 14,135 16,344 26,633 2,213,742
16,418,720 5,638,090 1,218,254 1,033,200 1,007,578 7,521,598
15,590,018 5,627,658 776,217 933,880 826,246 7,426,017
828,702 10,432 442,037 99,320 181,332 95,581
141,004 - 4,177 31,190 22,540 83,097
4,117,884 2,215,258 177,976 138,155 425,602 1,160,893
- - - - - -Reserve required by special law
Bonds
Long-term borrowings
Long-term bank borrowings
Long-term other borrowings
Allowance
Other fixed liabilities
Short-term borrowings
Short-term bank borrowings
Short-term other borrowings
Allowance
Other liquid liabilities
Fixed liabilities
Deferred assets
Total assets
Liabilities
Liquid liabilities
Bills payable
Accounts payable
Intangible fixed assets
Intangible fixed assets excluding software
Software
Investments and other assets
Investment securities
Other investments and other assets
Other liquid assets
Fixed assets
Tangible fixed assets
Land
Construction in process
Other tangible fixed assets
Bonds and debentures
Other securities
Inventories
Finished goods and merchandise
Works in process
Raw materials and goods in storage
Liquid assets
Cash and deposits
Bills receivable
Accounts receivable
Securities
Stocks
2. Assets, Liabilities and Net Assets and Profit
Goods
By capital
Number of corporations (companies)
152 By Size

(Unit: millions of yen)
Total Under 10 10 - 50 50 - 100 100 - 1,000 1,000 or over
6,430,506 55,427 520,862 544,478 723,989 4,585,750
6,266,711 55,427 466,235 529,839 714,053 4,501,157
861,257 23,918 62,033 24,692 52,914 697,700
1,294,645 849 71,288 77,561 74,535 1,070,412
638,308 609 452 27,265 23,111 586,871
656,337 240 70,836 50,296 51,424 483,541
4,190,654 30,660 334,711 430,077 587,366 2,807,840
48,906 280 12,394 3,411 7,210 25,611
4,141,748 30,380 322,317 426,666 580,156 2,782,229
Reserve 2,131,720 5,335 403,196 225,183 237,973 1,260,033
Retained earnings brought forward 2,010,028 25,045 -80,879 201,483 342,183 1,522,196
-79,845 - -1,797 -2,491 -762 -74,795
158,350 - 54,627 14,639 9,936 79,148
5,445 - - - - 5,445
51,141,952 9,227,518 2,955,032 2,596,015 5,093,677 31,269,710
28,168 - 23,656 3,114 1,398 -
437,063 533 34,852 11,020 88,866 301,792
156,526 - 59,307 4,494 29,764 62,961
12,823,515 982,262 1,387,714 1,618,246 1,946,896 6,888,397
9,643,050 412,047 829,288 1,203,520 1,632,970 5,565,225
2,422,570 802,283 469,031 322,211 198,568 630,477
757,895 -232,068 89,395 92,515 115,358 692,695
244,210 71,042 28,016 14,982 12,327 117,843
333,207 237,524 28,468 17,481 9,030 40,704
668,898 -398,550 88,943 90,016 118,655 769,834
486,911 411,120 10,374 19,070 8,500 37,847
187,923 8,252 121,449 23,871 4,766 29,585
967,886 4,318 -22,132 85,215 122,389 778,096
218,705 834 20,488 32,977 39,024 125,382
24,310 1 7,819 -993 3,336 14,147
724,871 3,483 -50,439 53,231 80,029 638,567
49,408 - - 903 159 48,346
147,164 - 1,976 9,386 31,700 104,102
2,665,416 1,674,230 231,211 88,950 256,307 414,718
2,986 - 2,938 - 48 -
1,980,867 -161,841 365,086 378,364 302,065 1,097,193
94,360 19,895 51,594 8,899 6,554 7,418
2,860 - 809 334 287 1,430
563,736 24,757 120,422 150,429 79,308 188,820
115,806 2,724 15,082 32,084 19,455 46,461
98,609 4,894 13,382 25,396 11,269 43,668
441,671 245,374 27,565 18,537 12,223 137,972
250,137 8,984 52,811 59,908 52,455 75,979
97,464 8,973 21,591 8,799 17,379 40,722
316,224 -477,442 61,830 73,978 103,135 554,723
17,756 5,869 9,704 1,074 648 461
152,110 9,604 36,324 46,930 19,047 40,205
By capital
taxes and public charges
Net operating income
Number of directors (persons)
Number of employees (persons)
Directors' bonus
Employees' salaries
Employees' bonus
Welfare expenses
Interest expensesRental or leasing expenses for fixedand liquid assets
Interim dividend
Dividends
Depreciation expenses
Special depreciation expenses
Value added
Directors' remuneration
Special profits
Special losses
Net profits before tax
Income taxes-current
Income taxes-deferred
Net profits for the period
Cost of salesSelling and general administrationexpenses
Operating profits
Non-operating revenues
Non-operating expenses
Ordinary profits
Subscription rights to shares
Liabilities and net assets
Bills receivable discounted outstanding
Accounts receivable from subsidiariesand associates - tradeAccounts payable from subsidiaries andassociates - trade
Sales
Others capital surplus
Earned surplus
Legal retained earnings
Other earned surplus
Treasury stock
Others net assets
Net assets
Shareholders' equity
Capital stock
Capital surplus
Capital reserve
and Loss Table by Sector and by Size (continued)
Leasing
By Size 153

Total Under 10 10 - 50 50 - 100 100 - 1,000 1,000 or over
5,109 3,222 1,702 130 43 12
2,589,493 54,642 499,723 201,074 887,863 946,191
284,195 29,613 124,851 34,080 21,484 74,167
31,541 40 209 2,974 4,669 23,649
443,314 11,817 24,819 33,453 198,555 174,670
9,791 29 9,563 - 84 115
5,851 - 5,767 - 84 -
115 - - - - 115
3,825 29 3,796 - - -
55,182 2,972 19,007 11,680 4,519 17,004
51,399 2,742 18,302 10,881 4,047 15,427
1,165 - - 43 94 1,028
2,618 230 705 756 378 549
1,765,470 10,171 321,274 118,887 658,552 656,586
2,048,756 84,642 213,155 319,477 764,925 666,557
1,753,295 43,168 166,919 278,579 675,016 589,613
153,340 2,628 63,062 47,127 21,470 19,053
6,062 788 3,076 162 1,305 731
1,593,893 39,752 100,781 231,290 652,241 569,829
31,936 239 1,634 6,330 6,764 16,969
19,275 207 949 3,368 2,517 12,234
12,661 32 685 2,962 4,247 4,735
263,525 41,235 44,602 34,568 83,145 59,975
51,675 64 11,998 12,578 12,946 14,089
Stocks 45,080 52 11,084 11,219 11,126 11,599
Bonds and debentures 1,124 1 - - - 1,123
Other securities 5,471 11 914 1,359 1,820 1,367
211,850 41,171 32,604 21,990 70,199 45,886
2,934 552 2,047 114 197 24
4,641,183 139,836 714,925 520,665 1,652,985 1,612,772
3,862,706 119,621 518,414 424,234 1,437,099 1,363,338
2,117,405 32,945 105,276 269,108 838,221 871,855
24,012 - 441 9,596 6,721 7,254
326,442 8,177 26,272 32,807 127,792 131,394
1,424,900 16,150 33,381 179,700 613,433 582,236
979,493 1,404 23,783 117,016 408,020 429,270
445,407 14,746 9,598 62,684 205,413 152,966
15,957 - 1,239 1,934 7,408 5,376
326,094 8,618 43,943 45,071 82,867 145,595
1,745,301 86,676 413,138 155,126 598,878 491,483
14,683 - 443 1,722 6,555 5,963
1,639,818 86,543 402,305 138,174 571,580 441,216
1,054,942 35,548 199,979 105,686 400,188 313,541
584,876 50,995 202,326 32,488 171,392 127,675
32,212 - 1,416 8,840 8,324 13,632
58,588 133 8,974 6,390 12,419 30,672
- - - - - -Reserve required by special law
Bonds
Long-term borrowings
Long-term bank borrowings
Long-term other borrowings
Allowance
Other fixed liabilities
Short-term borrowings
Short-term bank borrowings
Short-term other borrowings
Allowance
Other liquid liabilities
Fixed liabilities
Deferred assets
Total assets
Liabilities
Liquid liabilities
Bills payable
Accounts payable
Intangible fixed assets
Intangible fixed assets excluding software
Software
Investments and other assets
Investment securities
Other investments and other assets
Other liquid assets
Fixed assets
Tangible fixed assets
Land
Construction in process
Other tangible fixed assets
Bonds and debentures
Other securities
Inventories
Finished goods and merchandise
Works in process
Raw materials and goods in storage
Liquid assets
Cash and deposits
Bills receivable
Accounts receivable
Securities
Stocks
2. Assets, Liabilities and Net Assets and Profit
Miscellaneous Goods
By capital
Number of corporations (companies)
154 By Size

(Unit: millions of yen)
Total Under 10 10 - 50 50 - 100 100 - 1,000 1,000 or over
778,477 20,215 196,511 96,431 215,886 249,434
775,982 17,420 196,002 96,053 216,444 250,063
87,857 9,935 24,375 8,568 11,527 33,452
55,144 2,424 5,138 9,253 16,756 21,573
25,511 - 2,310 4,786 11,324 7,091
29,633 2,424 2,828 4,467 5,432 14,482
635,847 5,061 166,787 79,260 188,296 196,443
7,519 222 1,048 808 2,086 3,355
628,328 4,839 165,739 78,452 186,210 193,088
Reserve 278,992 14,777 68,525 45,201 73,939 76,550
Retained earnings brought forward 349,336 -9,938 97,214 33,251 112,271 116,538
-2,866 - -298 -1,028 -135 -1,405
2,483 2,795 509 378 -558 -641
12 - - - - 12
4,641,183 139,836 714,925 520,665 1,652,985 1,612,772
166 - 132 - 34 -
10,025 - - 6,015 3,012 998
10,714 - 88 5,673 1,005 3,948
2,878,343 139,448 482,411 480,110 950,560 825,814
2,137,803 61,148 267,625 342,231 796,344 670,455
634,679 85,231 198,937 121,491 119,043 109,977
105,861 -6,931 15,849 16,388 35,173 45,382
16,032 3,163 4,538 2,801 2,381 3,149
14,393 1,879 4,086 4,314 1,887 2,227
107,500 -5,647 16,301 14,875 35,667 46,304
9,042 2,642 829 1,060 3,346 1,165
7,513 352 2,189 2,738 1,160 1,074
109,029 -3,357 14,941 13,197 37,853 46,395
37,722 355 5,408 4,278 11,533 16,148
2,719 23 276 398 1,344 678
68,588 -3,735 9,257 8,521 24,976 29,569
13,974 - - - 13,603 371
58,121 - 1,091 859 43,926 12,245
340,355 13,536 18,903 64,137 185,250 58,529
2,434 - - 1,300 1,134 -
515,226 36,258 128,441 112,571 122,124 115,832
31,009 9,177 15,642 3,368 1,648 1,174
778 - 133 390 121 134
220,825 24,049 58,666 53,398 42,903 41,809
35,324 1,616 5,439 8,261 11,197 8,811
32,821 1,233 6,574 7,189 9,839 7,986
14,809 168 2,730 2,655 7,049 2,207
51,576 4,971 14,114 18,180 7,541 6,770
37,032 2,143 12,024 5,397 13,702 3,766
91,052 -7,099 13,119 13,733 28,124 43,175
9,380 4,564 4,133 437 151 95
76,717 10,472 25,618 16,912 12,594 11,121
By capital
taxes and public charges
Net operating income
Number of directors (persons)
Number of employees (persons)
Directors' bonus
Employees' salaries
Employees' bonus
Welfare expenses
Interest expensesRental or leasing expenses for fixedand liquid assets
Interim dividend
Dividends
Depreciation expenses
Special depreciation expenses
Value added
Directors' remuneration
Special profits
Special losses
Net profits before tax
Income taxes-current
Income taxes-deferred
Net profits for the period
Cost of salesSelling and general administrationexpenses
Operating profits
Non-operating revenues
Non-operating expenses
Ordinary profits
Subscription rights to shares
Liabilities and net assets
Bills receivable discounted outstanding
Accounts receivable from subsidiariesand associates - tradeAccounts payable from subsidiaries andassociates - trade
Sales
Others capital surplus
Earned surplus
Legal retained earnings
Other earned surplus
Treasury stock
Others net assets
Net assets
Shareholders' equity
Capital stock
Capital surplus
Capital reserve
and Loss Table by Sector and by Size (continued)
Rental and Leasing
By Size 155
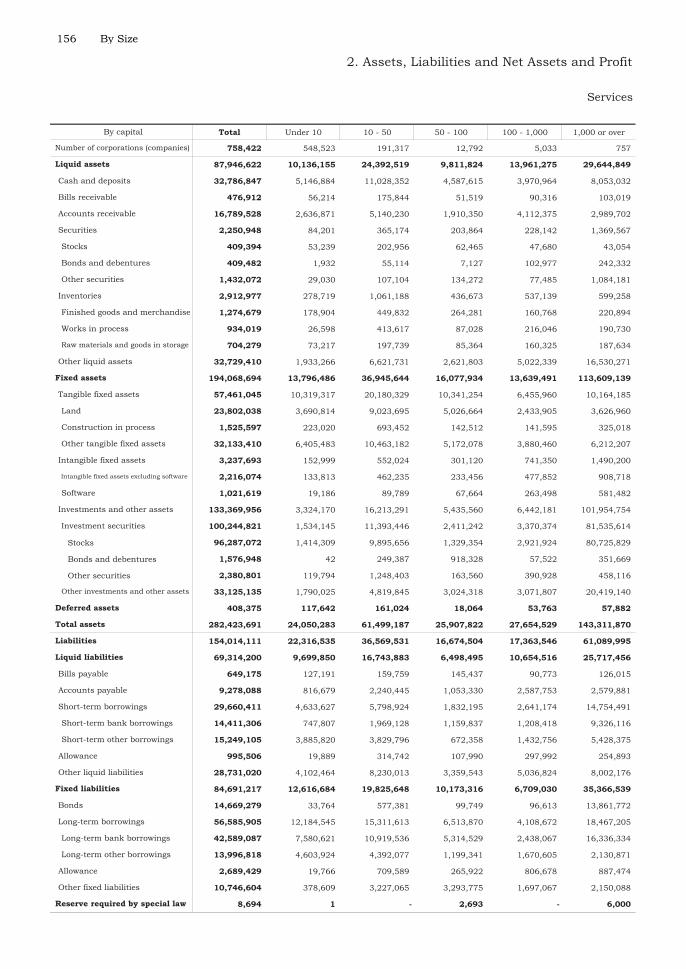
Total Under 10 10 - 50 50 - 100 100 - 1,000 1,000 or over
758,422 548,523 191,317 12,792 5,033 757
87,946,622 10,136,155 24,392,519 9,811,824 13,961,275 29,644,849
32,786,847 5,146,884 11,028,352 4,587,615 3,970,964 8,053,032
476,912 56,214 175,844 51,519 90,316 103,019
16,789,528 2,636,871 5,140,230 1,910,350 4,112,375 2,989,702
2,250,948 84,201 365,174 203,864 228,142 1,369,567
409,394 53,239 202,956 62,465 47,680 43,054
409,482 1,932 55,114 7,127 102,977 242,332
1,432,072 29,030 107,104 134,272 77,485 1,084,181
2,912,977 278,719 1,061,188 436,673 537,139 599,258
1,274,679 178,904 449,832 264,281 160,768 220,894
934,019 26,598 413,617 87,028 216,046 190,730
704,279 73,217 197,739 85,364 160,325 187,634
32,729,410 1,933,266 6,621,731 2,621,803 5,022,339 16,530,271
194,068,694 13,796,486 36,945,644 16,077,934 13,639,491 113,609,139
57,461,045 10,319,317 20,180,329 10,341,254 6,455,960 10,164,185
23,802,038 3,690,814 9,023,695 5,026,664 2,433,905 3,626,960
1,525,597 223,020 693,452 142,512 141,595 325,018
32,133,410 6,405,483 10,463,182 5,172,078 3,880,460 6,212,207
3,237,693 152,999 552,024 301,120 741,350 1,490,200
2,216,074 133,813 462,235 233,456 477,852 908,718
1,021,619 19,186 89,789 67,664 263,498 581,482
133,369,956 3,324,170 16,213,291 5,435,560 6,442,181 101,954,754
100,244,821 1,534,145 11,393,446 2,411,242 3,370,374 81,535,614
Stocks 96,287,072 1,414,309 9,895,656 1,329,354 2,921,924 80,725,829
Bonds and debentures 1,576,948 42 249,387 918,328 57,522 351,669
Other securities 2,380,801 119,794 1,248,403 163,560 390,928 458,116
33,125,135 1,790,025 4,819,845 3,024,318 3,071,807 20,419,140
408,375 117,642 161,024 18,064 53,763 57,882
282,423,691 24,050,283 61,499,187 25,907,822 27,654,529 143,311,870
154,014,111 22,316,535 36,569,531 16,674,504 17,363,546 61,089,995
69,314,200 9,699,850 16,743,883 6,498,495 10,654,516 25,717,456
649,175 127,191 159,759 145,437 90,773 126,015
9,278,088 816,679 2,240,445 1,053,330 2,587,753 2,579,881
29,660,411 4,633,627 5,798,924 1,832,195 2,641,174 14,754,491
14,411,306 747,807 1,969,128 1,159,837 1,208,418 9,326,116
15,249,105 3,885,820 3,829,796 672,358 1,432,756 5,428,375
995,506 19,889 314,742 107,990 297,992 254,893
28,731,020 4,102,464 8,230,013 3,359,543 5,036,824 8,002,176
84,691,217 12,616,684 19,825,648 10,173,316 6,709,030 35,366,539
14,669,279 33,764 577,381 99,749 96,613 13,861,772
56,585,905 12,184,545 15,311,613 6,513,870 4,108,672 18,467,205
42,589,087 7,580,621 10,919,536 5,314,529 2,438,067 16,336,334
13,996,818 4,603,924 4,392,077 1,199,341 1,670,605 2,130,871
2,689,429 19,766 709,589 265,922 806,678 887,474
10,746,604 378,609 3,227,065 3,293,775 1,697,067 2,150,088
8,694 1 - 2,693 - 6,000Reserve required by special law
Bonds
Long-term borrowings
Long-term bank borrowings
Long-term other borrowings
Allowance
Other fixed liabilities
Short-term borrowings
Short-term bank borrowings
Short-term other borrowings
Allowance
Other liquid liabilities
Fixed liabilities
Deferred assets
Total assets
Liabilities
Liquid liabilities
Bills payable
Accounts payable
Intangible fixed assets
Intangible fixed assets excluding software
Software
Investments and other assets
Investment securities
Other investments and other assets
Other liquid assets
Fixed assets
Tangible fixed assets
Land
Construction in process
Other tangible fixed assets
Bonds and debentures
Other securities
Inventories
Finished goods and merchandise
Works in process
Raw materials and goods in storage
Liquid assets
Cash and deposits
Bills receivable
Accounts receivable
Securities
Stocks
2. Assets, Liabilities and Net Assets and Profit
Services
By capital
Number of corporations (companies)
156 By Size

(Unit: millions of yen)
Total Under 10 10 - 50 50 - 100 100 - 1,000 1,000 or over
128,409,580 1,733,748 24,929,656 9,233,318 10,290,983 82,221,875
126,856,204 1,721,179 24,840,883 9,155,219 10,132,903 81,006,020
26,712,026 1,709,476 2,610,118 836,144 1,132,645 20,423,643
53,224,310 459,524 11,132,079 2,302,664 3,406,060 35,923,983
26,415,747 92,086 2,689,227 1,279,761 1,303,781 21,050,892
26,808,563 367,438 8,442,852 1,022,903 2,102,279 14,873,091
52,400,603 -433,554 12,052,953 6,064,192 6,294,919 28,422,093
1,318,558 80,027 271,167 119,949 334,480 512,935
51,082,045 -513,581 11,781,786 5,944,243 5,960,439 27,909,158
Reserve 22,301,935 792,431 5,657,551 4,424,200 2,331,062 9,096,691
Retained earnings brought forward 28,780,110 -1,306,012 6,124,235 1,520,043 3,629,377 18,812,467
-5,480,735 -14,267 -954,267 -47,781 -700,721 -3,763,699
1,431,532 12,569 88,773 75,231 156,476 1,098,483
121,844 - - 2,868 1,604 117,372
282,423,691 24,050,283 61,499,187 25,907,822 27,654,529 143,311,870
64,363 26,813 27,327 1,675 6,994 1,554
2,715,278 82,819 767,923 202,405 719,992 942,139
1,207,480 33,807 116,121 185,046 398,698 473,808
160,673,948 28,386,045 50,852,534 21,094,905 30,683,462 29,657,002
88,210,801 8,657,317 27,263,015 13,907,013 20,929,405 17,454,051
63,176,192 19,756,755 22,099,267 6,126,081 8,287,921 6,906,168
9,286,955 -28,027 1,490,252 1,061,811 1,466,136 5,296,783
3,981,038 612,843 806,740 328,257 238,479 1,994,719
1,992,769 222,479 724,815 232,567 171,855 641,053
11,275,224 362,337 1,572,177 1,157,501 1,532,760 6,650,449
1,173,707 102,421 225,330 91,254 101,777 652,925
2,768,991 118,172 483,244 216,124 345,475 1,605,976
9,679,940 346,586 1,314,263 1,032,631 1,289,062 5,697,398
2,069,700 220,486 538,305 288,964 476,307 545,638
-53,534 1,163 10,182 -13,570 20,937 -72,246
7,663,774 124,937 765,776 757,237 791,818 5,224,006
1,496,131 1,003 4,167 2,953 380,138 1,107,870
2,172,201 40,330 136,029 98,675 370,391 1,526,776
4,222,136 726,821 1,280,778 705,955 570,190 938,392
219,111 5,048 145,522 25,969 37,522 5,050
60,539,180 13,115,991 19,320,481 6,965,343 9,980,516 11,156,849
6,092,209 3,228,587 2,259,345 307,572 181,081 115,624
113,424 10,488 54,143 18,925 11,103 18,765
30,828,850 7,308,174 10,939,119 3,693,267 5,487,152 3,401,138
3,298,360 357,011 1,138,214 472,234 771,524 559,377
3,649,864 522,489 1,287,595 445,161 810,681 583,938
1,184,543 144,959 331,767 127,375 84,486 495,956
5,716,765 1,213,070 1,546,169 830,440 1,133,226 993,860
1,552,753 504,199 605,644 135,933 119,613 187,364
8,102,412 -172,986 1,158,485 934,436 1,381,650 4,800,827
1,296,914 812,092 423,081 36,515 18,180 7,046
11,610,719 3,140,189 4,214,722 1,408,923 1,835,735 1,011,150
By capital
taxes and public charges
Net operating income
Number of directors (persons)
Number of employees (persons)
Directors' bonus
Employees' salaries
Employees' bonus
Welfare expenses
Interest expensesRental or leasing expenses for fixedand liquid assets
Interim dividend
Dividends
Depreciation expenses
Special depreciation expenses
Value added
Directors' remuneration
Special profits
Special losses
Net profits before tax
Income taxes-current
Income taxes-deferred
Net profits for the period
Cost of salesSelling and general administrationexpenses
Operating profits
Non-operating revenues
Non-operating expenses
Ordinary profits
Subscription rights to shares
Liabilities and net assets
Bills receivable discounted outstanding
Accounts receivable from subsidiariesand associates - tradeAccounts payable from subsidiaries andassociates - trade
Sales
Others capital surplus
Earned surplus
Legal retained earnings
Other earned surplus
Treasury stock
Others net assets
Net assets
Shareholders' equity
Capital stock
Capital surplus
Capital reserve
and Loss Table by Sector and by Size (continued)
By Size 157
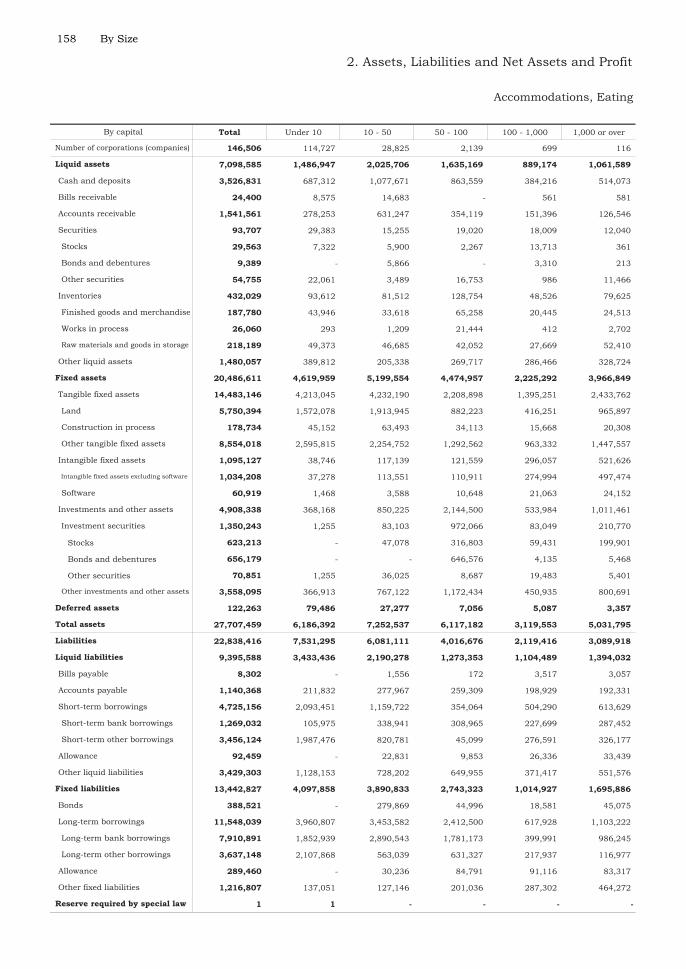
Total Under 10 10 - 50 50 - 100 100 - 1,000 1,000 or over
146,506 114,727 28,825 2,139 699 116
7,098,585 1,486,947 2,025,706 1,635,169 889,174 1,061,589
3,526,831 687,312 1,077,671 863,559 384,216 514,073
24,400 8,575 14,683 - 561 581
1,541,561 278,253 631,247 354,119 151,396 126,546
93,707 29,383 15,255 19,020 18,009 12,040
29,563 7,322 5,900 2,267 13,713 361
9,389 - 5,866 - 3,310 213
54,755 22,061 3,489 16,753 986 11,466
432,029 93,612 81,512 128,754 48,526 79,625
187,780 43,946 33,618 65,258 20,445 24,513
26,060 293 1,209 21,444 412 2,702
218,189 49,373 46,685 42,052 27,669 52,410
1,480,057 389,812 205,338 269,717 286,466 328,724
20,486,611 4,619,959 5,199,554 4,474,957 2,225,292 3,966,849
14,483,146 4,213,045 4,232,190 2,208,898 1,395,251 2,433,762
5,750,394 1,572,078 1,913,945 882,223 416,251 965,897
178,734 45,152 63,493 34,113 15,668 20,308
8,554,018 2,595,815 2,254,752 1,292,562 963,332 1,447,557
1,095,127 38,746 117,139 121,559 296,057 521,626
1,034,208 37,278 113,551 110,911 274,994 497,474
60,919 1,468 3,588 10,648 21,063 24,152
4,908,338 368,168 850,225 2,144,500 533,984 1,011,461
1,350,243 1,255 83,103 972,066 83,049 210,770
Stocks 623,213 - 47,078 316,803 59,431 199,901
Bonds and debentures 656,179 - - 646,576 4,135 5,468
Other securities 70,851 1,255 36,025 8,687 19,483 5,401
3,558,095 366,913 767,122 1,172,434 450,935 800,691
122,263 79,486 27,277 7,056 5,087 3,357
27,707,459 6,186,392 7,252,537 6,117,182 3,119,553 5,031,795
22,838,416 7,531,295 6,081,111 4,016,676 2,119,416 3,089,918
9,395,588 3,433,436 2,190,278 1,273,353 1,104,489 1,394,032
8,302 - 1,556 172 3,517 3,057
1,140,368 211,832 277,967 259,309 198,929 192,331
4,725,156 2,093,451 1,159,722 354,064 504,290 613,629
1,269,032 105,975 338,941 308,965 227,699 287,452
3,456,124 1,987,476 820,781 45,099 276,591 326,177
92,459 - 22,831 9,853 26,336 33,439
3,429,303 1,128,153 728,202 649,955 371,417 551,576
13,442,827 4,097,858 3,890,833 2,743,323 1,014,927 1,695,886
388,521 - 279,869 44,996 18,581 45,075
11,548,039 3,960,807 3,453,582 2,412,500 617,928 1,103,222
7,910,891 1,852,939 2,890,543 1,781,173 399,991 986,245
3,637,148 2,107,868 563,039 631,327 217,937 116,977
289,460 - 30,236 84,791 91,116 83,317
1,216,807 137,051 127,146 201,036 287,302 464,272
1 1 - - - -Reserve required by special law
Bonds
Long-term borrowings
Long-term bank borrowings
Long-term other borrowings
Allowance
Other fixed liabilities
Short-term borrowings
Short-term bank borrowings
Short-term other borrowings
Allowance
Other liquid liabilities
Fixed liabilities
Deferred assets
Total assets
Liabilities
Liquid liabilities
Bills payable
Accounts payable
Intangible fixed assets
Intangible fixed assets excluding software
Software
Investments and other assets
Investment securities
Other investments and other assets
Other liquid assets
Fixed assets
Tangible fixed assets
Land
Construction in process
Other tangible fixed assets
Bonds and debentures
Other securities
Inventories
Finished goods and merchandise
Works in process
Raw materials and goods in storage
Liquid assets
Cash and deposits
Bills receivable
Accounts receivable
Securities
Stocks
2. Assets, Liabilities and Net Assets and Profit
Accommodations, Eating
By capital
Number of corporations (companies)
158 By Size

(Unit: millions of yen)
Total Under 10 10 - 50 50 - 100 100 - 1,000 1,000 or over
4,869,043 -1,344,903 1,171,426 2,100,506 1,000,137 1,941,877
4,830,901 -1,312,209 1,169,558 2,076,754 995,035 1,901,763
1,565,171 379,451 399,219 149,207 153,304 483,990
1,744,404 3,476 16,268 408,716 499,721 816,223
727,043 7,256 5,746 186,827 154,880 372,334
1,017,361 -3,780 10,522 221,889 344,841 443,889
1,733,001 -1,695,136 763,190 1,535,308 369,092 760,547
145,197 31,356 33,544 13,790 15,889 50,618
1,587,804 -1,726,492 729,646 1,521,518 353,203 709,929
Reserve 2,446,487 224,143 689,333 878,630 241,418 412,963
Retained earnings brought forward -858,683 -1,950,635 40,313 642,888 111,785 296,966
-211,675 - -9,119 -16,477 -27,082 -158,997
35,750 -32,694 1,868 23,752 4,940 37,884
2,392 - - - 162 2,230
27,707,459 6,186,392 7,252,537 6,117,182 3,119,553 5,031,795
1 - - - 1 -
35,096 - 4,770 8,082 9,755 12,489
85,185 19,001 23,350 9,499 9,900 23,435
29,051,120 8,425,267 7,853,835 2,908,830 4,697,177 5,166,011
9,855,485 2,098,372 2,781,268 1,180,865 1,841,284 1,953,696
18,523,498 6,482,677 4,872,836 1,534,183 2,704,798 2,929,004
672,137 -155,782 199,731 193,782 151,095 283,311
342,410 166,100 71,190 27,874 29,834 47,412
313,222 65,662 109,376 46,875 37,935 53,374
701,325 -55,344 161,545 174,781 142,994 277,349
147,932 14,874 15,265 26,138 16,019 75,636
250,187 13,764 73,847 40,203 54,334 68,039
599,070 -54,234 102,963 160,716 104,679 284,946
282,090 37,675 45,408 42,133 48,423 108,451
-1,855 218 -2,612 -1,048 8,406 -6,819
318,835 -92,127 60,167 119,631 47,850 183,314
19,408 - - 858 24 18,526
109,638 937 5,765 39,287 27,185 36,464
952,853 201,214 242,318 141,243 141,578 226,500
11,798 - 10,415 1,221 65 97
13,119,868 3,820,346 3,825,053 1,387,347 1,759,559 2,327,563
918,213 579,520 255,589 39,176 25,903 18,025
13,919 10 8,750 95 858 4,206
8,096,107 2,645,232 2,536,743 676,537 951,417 1,286,178
379,714 34,907 154,919 47,290 59,082 83,516
486,206 75,244 129,601 53,031 90,874 137,456
184,533 32,896 73,858 29,667 20,193 27,919
2,132,747 496,851 361,155 354,577 455,375 464,789
420,825 144,364 178,565 22,859 24,955 50,082
487,604 -188,678 125,873 164,115 130,902 255,392
237,951 161,859 66,457 5,910 2,612 1,113
3,329,657 1,030,215 1,093,965 284,432 413,984 507,061
By capital
taxes and public charges
Net operating income
Number of directors (persons)
Number of employees (persons)
Directors' bonus
Employees' salaries
Employees' bonus
Welfare expenses
Interest expensesRental or leasing expenses for fixedand liquid assets
Interim dividend
Dividends
Depreciation expenses
Special depreciation expenses
Value added
Directors' remuneration
Special profits
Special losses
Net profits before tax
Income taxes-current
Income taxes-deferred
Net profits for the period
Cost of salesSelling and general administrationexpenses
Operating profits
Non-operating revenues
Non-operating expenses
Ordinary profits
Subscription rights to shares
Liabilities and net assets
Bills receivable discounted outstanding
Accounts receivable from subsidiariesand associates - tradeAccounts payable from subsidiaries andassociates - trade
Sales
Others capital surplus
Earned surplus
Legal retained earnings
Other earned surplus
Treasury stock
Others net assets
Net assets
Shareholders' equity
Capital stock
Capital surplus
Capital reserve
and Loss Table by Sector and by Size (continued)
and Drinking Services
By Size 159

Total Under 10 10 - 50 50 - 100 100 - 1,000 1,000 or over
21,833 13,212 7,255 934 377 55
2,002,364 238,356 330,620 819,346 354,304 259,738
1,041,039 131,858 219,204 453,276 139,491 97,210
1,124 - 346 - 555 223
392,599 29,882 59,213 167,072 81,231 55,201
37,820 19,217 3,396 362 6,711 8,134
4,307 - 234 362 3,350 361
3,493 - - - 3,310 183
30,020 19,217 3,162 - 51 7,590
89,739 7,052 10,249 48,758 13,164 10,516
19,571 4,664 4,382 2,287 3,731 4,507
21,767 - 208 21,444 115 -
48,401 2,388 5,659 25,027 9,318 6,009
440,043 50,347 38,212 149,878 113,152 88,454
8,932,511 1,223,228 1,858,675 3,274,661 1,027,854 1,548,093
6,848,699 1,188,557 1,784,879 1,728,453 851,637 1,295,173
2,791,487 449,088 604,927 701,434 328,125 707,913
48,684 8,021 69 20,586 10,592 9,416
4,008,528 731,448 1,179,883 1,006,433 512,920 577,844
70,107 13,165 11,530 12,371 10,894 22,147
52,797 12,510 10,950 5,299 5,934 18,104
17,310 655 580 7,072 4,960 4,043
2,013,705 21,506 62,266 1,533,837 165,323 230,773
805,202 1,211 4,488 685,937 32,227 81,339
Stocks 126,934 - 3,242 34,367 17,102 72,223
Bonds and debentures 655,687 - - 646,576 3,698 5,413
Other securities 22,581 1,211 1,246 4,994 11,427 3,703
1,208,503 20,295 57,778 847,900 133,096 149,434
12,124 473 4,776 3,946 1,596 1,333
10,946,999 1,462,057 2,194,071 4,097,953 1,383,754 1,809,164
8,667,339 1,637,534 2,055,174 2,722,038 1,038,476 1,214,117
2,676,434 500,063 486,462 583,198 544,917 561,794
796 - - 172 463 161
256,085 39,739 35,430 108,878 41,253 30,785
1,317,825 336,271 177,227 72,871 331,126 400,330
401,628 58,245 35,719 48,568 161,685 97,411
916,197 278,026 141,508 24,303 169,441 302,919
33,134 - 4,510 7,015 10,523 11,086
1,068,594 124,053 269,295 394,262 161,552 119,432
5,990,905 1,137,471 1,568,712 2,138,840 493,559 652,323
79,152 - - 43,402 7,958 27,792
5,189,207 1,114,411 1,517,744 1,952,384 307,569 297,099
3,968,352 814,521 1,263,244 1,384,417 236,445 269,725
1,220,855 299,890 254,500 567,967 71,124 27,374
130,200 - 6,784 33,948 34,561 54,907
592,346 23,060 44,184 109,106 143,471 272,525
- - - - - -Reserve required by special law
Bonds
Long-term borrowings
Long-term bank borrowings
Long-term other borrowings
Allowance
Other fixed liabilities
Short-term borrowings
Short-term bank borrowings
Short-term other borrowings
Allowance
Other liquid liabilities
Fixed liabilities
Deferred assets
Total assets
Liabilities
Liquid liabilities
Bills payable
Accounts payable
Intangible fixed assets
Intangible fixed assets excluding software
Software
Investments and other assets
Investment securities
Other investments and other assets
Other liquid assets
Fixed assets
Tangible fixed assets
Land
Construction in process
Other tangible fixed assets
Bonds and debentures
Other securities
Inventories
Finished goods and merchandise
Works in process
Raw materials and goods in storage
Liquid assets
Cash and deposits
Bills receivable
Accounts receivable
Securities
Stocks
2. Assets, Liabilities and Net Assets and Profit
Accommodations
By capital
Number of corporations (companies)
160 By Size

(Unit: millions of yen)
Total Under 10 10 - 50 50 - 100 100 - 1,000 1,000 or over
2,279,660 -175,477 138,897 1,375,915 345,278 595,047
2,256,918 -149,417 138,897 1,360,132 338,822 568,484
507,038 42,038 111,498 67,267 84,786 201,449
574,906 - -7,386 241,143 168,730 172,419
413,014 - - 161,677 86,951 164,386
161,892 - -7,386 79,466 81,779 8,033
1,195,430 -191,455 42,348 1,051,951 95,827 196,759
19,317 1,333 5,244 4,422 5,002 3,316
1,176,113 -192,788 37,104 1,047,529 90,825 193,443
Reserve 1,075,024 27,625 102,987 730,026 104,321 110,065
Retained earnings brought forward 101,089 -220,413 -65,883 317,503 -13,496 83,378
-20,456 - -7,563 -229 -10,521 -2,143
22,701 -26,060 - 15,783 6,456 26,522
41 - - - - 41
10,946,999 1,462,057 2,194,071 4,097,953 1,383,754 1,809,164
1 - - - 1 -
17,037 - 3,461 8,082 3,130 2,364
15,740 5,648 623 4,174 1,554 3,741
6,878,113 1,229,303 1,393,554 1,836,263 1,510,486 908,507
2,089,372 238,125 278,936 737,231 406,440 428,640
4,437,037 993,885 1,051,283 961,963 1,022,292 407,614
351,704 -2,707 63,335 137,069 81,754 72,253
96,427 31,204 29,149 16,640 6,026 13,408
132,098 27,964 35,845 36,807 11,385 20,097
316,033 533 56,639 116,902 76,395 65,564
47,389 270 3,285 16,964 6,013 20,857
52,527 2,168 10,389 16,297 10,186 13,487
310,895 -1,365 49,535 117,569 72,222 72,934
93,467 4,661 21,445 32,804 18,832 15,725
-10,482 - -2,492 -1,048 -1,252 -5,690
227,910 -6,026 30,582 85,813 54,642 62,899
1,623 - - 858 - 765
19,910 13 2,077 3,526 9,335 4,959
344,391 69,836 93,817 88,806 46,500 45,432
295 - - 133 65 97
2,594,799 411,643 575,948 660,032 564,429 382,747
129,863 55,340 49,715 12,161 8,753 3,894
1,093 - 69 95 529 400
1,188,563 266,771 327,050 234,224 199,911 160,607
89,856 5,066 20,267 20,586 19,977 23,960
118,069 11,950 27,201 19,252 30,670 28,996
86,147 16,126 27,819 21,310 8,592 12,300
605,070 49,848 51,312 220,977 209,696 73,237
110,581 25,375 36,999 15,668 13,139 19,400
265,557 -18,833 35,516 115,759 73,162 59,953
39,680 19,217 15,889 2,878 1,283 413
545,634 175,960 164,305 94,353 66,835 44,181
By capital
taxes and public charges
Net operating income
Number of directors (persons)
Number of employees (persons)
Directors' bonus
Employees' salaries
Employees' bonus
Welfare expenses
Interest expensesRental or leasing expenses for fixedand liquid assets
Interim dividend
Dividends
Depreciation expenses
Special depreciation expenses
Value added
Directors' remuneration
Special profits
Special losses
Net profits before tax
Income taxes-current
Income taxes-deferred
Net profits for the period
Cost of salesSelling and general administrationexpenses
Operating profits
Non-operating revenues
Non-operating expenses
Ordinary profits
Subscription rights to shares
Liabilities and net assets
Bills receivable discounted outstanding
Accounts receivable from subsidiariesand associates - tradeAccounts payable from subsidiaries andassociates - trade
Sales
Others capital surplus
Earned surplus
Legal retained earnings
Other earned surplus
Treasury stock
Others net assets
Net assets
Shareholders' equity
Capital stock
Capital surplus
Capital reserve
and Loss Table by Sector and by Size (continued)
By Size 161

Total Under 10 10 - 50 50 - 100 100 - 1,000 1,000 or over
124,673 101,515 21,570 1,205 322 61
5,096,221 1,248,591 1,695,086 815,823 534,870 801,851
2,485,792 555,454 858,467 410,283 244,725 416,863
23,276 8,575 14,337 - 6 358
1,148,962 248,371 572,034 187,047 70,165 71,345
55,887 10,166 11,859 18,658 11,298 3,906
25,256 7,322 5,666 1,905 10,363 -
5,896 - 5,866 - - 30
24,735 2,844 327 16,753 935 3,876
342,290 86,560 71,263 79,996 35,362 69,109
168,209 39,282 29,236 62,971 16,714 20,006
4,293 293 1,001 - 297 2,702
169,788 46,985 41,026 17,025 18,351 46,401
1,040,014 339,465 167,126 119,839 173,314 240,270
11,554,100 3,396,731 3,340,879 1,200,296 1,197,438 2,418,756
7,634,447 3,024,488 2,447,311 480,445 543,614 1,138,589
2,958,907 1,122,990 1,309,018 180,789 88,126 257,984
130,050 37,131 63,424 13,527 5,076 10,892
4,545,490 1,864,367 1,074,869 286,129 450,412 869,713
1,025,020 25,581 105,609 109,188 285,163 499,479
981,411 24,768 102,601 105,612 269,060 479,370
43,609 813 3,008 3,576 16,103 20,109
2,894,633 346,662 787,959 610,663 368,661 780,688
545,041 44 78,615 286,129 50,822 129,431
Stocks 496,279 - 43,836 282,436 42,329 127,678
Bonds and debentures 492 - - - 437 55
Other securities 48,270 44 34,779 3,693 8,056 1,698
2,349,592 346,618 709,344 324,534 317,839 651,257
110,139 79,013 22,501 3,110 3,491 2,024
16,760,460 4,724,335 5,058,466 2,019,229 1,735,799 3,222,631
14,171,077 5,893,761 4,025,937 1,294,638 1,080,940 1,875,801
6,719,154 2,933,373 1,703,816 690,155 559,572 832,238
7,506 - 1,556 - 3,054 2,896
884,283 172,093 242,537 150,431 157,676 161,546
3,407,331 1,757,180 982,495 281,193 173,164 213,299
867,404 47,730 303,222 260,397 66,014 190,041
2,539,927 1,709,450 679,273 20,796 107,150 23,258
59,325 - 18,321 2,838 15,813 22,353
2,360,709 1,004,100 458,907 255,693 209,865 432,144
7,451,922 2,960,387 2,322,121 604,483 521,368 1,043,563
309,369 - 279,869 1,594 10,623 17,283
6,358,832 2,846,396 1,935,838 460,116 310,359 806,123
3,942,539 1,038,418 1,627,299 396,756 163,546 716,520
2,416,293 1,807,978 308,539 63,360 146,813 89,603
159,260 - 23,452 50,843 56,555 28,410
624,461 113,991 82,962 91,930 143,831 191,747
1 1 - - - -Reserve required by special law
Bonds
Long-term borrowings
Long-term bank borrowings
Long-term other borrowings
Allowance
Other fixed liabilities
Short-term borrowings
Short-term bank borrowings
Short-term other borrowings
Allowance
Other liquid liabilities
Fixed liabilities
Deferred assets
Total assets
Liabilities
Liquid liabilities
Bills payable
Accounts payable
Intangible fixed assets
Intangible fixed assets excluding software
Software
Investments and other assets
Investment securities
Other investments and other assets
Other liquid assets
Fixed assets
Tangible fixed assets
Land
Construction in process
Other tangible fixed assets
Bonds and debentures
Other securities
Inventories
Finished goods and merchandise
Works in process
Raw materials and goods in storage
Liquid assets
Cash and deposits
Bills receivable
Accounts receivable
Securities
Stocks
2. Assets, Liabilities and Net Assets and Profit
Eating and
By capital
Number of corporations (companies)
162 By Size

(Unit: millions of yen)
Total Under 10 10 - 50 50 - 100 100 - 1,000 1,000 or over
2,589,383 -1,169,426 1,032,529 724,591 654,859 1,346,830
2,573,983 -1,162,792 1,030,661 716,622 656,213 1,333,279
1,058,133 337,413 287,721 81,940 68,518 282,541
1,169,498 3,476 23,654 167,573 330,991 643,804
314,029 7,256 5,746 25,150 67,929 207,948
855,469 -3,780 17,908 142,423 263,062 435,856
537,571 -1,503,681 720,842 483,357 273,265 563,788
125,880 30,023 28,300 9,368 10,887 47,302
411,691 -1,533,704 692,542 473,989 262,378 516,486
Reserve 1,371,463 196,518 586,346 148,604 137,097 302,898
Retained earnings brought forward -959,772 -1,730,222 106,196 325,385 125,281 213,588
-191,219 - -1,556 -16,248 -16,561 -156,854
13,049 -6,634 1,868 7,969 -1,516 11,362
2,351 - - - 162 2,189
16,760,460 4,724,335 5,058,466 2,019,229 1,735,799 3,222,631
- - - - - -
18,059 - 1,309 - 6,625 10,125
69,445 13,353 22,727 5,325 8,346 19,694
22,173,007 7,195,964 6,460,281 1,072,567 3,186,691 4,257,504
7,766,113 1,860,247 2,502,332 443,634 1,434,844 1,525,056
14,086,461 5,488,792 3,821,553 572,220 1,682,506 2,521,390
320,433 -153,075 136,396 56,713 69,341 211,058
245,983 134,896 42,041 11,234 23,808 34,004
181,124 37,698 73,531 10,068 26,550 33,277
385,292 -55,877 104,906 57,879 66,599 211,785
100,543 14,604 11,980 9,174 10,006 54,779
197,660 11,596 63,458 23,906 44,148 54,552
288,175 -52,869 53,428 43,147 32,457 212,012
188,623 33,014 23,963 9,329 29,591 92,726
8,627 218 -120 - 9,658 -1,129
90,925 -86,101 29,585 33,818 -6,792 120,415
17,785 - - - 24 17,761
89,728 924 3,688 35,761 17,850 31,505
608,462 131,378 148,501 52,437 95,078 181,068
11,503 - 10,415 1,088 - -
10,525,069 3,408,703 3,249,105 727,315 1,195,130 1,944,816
788,350 524,180 205,874 27,015 17,150 14,131
12,826 10 8,681 - 329 3,806
6,907,544 2,378,461 2,209,693 442,313 751,506 1,125,571
289,858 29,841 134,652 26,704 39,105 59,556
368,137 63,294 102,400 33,779 60,204 108,460
98,386 16,770 46,039 8,357 11,601 15,619
1,527,677 447,003 309,843 133,600 245,679 391,552
310,244 118,989 141,566 7,191 11,816 30,682
222,047 -169,845 90,357 48,356 57,740 195,439
198,271 142,642 50,568 3,032 1,329 700
2,784,023 854,255 929,660 190,079 347,149 462,880
By capital
taxes and public charges
Net operating income
Number of directors (persons)
Number of employees (persons)
Directors' bonus
Employees' salaries
Employees' bonus
Welfare expenses
Interest expensesRental or leasing expenses for fixedand liquid assets
Interim dividend
Dividends
Depreciation expenses
Special depreciation expenses
Value added
Directors' remuneration
Special profits
Special losses
Net profits before tax
Income taxes-current
Income taxes-deferred
Net profits for the period
Cost of salesSelling and general administrationexpenses
Operating profits
Non-operating revenues
Non-operating expenses
Ordinary profits
Subscription rights to shares
Liabilities and net assets
Bills receivable discounted outstanding
Accounts receivable from subsidiariesand associates - tradeAccounts payable from subsidiaries andassociates - trade
Sales
Others capital surplus
Earned surplus
Legal retained earnings
Other earned surplus
Treasury stock
Others net assets
Net assets
Shareholders' equity
Capital stock
Capital surplus
Capital reserve
and Loss Table by Sector and by Size (continued)
Drinking Services
By Size 163

Total Under 10 10 - 50 50 - 100 100 - 1,000 1,000 or over
129,122 94,289 30,792 2,848 1,106 87
14,123,210 1,354,387 6,214,297 2,421,173 2,298,177 1,835,176
5,691,237 495,217 1,997,090 1,525,363 835,703 837,864
33,488 1,032 27,789 333 3,361 973
1,701,178 177,822 517,472 155,600 577,170 273,114
197,840 1,556 48,735 23,096 16,099 108,354
66,742 - 43,526 20,188 3,028 -
22,000 1,373 84 - 1,534 19,009
109,098 183 5,125 2,908 11,537 89,345
549,343 35,759 245,506 120,150 79,998 67,930
366,701 30,076 160,178 94,919 45,098 36,430
22,607 1,571 2,959 353 14,709 3,015
160,035 4,112 82,369 24,878 20,191 28,485
5,950,124 643,001 3,377,705 596,631 785,846 546,941
26,829,788 2,325,508 10,388,393 6,965,181 3,843,244 3,307,462
20,929,246 2,014,666 8,726,594 5,757,720 2,435,603 1,994,663
8,992,622 441,558 3,759,643 3,156,971 966,397 668,053
319,647 9,620 113,879 82,033 83,700 30,415
11,616,977 1,563,488 4,853,072 2,518,716 1,385,506 1,296,195
601,500 19,297 186,950 61,323 116,295 217,635
490,908 18,692 160,777 49,976 90,060 171,403
110,592 605 26,173 11,347 26,235 46,232
5,299,042 291,545 1,474,849 1,146,138 1,291,346 1,095,164
1,635,949 12,934 215,995 427,199 315,507 664,314
Stocks 1,070,465 2,078 115,743 188,170 181,517 582,957
Bonds and debentures 225,431 - 18,545 158,029 17,047 31,810
Other securities 340,053 10,856 81,707 81,000 116,943 49,547
3,663,093 278,611 1,258,854 718,939 975,839 430,850
83,629 6,395 58,941 2,151 12,115 4,027
41,036,627 3,686,290 16,661,631 9,388,505 6,153,536 5,146,665
30,151,771 3,793,193 12,415,758 6,852,323 4,240,569 2,849,928
13,419,659 1,825,389 5,025,599 2,102,871 2,683,704 1,782,096
171,213 106,074 7,080 45,058 6,556 6,445
1,205,497 63,885 261,835 191,558 409,874 278,345
3,730,298 764,842 1,493,299 395,887 411,134 665,136
1,237,820 144,535 352,131 293,349 191,302 256,503
2,492,478 620,307 1,141,168 102,538 219,832 408,633
91,602 854 25,664 23,877 23,714 17,493
8,221,049 889,734 3,237,721 1,446,491 1,832,426 814,677
16,732,112 1,967,804 7,390,159 4,749,452 1,556,865 1,067,832
248,489 - 80,721 11,711 38,529 117,528
9,710,822 1,858,899 4,896,402 1,795,606 678,996 480,919
6,608,857 1,485,301 2,613,689 1,677,497 428,596 403,774
3,101,965 373,598 2,282,713 118,109 250,400 77,145
517,652 - 215,115 52,940 135,058 114,539
6,255,149 108,905 2,197,921 2,889,195 704,282 354,846
- - - - - -Reserve required by special law
Bonds
Long-term borrowings
Long-term bank borrowings
Long-term other borrowings
Allowance
Other fixed liabilities
Short-term borrowings
Short-term bank borrowings
Short-term other borrowings
Allowance
Other liquid liabilities
Fixed liabilities
Deferred assets
Total assets
Liabilities
Liquid liabilities
Bills payable
Accounts payable
Intangible fixed assets
Intangible fixed assets excluding software
Software
Investments and other assets
Investment securities
Other investments and other assets
Other liquid assets
Fixed assets
Tangible fixed assets
Land
Construction in process
Other tangible fixed assets
Bonds and debentures
Other securities
Inventories
Finished goods and merchandise
Works in process
Raw materials and goods in storage
Liquid assets
Cash and deposits
Bills receivable
Accounts receivable
Securities
Stocks
2. Assets, Liabilities and Net Assets and Profit
Living-Related and Personal Services
By capital
Number of corporations (companies)
164 By Size
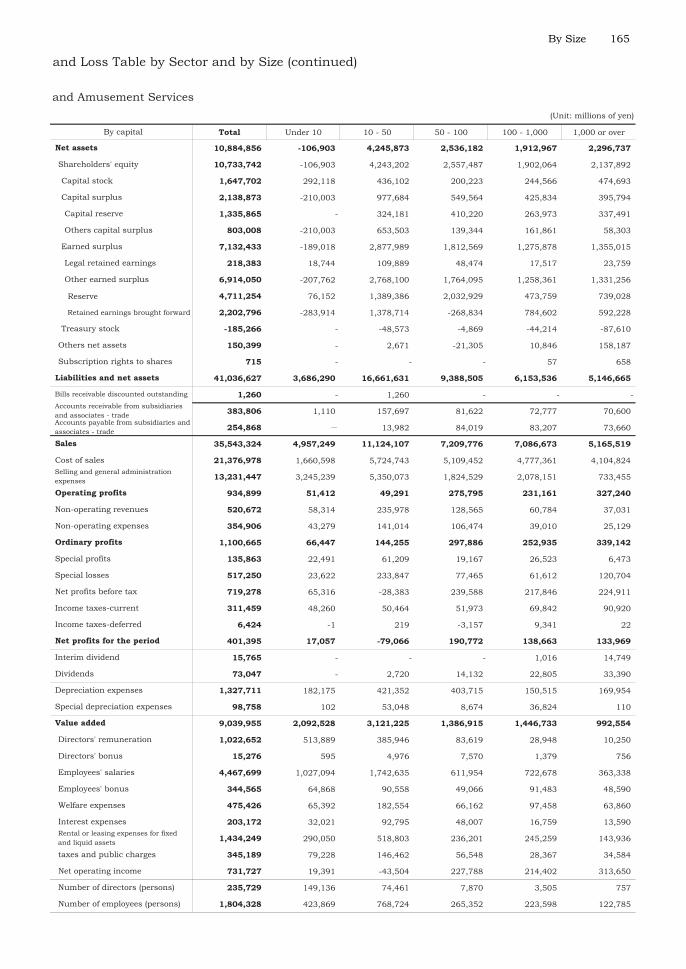
(Unit: millions of yen)
Total Under 10 10 - 50 50 - 100 100 - 1,000 1,000 or over
10,884,856 -106,903 4,245,873 2,536,182 1,912,967 2,296,737
10,733,742 -106,903 4,243,202 2,557,487 1,902,064 2,137,892
1,647,702 292,118 436,102 200,223 244,566 474,693
2,138,873 -210,003 977,684 549,564 425,834 395,794
1,335,865 - 324,181 410,220 263,973 337,491
803,008 -210,003 653,503 139,344 161,861 58,303
7,132,433 -189,018 2,877,989 1,812,569 1,275,878 1,355,015
218,383 18,744 109,889 48,474 17,517 23,759
6,914,050 -207,762 2,768,100 1,764,095 1,258,361 1,331,256
Reserve 4,711,254 76,152 1,389,386 2,032,929 473,759 739,028
Retained earnings brought forward 2,202,796 -283,914 1,378,714 -268,834 784,602 592,228
-185,266 - -48,573 -4,869 -44,214 -87,610
150,399 - 2,671 -21,305 10,846 158,187
715 - - - 57 658
41,036,627 3,686,290 16,661,631 9,388,505 6,153,536 5,146,665
1,260 - 1,260 - - -
383,806 1,110 157,697 81,622 72,777 70,600
254,868 13,982 84,019 83,207 73,660
35,543,324 4,957,249 11,124,107 7,209,776 7,086,673 5,165,519
21,376,978 1,660,598 5,724,743 5,109,452 4,777,361 4,104,824
13,231,447 3,245,239 5,350,073 1,824,529 2,078,151 733,455
934,899 51,412 49,291 275,795 231,161 327,240
520,672 58,314 235,978 128,565 60,784 37,031
354,906 43,279 141,014 106,474 39,010 25,129
1,100,665 66,447 144,255 297,886 252,935 339,142
135,863 22,491 61,209 19,167 26,523 6,473
517,250 23,622 233,847 77,465 61,612 120,704
719,278 65,316 -28,383 239,588 217,846 224,911
311,459 48,260 50,464 51,973 69,842 90,920
6,424 -1 219 -3,157 9,341 22
401,395 17,057 -79,066 190,772 138,663 133,969
15,765 - - - 1,016 14,749
73,047 - 2,720 14,132 22,805 33,390
1,327,711 182,175 421,352 403,715 150,515 169,954
98,758 102 53,048 8,674 36,824 110
9,039,955 2,092,528 3,121,225 1,386,915 1,446,733 992,554
1,022,652 513,889 385,946 83,619 28,948 10,250
15,276 595 4,976 7,570 1,379 756
4,467,699 1,027,094 1,742,635 611,954 722,678 363,338
344,565 64,868 90,558 49,066 91,483 48,590
475,426 65,392 182,554 66,162 97,458 63,860
203,172 32,021 92,795 48,007 16,759 13,590
1,434,249 290,050 518,803 236,201 245,259 143,936
345,189 79,228 146,462 56,548 28,367 34,584
731,727 19,391 -43,504 227,788 214,402 313,650
235,729 149,136 74,461 7,870 3,505 757
1,804,328 423,869 768,724 265,352 223,598 122,785
By capital
taxes and public charges
Net operating income
Number of directors (persons)
Number of employees (persons)
Directors' bonus
Employees' salaries
Employees' bonus
Welfare expenses
Interest expensesRental or leasing expenses for fixedand liquid assets
Interim dividend
Dividends
Depreciation expenses
Special depreciation expenses
Value added
Directors' remuneration
Special profits
Special losses
Net profits before tax
Income taxes-current
Income taxes-deferred
Net profits for the period
Cost of salesSelling and general administrationexpenses
Operating profits
Non-operating revenues
Non-operating expenses
Ordinary profits
Subscription rights to shares
Liabilities and net assets
Bills receivable discounted outstanding
Accounts receivable from subsidiariesand associates - tradeAccounts payable from subsidiaries andassociates - trade
Sales
Others capital surplus
Earned surplus
Legal retained earnings
Other earned surplus
Treasury stock
Others net assets
Net assets
Shareholders' equity
Capital stock
Capital surplus
Capital reserve
and Loss Table by Sector and by Size (continued)
and Amusement Services
By Size 165

Total Under 10 10 - 50 50 - 100 100 - 1,000 1,000 or over
94,849 73,913 19,171 1,350 391 24
6,825,037 611,317 3,125,987 618,538 1,476,123 993,072
2,612,226 286,524 1,115,502 396,495 522,423 291,282
4,450 496 1,013 - 2,228 713
1,225,884 125,611 296,793 94,973 494,955 213,552
93,811 1,556 20,976 4,287 1,821 65,171
24,509 - 20,414 4,084 11 -
15,986 1,373 84 - 551 13,978
53,316 183 478 203 1,259 51,193
226,007 25,842 109,652 26,359 48,498 15,656
146,207 20,209 89,924 9,450 24,919 1,705
16,030 1,571 - 270 12,570 1,619
63,770 4,062 19,728 16,639 11,009 12,332
2,662,659 171,288 1,582,051 96,424 406,198 406,698
7,887,008 1,012,509 2,842,321 1,630,262 1,825,582 576,334
5,227,006 755,595 2,118,514 1,165,185 1,016,529 171,183
2,153,221 197,762 871,993 573,379 444,927 65,160
92,549 9,620 52,519 101 21,831 8,478
2,981,236 548,213 1,194,002 591,705 549,771 97,545
181,194 7,415 34,878 39,893 69,189 29,819
107,914 6,810 12,563 36,619 50,242 1,680
73,280 605 22,315 3,274 18,947 28,139
2,478,808 249,499 688,929 425,184 739,864 375,332
622,274 12,398 59,655 175,535 147,805 226,881
Stocks 378,715 2,078 9,000 16,774 129,605 221,258
Bonds and debentures 182,271 - 17,803 157,613 3,699 3,156
Other securities 61,288 10,320 32,852 1,148 14,501 2,467
1,856,534 237,101 629,274 249,649 592,059 148,451
31,206 5,049 19,805 1,485 4,765 102
14,743,251 1,628,875 5,988,113 2,250,285 3,306,470 1,569,508
11,658,335 1,897,018 4,396,829 1,750,717 2,448,719 1,165,052
8,155,961 1,138,985 2,709,489 1,331,441 2,051,521 924,525
4,917 - 310 1,283 1,112 2,212
811,241 40,743 127,237 82,620 354,581 206,060
1,402,170 525,175 364,486 51,638 159,128 301,743
513,828 129,595 199,875 42,559 83,115 58,684
888,342 395,580 164,611 9,079 76,013 243,059
53,852 854 21,964 12,184 11,443 7,407
5,883,781 572,213 2,195,492 1,183,716 1,525,257 407,103
3,502,374 758,033 1,687,340 419,276 397,198 240,527
111,124 - 61,460 1,350 6,901 41,413
2,836,062 748,954 1,531,288 250,087 227,250 78,483
2,265,956 530,329 1,284,280 231,761 161,678 57,908
570,106 218,625 247,008 18,326 65,572 20,575
193,213 - 2,099 28,181 84,172 78,761
361,975 9,079 92,493 139,658 78,875 41,870
- - - - - -Reserve required by special law
Bonds
Long-term borrowings
Long-term bank borrowings
Long-term other borrowings
Allowance
Other fixed liabilities
Short-term borrowings
Short-term bank borrowings
Short-term other borrowings
Allowance
Other liquid liabilities
Fixed liabilities
Deferred assets
Total assets
Liabilities
Liquid liabilities
Bills payable
Accounts payable
Intangible fixed assets
Intangible fixed assets excluding software
Software
Investments and other assets
Investment securities
Other investments and other assets
Other liquid assets
Fixed assets
Tangible fixed assets
Land
Construction in process
Other tangible fixed assets
Bonds and debentures
Other securities
Inventories
Finished goods and merchandise
Works in process
Raw materials and goods in storage
Liquid assets
Cash and deposits
Bills receivable
Accounts receivable
Securities
Stocks
2. Assets, Liabilities and Net Assets and Profit
Living-Related and
By capital
Number of corporations (companies)
166 By Size

(Unit: millions of yen)
Total Under 10 10 - 50 50 - 100 100 - 1,000 1,000 or over
3,084,916 -268,143 1,591,284 499,568 857,751 404,456
3,068,991 -268,143 1,592,712 499,568 851,948 392,906
765,873 227,665 265,974 88,830 75,343 108,061
55,768 -210,003 23,497 93,589 87,280 61,405
161,227 - 11,625 42,086 50,374 57,142
-105,459 -210,003 11,872 51,503 36,906 4,263
2,281,555 -285,805 1,325,013 317,149 692,922 232,276
66,248 18,057 30,074 7,695 7,180 3,242
2,215,307 -303,862 1,294,939 309,454 685,742 229,034
Reserve 1,199,965 76,117 656,626 199,294 123,231 144,697
Retained earnings brought forward 1,015,342 -379,979 638,313 110,160 562,511 84,337
-34,205 - -21,772 - -3,597 -8,836
15,463 - -1,428 - 5,746 11,145
462 - - - 57 405
14,743,251 1,628,875 5,988,113 2,250,285 3,306,470 1,569,508
1,260 - 1,260 - - -
274,741 - 152,272 16,875 52,202 53,392
134,765 - 10,485 2,295 77,623 44,362
14,177,146 2,527,728 4,894,174 1,915,178 3,272,913 1,567,153
6,943,317 416,198 1,804,295 1,201,669 2,290,939 1,230,216
7,050,649 2,164,755 3,091,495 619,346 871,389 303,664
183,180 -53,225 -1,616 94,163 110,585 33,273
218,647 31,139 109,783 31,320 32,033 14,372
109,321 22,321 60,570 10,935 10,735 4,760
292,506 -44,407 47,597 114,548 131,883 42,885
31,824 9,701 15,608 3,105 1,598 1,812
123,883 1,904 51,675 36,686 25,071 8,547
200,447 -36,610 11,530 80,967 108,410 36,150
125,571 7,494 39,067 29,295 36,133 13,582
9,920 - 1,685 2,835 5,941 -541
64,956 -44,104 -29,222 48,837 66,336 23,109
1,400 - - - 845 555
30,162 - 2,052 7,391 12,542 8,177
386,672 81,587 147,291 72,158 61,490 24,146
53,907 102 9,573 8,674 35,558 -
4,799,404 1,442,382 1,857,626 502,844 782,669 213,883
688,306 402,772 242,424 24,739 15,173 3,198
4,207 595 2,277 371 620 344
2,710,881 797,599 1,122,998 263,419 413,328 113,537
188,971 32,042 55,205 23,558 63,084 15,082
302,586 58,858 124,823 32,873 60,054 25,978
58,727 18,425 29,980 4,523 3,580 2,219
585,517 157,008 253,743 47,453 108,528 18,785
135,756 46,733 57,772 16,268 11,297 3,686
124,453 -71,650 -31,596 89,640 107,005 31,054
174,471 123,398 46,526 2,835 1,430 282
1,111,831 335,930 513,322 105,773 122,840 33,966
By capital
taxes and public charges
Net operating income
Number of directors (persons)
Number of employees (persons)
Directors' bonus
Employees' salaries
Employees' bonus
Welfare expenses
Interest expensesRental or leasing expenses for fixedand liquid assets
Interim dividend
Dividends
Depreciation expenses
Special depreciation expenses
Value added
Directors' remuneration
Special profits
Special losses
Net profits before tax
Income taxes-current
Income taxes-deferred
Net profits for the period
Cost of salesSelling and general administrationexpenses
Operating profits
Non-operating revenues
Non-operating expenses
Ordinary profits
Subscription rights to shares
Liabilities and net assets
Bills receivable discounted outstanding
Accounts receivable from subsidiariesand associates - tradeAccounts payable from subsidiaries andassociates - trade
Sales
Others capital surplus
Earned surplus
Legal retained earnings
Other earned surplus
Treasury stock
Others net assets
Net assets
Shareholders' equity
Capital stock
Capital surplus
Capital reserve
and Loss Table by Sector and by Size (continued)
Personal Services
By Size 167

Total Under 10 10 - 50 50 - 100 100 - 1,000 1,000 or over
34,273 20,376 11,621 1,498 715 63
7,298,173 743,070 3,088,310 1,802,635 822,054 842,104
3,079,011 208,693 881,588 1,128,868 313,280 546,582
29,038 536 26,776 333 1,133 260
475,294 52,211 220,679 60,627 82,215 59,562
104,029 - 27,759 18,809 14,278 43,183
42,233 - 23,112 16,104 3,017 -
6,014 - - - 983 5,031
55,782 - 4,647 2,705 10,278 38,152
323,336 9,917 135,854 93,791 31,500 52,274
220,494 9,867 70,254 85,469 20,179 34,725
6,577 - 2,959 83 2,139 1,396
96,265 50 62,641 8,239 9,182 16,153
3,287,465 471,713 1,795,654 500,207 379,648 140,243
18,942,780 1,312,999 7,546,072 5,334,919 2,017,662 2,731,128
15,702,240 1,259,071 6,608,080 4,592,535 1,419,074 1,823,480
6,839,401 243,796 2,887,650 2,583,592 521,470 602,893
227,098 - 61,360 81,932 61,869 21,937
8,635,741 1,015,275 3,659,070 1,927,011 835,735 1,198,650
420,306 11,882 152,072 21,430 47,106 187,816
382,994 11,882 148,214 13,357 39,818 169,723
37,312 - 3,858 8,073 7,288 18,093
2,820,234 42,046 785,920 720,954 551,482 719,832
1,013,675 536 156,340 251,664 167,702 437,433
Stocks 691,750 - 106,743 171,396 51,912 361,699
Bonds and debentures 43,160 - 742 416 13,348 28,654
Other securities 278,765 536 48,855 79,852 102,442 47,080
1,806,559 41,510 629,580 469,290 383,780 282,399
52,423 1,346 39,136 666 7,350 3,925
26,293,376 2,057,415 10,673,518 7,138,220 2,847,066 3,577,157
18,493,436 1,896,175 8,018,929 5,101,606 1,791,850 1,684,876
5,263,698 686,404 2,316,110 771,430 632,183 857,571
166,296 106,074 6,770 43,775 5,444 4,233
394,256 23,142 134,598 108,938 55,293 72,285
2,328,128 239,667 1,128,813 344,249 252,006 363,393
723,992 14,940 152,256 250,790 108,187 197,819
1,604,136 224,727 976,557 93,459 143,819 165,574
37,750 - 3,700 11,693 12,271 10,086
2,337,268 317,521 1,042,229 262,775 307,169 407,574
13,229,738 1,209,771 5,702,819 4,330,176 1,159,667 827,305
137,365 - 19,261 10,361 31,628 76,115
6,874,760 1,109,945 3,365,114 1,545,519 451,746 402,436
4,342,901 954,972 1,329,409 1,445,736 266,918 345,866
2,531,859 154,973 2,035,705 99,783 184,828 56,570
324,439 - 213,016 24,759 50,886 35,778
5,893,174 99,826 2,105,428 2,749,537 625,407 312,976
- - - - - -Reserve required by special law
Bonds
Long-term borrowings
Long-term bank borrowings
Long-term other borrowings
Allowance
Other fixed liabilities
Short-term borrowings
Short-term bank borrowings
Short-term other borrowings
Allowance
Other liquid liabilities
Fixed liabilities
Deferred assets
Total assets
Liabilities
Liquid liabilities
Bills payable
Accounts payable
Intangible fixed assets
Intangible fixed assets excluding software
Software
Investments and other assets
Investment securities
Other investments and other assets
Other liquid assets
Fixed assets
Tangible fixed assets
Land
Construction in process
Other tangible fixed assets
Bonds and debentures
Other securities
Inventories
Finished goods and merchandise
Works in process
Raw materials and goods in storage
Liquid assets
Cash and deposits
Bills receivable
Accounts receivable
Securities
Stocks
2. Assets, Liabilities and Net Assets and Profit
Services For Amusement
By capital
Number of corporations (companies)
168 By Size
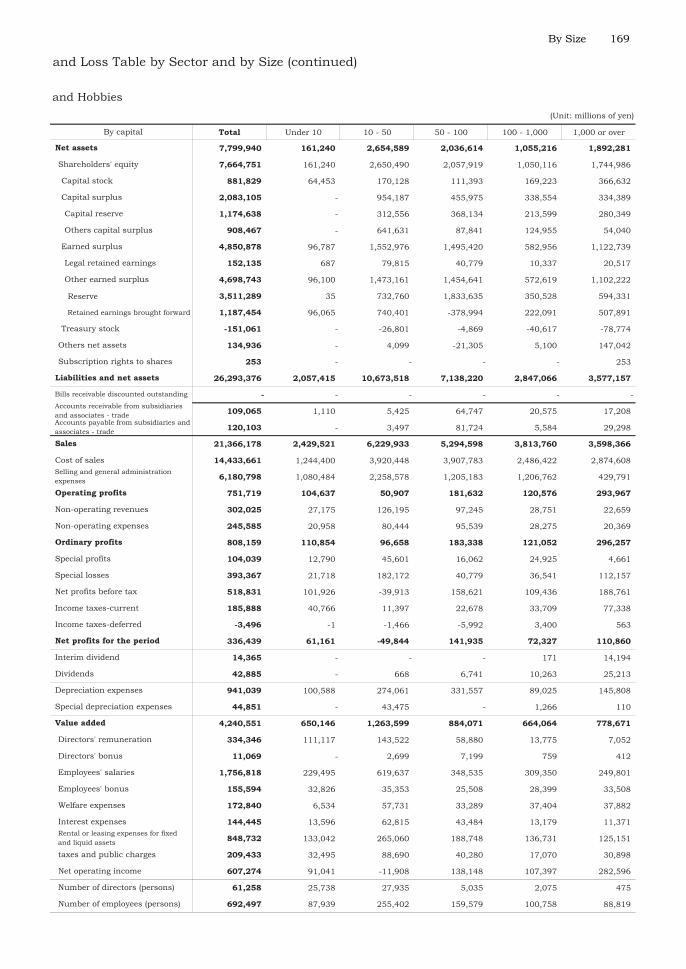
(Unit: millions of yen)
Total Under 10 10 - 50 50 - 100 100 - 1,000 1,000 or over
7,799,940 161,240 2,654,589 2,036,614 1,055,216 1,892,281
7,664,751 161,240 2,650,490 2,057,919 1,050,116 1,744,986
881,829 64,453 170,128 111,393 169,223 366,632
2,083,105 - 954,187 455,975 338,554 334,389
1,174,638 - 312,556 368,134 213,599 280,349
908,467 - 641,631 87,841 124,955 54,040
4,850,878 96,787 1,552,976 1,495,420 582,956 1,122,739
152,135 687 79,815 40,779 10,337 20,517
4,698,743 96,100 1,473,161 1,454,641 572,619 1,102,222
Reserve 3,511,289 35 732,760 1,833,635 350,528 594,331
Retained earnings brought forward 1,187,454 96,065 740,401 -378,994 222,091 507,891
-151,061 - -26,801 -4,869 -40,617 -78,774
134,936 - 4,099 -21,305 5,100 147,042
253 - - - - 253
26,293,376 2,057,415 10,673,518 7,138,220 2,847,066 3,577,157
- - - - - -
109,065 1,110 5,425 64,747 20,575 17,208
120,103 - 3,497 81,724 5,584 29,298
21,366,178 2,429,521 6,229,933 5,294,598 3,813,760 3,598,366
14,433,661 1,244,400 3,920,448 3,907,783 2,486,422 2,874,608
6,180,798 1,080,484 2,258,578 1,205,183 1,206,762 429,791
751,719 104,637 50,907 181,632 120,576 293,967
302,025 27,175 126,195 97,245 28,751 22,659
245,585 20,958 80,444 95,539 28,275 20,369
808,159 110,854 96,658 183,338 121,052 296,257
104,039 12,790 45,601 16,062 24,925 4,661
393,367 21,718 182,172 40,779 36,541 112,157
518,831 101,926 -39,913 158,621 109,436 188,761
185,888 40,766 11,397 22,678 33,709 77,338
-3,496 -1 -1,466 -5,992 3,400 563
336,439 61,161 -49,844 141,935 72,327 110,860
14,365 - - - 171 14,194
42,885 - 668 6,741 10,263 25,213
941,039 100,588 274,061 331,557 89,025 145,808
44,851 - 43,475 - 1,266 110
4,240,551 650,146 1,263,599 884,071 664,064 778,671
334,346 111,117 143,522 58,880 13,775 7,052
11,069 - 2,699 7,199 759 412
1,756,818 229,495 619,637 348,535 309,350 249,801
155,594 32,826 35,353 25,508 28,399 33,508
172,840 6,534 57,731 33,289 37,404 37,882
144,445 13,596 62,815 43,484 13,179 11,371
848,732 133,042 265,060 188,748 136,731 125,151
209,433 32,495 88,690 40,280 17,070 30,898
607,274 91,041 -11,908 138,148 107,397 282,596
61,258 25,738 27,935 5,035 2,075 475
692,497 87,939 255,402 159,579 100,758 88,819
By capital
taxes and public charges
Net operating income
Number of directors (persons)
Number of employees (persons)
Directors' bonus
Employees' salaries
Employees' bonus
Welfare expenses
Interest expensesRental or leasing expenses for fixedand liquid assets
Interim dividend
Dividends
Depreciation expenses
Special depreciation expenses
Value added
Directors' remuneration
Special profits
Special losses
Net profits before tax
Income taxes-current
Income taxes-deferred
Net profits for the period
Cost of salesSelling and general administrationexpenses
Operating profits
Non-operating revenues
Non-operating expenses
Ordinary profits
Subscription rights to shares
Liabilities and net assets
Bills receivable discounted outstanding
Accounts receivable from subsidiariesand associates - tradeAccounts payable from subsidiaries andassociates - trade
Sales
Others capital surplus
Earned surplus
Legal retained earnings
Other earned surplus
Treasury stock
Others net assets
Net assets
Shareholders' equity
Capital stock
Capital surplus
Capital reserve
and Loss Table by Sector and by Size (continued)
and Hobbies
By Size 169

Total Under 10 10 - 50 50 - 100 100 - 1,000 1,000 or over
250,184 175,046 69,346 3,981 1,455 356
41,534,891 3,945,527 7,593,834 3,074,299 4,841,914 22,079,317
13,212,929 2,310,419 3,838,465 1,165,749 953,048 4,945,248
194,671 29,167 49,864 10,958 35,817 68,865
6,833,950 1,065,968 1,761,078 584,678 1,833,854 1,588,372
1,453,210 18,310 109,400 129,920 110,529 1,085,051
205,287 15,895 103,462 38,108 19,831 27,991
230,061 7 552 137 62,281 167,084
1,017,862 2,408 5,386 91,675 28,417 889,976
896,109 47,267 409,617 105,721 150,832 182,672
250,397 25,581 95,599 38,676 28,305 62,236
596,795 17,960 302,617 60,508 115,115 100,595
48,917 3,726 11,401 6,537 7,412 19,841
18,944,022 474,396 1,425,410 1,077,273 1,757,834 14,209,109
116,680,212 2,203,442 14,215,369 1,616,312 4,320,135 94,324,954
8,555,283 999,793 2,325,844 521,566 1,024,283 3,683,797
3,582,746 405,186 979,248 269,697 506,431 1,422,184
572,279 32,696 310,330 3,473 11,115 214,665
4,400,258 561,911 1,036,266 248,396 506,737 2,046,948
854,741 20,715 146,290 66,340 139,945 481,451
383,701 14,002 101,704 39,186 57,759 171,050
471,040 6,713 44,586 27,154 82,186 310,401
107,270,188 1,182,934 11,743,235 1,028,406 3,155,907 90,159,706
85,435,619 745,425 10,214,449 606,268 2,211,253 71,658,224
Stocks 83,530,268 646,995 9,266,959 455,696 2,071,162 71,089,456
Bonds and debentures 387,791 42 18,742 106,685 9,031 253,291
Other securities 1,517,560 98,388 928,748 43,887 131,060 315,477
21,834,569 437,509 1,528,786 422,138 944,654 18,501,482
137,259 22,071 46,937 4,133 15,620 48,498
158,352,362 6,171,040 21,856,140 4,694,744 9,177,669 116,452,769
71,436,415 4,350,353 8,214,152 2,263,018 5,902,499 50,706,393
31,875,312 2,135,473 5,161,472 1,269,670 3,613,036 19,695,661
199,497 10,260 59,592 20,194 34,602 74,849
3,941,884 138,145 821,907 303,259 1,324,390 1,354,183
17,112,934 796,500 1,776,389 621,642 1,075,150 12,843,253
9,799,688 217,513 341,675 305,674 492,767 8,442,059
7,313,246 578,987 1,434,714 315,968 582,383 4,401,194
393,035 326 205,972 4,517 92,553 89,667
10,227,962 1,190,242 2,297,612 320,058 1,086,341 5,333,709
39,561,103 2,214,880 3,052,680 993,348 2,289,463 31,010,732
13,733,831 21,745 32,267 15,571 24,703 13,639,545
23,247,762 2,118,514 2,359,297 887,003 1,772,721 16,110,227
18,883,685 1,328,343 1,531,856 787,154 936,859 14,299,473
4,364,077 790,171 827,441 99,849 835,862 1,810,754
738,656 11,665 191,661 32,825 233,623 268,882
1,840,854 62,956 469,455 57,949 258,416 992,078
- - - - - -Reserve required by special law
Bonds
Long-term borrowings
Long-term bank borrowings
Long-term other borrowings
Allowance
Other fixed liabilities
Short-term borrowings
Short-term bank borrowings
Short-term other borrowings
Allowance
Other liquid liabilities
Fixed liabilities
Deferred assets
Total assets
Liabilities
Liquid liabilities
Bills payable
Accounts payable
Intangible fixed assets
Intangible fixed assets excluding software
Software
Investments and other assets
Investment securities
Other investments and other assets
Other liquid assets
Fixed assets
Tangible fixed assets
Land
Construction in process
Other tangible fixed assets
Bonds and debentures
Other securities
Inventories
Finished goods and merchandise
Works in process
Raw materials and goods in storage
Liquid assets
Cash and deposits
Bills receivable
Accounts receivable
Securities
Stocks
2. Assets, Liabilities and Net Assets and Profit
Scientific Research, Professional
By capital
Number of corporations (companies)
170 By Size

(Unit: millions of yen)
Total Under 10 10 - 50 50 - 100 100 - 1,000 1,000 or over
86,915,947 1,820,687 13,641,988 2,431,726 3,275,170 65,746,376
85,868,132 1,847,779 13,613,218 2,426,980 3,206,291 64,773,864
17,013,858 522,835 918,081 242,288 325,880 15,004,774
42,139,388 373,382 9,917,903 930,097 1,670,443 29,247,563
21,999,841 77,793 2,226,586 546,225 466,405 18,682,832
20,139,547 295,589 7,691,317 383,872 1,204,038 10,564,731
30,779,581 965,512 3,644,353 1,270,113 1,782,053 23,117,550
575,861 9,951 66,359 27,693 69,469 402,389
30,203,720 955,561 3,577,994 1,242,420 1,712,584 22,715,161
Reserve 9,971,541 117,443 1,211,336 732,663 667,839 7,242,260
Retained earnings brought forward 20,232,179 838,118 2,366,658 509,757 1,044,745 15,472,901
-4,064,695 -13,950 -867,119 -15,518 -572,085 -2,596,023
932,816 -27,092 28,770 2,063 67,777 861,298
114,999 - - 2,683 1,102 111,214
158,352,362 6,171,040 21,856,140 4,694,744 9,177,669 116,452,769
22,815 793 20,282 159 48 1,533
1,353,413 33,184 292,955 18,938 386,766 621,570
509,281 12,753 46,702 13,371 217,344 219,111
42,685,694 5,792,664 14,179,654 4,006,962 7,888,653 10,817,761
23,281,278 1,197,883 8,758,231 2,616,490 5,727,866 4,980,808
14,016,882 4,588,029 4,635,675 1,208,049 1,707,541 1,877,588
5,387,534 6,752 785,748 182,423 453,246 3,959,365
2,277,236 125,426 195,389 70,936 66,461 1,819,024
920,975 40,361 283,128 30,376 45,828 521,282
6,743,795 91,817 698,009 222,983 473,879 5,257,107
515,010 19,636 90,155 6,880 27,322 371,017
1,505,027 33,724 80,311 47,426 167,500 1,176,066
5,753,778 77,729 707,853 182,437 333,701 4,452,058
678,163 56,371 255,089 62,477 146,697 157,529
-80,830 333 8,625 -1,792 6,722 -94,718
5,156,445 21,025 444,139 121,752 180,282 4,389,247
1,274,008 - 3,313 908 338,572 931,215
1,487,216 39,393 53,021 17,017 151,227 1,226,558
785,570 111,432 247,159 38,900 92,276 295,803
85,081 4,946 70,413 4,875 4 4,843
17,130,326 2,795,189 5,314,937 1,651,819 2,219,909 5,148,472
2,057,320 1,011,529 824,733 96,573 58,911 65,574
45,603 5,139 20,463 5,704 4,726 9,571
6,211,914 1,219,525 2,370,710 964,883 1,092,494 564,302
1,169,898 113,295 465,344 195,172 245,192 150,895
1,016,907 142,019 425,440 106,258 198,115 145,075
574,230 29,742 58,476 21,238 27,182 437,592
871,735 168,009 283,587 79,278 142,187 198,674
369,415 128,921 138,912 21,528 25,038 55,016
4,813,304 -22,990 727,272 161,185 426,064 3,521,773
377,275 220,950 136,063 11,212 5,497 3,553
1,893,028 555,967 675,482 299,173 264,631 97,775
By capital
taxes and public charges
Net operating income
Number of directors (persons)
Number of employees (persons)
Directors' bonus
Employees' salaries
Employees' bonus
Welfare expenses
Interest expensesRental or leasing expenses for fixedand liquid assets
Interim dividend
Dividends
Depreciation expenses
Special depreciation expenses
Value added
Directors' remuneration
Special profits
Special losses
Net profits before tax
Income taxes-current
Income taxes-deferred
Net profits for the period
Cost of salesSelling and general administrationexpenses
Operating profits
Non-operating revenues
Non-operating expenses
Ordinary profits
Subscription rights to shares
Liabilities and net assets
Bills receivable discounted outstanding
Accounts receivable from subsidiariesand associates - tradeAccounts payable from subsidiaries andassociates - trade
Sales
Others capital surplus
Earned surplus
Legal retained earnings
Other earned surplus
Treasury stock
Others net assets
Net assets
Shareholders' equity
Capital stock
Capital surplus
Capital reserve
and Loss Table by Sector and by Size (continued)
and Technical Services
By Size 171

Total Under 10 10 - 50 50 - 100 100 - 1,000 1,000 or over
36,616 23,751 11,939 597 302 27
7,896,469 1,671,956 2,805,287 354,558 1,436,435 1,628,233
3,246,387 1,005,549 1,468,342 137,449 296,230 338,817
107,219 20,737 21,411 5,174 16,073 43,824
2,983,206 610,766 670,291 122,783 567,800 1,011,566
107,896 - 64,303 19,880 7,314 16,399
91,292 - 64,303 19,681 1,139 6,169
7,020 - - - 2,494 4,526
9,584 - - 199 3,681 5,704
116,002 13,921 31,201 2,607 29,841 38,432
32,030 7,433 19,915 836 2,723 1,123
77,617 6,057 7,138 1,751 25,719 36,952
6,355 431 4,148 20 1,399 357
1,335,759 20,983 549,739 66,665 519,177 179,195
3,210,412 219,744 550,289 269,126 687,858 1,483,395
1,139,829 59,727 212,593 194,164 406,062 267,283
640,435 6,584 88,021 110,206 260,188 175,436
7,528 - 2,631 1,094 3,801 2
491,866 53,143 121,941 82,864 142,073 91,845
95,481 5,353 20,052 5,094 35,631 29,351
23,158 2,383 6,462 1,910 8,930 3,473
72,323 2,970 13,590 3,184 26,701 25,878
1,975,102 154,664 317,644 69,868 246,165 1,186,761
1,325,616 - 166,124 26,964 87,381 1,045,147
Stocks 1,262,486 - 162,395 14,049 57,320 1,028,722
Bonds and debentures 13,893 - - 2,010 8,285 3,598
Other securities 49,237 - 3,729 10,905 21,776 12,827
649,486 154,664 151,520 42,904 158,784 141,614
11,172 - 5,444 259 5,005 464
11,118,053 1,891,700 3,361,020 623,943 2,129,298 3,112,092
6,347,779 1,345,600 1,727,621 421,781 1,184,947 1,667,830
4,604,856 899,267 1,337,831 212,711 794,988 1,360,059
120,398 10,260 43,718 18,328 17,122 30,970
1,943,605 33,287 415,962 89,630 430,420 974,306
743,057 172,358 229,388 42,904 110,522 187,885
276,442 31,394 63,641 38,009 98,712 44,686
466,615 140,964 165,747 4,895 11,810 143,199
67,076 30 8,330 617 34,144 23,955
1,730,720 683,332 640,433 61,232 202,780 142,943
1,742,923 446,333 389,790 209,070 389,959 307,771
10,508 - - 6,328 2,356 1,824
1,370,567 433,979 326,284 190,443 222,276 197,585
987,341 155,066 249,543 164,294 220,853 197,585
383,226 278,913 76,741 26,149 1,423 -
166,896 - 3,491 2,468 117,307 43,630
194,952 12,354 60,015 9,831 48,020 64,732
- - - - - -
Liquid assets
Cash and deposits
Bills receivable
2. Assets, Liabilities and Net Assets and Profit
Advertising
By capital
Number of corporations (companies)
Accounts receivable
Securities
Stocks
Bonds and debentures
Other securities
Inventories
Finished goods and merchandise
Works in process
Raw materials and goods in storage
Other liquid assets
Fixed assets
Tangible fixed assets
Land
Construction in process
Other tangible fixed assets
Intangible fixed assets
Intangible fixed assets excluding software
Software
Investments and other assets
Investment securities
Other investments and other assets
Deferred assets
Total assets
Liabilities
Liquid liabilities
Bills payable
Accounts payable
Short-term borrowings
Short-term bank borrowings
Short-term other borrowings
Allowance
Other liquid liabilities
Fixed liabilities
Bonds
Long-term borrowings
Long-term bank borrowings
Long-term other borrowings
Allowance
Other fixed liabilities
Reserve required by special law
172 By Size
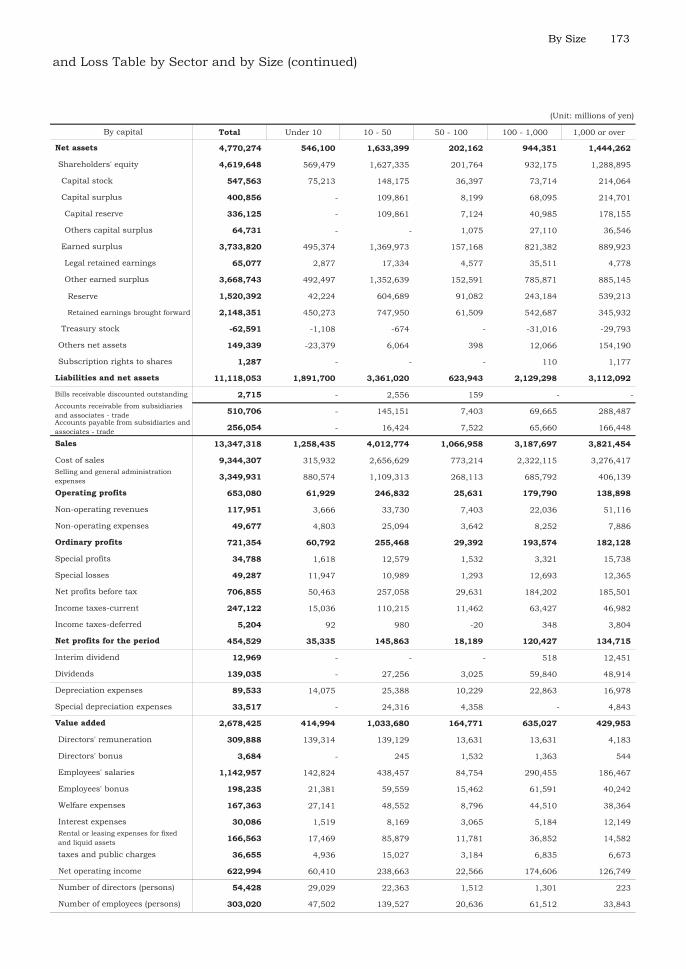
(Unit: millions of yen)
Total Under 10 10 - 50 50 - 100 100 - 1,000 1,000 or over
4,770,274 546,100 1,633,399 202,162 944,351 1,444,262
4,619,648 569,479 1,627,335 201,764 932,175 1,288,895
547,563 75,213 148,175 36,397 73,714 214,064
400,856 - 109,861 8,199 68,095 214,701
336,125 - 109,861 7,124 40,985 178,155
64,731 - - 1,075 27,110 36,546
3,733,820 495,374 1,369,973 157,168 821,382 889,923
65,077 2,877 17,334 4,577 35,511 4,778
3,668,743 492,497 1,352,639 152,591 785,871 885,145
Reserve 1,520,392 42,224 604,689 91,082 243,184 539,213
Retained earnings brought forward 2,148,351 450,273 747,950 61,509 542,687 345,932
-62,591 -1,108 -674 - -31,016 -29,793
149,339 -23,379 6,064 398 12,066 154,190
1,287 - - - 110 1,177
11,118,053 1,891,700 3,361,020 623,943 2,129,298 3,112,092
2,715 - 2,556 159 - -
510,706 - 145,151 7,403 69,665 288,487
256,054 - 16,424 7,522 65,660 166,448
13,347,318 1,258,435 4,012,774 1,066,958 3,187,697 3,821,454
9,344,307 315,932 2,656,629 773,214 2,322,115 3,276,417
3,349,931 880,574 1,109,313 268,113 685,792 406,139
653,080 61,929 246,832 25,631 179,790 138,898
117,951 3,666 33,730 7,403 22,036 51,116
49,677 4,803 25,094 3,642 8,252 7,886
721,354 60,792 255,468 29,392 193,574 182,128
34,788 1,618 12,579 1,532 3,321 15,738
49,287 11,947 10,989 1,293 12,693 12,365
706,855 50,463 257,058 29,631 184,202 185,501
247,122 15,036 110,215 11,462 63,427 46,982
5,204 92 980 -20 348 3,804
454,529 35,335 145,863 18,189 120,427 134,715
12,969 - - - 518 12,451
139,035 - 27,256 3,025 59,840 48,914
89,533 14,075 25,388 10,229 22,863 16,978
33,517 - 24,316 4,358 - 4,843
2,678,425 414,994 1,033,680 164,771 635,027 429,953
309,888 139,314 139,129 13,631 13,631 4,183
3,684 - 245 1,532 1,363 544
1,142,957 142,824 438,457 84,754 290,455 186,467
198,235 21,381 59,559 15,462 61,591 40,242
167,363 27,141 48,552 8,796 44,510 38,364
30,086 1,519 8,169 3,065 5,184 12,149
166,563 17,469 85,879 11,781 36,852 14,582
36,655 4,936 15,027 3,184 6,835 6,673
622,994 60,410 238,663 22,566 174,606 126,749
54,428 29,029 22,363 1,512 1,301 223
303,020 47,502 139,527 20,636 61,512 33,843
Net assets
Shareholders' equity
By capital
Capital stock
Capital surplus
Capital reserve
and Loss Table by Sector and by Size (continued)
Others capital surplus
Earned surplus
Legal retained earnings
Other earned surplus
Treasury stock
Others net assets
Subscription rights to shares
Liabilities and net assets
Bills receivable discounted outstanding
Accounts receivable from subsidiariesand associates - tradeAccounts payable from subsidiaries andassociates - trade
Sales
Cost of salesSelling and general administrationexpenses
Operating profits
Non-operating revenues
Non-operating expenses
Ordinary profits
Special profits
Special losses
Net profits before tax
Income taxes-current
Income taxes-deferred
Net profits for the period
Interim dividend
Dividends
Depreciation expenses
Special depreciation expenses
Value added
Directors' remuneration
taxes and public charges
Net operating income
Number of directors (persons)
Number of employees (persons)
Directors' bonus
Employees' salaries
Employees' bonus
Welfare expenses
Interest expensesRental or leasing expenses for fixedand liquid assets
By Size 173

Total Under 10 10 - 50 50 - 100 100 - 1,000 1,000 or over
2,846 1,328 828 210 211 269
21,671,275 79,262 278,057 891,122 543,832 19,879,002
4,916,033 23,881 63,688 286,388 123,194 4,418,882
17,345 - - - 89 17,256
422,388 - 4,728 9,083 9,908 398,669
1,258,067 13,507 19,693 89,729 82,598 1,052,540
55,571 13,507 19,693 79 2,009 20,283
221,688 - - 137 59,787 161,764
980,808 - - 89,513 20,802 870,493
92,835 - 1,527 4,358 6,377 80,573
56,516 - 237 1,271 825 54,183
18,579 - - 3,087 5,418 10,074
17,740 - 1,290 - 134 16,316
14,964,607 41,874 188,421 501,564 321,666 13,911,082
102,736,986 733,192 6,701,323 777,212 2,171,124 92,354,135
3,492,129 3,081 38,005 50,385 162,128 3,238,530
1,350,860 - 25,893 35,627 87,952 1,201,388
216,388 - 3,094 - 2,086 211,208
1,924,881 3,081 9,018 14,758 72,090 1,825,934
441,910 - 776 1,812 8,029 431,293
168,532 - 175 1,103 2,464 164,790
273,378 - 601 709 5,565 266,503
98,802,947 730,111 6,662,542 725,015 2,000,967 88,684,312
79,834,919 616,737 6,608,769 541,664 1,646,529 70,421,220
Stocks 78,262,789 616,737 5,789,009 408,644 1,560,763 69,887,636
Bonds and debentures 341,971 - - 104,675 308 236,988
Other securities 1,230,159 - 819,760 28,345 85,458 296,596
18,968,028 113,374 53,773 183,351 354,438 18,263,092
75,417 - 27,319 42 102 47,954
124,483,678 812,454 7,006,699 1,668,376 2,715,058 112,281,091
51,245,818 198,048 431,769 489,503 1,609,868 48,516,630
19,339,369 73,900 123,664 429,138 726,019 17,986,648
39,321 - 804 - 271 38,246
281,141 190 3,353 6,148 9,328 262,122
13,616,156 70,379 105,638 380,053 468,301 12,591,785
8,766,366 47,675 20,807 79,732 246,232 8,371,920
4,849,790 22,704 84,831 300,321 222,069 4,219,865
48,652 - 1,559 525 1,627 44,941
5,354,099 3,331 12,310 42,412 246,492 5,049,554
31,906,449 124,148 308,105 60,365 883,849 30,529,982
13,662,717 - 5,839 2,321 17,046 13,637,511
17,010,698 107,097 207,405 50,967 823,473 15,821,756
14,687,046 94,565 59,310 24,922 430,537 14,077,712
2,323,652 12,532 148,095 26,045 392,936 1,744,044
173,737 - 542 730 5,837 166,628
1,059,297 17,051 94,319 6,347 37,493 904,087
- - - - - -Reserve required by special law
Bonds
Long-term borrowings
Long-term bank borrowings
Long-term other borrowings
Allowance
Other fixed liabilities
Short-term borrowings
Short-term bank borrowings
Short-term other borrowings
Allowance
Other liquid liabilities
Fixed liabilities
Deferred assets
Total assets
Liabilities
Liquid liabilities
Bills payable
Accounts payable
Intangible fixed assets
Intangible fixed assets excluding software
Software
Investments and other assets
Investment securities
Other investments and other assets
Other liquid assets
Fixed assets
Tangible fixed assets
Land
Construction in process
Other tangible fixed assets
Bonds and debentures
Other securities
Inventories
Finished goods and merchandise
Works in process
Raw materials and goods in storage
Liquid assets
Cash and deposits
Bills receivable
Accounts receivable
Securities
Stocks
2. Assets, Liabilities and Net Assets and Profit
Pure Holding
By capital
Number of corporations (companies)
174 By Size

(Unit: millions of yen)
Total Under 10 10 - 50 50 - 100 100 - 1,000 1,000 or over
73,237,860 614,406 6,574,930 1,178,873 1,105,190 63,764,461
72,388,005 614,406 6,572,543 1,178,873 1,064,321 62,957,862
14,581,473 2,769 13,294 14,558 49,648 14,501,204
37,637,165 366,082 6,451,444 763,498 1,238,312 28,817,829
19,884,104 77,793 834,423 416,294 245,152 18,310,442
17,753,061 288,289 5,617,021 347,204 993,160 10,507,387
23,270,314 248,981 107,990 412,519 304,137 22,196,687
402,929 3 1,351 6,022 4,514 391,039
22,867,385 248,978 106,639 406,497 299,623 21,805,648
Reserve 6,798,179 - 35,435 44,809 103,939 6,613,996
Retained earnings brought forward 16,069,206 248,978 71,204 361,688 195,684 15,191,652
-3,100,947 -3,426 -185 -11,702 -527,776 -2,557,858
740,189 - 2,387 - 40,400 697,402
109,666 - - - 469 109,197
124,483,678 812,454 7,006,699 1,668,376 2,715,058 112,281,091
3,887 - 2,351 - 3 1,533
316,968 - 363 7,250 8,541 300,814
42,677 - - 4,982 5,042 32,653
6,503,467 11,565 102,381 140,380 230,624 6,018,517
1,162,252 - 36,502 89,796 77,781 958,173
1,488,795 20,535 48,121 42,625 89,867 1,287,647
3,852,420 -8,970 17,758 7,959 62,976 3,772,697
1,875,068 63,254 26,933 13,487 16,478 1,754,916
542,912 1,751 12,656 6,694 17,049 504,762
5,184,576 52,533 32,035 14,752 62,405 5,022,851
363,280 - 809 158 13,671 348,642
1,273,773 12 1,249 1,465 137,507 1,133,540
4,274,083 52,521 31,595 13,445 -61,431 4,237,953
92,708 923 5,973 -557 1,041 85,328
-93,343 - -145 -898 1,760 -94,060
4,274,718 51,598 25,767 14,900 -64,232 4,246,685
1,241,473 - - 908 323,068 917,497
1,234,553 35,285 7,139 5,576 20,814 1,165,739
265,925 598 1,318 3,502 7,213 253,294
- - - - - -
4,617,769 4,154 51,787 32,740 115,291 4,413,797
90,129 6,191 11,811 5,024 11,674 55,429
10,130 - 151 336 829 8,814
293,415 1,668 14,934 9,209 26,552 241,052
70,404 27 1,586 1,738 2,484 64,569
75,684 670 1,266 1,628 3,526 68,594
453,931 1,732 11,436 3,612 13,667 423,484
177,329 4,499 2,321 6,200 4,122 160,187
48,258 69 1,960 646 3,128 42,455
3,398,489 -10,702 6,322 4,347 49,309 3,349,213
6,128 531 1,120 604 967 2,906
52,709 398 3,576 3,628 6,578 38,529
By capital
taxes and public charges
Net operating income
Number of directors (persons)
Number of employees (persons)
Directors' bonus
Employees' salaries
Employees' bonus
Welfare expenses
Interest expensesRental or leasing expenses for fixedand liquid assets
Interim dividend
Dividends
Depreciation expenses
Special depreciation expenses
Value added
Directors' remuneration
Special profits
Special losses
Net profits before tax
Income taxes-current
Income taxes-deferred
Net profits for the period
Cost of salesSelling and general administrationexpenses
Operating profits
Non-operating revenues
Non-operating expenses
Ordinary profits
Subscription rights to shares
Liabilities and net assets
Bills receivable discounted outstanding
Accounts receivable from subsidiariesand associates - tradeAccounts payable from subsidiaries andassociates - trade
Sales
Others capital surplus
Earned surplus
Legal retained earnings
Other earned surplus
Treasury stock
Others net assets
Net assets
Shareholders' equity
Capital stock
Capital surplus
Capital reserve
and Loss Table by Sector and by Size (continued)
Companies
By Size 175

Total Under 10 10 - 50 50 - 100 100 - 1,000 1,000 or over
210,722 149,967 56,579 3,174 942 60
11,967,147 2,194,309 4,510,490 1,828,619 2,861,647 572,082
5,050,509 1,280,989 2,306,435 741,912 533,624 187,549
70,107 8,430 28,453 5,784 19,655 7,785
3,428,356 455,202 1,086,059 452,812 1,256,146 178,137
87,247 4,803 25,404 20,311 20,617 16,112
58,424 2,388 19,466 18,348 16,683 1,539
1,353 7 552 - - 794
27,470 2,408 5,386 1,963 3,934 13,779
687,272 33,346 376,889 98,756 114,614 63,667
161,851 18,148 75,447 36,569 24,757 6,930
500,599 11,903 295,479 55,670 83,978 53,569
24,822 3,295 5,963 6,517 5,879 3,168
2,643,656 411,539 687,250 509,044 916,991 118,832
10,732,814 1,250,506 6,963,757 569,974 1,461,153 487,424
3,923,325 936,985 2,075,246 277,017 456,093 177,984
1,591,451 398,602 865,334 123,864 158,291 45,360
348,363 32,696 304,605 2,379 5,228 3,455
1,983,511 505,687 905,307 150,774 292,574 129,169
317,350 15,362 125,462 59,434 96,285 20,807
192,011 11,619 95,067 36,173 46,365 2,787
125,339 3,743 30,395 23,261 49,920 18,020
6,492,139 298,159 4,763,049 233,523 908,775 288,633
4,275,084 128,688 3,439,556 37,640 477,343 191,857
Stocks 4,004,993 30,258 3,315,555 33,003 453,079 173,098
Bonds and debentures 31,927 42 18,742 - 438 12,705
Other securities 238,164 98,388 105,259 4,637 23,826 6,054
2,217,055 169,471 1,323,493 195,883 431,432 96,776
50,670 22,071 14,174 3,832 10,513 80
22,750,631 3,466,886 11,488,421 2,402,425 4,333,313 1,059,586
13,842,818 2,806,705 6,054,762 1,351,734 3,107,684 521,933
7,931,087 1,162,306 3,699,977 627,821 2,092,029 348,954
39,778 - 15,070 1,866 17,209 5,633
1,717,138 104,668 402,592 207,481 884,642 117,755
2,753,721 553,763 1,441,363 198,685 496,327 63,583
756,880 138,444 257,227 187,933 147,823 25,453
1,996,841 415,319 1,184,136 10,752 348,504 38,130
277,307 296 196,083 3,375 56,782 20,771
3,143,143 503,579 1,644,869 216,414 637,069 141,212
5,911,731 1,644,399 2,354,785 723,913 1,015,655 172,979
60,606 21,745 26,428 6,922 5,301 210
4,866,497 1,577,438 1,825,608 645,593 726,972 90,886
3,209,298 1,078,712 1,223,003 597,938 285,469 24,176
1,657,199 498,726 602,605 47,655 441,503 66,710
398,023 11,665 187,628 29,627 110,479 58,624
586,605 33,551 315,121 41,771 172,903 23,259
- - - - - -
2. Assets, Liabilities and Net Assets and Profit
Miscellaneous Scientific Research,
By capital
Number of corporations (companies)
Liquid assets
Cash and deposits
Bills receivable
Accounts receivable
Securities
Stocks
Bonds and debentures
Other securities
Inventories
Finished goods and merchandise
Works in process
Raw materials and goods in storage
Other liquid assets
Fixed assets
Tangible fixed assets
Land
Construction in process
Other tangible fixed assets
Intangible fixed assets
Intangible fixed assets excluding software
Software
Investments and other assets
Investment securities
Other investments and other assets
Deferred assets
Total assets
Liabilities
Liquid liabilities
Bills payable
Accounts payable
Short-term borrowings
Short-term bank borrowings
Short-term other borrowings
Allowance
Other liquid liabilities
Fixed liabilities
Bonds
Long-term borrowings
Long-term bank borrowings
Long-term other borrowings
Allowance
Other fixed liabilities
Reserve required by special law
176 By Size

(Unit: millions of yen)
Total Under 10 10 - 50 50 - 100 100 - 1,000 1,000 or over
8,907,813 660,181 5,433,659 1,050,691 1,225,629 537,653
8,860,479 663,894 5,413,340 1,046,343 1,209,795 527,107
1,884,822 444,853 756,612 191,333 202,518 289,506
4,101,367 7,300 3,356,598 158,400 364,036 215,033
1,779,612 - 1,282,302 122,807 180,268 194,235
2,321,755 7,300 2,074,296 35,593 183,768 20,798
3,775,447 221,157 2,166,390 700,426 656,534 30,940
107,855 7,071 47,674 17,094 29,444 6,572
3,667,592 214,086 2,118,716 683,332 627,090 24,368
Reserve 1,652,970 75,219 571,212 596,772 320,716 89,051
Retained earnings brought forward 2,014,622 138,867 1,547,504 86,560 306,374 -64,683
-901,157 -9,416 -866,260 -3,816 -13,293 -8,372
43,288 -3,713 20,319 1,665 15,311 9,706
4,046 - - 2,683 523 840
22,750,631 3,466,886 11,488,421 2,402,425 4,333,313 1,059,586
16,213 793 15,375 - 45 -
525,739 33,184 147,441 4,285 308,560 32,269
210,550 12,753 30,278 867 146,642 20,010
22,834,909 4,522,664 10,064,499 2,799,624 4,470,332 977,790
12,774,719 881,951 6,065,100 1,753,480 3,327,970 746,218
9,178,156 3,686,920 3,478,241 897,311 931,882 183,802
882,034 -46,207 521,158 148,833 210,480 47,770
284,217 58,506 134,726 50,046 27,947 12,992
328,386 33,807 245,378 20,040 20,527 8,634
837,865 -21,508 410,506 178,839 217,900 52,128
116,942 18,018 76,767 5,190 10,330 6,637
181,967 21,765 68,073 44,668 17,300 30,161
772,840 -25,255 419,200 139,361 210,930 28,604
338,333 40,412 138,901 51,572 82,229 25,219
7,309 241 7,790 -874 4,614 -4,462
427,198 -65,908 272,509 88,663 124,087 7,847
19,566 - 3,313 - 14,986 1,267
113,628 4,108 18,626 8,416 70,573 11,905
430,112 96,759 220,453 25,169 62,200 25,531
51,564 4,946 46,097 517 4 -
9,834,132 2,376,041 4,229,470 1,454,308 1,469,591 304,722
1,657,303 866,024 673,793 77,918 33,606 5,962
31,789 5,139 20,067 3,836 2,534 213
4,775,542 1,075,033 1,917,319 870,920 775,487 136,783
901,259 91,887 404,199 177,972 181,117 46,084
773,860 114,208 375,622 95,834 150,079 38,117
90,213 26,491 38,871 14,561 8,331 1,959
527,843 146,041 195,387 61,297 101,213 23,905
284,502 123,916 121,925 17,698 15,075 5,888
791,821 -72,698 482,287 134,272 202,149 45,811
316,719 191,390 112,580 9,096 3,229 424
1,537,299 508,067 532,379 274,909 196,541 25,403
Net assets
Shareholders' equity
Capital stock
Capital surplus
Capital reserve
and Loss Table by Sector and by Size (continued)
Professional and Technical Services
Others capital surplus
Earned surplus
Legal retained earnings
Other earned surplus
Treasury stock
Others net assets
Subscription rights to shares
Liabilities and net assets
Bills receivable discounted outstanding
Accounts receivable from subsidiariesand associates - tradeAccounts payable from subsidiaries andassociates - trade
Sales
Cost of salesSelling and general administrationexpenses
Operating profits
Non-operating revenues
Non-operating expenses
Ordinary profits
Special profits
Special losses
Net profits before tax
Income taxes-current
Income taxes-deferred
Net profits for the period
Rental or leasing expenses for fixedand liquid assets
Interim dividend
Dividends
Depreciation expenses
Special depreciation expenses
Value added
Directors' remuneration
By capital
taxes and public charges
Net operating income
Number of directors (persons)
Number of employees (persons)
Directors' bonus
Employees' salaries
Employees' bonus
Welfare expenses
Interest expenses
By Size 177

Total Under 10 10 - 50 50 - 100 100 - 1,000 1,000 or over
48,813 41,425 6,599 522 248 19
2,392,914 1,077,625 518,840 248,484 316,969 230,996
1,002,699 453,263 208,772 92,655 138,282 109,727
9,742 19 473 8,765 94 391
964,919 521,872 163,724 105,031 110,641 63,651
8,564 280 231 5,394 683 1,976
1,220 280 198 642 100 -
5,170 - - 4,350 - 820
2,174 - 33 402 583 1,156
97,273 15,136 59,248 6,156 5,678 11,055
34,991 13,110 9,263 4,818 2,955 4,845
50,368 429 47,514 794 776 855
11,914 1,597 2,471 544 1,947 5,355
309,717 87,055 86,392 30,483 61,591 44,196
3,753,744 1,762,303 710,590 440,731 498,765 341,355
2,818,912 1,426,312 600,189 235,618 365,995 190,798
876,839 471,336 172,941 79,964 103,845 48,753
217,269 124,124 78,921 2,262 9,564 2,398
1,724,804 830,852 348,327 153,392 252,586 139,647
91,192 28,657 10,831 11,027 22,971 17,706
65,248 24,076 8,640 10,179 17,460 4,893
25,944 4,581 2,191 848 5,511 12,813
843,640 307,334 99,570 194,086 109,799 132,851
257,298 102,682 12,128 25,687 26,865 89,936
Stocks 225,461 102,424 5,992 17,607 23,330 76,108
Bonds and debentures 6,551 - - 5,470 264 817
Other securities 25,286 258 6,136 2,610 3,271 13,011
586,342 204,652 87,442 168,399 82,934 42,915
11,248 7,144 2,310 544 1,185 65
6,157,906 2,847,072 1,231,740 689,759 816,919 572,416
4,408,332 1,880,380 1,106,316 550,341 571,222 300,073
1,799,484 733,455 360,957 347,577 224,640 132,855
11,745 - - 11,723 22 -
351,319 202,240 62,072 29,852 24,839 32,316
648,661 319,094 143,871 98,223 52,004 35,469
185,447 46,492 41,598 45,577 28,442 23,338
463,214 272,602 102,273 52,646 23,562 12,131
41,749 15,166 1,975 3,349 14,810 6,449
746,010 196,955 153,039 204,430 132,965 58,621
2,608,848 1,146,925 745,359 202,764 346,582 167,218
12,280 205 7,967 653 - 3,455
2,188,114 1,127,061 687,411 169,519 126,113 78,010
1,886,904 988,581 591,460 135,437 93,416 78,010
301,210 138,480 95,951 34,082 32,697 -
66,827 - 2,601 6,829 42,320 15,077
341,627 19,659 47,380 25,763 178,149 70,676
- - - - - -Reserve required by special law
Bonds
Long-term borrowings
Long-term bank borrowings
Long-term other borrowings
Allowance
Other fixed liabilities
Short-term borrowings
Short-term bank borrowings
Short-term other borrowings
Allowance
Other liquid liabilities
Fixed liabilities
Deferred assets
Total assets
Liabilities
Liquid liabilities
Bills payable
Accounts payable
Intangible fixed assets
Intangible fixed assets excluding software
Software
Investments and other assets
Investment securities
Other investments and other assets
Other liquid assets
Fixed assets
Tangible fixed assets
Land
Construction in process
Other tangible fixed assets
Bonds and debentures
Other securities
Inventories
Finished goods and merchandise
Works in process
Raw materials and goods in storage
Liquid assets
Cash and deposits
Bills receivable
Accounts receivable
Securities
Stocks
2. Assets, Liabilities and Net Assets and Profit
Medical, Health Care
By capital
Number of corporations (companies)
178 By Size

(Unit: millions of yen)
Total Under 10 10 - 50 50 - 100 100 - 1,000 1,000 or over
1,749,574 966,692 125,424 139,418 245,697 272,343
1,737,801 959,341 125,568 139,200 244,306 269,386
384,128 127,325 91,180 33,549 57,335 74,739
357,365 99,694 20,674 57,192 126,718 53,087
168,251 - 21,357 13,953 80,852 52,089
189,114 99,694 -683 43,239 45,866 998
1,007,578 732,322 13,879 52,004 63,508 145,865
17,106 6,793 1,527 1,979 4,585 2,222
990,472 725,529 12,352 50,025 58,923 143,643
Reserve 265,037 89,094 49,093 46,121 15,462 65,267
Retained earnings brought forward 725,435 636,435 -36,741 3,904 43,461 78,376
-11,270 - -165 -3,545 -3,255 -4,305
11,004 7,351 -144 33 1,378 2,386
769 - - 185 13 571
6,157,906 2,847,072 1,231,740 689,759 816,919 572,416
- - - - - -
17,514 - 8,593 5,764 1,409 1,748
64,662 - 4,768 53,461 4,253 2,180
6,064,393 2,824,787 1,399,789 663,440 690,197 486,180
2,775,961 870,648 555,747 453,248 516,239 380,079
3,185,804 1,937,046 835,567 185,691 147,910 79,590
102,628 17,093 8,475 24,501 26,048 26,511
180,997 118,239 33,616 8,765 11,333 9,044
80,601 24,420 42,051 5,698 3,955 4,477
203,024 110,912 40 27,568 33,426 31,078
27,602 18,324 2,140 6,329 325 484
40,485 20,370 8,187 5,013 3,977 2,938
190,141 108,866 -6,007 28,884 29,774 28,624
79,360 34,993 9,370 10,016 14,463 10,518
-3,135 939 -263 -3,230 -595 14
113,916 72,934 -15,114 22,098 15,906 18,092
9,974 - - - 2,035 7,939
23,328 - 5,743 1,903 9,268 6,414
196,860 101,940 41,026 13,876 23,615 16,403
720 - 709 11 - -
3,216,134 1,551,272 700,602 332,851 374,747 256,662
378,977 296,873 63,700 8,798 7,233 2,373
5,112 3,548 1,125 348 91 -
2,042,436 964,804 461,687 238,967 229,894 147,084
157,726 63,957 36,456 10,886 27,987 18,440
171,693 70,272 34,844 16,508 29,587 20,482
52,829 18,907 23,773 3,534 3,740 2,875
286,368 105,380 78,867 24,360 44,267 33,494
71,194 29,345 15,448 8,483 9,640 8,278
49,799 -1,814 -15,298 20,967 22,308 23,636
77,963 61,837 13,584 1,599 767 176
970,596 504,304 209,484 125,889 85,559 45,360
By capital
taxes and public charges
Net operating income
Number of directors (persons)
Number of employees (persons)
Directors' bonus
Employees' salaries
Employees' bonus
Welfare expenses
Interest expensesRental or leasing expenses for fixedand liquid assets
Interim dividend
Dividends
Depreciation expenses
Special depreciation expenses
Value added
Directors' remuneration
Special profits
Special losses
Net profits before tax
Income taxes-current
Income taxes-deferred
Net profits for the period
Cost of salesSelling and general administrationexpenses
Operating profits
Non-operating revenues
Non-operating expenses
Ordinary profits
Subscription rights to shares
Liabilities and net assets
Bills receivable discounted outstanding
Accounts receivable from subsidiariesand associates - tradeAccounts payable from subsidiaries andassociates - trade
Sales
Others capital surplus
Earned surplus
Legal retained earnings
Other earned surplus
Treasury stock
Others net assets
Net assets
Shareholders' equity
Capital stock
Capital surplus
Capital reserve
and Loss Table by Sector and by Size (continued)
and Welfare
By Size 179

Total Under 10 10 - 50 50 - 100 100 - 1,000 1,000 or over
21,799 16,202 5,081 385 114 17
1,426,538 308,650 560,601 213,514 128,781 214,992
858,990 238,344 330,173 115,087 63,190 112,196
861 - 481 131 238 11
128,581 11,675 57,893 20,367 21,821 16,825
50,598 - 44,400 685 3,626 1,887
18,341 - 14,718 685 2,938 -
1,312 - - - 462 850
30,945 - 29,682 - 226 1,037
63,931 16,351 11,606 4,470 4,504 27,000
51,345 16,245 8,004 3,230 3,167 20,699
4,289 - 103 254 300 3,632
8,297 106 3,499 986 1,037 2,669
323,577 42,280 116,048 72,774 35,402 57,073
2,154,304 561,166 807,139 156,131 308,110 321,758
1,454,451 448,225 591,530 111,058 148,674 154,964
813,023 305,338 332,996 49,843 50,429 74,417
11,269 1,962 3,881 4,949 - 477
630,159 140,925 254,653 56,266 98,245 80,070
91,093 31,570 9,837 1,953 8,812 38,921
38,004 28,691 3,774 1,268 2,357 1,914
53,089 2,879 6,063 685 6,455 37,007
608,760 81,371 205,772 43,120 150,624 127,873
173,312 - 97,295 4,235 9,256 62,526
Stocks 73,520 - 12,498 4,132 5,720 51,170
Bonds and debentures 5,873 - 206 - 1,414 4,253
Other securities 93,919 - 84,591 103 2,122 7,103
435,448 81,371 108,477 38,885 141,368 65,347
8,839 692 3,145 1,070 3,559 373
3,589,681 870,508 1,370,885 370,715 440,450 537,123
1,864,720 392,934 700,363 246,588 234,916 289,919
840,724 136,298 264,117 140,628 119,130 180,551
1,982 - - 113 124 1,745
62,425 6,162 21,114 17,785 6,941 10,423
214,157 35,575 89,197 23,963 22,761 42,661
127,152 10,314 58,876 16,348 16,662 24,952
87,005 25,261 30,321 7,615 6,099 17,709
19,188 - 5,571 1,315 4,914 7,388
542,972 94,561 148,235 97,452 84,390 118,334
1,023,996 256,636 436,246 105,960 115,786 109,368
26,825 - 5,811 1,409 597 19,008
770,391 254,881 333,658 84,127 49,538 48,187
675,003 201,159 314,564 69,093 42,267 47,920
95,388 53,722 19,094 15,034 7,271 267
57,389 - 19,289 6,113 16,591 15,396
169,391 1,755 77,488 14,311 49,060 26,777
- - - - - -Reserve required by special law
Bonds
Long-term borrowings
Long-term bank borrowings
Long-term other borrowings
Allowance
Other fixed liabilities
Short-term borrowings
Short-term bank borrowings
Short-term other borrowings
Allowance
Other liquid liabilities
Fixed liabilities
Deferred assets
Total assets
Liabilities
Liquid liabilities
Bills payable
Accounts payable
Intangible fixed assets
Intangible fixed assets excluding software
Software
Investments and other assets
Investment securities
Other investments and other assets
Other liquid assets
Fixed assets
Tangible fixed assets
Land
Construction in process
Other tangible fixed assets
Bonds and debentures
Other securities
Inventories
Finished goods and merchandise
Works in process
Raw materials and goods in storage
Liquid assets
Cash and deposits
Bills receivable
Accounts receivable
Securities
Stocks
2. Assets, Liabilities and Net Assets and Profit
Education,
By capital
Number of corporations (companies)
180 By Size
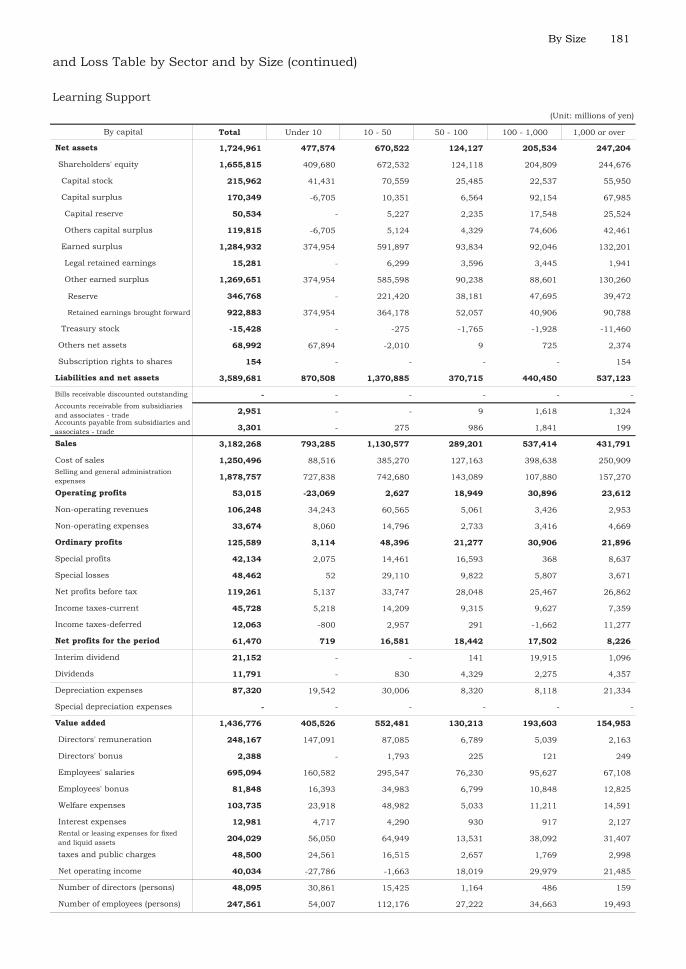
(Unit: millions of yen)
Total Under 10 10 - 50 50 - 100 100 - 1,000 1,000 or over
1,724,961 477,574 670,522 124,127 205,534 247,204
1,655,815 409,680 672,532 124,118 204,809 244,676
215,962 41,431 70,559 25,485 22,537 55,950
170,349 -6,705 10,351 6,564 92,154 67,985
50,534 - 5,227 2,235 17,548 25,524
119,815 -6,705 5,124 4,329 74,606 42,461
1,284,932 374,954 591,897 93,834 92,046 132,201
15,281 - 6,299 3,596 3,445 1,941
1,269,651 374,954 585,598 90,238 88,601 130,260
Reserve 346,768 - 221,420 38,181 47,695 39,472
Retained earnings brought forward 922,883 374,954 364,178 52,057 40,906 90,788
-15,428 - -275 -1,765 -1,928 -11,460
68,992 67,894 -2,010 9 725 2,374
154 - - - - 154
3,589,681 870,508 1,370,885 370,715 440,450 537,123
- - - - - -
2,951 - - 9 1,618 1,324
3,301 - 275 986 1,841 199
3,182,268 793,285 1,130,577 289,201 537,414 431,791
1,250,496 88,516 385,270 127,163 398,638 250,909
1,878,757 727,838 742,680 143,089 107,880 157,270
53,015 -23,069 2,627 18,949 30,896 23,612
106,248 34,243 60,565 5,061 3,426 2,953
33,674 8,060 14,796 2,733 3,416 4,669
125,589 3,114 48,396 21,277 30,906 21,896
42,134 2,075 14,461 16,593 368 8,637
48,462 52 29,110 9,822 5,807 3,671
119,261 5,137 33,747 28,048 25,467 26,862
45,728 5,218 14,209 9,315 9,627 7,359
12,063 -800 2,957 291 -1,662 11,277
61,470 719 16,581 18,442 17,502 8,226
21,152 - - 141 19,915 1,096
11,791 - 830 4,329 2,275 4,357
87,320 19,542 30,006 8,320 8,118 21,334
- - - - - -
1,436,776 405,526 552,481 130,213 193,603 154,953
248,167 147,091 87,085 6,789 5,039 2,163
2,388 - 1,793 225 121 249
695,094 160,582 295,547 76,230 95,627 67,108
81,848 16,393 34,983 6,799 10,848 12,825
103,735 23,918 48,982 5,033 11,211 14,591
12,981 4,717 4,290 930 917 2,127
204,029 56,050 64,949 13,531 38,092 31,407
48,500 24,561 16,515 2,657 1,769 2,998
40,034 -27,786 -1,663 18,019 29,979 21,485
48,095 30,861 15,425 1,164 486 159
247,561 54,007 112,176 27,222 34,663 19,493
By capital
taxes and public charges
Net operating income
Number of directors (persons)
Number of employees (persons)
Directors' bonus
Employees' salaries
Employees' bonus
Welfare expenses
Interest expensesRental or leasing expenses for fixedand liquid assets
Interim dividend
Dividends
Depreciation expenses
Special depreciation expenses
Value added
Directors' remuneration
Special profits
Special losses
Net profits before tax
Income taxes-current
Income taxes-deferred
Net profits for the period
Cost of salesSelling and general administrationexpenses
Operating profits
Non-operating revenues
Non-operating expenses
Ordinary profits
Subscription rights to shares
Liabilities and net assets
Bills receivable discounted outstanding
Accounts receivable from subsidiariesand associates - tradeAccounts payable from subsidiaries andassociates - trade
Sales
Others capital surplus
Earned surplus
Legal retained earnings
Other earned surplus
Treasury stock
Others net assets
Net assets
Shareholders' equity
Capital stock
Capital surplus
Capital reserve
and Loss Table by Sector and by Size (continued)
Learning Support
By Size 181
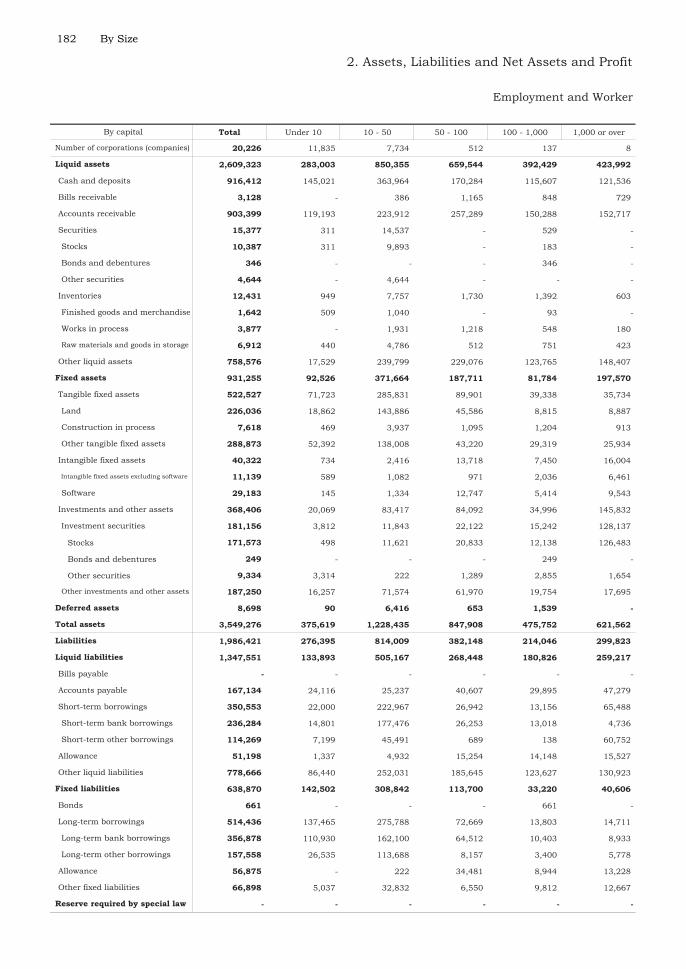
Total Under 10 10 - 50 50 - 100 100 - 1,000 1,000 or over
20,226 11,835 7,734 512 137 8
2,609,323 283,003 850,355 659,544 392,429 423,992
916,412 145,021 363,964 170,284 115,607 121,536
3,128 - 386 1,165 848 729
903,399 119,193 223,912 257,289 150,288 152,717
15,377 311 14,537 - 529 -
10,387 311 9,893 - 183 -
346 - - - 346 -
4,644 - 4,644 - - -
12,431 949 7,757 1,730 1,392 603
1,642 509 1,040 - 93 -
3,877 - 1,931 1,218 548 180
6,912 440 4,786 512 751 423
758,576 17,529 239,799 229,076 123,765 148,407
931,255 92,526 371,664 187,711 81,784 197,570
522,527 71,723 285,831 89,901 39,338 35,734
226,036 18,862 143,886 45,586 8,815 8,887
7,618 469 3,937 1,095 1,204 913
288,873 52,392 138,008 43,220 29,319 25,934
40,322 734 2,416 13,718 7,450 16,004
11,139 589 1,082 971 2,036 6,461
29,183 145 1,334 12,747 5,414 9,543
368,406 20,069 83,417 84,092 34,996 145,832
181,156 3,812 11,843 22,122 15,242 128,137
Stocks 171,573 498 11,621 20,833 12,138 126,483
Bonds and debentures 249 - - - 249 -
Other securities 9,334 3,314 222 1,289 2,855 1,654
187,250 16,257 71,574 61,970 19,754 17,695
8,698 90 6,416 653 1,539 -
3,549,276 375,619 1,228,435 847,908 475,752 621,562
1,986,421 276,395 814,009 382,148 214,046 299,823
1,347,551 133,893 505,167 268,448 180,826 259,217
- - - - - -
167,134 24,116 25,237 40,607 29,895 47,279
350,553 22,000 222,967 26,942 13,156 65,488
236,284 14,801 177,476 26,253 13,018 4,736
114,269 7,199 45,491 689 138 60,752
51,198 1,337 4,932 15,254 14,148 15,527
778,666 86,440 252,031 185,645 123,627 130,923
638,870 142,502 308,842 113,700 33,220 40,606
661 - - - 661 -
514,436 137,465 275,788 72,669 13,803 14,711
356,878 110,930 162,100 64,512 10,403 8,933
157,558 26,535 113,688 8,157 3,400 5,778
56,875 - 222 34,481 8,944 13,228
66,898 5,037 32,832 6,550 9,812 12,667
- - - - - -Reserve required by special law
Bonds
Long-term borrowings
Long-term bank borrowings
Long-term other borrowings
Allowance
Other fixed liabilities
Short-term borrowings
Short-term bank borrowings
Short-term other borrowings
Allowance
Other liquid liabilities
Fixed liabilities
Deferred assets
Total assets
Liabilities
Liquid liabilities
Bills payable
Accounts payable
Intangible fixed assets
Intangible fixed assets excluding software
Software
Investments and other assets
Investment securities
Other investments and other assets
Other liquid assets
Fixed assets
Tangible fixed assets
Land
Construction in process
Other tangible fixed assets
Bonds and debentures
Other securities
Inventories
Finished goods and merchandise
Works in process
Raw materials and goods in storage
Liquid assets
Cash and deposits
Bills receivable
Accounts receivable
Securities
Stocks
2. Assets, Liabilities and Net Assets and Profit
Employment and Worker
By capital
Number of corporations (companies)
182 By Size

(Unit: millions of yen)
Total Under 10 10 - 50 50 - 100 100 - 1,000 1,000 or over
1,562,855 99,224 414,426 465,760 261,706 321,739
1,502,454 99,224 414,130 408,910 260,644 319,546
278,220 43,790 126,990 32,962 28,203 46,275
114,455 - 17,227 13,753 36,073 47,402
62,827 - 2,741 9,410 21,953 28,723
51,628 - 14,486 4,343 14,120 18,679
1,128,729 55,434 273,604 363,802 197,492 238,397
21,025 218 3,588 13,594 1,568 2,057
1,107,704 55,216 270,016 350,208 195,924 236,340
Reserve 308,776 15,572 30,434 85,433 70,355 106,982
Retained earnings brought forward 798,928 39,644 239,582 264,775 125,569 129,358
-18,950 - -3,691 -1,607 -1,124 -12,528
60,401 - 296 56,850 1,062 2,193
- - - - - -
3,549,276 375,619 1,228,435 847,908 475,752 621,562
1,052 - 966 - 86 -
50,477 24,544 1,408 4,573 14,920 5,032
7,352 - - - 3,673 3,679
7,759,043 911,859 2,179,893 2,225,841 1,262,998 1,178,452
5,299,638 547,429 1,137,432 1,642,778 1,017,329 954,670
2,137,654 334,936 1,009,405 443,321 188,263 161,729
321,751 29,494 33,056 139,742 57,406 62,053
72,840 7,326 20,525 35,558 3,911 5,520
39,190 4,810 24,763 4,414 1,445 3,758
355,401 32,010 28,818 170,886 59,872 63,815
11,376 1,411 566 6,056 612 2,731
9,645 145 1,334 1,924 3,038 3,204
357,132 33,276 28,050 175,018 57,446 63,342
92,584 6,392 10,286 39,018 18,128 18,760
-3,314 149 741 -4,608 -64 468
267,862 26,735 17,023 140,608 39,382 44,114
4,129 - - - 1,328 2,801
39,747 - 74 11,211 10,851 17,611
42,721 10,064 13,534 9,269 4,811 5,043
- - - - - -
2,872,916 526,130 885,134 664,436 560,441 236,775
172,958 65,583 85,334 15,289 4,880 1,872
2,994 - 74 565 159 2,196
1,882,734 366,138 660,038 348,796 405,667 102,095
123,082 9,782 15,516 44,156 27,606 26,022
216,160 35,287 32,425 73,763 47,708 26,977
17,097 1,719 10,235 4,184 384 575
117,822 12,665 40,813 36,723 15,038 12,583
35,415 7,181 17,878 5,402 1,977 2,977
304,654 27,775 22,821 135,558 57,022 61,478
35,186 17,441 15,556 1,571 489 129
663,119 101,532 262,087 116,948 153,342 29,210
By capital
taxes and public charges
Net operating income
Number of directors (persons)
Number of employees (persons)
Directors' bonus
Employees' salaries
Employees' bonus
Welfare expenses
Interest expensesRental or leasing expenses for fixedand liquid assets
Interim dividend
Dividends
Depreciation expenses
Special depreciation expenses
Value added
Directors' remuneration
Special profits
Special losses
Net profits before tax
Income taxes-current
Income taxes-deferred
Net profits for the period
Cost of salesSelling and general administrationexpenses
Operating profits
Non-operating revenues
Non-operating expenses
Ordinary profits
Subscription rights to shares
Liabilities and net assets
Bills receivable discounted outstanding
Accounts receivable from subsidiariesand associates - tradeAccounts payable from subsidiaries andassociates - trade
Sales
Others capital surplus
Earned surplus
Legal retained earnings
Other earned surplus
Treasury stock
Others net assets
Net assets
Shareholders' equity
Capital stock
Capital surplus
Capital reserve
and Loss Table by Sector and by Size (continued)
Dispatching Services
By Size 183
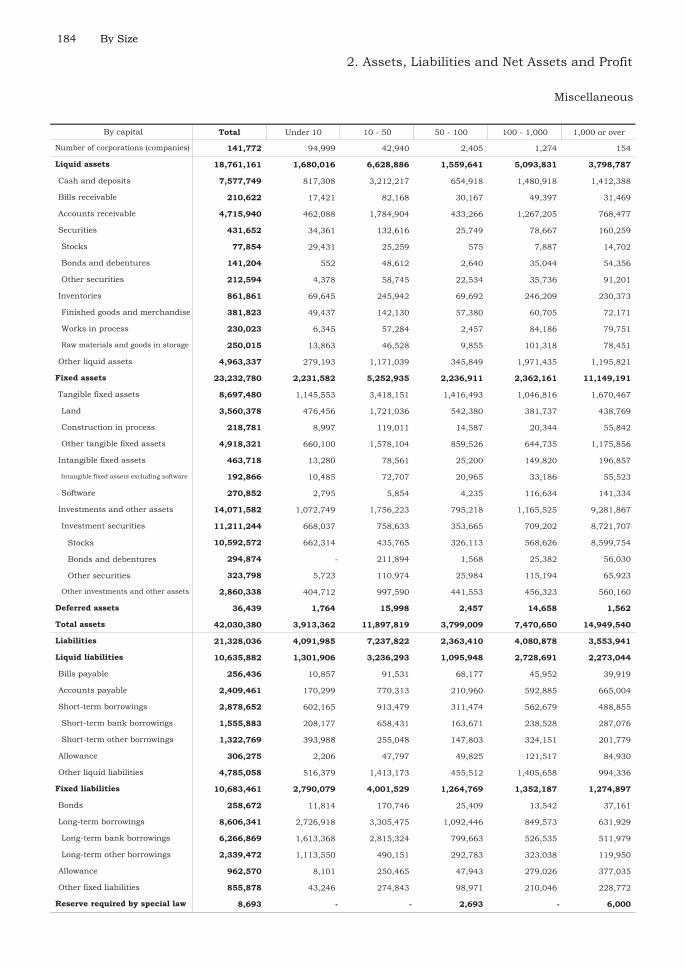
Total Under 10 10 - 50 50 - 100 100 - 1,000 1,000 or over
141,772 94,999 42,940 2,405 1,274 154
18,761,161 1,680,016 6,628,886 1,559,641 5,093,831 3,798,787
7,577,749 817,308 3,212,217 654,918 1,480,918 1,412,388
210,622 17,421 82,168 30,167 49,397 31,469
4,715,940 462,088 1,784,904 433,266 1,267,205 768,477
431,652 34,361 132,616 25,749 78,667 160,259
77,854 29,431 25,259 575 7,887 14,702
141,204 552 48,612 2,640 35,044 54,356
212,594 4,378 58,745 22,534 35,736 91,201
861,861 69,645 245,942 69,692 246,209 230,373
381,823 49,437 142,130 57,380 60,705 72,171
230,023 6,345 57,284 2,457 84,186 79,751
250,015 13,863 46,528 9,855 101,318 78,451
4,963,337 279,193 1,171,039 345,849 1,971,435 1,195,821
23,232,780 2,231,582 5,252,935 2,236,911 2,362,161 11,149,191
8,697,480 1,145,553 3,418,151 1,416,493 1,046,816 1,670,467
3,560,378 476,456 1,721,036 542,380 381,737 438,769
218,781 8,997 119,011 14,587 20,344 55,842
4,918,321 660,100 1,578,104 859,526 644,735 1,175,856
463,718 13,280 78,561 25,200 149,820 196,857
192,866 10,485 72,707 20,965 33,186 55,523
270,852 2,795 5,854 4,235 116,634 141,334
14,071,582 1,072,749 1,756,223 795,218 1,165,525 9,281,867
11,211,244 668,037 758,633 353,665 709,202 8,721,707
Stocks 10,592,572 662,314 435,765 326,113 568,626 8,599,754
Bonds and debentures 294,874 - 211,894 1,568 25,382 56,030
Other securities 323,798 5,723 110,974 25,984 115,194 65,923
2,860,338 404,712 997,590 441,553 456,323 560,160
36,439 1,764 15,998 2,457 14,658 1,562
42,030,380 3,913,362 11,897,819 3,799,009 7,470,650 14,949,540
21,328,036 4,091,985 7,237,822 2,363,410 4,080,878 3,553,941
10,635,882 1,301,906 3,236,293 1,095,948 2,728,691 2,273,044
256,436 10,857 91,531 68,177 45,952 39,919
2,409,461 170,299 770,313 210,960 592,885 665,004
2,878,652 602,165 913,479 311,474 562,679 488,855
1,555,883 208,177 658,431 163,671 238,528 287,076
1,322,769 393,988 255,048 147,803 324,151 201,779
306,275 2,206 47,797 49,825 121,517 84,930
4,785,058 516,379 1,413,173 455,512 1,405,658 994,336
10,683,461 2,790,079 4,001,529 1,264,769 1,352,187 1,274,897
258,672 11,814 170,746 25,409 13,542 37,161
8,606,341 2,726,918 3,305,475 1,092,446 849,573 631,929
6,266,869 1,613,368 2,815,324 799,663 526,535 511,979
2,339,472 1,113,550 490,151 292,783 323,038 119,950
962,570 8,101 250,465 47,943 279,026 377,035
855,878 43,246 274,843 98,971 210,046 228,772
8,693 - - 2,693 - 6,000Reserve required by special law
Bonds
Long-term borrowings
Long-term bank borrowings
Long-term other borrowings
Allowance
Other fixed liabilities
Short-term borrowings
Short-term bank borrowings
Short-term other borrowings
Allowance
Other liquid liabilities
Fixed liabilities
Deferred assets
Total assets
Liabilities
Liquid liabilities
Bills payable
Accounts payable
Intangible fixed assets
Intangible fixed assets excluding software
Software
Investments and other assets
Investment securities
Other investments and other assets
Other liquid assets
Fixed assets
Tangible fixed assets
Land
Construction in process
Other tangible fixed assets
Bonds and debentures
Other securities
Inventories
Finished goods and merchandise
Works in process
Raw materials and goods in storage
Liquid assets
Cash and deposits
Bills receivable
Accounts receivable
Securities
Stocks
2. Assets, Liabilities and Net Assets and Profit
Miscellaneous
By capital
Number of corporations (companies)
184 By Size

(Unit: millions of yen)
Total Under 10 10 - 50 50 - 100 100 - 1,000 1,000 or over
20,702,344 -178,623 4,659,997 1,435,599 3,389,772 11,395,599
20,527,359 -175,733 4,602,675 1,421,770 3,319,754 11,358,893
5,606,985 302,526 567,987 152,430 300,820 4,283,222
6,559,476 199,680 171,972 336,778 555,117 5,295,929
2,071,386 7,037 103,389 110,891 298,170 1,551,899
4,488,090 192,643 68,583 225,887 256,947 3,744,030
9,334,349 -677,622 3,888,041 936,562 2,514,850 2,672,518
325,705 12,965 49,961 10,823 222,007 29,949
9,008,644 -690,587 3,838,080 925,739 2,292,843 2,642,569
Reserve 4,252,072 270,027 2,066,549 610,243 814,534 490,719
Retained earnings brought forward 4,756,572 -960,614 1,771,531 315,496 1,478,309 2,151,850
-973,451 -317 -25,325 -4,000 -51,033 -892,776
172,170 -2,890 57,322 13,829 69,748 34,161
2,815 - - - 270 2,545
42,030,380 3,913,362 11,897,819 3,799,009 7,470,650 14,949,540
39,235 26,020 4,819 1,516 6,859 21
872,021 23,981 302,500 83,417 232,747 229,376
282,831 2,053 27,044 23,710 78,480 151,544
36,388,106 4,680,934 12,984,679 3,790,855 8,520,350 6,411,288
24,370,965 2,193,871 7,920,324 2,777,017 6,650,688 4,829,065
10,202,150 2,440,990 4,653,031 787,219 1,353,378 967,532
1,814,991 46,073 411,324 226,619 516,284 614,691
480,635 103,195 189,477 51,498 62,730 73,735
250,201 35,887 109,687 35,997 40,266 28,364
2,045,425 113,381 491,114 242,120 538,748 660,062
293,790 23,610 41,534 10,091 30,608 187,947
397,935 26,495 56,608 34,271 49,207 231,354
1,941,280 110,496 476,040 217,940 520,149 616,655
580,316 31,577 153,479 74,032 169,127 152,101
17,113 325 515 -26 -1,211 17,510
1,343,851 78,594 322,046 143,934 352,233 447,044
151,695 1,003 854 1,046 17,248 131,544
427,434 - 67,876 10,796 146,780 201,982
829,101 100,454 285,383 90,632 149,277 203,355
22,754 - 10,937 11,188 629 -
13,723,205 1,925,000 4,921,049 1,411,762 3,425,524 2,039,870
1,293,922 614,102 556,958 57,328 50,167 15,367
28,132 1,196 16,962 4,418 3,769 1,787
7,432,866 924,799 2,871,759 775,900 1,989,375 871,033
1,041,527 53,809 340,438 118,865 309,326 219,089
1,179,737 110,357 433,749 124,406 335,728 175,497
139,701 24,957 68,340 19,815 15,311 11,278
669,815 84,065 197,995 85,770 193,008 108,977
262,215 90,599 91,864 18,456 27,867 33,429
1,675,290 21,116 342,984 206,804 500,973 603,413
284,715 170,008 101,535 7,189 4,824 1,159
2,702,430 470,295 1,092,804 289,907 659,958 189,466
By capital
taxes and public charges
Net operating income
Number of directors (persons)
Number of employees (persons)
Directors' bonus
Employees' salaries
Employees' bonus
Welfare expenses
Interest expensesRental or leasing expenses for fixedand liquid assets
Interim dividend
Dividends
Depreciation expenses
Special depreciation expenses
Value added
Directors' remuneration
Special profits
Special losses
Net profits before tax
Income taxes-current
Income taxes-deferred
Net profits for the period
Cost of salesSelling and general administrationexpenses
Operating profits
Non-operating revenues
Non-operating expenses
Ordinary profits
Subscription rights to shares
Liabilities and net assets
Bills receivable discounted outstanding
Accounts receivable from subsidiariesand associates - tradeAccounts payable from subsidiaries andassociates - trade
Sales
Others capital surplus
Earned surplus
Legal retained earnings
Other earned surplus
Treasury stock
Others net assets
Net assets
Shareholders' equity
Capital stock
Capital surplus
Capital reserve
and Loss Table by Sector and by Size (continued)
Services
By Size 185

(Unit: millions of yen)
Total Under 10 10-100 100- 1,000 1,000 or over
2,823,889 1,805,081 986,869 26,053 5,886
915,111,823 66,622,871 236,691,924 88,126,412 523,670,616
477,194,707 52,028,357 158,177,609 53,928,632 213,060,109
190,344,243 19,039,649 77,988,054 21,142,593 72,173,947
18,659,954 1,652,820 3,396,217 1,319,408 12,291,509
268,190,510 31,335,888 76,793,338 31,466,631 128,594,653
23,805,658 504,568 3,918,384 2,984,878 16,397,828
12,329,169 390,395 2,942,410 1,525,514 7,470,850
11,476,489 114,173 975,974 1,459,364 8,926,978
414,111,458 14,089,946 74,595,931 31,212,902 294,212,679
278,094,092 4,385,310 37,140,312 15,718,099 220,850,371
Stocks 251,416,203 3,380,924 26,116,358 13,023,787 208,895,134
Bonds and debentures 10,430,271 86,031 2,657,874 972,094 6,714,272
Other securities 16,247,618 918,355 8,366,080 1,722,218 5,240,965
136,017,366 9,704,636 37,455,619 15,494,803 73,362,308
787,518,479 17,466,428 187,473,010 83,638,623 498,940,418
729,509,490 17,466,555 185,898,905 80,695,249 445,448,781
139,349,054 6,144,317 17,546,053 6,538,100 109,120,584
183,341,364 2,483,008 39,166,971 16,551,551 125,139,834
114,537,077 860,718 18,112,181 7,497,782 88,066,396
68,804,287 1,622,290 21,054,790 9,053,769 37,073,438
429,215,689 8,946,386 132,582,599 59,045,133 228,641,571
14,498,601 490,870 3,644,475 1,667,623 8,695,633
414,717,088 8,455,516 128,938,124 57,377,510 219,945,938
Reserve 231,703,481 6,564,111 80,270,442 33,039,111 111,829,817
Retained earnings brought forward 183,013,607 1,891,405 48,667,682 24,338,399 108,116,121
-22,396,617 -107,156 -3,396,718 -1,439,535 -17,453,208
57,714,381 -127 1,567,114 2,936,856 53,210,538
294,608 0 6,991 6,518 281,099
80,896,265 2,648,640 15,958,106 10,542,575 51,746,944
11,547,657 1,171,838 2,973,184 1,154,343 6,248,292
20,332,314 995,975 5,364,347 1,925,639 12,046,353
72,111,608 2,824,503 13,566,943 9,771,279 45,948,883
20,973,793 998,447 5,168,161 3,419,583 11,387,602
1,106,377 19,316 79,457 144,796 862,808
50,031,438 1,806,740 8,319,325 6,206,900 33,698,473
7,267,288 1,005 89,162 772,030 6,405,091
19,124,332 92,266 1,698,599 2,730,134 14,603,333
39,819,827 4,814,469 10,552,491 5,070,324 19,382,543
1,621,688 165,606 1,247,637 118,381 90,064
25,021,736 10,581,624 12,486,029 1,082,297 871,786
705,726 75,057 398,746 108,180 123,743
135,012,221 17,301,101 56,355,241 22,588,076 38,767,803
23,573,605 946,937 7,484,629 4,626,105 10,515,934
24,221,349 1,658,846 7,915,387 4,546,578 10,100,538
29,479,680 3,394,521 10,409,122 5,142,325 10,533,712
11,682,613 1,678,958 3,557,368 951,950 5,494,337
5,338,356 2,840,043 2,335,683 108,132 54,498
41,931,328 7,472,983 19,339,566 6,440,124 8,678,655
Note Investments and other assets do not contain the amounts for Banking and Insurance.
2. Assets, Liabilities and Net Assets and Profit and Loss Table by Sector and by Size (continued)
All Industries (including Finance and Insurance)
By capital
Number of corporations (companies)
Fixed assets
Tangible fixed assets
Land
Construction in process
Other tangible fixed assets
Intangible fixed assets
Intangible fixed assets excluding software
Software
Investments and other assets
Investment securities
Other investments and other assets
Net assets
Shareholders' equity
Capital stock
Capital surplus
Capital reserve
Others capital surplus
Earned surplus
Legal retained earnings
Other earned surplus
Treasury stock
Others net assets
Subscription rights to shares
Ordinary profits
Special profits
Special losses
Net profits before tax
Income taxes-current
Income taxes-deferred
Net profits for the period
Interim dividend
Dividends
Depreciation expenses
Special depreciation expenses
Directors' remuneration
Directors' bonus
Number of employees (persons)
Employees' salaries
Employees' bonus
Welfare expenses
Rental or leasing expenses for fixed and liquid assets
Taxes and public charges
Number of directors (persons)
186 By Size

(Unit: millions of yen)
Total Under 10 10-100 100- 1,000 1,000 or over
57,921 47,164 8,754 1,191 812
39,098,417 3,595,062 4,490,657 4,192,497 26,820,201
19,545,062 957,281 923,554 594,018 17,070,209
11,442,321 440,126 545,385 302,728 10,154,082
221,007 10,068 6,654 3,739 200,546
7,881,734 507,087 371,515 287,551 6,715,581
4,467,314 5,078 31,646 93,607 4,336,983
1,623,276 3,906 15,905 11,986 1,591,479
2,844,038 1,172 15,741 81,621 2,745,504
15,086,041 2,632,703 3,535,457 3,504,872 5,413,009
9,140,290 1,495,112 2,764,751 1,393,507 3,486,920
Stocks 6,630,027 1,209,568 2,053,436 1,201,419 2,165,604
Bonds and debentures 1,463,114 64,180 231,048 129,383 1,038,503
Other securities 1,047,149 221,364 480,267 62,705 282,813
5,945,751 1,137,591 770,706 2,111,365 1,926,089
151,208,086 1,895,915 3,898,158 6,080,840 139,333,173
114,971,577 1,882,911 3,812,429 5,476,830 103,799,407
34,381,989 136,122 201,274 375,519 33,669,074
32,352,441 1,987,175 2,120,993 1,825,980 26,418,293
20,733,892 741,288 541,979 1,042,371 18,408,254
11,618,549 1,245,887 1,579,014 783,609 8,010,039
51,346,805 -239,383 1,854,505 3,293,325 46,438,358
4,399,911 48,863 58,106 122,379 4,170,563
46,946,894 -288,246 1,796,399 3,170,946 42,267,795
Reserve 23,997,955 787,482 1,011,568 2,420,627 19,778,278
Retained earnings brought forward 22,948,939 -1,075,728 784,831 750,319 22,489,517
-3,109,658 -1,003 -364,343 -17,994 -2,726,318
36,220,626 13,004 85,723 603,406 35,518,493
15,883 0 6 604 15,273
12,676,181 219,310 389,755 556,086 11,511,030
636,929 100,681 63,887 97,990 374,371
1,768,694 225,825 179,716 52,338 1,310,815
11,544,416 94,166 273,926 601,738 10,574,586
3,186,870 28,102 121,927 143,980 2,892,861
157,631 526 -2,448 -59 159,612
8,199,915 65,538 154,447 457,817 7,522,113
978,597 0 16,172 28,818 933,607
3,202,466 8,755 243,854 145,480 2,804,377
1,684,650 65,735 33,071 57,751 1,528,093
2,494 86 2,155 232 21
478,235 228,344 92,665 44,829 112,397
33,463 1,364 4,919 7,096 20,084
6,260,578 175,095 288,507 375,651 5,421,325
1,756,636 12,643 55,561 100,278 1,588,154
1,782,940 23,377 53,475 94,953 1,611,135
1,094,439 91,664 49,950 54,240 898,585
1,101,544 35,578 22,009 31,889 1,012,068
95,133 64,248 17,627 5,036 8,222
1,401,397 73,661 84,135 90,573 1,153,028
107,184 50,515 13,092 5,900 37,677
Note Investments and other assets do not contain the amounts for Banking and Insurance.
2. Assets, Liabilities and Net Assets and Profit and Loss Table by Sector and by Size (continued)
Finance and Insurance
By capital
Number of corporations (companies)
Fixed assets
Tangible fixed assets
Land
Construction in process
Other tangible fixed assets
Intangible fixed assets
Intangible fixed assets excluding software
Software
Investments and other assets
Investment securities
Other investments and other assets
Net assets
Shareholders' equity
Capital stock
Capital surplus
Capital reserve
Others capital surplus
Earned surplus
Legal retained earnings
Other earned surplus
Treasury stock
Others net assets
Subscription rights to shares
Ordinary profits
Special profits
Special losses
Net profits before tax
Taxes and public charges
Income taxes-current
Income taxes-deferred
Net profits for the period
Interim dividend
Dividends
Depreciation expenses
Number of directors (persons)
Special depreciation expenses
Directors' remuneration
Directors' bonus
Number of employees (persons)
Number of sales offices (locations)
Employees' salaries
Employees' bonus
Welfare expenses
Rental or leasing expenses for fixed and liquid assets
By Size 187

Total Under 10 10-100 100- 1,000 1,000 or over
638 - 25 201 412
358,421,921 - 336,022 9,658,960 348,426,939
34,557,010 - 2,845 48,606 34,505,559
19,672,325 - 0 1,199 19,671,126
10,109,056 - 1,000 27,434 10,080,622
548,703,569 - 428,527 12,776,627 535,498,415
695,675,650 - 200,005 15,431,613 680,044,032
5,448,289 - 0 1,069 5,447,220
32,139,177 - 4,888 254,903 31,879,386
9,567,593 - 675 421,791 9,145,127
5,611,403 - 167 216,716 5,394,520
136,576 - 0 2,658 133,918
3,819,614 - 508 202,417 3,616,689
2,163,764 - 133 6,595 2,157,036
731,346 - 30 3,210 728,106
1,432,418 - 103 3,385 1,428,930
287,278 - 0 9,268 278,010
22,404,413 - 416 80,849 22,323,148
-5,287,325 - -1,018 -263,703 -5,022,604
1,733,862,720 - 973,493 38,455,211 1,694,434,016
1,636,639,192 - 871,369 35,626,496 1,600,141,327
1,345,331,101 - 853,878 34,932,806 1,309,544,417
89,330,744 - 0 199 89,330,545
14,889,876 - 0 0 14,889,876
61,143,771 - 7,832 301,431 60,834,508
4,759,887 - 0 47 4,759,840
21,306,919 - 0 0 21,306,919
37,489,781 - 0 0 37,489,781
32,387,375 - 2,015 122,950 32,262,410
1,713,696 - 1,622 77,415 1,634,659
208 - 0 188 20
5,881,354 - 5,606 110,544 5,765,204
22,404,480 - 416 80,916 22,323,148
97,223,528 - 102,124 2,828,715 94,292,689
78,302,273 - 85,743 2,420,497 75,796,033
23,405,142 - 1,213 104,625 23,299,304
19,369,446 - 0 1,351 19,368,095
13,233,445 - 0 1,351 13,232,094
6,136,001 - 0 0 6,136,001
38,037,636 - 84,530 2,314,603 35,638,503
3,823,964 - 1,367 96,047 3,726,550
34,213,672 - 83,163 2,218,556 31,911,953
2. Assets, Liabilities and Net Assets and Profit
Banking
By capital
Number of corporations (companies)
Cash and due from banks
Call loans, Receivables under resale agreements
Trading assets, Trading account securities
Money held in trust
Securities
Loans and bills discounted
Foreign exchanges
Other assets
Tangible fixed assets
Land
Construction in progress
Other tangible fixed assets
Intangible fixed assets
Intangible fixed assets excluding software
Software
Deferred tax assets
Customers liabilities for acceptances and guarantees
Allowance for loan losses
Total assets
Liabilities
Deposits
Call money, Payables under repurchase agreements
Trading liabilities
Borrowed money
Foreign exchanges
Bonds
Borrowed money from trust account
Other liabilities
Allowance
Reserve required by special law
Deferred tax liabilities
Acceptances and guarantees
Net assets
Shareholders' equity
Capital stock
Capital surplus
Capital reserves
Others capital surplus
Earned surplus
Legal retained earnings
Other earned surplus
188 By Size
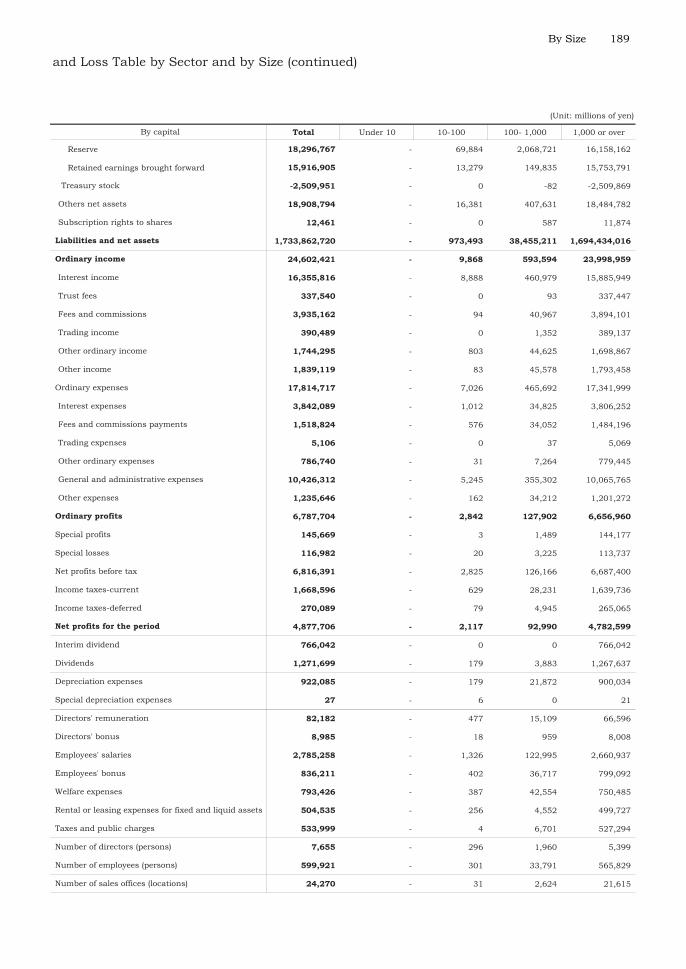
(Unit: millions of yen)
Total Under 10 10-100 100- 1,000 1,000 or over
Reserve 18,296,767 - 69,884 2,068,721 16,158,162
Retained earnings brought forward 15,916,905 - 13,279 149,835 15,753,791
-2,509,951 - 0 -82 -2,509,869
18,908,794 - 16,381 407,631 18,484,782
12,461 - 0 587 11,874
1,733,862,720 - 973,493 38,455,211 1,694,434,016
24,602,421 - 9,868 593,594 23,998,959
16,355,816 - 8,888 460,979 15,885,949
337,540 - 0 93 337,447
3,935,162 - 94 40,967 3,894,101
390,489 - 0 1,352 389,137
1,744,295 - 803 44,625 1,698,867
1,839,119 - 83 45,578 1,793,458
17,814,717 - 7,026 465,692 17,341,999
3,842,089 - 1,012 34,825 3,806,252
1,518,824 - 576 34,052 1,484,196
5,106 - 0 37 5,069
786,740 - 31 7,264 779,445
10,426,312 - 5,245 355,302 10,065,765
1,235,646 - 162 34,212 1,201,272
6,787,704 - 2,842 127,902 6,656,960
145,669 - 3 1,489 144,177
116,982 - 20 3,225 113,737
6,816,391 - 2,825 126,166 6,687,400
1,668,596 - 629 28,231 1,639,736
270,089 - 79 4,945 265,065
4,877,706 - 2,117 92,990 4,782,599
766,042 - 0 0 766,042
1,271,699 - 179 3,883 1,267,637
922,085 - 179 21,872 900,034
27 - 6 0 21
82,182 - 477 15,109 66,596
8,985 - 18 959 8,008
2,785,258 - 1,326 122,995 2,660,937
836,211 - 402 36,717 799,092
793,426 - 387 42,554 750,485
504,535 - 256 4,552 499,727
533,999 - 4 6,701 527,294
7,655 - 296 1,960 5,399
599,921 - 301 33,791 565,829
24,270 - 31 2,624 21,615
Treasury stock
Others net assets
and Loss Table by Sector and by Size (continued)
By capital
Subscription rights to shares
Liabilities and net assets
Ordinary income
Interest income
Trust fees
Fees and commissions
Trading income
Other ordinary income
Other income
Ordinary expenses
Interest expenses
Fees and commissions payments
Trading expenses
Other ordinary expenses
General and administrative expenses
Other expenses
Ordinary profits
Special profits
Special losses
Net profits before tax
Income taxes-current
Income taxes-deferred
Net profits for the period
Interim dividend
Dividends
Depreciation expenses
Special depreciation expenses
Directors' remuneration
Directors' bonus
Employees' salaries
Number of sales offices (locations)
Employees' bonus
Welfare expenses
Rental or leasing expenses for fixed and liquid assets
Taxes and public charges
Number of directors (persons)
Number of employees (persons)
By Size 189

Total Under 10 10-100 100- 1,000 1,000 or over
14,173 11,169 2,576 313 115
74,230,308 3,385,504 12,950,151 8,200,905 49,693,748
5,554,049 871,030 1,318,635 1,192,407 2,171,977
14,770,325 135,770 2,076,453 3,474,562 9,083,540
12,636,244 2,654 354,011 1,714,435 10,565,144
24,560,486 6 4,648,196 83,458 19,828,826
2,705,624 1,241,693 604,560 193,918 665,453
685,983 617,382 18,429 46,472 3,700
949,250 500,921 14,859 5,806 427,664
1,070,391 123,390 571,272 141,640 234,089
320,594 230,431 45,908 34,723 9,532
13,682,986 903,920 3,902,388 1,507,402 7,369,276
10,785,587 1,876,832 1,675,496 3,052,308 4,180,951
1,677,220 712,162 429,999 85,594 449,465
765,244 317,265 257,537 46,652 143,790
9,951 7,409 867 331 1,344
902,025 387,488 171,595 38,611 304,331
755,683 2,232 19,589 63,080 670,782
230,116 1,599 8,901 2,580 217,036
525,567 633 10,688 60,500 453,746
8,352,684 1,162,438 1,225,908 2,903,634 3,060,704
3,564,327 292,018 674,802 958,629 1,638,878
2,355,235 218,313 393,433 843,604 899,885
963,205 0 205,417 83,712 674,076
245,887 73,705 75,952 31,313 64,917
4,788,357 870,420 551,106 1,945,005 1,421,826
4,563 105 2,009 245 2,204
475,177 20 123,358 82,047 269,752
-1,144,535 -14,359 -196,944 -214,739 -718,493
84,351,100 5,248,102 14,554,070 11,120,766 53,428,162
75,117,871 4,287,860 12,799,849 9,217,359 48,812,803
60,190,675 1,937,916 11,725,933 6,436,068 40,090,758
25,502,129 6,529 4,604,503 263,373 20,627,724
17,002,520 746,504 3,170,075 3,910,446 9,175,495
8,770,464 198,895 724,526 1,271,104 6,575,939
8,232,056 547,609 2,445,549 2,639,342 2,599,556
873,000 179,859 289,306 143,125 260,710
16,813,026 1,005,024 3,662,049 2,119,124 10,026,829
14,821,942 2,349,937 1,061,226 2,753,495 8,657,284
1,911,399 124,720 23,105 4,872 1,758,702
10,445,830 1,168,724 919,851 2,338,173 6,019,082
6,840,414 204,634 433,919 756,036 5,445,825
3,605,416 964,090 485,932 1,582,137 573,257
1,112,999 72,027 70,492 328,346 642,134
1,351,714 984,466 47,778 82,104 237,366
0 0 0 0 0
Other fixed liabilities
Reserve required by special law
Fixed liabilities
Bonds
Long-term borrowings
Long-term bank borrowings
Long-term other borrowings
Allowance
Acceptances and guarantees Credit Guarantees Payable
Short-term borrowings
Short-term bank borrowings
Short-term other borrowings
Allowance
Other liquid liabilities
Deferred assets
Deferred tax assets
Allowance for loan losses
Total assets
Liabilities
Liquid assets
Investments and other assets
Investment securities
Stocks
Bonds and debentures
Other securities
Other investments and other assets
Land
Construction in process
Other tangible fixed assets
Intangible fixed assets
Intangible fixed assets excluding software
Software
Bonds and debentures
Other securities
Finished goods and merchandise
Other liquid assets
Fixed assets
Tangible fixed assets
Cash and deposits
Accounts receivable - operating loans
Accounts receivable - installmentCustomers' liabilities for acceptances and guaranteesCredit Guarantees Receivables
Securities
Stocks
2. Assets, Liabilities and Net Assets and Profit
Non-Deposit Money Corporations, Including
By capital
Number of corporations (companies)
Liquid assets
190 By Size
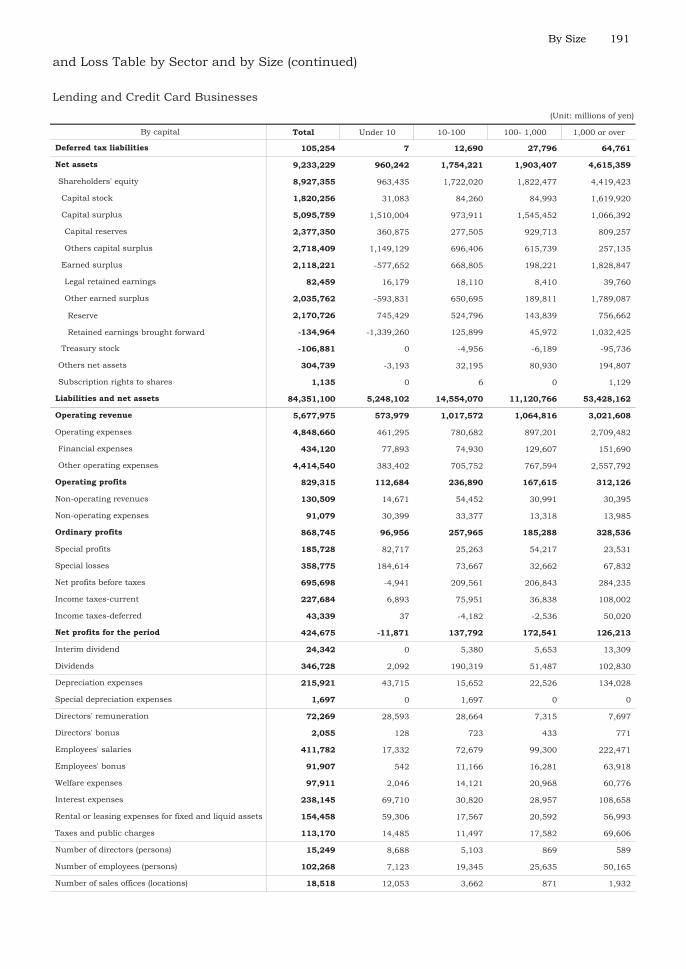
(Unit: millions of yen)
Total Under 10 10-100 100- 1,000 1,000 or over
105,254 7 12,690 27,796 64,761
9,233,229 960,242 1,754,221 1,903,407 4,615,359
8,927,355 963,435 1,722,020 1,822,477 4,419,423
1,820,256 31,083 84,260 84,993 1,619,920
5,095,759 1,510,004 973,911 1,545,452 1,066,392
2,377,350 360,875 277,505 929,713 809,257
2,718,409 1,149,129 696,406 615,739 257,135
2,118,221 -577,652 668,805 198,221 1,828,847
82,459 16,179 18,110 8,410 39,760
2,035,762 -593,831 650,695 189,811 1,789,087
Reserve 2,170,726 745,429 524,796 143,839 756,662
Retained earnings brought forward -134,964 -1,339,260 125,899 45,972 1,032,425
-106,881 0 -4,956 -6,189 -95,736
304,739 -3,193 32,195 80,930 194,807
1,135 0 6 0 1,129
84,351,100 5,248,102 14,554,070 11,120,766 53,428,162
5,677,975 573,979 1,017,572 1,064,816 3,021,608
4,848,660 461,295 780,682 897,201 2,709,482
434,120 77,893 74,930 129,607 151,690
4,414,540 383,402 705,752 767,594 2,557,792
829,315 112,684 236,890 167,615 312,126
130,509 14,671 54,452 30,991 30,395
91,079 30,399 33,377 13,318 13,985
868,745 96,956 257,965 185,288 328,536
185,728 82,717 25,263 54,217 23,531
358,775 184,614 73,667 32,662 67,832
695,698 -4,941 209,561 206,843 284,235
227,684 6,893 75,951 36,838 108,002
43,339 37 -4,182 -2,536 50,020
424,675 -11,871 137,792 172,541 126,213
24,342 0 5,380 5,653 13,309
346,728 2,092 190,319 51,487 102,830
215,921 43,715 15,652 22,526 134,028
1,697 0 1,697 0 0
72,269 28,593 28,664 7,315 7,697
2,055 128 723 433 771
411,782 17,332 72,679 99,300 222,471
91,907 542 11,166 16,281 63,918
97,911 2,046 14,121 20,968 60,776
238,145 69,710 30,820 28,957 108,658
154,458 59,306 17,567 20,592 56,993
113,170 14,485 11,497 17,582 69,606
15,249 8,688 5,103 869 589
102,268 7,123 19,345 25,635 50,165
18,518 12,053 3,662 871 1,932
Number of directors (persons)
Number of employees (persons)
Number of sales offices (locations)
Employees' salaries
Employees' bonus
Welfare expenses
Interest expenses
Rental or leasing expenses for fixed and liquid assets
Taxes and public charges
Interim dividend
Dividends
Depreciation expenses
Special depreciation expenses
Directors' remuneration
Directors' bonus
Special profits
Special losses
Net profits before taxes
Income taxes-current
Income taxes-deferred
Net profits for the period
Financial expenses
Other operating expenses
Operating profits
Non-operating revenues
Non-operating expenses
Ordinary profits
Treasury stock
Others net assets
Subscription rights to shares
Liabilities and net assets
Operating revenue
Operating expenses
Capital surplus
Capital reserves
Others capital surplus
Earned surplus
Legal retained earnings
Other earned surplus
Deferred tax liabilities
Net assets
Shareholders' equity
Capital stock
and Loss Table by Sector and by Size (continued)
Lending and Credit Card Businesses
By capital
By Size 191

Total Under 10 10-100 100- 1,000 1,000 or over
207 - - 109 98
123,358,674 - - 504,932 122,853,742
7,607,080 - - 116,263 7,490,817
4,807,230 - - 178,846 4,628,384
44,891,492 - - 15,655 44,875,837
1,111,635 - - 3,005 1,108,630
3,136,081 - - 129,654 3,006,427
54,349,762 - - 0 54,349,762
46,052 - - 521 45,531
5,999,495 - - 36,266 5,963,229
646,326 - - 7,520 638,806
763,521 - - 17,202 746,319
1,755,601 - - 136,082 1,619,519
173,259 - - 20,692 152,567
45,375 - - 10,163 35,212
4,515 - - 352 4,163
123,369 - - 10,177 113,192
375,144 - - 899 374,245
168,383 - - 350 168,033
206,761 - - 549 206,212
1,207,198 - - 114,491 1,092,707
901,203 - - 103,964 797,239
773,636 - - 103,359 670,277
47,582 - - 6 47,576
79,985 - - 599 79,386
305,995 - - 10,527 295,468
72 - - 2 70
171,011 - - 1,555 169,456
-33,438 - - -1,439 -31,999
125,251,920 - - 641,132 124,610,788
117,914,341 - - 367,079 117,547,262
111,860,080 - - 326,912 111,533,168
32,248,324 - - 4,001 32,244,323
301,573 - - 1,334 300,239
1,110,775 - - 76,870 1,033,905
57,287,681 - - 0 57,287,681
3,195,661 - - 102,940 3,092,721
4,901,168 - - 90,832 4,810,336
9,806,228 - - 24,070 9,782,158
157,443 - - 3,560 153,883
2,851,227 - - 23,305 2,827,922
5,852,827 - - 13,994 5,838,833
1,848,042 - - 340 1,847,702
3,582,360 - - 287 3,582,073
147,620 - - 8,905 138,715
274,805 - - 4,462 270,343
Allowance
Other fixed liabilities
Short-term borrowings
Allowance
Other liquid liabilities
Fixed liabilities
Bonds
Long-term borrowings
Trading products
Trade date accrual
Margin transaction liabilities
Loans payable secured by securities
Deposits received
Guarantee deposits received
Deferred assets
Deferred tax assets
Allowance for doubtful accounts
Total assets
Liabilities
Liquid liabilities
Investments and other assets
Investment securities
Stocks
Bonds and debentures
Other securities
Other investments and other assets
Land
Construction in process
Other tangible fixed assets
Intangible fixed assets
Intangible fixed assets excluding software
Software
Advances paid
Short-term guarantee deposits
Short-term loans receivable
Other liquid assets
Fixed assets
Tangible fixed assets
Cash and deposits
Cash segregated as deposits
Trading products
Trade date accrual
Margin transaction assets
Loans secured by securities
2. Assets, Liabilities and Net Assets and Profit
Finance Products
By capital
Number of corporations (companies)
Liquid assets
192 By Size

(Unit: millions of yen)
Total Under 10 10-100 100- 1,000 1,000 or over
120,113 - - 704 119,409
81,321 - - 25,469 55,852
7,337,579 - - 274,053 7,063,526
7,141,675 - - 212,097 6,929,578
1,757,669 - - 38,795 1,718,874
3,146,988 - - 18,896 3,128,092
1,877,187 - - 12,613 1,864,574
1,269,801 - - 6,283 1,263,518
2,299,337 - - 160,877 2,138,460
32,275 - - 9,515 22,760
2,267,062 - - 151,362 2,115,700
Reserve 462,434 - - 105,096 357,338
Retained earnings brought forward 1,804,628 - - 46,266 1,758,362
-62,319 - - -6,471 -55,848
194,699 - - 61,944 132,755
1,205 - - 12 1,193
125,251,920 - - 641,132 124,610,788
3,844,885 - - 89,087 3,755,798
365,015 - - 1,680 363,335
2,646,652 - - 79,878 2,566,774
833,218 - - 7,529 825,689
44,352 - - 3,073 41,279
7,945 - - 377 7,568
869,625 - - 10,225 859,400
52,107 - - 4,515 47,592
37,598 - - 3,019 34,579
884,134 - - 11,721 872,413
235,407 - - 4,370 231,037
39,493 - - 60 39,433
609,234 - - 7,291 601,943
66,888 - - 67 66,821
245,518 - - 2,056 243,462
92,163 - - 1,488 90,675
0 - - 0 0
16,837 - - 4,627 12,210
6,994 - - 869 6,125
591,103 - - 25,611 565,492
203,877 - - 5,823 198,054
132,792 - - 6,225 126,567
77,874 - - 568 77,306
169,260 - - 4,335 164,925
38,081 - - 1,164 36,917
1,276 - - 520 756
80,481 - - 5,173 75,308
2,188 - - 364 1,824
Number of directors (persons)
Number of employees (persons)
Number of sales offices (locations)
Employees' salaries
Employees' bonus
Welfare expenses
Interest expenses
Rental or leasing expenses for fixed and liquid assets
Taxes and public charges
Interim dividend
Dividends
Depreciation expenses
Special depreciation expenses
Directors' remuneration
Directors' bonus
Special profits
Special losses
Net profits before tax
Income taxes-current
Income taxes-deferred
Net profits for the period
Financial expenses
Selling and general administration expenses
Operating profits
Non-operating revenues
Non-operating expenses
Ordinary profits
Other earned surplus
Treasury stock
Others net assets
Subscription rights to shares
Liabilities and net assets
Operating revenue
Capital stock
Capital surplus
Capital reserves
Others capital surplus
Earned surplus
Legal retained earnings
Reserve required by special law
Deferred tax liabilities
Net assets
Shareholders' equity
and Loss Table by Sector and by Size (continued)
Transaction Dealers
By capital
By Size 193

Total Under 10 10-100 100- 1,000 1,000 or over
8,725 6,697 1,536 381 111
58,707,415 533,983 1,084,411 1,482,134 55,606,887
4,293,679 188,271 435,556 665,041 3,004,811
456,686 186,727 194 373 269,392
392,643 58,927 31,557 99,420 202,739
7,200,292 69,039 156,243 110,905 6,864,105
1,275,430 63,217 42,584 44,223 1,125,406
2,774,256 0 6,404 38,029 2,729,823
3,150,606 5,822 107,255 28,653 3,008,876
95,969 4,680 11,328 74,512 5,449
53,232 4,311 6,802 38,463 3,656
42,737 369 4,526 36,049 1,793
28,718,324 401 308,272 91,684 28,317,967
17,549,822 25,938 141,261 440,199 16,942,424
5,134,555 1,209,051 2,094,068 477,943 1,353,493
370,296 38,717 233,222 40,027 58,330
208,781 23,062 143,379 16,397 25,943
6,227 0 2,735 215 3,277
155,288 15,655 87,108 23,415 29,110
81,744 170 4,694 10,155 66,725
17,808 43 3,490 886 13,389
63,936 127 1,204 9,269 53,336
4,682,515 1,170,164 1,856,152 427,761 1,228,438
3,948,280 945,065 1,696,382 285,331 1,021,502
2,888,632 751,382 1,354,446 215,160 567,644
431,569 55,810 16,345 44,066 315,348
628,079 137,873 325,591 26,105 138,510
734,235 225,099 159,770 142,430 206,936
1,095 267 82 361 385
84,829 425 7,297 25,379 51,728
-132,381 -681 -17,871 -53,286 -60,543
63,795,513 1,743,045 3,167,987 1,932,531 56,951,950
57,166,318 1,031,653 1,849,043 1,040,594 53,245,028
54,690,314 517,317 557,578 873,607 52,741,812
66 0 66 0 0
749,914 21,445 34,996 80,416 613,057
36,544,562 445,892 297,075 86,877 35,714,718
5,114,678 20,242 115,414 35,345 4,943,677
31,429,884 425,650 181,661 51,532 30,771,041
196,887 3,567 7,512 37,410 148,398
17,198,885 46,413 217,929 668,904 16,265,639
2,172,300 505,130 1,280,478 144,024 242,668
156,037 96,922 44,376 7,332 7,407
1,203,313 314,643 760,876 90,362 37,432
417,911 188,467 151,161 60,060 18,223
785,402 126,176 609,715 30,302 19,209
84,198 0 19,876 17,135 47,187
Long-term bank borrowings
Long-term other borrowings
Allowance
Long-term other borrowings
Allowance
Other liquid liabilities
Fixed liabilities
Bonds
Long-term borrowings
Liabilities
Liquid liabilities
Bills payable
Accounts payable
Short-term borrowings
Long-term bank borrowings
Other securities
Other investments and other assets
Deferred assets
Deferred tax assets
Allowance for loan losses
Total assets
Intangible fixed assets excluding software
Software
Investments and other assets
Investment securities
Stocks
Bonds and debentures
Fixed assets
Tangible fixed assets
Land
Construction in process
Other tangible fixed assets
Intangible fixed assets
Other securities
Inventories
Finished goods and merchandise
Other inventories
Short-term loans receivable
Other liquid assets
Cash and deposits
Bills receivable
Accounts receivable
Securities
Stocks
Bonds and debentures
2. Assets, Liabilities and Net Assets and Profit
Futures Commodity
By capital
Number of corporations (companies)
Liquid assets
194 By Size

(Unit: millions of yen)
Total Under 10 10-100 100- 1,000 1,000 or over
728,752 93,565 455,350 29,195 150,642
11,810 0 0 1,176 10,634
291,894 9,206 10,987 21,787 249,914
6,629,195 711,392 1,318,944 891,937 3,706,922
5,962,278 695,486 1,293,240 850,770 3,122,782
1,034,442 20,509 41,829 107,015 865,089
2,311,067 472,623 1,077,618 220,513 540,313
1,129,608 380,351 218,382 80,831 450,044
1,181,459 92,272 859,236 139,682 90,269
3,009,489 202,363 529,885 528,421 1,748,820
93,984 28,250 25,495 6,867 33,372
2,915,505 174,113 504,390 521,554 1,715,448
Reserve 1,095,785 13,203 162,857 80,934 838,791
Retained earnings brought forward 1,819,720 160,910 341,533 440,620 876,657
-392,720 -9 -356,092 -5,179 -31,440
666,783 15,906 25,704 41,166 584,007
134 0 0 1 133
63,795,513 1,743,045 3,167,987 1,932,531 56,951,950
20 0 20 0 0
2,659,545 197,924 360,593 617,328 1,483,700
1,169,424 99,264 104,928 181,951 783,281
892,756 50,186 183,514 263,005 396,051
597,365 48,474 72,151 172,372 304,368
160,179 49,135 33,567 29,635 47,842
104,463 25,167 59,072 10,048 10,176
653,081 72,442 46,646 191,959 342,034
110,568 14,560 33,047 35,459 27,502
157,331 36,171 102,499 10,804 7,857
606,318 50,831 -22,806 216,614 361,679
185,362 9,454 18,799 59,697 97,412
-1,240 -70 464 -3,211 1,577
422,196 41,447 -42,069 160,128 262,690
35,292 0 9,410 20,008 5,874
325,790 5,789 31,669 77,362 210,970
41,478 2,633 4,996 6,401 27,448
87 0 87 0 0
54,295 13,850 17,289 13,220 9,936
9,403 77 2,608 4,222 2,496
240,571 10,727 45,748 73,835 110,261
82,066 566 12,849 31,643 37,008
50,387 1,277 9,058 14,369 25,683
31,531 9,616 10,880 2,975 8,060
47,978 2,844 6,807 15,589 22,738
22,031 1,575 3,873 5,052 11,531
9,499 5,004 2,603 1,133 759
43,782 4,234 11,859 11,921 15,768
9,965 6,851 2,113 695 306
Interest expenses
Rental or leasing expenses for fixed and liquid assets
Taxes and public charges
Number of directors (persons)
Number of employees (persons)
Number of sales offices (locations)
Special depreciation expenses
Directors' remuneration
Directors' bonus
Employees' salaries
Employees' bonus
Welfare expenses
Income taxes-current
Income taxes-deferred
Net profits for the period
Interim dividend
Dividends
Depreciation expenses
Non-operating revenues
Non-operating expenses
Ordinary profits
Special profits
Special losses
Net profits before tax
Liabilities and net assets
Bills receivable discounted outstanding
Operating revenue
Operating expenses
Selling and general administration expenses
Operating profits
Earned surplus
Legal retained earnings
Other earned surplus
Treasury stock
Others net assets
Subscription rights to shares
Net assets
Shareholders' equity
Capital stock
Capital surplus
Capital reserves
Others capital surplus
Other fixed liabilities
Reserve required by special law
Deferred tax liabilities
and Loss Table by Sector and by Size (continued)
Transaction Dealers etc.
By capital
By Size 195

Total Under 10 10-100 100- 1,000 1,000 or over
68 - - - 68
9,146,794 - - - 9,146,794
7,406,337 - - - 7,406,337
5,999 - - - 5,999
3,899,704 - - - 3,899,704
314,257,096 - - - 314,257,096
35,940,520 - - - 35,940,520
7,263,811 - - - 7,263,811
4,554,617 - - - 4,554,617
57,843 - - - 57,843
2,651,351 - - - 2,651,351
1,063,053 - - - 1,063,053
463,465 - - - 463,465
599,588 - - - 599,588
7,261,916 - - - 7,261,916
1,068,172 - - - 1,068,172
234,126 - - - 234,126
-70,623 - - - -70,623
387,476,905 - - - 387,476,905
357,869,284 - - - 357,869,284
332,195,452 - - - 332,195,452
1,959,988 - - - 1,959,988
15,915,814 - - - 15,915,814
1,819,291 - - - 1,819,291
3,780,452 - - - 3,780,452
1,964,161 - - - 1,964,161
234,126 - - - 234,126
29,607,621 - - - 29,607,621
13,490,363 - - - 13,490,363
6,149,150 - - - 6,149,150
2,306,205 - - - 2,306,205
2,045,143 - - - 2,045,143
261,062 - - - 261,062
5,067,974 - - - 5,067,974
348,086 - - - 348,086
4,719,888 - - - 4,719,888
Reserve 1,665,333 - - - 1,665,333
Retained earnings brought forward 3,054,555 - - - 3,054,555
-32,966 - - - -32,966
16,116,314 - - - 16,116,314
944 - - - 944
387,476,905 - - - 387,476,905
2. Assets, Liabilities and Net Assets and Profit
Insurance (excluding Miscellaneous
By capital
Number of corporations (companies)
Cash and deposits
Call loans, Receivables under resale agreements
Trading assets Trading account securities
Money held in trust
Securities
Loans receivable
Tangible fixed assets
Land
Construction in process
Other tangible fixed assets
Intangible fixed assets
Intangible fixed assets excluding software
Software
Rest of other assets
Deferred tax assets
Customers' liabilities for acceptances and guarantees
Allowance for loan losses
Total assets
Liabilities
Reserve for insurance policy liabilities
Bonds
Other liabilities
Allowance
Reserve required by special law
Deferred tax liabilities
Acceptances and guarantees
Net assets
Shareholders' equity
Capital stock and funds
Capital surplus
Legal capital surplus, Reserve for revaluation
Others capital surplus
Earned surplus
Legal retained earnings, Deficiency reserve
Other earned surplus
Treasury stock
Others net assets
Subscription rights to shares
Liabilities and net assets
196 By Size

(Unit: millions of yen)
Total Under 10 10-100 100- 1,000 1,000 or over
60,282,501 - - - 60,282,501
46,530,284 - - - 46,530,284
8,794,396 - - - 8,794,396
4,957,821 - - - 4,957,821
56,966,330 - - - 56,966,330
38,957,210 - - - 38,957,210
8,198,209 - - - 8,198,209
2,559,543 - - - 2,559,543
5,704,202 - - - 5,704,202
1,547,166 - - - 1,547,166
3,316,171 - - - 3,316,171
130,881 - - - 130,881
1,086,232 - - - 1,086,232
2,360,820 - - - 2,360,820
813,905 - - - 813,905
-196,351 - - - -196,351
1,743,266 - - - 1,743,266
81,561 - - - 81,561
979,264 - - - 979,264
373,948 - - - 373,948
0 - - - 0
15,385 - - - 15,385
2,624 - - - 2,624
1,849,114 - - - 1,849,114
488,108 - - - 488,108
645,033 - - - 645,033
85,618 - - - 85,618
152,214 - - - 152,214
366,450 - - - 366,450
678 - - - 678
441,992 - - - 441,992
11,875 - - - 11,875
Operating income
Insurance premiums and other
Investment income
Other operating income
and Loss Table by Sector and by Size (continued)
Insurance Institutions)
By capital
Operating expenses
Insurance claims and other
Provision of policy reserve and other
Investment expenses
Project expenses
Other operating expenses
Ordinary profits
Special profits
Special losses
Net profits before tax
Corporation tax and Inhabitants’tax
Income taxes-deferred
Net profits for the period
Interim dividend
Dividends
Depreciation expenses
Special depreciation expenses
Directors' remuneration
Taxes and public charges
Number of directors (persons)
Number of employees (persons)
Number of sales offices (locations)
Directors' bonus
Employees' salaries
Employees' bonus
Welfare expenses
Interest expenses
Rental or leasing expenses for fixed and liquid assets
By Size 197

Total Under 10 10-100 100- 1,000 1,000 or over
38 - - - 38
7,416,742 - - - 7,416,742
7,062,276 - - - 7,062,276
0 - - - 0
3,700,332 - - - 3,700,332
290,923,029 - - - 290,923,029
34,032,692 - - - 34,032,692
6,235,326 - - - 6,235,326
4,079,128 - - - 4,079,128
54,981 - - - 54,981
2,101,217 - - - 2,101,217
923,631 - - - 923,631
397,496 - - - 397,496
526,135 - - - 526,135
4,921,436 - - - 4,921,436
943,986 - - - 943,986
160,236 - - - 160,236
-53,735 - - - -53,735
356,265,951 - - - 356,265,951
333,518,316 - - - 333,518,316
311,972,223 - - - 311,972,223
1,469,477 - - - 1,469,477
13,463,845 - - - 13,463,845
1,276,329 - - - 1,276,329
3,517,381 - - - 3,517,381
1,658,825 - - - 1,658,825
160,236 - - - 160,236
22,747,635 - - - 22,747,635
10,367,873 - - - 10,367,873
5,298,152 - - - 5,298,152
1,710,305 - - - 1,710,305
1,505,407 - - - 1,505,407
204,898 - - - 204,898
3,387,724 - - - 3,387,724
141,798 - - - 141,798
3,245,926 - - - 3,245,926
Reserve 1,196,589 - - - 1,196,589
Retained earnings brought forward 2,049,337 - - - 2,049,337
-28,308 - - - -28,308
12,378,818 - - - 12,378,818
944 - - - 944
356,265,951 - - - 356,265,951
Subscription rights to shares
Liabilities and net assets
Others capital surplus
Earned surplus
Legal retained earnings, Deficiency reserve
Other earned surplus
Treasury stock
Others net assets
Acceptances and guarantees
Net assets
Shareholders' equity
Capital stock and funds
Capital surplus
Legal capital surplus, Reserve for revaluation
Reserve for insurance policy liabilities
Bonds
Other liabilities
Allowance
Reserve required by special law
Deferred tax liabilities
Rest of other assets
Deferred tax assets
Customers' liabilities for acceptances and guarantees
Allowance for loan losses
Total assets
Liabilities
Land
Construction in process
Other tangible fixed assets
Intangible fixed assets
Intangible fixed assets excluding software
Software
Call loans, Receivables under resale agreements
Trading assets Trading account securities
Money held in trust
Securities
Loans receivable
Tangible fixed assets
2. Assets, Liabilities and Net Assets and Profit
Life Insurance
By capital
Number of corporations (companies)
Cash and deposits
198 By Size

(Unit: millions of yen)
Total Under 10 10-100 100- 1,000 1,000 or over
50,182,284 - - - 50,182,284
37,321,494 - - - 37,321,494
7,954,620 - - - 7,954,620
4,906,170 - - - 4,906,170
47,661,612 - - - 47,661,612
31,504,728 - - - 31,504,728
7,856,767 - - - 7,856,767
2,444,736 - - - 2,444,736
4,341,536 - - - 4,341,536
1,513,845 - - - 1,513,845
2,520,672 - - - 2,520,672
111,639 - - - 111,639
999,311 - - - 999,311
1,633,000 - - - 1,633,000
694,385 - - - 694,385
-244,108 - - - -244,108
1,182,723 - - - 1,182,723
5,250 - - - 5,250
750,877 - - - 750,877
294,018 - - - 294,018
0 - - - 0
10,033 - - - 10,033
1,883 - - - 1,883
1,330,189 - - - 1,330,189
286,028 - - - 286,028
455,477 - - - 455,477
68,539 - - - 68,539
85,430 - - - 85,430
294,578 - - - 294,578
410 - - - 410
333,309 - - - 333,309
9,917 - - - 9,917
Taxes and public charges
Number of directors (persons)
Number of employees (persons)
Number of sales offices (locations)
Directors' bonus
Employees' salaries
Employees' bonus
Welfare expenses
Interest expenses
Rental or leasing expenses for fixed and liquid assets
Net profits for the period
Interim dividend
Dividends
Depreciation expenses
Special depreciation expenses
Directors' remuneration
Ordinary profits
Special profits
Special losses
Net profits before tax
Corporation tax and Inhabitants’tax
Income taxes-deferred
Operating expenses
Insurance claims and other
Provision of policy reserve and other
Investment expenses
Project expenses
Other operating expenses
Operating income
Insurance premiums and other
Investment income
Other operating income
and Loss Table by Sector and by Size (continued)
Institutions
By capital
By Size 199
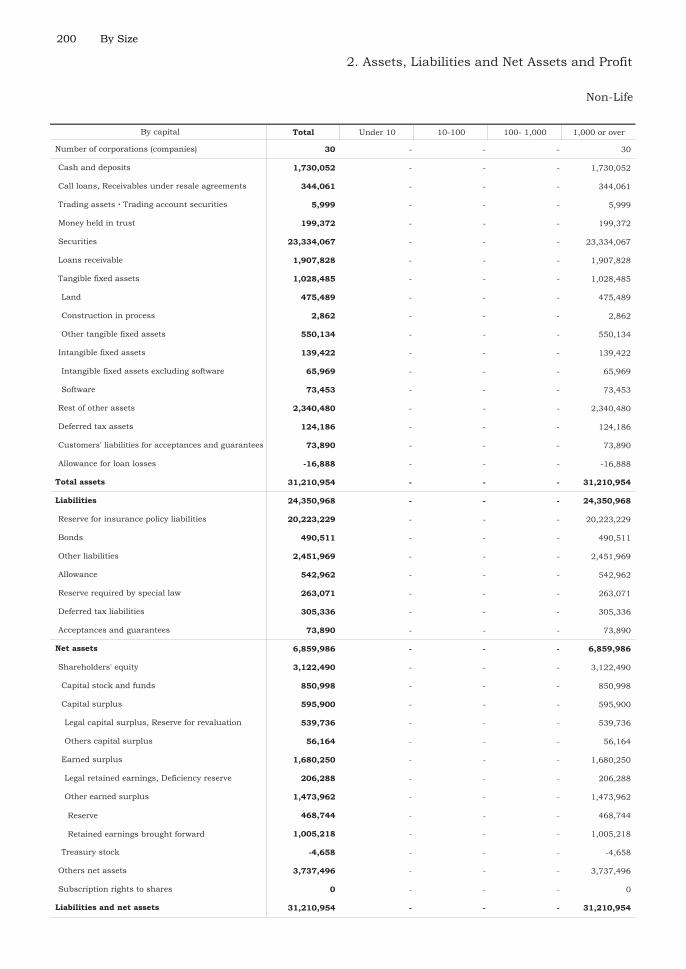
Total Under 10 10-100 100- 1,000 1,000 or over
30 - - - 30
1,730,052 - - - 1,730,052
344,061 - - - 344,061
5,999 - - - 5,999
199,372 - - - 199,372
23,334,067 - - - 23,334,067
1,907,828 - - - 1,907,828
1,028,485 - - - 1,028,485
475,489 - - - 475,489
2,862 - - - 2,862
550,134 - - - 550,134
139,422 - - - 139,422
65,969 - - - 65,969
73,453 - - - 73,453
2,340,480 - - - 2,340,480
124,186 - - - 124,186
73,890 - - - 73,890
-16,888 - - - -16,888
31,210,954 - - - 31,210,954
24,350,968 - - - 24,350,968
20,223,229 - - - 20,223,229
490,511 - - - 490,511
2,451,969 - - - 2,451,969
542,962 - - - 542,962
263,071 - - - 263,071
305,336 - - - 305,336
73,890 - - - 73,890
6,859,986 - - - 6,859,986
3,122,490 - - - 3,122,490
850,998 - - - 850,998
595,900 - - - 595,900
539,736 - - - 539,736
56,164 - - - 56,164
1,680,250 - - - 1,680,250
206,288 - - - 206,288
1,473,962 - - - 1,473,962
Reserve 468,744 - - - 468,744
Retained earnings brought forward 1,005,218 - - - 1,005,218
-4,658 - - - -4,658
3,737,496 - - - 3,737,496
0 - - - 0
31,210,954 - - - 31,210,954
Subscription rights to shares
Liabilities and net assets
Others capital surplus
Earned surplus
Legal retained earnings, Deficiency reserve
Other earned surplus
Treasury stock
Others net assets
Acceptances and guarantees
Net assets
Shareholders' equity
Capital stock and funds
Capital surplus
Legal capital surplus, Reserve for revaluation
Reserve for insurance policy liabilities
Bonds
Other liabilities
Allowance
Reserve required by special law
Deferred tax liabilities
Rest of other assets
Deferred tax assets
Customers' liabilities for acceptances and guarantees
Allowance for loan losses
Total assets
Liabilities
Land
Construction in process
Other tangible fixed assets
Intangible fixed assets
Intangible fixed assets excluding software
Software
Call loans, Receivables under resale agreements
Trading assets Trading account securities
Money held in trust
Securities
Loans receivable
Tangible fixed assets
2. Assets, Liabilities and Net Assets and Profit
Non-Life
By capital
Number of corporations (companies)
Cash and deposits
200 By Size

(Unit: millions of yen)
Total Under 10 10-100 100- 1,000 1,000 or over
10,100,217 - - - 10,100,217
9,208,790 - - - 9,208,790
839,776 - - - 839,776
51,651 - - - 51,651
9,304,718 - - - 9,304,718
7,452,482 - - - 7,452,482
341,442 - - - 341,442
114,807 - - - 114,807
1,362,666 - - - 1,362,666
33,321 - - - 33,321
795,499 - - - 795,499
19,242 - - - 19,242
86,921 - - - 86,921
727,820 - - - 727,820
119,520 - - - 119,520
47,757 - - - 47,757
560,543 - - - 560,543
76,311 - - - 76,311
228,387 - - - 228,387
79,930 - - - 79,930
0 - - - 0
5,352 - - - 5,352
741 - - - 741
518,925 - - - 518,925
202,080 - - - 202,080
189,556 - - - 189,556
17,079 - - - 17,079
66,784 - - - 66,784
71,872 - - - 71,872
268 - - - 268
108,683 - - - 108,683
1,958 - - - 1,958
Taxes and public charges
Number of directors (persons)
Number of employees (persons)
Number of sales offices (locations)
Directors' bonus
Employees' salaries
Employees' bonus
Welfare expenses
Interest expenses
Rental or leasing expenses for fixed and liquid assets
Net profits for the period
Interim dividend
Dividends
Depreciation expenses
Special depreciation expenses
Directors' remuneration
Ordinary profits
Special profits
Special losses
Net profits before tax
Corporation tax and Inhabitants’tax
Income taxes-deferred
Operating expenses
Insurance claims and other
Provision of policy reserve and other
Investment expenses
Project expenses
Other operating expenses
Operating income
Insurance premiums and other
Investment income
Other operating income
and Loss Table by Sector and by Size (continued)
Insurance Institutions
By capital
By Size 201

Total Under 10 10-100 100- 1,000 1,000 or over
34,110 29,298 4,617 187 8
1,480,592 314,035 862,187 264,004 40,366
931,880 215,763 512,121 170,281 33,715
3,799 782 3,017 0 0
206,882 53,183 116,111 33,320 4,268
58,805 17,350 33,263 8,192 0
27,268 1,625 24,268 1,375 0
1,177 51 317 809 0
30,360 15,674 8,678 6,008 0
8,601 3,099 5,136 361 5
4,263 1,345 2,748 170 0
4,338 1,754 2,388 191 5
106,046 5,341 82,998 17,707 0
164,579 18,517 109,541 34,143 2,378
1,364,453 509,179 720,285 97,778 37,211
492,883 206,402 259,658 25,914 909
256,901 99,799 144,302 12,800 0
5,895 2,659 3,052 183 1
230,087 103,944 112,304 12,931 908
27,926 2,676 7,230 12,878 5,142
12,158 2,264 3,484 4,960 1,450
15,768 412 3,746 7,918 3,692
843,644 300,101 453,397 58,986 31,160
726,480 258,029 393,567 45,583 29,301
612,524 239,873 305,557 39,296 27,798
20,758 8,370 9,286 1,599 1,503
93,198 9,786 78,724 4,688 0
117,164 42,072 59,830 13,403 1,859
4,386 887 965 1,108 1,426
31,623 754 25,389 5,084 396
-7,042 -46 -6,527 -461 -8
2,874,012 824,809 1,602,299 367,513 79,391
1,697,078 600,528 879,430 184,785 32,335
834,374 165,546 516,619 135,436 16,773
3,075 97 2,978 0 0
227,831 50,345 134,823 40,451 2,212
170,729 57,852 100,248 10,279 2,350
37,488 9,566 20,094 5,478 2,350
133,241 48,286 80,154 4,801 0
14,939 571 7,778 5,662 928
417,800 56,681 270,792 79,044 11,283
821,038 434,949 346,990 28,869 10,230
33,261 13,584 15,351 4,326 0
690,112 401,555 268,104 11,753 8,700
309,548 154,984 140,039 5,825 8,700
380,564 246,571 128,065 5,928 0
59,351 2,709 47,039 9,182 421
2. Assets, Liabilities and Net Assets and Profit
Miscellaneous
By capital
Number of corporations (companies)
Liquid assets
Cash and deposits
Bills receivable
Accounts receivable
Securities
Stocks
Bonds and debentures
Other securities
Inventories
Finished goods and merchandise
Other inventories
Short-term loans receivable
Other liquid assets
Fixed assets
Tangible fixed assets
Land
Construction in process
Other tangible fixed assets
Intangible fixed assets
Intangible fixed assets excluding software
Software
Investments and other assets
Investment securities
Stocks
Bonds and debentures
Other securities
Other investments and other assets
Deferred assets
Deferred tax assets
Allowance for loan losses
Total assets
Liabilities
Liquid liabilities
Bills payable
Accounts payable
Short-term borrowings
Short-term bank borrowings
Short-term other borrowings
Allowance
Other liquid liabilities
Fixed liabilities
Bonds
Long-term borrowings
Long-term bank borrowings
Long-term other borrowings
Allowance
202 By Size

(Unit: millions of yen)
Total Under 10 10-100 100- 1,000 1,000 or over
38,314 17,101 16,496 3,608 1,109
19,562 0 935 15,706 2,921
22,104 33 14,886 4,774 2,411
1,176,934 224,281 722,869 182,728 47,056
1,147,633 223,990 711,426 170,989 41,228
215,330 84,530 73,972 40,091 16,737
122,976 4,548 69,464 39,768 9,196
71,159 62 46,092 17,863 7,142
51,817 4,486 23,372 21,905 2,054
814,148 135,906 571,285 91,203 15,754
19,143 4,434 13,134 1,540 35
795,005 131,472 558,151 89,663 15,719
Reserve 306,910 28,850 254,031 22,037 1,992
Retained earnings brought forward 488,095 102,622 304,120 67,626 13,727
-4,821 -994 -3,295 -73 -459
29,297 291 11,443 11,735 5,828
4 0 0 4 0
2,874,012 824,809 1,602,299 367,513 79,391
0 0 0 0 0
1,828,190 813,213 668,566 298,686 47,725
348,563 95,663 141,803 99,849 11,248
1,329,191 680,973 458,925 160,350 28,943
150,436 36,577 67,838 38,487 7,534
49,894 23,551 22,262 3,084 997
19,475 10,216 7,798 859 602
180,855 49,912 82,302 40,712 7,929
11,976 3,404 5,574 2,310 688
11,776 5,040 3,530 2,628 578
181,055 48,276 84,346 40,394 8,039
55,916 11,755 26,548 14,844 2,769
2,301 559 1,191 683 -132
122,838 35,962 56,607 24,867 5,402
4,472 0 1,382 3,090 0
33,467 874 21,687 10,692 214
39,055 19,387 12,244 5,464 1,960
683 86 365 232 0
237,267 185,901 46,235 4,558 573
3,402 1,159 1,570 613 60
382,750 147,036 168,754 53,910 13,050
54,467 11,535 31,144 9,814 1,974
63,391 20,054 29,909 10,837 2,591
10,213 5,478 4,344 280 111
65,994 29,514 25,320 9,172 1,988
27,813 19,518 6,635 1,390 270
60,776 50,556 9,625 554 41
132,953 62,304 52,630 14,053 3,966
40,368 31,611 7,286 1,346 125
Other fixed liabilities
Reserve required by special law
Deferred tax liabilities
and Loss Table by Sector and by Size (continued)
Insurance Institutions
By capital
Net assets
Shareholders' equity
Capital stock
Capital surplus
Capital reserves
Others capital surplus
Earned surplus
Legal retained earnings
Other earned surplus
Treasury stock
Others net assets
Subscription rights to shares
Liabilities and net assets
Bills receivable discounted outstanding
Operating revenue
Operating expenses
Selling and general administration expenses
Operating profits
Non-operating revenues
Non-operating expenses
Ordinary profits
Special profits
Special losses
Net profits before tax
Income taxes-current
Income taxes-deferred
Net profits for the period
Interim dividend
Dividends
Depreciation expenses
Special depreciation expenses
Directors' remuneration
Directors' bonus
Employees' salaries
Employees' bonus
Welfare expenses
Interest expenses
Rental or leasing expenses for fixed and liquid assets
Taxes and public charges
Number of directors (persons)
Number of employees (persons)
Number of sales offices (locations)
By Size 203
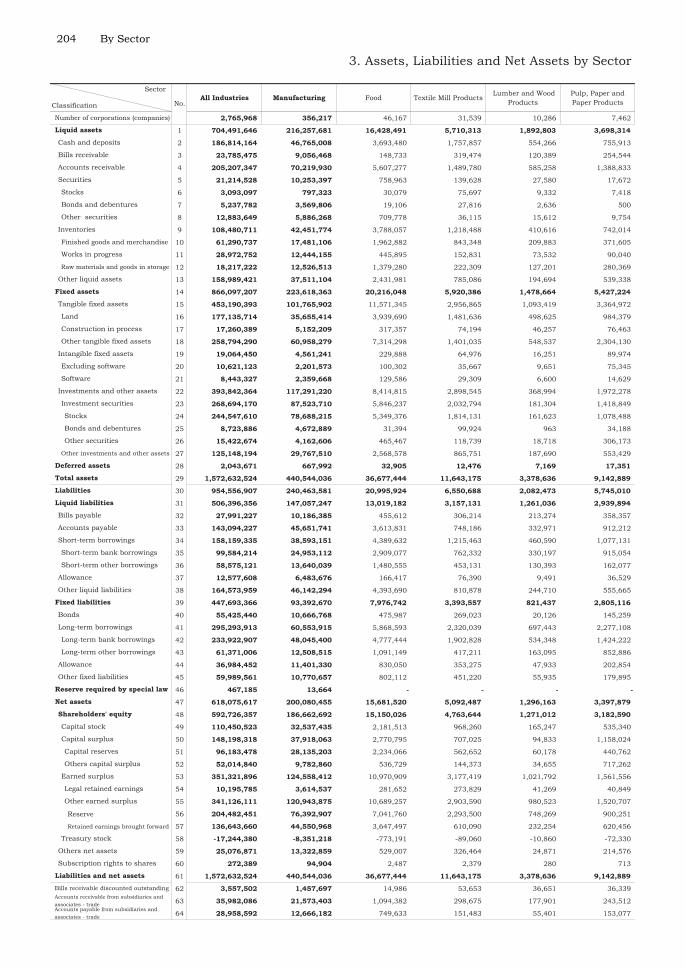
3. Assets, Liabilities and Net Assets by Sector
All Industries Manufacturing Food Textile Mill Products Lumber and Wood
ProductsPulp, Paper andPaper Products
2,765,968 356,217 46,167 31,539 10,286 7,462
1 704,491,646 216,257,681 16,428,491 5,710,313 1,892,803 3,698,314
2 186,814,164 46,765,008 3,693,480 1,757,857 554,266 755,913
3 23,785,475 9,056,468 148,733 319,474 120,389 254,544
4 205,207,347 70,219,930 5,607,277 1,489,780 585,258 1,388,833
5 21,214,528 10,253,397 758,963 139,628 27,580 17,672
6 3,093,097 797,323 30,079 75,697 9,332 7,418
7 5,237,782 3,569,806 19,106 27,816 2,636 500
8 12,883,649 5,886,268 709,778 36,115 15,612 9,754
9 108,480,711 42,451,774 3,788,057 1,218,488 410,616 742,014
10 61,290,737 17,481,106 1,962,882 843,348 209,883 371,605
11 28,972,752 12,444,155 445,895 152,831 73,532 90,040
12 18,217,222 12,526,513 1,379,280 222,309 127,201 280,369
13 158,989,421 37,511,104 2,431,981 785,086 194,694 539,338
14 866,097,207 223,618,363 20,216,048 5,920,386 1,478,664 5,427,224
15 453,190,393 101,765,902 11,571,345 2,956,865 1,093,419 3,364,972
16 177,135,714 35,655,414 3,939,690 1,481,636 498,625 984,379
17 17,260,389 5,152,209 317,357 74,194 46,257 76,463
18 258,794,290 60,958,279 7,314,298 1,401,035 548,537 2,304,130
19 19,064,450 4,561,241 229,888 64,976 16,251 89,974
20 10,621,123 2,201,573 100,302 35,667 9,651 75,345
21 8,443,327 2,359,668 129,586 29,309 6,600 14,629
22 393,842,364 117,291,220 8,414,815 2,898,545 368,994 1,972,278
23 268,694,170 87,523,710 5,846,237 2,032,794 181,304 1,418,849
24 244,547,610 78,688,215 5,349,376 1,814,131 161,623 1,078,488
25 8,723,886 4,672,889 31,394 99,924 963 34,188
26 15,422,674 4,162,606 465,467 118,739 18,718 306,173
27 125,148,194 29,767,510 2,568,578 865,751 187,690 553,429
28 2,043,671 667,992 32,905 12,476 7,169 17,351
29 1,572,632,524 440,544,036 36,677,444 11,643,175 3,378,636 9,142,889
30 954,556,907 240,463,581 20,995,924 6,550,688 2,082,473 5,745,010
31 506,396,356 147,057,247 13,019,182 3,157,131 1,261,036 2,939,894
32 27,991,227 10,186,385 455,612 306,214 213,274 358,357
33 143,094,227 45,651,741 3,613,831 748,186 332,971 912,212
34 158,159,335 38,593,151 4,389,632 1,215,463 460,590 1,077,131
35 99,584,214 24,953,112 2,909,077 762,332 330,197 915,054
36 58,575,121 13,640,039 1,480,555 453,131 130,393 162,077
37 12,577,608 6,483,676 166,417 76,390 9,491 36,529
38 164,573,959 46,142,294 4,393,690 810,878 244,710 555,665
39 447,693,366 93,392,670 7,976,742 3,393,557 821,437 2,805,116
40 55,425,440 10,666,768 475,987 269,023 20,126 145,259
41 295,293,913 60,553,915 5,868,593 2,320,039 697,443 2,277,108
42 233,922,907 48,045,400 4,777,444 1,902,828 534,348 1,424,222
43 61,371,006 12,508,515 1,091,149 417,211 163,095 852,886
44 36,984,452 11,401,330 830,050 353,275 47,933 202,854
45 59,989,561 10,770,657 802,112 451,220 55,935 179,895
46 467,185 13,664 - - - -
47 618,075,617 200,080,455 15,681,520 5,092,487 1,296,163 3,397,879
48 592,726,357 186,662,692 15,150,026 4,763,644 1,271,012 3,182,590
49 110,450,523 32,537,435 2,181,513 968,260 165,247 535,340
50 148,198,318 37,918,063 2,770,795 707,025 94,833 1,158,024
51 96,183,478 28,135,203 2,234,066 562,652 60,178 440,762
52 52,014,840 9,782,860 536,729 144,373 34,655 717,262
53 351,321,896 124,558,412 10,970,909 3,177,419 1,021,792 1,561,556
54 10,195,785 3,614,537 281,652 273,829 41,269 40,849
55 341,126,111 120,943,875 10,689,257 2,903,590 980,523 1,520,707
Reserve 56 204,482,451 76,392,907 7,041,760 2,293,500 748,269 900,251
Retained earnings brought forward 57 136,643,660 44,550,968 3,647,497 610,090 232,254 620,456
58 -17,244,380 -8,351,218 -773,191 -89,060 -10,860 -72,330
59 25,076,871 13,322,859 529,007 326,464 24,871 214,576
60 272,389 94,904 2,487 2,379 280 713
61 1,572,632,524 440,544,036 36,677,444 11,643,175 3,378,636 9,142,889
62 3,557,502 1,457,697 14,986 53,653 36,651 36,339
63 35,982,086 21,573,403 1,094,382 298,675 177,901 243,512
64 28,958,592 12,666,182 749,633 151,483 55,401 153,077
Bills receivable
Accounts receivable
Securities
Sector
Classification No.
Number of corporations (companies)
Liquid assets
Cash and deposits
Stocks
Bonds and debentures
Other securities
Inventories
Finished goods and merchandise
Works in progress
Raw materials and goods in storage
Other liquid assets
Fixed assets
Tangible fixed assets
Land
Construction in process
Other tangible fixed assets
Intangible fixed assets
Excluding software
Software
Investments and other assets
Investment securities
Stocks
Bonds and debentures
Other securities
Other investments and other assets
Deferred assets
Total assets
Liabilities
Liquid liabilities
Bills payable
Accounts payable
Short-term borrowings
Short-term bank borrowings
Short-term other borrowings
Allowance
Other liquid liabilities
Fixed liabilities
Bonds
Long-term borrowings
Long-term bank borrowings
Long-term other borrowings
Allowance
Other fixed liabilities
Shareholders' equity
Capital stock
Capital surplus
Reserve required by special law
Net assets
Capital reserves
Others capital surplus
Earned surplus
Bills receivable discounted outstandingAccounts receivable from subsidiaries andassociates - tradeAccounts payable from subsidiaries andassociates - trade
Legal retained earnings
Other earned surplus
Treasury stock
Others net assets
Subscription rights to shares
Liabilities and net assets
204 By Sector

(average for beginning of year)(Unit: millions of yen)
Printing and AlliedIndustries
Chemical and AlliedProducts
Petroleum and CoalProducts
Ceramic, Stone andClay Products
Iron and Steel Non-ferrous Metals
and ProductsFabricated Metal
Products
26,966 10,853 815 13,426 6,358 2,815 44,620
4,139,213 29,405,912 4,270,921 5,373,697 8,463,173 6,603,852 10,203,163 1
1,436,894 5,690,790 282,278 1,362,439 1,061,086 666,602 2,974,354 2
390,266 1,034,875 25,782 420,151 361,017 204,360 1,100,120 3
1,490,502 9,807,404 1,589,964 1,566,920 2,340,623 2,092,784 3,182,424 4
51,003 1,743,101 19,759 157,475 53,049 456,017 157,403 5
16,438 131,702 686 13,253 11,331 6,185 44,477 6
5,480 102,365 18 6,383 2,419 4,094 16,220 7
29,085 1,509,034 19,055 137,839 39,299 445,738 96,706 8
365,787 6,605,585 1,562,633 1,091,266 3,161,899 1,834,639 1,568,068 9
175,471 3,705,685 518,291 597,582 997,223 509,180 531,157 10
98,654 1,132,074 279,891 184,438 745,723 618,541 484,813 11
91,662 1,767,826 764,451 309,246 1,418,953 706,918 552,098 12
404,761 4,524,157 790,505 775,446 1,485,499 1,349,450 1,220,794 13
4,469,805 29,041,539 4,147,400 7,003,436 12,305,423 8,385,002 8,435,942 14
2,874,256 11,772,589 2,590,244 3,750,667 6,683,693 3,911,115 5,802,372 15
1,254,627 3,628,544 1,452,118 1,452,582 1,966,405 973,497 2,663,276 16
93,915 544,405 53,458 97,204 277,846 1,094,328 179,836 17
1,525,714 7,599,640 1,084,668 2,200,881 4,439,442 1,843,290 2,959,260 18
79,588 777,968 71,171 139,948 223,160 95,201 114,131 19
16,706 560,059 52,197 112,205 105,797 45,147 63,537 20
62,882 217,909 18,974 27,743 117,363 50,054 50,594 21
1,515,961 16,490,982 1,485,985 3,112,821 5,398,570 4,378,686 2,519,439 22
1,035,125 13,175,110 626,594 2,463,401 4,404,741 2,747,172 1,349,623 23
940,952 12,144,837 619,396 2,269,774 4,193,345 2,674,873 938,654 24
6,286 285,851 123 18,786 29,777 1,366 69,525 25
87,887 744,422 7,075 174,841 181,619 70,933 341,444 26
480,836 3,315,872 859,391 649,420 993,829 1,631,514 1,169,816 27
8,691 74,349 1,255 17,373 9,398 3,542 34,356 28
8,617,709 58,521,800 8,419,576 12,394,506 20,777,994 14,992,396 18,673,461 29
4,933,118 27,197,966 6,587,152 6,821,278 12,356,490 8,999,210 10,359,933 30
2,721,755 16,999,411 4,406,576 3,778,155 6,302,177 5,051,917 6,033,049 31
447,732 1,165,738 34,926 441,311 291,674 198,883 939,394 32
858,869 5,037,660 1,509,138 987,329 2,200,549 1,296,911 1,742,694 33
554,586 4,676,562 1,214,091 1,432,821 1,878,741 1,805,343 1,719,987 34
375,526 2,595,341 816,041 1,080,885 1,139,934 1,032,604 1,172,761 35
179,060 2,081,221 398,050 351,936 738,807 772,739 547,226 36
54,365 631,078 20,095 79,028 74,540 59,138 134,166 37
806,203 5,488,373 1,628,326 837,666 1,856,673 1,691,642 1,496,808 38
2,211,363 10,198,555 2,180,576 3,043,123 6,054,313 3,947,293 4,326,884 39
176,645 1,770,144 224,631 302,389 1,002,466 277,339 147,116 40
1,656,364 5,903,219 1,406,952 2,143,057 4,154,562 2,519,889 3,448,579 41
1,393,109 5,177,070 1,341,021 1,839,672 2,821,362 2,251,858 2,821,814 42
263,255 726,149 65,931 303,385 1,333,200 268,031 626,765 43
176,442 1,242,677 336,872 315,832 488,415 312,085 437,508 44
201,912 1,282,515 212,121 281,845 408,870 837,980 293,681 45
- - - - - - - 46
3,684,591 31,323,834 1,832,424 5,573,228 8,421,504 5,993,186 8,313,528 47
3,402,816 29,743,926 1,602,264 5,267,479 7,768,665 5,673,352 8,109,744 48
605,998 4,129,937 487,938 1,031,221 1,678,711 1,517,998 934,987 49
472,938 6,603,952 237,306 927,082 1,732,136 1,350,379 1,286,579 50
361,185 5,223,578 197,997 729,396 1,085,258 1,062,641 749,130 51
111,753 1,380,374 39,309 197,686 646,878 287,738 537,449 52
2,519,397 19,985,042 1,032,208 3,461,140 4,482,441 2,886,210 6,022,905 53
85,046 497,842 38,733 95,921 57,972 70,650 141,579 54
2,434,351 19,487,200 993,475 3,365,219 4,424,469 2,815,560 5,881,326 55
1,731,301 12,039,257 305,878 1,926,163 1,796,647 1,692,133 3,558,283 56
703,050 7,447,943 687,597 1,439,056 2,627,822 1,123,427 2,323,043 57
-195,517 -975,005 -155,188 -151,964 -124,623 -81,235 -134,727 58
281,707 1,560,247 230,002 301,266 652,410 319,560 203,682 59
68 19,661 158 4,483 429 274 102 60
8,617,709 58,521,800 8,419,576 12,394,506 20,777,994 14,992,396 18,673,461 61
64,007 106,202 1,944 117,957 60,133 19,969 159,307 62
205,634 2,233,873 397,291 270,906 553,373 703,814 444,385 63
251,583 1,302,605 219,551 176,304 488,322 468,134 248,367 64
No.
By Sector 205
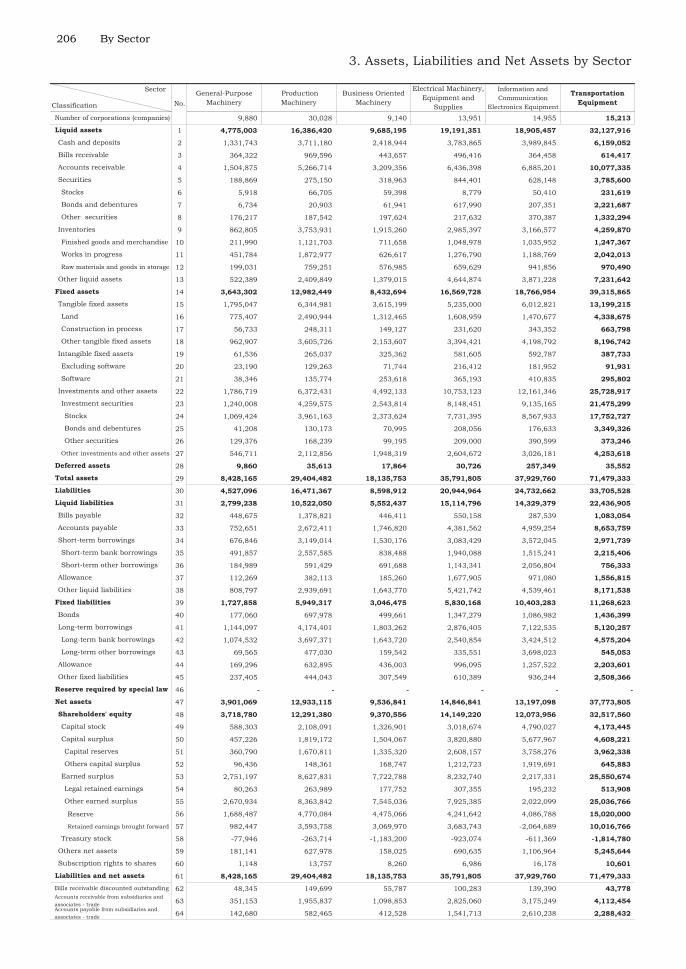
3. Assets, Liabilities and Net Assets by Sector
General-PurposeMachinery
ProductionMachinery
Business OrientedMachinery
Electrical Machinery,Equipment and
Supplies
Information andCommunication
Electronics Equipment
TransportationEquipment
9,880 30,028 9,140 13,951 14,955 15,213
1 4,775,003 16,386,420 9,685,195 19,191,351 18,905,457 32,127,916
2 1,331,743 3,711,180 2,418,944 3,783,865 3,989,845 6,159,052
3 364,322 969,596 443,657 496,416 364,458 614,417
4 1,504,875 5,266,714 3,209,356 6,436,398 6,885,201 10,077,335
5 188,869 275,150 318,963 844,401 628,148 3,785,600
6 5,918 66,705 59,398 8,779 50,410 231,619
7 6,734 20,903 61,941 617,990 207,351 2,221,687
8 176,217 187,542 197,624 217,632 370,387 1,332,294
9 862,805 3,753,931 1,915,260 2,985,397 3,166,577 4,259,870
10 211,990 1,121,703 711,658 1,048,978 1,035,952 1,247,367
11 451,784 1,872,977 626,617 1,276,790 1,188,769 2,042,013
12 199,031 759,251 576,985 659,629 941,856 970,490
13 522,389 2,409,849 1,379,015 4,644,874 3,871,228 7,231,642
14 3,643,302 12,982,449 8,432,694 16,569,728 18,766,954 39,315,865
15 1,795,047 6,344,981 3,615,199 5,235,000 6,012,821 13,199,215
16 775,407 2,490,944 1,312,465 1,608,959 1,470,677 4,338,675
17 56,733 248,311 149,127 231,620 343,352 663,798
18 962,907 3,605,726 2,153,607 3,394,421 4,198,792 8,196,742
19 61,536 265,037 325,362 581,605 592,787 387,733
20 23,190 129,263 71,744 216,412 181,952 91,931
21 38,346 135,774 253,618 365,193 410,835 295,802
22 1,786,719 6,372,431 4,492,133 10,753,123 12,161,346 25,728,917
23 1,240,008 4,259,575 2,543,814 8,148,451 9,135,165 21,475,299
24 1,069,424 3,961,163 2,373,624 7,731,395 8,567,933 17,752,727
25 41,208 130,173 70,995 208,056 176,633 3,349,326
26 129,376 168,239 99,195 209,000 390,599 373,246
27 546,711 2,112,856 1,948,319 2,604,672 3,026,181 4,253,618
28 9,860 35,613 17,864 30,726 257,349 35,552
29 8,428,165 29,404,482 18,135,753 35,791,805 37,929,760 71,479,333
30 4,527,096 16,471,367 8,598,912 20,944,964 24,732,662 33,705,528
31 2,799,238 10,522,050 5,552,437 15,114,796 14,329,379 22,436,905
32 448,675 1,378,821 446,411 550,158 287,539 1,083,054
33 752,651 2,672,411 1,746,820 4,381,562 4,959,254 8,653,759
34 676,846 3,149,014 1,530,176 3,083,429 3,572,045 2,971,739
35 491,857 2,557,585 838,488 1,940,088 1,515,241 2,215,406
36 184,989 591,429 691,688 1,143,341 2,056,804 756,333
37 112,269 382,113 185,260 1,677,905 971,080 1,556,815
38 808,797 2,939,691 1,643,770 5,421,742 4,539,461 8,171,538
39 1,727,858 5,949,317 3,046,475 5,830,168 10,403,283 11,268,623
40 177,060 697,978 499,661 1,347,279 1,086,982 1,436,399
41 1,144,097 4,174,401 1,803,262 2,876,405 7,122,535 5,120,257
42 1,074,532 3,697,371 1,643,720 2,540,854 3,424,512 4,575,204
43 69,565 477,030 159,542 335,551 3,698,023 545,053
44 169,296 632,895 436,003 996,095 1,257,522 2,203,601
45 237,405 444,043 307,549 610,389 936,244 2,508,366
46 - - - - - -
47 3,901,069 12,933,115 9,536,841 14,846,841 13,197,098 37,773,805
48 3,718,780 12,291,380 9,370,556 14,149,220 12,073,956 32,517,560
49 588,303 2,108,091 1,326,901 3,018,674 4,790,027 4,173,445
50 457,226 1,819,172 1,504,067 3,820,880 5,677,967 4,608,221
51 360,790 1,670,811 1,335,320 2,608,157 3,758,276 3,962,338
52 96,436 148,361 168,747 1,212,723 1,919,691 645,883
53 2,751,197 8,627,831 7,722,788 8,232,740 2,217,331 25,550,674
54 80,263 263,989 177,752 307,355 195,232 513,908
55 2,670,934 8,363,842 7,545,036 7,925,385 2,022,099 25,036,766
Reserve 56 1,688,487 4,770,084 4,475,066 4,241,642 4,086,788 15,020,000Retained earnings brought forward 57 982,447 3,593,758 3,069,970 3,683,743 -2,064,689 10,016,766
58 -77,946 -263,714 -1,183,200 -923,074 -611,369 -1,814,780
59 181,141 627,978 158,025 690,635 1,106,964 5,245,644
60 1,148 13,757 8,260 6,986 16,178 10,601
61 8,428,165 29,404,482 18,135,753 35,791,805 37,929,760 71,479,333
62 48,345 149,699 55,787 100,283 139,390 43,778
63 351,153 1,955,837 1,098,853 2,825,060 3,175,249 4,112,454
64 142,680 582,465 412,528 1,541,713 2,610,238 2,288,432
Bills receivable
Accounts receivable
Securities
Sector
Classification No.
Number of corporations (companies)
Liquid assets
Cash and deposits
Stocks
Bonds and debentures
Other securities
Inventories
Finished goods and merchandise
Works in progress
Raw materials and goods in storage
Other liquid assets
Fixed assets
Tangible fixed assets
Land
Construction in process
Other tangible fixed assets
Intangible fixed assets
Excluding software
Software
Investments and other assets
Investment securities
Stocks
Bonds and debentures
Other securities
Other investments and other assets
Deferred assets
Total assets
Liabilities
Liquid liabilities
Bills payable
Accounts payable
Short-term borrowings
Short-term bank borrowings
Short-term other borrowings
Allowance
Other liquid liabilities
Fixed liabilities
Bonds
Long-term borrowings
Long-term bank borrowings
Long-term other borrowings
Allowance
Other fixed liabilities
Shareholders' equity
Capital stock
Capital surplus
Reserve required by special law
Net assets
Capital reserves
Others capital surplus
Earned surplus
Bills receivable discounted outstandingAccounts receivable from subsidiaries andassociates - tradeAccounts payable from subsidiaries andassociates - trade
Legal retained earnings
Other earned surplus
Treasury stock
Others net assets
Subscription rights to shares
Liabilities and net assets
206 By Sector

(average for beginning of year) (continued)(Unit: millions of yen)
Motor Vehicles, Partsand Accessories
MiscellaneousTransportation
Equipment
MiscellaneousManufacturing
IndustriesNon-Manufacturing Agriculture, Forestry
and FisheriesAgriculture and
ForestryFisheries
10,447 4,766 61,743 2,409,751 26,809 22,786 4,023
27,381,688 4,746,228 18,996,487 488,233,965 2,163,803 1,580,775 583,028 1
4,984,733 1,174,319 5,134,420 140,049,156 876,665 607,492 269,173 2
478,579 135,838 1,423,891 14,729,007 10,100 9,629 471 3
8,791,495 1,285,840 5,698,282 134,987,417 257,501 194,920 62,581 4
3,677,854 107,746 630,616 10,961,131 11,080 2,045 9,035 5
220,201 11,418 27,896 2,295,774 8,418 1,949 6,469 6
2,141,077 80,610 246,163 1,667,976 - - - 7
1,316,576 15,718 356,557 6,997,381 2,662 96 2,566 8
2,937,331 1,322,539 3,158,882 66,028,937 688,807 523,622 165,185 9
1,164,119 83,248 1,681,151 43,809,631 406,960 309,384 97,576 10
995,736 1,046,277 678,773 16,528,597 176,899 131,385 45,514 11
777,476 193,014 798,958 5,690,709 104,948 82,853 22,095 12
6,511,696 719,946 2,950,396 121,478,317 319,650 243,067 76,583 13
36,528,297 2,787,568 17,076,502 642,478,844 2,163,472 1,670,853 492,619 14
11,488,047 1,711,168 9,192,102 351,424,491 1,742,664 1,368,439 374,225 15
3,711,144 627,531 3,362,908 141,480,300 401,750 322,336 79,414 16
609,162 54,636 604,005 12,108,180 91,348 48,699 42,649 17
7,167,741 1,029,001 5,225,189 197,836,011 1,249,566 997,404 252,162 18
353,982 33,751 444,925 14,503,209 131,512 125,246 6,266 19
84,217 7,714 310,468 8,419,550 128,085 122,286 5,799 20
269,765 26,037 134,457 6,083,659 3,427 2,960 467 21
24,686,268 1,042,649 7,439,475 276,551,144 289,296 177,168 112,128 22
20,881,711 593,588 5,440,448 181,170,460 97,144 49,543 47,601 23
17,212,992 539,735 5,046,500 165,859,395 72,541 39,188 33,353 24
3,319,817 29,509 118,315 4,050,997 1,403 1,105 298 25
348,902 24,344 275,633 11,260,068 23,200 9,250 13,950 26
3,804,557 449,061 1,999,027 95,380,684 192,152 127,625 64,527 27
32,891 2,661 62,163 1,375,679 7,570 6,407 1,163 28
63,942,876 7,536,457 36,135,152 1,132,088,488 4,334,845 3,258,035 1,076,810 29
28,984,167 4,721,361 18,853,810 714,093,326 3,320,046 2,439,924 880,122 30
19,155,177 3,281,728 10,632,159 359,339,109 1,476,050 999,731 476,319 31
822,159 260,895 1,138,612 17,804,842 26,529 9,683 16,846 32
7,852,461 801,298 3,244,934 97,442,486 303,027 223,386 79,641 33
2,252,664 719,075 3,184,955 119,566,184 720,716 509,617 211,099 34
1,811,622 403,784 2,264,695 74,631,102 524,780 364,083 160,697 35
441,042 315,291 920,260 44,935,082 195,936 145,534 50,402 36
1,429,939 126,876 256,997 6,093,932 4,230 3,270 960 37
6,797,954 1,373,584 2,806,661 118,431,665 421,548 253,775 167,773 38
9,828,990 1,439,633 8,207,987 354,300,696 1,826,507 1,422,704 403,803 39
1,273,955 162,444 610,284 44,758,672 14,464 9,887 4,577 40
4,141,119 979,138 5,917,153 234,739,998 1,696,328 1,316,302 380,026 41
3,696,258 878,946 4,804,459 185,877,507 1,255,930 1,013,090 242,840 42
444,861 100,192 1,112,694 48,862,491 440,398 303,212 137,186 43
2,036,681 166,920 961,975 25,583,122 19,906 9,595 10,311 44
2,377,235 131,131 718,575 49,218,904 95,809 86,920 8,889 45
- - 13,664 453,521 17,489 17,489 - 46
34,958,709 2,815,096 17,281,342 417,995,162 1,014,799 818,111 196,688 47
29,794,972 2,722,588 16,605,722 406,063,665 1,010,821 815,351 195,470 48
3,686,126 487,319 2,294,844 77,913,088 273,482 234,436 39,046 49
4,179,300 428,921 2,689,481 110,280,255 95,088 89,709 5,379 50
3,680,489 281,849 1,732,668 68,048,275 55,469 50,840 4,629 51
498,811 147,072 956,813 42,231,980 39,619 38,869 750 52
23,728,884 1,821,790 12,334,832 226,763,484 664,866 512,568 152,298 53
480,056 33,852 450,696 6,581,248 36,767 28,193 8,574 54
23,248,828 1,787,938 11,884,136 220,182,236 628,099 484,375 143,724 55
14,086,225 933,775 8,077,398 128,089,544 467,598 374,571 93,027 56
9,162,603 854,163 3,806,738 92,092,692 160,501 109,804 50,697 57
-1,799,338 -15,442 -713,435 -8,893,162 -22,615 -21,362 -1,253 58
5,153,526 92,118 668,680 11,754,012 3,937 2,719 1,218 59
10,211 390 6,940 177,485 41 41 - 60
63,942,876 7,536,457 36,135,152 1,132,088,488 4,334,845 3,258,035 1,076,810 61
27,150 16,628 249,267 2,099,805 - - - 62
3,795,044 317,410 1,431,051 14,408,683 24,294 13,802 10,492 63
2,125,350 163,082 823,666 16,292,410 28,462 25,283 3,179 64
No.
By Sector 207

3. Assets, Liabilities and Net Assets by Sector
Mining andQuarrying of Stone
and GravelConstruction
Production, Transmissionand Distribution of
Electricity
Production,Transmission andDistribution of Gas
Information andCommunications
Transport andPostal Activities
3,796 459,728 3,508 736 111,682 79,236
1 3,698,337 61,968,710 6,805,961 1,460,821 34,818,754 29,342,209
2 1,734,951 20,673,213 2,671,074 290,339 9,667,569 10,262,047
3 68,216 2,096,021 444 10,101 257,276 367,596
4 366,144 19,317,290 1,626,670 583,008 13,122,372 8,139,838
5 268,675 1,040,349 448,913 72,645 929,917 900,656
6 47,807 319,803 2,064 561 63,410 123,585
7 4,147 142,502 - 1,022 128,369 135,997
8 216,721 578,044 446,849 71,062 738,138 641,074
9 153,208 10,524,653 805,159 193,135 2,139,492 3,414,282
10 75,535 2,234,907 23,198 5,069 1,003,647 263,669
11 11,489 7,409,265 5,238 2,369 669,714 2,746,225
12 66,184 880,481 776,723 185,697 466,131 404,388
13 1,107,143 8,317,184 1,253,701 311,593 8,702,128 6,257,790
14 6,641,150 32,538,848 41,089,512 4,650,934 43,112,826 69,557,139
15 1,652,357 19,742,557 31,833,879 3,085,554 19,713,490 52,373,921
16 543,862 10,447,671 2,540,609 556,597 3,189,939 21,745,512
17 263,128 320,036 4,295,518 315,794 686,325 1,985,324
18 845,367 8,974,850 24,997,752 2,213,163 15,837,226 28,643,085
19 342,338 393,170 817,972 66,827 3,485,367 1,442,382
20 337,019 207,279 806,019 27,632 583,464 758,809
21 5,319 185,891 11,953 39,195 2,901,903 683,573
22 4,646,455 12,403,121 8,437,661 1,498,553 19,913,969 15,740,836
23 3,123,998 7,066,775 2,625,279 965,587 12,819,306 7,500,536
24 3,035,779 5,974,136 2,589,232 955,389 11,204,067 6,668,167
25 38,856 510,203 1,224 4,116 282,168 457,339
26 49,363 582,436 34,823 6,082 1,333,071 375,030
27 1,522,457 5,336,346 5,812,382 532,966 7,094,663 8,240,300
28 12,926 127,274 8,345 1,481 105,498 66,498
29 10,352,413 94,634,832 47,903,818 6,113,236 78,037,078 98,965,846
30 4,397,544 60,829,479 40,909,041 3,379,529 33,675,743 65,928,760
31 2,188,070 41,546,280 8,359,336 1,306,578 20,401,421 23,771,037
32 73,149 4,165,375 732 7,616 249,550 386,766
33 253,829 13,262,941 1,003,486 261,680 4,360,208 5,384,681
34 411,656 7,724,351 3,392,015 265,560 4,048,235 7,259,513
35 209,050 5,449,733 3,139,416 208,294 1,899,138 4,834,957
36 202,606 2,274,618 252,599 57,266 2,149,097 2,424,556
37 10,271 887,072 26,815 38,160 1,633,832 614,794
38 1,439,165 15,506,541 3,936,288 733,562 10,109,596 10,125,283
39 2,209,474 19,282,284 32,427,841 2,072,830 13,274,322 41,852,208
40 10,521 812,737 10,197,345 737,294 1,632,446 8,578,014
41 1,733,929 14,096,305 13,439,553 1,057,532 6,408,286 21,103,648
42 1,369,107 11,719,783 13,050,147 979,684 4,409,345 17,230,086
43 364,822 2,376,522 389,406 77,848 1,998,941 3,873,562
44 59,269 2,349,468 5,740,615 210,271 3,134,983 6,188,124
45 405,755 2,023,774 3,050,328 67,733 2,098,607 5,982,422
46 - 915 121,864 121 - 305,515
47 5,954,869 33,805,353 6,994,777 2,733,707 44,361,335 33,037,086
48 5,749,140 32,212,948 6,840,511 2,603,857 43,299,826 31,548,082
49 2,125,745 6,399,969 4,132,542 518,072 8,426,683 6,894,123
50 3,457,367 2,741,379 1,483,199 96,104 12,184,878 6,211,842
51 2,862,832 2,036,377 1,310,779 90,846 9,183,621 4,040,805
52 594,535 705,002 172,420 5,258 3,001,257 2,171,037
53 180,325 23,567,862 1,413,177 1,999,520 24,236,422 19,218,111
54 58,882 732,032 629,944 98,314 412,209 397,643
55 121,443 22,835,830 783,233 1,901,206 23,824,213 18,820,468
Reserve 56 1,067,891 14,479,923 2,087,079 1,234,198 9,617,672 12,911,286Retained earnings brought forward 57 -946,448 8,355,907 -1,303,846 667,008 14,206,541 5,909,182
58 -14,297 -496,262 -188,407 -9,839 -1,548,157 -775,994
59 205,729 1,589,910 153,451 129,814 1,042,420 1,485,167
60 - 2,495 815 36 19,089 3,837
61 10,352,413 94,634,832 47,903,818 6,113,236 78,037,078 98,965,846
62 26,838 388,248 - - 2,684 63,817
63 46,762 1,592,177 81,024 85,901 1,301,335 1,150,945
64 82,720 968,699 84,701 33,069 631,459 760,374
Bills receivable
Accounts receivable
Securities
Sector
Classification No.
Number of corporations (companies)
Liquid assets
Cash and deposits
Stocks
Bonds and debentures
Other securities
Inventories
Finished goods and merchandise
Works in progress
Raw materials and goods in storage
Other liquid assets
Fixed assets
Tangible fixed assets
Land
Construction in process
Other tangible fixed assets
Intangible fixed assets
Excluding software
Software
Investments and other assets
Investment securities
Stocks
Bonds and debentures
Other securities
Other investments and other assets
Deferred assets
Total assets
Liabilities
Liquid liabilities
Bills payable
Accounts payable
Short-term borrowings
Short-term bank borrowings
Short-term other borrowings
Allowance
Other liquid liabilities
Fixed liabilities
Bonds
Long-term borrowings
Long-term bank borrowings
Long-term other borrowings
Allowance
Other fixed liabilities
Shareholders' equity
Capital stock
Capital surplus
Reserve required by special law
Net assets
Capital reserves
Others capital surplus
Earned surplus
Bills receivable discounted outstandingAccounts receivable from subsidiaries andassociates - tradeAccounts payable from subsidiaries andassociates - trade
Legal retained earnings
Other earned surplus
Treasury stock
Others net assets
Subscription rights to shares
Liabilities and net assets
208 By Sector

(average for beginning of year) (continued)(Unit: millions of yen)
Railway, Road Passengerand Road Freight
TransportWater Transport
MiscellaneousTransport
Wholesale and RetailTrade Wholesale Trade Retail Trade Real Estate and Goods
Rental and Leasing
62,655 4,160 12,421 633,422 267,602 365,820 332,412
12,643,328 3,399,795 13,299,086 188,330,335 130,383,231 57,947,104 71,315,446 1
4,207,571 1,257,043 4,797,433 45,650,211 31,308,335 14,341,876 16,032,414 2
269,479 33,383 64,734 11,064,902 9,645,466 1,419,436 312,114 3
4,472,565 685,241 2,982,032 64,566,117 50,184,205 14,381,912 10,187,388 4
321,573 167,541 411,542 3,116,481 2,608,133 508,348 1,610,779 5
24,114 67,815 31,656 839,990 748,548 91,442 457,170 6
121,216 702 14,079 457,481 443,582 13,899 414,140 7
176,243 99,024 365,807 1,819,010 1,416,003 403,007 739,469 8
490,190 142,666 2,781,426 34,412,650 20,066,692 14,345,958 10,722,343 9
181,398 3,723 78,548 32,212,053 18,200,740 14,011,313 6,243,521 10
164,353 1,702 2,580,170 808,459 745,030 63,429 3,732,768 11
144,439 137,241 122,708 1,392,138 1,120,922 271,216 746,054 12
2,881,950 1,113,921 2,261,919 29,519,974 16,570,400 12,949,574 32,450,408 13
46,823,207 6,373,446 16,360,486 125,999,750 72,254,945 53,744,805 130,480,559 14
37,133,919 3,296,543 11,943,459 66,776,273 30,497,990 36,278,283 97,261,089 15
15,291,569 398,460 6,055,483 32,199,117 15,559,128 16,639,989 46,302,534 16
1,542,553 111,521 331,250 1,070,812 535,688 535,124 1,573,459 17
20,299,797 2,786,562 5,556,726 33,506,344 14,403,174 19,103,170 49,385,096 18
743,662 45,054 653,666 2,942,319 1,498,808 1,443,511 1,655,169 19
546,781 21,602 190,426 1,906,395 834,314 1,072,081 1,408,395 20
196,881 23,452 463,240 1,035,924 664,494 371,430 246,774 21
8,945,626 3,031,849 3,763,361 56,281,158 40,258,147 16,023,011 31,564,301 22
4,141,867 1,379,971 1,978,698 31,140,435 26,037,140 5,103,295 18,293,384 23
3,671,247 1,156,231 1,840,689 27,273,134 23,290,608 3,982,526 14,507,485 24
281,184 75,307 100,848 893,939 604,632 289,307 255,148 25
189,436 148,433 37,161 2,973,362 2,141,900 831,462 3,530,751 26
4,803,759 1,651,878 1,784,663 25,140,723 14,221,007 10,919,716 13,270,917 27
24,383 3,678 38,437 387,254 178,391 208,863 199,526 28
59,490,918 9,776,919 29,698,009 314,717,339 202,816,567 111,900,772 201,995,531 29
40,036,809 6,796,925 19,095,026 204,696,338 132,557,031 72,139,307 147,905,568 30
14,375,342 1,983,811 7,411,884 136,627,542 89,320,391 47,307,151 55,834,373 31
262,159 43,188 81,419 11,619,578 10,658,551 961,027 586,767 32
2,678,767 673,905 2,032,009 60,075,228 42,136,949 17,938,279 3,725,819 33
5,616,449 677,135 965,929 36,372,796 20,687,230 15,685,566 30,199,420 34
3,597,455 521,397 716,105 25,177,918 15,548,202 9,629,716 18,650,870 35
2,018,994 155,738 249,824 11,194,878 5,139,028 6,055,850 11,548,550 36
365,088 24,277 225,429 1,816,073 902,259 913,814 204,876 37
5,452,879 565,306 4,107,098 26,743,867 14,935,402 11,808,465 21,117,491 38
25,355,975 4,813,091 11,683,142 68,068,796 43,236,640 24,832,156 92,071,192 39
4,758,529 454,988 3,364,497 4,903,554 3,956,502 947,052 6,686,591 40
13,134,776 3,902,071 4,066,801 51,115,253 33,082,711 18,032,542 67,730,517 41
10,534,829 3,603,862 3,091,395 42,262,438 28,666,199 13,596,239 51,613,597 42
2,599,947 298,209 975,406 8,852,815 4,416,512 4,436,303 16,116,920 43
2,452,540 259,534 3,476,050 4,545,750 2,670,620 1,875,130 778,019 44
5,010,130 196,498 775,794 7,504,239 3,526,807 3,977,432 16,876,065 45
305,492 23 - - - - 3 46
19,454,109 2,979,994 10,602,983 110,021,001 70,259,536 39,761,465 54,089,963 47
18,389,011 2,861,788 10,297,283 108,253,736 69,261,921 38,991,815 50,696,018 48
3,275,027 482,673 3,136,423 13,257,189 8,247,633 5,009,556 7,522,275 49
3,771,528 414,558 2,025,756 19,491,629 13,010,510 6,481,119 10,929,058 50
2,216,828 327,615 1,496,362 15,886,947 11,294,413 4,592,534 5,867,695 51
1,554,700 86,943 529,394 3,604,682 1,716,097 1,888,585 5,061,363 52
11,683,470 1,982,148 5,552,493 77,095,084 48,850,766 28,244,318 32,771,153 53
245,918 46,978 104,747 1,896,442 1,111,652 784,790 1,012,765 54
11,437,552 1,935,170 5,447,746 75,198,642 47,739,114 27,459,528 31,758,388 55
7,975,720 964,971 3,970,595 49,790,585 31,654,753 18,135,832 14,150,972 56
3,461,832 970,199 1,477,151 25,408,057 16,084,361 9,323,696 17,607,416 57
-341,014 -17,591 -417,389 -1,590,166 -846,988 -743,178 -526,468 58
1,064,039 115,571 305,557 1,743,917 982,196 761,721 3,382,554 59
1,059 2,635 143 23,348 15,419 7,929 11,391 60
59,490,918 9,776,919 29,698,009 314,717,339 202,816,567 111,900,772 201,995,531 61
44,845 5,178 13,794 1,533,297 1,474,505 58,792 27,299 62
770,546 182,591 197,808 6,926,035 6,284,708 641,327 679,797 63
441,941 109,415 209,018 12,184,683 7,694,821 4,489,862 328,793 64
No.
By Sector 209

3. Assets, Liabilities and Net Assets by Sector
Real EstateGoods Rental and
Leasing Goods Leasing Miscellaneous GoodsRental and Leasing
ServicesAccommodations,
Eating and DrinkingServices
315,542 16,870 11,761 5,109 758,422 146,506
1 37,327,915 33,987,531 31,535,072 2,452,459 88,329,589 6,918,123
2 13,955,131 2,077,283 1,816,053 261,230 32,190,673 3,565,006
3 63,910 248,204 214,368 33,836 542,237 24,639
4 1,624,198 8,563,190 8,136,274 426,916 16,821,089 1,428,211
5 1,032,206 578,573 568,545 10,028 2,561,636 75,456
6 430,853 26,317 20,415 5,902 432,966 28,405
7 129,410 284,730 284,433 297 384,318 4,469
8 471,943 267,526 263,697 3,829 1,744,352 42,582
9 10,492,741 229,602 188,685 40,917 2,975,208 427,940
10 6,044,189 199,332 162,540 36,792 1,341,072 183,252
11 3,727,361 5,407 3,975 1,432 966,171 35,809
12 721,191 24,863 22,170 2,693 667,965 208,879
13 10,159,729 22,290,679 20,611,147 1,679,532 33,238,746 1,396,871
14 108,891,684 21,588,875 19,625,382 1,963,493 186,244,654 19,515,749
15 83,313,189 13,947,900 12,284,662 1,663,238 57,242,707 14,120,246
16 45,167,029 1,135,505 983,137 152,368 23,552,709 5,365,134
17 1,517,519 55,940 38,678 17,262 1,506,436 139,113
18 36,628,641 12,756,455 11,262,847 1,493,608 32,183,562 8,615,999
19 1,463,400 191,769 159,642 32,127 3,226,153 1,145,139
20 1,341,658 66,737 46,064 20,673 2,256,453 1,089,163
21 121,742 125,032 113,578 11,454 969,700 55,976
22 24,115,095 7,449,206 7,181,078 268,128 125,775,794 4,250,364
23 14,597,603 3,695,781 3,642,636 53,145 97,538,016 1,143,566
24 11,831,473 2,676,012 2,630,447 45,565 93,579,465 633,397
25 201,548 53,600 52,759 841 1,606,601 445,094
26 2,564,582 966,169 959,430 6,739 2,351,950 65,075
27 9,517,492 3,753,425 3,538,442 214,983 28,237,778 3,106,798
28 126,158 73,368 69,966 3,402 459,307 130,860
29 146,345,757 55,649,774 51,230,420 4,419,354 275,033,550 26,564,732
30 98,954,082 48,951,486 45,333,688 3,617,798 149,051,278 22,154,796
31 32,408,852 23,425,521 21,421,321 2,004,200 67,828,422 8,986,570
32 249,273 337,494 314,230 23,264 688,780 9,087
33 1,828,576 1,897,243 1,586,765 310,478 8,811,587 1,101,190
34 18,186,469 12,012,951 10,671,663 1,341,288 29,171,922 4,390,524
35 9,616,998 9,033,872 8,063,801 970,071 14,536,946 1,244,290
36 8,569,471 2,979,079 2,607,862 371,217 14,634,976 3,146,234
37 137,062 67,814 51,854 15,960 857,809 94,105
38 12,007,472 9,110,019 8,796,809 313,210 28,298,324 3,391,664
39 66,545,227 25,525,965 23,912,367 1,613,598 81,215,242 13,168,226
40 4,214,793 2,471,798 2,447,834 23,964 11,185,706 241,533
41 49,055,503 18,675,014 17,171,375 1,503,639 56,358,647 11,414,029
42 34,862,309 16,751,288 15,749,287 1,002,001 41,987,390 7,772,387
43 14,193,194 1,923,726 1,422,088 501,638 14,371,257 3,641,642
44 631,910 146,109 115,211 30,898 2,556,717 281,360
45 12,643,021 4,233,044 4,177,947 55,097 11,114,172 1,231,304
46 3 - - - 7,614 -
47 47,391,675 6,698,288 5,896,732 801,556 125,982,272 4,409,936
48 44,142,999 6,553,019 5,752,991 800,028 123,848,726 4,393,480
49 6,571,180 951,095 863,286 87,809 28,363,008 1,764,963
50 9,576,197 1,352,861 1,297,142 55,719 53,589,711 1,592,720
51 5,202,360 665,335 639,846 25,489 26,712,904 825,141
52 4,373,837 687,526 657,296 30,230 26,876,807 767,579
53 28,420,420 4,350,733 3,692,321 658,412 45,616,964 1,144,325
54 959,768 52,997 45,531 7,466 1,306,250 132,831
55 27,460,652 4,297,736 3,646,790 650,946 44,310,714 1,011,494
Reserve 56 11,831,631 2,319,341 2,034,210 285,131 22,282,340 2,300,727Retained earnings brought forward 57 15,629,021 1,978,395 1,612,580 365,815 22,028,374 -1,289,233
58 -424,798 -101,670 -99,758 -1,912 -3,720,957 -108,528
59 3,242,819 139,735 138,216 1,519 2,017,113 14,280
60 5,857 5,534 5,525 9 116,433 2,176
61 146,345,757 55,649,774 51,230,420 4,419,354 275,033,550 26,564,732
62 3,286 24,013 23,563 450 57,622 1
63 153,198 526,599 514,151 12,448 2,520,413 29,827
64 126,402 202,391 160,164 42,227 1,189,450 77,787
Bills receivable
Accounts receivable
Securities
Sector
Classification No.
Number of corporations (companies)
Liquid assets
Cash and deposits
Stocks
Bonds and debentures
Other securities
Inventories
Finished goods and merchandise
Works in progress
Raw materials and goods in storage
Other liquid assets
Fixed assets
Tangible fixed assets
Land
Construction in process
Other tangible fixed assets
Intangible fixed assets
Excluding software
Software
Investments and other assets
Investment securities
Stocks
Bonds and debentures
Other securities
Other investments and other assets
Deferred assets
Total assets
Liabilities
Liquid liabilities
Bills payable
Accounts payable
Short-term borrowings
Short-term bank borrowings
Short-term other borrowings
Allowance
Other liquid liabilities
Fixed liabilities
Bonds
Long-term borrowings
Long-term bank borrowings
Long-term other borrowings
Allowance
Other fixed liabilities
Shareholders' equity
Capital stock
Capital surplus
Reserve required by special law
Net assets
Capital reserves
Others capital surplus
Earned surplus
Bills receivable discounted outstandingAccounts receivable from subsidiaries andassociates - tradeAccounts payable from subsidiaries andassociates - trade
Legal retained earnings
Other earned surplus
Treasury stock
Others net assets
Subscription rights to shares
Liabilities and net assets
210 By Sector

(average for beginning of year) (continued)(Unit: millions of yen)
AccommodationsEating and Drinking
Services
Living-Related andPersonal Services andAmusement Services
Living-Related andPersonal Services
Services ForAmusement and
Hobbies
Scientific Research,Professional and
Technical ServicesAdvertising
21,833 124,673 129,122 94,849 34,273 250,184 36,616
1,868,415 5,049,708 13,968,463 6,633,638 7,334,825 43,132,970 7,237,283 1
1,022,262 2,542,744 5,873,054 2,549,276 3,323,778 12,755,035 2,785,334 2
1,163 23,476 17,230 4,310 12,920 263,383 93,358 3
364,163 1,064,048 1,660,021 1,161,200 498,821 7,021,335 2,983,106 4
24,471 50,985 240,597 122,437 118,160 1,761,901 117,789 5
4,317 24,088 72,292 28,894 43,398 216,785 89,771 6
4,449 20 17,657 10,136 7,521 209,368 4,905 7
15,705 26,877 150,648 83,407 67,241 1,335,748 23,113 8
99,703 328,237 558,539 225,771 332,768 1,058,885 122,430 9
21,969 161,283 367,518 140,789 226,729 391,199 33,892 10
28,449 7,360 23,407 14,892 8,515 603,403 81,100 11
49,285 159,594 167,614 70,090 97,524 64,283 7,438 12
356,653 1,040,218 5,619,022 2,570,644 3,048,378 20,272,431 1,135,266 13
8,230,025 11,285,724 26,651,570 7,730,308 18,921,262 109,939,625 3,209,321 14
6,714,222 7,406,024 20,922,419 5,161,654 15,760,765 9,378,340 1,131,447 15
2,639,860 2,725,274 9,042,210 2,132,360 6,909,850 3,896,844 628,828 16
49,226 89,887 316,938 76,777 240,161 599,186 23,278 17
4,025,136 4,590,863 11,563,271 2,952,517 8,610,754 4,882,310 479,341 18
73,061 1,072,078 552,519 121,376 431,143 865,469 89,521 19
54,570 1,034,593 449,383 55,756 393,627 401,952 18,739 20
18,491 37,485 103,136 65,620 37,516 463,517 70,782 21
1,442,742 2,807,622 5,176,632 2,447,278 2,729,354 99,695,816 1,988,353 22
605,308 538,258 1,631,990 636,972 995,018 81,945,939 1,390,049 23
138,630 494,767 1,027,940 339,445 688,495 79,932,621 1,318,346 24
444,602 492 272,003 240,686 31,317 515,419 16,927 25
22,076 42,999 332,047 56,841 275,206 1,497,899 54,776 26
837,434 2,269,364 3,544,642 1,810,306 1,734,336 17,749,877 598,304 27
10,472 120,388 114,770 32,153 82,617 148,091 12,403 28
10,108,912 16,455,820 40,734,803 14,396,099 26,338,704 153,220,686 10,459,007 29
8,297,814 13,856,982 30,221,520 11,320,577 18,900,943 67,417,549 6,056,540 30
2,372,764 6,613,806 12,762,288 7,919,458 4,842,830 31,457,681 4,218,156 31
714 8,373 170,903 11,243 159,660 233,362 126,497 32
251,919 849,271 1,198,401 828,359 370,042 3,758,020 1,885,057 33
1,171,307 3,219,217 3,320,000 1,365,499 1,954,501 17,314,117 677,159 34
343,679 900,611 1,281,376 552,942 728,434 9,771,445 254,809 35
827,628 2,318,606 2,038,624 812,557 1,226,067 7,542,672 422,350 36
28,524 65,581 81,495 49,308 32,187 294,469 60,483 37
920,300 2,471,364 7,991,489 5,665,049 2,326,440 9,857,713 1,468,960 38
5,925,050 7,243,176 17,459,232 3,401,119 14,058,113 35,959,868 1,838,384 39
59,970 181,563 392,028 98,477 293,551 10,303,599 8,162 40
5,145,183 6,268,846 10,101,412 2,761,074 7,340,338 23,015,418 1,451,443 41
3,771,384 4,001,003 6,944,832 2,244,782 4,700,050 18,481,423 1,092,155 42
1,373,799 2,267,843 3,156,580 516,292 2,640,288 4,533,995 359,288 43
128,914 152,446 496,174 177,520 318,654 674,154 178,150 44
590,983 640,321 6,469,618 364,048 6,105,570 1,966,697 200,629 45
- - - - - - - 46
1,811,098 2,598,838 10,513,283 3,075,522 7,437,761 85,803,137 4,402,467 47
1,794,738 2,598,742 10,351,292 3,046,320 7,304,972 84,212,027 4,259,847 48
541,893 1,223,070 2,216,211 799,064 1,417,147 17,569,981 641,699 49
554,160 1,038,560 2,366,424 22,990 2,343,434 42,537,432 344,447 50
392,787 432,354 1,610,474 154,147 1,456,327 21,929,838 281,403 51
161,373 606,206 755,950 -131,157 887,107 20,607,594 63,044 52
718,202 426,123 5,942,130 2,253,138 3,688,992 27,265,312 3,306,503 53
20,329 112,502 236,744 64,863 171,881 564,090 59,495 54
697,873 313,621 5,705,386 2,188,275 3,517,111 26,701,222 3,247,008 55
952,808 1,347,919 4,701,461 1,189,134 3,512,327 10,235,256 1,521,686 56
-254,935 -1,034,298 1,003,925 999,141 4,784 16,465,966 1,725,322 57
-19,517 -89,011 -173,473 -28,872 -144,601 -3,160,698 -32,802 58
16,290 -2,010 161,121 28,901 132,220 1,480,170 141,549 59
70 2,106 870 301 569 110,940 1,071 60
10,108,912 16,455,820 40,734,803 14,396,099 26,338,704 153,220,686 10,459,007 61
1 - 1,092 1,092 - 26,729 4,276 62
14,841 14,986 394,620 286,370 108,250 1,171,180 320,420 63
15,532 62,255 255,631 144,967 110,664 537,600 250,359 64
No.
By Sector 211

3. Assets, Liabilities and Net Assets by Sector(Unit: millions of yen)
Pure HoldingCompanies
Miscellaneous ScientificResearch, Professionaland Technical Services
Medical, Health careand Welfare
Education, LearningSupport
Employment andWorker Dispatching
Services
MiscellaneousServices
2,846 210,722 48,813 21,799 20,226 141,772
1 21,569,159 14,326,528 2,339,437 1,405,304 2,595,602 17,969,690
2 5,198,651 4,771,050 950,348 841,284 946,173 7,259,773
3 87,992 82,033 13,068 861 2,747 220,309
4 579,368 3,458,861 904,541 130,987 884,670 4,791,324
5 1,538,476 105,636 61,602 50,374 16,197 355,509
6 55,343 71,671 13,179 16,815 13,553 71,937
7 204,047 416 47,543 3,383 - 101,898
8 1,279,086 33,549 880 30,176 2,644 181,674
9 263,474 672,981 95,733 70,452 10,357 753,302
10 209,465 147,842 33,752 57,064 1,574 306,713
11 21,082 501,221 50,921 4,816 3,775 244,040
12 32,927 23,918 11,060 8,572 5,008 202,549
13 13,901,198 5,235,967 314,145 311,346 735,458 4,589,473
14 99,724,087 7,006,217 3,607,322 2,175,130 879,073 23,476,185
15 4,673,638 3,573,255 2,764,571 1,436,980 524,145 8,096,006
16 1,897,917 1,370,099 854,507 826,146 231,611 3,336,257
17 246,282 329,626 206,206 7,288 6,843 230,862
18 2,529,439 1,873,530 1,703,858 603,546 285,691 4,528,887
19 451,582 324,366 85,921 94,605 27,037 455,463
20 188,919 194,294 68,476 40,576 8,159 198,744
21 262,663 130,072 17,445 54,029 18,878 256,719
22 94,598,867 3,108,596 756,830 643,545 327,891 14,924,716
23 79,541,752 1,014,138 246,072 191,649 152,375 12,226,425
24 77,858,980 755,295 212,445 95,326 143,043 11,534,693
25 471,223 27,269 10,225 4,756 592 358,512
26 1,211,549 231,574 23,402 91,567 8,740 333,220
27 15,057,115 2,094,458 510,758 451,896 175,516 2,698,291
28 78,954 56,734 18,793 6,844 4,233 35,716
29 121,372,200 21,389,479 5,965,552 3,587,278 3,478,908 41,481,591
30 48,518,051 12,842,958 4,298,389 1,816,822 2,094,748 21,047,454
31 19,956,772 7,282,753 1,710,079 860,509 1,450,321 10,600,974
32 70,277 36,588 15,262 953 3,093 256,120
33 346,984 1,525,979 225,396 67,545 191,556 2,269,479
34 14,489,263 2,147,695 641,957 209,865 348,893 2,946,566
35 8,758,571 758,065 174,889 118,141 248,525 1,698,280
36 5,730,692 1,389,630 467,068 91,724 100,368 1,248,286
37 60,320 173,666 31,405 17,629 48,542 290,164
38 4,989,928 3,398,825 796,059 564,517 858,237 4,838,645
39 28,561,279 5,560,205 2,588,310 956,313 644,427 10,438,866
40 10,209,458 85,979 7,427 34,484 796 205,839
41 17,005,692 4,558,283 2,181,386 770,184 527,812 8,348,406
42 14,409,707 2,979,561 1,842,426 692,191 355,095 5,899,036
43 2,595,985 1,578,722 338,960 77,993 172,717 2,449,370
44 166,788 329,216 63,717 51,966 52,724 936,622
45 1,179,341 586,727 335,780 99,679 63,095 947,999
46 - - - - - 7,614
47 72,854,149 8,546,521 1,667,163 1,770,456 1,384,160 20,434,137
48 71,449,433 8,502,747 1,647,700 1,724,518 1,339,599 20,180,110
49 14,953,659 1,974,623 420,516 251,139 293,430 5,846,768
50 37,842,993 4,349,992 324,264 185,848 113,090 6,469,933
51 19,773,277 1,875,158 152,800 62,347 61,918 2,070,386
52 18,069,716 2,474,834 171,464 123,501 51,172 4,399,547
53 20,891,127 3,067,682 916,110 1,300,836 949,784 8,098,467
54 389,873 114,722 14,272 14,618 18,652 325,043
55 20,501,254 2,952,960 901,838 1,286,218 931,132 7,773,424
Reserve 56 7,111,078 1,602,492 262,938 382,238 302,046 4,097,674
Retained earnings brought forward 57 13,390,176 1,350,468 638,900 903,980 629,086 3,675,750
58 -2,238,346 -889,550 -13,190 -13,305 -16,705 -235,058
59 1,299,973 38,648 18,923 45,750 44,533 252,336
60 104,743 5,126 540 188 28 1,691
61 121,372,200 21,389,479 5,965,552 3,587,278 3,478,908 41,481,591
62 2,662 19,791 - 131 990 28,679
63 318,449 532,311 22,540 3,434 71,432 827,380
64 30,958 256,283 58,779 3,892 6,367 249,394
Bills receivable
Accounts receivable
Securities
Sector
Classification No.
Number of corporations (companies)
Liquid assets
Cash and deposits
Stocks
Bonds and debentures
Other securities
Inventories
Finished goods and merchandise
Works in progress
Raw materials and goods in storage
Other liquid assets
Fixed assets
Tangible fixed assets
Land
Construction in process
Other tangible fixed assets
Intangible fixed assets
Excluding software
Software
Investments and other assets
Investment securities
Stocks
Bonds and debentures
Other securities
Other investments and other assets
Deferred assets
Total assets
Liabilities
Liquid liabilities
Bills payable
Accounts payable
Short-term borrowings
Short-term bank borrowings
Short-term other borrowings
Allowance
Other liquid liabilities
Fixed liabilities
Bonds
Long-term borrowings
Long-term bank borrowings
Long-term other borrowings
Allowance
Other fixed liabilities
Shareholders' equity
Capital stock
Capital surplus
Reserve required by special law
Net assets
Capital reserves
Others capital surplus
Earned surplus
Bills receivable discounted outstandingAccounts receivable from subsidiaries andassociates - tradeAccounts payable from subsidiaries andassociates - trade
Legal retained earnings
Other earned surplus
Treasury stock
Others net assets
Subscription rights to shares
Liabilities and net assets
212 By Sector

(Unit: millions of yen)
All Industries(including Finance and Insurance) Finance and Insurance
2,823,889 57,921
904,795,399 38,698,1921 472,598,306 19,407,9132 188,515,600 11,379,8863 17,567,235 306,8464 266,515,471 7,721,1815 23,133,963 4,069,5136 12,038,325 1,417,2027 11,095,638 2,652,3118 409,063,130 15,220,7669 278,612,554 9,918,38410 251,193,508 6,645,89811 10,365,210 1,641,32412 17,053,836 1,631,16213 130,450,576 5,302,38214 770,921,424 152,845,80715 703,940,219 111,213,86216 144,639,535 34,189,01217 180,494,454 32,296,13618 116,969,828 20,786,35019 63,524,626 11,509,78620 399,165,629 47,843,73321 14,352,802 4,157,01722 384,812,827 43,686,716
Reserve 23 227,400,929 22,918,478Retained earnings brought forward 24 157,411,898 20,768,238
25 -20,359,399 -3,115,01926 66,694,616 41,617,74527 286,589 14,200
Sector
Classification No.
Number of corporations (companies)
Fixed assetsTangible fixed assetsLandConstruction in processOther tangible fixed assets
Intangible fixed assetsIntangible fixed assets excluding softwareSoftware
Investments and other assets
Capital reservesOthers capital surplus
Earned surplus
Investment securitiesStocksBonds and debenturesOther securities
Other fixed assetsNet assets
(Note) Investments and other assets do not contain the amounts for Banking and Insurance.
(average for beginning of year) (continued)
Legal retained earningsOther earned surplus
Treasury stockOthers net assetsSubscription rights to shares
Shareholders' equityCapital stockCapital surplus
By Sector 213

(Unit: millions of yen)
Banking
Non-Deposit MoneyCorporations, IncludingLending and Credit Card
Businesses
638 14,173
1 293,112,445 1 74,819,6982 30,416,855 2 4,902,8073 18,763,684 3 17,100,3424 9,648,789 4 11,568,5455 581,640,977 5 24,045,5346 677,251,393 6 2,864,9607 6,474,478 7 976,7578 29,752,164 8 969,2639 9,475,900 9 918,94010 5,618,045 10 478,01511 223,552 11 13,859,49512 3,634,303 12 11,088,27613 1,901,589 13 1,640,89414 539,735 14 730,45815 1,361,854 15 11,64416 338,637 16 898,79217 23,356,307 17 701,14218 -5,623,249 18 230,83519 1,676,509,969 19 470,30720 1,580,411,057 20 8,746,24021 1,304,373,534 21 4,583,16622 103,606,317 22 2,423,20023 13,239,245 23 1,194,61524 59,133,172 24 965,35125 4,045,797 25 4,163,07426 22,595,398 26 3,86127 10,374,693 27 508,82128 31,185,050 28 -1,302,12829 1,763,842 29 85,118,52830 193 30 75,872,74931 6,737,511 31 61,194,78632 23,356,305 32 24,846,65233 96,098,912 33 17,838,13434 75,502,377 34 8,695,87135 23,166,016 35 9,142,26336 19,384,851 36 906,70837 13,171,639 37 17,603,29238 6,213,212 38 14,569,25439 35,510,762 39 1,915,11840 3,609,210 40 9,413,54141 31,901,552 41 6,463,029
Reserve 42 17,192,833 42 2,950,512Retained earnings brought forward 43 14,708,719 43 1,207,863
44 -2,559,252 44 2,032,73245 20,585,229 45 046 11,306 46 108,70947 1,676,509,969 47 9,245,779
48 8,957,00249 1,981,96450 4,947,19851 2,592,65952 2,354,53953 2,092,06954 81,62655 2,010,443
Reserve 56 2,248,408Retained earnings brought forward 57 -237,965
58 -64,22959 287,79760 98061 85,118,528
Sector
Classification No.
Sector
Classification No.
Number of corporations (companies) Number of corporations (companies)
Cash and due from banksCall loans and receivables under resale agreements Cash and depositsTrading assets Trading account securities Accounts receivable - operating loans
Liquid assets
Money held in trust Accounts receivable - installmentSecurities Customers' liabilities for acceptances and guarantees,
Credit Guarantees Receivables
Loans and bills discounted SecuritiesForeign exchange
Bonds and debenturesOther securities
StocksOther assetsTangible fixed assetsLand
Other liquid assetsOther tangible fixed assets
Finished goods and merchandise
Fixed assetsConstruction in process
Tangible fixed assetsLandConstruction in process
Intangible fixed assetsIntangible fixed assets excluding softwareSoftware
Deferred tax assetsCustomers' liabilities for acceptances and guarantees Intangible fixed assets
Other tangible fixed assets
Intangible fixed assets excluding softwareAllowance for loan lossesTotal assets
Investments and other assetsDeposits
Software
Investment securitiesLiabilities
Call money, Payables under repurchase agreements
Trading liabilitiesBorrowed money
StocksBonds and debenturesOther securities
Foreign exchangeBonds
Deferred tax assets
Other investments and other assetsDeferred assets
Borrowed money from trust account
Acceptances and guaranteesNet assets
Other liabilities Allowance for loan lossesTotal assetsLiabilities
AllowanceReserve required by special law
Long-term borrowingsLong-term bank borrowings
Legal retained earningsOther earned surplus
3. Assets, Liabilities and Net Assets by Sector
Treasury stock
Liquid liabilitiesAcceptances and guarantees, Credit Guarantees Payable
Short-term borrowings
Deferred tax liabilities
Subscription rights to sharesLiabilities and net assets
Others capital surplusEarned surplusLegal retained earningsOther earned surplus
Treasury stockOthers net assets
Shareholders' equityCapital stockCapital surplusCapital reserves
Deferred tax liabilitiesNet assets
Long-term other borrowingsAllowanceOther fixed liabilities
Reserve required by special law
Short-term bank borrowingsShort-term other borrowings
AllowanceOther liquid liabilities
Fixed liabilitiesBonds
Liabilities and net assets
Shareholders' equityCapital stockCapital surplusCapital reservesOthers capital surplus
Earned surplus
Others net assetsSubscription rights to shares
214 By Sector

(Unit: millions of yen)
Finance ProductsTransaction Dealers
Futures CommodityTransactionDealers etc.
207 8,725
1 127,883,849 1 63,085,5352 6,525,879 2 3,212,1723 5,380,115 3 463,9014 44,441,221 4 816,4165 3,050,776 5 7,308,6306 3,570,843 6 1,566,7397 58,379,794 7 3,157,8078 145,068 8 2,584,0849 4,808,671 9 86,59210 674,883 10 44,45711 906,599 11 42,13512 1,693,854 12 33,543,86413 161,892 13 17,653,96014 44,926 14 4,899,42515 1,235 15 320,84716 115,731 16 165,92717 340,988 17 4,68318 176,342 18 150,23719 164,646 19 88,61720 1,190,974 20 16,52521 902,842 21 72,09222 778,911 22 4,489,96123 50,128 23 3,746,23824 73,803 24 2,867,36025 288,132 25 371,09226 187 26 507,78627 203,953 27 743,72328 -36,655 28 99529 129,745,188 29 78,68930 122,499,567 30 -147,50831 116,680,751 31 67,917,13632 32,140,743 32 61,361,89833 717,060 33 59,047,15734 1,496,064 34 6635 56,488,838 35 1,310,80736 3,782,178 36 42,869,17537 4,459,683 37 9,834,93938 12,786,066 38 33,034,23639 179,955 39 233,10440 4,630,164 40 14,634,00541 5,621,073 41 1,884,41842 1,660,991 42 155,49743 3,529,475 43 923,75444 149,108 44 269,12245 281,499 45 654,63246 101,578 46 87,28447 96,165 47 717,88348 7,245,621 48 13,41349 7,021,463 49 416,91050 1,733,162 50 6,555,23851 3,183,116 51 5,677,80452 1,899,524 52 1,094,84553 1,283,592 53 2,048,91154 2,175,281 54 1,035,12055 31,182 55 1,013,79156 2,144,099 56 2,927,678
Reserve 57 452,049 57 87,237Retained earnings brought forward 58 1,692,050 58 2,840,441
59 -70,096 Reserve 59 1,039,33160 223,128 Retained earnings brought forward 60 1,801,11061 1,030 61 -393,63062 129,745,188 62 877,326
63 10864 67,917,13665 0
No.
Sector
Classification No.
Number of corporations (companies) Number of corporations (companies)
Stocks
Liquid assetsCash and deposits Cash and depositsCash segregated as deposits Bills receivable
Liquid assets
Bonds and debenturesOther securities
InventoriesAdvances paidShort-term guarantee deposits
Trading products Accounts receivableTrade date accrual SecuritiesMargin transaction assets
Finished goods and merchandiseOther Liquid assets Other inventories
Short-term loans receivable
Short-term loans receivable
Fixed assetsOther liquid assets
Fixed assetsTangible fixed assets
Tangible fixed assetsLandConstruction in process
Intangible fixed assetsInvestments and other assets Intangible fixed assets excluding software
SoftwareInvestment securities
LandIntangible fixed assets Construction in process
Other tangible fixed assetsIntangible fixed assets excluding software
Bonds and debenturesOther securities
Deferred tax assets Other investments and other assets
Investments and other assetsInvestment securitiesStocksOther securities
Deferred assetsDeferred tax assetsAllowance for loan lossesLiabilities
Allowance for doubtful accountsTotal assets
Loans payable secured by securities
Total assetsLiabilitiesLiquid liabilities
Liquid liabilitiesTrading products
Short-term other borrowingsAllowance AllowanceOther Liquid liabilities Other liquid liabilities
Bills payableAccounts payableShort-term borrowingsShort-term bank borrowings
Margin transaction liabilities
Fixed liabilitiesBondsLong-term borrowingsLong-term bank borrowingsLong-term other borrowings
Bonds
AllowanceOther fixed liabilities
AllowanceOther fixed liabilities
Reserve required by special lawDeferred tax liabilitiesNet assetsShareholders' equityCapital stockCapital surplusCapital reservesOthers capital surplus
Earned surplusLegal retained earningsOther earned surplus
Treasury stockOthers net assetsSubscription rights to shares
Liabilities and net assetsBills receivable discounted outstanding
Net assetsShareholders' equityCapital stockCapital surplus
Legal retained earnings
Others net assets
Deposits receivedGuarantee deposits receivedShort-term borrowings
Reserve required by special lawDeferred tax liabilities
Long-term borrowings
Fixed liabilities
Subscription rights to sharesLiabilities and net assets
Capital reservesOthers capital surplus
Earned surplus
Other earned surplus
Treasury stock
(average for beginning of year) (continued)
Trade date accrual
StocksBonds and debentures
Other investments and other assetsDeferred assets
Software
Other tangible fixed assets
Loans secured by securities
Sector
Classification
By Sector 215

(Unit: millions of yen)Insurance (excluding
MiscellaneousInsurance
Institutions)
Life InsuranceInstitutions
68 38
1 6,496,382 1 5,544,6532 10,473,521 2 9,543,4093 9,997 3 04 3,298,321 4 3,163,0715 312,386,351 5 288,591,0536 37,649,491 6 35,783,0317 7,379,677 7 6,314,7958 4,607,689 8 4,108,4889 51,641 9 43,24610 2,720,347 10 2,163,06111 1,011,067 11 883,58312 441,311 12 397,12613 569,756 13 486,45714 6,368,208 14 4,081,49715 782,694 15 693,21516 249,806 16 151,22917 -75,953 17 -42,81518 386,029,562 18 354,706,72119 353,415,255 19 329,569,00920 326,927,888 20 306,942,30521 1,398,514 21 959,25622 16,167,283 22 14,271,39423 1,847,633 23 1,295,26824 3,275,700 24 3,038,35925 3,548,431 25 2,911,19826 249,806 26 151,22927 32,614,307 27 25,137,71228 12,996,643 28 10,158,61629 5,992,499 29 5,146,84030 2,617,928 30 1,987,69831 2,015,738 31 1,468,23132 602,190 32 519,46733 4,409,884 33 3,043,14934 328,739 34 122,79135 4,081,145 35 2,920,358
Reserve 36 1,668,029 Reserve 36 1,200,313Retained earnings brought forward 37 2,413,116 Retained earnings brought forward 37 1,720,045
38 -23,668 38 -19,07139 19,616,892 39 14,978,32440 772 40 77241 386,029,562 41 354,706,721
Sector
Classification No.
Sector
Classification No.
Number of corporations (companies) Number of corporations (companies)
Cash and depositsCall loans and receivables under resale agreements Call loans and receivables under resale agreements
Trading assets Trading account securities Trading assets Trading account securities
Cash and deposits
Money held in trust Money held in trustSecurities SecuritiesLoans receivable Loans receivableTangible fixed assetsLand LandConstruction in process
Tangible fixed assets
Construction in processOther tangible fixed assets Other tangible fixed assets
Intangible fixed assetsIntangible fixed assets excluding software
Intangible fixed assetsIntangible fixed assets excluding software
SoftwareRest of other assetsDeferred tax assets Deferred tax assets
SoftwareRest of other assets
Customers liabilities for acceptances and guarantees
Allowance for loan lossesTotal assets
Customers liabilities for acceptances and guarantees
Allowance for loan lossesTotal assets
LiabilitiesReserve for insurance policy liabilitiesBonds
LiabilitiesReserve for insurance policy liabilitiesBonds
Other liabilities Other liabilitiesAllowance Reserve required by special law
Allowance Reserve required by special law
Deferred tax liabilitiesAcceptances and guarantees
Net assets
Deferred tax liabilitiesAcceptances and guarantees
Net assetsShareholders' equityCapital stock and fundsCapital surplus
Shareholders' equityCapital stock and fundsCapital surplus
Other earned surplusLegal retained earnings, Deficiency reserveOther earned surplus
Capital reserves, Reserve for revaluationOthers capital surplus
Earned surplus
Capital reserves, Reserve for revaluationOthers capital surplus
Earned surplus
3. Assets, Liabilities and Net Assets by Sector
Liabilities and net assets Liabilities and net assets
Treasury shares Treasury sharesOthers net assets Others net assetsSubscription rights to shares Subscription rights to shares
Legal retained earnings, Deficiency reserve
216 By Sector

(Unit: millions of yen)
Non-Life InsuranceInstitutions
MiscellaneousInsurance
Institutions
30 34,110
1 951,729 1 1,400,3812 930,112 2 873,7893 9,997 3 3,5624 135,250 4 203,0415 23,795,298 5 43,1656 1,866,460 6 19,9507 1,064,882 7 2,0328 499,201 8 21,1839 8,395 9 8,77410 557,286 10 4,03411 127,484 11 4,74012 44,185 12 101,06913 83,299 13 166,98114 2,286,711 14 1,248,40415 89,479 15 428,70316 98,577 16 212,84117 -33,138 17 14,09118 31,322,841 18 201,77119 23,846,246 19 26,11020 19,985,583 20 12,45421 439,258 21 13,65622 1,895,889 22 793,59123 552,365 23 686,13824 237,341 24 576,42725 637,233 25 25,48926 98,577 26 84,22227 7,476,595 27 107,45328 2,838,027 28 4,00029 845,659 29 34,60930 630,230 30 -7,47331 547,507 31 2,679,92132 82,723 32 1,593,97133 1,366,735 33 845,46534 205,948 34 5,69935 1,160,787 35 214,029
Reserve 36 467,716 36 202,793Retained earnings brought forward 37 693,071 37 35,902
38 -4,597 38 166,89139 4,638,568 39 14,48040 0 40 408,46441 31,322,841 41 707,164
42 27,35643 593,77744 221,22845 372,54946 56,39747 29,63448 18,75049 22,59250 1,085,95051 1,058,57352 220,52653 114,13254 71,67055 42,46256 728,05957 19,02358 709,036
Reserve 59 317,828Retained earnings brought forward 60 391,208
61 -4,14462 27,37363 464 2,679,92165 52
Sector
Classification No.
Number of corporations (companies)
Liquid assetsCash and depositsBills receivableAccounts receivableSecuritiesStocksBonds and debenturesOther securities
InventoriesFinished goods and merchandiseOther inventories
Short-term loans receivableOther liquid assets
Fixed assetsTangible fixed assetsLandConstruction in processOther tangible fixed assets
Intangible fixed assetsIntangible fixed assets excluding softwareSoftware
Investments and other assetsInvestment securitiesStocksBonds and debenturesOther securities
Other investments and other assetsDeferred assetsDeferred tax assetsAllowance for loan lossesTotal assetsLiabilitiesLiquid liabilitiesBills payableAccounts payableShort-term borrowingsShort-term bank borrowingsShort-term other borrowings
AllowanceOther liquid liabilities
Fixed liabilitiesBondsLong-term borrowingsLong-term bank borrowingsLong-term other borrowings
AllowanceOther fixed liabilities
Shareholders' equity
Reserve required by special lawDeferred tax liabilitiesNet assets
Capital stockCapital surplusCapital reservesOthers capital surplus
Earned surplusLegal retained earningsOther earned surplus
Treasury stockOthers net assetsSubscription rights to shares
Liabilities and net assetsBills receivable discounted outstanding
Sector
Classification No.
Number of corporations (companies)
Cash and depositsCall loans and receivables under resale agreements
Trading assets Trading account securitiesMoney held in trustSecuritiesLoans receivableTangible fixed assetsLandConstruction in processOther tangible fixed assets
Intangible fixed assetsIntangible fixed assets excluding softwareSoftware
Rest of other assetsDeferred tax assets
Acceptances and guaranteesNet assets
Customers liabilities for acceptances and guarantees
Allowance for loan lossesTotal assetsLiabilitiesReserve for insurance policy liabilitiesBonds
Liabilities and net assets
Shareholders' equityCapital stock and fundsCapital surplusCapital reserves, Reserve for revaluationOthers capital surplus
Earned surplus
(average for beginning of year) (continued)
Legal retained earnings, Deficiency reserveOther earned surplus
Treasury sharesOthers net assetsSubscription rights to shares
Other liabilitiesAllowance Reserve required by special lawDeferred tax liabilities
By Sector 217

The stratified sampling method is used for the Financial Statements of Corporation by Industry,
in which enterprises are stratified into seven strata based on the amount of paid-up capital,
and then these strata are further classified into 45 groups by industry. The specific sampling
methods are described below:
Company Size Amount of paid-up capital Sampling method
Small- and Medium-sized enterprises
Under 10 million yenSystematic sampling with equal probability
10 million yen up to 20 million yen
Systematic sampling with equal probability
20 million yen up to 50 million yen
Systematic sampling with equal probability
50 million yen up to 100 million yen
Systematic sampling with equal probability
Moderatelylarge enterprises
100 million yen up to 500 million yen
Systematic sampling with equal probability
500 million yen up to 1 billion yen
Complete enumeration
Large enterprises 1 billion yen or more Complete enumeration
2. Computational method of Standard error ratio
The following symbols are used in formulas for Standard errors.
N 2 n –1 – N –1
n –1n
∑i=1
(yi – y
yi
–)21/2
, Standard error ratio =Standard error =
N: Population size yi: Value of the i-th sample enterprise
n: Sample size y: Sample mean =
Standard error
Ny
n1
–
–n
∑i=1
3. Standard error ratio (unit: %)
FY2015 Total assets Sales Investment in P&E
All Industries 1. 1 1. 3 2. 3
Manufacturing 1. 0 1. 1
Non-manufacturing 1. 5 1. 8
Notes: 1. Investment in P&E includes investment in software.
Variance Evaluation for the Financial Statements Statistics of Corporations by Industry
(Excluding Finance and Insurance)
1. Sample design of the Financial Statements Statistics of Corporations by Industry
2. 3
3. 2
2. All Industries and Non-Manufacturing don’t include Finance and Insurance.
218 Reference

Variance Evaluation for the Financial Statements Statistics of Corporations by Industry
(Finance and Insurance)
1. Sample design for the Financial Statements of Corporations by Industry
The stratified sampling method is used for the Financial Statements of Corporation by Industry,
in which enterprises are stratified into four strata based on the amount of paid-up capital,
and then these strata are further classified into 11 groups by industry. The specific sampling
methods are described below:
Company size Amount of paid-up capital Sampling method
Small and medium-sized enterprises
Under 10 million yenSystematic sampling with equal probability
10 million yen up to 100 million yen
Systematic sampling with equal probability
Moderately large enterprises
100 million yen up to 1 billion yen
Complete enumeration
Large enterprises 1 billion yen or more Complete enumeration
2. Computational method of Standard error ratio
The following symbols are used in formulas for Standard errors.
N 2 n –1 – N –1
n –1n
∑i=1
(yi – y
yi
–)21/2
, Standard error ratio =Standard error =
N: Population size yi: Value of the i-th sample enterprise
n: Sample size y: Sample mean =
Standard error
Ny
n1
–
–n
∑i=1
3. Standard error ratio (unit: %)
FY2015 Total assets Investment in P&E
Finance and Insurance 0. 5 2. 3
Notes: Investment in P&E includes investment in software.
Reference 219

Rat
io o
fA
ctua
lR
eve-
nue
to B
udge
t
Inco
me
Tax
Cor
pora
tion
Tax
par
ann
um daily
inte
-re
st(s
en)
Oct
.-Dec
.Ja
n.-M
ar.
Apr
.-Jun
eJu
ly-S
ept.
Oct
.-Dec
.Ja
n.-M
ar.
Apr
.-Jun
eJu
lyA
ug.
Sept
.O
ct.
Nov
.D
ec.
Jan.
Feb.
Mar
.A
pr.
May
June
July
Aug
.
( N
atio
nal T
ax a
nd S
tam
p R
even
ue: A
djus
ted
by a
ddin
g th
e pa
rt o
f the
tax
reve
nues
of A
pril
and
May
hi
ch b
elon
gs to
the
prec
edin
g fis
cal y
ear
to th
ose
of M
arch
of t
he p
rece
ding
fisc
al y
ear.
M
oney
Sto
ck: B
efor
e 20
04, f
igur
es a
re M
oney
Sup
ply
Dom
estic
ally
Lic
ense
d B
anks
: In
and
befo
re 1
992,
figu
res
are
bank
ing
acco
unts
of a
ll ba
nks.
Fig
ures
are
not
in s
erie
s be
caus
e of
the
mer
ger
of fi
nanc
ial i
nstit
utio
ns a
nd s
o on
. In
clud
ing
JOM
acc
ount
s in
and
aft
er 1
986.
A
vera
ge C
ontr
acte
d In
tere
st R
ates
on
Loan
s &
Dis
coun
ts: I
nclu
ding
ove
rdra
fts
in a
nd a
fter
Apr
il 19
92.
Rel
ease
d by
Min
istr
y of
Fin
ance
Ban
k of
Jap
an
Bill
ion
Yen
10 B
illio
nYe
n10
Bill
ion
Yen
Bill
ion
Yen
Unc
olla
t-er
aliz
edO
vern
i-gh
t E
nd o
fPe
riod
Ave
rage
Con
trac
ted
Inte
rest
Rat
eson
Loa
ns &
Dis
coun
ts(E
nd o
f Yea
r or
Mon
th)
()
Ave
rage
Out
stan
ding
Cha
nge
from
Pre
cedi
ng Y
ear
Trea
sury
fund
s an
dot
hers
Surp
lus/
shor
tage
of
fund
s
The
Ban
k of
Japa
nLo
ans
and
Mar
ket
Ope
ratio
ns
Net
chan
ge in
curr
ent
acc
ount
bala
nces
Act
ual
Dep
osits
Out
-st
andi
ng
Loan
s &
Bill
sD
isco
unte
dO
ut-
stan
ding
Dom
estic
ally
Lic
ense
d B
anks
(
)
Bill
ion
Yen
Bill
ion
Yen
Bill
ion
Yen
Mai
n E
con
omic
In
dica
tors
of J
apan
(Sep
tem
ber
2016
)
Cal
l Rat
esA
vera
geO
ut-
stan
ding
in th
e C
all
Mon
eyM
arke
t
Tota
l
Act
ual R
even
ueB
ank-
note
s in
circ
ulat
ion
End
of
Year
or
Mon
th
Ave
rage
Am
ount
sO
ut-
stan
ding
M3
M2
Bro
adly
-de
fined
Liqu
i-di
tyB
ankn
otes
Net
Rec
eipt
s &
Paym
ents
(of
Trea
sury
Fun
dsN
atio
nal T
ax a
nd S
tam
p R
even
ue (
)A
ccou
nts
of th
e B
ank
of J
apan
Mon
ey S
tock
()
Sour
ces
of C
hang
es in
Cur
rent
Acc
ount
Bal
ance
sat
the
Ban
k of
Jap
an a
nd M
arke
t Ope
ratio
ns
FYFY
FYFY
FY
In t
he
tran
slat
ion
pro
cess
from
Jap
anes
e, t
he
tim
e pe
riod
ca
tego
ries
wer
e ch
ange
d fr
om fi
scal
yea
r to
cal
enda
r ye
ar. A
s su
ch,
the
cate
gori
es m
ay d
iffer
slig
htl
y fr
om t
he
Japa
nes
e ve
rsio
n.
220

Jan.
4, 1
968
May
.16,
194
9=1
00=1
76.2
1C
YC
YC
YC
YC
YC
YC
YC
YC
YC
YC
YC
YC
YC
YC
YC
YC
YC
YC
YC
YC
YC
YC
YO
ct.-D
ec.
Jan.
-Mar
.A
pr.-J
une
July
-Sep
t.O
ct.-D
ec.
Jan.
-Mar
.A
pr.-J
une
July
Aug
.Se
pt.
Oct
.N
ov.
Dec
.Ja
n.Fe
b.M
ar.
Apr
.M
ayJu
neJu
lyA
ug.
()
Stoc
k Pr
ices
and
Yie
lds
(Nik
kei A
vera
ge):
Aft
er la
rge
repl
acem
ent o
f bra
nd c
ompo
nent
s on
24t
h A
pril,
200
0,
()
Susp
ensi
on o
f Bus
ines
s Tr
ansa
ctio
ns w
ith B
anks
: Sin
ce A
pril
2007
,
inde
x is
dis
cont
inuo
us a
s fo
r co
ntin
uous
ly a
nd s
impl
y co
mpa
ring
bef
ore
repl
acem
ent w
ith a
fter
rep
lace
men
t.fig
ures
are
not
ser
ies,
bec
ause
sur
vey
met
hodo
logy
has
bee
n ch
ange
d.
Toky
o St
ock
Pric
e In
dex:
Ave
rage
figu
res
are
calc
ulat
ed b
y Po
licy
Plan
ning
and
Res
earc
h D
ivis
ion
, Min
iste
r's S
ecre
tari
at ,
Min
istr
y of
Fin
ance
.
Rel
ease
d by
Japa
n Se
curi
ties
Dea
lers
Ass
ocia
tion
Toky
o St
ock
Exc
hang
eTo
kyo
Cle
arin
g H
ouse
Japa
nese
Ban
kers
Ass
ocia
tion
Toky
o Sh
oko
Res
earc
h C
o. L
td.
Bill
ion
Yen
Mill
ion
Shar
esB
illio
n Ye
nC
ase
Bill
ion
Yen
Cas
e
Ban
kD
eben
ture
s
Toky
o St
ock
Exc
hang
e (1
st S
ectio
n)
All
Cle
arin
gH
ouse
s
Tota
lA
mou
nt o
fLi
abili
ties
Num
ber
of C
ases
Tota
lLi
abili
ties
Bill
ion
Yen
Cle
arin
g of
Che
cks
and
Bill
s
Ret
urne
dC
heck
san
d B
ills
Susp
ensi
on o
f Bus
ines
sTr
ansa
ctio
ns w
ith B
anks
()
Bus
ines
s Fa
ilure
s
Gov
ernm
ent
Bon
ds
Loca
lG
over
nmen
tB
onds
Gov
ernm
ent
Gua
rant
eed
Bon
ds
Stra
ight
Cor
pora
teB
onds
Toky
o St
ock
Pric
e In
dex
Dai
ly A
vera
geTr
adin
gV
olum
e
Ave
rage
Yie
ld o
f Div
ided
Payi
ngC
ompa
nies
(End
of M
onth
)
Nik
kei
Ave
rage
Issu
es o
f Pub
lic a
nd C
orpo
rate
Bon
dsSt
ock
Pric
es a
nd Y
ield
s (A
vera
ge)
Toky
o
221
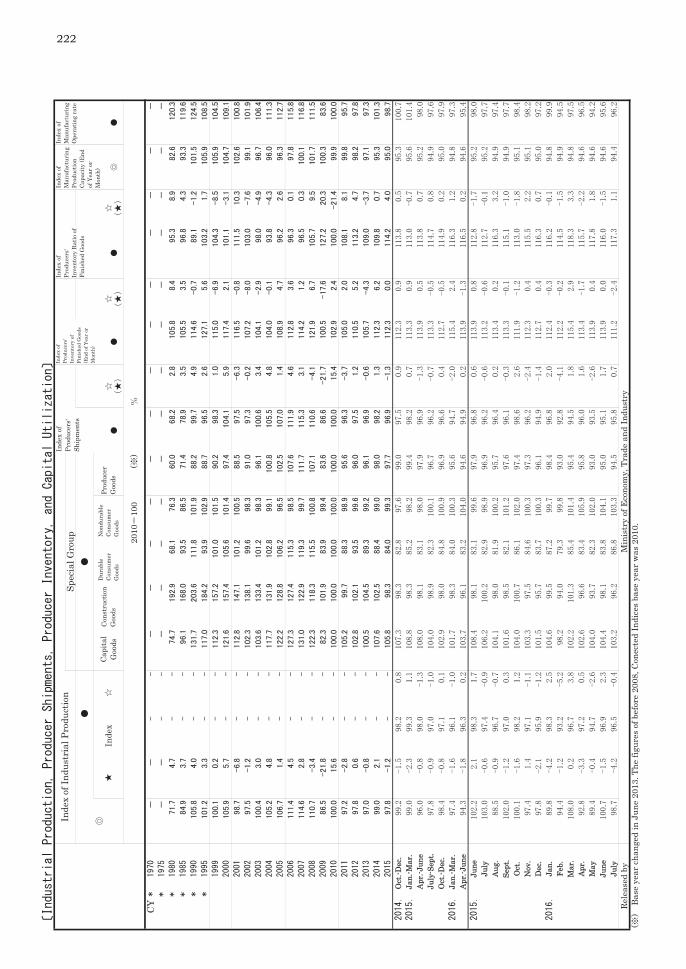
CY
CY
CY
CY
CY
CY
CY
CY
CY
CY
CY
CY
CY
CY
CY
CY
CY
CY
CY
CY
CY
CY
CY
Oct
.-Dec
.Ja
n.-M
ar.
Apr
.-Jun
eJu
ly-S
ept.
Oct
.-Dec
.Ja
n.-M
ar.
Apr
.-Jun
eJu
neJu
lyA
ug.
Sept
.O
ct.
Nov
.D
ec.
Jan.
Feb.
Mar
.A
pr.
May
June
July
()
Bas
e ye
ar c
hang
ed in
Jun
e 20
13. T
he fi
gure
s of
bef
ore
2008
, Con
ecte
d In
dice
s ba
se y
ear
was
201
0.
201
010
0(
)
Rel
ease
d by
Min
istr
y of
Eco
nom
y, T
rade
and
Indu
stry
Inde
xC
apita
lG
oods
Con
stru
ctio
nG
oods
Dur
able
Con
sum
erG
oods
Non
dura
ble
Con
sum
erG
oods
Inde
x of
Man
ufac
turi
ngO
pera
ting
rate
Inde
x of
Indu
stri
al P
rodu
ctio
nIn
dex
ofPr
oduc
ers'
Ship
men
ts
Inde
x of
Prod
ucer
s'In
vent
ory
ofFi
nish
ed G
oods
(End
of Y
ear
orM
onth
)
Inde
x of
Prod
ucer
s'In
vent
ory
Rat
io o
fFi
nish
ed G
oods
Inde
x of
Man
ufac
turi
ngPr
oduc
tion
Cap
acity
(End
of Y
ear
orM
onth
)
Spec
ial G
roup
Prod
ucer
Goo
ds
222

CY
CY
CY
CY
CY
CY
CY
CY
CY
CY
CY
CY
CY
CY
CY
CY
CY
CY
CY
CY
CY
CY
CY
Oct
.-Dec
.Ja
n.-M
ar.
Apr
.-Jun
eJu
ly-S
ept.
Oct
.-Dec
.Ja
n.-M
ar.
Apr
.-Jun
eJu
neJu
lyA
ug.
Sept
.O
ct.
Nov
.D
ec.
Jan.
Feb.
Mar
.A
pr.
May
June
July
()
Ord
ers
Rec
eive
d fo
r M
achi
nery
(280
Com
pani
es):
Bef
ore
Mar
ch 1
987,
bas
e w
as 1
78 C
ompa
nies
.
In
Apr
il 20
05, t
he s
easo
nal a
djus
tmen
ts in
the
surv
ey a
re m
ade
usin
g th
e C
ensu
s B
urea
u m
etho
d (X
-11
of X
-12-
AR
IMA
).
Si
nce
2006
,"m
obile
pho
ne" h
as b
een
excl
uded
.
O
rder
s R
ecei
ved
for
Con
stru
ctio
n (5
0 C
ompa
nies
): A
fter
Apr
il 19
85, b
ase
was
cha
nged
from
43
Com
pani
es to
50
Com
pani
es.
Rel
ease
d by
Cab
inet
Offi
ceM
inis
try
of L
and,
Infr
astr
uctu
re a
nd T
rans
port
Bill
ion
Yen
Bill
ion
Yen
Thou
sand
of U
nits
Bill
ion
Yen
Bill
ion
Yen
Con
do-
min
ium
by Man
ufac
-tu
ring
indu
stri
es
by N
onm
anuf
actu
ring
indu
stri
es(e
xcep
t Shi
psE
lect
rici
ty)
Priv
ate
Non
-R
esid
ence
Bill
ion
Yen
Thou
sand
of U
nits
Ord
ers
Rec
eive
d fo
r C
onst
ruct
ion
( 50
Com
pani
es)
()
New
Con
stru
ctio
n St
arts
of D
wel
lings
Tota
l
Dem
and
by Priv
ate
Sect
or
Tota
lN
umbe
r
Seas
onal
lyA
djus
ted
Ann
ual
Rat
es
With
inex
cept
Ship
sE
lect
rici
ty
Ord
ers
Rec
eive
d fo
r M
achi
nery
(280
Com
pani
es)
(
)
Ow
nH
ouse
Ren
ted
Hou
se
223

Oct
.-Dec
.Ja
n.-M
ar.
Apr
.-Jun
eJu
ly-S
ept.
Oct
.-Dec
.Ja
n.-M
ar.
Apr
.-Jun
eJu
neJu
lyA
ug.
Sept
.O
ct.
Nov
.D
ec.
Jan.
Feb.
Mar
.A
pr.
May
June
July
()
Bas
e ye
ar c
hang
ed in
Mar
ch 2
012.
In 1
989
and
befo
re, e
nter
pris
es w
ith 3
0 em
ploy
ees
and
over
.(bas
e ye
ar =
200
5)
La
bour
For
ce S
urve
y: T
he b
ench
mar
k po
pula
tion
for
calc
ulat
ing
the
resu
lts o
f the
Lab
our
Forc
e Su
rvey
has
bee
n re
vise
d to
the
2010
Cen
sus-
base
d po
pula
tion
estim
ates
in J
anua
ry 2
012.
In o
rder
to r
emov
e th
e ga
ps, d
ata
from
Oct
ober
200
5 th
roug
h D
ecem
ber
2011
hav
e be
en a
djus
ted
to c
ompa
rabl
e tim
e-se
ries
dat
a re
spon
ding
to th
e re
visi
on.
indi
cate
s Su
pple
men
tary
-est
imat
ed fi
gure
s (R
efer
entia
l fig
ures
:201
0-ce
nsus
bas
e).
The
reas
on o
f the
trea
tmen
t is
that
figu
res
cove
ring
f
rom
Mar
ch th
roug
h A
ugus
t 201
1 fo
r w
hole
Jap
an w
ere
mis
sing
due
to th
e da
mag
e ca
used
by
the
Gre
at E
ast J
apan
Ear
thqu
ake .
2010
= 1
00
()
10
thou
sand
Pe
rson
sTi
mes
Rel
ease
d by
Min
istr
y of
Hea
lth, L
abou
r an
d W
elfa
reM
inis
try
of In
tern
al A
ffair
s an
d C
omm
unic
atio
ns
Min
istr
y of
Hea
lth, L
abou
ran
d W
elfa
re
Tota
llyU
nem
ploy
ed
Une
mpl
oym
ent
rate
Rat
io o
fJo
b O
ffers
to App
lican
ts
Rat
e of
New
Job
Offe
rsto
New
App
lican
ts
Em
-pl
oyee
sM
anu-
fact
urin
g
Cas
h E
arni
ng In
dex
Em
ploy
men
t Ind
ex o
f Reg
ular
Em
ploy
ees
Inde
x of
Non
sche
dule
d H
ours
Wor
ked
Labo
urFo
rce
Em
-pl
oyed
Ent
erpr
ises
with
5 e
mpl
oyee
s a
nd o
ver.
All
Indu
st-
ries
Man
u-fa
ctur
ing
All
Indu
st-
ries
Man
u-fa
ctur
ing
All
Indu
st-
ries
224

Oct
.-Dec
.Ja
n.-M
ar.
Apr
.-Jun
eJu
ly-S
ept.
Oct
.-Dec
.Ja
n.-M
ar.
Apr
.-Jun
eJu
lyA
ug.
Sept
.O
ct.
Nov
.D
ec.
Jan.
Feb.
Mar
.A
pr.
May
June
July
Aug
.
Blo
ombe
rg(
) C
urre
nt S
urve
y of
Com
mer
ce: D
ata
is c
ompa
red
to th
em o
f pre
viou
s ye
ar o
r m
onth
aft
er s
tore
adj
ustm
ent.
()
Con
sum
er P
rice
Inde
x: B
ase
year
cha
nged
in A
ugus
t 201
1.
C
orpo
rate
Goo
ds P
rice
Inde
x: C
hang
ed to
the
2010
bas
e C
GPI
in J
uly
2012
.
F
amily
Inco
me
and
Exp
endi
ture
Sur
vey:
Tw
o-or
-mor
e-pe
rson
hou
seho
lds
(Inc
ludi
ng a
gric
ultu
ral,
fore
stry
and
fish
erie
s ho
useh
olds
) in
and
afte
r Ja
nuar
y 20
00.
Con
sum
er P
rice
Inde
x: B
ase
year
cha
nged
in A
ugus
t 201
6.
Rel
ease
d by
Min
istr
y of
Inte
rnal
Affa
irs
and
Com
mun
icat
ions
Min
istr
y of
Eco
nom
y Tr
ade
and
Indu
stry
Ban
k of
Jap
anM
inis
try
of In
tern
al A
ffair
s an
d C
omm
unic
atio
ns
Yen
(Dur
ing
mon
th o
r av
erag
edu
ring
yea
r)20
10 =
100
(
)
%$
/ bl
2015
= 1
00
()
%
Ave
rage
Gen
eral
Gen
eral
exc
ludi
ngFr
esh
Food
Gen
eral
exc
ludi
ngFr
esh
Food
Gen
eral
Exp
ort
(Yen
bas
is)
Impo
rt(Y
en b
asis
)D
omes
tic u
sing
chai
n-w
eigh
ted
inde
x fo
rmul
a
Fam
ily In
com
e an
d E
xpen
ditu
reC
urre
nt S
urve
y of
Com
mer
ceC
orpo
rate
Goo
ds P
rice
Inde
xC
rude
oil
pric
eD
ubai
Con
sum
er P
rice
Inde
xLi
ving
Exp
endi
ture
(Tw
o-or
-mor
e-pe
rson
hou
seho
lds)
Wor
kers
Hou
se-
hold
sSa
les
ofR
etai
ls
Sale
s of
Dep
artm
ents
tore
s an
dSu
perm
arke
tsD
omes
ticA
ll Ja
pan
Ku-
area
of T
okyo
Ave
rage
Prop
ensi
tyto
Con
sum
e
Dep
artm
ent
Stor
esSu
per
Mar
ket
225

Oct
.-Dec
.Ja
n.-M
ar.
Apr
.-Jun
eJu
ly-S
ept.
Oct
.-Dec
.Ja
n.-M
ar.
Apr
.-Jun
eJu
neJu
lyA
ug.
Sept
.O
ct.
Nov
.D
ec.
Jan.
Feb.
Mar
.A
pr.
May
June
July
()
Incl
udin
g "G
old
ore"
and
"Non
-mon
etar
y go
ld" i
n an
d af
ter
Janu
ary
1976
. E
U: 1
0 co
untr
ies
sinc
e 19
81, 1
2 co
untr
ies
sinc
e 19
86, 1
5 co
untr
ies
sinc
e 19
95, 2
5 co
untr
ies
sinc
e 20
04, a
nd 2
7 co
untr
ies
sinc
e 20
07.
Rel
ease
d by
Min
istr
y of
Fin
ance
Bill
ion
Yen
Bill
ion
Yen
Bill
ion
Yen
Bill
ion
Yen
Exp
orts
and
Impo
rts
on a
Cus
tom
s C
lear
ance
Bas
is
()
Exp
orts
Impo
rts
Tota
lM
etal
sto
U.S
.Ato EU
from EU
Mac
hi-
nery
and
Equ
ip-
men
ts
Ele
ctri
cE
quip
-m
ents
Mac
hi-
nery
and
Equ
ip-
men
ts
from
U.S
.Afr
omA
sia
Offi
ceM
achi
-na
ry
Pass
en-
ger
Car
s
Cru
de O
ilan
dPe
trol
eum
Prod
ucts
Offi
ceM
achi
-na
ry
to Asi
aTo
tal
Food
-st
uff
Cru
deM
ater
ials
and
Fuel
s
226
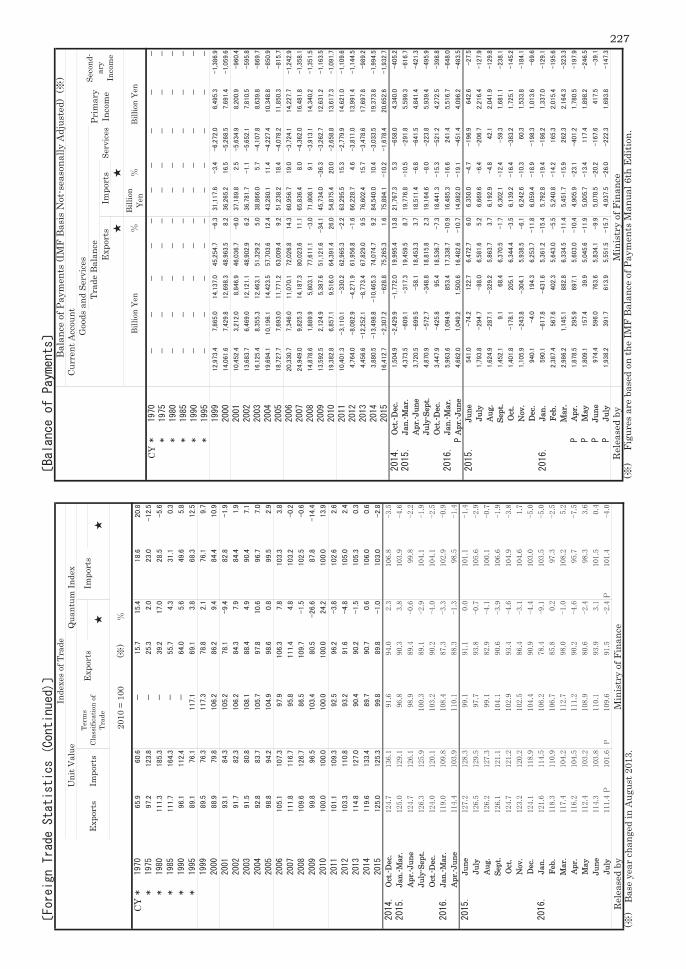
CY
Oct
.-Dec
.Ja
n.-M
ar.
Apr
.-Jun
eJu
ly-S
ept.
Oct
.-Dec
.Ja
n.-M
ar.
Apr
.-Jun
eJu
neJu
lyA
ug.
Sept
.O
ct.
Nov
.D
ec.
Jan.
Feb.
Mar
.A
pr.
May
June
July
()
Bas
e ye
ar c
hang
ed in
Aug
ust 2
013.
2010
= 1
00
(
)
Rel
ease
d by
Min
istr
y of
Fin
ance
Inde
xes
of T
rade
Uni
t Val
ueQ
uant
um In
dex
Exp
orts
Impo
rts
Term
sC
lass
ifica
tion
ofTr
ade
Exp
orts
Impo
rts
CY
Oct
.-Dec
.Ja
n.-M
ar.
Apr
.-Jun
eJu
ly-S
ept.
Oct
.-Dec
.Ja
n.-M
ar.
Apr
.-Jun
eJu
neJu
lyA
ug.
Sept
.O
ct.
Nov
.D
ec.
Jan.
Feb.
Mar
.A
pr.
May
June
July
()
Figu
res
are
base
d on
the
IMF
Bal
ance
of P
aym
ents
Man
ual 6
th E
ditio
n.R
elea
sed
byM
inis
try
of F
inan
ce
Bal
ance
of P
aym
ents
(IM
F B
asis
Not
-sea
sona
lly A
djus
ted)
()
Cur
rent
Acc
ount
Goo
ds a
nd S
ervi
ces
Prim
ary
Inco
me
Seco
nd-
ary
Inco
me
Trad
e B
alan
ceSe
rvic
esE
xpor
tsIm
port
s
Bill
ion
Yen
Bill
ion
Yen
Bill
ion
Yen
227

()
Ave
rage
CY
Oct
.-Dec
.Ja
n.-M
ar.
Apr
.-Jun
eJu
ly-S
ept.
Oct
.-Dec
.Ja
n.-M
ar.
Apr
.-Jun
eJu
lyA
ug.
Sept
.O
ct.
Nov
.D
ec.
Jan.
Feb.
Mar
.A
pr.
May
June
July
Aug
.
Gol
d &
For
eign
Exc
hang
e R
eser
ves:
Fig
ures
are
end
of y
ear
or m
onth
.
Rel
ease
d by
Min
istr
y of
Fin
ance
Ban
k of
Jap
an(
) Fi
gure
s ar
e ba
sed
on th
e IM
F B
alan
ce o
f Pay
men
ts M
anua
l 6th
Edi
tion.
F
igur
es a
re c
alcu
late
d by
Pol
icy
Plan
ning
and
Res
earc
h D
ivis
ion
, Min
iste
r's S
ecre
tari
at, M
inis
try
of F
inan
ce.
Bill
ion
Yen
Mill
ion
Dol
lar
Yen
Per
1 D
olla
r
Oth
erIn
vest
-m
ent
Res
erve
Ass
ets
Goo
ds a
nd S
ervi
ces
Prim
ary
Inco
me
Seco
nd-
ary
Inco
me
Inte
r-B
ank
Rat
esU
.S.D
olla
r Sp
otC
entr
al r
ate
Bill
ion
Yen
Bill
ion
Yen
Bill
ion
Yen
Fore
ign
Exc
hang
eR
ates
Cap
ital
Acc
ount
Fina
ncia
l Acc
ount
N
et E
rror
san
dO
mis
sion
s
Cur
rent
Acc
ount
(Sea
sona
lly A
djus
ted)
Dir
ect
Inve
st-
men
t
Port
folio
Inve
st-
men
t
Fina
ncia
lD
eriv
ativ
es(o
ther
than
Res
erve
s)
Trad
e B
alan
ceSe
rvic
esIn
clud
ing
Gol
dTr
anch
eE
xpor
ts
Bal
ance
of P
aym
ents
(IM
F B
asis
) Con
tinue
d (
)G
old
&Fo
reig
nE
xcha
nge
Res
erve
s
Impo
rts
Hig
h-Lo
w
228
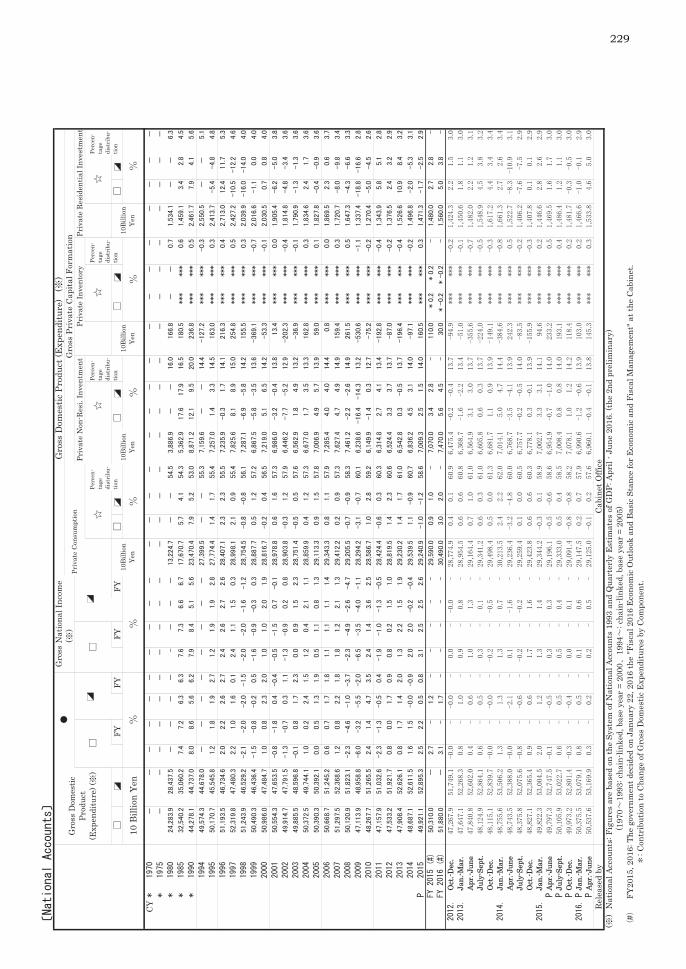
FYFY
FYFY
CY
Oct
.-Dec
.Ja
n.-M
ar.
Apr
.-Jun
eJu
ly-S
ept.
Oct
.-Dec
.Ja
n.-M
ar.
Apr
.-Jun
eJu
ly-S
ept.
Oct
.-Dec
.Ja
n.-M
ar.
Apr
.-Jun
eJu
ly-S
ept.
Oct
.-Dec
.Ja
n.-M
ar.
Apr
.-Jun
e
()
Nat
iona
l Acc
ount
s: F
igur
es a
re b
ased
on
the
Syst
em o
f Nat
iona
l Acc
ount
s 19
93 a
nd Q
uart
erly
Est
imat
es o
f GD
P: A
pril
- Jun
e 20
16. (
the
2nd
prel
imin
ary)
(197
019
93: c
hain
-link
ed, b
ase
year
= 2
000
1994
: cha
in-li
nked
, bas
e ye
ar =
200
5)
#FY
2015
, 201
6: T
he g
over
nmen
t dec
ided
on
Janu
ary
22, 2
016
the
"Fis
cal 2
016
Eco
nom
ic O
utlo
ok a
nd B
asic
Sta
nce
for
Eco
nom
ic a
nd F
isca
l Man
agem
ent"
at t
he C
abin
et.
: Con
trib
utio
n to
Cha
nge
of G
ross
Dom
estic
Exp
endi
ture
s by
Com
pone
nt.
Rel
ease
d by
Cab
inet
Offi
ce
10 B
illio
n Ye
n10
Bill
ion
Yen
10B
illio
nYe
n10
Bill
ion
Yen
10B
illio
nYe
n
Perc
en-
tage
dist
ribu
-tio
n
Gro
ss D
omes
ticPr
oduc
t(E
xpen
ditu
re) (
)
Gro
ss N
atio
nal I
ncom
e(
)G
ross
Dom
estic
Pro
duct
(Exp
endi
ture
) (
)Pr
ivat
e C
onsu
mpt
ion
Gro
ss P
riva
te C
apita
l For
mat
ion
Priv
ate
Non
-Res
i. In
vent
men
tPr
ivat
e In
vent
ory
Priv
ate
Res
iden
tial I
nves
tmen
tPe
rcen
-ta
gedi
stri
bu-
tion
Perc
en-
tage
dist
ribu
-tio
n
Perc
en-
tage
dist
ribu
-tio
n
229

CY
Oct
.-Dec
.Ja
n.-M
ar.
Apr
.-Jun
eJu
ly-S
ept.
Oct
.-Dec
.Ja
n.-M
ar.
Apr
.-Jun
eJu
ly-S
ept.
Oct
.-Dec
.Ja
n.-M
ar.
Apr
.-Jun
eJu
ly-S
ept.
Oct
.-Dec
.Ja
n.-M
ar.
Apr
.-Jun
e
()
Nat
iona
l Acc
ount
s: F
igur
es a
re b
ased
on
the
Syst
em o
f Nat
iona
l Acc
ount
s 19
93 a
nd Q
uart
erly
Est
imat
es o
f GD
P: A
pril
- Jun
e 20
16. (
the
2nd
pre
limin
ary)
(198
019
93: c
hain
-link
ed, b
ase
year
= 2
000
1994
: cha
in-li
nked
, bas
e ye
ar =
200
5)(
)FY
2015
, 201
6: T
he g
over
nmen
t dec
ided
on
Janu
ary
22, 2
016
the
"Fis
cal 2
016
Eco
nom
ic O
utlo
ok a
nd B
asic
Sta
nce
for
Eco
nom
ic a
nd F
isca
l Man
agem
ent"
at t
he C
abin
et.
()
Nat
iona
l Inc
ome,
Sav
ings
rat
io: B
ase
year
for
figur
es is
200
5. (1
980
1993
: Bas
e ye
ar fo
r fig
ures
is 2
000.
)
Rel
ease
d by
Cab
inet
Offi
ce
10 B
illio
n Ye
nTh
ousa
nd Y
en10
Bill
ion
Yen
10 B
illio
nYe
n10
Bill
ion
Yen
10 B
illio
nYe
n10
Bill
ion
Yen
Perc
en-
tage
dist
ribu
-tio
n
Seas
onal
lyA
djus
ted
Ann
ual R
ates
Per
Cap
itaPe
rcen
-ta
gedi
stri
bu-
tion
Gro
ss D
omes
tic P
rodu
ct (C
ontin
ued)
(
N
atio
nal I
ncom
e (
)
Savi
ngs
ratio
()
Gov
ernm
ent E
xpen
ditu
res
Exp
orts
of G
oods
and
Ser
vice
sIm
port
s of
Goo
ds a
nd S
ervi
ces
Gov
ernm
ent C
onsu
mpt
ion
Cap
ital F
orm
atio
n in
clud
ing
Inve
ntor
ies
Perc
en-
tage
dist
ribu
-tio
nPe
rcen
-ta
gedi
stri
bu-
tion
Perc
en-
tage
dist
ribu
-tio
n
230

Oct
.-Dec
.Ja
n.-M
ar.
Apr
.-Jun
eJu
ly-S
ept.
Oct
.-Dec
.Ja
n.-M
ar.
Apr
.-Jun
eJu
ly-S
ept.
Oct
.-Dec
.Ja
n.-M
ar.
Apr
.-Jun
eJu
ly-S
ept.
Oct
.-Dec
.Ja
n.-M
ar.
Apr
.-Jun
eJu
ly-S
ept.
Oct
.-Dec
.Ja
n.-M
ar.
(1)
'TA
NK
AN
' (A
ll In
dust
ries
.) : *
The
figu
res
are
fore
cast
ed in
the
surv
ey in
Jun
e, 2
016
(2)
Fin
anci
al S
tate
men
ts S
tatis
tics
of C
orpo
ratio
ns (A
ll In
dust
ries
.) :
Th
e fig
ures
do
not i
nclu
de F
inan
ce a
nd In
sura
nce,
and
incl
ude
pure
hol
ding
com
pany
that
has
finan
cial
inst
itutio
ns in
sub
sidi
ary
com
pany
sin
ce A
pril
- Jun
e, 2
008.
Si
nce
fisca
l yea
r 20
09, f
igur
es in
clud
e Ja
pan
Post
Hol
ding
s, J
apan
Pos
t Ser
vice
and
Jap
an P
ost N
etw
ork
Th
e fig
ures
of i
nves
tmen
t in
plan
t and
equ
ipm
ent i
nclu
de in
vest
men
t in
soft
war
e si
nce
fisca
l yea
r 20
02.
Th
e fig
ures
in [
] ar
e fo
reca
st o
f hal
f yea
r / f
isca
l yea
r of
"Bus
ines
s O
utlo
ok S
urve
y ",e
xclu
ding
Fin
ance
an
d In
sura
nce.
Rel
ease
d by
Min
istr
y of
Fin
ance
Ban
k of
Jap
an
Fina
ncia
l Sta
tem
ents
TAN
KA
N (A
ll In
dust
ries
.) (
1)
Sale
sO
rdin
ary
Prof
its a
ndLo
sses
Inve
stm
ent
in p
lant
and
equi
pmen
tSa
les
Cur
rent
Prof
it
Rat
io o
fC
urre
ntPr
ofit
toSa
les
Larg
eE
nter
pris
es(M
anuf
actu
rin
g)
Larg
eE
nter
pris
es(M
anuf
actu
rin
g)
Larg
eE
nter
pris
es(M
anuf
actu
rin
g)
Rec
ent
Fisc
al a
nd M
onet
ary
Polic
ies
(As
of S
epte
mbe
r 16
, 201
6)
2013
Jan
uar
y 11
E
mer
gen
cy E
con
omic
Mea
sure
s fo
r th
e R
evit
aliz
atio
n of
th
e Ja
pane
se E
cono
my
(Cab
inet
app
rova
l) Jan
uar
y 22
Jo
int
Sta
tem
ent
of t
he
Gov
ern
men
t an
d th
e B
ank
of J
apan
on
Ove
rcom
ing
Def
lati
on a
nd A
chie
vin
g S
ust
ain
able
Eco
nom
ic G
row
th
Jan
uar
y 31
FY
2012
su
pple
men
tary
bu
dget
(No.
1) (
subm
itte
d to
Die
t)
Feb
ruar
y 4
Fi
scal
pol
icy
spee
ch
Feb
ruar
y 26
FY
2012
su
pple
men
tary
bu
dget
(No.
1) p
asse
d F
ebru
ary
28
Polic
y ad
dres
s, F
isca
l pol
icy
spee
ch
Feb
ruar
y 28
FY
2013
bu
dget
(su
bmit
ted
to D
iet)
Fe
bru
ary
28
FY20
13 E
cono
mic
Ou
tloo
k an
d B
asic
Sta
nce
on
Eco
nom
ic a
nd F
isca
l Man
agem
ent
(Cab
inet
app
rova
l) M
arch
27
FY
2013
pro
visi
onal
bu
dget
(su
bmit
ted
to D
iet)
M
arch
29
FY
2013
pro
visi
onal
bu
dget
pas
sed
Mar
ch 2
9 B
ill o
n t
he F
Y201
3 R
evis
ed T
ax S
yste
m p
asse
d A
pri
l 4
Q
uan
tita
tive
an
d Q
ual
itat
ive
Eas
ing
intr
odu
ced
(Ban
k of
Jap
an M
onet
ary
Polic
y M
eeti
ng)
May
15
FY
2013
bu
dget
pas
sed
Ju
ne
14
Ja
pan
Rev
ital
izat
ion
Str
ateg
y (C
abin
et a
ppro
val)
Jun
e 14
B
asic
Pol
icy
on E
cono
mic
and
Fis
cal M
anag
emen
t an
d R
efor
m (p
lan
ned
fram
ewor
k) (C
abin
et a
ppro
val)
Au
gust
8
Init
iati
ves
to A
chie
ve F
isca
l Sou
ndn
ess
(Med
ium
-ter
m F
isca
l Pla
n) (C
abin
et c
onse
nt)
A
ugu
st 8
B
asic
Pol
icy
on B
udg
et R
equ
ests
for
FY20
14 (C
abin
et c
onse
nt)
O
ctob
er 1
R
aisi
ng
the
Nat
ion
al a
nd
Loca
l Con
sum
ptio
n T
ax R
ates
an
d A
ssoc
iate
d R
espo
nse
s (C
abin
et a
ppro
val)
Dec
ember
5
Eco
nom
ic P
olic
y fo
r A
chie
vin
g V
irtu
ous
Cyc
le (C
abin
et a
ppro
val)
Dec
ember
12
B
asic
Pol
icy
on t
he F
Y201
4 B
udg
et P
repa
rati
on (C
abin
et a
ppro
val)
Dec
ember
12
FY
2013
su
pple
men
tary
bu
dget
(No.
1) (
Cab
inet
app
rova
l) D
ecem
ber
21
FY
2014
Eco
nom
ic O
utl
ook
and
Bas
ic S
tan
ce o
n E
con
omic
and
Fis
cal M
anag
emen
t (C
abin
et c
onse
nt)
D
ecem
ber
24
R
ough
Est
imat
es o
f Rev
enu
es a
nd E
xpen
ditu
res
of F
Y201
4 G
ener
al A
ccou
nt
(Cab
inet
app
rova
l) D
ecem
ber
24
Ou
tlin
e of
th
e 20
14 T
ax R
efor
m (C
abin
et a
ppro
val)
2014
Jan
uar
y 24
Po
licy
addr
ess,
Fis
cal p
olic
y sp
eech
Ja
nu
ary
24
FY20
13 s
upp
lem
enta
ry b
udg
et (N
o. 1
) (su
bmit
ted
to D
iet)
Ja
nu
ary
24
FY20
14 b
udg
et (s
ubm
itte
d to
Die
t)
Janu
ary
24
FY20
14 E
cono
mic
Ou
tloo
k an
d B
asic
Sta
nce
on
Eco
nom
ic a
nd F
isca
l Man
agem
ent
(Cab
inet
app
rova
l) Ja
nuar
y 24
In
dust
rial
Com
peti
tive
ness
En
han
cem
ent
Act
ion
Pla
n (C
abin
et a
ppro
val)
Feb
ruar
y 6
FY
2013
su
pple
men
tary
bu
dget
(No.
1) p
asse
d M
arch
20
FY
2014
bu
dget
pas
sed
Mar
ch 2
0
Bill
on
the
FY2
014
Rev
ised
Tax
Sys
tem
pas
sed
Jun
e 24
Ja
pan
Rev
ital
izat
ion
Str
ateg
y, 2
014
Rev
isio
n (C
abin
et a
ppro
val)
June
24
2014
Bas
ic P
olic
y on
Eco
nom
ic a
nd F
isca
l Man
agem
ent
and
Ref
orm
(pla
nne
d fr
amew
ork)
(Cab
inet
app
rova
l) Ju
ly 2
5
Bas
ic P
olic
y on
Bu
dget
Req
ues
ts fo
r FY
2015
(Cab
inet
con
sen
t)
Oct
ober
31
E
xpan
sion
of t
he
Qu
anti
tati
ve a
nd
Qu
alit
ativ
e E
asin
g Po
licy
(Ban
k of
Jap
an M
onet
ary
Polic
y M
eeti
ng)
D
ecem
ber
27
E
mer
gen
cy E
con
omic
Mea
sure
s to
war
d th
e E
nh
ance
men
t of
th
e Po
siti
ve E
cono
mic
Cyc
le in
Loc
al C
omm
un
itie
s (C
abin
et a
ppro
val)
Dec
embe
r 27
B
asic
Pol
icy
on t
he F
Y201
5 B
udg
et P
repa
rati
on (C
abin
et a
ppro
val)
Dec
embe
r 27
Lo
ng-
term
Vis
ion
on
th
e C
reat
ion
of C
omm
un
itie
s, P
eopl
e an
d Jo
bs (C
abin
et a
ppro
val)
Dec
ember
27
C
ompr
ehen
sive
Str
ateg
ies
on t
he
Cre
atio
n o
f Com
mu
nit
ies,
Peo
ple
and
Jobs
(Cab
inet
app
rova
l) 20
15
Jan
uar
y 9
FY
2014
su
pple
men
tary
bu
dget
(No.
1; N
o. 1
for
spec
ial a
ccou
nts
and
No.
1 fo
r go
vern
men
t-af
filia
ted
agen
cies
) (C
abin
et a
ppro
val)
Jan
uar
y 12
FY
2015
Eco
nom
ic O
utl
ook
and
Bas
ic S
tan
ce o
n E
con
omic
and
Fis
cal M
anag
emen
t (C
abin
et c
onse
nt)
Ja
nu
ary
14
Rou
gh E
stim
ates
of R
even
ues
and
Exp
endi
ture
s of
FY2
015
Gen
eral
Acc
oun
t (C
abin
et a
ppro
val)
Janu
ary
14
Ou
tlin
e of
th
e 20
15 T
ax R
efor
m (C
abin
et a
ppro
val)
Jan
uar
y 22
Fi
scal
pol
icy
spee
ch
Jan
uar
y 22
FY
2014
su
pple
men
tary
bu
dget
(No.
1; N
o. 1
for
spec
ial a
ccou
nts
and
No.
1 fo
r go
vern
men
t-af
filia
ted
agen
cies
) (su
bmit
ted
to D
iet)
Feb
ruar
y 3
FY
2014
su
pple
men
tary
bu
dget
(No.
1; N
o. 1
for
spec
ial a
ccou
nt
and
No.
1 fo
r go
vern
men
t-af
filia
ted
agen
cies
) pas
sed
Feb
ruar
y 10
In
dust
rial
Com
peti
tive
ness
En
han
cem
ent
Act
ion
Pla
n (C
abin
et a
ppro
val)
Febr
uar
y 10
R
epor
t on
FY2
014
Prio
rity
Mea
sure
s fo
r E
nh
anci
ng
Indu
stri
al C
ompe
titi
vene
ss (C
abin
et a
ppro
val)
Feb
ruar
y 12
Po
licy
addr
ess,
Fis
cal p
olic
y sp
eech
F
ebru
ary
12
FY20
15 b
udg
et (s
ubm
itte
d to
Die
t)
Feb
ruar
y 12
FY
2015
Eco
nom
ic O
utl
ook
and
Bas
ic S
tan
ce o
n E
con
omic
and
Fis
cal M
anag
emen
t (C
abin
et a
ppro
val)
Mar
ch 2
7
FY20
15 p
rovi
sion
al b
udg
et (s
ubm
itte
d to
Die
t)
Mar
ch 3
0
FY20
15 p
rovi
sion
al b
udg
et p
asse
d M
arch
31
B
ill o
n t
he F
Y201
5 R
evis
ed T
ax S
yste
m p
asse
d A
pri
l 9
FY
2015
bu
dget
pas
sed
Jun
e 30
Ja
pan
Rev
ital
izat
ion
Str
ateg
y, 2
015
Rev
isio
n (C
abin
et a
ppro
val)
Jun
e 30
20
15 B
asic
Pol
icy
on E
cono
mic
and
Fis
cal M
anag
emen
t an
d R
efor
m (p
lan
ned
fram
ewor
k) (C
abin
et a
ppro
val)
June
30
2015
Bas
ic P
olic
y on
th
e C
reat
ion
of C
omm
un
itie
s, P
eopl
e an
d Jo
bs (C
abin
et a
ppro
val)
Ju
ly 2
4
Bas
ic P
olic
y on
Bu
dget
Req
ues
ts fo
r FY
2016
(Cab
inet
con
sen
t)
Nov
ember
27
B
asic
Pol
icy
on t
he F
Y201
6 B
udg
et P
repa
rati
on (C
abin
et a
ppro
val)
Dec
ember
18
FY
2016
su
pple
men
tary
bu
dget
(No.
1 a
nd
No.
1 fo
r sp
ecia
l acc
oun
ts) (
Cab
inet
app
rova
l) D
ecem
ber
22
FY
2016
Eco
nom
ic O
utl
ook
and
Bas
ic S
tan
ce o
n E
con
omic
and
Fis
cal M
anag
emen
t (C
abin
et c
onse
nt)
D
ecem
ber
24
20
15 C
ompr
ehen
sive
Str
ateg
ies
on t
he
Cre
atio
n o
f Com
mu
nit
ies,
Peo
ple
and
Jobs
(Rev
ised
) (C
abin
et a
ppro
val)
Dec
embe
r 24
R
ough
Est
imat
es o
f Rev
enu
es a
nd E
xpen
ditu
res
of F
Y201
6 G
ener
al A
ccou
nt
(Cab
inet
app
rova
l) D
ecem
ber
24
Ou
tlin
e of
th
e 20
16 T
ax R
efor
m (C
abin
et a
ppro
val)
2016
Jan
uar
y 4
Fi
scal
pol
icy
spee
ch
Jan
uar
y 4
FY
2015
su
pple
men
tary
bu
dget
(No.
1 a
nd
No.
1 fo
r sp
ecia
l acc
oun
ts) (
subm
itte
d to
Die
t)
Jan
uar
y 20
FY
2015
su
pple
men
tary
bu
dget
(No.
1 a
nd
No.
1 fo
r sp
ecia
l acc
oun
t) p
asse
d Jan
uar
y 22
Po
licy
addr
ess,
Fis
cal p
olic
y sp
eech
Ja
nu
ary
22
FY20
16 b
udg
et (s
ubm
itte
d to
Die
t)
Janu
ary
22
FY20
16 E
cono
mic
Ou
tloo
k an
d B
asic
Sta
nce
on
Eco
nom
ic a
nd F
isca
l Man
agem
ent
(Cab
inet
app
rova
l) Jan
uar
y 29
D
ecis
ion
on
th
e in
trod
uct
ion
of q
uan
tita
tive
and
qu
alit
ativ
e m
onet
ary
easi
ng
wit
h a
neg
ativ
e in
tere
st r
ate
(Ban
k of
Jap
an
Mon
etar
y Po
licy
Mee
tin
g)
Feb
ruar
y 5
In
dust
rial
Com
peti
tive
ness
En
han
cem
ent
Act
ion
Pla
n (2
016
vers
ion
) (C
abin
et a
ppro
val)
Feb
ruar
y 5
R
epor
t on
FY2
015
Prio
rity
Mea
sure
s fo
r E
nh
anci
ng
Indu
stri
al C
ompe
titi
vene
ss (C
abin
et a
ppro
val)
Mar
ch 2
9
FY20
16 b
udg
et p
asse
d M
arch
29
Bill
on
the
FY2
016
Rev
ised
Tax
Sys
tem
pas
sed
May
13
Fi
scal
pol
icy
spee
ch
May
13
FY
2016
su
pple
men
tary
bu
dget
(No.
1 a
nd
No.
1 fo
r sp
ecia
l acc
oun
ts) (
subm
itte
d to
Die
t)
May
17
FY
2016
su
pple
men
tary
bu
dget
(No.
1 a
nd
No.
1 fo
r sp
ecia
l acc
oun
t) p
asse
d Ju
ne
2
Japa
n R
evit
aliz
atio
n S
trat
egy
2016
(Cab
inet
app
rova
l) Ju
ne 2
20
16 B
asic
Pol
icy
on E
cono
mic
and
Fis
cal M
anag
emen
t an
d R
efor
m (p
lan
ned
fram
ewor
k) (C
abin
et a
ppro
val)
June
2
2016
Bas
ic P
olic
y on
th
e C
reat
ion
of C
omm
un
itie
s, P
eopl
e an
d Jo
bs (C
abin
et a
ppro
val)
June
2
Plan
to
Rea
lize
the
Dyn
amic
En
gage
men
t of
All
Cit
izen
s (C
abin
et a
ppro
val)
Ju
ly 2
9
Dec
isio
n o
n t
he
stre
ngt
hen
ing
of m
onet
ary
easi
ng
(Ban
k of
Jap
an M
onet
ary
Polic
y M
eeti
ng)
A
ugu
st 2
E
cono
mic
Mea
sure
s fo
r R
ealiz
ing
Inve
stm
ent
for
the
Futu
re (C
abin
et a
ppro
val)
231
Copyright © 2022 FDOKUMEN