The Rise and Fall of Dr. Paul Levy: A Case Study in Non-Profit Crisis Management
Upload
khangminh22Category
view
4download
0
Clemson UniversityTigerPrints
All Theses Theses
12-2013
DIFFERENCES BETWEEN FOR-PROFIT,NON-PROFIT, AND PUBLIC HOSPITALS INMEDICAL AND NON-MEDICALCATEGORIES: COSTS ANDOUTSOURCING DECISIONSJustin KnutterClemson University, [email protected]
Follow this and additional works at: https://tigerprints.clemson.edu/all_theses
Part of the Economics Commons
This Thesis is brought to you for free and open access by the Theses at TigerPrints. It has been accepted for inclusion in All Theses by an authorizedadministrator of TigerPrints. For more information, please contact [email protected].
Recommended CitationKnutter, Justin, "DIFFERENCES BETWEEN FOR-PROFIT, NON-PROFIT, AND PUBLIC HOSPITALS IN MEDICAL ANDNON-MEDICAL CATEGORIES: COSTS AND OUTSOURCING DECISIONS" (2013). All Theses. 1825.https://tigerprints.clemson.edu/all_theses/1825

DIFFERENCES BETWEEN FOR-PROFIT, NON-PROFIT, AND PUBLIC HOSPITALS IN MEDICAL
AND NON-MEDICAL CATEGORIES: COSTS AND OUTSOURCING DECISIONS
A Thesis
Presented to
The Graduate School of
Clemson University
In Partial Fulfillment
of the Requirements for the Degree
Master of Arts
Economics
by
Justin Knutter
December 2013
Accepted by:
Dr. Patrick Warren, Committee Chair
Dr. Daniel Miller
Dr. Matthew Lewis
ii
ABSTRACT
The purpose of this study is to measure and compare several potential
differences between for-profit, non-profit, and public hospitals in medical and non-
medical cost categories. To do this, costs associated with two medical and two non-
medical categories for California short-term general care hospitals were broken down
into several subsets in order to better understand exactly how and why each category
behaves as it does. The results show significant differences for total costs between for-
profits and the other hospital types across the board and a difference for outsourcing
decisions between for-profits and the other hospital types for the medical categories
but not for the non-medical categories.

iii
TABLE OF CONTENTS
Page
TITLE PAGE ........................................................................................................................ i
ABSTRACT ......................................................................................................................... ii
LIST OF TABLES ................................................................................................................ iv
SECTION
1. INTRODUCTION .............................................................................................. 1
2. DATA AND METHODS ..................................................................................... 4
3. RESULTS........................................................................................................ 11
a. Cardiac Catheterization Results ....................................................... 11
b. Electroencephalography Results ..................................................... 13
c. Grounds Keeping and Maintenance Results .................................... 15
d. Credit and Collection Results ........................................................... 17
4. DISCUSSION .................................................................................................. 19
APPENDICES ................................................................................................................... 25
A. For-Profit Summary Statistics ...................................................................... 26
B. Non-Profit Summary Statistics ..................................................................... 28
C. Public Summary Statistics ............................................................................ 30
D. Scatter Plots and Regressions ...................................................................... 32
REFERENCES ................................................................................................................... 42

iv
LIST OF TABLES
Table Page
1 Cardiac Catheterization Results ............................................................. 11
2 Electroencephalography Results ........................................................... 13
3 Grounds Keeping and Maintenance Results .......................................... 15
4 Credit and Collection Results ................................................................. 17

1
INTRODUCTION
Over the past several decades, economists have been examining for-profit, non-
profit, and public hospitals in an attempt to determine whether there are any
differences between them and, if there are, what causes these differences. The results
of these studies have been mixed, as some studies show for-profits to have higher costs,
some show the opposite, and some show no significant difference between the two.
Despite this apparent confusion, meta-analysis shows that the differences in results are
at least in part due to differences in methodology rather than actual differences in the
groups of hospitals examined. Furthermore, studies with stronger methodologies tend
to find smaller differences between for-profits and non-profits regarding a hospital’s
total costs (Shen, Eggleston, Lau, and Schmid 2005).
However, a point to note is that the above results come from looking at a
hospital’s total costs instead of breaking costs down into smaller categories, such as
medical costs and non-medical costs, which may tell a more complete story of any
potential differences between different hospital types. In fact, studies that have broken
costs down into discrete categories have found that results on differences between
hospital types are not necessarily the same across the chosen categories. For example,
administrative costs for for-profit hospitals seem to be significantly higher than for non-
profits or public hospitals, but salary and wage costs showed the opposite pattern, with
employee benefits for clinical personnel being much lower in for-profits (Woolhandler

2
and Himmelstein 1997). This would seem to suggest that inconclusive results when
measuring total costs may actually be hiding differing results between cost categories.
The above study suggests that medical costs would likely be lower in for-profits than in
non-profits or public hospitals but leaves open how non-medical costs besides
administrative costs would behave, as the driving forces behind administrative costs are
different from other non-medical costs such as maintenance and grounds keeping.
If for-profits do in fact have lower medical costs, one of the possible
explanations of these differences is that for-profits selectively locate in higher profit
areas or choose to perform only higher profit procedures (Norton and Staiger 1994),
and as a result appear to be more profitable and have lower costs. In comparison, non-
profit hospitals would be more likely to offer procedures that were not profitable and
public hospitals would be even more likely to offer such procedures. Evidence exists for
this theory (Horwitz 2005), but it is not clear from this study whether this explanation is
the main reason for observed cost differences between hospital types or whether other
important reasons also exist. Another hypothesis is that for-profits cut corners in ways
that are not easily observable in order to improve easily-measurable metrics such as
costs, resulting in lower costs but also a lower quality of care. However, previous studies
have not shown support for this idea, as quality of care does not appear significantly
different between for-profits and non-profits (Sloan, Picone, Taylor, and Chou 2001).
Nonetheless, this still remains a possibility. Thirdly, it may be that for-profits tend to
3
perform certain tasks more efficiently than non-profit or public hospitals due to the
difference in their structure, thus resulting in lower costs for for-profits.
A point to note about some of the above explanations is that they focus their
efforts to explain any differences in total costs between for-profit, non-profit, and public
hospitals as a result of differences in medical costs. However, as the example with
administrative costs shows, differences in medical costs are not the only possible
explanation for differences in total hospital costs. It is possible that other non-medical
costs may show different patterns between these three hospital types. Similarities or
differences in their patterns could shed light on whether overall results are driven by
medical factors, non-medical factors, or some combination of the two.
Additionally, other studies have shown that there are good reasons to believe
that outsourcing decisions are handled differently by for-profit hospitals. Specifically,
outsourcing becomes more attractive to for-profits than non-profit or public hospitals
when an outside source can provide a service that is relatively lower in both quality and
cost, especially if the quality of the service in question is important to the hospitals
(Marsh and Warren 2013). However, if true, we would expect to see different results
depending on which hospital activities we observe. For medical procedures, where
quality is very important, we would expect a stronger difference in outsourcing between
for-profit hospitals and non-profit or public hospitals if such outsourcing options exist.

4
By contrast, many non-medical operations would likely show little to no differences
because the quality of the results would be much less important.
DATA AND METHODS
The data used was taken from the complete 2011-2012 data set of annual
hospital financial data and the 2012 pivot profile collected by California’s Office of
Statewide Health Planning and Development. This annual financial data contained,
among other statistics, data on general measures of hospital size, staff, location,
caseload, revenues, costs, and inventories. For the purposes of this paper, only the cost
data, categorical data, and other potentially related data were necessary. In order to
focus in on the necessary categories, the original 446 hospitals in the data set were
reduced so that only the for-profit, non-profit, and public hospitals that performed
general short-term care remained, which reduced the number of hospitals in the data
set to 275. Religious hospitals were left out of the new data set so as to allow a focus on
just the for-profits, non-profits, and public hospitals. Additionally, a handful of
otherwise eligible hospitals were dropped because of miniscule numbers or
comparability issues, likely because the hospitals in question were not open or had not
been recording data for the entirety of the year.
In order to measure potential differences between the three hospital types, a
few different types of variables were created from the new data set for four separate
categories, two medical and two non-medical. To examine the effects on total costs, the

5
total adjusted direct expenses for a given hospital were divided by the number of units
of service for the category being examined. For the medical categories the units were
the total number of procedures for the chosen category and for the non-medical
category the units were either the size of the grounds in square feet or the amount of
gross patient revenue in thousands of dollars. Total costs per unit were also split up into
several different subsets in order to observe whether these exhibited different behavior
from total costs.
These subset variables were: employee compensation costs, capital costs,
outsourcing costs, and other costs. To examine the effects on employee compensation
costs, salary, wage, and employee benefits costs were totaled and then divided by the
number of units of service for the category being examined. For capital costs, leases,
rentals, and depreciation were totaled and then divided by the number of units of
service for the category being examined. For outsourcing costs, professional fees and
purchased services were totaled and then divided by the number of units of service for
the category being examined. For other costs, all other costs were divided by the
number of units of service for the category being examined.
Of note is the fact that the cost category subsets do not necessarily add up to the
total costs for any given hospital. This is because the individual cost categories are not
adjusted the way that total expenses are. Though this may at first seem to be a
problem, as it calls into question the comparability of the variables, there is no real
6
difference in the coefficients, statistical significance, or other important results for the
total adjusted expenses and the unadjusted expenses. So, because the adjusted
expenses are technically more accurate and because there is no practical problem with
comparability using the adjusted expenses, the total costs figure is calculated using the
adjusted expenses data.
In addition to the cost per unit variables, one other variable was examined:
percent of total costs outsourced. Percent of total costs outsourced was measured by
dividing outsourcing costs by total unadjusted costs. This variable was created to better
compare outsourcing decisions between the three hospital types.
The percent of total costs outsourced variable was calculated using the
unadjusted expenses because of direct comparability problems not present in the
general total cost variable. Because outsourcing costs were not adjusted, if the total
costs for a given hospital were adjusted by a large amount, this could greatly skew the
percent of total costs outsourced variable, possibly even giving the result that certain
hospitals outsource more than 100% of its costs. So, even though adjusted costs are a
more accurate measure of total costs, they are not suitable for the percent of total costs
outsourced variable.
For each of the above variables, four categories were looked at, two medical and
two non-medical. The categories of financial data that were tested were the cardiac
catheterization data, the electroencephalography data, the grounds keeping and
7
maintenance data, and the credit and collection data. These four sets of data were good
candidates for a number of reasons.
Cardiac catheterization is a relatively uniform procedure and the data available
for it is broken down by procedure rather than by operating hours or some other
measure, making the data easily comparable between hospitals and avoiding some
potential complicating factors. Using the cardiac catheterization data rather than overall
medical data also avoids the potential concern that the results reflect a different mix of
procedures between for-profits and non-profits rather than an actual cost difference.
The same argument applies for the electroencephalography data, as it too is
relatively uniform and the data for it is broken down by procedure. However, there is an
additional wrinkle with the electroencephalography data that is not present in the
cardiac catheterization data. On occasion, an electroencephalography procedure is done
for days or even weeks at a time for diagnostic purposes instead of the typical twenty to
thirty minute procedure. Although this is likely randomly distributed among hospitals,
this problem may call into question the comparability of the results between hospitals,
especially if the number of hospitals being looked at is especially small, as is the case
with public hospitals. However, as public hospitals have fewer data points across the
board, this problem would still crop up with any other procedure examined and thus
does not render electroencephalography data unsuitable.

8
Grounds keeping and maintenance data is measured in terms of the size of the
grounds in square feet which, like cardiac catheterization, makes the data uniform and
easily comparable between hospitals. In addition to meeting the requirement of being a
non-medical cost category, grounds keeping also avoids potential complications that
administrative data would bring to the table. However, the choice of grounds keeping
does still have a few potential problems. Due to the nature of the services, it is likely
that many of the hospitals chose to outsource large portions of their grounds keeping
expenses, which could cause problems with the regression and interpretation of other
categories, such as wage and capital costs. This is likely true of many non-medical cost
categories, though, so it does not make grounds keeping a poor candidate for this
purpose. Another shortcoming of the grounds keeping data is that fewer hospitals
submit records for grounds keeping than for cardiac catheterization. Again, though, this
problem holds for many non-medical categories, and enough hospitals submit their
grounds keeping data to prevent significance problems for total costs and outsourcing
costs.
Credit and collection data is measured in terms of the amount of gross patient
revenue in thousands of dollars, which potentially creates a comparability issue, as
patient revenue would differ depending on a hospital’s patient mix. To try to control for
this, variables for the percent of Medicare patients, the percent of Medi-Cal (the
California version of Medicaid) patients, and rural hospitals have been included in the
models. While credit and collection data still has the same outsourcing problem as the
9
grounds keeping data, it has significantly more data points in general which should give
results that are more statistically significant.
The model used for each variable used the same basic structure. Each variable
examined was tested for eight possible effects: changes as the amount of output for the
given category increased, a difference between for-profits and non-profits, any
interaction between output and for-profits vs. non-profits, a difference between for-
profit and public hospitals, any interaction between output and for-profit hospitals vs.
public hospitals, a difference between rural hospitals and other hospitals, the percent of
Medicare patient hours, and the percent of Medi-Cal patient hours. The model used for
each variable was:
Cost Variable in Hospitali = αOutputi + β1Non-profiti + β2Outputi*Non-profiti + γ1Publici + γ2Outputi*Publici
+ δRurali + θMedicarei + λMedi-Cali + εi
Output was measured simply as the units of service for a given category. This
would measure any changes in costs as the size of the given category grew. Non-profit
and public were simply dummy variables that would measure any initial difference
between the for-profits and non-profits or for-profit and public hospitals, respectively.
The interaction terms would measure any change in the relationship between either for-
profits and non-profits or for-profit and public hospitals as the amount of output
increased. Rural was a dummy variable denoting that a given hospital was a small and
rural hospital. Medicare and Medi-Cal were measures of patient mix in the hospitals,

10
giving the percent of patient days for the hospital that were either Medicare or Medi-Cal
patient days.
The rural variable was included in each model because there are strong reasons
to think that urban and rural settings tend to have different effects on for-profit, non-
profit and public hospitals, and represent an otherwise potentially confounding factor in
the results (Plante 2009). The Medicare and Medi-Cal variables were included to control
for patient mix at the hospitals, as this too is a potentially confounding factor.
It was quickly determined that most of the variables would need to be in logs in
order to draw proper conclusions from the models. Thus, in the final models used, all of
the cost variables, as well as the output variable, are logs. However, this raised a
problem, as a number of the hospitals reported zero costs in a given category. While this
represented only a minor problem for cardiac catheterization and
electroencephalography, more than half of the hospitals reported zero wage costs or
capital costs for grounds keeping and credit and collection. Unfortunately, these zeros
existed not because of a lack of reporting but because such a large percentage of total
costs were outsourced for grounds keeping and credit and collection, so it was not
possible to blithely discard the zeros from the data set. However, because these zeros
represented such a large portion of the data, any attempt to insert a plug figure would
give results that were more the result of the chosen plug figure rather than any variance
in the data. In the end, the zeros were simply dropped from the data set, and as a result

11
only a handful of for-profit and public data points remain for wage costs and capital
costs for grounds keeping and credit and collection.
RESULTS
Cardiac Catheterization Results
log(Total
Costs/Unit)
log(Wage
Costs/Unit)
log(Capital
Costs/Unit)
log(Outsourced
Costs/Unit)
Percent
Outsourced
log(Other
Costs/Unit)
log(Output) -0.49
(0.00)
-0.45
(0.00)
-0.56
(0.00)
-0.74
(0.00)
-0.15
(0.00)
-0.45
(0.02)
Non-Profit 0.54
(0.16)
0.94
(0.02)
0.38
(0.63)
-0.17
(0.83)
-0.53
(0.00)
0.86
(0.29)
Non-Profit
Interaction
-0.11
(0.32)
-0.25
(0.04)
-0.06
(0.81)
0.06
(0.79)
0.15
(0.00)
-0.08
(0.72)
Public 0.50
(0.51)
0.29
(0.70)
-2.08
(0.17)
-1.13
(0.45)
-0.62
(0.01)
1.93
(0.22)
Public
Interaction
-0.10
(0.66)
-0.04
(0.87)
0.68
(0.15)
0.32
(0.48)
0.18
(0.02)
-0.43
(0.37)
Rural -0.54
(0.00)
-0.50
(0.00)
-0.64
(0.07)
-0.75
(0.02)
-0.08
(0.14)
-0.67
(0.05)
% Medicare -0.73
(0.00)
-0.30
(0.32)
-1.85
(0.00)
-0.75
(0.20)
0.15
(0.05)
-1.96
(0.00)
% Medi-Cal -1.23
(0.00)
-0.99
(0.01)
-3.09
(0.00)
-1.81
(0.01)
0.01
(0.93)
-1.54
(0.02)
Observations 126 117 114 118 126 126
R Squared 0.59 0.57 0.30 0.31 0.30 0.36
(p values)
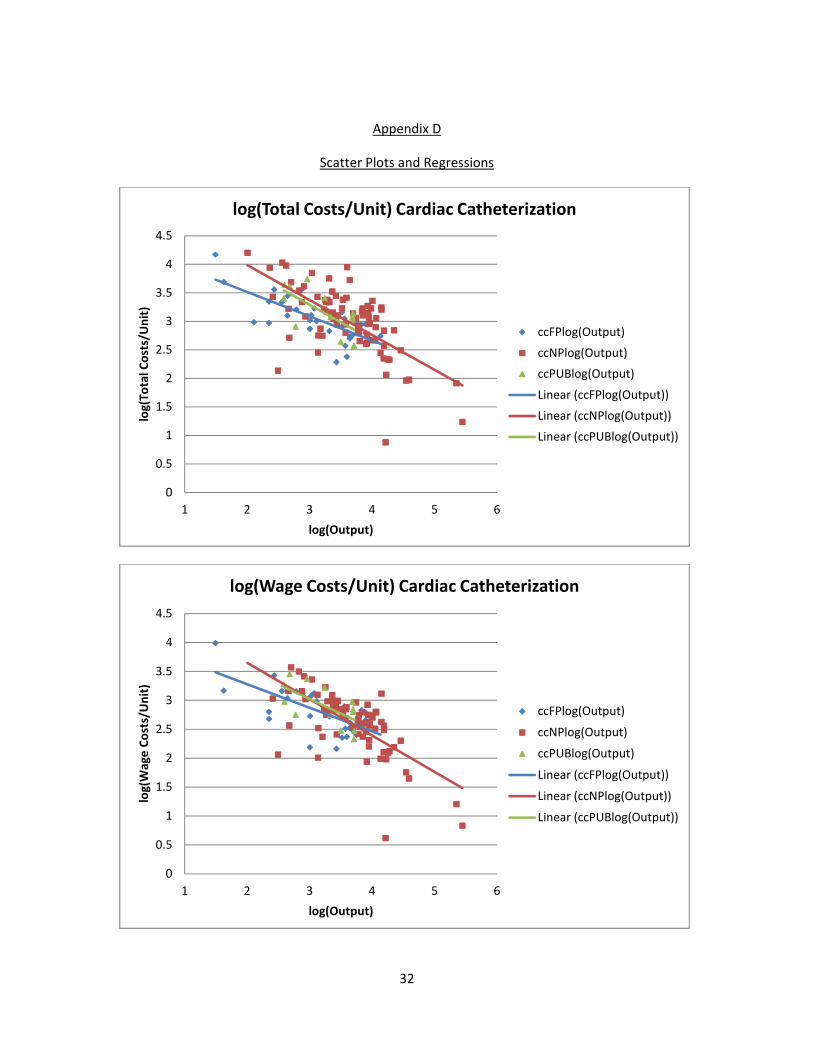
The results for total costs per unit and employment costs per unit show the same
basic patterns. As the number of cardiac catheterization procedures a hospital performs
increases, the costs per unit associated with the procedures decrease, as expected from
gains in efficiency. Additionally, at low levels of output, non-profits have higher costs
per procedure, but as the number of procedures the hospital performs increases, the
difference between them and for-profits seems to disappear. However, this secondary
effect is not statistically significant for total costs. Public hospitals show a similar pattern
12
as non-profits, but none of the results are statistically significantly different from for-
profits. The chosen variables seem to explain more than half of the observed variation in
total costs per unit and employment costs per unit.
Capital costs show the same pattern as total costs and employment costs with
one important exception: public hospital capital costs initially seem to start significantly
lower than do for-profits, with the difference disappearing as hospital size increases.
However, as public hospitals mostly have similar amounts of output, this actually means
that, over the observed range, public hospital capital costs per unit are fairly flat as
output increases, in contrast to for-profit and non-profit hospitals. The variables appear
to explain about a third of the observed variation.
The results for outsourcing costs per unit also showed that as the number of
procedures a hospital performs increases, the costs attributed to outsourcing per
procedure decreased. However, unlike the previous cost categories, it is for-profits that
seem to have higher spending, though as before this effect seems to disappear as the
amount of procedures increase. The variables seem to explain about a third of the
observed variation. Despite this, any difference in total outsourcing costs per unit
between hospital types is not statistically significant.
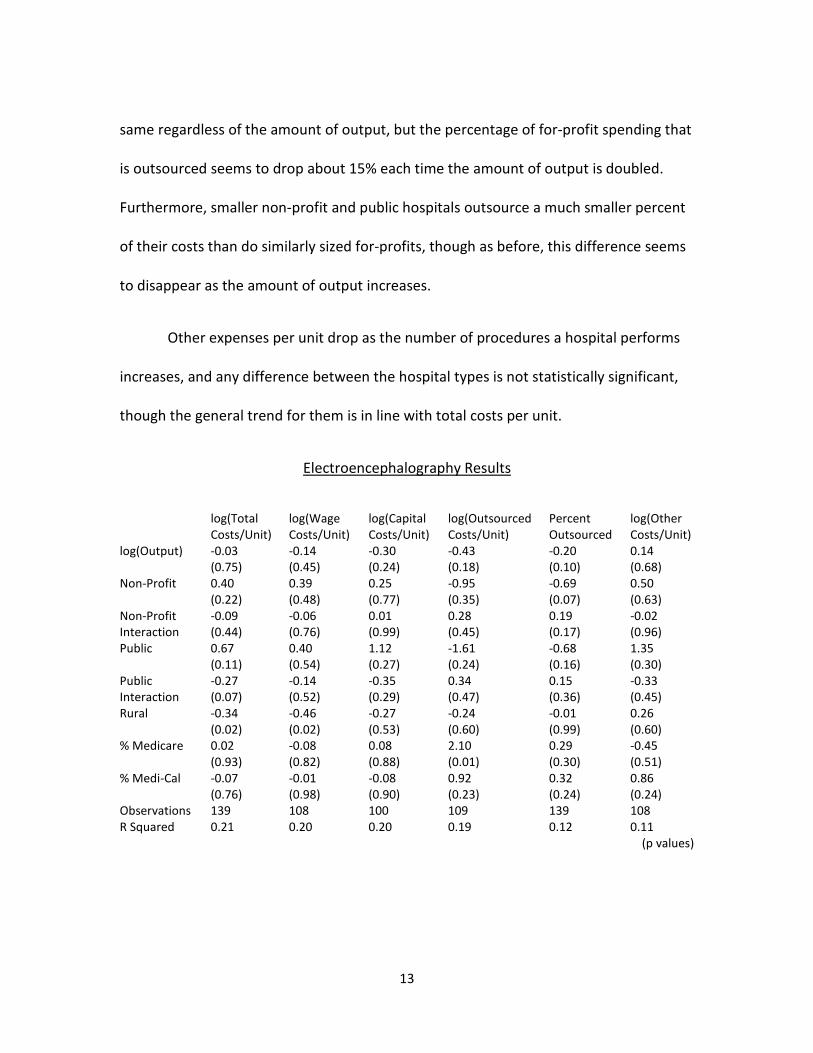
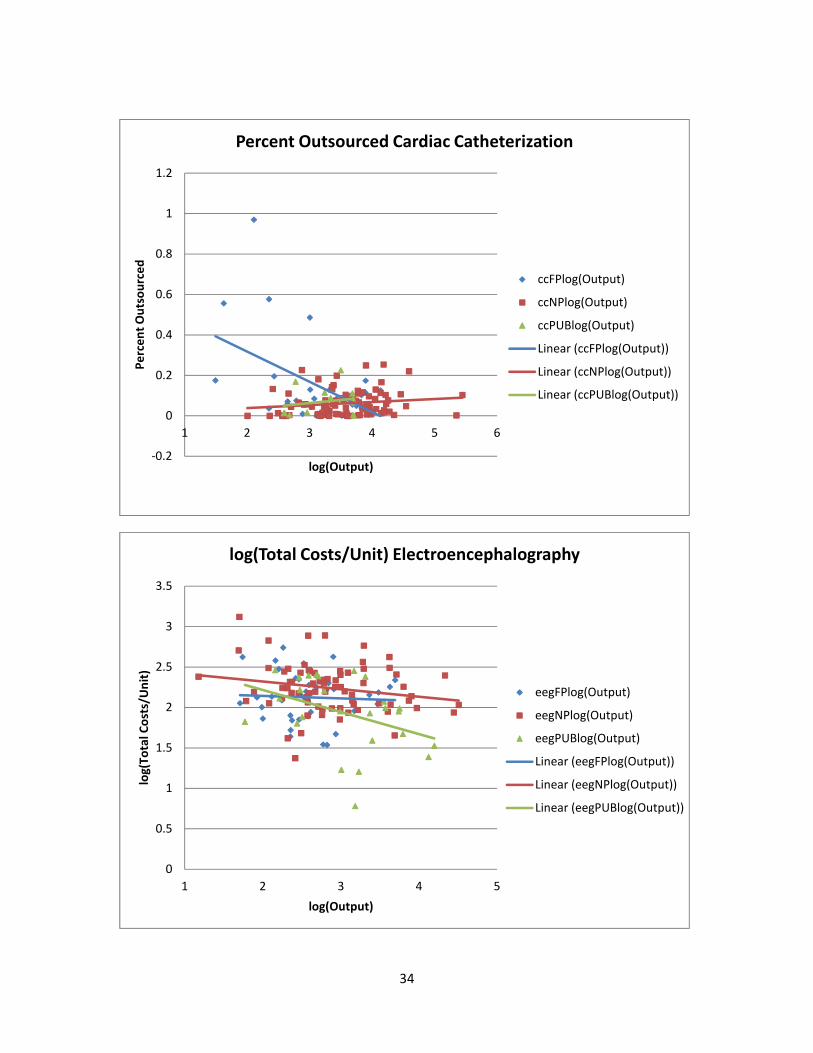
The percent of cardiac catheterization spending that is outsourced behaves very
differently for non-profits and public hospitals compared to for-profits. For non-profit
and public hospitals, the percentage of spending that is outsourced stays about the
13
same regardless of the amount of output, but the percentage of for-profit spending that
is outsourced seems to drop about 15% each time the amount of output is doubled.
Furthermore, smaller non-profit and public hospitals outsource a much smaller percent
of their costs than do similarly sized for-profits, though as before, this difference seems
to disappear as the amount of output increases.
Other expenses per unit drop as the number of procedures a hospital performs
increases, and any difference between the hospital types is not statistically significant,
though the general trend for them is in line with total costs per unit.
Electroencephalography Results
log(Total
Costs/Unit)
log(Wage
Costs/Unit)
log(Capital
Costs/Unit)
log(Outsourced
Costs/Unit)
Percent
Outsourced
log(Other
Costs/Unit)
log(Output) -0.03
(0.75)
-0.14
(0.45)
-0.30
(0.24)
-0.43
(0.18)
-0.20
(0.10)
0.14
(0.68)
Non-Profit 0.40
(0.22)
0.39
(0.48)
0.25
(0.77)
-0.95
(0.35)
-0.69
(0.07)
0.50
(0.63)
Non-Profit
Interaction
-0.09
(0.44)
-0.06
(0.76)
0.01
(0.99)
0.28
(0.45)
0.19
(0.17)
-0.02
(0.96)
Public 0.67
(0.11)
0.40
(0.54)
1.12
(0.27)
-1.61
(0.24)
-0.68
(0.16)
1.35
(0.30)
Public
Interaction
-0.27
(0.07)
-0.14
(0.52)
-0.35
(0.29)
0.34
(0.47)
0.15
(0.36)
-0.33
(0.45)
Rural -0.34
(0.02)
-0.46
(0.02)
-0.27
(0.53)
-0.24
(0.60)
-0.01
(0.99)
0.26
(0.60)
% Medicare 0.02
(0.93)
-0.08
(0.82)
0.08
(0.88)
2.10
(0.01)
0.29
(0.30)
-0.45
(0.51)
% Medi-Cal -0.07
(0.76)
-0.01
(0.98)
-0.08
(0.90)
0.92
(0.23)
0.32
(0.24)
0.86
(0.24)
Observations 139 108 100 109 139 108
R Squared 0.21 0.20 0.20 0.19 0.12 0.11
(p values)

14
The second medical category examined, electroencephalography, mostly shared
the same general trend of results for total costs per unit and employment costs per unit
with cardiac catheterization. The main difference is that public hospital costs did not
appear to converge with for-profits and non-profits at higher outputs. If anything, the
difference seems to widen as output increases. However, none of the output or non-
profit results were statistically significant, and the public results for employment costs
were also not statistically significant. Additionally, the variables explained only a fifth of
the observed variation.
Capital costs per unit are, again, mostly similar to the cardiac catheterization
results with one difference: instead of remaining flat, public hospital capital costs per
unit appear to drop much faster than for-profit or non-profit costs per unit. However,
the differences between the hospital types were not statistically significant. Again, the
variables only explained a fifth of the observed variation.
Outsourced costs per unit are effectively the same for both
electroencephalography and cardiac catheterization, as only the general trend in output
is statistically significant. Only a fifth of the observed variation is explained by the
variables.
Percent outsourced also gives the same general trend in the results for both
electroencephalography and cardiac catheterization. However, the variables only
explain about twelve percent of the observed variation in electroencephalography.

15
With the exception that other costs per unit for electroencephalography remain
largely flat while they fall precipitously for cardiac catheterization, there are no
important differences between the two medical categories. The variables explain only
about ten percent of the observed variation.
Grounds Keeping and Maintenance Results
log(Total
Costs/Unit)
log(Wage
Costs/Unit)
log(Capital
Costs/Unit)
log(Outsourced
Costs/Unit)
Percent
Outsourced
log(Other
Costs/Unit)
log(Output) -0.75
(0.00)
-0.58
(0.28)
-1.33
(0.09)
-0.55
(0.12)
0.05
(0.80)
-0.47
(0.60)
Non-Profit -0.49
(0.62)
-2.62
(0.42)
-4.32
(0.35)
1.68
(0.43)
1.08
(0.34)
-1.92
(0.71)
Non-Profit
Interaction
0.12
(0.50)
0.45
(0.46)
0.77
(0.35)
-0.25
(0.53)
-0.20
(0.33)
0.32
(0.74)
Public -1.51
(0.19)
-0.96
(0.77)
-5.46
(0.30)
0.52
(0.84)
1.50
(0.26)
-0.05
(0.99)
Public
Interaction
0.32
(0.13)
0.22
(0.72)
1.01
(0.29)
-0.06
(0.90)
-0.31
(0.20)
0.09
(0.93)
Rural -0.21
(0.07)
0.02
(0.95)
0.13
(0.82)
-0.25
(0.33)
0.00
(1.00)
0.01
(0.98)
% Medicare 0.01
(0.99)
0.80
(0.39)
0.56
(0.65)
-0.49
(0.45)
-0.44
(0.20)
-0.17
(0.89)
% Medi-Cal 0.13
(0.57)
0.14
(0.84)
0.69
(0.56)
-1.31
(0.01)
-0.59
(0.03)
-1.06
(0.26)
Observations 110 43 56 109 112 72
R Squared 0.49 0.21 0.18 0.25 0.13 0.07
(p values)
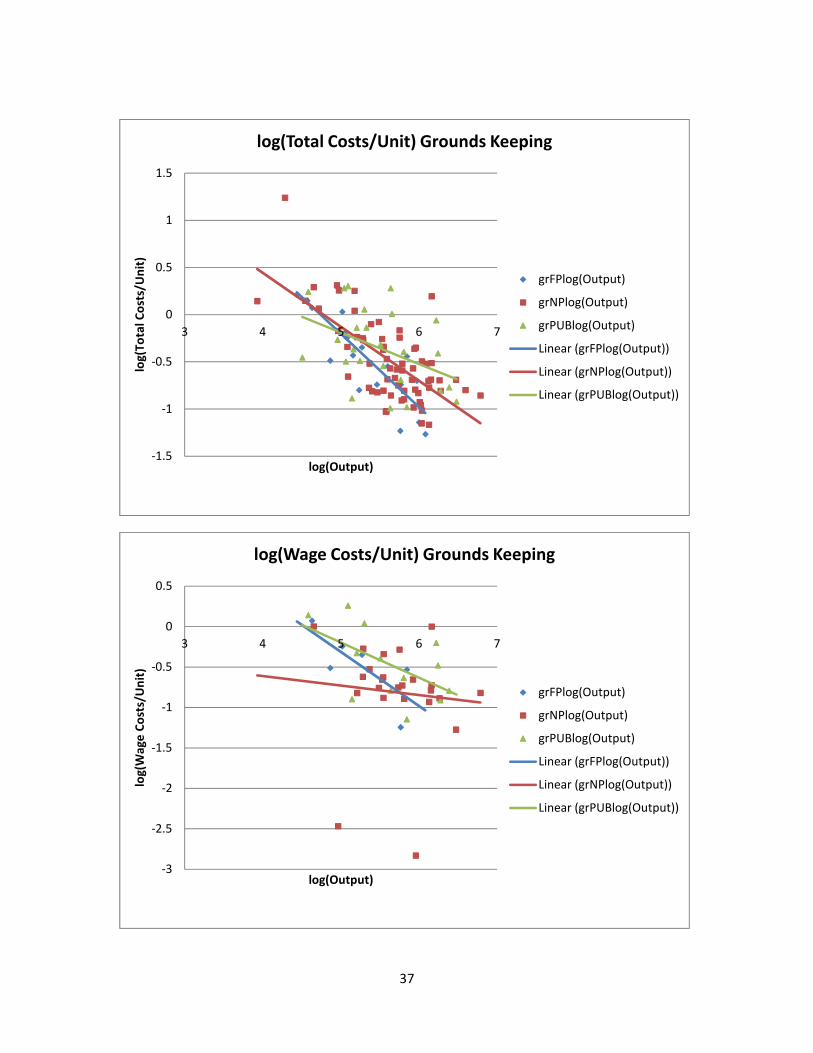
The total costs per unit for grounds keeping fall as the size of the grounds
increases, as expected. Non-profit hospitals are not significantly different from for-
profits, but public hospitals appear to have initially lower costs, but then higher costs,
than the other hospital types. However, this difference is slight at best. The variables
seem to explain about fifty percent of the observed variance.

16
For employment costs per unit and capital costs per unit, none of the variables
comparing the hospital types are statistically significant. However, this is largely because
both of these measurements have the same basic problem: grounds keeping costs are
outsourced to such an extent that between half and two thirds of hospitals in the data
set report no wage or capital costs. Moreover, for employment costs per unit, there are
just six non-zero for-profit data points, and the situation is only marginally better for
capital costs per unit, with just nine available for-profit data points. As a result, it is very
difficult to draw any conclusions from the lack of statistical significance comparing
hospital types for these measurements.
Despite this major problem, the results for employment costs per unit and
capital costs per unit may still be somewhat useful. All three measurements show the
same pattern of falling costs per unit as exhibited by total costs per unit. However, this
result is not statistically significant for employment costs per unit.
The results for outsourced costs per unit also show a general pattern of falling
costs per unit as the size of the grounds increases. While the non-profit and public
hospital results are the opposite of their results for total costs per unit, the results are
all not statistically significant. The variables explain about twenty five percent of the
observed variation.
The percent of total expenses that have been outsourced follows the same
pattern as the outsourced costs per unit with the exception of the general output
17
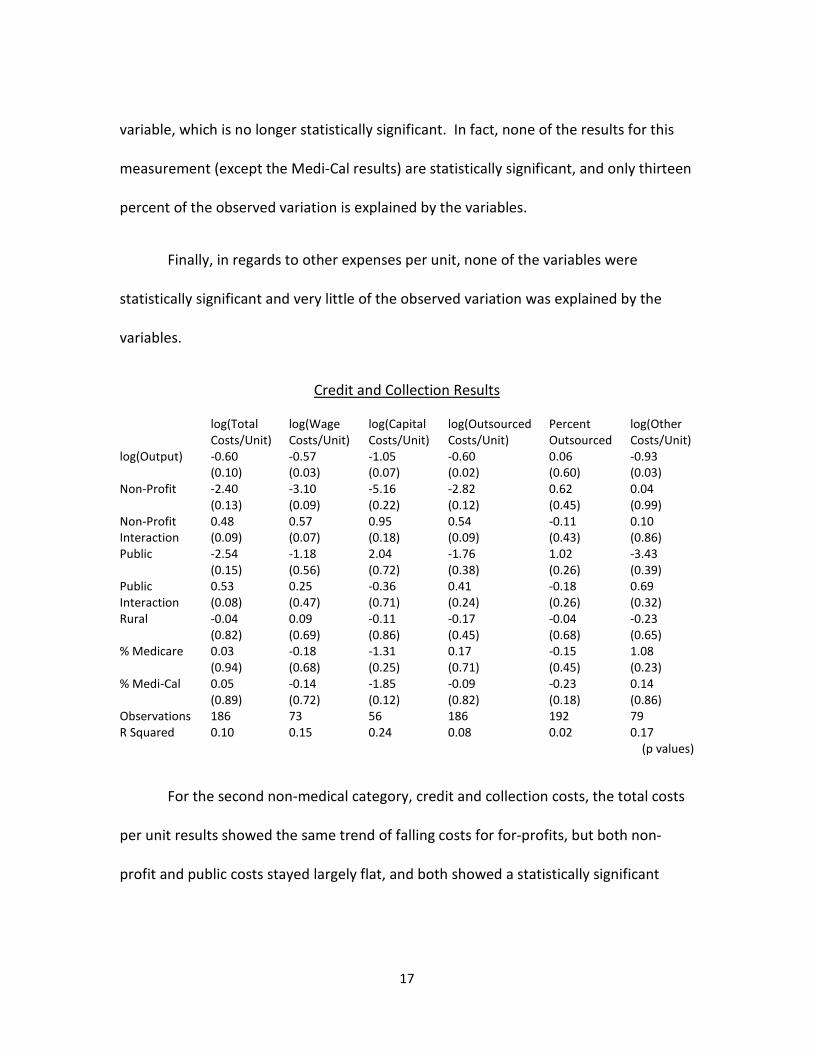
variable, which is no longer statistically significant. In fact, none of the results for this
measurement (except the Medi-Cal results) are statistically significant, and only thirteen
percent of the observed variation is explained by the variables.
Finally, in regards to other expenses per unit, none of the variables were
statistically significant and very little of the observed variation was explained by the
variables.
Credit and Collection Results
log(Total
Costs/Unit)
log(Wage
Costs/Unit)
log(Capital
Costs/Unit)
log(Outsourced
Costs/Unit)
Percent
Outsourced
log(Other
Costs/Unit)
log(Output) -0.60
(0.10)
-0.57
(0.03)
-1.05
(0.07)
-0.60
(0.02)
0.06
(0.60)
-0.93
(0.03)
Non-Profit -2.40
(0.13)
-3.10
(0.09)
-5.16
(0.22)
-2.82
(0.12)
0.62
(0.45)
0.04
(0.99)
Non-Profit
Interaction
0.48
(0.09)
0.57
(0.07)
0.95
(0.18)
0.54
(0.09)
-0.11
(0.43)
0.10
(0.86)
Public -2.54
(0.15)
-1.18
(0.56)
2.04
(0.72)
-1.76
(0.38)
1.02
(0.26)
-3.43
(0.39)
Public
Interaction
0.53
(0.08)
0.25
(0.47)
-0.36
(0.71)
0.41
(0.24)
-0.18
(0.26)
0.69
(0.32)
Rural -0.04
(0.82)
0.09
(0.69)
-0.11
(0.86)
-0.17
(0.45)
-0.04
(0.68)
-0.23
(0.65)
% Medicare 0.03
(0.94)
-0.18
(0.68)
-1.31
(0.25)
0.17
(0.71)
-0.15
(0.45)
1.08
(0.23)
% Medi-Cal 0.05
(0.89)
-0.14
(0.72)
-1.85
(0.12)
-0.09
(0.82)
-0.23
(0.18)
0.14
(0.86)
Observations 186 73 56 186 192 79
R Squared 0.10 0.15 0.24 0.08 0.02 0.17
(p values)
For the second non-medical category, credit and collection costs, the total costs
per unit results showed the same trend of falling costs for for-profits, but both non-
profit and public costs stayed largely flat, and both showed a statistically significant

18
difference from for-profit hospitals. Only ten percent of the observed variation was
explained by the variables.
Like grounds keeping, wage and capital costs have numerous dropped data
points, and once again between half and two thirds of hospitals in the data set report no
wage or capital costs due to the extent of outsourcing. While public hospitals report no
statistically significant difference from for-profits, non-profit hospital do, as their costs
remain flat while the other hospital types’ costs fall. However, it is worth noting that for-
profit hospitals only have fourteen data points for wage costs and eleven for capital
costs, so this result is not particularly robust. For employment costs, the variables
explain about fifteen percent of the observed variation, and for capital costs, the
variables explain about a quarter of the observed variation.
Both non-profit and public hospital outsourced costs remain fairly flat as for-
profits outsourced costs fall, but the difference is not statistically significant for public
hospitals. Only eight percent of the observed variation was explained by the variables.
The three hospital types showed no statistically significant differences for
percent outsourced, and all three showed no significant changes as output increased.
Only two percent of the observed variation was explained by the variables.
Other costs per unit generally fell as the amount of patient revenue increased,
and the three hospital types showed no statistically significant differences. The variables
explained seventeen percent of the observed variation.

19
DISCUSSION
By focusing in on cardiac catheterization and electroencephalography, two
procedures that are relatively uniform, we can largely discount the possibility that the
differences found are due to for-profits choosing to only perform more profitable
procedures, which is a possible concern when looking at medical costs as a whole
(Horwitz 2005). The results for total cardiac catheterization costs per unit show that for-
profit hospitals tend to have lower costs per unit than non-profits, but that the two
seem to converge as more procedures are performed. In fact, by the mean level of
output, the difference between the two has largely disappeared. While the public
hospital total cost per unit results are not significantly different from the for-profit
results for cardiac catheterization, this is due to a lack of data for public hospitals.
Ignoring the significance problem, public hospitals seem to behave much like non-profit
hospitals with regards to their total costs per unit. The electroencephalography results
show a similar pattern when comparing for-profits and non-profits, but the difference
between them is not significant. Public hospitals have slightly more data points for
electroencephalography, but there is likely a skewness problem in the data.
On the surface, it may seem plausible that the tendency for for-profit hospitals
to have a lower cost per unit may be the result of them cutting corners in health care to
improve easy to observe metrics (such as expenses) at the cost of more difficult to
observe ones (such as longer-term mortality differences). However, previous studies

20
(Sloan, Picone, Taylor, and Chou 2001) have failed to show a difference in quality
between hospital ownership types, even in difficult to observe categories.
Another plausible story is that for-profits keep costs down by either locating in
different areas than other hospitals (Norton and Staiger 1994) or serving a different
mixture of patients (Plante 2009). However, these explanations have been largely
separated out by controlling for hospital location and patient mix.
It is also possible that for-profits simply tend to be more efficient than non-profit
or public hospitals, at least when the hospitals are small, due to the difference in their
structure. This would not only explain the difference between for-profits and non-
profits, but may also explain why the difference disappears as more procedures are
performed, as for-profits would be more responsive initially, but could lose this
advantage as more procedures are done. However, there is limited evidence in the
literature to support such a conclusion.
While the above lines of thinking also hold for employment costs per unit and
capital costs per unit, as the anomalies in the public data can be explained by a lack of
data, the results for outsourcing decisions must be looked at a little closer. For both
medical categories, it is fairly clear that for-profits tend to outsource a much larger
percent of their costs than the other hospital types do, thought as before, this
difference seems to disappear for hospitals that perform a large amount of these
procedures. The difference for cardiac catheterization seems to disappear by the mean
21
level of output while the difference for electroencephalography seems to extend to
hospitals with output somewhat higher than the mean. This result fits the story that for-
profits tend to outsource more than non-profit and public hospitals when an outside
source can provide a service that is relatively lower in both quality and cost, especially if
the quality of the service in question is important to the hospitals, as medical costs
would be. So, this result appears to concur with what other research has previously
found regarding outsourcing (Marsh and Warren 2013).
Interesting to note is that non-profit and public hospitals, as well as for-profit
hospitals to a lesser extent, seem to outsource much more of their
electroencephalography costs than their cardiac catheterization costs, and as a result
the measured differences between them were less significant. This may reflect the fact
that cardiac catheterization is an invasive procedure with a potential risk of
complications while electroencephalography is rarely invasive and has essentially no risk
of complications in most procedures. So, quality differences would likely be more
important for cardiac catheterization procedures, and as stated above this would lead to
less outsourcing, which is what we see in the data.
A close look at the difference in percent outsourced between the hospital types
shows that all hospital types seem to outsource a similar percent of their costs as more
cardiac catheterizations are performed. It is possible that these results indicate that for-
profits change their outsourcing decisions to be more like non-profit and public

22
hospitals as the number of procedures performed increases. This may be because as
more procedures are performed, it makes an increasing amount of sense for for-profits
to keep more of their medical spending in-house, eventually falling in line with how non-
profit and public hospitals outsource. Again, though, further research is necessary to
properly determine if this is actually the case.
Total costs per unit for both cardiac catheterization and electroencephalography
appear to be primarily driven by employment costs per unit, which on average account
for more than half of a hospital’s total costs per unit. For cardiac catheterization, capital
costs per unit and outsourcing costs per unit each make up on average about ten
percent of a hospital’s total costs per unit, and other costs per unit make up the
remainder. For electroencephalography, capital costs per unit make up about thirty
percent, outsourcing costs per unit make up about ten percent, and other costs per unit
make up the remainder.
The purpose of looking at grounds keeping costs per unit and credit and
collection costs per unit was to look at two purely non-medical cost categories to
determine if there is a difference in how medical and non-medical costs are handled.
The results for total costs per unit showed that for-profits tend to have lower costs than
the other two hospital types, though this result was not statistically significant for non-
profits in regards to grounds keeping.

23
Though the medical data also shows a difference between for-profits and the
other hospital types, it is interesting to note that for grounds keeping, as well as for
credit and collection, the difference between the hospital types appears to grow, not
shrink, as the amount of output increases, and that this difference begins to appear
before the mean level of output. This seems to suggest that while for medical costs for-
profits slowly behave more like the other hospital types as output increases, for-profits
slowly behave less and less like their counterparts for non-medical costs. It is possible
that this difference develops because non-medical categories do not share the same
concerns with quality as medical categories do, but again, further research is necessary
to determine the cause of this difference.
The total cost per unit figures do seem to suggest that the general efficiency
difference between for-profits and other hospital types extends to non-medical
categories as well. However, the difference that exists is less clear in the non-medical
categories for two important reasons. One is that employment and capital costs are
much smaller as a percentage of total costs for these non-medical categories, which not
only lessens their impact but makes it impossible to draw firm conclusions from the
results. The second reason has to do with differences in outsourcing decisions.
Like medical outsourced costs per unit, non-medical outsourced costs per unit
are essentially a wash, with the exception of non-profits for credit and collection. More
importantly, the percent outsourced results for both grounds keeping and credit and
24
collection show no real difference between the hospital types, whereas the percent
outsourced results for the medical categories showed a very strong difference between
for-profits the other two hospital types. Thus, for non-medical costs, the type of
ownership of the hospital appears to have essentially no relationship with how costs are
outsourced.
This seems to imply that all three hospital types handle their outsourcing
decisions the same way for non-medical categories, unlike cardiac catheterization and
electroencephalography where for-profits outsource a larger percent of their costs. This
result is also in keeping with previous research results because quality differences in
non-medical categories are nowhere near as important to a hospital as quality
differences in medical procedures, and so we would expect grounds keeping and credit
and collection results to show either much less of a difference or no difference at all in
outsourcing decisions between hospital types (Marsh and Warren 2013).
Finally, it is also possible that some of the differences between the medical and
non-medical results for total costs per unit and outsourced costs per unit may be due in
part to differences in the make-up of total costs per unit. For both grounds keeping and
credit and collection, outsourced costs account for nearly three quarters of total costs
whereas for cardiac catheterization and electroencephalography outsourced costs only
make up about ten percent of total costs.

25
APPENDICES

26
Appendix A
For-Profit Summary Statistics
# Observations Mean Std. Dev. Minimum Maximum
Cardiac Catheterization
log(Output)
31 3.10 0.67 1.49 4.13
Cardiac Catheterization
log(Total Costs/Unit)
31 3.05 0.39 2.29 4.17
Cardiac Catheterization
log(Wage Costs/Unit)
30 2.82 0.39 2.16 3.99
Cardiac Catheterization
log(Capital Costs/Unit)
29 1.72 0.73 -0.16 3.39
Cardiac Catheterization
log(Outsourced Costs/Unit)
31 1.85 0.87 -0.68 3.44
Cardiac Catheterization
Percent Outsourced
31 0.15 0.21 0.01 0.97
Cardiac Catheterization
log(Other Costs/Unit)
31 1.83 0.74 0.36 3.35
Electroencephalography
log(Output)
39 2.61 0.50 1.71 3.69
Electroencephalography
log(Total Costs/Unit)
39 2.12 0.30 1.54 2.74
Electroencephalography
log(Wage Costs/Unit)
22 1.88 0.56 0.06 2.55
Electroencephalography
log(Capital Costs/Unit)
24 0.84 0.54 0.10 2.10
Electroencephalography
log(Outsourced Costs/Unit)
30 1.56 0.95 -1.63 2.62
Electroencephalography
Percent Outsourced
40 0.47 0.45 0 1
Electroencephalography
log(Other Costs/Unit)
22 0.10 1.05 -2.46 2.74
Grounds Keeping
log(Output)
21 5.29 0.49 4.44 6.08
Grounds Keeping
log(Total Costs/Unit)
21 -0.45 0.46 -1.27 0.29
Grounds Keeping
log(Wage Costs/Unit)
6 -0.47 0.44 -1.24 0.07
Grounds Keeping
log(Capital Costs/Unit)
9 -2.28 1.05 -3.94 -0.38
Grounds Keeping
log(Outsourced Costs/Unit)
20 -0.89 0.89 -3.02 0.26
Grounds Keeping
Percent Outsourced
21 0.73 0.41 0 1
Grounds Keeping
log(Other Costs/Unit)
10 -1.95 0.88 -3.63 -1.02
27
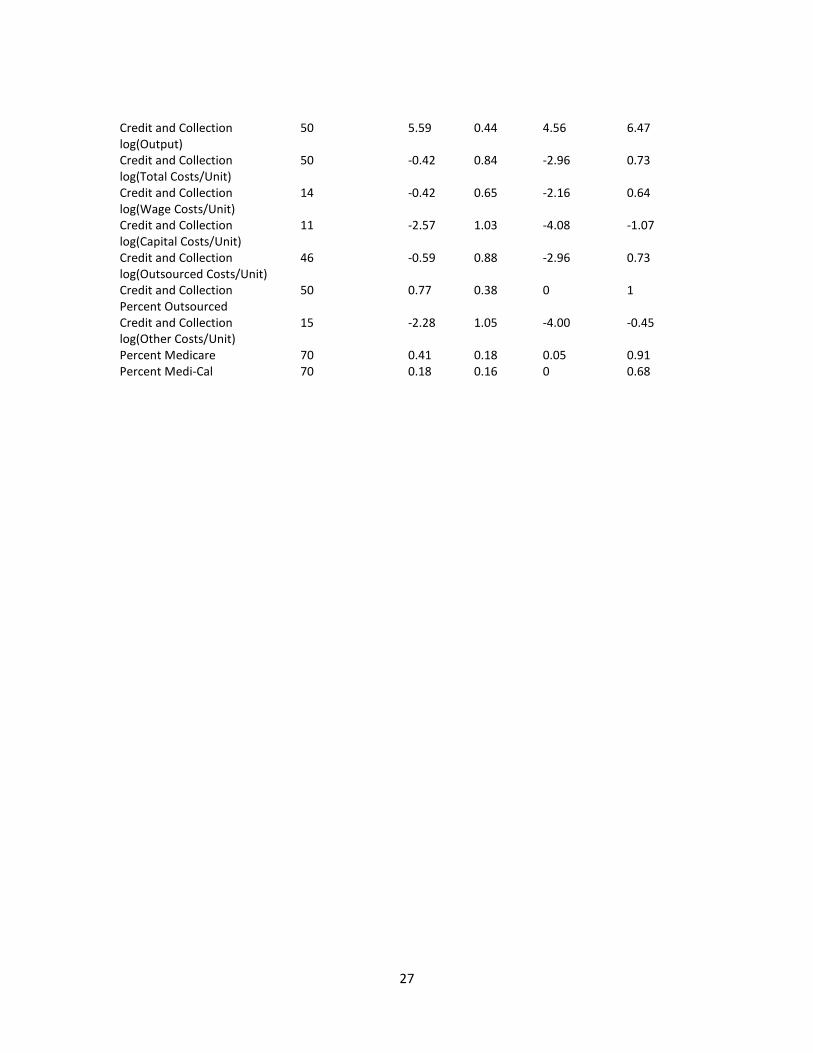
Credit and Collection
log(Output)
50 5.59 0.44 4.56 6.47
Credit and Collection
log(Total Costs/Unit)
50 -0.42 0.84 -2.96 0.73
Credit and Collection
log(Wage Costs/Unit)
14 -0.42 0.65 -2.16 0.64
Credit and Collection
log(Capital Costs/Unit)
11 -2.57 1.03 -4.08 -1.07
Credit and Collection
log(Outsourced Costs/Unit)
46 -0.59 0.88 -2.96 0.73
Credit and Collection
Percent Outsourced
50 0.77 0.38 0 1
Credit and Collection
log(Other Costs/Unit)
15 -2.28 1.05 -4.00 -0.45
Percent Medicare 70 0.41 0.18 0.05 0.91
Percent Medi-Cal 70 0.18 0.16 0 0.68

28
Appendix B
Non-Profit Summary Statistics
# Observations Mean Std. Dev. Minimum Maximum
Cardiac Catheterization
log(Output)
82 3.60 0.62 2.00 5.44
Cardiac Catheterization
log(Total Costs/Unit)
82 3.00 0.57 0.88 4.20
Cardiac Catheterization
log(Wage Costs/Unit)
74 2.59 0.53 0.62 3.57
Cardiac Catheterization
log(Capital Costs/Unit)
73 1.67 0.76 -0.64 3.10
Cardiac Catheterization
log(Outsourced Costs/Unit)
74 1.51 0.72 -0.70 2.70
Cardiac Catheterization
Percent Outsourced
87 0.06 0.06 0 0.25
Cardiac Catheterization
log(Other Costs/Unit)
82 2.31 0.90 -0.10 4.20
Electroencephalography
log(Output)
75 2.85 0.65 1.18 4.51
Electroencephalography
log(Total Costs/Unit)
75 2.24 0.30 1.37 3.12
Electroencephalography
log(Wage Costs/Unit)
63 2.10 0.35 1.25 3.08
Electroencephalography
log(Capital Costs/Unit)
56 1.06 0.60 -0.45 2.48
Electroencephalography
log(Outsourced Costs/Unit)
59 1.28 0.84 -0.83 2.48
Electroencephalography
Percent Outsourced
77 0.26 0.34 0 1
Electroencephalography
log(Other Costs/Unit)
63 0.57 0.70 -0.94 2.36
Grounds Keeping
log(Output)
66 5.64 0.53 3.93 6.79
Grounds Keeping
log(Total Costs/Unit)
66 -0.49 0.44 -1.17 1.24
Grounds Keeping
log(Wage Costs/Unit)
24 -0.81 0.64 -2.83 0.01
Grounds Keeping
log(Capital Costs/Unit)
36 -2.37 0.98 -4.37 0.07
Grounds Keeping
log(Outsourced Costs/Unit)
64 -0.80 0.77 -4.19 1.23
Grounds Keeping
Percent Outsourced
66 0.70 0.37 0 1
Grounds Keeping
log(Other Costs/Unit)
41 -2.22 1.15 -5.73 -0.44
29
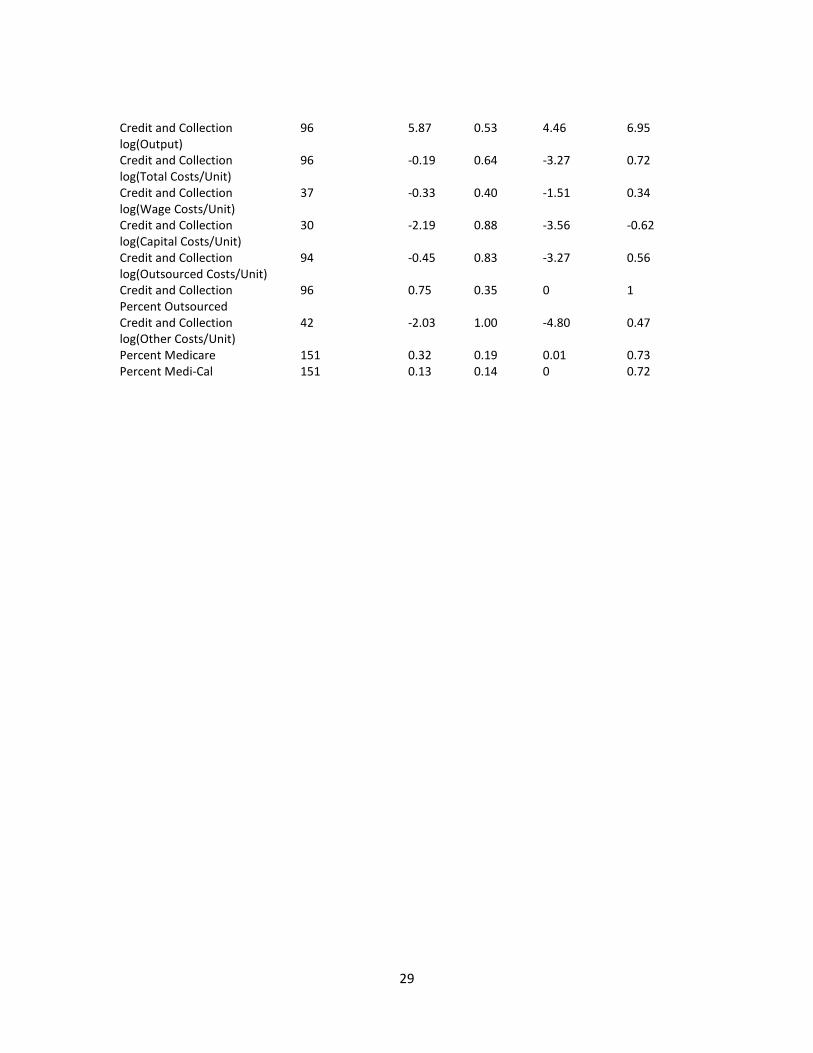
Credit and Collection
log(Output)
96 5.87 0.53 4.46 6.95
Credit and Collection
log(Total Costs/Unit)
96 -0.19 0.64 -3.27 0.72
Credit and Collection
log(Wage Costs/Unit)
37 -0.33 0.40 -1.51 0.34
Credit and Collection
log(Capital Costs/Unit)
30 -2.19 0.88 -3.56 -0.62
Credit and Collection
log(Outsourced Costs/Unit)
94 -0.45 0.83 -3.27 0.56
Credit and Collection
Percent Outsourced
96 0.75 0.35 0 1
Credit and Collection
log(Other Costs/Unit)
42 -2.03 1.00 -4.80 0.47
Percent Medicare 151 0.32 0.19 0.01 0.73
Percent Medi-Cal 151 0.13 0.14 0 0.72

30
Appendix C
Public Summary Statistics
# Observations Mean Std. Dev. Minimum Maximum
Cardiac Catheterization
log(Output)
13 3.24 0.46 2.59 3.71
Cardiac Catheterization
log(Total Costs/Unit)
13 3.14 0.40 2.57 3.74
Cardiac Catheterization
log(Wage Costs/Unit)
13 2.90 0.36 2.33 3.45
Cardiac Catheterization
log(Capital Costs/Unit)
12 1.74 0.87 -0.06 2.84
Cardiac Catheterization
log(Outsourced Costs/Unit)
13 1.62 0.78 -0.48 2.47
Cardiac Catheterization
Percent Outsourced
13 0.07 0.07 0.01 0.23
Cardiac Catheterization
log(Other Costs/Unit)
13 2.41 0.65 1.46 3.46
Electroencephalography
log(Output)
26 3.04 0.63 1.77 4.20
Electroencephalography
log(Total Costs/Unit)
26 1.93 0.44 0.78 2.46
Electroencephalography
log(Wage Costs/Unit)
23 1.80 0.40 0.78 2.40
Electroencephalography
log(Capital Costs/Unit)
20 0.73 0.70 -0.57 1.84
Electroencephalography
log(Outsourced Costs/Unit)
20 0.68 1.19 -2.70 2.39
Electroencephalography
Percent Outsourced
26 0.17 0.27 0 0.99
Electroencephalography
log(Other Costs/Unit)
23 0.63 0.64 -0.94 2.06
Grounds Keeping
log(Output)
25 5.50 0.54 4.51 6.48
Grounds Keeping
log(Total Costs/Unit)
25 -0.36 0.41 -0.99 0.30
Grounds Keeping
log(Wage Costs/Unit)
13 -0.47 0.44 -1.15 0.26
Grounds Keeping
log(Capital Costs/Unit)
11 -2.04 0.70 -3.18 -1.16
Grounds Keeping
log(Outsourced Costs/Unit)
25 -1.00 0.76 -2.49 0.27
Grounds Keeping
Percent Outsourced
25 0.50 0.43 0.01 1
Grounds Keeping
log(Other Costs/Unit)
21 -1.78 0.93 -3.78 -0.08
31
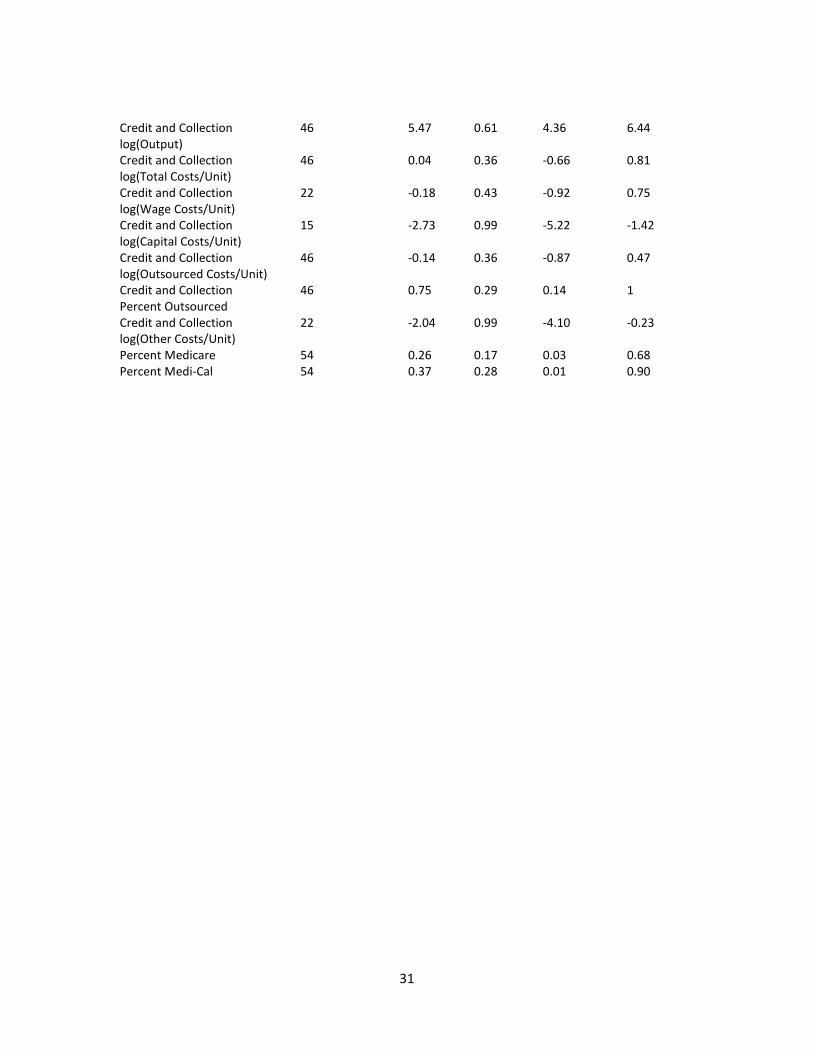
Credit and Collection
log(Output)
46 5.47 0.61 4.36 6.44
Credit and Collection
log(Total Costs/Unit)
46 0.04 0.36 -0.66 0.81
Credit and Collection
log(Wage Costs/Unit)
22 -0.18 0.43 -0.92 0.75
Credit and Collection
log(Capital Costs/Unit)
15 -2.73 0.99 -5.22 -1.42
Credit and Collection
log(Outsourced Costs/Unit)
46 -0.14 0.36 -0.87 0.47
Credit and Collection
Percent Outsourced
46 0.75 0.29 0.14 1
Credit and Collection
log(Other Costs/Unit)
22 -2.04 0.99 -4.10 -0.23
Percent Medicare 54 0.26 0.17 0.03 0.68
Percent Medi-Cal 54 0.37 0.28 0.01 0.90
32
Appendix D
Scatter Plots and Regressions
0
0.5
1
1.5
2
2.5
3
3.5
4
4.5
1 2 3 4 5 6
log
(To
tal
Co
sts/
Un
it)
log(Output)
log(Total Costs/Unit) Cardiac Catheterization
ccFPlog(Output)
ccNPlog(Output)
ccPUBlog(Output)
Linear (ccFPlog(Output))
Linear (ccNPlog(Output))
Linear (ccPUBlog(Output))
0
0.5
1
1.5
2
2.5
3
3.5
4
4.5
1 2 3 4 5 6
log
(Wa
ge
Co
sts/
Un
it)
log(Output)
log(Wage Costs/Unit) Cardiac Catheterization
ccFPlog(Output)
ccNPlog(Output)
ccPUBlog(Output)
Linear (ccFPlog(Output))
Linear (ccNPlog(Output))
Linear (ccPUBlog(Output))

33
-1
-0.5
0
0.5
1
1.5
2
2.5
3
3.5
4
1 2 3 4 5 6
log
(Ca
pit
al
Co
sts/
Un
it)
log(Output)
log(Capital Costs/Unit) Cardiac Catheterization
ccFPlog(Output)
ccNPlog(Output)
ccPUBlog(Output)
Linear (ccFPlog(Output))
Linear (ccNPlog(Output))
Linear (ccPUBlog(Output))
-1
-0.5
0
0.5
1
1.5
2
2.5
3
3.5
4
1 2 3 4 5 6
log
(Ou
tso
urc
ed
Co
sts/
Un
it)
log(Output)
log(Outsourced Costs/Unit) Cardiac Catheterization
ccFPlog(Output)
ccNPlog(Output)
ccPUBlog(Output)
Linear (ccFPlog(Output))
Linear (ccNPlog(Output))
Linear (ccPUBlog(Output))
34
-0.2
0
0.2
0.4
0.6
0.8
1
1.2
1 2 3 4 5 6
Pe
rce
nt
Ou
tso
urc
ed
log(Output)
Percent Outsourced Cardiac Catheterization
ccFPlog(Output)
ccNPlog(Output)
ccPUBlog(Output)
Linear (ccFPlog(Output))
Linear (ccNPlog(Output))
Linear (ccPUBlog(Output))
0
0.5
1
1.5
2
2.5
3
3.5
1 2 3 4 5
log
(To
tal
Co
sts/
Un
it)
log(Output)
log(Total Costs/Unit) Electroencephalography
eegFPlog(Output)
eegNPlog(Output)
eegPUBlog(Output)
Linear (eegFPlog(Output))
Linear (eegNPlog(Output))
Linear (eegPUBlog(Output))

35
0
0.5
1
1.5
2
2.5
3
3.5
1 2 3 4 5
log
(Wa
ge
Co
sts/
Un
it)
log(Output)
log(Wage Costs/Unit) Electroencephalography
eegFPlog(Output)
eegNPlog(Output)
eegPUBlog(Output)
Linear (eegFPlog(Output))
Linear (eegNPlog(Output))
Linear (eegPUBlog(Output))
-1
-0.5
0
0.5
1
1.5
2
2.5
3
1 2 3 4 5
log
(Ca
pit
al
Co
sts/
Un
it)
log(Output)
log(Capital Costs/Unit) Electroencephalography
eegFPlog(Output)
eegNPlog(Output)
eegPUBlog(Output)
Linear (eegFPlog(Output))
Linear (eegNPlog(Output))
Linear (eegPUBlog(Output))

36
-3
-2
-1
0
1
2
3
1 2 3 4 5
log
(Ou
tso
urc
ed
Co
sts/
Un
it)
log(Output)
log(Outsourced Costs/Unit) Electroencephalography
eegFPlog(Output)
eegNPlog(Output)
eegPUBlog(Output)
Linear (eegFPlog(Output))
Linear (eegNPlog(Output))
Linear (eegPUBlog(Output))
0
0.2
0.4
0.6
0.8
1
1.2
1 2 3 4 5
Pe
rce
nt
Ou
tso
urc
ed
log(Output)
Percent Outsourced Electroencephalography
eegFPlog(Output)
eegNPlog(Output)
eegPUBlog(Output)
Linear (eegFPlog(Output))
Linear (eegNPlog(Output))
Linear (eegPUBlog(Output))
37
-1.5
-1
-0.5
0
0.5
1
1.5
3 4 5 6 7
log
(To
tal
Co
sts/
Un
it)
log(Output)
log(Total Costs/Unit) Grounds Keeping
grFPlog(Output)
grNPlog(Output)
grPUBlog(Output)
Linear (grFPlog(Output))
Linear (grNPlog(Output))
Linear (grPUBlog(Output))
-3
-2.5
-2
-1.5
-1
-0.5
0
0.5
3 4 5 6 7
log
(Wa
ge
Co
sts/
Un
it)
log(Output)
log(Wage Costs/Unit) Grounds Keeping
grFPlog(Output)
grNPlog(Output)
grPUBlog(Output)
Linear (grFPlog(Output))
Linear (grNPlog(Output))
Linear (grPUBlog(Output))
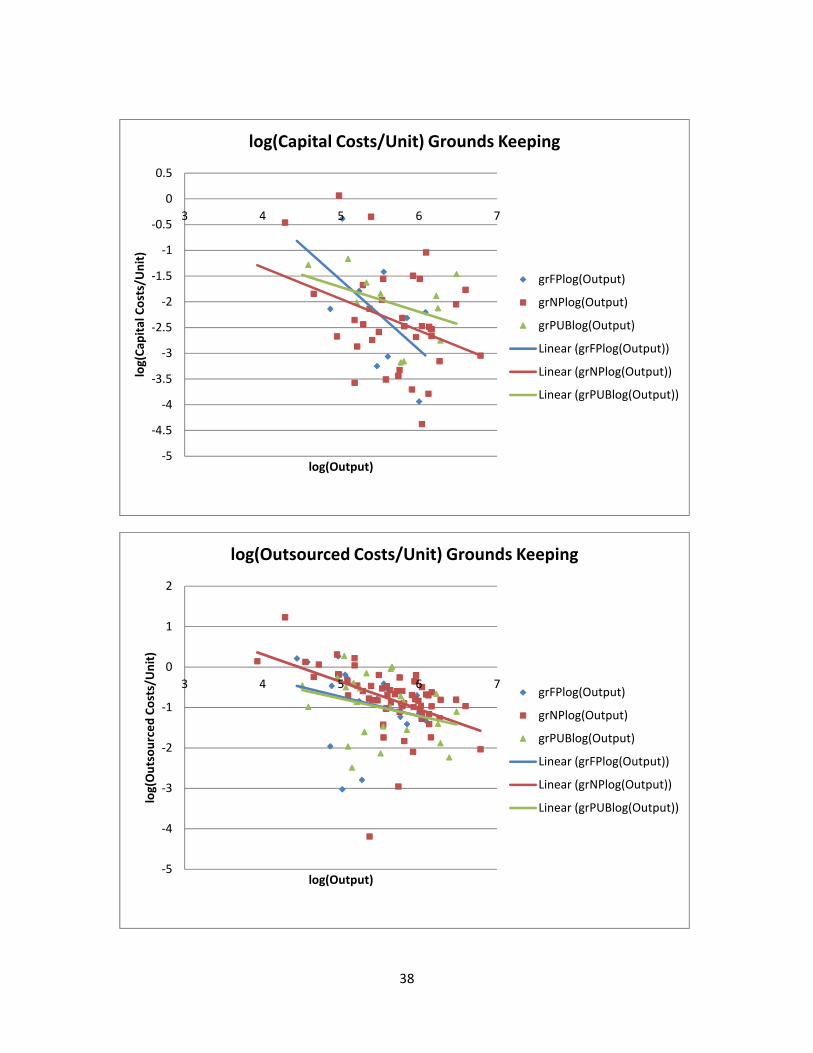
38
-5
-4.5
-4
-3.5
-3
-2.5
-2
-1.5
-1
-0.5
0
0.5
3 4 5 6 7
log
(Ca
pit
al
Co
sts/
Un
it)
log(Output)
log(Capital Costs/Unit) Grounds Keeping
grFPlog(Output)
grNPlog(Output)
grPUBlog(Output)
Linear (grFPlog(Output))
Linear (grNPlog(Output))
Linear (grPUBlog(Output))
-5
-4
-3
-2
-1
0
1
2
3 4 5 6 7
log
(Ou
tso
urc
ed
Co
sts/
Un
it)
log(Output)
log(Outsourced Costs/Unit) Grounds Keeping
grFPlog(Output)
grNPlog(Output)
grPUBlog(Output)
Linear (grFPlog(Output))
Linear (grNPlog(Output))
Linear (grPUBlog(Output))

39
0
0.2
0.4
0.6
0.8
1
1.2
3 4 5 6 7
Pe
rce
nt
Ou
tso
urc
ed
log(Output)
Percent Outsourced Grounds Keeping
grFPlog(Output)
grNPlog(Output)
grPUBlog(Output)
Linear (grFPlog(Output))
Linear (grNPlog(Output))
Linear (grPUBlog(Output))
-3.5
-3
-2.5
-2
-1.5
-1
-0.5
0
0.5
1
1.5
4 5 6 7
log
(To
tal
Co
sts/
Un
it)
log(Output)
log(Total Costs/Unit) Credit and Collection
credFPlog(Output)
credNPlog(Output)
credPUBlog(Output)
Linear (credFPlog(Output))
Linear (credNPlog(Output))
Linear (credPUBlog(Output))

40
-2.5
-2
-1.5
-1
-0.5
0
0.5
1
4 5 6 7
log
(Wa
ge
Co
sts/
Un
it)
log(Output)
log(Wage Costs/Unit) Credit and Collection
credFPlog(Output)
credNPlog(Output)
credPUBlog(Output)
Linear (credFPlog(Output))
Linear (credNPlog(Output))
Linear (credPUBlog(Output))
-6
-5
-4
-3
-2
-1
0
4 5 6 7
log
(Ca
pit
al
Co
sts/
Un
it)
log(Output)
log(Capital Costs/Unit) Credit and Collection
credFPlog(Output)
credNPlog(Output)
credPUBlog(Output)
Linear (credFPlog(Output))
Linear (credNPlog(Output))
Linear (credPUBlog(Output))

41
-3.5
-3
-2.5
-2
-1.5
-1
-0.5
0
0.5
1
4 5 6 7
log
(Ou
tso
urc
ed
Co
sts/
Un
it)
log(Output)
log(Outsourced Costs/Unit) Credit and Collection
credFPlog(Output)
credNPlog(Output)
credPUBlog(Output)
Linear (credFPlog(Output))
Linear (credNPlog(Output))
Linear (credPUBlog(Output))
0
0.2
0.4
0.6
0.8
1
1.2
4 5 6 7
Pe
rce
nt
Ou
tso
urc
ed
log(Output)
Percent Outsourced Credit and Collection
credFPlog(Output)
credNPlog(Output)
credPUBlog(Output)
Linear (credFPlog(Output))
Linear (credNPlog(Output))
Linear (credPUBlog(Output))

42
REFERENCES
Horwitz, Jill R. “Making Profits and Providing Care: Comparing Nonprofit, For-Profit, and
Government Hospitals.” Health Affairs, May 2005, Vol. 24, No. 3
Marsh, Christina and Patrick Warren. “Outsourcing and Ownership: Theory and Evidence
from California General Care Hospitals.” Working Paper, 2013
Norton, Edward C. and Douglas O. Staiger. “How Hospital Ownership Affects Access to
Care for the Uninsured.” The RAND Journal of Economics, Spring 1994, Vol. 25,
No. 1, pp. 171-185
Plante, Catherine. “The Differentiation between For-Profit and Nonprofit Hospitals:
Another Look.” Research in Healthcare Financial Management, 2009, Vol. 12, No.
1, pp. 7-17
Yu-Chu Shen, Karen Eggleston, Joseph Lau, Christopher Schmid. “Hospital Ownership
and Financial Performance: A Quantitative Research Review.” Working Paper,
September 2005
Frank A Sloan, Gabriel A Picone, Donald H Taylor Jr., Shin-Yi Chou. “Hospital ownership
and cost and quality of care: is there a dime’s worth of difference?” Journal of
Health Economics, January 2001, Vol. 20, No. 1, pp. 1–21
Woolhandler, Steffie, and David H. Himmelstein. “Costs of Care and Administration at
For-Profit and Other Hospitals in the United States.” New England Journal of
Medicine. 1997
Copyright © 2022 FDOKUMEN