Annual Report and Audited Financial Statements
459
For the financial year ended 30 November 2016 Dimensional Funds plc Authorised and Regulated by the Central Bank of Ireland Annual Report and Audited Financial Statements
-
Upload
khangminh22 -
Category
Documents
-
view
0 -
download
0
Transcript of Annual Report and Audited Financial Statements

For the fi nancial year ended 30 November 2016
Dimensional Funds plcAuthorised and Regulated by the Central Bank of Ireland
Annual Report and Audited Financial Statements
No marketing notification has been submitted in Germany for the following Funds of Dimensional Funds plc:
Emerging Markets Value II Fund
Euro Inflation Linked Long Duration Fixed Income Fund
European Core Equity Fund
Global Core Equity II Fund
Global Short Fixed Income II Fund
Global Value Fund
Japan Core Equity Fund
Sterling Inflation Linked Intermediate Duration Fixed Income Fund
Sterling Inflation Linked Long Duration Fixed Income Fund
U.S. Core Equity Fund
U.S. Small Companies II Fund
U.S. Value Fund
World Allocation 20/80 Fund
World Allocation 80/20 Fund
World Allocation 40/60 Fund
World Allocation 60/40 Fund
Accordingly, these Funds must not be publicly marketed in Germany.

Table of Contents
Dimensional Fund Advisors Annual Report and Audited Financial Statements, 30 November 2016 1
General Information 2
Investment Manager’s Reports 3
Directors’ Report 8
Depositary Report 15
Independent Auditors’ Report 16
Statement of Financial Position 18
Statement of Comprehensive Income 27
Statement of Changes in Net Assets Attributable to Holders of Redeemable Shares 36
Portfolio of Investments
Emerging Markets Large Cap Core Equity Fund 39
Emerging Markets Value Fund 46
Euro Inflation Linked Intermediate Duration Fixed Income Fund 63
Euro Inflation Linked Long Duration Fixed Income Fund 64
European Small Companies Fund 65
European Value Fund 76
Global Core Equity Fund 78
Global Short Fixed Income Fund 131
Global Short-Term Investment Grade Fixed Income Fund 137
Global Small Companies Fund 145
Global Sustainability Core Equity Fund 186
Global Targeted Value Fund 202
Global Ultra Short Fixed Income Fund 238
Global Value Fund ( launched on 11 July 2016) 242
Pacific Basin Small Companies Fund 248
Sterling Inflation Linked Intermediate Duration Fixed Income Fund 267
U.S Core Equity Fund 268
U.S. Small Companies Fund 282
World Allocation 20/80 Fund 296
World Allocation 40/60 Fund 297
World Allocation 60/40 Fund 298
World Allocation 80/20 Fund 299
World Equity Fund 300
Notes to the Financial Statements 373
Statement of Portfolio Changes (unaudited) 420
Remuneration Policy (unaudited) 446
Securities Financing Transactions (unaudited) 447

General Information
Dimensional Fund Advisors Annual Report and Audited Financial Statements, 30 November 2016 2
Board of Directors: Arthur Barlow (American)
Peter Blessing (Irish)* **
David G. Booth (American)
Dermot S.L. Butler (Canadian)* **
Gregory K. Hinkle (American) (Appointed 29 August 2016)**
David R. Martin (American)** (Resigned 31 March 2016)
Catherine L. Newell (American)**
Gerard O’Reilly (Irish)
Eduardo Repetto (American)
John Romiza (American)
David Salisbury (British)**
Investment Manager: Dimensional Fund Advisors Ltd.
20 Triton Street
Regent’s Place
London, NW1 3BF
England
Investment Sub-Advisor: (All Funds)
Dimensional Fund Advisors LP
6300 Bee Cave Road, Building 1
Austin, TX 78746
USA
Investment Sub-Advisor: (All Funds)
DFA Australia Limited
Level 43
1 Macquarie Place
Sydney NSW 2000
Australia
Investment Sub-Advisor: (All Funds)
Dimensional Fund Advisors Pte. Ltd
8 Marina View
Asia Square Tower 1
Suite 33-01
Singapore 018960
* Independent directors
** Non-executive directors
Investment Sub-Advisor: (All Funds)
Dimensional Japan Ltd
Kokusai Building
Suite 808
3-1-1 Marunouchi
Chiyoda-ku
Tokyo 100–0005
Japan
Registered Auditors: PricewaterhouseCoopers
Chartered Accountants and Statutory Audit Firm
1 Spencer Dock
North Wall Quay
Dublin 1
Ireland
Registered Office: 25/28 North Wall Quay
Dublin 1
Ireland
Administrator: State Street Fund Services (Ireland) Limited
78 Sir John Rogerson’s Quay
Dublin 2
Ireland
Depositary: State Street Custodial Services (Ireland) Limited
78 Sir John Rogerson’s Quay
Dublin 2
Ireland
Listing Sponsor: A&L Listing
25/28 North Wall Quay
Dublin 1
Ireland
Legal Advisers in Ireland: A&L Goodbody
International Financial Services Centre
North Wall Quay
Dublin 1
Ireland
Secretary: Goodbody Secretarial Limited
25/28 North Wall Quay
Dublin 1
Ireland

Investment Manager’s Reports
Dimensional Fund Advisors Annual Report and Audited Financial Statements, 30 November 2016 3
Emerging Markets Large Cap Core Equity Fund The Emerging Markets Large Cap Core Equity Fund (the “Fund”)
has been invested in a broad range of large cap companies with
increased exposure to companies with smaller relative market
capitalisation, lower relative price, and higher profitability across the
emerging markets region and as at 30 November 2016 had
exposure to approximately 700 companies. This reflects our
approach of seeking to deliver highly diversified exposure to
emerging markets large cap companies.
Over the twelve months to 30 November 2016, the total return of the
Fund in U.S. Dollars (the Base Currency of the Fund) was 10.36%,
with strong performance in the emerging market countries. This
compares to a total return of 8.47% for the MSCI Emerging Markets
Index (the "Index"). The Fund’s greater emphasis to value
companies contributed to the outperformance over this period.
The Fund is fully invested and seeks to capture the returns of
emerging markets large cap companies. Fair value adjustments and
the time of valuation of currency can create differences between the
performance of the Fund versus the Index. The Index has been
included for market context purposes only.
Emerging Markets Value Fund The Emerging Markets Value Fund (the “Fund”) has been invested
in a broad range of companies with high book-to-market ratios
across the emerging markets region and as at 30 November 2016
had holdings in approximately 1,800 companies. This reflects our
approach of seeking to deliver highly diversified exposure to
emerging markets value companies.
Over the twelve months to 30 November 2016, the total return of the
Fund in U.S. Dollars (the Base Currency of the Fund) was 14.43%,
as value companies performed well in emerging markets. This
compares to a total return of 8.47% for the MSCI Emerging Markets
Index (the "Index"). The Fund’s greater emphasis to small cap
companies also added to outperformance over this period.
The Fund is fully invested and seeks to capture the returns of
emerging markets value companies. Fair value adjustments and the
time of valuation of currency can create differences between the
performance of the Fund versus the Index. The Index has been
included for market context purposes only.
Euro Inflation Linked Intermediate Duration Fixed Income Fund The Euro Inflation Linked Intermediate Duration Fixed Income Fund
(the “Fund”) has been invested in EUR inflation linked issues of
Eurozone governments with maturities between three and twenty
years. The real yield to maturity on 30 November 2016 was
approximately -0.56%.
For the twelve months ending 30 November 2016, the total return
was -0.24%. This compares to a return Barclays Capital French
EMU HICP Linked 5-15 Year Bond Index (the "Index") of 0.45%. The
Index has been included for market context purposes only.
Euro Inflation Linked Long Duration Fixed Income Fund The Euro Inflation Linked Long Duration Fixed Income Fund (the
“Fund”) has been invested in EUR inflation linked issues of
Eurozone governments with maturities greater than 8 years. The real
yield to maturity on 30 November 2016 was approximately -0.31%.
For the twelve months ending 30 November 2016, the total return
was 5.15%. This compares to a return of the Barclays France
Government EMU HICP Linked 15+ Years Index (the "Index") of
0.52%. The Index has been included for market context purposes
only.
European Small Companies Fund The European Small Companies Fund (the “Fund”) has been
invested in a broad range of small companies across the European
region and as at 30 November 2016 had holdings in approximately
1,200 companies. This reflects our approach of seeking to deliver
highly diversified exposure to European small companies.
Over the twelve months to 30 November 2016, the total return of the
Fund in Euro (the Base Currency of the Fund) was -3.50%, as small
cap companies declined in value over the period. This compares to a
return of -5.98% for the MSCI Europe Small Cap Index (the "Index").
The Fund’s greater weight in micro-cap stocks which performed well
contributed to the outperformance.
The Fund is fully invested and seeks to capture the returns of
European small companies. Fair value adjustments and the time of
valuation of currency can create differences between the
performance of the Fund versus the Index. The Index has been
included for market context purposes only.
European Value Fund The European Value Fund (the “Fund”) has been invested in a broad
range of large cap value companies across the European region and
as at 30 November 2016 had holdings in approximately 140
companies. This reflects our approach of seeking to deliver highly
diversified exposure to European value companies.
Over the twelve months to 30 November 2016 the total return of the
Fund in Euro (the Base Currency of the Fund) was -4.22%, reflecting
the performance of European markets. This compares to a return of
-5.94% for the MSCI Europe Value Index (the "Index"). The Fund’s
greater allocation to low relative price companies, resulted in much
of the outperformance.
The Fund is fully invested and seeks to capture the returns of
European large cap value companies. Fair value adjustments and
the time of valuation of currency can create differences between the
performance of the Fund versus the Index. The Index has been
included for market context purposes only.
Investment Manager’s Reports (continued)
Dimensional Fund Advisors Annual Report and Audited Financial Statements, 30 November 2016 4
Global Core Equity Fund The Global Core Equity Fund (the “Fund”) has been invested in a
broad range of companies with increased exposure to companies
with high book-to-market ratios and smaller market capitalisations
across developed world markets. As at 30 November 2016, the Fund
had exposure to approximately 6,400 companies which reflects our
approach of seeking to deliver highly diversified exposure to
developed markets companies.
Over the twelve months to 30 November 2016, the total return of the
Fund in U.S. Dollars (the Base Currency of the Fund) was 4.62%,
mainly driven by strong performance in US and Canada. This
compares to a total return of 3.15 % for the MSCI World Index
(the "Index"). The Fund outperformed the MSCI World Index due to
greater allocation to small cap and low relative price companies.
The Fund is fully invested and seeks to capture the returns of global
markets. Fair value adjustments and the time of valuation of
currency can create differences between the performance of the
Fund versus the Index. The Index has been included for market
context purposes only.
Global Short Fixed Income Fund The Global Short Fixed Income Fund (the “Fund”) has been invested
in a broad range of high quality fixed income instruments with
maturities at or below five years. As at 30 November 2016, the Fund
was diversified across 4 currencies (USD, GBP, SGD & SEK) of
issuers from 16 countries as well as supranational organisations.
The allocation across currencies has increased from 3 to 4 by
including SEK-denominated securities from December 2015. Foreign
currency exposures are hedged back to Euro (the Base Currency of
the Fund). As at 30 November 2016, the average maturity of the
Fund was approximately 3.73 years, resulting in a duration of
approximately 3.54.
Over the twelve months to 30 November 2016, the total return of the
Fund in Euro was 0.60%. This compares to a return on the Citigroup
WGBI Currency Hedged 1 to 5 Year EUR Index (the "Index")
of -0.08%. The Index has been included for market context purposes
only.
Global Short-Term Investment Grade Fixed Income Fund The Global Short-Term Investment Grade Fixed Income Fund (the
“Fund”) has been invested in a broad range of high quality fixed
income issues with maturities at or below five years and an average
duration of below 3 years. As of 30 November 2016, the yield to
maturity at this time was approximately 2.34%.
For the twelve months ending 30 November 2016, the total return
was 2.05%. This compares to a return on the Barclays Global
Aggregate Credit 1-5 Index (the "Index") of 2.08%. The Index has
been included for market context purposes only.
Global Small Companies Fund The Global Small Companies Fund (the “Fund”) has been invested
in a broad range of companies with smaller market capitalisations
across developed world markets. As at 30 November 2016 the Fund
had exposure to approximately 4,900 companies which reflects our
approach of seeking to deliver highly diversified exposure to
developed markets small companies.
Over the twelve months to 30 November 2016, the total return of the
Fund in USD (the Base Currency of the Fund) was 7.94%. This
compares to a return of 7.31% for the MSCI World Small Cap Index
(the "Index"). The Fund’s general exclusion of securities with both
high relative price and low profitability contributed to relative returns,
as these securities underperformed during the period.
The Fund is fully invested and seeks to capture the returns of global
small-cap companies. Fair value adjustments and the time of
valuation of currency can create differences between the
performance of the Fund versus the Index. The Index has been
included for market context purposes only.
Global Sustainability Core Equity Fund The Global Sustainability Core Equity Fund (the “Fund”) has been
invested in a broad range of companies with increased exposure to
companies with high book-to-market ratios and smaller market
capitalisations across developed world markets, while also adjusting
the composition of the Fund based on environmental impact
considerations. As at 30 November 2016, the Fund had exposure to
approximately 6,100 companies which reflects our approach of
seeking to deliver highly diversified exposure to developed markets
companies.
Over the twelve months to 30 November 2016, the total return of the
Fund in U.S. Dollars (the Base Currency of the Fund) was 3.46%,
mainly driven by strong performance in US and Canada. This
compares to a total return of 3.15% for the MSCI World Index
(the "Index"). The Fund outperformed the MSCI World Index due to
a greater allocation to small cap and low relative price companies.
The Fund is fully invested and seeks to capture the returns of global
markets. Fair value adjustments and the time of valuation of
currency can create differences between the performance of the
Fund versus the Index. The Index has been included for market
context purposes only.

Investment Manager’s Reports (continued)
Dimensional Fund Advisors Annual Report and Audited Financial Statements, 30 November 2016 5
Global Targeted Value Fund The Global Targeted Value Fund (the “Fund”) has been invested in a
broad range of small and mid-cap companies with high book-to-
market ratios across developed world markets and as at 30
November 2016 had holdings in approximately 4,300 companies.
This reflects our approach of seeking to deliver highly diversified
exposure to small and mid-cap developed markets value companies.
Over the twelve months to 30 November 2016, the total return of the
Fund in U.S. Dollars (the Base Currency of the Fund) was 9.16%,
due to strong performance of mid cap companies. This compares to
a total return of 9.52% for the MSCI World SMID Value Index (the
"Index"). The Fund underperformed the MSCI World SMID Value
Index due to its lower allocation to mid-cap companies, which
performed well over the period.
The Fund is fully invested and seeks to capture the returns of global
small and mid-cap value companies. Fair value adjustments and the
time of valuation of currency can create differences between the
performance of the Fund versus the Index. The Index has been
included for market context purposes only.
Global Ultra Short Fixed Income Fund
The Global Ultra Short Fixed Income Fund (the “Fund”) has been
invested in securities with maturity up to 2 years and a minimum
credit rating of AA-. The Fund can have an average maturity of up to
1 year. As of 30 November 2016, the yield to maturity at this time
was approximately 0.13%.
For the twelve months ending 30 November 2016, the total return of
the Fund in GBP was 0.39%. This compares to a return of GBP One
Month LIBOR (the "Index") of 0.46%. The Index has been included
for market context purposes only.
Global Value Fund
The Global Value Fund (the “Fund”) has been invested in a broad
range of large cap value companies across developed world markets
and as at 30 November 2016 had holdings in approximately 550
companies. This reflects our approach of seeking to deliver highly
diversified exposure to developed value companies.
Since the inception of the Fund to 30 November 2016 the total return
of the Fund in U.S. Dollars (the Base Currency of the Fund) was
4.89%. This compares to a return of 2.24% for the MSCI World
Value Index (the "Index"). Much of the outperformance relative to the
Index can be explained by the greater focus of the Fund on lower
relative price companies.
The Fund is fully invested and seeks to capture the returns of global
large cap value companies. Fair value adjustments and the time of
valuation of currency can create differences between the
performance of the Fund versus the Index. The Index has been
included for market context purposes only.
Pacific Basin Small Companies Fund The Pacific Basin Small Companies Fund (the “Fund”) has been
invested in a broad range of small companies across the Pacific
Basin region (Australia, Hong Kong, Japan, New Zealand,
Singapore, South Korea and Taiwan – South Korea and Taiwan are
included in the Fund to increase diversification although they are not
in the MSCI Pacific Small Cap Index) and as at 30 November 2016
had holdings in approximately 2,200 companies. This reflects our
approach of seeking to deliver highly diversified exposure to Pacific
Basin small companies.
Over the twelve months to 30 November 2016, the total return of the
Fund in U.S. Dollars (the Base Currency of the Fund) was 7.71%,
due to strong performance in Pacific Basin markets. This compares
to a total return of 7.35% for the MSCI Pacific Small Cap Index (the
"Index"). The Fund outperformed the Index due to its greater
allocation to small cap stocks, which performed well during the
period.
The Fund is fully invested and seeks to be well positioned to capture
the returns of small companies in the Pacific Basin. Fair value
adjustments and the time of valuation of currency can create
differences between the performance of the Fund versus the Index.
The Index has been included for market context purposes only.
Sterling Inflation Linked Intermediate Duration Fixed Income Fund The Sterling Inflation Linked Intermediate Fund (the “Fund”) has
been invested in sterling inflation linked issues of the U.K.
government with maturities between three and twenty years. The
real yield to maturity on 30 November 2016 was -1.63%.
For the twelve months ending 30 November 2016, the total return in
sterling was 9.51%. This compares to a return of the Barclays UK
Government Inflation-Linked 5-15 years Index (the "Index") of
9.86%. The Index has been included for market context purposes
only.
U.S. Core Equity Fund The U.S. Core Equity Fund (the “Fund”) has been invested in a
broad range of U.S. companies with increased exposure to
companies with high book-to-market ratios and smaller market
capitalisations. As at 30 November 2016, the Fund had exposure to
approximately 1,600 companies which reflects our approach of
seeking to deliver highly diversified exposure to developed markets
companies.
Over the twelve months to 30 November 2016, the total return of the
Fund in U.S. Dollars (the Base Currency of the Fund) was 9.65%,
due to strong performance in the U.S. market. This compares to a
total return of 7.64% for the Russell 3000 Index (the "Index"). The
Fund outperformed the Russell 3000 Index due to its higher
allocation to small cap stocks, which performed well during the
period.
Investment Manager’s Reports (continued)
Dimensional Fund Advisors Annual Report and Audited Financial Statements, 30 November 2016 6
U.S. Core Equity Fund (continued) The Fund is fully invested and seeks to capture the returns of the
U.S. market. The time of valuation of currency can create differences
between the performance of the Fund versus the Index. The Index
has been included for market context purposes only.
U.S. Small Companies Fund
The U.S Small Companies Fund (the “Fund”) has been invested in a
broad range of U.S. small companies and as of 30 November 2016
had holdings in approximately 1,600 companies. This reflects our
approach of seeking to deliver highly diversified exposure to U.S.
small companies.
Over the twelve months to 30 November 2016, the total return of the
Fund in U.S. Dollars (the Base Currency of the Fund) was 13.64%,
due to strong performance in the U.S. market. This compares to a
total return of 11.58% for the Russell 2000 Index (the "Index"). The
fund outperformed the Russell 2000 Index due to its higher
allocation to value stocks.
The Fund is fully invested and seeks to be well positioned to capture
the returns of U.S. small companies. The time of valuation of
currency can create differences between the performance of the
Fund versus the Index. The Index has been included for market
context purposes only.
World Allocation 20/80 Fund The World Allocation 20/80 Fund (the “Fund”) has been invested in a
broad range of equity securities of companies across developed and
emerging markets and fixed income securities of issuers in global
developed countries. The equity component of the Fund will
generally have a greater allocation to companies that are deemed to
be small companies and value companies. The fixed income
component will generally be invested in a broad range of high quality
fixed income issues with maturities at or below five years. The
aggregate exposure to equity and fixed income securities is
approximately 20% and 80% respectively.
As at 30 November 2016, the equity component of the Fund had
exposure to approximately 9,000 companies reflecting an approach
of seeking to deliver highly diversified exposure to developed and
emerging markets companies.
As at 30 November 2016 the fixed income component of the World
Allocation 20/80 Fund was diversified across approximately 550
bonds from 18 different countries as well as supranational
organisations and had an average credit rating of AA.
Over the twelve months to 30th November 2016, the total return of
the Fund was 6.07% in Pounds Sterling (the Base Currency of the
Fund). This compares to a return of 5.43% for the 20% MSCI World
All Country Index /80% Citigroup WGBI Currency Hedged 1 to 5
Year Index (the "Index"). The Fund outperformed its comparable
Index due to greater allocation to small cap and low relative price
companies within equities and greater allocation to securities with a
longer maturity within fixed income.
Fair value adjustments and the time of valuation of currency can
create differences between the performance of the Fund versus the
Index. The Index has been included for market context purposes
only.
World Allocation 40/60 Fund The World Allocation 40/60 Fund (the “Fund”) has been invested in a
broad range of equity securities of companies across developed and
emerging markets and fixed income securities of issuers in global
developed countries. The equity component of the Fund will
generally have a greater allocation to companies that are deemed to
be small companies and value companies. The fixed income
component will generally be invested in a broad range of high quality
fixed income issues with maturities at or below five years. The
aggregate exposure to equity and fixed income securities is
approximately 40% and 60% respectively.
As at 30 November 2016, the equity component of the Fund had
exposure to approximately 11,700 companies reflecting an approach
of seeking to deliver highly diversified exposure to developed and
emerging markets companies.
As at 30 November 2016 the fixed income component of the World
Allocation 40/60 Fund was diversified across approximately 680
bonds from 18 different countries as well as supranational
organisations and had an average credit rating of AA.
Over the twelve months to 30 November 2016, the return of the
Fund was 11.59% in Pounds Sterling (the Base Currency of the
Fund). This compares to a return of 10.09% for the 40% MSCI World
All Country Index / 60% Citigroup WGBI Currency Hedged 1 to 5
Year Index (the "Index"). The Fund outperformed its comparable
index due to greater allocation to small cap and low relative price
companies within equities and greater allocation to securities with a
longer maturity within fixed income.
Fair value adjustments and the time of valuation of currency can
create differences between the performance of the Fund versus the
Index. The Index has been included for market context purposes
only.
World Allocation 60/40 Fund The World Allocation 60/40 Fund (the “Fund”) has been invested in a
broad range of equity securities of companies across developed and
emerging markets and fixed income securities of issuers in global
developed countries. The equity component of the Fund will
generally have a greater allocation to companies that are deemed to
be small companies and value companies. The fixed income
component will generally invested in a broad range of high quality
fixed income issues with maturities at or below five years. The
aggregate exposure to equity and fixed income securities is
approximately 60% and 40% respectively.
As at 30 November 2016, the equity component of the Fund had
exposure to approximately 11,700 companies reflecting an approach
of seeking to deliver a highly diversified exposure to developed and
emerging markets companies.
Investment Manager’s Reports (continued)
Dimensional Fund Advisors Annual Report and Audited Financial Statements, 30 November 2016 7
World Allocation 60/40 Fund (continued) As at 30 November 2016, the fixed income component of the World
Allocation 60/40 Fund was diversified across approximately 680
bonds from 18 different countries as well as supranational
organisations and had an average credit rating of AA.
Over the twelve months to 30 November 2016, the return of the
Fund was 17.11% in Pounds Sterling (the Base Currency of the
Fund). This compares to a return of 14.88% for the 60% MSCI World
All Country Index / 40% Citigroup WGBI Currency Hedged 1 to 5
Year Index (the "Index"). The Fund outperformed its comparable
Index due to greater allocation to small cap and low relative price
companies within equities and greater allocation to securities with a
longer maturity within fixed income.
Fair value adjustments and the time of valuation of currency can
create differences between the performance of the Fund versus the
Index. The Index has been included for market context purposes
only.
World Allocation 80/20 Fund The World Allocation 80/20 Fund (the “Fund”) has been invested in a
broad range of equity securities of companies across developed and
emerging markets and fixed income securities of issuers in global
developed countries. The equity component of the Fund will
generally have a greater allocation to companies that are deemed to
be small companies and value companies. The fixed income
component will generally be invested in a broad range of high quality
fixed income issues with maturities at or below five years. The
aggregate exposure to equity and fixed income securities is
approximately 80% and 20% respectively.
As at 30 November 2016, the equity component of the Fund had
exposure to approximately 11,700 companies reflecting an approach
of seeking to deliver highly diversified exposure to developed and
emerging markets companies.
As at 30 November 2016 the fixed income component of the World
Allocation 80/20 Fund was diversified across approximately 530
bonds from 18 different countries as well as supranational
organisations and had an average credit rating of AA.
Over the twelve months to 30 November 2016, the return of the
Fund was 22.62% in Pounds Sterling (the Base Currency of the
Fund). This compares to a return of 19.82% for the 80% MSCI World
All Country Index /20% Citigroup WGBI Currency Hedged 1 to 5
Year Index (the "Index"). The Fund outperformed its comparable
Index due to greater allocation to small cap and low relative price
companies within equities and greater allocation to securities with a
longer maturity within fixed income.
Fair value adjustments and the time of valuation of currency can
create differences between the performance of the Fund versus the
Index. The Index has been included for market context purposes
only.
World Equity Fund The World Equity Fund (the “Fund”) has been invested in a broad
range of companies with increased exposure to companies with high
book-to-market ratios and smaller market capitalisations across
developed and emerging markets.
As at 30 November 2016, the Fund had exposure to approximately
8,800 companies reflecting our approach of delivering highly
diversified exposure to developed and emerging markets
companies.
Over the twelve months to 30 November 2016, the return of the
Fund was 27.45% in Pounds Sterling (the Base Currency of the
Fund), due to strong performance in equity markets. This compares
to a return of 24.91 % for the MSCI All Country World Index (the
"Index"). The Fund outperformed the Index due to greater allocation
to small cap and low relative price companies.
The Fund is fully invested and seeks to capture the returns of global
markets. Fair value adjustments and the time of valuation of
currency can create differences between the performance of the
Fund versus the Index. The Index has been included for market
context purposes only.
Dimensional Fund Advisors Ltd.
January 2017

Directors’ Report
Dimensional Fund Advisors Annual Report and Audited Financial Statements, 30 November 2016 8
The Directors (the “Directors”) of Dimensional Funds plc (the “Company”) submit this Annual Report together with the audited financial statements
for the financial year ended 30 November 2016. As at 30 November 2016 there were 23 active funds (30 November 2015: 22) (each a “Fund”,
together the “Funds”).
The Company is established as an umbrella investment company with segregated liability between Funds and variable capital incorporated in
Ireland as a public limited company pursuant to the Companies Act 2014 and the European Communities (Undertakings for Collective Investment in
Transferable Securities) Regulations, 2011 (as amended), and under the Central Bank (Supervision & Enforcement) Act 2013 (Section 48(1))
(Undertakings for Collective Investment in Transferable Securities) Regulations 2015) (together the “UCITS Regulations”).
The Company is constituted as an umbrella fund insofar as the share capital of the Company will be divided into different portfolios of assets which
will comprise separate funds. In accordance with the requirements of the Central Bank of Ireland (the "Central Bank") UCITS Regulations, shares
may be divided into different classes to accommodate different subscription and/or redemption charges and/or charges and/or dividend and/or fee
arrangements. The portfolio of assets maintained and comprising a separate Fund will be invested in accordance with the investment objectives
and policies applicable to such Fund. The Directors of the Company have established 31 Funds as at 31 November 2016 (30 November 2015:
32 Funds), all of which have been approved by the Central Bank.
Emerging Markets Large Cap Core Equity Fund
Emerging Markets Value Fund
Emerging Markets Value II Fund*
Euro Inflation Linked Intermediate Duration Fixed Income Fund
Euro Inflation Linked Long Duration Fixed Income Fund
European Core Equity Fund*
European Small Companies Fund
European Value Fund
Global Core Equity Fund
Global Core Equity II Fund*
Global Short Fixed Income Fund
Global Short Fixed Income II Fund*
Global Short-Term Investment Grade Fixed Income Fund
Global Small Companies Fund
Global Sustainability Core Equity Fund
Global Targeted Value Fund
Global Ultra Short Fixed Income Fund
Global Value Fund**
Japan Core Equity Fund*
Pacific Basin Small Companies Fund
Sterling Inflation Linked Intermediate Duration Fixed Income Fund
Sterling Inflation Linked Long Duration Fixed Income Fund***
U.S. Core Equity Fund
U.S. Small Companies Fund
U.S. Small Companies II Fund*
U.S. Value Fund*
World Allocation 20/80 Fund
World Allocation 40/60 Fund
World Allocation 60/40 Fund
World Allocation 80/20 Fund
World Equity Fund
* These funds have not issued any shares to investors and have remained dormant from the date of their approval.
** Global Value Fund commenced trading on 11 July 2016.
*** Sterling Inflation Linked Long Duration Fixed Income Fund terminated 24 March 2015.
Directors’ Report (continued)
Dimensional Fund Advisors Annual Report and Audited Financial Statements, 30 November 2016 9
Statement of Directors’ Responsibilities The Directors are responsible for preparing the Annual Report and the financial statements in accordance with applicable Irish law and Financial
Reporting Standard (“FRS 102”); the Financial Reporting Standard applicable in the UK and Republic of Ireland. FRS 102 is effective for accounting
periods commencing 1 January 2015.
Irish company law requires the Directors to prepare financial statements for each financial year that give a true and fair view of the assets, liabilities
and financial position for the Company and of the profit or loss of the Company for that financial year. In preparing the financial statements, the
Directors are required to:
select suitable accounting policies and then apply them consistently;
make judgements and estimates that are reasonable and prudent;
state, whether the financial statements have been prepared in accordance with applicable accounting standards, and note the effect &
reasons for any departure from these standards; and
prepare the financial statements on a going concern basis unless it is inappropriate to presume that the Company will continue in
business.
The Directors confirm that they have complied with the above requirements in preparing the financial statements.
The Directors are responsible for keeping adequate accounting records which disclose, with reasonable accuracy at any time, the financial position
of the Company and to enable them to ensure that the financial statements are prepared in accordance with accounting standards generally
accepted in Ireland and that they comply with the Companies Act, 2014 and the UCITS Regulations. They are also responsible for safeguarding the
assets of the Company and hence for taking reasonable steps for the prevention and detection of fraud and other irregularities.
Under the UCITS Regulations, the Directors are required to entrust the assets of the Company to the depositary for safe-keeping. In carrying out
this duty, the Directors have delegated custody of the Company’s assets to State Street Custodial Services (Ireland) Limited (the “Depositary”).
The measures taken by the Directors to secure compliance with the Company’s obligations to keep adequate accounting records include the use of
appropriate systems and procedures and employment of competent persons. The accounting records are retained at the offices of State Street
Fund Services (Ireland) Limited, 78 Sir John Rogerson’s Quay, Dublin 2, Ireland (the “Administrator”). The Investment Manager is responsible for
the maintenance and integrity of the corporate and financial information regarding the Company included on the Investment Manager's website.
Legislation in the Republic of Ireland governing the preparation and dissemination of financial statements may differ from legislation in other
jurisdictions.
Principal Activities and Review of the Business The Company has been formed to provide investors with an opportunity to purchase shares in a series of investment funds.
The investment objective of the Emerging Markets Large Cap Core Equity Fund is to seek long term capital appreciation. The investment objective
of the Emerging Markets Value Fund, Emerging Markets Value II Fund, European Core Equity Fund, European Small Companies Fund, European
Value Fund, Global Core Equity Fund, Global Core Equity II Fund, Global Small Companies Fund, Global Sustainability Core Equity Fund, Global
Targeted Value Fund, Global Value Fund, Japan Core Equity Fund, Pacific Basin Small Companies Fund, U.S. Small Companies Fund, U.S Small
Companies II Fund, U.S. Core Equity Fund, U.S. Value Fund, World Allocation 20/80 Fund, World Allocation 40/60 Fund, World Allocation 60/40
Fund, World Allocation 80/20 Fund and World Equity Fund, is to maximise or achieve long-term total return.
The investment objective of the Euro Inflation Linked Intermediate Duration Fixed Income Fund and the Sterling Inflation Linked Intermediate
Duration Fixed Income Fund is to seek to provide inflation protected intermediate-term fixed income return.
The investment objective of the Global Ultra Short Fixed Income Fund is to seek to maximise returns from investment in short-term debt.
The investment objective of the Euro Inflation Linked Long Duration Fixed Income Fund is to seek to provide inflation protected long-term fixed
income return.
Directors’ Report (continued)
Dimensional Fund Advisors Annual Report and Audited Financial Statements, 30 November 2016 10
Principal Activities and Review of the Business (continued) The investment objective of the Global Short Fixed Income Fund and the Global Short Fixed Income II Fund is to seek to maximise current income
while preserving capital.
The investment objective of the Global Short-Term Investment Grade Fixed Income Fund is to seek to maximise total returns from the universe of
debt obligations in which the Fund invests.
A review of the performance of the Company together with an analysis of key financial and non-financial performance indicators is available in the
Investment Manager’s Reports.
Significant Events during the Financial Year EUR Accumulation Class of the World Allocation 20/80 Fund, World Allocation 40/60 Fund, World Allocation 60/40 Fund and World Allocation 80/20
Fund launched on 30 December 2015.
An addendum was issued on 26 February 2016. It was supplemental to the prospectus dated 23 June 2015. The main changes were as follows:
1. Amendment to the investment policies of the World Allocation 40/60 Fund and the World Allocation 60/40 Fund to align them more closely with
the World Allocation 20/80 Fund and the World Allocation 80/20 Fund, where appropriate.
2. Addition of JPY Accumulation and JPY Distributing share classes in the World Allocation 20/80 Fund.
3. Addition of USD Accumulation, USD Distributing, GBP Accumulation and GBP Distributing share classes in the Emerging Markets Large Cap
Core Equity Fund.
4. Reduction of the investment management fee for the Global Sustainability Core Equity Fund by 7bps.
5. Amendment to the investment policies of the Global Sustainability Core Equity Fund to provide additional disclosure about the profile of
companies the fund may invest in.
6. Amendment to the collateral policy to provide for derogation from collateral diversification requirements.
7. Deletion of reference to ‘UCITS Notices’ which have been replaced by the ‘Central Bank UCITS Regulations’.
8. Addition of disclosure in relation to the Investment Manager potentially investing in sub-funds of the Company.
9. Updates to the tax section.
10. Update to the OECD Common Reporting Standard description.
USD Accumulation Class of Emerging Markets Large Cap Core Equity Fund launched on 17 March 2016.
SEK Accumulation Class of World Equity Fund launched on 23 March 2016.
David R. Martin resigned as a Director of the Company on 31 March 2016.
An addendum was issued on 8 June 2016. It was supplemental to the prospectus dated 23 June 2015. The main changes were as follows:
1. Addition of EUR P Accumulation share class to the Global Value Fund.
2. Amendment to the investment policies of the Global Value Fund to limit investment in CIS to 5% of the Fund’s net assets.
3. Addition of a new risk factor in respect of the use of an Umbrella Cash Subscription and Redemption Account.
The Global Value Fund launched on 11 July 2016.
EUR P Accumulation Class of Global Value Fund launched on 11 July 2016.
EUR Accumulation Class of Euro Inflation Linked Intermediate Duration Fixed Income Fund launched 14 July 2016.
EUR Accumulation Class of Euro Inflation Linked Long Duration Fixed Income Fund launched 14 July 2016.
EUR Accumulation Class of Global Core Equity Fund launched 14 July 2016.
EUR Accumulation Class of Global Value Fund launched on 5 August 2016.
Directors’ Report (continued)
Dimensional Fund Advisors Annual Report and Audited Financial Statements, 30 November 2016 11
Significant Events during the Financial Year (continued) GBP Accumulation Class of Global Value Fund launched on 25 August 2016.
GBP Distributing Class of Global Value Fund launched on 25 August 2016.
Gregory K. Hinkle was appointed as a Director on 29 August 2016.
EUR Accumulation Class of Emerging Markets Large Cap Core Equity Fund launched on 31 August 2016.
JPY Accumulation Class of Global Core Equity Fund launched on 21 September 2016.
JPY Accumulation Class of Emerging Market Value Fund launched on 21 September 2016.
EUR Distributing Class of Emerging Markets Large Cap Core Equity Fund launched on 22 September 2016.
The Company entered into a Depositary agreement (as required by UCITS V) with State Street Custodial Services (Ireland) Limited dated 27 July
2016, which superseded and replaced the Custody agreement.
Other than the above these were no other significant events during the financial year ended 30 November 2016.
Outlook
Our goal at Dimensional is to deliver an outstanding investment experience to our clients. Our close ties to academia help us to identify leading
research that can be beneficial to investors, and our team works to interpret, rigorously test, and consider the practical applicability of those ideas in
carefully implemented investment strategies. This focus on research and implementation has been central to Dimensional’s approach since our
founding and will continue to be a key part of our offer to investors.
Risk Management Objectives and Policies Information in relation to the Company’s Risk Management Objectives and Policies are included in note 11 to the financial statements.
Segregated Liability The Company is an umbrella investment company with segregated liability between Funds.
Results and Dividends The Directors may declare dividends in respect of any redeemable shares out of net income (including dividend and interest income) and the
excess of realised and unrealised capital gains over realised and unrealised losses in respect of investments of the Company.
The Directors anticipate that there will be no dividend distributions in respect of the accumulation classes of the funds. Accordingly, income and
capital gains arising in respect of the accumulation classes of the Funds will be re-invested in the relevant Fund and reflected in the net asset value
per share of the relevant Fund.
The Directors anticipate making dividend distributions in respect of the distributing classes of the funds. Accordingly, any income arising in respect
of the distributing classes of the Funds, will be distributed to investors in the relevant Fund in accordance with their respective shareholdings.
Dividends of the GBP distributing class will normally be declared by the Directors for the periods ending 31 May and 30 November. Dividends of the
JPY distributing classes, if any are declared by the directors, will normally be declared for the periods ending 28 February, 31 May, 31 August and
30 November. Dividends of the other distributing classes will normally be declared by the directors for the period ending 30 November.
Dividends declared and paid during the financial year are disclosed in note 14 to the financial statements.
Connected party transactions Regulation 41 of the UCITS Regulations 'Restrictions of transactions with connected persons' states that 'A responsible person shall ensure that
any transaction between a UCITS and a connected person is conducted a) at arm’s length; and b) in the best interest of the unit-holders of the
UCITS'.
As required under UCITS Regulation 78.4, the Directors, as responsible persons are satisfied that there are in place arrangements, evidenced by
written procedures, to ensure that the obligations that are prescribed by Regulation 41(1) are applied to all transactions with a connected party; and
all transactions with connected parties that were entered into during the period to which the report relates complied with the obligations that are
prescribed by Regulation 41(1).

Directors’ Report (continued)
Dimensional Fund Advisors Annual Report and Audited Financial Statements, 30 November 2016 12
Post Balance Sheet Events An addendum, supplemental to the Prospectus, was issued on 5 January 2017. The purpose of this addendum was to include a disclosure in
respect of Hong Kong investors and to remove “in priority” language in respect of large redemptions, to align with the amended Memorandum and
Articles of Association.
There are no other post balance events in respect of the Company that may be deemed relevant to the accuracy of the financial statements.
Directors The names of the persons who were Directors during the financial year ended 30 November 2016 are set out on page 2.
Directors’ and Secretary’s Interests in Shares and Contracts During the financial years ended 30 November 2016 and 30 November 2015 David Salisbury held shares in certain Funds as disclosed in note 10
to the financial statements.
The authorised share capital of the Company is 500,000,030,000 shares of no par value divided into 30,000 subscriber shares of no par value, and
500,000,000,000 shares of no par value, initially designated as unclassified shares. As at 30 November 2016 Dimensional Fund Advisors LP, Peter
Blessing, David G. Booth, Dermot S.L. Butler, Arthur Barlow and Catherine L. Newell held one subscriber share each (fully paid-up) in the Company
(30 November 2015: Dimensional Fund Advisors LP, Peter Blessing, David G. Booth, Dermot S.L. Butler, Arthur Barlow and Catherine L. Newell).
Arthur Barlow, David G. Booth, Gregory K. Hinkle, Catherine L. Newell, Gerard O’Reilly, Eduardo Repetto, and John Romiza, as employees of the
Investment Manager or the Sub-Advisors for the financial year ended 30 November 2016 or part of it, are not entitled to remuneration from the
Company for this financial year.
David Salisbury was an employee of the Investment Manager until 31 December 2014. He left the investment manager on the 31 December 2014
as an employee and was then remunerated from the funds from 1 January 2015 onwards as a Director.
Aside from the information disclosed above, the Directors and Secretary and their families had no other interest in the shares of the Funds as at and
during the financial years ended 30 November 2016 or 30 November 2015. No Director had a material interest in any other contract of significance,
during or at the end of the financial year, in relation to the business of the Company.
Compliance statement The Directors acknowledge that they are responsible for securing the Company’s compliance with its relevant obligations. These include all
requirements of the Company under Section 225 of Companies Act 2014, and all tax law within the Republic of Ireland (the “relevant obligations”).
In keeping with this responsibility, the Directors have:
prepared a compliance statement setting out the Company's policies (that, in the directors’ opinion, are appropriate to the Company) for
ensuring compliance by the Company with its relevant obligations;
adequate structures in place, that in the directors’ opinion are designed to secure material compliance with the Company’s relevant
obligations; and
an annual review procedure in place to review the Company's relevant obligations and ensure a structure is in place to comply with these
obligations.
Audit Committee The Directors are aware of section 167 of the Companies Act 2014 which requires certain companies to establish an audit committee. For the year
ending 30 November 2016, the Directors confirm that they did not establish an audit committee due to the fact that the Board believes that the
Company already has adequate procedures in place that cover, in all material respects, the areas of responsibility of an audit committee, as
provided for in Section 167(7) of the Companies Act 2014 and in light of the nature, scale and complexity of the Company's sub-funds, the Board
does not believe that a separate audit committee is required in the circumstances..
Relevant Audit Information So far as the Directors are aware, there is no relevant audit information of which the Company's auditors are unaware and the Directors have taken
all the steps that should have been taken as Directors in order to make themselves aware of any relevant audit information and to establish that the
Company's auditors are aware of that information.
Independent Auditors The Auditors, PricewaterhouseCoopers, will be re-appointed in accordance with section 383(2) of the Companies Act, 2014.
Directors’ Report (continued)
Dimensional Fund Advisors Annual Report and Audited Financial Statements, 30 November 2016 13
Corporate Governance Statement The Company is subject to and complies with Irish Statute comprising the Companies Act, 2014, the UCITS Regulations and the Listing Rules of
the Irish Stock Exchange ("ISE"), as applicable to investment funds, and with the business plan of the Company.
Although there is no specific statutory corporate governance code applicable to Irish collective investment schemes whose shares are admitted to
trading on the ISE, the Company is subject to corporate governance practices imposed by:
(i) The Companies Act, 2014 which are available for inspection at the registered office of the Company and may also be obtained at
www.irishstatutebook.ie;
(ii) The Articles of Association of the Company which are available for inspection at the registered office of the Company and at the
Companies Registration Office in Ireland;
(iii) The Central Bank in their UCITS Regulations and Guidance Notes which can be obtained from the Central Bank’s website at:
www.centralbank.ie and are available for inspection at the registered office of the Company; and
(iv) ISE through the ISE Code of Listing Requirements and Procedures which can be obtained from the ISE’s website at www.ise.ie;
A voluntary corporate governance code (the “Code”) was issued by Irish Funds (formerly the Irish Funds Industry Association) in December 2011.
The Board of Directors (the “Board”) adopted the Code with effect from 31 December 2012. Paragraph 4.1 of the Code recommends that the Board
comprise a majority of non-executive directors. The Board currently consists of five non-executive and five executive directors. The Board believes
that this is in the best interests of Shareholders as having more senior people from the Dimensional group on the Board adds to its capabilities and
expertise.
Financial Reporting Process – Description of Main Features The Board is ultimately responsible for overseeing the establishment and maintenance of adequate internal control and risk management systems
of the Company in relation to the financial reporting process. As the Company has no employees, all functions including the preparation of the
financial statements have been outsourced. The Company has appointed State Street Fund Services (Ireland) Limited as its Administrator
consistent with the regulatory framework applicable to investment fund companies such as the Company.
On appointing the Administrator the Board noted that it was regulated by the Central Bank and, in the Board’s opinion, had significant experience as
an administrator. The Board also noted the independence of the Administrator from the Company’s Investment Manager. Subject to the supervision
of the Board, the appointment of the Administrator is intended to manage rather than eliminate the risk of failure to achieve the Company’s financial
reporting objectives and can only provide reasonable and not absolute assurance against material misstatement or loss.
The annual and interim financial statements of the Company are required to be approved by the Board of the Company and filed with the Central
Bank. The annual financial statements are also required to be filed with the ISE. The annual financial statements are required to be audited by
independent auditors who report annually to the Board on their findings. The Board evaluates and discusses significant accounting and reporting
issues as the need arises.
Risk Assessment The Board is responsible for assessing the risk of irregularities whether caused by fraud or error in financial reporting and for ensuring that
processes are in place for the timely identification of internal and external matters with a potential effect on financial reporting. The Board’s
appointment of an Administrator and Depositary independent of the Investment Manager to the Company and which is regulated by Central Bank is
intended to mitigate though not eliminate the risk of fraud or irregularities which may impact the financial statements of the Company.
Monitoring The Board receives regular presentations and review reports from the Depositary, Investment Manager and Administrator. The Board also has an
annual process to ensure that appropriate measures are taken to consider and address any control weaknesses identified and measures
recommended by the independent auditors.
Capital Structure No person has a significant direct or indirect holding of securities in the Company. No person has any special rights of control over the Company’s
share capital. There are no restrictions on voting rights.
For the appointment and replacement of Directors, the Company is governed by its Memorandum and Articles of Association, Irish Statute
comprising the Companies Act, 2014, the UCITS Regulations, the Listing Rules of the ISE as applicable to investment funds and the Code which it
adopted. The Articles of Association themselves may be amended by special resolution of the shareholders.
Directors’ Report (continued)
Dimensional Fund Advisors Annual Report and Audited Financial Statements, 30 November 2016 14
Composition and Operation of the Board of Directors There are ten Directors currently, five of whom are non-executive and two of whom are independent of the Investment Manager as required by the
ISE Listing Rules for investment funds. All related party transactions during the financial year are detailed in note 10 to the financial statements. The
Articles of Association do not provide for retirement of Directors by rotation. However, the Directors may be removed by the shareholders by
ordinary resolution in accordance with the procedures established under the Irish Companies Act, 2014. The Board generally meets at least
quarterly.
The Directors have designated two sub-committees to carry out the management functions of the Company. A management committee consisting
of Arthur Barlow, Gregory K. Hinkle, John Romiza and Catherine L. Newell (the “Management Committee”) and an independent committee
consisting of Peter Blessing, David Salisbury and Dermot S.L. Butler (the “Independent Committee”). The Management Committee is responsible
for risk management, monitoring of investment performance, monitoring of capital, review of accounting policies and procedures, monitoring
compliance and financial control. The Independent Committee is responsible for monitoring compliance, monitoring of capital complaints handling
and internal audit. Both committees in conjunction with the Board are also responsible for decision taking and supervision of delegates.
The Board is responsible for managing the business affairs of the Company in accordance with the Articles of Association. Subject to its supervision
and direction the Board has delegated the day to day administration of the Company to the Administrator and the Investment Management and
distribution functions to Dimensional Fund Advisors Ltd. as the Investment Manager. The Company has appointed State Street Custodial Services
(Ireland) Limited as the Depositary to the Company with responsibility for the safekeeping of the assets of the Company.
Shareholders Meetings The Annual General Meeting of the Company will usually be held in Dublin, normally during the month of August or such other date as the Directors
may determine. Notice convening the Annual General Meeting in each financial year at which the audited financial statements of the Company will
be presented (together with the Directors' and Auditors' Reports of the Company) will be sent to shareholders at their registered addresses not less
than 21 days before the date fixed for the meeting. Other general meetings may be convened from time to time by the Directors in such manner as
provided by Irish law.
Each of the shares entitles the holder to attend and vote at meetings of the Company and of the Fund represented by those shares. Matters will be
determined by a meeting of shareholders on a poll. Each share gives the holder one vote in relation to any matters relating to the Company which
are submitted to shareholders for a vote by poll. No business shall be transacted at any shareholder meeting unless a quorum is present. Two
shareholders present either in person or by proxy shall be a quorum for a general meeting. If within half an hour after the time appointed for a
meeting a quorum is not present, the meeting, if convened on the requisition of or by shareholders, shall be dissolved. In any other case it shall
stand adjourned to the same day in the next week, at the same time and place or to such other day and at such other time and place as the
Directors may determine. One shareholder present either in person or by proxy shall be a quorum for any such adjourned meeting.
Approved on behalf of the Board of Directors
Peter Blessing Dermot S.L. Butler Director Director 7 March 2017
Depositary Report to the Shareholders of Dimensional Funds plc
Dimensional Fund Advisors Annual Report and Audited Financial Statements, 30 November 2016 15
We have enquired into the conduct of the Company for the year ended 30 November 2016, in our capacity as Depositary to the Company.
This report including the opinion has been prepared for and solely for the shareholders in the Company as a body, in accordance with Regulation
34, (1), (3) and (4) in Part 5 of the European Communities (Undertakings for Collective Investment in Transferable Securities) Regulations 2011, as
amended, (‘the UCITS Regulations’), and for no other purpose. We do not, in giving this opinion, accept or assume responsibility for any other
purpose or to any other person to whom this report is shown.
Responsibilities of the Depositary Our duties and responsibilities are outlined in Regulation 34, (1), (3) and (4) in Part 5 of the UCITS Regulations. One of those duties is to enquire
into the conduct of the Company in each annual accounting period and report thereon to the shareholders.
Our report shall state whether, in our opinion, the Company has been managed in that period in accordance with the provisions of the Company’s
Memorandum and Articles of Association and the UCITS Regulations. It is the overall responsibility of the Company to comply with these
provisions. If the Company has not so complied, we as Depositary must state why this is the case and outline the steps which we have taken to
rectify the situation.
Basis of Depositary Opinion The Depositary conducts such reviews as it, in its reasonable opinion, considers necessary in order to comply with its duties as outlined in
Regulation 34, (1), (3) and (4) in Part 5 of the UCITS Regulations and to ensure that, in all material respects, the Company has been managed
(i) in accordance with the limitations imposed on its investment and borrowing powers by the provisions of the Company’s Memorandum and
Articles of Association and the UCITS Regulations and
(ii) otherwise in accordance with the Company’s constitutional documentation and the appropriate regulations.
Opinion In our opinion, the Company has been managed during the year, in all material respects:
(i) in accordance with the limitations imposed on the investment and borrowing powers of the Company by the Memorandum & Articles of
Association, the UCITS Regulations and the Central Bank (Supervision and Enforcement) Act 2013 (Section 48(1)) (Undertakings for
Collective Investment in Transferable Securities) Regulations 2015 (‘the Central Bank UCITS Regulations’); and
(ii) otherwise in accordance with the provisions of the Deed of Constitution, the UCITS Regulations and the Central Bank UCITS
Regulations.
State Street Custodial Services (Ireland) Limited
78 Sir John Rogerson’s Quay
Dublin 2
Ireland
7 March 2017

Independent Auditors’ Report to the Members of Dimensional Funds plc
Report on the financial statements
Dimensional Fund Advisors Annual Report and Audited Financial Statements, 30 November 2016 16
Our opinion In our opinion, Dimensional Funds plc’s financial statements (the “financial statements”):
give a true and fair view of the company’s and funds’ assets, liabilities and financial position as at 30 November 2016 and of their results
for the year then ended;
have been properly prepared in accordance with Generally Accepted Accounting Practice in Ireland; and
have been properly prepared in accordance with the requirements of the Companies Act 2014 and the European Communities
(Undertakings for Collective Investment in Transferable Securities) Regulations 2011 (as amended).
What we have audited The financial statements, included within the Annual Report and Audited Financial Statements, comprise:
the Statement of Financial Position as at 30 November 2016;
the Statement of Comprehensive Income for the year then ended;
the Statement of Changes in Net Assets Attributable to Holders of Redeemable Shares for the year then ended;
the Portfolio of Investments for each of the funds as at 30 November 2016; and
the notes to the financial statements for the company and for each of its funds which include a summary of significant accounting policies
and other explanatory information.
The financial reporting framework that has been applied in the preparation of the financial statements is Irish law and accounting standards issued
by the Financial Reporting Council and promulgated by the Institute of Chartered Accountants in Ireland (Generally Accepted Accounting Practice in
Ireland), including FRS 102 “The Financial Reporting Standard applicable in the UK and Republic of Ireland”.
In applying the financial reporting framework, the directors have made a number of subjective judgements, for example in respect of significant
accounting estimates. In making such estimates, they have made assumptions and considered future events.
Matters on which we are required to report by the Companies Act 2014 We have obtained all the information and explanations which we consider necessary for the purposes of our audit.
In our opinion the accounting records of the company were sufficient to permit the financial statements to be readily and properly audited.
The financial statements are in agreement with the accounting records.
In our opinion the information given in the Directors’ Report is consistent with the financial statements.
In our opinion, based on the work undertaken in the course of our audit of the financial statements, the description of the main features of
the internal control and risk management systems in relation to the financial reporting process included in the Corporate Governance
Statement, is consistent with the financial statements and has been prepared in accordance with section 1373(2)(c) of the Companies Act
2014.
Based on our knowledge and understanding of the company and its environment obtained in the course of our audit of the financial
statements, we have not identified material misstatements in the description of the main features of the internal control and risk
management systems in relation to the financial reporting process included in the Corporate Governance Statement.
In our opinion, based on the work undertaken during the course of our audit of the financial statements, the information required by
section 1373(2)(a),(b),(e) and (f) is contained in the Corporate Governance Statement.
Matter on which we are required to report by exception Directors’ remuneration and transactions
Under the Companies Act 2014 we are required to report to you if, in our opinion, the disclosures of directors’ remuneration and transactions
specified by sections 305 to 312 of that Act have not been made. We have no exceptions to report arising from this responsibility.
Responsibilities for the financial statements and the audit Our responsibilities and those of the directors
As explained more fully in the Statement of Directors’ Responsibilities set out on page 9 the directors are responsible for the preparation of the
financial statements and for being satisfied that they give a true and fair view.
Our responsibility is to audit and express an opinion on the financial statements in accordance with Irish law and International Standards on
Auditing (UK and Ireland). Those standards require us to comply with the Auditing Practices Board’s Ethical Standards for Auditors.
Independent Auditors’ Report to the Members of Dimensional Funds plc
(continued)
Dimensional Fund Advisors Annual Report and Audited Financial Statements, 30 November 2016 17
Responsibilities for the financial statements and the audit (continued) Our responsibilities and those of the directors (continued)
This report, including the opinions, has been prepared for and only for the company’s members as a body in accordance with section 391 of the
Companies Act 2014 and for no other purpose. We do not, in giving these opinions, accept or assume responsibility for any other purpose or to any
other person to whom this report is shown or into whose hands it may come save where expressly agreed by our prior consent in writing.
What an audit of financial statements involves
We conducted our audit in accordance with International Standards on Auditing (UK and Ireland). An audit involves obtaining evidence about the
amounts and disclosures in the financial statements sufficient to give reasonable assurance that the financial statements are free from material
misstatement, whether caused by fraud or error. This includes an assessment of:
whether the accounting policies are appropriate to the company’s circumstances and have been consistently applied and adequately
disclosed;
the reasonableness of significant accounting estimates made by the directors; and
the overall presentation of the financial statements.
We primarily focus our work in these areas by assessing the directors’ judgements against available evidence, forming our own judgements, and
evaluating the disclosures in the financial statements.
We test and examine information, using sampling and other auditing techniques, to the extent we consider necessary to provide a reasonable basis
for us to draw conclusions. We obtain audit evidence through testing the effectiveness of controls, substantive procedures or a combination of both.
In addition, we read all the financial and non-financial information in the Annual Report and Audited Financial Statements to identify material
inconsistencies with the audited financial statements and to identify any information that is apparently materially incorrect based on, or materially
inconsistent with, the knowledge acquired by us in the course of performing the audit. If we become aware of any apparent material misstatements
or inconsistencies we consider the implications for our report.
Olivia Hayden
for and on behalf of PricewaterhouseCoopers
Chartered Accountants and Statutory Audit Firm
Dublin
30 March 2017
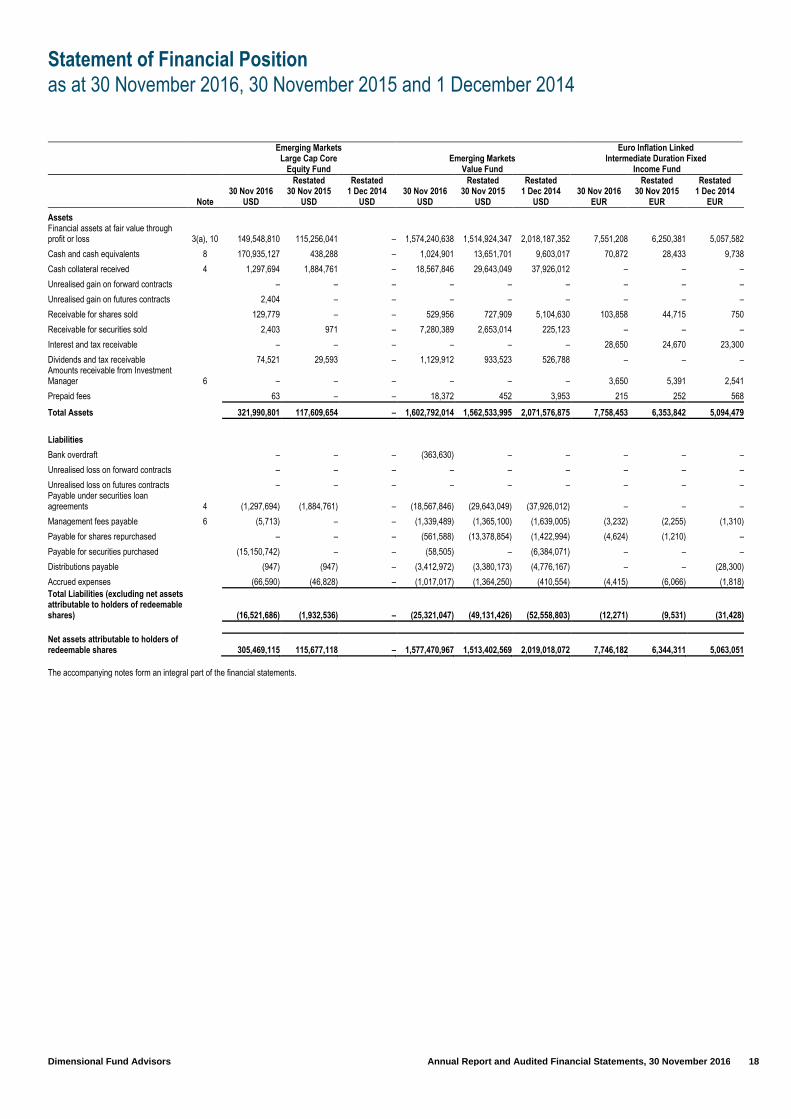
Statement of Financial Position
as at 30 November 2016, 30 November 2015 and 1 December 2014
Dimensional Fund Advisors Annual Report and Audited Financial Statements, 30 November 2016 18
Emerging Markets Large Cap Core
Equity Fund Emerging Markets
Value Fund
Euro Inflation Linked Intermediate Duration Fixed
Income Fund
Note 30 Nov 2016
USD
Restated 30 Nov 2015
USD
Restated 1 Dec 2014
USD 30 Nov 2016
USD
Restated 30 Nov 2015
USD
Restated 1 Dec 2014
USD
30 Nov 2016
EUR
Restated 30 Nov 2015
EUR
Restated 1 Dec 2014
EUR
Assets Financial assets at fair value through profit or loss 3(a), 10 149,548,810 115,256,041 – 1,574,240,638 1,514,924,347 2,018,187,352 7,551,208 6,250,381 5,057,582
Cash and cash equivalents 8 170,935,127 438,288 – 1,024,901 13,651,701 9,603,017 70,872 28,433 9,738
Cash collateral received 4 1,297,694 1,884,761 – 18,567,846 29,643,049 37,926,012 – – –
Unrealised gain on forward contracts – – – – – – – – –
Unrealised gain on futures contracts 2,404 – – – – – – – –
Receivable for shares sold 129,779 – – 529,956 727,909 5,104,630 103,858 44,715 750
Receivable for securities sold 2,403 971 – 7,280,389 2,653,014 225,123 – – –
Interest and tax receivable – – – – – – 28,650 24,670 23,300
Dividends and tax receivable 74,521 29,593 – 1,129,912 933,523 526,788 – – – Amounts receivable from Investment Manager 6 – – – – – – 3,650 5,391 2,541
Prepaid fees 63 – – 18,372 452 3,953 215 252 568
Total Assets 321,990,801 117,609,654 – 1,602,792,014 1,562,533,995 2,071,576,875 7,758,453 6,353,842 5,094,479
Liabilities
Bank overdraft – – – (363,630) – – – – –
Unrealised loss on forward contracts – – – – – – – – –
Unrealised loss on futures contracts – – – – – – – – – Payable under securities loan agreements 4 (1,297,694) (1,884,761) – (18,567,846) (29,643,049) (37,926,012) – – –
Management fees payable 6 (5,713) – – (1,339,489) (1,365,100) (1,639,005) (3,232) (2,255) (1,310)
Payable for shares repurchased – – – (561,588) (13,378,854) (1,422,994) (4,624) (1,210) –
Payable for securities purchased (15,150,742) – – (58,505) – (6,384,071) – – –
Distributions payable (947) (947) – (3,412,972) (3,380,173) (4,776,167) – – (28,300)
Accrued expenses (66,590) (46,828) – (1,017,017) (1,364,250) (410,554) (4,415) (6,066) (1,818)
Total Liabilities (excluding net assets attributable to holders of redeemable shares) (16,521,686) (1,932,536) – (25,321,047) (49,131,426) (52,558,803) (12,271) (9,531) (31,428)
Net assets attributable to holders of redeemable shares 305,469,115 115,677,118 – 1,577,470,967 1,513,402,569 2,019,018,072 7,746,182 6,344,311 5,063,051
The accompanying notes form an integral part of the financial statements.

Statement of Financial Position
as at 30 November 2016, 30 November 2015 and 1 December 2014 (continued)
Dimensional Fund Advisors Annual Report and Audited Financial Statements, 30 November 2016 19
Euro Inflation Linked Long Duration Fixed
Income Fund European Small
Companies Fund European
Value Fund
Note 30 Nov 2016
EUR
Restated 30 Nov 2015
EUR
Restated 1 Dec 2014
EUR 30 Nov 2016
EUR
Restated 30 Nov 2015
EUR
Restated 1 Dec 2014
EUR 30 Nov 2016
EUR
Restated 30 Nov 2015
EUR
Restated 1 Dec 2014
EUR
Assets
Financial assets at fair value through profit or loss 3(a), 10 119,615 15,097,907 13,177,610 145,734,333 165,124,039 159,016,252 61,515,240 57,408,499 79,086,070
Cash and cash equivalents 8 5,590 51,936 26,967 383,878 667,096 626,913 80,218 171,650 230,277
Cash collateral received 4 – – – 4,140,502 7,090,084 7,082,739 1,851,214 2,538,382 3,020,197
Unrealised gain on forward contracts – – – – – – – – –
Unrealised gain on futures contracts – – – – – – – – –
Receivable for shares sold – – – 306,624 3,670,335 248,404 85,595 169,824 66,504
Receivable for securities sold – – – 1,202,909 119,751 85,180 – – 633,526
Interest and tax receivable 516 70,926 66,211 – – – – – –
Dividends and tax receivable – – – 391,870 382,220 377,996 346,230 302,385 332,563 Amounts receivable from Investment Manager 6 832 – – – – – – 134 –
Prepaid fees 3,426 – 628 1,634 – 1,195 1,077 644 2,180
Total Assets 129,979 15,220,769 13,271,416 152,161,750 177,053,525 167,438,679 63,879,574 60,591,518 83,371,317
Liabilities
Bank overdraft – – – – – – – – –
Unrealised loss on forward contracts – – – – – – – – –
Unrealised loss on futures contracts – – – – – – – – – Payable under securities loan agreements 4 – – – (4,140,502) (7,090,084) (7,082,739) (1,851,214) (2,538,382) (3,020,197)
Management fees payable 6 (167) (7,520) (6,338) (120,715) (132,366) (130,095) (40,584) (36,545) (65,183)
Payable for shares repurchased – – – (107,872) (25,275) (266,292) (20,203) (98,624) (204,886)
Payable for securities purchased – – – (11,220) (157,473) (147,130) – – –
Distributions payable – – – (798,537) (1,008,825) (1,373,439) (676,653) (538,233) (1,262,809)
Accrued expenses (5,887) (20,693) (3,066) (96,010) (127,610) (41,584) (35,794) (54,778) (25,929)
Total Liabilities (excluding net assets attributable to holders of redeemable shares) (6,054) (28,213) (9,404) (5,274,856) (8,541,633) (9,041,279) (2,624,448) (3,266,562) (4,579,004)
Net assets attributable to holders of redeemable shares 123,925 15,192,556 13,262,012 146,886,894 168,511,892 158,397,400 61,255,126 57,324,956 78,792,313
The accompanying notes form an integral part of the financial statements.
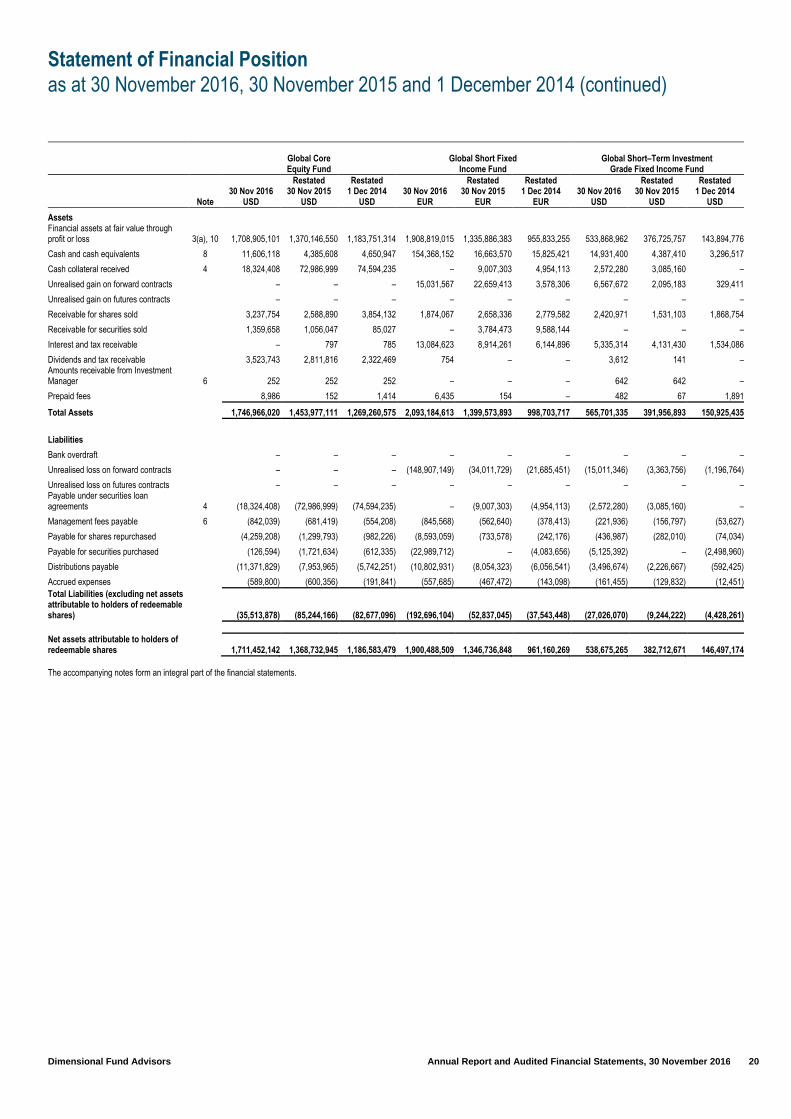
Statement of Financial Position
as at 30 November 2016, 30 November 2015 and 1 December 2014 (continued)
Dimensional Fund Advisors Annual Report and Audited Financial Statements, 30 November 2016 20
Global Core Equity Fund
Global Short Fixed
Income Fund Global Short–Term Investment
Grade Fixed Income Fund
Note 30 Nov 2016
USD
Restated 30 Nov 2015
USD
Restated 1 Dec 2014
USD 30 Nov 2016
EUR
Restated 30 Nov 2015
EUR
Restated 1 Dec 2014
EUR 30 Nov 2016
USD
Restated 30 Nov 2015
USD
Restated 1 Dec 2014
USD
Assets
Financial assets at fair value through profit or loss 3(a), 10 1,708,905,101 1,370,146,550 1,183,751,314 1,908,819,015 1,335,886,383 955,833,255 533,868,962 376,725,757 143,894,776
Cash and cash equivalents 8 11,606,118 4,385,608 4,650,947 154,368,152 16,663,570 15,825,421 14,931,400 4,387,410 3,296,517
Cash collateral received 4 18,324,408 72,986,999 74,594,235 – 9,007,303 4,954,113 2,572,280 3,085,160 –
Unrealised gain on forward contracts – – – 15,031,567 22,659,413 3,578,306 6,567,672 2,095,183 329,411
Unrealised gain on futures contracts – – – – – – – – –
Receivable for shares sold 3,237,754 2,588,890 3,854,132 1,874,067 2,658,336 2,779,582 2,420,971 1,531,103 1,868,754
Receivable for securities sold 1,359,658 1,056,047 85,027 – 3,784,473 9,588,144 – – –
Interest and tax receivable – 797 785 13,084,623 8,914,261 6,144,896 5,335,314 4,131,430 1,534,086
Dividends and tax receivable 3,523,743 2,811,816 2,322,469 754 – – 3,612 141 – Amounts receivable from Investment Manager 6 252 252 252 – – – 642 642 –
Prepaid fees 8,986 152 1,414 6,435 154 – 482 67 1,891
Total Assets 1,746,966,020 1,453,977,111 1,269,260,575 2,093,184,613 1,399,573,893 998,703,717 565,701,335 391,956,893 150,925,435
Liabilities
Bank overdraft – – – – – – – – –
Unrealised loss on forward contracts – – – (148,907,149) (34,011,729) (21,685,451) (15,011,346) (3,363,756) (1,196,764)
Unrealised loss on futures contracts – – – – – – – – – Payable under securities loan agreements 4 (18,324,408) (72,986,999) (74,594,235) – (9,007,303) (4,954,113) (2,572,280) (3,085,160) –
Management fees payable 6 (842,039) (681,419) (554,208) (845,568) (562,640) (378,413) (221,936) (156,797) (53,627)
Payable for shares repurchased (4,259,208) (1,299,793) (982,226) (8,593,059) (733,578) (242,176) (436,987) (282,010) (74,034)
Payable for securities purchased (126,594) (1,721,634) (612,335) (22,989,712) – (4,083,656) (5,125,392) – (2,498,960)
Distributions payable (11,371,829) (7,953,965) (5,742,251) (10,802,931) (8,054,323) (6,056,541) (3,496,674) (2,226,667) (592,425)
Accrued expenses (589,800) (600,356) (191,841) (557,685) (467,472) (143,098) (161,455) (129,832) (12,451)
Total Liabilities (excluding net assets attributable to holders of redeemable shares) (35,513,878) (85,244,166) (82,677,096) (192,696,104) (52,837,045) (37,543,448) (27,026,070) (9,244,222) (4,428,261)
Net assets attributable to holders of redeemable shares 1,711,452,142 1,368,732,945 1,186,583,479 1,900,488,509 1,346,736,848 961,160,269 538,675,265 382,712,671 146,497,174
The accompanying notes form an integral part of the financial statements.

Statement of Financial Position
as at 30 November 2016, 30 November 2015 and 1 December 2014 (continued)
Dimensional Fund Advisors Annual Report and Audited Financial Statements, 30 November 2016 21
Global Small
Companies Fund
Global Sustainability
Core Equity Fund Global Targeted
Value Fund
Note 30 Nov 2016
USD
Restated 30 Nov 2015
USD
Restated 1 Dec 2014
USD 30 Nov 2016
USD
Restated 30 Nov 2015
USD
Restated 1 Dec 2014
USD 30 Nov 2016
USD
Restated 30 Nov 2015
USD
Restated 1 Dec 2014
USD
Assets
Financial assets at fair value through profit or loss 3(a), 10 483,191,311 471,212,773 375,736,942 94,547,498 80,649,411 67,896,852 1,866,658,104 1,519,538,678 1,311,361,899
Cash and cash equivalents 8 2,590,413 1,470,974 1,221,394 1,019,428 228,273 494,443 7,727,132 5,364,077 5,189,330
Cash collateral received 4 7,593,955 41,117,792 36,295,235 599,596 9,665,985 7,657,863 28,185,053 143,863,173 132,875,721
Unrealised gain on forward contracts – 154 – – 61 – – – –
Unrealised gain on futures contracts – – – – – – – – –
Receivable for shares sold 629,981 976,702 1,116,680 136,077 194,283 23,032 2,947,746 3,883,290 2,830,831
Receivable for securities sold 534,237 78,786 588,720 – 72,122 1,110 8,732,050 409,920 2,006,697
Interest and tax receivable – 613 604 – – – – 5,303 5,218
Dividends and tax receivable 719,888 645,785 495,682 371,682 173,960 231,131 2,987,709 2,588,432 1,917,123 Amounts receivable from Investment Manager 6 – – 83,673 21,731 24,353 9,281 – – –
Prepaid fees 2,946 – 28,417 553 86 1452 11,128 – 1,392
Total Assets 495,262,731 515,503,579 415,567,347 96,696,565 91,008,534 76,315,164 1,917,248,922 1,675,652,873 1,456,188,211
Liabilities
Bank overdraft – – – (115,729) – – – – –
Unrealised loss on forward contracts – – – – – – (293) – –
Unrealised loss on futures contracts – – – – – – – – – Payable under securities loan agreements 4 (7,593,955) (41,117,792) (36,295,235) (599,596) (9,665,985) (7,657,863) (28,185,053) (143,863,173) (132,875,721)
Management fees payable 6 (341,691) (334,076) (293,860) (60,437) (53,671) (40,720) (1,516,222) (1,253,933) (1,032,410)
Payable for shares repurchased (467,239) (184,986) (98,200) (150,622) (75,647) (253,389) (1,902,383) (1,248,910) (1,546,142)
Payable for securities purchased (9,788) (347,460) (757,186) (160,534) (94,701) (530) (800,071) (1,485,631) (2,481,576)
Distributions payable (2,375,287) (1,703,744) (653,375) (300,709) (180,442) (152,432) (7,690,712) (6,002,291) (4,043,463)
Accrued expenses (250,254) (288,094) (71,788) (45,599) (67,645) (12,092) (678,955) (693,851) (236,306)
Total Liabilities (excluding net assets attributable to holders of redeemable shares) (11,038,214) (43,976,152) (38,169,644) (1,433,226) (10,138,091) (8,117,026) (40,773,689) (154,547,789) (142,215,618)
Net assets attributable to holders of redeemable shares 484,224,517 471,527,427 377,397,703 95,263,339 80,870,443 68,198,138 1,876,475,233 1,521,105,084 1,313,972,593
The accompanying notes form an integral part of the financial statements.
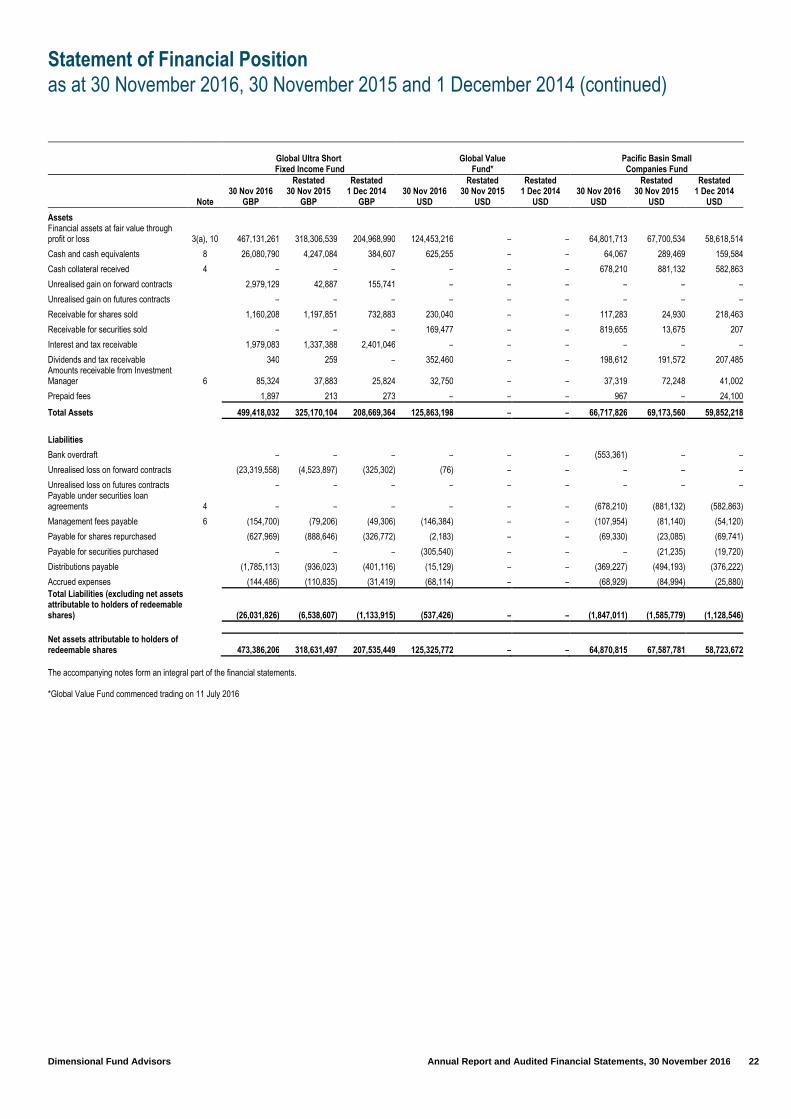
Statement of Financial Position
as at 30 November 2016, 30 November 2015 and 1 December 2014 (continued)
Dimensional Fund Advisors Annual Report and Audited Financial Statements, 30 November 2016 22
Global Ultra Short
Fixed Income Fund Global Value
Fund* Pacific Basin Small Companies Fund
Note 30 Nov 2016
GBP
Restated 30 Nov 2015
GBP
Restated 1 Dec 2014
GBP 30 Nov 2016
USD
Restated 30 Nov 2015
USD
Restated 1 Dec 2014
USD 30 Nov 2016
USD
Restated 30 Nov 2015
USD
Restated 1 Dec 2014
USD
Assets
Financial assets at fair value through profit or loss 3(a), 10 467,131,261 318,306,539 204,968,990 124,453,216 – – 64,801,713 67,700,534 58,618,514
Cash and cash equivalents 8 26,080,790 4,247,084 384,607 625,255 – – 64,067 289,469 159,584
Cash collateral received 4 – – – – – – 678,210 881,132 582,863
Unrealised gain on forward contracts 2,979,129 42,887 155,741 – – – – – –
Unrealised gain on futures contracts – – – – – – – – –
Receivable for shares sold 1,160,208 1,197,851 732,883 230,040 – – 117,283 24,930 218,463
Receivable for securities sold – – – 169,477 – – 819,655 13,675 207
Interest and tax receivable 1,979,083 1,337,388 2,401,046 – – – – – –
Dividends and tax receivable 340 259 – 352,460 – – 198,612 191,572 207,485 Amounts receivable from Investment Manager 6 85,324 37,883 25,824 32,750 – – 37,319 72,248 41,002
Prepaid fees 1,897 213 273 – – – 967 – 24,100
Total Assets 499,418,032 325,170,104 208,669,364 125,863,198 – – 66,717,826 69,173,560 59,852,218
Liabilities
Bank overdraft – – – – – – (553,361) – –
Unrealised loss on forward contracts (23,319,558) (4,523,897) (325,302) (76) – – – – –
Unrealised loss on futures contracts – – – – – – – – – Payable under securities loan agreements 4 – – – – – – (678,210) (881,132) (582,863)
Management fees payable 6 (154,700) (79,206) (49,306) (146,384) – – (107,954) (81,140) (54,120)
Payable for shares repurchased (627,969) (888,646) (326,772) (2,183) – – (69,330) (23,085) (69,741)
Payable for securities purchased – – – (305,540) – – – (21,235) (19,720)
Distributions payable (1,785,113) (936,023) (401,116) (15,129) – – (369,227) (494,193) (376,222)
Accrued expenses (144,486) (110,835) (31,419) (68,114) – – (68,929) (84,994) (25,880)
Total Liabilities (excluding net assets attributable to holders of redeemable shares) (26,031,826) (6,538,607) (1,133,915) (537,426) – – (1,847,011) (1,585,779) (1,128,546)
Net assets attributable to holders of redeemable shares 473,386,206 318,631,497 207,535,449 125,325,772 – – 64,870,815 67,587,781 58,723,672
The accompanying notes form an integral part of the financial statements. *Global Value Fund commenced trading on 11 July 2016
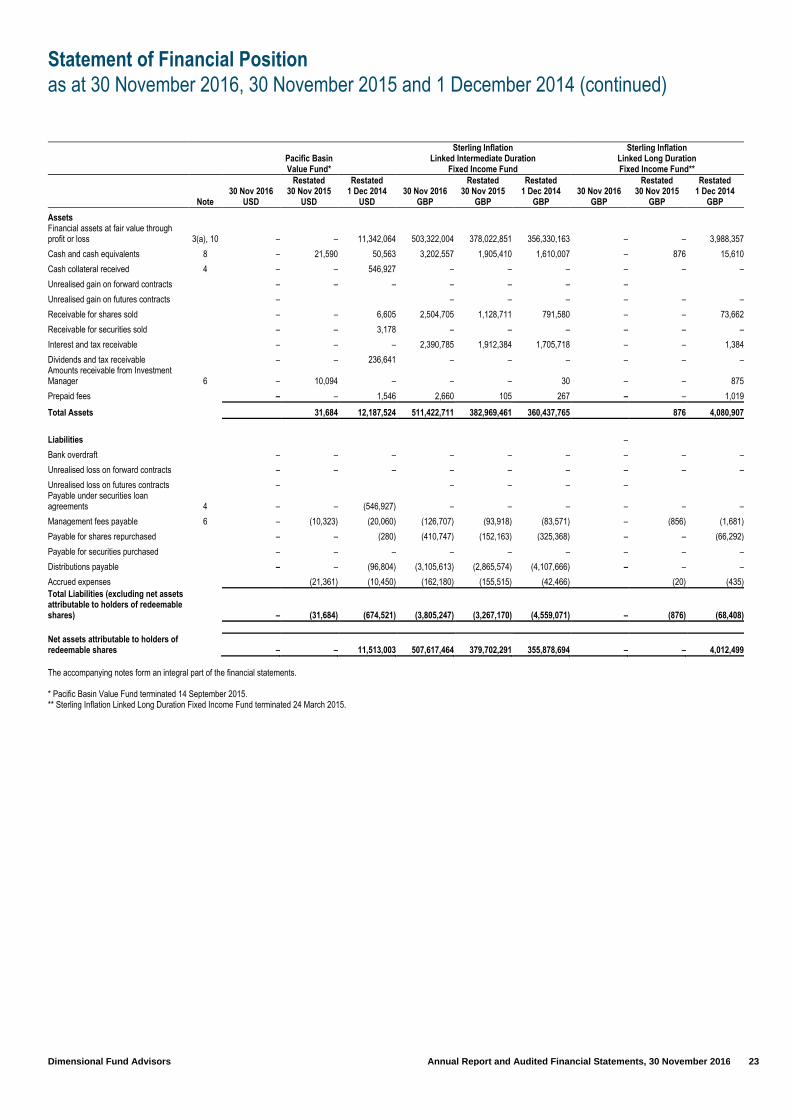
Statement of Financial Position
as at 30 November 2016, 30 November 2015 and 1 December 2014 (continued)
Dimensional Fund Advisors Annual Report and Audited Financial Statements, 30 November 2016 23
Pacific Basin Value Fund*
Sterling Inflation Linked Intermediate Duration
Fixed Income Fund
Sterling Inflation Linked Long Duration Fixed Income Fund**
Note 30 Nov 2016
USD
Restated 30 Nov 2015
USD
Restated 1 Dec 2014
USD 30 Nov 2016
GBP
Restated 30 Nov 2015
GBP
Restated 1 Dec 2014
GBP 30 Nov 2016
GBP
Restated 30 Nov 2015
GBP
Restated 1 Dec 2014
GBP
Assets
Financial assets at fair value through profit or loss 3(a), 10 – – 11,342,064 503,322,004 378,022,851 356,330,163 – – 3,988,357
Cash and cash equivalents 8 – 21,590 50,563 3,202,557 1,905,410 1,610,007 – 876 15,610
Cash collateral received 4 – – 546,927 – – – – – –
Unrealised gain on forward contracts – – – – – – –
Unrealised gain on futures contracts – – – – – – –
Receivable for shares sold – – 6,605 2,504,705 1,128,711 791,580 – – 73,662
Receivable for securities sold – – 3,178 – – – – – –
Interest and tax receivable – – – 2,390,785 1,912,384 1,705,718 – – 1,384
Dividends and tax receivable – – 236,641 – – – – – – Amounts receivable from Investment Manager 6 – 10,094 – – – 30 – – 875
Prepaid fees – – 1,546 2,660 105 267 – – 1,019
Total Assets 31,684 12,187,524 511,422,711 382,969,461 360,437,765 876 4,080,907
Liabilities –
Bank overdraft – – – – – – – – –
Unrealised loss on forward contracts – – – – – – – – –
Unrealised loss on futures contracts – – – – – Payable under securities loan agreements 4 – – (546,927) – – – – – –
Management fees payable 6 – (10,323) (20,060) (126,707) (93,918) (83,571) – (856) (1,681)
Payable for shares repurchased – – (280) (410,747) (152,163) (325,368) – – (66,292)
Payable for securities purchased – – – – – – – – –
Distributions payable – – (96,804) (3,105,613) (2,865,574) (4,107,666) – – –
Accrued expenses (21,361) (10,450) (162,180) (155,515) (42,466) (20) (435)
Total Liabilities (excluding net assets attributable to holders of redeemable shares) – (31,684) (674,521) (3,805,247) (3,267,170) (4,559,071) – (876) (68,408)
Net assets attributable to holders of redeemable shares – – 11,513,003 507,617,464 379,702,291 355,878,694 – – 4,012,499
The accompanying notes form an integral part of the financial statements. * Pacific Basin Value Fund terminated 14 September 2015. ** Sterling Inflation Linked Long Duration Fixed Income Fund terminated 24 March 2015.
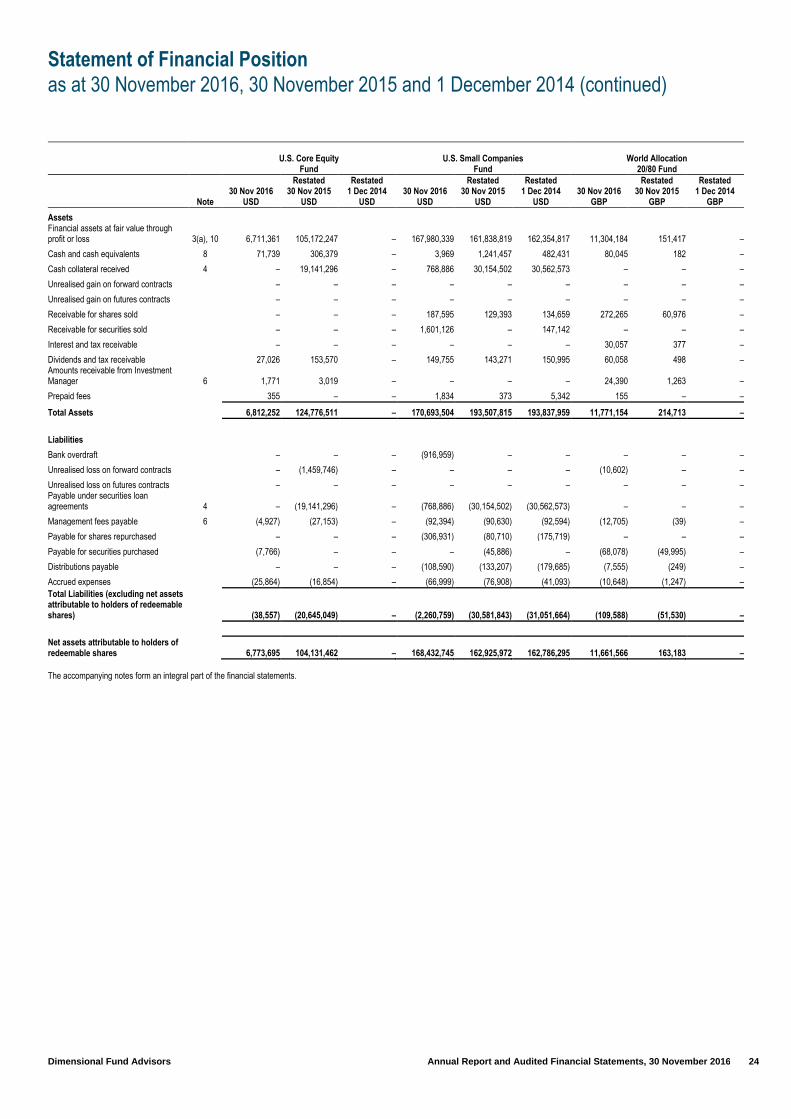
Statement of Financial Position
as at 30 November 2016, 30 November 2015 and 1 December 2014 (continued)
Dimensional Fund Advisors Annual Report and Audited Financial Statements, 30 November 2016 24
U.S. Core Equity
Fund U.S. Small Companies
Fund World Allocation
20/80 Fund
Note 30 Nov 2016
USD
Restated 30 Nov 2015
USD
Restated 1 Dec 2014
USD 30 Nov 2016
USD
Restated 30 Nov 2015
USD
Restated 1 Dec 2014
USD 30 Nov 2016
GBP
Restated 30 Nov 2015
GBP
Restated 1 Dec 2014
GBP
Assets
Financial assets at fair value through profit or loss 3(a), 10 6,711,361 105,172,247 – 167,980,339 161,838,819 162,354,817 11,304,184 151,417 –
Cash and cash equivalents 8 71,739 306,379 – 3,969 1,241,457 482,431 80,045 182 –
Cash collateral received 4 – 19,141,296 – 768,886 30,154,502 30,562,573 – – –
Unrealised gain on forward contracts – – – – – – – – –
Unrealised gain on futures contracts – – – – – – – – –
Receivable for shares sold – – – 187,595 129,393 134,659 272,265 60,976 –
Receivable for securities sold – – – 1,601,126 – 147,142 – – –
Interest and tax receivable – – – – – – 30,057 377 –
Dividends and tax receivable 27,026 153,570 – 149,755 143,271 150,995 60,058 498 – Amounts receivable from Investment Manager 6 1,771 3,019 – – – – 24,390 1,263 –
Prepaid fees 355 – – 1,834 373 5,342 155 – –
Total Assets 6,812,252 124,776,511 – 170,693,504 193,507,815 193,837,959 11,771,154 214,713 –
Liabilities
Bank overdraft – – – (916,959) – – – – –
Unrealised loss on forward contracts – (1,459,746) – – – – (10,602) – –
Unrealised loss on futures contracts – – – – – – – – – Payable under securities loan agreements 4 – (19,141,296) – (768,886) (30,154,502) (30,562,573) – – –
Management fees payable 6 (4,927) (27,153) – (92,394) (90,630) (92,594) (12,705) (39) –
Payable for shares repurchased – – – (306,931) (80,710) (175,719) – – –
Payable for securities purchased (7,766) – – – (45,886) – (68,078) (49,995) –
Distributions payable – – – (108,590) (133,207) (179,685) (7,555) (249) –
Accrued expenses (25,864) (16,854) – (66,999) (76,908) (41,093) (10,648) (1,247) – Total Liabilities (excluding net assets attributable to holders of redeemable shares) (38,557) (20,645,049) – (2,260,759) (30,581,843) (31,051,664) (109,588) (51,530) –
Net assets attributable to holders of redeemable shares 6,773,695 104,131,462 – 168,432,745 162,925,972 162,786,295 11,661,566 163,183 – The accompanying notes form an integral part of the financial statements.

Statement of Financial Position
as at 30 November 2016, 30 November 2015 and 1 December 2014 (continued)
Dimensional Fund Advisors Annual Report and Audited Financial Statements, 30 November 2016 25
World Allocation
40/60 Fund World Allocation
60/40 Fund World Allocation
80/20 Fund
Note 30 Nov 2016
GBP
Restated 30 Nov 2015
GBP
Restated 1 Dec 2014
GBP 30 Nov 2016
GBP
Restated 30 Nov 2015
GBP
Restated 1 Dec 2014
GBP 30 Nov 2016
GBP
Restated 30 Nov 2015
GBP
Restated 1 Dec 2014
GBP
Assets
Financial assets at fair value through profit or loss 3(a), 10 209,396,647 118,593,057 89,253,947 411,203,827 262,014,953 177,903,679 32,939,435 457,219 –
Cash and cash equivalents 8 1,173,573 801,844 80,189 426,606 1,834,013 304,163 383,218 22,395 –
Cash collateral received 4 – – – – – – – – –
Unrealised gain on forward contracts – – – 401 – – – – –
Unrealised gain on futures contracts – – – – – – – – –
Receivable for shares sold 1,097,181 340,455 247,256 1,687,752 628,958 1,314,016 436,378 – –
Receivable for securities sold – 900,000 – – 400,000 – – – –
Interest and tax receivable – – – – – – – – –
Dividends and tax receivable 1,569,076 591,484 571,070 2,921,771 1,282,842 1,122,149 218,347 3,029 – Amounts receivable from Investment Manager 6 94,829 51,191 34,036 235,950 149,194 99,596 77,898 1,430 –
Prepaid fees 699 73 73 1,133 76 76 145 – –
Total Assets 213,332,005 121,278,104 90,186,571 416,477,440 266,310,036 180,743,679 34,055,421 484,073 –
Liabilities
Bank overdraft – – – – – – – – –
Unrealised loss on forward contracts (6,952) – – (10,333) – – (1,678) – –
Unrealised loss on futures contracts – – – – – – – – – Payable under securities loan agreements 4 – – – – – – – – –
Management fees payable 6 (102,093) (58,654) (42,191) (255,653) (169,637) (115,039) (54,447) (128) –
Payable for shares repurchased (124,886) (446,182) (156,467) (246,813) (146,225) (28,844) – – –
Payable for securities purchased (1,300,000) (1,650,000) – – (1,900,000) (1,071,483) (410,000) (21,582) –
Distributions payable (452,810) (226,499) (176,144) (969,882) (676,468) (483,211) (30,374) (1,702) –
Accrued expenses (59,898) (45,152) (21,802) (100,681) (88,445) (36,551) (23,463) (1,318) – Total Liabilities (excluding net assets attributable to holders of redeemable shares) (2,046,639) (2,426,487) (396,604) (1,583,362) (2,980,775) (1,735,128) (519,962) (24,730) –
Net assets attributable to holders of redeemable shares 211,285,366 118,851,617 89,789,967 414,894,078 263,329,261 179,008,551 33,535,459 459,343 – The accompanying notes form an integral part of the financial statements.

Statement of Financial Position
as at 30 November 2016, 30 November 2015 and 1 December 2014 (continued)
Dimensional Fund Advisors Annual Report and Audited Financial Statements, 30 November 2016 26
World Equity
Fund
Dimensional
Funds plc
Note 30 Nov 2016
GBP
Restated 30 Nov 2015
GBP
Restated 1 Dec 2014
GBP 30 Nov 2016
EUR
Restated 30 Nov 2015
EUR
Restated 1 Dec 2014
EUR
Assets
Financial assets at fair value through profit or loss 3(a), 10 763,331,245 393,512,425 271,312,324 10,753,320,969 8,831,392,342 6,706,109,226
Cash and cash equivalents 8 4,894,333 603,329 1,134,239 235,964,774 61,089,516 41,365,471
Cash collateral received 4 9,825,679 17,000,263 29,886,804 91,741,434 376,446,691 310,631,829
Unrealised gain on forward contracts – – – 24,745,983 24,703,888 4,038,795
Unrealised gain on futures contracts – – – 2,269 – –
Receivable for shares sold 1,076,962 4,404,932 1,201,795 182,505,828 27,126,598 20,758,657
Receivable for securities sold 844,345 17,329 19,760 21,541,981 9,837,503 12,788,654
Interest and tax receivable – – – 23,342,157 17,559,840 12,636,192
Dividends and tax receivable 1,300,742 647,111 406,616 16,905,552 11,545,747 8,242,832 Amounts receivable from Investment Manager 6 – 80 24,534 705,576 453,826 342,796
Prepaid fees 1,908 92 92 66,044 2,916 62,694
Total Assets 781,275,214 416,185,561 303,986,164 11,350,842,567 9,360,158,867 7,116,977,146
Liabilities
Bank overdraft – (735,767) – (1,839,667) (1,048,848) –
Unrealised loss on forward contracts – (322) – (190,635,414) (45,026,627) (23,056,124)
Unrealised loss on futures contracts – – – – – – Payable under securities loan agreements 4 (9,825,679) (17,000,263) (29,886,804) (91,741,434) (376,446,691) (310,631,829)
Management fees payable 6 (532,199) (253,266) (173,440) (6,887,477) (5,513,470) (4,204,428)
Payable for shares repurchased (1,444,716) (425,175) (104,353) (19,792,471) (19,480,601) (5,695,564)
Payable for securities purchased (110,851) (1,177,899) (479,262) (45,748,767) (10,516,998) (16,430,181)
Distributions payable (3,855,404) (1,754,983) (981,055) (51,824,885) (39,707,413) (29,801,229)
Accrued expenses (321,056) (282,846) (82,876) (4,538,713) (4,863,266) (1,300,096)
Total Liabilities (excluding net assets attributable to holders of redeemable shares) (16,089,905) (21,630,521) (31,707,790) (413,008,828) (502,603,914) (391,119,451)
Net assets attributable to holders of redeemable shares 765,185,309 394,555,040 272,278,374 10,937,833,739 8,857,554,953 6,725,857,695
The accompanying notes form an integral part of the financial statements. All the intercompany balances due to cross investment within the Company have been eliminated in the Company total. Refer to note 10 for further detail. Approved on behalf of the Board of Directors on 7 March 2017
Peter Blessing Dermot S.L. Butler Director Director 7 March 2017
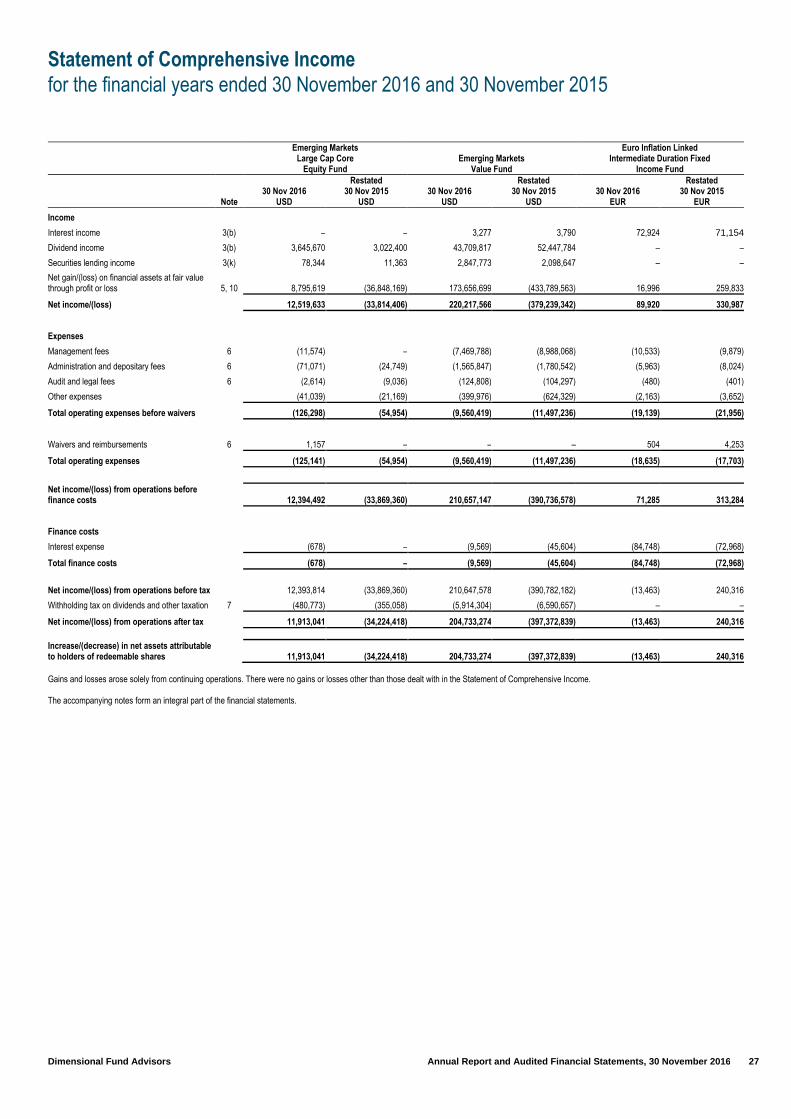
Statement of Comprehensive Income
for the financial years ended 30 November 2016 and 30 November 2015
Dimensional Fund Advisors Annual Report and Audited Financial Statements, 30 November 2016 27
Emerging Markets Large Cap Core
Equity Fund Emerging Markets
Value Fund
Euro Inflation Linked Intermediate Duration Fixed
Income Fund
Note 30 Nov 2016
USD
Restated 30 Nov 2015
USD 30 Nov 2016
USD
Restated 30 Nov 2015
USD 30 Nov 2016
EUR
Restated 30 Nov 2015
EUR
Income
Interest income 3(b) – – 3,277 3,790 72,924 71,154
Dividend income 3(b) 3,645,670 3,022,400 43,709,817 52,447,784 – –
Securities lending income 3(k) 78,344 11,363 2,847,773 2,098,647 – –
Net gain/(loss) on financial assets at fair value through profit or loss 5, 10 8,795,619 (36,848,169) 173,656,699 (433,789,563) 16,996 259,833
Net income/(loss) 12,519,633 (33,814,406) 220,217,566 (379,239,342) 89,920 330,987
Expenses
Management fees 6 (11,574) – (7,469,788) (8,988,068) (10,533) (9,879)
Administration and depositary fees 6 (71,071) (24,749) (1,565,847) (1,780,542) (5,963) (8,024)
Audit and legal fees 6 (2,614) (9,036) (124,808) (104,297) (480) (401)
Other expenses (41,039) (21,169) (399,976) (624,329) (2,163) (3,652)
Total operating expenses before waivers (126,298) (54,954) (9,560,419) (11,497,236) (19,139) (21,956)
Waivers and reimbursements 6 1,157 – – – 504 4,253
Total operating expenses (125,141) (54,954) (9,560,419) (11,497,236) (18,635) (17,703)
Net income/(loss) from operations before finance costs 12,394,492 (33,869,360) 210,657,147 (390,736,578) 71,285 313,284
Finance costs
Interest expense (678) – (9,569) (45,604) (84,748) (72,968)
Total finance costs (678) – (9,569) (45,604) (84,748) (72,968)
Net income/(loss) from operations before tax 12,393,814 (33,869,360) 210,647,578 (390,782,182) (13,463) 240,316
Withholding tax on dividends and other taxation 7 (480,773) (355,058) (5,914,304) (6,590,657) – –
Net income/(loss) from operations after tax 11,913,041 (34,224,418) 204,733,274 (397,372,839) (13,463) 240,316
Increase/(decrease) in net assets attributable to holders of redeemable shares 11,913,041 (34,224,418) 204,733,274 (397,372,839) (13,463) 240,316
Gains and losses arose solely from continuing operations. There were no gains or losses other than those dealt with in the Statement of Comprehensive Income. The accompanying notes form an integral part of the financial statements.
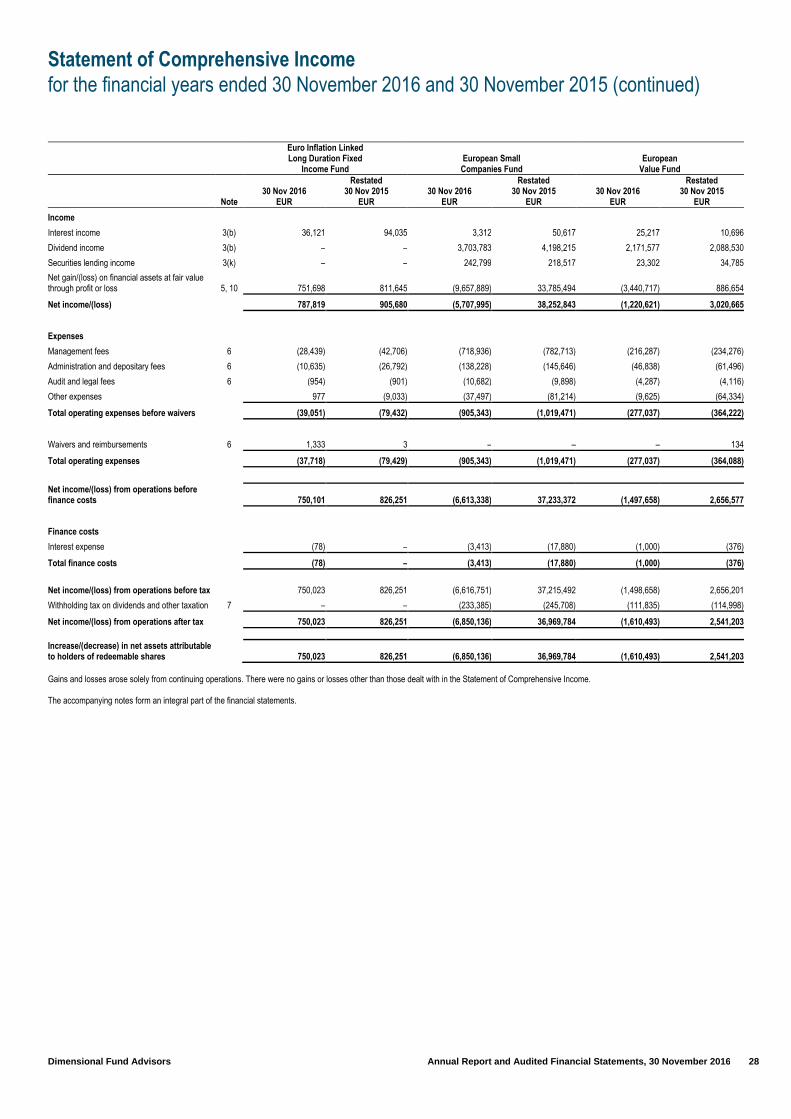
Statement of Comprehensive Income
for the financial years ended 30 November 2016 and 30 November 2015 (continued)
Dimensional Fund Advisors Annual Report and Audited Financial Statements, 30 November 2016 28
Euro Inflation Linked Long Duration Fixed
Income Fund European Small Companies Fund
European Value Fund
Note 30 Nov 2016
EUR
Restated 30 Nov 2015
EUR 30 Nov 2016
EUR
Restated 30 Nov 2015
EUR 30 Nov 2016
EUR
Restated 30 Nov 2015
EUR
Income
Interest income 3(b) 36,121 94,035 3,312 50,617 25,217 10,696
Dividend income 3(b) – – 3,703,783 4,198,215 2,171,577 2,088,530
Securities lending income 3(k) – – 242,799 218,517 23,302 34,785
Net gain/(loss) on financial assets at fair value through profit or loss 5, 10 751,698 811,645 (9,657,889) 33,785,494 (3,440,717) 886,654
Net income/(loss) 787,819 905,680 (5,707,995) 38,252,843 (1,220,621) 3,020,665
Expenses
Management fees 6 (28,439) (42,706) (718,936) (782,713) (216,287) (234,276)
Administration and depositary fees 6 (10,635) (26,792) (138,228) (145,646) (46,838) (61,496)
Audit and legal fees 6 (954) (901) (10,682) (9,898) (4,287) (4,116)
Other expenses 977 (9,033) (37,497) (81,214) (9,625) (64,334)
Total operating expenses before waivers (39,051) (79,432) (905,343) (1,019,471) (277,037) (364,222)
Waivers and reimbursements 6 1,333 3 – – – 134
Total operating expenses (37,718) (79,429) (905,343) (1,019,471) (277,037) (364,088)
Net income/(loss) from operations before finance costs 750,101 826,251 (6,613,338) 37,233,372 (1,497,658) 2,656,577
Finance costs
Interest expense (78) – (3,413) (17,880) (1,000) (376)
Total finance costs (78) – (3,413) (17,880) (1,000) (376)
Net income/(loss) from operations before tax 750,023 826,251 (6,616,751) 37,215,492 (1,498,658) 2,656,201
Withholding tax on dividends and other taxation 7 – – (233,385) (245,708) (111,835) (114,998)
Net income/(loss) from operations after tax 750,023 826,251 (6,850,136) 36,969,784 (1,610,493) 2,541,203
Increase/(decrease) in net assets attributable to holders of redeemable shares 750,023 826,251 (6,850,136) 36,969,784 (1,610,493) 2,541,203
Gains and losses arose solely from continuing operations. There were no gains or losses other than those dealt with in the Statement of Comprehensive Income. The accompanying notes form an integral part of the financial statements.

Statement of Comprehensive Income
for the financial years ended 30 November 2016 and 30 November 2015 (continued)
Dimensional Fund Advisors Annual Report and Audited Financial Statements, 30 November 2016 29
Global Core Equity Fund
Global Short Fixed
Income Fund Global Short–Term Investment
Grade Fixed Income Fund
Note 30 Nov 2016
USD
Restated 30 Nov 2015
USD 30 Nov 2016
EUR
Restated 30 Nov 2015
EUR 30 Nov 2016
USD
Restated 30 Nov 2015
USD
Income
Interest income 3(b) 11,603 14,739 28,909,291 21,782,293 8,732,816 4,758,013
Dividend income 3(b) 39,118,182 30,611,839 – – – 582
Securities lending income 3(k) 829,962 622,021 8,135 14,802 2,936 –
Net gain/(loss) on financial assets at fair value through profit or loss 5, 10 53,194,325 (32,935,948) (10,821,574) 53,024,513 (57,094,023) (21,796,772)
Net income/(loss) 93,154,072 (1,687,349) 18,095,852 74,821,608 (48,358,271) (17,038,177)
Expenses
Management fees 6 (4,559,552) (3,883,644) (4,162,650) (2,997,488) (1,148,813) (691,375)
Administration and depositary fees 6 (811,569) (688,309) (653,679) (494,489) (209,621) (127,246)
Audit and legal fees 6 (114,163) (74,863) (122,626) (76,595) (34,259) (24,366)
Other expenses (293,531) (276,149) (200,707) (173,891) (67,932) (68,291)
Total operating expenses before waivers (5,778,815) (4,922,965) (5,139,662) (3,742,463) (1,460,625) (911,278)
Waivers and reimbursements 6 – – – – – 642
Total operating expenses (5,778,815) (4,922,965) (5,139,662) (3,742,463) (1,460,625) (910,636)
Net income/(loss) from operations before finance costs 87,375,257 (6,610,314) 12,956,190 71,079,145 (49,818,896) (17,948,813)
Finance costs
Interest expense (5,235) (3,154) (94,693) (31,550) (216) (15,981)
Total finance costs (5,235) (3,154) (94,693) (31,550) (216) (15,981)
Net income/(loss) from operations before tax 87,370,022 (6,613,468) 12,861,497 71,047,595 (49,819,112) (17,964,794)
Withholding tax on dividends and other taxation 7 (7,362,068) (6,041,896) (15,024) 30,351 (1,181) (16,281)
Net income/(loss) from operations after tax 80,007,954 (12,655,364) 12,846,473 71,077,946 (49,820,293) (17,981,075)
Increase/(decrease) in net assets attributable to holders of redeemable shares 80,007,954 (12,655,364) 12,846,473 71,077,946 (49,820,293) (17,981,075)
Gains and losses arose solely from continuing operations. There were no gains or losses other than those dealt with in the Statement of Comprehensive Income. The accompanying notes form an integral part of the financial statements.

Statement of Comprehensive Income
for the financial years ended 30 November 2016 and 30 November 2015 (continued)
Dimensional Fund Advisors Annual Report and Audited Financial Statements, 30 November 2016 30
Global Small
Companies Fund
Global Sustainability
Core Equity Fund Global Targeted
Value Fund
Note 30 Nov 2016
USD
Restated 30 Nov 2015
USD 30 Nov 2016
USD
Restated 30 Nov 2015
USD 30 Nov 2016
USD
Restated 30 Nov 2015
USD
Income
Interest income 3(b) 2,752 3,725 225 93 16,455 43,769
Dividend income 3(b) 10,870,752 8,939,064 2,033,816 1,534,067 34,619,599 29,298,034
Securities lending income 3(k) 702,096 431,451 26,136 24,086 1,610,450 1,360,365
Net gain/(loss) on financial assets at fair value through profit or loss 5, 10 32,065,461 3,582,360 1,916,097 (1,574,247) 147,434,511 (22,956,872)
Net income/(loss) 43,641,061 12,956,600 3,976,274 (16,001) 183,681,015 7,745,296
Expenses
Management fees 6 (2,049,415) (1,908,578) (291,971) (303,573) (8,151,304) (7,243,409)
Administration and depositary fees 6 (333,279) (379,597) (76,429) (73,326) (935,488) (804,286)
Audit and legal fees 6 (34,431) (25,901) (5,890) (4,365) (122,961) (85,818)
Other expenses (125,012) (130,793) (17,440) (39,125) (247,247) (294,906)
Total operating expenses before waivers (2,542,137) (2,444,869) (391,730) (420,389) (9,457,000) (8,428,419)
Waivers and reimbursements 6 – 1,340 61,505 74,390 – –
Total operating expenses (2,542,137) (2,443,529) (330,225) (345,999) (9,457,000) (8,428,419)
Net income/(loss) from operations before finance costs 41,098,924 10,513,071 3,646,049 (362,000) 174,224,015 (683,123)
Finance costs
Interest expense (1,857) (519) (185) (29) (5,461) (4,838)
Total finance costs (1,857) (519) (185) (29) (5,461) (4,838)
Net income/(loss) from operations before tax 41,097,067 10,512,552 3,645,864 (362,029) 174,218,554 (687,961)
Withholding tax on dividends and other taxation 7 (1,902,971) (1,555,752) (335,983) (274,504) (5,451,911) (4,670,198)
Net income/(loss) from operations after tax 39,194,096 8,956,800 3,309,881 (636,533) 168,766,643 (5,358,159)
Increase/(decrease) in net assets attributable to holders of redeemable shares 39,194,096 8,956,800 3,309,881 (636,533) 168,766,643 (5,358,159)
Gains and losses arose solely from continuing operations. There were no gains or losses other than those dealt with in the Statement of Comprehensive Income. The accompanying notes form an integral part of the financial statements.

Statement of Comprehensive Income
for the financial years ended 30 November 2016 and 30 November 2015 (continued)
Dimensional Fund Advisors Annual Report and Audited Financial Statements, 30 November 2016 31
Global Ultra Short
Fixed Income Fund Global Value Fund*
Pacific Basin Small
Companies fund
Note 30 Nov 2016
GBP
Restated 30 Nov 2015
GBP 30 Nov 2016
USD
Restated 30 Nov 2015
USD 30 Nov 2016
USD
Restated 30 Nov 2015
USD
Income
Interest income 3(b) 3,505,114 1,756,311 – – 205 208
Dividend income 3(b) – – 1,176,594 – 1,570,408 1,584,385
Securities lending income 3(k) 1,742 4,159 554 – 88,614 76,023
Net gain/(loss) on financial assets at fair value through profit or loss 5, 10 5,243,182 (3,731,495) 8,169,381 – 3,178,402 1,968,783
Net income/(loss) 8,750,038 (1,971,025) 9,346,529 – 4,837,629 3,629,399
Expenses
Management fees 6 (572,306) (360,905) (320,763) – (291,313) (315,637)
Administration and depositary fees 6 (180,202) (120,630) (46,115) – (108,549) (100,993)
Audit and legal fees 6 (28,522) (20,097) (9,814) – (4,563) (3,707)
Other expenses (60,404) (41,486) (33,241) – (42,207) (67,295)
Total operating expenses before waivers (841,434) (543,118) (409,933) – (446,632) (487,632)
Waivers and reimbursements 6 82,705 59,636 37,682 – 39,696 43,466
Total operating expenses (758,729) (483,482) (372,251) – (406,936) (444,166)
Net income/(loss) from operations before finance costs 7,991,309 (2,454,507) 8,974,278 – 4,430,693 3,185,233
Finance costs
Interest expense (27,055) (57,809) (259) – (71) (6)
Total finance costs (27,055) (57,809) (259) – (71) (6)
Net income/(loss) from operations before tax 7,964,254 (2,512,316) 8,974,019 – 4,430,622 3,185,227
Withholding tax on dividends and other taxation 7 1,687 (1,687) (221,072) – (163,387) (169,975)
Net income/(loss) from operations after tax 7,965,941 (2,514,003) 8,752,947 – 4,267,235 3,015,252
Increase/(decrease) in net assets attributable to holders of redeemable shares 7,965,941 (2,514,003) 8,752,947 – 4,267,235 3,015,252
Gains and losses arose solely from continuing operations. There were no gains and losses other than those dealt with in the Statement of Comprehensive Income. The accompanying notes form an integral part of the financial statements. *Global Value Fund commenced trading on 11 July 2016.
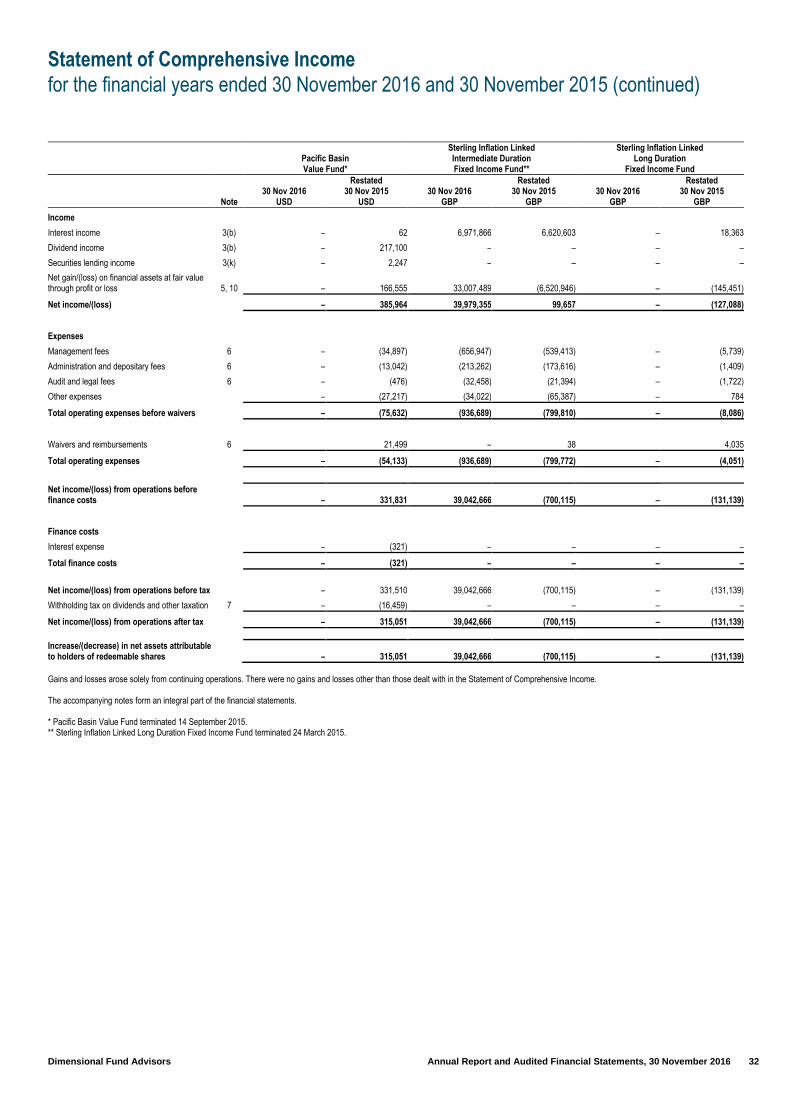
Statement of Comprehensive Income
for the financial years ended 30 November 2016 and 30 November 2015 (continued)
Dimensional Fund Advisors Annual Report and Audited Financial Statements, 30 November 2016 32
Pacific Basin Value Fund*
Sterling Inflation Linked Intermediate Duration Fixed Income Fund**
Sterling Inflation Linked Long Duration
Fixed Income Fund
Note 30 Nov 2016
USD
Restated 30 Nov 2015
USD 30 Nov 2016
GBP
Restated 30 Nov 2015
GBP 30 Nov 2016
GBP
Restated 30 Nov 2015
GBP
Income
Interest income 3(b) – 62 6,971,866 6,620,603 – 18,363
Dividend income 3(b) – 217,100 – – – –
Securities lending income 3(k) – 2,247 – – – –
Net gain/(loss) on financial assets at fair value through profit or loss 5, 10 – 166,555 33,007,489 (6,520,946) – (145,451)
Net income/(loss) – 385,964 39,979,355 99,657 – (127,088)
Expenses
Management fees 6 – (34,897) (656,947) (539,413) – (5,739)
Administration and depositary fees 6 – (13,042) (213,262) (173,616) – (1,409)
Audit and legal fees 6 – (476) (32,458) (21,394) – (1,722)
Other expenses – (27,217) (34,022) (65,387) – 784
Total operating expenses before waivers – (75,632) (936,689) (799,810) – (8,086)
Waivers and reimbursements 6 21,499 – 38 4,035
Total operating expenses – (54,133) (936,689) (799,772) – (4,051)
Net income/(loss) from operations before finance costs – 331,831 39,042,666 (700,115) – (131,139)
Finance costs
Interest expense – (321) – – – –
Total finance costs – (321) – – – –
Net income/(loss) from operations before tax – 331,510 39,042,666 (700,115) – (131,139)
Withholding tax on dividends and other taxation 7 – (16,459) – – – –
Net income/(loss) from operations after tax – 315,051 39,042,666 (700,115) – (131,139)
Increase/(decrease) in net assets attributable to holders of redeemable shares – 315,051 39,042,666 (700,115) – (131,139)
Gains and losses arose solely from continuing operations. There were no gains and losses other than those dealt with in the Statement of Comprehensive Income. The accompanying notes form an integral part of the financial statements. * Pacific Basin Value Fund terminated 14 September 2015. ** Sterling Inflation Linked Long Duration Fixed Income Fund terminated 24 March 2015.
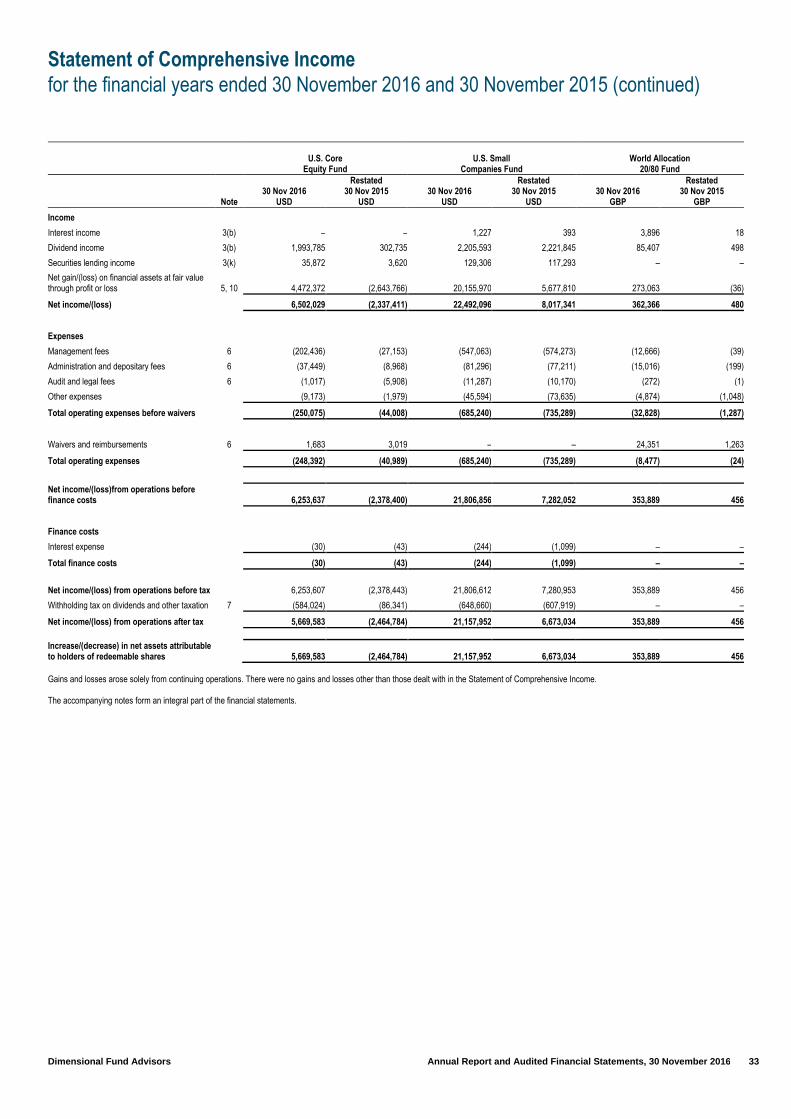
Statement of Comprehensive Income
for the financial years ended 30 November 2016 and 30 November 2015 (continued)
Dimensional Fund Advisors Annual Report and Audited Financial Statements, 30 November 2016 33
U.S. Core
Equity Fund
U.S. Small
Companies Fund
World Allocation
20/80 Fund
Note 30 Nov 2016
USD
Restated 30 Nov 2015
USD 30 Nov 2016
USD
Restated 30 Nov 2015
USD 30 Nov 2016
GBP
Restated 30 Nov 2015
GBP
Income
Interest income 3(b) – – 1,227 393 3,896 18
Dividend income 3(b) 1,993,785 302,735 2,205,593 2,221,845 85,407 498
Securities lending income 3(k) 35,872 3,620 129,306 117,293 – –
Net gain/(loss) on financial assets at fair value through profit or loss 5, 10 4,472,372 (2,643,766) 20,155,970 5,677,810 273,063 (36)
Net income/(loss) 6,502,029 (2,337,411) 22,492,096 8,017,341 362,366 480
Expenses
Management fees 6 (202,436) (27,153) (547,063) (574,273) (12,666) (39)
Administration and depositary fees 6 (37,449) (8,968) (81,296) (77,211) (15,016) (199)
Audit and legal fees 6 (1,017) (5,908) (11,287) (10,170) (272) (1)
Other expenses (9,173) (1,979) (45,594) (73,635) (4,874) (1,048)
Total operating expenses before waivers (250,075) (44,008) (685,240) (735,289) (32,828) (1,287)
Waivers and reimbursements 6 1,683 3,019 – – 24,351 1,263
Total operating expenses (248,392) (40,989) (685,240) (735,289) (8,477) (24)
Net income/(loss)from operations before finance costs 6,253,637 (2,378,400) 21,806,856 7,282,052 353,889 456
Finance costs
Interest expense (30) (43) (244) (1,099) – –
Total finance costs (30) (43) (244) (1,099) – –
Net income/(loss) from operations before tax 6,253,607 (2,378,443) 21,806,612 7,280,953 353,889 456
Withholding tax on dividends and other taxation 7 (584,024) (86,341) (648,660) (607,919) – –
Net income/(loss) from operations after tax 5,669,583 (2,464,784) 21,157,952 6,673,034 353,889 456
Increase/(decrease) in net assets attributable to holders of redeemable shares 5,669,583 (2,464,784) 21,157,952 6,673,034 353,889 456
Gains and losses arose solely from continuing operations. There were no gains and losses other than those dealt with in the Statement of Comprehensive Income. The accompanying notes form an integral part of the financial statements.

Statement of Comprehensive Income
for the financial years ended 30 November 2016 and 30 November 2015 (continued)
Dimensional Fund Advisors Annual Report and Audited Financial Statements, 30 November 2016 34
World Allocation
40/60 Fund
World Allocation
60/40 Fund World Allocation
80/20 Fund
Note 30 Nov 2016
GBP
Restated 30 Nov 2015
GBP 30 Nov 2016
GBP
Restated 30 Nov 2015
GBP 30 Nov 2016
GBP
Restated 30 Nov 2015
GBP
Income
Interest income 3(b) 760 459 1,581 1,137 – –
Dividend income 3(b) 2,701,025 1,539,524 5,750,112 3,707,163 297,356 3,029
Securities lending income 3(k) – – – – – –
Net gain/(loss) on financial assets at fair value through profit or loss 5, 10 15,242,096 21,883 48,321,014 (126,069) 3,443,260 4,130
Net income 17,943,881 1,561,866 54,072,707 3,582,231 3,740,616 7,159
Expenses
Management fees 6 (472,272) (312,044) (1,142,228) (779,741) (54,319) (128)
Administration and depositary fees 6 (44,379) (33,063) (74,183) (67,531) (27,783) (269)
Audit and legal fees 6 (10,692) (6,212) (22,318) (13,291) (4,780) (2)
Other expenses (13,446) (18,358) (17,879) (29,773) (5,759) (1,047)
Total operating expenses before waivers (540,789) (369,677) (1,256,608) (890,336) (92,641) (1,446)
Waivers and reimbursements 6 451,298 280,091 1,058,047 692,124 77,770 1,430
Total operating expenses (89,491) (89,586) (198,561) (198,212) (14,871) (16)
Net income from operations before finance costs 17,854,390 1,472,280 53,874,146 3,384,019 3,725,745 7,143
Finance costs
Interest expense (22) (22) (195) – (164) –
Total finance costs (22) (22) (195) – (164) –
Net income from operations before tax 17,854,368 1,472,258 53,873,951 3,384,019 3,725,581 7,143
Withholding tax on dividends and other taxation 7 (11,824) (33,608) (39,270) (101,368) – –
Net income from operations after tax 17,842,544 1,438,650 53,834,681 3,282,651 3,725,581 7,143
Increase in net assets attributable to holders of redeemable shares 17,842,544 1,438,650 53,834,681 3,282,651 3,725,581 7,143
Gains and losses arose solely from continuing operations. There were no gains and losses other than those dealt with in the Statement of Comprehensive Income. The accompanying notes form an integral part of the financial statements.
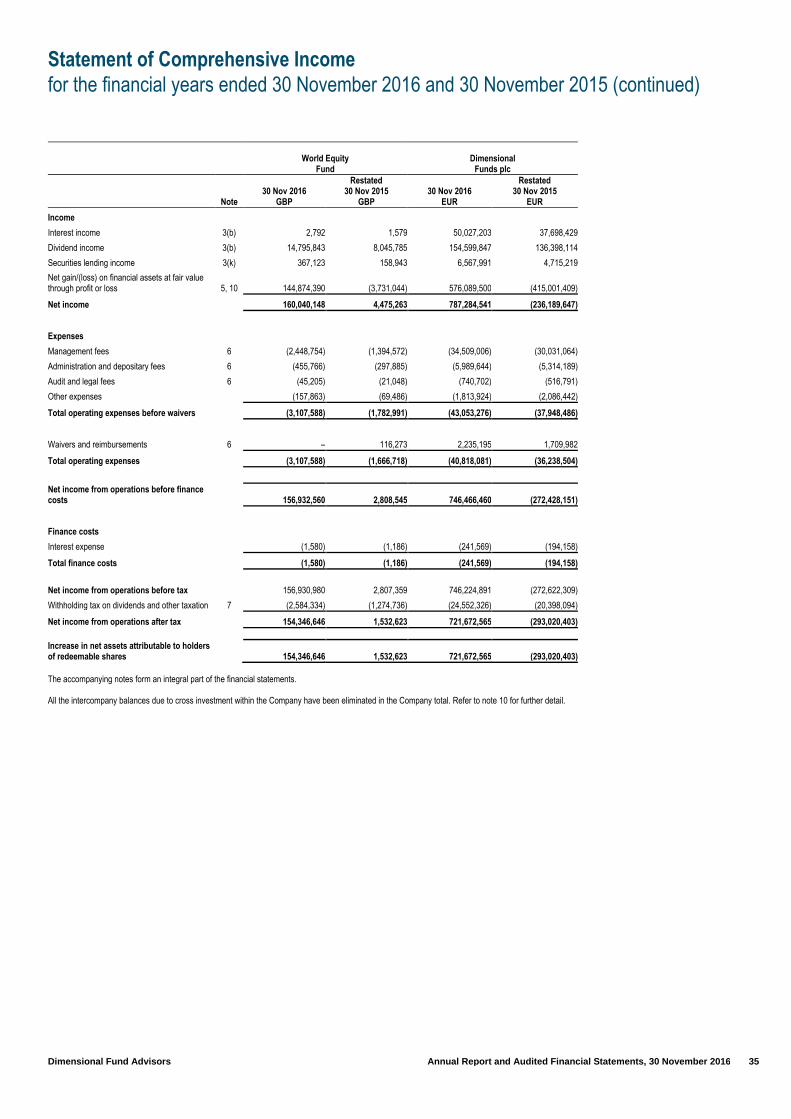
Statement of Comprehensive Income
for the financial years ended 30 November 2016 and 30 November 2015 (continued)
Dimensional Fund Advisors Annual Report and Audited Financial Statements, 30 November 2016 35
World Equity
Fund
Dimensional
Funds plc
Note 30 Nov 2016
GBP
Restated 30 Nov 2015
GBP 30 Nov 2016
EUR
Restated 30 Nov 2015
EUR
Income
Interest income 3(b) 2,792 1,579 50,027,203 37,698,429
Dividend income 3(b) 14,795,843 8,045,785 154,599,847 136,398,114
Securities lending income 3(k) 367,123 158,943 6,567,991 4,715,219
Net gain/(loss) on financial assets at fair value through profit or loss 5, 10 144,874,390 (3,731,044) 576,089,500 (415,001,409)
Net income 160,040,148 4,475,263 787,284,541 (236,189,647)
Expenses
Management fees 6 (2,448,754) (1,394,572) (34,509,006) (30,031,064)
Administration and depositary fees 6 (455,766) (297,885) (5,989,644) (5,314,189)
Audit and legal fees 6 (45,205) (21,048) (740,702) (516,791)
Other expenses (157,863) (69,486) (1,813,924) (2,086,442)
Total operating expenses before waivers (3,107,588) (1,782,991) (43,053,276) (37,948,486)
Waivers and reimbursements 6 – 116,273 2,235,195 1,709,982
Total operating expenses (3,107,588) (1,666,718) (40,818,081) (36,238,504)
Net income from operations before finance costs 156,932,560 2,808,545 746,466,460 (272,428,151)
Finance costs
Interest expense (1,580) (1,186) (241,569) (194,158)
Total finance costs (1,580) (1,186) (241,569) (194,158)
Net income from operations before tax 156,930,980 2,807,359 746,224,891 (272,622,309)
Withholding tax on dividends and other taxation 7 (2,584,334) (1,274,736) (24,552,326) (20,398,094)
Net income from operations after tax 154,346,646 1,532,623 721,672,565 (293,020,403)
Increase in net assets attributable to holders of redeemable shares 154,346,646 1,532,623 721,672,565 (293,020,403)
The accompanying notes form an integral part of the financial statements. All the intercompany balances due to cross investment within the Company have been eliminated in the Company total. Refer to note 10 for further detail.
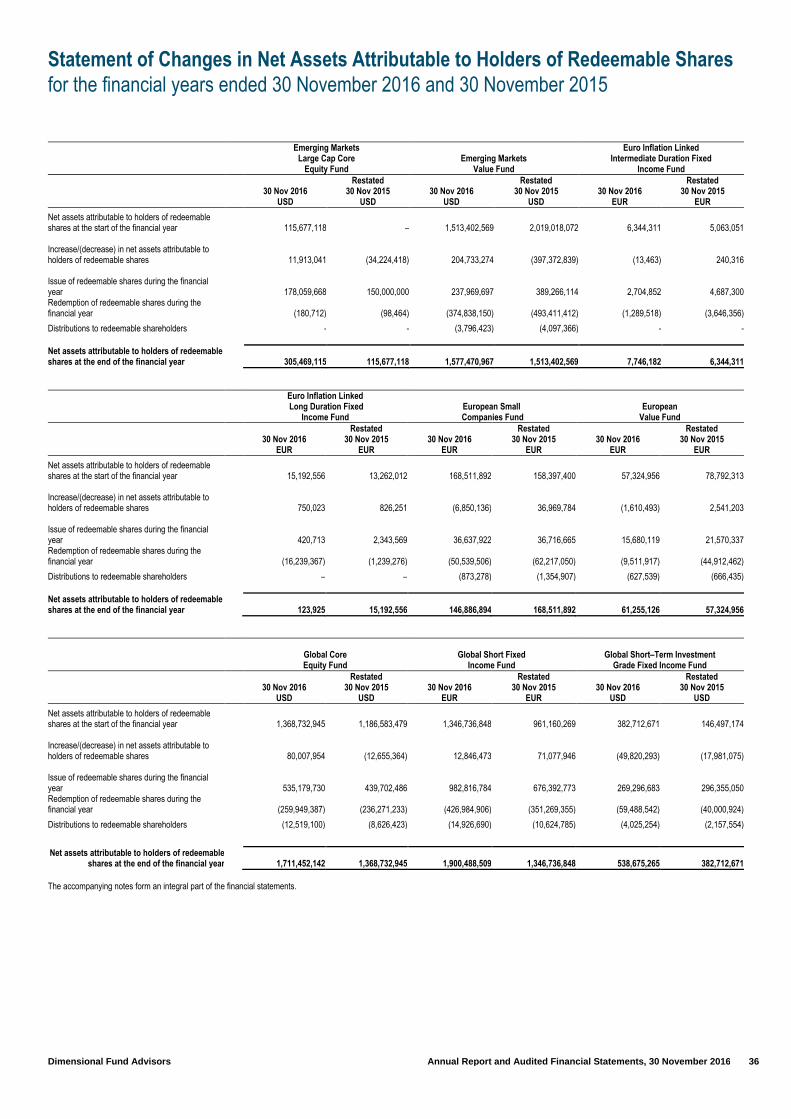
Statement of Changes in Net Assets Attributable to Holders of Redeemable Shares
for the financial years ended 30 November 2016 and 30 November 2015
Dimensional Fund Advisors Annual Report and Audited Financial Statements, 30 November 2016 36
Emerging Markets Large Cap Core
Equity Fund Emerging Markets
Value Fund
Euro Inflation Linked Intermediate Duration Fixed
Income Fund
30 Nov 2016
USD
Restated 30 Nov 2015
USD 30 Nov 2016
USD
Restated 30 Nov 2015
USD 30 Nov 2016
EUR
Restated 30 Nov 2015
EUR
Net assets attributable to holders of redeemable shares at the start of the financial year 115,677,118 – 1,513,402,569 2,019,018,072 6,344,311 5,063,051 Increase/(decrease) in net assets attributable to holders of redeemable shares 11,913,041 (34,224,418) 204,733,274 (397,372,839) (13,463) 240,316 Issue of redeemable shares during the financial year 178,059,668 150,000,000 237,969,697 389,266,114 2,704,852 4,687,300 Redemption of redeemable shares during the financial year (180,712) (98,464) (374,838,150) (493,411,412) (1,289,518) (3,646,356)
Distributions to redeemable shareholders - - (3,796,423) (4,097,366) - -
Net assets attributable to holders of redeemable shares at the end of the financial year 305,469,115 115,677,118 1,577,470,967 1,513,402,569 7,746,182 6,344,311
Euro Inflation Linked Long Duration Fixed
Income Fund European Small
Companies Fund European
Value Fund
30 Nov 2016
EUR
Restated 30 Nov 2015
EUR 30 Nov 2016
EUR
Restated 30 Nov 2015
EUR 30 Nov 2016
EUR
Restated 30 Nov 2015
EUR
Net assets attributable to holders of redeemable shares at the start of the financial year 15,192,556 13,262,012 168,511,892 158,397,400 57,324,956 78,792,313 Increase/(decrease) in net assets attributable to holders of redeemable shares 750,023 826,251 (6,850,136) 36,969,784 (1,610,493) 2,541,203 Issue of redeemable shares during the financial year 420,713 2,343,569 36,637,922 36,716,665 15,680,119 21,570,337 Redemption of redeemable shares during the financial year (16,239,367) (1,239,276) (50,539,506) (62,217,050) (9,511,917) (44,912,462)
Distributions to redeemable shareholders – – (873,278) (1,354,907) (627,539) (666,435)
Net assets attributable to holders of redeemable shares at the end of the financial year 123,925 15,192,556 146,886,894 168,511,892 61,255,126 57,324,956
Global Core Equity Fund
Global Short Fixed
Income Fund Global Short–Term Investment
Grade Fixed Income Fund
30 Nov 2016
USD
Restated 30 Nov 2015
USD 30 Nov 2016
EUR
Restated 30 Nov 2015
EUR 30 Nov 2016
USD
Restated 30 Nov 2015
USD
Net assets attributable to holders of redeemable shares at the start of the financial year 1,368,732,945 1,186,583,479 1,346,736,848 961,160,269 382,712,671 146,497,174 Increase/(decrease) in net assets attributable to holders of redeemable shares 80,007,954 (12,655,364) 12,846,473 71,077,946 (49,820,293) (17,981,075) Issue of redeemable shares during the financial year 535,179,730 439,702,486 982,816,784 676,392,773 269,296,683 296,355,050 Redemption of redeemable shares during the financial year (259,949,387) (236,271,233) (426,984,906) (351,269,355) (59,488,542) (40,000,924)
Distributions to redeemable shareholders (12,519,100) (8,626,423) (14,926,690) (10,624,785) (4,025,254) (2,157,554)
Net assets attributable to holders of redeemable shares at the end of the financial year 1,711,452,142 1,368,732,945 1,900,488,509 1,346,736,848 538,675,265 382,712,671
The accompanying notes form an integral part of the financial statements.
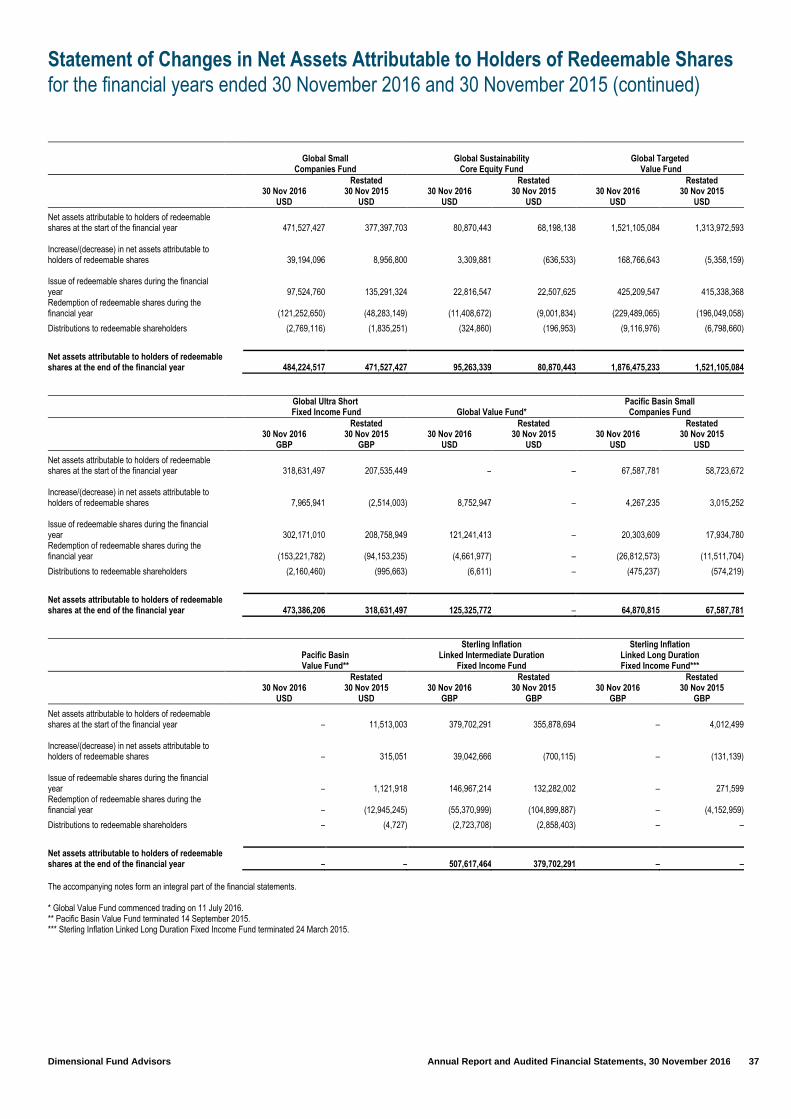
Statement of Changes in Net Assets Attributable to Holders of Redeemable Shares
for the financial years ended 30 November 2016 and 30 November 2015 (continued)
Dimensional Fund Advisors Annual Report and Audited Financial Statements, 30 November 2016 37
Global Small
Companies Fund
Global Sustainability
Core Equity Fund Global Targeted
Value Fund
30 Nov 2016
USD
Restated 30 Nov 2015
USD 30 Nov 2016
USD
Restated 30 Nov 2015
USD 30 Nov 2016
USD
Restated 30 Nov 2015
USD
Net assets attributable to holders of redeemable shares at the start of the financial year 471,527,427 377,397,703 80,870,443 68,198,138 1,521,105,084 1,313,972,593 Increase/(decrease) in net assets attributable to holders of redeemable shares 39,194,096 8,956,800 3,309,881 (636,533) 168,766,643 (5,358,159) Issue of redeemable shares during the financial year 97,524,760 135,291,324 22,816,547 22,507,625 425,209,547 415,338,368 Redemption of redeemable shares during the financial year (121,252,650) (48,283,149) (11,408,672) (9,001,834) (229,489,065) (196,049,058)
Distributions to redeemable shareholders (2,769,116) (1,835,251) (324,860) (196,953) (9,116,976) (6,798,660)
Net assets attributable to holders of redeemable shares at the end of the financial year 484,224,517 471,527,427 95,263,339 80,870,443 1,876,475,233 1,521,105,084
Global Ultra Short
Fixed Income Fund
Global Value Fund* Pacific Basin Small Companies Fund
30 Nov 2016
GBP
Restated 30 Nov 2015
GBP 30 Nov 2016
USD
Restated 30 Nov 2015
USD 30 Nov 2016
USD
Restated 30 Nov 2015
USD
Net assets attributable to holders of redeemable shares at the start of the financial year 318,631,497 207,535,449 – – 67,587,781 58,723,672 Increase/(decrease) in net assets attributable to holders of redeemable shares 7,965,941 (2,514,003) 8,752,947 – 4,267,235 3,015,252 Issue of redeemable shares during the financial year 302,171,010 208,758,949 121,241,413 – 20,303,609 17,934,780 Redemption of redeemable shares during the financial year (153,221,782) (94,153,235) (4,661,977) – (26,812,573) (11,511,704)
Distributions to redeemable shareholders (2,160,460) (995,663) (6,611) – (475,237) (574,219)
Net assets attributable to holders of redeemable shares at the end of the financial year 473,386,206 318,631,497 125,325,772 – 64,870,815 67,587,781
Pacific Basin Value Fund**
Sterling Inflation Linked Intermediate Duration
Fixed Income Fund
Sterling Inflation Linked Long Duration Fixed Income Fund***
30 Nov 2016
USD
Restated 30 Nov 2015
USD 30 Nov 2016
GBP
Restated 30 Nov 2015
GBP 30 Nov 2016
GBP
Restated 30 Nov 2015
GBP
Net assets attributable to holders of redeemable shares at the start of the financial year – 11,513,003 379,702,291 355,878,694 – 4,012,499 Increase/(decrease) in net assets attributable to holders of redeemable shares – 315,051 39,042,666 (700,115) – (131,139) Issue of redeemable shares during the financial year – 1,121,918 146,967,214 132,282,002 – 271,599 Redemption of redeemable shares during the financial year – (12,945,245) (55,370,999) (104,899,887) – (4,152,959)
Distributions to redeemable shareholders – (4,727) (2,723,708) (2,858,403) – –
Net assets attributable to holders of redeemable shares at the end of the financial year – – 507,617,464 379,702,291 – –
The accompanying notes form an integral part of the financial statements. * Global Value Fund commenced trading on 11 July 2016. ** Pacific Basin Value Fund terminated 14 September 2015. *** Sterling Inflation Linked Long Duration Fixed Income Fund terminated 24 March 2015.
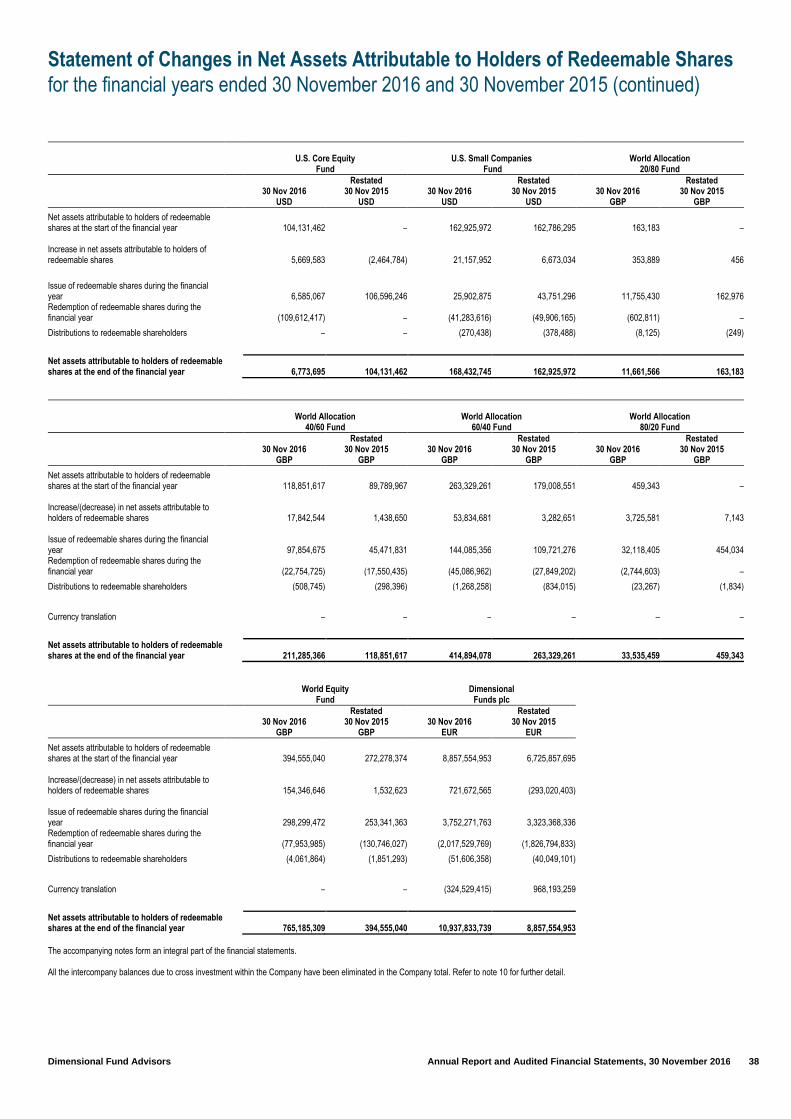
Statement of Changes in Net Assets Attributable to Holders of Redeemable Shares
for the financial years ended 30 November 2016 and 30 November 2015 (continued)
Dimensional Fund Advisors Annual Report and Audited Financial Statements, 30 November 2016 38
U.S. Core Equity
Fund
U.S. Small Companies
Fund
World Allocation
20/80 Fund
30 Nov 2016
USD
Restated 30 Nov 2015
USD 30 Nov 2016
USD
Restated 30 Nov 2015
USD 30 Nov 2016
GBP
Restated 30 Nov 2015
GBP
Net assets attributable to holders of redeemable shares at the start of the financial year 104,131,462 – 162,925,972 162,786,295 163,183 – Increase in net assets attributable to holders of redeemable shares 5,669,583 (2,464,784) 21,157,952 6,673,034 353,889 456
Issue of redeemable shares during the financial year 6,585,067 106,596,246 25,902,875 43,751,296 11,755,430 162,976 Redemption of redeemable shares during the financial year (109,612,417) – (41,283,616) (49,906,165) (602,811) –
Distributions to redeemable shareholders – – (270,438) (378,488) (8,125) (249)
Net assets attributable to holders of redeemable shares at the end of the financial year 6,773,695 104,131,462 168,432,745 162,925,972 11,661,566 163,183
World Allocation
40/60 Fund World Allocation
60/40 Fund World Allocation
80/20 Fund
30 Nov 2016
GBP
Restated 30 Nov 2015
GBP 30 Nov 2016
GBP
Restated 30 Nov 2015
GBP 30 Nov 2016
GBP
Restated 30 Nov 2015
GBP
Net assets attributable to holders of redeemable shares at the start of the financial year 118,851,617 89,789,967 263,329,261 179,008,551 459,343 – Increase/(decrease) in net assets attributable to holders of redeemable shares 17,842,544 1,438,650 53,834,681 3,282,651 3,725,581 7,143 Issue of redeemable shares during the financial year 97,854,675 45,471,831 144,085,356 109,721,276 32,118,405 454,034 Redemption of redeemable shares during the financial year (22,754,725) (17,550,435) (45,086,962) (27,849,202) (2,744,603) –
Distributions to redeemable shareholders (508,745) (298,396) (1,268,258) (834,015) (23,267) (1,834)
Currency translation – – – – – –
Net assets attributable to holders of redeemable shares at the end of the financial year 211,285,366 118,851,617 414,894,078 263,329,261 33,535,459 459,343
World Equity
Fund Dimensional
Funds plc
30 Nov 2016
GBP
Restated 30 Nov 2015
GBP 30 Nov 2016
EUR
Restated 30 Nov 2015
EUR
Net assets attributable to holders of redeemable shares at the start of the financial year 394,555,040 272,278,374 8,857,554,953 6,725,857,695 Increase/(decrease) in net assets attributable to holders of redeemable shares 154,346,646 1,532,623 721,672,565 (293,020,403) Issue of redeemable shares during the financial year 298,299,472 253,341,363 3,752,271,763 3,323,368,336 Redemption of redeemable shares during the financial year (77,953,985) (130,746,027) (2,017,529,769) (1,826,794,833)
Distributions to redeemable shareholders (4,061,864) (1,851,293) (51,606,358) (40,049,101)
Currency translation – – (324,529,415) 968,193,259
Net assets attributable to holders of redeemable shares at the end of the financial year 765,185,309 394,555,040 10,937,833,739 8,857,554,953
The accompanying notes form an integral part of the financial statements. All the intercompany balances due to cross investment within the Company have been eliminated in the Company total. Refer to note 10 for further detail.
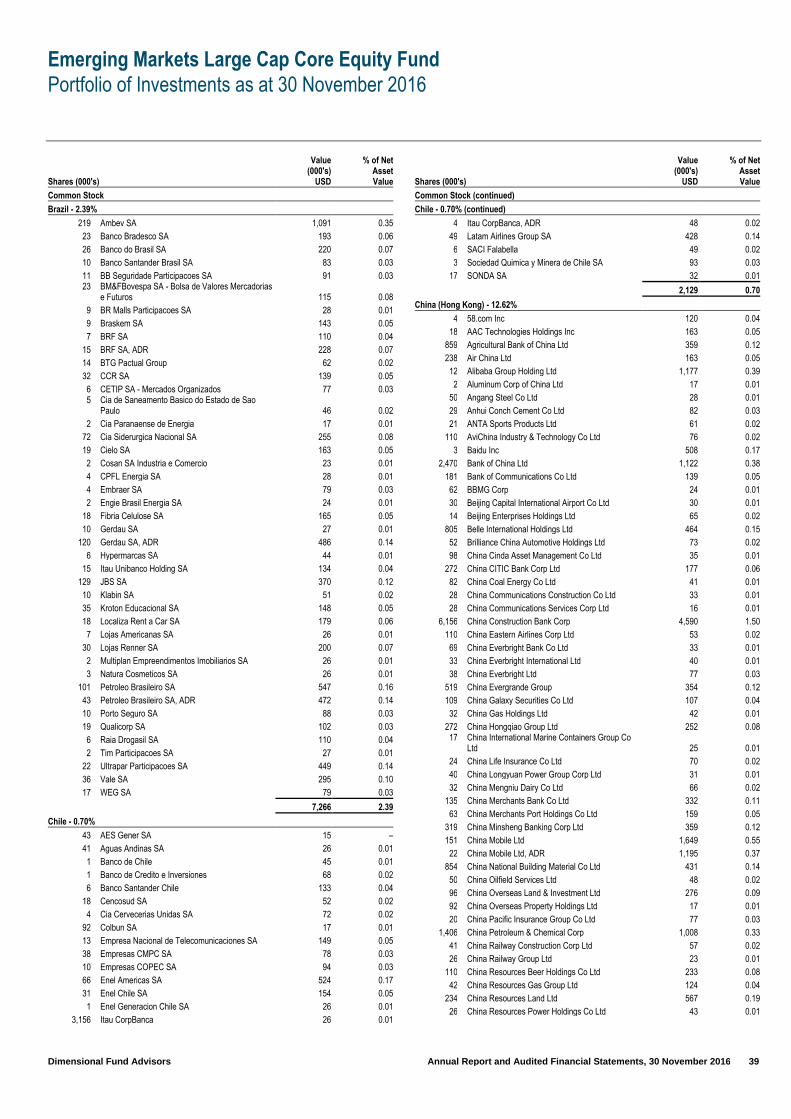
Emerging Markets Large Cap Core Equity Fund
Portfolio of Investments as at 30 November 2016
Dimensional Fund Advisors Annual Report and Audited Financial Statements, 30 November 2016 39
Shares (000's)
Value (000's)
USD
% of Net Asset Value
Common Stock
Brazil - 2.39%
219 Ambev SA 1,091 0.35
23 Banco Bradesco SA 193 0.06
26 Banco do Brasil SA 220 0.07
10 Banco Santander Brasil SA 83 0.03
11 BB Seguridade Participacoes SA 91 0.03 23
BM&FBovespa SA - Bolsa de Valores Mercadorias e Futuros 115 0.08
9 BR Malls Participacoes SA 28 0.01
9 Braskem SA 143 0.05
7 BRF SA 110 0.04
15 BRF SA, ADR 228 0.07
14 BTG Pactual Group 62 0.02
32 CCR SA 139 0.05
6 CETIP SA - Mercados Organizados 77 0.03 5
Cia de Saneamento Basico do Estado de Sao Paulo 46 0.02
2 Cia Paranaense de Energia 17 0.01
72 Cia Siderurgica Nacional SA 255 0.08
19 Cielo SA 163 0.05
2 Cosan SA Industria e Comercio 23 0.01
4 CPFL Energia SA 28 0.01
4 Embraer SA 79 0.03
2 Engie Brasil Energia SA 24 0.01
18 Fibria Celulose SA 165 0.05
10 Gerdau SA 27 0.01
120 Gerdau SA, ADR 486 0.14
6 Hypermarcas SA 44 0.01
15 Itau Unibanco Holding SA 134 0.04
129 JBS SA 370 0.12
10 Klabin SA 51 0.02
35 Kroton Educacional SA 148 0.05
18 Localiza Rent a Car SA 179 0.06
7 Lojas Americanas SA 26 0.01
30 Lojas Renner SA 200 0.07
2 Multiplan Empreendimentos Imobiliarios SA 26 0.01
3 Natura Cosmeticos SA 26 0.01
101 Petroleo Brasileiro SA 547 0.16
43 Petroleo Brasileiro SA, ADR 472 0.14
10 Porto Seguro SA 88 0.03
19 Qualicorp SA 102 0.03
6 Raia Drogasil SA 110 0.04
2 Tim Participacoes SA 27 0.01
22 Ultrapar Participacoes SA 449 0.14
36 Vale SA 295 0.10
17 WEG SA 79 0.03
7,266 2.39
Chile - 0.70%
43 AES Gener SA 15 –
41 Aguas Andinas SA 26 0.01
1 Banco de Chile 45 0.01
1 Banco de Credito e Inversiones 68 0.02
6 Banco Santander Chile 133 0.04
18 Cencosud SA 52 0.02
4 Cia Cervecerias Unidas SA 72 0.02
92 Colbun SA 17 0.01
13 Empresa Nacional de Telecomunicaciones SA 149 0.05
38 Empresas CMPC SA 78 0.03
10 Empresas COPEC SA 94 0.03
66 Enel Americas SA 524 0.17
31 Enel Chile SA 154 0.05
1 Enel Generacion Chile SA 26 0.01
3,156 Itau CorpBanca 26 0.01
Shares (000's)
Value (000's)
USD
% of Net Asset Value
Common Stock (continued)
Chile - 0.70% (continued)
4 Itau CorpBanca, ADR 48 0.02
49 Latam Airlines Group SA 428 0.14
6 SACI Falabella 49 0.02
3 Sociedad Quimica y Minera de Chile SA 93 0.03
17 SONDA SA 32 0.01
2,129 0.70
China (Hong Kong) - 12.62%
4 58.com Inc 120 0.04
18 AAC Technologies Holdings Inc 163 0.05
859 Agricultural Bank of China Ltd 359 0.12
238 Air China Ltd 163 0.05
12 Alibaba Group Holding Ltd 1,177 0.39
2 Aluminum Corp of China Ltd 17 0.01
50 Angang Steel Co Ltd 28 0.01
29 Anhui Conch Cement Co Ltd 82 0.03
21 ANTA Sports Products Ltd 61 0.02
110 AviChina Industry & Technology Co Ltd 76 0.02
3 Baidu Inc 508 0.17
2,470 Bank of China Ltd 1,122 0.38
181 Bank of Communications Co Ltd 139 0.05
62 BBMG Corp 24 0.01
30 Beijing Capital International Airport Co Ltd 30 0.01
14 Beijing Enterprises Holdings Ltd 65 0.02
805 Belle International Holdings Ltd 464 0.15
52 Brilliance China Automotive Holdings Ltd 73 0.02
98 China Cinda Asset Management Co Ltd 35 0.01
272 China CITIC Bank Corp Ltd 177 0.06
82 China Coal Energy Co Ltd 41 0.01
28 China Communications Construction Co Ltd 33 0.01
28 China Communications Services Corp Ltd 16 0.01
6,156 China Construction Bank Corp 4,590 1.50
110 China Eastern Airlines Corp Ltd 53 0.02
69 China Everbright Bank Co Ltd 33 0.01
33 China Everbright International Ltd 40 0.01
38 China Everbright Ltd 77 0.03
519 China Evergrande Group 354 0.12
109 China Galaxy Securities Co Ltd 107 0.04
32 China Gas Holdings Ltd 42 0.01
272 China Hongqiao Group Ltd 252 0.08 17
China International Marine Containers Group Co Ltd 25 0.01
24 China Life Insurance Co Ltd 70 0.02
40 China Longyuan Power Group Corp Ltd 31 0.01
32 China Mengniu Dairy Co Ltd 66 0.02
135 China Merchants Bank Co Ltd 332 0.11
63 China Merchants Port Holdings Co Ltd 159 0.05
319 China Minsheng Banking Corp Ltd 359 0.12
151 China Mobile Ltd 1,649 0.55
22 China Mobile Ltd, ADR 1,195 0.37
854 China National Building Material Co Ltd 431 0.14
50 China Oilfield Services Ltd 48 0.02
96 China Overseas Land & Investment Ltd 276 0.09
92 China Overseas Property Holdings Ltd 17 0.01
20 China Pacific Insurance Group Co Ltd 77 0.03
1,406 China Petroleum & Chemical Corp 1,008 0.33
41 China Railway Construction Corp Ltd 57 0.02
26 China Railway Group Ltd 23 0.01
110 China Resources Beer Holdings Co Ltd 233 0.08
42 China Resources Gas Group Ltd 124 0.04
234 China Resources Land Ltd 567 0.19
26 China Resources Power Holdings Co Ltd 43 0.01
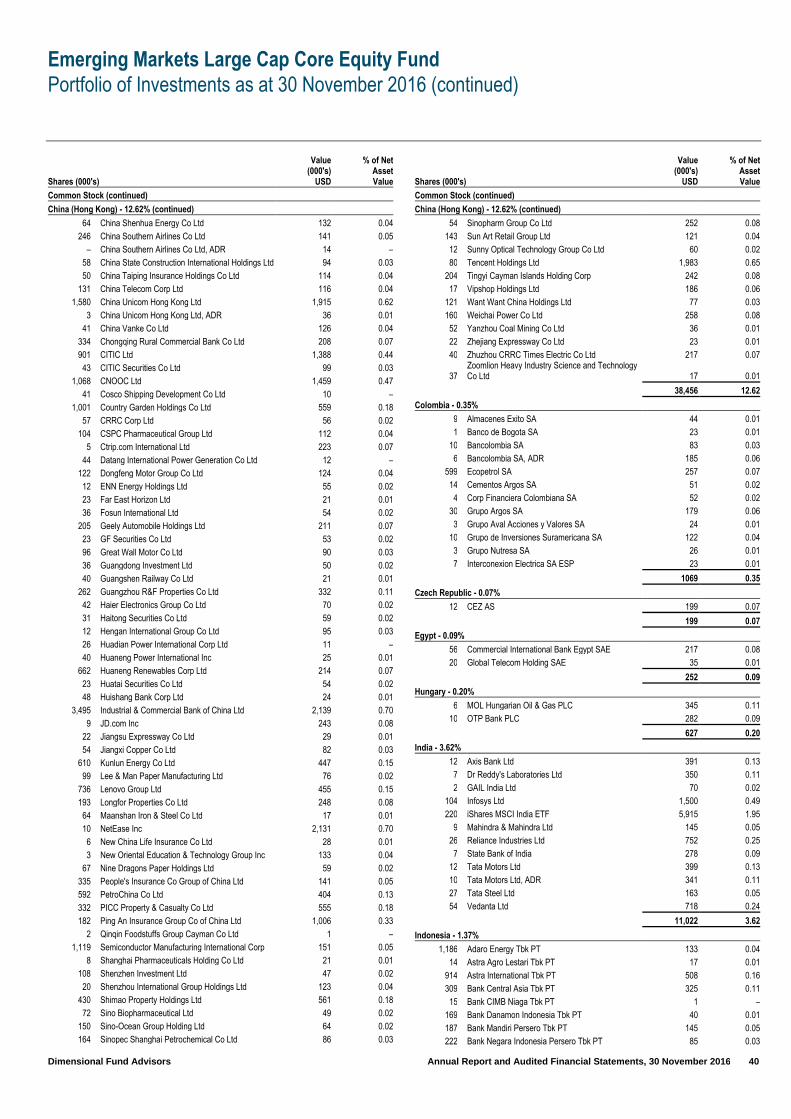
Emerging Markets Large Cap Core Equity Fund
Portfolio of Investments as at 30 November 2016 (continued)
Dimensional Fund Advisors Annual Report and Audited Financial Statements, 30 November 2016 40
Shares (000's)
Value (000's)
USD
% of Net Asset Value
Common Stock (continued)
China (Hong Kong) - 12.62% (continued)
64 China Shenhua Energy Co Ltd 132 0.04
246 China Southern Airlines Co Ltd 141 0.05
– China Southern Airlines Co Ltd, ADR 14 –
58 China State Construction International Holdings Ltd 94 0.03
50 China Taiping Insurance Holdings Co Ltd 114 0.04
131 China Telecom Corp Ltd 116 0.04
1,580 China Unicom Hong Kong Ltd 1,915 0.62
3 China Unicom Hong Kong Ltd, ADR 36 0.01
41 China Vanke Co Ltd 126 0.04
334 Chongqing Rural Commercial Bank Co Ltd 208 0.07
901 CITIC Ltd 1,388 0.44
43 CITIC Securities Co Ltd 99 0.03
1,068 CNOOC Ltd 1,459 0.47
41 Cosco Shipping Development Co Ltd 10 –
1,001 Country Garden Holdings Co Ltd 559 0.18
57 CRRC Corp Ltd 56 0.02
104 CSPC Pharmaceutical Group Ltd 112 0.04
5 Ctrip.com International Ltd 223 0.07
44 Datang International Power Generation Co Ltd 12 –
122 Dongfeng Motor Group Co Ltd 124 0.04
12 ENN Energy Holdings Ltd 55 0.02
23 Far East Horizon Ltd 21 0.01
36 Fosun International Ltd 54 0.02
205 Geely Automobile Holdings Ltd 211 0.07
23 GF Securities Co Ltd 53 0.02
96 Great Wall Motor Co Ltd 90 0.03
36 Guangdong Investment Ltd 50 0.02
40 Guangshen Railway Co Ltd 21 0.01
262 Guangzhou R&F Properties Co Ltd 332 0.11
42 Haier Electronics Group Co Ltd 70 0.02
31 Haitong Securities Co Ltd 59 0.02
12 Hengan International Group Co Ltd 95 0.03
26 Huadian Power International Corp Ltd 11 –
40 Huaneng Power International Inc 25 0.01
662 Huaneng Renewables Corp Ltd 214 0.07
23 Huatai Securities Co Ltd 54 0.02
48 Huishang Bank Corp Ltd 24 0.01
3,495 Industrial & Commercial Bank of China Ltd 2,139 0.70
9 JD.com Inc 243 0.08
22 Jiangsu Expressway Co Ltd 29 0.01
54 Jiangxi Copper Co Ltd 82 0.03
610 Kunlun Energy Co Ltd 447 0.15
99 Lee & Man Paper Manufacturing Ltd 76 0.02
736 Lenovo Group Ltd 455 0.15
193 Longfor Properties Co Ltd 248 0.08
64 Maanshan Iron & Steel Co Ltd 17 0.01
10 NetEase Inc 2,131 0.70
6 New China Life Insurance Co Ltd 28 0.01
3 New Oriental Education & Technology Group Inc 133 0.04
67 Nine Dragons Paper Holdings Ltd 59 0.02
335 People's Insurance Co Group of China Ltd 141 0.05
592 PetroChina Co Ltd 404 0.13
332 PICC Property & Casualty Co Ltd 555 0.18
182 Ping An Insurance Group Co of China Ltd 1,006 0.33
2 Qinqin Foodstuffs Group Cayman Co Ltd 1 –
1,119 Semiconductor Manufacturing International Corp 151 0.05
8 Shanghai Pharmaceuticals Holding Co Ltd 21 0.01
108 Shenzhen Investment Ltd 47 0.02
20 Shenzhou International Group Holdings Ltd 123 0.04
430 Shimao Property Holdings Ltd 561 0.18
72 Sino Biopharmaceutical Ltd 49 0.02
150 Sino-Ocean Group Holding Ltd 64 0.02
164 Sinopec Shanghai Petrochemical Co Ltd 86 0.03
Shares (000's)
Value (000's)
USD
% of Net Asset Value
Common Stock (continued)
China (Hong Kong) - 12.62% (continued)
54 Sinopharm Group Co Ltd 252 0.08
143 Sun Art Retail Group Ltd 121 0.04
12 Sunny Optical Technology Group Co Ltd 60 0.02
80 Tencent Holdings Ltd 1,983 0.65
204 Tingyi Cayman Islands Holding Corp 242 0.08
17 Vipshop Holdings Ltd 186 0.06
121 Want Want China Holdings Ltd 77 0.03
160 Weichai Power Co Ltd 258 0.08
52 Yanzhou Coal Mining Co Ltd 36 0.01
22 Zhejiang Expressway Co Ltd 23 0.01
40 Zhuzhou CRRC Times Electric Co Ltd 217 0.07
37 Zoomlion Heavy Industry Science and Technology Co Ltd 17 0.01
38,456 12.62
Colombia - 0.35%
9 Almacenes Exito SA 44 0.01
1 Banco de Bogota SA 23 0.01
10 Bancolombia SA 83 0.03
6 Bancolombia SA, ADR 185 0.06
599 Ecopetrol SA 257 0.07
14 Cementos Argos SA 51 0.02
4 Corp Financiera Colombiana SA 52 0.02
30 Grupo Argos SA 179 0.06
3 Grupo Aval Acciones y Valores SA 24 0.01
10 Grupo de Inversiones Suramericana SA 122 0.04
3 Grupo Nutresa SA 26 0.01
7 Interconexion Electrica SA ESP 23 0.01
1069 0.35
Czech Republic - 0.07%
12 CEZ AS 199 0.07
199 0.07
Egypt - 0.09%
56 Commercial International Bank Egypt SAE 217 0.08
20 Global Telecom Holding SAE 35 0.01
252 0.09
Hungary - 0.20%
6 MOL Hungarian Oil & Gas PLC 345 0.11
10 OTP Bank PLC 282 0.09
627 0.20
India - 3.62%
12 Axis Bank Ltd 391 0.13
7 Dr Reddy's Laboratories Ltd 350 0.11
2 GAIL India Ltd 70 0.02
104 Infosys Ltd 1,500 0.49
220 iShares MSCI India ETF 5,915 1.95
9 Mahindra & Mahindra Ltd 145 0.05
26 Reliance Industries Ltd 752 0.25
7 State Bank of India 278 0.09
12 Tata Motors Ltd 399 0.13
10 Tata Motors Ltd, ADR 341 0.11
27 Tata Steel Ltd 163 0.05
54 Vedanta Ltd 718 0.24
11,022 3.62
Indonesia - 1.37%
1,186 Adaro Energy Tbk PT 133 0.04
14 Astra Agro Lestari Tbk PT 17 0.01
914 Astra International Tbk PT 508 0.16
309 Bank Central Asia Tbk PT 325 0.11
15 Bank CIMB Niaga Tbk PT 1 –
169 Bank Danamon Indonesia Tbk PT 40 0.01
187 Bank Mandiri Persero Tbk PT 145 0.05
222 Bank Negara Indonesia Persero Tbk PT 85 0.03
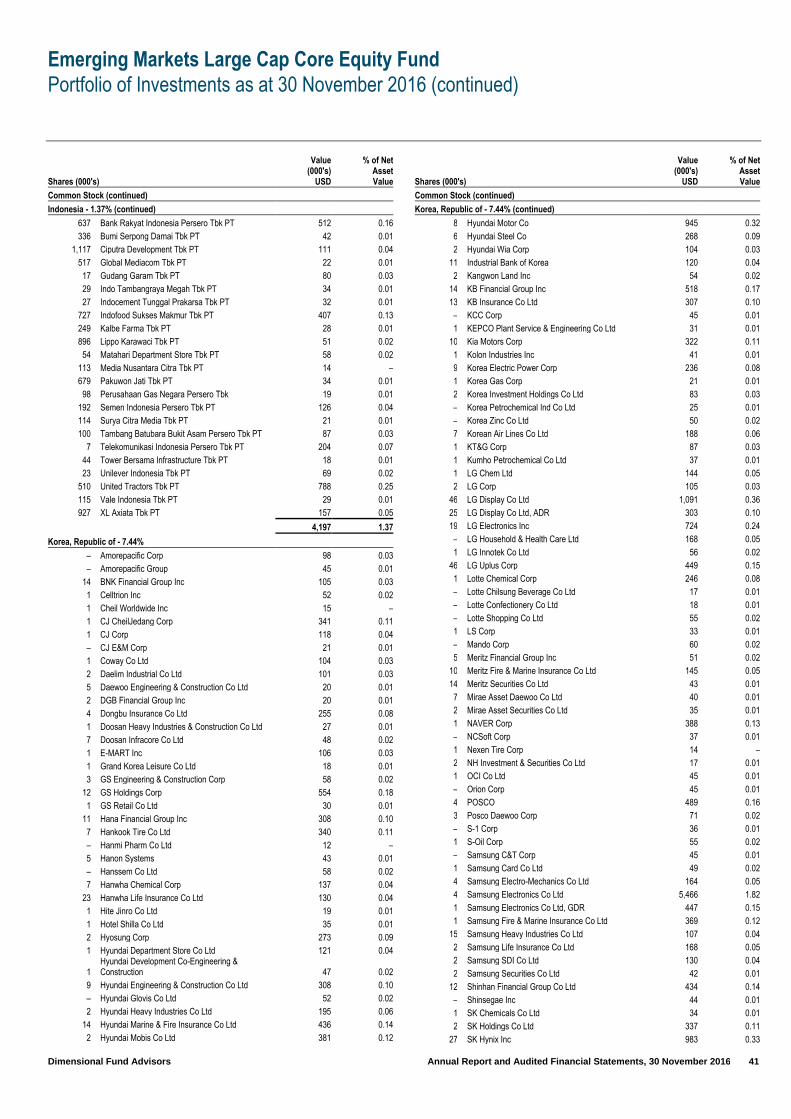
Emerging Markets Large Cap Core Equity Fund
Portfolio of Investments as at 30 November 2016 (continued)
Dimensional Fund Advisors Annual Report and Audited Financial Statements, 30 November 2016 41
Shares (000's)
Value (000's)
USD
% of Net Asset Value
Common Stock (continued)
Indonesia - 1.37% (continued)
637 Bank Rakyat Indonesia Persero Tbk PT 512 0.16
336 Bumi Serpong Damai Tbk PT 42 0.01
1,117 Ciputra Development Tbk PT 111 0.04
517 Global Mediacom Tbk PT 22 0.01
17 Gudang Garam Tbk PT 80 0.03
29 Indo Tambangraya Megah Tbk PT 34 0.01
27 Indocement Tunggal Prakarsa Tbk PT 32 0.01
727 Indofood Sukses Makmur Tbk PT 407 0.13
249 Kalbe Farma Tbk PT 28 0.01
896 Lippo Karawaci Tbk PT 51 0.02
54 Matahari Department Store Tbk PT 58 0.02
113 Media Nusantara Citra Tbk PT 14 –
679 Pakuwon Jati Tbk PT 34 0.01
98 Perusahaan Gas Negara Persero Tbk 19 0.01
192 Semen Indonesia Persero Tbk PT 126 0.04
114 Surya Citra Media Tbk PT 21 0.01
100 Tambang Batubara Bukit Asam Persero Tbk PT 87 0.03
7 Telekomunikasi Indonesia Persero Tbk PT 204 0.07
44 Tower Bersama Infrastructure Tbk PT 18 0.01
23 Unilever Indonesia Tbk PT 69 0.02
510 United Tractors Tbk PT 788 0.25
115 Vale Indonesia Tbk PT 29 0.01
927 XL Axiata Tbk PT 157 0.05
4,197 1.37
Korea, Republic of - 7.44%
– Amorepacific Corp 98 0.03
– Amorepacific Group 45 0.01
14 BNK Financial Group Inc 105 0.03
1 Celltrion Inc 52 0.02
1 Cheil Worldwide Inc 15 –
1 CJ CheilJedang Corp 341 0.11
1 CJ Corp 118 0.04
– CJ E&M Corp 21 0.01
1 Coway Co Ltd 104 0.03
2 Daelim Industrial Co Ltd 101 0.03
5 Daewoo Engineering & Construction Co Ltd 20 0.01
2 DGB Financial Group Inc 20 0.01
4 Dongbu Insurance Co Ltd 255 0.08
1 Doosan Heavy Industries & Construction Co Ltd 27 0.01
7 Doosan Infracore Co Ltd 48 0.02
1 E-MART Inc 106 0.03
1 Grand Korea Leisure Co Ltd 18 0.01
3 GS Engineering & Construction Corp 58 0.02
12 GS Holdings Corp 554 0.18
1 GS Retail Co Ltd 30 0.01
11 Hana Financial Group Inc 308 0.10
7 Hankook Tire Co Ltd 340 0.11
– Hanmi Pharm Co Ltd 12 –
5 Hanon Systems 43 0.01
– Hanssem Co Ltd 58 0.02
7 Hanwha Chemical Corp 137 0.04
23 Hanwha Life Insurance Co Ltd 130 0.04
1 Hite Jinro Co Ltd 19 0.01
1 Hotel Shilla Co Ltd 35 0.01
2 Hyosung Corp 273 0.09
1 Hyundai Department Store Co Ltd 121 0.04
1 Hyundai Development Co-Engineering & Construction 47 0.02
9 Hyundai Engineering & Construction Co Ltd 308 0.10
– Hyundai Glovis Co Ltd 52 0.02
2 Hyundai Heavy Industries Co Ltd 195 0.06
14 Hyundai Marine & Fire Insurance Co Ltd 436 0.14
2 Hyundai Mobis Co Ltd 381 0.12
Shares (000's)
Value (000's)
USD
% of Net Asset Value
Common Stock (continued)
Korea, Republic of - 7.44% (continued)
8 Hyundai Motor Co 945 0.32
6 Hyundai Steel Co 268 0.09
2 Hyundai Wia Corp 104 0.03
11 Industrial Bank of Korea 120 0.04
2 Kangwon Land Inc 54 0.02
14 KB Financial Group Inc 518 0.17
13 KB Insurance Co Ltd 307 0.10
– KCC Corp 45 0.01
1 KEPCO Plant Service & Engineering Co Ltd 31 0.01
10 Kia Motors Corp 322 0.11
1 Kolon Industries Inc 41 0.01
9 Korea Electric Power Corp 236 0.08
1 Korea Gas Corp 21 0.01
2 Korea Investment Holdings Co Ltd 83 0.03
– Korea Petrochemical Ind Co Ltd 25 0.01
– Korea Zinc Co Ltd 50 0.02
7 Korean Air Lines Co Ltd 188 0.06
1 KT&G Corp 87 0.03
1 Kumho Petrochemical Co Ltd 37 0.01
1 LG Chem Ltd 144 0.05
2 LG Corp 105 0.03
46 LG Display Co Ltd 1,091 0.36
25 LG Display Co Ltd, ADR 303 0.10
19 LG Electronics Inc 724 0.24
– LG Household & Health Care Ltd 168 0.05
1 LG Innotek Co Ltd 56 0.02
46 LG Uplus Corp 449 0.15
1 Lotte Chemical Corp 246 0.08
– Lotte Chilsung Beverage Co Ltd 17 0.01
– Lotte Confectionery Co Ltd 18 0.01
– Lotte Shopping Co Ltd 55 0.02
1 LS Corp 33 0.01
– Mando Corp 60 0.02
5 Meritz Financial Group Inc 51 0.02
10 Meritz Fire & Marine Insurance Co Ltd 145 0.05
14 Meritz Securities Co Ltd 43 0.01
7 Mirae Asset Daewoo Co Ltd 40 0.01
2 Mirae Asset Securities Co Ltd 35 0.01
1 NAVER Corp 388 0.13
– NCSoft Corp 37 0.01
1 Nexen Tire Corp 14 –
2 NH Investment & Securities Co Ltd 17 0.01
1 OCI Co Ltd 45 0.01
– Orion Corp 45 0.01
4 POSCO 489 0.16
3 Posco Daewoo Corp 71 0.02
– S-1 Corp 36 0.01
1 S-Oil Corp 55 0.02
– Samsung C&T Corp 45 0.01
1 Samsung Card Co Ltd 49 0.02
4 Samsung Electro-Mechanics Co Ltd 164 0.05
4 Samsung Electronics Co Ltd 5,466 1.82
1 Samsung Electronics Co Ltd, GDR 447 0.15
1 Samsung Fire & Marine Insurance Co Ltd 369 0.12
15 Samsung Heavy Industries Co Ltd 107 0.04
2 Samsung Life Insurance Co Ltd 168 0.05
2 Samsung SDI Co Ltd 130 0.04
2 Samsung Securities Co Ltd 42 0.01
12 Shinhan Financial Group Co Ltd 434 0.14
– Shinsegae Inc 44 0.01
1 SK Chemicals Co Ltd 34 0.01
2 SK Holdings Co Ltd 337 0.11
27 SK Hynix Inc 983 0.33

Emerging Markets Large Cap Core Equity Fund
Portfolio of Investments as at 30 November 2016 (continued)
Dimensional Fund Advisors Annual Report and Audited Financial Statements, 30 November 2016 42
Shares (000's)
Value (000's)
USD
% of Net Asset Value
Common Stock (continued)
Korea, Republic of - 7.44% (continued)
2 SK Innovation Co Ltd 303 0.10
– SK Telecom Co Ltd 23 0.01
1 Youngone Corp 16 0.01
22,654 7.44
Malaysia - 1.39%
61 Aeon Co M Bhd 37 0.01
608 AirAsia Bhd 376 0.13
103 Alliance Financial Group Bhd 89 0.03
210 AMMB Holdings Bhd 196 0.06
36 Astro Malaysia Holdings Bhd 21 0.01
97 Axiata Group Bhd 91 0.03
27 Berjaya Sports Toto Bhd 19 0.01
11 BIMB Holdings Bhd 10 –
3 British American Tobacco Malaysia Bhd 31 0.01
68 Bumi Armada Bhd 8 –
10 Bursa Malaysia Bhd 20 0.01
6 Carlsberg Brewery Malaysia Bhd 19 0.01
95 CIMB Group Holdings Bhd 97 0.03
55 DiGi.Com Bhd 60 0.02
192 Felda Global Ventures Holdings Bhd 66 0.02
37 Gamuda Bhd 40 0.01
230 Genting Bhd 409 0.13
86 Genting Malaysia Bhd 90 0.03
47 HAP Seng Consolidated Bhd 84 0.03
22 Hartalega Holdings Bhd 24 0.01
9 Hong Leong Bank Bhd 28 0.01
40 Hong Leong Financial Group Bhd 134 0.04
17 IHH Healthcare Bhd 25 0.01
143 IJM Corp Bhd 104 0.03
50 IOI Corp Bhd 49 0.02
76 IOI Properties Group Bhd 36 0.01
4 Kuala Lumpur Kepong Bhd 21 0.01
9 Lafarge Malaysia Bhd 15 –
167 Malayan Banking Bhd 289 0.09
21 Malaysia Airports Holdings Bhd 30 0.01
133 Malaysia Building Society Bhd 27 0.01
33 Maxis Bhd 44 0.01
83 MISC Bhd 136 0.04
78 Petronas Chemicals Group Bhd 120 0.04
5 Petronas Dagangan Bhd 24 0.01
7 Petronas Gas Bhd 35 0.01
16 PPB Group Bhd 56 0.02
76 Public Bank Bhd 332 0.12
29 RHB Bank Bhd 32 0.01
822 SapuraKencana Petroleum Bhd 267 0.09
52 Sime Darby Bhd 92 0.03
19 SP Setia Bhd Group 14 –
33 Sunway Bhd 21 0.01
12 Telekom Malaysia Bhd 17 0.01
36 Tenaga Nasional Bhd 112 0.04
80 UEM Sunrise Bhd 19 0.01
25 UMW Holdings Bhd 29 0.01
21 Westports Holdings Bhd 20 0.01
844 YTL Corp Bhd 272 0.09
4,187 1.39
Mexico - 3.02%
428 Alfa SAB de CV 567 0.19
65 Alpek SAB de CV 89 0.03
1,295 America Movil SAB de CV 786 0.26
137 Arca Continental SAB de CV 724 0.24
104 Cemex SAB de CV 816 0.27
2 Coca-Cola Femsa SAB de CV 155 0.05
11 El Puerto de Liverpool SAB de CV 83 0.03
Shares (000's)
Value (000's)
USD
% of Net Asset Value
Common Stock (continued)
Mexico - 3.02% (continued)
10 Fomento Economico Mexicano SAB de CV 729 0.23
13 Gruma SAB de CV 148 0.05
10 Grupo Aeroportuario del Pacifico SAB de CV 84 0.03
2 Grupo Aeroportuario del Sureste SAB de CV 239 0.08
92 Grupo Bimbo SAB de CV 212 0.07
41 Grupo Carso SAB de CV 151 0.05
3 Grupo Elektra SAB DE CV 43 0.01
134 Grupo Financiero Banorte SAB de CV 624 0.21
61 Grupo Financiero Inbursa SAB de CV 83 0.03
87 Grupo Financiero Santander Mexico SAB de CV 121 0.04
60 Grupo Lala SAB de CV 92 0.03
579 Grupo Mexico SAB de CV 1,584 0.50
28 Grupo Sanborns SAB de CV 31 0.01
24 Grupo Televisa SAB 100 0.03
17 Grupo Televisa SAB, ADR 350 0.11
18 Impulsora del Desarrollo y el Empleo en America Latina SAB de CV 23 0.02
10 Industrias Penoles SAB de CV 211 0.07
4 Infraestructura Energetica Nova SAB de CV 19 0.01
88 Kimberly-Clark de Mexico SAB de CV 153 0.05
33 Megacable Holdings SAB de CV 103 0.03
143 Mexichem SAB de CV 341 0.11
13 Organizacion Soriana SAB de CV 30 0.01
22 Promotora y Operadora de Infraestructura SAB de CV 193 0.06
30 Telesites SAB de CV 18 0.01
164 Wal-Mart de Mexico SAB de CV 302 0.10
9,222 3.02
Peru - 0.29%
6 Credicorp Ltd 925 0.29
925 0.29
Philippines - 0.67%
22 Aboitiz Equity Ventures Inc 32 0.01
26 Aboitiz Power Corp 22 0.01
480 Alliance Global Group Inc 126 0.04
5 Ayala Corp 69 0.02
98 Ayala Land Inc 65 0.02
31 Bank of the Philippine Islands 56 0.02
58 BDO Unibank Inc 130 0.04
843 DMCI Holdings Inc 229 0.07
1,278 Energy Development Corp 131 0.04
1 Globe Telecom Inc 24 0.01
7 GT Capital Holdings Inc 168 0.05
61 International Container Terminal Services Inc 88 0.03
82 JG Summit Holdings Inc 113 0.04
10 Jollibee Foods Corp 45 0.01
115 LT Group Inc 30 0.01
640 Megaworld Corp 47 0.02
239 Metro Pacific Investments Corp 30 0.01
12 Metropolitan Bank & Trust Co 18 0.01
1 PLDT Inc 36 0.01
3 PLDT Inc, ADR 82 0.03
47 Puregold Price Club Inc 37 0.01
279 Robinsons Land Corp 144 0.05
15 Robinsons Retail Holdings Inc 22 0.01
98 San Miguel Corp 165 0.05
5 Security Bank Corp 19 0.01
8 Semirara Mining & Power Corp 20 0.01
2 SM Investments Corp 30 0.01
81 SM Prime Holdings Inc 43 0.01
13 Universal Robina Corp 44 0.01
2,065 0.67
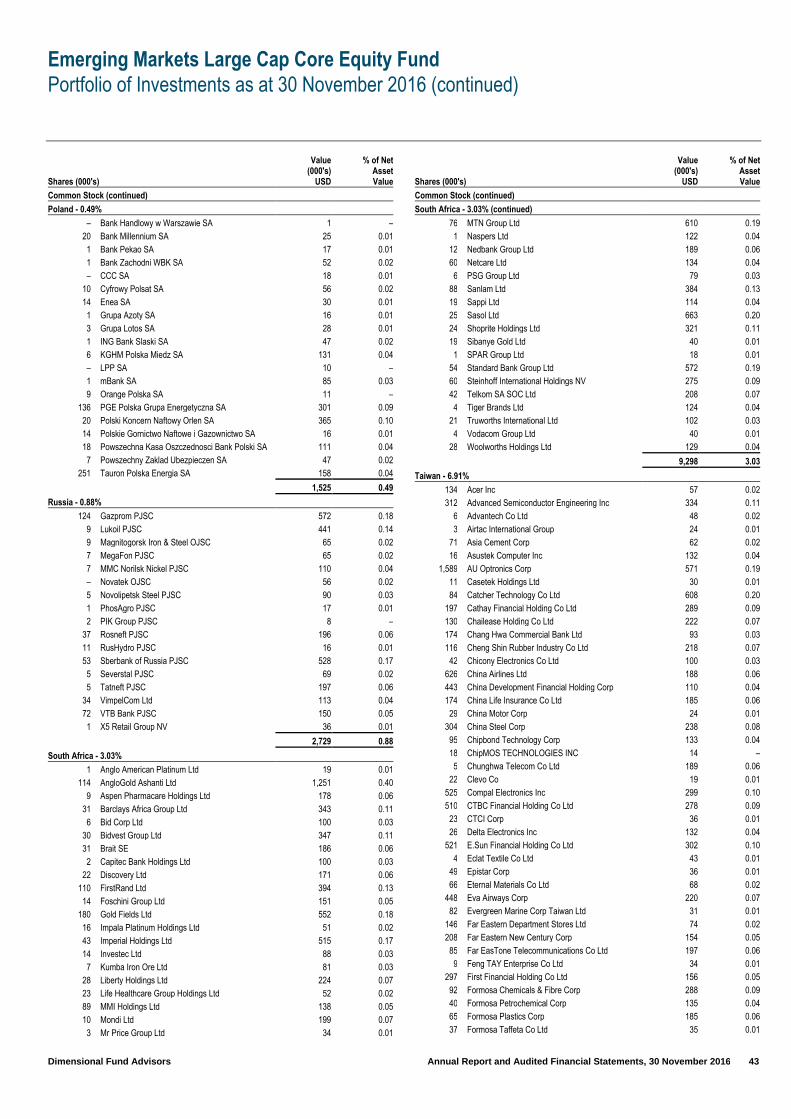
Emerging Markets Large Cap Core Equity Fund
Portfolio of Investments as at 30 November 2016 (continued)
Dimensional Fund Advisors Annual Report and Audited Financial Statements, 30 November 2016 43
Shares (000's)
Value (000's)
USD
% of Net Asset Value
Common Stock (continued)
Poland - 0.49%
– Bank Handlowy w Warszawie SA 1 –
20 Bank Millennium SA 25 0.01
1 Bank Pekao SA 17 0.01
1 Bank Zachodni WBK SA 52 0.02
– CCC SA 18 0.01
10 Cyfrowy Polsat SA 56 0.02
14 Enea SA 30 0.01
1 Grupa Azoty SA 16 0.01
3 Grupa Lotos SA 28 0.01
1 ING Bank Slaski SA 47 0.02
6 KGHM Polska Miedz SA 131 0.04
– LPP SA 10 –
1 mBank SA 85 0.03
9 Orange Polska SA 11 –
136 PGE Polska Grupa Energetyczna SA 301 0.09
20 Polski Koncern Naftowy Orlen SA 365 0.10
14 Polskie Gornictwo Naftowe i Gazownictwo SA 16 0.01
18 Powszechna Kasa Oszczednosci Bank Polski SA 111 0.04
7 Powszechny Zaklad Ubezpieczen SA 47 0.02
251 Tauron Polska Energia SA 158 0.04
1,525 0.49
Russia - 0.88%
124 Gazprom PJSC 572 0.18
9 Lukoil PJSC 441 0.14
9 Magnitogorsk Iron & Steel OJSC 65 0.02
7 MegaFon PJSC 65 0.02
7 MMC Norilsk Nickel PJSC 110 0.04
– Novatek OJSC 56 0.02
5 Novolipetsk Steel PJSC 90 0.03
1 PhosAgro PJSC 17 0.01
2 PIK Group PJSC 8 –
37 Rosneft PJSC 196 0.06
11 RusHydro PJSC 16 0.01
53 Sberbank of Russia PJSC 528 0.17
5 Severstal PJSC 69 0.02
5 Tatneft PJSC 197 0.06
34 VimpelCom Ltd 113 0.04
72 VTB Bank PJSC 150 0.05
1 X5 Retail Group NV 36 0.01
2,729 0.88
South Africa - 3.03%
1 Anglo American Platinum Ltd 19 0.01
114 AngloGold Ashanti Ltd 1,251 0.40
9 Aspen Pharmacare Holdings Ltd 178 0.06
31 Barclays Africa Group Ltd 343 0.11
6 Bid Corp Ltd 100 0.03
30 Bidvest Group Ltd 347 0.11
31 Brait SE 186 0.06
2 Capitec Bank Holdings Ltd 100 0.03
22 Discovery Ltd 171 0.06
110 FirstRand Ltd 394 0.13
14 Foschini Group Ltd 151 0.05
180 Gold Fields Ltd 552 0.18
16 Impala Platinum Holdings Ltd 51 0.02
43 Imperial Holdings Ltd 515 0.17
14 Investec Ltd 88 0.03
7 Kumba Iron Ore Ltd 81 0.03
28 Liberty Holdings Ltd 224 0.07
23 Life Healthcare Group Holdings Ltd 52 0.02
89 MMI Holdings Ltd 138 0.05
10 Mondi Ltd 199 0.07
3 Mr Price Group Ltd 34 0.01
Shares (000's)
Value (000's)
USD
% of Net Asset Value
Common Stock (continued)
South Africa - 3.03% (continued)
76 MTN Group Ltd 610 0.19
1 Naspers Ltd 122 0.04
12 Nedbank Group Ltd 189 0.06
60 Netcare Ltd 134 0.04
6 PSG Group Ltd 79 0.03
88 Sanlam Ltd 384 0.13
19 Sappi Ltd 114 0.04
25 Sasol Ltd 663 0.20
24 Shoprite Holdings Ltd 321 0.11
19 Sibanye Gold Ltd 40 0.01
1 SPAR Group Ltd 18 0.01
54 Standard Bank Group Ltd 572 0.19
60 Steinhoff International Holdings NV 275 0.09
42 Telkom SA SOC Ltd 208 0.07
4 Tiger Brands Ltd 124 0.04
21 Truworths International Ltd 102 0.03
4 Vodacom Group Ltd 40 0.01
28 Woolworths Holdings Ltd 129 0.04
9,298 3.03
Taiwan - 6.91%
134 Acer Inc 57 0.02
312 Advanced Semiconductor Engineering Inc 334 0.11
6 Advantech Co Ltd 48 0.02
3 Airtac International Group 24 0.01
71 Asia Cement Corp 62 0.02
16 Asustek Computer Inc 132 0.04
1,589 AU Optronics Corp 571 0.19
11 Casetek Holdings Ltd 30 0.01
84 Catcher Technology Co Ltd 608 0.20
197 Cathay Financial Holding Co Ltd 289 0.09
130 Chailease Holding Co Ltd 222 0.07
174 Chang Hwa Commercial Bank Ltd 93 0.03
116 Cheng Shin Rubber Industry Co Ltd 218 0.07
42 Chicony Electronics Co Ltd 100 0.03
626 China Airlines Ltd 188 0.06
443 China Development Financial Holding Corp 110 0.04
174 China Life Insurance Co Ltd 185 0.06
29 China Motor Corp 24 0.01
304 China Steel Corp 238 0.08
95 Chipbond Technology Corp 133 0.04
18 ChipMOS TECHNOLOGIES INC 14 –
5 Chunghwa Telecom Co Ltd 189 0.06
22 Clevo Co 19 0.01
525 Compal Electronics Inc 299 0.10
510 CTBC Financial Holding Co Ltd 278 0.09
23 CTCI Corp 36 0.01
26 Delta Electronics Inc 132 0.04
521 E.Sun Financial Holding Co Ltd 302 0.10
4 Eclat Textile Co Ltd 43 0.01
49 Epistar Corp 36 0.01
66 Eternal Materials Co Ltd 68 0.02
448 Eva Airways Corp 220 0.07
82 Evergreen Marine Corp Taiwan Ltd 31 0.01
146 Far Eastern Department Stores Ltd 74 0.02
208 Far Eastern New Century Corp 154 0.05
85 Far EasTone Telecommunications Co Ltd 197 0.06
9 Feng TAY Enterprise Co Ltd 34 0.01
297 First Financial Holding Co Ltd 156 0.05
92 Formosa Chemicals & Fibre Corp 288 0.09
40 Formosa Petrochemical Corp 135 0.04
65 Formosa Plastics Corp 185 0.06
37 Formosa Taffeta Co Ltd 35 0.01

Emerging Markets Large Cap Core Equity Fund
Portfolio of Investments as at 30 November 2016 (continued)
Dimensional Fund Advisors Annual Report and Audited Financial Statements, 30 November 2016 44
Shares (000's)
Value (000's)
USD
% of Net Asset Value
Common Stock (continued)
Taiwan - 6.91% (continued)
47 Foxconn Technology Co Ltd 122 0.04
241 Fubon Financial Holding Co Ltd 373 0.12
6 Giant Manufacturing Co Ltd 36 0.01
147 Highwealth Construction Corp 221 0.07
5 Hiwin Technologies Corp 22 0.01
460 Hon Hai Precision Industry Co Ltd 1,180 0.39
6 Hotai Motor Co Ltd 69 0.02
40 HTC Corp 105 0.03
220 Hua Nan Financial Holdings Co Ltd 112 0.04
1,343 Innolux Corp 462 0.15
198 Inotera Memories Inc 186 0.06
336 Inventec Corp 226 0.08
33 Kenda Rubber Industrial Co Ltd 48 0.02
2 King Slide Works Co Ltd 23 0.01
381 King Yuan Electronics Co Ltd 314 0.10
73 King's Town Bank Co Ltd 62 0.02
34 Kinsus Interconnect Technology Corp 76 0.02
2 Largan Precision Co Ltd 231 0.08
207 Lite-On Technology Corp 326 0.11
3 Makalot Industrial Co Ltd 13 0.00
28 MediaTek Inc 194 0.06
242 Mega Financial Holding Co Ltd 173 0.06
5 Merida Industry Co Ltd 22 0.01
29 Micro-Star International Co Ltd 77 0.03
77 Nan Ya Plastics Corp 162 0.05
15 Nan Ya Printed Circuit Board Corp 11 0.00
21 Nanya Technology Corp 29 0.01
34 Novatek Microelectronics Corp 113 0.04
3 PChome Online Inc 23 0.01
260 Pegatron Corp 618 0.20
6 Phison Electronics Corp 46 0.02
219 Pou Chen Corp 274 0.09
132 Powertech Technology Inc 338 0.11
13 President Chain Store Corp 98 0.03
117 Quanta Computer Inc 217 0.07
9 Realtek Semiconductor Corp 28 0.01
24 Ruentex Development Co Ltd 28 0.01
501 Shin Kong Financial Holding Co Ltd 129 0.04
54 Siliconware Precision Industries Co Ltd 82 0.03
24 Simplo Technology Co Ltd 71 0.02
274 SinoPac Financial Holdings Co Ltd 78 0.03
65 Synnex Technology International Corp 66 0.02
302 Taishin Financial Holding Co Ltd 111 0.04
216 Taiwan Business Bank 55 0.02
105 Taiwan Cement Corp 121 0.04
247 Taiwan Cooperative Financial Holding Co Ltd 109 0.04
39 Taiwan Fertilizer Co Ltd 50 0.02
53 Taiwan Glass Industry Corp 22 0.01
29 Taiwan Mobile Co Ltd 98 0.03
414 Taiwan Semiconductor Manufacturing Co Ltd 2,380 0.78
70 Taiwan Semiconductor Manufacturing Co Ltd, ADR 2,058 0.68
92 Teco Electric and Machinery Co Ltd 77 0.03
27 Tong Yang Industry Co Ltd 57 0.02
15 TPK Holding Co Ltd 25 0.01
7 Transcend Information Inc 19 0.01
58 Tripod Technology Corp 133 0.04
22 U-Ming Marine Transport Corp 18 0.01
131 Uni-President Enterprises Corp 224 0.07
2,009 United Microelectronics Corp 708 0.23
70 Vanguard International Semiconductor Corp 131 0.04
136 Wan Hai Lines Ltd 71 0.02
22 Win Semiconductors Corp 63 0.02
294 Winbond Electronics Corp 91 0.03
Shares (000's)
Value (000's)
USD
% of Net Asset Value
Common Stock (continued)
Taiwan - 6.91% (continued)
335 Wistron Corp 239 0.08
203 WPG Holdings Ltd 251 0.09
50 Yageo Corp 94 0.03
70 Yang Ming Marine Transport Corp 13 0.00
284 Yuanta Financial Holding Co Ltd 103 0.03
43 Yulon Motor Co Ltd 37 0.01
51 Zhen Ding Technology Holding Ltd 102 0.03
21,135 6.91
Thailand - 1.27%
20 Advanced Info Service PCL 80 0.03
6 Airports of Thailand PCL 65 0.02
85 Bangchak Petroleum PCL 78 0.03
10 Bangkok Bank PCL 42 0.01
41 Bangkok Dusit Medical Services PCL 27 0.01
73 Banpu PCL 38 0.01
11 BEC World PCL 5 0.00
29 Berli Jucker PCL 43 0.01
6 Bumrungrad Hospital PCL 34 0.01
21 Central Pattana PCL 34 0.01
45 Central Plaza Hotel PCL 52 0.02
286 Charoen Pokphand Foods PCL 231 0.08
59 CP ALL PCL 100 0.03
14 Delta Electronics Thailand PCL 29 0.01
15 Energy Absolute PCL 13 0.00
9 Glow Energy PCL 20 0.01
190 Home Product Center PCL 55 0.02
67 Indorama Ventures PCL 62 0.02
780 IRPC PCL 106 0.03
73 Jasmine International PCL 16 0.01
20 Kasikornbank PCL 96 0.03
10 Kasikornbank PCL, NVDR 46 0.02
11 KCE Electronics PCL 36 0.01
187 Krung Thai Bank PCL 92 0.03
185 Land & Houses PCL 48 0.02
42 Minor International PCL 44 0.01
7 MK Restaurants Group PCL 11 0.00
139 Pruksa Real Estate PCL 59 0.02
165 PTT Exploration & Production PCL 381 0.12
50 PTT Global Chemical PCL 87 0.03
124 PTT PCL 1,211 0.39
11 Siam Cement PCL 143 0.05
9 Siam City Cement PCL 64 0.02
30 Siam Commercial Bank PCL 122 0.04
108 Thai Airways International PCL 75 0.02
48 Thai Oil PCL 99 0.03
29 Thaicom PCL 16 0.01
276 TMB Bank PCL 16 0.01
72 Total Access Communication PCL 69 0.02
348 True Corp PCL 70 0.02
3,915 1.27
Turkey - 0.48%
54 Akbank TAS 117 0.04
14 Anadolu Efes Biracilik Ve Malt Sanayii AS 75 0.02
9 Arcelik AS 50 0.02
5 BIM Birlesik Magazalar AS 71 0.02
5 Coca-Cola Icecek AS 52 0.02
27 Eregli Demir ve Celik Fabrikalari TAS 37 0.01
2 Ford Otomotiv Sanayi AS 17 0.01
25 KOC Holding AS 90 0.03
4 Koza Altin Isletmeleri AS 17 0.01
37 Petkim Petrokimya Holding AS 39 0.01
15 Soda Sanayii AS 20 0.01
4 TAV Havalimanlari Holding AS 16 0.01

Emerging Markets Large Cap Core Equity Fund
Portfolio of Investments as at 30 November 2016 (continued)
Dimensional Fund Advisors Annual Report and Audited Financial Statements, 30 November 2016 45
Shares (000's)
Value (000's)
USD
% of Net Asset Value
Common Stock (continued)
Turkey - 0.48% (continued)
4 Tofas Turk Otomobil Fabrikasi AS 25 0.01
5 Tupras Turkiye Petrol Rafinerileri AS 92 0.03
118 Turk Hava Yollari AO 165 0.05
26 Turkcell Iletisim Hizmetleri AS 67 0.02
71 Turkiye Garanti Bankasi AS 150 0.04
31 Turkiye Halk Bankasi AS 79 0.03
31 Turkiye Is Bankasi 43 0.01
38 Turkiye Sinai Kalkinma Bankasi AS 14 0.00
215 Turkiye Sise ve Cam Fabrikalari AS 208 0.05
57 Turkiye Vakiflar Bankasi TAO 69 0.02
3 Ulker Biskuvi Sanayi AS 14 0.00
21 Yapi ve Kredi Bankasi AS 19 0.01
1,546 0.48
Total Common Stock – 47.28% (30 November 2015: 96.76%) 144,418 47.28
Preferred Stock
Brazil - 1.57%
80 Banco Bradesco SA 704 0.23
18 Cia Brasileira de Distribuicao 291 0.10
12 Cia Energetica de Minas Gerais 27 0.01
184 Itau Unibanco Holding SA 1,923 0.63
17 Lojas Americanas SA 80 0.03
265 Petroleo Brasileiro SA 1,247 0.41
10 Suzano Papel e Celulose SA 38 0.01
3 Telefonica Brasil SA 45 0.01
2 Usinas Siderurgicas de Minas Gerais SA 2 0.00
56 Vale SA 424 0.14
Shares (000's)
Value (000's)
USD
% of Net Asset Value
Preferred Stock (continued) 4,781 1.57
Colombia - 0.04%
3 Banco Davivienda SA 32 0.01
11 Grupo Argos SA 59 0.02
5 Grupo de Inversiones Suramericana SA 46 0.01
137 0.04
Total Preferred Stock – 1.61% (30 November 2015: 2.72%) 4,918 1.61
Real Estate Investment Trust
Mexico - 0.04%
82 Fibra Uno Administracion SA de CV 127 0.04
127 0.04
South Africa - 0.02%
21 Growthpoint Properties Ltd 37 0.01
34 Redefine Properties Ltd 25 0.01
62 0.02
Turkey - 0.01%
29 Emlak Konut Gayrimenkul Yatirim Ortakligi AS 24 0.01
24 0.01
Total Real Estate Investment Trust – 0.11% (30 November 2015: 0.15%) 213 0.07
Rights
Taiwan – 0.00%
11 Taishin Financial Holding Co Ltd – –
– –
Total Rights – 0.00% (30 November 2015: 0.00%) – –
Total Investments – 48.96% (30 November 2015: 99.63%) 149,549 48.96
Futures Contracts – 0.00% (December 31, 2015: (0.00)%)
Number of Contracts Long/(Short) Investment Maturity Date Counterparty
Unrealised Appreciation/
(Depreciation) USD
% of Net Asset Value
465 MSCI Emerging Market Mini Futures 16/12/2016 Citibank N.A. 1 –
516 S&P 500 E-Mini Index Futures 16/12/2016 Citibank N.A. 1 –
Unrealised Appreciation of Futures Contracts 2 –
Unrealised Depreciation of Futures Contracts – –
Net Unrealised Appreciation of Futures Contracts – (7.04)% (30 November 2015: Nil) 2 –
Value (000's)
USD
% of Net
Asset Value
Cash and Cash Equivalents – 0.29% (30 November 2015: 0.38%) 898 0.29
Other Net Assets – 50.75% (30 November 2015: (0.01)%) 155,020 50.75
Total Net Assets 305,469 100.00
– Amounts designated as “–” are either, less than $500 or less than 500 shares.
Analysis of Total Assets (unaudited) % of Total
Assets
Transferable securities admitted to an official stock exchange listing 44.57
Other transferable securities of the type referred to in Regulations 68 (1)(a), (b) and (c) 0.02
Investment funds 1.84
Current Assets 53.57
Total Assets 100.00
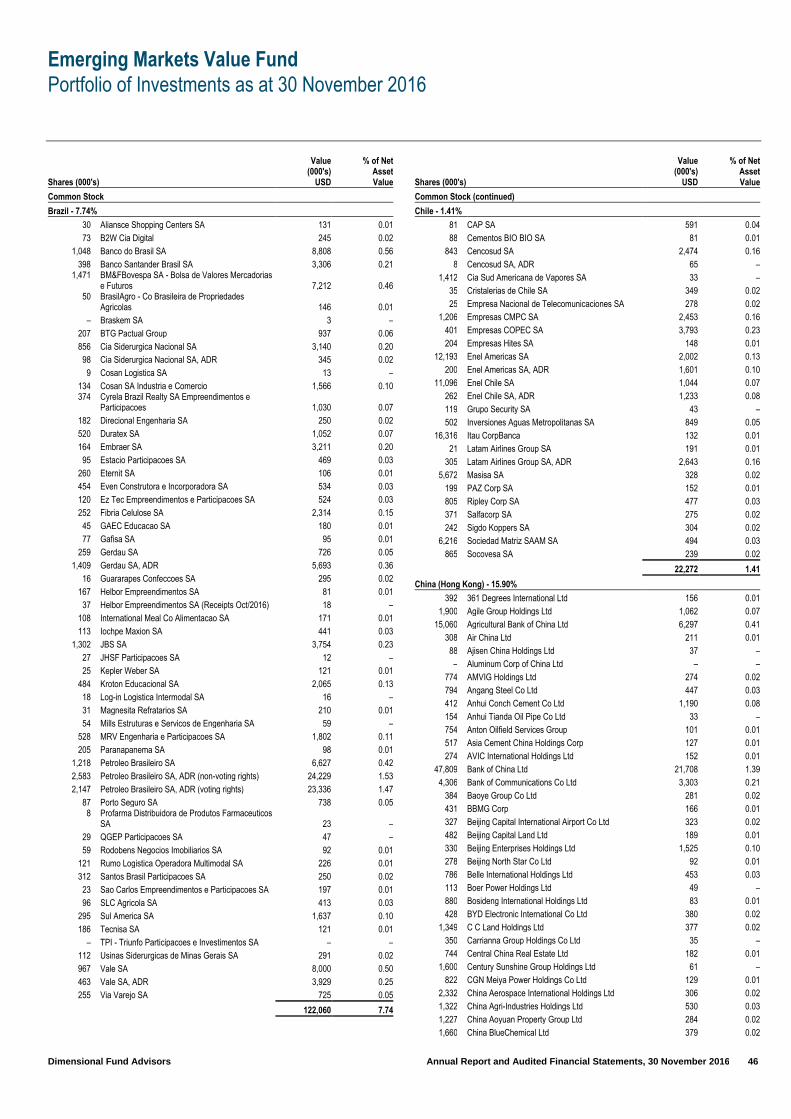
Emerging Markets Value Fund
Portfolio of Investments as at 30 November 2016
Dimensional Fund Advisors Annual Report and Audited Financial Statements, 30 November 2016 46
Shares (000's)
Value (000's)
USD
% of Net Asset Value
Common Stock
Brazil - 7.74%
30 Aliansce Shopping Centers SA 131 0.01
73 B2W Cia Digital 245 0.02
1,048 Banco do Brasil SA 8,808 0.56
398 Banco Santander Brasil SA 3,306 0.21 1,471
BM&FBovespa SA - Bolsa de Valores Mercadorias e Futuros 7,212 0.46
50 BrasilAgro - Co Brasileira de Propriedades Agricolas 146 0.01
– Braskem SA 3 –
207 BTG Pactual Group 937 0.06
856 Cia Siderurgica Nacional SA 3,140 0.20
98 Cia Siderurgica Nacional SA, ADR 345 0.02
9 Cosan Logistica SA 13 –
134 Cosan SA Industria e Comercio 1,566 0.10 374
Cyrela Brazil Realty SA Empreendimentos e Participacoes 1,030 0.07
182 Direcional Engenharia SA 250 0.02
520 Duratex SA 1,052 0.07
164 Embraer SA 3,211 0.20
95 Estacio Participacoes SA 469 0.03
260 Eternit SA 106 0.01
454 Even Construtora e Incorporadora SA 534 0.03
120 Ez Tec Empreendimentos e Participacoes SA 524 0.03
252 Fibria Celulose SA 2,314 0.15
45 GAEC Educacao SA 180 0.01
77 Gafisa SA 95 0.01
259 Gerdau SA 726 0.05
1,409 Gerdau SA, ADR 5,693 0.36
16 Guararapes Confeccoes SA 295 0.02
167 Helbor Empreendimentos SA 81 0.01
37 Helbor Empreendimentos SA (Receipts Oct/2016) 18 –
108 International Meal Co Alimentacao SA 171 0.01
113 Iochpe Maxion SA 441 0.03
1,302 JBS SA 3,754 0.23
27 JHSF Participacoes SA 12 –
25 Kepler Weber SA 121 0.01
484 Kroton Educacional SA 2,065 0.13
18 Log-in Logistica Intermodal SA 16 –
31 Magnesita Refratarios SA 210 0.01
54 Mills Estruturas e Servicos de Engenharia SA 59 –
528 MRV Engenharia e Participacoes SA 1,802 0.11
205 Paranapanema SA 98 0.01
1,218 Petroleo Brasileiro SA 6,627 0.42
2,583 Petroleo Brasileiro SA, ADR (non-voting rights) 24,229 1.53
2,147 Petroleo Brasileiro SA, ADR (voting rights) 23,336 1.47
87 Porto Seguro SA 738 0.05 8
Profarma Distribuidora de Produtos Farmaceuticos SA 23 –
29 QGEP Participacoes SA 47 –
59 Rodobens Negocios Imobiliarios SA 92 0.01
121 Rumo Logistica Operadora Multimodal SA 226 0.01
312 Santos Brasil Participacoes SA 250 0.02
23 Sao Carlos Empreendimentos e Participacoes SA 197 0.01
96 SLC Agricola SA 413 0.03
295 Sul America SA 1,637 0.10
186 Tecnisa SA 121 0.01
– TPI - Triunfo Participacoes e Investimentos SA – –
112 Usinas Siderurgicas de Minas Gerais SA 291 0.02
967 Vale SA 8,000 0.50
463 Vale SA, ADR 3,929 0.25
255 Via Varejo SA 725 0.05
122,060 7.74
Shares (000's)
Value (000's)
USD
% of Net Asset Value
Common Stock (continued)
Chile - 1.41%
81 CAP SA 591 0.04
88 Cementos BIO BIO SA 81 0.01
843 Cencosud SA 2,474 0.16
8 Cencosud SA, ADR 65 –
1,412 Cia Sud Americana de Vapores SA 33 –
35 Cristalerias de Chile SA 349 0.02
25 Empresa Nacional de Telecomunicaciones SA 278 0.02
1,206 Empresas CMPC SA 2,453 0.16
401 Empresas COPEC SA 3,793 0.23
204 Empresas Hites SA 148 0.01
12,193 Enel Americas SA 2,002 0.13
200 Enel Americas SA, ADR 1,601 0.10
11,096 Enel Chile SA 1,044 0.07
262 Enel Chile SA, ADR 1,233 0.08
119 Grupo Security SA 43 –
502 Inversiones Aguas Metropolitanas SA 849 0.05
16,316 Itau CorpBanca 132 0.01
21 Latam Airlines Group SA 191 0.01
305 Latam Airlines Group SA, ADR 2,643 0.16
5,672 Masisa SA 328 0.02
199 PAZ Corp SA 152 0.01
805 Ripley Corp SA 477 0.03
371 Salfacorp SA 275 0.02
242 Sigdo Koppers SA 304 0.02
6,216 Sociedad Matriz SAAM SA 494 0.03
865 Socovesa SA 239 0.02
22,272 1.41
China (Hong Kong) - 15.90%
392 361 Degrees International Ltd 156 0.01
1,900 Agile Group Holdings Ltd 1,062 0.07
15,060 Agricultural Bank of China Ltd 6,297 0.41
308 Air China Ltd 211 0.01
88 Ajisen China Holdings Ltd 37 –
– Aluminum Corp of China Ltd – –
774 AMVIG Holdings Ltd 274 0.02
794 Angang Steel Co Ltd 447 0.03
412 Anhui Conch Cement Co Ltd 1,190 0.08
154 Anhui Tianda Oil Pipe Co Ltd 33 –
754 Anton Oilfield Services Group 101 0.01
517 Asia Cement China Holdings Corp 127 0.01
274 AVIC International Holdings Ltd 152 0.01
47,809 Bank of China Ltd 21,708 1.39
4,306 Bank of Communications Co Ltd 3,303 0.21
384 Baoye Group Co Ltd 281 0.02
431 BBMG Corp 166 0.01
327 Beijing Capital International Airport Co Ltd 323 0.02
482 Beijing Capital Land Ltd 189 0.01
330 Beijing Enterprises Holdings Ltd 1,525 0.10
278 Beijing North Star Co Ltd 92 0.01
786 Belle International Holdings Ltd 453 0.03
113 Boer Power Holdings Ltd 49 –
880 Bosideng International Holdings Ltd 83 0.01
428 BYD Electronic International Co Ltd 380 0.02
1,349 C C Land Holdings Ltd 377 0.02
350 Carrianna Group Holdings Co Ltd 35 –
744 Central China Real Estate Ltd 182 0.01
1,600 Century Sunshine Group Holdings Ltd 61 –
822 CGN Meiya Power Holdings Co Ltd 129 0.01
2,332 China Aerospace International Holdings Ltd 306 0.02
1,322 China Agri-Industries Holdings Ltd 530 0.03
1,227 China Aoyuan Property Group Ltd 284 0.02
1,660 China BlueChemical Ltd 379 0.02
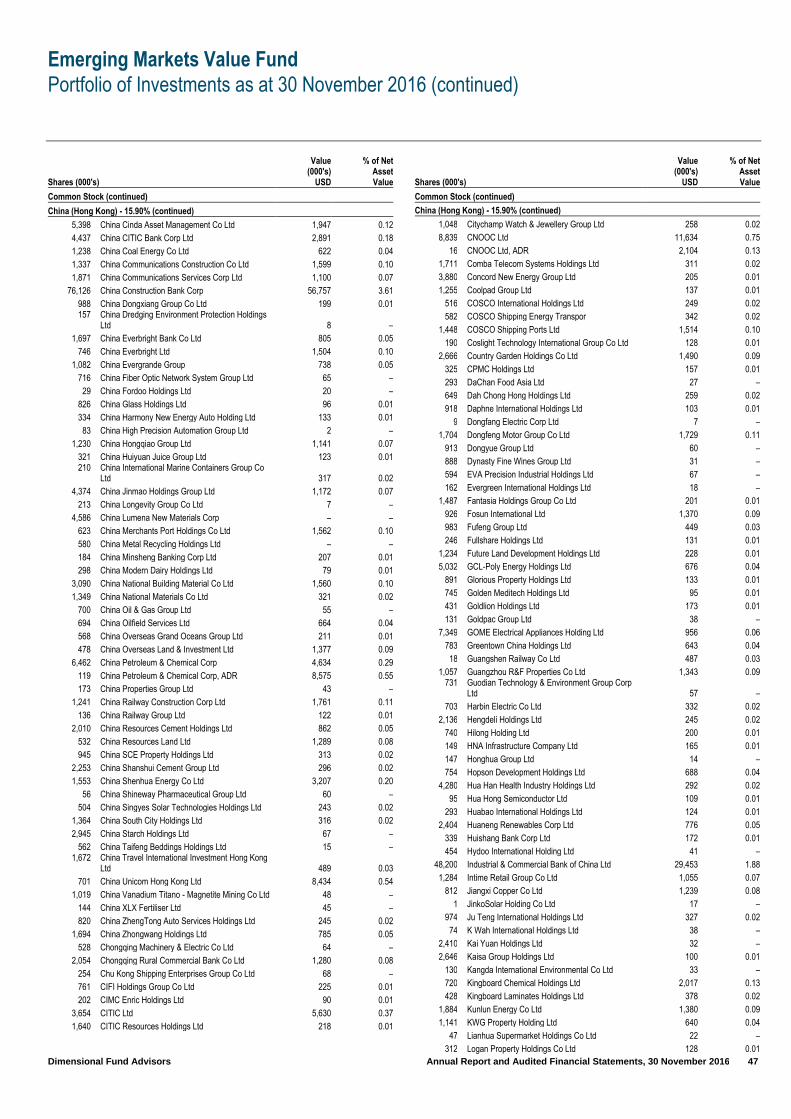
Emerging Markets Value Fund
Portfolio of Investments as at 30 November 2016 (continued)
Dimensional Fund Advisors Annual Report and Audited Financial Statements, 30 November 2016 47
Shares (000's)
Value (000's)
USD
% of Net Asset Value
Common Stock (continued)
China (Hong Kong) - 15.90% (continued)
5,398 China Cinda Asset Management Co Ltd 1,947 0.12
4,437 China CITIC Bank Corp Ltd 2,891 0.18
1,238 China Coal Energy Co Ltd 622 0.04
1,337 China Communications Construction Co Ltd 1,599 0.10
1,871 China Communications Services Corp Ltd 1,100 0.07
76,126 China Construction Bank Corp 56,757 3.61
988 China Dongxiang Group Co Ltd 199 0.01 157
China Dredging Environment Protection Holdings Ltd 8 –
1,697 China Everbright Bank Co Ltd 805 0.05
746 China Everbright Ltd 1,504 0.10
1,082 China Evergrande Group 738 0.05
716 China Fiber Optic Network System Group Ltd 65 –
29 China Fordoo Holdings Ltd 20 –
826 China Glass Holdings Ltd 96 0.01
334 China Harmony New Energy Auto Holding Ltd 133 0.01
83 China High Precision Automation Group Ltd 2 –
1,230 China Hongqiao Group Ltd 1,141 0.07
321 China Huiyuan Juice Group Ltd 123 0.01 210
China International Marine Containers Group Co Ltd 317 0.02
4,374 China Jinmao Holdings Group Ltd 1,172 0.07
213 China Longevity Group Co Ltd 7 –
4,586 China Lumena New Materials Corp – –
623 China Merchants Port Holdings Co Ltd 1,562 0.10
580 China Metal Recycling Holdings Ltd – –
184 China Minsheng Banking Corp Ltd 207 0.01
298 China Modern Dairy Holdings Ltd 79 0.01
3,090 China National Building Material Co Ltd 1,560 0.10
1,349 China National Materials Co Ltd 321 0.02
700 China Oil & Gas Group Ltd 55 –
694 China Oilfield Services Ltd 664 0.04
568 China Overseas Grand Oceans Group Ltd 211 0.01
478 China Overseas Land & Investment Ltd 1,377 0.09
6,462 China Petroleum & Chemical Corp 4,634 0.29
119 China Petroleum & Chemical Corp, ADR 8,575 0.55
173 China Properties Group Ltd 43 –
1,241 China Railway Construction Corp Ltd 1,761 0.11
136 China Railway Group Ltd 122 0.01
2,010 China Resources Cement Holdings Ltd 862 0.05
532 China Resources Land Ltd 1,289 0.08
945 China SCE Property Holdings Ltd 313 0.02
2,253 China Shanshui Cement Group Ltd 296 0.02
1,553 China Shenhua Energy Co Ltd 3,207 0.20
56 China Shineway Pharmaceutical Group Ltd 60 –
504 China Singyes Solar Technologies Holdings Ltd 243 0.02
1,364 China South City Holdings Ltd 316 0.02
2,945 China Starch Holdings Ltd 67 –
562 China Taifeng Beddings Holdings Ltd 15 – 1,672
China Travel International Investment Hong Kong Ltd 489 0.03
701 China Unicom Hong Kong Ltd 8,434 0.54
1,019 China Vanadium Titano - Magnetite Mining Co Ltd 48 –
144 China XLX Fertiliser Ltd 45 –
820 China ZhengTong Auto Services Holdings Ltd 245 0.02
1,694 China Zhongwang Holdings Ltd 785 0.05
528 Chongqing Machinery & Electric Co Ltd 64 –
2,054 Chongqing Rural Commercial Bank Co Ltd 1,280 0.08
254 Chu Kong Shipping Enterprises Group Co Ltd 68 –
761 CIFI Holdings Group Co Ltd 225 0.01
202 CIMC Enric Holdings Ltd 90 0.01
3,654 CITIC Ltd 5,630 0.37
1,640 CITIC Resources Holdings Ltd 218 0.01
Shares (000's)
Value (000's)
USD
% of Net Asset Value
Common Stock (continued)
China (Hong Kong) - 15.90% (continued)
1,048 Citychamp Watch & Jewellery Group Ltd 258 0.02
8,839 CNOOC Ltd 11,634 0.75
16 CNOOC Ltd, ADR 2,104 0.13
1,711 Comba Telecom Systems Holdings Ltd 311 0.02
3,880 Concord New Energy Group Ltd 205 0.01
1,255 Coolpad Group Ltd 137 0.01
516 COSCO International Holdings Ltd 249 0.02
582 COSCO Shipping Energy Transpor 342 0.02
1,448 COSCO Shipping Ports Ltd 1,514 0.10
190 Coslight Technology International Group Co Ltd 128 0.01
2,666 Country Garden Holdings Co Ltd 1,490 0.09
325 CPMC Holdings Ltd 157 0.01
293 DaChan Food Asia Ltd 27 –
649 Dah Chong Hong Holdings Ltd 259 0.02
918 Daphne International Holdings Ltd 103 0.01
9 Dongfang Electric Corp Ltd 7 –
1,704 Dongfeng Motor Group Co Ltd 1,729 0.11
913 Dongyue Group Ltd 60 –
888 Dynasty Fine Wines Group Ltd 31 –
594 EVA Precision Industrial Holdings Ltd 67 –
162 Evergreen International Holdings Ltd 18 –
1,487 Fantasia Holdings Group Co Ltd 201 0.01
926 Fosun International Ltd 1,370 0.09
983 Fufeng Group Ltd 449 0.03
246 Fullshare Holdings Ltd 131 0.01
1,234 Future Land Development Holdings Ltd 228 0.01
5,032 GCL-Poly Energy Holdings Ltd 676 0.04
891 Glorious Property Holdings Ltd 133 0.01
745 Golden Meditech Holdings Ltd 95 0.01
431 Goldlion Holdings Ltd 173 0.01
131 Goldpac Group Ltd 38 –
7,349 GOME Electrical Appliances Holding Ltd 956 0.06
783 Greentown China Holdings Ltd 643 0.04
18 Guangshen Railway Co Ltd 487 0.03
1,057 Guangzhou R&F Properties Co Ltd 1,343 0.09 731
Guodian Technology & Environment Group Corp Ltd 57 –
703 Harbin Electric Co Ltd 332 0.02
2,136 Hengdeli Holdings Ltd 245 0.02
740 Hilong Holding Ltd 200 0.01
149 HNA Infrastructure Company Ltd 165 0.01
147 Honghua Group Ltd 14 –
754 Hopson Development Holdings Ltd 688 0.04
4,280 Hua Han Health Industry Holdings Ltd 292 0.02
95 Hua Hong Semiconductor Ltd 109 0.01
293 Huabao International Holdings Ltd 124 0.01
2,404 Huaneng Renewables Corp Ltd 776 0.05
339 Huishang Bank Corp Ltd 172 0.01
454 Hydoo International Holding Ltd 41 –
48,200 Industrial & Commercial Bank of China Ltd 29,453 1.88
1,284 Intime Retail Group Co Ltd 1,055 0.07
812 Jiangxi Copper Co Ltd 1,239 0.08
1 JinkoSolar Holding Co Ltd 17 –
974 Ju Teng International Holdings Ltd 327 0.02
74 K Wah International Holdings Ltd 38 –
2,410 Kai Yuan Holdings Ltd 32 –
2,646 Kaisa Group Holdings Ltd 100 0.01
130 Kangda International Environmental Co Ltd 33 –
720 Kingboard Chemical Holdings Ltd 2,017 0.13
428 Kingboard Laminates Holdings Ltd 378 0.02
1,884 Kunlun Energy Co Ltd 1,380 0.09
1,141 KWG Property Holding Ltd 640 0.04
47 Lianhua Supermarket Holdings Co Ltd 22 –
312 Logan Property Holdings Co Ltd 128 0.01

Emerging Markets Value Fund
Portfolio of Investments as at 30 November 2016 (continued)
Dimensional Fund Advisors Annual Report and Audited Financial Statements, 30 November 2016 48
Shares (000's)
Value (000's)
USD
% of Net Asset Value
Common Stock (continued)
China (Hong Kong) - 15.90% (continued)
324 Longfor Properties Co Ltd 415 0.03
1,865 Lonking Holdings Ltd 372 0.02
1,358 Maoye International Holdings Ltd 126 0.01
228 MIE Holdings Corp 22 –
1,470 Mingyuan Medicare Development Co Ltd 8 –
1,836 Minmetals Land Ltd 234 0.01
1,560 MMG Ltd 437 0.03
170 Modern Land China Co Ltd 22 –
3,230 Munsun Capital Group Ltd 97 0.01
324 Nature Home Holding Co Ltd 45 –
659 New World Department Store China Ltd 92 0.01
1,445 Nine Dragons Paper Holdings Ltd 1,268 0.08
461 NVC Lighting Holding Ltd 63 –
825 Parkson Retail Group Ltd 86 0.01
1,070 People's Insurance Co Group of China Ltd 451 0.03
5,158 PetroChina Co Ltd 3,519 0.23
768 Poly Property Group Co Ltd 239 0.02
347 Pou Sheng International Holdings Ltd 106 0.01
1,134 Powerlong Real Estate Holdings Ltd 333 0.02
966 Qingling Motors Co Ltd 292 0.02
334 Qinhuangdao Port Co Ltd 81 0.01
1,017 Qunxing Paper Holdings Co Ltd 50 –
329 Real Gold Mining Ltd 11 –
848 Real Nutriceutical Group Ltd 67 –
81 Red Star Macalline Group Corp Ltd 79 0.01
3,200 REXLot Holdings Ltd 50 – 352
Sany Heavy Equipment International Holdings Co Ltd 61 –
394 Semiconductor Manufacturing International Corp 53 – 93
Semiconductor Manufacturing International Corp, ADR 624 0.04
71 Shandong Chenming Paper Holdings Ltd 70 –
480 Shanghai Electric Group Co Ltd 231 0.01
523 Shanghai Industrial Holdings Ltd 1,472 0.09 726
Shanghai Jin Jiang International Hotels Group Co Ltd 202 0.01
422 Shanghai Prime Machinery Co Ltd 80 0.01
18 Shengjing Bank Co Ltd 18 –
716 Shenguan Holdings Group Ltd 61 –
2,560 Shenzhen Investment Ltd 1,114 0.07
1,337 Shimao Property Holdings Ltd 1,746 0.11 1,438
Shougang Concord International Enterprises Co Ltd 51 –
1,518 Shougang Fushan Resources Group Ltd 326 0.02
768 Shunfeng International Clean Energy Ltd 65 –
618 Silver Grant International Industries Ltd 68 –
763 SIM Technology Group Ltd 31 –
2,756 Sino-Ocean Group Holding Ltd 1,173 0.07
1,596 Sinofert Holdings Ltd 220 0.01
123 SinoMedia Holding Ltd 30 –
172 Sinopec Engineering Group Co Ltd 149 0.01
394 Sinopec Kantons Holdings Ltd 177 0.01
277 Sinotrans Ltd 139 0.01
890 Sinotrans Shipping Ltd 194 0.01
791 Sinotruk Hong Kong Ltd 549 0.03
1,184 Skyworth Digital Holdings Ltd 742 0.05
304 Springland International Holdings Ltd 47 –
527 Sunac China Holdings Ltd 400 0.03
1,603 TCC International Holdings Ltd 393 0.02
170 TCL Multimedia Technology Holdings Ltd 83 0.01
625 Tian An China Investment Co Ltd 348 0.02
962 Tiangong International Co Ltd 115 0.01
2,184 Tianjin Port Development Holdings Ltd 340 0.02
1,024 Tianyi Summi Holdings Ltd 148 0.01
368 Tomson Group Ltd 122 0.01
Shares (000's)
Value (000's)
USD
% of Net Asset Value
Common Stock (continued)
China (Hong Kong) - 15.90% (continued)
206 TPV Technology Ltd 38 –
502 Trigiant Group Ltd 73 –
2,178 Trony Solar Holdings Co Ltd 33 –
50 Truly International Holdings Ltd 20 –
1,020 Universal Health International Group Holding Ltd 51 –
2,150 V1 Group Ltd 93 0.01
138 Wasion Group Holdings Ltd 87 0.01
268 Weichai Power Co Ltd 431 0.03
420 Weiqiao Textile Co 273 0.02
592 Welling Holding Ltd 116 0.01
2,264 West China Cement Ltd 230 0.01
1,080 Xiamen International Port Co Ltd 221 0.01
268 Xinchen China Power Holdings Ltd 43 –
875 Xingda International Holdings Ltd 357 0.02
234 Xiwang Special Steel Co Ltd 26 –
228 Yanzhou Coal Mining Co Ltd 159 0.01
1,008 Yingde Gases Group Co Ltd 397 0.03
132 Yip's Chemical Holdings Ltd 58 –
293 Youyuan International Holdings Ltd 78 –
888 Yuanda China Holdings Ltd 21 –
7,201 Yuexiu Property Co Ltd 1,065 0.07
1,127 Yuzhou Properties Co Ltd 411 0.03
155 Zhejiang Glass Co Ltd – –
402 Zhong An Real Estate Ltd 37 –
434 Zhongsheng Group Holdings Ltd 402 0.03 943
Zoomlion Heavy Industry Science and Technology Co Ltd 433 0.03
250,815 15.90
Colombia - 0.42%
228 Almacenes Exito SA 1,060 0.07
3,385 Ecopetrol SA 1,453 0.09
240 Grupo Argos SA 1,404 0.09
182 Grupo de Inversiones Suramericana SA 2,096 0.14
68 Grupo Nutresa SA 503 0.03
6,516 0.42
Czech Republic - 0.22%
148 CEZ AS 2,398 0.15
5 Pegas Nonwovens SA 143 0.01
132 Unipetrol AS 956 0.06
3,497 0.22
Greece - 0.08%
68 Alpha Bank AE 137 0.01
186 Ellaktor SA 227 0.02
76 GEK Terna Holding Real Estate Construction SA 182 0.01
31 Hellenic Petroleum SA 144 0.01
47 Intracom Holdings SA 15 –
56 Intralot SA-Integrated Lottery Systems & Services 64 –
61 Mytilineos Holdings SA 381 0.03
10 Terna Energy SA 30 –
1,180 0.08
Hong Kong - 0.00%
249 Samson Holding Ltd 19 –
19 –
Hungary - 0.41%
35 MOL Hungarian Oil & Gas PLC 2,216 0.14
158 OTP Bank PLC 4,245 0.27
6,461 0.41
India - 12.41%
15 Aarti Industries 153 0.01
24 Aban Offshore Ltd 85 0.01
22 ACC Ltd 438 0.03
393 Adani Enterprises Ltd 393 0.02

Emerging Markets Value Fund
Portfolio of Investments as at 30 November 2016 (continued)
Dimensional Fund Advisors Annual Report and Audited Financial Statements, 30 November 2016 49
Shares (000's)
Value (000's)
USD
% of Net Asset Value
Common Stock (continued)
India - 12.41% (continued)
191 Adani Ports & Special Economic Zone Ltd 773 0.05
1,196 Adani Power Ltd 501 0.03
256 Adani Transmission Ltd 217 0.01
310 Aditya Birla Fashion and Retail Ltd 632 0.04
71 Aditya Birla Nuvo Ltd 1,301 0.08
96 Alembic Ltd 50 –
97 Allcargo Logistics Ltd 252 0.02
530 Alok Industries Ltd 21 –
282 Ambuja Cements Ltd 867 0.05
78 Amtek Auto Ltd 47 –
51 Anant Raj Ltd 31 –
235 Andhra Bank 177 0.01
23 Apar Industries Ltd 195 0.01
367 Apollo Tyres Ltd 1,020 0.06
259 Arvind Ltd 1,376 0.09
23 Arvind SmartSpaces Ltd 24 –
113 Ashoka Buildcon Ltd 238 0.02
4 Atul Ltd 143 0.01
1,468 Axis Bank Ltd 10,048 0.65
28 Bajaj Finance Ltd 372 0.02
33 Bajaj Finserv Ltd 1,451 0.09
44 Bajaj Holdings & Investment Ltd 1,375 0.09
47 Balkrishna Industries Ltd 685 0.04
21 Balmer Lawrie & Co Ltd 298 0.02
130 Balrampur Chini Mills Ltd 233 0.01
458 Bank of Baroda 1,095 0.07
2 BEML Ltd 23 –
4 Bharat Electronics Ltd 81 0.01
589 Bharat Heavy Electricals Ltd 1,117 0.07
1,754 Bharti Airtel Ltd 8,289 0.54
59 Biocon Ltd 783 0.05
32 Birla Corp Ltd 315 0.02
10 Brigade Enterprises Ltd 22 –
665 Cairn India Ltd 2,456 0.16
37 Canara Bank 172 0.01
38 Ceat Ltd 713 0.05
278 Chambal Fertilizers & Chemicals Ltd 256 0.02
307 Chennai Super Kings Cricket Ltd 2 –
69 Cipla Ltd 570 0.04
163 City Union Bank Ltd 321 0.02
25 Container Corp Of India Ltd 434 0.03
80 Coromandel International Ltd 306 0.02
133 Cox & Kings Ltd 318 0.02
564 Crompton Greaves Consumer Electricals Ltd 1,218 0.08
457 Crompton Greaves Ltd 520 0.03
82 Cyient Ltd 601 0.04
16 Dalmia Bharat Ltd 385 0.02
283 DCB Bank Ltd 461 0.03
65 DCM Shriram Ltd 200 0.01
79 Deepak Fertilisers & Petrochemicals Corp Ltd 224 0.01
8 Deepak Nitrite Ltd 11 –
96 Delta Corp Ltd 161 0.01
24 DEN Networks Ltd 21 –
216 Dewan Housing Finance Corp Ltd 806 0.05
69 Dishman Pharmaceuticals & Chemicals Ltd 237 0.02
357 DLF Ltd 597 0.04
371 Edelweiss Financial Services Ltd 550 0.03
107 EID Parry India Ltd 388 0.02
194 EIH Ltd 290 0.02
100 Engineers India Ltd 427 0.03
30 Eros International Media Ltd 76 –
14 Escorts Ltd 65 –
79 Essel Propack Ltd 298 0.02
Shares (000's)
Value (000's)
USD
% of Net Asset Value
Common Stock (continued)
India - 12.41% (continued)
31 Eveready Industries India Ltd 99 0.01
125 Exide Industries Ltd 331 0.02
1,789 Federal Bank Ltd 1,846 0.12
82 Finolex Cables Ltd 492 0.03
25 Finolex Industries Ltd 159 0.01
376 Firstsource Solutions Ltd 202 0.01
118 Future Enterprises Ltd 28 –
118 Future Retail Ltd 213 0.01
423 GAIL India Ltd 2,617 0.17
16 Gateway Distriparks Ltd 56 –
65 Gati Ltd 118 0.01
18 Genus Power Infrastructures Ltd 11 –
35 Geometric Ltd 123 0.01
59 GHCL Ltd 209 0.01
10 GIC Housing Finance Ltd 42 –
8 Global Offshore Services Ltd 15 –
8 Godfrey Phillips India Ltd 112 0.01
75 Graphite India Ltd 83 0.01
147 Grasim Industries Ltd 1,854 0.13
106 Great Eastern Shipping Co Ltd 564 0.04
6 Greaves Cotton Ltd 12 –
46 Gujarat Alkalies & Chemicals Ltd 245 0.02
10 Gujarat Ambuja Exports Ltd 13 –
38 Gujarat Fluorochemicals Ltd 272 0.02
190 Gujarat Mineral Development Corp Ltd 295 0.02
20 Gujarat Narmada Valley Fertilizers & Chemicals Ltd 66 –
109 Gujarat State Fertilizers & Chemicals Ltd 143 0.01
266 Gujarat State Petronet Ltd 610 0.04
6 Gulf Oil Lubricants India Ltd 56 –
35 Hathway Cable & Datacom Ltd 18 –
12 HEG Ltd 28 –
120 HeidelbergCement India Ltd 201 0.01
4 Hexa Tradex Ltd 1 –
30 Hikal Ltd 100 0.01
970 Himachal Futuristic Communications Ltd 179 0.01
30 Himadri Speciality Chemical Ltd 17 –
86 Himatsingka Seide Ltd 356 0.02
1,201 Hindalco Industries Ltd 3,069 0.19
6 Hinduja Global Solutions Ltd 49 –
3 Hindustan Media Ventures Ltd 13 –
142 Housing Development & Infrastructure Ltd 128 0.01
47 HSIL Ltd 199 0.01
83 HT Media Ltd 87 0.01
3,514 ICICI Bank Ltd 13,607 0.87
1,814 Idea Cellular Ltd 2,040 0.13
1,490 IDFC Bank Ltd 1,496 0.09
1,472 IDFC Ltd 1,238 0.08
615 IFCI Ltd 209 0.01
264 IIFL Holdings Ltd 1,025 0.06
42 IL&FS Transportation Networks Ltd 61 –
331 India Cements Ltd 576 0.04
181 Indiabulls Housing Finance Ltd 2,021 0.13
262 Indiabulls Real Estate Ltd 268 0.02
131 Indian Bank 483 0.03
219 Indian Hotels Co Ltd 325 0.02
2 INEOS Styrolution India Ltd 17 –
7 Inox Leisure Ltd 23 –
45 Intellect Design Arena Ltd 95 0.01
25 Ipca Laboratories Ltd 210 0.01
31 ITD Cementation India Ltd 64 –
11 J Kumar Infraprojects Ltd 31 –
5 Jagran Prakashan Ltd 13 –
490 Jain Irrigation Systems Ltd 641 0.04

Emerging Markets Value Fund
Portfolio of Investments as at 30 November 2016 (continued)
Dimensional Fund Advisors Annual Report and Audited Financial Statements, 30 November 2016 50
Shares (000's)
Value (000's)
USD
% of Net Asset Value
Common Stock (continued)
India - 12.41% (continued)
156 Jaiprakash Associates Ltd 18 –
449 Jammu & Kashmir Bank Ltd 393 0.02
42 JB Chemicals & Pharmaceuticals Ltd 216 0.01
69 JBF Industries Ltd 208 0.01
34 Jindal Poly Films Ltd 175 0.01
279 Jindal Saw Ltd 225 0.01
194 Jindal Steel & Power Ltd 199 0.01
22 JK Cement Ltd 238 0.02
29 JK Lakshmi Cement Ltd 170 0.01
148 JK Tyre & Industries Ltd 264 0.02
448 JM Financial Ltd 455 0.03
816 JSW Energy Ltd 710 0.05
160 JSW Steel Ltd 3,996 0.25
22 JITF Infralogistics Ltd 13 –
75 Jubilant Life Sciences Ltd 775 0.05
68 Kalpataru Power Transmission Ltd 241 0.02
6 Kalyani Steels Ltd 27 –
204 Karnataka Bank Ltd 323 0.02
369 Karur Vysya Bank Ltd 452 0.03
34 Kaveri Seed Co Ltd 209 0.01
57 KCP Ltd 73 –
107 KEC International Ltd 226 0.01
4 Kirloskar Brothers Ltd 11 –
35 Kirloskar Oil Engines Ltd 167 0.01
178 KPIT Technologies Ltd 343 0.02
10 KPR Mill Ltd 89 0.01
47 KRBL Ltd 186 0.01
32 KSK Energy Ventures Ltd 10 –
43 Kwality Ltd 80 0.01
4 Lakshmi Machine Works Ltd 227 0.01
62 Lakshmi Vilas Bank Ltd 135 0.01
145 LIC Housing Finance Ltd 1,196 0.08
77 Magma Fincorp Ltd 114 0.01
147 Mahindra & Mahindra Financial Services Ltd 635 0.04
400 Mahindra & Mahindra Ltd 6,925 0.45
34 Mahindra & Mahindra Ltd, GDR 584 0.04
11 Mahindra CIE Automotive Ltd 30 –
19 Mahindra Holidays & Resorts India Ltd 110 0.01
16 Mahindra Lifespace Developers Ltd 88 0.01
16 Man Infraconstruction Ltd 10 –
454 Manappuram Finance Ltd 511 0.03
10 Max India Ltd 20 –
2 Max Ventures & Industries Ltd 2 –
52 McLeod Russel India Ltd 115 0.01
39 Meghmani Organics Ltd 25 –
42 Mercator Ltd 25 –
8 Merck Ltd 119 0.01
42 Mirza International Ltd 49 –
23 MOIL Ltd 128 0.01
102 Mphasis Ltd 785 0.05
1 MRF Ltd 1,057 0.07
145 Muthoot Finance Ltd 640 0.04
382 Nagarjuna Fertilizers and Chemicals Ltd 54 –
813 National Aluminium Co Ltd 677 0.04
24 Nava Bharat Ventures Ltd 44 –
316 NCC Ltd 369 0.02
121 Nectar Lifesciences Ltd 59 –
63 NIIT Ltd 70 –
58 NIIT Technologies Ltd 363 0.02
13 Nilkamal Ltd 256 0.02
26 NOCIL Ltd 26 –
72 Oberoi Realty Ltd 305 0.02
38 OCL India Ltd 451 0.03
Shares (000's)
Value (000's)
USD
% of Net Asset Value
Common Stock (continued)
India - 12.41% (continued)
35 Omaxe Ltd 83 0.01
64 OnMobile Global Ltd 86 0.01
94 Orient Cement Ltd 187 0.01
43 Oriental Bank of Commerce 75 –
48 PC Jeweller Ltd 257 0.02
11 Persistent Systems Ltd 101 0.01
208 Petronet LNG Ltd 1,178 0.07
88 Piramal Enterprises Ltd 2,174 0.14
8 Polaris Consulting & Services Ltd 19 –
4 Polyplex Corp Ltd 19 –
1,125 Power Finance Corp Ltd 2,199 0.14
129 Praj Industries Ltd 145 0.01
50 Prestige Estates Projects Ltd 113 0.01
243 PTC India Financial Services Ltd 139 0.01
408 PTC India Ltd 426 0.03
211 Punjab National Bank 425 0.03
57 Radico Khaitan Ltd 99 0.01
287 Rain Industries Ltd 212 0.01
73 Rajesh Exports Ltd 496 0.03
49 Ramco Cements Ltd 434 0.03
2 Ramco Systems Ltd 10 –
43 Rashtriya Chemicals & Fertilizers Ltd 29 –
10 Ratnamani Metals & Tubes Ltd 80 0.01
51 Raymond Ltd 378 0.02
315 Redington India Ltd 450 0.03
699 REI Agro Ltd 6 –
107 Reliance Capital Ltd 687 0.04
1,499 Reliance Communications Ltd 821 0.05
1,660 Reliance Industries Ltd 23,941 1.50
23 Reliance Industries Ltd, GDR 654 0.04
826 Reliance Power Ltd 502 0.03
171 Rolta India Ltd 128 0.01
94 Ruchi Soya Industries Ltd 28 –
1,191 Rural Electrification Corp Ltd 2,383 0.15
24 Sanghvi Movers Ltd 76 –
7 Shilpi Cable Technologies Ltd 19 –
188 Shipping Corp of India Ltd 161 0.01
2 Shriram City Union Finance Ltd 63 –
128 Shriram Transport Finance Co Ltd 1,680 0.11
8 Simplex Infrastructures Ltd 35 –
490 Sintex Industries Ltd 555 0.04
59 Sobha Ltd 219 0.01
33 Sona Koyo Steering Systems Ltd 29 –
78 Sonata Software Ltd 177 0.01
973 South Indian Bank Ltd 305 0.02
213 Srei Infrastructure Finance Ltd 251 0.02
29 SRF Ltd 663 0.04
20 State Bank of Bikaner & Jaipur 208 0.01
843 State Bank of India 3,167 0.20
6 State Bank of India, GDR 216 0.01
11 State Bank of Travancore 87 0.01
30 Steel Authority of India Ltd 22 –
196 Sterlite Technologies Ltd 274 0.02
27 Sun TV Network Ltd 183 0.01
7 Sundram Fasteners Ltd 31 –
6 Sunteck Realty Ltd 18 –
176 Syndicate Bank 173 0.01
45 TAKE Solutions Ltd 83 0.01
62 Tamil Nadu Newsprint & Papers Ltd 317 0.02
136 Tata Chemicals Ltd 954 0.06
563 Tata Global Beverages Ltd 1,015 0.06
1,383 Tata Motors Ltd 9,234 0.60
42 Tata Motors Ltd, ADR 1,375 0.09

Emerging Markets Value Fund
Portfolio of Investments as at 30 November 2016 (continued)
Dimensional Fund Advisors Annual Report and Audited Financial Statements, 30 November 2016 51
Shares (000's)
Value (000's)
USD
% of Net Asset Value
Common Stock (continued)
India - 12.41% (continued)
445 Tata Steel Ltd 2,691 0.17
18 TCI Express Ltd 76 –
262 Tech Mahindra Ltd 1,861 0.12
32 Techno Electric & Engineering Co Ltd 143 0.01
102 The Karnataka Bank 162 0.01
1 Tide Water Oil Co India Ltd 72 –
92 Time Technoplast Ltd 124 0.01
18 Titagarh Wagons Ltd 29 –
36 Transport Corp of India Ltd 92 0.01
35 Triveni Engineering & Industries Ltd 30 –
81 Tube Investments of India Ltd 684 0.04
43 TV18 Broadcast Ltd 24 –
216 UCO Bank 107 0.01
54 Uflex Ltd 219 0.01
48 Unichem Laboratories Ltd 187 0.01
228 Union Bank of India 505 0.03
151 UPL Ltd 1,399 0.09
11 VA Tech Wabag Ltd 82 0.01
40 Vardhman Textiles Ltd 646 0.04
356 Vedanta Ltd 1,189 0.08
313 Vedanta Ltd, ADR 4,188 0.27
– Vesuvius India Ltd 7 –
72 Vijaya Bank 46 –
201 Welspun Corp Ltd 234 0.01
87 Welspun Enterprises Ltd 80 0.01
101 Welspun India Ltd 103 0.01
624 Wipro Ltd 4,236 0.28
16 Wockhardt Ltd 167 0.01
53 Yes Bank Ltd 909 0.06
18 Zensar Technologies Ltd 265 0.02
2 Zuari Agro Chemicals Ltd 5 –
195,791 12.41
Indonesia - 2.98%
22,961 Adaro Energy Tbk PT 2,582 0.16
2,196 Adhi Karya Persero Tbk PT 309 0.02
9,095 Agung Podomoro Land Tbk PT 158 0.01
13,856 Alam Sutera Realty Tbk PT 388 0.02
12,105 Aneka Tambang Persero Tbk PT 865 0.05
150 Asahimas Flat Glass Tbk PT 73 –
554 Astra Agro Lestari Tbk PT 675 0.04
68 Astra Otoparts Tbk PT 10 –
73,334 Bakrie and Brothers Tbk PT 271 0.02
18,732 Bakrie Sumatera Plantations Tbk PT 69 –
51,916 Bakrie Telecom Tbk PT 192 0.01
27,918 Bakrieland Development Tbk PT 103 0.01
6,037 Bank Bukopin Tbk 285 0.02
4,320 Bank Danamon Indonesia Tbk PT 1,036 0.07
10,554 Bank Mandiri Persero Tbk PT 8,184 0.53
8,016 Bank Negara Indonesia Persero Tbk PT 3,055 0.19
6,223 Bank Pan Indonesia Tbk PT 337 0.02
4,022 Bank Pembangunan Daerah Jawa Barat Dan Banten Tbk PT 459 0.03
3,445 Bank Pembangunan Daerah Jawa Timur Tbk PT 128 0.01
5,874 Bank Tabungan Negara Persero Tbk PT 714 0.05
5,822 Barito Pacific Tbk PT 674 0.04
4,882 Bekasi Fajar Industrial Estate Tbk PT 96 0.01
16,524 Benakat Integra Tbk PT 101 0.01
19,202 Berlian Laju Tanker Tbk PT – –
1,198 BISI International Tbk PT 162 0.01
148 Blue Bird Tbk PT 32 –
3,831 Bumi Serpong Damai Tbk PT 479 0.03
849 Catur Sentosa Adiprana Tbk PT 31 –
9,445 Ciputra Development Tbk PT 940 0.06
Shares (000's)
Value (000's)
USD
% of Net Asset Value
Common Stock (continued)
Indonesia - 2.98% (continued)
5,349 Ciputra Property Tbk PT 282 0.02
1,327 Ciputra Surya Tbk PT 269 0.02
4,177 Clipan Finance Indonesia Tbk PT 75 –
20,564 Darma Henwa Tbk PT 76 –
2,701 Delta Dunia Makmur Tbk PT 101 0.01
14,159 Eagle High Plantations Tbk PT 216 0.01
5,282 Elnusa Tbk PT 167 0.01
64,800 Energi Mega Persada Tbk PT 239 0.02
1,461 Erajaya Swasembada Tbk PT 66 –
2,945 Gajah Tunggal Tbk PT 218 0.01
6,116 Garuda Indonesia Persero Tbk PT 172 0.01
9,293 Global Mediacom Tbk PT 404 0.03
16,581 Hanson International Tbk PT 206 0.01
1,137 Harum Energy Tbk PT 181 0.01
2,842 Holcim Indonesia Tbk PT 194 0.01
5,491 Indah Kiat Pulp & Paper Corp Tbk PT 395 0.03
584 Indo Tambangraya Megah Tbk PT 688 0.04
6,496 Indofood Sukses Makmur Tbk PT 3,642 0.24
216 Inovisi Infracom Tbk PT – –
10,525 Intiland Development Tbk PT 388 0.02
267 Jakarta International Hotel & Development Tbk PT 10 –
3,488 Japfa Comfeed Indonesia Tbk PT 430 0.03
2,143 Jaya Real Property Tbk PT 134 0.01
28,989 Kawasan Industri Jababeka Tbk PT 616 0.04
559 Lippo Cikarang Tbk PT 226 0.01
22,135 Lippo Karawaci Tbk PT 1,248 0.08
3,156 Medco Energi Internasional Tbk PT 293 0.02
117 Mitra Adiperkasa Tbk PT 45 –
479 Mitra Pinasthika Mustika Tbk PT 29 –
47,216 MNC Investama Tbk PT 494 0.03
749 MNC Land Tbk PT 61 –
13,359 Modernland Realty Tbk PT 345 0.02
1,126 Multistrada Arah Sarana Tbk PT 26 –
13,605 Nusantara Infrastructure Tbk PT 132 0.01
588 Pabrik Kertas Tjiwi Kimia Tbk PT 33 –
6,877 Pan Brothers Tbk PT 226 0.01
9,818 Panin Financial Tbk PT 132 0.01
670 Paninvest Tbk PT 31 – 6,225
Perusahaan Perkebunan London Sumatra Indonesia Tbk PT 833 0.05
4,955 Ramayana Lestari Sentosa Tbk PT 435 0.03
6,501 Salim Ivomas Pratama Tbk PT 248 0.02
1,363 Sampoerna Agro PT 192 0.01
2,315 Semen Baturaja Persero Tbk PT 442 0.03
1,807 Semen Indonesia Persero Tbk PT 1,181 0.07
61 Sinar Mas Multiartha Tbk PT 38 –
13,372 Sri Rejeki Isman Tbk PT 237 0.02
6,321 Surya Semesta Internusa Tbk PT 240 0.02
543 Tambang Batubara Bukit Asam Persero Tbk PT 471 0.03
159 Tempo Scan Pacific Tbk PT 24 –
3,508 Tiga Pilar Sejahtera Food Tbk 484 0.03
6,373 Timah Persero Tbk PT 566 0.04
1,986 Tiphone Mobile Indonesia Tbk PT 105 0.01
19,343 Truba Alam Manunggal Engineering PT 50 –
3,823 Tunas Baru Lampung Tbk PT 265 0.02
3,540 Tunas Ridean Tbk PT 337 0.02
2,739 United Tractors Tbk PT 4,235 0.28
3,689 Vale Indonesia Tbk PT 916 0.06
3,223 Visi Media Asia Tbk PT 63 –
4,216 XL Axiata Tbk PT 715 0.05
46,975 2.98

Emerging Markets Value Fund
Portfolio of Investments as at 30 November 2016 (continued)
Dimensional Fund Advisors Annual Report and Audited Financial Statements, 30 November 2016 52
Shares (000's)
Value (000's)
USD
% of Net Asset Value
Common Stock (continued)
Israel - –%
– Electra Real Estate Ltd – –
– Formula Systems 1985 Ltd – –
– Formula Vision Technologies Ltd – –
– –
Korea, Republic of - 14.99%
11 Ace Technologies Corp 27 –
14 AJ Rent A Car Co Ltd 102 0.01
6 Amotech Co Ltd 104 0.01
2 Asia Cement Co Ltd 145 0.01
1 ASIA Holdings Co Ltd 135 0.01
6 Asia Paper Manufacturing Co Ltd 101 0.01
111 Asiana Airlines Inc 449 0.03
17 Austem Co Ltd 46 –
11 Avaco Co Ltd 54 –
3 BH Co Ltd 30 –
412 BNK Financial Group Inc 3,154 0.20
2 Bookook Securities Co Ltd 33 –
1 Busan City Gas Co Ltd 18 –
84 China Great Star International Ltd 98 0.01
20 Chinyang Holdings Corp 58 –
2 Chokwang Paint Ltd 19 –
1 Chosun Refractories Co Ltd 88 0.01
24 CJ Hellovision Co Ltd 189 0.01
1 CJ O Shopping Co Ltd 111 0.01
1 CKD Bio Corp 21 –
15 Dae Dong Industrial Co Ltd 93 0.01
2 Dae Han Flour Mills Co Ltd 238 0.02
23 Dae Hyun Co Ltd 75 –
16 Dae Won Kang Up Co Ltd 62 –
108 Dae Young Packaging Co Ltd 86 0.01
35 Daeduck Electronics Co 230 0.01
20 Daeduck GDS Co Ltd 183 0.01
6 Daegu Department Store 73 –
19 Daehan Steel Co Ltd 143 0.01
6 Daekyo Co Ltd 44 –
22 Daelim Industrial Co Ltd 1,404 0.09
14 Daesang Holdings Co Ltd 125 0.01
8 Daesung Holdings Co Ltd 68 –
3 Daewon San Up Co Ltd 21 –
116 Daewoo Engineering & Construction Co Ltd 513 0.03
1 Dahaam E-Tec Co Ltd 2 –
41 Daishin Securities Co Ltd 362 0.02
23 Daou Technology Inc 362 0.02
4 DCM Corp 40 –
243 DGB Financial Group Inc 1,988 0.13
17 Display Tech Co Ltd 55 –
7 DK UIL Co Ltd 66 –
13 Dong Ah Tire & Rubber Co Ltd 287 0.02
5 Dong-Ah Geological Engineering Co Ltd 35 –
2 Dong-Il Corp 84 0.01
25 Dongbang Transport Logistics Co Ltd 41 –
87 DONGBU Co Ltd 53 –
22 Dongbu Securities Co Ltd 61 –
2 Dongil Industries Co Ltd 128 0.01
34 Dongkook Industrial Co Ltd 70 –
30 Dongkuk Industries Co Ltd 120 0.01
76 Dongkuk Steel Mill Co Ltd 630 0.04
16 Dongsung Corp 84 0.01
– Dongwha Enterprise Co Ltd 14 –
6 Dongwon Development Co Ltd 21 –
5 Dongyang E&P Inc 56 –
49 Doosan Heavy Industries & Construction Co Ltd 1,080 0.07
83 Doosan Infracore Co Ltd 556 0.04
Shares (000's)
Value (000's)
USD
% of Net Asset Value
Common Stock (continued)
Korea, Republic of - 14.99% (continued)
10 DRB Holding Co Ltd 93 0.01
25 DY Corp 154 0.01
8 e-LITECOM Co Ltd 60 –
19 E-MART Inc 3,000 0.19
6 Eagon Industrial Ltd 55 –
16 Easy Bio Inc 80 0.01
6 Elentec Co Ltd 29 –
42 Eugene Corp 177 0.01
117 Eugene Investment & Securities Co Ltd 230 0.01
12 Eusu Holdings Co Ltd 61 –
5 EVERDIGM Corp 44 –
36 FarmStory Co Ltd 44 –
20 Fine Technix Co Ltd 49 –
1 F&F Co Ltd 16 –
2 Gaon Cable Co Ltd 40 –
9 Golfzonyuwonholdings Co Ltd 57 –
37 GS Engineering & Construction Corp 739 0.05
42 GS Global Corp 95 0.01
70 GS Holdings Corp 3,244 0.21
1 Gwangju Shinsegae Co Ltd 103 0.01
10 Halla Holdings Corp 519 0.03
24 Han Kuk Carbon Co Ltd 121 0.01
223 Hana Financial Group Inc 6,145 0.39
16 Hana Micron Inc 70 –
5 Hanil Cement Co Ltd 281 0.02
14 Hanjin Heavy Industries & Construction Holdings Co Ltd 60 –
37 Hanjin Kal Corp 556 0.04
12 Hanjin Transportation Co Ltd 283 0.02
1 Hankuk Glass Industries Inc 32 –
5 Hankuk Paper Manufacturing Co Ltd 134 0.01
2 HanmiGlobal Co Ltd 18 –
6 Hanshin Construction 77 –
71 Hansol Holdings Co Ltd 348 0.02
65 Hansol HomeDeco Co Ltd 85 0.01
121 Hanwha Chemical Corp 2,400 0.15
37 Hanwha General Insurance Co Ltd 249 0.02
265 Hanwha Life Insurance Co Ltd 1,510 0.10
1 Hanwha Techwin Co Ltd 37 –
15 Hanyang Securities Co Ltd 93 0.01
30 Harim Holdings Co Ltd 101 0.01
88 Heung-A Shipping Co Ltd 96 0.01
14 Hitejinro Holdings Co Ltd 149 0.01
12 HMC Investment Securities Co Ltd 101 0.01
3 HS R&A Co Ltd 98 0.01
17 Humax Co Ltd 191 0.01
14 Huvis Corp 90 0.01
20 Hwa Shin Co Ltd 103 0.01
1 Hwacheon Machine Tool Co Ltd 28 –
9 HwaSung Industrial Co Ltd 106 0.01
4 Hy-Lok Corp 76 –
16 Hyundai BNG Steel Co Ltd 153 0.01
6 Hyundai Corp 108 0.01
17 Hyundai Department Store Co Ltd 1,588 0.10
95 Hyundai Engineering & Construction Co Ltd 3,202 0.20
18 Hyundai Greenfood Co Ltd 253 0.02
38 Hyundai Heavy Industries Co Ltd 4,612 0.29
5 Hyundai Home Shopping Network Corp 447 0.03
45 Hyundai Hy Communications & Network Co Ltd 141 0.01
9 Hyundai Mipo Dockyard Co Ltd 476 0.03
80 Hyundai Mobis Co Ltd 16,982 1.09
192 Hyundai Motor Co 21,864 1.40
117 Hyundai Steel Co 4,953 0.31
20 Hyundai Wia Corp 1,198 0.08
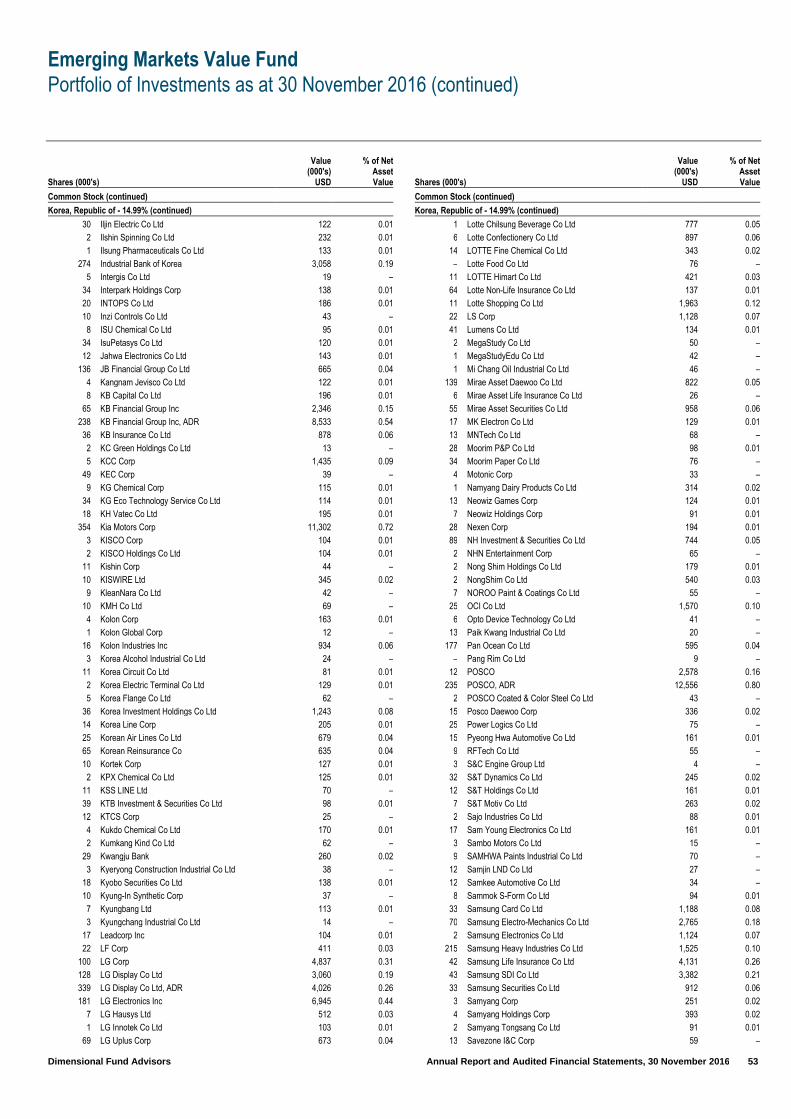
Emerging Markets Value Fund
Portfolio of Investments as at 30 November 2016 (continued)
Dimensional Fund Advisors Annual Report and Audited Financial Statements, 30 November 2016 53
Shares (000's)
Value (000's)
USD
% of Net Asset Value
Common Stock (continued)
Korea, Republic of - 14.99% (continued)
30 Iljin Electric Co Ltd 122 0.01
2 Ilshin Spinning Co Ltd 232 0.01
1 Ilsung Pharmaceuticals Co Ltd 133 0.01
274 Industrial Bank of Korea 3,058 0.19
5 Intergis Co Ltd 19 –
34 Interpark Holdings Corp 138 0.01
20 INTOPS Co Ltd 186 0.01
10 Inzi Controls Co Ltd 43 –
8 ISU Chemical Co Ltd 95 0.01
34 IsuPetasys Co Ltd 120 0.01
12 Jahwa Electronics Co Ltd 143 0.01
136 JB Financial Group Co Ltd 665 0.04
4 Kangnam Jevisco Co Ltd 122 0.01
8 KB Capital Co Ltd 196 0.01
65 KB Financial Group Inc 2,346 0.15
238 KB Financial Group Inc, ADR 8,533 0.54
36 KB Insurance Co Ltd 878 0.06
2 KC Green Holdings Co Ltd 13 –
5 KCC Corp 1,435 0.09
49 KEC Corp 39 –
9 KG Chemical Corp 115 0.01
34 KG Eco Technology Service Co Ltd 114 0.01
18 KH Vatec Co Ltd 195 0.01
354 Kia Motors Corp 11,302 0.72
3 KISCO Corp 104 0.01
2 KISCO Holdings Co Ltd 104 0.01
11 Kishin Corp 44 –
10 KISWIRE Ltd 345 0.02
9 KleanNara Co Ltd 42 –
10 KMH Co Ltd 69 –
4 Kolon Corp 163 0.01
1 Kolon Global Corp 12 –
16 Kolon Industries Inc 934 0.06
3 Korea Alcohol Industrial Co Ltd 24 –
11 Korea Circuit Co Ltd 81 0.01
2 Korea Electric Terminal Co Ltd 129 0.01
5 Korea Flange Co Ltd 62 –
36 Korea Investment Holdings Co Ltd 1,243 0.08
14 Korea Line Corp 205 0.01
25 Korean Air Lines Co Ltd 679 0.04
65 Korean Reinsurance Co 635 0.04
10 Kortek Corp 127 0.01
2 KPX Chemical Co Ltd 125 0.01
11 KSS LINE Ltd 70 –
39 KTB Investment & Securities Co Ltd 98 0.01
12 KTCS Corp 25 –
4 Kukdo Chemical Co Ltd 170 0.01
2 Kumkang Kind Co Ltd 62 –
29 Kwangju Bank 260 0.02
3 Kyeryong Construction Industrial Co Ltd 38 –
18 Kyobo Securities Co Ltd 138 0.01
10 Kyung-In Synthetic Corp 37 –
7 Kyungbang Ltd 113 0.01
3 Kyungchang Industrial Co Ltd 14 –
17 Leadcorp Inc 104 0.01
22 LF Corp 411 0.03
100 LG Corp 4,837 0.31
128 LG Display Co Ltd 3,060 0.19
339 LG Display Co Ltd, ADR 4,026 0.26
181 LG Electronics Inc 6,945 0.44
7 LG Hausys Ltd 512 0.03
1 LG Innotek Co Ltd 103 0.01
69 LG Uplus Corp 673 0.04
Shares (000's)
Value (000's)
USD
% of Net Asset Value
Common Stock (continued)
Korea, Republic of - 14.99% (continued)
1 Lotte Chilsung Beverage Co Ltd 777 0.05
6 Lotte Confectionery Co Ltd 897 0.06
14 LOTTE Fine Chemical Co Ltd 343 0.02
– Lotte Food Co Ltd 76 –
11 LOTTE Himart Co Ltd 421 0.03
64 Lotte Non-Life Insurance Co Ltd 137 0.01
11 Lotte Shopping Co Ltd 1,963 0.12
22 LS Corp 1,128 0.07
41 Lumens Co Ltd 134 0.01
2 MegaStudy Co Ltd 50 –
1 MegaStudyEdu Co Ltd 42 –
1 Mi Chang Oil Industrial Co Ltd 46 –
139 Mirae Asset Daewoo Co Ltd 822 0.05
6 Mirae Asset Life Insurance Co Ltd 26 –
55 Mirae Asset Securities Co Ltd 958 0.06
17 MK Electron Co Ltd 129 0.01
13 MNTech Co Ltd 68 –
28 Moorim P&P Co Ltd 98 0.01
34 Moorim Paper Co Ltd 76 –
4 Motonic Corp 33 –
1 Namyang Dairy Products Co Ltd 314 0.02
13 Neowiz Games Corp 124 0.01
7 Neowiz Holdings Corp 91 0.01
28 Nexen Corp 194 0.01
89 NH Investment & Securities Co Ltd 744 0.05
2 NHN Entertainment Corp 65 –
2 Nong Shim Holdings Co Ltd 179 0.01
2 NongShim Co Ltd 540 0.03
7 NOROO Paint & Coatings Co Ltd 55 –
25 OCI Co Ltd 1,570 0.10
6 Opto Device Technology Co Ltd 41 –
13 Paik Kwang Industrial Co Ltd 20 –
177 Pan Ocean Co Ltd 595 0.04
– Pang Rim Co Ltd 9 –
12 POSCO 2,578 0.16
235 POSCO, ADR 12,556 0.80
2 POSCO Coated & Color Steel Co Ltd 43 –
15 Posco Daewoo Corp 336 0.02
25 Power Logics Co Ltd 75 –
15 Pyeong Hwa Automotive Co Ltd 161 0.01
9 RFTech Co Ltd 55 –
3 S&C Engine Group Ltd 4 –
32 S&T Dynamics Co Ltd 245 0.02
12 S&T Holdings Co Ltd 161 0.01
7 S&T Motiv Co Ltd 263 0.02
2 Sajo Industries Co Ltd 88 0.01
17 Sam Young Electronics Co Ltd 161 0.01
3 Sambo Motors Co Ltd 15 –
9 SAMHWA Paints Industrial Co Ltd 70 –
12 Samjin LND Co Ltd 27 –
12 Samkee Automotive Co Ltd 34 –
8 Sammok S-Form Co Ltd 94 0.01
33 Samsung Card Co Ltd 1,188 0.08
70 Samsung Electro-Mechanics Co Ltd 2,765 0.18
2 Samsung Electronics Co Ltd 1,124 0.07
215 Samsung Heavy Industries Co Ltd 1,525 0.10
42 Samsung Life Insurance Co Ltd 4,131 0.26
43 Samsung SDI Co Ltd 3,382 0.21
33 Samsung Securities Co Ltd 912 0.06
3 Samyang Corp 251 0.02
4 Samyang Holdings Corp 393 0.02
2 Samyang Tongsang Co Ltd 91 0.01
13 Savezone I&C Corp 59 –
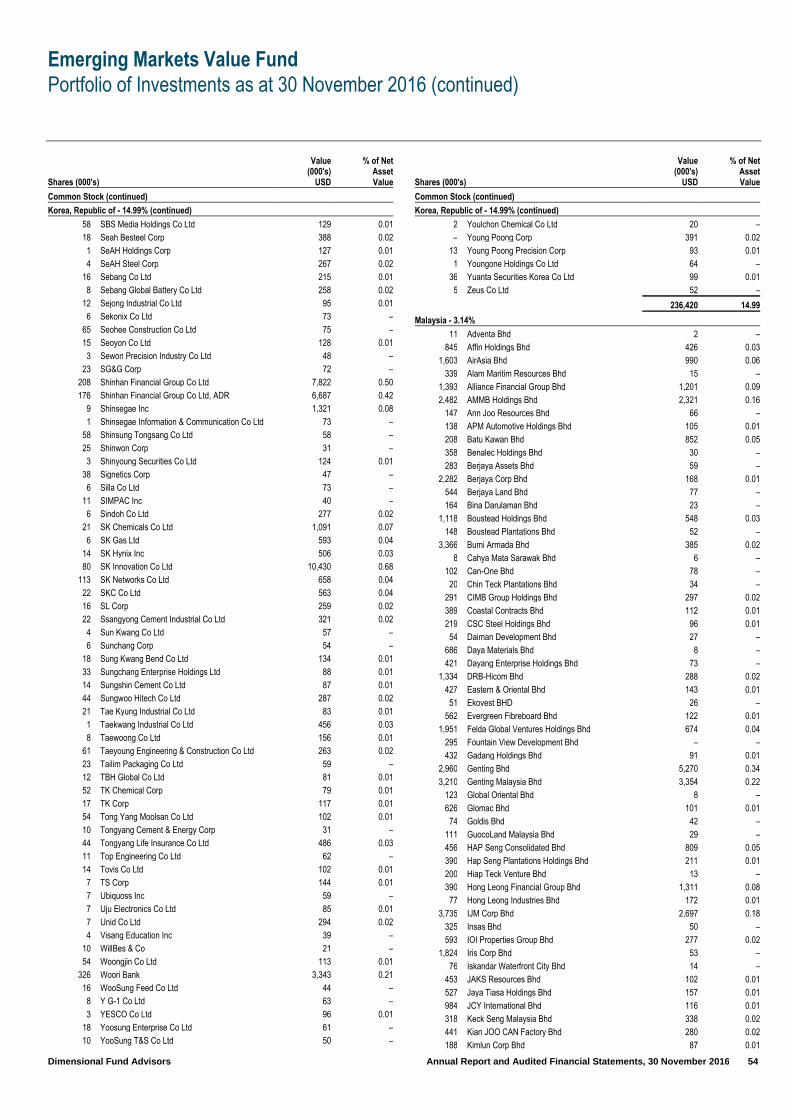
Emerging Markets Value Fund
Portfolio of Investments as at 30 November 2016 (continued)
Dimensional Fund Advisors Annual Report and Audited Financial Statements, 30 November 2016 54
Shares (000's)
Value (000's)
USD
% of Net Asset Value
Common Stock (continued)
Korea, Republic of - 14.99% (continued)
58 SBS Media Holdings Co Ltd 129 0.01
18 Seah Besteel Corp 388 0.02
1 SeAH Holdings Corp 127 0.01
4 SeAH Steel Corp 267 0.02
16 Sebang Co Ltd 215 0.01
8 Sebang Global Battery Co Ltd 258 0.02
12 Sejong Industrial Co Ltd 95 0.01
6 Sekonix Co Ltd 73 –
65 Seohee Construction Co Ltd 75 –
15 Seoyon Co Ltd 128 0.01
3 Sewon Precision Industry Co Ltd 48 –
23 SG&G Corp 72 –
208 Shinhan Financial Group Co Ltd 7,822 0.50
176 Shinhan Financial Group Co Ltd, ADR 6,687 0.42
9 Shinsegae Inc 1,321 0.08
1 Shinsegae Information & Communication Co Ltd 73 –
58 Shinsung Tongsang Co Ltd 58 –
25 Shinwon Corp 31 –
3 Shinyoung Securities Co Ltd 124 0.01
38 Signetics Corp 47 –
6 Silla Co Ltd 73 –
11 SIMPAC Inc 40 –
6 Sindoh Co Ltd 277 0.02
21 SK Chemicals Co Ltd 1,091 0.07
6 SK Gas Ltd 593 0.04
14 SK Hynix Inc 506 0.03
80 SK Innovation Co Ltd 10,430 0.68
113 SK Networks Co Ltd 658 0.04
22 SKC Co Ltd 563 0.04
16 SL Corp 259 0.02
22 Ssangyong Cement Industrial Co Ltd 321 0.02
4 Sun Kwang Co Ltd 57 –
6 Sunchang Corp 54 –
18 Sung Kwang Bend Co Ltd 134 0.01
33 Sungchang Enterprise Holdings Ltd 88 0.01
14 Sungshin Cement Co Ltd 87 0.01
44 Sungwoo Hitech Co Ltd 287 0.02
21 Tae Kyung Industrial Co Ltd 83 0.01
1 Taekwang Industrial Co Ltd 456 0.03
8 Taewoong Co Ltd 156 0.01
61 Taeyoung Engineering & Construction Co Ltd 263 0.02
23 Tailim Packaging Co Ltd 59 –
12 TBH Global Co Ltd 81 0.01
52 TK Chemical Corp 79 0.01
17 TK Corp 117 0.01
54 Tong Yang Moolsan Co Ltd 102 0.01
10 Tongyang Cement & Energy Corp 31 –
44 Tongyang Life Insurance Co Ltd 486 0.03
11 Top Engineering Co Ltd 62 –
14 Tovis Co Ltd 102 0.01
7 TS Corp 144 0.01
7 Ubiquoss Inc 59 –
7 Uju Electronics Co Ltd 85 0.01
7 Unid Co Ltd 294 0.02
4 Visang Education Inc 39 –
10 WillBes & Co 21 –
54 Woongjin Co Ltd 113 0.01
326 Woori Bank 3,343 0.21
16 WooSung Feed Co Ltd 44 –
8 Y G-1 Co Ltd 63 –
3 YESCO Co Ltd 96 0.01
18 Yoosung Enterprise Co Ltd 61 –
10 YooSung T&S Co Ltd 50 –
Shares (000's)
Value (000's)
USD
% of Net Asset Value
Common Stock (continued)
Korea, Republic of - 14.99% (continued)
2 Youlchon Chemical Co Ltd 20 –
– Young Poong Corp 391 0.02
13 Young Poong Precision Corp 93 0.01
1 Youngone Holdings Co Ltd 64 –
36 Yuanta Securities Korea Co Ltd 99 0.01
5 Zeus Co Ltd 52 –
236,420 14.99
Malaysia - 3.14%
11 Adventa Bhd 2 –
845 Affin Holdings Bhd 426 0.03
1,603 AirAsia Bhd 990 0.06
339 Alam Maritim Resources Bhd 15 –
1,393 Alliance Financial Group Bhd 1,201 0.09
2,482 AMMB Holdings Bhd 2,321 0.16
147 Ann Joo Resources Bhd 66 –
138 APM Automotive Holdings Bhd 105 0.01
208 Batu Kawan Bhd 852 0.05
358 Benalec Holdings Bhd 30 –
283 Berjaya Assets Bhd 59 –
2,282 Berjaya Corp Bhd 168 0.01
544 Berjaya Land Bhd 77 –
164 Bina Darulaman Bhd 23 –
1,118 Boustead Holdings Bhd 548 0.03
148 Boustead Plantations Bhd 52 –
3,366 Bumi Armada Bhd 385 0.02
8 Cahya Mata Sarawak Bhd 6 –
102 Can-One Bhd 78 –
20 Chin Teck Plantations Bhd 34 –
291 CIMB Group Holdings Bhd 297 0.02
389 Coastal Contracts Bhd 112 0.01
219 CSC Steel Holdings Bhd 96 0.01
54 Daiman Development Bhd 27 –
686 Daya Materials Bhd 8 –
421 Dayang Enterprise Holdings Bhd 73 –
1,334 DRB-Hicom Bhd 288 0.02
427 Eastern & Oriental Bhd 143 0.01
51 Ekovest BHD 26 –
562 Evergreen Fibreboard Bhd 122 0.01
1,951 Felda Global Ventures Holdings Bhd 674 0.04
295 Fountain View Development Bhd – –
432 Gadang Holdings Bhd 91 0.01
2,960 Genting Bhd 5,270 0.34
3,210 Genting Malaysia Bhd 3,354 0.22
123 Global Oriental Bhd 8 –
626 Glomac Bhd 101 0.01
74 Goldis Bhd 42 –
111 GuocoLand Malaysia Bhd 29 –
456 HAP Seng Consolidated Bhd 809 0.05
390 Hap Seng Plantations Holdings Bhd 211 0.01
200 Hiap Teck Venture Bhd 13 –
390 Hong Leong Financial Group Bhd 1,311 0.08
77 Hong Leong Industries Bhd 172 0.01
3,735 IJM Corp Bhd 2,697 0.18
325 Insas Bhd 50 –
593 IOI Properties Group Bhd 277 0.02
1,824 Iris Corp Bhd 53 –
76 Iskandar Waterfront City Bhd 14 –
453 JAKS Resources Bhd 102 0.01
527 Jaya Tiasa Holdings Bhd 157 0.01
984 JCY International Bhd 116 0.01
318 Keck Seng Malaysia Bhd 338 0.02
441 Kian JOO CAN Factory Bhd 280 0.02
188 Kimlun Corp Bhd 87 0.01
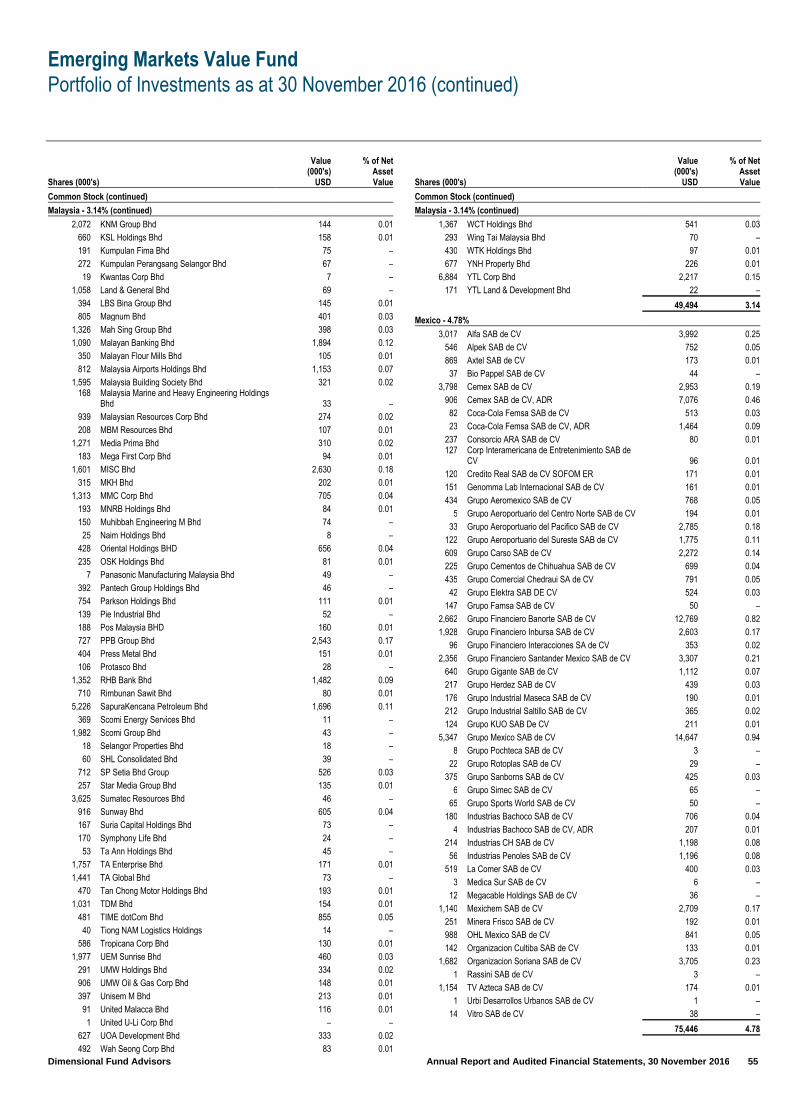
Emerging Markets Value Fund
Portfolio of Investments as at 30 November 2016 (continued)
Dimensional Fund Advisors Annual Report and Audited Financial Statements, 30 November 2016 55
Shares (000's)
Value (000's)
USD
% of Net Asset Value
Common Stock (continued)
Malaysia - 3.14% (continued)
2,072 KNM Group Bhd 144 0.01
660 KSL Holdings Bhd 158 0.01
191 Kumpulan Fima Bhd 75 –
272 Kumpulan Perangsang Selangor Bhd 67 –
19 Kwantas Corp Bhd 7 –
1,058 Land & General Bhd 69 –
394 LBS Bina Group Bhd 145 0.01
805 Magnum Bhd 401 0.03
1,326 Mah Sing Group Bhd 398 0.03
1,090 Malayan Banking Bhd 1,894 0.12
350 Malayan Flour Mills Bhd 105 0.01
812 Malaysia Airports Holdings Bhd 1,153 0.07
1,595 Malaysia Building Society Bhd 321 0.02 168
Malaysia Marine and Heavy Engineering Holdings Bhd 33 –
939 Malaysian Resources Corp Bhd 274 0.02
208 MBM Resources Bhd 107 0.01
1,271 Media Prima Bhd 310 0.02
183 Mega First Corp Bhd 94 0.01
1,601 MISC Bhd 2,630 0.18
315 MKH Bhd 202 0.01
1,313 MMC Corp Bhd 705 0.04
193 MNRB Holdings Bhd 84 0.01
150 Muhibbah Engineering M Bhd 74 –
25 Naim Holdings Bhd 8 –
428 Oriental Holdings BHD 656 0.04
235 OSK Holdings Bhd 81 0.01
7 Panasonic Manufacturing Malaysia Bhd 49 –
392 Pantech Group Holdings Bhd 46 –
754 Parkson Holdings Bhd 111 0.01
139 Pie Industrial Bhd 52 –
188 Pos Malaysia BHD 160 0.01
727 PPB Group Bhd 2,543 0.17
404 Press Metal Bhd 151 0.01
106 Protasco Bhd 28 –
1,352 RHB Bank Bhd 1,482 0.09
710 Rimbunan Sawit Bhd 80 0.01
5,226 SapuraKencana Petroleum Bhd 1,696 0.11
369 Scomi Energy Services Bhd 11 –
1,982 Scomi Group Bhd 43 –
18 Selangor Properties Bhd 18 –
60 SHL Consolidated Bhd 39 –
712 SP Setia Bhd Group 526 0.03
257 Star Media Group Bhd 135 0.01
3,625 Sumatec Resources Bhd 46 –
916 Sunway Bhd 605 0.04
167 Suria Capital Holdings Bhd 73 –
170 Symphony Life Bhd 24 –
53 Ta Ann Holdings Bhd 45 –
1,757 TA Enterprise Bhd 171 0.01
1,441 TA Global Bhd 73 –
470 Tan Chong Motor Holdings Bhd 193 0.01
1,031 TDM Bhd 154 0.01
481 TIME dotCom Bhd 855 0.05
40 Tiong NAM Logistics Holdings 14 –
586 Tropicana Corp Bhd 130 0.01
1,977 UEM Sunrise Bhd 460 0.03
291 UMW Holdings Bhd 334 0.02
906 UMW Oil & Gas Corp Bhd 148 0.01
397 Unisem M Bhd 213 0.01
91 United Malacca Bhd 116 0.01
1 United U-Li Corp Bhd – –
627 UOA Development Bhd 333 0.02
492 Wah Seong Corp Bhd 83 0.01
Shares (000's)
Value (000's)
USD
% of Net Asset Value
Common Stock (continued)
Malaysia - 3.14% (continued)
1,367 WCT Holdings Bhd 541 0.03
293 Wing Tai Malaysia Bhd 70 –
430 WTK Holdings Bhd 97 0.01
677 YNH Property Bhd 226 0.01
6,884 YTL Corp Bhd 2,217 0.15
171 YTL Land & Development Bhd 22 –
49,494 3.14
Mexico - 4.78%
3,017 Alfa SAB de CV 3,992 0.25
546 Alpek SAB de CV 752 0.05
869 Axtel SAB de CV 173 0.01
37 Bio Pappel SAB de CV 44 –
3,798 Cemex SAB de CV 2,953 0.19
906 Cemex SAB de CV, ADR 7,076 0.46
82 Coca-Cola Femsa SAB de CV 513 0.03
23 Coca-Cola Femsa SAB de CV, ADR 1,464 0.09
237 Consorcio ARA SAB de CV 80 0.01 127
Corp Interamericana de Entretenimiento SAB de CV 96 0.01
120 Credito Real SAB de CV SOFOM ER 171 0.01
151 Genomma Lab Internacional SAB de CV 161 0.01
434 Grupo Aeromexico SAB de CV 768 0.05
5 Grupo Aeroportuario del Centro Norte SAB de CV 194 0.01
33 Grupo Aeroportuario del Pacifico SAB de CV 2,785 0.18
122 Grupo Aeroportuario del Sureste SAB de CV 1,775 0.11
609 Grupo Carso SAB de CV 2,272 0.14
225 Grupo Cementos de Chihuahua SAB de CV 699 0.04
435 Grupo Comercial Chedraui SA de CV 791 0.05
42 Grupo Elektra SAB DE CV 524 0.03
147 Grupo Famsa SAB de CV 50 –
2,662 Grupo Financiero Banorte SAB de CV 12,769 0.82
1,928 Grupo Financiero Inbursa SAB de CV 2,603 0.17
96 Grupo Financiero Interacciones SA de CV 353 0.02
2,356 Grupo Financiero Santander Mexico SAB de CV 3,307 0.21
640 Grupo Gigante SAB de CV 1,112 0.07
217 Grupo Herdez SAB de CV 439 0.03
176 Grupo Industrial Maseca SAB de CV 190 0.01
212 Grupo Industrial Saltillo SAB de CV 365 0.02
124 Grupo KUO SAB De CV 211 0.01
5,347 Grupo Mexico SAB de CV 14,647 0.94
8 Grupo Pochteca SAB de CV 3 –
22 Grupo Rotoplas SAB de CV 29 –
375 Grupo Sanborns SAB de CV 425 0.03
6 Grupo Simec SAB de CV 65 –
65 Grupo Sports World SAB de CV 50 –
180 Industrias Bachoco SAB de CV 706 0.04
4 Industrias Bachoco SAB de CV, ADR 207 0.01
214 Industrias CH SAB de CV 1,198 0.08
56 Industrias Penoles SAB de CV 1,196 0.08
519 La Comer SAB de CV 400 0.03
3 Medica Sur SAB de CV 6 –
12 Megacable Holdings SAB de CV 36 –
1,140 Mexichem SAB de CV 2,709 0.17
251 Minera Frisco SAB de CV 192 0.01
988 OHL Mexico SAB de CV 841 0.05
142 Organizacion Cultiba SAB de CV 133 0.01
1,682 Organizacion Soriana SAB de CV 3,705 0.23
1 Rassini SAB de CV 3 –
1,154 TV Azteca SAB de CV 174 0.01
1 Urbi Desarrollos Urbanos SAB de CV 1 –
14 Vitro SAB de CV 38 –
75,446 4.78

Emerging Markets Value Fund
Portfolio of Investments as at 30 November 2016 (continued)
Dimensional Fund Advisors Annual Report and Audited Financial Statements, 30 November 2016 56
Shares (000's)
Value (000's)
USD
% of Net Asset Value
Common Stock (continued)
Philippines - 1.35%
3,424 Alliance Global Group Inc 896 0.06
7 Asia United Bank Corp 7 –
702 Atlas Consolidated Mining & Development Corp 75 –
6 Ayala Corp 92 0.01
1,401 BDO Unibank Inc 3,150 0.21
339 Bloomberry Resorts Corp 44 –
270 Cebu Air Inc 551 0.03
5,159 Century Properties Group Inc 55 –
462 China Banking Corp 351 0.02
3,460 Cosco Capital Inc 591 0.04
408 East West Banking Corp 156 0.01
272 EEI Corp 35 –
66 Emperador Inc 9 –
1,164 Empire East Land Holdings Inc 17 –
860 Energy Development Corp 88 0.01
18,095 Filinvest Land Inc 631 0.04
469 First Philippine Holdings Corp 628 0.04
337 Integrated Micro-Electronics Inc 40 –
1,896 JG Summit Holdings Inc 2,611 0.16
3,498 Lopez Holdings Corp 547 0.03
2,217 LT Group Inc 584 0.04
377 Megawide Construction Corp 115 0.02
12,239 Megaworld Corp 905 0.06
410 Metropolitan Bank & Trust Co 618 0.04
255 Nickel Asia Corp 42 –
703 Pepsi-Cola Products Philippines Inc 45 –
3,611 Petron Corp 683 0.04
410 Philippine National Bank 456 0.03
13 Philtown Properties Inc – –
1,886 Phinma Energy Corp 79 0.01
73 Phoenix Petroleum Philippines Inc 8 –
571 RFM Corp 51 –
567 Rizal Commercial Banking Corp 406 0.03
3,362 Robinsons Land Corp 1,742 0.11
104 Robinsons Retail Holdings Inc 151 0.01
900 San Miguel Corp 1,517 0.10
15 San Miguel Pure Foods Co Inc 67 –
309 Security Bank Corp 1,124 0.07
286 SSI Group Inc 15 –
96 Top Frontier Investment Holdings Inc 463 0.03
921 Travellers International Hotel Group Inc 58 –
634 Union Bank of the Philippines 951 0.06
6,969 Vista Land & Lifescapes Inc 701 0.04
21355 1.35
Poland - 1.39%
48 Agora SA 128 0.01
133 Asseco Poland SA 1,666 0.11
441 Bank Millennium SA 555 0.04
38 Ciech SA 507 0.03
2 ComArch SA 84 0.01
4 Emperia Holding SA 61 –
284 Enea SA 628 0.04
6 Firma Oponiarska Debica SA 136 0.01
492 Getin Holding SA 105 0.01
90 Getin Noble Bank SA 25 –
4 Gobarto SA 7 –
26 Grupa Azoty SA 384 0.02
8 Grupa Kety SA 681 0.04
108 Grupa Lotos SA 953 0.06
182 Impexmetal SA 136 0.01
42 Kernel Holding SA 654 0.04
165 KGHM Polska Miedz SA 3,428 0.22
2 Lubelski Wegiel Bogdanka SA 29 –
Shares (000's)
Value (000's)
USD
% of Net Asset Value
Common Stock (continued)
Poland - 1.39% (continued)
446 Netia SA 499 0.03
40 Orbis SA 651 0.04
10 Pelion SA 126 0.01
1,258 PGE Polska Grupa Energetyczna SA 2,772 0.18
24 PKP Cargo SA 275 0.02
217 Polski Koncern Naftowy Orlen SA 3,940 0.24
395 Powszechna Kasa Oszczednosci Bank Polski SA 2,396 0.15
– Stalprodukt SA 56 –
1,530 Tauron Polska Energia SA 965 0.06
33 Trakcja SA 106 0.01
40 Vistula Group SA 32 –
21,985 1.39
Russia - 2.39%
4,486 Gazprom PJSC 20,718 1.31
269 Lukoil PJSC 13,187 0.84
138 Magnitogorsk Iron & Steel OJSC 961 0.06
37 Mechel PJSC 219 0.01
1,867 RusHydro PJSC 2,620 0.17
37,705 2.39
South Africa - 7.60%
153 Adcorp Holdings Ltd 150 0.01
143 Aeci Ltd 1,008 0.06
763 African Bank Investments Ltd – –
39 African Oxygen Ltd 55 –
72 African Rainbow Minerals Ltd 545 0.03
153 Alexander Forbes Group Holdings Ltd 70 –
10 Allied Electronics Corp Ltd 5 –
14 Anglo American Platinum Ltd 281 0.02
91 AngloGold Ashanti Ltd 991 0.06
5 Astral Foods Ltd 42 –
341 Aveng Ltd 179 0.01
575 Barclays Africa Group Ltd 6,413 0.41
413 Barloworld Ltd 3,122 0.20
454 Blue Label Telecoms Ltd 614 0.04
739 Brait SE 4,463 0.27
165 Caxton and CTP Publishers and Printers Ltd 152 0.01
254 Clover Industries Ltd 351 0.02
118 Consolidated Infrastructure Group Ltd 191 0.01
424 DataTec Ltd 1,350 0.09
474 DRDGOLD Ltd 199 0.01
76 enX Group Ltd 100 0.02
583 eXtract Group Ltd 15 –
147 Exxaro Resources Ltd 1,005 0.06
678 Gold Fields Ltd 2,103 0.13
735 Gold Fields Ltd, ADR 2,256 0.14
217 Grindrod Ltd 214 0.01
186 Group Five Ltd 323 0.02
144 Harmony Gold Mining Co Ltd 325 0.02
29 Hudaco Industries Ltd 223 0.01
203 Hulamin Ltd 72 –
468 Impala Platinum Holdings Ltd 1,465 0.09
230 Imperial Holdings Ltd 2,765 0.18
290 Investec Ltd 1,845 0.12
291 KAP Industrial Holdings Ltd 157 0.01
65 Kumba Iron Ore Ltd 769 0.05
194 Lewis Group Ltd 519 0.03
171 Liberty Holdings Ltd 1,343 0.09
2,712 Merafe Resources Ltd 254 0.02
200 Metair Investments Ltd 299 0.02
1,533 MMI Holdings Ltd 2,387 0.15
251 Mpact Ltd 566 0.04
1,562 MTN Group Ltd 12,519 0.80
674 Murray & Roberts Holdings Ltd 539 0.03
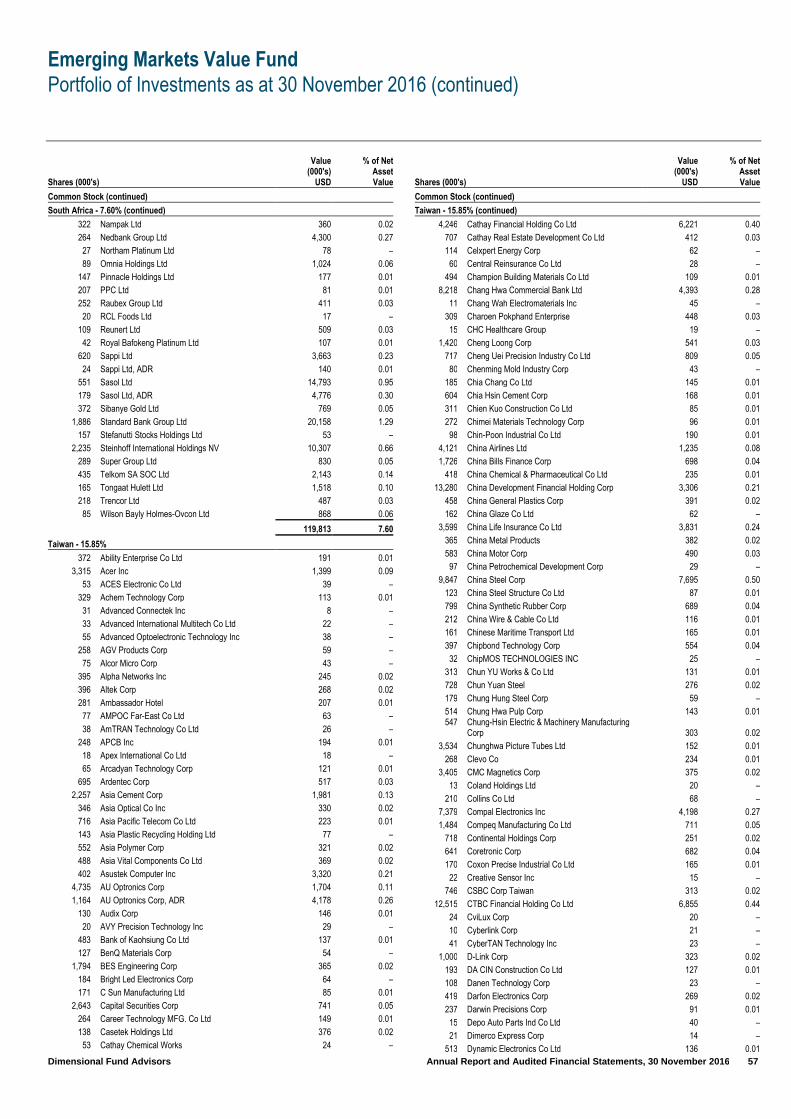
Emerging Markets Value Fund
Portfolio of Investments as at 30 November 2016 (continued)
Dimensional Fund Advisors Annual Report and Audited Financial Statements, 30 November 2016 57
Shares (000's)
Value (000's)
USD
% of Net Asset Value
Common Stock (continued)
South Africa - 7.60% (continued)
322 Nampak Ltd 360 0.02
264 Nedbank Group Ltd 4,300 0.27
27 Northam Platinum Ltd 78 –
89 Omnia Holdings Ltd 1,024 0.06
147 Pinnacle Holdings Ltd 177 0.01
207 PPC Ltd 81 0.01
252 Raubex Group Ltd 411 0.03
20 RCL Foods Ltd 17 –
109 Reunert Ltd 509 0.03
42 Royal Bafokeng Platinum Ltd 107 0.01
620 Sappi Ltd 3,663 0.23
24 Sappi Ltd, ADR 140 0.01
551 Sasol Ltd 14,793 0.95
179 Sasol Ltd, ADR 4,776 0.30
372 Sibanye Gold Ltd 769 0.05
1,886 Standard Bank Group Ltd 20,158 1.29
157 Stefanutti Stocks Holdings Ltd 53 –
2,235 Steinhoff International Holdings NV 10,307 0.66
289 Super Group Ltd 830 0.05
435 Telkom SA SOC Ltd 2,143 0.14
165 Tongaat Hulett Ltd 1,518 0.10
218 Trencor Ltd 487 0.03
85 Wilson Bayly Holmes-Ovcon Ltd 868 0.06
119,813 7.60
Taiwan - 15.85%
372 Ability Enterprise Co Ltd 191 0.01
3,315 Acer Inc 1,399 0.09
53 ACES Electronic Co Ltd 39 –
329 Achem Technology Corp 113 0.01
31 Advanced Connectek Inc 8 –
33 Advanced International Multitech Co Ltd 22 –
55 Advanced Optoelectronic Technology Inc 38 –
258 AGV Products Corp 59 –
75 Alcor Micro Corp 43 –
395 Alpha Networks Inc 245 0.02
396 Altek Corp 268 0.02
281 Ambassador Hotel 207 0.01
77 AMPOC Far-East Co Ltd 63 –
38 AmTRAN Technology Co Ltd 26 –
248 APCB Inc 194 0.01
18 Apex International Co Ltd 18 –
65 Arcadyan Technology Corp 121 0.01
695 Ardentec Corp 517 0.03
2,257 Asia Cement Corp 1,981 0.13
346 Asia Optical Co Inc 330 0.02
716 Asia Pacific Telecom Co Ltd 223 0.01
143 Asia Plastic Recycling Holding Ltd 77 –
552 Asia Polymer Corp 321 0.02
488 Asia Vital Components Co Ltd 369 0.02
402 Asustek Computer Inc 3,320 0.21
4,735 AU Optronics Corp 1,704 0.11
1,164 AU Optronics Corp, ADR 4,178 0.26
130 Audix Corp 146 0.01
20 AVY Precision Technology Inc 29 –
483 Bank of Kaohsiung Co Ltd 137 0.01
127 BenQ Materials Corp 54 –
1,794 BES Engineering Corp 365 0.02
184 Bright Led Electronics Corp 64 –
171 C Sun Manufacturing Ltd 85 0.01
2,643 Capital Securities Corp 741 0.05
264 Career Technology MFG. Co Ltd 149 0.01
138 Casetek Holdings Ltd 376 0.02
53 Cathay Chemical Works 24 –
Shares (000's)
Value (000's)
USD
% of Net Asset Value
Common Stock (continued)
Taiwan - 15.85% (continued)
4,246 Cathay Financial Holding Co Ltd 6,221 0.40
707 Cathay Real Estate Development Co Ltd 412 0.03
114 Celxpert Energy Corp 62 –
60 Central Reinsurance Co Ltd 28 –
494 Champion Building Materials Co Ltd 109 0.01
8,218 Chang Hwa Commercial Bank Ltd 4,393 0.28
11 Chang Wah Electromaterials Inc 45 –
309 Charoen Pokphand Enterprise 448 0.03
15 CHC Healthcare Group 19 –
1,420 Cheng Loong Corp 541 0.03
717 Cheng Uei Precision Industry Co Ltd 809 0.05
80 Chenming Mold Industry Corp 43 –
185 Chia Chang Co Ltd 145 0.01
604 Chia Hsin Cement Corp 168 0.01
311 Chien Kuo Construction Co Ltd 85 0.01
272 Chimei Materials Technology Corp 96 0.01
98 Chin-Poon Industrial Co Ltd 190 0.01
4,121 China Airlines Ltd 1,235 0.08
1,726 China Bills Finance Corp 698 0.04
418 China Chemical & Pharmaceutical Co Ltd 235 0.01
13,280 China Development Financial Holding Corp 3,306 0.21
458 China General Plastics Corp 391 0.02
162 China Glaze Co Ltd 62 –
3,599 China Life Insurance Co Ltd 3,831 0.24
365 China Metal Products 382 0.02
583 China Motor Corp 490 0.03
97 China Petrochemical Development Corp 29 –
9,847 China Steel Corp 7,695 0.50
123 China Steel Structure Co Ltd 87 0.01
799 China Synthetic Rubber Corp 689 0.04
212 China Wire & Cable Co Ltd 116 0.01
161 Chinese Maritime Transport Ltd 165 0.01
397 Chipbond Technology Corp 554 0.04
32 ChipMOS TECHNOLOGIES INC 25 –
313 Chun YU Works & Co Ltd 131 0.01
728 Chun Yuan Steel 276 0.02
179 Chung Hung Steel Corp 59 –
514 Chung Hwa Pulp Corp 143 0.01 547
Chung-Hsin Electric & Machinery Manufacturing Corp 303 0.02
3,534 Chunghwa Picture Tubes Ltd 152 0.01
268 Clevo Co 234 0.01
3,405 CMC Magnetics Corp 375 0.02
13 Coland Holdings Ltd 20 –
210 Collins Co Ltd 68 –
7,379 Compal Electronics Inc 4,198 0.27
1,484 Compeq Manufacturing Co Ltd 711 0.05
718 Continental Holdings Corp 251 0.02
641 Coretronic Corp 682 0.04
170 Coxon Precise Industrial Co Ltd 165 0.01
22 Creative Sensor Inc 15 –
746 CSBC Corp Taiwan 313 0.02
12,515 CTBC Financial Holding Co Ltd 6,855 0.44
24 CviLux Corp 20 –
10 Cyberlink Corp 21 –
41 CyberTAN Technology Inc 23 –
1,000 D-Link Corp 323 0.02
193 DA CIN Construction Co Ltd 127 0.01
108 Danen Technology Corp 23 –
419 Darfon Electronics Corp 269 0.02
237 Darwin Precisions Corp 91 0.01
15 Depo Auto Parts Ind Co Ltd 40 –
21 Dimerco Express Corp 14 –
513 Dynamic Electronics Co Ltd 136 0.01

Emerging Markets Value Fund
Portfolio of Investments as at 30 November 2016 (continued)
Dimensional Fund Advisors Annual Report and Audited Financial Statements, 30 November 2016 58
Shares (000's)
Value (000's)
USD
% of Net Asset Value
Common Stock (continued)
Taiwan - 15.85% (continued)
118 Dynapack International Technology Corp 140 0.01
545 E Ink Holdings Inc 389 0.02
10,580 E.Sun Financial Holding Co Ltd 6,136 0.40
303 Edimax Technology Co Ltd 95 0.01
149 Edison Opto Corp 61 –
536 Elitegroup Computer Systems Co Ltd 219 0.01
117 ENG Electric Co Ltd 66 –
944 EnTie Commercial Bank Co Ltd 373 0.02
189 Epistar Corp 138 0.01
165 Eternal Materials Co Ltd 172 0.01
2,567 Eva Airways Corp 1,257 0.08
889 Evergreen International Storage & Transport Corp 372 0.02
1,935 Evergreen Marine Corp Taiwan Ltd 731 0.05
75 Everlight Chemical Industrial Corp 46 –
243 Everlight Electronics Co Ltd 354 0.02
129 Excelsior Medical Co Ltd 181 0.01
1,201 Far Eastern Department Stores Ltd 610 0.04
2,778 Far Eastern International Bank 789 0.05
2,577 Far Eastern New Century Corp 1,903 0.12
117 Farglory F T Z Investment Holding Co Ltd 54 –
376 Farglory Land Development Co Ltd 438 0.03
739 Federal Corp 296 0.02
229 First Copper Technology Co Ltd 56 –
13,143 First Financial Holding Co Ltd 6,919 0.44
266 First Hotel 135 0.01
279 First Insurance Co Ltd 121 0.01
597 First Steamship Co Ltd 148 0.01
218 Formosa Advanced Technologies Co Ltd 159 0.01
59 Formosa Oilseed Processing Co Ltd 82 0.01
1,120 Formosa Taffeta Co Ltd 1,048 0.07
617 Formosan Rubber Group Inc 293 0.02
483 Formosan Union Chemical 256 0.02
330 Founding Construction & Development Co Ltd 166 0.01
1,086 Foxconn Technology Co Ltd 2,840 0.18
181 Foxlink Image Technology Co Ltd 93 0.01
309 Froch Enterprise Co Ltd 105 0.01
7,784 Fubon Financial Holding Co Ltd 12,033 0.77
341 Fulltech Fiber Glass Corp 131 0.01
149 Fwusow Industry Co Ltd 72 –
270 G Shank Enterprise Co Ltd 212 0.01
48 Gallant Precision Machining Co Ltd 29 –
528 Gemtek Technology Corp 341 0.02
321 Genesis Photonics Inc 27 –
69 Genius Electronic Optical Co Ltd 200 0.01
276 Getac Technology Corp 350 0.02
182 Giantplus Technology Co Ltd 88 0.01
663 Gigabyte Technology Co Ltd 876 0.06
324 Gigastorage Corp 219 0.01
507 Gintech Energy Corp 277 0.02
462 Global Brands Manufacture Ltd 172 0.01
117 Globe Union Industrial Corp 53 –
756 Gloria Material Technology Corp 421 0.03
499 Gold Circuit Electronics Ltd 177 0.01
1,897 Goldsun Building Materials Co Ltd 408 0.03
40 Grand Ocean Retail Group Ltd 28 –
1,180 Grand Pacific Petrochemical 784 0.05
44 Great China Metal Industry 31 –
280 Great Wall Enterprise Co Ltd 260 0.02
225 Green Energy Technology Inc 108 0.01
123 GTM Holdings Corp 62 –
478 Hannstar Board Corp 293 0.02
3,344 HannStar Display Corp 944 0.06
398 HannsTouch Solution Inc 114 0.01
Shares (000's)
Value (000's)
USD
% of Net Asset Value
Common Stock (continued)
Taiwan - 15.85% (continued)
29 Harvatek Corp 9 –
343 Hey Song Corp 349 0.02
24 Hiroca Holdings Ltd 71 –
20 Hitron Technology Inc 13 –
450 Ho Tung Chemical Corp 112 0.01
396 Hocheng Corp 112 0.01
338 Holy Stone Enterprise Co Ltd 337 0.02
5,236 Hon Hai Precision Industry Co Ltd 13,449 0.86
91 Hong TAI Electric Industrial 26 –
116 Hsin Kuang Steel Co Ltd 81 0.01
241 Hsing TA Cement Co 75 –
586 HTC Corp 1,545 0.10
399 HUA ENG Wire & Cable Co Ltd 104 0.01
9,124 Hua Nan Financial Holdings Co Ltd 4,631 0.29
72 Huang Hsiang Construction Corp 94 0.01
219 Hung Ching Development & Construction Co Ltd 133 0.01
366 Hung Poo Real Estate Development Corp 311 0.02
57 Hung Sheng Construction Ltd 32 –
268 I-Chiun Precision Industry Co Ltd 68 –
319 Ichia Technologies Inc 139 0.01
85 Infortrend Technology Inc 40 –
12,397 Innolux Corp 4,265 0.27
3,236 Inotera Memories Inc 3,046 0.19
17 Inpaq Technology Co Ltd 11 –
79 ITEQ Corp 82 0.01
32 Jentech Precision Industrial Co Ltd 48 –
1,908 Jih Sun Financial Holdings Co Ltd 401 0.03
51 Jinli Group Holdings Ltd 62 –
172 K Laser Technology Inc 92 0.01
125 Kang Na Hsiung Enterprise Co Ltd 43 –
183 Kaulin Manufacturing Co Ltd 91 0.01
124 Kenmec Mechanical Engineering Co Ltd 41 –
267 Kindom Construction Corp 168 0.01
582 King Yuan Electronics Co Ltd 480 0.03
965 King's Town Bank Co Ltd 819 0.05
36 King's Town Construction Co Ltd 24 –
39 Kingcan Holdings Ltd 39 –
108 Kinko Optical Co Ltd 70 –
1,954 Kinpo Electronics 697 0.04
278 Kinsus Interconnect Technology Corp 618 0.04
25 KS Terminals Inc 26 –
469 Kung Sing Engineering Corp 146 0.01
147 Kuo Toong International Co Ltd 80 0.01
334 Kuoyang Construction Co Ltd 133 0.01
38 Kwong Fong Industries Corp 30 –
248 KYE Systems Corp 69 –
243 L&K Engineering Co Ltd 194 0.01
282 LAN FA Textile 73 –
66 Lanner Electronics Inc 90 0.01
135 Leader Electronics Inc 41 –
1,103 Lealea Enterprise Co Ltd 279 0.02
150 Ledtech Electronics Corp 66 –
294 LEE CHI Enterprises Co Ltd 94 0.01
104 Lelon Electronics Corp 119 0.01
479 Leofoo Development Co Ltd 123 0.01
217 LES Enphants Co Ltd 80 0.01
486 Lextar Electronics Corp 192 0.01
962 Li Peng Enterprise Co Ltd 231 0.01
730 Lien Hwa Industrial Corp 503 0.03
559 Lingsen Precision Industries Ltd 210 0.01
328 Lite-On Semiconductor Corp 216 0.01
2,442 Lite-On Technology Corp 3,850 0.24
871 Long Chen Paper Co Ltd 442 0.03

Emerging Markets Value Fund
Portfolio of Investments as at 30 November 2016 (continued)
Dimensional Fund Advisors Annual Report and Audited Financial Statements, 30 November 2016 59
Shares (000's)
Value (000's)
USD
% of Net Asset Value
Common Stock (continued)
Taiwan - 15.85% (continued)
32 Longwell Co 29 –
70 Lotes Co Ltd 198 0.01
374 Lucky Cement Corp 109 0.01
18 Lumax International Corp Ltd 30 –
45 LuxNet Corp 46 –
5,847 Macronix International 739 0.05
181 Marketech International Corp 151 0.01
1,758 Masterlink Securities Corp 461 0.03
229 Mayer Steel Pipe Corp 106 0.01
11,461 Mega Financial Holding Co Ltd 8,167 0.53
735 Mercuries Life Insurance Co Ltd 396 0.03
297 Micro-Star International Co Ltd 790 0.05
141 MIN AIK Technology Co Ltd 134 0.01
85 Mirle Automation Corp 100 0.01
395 Mitac Holdings Corp 402 0.03
264 Motech Industries Inc 223 0.01
290 Nan Ren Lake Leisure Amusement Co Ltd 72 –
318 Nan Ya Printed Circuit Board Corp 241 0.02
945 Neo Solar Power Corp 439 0.03
141 New Asia Construction & Development Corp 32 –
32 New Era Electronics Co Ltd 22 –
432 Nien Hsing Textile Co Ltd 330 0.02
36 Nishoku Technology Inc 77 –
869 OptoTech Corp 381 0.02
217 Orient Semiconductor Electronics Ltd 78 –
268 Pacific Construction Co 103 0.01
574 Pan Jit International Inc 267 0.02
259 Pan-International Industrial Corp 192 0.01
1,844 Pegatron Corp 4,384 0.28
69 Portwell Inc 84 0.01
1,310 President Securities Corp 464 0.03
1,028 Prince Housing & Development Corp 348 0.02
49 Promise Technology Inc 21 –
2,682 Qisda Corp 1,292 0.08
21 Qualipoly Chemical Corp 22 –
310 Quanta Storage Inc 271 0.02
453 Quintain Steel Co Ltd 121 0.01
300 Radiant Opto-Electronics Corp 545 0.03
439 Radium Life Tech Co Ltd 135 0.01
84 Ralec Electronic Corp 123 0.01
961 Rich Development Co Ltd 249 0.02
1,570 Ritek Corp 252 0.02
32 Rotam Global Agrosciences Ltd 32 –
730 Sampo Corp 413 0.03
94 Sanyang Motor Co Ltd 62 –
22 SDI Corp 29 –
121 Sesoda Corp 102 0.01
53 Shan-Loong Transportation Co Ltd 45 –
167 Sheng Yu Steel Co Ltd 194 0.01
145 ShenMao Technology Inc 131 0.01
50 Shih Her Technologies Inc 45 –
398 Shih Wei Navigation Co Ltd 120 0.01
527 Shihlin Electric & Engineering Corp 662 0.04
12,478 Shin Kong Financial Holding Co Ltd 3,214 0.20
76 Shining Building Business Co Ltd 27 –
312 Shinkong Insurance Co Ltd 261 0.02
2,225 Shinkong Synthetic Fibers Corp 633 0.04
544 Sigurd Microelectronics Corp 400 0.03
59 Simplo Technology Co Ltd 174 0.01
537 Sincere Navigation Corp 340 0.02
913 Sino-American Silicon Products Inc 828 0.05
602 Sinon Corp 289 0.02
12,825 SinoPac Financial Holdings Co Ltd 3,659 0.23
Shares (000's)
Value (000's)
USD
% of Net Asset Value
Common Stock (continued)
Taiwan - 15.85% (continued)
15 Sirtec International Co Ltd 19 –
213 Siward Crystal Technology Co Ltd 122 0.01
386 Solar Applied Materials Technology Co 79 0.01
314 Solartech Energy Corp 137 0.01
298 Southeast Cement Co Ltd 141 0.01
97 Spirox Corp 54 –
76 Stark Technology Inc 65 –
984 Sunplus Technology Co Ltd 347 0.02
226 Sunrex Technology Corp 121 0.01
47 Sunspring Metal Corp 60 –
423 Supreme Electronics Co Ltd 338 0.02
307 Sweeten Real Estate Development Co Ltd 142 0.01
336 Synnex Technology International Corp 342 0.02
118 Systex Corp 205 0.01
123 T-Mac Techvest PCB Co Ltd 49 –
1,258 TA Chen Stainless Pipe 724 0.05
63 Ta Ya Electric Wire & Cable 11 –
179 TA-I Technology Co Ltd 106 0.01
141 Tah Hsin Industrial Corp 111 0.01
3,203 Taichung Commercial Bank Co Ltd 924 0.06
87 Taiflex Scientific Co Ltd 89 0.01
65 Tainan Enterprises Co Ltd 62 –
1,527 Tainan Spinning Co Ltd 588 0.04
223 Tainergy Tech Co Ltd 87 0.01
12,739 Taishin Financial Holding Co Ltd 4,671 0.30
5,322 Taiwan Business Bank 1,346 0.09
4,434 Taiwan Cement Corp 5,112 0.32
148 Taiwan Cogeneration Corp 104 0.01
9,472 Taiwan Cooperative Financial Holding Co Ltd 4,173 0.26
785 Taiwan Fertilizer Co Ltd 998 0.06
227 Taiwan Fire & Marine Insurance Co Ltd 144 0.01
783 Taiwan Glass Industry Corp 331 0.02
55 Taiwan Hon Chuan Enterprise Co Ltd 94 0.01
241 Taiwan Hopax Chemicals Manufacturing Co Ltd 136 0.01
495 Taiwan Kolin Co Ltd – –
702 Taiwan Land Development Corp 223 0.01
262 Taiwan Mask Corp 68 –
270 Taiwan Navigation Co Ltd 111 0.01
309 Taiwan PCB Techvest Co Ltd 300 0.02
582 Taiwan Pulp & Paper Corp 195 0.01
199 Taiwan Sakura Corp 225 0.01
93 Taiwan Styrene Monomer 61 –
306 Taiwan Surface Mounting Technology Corp 248 0.02
233 Taiwan TEA Corp 105 0.01
153 Taiwan Union Technology Corp 152 0.01
177 Taiyen Biotech Co Ltd 166 0.01
1,479 Tatung Co Ltd 456 0.03
2,305 Teco Electric and Machinery Co Ltd 1,930 0.12
148 Ton Yi Industrial Corp 63 –
322 Tong-Tai Machine & Tool Co Ltd 214 0.01
236 Topoint Technology Co Ltd 142 0.01
376 Transasia Airways Corp 40 –
430 Tripod Technology Corp 985 0.06
40 Tsann Kuen Enterprise Co Ltd 36 –
1,329 Tung Ho Steel Enterprise Corp 908 0.06
200 TXC Corp 257 0.02
214 Tycoons Group Enterprise 32 –
36 Tyntek Corp 13 –
19 T3EX Global Holdings Corp 12 –
183 U-Ming Marine Transport Corp 150 0.01
2,498 Unimicron Technology Corp 935 0.06
1,632 Union Bank Of Taiwan 459 0.03
162 Unitech Computer Co Ltd 85 0.01
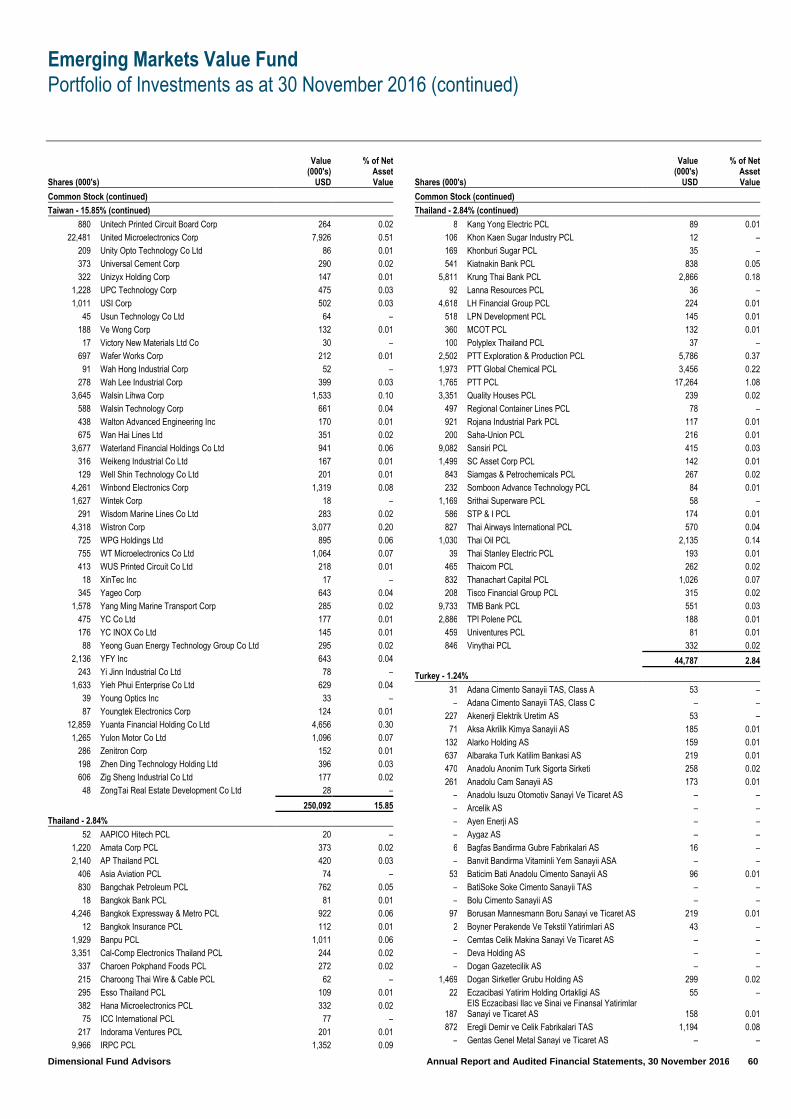
Emerging Markets Value Fund
Portfolio of Investments as at 30 November 2016 (continued)
Dimensional Fund Advisors Annual Report and Audited Financial Statements, 30 November 2016 60
Shares (000's)
Value (000's)
USD
% of Net Asset Value
Common Stock (continued)
Taiwan - 15.85% (continued)
880 Unitech Printed Circuit Board Corp 264 0.02
22,481 United Microelectronics Corp 7,926 0.51
209 Unity Opto Technology Co Ltd 86 0.01
373 Universal Cement Corp 290 0.02
322 Unizyx Holding Corp 147 0.01
1,228 UPC Technology Corp 475 0.03
1,011 USI Corp 502 0.03
45 Usun Technology Co Ltd 64 –
188 Ve Wong Corp 132 0.01
17 Victory New Materials Ltd Co 30 –
697 Wafer Works Corp 212 0.01
91 Wah Hong Industrial Corp 52 –
278 Wah Lee Industrial Corp 399 0.03
3,645 Walsin Lihwa Corp 1,533 0.10
588 Walsin Technology Corp 661 0.04
438 Walton Advanced Engineering Inc 170 0.01
675 Wan Hai Lines Ltd 351 0.02
3,677 Waterland Financial Holdings Co Ltd 941 0.06
316 Weikeng Industrial Co Ltd 167 0.01
129 Well Shin Technology Co Ltd 201 0.01
4,261 Winbond Electronics Corp 1,319 0.08
1,627 Wintek Corp 18 –
291 Wisdom Marine Lines Co Ltd 283 0.02
4,318 Wistron Corp 3,077 0.20
725 WPG Holdings Ltd 895 0.06
755 WT Microelectronics Co Ltd 1,064 0.07
413 WUS Printed Circuit Co Ltd 218 0.01
18 XinTec Inc 17 –
345 Yageo Corp 643 0.04
1,578 Yang Ming Marine Transport Corp 285 0.02
475 YC Co Ltd 177 0.01
176 YC INOX Co Ltd 145 0.01
88 Yeong Guan Energy Technology Group Co Ltd 295 0.02
2,136 YFY Inc 643 0.04
243 Yi Jinn Industrial Co Ltd 78 –
1,633 Yieh Phui Enterprise Co Ltd 629 0.04
39 Young Optics Inc 33 –
87 Youngtek Electronics Corp 124 0.01
12,859 Yuanta Financial Holding Co Ltd 4,656 0.30
1,265 Yulon Motor Co Ltd 1,096 0.07
286 Zenitron Corp 152 0.01
198 Zhen Ding Technology Holding Ltd 396 0.03
606 Zig Sheng Industrial Co Ltd 177 0.02
48 ZongTai Real Estate Development Co Ltd 28 –
250,092 15.85
Thailand - 2.84%
52 AAPICO Hitech PCL 20 –
1,220 Amata Corp PCL 373 0.02
2,140 AP Thailand PCL 420 0.03
406 Asia Aviation PCL 74 –
830 Bangchak Petroleum PCL 762 0.05
18 Bangkok Bank PCL 81 0.01
4,246 Bangkok Expressway & Metro PCL 922 0.06
12 Bangkok Insurance PCL 112 0.01
1,929 Banpu PCL 1,011 0.06
3,351 Cal-Comp Electronics Thailand PCL 244 0.02
337 Charoen Pokphand Foods PCL 272 0.02
215 Charoong Thai Wire & Cable PCL 62 –
295 Esso Thailand PCL 109 0.01
382 Hana Microelectronics PCL 332 0.02
75 ICC International PCL 77 –
217 Indorama Ventures PCL 201 0.01
9,966 IRPC PCL 1,352 0.09
Shares (000's)
Value (000's)
USD
% of Net Asset Value
Common Stock (continued)
Thailand - 2.84% (continued)
8 Kang Yong Electric PCL 89 0.01
106 Khon Kaen Sugar Industry PCL 12 –
169 Khonburi Sugar PCL 35 –
541 Kiatnakin Bank PCL 838 0.05
5,811 Krung Thai Bank PCL 2,866 0.18
92 Lanna Resources PCL 36 –
4,618 LH Financial Group PCL 224 0.01
518 LPN Development PCL 145 0.01
360 MCOT PCL 132 0.01
100 Polyplex Thailand PCL 37 –
2,502 PTT Exploration & Production PCL 5,786 0.37
1,973 PTT Global Chemical PCL 3,456 0.22
1,765 PTT PCL 17,264 1.08
3,351 Quality Houses PCL 239 0.02
497 Regional Container Lines PCL 78 –
921 Rojana Industrial Park PCL 117 0.01
200 Saha-Union PCL 216 0.01
9,082 Sansiri PCL 415 0.03
1,499 SC Asset Corp PCL 142 0.01
843 Siamgas & Petrochemicals PCL 267 0.02
232 Somboon Advance Technology PCL 84 0.01
1,169 Srithai Superware PCL 58 –
586 STP & I PCL 174 0.01
827 Thai Airways International PCL 570 0.04
1,030 Thai Oil PCL 2,135 0.14
39 Thai Stanley Electric PCL 193 0.01
465 Thaicom PCL 262 0.02
832 Thanachart Capital PCL 1,026 0.07
208 Tisco Financial Group PCL 315 0.02
9,733 TMB Bank PCL 551 0.03
2,886 TPI Polene PCL 188 0.01
459 Univentures PCL 81 0.01
846 Vinythai PCL 332 0.02
44,787 2.84
Turkey - 1.24%
31 Adana Cimento Sanayii TAS, Class A 53 –
– Adana Cimento Sanayii TAS, Class C – –
227 Akenerji Elektrik Uretim AS 53 –
71 Aksa Akrilik Kimya Sanayii AS 185 0.01
132 Alarko Holding AS 159 0.01
637 Albaraka Turk Katilim Bankasi AS 219 0.01
470 Anadolu Anonim Turk Sigorta Sirketi 258 0.02
261 Anadolu Cam Sanayii AS 173 0.01
– Anadolu Isuzu Otomotiv Sanayi Ve Ticaret AS – –
– Arcelik AS – –
– Ayen Enerji AS – –
– Aygaz AS – –
6 Bagfas Bandirma Gubre Fabrikalari AS 16 –
– Banvit Bandirma Vitaminli Yem Sanayii ASA – –
53 Baticim Bati Anadolu Cimento Sanayii AS 96 0.01
– BatiSoke Soke Cimento Sanayii TAS – –
– Bolu Cimento Sanayii AS – –
97 Borusan Mannesmann Boru Sanayi ve Ticaret AS 219 0.01
2 Boyner Perakende Ve Tekstil Yatirimlari AS 43 –
– Cemtas Celik Makina Sanayi Ve Ticaret AS – –
– Deva Holding AS – –
– Dogan Gazetecilik AS – –
1,469 Dogan Sirketler Grubu Holding AS 299 0.02
22 Eczacibasi Yatirim Holding Ortakligi AS 55 –
187 EIS Eczacibasi Ilac ve Sinai ve Finansal Yatirimlar Sanayi ve Ticaret AS 158 0.01
872 Eregli Demir ve Celik Fabrikalari TAS 1,194 0.08
– Gentas Genel Metal Sanayi ve Ticaret AS – –

Emerging Markets Value Fund
Portfolio of Investments as at 30 November 2016 (continued)
Dimensional Fund Advisors Annual Report and Audited Financial Statements, 30 November 2016 61
Shares (000's)
Value (000's)
USD
% of Net Asset Value
Common Stock (continued)
Turkey - 1.24% (continued)
– Haci Omer Sabanci Holding AS – –
– Hektas Ticaret TAS – –
162 Ihlas Holding AS 13 –
201 Ipek Dogal Enerji Kaynaklari Arastirma Ve Uretim AS 117 0.01
– Is Finansal Kiralama AS – –
91 Is Yatirim Menkul Degerler AS 32 –
– Izmir Demir Celik Sanayi AS – – 1,014
Kardemir Karabuk Demir Celik Sanayi ve Ticaret AS 303 0.02
137 Kardemir Karabuk Demir Celik Sanayi ve Ticaret AS, Class A 50 –
– Kardemir Karabuk Demir Celik Sanayi ve Ticaret AS, Class B – –
– KOC Holding AS – –
27 Koza Altin Isletmeleri AS 122 0.01
330 Koza Anadolu Metal Madencilik Isletmeleri AS 200 0.01
– Marti Otel Isletmeleri AS – –
– Menderes Tekstil Sanayi ve Ticaret AS – –
30 NET Holding AS 27 – 69
Park Elektrik Uretim Madencilik Sanayi ve Ticaret AS 40 –
19 Pegasus Hava Tasimaciligi AS 71 –
– Petkim Petrokimya Holding AS – –
14 Pinar Entegre Et ve Un Sanayi AS 40 –
105 Sarkuysan Elektrolitik Bakir Sanayi ve Ticaret AS 92 0.01
713 Sekerbank TAS 228 0.01
319 Selcuk Ecza Deposu Ticaret ve Sanayi AS 296 0.02
58 Soda Sanayii AS 77 –
– Tat Gida Sanayi AS – –
46 Tekfen Holding AS 82 0.01
564 Trakya Cam Sanayii AS 460 0.03
187 Turcas Petrol AS 74 –
1,124 Turk Hava Yollari AO 1,571 0.10
– Turker proje Gayrimenkul ve Yatirim Gelistirme AS – –
912 Turkiye Garanti Bankasi AS 1,928 0.12
1,092 Turkiye Halk Bankasi AS 2,785 0.19
2,267 Turkiye Is Bankasi 3,175 0.21
1,248 Turkiye Sinai Kalkinma Bankasi AS 453 0.03
1,643 Turkiye Sise ve Cam Fabrikalari AS 1,582 0.10
1,265 Turkiye Vakiflar Bankasi TAO 1,531 0.10
– Ulker Biskuvi Sanayi AS – –
– Uzel Makina Sanayii AS – –
54 Vestel Elektronik Sanayi ve Ticaret AS 94 0.01
960 Yapi ve Kredi Bankasi AS 869 0.06
19,492 1.24
Total Common Stock – 97.14% (30 November 2015: 98.51%) 1,532,175 97.14
Preferred Stock
Brazil - 2.52%
156 Banco ABC Brasil SA 637 0.04
307 Banco do Estado do Rio Grande do Sul SA 1,021 0.06
267 Banco Pan SA 109 0.01
38 Banco Pine SA 48 –
268 Cia Brasileira de Distribuicao 4,319 0.27
118 Cia Ferro Ligas da Bahia - Ferbasa 256 0.02
66 Eucatex SA Industria e Comercio 52 –
453 Marcopolo SA 353 0.02
2,095 Petroleo Brasileiro SA 9,876 0.63
364 Suzano Papel e Celulose SA 1,382 0.09
94 Unipar Carbocloro SA 188 0.01
15 Usinas Siderurgicas de Minas Gerais SA 19 –
2,861 Vale SA 21,569 1.37
39,829 2.52
Shares (000's)
Value (000's)
USD
% of Net Asset Value
Preferred Stock (continued)
Colombia - 0.14%
371 Avianca Holdings SA 323 0.02
99 Grupo Argos SA 558 0.04
115 Grupo de Inversiones Suramericana SA 1,282 0.08
2,163 0.14
India - 0.00%
35 UPL Ltd 7 –
7 –
Total Preferred Stock – 2.66% (30 November 2015: 1.54%) 41,999 2.66
Real Estate Investment Trust
Turkey - 0.00%
– Is Gayrimenkul Yatirim Ortakligi AS – –
– – Total Real Estate Investment Trust – 0.00% (30 November 2015: 0.03%) – –
Rights
Brazil - 0.00%
18 Marcopolo SA – –
– –
Chile - 0.00%
2 Latam Airlines Group SA – –
– –
China (Hong Kong) - 0.00%
780 MMG Ltd 65 –
65 –
Korea, Republic of - 0.00%
17 Heung-A Shipping Co Ltd 2 –
2 –
South Africa - 0.00%
23 KAP Industrial Holdings Ltd – –
– –
Taiwan - 0.00%
484 Taishin Financial Holding Co Ltd – –
31 Unity Opto Technology Co Ltd – –
– –
Total Rights – 0.00% (30 November 2015: 0.00%) 67 –
Warrants
Malaysia - 0.00%
86 Gadang Holdings Bhd – –
– –
Total Warrants – 0.00% (30 November 2015: 0.00%) – –
Total Investments 99.80% (30 November 2015: 100.09%) 1,574,241 99.80
Value (000's)
USD
% of Net Asset Value
Cash and Cash Equivalents– 0.04% (30 November 2015: 0.90%) 661 0.04 Other Assets in Excess of Liabilities – 0.16% (30 November 2015: (0.99)%) 2,569 0.16
Total Net Assets 1,577,471 100.00
– Amounts designated as “–” are either, less than $500 or less than 500 shares.
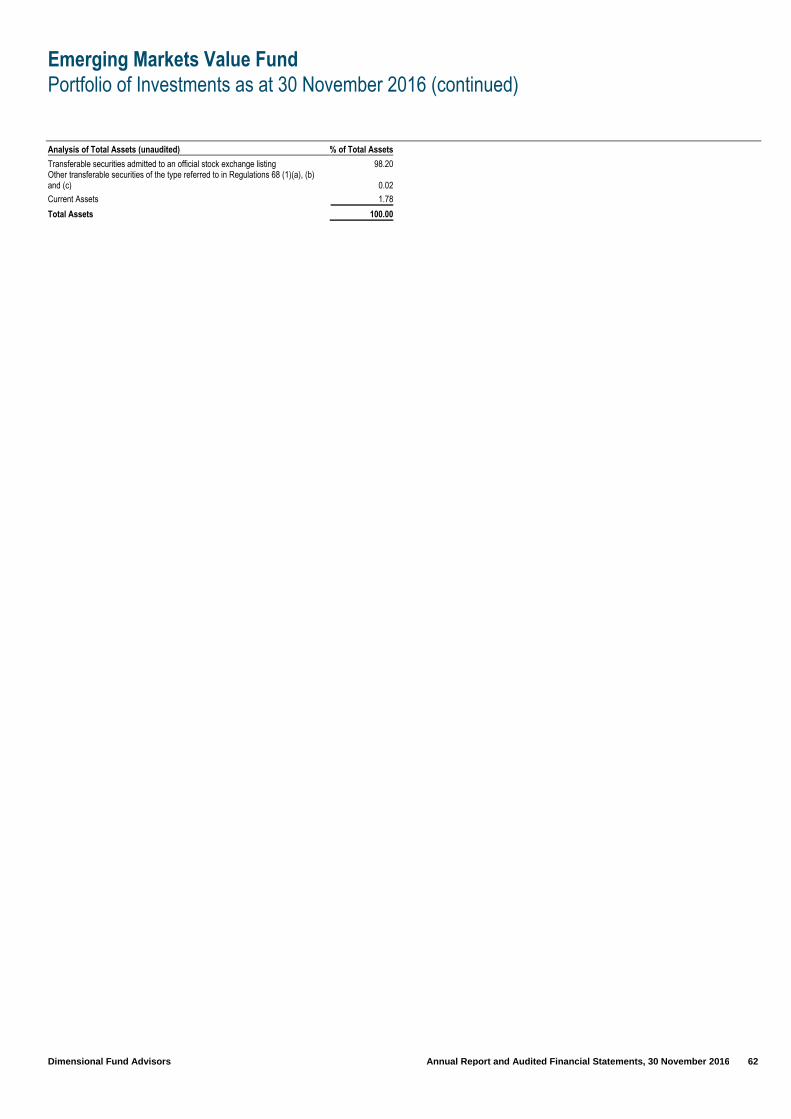
Emerging Markets Value Fund
Portfolio of Investments as at 30 November 2016 (continued)
Dimensional Fund Advisors Annual Report and Audited Financial Statements, 30 November 2016 62
Analysis of Total Assets (unaudited) % of Total Assets
Transferable securities admitted to an official stock exchange listing 98.20 Other transferable securities of the type referred to in Regulations 68 (1)(a), (b) and (c) 0.02
Current Assets 1.78
Total Assets 100.00

Euro Inflation Linked Intermediate Duration Fixed Income Fund
Portfolio of Investments as at 30 November 2016
Dimensional Fund Advisors Annual Report and Audited Financial Statements, 30 November 2016 63
Face Value (000's)
Coupon Rate %
Maturity Date
Value (000's) EUR
% of Net Asset Value
Government Bonds
France – 85.60%
915 France Government Bond OAT 1.100 25/07/2022 1,124 14.51
1,421 France Government Bond OAT 0.250 25/07/2024 1,568 20.24
1,090 France Government Bond OAT 1.850 25/07/2027 1,466 18.93
415 France Government Bond OAT 0.700 25/07/2030 479 6.18
1,035 France Government Bond OAT 3.150 25/07/2032 1,994 25.74
6,631 85.60
Germany – 11.88%
818
Deutsche Bundesrepublik Inflation Linked Bond 0.100 15/04/2023 920 11.88
920 11.88
Total Government Bonds - 97.48% (30 November 2015: 98.52%) 7,551 97.48
Total Investments - 97.48% (30 November 2015: 98.52%) 7,551 97.48
Cash and Cash Equivalents - 0.92% (30 November 2015: 0.44%) 71 0.92 Other Assets in Excess of Liabilities - 1.60% (30 November 2015: 1.04%) 124 1.60
Total Net Assets 7,746 100.00
Analysis of Total Assets (unaudited) % of Total Assets
Transferable securities admitted to an official exchange listing 91.16
Transferable securities dealt in on another regulated market 6.17
Current assets 2.67
Total Assets 100.00

Euro Inflation Linked Long Duration Fixed Income Fund
Portfolio of Investments as at 30 November 2016
Dimensional Fund Advisors Annual Report and Audited Financial Statements, 30 November 2016 64
Face Value (000's)
Coupon Rate %
Maturity Date
Value (000's)
EUR
% of Net Asset Value
Government Bonds
France - 80.65%
1 France Government Bond OAT 0.250 25/07/2024 1 0.81
10 France Government Bond OAT 1.850 25/07/2027 14 11.29
24 France Government Bond OAT 0.700 25/07/2030 28 22.58
15 France Government Bond OAT 3.150 25/07/2032 29 23.39
17 France Government Bond OAT 1.800 25/07/2040 28 22.58
100 80.65
Germany - 16.13%
17 Deutsche Bundesrepublik Inflation Linked Bond 0.500 15/04/2030 20 16.13
20 16.13
Total Government Bonds – 96.78% (30 November 2015: 99.38%) 120 96.78
Total Investments – 96.78% (30 November 2015: 99.38%) 120 96.78
Cash and Cash Equivalents– 4.83% (30 November 2015: 0.34%) 6 4.83 Liabilities in Excess of Other Assets – (1.61)% (30 November 2015: 0.28%) (2) (1.61)
Total Net Assets 124 100.00
Analysis of Total Assets (unaudited) % of Total Assets
Transferable securities admitted to an official exchange listing 92.03
Current Assets 7.97
Total Assets 100.00

European Small Companies Fund
Portfolio of Investments as at 30 November 2016
Dimensional Fund Advisors Annual Report and Audited Financial Statements, 30 November 2016 65
.
Shares (000's)
Value (000's)
EUR
% of Net Asset Value
Common Stock
Austria - 2.62%
1 Agrana Beteiligungs AG 57 0.04
8 Andritz AG 393 0.28
26 Atrium European Real Estate Ltd 100 0.07
3 Austria Technologie & Systemtechnik AG 33 0.02
11 Buwog AG 242 0.16
10 CA Immobilien Anlagen AG 166 0.11
11 Conwert Immobilien Invest SE 174 0.12
1 DO & CO AG 48 0.03
4 EVN AG 47 0.03
2 Flughafen Wien AG 43 0.03
134 Immofinanz AG 262 0.18
1 Kapsch TrafficCom AG 32 0.02
2 Lenzing AG 183 0.12
1 Mayr Melnhof Karton AG 124 0.08
2 Oberbank AG 144 0.10
6 Oesterreichische Post AG 185 0.13
2 Palfinger AG 58 0.04
2 POLYTEC Holding AG 21 0.01
2 Porr Ag 66 0.04
15 Raiffeisen Bank International AG 261 0.18
5 RHI AG 113 0.08
1 Rosenbauer International AG 39 0.03
8 S IMMO AG 76 0.05
2 Schoeller-Bleckmann Oilfield Equipment AG 103 0.07
2 Semperit AG Holding 44 0.03
3 Strabag SE 95 0.06
12 Telekom Austria AG 65 0.04
– UBM Development AG 2 –
18 UNIQA Insurance Group AG 115 0.08
6 Verbund AG 85 0.06
3 Vienna Insurance Group AG Wiener Versicherung Gruppe 49 0.03
1 voestalpine AG 24 0.02
19 Wienerberger AG 309 0.22
5 Zumtobel Group AG 85 0.06
3,843 2.62
Belgium - 3.03%
8 Ablynx NV 77 0.05
3 Ackermans & van Haaren NV 428 0.3
33 AGFA-Gevaert NV 141 0.10
– Atenor 11 0.01
– Banque Nationale de Belgique 110 0.07
1 Barco NV 101 0.07
6 Bekaert SA 238 0.16
11 bpost SA 236 0.16
1 Cie d'Entreprises CFE 95 0.06
1 Cie Immobiliere de Belgique SA 28 0.02
3 D'ieteren SA 119 0.08
13 Deceuninck NV 31 0.02
12 Econocom Group SA 166 0.11
4 Elia System Operator SA 206 0.14
17 Euronav NV 120 0.08
2 EVS Broadcast Equipment SA 53 0.04
5 Exmar NV 33 0.02
6 Fagron 53 0.04
6 Galapagos NV 341 0.23
3 Gimv NV 164 0.11
2 Ion Beam Applications 91 0.06
2 Kinepolis Group NV 75 0.05
– Lotus Bakeries 90 0.06
4 MDxHealth 16 0.01
3 Melexis NV 159 0.11
Shares (000's)
Value (000's)
EUR
% of Net Asset Value
Common Stock (continued)
Belgium - 3.03% (continued)
12 Nyrstar NV 79 0.05
9 Ontex Group NV 239 0.16
6 Orange Belgium SA 108 0.07
– Picanol 37 0.03
– RealDolmen 5 –
– RealDolmen NV/SA – –
5 Recticel SA 27 0.02
– Resilux 24 0.02
1 Roularta Media Group NV 20 0.01
1 Sioen Industries NV 45 0.03
1 Sipef SA 53 0.04
4 Telenet Group Holding NV 186 0.13
5 Tessenderlo Chemie NV 163 0.11
5 ThromboGenics NV 14 0.01
3 Umicore SA 185 0.13
1 Van de Velde NV 68 0.05
13 Viohalco SA 15 0.01
4,450 3.03
Denmark - 2.85%
1 ALK-Abello AS 91 0.06
10 Alm Brand AS 73 0.05
4 Ambu AS 145 0.10
7 Bang & Olufsen AS 67 0.05
3 Bavarian Nordic AS 85 0.06
– Brodrene Hartmann AS 14 0.01
2 D/S Norden AS 31 0.02
4 Dfds AS 147 0.10
– Djurslands Bank AS 9 0.01
6 FLSmidth & Co AS 217 0.15
17 GN Store Nord AS 317 0.21
1 Harboes Bryggeri AS 19 0.01
1 IC Group AS 24 0.02
– Jeudan AS 4 –
8 Jyske Bank AS 330 0.22
– Lan & Spar Bank 13 0.01
4 Matas AS 47 0.03
3 NKT Holding AS 203 0.14
1 NNIT AS 29 0.02
2 Nordjyske Bank AS 27 0.02
1 Parken Sport & Entertainment AS 8 0.01
3 Per Aarsleff Holding AS 60 0.04
1 Ringkjoebing Landbobank AS 144 0.10
– Rockwool International AS 19 0.01
1 Rockwool International AS, Class B 136 0.09
7 Royal Unibrew AS 244 0.17
2 Santa Fe Group AS 17 0.01
2 Schouw & Co AB 103 0.07
5 SimCorp AS 211 0.14
1 Solar AS 46 0.03
11 Spar Nord Bank AS 108 0.07
10 Sydbank AS 270 0.18
103 TDC AS 493 0.33
– Tivoli AS 24 0.02
14 TK Development AS 15 0.01
8 Topdanmark AS 190 0.13
1 Tryg AS 9 0.01
– United International Enterprises 48 0.03
1 Vestjysk Bank AS 2 –
8 William Demant Holding AS 126 0.09
2 Zealand Pharma AS 28 0.02
4,193 2.85
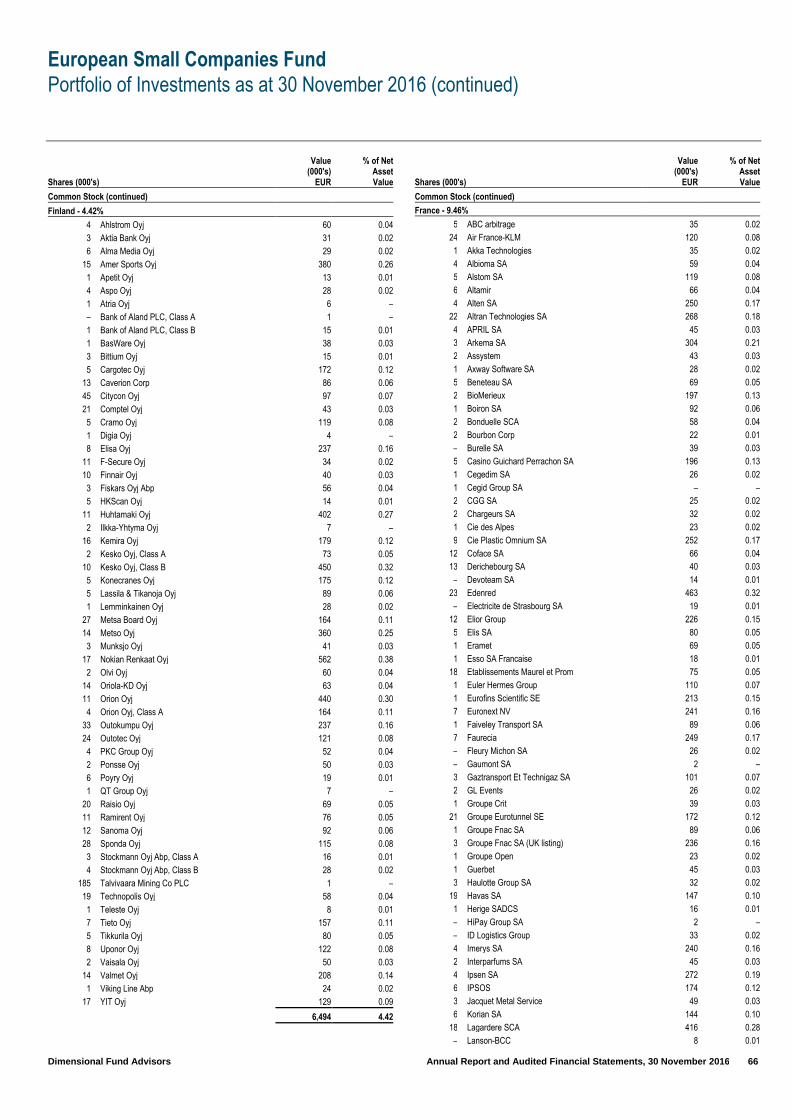
European Small Companies Fund
Portfolio of Investments as at 30 November 2016 (continued)
Dimensional Fund Advisors Annual Report and Audited Financial Statements, 30 November 2016 66
Shares (000's)
Value (000's)
EUR
% of Net Asset Value
Common Stock (continued)
Finland - 4.42%
4 Ahlstrom Oyj 60 0.04
3 Aktia Bank Oyj 31 0.02
6 Alma Media Oyj 29 0.02
15 Amer Sports Oyj 380 0.26
1 Apetit Oyj 13 0.01
4 Aspo Oyj 28 0.02
1 Atria Oyj 6 –
– Bank of Aland PLC, Class A 1 –
1 Bank of Aland PLC, Class B 15 0.01
1 BasWare Oyj 38 0.03
3 Bittium Oyj 15 0.01
5 Cargotec Oyj 172 0.12
13 Caverion Corp 86 0.06
45 Citycon Oyj 97 0.07
21 Comptel Oyj 43 0.03
5 Cramo Oyj 119 0.08
1 Digia Oyj 4 –
8 Elisa Oyj 237 0.16
11 F-Secure Oyj 34 0.02
10 Finnair Oyj 40 0.03
3 Fiskars Oyj Abp 56 0.04
5 HKScan Oyj 14 0.01
11 Huhtamaki Oyj 402 0.27
2 Ilkka-Yhtyma Oyj 7 –
16 Kemira Oyj 179 0.12
2 Kesko Oyj, Class A 73 0.05
10 Kesko Oyj, Class B 450 0.32
5 Konecranes Oyj 175 0.12
5 Lassila & Tikanoja Oyj 89 0.06
1 Lemminkainen Oyj 28 0.02
27 Metsa Board Oyj 164 0.11
14 Metso Oyj 360 0.25
3 Munksjo Oyj 41 0.03
17 Nokian Renkaat Oyj 562 0.38
2 Olvi Oyj 60 0.04
14 Oriola-KD Oyj 63 0.04
11 Orion Oyj 440 0.30
4 Orion Oyj, Class A 164 0.11
33 Outokumpu Oyj 237 0.16
24 Outotec Oyj 121 0.08
4 PKC Group Oyj 52 0.04
2 Ponsse Oyj 50 0.03
6 Poyry Oyj 19 0.01
1 QT Group Oyj 7 –
20 Raisio Oyj 69 0.05
11 Ramirent Oyj 76 0.05
12 Sanoma Oyj 92 0.06
28 Sponda Oyj 115 0.08
3 Stockmann Oyj Abp, Class A 16 0.01
4 Stockmann Oyj Abp, Class B 28 0.02
185 Talvivaara Mining Co PLC 1 –
19 Technopolis Oyj 58 0.04
1 Teleste Oyj 8 0.01
7 Tieto Oyj 157 0.11
5 Tikkurila Oyj 80 0.05
8 Uponor Oyj 122 0.08
2 Vaisala Oyj 50 0.03
14 Valmet Oyj 208 0.14
1 Viking Line Abp 24 0.02
17 YIT Oyj 129 0.09
6,494 4.42
Shares (000's)
Value (000's)
EUR
% of Net Asset Value
Common Stock (continued)
France - 9.46%
5 ABC arbitrage 35 0.02
24 Air France-KLM 120 0.08
1 Akka Technologies 35 0.02
4 Albioma SA 59 0.04
5 Alstom SA 119 0.08
6 Altamir 66 0.04
4 Alten SA 250 0.17
22 Altran Technologies SA 268 0.18
4 APRIL SA 45 0.03
3 Arkema SA 304 0.21
2 Assystem 43 0.03
1 Axway Software SA 28 0.02
5 Beneteau SA 69 0.05
2 BioMerieux 197 0.13
1 Boiron SA 92 0.06
2 Bonduelle SCA 58 0.04
2 Bourbon Corp 22 0.01
– Burelle SA 39 0.03
5 Casino Guichard Perrachon SA 196 0.13
1 Cegedim SA 26 0.02
1 Cegid Group SA – –
2 CGG SA 25 0.02
2 Chargeurs SA 32 0.02
1 Cie des Alpes 23 0.02
9 Cie Plastic Omnium SA 252 0.17
12 Coface SA 66 0.04
13 Derichebourg SA 40 0.03
– Devoteam SA 14 0.01
23 Edenred 463 0.32
– Electricite de Strasbourg SA 19 0.01
12 Elior Group 226 0.15
5 Elis SA 80 0.05
1 Eramet 69 0.05
1 Esso SA Francaise 18 0.01
18 Etablissements Maurel et Prom 75 0.05
1 Euler Hermes Group 110 0.07
1 Eurofins Scientific SE 213 0.15
7 Euronext NV 241 0.16
1 Faiveley Transport SA 89 0.06
7 Faurecia 249 0.17
– Fleury Michon SA 26 0.02
– Gaumont SA 2 –
3 Gaztransport Et Technigaz SA 101 0.07
2 GL Events 26 0.02
1 Groupe Crit 39 0.03
21 Groupe Eurotunnel SE 172 0.12
1 Groupe Fnac SA 89 0.06
3 Groupe Fnac SA (UK listing) 236 0.16
1 Groupe Open 23 0.02
1 Guerbet 45 0.03
3 Haulotte Group SA 32 0.02
19 Havas SA 147 0.10
1 Herige SADCS 16 0.01
– HiPay Group SA 2 –
– ID Logistics Group 33 0.02
4 Imerys SA 240 0.16
2 Interparfums SA 45 0.03
4 Ipsen SA 272 0.19
6 IPSOS 174 0.12
3 Jacquet Metal Service 49 0.03
6 Korian SA 144 0.10
18 Lagardere SCA 416 0.28
– Lanson-BCC 8 0.01
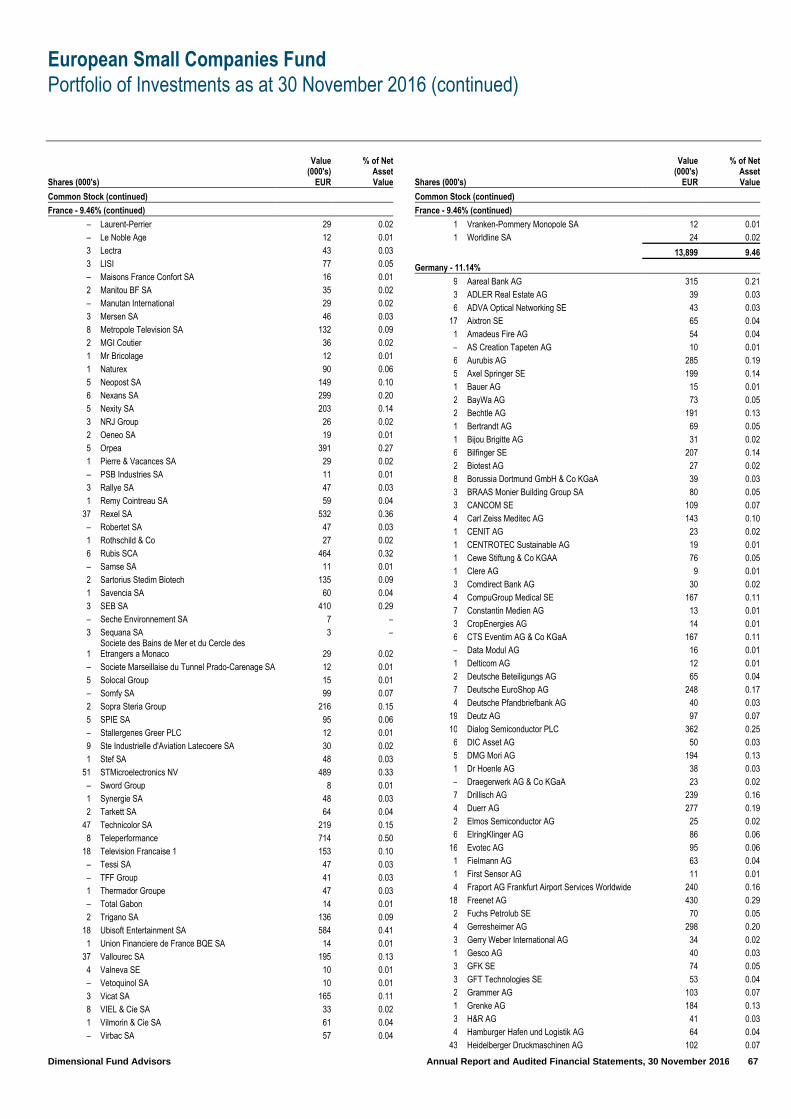
European Small Companies Fund
Portfolio of Investments as at 30 November 2016 (continued)
Dimensional Fund Advisors Annual Report and Audited Financial Statements, 30 November 2016 67
Shares (000's)
Value (000's)
EUR
% of Net Asset Value
Common Stock (continued)
France - 9.46% (continued)
– Laurent-Perrier 29 0.02
– Le Noble Age 12 0.01
3 Lectra 43 0.03
3 LISI 77 0.05
– Maisons France Confort SA 16 0.01
2 Manitou BF SA 35 0.02
– Manutan International 29 0.02
3 Mersen SA 46 0.03
8 Metropole Television SA 132 0.09
2 MGI Coutier 36 0.02
1 Mr Bricolage 12 0.01
1 Naturex 90 0.06
5 Neopost SA 149 0.10
6 Nexans SA 299 0.20
5 Nexity SA 203 0.14
3 NRJ Group 26 0.02
2 Oeneo SA 19 0.01
5 Orpea 391 0.27
1 Pierre & Vacances SA 29 0.02
– PSB Industries SA 11 0.01
3 Rallye SA 47 0.03
1 Remy Cointreau SA 59 0.04
37 Rexel SA 532 0.36
– Robertet SA 47 0.03
1 Rothschild & Co 27 0.02
6 Rubis SCA 464 0.32
– Samse SA 11 0.01
2 Sartorius Stedim Biotech 135 0.09
1 Savencia SA 60 0.04
3 SEB SA 410 0.29
– Seche Environnement SA 7 –
3 Sequana SA 3 –
1 Societe des Bains de Mer et du Cercle des Etrangers a Monaco 29 0.02
– Societe Marseillaise du Tunnel Prado-Carenage SA 12 0.01
5 Solocal Group 15 0.01
– Somfy SA 99 0.07
2 Sopra Steria Group 216 0.15
5 SPIE SA 95 0.06
– Stallergenes Greer PLC 12 0.01
9 Ste Industrielle d'Aviation Latecoere SA 30 0.02
1 Stef SA 48 0.03
51 STMicroelectronics NV 489 0.33
– Sword Group 8 0.01
1 Synergie SA 48 0.03
2 Tarkett SA 64 0.04
47 Technicolor SA 219 0.15
8 Teleperformance 714 0.50
18 Television Francaise 1 153 0.10
– Tessi SA 47 0.03
– TFF Group 41 0.03
1 Thermador Groupe 47 0.03
– Total Gabon 14 0.01
2 Trigano SA 136 0.09
18 Ubisoft Entertainment SA 584 0.41
1 Union Financiere de France BQE SA 14 0.01
37 Vallourec SA 195 0.13
4 Valneva SE 10 0.01
– Vetoquinol SA 10 0.01
3 Vicat SA 165 0.11
8 VIEL & Cie SA 33 0.02
1 Vilmorin & Cie SA 61 0.04
– Virbac SA 57 0.04
Shares (000's)
Value (000's)
EUR
% of Net Asset Value
Common Stock (continued)
France - 9.46% (continued)
1 Vranken-Pommery Monopole SA 12 0.01
1 Worldline SA 24 0.02
13,899 9.46
Germany - 11.14%
9 Aareal Bank AG 315 0.21
3 ADLER Real Estate AG 39 0.03
6 ADVA Optical Networking SE 43 0.03
17 Aixtron SE 65 0.04
1 Amadeus Fire AG 54 0.04
– AS Creation Tapeten AG 10 0.01
6 Aurubis AG 285 0.19
5 Axel Springer SE 199 0.14
1 Bauer AG 15 0.01
2 BayWa AG 73 0.05
2 Bechtle AG 191 0.13
1 Bertrandt AG 69 0.05
1 Bijou Brigitte AG 31 0.02
6 Bilfinger SE 207 0.14
2 Biotest AG 27 0.02
8 Borussia Dortmund GmbH & Co KGaA 39 0.03
3 BRAAS Monier Building Group SA 80 0.05
3 CANCOM SE 109 0.07
4 Carl Zeiss Meditec AG 143 0.10
1 CENIT AG 23 0.02
1 CENTROTEC Sustainable AG 19 0.01
1 Cewe Stiftung & Co KGAA 76 0.05
1 Clere AG 9 0.01
3 Comdirect Bank AG 30 0.02
4 CompuGroup Medical SE 167 0.11
7 Constantin Medien AG 13 0.01
3 CropEnergies AG 14 0.01
6 CTS Eventim AG & Co KGaA 167 0.11
– Data Modul AG 16 0.01
1 Delticom AG 12 0.01
2 Deutsche Beteiligungs AG 65 0.04
7 Deutsche EuroShop AG 248 0.17
4 Deutsche Pfandbriefbank AG 40 0.03
19 Deutz AG 97 0.07
10 Dialog Semiconductor PLC 362 0.25
6 DIC Asset AG 50 0.03
5 DMG Mori AG 194 0.13
1 Dr Hoenle AG 38 0.03
– Draegerwerk AG & Co KGaA 23 0.02
7 Drillisch AG 239 0.16
4 Duerr AG 277 0.19
2 Elmos Semiconductor AG 25 0.02
6 ElringKlinger AG 86 0.06
16 Evotec AG 95 0.06
1 Fielmann AG 63 0.04
1 First Sensor AG 11 0.01
4 Fraport AG Frankfurt Airport Services Worldwide 240 0.16
18 Freenet AG 430 0.29
2 Fuchs Petrolub SE 70 0.05
4 Gerresheimer AG 298 0.20
3 Gerry Weber International AG 34 0.02
1 Gesco AG 40 0.03
3 GFK SE 74 0.05
3 GFT Technologies SE 53 0.04
2 Grammer AG 103 0.07
1 Grenke AG 184 0.13
3 H&R AG 41 0.03
4 Hamburger Hafen und Logistik AG 64 0.04
43 Heidelberger Druckmaschinen AG 102 0.07
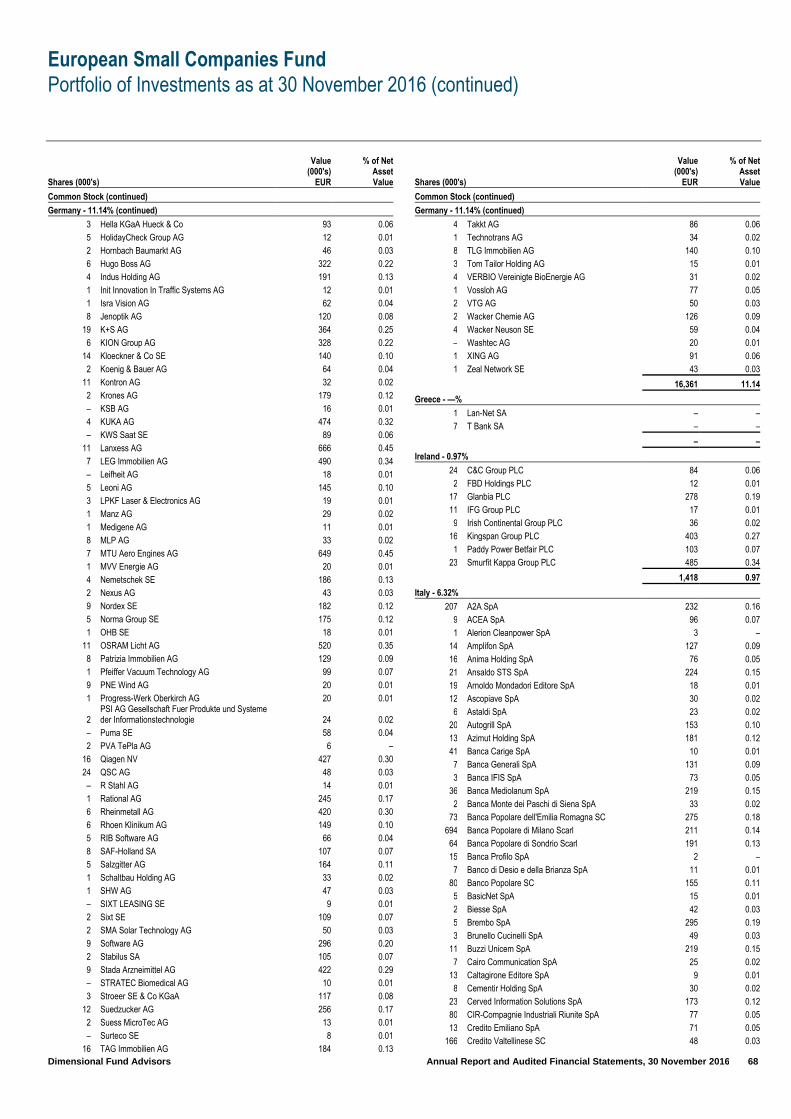
European Small Companies Fund
Portfolio of Investments as at 30 November 2016 (continued)
Dimensional Fund Advisors Annual Report and Audited Financial Statements, 30 November 2016 68
Shares (000's)
Value (000's)
EUR
% of Net Asset Value
Common Stock (continued)
Germany - 11.14% (continued)
3 Hella KGaA Hueck & Co 93 0.06
5 HolidayCheck Group AG 12 0.01
2 Hornbach Baumarkt AG 46 0.03
6 Hugo Boss AG 322 0.22
4 Indus Holding AG 191 0.13
1 Init Innovation In Traffic Systems AG 12 0.01
1 Isra Vision AG 62 0.04
8 Jenoptik AG 120 0.08
19 K+S AG 364 0.25
6 KION Group AG 328 0.22
14 Kloeckner & Co SE 140 0.10
2 Koenig & Bauer AG 64 0.04
11 Kontron AG 32 0.02
2 Krones AG 179 0.12
– KSB AG 16 0.01
4 KUKA AG 474 0.32
– KWS Saat SE 89 0.06
11 Lanxess AG 666 0.45
7 LEG Immobilien AG 490 0.34
– Leifheit AG 18 0.01
5 Leoni AG 145 0.10
3 LPKF Laser & Electronics AG 19 0.01
1 Manz AG 29 0.02
1 Medigene AG 11 0.01
8 MLP AG 33 0.02
7 MTU Aero Engines AG 649 0.45
1 MVV Energie AG 20 0.01
4 Nemetschek SE 186 0.13
2 Nexus AG 43 0.03
9 Nordex SE 182 0.12
5 Norma Group SE 175 0.12
1 OHB SE 18 0.01
11 OSRAM Licht AG 520 0.35
8 Patrizia Immobilien AG 129 0.09
1 Pfeiffer Vacuum Technology AG 99 0.07
9 PNE Wind AG 20 0.01
1 Progress-Werk Oberkirch AG 20 0.01
2 PSI AG Gesellschaft Fuer Produkte und Systeme der Informationstechnologie 24 0.02
– Puma SE 58 0.04
2 PVA TePla AG 6 –
16 Qiagen NV 427 0.30
24 QSC AG 48 0.03
– R Stahl AG 14 0.01
1 Rational AG 245 0.17
6 Rheinmetall AG 420 0.30
6 Rhoen Klinikum AG 149 0.10
5 RIB Software AG 66 0.04
8 SAF-Holland SA 107 0.07
5 Salzgitter AG 164 0.11
1 Schaltbau Holding AG 33 0.02
1 SHW AG 47 0.03
– SIXT LEASING SE 9 0.01
2 Sixt SE 109 0.07
2 SMA Solar Technology AG 50 0.03
9 Software AG 296 0.20
2 Stabilus SA 105 0.07
9 Stada Arzneimittel AG 422 0.29
– STRATEC Biomedical AG 10 0.01
3 Stroeer SE & Co KGaA 117 0.08
12 Suedzucker AG 256 0.17
2 Suess MicroTec AG 13 0.01
– Surteco SE 8 0.01
16 TAG Immobilien AG 184 0.13
Shares (000's)
Value (000's)
EUR
% of Net Asset Value
Common Stock (continued)
Germany - 11.14% (continued)
4 Takkt AG 86 0.06
1 Technotrans AG 34 0.02
8 TLG Immobilien AG 140 0.10
3 Tom Tailor Holding AG 15 0.01
4 VERBIO Vereinigte BioEnergie AG 31 0.02
1 Vossloh AG 77 0.05
2 VTG AG 50 0.03
2 Wacker Chemie AG 126 0.09
4 Wacker Neuson SE 59 0.04
– Washtec AG 20 0.01
1 XING AG 91 0.06
1 Zeal Network SE 43 0.03
16,361 11.14
Greece - —%
1 Lan-Net SA – –
7 T Bank SA – –
– –
Ireland - 0.97%
24 C&C Group PLC 84 0.06
2 FBD Holdings PLC 12 0.01
17 Glanbia PLC 278 0.19
11 IFG Group PLC 17 0.01
9 Irish Continental Group PLC 36 0.02
16 Kingspan Group PLC 403 0.27
1 Paddy Power Betfair PLC 103 0.07
23 Smurfit Kappa Group PLC 485 0.34
1,418 0.97
Italy - 6.32%
207 A2A SpA 232 0.16
9 ACEA SpA 96 0.07
1 Alerion Cleanpower SpA 3 –
14 Amplifon SpA 127 0.09
16 Anima Holding SpA 76 0.05
21 Ansaldo STS SpA 224 0.15
19 Arnoldo Mondadori Editore SpA 18 0.01
12 Ascopiave SpA 30 0.02
6 Astaldi SpA 23 0.02
20 Autogrill SpA 153 0.10
13 Azimut Holding SpA 181 0.12
41 Banca Carige SpA 10 0.01
7 Banca Generali SpA 131 0.09
3 Banca IFIS SpA 73 0.05
36 Banca Mediolanum SpA 219 0.15
2 Banca Monte dei Paschi di Siena SpA 33 0.02
73 Banca Popolare dell'Emilia Romagna SC 275 0.18
694 Banca Popolare di Milano Scarl 211 0.14
64 Banca Popolare di Sondrio Scarl 191 0.13
15 Banca Profilo SpA 2 –
7 Banco di Desio e della Brianza SpA 11 0.01
80 Banco Popolare SC 155 0.11
5 BasicNet SpA 15 0.01
2 Biesse SpA 42 0.03
5 Brembo SpA 295 0.19
3 Brunello Cucinelli SpA 49 0.03
11 Buzzi Unicem SpA 219 0.15
7 Cairo Communication SpA 25 0.02
13 Caltagirone Editore SpA 9 0.01
8 Cementir Holding SpA 30 0.02
23 Cerved Information Solutions SpA 173 0.12
80 CIR-Compagnie Industriali Riunite SpA 77 0.05
13 Credito Emiliano SpA 71 0.05
166 Credito Valtellinese SC 48 0.03

European Small Companies Fund
Portfolio of Investments as at 30 November 2016 (continued)
Dimensional Fund Advisors Annual Report and Audited Financial Statements, 30 November 2016 69
Shares (000's)
Value (000's)
EUR
% of Net Asset Value
Common Stock (continued)
Italy - 6.32% (continued)
2 Danieli & C Officine Meccaniche SpA 40 0.03
2 Datalogic SpA 41 0.03
46 Davide Campari-Milano SpA 414 0.28
6 De' Longhi SpA 130 0.09
16 DeA Capital SpA 16 0.01
4 DiaSorin SpA 191 0.13
2 Ei Towers SpA 99 0.07
2 El.En. SpA 44 0.03
8 ERG SpA 73 0.05
4 Esprinet SpA 25 0.02
7 Eurotech SpA 9 0.01
11 Falck Renewables SpA 9 0.01
50 Fincantieri SpA 21 0.01
18 FinecoBank Banca Fineco SpA 87 0.06
10 Geox SpA 19 0.01
22 Gruppo Editoriale L'Espresso SpA 16 0.01
3 Gruppo MutuiOnline SpA 25 0.02
117 Hera SpA 229 0.16
2 Industria Macchine Automatiche SpA 134 0.09
18 Infrastrutture Wireless Italiane SpA 71 0.05
50 Intek Group SpA 10 0.01
11 Interpump Group SpA 162 0.11
112 Iren SpA 157 0.11
2 Italmobiliare SpA 63 0.04
54 Juventus Football Club SpA 15 0.01
3 La Doria SpA 19 0.01
10 Maire Tecnimont SpA 23 0.02
3 MARR SpA 54 0.04
97 Mediaset SpA 221 0.15
5 Mediobanca SpA 30 0.02
19 Moleskine SpA 46 0.03
15 Moncler SpA 235 0.16
8 Nice SpA 18 0.01
12 OVS SpA 57 0.04
36 Parmalat SpA 91 0.06
31 Piaggio & C SpA 47 0.03
27 Prysmian SpA 611 0.41
12 RAI Way SpA 37 0.03
9 Recordati SpA 243 0.17
1 Reply SpA 112 0.08
1 Sabaf SpA 11 0.01
6 Safilo Group SpA 44 0.03
824 Saipem SpA 350 0.24
33 Salini Impregilo SpA 86 0.06
5 Salvatore Ferragamo SpA 93 0.06
39 Saras SpA 65 0.04
4 Save SpA 61 0.04
21 Snia SpA – –
19 Societa Cattolica di Assicurazioni Scrl 103 0.07
11 Societa Iniziative Autostradali e Servizi SpA 84 0.06
9 Sogefi SpA 18 0.01
5 SOL SpA 36 0.02
15 Tamburi Investment Partners SpA 55 0.04
218 Tiscali SpA 9 0.01
2 Tod's SpA 96 0.07
12 Trevi Finanziaria Industriale SpA 10 0.01
55 Unipol Gruppo Finanziario SpA 159 0.11
142 UnipolSai SpA 254 0.16
5 Vittoria Assicurazioni SpA 50 0.03
8 Yoox Net-A-Porter Group SpA 200 0.14
4 Zignago Vetro SpA 22 0.01
9,277 6.32
Shares (000's)
Value (000's)
EUR
% of Net Asset Value
Common Stock (continued)
Netherlands - 3.36%
14 Aalberts Industries NV 403 0.27
4 Accell Group 73 0.05
5 AMG Advanced Metallurgical Group NV 80 0.05
3 Amsterdam Commodities NV 60 0.04
7 APERAM SA 294 0.20
7 Arcadis NV 82 0.06
7 ASM International NV 288 0.20
6 BE Semiconductor Industries NV 194 0.13
3 Beter Bed Holding NV 40 0.03
9 BinckBank NV 47 0.03
11 Boskalis Westminster 317 0.22
3 Brunel International NV 45 0.03
8 Corbion NV 187 0.13
67 Delta Lloyd NV 363 0.26
2 Flow Traders 66 0.04
8 Fugro NV 120 0.08
8 Gemalto NV 390 0.27
4 Heijmans NV 20 0.01
1 Hunter Douglas NV 42 0.03
4 IMCD Group NV 164 0.11
2 KAS Bank NV 17 0.01
2 Kendrion NV 51 0.03
33 Koninklijke BAM Groep NV 133 0.09
1 Nederland Apparatenfabriek 23 0.02
8 OCI NV 108 0.07
9 Ordina NV 18 0.01
60 PostNL NV 279 0.19
5 Refresco Group NV 65 0.04
28 SBM Offshore NV 385 0.26
3 Sligro Food Group NV 107 0.07
7 Telegraaf Media Groep NV 25 0.02
5 TKH Group NV 186 0.13
18 TomTom NV 134 0.09
1 Van Lanschot NV 12 0.01
10 Wessanen 116 0.08
4,934 3.36
Norway - 2.12%
61 ABG Sundal Collier Holding ASA 31 0.02
1 AF Gruppen ASA 21 0.01
45 Akastor ASA 61 0.04
3 Aker ASA 114 0.08
12 Aker BP ASA 186 0.13
19 Aker Solutions ASA 80 0.05
5 American Shipping Co ASA 14 0.01
8 Atea ASA 70 0.05
10 Austevoll Seafood ASA 91 0.06
147 Axactor AB 50 0.03
5 Bakkafrost P/F 191 0.13
3 Bonheur ASA 19 0.01
11 Borregaard ASA 104 0.07
8 BW LPG Ltd 25 0.02
229 BW Offshore Ltd 10 0.01
47 DNO ASA 39 0.03
4 Ekornes ASA 43 0.03
10 Entra ASA 97 0.07
6 Fred Olsen Energy ASA 9 0.01
9 Frontline Ltd 58 0.04
7 Grieg Seafood ASA 67 0.05
13 Hexagon Composites ASA 39 0.03
6 Hoegh LNG Holdings Ltd 58 0.04
32 Kongsberg Automotive ASA 20 0.01
3 Kongsberg Gruppen ASA 38 0.03
22 Kvaerner ASA 25 0.02
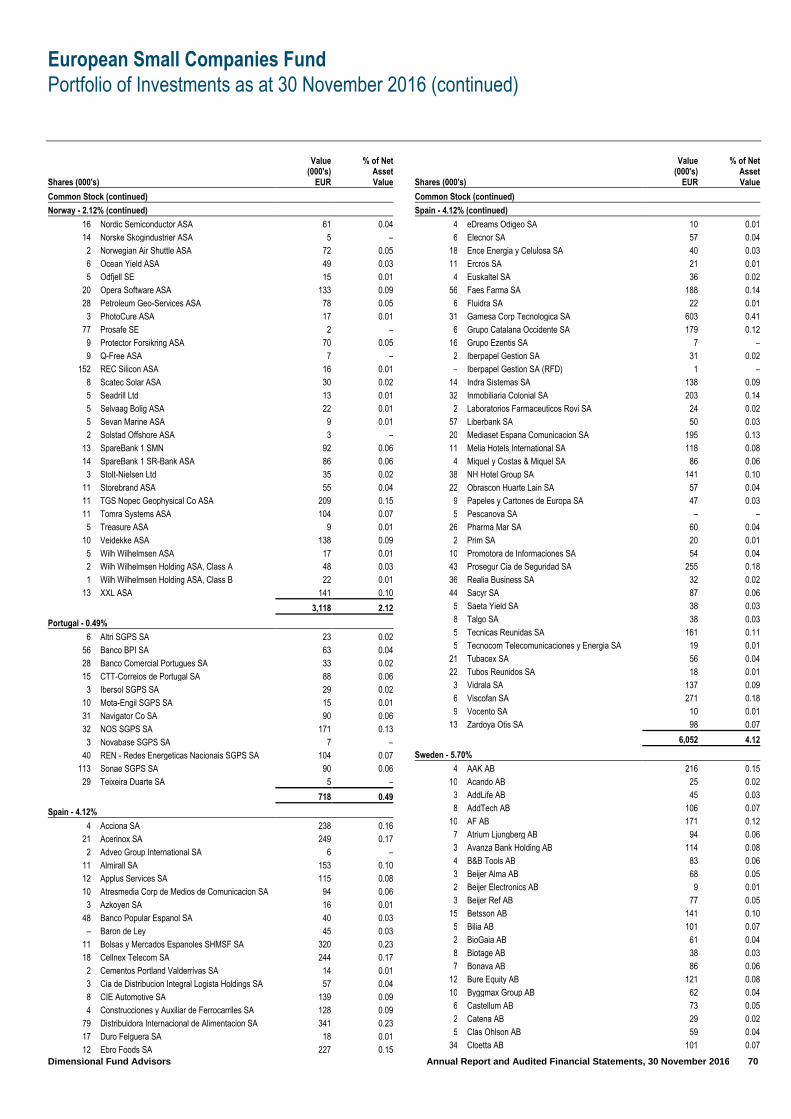
European Small Companies Fund
Portfolio of Investments as at 30 November 2016 (continued)
Dimensional Fund Advisors Annual Report and Audited Financial Statements, 30 November 2016 70
Shares (000's)
Value (000's)
EUR
% of Net Asset Value
Common Stock (continued)
Norway - 2.12% (continued)
16 Nordic Semiconductor ASA 61 0.04
14 Norske Skogindustrier ASA 5 –
2 Norwegian Air Shuttle ASA 72 0.05
6 Ocean Yield ASA 49 0.03
5 Odfjell SE 15 0.01
20 Opera Software ASA 133 0.09
28 Petroleum Geo-Services ASA 78 0.05
3 PhotoCure ASA 17 0.01
77 Prosafe SE 2 –
9 Protector Forsikring ASA 70 0.05
9 Q-Free ASA 7 –
152 REC Silicon ASA 16 0.01
8 Scatec Solar ASA 30 0.02
5 Seadrill Ltd 13 0.01
5 Selvaag Bolig ASA 22 0.01
5 Sevan Marine ASA 9 0.01
2 Solstad Offshore ASA 3 –
13 SpareBank 1 SMN 92 0.06
14 SpareBank 1 SR-Bank ASA 86 0.06
3 Stolt-Nielsen Ltd 35 0.02
11 Storebrand ASA 55 0.04
11 TGS Nopec Geophysical Co ASA 209 0.15
11 Tomra Systems ASA 104 0.07
5 Treasure ASA 9 0.01
10 Veidekke ASA 138 0.09
5 Wilh Wilhelmsen ASA 17 0.01
2 Wilh Wilhelmsen Holding ASA, Class A 48 0.03
1 Wilh Wilhelmsen Holding ASA, Class B 22 0.01
13 XXL ASA 141 0.10
3,118 2.12
Portugal - 0.49%
6 Altri SGPS SA 23 0.02
56 Banco BPI SA 63 0.04
28 Banco Comercial Portugues SA 33 0.02
15 CTT-Correios de Portugal SA 88 0.06
3 Ibersol SGPS SA 29 0.02
10 Mota-Engil SGPS SA 15 0.01
31 Navigator Co SA 90 0.06
32 NOS SGPS SA 171 0.13
3 Novabase SGPS SA 7 –
40 REN - Redes Energeticas Nacionais SGPS SA 104 0.07
113 Sonae SGPS SA 90 0.06
29 Teixeira Duarte SA 5 –
718 0.49
Spain - 4.12%
4 Acciona SA 238 0.16
21 Acerinox SA 249 0.17
2 Adveo Group International SA 6 –
11 Almirall SA 153 0.10
12 Applus Services SA 115 0.08
10 Atresmedia Corp de Medios de Comunicacion SA 94 0.06
3 Azkoyen SA 16 0.01
48 Banco Popular Espanol SA 40 0.03
– Baron de Ley 45 0.03
11 Bolsas y Mercados Espanoles SHMSF SA 320 0.23
18 Cellnex Telecom SA 244 0.17
2 Cementos Portland Valderrivas SA 14 0.01
3 Cia de Distribucion Integral Logista Holdings SA 57 0.04
8 CIE Automotive SA 139 0.09
4 Construcciones y Auxiliar de Ferrocarriles SA 128 0.09
79 Distribuidora Internacional de Alimentacion SA 341 0.23
17 Duro Felguera SA 18 0.01
12 Ebro Foods SA 227 0.15
Shares (000's)
Value (000's)
EUR
% of Net Asset Value
Common Stock (continued)
Spain - 4.12% (continued)
4 eDreams Odigeo SA 10 0.01
6 Elecnor SA 57 0.04
18 Ence Energia y Celulosa SA 40 0.03
11 Ercros SA 21 0.01
4 Euskaltel SA 36 0.02
56 Faes Farma SA 188 0.14
6 Fluidra SA 22 0.01
31 Gamesa Corp Tecnologica SA 603 0.41
6 Grupo Catalana Occidente SA 179 0.12
16 Grupo Ezentis SA 7 –
2 Iberpapel Gestion SA 31 0.02
– Iberpapel Gestion SA (RFD) 1 –
14 Indra Sistemas SA 138 0.09
32 Inmobiliaria Colonial SA 203 0.14
2 Laboratorios Farmaceuticos Rovi SA 24 0.02
57 Liberbank SA 50 0.03
20 Mediaset Espana Comunicacion SA 195 0.13
11 Melia Hotels International SA 118 0.08
4 Miquel y Costas & Miquel SA 86 0.06
38 NH Hotel Group SA 141 0.10
22 Obrascon Huarte Lain SA 57 0.04
9 Papeles y Cartones de Europa SA 47 0.03
5 Pescanova SA – –
26 Pharma Mar SA 60 0.04
2 Prim SA 20 0.01
10 Promotora de Informaciones SA 54 0.04
43 Prosegur Cia de Seguridad SA 255 0.18
36 Realia Business SA 32 0.02
44 Sacyr SA 87 0.06
5 Saeta Yield SA 38 0.03
8 Talgo SA 38 0.03
5 Tecnicas Reunidas SA 161 0.11
5 Tecnocom Telecomunicaciones y Energia SA 19 0.01
21 Tubacex SA 56 0.04
22 Tubos Reunidos SA 18 0.01
3 Vidrala SA 137 0.09
6 Viscofan SA 271 0.18
9 Vocento SA 10 0.01
13 Zardoya Otis SA 98 0.07
6,052 4.12
Sweden - 5.70%
4 AAK AB 216 0.15
10 Acando AB 25 0.02
3 AddLife AB 45 0.03
8 AddTech AB 106 0.07
10 AF AB 171 0.12
7 Atrium Ljungberg AB 94 0.06
3 Avanza Bank Holding AB 114 0.08
4 B&B Tools AB 83 0.06
3 Beijer Alma AB 68 0.05
2 Beijer Electronics AB 9 0.01
3 Beijer Ref AB 77 0.05
15 Betsson AB 141 0.10
5 Bilia AB 101 0.07
2 BioGaia AB 61 0.04
8 Biotage AB 38 0.03
7 Bonava AB 86 0.06
12 Bure Equity AB 121 0.08
10 Byggmax Group AB 62 0.04
6 Castellum AB 73 0.05
2 Catena AB 29 0.02
5 Clas Ohlson AB 59 0.04
34 Cloetta AB 101 0.07
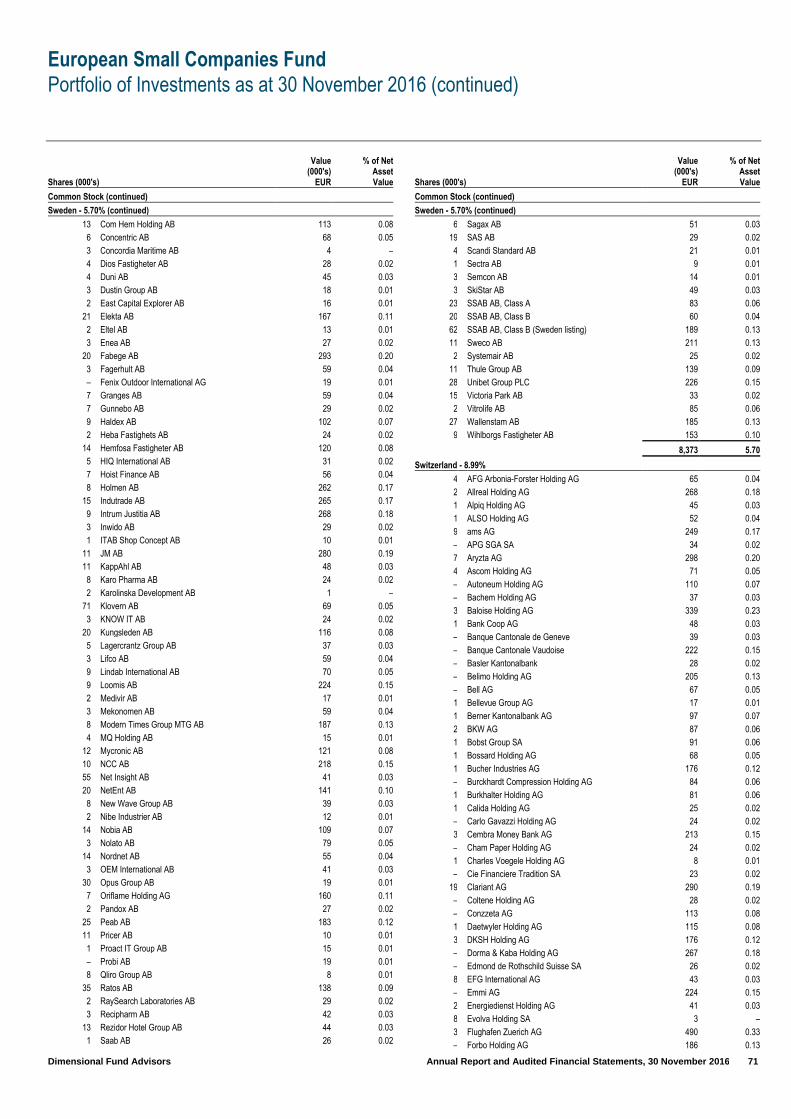
European Small Companies Fund
Portfolio of Investments as at 30 November 2016 (continued)
Dimensional Fund Advisors Annual Report and Audited Financial Statements, 30 November 2016 71
Shares (000's)
Value (000's)
EUR
% of Net Asset Value
Common Stock (continued)
Sweden - 5.70% (continued)
13 Com Hem Holding AB 113 0.08
6 Concentric AB 68 0.05
3 Concordia Maritime AB 4 –
4 Dios Fastigheter AB 28 0.02
4 Duni AB 45 0.03
3 Dustin Group AB 18 0.01
2 East Capital Explorer AB 16 0.01
21 Elekta AB 167 0.11
2 Eltel AB 13 0.01
3 Enea AB 27 0.02
20 Fabege AB 293 0.20
3 Fagerhult AB 59 0.04
– Fenix Outdoor International AG 19 0.01
7 Granges AB 59 0.04
7 Gunnebo AB 29 0.02
9 Haldex AB 102 0.07
2 Heba Fastighets AB 24 0.02
14 Hemfosa Fastigheter AB 120 0.08
5 HIQ International AB 31 0.02
7 Hoist Finance AB 56 0.04
8 Holmen AB 262 0.17
15 Indutrade AB 265 0.17
9 Intrum Justitia AB 268 0.18
3 Inwido AB 29 0.02
1 ITAB Shop Concept AB 10 0.01
11 JM AB 280 0.19
11 KappAhl AB 48 0.03
8 Karo Pharma AB 24 0.02
2 Karolinska Development AB 1 –
71 Klovern AB 69 0.05
3 KNOW IT AB 24 0.02
20 Kungsleden AB 116 0.08
5 Lagercrantz Group AB 37 0.03
3 Lifco AB 59 0.04
9 Lindab International AB 70 0.05
9 Loomis AB 224 0.15
2 Medivir AB 17 0.01
3 Mekonomen AB 59 0.04
8 Modern Times Group MTG AB 187 0.13
4 MQ Holding AB 15 0.01
12 Mycronic AB 121 0.08
10 NCC AB 218 0.15
55 Net Insight AB 41 0.03
20 NetEnt AB 141 0.10
8 New Wave Group AB 39 0.03
2 Nibe Industrier AB 12 0.01
14 Nobia AB 109 0.07
3 Nolato AB 79 0.05
14 Nordnet AB 55 0.04
3 OEM International AB 41 0.03
30 Opus Group AB 19 0.01
7 Oriflame Holding AG 160 0.11
2 Pandox AB 27 0.02
25 Peab AB 183 0.12
11 Pricer AB 10 0.01
1 Proact IT Group AB 15 0.01
– Probi AB 19 0.01
8 Qliro Group AB 8 0.01
35 Ratos AB 138 0.09
2 RaySearch Laboratories AB 29 0.02
3 Recipharm AB 42 0.03
13 Rezidor Hotel Group AB 44 0.03
1 Saab AB 26 0.02
Shares (000's)
Value (000's)
EUR
% of Net Asset Value
Common Stock (continued)
Sweden - 5.70% (continued)
6 Sagax AB 51 0.03
19 SAS AB 29 0.02
4 Scandi Standard AB 21 0.01
1 Sectra AB 9 0.01
3 Semcon AB 14 0.01
3 SkiStar AB 49 0.03
23 SSAB AB, Class A 83 0.06
20 SSAB AB, Class B 60 0.04
62 SSAB AB, Class B (Sweden listing) 189 0.13
11 Sweco AB 211 0.13
2 Systemair AB 25 0.02
11 Thule Group AB 139 0.09
28 Unibet Group PLC 226 0.15
15 Victoria Park AB 33 0.02
2 Vitrolife AB 85 0.06
27 Wallenstam AB 185 0.13
9 Wihlborgs Fastigheter AB 153 0.10
8,373 5.70
Switzerland - 8.99%
4 AFG Arbonia-Forster Holding AG 65 0.04
2 Allreal Holding AG 268 0.18
1 Alpiq Holding AG 45 0.03
1 ALSO Holding AG 52 0.04
9 ams AG 249 0.17
– APG SGA SA 34 0.02
7 Aryzta AG 298 0.20
4 Ascom Holding AG 71 0.05
– Autoneum Holding AG 110 0.07
– Bachem Holding AG 37 0.03
3 Baloise Holding AG 339 0.23
1 Bank Coop AG 48 0.03
– Banque Cantonale de Geneve 39 0.03
– Banque Cantonale Vaudoise 222 0.15
– Basler Kantonalbank 28 0.02
– Belimo Holding AG 205 0.13
– Bell AG 67 0.05
1 Bellevue Group AG 17 0.01
1 Berner Kantonalbank AG 97 0.07
2 BKW AG 87 0.06
1 Bobst Group SA 91 0.06
1 Bossard Holding AG 68 0.05
1 Bucher Industries AG 176 0.12
– Burckhardt Compression Holding AG 84 0.06
1 Burkhalter Holding AG 81 0.06
1 Calida Holding AG 25 0.02
– Carlo Gavazzi Holding AG 24 0.02
3 Cembra Money Bank AG 213 0.15
– Cham Paper Holding AG 24 0.02
1 Charles Voegele Holding AG 8 0.01
– Cie Financiere Tradition SA 23 0.02
19 Clariant AG 290 0.19
– Coltene Holding AG 28 0.02
– Conzzeta AG 113 0.08
1 Daetwyler Holding AG 115 0.08
3 DKSH Holding AG 176 0.12
– Dorma & Kaba Holding AG 267 0.18
– Edmond de Rothschild Suisse SA 26 0.02
8 EFG International AG 43 0.03
– Emmi AG 224 0.15
2 Energiedienst Holding AG 41 0.03
8 Evolva Holding SA 3 –
3 Flughafen Zuerich AG 490 0.33
– Forbo Holding AG 186 0.13

European Small Companies Fund
Portfolio of Investments as at 30 November 2016 (continued)
Dimensional Fund Advisors Annual Report and Audited Financial Statements, 30 November 2016 72
Shares (000's)
Value (000's)
EUR
% of Net Asset Value
Common Stock (continued)
Switzerland - 8.99% (continued)
23 GAM Holding AG 215 0.15
5 Gategroup Holding AG 246 0.17
1 Georg Fischer AG 513 0.35
– Gurit Holding AG 62 0.04
1 Helvetia Holding AG 499 0.34
– Hiag Immobilien Holding AG 29 0.02
– HOCHDORF Holding AG 45 0.03
2 Huber & Suhner AG 111 0.08
2 Implenia AG 110 0.07
– Inficon Holding AG 65 0.04
– Interroll Holding AG 92 0.06
– Intershop Holding AG 74 0.05
– Jungfraubahn Holding AG 2 –
1 Kardex AG 66 0.04
1 Komax Holding AG 145 0.10
8 Kudelski SA 123 0.08
– LEM Holding SA 101 0.07
2 Liechtensteinische Landesbank AG 71 0.05
21 Logitech International SA 479 0.33
– Luzerner Kantonalbank AG 162 0.11
– Metall Zug AG 89 0.06
13 Meyer Burger Technology AG 28 0.02
2 Mikron Holding AG 13 0.01
2 Mobilezone Holding AG 29 0.02
1 Mobimo Holding AG 224 0.14
28 OC Oerlikon Corp AG 246 0.17
3 Orascom Development Holding AG 14 0.01
– Orell Fuessli Holding AG 12 0.01
1 Orior AG 42 0.03
1 Panalpina Welttransport Holding AG 171 0.12
– Phoenix Mecano AG 52 0.04
– Plazza AG 34 0.02
6 PSP Swiss Property AG 457 0.31
– Rieter Holding AG 73 0.05
– Romande Energie Holding SA 58 0.04
– Schaffner Holding AG 38 0.03
76 Schmolz & Bickenbach AG 46 0.03
– Schweiter Technologies AG 164 0.11
2 SFS Group AG 124 0.08
1 Siegfried Holding AG 123 0.08
– St Galler Kantonalbank AG 118 0.08
– Straumann Holding AG 21 0.01
2 Sulzer AG 150 0.10
3 Sunrise Communications Group AG 201 0.14
2 Swiss Prime Site AG 181 0.12
1 Swissquote Group Holding SA 31 0.02
– Tamedia AG 66 0.04
1 Tecan Group AG 186 0.13
9 Temenos Group AG 566 0.38
1 U-Blox AG 132 0.09
2 Valiant Holding AG 204 0.14
1 Valora Holding AG 141 0.10
– Vaudoise Assurances Holding SA 58 0.04
– Vetropack Holding AG 61 0.04
11 Von Roll Holding AG 7 –
4 Vontobel Holding AG 169 0.12
– VP Bank AG 10 0.01
– VZ Holding AG 114 0.08
1 Walliser Kantonalbank 51 0.03
– Warteck Invest AG 30 0.02
– Ypsomed Holding AG 64 0.04
2 Zehnder Group AG 44 0.03
Shares (000's)
Value (000's)
EUR
% of Net Asset Value
Common Stock (continued)
Switzerland - 8.99% (continued)
– Zug Estates Holding AG 52 0.04
– Zuger Kantonalbank AG 100 0.07
13,201 8.99
United Kingdom - 28.96%
5 4imprint Group PLC 99 0.07
17 888 Holdings PLC 42 0.03
15 A.G. Barr PLC 89 0.06
78 AA PLC 245 0.17
29 Acacia Mining PLC 138 0.09
13 Acal PLC 33 0.02
192 Afren PLC – –
31 Aggreko PLC 303 0.21
9 Aldermore Group PLC 23 0.02
29 Alizyme PLC – –
13 Alumasc Group 24 0.02
52 AMEC PLC 268 0.18
25 Anglo Pacific Group PLC 34 0.02
4 Anglo-Eastern Plantations PLC 27 0.02
16 Arrow Global Group PLC 55 0.04
51 Ashmore Group PLC 165 0.11
13 Auto Trader Group PLC 63 0.04
4 Aveva Group PLC 81 0.06
4 Avon Rubber PLC 52 0.04
84 B&M European Value Retail SA 247 0.17
89 Balfour Beatty PLC 282 0.19
145 BBA Aviation PLC 448 0.30
75 Beazley PLC 337 0.23
17 Bellway PLC 484 0.33
25 Berendsen PLC 264 0.18
7 Berkeley Group Holdings PLC 198 0.13
6 BGEO Group PLC 206 0.14
11 Bloomsbury Publishing PLC 21 0.01
29 Bodycote PLC 199 0.14
213 Booker Group PLC 432 0.29
14 Boot Henry PLC 32 0.02
19 Bovis Homes Group PLC 182 0.12
4 Braemar Shipping Services PLC 13 0.01
22 Brammer PLC 45 0.03
40 Brewin Dolphin Holdings PLC 136 0.09
31 Britvic PLC 209 0.14
47 BTG PLC 326 0.22
84 Cairn Energy PLC 209 0.14
10 Cambian Group PLC 16 0.01
21 Cape PLC 35 0.02
66 Capital & Counties Properties PLC 220 0.15
12 Carclo PLC 18 0.01
18 Card Factory PLC 55 0.04
64 Carillion PLC 186 0.13
3 Carpetright PLC 7 –
16 Carr's Group PLC 29 0.02
8 Castings PLC 38 0.03
190 Centamin PLC 292 0.20
26 Centaur Media PLC 12 0.01
6 Charles Stanley Group PLC 21 0.01
11 Charles Taylor PLC 33 0.02
45 Chemring Group PLC 87 0.06
20 Chesnara PLC 83 0.06
23 Cineworld Group PLC 147 0.10
3 Circassia Pharmaceuticals Plc 3 –
3 Clarkson PLC 73 0.05
19 Close Brothers Group PLC 306 0.21
3 CLS Holdings PLC 57 0.04
169 Cobham PLC 327 0.22
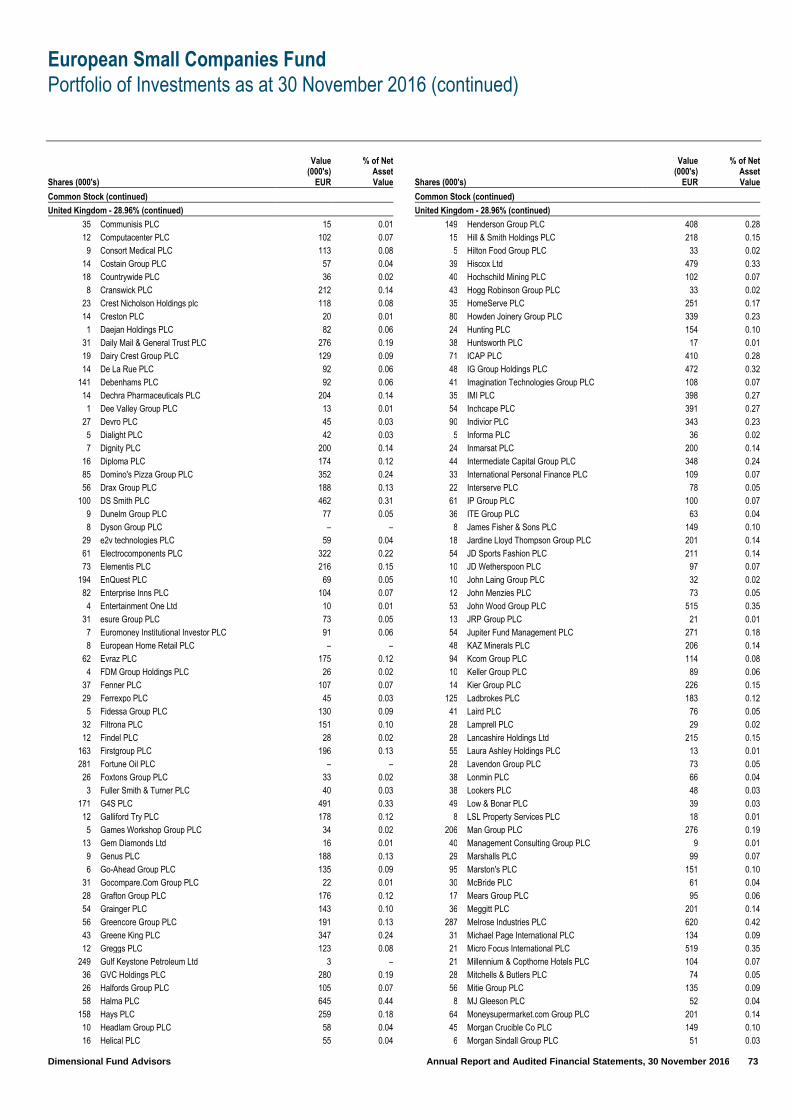
European Small Companies Fund
Portfolio of Investments as at 30 November 2016 (continued)
Dimensional Fund Advisors Annual Report and Audited Financial Statements, 30 November 2016 73
Shares (000's)
Value (000's)
EUR
% of Net Asset Value
Common Stock (continued)
United Kingdom - 28.96% (continued)
35 Communisis PLC 15 0.01
12 Computacenter PLC 102 0.07
9 Consort Medical PLC 113 0.08
14 Costain Group PLC 57 0.04
18 Countrywide PLC 36 0.02
8 Cranswick PLC 212 0.14
23 Crest Nicholson Holdings plc 118 0.08
14 Creston PLC 20 0.01
1 Daejan Holdings PLC 82 0.06
31 Daily Mail & General Trust PLC 276 0.19
19 Dairy Crest Group PLC 129 0.09
14 De La Rue PLC 92 0.06
141 Debenhams PLC 92 0.06
14 Dechra Pharmaceuticals PLC 204 0.14
1 Dee Valley Group PLC 13 0.01
27 Devro PLC 45 0.03
5 Dialight PLC 42 0.03
7 Dignity PLC 200 0.14
16 Diploma PLC 174 0.12
85 Domino's Pizza Group PLC 352 0.24
56 Drax Group PLC 188 0.13
100 DS Smith PLC 462 0.31
9 Dunelm Group PLC 77 0.05
8 Dyson Group PLC – –
29 e2v technologies PLC 59 0.04
61 Electrocomponents PLC 322 0.22
73 Elementis PLC 216 0.15
194 EnQuest PLC 69 0.05
82 Enterprise Inns PLC 104 0.07
4 Entertainment One Ltd 10 0.01
31 esure Group PLC 73 0.05
7 Euromoney Institutional Investor PLC 91 0.06
8 European Home Retail PLC – –
62 Evraz PLC 175 0.12
4 FDM Group Holdings PLC 26 0.02
37 Fenner PLC 107 0.07
29 Ferrexpo PLC 45 0.03
5 Fidessa Group PLC 130 0.09
32 Filtrona PLC 151 0.10
12 Findel PLC 28 0.02
163 Firstgroup PLC 196 0.13
281 Fortune Oil PLC – –
26 Foxtons Group PLC 33 0.02
3 Fuller Smith & Turner PLC 40 0.03
171 G4S PLC 491 0.33
12 Galliford Try PLC 178 0.12
5 Games Workshop Group PLC 34 0.02
13 Gem Diamonds Ltd 16 0.01
9 Genus PLC 188 0.13
6 Go-Ahead Group PLC 135 0.09
31 Gocompare.Com Group PLC 22 0.01
28 Grafton Group PLC 176 0.12
54 Grainger PLC 143 0.10
56 Greencore Group PLC 191 0.13
43 Greene King PLC 347 0.24
12 Greggs PLC 123 0.08
249 Gulf Keystone Petroleum Ltd 3 –
36 GVC Holdings PLC 280 0.19
26 Halfords Group PLC 105 0.07
58 Halma PLC 645 0.44
158 Hays PLC 259 0.18
10 Headlam Group PLC 58 0.04
16 Helical PLC 55 0.04
Shares (000's)
Value (000's)
EUR
% of Net Asset Value
Common Stock (continued)
United Kingdom - 28.96% (continued)
149 Henderson Group PLC 408 0.28
15 Hill & Smith Holdings PLC 218 0.15
5 Hilton Food Group PLC 33 0.02
39 Hiscox Ltd 479 0.33
40 Hochschild Mining PLC 102 0.07
43 Hogg Robinson Group PLC 33 0.02
35 HomeServe PLC 251 0.17
80 Howden Joinery Group PLC 339 0.23
24 Hunting PLC 154 0.10
38 Huntsworth PLC 17 0.01
71 ICAP PLC 410 0.28
48 IG Group Holdings PLC 472 0.32
41 Imagination Technologies Group PLC 108 0.07
35 IMI PLC 398 0.27
54 Inchcape PLC 391 0.27
90 Indivior PLC 343 0.23
5 Informa PLC 36 0.02
24 Inmarsat PLC 200 0.14
44 Intermediate Capital Group PLC 348 0.24
33 International Personal Finance PLC 109 0.07
22 Interserve PLC 78 0.05
61 IP Group PLC 100 0.07
36 ITE Group PLC 63 0.04
8 James Fisher & Sons PLC 149 0.10
18 Jardine Lloyd Thompson Group PLC 201 0.14
54 JD Sports Fashion PLC 211 0.14
10 JD Wetherspoon PLC 97 0.07
10 John Laing Group PLC 32 0.02
12 John Menzies PLC 73 0.05
53 John Wood Group PLC 515 0.35
13 JRP Group PLC 21 0.01
54 Jupiter Fund Management PLC 271 0.18
48 KAZ Minerals PLC 206 0.14
94 Kcom Group PLC 114 0.08
10 Keller Group PLC 89 0.06
14 Kier Group PLC 226 0.15
125 Ladbrokes PLC 183 0.12
41 Laird PLC 76 0.05
28 Lamprell PLC 29 0.02
28 Lancashire Holdings Ltd 215 0.15
55 Laura Ashley Holdings PLC 13 0.01
28 Lavendon Group PLC 73 0.05
38 Lonmin PLC 66 0.04
38 Lookers PLC 48 0.03
49 Low & Bonar PLC 39 0.03
8 LSL Property Services PLC 18 0.01
206 Man Group PLC 276 0.19
40 Management Consulting Group PLC 9 0.01
29 Marshalls PLC 99 0.07
95 Marston's PLC 151 0.10
30 McBride PLC 61 0.04
17 Mears Group PLC 95 0.06
36 Meggitt PLC 201 0.14
287 Melrose Industries PLC 620 0.42
31 Michael Page International PLC 134 0.09
21 Micro Focus International PLC 519 0.35
21 Millennium & Copthorne Hotels PLC 104 0.07
28 Mitchells & Butlers PLC 74 0.05
56 Mitie Group PLC 135 0.09
8 MJ Gleeson PLC 52 0.04
64 Moneysupermarket.com Group PLC 201 0.14
45 Morgan Crucible Co PLC 149 0.10
6 Morgan Sindall Group PLC 51 0.03
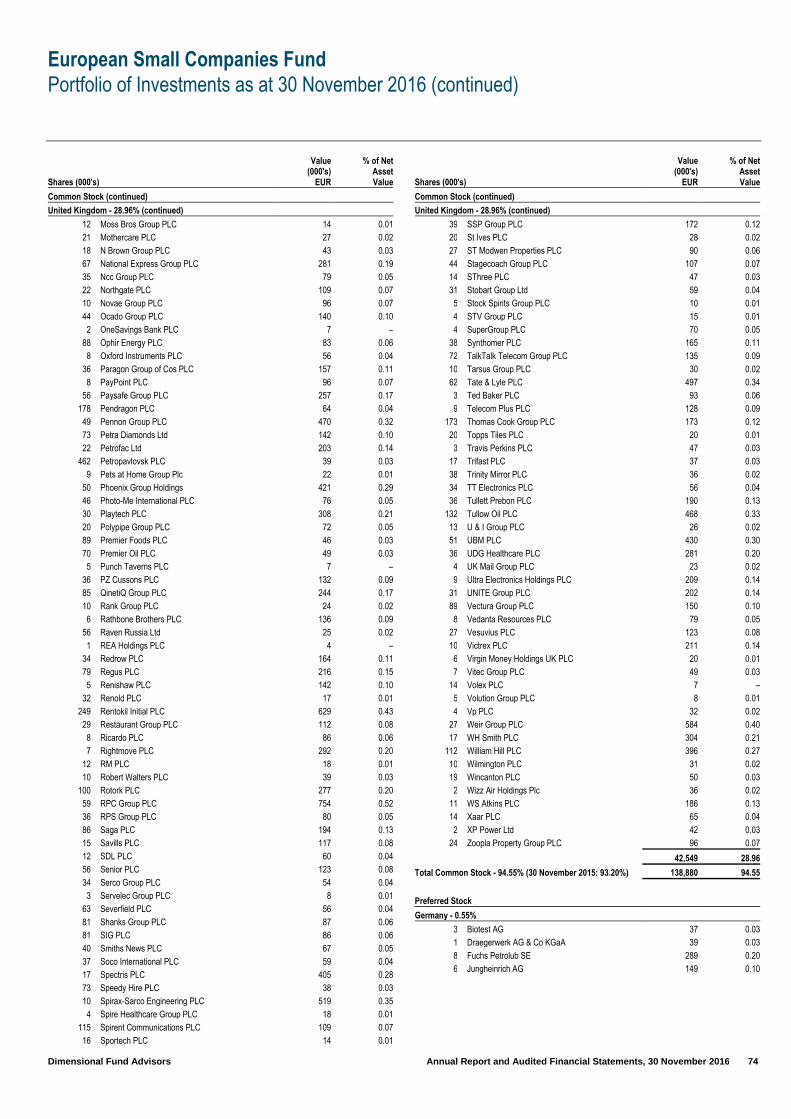
European Small Companies Fund
Portfolio of Investments as at 30 November 2016 (continued)
Dimensional Fund Advisors Annual Report and Audited Financial Statements, 30 November 2016 74
Shares (000's)
Value (000's)
EUR
% of Net Asset Value
Common Stock (continued)
United Kingdom - 28.96% (continued)
12 Moss Bros Group PLC 14 0.01
21 Mothercare PLC 27 0.02
18 N Brown Group PLC 43 0.03
67 National Express Group PLC 281 0.19
35 Ncc Group PLC 79 0.05
22 Northgate PLC 109 0.07
10 Novae Group PLC 96 0.07
44 Ocado Group PLC 140 0.10
2 OneSavings Bank PLC 7 –
88 Ophir Energy PLC 83 0.06
8 Oxford Instruments PLC 56 0.04
36 Paragon Group of Cos PLC 157 0.11
8 PayPoint PLC 96 0.07
56 Paysafe Group PLC 257 0.17
178 Pendragon PLC 64 0.04
49 Pennon Group PLC 470 0.32
73 Petra Diamonds Ltd 142 0.10
22 Petrofac Ltd 203 0.14
462 Petropavlovsk PLC 39 0.03
9 Pets at Home Group Plc 22 0.01
50 Phoenix Group Holdings 421 0.29
46 Photo-Me International PLC 76 0.05
30 Playtech PLC 308 0.21
20 Polypipe Group PLC 72 0.05
89 Premier Foods PLC 46 0.03
70 Premier Oil PLC 49 0.03
5 Punch Taverns PLC 7 –
36 PZ Cussons PLC 132 0.09
85 QinetiQ Group PLC 244 0.17
10 Rank Group PLC 24 0.02
6 Rathbone Brothers PLC 136 0.09
56 Raven Russia Ltd 25 0.02
1 REA Holdings PLC 4 –
34 Redrow PLC 164 0.11
79 Regus PLC 216 0.15
5 Renishaw PLC 142 0.10
32 Renold PLC 17 0.01
249 Rentokil Initial PLC 629 0.43
29 Restaurant Group PLC 112 0.08
8 Ricardo PLC 86 0.06
7 Rightmove PLC 292 0.20
12 RM PLC 18 0.01
10 Robert Walters PLC 39 0.03
100 Rotork PLC 277 0.20
59 RPC Group PLC 754 0.52
36 RPS Group PLC 80 0.05
86 Saga PLC 194 0.13
15 Savills PLC 117 0.08
12 SDL PLC 60 0.04
56 Senior PLC 123 0.08
34 Serco Group PLC 54 0.04
3 Servelec Group PLC 8 0.01
63 Severfield PLC 56 0.04
81 Shanks Group PLC 87 0.06
81 SIG PLC 86 0.06
40 Smiths News PLC 67 0.05
37 Soco International PLC 59 0.04
17 Spectris PLC 405 0.28
73 Speedy Hire PLC 38 0.03
10 Spirax-Sarco Engineering PLC 519 0.35
4 Spire Healthcare Group PLC 18 0.01
115 Spirent Communications PLC 109 0.07
16 Sportech PLC 14 0.01
Shares (000's)
Value (000's)
EUR
% of Net Asset Value
Common Stock (continued)
United Kingdom - 28.96% (continued)
39 SSP Group PLC 172 0.12
20 St Ives PLC 28 0.02
27 ST Modwen Properties PLC 90 0.06
44 Stagecoach Group PLC 107 0.07
14 SThree PLC 47 0.03
31 Stobart Group Ltd 59 0.04
5 Stock Spirits Group PLC 10 0.01
4 STV Group PLC 15 0.01
4 SuperGroup PLC 70 0.05
38 Synthomer PLC 165 0.11
72 TalkTalk Telecom Group PLC 135 0.09
10 Tarsus Group PLC 30 0.02
62 Tate & Lyle PLC 497 0.34
3 Ted Baker PLC 93 0.06
9 Telecom Plus PLC 128 0.09
173 Thomas Cook Group PLC 173 0.12
20 Topps Tiles PLC 20 0.01
3 Travis Perkins PLC 47 0.03
17 Trifast PLC 37 0.03
38 Trinity Mirror PLC 36 0.02
34 TT Electronics PLC 56 0.04
36 Tullett Prebon PLC 190 0.13
132 Tullow Oil PLC 468 0.33
13 U & I Group PLC 26 0.02
51 UBM PLC 430 0.30
36 UDG Healthcare PLC 281 0.20
4 UK Mail Group PLC 23 0.02
9 Ultra Electronics Holdings PLC 209 0.14
31 UNITE Group PLC 202 0.14
89 Vectura Group PLC 150 0.10
8 Vedanta Resources PLC 79 0.05
27 Vesuvius PLC 123 0.08
10 Victrex PLC 211 0.14
6 Virgin Money Holdings UK PLC 20 0.01
7 Vitec Group PLC 49 0.03
14 Volex PLC 7 –
5 Volution Group PLC 8 0.01
4 Vp PLC 32 0.02
27 Weir Group PLC 584 0.40
17 WH Smith PLC 304 0.21
112 William Hill PLC 396 0.27
10 Wilmington PLC 31 0.02
19 Wincanton PLC 50 0.03
2 Wizz Air Holdings Plc 36 0.02
11 WS Atkins PLC 186 0.13
14 Xaar PLC 65 0.04
2 XP Power Ltd 42 0.03
24 Zoopla Property Group PLC 96 0.07
42,549 28.96
Total Common Stock - 94.55% (30 November 2015: 93.20%) 138,880 94.55
Preferred Stock
Germany - 0.55%
3 Biotest AG 37 0.03
1 Draegerwerk AG & Co KGaA 39 0.03
8 Fuchs Petrolub SE 289 0.20
6 Jungheinrich AG 149 0.10

European Small Companies Fund
Portfolio of Investments as at 30 November 2016 (continued)
Dimensional Fund Advisors Annual Report and Audited Financial Statements, 30 November 2016 75
Shares (000's)
Value (000's)
EUR
% of Net Asset Value
Preferred Stock (continued)
Germany - 0.55% (continued)
3 Sartorius AG 205 0.14
2 Sixt SE 73 0.05
792 0.55
Total Preferred Stock – 0.55% (30 November 2015: 0.30%) 792 0.55
Real Estate Investment Trust
Belgium - 0.75%
2 Aedifica SA 142 0.10
– Ascencio 9 0.01
4 Befimmo SA 188 0.13
1 Care Property Invest 10 0.01
3 Cofinimmo SA 296 0.20
1 Intervest Offices & Warehouses NV 26 0.02
– Leasinvest Real Estate SCA 38 0.02
1 Montea SCA 20 0.01
1 Retail Estates NV 101 0.07
3 Warehouses De Pauw CVA 224 0.15
– Wereldhave Belgium NV 46 0.03
1,100 0.75
France - 0.50%
1 Affine SA 7 –
– Altarea SCA 67 0.05
1 ANF Immobilier 21 0.01
1 Argan SA 12 0.01
2 Fonciere Des Regions 172 0.12
4 ICADE 285 0.19
8 Mercialys SA 149 0.10
1 Terreis 26 0.02
739 0.50
Germany - 0.20%
17 Alstria Office REIT-AG 192 0.13
11 Hamborner REIT AG 99 0.07
291 0.20
Ireland - 0.02%
9 Green REIT PLC 12 0.01
22 Hibernia REIT PLC 25 0.01
37 0.02
Italy - 0.08%
169 Beni Stabili SpA SIIQ 84 0.06
53 Immobiliare Grande Distribuzione SIIQ SpA 34 0.02
118 0.08
Netherlands - 0.35%
6 Eurocommercial Properties NV 195 0.13
21 NSI NV 77 0.05
3 Vastned Retail NV 81 0.05
4 Wereldhave NV 170 0.12
523 0.35
Spain - 0.33%
51 Merlin Properties Socimi SA 483 0.33
483 0.33
United Kingdom - 1.89%
223 Assura PLC 151 0.10
22 Big Yellow Group PLC 169 0.12
115 Capital & Regional PLC 74 0.05
12 Derwent London PLC 329 0.22
45 Great Portland Estates PLC 326 0.22
100 Hansteen Holdings PLC 125 0.09
Shares (000's)
Value (000's)
EUR
% of Net Asset Value
Real Estate Investment Trust (continued)
United Kingdom - 1.89% (continued)
92 LondonMetric Property PLC 156 0.11
10 McKay Securities PLC 21 0.01
8 Mucklow A & J Group PLC 43 0.03
85 Primary Health Properties PLC 111 0.08
160 Redefine International PLC 69 0.05
31 Safestore Holdings PLC 127 0.09
44 Schroder Real Estate Investment Trust Ltd 30 0.02
102 Segro PLC 504 0.34
35 Shaftesbury PLC 379 0.26
10 Town Centre Securities PLC 35 0.02
15 Workspace Group PLC 122 0.08
2,771 1.89 Total Real Estate Investment Trust – 4.12% (30 November 2015: 4.49%) 6,062 4.12
Rights
Austria - —%
6 Intercell AG – –
– –
Italy - —%
694 Banca Popolare Di Milano – –
80 Banco Popolare Soc Cooperativa – –
– –
Total Rights – 0.00% (30 November 2015: 0.00%) – –
Total Investments – 99.22% (30 November 2015: 97.99%) 145,734 99.22
Cash and Cash Equivalents – 0.26 % (30 November 2015: 0.40%) 384 0.26 Other Assets in Excess of Liabilities – 0.52% (30 November 2015: 1.61%) 769 0.52
Total Net Assets 146,887 100.00
– Amounts designated as “–“ are either €0, less than €500 or less than 500 shares
Analysis of Total Assets (unaudited) % of Total Assets
Transferable securities admitted to an official exchange listing 95.78
Current Assets 4.22
Total Assets 100.00
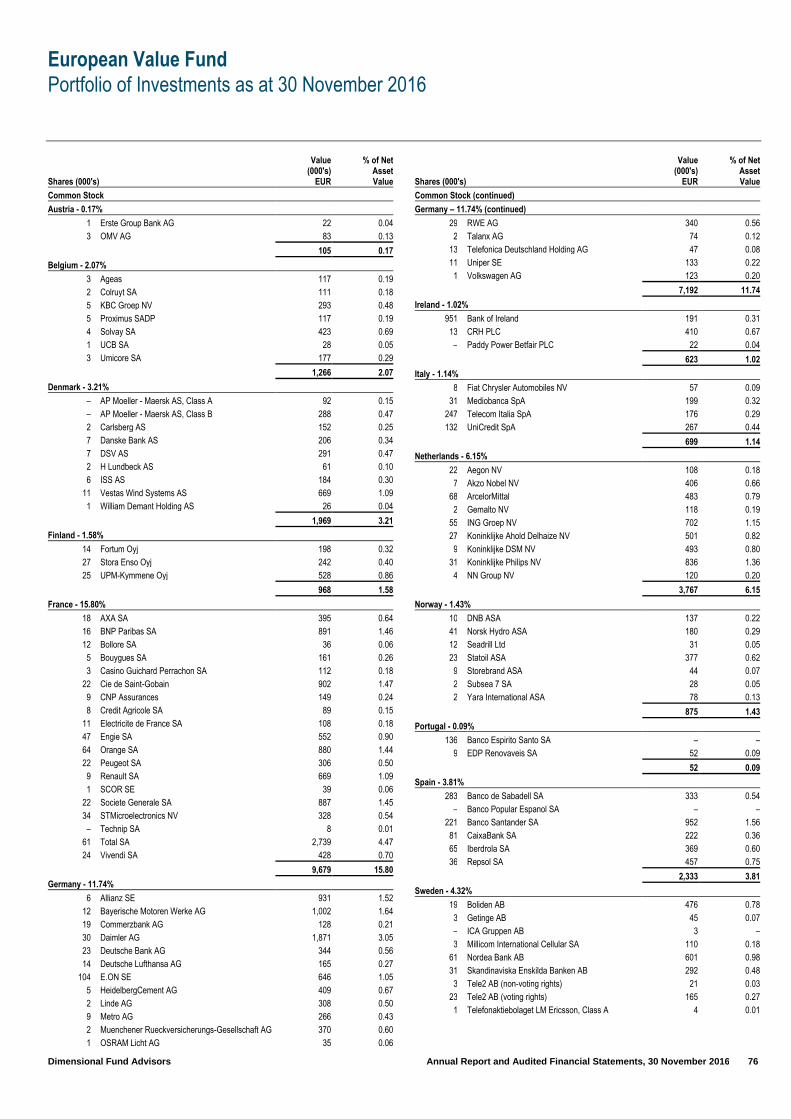
European Value Fund
Portfolio of Investments as at 30 November 2016
Dimensional Fund Advisors Annual Report and Audited Financial Statements, 30 November 2016 76
Shares (000's)
Value (000's)
EUR
% of Net Asset Value
Common Stock
Austria - 0.17%
1 Erste Group Bank AG 22 0.04
3 OMV AG 83 0.13
105 0.17
Belgium - 2.07%
3 Ageas 117 0.19
2 Colruyt SA 111 0.18
5 KBC Groep NV 293 0.48
5 Proximus SADP 117 0.19
4 Solvay SA 423 0.69
1 UCB SA 28 0.05
3 Umicore SA 177 0.29
1,266 2.07
Denmark - 3.21%
– AP Moeller - Maersk AS, Class A 92 0.15
– AP Moeller - Maersk AS, Class B 288 0.47
2 Carlsberg AS 152 0.25
7 Danske Bank AS 206 0.34
7 DSV AS 291 0.47
2 H Lundbeck AS 61 0.10
6 ISS AS 184 0.30
11 Vestas Wind Systems AS 669 1.09
1 William Demant Holding AS 26 0.04
1,969 3.21
Finland - 1.58%
14 Fortum Oyj 198 0.32
27 Stora Enso Oyj 242 0.40
25 UPM-Kymmene Oyj 528 0.86
968 1.58
France - 15.80%
18 AXA SA 395 0.64
16 BNP Paribas SA 891 1.46
12 Bollore SA 36 0.06
5 Bouygues SA 161 0.26
3 Casino Guichard Perrachon SA 112 0.18
22 Cie de Saint-Gobain 902 1.47
9 CNP Assurances 149 0.24
8 Credit Agricole SA 89 0.15
11 Electricite de France SA 108 0.18
47 Engie SA 552 0.90
64 Orange SA 880 1.44
22 Peugeot SA 306 0.50
9 Renault SA 669 1.09
1 SCOR SE 39 0.06
22 Societe Generale SA 887 1.45
34 STMicroelectronics NV 328 0.54
– Technip SA 8 0.01
61 Total SA 2,739 4.47
24 Vivendi SA 428 0.70
9,679 15.80
Germany - 11.74%
6 Allianz SE 931 1.52
12 Bayerische Motoren Werke AG 1,002 1.64
19 Commerzbank AG 128 0.21
30 Daimler AG 1,871 3.05
23 Deutsche Bank AG 344 0.56
14 Deutsche Lufthansa AG 165 0.27
104 E.ON SE 646 1.05
5 HeidelbergCement AG 409 0.67
2 Linde AG 308 0.50
9 Metro AG 266 0.43
2 Muenchener Rueckversicherungs-Gesellschaft AG 370 0.60
1 OSRAM Licht AG 35 0.06
Shares (000's)
Value (000's)
EUR
% of Net Asset Value
Common Stock (continued)
Germany – 11.74% (continued)
29 RWE AG 340 0.56
2 Talanx AG 74 0.12
13 Telefonica Deutschland Holding AG 47 0.08
11 Uniper SE 133 0.22
1 Volkswagen AG 123 0.20
7,192 11.74
Ireland - 1.02%
951 Bank of Ireland 191 0.31
13 CRH PLC 410 0.67
– Paddy Power Betfair PLC 22 0.04
623 1.02
Italy - 1.14%
8 Fiat Chrysler Automobiles NV 57 0.09
31 Mediobanca SpA 199 0.32
247 Telecom Italia SpA 176 0.29
132 UniCredit SpA 267 0.44
699 1.14
Netherlands - 6.15%
22 Aegon NV 108 0.18
7 Akzo Nobel NV 406 0.66
68 ArcelorMittal 483 0.79
2 Gemalto NV 118 0.19
55 ING Groep NV 702 1.15
27 Koninklijke Ahold Delhaize NV 501 0.82
9 Koninklijke DSM NV 493 0.80
31 Koninklijke Philips NV 836 1.36
4 NN Group NV 120 0.20
3,767 6.15
Norway - 1.43%
10 DNB ASA 137 0.22
41 Norsk Hydro ASA 180 0.29
12 Seadrill Ltd 31 0.05
23 Statoil ASA 377 0.62
9 Storebrand ASA 44 0.07
2 Subsea 7 SA 28 0.05
2 Yara International ASA 78 0.13
875 1.43
Portugal - 0.09%
136 Banco Espirito Santo SA – –
9 EDP Renovaveis SA 52 0.09
52 0.09
Spain - 3.81%
283 Banco de Sabadell SA 333 0.54
– Banco Popular Espanol SA – –
221 Banco Santander SA 952 1.56
81 CaixaBank SA 222 0.36
65 Iberdrola SA 369 0.60
36 Repsol SA 457 0.75
2,333 3.81
Sweden - 4.32%
19 Boliden AB 476 0.78
3 Getinge AB 45 0.07
– ICA Gruppen AB 3 –
3 Millicom International Cellular SA 110 0.18
61 Nordea Bank AB 601 0.98
31 Skandinaviska Enskilda Banken AB 292 0.48
3 Tele2 AB (non-voting rights) 21 0.03
23 Tele2 AB (voting rights) 165 0.27
1 Telefonaktiebolaget LM Ericsson, Class A 4 0.01
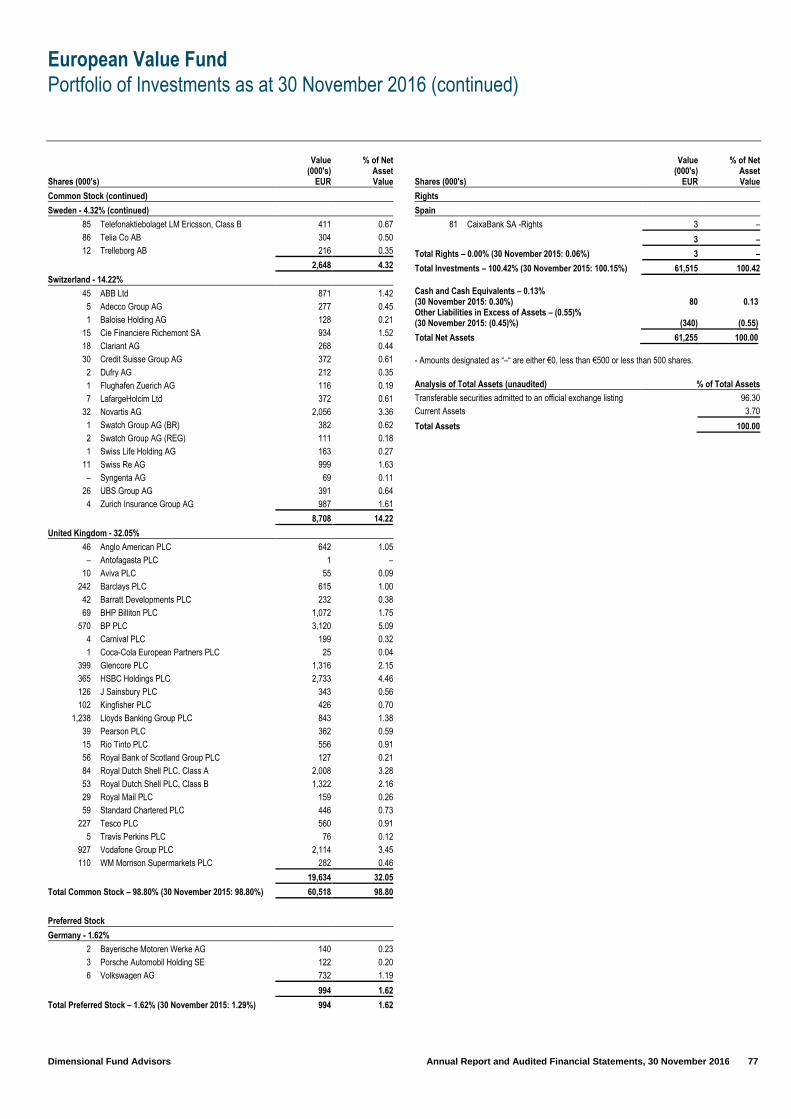
European Value Fund
Portfolio of Investments as at 30 November 2016 (continued)
Dimensional Fund Advisors Annual Report and Audited Financial Statements, 30 November 2016 77
Shares (000's)
Value (000's)
EUR
% of Net Asset Value
Common Stock (continued)
Sweden - 4.32% (continued)
85 Telefonaktiebolaget LM Ericsson, Class B 411 0.67
86 Telia Co AB 304 0.50
12 Trelleborg AB 216 0.35
2,648 4.32
Switzerland - 14.22%
45 ABB Ltd 871 1.42
5 Adecco Group AG 277 0.45
1 Baloise Holding AG 128 0.21
15 Cie Financiere Richemont SA 934 1.52
18 Clariant AG 268 0.44
30 Credit Suisse Group AG 372 0.61
2 Dufry AG 212 0.35
1 Flughafen Zuerich AG 116 0.19
7 LafargeHolcim Ltd 372 0.61
32 Novartis AG 2,056 3.36
1 Swatch Group AG (BR) 382 0.62
2 Swatch Group AG (REG) 111 0.18
1 Swiss Life Holding AG 163 0.27
11 Swiss Re AG 999 1.63
– Syngenta AG 69 0.11
26 UBS Group AG 391 0.64
4 Zurich Insurance Group AG 987 1.61
8,708 14.22
United Kingdom - 32.05%
46 Anglo American PLC 642 1.05
– Antofagasta PLC 1 –
10 Aviva PLC 55 0.09
242 Barclays PLC 615 1.00
42 Barratt Developments PLC 232 0.38
69 BHP Billiton PLC 1,072 1.75
570 BP PLC 3,120 5.09
4 Carnival PLC 199 0.32
1 Coca-Cola European Partners PLC 25 0.04
399 Glencore PLC 1,316 2.15
365 HSBC Holdings PLC 2,733 4.46
126 J Sainsbury PLC 343 0.56
102 Kingfisher PLC 426 0.70
1,238 Lloyds Banking Group PLC 843 1.38
39 Pearson PLC 362 0.59
15 Rio Tinto PLC 556 0.91
56 Royal Bank of Scotland Group PLC 127 0.21
84 Royal Dutch Shell PLC, Class A 2,008 3.28
53 Royal Dutch Shell PLC, Class B 1,322 2.16
29 Royal Mail PLC 159 0.26
59 Standard Chartered PLC 446 0.73
227 Tesco PLC 560 0.91
5 Travis Perkins PLC 76 0.12
927 Vodafone Group PLC 2,114 3.45
110 WM Morrison Supermarkets PLC 282 0.46
19,634 32.05
Total Common Stock – 98.80% (30 November 2015: 98.80%) 60,518 98.80
Preferred Stock
Germany - 1.62%
2 Bayerische Motoren Werke AG 140 0.23
3 Porsche Automobil Holding SE 122 0.20
6 Volkswagen AG 732 1.19
994 1.62
Total Preferred Stock – 1.62% (30 November 2015: 1.29%) 994 1.62
Shares (000's)
Value (000's)
EUR
% of Net Asset Value
Rights
Spain
81 CaixaBank SA -Rights 3 –
3 –
Total Rights – 0.00% (30 November 2015: 0.06%) 3 –
Total Investments – 100.42% (30 November 2015: 100.15%) 61,515 100.42 Cash and Cash Equivalents – 0.13% (30 November 2015: 0.30%) 80 0.13 Other Liabilities in Excess of Assets – (0.55)% (30 November 2015: (0.45)%) (340) (0.55)
Total Net Assets 61,255 100.00
- Amounts designated as “–“ are either €0, less than €500 or less than 500 shares.
Analysis of Total Assets (unaudited) % of Total Assets
Transferable securities admitted to an official exchange listing 96.30
Current Assets 3.70
Total Assets 100.00
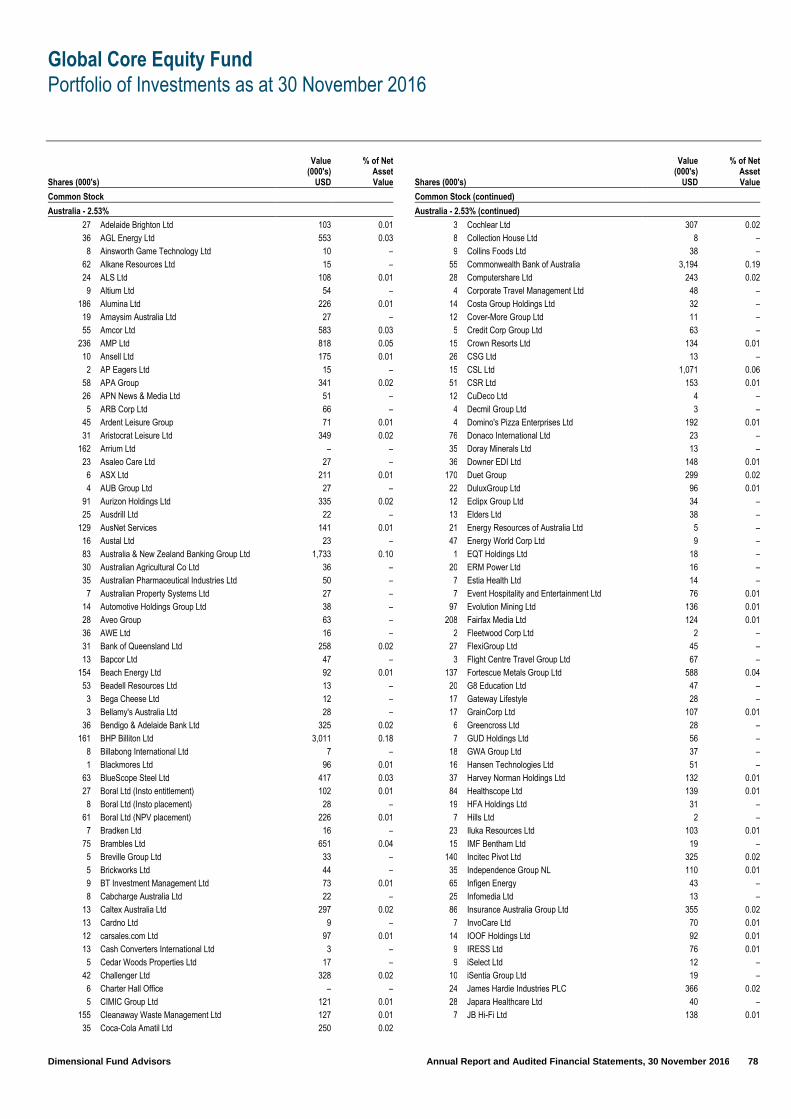
Global Core Equity Fund
Portfolio of Investments as at 30 November 2016
Dimensional Fund Advisors Annual Report and Audited Financial Statements, 30 November 2016 78
Shares (000's)
Value (000's)
USD
% of Net Asset Value
Common Stock
Australia - 2.53%
27 Adelaide Brighton Ltd 103 0.01
36 AGL Energy Ltd 553 0.03
8 Ainsworth Game Technology Ltd 10 –
62 Alkane Resources Ltd 15 –
24 ALS Ltd 108 0.01
9 Altium Ltd 54 –
186 Alumina Ltd 226 0.01
19 Amaysim Australia Ltd 27 –
55 Amcor Ltd 583 0.03
236 AMP Ltd 818 0.05
10 Ansell Ltd 175 0.01
2 AP Eagers Ltd 15 –
58 APA Group 341 0.02
26 APN News & Media Ltd 51 –
5 ARB Corp Ltd 66 –
45 Ardent Leisure Group 71 0.01
31 Aristocrat Leisure Ltd 349 0.02
162 Arrium Ltd – –
23 Asaleo Care Ltd 27 –
6 ASX Ltd 211 0.01
4 AUB Group Ltd 27 –
91 Aurizon Holdings Ltd 335 0.02
25 Ausdrill Ltd 22 –
129 AusNet Services 141 0.01
16 Austal Ltd 23 –
83 Australia & New Zealand Banking Group Ltd 1,733 0.10
30 Australian Agricultural Co Ltd 36 –
35 Australian Pharmaceutical Industries Ltd 50 –
7 Australian Property Systems Ltd 27 –
14 Automotive Holdings Group Ltd 38 –
28 Aveo Group 63 –
36 AWE Ltd 16 –
31 Bank of Queensland Ltd 258 0.02
13 Bapcor Ltd 47 –
154 Beach Energy Ltd 92 0.01
53 Beadell Resources Ltd 13 –
3 Bega Cheese Ltd 12 –
3 Bellamy's Australia Ltd 28 –
36 Bendigo & Adelaide Bank Ltd 325 0.02
161 BHP Billiton Ltd 3,011 0.18
8 Billabong International Ltd 7 –
1 Blackmores Ltd 96 0.01
63 BlueScope Steel Ltd 417 0.03
27 Boral Ltd (Insto entitlement) 102 0.01
8 Boral Ltd (Insto placement) 28 –
61 Boral Ltd (NPV placement) 226 0.01
7 Bradken Ltd 16 –
75 Brambles Ltd 651 0.04
5 Breville Group Ltd 33 –
5 Brickworks Ltd 44 –
9 BT Investment Management Ltd 73 0.01
8 Cabcharge Australia Ltd 22 –
13 Caltex Australia Ltd 297 0.02
13 Cardno Ltd 9 –
12 carsales.com Ltd 97 0.01
13 Cash Converters International Ltd 3 –
5 Cedar Woods Properties Ltd 17 –
42 Challenger Ltd 328 0.02
6 Charter Hall Office – –
5 CIMIC Group Ltd 121 0.01
155 Cleanaway Waste Management Ltd 127 0.01
35 Coca-Cola Amatil Ltd 250 0.02
Shares (000's)
Value (000's)
USD
% of Net Asset Value
Common Stock (continued)
Australia - 2.53% (continued)
3 Cochlear Ltd 307 0.02
8 Collection House Ltd 8 –
9 Collins Foods Ltd 38 –
55 Commonwealth Bank of Australia 3,194 0.19
28 Computershare Ltd 243 0.02
4 Corporate Travel Management Ltd 48 –
14 Costa Group Holdings Ltd 32 –
12 Cover-More Group Ltd 11 –
5 Credit Corp Group Ltd 63 –
15 Crown Resorts Ltd 134 0.01
26 CSG Ltd 13 –
15 CSL Ltd 1,071 0.06
51 CSR Ltd 153 0.01
12 CuDeco Ltd 4 –
4 Decmil Group Ltd 3 –
4 Domino's Pizza Enterprises Ltd 192 0.01
76 Donaco International Ltd 23 –
35 Doray Minerals Ltd 13 –
36 Downer EDI Ltd 148 0.01
170 Duet Group 299 0.02
22 DuluxGroup Ltd 96 0.01
12 Eclipx Group Ltd 34 –
13 Elders Ltd 38 –
21 Energy Resources of Australia Ltd 5 –
47 Energy World Corp Ltd 9 –
1 EQT Holdings Ltd 18 –
20 ERM Power Ltd 16 –
7 Estia Health Ltd 14 –
7 Event Hospitality and Entertainment Ltd 76 0.01
97 Evolution Mining Ltd 136 0.01
208 Fairfax Media Ltd 124 0.01
2 Fleetwood Corp Ltd 2 –
27 FlexiGroup Ltd 45 –
3 Flight Centre Travel Group Ltd 67 –
137 Fortescue Metals Group Ltd 588 0.04
20 G8 Education Ltd 47 –
17 Gateway Lifestyle 28 –
17 GrainCorp Ltd 107 0.01
6 Greencross Ltd 28 –
7 GUD Holdings Ltd 56 –
18 GWA Group Ltd 37 –
16 Hansen Technologies Ltd 51 –
37 Harvey Norman Holdings Ltd 132 0.01
84 Healthscope Ltd 139 0.01
19 HFA Holdings Ltd 31 –
7 Hills Ltd 2 –
23 Iluka Resources Ltd 103 0.01
15 IMF Bentham Ltd 19 –
140 Incitec Pivot Ltd 325 0.02
35 Independence Group NL 110 0.01
65 Infigen Energy 43 –
25 Infomedia Ltd 13 –
86 Insurance Australia Group Ltd 355 0.02
7 InvoCare Ltd 70 0.01
14 IOOF Holdings Ltd 92 0.01
9 IRESS Ltd 76 0.01
9 iSelect Ltd 12 –
10 iSentia Group Ltd 19 –
24 James Hardie Industries PLC 366 0.02
28 Japara Healthcare Ltd 40 –
7 JB Hi-Fi Ltd 138 0.01
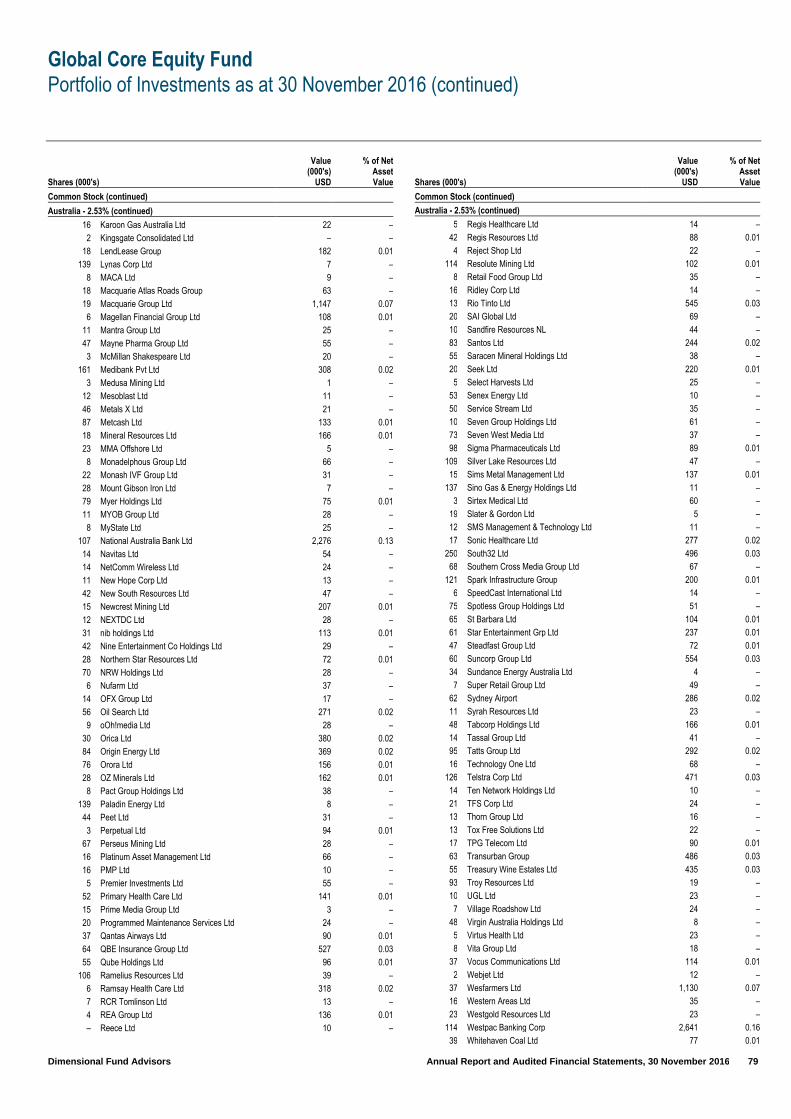
Global Core Equity Fund
Portfolio of Investments as at 30 November 2016 (continued)
Dimensional Fund Advisors Annual Report and Audited Financial Statements, 30 November 2016 79
Shares (000's)
Value (000's)
USD
% of Net Asset Value
Common Stock (continued)
Australia - 2.53% (continued)
16 Karoon Gas Australia Ltd 22 –
2 Kingsgate Consolidated Ltd – –
18 LendLease Group 182 0.01
139 Lynas Corp Ltd 7 –
8 MACA Ltd 9 –
18 Macquarie Atlas Roads Group 63 –
19 Macquarie Group Ltd 1,147 0.07
6 Magellan Financial Group Ltd 108 0.01
11 Mantra Group Ltd 25 –
47 Mayne Pharma Group Ltd 55 –
3 McMillan Shakespeare Ltd 20 –
161 Medibank Pvt Ltd 308 0.02
3 Medusa Mining Ltd 1 –
12 Mesoblast Ltd 11 –
46 Metals X Ltd 21 –
87 Metcash Ltd 133 0.01
18 Mineral Resources Ltd 166 0.01
23 MMA Offshore Ltd 5 –
8 Monadelphous Group Ltd 66 –
22 Monash IVF Group Ltd 31 –
28 Mount Gibson Iron Ltd 7 –
79 Myer Holdings Ltd 75 0.01
11 MYOB Group Ltd 28 –
8 MyState Ltd 25 –
107 National Australia Bank Ltd 2,276 0.13
14 Navitas Ltd 54 –
14 NetComm Wireless Ltd 24 –
11 New Hope Corp Ltd 13 –
42 New South Resources Ltd 47 –
15 Newcrest Mining Ltd 207 0.01
12 NEXTDC Ltd 28 –
31 nib holdings Ltd 113 0.01
42 Nine Entertainment Co Holdings Ltd 29 –
28 Northern Star Resources Ltd 72 0.01
70 NRW Holdings Ltd 28 –
6 Nufarm Ltd 37 –
14 OFX Group Ltd 17 –
56 Oil Search Ltd 271 0.02
9 oOh!media Ltd 28 –
30 Orica Ltd 380 0.02
84 Origin Energy Ltd 369 0.02
76 Orora Ltd 156 0.01
28 OZ Minerals Ltd 162 0.01
8 Pact Group Holdings Ltd 38 –
139 Paladin Energy Ltd 8 –
44 Peet Ltd 31 –
3 Perpetual Ltd 94 0.01
67 Perseus Mining Ltd 28 –
16 Platinum Asset Management Ltd 66 –
16 PMP Ltd 10 –
5 Premier Investments Ltd 55 –
52 Primary Health Care Ltd 141 0.01
15 Prime Media Group Ltd 3 –
20 Programmed Maintenance Services Ltd 24 –
37 Qantas Airways Ltd 90 0.01
64 QBE Insurance Group Ltd 527 0.03
55 Qube Holdings Ltd 96 0.01
106 Ramelius Resources Ltd 39 –
6 Ramsay Health Care Ltd 318 0.02
7 RCR Tomlinson Ltd 13 –
4 REA Group Ltd 136 0.01
– Reece Ltd 10 –
Shares (000's)
Value (000's)
USD
% of Net Asset Value
Common Stock (continued)
Australia - 2.53% (continued)
5 Regis Healthcare Ltd 14 –
42 Regis Resources Ltd 88 0.01
4 Reject Shop Ltd 22 –
114 Resolute Mining Ltd 102 0.01
8 Retail Food Group Ltd 35 –
16 Ridley Corp Ltd 14 –
13 Rio Tinto Ltd 545 0.03
20 SAI Global Ltd 69 –
10 Sandfire Resources NL 44 –
83 Santos Ltd 244 0.02
55 Saracen Mineral Holdings Ltd 38 –
20 Seek Ltd 220 0.01
5 Select Harvests Ltd 25 –
53 Senex Energy Ltd 10 –
50 Service Stream Ltd 35 –
10 Seven Group Holdings Ltd 61 –
73 Seven West Media Ltd 37 –
98 Sigma Pharmaceuticals Ltd 89 0.01
109 Silver Lake Resources Ltd 47 –
15 Sims Metal Management Ltd 137 0.01
137 Sino Gas & Energy Holdings Ltd 11 –
3 Sirtex Medical Ltd 60 –
19 Slater & Gordon Ltd 5 –
12 SMS Management & Technology Ltd 11 –
17 Sonic Healthcare Ltd 277 0.02
250 South32 Ltd 496 0.03
68 Southern Cross Media Group Ltd 67 –
121 Spark Infrastructure Group 200 0.01
6 SpeedCast International Ltd 14 –
75 Spotless Group Holdings Ltd 51 –
65 St Barbara Ltd 104 0.01
61 Star Entertainment Grp Ltd 237 0.01
47 Steadfast Group Ltd 72 0.01
60 Suncorp Group Ltd 554 0.03
34 Sundance Energy Australia Ltd 4 –
7 Super Retail Group Ltd 49 –
62 Sydney Airport 286 0.02
11 Syrah Resources Ltd 23 –
48 Tabcorp Holdings Ltd 166 0.01
14 Tassal Group Ltd 41 –
95 Tatts Group Ltd 292 0.02
16 Technology One Ltd 68 –
126 Telstra Corp Ltd 471 0.03
14 Ten Network Holdings Ltd 10 –
21 TFS Corp Ltd 24 –
13 Thorn Group Ltd 16 –
13 Tox Free Solutions Ltd 22 –
17 TPG Telecom Ltd 90 0.01
63 Transurban Group 486 0.03
55 Treasury Wine Estates Ltd 435 0.03
93 Troy Resources Ltd 19 –
10 UGL Ltd 23 –
7 Village Roadshow Ltd 24 –
48 Virgin Australia Holdings Ltd 8 –
5 Virtus Health Ltd 23 –
8 Vita Group Ltd 18 –
37 Vocus Communications Ltd 114 0.01
2 Webjet Ltd 12 –
37 Wesfarmers Ltd 1,130 0.07
16 Western Areas Ltd 35 –
23 Westgold Resources Ltd 23 –
114 Westpac Banking Corp 2,641 0.16
39 Whitehaven Coal Ltd 77 0.01

Global Core Equity Fund
Portfolio of Investments as at 30 November 2016 (continued)
Dimensional Fund Advisors Annual Report and Audited Financial Statements, 30 November 2016 80
Shares (000's)
Value (000's)
USD
% of Net Asset Value
Common Stock (continued)
Australia - 2.53% (continued)
23 Woodside Petroleum Ltd 513 0.03
42 Woolworths Ltd 702 0.04
21 WorleyParsons Ltd 139 0.01
32 WPP AUNZ Ltd 22 –
43,362 2.53
Austria - 0.17%
– Agrana Beteiligungs AG 6 –
5 Andritz AG 242 0.02
16 Atrium European Real Estate Ltd 64 –
1 Austria Technologie & Systemtechnik AG 15 –
5 Buwog AG 109 0.01
6 CA Immobilien Anlagen AG 106 0.01
4 Conwert Immobilien Invest SE 68 0.01
1 DO & CO AG 31 –
13 Erste Group Bank AG 357 0.02
3 EVN AG 30 –
56 Immofinanz AG 115 0.01
– Lenzing AG 53 –
1 Mayr Melnhof Karton AG 63 –
– Oberbank AG 15 –
1 Oesterreichische Post AG 43 –
9 OMV AG 294 0.02
1 Palfinger AG 25 –
1 Porr Ag 34 –
11 Raiffeisen Bank International AG 192 0.01
1 RHI AG 27 –
– Rosenbauer International AG 17 –
4 S IMMO AG 39 –
– Schoeller-Bleckmann Oilfield Equipment AG 24 –
1 Semperit AG Holding 32 –
1 Strabag SE 38 –
6 Telekom Austria AG 36 –
– UBM Development AG 5 –
11 UNIQA Insurance Group AG 74 0.01
3 Verbund AG 50 –
3 Vienna Insurance Group AG Wiener Versicherung Gruppe 67 0.01
12 voestalpine AG 441 0.03
10 Wienerberger AG 183 0.01
1 Zumtobel Group AG 18 –
2,913 0.17
Belgium - 0.47%
2 Ablynx NV 20 –
2 Ackermans & van Haaren NV 275 0.02
15 Ageas 576 0.03
20 AGFA-Gevaert NV 90 0.01
26 Anheuser-Busch InBev SA 2,695 0.16
– Atenor 12 –
– Banque Nationale de Belgique 57 –
1 Barco NV 69 –
3 Bekaert SA 143 0.01
7 bpost SA 159 0.01
1 Celyad SA 10 –
– Cie d'Entreprises CFE 49 –
– Cie Immobiliere de Belgique SA 10 –
7 Colruyt SA 335 0.02
2 D'ieteren SA 75 0.01
4 Deceuninck NV 9 –
5 Econocom Group SA 71 –
2 Elia System Operator SA 97 0.01
9 Euronav NV 69 –
1 EVS Broadcast Equipment SA 38 –
1 Exmar NV 10 –
Shares (000's)
Value (000's)
USD
% of Net Asset Value
Common Stock (continued)
Belgium - 0.47% (continued)
2 Fagron 17 –
2 Galapagos NV 113 0.01
2 Gimv NV 109 0.01
1 Ion Beam Applications 50 –
10 KBC Group NV 601 0.04
1 Kinepolis Group NV 35 –
– Lotus Bakeries 51 –
1 Melexis NV 53 –
7 Nyrstar NV 47 –
6 Ontex Group NV 160 0.01
3 Orange Belgium SA 59 –
12 Proximus SADP 343 0.02
5 Recticel SA 28 –
– Resilux 18 –
1 Sioen Industries NV 39 –
– Sipef SA 28 –
4 Solvay SA 415 0.03
4 Telenet Group Holding NV 198 0.01
3 Tessenderlo Chemie NV 88 0.01
2 ThromboGenics NV 5 –
5 UCB SA 332 0.02
7 Umicore SA 418 0.03
– Van de Velde NV 33 –
1 Viohalco SA 2 –
8,111 0.47
Canada - 3.63%
5 Absolute Software Corp 25 –
1 Acadian Timber Corp 13 –
13 Advantage Oil & Gas Ltd 94 0.01
5 Aecon Group Inc 55 –
24 Africa Oil Corp 34 –
1 Ag Growth International Inc 35 –
11 AGF Management Ltd 43 –
10 Agnico Eagle Mines Ltd 411 0.02
7 Agrium Inc 688 0.04
1 AGT Food & Ingredients Inc 30 –
11 Aimia Inc 66 –
4 Air Canada 43 –
2 AirBoss of America Corp 16 –
18 Alacer Gold Corp 34 –
24 Alamos Gold Inc 156 0.01
4 Alaris Royalty Corp 66 –
2 Algoma Central Corp 19 –
17 Algonquin Power & Utilities Corp 144 0.01
13 Alimentation Couche-Tard Inc 604 0.04
14 AltaGas Ltd 346 0.02
4 Altius Minerals Corp 34 –
2 Altus Group Ltd 34 –
8 Amaya Inc 111 0.01
5 Andrew Peller Ltd 40 –
18 ARC Resources Ltd 309 0.02
21 Argonaut Gold Inc 39 –
14 Asanko Gold Inc 50 –
5 Atco Ltd 175 0.01
50 Athabasca Oil Corp 51 –
6 ATS Automation Tooling Systems Inc 44 –
9 AuRico Metals Inc 7 –
3 AutoCanada Inc 38 –
1 Avigilon Corp 10 –
79 B2Gold Corp 191 0.01
2 Badger Daylighting Ltd 35 –
28 Bank of Montreal 1,866 0.11
36 Bank of Nova Scotia 1,996 0.12

Global Core Equity Fund
Portfolio of Investments as at 30 November 2016 (continued)
Dimensional Fund Advisors Annual Report and Audited Financial Statements, 30 November 2016 81
Shares (000's)
Value (000's)
USD
% of Net Asset Value
Common Stock (continued)
Canada - 3.63% (continued)
5 Banro Corp 1 –
22 Barrick Gold Corp 328 0.02
18 Baytex Energy Corp 77 0.01
7 BCE Inc 310 0.02
9 Bellatrix Exploration Ltd 7 –
8 Birchcliff Energy Ltd 56 –
2 Bird Construction Inc 14 –
1 Black Diamond Group Ltd 4 –
34 BlackBerry Ltd 264 0.02
44 BlackPearl Resources Inc 58 –
111 Bombardier Inc 155 0.01
23 Bonavista Energy Corp 78 0.01
4 Bonterra Energy Corp 73 –
5 Boralex Inc 60 –
27 Brookfield Asset Management Inc 887 0.05
3 BRP Inc 57 –
20 CAE Inc 288 0.02
4 Calfrac Well Services Ltd 11 –
1 Calian Group Ltd 9 –
1 Callidus Capital Corp 15 –
25 Cameco Corp 227 0.01
13 Canaccord Genuity Group Inc 40 –
14 Canacol Energy Ltd 47 –
6 Canadian Energy Services & Technology Corp 33 –
16 Canadian Imperial Bank of Commerce 1,228 0.07
24 Canadian National Railway Co 1,578 0.09
47 Canadian Natural Resources Ltd 1,593 0.09
4 Canadian Pacific Railway Ltd 666 0.04
4 Canadian Tire Corp Ltd 454 0.03
7 Canadian Utilities Ltd 181 0.01
9 Canadian Western Bank 188 0.01
3 Canam Group Inc 21 –
11 Canexus Corp 12 –
7 Canfor Corp 72 –
3 Canfor Pulp Products Inc 22 –
6 CanWel Building Materials Group Ltd 25 –
5 Canyon Services Group Inc 21 –
7 Capital Power Corp 129 0.01
65 Capstone Mining Corp 50 –
8 Cascades Inc 71 –
2 CCL Industries Inc 271 0.02
11 Celestica Inc 134 0.01
39 Cenovus Energy Inc 596 0.04
18 Centerra Gold Inc 95 0.01
13 Cequence Energy Ltd 2 –
1 Cervus Equipment Corp 8 –
9 CGI Group Inc 435 0.03
12 Chartwell Retirement Residences 131 0.01
30 China Gold International Resources Corp Ltd 62 –
11 CI Financial Corp 225 0.01
4 Cineplex Inc 133 0.01
2 Clearwater Seafoods Inc 20 –
1 Cogeco Communications Inc 62 –
1 Cogeco Inc 46 –
2 Colliers International Group Inc 70 –
5 Computer Modelling Group Ltd 31 –
2 Concordia International Corp 6 –
1 Constellation Software Inc 424 0.03
11 Continental Gold Inc 28 –
10 Copper Mountain Mining Corp 6 –
13 Corus Entertainment Inc 116 0.01
11 Cott Corp 126 0.01
30 Crescent Point Energy Corp 376 0.02
Shares (000's)
Value (000's)
USD
% of Net Asset Value
Common Stock (continued)
Canada - 3.63% (continued)
15 Crew Energy Inc 85 0.01
7 CRH Medical Corp 38 –
7 Delphi Energy Corp 7 –
82 Denison Mines Corp 35 –
3 Descartes Systems Group Inc 64 –
12 Detour Gold Corp 153 0.01
7 DH Corp 96 0.01
23 DHX Media Ltd 120 0.01
6 Dollarama Inc 410 0.02
6 Dominion Diamond Corp 56 –
3 Dorel Industries Inc 84 0.01
15 Dundee Precious Metals Inc 24 –
3 Eastern Platinum Ltd 1 –
18 ECN Capital Corp 41 –
55 Eldorado Gold Corp 152 0.01
30 Element Fleet Management Corp 247 0.02
3 Emera Inc 87 0.01
14 Empire Co Ltd 193 0.01
27 Enbridge Inc 1,146 0.07
9 Enbridge Income Fund Holdings Inc 237 0.01
38 Encana Corp 471 0.03
7 Endeavour Mining Corp 103 0.01
8 Enercare Inc 104 0.01
7 Enerflex Ltd 90 0.01
2 Enghouse Systems Ltd 64 –
11 Ensign Energy Services Inc 73 –
1 Equitable Group Inc 27 –
9 Essential Energy Services Ltd 4 –
1 Evertz Technologies Ltd 8 –
2 Exchange Income Corp 63 –
4 Exco Technologies Ltd 30 –
4 Extendicare Inc 27 –
1 Fairfax Financial Holdings Ltd 540 0.03
3 Fiera Capital Corp 28 –
14 Finning International Inc 275 0.02
2 Firm Capital Mortgage Investment Corp 20 –
10 First Capital Realty Inc 149 0.01
7 First Majestic Silver Corp 62 –
1 First National Financial Corp 24 –
52 First Quantum Minerals Ltd 589 0.04
2 FirstService Corp 86 0.01
15 Fortis Inc (Canada listing) 450 0.03
7 Fortis Inc (US listing) 209 0.01
13 Fortuna Silver Mines Inc 77 0.01
4 Franco-Nevada Corp 232 0.01
8 Freehold Royalties Ltd 80 0.01
4 Genworth MI Canada Inc 101 0.01
3 George Weston Ltd 256 0.02
5 Gibson Energy Inc 63 –
9 Gildan Activewear Inc 256 0.02
1 Gluskin Sheff + Associates Inc 13 –
2 GMP Capital Inc 7 –
34 Goldcorp Inc 452 0.03
49 Golden Star Resources Ltd 42 –
29 Gran Tierra Energy Inc 82 0.01
2 Granite Oil Corp 8 –
3 Great Canadian Gaming Corp 54 –
7 Great-West Lifeco Inc 185 0.01
2 Guardian Capital Group Ltd 34 –
3 Guyana Goldfields Inc 11 –
2 Heroux-Devtek Inc 28 –
1 High Liner Foods Inc 20 –
6 Home Capital Group Inc 136 0.01
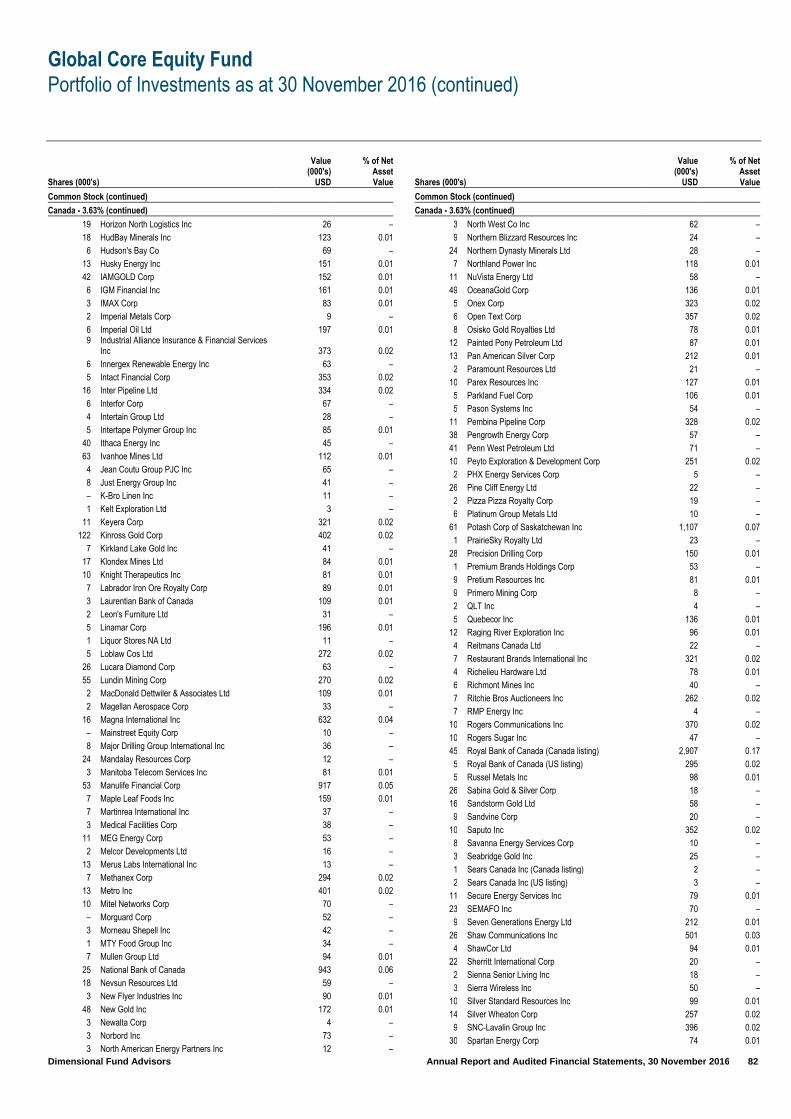
Global Core Equity Fund
Portfolio of Investments as at 30 November 2016 (continued)
Dimensional Fund Advisors Annual Report and Audited Financial Statements, 30 November 2016 82
Shares (000's)
Value (000's)
USD
% of Net Asset Value
Common Stock (continued)
Canada - 3.63% (continued)
19 Horizon North Logistics Inc 26 –
18 HudBay Minerals Inc 123 0.01
6 Hudson's Bay Co 69 –
13 Husky Energy Inc 151 0.01
42 IAMGOLD Corp 152 0.01
6 IGM Financial Inc 161 0.01
3 IMAX Corp 83 0.01
2 Imperial Metals Corp 9 –
6 Imperial Oil Ltd 197 0.01 9
Industrial Alliance Insurance & Financial Services Inc 373 0.02
6 Innergex Renewable Energy Inc 63 –
5 Intact Financial Corp 353 0.02
16 Inter Pipeline Ltd 334 0.02
6 Interfor Corp 67 –
4 Intertain Group Ltd 28 –
5 Intertape Polymer Group Inc 85 0.01
40 Ithaca Energy Inc 45 –
63 Ivanhoe Mines Ltd 112 0.01
4 Jean Coutu Group PJC Inc 65 –
8 Just Energy Group Inc 41 –
– K-Bro Linen Inc 11 –
1 Kelt Exploration Ltd 3 –
11 Keyera Corp 321 0.02
122 Kinross Gold Corp 402 0.02
7 Kirkland Lake Gold Inc 41 –
17 Klondex Mines Ltd 84 0.01
10 Knight Therapeutics Inc 81 0.01
7 Labrador Iron Ore Royalty Corp 89 0.01
3 Laurentian Bank of Canada 109 0.01
2 Leon's Furniture Ltd 31 –
5 Linamar Corp 196 0.01
1 Liquor Stores NA Ltd 11 –
5 Loblaw Cos Ltd 272 0.02
26 Lucara Diamond Corp 63 –
55 Lundin Mining Corp 270 0.02
2 MacDonald Dettwiler & Associates Ltd 109 0.01
2 Magellan Aerospace Corp 33 –
16 Magna International Inc 632 0.04
– Mainstreet Equity Corp 10 –
8 Major Drilling Group International Inc 36 –
24 Mandalay Resources Corp 12 –
3 Manitoba Telecom Services Inc 81 0.01
53 Manulife Financial Corp 917 0.05
7 Maple Leaf Foods Inc 159 0.01
7 Martinrea International Inc 37 –
3 Medical Facilities Corp 38 –
11 MEG Energy Corp 53 –
2 Melcor Developments Ltd 16 –
13 Merus Labs International Inc 13 –
7 Methanex Corp 294 0.02
13 Metro Inc 401 0.02
10 Mitel Networks Corp 70 –
– Morguard Corp 52 –
3 Morneau Shepell Inc 42 –
1 MTY Food Group Inc 34 –
7 Mullen Group Ltd 94 0.01
25 National Bank of Canada 943 0.06
18 Nevsun Resources Ltd 59 –
3 New Flyer Industries Inc 90 0.01
48 New Gold Inc 172 0.01
3 Newalta Corp 4 –
3 Norbord Inc 73 –
3 North American Energy Partners Inc 12 –
Shares (000's)
Value (000's)
USD
% of Net Asset Value
Common Stock (continued)
Canada - 3.63% (continued)
3 North West Co Inc 62 –
9 Northern Blizzard Resources Inc 24 –
24 Northern Dynasty Minerals Ltd 28 –
7 Northland Power Inc 118 0.01
11 NuVista Energy Ltd 58 –
49 OceanaGold Corp 136 0.01
5 Onex Corp 323 0.02
6 Open Text Corp 357 0.02
8 Osisko Gold Royalties Ltd 78 0.01
12 Painted Pony Petroleum Ltd 87 0.01
13 Pan American Silver Corp 212 0.01
2 Paramount Resources Ltd 21 –
10 Parex Resources Inc 127 0.01
5 Parkland Fuel Corp 106 0.01
5 Pason Systems Inc 54 –
11 Pembina Pipeline Corp 328 0.02
38 Pengrowth Energy Corp 57 –
41 Penn West Petroleum Ltd 71 –
10 Peyto Exploration & Development Corp 251 0.02
2 PHX Energy Services Corp 5 –
26 Pine Cliff Energy Ltd 22 –
2 Pizza Pizza Royalty Corp 19 –
6 Platinum Group Metals Ltd 10 –
61 Potash Corp of Saskatchewan Inc 1,107 0.07
1 PrairieSky Royalty Ltd 23 –
28 Precision Drilling Corp 150 0.01
1 Premium Brands Holdings Corp 53 –
9 Pretium Resources Inc 81 0.01
9 Primero Mining Corp 8 –
2 QLT Inc 4 –
5 Quebecor Inc 136 0.01
12 Raging River Exploration Inc 96 0.01
4 Reitmans Canada Ltd 22 –
7 Restaurant Brands International Inc 321 0.02
4 Richelieu Hardware Ltd 78 0.01
6 Richmont Mines Inc 40 –
7 Ritchie Bros Auctioneers Inc 262 0.02
7 RMP Energy Inc 4 –
10 Rogers Communications Inc 370 0.02
10 Rogers Sugar Inc 47 –
45 Royal Bank of Canada (Canada listing) 2,907 0.17
5 Royal Bank of Canada (US listing) 295 0.02
5 Russel Metals Inc 98 0.01
26 Sabina Gold & Silver Corp 18 –
16 Sandstorm Gold Ltd 58 –
9 Sandvine Corp 20 –
10 Saputo Inc 352 0.02
8 Savanna Energy Services Corp 10 –
3 Seabridge Gold Inc 25 –
1 Sears Canada Inc (Canada listing) 2 –
2 Sears Canada Inc (US listing) 3 –
11 Secure Energy Services Inc 79 0.01
23 SEMAFO Inc 70 –
9 Seven Generations Energy Ltd 212 0.01
26 Shaw Communications Inc 501 0.03
4 ShawCor Ltd 94 0.01
22 Sherritt International Corp 20 –
2 Sienna Senior Living Inc 18 –
3 Sierra Wireless Inc 50 –
10 Silver Standard Resources Inc 99 0.01
14 Silver Wheaton Corp 257 0.02
9 SNC-Lavalin Group Inc 396 0.02
30 Spartan Energy Corp 74 0.01
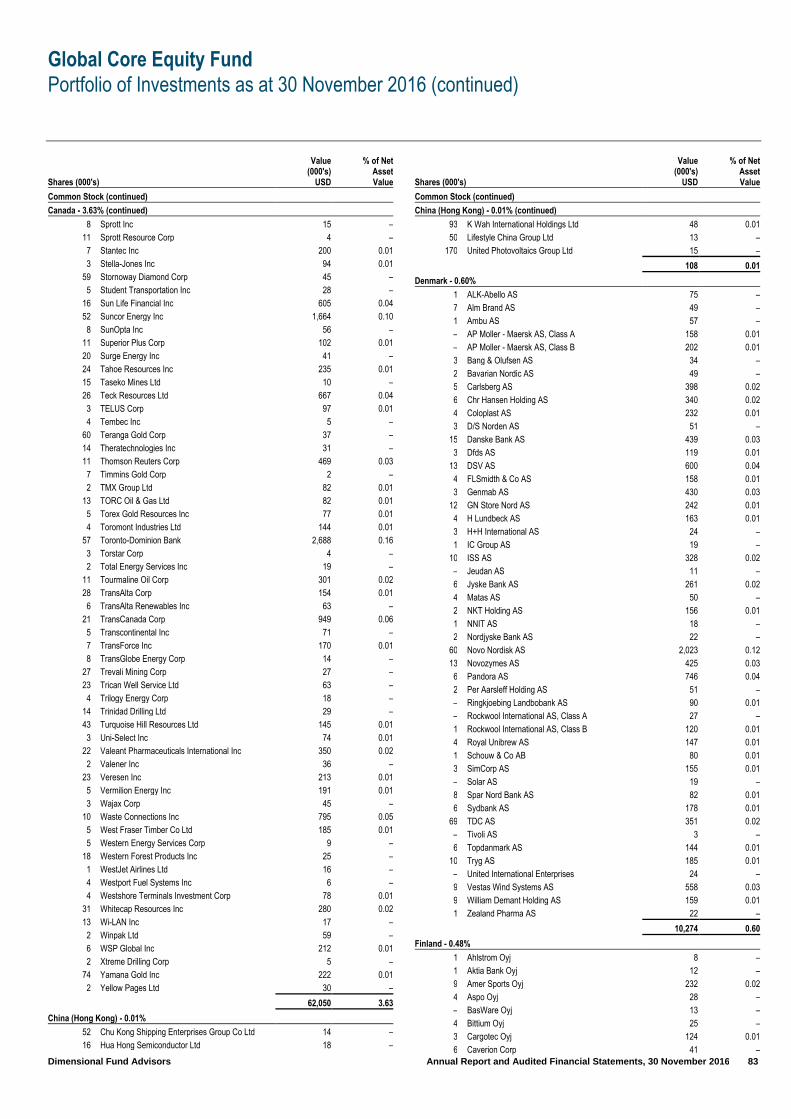
Global Core Equity Fund
Portfolio of Investments as at 30 November 2016 (continued)
Dimensional Fund Advisors Annual Report and Audited Financial Statements, 30 November 2016 83
Shares (000's)
Value (000's)
USD
% of Net Asset Value
Common Stock (continued)
Canada - 3.63% (continued)
8 Sprott Inc 15 –
11 Sprott Resource Corp 4 –
7 Stantec Inc 200 0.01
3 Stella-Jones Inc 94 0.01
59 Stornoway Diamond Corp 45 –
5 Student Transportation Inc 28 –
16 Sun Life Financial Inc 605 0.04
52 Suncor Energy Inc 1,664 0.10
8 SunOpta Inc 56 –
11 Superior Plus Corp 102 0.01
20 Surge Energy Inc 41 –
24 Tahoe Resources Inc 235 0.01
15 Taseko Mines Ltd 10 –
26 Teck Resources Ltd 667 0.04
3 TELUS Corp 97 0.01
4 Tembec Inc 5 –
60 Teranga Gold Corp 37 –
14 Theratechnologies Inc 31 –
11 Thomson Reuters Corp 469 0.03
7 Timmins Gold Corp 2 –
2 TMX Group Ltd 82 0.01
13 TORC Oil & Gas Ltd 82 0.01
5 Torex Gold Resources Inc 77 0.01
4 Toromont Industries Ltd 144 0.01
57 Toronto-Dominion Bank 2,688 0.16
3 Torstar Corp 4 –
2 Total Energy Services Inc 19 –
11 Tourmaline Oil Corp 301 0.02
28 TransAlta Corp 154 0.01
6 TransAlta Renewables Inc 63 –
21 TransCanada Corp 949 0.06
5 Transcontinental Inc 71 –
7 TransForce Inc 170 0.01
8 TransGlobe Energy Corp 14 –
27 Trevali Mining Corp 27 –
23 Trican Well Service Ltd 63 –
4 Trilogy Energy Corp 18 –
14 Trinidad Drilling Ltd 29 –
43 Turquoise Hill Resources Ltd 145 0.01
3 Uni-Select Inc 74 0.01
22 Valeant Pharmaceuticals International Inc 350 0.02
2 Valener Inc 36 –
23 Veresen Inc 213 0.01
5 Vermilion Energy Inc 191 0.01
3 Wajax Corp 45 –
10 Waste Connections Inc 795 0.05
5 West Fraser Timber Co Ltd 185 0.01
5 Western Energy Services Corp 9 –
18 Western Forest Products Inc 25 –
1 WestJet Airlines Ltd 16 –
4 Westport Fuel Systems Inc 6 –
4 Westshore Terminals Investment Corp 78 0.01
31 Whitecap Resources Inc 280 0.02
13 Wi-LAN Inc 17 –
2 Winpak Ltd 59 –
6 WSP Global Inc 212 0.01
2 Xtreme Drilling Corp 5 –
74 Yamana Gold Inc 222 0.01
2 Yellow Pages Ltd 30 –
62,050 3.63
China (Hong Kong) - 0.01%
52 Chu Kong Shipping Enterprises Group Co Ltd 14 –
16 Hua Hong Semiconductor Ltd 18 –
Shares (000's)
Value (000's)
USD
% of Net Asset Value
Common Stock (continued)
China (Hong Kong) - 0.01% (continued)
93 K Wah International Holdings Ltd 48 0.01
50 Lifestyle China Group Ltd 13 –
170 United Photovoltaics Group Ltd 15 –
108 0.01
Denmark - 0.60%
1 ALK-Abello AS 75 –
7 Alm Brand AS 49 –
1 Ambu AS 57 –
– AP Moller - Maersk AS, Class A 158 0.01
– AP Moller - Maersk AS, Class B 202 0.01
3 Bang & Olufsen AS 34 –
2 Bavarian Nordic AS 49 –
5 Carlsberg AS 398 0.02
6 Chr Hansen Holding AS 340 0.02
4 Coloplast AS 232 0.01
3 D/S Norden AS 51 –
15 Danske Bank AS 439 0.03
3 Dfds AS 119 0.01
13 DSV AS 600 0.04
4 FLSmidth & Co AS 158 0.01
3 Genmab AS 430 0.03
12 GN Store Nord AS 242 0.01
4 H Lundbeck AS 163 0.01
3 H+H International AS 24 –
1 IC Group AS 19 –
10 ISS AS 328 0.02
– Jeudan AS 11 –
6 Jyske Bank AS 261 0.02
4 Matas AS 50 –
2 NKT Holding AS 156 0.01
1 NNIT AS 18 –
2 Nordjyske Bank AS 22 –
60 Novo Nordisk AS 2,023 0.12
13 Novozymes AS 425 0.03
6 Pandora AS 746 0.04
2 Per Aarsleff Holding AS 51 –
– Ringkjoebing Landbobank AS 90 0.01
– Rockwool International AS, Class A 27 –
1 Rockwool International AS, Class B 120 0.01
4 Royal Unibrew AS 147 0.01
1 Schouw & Co AB 80 0.01
3 SimCorp AS 155 0.01
– Solar AS 19 –
8 Spar Nord Bank AS 82 0.01
6 Sydbank AS 178 0.01
69 TDC AS 351 0.02
– Tivoli AS 3 –
6 Topdanmark AS 144 0.01
10 Tryg AS 185 0.01
– United International Enterprises 24 –
9 Vestas Wind Systems AS 558 0.03
9 William Demant Holding AS 159 0.01
1 Zealand Pharma AS 22 –
10,274 0.60
Finland - 0.48%
1 Ahlstrom Oyj 8 –
1 Aktia Bank Oyj 12 –
9 Amer Sports Oyj 232 0.02
4 Aspo Oyj 28 –
– BasWare Oyj 13 –
4 Bittium Oyj 25 –
3 Cargotec Oyj 124 0.01
6 Caverion Corp 41 –

Global Core Equity Fund
Portfolio of Investments as at 30 November 2016 (continued)
Dimensional Fund Advisors Annual Report and Audited Financial Statements, 30 November 2016 84
Shares (000's)
Value (000's)
USD
% of Net Asset Value
Common Stock (continued)
Finland - 0.48% (continued)
30 Citycon Oyj 69 0.01
3 Cramo Oyj 80 0.01
9 Elisa Oyj 289 0.02
10 F-Secure Oyj 33 –
8 Finnair Oyj 34 –
2 Fiskars Oyj Abp 33 –
16 Fortum Oyj 228 0.01
5 HKScan Oyj 15 –
6 Huhtamaki Oyj 210 0.01
9 Kemira Oyj 104 0.01
1 Kesko Oyj, Class A 63 0.01
6 Kesko Oyj, Class B 304 0.02
15 Kone Oyj 662 0.04
2 Konecranes OYJ 85 0.01
2 Lassila & Tikanoja Oyj 41 –
1 Lemminkainen Oyj 21 –
15 Metsa Board Oyj 96 0.01
6 Metso Oyj 181 0.01
– Munksjo Oyj 2 –
11 Neste Oyj 446 0.03
130 Nokia Oyj 559 0.03
7 Nokian Renkaat Oyj 256 0.02
1 Olvi Oyj 31 –
11 Oriola-KD Oyj 51 –
1 Orion Oyj, Class A 61 –
6 Orion Oyj, Class B 268 0.02
25 Outokumpu Oyj 192 0.01
11 Outotec Oyj 56 –
2 PKC Group Oyj 38 –
1 Ponsse Oy 30 –
9 Raisio Oyj 34 –
5 Ramirent Oyj 39 –
17 Sampo Oyj 736 0.04
7 Sanoma Oyj 56 –
13 Sponda Oyj 54 –
3 Stockmann Oyj Abp 21 –
56 Stora Enso Oyj 537 0.03
13 Talvivaara Mining Co PLC – –
11 Technopolis Oyj 35 –
3 Tieto Oyj 74 0.01
3 Tikkurila Oyj 52 –
36 UPM-Kymmene Oyj 815 0.05
4 Uponor Oyj 67 0.01
– Vaisala Oyj 13 –
8 Valmet Oyj 118 0.01
9 Wartsila Oyj Abp 396 0.02
8 YIT Oyj 61 –
8,129 0.48
France - 2.86%
3 ABC arbitrage 28 –
12 Accor SA 437 0.03
2 Aeroports de Paris 153 0.01
10 Air France-KLM 56 –
12 Air Liquide SA 1,267 0.08
17 Airbus Group SE 1,058 0.06
1 Akka Technologies 22 –
1 Albioma SA 18 –
11 Alstom SA 286 0.02
2 Altamir 19 –
2 Alten SA 104 0.01
9 Altran Technologies SA 118 0.01
– APRIL SA 5 –
6 Arkema SA 579 0.03
Shares (000's)
Value (000's)
USD
% of Net Asset Value
Common Stock (continued)
France - 2.86% (continued)
1 Assystem 34 –
6 Atos SE 657 0.04
51 AXA SA 1,205 0.07
– Axway Software SA 14 –
2 Beneteau SA 29 –
1 BioMerieux 111 0.01
35 BNP Paribas SA 2,018 0.12
– Boiron SA 32 –
– Bollore SA (non-voting rights) 1 –
55 Bollore SA(voting rights) 181 0.01
1 Bonduelle SCA 30 –
2 Bourbon Corp 25 –
15 Bouygues SA 515 0.03
17 Bureau Veritas SA 326 0.02
– Burelle SA 28 –
6 Capgemini SA 484 0.03
42 Carrefour SA 977 0.06
6 Casino Guichard Perrachon SA 265 0.02
1 Cegedim SA 16 –
1 Cegid Group – –
2 CGG SA 34 –
3 Chargeurs SA 57 –
2 Christian Dior SE 366 0.02
20 Cie de Saint-Gobain 886 0.05
2 Cie des Alpes 29 –
14 Cie Generale des Etablissements Michelin 1,466 0.09
4 Cie Plastic Omnium SA 126 0.01
7 CNP Assurances 118 0.01
8 Coface SA 44 –
33 Credit Agricole SA 369 0.02
17 Danone SA 1,041 0.06
– Dassault Aviation SA 61 –
6 Dassault Systemes 430 0.03
8 Derichebourg SA 24 –
1 Devoteam SA 36 –
15 Edenred 309 0.02
5 Eiffage SA 315 0.02
26 Electricite de France SA 271 0.02
6 Elior Group 126 0.01
2 Elis SA 36 –
55 Engie SA 678 0.04
– Eramet 26 –
7 Essilor International SA 792 0.05
– Esso SA Francaise 17 –
13 Etablissements Maurel et Prom 55 –
1 Euler Hermes Group 77 0.01
– Eurofins Scientific SE 210 0.01
3 Euronext NV 127 0.01
12 Eutelsat Communications SA 219 0.01
– Faiveley Transport SA 34 –
5 Faurecia 182 0.01
1 Gaztransport Et Technigaz SA 38 –
1 GL Events 22 –
– Groupe Crit 32 –
27 Groupe Eurotunnel SE 237 0.01
1 Groupe Fnac SA (France listing) 79 0.01
1 Groupe Fnac SA (UK listing) 79 0.01
– Guerbet 22 –
2 Haulotte Group SA 22 –
10 Havas SA 77 0.01
1 Hermes International 312 0.02
– ID Logistics Group 33 –
1 Iliad SA 246 0.02
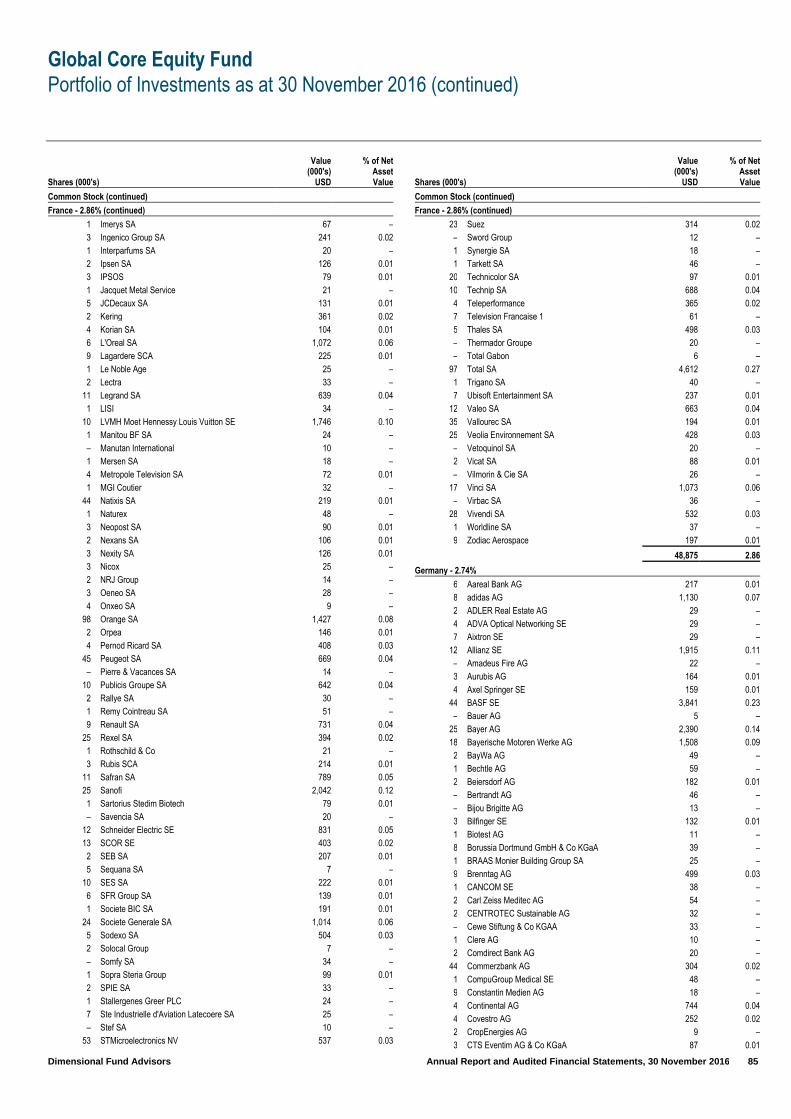
Global Core Equity Fund
Portfolio of Investments as at 30 November 2016 (continued)
Dimensional Fund Advisors Annual Report and Audited Financial Statements, 30 November 2016 85
Shares (000's)
Value (000's)
USD
% of Net Asset Value
Common Stock (continued)
France - 2.86% (continued)
1 Imerys SA 67 –
3 Ingenico Group SA 241 0.02
1 Interparfums SA 20 –
2 Ipsen SA 126 0.01
3 IPSOS 79 0.01
1 Jacquet Metal Service 21 –
5 JCDecaux SA 131 0.01
2 Kering 361 0.02
4 Korian SA 104 0.01
6 L'Oreal SA 1,072 0.06
9 Lagardere SCA 225 0.01
1 Le Noble Age 25 –
2 Lectra 33 –
11 Legrand SA 639 0.04
1 LISI 34 –
10 LVMH Moet Hennessy Louis Vuitton SE 1,746 0.10
1 Manitou BF SA 24 –
– Manutan International 10 –
1 Mersen SA 18 –
4 Metropole Television SA 72 0.01
1 MGI Coutier 32 –
44 Natixis SA 219 0.01
1 Naturex 48 –
3 Neopost SA 90 0.01
2 Nexans SA 106 0.01
3 Nexity SA 126 0.01
3 Nicox 25 –
2 NRJ Group 14 –
3 Oeneo SA 28 –
4 Onxeo SA 9 –
98 Orange SA 1,427 0.08
2 Orpea 146 0.01
4 Pernod Ricard SA 408 0.03
45 Peugeot SA 669 0.04
– Pierre & Vacances SA 14 –
10 Publicis Groupe SA 642 0.04
2 Rallye SA 30 –
1 Remy Cointreau SA 51 –
9 Renault SA 731 0.04
25 Rexel SA 394 0.02
1 Rothschild & Co 21 –
3 Rubis SCA 214 0.01
11 Safran SA 789 0.05
25 Sanofi 2,042 0.12
1 Sartorius Stedim Biotech 79 0.01
– Savencia SA 20 –
12 Schneider Electric SE 831 0.05
13 SCOR SE 403 0.02
2 SEB SA 207 0.01
5 Sequana SA 7 –
10 SES SA 222 0.01
6 SFR Group SA 139 0.01
1 Societe BIC SA 191 0.01
24 Societe Generale SA 1,014 0.06
5 Sodexo SA 504 0.03
2 Solocal Group 7 –
– Somfy SA 34 –
1 Sopra Steria Group 99 0.01
2 SPIE SA 33 –
1 Stallergenes Greer PLC 24 –
7 Ste Industrielle d'Aviation Latecoere SA 25 –
– Stef SA 10 –
53 STMicroelectronics NV 537 0.03
Shares (000's)
Value (000's)
USD
% of Net Asset Value
Common Stock (continued)
France - 2.86% (continued)
23 Suez 314 0.02
– Sword Group 12 –
1 Synergie SA 18 –
1 Tarkett SA 46 –
20 Technicolor SA 97 0.01
10 Technip SA 688 0.04
4 Teleperformance 365 0.02
7 Television Francaise 1 61 –
5 Thales SA 498 0.03
– Thermador Groupe 20 –
– Total Gabon 6 –
97 Total SA 4,612 0.27
1 Trigano SA 40 –
7 Ubisoft Entertainment SA 237 0.01
12 Valeo SA 663 0.04
35 Vallourec SA 194 0.01
25 Veolia Environnement SA 428 0.03
– Vetoquinol SA 20 –
2 Vicat SA 88 0.01
– Vilmorin & Cie SA 26 –
17 Vinci SA 1,073 0.06
– Virbac SA 36 –
28 Vivendi SA 532 0.03
1 Worldline SA 37 –
9 Zodiac Aerospace 197 0.01
48,875 2.86
Germany - 2.74%
6 Aareal Bank AG 217 0.01
8 adidas AG 1,130 0.07
2 ADLER Real Estate AG 29 –
4 ADVA Optical Networking SE 29 –
7 Aixtron SE 29 –
12 Allianz SE 1,915 0.11
– Amadeus Fire AG 22 –
3 Aurubis AG 164 0.01
4 Axel Springer SE 159 0.01
44 BASF SE 3,841 0.23
– Bauer AG 5 –
25 Bayer AG 2,390 0.14
18 Bayerische Motoren Werke AG 1,508 0.09
2 BayWa AG 49 –
1 Bechtle AG 59 –
2 Beiersdorf AG 182 0.01
– Bertrandt AG 46 –
– Bijou Brigitte AG 13 –
3 Bilfinger SE 132 0.01
1 Biotest AG 11 –
8 Borussia Dortmund GmbH & Co KGaA 39 –
1 BRAAS Monier Building Group SA 25 –
9 Brenntag AG 499 0.03
1 CANCOM SE 38 –
2 Carl Zeiss Meditec AG 54 –
2 CENTROTEC Sustainable AG 32 –
– Cewe Stiftung & Co KGAA 33 –
1 Clere AG 10 –
2 Comdirect Bank AG 20 –
44 Commerzbank AG 304 0.02
1 CompuGroup Medical SE 48 –
9 Constantin Medien AG 18 –
4 Continental AG 744 0.04
4 Covestro AG 252 0.02
2 CropEnergies AG 9 –
3 CTS Eventim AG & Co KGaA 87 0.01

Global Core Equity Fund
Portfolio of Investments as at 30 November 2016 (continued)
Dimensional Fund Advisors Annual Report and Audited Financial Statements, 30 November 2016 86
Shares (000's)
Value (000's)
USD
% of Net Asset Value
Common Stock (continued)
Germany - 2.74% (continued)
47 Daimler AG 3,095 0.18
48 Deutsche Bank AG 761 0.05
1 Deutsche Beteiligungs AG 31 –
8 Deutsche Boerse AG 678 0.04
3 Deutsche EuroShop AG 123 0.01
24 Deutsche Lufthansa AG 307 0.02
4 Deutsche Pfandbriefbank AG 39 –
32 Deutsche Post AG 1,014 0.06
156 Deutsche Telekom AG 2,453 0.14
21 Deutsche Wohnen AG 654 0.04
11 Deutz AG 62 –
6 Dialog Semiconductor PLC 245 0.02
3 DIC Asset AG 24 –
2 DMG Mori AG 100 0.01
– Draegerwerk AG & Co KGaA 10 –
2 Drillisch AG 78 0.01
2 Duerr AG 135 0.01
156 E.ON SE 1,025 0.06
1 Elmos Semiconductor AG 10 –
2 ElringKlinger AG 32 –
3 Evonik Industries AG 76 0.01
4 Evotec AG 26 –
2 Fielmann AG 99 0.01
3 Fraport AG Frankfurt Airport Services Worldwide 160 0.01
6 Freenet AG 151 0.01
6 Fresenius Medical Care AG & Co KGaA 441 0.03
15 Fresenius SE & Co KGaA 1,070 0.06
2 Fuchs Petrolub SE 71 –
8 GEA Group AG 313 0.02
2 Gerresheimer AG 135 0.01
1 Gerry Weber International AG 16 –
– Gesco AG 20 –
1 GFK SE 41 –
2 GFT Technologies SE 37 –
1 Grammer AG 45 –
– Grenke AG 53 –
1 H&R GmbH & Co KGaA 14 –
2 Hamburger Hafen und Logistik AG 28 –
2 Hannover Rueck SE 207 0.01
7 HeidelbergCement AG 623 0.04
18 Heidelberger Druckmaschinen AG 45 –
2 Hella KGaA Hueck & Co 78 0.01
2 Henkel AG & Co KGaA 227 0.01
2 Hochtief AG 234 0.01
1 Hornbach Baumarkt AG 25 –
4 Hugo Boss AG 212 0.01
2 Indus Holding AG 103 0.01
53 Infineon Technologies AG 883 0.05
– Isra Vision AG 37 –
3 Jenoptik AG 59 –
17 K+S AG 337 0.02
5 KION Group AG 271 0.02
9 Kloeckner & Co SE 100 0.01
1 Koenig & Bauer AG 36 –
6 Kontron AG 19 –
1 Krones AG 72 –
1 KUKA AG 154 0.01
– KWS Saat SE 26 –
8 Lanxess AG 466 0.03
4 LEG Immobilien AG 336 0.02
3 Leoni AG 96 0.01
7 Linde AG 1,143 0.07
2 LPKF Laser & Electronics AG 11 –
Shares (000's)
Value (000's)
USD
% of Net Asset Value
Common Stock (continued)
Germany - 2.74% (continued)
2 MAN SE 157 0.01
– Manz AG 16 –
3 Merck KGaA 278 0.02
17 Metro AG 499 0.03
6 MLP AG 26 –
4 MTU Aero Engines AG 379 0.02
4 Muenchener Rueckversicherungs-Gesellschaft AG in Muenchen 768 0.05
1 Nemetschek SE 50 –
3 Nordex SE 73 –
2 Norma Group SE 83 0.01
6 OSRAM Licht AG 331 0.02
3 Patrizia Immobilien AG 48 –
1 Pfeiffer Vacuum Technology AG 65 –
2 PNE Wind AG 5 –
11 ProSiebenSat.1 Media SE 364 0.02
– Puma SE 35 –
15 Qiagen NV 421 0.03
8 QSC AG 16 –
– Rational AG 103 0.01
3 Rheinmetall AG 206 0.01
3 Rhoen Klinikum AG 89 0.01
3 RIB Software AG 40 –
2 RTL Group SA 118 0.01
47 RWE AG 589 0.04
3 SAF-Holland SA 41 –
3 Salzgitter AG 111 0.01
20 SAP SE 1,695 0.10
1 Schaltbau Holding AG 19 –
1 SHW AG 23 –
23 Siemens AG 2,604 0.15
1 Siltronic AG 35 –
1 Sixt SE 55 –
1 SMA Solar Technology AG 15 –
2 Software AG 81 0.01
1 Stabilus SA 53 –
5 Stada Arzneimittel AG 235 0.01
– STRATEC Biomedical AG 13 –
1 Stroeer SE & Co KGaA 54 –
8 Suedzucker AG 184 0.01
2 Suess MicroTec AG 13 –
1 Surteco SE 20 –
7 Symrise AG 406 0.02
8 TAG Immobilien AG 101 0.01
3 Takkt AG 54 –
4 Talanx AG 129 0.01
34 Telefonica Deutschland Holding AG 135 0.01
14 thyssenkrupp AG 321 0.02
5 TLG Immobilien AG 93 0.01
– Tom Tailor Holding AG 1 –
17 Uniper SE 209 0.01
8 United Internet AG 291 0.02
4 VERBIO Vereinigte BioEnergie AG 27 –
2 Volkswagen AG 276 0.02
23 Vonovia SE 753 0.04
1 Vossloh AG 50 –
1 VTG AG 17 –
1 Wacker Chemie AG 132 0.01
3 Wacker Neuson SE 45 –
1 Washtec AG 69 –
2 Wirecard AG 97 0.01
– XING AG 32 –

Global Core Equity Fund
Portfolio of Investments as at 30 November 2016 (continued)
Dimensional Fund Advisors Annual Report and Audited Financial Statements, 30 November 2016 87
Shares (000's)
Value (000's)
USD
% of Net Asset Value
Common Stock (continued)
Germany - 2.74% (continued)
2 Zalando SE 75 0.01
– Zeal Network SE 11 –
46,948 2.74
Hong Kong - 1.18%
52 13 Holdings Ltd 17 –
115 Agritrade Resources Ltd 19 –
337 AIA Group Ltd 2,050 0.12
106 Allied Properties HK Ltd 24 –
36 APT Satellite Holdings Ltd 20 –
44 Asia Financial Holdings Ltd 24 –
12 Asia Satellite Telecommunications Holdings Ltd 15 –
99 Asia Standard International Group Ltd 22 –
17 ASM Pacific Technology Ltd 168 0.01
2 Associated International Hotels Ltd 6 –
375 Auto Italia Holdings 6 –
52 Bank of East Asia Ltd 215 0.01
780 BEP International Holdings Ltd 57 –
153 BOC Hong Kong Holdings Ltd 573 0.03
40 Bonjour Holdings Ltd 2 –
80 Bright Smart Securities & Commodities Group Ltd 34 –
242 Brightoil Petroleum Holdings Ltd 73 0.01
440 Burwill Holdings Ltd 10 –
24 Cafe de Coral Holdings Ltd 86 0.01
128 Cathay Pacific Airways Ltd 173 0.01
184 Century City International Holdings Ltd 13 –
18 Cheung Kong Infrastructure Holdings Ltd 150 0.01
83 Cheung Kong Property Holdings Ltd 565 0.03
11 Chevalier International Holdings Ltd 17 –
328 China Energy Development Holdings Ltd 4 –
34 China Metal International Holdings Inc 11 –
2 China Motor Bus Co Ltd 26 –
60 China Star Entertainment Ltd 4 –
720 China Strategic Holdings Ltd 17 –
27 Chinese Estates Holdings Ltd 49 –
30 Chow Sang Sang Holdings International Ltd 56 –
94 Chow Tai Fook Jewellery Group Ltd 77 0.01
152 Chuang's Consortium International Ltd 32 –
156 CITIC Telecom International Holdings Ltd 51 –
85 CK Hutchison Holdings Ltd 1,030 0.06
414 CK Life Sciences Int'l Holdings Inc 39 –
57 CLP Holdings Ltd 561 0.03
55 CNQC International Holdings Ltd 20 –
230 Common Splendor International Health Industry Group Ltd 20 –
22 Convenience Retail Asia Ltd 11 –
552 Convoy Global Holdings Ltd 18 –
20 Cross-Harbour Holdings Ltd 29 –
310 CSI Properties Ltd 11 –
53 CW Group Holdings Ltd 11 –
38 Dah Sing Banking Group Ltd 71 0.01
14 Dah Sing Financial Holdings Ltd 92 0.01
420 Emperor Capital Group Ltd 44 –
75 Emperor Entertainment Hotel Ltd 19 –
160 Emperor International Holdings Ltd 37 –
360 Emperor Watch & Jewellery Ltd 13 –
378 Enerchina Holdings Ltd 21 –
125 Esprit Holdings Ltd 102 0.01
8 Fairwood Holdings Ltd 35 –
108 Far East Consortium International Ltd 47 –
253 FIH Mobile Ltd 81 0.01
176 First Pacific Co Ltd 124 0.01
104 First Shanghai Investments Ltd 19 –
400 Freeman FinTech Corp Ltd 26 –
Shares (000's)
Value (000's)
USD
% of Net Asset Value
Common Stock (continued)
Hong Kong - 1.18% (continued)
2,249 G-Resources Group Ltd 43 –
111 Galaxy Entertainment Group Ltd 549 0.03
618 GCL New Energy Holdings Ltd 37 –
16 Get Nice Financial Group Ltd 2 –
648 Get Nice Holdings Ltd 22 –
98 Giordano International Ltd 52 –
632 Global Brands Group Holding Ltd 98 0.01
23 Great Eagle Holdings Ltd 102 0.01
1 Guoco Group Ltd 11 –
227 Guotai Junan International Holdings Ltd 90 0.01
142 Haitong International Securities Group Ltd 98 0.01
82 Hang Lung Group Ltd 301 0.02
114 Hang Lung Properties Ltd 257 0.02
23 Hang Seng Bank Ltd 431 0.03
14 Hanison Construction Holdings Ltd 2 –
317 Hao Tian Development Group Ltd 14 –
3 Harbour Centre Development Ltd 5 –
55 Henderson Land Development Co Ltd 305 0.02
544 HengTen Networks Group 48 –
148 HK Electric Investments & HK Electric Investments Ltd 130 0.01
43 HKBN Ltd 48 –
39 HKR International Ltd 18 –
164 HKT Trust & HKT Ltd 213 0.01
182 Hong Kong & China Gas Co Ltd 339 0.02
4 Hong Kong Aircraft Engineering Co Ltd 29 –
35 Hong Kong Exchanges & Clearing Ltd 929 0.06
16 Hong Kong Ferry Holdings Co Ltd 19 –
57 Hong Kong Television Network Ltd 9 –
49 Hongkong & Shanghai Hotels Ltd 57 –
46 Hongkong Chinese Ltd 8 –
47 Hopewell Holdings Ltd 170 0.01
164 Hsin Chong Construction Group Ltd 8 –
126 Hutchison Telecommunications Hong Kong Holdings Ltd 42 –
43 Hysan Development Co Ltd 191 0.01
55 IGG Inc 43 –
82 IT Ltd 34 –
25 ITC Properties Group Ltd 10 –
28 Johnson Electric Holdings Ltd 82 0.01
47 Kerry Logistics Network Ltd 63 –
48 Kerry Properties Ltd 137 0.01
316 Kingston Financial Group Ltd 151 0.01
24 Kowloon Development Co Ltd 23 –
23 L'Occitane International SA 45 –
1,270 Lai Sun Development Co Ltd 25 –
150 Lai Sun Garment International Ltd 30 –
970 Landing International Development Ltd 24 –
592 Li & Fung Ltd 259 0.02
50 Lifestyle International Holdings Ltd 64 –
26 Liu Chong Hing Investment Ltd 37 –
29 Luk Fook Holdings International Ltd 84 0.01
82 Macau Legend Development Ltd 18 –
105 Man Wah Holdings Ltd 73 0.01
1,360 Mason Financial Holdings Ltd 33 –
309 Master Glory Group Ltd 18 –
65 Melco International Development Ltd 104 0.01
52 MGM China Holdings Ltd 115 0.01
18 Midland Holdings Ltd 6 –
15 Miramar Hotel & Investment 34 –
740 Mongolian Mining Corp 24 –
47 MTR Corp Ltd 236 0.01
150 NagaCorp Ltd 92 0.01
2,424 NetMind Financial Holdings Ltd 20 –

Global Core Equity Fund
Portfolio of Investments as at 30 November 2016 (continued)
Dimensional Fund Advisors Annual Report and Audited Financial Statements, 30 November 2016 88
Shares (000's)
Value (000's)
USD
% of Net Asset Value
Common Stock (continued)
Hong Kong - 1.18% (continued)
235 New World Development Co Ltd 262 0.02
62 NewOcean Energy Holdings Ltd 17 –
106 NWS Holdings Ltd 183 0.01
17 Orient Overseas International Ltd 68 0.01
398 Pacific Basin Shipping Ltd 65 –
57 Pacific Textiles Holdings Ltd 66 0.01
327 PCCW Ltd 190 0.01
108 Pico Far East Holdings Ltd 34 –
8 Playmates Holdings Ltd 10 –
110 Polytec Asset Holdings Ltd 8 –
73 Power Assets Holdings Ltd 701 0.04
30 Prada SpA 105 0.01
22 Public Financial Holdings Ltd 10 –
46 Regal Hotels International Holdings Ltd 25 –
87 Sa Sa International Holdings Ltd 39 –
6 Safety Godown Co Ltd 15 –
86 Samsonite International SA 269 0.02
67 Sands China Ltd 328 0.02
20 SEA Holdings Ltd 51 –
95 Shangri-La Asia Ltd 103 0.01
75 Shenwan Hongyuan HK Ltd 42 –
110 Shun Tak Holdings Ltd 40 –
38 Singamas Container Holdings Ltd 4 –
140 Sino Land Co Ltd 220 0.01
16 Sitoy Group Holdings Ltd 4 –
170 SJM Holdings Ltd 137 0.01
400 Skyway Securities Group Ltd 9 –
33 SmarTone Telecommunications Holdings Ltd 45 –
16 SOCAM Development Ltd 5 –
14 Soundwill Holdings Ltd 25 –
48 Stella International Holdings Ltd 81 0.01
46 Sun Hung Kai & Co Ltd 29 –
35 Sun Hung Kai Properties Ltd 461 0.03
26 Swire Pacific Ltd, Class A 254 0.02
41 Swire Pacific Ltd, Class B 73 0.01
60 Swire Properties Ltd 181 0.01
20 TAI Cheung Holdings Ltd 17 –
54 Tao Heung Holdings Ltd 15 –
81 Techtronic Industries Co Ltd 315 0.02
29 Television Broadcasts Ltd 104 0.01
50 Texwinca Holdings Ltd 36 –
17 Transport International Holdings Ltd 51 –
30 Trinity Ltd 2 –
47 TSC Group Holdings Ltd 6 –
46 United Laboratories International Holdings Ltd 25 –
11 Varitronix International Ltd 5 –
214 Victory City International Holdings Ltd 8 –
44 Vitasoy International Holdings Ltd 91 0.01
84 VST Holdings Ltd 28 –
10 VTech Holdings Ltd 124 0.01
484 WH Group Ltd 403 0.02
44 Wharf Holdings Ltd 329 0.02
51 Wheelock & Co Ltd 302 0.02
5 Wing On Co International Ltd 15 –
14 Wing Tai Properties Ltd 8 –
70 Wynn Macau Ltd 130 0.01
160 Xinyi Glass Holdings Ltd 119 0.01
60 Yat Sing Holdings Ltd 31 –
64 Yue Yuen Industrial Holdings Ltd 230 0.01
20,261 1.18
Ireland - 0.23%
3 Adient PLC 168 0.01
1,655 Bank of Ireland 352 0.02
Shares (000's)
Value (000's)
USD
% of Net Asset Value
Common Stock (continued)
Ireland - 0.23% (continued)
28 C&C Group PLC 101 0.01
36 CRH PLC 1,213 0.07
6 Datalex PLC 21 –
1 FBD Holdings PLC 5 –
12 Glanbia PLC 199 0.01
6 Irish Continental Group PLC 29 –
7 Kerry Group PLC 507 0.03
9 Kingspan Group PLC 239 0.02
5 Paddy Power Betfair PLC 567 0.03
20 Smurfit Kappa Group PLC 455 0.03
3,856 0.23
Israel - 0.22%
5 Airport City Ltd 52 –
8 Amot Investments Ltd 35 –
2 Azrieli Group Ltd 98 0.01
29 Bank Hapoalim BM 174 0.01
66 Bank Leumi Le-Israel BM 267 0.02
– Bayside Land Corp 19 –
103 Bezeq The Israeli Telecommunication Corp Ltd 191 0.01
– Big Shopping Centers Ltd 24 –
4 Cellcom Israel Ltd 35 –
2 Clal Insurance Enterprises Holdings Ltd 29 –
4 Delek Automotive Systems Ltd 37 –
– Delek Group Ltd 78 0.01
1 Delta-Galil Industries Ltd 25 –
2 Elbit Systems Ltd 158 0.01
– Electra Ltd 20 –
4 First International Bank Of Israel Ltd 54 –
1 Formula Systems 1985 Ltd 45 –
3 Frutarom Industries Ltd 139 0.01
5 Gilat Satellite Networks Ltd 23 –
10 Harel Insurance Investments & Financial Services Ltd 41 –
1 IDI Insurance Co Ltd 36 –
29 Israel Chemicals Ltd 113 0.01
70 Israel Discount Bank Ltd 142 0.01
1 Jerusalem Oil Exploration 34 –
5 Matrix IT Ltd 43 –
1 Melisron Ltd 57 0.01
1 Mellanox Technologies Ltd 29 –
1 Menora Mivtachim Holdings Ltd 12 –
36 Migdal Insurance & Financial Holding Ltd 26 –
9 Mizrahi Tefahot Bank Ltd 126 0.01
2 Nice Ltd 143 0.01
2 Nova Measuring Instruments Ltd 25 –
53 Oil Refineries Ltd 20 –
8 Partner Communications Co Ltd 37 –
– Paz Oil Co Ltd 77 0.01
3 Sapiens International Corp NV 41 –
14 Shikun & Binui Ltd 27 –
7 Shufersal Ltd 26 –
4 Strauss Group Ltd 65 0.01
29 Teva Pharmaceutical Industries Ltd 1,056 0.06
5 Tower Semiconductor Ltd 84 0.01
3,763 0.22
Italy - 0.83%
108 A2A SpA 129 0.01
4 ACEA SpA 39 –
7 Amplifon SpA 67 0.01
8 Anima Holding SpA 38 –
4 Ansaldo STS SpA 45 –
23 Arnoldo Mondadori Editore SpA 22 –
8 Ascopiave SpA 21 –

Global Core Equity Fund
Portfolio of Investments as at 30 November 2016 (continued)
Dimensional Fund Advisors Annual Report and Audited Financial Statements, 30 November 2016 89
Shares (000's)
Value (000's)
USD
% of Net Asset Value
Common Stock (continued)
Italy - 0.83% (continued)
79 Assicurazioni Generali SpA 996 0.06
5 Astaldi SpA 25 –
22 Atlantia SpA 494 0.03
8 Autogrill SpA 64 –
7 Azimut Holding SpA 108 0.01
25 Banca Carige SpA 7 –
4 Banca Generali SpA 76 0.01
1 Banca IFIS SpA 33 –
20 Banca Mediolanum SpA 131 0.01
1 Banca Monte dei Paschi di Siena SpA 28 –
26 Banca Popolare dell'Etruria e del Lazio SC – –
354 Banca Popolare di Milano Scarl 114 0.01
39 Banca Popolare di Sondrio SCPA 123 0.01
59 Banco Popolare SC 121 0.01
43 BPER Banca 172 0.01
2 Brembo SpA 120 0.01
2 Brunello Cucinelli SpA 42 –
5 Buzzi Unicem SpA 109 0.01
1 Cairo Communication SpA 3 –
3 Cementir Holding SpA 13 –
10 Cerved Information Solutions SpA 79 0.01
27 CIR-Compagnie Industriali Riunite SpA 27 –
77 CNH Industrial NV 658 0.04
8 Credito Emiliano SpA 44 –
93 Credito Valtellinese SC 29 –
1 Danieli & C Officine Meccaniche SpA 18 –
2 Datalogic SpA 30 –
16 Davide Campari-Milano SpA 154 0.01
3 De' Longhi SpA 64 –
10 DeA Capital SpA 11 –
1 DiaSorin SpA 71 0.01
1 Ei Towers SpA 62 –
266 Enel SpA 1,072 0.06
82 Eni SpA 1,144 0.07
4 ERG SpA 40 –
4 Esprinet SpA 25 –
21 Falck Renewables SpA 18 –
9 Ferrari NV 471 0.03
95 Fiat Chrysler Automobiles NV 732 0.04
76 Fincantieri SpA 33 –
13 FinecoBank Banca Fineco SpA 67 0.01
7 Geox SpA 15 –
23 Gruppo Editoriale L'Espresso SpA 17 –
3 Gruppo MutuiOnline SpA 25 –
42 Hera SpA 87 0.01
1 Industria Macchine Automatiche SpA 60 –
10 Infrastrutture Wireless Italiane SpA 44 –
4 Interpump Group SpA 63 –
260 Intesa Sanpaolo SpA 572 0.03
31 Iren SpA 46 –
23 Italgas SpA 83 0.01
1 Italmobiliare SpA 37 –
28 Leonardo-Finmeccanica SpA 362 0.02
7 Luxottica Group SpA 356 0.02
6 Maire Tecnimont SpA 14 –
3 MARR SpA 45 –
51 Mediaset SpA 124 0.01
43 Mediobanca SpA 299 0.02
10 Moleskine SpA 25 –
9 Moncler SpA 140 0.01
3 OVS SpA 14 –
22 Parmalat SpA 58 –
6 Piaggio & C SpA 9 –
Shares (000's)
Value (000's)
USD
% of Net Asset Value
Common Stock (continued)
Italy - 0.83% (continued)
11 Prysmian SpA 253 0.02
7 Recordati SpA 181 0.01
– Reply SpA 38 –
3 Safilo Group SpA 24 –
545 Saipem SpA 246 0.02
14 Salini Impregilo SpA 38 –
3 Salvatore Ferragamo SpA 76 0.01
29 Saras SpA 52 –
– Save SpA 2 –
116 Snam SpA 449 0.03
13 Societa Cattolica di Assicurazioni SCRL 72 0.01
7 Societa Iniziative Autostradali e Servizi SpA 57 –
2 SOL SpA 20 –
7 Tamburi Investment Partners SpA 27 –
696 Telecom Italia SpA 525 0.03
14 Tenaris SA 231 0.01
91 Terna Rete Elettrica Nazionale SpA 394 0.02
501 Tiscali SpA 21 –
1 Tod's SpA 60 –
9 Trevi Finanziaria Industriale SpA 7 –
178 UniCredit SpA 380 0.02
54 Unione di Banche Italiane SpA 121 0.01
39 Unipol Gruppo Finanziario SpA 119 0.01
112 UnipolSai SpA 213 0.01
1 Vittoria Assicurazioni SpA 12 –
3 Yoox Net-A-Porter Group SpA 77 0.01
14,179 0.83
Japan - 9.42%
32 77 Bank Ltd 153 0.01
1 ABC-Mart Inc 71 0.01
2 Accordia Golf Co Ltd 25 –
2 Achilles Corp 32 –
12 Acom Co Ltd 60 –
2 Adastria Co Ltd 53 –
7 ADEKA Corp 90 0.01
8 Advantest Corp 115 0.01
36 Aeon Co Ltd 497 0.03
1 Aeon Delight Co Ltd 39 –
9 AEON Financial Service Co Ltd 148 0.01
9 Aeon Mall Co Ltd 133 0.01
3 Ahresty Corp 28 –
2 Ai Holdings Corp 55 –
3 Aica Kogyo Co Ltd 72 0.01
1 Aichi Bank Ltd 57 –
4 Aichi Corp 33 –
1 Aichi Steel Corp 37 –
3 Aida Engineering Ltd 32 –
2 Ain Holdings Inc 113 0.01
1 Aiphone Co Ltd 21 –
16 Air Water Inc 277 0.02
3 Aisan Industry Co Ltd 29 –
11 Aisin Seiki Co Ltd 491 0.03
4 Aizawa Securities Co Ltd 24 –
17 Ajinomoto Co Inc 327 0.02
9 Akebono Brake Industry Co Ltd 25 –
13 Akita Bank Ltd 42 –
2 Alconix Corp 24 –
9 Alfresa Holdings Corp 139 0.01
2 Alpen Co Ltd 45 –
3 Alpine Electronics Inc 42 –
15 Alps Electric Co Ltd 392 0.02
16 Amada Holdings Co Ltd 179 0.01
5 Amano Corp 78 0.01
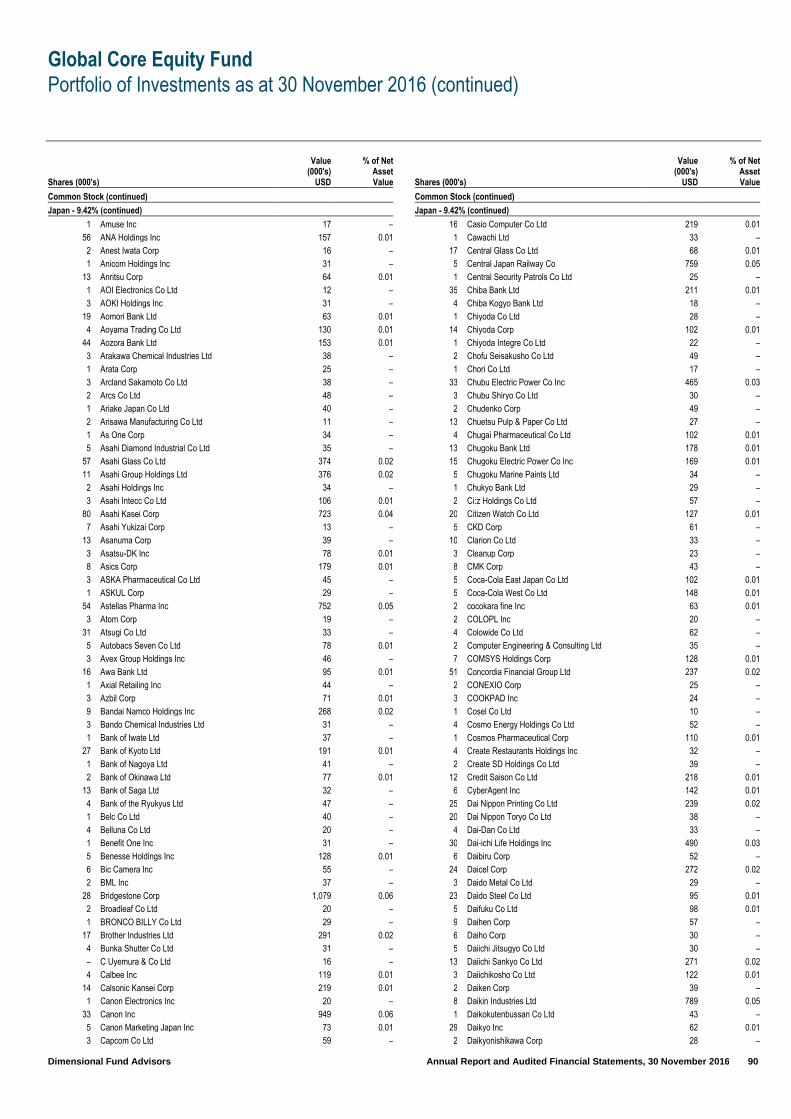
Global Core Equity Fund
Portfolio of Investments as at 30 November 2016 (continued)
Dimensional Fund Advisors Annual Report and Audited Financial Statements, 30 November 2016 90
Shares (000's)
Value (000's)
USD
% of Net Asset Value
Common Stock (continued)
Japan - 9.42% (continued)
1 Amuse Inc 17 –
56 ANA Holdings Inc 157 0.01
2 Anest Iwata Corp 16 –
1 Anicom Holdings Inc 31 –
13 Anritsu Corp 64 0.01
1 AOI Electronics Co Ltd 12 –
3 AOKI Holdings Inc 31 –
19 Aomori Bank Ltd 63 0.01
4 Aoyama Trading Co Ltd 130 0.01
44 Aozora Bank Ltd 153 0.01
3 Arakawa Chemical Industries Ltd 38 –
1 Arata Corp 25 –
3 Arcland Sakamoto Co Ltd 38 –
2 Arcs Co Ltd 48 –
1 Ariake Japan Co Ltd 40 –
2 Arisawa Manufacturing Co Ltd 11 –
1 As One Corp 34 –
5 Asahi Diamond Industrial Co Ltd 35 –
57 Asahi Glass Co Ltd 374 0.02
11 Asahi Group Holdings Ltd 376 0.02
2 Asahi Holdings Inc 34 –
3 Asahi Intecc Co Ltd 106 0.01
80 Asahi Kasei Corp 723 0.04
7 Asahi Yukizai Corp 13 –
13 Asanuma Corp 39 –
3 Asatsu-DK Inc 78 0.01
8 Asics Corp 179 0.01
3 ASKA Pharmaceutical Co Ltd 45 –
1 ASKUL Corp 29 –
54 Astellas Pharma Inc 752 0.05
3 Atom Corp 19 –
31 Atsugi Co Ltd 33 –
5 Autobacs Seven Co Ltd 78 0.01
3 Avex Group Holdings Inc 46 –
16 Awa Bank Ltd 95 0.01
1 Axial Retailing Inc 44 –
3 Azbil Corp 71 0.01
9 Bandai Namco Holdings Inc 268 0.02
3 Bando Chemical Industries Ltd 31 –
1 Bank of Iwate Ltd 37 –
27 Bank of Kyoto Ltd 191 0.01
1 Bank of Nagoya Ltd 41 –
2 Bank of Okinawa Ltd 77 0.01
13 Bank of Saga Ltd 32 –
4 Bank of the Ryukyus Ltd 47 –
1 Belc Co Ltd 40 –
4 Belluna Co Ltd 20 –
1 Benefit One Inc 31 –
5 Benesse Holdings Inc 128 0.01
6 Bic Camera Inc 55 –
2 BML Inc 37 –
28 Bridgestone Corp 1,079 0.06
2 Broadleaf Co Ltd 20 –
1 BRONCO BILLY Co Ltd 29 –
17 Brother Industries Ltd 291 0.02
4 Bunka Shutter Co Ltd 31 –
– C Uyemura & Co Ltd 16 –
4 Calbee Inc 119 0.01
14 Calsonic Kansei Corp 219 0.01
1 Canon Electronics Inc 20 –
33 Canon Inc 949 0.06
5 Canon Marketing Japan Inc 73 0.01
3 Capcom Co Ltd 59 –
Shares (000's)
Value (000's)
USD
% of Net Asset Value
Common Stock (continued)
Japan - 9.42% (continued)
16 Casio Computer Co Ltd 219 0.01
1 Cawachi Ltd 33 –
17 Central Glass Co Ltd 68 0.01
5 Central Japan Railway Co 759 0.05
1 Central Security Patrols Co Ltd 25 –
35 Chiba Bank Ltd 211 0.01
4 Chiba Kogyo Bank Ltd 18 –
1 Chiyoda Co Ltd 28 –
14 Chiyoda Corp 102 0.01
1 Chiyoda Integre Co Ltd 22 –
2 Chofu Seisakusho Co Ltd 49 –
1 Chori Co Ltd 17 –
33 Chubu Electric Power Co Inc 465 0.03
3 Chubu Shiryo Co Ltd 30 –
2 Chudenko Corp 49 –
13 Chuetsu Pulp & Paper Co Ltd 27 –
4 Chugai Pharmaceutical Co Ltd 102 0.01
13 Chugoku Bank Ltd 178 0.01
15 Chugoku Electric Power Co Inc 169 0.01
5 Chugoku Marine Paints Ltd 34 –
1 Chukyo Bank Ltd 29 –
2 Ci:z Holdings Co Ltd 57 –
20 Citizen Watch Co Ltd 127 0.01
5 CKD Corp 61 –
10 Clarion Co Ltd 33 –
3 Cleanup Corp 23 –
8 CMK Corp 43 –
5 Coca-Cola East Japan Co Ltd 102 0.01
5 Coca-Cola West Co Ltd 148 0.01
2 cocokara fine Inc 63 0.01
2 COLOPL Inc 20 –
4 Colowide Co Ltd 62 –
2 Computer Engineering & Consulting Ltd 35 –
7 COMSYS Holdings Corp 128 0.01
51 Concordia Financial Group Ltd 237 0.02
2 CONEXIO Corp 25 –
3 COOKPAD Inc 24 –
1 Cosel Co Ltd 10 –
4 Cosmo Energy Holdings Co Ltd 52 –
1 Cosmos Pharmaceutical Corp 110 0.01
4 Create Restaurants Holdings Inc 32 –
2 Create SD Holdings Co Ltd 39 –
12 Credit Saison Co Ltd 218 0.01
6 CyberAgent Inc 142 0.01
25 Dai Nippon Printing Co Ltd 239 0.02
20 Dai Nippon Toryo Co Ltd 38 –
4 Dai-Dan Co Ltd 33 –
30 Dai-ichi Life Holdings Inc 490 0.03
6 Daibiru Corp 52 –
24 Daicel Corp 272 0.02
3 Daido Metal Co Ltd 29 –
23 Daido Steel Co Ltd 95 0.01
5 Daifuku Co Ltd 98 0.01
9 Daihen Corp 57 –
6 Daiho Corp 30 –
5 Daiichi Jitsugyo Co Ltd 30 –
13 Daiichi Sankyo Co Ltd 271 0.02
3 Daiichikosho Co Ltd 122 0.01
2 Daiken Corp 39 –
8 Daikin Industries Ltd 789 0.05
1 Daikokutenbussan Co Ltd 43 –
29 Daikyo Inc 62 0.01
2 Daikyonishikawa Corp 28 –

Global Core Equity Fund
Portfolio of Investments as at 30 November 2016 (continued)
Dimensional Fund Advisors Annual Report and Audited Financial Statements, 30 November 2016 91
Shares (000's)
Value (000's)
USD
% of Net Asset Value
Common Stock (continued)
Japan - 9.42% (continued)
6 Dainichiseika Color & Chemicals Manufacturing Co Ltd 32 –
5 Daio Paper Corp 56 –
2 Daisan Bank Ltd 29 –
2 Daiseki Co Ltd 46 –
25 Daishi Bank Ltd 106 0.01
1 Daito Pharmaceutical Co Ltd 25 –
3 Daito Trust Construction Co Ltd 483 0.03
19 Daiwa House Industry Co Ltd 536 0.03
3 Daiwa Industries Ltd 28 –
72 Daiwa Securities Group Inc 441 0.03
11 Daiwabo Holdings Co Ltd 29 –
6 DCM Holdings Co Ltd 55 –
5 DeNA Co Ltd 142 0.01
35 Denka Co Ltd 156 0.01
5 Denki Kogyo Co Ltd 26 –
14 Denso Corp 632 0.04
5 Dentsu Inc 214 0.01
2 Denyo Co Ltd 23 –
2 Descente Ltd 22 –
4 Dexerials Corp 31 –
8 DIC Corp 240 0.02
1 Digital Arts Inc 24 –
2 Digital Garage Inc 39 –
2 Dip Corp 38 –
1 Disco Corp 120 0.01
10 DKS Co Ltd 31 –
9 DMG Mori Co Ltd 104 0.01
6 Don Quijote Holdings Co Ltd 220 0.01
2 Doshisha Co Ltd 31 –
2 Doutor Nichires Holdings Co Ltd 37 –
20 Dowa Holdings Co Ltd 156 0.01
1 DTS Corp 31 –
3 Duskin Co Ltd 57 –
– Dydo Drinco Inc 20 –
3 Eagle Industry Co Ltd 44 –
11 East Japan Railway Co 975 0.06
8 Ebara Corp 221 0.01
6 EDION Corp 62 0.01
1 eGuarantee Inc 26 –
2 Ehime Bank Ltd 24 –
7 Eighteenth Bank Ltd 21 –
– Eiken Chemical Co Ltd 8 –
4 Eisai Co Ltd 211 0.01
1 Eizo Corp 33 –
2 Elecom Co Ltd 28 –
8 Electric Power Development Co Ltd 168 0.01
1 Elematec Corp 20 –
1 en-japan Inc 14 –
1 Enplas Corp 26 –
3 EPS Holdings Inc 36 –
1 eRex Co Ltd 26 –
3 ESPEC Corp 30 –
3 Exedy Corp 75 0.01
2 Ezaki Glico Co Ltd 99 0.01
2 F@N Communications Inc 12 –
5 FamilyMart UNY Holdings Co Ltd 333 0.02
5 FANUC Corp 785 0.05
2 Fast Retailing Co Ltd 526 0.03
3 FCC Co Ltd 56 –
4 Ferrotec Corp 48 –
13 FIDEA Holdings Co Ltd 22 –
2 Fields Corp 24 –
3 Financial Products Group Co Ltd 25 –
Shares (000's)
Value (000's)
USD
% of Net Asset Value
Common Stock (continued)
Japan - 9.42% (continued)
2 FINDEX Inc 15 –
2 Foster Electric Co Ltd 43 –
1 FP Corp 50 –
3 France Bed Holdings Co Ltd 22 –
12 Fudo Tetra Corp 22 –
2 Fuji Co Ltd 37 –
5 Fuji Corp Ltd 29 –
48 Fuji Electric Co Ltd 239 0.02
20 Fuji Heavy Industries Ltd 830 0.05
3 Fuji Kyuko Co Ltd 28 –
5 Fuji Machine Manufacturing Co Ltd 53 –
3 Fuji Media Holdings Inc 39 –
8 Fuji Oil Co Ltd 24 –
3 Fuji Oil Holdings Inc 63 0.01
1 Fuji Pharma Co Ltd 30 –
1 Fuji Seal International Inc 49 –
2 Fuji Soft Inc 35 –
1 Fujibo Holdings Inc 44 –
11 FUJIFILM Holdings Corp 398 0.02
4 Fujikura Kasei Co Ltd 23 –
22 Fujikura Ltd 121 0.01
1 Fujimi Inc 9 –
1 Fujimori Kogyo Co Ltd 32 –
6 Fujitec Co Ltd 68 0.01
2 Fujitsu Frontech Ltd 19 –
4 Fujitsu General Ltd 79 0.01
100 Fujitsu Ltd 602 0.04
3 Fukuda Corp 30 –
1 Fukuda Denshi Co Ltd 38 –
17 Fukui Bank Ltd 42 –
61 Fukuoka Financial Group Inc 268 0.02
39 Fukushima Bank Ltd 32 –
2 Fukushima Industries Corp 58 –
15 Fukuyama Transporting Co Ltd 82 0.01
3 FULLCAST Holdings Co Ltd 22 –
2 Funai Electric Co Ltd 13 –
19 Furukawa Co Ltd 35 –
5 Furukawa Electric Co Ltd 159 0.01
1 Furuno Electric Co Ltd 10 –
1 Fuso Chemical Co Ltd 29 –
1 Fuso Pharmaceutical Industries Ltd 15 –
3 Futaba Corp 47 –
7 Futaba Industrial Co Ltd 42 –
4 Future Corp 27 –
2 Fuyo General Lease Co Ltd 86 0.01
3 G-Tekt Corp 58 –
4 GCA Corp 30 –
– Genky Stores Inc 20 –
2 Geo Holdings Corp 27 –
2 Globeride Inc 28 –
4 Glory Ltd 129 0.01
3 GMO internet Inc 49 –
1 GMO Payment Gateway Inc 42 –
2 Godo Steel Ltd 34 –
1 Goldcrest Co Ltd 27 –
10 Gree Inc 52 –
28 GS Yuasa Corp 114 0.01
1 Gun-Ei Chemical Industry Co Ltd 13 –
35 GungHo Online Entertainment Inc 78 0.01
32 Gunma Bank Ltd 165 0.01
11 Gunze Ltd 37 –
2 Gurunavi Inc 49 –
3 H-One Co Ltd 34 –

Global Core Equity Fund
Portfolio of Investments as at 30 November 2016 (continued)
Dimensional Fund Advisors Annual Report and Audited Financial Statements, 30 November 2016 92
Shares (000's)
Value (000's)
USD
% of Net Asset Value
Common Stock (continued)
Japan - 9.42% (continued)
7 H2O Retailing Corp 103 0.01
32 Hachijuni Bank Ltd 174 0.01
11 Hakuhodo DY Holdings Inc 125 0.01
1 Hakuto Co Ltd 4 –
1 Hamakyorex Co Ltd 22 –
5 Hamamatsu Photonics KK 129 0.01
13 Hankyu Hanshin Holdings Inc 414 0.03
12 Hanwa Co Ltd 79 0.01
3 Happinet Corp 31 –
2 Harmonic Drive Systems Inc 53 –
20 Haseko Corp 206 0.01
16 Hazama Ando Corp 114 0.01
5 Heiwa Corp 109 0.01
2 Heiwa Real Estate Co Ltd 36 –
2 Heiwado Co Ltd 38 –
2 HI-LEX CORP 40 –
1 Hibiya Engineering Ltd 20 –
1 Hiday Hidaka Corp 24 –
1 Hikari Tsushin Inc 117 0.01
19 Hino Motors Ltd 201 0.01
1 Hirose Electric Co Ltd 114 0.01
43 Hiroshima Bank Ltd 193 0.01
9 Hiroshima Gas Co Ltd 26 –
3 HIS Co Ltd 91 0.01
3 Hisaka Works Ltd 23 –
2 Hisamitsu Pharmaceutical Co Inc 116 0.01
5 Hitachi Capital Corp 129 0.01
8 Hitachi Chemical Co Ltd 190 0.01
9 Hitachi Construction Machinery Co Ltd 180 0.01
3 Hitachi High-Technologies Corp 104 0.01
4 Hitachi Koki Co Ltd 34 –
2 Hitachi Kokusai Electric Inc 38 –
263 Hitachi Ltd 1,430 0.09
2 Hitachi Maxell Ltd 44 –
17 Hitachi Metals Ltd 227 0.01
3 Hitachi Transport System Ltd 60 –
11 Hitachi Zosen Corp 57 –
4 Hochiki Corp 47 –
1 Hodogaya Chemical Co Ltd 30 –
1 Hogy Medical Co Ltd 35 –
12 Hokkaido Electric Power Co Inc 86 0.01
10 Hokkaido Gas Co Ltd 24 –
21 Hokkoku Bank Ltd 74 0.01
1 Hokuetsu Bank Ltd 29 –
12 Hokuetsu Kishu Paper Co Ltd 70 0.01
10 Hokuhoku Financial Group Inc 170 0.01
13 Hokuriku Electric Power Co 140 0.01
1 Hokuto Corp 23 –
65 Honda Motor Co Ltd 1,944 0.12
2 Horiba Ltd 104 0.01
2 Hoshizaki Corp 129 0.01
3 Hosiden Corp 28 –
2 Hosokawa Micron Corp 12 –
4 House Foods Group Inc 89 0.01
12 Hoya Corp 466 0.03
11 Hulic Co Ltd 108 0.01
20 Hyakugo Bank Ltd 77 0.01
21 Hyakujushi Bank Ltd 71 0.01
9 Ibiden Co Ltd 124 0.01
2 IBJ Leasing Co Ltd 43 –
– Ichibanya Co Ltd 6 –
20 Ichigo Inc 76 0.01
3 Ichinen Holdings Co Ltd 28 –
Shares (000's)
Value (000's)
USD
% of Net Asset Value
Common Stock (continued)
Japan - 9.42% (continued)
4 Ichiyoshi Securities Co Ltd 33 –
1 Icom Inc 17 –
3 Idec Corp 24 –
8 Idemitsu Kosan Co Ltd 175 0.01
3 IDOM Inc 14 –
1 Ihara Chemical Industry Co Ltd 9 –
118 IHI Corp 334 0.02
7 Iida Group Holdings Co Ltd 141 0.01
6 Iino Kaiun Kaisha Ltd 21 –
2 Imasen Electric Industrial 14 –
2 Inaba Denki Sangyo Co Ltd 52 –
3 Inabata & Co Ltd 37 –
2 Inageya Co Ltd 23 –
4 Ines Corp 41 –
2 Infocom Corp 28 –
3 Infomart Corp 33 –
2 Information Services International-Dentsu Ltd 36 –
38 Inpex Corp 374 0.02
2 Intage Holdings Inc 25 –
2 Internet Initiative Japan Inc 32 –
4 Inui Global Logistics Co Ltd 31 –
1 Iriso Electronics Co Ltd 54 –
12 Iseki & Co Ltd 24 –
17 Isetan Mitsukoshi Holdings Ltd 193 0.01
4 Ishihara Sangyo Kaisha Ltd 31 –
4 Istyle Inc 24 –
45 Isuzu Motors Ltd 544 0.03
3 Ito En Ltd 106 0.01
37 ITOCHU Corp 512 0.03
4 Itochu Enex Co Ltd 27 –
3 Itochu Techno-Solutions Corp 82 0.01
1 Itochu-Shokuhin Co Ltd 34 –
8 Itoham Yonekyu Holdings Inc 70 0.01
4 Itoki Corp 29 –
2 IwaiCosmo Holdings Inc 22 –
16 Iwatani Corp 87 0.01
– Iwatsuka Confectionery Co Ltd 6 –
20 Iyo Bank Ltd 130 0.01
2 Izumi Co Ltd 110 0.01
22 J Front Retailing Co Ltd 309 0.02
8 J Trust Co Ltd 69 0.01
1 J-Oil Mills Inc 33 –
2 JAC Recruitment Co Ltd 22 –
12 Jaccs Co Ltd 56 –
3 Jafco Co Ltd 95 0.01
1 Jamco Corp 16 –
2 Janome Sewing Machine Co Ltd 18 –
2 Japan Airlines Co Ltd 48 –
2 Japan Airport Terminal Co Ltd 57 –
4 Japan Aviation Electronics Industry Ltd 55 –
2 Japan Digital Laboratory Co Ltd 40 –
29 Japan Display Inc 69 0.01
1 Japan Drilling Co Ltd 21 –
26 Japan Exchange Group Inc 398 0.02
2 Japan Lifeline Co Ltd 36 –
2 Japan Petroleum Exploration Co Ltd 41 –
11 Japan Pulp & Paper Co Ltd 34 –
1 Japan Radio Co Ltd 17 –
6 Japan Securities Finance Co Ltd 31 –
4 Japan Steel Works Ltd 79 0.01
34 Japan Tobacco Inc 1,182 0.07
7 Japan Wool Textile Co Ltd 52 –
1 JCU Corp 40 –

Global Core Equity Fund
Portfolio of Investments as at 30 November 2016 (continued)
Dimensional Fund Advisors Annual Report and Audited Financial Statements, 30 November 2016 93
Shares (000's)
Value (000's)
USD
% of Net Asset Value
Common Stock (continued)
Japan - 9.42% (continued)
6 Jeol Ltd 24 –
23 JFE Holdings Inc 349 0.02
7 JGC Corp 110 0.01
23 Jimoto Holdings Inc 38 –
1 Jin Co Ltd 25 –
5 Joshin Denki Co Ltd 42 –
1 Joyful Honda Co Ltd 37 –
2 JSP Corp 53 –
15 JSR Corp 216 0.01
19 JTEKT Corp 307 0.02
2 Juki Corp 19 –
23 Juroku Bank Ltd 75 0.01
17 JVC Kenwood Corp 47 –
92 JX Holdings Inc 357 0.02
1 K&O Energy Group Inc 15 –
5 K's Holdings Corp 97 0.01
13 kabu.com Securities Co Ltd 43 –
4 Kadokawa Dwango 50 –
2 Kaga Electronics Co Ltd 33 –
2 Kagome Co Ltd 59 –
46 Kajima Corp 325 0.02
7 Kakaku.com Inc 112 0.01
2 Kaken Pharmaceutical Co Ltd 107 0.01
– Kameda Seika Co Ltd 14 –
2 Kamei Corp 23 –
20 Kamigumi Co Ltd 186 0.01
2 Kanaden Corp 21 –
2 Kanagawa Chuo Kotsu Co Ltd 13 –
2 Kanamoto Co Ltd 46 –
7 Kandenko Co Ltd 65 0.01
28 Kaneka Corp 227 0.01
42 Kanematsu Corp 70 0.01
2 Kanematsu Electronics Ltd 41 –
38 Kansai Electric Power Co Inc 374 0.02
10 Kansai Paint Co Ltd 180 0.01
3 Kansai Urban Banking Corp 34 –
3 Kanto Denka Kogyo Co Ltd 25 –
16 Kao Corp 723 0.04
3 Kappa Create Co Ltd 35 –
3 Kasai Kogyo Co Ltd 39 –
2 Katakura Industries Co Ltd 21 –
2 Kato Sangyo Co Ltd 45 –
1 Kato Works Co Ltd 21 –
1 Kawada Technologies Inc 41 –
113 Kawasaki Heavy Industries Ltd 364 0.02
77 Kawasaki Kisen Kaisha Ltd 171 0.01
58 KDDI Corp 1,521 0.09
35 Keihan Holdings Co Ltd 225 0.01
4 Keihanshin Building Co Ltd 21 –
3 Keihin Corp 43 –
26 Keikyu Corp 282 0.02
29 Keio Corp 233 0.02
8 Keisei Electric Railway Co Ltd 203 0.01
20 Keiyo Bank Ltd 86 0.01
6 Keiyo Co Ltd 27 –
12 Kenedix Inc 46 –
6 Kewpie Corp 150 0.01
2 Key Coffee Inc 29 –
1 Keyence Corp 581 0.04
1 KFC Holdings Japan Ltd 18 –
5 Kikkoman Corp 154 0.01
11 Kinden Corp 145 0.01
8 Kintetsu Department Store Co Ltd 25 –
Shares (000's)
Value (000's)
USD
% of Net Asset Value
Common Stock (continued)
Japan - 9.42% (continued)
90 Kintetsu Group Holdings Co Ltd 350 0.02
3 Kintetsu World Express Inc 40 –
30 Kirin Holdings Co Ltd 485 0.03
2 Kissei Pharmaceutical Co Ltd 43 –
1 Kita-Nippon Bank Ltd 24 –
1 Kitagawa Iron Works Co Ltd 18 –
4 Kito Corp 39 –
8 Kitz Corp 48 –
5 Kiyo Bank Ltd 80 0.01
3 KLab Inc 15 –
9 KNT-CT Holdings Co Ltd 12 –
3 Koa Corp 32 –
2 Koatsu Gas Kogyo Co Ltd 13 –
3 Kobayashi Pharmaceutical Co Ltd 115 0.01
1 Kobe Bussan Co Ltd 21 –
1 Kobe Electric Railway Co Ltd 3 –
28 Kobe Steel Ltd 268 0.02
3 Kohnan Shoji Co Ltd 65 0.01
5 Koito Manufacturing Co Ltd 265 0.02
8 Kokuyo Co Ltd 98 0.01
26 Komatsu Ltd 623 0.04
4 Komatsu Seiren Co Ltd 27 –
2 Komeri Co Ltd 60 –
5 Komori Corp 61 –
1 Konaka Co Ltd 2 –
4 Konami Holdings Corp 137 0.01
35 Konica Minolta Inc 336 0.02
4 Konishi Co Ltd 40 –
2 Konoike Transport Co Ltd 34 –
2 Kose Corp 121 0.01
1 Kotobuki Spirits Co Ltd 21 –
10 Krosaki Harima Corp 28 –
33 Kubota Corp 506 0.03
30 Kumagai Gumi Co Ltd 78 0.01
5 Kumiai Chemical Industry Co Ltd 31 –
1 Kura Corp 43 –
15 Kurabo Industries Ltd 31 –
24 Kuraray Co Ltd 342 0.02
1 Kureha Corp 54 –
1 Kurimoto Ltd 17 –
8 Kurita Water Industries Ltd 174 0.01
3 Kuroda Electric Co Ltd 55 –
1 Kusuri no Aoki Holdings Co Ltd 51 –
18 KYB Corp 83 0.01
8 Kyocera Corp 366 0.02
6 Kyodo Printing Co Ltd 20 –
1 Kyoei Steel Ltd 26 –
3 Kyokuto Kaihatsu Kogyo Co Ltd 35 –
2 Kyokuto Securities Co Ltd 26 –
1 Kyokuyo Co Ltd 19 –
3 KYORIN Holdings Inc 70 0.01
1 Kyoritsu Maintenance Co Ltd 45 –
2 Kyosan Electric Manufacturing Co Ltd 7 –
7 Kyowa Exeo Corp 103 0.01
10 Kyowa Hakko Kirin Co Ltd 144 0.01
4 Kyudenko Corp 113 0.01
24 Kyushu Electric Power Co Inc 241 0.02
24 Kyushu Financial Group Inc 159 0.01
2 LAC Co Ltd 24 –
1 Laox Co Ltd 7 –
2 Lasertec Corp 31 –
3 Lawson Inc 209 0.01
18 Leopalace21 Corp 97 0.01
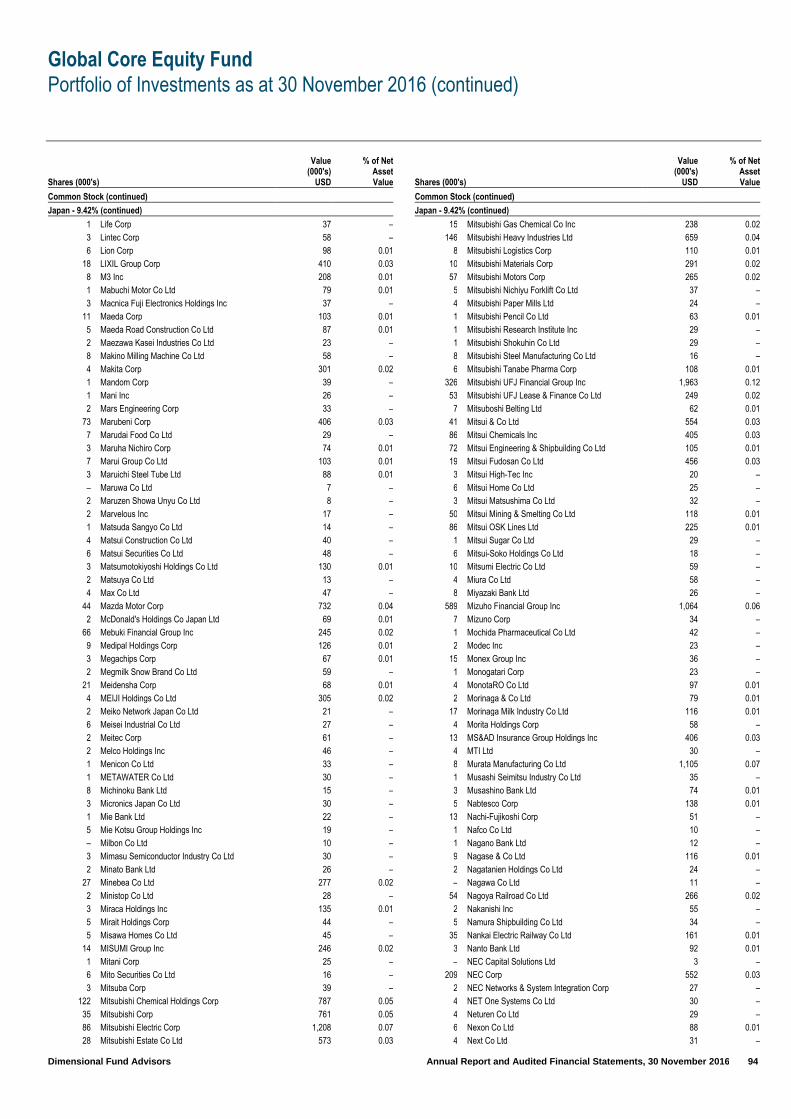
Global Core Equity Fund
Portfolio of Investments as at 30 November 2016 (continued)
Dimensional Fund Advisors Annual Report and Audited Financial Statements, 30 November 2016 94
Shares (000's)
Value (000's)
USD
% of Net Asset Value
Common Stock (continued)
Japan - 9.42% (continued)
1 Life Corp 37 –
3 Lintec Corp 58 –
6 Lion Corp 98 0.01
18 LIXIL Group Corp 410 0.03
8 M3 Inc 208 0.01
1 Mabuchi Motor Co Ltd 79 0.01
3 Macnica Fuji Electronics Holdings Inc 37 –
11 Maeda Corp 103 0.01
5 Maeda Road Construction Co Ltd 87 0.01
2 Maezawa Kasei Industries Co Ltd 23 –
8 Makino Milling Machine Co Ltd 58 –
4 Makita Corp 301 0.02
1 Mandom Corp 39 –
1 Mani Inc 26 –
2 Mars Engineering Corp 33 –
73 Marubeni Corp 406 0.03
7 Marudai Food Co Ltd 29 –
3 Maruha Nichiro Corp 74 0.01
7 Marui Group Co Ltd 103 0.01
3 Maruichi Steel Tube Ltd 88 0.01
– Maruwa Co Ltd 7 –
2 Maruzen Showa Unyu Co Ltd 8 –
2 Marvelous Inc 17 –
1 Matsuda Sangyo Co Ltd 14 –
4 Matsui Construction Co Ltd 40 –
6 Matsui Securities Co Ltd 48 –
3 Matsumotokiyoshi Holdings Co Ltd 130 0.01
2 Matsuya Co Ltd 13 –
4 Max Co Ltd 47 –
44 Mazda Motor Corp 732 0.04
2 McDonald's Holdings Co Japan Ltd 69 0.01
66 Mebuki Financial Group Inc 245 0.02
9 Medipal Holdings Corp 126 0.01
3 Megachips Corp 67 0.01
2 Megmilk Snow Brand Co Ltd 59 –
21 Meidensha Corp 68 0.01
4 MEIJI Holdings Co Ltd 305 0.02
2 Meiko Network Japan Co Ltd 21 –
6 Meisei Industrial Co Ltd 27 –
2 Meitec Corp 61 –
2 Melco Holdings Inc 46 –
1 Menicon Co Ltd 33 –
1 METAWATER Co Ltd 30 –
8 Michinoku Bank Ltd 15 –
3 Micronics Japan Co Ltd 30 –
1 Mie Bank Ltd 22 –
5 Mie Kotsu Group Holdings Inc 19 –
– Milbon Co Ltd 10 –
3 Mimasu Semiconductor Industry Co Ltd 30 –
2 Minato Bank Ltd 26 –
27 Minebea Co Ltd 277 0.02
2 Ministop Co Ltd 28 –
3 Miraca Holdings Inc 135 0.01
5 Mirait Holdings Corp 44 –
5 Misawa Homes Co Ltd 45 –
14 MISUMI Group Inc 246 0.02
1 Mitani Corp 25 –
6 Mito Securities Co Ltd 16 –
3 Mitsuba Corp 39 –
122 Mitsubishi Chemical Holdings Corp 787 0.05
35 Mitsubishi Corp 761 0.05
86 Mitsubishi Electric Corp 1,208 0.07
28 Mitsubishi Estate Co Ltd 573 0.03
Shares (000's)
Value (000's)
USD
% of Net Asset Value
Common Stock (continued)
Japan - 9.42% (continued)
15 Mitsubishi Gas Chemical Co Inc 238 0.02
146 Mitsubishi Heavy Industries Ltd 659 0.04
8 Mitsubishi Logistics Corp 110 0.01
10 Mitsubishi Materials Corp 291 0.02
57 Mitsubishi Motors Corp 265 0.02
5 Mitsubishi Nichiyu Forklift Co Ltd 37 –
4 Mitsubishi Paper Mills Ltd 24 –
1 Mitsubishi Pencil Co Ltd 63 0.01
1 Mitsubishi Research Institute Inc 29 –
1 Mitsubishi Shokuhin Co Ltd 29 –
8 Mitsubishi Steel Manufacturing Co Ltd 16 –
6 Mitsubishi Tanabe Pharma Corp 108 0.01
326 Mitsubishi UFJ Financial Group Inc 1,963 0.12
53 Mitsubishi UFJ Lease & Finance Co Ltd 249 0.02
7 Mitsuboshi Belting Ltd 62 0.01
41 Mitsui & Co Ltd 554 0.03
86 Mitsui Chemicals Inc 405 0.03
72 Mitsui Engineering & Shipbuilding Co Ltd 105 0.01
19 Mitsui Fudosan Co Ltd 456 0.03
3 Mitsui High-Tec Inc 20 –
6 Mitsui Home Co Ltd 25 –
3 Mitsui Matsushima Co Ltd 32 –
50 Mitsui Mining & Smelting Co Ltd 118 0.01
86 Mitsui OSK Lines Ltd 225 0.01
1 Mitsui Sugar Co Ltd 29 –
6 Mitsui-Soko Holdings Co Ltd 18 –
10 Mitsumi Electric Co Ltd 59 –
4 Miura Co Ltd 58 –
8 Miyazaki Bank Ltd 26 –
589 Mizuho Financial Group Inc 1,064 0.06
7 Mizuno Corp 34 –
1 Mochida Pharmaceutical Co Ltd 42 –
2 Modec Inc 23 –
15 Monex Group Inc 36 –
1 Monogatari Corp 23 –
4 MonotaRO Co Ltd 97 0.01
2 Morinaga & Co Ltd 79 0.01
17 Morinaga Milk Industry Co Ltd 116 0.01
4 Morita Holdings Corp 58 –
13 MS&AD Insurance Group Holdings Inc 406 0.03
4 MTI Ltd 30 –
8 Murata Manufacturing Co Ltd 1,105 0.07
1 Musashi Seimitsu Industry Co Ltd 35 –
3 Musashino Bank Ltd 74 0.01
5 Nabtesco Corp 138 0.01
13 Nachi-Fujikoshi Corp 51 –
1 Nafco Co Ltd 10 –
1 Nagano Bank Ltd 12 –
9 Nagase & Co Ltd 116 0.01
2 Nagatanien Holdings Co Ltd 24 –
– Nagawa Co Ltd 11 –
54 Nagoya Railroad Co Ltd 266 0.02
2 Nakanishi Inc 55 –
5 Namura Shipbuilding Co Ltd 34 –
35 Nankai Electric Railway Co Ltd 161 0.01
3 Nanto Bank Ltd 92 0.01
– NEC Capital Solutions Ltd 3 –
209 NEC Corp 552 0.03
2 NEC Networks & System Integration Corp 27 –
4 NET One Systems Co Ltd 30 –
4 Neturen Co Ltd 29 –
6 Nexon Co Ltd 88 0.01
4 Next Co Ltd 31 –
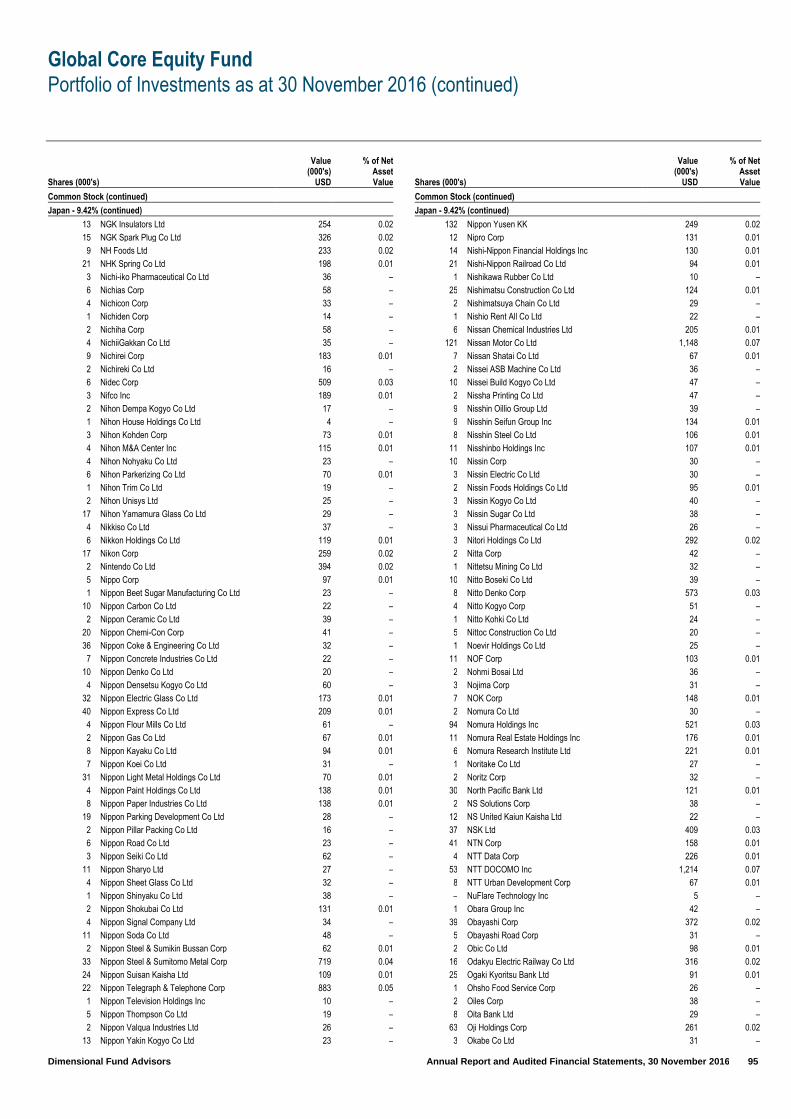
Global Core Equity Fund
Portfolio of Investments as at 30 November 2016 (continued)
Dimensional Fund Advisors Annual Report and Audited Financial Statements, 30 November 2016 95
Shares (000's)
Value (000's)
USD
% of Net Asset Value
Common Stock (continued)
Japan - 9.42% (continued)
13 NGK Insulators Ltd 254 0.02
15 NGK Spark Plug Co Ltd 326 0.02
9 NH Foods Ltd 233 0.02
21 NHK Spring Co Ltd 198 0.01
3 Nichi-iko Pharmaceutical Co Ltd 36 –
6 Nichias Corp 58 –
4 Nichicon Corp 33 –
1 Nichiden Corp 14 –
2 Nichiha Corp 58 –
4 NichiiGakkan Co Ltd 35 –
9 Nichirei Corp 183 0.01
2 Nichireki Co Ltd 16 –
6 Nidec Corp 509 0.03
3 Nifco Inc 189 0.01
2 Nihon Dempa Kogyo Co Ltd 17 –
1 Nihon House Holdings Co Ltd 4 –
3 Nihon Kohden Corp 73 0.01
4 Nihon M&A Center Inc 115 0.01
4 Nihon Nohyaku Co Ltd 23 –
6 Nihon Parkerizing Co Ltd 70 0.01
1 Nihon Trim Co Ltd 19 –
2 Nihon Unisys Ltd 25 –
17 Nihon Yamamura Glass Co Ltd 29 –
4 Nikkiso Co Ltd 37 –
6 Nikkon Holdings Co Ltd 119 0.01
17 Nikon Corp 259 0.02
2 Nintendo Co Ltd 394 0.02
5 Nippo Corp 97 0.01
1 Nippon Beet Sugar Manufacturing Co Ltd 23 –
10 Nippon Carbon Co Ltd 22 –
2 Nippon Ceramic Co Ltd 39 –
20 Nippon Chemi-Con Corp 41 –
36 Nippon Coke & Engineering Co Ltd 32 –
7 Nippon Concrete Industries Co Ltd 22 –
10 Nippon Denko Co Ltd 20 –
4 Nippon Densetsu Kogyo Co Ltd 60 –
32 Nippon Electric Glass Co Ltd 173 0.01
40 Nippon Express Co Ltd 209 0.01
4 Nippon Flour Mills Co Ltd 61 –
2 Nippon Gas Co Ltd 67 0.01
8 Nippon Kayaku Co Ltd 94 0.01
7 Nippon Koei Co Ltd 31 –
31 Nippon Light Metal Holdings Co Ltd 70 0.01
4 Nippon Paint Holdings Co Ltd 138 0.01
8 Nippon Paper Industries Co Ltd 138 0.01
19 Nippon Parking Development Co Ltd 28 –
2 Nippon Pillar Packing Co Ltd 16 –
6 Nippon Road Co Ltd 23 –
3 Nippon Seiki Co Ltd 62 –
11 Nippon Sharyo Ltd 27 –
4 Nippon Sheet Glass Co Ltd 32 –
1 Nippon Shinyaku Co Ltd 38 –
2 Nippon Shokubai Co Ltd 131 0.01
4 Nippon Signal Company Ltd 34 –
11 Nippon Soda Co Ltd 48 –
2 Nippon Steel & Sumikin Bussan Corp 62 0.01
33 Nippon Steel & Sumitomo Metal Corp 719 0.04
24 Nippon Suisan Kaisha Ltd 109 0.01
22 Nippon Telegraph & Telephone Corp 883 0.05
1 Nippon Television Holdings Inc 10 –
5 Nippon Thompson Co Ltd 19 –
2 Nippon Valqua Industries Ltd 26 –
13 Nippon Yakin Kogyo Co Ltd 23 –
Shares (000's)
Value (000's)
USD
% of Net Asset Value
Common Stock (continued)
Japan - 9.42% (continued)
132 Nippon Yusen KK 249 0.02
12 Nipro Corp 131 0.01
14 Nishi-Nippon Financial Holdings Inc 130 0.01
21 Nishi-Nippon Railroad Co Ltd 94 0.01
1 Nishikawa Rubber Co Ltd 10 –
25 Nishimatsu Construction Co Ltd 124 0.01
2 Nishimatsuya Chain Co Ltd 29 –
1 Nishio Rent All Co Ltd 22 –
6 Nissan Chemical Industries Ltd 205 0.01
121 Nissan Motor Co Ltd 1,148 0.07
7 Nissan Shatai Co Ltd 67 0.01
2 Nissei ASB Machine Co Ltd 36 –
10 Nissei Build Kogyo Co Ltd 47 –
2 Nissha Printing Co Ltd 47 –
9 Nisshin Oillio Group Ltd 39 –
9 Nisshin Seifun Group Inc 134 0.01
8 Nisshin Steel Co Ltd 106 0.01
11 Nisshinbo Holdings Inc 107 0.01
10 Nissin Corp 30 –
3 Nissin Electric Co Ltd 30 –
2 Nissin Foods Holdings Co Ltd 95 0.01
3 Nissin Kogyo Co Ltd 40 –
3 Nissin Sugar Co Ltd 38 –
3 Nissui Pharmaceutical Co Ltd 26 –
3 Nitori Holdings Co Ltd 292 0.02
2 Nitta Corp 42 –
1 Nittetsu Mining Co Ltd 32 –
10 Nitto Boseki Co Ltd 39 –
8 Nitto Denko Corp 573 0.03
4 Nitto Kogyo Corp 51 –
1 Nitto Kohki Co Ltd 24 –
5 Nittoc Construction Co Ltd 20 –
1 Noevir Holdings Co Ltd 25 –
11 NOF Corp 103 0.01
2 Nohmi Bosai Ltd 36 –
3 Nojima Corp 31 –
7 NOK Corp 148 0.01
2 Nomura Co Ltd 30 –
94 Nomura Holdings Inc 521 0.03
11 Nomura Real Estate Holdings Inc 176 0.01
6 Nomura Research Institute Ltd 221 0.01
1 Noritake Co Ltd 27 –
2 Noritz Corp 32 –
30 North Pacific Bank Ltd 121 0.01
2 NS Solutions Corp 38 –
12 NS United Kaiun Kaisha Ltd 22 –
37 NSK Ltd 409 0.03
41 NTN Corp 158 0.01
4 NTT Data Corp 226 0.01
53 NTT DOCOMO Inc 1,214 0.07
8 NTT Urban Development Corp 67 0.01
– NuFlare Technology Inc 5 –
1 Obara Group Inc 42 –
39 Obayashi Corp 372 0.02
5 Obayashi Road Corp 31 –
2 Obic Co Ltd 98 0.01
16 Odakyu Electric Railway Co Ltd 316 0.02
25 Ogaki Kyoritsu Bank Ltd 91 0.01
1 Ohsho Food Service Corp 26 –
2 Oiles Corp 38 –
8 Oita Bank Ltd 29 –
63 Oji Holdings Corp 261 0.02
3 Okabe Co Ltd 31 –
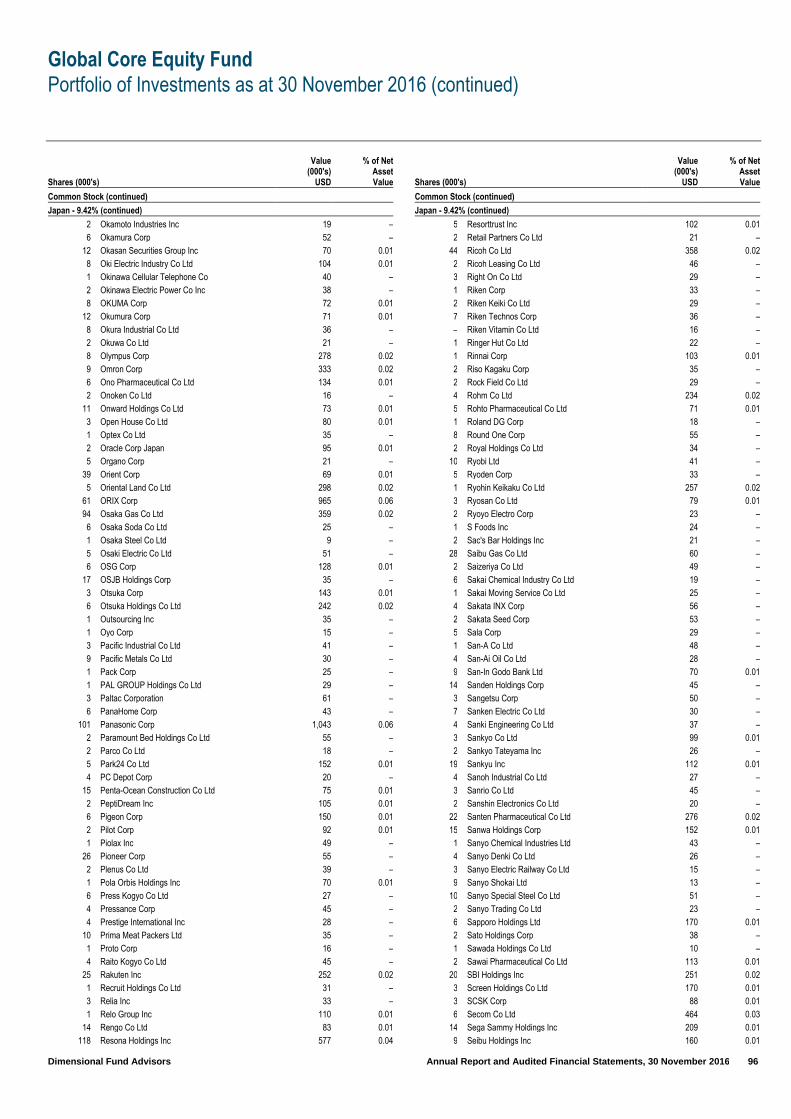
Global Core Equity Fund
Portfolio of Investments as at 30 November 2016 (continued)
Dimensional Fund Advisors Annual Report and Audited Financial Statements, 30 November 2016 96
Shares (000's)
Value (000's)
USD
% of Net Asset Value
Common Stock (continued)
Japan - 9.42% (continued)
2 Okamoto Industries Inc 19 –
6 Okamura Corp 52 –
12 Okasan Securities Group Inc 70 0.01
8 Oki Electric Industry Co Ltd 104 0.01
1 Okinawa Cellular Telephone Co 40 –
2 Okinawa Electric Power Co Inc 38 –
8 OKUMA Corp 72 0.01
12 Okumura Corp 71 0.01
8 Okura Industrial Co Ltd 36 –
2 Okuwa Co Ltd 21 –
8 Olympus Corp 278 0.02
9 Omron Corp 333 0.02
6 Ono Pharmaceutical Co Ltd 134 0.01
2 Onoken Co Ltd 16 –
11 Onward Holdings Co Ltd 73 0.01
3 Open House Co Ltd 80 0.01
1 Optex Co Ltd 35 –
2 Oracle Corp Japan 95 0.01
5 Organo Corp 21 –
39 Orient Corp 69 0.01
5 Oriental Land Co Ltd 298 0.02
61 ORIX Corp 965 0.06
94 Osaka Gas Co Ltd 359 0.02
6 Osaka Soda Co Ltd 25 –
1 Osaka Steel Co Ltd 9 –
5 Osaki Electric Co Ltd 51 –
6 OSG Corp 128 0.01
17 OSJB Holdings Corp 35 –
3 Otsuka Corp 143 0.01
6 Otsuka Holdings Co Ltd 242 0.02
1 Outsourcing Inc 35 –
1 Oyo Corp 15 –
3 Pacific Industrial Co Ltd 41 –
9 Pacific Metals Co Ltd 30 –
1 Pack Corp 25 –
1 PAL GROUP Holdings Co Ltd 29 –
3 Paltac Corporation 61 –
6 PanaHome Corp 43 –
101 Panasonic Corp 1,043 0.06
2 Paramount Bed Holdings Co Ltd 55 –
2 Parco Co Ltd 18 –
5 Park24 Co Ltd 152 0.01
4 PC Depot Corp 20 –
15 Penta-Ocean Construction Co Ltd 75 0.01
2 PeptiDream Inc 105 0.01
6 Pigeon Corp 150 0.01
2 Pilot Corp 92 0.01
1 Piolax Inc 49 –
26 Pioneer Corp 55 –
2 Plenus Co Ltd 39 –
1 Pola Orbis Holdings Inc 70 0.01
6 Press Kogyo Co Ltd 27 –
4 Pressance Corp 45 –
4 Prestige International Inc 28 –
10 Prima Meat Packers Ltd 35 –
1 Proto Corp 16 –
4 Raito Kogyo Co Ltd 45 –
25 Rakuten Inc 252 0.02
1 Recruit Holdings Co Ltd 31 –
3 Relia Inc 33 –
1 Relo Group Inc 110 0.01
14 Rengo Co Ltd 83 0.01
118 Resona Holdings Inc 577 0.04
Shares (000's)
Value (000's)
USD
% of Net Asset Value
Common Stock (continued)
Japan - 9.42% (continued)
5 Resorttrust Inc 102 0.01
2 Retail Partners Co Ltd 21 –
44 Ricoh Co Ltd 358 0.02
2 Ricoh Leasing Co Ltd 46 –
3 Right On Co Ltd 29 –
1 Riken Corp 33 –
2 Riken Keiki Co Ltd 29 –
7 Riken Technos Corp 36 –
– Riken Vitamin Co Ltd 16 –
1 Ringer Hut Co Ltd 22 –
1 Rinnai Corp 103 0.01
2 Riso Kagaku Corp 35 –
2 Rock Field Co Ltd 29 –
4 Rohm Co Ltd 234 0.02
5 Rohto Pharmaceutical Co Ltd 71 0.01
1 Roland DG Corp 18 –
8 Round One Corp 55 –
2 Royal Holdings Co Ltd 34 –
10 Ryobi Ltd 41 –
5 Ryoden Corp 33 –
1 Ryohin Keikaku Co Ltd 257 0.02
3 Ryosan Co Ltd 79 0.01
2 Ryoyo Electro Corp 23 –
1 S Foods Inc 24 –
2 Sac's Bar Holdings Inc 21 –
28 Saibu Gas Co Ltd 60 –
2 Saizeriya Co Ltd 49 –
6 Sakai Chemical Industry Co Ltd 19 –
1 Sakai Moving Service Co Ltd 25 –
4 Sakata INX Corp 56 –
2 Sakata Seed Corp 53 –
5 Sala Corp 29 –
1 San-A Co Ltd 48 –
4 San-Ai Oil Co Ltd 28 –
9 San-In Godo Bank Ltd 70 0.01
14 Sanden Holdings Corp 45 –
3 Sangetsu Corp 50 –
7 Sanken Electric Co Ltd 30 –
4 Sanki Engineering Co Ltd 37 –
3 Sankyo Co Ltd 99 0.01
2 Sankyo Tateyama Inc 26 –
19 Sankyu Inc 112 0.01
4 Sanoh Industrial Co Ltd 27 –
3 Sanrio Co Ltd 45 –
2 Sanshin Electronics Co Ltd 20 –
22 Santen Pharmaceutical Co Ltd 276 0.02
15 Sanwa Holdings Corp 152 0.01
1 Sanyo Chemical Industries Ltd 43 –
4 Sanyo Denki Co Ltd 26 –
3 Sanyo Electric Railway Co Ltd 15 –
9 Sanyo Shokai Ltd 13 –
10 Sanyo Special Steel Co Ltd 51 –
2 Sanyo Trading Co Ltd 23 –
6 Sapporo Holdings Ltd 170 0.01
2 Sato Holdings Corp 38 –
1 Sawada Holdings Co Ltd 10 –
2 Sawai Pharmaceutical Co Ltd 113 0.01
20 SBI Holdings Inc 251 0.02
3 Screen Holdings Co Ltd 170 0.01
3 SCSK Corp 88 0.01
6 Secom Co Ltd 464 0.03
14 Sega Sammy Holdings Inc 209 0.01
9 Seibu Holdings Inc 160 0.01

Global Core Equity Fund
Portfolio of Investments as at 30 November 2016 (continued)
Dimensional Fund Advisors Annual Report and Audited Financial Statements, 30 November 2016 97
Shares (000's)
Value (000's)
USD
% of Net Asset Value
Common Stock (continued)
Japan - 9.42% (continued)
11 Seika Corp 32 –
3 Seikagaku Corp 39 –
7 Seikitokyu Kogyo Co Ltd 30 –
18 Seiko Epson Corp 371 0.02
16 Seiko Holdings Corp 57 –
11 Seino Holdings Co Ltd 124 0.01
5 Seiren Co Ltd 64 0.01
27 Sekisui Chemical Co Ltd 412 0.03
23 Sekisui House Ltd 387 0.02
3 Sekisui Jushi Corp 47 –
3 Sekisui Plastics Co Ltd 25 –
7 Senko Co Ltd 50 –
19 Senshu Ikeda Holdings Inc 85 0.01
3 Senshukai Co Ltd 20 –
10 Septeni Holdings Co Ltd 32 –
1 Seria Co Ltd 72 0.01
24 Seven & i Holdings Co Ltd 958 0.06
44 Seven Bank Ltd 128 0.01
120 Sharp Corp 199 0.01
4 Shibusawa Warehouse Co Ltd 12 –
1 Shibuya Corp 22 –
20 Shiga Bank Ltd 106 0.01
21 Shikoku Bank Ltd 55 –
4 Shikoku Chemicals Corp 35 –
13 Shikoku Electric Power Co Inc 124 0.01
2 Shima Seiki Manufacturing Ltd 67 0.01
5 Shimachu Co Ltd 125 0.01
9 Shimadzu Corp 139 0.01
1 Shimamura Co Ltd 132 0.01
2 Shimano Inc 317 0.02
1 Shimizu Bank Ltd 15 –
23 Shimizu Corp 214 0.01
11 Shin-Etsu Chemical Co Ltd 832 0.05
5 Shin-Etsu Polymer Co Ltd 32 –
8 Shindengen Electric Manufacturing Co Ltd 31 –
5 Shinko Electric Industries Co Ltd 33 –
3 Shinko Plantech Co Ltd 18 –
3 Shinko Shoji Co Ltd 28 –
7 Shinmaywa Industries Ltd 60 –
3 Shinnihon Corp 27 –
1 Shinoken Group Co Ltd 24 –
78 Shinsei Bank Ltd 127 0.01
5 Shionogi & Co Ltd 262 0.02
2 Ship Healthcare Holdings Inc 61 –
13 Shiseido Co Ltd 347 0.02
23 Shizuoka Bank Ltd 189 0.01
4 Shizuoka Gas Co Ltd 28 –
5 Shochiku Co Ltd 54 –
2 Shoei Foods Corp 29 –
4 Showa Corp 24 –
14 Showa Denko KK 189 0.01
11 Showa Sangyo Co Ltd 57 –
14 Showa Shell Sekiyu KK 131 0.01
1 Siix Corp 44 –
1 Sinanen Holdings Co Ltd 21 –
19 Sinfonia Technology Co Ltd 41 –
1 Sinko Industries Ltd 9 –
4 Sintokogio Ltd 37 –
13 SKY Perfect JSAT Holdings Inc 62 0.01
7 Skylark Co Ltd 96 0.01
1 SMC Corp 319 0.02
7 SMK Corp 27 –
2 SMS Co Ltd 50 –
Shares (000's)
Value (000's)
USD
% of Net Asset Value
Common Stock (continued)
Japan - 9.42% (continued)
2 Sodick Co Ltd 18 –
34 SoftBank Group Corp 2,018 0.12
1 Sogo Medical Co Ltd 18 –
4 Sohgo Security Services Co Ltd 156 0.01
95 Sojitz Corp 244 0.02
12 Sompo Holdings Inc 389 0.02
55 Sony Corp 1,604 0.10
9 Sony Financial Holdings Inc 133 0.01
29 Sotetsu Holdings Inc 143 0.01
9 Sparx Group Co Ltd 17 –
3 Square Enix Holdings Co Ltd 86 0.01
1 SRA Holdings 25 –
1 St Marc Holdings Co Ltd 44 –
11 Stanley Electric Co Ltd 323 0.02
3 Star Micronics Co Ltd 39 –
11 Start Today Co Ltd 171 0.01
2 Starts Corp Inc 44 –
1 Starzen Co Ltd 33 –
1 Studio Alice Co Ltd 20 –
2 Sugi Holdings Co Ltd 80 0.01
18 Sumco Corp 201 0.01
17 Sumitomo Bakelite Co Ltd 93 0.01
117 Sumitomo Chemical Co Ltd 545 0.03
31 Sumitomo Corp 375 0.02
7 Sumitomo Dainippon Pharma Co Ltd 113 0.01
3 Sumitomo Densetsu Co Ltd 30 –
37 Sumitomo Electric Industries Ltd 529 0.03
11 Sumitomo Forestry Co Ltd 149 0.01
44 Sumitomo Heavy Industries Ltd 270 0.02
22 Sumitomo Metal Mining Co Ltd 297 0.02
76 Sumitomo Mitsui Construction Co Ltd 85 0.01
33 Sumitomo Mitsui Financial Group Inc 1,233 0.07
8 Sumitomo Mitsui Trust Holdings Inc 291 0.02
28 Sumitomo Osaka Cement Co Ltd 100 0.01
1 Sumitomo Real Estate Sales Co Ltd 30 –
8 Sumitomo Realty & Development Co Ltd 225 0.01
3 Sumitomo Riko Co Ltd 27 –
18 Sumitomo Rubber Industries Ltd 307 0.02
1 Sumitomo Seika Chemicals Co Ltd 23 –
14 Sumitomo Warehouse Co Ltd 73 0.01
4 Sun Frontier Fudousan Co Ltd 34 –
1 Sundrug Co Ltd 98 0.01
5 Suntory Beverage & Food Ltd 202 0.01
9 Suruga Bank Ltd 206 0.01
6 Suzuken Co Ltd Japan 170 0.01
15 Suzuki Motor Corp 484 0.03
31 SWCC Showa Holdings Co Ltd 23 –
5 Sysmex Corp 305 0.02
2 Systena Corp 27 –
1 T Hasegawa Co Ltd 21 –
24 T&D Holdings Inc 311 0.02
1 T&K Toka Co Ltd 10 –
3 T-Gaia Corp 41 –
1 Tabuchi Electric Co Ltd 5 –
3 Tachi-S Co Ltd 38 –
2 Tachibana Eletech Co Ltd 22 –
8 Tadano Ltd 87 0.01
2 Taihei Dengyo Kaisha Ltd 19 –
110 Taiheiyo Cement Corp 349 0.02
2 Taiho Kogyo Co Ltd 30 –
2 Taikisha Ltd 52 –
4 Taiko Bank Ltd 9 –
50 Taisei Corp 364 0.02

Global Core Equity Fund
Portfolio of Investments as at 30 November 2016 (continued)
Dimensional Fund Advisors Annual Report and Audited Financial Statements, 30 November 2016 98
Shares (000's)
Value (000's)
USD
% of Net Asset Value
Common Stock (continued)
Japan - 9.42% (continued)
1 Taisho Pharmaceutical Holdings Co Ltd 103 0.01
1 Taiyo Holdings Co Ltd 43 –
14 Taiyo Nippon Sanso Corp 158 0.01
11 Taiyo Yuden Co Ltd 123 0.01
1 Takamatsu Construction Group Co Ltd 31 –
2 Takaoka Toko Co Ltd 33 –
9 Takara Holdings Inc 85 0.01
7 Takara Leben Co Ltd 42 –
3 Takara Standard Co Ltd 42 –
1 Takasago International Corp 27 –
4 Takasago Thermal Engineering Co Ltd 48 –
22 Takashimaya Co Ltd 184 0.01
2 Takata Corp 12 –
16 Takeda Pharmaceutical Co Ltd 649 0.04
4 Takeei Corp 29 –
2 Takeuchi Manufacturing Co Ltd 53 –
8 Takiron Co Ltd 35 –
5 Takuma Co Ltd 42 –
2 Tamron Co Ltd 41 –
9 Tamura Corp 35 –
2 TASAKI & Co Ltd 32 –
1 Tatsuta Electric Wire and Cable Co Ltd 3 –
2 Tayca Corp 11 –
9 TDK Corp 610 0.04
1 TechnoPro Holdings Inc 38 –
16 Teijin Ltd 308 0.02
2 Teikoku Sen-I Co Ltd 23 –
12 Tekken Corp 37 –
7 Temp Holdings Co Ltd 117 0.01
2 Tenma Corp 31 –
7 Terumo Corp 238 0.02
10 THK Co Ltd 219 0.01
6 TIS Inc 128 0.01
1 TKC Corp 30 –
3 Toa Corp (Hyogo) 28 –
1 Toa Corp (Tokyo) 24 –
6 Toa Road Corp 17 –
10 Toagosei Co Ltd 96 0.01
8 Tobishima Corp 14 –
55 Tobu Railway Co Ltd 266 0.02
2 Tocalo Co Ltd 33 –
6 Tochigi Bank Ltd 26 –
8 Toda Corp 45 –
7 Toei Co Ltd 57 –
5 Toenec Corp 23 –
16 Toho Bank Ltd 58 –
1 Toho Co Ltd (Kobe) 22 –
4 Toho Co Ltd (Tokyo) 110 0.01
31 Toho Gas Co Ltd 247 0.02
3 Toho Holdings Co Ltd 63 0.01
3 Toho Titanium Co Ltd 20 –
8 Toho Zinc Co Ltd 31 –
24 Tohoku Electric Power Co Inc 285 0.02
15 Tokai Carbon Co Ltd 51 –
– Tokai Corp 13 –
9 TOKAI Holdings Corp 58 –
4 Tokai Rika Co Ltd 80 0.01
17 Tokai Tokyo Financial Holdings Inc 87 0.01
1 Token Corp 36 –
17 Tokio Marine Holdings Inc 732 0.04
1 Tokushu Tokai Paper Co Ltd 39 –
16 Tokuyama Corp 64 0.01
3 Tokyo Broadcasting System Holdings Inc 51 –
Shares (000's)
Value (000's)
USD
% of Net Asset Value
Common Stock (continued)
Japan - 9.42% (continued)
4 Tokyo Century Corp 134 0.01
6 Tokyo Dome Corp 62 0.01
74 Tokyo Electric Power Co Holdings Inc 278 0.02
7 Tokyo Electron Ltd 612 0.04
3 Tokyo Energy & Systems Inc 25 –
105 Tokyo Gas Co Ltd 461 0.03
4 Tokyo Ohka Kogyo Co Ltd 126 0.01
2 Tokyo Rope Manufacturing Co Ltd 35 –
3 Tokyo Seimitsu Co Ltd 71 0.01
11 Tokyo Steel Manufacturing Co Ltd 82 0.01
15 Tokyo Tatemono Co Ltd 194 0.01
2 Tokyo TY Financial Group Inc 73 0.01
7 Tokyotokeiba Co Ltd 17 –
4 Tokyu Construction Co Ltd 36 –
59 Tokyu Corp 444 0.03
45 Tokyu Fudosan Holdings Corp 264 0.02
4 Tomoku Co Ltd 11 –
9 TOMONY Holdings Inc 50 –
3 Tomy Co Ltd 27 –
10 Tonami Holdings Co Ltd 30 –
18 TonenGeneral Sekiyu KK 174 0.01
9 Topcon Corp 144 0.01
4 Toppan Forms Co Ltd 35 –
25 Toppan Printing Co Ltd 229 0.01
1 Topre Corp 34 –
2 Topy Industries Ltd 54 –
55 Toray Industries Inc 452 0.03
2 Toridoll Holdings Corp 33 –
1 Torii Pharmaceutical Co Ltd 17 –
4 Torishima Pump Manufacturing Co Ltd 35 –
5 Tosei Corp 36 –
60 Toshiba Corp 225 0.01
10 Toshiba Machine Co Ltd 38 –
3 Toshiba Plant Systems & Services Corp 50 –
11 Toshiba TEC Corp 55 –
1 Tosho Co Ltd 35 –
7 Tosho Printing Co Ltd 29 –
54 Tosoh Corp 369 0.02
2 Totetsu Kogyo Co Ltd 46 –
7 TOTO Ltd 276 0.02
1 Tottori Bank Ltd 8 –
22 Towa Bank Ltd 21 –
3 Towa Corp 32 –
1 Towa Pharmaceutical Co Ltd 29 –
8 Toyo Construction Co Ltd 28 –
3 Toyo Corp 29 –
10 Toyo Engineering Corp 28 –
18 Toyo Ink SC Holdings Co Ltd 83 0.01
18 Toyo Kanetsu KK 56 –
4 Toyo Kohan Co Ltd 13 –
10 Toyo Securities Co Ltd 21 –
7 Toyo Seikan Group Holdings Ltd 141 0.01
3 Toyo Suisan Kaisha Ltd 121 0.01
1 Toyo Tanso Co Ltd 19 –
8 Toyo Tire & Rubber Co Ltd 102 0.01
63 Toyobo Co Ltd 96 0.01
8 Toyoda Gosei Co Ltd 167 0.01
5 Toyota Boshoku Corp 113 0.01
4 Toyota Industries Corp 210 0.01
125 Toyota Motor Corp 7,432 0.44
17 Toyota Tsusho Corp 426 0.03
2 TPR Co Ltd 45 –
1 Trancom Co Ltd 24 –
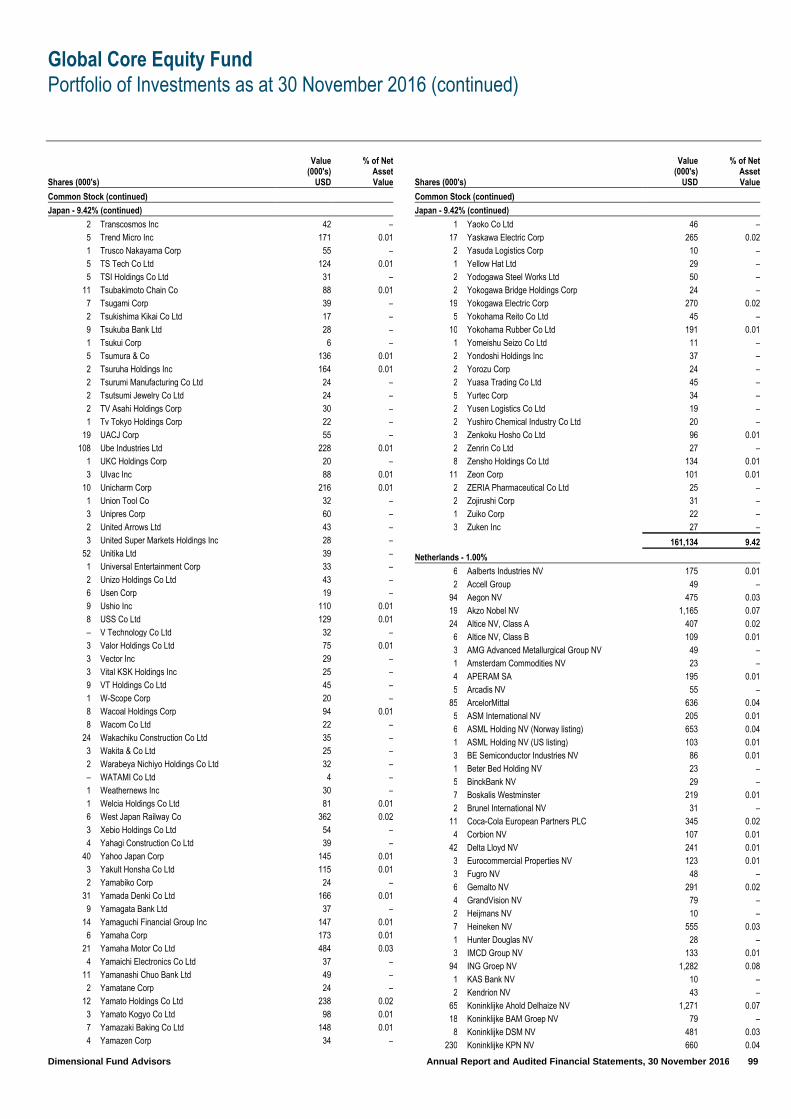
Global Core Equity Fund
Portfolio of Investments as at 30 November 2016 (continued)
Dimensional Fund Advisors Annual Report and Audited Financial Statements, 30 November 2016 99
Shares (000's)
Value (000's)
USD
% of Net Asset Value
Common Stock (continued)
Japan - 9.42% (continued)
2 Transcosmos Inc 42 –
5 Trend Micro Inc 171 0.01
1 Trusco Nakayama Corp 55 –
5 TS Tech Co Ltd 124 0.01
5 TSI Holdings Co Ltd 31 –
11 Tsubakimoto Chain Co 88 0.01
7 Tsugami Corp 39 –
2 Tsukishima Kikai Co Ltd 17 –
9 Tsukuba Bank Ltd 28 –
1 Tsukui Corp 6 –
5 Tsumura & Co 136 0.01
2 Tsuruha Holdings Inc 164 0.01
2 Tsurumi Manufacturing Co Ltd 24 –
2 Tsutsumi Jewelry Co Ltd 24 –
2 TV Asahi Holdings Corp 30 –
1 Tv Tokyo Holdings Corp 22 –
19 UACJ Corp 55 –
108 Ube Industries Ltd 228 0.01
1 UKC Holdings Corp 20 –
3 Ulvac Inc 88 0.01
10 Unicharm Corp 216 0.01
1 Union Tool Co 32 –
3 Unipres Corp 60 –
2 United Arrows Ltd 43 –
3 United Super Markets Holdings Inc 28 –
52 Unitika Ltd 39 –
1 Universal Entertainment Corp 33 –
2 Unizo Holdings Co Ltd 43 –
6 Usen Corp 19 –
9 Ushio Inc 110 0.01
8 USS Co Ltd 129 0.01
– V Technology Co Ltd 32 –
3 Valor Holdings Co Ltd 75 0.01
3 Vector Inc 29 –
3 Vital KSK Holdings Inc 25 –
9 VT Holdings Co Ltd 45 –
1 W-Scope Corp 20 –
8 Wacoal Holdings Corp 94 0.01
8 Wacom Co Ltd 22 –
24 Wakachiku Construction Co Ltd 35 –
3 Wakita & Co Ltd 25 –
2 Warabeya Nichiyo Holdings Co Ltd 32 –
– WATAMI Co Ltd 4 –
1 Weathernews Inc 30 –
1 Welcia Holdings Co Ltd 81 0.01
6 West Japan Railway Co 362 0.02
3 Xebio Holdings Co Ltd 54 –
4 Yahagi Construction Co Ltd 39 –
40 Yahoo Japan Corp 145 0.01
3 Yakult Honsha Co Ltd 115 0.01
2 Yamabiko Corp 24 –
31 Yamada Denki Co Ltd 166 0.01
9 Yamagata Bank Ltd 37 –
14 Yamaguchi Financial Group Inc 147 0.01
6 Yamaha Corp 173 0.01
21 Yamaha Motor Co Ltd 484 0.03
4 Yamaichi Electronics Co Ltd 37 –
11 Yamanashi Chuo Bank Ltd 49 –
2 Yamatane Corp 24 –
12 Yamato Holdings Co Ltd 238 0.02
3 Yamato Kogyo Co Ltd 98 0.01
7 Yamazaki Baking Co Ltd 148 0.01
4 Yamazen Corp 34 –
Shares (000's)
Value (000's)
USD
% of Net Asset Value
Common Stock (continued)
Japan - 9.42% (continued)
1 Yaoko Co Ltd 46 –
17 Yaskawa Electric Corp 265 0.02
2 Yasuda Logistics Corp 10 –
1 Yellow Hat Ltd 29 –
2 Yodogawa Steel Works Ltd 50 –
2 Yokogawa Bridge Holdings Corp 24 –
19 Yokogawa Electric Corp 270 0.02
5 Yokohama Reito Co Ltd 45 –
10 Yokohama Rubber Co Ltd 191 0.01
1 Yomeishu Seizo Co Ltd 11 –
2 Yondoshi Holdings Inc 37 –
2 Yorozu Corp 24 –
2 Yuasa Trading Co Ltd 45 –
5 Yurtec Corp 34 –
2 Yusen Logistics Co Ltd 19 –
2 Yushiro Chemical Industry Co Ltd 20 –
3 Zenkoku Hosho Co Ltd 96 0.01
2 Zenrin Co Ltd 27 –
8 Zensho Holdings Co Ltd 134 0.01
11 Zeon Corp 101 0.01
2 ZERIA Pharmaceutical Co Ltd 25 –
2 Zojirushi Corp 31 –
1 Zuiko Corp 22 –
3 Zuken Inc 27 –
161,134 9.42
Netherlands - 1.00%
6 Aalberts Industries NV 175 0.01
2 Accell Group 49 –
94 Aegon NV 475 0.03
19 Akzo Nobel NV 1,165 0.07
24 Altice NV, Class A 407 0.02
6 Altice NV, Class B 109 0.01
3 AMG Advanced Metallurgical Group NV 49 –
1 Amsterdam Commodities NV 23 –
4 APERAM SA 195 0.01
5 Arcadis NV 55 –
85 ArcelorMittal 636 0.04
5 ASM International NV 205 0.01
6 ASML Holding NV (Norway listing) 653 0.04
1 ASML Holding NV (US listing) 103 0.01
3 BE Semiconductor Industries NV 86 0.01
1 Beter Bed Holding NV 23 –
5 BinckBank NV 29 –
7 Boskalis Westminster 219 0.01
2 Brunel International NV 31 –
11 Coca-Cola European Partners PLC 345 0.02
4 Corbion NV 107 0.01
42 Delta Lloyd NV 241 0.01
3 Eurocommercial Properties NV 123 0.01
3 Fugro NV 48 –
6 Gemalto NV 291 0.02
4 GrandVision NV 79 –
2 Heijmans NV 10 –
7 Heineken NV 555 0.03
1 Hunter Douglas NV 28 –
3 IMCD Group NV 133 0.01
94 ING Groep NV 1,282 0.08
1 KAS Bank NV 10 –
2 Kendrion NV 43 –
65 Koninklijke Ahold Delhaize NV 1,271 0.07
18 Koninklijke BAM Groep NV 79 –
8 Koninklijke DSM NV 481 0.03
230 Koninklijke KPN NV 660 0.04

Global Core Equity Fund
Portfolio of Investments as at 30 November 2016 (continued)
Dimensional Fund Advisors Annual Report and Audited Financial Statements, 30 November 2016 100
Shares (000's)
Value (000's)
USD
% of Net Asset Value
Common Stock (continued)
Netherlands - 1.00% (continued)
41 Koninklijke Philips NV 1,183 0.07
6 Koninklijke Vopak NV 283 0.02
13 NN Group NV 430 0.03
3 NXP Semiconductors NV 293 0.02
8 Ordina NV 16 –
32 PostNL NV 159 0.01
9 Randstad Holding NV 454 0.03
41 RELX NV 662 0.04
18 SBM Offshore NV 256 0.02
2 Sligro Food Group NV 81 0.01
2 Telegraaf Media Groep NV 9 –
2 TKH Group NV 64 –
7 TomTom NV 53 –
48 Unilever NV 1,918 0.11
4 Wessanen 54 –
19 Wolters Kluwer NV 672 0.04
17,060 1.00
New Zealand - 0.16%
25 a2 Milk Co Ltd 43 –
46 Air New Zealand Ltd 71 –
54 Argosy Property Ltd 40 –
20 Arvida Group Ltd 17 –
25 Auckland International Airport Ltd 107 0.01
32 Chorus Ltd 90 0.01
44 Contact Energy Ltd 147 0.01
7 Ebos Group Ltd 80 0.01
31 Fisher & Paykel Healthcare Corp Ltd 180 0.01
38 Fletcher Building Ltd 278 0.02
5 Fonterra Co-operative Group Ltd 23 –
8 Freightways Ltd 36 –
25 Genesis Energy Ltd 35 –
37 Heartland Bank Ltd 40 –
32 Infratil Ltd 63 –
4 Investore Property Ltd 5 –
3 Kathmandu Holdings Ltd 5 –
87 Kiwi Property Group Ltd 90 0.01
6 Mainfreight Ltd 83 0.01
31 Mercury NZ Ltd 66 –
61 Meridian Energy Ltd 111 0.01
9 Metlifecare Ltd 37 –
8 Metro Performance Glass Ltd 10 –
12 New Zealand Refining Co Ltd 22 –
17 NZME Ltd 7 –
10 Port of Tauranga Ltd 27 –
58 Precinct Properties New Zealand Ltd 49 –
23 Property for Industry Ltd 25 –
7 Restaurant Brands New Zealand Ltd 25 –
13 Ryman Healthcare Ltd 79 0.01
8 Scales Corp Ltd 19 –
13 Skellerup Holdings Ltd 14 –
30 SKY Network Television Ltd 102 0.01
42 SKYCITY Entertainment Group Ltd 117 0.01
95 Spark New Zealand Ltd 245 0.01
19 Steel & Tube Holdings Ltd 32 –
18 Stride Property Group 23 –
19 Summerset Group Holdings Ltd 65 –
4 Tilt Renewables Ltd 5 –
6 Tourism Holdings Ltd 13 –
8 Tower Ltd 4 –
23 Trade Me Group Ltd 79 0.01
4 Trustpower Ltd 12 –
14 Vector Ltd 32 –
10 Warehouse Group Ltd 20 –
Shares (000's)
Value (000's)
USD
% of Net Asset Value
Common Stock (continued)
New Zealand - 0.16% (continued)
2 Xero Ltd 23 –
16 Z Energy Ltd 82 0.01
2,778 0.16
Norway - 0.28%
34 ABG Sundal Collier Holding ASA 19 –
1 AF Gruppen ASA 15 –
8 Akastor ASA 11 –
3 Aker ASA 113 0.01
10 Aker BP ASA 166 0.01
16 Aker Solutions ASA 71 0.01
2 American Shipping Co ASA 5 –
4 Atea ASA 36 –
8 Austevoll Seafood ASA 72 0.01
2 Bakkafrost P/F 104 0.01
3 Bonheur ASA 22 –
7 Borregaard ASA 75 0.01
8 BW LPG Ltd 27 –
475 BW Offshore Ltd 22 –
26 DNB ASA 383 0.02
20 DNO ASA 17 –
1 Ekornes ASA 14 –
5 Entra ASA 49 –
5 Fred Olsen Energy ASA 8 –
5 Frontline Ltd 39 –
4 Gjensidige Forsikring ASA 57 –
– Golar LNG Ltd 9 –
5 Grieg Seafood ASA 48 –
4 Hexagon Composites ASA 13 –
2 Hoegh LNG Holdings Ltd 16 –
52 Kongsberg Automotive ASA 35 –
3 Kongsberg Gruppen ASA 36 –
9 Kvaerner ASA 11 –
2 Leroy Seafood Group ASA 108 0.01
15 Marine Harvest ASA 272 0.02
11 Nordic Semiconductor ASA 43 –
43 Norsk Hydro ASA 203 0.01
2 Norwegian Air Shuttle ASA 60 –
4 Ocean Yield ASA 34 –
1 Olav Thon Eiendomsselskap ASA 25 –
4 Opera Software ASA 24 –
20 Orkla ASA 176 0.01
17 Petroleum Geo-Services ASA 50 –
49 Prosafe SE 2 –
3 Protector Forsikring ASA 27 –
139 REC Silicon ASA 15 –
3 Salmar ASA 102 0.01
5 Scatec Solar ASA 19 –
4 Schibsted ASA, Class A 78 0.01
3 Schibsted ASA, Class B 62 –
32 Seadrill Ltd 92 0.01
4 Selvaag Bolig ASA 20 –
– Solstad Offshore ASA – –
11 SpareBank 1 SR-Bank ASA 70 0.01
23 Statoil ASA 407 0.02
2 Stolt-Nielsen Ltd 26 –
25 Storebrand ASA 129 0.01
21 Subsea 7 SA 249 0.02
24 Telenor ASA 351 0.02
10 TGS Nopec Geophysical Co ASA 189 0.01
6 Tomra Systems ASA 58 –
5 Treasure ASA 9 –
6 Veidekke ASA 89 0.01
5 Wilh Wilhelmsen ASA 17 –
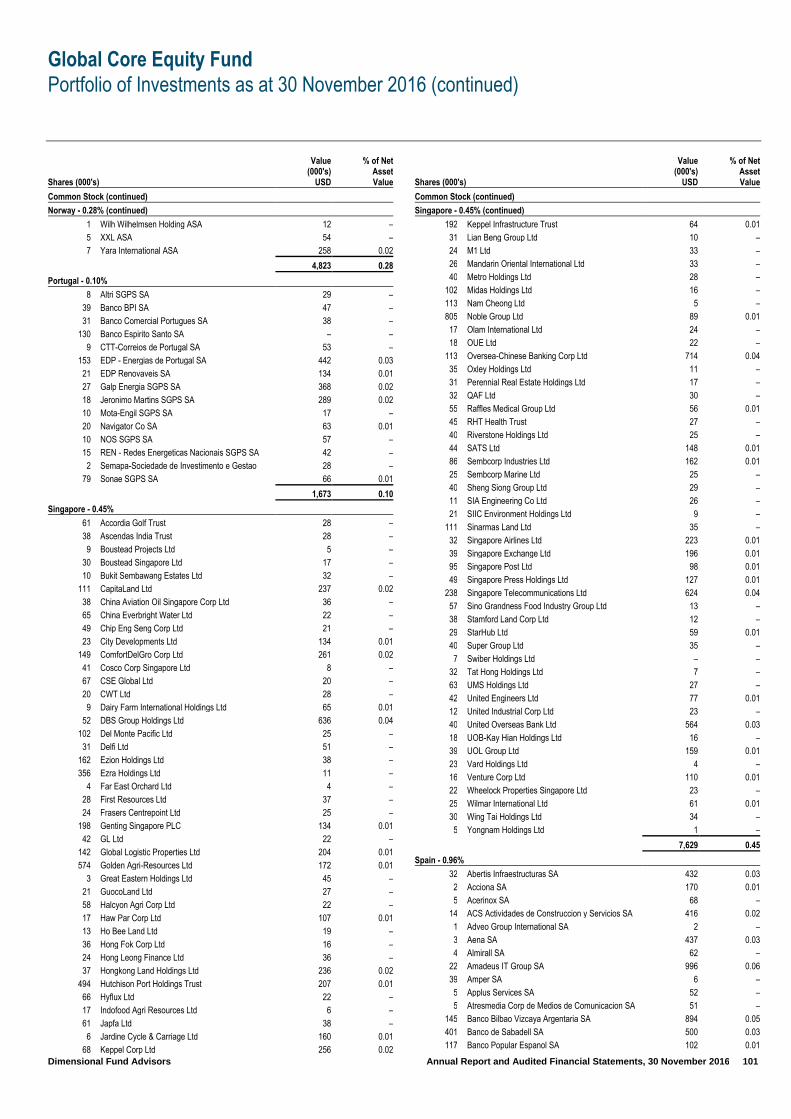
Global Core Equity Fund
Portfolio of Investments as at 30 November 2016 (continued)
Dimensional Fund Advisors Annual Report and Audited Financial Statements, 30 November 2016 101
Shares (000's)
Value (000's)
USD
% of Net Asset Value
Common Stock (continued)
Norway - 0.28% (continued)
1 Wilh Wilhelmsen Holding ASA 12 –
5 XXL ASA 54 –
7 Yara International ASA 258 0.02
4,823 0.28
Portugal - 0.10%
8 Altri SGPS SA 29 –
39 Banco BPI SA 47 –
31 Banco Comercial Portugues SA 38 –
130 Banco Espirito Santo SA – –
9 CTT-Correios de Portugal SA 53 –
153 EDP - Energias de Portugal SA 442 0.03
21 EDP Renovaveis SA 134 0.01
27 Galp Energia SGPS SA 368 0.02
18 Jeronimo Martins SGPS SA 289 0.02
10 Mota-Engil SGPS SA 17 –
20 Navigator Co SA 63 0.01
10 NOS SGPS SA 57 –
15 REN - Redes Energeticas Nacionais SGPS SA 42 –
2 Semapa-Sociedade de Investimento e Gestao 28 –
79 Sonae SGPS SA 66 0.01
1,673 0.10
Singapore - 0.45%
61 Accordia Golf Trust 28 –
38 Ascendas India Trust 28 –
9 Boustead Projects Ltd 5 –
30 Boustead Singapore Ltd 17 –
10 Bukit Sembawang Estates Ltd 32 –
111 CapitaLand Ltd 237 0.02
38 China Aviation Oil Singapore Corp Ltd 36 –
65 China Everbright Water Ltd 22 –
49 Chip Eng Seng Corp Ltd 21 –
23 City Developments Ltd 134 0.01
149 ComfortDelGro Corp Ltd 261 0.02
41 Cosco Corp Singapore Ltd 8 –
67 CSE Global Ltd 20 –
20 CWT Ltd 28 –
9 Dairy Farm International Holdings Ltd 65 0.01
52 DBS Group Holdings Ltd 636 0.04
102 Del Monte Pacific Ltd 25 –
31 Delfi Ltd 51 –
162 Ezion Holdings Ltd 38 –
356 Ezra Holdings Ltd 11 –
4 Far East Orchard Ltd 4 –
28 First Resources Ltd 37 –
24 Frasers Centrepoint Ltd 25 –
198 Genting Singapore PLC 134 0.01
42 GL Ltd 22 –
142 Global Logistic Properties Ltd 204 0.01
574 Golden Agri-Resources Ltd 172 0.01
3 Great Eastern Holdings Ltd 45 –
21 GuocoLand Ltd 27 –
58 Halcyon Agri Corp Ltd 22 –
17 Haw Par Corp Ltd 107 0.01
13 Ho Bee Land Ltd 19 –
36 Hong Fok Corp Ltd 16 –
24 Hong Leong Finance Ltd 36 –
37 Hongkong Land Holdings Ltd 236 0.02
494 Hutchison Port Holdings Trust 207 0.01
66 Hyflux Ltd 22 –
17 Indofood Agri Resources Ltd 6 –
61 Japfa Ltd 38 –
6 Jardine Cycle & Carriage Ltd 160 0.01
68 Keppel Corp Ltd 256 0.02
Shares (000's)
Value (000's)
USD
% of Net Asset Value
Common Stock (continued)
Singapore - 0.45% (continued)
192 Keppel Infrastructure Trust 64 0.01
31 Lian Beng Group Ltd 10 –
24 M1 Ltd 33 –
26 Mandarin Oriental International Ltd 33 –
40 Metro Holdings Ltd 28 –
102 Midas Holdings Ltd 16 –
113 Nam Cheong Ltd 5 –
805 Noble Group Ltd 89 0.01
17 Olam International Ltd 24 –
18 OUE Ltd 22 –
113 Oversea-Chinese Banking Corp Ltd 714 0.04
35 Oxley Holdings Ltd 11 –
31 Perennial Real Estate Holdings Ltd 17 –
32 QAF Ltd 30 –
55 Raffles Medical Group Ltd 56 0.01
45 RHT Health Trust 27 –
40 Riverstone Holdings Ltd 25 –
44 SATS Ltd 148 0.01
86 Sembcorp Industries Ltd 162 0.01
25 Sembcorp Marine Ltd 25 –
40 Sheng Siong Group Ltd 29 –
11 SIA Engineering Co Ltd 26 –
21 SIIC Environment Holdings Ltd 9 –
111 Sinarmas Land Ltd 35 –
32 Singapore Airlines Ltd 223 0.01
39 Singapore Exchange Ltd 196 0.01
95 Singapore Post Ltd 98 0.01
49 Singapore Press Holdings Ltd 127 0.01
238 Singapore Telecommunications Ltd 624 0.04
57 Sino Grandness Food Industry Group Ltd 13 –
38 Stamford Land Corp Ltd 12 –
29 StarHub Ltd 59 0.01
40 Super Group Ltd 35 –
7 Swiber Holdings Ltd – –
32 Tat Hong Holdings Ltd 7 –
63 UMS Holdings Ltd 27 –
42 United Engineers Ltd 77 0.01
12 United Industrial Corp Ltd 23 –
40 United Overseas Bank Ltd 564 0.03
18 UOB-Kay Hian Holdings Ltd 16 –
39 UOL Group Ltd 159 0.01
23 Vard Holdings Ltd 4 –
16 Venture Corp Ltd 110 0.01
22 Wheelock Properties Singapore Ltd 23 –
25 Wilmar International Ltd 61 0.01
30 Wing Tai Holdings Ltd 34 –
5 Yongnam Holdings Ltd 1 –
7,629 0.45
Spain - 0.96%
32 Abertis Infraestructuras SA 432 0.03
2 Acciona SA 170 0.01
5 Acerinox SA 68 –
14 ACS Actividades de Construccion y Servicios SA 416 0.02
1 Adveo Group International SA 2 –
3 Aena SA 437 0.03
4 Almirall SA 62 –
22 Amadeus IT Group SA 996 0.06
39 Amper SA 6 –
5 Applus Services SA 52 –
5 Atresmedia Corp de Medios de Comunicacion SA 51 –
145 Banco Bilbao Vizcaya Argentaria SA 894 0.05
401 Banco de Sabadell SA 500 0.03
117 Banco Popular Espanol SA 102 0.01
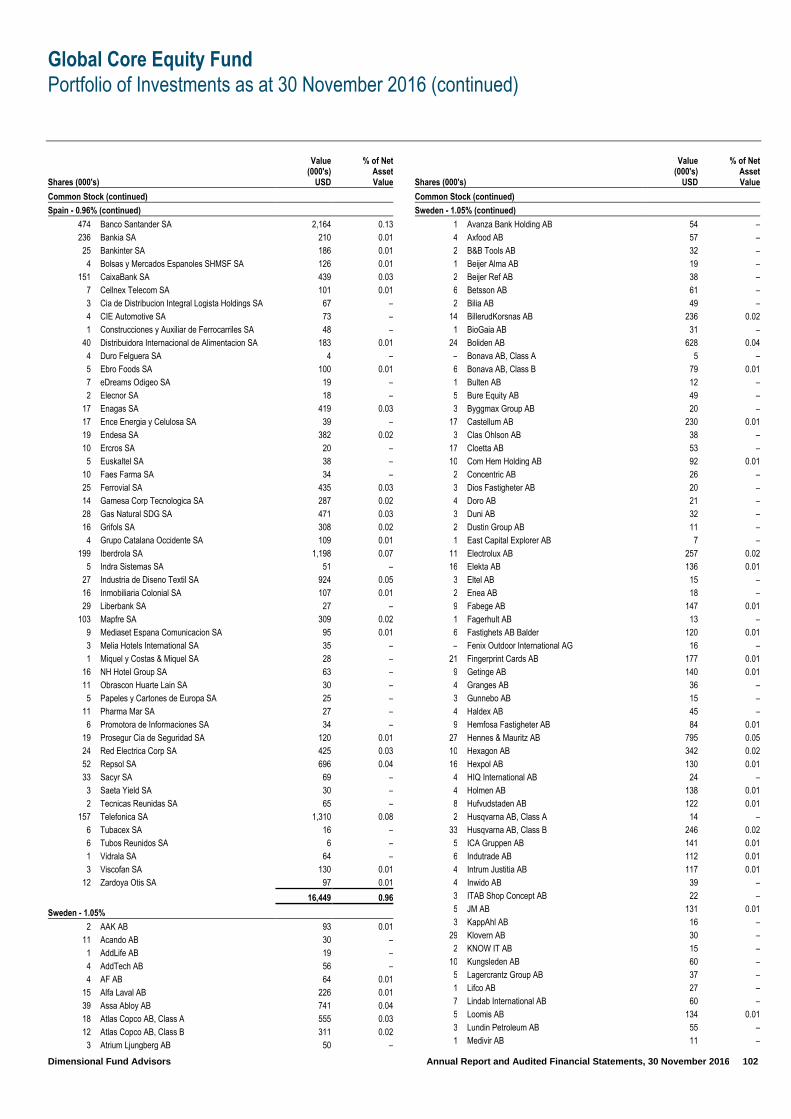
Global Core Equity Fund
Portfolio of Investments as at 30 November 2016 (continued)
Dimensional Fund Advisors Annual Report and Audited Financial Statements, 30 November 2016 102
Shares (000's)
Value (000's)
USD
% of Net Asset Value
Common Stock (continued)
Spain - 0.96% (continued)
474 Banco Santander SA 2,164 0.13
236 Bankia SA 210 0.01
25 Bankinter SA 186 0.01
4 Bolsas y Mercados Espanoles SHMSF SA 126 0.01
151 CaixaBank SA 439 0.03
7 Cellnex Telecom SA 101 0.01
3 Cia de Distribucion Integral Logista Holdings SA 67 –
4 CIE Automotive SA 73 –
1 Construcciones y Auxiliar de Ferrocarriles SA 48 –
40 Distribuidora Internacional de Alimentacion SA 183 0.01
4 Duro Felguera SA 4 –
5 Ebro Foods SA 100 0.01
7 eDreams Odigeo SA 19 –
2 Elecnor SA 18 –
17 Enagas SA 419 0.03
17 Ence Energia y Celulosa SA 39 –
19 Endesa SA 382 0.02
10 Ercros SA 20 –
5 Euskaltel SA 38 –
10 Faes Farma SA 34 –
25 Ferrovial SA 435 0.03
14 Gamesa Corp Tecnologica SA 287 0.02
28 Gas Natural SDG SA 471 0.03
16 Grifols SA 308 0.02
4 Grupo Catalana Occidente SA 109 0.01
199 Iberdrola SA 1,198 0.07
5 Indra Sistemas SA 51 –
27 Industria de Diseno Textil SA 924 0.05
16 Inmobiliaria Colonial SA 107 0.01
29 Liberbank SA 27 –
103 Mapfre SA 309 0.02
9 Mediaset Espana Comunicacion SA 95 0.01
3 Melia Hotels International SA 35 –
1 Miquel y Costas & Miquel SA 28 –
16 NH Hotel Group SA 63 –
11 Obrascon Huarte Lain SA 30 –
5 Papeles y Cartones de Europa SA 25 –
11 Pharma Mar SA 27 –
6 Promotora de Informaciones SA 34 –
19 Prosegur Cia de Seguridad SA 120 0.01
24 Red Electrica Corp SA 425 0.03
52 Repsol SA 696 0.04
33 Sacyr SA 69 –
3 Saeta Yield SA 30 –
2 Tecnicas Reunidas SA 65 –
157 Telefonica SA 1,310 0.08
6 Tubacex SA 16 –
6 Tubos Reunidos SA 6 –
1 Vidrala SA 64 –
3 Viscofan SA 130 0.01
12 Zardoya Otis SA 97 0.01
16,449 0.96
Sweden - 1.05%
2 AAK AB 93 0.01
11 Acando AB 30 –
1 AddLife AB 19 –
4 AddTech AB 56 –
4 AF AB 64 0.01
15 Alfa Laval AB 226 0.01
39 Assa Abloy AB 741 0.04
18 Atlas Copco AB, Class A 555 0.03
12 Atlas Copco AB, Class B 311 0.02
3 Atrium Ljungberg AB 50 –
Shares (000's)
Value (000's)
USD
% of Net Asset Value
Common Stock (continued)
Sweden - 1.05% (continued)
1 Avanza Bank Holding AB 54 –
4 Axfood AB 57 –
2 B&B Tools AB 32 –
1 Beijer Alma AB 19 –
2 Beijer Ref AB 38 –
6 Betsson AB 61 –
2 Bilia AB 49 –
14 BillerudKorsnas AB 236 0.02
1 BioGaia AB 31 –
24 Boliden AB 628 0.04
– Bonava AB, Class A 5 –
6 Bonava AB, Class B 79 0.01
1 Bulten AB 12 –
5 Bure Equity AB 49 –
3 Byggmax Group AB 20 –
17 Castellum AB 230 0.01
3 Clas Ohlson AB 38 –
17 Cloetta AB 53 –
10 Com Hem Holding AB 92 0.01
2 Concentric AB 26 –
3 Dios Fastigheter AB 20 –
4 Doro AB 21 –
3 Duni AB 32 –
2 Dustin Group AB 11 –
1 East Capital Explorer AB 7 –
11 Electrolux AB 257 0.02
16 Elekta AB 136 0.01
3 Eltel AB 15 –
2 Enea AB 18 –
9 Fabege AB 147 0.01
1 Fagerhult AB 13 –
6 Fastighets AB Balder 120 0.01
– Fenix Outdoor International AG 16 –
21 Fingerprint Cards AB 177 0.01
9 Getinge AB 140 0.01
4 Granges AB 36 –
3 Gunnebo AB 15 –
4 Haldex AB 45 –
9 Hemfosa Fastigheter AB 84 0.01
27 Hennes & Mauritz AB 795 0.05
10 Hexagon AB 342 0.02
16 Hexpol AB 130 0.01
4 HIQ International AB 24 –
4 Holmen AB 138 0.01
8 Hufvudstaden AB 122 0.01
2 Husqvarna AB, Class A 14 –
33 Husqvarna AB, Class B 246 0.02
5 ICA Gruppen AB 141 0.01
6 Indutrade AB 112 0.01
4 Intrum Justitia AB 117 0.01
4 Inwido AB 39 –
3 ITAB Shop Concept AB 22 –
5 JM AB 131 0.01
3 KappAhl AB 16 –
29 Klovern AB 30 –
2 KNOW IT AB 15 –
10 Kungsleden AB 60 –
5 Lagercrantz Group AB 37 –
1 Lifco AB 27 –
7 Lindab International AB 60 –
5 Loomis AB 134 0.01
3 Lundin Petroleum AB 55 –
1 Medivir AB 11 –
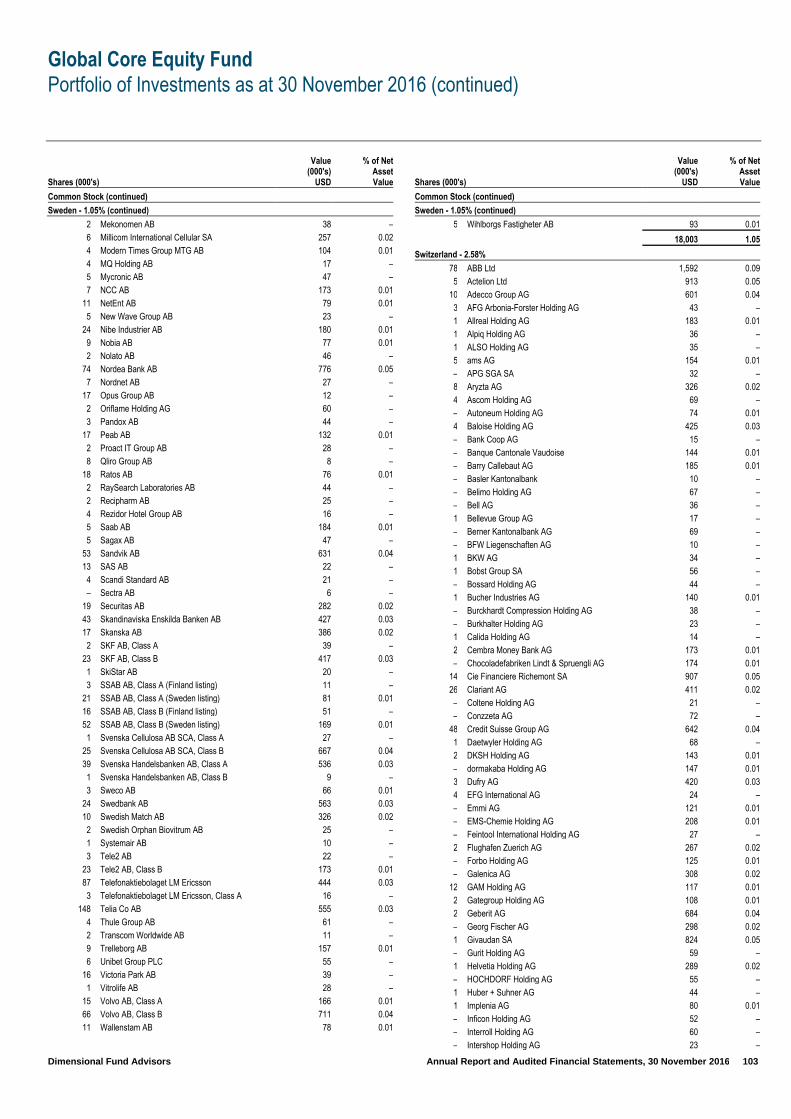
Global Core Equity Fund
Portfolio of Investments as at 30 November 2016 (continued)
Dimensional Fund Advisors Annual Report and Audited Financial Statements, 30 November 2016 103
Shares (000's)
Value (000's)
USD
% of Net Asset Value
Common Stock (continued)
Sweden - 1.05% (continued)
2 Mekonomen AB 38 –
6 Millicom International Cellular SA 257 0.02
4 Modern Times Group MTG AB 104 0.01
4 MQ Holding AB 17 –
5 Mycronic AB 47 –
7 NCC AB 173 0.01
11 NetEnt AB 79 0.01
5 New Wave Group AB 23 –
24 Nibe Industrier AB 180 0.01
9 Nobia AB 77 0.01
2 Nolato AB 46 –
74 Nordea Bank AB 776 0.05
7 Nordnet AB 27 –
17 Opus Group AB 12 –
2 Oriflame Holding AG 60 –
3 Pandox AB 44 –
17 Peab AB 132 0.01
2 Proact IT Group AB 28 –
8 Qliro Group AB 8 –
18 Ratos AB 76 0.01
2 RaySearch Laboratories AB 44 –
2 Recipharm AB 25 –
4 Rezidor Hotel Group AB 16 –
5 Saab AB 184 0.01
5 Sagax AB 47 –
53 Sandvik AB 631 0.04
13 SAS AB 22 –
4 Scandi Standard AB 21 –
– Sectra AB 6 –
19 Securitas AB 282 0.02
43 Skandinaviska Enskilda Banken AB 427 0.03
17 Skanska AB 386 0.02
2 SKF AB, Class A 39 –
23 SKF AB, Class B 417 0.03
1 SkiStar AB 20 –
3 SSAB AB, Class A (Finland listing) 11 –
21 SSAB AB, Class A (Sweden listing) 81 0.01
16 SSAB AB, Class B (Finland listing) 51 –
52 SSAB AB, Class B (Sweden listing) 169 0.01
1 Svenska Cellulosa AB SCA, Class A 27 –
25 Svenska Cellulosa AB SCA, Class B 667 0.04
39 Svenska Handelsbanken AB, Class A 536 0.03
1 Svenska Handelsbanken AB, Class B 9 –
3 Sweco AB 66 0.01
24 Swedbank AB 563 0.03
10 Swedish Match AB 326 0.02
2 Swedish Orphan Biovitrum AB 25 –
1 Systemair AB 10 –
3 Tele2 AB 22 –
23 Tele2 AB, Class B 173 0.01
87 Telefonaktiebolaget LM Ericsson 444 0.03
3 Telefonaktiebolaget LM Ericsson, Class A 16 –
148 Telia Co AB 555 0.03
4 Thule Group AB 61 –
2 Transcom Worldwide AB 11 –
9 Trelleborg AB 157 0.01
6 Unibet Group PLC 55 –
16 Victoria Park AB 39 –
1 Vitrolife AB 28 –
15 Volvo AB, Class A 166 0.01
66 Volvo AB, Class B 711 0.04
11 Wallenstam AB 78 0.01
Shares (000's)
Value (000's)
USD
% of Net Asset Value
Common Stock (continued)
Sweden - 1.05% (continued)
5 Wihlborgs Fastigheter AB 93 0.01
18,003 1.05
Switzerland - 2.58%
78 ABB Ltd 1,592 0.09
5 Actelion Ltd 913 0.05
10 Adecco Group AG 601 0.04
3 AFG Arbonia-Forster Holding AG 43 –
1 Allreal Holding AG 183 0.01
1 Alpiq Holding AG 36 –
1 ALSO Holding AG 35 –
5 ams AG 154 0.01
– APG SGA SA 32 –
8 Aryzta AG 326 0.02
4 Ascom Holding AG 69 –
– Autoneum Holding AG 74 0.01
4 Baloise Holding AG 425 0.03
– Bank Coop AG 15 –
– Banque Cantonale Vaudoise 144 0.01
– Barry Callebaut AG 185 0.01
– Basler Kantonalbank 10 –
– Belimo Holding AG 67 –
– Bell AG 36 –
1 Bellevue Group AG 17 –
– Berner Kantonalbank AG 69 –
– BFW Liegenschaften AG 10 –
1 BKW AG 34 –
1 Bobst Group SA 56 –
– Bossard Holding AG 44 –
1 Bucher Industries AG 140 0.01
– Burckhardt Compression Holding AG 38 –
– Burkhalter Holding AG 23 –
1 Calida Holding AG 14 –
2 Cembra Money Bank AG 173 0.01
– Chocoladefabriken Lindt & Spruengli AG 174 0.01
14 Cie Financiere Richemont SA 907 0.05
26 Clariant AG 411 0.02
– Coltene Holding AG 21 –
– Conzzeta AG 72 –
48 Credit Suisse Group AG 642 0.04
1 Daetwyler Holding AG 68 –
2 DKSH Holding AG 143 0.01
– dormakaba Holding AG 147 0.01
3 Dufry AG 420 0.03
4 EFG International AG 24 –
– Emmi AG 121 0.01
– EMS-Chemie Holding AG 208 0.01
– Feintool International Holding AG 27 –
2 Flughafen Zuerich AG 267 0.02
– Forbo Holding AG 125 0.01
– Galenica AG 308 0.02
12 GAM Holding AG 117 0.01
2 Gategroup Holding AG 108 0.01
2 Geberit AG 684 0.04
– Georg Fischer AG 298 0.02
1 Givaudan SA 824 0.05
– Gurit Holding AG 59 –
1 Helvetia Holding AG 289 0.02
– HOCHDORF Holding AG 55 –
1 Huber + Suhner AG 44 –
1 Implenia AG 80 0.01
– Inficon Holding AG 52 –
– Interroll Holding AG 60 –
– Intershop Holding AG 23 –
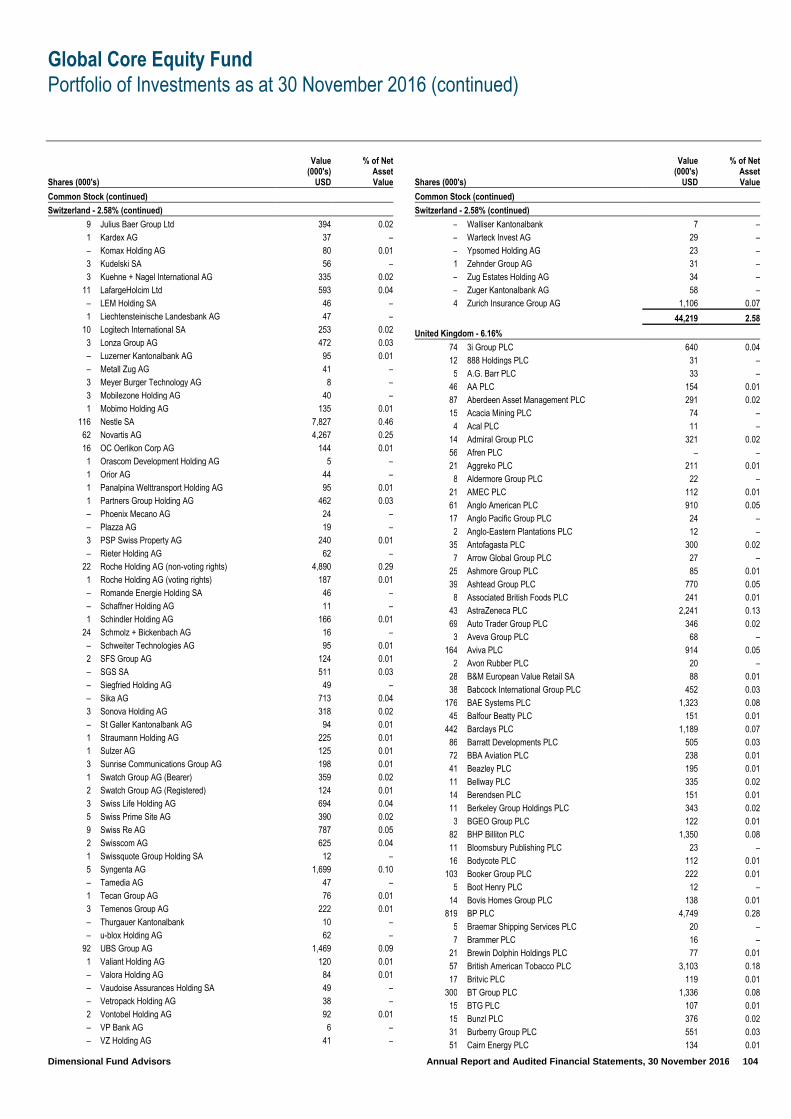
Global Core Equity Fund
Portfolio of Investments as at 30 November 2016 (continued)
Dimensional Fund Advisors Annual Report and Audited Financial Statements, 30 November 2016 104
Shares (000's)
Value (000's)
USD
% of Net Asset Value
Common Stock (continued)
Switzerland - 2.58% (continued)
9 Julius Baer Group Ltd 394 0.02
1 Kardex AG 37 –
– Komax Holding AG 80 0.01
3 Kudelski SA 56 –
3 Kuehne + Nagel International AG 335 0.02
11 LafargeHolcim Ltd 593 0.04
– LEM Holding SA 46 –
1 Liechtensteinische Landesbank AG 47 –
10 Logitech International SA 253 0.02
3 Lonza Group AG 472 0.03
– Luzerner Kantonalbank AG 95 0.01
– Metall Zug AG 41 –
3 Meyer Burger Technology AG 8 –
3 Mobilezone Holding AG 40 –
1 Mobimo Holding AG 135 0.01
116 Nestle SA 7,827 0.46
62 Novartis AG 4,267 0.25
16 OC Oerlikon Corp AG 144 0.01
1 Orascom Development Holding AG 5 –
1 Orior AG 44 –
1 Panalpina Welttransport Holding AG 95 0.01
1 Partners Group Holding AG 462 0.03
– Phoenix Mecano AG 24 –
– Plazza AG 19 –
3 PSP Swiss Property AG 240 0.01
– Rieter Holding AG 62 –
22 Roche Holding AG (non-voting rights) 4,890 0.29
1 Roche Holding AG (voting rights) 187 0.01
– Romande Energie Holding SA 46 –
– Schaffner Holding AG 11 –
1 Schindler Holding AG 166 0.01
24 Schmolz + Bickenbach AG 16 –
– Schweiter Technologies AG 95 0.01
2 SFS Group AG 124 0.01
– SGS SA 511 0.03
– Siegfried Holding AG 49 –
– Sika AG 713 0.04
3 Sonova Holding AG 318 0.02
– St Galler Kantonalbank AG 94 0.01
1 Straumann Holding AG 225 0.01
1 Sulzer AG 125 0.01
3 Sunrise Communications Group AG 198 0.01
1 Swatch Group AG (Bearer) 359 0.02
2 Swatch Group AG (Registered) 124 0.01
3 Swiss Life Holding AG 694 0.04
5 Swiss Prime Site AG 390 0.02
9 Swiss Re AG 787 0.05
2 Swisscom AG 625 0.04
1 Swissquote Group Holding SA 12 –
5 Syngenta AG 1,699 0.10
– Tamedia AG 47 –
1 Tecan Group AG 76 0.01
3 Temenos Group AG 222 0.01
– Thurgauer Kantonalbank 10 –
– u-blox Holding AG 62 –
92 UBS Group AG 1,469 0.09
1 Valiant Holding AG 120 0.01
– Valora Holding AG 84 0.01
– Vaudoise Assurances Holding SA 49 –
– Vetropack Holding AG 38 –
2 Vontobel Holding AG 92 0.01
– VP Bank AG 6 –
– VZ Holding AG 41 –
Shares (000's)
Value (000's)
USD
% of Net Asset Value
Common Stock (continued)
Switzerland - 2.58% (continued)
– Walliser Kantonalbank 7 –
– Warteck Invest AG 29 –
– Ypsomed Holding AG 23 –
1 Zehnder Group AG 31 –
– Zug Estates Holding AG 34 –
– Zuger Kantonalbank AG 58 –
4 Zurich Insurance Group AG 1,106 0.07
44,219 2.58
United Kingdom - 6.16%
74 3i Group PLC 640 0.04
12 888 Holdings PLC 31 –
5 A.G. Barr PLC 33 –
46 AA PLC 154 0.01
87 Aberdeen Asset Management PLC 291 0.02
15 Acacia Mining PLC 74 –
4 Acal PLC 11 –
14 Admiral Group PLC 321 0.02
56 Afren PLC – –
21 Aggreko PLC 211 0.01
8 Aldermore Group PLC 22 –
21 AMEC PLC 112 0.01
61 Anglo American PLC 910 0.05
17 Anglo Pacific Group PLC 24 –
2 Anglo-Eastern Plantations PLC 12 –
35 Antofagasta PLC 300 0.02
7 Arrow Global Group PLC 27 –
25 Ashmore Group PLC 85 0.01
39 Ashtead Group PLC 770 0.05
8 Associated British Foods PLC 241 0.01
43 AstraZeneca PLC 2,241 0.13
69 Auto Trader Group PLC 346 0.02
3 Aveva Group PLC 68 –
164 Aviva PLC 914 0.05
2 Avon Rubber PLC 20 –
28 B&M European Value Retail SA 88 0.01
38 Babcock International Group PLC 452 0.03
176 BAE Systems PLC 1,323 0.08
45 Balfour Beatty PLC 151 0.01
442 Barclays PLC 1,189 0.07
86 Barratt Developments PLC 505 0.03
72 BBA Aviation PLC 238 0.01
41 Beazley PLC 195 0.01
11 Bellway PLC 335 0.02
14 Berendsen PLC 151 0.01
11 Berkeley Group Holdings PLC 343 0.02
3 BGEO Group PLC 122 0.01
82 BHP Billiton PLC 1,350 0.08
11 Bloomsbury Publishing PLC 23 –
16 Bodycote PLC 112 0.01
103 Booker Group PLC 222 0.01
5 Boot Henry PLC 12 –
14 Bovis Homes Group PLC 138 0.01
819 BP PLC 4,749 0.28
5 Braemar Shipping Services PLC 20 –
7 Brammer PLC 16 –
21 Brewin Dolphin Holdings PLC 77 0.01
57 British American Tobacco PLC 3,103 0.18
17 Britvic PLC 119 0.01
300 BT Group PLC 1,336 0.08
15 BTG PLC 107 0.01
15 Bunzl PLC 376 0.02
31 Burberry Group PLC 551 0.03
51 Cairn Energy PLC 134 0.01

Global Core Equity Fund
Portfolio of Investments as at 30 November 2016 (continued)
Dimensional Fund Advisors Annual Report and Audited Financial Statements, 30 November 2016 105
Shares (000's)
Value (000's)
USD
% of Net Asset Value
Common Stock (continued)
United Kingdom - 6.16% (continued)
6 Cambian Group PLC 9 –
11 Cape PLC 19 –
33 Capita PLC 214 0.01
48 Capital & Counties Properties PLC 170 0.01
11 Card Factory PLC 35 –
43 Carillion PLC 132 0.01
4 Carnival PLC 228 0.01
2 Castings PLC 8 –
96 Centamin PLC 157 0.01
310 Centrica PLC 815 0.05
21 Chemring Group PLC 44 –
4 Chesnara PLC 15 –
14 Cineworld Group PLC 96 0.01
6 Circassia Pharmaceuticals Plc 7 –
2 Clarkson PLC 49 –
13 Close Brothers Group PLC 222 0.01
1 CLS Holdings PLC 23 –
123 Cobham PLC 252 0.02
15 Coca-Cola HBC AG 314 0.02
21 Communisis PLC 10 –
57 Compass Group PLC 968 0.06
8 Computacenter PLC 72 –
2 Consort Medical PLC 30 –
5 Costain Group PLC 21 –
9 Countrywide PLC 19 –
3 Cranswick PLC 72 –
19 Crest Nicholson Holdings plc 102 0.01
9 Croda International PLC 386 0.02
16 CYBG PLC 56 –
1 Daejan Holdings PLC 50 –
16 Daily Mail & General Trust PLC 149 0.01
9 Dairy Crest Group PLC 64 –
4 DCC PLC 335 0.02
9 De La Rue PLC 66 –
95 Debenhams PLC 65 –
4 Dechra Pharmaceuticals PLC 72 –
16 Devro PLC 28 –
80 Diageo PLC 2,013 0.12
3 Dialight PLC 22 –
3 Dignity PLC 94 0.01
9 Diploma PLC 106 0.01
110 Direct Line Insurance Group PLC 477 0.03
67 Dixons Carphone PLC 276 0.02
30 Domino's Pizza Group PLC 130 0.01
39 Drax Group PLC 139 0.01
66 DS Smith PLC 323 0.02
6 Dunelm Group PLC 60 –
9 e2v technologies PLC 20 –
9 easyJet PLC 113 0.01
29 Electrocomponents PLC 160 0.01
42 Elementis PLC 133 0.01
133 EnQuest PLC 50 –
41 Enterprise Inns PLC 56 –
2 Entertainment One Ltd 6 –
21 esure Group PLC 52 –
4 Euromoney Institutional Investor PLC 49 –
30 Evraz PLC 89 0.01
45 Experian PLC 855 0.05
2 FDM Group Holdings PLC 15 –
15 Fenner PLC 46 –
13 Ferrexpo PLC 21 –
3 Fidessa Group PLC 72 –
16 Filtrona PLC 81 0.01
Shares (000's)
Value (000's)
USD
% of Net Asset Value
Common Stock (continued)
United Kingdom - 6.16% (continued)
111 Firstgroup PLC 142 0.01
12 Foxtons Group PLC 15 –
10 Fresnillo PLC 151 0.01
1 Fuller Smith & Turner PLC 8 –
97 G4S PLC 297 0.02
7 Galliford Try PLC 113 0.01
4 GAME Digital PLC 3 –
– Games Workshop Group PLC 3 –
11 Gem Diamonds Ltd 14 –
5 Genus PLC 109 0.01
154 GKN PLC 596 0.04
147 GlaxoSmithKline PLC 2,744 0.16
323 Glencore PLC 1,130 0.07
3 Go-Ahead Group PLC 67 –
21 Gocompare.Com Group PLC 16 –
17 Grafton Group PLC 115 0.01
30 Grainger PLC 85 0.01
25 Greencore Group PLC 90 0.01
26 Greene King PLC 224 0.01
6 Greggs PLC 66 –
43 Gulf Keystone Petroleum Ltd 1 –
11 Gulf Marine Services PLC 7 –
16 GVC Holdings PLC 133 0.01
16 Halfords Group PLC 67 –
27 Halma PLC 315 0.02
17 Hargreaves Lansdown PLC 243 0.01
94 Hays PLC 164 0.01
7 Headlam Group PLC 42 –
9 Helical PLC 34 –
73 Henderson Group PLC 211 0.01
9 Hikma Pharmaceuticals PLC 194 0.01
6 Hill & Smith Holdings PLC 89 0.01
1 Hilton Food Group PLC 10 –
20 Hiscox Ltd 266 0.02
24 Hochschild Mining PLC 65 –
14 Hogg Robinson Group PLC 12 –
17 HomeServe PLC 133 0.01
40 Howden Joinery Group PLC 179 0.01
566 HSBC Holdings PLC 4,484 0.26
15 Hunting PLC 99 0.01
6 Huntsworth PLC 3 –
35 ICAP PLC 216 0.01
23 IG Group Holdings PLC 237 0.01
9 IHS Markit Ltd 338 0.02
22 Imagination Technologies Group PLC 61 –
17 IMI PLC 204 0.01
29 Imperial Tobacco Group PLC 1,225 0.07
34 Inchcape PLC 257 0.02
53 Indivior PLC 212 0.01
58 Informa PLC 469 0.03
35 Inmarsat PLC 315 0.02
13 InterContinental Hotels Group PLC 539 0.03
21 Intermediate Capital Group PLC 177 0.01
47 International Consolidated Airlines Group SA 255 0.02
13 International Personal Finance PLC 44 –
8 Interserve PLC 31 –
11 Intertek Group PLC 450 0.03
55 Investec PLC 359 0.02
20 IP Group PLC 34 –
19 ITE Group PLC 35 –
175 ITV PLC 368 0.02
145 J Sainsbury PLC 419 0.03
5 James Fisher & Sons PLC 92 0.01
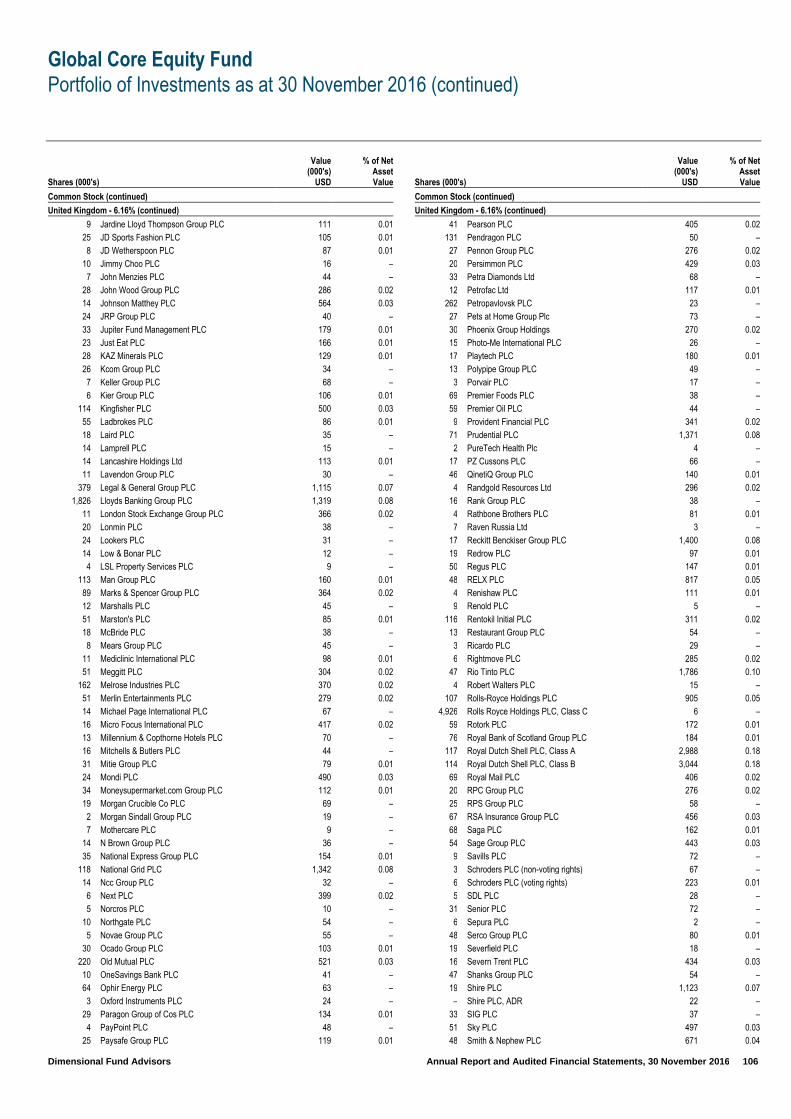
Global Core Equity Fund
Portfolio of Investments as at 30 November 2016 (continued)
Dimensional Fund Advisors Annual Report and Audited Financial Statements, 30 November 2016 106
Shares (000's)
Value (000's)
USD
% of Net Asset Value
Common Stock (continued)
United Kingdom - 6.16% (continued)
9 Jardine Lloyd Thompson Group PLC 111 0.01
25 JD Sports Fashion PLC 105 0.01
8 JD Wetherspoon PLC 87 0.01
10 Jimmy Choo PLC 16 –
7 John Menzies PLC 44 –
28 John Wood Group PLC 286 0.02
14 Johnson Matthey PLC 564 0.03
24 JRP Group PLC 40 –
33 Jupiter Fund Management PLC 179 0.01
23 Just Eat PLC 166 0.01
28 KAZ Minerals PLC 129 0.01
26 Kcom Group PLC 34 –
7 Keller Group PLC 68 –
6 Kier Group PLC 106 0.01
114 Kingfisher PLC 500 0.03
55 Ladbrokes PLC 86 0.01
18 Laird PLC 35 –
14 Lamprell PLC 15 –
14 Lancashire Holdings Ltd 113 0.01
11 Lavendon Group PLC 30 –
379 Legal & General Group PLC 1,115 0.07
1,826 Lloyds Banking Group PLC 1,319 0.08
11 London Stock Exchange Group PLC 366 0.02
20 Lonmin PLC 38 –
24 Lookers PLC 31 –
14 Low & Bonar PLC 12 –
4 LSL Property Services PLC 9 –
113 Man Group PLC 160 0.01
89 Marks & Spencer Group PLC 364 0.02
12 Marshalls PLC 45 –
51 Marston's PLC 85 0.01
18 McBride PLC 38 –
8 Mears Group PLC 45 –
11 Mediclinic International PLC 98 0.01
51 Meggitt PLC 304 0.02
162 Melrose Industries PLC 370 0.02
51 Merlin Entertainments PLC 279 0.02
14 Michael Page International PLC 67 –
16 Micro Focus International PLC 417 0.02
13 Millennium & Copthorne Hotels PLC 70 –
16 Mitchells & Butlers PLC 44 –
31 Mitie Group PLC 79 0.01
24 Mondi PLC 490 0.03
34 Moneysupermarket.com Group PLC 112 0.01
19 Morgan Crucible Co PLC 69 –
2 Morgan Sindall Group PLC 19 –
7 Mothercare PLC 9 –
14 N Brown Group PLC 36 –
35 National Express Group PLC 154 0.01
118 National Grid PLC 1,342 0.08
14 Ncc Group PLC 32 –
6 Next PLC 399 0.02
5 Norcros PLC 10 –
10 Northgate PLC 54 –
5 Novae Group PLC 55 –
30 Ocado Group PLC 103 0.01
220 Old Mutual PLC 521 0.03
10 OneSavings Bank PLC 41 –
64 Ophir Energy PLC 63 –
3 Oxford Instruments PLC 24 –
29 Paragon Group of Cos PLC 134 0.01
4 PayPoint PLC 48 –
25 Paysafe Group PLC 119 0.01
Shares (000's)
Value (000's)
USD
% of Net Asset Value
Common Stock (continued)
United Kingdom - 6.16% (continued)
41 Pearson PLC 405 0.02
131 Pendragon PLC 50 –
27 Pennon Group PLC 276 0.02
20 Persimmon PLC 429 0.03
33 Petra Diamonds Ltd 68 –
12 Petrofac Ltd 117 0.01
262 Petropavlovsk PLC 23 –
27 Pets at Home Group Plc 73 –
30 Phoenix Group Holdings 270 0.02
15 Photo-Me International PLC 26 –
17 Playtech PLC 180 0.01
13 Polypipe Group PLC 49 –
3 Porvair PLC 17 –
69 Premier Foods PLC 38 –
59 Premier Oil PLC 44 –
9 Provident Financial PLC 341 0.02
71 Prudential PLC 1,371 0.08
2 PureTech Health Plc 4 –
17 PZ Cussons PLC 66 –
46 QinetiQ Group PLC 140 0.01
4 Randgold Resources Ltd 296 0.02
16 Rank Group PLC 38 –
4 Rathbone Brothers PLC 81 0.01
7 Raven Russia Ltd 3 –
17 Reckitt Benckiser Group PLC 1,400 0.08
19 Redrow PLC 97 0.01
50 Regus PLC 147 0.01
48 RELX PLC 817 0.05
4 Renishaw PLC 111 0.01
9 Renold PLC 5 –
116 Rentokil Initial PLC 311 0.02
13 Restaurant Group PLC 54 –
3 Ricardo PLC 29 –
6 Rightmove PLC 285 0.02
47 Rio Tinto PLC 1,786 0.10
4 Robert Walters PLC 15 –
107 Rolls-Royce Holdings PLC 905 0.05
4,926 Rolls Royce Holdings PLC, Class C 6 –
59 Rotork PLC 172 0.01
76 Royal Bank of Scotland Group PLC 184 0.01
117 Royal Dutch Shell PLC, Class A 2,988 0.18
114 Royal Dutch Shell PLC, Class B 3,044 0.18
69 Royal Mail PLC 406 0.02
20 RPC Group PLC 276 0.02
25 RPS Group PLC 58 –
67 RSA Insurance Group PLC 456 0.03
68 Saga PLC 162 0.01
54 Sage Group PLC 443 0.03
9 Savills PLC 72 –
3 Schroders PLC (non-voting rights) 67 –
6 Schroders PLC (voting rights) 223 0.01
5 SDL PLC 28 –
31 Senior PLC 72 –
6 Sepura PLC 2 –
48 Serco Group PLC 80 0.01
19 Severfield PLC 18 –
16 Severn Trent PLC 434 0.03
47 Shanks Group PLC 54 –
19 Shire PLC 1,123 0.07
– Shire PLC, ADR 22 –
33 SIG PLC 37 –
51 Sky PLC 497 0.03
48 Smith & Nephew PLC 671 0.04

Global Core Equity Fund
Portfolio of Investments as at 30 November 2016 (continued)
Dimensional Fund Advisors Annual Report and Audited Financial Statements, 30 November 2016 107
Shares (000's)
Value (000's)
USD
% of Net Asset Value
Common Stock (continued)
United Kingdom - 6.16% (continued)
35 Smiths Group PLC 625 0.04
12 Smiths News PLC 21 –
12 Soco International PLC 21 –
10 Spectris PLC 250 0.02
51 Speedy Hire PLC 28 –
5 Spirax-Sarco Engineering PLC 268 0.02
12 Spire Healthcare Group PLC 54 –
48 Spirent Communications PLC 48 –
12 Sportech PLC 11 –
14 Sports Direct International PLC 54 –
56 SSE PLC 1,034 0.06
24 SSP Group PLC 109 0.01
15 St Ives PLC 23 –
33 St James's Place PLC 386 0.02
21 St Modwen Properties PLC 75 –
23 Stagecoach Group PLC 58 –
93 Standard Chartered PLC 742 0.04
89 Standard Life PLC 385 0.02
6 SThree PLC 20 –
17 Stobart Group Ltd 34 –
2 SuperGroup PLC 45 –
22 Synthomer PLC 103 0.01
33 TalkTalk Telecom Group PLC 66 –
3 Tarsus Group PLC 11 –
20 Tate & Lyle PLC 172 0.01
222 Taylor Wimpey PLC 411 0.02
2 Ted Baker PLC 60 –
5 Telecom Plus PLC 73 –
434 Tesco PLC 1,133 0.07
99 Thomas Cook Group PLC 105 0.01
11 Topps Tiles PLC 12 –
17 Travis Perkins PLC 286 0.02
3 Trifast PLC 6 –
27 Trinity Mirror PLC 27 –
14 TT Electronics PLC 25 –
28 TUI AG 375 0.02
21 Tullett Prebon PLC 119 0.01
75 Tullow Oil PLC 281 0.02
6 Tyman PLC 18 –
13 U & I Group PLC 28 –
26 UBM PLC 235 0.01
18 UDG Healthcare PLC 148 0.01
4 Ultra Electronics Holdings PLC 112 0.01
38 Unilever PLC 1,524 0.09
16 UNITE Group PLC 109 0.01
39 United Utilities Group PLC 428 0.03
24 Vectura Group PLC 43 –
7 Vedanta Resources PLC 70 –
22 Vesuvius PLC 108 0.01
6 Victrex PLC 137 0.01
14 Virgin Money Holdings UK PLC 54 –
1 Vitec Group PLC 5 –
909 Vodafone Group PLC 2,196 0.13
1 Vp PLC 11 –
15 Weir Group PLC 348 0.02
7 WH Smith PLC 137 0.01
9 Whitbread PLC 397 0.02
67 William Hill PLC 253 0.02
8 Wincanton PLC 23 –
183 Wm Morrison Supermarkets PLC 497 0.03
13 Wolseley PLC 781 0.05
26 Worldpay Group PLC 88 0.01
37 WPP PLC 800 0.05
Shares (000's)
Value (000's)
USD
% of Net Asset Value
Common Stock (continued)
United Kingdom - 6.16% (continued)
8 WS Atkins PLC 137 0.01
5 Xaar PLC 24 –
1 XP Power Ltd 14 –
13 Zoopla Property Group PLC 53 –
105,502 6.16
United States - 57.65%
2 1-800-Flowers.com Inc 25 –
2 1st Source Corp 71 –
3 3D Systems Corp 39 –
19 3M Co 3,222 0.19
2 A H Belo Corp 13 –
3 A Schulman Inc 95 0.01
2 A-Mark Precious Metals Inc 25 –
4 AAON Inc 117 0.01
3 AAR Corp 123 0.01
6 Aaron's Inc 181 0.01
1 Abaxis Inc 40 –
46 Abbott Laboratories 1,759 0.10
50 AbbVie Inc 3,067 0.18
2 Abeona Therapeutics Inc 11 –
5 Abercrombie & Fitch Co 66 –
2 ABIOMED Inc 202 0.01
5 ABM Industries Inc 223 0.01
9 Abraxas Petroleum Corp 19 –
2 Acacia Research Corp 14 –
6 Acadia Healthcare Co Inc 244 0.01
19 Accenture PLC 2,243 0.13
2 Access National Corp 59 –
9 ACCO Brands Corp 117 0.01
3 Accretive Health Inc 8 –
5 Accuray Inc 28 –
2 Aceto Corp 44 –
11 ACI Worldwide Inc 196 0.01
1 ACNB Corp 20 –
3 Acorda Therapeutics Inc 52 –
29 Activision Blizzard Inc 1,053 0.06
3 Actua Corp 47 –
4 Actuant Corp 106 0.01
3 Acuity Brands Inc 730 0.04
6 Acxiom Corp 161 0.01
3 Adamas Pharmaceuticals Inc 51 –
1 Adams Resources & Energy Inc 20 –
1 Addus HomeCare Corp 42 –
1 Adeptus Health Inc 5 –
9 Adobe Systems Inc 891 0.05
4 ADTRAN Inc 86 0.01
4 Advance Auto Parts Inc 622 0.04
2 Advanced Drainage Systems Inc 51 –
2 Advanced Energy Industries Inc 138 0.01
64 Advanced Micro Devices Inc 571 0.03
1 AdvanSix Inc 18 –
3 Advisory Board Co 93 0.01
14 AECOM 497 0.03
2 Aegion Corp 58 –
1 AEP Industries Inc 97 0.01
4 Aerojet Rocketdyne Holdings Inc 89 0.01
3 Aerovironment Inc 81 0.01
46 AES Corp 530 0.03
14 Aetna Inc 1,893 0.11
4 Affiliated Managers Group Inc 543 0.03
21 Aflac Inc 1,510 0.09
7 AGCO Corp 393 0.02
16 Agilent Technologies Inc 712 0.04
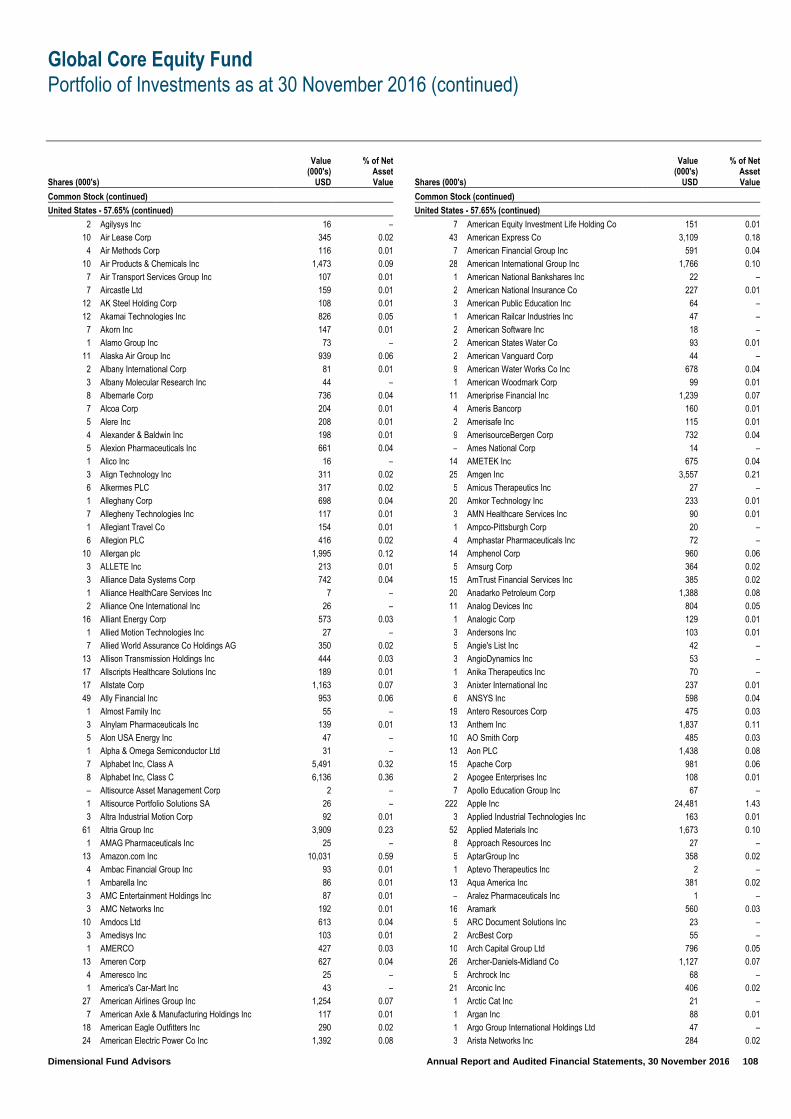
Global Core Equity Fund
Portfolio of Investments as at 30 November 2016 (continued)
Dimensional Fund Advisors Annual Report and Audited Financial Statements, 30 November 2016 108
Shares (000's)
Value (000's)
USD
% of Net Asset Value
Common Stock (continued)
United States - 57.65% (continued)
2 Agilysys Inc 16 –
10 Air Lease Corp 345 0.02
4 Air Methods Corp 116 0.01
10 Air Products & Chemicals Inc 1,473 0.09
7 Air Transport Services Group Inc 107 0.01
7 Aircastle Ltd 159 0.01
12 AK Steel Holding Corp 108 0.01
12 Akamai Technologies Inc 826 0.05
7 Akorn Inc 147 0.01
1 Alamo Group Inc 73 –
11 Alaska Air Group Inc 939 0.06
2 Albany International Corp 81 0.01
3 Albany Molecular Research Inc 44 –
8 Albemarle Corp 736 0.04
7 Alcoa Corp 204 0.01
5 Alere Inc 208 0.01
4 Alexander & Baldwin Inc 198 0.01
5 Alexion Pharmaceuticals Inc 661 0.04
1 Alico Inc 16 –
3 Align Technology Inc 311 0.02
6 Alkermes PLC 317 0.02
1 Alleghany Corp 698 0.04
7 Allegheny Technologies Inc 117 0.01
1 Allegiant Travel Co 154 0.01
6 Allegion PLC 416 0.02
10 Allergan plc 1,995 0.12
3 ALLETE Inc 213 0.01
3 Alliance Data Systems Corp 742 0.04
1 Alliance HealthCare Services Inc 7 –
2 Alliance One International Inc 26 –
16 Alliant Energy Corp 573 0.03
1 Allied Motion Technologies Inc 27 –
7 Allied World Assurance Co Holdings AG 350 0.02
13 Allison Transmission Holdings Inc 444 0.03
17 Allscripts Healthcare Solutions Inc 189 0.01
17 Allstate Corp 1,163 0.07
49 Ally Financial Inc 953 0.06
1 Almost Family Inc 55 –
3 Alnylam Pharmaceuticals Inc 139 0.01
5 Alon USA Energy Inc 47 –
1 Alpha & Omega Semiconductor Ltd 31 –
7 Alphabet Inc, Class A 5,491 0.32
8 Alphabet Inc, Class C 6,136 0.36
– Altisource Asset Management Corp 2 –
1 Altisource Portfolio Solutions SA 26 –
3 Altra Industrial Motion Corp 92 0.01
61 Altria Group Inc 3,909 0.23
1 AMAG Pharmaceuticals Inc 25 –
13 Amazon.com Inc 10,031 0.59
4 Ambac Financial Group Inc 93 0.01
1 Ambarella Inc 86 0.01
3 AMC Entertainment Holdings Inc 87 0.01
3 AMC Networks Inc 192 0.01
10 Amdocs Ltd 613 0.04
3 Amedisys Inc 103 0.01
1 AMERCO 427 0.03
13 Ameren Corp 627 0.04
4 Ameresco Inc 25 –
1 America's Car-Mart Inc 43 –
27 American Airlines Group Inc 1,254 0.07
7 American Axle & Manufacturing Holdings Inc 117 0.01
18 American Eagle Outfitters Inc 290 0.02
24 American Electric Power Co Inc 1,392 0.08
Shares (000's)
Value (000's)
USD
% of Net Asset Value
Common Stock (continued)
United States - 57.65% (continued)
7 American Equity Investment Life Holding Co 151 0.01
43 American Express Co 3,109 0.18
7 American Financial Group Inc 591 0.04
28 American International Group Inc 1,766 0.10
1 American National Bankshares Inc 22 –
2 American National Insurance Co 227 0.01
3 American Public Education Inc 64 –
1 American Railcar Industries Inc 47 –
2 American Software Inc 18 –
2 American States Water Co 93 0.01
2 American Vanguard Corp 44 –
9 American Water Works Co Inc 678 0.04
1 American Woodmark Corp 99 0.01
11 Ameriprise Financial Inc 1,239 0.07
4 Ameris Bancorp 160 0.01
2 Amerisafe Inc 115 0.01
9 AmerisourceBergen Corp 732 0.04
– Ames National Corp 14 –
14 AMETEK Inc 675 0.04
25 Amgen Inc 3,557 0.21
5 Amicus Therapeutics Inc 27 –
20 Amkor Technology Inc 233 0.01
3 AMN Healthcare Services Inc 90 0.01
1 Ampco-Pittsburgh Corp 20 –
4 Amphastar Pharmaceuticals Inc 72 –
14 Amphenol Corp 960 0.06
5 Amsurg Corp 364 0.02
15 AmTrust Financial Services Inc 385 0.02
20 Anadarko Petroleum Corp 1,388 0.08
11 Analog Devices Inc 804 0.05
1 Analogic Corp 129 0.01
3 Andersons Inc 103 0.01
5 Angie's List Inc 42 –
3 AngioDynamics Inc 53 –
1 Anika Therapeutics Inc 70 –
3 Anixter International Inc 237 0.01
6 ANSYS Inc 598 0.04
19 Antero Resources Corp 475 0.03
13 Anthem Inc 1,837 0.11
10 AO Smith Corp 485 0.03
13 Aon PLC 1,438 0.08
15 Apache Corp 981 0.06
2 Apogee Enterprises Inc 108 0.01
7 Apollo Education Group Inc 67 –
222 Apple Inc 24,481 1.43
3 Applied Industrial Technologies Inc 163 0.01
52 Applied Materials Inc 1,673 0.10
8 Approach Resources Inc 27 –
5 AptarGroup Inc 358 0.02
1 Aptevo Therapeutics Inc 2 –
13 Aqua America Inc 381 0.02
– Aralez Pharmaceuticals Inc 1 –
16 Aramark 560 0.03
5 ARC Document Solutions Inc 23 –
2 ArcBest Corp 55 –
10 Arch Capital Group Ltd 796 0.05
26 Archer-Daniels-Midland Co 1,127 0.07
5 Archrock Inc 68 –
21 Arconic Inc 406 0.02
1 Arctic Cat Inc 21 –
1 Argan Inc 88 0.01
1 Argo Group International Holdings Ltd 47 –
3 Arista Networks Inc 284 0.02
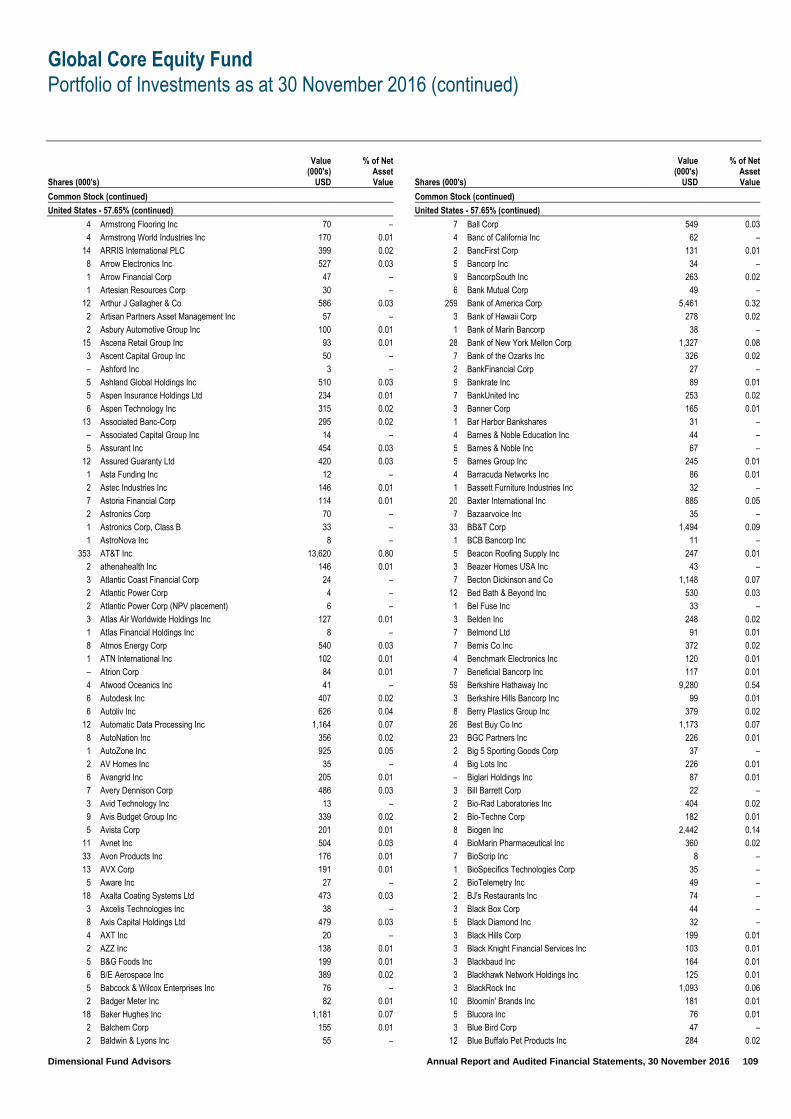
Global Core Equity Fund
Portfolio of Investments as at 30 November 2016 (continued)
Dimensional Fund Advisors Annual Report and Audited Financial Statements, 30 November 2016 109
Shares (000's)
Value (000's)
USD
% of Net Asset Value
Common Stock (continued)
United States - 57.65% (continued)
4 Armstrong Flooring Inc 70 –
4 Armstrong World Industries Inc 170 0.01
14 ARRIS International PLC 399 0.02
8 Arrow Electronics Inc 527 0.03
1 Arrow Financial Corp 47 –
1 Artesian Resources Corp 30 –
12 Arthur J Gallagher & Co 586 0.03
2 Artisan Partners Asset Management Inc 57 –
2 Asbury Automotive Group Inc 100 0.01
15 Ascena Retail Group Inc 93 0.01
3 Ascent Capital Group Inc 50 –
– Ashford Inc 3 –
5 Ashland Global Holdings Inc 510 0.03
5 Aspen Insurance Holdings Ltd 234 0.01
6 Aspen Technology Inc 315 0.02
13 Associated Banc-Corp 295 0.02
– Associated Capital Group Inc 14 –
5 Assurant Inc 454 0.03
12 Assured Guaranty Ltd 420 0.03
1 Asta Funding Inc 12 –
2 Astec Industries Inc 146 0.01
7 Astoria Financial Corp 114 0.01
2 Astronics Corp 70 –
1 Astronics Corp, Class B 33 –
1 AstroNova Inc 8 –
353 AT&T Inc 13,620 0.80
2 athenahealth Inc 146 0.01
3 Atlantic Coast Financial Corp 24 –
2 Atlantic Power Corp 4 –
2 Atlantic Power Corp (NPV placement) 6 –
3 Atlas Air Worldwide Holdings Inc 127 0.01
1 Atlas Financial Holdings Inc 8 –
8 Atmos Energy Corp 540 0.03
1 ATN International Inc 102 0.01
– Atrion Corp 84 0.01
4 Atwood Oceanics Inc 41 –
6 Autodesk Inc 407 0.02
6 Autoliv Inc 626 0.04
12 Automatic Data Processing Inc 1,164 0.07
8 AutoNation Inc 356 0.02
1 AutoZone Inc 925 0.05
2 AV Homes Inc 35 –
6 Avangrid Inc 205 0.01
7 Avery Dennison Corp 486 0.03
3 Avid Technology Inc 13 –
9 Avis Budget Group Inc 339 0.02
5 Avista Corp 201 0.01
11 Avnet Inc 504 0.03
33 Avon Products Inc 176 0.01
13 AVX Corp 191 0.01
5 Aware Inc 27 –
18 Axalta Coating Systems Ltd 473 0.03
3 Axcelis Technologies Inc 38 –
8 Axis Capital Holdings Ltd 479 0.03
4 AXT Inc 20 –
2 AZZ Inc 138 0.01
5 B&G Foods Inc 199 0.01
6 B/E Aerospace Inc 389 0.02
5 Babcock & Wilcox Enterprises Inc 76 –
2 Badger Meter Inc 82 0.01
18 Baker Hughes Inc 1,181 0.07
2 Balchem Corp 155 0.01
2 Baldwin & Lyons Inc 55 –
Shares (000's)
Value (000's)
USD
% of Net Asset Value
Common Stock (continued)
United States - 57.65% (continued)
7 Ball Corp 549 0.03
4 Banc of California Inc 62 –
2 BancFirst Corp 131 0.01
5 Bancorp Inc 34 –
9 BancorpSouth Inc 263 0.02
6 Bank Mutual Corp 49 –
259 Bank of America Corp 5,461 0.32
3 Bank of Hawaii Corp 278 0.02
1 Bank of Marin Bancorp 38 –
28 Bank of New York Mellon Corp 1,327 0.08
7 Bank of the Ozarks Inc 326 0.02
2 BankFinancial Corp 27 –
9 Bankrate Inc 89 0.01
7 BankUnited Inc 253 0.02
3 Banner Corp 165 0.01
1 Bar Harbor Bankshares 31 –
4 Barnes & Noble Education Inc 44 –
5 Barnes & Noble Inc 67 –
5 Barnes Group Inc 245 0.01
4 Barracuda Networks Inc 86 0.01
1 Bassett Furniture Industries Inc 32 –
20 Baxter International Inc 885 0.05
7 Bazaarvoice Inc 35 –
33 BB&T Corp 1,494 0.09
1 BCB Bancorp Inc 11 –
5 Beacon Roofing Supply Inc 247 0.01
3 Beazer Homes USA Inc 43 –
7 Becton Dickinson and Co 1,148 0.07
12 Bed Bath & Beyond Inc 530 0.03
1 Bel Fuse Inc 33 –
3 Belden Inc 248 0.02
7 Belmond Ltd 91 0.01
7 Bemis Co Inc 372 0.02
4 Benchmark Electronics Inc 120 0.01
7 Beneficial Bancorp Inc 117 0.01
59 Berkshire Hathaway Inc 9,280 0.54
3 Berkshire Hills Bancorp Inc 99 0.01
8 Berry Plastics Group Inc 379 0.02
26 Best Buy Co Inc 1,173 0.07
23 BGC Partners Inc 226 0.01
2 Big 5 Sporting Goods Corp 37 –
4 Big Lots Inc 226 0.01
– Biglari Holdings Inc 87 0.01
3 Bill Barrett Corp 22 –
2 Bio-Rad Laboratories Inc 404 0.02
2 Bio-Techne Corp 182 0.01
8 Biogen Inc 2,442 0.14
4 BioMarin Pharmaceutical Inc 360 0.02
7 BioScrip Inc 8 –
1 BioSpecifics Technologies Corp 35 –
2 BioTelemetry Inc 49 –
2 BJ's Restaurants Inc 74 –
3 Black Box Corp 44 –
5 Black Diamond Inc 32 –
3 Black Hills Corp 199 0.01
3 Black Knight Financial Services Inc 103 0.01
3 Blackbaud Inc 164 0.01
3 Blackhawk Network Holdings Inc 125 0.01
3 BlackRock Inc 1,093 0.06
10 Bloomin' Brands Inc 181 0.01
5 Blucora Inc 76 0.01
3 Blue Bird Corp 47 –
12 Blue Buffalo Pet Products Inc 284 0.02

Global Core Equity Fund
Portfolio of Investments as at 30 November 2016 (continued)
Dimensional Fund Advisors Annual Report and Audited Financial Statements, 30 November 2016 110
Shares (000's)
Value (000's)
USD
% of Net Asset Value
Common Stock (continued)
United States - 57.65% (continued)
4 Blue Hills Bancorp Inc 69 –
1 Blue Nile Inc 48 –
1 Bluebird Bio Inc 59 –
6 BMC Stock Holdings Inc 111 0.01
4 BNC Bancorp 131 0.01
2 Bob Evans Farms Inc 87 0.01
4 BofI Holding Inc 91 0.01
2 Boingo Wireless Inc 27 –
3 Boise Cascade Co 75 –
4 BOK Financial Corp 332 0.02
– Bon-Ton Stores Inc 1 –
3 Boot Barn Holdings Inc 44 –
9 Booz Allen Hamilton Holding Corp 329 0.02
21 BorgWarner Inc 755 0.04
1 Boston Beer Co Inc 107 0.01
9 Boston Private Financial Holdings Inc 135 0.01
35 Boston Scientific Corp 707 0.04
2 Bottomline Technologies de Inc 45 –
4 Brady Corp 133 0.01
2 Bravo Brio Restaurant Group Inc 7 –
2 Bridge Bancorp Inc 54 –
6 Bridgepoint Education Inc 65 –
4 Briggs & Stratton Corp 93 0.01
5 Bright Horizons Family Solutions Inc 311 0.02
4 Brink's Co 145 0.01
4 Brinker International Inc 208 0.01
32 Bristol-Myers Squibb Co 1,795 0.11
2 Bristow Group Inc 34 –
10 Broadcom Ltd 1,716 0.10
8 Broadridge Financial Solutions Inc 492 0.03
38 Brocade Communications Systems Inc 474 0.03
17 Brookdale Senior Living Inc 201 0.01
6 Brookline Bancorp Inc 91 0.01
6 Brooks Automation Inc 95 0.01
11 Brown & Brown Inc 468 0.03
3 Brown-Forman Corp, Class A 132 0.01
7 Brown-Forman Corp, Class B 325 0.02
10 Bruker Corp 217 0.01
8 Brunswick Corp 401 0.02
2 Bryn Mawr Bank Corp 72 –
1 BSB Bancorp Inc 28 –
1 Buckle Inc 37 –
1 Buffalo Wild Wings Inc 197 0.01
1 Build-A-Bear Workshop Inc 20 –
7 Builders FirstSource Inc 83 0.01
12 Bunge Ltd 824 0.05
5 Burlington Stores Inc 453 0.03
9 BWX Technologies Inc 372 0.02
– C&F Financial Corp 10 –
28 CA Inc 884 0.05
6 Cabela's Inc 375 0.02
– Cable One Inc 269 0.02
5 Cabot Corp 241 0.01
2 Cabot Microelectronics Corp 105 0.01
21 Cabot Oil & Gas Corp 459 0.03
2 CACI International Inc 243 0.01
16 Cadence Design Systems Inc 431 0.03
10 Caesars Entertainment Corp 72 –
2 CAI International Inc 16 –
4 Cal-Maine Foods Inc 172 0.01
2 Calamos Asset Management Inc 12 –
1 CalAmp Corp 20 –
10 CalAtlantic Group Inc 334 0.02
Shares (000's)
Value (000's)
USD
% of Net Asset Value
Common Stock (continued)
United States - 57.65% (continued)
1 Calavo Growers Inc 65 –
4 Caleres Inc 147 0.01
5 Calgon Carbon Corp 80 0.01
3 California Water Service Group 95 0.01
6 Calix Inc 47 –
9 Callaway Golf Co 105 0.01
7 Callon Petroleum Co 131 0.01
35 Calpine Corp 390 0.02
5 Cambium Learning Group Inc 23 –
3 Cambrex Corp 134 0.01
1 Camden National Corp 49 –
11 Campbell Soup Co 647 0.04
2 Cantel Medical Corp 146 0.01
1 Capella Education Co 107 0.01
2 Capital Bank Financial Corp 90 0.01
2 Capital City Bank Group Inc 31 –
20 Capital One Financial Corp 1,691 0.10
2 Capital Senior Living Corp 28 –
12 Capitol Federal Financial Inc 198 0.01
– Cara Therapeutics Inc 2 –
1 CARBO Ceramics Inc 10 –
3 Cardinal Financial Corp 87 0.01
17 Cardinal Health Inc 1,187 0.07
3 Cardtronics PLC 162 0.01
8 Career Education Corp 79 0.01
5 Carlisle Cos Inc 533 0.03
17 CarMax Inc 1,001 0.06
2 Carmike Cinemas Inc 60 –
17 Carnival Corp 882 0.05
2 Carolina Financial Corp 42 –
4 Carpenter Technology Corp 154 0.01
2 Carriage Services Inc 41 –
5 Carrizo Oil & Gas Inc 202 0.01
2 Carrols Restaurant Group Inc 32 –
3 Carter's Inc 295 0.02
6 Cascade Bancorp 47 –
4 Casella Waste Systems Inc 47 –
4 Casey's General Stores Inc 431 0.03
1 Cass Information Systems Inc 58 –
9 Catalent Inc 210 0.01
25 Caterpillar Inc 2,366 0.14
7 Cathay General Bancorp 245 0.01
2 Cato Corp 71 –
1 Cavco Industries Inc 63 –
2 Cavium Inc 103 0.01
7 CBIZ Inc 81 0.01
6 CBOE Holdings Inc 387 0.02
27 CBRE Group Inc 780 0.05
– CBS Corp, Class A (voting rights) 26 –
22 CBS Corp, Class B (non-voting rights) 1,320 0.08
2 CDI Corp 12 –
10 CDK Global Inc 553 0.03
10 CDW Corp 535 0.03
2 CEB Inc 93 0.01
5 CECO Environmental Corp 75 –
5 Celadon Group Inc 38 –
10 Celanese Corp 773 0.05
24 Celgene Corp 2,810 0.16
10 Centene Corp 580 0.03
30 CenterPoint Energy Inc 720 0.04
4 CenterState Banks Inc 91 0.01
6 Central European Media Enterprises Ltd 15 –
4 Central Garden & Pet Co 101 0.01
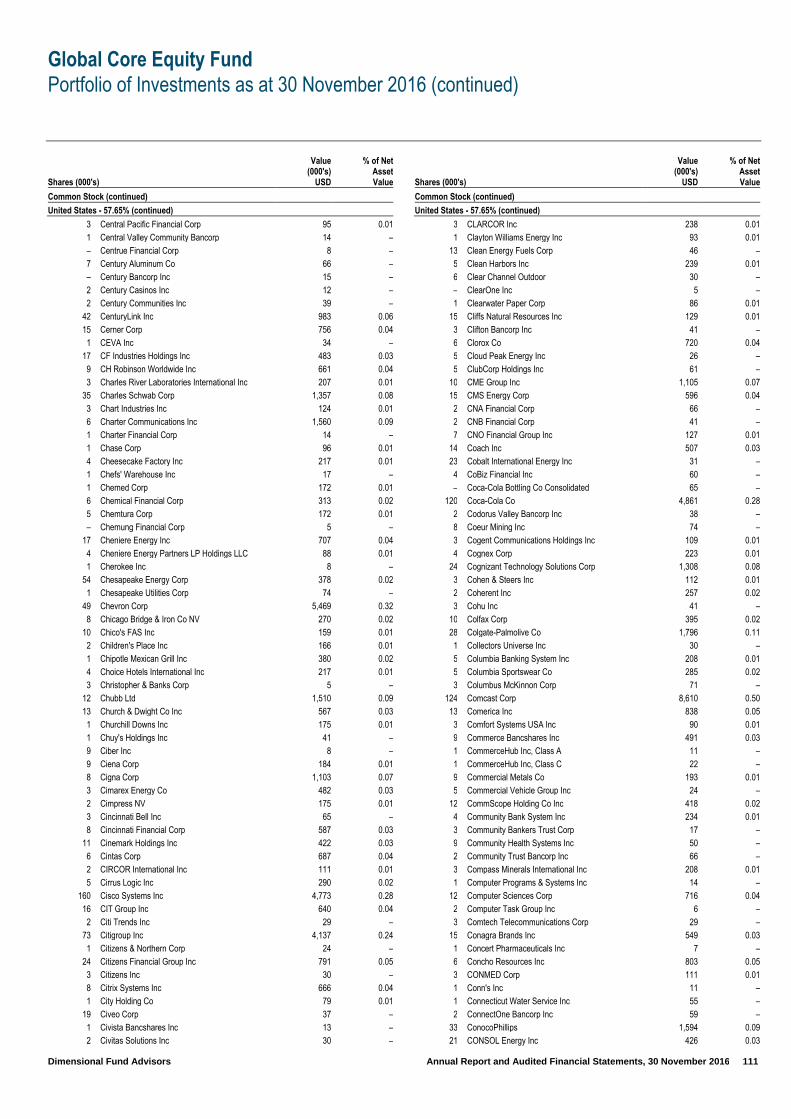
Global Core Equity Fund
Portfolio of Investments as at 30 November 2016 (continued)
Dimensional Fund Advisors Annual Report and Audited Financial Statements, 30 November 2016 111
Shares (000's)
Value (000's)
USD
% of Net Asset Value
Common Stock (continued)
United States - 57.65% (continued)
3 Central Pacific Financial Corp 95 0.01
1 Central Valley Community Bancorp 14 –
– Centrue Financial Corp 8 –
7 Century Aluminum Co 66 –
– Century Bancorp Inc 15 –
2 Century Casinos Inc 12 –
2 Century Communities Inc 39 –
42 CenturyLink Inc 983 0.06
15 Cerner Corp 756 0.04
1 CEVA Inc 34 –
17 CF Industries Holdings Inc 483 0.03
9 CH Robinson Worldwide Inc 661 0.04
3 Charles River Laboratories International Inc 207 0.01
35 Charles Schwab Corp 1,357 0.08
3 Chart Industries Inc 124 0.01
6 Charter Communications Inc 1,560 0.09
1 Charter Financial Corp 14 –
1 Chase Corp 96 0.01
4 Cheesecake Factory Inc 217 0.01
1 Chefs' Warehouse Inc 17 –
1 Chemed Corp 172 0.01
6 Chemical Financial Corp 313 0.02
5 Chemtura Corp 172 0.01
– Chemung Financial Corp 5 –
17 Cheniere Energy Inc 707 0.04
4 Cheniere Energy Partners LP Holdings LLC 88 0.01
1 Cherokee Inc 8 –
54 Chesapeake Energy Corp 378 0.02
1 Chesapeake Utilities Corp 74 –
49 Chevron Corp 5,469 0.32
8 Chicago Bridge & Iron Co NV 270 0.02
10 Chico's FAS Inc 159 0.01
2 Children's Place Inc 166 0.01
1 Chipotle Mexican Grill Inc 380 0.02
4 Choice Hotels International Inc 217 0.01
3 Christopher & Banks Corp 5 –
12 Chubb Ltd 1,510 0.09
13 Church & Dwight Co Inc 567 0.03
1 Churchill Downs Inc 175 0.01
1 Chuy's Holdings Inc 41 –
9 Ciber Inc 8 –
9 Ciena Corp 184 0.01
8 Cigna Corp 1,103 0.07
3 Cimarex Energy Co 482 0.03
2 Cimpress NV 175 0.01
3 Cincinnati Bell Inc 65 –
8 Cincinnati Financial Corp 587 0.03
11 Cinemark Holdings Inc 422 0.03
6 Cintas Corp 687 0.04
2 CIRCOR International Inc 111 0.01
5 Cirrus Logic Inc 290 0.02
160 Cisco Systems Inc 4,773 0.28
16 CIT Group Inc 640 0.04
2 Citi Trends Inc 29 –
73 Citigroup Inc 4,137 0.24
1 Citizens & Northern Corp 24 –
24 Citizens Financial Group Inc 791 0.05
3 Citizens Inc 30 –
8 Citrix Systems Inc 666 0.04
1 City Holding Co 79 0.01
19 Civeo Corp 37 –
1 Civista Bancshares Inc 13 –
2 Civitas Solutions Inc 30 –
Shares (000's)
Value (000's)
USD
% of Net Asset Value
Common Stock (continued)
United States - 57.65% (continued)
3 CLARCOR Inc 238 0.01
1 Clayton Williams Energy Inc 93 0.01
13 Clean Energy Fuels Corp 46 –
5 Clean Harbors Inc 239 0.01
6 Clear Channel Outdoor 30 –
– ClearOne Inc 5 –
1 Clearwater Paper Corp 86 0.01
15 Cliffs Natural Resources Inc 129 0.01
3 Clifton Bancorp Inc 41 –
6 Clorox Co 720 0.04
5 Cloud Peak Energy Inc 26 –
5 ClubCorp Holdings Inc 61 –
10 CME Group Inc 1,105 0.07
15 CMS Energy Corp 596 0.04
2 CNA Financial Corp 66 –
2 CNB Financial Corp 41 –
7 CNO Financial Group Inc 127 0.01
14 Coach Inc 507 0.03
23 Cobalt International Energy Inc 31 –
4 CoBiz Financial Inc 60 –
– Coca-Cola Bottling Co Consolidated 65 –
120 Coca-Cola Co 4,861 0.28
2 Codorus Valley Bancorp Inc 38 –
8 Coeur Mining Inc 74 –
3 Cogent Communications Holdings Inc 109 0.01
4 Cognex Corp 223 0.01
24 Cognizant Technology Solutions Corp 1,308 0.08
3 Cohen & Steers Inc 112 0.01
2 Coherent Inc 257 0.02
3 Cohu Inc 41 –
10 Colfax Corp 395 0.02
28 Colgate-Palmolive Co 1,796 0.11
1 Collectors Universe Inc 30 –
5 Columbia Banking System Inc 208 0.01
5 Columbia Sportswear Co 285 0.02
3 Columbus McKinnon Corp 71 –
124 Comcast Corp 8,610 0.50
13 Comerica Inc 838 0.05
3 Comfort Systems USA Inc 90 0.01
9 Commerce Bancshares Inc 491 0.03
1 CommerceHub Inc, Class A 11 –
1 CommerceHub Inc, Class C 22 –
9 Commercial Metals Co 193 0.01
5 Commercial Vehicle Group Inc 24 –
12 CommScope Holding Co Inc 418 0.02
4 Community Bank System Inc 234 0.01
3 Community Bankers Trust Corp 17 –
9 Community Health Systems Inc 50 –
2 Community Trust Bancorp Inc 66 –
3 Compass Minerals International Inc 208 0.01
1 Computer Programs & Systems Inc 14 –
12 Computer Sciences Corp 716 0.04
2 Computer Task Group Inc 6 –
3 Comtech Telecommunications Corp 29 –
15 Conagra Brands Inc 549 0.03
1 Concert Pharmaceuticals Inc 7 –
6 Concho Resources Inc 803 0.05
3 CONMED Corp 111 0.01
1 Conn's Inc 11 –
1 Connecticut Water Service Inc 55 –
2 ConnectOne Bancorp Inc 59 –
33 ConocoPhillips 1,594 0.09
21 CONSOL Energy Inc 426 0.03

Global Core Equity Fund
Portfolio of Investments as at 30 November 2016 (continued)
Dimensional Fund Advisors Annual Report and Audited Financial Statements, 30 November 2016 112
Shares (000's)
Value (000's)
USD
% of Net Asset Value
Common Stock (continued)
United States - 57.65% (continued)
5 Consolidated Communications Holdings Inc 130 0.01
16 Consolidated Edison Inc 1,089 0.06
– Consolidated-Tomoka Land Co 21 –
6 Constellation Brands Inc 938 0.06
2 Consumer Portfolio Services Inc 9 –
1 Container Store Group Inc 7 –
5 Contango Oil & Gas Co 47 –
4 Continental Building Products Inc 82 0.01
6 Continental Resources Inc 344 0.02
9 Convergys Corp 225 0.01
4 Cooper Cos Inc 594 0.04
5 Cooper Tire & Rubber Co 178 0.01
1 Cooper-Standard Holdings Inc 134 0.01
3 Copa Holdings SA 241 0.01
7 Copart Inc 406 0.02
3 Core Laboratories NV 301 0.02
1 Core Molding Technologies Inc 15 –
3 Core-Mark Holding Co Inc 117 0.01
7 CoreLogic Inc 264 0.02
44 Corning Inc 1,063 0.06
1 CorVel Corp 33 –
1 CoStar Group Inc 242 0.01
14 Costco Wholesale Corp 2,154 0.13
32 Coty Inc 603 0.04
12 Covanta Holding Corp 168 0.01
1 Covenant Transportation Group Inc 30 –
2 Covisint Corp 4 –
10 Cowen Group Inc 35 –
4 CR Bard Inc 769 0.05
1 CRA International Inc 36 –
2 Cracker Barrel Old Country Store Inc 253 0.02
2 Craft Brew Alliance Inc 24 –
5 Crane Co 354 0.02
3 Crawford & Co, Class A 30 –
2 Crawford & Co, Class B 21 –
2 Cray Inc 48 –
1 Credit Acceptance Corp 273 0.02
8 Cree Inc 201 0.01
1 Crimson Wine Group Ltd 5 –
6 Crocs Inc 41 –
3 Cross Country Healthcare Inc 42 –
9 Crown Holdings Inc 489 0.03
2 CryoLife Inc 45 –
3 CSG Systems International Inc 112 0.01
9 CSRA Inc 276 0.02
7 CST Brands Inc 331 0.02
1 CSW Industrials Inc 45 –
62 CSX Corp 2,224 0.13
2 CTS Corp 41 –
2 CU Bancorp 63 –
2 Cubic Corp 115 0.01
5 Cullen/Frost Bankers Inc 439 0.03
2 Culp Inc 53 –
10 Cummins Inc 1,444 0.09
2 Cumulus Media Inc 3 –
3 Curtiss-Wright Corp 342 0.02
3 Customers Bancorp Inc 82 0.01
10 CVB Financial Corp 215 0.01
3 CVR Energy Inc 52 –
49 CVS Health Corp 3,762 0.22
1 Cynosure Inc 63 –
26 Cypress Semiconductor Corp 290 0.02
– Daily Journal Corp 17 –
Shares (000's)
Value (000's)
USD
% of Net Asset Value
Common Stock (continued)
United States - 57.65% (continued)
5 Daktronics Inc 48 –
12 Dana Inc 199 0.01
17 Danaher Corp 1,355 0.08
9 Darden Restaurants Inc 678 0.04
15 Darling Ingredients Inc 197 0.01
2 Datalink Corp 24 –
3 Dave & Buster's Entertainment Inc 152 0.01
14 DaVita Inc 892 0.05
1 Dawson Geophysical Co 9 –
7 Dean Foods Co 135 0.01
3 Deckers Outdoor Corp 176 0.01
20 Deere & Co 2,010 0.12
1 Del Frisco's Restaurant Group Inc 24 –
3 Del Taco Restaurants Inc 49 –
5 Delek US Holdings Inc 105 0.01
6 Dell Technologies Inc 307 0.02
13 Delphi Automotive PLC 836 0.05
43 Delta Air Lines Inc 2,066 0.12
1 Delta Apparel Inc 23 –
1 Delta Natural Gas Co Inc 25 –
1 Deltic Timber Corp 77 0.01
4 Deluxe Corp 248 0.02
19 Denbury Resources Inc 73 –
5 Denny's Corp 63 –
11 DENTSPLY SIRONA Inc 616 0.04
4 Depomed Inc 68 –
3 Derma Sciences Inc 14 –
1 Destination Maternity Corp 5 –
4 Destination XL Group Inc 17 –
14 Devon Energy Corp 669 0.04
5 DeVry Education Group Inc 146 0.01
3 DexCom Inc 170 0.01
7 DHI Group Inc 40 –
10 DHT Holdings Inc 37 –
– Diamond Hill Investment Group Inc 84 0.01
12 Diamond Offshore Drilling Inc 210 0.01
5 Diamondback Energy Inc 568 0.03
2 Dicerna Pharmaceuticals Inc 7 –
8 Dick's Sporting Goods Inc 486 0.03
4 Diebold Inc 101 0.01
2 Digi International Inc 28 –
5 DigitalGlobe Inc 172 0.01
3 Dillard's Inc 218 0.01
4 Dime Community Bancshares Inc 67 –
2 DineEquity Inc 154 0.01
4 Diodes Inc 87 0.01
2 Diplomat Pharmacy Inc 33 –
29 Discover Financial Services 1,945 0.11
12 Discovery Communications Inc, Class A 318 0.02
18 Discovery Communications Inc, Class C 480 0.03
9 DISH Network Corp 501 0.03
3 Dixie Group Inc 9 –
3 DMC Global Inc 45 –
4 Dolby Laboratories Inc 205 0.01
12 Dollar General Corp 925 0.05
11 Dollar Tree Inc 957 0.06
20 Dominion Resources Inc 1,467 0.09
3 Domino's Pizza Inc 583 0.03
5 Domtar Corp 207 0.01
8 Donaldson Co Inc 330 0.02
2 Donegal Group Inc 32 –
2 Donnelley Financial Solutions Inc 35 –
3 Dorian LPG Ltd 22 –
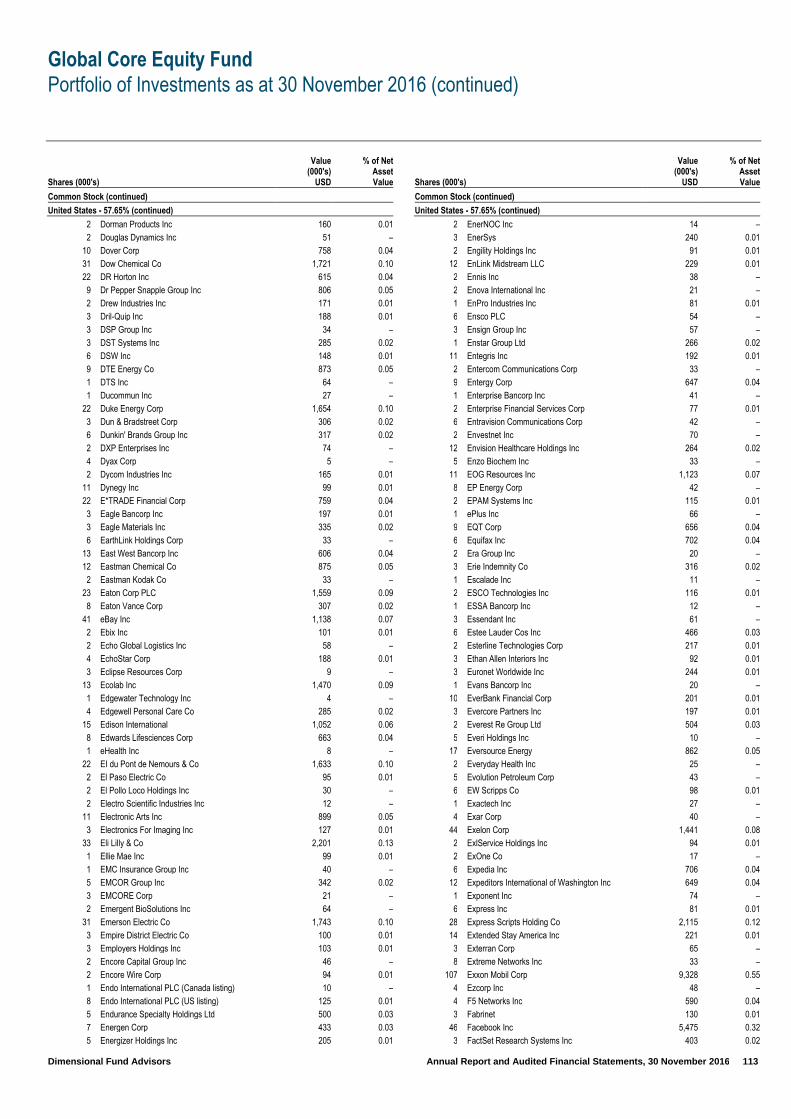
Global Core Equity Fund
Portfolio of Investments as at 30 November 2016 (continued)
Dimensional Fund Advisors Annual Report and Audited Financial Statements, 30 November 2016 113
Shares (000's)
Value (000's)
USD
% of Net Asset Value
Common Stock (continued)
United States - 57.65% (continued)
2 Dorman Products Inc 160 0.01
2 Douglas Dynamics Inc 51 –
10 Dover Corp 758 0.04
31 Dow Chemical Co 1,721 0.10
22 DR Horton Inc 615 0.04
9 Dr Pepper Snapple Group Inc 806 0.05
2 Drew Industries Inc 171 0.01
3 Dril-Quip Inc 188 0.01
3 DSP Group Inc 34 –
3 DST Systems Inc 285 0.02
6 DSW Inc 148 0.01
9 DTE Energy Co 873 0.05
1 DTS Inc 64 –
1 Ducommun Inc 27 –
22 Duke Energy Corp 1,654 0.10
3 Dun & Bradstreet Corp 306 0.02
6 Dunkin' Brands Group Inc 317 0.02
2 DXP Enterprises Inc 74 –
4 Dyax Corp 5 –
2 Dycom Industries Inc 165 0.01
11 Dynegy Inc 99 0.01
22 E*TRADE Financial Corp 759 0.04
3 Eagle Bancorp Inc 197 0.01
3 Eagle Materials Inc 335 0.02
6 EarthLink Holdings Corp 33 –
13 East West Bancorp Inc 606 0.04
12 Eastman Chemical Co 875 0.05
2 Eastman Kodak Co 33 –
23 Eaton Corp PLC 1,559 0.09
8 Eaton Vance Corp 307 0.02
41 eBay Inc 1,138 0.07
2 Ebix Inc 101 0.01
2 Echo Global Logistics Inc 58 –
4 EchoStar Corp 188 0.01
3 Eclipse Resources Corp 9 –
13 Ecolab Inc 1,470 0.09
1 Edgewater Technology Inc 4 –
4 Edgewell Personal Care Co 285 0.02
15 Edison International 1,052 0.06
8 Edwards Lifesciences Corp 663 0.04
1 eHealth Inc 8 –
22 EI du Pont de Nemours & Co 1,633 0.10
2 El Paso Electric Co 95 0.01
2 El Pollo Loco Holdings Inc 30 –
2 Electro Scientific Industries Inc 12 –
11 Electronic Arts Inc 899 0.05
3 Electronics For Imaging Inc 127 0.01
33 Eli Lilly & Co 2,201 0.13
1 Ellie Mae Inc 99 0.01
1 EMC Insurance Group Inc 40 –
5 EMCOR Group Inc 342 0.02
3 EMCORE Corp 21 –
2 Emergent BioSolutions Inc 64 –
31 Emerson Electric Co 1,743 0.10
3 Empire District Electric Co 100 0.01
3 Employers Holdings Inc 103 0.01
2 Encore Capital Group Inc 46 –
2 Encore Wire Corp 94 0.01
1 Endo International PLC (Canada listing) 10 –
8 Endo International PLC (US listing) 125 0.01
5 Endurance Specialty Holdings Ltd 500 0.03
7 Energen Corp 433 0.03
5 Energizer Holdings Inc 205 0.01
Shares (000's)
Value (000's)
USD
% of Net Asset Value
Common Stock (continued)
United States - 57.65% (continued)
2 EnerNOC Inc 14 –
3 EnerSys 240 0.01
2 Engility Holdings Inc 91 0.01
12 EnLink Midstream LLC 229 0.01
2 Ennis Inc 38 –
2 Enova International Inc 21 –
1 EnPro Industries Inc 81 0.01
6 Ensco PLC 54 –
3 Ensign Group Inc 57 –
1 Enstar Group Ltd 266 0.02
11 Entegris Inc 192 0.01
2 Entercom Communications Corp 33 –
9 Entergy Corp 647 0.04
1 Enterprise Bancorp Inc 41 –
2 Enterprise Financial Services Corp 77 0.01
6 Entravision Communications Corp 42 –
2 Envestnet Inc 70 –
12 Envision Healthcare Holdings Inc 264 0.02
5 Enzo Biochem Inc 33 –
11 EOG Resources Inc 1,123 0.07
8 EP Energy Corp 42 –
2 EPAM Systems Inc 115 0.01
1 ePlus Inc 66 –
9 EQT Corp 656 0.04
6 Equifax Inc 702 0.04
2 Era Group Inc 20 –
3 Erie Indemnity Co 316 0.02
1 Escalade Inc 11 –
2 ESCO Technologies Inc 116 0.01
1 ESSA Bancorp Inc 12 –
3 Essendant Inc 61 –
6 Estee Lauder Cos Inc 466 0.03
2 Esterline Technologies Corp 217 0.01
3 Ethan Allen Interiors Inc 92 0.01
3 Euronet Worldwide Inc 244 0.01
1 Evans Bancorp Inc 20 –
10 EverBank Financial Corp 201 0.01
3 Evercore Partners Inc 197 0.01
2 Everest Re Group Ltd 504 0.03
5 Everi Holdings Inc 10 –
17 Eversource Energy 862 0.05
2 Everyday Health Inc 25 –
5 Evolution Petroleum Corp 43 –
6 EW Scripps Co 98 0.01
1 Exactech Inc 27 –
4 Exar Corp 40 –
44 Exelon Corp 1,441 0.08
2 ExlService Holdings Inc 94 0.01
2 ExOne Co 17 –
6 Expedia Inc 706 0.04
12 Expeditors International of Washington Inc 649 0.04
1 Exponent Inc 74 –
6 Express Inc 81 0.01
28 Express Scripts Holding Co 2,115 0.12
14 Extended Stay America Inc 221 0.01
3 Exterran Corp 65 –
8 Extreme Networks Inc 33 –
107 Exxon Mobil Corp 9,328 0.55
4 Ezcorp Inc 48 –
4 F5 Networks Inc 590 0.04
3 Fabrinet 130 0.01
46 Facebook Inc 5,475 0.32
3 FactSet Research Systems Inc 403 0.02
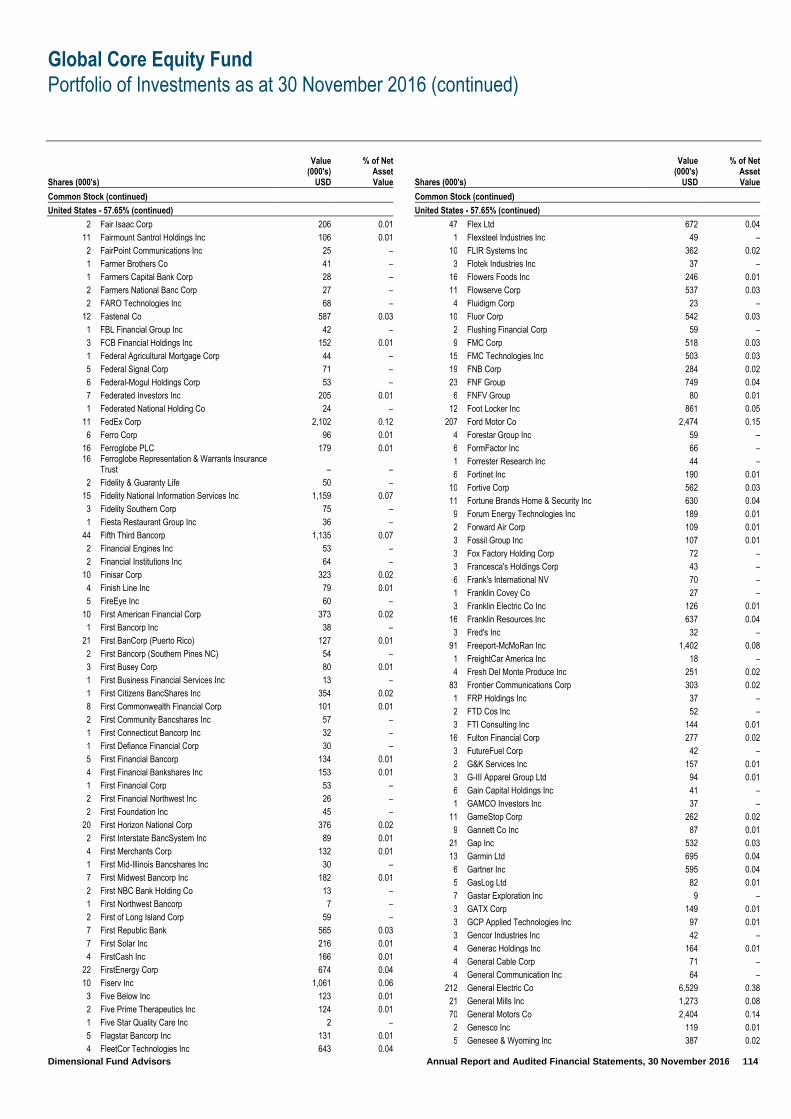
Global Core Equity Fund
Portfolio of Investments as at 30 November 2016 (continued)
Dimensional Fund Advisors Annual Report and Audited Financial Statements, 30 November 2016 114
Shares (000's)
Value (000's)
USD
% of Net Asset Value
Common Stock (continued)
United States - 57.65% (continued)
2 Fair Isaac Corp 206 0.01
11 Fairmount Santrol Holdings Inc 106 0.01
2 FairPoint Communications Inc 25 –
1 Farmer Brothers Co 41 –
1 Farmers Capital Bank Corp 28 –
2 Farmers National Banc Corp 27 –
2 FARO Technologies Inc 68 –
12 Fastenal Co 587 0.03
1 FBL Financial Group Inc 42 –
3 FCB Financial Holdings Inc 152 0.01
1 Federal Agricultural Mortgage Corp 44 –
5 Federal Signal Corp 71 –
6 Federal-Mogul Holdings Corp 53 –
7 Federated Investors Inc 205 0.01
1 Federated National Holding Co 24 –
11 FedEx Corp 2,102 0.12
6 Ferro Corp 96 0.01
16 Ferroglobe PLC 179 0.01 16
Ferroglobe Representation & Warrants Insurance Trust – –
2 Fidelity & Guaranty Life 50 –
15 Fidelity National Information Services Inc 1,159 0.07
3 Fidelity Southern Corp 75 –
1 Fiesta Restaurant Group Inc 36 –
44 Fifth Third Bancorp 1,135 0.07
2 Financial Engines Inc 53 –
2 Financial Institutions Inc 64 –
10 Finisar Corp 323 0.02
4 Finish Line Inc 79 0.01
5 FireEye Inc 60 –
10 First American Financial Corp 373 0.02
1 First Bancorp Inc 38 –
21 First BanCorp (Puerto Rico) 127 0.01
2 First Bancorp (Southern Pines NC) 54 –
3 First Busey Corp 80 0.01
1 First Business Financial Services Inc 13 –
1 First Citizens BancShares Inc 354 0.02
8 First Commonwealth Financial Corp 101 0.01
2 First Community Bancshares Inc 57 –
1 First Connecticut Bancorp Inc 32 –
1 First Defiance Financial Corp 30 –
5 First Financial Bancorp 134 0.01
4 First Financial Bankshares Inc 153 0.01
1 First Financial Corp 53 –
2 First Financial Northwest Inc 26 –
2 First Foundation Inc 45 –
20 First Horizon National Corp 376 0.02
2 First Interstate BancSystem Inc 89 0.01
4 First Merchants Corp 132 0.01
1 First Mid-Illinois Bancshares Inc 30 –
7 First Midwest Bancorp Inc 182 0.01
2 First NBC Bank Holding Co 13 –
1 First Northwest Bancorp 7 –
2 First of Long Island Corp 59 –
7 First Republic Bank 565 0.03
7 First Solar Inc 216 0.01
4 FirstCash Inc 166 0.01
22 FirstEnergy Corp 674 0.04
10 Fiserv Inc 1,061 0.06
3 Five Below Inc 123 0.01
2 Five Prime Therapeutics Inc 124 0.01
1 Five Star Quality Care Inc 2 –
5 Flagstar Bancorp Inc 131 0.01
4 FleetCor Technologies Inc 643 0.04
Shares (000's)
Value (000's)
USD
% of Net Asset Value
Common Stock (continued)
United States - 57.65% (continued)
47 Flex Ltd 672 0.04
1 Flexsteel Industries Inc 49 –
10 FLIR Systems Inc 362 0.02
3 Flotek Industries Inc 37 –
16 Flowers Foods Inc 246 0.01
11 Flowserve Corp 537 0.03
4 Fluidigm Corp 23 –
10 Fluor Corp 542 0.03
2 Flushing Financial Corp 59 –
9 FMC Corp 518 0.03
15 FMC Technologies Inc 503 0.03
19 FNB Corp 284 0.02
23 FNF Group 749 0.04
6 FNFV Group 80 0.01
12 Foot Locker Inc 861 0.05
207 Ford Motor Co 2,474 0.15
4 Forestar Group Inc 59 –
6 FormFactor Inc 66 –
1 Forrester Research Inc 44 –
6 Fortinet Inc 190 0.01
10 Fortive Corp 562 0.03
11 Fortune Brands Home & Security Inc 630 0.04
9 Forum Energy Technologies Inc 189 0.01
2 Forward Air Corp 109 0.01
3 Fossil Group Inc 107 0.01
3 Fox Factory Holding Corp 72 –
3 Francesca's Holdings Corp 43 –
6 Frank's International NV 70 –
1 Franklin Covey Co 27 –
3 Franklin Electric Co Inc 126 0.01
16 Franklin Resources Inc 637 0.04
3 Fred's Inc 32 –
91 Freeport-McMoRan Inc 1,402 0.08
1 FreightCar America Inc 18 –
4 Fresh Del Monte Produce Inc 251 0.02
83 Frontier Communications Corp 303 0.02
1 FRP Holdings Inc 37 –
2 FTD Cos Inc 52 –
3 FTI Consulting Inc 144 0.01
16 Fulton Financial Corp 277 0.02
3 FutureFuel Corp 42 –
2 G&K Services Inc 157 0.01
3 G-III Apparel Group Ltd 94 0.01
6 Gain Capital Holdings Inc 41 –
1 GAMCO Investors Inc 37 –
11 GameStop Corp 262 0.02
9 Gannett Co Inc 87 0.01
21 Gap Inc 532 0.03
13 Garmin Ltd 695 0.04
6 Gartner Inc 595 0.04
5 GasLog Ltd 82 0.01
7 Gastar Exploration Inc 9 –
3 GATX Corp 149 0.01
3 GCP Applied Technologies Inc 97 0.01
3 Gencor Industries Inc 42 –
4 Generac Holdings Inc 164 0.01
4 General Cable Corp 71 –
4 General Communication Inc 64 –
212 General Electric Co 6,529 0.38
21 General Mills Inc 1,273 0.08
70 General Motors Co 2,404 0.14
2 Genesco Inc 119 0.01
5 Genesee & Wyoming Inc 387 0.02
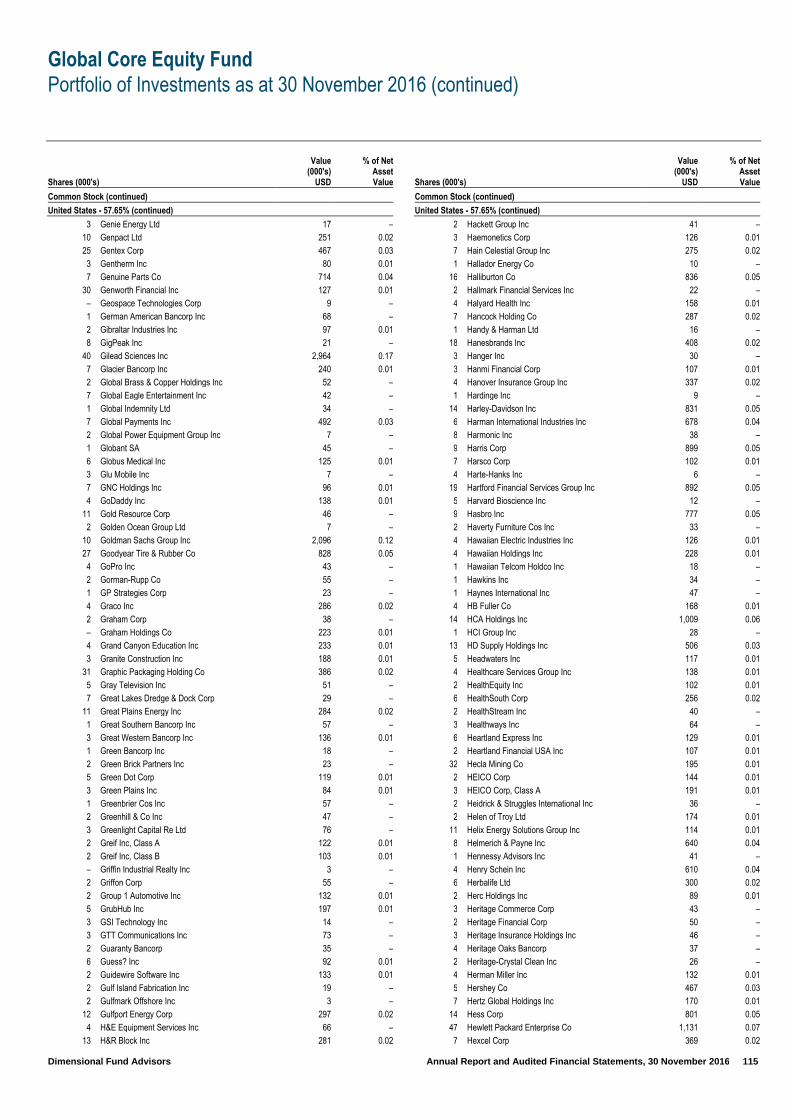
Global Core Equity Fund
Portfolio of Investments as at 30 November 2016 (continued)
Dimensional Fund Advisors Annual Report and Audited Financial Statements, 30 November 2016 115
Shares (000's)
Value (000's)
USD
% of Net Asset Value
Common Stock (continued)
United States - 57.65% (continued)
3 Genie Energy Ltd 17 –
10 Genpact Ltd 251 0.02
25 Gentex Corp 467 0.03
3 Gentherm Inc 80 0.01
7 Genuine Parts Co 714 0.04
30 Genworth Financial Inc 127 0.01
– Geospace Technologies Corp 9 –
1 German American Bancorp Inc 68 –
2 Gibraltar Industries Inc 97 0.01
8 GigPeak Inc 21 –
40 Gilead Sciences Inc 2,964 0.17
7 Glacier Bancorp Inc 240 0.01
2 Global Brass & Copper Holdings Inc 52 –
7 Global Eagle Entertainment Inc 42 –
1 Global Indemnity Ltd 34 –
7 Global Payments Inc 492 0.03
2 Global Power Equipment Group Inc 7 –
1 Globant SA 45 –
6 Globus Medical Inc 125 0.01
3 Glu Mobile Inc 7 –
7 GNC Holdings Inc 96 0.01
4 GoDaddy Inc 138 0.01
11 Gold Resource Corp 46 –
2 Golden Ocean Group Ltd 7 –
10 Goldman Sachs Group Inc 2,096 0.12
27 Goodyear Tire & Rubber Co 828 0.05
4 GoPro Inc 43 –
2 Gorman-Rupp Co 55 –
1 GP Strategies Corp 23 –
4 Graco Inc 286 0.02
2 Graham Corp 38 –
– Graham Holdings Co 223 0.01
4 Grand Canyon Education Inc 233 0.01
3 Granite Construction Inc 188 0.01
31 Graphic Packaging Holding Co 386 0.02
5 Gray Television Inc 51 –
7 Great Lakes Dredge & Dock Corp 29 –
11 Great Plains Energy Inc 284 0.02
1 Great Southern Bancorp Inc 57 –
3 Great Western Bancorp Inc 136 0.01
1 Green Bancorp Inc 18 –
2 Green Brick Partners Inc 23 –
5 Green Dot Corp 119 0.01
3 Green Plains Inc 84 0.01
1 Greenbrier Cos Inc 57 –
2 Greenhill & Co Inc 47 –
3 Greenlight Capital Re Ltd 76 –
2 Greif Inc, Class A 122 0.01
2 Greif Inc, Class B 103 0.01
– Griffin Industrial Realty Inc 3 –
2 Griffon Corp 55 –
2 Group 1 Automotive Inc 132 0.01
5 GrubHub Inc 197 0.01
3 GSI Technology Inc 14 –
3 GTT Communications Inc 73 –
2 Guaranty Bancorp 35 –
6 Guess? Inc 92 0.01
2 Guidewire Software Inc 133 0.01
2 Gulf Island Fabrication Inc 19 –
2 Gulfmark Offshore Inc 3 –
12 Gulfport Energy Corp 297 0.02
4 H&E Equipment Services Inc 66 –
13 H&R Block Inc 281 0.02
Shares (000's)
Value (000's)
USD
% of Net Asset Value
Common Stock (continued)
United States - 57.65% (continued)
2 Hackett Group Inc 41 –
3 Haemonetics Corp 126 0.01
7 Hain Celestial Group Inc 275 0.02
1 Hallador Energy Co 10 –
16 Halliburton Co 836 0.05
2 Hallmark Financial Services Inc 22 –
4 Halyard Health Inc 158 0.01
7 Hancock Holding Co 287 0.02
1 Handy & Harman Ltd 16 –
18 Hanesbrands Inc 408 0.02
3 Hanger Inc 30 –
3 Hanmi Financial Corp 107 0.01
4 Hanover Insurance Group Inc 337 0.02
1 Hardinge Inc 9 –
14 Harley-Davidson Inc 831 0.05
6 Harman International Industries Inc 678 0.04
8 Harmonic Inc 38 –
9 Harris Corp 899 0.05
7 Harsco Corp 102 0.01
4 Harte-Hanks Inc 6 –
19 Hartford Financial Services Group Inc 892 0.05
5 Harvard Bioscience Inc 12 –
9 Hasbro Inc 777 0.05
2 Haverty Furniture Cos Inc 33 –
4 Hawaiian Electric Industries Inc 126 0.01
4 Hawaiian Holdings Inc 228 0.01
1 Hawaiian Telcom Holdco Inc 18 –
1 Hawkins Inc 34 –
1 Haynes International Inc 47 –
4 HB Fuller Co 168 0.01
14 HCA Holdings Inc 1,009 0.06
1 HCI Group Inc 28 –
13 HD Supply Holdings Inc 506 0.03
5 Headwaters Inc 117 0.01
4 Healthcare Services Group Inc 138 0.01
2 HealthEquity Inc 102 0.01
6 HealthSouth Corp 256 0.02
2 HealthStream Inc 40 –
3 Healthways Inc 64 –
6 Heartland Express Inc 129 0.01
2 Heartland Financial USA Inc 107 0.01
32 Hecla Mining Co 195 0.01
2 HEICO Corp 144 0.01
3 HEICO Corp, Class A 191 0.01
2 Heidrick & Struggles International Inc 36 –
2 Helen of Troy Ltd 174 0.01
11 Helix Energy Solutions Group Inc 114 0.01
8 Helmerich & Payne Inc 640 0.04
1 Hennessy Advisors Inc 41 –
4 Henry Schein Inc 610 0.04
6 Herbalife Ltd 300 0.02
2 Herc Holdings Inc 89 0.01
3 Heritage Commerce Corp 43 –
2 Heritage Financial Corp 50 –
3 Heritage Insurance Holdings Inc 46 –
4 Heritage Oaks Bancorp 37 –
2 Heritage-Crystal Clean Inc 26 –
4 Herman Miller Inc 132 0.01
5 Hershey Co 467 0.03
7 Hertz Global Holdings Inc 170 0.01
14 Hess Corp 801 0.05
47 Hewlett Packard Enterprise Co 1,131 0.07
7 Hexcel Corp 369 0.02
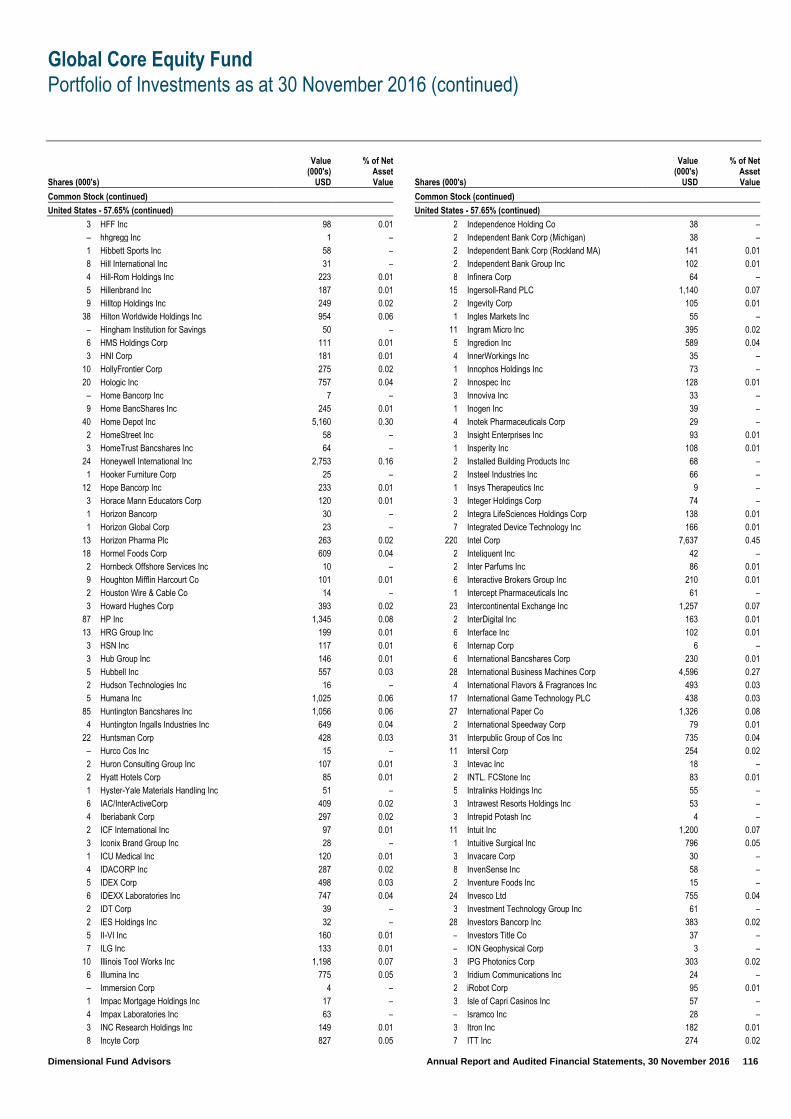
Global Core Equity Fund
Portfolio of Investments as at 30 November 2016 (continued)
Dimensional Fund Advisors Annual Report and Audited Financial Statements, 30 November 2016 116
Shares (000's)
Value (000's)
USD
% of Net Asset Value
Common Stock (continued)
United States - 57.65% (continued)
3 HFF Inc 98 0.01
– hhgregg Inc 1 –
1 Hibbett Sports Inc 58 –
8 Hill International Inc 31 –
4 Hill-Rom Holdings Inc 223 0.01
5 Hillenbrand Inc 187 0.01
9 Hilltop Holdings Inc 249 0.02
38 Hilton Worldwide Holdings Inc 954 0.06
– Hingham Institution for Savings 50 –
6 HMS Holdings Corp 111 0.01
3 HNI Corp 181 0.01
10 HollyFrontier Corp 275 0.02
20 Hologic Inc 757 0.04
– Home Bancorp Inc 7 –
9 Home BancShares Inc 245 0.01
40 Home Depot Inc 5,160 0.30
2 HomeStreet Inc 58 –
3 HomeTrust Bancshares Inc 64 –
24 Honeywell International Inc 2,753 0.16
1 Hooker Furniture Corp 25 –
12 Hope Bancorp Inc 233 0.01
3 Horace Mann Educators Corp 120 0.01
1 Horizon Bancorp 30 –
1 Horizon Global Corp 23 –
13 Horizon Pharma Plc 263 0.02
18 Hormel Foods Corp 609 0.04
2 Hornbeck Offshore Services Inc 10 –
9 Houghton Mifflin Harcourt Co 101 0.01
2 Houston Wire & Cable Co 14 –
3 Howard Hughes Corp 393 0.02
87 HP Inc 1,345 0.08
13 HRG Group Inc 199 0.01
3 HSN Inc 117 0.01
3 Hub Group Inc 146 0.01
5 Hubbell Inc 557 0.03
2 Hudson Technologies Inc 16 –
5 Humana Inc 1,025 0.06
85 Huntington Bancshares Inc 1,056 0.06
4 Huntington Ingalls Industries Inc 649 0.04
22 Huntsman Corp 428 0.03
– Hurco Cos Inc 15 –
2 Huron Consulting Group Inc 107 0.01
2 Hyatt Hotels Corp 85 0.01
1 Hyster-Yale Materials Handling Inc 51 –
6 IAC/InterActiveCorp 409 0.02
4 Iberiabank Corp 297 0.02
2 ICF International Inc 97 0.01
3 Iconix Brand Group Inc 28 –
1 ICU Medical Inc 120 0.01
4 IDACORP Inc 287 0.02
5 IDEX Corp 498 0.03
6 IDEXX Laboratories Inc 747 0.04
2 IDT Corp 39 –
2 IES Holdings Inc 32 –
5 II-VI Inc 160 0.01
7 ILG Inc 133 0.01
10 Illinois Tool Works Inc 1,198 0.07
6 Illumina Inc 775 0.05
– Immersion Corp 4 –
1 Impac Mortgage Holdings Inc 17 –
4 Impax Laboratories Inc 63 –
3 INC Research Holdings Inc 149 0.01
8 Incyte Corp 827 0.05
Shares (000's)
Value (000's)
USD
% of Net Asset Value
Common Stock (continued)
United States - 57.65% (continued)
2 Independence Holding Co 38 –
2 Independent Bank Corp (Michigan) 38 –
2 Independent Bank Corp (Rockland MA) 141 0.01
2 Independent Bank Group Inc 102 0.01
8 Infinera Corp 64 –
15 Ingersoll-Rand PLC 1,140 0.07
2 Ingevity Corp 105 0.01
1 Ingles Markets Inc 55 –
11 Ingram Micro Inc 395 0.02
5 Ingredion Inc 589 0.04
4 InnerWorkings Inc 35 –
1 Innophos Holdings Inc 73 –
2 Innospec Inc 128 0.01
3 Innoviva Inc 33 –
1 Inogen Inc 39 –
4 Inotek Pharmaceuticals Corp 29 –
3 Insight Enterprises Inc 93 0.01
1 Insperity Inc 108 0.01
2 Installed Building Products Inc 68 –
2 Insteel Industries Inc 66 –
1 Insys Therapeutics Inc 9 –
3 Integer Holdings Corp 74 –
2 Integra LifeSciences Holdings Corp 138 0.01
7 Integrated Device Technology Inc 166 0.01
220 Intel Corp 7,637 0.45
2 Inteliquent Inc 42 –
2 Inter Parfums Inc 86 0.01
6 Interactive Brokers Group Inc 210 0.01
1 Intercept Pharmaceuticals Inc 61 –
23 Intercontinental Exchange Inc 1,257 0.07
2 InterDigital Inc 163 0.01
6 Interface Inc 102 0.01
6 Internap Corp 6 –
6 International Bancshares Corp 230 0.01
28 International Business Machines Corp 4,596 0.27
4 International Flavors & Fragrances Inc 493 0.03
17 International Game Technology PLC 438 0.03
27 International Paper Co 1,326 0.08
2 International Speedway Corp 79 0.01
31 Interpublic Group of Cos Inc 735 0.04
11 Intersil Corp 254 0.02
3 Intevac Inc 18 –
2 INTL. FCStone Inc 83 0.01
5 Intralinks Holdings Inc 55 –
3 Intrawest Resorts Holdings Inc 53 –
3 Intrepid Potash Inc 4 –
11 Intuit Inc 1,200 0.07
1 Intuitive Surgical Inc 796 0.05
3 Invacare Corp 30 –
8 InvenSense Inc 58 –
2 Inventure Foods Inc 15 –
24 Invesco Ltd 755 0.04
3 Investment Technology Group Inc 61 –
28 Investors Bancorp Inc 383 0.02
– Investors Title Co 37 –
– ION Geophysical Corp 3 –
3 IPG Photonics Corp 303 0.02
3 Iridium Communications Inc 24 –
2 iRobot Corp 95 0.01
3 Isle of Capri Casinos Inc 57 –
– Isramco Inc 28 –
3 Itron Inc 182 0.01
7 ITT Inc 274 0.02
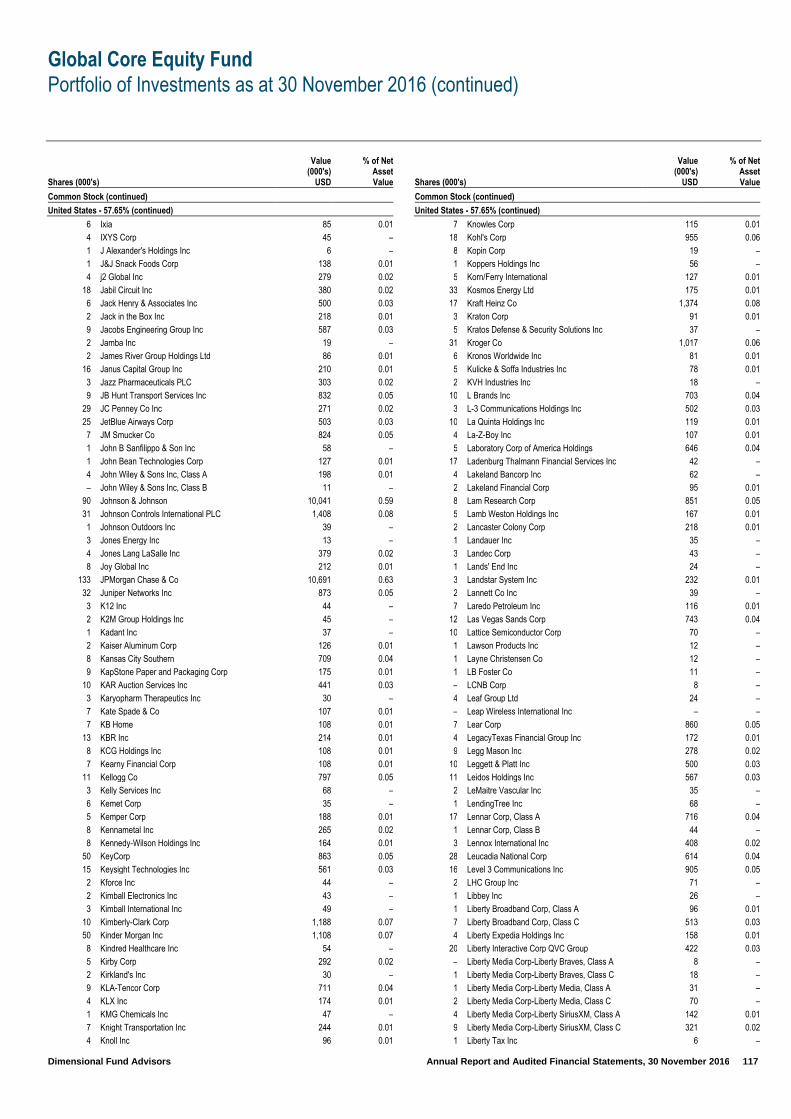
Global Core Equity Fund
Portfolio of Investments as at 30 November 2016 (continued)
Dimensional Fund Advisors Annual Report and Audited Financial Statements, 30 November 2016 117
Shares (000's)
Value (000's)
USD
% of Net Asset Value
Common Stock (continued)
United States - 57.65% (continued)
6 Ixia 85 0.01
4 IXYS Corp 45 –
1 J Alexander's Holdings Inc 6 –
1 J&J Snack Foods Corp 138 0.01
4 j2 Global Inc 279 0.02
18 Jabil Circuit Inc 380 0.02
6 Jack Henry & Associates Inc 500 0.03
2 Jack in the Box Inc 218 0.01
9 Jacobs Engineering Group Inc 587 0.03
2 Jamba Inc 19 –
2 James River Group Holdings Ltd 86 0.01
16 Janus Capital Group Inc 210 0.01
3 Jazz Pharmaceuticals PLC 303 0.02
9 JB Hunt Transport Services Inc 832 0.05
29 JC Penney Co Inc 271 0.02
25 JetBlue Airways Corp 503 0.03
7 JM Smucker Co 824 0.05
1 John B Sanfilippo & Son Inc 58 –
1 John Bean Technologies Corp 127 0.01
4 John Wiley & Sons Inc, Class A 198 0.01
– John Wiley & Sons Inc, Class B 11 –
90 Johnson & Johnson 10,041 0.59
31 Johnson Controls International PLC 1,408 0.08
1 Johnson Outdoors Inc 39 –
3 Jones Energy Inc 13 –
4 Jones Lang LaSalle Inc 379 0.02
8 Joy Global Inc 212 0.01
133 JPMorgan Chase & Co 10,691 0.63
32 Juniper Networks Inc 873 0.05
3 K12 Inc 44 –
2 K2M Group Holdings Inc 45 –
1 Kadant Inc 37 –
2 Kaiser Aluminum Corp 126 0.01
8 Kansas City Southern 709 0.04
9 KapStone Paper and Packaging Corp 175 0.01
10 KAR Auction Services Inc 441 0.03
3 Karyopharm Therapeutics Inc 30 –
7 Kate Spade & Co 107 0.01
7 KB Home 108 0.01
13 KBR Inc 214 0.01
8 KCG Holdings Inc 108 0.01
7 Kearny Financial Corp 108 0.01
11 Kellogg Co 797 0.05
3 Kelly Services Inc 68 –
6 Kemet Corp 35 –
5 Kemper Corp 188 0.01
8 Kennametal Inc 265 0.02
8 Kennedy-Wilson Holdings Inc 164 0.01
50 KeyCorp 863 0.05
15 Keysight Technologies Inc 561 0.03
2 Kforce Inc 44 –
2 Kimball Electronics Inc 43 –
3 Kimball International Inc 49 –
10 Kimberly-Clark Corp 1,188 0.07
50 Kinder Morgan Inc 1,108 0.07
8 Kindred Healthcare Inc 54 –
5 Kirby Corp 292 0.02
2 Kirkland's Inc 30 –
9 KLA-Tencor Corp 711 0.04
4 KLX Inc 174 0.01
1 KMG Chemicals Inc 47 –
7 Knight Transportation Inc 244 0.01
4 Knoll Inc 96 0.01
Shares (000's)
Value (000's)
USD
% of Net Asset Value
Common Stock (continued)
United States - 57.65% (continued)
7 Knowles Corp 115 0.01
18 Kohl's Corp 955 0.06
8 Kopin Corp 19 –
1 Koppers Holdings Inc 56 –
5 Korn/Ferry International 127 0.01
33 Kosmos Energy Ltd 175 0.01
17 Kraft Heinz Co 1,374 0.08
3 Kraton Corp 91 0.01
5 Kratos Defense & Security Solutions Inc 37 –
31 Kroger Co 1,017 0.06
6 Kronos Worldwide Inc 81 0.01
5 Kulicke & Soffa Industries Inc 78 0.01
2 KVH Industries Inc 18 –
10 L Brands Inc 703 0.04
3 L-3 Communications Holdings Inc 502 0.03
10 La Quinta Holdings Inc 119 0.01
4 La-Z-Boy Inc 107 0.01
5 Laboratory Corp of America Holdings 646 0.04
17 Ladenburg Thalmann Financial Services Inc 42 –
4 Lakeland Bancorp Inc 62 –
2 Lakeland Financial Corp 95 0.01
8 Lam Research Corp 851 0.05
5 Lamb Weston Holdings Inc 167 0.01
2 Lancaster Colony Corp 218 0.01
1 Landauer Inc 35 –
3 Landec Corp 43 –
1 Lands' End Inc 24 –
3 Landstar System Inc 232 0.01
2 Lannett Co Inc 39 –
7 Laredo Petroleum Inc 116 0.01
12 Las Vegas Sands Corp 743 0.04
10 Lattice Semiconductor Corp 70 –
1 Lawson Products Inc 12 –
1 Layne Christensen Co 12 –
1 LB Foster Co 11 –
– LCNB Corp 8 –
4 Leaf Group Ltd 24 –
– Leap Wireless International Inc – –
7 Lear Corp 860 0.05
4 LegacyTexas Financial Group Inc 172 0.01
9 Legg Mason Inc 278 0.02
10 Leggett & Platt Inc 500 0.03
11 Leidos Holdings Inc 567 0.03
2 LeMaitre Vascular Inc 35 –
1 LendingTree Inc 68 –
17 Lennar Corp, Class A 716 0.04
1 Lennar Corp, Class B 44 –
3 Lennox International Inc 408 0.02
28 Leucadia National Corp 614 0.04
16 Level 3 Communications Inc 905 0.05
2 LHC Group Inc 71 –
1 Libbey Inc 26 –
1 Liberty Broadband Corp, Class A 96 0.01
7 Liberty Broadband Corp, Class C 513 0.03
4 Liberty Expedia Holdings Inc 158 0.01
20 Liberty Interactive Corp QVC Group 422 0.03
– Liberty Media Corp-Liberty Braves, Class A 8 –
1 Liberty Media Corp-Liberty Braves, Class C 18 –
1 Liberty Media Corp-Liberty Media, Class A 31 –
2 Liberty Media Corp-Liberty Media, Class C 70 –
4 Liberty Media Corp-Liberty SiriusXM, Class A 142 0.01
9 Liberty Media Corp-Liberty SiriusXM, Class C 321 0.02
1 Liberty Tax Inc 6 –

Global Core Equity Fund
Portfolio of Investments as at 30 November 2016 (continued)
Dimensional Fund Advisors Annual Report and Audited Financial Statements, 30 November 2016 118
Shares (000's)
Value (000's)
USD
% of Net Asset Value
Common Stock (continued)
United States - 57.65% (continued)
6 Liberty TripAdvisor Holdings Inc 100 0.01
5 Liberty Ventures 210 0.01
4 LifePoint Health Inc 221 0.01
1 Lifetime Brands Inc 17 –
1 Ligand Pharmaceuticals Inc 63 –
11 Limelight Networks Inc 24 –
1 Limoneira Co 23 –
4 Lincoln Electric Holdings Inc 305 0.02
11 Lincoln National Corp 709 0.04
1 Lindsay Corp 43 –
8 Linear Technology Corp 522 0.03
2 LinkedIn Corp 393 0.02
5 Lionbridge Technologies Inc 26 –
6 Lions Gate Entertainment Corp 151 0.01
2 Lipocine Inc 6 –
3 Liquidity Services Inc 29 –
2 Lithia Motors Inc 177 0.01
1 Littelfuse Inc 209 0.01
2 LivaNova PLC 79 0.01
16 Live Nation Entertainment Inc 451 0.03
23 LKQ Corp 754 0.04
1 LMI Aerospace Inc 9 –
16 Loews Corp 704 0.04
1 LogMeIn Inc 81 0.01
– Loral Space & Communications Inc 1 –
10 Louisiana-Pacific Corp 192 0.01
27 Lowe's Cos Inc 1,912 0.11
7 LPL Financial Holdings Inc 294 0.02
2 LSB Industries Inc 16 –
2 LSC Communications Inc 38 –
2 LSI Industries Inc 18 –
1 Luby's Inc 3 –
6 lululemon athletica Inc 363 0.02
1 Lumber Liquidators Holdings Inc 13 –
2 Lumentum Holdings Inc 89 0.01
4 Luminex Corp 84 0.01
2 Lumos Networks Corp 35 –
1 Lydall Inc 81 0.01
19 LyondellBasell Industries NV 1,697 0.10
6 M&T Bank Corp 912 0.05
2 M/I Homes Inc 50 –
2 Macatawa Bank Corp 16 –
1 MACOM Technology Solutions Holdings Inc 56 –
6 Macquarie Infrastructure Corp 475 0.03
2 MacroGenics Inc 41 –
26 Macy's Inc 1,084 0.06
2 Madison Square Garden Co 278 0.02
2 Magellan Health Inc 157 0.01
7 Maiden Holdings Ltd 114 0.01
2 MainSource Financial Group Inc 57 –
2 Malibu Boats Inc 31 –
9 Mallinckrodt PLC 489 0.03
1 Malvern Bancorp Inc 26 –
4 Manhattan Associates Inc 215 0.01
12 Manitowoc Co Inc 72 –
10 Manitowoc Foodservice Inc 169 0.01
2 Manning & Napier Inc 16 –
6 ManpowerGroup Inc 498 0.03
2 ManTech International Corp 89 0.01
40 Marathon Oil Corp 730 0.04
39 Marathon Petroleum Corp 1,831 0.11
2 Marchex Inc 6 –
2 Marcus & Millichap Inc 55 –
Shares (000's)
Value (000's)
USD
% of Net Asset Value
Common Stock (continued)
United States - 57.65% (continued)
2 Marcus Corp 64 –
1 Marine Products Corp 8 –
2 MarineMax Inc 36 –
1 Markel Corp 537 0.03
2 MarketAxess Holdings Inc 353 0.02
1 Marlin Business Services Corp 20 –
17 Marriott International Inc 1,346 0.08
2 Marriott Vacations Worldwide Corp 182 0.01
25 Marsh & McLennan Cos Inc 1,730 0.10
3 Marten Transport Ltd 77 0.01
3 Martin Marietta Materials Inc 701 0.04
38 Marvell Technology Group Ltd 543 0.03
23 Masco Corp 734 0.04
3 Masimo Corp 162 0.01
7 MasTec Inc 249 0.02
30 Mastercard Inc 3,046 0.18
2 Materion Corp 74 –
2 Matrix Service Co 52 –
3 Matson Inc 127 0.01
18 Mattel Inc 571 0.03
2 Matthews International Corp 161 0.01
9 Maxim Integrated Products Inc 343 0.02
4 MAXIMUS Inc 243 0.01
2 MaxLinear Inc 39 –
2 Maxwell Technologies Inc 10 –
7 MB Financial Inc 294 0.02
13 MBIA Inc 135 0.01
2 MBT Financial Corp 18 –
1 McClatchy Co 8 –
5 McCormick & Co Inc (non-voting rights) 449 0.03
1 McCormick & Co Inc (voting rights) 50 –
22 McDermott International Inc 154 0.01
28 McDonald's Corp 3,292 0.19
11 McEwen Mining Inc 32 –
3 McGrath RentCorp 94 0.01
7 McKesson Corp 1,015 0.06
4 MDC Holdings Inc 105 0.01
14 MDU Resources Group Inc 386 0.02
10 Mead Johnson Nutrition Co 692 0.04
10 Media General Inc 185 0.01
4 Medicines Co 133 0.01
1 Medifast Inc 47 –
7 MEDNAX Inc 459 0.03
30 Medtronic PLC 2,222 0.13
3 MeetMe Inc 16 –
8 Mentor Graphics Corp 293 0.02
1 Mercantile Bank Corp 40 –
5 Mercer International Inc 49 –
1 Merchants Bancshares Inc 40 –
125 Merck & Co Inc 7,633 0.45
5 Mercury General Corp 267 0.02
4 Mercury Systems Inc 121 0.01
4 Meredith Corp 205 0.01
6 Meridian Bancorp Inc 100 0.01
3 Meridian Bioscience Inc 48 –
4 Merit Medical Systems Inc 104 0.01
4 Meritage Homes Corp 136 0.01
7 Meritor Inc 93 0.01
– Mesa Laboratories Inc 38 –
1 Meta Financial Group Inc 76 0.01
2 Methode Electronics Inc 87 0.01
23 MetLife Inc 1,288 0.08
1 Mettler-Toledo International Inc 512 0.03

Global Core Equity Fund
Portfolio of Investments as at 30 November 2016 (continued)
Dimensional Fund Advisors Annual Report and Audited Financial Statements, 30 November 2016 119
Shares (000's)
Value (000's)
USD
% of Net Asset Value
Common Stock (continued)
United States - 57.65% (continued)
2 MGE Energy Inc 134 0.01
32 MGIC Investment Corp 287 0.02
41 MGM Resorts International 1,182 0.07
2 MGP Ingredients Inc 75 –
13 Michael Kors Holdings Ltd 590 0.04
10 Michaels Cos Inc 255 0.02
7 Microchip Technology Inc 464 0.03
71 Micron Technology Inc 1,379 0.08
8 Microsemi Corp 444 0.03
257 Microsoft Corp 15,464 0.90
1 MicroStrategy Inc 115 0.01
1 Middleburg Financial Corp 18 –
4 Middleby Corp 565 0.03
2 Middlesex Water Co 66 –
1 MidSouth Bancorp Inc 17 –
1 MidWestOne Financial Group Inc 27 –
1 Miller Industries Inc 31 –
3 MiMedx Group Inc 30 –
3 Minerals Technologies Inc 249 0.02
3 Mistras Group Inc 72 –
4 MKS Instruments Inc 242 0.01
4 Mobile Mini Inc 123 0.01
6 Modine Manufacturing Co 67 –
7 ModusLink Global Solutions Inc 10 –
1 Moelis & Co 29 –
4 Mohawk Industries Inc 737 0.04
5 Molina Healthcare Inc 267 0.02
7 Molson Coors Brewing Co 683 0.04
1 Momenta Pharmaceuticals Inc 17 –
36 Mondelez International Inc 1,478 0.09
2 MoneyGram International Inc 25 –
– Monolithic Power Systems Inc 39 –
3 Monotype Imaging Holdings Inc 56 –
2 Monro Muffler Brake Inc 131 0.01
14 Monsanto Co 1,411 0.08
15 Monster Beverage Corp 661 0.04
8 Moody's Corp 786 0.05
3 Moog Inc 227 0.01
40 Morgan Stanley 1,659 0.10
3 Morningstar Inc 231 0.01
29 Mosaic Co 815 0.05
1 Motorcar Parts of America Inc 33 –
9 Motorola Solutions Inc 706 0.04
1 Movado Group Inc 31 –
10 MRC Global Inc 195 0.01
3 MSA Safety Inc 166 0.01
4 MSC Industrial Direct Co Inc 353 0.02
6 MSCI Inc 470 0.03
4 MSG Networks Inc 82 0.01
1 MTS Systems Corp 47 –
5 Mueller Industries Inc 192 0.01
11 Mueller Water Products Inc 146 0.01
2 Multi-Color Corp 116 0.01
16 Murphy Oil Corp 533 0.03
4 Murphy USA Inc 258 0.02
– MutualFirst Financial Inc 12 –
2 Myers Industries Inc 34 –
22 Mylan NV 816 0.05
1 MYR Group Inc 55 –
3 Myriad Genetics Inc 49 –
26 Nabors Industries Ltd 414 0.02
1 NACCO Industries Inc 55 –
2 Nanometrics Inc 43 –
Shares (000's)
Value (000's)
USD
% of Net Asset Value
Common Stock (continued)
United States - 57.65% (continued)
7 Nasdaq Inc 449 0.03
– Nathan's Famous Inc 8 –
3 National Bank Holdings Corp 88 0.01
1 National Bankshares Inc 22 –
2 National Beverage Corp 110 0.01
5 National CineMedia Inc 71 –
6 National Fuel Gas Co 351 0.02
10 National General Holdings Corp 217 0.01
1 National HealthCare Corp 94 0.01
9 National Instruments Corp 278 0.02
18 National Oilwell Varco Inc 662 0.04
– National Presto Industries Inc 38 –
2 National Research Corp 27 –
– National Western Life Group Inc 64 –
2 Nationstar Mortgage Holdings Inc 34 –
1 Natural Gas Services Group Inc 40 –
1 Natural Grocers by Vitamin Cottage Inc 10 –
3 Nature's Sunshine Products Inc 39 –
2 Natus Medical Inc 72 –
2 Nautilus Inc 31 –
31 Navient Corp 535 0.03
5 Navigant Consulting Inc 127 0.01
1 Navigators Group Inc 153 0.01
1 Navistar International Corp 27 –
4 NBT Bancorp Inc 163 0.01
4 NCI Building Systems Inc 71 –
2 NCI Inc 21 –
10 NCR Corp 398 0.02
1 Neenah Paper Inc 115 0.01
3 Nelnet Inc 147 0.01
1 Neogen Corp 88 0.01
4 NeoGenomics Inc 37 –
4 NeoPhotonics Corp 50 –
20 NetApp Inc 734 0.04
7 Netflix Inc 792 0.05
3 NETGEAR Inc 142 0.01
14 NetScout Systems Inc 444 0.03
2 Neurocrine Biosciences Inc 107 0.01
2 NeuStar Inc 48 –
2 New Home Co Inc 29 –
6 New Jersey Resources Corp 217 0.01
5 New Media Investment Group Inc 73 –
12 New York & Co Inc 25 –
38 New York Community Bancorp Inc 604 0.04
10 New York Times Co 133 0.01
16 Newell Brands Inc 769 0.05
7 Newfield Exploration Co 298 0.02
1 NewMarket Corp 315 0.02
26 Newmont Mining Corp 857 0.05
8 Newpark Resources Inc 55 –
30 News Corp, Class A 352 0.02
15 News Corp, Class B 177 0.01
6 NewStar Financial Inc 49 –
1 Nexstar Broadcasting Group Inc 79 0.01
15 NextEra Energy Inc 1,706 0.10
4 NIC Inc 100 0.01
18 Nielsen Holdings PLC 789 0.05
34 NIKE Inc 1,727 0.10
23 NiSource Inc 497 0.03
1 NL Industries Inc 4 –
4 NMI Holdings Inc 33 –
2 NN Inc 33 –
16 Noble Corp PLC 100 0.01
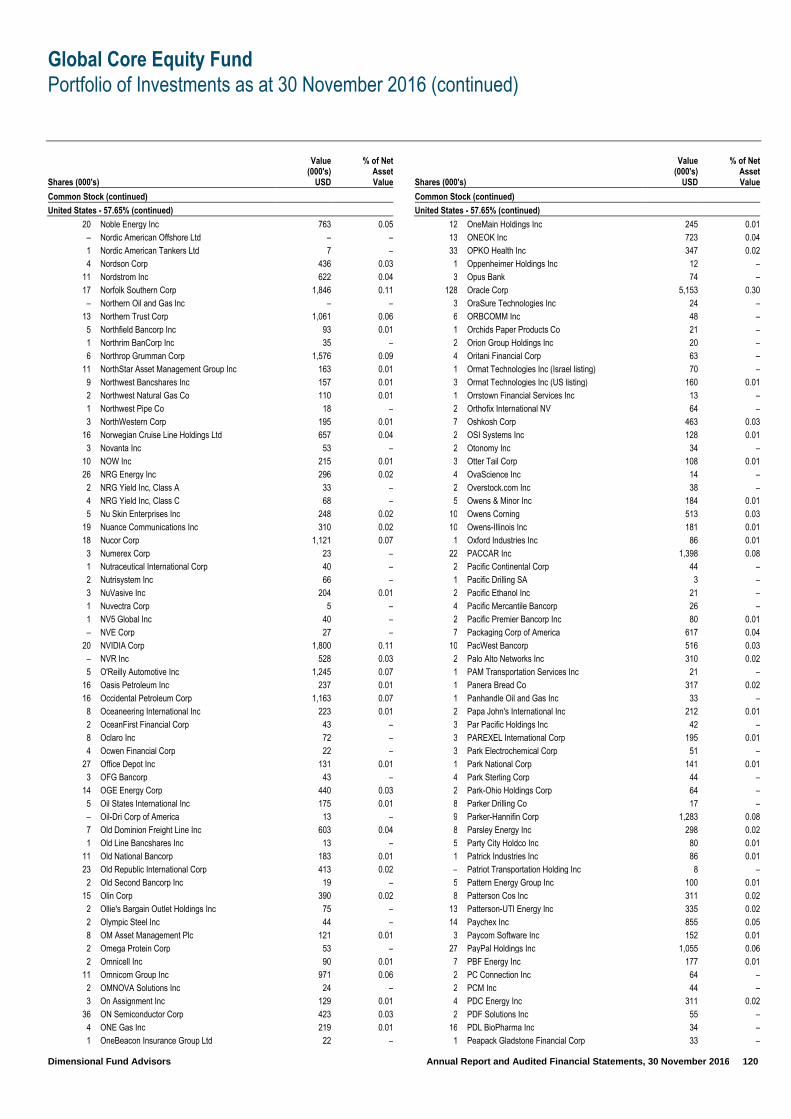
Global Core Equity Fund
Portfolio of Investments as at 30 November 2016 (continued)
Dimensional Fund Advisors Annual Report and Audited Financial Statements, 30 November 2016 120
Shares (000's)
Value (000's)
USD
% of Net Asset Value
Common Stock (continued)
United States - 57.65% (continued)
20 Noble Energy Inc 763 0.05
– Nordic American Offshore Ltd – –
1 Nordic American Tankers Ltd 7 –
4 Nordson Corp 436 0.03
11 Nordstrom Inc 622 0.04
17 Norfolk Southern Corp 1,846 0.11
– Northern Oil and Gas Inc – –
13 Northern Trust Corp 1,061 0.06
5 Northfield Bancorp Inc 93 0.01
1 Northrim BanCorp Inc 35 –
6 Northrop Grumman Corp 1,576 0.09
11 NorthStar Asset Management Group Inc 163 0.01
9 Northwest Bancshares Inc 157 0.01
2 Northwest Natural Gas Co 110 0.01
1 Northwest Pipe Co 18 –
3 NorthWestern Corp 195 0.01
16 Norwegian Cruise Line Holdings Ltd 657 0.04
3 Novanta Inc 53 –
10 NOW Inc 215 0.01
26 NRG Energy Inc 296 0.02
2 NRG Yield Inc, Class A 33 –
4 NRG Yield Inc, Class C 68 –
5 Nu Skin Enterprises Inc 248 0.02
19 Nuance Communications Inc 310 0.02
18 Nucor Corp 1,121 0.07
3 Numerex Corp 23 –
1 Nutraceutical International Corp 40 –
2 Nutrisystem Inc 66 –
3 NuVasive Inc 204 0.01
1 Nuvectra Corp 5 –
1 NV5 Global Inc 40 –
– NVE Corp 27 –
20 NVIDIA Corp 1,800 0.11
– NVR Inc 528 0.03
5 O'Reilly Automotive Inc 1,245 0.07
16 Oasis Petroleum Inc 237 0.01
16 Occidental Petroleum Corp 1,163 0.07
8 Oceaneering International Inc 223 0.01
2 OceanFirst Financial Corp 43 –
8 Oclaro Inc 72 –
4 Ocwen Financial Corp 22 –
27 Office Depot Inc 131 0.01
3 OFG Bancorp 43 –
14 OGE Energy Corp 440 0.03
5 Oil States International Inc 175 0.01
– Oil-Dri Corp of America 13 –
7 Old Dominion Freight Line Inc 603 0.04
1 Old Line Bancshares Inc 13 –
11 Old National Bancorp 183 0.01
23 Old Republic International Corp 413 0.02
2 Old Second Bancorp Inc 19 –
15 Olin Corp 390 0.02
2 Ollie's Bargain Outlet Holdings Inc 75 –
2 Olympic Steel Inc 44 –
8 OM Asset Management Plc 121 0.01
2 Omega Protein Corp 53 –
2 Omnicell Inc 90 0.01
11 Omnicom Group Inc 971 0.06
2 OMNOVA Solutions Inc 24 –
3 On Assignment Inc 129 0.01
36 ON Semiconductor Corp 423 0.03
4 ONE Gas Inc 219 0.01
1 OneBeacon Insurance Group Ltd 22 –
Shares (000's)
Value (000's)
USD
% of Net Asset Value
Common Stock (continued)
United States - 57.65% (continued)
12 OneMain Holdings Inc 245 0.01
13 ONEOK Inc 723 0.04
33 OPKO Health Inc 347 0.02
1 Oppenheimer Holdings Inc 12 –
3 Opus Bank 74 –
128 Oracle Corp 5,153 0.30
3 OraSure Technologies Inc 24 –
6 ORBCOMM Inc 48 –
1 Orchids Paper Products Co 21 –
2 Orion Group Holdings Inc 20 –
4 Oritani Financial Corp 63 –
1 Ormat Technologies Inc (Israel listing) 70 –
3 Ormat Technologies Inc (US listing) 160 0.01
1 Orrstown Financial Services Inc 13 –
2 Orthofix International NV 64 –
7 Oshkosh Corp 463 0.03
2 OSI Systems Inc 128 0.01
2 Otonomy Inc 34 –
3 Otter Tail Corp 108 0.01
4 OvaScience Inc 14 –
2 Overstock.com Inc 38 –
5 Owens & Minor Inc 184 0.01
10 Owens Corning 513 0.03
10 Owens-Illinois Inc 181 0.01
1 Oxford Industries Inc 86 0.01
22 PACCAR Inc 1,398 0.08
2 Pacific Continental Corp 44 –
1 Pacific Drilling SA 3 –
2 Pacific Ethanol Inc 21 –
4 Pacific Mercantile Bancorp 26 –
2 Pacific Premier Bancorp Inc 80 0.01
7 Packaging Corp of America 617 0.04
10 PacWest Bancorp 516 0.03
2 Palo Alto Networks Inc 310 0.02
1 PAM Transportation Services Inc 21 –
1 Panera Bread Co 317 0.02
1 Panhandle Oil and Gas Inc 33 –
2 Papa John's International Inc 212 0.01
3 Par Pacific Holdings Inc 42 –
3 PAREXEL International Corp 195 0.01
3 Park Electrochemical Corp 51 –
1 Park National Corp 141 0.01
4 Park Sterling Corp 44 –
2 Park-Ohio Holdings Corp 64 –
8 Parker Drilling Co 17 –
9 Parker-Hannifin Corp 1,283 0.08
8 Parsley Energy Inc 298 0.02
5 Party City Holdco Inc 80 0.01
1 Patrick Industries Inc 86 0.01
– Patriot Transportation Holding Inc 8 –
5 Pattern Energy Group Inc 100 0.01
8 Patterson Cos Inc 311 0.02
13 Patterson-UTI Energy Inc 335 0.02
14 Paychex Inc 855 0.05
3 Paycom Software Inc 152 0.01
27 PayPal Holdings Inc 1,055 0.06
7 PBF Energy Inc 177 0.01
2 PC Connection Inc 64 –
2 PCM Inc 44 –
4 PDC Energy Inc 311 0.02
2 PDF Solutions Inc 55 –
16 PDL BioPharma Inc 34 –
1 Peapack Gladstone Financial Corp 33 –
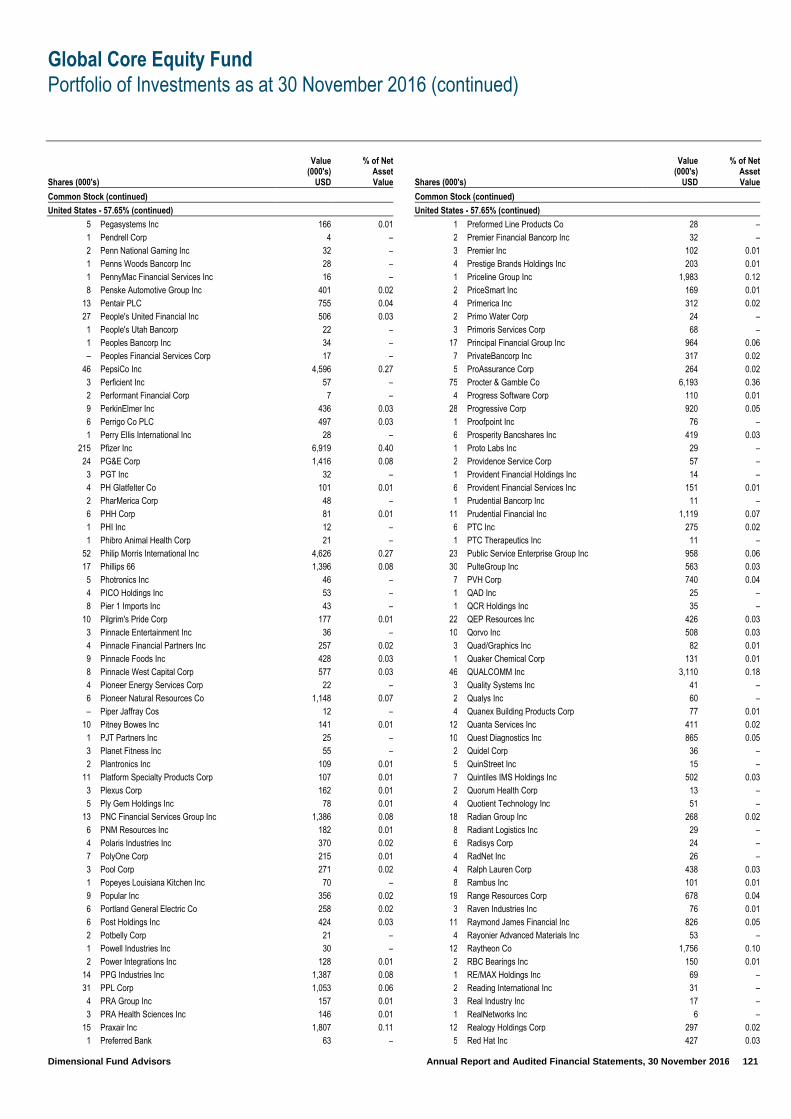
Global Core Equity Fund
Portfolio of Investments as at 30 November 2016 (continued)
Dimensional Fund Advisors Annual Report and Audited Financial Statements, 30 November 2016 121
Shares (000's)
Value (000's)
USD
% of Net Asset Value
Common Stock (continued)
United States - 57.65% (continued)
5 Pegasystems Inc 166 0.01
1 Pendrell Corp 4 –
2 Penn National Gaming Inc 32 –
1 Penns Woods Bancorp Inc 28 –
1 PennyMac Financial Services Inc 16 –
8 Penske Automotive Group Inc 401 0.02
13 Pentair PLC 755 0.04
27 People's United Financial Inc 506 0.03
1 People's Utah Bancorp 22 –
1 Peoples Bancorp Inc 34 –
– Peoples Financial Services Corp 17 –
46 PepsiCo Inc 4,596 0.27
3 Perficient Inc 57 –
2 Performant Financial Corp 7 –
9 PerkinElmer Inc 436 0.03
6 Perrigo Co PLC 497 0.03
1 Perry Ellis International Inc 28 –
215 Pfizer Inc 6,919 0.40
24 PG&E Corp 1,416 0.08
3 PGT Inc 32 –
4 PH Glatfelter Co 101 0.01
2 PharMerica Corp 48 –
6 PHH Corp 81 0.01
1 PHI Inc 12 –
1 Phibro Animal Health Corp 21 –
52 Philip Morris International Inc 4,626 0.27
17 Phillips 66 1,396 0.08
5 Photronics Inc 46 –
4 PICO Holdings Inc 53 –
8 Pier 1 Imports Inc 43 –
10 Pilgrim's Pride Corp 177 0.01
3 Pinnacle Entertainment Inc 36 –
4 Pinnacle Financial Partners Inc 257 0.02
9 Pinnacle Foods Inc 428 0.03
8 Pinnacle West Capital Corp 577 0.03
4 Pioneer Energy Services Corp 22 –
6 Pioneer Natural Resources Co 1,148 0.07
– Piper Jaffray Cos 12 –
10 Pitney Bowes Inc 141 0.01
1 PJT Partners Inc 25 –
3 Planet Fitness Inc 55 –
2 Plantronics Inc 109 0.01
11 Platform Specialty Products Corp 107 0.01
3 Plexus Corp 162 0.01
5 Ply Gem Holdings Inc 78 0.01
13 PNC Financial Services Group Inc 1,386 0.08
6 PNM Resources Inc 182 0.01
4 Polaris Industries Inc 370 0.02
7 PolyOne Corp 215 0.01
3 Pool Corp 271 0.02
1 Popeyes Louisiana Kitchen Inc 70 –
9 Popular Inc 356 0.02
6 Portland General Electric Co 258 0.02
6 Post Holdings Inc 424 0.03
2 Potbelly Corp 21 –
1 Powell Industries Inc 30 –
2 Power Integrations Inc 128 0.01
14 PPG Industries Inc 1,387 0.08
31 PPL Corp 1,053 0.06
4 PRA Group Inc 157 0.01
3 PRA Health Sciences Inc 146 0.01
15 Praxair Inc 1,807 0.11
1 Preferred Bank 63 –
Shares (000's)
Value (000's)
USD
% of Net Asset Value
Common Stock (continued)
United States - 57.65% (continued)
1 Preformed Line Products Co 28 –
2 Premier Financial Bancorp Inc 32 –
3 Premier Inc 102 0.01
4 Prestige Brands Holdings Inc 203 0.01
1 Priceline Group Inc 1,983 0.12
2 PriceSmart Inc 169 0.01
4 Primerica Inc 312 0.02
2 Primo Water Corp 24 –
3 Primoris Services Corp 68 –
17 Principal Financial Group Inc 964 0.06
7 PrivateBancorp Inc 317 0.02
5 ProAssurance Corp 264 0.02
75 Procter & Gamble Co 6,193 0.36
4 Progress Software Corp 110 0.01
28 Progressive Corp 920 0.05
1 Proofpoint Inc 76 –
6 Prosperity Bancshares Inc 419 0.03
1 Proto Labs Inc 29 –
2 Providence Service Corp 57 –
1 Provident Financial Holdings Inc 14 –
6 Provident Financial Services Inc 151 0.01
1 Prudential Bancorp Inc 11 –
11 Prudential Financial Inc 1,119 0.07
6 PTC Inc 275 0.02
1 PTC Therapeutics Inc 11 –
23 Public Service Enterprise Group Inc 958 0.06
30 PulteGroup Inc 563 0.03
7 PVH Corp 740 0.04
1 QAD Inc 25 –
1 QCR Holdings Inc 35 –
22 QEP Resources Inc 426 0.03
10 Qorvo Inc 508 0.03
3 Quad/Graphics Inc 82 0.01
1 Quaker Chemical Corp 131 0.01
46 QUALCOMM Inc 3,110 0.18
3 Quality Systems Inc 41 –
2 Qualys Inc 60 –
4 Quanex Building Products Corp 77 0.01
12 Quanta Services Inc 411 0.02
10 Quest Diagnostics Inc 865 0.05
2 Quidel Corp 36 –
5 QuinStreet Inc 15 –
7 Quintiles IMS Holdings Inc 502 0.03
2 Quorum Health Corp 13 –
4 Quotient Technology Inc 51 –
18 Radian Group Inc 268 0.02
8 Radiant Logistics Inc 29 –
6 Radisys Corp 24 –
4 RadNet Inc 26 –
4 Ralph Lauren Corp 438 0.03
8 Rambus Inc 101 0.01
19 Range Resources Corp 678 0.04
3 Raven Industries Inc 76 0.01
11 Raymond James Financial Inc 826 0.05
4 Rayonier Advanced Materials Inc 53 –
12 Raytheon Co 1,756 0.10
2 RBC Bearings Inc 150 0.01
1 RE/MAX Holdings Inc 69 –
2 Reading International Inc 31 –
3 Real Industry Inc 17 –
1 RealNetworks Inc 6 –
12 Realogy Holdings Corp 297 0.02
5 Red Hat Inc 427 0.03

Global Core Equity Fund
Portfolio of Investments as at 30 November 2016 (continued)
Dimensional Fund Advisors Annual Report and Audited Financial Statements, 30 November 2016 122
Shares (000's)
Value (000's)
USD
% of Net Asset Value
Common Stock (continued)
United States - 57.65% (continued)
1 Red Lion Hotels Corp 11 –
1 Red Robin Gourmet Burgers Inc 67 –
4 Regal Beloit Corp 285 0.02
9 Regal Entertainment Group 205 0.01
2 Regeneron Pharmaceuticals Inc 728 0.04
2 Regional Management Corp 49 –
57 Regions Financial Corp 773 0.05
4 Regis Corp 56 –
5 Reinsurance Group of America Inc 619 0.04
1 Reis Inc 28 –
6 Reliance Steel & Aluminum Co 504 0.03
4 RenaissanceRe Holdings Ltd 484 0.03
4 Renasant Corp 158 0.01
4 Renewable Energy Group Inc 36 –
6 Rent-A-Center Inc 68 –
– Rentech Inc 1 –
1 Repligen Corp 20 –
2 Republic Bancorp Inc 58 –
16 Republic Services Inc 869 0.05
10 ResMed Inc 593 0.04
6 Resolute Forest Products Inc 26 –
3 Resources Connection Inc 53 –
2 Restoration Hardware Holdings Inc 55 –
6 RetailMeNot Inc 52 –
3 Retrophin Inc 59 –
3 Revlon Inc 84 0.01
– REX American Resources Corp 47 –
9 Rexnord Corp 208 0.01
29 Reynolds American Inc 1,562 0.09
17 Rice Energy Inc 422 0.03
8 Rigel Pharmaceuticals Inc 20 –
– Rightside Group Ltd 4 –
1 RigNet Inc 24 –
3 Ring Energy Inc 35 –
38 Rite Aid Corp 304 0.02
6 Riverview Bancorp Inc 34 –
3 RLI Corp 192 0.01
– RMR Group Inc 17 –
2 Roadrunner Transportation Systems Inc 23 –
8 Robert Half International Inc 364 0.02
6 Rockwell Automation Inc 845 0.05
7 Rockwell Collins Inc 694 0.04
2 Rogers Corp 136 0.01
11 Rollins Inc 341 0.02
5 Roper Technologies Inc 907 0.05
19 Ross Stores Inc 1,266 0.07
10 Rowan Cos PLC 181 0.01
11 Royal Caribbean Cruises Ltd 853 0.05
6 Royal Gold Inc 386 0.02
8 RPC Inc 159 0.01
9 RPM International Inc 490 0.03
4 RPX Corp 40 –
6 RR Donnelley & Sons Co 111 0.01
9 RSP Permian Inc 404 0.02
4 RTI Surgical Inc 12 –
2 Rubicon Project Inc 14 –
4 Ruby Tuesday Inc 11 –
4 Rudolph Technologies Inc 77 0.01
4 Rush Enterprises Inc 108 0.01
3 Ruth's Hospitality Group Inc 46 –
6 Ryder System Inc 450 0.03
2 Ryerson Holding Corp 23 –
12 S&P Global Inc 1,394 0.08
Shares (000's)
Value (000's)
USD
% of Net Asset Value
Common Stock (continued)
United States - 57.65% (continued)
3 S&T Bancorp Inc 98 0.01
15 Sabre Corp 396 0.02
2 Safeguard Scientifics Inc 20 –
2 Safety Insurance Group Inc 110 0.01
8 Safeway Inc 8 –
1 Saga Communications Inc 30 –
2 Saia Inc 87 0.01
4 Salem Media Group Inc 20 –
9 salesforce.com Inc 665 0.04
10 Sally Beauty Holdings Inc 258 0.02
2 Sanderson Farms Inc 158 0.01
2 Sandy Spring Bancorp Inc 80 0.01
6 Sangamo BioSciences Inc 20 –
6 Sanmina Corp 199 0.01
24 Santander Consumer USA Holdings Inc 334 0.02
6 SBA Communications Corp 609 0.04
10 SCANA Corp 678 0.04
2 ScanSource Inc 76 –
32 Schlumberger Ltd 2,694 0.16
3 Schnitzer Steel Industries Inc 86 0.01
3 Scholastic Corp 116 0.01
3 Schweitzer-Mauduit International Inc 121 0.01
4 SciClone Pharmaceuticals Inc 44 –
3 Science Applications International Corp 239 0.01
13 Scorpio Tankers Inc 54 –
4 Scotts Miracle-Gro Co 393 0.02
7 Scripps Networks Interactive Inc 495 0.03
– Seaboard Corp 213 0.01
2 Seachange International Inc 6 –
4 Seacoast Banking Corp of Florida 90 0.01
1 SEACOR Holdings Inc 76 –
19 Seagate Technology PLC 754 0.04
12 Sealed Air Corp 548 0.03
3 Sears Hometown and Outlet Stores Inc 17 –
– SeaSpine Holdings Corp 3 –
5 Seattle Genetics Inc 301 0.02
7 SeaWorld Entertainment Inc 123 0.01
11 SEI Investments Co 515 0.03
3 Select Comfort Corp 69 –
12 Select Medical Holdings Corp 148 0.01
5 Selective Insurance Group Inc 203 0.01
4 SemGroup Corp 156 0.01
11 Sempra Energy 1,129 0.07
4 Semtech Corp 125 0.01
1 Seneca Foods Corp 44 –
15 Sensata Technologies Holding NV 545 0.03
3 Sensient Technologies Corp 257 0.02
5 Sequential Brands Group Inc 24 –
18 Service Corp International 477 0.03
8 ServiceMaster Global Holdings Inc 291 0.02
4 ServiceNow Inc 338 0.02
6 ServiceSource International Inc 38 –
2 ServisFirst Bancshares Inc 125 0.01
1 Shake Shack Inc 44 –
3 Shenandoah Telecommunications Co 91 0.01
4 Sherwin-Williams Co 948 0.06
2 Shiloh Industries Inc 11 –
5 Ship Finance International Ltd 74 –
1 Shoe Carnival Inc 35 –
1 Shore Bancshares Inc 13 –
4 ShoreTel Inc 31 –
2 Shutterfly Inc 125 0.01
1 Shutterstock Inc 38 –
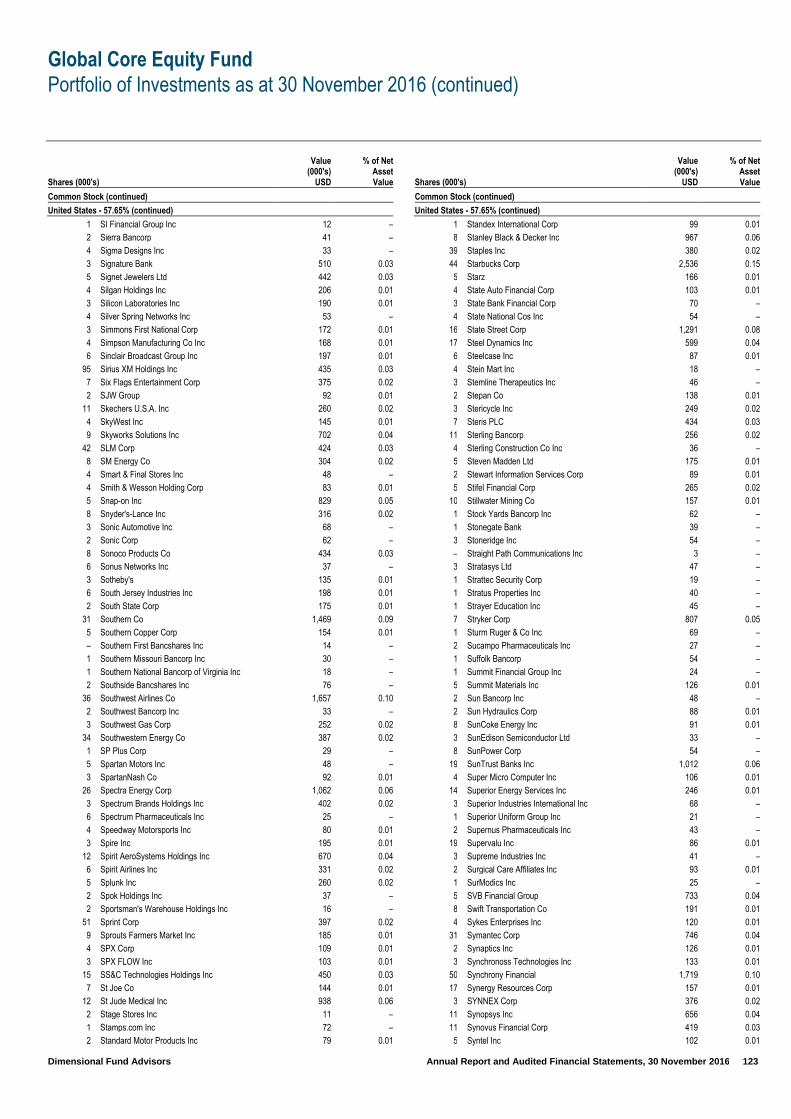
Global Core Equity Fund
Portfolio of Investments as at 30 November 2016 (continued)
Dimensional Fund Advisors Annual Report and Audited Financial Statements, 30 November 2016 123
Shares (000's)
Value (000's)
USD
% of Net Asset Value
Common Stock (continued)
United States - 57.65% (continued)
1 SI Financial Group Inc 12 –
2 Sierra Bancorp 41 –
4 Sigma Designs Inc 33 –
3 Signature Bank 510 0.03
5 Signet Jewelers Ltd 442 0.03
4 Silgan Holdings Inc 206 0.01
3 Silicon Laboratories Inc 190 0.01
4 Silver Spring Networks Inc 53 –
3 Simmons First National Corp 172 0.01
4 Simpson Manufacturing Co Inc 168 0.01
6 Sinclair Broadcast Group Inc 197 0.01
95 Sirius XM Holdings Inc 435 0.03
7 Six Flags Entertainment Corp 375 0.02
2 SJW Group 92 0.01
11 Skechers U.S.A. Inc 260 0.02
4 SkyWest Inc 145 0.01
9 Skyworks Solutions Inc 702 0.04
42 SLM Corp 424 0.03
8 SM Energy Co 304 0.02
4 Smart & Final Stores Inc 48 –
4 Smith & Wesson Holding Corp 83 0.01
5 Snap-on Inc 829 0.05
8 Snyder's-Lance Inc 316 0.02
3 Sonic Automotive Inc 68 –
2 Sonic Corp 62 –
8 Sonoco Products Co 434 0.03
6 Sonus Networks Inc 37 –
3 Sotheby's 135 0.01
6 South Jersey Industries Inc 198 0.01
2 South State Corp 175 0.01
31 Southern Co 1,469 0.09
5 Southern Copper Corp 154 0.01
– Southern First Bancshares Inc 14 –
1 Southern Missouri Bancorp Inc 30 –
1 Southern National Bancorp of Virginia Inc 18 –
2 Southside Bancshares Inc 76 –
36 Southwest Airlines Co 1,657 0.10
2 Southwest Bancorp Inc 33 –
3 Southwest Gas Corp 252 0.02
34 Southwestern Energy Co 387 0.02
1 SP Plus Corp 29 –
5 Spartan Motors Inc 48 –
3 SpartanNash Co 92 0.01
26 Spectra Energy Corp 1,062 0.06
3 Spectrum Brands Holdings Inc 402 0.02
6 Spectrum Pharmaceuticals Inc 25 –
4 Speedway Motorsports Inc 80 0.01
3 Spire Inc 195 0.01
12 Spirit AeroSystems Holdings Inc 670 0.04
6 Spirit Airlines Inc 331 0.02
5 Splunk Inc 260 0.02
2 Spok Holdings Inc 37 –
2 Sportsman's Warehouse Holdings Inc 16 –
51 Sprint Corp 397 0.02
9 Sprouts Farmers Market Inc 185 0.01
4 SPX Corp 109 0.01
3 SPX FLOW Inc 103 0.01
15 SS&C Technologies Holdings Inc 450 0.03
7 St Joe Co 144 0.01
12 St Jude Medical Inc 938 0.06
2 Stage Stores Inc 11 –
1 Stamps.com Inc 72 –
2 Standard Motor Products Inc 79 0.01
Shares (000's)
Value (000's)
USD
% of Net Asset Value
Common Stock (continued)
United States - 57.65% (continued)
1 Standex International Corp 99 0.01
8 Stanley Black & Decker Inc 967 0.06
39 Staples Inc 380 0.02
44 Starbucks Corp 2,536 0.15
5 Starz 166 0.01
4 State Auto Financial Corp 103 0.01
3 State Bank Financial Corp 70 –
4 State National Cos Inc 54 –
16 State Street Corp 1,291 0.08
17 Steel Dynamics Inc 599 0.04
6 Steelcase Inc 87 0.01
4 Stein Mart Inc 18 –
3 Stemline Therapeutics Inc 46 –
2 Stepan Co 138 0.01
3 Stericycle Inc 249 0.02
7 Steris PLC 434 0.03
11 Sterling Bancorp 256 0.02
4 Sterling Construction Co Inc 36 –
5 Steven Madden Ltd 175 0.01
2 Stewart Information Services Corp 89 0.01
5 Stifel Financial Corp 265 0.02
10 Stillwater Mining Co 157 0.01
1 Stock Yards Bancorp Inc 62 –
1 Stonegate Bank 39 –
3 Stoneridge Inc 54 –
– Straight Path Communications Inc 3 –
3 Stratasys Ltd 47 –
1 Strattec Security Corp 19 –
1 Stratus Properties Inc 40 –
1 Strayer Education Inc 45 –
7 Stryker Corp 807 0.05
1 Sturm Ruger & Co Inc 69 –
2 Sucampo Pharmaceuticals Inc 27 –
1 Suffolk Bancorp 54 –
1 Summit Financial Group Inc 24 –
5 Summit Materials Inc 126 0.01
2 Sun Bancorp Inc 48 –
2 Sun Hydraulics Corp 88 0.01
8 SunCoke Energy Inc 91 0.01
3 SunEdison Semiconductor Ltd 33 –
8 SunPower Corp 54 –
19 SunTrust Banks Inc 1,012 0.06
4 Super Micro Computer Inc 106 0.01
14 Superior Energy Services Inc 246 0.01
3 Superior Industries International Inc 68 –
1 Superior Uniform Group Inc 21 –
2 Supernus Pharmaceuticals Inc 43 –
19 Supervalu Inc 86 0.01
3 Supreme Industries Inc 41 –
2 Surgical Care Affiliates Inc 93 0.01
1 SurModics Inc 25 –
5 SVB Financial Group 733 0.04
8 Swift Transportation Co 191 0.01
4 Sykes Enterprises Inc 120 0.01
31 Symantec Corp 746 0.04
2 Synaptics Inc 126 0.01
3 Synchronoss Technologies Inc 133 0.01
50 Synchrony Financial 1,719 0.10
17 Synergy Resources Corp 157 0.01
3 SYNNEX Corp 376 0.02
11 Synopsys Inc 656 0.04
11 Synovus Financial Corp 419 0.03
5 Syntel Inc 102 0.01

Global Core Equity Fund
Portfolio of Investments as at 30 November 2016 (continued)
Dimensional Fund Advisors Annual Report and Audited Financial Statements, 30 November 2016 124
Shares (000's)
Value (000's)
USD
% of Net Asset Value
Common Stock (continued)
United States - 57.65% (continued)
23 Sysco Corp 1,237 0.07
3 Systemax Inc 23 –
13 T Rowe Price Group Inc 957 0.06
12 T-Mobile US Inc 674 0.04
1 Tableau Software Inc 48 –
2 Tailored Brands Inc 45 –
5 Take-Two Interactive Software Inc 248 0.02
7 Talen Energy Corp 101 0.01
1 Tangoe Inc 7 –
14 Targa Resources Corp 741 0.04
26 Target Corp 2,046 0.12
2 Taro Pharmaceutical Industries Ltd 169 0.01
2 TASER International Inc 67 –
3 Taylor Morrison Home Corp 64 –
14 TCF Financial Corp 245 0.01
18 TD Ameritrade Holding Corp 746 0.04
16 TE Connectivity Ltd 1,057 0.06
3 Team Health Holdings Inc 148 0.01
2 Team Inc 81 0.01
3 Tech Data Corp 255 0.02
2 TechTarget Inc 14 –
4 Teekay Corp 33 –
10 Teekay Tankers Ltd 22 –
22 TEGNA Inc 503 0.03
2 Tejon Ranch Co 59 –
2 Teledyne Technologies Inc 306 0.02
3 Teleflex Inc 490 0.03
3 Telenav Inc 16 –
8 Telephone & Data Systems Inc 225 0.01
4 TeleTech Holdings Inc 112 0.01
3 Tempur Sealy International Inc 209 0.01
6 Tenet Healthcare Corp 98 0.01
1 Tennant Co 97 0.01
4 Tenneco Inc 245 0.01
6 Teradata Corp 173 0.01
13 Teradyne Inc 307 0.02
10 Terex Corp 296 0.02
1 Territorial Bancorp Inc 19 –
2 TESARO Inc 205 0.01
6 Tesco Corp 45 –
3 Tesla Motors Inc 531 0.03
13 Tesoro Corp 1,064 0.06
1 TESSCO Technologies Inc 7 –
4 Tessera Technologies Inc 145 0.01
4 Tetra Tech Inc 179 0.01
9 TETRA Technologies Inc 51 –
4 Texas Capital Bancshares Inc 300 0.02
33 Texas Instruments Inc 2,441 0.14
4 Texas Roadhouse Inc 205 0.01
2 Textainer Group Holdings Ltd 22 –
10 TFS Financial Corp 184 0.01
1 Theravance Biopharma Inc 21 –
13 Thermo Fisher Scientific Inc 1,774 0.10
4 Thermon Group Holdings Inc 68 –
5 Thor Industries Inc 487 0.03
3 Tidewater Inc 6 –
11 Tiffany & Co 934 0.06
1 Tile Shop Holdings Inc 12 –
10 Time Inc 155 0.01
27 Time Warner Inc 2,469 0.14
7 Timken Co 284 0.02
6 TimkenSteel Corp 90 0.01
3 Tiptree Financial Inc 17 –
Shares (000's)
Value (000's)
USD
% of Net Asset Value
Common Stock (continued)
United States - 57.65% (continued)
3 Titan International Inc 37 –
9 TiVo Corp 183 0.01
19 TJX Cos Inc 1,522 0.09
14 Toll Brothers Inc 404 0.02
1 Tompkins Financial Corp 122 0.01
3 Tootsie Roll Industries Inc 102 0.01
3 TopBuild Corp 95 0.01
9 Torchmark Corp 656 0.04
7 Toro Co 349 0.02
12 Total System Services Inc 585 0.03
1 Tower International Inc 29 –
5 Towne Bank 151 0.01
6 Tractor Supply Co 447 0.03
3 TransDigm Group Inc 714 0.04
32 Transocean Ltd 412 0.02
10 TransUnion 292 0.02
23 Travelers Cos Inc 2,564 0.15
9 Travelport Worldwide Ltd 125 0.01
3 TRC Cos Inc 32 –
4 Trecora Resources 46 –
4 Tredegar Corp 81 0.01
5 TreeHouse Foods Inc 345 0.02
2 Trex Co Inc 118 0.01
14 TRI Pointe Group Inc 160 0.01
2 TriCo Bancshares 51 –
4 TriMas Corp 86 0.01
17 Trimble Inc 475 0.03
5 TriNet Group Inc 119 0.01
13 Trinity Industries Inc 367 0.02
2 Trinity Place Holdings Inc 17 –
3 Trinseo SA 158 0.01
5 TripAdvisor Inc 251 0.02
2 Triple-S Management Corp 42 –
3 TriState Capital Holdings Inc 54 –
2 Triton International Ltd 48 –
4 Triumph Group Inc 125 0.01
3 tronc Inc 35 –
5 Tronox Ltd 55 –
4 TrueBlue Inc 79 0.01
5 TrueCar Inc 66 –
7 TrustCo Bank Corp NY 60 –
6 Trustmark Corp 205 0.01
10 TTM Technologies Inc 133 0.01
5 Tuesday Morning Corp 21 –
3 Tupperware Brands Corp 169 0.01
4 Tutor Perini Corp 114 0.01
46 Twenty-First Century Fox Inc, Class A 1,293 0.08
18 Twenty-First Century Fox Inc, Class B 509 0.03
1 Twin Disc Inc 13 –
22 Twitter Inc 410 0.02
1 Tyler Technologies Inc 223 0.01
21 Tyson Foods Inc 1,180 0.07
3 Ubiquiti Networks Inc 190 0.01
– UFP Technologies Inc 7 –
13 UGI Corp 585 0.03
3 Ulta Salon Cosmetics & Fragrance Inc 788 0.05
1 Ultimate Software Group Inc 251 0.02
2 Ultra Clean Holdings Inc 18 –
3 Ultratech Inc 58 –
4 UMB Financial Corp 316 0.02
19 Umpqua Holdings Corp 344 0.02
9 Under Armour Inc, Class A 292 0.02
9 Under Armour Inc, Class C 228 0.01

Global Core Equity Fund
Portfolio of Investments as at 30 November 2016 (continued)
Dimensional Fund Advisors Annual Report and Audited Financial Statements, 30 November 2016 125
Shares (000's)
Value (000's)
USD
% of Net Asset Value
Common Stock (continued)
United States - 57.65% (continued)
1 Unifi Inc 46 –
1 UniFirst Corp 180 0.01
4 Union Bankshares Corp 133 0.01
28 Union Pacific Corp 2,869 0.17
2 Unisys Corp 30 –
6 Unit Corp 151 0.01
7 United Bankshares Inc 319 0.02
7 United Community Banks Inc 178 0.01
3 United Community Financial Corp 26 –
26 United Continental Holdings Inc 1,794 0.11
4 United Financial Bancorp Inc 74 –
3 United Fire Group Inc 116 0.01
1 United Insurance Holdings Corp 19 –
5 United Natural Foods Inc 214 0.01
21 United Parcel Service Inc 2,471 0.15
8 United Rentals Inc 773 0.05
2 United States Cellular Corp 75 –
– United States Lime & Minerals Inc 30 –
14 United States Steel Corp 464 0.03
32 United Technologies Corp 3,493 0.20
4 United Therapeutics Corp 444 0.03
45 UnitedHealth Group Inc 7,155 0.42
1 Unitil Corp 29 –
5 Univar Inc 115 0.01
6 Universal American Corp 59 –
2 Universal Corp 110 0.01
– Universal Display Corp 11 –
1 Universal Electronics Inc 52 –
2 Universal Forest Products Inc 180 0.01
6 Universal Health Services Inc 780 0.05
3 Universal Insurance Holdings Inc 78 0.01
1 Universal Logistics Holdings Inc 18 –
1 Universal Stainless & Alloy Products Inc 10 –
2 Universal Technical Institute Inc 5 –
2 Univest Corp of Pennsylvania 59 –
18 Unum Group 761 0.05
10 Urban Outfitters Inc 327 0.02
61 US Bancorp 3,037 0.18
1 US Concrete Inc 48 –
2 US Ecology Inc 98 0.01
1 US Physical Therapy Inc 41 –
2 US Silica Holdings Inc 107 0.01
1 USA Truck Inc 8 –
1 USANA Health Sciences Inc 80 0.01
10 USG Corp 296 0.02
1 Utah Medical Products Inc 34 –
5 Vaalco Energy Inc 4 –
3 Vail Resorts Inc 424 0.03
31 Valero Energy Corp 1,898 0.11
7 Validus Holdings Ltd 369 0.02
23 Valley National Bancorp 256 0.02
1 Valmont Industries Inc 219 0.01
4 Valspar Corp 385 0.02
8 Vantiv Inc 424 0.03
6 Varian Medical Systems Inc 572 0.03
3 VASCO Data Security International Inc 44 –
– Vascular Solutions Inc 19 –
6 VCA Inc 404 0.02
10 Vector Group Ltd 210 0.01
6 Vectren Corp 293 0.02
2 Vectrus Inc 35 –
4 Veeco Instruments Inc 102 0.01
4 Veeva Systems Inc 177 0.01
Shares (000's)
Value (000's)
USD
% of Net Asset Value
Common Stock (continued)
United States - 57.65% (continued)
3 Vera Bradley Inc 49 –
10 VeriFone Systems Inc 161 0.01
5 Verint Systems Inc 178 0.01
7 VeriSign Inc 584 0.03
8 Verisk Analytics Inc 642 0.04
2 Veritex Holdings Inc 36 –
1 Veritiv Corp 59 –
177 Verizon Communications Inc 8,810 0.52
2 Versartis Inc 28 –
5 Versum Materials Inc 125 0.01
5 Vertex Pharmaceuticals Inc 369 0.02
12 VF Corp 655 0.04
1 Viacom Inc, Class A 55 –
22 Viacom Inc, Class B 818 0.05
2 Viad Corp 84 0.01
3 ViaSat Inc 244 0.01
21 Viavi Solutions Inc 166 0.01
1 Village Super Market Inc 31 –
3 Vince Holding Corp 11 –
3 Virgin America Inc 147 0.01
1 Virtus Investment Partners Inc 76 0.01
2 Virtusa Corp 37 –
56 Visa Inc 4,318 0.25
13 Vishay Intertechnology Inc 196 0.01
1 Vishay Precision Group Inc 14 –
5 Vista Outdoor Inc 205 0.01
3 Visteon Corp 255 0.02
2 Vitamin Shoppe Inc 55 –
2 VMware Inc 168 0.01
17 Vonage Holdings Corp 114 0.01
2 VOXX International Corp 9 –
16 Voya Financial Inc 605 0.04
1 VSE Corp 39 –
7 Vulcan Materials Co 844 0.05
10 VWR Corp 274 0.02
4 W&T Offshore Inc 7 –
6 Wabash National Corp 81 0.01
3 WABCO Holdings Inc 336 0.02
6 Wabtec Corp 526 0.03
5 Waddell & Reed Financial Inc 89 0.01
72 Wal-Mart Stores Inc 5,091 0.30
29 Walgreens Boots Alliance Inc 2,448 0.14
2 Walker & Dunlop Inc 71 –
59 Walt Disney Co 5,857 0.34
7 Washington Federal Inc 233 0.01
2 Washington Trust Bancorp Inc 87 0.01
1 WashingtonFirst Bankshares Inc 28 –
24 Waste Management Inc 1,697 0.10
4 Waters Corp 549 0.03
3 Waterstone Financial Inc 49 –
2 Watsco Inc 297 0.02
2 Watts Water Technologies Inc 143 0.01
2 WCI Communities Inc 42 –
1 WD-40 Co 102 0.01
59 Weatherford International PLC 301 0.02
5 Web.com Group Inc 74 –
2 WebMD Health Corp 125 0.01
8 Webster Financial Corp 408 0.02
16 WEC Energy Group Inc 911 0.05
2 Weight Watchers International Inc 16 –
2 Weis Markets Inc 124 0.01
3 WellCare Health Plans Inc 452 0.03
189 Wells Fargo & Co 9,996 0.58
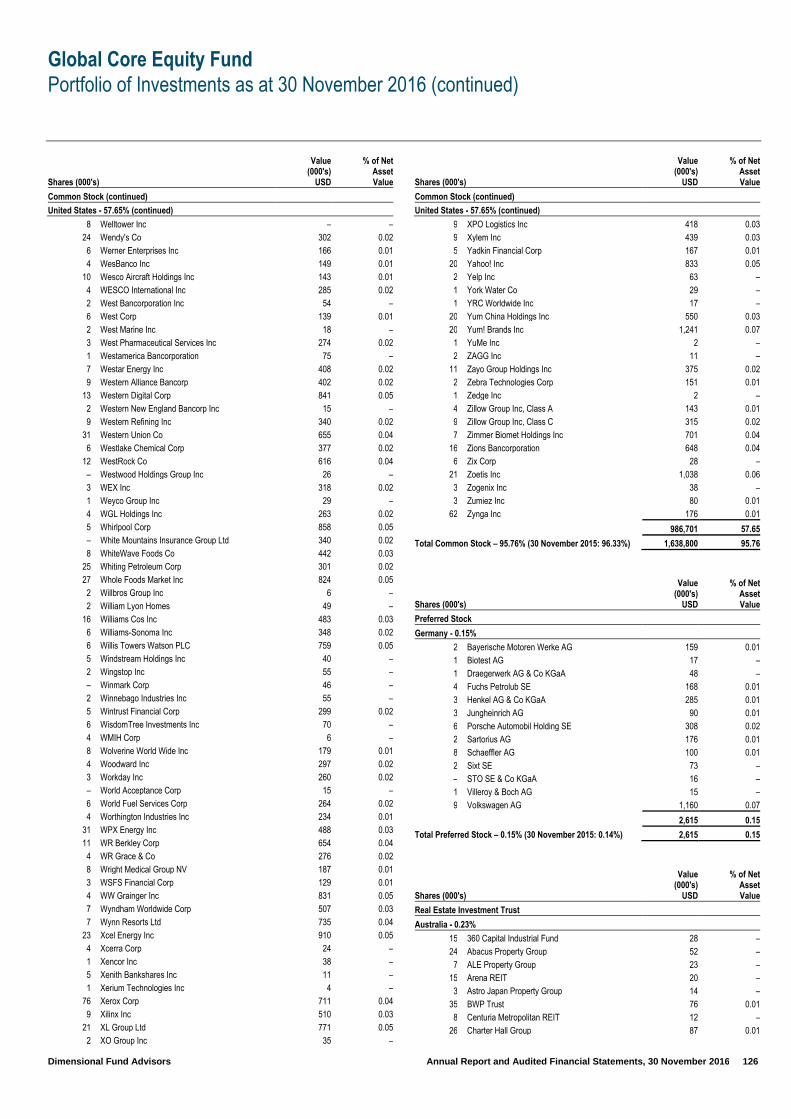
Global Core Equity Fund
Portfolio of Investments as at 30 November 2016 (continued)
Dimensional Fund Advisors Annual Report and Audited Financial Statements, 30 November 2016 126
Shares (000's)
Value (000's)
USD
% of Net Asset Value
Common Stock (continued)
United States - 57.65% (continued)
8 Welltower Inc – –
24 Wendy's Co 302 0.02
6 Werner Enterprises Inc 166 0.01
4 WesBanco Inc 149 0.01
10 Wesco Aircraft Holdings Inc 143 0.01
4 WESCO International Inc 285 0.02
2 West Bancorporation Inc 54 –
6 West Corp 139 0.01
2 West Marine Inc 18 –
3 West Pharmaceutical Services Inc 274 0.02
1 Westamerica Bancorporation 75 –
7 Westar Energy Inc 408 0.02
9 Western Alliance Bancorp 402 0.02
13 Western Digital Corp 841 0.05
2 Western New England Bancorp Inc 15 –
9 Western Refining Inc 340 0.02
31 Western Union Co 655 0.04
6 Westlake Chemical Corp 377 0.02
12 WestRock Co 616 0.04
– Westwood Holdings Group Inc 26 –
3 WEX Inc 318 0.02
1 Weyco Group Inc 29 –
4 WGL Holdings Inc 263 0.02
5 Whirlpool Corp 858 0.05
– White Mountains Insurance Group Ltd 340 0.02
8 WhiteWave Foods Co 442 0.03
25 Whiting Petroleum Corp 301 0.02
27 Whole Foods Market Inc 824 0.05
2 Willbros Group Inc 6 –
2 William Lyon Homes 49 –
16 Williams Cos Inc 483 0.03
6 Williams-Sonoma Inc 348 0.02
6 Willis Towers Watson PLC 759 0.05
5 Windstream Holdings Inc 40 –
2 Wingstop Inc 55 –
– Winmark Corp 46 –
2 Winnebago Industries Inc 55 –
5 Wintrust Financial Corp 299 0.02
6 WisdomTree Investments Inc 70 –
4 WMIH Corp 6 –
8 Wolverine World Wide Inc 179 0.01
4 Woodward Inc 297 0.02
3 Workday Inc 260 0.02
– World Acceptance Corp 15 –
6 World Fuel Services Corp 264 0.02
4 Worthington Industries Inc 234 0.01
31 WPX Energy Inc 488 0.03
11 WR Berkley Corp 654 0.04
4 WR Grace & Co 276 0.02
8 Wright Medical Group NV 187 0.01
3 WSFS Financial Corp 129 0.01
4 WW Grainger Inc 831 0.05
7 Wyndham Worldwide Corp 507 0.03
7 Wynn Resorts Ltd 735 0.04
23 Xcel Energy Inc 910 0.05
4 Xcerra Corp 24 –
1 Xencor Inc 38 –
5 Xenith Bankshares Inc 11 –
1 Xerium Technologies Inc 4 –
76 Xerox Corp 711 0.04
9 Xilinx Inc 510 0.03
21 XL Group Ltd 771 0.05
2 XO Group Inc 35 –
Shares (000's)
Value (000's)
USD
% of Net Asset Value
Common Stock (continued)
United States - 57.65% (continued)
9 XPO Logistics Inc 418 0.03
9 Xylem Inc 439 0.03
5 Yadkin Financial Corp 167 0.01
20 Yahoo! Inc 833 0.05
2 Yelp Inc 63 –
1 York Water Co 29 –
1 YRC Worldwide Inc 17 –
20 Yum China Holdings Inc 550 0.03
20 Yum! Brands Inc 1,241 0.07
1 YuMe Inc 2 –
2 ZAGG Inc 11 –
11 Zayo Group Holdings Inc 375 0.02
2 Zebra Technologies Corp 151 0.01
1 Zedge Inc 2 –
4 Zillow Group Inc, Class A 143 0.01
9 Zillow Group Inc, Class C 315 0.02
7 Zimmer Biomet Holdings Inc 701 0.04
16 Zions Bancorporation 648 0.04
6 Zix Corp 28 –
21 Zoetis Inc 1,038 0.06
3 Zogenix Inc 38 –
3 Zumiez Inc 80 0.01
62 Zynga Inc 176 0.01
986,701 57.65
Total Common Stock – 95.76% (30 November 2015: 96.33%) 1,638,800 95.76
Shares (000's)
Value (000's)
USD
% of Net Asset Value
Preferred Stock
Germany - 0.15%
2 Bayerische Motoren Werke AG 159 0.01
1 Biotest AG 17 –
1 Draegerwerk AG & Co KGaA 48 –
4 Fuchs Petrolub SE 168 0.01
3 Henkel AG & Co KGaA 285 0.01
3 Jungheinrich AG 90 0.01
6 Porsche Automobil Holding SE 308 0.02
2 Sartorius AG 176 0.01
8 Schaeffler AG 100 0.01
2 Sixt SE 73 –
– STO SE & Co KGaA 16 –
1 Villeroy & Boch AG 15 –
9 Volkswagen AG 1,160 0.07
2,615 0.15
Total Preferred Stock – 0.15% (30 November 2015: 0.14%) 2,615 0.15
Shares (000's)
Value (000's)
USD
% of Net Asset Value
Real Estate Investment Trust
Australia - 0.23%
15 360 Capital Industrial Fund 28 –
24 Abacus Property Group 52 –
7 ALE Property Group 23 –
15 Arena REIT 20 –
3 Astro Japan Property Group 14 –
35 BWP Trust 76 0.01
8 Centuria Metropolitan REIT 12 –
26 Charter Hall Group 87 0.01

Global Core Equity Fund
Portfolio of Investments as at 30 November 2016 (continued)
Dimensional Fund Advisors Annual Report and Audited Financial Statements, 30 November 2016 127
Shares (000's)
Value (000's)
USD
% of Net Asset Value
Real Estate Investment Trust (continued)
Australia - 0.23% (continued)
21 Charter Hall Retail REIT 67 0.01
87 Cromwell Property Group 59 –
50 Dexus Property Group 338 0.02
9 Folkestone Education Trust 16 –
6 Galileo Japan Trust – –
18 GDI Property Group 13 –
16 Generation Healthcare REIT 21 –
97 Goodman Group 476 0.03
95 GPT Group 340 0.02
15 Growthpoint Properties Australia Ltd 33 –
16 Hotel Property Investments 32 –
9 Industria REIT 13 –
11 Ingenia Communities Group 22 –
34 Investa Office Fund 110 0.01
206 Mirvac Group 311 0.02
162 Scentre Group 508 0.03
40 Shopping Centres Australasia Property Group 62 –
125 Stockland 399 0.02
184 Vicinity Centres 397 0.02
60 Westfield Corp 404 0.03
3,933 0.23
Belgium - 0.03%
1 Aedifica SA 71 –
– Ascencio 16 –
1 Befimmo SA 73 0.01
1 Care Property Invest 15 –
2 Cofinimmo SA 169 0.01
– Home Invest Belgium 5 –
1 Intervest Offices & Warehouses NV 13 –
– Leasinvest Real Estate SCA 29 –
– Montea SCA 12 –
1 Retail Estates NV 44 –
1 Warehouses De Pauw CVA 85 0.01
– Wereldhave Belgium NV 26 –
558 0.03
Canada - 0.08%
4 Allied Properties Real Estate Investment Trust 86 0.01
6 Artis Real Estate Investment Trust 53 –
1 Boardwalk Real Estate Investment Trust 42 –
1 Brookfield Canada Office Properties 16 –
4 Canadian Apartment Properties REIT 92 0.01
2 Canadian Real Estate Investment Trust 78 0.01
3 Choice Properties Real Estate Investment Trust 29 –
7 Cominar Real Estate Investment Trust 72 0.01
3 Crombie Real Estate Investment Trust 25 –
3 CT Real Estate Investment Trust 32 –
4 Dream Global Real Estate Investment Trust 29 –
5 Dream Industrial Real Estate Investment Trust 30 –
3 Dream Office Real Estate Investment Trust 46 –
2 Granite Real Estate Investment Trust 69 0.01
10 H&R Real Estate Investment Trust 168 0.01
6 InterRent Real Estate Investment Trust 30 –
5 Killam Apartment Real Estate Investment Trust 43 –
4 Milestone Apartments Real Estate Investment Trust 46 –
2 Morguard Real Estate Investment Trust 20 –
1 Northview Apartment Real Estate Investment Trust 14 – 4
NorthWest Healthcare Properties Real Estate Investment Trust 31 –
3 Plaza Retail REIT 10 –
10 Pure Industrial Real Estate Trust 41 –
8 RioCan Real Estate Investment Trust 166 0.01
2 Slate Retail REIT 25 –
Shares (000's)
Value (000's)
USD
% of Net Asset Value
Real Estate Investment Trust (continued)
Canada - 0.08% (continued)
4 Smart Real Estate Investment Trust 95 0.01
2 WPT Industrial Real Estate Investment Trust 23 –
1,411 0.08
France - 0.08%
– Altarea SCA 71 0.01
1 ANF Immobilier 11 –
1 Argan SA 23 –
2 Fonciere Des Regions 189 0.01
3 Gecina SA 389 0.02
2 ICADE 169 0.01
12 Klepierre 429 0.03
3 Mercialys SA 61 –
1 Terreis 23 –
1,365 0.08
Germany - 0.01%
9 Alstria Office REIT-AG 117 0.01
5 Hamborner REIT AG 43 –
160 0.01
Hong Kong - 0.07%
137 Champion REIT 78 0.01
106 Fortune Real Estate Investment Trust 125 0.01
119 Link REIT 823 0.05
75 Prosperity REIT 30 –
94 Regal Real Estate Investment Trust 26 –
67 Sunlight Real Estate Investment Trust 40 –
1,122 0.07
Ireland - 0.01%
41 Green REIT PLC 55 0.01
42 Hibernia REIT PLC 53 –
108 0.01
Italy - 0.00%
75 Beni Stabili SpA SIIQ 40 –
34 Immobiliare Grande Distribuzione SIIQ SpA 22 –
62 –
Japan - 0.33%
– Activia Properties Inc 176 0.01
– Advance Residence Investment Corp 235 0.01
– AEON REIT Investment Corp 74 –
– Comforia Residential REIT Inc 77 0.01
– Daiwa House REIT Investment Corp 192 0.01
– Daiwa Office Investment Corp 122 0.01
– Frontier Real Estate Investment Corp 152 0.01
– Fukuoka REIT Corp 67 –
– Global One Real Estate Investment Corp 60 –
– GLP J-Reit 201 0.01
– Hankyu Reit Inc 57 –
– Heiwa Real Estate REIT Inc 34 –
– Hoshino Resorts REIT Inc 53 –
– Ichigo Office REIT Investment 62 –
– Industrial & Infrastructure Fund Investment Corp 97 0.01
1 Invincible Investment Corp 94 0.01
– Japan Excellent Inc 107 0.01
1 Japan Hotel REIT Investment Corp 169 0.01
– Japan Logistics Fund Inc 116 0.01
– Japan Prime Realty Investment Corp 232 0.01
– Japan Real Estate Investment Corp 391 0.02
– Japan Rental Housing Investments Inc 88 0.01
– Japan Retail Fund Investment Corp 283 0.02
– Kenedix Office Investment Corp 171 0.01
– Kenedix Residential Investment Corp 47 –
– Kenedix Retail REIT Corp 68 –

Global Core Equity Fund
Portfolio of Investments as at 30 November 2016 (continued)
Dimensional Fund Advisors Annual Report and Audited Financial Statements, 30 November 2016 128
Shares (000's)
Value (000's)
USD
% of Net Asset Value
Real Estate Investment Trust (continued)
Japan - 0.33% (continued)
– MCUBS MidCity Investment Corp 39 –
– Mori Hills REIT Investment Corp 130 0.01
– Mori Trust Sogo Reit Inc 103 0.01
– Nippon Accommodations Fund Inc 128 0.01
– Nippon Building Fund Inc 424 0.03
– Nippon Prologis REIT Inc 187 0.01
– Nippon REIT Investment Corp 53 –
1 Nomura Real Estate Master Fund Inc 307 0.02
– Orix JREIT Inc 212 0.01
– Premier Investment Corp 101 0.01
– Sekisui House REIT Inc 57 –
– Sekisui House SI Residential Investment Corp 82 0.01
– SIA Reit Inc 23 –
– Starts Proceed Investment Corp 17 –
– Tokyu REIT Inc 73 –
– United Urban Investment Corp 251 0.02
5,612 0.33
Netherlands - 0.07%
11 NSI NV 42 –
5 Unibail-Rodamco SE 978 0.06
1 Vastned Retail NV 41 –
2 Wereldhave NV 98 0.01
1,159 0.07
New Zealand - 0.01%
67 Goodman Property Trust 58 0.01
27 Vital Healthcare Property Trust 39 –
97 0.01
Singapore - 0.10%
28 AIMS AMP Capital Industrial REIT 26 –
52 Ascendas Hospitality Trust 25 –
164 Ascendas Real Estate Investment Trust 267 0.02
74 Ascott Residence Trust 59 –
43 Cache Logistics Trust 24 –
47 Cambridge Industrial Trust 18 –
124 CapitaLand Commercial Trust 131 0.01
103 CapitaLand Mall Trust 139 0.01
28 CapitaLand Retail China Trust 27 –
50 CDL Hospitality Trusts 46 –
42 Far East Hospitality Trust 17 –
33 First Real Estate Investment Trust 29 –
31 Frasers Centrepoint Trust 42 –
31 Frasers Commercial Trust 28 –
83 Frasers Hospitality Trust 36 –
46 Keppel DC REIT 39 –
111 Keppel REIT 83 0.01
129 Lippo Malls Indonesia Retail Trust 34 –
127 Mapletree Commercial Trust 127 0.01
111 Mapletree Greater China Commercial Trust 75 0.01
69 Mapletree Industrial Trust 79 0.01
111 Mapletree Logistics Trust 79 0.01
21 OUE Commercial Real Estate Investment Trust 10 –
62 OUE Hospitality Trust 28 –
27 Parkway Life Real Estate Investment Trust 46 –
38 Sabana Shari'ah Compliant Industrial Real Estate Investment Trust 14 –
48 Soilbuild Business Space REIT 21 –
39 SPH REIT 26 –
81 Starhill Global REIT 43 –
148 Suntec Real Estate Investment Trust 174 0.01
1,792 0.10
Shares (000's)
Value (000's)
USD
% of Net Asset Value
Real Estate Investment Trust (continued)
Spain - 0.02%
4 Hispania Activos Inmobiliarios SOCIMI SA 44 –
32 Merlin Properties Socimi SA 322 0.02
366 0.02
United Kingdom - 0.17%
98 Assura PLC 70 –
11 Big Yellow Group PLC 96 0.01
50 British Land Co PLC 367 0.02
43 Capital & Regional PLC 29 –
7 Derwent London PLC 213 0.01
23 Great Portland Estates PLC 176 0.01
48 Hammerson PLC 327 0.02
59 Hansteen Holdings PLC 79 0.01
73 Intu Properties PLC 245 0.01
37 Land Securities Group PLC 447 0.03
43 LondonMetric Property PLC 77 0.01
3 McKay Securities PLC 7 –
3 Mucklow A & J Group PLC 15 –
45 Primary Health Properties PLC 62 –
87 Redefine International PLC 40 –
15 Safestore Holdings PLC 66 –
35 Schroder Real Estate Investment Trust Ltd 26 –
59 Segro PLC 307 0.02
18 Shaftesbury PLC 213 0.01
9 Workspace Group PLC 77 0.01
2,939 0.17
United States - 2.73%
5 Acadia Realty Trust 168 0.01
2 Agree Realty Corp 76 0.01
– Alexander's Inc 171 0.01
6 Alexandria Real Estate Equities Inc 604 0.04
– Altisource Residential Corp 2 –
3 American Assets Trust Inc 120 0.01
9 American Campus Communities Inc 441 0.03
17 American Homes 4 Rent 367 0.02
5 American Tower Corp 471 0.03
12 Apartment Investment & Management Co 487 0.03
12 Apple Hospitality REIT Inc 224 0.01
2 Ashford Hospitality Prime Inc 30 –
11 Ashford Hospitality Trust Inc 75 –
7 AvalonBay Communities Inc 1,137 0.07
1 Bluerock Residential Growth REIT Inc 14 –
8 Boston Properties Inc 948 0.06
13 Brandywine Realty Trust 194 0.01
21 Brixmor Property Group Inc 514 0.03
6 Camden Property Trust 507 0.03
6 Care Capital Properties Inc 138 0.01
4 CareTrust REIT Inc 63 –
13 CBL & Associates Properties Inc 158 0.01
7 Cedar Realty Trust Inc 43 –
4 Chatham Lodging Trust 69 –
4 Chesapeake Lodging Trust 102 0.01
2 City Office REIT Inc 25 –
7 Colony Starwood Homes 210 0.01
8 Columbia Property Trust Inc 177 0.01
6 Communications Sales & Leasing Inc 161 0.01
4 CoreCivic Inc 91 0.01
2 CoreSite Realty Corp 162 0.01
6 Corporate Office Properties Trust 184 0.01
25 Cousins Properties Inc 199 0.01
4 Crown Castle International Corp 334 0.02
9 CubeSmart 233 0.01
6 CyrusOne Inc 249 0.02
7 DCT Industrial Trust Inc 301 0.02
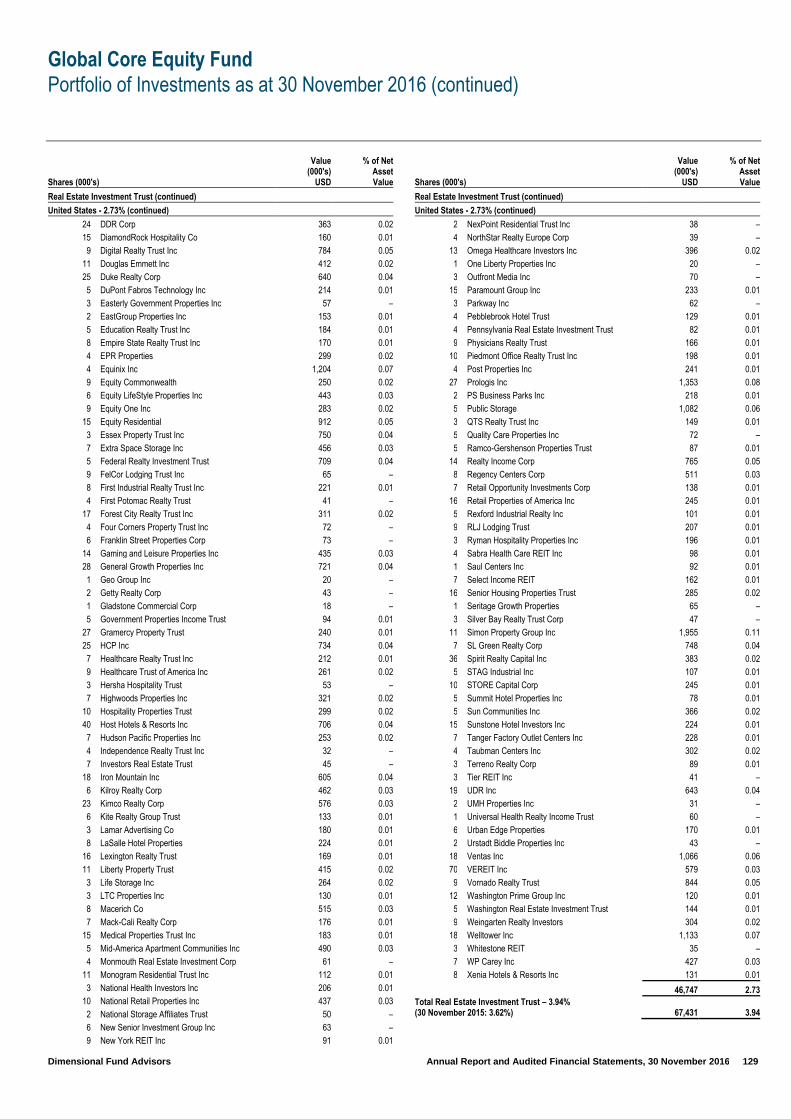
Global Core Equity Fund
Portfolio of Investments as at 30 November 2016 (continued)
Dimensional Fund Advisors Annual Report and Audited Financial Statements, 30 November 2016 129
Shares (000's)
Value (000's)
USD
% of Net Asset Value
Real Estate Investment Trust (continued)
United States - 2.73% (continued)
24 DDR Corp 363 0.02
15 DiamondRock Hospitality Co 160 0.01
9 Digital Realty Trust Inc 784 0.05
11 Douglas Emmett Inc 412 0.02
25 Duke Realty Corp 640 0.04
5 DuPont Fabros Technology Inc 214 0.01
3 Easterly Government Properties Inc 57 –
2 EastGroup Properties Inc 153 0.01
5 Education Realty Trust Inc 184 0.01
8 Empire State Realty Trust Inc 170 0.01
4 EPR Properties 299 0.02
4 Equinix Inc 1,204 0.07
9 Equity Commonwealth 250 0.02
6 Equity LifeStyle Properties Inc 443 0.03
9 Equity One Inc 283 0.02
15 Equity Residential 912 0.05
3 Essex Property Trust Inc 750 0.04
7 Extra Space Storage Inc 456 0.03
5 Federal Realty Investment Trust 709 0.04
9 FelCor Lodging Trust Inc 65 –
8 First Industrial Realty Trust Inc 221 0.01
4 First Potomac Realty Trust 41 –
17 Forest City Realty Trust Inc 311 0.02
4 Four Corners Property Trust Inc 72 –
6 Franklin Street Properties Corp 73 –
14 Gaming and Leisure Properties Inc 435 0.03
28 General Growth Properties Inc 721 0.04
1 Geo Group Inc 20 –
2 Getty Realty Corp 43 –
1 Gladstone Commercial Corp 18 –
5 Government Properties Income Trust 94 0.01
27 Gramercy Property Trust 240 0.01
25 HCP Inc 734 0.04
7 Healthcare Realty Trust Inc 212 0.01
9 Healthcare Trust of America Inc 261 0.02
3 Hersha Hospitality Trust 53 –
7 Highwoods Properties Inc 321 0.02
10 Hospitality Properties Trust 299 0.02
40 Host Hotels & Resorts Inc 706 0.04
7 Hudson Pacific Properties Inc 253 0.02
4 Independence Realty Trust Inc 32 –
7 Investors Real Estate Trust 45 –
18 Iron Mountain Inc 605 0.04
6 Kilroy Realty Corp 462 0.03
23 Kimco Realty Corp 576 0.03
6 Kite Realty Group Trust 133 0.01
3 Lamar Advertising Co 180 0.01
8 LaSalle Hotel Properties 224 0.01
16 Lexington Realty Trust 169 0.01
11 Liberty Property Trust 415 0.02
3 Life Storage Inc 264 0.02
3 LTC Properties Inc 130 0.01
8 Macerich Co 515 0.03
7 Mack-Cali Realty Corp 176 0.01
15 Medical Properties Trust Inc 183 0.01
5 Mid-America Apartment Communities Inc 490 0.03
4 Monmouth Real Estate Investment Corp 61 –
11 Monogram Residential Trust Inc 112 0.01
3 National Health Investors Inc 206 0.01
10 National Retail Properties Inc 437 0.03
2 National Storage Affiliates Trust 50 –
6 New Senior Investment Group Inc 63 –
9 New York REIT Inc 91 0.01
Shares (000's)
Value (000's)
USD
% of Net Asset Value
Real Estate Investment Trust (continued)
United States - 2.73% (continued)
2 NexPoint Residential Trust Inc 38 –
4 NorthStar Realty Europe Corp 39 –
13 Omega Healthcare Investors Inc 396 0.02
1 One Liberty Properties Inc 20 –
3 Outfront Media Inc 70 –
15 Paramount Group Inc 233 0.01
3 Parkway Inc 62 –
4 Pebblebrook Hotel Trust 129 0.01
4 Pennsylvania Real Estate Investment Trust 82 0.01
9 Physicians Realty Trust 166 0.01
10 Piedmont Office Realty Trust Inc 198 0.01
4 Post Properties Inc 241 0.01
27 Prologis Inc 1,353 0.08
2 PS Business Parks Inc 218 0.01
5 Public Storage 1,082 0.06
3 QTS Realty Trust Inc 149 0.01
5 Quality Care Properties Inc 72 –
5 Ramco-Gershenson Properties Trust 87 0.01
14 Realty Income Corp 765 0.05
8 Regency Centers Corp 511 0.03
7 Retail Opportunity Investments Corp 138 0.01
16 Retail Properties of America Inc 245 0.01
5 Rexford Industrial Realty Inc 101 0.01
9 RLJ Lodging Trust 207 0.01
3 Ryman Hospitality Properties Inc 196 0.01
4 Sabra Health Care REIT Inc 98 0.01
1 Saul Centers Inc 92 0.01
7 Select Income REIT 162 0.01
16 Senior Housing Properties Trust 285 0.02
1 Seritage Growth Properties 65 –
3 Silver Bay Realty Trust Corp 47 –
11 Simon Property Group Inc 1,955 0.11
7 SL Green Realty Corp 748 0.04
36 Spirit Realty Capital Inc 383 0.02
5 STAG Industrial Inc 107 0.01
10 STORE Capital Corp 245 0.01
5 Summit Hotel Properties Inc 78 0.01
5 Sun Communities Inc 366 0.02
15 Sunstone Hotel Investors Inc 224 0.01
7 Tanger Factory Outlet Centers Inc 228 0.01
4 Taubman Centers Inc 302 0.02
3 Terreno Realty Corp 89 0.01
3 Tier REIT Inc 41 –
19 UDR Inc 643 0.04
2 UMH Properties Inc 31 –
1 Universal Health Realty Income Trust 60 –
6 Urban Edge Properties 170 0.01
2 Urstadt Biddle Properties Inc 43 –
18 Ventas Inc 1,066 0.06
70 VEREIT Inc 579 0.03
9 Vornado Realty Trust 844 0.05
12 Washington Prime Group Inc 120 0.01
5 Washington Real Estate Investment Trust 144 0.01
9 Weingarten Realty Investors 304 0.02
18 Welltower Inc 1,133 0.07
3 Whitestone REIT 35 –
7 WP Carey Inc 427 0.03
8 Xenia Hotels & Resorts Inc 131 0.01
46,747 2.73 Total Real Estate Investment Trust – 3.94% (30 November 2015: 3.62%) 67,431 3.94
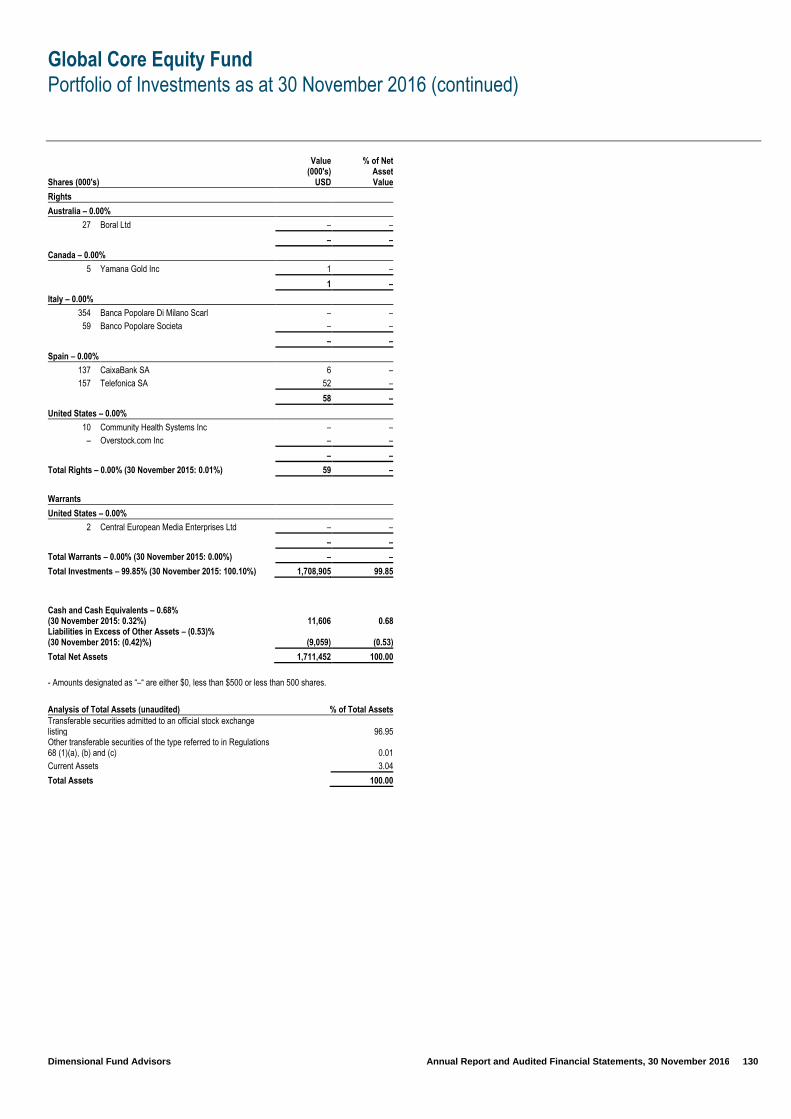
Global Core Equity Fund
Portfolio of Investments as at 30 November 2016 (continued)
Dimensional Fund Advisors Annual Report and Audited Financial Statements, 30 November 2016 130
Shares (000's)
Value (000's)
USD
% of Net Asset Value
Rights
Australia – 0.00%
27 Boral Ltd – –
– –
Canada – 0.00%
5 Yamana Gold Inc 1 –
1 –
Italy – 0.00%
354 Banca Popolare Di Milano Scarl – –
59 Banco Popolare Societa – –
– –
Spain – 0.00%
137 CaixaBank SA 6 –
157 Telefonica SA 52 –
58 –
United States – 0.00%
10 Community Health Systems Inc – –
– Overstock.com Inc – –
– –
Total Rights – 0.00% (30 November 2015: 0.01%) 59 –
Warrants
United States – 0.00%
2 Central European Media Enterprises Ltd – –
– –
Total Warrants – 0.00% (30 November 2015: 0.00%) – –
Total Investments – 99.85% (30 November 2015: 100.10%) 1,708,905 99.85
Cash and Cash Equivalents – 0.68% (30 November 2015: 0.32%) 11,606 0.68 Liabilities in Excess of Other Assets – (0.53)% (30 November 2015: (0.42)%) (9,059) (0.53)
Total Net Assets 1,711,452 100.00
- Amounts designated as “–“ are either $0, less than $500 or less than 500 shares.
Analysis of Total Assets (unaudited) % of Total Assets
Transferable securities admitted to an official stock exchange listing 96.95 Other transferable securities of the type referred to in Regulations 68 (1)(a), (b) and (c) 0.01
Current Assets 3.04
Total Assets 100.00
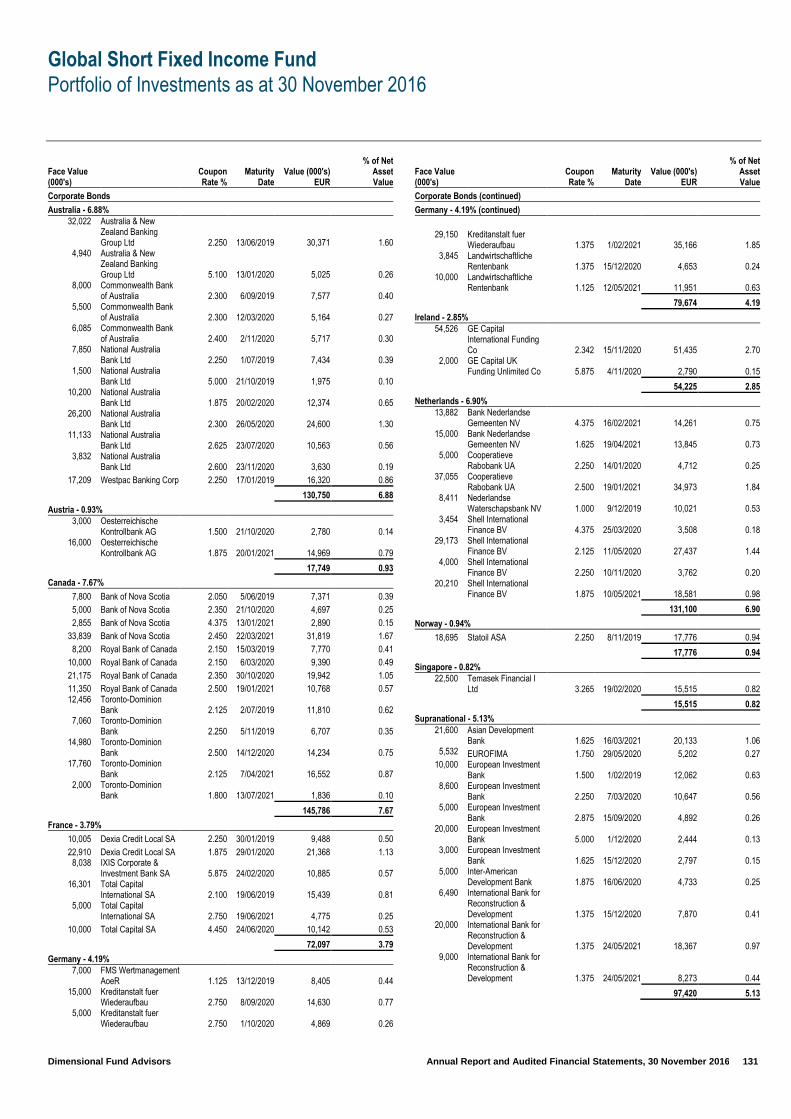
Global Short Fixed Income Fund
Portfolio of Investments as at 30 November 2016
Dimensional Fund Advisors Annual Report and Audited Financial Statements, 30 November 2016 131
Face Value (000's)
Coupon Rate %
Maturity Date
Value (000's) EUR
% of Net Asset Value
Corporate Bonds
Australia - 6.88% 32,022
Australia & New Zealand Banking Group Ltd 2.250 13/06/2019 30,371 1.60
4,940
Australia & New Zealand Banking Group Ltd 5.100 13/01/2020 5,025 0.26
8,000 Commonwealth Bank of Australia 2.300 6/09/2019 7,577 0.40
5,500 Commonwealth Bank of Australia 2.300 12/03/2020 5,164 0.27
6,085 Commonwealth Bank of Australia 2.400 2/11/2020 5,717 0.30
7,850 National Australia Bank Ltd 2.250 1/07/2019 7,434 0.39
1,500 National Australia Bank Ltd 5.000 21/10/2019 1,975 0.10
10,200 National Australia Bank Ltd 1.875 20/02/2020 12,374 0.65
26,200 National Australia Bank Ltd 2.300 26/05/2020 24,600 1.30
11,133 National Australia Bank Ltd 2.625 23/07/2020 10,563 0.56
3,832 National Australia Bank Ltd 2.600 23/11/2020 3,630 0.19
17,209 Westpac Banking Corp 2.250 17/01/2019 16,320 0.86
130,750 6.88
Austria - 0.93% 3,000
Oesterreichische Kontrollbank AG 1.500 21/10/2020 2,780 0.14
16,000 Oesterreichische Kontrollbank AG 1.875 20/01/2021 14,969 0.79
17,749 0.93
Canada - 7.67%
7,800 Bank of Nova Scotia 2.050 5/06/2019 7,371 0.39
5,000 Bank of Nova Scotia 2.350 21/10/2020 4,697 0.25
2,855 Bank of Nova Scotia 4.375 13/01/2021 2,890 0.15
33,839 Bank of Nova Scotia 2.450 22/03/2021 31,819 1.67
8,200 Royal Bank of Canada 2.150 15/03/2019 7,770 0.41
10,000 Royal Bank of Canada 2.150 6/03/2020 9,390 0.49
21,175 Royal Bank of Canada 2.350 30/10/2020 19,942 1.05
11,350 Royal Bank of Canada 2.500 19/01/2021 10,768 0.57 12,456
Toronto-Dominion Bank 2.125 2/07/2019 11,810 0.62
7,060 Toronto-Dominion Bank 2.250 5/11/2019 6,707 0.35
14,980 Toronto-Dominion Bank 2.500 14/12/2020 14,234 0.75
17,760 Toronto-Dominion Bank 2.125 7/04/2021 16,552 0.87
2,000 Toronto-Dominion Bank 1.800 13/07/2021 1,836 0.10
145,786 7.67
France - 3.79%
10,005 Dexia Credit Local SA 2.250 30/01/2019 9,488 0.50
22,910 Dexia Credit Local SA 1.875 29/01/2020 21,368 1.13 8,038
IXIS Corporate & Investment Bank SA 5.875 24/02/2020 10,885 0.57
16,301 Total Capital International SA 2.100 19/06/2019 15,439 0.81
5,000 Total Capital International SA 2.750 19/06/2021 4,775 0.25
10,000 Total Capital SA 4.450 24/06/2020 10,142 0.53
72,097 3.79
Germany - 4.19% 7,000
FMS Wertmanagement AoeR 1.125 13/12/2019 8,405 0.44
15,000 Kreditanstalt fuer Wiederaufbau 2.750 8/09/2020 14,630 0.77
5,000 Kreditanstalt fuer Wiederaufbau 2.750 1/10/2020 4,869 0.26
Face Value (000's)
Coupon Rate %
Maturity Date
Value (000's) EUR
% of Net Asset Value
Corporate Bonds (continued)
Germany - 4.19% (continued)
29,150 Kreditanstalt fuer Wiederaufbau 1.375 1/02/2021 35,166 1.85
3,845 Landwirtschaftliche Rentenbank 1.375 15/12/2020 4,653 0.24
10,000 Landwirtschaftliche Rentenbank 1.125 12/05/2021 11,951 0.63
79,674 4.19
Ireland - 2.85% 54,526
GE Capital International Funding Co 2.342 15/11/2020 51,435 2.70
2,000 GE Capital UK Funding Unlimited Co 5.875 4/11/2020 2,790 0.15
54,225 2.85
Netherlands - 6.90% 13,882
Bank Nederlandse Gemeenten NV 4.375 16/02/2021 14,261 0.75
15,000 Bank Nederlandse Gemeenten NV 1.625 19/04/2021 13,845 0.73
5,000 Cooperatieve Rabobank UA 2.250 14/01/2020 4,712 0.25
37,055 Cooperatieve Rabobank UA 2.500 19/01/2021 34,973 1.84
8,411 Nederlandse Waterschapsbank NV 1.000 9/12/2019 10,021 0.53
3,454 Shell International Finance BV 4.375 25/03/2020 3,508 0.18
29,173 Shell International Finance BV 2.125 11/05/2020 27,437 1.44
4,000 Shell International Finance BV 2.250 10/11/2020 3,762 0.20
20,210 Shell International Finance BV 1.875 10/05/2021 18,581 0.98
131,100 6.90
Norway - 0.94%
18,695 Statoil ASA 2.250 8/11/2019 17,776 0.94
17,776 0.94
Singapore - 0.82% 22,500
Temasek Financial I Ltd 3.265 19/02/2020 15,515 0.82
15,515 0.82
Supranational - 5.13% 21,600
Asian Development Bank 1.625 16/03/2021 20,133 1.06
5,532 EUROFIMA 1.750 29/05/2020 5,202 0.27 10,000
European Investment Bank 1.500 1/02/2019 12,062 0.63
8,600 European Investment Bank 2.250 7/03/2020 10,647 0.56
5,000 European Investment Bank 2.875 15/09/2020 4,892 0.26
20,000 European Investment Bank 5.000 1/12/2020 2,444 0.13
3,000 European Investment Bank 1.625 15/12/2020 2,797 0.15
5,000 Inter-American Development Bank 1.875 16/06/2020 4,733 0.25
6,490
International Bank for Reconstruction & Development 1.375 15/12/2020 7,870 0.41
20,000
International Bank for Reconstruction & Development 1.375 24/05/2021 18,367 0.97
9,000
International Bank for Reconstruction & Development 1.375 24/05/2021 8,273 0.44
97,420 5.13
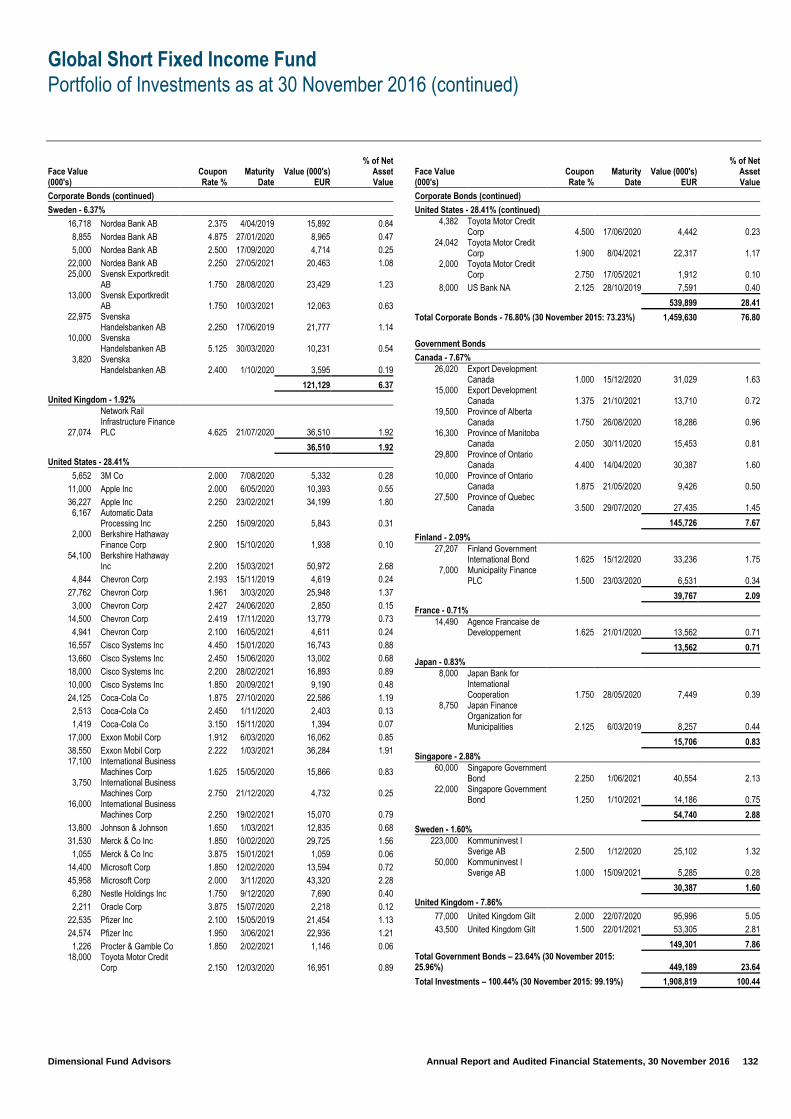
Global Short Fixed Income Fund
Portfolio of Investments as at 30 November 2016 (continued)
Dimensional Fund Advisors Annual Report and Audited Financial Statements, 30 November 2016 132
Face Value (000's)
Coupon Rate %
Maturity Date
Value (000's) EUR
% of Net Asset Value
Corporate Bonds (continued)
Sweden - 6.37%
16,718 Nordea Bank AB 2.375 4/04/2019 15,892 0.84
8,855 Nordea Bank AB 4.875 27/01/2020 8,965 0.47
5,000 Nordea Bank AB 2.500 17/09/2020 4,714 0.25
22,000 Nordea Bank AB 2.250 27/05/2021 20,463 1.08 25,000
Svensk Exportkredit AB 1.750 28/08/2020 23,429 1.23
13,000 Svensk Exportkredit AB 1.750 10/03/2021 12,063 0.63
22,975 Svenska Handelsbanken AB 2.250 17/06/2019 21,777 1.14
10,000 Svenska Handelsbanken AB 5.125 30/03/2020 10,231 0.54
3,820 Svenska Handelsbanken AB 2.400 1/10/2020 3,595 0.19
121,129 6.37
United Kingdom - 1.92%
27,074
Network Rail Infrastructure Finance PLC 4.625 21/07/2020 36,510 1.92
36,510 1.92
United States - 28.41%
5,652 3M Co 2.000 7/08/2020 5,332 0.28
11,000 Apple Inc 2.000 6/05/2020 10,393 0.55
36,227 Apple Inc 2.250 23/02/2021 34,199 1.80 6,167
Automatic Data Processing Inc 2.250 15/09/2020 5,843 0.31
2,000 Berkshire Hathaway Finance Corp 2.900 15/10/2020 1,938 0.10
54,100 Berkshire Hathaway Inc 2.200 15/03/2021 50,972 2.68
4,844 Chevron Corp 2.193 15/11/2019 4,619 0.24
27,762 Chevron Corp 1.961 3/03/2020 25,948 1.37
3,000 Chevron Corp 2.427 24/06/2020 2,850 0.15
14,500 Chevron Corp 2.419 17/11/2020 13,779 0.73
4,941 Chevron Corp 2.100 16/05/2021 4,611 0.24
16,557 Cisco Systems Inc 4.450 15/01/2020 16,743 0.88
13,660 Cisco Systems Inc 2.450 15/06/2020 13,002 0.68
18,000 Cisco Systems Inc 2.200 28/02/2021 16,893 0.89
10,000 Cisco Systems Inc 1.850 20/09/2021 9,190 0.48
24,125 Coca-Cola Co 1.875 27/10/2020 22,586 1.19
2,513 Coca-Cola Co 2.450 1/11/2020 2,403 0.13
1,419 Coca-Cola Co 3.150 15/11/2020 1,394 0.07
17,000 Exxon Mobil Corp 1.912 6/03/2020 16,062 0.85
38,550 Exxon Mobil Corp 2.222 1/03/2021 36,284 1.91 17,100
International Business Machines Corp 1.625 15/05/2020 15,866 0.83
3,750 International Business Machines Corp 2.750 21/12/2020 4,732 0.25
16,000 International Business Machines Corp 2.250 19/02/2021 15,070 0.79
13,800 Johnson & Johnson 1.650 1/03/2021 12,835 0.68
31,530 Merck & Co Inc 1.850 10/02/2020 29,725 1.56
1,055 Merck & Co Inc 3.875 15/01/2021 1,059 0.06
14,400 Microsoft Corp 1.850 12/02/2020 13,594 0.72
45,958 Microsoft Corp 2.000 3/11/2020 43,320 2.28
6,280 Nestle Holdings Inc 1.750 9/12/2020 7,690 0.40
2,211 Oracle Corp 3.875 15/07/2020 2,218 0.12
22,535 Pfizer Inc 2.100 15/05/2019 21,454 1.13
24,574 Pfizer Inc 1.950 3/06/2021 22,936 1.21
1,226 Procter & Gamble Co 1.850 2/02/2021 1,146 0.06 18,000
Toyota Motor Credit Corp 2.150 12/03/2020 16,951 0.89
Face Value (000's)
Coupon Rate %
Maturity Date
Value (000's) EUR
% of Net Asset Value
Corporate Bonds (continued)
United States - 28.41% (continued) 4,382
Toyota Motor Credit Corp 4.500 17/06/2020 4,442 0.23
24,042 Toyota Motor Credit Corp 1.900 8/04/2021 22,317 1.17
2,000 Toyota Motor Credit Corp 2.750 17/05/2021 1,912 0.10
8,000 US Bank NA 2.125 28/10/2019 7,591 0.40
539,899 28.41
Total Corporate Bonds - 76.80% (30 November 2015: 73.23%) 1,459,630 76.80
Government Bonds
Canada - 7.67% 26,020
Export Development Canada 1.000 15/12/2020 31,029 1.63
15,000 Export Development Canada 1.375 21/10/2021 13,710 0.72
19,500 Province of Alberta Canada 1.750 26/08/2020 18,286 0.96
16,300 Province of Manitoba Canada 2.050 30/11/2020 15,453 0.81
29,800 Province of Ontario Canada 4.400 14/04/2020 30,387 1.60
10,000 Province of Ontario Canada 1.875 21/05/2020 9,426 0.50
27,500 Province of Quebec Canada 3.500 29/07/2020 27,435 1.45
145,726 7.67
Finland - 2.09% 27,207
Finland Government International Bond 1.625 15/12/2020 33,236 1.75
7,000 Municipality Finance PLC 1.500 23/03/2020 6,531 0.34
39,767 2.09
France - 0.71% 14,490
Agence Francaise de Developpement 1.625 21/01/2020 13,562 0.71
13,562 0.71
Japan - 0.83% 8,000
Japan Bank for International Cooperation 1.750 28/05/2020 7,449 0.39
8,750
Japan Finance Organization for Municipalities 2.125 6/03/2019 8,257 0.44
15,706 0.83
Singapore - 2.88% 60,000
Singapore Government Bond 2.250 1/06/2021 40,554 2.13
22,000 Singapore Government Bond 1.250 1/10/2021 14,186 0.75
54,740 2.88
Sweden - 1.60% 223,000
Kommuninvest I Sverige AB 2.500 1/12/2020 25,102 1.32
50,000 Kommuninvest I Sverige AB 1.000 15/09/2021 5,285 0.28
30,387 1.60
United Kingdom - 7.86%
77,000 United Kingdom Gilt 2.000 22/07/2020 95,996 5.05
43,500 United Kingdom Gilt 1.500 22/01/2021 53,305 2.81
149,301 7.86 Total Government Bonds – 23.64% (30 November 2015: 25.96%) 449,189 23.64
Total Investments – 100.44% (30 November 2015: 99.19%) 1,908,819 100.44
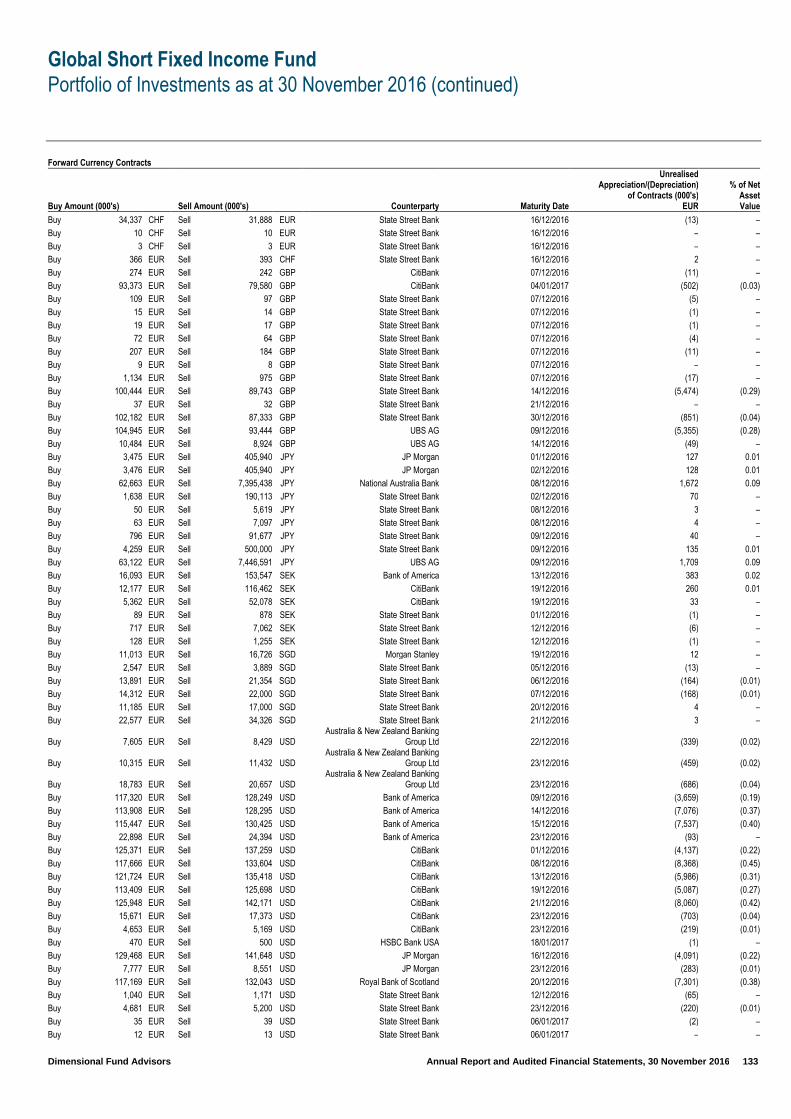
Global Short Fixed Income Fund
Portfolio of Investments as at 30 November 2016 (continued)
Dimensional Fund Advisors Annual Report and Audited Financial Statements, 30 November 2016 133
Forward Currency Contracts
Buy Amount (000's) Sell Amount (000's) Counterparty Maturity Date
Unrealised Appreciation/(Depreciation)
of Contracts (000's) EUR
% of Net Asset Value
Buy 34,337 CHF Sell 31,888 EUR State Street Bank 16/12/2016 (13) –
Buy 10 CHF Sell 10 EUR State Street Bank 16/12/2016 – –
Buy 3 CHF Sell 3 EUR State Street Bank 16/12/2016 – –
Buy 366 EUR Sell 393 CHF State Street Bank 16/12/2016 2 –
Buy 274 EUR Sell 242 GBP CitiBank 07/12/2016 (11) –
Buy 93,373 EUR Sell 79,580 GBP CitiBank 04/01/2017 (502) (0.03)
Buy 109 EUR Sell 97 GBP State Street Bank 07/12/2016 (5) –
Buy 15 EUR Sell 14 GBP State Street Bank 07/12/2016 (1) –
Buy 19 EUR Sell 17 GBP State Street Bank 07/12/2016 (1) –
Buy 72 EUR Sell 64 GBP State Street Bank 07/12/2016 (4) –
Buy 207 EUR Sell 184 GBP State Street Bank 07/12/2016 (11) –
Buy 9 EUR Sell 8 GBP State Street Bank 07/12/2016 – –
Buy 1,134 EUR Sell 975 GBP State Street Bank 07/12/2016 (17) –
Buy 100,444 EUR Sell 89,743 GBP State Street Bank 14/12/2016 (5,474) (0.29)
Buy 37 EUR Sell 32 GBP State Street Bank 21/12/2016 – –
Buy 102,182 EUR Sell 87,333 GBP State Street Bank 30/12/2016 (851) (0.04)
Buy 104,945 EUR Sell 93,444 GBP UBS AG 09/12/2016 (5,355) (0.28)
Buy 10,484 EUR Sell 8,924 GBP UBS AG 14/12/2016 (49) –
Buy 3,475 EUR Sell 405,940 JPY JP Morgan 01/12/2016 127 0.01
Buy 3,476 EUR Sell 405,940 JPY JP Morgan 02/12/2016 128 0.01
Buy 62,663 EUR Sell 7,395,438 JPY National Australia Bank 08/12/2016 1,672 0.09
Buy 1,638 EUR Sell 190,113 JPY State Street Bank 02/12/2016 70 –
Buy 50 EUR Sell 5,619 JPY State Street Bank 08/12/2016 3 –
Buy 63 EUR Sell 7,097 JPY State Street Bank 08/12/2016 4 –
Buy 796 EUR Sell 91,677 JPY State Street Bank 09/12/2016 40 –
Buy 4,259 EUR Sell 500,000 JPY State Street Bank 09/12/2016 135 0.01
Buy 63,122 EUR Sell 7,446,591 JPY UBS AG 09/12/2016 1,709 0.09
Buy 16,093 EUR Sell 153,547 SEK Bank of America 13/12/2016 383 0.02
Buy 12,177 EUR Sell 116,462 SEK CitiBank 19/12/2016 260 0.01
Buy 5,362 EUR Sell 52,078 SEK CitiBank 19/12/2016 33 –
Buy 89 EUR Sell 878 SEK State Street Bank 01/12/2016 (1) –
Buy 717 EUR Sell 7,062 SEK State Street Bank 12/12/2016 (6) –
Buy 128 EUR Sell 1,255 SEK State Street Bank 12/12/2016 (1) –
Buy 11,013 EUR Sell 16,726 SGD Morgan Stanley 19/12/2016 12 –
Buy 2,547 EUR Sell 3,889 SGD State Street Bank 05/12/2016 (13) –
Buy 13,891 EUR Sell 21,354 SGD State Street Bank 06/12/2016 (164) (0.01)
Buy 14,312 EUR Sell 22,000 SGD State Street Bank 07/12/2016 (168) (0.01)
Buy 11,185 EUR Sell 17,000 SGD State Street Bank 20/12/2016 4 –
Buy 22,577 EUR Sell 34,326 SGD State Street Bank 21/12/2016 3 –
Buy 7,605 EUR Sell 8,429 USD Australia & New Zealand Banking
Group Ltd 22/12/2016 (339) (0.02)
Buy 10,315 EUR Sell 11,432 USD Australia & New Zealand Banking
Group Ltd 23/12/2016 (459) (0.02)
Buy 18,783 EUR Sell 20,657 USD Australia & New Zealand Banking
Group Ltd 23/12/2016 (686) (0.04)
Buy 117,320 EUR Sell 128,249 USD Bank of America 09/12/2016 (3,659) (0.19)
Buy 113,908 EUR Sell 128,295 USD Bank of America 14/12/2016 (7,076) (0.37)
Buy 115,447 EUR Sell 130,425 USD Bank of America 15/12/2016 (7,537) (0.40)
Buy 22,898 EUR Sell 24,394 USD Bank of America 23/12/2016 (93) –
Buy 125,371 EUR Sell 137,259 USD CitiBank 01/12/2016 (4,137) (0.22)
Buy 117,666 EUR Sell 133,604 USD CitiBank 08/12/2016 (8,368) (0.45)
Buy 121,724 EUR Sell 135,418 USD CitiBank 13/12/2016 (5,986) (0.31)
Buy 113,409 EUR Sell 125,698 USD CitiBank 19/12/2016 (5,087) (0.27)
Buy 125,948 EUR Sell 142,171 USD CitiBank 21/12/2016 (8,060) (0.42)
Buy 15,671 EUR Sell 17,373 USD CitiBank 23/12/2016 (703) (0.04)
Buy 4,653 EUR Sell 5,169 USD CitiBank 23/12/2016 (219) (0.01)
Buy 470 EUR Sell 500 USD HSBC Bank USA 18/01/2017 (1) –
Buy 129,468 EUR Sell 141,648 USD JP Morgan 16/12/2016 (4,091) (0.22)
Buy 7,777 EUR Sell 8,551 USD JP Morgan 23/12/2016 (283) (0.01)
Buy 117,169 EUR Sell 132,043 USD Royal Bank of Scotland 20/12/2016 (7,301) (0.38)
Buy 1,040 EUR Sell 1,171 USD State Street Bank 12/12/2016 (65) –
Buy 4,681 EUR Sell 5,200 USD State Street Bank 23/12/2016 (220) (0.01)
Buy 35 EUR Sell 39 USD State Street Bank 06/01/2017 (2) –
Buy 12 EUR Sell 13 USD State Street Bank 06/01/2017 – –
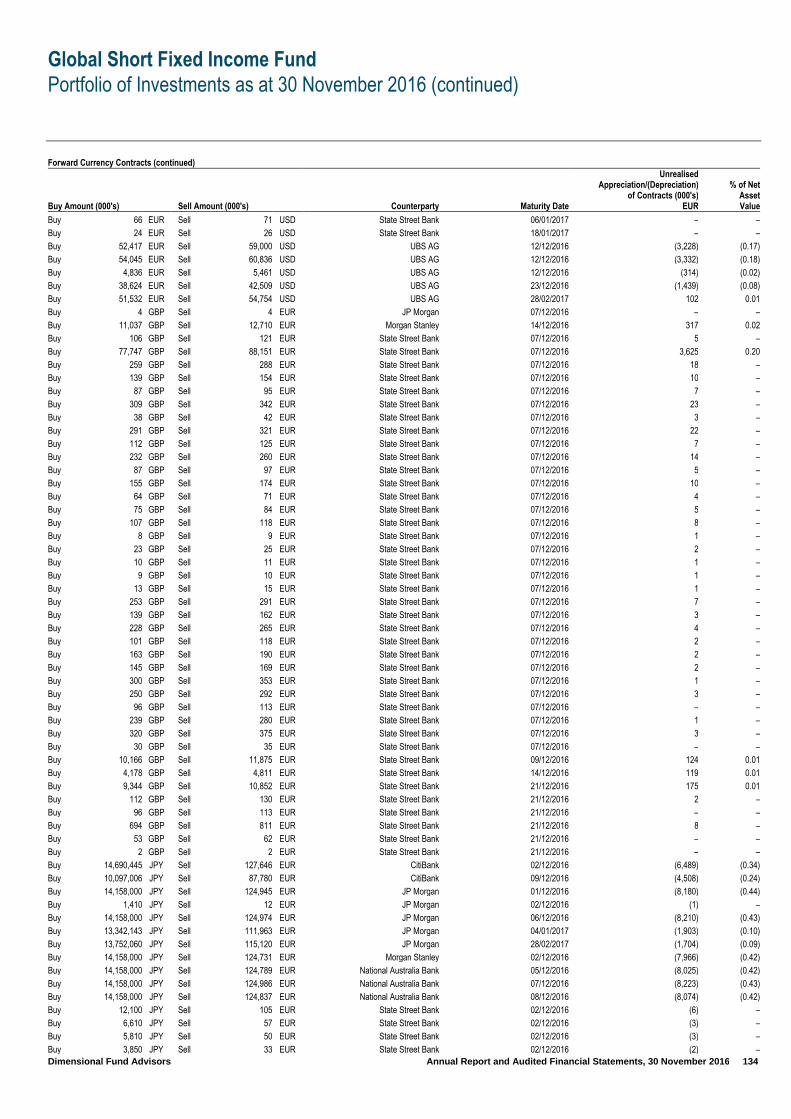
Global Short Fixed Income Fund
Portfolio of Investments as at 30 November 2016 (continued)
Dimensional Fund Advisors Annual Report and Audited Financial Statements, 30 November 2016 134
Forward Currency Contracts (continued)
Buy Amount (000's) Sell Amount (000's) Counterparty Maturity Date
Unrealised Appreciation/(Depreciation)
of Contracts (000's) EUR
% of Net Asset Value
Buy 66 EUR Sell 71 USD State Street Bank 06/01/2017 – –
Buy 24 EUR Sell 26 USD State Street Bank 18/01/2017 – –
Buy 52,417 EUR Sell 59,000 USD UBS AG 12/12/2016 (3,228) (0.17)
Buy 54,045 EUR Sell 60,836 USD UBS AG 12/12/2016 (3,332) (0.18)
Buy 4,836 EUR Sell 5,461 USD UBS AG 12/12/2016 (314) (0.02)
Buy 38,624 EUR Sell 42,509 USD UBS AG 23/12/2016 (1,439) (0.08)
Buy 51,532 EUR Sell 54,754 USD UBS AG 28/02/2017 102 0.01
Buy 4 GBP Sell 4 EUR JP Morgan 07/12/2016 – –
Buy 11,037 GBP Sell 12,710 EUR Morgan Stanley 14/12/2016 317 0.02
Buy 106 GBP Sell 121 EUR State Street Bank 07/12/2016 5 –
Buy 77,747 GBP Sell 88,151 EUR State Street Bank 07/12/2016 3,625 0.20
Buy 259 GBP Sell 288 EUR State Street Bank 07/12/2016 18 –
Buy 139 GBP Sell 154 EUR State Street Bank 07/12/2016 10 –
Buy 87 GBP Sell 95 EUR State Street Bank 07/12/2016 7 –
Buy 309 GBP Sell 342 EUR State Street Bank 07/12/2016 23 –
Buy 38 GBP Sell 42 EUR State Street Bank 07/12/2016 3 –
Buy 291 GBP Sell 321 EUR State Street Bank 07/12/2016 22 –
Buy 112 GBP Sell 125 EUR State Street Bank 07/12/2016 7 –
Buy 232 GBP Sell 260 EUR State Street Bank 07/12/2016 14 –
Buy 87 GBP Sell 97 EUR State Street Bank 07/12/2016 5 –
Buy 155 GBP Sell 174 EUR State Street Bank 07/12/2016 10 –
Buy 64 GBP Sell 71 EUR State Street Bank 07/12/2016 4 –
Buy 75 GBP Sell 84 EUR State Street Bank 07/12/2016 5 –
Buy 107 GBP Sell 118 EUR State Street Bank 07/12/2016 8 –
Buy 8 GBP Sell 9 EUR State Street Bank 07/12/2016 1 –
Buy 23 GBP Sell 25 EUR State Street Bank 07/12/2016 2 –
Buy 10 GBP Sell 11 EUR State Street Bank 07/12/2016 1 –
Buy 9 GBP Sell 10 EUR State Street Bank 07/12/2016 1 –
Buy 13 GBP Sell 15 EUR State Street Bank 07/12/2016 1 –
Buy 253 GBP Sell 291 EUR State Street Bank 07/12/2016 7 –
Buy 139 GBP Sell 162 EUR State Street Bank 07/12/2016 3 –
Buy 228 GBP Sell 265 EUR State Street Bank 07/12/2016 4 –
Buy 101 GBP Sell 118 EUR State Street Bank 07/12/2016 2 –
Buy 163 GBP Sell 190 EUR State Street Bank 07/12/2016 2 –
Buy 145 GBP Sell 169 EUR State Street Bank 07/12/2016 2 –
Buy 300 GBP Sell 353 EUR State Street Bank 07/12/2016 1 –
Buy 250 GBP Sell 292 EUR State Street Bank 07/12/2016 3 –
Buy 96 GBP Sell 113 EUR State Street Bank 07/12/2016 – –
Buy 239 GBP Sell 280 EUR State Street Bank 07/12/2016 1 –
Buy 320 GBP Sell 375 EUR State Street Bank 07/12/2016 3 –
Buy 30 GBP Sell 35 EUR State Street Bank 07/12/2016 – –
Buy 10,166 GBP Sell 11,875 EUR State Street Bank 09/12/2016 124 0.01
Buy 4,178 GBP Sell 4,811 EUR State Street Bank 14/12/2016 119 0.01
Buy 9,344 GBP Sell 10,852 EUR State Street Bank 21/12/2016 175 0.01
Buy 112 GBP Sell 130 EUR State Street Bank 21/12/2016 2 –
Buy 96 GBP Sell 113 EUR State Street Bank 21/12/2016 – –
Buy 694 GBP Sell 811 EUR State Street Bank 21/12/2016 8 –
Buy 53 GBP Sell 62 EUR State Street Bank 21/12/2016 – –
Buy 2 GBP Sell 2 EUR State Street Bank 21/12/2016 – –
Buy 14,690,445 JPY Sell 127,646 EUR CitiBank 02/12/2016 (6,489) (0.34)
Buy 10,097,006 JPY Sell 87,780 EUR CitiBank 09/12/2016 (4,508) (0.24)
Buy 14,158,000 JPY Sell 124,945 EUR JP Morgan 01/12/2016 (8,180) (0.44)
Buy 1,410 JPY Sell 12 EUR JP Morgan 02/12/2016 (1) –
Buy 14,158,000 JPY Sell 124,974 EUR JP Morgan 06/12/2016 (8,210) (0.43)
Buy 13,342,143 JPY Sell 111,963 EUR JP Morgan 04/01/2017 (1,903) (0.10)
Buy 13,752,060 JPY Sell 115,120 EUR JP Morgan 28/02/2017 (1,704) (0.09)
Buy 14,158,000 JPY Sell 124,731 EUR Morgan Stanley 02/12/2016 (7,966) (0.42)
Buy 14,158,000 JPY Sell 124,789 EUR National Australia Bank 05/12/2016 (8,025) (0.42)
Buy 14,158,000 JPY Sell 124,986 EUR National Australia Bank 07/12/2016 (8,223) (0.43)
Buy 14,158,000 JPY Sell 124,837 EUR National Australia Bank 08/12/2016 (8,074) (0.42)
Buy 12,100 JPY Sell 105 EUR State Street Bank 02/12/2016 (6) –
Buy 6,610 JPY Sell 57 EUR State Street Bank 02/12/2016 (3) –
Buy 5,810 JPY Sell 50 EUR State Street Bank 02/12/2016 (3) –
Buy 3,850 JPY Sell 33 EUR State Street Bank 02/12/2016 (2) –

Global Short Fixed Income Fund
Portfolio of Investments as at 30 November 2016 (continued)
Dimensional Fund Advisors Annual Report and Audited Financial Statements, 30 November 2016 135
Forward Currency Contracts (continued)
Buy Amount (000's) Sell Amount (000's) Counterparty Maturity Date
Unrealised Appreciation/(Depreciation)
of Contracts (000's) EUR
% of Net Asset Value
Buy 4,570 JPY Sell 40 EUR State Street Bank 02/12/2016 (2) –
Buy 4,020 JPY Sell 35 EUR State Street Bank 02/12/2016 (2) –
Buy 2,810 JPY Sell 24 EUR State Street Bank 02/12/2016 (1) –
Buy 3,250 JPY Sell 28 EUR State Street Bank 02/12/2016 (1) –
Buy 6,820 JPY Sell 59 EUR State Street Bank 02/12/2016 (3) –
Buy 7,460 JPY Sell 64 EUR State Street Bank 02/12/2016 (3) –
Buy 7,280 JPY Sell 62 EUR State Street Bank 05/12/2016 (2) –
Buy 1,150 JPY Sell 10 EUR State Street Bank 02/12/2016 – –
Buy 1,020 JPY Sell 9 EUR State Street Bank 02/12/2016 – –
Buy 1,600 JPY Sell 14 EUR State Street Bank 02/12/2016 – –
Buy 2,170 JPY Sell 18 EUR State Street Bank 02/12/2016 – –
Buy 13,230 JPY Sell 110 EUR State Street Bank 02/12/2016 (1) –
Buy 6,590 JPY Sell 55 EUR State Street Bank 02/12/2016 (1) –
Buy 12,664 JPY Sell 112 EUR State Street Bank 08/12/2016 (8) –
Buy 820 JPY Sell 7 EUR State Street Bank 09/12/2016 – –
Buy 10,484 JPY Sell 89 EUR State Street Bank 09/12/2016 (3) –
Buy 503,599 JPY Sell 4,319 EUR State Street Bank 09/12/2016 (166) (0.01)
Buy 55,021 JPY Sell 471 EUR State Street Bank 09/12/2016 (17) –
Buy 14,553 JPY Sell 122 EUR State Street Bank 30/12/2016 (2) –
Buy 6,100 JPY Sell 51 EUR State Street Bank 28/02/2017 (1) –
Buy 18,609 JPY Sell 155 EUR State Street Bank 28/02/2017 (2) –
Buy 133,216 NOK Sell 14,668 EUR State Street Bank 23/01/2017 58 –
Buy 7,724 NOK Sell 850 EUR State Street Bank 23/01/2017 4 –
Buy 82,780 SEK Sell 8,505 EUR Morgan Stanley 01/12/2016 (36) –
Buy 82,702 SEK Sell 8,469 EUR Morgan Stanley 04/01/2017 (5) –
Buy 867 SEK Sell 88 EUR State Street Bank 01/12/2016 1 –
Buy 107 SEK Sell 11 EUR State Street Bank 01/12/2016 – –
Buy 125,748 SEK Sell 12,732 EUR State Street Bank 12/12/2016 134 0.01
Buy 189 SEK Sell 19 EUR State Street Bank 12/12/2016 – –
Buy 3,889 SGD Sell 2,568 EUR State Street Bank 05/12/2016 (8) –
Buy 4,797 SGD Sell 3,166 EUR State Street Bank 21/12/2016 (12) –
Buy 8,854 USD Sell 8,117 EUR Bank of America 23/12/2016 228 0.01
Buy 81,412 USD Sell 76,598 EUR Barclays Bank 01/12/2016 217 0.01
Buy 16,000 USD Sell 14,901 EUR HSBC Bank USA 21/12/2016 180 0.01
Buy 62,537 USD Sell 58,862 EUR JP Morgan 08/12/2016 131 0.01
Buy 22,527 USD Sell 21,199 EUR JP Morgan 13/12/2016 46 –
Buy 41,734 USD Sell 37,803 EUR JP Morgan 18/01/2017 1,475 0.08
Buy 16,687 USD Sell 15,541 EUR Morgan Stanley 21/12/2016 188 0.01
Buy 8,854 USD Sell 8,117 EUR Morgan Stanley 23/12/2016 228 0.01
Buy 6,261 USD Sell 5,905 EUR State Street Bank 16/12/2016 (2) –
Buy 8,854 USD Sell 8,117 EUR State Street Bank 23/12/2016 228 0.01
Buy 50 USD Sell 45 EUR State Street Bank 06/01/2017 2 –
Buy 62,093 USD Sell 55,954 EUR State Street Bank 06/01/2017 2,517 0.13
Buy 158 USD Sell 142 EUR State Street Bank 06/01/2017 7 –
Buy 1,001 USD Sell 906 EUR State Street Bank 06/01/2017 36 –
Buy 48 USD Sell 44 EUR State Street Bank 06/01/2017 1 –
Buy 2,135 USD Sell 1,956 EUR State Street Bank 06/01/2017 54 –
Buy 3,030 USD Sell 2,817 EUR State Street Bank 06/01/2017 36 –
Buy 208 USD Sell 196 EUR State Street Bank 06/01/2017 1 –
Buy 3,112 USD Sell 2,922 EUR State Street Bank 06/01/2017 9 –
Buy 37 USD Sell 35 EUR State Street Bank 06/01/2017 – –
Buy 140 USD Sell 132 EUR State Street Bank 06/01/2017 – –
Buy 41 USD Sell 38 EUR State Street Bank 06/01/2017 – –
Buy 14 USD Sell 13 EUR State Street Bank 18/01/2017 – –
Buy 250 USD Sell 228 EUR State Street Bank 18/01/2017 7 –
Buy 247 USD Sell 221 EUR State Street Bank 18/01/2017 11 –
Buy 1 USD Sell 1 EUR State Street Bank 18/01/2017 – –
Buy 20 USD Sell 19 EUR State Street Bank 18/01/2017 – –
Buy 350 USD Sell 328 EUR State Street Bank 18/01/2017 1 –
Unrealised Appreciation of Forward Currency Contracts 15,032 0.79
Unrealised Depreciation of Forward Currency Contracts (148,907) (7.83)
Net Unrealised Depreciation of Forward Currency Contracts – (7.04)% (30 November 2015: (0.84)%) (133,875) (7.04)
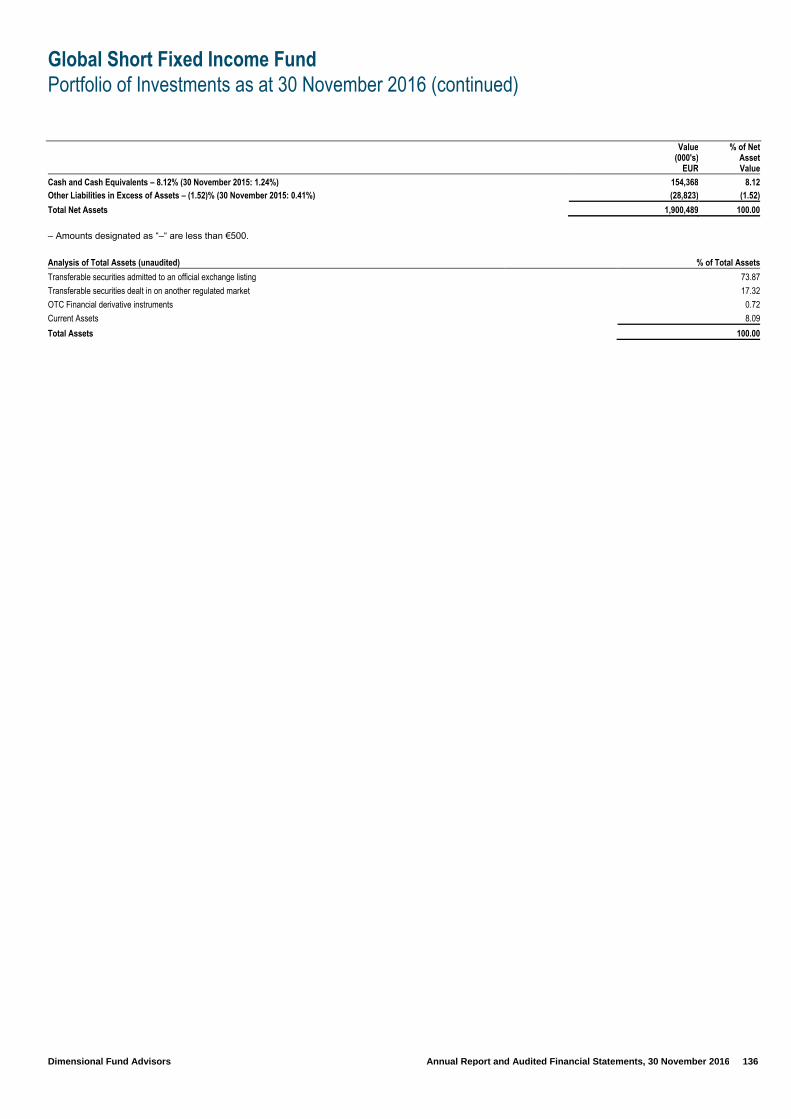
Global Short Fixed Income Fund
Portfolio of Investments as at 30 November 2016 (continued)
Dimensional Fund Advisors Annual Report and Audited Financial Statements, 30 November 2016 136
Value (000's)
EUR
% of Net Asset Value
Cash and Cash Equivalents – 8.12% (30 November 2015: 1.24%) 154,368 8.12 Other Liabilities in Excess of Assets – (1.52)% (30 November 2015: 0.41%) (28,823) (1.52)
Total Net Assets 1,900,489 100.00
– Amounts designated as “–“ are less than €500.
Analysis of Total Assets (unaudited) % of Total Assets
Transferable securities admitted to an official exchange listing 73.87
Transferable securities dealt in on another regulated market 17.32
OTC Financial derivative instruments 0.72
Current Assets 8.09
Total Assets 100.00
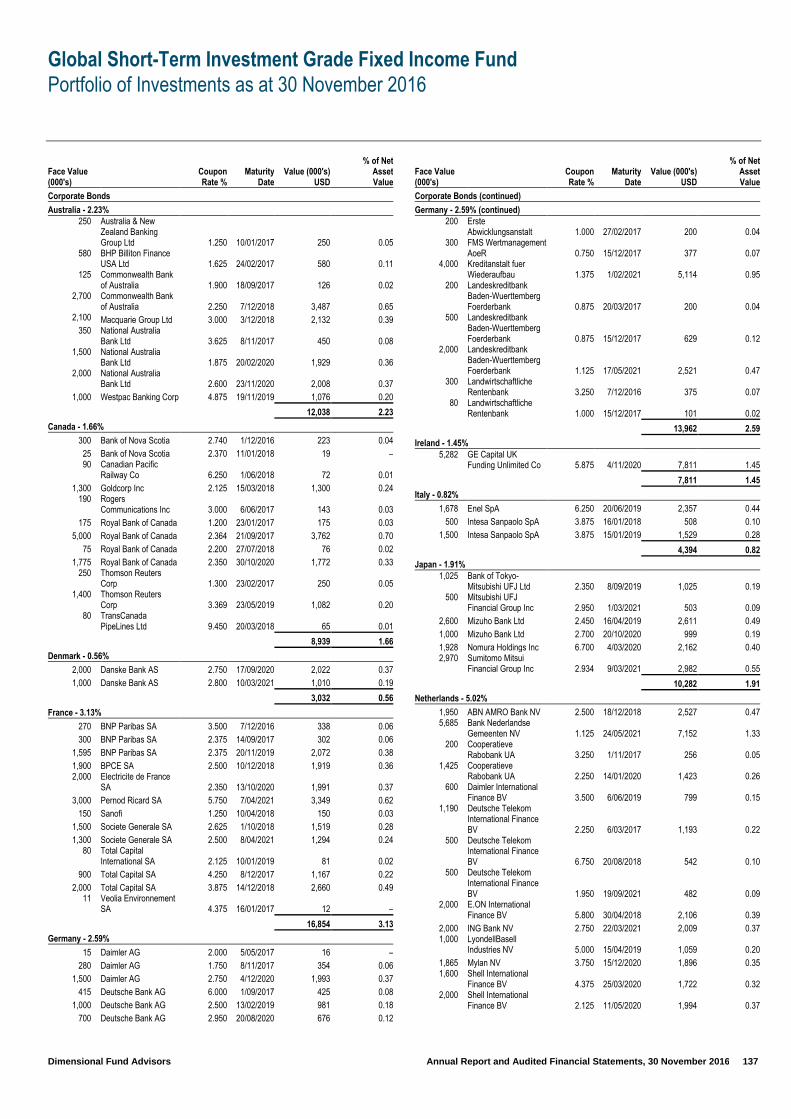
Global Short-Term Investment Grade Fixed Income Fund
Portfolio of Investments as at 30 November 2016
Dimensional Fund Advisors Annual Report and Audited Financial Statements, 30 November 2016 137
Face Value (000's)
Coupon Rate %
Maturity Date
Value (000's) USD
% of Net Asset Value
Corporate Bonds
Australia - 2.23% 250
Australia & New Zealand Banking Group Ltd 1.250 10/01/2017 250 0.05
580 BHP Billiton Finance USA Ltd 1.625 24/02/2017 580 0.11
125 Commonwealth Bank of Australia 1.900 18/09/2017 126 0.02
2,700 Commonwealth Bank of Australia 2.250 7/12/2018 3,487 0.65
2,100 Macquarie Group Ltd 3.000 3/12/2018 2,132 0.39 350
National Australia Bank Ltd 3.625 8/11/2017 450 0.08
1,500 National Australia Bank Ltd 1.875 20/02/2020 1,929 0.36
2,000 National Australia Bank Ltd 2.600 23/11/2020 2,008 0.37
1,000 Westpac Banking Corp 4.875 19/11/2019 1,076 0.20
12,038 2.23
Canada - 1.66%
300 Bank of Nova Scotia 2.740 1/12/2016 223 0.04
25 Bank of Nova Scotia 2.370 11/01/2018 19 – 90
Canadian Pacific Railway Co 6.250 1/06/2018 72 0.01
1,300 Goldcorp Inc 2.125 15/03/2018 1,300 0.24 190
Rogers Communications Inc 3.000 6/06/2017 143 0.03
175 Royal Bank of Canada 1.200 23/01/2017 175 0.03
5,000 Royal Bank of Canada 2.364 21/09/2017 3,762 0.70
75 Royal Bank of Canada 2.200 27/07/2018 76 0.02
1,775 Royal Bank of Canada 2.350 30/10/2020 1,772 0.33 250
Thomson Reuters Corp 1.300 23/02/2017 250 0.05
1,400 Thomson Reuters Corp 3.369 23/05/2019 1,082 0.20
80 TransCanada PipeLines Ltd 9.450 20/03/2018 65 0.01
8,939 1.66
Denmark - 0.56%
2,000 Danske Bank AS 2.750 17/09/2020 2,022 0.37
1,000 Danske Bank AS 2.800 10/03/2021 1,010 0.19
3,032 0.56
France - 3.13%
270 BNP Paribas SA 3.500 7/12/2016 338 0.06
300 BNP Paribas SA 2.375 14/09/2017 302 0.06
1,595 BNP Paribas SA 2.375 20/11/2019 2,072 0.38
1,900 BPCE SA 2.500 10/12/2018 1,919 0.36 2,000
Electricite de France SA 2.350 13/10/2020 1,991 0.37
3,000 Pernod Ricard SA 5.750 7/04/2021 3,349 0.62
150 Sanofi 1.250 10/04/2018 150 0.03
1,500 Societe Generale SA 2.625 1/10/2018 1,519 0.28
1,300 Societe Generale SA 2.500 8/04/2021 1,294 0.24 80
Total Capital International SA 2.125 10/01/2019 81 0.02
900 Total Capital SA 4.250 8/12/2017 1,167 0.22
2,000 Total Capital SA 3.875 14/12/2018 2,660 0.49 11
Veolia Environnement SA 4.375 16/01/2017 12 –
16,854 3.13
Germany - 2.59%
15 Daimler AG 2.000 5/05/2017 16 –
280 Daimler AG 1.750 8/11/2017 354 0.06
1,500 Daimler AG 2.750 4/12/2020 1,993 0.37
415 Deutsche Bank AG 6.000 1/09/2017 425 0.08
1,000 Deutsche Bank AG 2.500 13/02/2019 981 0.18
700 Deutsche Bank AG 2.950 20/08/2020 676 0.12
Face Value (000's)
Coupon Rate %
Maturity Date
Value (000's) USD
% of Net Asset Value
Corporate Bonds (continued)
Germany - 2.59% (continued) 200
Erste Abwicklungsanstalt 1.000 27/02/2017 200 0.04
300 FMS Wertmanagement AoeR 0.750 15/12/2017 377 0.07
4,000 Kreditanstalt fuer Wiederaufbau 1.375 1/02/2021 5,114 0.95
200
Landeskreditbank Baden-Wuerttemberg Foerderbank 0.875 20/03/2017 200 0.04
500
Landeskreditbank Baden-Wuerttemberg Foerderbank 0.875 15/12/2017 629 0.12
2,000
Landeskreditbank Baden-Wuerttemberg Foerderbank 1.125 17/05/2021 2,521 0.47
300 Landwirtschaftliche Rentenbank 3.250 7/12/2016 375 0.07
80 Landwirtschaftliche Rentenbank 1.000 15/12/2017 101 0.02
13,962 2.59
Ireland - 1.45% 5,282
GE Capital UK Funding Unlimited Co 5.875 4/11/2020 7,811 1.45
7,811 1.45
Italy - 0.82%
1,678 Enel SpA 6.250 20/06/2019 2,357 0.44
500 Intesa Sanpaolo SpA 3.875 16/01/2018 508 0.10
1,500 Intesa Sanpaolo SpA 3.875 15/01/2019 1,529 0.28
4,394 0.82
Japan - 1.91% 1,025
Bank of Tokyo-Mitsubishi UFJ Ltd 2.350 8/09/2019 1,025 0.19
500 Mitsubishi UFJ Financial Group Inc 2.950 1/03/2021 503 0.09
2,600 Mizuho Bank Ltd 2.450 16/04/2019 2,611 0.49
1,000 Mizuho Bank Ltd 2.700 20/10/2020 999 0.19
1,928 Nomura Holdings Inc 6.700 4/03/2020 2,162 0.40 2,970
Sumitomo Mitsui Financial Group Inc 2.934 9/03/2021 2,982 0.55
10,282 1.91
Netherlands - 5.02%
1,950 ABN AMRO Bank NV 2.500 18/12/2018 2,527 0.47 5,685
Bank Nederlandse Gemeenten NV 1.125 24/05/2021 7,152 1.33
200 Cooperatieve Rabobank UA 3.250 1/11/2017 256 0.05
1,425 Cooperatieve Rabobank UA 2.250 14/01/2020 1,423 0.26
600 Daimler International Finance BV 3.500 6/06/2019 799 0.15
1,190
Deutsche Telekom International Finance BV 2.250 6/03/2017 1,193 0.22
500
Deutsche Telekom International Finance BV 6.750 20/08/2018 542 0.10
500
Deutsche Telekom International Finance BV 1.950 19/09/2021 482 0.09
2,000 E.ON International Finance BV 5.800 30/04/2018 2,106 0.39
2,000 ING Bank NV 2.750 22/03/2021 2,009 0.37 1,000
LyondellBasell Industries NV 5.000 15/04/2019 1,059 0.20
1,865 Mylan NV 3.750 15/12/2020 1,896 0.35 1,600
Shell International Finance BV 4.375 25/03/2020 1,722 0.32
2,000 Shell International Finance BV 2.125 11/05/2020 1,994 0.37

Global Short-Term Investment Grade Fixed Income Fund
Portfolio of Investments as at 30 November 2016 (continued)
Dimensional Fund Advisors Annual Report and Audited Financial Statements, 30 November 2016 138
Face Value (000's)
Coupon Rate %
Maturity Date
Value (000's) USD
% of Net Asset Value
Corporate Bonds (continued)
Netherlands - 5.02% (continued)
450 Volkswagen Financial Services NV 2.375 13/11/2018 575 0.11
1,000 Volkswagen Financial Services NV 2.625 22/07/2019 1,291 0.24
27,026 5.02
Singapore - 0.20% 1,500
Temasek Financial I Ltd 3.265 19/02/2020 1,096 0.20
1,096 0.20
Spain - 0.32% 400
Telefonica Emisiones SAU 6.221 3/07/2017 410 0.08
600 Telefonica Emisiones SAU 5.375 2/02/2018 788 0.15
500 Telefonica Emisiones SAU 3.192 27/04/2018 508 0.09
1,706 0.32
Supranational - 3.10% 200
African Development Bank 1.125 15/12/2016 250 0.05
80 African Development Bank 1.625 2/10/2018 80 0.02
150 Asian Development Bank 1.000 15/12/2016 188 0.03
75 Asian Development Bank 1.750 11/09/2018 76 0.01
185 Council Of Europe Development Bank 1.750 19/12/2016 232 0.04
200 EUROFIMA 5.000 3/04/2017 203 0.04 140
European Investment Bank 3.250 7/12/2016 175 0.03
170 European Investment Bank 4.125 7/12/2017 221 0.04
5,000 European Investment Bank 1.500 1/02/2019 6,392 1.19
2,000 European Investment Bank 2.250 7/03/2020 2,624 0.49
4,000 European Investment Bank 5.375 7/06/2021 5,960 1.11
180 Inter-American Development Bank 1.125 15/03/2017 180 0.03
80
International Bank for Reconstruction & Development 1.250 2/10/2017 101 0.02
16,682 3.10
Sweden - 2.00% 55
Svensk Exportkredit AB 1.125 15/12/2016 69 0.01
5,300 Svensk Exportkredit AB 1.875 21/12/2018 6,817 1.27
2,900 Svenska Handelsbanken AB 4.000 18/01/2019 3,874 0.72
10,760 2.00
Switzerland - 0.68%
2,600 Credit Suisse AG 2.300 28/05/2019 2,606 0.48
800 UBS AG 6.625 11/04/2018 1,080 0.20
3,686 0.68
United Kingdom - 6.29%
2,000 Aon PLC 2.800 15/03/2021 2,007 0.37
1,374 AstraZeneca PLC 2.375 16/11/2020 1,369 0.25
4,000 Barclays PLC 3.250 12/01/2021 3,984 0.74 60
BP Capital Markets PLC 1.846 5/05/2017 60 0.01
68 BP Capital Markets PLC 1.375 6/11/2017 68 0.01
1,300 BP Capital Markets PLC 4.325 10/12/2018 1,742 0.32
100
British Telecommunications PLC 1.250 14/02/2017 100 0.02
Face Value (000's)
Coupon Rate %
Maturity Date
Value (000's) USD
% of Net Asset Value
Corporate Bonds (continued)
United Kingdom - 6.29% (continued)
950
British Telecommunications PLC 6.625 23/06/2017 1,227 0.23
255 Diageo Capital PLC 1.500 11/05/2017 256 0.05
1,500 FCE Bank PLC 2.759 13/11/2019 1,945 0.36 200
GlaxoSmithKline Capital PLC 1.500 8/05/2017 200 0.04
200 Lloyds Bank PLC 1.500 2/05/2017 252 0.05 1,200 Lloyds Bank PLC 2.700 17/08/2020 1,211 0.23
190 National Grid Gas PLC 6.000 7/06/2017 244 0.05
25 National Grid PLC 5.000 2/07/2018 29 0.01 1,500
Nationwide Building Society 2.350 21/01/2020 1,497 0.28
150
Network Rail Infrastructure Finance PLC 1.125 15/12/2016 188 0.03
250
Network Rail Infrastructure Finance PLC 1.000 7/12/2017 315 0.06
6,075
Network Rail Infrastructure Finance PLC 4.625 21/07/2020 8,683 1.61
1,100 Santander UK PLC 4.125 14/09/2017 1,411 0.26
2,000 Santander UK PLC 2.500 14/03/2019 2,011 0.37
2,500 Sky PLC 2.875 24/11/2020 3,316 0.62
350 Unilever PLC 2.000 19/12/2018 451 0.08
150 Vodafone Group PLC 8.125 26/11/2018 214 0.04
1,001 Vodafone Group PLC 5.450 10/06/2019 1,083 0.20
33,863 6.29
United States - 56.72%
1,100 Abbott Laboratories 5.125 1/04/2019 1,178 0.22
3,000 AbbVie Inc 2.500 14/05/2020 2,994 0.56
2,080 Actavis Inc 1.875 1/10/2017 2,084 0.39
200 Aetna Inc 1.500 15/11/2017 200 0.04
380 Aflac Inc 2.650 15/02/2017 381 0.07
1,569 Aflac Inc 2.400 16/03/2020 1,578 0.29 4
Agilent Technologies Inc 6.500 1/11/2017 4 –
600 Agilent Technologies Inc 5.000 15/07/2020 650 0.12
600 Ahold Finance USA LLC 6.500 14/03/2017 762 0.14
1,825 Airgas Inc 2.375 15/02/2020 1,832 0.34
2,000 Altria Group Inc 4.750 5/05/2021 2,181 0.40
1,700 Amazon.com Inc 2.600 5/12/2019 1,735 0.32
100 American Express Co 7.000 19/03/2018 107 0.02 700
American Express Credit Corp 2.250 15/08/2019 704 0.13
2,000 American Express Credit Corp 2.250 5/05/2021 1,979 0.37
300 American Honda Finance Corp 2.125 28/02/2017 301 0.06
80 American Honda Finance Corp 2.125 10/10/2018 81 0.01
500 American International Group Inc 2.300 16/07/2019 503 0.09
2,810 American International Group Inc 3.375 15/08/2020 2,897 0.54
2,200 Ameriprise Financial Inc 5.300 15/03/2020 2,394 0.44
2,000 AmerisourceBergen Corp 4.875 15/11/2019 2,153 0.40
2,376 Amgen Inc 2.200 22/05/2019 2,391 0.44
1,000 Amphenol Corp 2.550 30/01/2019 1,012 0.19 150
Anheuser-Busch InBev Worldwide Inc 1.375 15/07/2017 150 0.03
1,800 Anheuser-Busch InBev Worldwide Inc 5.375 15/01/2020 1,966 0.36
90 Anthem Inc 5.875 15/06/2017 92 0.02
1,182 Anthem Inc 1.875 15/01/2018 1,184 0.22

Global Short-Term Investment Grade Fixed Income Fund
Portfolio of Investments as at 30 November 2016 (continued)
Dimensional Fund Advisors Annual Report and Audited Financial Statements, 30 November 2016 139
Face Value (000's)
Coupon Rate %
Maturity Date
Value (000's) USD
% of Net Asset Value
Corporate Bonds (continued)
United States - 56.72% (continued)
1,000 Anthem Inc 2.250 15/08/2019 999 0.19
3,000 Apple Inc 2.250 23/02/2021 3,002 0.56
2,000 Applied Materials Inc 2.625 1/10/2020 2,021 0.37
1,000 Associated Banc-Corp 2.750 15/11/2019 1,004 0.19
385 AT&T Inc 1.600 15/02/2017 385 0.07
950 AT&T Inc 2.400 15/03/2017 953 0.18
400 AT&T Inc 5.875 28/04/2017 511 0.09
30 AT&T Inc 1.400 1/12/2017 30 0.01
1,000 Autodesk Inc 1.950 15/12/2017 1,003 0.19
750 AutoZone Inc 1.300 13/01/2017 750 0.14
1,773 Baker Hughes Inc 3.200 15/08/2021 1,812 0.34
25 Bank of America Corp 6.000 1/09/2017 26 –
650 Bank of America Corp 7.750 30/04/2018 890 0.17
1,300 Bank of America Corp 5.500 4/12/2019 1,827 0.34
1,000 Bank of America Corp 2.625 19/10/2020 1,000 0.19 2,900
Bank of New York Mellon Corp 2.200 15/05/2019 2,921 0.54
3,000 Baxter International Inc 1.700 15/08/2021 2,897 0.54
25 BB&T Corp 1.450 12/01/2018 25 –
2,500 BB&T Corp 2.450 15/01/2020 2,516 0.47
60 Beam Suntory Inc 1.875 15/05/2017 60 0.01 800
Berkshire Hathaway Finance Corp 2.900 15/10/2020 822 0.15
150 Berkshire Hathaway Inc 1.900 31/01/2017 150 0.03
1,500 Biogen Inc 2.900 15/09/2020 1,521 0.28
5,000 BMW US Capital LLC 2.000 11/04/2021 4,898 0.91
1,000 Boston Scientific Corp 6.000 15/01/2020 1,102 0.20 305
Branch Banking & Trust Co 1.000 3/04/2017 305 0.06
1,020 Buckeye Partners LP 2.650 15/11/2018 1,027 0.19 1,050
Burlington Northern Santa Fe LLC 4.700 1/10/2019 1,131 0.21
200 Campbell Soup Co 3.050 15/07/2017 202 0.04
800 Capital One Bank USA 2.300 5/06/2019 803 0.15
600 Cardinal Health Inc 1.700 15/03/2018 600 0.11 1,000
Caterpillar Financial Services Corp 2.000 5/03/2020 995 0.18
210 CBS Corp 1.950 1/07/2017 210 0.04
2,250 CBS Corp 2.300 15/08/2019 2,259 0.42
1,640 CF Industries Inc 6.875 1/05/2018 1,730 0.32
1,020 Chubb Corp 5.750 15/05/2018 1,080 0.20 1,500
Chubb INA Holdings Inc 2.300 3/11/2020 1,498 0.28
60 Cisco Systems Inc 3.150 14/03/2017 60 0.01
3,000 Cisco Systems Inc 2.200 28/02/2021 2,984 0.55
50 Citigroup Inc 6.250 29/06/2017 36 0.01
2,000 Citigroup Inc 2.400 18/02/2020 1,996 0.37
3,000 Citizens Bank NA 2.450 4/12/2019 3,017 0.56
1,000 CNA Financial Corp 7.350 15/11/2019 1,140 0.21
3,560 Coca-Cola Co 1.875 27/10/2020 3,532 0.66 1,200
Coca-Cola European Partners US LLC 3.500 15/09/2020 1,240 0.23
130 Comcast Corp 6.300 15/11/2017 136 0.03
550 Comerica Inc 2.125 23/05/2019 551 0.10 2,000
Consolidated Edison Inc 2.000 15/05/2021 1,961 0.36
1,400 Constellation Energy Group Inc 5.150 1/12/2020 1,519 0.28
1,000 Corning Inc 4.250 15/08/2020 1,053 0.20 1,000
Costco Wholesale Corp 1.700 15/12/2019 1,001 0.19
1,852 Coventry Health Care Inc 5.950 15/03/2017 1,877 0.35
650 CVS Health Corp 2.250 5/12/2018 655 0.12
1,000 CVS Health Corp 2.250 12/08/2019 1,004 0.19
1,700 CVS Health Corp 2.800 20/07/2020 1,722 0.32
1,200 CVS Health Corp 4.125 15/05/2021 1,272 0.24
Face Value (000's)
Coupon Rate %
Maturity Date
Value (000's) USD
% of Net Asset Value
Corporate Bonds (continued)
United States - 56.72% (continued)
300 Dollar General Corp 1.875 15/04/2018 300 0.06 2,000
Dominion Gas Holdings LLC 2.800 15/11/2020 2,022 0.38
1,000 Dover Corp 4.300 1/03/2021 1,066 0.20
250 Duke Energy Corp 1.625 15/08/2017 250 0.05
1,200 Duke Energy Corp 2.100 15/06/2018 1,207 0.22
83 Eastman Chemical Co 2.400 1/06/2017 84 0.02
169 eBay Inc 1.350 15/07/2017 169 0.03
850 eBay Inc 2.200 1/08/2019 849 0.16 2,396
Edwards Lifesciences Corp 2.875 15/10/2018 2,438 0.45
2,000 Electronic Arts Inc 3.700 1/03/2021 2,075 0.38
540 EMC Corp 1.875 1/06/2018 532 0.10 420
Enterprise Products Operating LLC 6.300 15/09/2017 434 0.08
1,800 Enterprise Products Operating LLC 5.200 1/09/2020 1,970 0.37
750 EOG Resources Inc 5.625 1/06/2019 811 0.15 100
Exelon Generation Co LLC 6.200 1/10/2017 104 0.02
1,000 Exelon Generation Co LLC 5.200 1/10/2019 1,075 0.20
1,000 Express Scripts Holding Co 2.250 15/06/2019 1,002 0.19
1,000 Express Scripts Holding Co 3.300 25/02/2021 1,023 0.19
1,323 FedEx Corp 2.300 1/02/2020 1,324 0.25
1,700 Fifth Third Bank 2.375 25/04/2019 1,715 0.32
3,000 Fiserv Inc 2.700 1/06/2020 3,013 0.56
140 FMC Technologies Inc 2.000 1/10/2017 140 0.03 150
Ford Motor Credit Co LLC 1.500 17/01/2017 150 0.03
700 Ford Motor Credit Co LLC 2.375 12/03/2019 699 0.13
705 Ford Motor Credit Co LLC 3.200 15/01/2021 704 0.13
3,000 Fortune Brands Home & Security Inc 3.000 15/06/2020 3,032 0.56
175 GATX Corp 1.250 4/03/2017 175 0.03
1,000 GATX Corp 2.500 15/03/2019 1,002 0.19
175 General Electric Co 5.625 15/09/2017 181 0.03
1,500 Gilead Sciences 4.500 1/04/2021 1,620 0.30
750 Gilead Sciences Inc 2.050 1/04/2019 753 0.14 350
GlaxoSmithKline Capital Inc 5.650 15/05/2018 370 0.07
10 Goldman Sachs Group Inc 6.375 2/05/2018 12 –
1,300 Goldman Sachs Group Inc 7.500 15/02/2019 1,448 0.27
401 Goldman Sachs Group Inc 6.000 15/06/2020 447 0.08
1,000 Goldman Sachs Group Inc 2.625 25/04/2021 995 0.18
1,120 Harley-Davidson Financial Services Inc 2.150 26/02/2020 1,111 0.21
700 Harley-Davidson Financial Services Inc 2.850 15/01/2021 709 0.13
2,704 Hewlett Packard Enterprise Co 3.850 15/10/2020 2,783 0.52
900 Home Depot Inc 2.000 15/06/2019 909 0.17
300 HSBC USA Inc 1.625 16/01/2018 300 0.06
2,000 HSBC USA Inc 2.375 13/11/2019 2,004 0.37
1,300 Humana Inc 2.625 1/10/2019 1,310 0.24 2,500
Indiana Michigan Power Co 7.000 15/03/2019 2,764 0.51
3,000 Intel Corp 2.450 29/07/2020 3,039 0.56 1,000
Intercontinental Exchange Inc 2.500 15/10/2018 1,015 0.19
1,000 Intercontinental Exchange Inc 2.750 1/12/2020 1,011 0.19
200 International Business Machines Corp 1.625 15/05/2020 197 0.04
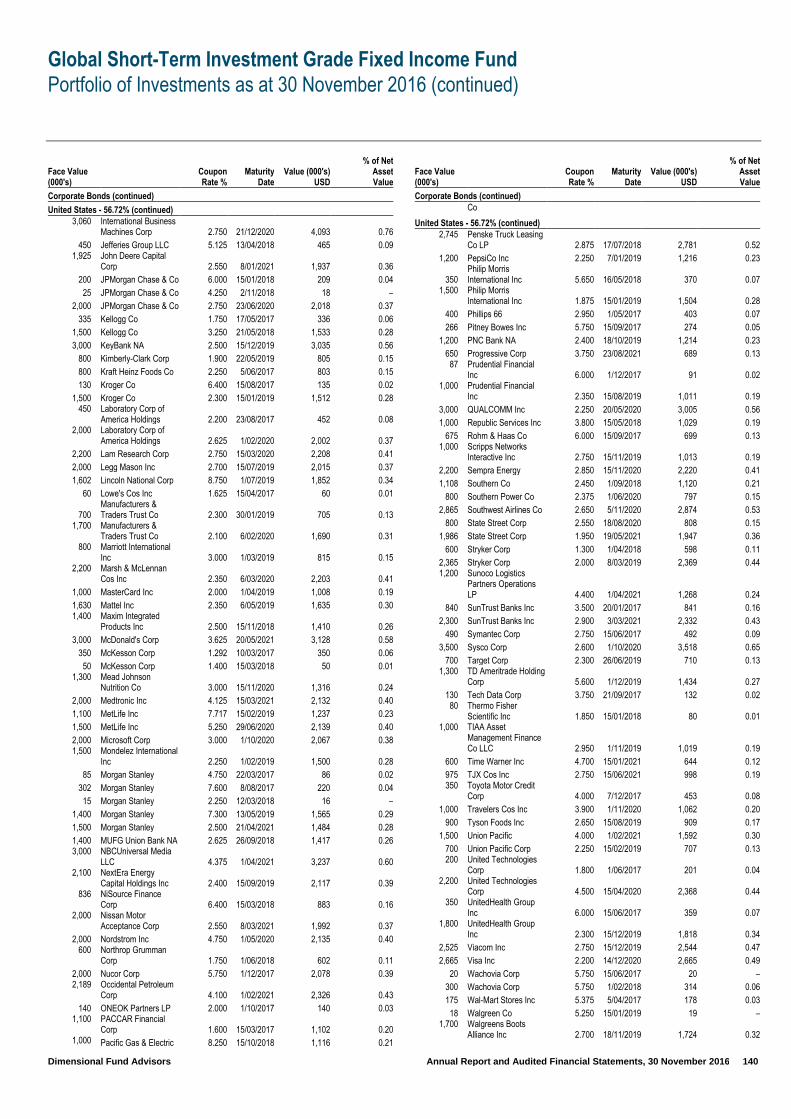
Global Short-Term Investment Grade Fixed Income Fund
Portfolio of Investments as at 30 November 2016 (continued)
Dimensional Fund Advisors Annual Report and Audited Financial Statements, 30 November 2016 140
Face Value (000's)
Coupon Rate %
Maturity Date
Value (000's) USD
% of Net Asset Value
Corporate Bonds (continued)
United States - 56.72% (continued) 3,060
International Business Machines Corp 2.750 21/12/2020 4,093 0.76
450 Jefferies Group LLC 5.125 13/04/2018 465 0.09 1,925
John Deere Capital Corp 2.550 8/01/2021 1,937 0.36
200 JPMorgan Chase & Co 6.000 15/01/2018 209 0.04
25 JPMorgan Chase & Co 4.250 2/11/2018 18 –
2,000 JPMorgan Chase & Co 2.750 23/06/2020 2,018 0.37
335 Kellogg Co 1.750 17/05/2017 336 0.06
1,500 Kellogg Co 3.250 21/05/2018 1,533 0.28
3,000 KeyBank NA 2.500 15/12/2019 3,035 0.56
800 Kimberly-Clark Corp 1.900 22/05/2019 805 0.15
800 Kraft Heinz Foods Co 2.250 5/06/2017 803 0.15
130 Kroger Co 6.400 15/08/2017 135 0.02
1,500 Kroger Co 2.300 15/01/2019 1,512 0.28 450
Laboratory Corp of America Holdings 2.200 23/08/2017 452 0.08
2,000 Laboratory Corp of America Holdings 2.625 1/02/2020 2,002 0.37
2,200 Lam Research Corp 2.750 15/03/2020 2,208 0.41
2,000 Legg Mason Inc 2.700 15/07/2019 2,015 0.37
1,602 Lincoln National Corp 8.750 1/07/2019 1,852 0.34
60 Lowe's Cos Inc 1.625 15/04/2017 60 0.01
700 Manufacturers & Traders Trust Co 2.300 30/01/2019 705 0.13
1,700 Manufacturers & Traders Trust Co 2.100 6/02/2020 1,690 0.31
800 Marriott International Inc 3.000 1/03/2019 815 0.15
2,200 Marsh & McLennan Cos Inc 2.350 6/03/2020 2,203 0.41
1,000 MasterCard Inc 2.000 1/04/2019 1,008 0.19
1,630 Mattel Inc 2.350 6/05/2019 1,635 0.30 1,400
Maxim Integrated Products Inc 2.500 15/11/2018 1,410 0.26
3,000 McDonald's Corp 3.625 20/05/2021 3,128 0.58
350 McKesson Corp 1.292 10/03/2017 350 0.06
50 McKesson Corp 1.400 15/03/2018 50 0.01 1,300
Mead Johnson Nutrition Co 3.000 15/11/2020 1,316 0.24
2,000 Medtronic Inc 4.125 15/03/2021 2,132 0.40
1,100 MetLife Inc 7.717 15/02/2019 1,237 0.23
1,500 MetLife Inc 5.250 29/06/2020 2,139 0.40
2,000 Microsoft Corp 3.000 1/10/2020 2,067 0.38 1,500
Mondelez International Inc 2.250 1/02/2019 1,500 0.28
85 Morgan Stanley 4.750 22/03/2017 86 0.02
302 Morgan Stanley 7.600 8/08/2017 220 0.04
15 Morgan Stanley 2.250 12/03/2018 16 –
1,400 Morgan Stanley 7.300 13/05/2019 1,565 0.29
1,500 Morgan Stanley 2.500 21/04/2021 1,484 0.28
1,400 MUFG Union Bank NA 2.625 26/09/2018 1,417 0.26 3,000
NBCUniversal Media LLC 4.375 1/04/2021 3,237 0.60
2,100 NextEra Energy Capital Holdings Inc 2.400 15/09/2019 2,117 0.39
836 NiSource Finance Corp 6.400 15/03/2018 883 0.16
2,000 Nissan Motor Acceptance Corp 2.550 8/03/2021 1,992 0.37
2,000 Nordstrom Inc 4.750 1/05/2020 2,135 0.40 600
Northrop Grumman Corp 1.750 1/06/2018 602 0.11
2,000 Nucor Corp 5.750 1/12/2017 2,078 0.39 2,189
Occidental Petroleum Corp 4.100 1/02/2021 2,326 0.43
140 ONEOK Partners LP 2.000 1/10/2017 140 0.03 1,100
PACCAR Financial Corp 1.600 15/03/2017 1,102 0.20
1,000 Pacific Gas & Electric 8.250 15/10/2018 1,116 0.21
Face Value (000's)
Coupon Rate %
Maturity Date
Value (000's) USD
% of Net Asset Value
Corporate Bonds (continued) Co
United States - 56.72% (continued) 2,745
Penske Truck Leasing Co LP 2.875 17/07/2018 2,781 0.52
1,200 PepsiCo Inc 2.250 7/01/2019 1,216 0.23
350 Philip Morris International Inc 5.650 16/05/2018 370 0.07
1,500 Philip Morris International Inc 1.875 15/01/2019 1,504 0.28
400 Phillips 66 2.950 1/05/2017 403 0.07
266 Pitney Bowes Inc 5.750 15/09/2017 274 0.05
1,200 PNC Bank NA 2.400 18/10/2019 1,214 0.23
650 Progressive Corp 3.750 23/08/2021 689 0.13 87
Prudential Financial Inc 6.000 1/12/2017 91 0.02
1,000 Prudential Financial Inc 2.350 15/08/2019 1,011 0.19
3,000 QUALCOMM Inc 2.250 20/05/2020 3,005 0.56
1,000 Republic Services Inc 3.800 15/05/2018 1,029 0.19
675 Rohm & Haas Co 6.000 15/09/2017 699 0.13 1,000
Scripps Networks Interactive Inc 2.750 15/11/2019 1,013 0.19
2,200 Sempra Energy 2.850 15/11/2020 2,220 0.41
1,108 Southern Co 2.450 1/09/2018 1,120 0.21
800 Southern Power Co 2.375 1/06/2020 797 0.15
2,865 Southwest Airlines Co 2.650 5/11/2020 2,874 0.53
800 State Street Corp 2.550 18/08/2020 808 0.15
1,986 State Street Corp 1.950 19/05/2021 1,947 0.36
600 Stryker Corp 1.300 1/04/2018 598 0.11
2,365 Stryker Corp 2.000 8/03/2019 2,369 0.44 1,200
Sunoco Logistics Partners Operations LP 4.400 1/04/2021 1,268 0.24
840 SunTrust Banks Inc 3.500 20/01/2017 841 0.16
2,300 SunTrust Banks Inc 2.900 3/03/2021 2,332 0.43
490 Symantec Corp 2.750 15/06/2017 492 0.09
3,500 Sysco Corp 2.600 1/10/2020 3,518 0.65
700 Target Corp 2.300 26/06/2019 710 0.13 1,300
TD Ameritrade Holding Corp 5.600 1/12/2019 1,434 0.27
130 Tech Data Corp 3.750 21/09/2017 132 0.02 80
Thermo Fisher Scientific Inc 1.850 15/01/2018 80 0.01
1,000
TIAA Asset Management Finance Co LLC 2.950 1/11/2019 1,019 0.19
600 Time Warner Inc 4.700 15/01/2021 644 0.12
975 TJX Cos Inc 2.750 15/06/2021 998 0.19 350
Toyota Motor Credit Corp 4.000 7/12/2017 453 0.08
1,000 Travelers Cos Inc 3.900 1/11/2020 1,062 0.20
900 Tyson Foods Inc 2.650 15/08/2019 909 0.17
1,500 Union Pacific 4.000 1/02/2021 1,592 0.30
700 Union Pacific Corp 2.250 15/02/2019 707 0.13 200
United Technologies Corp 1.800 1/06/2017 201 0.04
2,200 United Technologies Corp 4.500 15/04/2020 2,368 0.44
350 UnitedHealth Group Inc 6.000 15/06/2017 359 0.07
1,800 UnitedHealth Group Inc 2.300 15/12/2019 1,818 0.34
2,525 Viacom Inc 2.750 15/12/2019 2,544 0.47
2,665 Visa Inc 2.200 14/12/2020 2,665 0.49
20 Wachovia Corp 5.750 15/06/2017 20 –
300 Wachovia Corp 5.750 1/02/2018 314 0.06
175 Wal-Mart Stores Inc 5.375 5/04/2017 178 0.03
18 Walgreen Co 5.250 15/01/2019 19 – 1,700
Walgreens Boots Alliance Inc 2.700 18/11/2019 1,724 0.32

Global Short-Term Investment Grade Fixed Income Fund
Portfolio of Investments as at 30 November 2016 (continued)
Dimensional Fund Advisors Annual Report and Audited Financial Statements, 30 November 2016 141
Face Value (000's)
Coupon Rate %
Maturity Date
Value (000's) USD
% of Net Asset Value
Corporate Bonds (continued)
United States - 56.72% (continued) 2,000
Walgreens Boots Alliance Inc 2.600 1/06/2021 1,991 0.37
80 Walt Disney Co 1.125 15/02/2017 80 0.01
3,000 Walt Disney Co 2.150 17/09/2020 3,008 0.56 3,000
Waste Management Inc 4.600 1/03/2021 3,249 0.60
120 Wells Fargo & Co 2.625 15/12/2016 120 0.02
1,100 Wells Fargo & Co 2.125 22/04/2019 1,104 0.20
2,000 Wells Fargo & Co 2.550 7/12/2020 2,004 0.37
500 Western Union Co 3.650 22/08/2018 513 0.10
400 Whirlpool Corp 1.350 1/03/2017 400 0.07 151
Wyndham Worldwide Corp 2.500 1/03/2018 152 0.03
2,100 Xcel Energy Inc 2.400 15/03/2021 2,094 0.39
550 Xerox Corp 2.750 15/03/2019 551 0.10
2,000 Xerox Corp 5.625 15/12/2019 2,150 0.40
750 Xilinx Inc 2.125 15/03/2019 752 0.14
305,547 56.72
Total Corporate Bonds – 88.68% (30 November 2015: 89.87%) 477,678 88.68
Government Bonds
Canada - 0.50% 150
Export Development Canada 0.875 7/12/2016 188 0.04
2,000 Province of Alberta Canada 1.750 26/08/2020 1,989 0.37
220 Province of British Columbia Canada 1.200 25/04/2017 220 0.04
250 Province of Manitoba Canada 1.300 3/04/2017 250 0.05
30 Province of Manitoba Canada 4.250 5/03/2018 23 –
25 Province of New Brunswick Canada 4.450 26/03/2018 19 –
2,689 0.50
Denmark - 0.02%
87 Kommunekredit 1.125 15/03/2018 87 0.02
87 0.02
Finland - 0.10% 445
Municipality Finance PLC 1.125 7/12/2017 561 0.10
561 0.10
France - 0.74% 4,000
Agence Francaise de Developpement 1.625 21/01/2020 3,968 0.74
3,968 0.74
Face Value (000's)
Coupon Rate %
Maturity Date
Value (000's) USD
% of Net Asset Value
Government Bonds (continued)
Italy - 0.09% 450
Italy Government International Bond 5.375 12/06/2017 461 0.09
461 0.09
Japan - 0.60% 2,000
Japan Bank for International Cooperation 1.750 28/05/2020 1,974 0.37
900
Japan Finance Organization for Municipalities 5.750 9/08/2019 1,271 0.23
3,245 0.60
Norway - 0.03%
150 Kommunalbanken AS 1.125 15/12/2016 188 0.03
188 0.03
Singapore - 2.78% 1,000
Singapore Government Bond 1.625 1/10/2019 704 0.13
18,000 Singapore Government Bond 2.250 1/06/2021 12,894 2.40
2,000 Singapore Government Bond 1.250 1/10/2021 1,367 0.25
14,965 2.78
Spain - 0.28% 1,000
Instituto de Credito Oficial 5.000 10/04/2017 1,014 0.19
500 Spain Government International Bond 4.000 6/03/2018 513 0.09
1,527 0.28
Sweden - 3.22% 240
Kommuninvest I Sverige AB 1.625 13/02/2017 240 0.05
180 Kommuninvest I Sverige AB 1.000 24/10/2017 180 0.03
90,000 Kommuninvest I Sverige AB 2.500 1/12/2020 10,737 1.99
47,000 Sweden Government Bond 5.000 1/12/2020 6,214 1.15
17,371 3.22
United States - 2.07% 7,000
United States Treasury Note 1.750 30/09/2019 7,076 1.32
4,000 United States Treasury Note 2.000 31/07/2020 4,053 0.75
11,129 2.07
Total Government Bonds – 10.43% (30 November 2015: 8.57%) 56,191 10.43
Total Investments – 99.11% (30 November 2015: 98.44%) 533,869 99.11
Forward Currency Contracts
Buy Amount (000's) Sell Amount (000's) Counterparty Maturity Date
Unrealised Appreciation/(Depreciation)
of Contracts (000's) USD
% of Net Asset Value
Buy 1,550 CHF Sell 1,600 USD State Street Bank 14/12/2016 (74) (0.01)
Buy 8,200 CHF Sell 8,452 USD State Street Bank 14/12/2016 (381) (0.08)
Buy 300 CHF Sell 305 USD State Street Bank 14/12/2016 (10) –
Buy 245 CHF Sell 248 USD State Street Bank 14/12/2016 (7) –
Buy 91,951 EUR Sell 103,624 USD CitiBank 22/12/2016 (6,064) (1.14)
Buy 119 EUR Sell 132 USD State Street Bank 09/12/2016 (5) –
Buy 72,566 EUR Sell 80,222 USD State Street Bank 09/12/2016 (3,295) (0.62)
Buy 280 EUR Sell 309 USD State Street Bank 09/12/2016 (12) –
Buy 17 EUR Sell 18 USD State Street Bank 09/12/2016 (1) –
Buy 286 EUR Sell 312 USD State Street Bank 09/12/2016 (8) –
Buy 463 EUR Sell 502 USD State Street Bank 09/12/2016 (12) –
Buy 99 EUR Sell 106 USD State Street Bank 09/12/2016 (1) –
Buy 231 EUR Sell 248 USD State Street Bank 09/12/2016 (3) –
Buy 160 EUR Sell 171 USD State Street Bank 09/12/2016 (1) –

Global Short-Term Investment Grade Fixed Income Fund
Portfolio of Investments as at 30 November 2016 (continued)
Dimensional Fund Advisors Annual Report and Audited Financial Statements, 30 November 2016 142
Buy 209 EUR Sell 222 USD State Street Bank 09/12/2016 (1) –
Forward Currency Contracts (continued)
Buy Amount (000's) Sell Amount (000's) Counterparty Maturity Date
Unrealised Appreciation/(Depreciation)
of Contracts (000's) USD
% of Net Asset Value
Buy 166 EUR Sell 176 USD State Street Bank 09/12/2016 – –
Buy 178 EUR Sell 190 USD State Street Bank 09/12/2016 (1) –
Buy 140 EUR Sell 149 USD State Street Bank 09/12/2016 – –
Buy 78 EUR Sell 82 USD State Street Bank 09/12/2016 – –
Buy 214 EUR Sell 226 USD State Street Bank 09/12/2016 – –
Buy 93 EUR Sell 98 USD State Street Bank 09/12/2016 – –
Buy 133 EUR Sell 142 USD State Street Bank 09/12/2016 (1) –
Buy 48 EUR Sell 54 USD State Street Bank 22/12/2016 (3) –
Buy 75 EUR Sell 84 USD State Street Bank 22/12/2016 (5) –
Buy 137 EUR Sell 155 USD State Street Bank 22/12/2016 (9) –
Buy 27 EUR Sell 31 USD State Street Bank 22/12/2016 (2) –
Buy 73 EUR Sell 83 USD State Street Bank 22/12/2016 (5) –
Buy 57 EUR Sell 64 USD State Street Bank 22/12/2016 (4) –
Buy 41 EUR Sell 46 USD State Street Bank 22/12/2016 (2) –
Buy 9 EUR Sell 10 USD State Street Bank 22/12/2016 (1) –
Buy 83 EUR Sell 92 USD State Street Bank 22/12/2016 (5) –
Buy 479 EUR Sell 529 USD State Street Bank 22/12/2016 (21) –
Buy 97 EUR Sell 108 USD State Street Bank 22/12/2016 (5) –
Buy 184 EUR Sell 203 USD State Street Bank 22/12/2016 (8) –
Buy 68 EUR Sell 74 USD State Street Bank 22/12/2016 (3) –
Buy 63 EUR Sell 69 USD State Street Bank 22/12/2016 (2) –
Buy 255 EUR Sell 279 USD State Street Bank 22/12/2016 (9) –
Buy 524 EUR Sell 571 USD State Street Bank 22/12/2016 (15) –
Buy 101 EUR Sell 110 USD State Street Bank 22/12/2016 (3) –
Buy 52 EUR Sell 57 USD State Street Bank 22/12/2016 (2) –
Buy 43 EUR Sell 47 USD State Street Bank 22/12/2016 (2) –
Buy 97 EUR Sell 108 USD State Street Bank 22/12/2016 (5) –
Buy 29 EUR Sell 33 USD State Street Bank 22/12/2016 (1) –
Buy 56 EUR Sell 62 USD State Street Bank 22/12/2016 (3) –
Buy 80 EUR Sell 88 USD State Street Bank 22/12/2016 (4) –
Buy 494 EUR Sell 545 USD State Street Bank 22/12/2016 (21) –
Buy 62 EUR Sell 68 USD State Street Bank 22/12/2016 (2) –
Buy 250 EUR Sell 272 USD State Street Bank 22/12/2016 (7) –
Buy 148 EUR Sell 160 USD State Street Bank 22/12/2016 (4) –
Buy 657 EUR Sell 706 USD State Street Bank 22/12/2016 (9) –
Buy 177 EUR Sell 189 USD State Street Bank 22/12/2016 (2) –
Buy 97 EUR Sell 103 USD State Street Bank 22/12/2016 – –
Buy 66 EUR Sell 70 USD State Street Bank 22/12/2016 – –
Buy 300 EUR Sell 319 USD State Street Bank 22/12/2016 (1) –
Buy 171 EUR Sell 182 USD State Street Bank 22/12/2016 – –
Buy 64 EUR Sell 67 USD State Street Bank 22/12/2016 – –
Buy 184 EUR Sell 195 USD State Street Bank 22/12/2016 – –
Buy 383 EUR Sell 406 USD State Street Bank 22/12/2016 – –
Buy 77,000 GBP Sell 98,071 USD Barclays Bank 07/12/2016 (1,723) (0.33)
Buy 76,523 GBP Sell 97,494 USD Barclays Bank 07/12/2016 (1,742) (0.33)
Buy 92,090 GBP Sell 114,011 USD CitiBank 16/12/2016 1,253 0.24
Buy 291 GBP Sell 370 USD State Street Bank 07/12/2016 (6) –
Buy 721 GBP Sell 920 USD State Street Bank 07/12/2016 (17) –
Buy 312 GBP Sell 394 USD State Street Bank 07/12/2016 (4) –
Buy 615 GBP Sell 766 USD State Street Bank 07/12/2016 4 –
Buy 420 GBP Sell 519 USD State Street Bank 07/12/2016 6 –
Buy 464 GBP Sell 563 USD State Street Bank 07/12/2016 18 –
Buy 916 GBP Sell 1,119 USD State Street Bank 07/12/2016 27 0.01
Buy 153 GBP Sell 187 USD State Street Bank 07/12/2016 4 –
Buy 247 GBP Sell 302 USD State Street Bank 07/12/2016 8 –
Buy 290 GBP Sell 354 USD State Street Bank 07/12/2016 9 –
Buy 62 GBP Sell 76 USD State Street Bank 07/12/2016 1 –
Buy 353 GBP Sell 433 USD State Street Bank 07/12/2016 8 –
Buy 326 GBP Sell 400 USD State Street Bank 07/12/2016 8 –
Buy 283 GBP Sell 346 USD State Street Bank 07/12/2016 8 –
Buy 52 GBP Sell 63 USD State Street Bank 07/12/2016 1 –
Buy 443 GBP Sell 541 USD State Street Bank 07/12/2016 14 –
Buy 176 GBP Sell 215 USD State Street Bank 07/12/2016 5 –
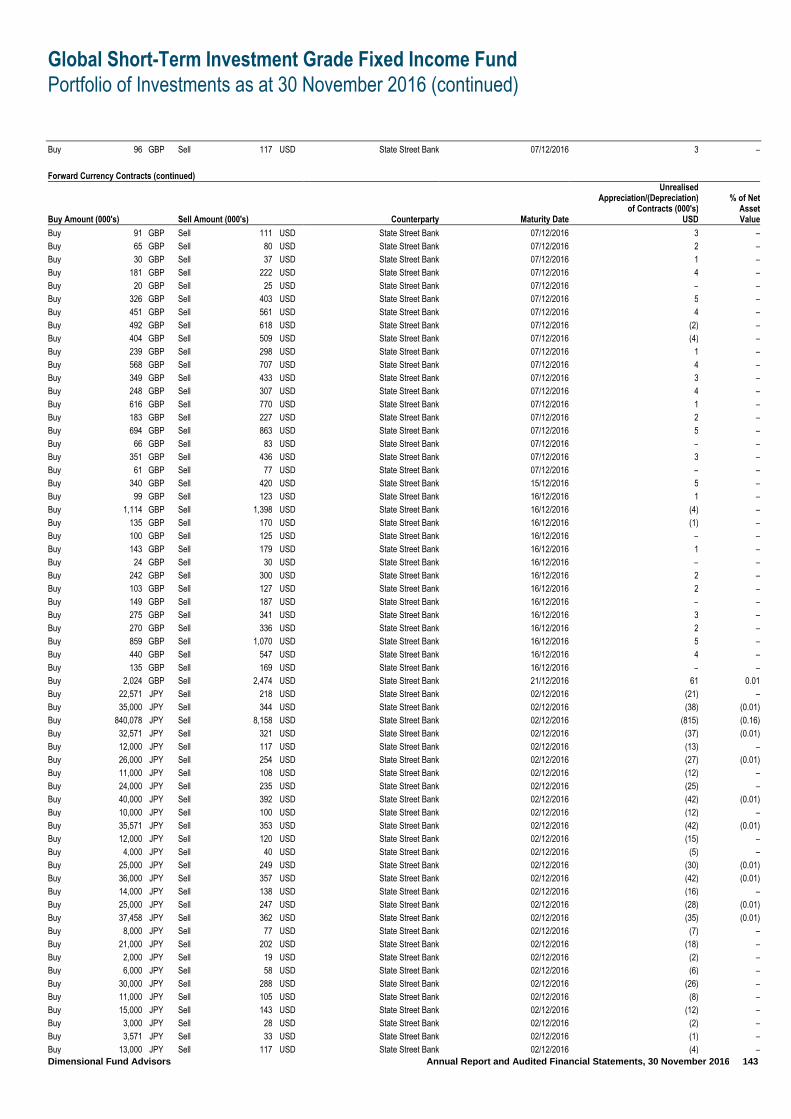
Global Short-Term Investment Grade Fixed Income Fund
Portfolio of Investments as at 30 November 2016 (continued)
Dimensional Fund Advisors Annual Report and Audited Financial Statements, 30 November 2016 143
Buy 96 GBP Sell 117 USD State Street Bank 07/12/2016 3 –
Forward Currency Contracts (continued)
Buy Amount (000's) Sell Amount (000's) Counterparty Maturity Date
Unrealised Appreciation/(Depreciation)
of Contracts (000's) USD
% of Net Asset Value
Buy 91 GBP Sell 111 USD State Street Bank 07/12/2016 3 –
Buy 65 GBP Sell 80 USD State Street Bank 07/12/2016 2 –
Buy 30 GBP Sell 37 USD State Street Bank 07/12/2016 1 –
Buy 181 GBP Sell 222 USD State Street Bank 07/12/2016 4 –
Buy 20 GBP Sell 25 USD State Street Bank 07/12/2016 – –
Buy 326 GBP Sell 403 USD State Street Bank 07/12/2016 5 –
Buy 451 GBP Sell 561 USD State Street Bank 07/12/2016 4 –
Buy 492 GBP Sell 618 USD State Street Bank 07/12/2016 (2) –
Buy 404 GBP Sell 509 USD State Street Bank 07/12/2016 (4) –
Buy 239 GBP Sell 298 USD State Street Bank 07/12/2016 1 –
Buy 568 GBP Sell 707 USD State Street Bank 07/12/2016 4 –
Buy 349 GBP Sell 433 USD State Street Bank 07/12/2016 3 –
Buy 248 GBP Sell 307 USD State Street Bank 07/12/2016 4 –
Buy 616 GBP Sell 770 USD State Street Bank 07/12/2016 1 –
Buy 183 GBP Sell 227 USD State Street Bank 07/12/2016 2 –
Buy 694 GBP Sell 863 USD State Street Bank 07/12/2016 5 –
Buy 66 GBP Sell 83 USD State Street Bank 07/12/2016 – –
Buy 351 GBP Sell 436 USD State Street Bank 07/12/2016 3 –
Buy 61 GBP Sell 77 USD State Street Bank 07/12/2016 – –
Buy 340 GBP Sell 420 USD State Street Bank 15/12/2016 5 –
Buy 99 GBP Sell 123 USD State Street Bank 16/12/2016 1 –
Buy 1,114 GBP Sell 1,398 USD State Street Bank 16/12/2016 (4) –
Buy 135 GBP Sell 170 USD State Street Bank 16/12/2016 (1) –
Buy 100 GBP Sell 125 USD State Street Bank 16/12/2016 – –
Buy 143 GBP Sell 179 USD State Street Bank 16/12/2016 1 –
Buy 24 GBP Sell 30 USD State Street Bank 16/12/2016 – –
Buy 242 GBP Sell 300 USD State Street Bank 16/12/2016 2 –
Buy 103 GBP Sell 127 USD State Street Bank 16/12/2016 2 –
Buy 149 GBP Sell 187 USD State Street Bank 16/12/2016 – –
Buy 275 GBP Sell 341 USD State Street Bank 16/12/2016 3 –
Buy 270 GBP Sell 336 USD State Street Bank 16/12/2016 2 –
Buy 859 GBP Sell 1,070 USD State Street Bank 16/12/2016 5 –
Buy 440 GBP Sell 547 USD State Street Bank 16/12/2016 4 –
Buy 135 GBP Sell 169 USD State Street Bank 16/12/2016 – –
Buy 2,024 GBP Sell 2,474 USD State Street Bank 21/12/2016 61 0.01
Buy 22,571 JPY Sell 218 USD State Street Bank 02/12/2016 (21) –
Buy 35,000 JPY Sell 344 USD State Street Bank 02/12/2016 (38) (0.01)
Buy 840,078 JPY Sell 8,158 USD State Street Bank 02/12/2016 (815) (0.16)
Buy 32,571 JPY Sell 321 USD State Street Bank 02/12/2016 (37) (0.01)
Buy 12,000 JPY Sell 117 USD State Street Bank 02/12/2016 (13) –
Buy 26,000 JPY Sell 254 USD State Street Bank 02/12/2016 (27) (0.01)
Buy 11,000 JPY Sell 108 USD State Street Bank 02/12/2016 (12) –
Buy 24,000 JPY Sell 235 USD State Street Bank 02/12/2016 (25) –
Buy 40,000 JPY Sell 392 USD State Street Bank 02/12/2016 (42) (0.01)
Buy 10,000 JPY Sell 100 USD State Street Bank 02/12/2016 (12) –
Buy 35,571 JPY Sell 353 USD State Street Bank 02/12/2016 (42) (0.01)
Buy 12,000 JPY Sell 120 USD State Street Bank 02/12/2016 (15) –
Buy 4,000 JPY Sell 40 USD State Street Bank 02/12/2016 (5) –
Buy 25,000 JPY Sell 249 USD State Street Bank 02/12/2016 (30) (0.01)
Buy 36,000 JPY Sell 357 USD State Street Bank 02/12/2016 (42) (0.01)
Buy 14,000 JPY Sell 138 USD State Street Bank 02/12/2016 (16) –
Buy 25,000 JPY Sell 247 USD State Street Bank 02/12/2016 (28) (0.01)
Buy 37,458 JPY Sell 362 USD State Street Bank 02/12/2016 (35) (0.01)
Buy 8,000 JPY Sell 77 USD State Street Bank 02/12/2016 (7) –
Buy 21,000 JPY Sell 202 USD State Street Bank 02/12/2016 (18) –
Buy 2,000 JPY Sell 19 USD State Street Bank 02/12/2016 (2) –
Buy 6,000 JPY Sell 58 USD State Street Bank 02/12/2016 (6) –
Buy 30,000 JPY Sell 288 USD State Street Bank 02/12/2016 (26) –
Buy 11,000 JPY Sell 105 USD State Street Bank 02/12/2016 (8) –
Buy 15,000 JPY Sell 143 USD State Street Bank 02/12/2016 (12) –
Buy 3,000 JPY Sell 28 USD State Street Bank 02/12/2016 (2) –
Buy 3,571 JPY Sell 33 USD State Street Bank 02/12/2016 (1) –
Buy 13,000 JPY Sell 117 USD State Street Bank 02/12/2016 (4) –
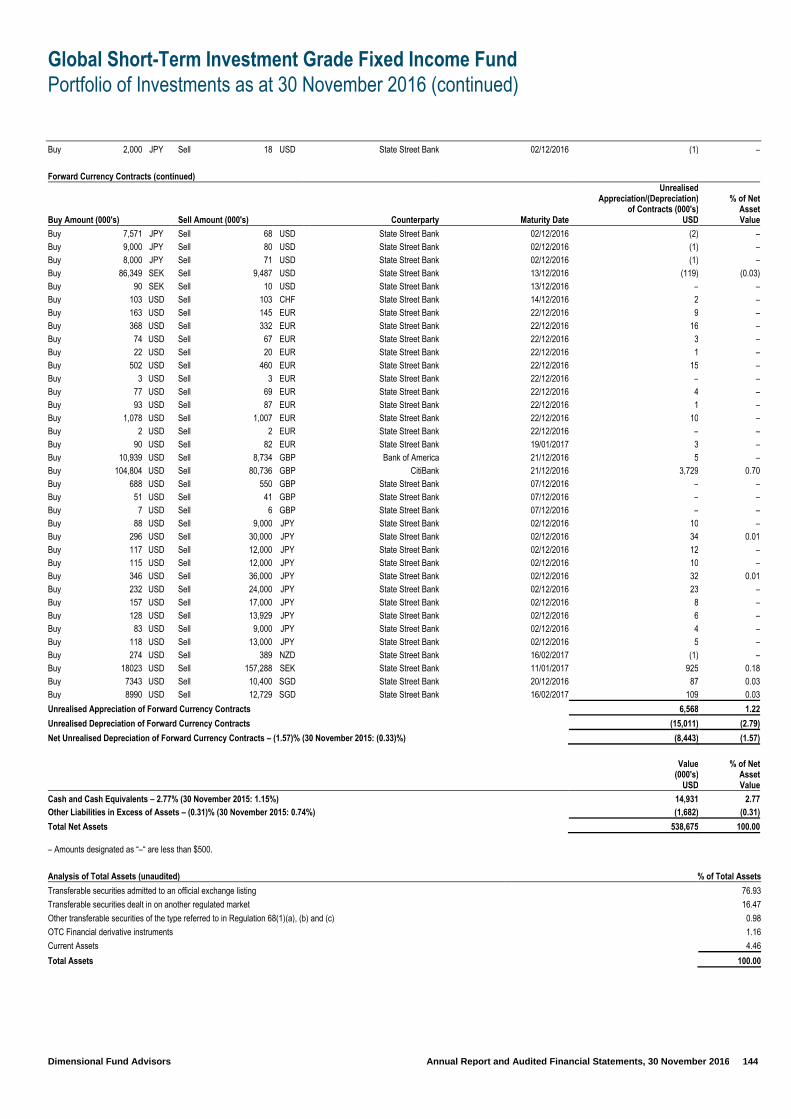
Global Short-Term Investment Grade Fixed Income Fund
Portfolio of Investments as at 30 November 2016 (continued)
Dimensional Fund Advisors Annual Report and Audited Financial Statements, 30 November 2016 144
Buy 2,000 JPY Sell 18 USD State Street Bank 02/12/2016 (1) –
Forward Currency Contracts (continued)
Buy Amount (000's) Sell Amount (000's) Counterparty Maturity Date
Unrealised Appreciation/(Depreciation)
of Contracts (000's) USD
% of Net Asset Value
Buy 7,571 JPY Sell 68 USD State Street Bank 02/12/2016 (2) –
Buy 9,000 JPY Sell 80 USD State Street Bank 02/12/2016 (1) –
Buy 8,000 JPY Sell 71 USD State Street Bank 02/12/2016 (1) –
Buy 86,349 SEK Sell 9,487 USD State Street Bank 13/12/2016 (119) (0.03)
Buy 90 SEK Sell 10 USD State Street Bank 13/12/2016 – –
Buy 103 USD Sell 103 CHF State Street Bank 14/12/2016 2 –
Buy 163 USD Sell 145 EUR State Street Bank 22/12/2016 9 –
Buy 368 USD Sell 332 EUR State Street Bank 22/12/2016 16 –
Buy 74 USD Sell 67 EUR State Street Bank 22/12/2016 3 –
Buy 22 USD Sell 20 EUR State Street Bank 22/12/2016 1 –
Buy 502 USD Sell 460 EUR State Street Bank 22/12/2016 15 –
Buy 3 USD Sell 3 EUR State Street Bank 22/12/2016 – –
Buy 77 USD Sell 69 EUR State Street Bank 22/12/2016 4 –
Buy 93 USD Sell 87 EUR State Street Bank 22/12/2016 1 –
Buy 1,078 USD Sell 1,007 EUR State Street Bank 22/12/2016 10 –
Buy 2 USD Sell 2 EUR State Street Bank 22/12/2016 – –
Buy 90 USD Sell 82 EUR State Street Bank 19/01/2017 3 –
Buy 10,939 USD Sell 8,734 GBP Bank of America 21/12/2016 5 –
Buy 104,804 USD Sell 80,736 GBP CitiBank 21/12/2016 3,729 0.70
Buy 688 USD Sell 550 GBP State Street Bank 07/12/2016 – –
Buy 51 USD Sell 41 GBP State Street Bank 07/12/2016 – –
Buy 7 USD Sell 6 GBP State Street Bank 07/12/2016 – –
Buy 88 USD Sell 9,000 JPY State Street Bank 02/12/2016 10 –
Buy 296 USD Sell 30,000 JPY State Street Bank 02/12/2016 34 0.01
Buy 117 USD Sell 12,000 JPY State Street Bank 02/12/2016 12 –
Buy 115 USD Sell 12,000 JPY State Street Bank 02/12/2016 10 –
Buy 346 USD Sell 36,000 JPY State Street Bank 02/12/2016 32 0.01
Buy 232 USD Sell 24,000 JPY State Street Bank 02/12/2016 23 –
Buy 157 USD Sell 17,000 JPY State Street Bank 02/12/2016 8 –
Buy 128 USD Sell 13,929 JPY State Street Bank 02/12/2016 6 –
Buy 83 USD Sell 9,000 JPY State Street Bank 02/12/2016 4 –
Buy 118 USD Sell 13,000 JPY State Street Bank 02/12/2016 5 –
Buy 274 USD Sell 389 NZD State Street Bank 16/02/2017 (1) –
Buy 18023 USD Sell 157,288 SEK State Street Bank 11/01/2017 925 0.18
Buy 7343 USD Sell 10,400 SGD State Street Bank 20/12/2016 87 0.03
Buy 8990 USD Sell 12,729 SGD State Street Bank 16/02/2017 109 0.03
Unrealised Appreciation of Forward Currency Contracts 6,568 1.22
Unrealised Depreciation of Forward Currency Contracts (15,011) (2.79)
Net Unrealised Depreciation of Forward Currency Contracts – (1.57)% (30 November 2015: (0.33)%) (8,443) (1.57)
Value (000's)
USD
% of Net Asset Value
Cash and Cash Equivalents – 2.77% (30 November 2015: 1.15%) 14,931 2.77 Other Liabilities in Excess of Assets – (0.31)% (30 November 2015: 0.74%) (1,682) (0.31)
Total Net Assets 538,675 100.00 – Amounts designated as “–“ are less than $500.
Analysis of Total Assets (unaudited) % of Total Assets
Transferable securities admitted to an official exchange listing 76.93
Transferable securities dealt in on another regulated market 16.47
Other transferable securities of the type referred to in Regulation 68(1)(a), (b) and (c) 0.98
OTC Financial derivative instruments 1.16
Current Assets 4.46
Total Assets 100.00

Global Small Companies Fund
Portfolio of Investments as at 30 November 2016
Dimensional Fund Advisors Annual Report and Audited Financial Statements, 30 November 2016 145
Shares (000's)
Value (000's)
USD
% of Net Asset Value
Common Stock
Australia - 2.58%
7 Acrux Ltd 2 –
44 Adelaide Brighton Ltd 166 0.03
14 Ainsworth Game Technology Ltd 18 –
54 ALS Ltd 241 0.06
13 Altium Ltd 83 0.02
14 Ansell Ltd 238 0.06
8 AP Eagers Ltd 52 0.01
38 APN News & Media Ltd 73 0.02
8 ARB Corp Ltd 99 0.03
49 Ardent Leisure Group 77 0.02
223 Arrium Ltd – –
41 Asaleo Care Ltd 46 0.01
36 ASG Group Ltd 43 0.01
6 AUB Group Ltd 44 0.01
16 Ausdrill Ltd 15 –
31 Austal Ltd 43 0.01
39 Australian Agricultural Co Ltd 47 0.01
38 Australian Pharmaceutical Industries Ltd 53 0.01
13 Australian Property Systems Ltd 50 0.01
22 Automotive Holdings Group Ltd 58 0.01
42 Aveo Group 95 0.03
55 AWE Ltd 25 0.01
28 Bank of Queensland Ltd 233 0.06
27 Bapcor Ltd 98 0.02
153 Beach Energy Ltd 91 0.02
212 Beadell Resources Ltd 51 0.01
13 Bega Cheese Ltd 49 0.01
5 Bellamy's Australia Ltd 48 0.01
15 Billabong International Ltd 13 –
1 Blackmores Ltd 91 0.02
4 Blue Sky Alternative Investments Ltd 22 –
15 Bradken Ltd 36 0.01
8 Breville Group Ltd 53 0.01
7 Brickworks Ltd 61 0.01
19 BT Investment Management Ltd 152 0.03
15 Cabcharge Australia Ltd 40 0.01
59 Capitol Health Ltd 5 –
17 Cardno Ltd 12 –
30 Carnarvon Petroleum Ltd 2 –
20 carsales.com Ltd 159 0.04
38 Cash Converters International Ltd 9 –
7 Cedar Woods Properties Ltd 26 0.01
3 Charter Hall Office – –
172 Cleanaway Waste Management Ltd 141 0.03
16 Collection House Ltd 18 –
5 Corporate Travel Management Ltd 71 0.01
17 Cover-More Group Ltd 17 –
4 Credit Corp Group Ltd 58 0.01
14 CSG Ltd 7 –
53 CSR Ltd 159 0.03
9 CuDeco Ltd 3 –
16 Decmil Group Ltd 13 –
67 Doray Minerals Ltd 25 0.01
48 Downer EDI Ltd 198 0.05
37 DuluxGroup Ltd 161 0.03
4 Eclipx Group Ltd 11 –
12 Elders Ltd 34 0.01
29 Energy Resources of Australia Ltd 7 –
50 Energy World Corp Ltd 10 –
2 EQT Holdings Ltd 21 –
12 ERM Power Ltd 10 –
10 Estia Health Ltd 21 –
Shares (000's)
Value (000's)
USD
% of Net Asset Value
Common Stock (continued)
Australia - 2.58% (continued)
11 Event Hospitality and Entertainment Ltd 114 0.03
110 Evolution Mining Ltd 153 0.03
255 Fairfax Media Ltd 152 0.03
3 Fleetwood Corp Ltd 4 –
27 FlexiGroup Ltd 45 0.01
5 Flight Centre Travel Group Ltd 130 0.03
30 G8 Education Ltd 70 0.01
6 GBST Holdings Ltd 18 –
16 Genworth Mortgage Insurance Australia Ltd 36 0.01
19 GrainCorp Ltd 120 0.02
10 Greencross Ltd 50 0.01
9 GUD Holdings Ltd 68 0.01
18 GWA Group Ltd 37 0.01
15 Hansen Technologies Ltd 48 0.01
4 HFA Holdings Ltd 7 –
20 Hills Ltd 6 –
122 Horizon Oil Ltd 4 –
36 Iluka Resources Ltd 164 0.03
16 Imdex Ltd 7 –
18 IMF Bentham Ltd 22 –
50 Independence Group NL 156 0.03
88 Infigen Energy 59 0.01
36 Infomedia Ltd 19 –
11 InvoCare Ltd 105 0.02
28 IOOF Holdings Ltd 179 0.05
13 IRESS Ltd 115 0.02
16 iSelect Ltd 23 –
9 iSentia Group Ltd 18 –
7 Japara Healthcare Ltd 10 –
12 JB Hi-Fi Ltd 242 0.05
23 Karoon Gas Australia Ltd 31 0.01
9 Kingsgate Consolidated Ltd 2 –
326 Lynas Corp Ltd 16 –
6 MACA Ltd 6 –
33 Macquarie Atlas Roads Group 116 0.02
10 Magellan Financial Group Ltd 171 0.05
32 Mantra Group Ltd 73 0.02
135 Mayne Pharma Group Ltd 159 0.03
7 McMillan Shakespeare Ltd 52 0.01
3 Medusa Mining Ltd 1 –
14 Mesoblast Ltd 12 –
61 Metals X Ltd 28 0.01
87 Metcash Ltd 134 0.03
14 Michael Hill International Ltd 16 –
13 Mineral Resources Ltd 116 0.02
33 MMA Offshore Ltd 7 –
12 Monadelphous Group Ltd 95 0.03
19 Monash IVF Group Ltd 28 0.01
5 Mortgage Choice Ltd 8 –
67 Mount Gibson Iron Ltd 16 –
64 Myer Holdings Ltd 60 0.01
19 MYOB Group Ltd 50 0.01
4 MyState Ltd 13 –
59 National Storage REIT 66 0.01
25 Navitas Ltd 94 0.02
17 New Hope Corp Ltd 20 –
24 NEXTDC Ltd 56 0.01
45 nib holdings Ltd 163 0.04
45 Nine Entertainment Co Holdings Ltd 31 0.01
58 Northern Star Resources Ltd 152 0.04
18 Nufarm Ltd 115 0.02
14 OFX Group Ltd 16 –
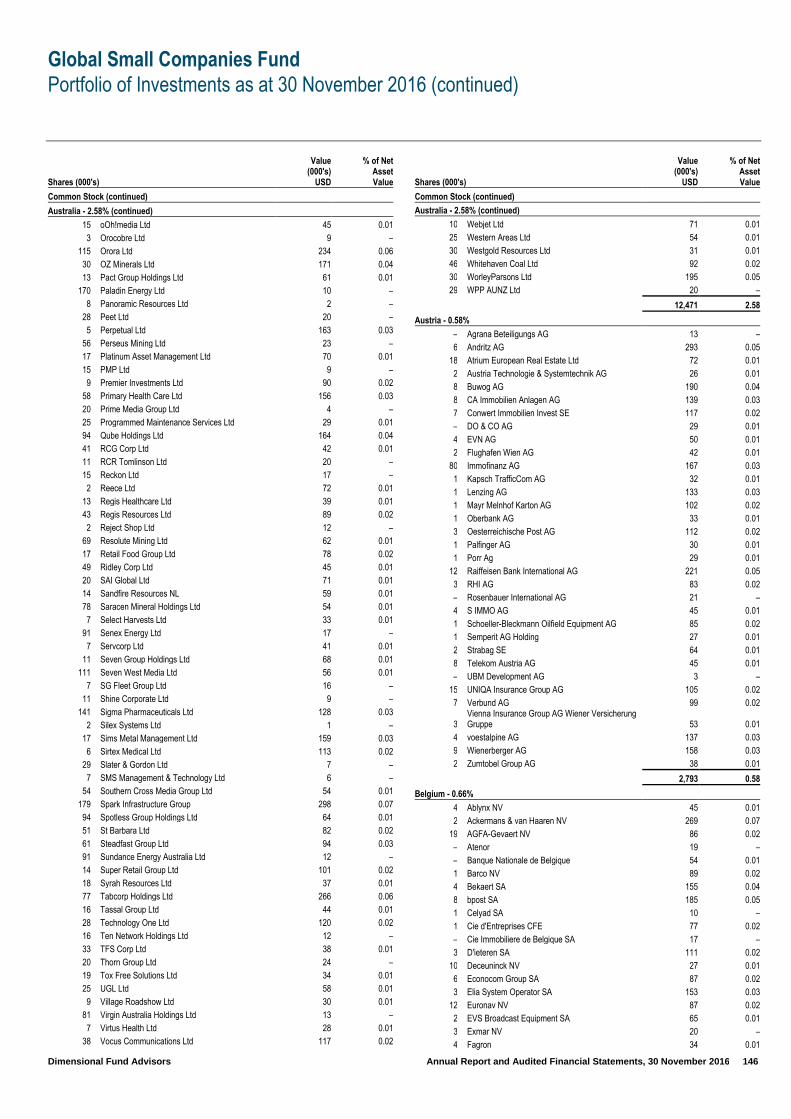
Global Small Companies Fund
Portfolio of Investments as at 30 November 2016 (continued)
Dimensional Fund Advisors Annual Report and Audited Financial Statements, 30 November 2016 146
Shares (000's)
Value (000's)
USD
% of Net Asset Value
Common Stock (continued)
Australia - 2.58% (continued)
15 oOh!media Ltd 45 0.01
3 Orocobre Ltd 9 –
115 Orora Ltd 234 0.06
30 OZ Minerals Ltd 171 0.04
13 Pact Group Holdings Ltd 61 0.01
170 Paladin Energy Ltd 10 –
8 Panoramic Resources Ltd 2 –
28 Peet Ltd 20 –
5 Perpetual Ltd 163 0.03
56 Perseus Mining Ltd 23 –
17 Platinum Asset Management Ltd 70 0.01
15 PMP Ltd 9 –
9 Premier Investments Ltd 90 0.02
58 Primary Health Care Ltd 156 0.03
20 Prime Media Group Ltd 4 –
25 Programmed Maintenance Services Ltd 29 0.01
94 Qube Holdings Ltd 164 0.04
41 RCG Corp Ltd 42 0.01
11 RCR Tomlinson Ltd 20 –
15 Reckon Ltd 17 –
2 Reece Ltd 72 0.01
13 Regis Healthcare Ltd 39 0.01
43 Regis Resources Ltd 89 0.02
2 Reject Shop Ltd 12 –
69 Resolute Mining Ltd 62 0.01
17 Retail Food Group Ltd 78 0.02
49 Ridley Corp Ltd 45 0.01
20 SAI Global Ltd 71 0.01
14 Sandfire Resources NL 59 0.01
78 Saracen Mineral Holdings Ltd 54 0.01
7 Select Harvests Ltd 33 0.01
91 Senex Energy Ltd 17 –
7 Servcorp Ltd 41 0.01
11 Seven Group Holdings Ltd 68 0.01
111 Seven West Media Ltd 56 0.01
7 SG Fleet Group Ltd 16 –
11 Shine Corporate Ltd 9 –
141 Sigma Pharmaceuticals Ltd 128 0.03
2 Silex Systems Ltd 1 –
17 Sims Metal Management Ltd 159 0.03
6 Sirtex Medical Ltd 113 0.02
29 Slater & Gordon Ltd 7 –
7 SMS Management & Technology Ltd 6 –
54 Southern Cross Media Group Ltd 54 0.01
179 Spark Infrastructure Group 298 0.07
94 Spotless Group Holdings Ltd 64 0.01
51 St Barbara Ltd 82 0.02
61 Steadfast Group Ltd 94 0.03
91 Sundance Energy Australia Ltd 12 –
14 Super Retail Group Ltd 101 0.02
18 Syrah Resources Ltd 37 0.01
77 Tabcorp Holdings Ltd 266 0.06
16 Tassal Group Ltd 44 0.01
28 Technology One Ltd 120 0.02
16 Ten Network Holdings Ltd 12 –
33 TFS Corp Ltd 38 0.01
20 Thorn Group Ltd 24 –
19 Tox Free Solutions Ltd 34 0.01
25 UGL Ltd 58 0.01
9 Village Roadshow Ltd 30 0.01
81 Virgin Australia Holdings Ltd 13 –
7 Virtus Health Ltd 28 0.01
38 Vocus Communications Ltd 117 0.02
Shares (000's)
Value (000's)
USD
% of Net Asset Value
Common Stock (continued)
Australia - 2.58% (continued)
10 Webjet Ltd 71 0.01
25 Western Areas Ltd 54 0.01
30 Westgold Resources Ltd 31 0.01
46 Whitehaven Coal Ltd 92 0.02
30 WorleyParsons Ltd 195 0.05
29 WPP AUNZ Ltd 20 –
12,471 2.58
Austria - 0.58%
– Agrana Beteiligungs AG 13 –
6 Andritz AG 293 0.05
18 Atrium European Real Estate Ltd 72 0.01
2 Austria Technologie & Systemtechnik AG 26 0.01
8 Buwog AG 190 0.04
8 CA Immobilien Anlagen AG 139 0.03
7 Conwert Immobilien Invest SE 117 0.02
– DO & CO AG 29 0.01
4 EVN AG 50 0.01
2 Flughafen Wien AG 42 0.01
80 Immofinanz AG 167 0.03
1 Kapsch TrafficCom AG 32 0.01
1 Lenzing AG 133 0.03
1 Mayr Melnhof Karton AG 102 0.02
1 Oberbank AG 33 0.01
3 Oesterreichische Post AG 112 0.02
1 Palfinger AG 30 0.01
1 Porr Ag 29 0.01
12 Raiffeisen Bank International AG 221 0.05
3 RHI AG 83 0.02
– Rosenbauer International AG 21 –
4 S IMMO AG 45 0.01
1 Schoeller-Bleckmann Oilfield Equipment AG 85 0.02
1 Semperit AG Holding 27 0.01
2 Strabag SE 64 0.01
8 Telekom Austria AG 45 0.01
– UBM Development AG 3 –
15 UNIQA Insurance Group AG 105 0.02
7 Verbund AG 99 0.02
3 Vienna Insurance Group AG Wiener Versicherung Gruppe 53 0.01
4 voestalpine AG 137 0.03
9 Wienerberger AG 158 0.03
2 Zumtobel Group AG 38 0.01
2,793 0.58
Belgium - 0.66%
4 Ablynx NV 45 0.01
2 Ackermans & van Haaren NV 269 0.07
19 AGFA-Gevaert NV 86 0.02
– Atenor 19 –
– Banque Nationale de Belgique 54 0.01
1 Barco NV 89 0.02
4 Bekaert SA 155 0.04
8 bpost SA 185 0.05
1 Celyad SA 10 –
1 Cie d'Entreprises CFE 77 0.02
– Cie Immobiliere de Belgique SA 17 –
3 D'ieteren SA 111 0.02
10 Deceuninck NV 27 0.01
6 Econocom Group SA 87 0.02
3 Elia System Operator SA 153 0.03
12 Euronav NV 87 0.02
2 EVS Broadcast Equipment SA 65 0.01
3 Exmar NV 20 –
4 Fagron 34 0.01
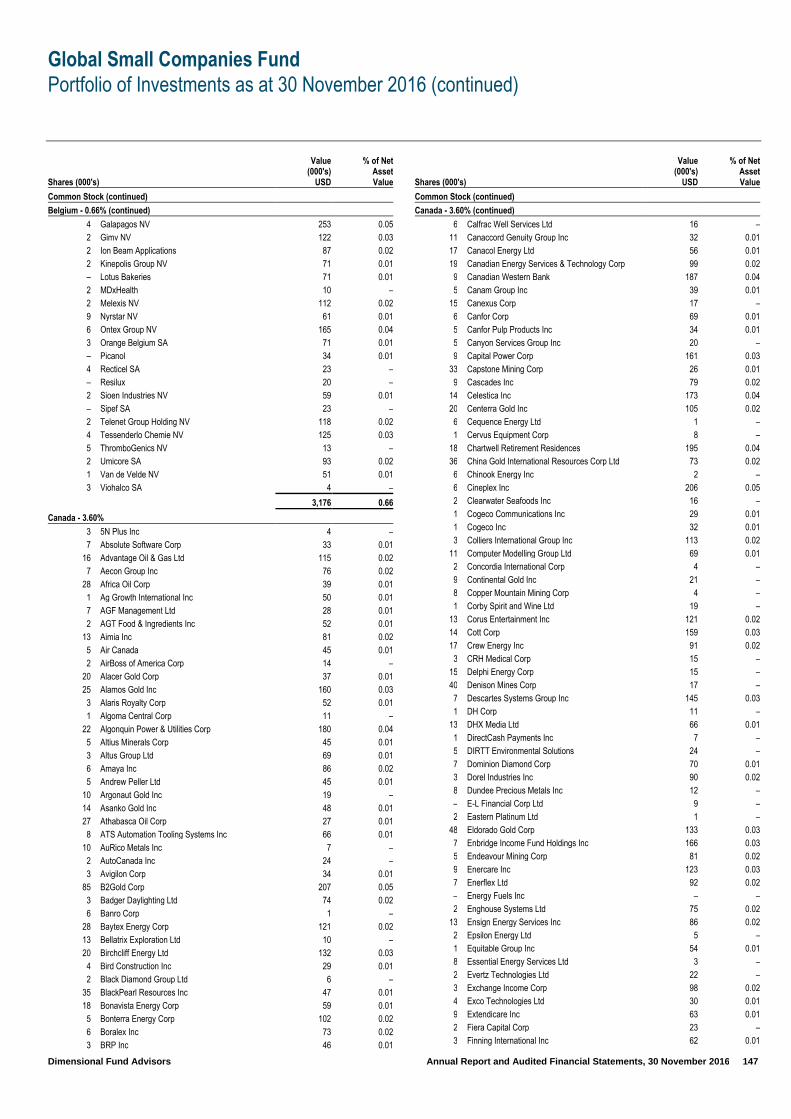
Global Small Companies Fund
Portfolio of Investments as at 30 November 2016 (continued)
Dimensional Fund Advisors Annual Report and Audited Financial Statements, 30 November 2016 147
Shares (000's)
Value (000's)
USD
% of Net Asset Value
Common Stock (continued)
Belgium - 0.66% (continued)
4 Galapagos NV 253 0.05
2 Gimv NV 122 0.03
2 Ion Beam Applications 87 0.02
2 Kinepolis Group NV 71 0.01
– Lotus Bakeries 71 0.01
2 MDxHealth 10 –
2 Melexis NV 112 0.02
9 Nyrstar NV 61 0.01
6 Ontex Group NV 165 0.04
3 Orange Belgium SA 71 0.01
– Picanol 34 0.01
4 Recticel SA 23 –
– Resilux 20 –
2 Sioen Industries NV 59 0.01
– Sipef SA 23 –
2 Telenet Group Holding NV 118 0.02
4 Tessenderlo Chemie NV 125 0.03
5 ThromboGenics NV 13 –
2 Umicore SA 93 0.02
1 Van de Velde NV 51 0.01
3 Viohalco SA 4 –
3,176 0.66
Canada - 3.60%
3 5N Plus Inc 4 –
7 Absolute Software Corp 33 0.01
16 Advantage Oil & Gas Ltd 115 0.02
7 Aecon Group Inc 76 0.02
28 Africa Oil Corp 39 0.01
1 Ag Growth International Inc 50 0.01
7 AGF Management Ltd 28 0.01
2 AGT Food & Ingredients Inc 52 0.01
13 Aimia Inc 81 0.02
5 Air Canada 45 0.01
2 AirBoss of America Corp 14 –
20 Alacer Gold Corp 37 0.01
25 Alamos Gold Inc 160 0.03
3 Alaris Royalty Corp 52 0.01
1 Algoma Central Corp 11 –
22 Algonquin Power & Utilities Corp 180 0.04
5 Altius Minerals Corp 45 0.01
3 Altus Group Ltd 69 0.01
6 Amaya Inc 86 0.02
5 Andrew Peller Ltd 45 0.01
10 Argonaut Gold Inc 19 –
14 Asanko Gold Inc 48 0.01
27 Athabasca Oil Corp 27 0.01
8 ATS Automation Tooling Systems Inc 66 0.01
10 AuRico Metals Inc 7 –
2 AutoCanada Inc 24 –
3 Avigilon Corp 34 0.01
85 B2Gold Corp 207 0.05
3 Badger Daylighting Ltd 74 0.02
6 Banro Corp 1 –
28 Baytex Energy Corp 121 0.02
13 Bellatrix Exploration Ltd 10 –
20 Birchcliff Energy Ltd 132 0.03
4 Bird Construction Inc 29 0.01
2 Black Diamond Group Ltd 6 –
35 BlackPearl Resources Inc 47 0.01
18 Bonavista Energy Corp 59 0.01
5 Bonterra Energy Corp 102 0.02
6 Boralex Inc 73 0.02
3 BRP Inc 46 0.01
Shares (000's)
Value (000's)
USD
% of Net Asset Value
Common Stock (continued)
Canada - 3.60% (continued)
6 Calfrac Well Services Ltd 16 –
11 Canaccord Genuity Group Inc 32 0.01
17 Canacol Energy Ltd 56 0.01
19 Canadian Energy Services & Technology Corp 99 0.02
9 Canadian Western Bank 187 0.04
5 Canam Group Inc 39 0.01
15 Canexus Corp 17 –
6 Canfor Corp 69 0.01
5 Canfor Pulp Products Inc 34 0.01
5 Canyon Services Group Inc 20 –
9 Capital Power Corp 161 0.03
33 Capstone Mining Corp 26 0.01
9 Cascades Inc 79 0.02
14 Celestica Inc 173 0.04
20 Centerra Gold Inc 105 0.02
6 Cequence Energy Ltd 1 –
1 Cervus Equipment Corp 8 –
18 Chartwell Retirement Residences 195 0.04
36 China Gold International Resources Corp Ltd 73 0.02
6 Chinook Energy Inc 2 –
6 Cineplex Inc 206 0.05
2 Clearwater Seafoods Inc 16 –
1 Cogeco Communications Inc 29 0.01
1 Cogeco Inc 32 0.01
3 Colliers International Group Inc 113 0.02
11 Computer Modelling Group Ltd 69 0.01
2 Concordia International Corp 4 –
9 Continental Gold Inc 21 –
8 Copper Mountain Mining Corp 4 –
1 Corby Spirit and Wine Ltd 19 –
13 Corus Entertainment Inc 121 0.02
14 Cott Corp 159 0.03
17 Crew Energy Inc 91 0.02
3 CRH Medical Corp 15 –
15 Delphi Energy Corp 15 –
40 Denison Mines Corp 17 –
7 Descartes Systems Group Inc 145 0.03
1 DH Corp 11 –
13 DHX Media Ltd 66 0.01
1 DirectCash Payments Inc 7 –
5 DIRTT Environmental Solutions 24 –
7 Dominion Diamond Corp 70 0.01
3 Dorel Industries Inc 90 0.02
8 Dundee Precious Metals Inc 12 –
– E-L Financial Corp Ltd 9 –
2 Eastern Platinum Ltd 1 –
48 Eldorado Gold Corp 133 0.03
7 Enbridge Income Fund Holdings Inc 166 0.03
5 Endeavour Mining Corp 81 0.02
9 Enercare Inc 123 0.03
7 Enerflex Ltd 92 0.02
– Energy Fuels Inc – –
2 Enghouse Systems Ltd 75 0.02
13 Ensign Energy Services Inc 86 0.02
2 Epsilon Energy Ltd 5 –
1 Equitable Group Inc 54 0.01
8 Essential Energy Services Ltd 3 –
2 Evertz Technologies Ltd 22 –
3 Exchange Income Corp 98 0.02
4 Exco Technologies Ltd 30 0.01
9 Extendicare Inc 63 0.01
2 Fiera Capital Corp 23 –
3 Finning International Inc 62 0.01

Global Small Companies Fund
Portfolio of Investments as at 30 November 2016 (continued)
Dimensional Fund Advisors Annual Report and Audited Financial Statements, 30 November 2016 148
Shares (000's)
Value (000's)
USD
% of Net Asset Value
Common Stock (continued)
Canada - 3.60% (continued)
3 Firm Capital Mortgage Investment Corp 27 0.01
2 First National Financial Corp 35 0.01
3 FirstService Corp 135 0.03
1 Fortis Inc 17 –
15 Fortuna Silver Mines Inc 90 0.02
8 Freehold Royalties Ltd 79 0.02
1 Gamehost Inc 8 –
– Genesis Land Development Corp – –
5 Genworth MI Canada Inc 113 0.02
14 Gibson Energy Inc 193 0.04
3 Gluskin Sheff + Associates Inc 32 0.01
5 GMP Capital Inc 14 –
16 Golden Star Resources Ltd 13 –
25 Gran Tierra Energy Inc 72 0.01
2 Granite Oil Corp 8 –
4 Great Canadian Gaming Corp 76 0.02
6 Great Panther Silver Ltd 9 –
2 Guardian Capital Group Ltd 36 0.01
5 Guyana Goldfields Inc 22 –
3 Heroux-Devtek Inc 33 0.01
2 High Liner Foods Inc 28 0.01
– HNZ Group Inc 1 –
7 Home Capital Group Inc 150 0.03
11 Horizon North Logistics Inc 16 –
22 HudBay Minerals Inc 150 0.03
5 Hudson's Bay Co 60 0.01
53 IAMGOLD Corp 192 0.04
4 Imperial Metals Corp 20 –
11 Innergex Renewable Energy Inc 112 0.02
7 Interfor Corp 73 0.02
3 International Tower Hill Mines Ltd 1 –
1 Intertain Group Ltd 8 –
7 Intertape Polymer Group Inc 128 0.03
16 Ithaca Energy Inc 18 –
32 Ivanhoe Mines Ltd 55 0.01
4 Jean Coutu Group PJC Inc 56 0.01
9 Just Energy Group Inc 49 0.01
1 K-Bro Linen Inc 22 –
4 Kelt Exploration Ltd 17 –
11 Kirkland Lake Gold Inc 58 0.01
12 Klondex Mines Ltd 58 0.01
11 Knight Therapeutics Inc 81 0.02
6 Labrador Iron Ore Royalty Corp 83 0.02
3 Laurentian Bank of Canada 124 0.03
2 Leon's Furniture Ltd 28 0.01
5 Linamar Corp 179 0.04
2 Liquor Stores NA Ltd 18 –
33 Lucara Diamond Corp 79 0.02
68 Lundin Mining Corp 332 0.08
3 MacDonald Dettwiler & Associates Ltd 170 0.04
2 Magellan Aerospace Corp 21 –
1 Mainstreet Equity Corp 14 –
8 Major Drilling Group International Inc 38 0.01
31 Mandalay Resources Corp 15 –
3 Manitoba Telecom Services Inc 75 0.02
3 Maple Leaf Foods Inc 76 0.02
9 Martinrea International Inc 51 0.01
1 Mediagrif Interactive Technologies Inc 19 –
3 Medical Facilities Corp 33 0.01
9 MEG Energy Corp 46 0.01
1 Melcor Developments Ltd 15 –
8 Merus Labs International Inc 8 –
6 Methanex Corp 263 0.05
Shares (000's)
Value (000's)
USD
% of Net Asset Value
Common Stock (continued)
Canada - 3.60% (continued)
7 Mitel Networks Corp 52 0.01
1 Morguard Corp 100 0.02
3 Morneau Shepell Inc 46 0.01
1 MTY Food Group Inc 52 0.01
10 Mullen Group Ltd 132 0.03
3 Nautilus Minerals Inc – –
6 Neptune Technologies & Bioressources Inc 6 –
34 Nevsun Resources Ltd 111 0.02
4 New Flyer Industries Inc 135 0.03
56 New Gold Inc 200 0.05
5 Newalta Corp 6 –
5 Norbord Inc 123 0.03
3 North American Energy Partners Inc 9 –
4 North West Co Inc 84 0.02
– Northland Power Inc – –
18 NuVista Energy Ltd 92 0.02
57 OceanaGold Corp 157 0.03
3 Osisko Gold Royalties Ltd 30 0.01
11 Painted Pony Petroleum Ltd 76 0.02
16 Pan American Silver Corp 272 0.07
4 Paramount Resources Ltd 58 0.01
17 Parex Resources Inc 224 0.05
10 Parkland Fuel Corp 198 0.05
7 Pason Systems Inc 86 0.02
50 Pengrowth Energy Corp 77 0.02
33 Penn West Petroleum Ltd 58 0.01
2 PHX Energy Services Corp 6 –
2 Pizza Pizza Royalty Corp 23 –
5 Platinum Group Metals Ltd 7 –
28 Precision Drilling Corp 150 0.03
2 Premium Brands Holdings Corp 110 0.02
12 Pretium Resources Inc 103 0.02
13 Primero Mining Corp 11 –
3 Pulse Seismic Inc 4 –
1 QLT Inc 3 –
20 Raging River Exploration Inc 160 0.03
2 RB Energy Inc – –
7 Redknee Solutions Inc 9 –
7 Reitmans Canada Ltd 33 0.01
5 Richelieu Hardware Ltd 99 0.02
5 Richmont Mines Inc 33 0.01
10 RMP Energy Inc 5 –
1 Rocky Mountain Dealerships Inc 6 –
6 Rogers Sugar Inc 27 0.01
7 Russel Metals Inc 135 0.03
10 Sabina Gold & Silver Corp 7 –
10 Sandstorm Gold Ltd 38 0.01
14 Sandvine Corp 32 0.01
7 Savanna Energy Services Corp 9 –
6 Seabridge Gold Inc 51 0.01
2 Sears Canada Inc (Canada listing) 3 –
3 Sears Canada Inc (US listing) 4 –
15 Secure Energy Services Inc 107 0.02
36 SEMAFO Inc 110 0.02
6 ShawCor Ltd 146 0.03
27 Sherritt International Corp 25 0.01
2 Sienna Senior Living Inc 26 0.01
4 Sierra Wireless Inc 55 0.01
13 Silver Standard Resources Inc 126 0.03
4 Solium Capital Inc 26 0.01
20 Spartan Energy Corp 48 0.01
12 Sprott Inc 23 –
13 Sprott Resource Corp 5 –
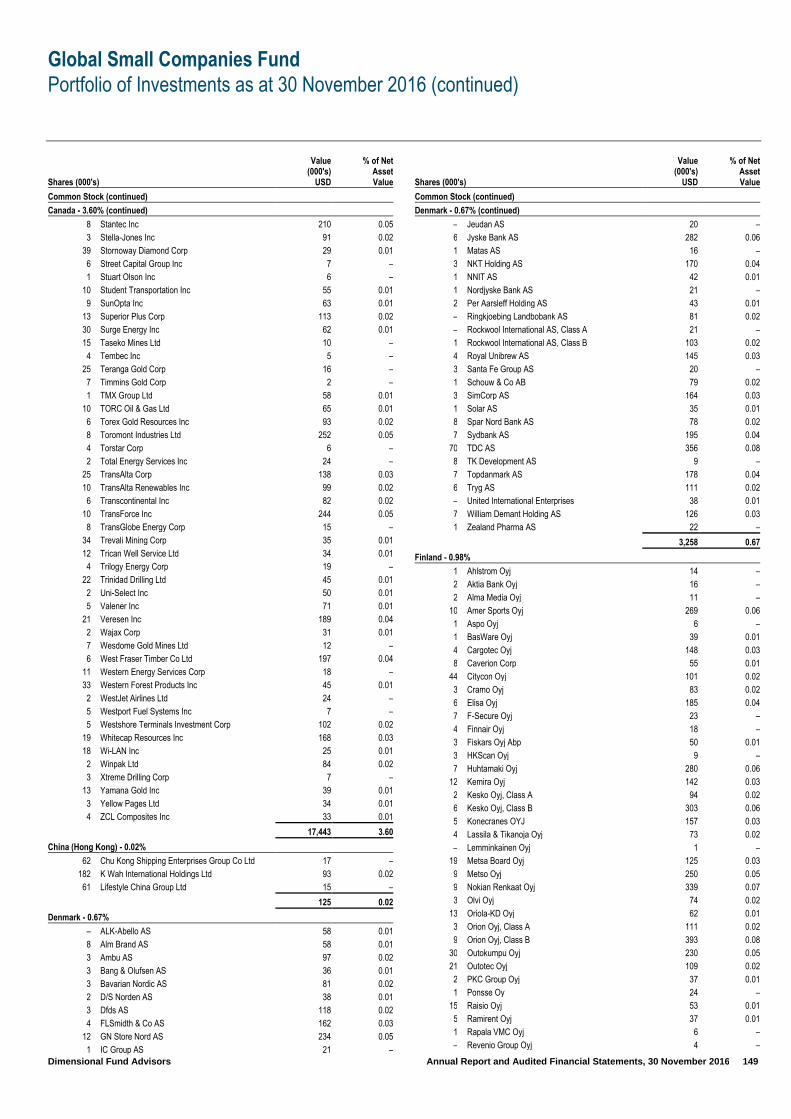
Global Small Companies Fund
Portfolio of Investments as at 30 November 2016 (continued)
Dimensional Fund Advisors Annual Report and Audited Financial Statements, 30 November 2016 149
Shares (000's)
Value (000's)
USD
% of Net Asset Value
Common Stock (continued)
Canada - 3.60% (continued)
8 Stantec Inc 210 0.05
3 Stella-Jones Inc 91 0.02
39 Stornoway Diamond Corp 29 0.01
6 Street Capital Group Inc 7 –
1 Stuart Olson Inc 6 –
10 Student Transportation Inc 55 0.01
9 SunOpta Inc 63 0.01
13 Superior Plus Corp 113 0.02
30 Surge Energy Inc 62 0.01
15 Taseko Mines Ltd 10 –
4 Tembec Inc 5 –
25 Teranga Gold Corp 16 –
7 Timmins Gold Corp 2 –
1 TMX Group Ltd 58 0.01
10 TORC Oil & Gas Ltd 65 0.01
6 Torex Gold Resources Inc 93 0.02
8 Toromont Industries Ltd 252 0.05
4 Torstar Corp 6 –
2 Total Energy Services Inc 24 –
25 TransAlta Corp 138 0.03
10 TransAlta Renewables Inc 99 0.02
6 Transcontinental Inc 82 0.02
10 TransForce Inc 244 0.05
8 TransGlobe Energy Corp 15 –
34 Trevali Mining Corp 35 0.01
12 Trican Well Service Ltd 34 0.01
4 Trilogy Energy Corp 19 –
22 Trinidad Drilling Ltd 45 0.01
2 Uni-Select Inc 50 0.01
5 Valener Inc 71 0.01
21 Veresen Inc 189 0.04
2 Wajax Corp 31 0.01
7 Wesdome Gold Mines Ltd 12 –
6 West Fraser Timber Co Ltd 197 0.04
11 Western Energy Services Corp 18 –
33 Western Forest Products Inc 45 0.01
2 WestJet Airlines Ltd 24 –
5 Westport Fuel Systems Inc 7 –
5 Westshore Terminals Investment Corp 102 0.02
19 Whitecap Resources Inc 168 0.03
18 Wi-LAN Inc 25 0.01
2 Winpak Ltd 84 0.02
3 Xtreme Drilling Corp 7 –
13 Yamana Gold Inc 39 0.01
3 Yellow Pages Ltd 34 0.01
4 ZCL Composites Inc 33 0.01
17,443 3.60
China (Hong Kong) - 0.02%
62 Chu Kong Shipping Enterprises Group Co Ltd 17 –
182 K Wah International Holdings Ltd 93 0.02
61 Lifestyle China Group Ltd 15 –
125 0.02
Denmark - 0.67%
– ALK-Abello AS 58 0.01
8 Alm Brand AS 58 0.01
3 Ambu AS 97 0.02
3 Bang & Olufsen AS 36 0.01
3 Bavarian Nordic AS 81 0.02
2 D/S Norden AS 38 0.01
3 Dfds AS 118 0.02
4 FLSmidth & Co AS 162 0.03
12 GN Store Nord AS 234 0.05
1 IC Group AS 21 –
Shares (000's)
Value (000's)
USD
% of Net Asset Value
Common Stock (continued)
Denmark - 0.67% (continued)
– Jeudan AS 20 –
6 Jyske Bank AS 282 0.06
1 Matas AS 16 –
3 NKT Holding AS 170 0.04
1 NNIT AS 42 0.01
1 Nordjyske Bank AS 21 –
2 Per Aarsleff Holding AS 43 0.01
– Ringkjoebing Landbobank AS 81 0.02
– Rockwool International AS, Class A 21 –
1 Rockwool International AS, Class B 103 0.02
4 Royal Unibrew AS 145 0.03
3 Santa Fe Group AS 20 –
1 Schouw & Co AB 79 0.02
3 SimCorp AS 164 0.03
1 Solar AS 35 0.01
8 Spar Nord Bank AS 78 0.02
7 Sydbank AS 195 0.04
70 TDC AS 356 0.08
8 TK Development AS 9 –
7 Topdanmark AS 178 0.04
6 Tryg AS 111 0.02
– United International Enterprises 38 0.01
7 William Demant Holding AS 126 0.03
1 Zealand Pharma AS 22 –
3,258 0.67
Finland - 0.98%
1 Ahlstrom Oyj 14 –
2 Aktia Bank Oyj 16 –
2 Alma Media Oyj 11 –
10 Amer Sports Oyj 269 0.06
1 Aspo Oyj 6 –
1 BasWare Oyj 39 0.01
4 Cargotec Oyj 148 0.03
8 Caverion Corp 55 0.01
44 Citycon Oyj 101 0.02
3 Cramo Oyj 83 0.02
6 Elisa Oyj 185 0.04
7 F-Secure Oyj 23 –
4 Finnair Oyj 18 –
3 Fiskars Oyj Abp 50 0.01
3 HKScan Oyj 9 –
7 Huhtamaki Oyj 280 0.06
12 Kemira Oyj 142 0.03
2 Kesko Oyj, Class A 94 0.02
6 Kesko Oyj, Class B 303 0.06
5 Konecranes OYJ 157 0.03
4 Lassila & Tikanoja Oyj 73 0.02
– Lemminkainen Oyj 1 –
19 Metsa Board Oyj 125 0.03
9 Metso Oyj 250 0.05
9 Nokian Renkaat Oyj 339 0.07
3 Olvi Oyj 74 0.02
13 Oriola-KD Oyj 62 0.01
3 Orion Oyj, Class A 111 0.02
9 Orion Oyj, Class B 393 0.08
30 Outokumpu Oyj 230 0.05
21 Outotec Oyj 109 0.02
2 PKC Group Oyj 37 0.01
1 Ponsse Oy 24 –
15 Raisio Oyj 53 0.01
5 Ramirent Oyj 37 0.01
1 Rapala VMC Oyj 6 –
– Revenio Group Oyj 4 –
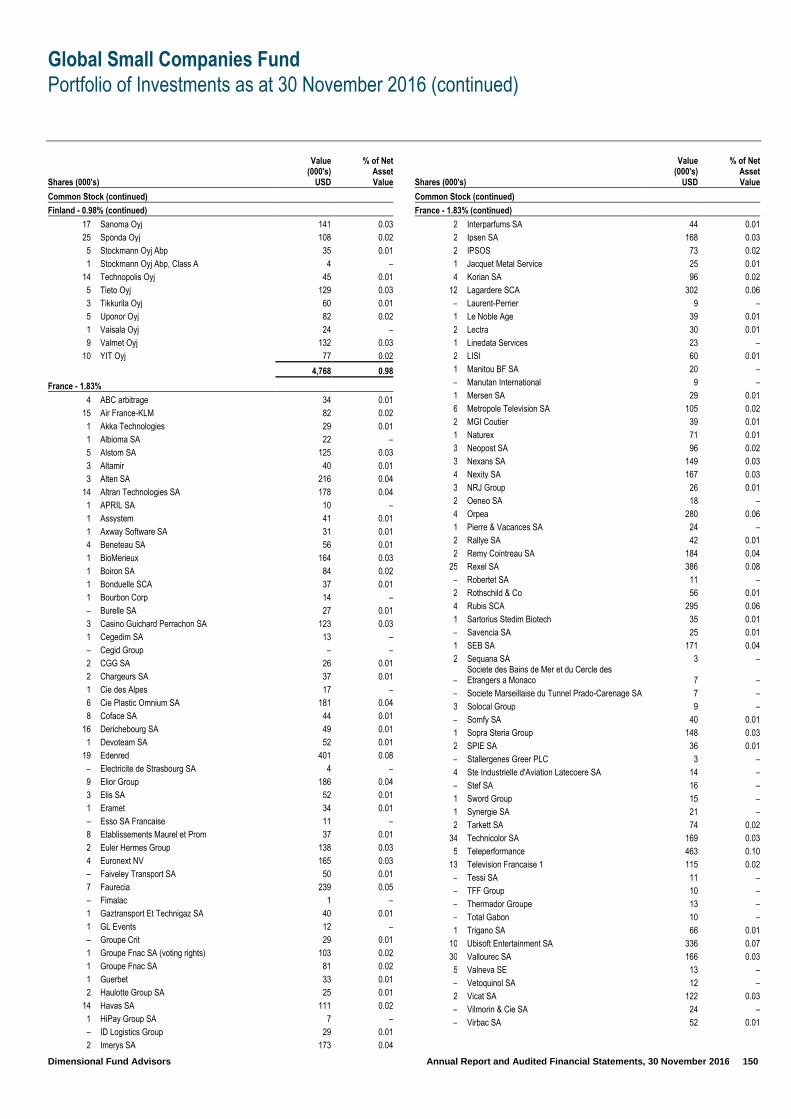
Global Small Companies Fund
Portfolio of Investments as at 30 November 2016 (continued)
Dimensional Fund Advisors Annual Report and Audited Financial Statements, 30 November 2016 150
Shares (000's)
Value (000's)
USD
% of Net Asset Value
Common Stock (continued)
Finland - 0.98% (continued)
17 Sanoma Oyj 141 0.03
25 Sponda Oyj 108 0.02
5 Stockmann Oyj Abp 35 0.01
1 Stockmann Oyj Abp, Class A 4 –
14 Technopolis Oyj 45 0.01
5 Tieto Oyj 129 0.03
3 Tikkurila Oyj 60 0.01
5 Uponor Oyj 82 0.02
1 Vaisala Oyj 24 –
9 Valmet Oyj 132 0.03
10 YIT Oyj 77 0.02
4,768 0.98
France - 1.83%
4 ABC arbitrage 34 0.01
15 Air France-KLM 82 0.02
1 Akka Technologies 29 0.01
1 Albioma SA 22 –
5 Alstom SA 125 0.03
3 Altamir 40 0.01
3 Alten SA 216 0.04
14 Altran Technologies SA 178 0.04
1 APRIL SA 10 –
1 Assystem 41 0.01
1 Axway Software SA 31 0.01
4 Beneteau SA 56 0.01
1 BioMerieux 164 0.03
1 Boiron SA 84 0.02
1 Bonduelle SCA 37 0.01
1 Bourbon Corp 14 –
– Burelle SA 27 0.01
3 Casino Guichard Perrachon SA 123 0.03
1 Cegedim SA 13 –
– Cegid Group – –
2 CGG SA 26 0.01
2 Chargeurs SA 37 0.01
1 Cie des Alpes 17 –
6 Cie Plastic Omnium SA 181 0.04
8 Coface SA 44 0.01
16 Derichebourg SA 49 0.01
1 Devoteam SA 52 0.01
19 Edenred 401 0.08
– Electricite de Strasbourg SA 4 –
9 Elior Group 186 0.04
3 Elis SA 52 0.01
1 Eramet 34 0.01
– Esso SA Francaise 11 –
8 Etablissements Maurel et Prom 37 0.01
2 Euler Hermes Group 138 0.03
4 Euronext NV 165 0.03
– Faiveley Transport SA 50 0.01
7 Faurecia 239 0.05
– Fimalac 1 –
1 Gaztransport Et Technigaz SA 40 0.01
1 GL Events 12 –
– Groupe Crit 29 0.01
1 Groupe Fnac SA (voting rights) 103 0.02
1 Groupe Fnac SA 81 0.02
1 Guerbet 33 0.01
2 Haulotte Group SA 25 0.01
14 Havas SA 111 0.02
1 HiPay Group SA 7 –
– ID Logistics Group 29 0.01
2 Imerys SA 173 0.04
Shares (000's)
Value (000's)
USD
% of Net Asset Value
Common Stock (continued)
France - 1.83% (continued)
2 Interparfums SA 44 0.01
2 Ipsen SA 168 0.03
2 IPSOS 73 0.02
1 Jacquet Metal Service 25 0.01
4 Korian SA 96 0.02
12 Lagardere SCA 302 0.06
– Laurent-Perrier 9 –
1 Le Noble Age 39 0.01
2 Lectra 30 0.01
1 Linedata Services 23 –
2 LISI 60 0.01
1 Manitou BF SA 20 –
– Manutan International 9 –
1 Mersen SA 29 0.01
6 Metropole Television SA 105 0.02
2 MGI Coutier 39 0.01
1 Naturex 71 0.01
3 Neopost SA 96 0.02
3 Nexans SA 149 0.03
4 Nexity SA 167 0.03
3 NRJ Group 26 0.01
2 Oeneo SA 18 –
4 Orpea 280 0.06
1 Pierre & Vacances SA 24 –
2 Rallye SA 42 0.01
2 Remy Cointreau SA 184 0.04
25 Rexel SA 386 0.08
– Robertet SA 11 –
2 Rothschild & Co 56 0.01
4 Rubis SCA 295 0.06
1 Sartorius Stedim Biotech 35 0.01
– Savencia SA 25 0.01
1 SEB SA 171 0.04
2 Sequana SA 3 –
– Societe des Bains de Mer et du Cercle des Etrangers a Monaco 7 –
– Societe Marseillaise du Tunnel Prado-Carenage SA 7 –
3 Solocal Group 9 –
– Somfy SA 40 0.01
1 Sopra Steria Group 148 0.03
2 SPIE SA 36 0.01
– Stallergenes Greer PLC 3 –
4 Ste Industrielle d'Aviation Latecoere SA 14 –
– Stef SA 16 –
1 Sword Group 15 –
1 Synergie SA 21 –
2 Tarkett SA 74 0.02
34 Technicolor SA 169 0.03
5 Teleperformance 463 0.10
13 Television Francaise 1 115 0.02
– Tessi SA 11 –
– TFF Group 10 –
– Thermador Groupe 13 –
– Total Gabon 10 –
1 Trigano SA 66 0.01
10 Ubisoft Entertainment SA 336 0.07
30 Vallourec SA 166 0.03
5 Valneva SE 13 –
– Vetoquinol SA 12 –
2 Vicat SA 122 0.03
– Vilmorin & Cie SA 24 –
– Virbac SA 52 0.01

Global Small Companies Fund
Portfolio of Investments as at 30 November 2016 (continued)
Dimensional Fund Advisors Annual Report and Audited Financial Statements, 30 November 2016 151
Shares (000's)
Value (000's)
USD
% of Net Asset Value
Common Stock (continued)
France - 1.83% (continued)
3 Worldline SA 73 0.02
8,848 1.83
Germany - 2.56%
6 Aareal Bank AG 220 0.05
2 ADLER Real Estate AG 34 0.01
6 ADVA Optical Networking SE 46 0.01
12 Aixtron SE 50 0.01
1 Amadeus Fire AG 41 0.01
3 Aurubis AG 185 0.04
4 Axel Springer SE 151 0.03
1 Bauer AG 14 –
2 BayWa AG 48 0.01
2 Bechtle AG 154 0.03
1 Bertrandt AG 69 0.01
1 Bijou Brigitte AG 34 0.01
4 Bilfinger SE 134 0.03
1 Biotest AG 12 –
7 Borussia Dortmund GmbH & Co KGaA 38 0.01
2 BRAAS Monier Building Group SA 46 0.01
2 CANCOM SE 85 0.02
3 Carl Zeiss Meditec AG 118 0.02
2 CENIT AG 32 0.01
1 CENTROTEC Sustainable AG 22 –
1 Cewe Stiftung & Co KGAA 68 0.01
1 Clere AG 11 –
4 Comdirect Bank AG 36 0.01
3 CompuGroup Medical SE 103 0.02
– CropEnergies AG 1 –
4 CTS Eventim AG & Co KGaA 125 0.03
1 Delticom AG 14 –
1 Deutsche Beteiligungs AG 33 0.01
5 Deutsche EuroShop AG 184 0.04
5 Deutsche Lufthansa AG 60 0.01
2 Deutsche Pfandbriefbank AG 18 –
11 Deutz AG 61 0.01
7 Dialog Semiconductor PLC 269 0.06
4 DIC Asset AG 40 0.01
4 DMG Mori AG 186 0.04
– Dr Hoenle AG 9 –
– Draegerwerk AG & Co KGaA 5 –
5 Drillisch AG 185 0.04
3 Duerr AG 225 0.05
2 Elmos Semiconductor AG 23 –
3 ElringKlinger AG 48 0.01
22 Evotec AG 141 0.03
4 Fraport AG Frankfurt Airport Services Worldwide 207 0.04
12 Freenet AG 303 0.07
4 Fuchs Petrolub SE 152 0.03
3 Gerresheimer AG 230 0.05
2 Gerry Weber International AG 24 –
– Gesco AG 13 –
2 GFK SE 54 0.01
2 GFT Technologies SE 36 0.01
1 Grammer AG 64 0.01
1 Grenke AG 121 0.02
– H&R GmbH & Co KGaA 8 –
2 Hamburger Hafen und Logistik AG 30 0.01
25 Heidelberger Druckmaschinen AG 64 0.01
2 Hella KGaA Hueck & Co 69 0.01
4 HolidayCheck Group AG 10 –
1 Hornbach Baumarkt AG 18 –
3 Hugo Boss AG 163 0.03
2 Indus Holding AG 134 0.03
Shares (000's)
Value (000's)
USD
% of Net Asset Value
Common Stock (continued)
Germany - 2.56% (continued)
1 Init Innovation In Traffic Systems AG 14 –
– Isra Vision AG 32 0.01
6 Jenoptik AG 97 0.02
15 K+S AG 313 0.06
12 Kloeckner & Co SE 127 0.03
2 Koenig & Bauer AG 79 0.02
4 Kontron AG 12 –
2 Krones AG 143 0.03
– KSB AG 4 –
3 KUKA AG 333 0.07
– KWS Saat SE 82 0.02
8 Lanxess AG 499 0.10
7 LEG Immobilien AG 501 0.10
3 Leoni AG 103 0.02
2 LPKF Laser & Electronics AG 15 –
– Manz AG 7 –
6 MLP AG 26 0.01
4 MTU Aero Engines AG 453 0.10
2 Nemetschek SE 137 0.03
1 Nexus AG 25 0.01
6 Nordex SE 124 0.03
3 Norma Group SE 129 0.03
7 OSRAM Licht AG 374 0.09
5 Patrizia Immobilien AG 87 0.02
1 Pfeiffer Vacuum Technology AG 72 0.01
11 PNE Wind AG 26 0.01
– Puma SE 65 0.01
21 Qiagen NV 566 0.13
12 QSC AG 25 0.01
– R Stahl AG 3 –
– Rational AG 177 0.04
4 Rheinmetall AG 288 0.07
4 Rhoen Klinikum AG 104 0.02
3 RIB Software AG 38 0.01
5 SAF-Holland SA 71 0.01
5 Salzgitter AG 169 0.03
– Schaltbau Holding AG 16 –
1 SHW AG 22 –
– Siltronic AG 14 –
2 Sixt SE 94 0.02
1 SMA Solar Technology AG 29 0.01
5 Software AG 191 0.04
2 Stabilus SA 98 0.02
6 Stada Arzneimittel AG 308 0.06
– STRATEC Biomedical AG 19 –
3 Stroeer SE & Co KGaA 95 0.02
11 Suedzucker AG 238 0.05
2 Suess MicroTec AG 13 –
1 Surteco SE 23 –
13 TAG Immobilien AG 167 0.03
4 Takkt AG 74 0.02
– Technotrans AG 9 –
7 TLG Immobilien AG 127 0.03
1 Tom Tailor Holding AG 6 –
1 Vossloh AG 71 0.01
1 VTG AG 44 0.01
2 Wacker Chemie AG 151 0.03
3 Wacker Neuson SE 45 0.01
1 Washtec AG 61 0.01
– XING AG 50 0.01
– Zeal Network SE 16 –
12,379 2.56
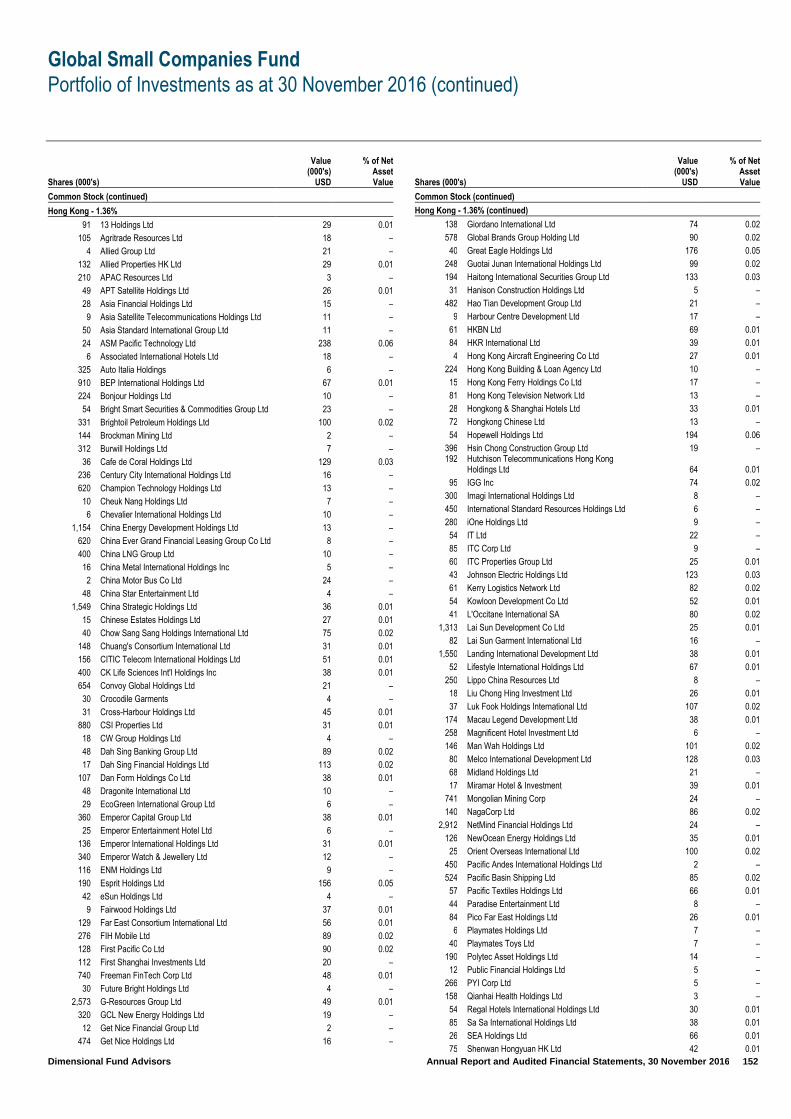
Global Small Companies Fund
Portfolio of Investments as at 30 November 2016 (continued)
Dimensional Fund Advisors Annual Report and Audited Financial Statements, 30 November 2016 152
Shares (000's)
Value (000's)
USD
% of Net Asset Value
Common Stock (continued)
Hong Kong - 1.36%
91 13 Holdings Ltd 29 0.01
105 Agritrade Resources Ltd 18 –
4 Allied Group Ltd 21 –
132 Allied Properties HK Ltd 29 0.01
210 APAC Resources Ltd 3 –
49 APT Satellite Holdings Ltd 26 0.01
28 Asia Financial Holdings Ltd 15 –
9 Asia Satellite Telecommunications Holdings Ltd 11 –
50 Asia Standard International Group Ltd 11 –
24 ASM Pacific Technology Ltd 238 0.06
6 Associated International Hotels Ltd 18 –
325 Auto Italia Holdings 6 –
910 BEP International Holdings Ltd 67 0.01
224 Bonjour Holdings Ltd 10 –
54 Bright Smart Securities & Commodities Group Ltd 23 –
331 Brightoil Petroleum Holdings Ltd 100 0.02
144 Brockman Mining Ltd 2 –
312 Burwill Holdings Ltd 7 –
36 Cafe de Coral Holdings Ltd 129 0.03
236 Century City International Holdings Ltd 16 –
620 Champion Technology Holdings Ltd 13 –
10 Cheuk Nang Holdings Ltd 7 –
6 Chevalier International Holdings Ltd 10 –
1,154 China Energy Development Holdings Ltd 13 –
620 China Ever Grand Financial Leasing Group Co Ltd 8 –
400 China LNG Group Ltd 10 –
16 China Metal International Holdings Inc 5 –
2 China Motor Bus Co Ltd 24 –
48 China Star Entertainment Ltd 4 –
1,549 China Strategic Holdings Ltd 36 0.01
15 Chinese Estates Holdings Ltd 27 0.01
40 Chow Sang Sang Holdings International Ltd 75 0.02
148 Chuang's Consortium International Ltd 31 0.01
156 CITIC Telecom International Holdings Ltd 51 0.01
400 CK Life Sciences Int'l Holdings Inc 38 0.01
654 Convoy Global Holdings Ltd 21 –
30 Crocodile Garments 4 –
31 Cross-Harbour Holdings Ltd 45 0.01
880 CSI Properties Ltd 31 0.01
18 CW Group Holdings Ltd 4 –
48 Dah Sing Banking Group Ltd 89 0.02
17 Dah Sing Financial Holdings Ltd 113 0.02
107 Dan Form Holdings Co Ltd 38 0.01
48 Dragonite International Ltd 10 –
29 EcoGreen International Group Ltd 6 –
360 Emperor Capital Group Ltd 38 0.01
25 Emperor Entertainment Hotel Ltd 6 –
136 Emperor International Holdings Ltd 31 0.01
340 Emperor Watch & Jewellery Ltd 12 –
116 ENM Holdings Ltd 9 –
190 Esprit Holdings Ltd 156 0.05
42 eSun Holdings Ltd 4 –
9 Fairwood Holdings Ltd 37 0.01
129 Far East Consortium International Ltd 56 0.01
276 FIH Mobile Ltd 89 0.02
128 First Pacific Co Ltd 90 0.02
112 First Shanghai Investments Ltd 20 –
740 Freeman FinTech Corp Ltd 48 0.01
30 Future Bright Holdings Ltd 4 –
2,573 G-Resources Group Ltd 49 0.01
320 GCL New Energy Holdings Ltd 19 –
12 Get Nice Financial Group Ltd 2 –
474 Get Nice Holdings Ltd 16 –
Shares (000's)
Value (000's)
USD
% of Net Asset Value
Common Stock (continued)
Hong Kong - 1.36% (continued)
138 Giordano International Ltd 74 0.02
578 Global Brands Group Holding Ltd 90 0.02
40 Great Eagle Holdings Ltd 176 0.05
248 Guotai Junan International Holdings Ltd 99 0.02
194 Haitong International Securities Group Ltd 133 0.03
31 Hanison Construction Holdings Ltd 5 –
482 Hao Tian Development Group Ltd 21 –
9 Harbour Centre Development Ltd 17 –
61 HKBN Ltd 69 0.01
84 HKR International Ltd 39 0.01
4 Hong Kong Aircraft Engineering Co Ltd 27 0.01
224 Hong Kong Building & Loan Agency Ltd 10 –
15 Hong Kong Ferry Holdings Co Ltd 17 –
81 Hong Kong Television Network Ltd 13 –
28 Hongkong & Shanghai Hotels Ltd 33 0.01
72 Hongkong Chinese Ltd 13 –
54 Hopewell Holdings Ltd 194 0.06
396 Hsin Chong Construction Group Ltd 19 – 192
Hutchison Telecommunications Hong Kong Holdings Ltd 64 0.01
95 IGG Inc 74 0.02
300 Imagi International Holdings Ltd 8 –
450 International Standard Resources Holdings Ltd 6 –
280 iOne Holdings Ltd 9 –
54 IT Ltd 22 –
85 ITC Corp Ltd 9 –
60 ITC Properties Group Ltd 25 0.01
43 Johnson Electric Holdings Ltd 123 0.03
61 Kerry Logistics Network Ltd 82 0.02
54 Kowloon Development Co Ltd 52 0.01
41 L'Occitane International SA 80 0.02
1,313 Lai Sun Development Co Ltd 25 0.01
82 Lai Sun Garment International Ltd 16 –
1,550 Landing International Development Ltd 38 0.01
52 Lifestyle International Holdings Ltd 67 0.01
250 Lippo China Resources Ltd 8 –
18 Liu Chong Hing Investment Ltd 26 0.01
37 Luk Fook Holdings International Ltd 107 0.02
174 Macau Legend Development Ltd 38 0.01
258 Magnificent Hotel Investment Ltd 6 –
146 Man Wah Holdings Ltd 101 0.02
80 Melco International Development Ltd 128 0.03
68 Midland Holdings Ltd 21 –
17 Miramar Hotel & Investment 39 0.01
741 Mongolian Mining Corp 24 –
140 NagaCorp Ltd 86 0.02
2,912 NetMind Financial Holdings Ltd 24 –
126 NewOcean Energy Holdings Ltd 35 0.01
25 Orient Overseas International Ltd 100 0.02
450 Pacific Andes International Holdings Ltd 2 –
524 Pacific Basin Shipping Ltd 85 0.02
57 Pacific Textiles Holdings Ltd 66 0.01
44 Paradise Entertainment Ltd 8 –
84 Pico Far East Holdings Ltd 26 0.01
6 Playmates Holdings Ltd 7 –
40 Playmates Toys Ltd 7 –
190 Polytec Asset Holdings Ltd 14 –
12 Public Financial Holdings Ltd 5 –
266 PYI Corp Ltd 5 –
158 Qianhai Health Holdings Ltd 3 –
54 Regal Hotels International Holdings Ltd 30 0.01
85 Sa Sa International Holdings Ltd 38 0.01
26 SEA Holdings Ltd 66 0.01
75 Shenwan Hongyuan HK Ltd 42 0.01
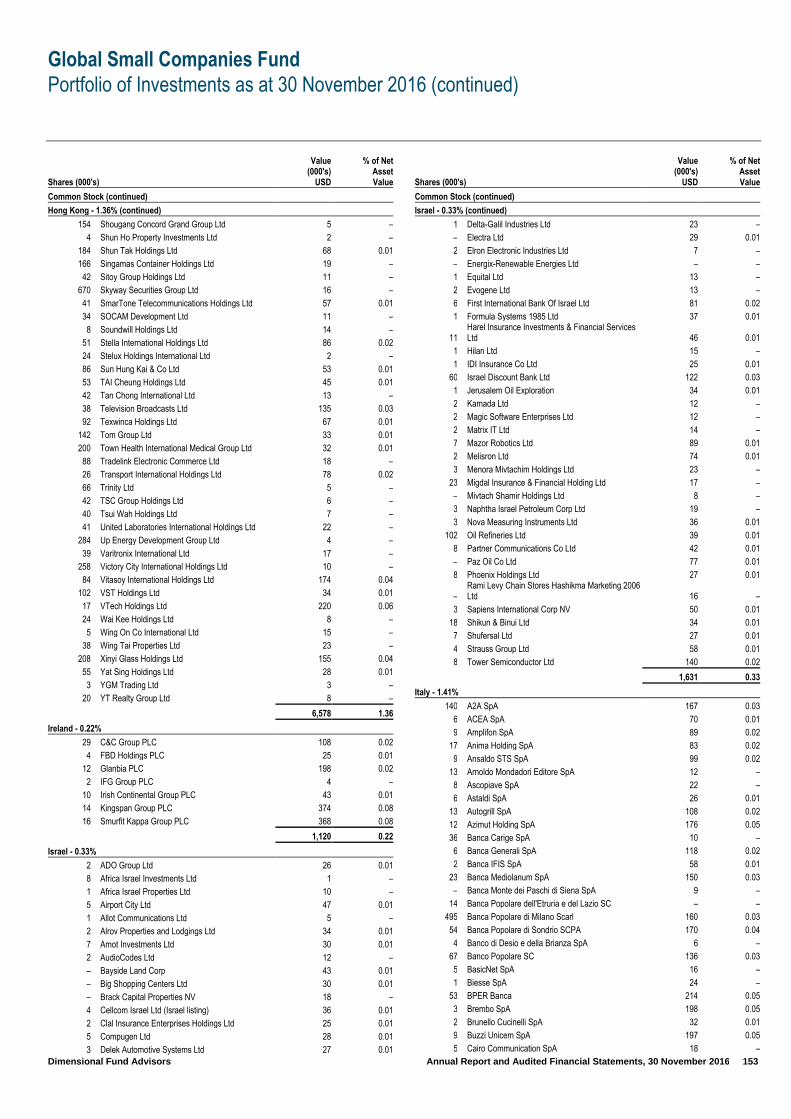
Global Small Companies Fund
Portfolio of Investments as at 30 November 2016 (continued)
Dimensional Fund Advisors Annual Report and Audited Financial Statements, 30 November 2016 153
Shares (000's)
Value (000's)
USD
% of Net Asset Value
Common Stock (continued)
Hong Kong - 1.36% (continued)
154 Shougang Concord Grand Group Ltd 5 –
4 Shun Ho Property Investments Ltd 2 –
184 Shun Tak Holdings Ltd 68 0.01
166 Singamas Container Holdings Ltd 19 –
42 Sitoy Group Holdings Ltd 11 –
670 Skyway Securities Group Ltd 16 –
41 SmarTone Telecommunications Holdings Ltd 57 0.01
34 SOCAM Development Ltd 11 –
8 Soundwill Holdings Ltd 14 –
51 Stella International Holdings Ltd 86 0.02
24 Stelux Holdings International Ltd 2 –
86 Sun Hung Kai & Co Ltd 53 0.01
53 TAI Cheung Holdings Ltd 45 0.01
42 Tan Chong International Ltd 13 –
38 Television Broadcasts Ltd 135 0.03
92 Texwinca Holdings Ltd 67 0.01
142 Tom Group Ltd 33 0.01
200 Town Health International Medical Group Ltd 32 0.01
88 Tradelink Electronic Commerce Ltd 18 –
26 Transport International Holdings Ltd 78 0.02
66 Trinity Ltd 5 –
42 TSC Group Holdings Ltd 6 –
40 Tsui Wah Holdings Ltd 7 –
41 United Laboratories International Holdings Ltd 22 –
284 Up Energy Development Group Ltd 4 –
39 Varitronix International Ltd 17 –
258 Victory City International Holdings Ltd 10 –
84 Vitasoy International Holdings Ltd 174 0.04
102 VST Holdings Ltd 34 0.01
17 VTech Holdings Ltd 220 0.06
24 Wai Kee Holdings Ltd 8 –
5 Wing On Co International Ltd 15 –
38 Wing Tai Properties Ltd 23 –
208 Xinyi Glass Holdings Ltd 155 0.04
55 Yat Sing Holdings Ltd 28 0.01
3 YGM Trading Ltd 3 –
20 YT Realty Group Ltd 8 –
6,578 1.36
Ireland - 0.22%
29 C&C Group PLC 108 0.02
4 FBD Holdings PLC 25 0.01
12 Glanbia PLC 198 0.02
2 IFG Group PLC 4 –
10 Irish Continental Group PLC 43 0.01
14 Kingspan Group PLC 374 0.08
16 Smurfit Kappa Group PLC 368 0.08
1,120 0.22
Israel - 0.33%
2 ADO Group Ltd 26 0.01
8 Africa Israel Investments Ltd 1 –
1 Africa Israel Properties Ltd 10 –
5 Airport City Ltd 47 0.01
1 Allot Communications Ltd 5 –
2 Alrov Properties and Lodgings Ltd 34 0.01
7 Amot Investments Ltd 30 0.01
2 AudioCodes Ltd 12 –
– Bayside Land Corp 43 0.01
– Big Shopping Centers Ltd 30 0.01
– Brack Capital Properties NV 18 –
4 Cellcom Israel Ltd (Israel listing) 36 0.01
2 Clal Insurance Enterprises Holdings Ltd 25 0.01
5 Compugen Ltd 28 0.01
3 Delek Automotive Systems Ltd 27 0.01
Shares (000's)
Value (000's)
USD
% of Net Asset Value
Common Stock (continued)
Israel - 0.33% (continued)
1 Delta-Galil Industries Ltd 23 –
– Electra Ltd 29 0.01
2 Elron Electronic Industries Ltd 7 –
– Energix-Renewable Energies Ltd – –
1 Equital Ltd 13 –
2 Evogene Ltd 13 –
6 First International Bank Of Israel Ltd 81 0.02
1 Formula Systems 1985 Ltd 37 0.01
11 Harel Insurance Investments & Financial Services Ltd 46 0.01
1 Hilan Ltd 15 –
1 IDI Insurance Co Ltd 25 0.01
60 Israel Discount Bank Ltd 122 0.03
1 Jerusalem Oil Exploration 34 0.01
2 Kamada Ltd 12 –
2 Magic Software Enterprises Ltd 12 –
2 Matrix IT Ltd 14 –
7 Mazor Robotics Ltd 89 0.01
2 Melisron Ltd 74 0.01
3 Menora Mivtachim Holdings Ltd 23 –
23 Migdal Insurance & Financial Holding Ltd 17 –
– Mivtach Shamir Holdings Ltd 8 –
3 Naphtha Israel Petroleum Corp Ltd 19 –
3 Nova Measuring Instruments Ltd 36 0.01
102 Oil Refineries Ltd 39 0.01
8 Partner Communications Co Ltd 42 0.01
– Paz Oil Co Ltd 77 0.01
8 Phoenix Holdings Ltd 27 0.01
– Rami Levy Chain Stores Hashikma Marketing 2006 Ltd 16 –
3 Sapiens International Corp NV 50 0.01
18 Shikun & Binui Ltd 34 0.01
7 Shufersal Ltd 27 0.01
4 Strauss Group Ltd 58 0.01
8 Tower Semiconductor Ltd 140 0.02
1,631 0.33
Italy - 1.41%
140 A2A SpA 167 0.03
6 ACEA SpA 70 0.01
9 Amplifon SpA 89 0.02
17 Anima Holding SpA 83 0.02
9 Ansaldo STS SpA 99 0.02
13 Arnoldo Mondadori Editore SpA 12 –
8 Ascopiave SpA 22 –
6 Astaldi SpA 26 0.01
13 Autogrill SpA 108 0.02
12 Azimut Holding SpA 176 0.05
36 Banca Carige SpA 10 –
6 Banca Generali SpA 118 0.02
2 Banca IFIS SpA 58 0.01
23 Banca Mediolanum SpA 150 0.03
– Banca Monte dei Paschi di Siena SpA 9 –
14 Banca Popolare dell'Etruria e del Lazio SC – –
495 Banca Popolare di Milano Scarl 160 0.03
54 Banca Popolare di Sondrio SCPA 170 0.04
4 Banco di Desio e della Brianza SpA 6 –
67 Banco Popolare SC 136 0.03
5 BasicNet SpA 16 –
1 Biesse SpA 24 –
53 BPER Banca 214 0.05
3 Brembo SpA 198 0.05
2 Brunello Cucinelli SpA 32 0.01
9 Buzzi Unicem SpA 197 0.05
5 Cairo Communication SpA 18 –
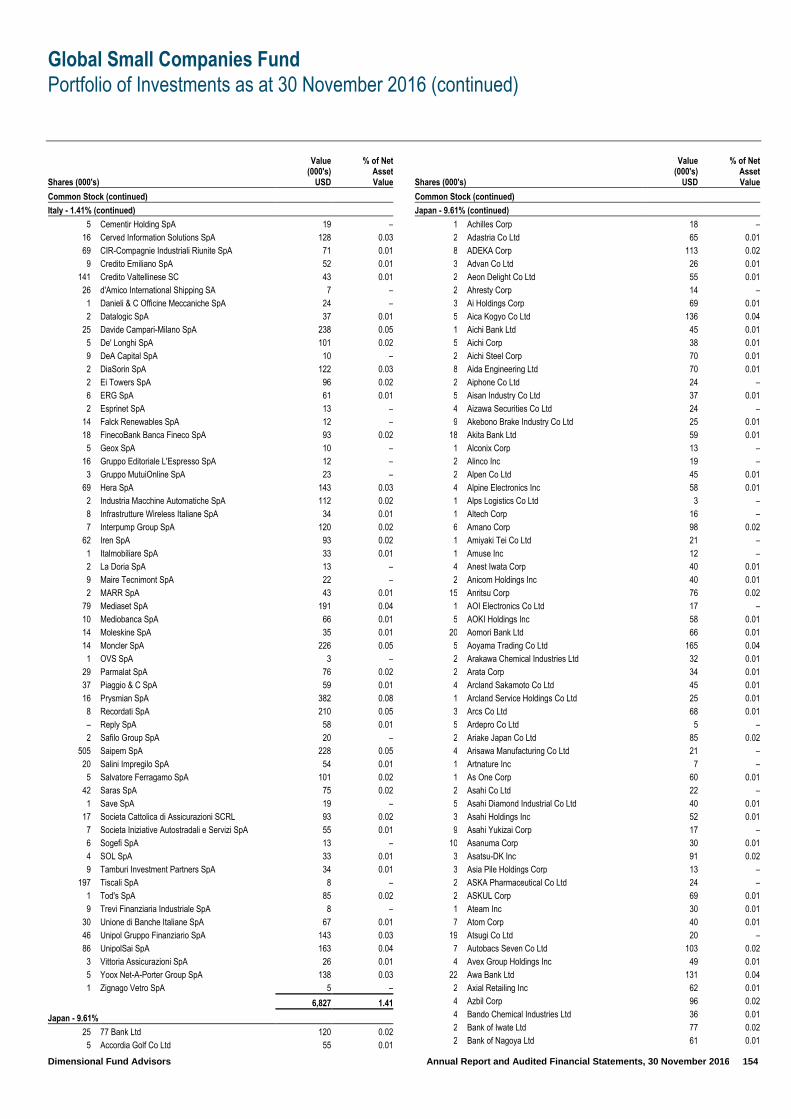
Global Small Companies Fund
Portfolio of Investments as at 30 November 2016 (continued)
Dimensional Fund Advisors Annual Report and Audited Financial Statements, 30 November 2016 154
Shares (000's)
Value (000's)
USD
% of Net Asset Value
Common Stock (continued)
Italy - 1.41% (continued)
5 Cementir Holding SpA 19 –
16 Cerved Information Solutions SpA 128 0.03
69 CIR-Compagnie Industriali Riunite SpA 71 0.01
9 Credito Emiliano SpA 52 0.01
141 Credito Valtellinese SC 43 0.01
26 d'Amico International Shipping SA 7 –
1 Danieli & C Officine Meccaniche SpA 24 –
2 Datalogic SpA 37 0.01
25 Davide Campari-Milano SpA 238 0.05
5 De' Longhi SpA 101 0.02
9 DeA Capital SpA 10 –
2 DiaSorin SpA 122 0.03
2 Ei Towers SpA 96 0.02
6 ERG SpA 61 0.01
2 Esprinet SpA 13 –
14 Falck Renewables SpA 12 –
18 FinecoBank Banca Fineco SpA 93 0.02
5 Geox SpA 10 –
16 Gruppo Editoriale L'Espresso SpA 12 –
3 Gruppo MutuiOnline SpA 23 –
69 Hera SpA 143 0.03
2 Industria Macchine Automatiche SpA 112 0.02
8 Infrastrutture Wireless Italiane SpA 34 0.01
7 Interpump Group SpA 120 0.02
62 Iren SpA 93 0.02
1 Italmobiliare SpA 33 0.01
2 La Doria SpA 13 –
9 Maire Tecnimont SpA 22 –
2 MARR SpA 43 0.01
79 Mediaset SpA 191 0.04
10 Mediobanca SpA 66 0.01
14 Moleskine SpA 35 0.01
14 Moncler SpA 226 0.05
1 OVS SpA 3 –
29 Parmalat SpA 76 0.02
37 Piaggio & C SpA 59 0.01
16 Prysmian SpA 382 0.08
8 Recordati SpA 210 0.05
– Reply SpA 58 0.01
2 Safilo Group SpA 20 –
505 Saipem SpA 228 0.05
20 Salini Impregilo SpA 54 0.01
5 Salvatore Ferragamo SpA 101 0.02
42 Saras SpA 75 0.02
1 Save SpA 19 –
17 Societa Cattolica di Assicurazioni SCRL 93 0.02
7 Societa Iniziative Autostradali e Servizi SpA 55 0.01
6 Sogefi SpA 13 –
4 SOL SpA 33 0.01
9 Tamburi Investment Partners SpA 34 0.01
197 Tiscali SpA 8 –
1 Tod's SpA 85 0.02
9 Trevi Finanziaria Industriale SpA 8 –
30 Unione di Banche Italiane SpA 67 0.01
46 Unipol Gruppo Finanziario SpA 143 0.03
86 UnipolSai SpA 163 0.04
3 Vittoria Assicurazioni SpA 26 0.01
5 Yoox Net-A-Porter Group SpA 138 0.03
1 Zignago Vetro SpA 5 –
6,827 1.41
Japan - 9.61%
25 77 Bank Ltd 120 0.02
5 Accordia Golf Co Ltd 55 0.01
Shares (000's)
Value (000's)
USD
% of Net Asset Value
Common Stock (continued)
Japan - 9.61% (continued)
1 Achilles Corp 18 –
2 Adastria Co Ltd 65 0.01
8 ADEKA Corp 113 0.02
3 Advan Co Ltd 26 0.01
2 Aeon Delight Co Ltd 55 0.01
2 Ahresty Corp 14 –
3 Ai Holdings Corp 69 0.01
5 Aica Kogyo Co Ltd 136 0.04
1 Aichi Bank Ltd 45 0.01
5 Aichi Corp 38 0.01
2 Aichi Steel Corp 70 0.01
8 Aida Engineering Ltd 70 0.01
2 Aiphone Co Ltd 24 –
5 Aisan Industry Co Ltd 37 0.01
4 Aizawa Securities Co Ltd 24 –
9 Akebono Brake Industry Co Ltd 25 0.01
18 Akita Bank Ltd 59 0.01
1 Alconix Corp 13 –
2 Alinco Inc 19 –
2 Alpen Co Ltd 45 0.01
4 Alpine Electronics Inc 58 0.01
1 Alps Logistics Co Ltd 3 –
1 Altech Corp 16 –
6 Amano Corp 98 0.02
1 Amiyaki Tei Co Ltd 21 –
1 Amuse Inc 12 –
4 Anest Iwata Corp 40 0.01
2 Anicom Holdings Inc 40 0.01
15 Anritsu Corp 76 0.02
1 AOI Electronics Co Ltd 17 –
5 AOKI Holdings Inc 58 0.01
20 Aomori Bank Ltd 66 0.01
5 Aoyama Trading Co Ltd 165 0.04
2 Arakawa Chemical Industries Ltd 32 0.01
2 Arata Corp 34 0.01
4 Arcland Sakamoto Co Ltd 45 0.01
1 Arcland Service Holdings Co Ltd 25 0.01
3 Arcs Co Ltd 68 0.01
5 Ardepro Co Ltd 5 –
2 Ariake Japan Co Ltd 85 0.02
4 Arisawa Manufacturing Co Ltd 21 –
1 Artnature Inc 7 –
1 As One Corp 60 0.01
2 Asahi Co Ltd 22 –
5 Asahi Diamond Industrial Co Ltd 40 0.01
3 Asahi Holdings Inc 52 0.01
9 Asahi Yukizai Corp 17 –
10 Asanuma Corp 30 0.01
3 Asatsu-DK Inc 91 0.02
3 Asia Pile Holdings Corp 13 –
2 ASKA Pharmaceutical Co Ltd 24 –
2 ASKUL Corp 69 0.01
1 Ateam Inc 30 0.01
7 Atom Corp 40 0.01
19 Atsugi Co Ltd 20 –
7 Autobacs Seven Co Ltd 103 0.02
4 Avex Group Holdings Inc 49 0.01
22 Awa Bank Ltd 131 0.04
2 Axial Retailing Inc 62 0.01
4 Azbil Corp 96 0.02
4 Bando Chemical Industries Ltd 36 0.01
2 Bank of Iwate Ltd 77 0.02
2 Bank of Nagoya Ltd 61 0.01

Global Small Companies Fund
Portfolio of Investments as at 30 November 2016 (continued)
Dimensional Fund Advisors Annual Report and Audited Financial Statements, 30 November 2016 155
Shares (000's)
Value (000's)
USD
% of Net Asset Value
Common Stock (continued)
Japan - 9.61% (continued)
2 Bank of Okinawa Ltd 82 0.02
12 Bank of Saga Ltd 29 0.01
3 Bank of the Ryukyus Ltd 39 0.01
1 Belc Co Ltd 29 0.01
8 Belluna Co Ltd 42 0.01
1 Benefit One Inc 33 0.01
10 Bic Camera Inc 88 0.02
1 Biofermin Pharmaceutical Co Ltd 16 –
3 BML Inc 60 0.01
1 Broadleaf Co Ltd 17 –
1 BRONCO BILLY Co Ltd 13 –
8 Bunka Shutter Co Ltd 57 0.01
1 C Uyemura & Co Ltd 20 –
2 CAC Holdings Corp 15 –
1 Can Do Co Ltd 14 –
2 Canon Electronics Inc 32 0.01
5 Capcom Co Ltd 101 0.02
2 Cawachi Ltd 43 0.01
19 Central Glass Co Ltd 76 0.02
1 Central Sports Co Ltd 19 –
5 Chiba Kogyo Bank Ltd 22 –
2 Chiyoda Co Ltd 42 0.01
12 Chiyoda Corp 87 0.02
1 Chiyoda Integre Co Ltd 22 –
2 Chofu Seisakusho Co Ltd 42 0.01
1 Chori Co Ltd 21 –
4 Chubu Shiryo Co Ltd 35 0.01
3 Chudenko Corp 57 0.01
14 Chuetsu Pulp & Paper Co Ltd 30 0.01
11 Chugai Ro Co Ltd 20 –
6 Chugoku Marine Paints Ltd 41 0.01
1 Chukyo Bank Ltd 23 –
3 Ci:z Holdings Co Ltd 73 0.02
26 Citizen Watch Co Ltd 158 0.04
6 CKD Corp 76 0.02
12 Clarion Co Ltd 40 0.01
1 Cleanup Corp 12 –
2 CMIC Holdings Co Ltd 20 –
5 CMK Corp 24 –
4 Coca-Cola East Japan Co Ltd 94 0.02
2 cocokara fine Inc 55 0.01
3 COLOPL Inc 24 –
5 Colowide Co Ltd 88 0.02
3 Computer Engineering & Consulting Ltd 45 0.01
1 CONEXIO Corp 9 –
5 COOKPAD Inc 46 0.01
1 Corona Corp 9 –
4 Cosel Co Ltd 37 0.01
6 Cosmo Energy Holdings Co Ltd 79 0.02
3 Create Restaurants Holdings Inc 29 0.01
2 Create SD Holdings Co Ltd 45 0.01
– CROOZ Inc 7 –
1 CTI Engineering Co Ltd 10 –
18 Dai Nippon Toryo Co Ltd 35 0.01
1 Dai-Dan Co Ltd 8 –
1 Dai-ichi Seiko Co Ltd 15 –
5 Daibiru Corp 42 0.01
3 Daido Metal Co Ltd 29 0.01
29 Daido Steel Co Ltd 120 0.02
3 Daidoh Ltd 12 –
3 Daihatsu Diesel Manufacturing Co Ltd 19 –
12 Daihen Corp 76 0.02
11 Daiho Corp 56 0.01
Shares (000's)
Value (000's)
USD
% of Net Asset Value
Common Stock (continued)
Japan - 9.61% (continued)
3 Daiichi Jitsugyo Co Ltd 18 –
– Daiichi Kensetsu Corp 4 –
1 Daiken Corp 21 –
1 Daiken Medical Co Ltd 7 –
– Daikokutenbussan Co Ltd 17 –
35 Daikyo Inc 75 0.02 6
Dainichiseika Color & Chemicals Manufacturing Co Ltd 32 0.01
8 Daio Paper Corp 89 0.02
2 Daisan Bank Ltd 26 0.01
3 Daiseki Co Ltd 61 0.01
32 Daishi Bank Ltd 136 0.04
1 Daito Pharmaceutical Co Ltd 17 –
4 Daiwa Industries Ltd 32 0.01
17 Daiwabo Holdings Co Ltd 45 0.01
8 DCM Holdings Co Ltd 72 0.01
46 Denka Co Ltd 206 0.05
6 Denki Kogyo Co Ltd 31 0.01
2 Denyo Co Ltd 21 –
4 Descente Ltd 44 0.01
1 Dexerials Corp 8 –
1 Digital Arts Inc 19 –
5 Digital Garage Inc 79 0.02
3 Dip Corp 57 0.01
7 DKS Co Ltd 22 –
11 DMG Mori Co Ltd 130 0.04
3 Doshisha Co Ltd 45 0.01
3 Doutor Nichires Holdings Co Ltd 54 0.01
22 Dowa Holdings Co Ltd 171 0.05
2 DTS Corp 47 0.01
1 Dunlop Sports Co Ltd 6 –
5 Duskin Co Ltd 93 0.02
1 Dydo Drinco Inc 40 0.01
2 Eagle Industry Co Ltd 31 0.01
9 EDION Corp 87 0.02
4 Ehime Bank Ltd 46 0.01
18 Eighteenth Bank Ltd 54 0.01
2 Eiken Chemical Co Ltd 45 0.01
2 Eizo Corp 65 0.01
2 Elecom Co Ltd 33 0.01
1 Elematec Corp 21 –
2 en-japan Inc 34 0.01
2 Endo Lighting Corp 12 –
2 Enplas Corp 44 0.01
2 EPS Holdings Inc 25 0.01
3 ESPEC Corp 31 0.01
1 Excel Co Ltd 10 –
3 Exedy Corp 86 0.02
3 F@N Communications Inc 17 –
4 FCC Co Ltd 62 0.01
13 FDK Corp 11 –
4 Ferrotec Corp 49 0.01
13 FIDEA Holdings Co Ltd 22 –
1 Fields Corp 15 –
6 Financial Products Group Co Ltd 47 0.01
2 FINDEX Inc 14 –
3 Foster Electric Co Ltd 60 0.01
1 France Bed Holdings Co Ltd 11 –
13 Fudo Tetra Corp 24 –
2 Fuji Co Ltd 47 0.01
2 Fuji Corp Ltd 15 –
6 Fuji Kyuko Co Ltd 56 0.01
5 Fuji Machine Manufacturing Co Ltd 61 0.01
5 Fuji Oil Co Ltd 14 –
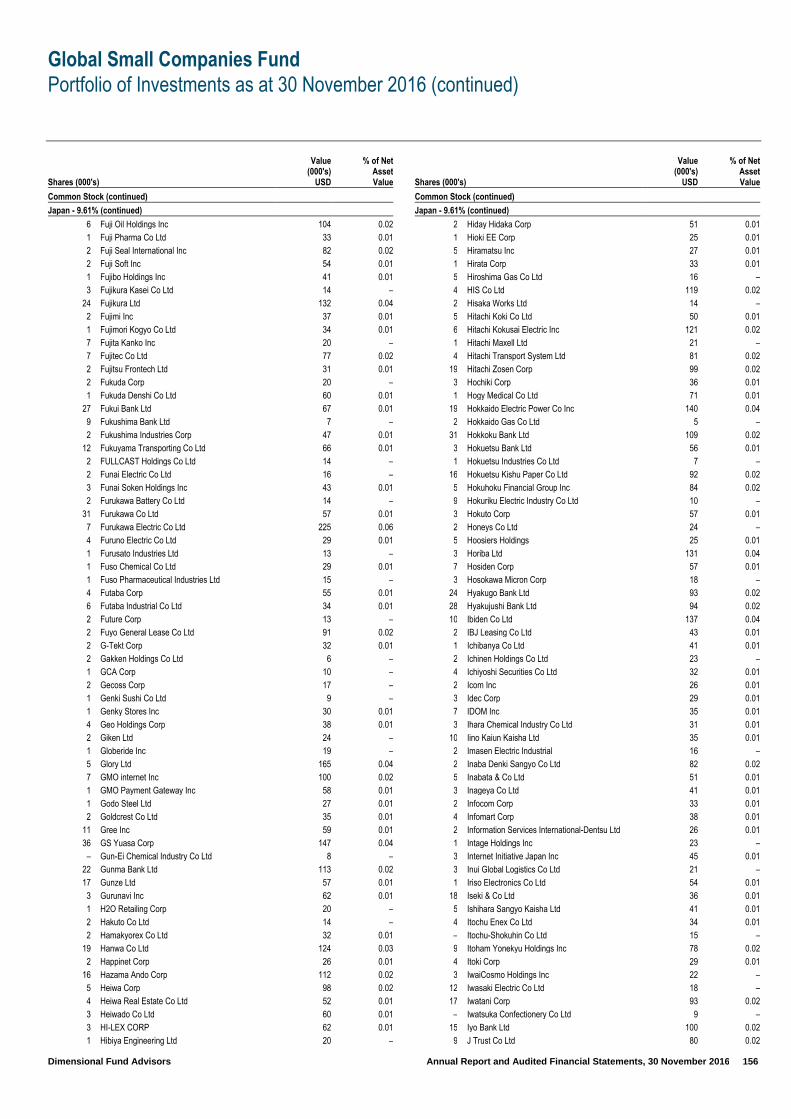
Global Small Companies Fund
Portfolio of Investments as at 30 November 2016 (continued)
Dimensional Fund Advisors Annual Report and Audited Financial Statements, 30 November 2016 156
Shares (000's)
Value (000's)
USD
% of Net Asset Value
Common Stock (continued)
Japan - 9.61% (continued)
6 Fuji Oil Holdings Inc 104 0.02
1 Fuji Pharma Co Ltd 33 0.01
2 Fuji Seal International Inc 82 0.02
2 Fuji Soft Inc 54 0.01
1 Fujibo Holdings Inc 41 0.01
3 Fujikura Kasei Co Ltd 14 –
24 Fujikura Ltd 132 0.04
2 Fujimi Inc 37 0.01
1 Fujimori Kogyo Co Ltd 34 0.01
7 Fujita Kanko Inc 20 –
7 Fujitec Co Ltd 77 0.02
2 Fujitsu Frontech Ltd 31 0.01
2 Fukuda Corp 20 –
1 Fukuda Denshi Co Ltd 60 0.01
27 Fukui Bank Ltd 67 0.01
9 Fukushima Bank Ltd 7 –
2 Fukushima Industries Corp 47 0.01
12 Fukuyama Transporting Co Ltd 66 0.01
2 FULLCAST Holdings Co Ltd 14 –
2 Funai Electric Co Ltd 16 –
3 Funai Soken Holdings Inc 43 0.01
2 Furukawa Battery Co Ltd 14 –
31 Furukawa Co Ltd 57 0.01
7 Furukawa Electric Co Ltd 225 0.06
4 Furuno Electric Co Ltd 29 0.01
1 Furusato Industries Ltd 13 –
1 Fuso Chemical Co Ltd 29 0.01
1 Fuso Pharmaceutical Industries Ltd 15 –
4 Futaba Corp 55 0.01
6 Futaba Industrial Co Ltd 34 0.01
2 Future Corp 13 –
2 Fuyo General Lease Co Ltd 91 0.02
2 G-Tekt Corp 32 0.01
2 Gakken Holdings Co Ltd 6 –
1 GCA Corp 10 –
2 Gecoss Corp 17 –
1 Genki Sushi Co Ltd 9 –
1 Genky Stores Inc 30 0.01
4 Geo Holdings Corp 38 0.01
2 Giken Ltd 24 –
1 Globeride Inc 19 –
5 Glory Ltd 165 0.04
7 GMO internet Inc 100 0.02
1 GMO Payment Gateway Inc 58 0.01
1 Godo Steel Ltd 27 0.01
2 Goldcrest Co Ltd 35 0.01
11 Gree Inc 59 0.01
36 GS Yuasa Corp 147 0.04
– Gun-Ei Chemical Industry Co Ltd 8 –
22 Gunma Bank Ltd 113 0.02
17 Gunze Ltd 57 0.01
3 Gurunavi Inc 62 0.01
1 H2O Retailing Corp 20 –
2 Hakuto Co Ltd 14 –
2 Hamakyorex Co Ltd 32 0.01
19 Hanwa Co Ltd 124 0.03
2 Happinet Corp 26 0.01
16 Hazama Ando Corp 112 0.02
5 Heiwa Corp 98 0.02
4 Heiwa Real Estate Co Ltd 52 0.01
3 Heiwado Co Ltd 60 0.01
3 HI-LEX CORP 62 0.01
1 Hibiya Engineering Ltd 20 –
Shares (000's)
Value (000's)
USD
% of Net Asset Value
Common Stock (continued)
Japan - 9.61% (continued)
2 Hiday Hidaka Corp 51 0.01
1 Hioki EE Corp 25 0.01
5 Hiramatsu Inc 27 0.01
1 Hirata Corp 33 0.01
5 Hiroshima Gas Co Ltd 16 –
4 HIS Co Ltd 119 0.02
2 Hisaka Works Ltd 14 –
5 Hitachi Koki Co Ltd 50 0.01
6 Hitachi Kokusai Electric Inc 121 0.02
1 Hitachi Maxell Ltd 21 –
4 Hitachi Transport System Ltd 81 0.02
19 Hitachi Zosen Corp 99 0.02
3 Hochiki Corp 36 0.01
1 Hogy Medical Co Ltd 71 0.01
19 Hokkaido Electric Power Co Inc 140 0.04
2 Hokkaido Gas Co Ltd 5 –
31 Hokkoku Bank Ltd 109 0.02
3 Hokuetsu Bank Ltd 56 0.01
1 Hokuetsu Industries Co Ltd 7 –
16 Hokuetsu Kishu Paper Co Ltd 92 0.02
5 Hokuhoku Financial Group Inc 84 0.02
9 Hokuriku Electric Industry Co Ltd 10 –
3 Hokuto Corp 57 0.01
2 Honeys Co Ltd 24 –
5 Hoosiers Holdings 25 0.01
3 Horiba Ltd 131 0.04
7 Hosiden Corp 57 0.01
3 Hosokawa Micron Corp 18 –
24 Hyakugo Bank Ltd 93 0.02
28 Hyakujushi Bank Ltd 94 0.02
10 Ibiden Co Ltd 137 0.04
2 IBJ Leasing Co Ltd 43 0.01
1 Ichibanya Co Ltd 41 0.01
2 Ichinen Holdings Co Ltd 23 –
4 Ichiyoshi Securities Co Ltd 32 0.01
2 Icom Inc 26 0.01
3 Idec Corp 29 0.01
7 IDOM Inc 35 0.01
3 Ihara Chemical Industry Co Ltd 31 0.01
10 Iino Kaiun Kaisha Ltd 35 0.01
2 Imasen Electric Industrial 16 –
2 Inaba Denki Sangyo Co Ltd 82 0.02
5 Inabata & Co Ltd 51 0.01
3 Inageya Co Ltd 41 0.01
2 Infocom Corp 33 0.01
4 Infomart Corp 38 0.01
2 Information Services International-Dentsu Ltd 26 0.01
1 Intage Holdings Inc 23 –
3 Internet Initiative Japan Inc 45 0.01
3 Inui Global Logistics Co Ltd 21 –
1 Iriso Electronics Co Ltd 54 0.01
18 Iseki & Co Ltd 36 0.01
5 Ishihara Sangyo Kaisha Ltd 41 0.01
4 Itochu Enex Co Ltd 34 0.01
– Itochu-Shokuhin Co Ltd 15 –
9 Itoham Yonekyu Holdings Inc 78 0.02
4 Itoki Corp 29 0.01
3 IwaiCosmo Holdings Inc 22 –
12 Iwasaki Electric Co Ltd 18 –
17 Iwatani Corp 93 0.02
– Iwatsuka Confectionery Co Ltd 9 –
15 Iyo Bank Ltd 100 0.02
9 J Trust Co Ltd 80 0.02

Global Small Companies Fund
Portfolio of Investments as at 30 November 2016 (continued)
Dimensional Fund Advisors Annual Report and Audited Financial Statements, 30 November 2016 157
Shares (000's)
Value (000's)
USD
% of Net Asset Value
Common Stock (continued)
Japan - 9.61% (continued)
1 J-Oil Mills Inc 36 0.01
15 Jaccs Co Ltd 70 0.01
4 Jafco Co Ltd 133 0.04
2 Jalux Inc 25 0.01
1 Jamco Corp 24 –
3 Janome Sewing Machine Co Ltd 20 –
7 Japan Aviation Electronics Industry Ltd 96 0.02
2 Japan Digital Laboratory Co Ltd 40 0.01
37 Japan Display Inc 87 0.02
1 Japan Drilling Co Ltd 13 –
2 Japan Material Co Ltd 49 0.01
3 Japan Petroleum Exploration Co Ltd 70 0.01
1 Japan Property Management Center Co Ltd 15 –
7 Japan Pulp & Paper Co Ltd 21 –
1 Japan Radio Co Ltd 17 –
11 Japan Securities Finance Co Ltd 55 0.01
7 Japan Steel Works Ltd 119 0.02
1 Japan Transcity Corp 4 –
6 Japan Wool Textile Co Ltd 44 0.01
1 JCU Corp 26 0.01
8 Jeol Ltd 32 0.01
13 Jimoto Holdings Inc 22 –
1 Jin Co Ltd 51 0.01
4 Joshin Denki Co Ltd 34 0.01
2 Joyful Honda Co Ltd 48 0.01
5 JP-Holdings Inc 11 –
1 JSP Corp 35 0.01
3 Juki Corp 26 0.01
33 Juroku Bank Ltd 107 0.02
4 Justsystems Corp 38 0.01
8 JVC Kenwood Corp 24 –
2 K&O Energy Group Inc 23 –
5 K's Holdings Corp 100 0.02
18 kabu.com Securities Co Ltd 58 0.01
2 Kadokawa Dwango 28 0.01
2 Kaga Electronics Co Ltd 33 0.01
1 Kakiyasu Honten Co Ltd 17 –
1 Kameda Seika Co Ltd 55 0.01
2 Kamei Corp 21 –
1 Kanaden Corp 9 –
4 Kanagawa Chuo Kotsu Co Ltd 26 0.01
3 Kanamoto Co Ltd 65 0.01
10 Kandenko Co Ltd 93 0.02
47 Kanematsu Corp 79 0.02
2 Kanematsu Electronics Ltd 43 0.01
3 Kansai Urban Banking Corp 39 0.01
4 Kanto Denka Kogyo Co Ltd 34 0.01
2 Kappa Create Co Ltd 20 –
2 Kasai Kogyo Co Ltd 21 –
3 Katakura Industries Co Ltd 28 0.01
3 Kato Sangyo Co Ltd 67 0.01
1 Kato Works Co Ltd 21 –
– Kawada Technologies Inc 24 –
2 Kawai Musical Instruments Manufacturing Co Ltd 30 0.01
4 Keihanshin Building Co Ltd 20 –
5 Keihin Corp 90 0.02
26 Keiyo Bank Ltd 112 0.02
4 Keiyo Co Ltd 18 –
24 Kenedix Inc 90 0.02
1 Kenko Mayonnaise Co Ltd 25 0.01
3 Key Coffee Inc 48 0.01
2 KFC Holdings Japan Ltd 30 0.01
– Kinki Sharyo Co Ltd 8 –
Shares (000's)
Value (000's)
USD
% of Net Asset Value
Common Stock (continued)
Japan - 9.61% (continued)
4 Kintetsu Department Store Co Ltd 12 –
5 Kintetsu World Express Inc 73 0.02
2 Kissei Pharmaceutical Co Ltd 54 0.01
1 Kita-Nippon Bank Ltd 24 –
1 Kitagawa Iron Works Co Ltd 24 –
6 Kitano Construction Corp 16 –
3 Kito Corp 26 0.01
9 Kitz Corp 50 0.01
7 Kiyo Bank Ltd 100 0.02
2 KLab Inc 12 –
13 KNT-CT Holdings Co Ltd 17 –
4 Koa Corp 35 0.01
4 Koatsu Gas Kogyo Co Ltd 25 0.01
1 Kobe Bussan Co Ltd 32 0.01
3 Kobe Electric Railway Co Ltd 10 –
3 Kohnan Shoji Co Ltd 61 0.01
1 Kokusai Co Ltd 8 –
9 Kokuyo Co Ltd 107 0.02
4 Komatsu Seiren Co Ltd 24 –
1 Komatsu Wall Industry Co Ltd 19 –
1 Komehyo Co Ltd 5 –
3 Komeri Co Ltd 72 0.01
5 Komori Corp 67 0.01
4 Konaka Co Ltd 17 –
1 Kondotec Inc 6 –
4 Konishi Co Ltd 47 0.01
2 Konoike Transport Co Ltd 33 0.01
1 Koshidaka Holdings Co Ltd 16 –
2 Kotobuki Spirits Co Ltd 46 0.01
1 Kourakuen Holdings Corp 17 –
3 KU Holdings Co Ltd 24 –
33 Kumagai Gumi Co Ltd 86 0.02
6 Kumiai Chemical Industry Co Ltd 37 0.01
1 Kura Corp 52 0.01
23 Kurabo Industries Ltd 47 0.01
1 Kureha Corp 58 0.01
1 Kurimoto Ltd 23 –
– Kuriyama Holdings Corp 5 –
4 Kuroda Electric Co Ltd 83 0.02
1 Kusuri no Aoki Holdings Co Ltd 60 0.01
21 KYB Corp 97 0.02
10 Kyodo Printing Co Ltd 34 0.01
2 Kyoei Steel Ltd 35 0.01
4 Kyokuto Kaihatsu Kogyo Co Ltd 46 0.01
2 Kyokuto Securities Co Ltd 34 0.01
1 Kyokuyo Co Ltd 26 0.01
5 KYORIN Holdings Inc 100 0.02
1 Kyoritsu Maintenance Co Ltd 88 0.02
7 Kyosan Electric Manufacturing Co Ltd 24 –
9 Kyowa Exeo Corp 129 0.03
4 Kyudenko Corp 113 0.02
2 LAC Co Ltd 14 –
5 Laox Co Ltd 35 0.01
2 Lasertec Corp 31 0.01
28 Leopalace21 Corp 154 0.04
2 Life Corp 54 0.01
4 Lintec Corp 92 0.02
2 Macnica Fuji Electronics Holdings Inc 26 0.01
14 Maeda Corp 131 0.04
1 Maeda Kosen Co Ltd 15 –
7 Maeda Road Construction Co Ltd 121 0.02
3 Maezawa Kasei Industries Co Ltd 26 0.01
2 Maezawa Kyuso Industries Co Ltd 25 0.01
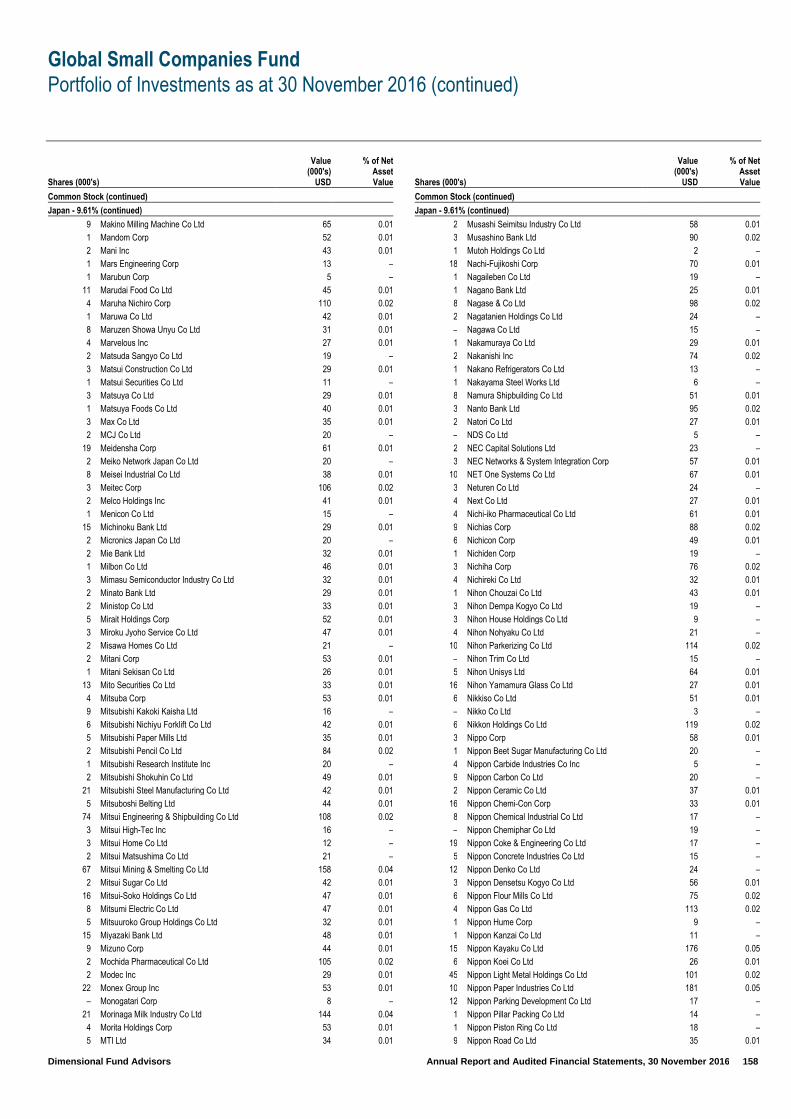
Global Small Companies Fund
Portfolio of Investments as at 30 November 2016 (continued)
Dimensional Fund Advisors Annual Report and Audited Financial Statements, 30 November 2016 158
Shares (000's)
Value (000's)
USD
% of Net Asset Value
Common Stock (continued)
Japan - 9.61% (continued)
9 Makino Milling Machine Co Ltd 65 0.01
1 Mandom Corp 52 0.01
2 Mani Inc 43 0.01
1 Mars Engineering Corp 13 –
1 Marubun Corp 5 –
11 Marudai Food Co Ltd 45 0.01
4 Maruha Nichiro Corp 110 0.02
1 Maruwa Co Ltd 42 0.01
8 Maruzen Showa Unyu Co Ltd 31 0.01
4 Marvelous Inc 27 0.01
2 Matsuda Sangyo Co Ltd 19 –
3 Matsui Construction Co Ltd 29 0.01
1 Matsui Securities Co Ltd 11 –
3 Matsuya Co Ltd 29 0.01
1 Matsuya Foods Co Ltd 40 0.01
3 Max Co Ltd 35 0.01
2 MCJ Co Ltd 20 –
19 Meidensha Corp 61 0.01
2 Meiko Network Japan Co Ltd 20 –
8 Meisei Industrial Co Ltd 38 0.01
3 Meitec Corp 106 0.02
2 Melco Holdings Inc 41 0.01
1 Menicon Co Ltd 15 –
15 Michinoku Bank Ltd 29 0.01
2 Micronics Japan Co Ltd 20 –
2 Mie Bank Ltd 32 0.01
1 Milbon Co Ltd 46 0.01
3 Mimasu Semiconductor Industry Co Ltd 32 0.01
2 Minato Bank Ltd 29 0.01
2 Ministop Co Ltd 33 0.01
5 Mirait Holdings Corp 52 0.01
3 Miroku Jyoho Service Co Ltd 47 0.01
2 Misawa Homes Co Ltd 21 –
2 Mitani Corp 53 0.01
1 Mitani Sekisan Co Ltd 26 0.01
13 Mito Securities Co Ltd 33 0.01
4 Mitsuba Corp 53 0.01
9 Mitsubishi Kakoki Kaisha Ltd 16 –
6 Mitsubishi Nichiyu Forklift Co Ltd 42 0.01
5 Mitsubishi Paper Mills Ltd 35 0.01
2 Mitsubishi Pencil Co Ltd 84 0.02
1 Mitsubishi Research Institute Inc 20 –
2 Mitsubishi Shokuhin Co Ltd 49 0.01
21 Mitsubishi Steel Manufacturing Co Ltd 42 0.01
5 Mitsuboshi Belting Ltd 44 0.01
74 Mitsui Engineering & Shipbuilding Co Ltd 108 0.02
3 Mitsui High-Tec Inc 16 –
3 Mitsui Home Co Ltd 12 –
2 Mitsui Matsushima Co Ltd 21 –
67 Mitsui Mining & Smelting Co Ltd 158 0.04
2 Mitsui Sugar Co Ltd 42 0.01
16 Mitsui-Soko Holdings Co Ltd 47 0.01
8 Mitsumi Electric Co Ltd 47 0.01
5 Mitsuuroko Group Holdings Co Ltd 32 0.01
15 Miyazaki Bank Ltd 48 0.01
9 Mizuno Corp 44 0.01
2 Mochida Pharmaceutical Co Ltd 105 0.02
2 Modec Inc 29 0.01
22 Monex Group Inc 53 0.01
– Monogatari Corp 8 –
21 Morinaga Milk Industry Co Ltd 144 0.04
4 Morita Holdings Corp 53 0.01
5 MTI Ltd 34 0.01
Shares (000's)
Value (000's)
USD
% of Net Asset Value
Common Stock (continued)
Japan - 9.61% (continued)
2 Musashi Seimitsu Industry Co Ltd 58 0.01
3 Musashino Bank Ltd 90 0.02
1 Mutoh Holdings Co Ltd 2 –
18 Nachi-Fujikoshi Corp 70 0.01
1 Nagaileben Co Ltd 19 –
1 Nagano Bank Ltd 25 0.01
8 Nagase & Co Ltd 98 0.02
2 Nagatanien Holdings Co Ltd 24 –
– Nagawa Co Ltd 15 –
1 Nakamuraya Co Ltd 29 0.01
2 Nakanishi Inc 74 0.02
1 Nakano Refrigerators Co Ltd 13 –
1 Nakayama Steel Works Ltd 6 –
8 Namura Shipbuilding Co Ltd 51 0.01
3 Nanto Bank Ltd 95 0.02
2 Natori Co Ltd 27 0.01
– NDS Co Ltd 5 –
2 NEC Capital Solutions Ltd 23 –
3 NEC Networks & System Integration Corp 57 0.01
10 NET One Systems Co Ltd 67 0.01
3 Neturen Co Ltd 24 –
4 Next Co Ltd 27 0.01
4 Nichi-iko Pharmaceutical Co Ltd 61 0.01
9 Nichias Corp 88 0.02
6 Nichicon Corp 49 0.01
1 Nichiden Corp 19 –
3 Nichiha Corp 76 0.02
4 Nichireki Co Ltd 32 0.01
1 Nihon Chouzai Co Ltd 43 0.01
3 Nihon Dempa Kogyo Co Ltd 19 –
3 Nihon House Holdings Co Ltd 9 –
4 Nihon Nohyaku Co Ltd 21 –
10 Nihon Parkerizing Co Ltd 114 0.02
– Nihon Trim Co Ltd 15 –
5 Nihon Unisys Ltd 64 0.01
16 Nihon Yamamura Glass Co Ltd 27 0.01
6 Nikkiso Co Ltd 51 0.01
– Nikko Co Ltd 3 –
6 Nikkon Holdings Co Ltd 119 0.02
3 Nippo Corp 58 0.01
1 Nippon Beet Sugar Manufacturing Co Ltd 20 –
4 Nippon Carbide Industries Co Inc 5 –
9 Nippon Carbon Co Ltd 20 –
2 Nippon Ceramic Co Ltd 37 0.01
16 Nippon Chemi-Con Corp 33 0.01
8 Nippon Chemical Industrial Co Ltd 17 –
– Nippon Chemiphar Co Ltd 19 –
19 Nippon Coke & Engineering Co Ltd 17 –
5 Nippon Concrete Industries Co Ltd 15 –
12 Nippon Denko Co Ltd 24 –
3 Nippon Densetsu Kogyo Co Ltd 56 0.01
6 Nippon Flour Mills Co Ltd 75 0.02
4 Nippon Gas Co Ltd 113 0.02
1 Nippon Hume Corp 9 –
1 Nippon Kanzai Co Ltd 11 –
15 Nippon Kayaku Co Ltd 176 0.05
6 Nippon Koei Co Ltd 26 0.01
45 Nippon Light Metal Holdings Co Ltd 101 0.02
10 Nippon Paper Industries Co Ltd 181 0.05
12 Nippon Parking Development Co Ltd 17 –
1 Nippon Pillar Packing Co Ltd 14 –
1 Nippon Piston Ring Co Ltd 18 –
9 Nippon Road Co Ltd 35 0.01
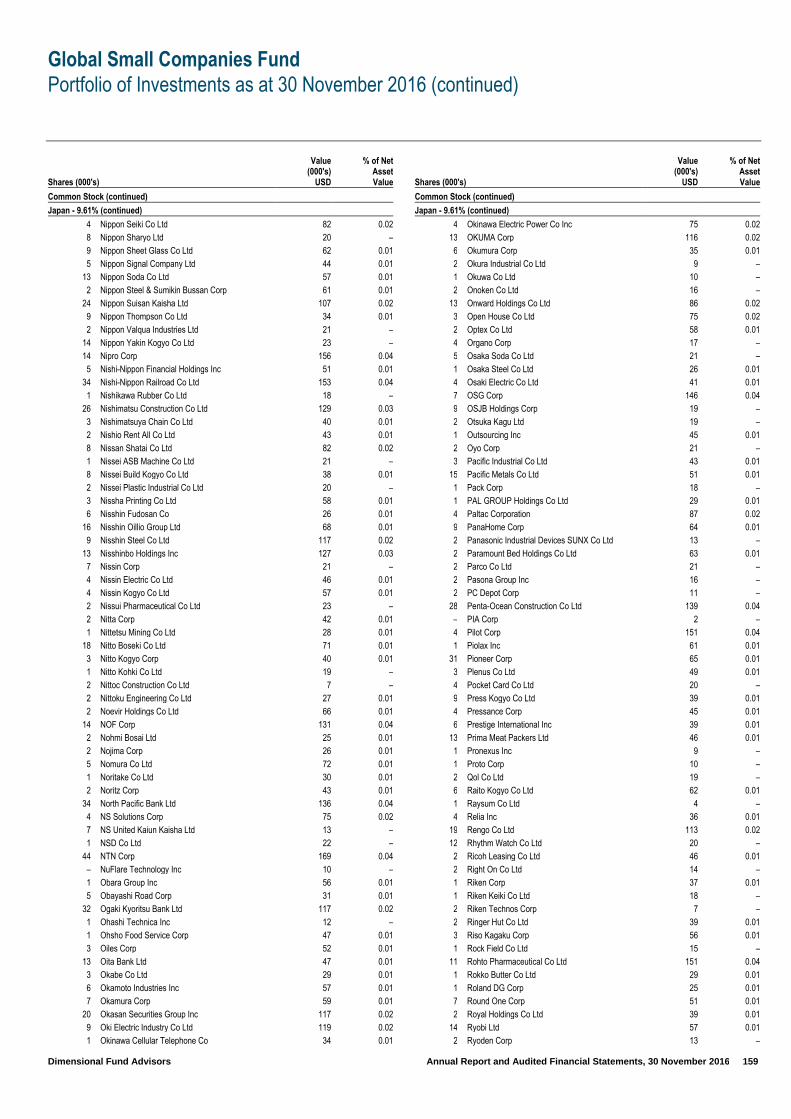
Global Small Companies Fund
Portfolio of Investments as at 30 November 2016 (continued)
Dimensional Fund Advisors Annual Report and Audited Financial Statements, 30 November 2016 159
Shares (000's)
Value (000's)
USD
% of Net Asset Value
Common Stock (continued)
Japan - 9.61% (continued)
4 Nippon Seiki Co Ltd 82 0.02
8 Nippon Sharyo Ltd 20 –
9 Nippon Sheet Glass Co Ltd 62 0.01
5 Nippon Signal Company Ltd 44 0.01
13 Nippon Soda Co Ltd 57 0.01
2 Nippon Steel & Sumikin Bussan Corp 61 0.01
24 Nippon Suisan Kaisha Ltd 107 0.02
9 Nippon Thompson Co Ltd 34 0.01
2 Nippon Valqua Industries Ltd 21 –
14 Nippon Yakin Kogyo Co Ltd 23 –
14 Nipro Corp 156 0.04
5 Nishi-Nippon Financial Holdings Inc 51 0.01
34 Nishi-Nippon Railroad Co Ltd 153 0.04
1 Nishikawa Rubber Co Ltd 18 –
26 Nishimatsu Construction Co Ltd 129 0.03
3 Nishimatsuya Chain Co Ltd 40 0.01
2 Nishio Rent All Co Ltd 43 0.01
8 Nissan Shatai Co Ltd 82 0.02
1 Nissei ASB Machine Co Ltd 21 –
8 Nissei Build Kogyo Co Ltd 38 0.01
2 Nissei Plastic Industrial Co Ltd 20 –
3 Nissha Printing Co Ltd 58 0.01
6 Nisshin Fudosan Co 26 0.01
16 Nisshin Oillio Group Ltd 68 0.01
9 Nisshin Steel Co Ltd 117 0.02
13 Nisshinbo Holdings Inc 127 0.03
7 Nissin Corp 21 –
4 Nissin Electric Co Ltd 46 0.01
4 Nissin Kogyo Co Ltd 57 0.01
2 Nissui Pharmaceutical Co Ltd 23 –
2 Nitta Corp 42 0.01
1 Nittetsu Mining Co Ltd 28 0.01
18 Nitto Boseki Co Ltd 71 0.01
3 Nitto Kogyo Corp 40 0.01
1 Nitto Kohki Co Ltd 19 –
2 Nittoc Construction Co Ltd 7 –
2 Nittoku Engineering Co Ltd 27 0.01
2 Noevir Holdings Co Ltd 66 0.01
14 NOF Corp 131 0.04
2 Nohmi Bosai Ltd 25 0.01
2 Nojima Corp 26 0.01
5 Nomura Co Ltd 72 0.01
1 Noritake Co Ltd 30 0.01
2 Noritz Corp 43 0.01
34 North Pacific Bank Ltd 136 0.04
4 NS Solutions Corp 75 0.02
7 NS United Kaiun Kaisha Ltd 13 –
1 NSD Co Ltd 22 –
44 NTN Corp 169 0.04
– NuFlare Technology Inc 10 –
1 Obara Group Inc 56 0.01
5 Obayashi Road Corp 31 0.01
32 Ogaki Kyoritsu Bank Ltd 117 0.02
1 Ohashi Technica Inc 12 –
1 Ohsho Food Service Corp 47 0.01
3 Oiles Corp 52 0.01
13 Oita Bank Ltd 47 0.01
3 Okabe Co Ltd 29 0.01
6 Okamoto Industries Inc 57 0.01
7 Okamura Corp 59 0.01
20 Okasan Securities Group Inc 117 0.02
9 Oki Electric Industry Co Ltd 119 0.02
1 Okinawa Cellular Telephone Co 34 0.01
Shares (000's)
Value (000's)
USD
% of Net Asset Value
Common Stock (continued)
Japan - 9.61% (continued)
4 Okinawa Electric Power Co Inc 75 0.02
13 OKUMA Corp 116 0.02
6 Okumura Corp 35 0.01
2 Okura Industrial Co Ltd 9 –
1 Okuwa Co Ltd 10 –
2 Onoken Co Ltd 16 –
13 Onward Holdings Co Ltd 86 0.02
3 Open House Co Ltd 75 0.02
2 Optex Co Ltd 58 0.01
4 Organo Corp 17 –
5 Osaka Soda Co Ltd 21 –
1 Osaka Steel Co Ltd 26 0.01
4 Osaki Electric Co Ltd 41 0.01
7 OSG Corp 146 0.04
9 OSJB Holdings Corp 19 –
2 Otsuka Kagu Ltd 19 –
1 Outsourcing Inc 45 0.01
2 Oyo Corp 21 –
3 Pacific Industrial Co Ltd 43 0.01
15 Pacific Metals Co Ltd 51 0.01
1 Pack Corp 18 –
1 PAL GROUP Holdings Co Ltd 29 0.01
4 Paltac Corporation 87 0.02
9 PanaHome Corp 64 0.01
2 Panasonic Industrial Devices SUNX Co Ltd 13 –
2 Paramount Bed Holdings Co Ltd 63 0.01
2 Parco Co Ltd 21 –
2 Pasona Group Inc 16 –
2 PC Depot Corp 11 –
28 Penta-Ocean Construction Co Ltd 139 0.04
– PIA Corp 2 –
4 Pilot Corp 151 0.04
1 Piolax Inc 61 0.01
31 Pioneer Corp 65 0.01
3 Plenus Co Ltd 49 0.01
4 Pocket Card Co Ltd 20 –
9 Press Kogyo Co Ltd 39 0.01
4 Pressance Corp 45 0.01
6 Prestige International Inc 39 0.01
13 Prima Meat Packers Ltd 46 0.01
1 Pronexus Inc 9 –
1 Proto Corp 10 –
2 Qol Co Ltd 19 –
6 Raito Kogyo Co Ltd 62 0.01
1 Raysum Co Ltd 4 –
4 Relia Inc 36 0.01
19 Rengo Co Ltd 113 0.02
12 Rhythm Watch Co Ltd 20 –
2 Ricoh Leasing Co Ltd 46 0.01
2 Right On Co Ltd 14 –
1 Riken Corp 37 0.01
1 Riken Keiki Co Ltd 18 –
2 Riken Technos Corp 7 –
2 Ringer Hut Co Ltd 39 0.01
3 Riso Kagaku Corp 56 0.01
1 Rock Field Co Ltd 15 –
11 Rohto Pharmaceutical Co Ltd 151 0.04
1 Rokko Butter Co Ltd 29 0.01
1 Roland DG Corp 25 0.01
7 Round One Corp 51 0.01
2 Royal Holdings Co Ltd 39 0.01
14 Ryobi Ltd 57 0.01
2 Ryoden Corp 13 –
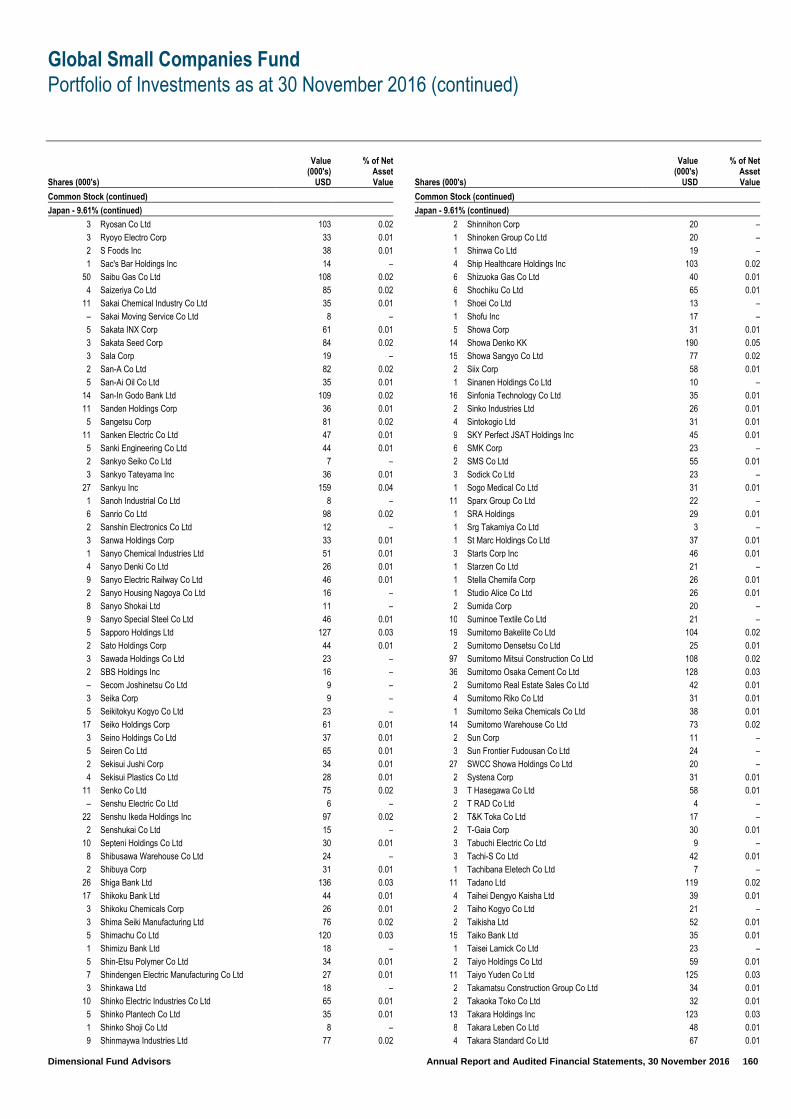
Global Small Companies Fund
Portfolio of Investments as at 30 November 2016 (continued)
Dimensional Fund Advisors Annual Report and Audited Financial Statements, 30 November 2016 160
Shares (000's)
Value (000's)
USD
% of Net Asset Value
Common Stock (continued)
Japan - 9.61% (continued)
3 Ryosan Co Ltd 103 0.02
3 Ryoyo Electro Corp 33 0.01
2 S Foods Inc 38 0.01
1 Sac's Bar Holdings Inc 14 –
50 Saibu Gas Co Ltd 108 0.02
4 Saizeriya Co Ltd 85 0.02
11 Sakai Chemical Industry Co Ltd 35 0.01
– Sakai Moving Service Co Ltd 8 –
5 Sakata INX Corp 61 0.01
3 Sakata Seed Corp 84 0.02
3 Sala Corp 19 –
2 San-A Co Ltd 82 0.02
5 San-Ai Oil Co Ltd 35 0.01
14 San-In Godo Bank Ltd 109 0.02
11 Sanden Holdings Corp 36 0.01
5 Sangetsu Corp 81 0.02
11 Sanken Electric Co Ltd 47 0.01
5 Sanki Engineering Co Ltd 44 0.01
2 Sankyo Seiko Co Ltd 7 –
3 Sankyo Tateyama Inc 36 0.01
27 Sankyu Inc 159 0.04
1 Sanoh Industrial Co Ltd 8 –
6 Sanrio Co Ltd 98 0.02
2 Sanshin Electronics Co Ltd 12 –
3 Sanwa Holdings Corp 33 0.01
1 Sanyo Chemical Industries Ltd 51 0.01
4 Sanyo Denki Co Ltd 26 0.01
9 Sanyo Electric Railway Co Ltd 46 0.01
2 Sanyo Housing Nagoya Co Ltd 16 –
8 Sanyo Shokai Ltd 11 –
9 Sanyo Special Steel Co Ltd 46 0.01
5 Sapporo Holdings Ltd 127 0.03
2 Sato Holdings Corp 44 0.01
3 Sawada Holdings Co Ltd 23 –
2 SBS Holdings Inc 16 –
– Secom Joshinetsu Co Ltd 9 –
3 Seika Corp 9 –
5 Seikitokyu Kogyo Co Ltd 23 –
17 Seiko Holdings Corp 61 0.01
3 Seino Holdings Co Ltd 37 0.01
5 Seiren Co Ltd 65 0.01
2 Sekisui Jushi Corp 34 0.01
4 Sekisui Plastics Co Ltd 28 0.01
11 Senko Co Ltd 75 0.02
– Senshu Electric Co Ltd 6 –
22 Senshu Ikeda Holdings Inc 97 0.02
2 Senshukai Co Ltd 15 –
10 Septeni Holdings Co Ltd 30 0.01
8 Shibusawa Warehouse Co Ltd 24 –
2 Shibuya Corp 31 0.01
26 Shiga Bank Ltd 136 0.03
17 Shikoku Bank Ltd 44 0.01
3 Shikoku Chemicals Corp 26 0.01
3 Shima Seiki Manufacturing Ltd 76 0.02
5 Shimachu Co Ltd 120 0.03
1 Shimizu Bank Ltd 18 –
5 Shin-Etsu Polymer Co Ltd 34 0.01
7 Shindengen Electric Manufacturing Co Ltd 27 0.01
3 Shinkawa Ltd 18 –
10 Shinko Electric Industries Co Ltd 65 0.01
5 Shinko Plantech Co Ltd 35 0.01
1 Shinko Shoji Co Ltd 8 –
9 Shinmaywa Industries Ltd 77 0.02
Shares (000's)
Value (000's)
USD
% of Net Asset Value
Common Stock (continued)
Japan - 9.61% (continued)
2 Shinnihon Corp 20 –
1 Shinoken Group Co Ltd 20 –
1 Shinwa Co Ltd 19 –
4 Ship Healthcare Holdings Inc 103 0.02
6 Shizuoka Gas Co Ltd 40 0.01
6 Shochiku Co Ltd 65 0.01
1 Shoei Co Ltd 13 –
1 Shofu Inc 17 –
5 Showa Corp 31 0.01
14 Showa Denko KK 190 0.05
15 Showa Sangyo Co Ltd 77 0.02
2 Siix Corp 58 0.01
1 Sinanen Holdings Co Ltd 10 –
16 Sinfonia Technology Co Ltd 35 0.01
2 Sinko Industries Ltd 26 0.01
4 Sintokogio Ltd 31 0.01
9 SKY Perfect JSAT Holdings Inc 45 0.01
6 SMK Corp 23 –
2 SMS Co Ltd 55 0.01
3 Sodick Co Ltd 23 –
1 Sogo Medical Co Ltd 31 0.01
11 Sparx Group Co Ltd 22 –
1 SRA Holdings 29 0.01
1 Srg Takamiya Co Ltd 3 –
1 St Marc Holdings Co Ltd 37 0.01
3 Starts Corp Inc 46 0.01
1 Starzen Co Ltd 21 –
1 Stella Chemifa Corp 26 0.01
1 Studio Alice Co Ltd 26 0.01
2 Sumida Corp 20 –
10 Suminoe Textile Co Ltd 21 –
19 Sumitomo Bakelite Co Ltd 104 0.02
2 Sumitomo Densetsu Co Ltd 25 0.01
97 Sumitomo Mitsui Construction Co Ltd 108 0.02
36 Sumitomo Osaka Cement Co Ltd 128 0.03
2 Sumitomo Real Estate Sales Co Ltd 42 0.01
4 Sumitomo Riko Co Ltd 31 0.01
1 Sumitomo Seika Chemicals Co Ltd 38 0.01
14 Sumitomo Warehouse Co Ltd 73 0.02
2 Sun Corp 11 –
3 Sun Frontier Fudousan Co Ltd 24 –
27 SWCC Showa Holdings Co Ltd 20 –
2 Systena Corp 31 0.01
3 T Hasegawa Co Ltd 58 0.01
2 T RAD Co Ltd 4 –
2 T&K Toka Co Ltd 17 –
2 T-Gaia Corp 30 0.01
3 Tabuchi Electric Co Ltd 9 –
3 Tachi-S Co Ltd 42 0.01
1 Tachibana Eletech Co Ltd 7 –
11 Tadano Ltd 119 0.02
4 Taihei Dengyo Kaisha Ltd 39 0.01
2 Taiho Kogyo Co Ltd 21 –
2 Taikisha Ltd 52 0.01
15 Taiko Bank Ltd 35 0.01
1 Taisei Lamick Co Ltd 23 –
2 Taiyo Holdings Co Ltd 59 0.01
11 Taiyo Yuden Co Ltd 125 0.03
2 Takamatsu Construction Group Co Ltd 34 0.01
2 Takaoka Toko Co Ltd 32 0.01
13 Takara Holdings Inc 123 0.03
8 Takara Leben Co Ltd 48 0.01
4 Takara Standard Co Ltd 67 0.01
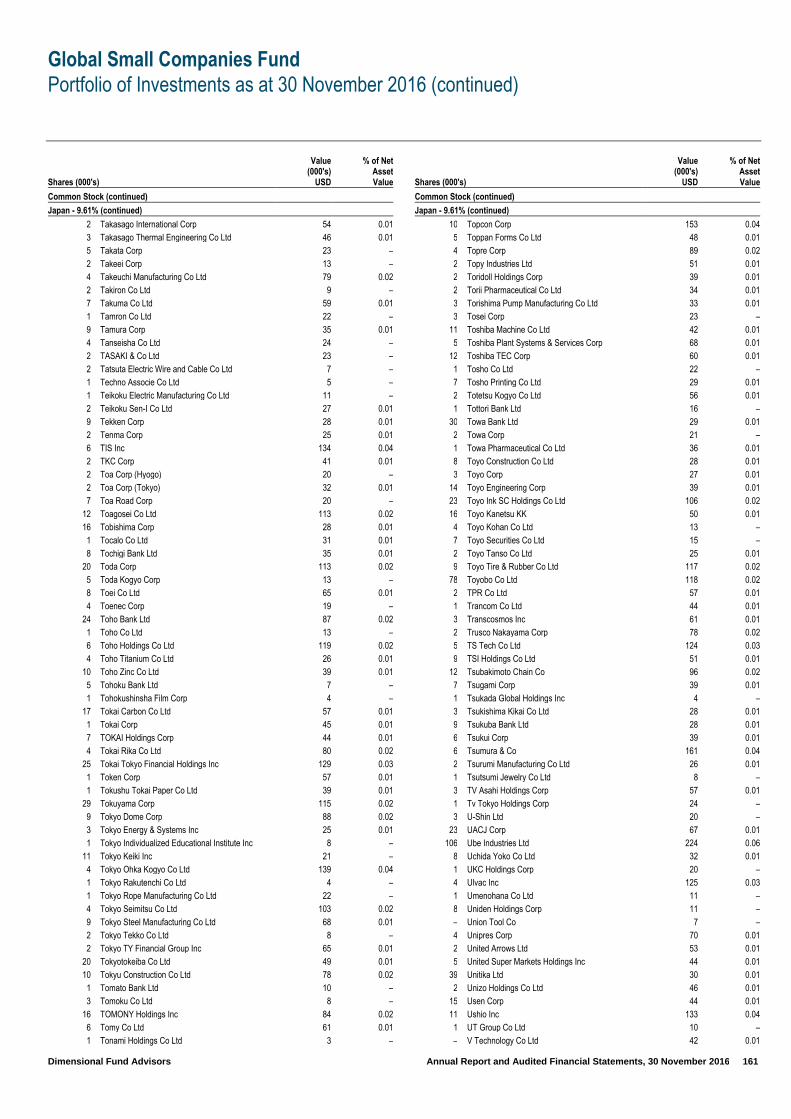
Global Small Companies Fund
Portfolio of Investments as at 30 November 2016 (continued)
Dimensional Fund Advisors Annual Report and Audited Financial Statements, 30 November 2016 161
Shares (000's)
Value (000's)
USD
% of Net Asset Value
Common Stock (continued)
Japan - 9.61% (continued)
2 Takasago International Corp 54 0.01
3 Takasago Thermal Engineering Co Ltd 46 0.01
5 Takata Corp 23 –
2 Takeei Corp 13 –
4 Takeuchi Manufacturing Co Ltd 79 0.02
2 Takiron Co Ltd 9 –
7 Takuma Co Ltd 59 0.01
1 Tamron Co Ltd 22 –
9 Tamura Corp 35 0.01
4 Tanseisha Co Ltd 24 –
2 TASAKI & Co Ltd 23 –
2 Tatsuta Electric Wire and Cable Co Ltd 7 –
1 Techno Associe Co Ltd 5 –
1 Teikoku Electric Manufacturing Co Ltd 11 –
2 Teikoku Sen-I Co Ltd 27 0.01
9 Tekken Corp 28 0.01
2 Tenma Corp 25 0.01
6 TIS Inc 134 0.04
2 TKC Corp 41 0.01
2 Toa Corp (Hyogo) 20 –
2 Toa Corp (Tokyo) 32 0.01
7 Toa Road Corp 20 –
12 Toagosei Co Ltd 113 0.02
16 Tobishima Corp 28 0.01
1 Tocalo Co Ltd 31 0.01
8 Tochigi Bank Ltd 35 0.01
20 Toda Corp 113 0.02
5 Toda Kogyo Corp 13 –
8 Toei Co Ltd 65 0.01
4 Toenec Corp 19 –
24 Toho Bank Ltd 87 0.02
1 Toho Co Ltd 13 –
6 Toho Holdings Co Ltd 119 0.02
4 Toho Titanium Co Ltd 26 0.01
10 Toho Zinc Co Ltd 39 0.01
5 Tohoku Bank Ltd 7 –
1 Tohokushinsha Film Corp 4 –
17 Tokai Carbon Co Ltd 57 0.01
1 Tokai Corp 45 0.01
7 TOKAI Holdings Corp 44 0.01
4 Tokai Rika Co Ltd 80 0.02
25 Tokai Tokyo Financial Holdings Inc 129 0.03
1 Token Corp 57 0.01
1 Tokushu Tokai Paper Co Ltd 39 0.01
29 Tokuyama Corp 115 0.02
9 Tokyo Dome Corp 88 0.02
3 Tokyo Energy & Systems Inc 25 0.01
1 Tokyo Individualized Educational Institute Inc 8 –
11 Tokyo Keiki Inc 21 –
4 Tokyo Ohka Kogyo Co Ltd 139 0.04
1 Tokyo Rakutenchi Co Ltd 4 –
1 Tokyo Rope Manufacturing Co Ltd 22 –
4 Tokyo Seimitsu Co Ltd 103 0.02
9 Tokyo Steel Manufacturing Co Ltd 68 0.01
2 Tokyo Tekko Co Ltd 8 –
2 Tokyo TY Financial Group Inc 65 0.01
20 Tokyotokeiba Co Ltd 49 0.01
10 Tokyu Construction Co Ltd 78 0.02
1 Tomato Bank Ltd 10 –
3 Tomoku Co Ltd 8 –
16 TOMONY Holdings Inc 84 0.02
6 Tomy Co Ltd 61 0.01
1 Tonami Holdings Co Ltd 3 –
Shares (000's)
Value (000's)
USD
% of Net Asset Value
Common Stock (continued)
Japan - 9.61% (continued)
10 Topcon Corp 153 0.04
5 Toppan Forms Co Ltd 48 0.01
4 Topre Corp 89 0.02
2 Topy Industries Ltd 51 0.01
2 Toridoll Holdings Corp 39 0.01
2 Torii Pharmaceutical Co Ltd 34 0.01
3 Torishima Pump Manufacturing Co Ltd 33 0.01
3 Tosei Corp 23 –
11 Toshiba Machine Co Ltd 42 0.01
5 Toshiba Plant Systems & Services Corp 68 0.01
12 Toshiba TEC Corp 60 0.01
1 Tosho Co Ltd 22 –
7 Tosho Printing Co Ltd 29 0.01
2 Totetsu Kogyo Co Ltd 56 0.01
1 Tottori Bank Ltd 16 –
30 Towa Bank Ltd 29 0.01
2 Towa Corp 21 –
1 Towa Pharmaceutical Co Ltd 36 0.01
8 Toyo Construction Co Ltd 28 0.01
3 Toyo Corp 27 0.01
14 Toyo Engineering Corp 39 0.01
23 Toyo Ink SC Holdings Co Ltd 106 0.02
16 Toyo Kanetsu KK 50 0.01
4 Toyo Kohan Co Ltd 13 –
7 Toyo Securities Co Ltd 15 –
2 Toyo Tanso Co Ltd 25 0.01
9 Toyo Tire & Rubber Co Ltd 117 0.02
78 Toyobo Co Ltd 118 0.02
2 TPR Co Ltd 57 0.01
1 Trancom Co Ltd 44 0.01
3 Transcosmos Inc 61 0.01
2 Trusco Nakayama Corp 78 0.02
5 TS Tech Co Ltd 124 0.03
9 TSI Holdings Co Ltd 51 0.01
12 Tsubakimoto Chain Co 96 0.02
7 Tsugami Corp 39 0.01
1 Tsukada Global Holdings Inc 4 –
3 Tsukishima Kikai Co Ltd 28 0.01
9 Tsukuba Bank Ltd 28 0.01
6 Tsukui Corp 39 0.01
6 Tsumura & Co 161 0.04
2 Tsurumi Manufacturing Co Ltd 26 0.01
1 Tsutsumi Jewelry Co Ltd 8 –
3 TV Asahi Holdings Corp 57 0.01
1 Tv Tokyo Holdings Corp 24 –
3 U-Shin Ltd 20 –
23 UACJ Corp 67 0.01
106 Ube Industries Ltd 224 0.06
8 Uchida Yoko Co Ltd 32 0.01
1 UKC Holdings Corp 20 –
4 Ulvac Inc 125 0.03
1 Umenohana Co Ltd 11 –
8 Uniden Holdings Corp 11 –
– Union Tool Co 7 –
4 Unipres Corp 70 0.01
2 United Arrows Ltd 53 0.01
5 United Super Markets Holdings Inc 44 0.01
39 Unitika Ltd 30 0.01
2 Unizo Holdings Co Ltd 46 0.01
15 Usen Corp 44 0.01
11 Ushio Inc 133 0.04
1 UT Group Co Ltd 10 –
– V Technology Co Ltd 42 0.01
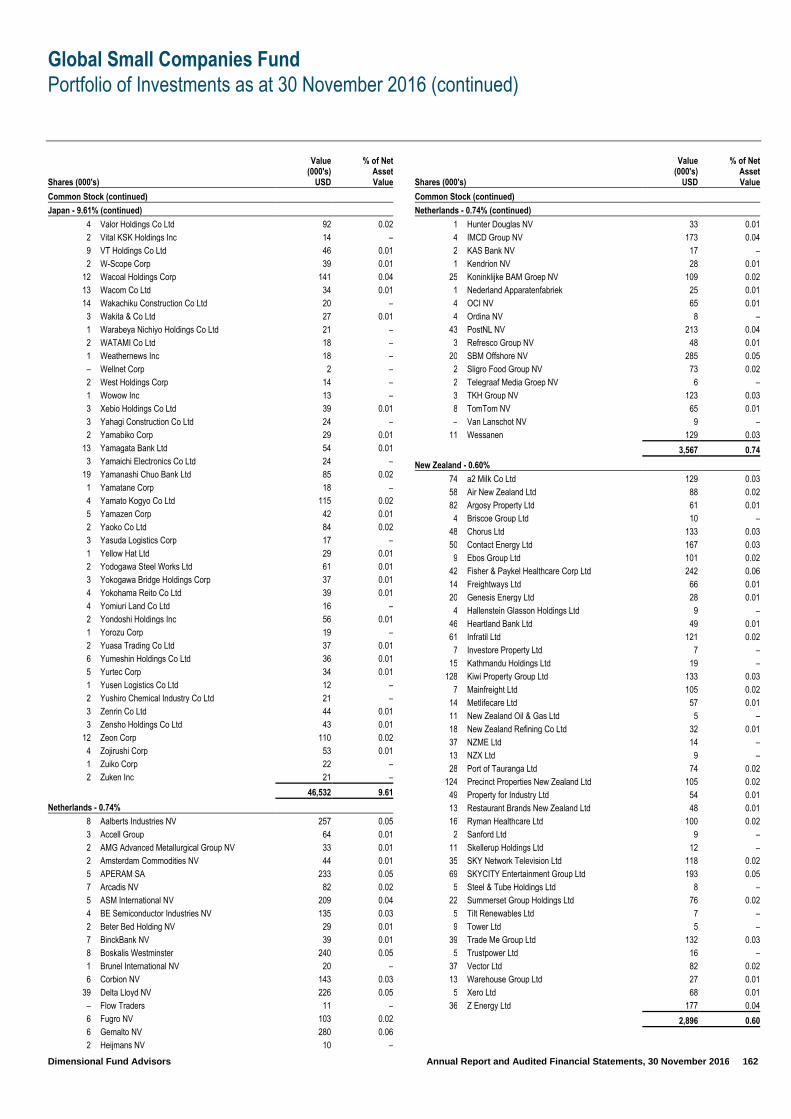
Global Small Companies Fund
Portfolio of Investments as at 30 November 2016 (continued)
Dimensional Fund Advisors Annual Report and Audited Financial Statements, 30 November 2016 162
Shares (000's)
Value (000's)
USD
% of Net Asset Value
Common Stock (continued)
Japan - 9.61% (continued)
4 Valor Holdings Co Ltd 92 0.02
2 Vital KSK Holdings Inc 14 –
9 VT Holdings Co Ltd 46 0.01
2 W-Scope Corp 39 0.01
12 Wacoal Holdings Corp 141 0.04
13 Wacom Co Ltd 34 0.01
14 Wakachiku Construction Co Ltd 20 –
3 Wakita & Co Ltd 27 0.01
1 Warabeya Nichiyo Holdings Co Ltd 21 –
2 WATAMI Co Ltd 18 –
1 Weathernews Inc 18 –
– Wellnet Corp 2 –
2 West Holdings Corp 14 –
1 Wowow Inc 13 –
3 Xebio Holdings Co Ltd 39 0.01
3 Yahagi Construction Co Ltd 24 –
2 Yamabiko Corp 29 0.01
13 Yamagata Bank Ltd 54 0.01
3 Yamaichi Electronics Co Ltd 24 –
19 Yamanashi Chuo Bank Ltd 85 0.02
1 Yamatane Corp 18 –
4 Yamato Kogyo Co Ltd 115 0.02
5 Yamazen Corp 42 0.01
2 Yaoko Co Ltd 84 0.02
3 Yasuda Logistics Corp 17 –
1 Yellow Hat Ltd 29 0.01
2 Yodogawa Steel Works Ltd 61 0.01
3 Yokogawa Bridge Holdings Corp 37 0.01
4 Yokohama Reito Co Ltd 39 0.01
4 Yomiuri Land Co Ltd 16 –
2 Yondoshi Holdings Inc 56 0.01
1 Yorozu Corp 19 –
2 Yuasa Trading Co Ltd 37 0.01
6 Yumeshin Holdings Co Ltd 36 0.01
5 Yurtec Corp 34 0.01
1 Yusen Logistics Co Ltd 12 –
2 Yushiro Chemical Industry Co Ltd 21 –
3 Zenrin Co Ltd 44 0.01
3 Zensho Holdings Co Ltd 43 0.01
12 Zeon Corp 110 0.02
4 Zojirushi Corp 53 0.01
1 Zuiko Corp 22 –
2 Zuken Inc 21 –
46,532 9.61
Netherlands - 0.74%
8 Aalberts Industries NV 257 0.05
3 Accell Group 64 0.01
2 AMG Advanced Metallurgical Group NV 33 0.01
2 Amsterdam Commodities NV 44 0.01
5 APERAM SA 233 0.05
7 Arcadis NV 82 0.02
5 ASM International NV 209 0.04
4 BE Semiconductor Industries NV 135 0.03
2 Beter Bed Holding NV 29 0.01
7 BinckBank NV 39 0.01
8 Boskalis Westminster 240 0.05
1 Brunel International NV 20 –
6 Corbion NV 143 0.03
39 Delta Lloyd NV 226 0.05
– Flow Traders 11 –
6 Fugro NV 103 0.02
6 Gemalto NV 280 0.06
2 Heijmans NV 10 –
Shares (000's)
Value (000's)
USD
% of Net Asset Value
Common Stock (continued)
Netherlands - 0.74% (continued)
1 Hunter Douglas NV 33 0.01
4 IMCD Group NV 173 0.04
2 KAS Bank NV 17 –
1 Kendrion NV 28 0.01
25 Koninklijke BAM Groep NV 109 0.02
1 Nederland Apparatenfabriek 25 0.01
4 OCI NV 65 0.01
4 Ordina NV 8 –
43 PostNL NV 213 0.04
3 Refresco Group NV 48 0.01
20 SBM Offshore NV 285 0.05
2 Sligro Food Group NV 73 0.02
2 Telegraaf Media Groep NV 6 –
3 TKH Group NV 123 0.03
8 TomTom NV 65 0.01
– Van Lanschot NV 9 –
11 Wessanen 129 0.03
3,567 0.74
New Zealand - 0.60%
74 a2 Milk Co Ltd 129 0.03
58 Air New Zealand Ltd 88 0.02
82 Argosy Property Ltd 61 0.01
4 Briscoe Group Ltd 10 –
48 Chorus Ltd 133 0.03
50 Contact Energy Ltd 167 0.03
9 Ebos Group Ltd 101 0.02
42 Fisher & Paykel Healthcare Corp Ltd 242 0.06
14 Freightways Ltd 66 0.01
20 Genesis Energy Ltd 28 0.01
4 Hallenstein Glasson Holdings Ltd 9 –
46 Heartland Bank Ltd 49 0.01
61 Infratil Ltd 121 0.02
7 Investore Property Ltd 7 –
15 Kathmandu Holdings Ltd 19 –
128 Kiwi Property Group Ltd 133 0.03
7 Mainfreight Ltd 105 0.02
14 Metlifecare Ltd 57 0.01
11 New Zealand Oil & Gas Ltd 5 –
18 New Zealand Refining Co Ltd 32 0.01
37 NZME Ltd 14 –
13 NZX Ltd 9 –
28 Port of Tauranga Ltd 74 0.02
124 Precinct Properties New Zealand Ltd 105 0.02
49 Property for Industry Ltd 54 0.01
13 Restaurant Brands New Zealand Ltd 48 0.01
16 Ryman Healthcare Ltd 100 0.02
2 Sanford Ltd 9 –
11 Skellerup Holdings Ltd 12 –
35 SKY Network Television Ltd 118 0.02
69 SKYCITY Entertainment Group Ltd 193 0.05
5 Steel & Tube Holdings Ltd 8 –
22 Summerset Group Holdings Ltd 76 0.02
5 Tilt Renewables Ltd 7 –
9 Tower Ltd 5 –
39 Trade Me Group Ltd 132 0.03
5 Trustpower Ltd 16 –
37 Vector Ltd 82 0.02
13 Warehouse Group Ltd 27 0.01
5 Xero Ltd 68 0.01
36 Z Energy Ltd 177 0.04
2,896 0.60
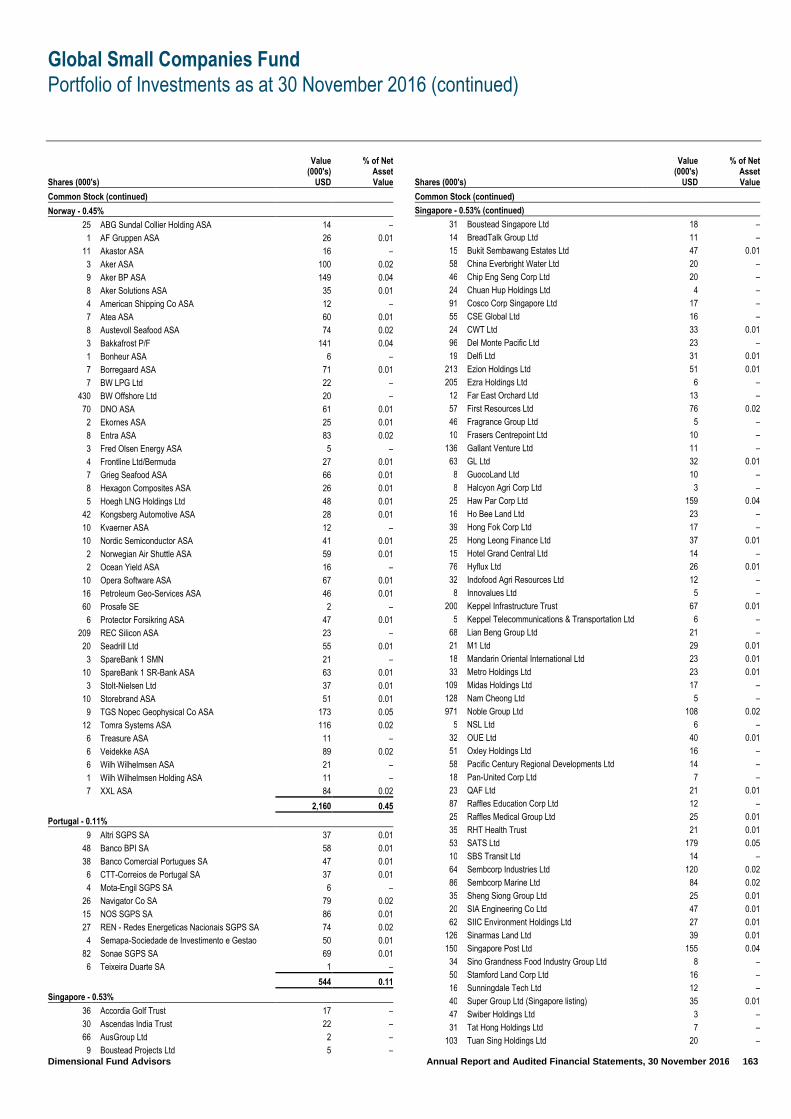
Global Small Companies Fund
Portfolio of Investments as at 30 November 2016 (continued)
Dimensional Fund Advisors Annual Report and Audited Financial Statements, 30 November 2016 163
Shares (000's)
Value (000's)
USD
% of Net Asset Value
Common Stock (continued)
Norway - 0.45%
25 ABG Sundal Collier Holding ASA 14 –
1 AF Gruppen ASA 26 0.01
11 Akastor ASA 16 –
3 Aker ASA 100 0.02
9 Aker BP ASA 149 0.04
8 Aker Solutions ASA 35 0.01
4 American Shipping Co ASA 12 –
7 Atea ASA 60 0.01
8 Austevoll Seafood ASA 74 0.02
3 Bakkafrost P/F 141 0.04
1 Bonheur ASA 6 –
7 Borregaard ASA 71 0.01
7 BW LPG Ltd 22 –
430 BW Offshore Ltd 20 –
70 DNO ASA 61 0.01
2 Ekornes ASA 25 0.01
8 Entra ASA 83 0.02
3 Fred Olsen Energy ASA 5 –
4 Frontline Ltd/Bermuda 27 0.01
7 Grieg Seafood ASA 66 0.01
8 Hexagon Composites ASA 26 0.01
5 Hoegh LNG Holdings Ltd 48 0.01
42 Kongsberg Automotive ASA 28 0.01
10 Kvaerner ASA 12 –
10 Nordic Semiconductor ASA 41 0.01
2 Norwegian Air Shuttle ASA 59 0.01
2 Ocean Yield ASA 16 –
10 Opera Software ASA 67 0.01
16 Petroleum Geo-Services ASA 46 0.01
60 Prosafe SE 2 –
6 Protector Forsikring ASA 47 0.01
209 REC Silicon ASA 23 –
20 Seadrill Ltd 55 0.01
3 SpareBank 1 SMN 21 –
10 SpareBank 1 SR-Bank ASA 63 0.01
3 Stolt-Nielsen Ltd 37 0.01
10 Storebrand ASA 51 0.01
9 TGS Nopec Geophysical Co ASA 173 0.05
12 Tomra Systems ASA 116 0.02
6 Treasure ASA 11 –
6 Veidekke ASA 89 0.02
6 Wilh Wilhelmsen ASA 21 –
1 Wilh Wilhelmsen Holding ASA 11 –
7 XXL ASA 84 0.02
2,160 0.45
Portugal - 0.11%
9 Altri SGPS SA 37 0.01
48 Banco BPI SA 58 0.01
38 Banco Comercial Portugues SA 47 0.01
6 CTT-Correios de Portugal SA 37 0.01
4 Mota-Engil SGPS SA 6 –
26 Navigator Co SA 79 0.02
15 NOS SGPS SA 86 0.01
27 REN - Redes Energeticas Nacionais SGPS SA 74 0.02
4 Semapa-Sociedade de Investimento e Gestao 50 0.01
82 Sonae SGPS SA 69 0.01
6 Teixeira Duarte SA 1 –
544 0.11
Singapore - 0.53%
36 Accordia Golf Trust 17 –
30 Ascendas India Trust 22 –
66 AusGroup Ltd 2 –
9 Boustead Projects Ltd 5 –
Shares (000's)
Value (000's)
USD
% of Net Asset Value
Common Stock (continued)
Singapore - 0.53% (continued)
31 Boustead Singapore Ltd 18 –
14 BreadTalk Group Ltd 11 –
15 Bukit Sembawang Estates Ltd 47 0.01
58 China Everbright Water Ltd 20 –
46 Chip Eng Seng Corp Ltd 20 –
24 Chuan Hup Holdings Ltd 4 –
91 Cosco Corp Singapore Ltd 17 –
55 CSE Global Ltd 16 –
24 CWT Ltd 33 0.01
96 Del Monte Pacific Ltd 23 –
19 Delfi Ltd 31 0.01
213 Ezion Holdings Ltd 51 0.01
205 Ezra Holdings Ltd 6 –
12 Far East Orchard Ltd 13 –
57 First Resources Ltd 76 0.02
46 Fragrance Group Ltd 5 –
10 Frasers Centrepoint Ltd 10 –
136 Gallant Venture Ltd 11 –
63 GL Ltd 32 0.01
8 GuocoLand Ltd 10 –
8 Halcyon Agri Corp Ltd 3 –
25 Haw Par Corp Ltd 159 0.04
16 Ho Bee Land Ltd 23 –
39 Hong Fok Corp Ltd 17 –
25 Hong Leong Finance Ltd 37 0.01
15 Hotel Grand Central Ltd 14 –
76 Hyflux Ltd 26 0.01
32 Indofood Agri Resources Ltd 12 –
8 Innovalues Ltd 5 –
200 Keppel Infrastructure Trust 67 0.01
5 Keppel Telecommunications & Transportation Ltd 6 –
68 Lian Beng Group Ltd 21 –
21 M1 Ltd 29 0.01
18 Mandarin Oriental International Ltd 23 0.01
33 Metro Holdings Ltd 23 0.01
109 Midas Holdings Ltd 17 –
128 Nam Cheong Ltd 5 –
971 Noble Group Ltd 108 0.02
5 NSL Ltd 6 –
32 OUE Ltd 40 0.01
51 Oxley Holdings Ltd 16 –
58 Pacific Century Regional Developments Ltd 14 –
18 Pan-United Corp Ltd 7 –
23 QAF Ltd 21 0.01
87 Raffles Education Corp Ltd 12 –
25 Raffles Medical Group Ltd 25 0.01
35 RHT Health Trust 21 0.01
53 SATS Ltd 179 0.05
10 SBS Transit Ltd 14 –
64 Sembcorp Industries Ltd 120 0.02
86 Sembcorp Marine Ltd 84 0.02
35 Sheng Siong Group Ltd 25 0.01
20 SIA Engineering Co Ltd 47 0.01
62 SIIC Environment Holdings Ltd 27 0.01
126 Sinarmas Land Ltd 39 0.01
150 Singapore Post Ltd 155 0.04
34 Sino Grandness Food Industry Group Ltd 8 –
50 Stamford Land Corp Ltd 16 –
16 Sunningdale Tech Ltd 12 –
40 Super Group Ltd (Singapore listing) 35 0.01
47 Swiber Holdings Ltd 3 –
31 Tat Hong Holdings Ltd 7 –
103 Tuan Sing Holdings Ltd 20 –

Global Small Companies Fund
Portfolio of Investments as at 30 November 2016 (continued)
Dimensional Fund Advisors Annual Report and Audited Financial Statements, 30 November 2016 164
Shares (000's)
Value (000's)
USD
% of Net Asset Value
Common Stock (continued)
Singapore - 0.53% (continued)
64 UMS Holdings Ltd 27 0.01
39 United Engineers Ltd 70 0.01
7 United Industrial Corp Ltd 13 –
39 UOB-Kay Hian Holdings Ltd 35 0.01
21 UOL Group Ltd 84 0.02
34 UPP Holdings Ltd 7 –
38 Vard Holdings Ltd 6 –
27 Venture Corp Ltd 184 0.05
27 Wheelock Properties Singapore Ltd 28 0.01
41 Wing Tai Holdings Ltd 46 0.01
25 Yongnam Holdings Ltd 3 –
2,551 0.53
Spain - 0.87%
3 Acciona SA 216 0.04
18 Acerinox SA 232 0.04
1 Adveo Group International SA 3 –
6 Almirall SA 95 0.02
13 Amper SA 2 –
8 Applus Services SA 79 0.02
7 Atresmedia Corp de Medios de Comunicacion SA 73 0.02
40 Banco Popular Espanol SA 35 0.01
– Baron de Ley 36 0.01
7 Bolsas y Mercados Espanoles SHMSF SA 206 0.04
4 Cia de Distribucion Integral Logista Holdings SA 85 0.02
5 CIE Automotive SA 87 0.02
2 Construcciones y Auxiliar de Ferrocarriles SA 82 0.02
57 Distribuidora Internacional de Alimentacion SA 260 0.05
8 Duro Felguera SA 8 –
7 Ebro Foods SA 144 0.03
1 Elecnor SA 13 –
17 Ence Energia y Celulosa SA 39 0.01
2 Euskaltel SA 20 –
25 Faes Farma SA 90 0.02
21 Gamesa Corp Tecnologica SA 432 0.08
5 Grupo Catalana Occidente SA 136 0.03
16 Grupo Ezentis SA 8 –
– Iberpapel Gestion SA – –
1 Iberpapel Gestion SA 19 –
12 Indra Sistemas SA 127 0.03
21 Inmobiliaria Colonial SA 140 0.03
2 Laboratorios Farmaceuticos Rovi SA 21 –
47 Liberbank SA 44 0.01
16 Mediaset Espana Comunicacion SA 162 0.03
9 Melia Hotels International SA 106 0.02
2 Miquel y Costas & Miquel SA 39 0.01
23 NH Hotel Group SA 89 0.02
3 Nmas1 Dinamia SA 28 0.01
15 Obrascon Huarte Lain SA 42 0.01
5 Papeles y Cartones de Europa SA 26 0.01
1 Pescanova SA – –
19 Pharma Mar SA 47 0.01
5 Promotora de Informaciones SA 31 0.01
28 Prosegur Cia de Seguridad SA 177 0.04
8 Realia Business SA 7 –
29 Sacyr SA 60 0.01
3 Saeta Yield SA 26 0.01
3 Tecnicas Reunidas SA 129 0.03
18 Tubacex SA 51 0.01
5 Tubos Reunidos SA 4 –
2 Vidrala SA 99 0.02
4 Viscofan SA 208 0.04
21 Zardoya Otis SA 162 0.03
4,225 0.87
Shares (000's)
Value (000's)
USD
% of Net Asset Value
Common Stock (continued)
Sweden - 1.24%
3 AAK AB 155 0.03
7 Acando AB 19 –
2 AddLife AB 26 0.01
5 AddTech AB 76 0.02
5 AF AB 93 0.02
3 Atrium Ljungberg AB 42 0.01
2 Avanza Bank Holding AB 88 0.02
3 B&B Tools AB 60 0.01
2 Beijer Alma AB 37 0.01
3 Beijer Ref AB 66 0.01
5 Betsson AB 52 0.01
5 Bilia AB 95 0.02
1 BioGaia AB 46 0.01
8 Bonava AB, Shares B 99 0.02
2 Bulten ABEURONEXT NV 23 –
5 Bure Equity AB 56 0.01
5 Byggmax Group AB 31 0.01
3 Clas Ohlson AB 41 0.01
24 Cloetta AB 76 0.02
12 Com Hem Holding AB 110 0.02
4 Concentric AB 46 0.01
5 Dios Fastigheter AB 31 0.01
2 Doro AB 10 –
3 Duni AB 40 0.01
2 Dustin Group AB 10 –
2 East Capital Explorer AB 12 –
3 Enea AB 24 –
12 Fabege AB 193 0.04
1 Fagerhult AB 14 –
7 Granges AB 65 0.01
2 Gunnebo AB 7 –
4 Haldex AB 47 0.01
15 Hemfosa Fastigheter AB 141 0.03
8 Hexpol AB 71 0.01
6 HIQ International AB 37 0.01
6 Holmen AB 187 0.04
8 Indutrade AB 153 0.03
7 Intrum Justitia AB 202 0.04
4 Inwido AB 41 0.01
3 ITAB Shop Concept AB 22 –
8 JM AB 216 0.05
4 KappAhl AB 20 –
46 Klovern AB 47 0.01
14 Kungsleden AB 89 0.02
4 Lagercrantz Group AB 35 0.01
1 Lifco AB 27 0.01
6 Lindab International AB 50 0.01
8 Loomis AB 203 0.05
3 Medivir AB 27 0.01
3 Mekonomen AB 54 0.01
6 Modern Times Group MTG AB 147 0.03
3 MQ Holding AB 13 –
8 Mycronic AB 78 0.02
7 NCC AB 160 0.03
34 Net Insight AB 27 0.01
15 NetEnt AB 108 0.02
2 New Wave Group AB 9 –
2 Nibe Industrier AB 11 –
10 Nobia AB 85 0.02
3 Nolato AB 73 0.02
14 Nordnet AB 56 0.01
1 OEM International AB 10 –
7 Opus Group AB 5 –
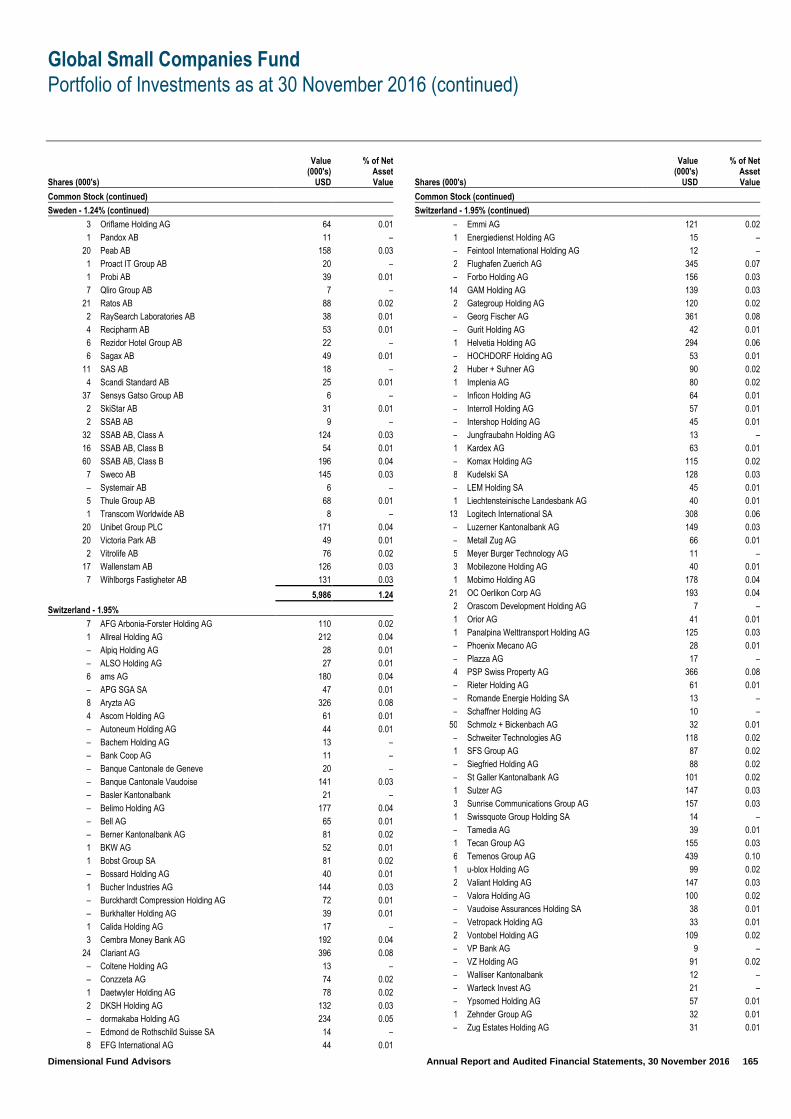
Global Small Companies Fund
Portfolio of Investments as at 30 November 2016 (continued)
Dimensional Fund Advisors Annual Report and Audited Financial Statements, 30 November 2016 165
Shares (000's)
Value (000's)
USD
% of Net Asset Value
Common Stock (continued)
Sweden - 1.24% (continued)
3 Oriflame Holding AG 64 0.01
1 Pandox AB 11 –
20 Peab AB 158 0.03
1 Proact IT Group AB 20 –
1 Probi AB 39 0.01
7 Qliro Group AB 7 –
21 Ratos AB 88 0.02
2 RaySearch Laboratories AB 38 0.01
4 Recipharm AB 53 0.01
6 Rezidor Hotel Group AB 22 –
6 Sagax AB 49 0.01
11 SAS AB 18 –
4 Scandi Standard AB 25 0.01
37 Sensys Gatso Group AB 6 –
2 SkiStar AB 31 0.01
2 SSAB AB 9 –
32 SSAB AB, Class A 124 0.03
16 SSAB AB, Class B 54 0.01
60 SSAB AB, Class B 196 0.04
7 Sweco AB 145 0.03
– Systemair AB 6 –
5 Thule Group AB 68 0.01
1 Transcom Worldwide AB 8 –
20 Unibet Group PLC 171 0.04
20 Victoria Park AB 49 0.01
2 Vitrolife AB 76 0.02
17 Wallenstam AB 126 0.03
7 Wihlborgs Fastigheter AB 131 0.03
5,986 1.24
Switzerland - 1.95%
7 AFG Arbonia-Forster Holding AG 110 0.02
1 Allreal Holding AG 212 0.04
– Alpiq Holding AG 28 0.01
– ALSO Holding AG 27 0.01
6 ams AG 180 0.04
– APG SGA SA 47 0.01
8 Aryzta AG 326 0.08
4 Ascom Holding AG 61 0.01
– Autoneum Holding AG 44 0.01
– Bachem Holding AG 13 –
– Bank Coop AG 11 –
– Banque Cantonale de Geneve 20 –
– Banque Cantonale Vaudoise 141 0.03
– Basler Kantonalbank 21 –
– Belimo Holding AG 177 0.04
– Bell AG 65 0.01
– Berner Kantonalbank AG 81 0.02
1 BKW AG 52 0.01
1 Bobst Group SA 81 0.02
– Bossard Holding AG 40 0.01
1 Bucher Industries AG 144 0.03
– Burckhardt Compression Holding AG 72 0.01
– Burkhalter Holding AG 39 0.01
1 Calida Holding AG 17 –
3 Cembra Money Bank AG 192 0.04
24 Clariant AG 396 0.08
– Coltene Holding AG 13 –
– Conzzeta AG 74 0.02
1 Daetwyler Holding AG 78 0.02
2 DKSH Holding AG 132 0.03
– dormakaba Holding AG 234 0.05
– Edmond de Rothschild Suisse SA 14 –
8 EFG International AG 44 0.01
Shares (000's)
Value (000's)
USD
% of Net Asset Value
Common Stock (continued)
Switzerland - 1.95% (continued)
– Emmi AG 121 0.02
1 Energiedienst Holding AG 15 –
– Feintool International Holding AG 12 –
2 Flughafen Zuerich AG 345 0.07
– Forbo Holding AG 156 0.03
14 GAM Holding AG 139 0.03
2 Gategroup Holding AG 120 0.02
– Georg Fischer AG 361 0.08
– Gurit Holding AG 42 0.01
1 Helvetia Holding AG 294 0.06
– HOCHDORF Holding AG 53 0.01
2 Huber + Suhner AG 90 0.02
1 Implenia AG 80 0.02
– Inficon Holding AG 64 0.01
– Interroll Holding AG 57 0.01
– Intershop Holding AG 45 0.01
– Jungfraubahn Holding AG 13 –
1 Kardex AG 63 0.01
– Komax Holding AG 115 0.02
8 Kudelski SA 128 0.03
– LEM Holding SA 45 0.01
1 Liechtensteinische Landesbank AG 40 0.01
13 Logitech International SA 308 0.06
– Luzerner Kantonalbank AG 149 0.03
– Metall Zug AG 66 0.01
5 Meyer Burger Technology AG 11 –
3 Mobilezone Holding AG 40 0.01
1 Mobimo Holding AG 178 0.04
21 OC Oerlikon Corp AG 193 0.04
2 Orascom Development Holding AG 7 –
1 Orior AG 41 0.01
1 Panalpina Welttransport Holding AG 125 0.03
– Phoenix Mecano AG 28 0.01
– Plazza AG 17 –
4 PSP Swiss Property AG 366 0.08
– Rieter Holding AG 61 0.01
– Romande Energie Holding SA 13 –
– Schaffner Holding AG 10 –
50 Schmolz + Bickenbach AG 32 0.01
– Schweiter Technologies AG 118 0.02
1 SFS Group AG 87 0.02
– Siegfried Holding AG 88 0.02
– St Galler Kantonalbank AG 101 0.02
1 Sulzer AG 147 0.03
3 Sunrise Communications Group AG 157 0.03
1 Swissquote Group Holding SA 14 –
– Tamedia AG 39 0.01
1 Tecan Group AG 155 0.03
6 Temenos Group AG 439 0.10
1 u-blox Holding AG 99 0.02
2 Valiant Holding AG 147 0.03
– Valora Holding AG 100 0.02
– Vaudoise Assurances Holding SA 38 0.01
– Vetropack Holding AG 33 0.01
2 Vontobel Holding AG 109 0.02
– VP Bank AG 9 –
– VZ Holding AG 91 0.02
– Walliser Kantonalbank 12 –
– Warteck Invest AG 21 –
– Ypsomed Holding AG 57 0.01
1 Zehnder Group AG 32 0.01
– Zug Estates Holding AG 31 0.01
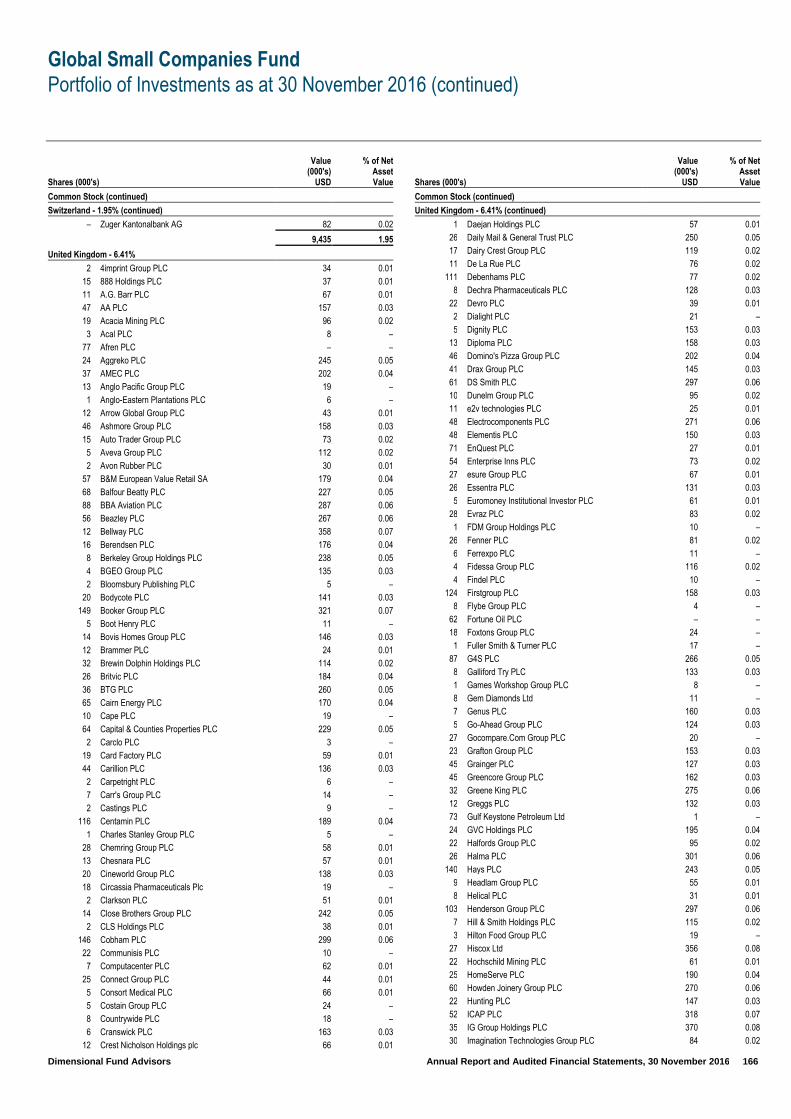
Global Small Companies Fund
Portfolio of Investments as at 30 November 2016 (continued)
Dimensional Fund Advisors Annual Report and Audited Financial Statements, 30 November 2016 166
Shares (000's)
Value (000's)
USD
% of Net Asset Value
Common Stock (continued)
Switzerland - 1.95% (continued)
– Zuger Kantonalbank AG 82 0.02
9,435 1.95
United Kingdom - 6.41%
2 4imprint Group PLC 34 0.01
15 888 Holdings PLC 37 0.01
11 A.G. Barr PLC 67 0.01
47 AA PLC 157 0.03
19 Acacia Mining PLC 96 0.02
3 Acal PLC 8 –
77 Afren PLC – –
24 Aggreko PLC 245 0.05
37 AMEC PLC 202 0.04
13 Anglo Pacific Group PLC 19 –
1 Anglo-Eastern Plantations PLC 6 –
12 Arrow Global Group PLC 43 0.01
46 Ashmore Group PLC 158 0.03
15 Auto Trader Group PLC 73 0.02
5 Aveva Group PLC 112 0.02
2 Avon Rubber PLC 30 0.01
57 B&M European Value Retail SA 179 0.04
68 Balfour Beatty PLC 227 0.05
88 BBA Aviation PLC 287 0.06
56 Beazley PLC 267 0.06
12 Bellway PLC 358 0.07
16 Berendsen PLC 176 0.04
8 Berkeley Group Holdings PLC 238 0.05
4 BGEO Group PLC 135 0.03
2 Bloomsbury Publishing PLC 5 –
20 Bodycote PLC 141 0.03
149 Booker Group PLC 321 0.07
5 Boot Henry PLC 11 –
14 Bovis Homes Group PLC 146 0.03
12 Brammer PLC 24 0.01
32 Brewin Dolphin Holdings PLC 114 0.02
26 Britvic PLC 184 0.04
36 BTG PLC 260 0.05
65 Cairn Energy PLC 170 0.04
10 Cape PLC 19 –
64 Capital & Counties Properties PLC 229 0.05
2 Carclo PLC 3 –
19 Card Factory PLC 59 0.01
44 Carillion PLC 136 0.03
2 Carpetright PLC 6 –
7 Carr's Group PLC 14 –
2 Castings PLC 9 –
116 Centamin PLC 189 0.04
1 Charles Stanley Group PLC 5 –
28 Chemring Group PLC 58 0.01
13 Chesnara PLC 57 0.01
20 Cineworld Group PLC 138 0.03
18 Circassia Pharmaceuticals Plc 19 –
2 Clarkson PLC 51 0.01
14 Close Brothers Group PLC 242 0.05
2 CLS Holdings PLC 38 0.01
146 Cobham PLC 299 0.06
22 Communisis PLC 10 –
7 Computacenter PLC 62 0.01
25 Connect Group PLC 44 0.01
5 Consort Medical PLC 66 0.01
5 Costain Group PLC 24 –
8 Countrywide PLC 18 –
6 Cranswick PLC 163 0.03
12 Crest Nicholson Holdings plc 66 0.01
Shares (000's)
Value (000's)
USD
% of Net Asset Value
Common Stock (continued)
United Kingdom - 6.41% (continued)
1 Daejan Holdings PLC 57 0.01
26 Daily Mail & General Trust PLC 250 0.05
17 Dairy Crest Group PLC 119 0.02
11 De La Rue PLC 76 0.02
111 Debenhams PLC 77 0.02
8 Dechra Pharmaceuticals PLC 128 0.03
22 Devro PLC 39 0.01
2 Dialight PLC 21 –
5 Dignity PLC 153 0.03
13 Diploma PLC 158 0.03
46 Domino's Pizza Group PLC 202 0.04
41 Drax Group PLC 145 0.03
61 DS Smith PLC 297 0.06
10 Dunelm Group PLC 95 0.02
11 e2v technologies PLC 25 0.01
48 Electrocomponents PLC 271 0.06
48 Elementis PLC 150 0.03
71 EnQuest PLC 27 0.01
54 Enterprise Inns PLC 73 0.02
27 esure Group PLC 67 0.01
26 Essentra PLC 131 0.03
5 Euromoney Institutional Investor PLC 61 0.01
28 Evraz PLC 83 0.02
1 FDM Group Holdings PLC 10 –
26 Fenner PLC 81 0.02
6 Ferrexpo PLC 11 –
4 Fidessa Group PLC 116 0.02
4 Findel PLC 10 –
124 Firstgroup PLC 158 0.03
8 Flybe Group PLC 4 –
62 Fortune Oil PLC – –
18 Foxtons Group PLC 24 –
1 Fuller Smith & Turner PLC 17 –
87 G4S PLC 266 0.05
8 Galliford Try PLC 133 0.03
1 Games Workshop Group PLC 8 –
8 Gem Diamonds Ltd 11 –
7 Genus PLC 160 0.03
5 Go-Ahead Group PLC 124 0.03
27 Gocompare.Com Group PLC 20 –
23 Grafton Group PLC 153 0.03
45 Grainger PLC 127 0.03
45 Greencore Group PLC 162 0.03
32 Greene King PLC 275 0.06
12 Greggs PLC 132 0.03
73 Gulf Keystone Petroleum Ltd 1 –
24 GVC Holdings PLC 195 0.04
22 Halfords Group PLC 95 0.02
26 Halma PLC 301 0.06
140 Hays PLC 243 0.05
9 Headlam Group PLC 55 0.01
8 Helical PLC 31 0.01
103 Henderson Group PLC 297 0.06
7 Hill & Smith Holdings PLC 115 0.02
3 Hilton Food Group PLC 19 –
27 Hiscox Ltd 356 0.08
22 Hochschild Mining PLC 61 0.01
25 HomeServe PLC 190 0.04
60 Howden Joinery Group PLC 270 0.06
22 Hunting PLC 147 0.03
52 ICAP PLC 318 0.07
35 IG Group Holdings PLC 370 0.08
30 Imagination Technologies Group PLC 84 0.02

Global Small Companies Fund
Portfolio of Investments as at 30 November 2016 (continued)
Dimensional Fund Advisors Annual Report and Audited Financial Statements, 30 November 2016 167
Shares (000's)
Value (000's)
USD
% of Net Asset Value
Common Stock (continued)
United Kingdom - 6.41% (continued)
24 IMI PLC 295 0.06
37 Inchcape PLC 280 0.06
66 Indivior PLC 267 0.06
23 Inmarsat PLC 203 0.04
29 Intermediate Capital Group PLC 242 0.05
23 International Personal Finance PLC 81 0.02
16 Interserve PLC 59 0.01
32 IP Group PLC 55 0.01
34 ITE Group PLC 63 0.01
5 James Fisher & Sons PLC 97 0.02
14 Jardine Lloyd Thompson Group PLC 172 0.04
39 JD Sports Fashion PLC 163 0.03
9 JD Wetherspoon PLC 97 0.02
8 John Menzies PLC 55 0.01
35 John Wood Group PLC 358 0.07
27 JRP Group PLC 44 0.01
40 Jupiter Fund Management PLC 212 0.04
23 KAZ Minerals PLC 106 0.02
70 Kcom Group PLC 91 0.02
7 Keller Group PLC 70 0.02
10 Kier Group PLC 174 0.04
84 Ladbrokes PLC 130 0.03
27 Laird PLC 52 0.01
21 Lamprell PLC 23 –
20 Lancashire Holdings Ltd 157 0.03
8 Lavendon Group PLC 22 –
21 Lonmin PLC 40 0.01
30 Lookers PLC 39 0.01
28 Low & Bonar PLC 24 –
3 LSL Property Services PLC 9 –
154 Man Group PLC 218 0.05
22 Marshalls PLC 80 0.02
59 Marston's PLC 99 0.02
21 McBride PLC 45 0.01
9 Mears Group PLC 53 0.01
46 Meggitt PLC 271 0.06
170 Melrose Industries PLC 389 0.08
25 Michael Page International PLC 118 0.02
12 Millennium & Copthorne Hotels PLC 67 0.01
19 Mitchells & Butlers PLC 55 0.01
41 Mitie Group PLC 104 0.02
2 MJ Gleeson PLC 12 –
46 Moneysupermarket.com Group PLC 153 0.03
38 Morgan Crucible Co PLC 135 0.03
3 Morgan Sindall Group PLC 29 0.01
11 Mothercare PLC 15 –
11 N Brown Group PLC 27 0.01
46 National Express Group PLC 206 0.04
10 Ncc Group PLC 24 –
12 Northgate PLC 64 0.01
6 Novae Group PLC 57 0.01
48 Ocado Group PLC 162 0.03
7 OneSavings Bank PLC 29 0.01
92 Ophir Energy PLC 92 0.02
6 Oxford Instruments PLC 44 0.01
32 Paragon Group of Cos PLC 145 0.03
4 PayPoint PLC 55 0.01
26 Paysafe Group PLC 128 0.03
139 Pendragon PLC 53 0.01
32 Pennon Group PLC 327 0.07
66 Petra Diamonds Ltd 136 0.03
10 Petrofac Ltd 96 0.02
99 Petropavlovsk PLC 9 –
Shares (000's)
Value (000's)
USD
% of Net Asset Value
Common Stock (continued)
United Kingdom - 6.41% (continued)
12 Pets at Home Group Plc 32 0.01
37 Phoenix Group Holdings 329 0.06
27 Photo-Me International PLC 47 0.01
24 Playtech PLC 259 0.05
6 Polypipe Group PLC 25 0.01
94 Premier Foods PLC 52 0.01
47 Premier Oil PLC 35 0.01
23 PZ Cussons PLC 88 0.02
53 QinetiQ Group PLC 161 0.03
16 Rank Group PLC 38 0.01
5 Rathbone Brothers PLC 113 0.02
15 Raven Russia Ltd 7 –
25 Redrow PLC 128 0.03
61 Regus PLC 177 0.04
5 Renishaw PLC 150 0.03
7 Renold PLC 4 –
137 Rentokil Initial PLC 367 0.07
17 Restaurant Group PLC 69 0.01
5 Ricardo PLC 51 0.01
3 Rightmove PLC 151 0.03
3 RM PLC 4 –
6 Robert Walters PLC 28 0.01
77 Rotork PLC 225 0.05
34 RPC Group PLC 453 0.10
27 RPS Group PLC 64 0.01
54 Saga PLC 128 0.03
13 Savills PLC 107 0.02
11 SDL PLC 60 0.01
46 Senior PLC 106 0.02
14 Sepura PLC 4 –
42 Serco Group PLC 70 0.01
2 Servelec Group PLC 7 –
16 Severfield PLC 15 –
54 Shanks Group PLC 62 0.01
55 SIG PLC 62 0.01
17 Soco International PLC 29 0.01
12 Spectris PLC 316 0.07
50 Speedy Hire PLC 28 0.01
7 Spirax-Sarco Engineering PLC 392 0.08
6 Spire Healthcare Group PLC 25 0.01
58 Spirent Communications PLC 59 0.01
9 Sports Direct International PLC 34 0.01
42 SSP Group PLC 195 0.04
9 St Ives PLC 14 –
19 St Modwen Properties PLC 68 0.01
36 Stagecoach Group PLC 92 0.02
9 SThree PLC 31 0.01
14 Stobart Group Ltd 29 0.01
1 Stock Spirits Group PLC 1 –
4 SuperGroup PLC 76 0.02
26 Synthomer PLC 122 0.03
46 TalkTalk Telecom Group PLC 92 0.02
2 Tarsus Group PLC 7 –
45 Tate & Lyle PLC 383 0.08
3 Ted Baker PLC 101 0.02
7 Telecom Plus PLC 106 0.02
97 Thomas Cook Group PLC 102 0.02
10 Topps Tiles PLC 11 –
3 Travis Perkins PLC 46 0.01
3 Trifast PLC 7 –
30 Trinity Mirror PLC 29 0.01
17 TT Electronics PLC 29 0.01
26 Tullett Prebon PLC 143 0.03

Global Small Companies Fund
Portfolio of Investments as at 30 November 2016 (continued)
Dimensional Fund Advisors Annual Report and Audited Financial Statements, 30 November 2016 168
Shares (000's)
Value (000's)
USD
% of Net Asset Value
Common Stock (continued)
United Kingdom - 6.41% (continued)
101 Tullow Oil PLC 378 0.08
9 U & I Group PLC 19 –
39 UBM PLC 346 0.07
28 UDG Healthcare PLC 228 0.05
1 UK Mail Group PLC 6 –
7 Ultra Electronics Holdings PLC 183 0.04
24 UNITE Group PLC 168 0.03
71 Vectura Group PLC 127 0.03
8 Vedanta Resources PLC 85 0.02
20 Vesuvius PLC 100 0.02
10 Victrex PLC 208 0.04
12 Virgin Money Holdings UK PLC 48 0.01
1 Vitec Group PLC 12 –
4 Volution Group PLC 7 –
1 Vp PLC 8 –
21 Weir Group PLC 475 0.12
10 WH Smith PLC 195 0.04
75 William Hill PLC 282 0.06
2 Wilmington PLC 7 –
14 Wincanton PLC 39 0.01
1 Wizz Air Holdings Plc 27 0.01
9 WS Atkins PLC 154 0.03
7 Xaar PLC 35 0.01
2 XP Power Ltd 42 0.01
10 Zoopla Property Group PLC 44 0.01
31,054 6.41
United States - 53.07%
2 1-800-Flowers.com Inc 25 0.01
3 1st Source Corp 111 0.02
6 3D Systems Corp 89 0.02
2 A H Belo Corp 14 –
3 A Schulman Inc 86 0.02
1 A. M. Castle & Co – –
6 AAON Inc 191 0.04
4 AAR Corp 148 0.03
8 Aaron's Inc 224 0.05
2 Abaxis Inc 90 0.02
7 Abercrombie & Fitch Co 98 0.02
3 ABIOMED Inc 338 0.07
5 ABM Industries Inc 240 0.05
8 Abraxas Petroleum Corp 16 –
4 Acacia Research Corp 26 0.01
7 Acadia Healthcare Co Inc 256 0.05
2 Access National Corp 43 0.01
11 ACCO Brands Corp 140 0.03
3 Accretive Health Inc 8 –
– Accuray Inc 2 –
3 Aceto Corp 62 0.01
11 ACI Worldwide Inc 198 0.04
5 Acorda Therapeutics Inc 107 0.02
6 Actua Corp 76 0.02
6 Actuant Corp 156 0.03
7 Acxiom Corp 195 0.04
1 Adams Resources & Energy Inc 37 0.01
1 Addus HomeCare Corp 39 0.01
– Adeptus Health Inc 3 –
5 ADTRAN Inc 111 0.02
1 Advanced Drainage Systems Inc 21 –
5 Advanced Energy Industries Inc 274 0.06
56 Advanced Micro Devices Inc 503 0.10
4 Advisory Board Co 153 0.03
16 AECOM 579 0.13
3 Aegion Corp 80 0.02
Shares (000's)
Value (000's)
USD
% of Net Asset Value
Common Stock (continued)
United States - 53.07% (continued)
1 AEP Industries Inc 96 0.02
7 Aerojet Rocketdyne Holdings Inc 148 0.03
3 Aerovironment Inc 76 0.02
8 AGCO Corp 466 0.10
2 Agilysys Inc 20 –
11 Air Lease Corp 386 0.08
4 Air Methods Corp 136 0.03
7 Air Transport Services Group Inc 115 0.02
5 Aircastle Ltd 110 0.02
8 AK Steel Holding Corp 70 0.01
1 Akebia Therapeutics Inc 6 –
10 Akorn Inc 209 0.04
1 Alamo Group Inc 79 0.02
1 Alaska Communications Systems Group Inc 2 –
3 Albany International Corp 154 0.03
3 Albany Molecular Research Inc 47 0.01
8 Alere Inc 337 0.07
5 Alexander & Baldwin Inc 234 0.05
1 Alico Inc 27 0.01
10 Allegheny Technologies Inc 176 0.04
2 Allegiant Travel Co 260 0.05
5 ALLETE Inc 325 0.07
1 Alliance HealthCare Services Inc 5 –
– Alliance One International Inc 5 –
1 Allied Motion Technologies Inc 28 0.01
9 Allied World Assurance Co Holdings AG 434 0.09
15 Allison Transmission Holdings Inc 502 0.10
19 Allscripts Healthcare Solutions Inc 207 0.04
1 Almost Family Inc 53 0.01
8 Alon USA Energy Inc 78 0.02
3 Alpha & Omega Semiconductor Ltd 56 0.01
– Altisource Asset Management Corp 2 –
1 Altisource Portfolio Solutions SA 40 0.01
3 Altra Industrial Motion Corp 117 0.02
2 AMAG Pharmaceuticals Inc 55 0.01
5 Ambac Financial Group Inc 115 0.02
2 AMC Entertainment Holdings Inc 76 0.02
2 AMC Networks Inc 114 0.02
3 Amedisys Inc 137 0.03
4 Ameresco Inc 21 –
1 America's Car-Mart Inc 47 0.01
8 American Axle & Manufacturing Holdings Inc 123 0.03
19 American Eagle Outfitters Inc 317 0.07
10 American Equity Investment Life Holding Co 197 0.04
1 American National Bankshares Inc 28 0.01
3 American National Insurance Co 334 0.07
2 American Public Education Inc 43 0.01
1 American Railcar Industries Inc 58 0.01
3 American Software Inc 33 0.01
4 American States Water Co 166 0.03
– American Superconductor Corp 1 –
3 American Vanguard Corp 55 0.01
2 American Woodmark Corp 136 0.03
4 Ameris Bancorp 177 0.04
2 Amerisafe Inc 143 0.03
– Ames National Corp 11 –
8 Amicus Therapeutics Inc 45 0.01
27 Amkor Technology Inc 323 0.07
5 AMN Healthcare Services Inc 168 0.03
1 Ampco-Pittsburgh Corp 17 –
4 Amphastar Pharmaceuticals Inc 76 0.02
7 Amsurg Corp 451 0.09
15 AmTrust Financial Services Inc 385 0.08
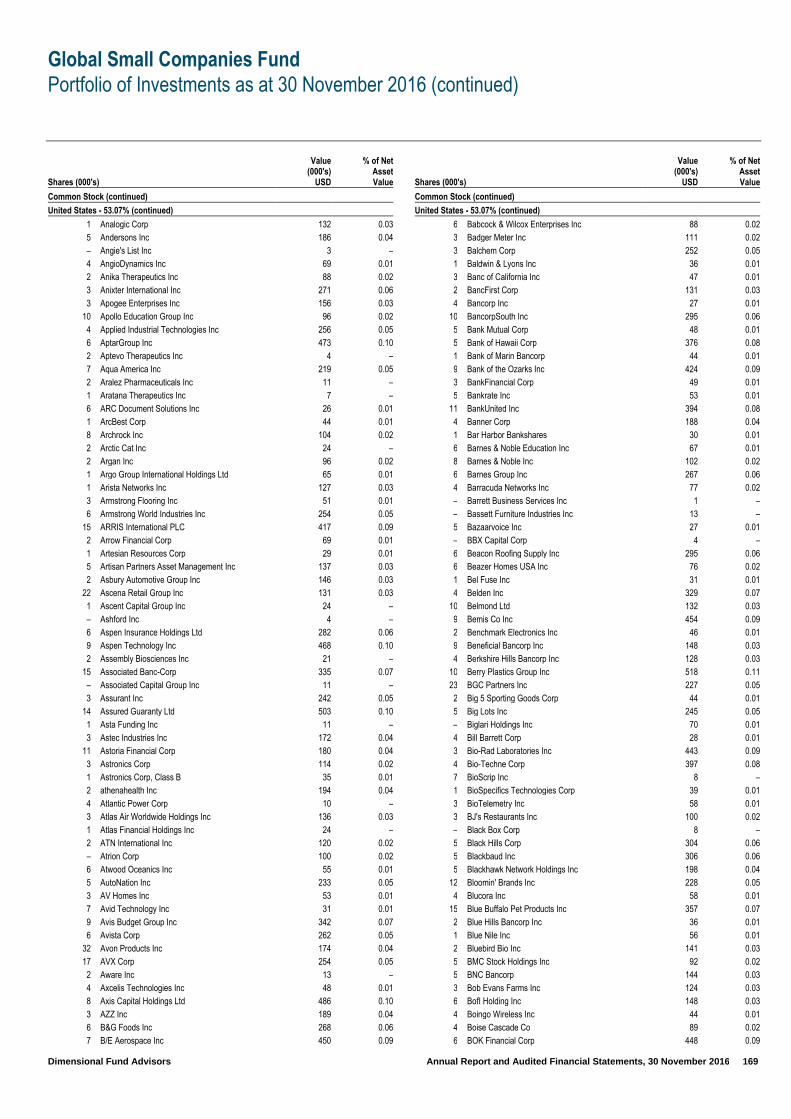
Global Small Companies Fund
Portfolio of Investments as at 30 November 2016 (continued)
Dimensional Fund Advisors Annual Report and Audited Financial Statements, 30 November 2016 169
Shares (000's)
Value (000's)
USD
% of Net Asset Value
Common Stock (continued)
United States - 53.07% (continued)
1 Analogic Corp 132 0.03
5 Andersons Inc 186 0.04
– Angie's List Inc 3 –
4 AngioDynamics Inc 69 0.01
2 Anika Therapeutics Inc 88 0.02
3 Anixter International Inc 271 0.06
3 Apogee Enterprises Inc 156 0.03
10 Apollo Education Group Inc 96 0.02
4 Applied Industrial Technologies Inc 256 0.05
6 AptarGroup Inc 473 0.10
2 Aptevo Therapeutics Inc 4 –
7 Aqua America Inc 219 0.05
2 Aralez Pharmaceuticals Inc 11 –
1 Aratana Therapeutics Inc 7 –
6 ARC Document Solutions Inc 26 0.01
1 ArcBest Corp 44 0.01
8 Archrock Inc 104 0.02
2 Arctic Cat Inc 24 –
2 Argan Inc 96 0.02
1 Argo Group International Holdings Ltd 65 0.01
1 Arista Networks Inc 127 0.03
3 Armstrong Flooring Inc 51 0.01
6 Armstrong World Industries Inc 254 0.05
15 ARRIS International PLC 417 0.09
2 Arrow Financial Corp 69 0.01
1 Artesian Resources Corp 29 0.01
5 Artisan Partners Asset Management Inc 137 0.03
2 Asbury Automotive Group Inc 146 0.03
22 Ascena Retail Group Inc 131 0.03
1 Ascent Capital Group Inc 24 –
– Ashford Inc 4 –
6 Aspen Insurance Holdings Ltd 282 0.06
9 Aspen Technology Inc 468 0.10
2 Assembly Biosciences Inc 21 –
15 Associated Banc-Corp 335 0.07
– Associated Capital Group Inc 11 –
3 Assurant Inc 242 0.05
14 Assured Guaranty Ltd 503 0.10
1 Asta Funding Inc 11 –
3 Astec Industries Inc 172 0.04
11 Astoria Financial Corp 180 0.04
3 Astronics Corp 114 0.02
1 Astronics Corp, Class B 35 0.01
2 athenahealth Inc 194 0.04
4 Atlantic Power Corp 10 –
3 Atlas Air Worldwide Holdings Inc 136 0.03
1 Atlas Financial Holdings Inc 24 –
2 ATN International Inc 120 0.02
– Atrion Corp 100 0.02
6 Atwood Oceanics Inc 55 0.01
5 AutoNation Inc 233 0.05
3 AV Homes Inc 53 0.01
7 Avid Technology Inc 31 0.01
9 Avis Budget Group Inc 342 0.07
6 Avista Corp 262 0.05
32 Avon Products Inc 174 0.04
17 AVX Corp 254 0.05
2 Aware Inc 13 –
4 Axcelis Technologies Inc 48 0.01
8 Axis Capital Holdings Ltd 486 0.10
3 AZZ Inc 189 0.04
6 B&G Foods Inc 268 0.06
7 B/E Aerospace Inc 450 0.09
Shares (000's)
Value (000's)
USD
% of Net Asset Value
Common Stock (continued)
United States - 53.07% (continued)
6 Babcock & Wilcox Enterprises Inc 88 0.02
3 Badger Meter Inc 111 0.02
3 Balchem Corp 252 0.05
1 Baldwin & Lyons Inc 36 0.01
3 Banc of California Inc 47 0.01
2 BancFirst Corp 131 0.03
4 Bancorp Inc 27 0.01
10 BancorpSouth Inc 295 0.06
5 Bank Mutual Corp 48 0.01
5 Bank of Hawaii Corp 376 0.08
1 Bank of Marin Bancorp 44 0.01
9 Bank of the Ozarks Inc 424 0.09
3 BankFinancial Corp 49 0.01
5 Bankrate Inc 53 0.01
11 BankUnited Inc 394 0.08
4 Banner Corp 188 0.04
1 Bar Harbor Bankshares 30 0.01
6 Barnes & Noble Education Inc 67 0.01
8 Barnes & Noble Inc 102 0.02
6 Barnes Group Inc 267 0.06
4 Barracuda Networks Inc 77 0.02
– Barrett Business Services Inc 1 –
– Bassett Furniture Industries Inc 13 –
5 Bazaarvoice Inc 27 0.01
– BBX Capital Corp 4 –
6 Beacon Roofing Supply Inc 295 0.06
6 Beazer Homes USA Inc 76 0.02
1 Bel Fuse Inc 31 0.01
4 Belden Inc 329 0.07
10 Belmond Ltd 132 0.03
9 Bemis Co Inc 454 0.09
2 Benchmark Electronics Inc 46 0.01
9 Beneficial Bancorp Inc 148 0.03
4 Berkshire Hills Bancorp Inc 128 0.03
10 Berry Plastics Group Inc 518 0.11
23 BGC Partners Inc 227 0.05
2 Big 5 Sporting Goods Corp 44 0.01
5 Big Lots Inc 245 0.05
– Biglari Holdings Inc 70 0.01
4 Bill Barrett Corp 28 0.01
3 Bio-Rad Laboratories Inc 443 0.09
4 Bio-Techne Corp 397 0.08
7 BioScrip Inc 8 –
1 BioSpecifics Technologies Corp 39 0.01
3 BioTelemetry Inc 58 0.01
3 BJ's Restaurants Inc 100 0.02
– Black Box Corp 8 –
5 Black Hills Corp 304 0.06
5 Blackbaud Inc 306 0.06
5 Blackhawk Network Holdings Inc 198 0.04
12 Bloomin' Brands Inc 228 0.05
4 Blucora Inc 58 0.01
15 Blue Buffalo Pet Products Inc 357 0.07
2 Blue Hills Bancorp Inc 36 0.01
1 Blue Nile Inc 56 0.01
2 Bluebird Bio Inc 141 0.03
5 BMC Stock Holdings Inc 92 0.02
5 BNC Bancorp 144 0.03
3 Bob Evans Farms Inc 124 0.03
6 BofI Holding Inc 148 0.03
4 Boingo Wireless Inc 44 0.01
4 Boise Cascade Co 89 0.02
6 BOK Financial Corp 448 0.09
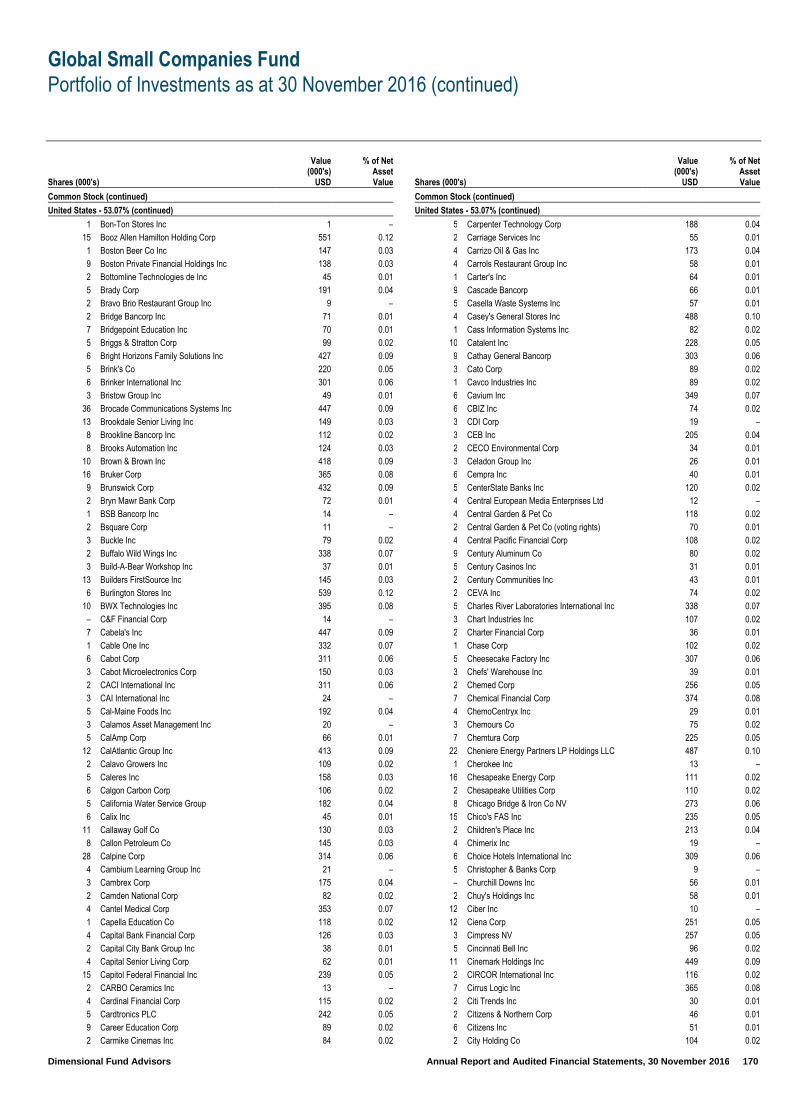
Global Small Companies Fund
Portfolio of Investments as at 30 November 2016 (continued)
Dimensional Fund Advisors Annual Report and Audited Financial Statements, 30 November 2016 170
Shares (000's)
Value (000's)
USD
% of Net Asset Value
Common Stock (continued)
United States - 53.07% (continued)
1 Bon-Ton Stores Inc 1 –
15 Booz Allen Hamilton Holding Corp 551 0.12
1 Boston Beer Co Inc 147 0.03
9 Boston Private Financial Holdings Inc 138 0.03
2 Bottomline Technologies de Inc 45 0.01
5 Brady Corp 191 0.04
2 Bravo Brio Restaurant Group Inc 9 –
2 Bridge Bancorp Inc 71 0.01
7 Bridgepoint Education Inc 70 0.01
5 Briggs & Stratton Corp 99 0.02
6 Bright Horizons Family Solutions Inc 427 0.09
5 Brink's Co 220 0.05
6 Brinker International Inc 301 0.06
3 Bristow Group Inc 49 0.01
36 Brocade Communications Systems Inc 447 0.09
13 Brookdale Senior Living Inc 149 0.03
8 Brookline Bancorp Inc 112 0.02
8 Brooks Automation Inc 124 0.03
10 Brown & Brown Inc 418 0.09
16 Bruker Corp 365 0.08
9 Brunswick Corp 432 0.09
2 Bryn Mawr Bank Corp 72 0.01
1 BSB Bancorp Inc 14 –
2 Bsquare Corp 11 –
3 Buckle Inc 79 0.02
2 Buffalo Wild Wings Inc 338 0.07
3 Build-A-Bear Workshop Inc 37 0.01
13 Builders FirstSource Inc 145 0.03
6 Burlington Stores Inc 539 0.12
10 BWX Technologies Inc 395 0.08
– C&F Financial Corp 14 –
7 Cabela's Inc 447 0.09
1 Cable One Inc 332 0.07
6 Cabot Corp 311 0.06
3 Cabot Microelectronics Corp 150 0.03
2 CACI International Inc 311 0.06
3 CAI International Inc 24 –
5 Cal-Maine Foods Inc 192 0.04
3 Calamos Asset Management Inc 20 –
5 CalAmp Corp 66 0.01
12 CalAtlantic Group Inc 413 0.09
2 Calavo Growers Inc 109 0.02
5 Caleres Inc 158 0.03
6 Calgon Carbon Corp 106 0.02
5 California Water Service Group 182 0.04
6 Calix Inc 45 0.01
11 Callaway Golf Co 130 0.03
8 Callon Petroleum Co 145 0.03
28 Calpine Corp 314 0.06
4 Cambium Learning Group Inc 21 –
3 Cambrex Corp 175 0.04
2 Camden National Corp 82 0.02
4 Cantel Medical Corp 353 0.07
1 Capella Education Co 118 0.02
4 Capital Bank Financial Corp 126 0.03
2 Capital City Bank Group Inc 38 0.01
4 Capital Senior Living Corp 62 0.01
15 Capitol Federal Financial Inc 239 0.05
2 CARBO Ceramics Inc 13 –
4 Cardinal Financial Corp 115 0.02
5 Cardtronics PLC 242 0.05
9 Career Education Corp 89 0.02
2 Carmike Cinemas Inc 84 0.02
Shares (000's)
Value (000's)
USD
% of Net Asset Value
Common Stock (continued)
United States - 53.07% (continued)
5 Carpenter Technology Corp 188 0.04
2 Carriage Services Inc 55 0.01
4 Carrizo Oil & Gas Inc 173 0.04
4 Carrols Restaurant Group Inc 58 0.01
1 Carter's Inc 64 0.01
9 Cascade Bancorp 66 0.01
5 Casella Waste Systems Inc 57 0.01
4 Casey's General Stores Inc 488 0.10
1 Cass Information Systems Inc 82 0.02
10 Catalent Inc 228 0.05
9 Cathay General Bancorp 303 0.06
3 Cato Corp 89 0.02
1 Cavco Industries Inc 89 0.02
6 Cavium Inc 349 0.07
6 CBIZ Inc 74 0.02
3 CDI Corp 19 –
3 CEB Inc 205 0.04
2 CECO Environmental Corp 34 0.01
3 Celadon Group Inc 26 0.01
6 Cempra Inc 40 0.01
5 CenterState Banks Inc 120 0.02
4 Central European Media Enterprises Ltd 12 –
4 Central Garden & Pet Co 118 0.02
2 Central Garden & Pet Co (voting rights) 70 0.01
4 Central Pacific Financial Corp 108 0.02
9 Century Aluminum Co 80 0.02
5 Century Casinos Inc 31 0.01
2 Century Communities Inc 43 0.01
2 CEVA Inc 74 0.02
5 Charles River Laboratories International Inc 338 0.07
3 Chart Industries Inc 107 0.02
2 Charter Financial Corp 36 0.01
1 Chase Corp 102 0.02
5 Cheesecake Factory Inc 307 0.06
3 Chefs' Warehouse Inc 39 0.01
2 Chemed Corp 256 0.05
7 Chemical Financial Corp 374 0.08
4 ChemoCentryx Inc 29 0.01
3 Chemours Co 75 0.02
7 Chemtura Corp 225 0.05
22 Cheniere Energy Partners LP Holdings LLC 487 0.10
1 Cherokee Inc 13 –
16 Chesapeake Energy Corp 111 0.02
2 Chesapeake Utilities Corp 110 0.02
8 Chicago Bridge & Iron Co NV 273 0.06
15 Chico's FAS Inc 235 0.05
2 Children's Place Inc 213 0.04
4 Chimerix Inc 19 –
6 Choice Hotels International Inc 309 0.06
5 Christopher & Banks Corp 9 –
– Churchill Downs Inc 56 0.01
2 Chuy's Holdings Inc 58 0.01
12 Ciber Inc 10 –
12 Ciena Corp 251 0.05
3 Cimpress NV 257 0.05
5 Cincinnati Bell Inc 96 0.02
11 Cinemark Holdings Inc 449 0.09
2 CIRCOR International Inc 116 0.02
7 Cirrus Logic Inc 365 0.08
2 Citi Trends Inc 30 0.01
2 Citizens & Northern Corp 46 0.01
6 Citizens Inc 51 0.01
2 City Holding Co 104 0.02

Global Small Companies Fund
Portfolio of Investments as at 30 November 2016 (continued)
Dimensional Fund Advisors Annual Report and Audited Financial Statements, 30 November 2016 171
Shares (000's)
Value (000's)
USD
% of Net Asset Value
Common Stock (continued)
United States - 53.07% (continued)
8 Civeo Corp 16 –
2 Civitas Solutions Inc 30 0.01
5 CLARCOR Inc 350 0.07
1 Clayton Williams Energy Inc 100 0.02
4 Clean Energy Fuels Corp 14 –
6 Clean Harbors Inc 318 0.07
4 Clear Channel Outdoor 22 –
1 Clearfield Inc 21 –
2 Clearwater Paper Corp 122 0.03
3 Clifton Bancorp Inc 52 0.01
3 Cloud Peak Energy Inc 20 –
6 ClubCorp Holdings Inc 78 0.02
2 CNB Financial Corp 35 0.01
3 CNO Financial Group Inc 46 0.01
43 Cobalt International Energy Inc 58 0.01
5 CoBiz Financial Inc 74 0.02
1 Coca-Cola Bottling Co Consolidated 125 0.03
7 Coeur Mining Inc 70 0.01
5 Cogent Communications Holdings Inc 185 0.04
9 Cognex Corp 508 0.10
5 Cohen & Steers Inc 176 0.04
3 Coherent Inc 340 0.07
3 Cohu Inc 32 0.01
14 Colfax Corp 534 0.11
1 Collectors Universe Inc 21 –
6 Columbia Banking System Inc 253 0.05
7 Columbia Sportswear Co 406 0.08
3 Columbus McKinnon Corp 80 0.02
4 Comfort Systems USA Inc 141 0.03
10 Commerce Bancshares Inc 526 0.11
13 Commercial Metals Co 284 0.06
4 Commercial Vehicle Group Inc 18 –
1 CommScope Holding Co Inc 29 0.01
5 Community Bank System Inc 274 0.06
2 Community Health Systems Inc 10 –
2 Community Trust Bancorp Inc 79 0.02
3 Compass Minerals International Inc 264 0.05
1 Computer Programs & Systems Inc 27 0.01
9 Computer Sciences Corp 561 0.13
1 Computer Task Group Inc 5 –
2 Comtech Telecommunications Corp 19 –
2 Concert Pharmaceuticals Inc 22 –
3 CONMED Corp 116 0.02
1 Conn's Inc 14 –
1 Connecticut Water Service Inc 73 0.02
4 ConnectOne Bancorp Inc 99 0.02
24 CONSOL Energy Inc 493 0.10
6 Consolidated Communications Holdings Inc 164 0.03
1 Consolidated-Tomoka Land Co 39 0.01
2 Consumer Portfolio Services Inc 12 –
1 Container Store Group Inc 7 –
2 Contango Oil & Gas Co 15 –
4 Continental Building Products Inc 91 0.02
3 Convergys Corp 89 0.02
6 Cooper Tire & Rubber Co 225 0.05
2 Cooper-Standard Holdings Inc 182 0.04
2 Copa Holdings SA 216 0.04
5 Copart Inc 282 0.06
4 Core Laboratories NV 448 0.09
1 Core Molding Technologies Inc 22 –
5 Core-Mark Holding Co Inc 180 0.04
9 CoreLogic Inc 356 0.07
2 CorVel Corp 54 0.01
Shares (000's)
Value (000's)
USD
% of Net Asset Value
Common Stock (continued)
United States - 53.07% (continued)
14 Covanta Holding Corp 203 0.04
2 Covenant Transportation Group Inc 37 0.01
2 Covisint Corp 4 –
13 Cowen Group Inc 47 0.01
– CRA International Inc 14 –
2 Cracker Barrel Old Country Store Inc 387 0.08
2 Craft Brew Alliance Inc 30 0.01
6 Crane Co 417 0.09
3 Crawford & Co, Class A 30 0.01
3 Crawford & Co, Class B 44 0.01
3 Cray Inc 51 0.01
2 Credit Acceptance Corp 354 0.07
10 Cree Inc 247 0.05
7 Crocs Inc 51 0.01
5 Cross Country Healthcare Inc 68 0.01
4 CryoLife Inc 74 0.02
4 CSG Systems International Inc 158 0.03
16 CSRA Inc 520 0.11
– CSS Industries Inc 9 –
7 CST Brands Inc 355 0.07
2 CTS Corp 35 0.01
2 CU Bancorp 54 0.01
3 Cubic Corp 132 0.03
3 CUI Global Inc 16 –
5 Cullen/Frost Bankers Inc 415 0.09
1 Culp Inc 48 0.01
3 Cumulus Media Inc 4 –
5 Curtiss-Wright Corp 471 0.10
3 Customers Bancorp Inc 97 0.02
2 Cutera Inc 25 0.01
12 CVB Financial Corp 252 0.05
9 CVR Energy Inc 142 0.03
3 Cynosure Inc 117 0.02
30 Cypress Semiconductor Corp 340 0.07
– Daily Journal Corp 18 –
5 Daktronics Inc 54 0.01
16 Dana Inc 264 0.05
16 Darling Ingredients Inc 215 0.04
2 Datalink Corp 28 0.01
4 Dave & Buster's Entertainment Inc 188 0.04
10 Dean Foods Co 197 0.04
3 Deckers Outdoor Corp 198 0.04
3 Del Frisco's Restaurant Group Inc 45 0.01
3 Del Taco Restaurants Inc 36 0.01
6 Delek US Holdings Inc 121 0.02
1 Delta Natural Gas Co Inc 14 –
1 Deltic Timber Corp 92 0.02
5 Deluxe Corp 336 0.07
13 Denbury Resources Inc 49 0.01
11 Denny's Corp 138 0.03
6 Depomed Inc 108 0.02
2 Derma Sciences Inc 10 –
1 Destination Maternity Corp 7 –
7 Destination XL Group Inc 28 0.01
7 DeVry Education Group Inc 215 0.04
6 DHI Group Inc 38 0.01
10 DHT Holdings Inc 35 0.01
– Diamond Hill Investment Group Inc 65 0.01
12 Diamond Offshore Drilling Inc 225 0.05
9 Diebold Inc 195 0.04
4 Digi International Inc 48 0.01
7 DigitalGlobe Inc 223 0.05
3 Dillard's Inc 203 0.04

Global Small Companies Fund
Portfolio of Investments as at 30 November 2016 (continued)
Dimensional Fund Advisors Annual Report and Audited Financial Statements, 30 November 2016 172
Shares (000's)
Value (000's)
USD
% of Net Asset Value
Common Stock (continued)
United States - 53.07% (continued)
4 Dime Community Bancshares Inc 79 0.02
2 DineEquity Inc 162 0.03
5 Diodes Inc 131 0.03
4 Diplomat Pharmacy Inc 53 0.01
2 Dixie Group Inc 6 –
1 DMC Global Inc 17 –
4 Dolby Laboratories Inc 202 0.04
7 Domtar Corp 265 0.05
11 Donaldson Co Inc 466 0.10
3 Donegal Group Inc 43 0.01
3 Donnelley Financial Solutions Inc 50 0.01
6 Dorian LPG Ltd 41 0.01
3 Dorman Products Inc 250 0.05
3 Douglas Dynamics Inc 92 0.02
2 Drew Industries Inc 256 0.05
4 Dril-Quip Inc 211 0.04
3 DSP Group Inc 39 0.01
3 DST Systems Inc 359 0.07
8 DSW Inc 181 0.04
2 DTS Inc 97 0.02
1 Ducommun Inc 30 0.01
4 Dun & Bradstreet Corp 463 0.10
8 Dunkin' Brands Group Inc 429 0.09
1 DXP Enterprises Inc 28 0.01
11 Dyax Corp 12 –
3 Dycom Industries Inc 246 0.05
13 Dynegy Inc 112 0.02
4 Eagle Bancorp Inc 222 0.05
4 Eagle Materials Inc 414 0.09
12 EarthLink Holdings Corp 64 0.01
4 East West Bancorp Inc 194 0.04
2 Eastman Kodak Co 35 0.01
10 Eaton Vance Corp 394 0.08
3 Ebix Inc 169 0.03
3 Echo Global Logistics Inc 83 0.02
4 EchoStar Corp 220 0.05
5 Edgewell Personal Care Co 400 0.08
– eHealth Inc 5 –
4 El Paso Electric Co 190 0.04
4 El Pollo Loco Holdings Inc 53 0.01
3 Electro Scientific Industries Inc 17 –
5 Electronics For Imaging Inc 218 0.05
3 Ellie Mae Inc 208 0.04
2 EMC Insurance Group Inc 68 0.01
6 EMCOR Group Inc 439 0.09
4 EMCORE Corp 24 –
4 Emergent BioSolutions Inc 111 0.02
4 Emergent Capital Inc 6 –
5 Empire District Electric Co 175 0.04
4 Employers Holdings Inc 128 0.03
1 Enanta Pharmaceuticals Inc 28 0.01
3 Encore Capital Group Inc 72 0.01
3 Encore Wire Corp 111 0.02
3 Endo International PLC 46 0.01
– Endo International PLC (Canada listing) 4 –
7 Endurance Specialty Holdings Ltd 659 0.15
8 Energen Corp 523 0.11
7 Energizer Holdings Inc 302 0.06
3 EnerNOC Inc 18 –
4 EnerSys 344 0.07
4 Engility Holdings Inc 128 0.03
14 EnLink Midstream LLC 252 0.05
3 Ennis Inc 50 0.01
Shares (000's)
Value (000's)
USD
% of Net Asset Value
Common Stock (continued)
United States - 53.07% (continued)
3 Enova International Inc 30 0.01
2 EnPro Industries Inc 145 0.03
20 Ensco PLC 196 0.04
6 Ensign Group Inc 122 0.03
1 Enstar Group Ltd 280 0.06
12 Entegris Inc 218 0.05
3 Entercom Communications Corp 51 0.01
3 Enterprise Financial Services Corp 101 0.02
7 Entravision Communications Corp 43 0.01
2 Envestnet Inc 66 0.01
12 Envision Healthcare Holdings Inc 274 0.06
8 Enzo Biochem Inc 54 0.01
5 EP Energy Corp 24 –
5 EPAM Systems Inc 343 0.07
1 ePlus Inc 72 0.01
2 Era Group Inc 26 0.01
4 Erie Indemnity Co 451 0.09
2 Escalade Inc 21 –
3 ESCO Technologies Inc 150 0.03
1 ESSA Bancorp Inc 10 –
4 Essendant Inc 78 0.02
4 Essent Group Ltd 117 0.02
3 Esterline Technologies Corp 277 0.06
3 Ethan Allen Interiors Inc 117 0.02
5 Euronet Worldwide Inc 385 0.08
12 EverBank Financial Corp 237 0.05
4 Evercore Partners Inc 287 0.06
7 Everi Holdings Inc 16 –
3 Everyday Health Inc 35 0.01
2 Evolution Petroleum Corp 17 –
8 EW Scripps Co 129 0.03
1 Exactech Inc 36 0.01
5 Exar Corp 53 0.01
4 ExlService Holdings Inc 178 0.04
3 Exponent Inc 171 0.04
9 Express Inc 120 0.02
14 Extended Stay America Inc 221 0.05
4 Exterran Corp 78 0.02
7 Extreme Networks Inc 31 0.01
9 Ezcorp Inc 100 0.02
4 Fabrinet 178 0.04
3 Fair Isaac Corp 338 0.07
2 FairPoint Communications Inc 35 0.01
– Famous Dave's of America Inc 2 –
2 Farmer Brothers Co 61 0.01
1 Farmers Capital Bank Corp 35 0.01
2 Farmers National Banc Corp 29 0.01
2 FARO Technologies Inc 75 0.02
1 FBL Financial Group Inc 67 0.01
4 FCB Financial Holdings Inc 170 0.04
1 Federal Agricultural Mortgage Corp 54 0.01
7 Federal Signal Corp 116 0.02
15 Federal-Mogul Holdings Corp 140 0.03
11 Federated Investors Inc 293 0.06
2 Federated National Holding Co 27 0.01
10 Ferro Corp 145 0.03
7 Ferroglobe PLC 75 0.02 7
Ferroglobe Representation & Warrants Insurance Trust – –
1 Fidelity & Guaranty Life 33 0.01
5 Fidelity Southern Corp 111 0.02
3 Fiesta Restaurant Group Inc 76 0.02
5 Financial Engines Inc 161 0.03
2 Financial Institutions Inc 62 0.01

Global Small Companies Fund
Portfolio of Investments as at 30 November 2016 (continued)
Dimensional Fund Advisors Annual Report and Audited Financial Statements, 30 November 2016 173
Shares (000's)
Value (000's)
USD
% of Net Asset Value
Common Stock (continued)
United States - 53.07% (continued)
11 Finisar Corp 350 0.07
4 Finish Line Inc 94 0.02
1 FireEye Inc 12 –
3 First Acceptance Corp 4 –
12 First American Financial Corp 441 0.09
1 First Bancorp Inc 27 0.01
21 First BanCorp/Puerto Rico 123 0.03
2 First Bancorp/Southern Pines NC 48 0.01
4 First Busey Corp 117 0.02
1 First Business Financial Services Inc 21 –
1 First Citizens BancShares Inc 419 0.09
9 First Commonwealth Financial Corp 115 0.02
2 First Community Bancshares Inc 55 0.01
2 First Connecticut Bancorp Inc 36 0.01
1 First Defiance Financial Corp 60 0.01
6 First Financial Bancorp 164 0.03
3 First Financial Bankshares Inc 147 0.03
1 First Financial Corp/IN 61 0.01
1 First Financial Northwest Inc 22 –
22 First Horizon National Corp 428 0.09
2 First Interstate BancSystem Inc 80 0.02
5 First Merchants Corp 158 0.03
9 First Midwest Bancorp Inc 207 0.04
2 First NBC Bank Holding Co 17 –
2 First of Long Island Corp 40 0.01
7 First Solar Inc 223 0.05
6 FirstCash Inc 262 0.05
10 Fitbit Inc 81 0.02
6 Five Below Inc 230 0.05
3 Five Prime Therapeutics Inc 181 0.04
1 Five Star Quality Care Inc 2 –
6 Flagstar Bancorp Inc 178 0.04
1 Flexsteel Industries Inc 44 0.01
12 FLIR Systems Inc 430 0.09
4 Flotek Industries Inc 56 0.01
19 Flowers Foods Inc 298 0.06
3 Flushing Financial Corp 77 0.02
22 FNB Corp 339 0.07
3 FNFV Group 33 0.01
4 Forestar Group Inc 48 0.01
8 FormFactor Inc 90 0.02
2 Forrester Research Inc 86 0.02
5 Fortress Biotech Inc 11 –
8 Forum Energy Technologies Inc 178 0.04
3 Forward Air Corp 150 0.03
2 Fossil Group Inc 73 0.02
3 Fox Factory Holding Corp 86 0.02
4 Francesca's Holdings Corp 64 0.01
12 Frank's International NV 153 0.03
2 Franklin Covey Co 45 0.01
5 Franklin Electric Co Inc 180 0.04
5 Fred's Inc 52 0.01
1 FreightCar America Inc 15 –
1 Frequency Electronics Inc 8 –
5 Fresh Del Monte Produce Inc 303 0.06
40 Frontier Communications Corp 146 0.03
1 FRP Holdings Inc 46 0.01
4 FTD Cos Inc 83 0.02
5 FTI Consulting Inc 193 0.04
18 Fulton Financial Corp 327 0.07
5 FutureFuel Corp 68 0.01
2 G&K Services Inc 214 0.04
4 G-III Apparel Group Ltd 118 0.02
Shares (000's)
Value (000's)
USD
% of Net Asset Value
Common Stock (continued)
United States - 53.07% (continued)
7 Gain Capital Holdings Inc 48 0.01
1 GAMCO Investors Inc 38 0.01
10 GameStop Corp 241 0.05
6 Gannett Co Inc 59 0.01
1 Gas Natural Inc 12 –
6 GasLog Ltd 100 0.02
5 Gastar Exploration Inc 6 –
4 GATX Corp 213 0.04
4 GCP Applied Technologies Inc 101 0.02
6 Generac Holdings Inc 244 0.05
2 General Cable Corp 47 0.01
4 General Communication Inc 66 0.01
3 Genesco Inc 161 0.03
6 Genesee & Wyoming Inc 434 0.09
3 Genie Energy Ltd 18 –
23 Gentex Corp 433 0.09
4 Gentherm Inc 117 0.02
35 Genworth Financial Inc 149 0.03
1 Geospace Technologies Corp 15 –
2 German American Bancorp Inc 92 0.02
3 Gibraltar Industries Inc 156 0.03
7 Glacier Bancorp Inc 249 0.05
3 Global Brass & Copper Holdings Inc 77 0.02
5 Global Eagle Entertainment Inc 30 0.01
1 Global Indemnity Ltd 49 0.01
1 Global Power Equipment Group Inc 5 –
3 Globant SA 104 0.02
8 Globus Medical Inc 171 0.04
7 GNC Holdings Inc 108 0.02
6 Gold Resource Corp 24 –
2 Golden Ocean Group Ltd 8 –
3 Gorman-Rupp Co 76 0.02
2 GP Strategies Corp 44 0.01
4 Graco Inc 362 0.07
1 Graham Corp 22 –
– Graham Holdings Co 205 0.04
5 Grand Canyon Education Inc 280 0.06
4 Granite Construction Inc 239 0.05
31 Graphic Packaging Holding Co 384 0.08
7 Gray Television Inc 71 0.01
5 Great Lakes Dredge & Dock Corp 21 –
13 Great Plains Energy Inc 335 0.07
2 Great Southern Bancorp Inc 77 0.02
1 Great Western Bancorp Inc 44 0.01
– Green Brick Partners Inc 4 –
5 Green Dot Corp 130 0.03
5 Green Plains Inc 123 0.03
2 Greenbrier Cos Inc 93 0.02
3 Greenhill & Co Inc 81 0.02
3 Greenlight Capital Re Ltd 69 0.01
3 Greif Inc, Class A 138 0.03
2 Greif Inc, Class B 129 0.03
4 Griffon Corp 96 0.02
2 Group 1 Automotive Inc 175 0.04
7 GrubHub Inc 271 0.06
4 GSI Technology Inc 20 –
4 GTT Communications Inc 92 0.02
2 Guaranty Bancorp 45 0.01
9 Guess? Inc 132 0.03
7 Guidewire Software Inc 390 0.08
2 Gulf Island Fabrication Inc 21 –
2 Gulfmark Offshore Inc 3 –
14 Gulfport Energy Corp 363 0.07
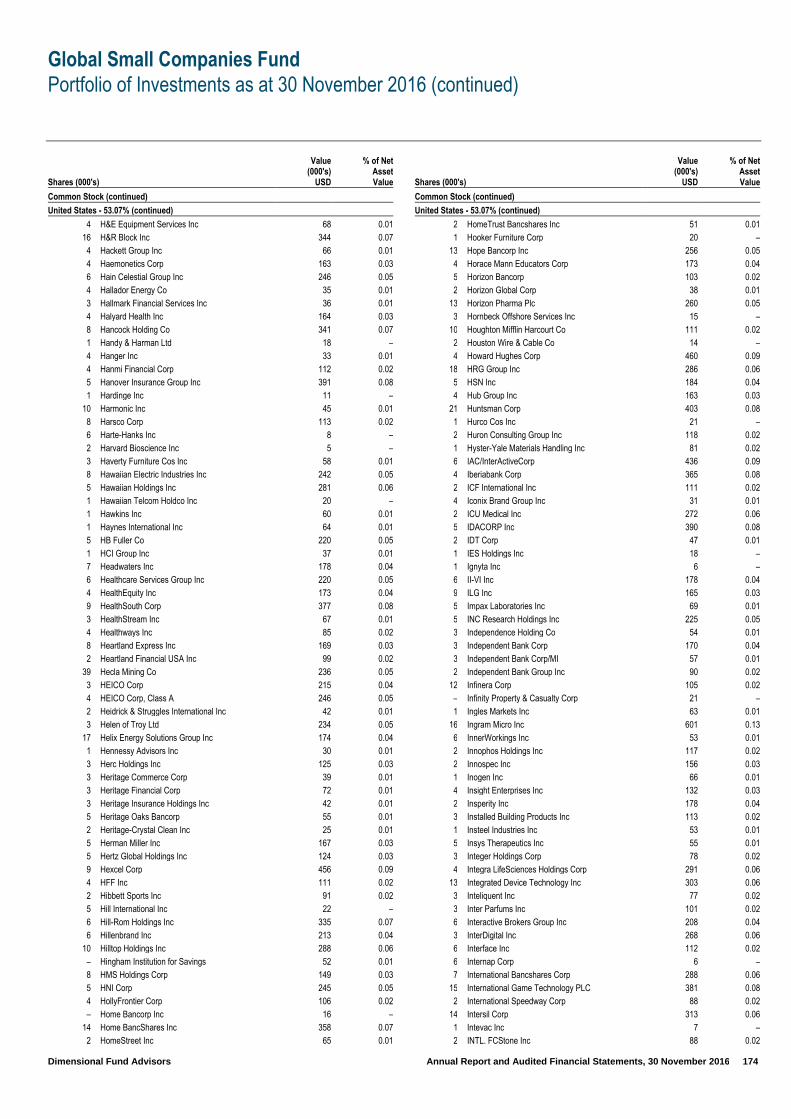
Global Small Companies Fund
Portfolio of Investments as at 30 November 2016 (continued)
Dimensional Fund Advisors Annual Report and Audited Financial Statements, 30 November 2016 174
Shares (000's)
Value (000's)
USD
% of Net Asset Value
Common Stock (continued)
United States - 53.07% (continued)
4 H&E Equipment Services Inc 68 0.01
16 H&R Block Inc 344 0.07
4 Hackett Group Inc 66 0.01
4 Haemonetics Corp 163 0.03
6 Hain Celestial Group Inc 246 0.05
4 Hallador Energy Co 35 0.01
3 Hallmark Financial Services Inc 36 0.01
4 Halyard Health Inc 164 0.03
8 Hancock Holding Co 341 0.07
1 Handy & Harman Ltd 18 –
4 Hanger Inc 33 0.01
4 Hanmi Financial Corp 112 0.02
5 Hanover Insurance Group Inc 391 0.08
1 Hardinge Inc 11 –
10 Harmonic Inc 45 0.01
8 Harsco Corp 113 0.02
6 Harte-Hanks Inc 8 –
2 Harvard Bioscience Inc 5 –
3 Haverty Furniture Cos Inc 58 0.01
8 Hawaiian Electric Industries Inc 242 0.05
5 Hawaiian Holdings Inc 281 0.06
1 Hawaiian Telcom Holdco Inc 20 –
1 Hawkins Inc 60 0.01
1 Haynes International Inc 64 0.01
5 HB Fuller Co 220 0.05
1 HCI Group Inc 37 0.01
7 Headwaters Inc 178 0.04
6 Healthcare Services Group Inc 220 0.05
4 HealthEquity Inc 173 0.04
9 HealthSouth Corp 377 0.08
3 HealthStream Inc 67 0.01
4 Healthways Inc 85 0.02
8 Heartland Express Inc 169 0.03
2 Heartland Financial USA Inc 99 0.02
39 Hecla Mining Co 236 0.05
3 HEICO Corp 215 0.04
4 HEICO Corp, Class A 246 0.05
2 Heidrick & Struggles International Inc 42 0.01
3 Helen of Troy Ltd 234 0.05
17 Helix Energy Solutions Group Inc 174 0.04
1 Hennessy Advisors Inc 30 0.01
3 Herc Holdings Inc 125 0.03
3 Heritage Commerce Corp 39 0.01
3 Heritage Financial Corp 72 0.01
3 Heritage Insurance Holdings Inc 42 0.01
5 Heritage Oaks Bancorp 55 0.01
2 Heritage-Crystal Clean Inc 25 0.01
5 Herman Miller Inc 167 0.03
5 Hertz Global Holdings Inc 124 0.03
9 Hexcel Corp 456 0.09
4 HFF Inc 111 0.02
2 Hibbett Sports Inc 91 0.02
5 Hill International Inc 22 –
6 Hill-Rom Holdings Inc 335 0.07
6 Hillenbrand Inc 213 0.04
10 Hilltop Holdings Inc 288 0.06
– Hingham Institution for Savings 52 0.01
8 HMS Holdings Corp 149 0.03
5 HNI Corp 245 0.05
4 HollyFrontier Corp 106 0.02
– Home Bancorp Inc 16 –
14 Home BancShares Inc 358 0.07
2 HomeStreet Inc 65 0.01
Shares (000's)
Value (000's)
USD
% of Net Asset Value
Common Stock (continued)
United States - 53.07% (continued)
2 HomeTrust Bancshares Inc 51 0.01
1 Hooker Furniture Corp 20 –
13 Hope Bancorp Inc 256 0.05
4 Horace Mann Educators Corp 173 0.04
5 Horizon Bancorp 103 0.02
2 Horizon Global Corp 38 0.01
13 Horizon Pharma Plc 260 0.05
3 Hornbeck Offshore Services Inc 15 –
10 Houghton Mifflin Harcourt Co 111 0.02
2 Houston Wire & Cable Co 14 –
4 Howard Hughes Corp 460 0.09
18 HRG Group Inc 286 0.06
5 HSN Inc 184 0.04
4 Hub Group Inc 163 0.03
21 Huntsman Corp 403 0.08
1 Hurco Cos Inc 21 –
2 Huron Consulting Group Inc 118 0.02
1 Hyster-Yale Materials Handling Inc 81 0.02
6 IAC/InterActiveCorp 436 0.09
4 Iberiabank Corp 365 0.08
2 ICF International Inc 111 0.02
4 Iconix Brand Group Inc 31 0.01
2 ICU Medical Inc 272 0.06
5 IDACORP Inc 390 0.08
2 IDT Corp 47 0.01
1 IES Holdings Inc 18 –
1 Ignyta Inc 6 –
6 II-VI Inc 178 0.04
9 ILG Inc 165 0.03
5 Impax Laboratories Inc 69 0.01
5 INC Research Holdings Inc 225 0.05
3 Independence Holding Co 54 0.01
3 Independent Bank Corp 170 0.04
3 Independent Bank Corp/MI 57 0.01
2 Independent Bank Group Inc 90 0.02
12 Infinera Corp 105 0.02
– Infinity Property & Casualty Corp 21 –
1 Ingles Markets Inc 63 0.01
16 Ingram Micro Inc 601 0.13
6 InnerWorkings Inc 53 0.01
2 Innophos Holdings Inc 117 0.02
2 Innospec Inc 156 0.03
1 Inogen Inc 66 0.01
4 Insight Enterprises Inc 132 0.03
2 Insperity Inc 178 0.04
3 Installed Building Products Inc 113 0.02
1 Insteel Industries Inc 53 0.01
5 Insys Therapeutics Inc 55 0.01
3 Integer Holdings Corp 78 0.02
4 Integra LifeSciences Holdings Corp 291 0.06
13 Integrated Device Technology Inc 303 0.06
3 Inteliquent Inc 77 0.02
3 Inter Parfums Inc 101 0.02
6 Interactive Brokers Group Inc 208 0.04
3 InterDigital Inc 268 0.06
6 Interface Inc 112 0.02
6 Internap Corp 6 –
7 International Bancshares Corp 288 0.06
15 International Game Technology PLC 381 0.08
2 International Speedway Corp 88 0.02
14 Intersil Corp 313 0.06
1 Intevac Inc 7 –
2 INTL. FCStone Inc 88 0.02
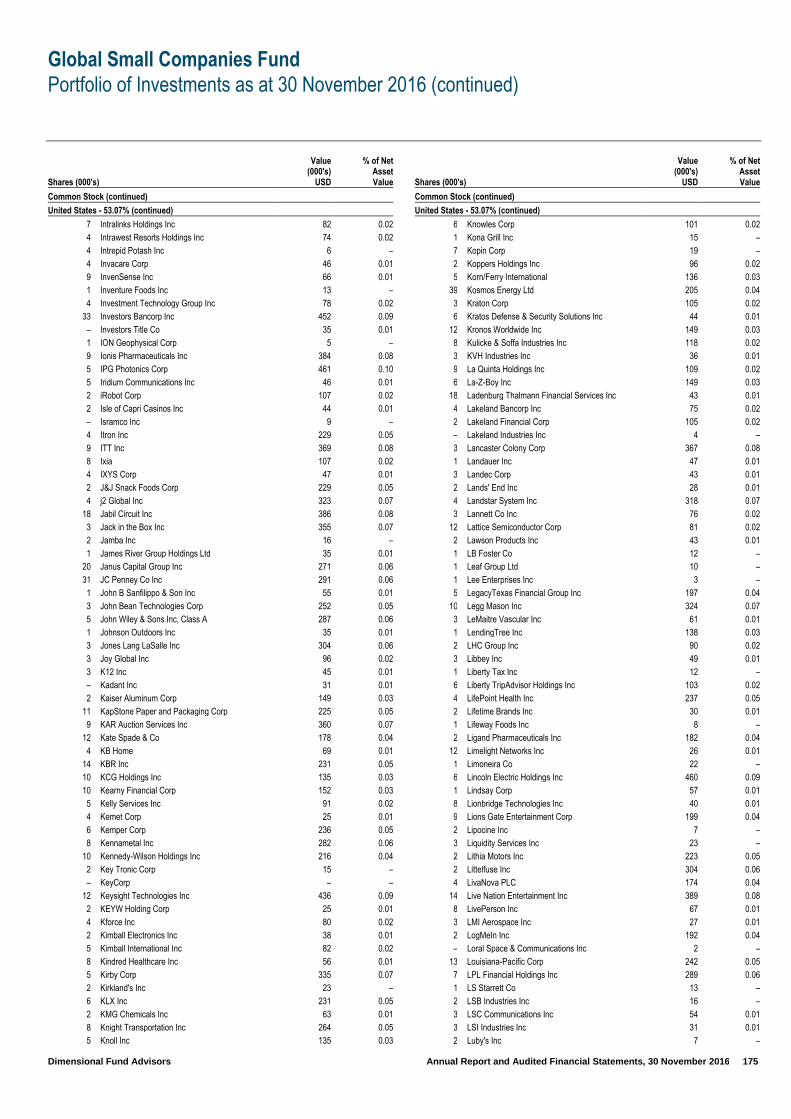
Global Small Companies Fund
Portfolio of Investments as at 30 November 2016 (continued)
Dimensional Fund Advisors Annual Report and Audited Financial Statements, 30 November 2016 175
Shares (000's)
Value (000's)
USD
% of Net Asset Value
Common Stock (continued)
United States - 53.07% (continued)
7 Intralinks Holdings Inc 82 0.02
4 Intrawest Resorts Holdings Inc 74 0.02
4 Intrepid Potash Inc 6 –
4 Invacare Corp 46 0.01
9 InvenSense Inc 66 0.01
1 Inventure Foods Inc 13 –
4 Investment Technology Group Inc 78 0.02
33 Investors Bancorp Inc 452 0.09
– Investors Title Co 35 0.01
1 ION Geophysical Corp 5 –
9 Ionis Pharmaceuticals Inc 384 0.08
5 IPG Photonics Corp 461 0.10
5 Iridium Communications Inc 46 0.01
2 iRobot Corp 107 0.02
2 Isle of Capri Casinos Inc 44 0.01
– Isramco Inc 9 –
4 Itron Inc 229 0.05
9 ITT Inc 369 0.08
8 Ixia 107 0.02
4 IXYS Corp 47 0.01
2 J&J Snack Foods Corp 229 0.05
4 j2 Global Inc 323 0.07
18 Jabil Circuit Inc 386 0.08
3 Jack in the Box Inc 355 0.07
2 Jamba Inc 16 –
1 James River Group Holdings Ltd 35 0.01
20 Janus Capital Group Inc 271 0.06
31 JC Penney Co Inc 291 0.06
1 John B Sanfilippo & Son Inc 55 0.01
3 John Bean Technologies Corp 252 0.05
5 John Wiley & Sons Inc, Class A 287 0.06
1 Johnson Outdoors Inc 35 0.01
3 Jones Lang LaSalle Inc 304 0.06
3 Joy Global Inc 96 0.02
3 K12 Inc 45 0.01
– Kadant Inc 31 0.01
2 Kaiser Aluminum Corp 149 0.03
11 KapStone Paper and Packaging Corp 225 0.05
9 KAR Auction Services Inc 360 0.07
12 Kate Spade & Co 178 0.04
4 KB Home 69 0.01
14 KBR Inc 231 0.05
10 KCG Holdings Inc 135 0.03
10 Kearny Financial Corp 152 0.03
5 Kelly Services Inc 91 0.02
4 Kemet Corp 25 0.01
6 Kemper Corp 236 0.05
8 Kennametal Inc 282 0.06
10 Kennedy-Wilson Holdings Inc 216 0.04
2 Key Tronic Corp 15 –
– KeyCorp – –
12 Keysight Technologies Inc 436 0.09
2 KEYW Holding Corp 25 0.01
4 Kforce Inc 80 0.02
2 Kimball Electronics Inc 38 0.01
5 Kimball International Inc 82 0.02
8 Kindred Healthcare Inc 56 0.01
5 Kirby Corp 335 0.07
2 Kirkland's Inc 23 –
6 KLX Inc 231 0.05
2 KMG Chemicals Inc 63 0.01
8 Knight Transportation Inc 264 0.05
5 Knoll Inc 135 0.03
Shares (000's)
Value (000's)
USD
% of Net Asset Value
Common Stock (continued)
United States - 53.07% (continued)
6 Knowles Corp 101 0.02
1 Kona Grill Inc 15 –
7 Kopin Corp 19 –
2 Koppers Holdings Inc 96 0.02
5 Korn/Ferry International 136 0.03
39 Kosmos Energy Ltd 205 0.04
3 Kraton Corp 105 0.02
6 Kratos Defense & Security Solutions Inc 44 0.01
12 Kronos Worldwide Inc 149 0.03
8 Kulicke & Soffa Industries Inc 118 0.02
3 KVH Industries Inc 36 0.01
9 La Quinta Holdings Inc 109 0.02
6 La-Z-Boy Inc 149 0.03
18 Ladenburg Thalmann Financial Services Inc 43 0.01
4 Lakeland Bancorp Inc 75 0.02
2 Lakeland Financial Corp 105 0.02
– Lakeland Industries Inc 4 –
3 Lancaster Colony Corp 367 0.08
1 Landauer Inc 47 0.01
3 Landec Corp 43 0.01
2 Lands' End Inc 28 0.01
4 Landstar System Inc 318 0.07
3 Lannett Co Inc 76 0.02
12 Lattice Semiconductor Corp 81 0.02
2 Lawson Products Inc 43 0.01
1 LB Foster Co 12 –
1 Leaf Group Ltd 10 –
1 Lee Enterprises Inc 3 –
5 LegacyTexas Financial Group Inc 197 0.04
10 Legg Mason Inc 324 0.07
3 LeMaitre Vascular Inc 61 0.01
1 LendingTree Inc 138 0.03
2 LHC Group Inc 90 0.02
3 Libbey Inc 49 0.01
1 Liberty Tax Inc 12 –
6 Liberty TripAdvisor Holdings Inc 103 0.02
4 LifePoint Health Inc 237 0.05
2 Lifetime Brands Inc 30 0.01
1 Lifeway Foods Inc 8 –
2 Ligand Pharmaceuticals Inc 182 0.04
12 Limelight Networks Inc 26 0.01
1 Limoneira Co 22 –
6 Lincoln Electric Holdings Inc 460 0.09
1 Lindsay Corp 57 0.01
8 Lionbridge Technologies Inc 40 0.01
9 Lions Gate Entertainment Corp 199 0.04
2 Lipocine Inc 7 –
3 Liquidity Services Inc 23 –
2 Lithia Motors Inc 223 0.05
2 Littelfuse Inc 304 0.06
4 LivaNova PLC 174 0.04
14 Live Nation Entertainment Inc 389 0.08
8 LivePerson Inc 67 0.01
3 LMI Aerospace Inc 27 0.01
2 LogMeIn Inc 192 0.04
– Loral Space & Communications Inc 2 –
13 Louisiana-Pacific Corp 242 0.05
7 LPL Financial Holdings Inc 289 0.06
1 LS Starrett Co 13 –
2 LSB Industries Inc 16 –
3 LSC Communications Inc 54 0.01
3 LSI Industries Inc 31 0.01
2 Luby's Inc 7 –

Global Small Companies Fund
Portfolio of Investments as at 30 November 2016 (continued)
Dimensional Fund Advisors Annual Report and Audited Financial Statements, 30 November 2016 176
Shares (000's)
Value (000's)
USD
% of Net Asset Value
Common Stock (continued)
United States - 53.07% (continued)
2 Lumber Liquidators Holdings Inc 28 0.01
2 Lumentum Holdings Inc 75 0.02
3 Luminex Corp 64 0.01
2 Lumos Networks Corp 35 0.01
2 Lydall Inc 115 0.02
3 M/I Homes Inc 59 0.01
5 Macatawa Bank Corp 51 0.01
2 MACOM Technology Solutions Holdings Inc 80 0.02
2 Madison Square Garden Co 366 0.08
3 Magellan Health Inc 196 0.04
9 Maiden Holdings Ltd 135 0.03
2 MainSource Financial Group Inc 67 0.01
1 Malibu Boats Inc 27 0.01
7 Manhattan Associates Inc 362 0.07
12 Manitowoc Co Inc 72 0.01
15 Manitowoc Foodservice Inc 258 0.05
3 Manning & Napier Inc 21 –
5 ManpowerGroup Inc 418 0.09
3 ManTech International Corp 110 0.02
3 Marchex Inc 7 –
2 Marcus & Millichap Inc 61 0.01
1 Marcus Corp 32 0.01
2 Marin Software Inc 5 –
3 Marine Products Corp 36 0.01
3 MarineMax Inc 48 0.01
1 MarketAxess Holdings Inc 87 0.02
1 Marlin Business Services Corp 28 0.01
3 Marriott Vacations Worldwide Corp 220 0.05
3 Marten Transport Ltd 79 0.02
4 Masimo Corp 274 0.06
8 MasTec Inc 290 0.06
2 Matador Resources Co 63 0.01
2 Materion Corp 83 0.02
3 Matrix Service Co 63 0.01
5 Matson Inc 174 0.04
3 Matthews International Corp 252 0.05
6 MAXIMUS Inc 325 0.07
3 MaxLinear Inc 60 0.01
1 Maxwell Technologies Inc 6 –
7 MB Financial Inc 309 0.06
16 MBIA Inc 164 0.03
1 McClatchy Co 8 –
16 McDermott International Inc 111 0.02
4 McEwen Mining Inc 12 –
17 McEwen Mining Inc 48 0.01
3 McGrath RentCorp 102 0.02
6 MDC Holdings Inc 150 0.03
20 MDU Resources Group Inc 553 0.12
13 Media General Inc 235 0.05
6 Medicines Co 212 0.04
1 Medifast Inc 45 0.01
2 MeetMe Inc 11 –
11 Mentor Graphics Corp 390 0.08
2 Mercantile Bank Corp 59 0.01
6 Mercer International Inc 58 0.01
1 Merchants Bancshares Inc 29 0.01
6 Mercury General Corp 348 0.07
4 Mercury Systems Inc 122 0.03
4 Meredith Corp 205 0.04
6 Meridian Bancorp Inc 110 0.02
4 Meridian Bioscience Inc 68 0.01
4 Merit Medical Systems Inc 105 0.02
4 Meritage Homes Corp 158 0.03
Shares (000's)
Value (000's)
USD
% of Net Asset Value
Common Stock (continued)
United States - 53.07% (continued)
9 Meritor Inc 116 0.02
– Mesa Laboratories Inc 50 0.01
1 Meta Financial Group Inc 93 0.02
4 Methode Electronics Inc 136 0.03
4 MGE Energy Inc 230 0.05
26 MGIC Investment Corp 232 0.05
2 MGP Ingredients Inc 76 0.02
11 Michaels Cos Inc 267 0.06
11 Microsemi Corp 621 0.14
1 MicroStrategy Inc 178 0.04
2 Middlesex Water Co 71 0.01
1 MidSouth Bancorp Inc 17 –
1 MidWestOne Financial Group Inc 40 0.01
2 Miller Industries Inc 48 0.01
3 Minerals Technologies Inc 257 0.05
3 Mistras Group Inc 73 0.02
1 Mitcham Industries Inc 2 –
5 MKS Instruments Inc 274 0.06
4 Mobile Mini Inc 135 0.03
8 Modine Manufacturing Co 90 0.02
5 ModusLink Global Solutions Inc 7 –
2 Moelis & Co 72 0.01
5 Molina Healthcare Inc 270 0.06
1 Momenta Pharmaceuticals Inc 15 –
4 MoneyGram International Inc 48 0.01
1 Monolithic Power Systems Inc 78 0.02
4 Monotype Imaging Holdings Inc 74 0.02
3 Monro Muffler Brake Inc 184 0.04
4 Moog Inc 263 0.05
4 Morningstar Inc 283 0.06
2 Motorcar Parts of America Inc 44 0.01
1 Movado Group Inc 37 0.01
11 MRC Global Inc 224 0.05
4 MSA Safety Inc 231 0.05
4 MSC Industrial Direct Co Inc 335 0.07
6 MSG Networks Inc 123 0.03
1 MTS Systems Corp 77 0.02
6 Mueller Industries Inc 214 0.04
18 Mueller Water Products Inc 233 0.05
2 Multi-Color Corp 112 0.02
14 Murphy Oil Corp 482 0.10
4 Murphy USA Inc 286 0.06
3 Myers Industries Inc 41 0.01
2 MYR Group Inc 70 0.01
7 Myriad Genetics Inc 115 0.02
24 Nabors Industries Ltd 390 0.08
1 NACCO Industries Inc 66 0.01
3 Nanometrics Inc 60 0.01
– Nathan's Famous Inc 21 –
3 National Bank Holdings Corp 91 0.02
1 National Bankshares Inc 32 0.01
5 National Beverage Corp 242 0.05
7 National CineMedia Inc 100 0.02
8 National Fuel Gas Co 476 0.10
10 National General Holdings Corp 235 0.05
2 National HealthCare Corp 114 0.02
12 National Instruments Corp 365 0.08
1 National Presto Industries Inc 55 0.01
2 National Research Corp 27 0.01
– National Western Life Group Inc 105 0.02
8 Nationstar Mortgage Holdings Inc 127 0.03
2 Natural Gas Services Group Inc 43 0.01
2 Natural Grocers by Vitamin Cottage Inc 18 –

Global Small Companies Fund
Portfolio of Investments as at 30 November 2016 (continued)
Dimensional Fund Advisors Annual Report and Audited Financial Statements, 30 November 2016 177
Shares (000's)
Value (000's)
USD
% of Net Asset Value
Common Stock (continued)
United States - 53.07% (continued)
1 Nature's Sunshine Products Inc 13 –
4 Natus Medical Inc 142 0.03
3 Nautilus Inc 46 0.01
30 Navient Corp 513 0.11
6 Navigant Consulting Inc 140 0.03
2 Navigators Group Inc 170 0.04
5 NBT Bancorp Inc 174 0.04
4 NCI Building Systems Inc 70 0.01
1 NCI Inc 14 –
10 NCR Corp 396 0.08
2 Neenah Paper Inc 142 0.03
3 Nelnet Inc 171 0.04
3 Neogen Corp 186 0.04
4 NeoGenomics Inc 35 0.01
5 NeoPhotonics Corp 70 0.01
3 NETGEAR Inc 187 0.04
8 NetScout Systems Inc 236 0.05
7 Neurocrine Biosciences Inc 336 0.07
3 NeuStar Inc 69 0.01
9 New Jersey Resources Corp 306 0.06
3 New Media Investment Group Inc 48 0.01
4 New York & Co Inc 8 –
15 New York Times Co 193 0.04
1 NewMarket Corp 367 0.08
10 Newpark Resources Inc 76 0.02
5 NewStar Financial Inc 41 0.01
3 Nexstar Broadcasting Group Inc 171 0.04
6 NIC Inc 155 0.03
1 Nicholas Financial Inc 8 –
5 NL Industries Inc 32 0.01
6 NMI Holdings Inc 49 0.01
2 NN Inc 33 0.01
24 Noble Corp PLC 149 0.03
– Nordic American Offshore Ltd – –
4 Nordic American Tankers Ltd 37 0.01
2 Nordson Corp 220 0.05
– Northern Oil and Gas Inc – –
5 Northfield Bancorp Inc 88 0.02
1 Northrim BanCorp Inc 17 –
17 NorthStar Asset Management Group Inc 250 0.05
10 Northwest Bancshares Inc 186 0.04
3 Northwest Natural Gas Co 158 0.03
1 Northwest Pipe Co 10 –
5 NorthWestern Corp 283 0.06
4 Novanta Inc 86 0.02
6 NOW Inc 133 0.03
27 NRG Energy Inc 311 0.06
3 NRG Yield Inc, Class A 48 0.01
7 NRG Yield Inc, Class C 103 0.02
5 Nu Skin Enterprises Inc 242 0.05
13 Nuance Communications Inc 209 0.04
1 Numerex Corp 8 –
1 Nutraceutical International Corp 19 –
2 Nutrisystem Inc 90 0.02
4 NuVasive Inc 245 0.05
1 Nuvectra Corp 5 –
– NV5 Global Inc 18 –
1 NVE Corp 33 0.01
6 Oasis Petroleum Inc 97 0.02
8 Oceaneering International Inc 207 0.04
4 OceanFirst Financial Corp 84 0.02
7 Oclaro Inc 64 0.01
6 Ocwen Financial Corp 33 0.01
Shares (000's)
Value (000's)
USD
% of Net Asset Value
Common Stock (continued)
United States - 53.07% (continued)
49 Office Depot Inc 241 0.05
4 OFG Bancorp 51 0.01
5 Oil States International Inc 192 0.04
1 Oil-Dri Corp of America 28 0.01
1 Old Line Bancshares Inc 16 –
12 Old National Bancorp 197 0.04
28 Old Republic International Corp 494 0.10
2 Old Second Bancorp Inc 16 –
15 Olin Corp 393 0.08
5 Ollie's Bargain Outlet Holdings Inc 143 0.03
– Olympic Steel Inc 10 –
9 OM Asset Management Plc 125 0.03
1 Omega Flex Inc 33 0.01
2 Omega Protein Corp 36 0.01
4 Omnicell Inc 141 0.03
6 OMNOVA Solutions Inc 57 0.01
5 On Assignment Inc 226 0.05
35 ON Semiconductor Corp 417 0.09
5 ONE Gas Inc 314 0.06
3 OneBeacon Insurance Group Ltd 39 0.01
9 OneMain Holdings Inc 185 0.04
1 Oppenheimer Holdings Inc 26 0.01
4 Opus Bank 96 0.02
3 OraSure Technologies Inc 27 0.01
8 ORBCOMM Inc 70 0.01
1 Orchids Paper Products Co 28 0.01
3 Orion Group Holdings Inc 33 0.01
4 Oritani Financial Corp 69 0.01
1 Ormat Technologies Inc (Israel listing) 68 0.01
5 Ormat Technologies Inc (US listing) 247 0.05
1 Orrstown Financial Services Inc 13 –
2 Orthofix International NV 72 0.01
8 Oshkosh Corp 541 0.12
2 OSI Systems Inc 140 0.03
4 Otter Tail Corp 142 0.03
1 Overstock.com Inc 15 –
7 Owens & Minor Inc 224 0.05
16 Owens-Illinois Inc 288 0.06
1 Oxford Industries Inc 107 0.02
2 Pacific Continental Corp 47 0.01
1 Pacific Drilling SA 5 –
2 Pacific Premier Bancorp Inc 71 0.01
6 PacWest Bancorp 299 0.06
1 PAM Transportation Services Inc 20 –
2 Panera Bread Co 407 0.08
2 Panhandle Oil and Gas Inc 48 0.01
4 Papa John's International Inc 347 0.07
4 Par Pacific Holdings Inc 61 0.01
5 PAREXEL International Corp 316 0.07
2 Park Electrochemical Corp 40 0.01
2 Park National Corp 184 0.04
5 Park Sterling Corp 50 0.01
1 Park-Ohio Holdings Corp 51 0.01
14 Parker Drilling Co 29 0.01
15 Parsley Energy Inc 573 0.13
2 Party City Holdco Inc 25 0.01
2 Patrick Industries Inc 125 0.03
– Patriot Transportation Holding Inc 5 –
5 Pattern Energy Group Inc 103 0.02
9 Patterson Cos Inc 334 0.07
15 Patterson-UTI Energy Inc 396 0.08
5 Paycom Software Inc 244 0.05
11 PBF Energy Inc 252 0.05

Global Small Companies Fund
Portfolio of Investments as at 30 November 2016 (continued)
Dimensional Fund Advisors Annual Report and Audited Financial Statements, 30 November 2016 178
Shares (000's)
Value (000's)
USD
% of Net Asset Value
Common Stock (continued)
United States - 53.07% (continued)
2 PC Connection Inc 66 0.01
1 PC-Tel Inc 7 –
1 PCM Inc 17 –
5 PDC Energy Inc 369 0.08
3 PDF Solutions Inc 72 0.01
7 PDL BioPharma Inc 16 –
1 Peapack Gladstone Financial Corp 31 0.01
7 Pegasystems Inc 262 0.05
1 Pendrell Corp 6 –
5 Penn National Gaming Inc 62 0.01
1 Penns Woods Bancorp Inc 36 0.01
2 PennyMac Financial Services Inc 36 0.01
8 Penske Automotive Group Inc 423 0.09
26 People's United Financial Inc 488 0.10
2 Peoples Bancorp Inc 49 0.01
1 Peoples Financial Services Corp 35 0.01
2 Perceptron Inc 12 –
3 Perficient Inc 54 0.01
4 Performant Financial Corp 14 –
2 Perry Ellis International Inc 44 0.01
1 PetMed Express Inc 18 –
1 PFSweb Inc 10 –
5 PGT Inc 57 0.01
5 PH Glatfelter Co 121 0.02
3 PharMerica Corp 77 0.02
5 PHH Corp 76 0.02
1 PHI Inc 22 –
2 Phibro Animal Health Corp 42 0.01
5 Photronics Inc 48 0.01
2 PICO Holdings Inc 24 –
9 Pier 1 Imports Inc 49 0.01
6 Pinnacle Entertainment Inc 79 0.02
4 Pinnacle Financial Partners Inc 261 0.05
7 Pioneer Energy Services Corp 36 0.01
– Piper Jaffray Cos 31 0.01
16 Pitney Bowes Inc 233 0.05
1 Planet Fitness Inc 11 –
8 Planet Payment Inc 34 0.01
4 Plantronics Inc 188 0.04
20 Platform Specialty Products Corp 190 0.04
3 Plexus Corp 164 0.03
6 Ply Gem Holdings Inc 95 0.02
9 PNM Resources Inc 273 0.06
8 PolyOne Corp 257 0.05
4 Pool Corp 383 0.08
2 Popeyes Louisiana Kitchen Inc 122 0.03
10 Popular Inc 409 0.08
8 Portland General Electric Co 344 0.07
5 Post Holdings Inc 387 0.08
– Potbelly Corp 5 –
1 Powell Industries Inc 46 0.01
3 Power Integrations Inc 197 0.04
1 Power Solutions International Inc 8 –
5 PRA Group Inc 166 0.03
3 PRA Health Sciences Inc 182 0.04
2 Preferred Bank 69 0.01
1 Preformed Line Products Co 28 0.01
2 Premier Inc 61 0.01
6 Prestige Brands Holdings Inc 264 0.05
1 PRGX Global Inc 6 –
3 PriceSmart Inc 281 0.06
5 Primerica Inc 349 0.07
2 Primo Water Corp 28 0.01
Shares (000's)
Value (000's)
USD
% of Net Asset Value
Common Stock (continued)
United States - 53.07% (continued)
5 Primoris Services Corp 117 0.02
9 PrivateBancorp Inc 416 0.09
6 ProAssurance Corp 316 0.07
6 Progress Software Corp 163 0.03
3 Proofpoint Inc 234 0.05
7 Prosperity Bancshares Inc 490 0.10
2 Proto Labs Inc 94 0.02
2 Providence Service Corp 61 0.01
– Provident Financial Holdings Inc 8 –
6 Provident Financial Services Inc 171 0.04
1 Prudential Bancorp Inc 9 –
10 PTC Inc 475 0.10
2 Pzena Investment Management Inc 16 –
2 QAD Inc 57 0.01
1 QCR Holdings Inc 43 0.01
26 QEP Resources Inc 505 0.10
4 Quad/Graphics Inc 103 0.02
1 Quaker Chemical Corp 163 0.03
6 Quality Systems Inc 78 0.02
3 Qualys Inc 96 0.02
3 Quanex Building Products Corp 65 0.01
14 Quanta Services Inc 462 0.10
3 Quidel Corp 78 0.02
3 QuinStreet Inc 11 –
1 Qumu Corp 1 –
1 Quorum Health Corp 4 –
9 Quotient Technology Inc 117 0.02
16 Radian Group Inc 236 0.05
4 Radiant Logistics Inc 15 –
4 RadNet Inc 27 0.01
11 Rambus Inc 146 0.03
3 Raven Industries Inc 85 0.02
4 Rayonier Advanced Materials Inc 57 0.01
3 RBC Bearings Inc 221 0.05
1 RCI Hospitality Holdings Inc 12 –
2 RE/MAX Holdings Inc 93 0.02
2 Reading International Inc 28 0.01
2 Real Industry Inc 9 –
4 RealNetworks Inc 19 –
12 Realogy Holdings Corp 279 0.06
1 Red Lion Hotels Corp 9 –
2 Red Robin Gourmet Burgers Inc 78 0.02
5 Regal Beloit Corp 344 0.07
14 Regal Entertainment Group 315 0.07
2 Regional Management Corp 49 0.01
5 Regis Corp 68 0.01
1 Reis Inc 27 0.01
7 Reliance Steel & Aluminum Co 549 0.12
4 RenaissanceRe Holdings Ltd 543 0.12
5 Renasant Corp 199 0.04
5 Renewable Energy Group Inc 46 0.01
5 Rent-A-Center Inc 62 0.01
– Rentech Inc – –
3 Repligen Corp 90 0.02
2 Republic Bancorp Inc 74 0.02
10 Resolute Forest Products Inc 45 0.01
4 Resources Connection Inc 60 0.01
4 Restoration Hardware Holdings Inc 138 0.03
3 RetailMeNot Inc 28 0.01
2 Retrophin Inc 33 0.01
6 Revlon Inc 156 0.03
1 REX American Resources Corp 59 0.01
9 Rexnord Corp 208 0.04
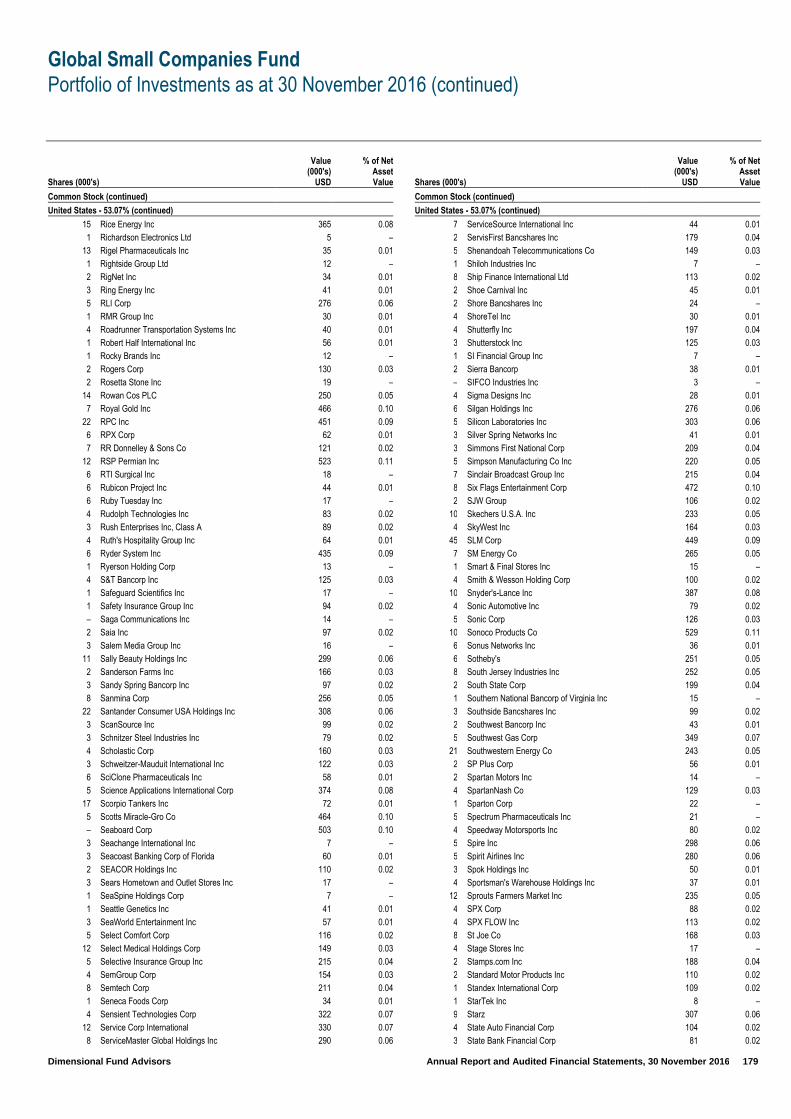
Global Small Companies Fund
Portfolio of Investments as at 30 November 2016 (continued)
Dimensional Fund Advisors Annual Report and Audited Financial Statements, 30 November 2016 179
Shares (000's)
Value (000's)
USD
% of Net Asset Value
Common Stock (continued)
United States - 53.07% (continued)
15 Rice Energy Inc 365 0.08
1 Richardson Electronics Ltd 5 –
13 Rigel Pharmaceuticals Inc 35 0.01
1 Rightside Group Ltd 12 –
2 RigNet Inc 34 0.01
3 Ring Energy Inc 41 0.01
5 RLI Corp 276 0.06
1 RMR Group Inc 30 0.01
4 Roadrunner Transportation Systems Inc 40 0.01
1 Robert Half International Inc 56 0.01
1 Rocky Brands Inc 12 –
2 Rogers Corp 130 0.03
2 Rosetta Stone Inc 19 –
14 Rowan Cos PLC 250 0.05
7 Royal Gold Inc 466 0.10
22 RPC Inc 451 0.09
6 RPX Corp 62 0.01
7 RR Donnelley & Sons Co 121 0.02
12 RSP Permian Inc 523 0.11
6 RTI Surgical Inc 18 –
6 Rubicon Project Inc 44 0.01
6 Ruby Tuesday Inc 17 –
4 Rudolph Technologies Inc 83 0.02
3 Rush Enterprises Inc, Class A 89 0.02
4 Ruth's Hospitality Group Inc 64 0.01
6 Ryder System Inc 435 0.09
1 Ryerson Holding Corp 13 –
4 S&T Bancorp Inc 125 0.03
1 Safeguard Scientifics Inc 17 –
1 Safety Insurance Group Inc 94 0.02
– Saga Communications Inc 14 –
2 Saia Inc 97 0.02
3 Salem Media Group Inc 16 –
11 Sally Beauty Holdings Inc 299 0.06
2 Sanderson Farms Inc 166 0.03
3 Sandy Spring Bancorp Inc 97 0.02
8 Sanmina Corp 256 0.05
22 Santander Consumer USA Holdings Inc 308 0.06
3 ScanSource Inc 99 0.02
3 Schnitzer Steel Industries Inc 79 0.02
4 Scholastic Corp 160 0.03
3 Schweitzer-Mauduit International Inc 122 0.03
6 SciClone Pharmaceuticals Inc 58 0.01
5 Science Applications International Corp 374 0.08
17 Scorpio Tankers Inc 72 0.01
5 Scotts Miracle-Gro Co 464 0.10
– Seaboard Corp 503 0.10
3 Seachange International Inc 7 –
3 Seacoast Banking Corp of Florida 60 0.01
2 SEACOR Holdings Inc 110 0.02
3 Sears Hometown and Outlet Stores Inc 17 –
1 SeaSpine Holdings Corp 7 –
1 Seattle Genetics Inc 41 0.01
3 SeaWorld Entertainment Inc 57 0.01
5 Select Comfort Corp 116 0.02
12 Select Medical Holdings Corp 149 0.03
5 Selective Insurance Group Inc 215 0.04
4 SemGroup Corp 154 0.03
8 Semtech Corp 211 0.04
1 Seneca Foods Corp 34 0.01
4 Sensient Technologies Corp 322 0.07
12 Service Corp International 330 0.07
8 ServiceMaster Global Holdings Inc 290 0.06
Shares (000's)
Value (000's)
USD
% of Net Asset Value
Common Stock (continued)
United States - 53.07% (continued)
7 ServiceSource International Inc 44 0.01
2 ServisFirst Bancshares Inc 179 0.04
5 Shenandoah Telecommunications Co 149 0.03
1 Shiloh Industries Inc 7 –
8 Ship Finance International Ltd 113 0.02
2 Shoe Carnival Inc 45 0.01
2 Shore Bancshares Inc 24 –
4 ShoreTel Inc 30 0.01
4 Shutterfly Inc 197 0.04
3 Shutterstock Inc 125 0.03
1 SI Financial Group Inc 7 –
2 Sierra Bancorp 38 0.01
– SIFCO Industries Inc 3 –
4 Sigma Designs Inc 28 0.01
6 Silgan Holdings Inc 276 0.06
5 Silicon Laboratories Inc 303 0.06
3 Silver Spring Networks Inc 41 0.01
3 Simmons First National Corp 209 0.04
5 Simpson Manufacturing Co Inc 220 0.05
7 Sinclair Broadcast Group Inc 215 0.04
8 Six Flags Entertainment Corp 472 0.10
2 SJW Group 106 0.02
10 Skechers U.S.A. Inc 233 0.05
4 SkyWest Inc 164 0.03
45 SLM Corp 449 0.09
7 SM Energy Co 265 0.05
1 Smart & Final Stores Inc 15 –
4 Smith & Wesson Holding Corp 100 0.02
10 Snyder's-Lance Inc 387 0.08
4 Sonic Automotive Inc 79 0.02
5 Sonic Corp 126 0.03
10 Sonoco Products Co 529 0.11
6 Sonus Networks Inc 36 0.01
6 Sotheby's 251 0.05
8 South Jersey Industries Inc 252 0.05
2 South State Corp 199 0.04
1 Southern National Bancorp of Virginia Inc 15 –
3 Southside Bancshares Inc 99 0.02
2 Southwest Bancorp Inc 43 0.01
5 Southwest Gas Corp 349 0.07
21 Southwestern Energy Co 243 0.05
2 SP Plus Corp 56 0.01
2 Spartan Motors Inc 14 –
4 SpartanNash Co 129 0.03
1 Sparton Corp 22 –
5 Spectrum Pharmaceuticals Inc 21 –
4 Speedway Motorsports Inc 80 0.02
5 Spire Inc 298 0.06
5 Spirit Airlines Inc 280 0.06
3 Spok Holdings Inc 50 0.01
4 Sportsman's Warehouse Holdings Inc 37 0.01
12 Sprouts Farmers Market Inc 235 0.05
4 SPX Corp 88 0.02
4 SPX FLOW Inc 113 0.02
8 St Joe Co 168 0.03
4 Stage Stores Inc 17 –
2 Stamps.com Inc 188 0.04
2 Standard Motor Products Inc 110 0.02
1 Standex International Corp 109 0.02
1 StarTek Inc 8 –
9 Starz 307 0.06
4 State Auto Financial Corp 104 0.02
3 State Bank Financial Corp 81 0.02
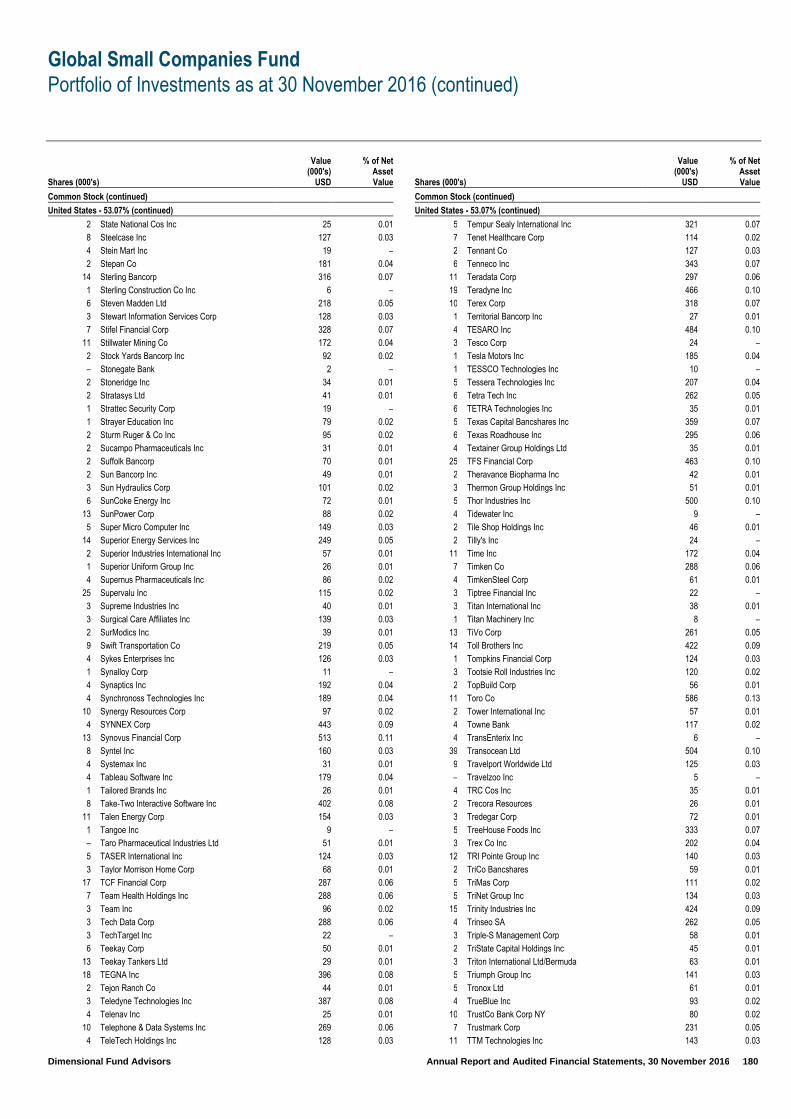
Global Small Companies Fund
Portfolio of Investments as at 30 November 2016 (continued)
Dimensional Fund Advisors Annual Report and Audited Financial Statements, 30 November 2016 180
Shares (000's)
Value (000's)
USD
% of Net Asset Value
Common Stock (continued)
United States - 53.07% (continued)
2 State National Cos Inc 25 0.01
8 Steelcase Inc 127 0.03
4 Stein Mart Inc 19 –
2 Stepan Co 181 0.04
14 Sterling Bancorp 316 0.07
1 Sterling Construction Co Inc 6 –
6 Steven Madden Ltd 218 0.05
3 Stewart Information Services Corp 128 0.03
7 Stifel Financial Corp 328 0.07
11 Stillwater Mining Co 172 0.04
2 Stock Yards Bancorp Inc 92 0.02
– Stonegate Bank 2 –
2 Stoneridge Inc 34 0.01
2 Stratasys Ltd 41 0.01
1 Strattec Security Corp 19 –
1 Strayer Education Inc 79 0.02
2 Sturm Ruger & Co Inc 95 0.02
2 Sucampo Pharmaceuticals Inc 31 0.01
2 Suffolk Bancorp 70 0.01
2 Sun Bancorp Inc 49 0.01
3 Sun Hydraulics Corp 101 0.02
6 SunCoke Energy Inc 72 0.01
13 SunPower Corp 88 0.02
5 Super Micro Computer Inc 149 0.03
14 Superior Energy Services Inc 249 0.05
2 Superior Industries International Inc 57 0.01
1 Superior Uniform Group Inc 26 0.01
4 Supernus Pharmaceuticals Inc 86 0.02
25 Supervalu Inc 115 0.02
3 Supreme Industries Inc 40 0.01
3 Surgical Care Affiliates Inc 139 0.03
2 SurModics Inc 39 0.01
9 Swift Transportation Co 219 0.05
4 Sykes Enterprises Inc 126 0.03
1 Synalloy Corp 11 –
4 Synaptics Inc 192 0.04
4 Synchronoss Technologies Inc 189 0.04
10 Synergy Resources Corp 97 0.02
4 SYNNEX Corp 443 0.09
13 Synovus Financial Corp 513 0.11
8 Syntel Inc 160 0.03
4 Systemax Inc 31 0.01
4 Tableau Software Inc 179 0.04
1 Tailored Brands Inc 26 0.01
8 Take-Two Interactive Software Inc 402 0.08
11 Talen Energy Corp 154 0.03
1 Tangoe Inc 9 –
– Taro Pharmaceutical Industries Ltd 51 0.01
5 TASER International Inc 124 0.03
3 Taylor Morrison Home Corp 68 0.01
17 TCF Financial Corp 287 0.06
7 Team Health Holdings Inc 288 0.06
3 Team Inc 96 0.02
3 Tech Data Corp 288 0.06
3 TechTarget Inc 22 –
6 Teekay Corp 50 0.01
13 Teekay Tankers Ltd 29 0.01
18 TEGNA Inc 396 0.08
2 Tejon Ranch Co 44 0.01
3 Teledyne Technologies Inc 387 0.08
4 Telenav Inc 25 0.01
10 Telephone & Data Systems Inc 269 0.06
4 TeleTech Holdings Inc 128 0.03
Shares (000's)
Value (000's)
USD
% of Net Asset Value
Common Stock (continued)
United States - 53.07% (continued)
5 Tempur Sealy International Inc 321 0.07
7 Tenet Healthcare Corp 114 0.02
2 Tennant Co 127 0.03
6 Tenneco Inc 343 0.07
11 Teradata Corp 297 0.06
19 Teradyne Inc 466 0.10
10 Terex Corp 318 0.07
1 Territorial Bancorp Inc 27 0.01
4 TESARO Inc 484 0.10
3 Tesco Corp 24 –
1 Tesla Motors Inc 185 0.04
1 TESSCO Technologies Inc 10 –
5 Tessera Technologies Inc 207 0.04
6 Tetra Tech Inc 262 0.05
6 TETRA Technologies Inc 35 0.01
5 Texas Capital Bancshares Inc 359 0.07
6 Texas Roadhouse Inc 295 0.06
4 Textainer Group Holdings Ltd 35 0.01
25 TFS Financial Corp 463 0.10
2 Theravance Biopharma Inc 42 0.01
3 Thermon Group Holdings Inc 51 0.01
5 Thor Industries Inc 500 0.10
4 Tidewater Inc 9 –
2 Tile Shop Holdings Inc 46 0.01
2 Tilly's Inc 24 –
11 Time Inc 172 0.04
7 Timken Co 288 0.06
4 TimkenSteel Corp 61 0.01
3 Tiptree Financial Inc 22 –
3 Titan International Inc 38 0.01
1 Titan Machinery Inc 8 –
13 TiVo Corp 261 0.05
14 Toll Brothers Inc 422 0.09
1 Tompkins Financial Corp 124 0.03
3 Tootsie Roll Industries Inc 120 0.02
2 TopBuild Corp 56 0.01
11 Toro Co 586 0.13
2 Tower International Inc 57 0.01
4 Towne Bank 117 0.02
4 TransEnterix Inc 6 –
39 Transocean Ltd 504 0.10
9 Travelport Worldwide Ltd 125 0.03
– Travelzoo Inc 5 –
4 TRC Cos Inc 35 0.01
2 Trecora Resources 26 0.01
3 Tredegar Corp 72 0.01
5 TreeHouse Foods Inc 333 0.07
3 Trex Co Inc 202 0.04
12 TRI Pointe Group Inc 140 0.03
2 TriCo Bancshares 59 0.01
5 TriMas Corp 111 0.02
5 TriNet Group Inc 134 0.03
15 Trinity Industries Inc 424 0.09
4 Trinseo SA 262 0.05
3 Triple-S Management Corp 58 0.01
2 TriState Capital Holdings Inc 45 0.01
3 Triton International Ltd/Bermuda 63 0.01
5 Triumph Group Inc 141 0.03
5 Tronox Ltd 61 0.01
4 TrueBlue Inc 93 0.02
10 TrustCo Bank Corp NY 80 0.02
7 Trustmark Corp 231 0.05
11 TTM Technologies Inc 143 0.03

Global Small Companies Fund
Portfolio of Investments as at 30 November 2016 (continued)
Dimensional Fund Advisors Annual Report and Audited Financial Statements, 30 November 2016 181
Shares (000's)
Value (000's)
USD
% of Net Asset Value
Common Stock (continued)
United States - 53.07% (continued)
2 Tuesday Morning Corp 7 –
5 Tupperware Brands Corp 259 0.05
5 Tutor Perini Corp 124 0.03
1 Twin Disc Inc 8 –
2 Tyler Technologies Inc 369 0.08
8 Ubiquiti Networks Inc 460 0.09
1 UFP Technologies Inc 28 0.01
3 Ultra Clean Holdings Inc 29 0.01
2 Ultratech Inc 54 0.01
5 UMB Financial Corp 398 0.08
23 Umpqua Holdings Corp 415 0.09
1 Unifi Inc 34 0.01
2 UniFirst Corp 230 0.05
4 Union Bankshares Corp 144 0.03
5 Unisys Corp 69 0.01
4 Unit Corp 93 0.02
8 United Bankshares Inc 352 0.07
6 United Community Banks Inc 165 0.03
6 United Community Financial Corp 50 0.01
6 United Financial Bancorp Inc 97 0.02
2 United Fire Group Inc 99 0.02
2 United Insurance Holdings Corp 27 0.01
4 United Natural Foods Inc 204 0.04
5 United States Cellular Corp 200 0.04
1 United States Lime & Minerals Inc 50 0.01
15 United States Steel Corp 481 0.10
1 United Therapeutics Corp 170 0.04
2 Unitil Corp 68 0.01
10 Univar Inc 242 0.05
8 Universal American Corp 79 0.02
2 Universal Corp 122 0.03
3 Universal Display Corp 189 0.04
1 Universal Electronics Inc 96 0.02
2 Universal Forest Products Inc 191 0.04
4 Universal Insurance Holdings Inc 92 0.02
2 Universal Logistics Holdings Inc 35 0.01
– Universal Stainless & Alloy Products Inc 5 –
3 Universal Technical Institute Inc 7 –
3 Univest Corp of Pennsylvania 76 0.02
10 Urban Outfitters Inc 303 0.06
1 US Concrete Inc 82 0.02
2 US Ecology Inc 96 0.02
1 US Physical Therapy Inc 78 0.02
5 US Silica Holdings Inc 234 0.05
1 USA Truck Inc 6 –
3 USANA Health Sciences Inc 159 0.03
15 USG Corp 421 0.09
– Utah Medical Products Inc 28 0.01
5 Vaalco Energy Inc 4 –
3 Vail Resorts Inc 534 0.11
9 Validus Holdings Ltd 472 0.10
25 Valley National Bancorp 288 0.06
2 Valmont Industries Inc 316 0.07
3 VASCO Data Security International Inc 48 0.01
2 Vascular Solutions Inc 92 0.02
7 VCA Inc 408 0.08
12 Vector Group Ltd 255 0.05
8 Vectren Corp 416 0.09
1 Vectrus Inc 16 –
4 Veeco Instruments Inc 105 0.02
7 Veeva Systems Inc 334 0.07
3 Vera Bradley Inc 44 0.01
11 VeriFone Systems Inc 184 0.04
Shares (000's)
Value (000's)
USD
% of Net Asset Value
Common Stock (continued)
United States - 53.07% (continued)
6 Verint Systems Inc 207 0.04
2 Veritiv Corp 79 0.02
2 Viad Corp 74 0.02
5 ViaSat Inc 346 0.07
12 Viavi Solutions Inc 94 0.02
2 Vicor Corp 24 –
1 Village Super Market Inc 42 0.01
3 Vince Holding Corp 11 –
– Virgin America Inc 25 0.01
1 Virtus Investment Partners Inc 87 0.02
3 Virtusa Corp 62 0.01
15 Vishay Intertechnology Inc 226 0.05
1 Vishay Precision Group Inc 12 –
4 Vista Outdoor Inc 166 0.03
4 Visteon Corp 291 0.06
3 Vitamin Shoppe Inc 73 0.02
3 Volt Information Sciences Inc 16 –
16 Vonage Holdings Corp 105 0.02
2 VOXX International Corp 9 –
1 VSE Corp 29 0.01
12 VWR Corp 315 0.07
7 Wabash National Corp 93 0.02
– WABCO Holdings Inc 1 –
5 Waddell & Reed Financial Inc 107 0.02
3 Walker & Dunlop Inc 97 0.02
9 Washington Federal Inc 277 0.06
2 Washington Trust Bancorp Inc 83 0.02
3 Waterstone Financial Inc 57 0.01
3 Watsco Inc 415 0.09
3 Watts Water Technologies Inc 206 0.04
3 WCI Communities Inc 75 0.02
1 WD-40 Co 148 0.03
58 Weatherford International PLC 295 0.06
2 Web.com Group Inc 34 0.01
4 WebMD Health Corp 206 0.04
9 Webster Financial Corp 437 0.09
2 Weight Watchers International Inc 20 –
3 Weis Markets Inc 142 0.03
4 WellCare Health Plans Inc 613 0.14
29 Wendy's Co 369 0.08
7 Werner Enterprises Inc 197 0.04
4 WesBanco Inc 171 0.04
10 Wesco Aircraft Holdings Inc 152 0.03
4 WESCO International Inc 261 0.05
2 West Bancorporation Inc 38 0.01
8 West Corp 188 0.04
3 West Marine Inc 24 –
6 West Pharmaceutical Services Inc 457 0.09
2 Westamerica Bancorporation 146 0.03
7 Westar Energy Inc 397 0.08
10 Western Alliance Bancorp 484 0.10
1 Western New England Bancorp Inc 10 –
10 Western Refining Inc 357 0.07
1 Westwood Holdings Group Inc 41 0.01
4 WEX Inc 399 0.08
1 Weyco Group Inc 23 –
5 WGL Holdings Inc 354 0.07
1 White Mountains Insurance Group Ltd 462 0.10
10 Whiting Petroleum Corp 126 0.03
4 Willbros Group Inc 11 –
3 William Lyon Homes 63 0.01
7 Williams-Sonoma Inc 402 0.08
– Winmark Corp 39 0.01
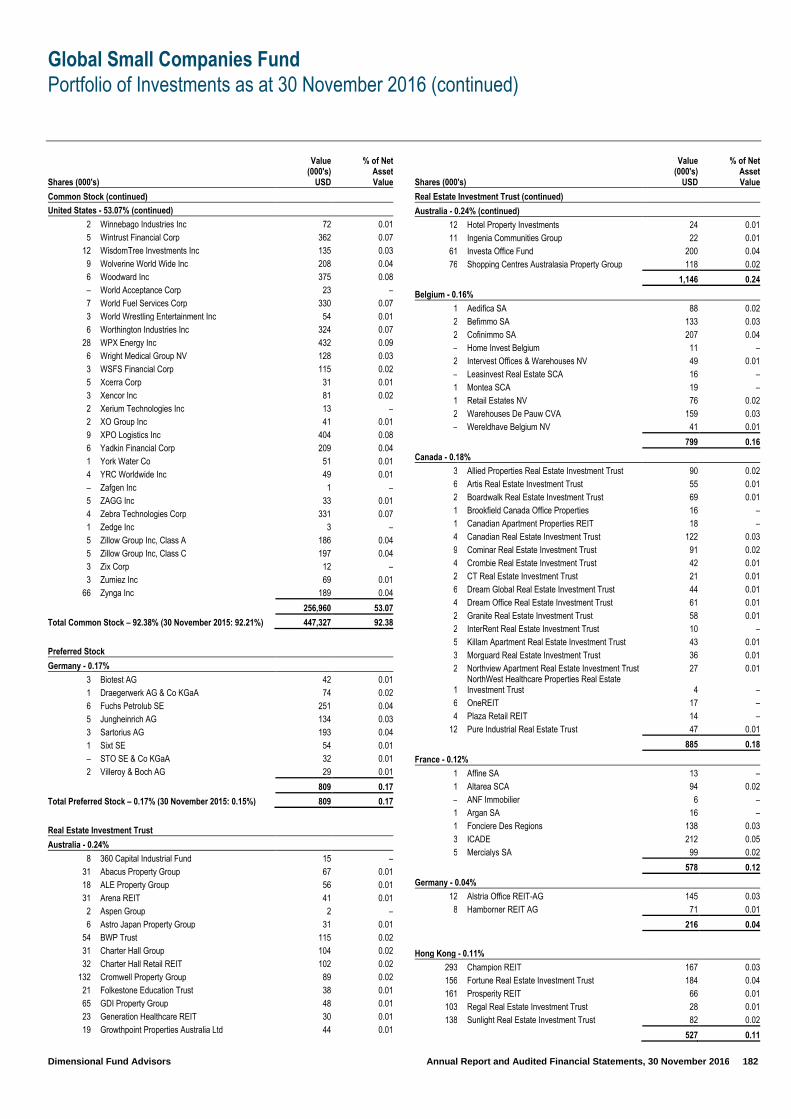
Global Small Companies Fund
Portfolio of Investments as at 30 November 2016 (continued)
Dimensional Fund Advisors Annual Report and Audited Financial Statements, 30 November 2016 182
Shares (000's)
Value (000's)
USD
% of Net Asset Value
Common Stock (continued)
United States - 53.07% (continued)
2 Winnebago Industries Inc 72 0.01
5 Wintrust Financial Corp 362 0.07
12 WisdomTree Investments Inc 135 0.03
9 Wolverine World Wide Inc 208 0.04
6 Woodward Inc 375 0.08
– World Acceptance Corp 23 –
7 World Fuel Services Corp 330 0.07
3 World Wrestling Entertainment Inc 54 0.01
6 Worthington Industries Inc 324 0.07
28 WPX Energy Inc 432 0.09
6 Wright Medical Group NV 128 0.03
3 WSFS Financial Corp 115 0.02
5 Xcerra Corp 31 0.01
3 Xencor Inc 81 0.02
2 Xerium Technologies Inc 13 –
2 XO Group Inc 41 0.01
9 XPO Logistics Inc 404 0.08
6 Yadkin Financial Corp 209 0.04
1 York Water Co 51 0.01
4 YRC Worldwide Inc 49 0.01
– Zafgen Inc 1 –
5 ZAGG Inc 33 0.01
4 Zebra Technologies Corp 331 0.07
1 Zedge Inc 3 –
5 Zillow Group Inc, Class A 186 0.04
5 Zillow Group Inc, Class C 197 0.04
3 Zix Corp 12 –
3 Zumiez Inc 69 0.01
66 Zynga Inc 189 0.04
256,960 53.07
Total Common Stock – 92.38% (30 November 2015: 92.21%) 447,327 92.38
Preferred Stock
Germany - 0.17%
3 Biotest AG 42 0.01
1 Draegerwerk AG & Co KGaA 74 0.02
6 Fuchs Petrolub SE 251 0.04
5 Jungheinrich AG 134 0.03
3 Sartorius AG 193 0.04
1 Sixt SE 54 0.01
– STO SE & Co KGaA 32 0.01
2 Villeroy & Boch AG 29 0.01
809 0.17
Total Preferred Stock – 0.17% (30 November 2015: 0.15%) 809 0.17
Real Estate Investment Trust
Australia - 0.24%
8 360 Capital Industrial Fund 15 –
31 Abacus Property Group 67 0.01
18 ALE Property Group 56 0.01
31 Arena REIT 41 0.01
2 Aspen Group 2 –
6 Astro Japan Property Group 31 0.01
54 BWP Trust 115 0.02
31 Charter Hall Group 104 0.02
32 Charter Hall Retail REIT 102 0.02
132 Cromwell Property Group 89 0.02
21 Folkestone Education Trust 38 0.01
65 GDI Property Group 48 0.01
23 Generation Healthcare REIT 30 0.01
19 Growthpoint Properties Australia Ltd 44 0.01
Shares (000's)
Value (000's)
USD
% of Net Asset Value
Real Estate Investment Trust (continued)
Australia - 0.24% (continued)
12 Hotel Property Investments 24 0.01
11 Ingenia Communities Group 22 0.01
61 Investa Office Fund 200 0.04
76 Shopping Centres Australasia Property Group 118 0.02
1,146 0.24
Belgium - 0.16%
1 Aedifica SA 88 0.02
2 Befimmo SA 133 0.03
2 Cofinimmo SA 207 0.04
– Home Invest Belgium 11 –
2 Intervest Offices & Warehouses NV 49 0.01
– Leasinvest Real Estate SCA 16 –
1 Montea SCA 19 –
1 Retail Estates NV 76 0.02
2 Warehouses De Pauw CVA 159 0.03
– Wereldhave Belgium NV 41 0.01
799 0.16
Canada - 0.18%
3 Allied Properties Real Estate Investment Trust 90 0.02
6 Artis Real Estate Investment Trust 55 0.01
2 Boardwalk Real Estate Investment Trust 69 0.01
1 Brookfield Canada Office Properties 16 –
1 Canadian Apartment Properties REIT 18 –
4 Canadian Real Estate Investment Trust 122 0.03
9 Cominar Real Estate Investment Trust 91 0.02
4 Crombie Real Estate Investment Trust 42 0.01
2 CT Real Estate Investment Trust 21 0.01
6 Dream Global Real Estate Investment Trust 44 0.01
4 Dream Office Real Estate Investment Trust 61 0.01
2 Granite Real Estate Investment Trust 58 0.01
2 InterRent Real Estate Investment Trust 10 –
5 Killam Apartment Real Estate Investment Trust 43 0.01
3 Morguard Real Estate Investment Trust 36 0.01
2 Northview Apartment Real Estate Investment Trust 27 0.01
1 NorthWest Healthcare Properties Real Estate Investment Trust 4 –
6 OneREIT 17 –
4 Plaza Retail REIT 14 –
12 Pure Industrial Real Estate Trust 47 0.01
885 0.18
France - 0.12%
1 Affine SA 13 –
1 Altarea SCA 94 0.02
– ANF Immobilier 6 –
1 Argan SA 16 –
1 Fonciere Des Regions 138 0.03
3 ICADE 212 0.05
5 Mercialys SA 99 0.02
578 0.12
Germany - 0.04%
12 Alstria Office REIT-AG 145 0.03
8 Hamborner REIT AG 71 0.01
216 0.04
Hong Kong - 0.11%
293 Champion REIT 167 0.03
156 Fortune Real Estate Investment Trust 184 0.04
161 Prosperity REIT 66 0.01
103 Regal Real Estate Investment Trust 28 0.01
138 Sunlight Real Estate Investment Trust 82 0.02
527 0.11
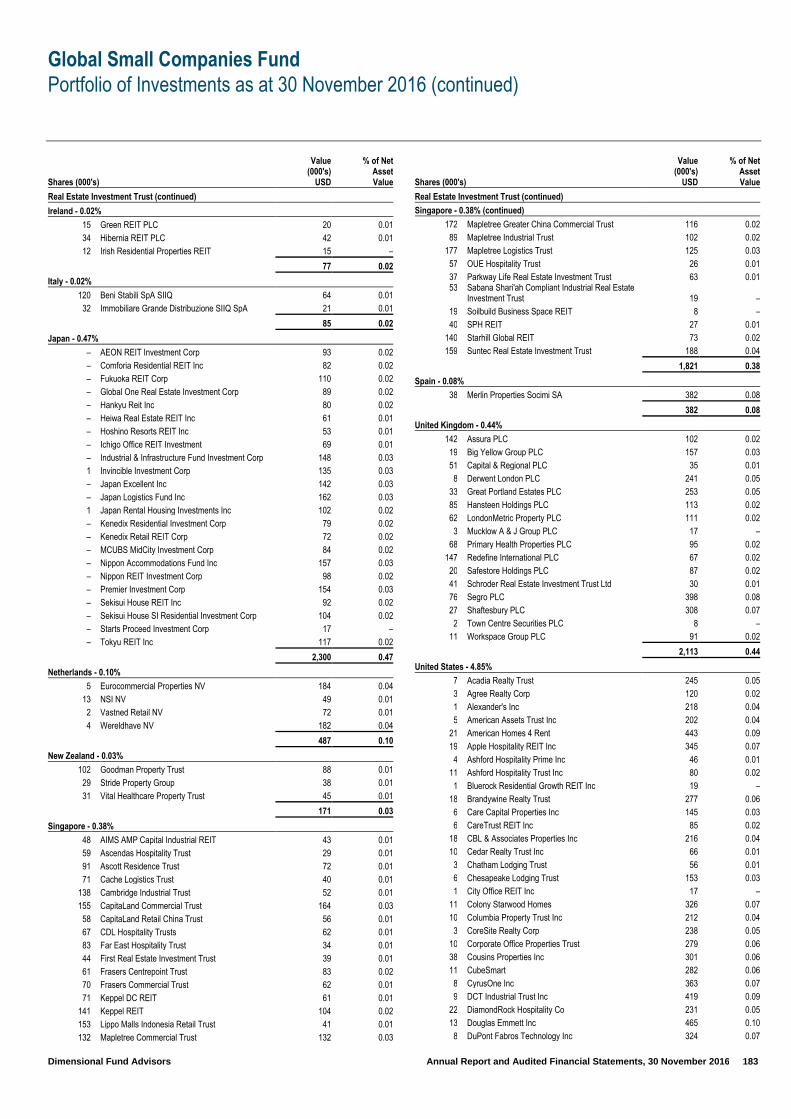
Global Small Companies Fund
Portfolio of Investments as at 30 November 2016 (continued)
Dimensional Fund Advisors Annual Report and Audited Financial Statements, 30 November 2016 183
Shares (000's)
Value (000's)
USD
% of Net Asset Value
Real Estate Investment Trust (continued)
Ireland - 0.02%
15 Green REIT PLC 20 0.01
34 Hibernia REIT PLC 42 0.01
12 Irish Residential Properties REIT 15 –
77 0.02
Italy - 0.02%
120 Beni Stabili SpA SIIQ 64 0.01
32 Immobiliare Grande Distribuzione SIIQ SpA 21 0.01
85 0.02
Japan - 0.47%
– AEON REIT Investment Corp 93 0.02
– Comforia Residential REIT Inc 82 0.02
– Fukuoka REIT Corp 110 0.02
– Global One Real Estate Investment Corp 89 0.02
– Hankyu Reit Inc 80 0.02
– Heiwa Real Estate REIT Inc 61 0.01
– Hoshino Resorts REIT Inc 53 0.01
– Ichigo Office REIT Investment 69 0.01
– Industrial & Infrastructure Fund Investment Corp 148 0.03
1 Invincible Investment Corp 135 0.03
– Japan Excellent Inc 142 0.03
– Japan Logistics Fund Inc 162 0.03
1 Japan Rental Housing Investments Inc 102 0.02
– Kenedix Residential Investment Corp 79 0.02
– Kenedix Retail REIT Corp 72 0.02
– MCUBS MidCity Investment Corp 84 0.02
– Nippon Accommodations Fund Inc 157 0.03
– Nippon REIT Investment Corp 98 0.02
– Premier Investment Corp 154 0.03
– Sekisui House REIT Inc 92 0.02
– Sekisui House SI Residential Investment Corp 104 0.02
– Starts Proceed Investment Corp 17 –
– Tokyu REIT Inc 117 0.02
2,300 0.47
Netherlands - 0.10%
5 Eurocommercial Properties NV 184 0.04
13 NSI NV 49 0.01
2 Vastned Retail NV 72 0.01
4 Wereldhave NV 182 0.04
487 0.10
New Zealand - 0.03%
102 Goodman Property Trust 88 0.01
29 Stride Property Group 38 0.01
31 Vital Healthcare Property Trust 45 0.01
171 0.03
Singapore - 0.38%
48 AIMS AMP Capital Industrial REIT 43 0.01
59 Ascendas Hospitality Trust 29 0.01
91 Ascott Residence Trust 72 0.01
71 Cache Logistics Trust 40 0.01
138 Cambridge Industrial Trust 52 0.01
155 CapitaLand Commercial Trust 164 0.03
58 CapitaLand Retail China Trust 56 0.01
67 CDL Hospitality Trusts 62 0.01
83 Far East Hospitality Trust 34 0.01
44 First Real Estate Investment Trust 39 0.01
61 Frasers Centrepoint Trust 83 0.02
70 Frasers Commercial Trust 62 0.01
71 Keppel DC REIT 61 0.01
141 Keppel REIT 104 0.02
153 Lippo Malls Indonesia Retail Trust 41 0.01
132 Mapletree Commercial Trust 132 0.03
Shares (000's)
Value (000's)
USD
% of Net Asset Value
Real Estate Investment Trust (continued)
Singapore - 0.38% (continued)
172 Mapletree Greater China Commercial Trust 116 0.02
89 Mapletree Industrial Trust 102 0.02
177 Mapletree Logistics Trust 125 0.03
57 OUE Hospitality Trust 26 0.01
37 Parkway Life Real Estate Investment Trust 63 0.01 53
Sabana Shari'ah Compliant Industrial Real Estate Investment Trust 19 –
19 Soilbuild Business Space REIT 8 –
40 SPH REIT 27 0.01
140 Starhill Global REIT 73 0.02
159 Suntec Real Estate Investment Trust 188 0.04
1,821 0.38
Spain - 0.08%
38 Merlin Properties Socimi SA 382 0.08
382 0.08
United Kingdom - 0.44%
142 Assura PLC 102 0.02
19 Big Yellow Group PLC 157 0.03
51 Capital & Regional PLC 35 0.01
8 Derwent London PLC 241 0.05
33 Great Portland Estates PLC 253 0.05
85 Hansteen Holdings PLC 113 0.02
62 LondonMetric Property PLC 111 0.02
3 Mucklow A & J Group PLC 17 –
68 Primary Health Properties PLC 95 0.02
147 Redefine International PLC 67 0.02
20 Safestore Holdings PLC 87 0.02
41 Schroder Real Estate Investment Trust Ltd 30 0.01
76 Segro PLC 398 0.08
27 Shaftesbury PLC 308 0.07
2 Town Centre Securities PLC 8 –
11 Workspace Group PLC 91 0.02
2,113 0.44
United States - 4.85%
7 Acadia Realty Trust 245 0.05
3 Agree Realty Corp 120 0.02
1 Alexander's Inc 218 0.04
5 American Assets Trust Inc 202 0.04
21 American Homes 4 Rent 443 0.09
19 Apple Hospitality REIT Inc 345 0.07
4 Ashford Hospitality Prime Inc 46 0.01
11 Ashford Hospitality Trust Inc 80 0.02
1 Bluerock Residential Growth REIT Inc 19 –
18 Brandywine Realty Trust 277 0.06
6 Care Capital Properties Inc 145 0.03
6 CareTrust REIT Inc 85 0.02
18 CBL & Associates Properties Inc 216 0.04
10 Cedar Realty Trust Inc 66 0.01
3 Chatham Lodging Trust 56 0.01
6 Chesapeake Lodging Trust 153 0.03
1 City Office REIT Inc 17 –
11 Colony Starwood Homes 326 0.07
10 Columbia Property Trust Inc 212 0.04
3 CoreSite Realty Corp 238 0.05
10 Corporate Office Properties Trust 279 0.06
38 Cousins Properties Inc 301 0.06
11 CubeSmart 282 0.06
8 CyrusOne Inc 363 0.07
9 DCT Industrial Trust Inc 419 0.09
22 DiamondRock Hospitality Co 231 0.05
13 Douglas Emmett Inc 465 0.10
8 DuPont Fabros Technology Inc 324 0.07
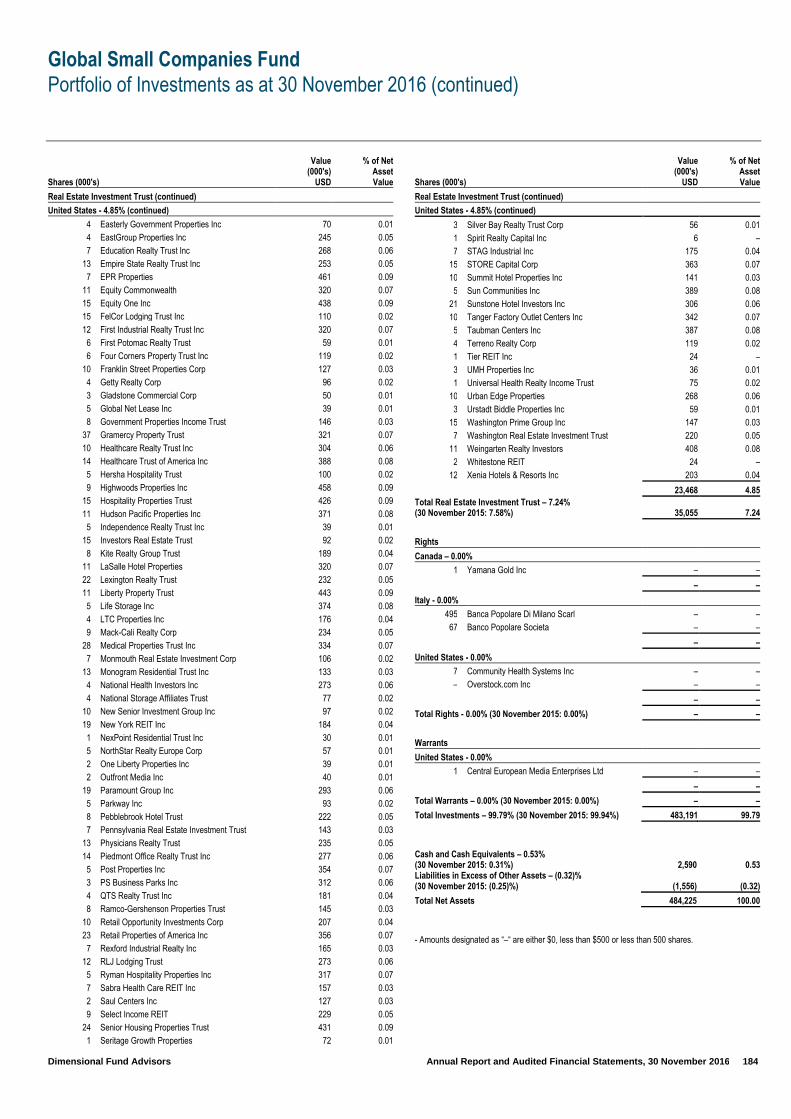
Global Small Companies Fund
Portfolio of Investments as at 30 November 2016 (continued)
Dimensional Fund Advisors Annual Report and Audited Financial Statements, 30 November 2016 184
Shares (000's)
Value (000's)
USD
% of Net Asset Value
Real Estate Investment Trust (continued)
United States - 4.85% (continued)
4 Easterly Government Properties Inc 70 0.01
4 EastGroup Properties Inc 245 0.05
7 Education Realty Trust Inc 268 0.06
13 Empire State Realty Trust Inc 253 0.05
7 EPR Properties 461 0.09
11 Equity Commonwealth 320 0.07
15 Equity One Inc 438 0.09
15 FelCor Lodging Trust Inc 110 0.02
12 First Industrial Realty Trust Inc 320 0.07
6 First Potomac Realty Trust 59 0.01
6 Four Corners Property Trust Inc 119 0.02
10 Franklin Street Properties Corp 127 0.03
4 Getty Realty Corp 96 0.02
3 Gladstone Commercial Corp 50 0.01
5 Global Net Lease Inc 39 0.01
8 Government Properties Income Trust 146 0.03
37 Gramercy Property Trust 321 0.07
10 Healthcare Realty Trust Inc 304 0.06
14 Healthcare Trust of America Inc 388 0.08
5 Hersha Hospitality Trust 100 0.02
9 Highwoods Properties Inc 458 0.09
15 Hospitality Properties Trust 426 0.09
11 Hudson Pacific Properties Inc 371 0.08
5 Independence Realty Trust Inc 39 0.01
15 Investors Real Estate Trust 92 0.02
8 Kite Realty Group Trust 189 0.04
11 LaSalle Hotel Properties 320 0.07
22 Lexington Realty Trust 232 0.05
11 Liberty Property Trust 443 0.09
5 Life Storage Inc 374 0.08
4 LTC Properties Inc 176 0.04
9 Mack-Cali Realty Corp 234 0.05
28 Medical Properties Trust Inc 334 0.07
7 Monmouth Real Estate Investment Corp 106 0.02
13 Monogram Residential Trust Inc 133 0.03
4 National Health Investors Inc 273 0.06
4 National Storage Affiliates Trust 77 0.02
10 New Senior Investment Group Inc 97 0.02
19 New York REIT Inc 184 0.04
1 NexPoint Residential Trust Inc 30 0.01
5 NorthStar Realty Europe Corp 57 0.01
2 One Liberty Properties Inc 39 0.01
2 Outfront Media Inc 40 0.01
19 Paramount Group Inc 293 0.06
5 Parkway Inc 93 0.02
8 Pebblebrook Hotel Trust 222 0.05
7 Pennsylvania Real Estate Investment Trust 143 0.03
13 Physicians Realty Trust 235 0.05
14 Piedmont Office Realty Trust Inc 277 0.06
5 Post Properties Inc 354 0.07
3 PS Business Parks Inc 312 0.06
4 QTS Realty Trust Inc 181 0.04
8 Ramco-Gershenson Properties Trust 145 0.03
10 Retail Opportunity Investments Corp 207 0.04
23 Retail Properties of America Inc 356 0.07
7 Rexford Industrial Realty Inc 165 0.03
12 RLJ Lodging Trust 273 0.06
5 Ryman Hospitality Properties Inc 317 0.07
7 Sabra Health Care REIT Inc 157 0.03
2 Saul Centers Inc 127 0.03
9 Select Income REIT 229 0.05
24 Senior Housing Properties Trust 431 0.09
1 Seritage Growth Properties 72 0.01
Shares (000's)
Value (000's)
USD
% of Net Asset Value
Real Estate Investment Trust (continued)
United States - 4.85% (continued)
3 Silver Bay Realty Trust Corp 56 0.01
1 Spirit Realty Capital Inc 6 –
7 STAG Industrial Inc 175 0.04
15 STORE Capital Corp 363 0.07
10 Summit Hotel Properties Inc 141 0.03
5 Sun Communities Inc 389 0.08
21 Sunstone Hotel Investors Inc 306 0.06
10 Tanger Factory Outlet Centers Inc 342 0.07
5 Taubman Centers Inc 387 0.08
4 Terreno Realty Corp 119 0.02
1 Tier REIT Inc 24 –
3 UMH Properties Inc 36 0.01
1 Universal Health Realty Income Trust 75 0.02
10 Urban Edge Properties 268 0.06
3 Urstadt Biddle Properties Inc 59 0.01
15 Washington Prime Group Inc 147 0.03
7 Washington Real Estate Investment Trust 220 0.05
11 Weingarten Realty Investors 408 0.08
2 Whitestone REIT 24 –
12 Xenia Hotels & Resorts Inc 203 0.04
23,468 4.85 Total Real Estate Investment Trust – 7.24% (30 November 2015: 7.58%) 35,055 7.24
Rights
Canada – 0.00%
1 Yamana Gold Inc – –
– –
Italy - 0.00%
495 Banca Popolare Di Milano Scarl – –
67 Banco Popolare Societa – –
– –
United States - 0.00%
7 Community Health Systems Inc – –
– Overstock.com Inc – –
– –
Total Rights - 0.00% (30 November 2015: 0.00%) – –
Warrants
United States - 0.00%
1 Central European Media Enterprises Ltd – –
– –
Total Warrants – 0.00% (30 November 2015: 0.00%) – –
Total Investments – 99.79% (30 November 2015: 99.94%) 483,191 99.79
Cash and Cash Equivalents – 0.53% (30 November 2015: 0.31%) 2,590 0.53 Liabilities in Excess of Other Assets – (0.32)% (30 November 2015: (0.25)%) (1,556) (0.32)
Total Net Assets 484,225 100.00
- Amounts designated as “–“ are either $0, less than $500 or less than 500 shares.
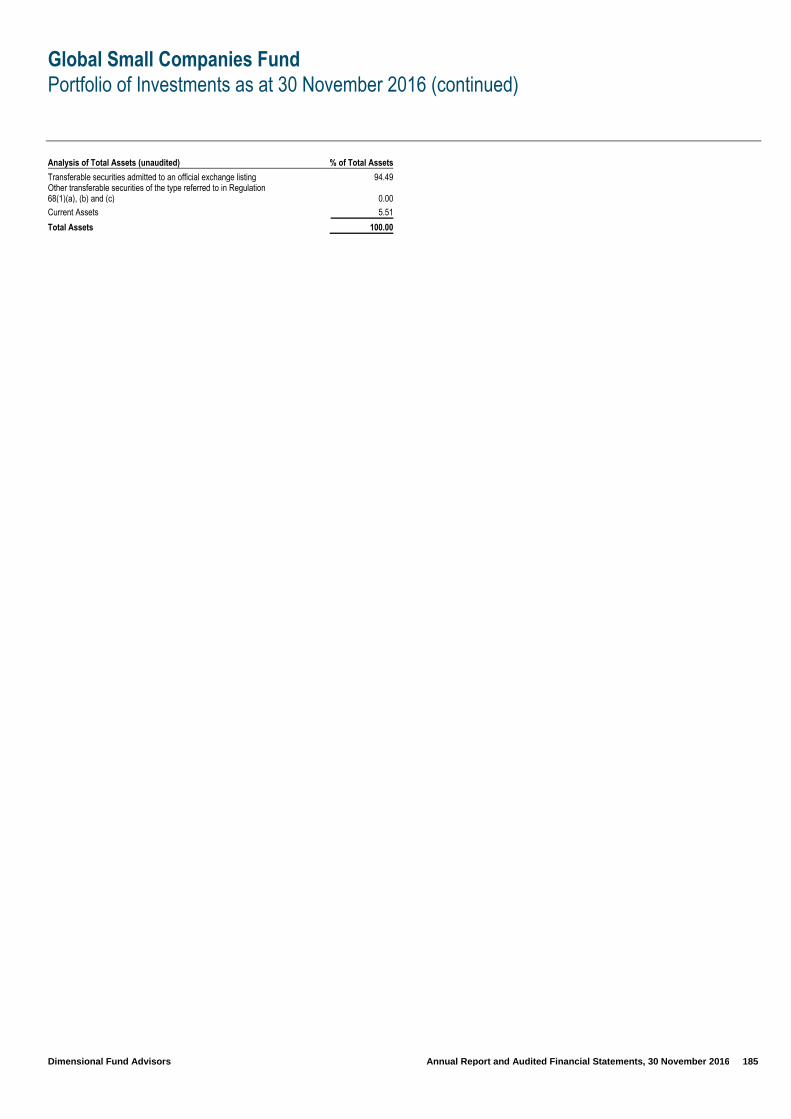
Global Small Companies Fund
Portfolio of Investments as at 30 November 2016 (continued)
Dimensional Fund Advisors Annual Report and Audited Financial Statements, 30 November 2016 185
Analysis of Total Assets (unaudited) % of Total Assets
Transferable securities admitted to an official exchange listing 94.49 Other transferable securities of the type referred to in Regulation 68(1)(a), (b) and (c) 0.00
Current Assets 5.51
Total Assets 100.00

Global Sustainability Core Equity Fund
Portfolio of Investments as at 30 November 2016
Dimensional Fund Advisors Annual Report and Audited Financial Statements, 30 November 2016 186
Shares (000's)
Value (000's)
USD
% of Net Asset Value
Investment Funds
Ireland - 17.36% 1,593
Dimensional Funds plc - Global Small Companies Fund - USD Distributing Class 16,550 17.36
16,550 17.36
Total Investment Funds – 17.36% (30 November 2015: 16.09%) 16,550 17.36
Common Stock
Australia - 1.67%
4 Amcor Ltd 39 0.04
15 AMP Ltd 51 0.05
4 APA Group 21 0.02
2 Aristocrat Leisure Ltd 24 0.03
5 Australia & New Zealand Banking Group Ltd 100 0.10
5 Brambles Ltd 45 0.05
1 Caltex Australia Ltd 26 0.03
2 Challenger Ltd 14 0.01
3 Coca-Cola Amatil Ltd 22 0.02
– Cochlear Ltd 16 0.02
4 Commonwealth Bank of Australia 210 0.22
3 Computershare Ltd 28 0.03
1 CSL Ltd 45 0.05
7 Duet Group 12 0.01
4 DuluxGroup Ltd 18 0.02
13 Fortescue Metals Group Ltd 55 0.06
7 Insurance Australia Group Ltd 29 0.03
2 LendLease Group 18 0.02
1 Macquarie Group Ltd 72 0.08
12 Medibank Pvt Ltd 23 0.02
10 Metcash Ltd 15 0.02
9 National Australia Bank Ltd 199 0.21
1 Newcrest Mining Ltd 21 0.02
1 Orica Ltd 18 0.02
1 Orora Ltd 3 –
1 Primary Health Care Ltd 3 –
6 QBE Insurance Group Ltd 51 0.05
– Ramsay Health Care Ltd 11 0.01
– REA Group Ltd 13 0.01
2 Seek Ltd 25 0.03
1 Sims Metal Management Ltd 10 0.01
1 Sonic Healthcare Ltd 20 0.02
3 Suncorp Group Ltd 30 0.03
3 Sydney Airport 15 0.02
7 Tatts Group Ltd 22 0.02
2 TPG Telecom Ltd 9 0.01
4 Transurban Group 27 0.03
1 Treasury Wine Estates Ltd 8 0.01
2 Vocus Communications Ltd 5 0.01
10 Westpac Banking Corp 221 0.23
– WorleyParsons Ltd 2 –
1,596 1.67
Austria - 0.02%
– Andritz AG 10 0.01
1 Raiffeisen Bank International AG 10 0.01
20 0.02
Belgium - 0.26%
1 Ageas 47 0.05
– bpost SA 10 0.01
1 Colruyt SA 33 0.03
1 KBC Group NV 40 0.04
– Ontex Group NV 9 0.01
Shares (000's)
Value (000's)
USD
% of Net Asset Value
Common Stock (continued)
Belgium - 0.26% (continued)
1 Proximus SADP 34 0.04
– Telenet Group Holding NV 20 0.02
– UCB SA 23 0.02
1 Umicore SA 36 0.04
252 0.26
Canada - 2.44%
1 Agnico Eagle Mines Ltd 39 0.04
– Agrium Inc 42 0.04
1 Alimentation Couche-Tard Inc 24 0.03
1 Bank of Montreal 98 0.10
2 Bank of Nova Scotia 126 0.13
1 Barrick Gold Corp 8 0.01
1 BCE Inc 23 0.02
2 BlackBerry Ltd 13 0.01
8 Bombardier Inc 12 0.01
3 CAE Inc 41 0.04
3 Cameco Corp 23 0.02
1 Canadian Imperial Bank of Commerce 77 0.08
– Canadian Tire Corp Ltd 44 0.05
– Canadian Western Bank 6 0.01
– CCL Industries Inc 35 0.04
1 Celestica Inc 11 0.01
1 CGI Group Inc 44 0.05
1 CI Financial Corp 28 0.03
– Constellation Software Inc 47 0.05
1 Corus Entertainment Inc 5 0.01
1 Cott Corp 8 0.01
1 Detour Gold Corp 8 0.01
– DH Corp 6 0.01
– Dollarama Inc 30 0.03
– Dorel Industries Inc 8 0.01
2 ECN Capital Corp 4 –
1 Empire Co Ltd 19 0.02
2 Enbridge Inc 103 0.11
– Enbridge Income Fund Holdings Inc 2 –
– Ensign Energy Services Inc 2 –
– Fairfax Financial Holdings Ltd 48 0.05
1 Finning International Inc 15 0.02
1 First Capital Realty Inc 12 0.01
1 First Quantum Minerals Ltd 11 0.01
– George Weston Ltd 24 0.03
2 Goldcorp Inc 32 0.03
1 Great-West Lifeco Inc 16 0.02
– Home Capital Group Inc 6 0.01
1 IAMGOLD Corp 4 –
1 IGM Financial Inc 26 0.03
1 Industrial Alliance Insurance & Financial Services Inc 40 0.04
– Intact Financial Corp 22 0.02
– Inter Pipeline Ltd 8 0.01
– Keyera Corp – –
3 Kinross Gold Corp 10 0.01
– Linamar Corp 12 0.01
1 Loblaw Cos Ltd 31 0.03
1 Lundin Mining Corp 6 0.01
1 Magna International Inc 35 0.04
1 Metro Inc 18 0.02
1 Mullen Group Ltd 8 0.01
2 National Bank of Canada 73 0.08
1 New Gold Inc 3 –

Global Sustainability Core Equity Fund
Portfolio of Investments as at 30 November 2016 (continued)
Dimensional Fund Advisors Annual Report and Audited Financial Statements, 30 November 2016 187
Shares (000's)
Value (000's)
USD
% of Net Asset Value
Common Stock (continued)
Canada - 2.44% (continued)
1 Open Text Corp 32 0.03
1 Pembina Pipeline Corp 16 0.02
1 Precision Drilling Corp 5 0.01
1 Quebecor Inc 14 0.01
1 Restaurant Brands International Inc 29 0.03
1 Ritchie Bros Auctioneers Inc 19 0.02
1 Rogers Communications Inc 25 0.03
4 Royal Bank of Canada (Canada listing) 242 0.25
– Royal Bank of Canada (US listing) 10 0.01
1 Saputo Inc 33 0.03
– Sears Canada Inc – –
2 Shaw Communications Inc 42 0.04
– ShawCor Ltd 5 0.01
2 Silver Standard Resources Inc 17 0.02
2 Silver Wheaton Corp 40 0.04
1 SNC-Lavalin Group Inc 46 0.05
– Stantec Inc 11 0.01
1 Sun Life Financial Inc 54 0.06
1 Superior Plus Corp 9 0.01
4 Toronto-Dominion Bank 173 0.18
1 TransForce Inc 13 0.01
1 Valeant Pharmaceuticals International Inc 20 0.02
– Waste Connections Inc 23 0.02
– West Fraser Timber Co Ltd 7 0.01
– Westshore Terminals Investment Corp 8 0.01
1 WSP Global Inc 28 0.03
4 Yamana Gold Inc 11 0.01
2,328 2.44
Denmark - 0.70%
– Carlsberg AS 17 0.02
1 Chr Hansen Holding AS 55 0.06
– Coloplast AS 16 0.02
2 Danske Bank AS 61 0.06
– FLSmidth & Co AS 10 0.01
– Genmab AS 22 0.02
1 GN Store Nord AS 12 0.01
– H Lundbeck AS 11 0.01
1 ISS AS 30 0.03
– Jyske Bank AS 19 0.02
6 Novo Nordisk AS 192 0.21
1 Novozymes AS 28 0.03
1 Pandora AS 61 0.06
– SimCorp AS 9 0.01
3 TDC AS 18 0.02
– Topdanmark AS 1 –
1 Tryg AS 18 0.02
1 Vestas Wind Systems AS 78 0.08
1 William Demant Holding AS 12 0.01
670 0.70
Finland - 0.41%
1 Amer Sports Oyj 20 0.02
– Cargotec Oyj 10 0.01
1 Elisa Oyj 17 0.02
1 Huhtamaki Oyj 21 0.02
– Kesko Oyj 16 0.02
1 Kone Oyj 50 0.05
1 Neste Oyj 36 0.04
14 Nokia Oyj 58 0.06
– Orion Oyj 14 0.01
1 Outokumpu Oyj 10 0.01
1 Sampo Oyj 52 0.06
2 UPM-Kymmene Oyj 49 0.05
Shares (000's)
Value (000's)
USD
% of Net Asset Value
Common Stock (continued)
Finland - 0.41% (continued)
– Valmet Oyj 2 –
1 Wartsila Oyj Abp 40 0.04
395 0.41
France - 2.93%
– Aeroports de Paris 9 0.01
2 Airbus Group SE 99 0.10
1 Alstom SA 14 0.01
– Alten SA 11 0.01
– Arkema SA 18 0.02
1 Atos SE 86 0.09
5 AXA SA 127 0.13
– Bollore SA – –
2 BNP Paribas SA 140 0.15
2 Bollore SA 7 0.01
1 Bouygues SA 34 0.04
1 Bureau Veritas SA 21 0.02
– Capgemini SA 35 0.04
3 Carrefour SA 63 0.07
– Casino Guichard Perrachon SA 14 0.01
– Christian Dior SE 37 0.04
1 CNP Assurances 25 0.03
5 Credit Agricole SA 59 0.06
1 Danone SA 70 0.07
1 Dassault Systemes 40 0.04
2 Edenred 33 0.03
– Eiffage SA 19 0.02
1 Electricite de France SA 11 0.01
1 Essilor International SA 70 0.07
1 Eutelsat Communications SA 19 0.02
– Faurecia 9 0.01
2 Groupe Eurotunnel SE 17 0.02
– Hermes International 21 0.02
– Iliad SA 21 0.02
– Ingenico Group SA 23 0.02
– JCDecaux SA 8 0.01
– Kering 25 0.03
1 L'Oreal SA 121 0.13
– Lagardere SCA 11 0.01
1 Legrand SA 45 0.05
1 LVMH Moet Hennessy Louis Vuitton SE 137 0.14
6 Natixis SA 28 0.03
– Nexity SA 18 0.02
6 Orange SA 83 0.09
– Pernod Ricard SA 32 0.03
4 Peugeot SA 58 0.06
1 Publicis Groupe SA 57 0.06
1 Renault SA 44 0.05
2 Rexel SA 24 0.03
– Rubis SCA 16 0.02
1 Safran SA 44 0.05
2 Sanofi 196 0.21
1 Schneider Electric SE 77 0.08
2 SCOR SE 50 0.05
1 SES SA 18 0.02
– SFR Group SA 10 0.01
– Societe BIC SA 13 0.01
2 Societe Generale SA 95 0.10
– Sodexo SA 48 0.05
1 Suez 16 0.02
1 Technip SA 74 0.08
– Teleperformance 12 0.01
1 Television Francaise 1 11 0.01
– Thales SA 47 0.05
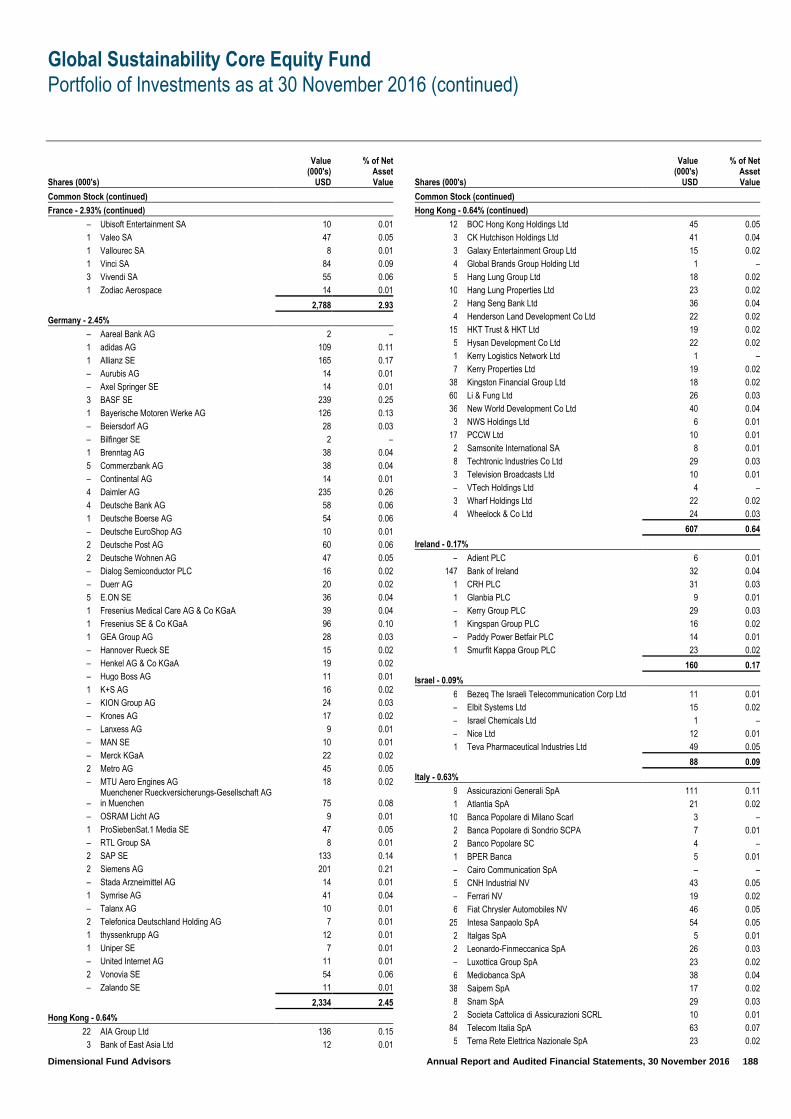
Global Sustainability Core Equity Fund
Portfolio of Investments as at 30 November 2016 (continued)
Dimensional Fund Advisors Annual Report and Audited Financial Statements, 30 November 2016 188
Shares (000's)
Value (000's)
USD
% of Net Asset Value
Common Stock (continued)
France - 2.93% (continued)
– Ubisoft Entertainment SA 10 0.01
1 Valeo SA 47 0.05
1 Vallourec SA 8 0.01
1 Vinci SA 84 0.09
3 Vivendi SA 55 0.06
1 Zodiac Aerospace 14 0.01
2,788 2.93
Germany - 2.45%
– Aareal Bank AG 2 –
1 adidas AG 109 0.11
1 Allianz SE 165 0.17
– Aurubis AG 14 0.01
– Axel Springer SE 14 0.01
3 BASF SE 239 0.25
1 Bayerische Motoren Werke AG 126 0.13
– Beiersdorf AG 28 0.03
– Bilfinger SE 2 –
1 Brenntag AG 38 0.04
5 Commerzbank AG 38 0.04
– Continental AG 14 0.01
4 Daimler AG 235 0.26
4 Deutsche Bank AG 58 0.06
1 Deutsche Boerse AG 54 0.06
– Deutsche EuroShop AG 10 0.01
2 Deutsche Post AG 60 0.06
2 Deutsche Wohnen AG 47 0.05
– Dialog Semiconductor PLC 16 0.02
– Duerr AG 20 0.02
5 E.ON SE 36 0.04
1 Fresenius Medical Care AG & Co KGaA 39 0.04
1 Fresenius SE & Co KGaA 96 0.10
1 GEA Group AG 28 0.03
– Hannover Rueck SE 15 0.02
– Henkel AG & Co KGaA 19 0.02
– Hugo Boss AG 11 0.01
1 K+S AG 16 0.02
– KION Group AG 24 0.03
– Krones AG 17 0.02
– Lanxess AG 9 0.01
– MAN SE 10 0.01
– Merck KGaA 22 0.02
2 Metro AG 45 0.05
– MTU Aero Engines AG 18 0.02
– Muenchener Rueckversicherungs-Gesellschaft AG in Muenchen 75 0.08
– OSRAM Licht AG 9 0.01
1 ProSiebenSat.1 Media SE 47 0.05
– RTL Group SA 8 0.01
2 SAP SE 133 0.14
2 Siemens AG 201 0.21
– Stada Arzneimittel AG 14 0.01
1 Symrise AG 41 0.04
– Talanx AG 10 0.01
2 Telefonica Deutschland Holding AG 7 0.01
1 thyssenkrupp AG 12 0.01
1 Uniper SE 7 0.01
– United Internet AG 11 0.01
2 Vonovia SE 54 0.06
– Zalando SE 11 0.01
2,334 2.45
Hong Kong - 0.64%
22 AIA Group Ltd 136 0.15
3 Bank of East Asia Ltd 12 0.01
Shares (000's)
Value (000's)
USD
% of Net Asset Value
Common Stock (continued)
Hong Kong - 0.64% (continued)
12 BOC Hong Kong Holdings Ltd 45 0.05
3 CK Hutchison Holdings Ltd 41 0.04
3 Galaxy Entertainment Group Ltd 15 0.02
4 Global Brands Group Holding Ltd 1 –
5 Hang Lung Group Ltd 18 0.02
10 Hang Lung Properties Ltd 23 0.02
2 Hang Seng Bank Ltd 36 0.04
4 Henderson Land Development Co Ltd 22 0.02
15 HKT Trust & HKT Ltd 19 0.02
5 Hysan Development Co Ltd 22 0.02
1 Kerry Logistics Network Ltd 1 –
7 Kerry Properties Ltd 19 0.02
38 Kingston Financial Group Ltd 18 0.02
60 Li & Fung Ltd 26 0.03
36 New World Development Co Ltd 40 0.04
3 NWS Holdings Ltd 6 0.01
17 PCCW Ltd 10 0.01
2 Samsonite International SA 8 0.01
8 Techtronic Industries Co Ltd 29 0.03
3 Television Broadcasts Ltd 10 0.01
– VTech Holdings Ltd 4 –
3 Wharf Holdings Ltd 22 0.02
4 Wheelock & Co Ltd 24 0.03
607 0.64
Ireland - 0.17%
– Adient PLC 6 0.01
147 Bank of Ireland 32 0.04
1 CRH PLC 31 0.03
1 Glanbia PLC 9 0.01
– Kerry Group PLC 29 0.03
1 Kingspan Group PLC 16 0.02
– Paddy Power Betfair PLC 14 0.01
1 Smurfit Kappa Group PLC 23 0.02
160 0.17
Israel - 0.09%
6 Bezeq The Israeli Telecommunication Corp Ltd 11 0.01
– Elbit Systems Ltd 15 0.02
– Israel Chemicals Ltd 1 –
– Nice Ltd 12 0.01
1 Teva Pharmaceutical Industries Ltd 49 0.05
88 0.09
Italy - 0.63%
9 Assicurazioni Generali SpA 111 0.11
1 Atlantia SpA 21 0.02
10 Banca Popolare di Milano Scarl 3 –
2 Banca Popolare di Sondrio SCPA 7 0.01
2 Banco Popolare SC 4 –
1 BPER Banca 5 0.01
– Cairo Communication SpA – –
5 CNH Industrial NV 43 0.05
– Ferrari NV 19 0.02
6 Fiat Chrysler Automobiles NV 46 0.05
25 Intesa Sanpaolo SpA 54 0.05
2 Italgas SpA 5 0.01
2 Leonardo-Finmeccanica SpA 26 0.03
– Luxottica Group SpA 23 0.02
6 Mediobanca SpA 38 0.04
38 Saipem SpA 17 0.02
8 Snam SpA 29 0.03
2 Societa Cattolica di Assicurazioni SCRL 10 0.01
84 Telecom Italia SpA 63 0.07
5 Terna Rete Elettrica Nazionale SpA 23 0.02
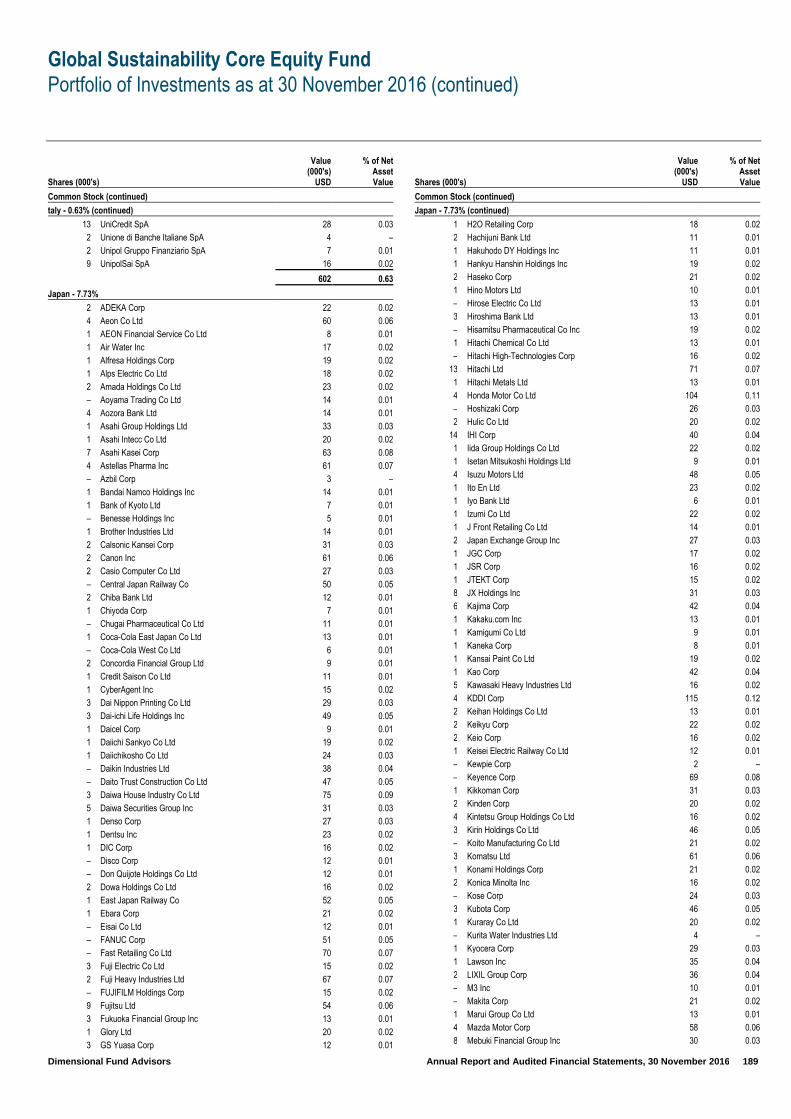
Global Sustainability Core Equity Fund
Portfolio of Investments as at 30 November 2016 (continued)
Dimensional Fund Advisors Annual Report and Audited Financial Statements, 30 November 2016 189
Shares (000's)
Value (000's)
USD
% of Net Asset Value
Common Stock (continued)
taly - 0.63% (continued)
13 UniCredit SpA 28 0.03
2 Unione di Banche Italiane SpA 4 –
2 Unipol Gruppo Finanziario SpA 7 0.01
9 UnipolSai SpA 16 0.02
602 0.63
Japan - 7.73%
2 ADEKA Corp 22 0.02
4 Aeon Co Ltd 60 0.06
1 AEON Financial Service Co Ltd 8 0.01
1 Air Water Inc 17 0.02
1 Alfresa Holdings Corp 19 0.02
1 Alps Electric Co Ltd 18 0.02
2 Amada Holdings Co Ltd 23 0.02
– Aoyama Trading Co Ltd 14 0.01
4 Aozora Bank Ltd 14 0.01
1 Asahi Group Holdings Ltd 33 0.03
1 Asahi Intecc Co Ltd 20 0.02
7 Asahi Kasei Corp 63 0.08
4 Astellas Pharma Inc 61 0.07
– Azbil Corp 3 –
1 Bandai Namco Holdings Inc 14 0.01
1 Bank of Kyoto Ltd 7 0.01
– Benesse Holdings Inc 5 0.01
1 Brother Industries Ltd 14 0.01
2 Calsonic Kansei Corp 31 0.03
2 Canon Inc 61 0.06
2 Casio Computer Co Ltd 27 0.03
– Central Japan Railway Co 50 0.05
2 Chiba Bank Ltd 12 0.01
1 Chiyoda Corp 7 0.01
– Chugai Pharmaceutical Co Ltd 11 0.01
1 Coca-Cola East Japan Co Ltd 13 0.01
– Coca-Cola West Co Ltd 6 0.01
2 Concordia Financial Group Ltd 9 0.01
1 Credit Saison Co Ltd 11 0.01
1 CyberAgent Inc 15 0.02
3 Dai Nippon Printing Co Ltd 29 0.03
3 Dai-ichi Life Holdings Inc 49 0.05
1 Daicel Corp 9 0.01
1 Daiichi Sankyo Co Ltd 19 0.02
1 Daiichikosho Co Ltd 24 0.03
– Daikin Industries Ltd 38 0.04
– Daito Trust Construction Co Ltd 47 0.05
3 Daiwa House Industry Co Ltd 75 0.09
5 Daiwa Securities Group Inc 31 0.03
1 Denso Corp 27 0.03
1 Dentsu Inc 23 0.02
1 DIC Corp 16 0.02
– Disco Corp 12 0.01
– Don Quijote Holdings Co Ltd 12 0.01
2 Dowa Holdings Co Ltd 16 0.02
1 East Japan Railway Co 52 0.05
1 Ebara Corp 21 0.02
– Eisai Co Ltd 12 0.01
– FANUC Corp 51 0.05
– Fast Retailing Co Ltd 70 0.07
3 Fuji Electric Co Ltd 15 0.02
2 Fuji Heavy Industries Ltd 67 0.07
– FUJIFILM Holdings Corp 15 0.02
9 Fujitsu Ltd 54 0.06
3 Fukuoka Financial Group Inc 13 0.01
1 Glory Ltd 20 0.02
3 GS Yuasa Corp 12 0.01
Shares (000's)
Value (000's)
USD
% of Net Asset Value
Common Stock (continued)
Japan - 7.73% (continued)
1 H2O Retailing Corp 18 0.02
2 Hachijuni Bank Ltd 11 0.01
1 Hakuhodo DY Holdings Inc 11 0.01
1 Hankyu Hanshin Holdings Inc 19 0.02
2 Haseko Corp 21 0.02
1 Hino Motors Ltd 10 0.01
– Hirose Electric Co Ltd 13 0.01
3 Hiroshima Bank Ltd 13 0.01
– Hisamitsu Pharmaceutical Co Inc 19 0.02
1 Hitachi Chemical Co Ltd 13 0.01
– Hitachi High-Technologies Corp 16 0.02
13 Hitachi Ltd 71 0.07
1 Hitachi Metals Ltd 13 0.01
4 Honda Motor Co Ltd 104 0.11
– Hoshizaki Corp 26 0.03
2 Hulic Co Ltd 20 0.02
14 IHI Corp 40 0.04
1 Iida Group Holdings Co Ltd 22 0.02
1 Isetan Mitsukoshi Holdings Ltd 9 0.01
4 Isuzu Motors Ltd 48 0.05
1 Ito En Ltd 23 0.02
1 Iyo Bank Ltd 6 0.01
1 Izumi Co Ltd 22 0.02
1 J Front Retailing Co Ltd 14 0.01
2 Japan Exchange Group Inc 27 0.03
1 JGC Corp 17 0.02
1 JSR Corp 16 0.02
1 JTEKT Corp 15 0.02
8 JX Holdings Inc 31 0.03
6 Kajima Corp 42 0.04
1 Kakaku.com Inc 13 0.01
1 Kamigumi Co Ltd 9 0.01
1 Kaneka Corp 8 0.01
1 Kansai Paint Co Ltd 19 0.02
1 Kao Corp 42 0.04
5 Kawasaki Heavy Industries Ltd 16 0.02
4 KDDI Corp 115 0.12
2 Keihan Holdings Co Ltd 13 0.01
2 Keikyu Corp 22 0.02
2 Keio Corp 16 0.02
1 Keisei Electric Railway Co Ltd 12 0.01
– Kewpie Corp 2 –
– Keyence Corp 69 0.08
1 Kikkoman Corp 31 0.03
2 Kinden Corp 20 0.02
4 Kintetsu Group Holdings Co Ltd 16 0.02
3 Kirin Holdings Co Ltd 46 0.05
– Koito Manufacturing Co Ltd 21 0.02
3 Komatsu Ltd 61 0.06
1 Konami Holdings Corp 21 0.02
2 Konica Minolta Inc 16 0.02
– Kose Corp 24 0.03
3 Kubota Corp 46 0.05
1 Kuraray Co Ltd 20 0.02
– Kurita Water Industries Ltd 4 –
1 Kyocera Corp 29 0.03
1 Lawson Inc 35 0.04
2 LIXIL Group Corp 36 0.04
– M3 Inc 10 0.01
– Makita Corp 21 0.02
1 Marui Group Co Ltd 13 0.01
4 Mazda Motor Corp 58 0.06
8 Mebuki Financial Group Inc 30 0.03

Global Sustainability Core Equity Fund
Portfolio of Investments as at 30 November 2016 (continued)
Dimensional Fund Advisors Annual Report and Audited Financial Statements, 30 November 2016 190
Shares (000's)
Value (000's)
USD
% of Net Asset Value
Common Stock (continued)
Japan - 7.73% (continued)
1 Medipal Holdings Corp 14 0.01
– MEIJI Holdings Co Ltd 16 0.02
1 Minebea Co Ltd 10 0.01
– Miraca Holdings Inc 14 0.01
1 MISUMI Group Inc 20 0.02
6 Mitsubishi Chemical Holdings Corp 41 0.04
7 Mitsubishi Electric Corp 98 0.11
3 Mitsubishi Estate Co Ltd 61 0.06
1 Mitsubishi Gas Chemical Co Inc 8 0.01
14 Mitsubishi Heavy Industries Ltd 63 0.07
1 Mitsubishi Logistics Corp 14 0.01
6 Mitsubishi Motors Corp 27 0.03
– Mitsubishi Tanabe Pharma Corp 8 0.01
29 Mitsubishi UFJ Financial Group Inc 176 0.19
6 Mitsui Chemicals Inc 28 0.03
26 Mizuho Financial Group Inc 46 0.05
1 MonotaRO Co Ltd 17 0.02
1 MS&AD Insurance Group Holdings Inc 29 0.03
1 Nabtesco Corp 13 0.01
3 Nagoya Railroad Co Ltd 15 0.02
3 Nankai Electric Railway Co Ltd 14 0.01
18 NEC Corp 48 0.05
1 Nexon Co Ltd 10 0.01
1 NHK Spring Co Ltd 5 0.01
1 Nichirei Corp 18 0.02
– Nidec Corp 36 0.04
1 Nihon Kohden Corp 20 0.02
1 Nikon Corp 18 0.02
– Nintendo Co Ltd 25 0.03
3 Nippon Express Co Ltd 16 0.02
1 Nippon Kayaku Co Ltd 12 0.01
1 Nippon Paint Holdings Co Ltd 19 0.02
– Nippon Shokubai Co Ltd 12 0.01
1 Nishi-Nippon Financial Holdings Inc 8 0.01
1 Nissan Chemical Industries Ltd 24 0.03
12 Nissan Motor Co Ltd 109 0.12
1 Nisshin Seifun Group Inc 9 0.01
– Nitori Holdings Co Ltd 21 0.02
1 Nitto Denko Corp 42 0.04
7 Nomura Holdings Inc 36 0.04
1 Nomura Real Estate Holdings Inc 11 0.01
– Nomura Research Institute Ltd 15 0.02
2 NSK Ltd 22 0.02
– NTT Data Corp 20 0.02
4 NTT DOCOMO Inc 80 0.08
3 Obayashi Corp 31 0.03
1 Odakyu Electric Railway Co Ltd 10 0.01
4 Oji Holdings Corp 17 0.02
1 Olympus Corp 36 0.04
– Omron Corp 15 0.02
1 Ono Pharmaceutical Co Ltd 11 0.01
– Oriental Land Co Ltd 11 0.01
7 Osaka Gas Co Ltd 27 0.03
– Otsuka Corp 15 0.02
8 Panasonic Corp 79 0.09
1 Pigeon Corp 15 0.02
1 Rakuten Inc 14 0.01
– Recruit Holdings Co Ltd 15 0.02
4 Resona Holdings Inc 21 0.02
4 Ricoh Co Ltd 29 0.03
– Rinnai Corp 9 0.01
– Ryohin Keikaku Co Ltd 20 0.02
1 Santen Pharmaceutical Co Ltd 16 0.02
Shares (000's)
Value (000's)
USD
% of Net Asset Value
Common Stock (continued)
Japan - 7.73% (continued)
2 Sanwa Holdings Corp 22 0.02
– Sapporo Holdings Ltd 5 0.01
– Sawai Pharmaceutical Co Ltd 11 0.01
3 SBI Holdings Inc 32 0.03
1 Secom Co Ltd 52 0.05
– Sega Sammy Holdings Inc 6 0.01
1 Seiko Epson Corp 12 0.01
2 Sekisui House Ltd 35 0.04
2 Seven & i Holdings Co Ltd 70 0.07
4 Seven Bank Ltd 11 0.01
1 Shimadzu Corp 15 0.02
– Shimamura Co Ltd 12 0.01
– Shimano Inc 33 0.03
4 Shimizu Corp 37 0.04
1 Shin-Etsu Chemical Co Ltd 60 0.06
9 Shinsei Bank Ltd 15 0.02
2 Shiseido Co Ltd 56 0.06
1 Shizuoka Bank Ltd 8 0.01
– Showa Denko KK 5 0.01
1 Showa Shell Sekiyu KK 10 0.01
– SMC Corp 29 0.03
2 SoftBank Group Corp 108 0.12
– Sohgo Security Services Co Ltd 16 0.02
1 Sompo Holdings Inc 30 0.03
1 Sony Financial Holdings Inc 12 0.01
2 Sotetsu Holdings Inc 10 0.01
1 Start Today Co Ltd 20 0.02
8 Sumitomo Chemical Co Ltd 37 0.04
– Sumitomo Dainippon Pharma Co Ltd 7 0.01
2 Sumitomo Electric Industries Ltd 27 0.03
– Sumitomo Forestry Co Ltd 6 0.01
6 Sumitomo Heavy Industries Ltd 37 0.04
1 Sumitomo Metal Mining Co Ltd 13 0.01
4 Sumitomo Mitsui Financial Group Inc 132 0.15
1 Sumitomo Mitsui Trust Holdings Inc 33 0.03
– Suntory Beverage & Food Ltd 13 0.01
1 Suruga Bank Ltd 11 0.01
1 Suzuken Co Ltd 15 0.02
2 Suzuki Motor Corp 49 0.05
1 Sysmex Corp 30 0.03
3 T&D Holdings Inc 36 0.04
2 Taisei Corp 15 0.02
– Taisho Pharmaceutical Holdings Co Ltd 26 0.03
1 Takashimaya Co Ltd 8 0.01
2 Takeda Pharmaceutical Co Ltd 66 0.07
– TechnoPro Holdings Inc 13 0.01
1 Teijin Ltd 23 0.02
– Temp Holdings Co Ltd 5 0.01
– THK Co Ltd 4 –
3 Tobu Railway Co Ltd 14 0.01
1 Toho Co Ltd 20 0.02
2 Toho Gas Co Ltd 16 0.02
1 Tokio Marine Holdings Inc 61 0.06
– Tokyo Electron Ltd 37 0.04
9 Tokyo Gas Co Ltd 40 0.04
2 Tokyo Tatemono Co Ltd 24 0.03
4 Tokyu Corp 30 0.03
4 Tokyu Fudosan Holdings Corp 25 0.03
1 TonenGeneral Sekiyu KK 10 0.01
1 Toppan Printing Co Ltd 9 0.01
5 Toray Industries Inc 41 0.04
1 TOTO Ltd 19 0.02
1 Toyo Seikan Group Holdings Ltd 11 0.01

Global Sustainability Core Equity Fund
Portfolio of Investments as at 30 November 2016 (continued)
Dimensional Fund Advisors Annual Report and Audited Financial Statements, 30 November 2016 191
Shares (000's)
Value (000's)
USD
% of Net Asset Value
Common Stock (continued)
Japan - 7.73% (continued)
1 Toyo Suisan Kaisha Ltd 21 0.02
9 Toyobo Co Ltd 14 0.01
1 Toyoda Gosei Co Ltd 13 0.01
8 Toyota Motor Corp 483 0.52
1 Toyota Tsusho Corp 36 0.04
– Trend Micro Inc 15 0.02
1 TS Tech Co Ltd 13 0.01
– Tsuruha Holdings Inc 10 0.01
1 Unicharm Corp 17 0.02
1 Ushio Inc 6 0.01
1 USS Co Ltd 11 0.01
– West Japan Railway Co 18 0.02
3 Yahoo Japan Corp 11 0.01
– Yakult Honsha Co Ltd 9 0.01
2 Yamada Denki Co Ltd 12 0.01
1 Yamaguchi Financial Group Inc 11 0.01
1 Yamaha Motor Co Ltd 12 0.01
– Yamato Holdings Co Ltd 6 0.01
– Yamazaki Baking Co Ltd 8 0.01
1 Yaskawa Electric Corp 20 0.02
1 Yokogawa Electric Corp 20 0.02
7,361 7.73
Netherlands - 1.19%
7 Aegon NV 35 0.04
1 Akzo Nobel NV 83 0.09
1 Altice NV, Class A 25 0.03
1 Altice NV, Class B 16 0.02
1 APERAM SA 24 0.03
1 Arcadis NV 16 0.02
1 ASML Holding NV 65 0.07
1 Coca-Cola European Partners PLC 22 0.02
2 Delta Lloyd NV 12 0.01
– Eurocommercial Properties NV 8 0.01
– Fugro NV 1 –
– Gemalto NV 10 0.01
1 Heineken NV 38 0.04
7 ING Groep NV 92 0.09
5 Koninklijke Ahold Delhaize NV 98 0.10
1 Koninklijke DSM NV 49 0.05
18 Koninklijke KPN NV 53 0.06
4 Koninklijke Philips NV 107 0.10
– Koninklijke Vopak NV 10 0.01
1 NN Group NV 48 0.05
3 PostNL NV 16 0.02
1 Randstad Holding NV 47 0.05
3 RELX NV 55 0.06
4 Unilever NV 141 0.14
2 Wolters Kluwer NV 62 0.07
1,133 1.19
New Zealand - 0.07%
2 Auckland International Airport Ltd 9 0.01
3 Fletcher Building Ltd 20 0.02
6 Meridian Energy Ltd 12 0.01
11 Spark New Zealand Ltd 28 0.03
69 0.07
Norway - 0.20%
3 DNB ASA 50 0.05
1 Gjensidige Forsikring ASA 18 0.02
– Leroy Seafood Group ASA 23 0.02
1 Marine Harvest ASA 25 0.02
2 Orkla ASA 16 0.02
– Petroleum Geo-Services ASA 1 –
Shares (000's)
Value (000's)
USD
% of Net Asset Value
Common Stock (continued)
Norway - 0.20% (continued)
– Schibsted ASA, Class A 5 0.01
– Schibsted ASA, Class B 5 0.01
– Seadrill Ltd – –
4 Storebrand ASA 21 0.02
2 Subsea 7 SA 22 0.02
– TGS Nopec Geophysical Co ASA 9 0.01
195 0.20
Portugal - 0.05%
2 Galp Energia SGPS SA 33 0.03
1 Jeronimo Martins SGPS SA 18 0.02
51 0.05
Singapore - 0.29%
4 City Developments Ltd 25 0.03
3 ComfortDelGro Corp Ltd 5 0.01
3 DBS Group Holdings Ltd 34 0.04
8 Global Logistic Properties Ltd 12 0.01
44 Hutchison Port Holdings Trust 18 0.02
5 Keppel Corp Ltd 20 0.02
8 Oversea-Chinese Banking Corp Ltd 52 0.05
4 Singapore Press Holdings Ltd 10 0.01
19 Singapore Telecommunications Ltd 49 0.04
2 United Overseas Bank Ltd 35 0.04
4 UOL Group Ltd 15 0.02
275 0.29
Spain - 0.83%
3 Abertis Infraestructuras SA 38 0.04
– Acciona SA 11 0.01
1 ACS Actividades de Construccion y Servicios SA 23 0.02
– Aena SA 2 –
2 Amadeus IT Group SA 87 0.09
8 Banco Bilbao Vizcaya Argentaria SA 50 0.05
25 Banco de Sabadell SA 31 0.03
9 Banco Popular Espanol SA 8 0.01
40 Banco Santander SA 181 0.20
15 Bankia SA 13 0.01
4 Bankinter SA 33 0.03
13 CaixaBank SA 38 0.04
– Distribuidora Internacional de Alimentacion SA 1 –
1 Enagas SA 28 0.03
1 Ferrovial SA 16 0.02
1 Gamesa Corp Tecnologica SA 22 0.02
2 Gas Natural SDG SA 27 0.03
1 Grifols SA 15 0.02
7 Mapfre SA 20 0.02
1 Mediaset Espana Comunicacion SA 9 0.01
1 Repsol SA 15 0.02
14 Telefonica SA 114 0.12
1 Zardoya Otis SA 7 0.01
789 0.83
Sweden - 1.20%
1 Alfa Laval AB 21 0.02
3 Assa Abloy AB 50 0.06
2 Atlas Copco AB, Class A 52 0.06
1 Atlas Copco AB, Class B 25 0.03
1 Axfood AB 9 0.01
1 BillerudKorsnas AB 23 0.02
2 Boliden AB 40 0.04
– Bonava AB 4 –
1 Castellum AB 11 0.01
1 Com Hem Holding AB 5 0.01
1 Electrolux AB 13 0.01
2 Elekta AB 15 0.02
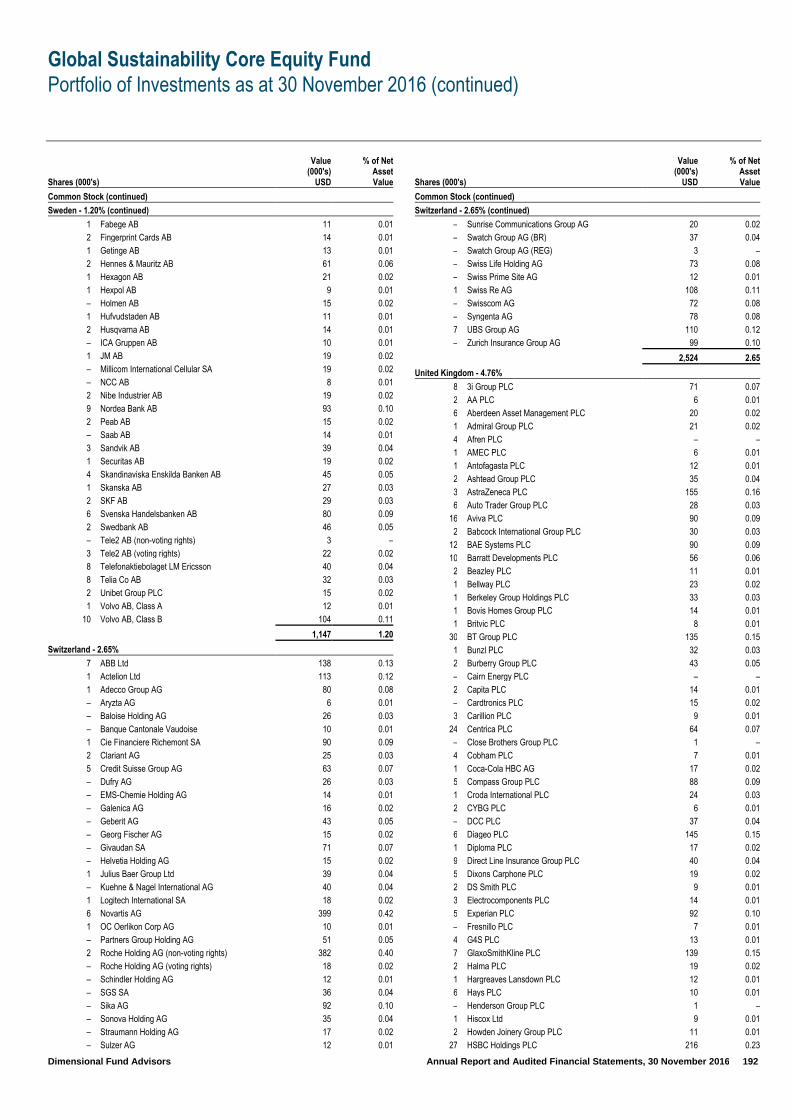
Global Sustainability Core Equity Fund
Portfolio of Investments as at 30 November 2016 (continued)
Dimensional Fund Advisors Annual Report and Audited Financial Statements, 30 November 2016 192
Shares (000's)
Value (000's)
USD
% of Net Asset Value
Common Stock (continued)
Sweden - 1.20% (continued)
1 Fabege AB 11 0.01
2 Fingerprint Cards AB 14 0.01
1 Getinge AB 13 0.01
2 Hennes & Mauritz AB 61 0.06
1 Hexagon AB 21 0.02
1 Hexpol AB 9 0.01
– Holmen AB 15 0.02
1 Hufvudstaden AB 11 0.01
2 Husqvarna AB 14 0.01
– ICA Gruppen AB 10 0.01
1 JM AB 19 0.02
– Millicom International Cellular SA 19 0.02
– NCC AB 8 0.01
2 Nibe Industrier AB 19 0.02
9 Nordea Bank AB 93 0.10
2 Peab AB 15 0.02
– Saab AB 14 0.01
3 Sandvik AB 39 0.04
1 Securitas AB 19 0.02
4 Skandinaviska Enskilda Banken AB 45 0.05
1 Skanska AB 27 0.03
2 SKF AB 29 0.03
6 Svenska Handelsbanken AB 80 0.09
2 Swedbank AB 46 0.05
– Tele2 AB (non-voting rights) 3 –
3 Tele2 AB (voting rights) 22 0.02
8 Telefonaktiebolaget LM Ericsson 40 0.04
8 Telia Co AB 32 0.03
2 Unibet Group PLC 15 0.02
1 Volvo AB, Class A 12 0.01
10 Volvo AB, Class B 104 0.11
1,147 1.20
Switzerland - 2.65%
7 ABB Ltd 138 0.13
1 Actelion Ltd 113 0.12
1 Adecco Group AG 80 0.08
– Aryzta AG 6 0.01
– Baloise Holding AG 26 0.03
– Banque Cantonale Vaudoise 10 0.01
1 Cie Financiere Richemont SA 90 0.09
2 Clariant AG 25 0.03
5 Credit Suisse Group AG 63 0.07
– Dufry AG 26 0.03
– EMS-Chemie Holding AG 14 0.01
– Galenica AG 16 0.02
– Geberit AG 43 0.05
– Georg Fischer AG 15 0.02
– Givaudan SA 71 0.07
– Helvetia Holding AG 15 0.02
1 Julius Baer Group Ltd 39 0.04
– Kuehne & Nagel International AG 40 0.04
1 Logitech International SA 18 0.02
6 Novartis AG 399 0.42
1 OC Oerlikon Corp AG 10 0.01
– Partners Group Holding AG 51 0.05
2 Roche Holding AG (non-voting rights) 382 0.40
– Roche Holding AG (voting rights) 18 0.02
– Schindler Holding AG 12 0.01
– SGS SA 36 0.04
– Sika AG 92 0.10
– Sonova Holding AG 35 0.04
– Straumann Holding AG 17 0.02
– Sulzer AG 12 0.01
Shares (000's)
Value (000's)
USD
% of Net Asset Value
Common Stock (continued)
Switzerland - 2.65% (continued)
– Sunrise Communications Group AG 20 0.02
– Swatch Group AG (BR) 37 0.04
– Swatch Group AG (REG) 3 –
– Swiss Life Holding AG 73 0.08
– Swiss Prime Site AG 12 0.01
1 Swiss Re AG 108 0.11
– Swisscom AG 72 0.08
– Syngenta AG 78 0.08
7 UBS Group AG 110 0.12
– Zurich Insurance Group AG 99 0.10
2,524 2.65
United Kingdom - 4.76%
8 3i Group PLC 71 0.07
2 AA PLC 6 0.01
6 Aberdeen Asset Management PLC 20 0.02
1 Admiral Group PLC 21 0.02
4 Afren PLC – –
1 AMEC PLC 6 0.01
1 Antofagasta PLC 12 0.01
2 Ashtead Group PLC 35 0.04
3 AstraZeneca PLC 155 0.16
6 Auto Trader Group PLC 28 0.03
16 Aviva PLC 90 0.09
2 Babcock International Group PLC 30 0.03
12 BAE Systems PLC 90 0.09
10 Barratt Developments PLC 56 0.06
2 Beazley PLC 11 0.01
1 Bellway PLC 23 0.02
1 Berkeley Group Holdings PLC 33 0.03
1 Bovis Homes Group PLC 14 0.01
1 Britvic PLC 8 0.01
30 BT Group PLC 135 0.15
1 Bunzl PLC 32 0.03
2 Burberry Group PLC 43 0.05
– Cairn Energy PLC – –
2 Capita PLC 14 0.01
– Cardtronics PLC 15 0.02
3 Carillion PLC 9 0.01
24 Centrica PLC 64 0.07
– Close Brothers Group PLC 1 –
4 Cobham PLC 7 0.01
1 Coca-Cola HBC AG 17 0.02
5 Compass Group PLC 88 0.09
1 Croda International PLC 24 0.03
2 CYBG PLC 6 0.01
– DCC PLC 37 0.04
6 Diageo PLC 145 0.15
1 Diploma PLC 17 0.02
9 Direct Line Insurance Group PLC 40 0.04
5 Dixons Carphone PLC 19 0.02
2 DS Smith PLC 9 0.01
3 Electrocomponents PLC 14 0.01
5 Experian PLC 92 0.10
– Fresnillo PLC 7 0.01
4 G4S PLC 13 0.01
7 GlaxoSmithKline PLC 139 0.15
2 Halma PLC 19 0.02
1 Hargreaves Lansdown PLC 12 0.01
6 Hays PLC 10 0.01
– Henderson Group PLC 1 –
1 Hiscox Ltd 9 0.01
2 Howden Joinery Group PLC 11 0.01
27 HSBC Holdings PLC 216 0.23
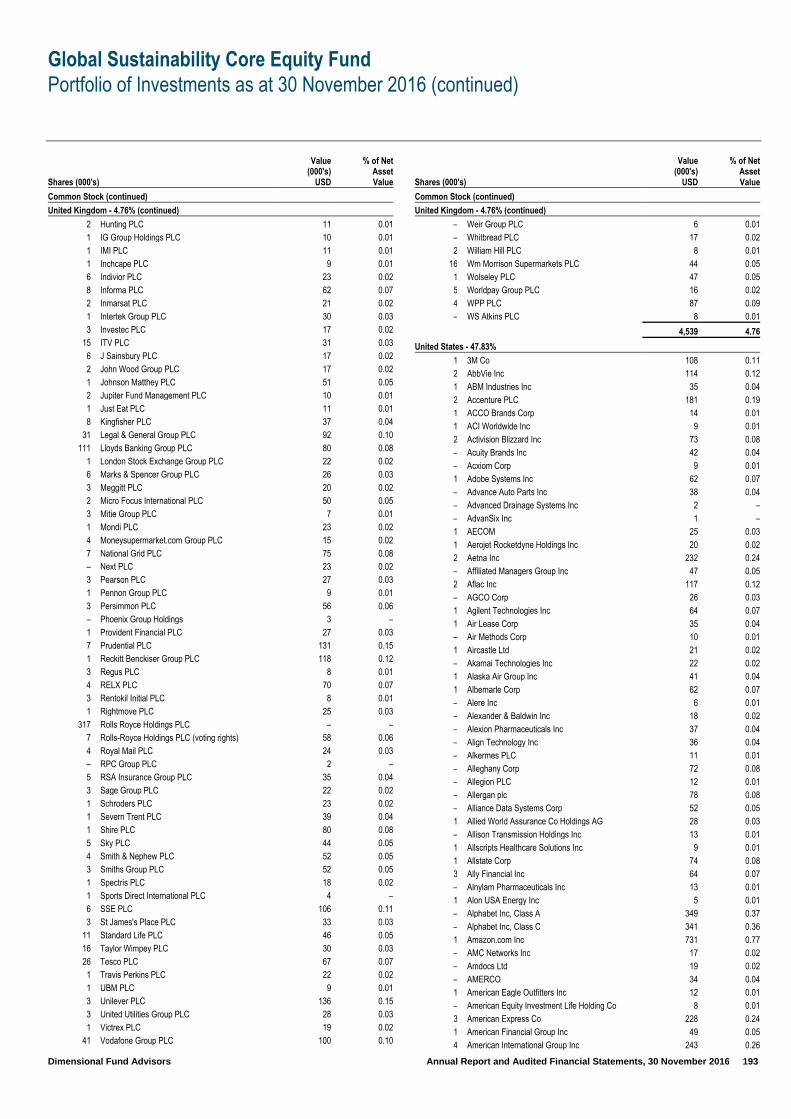
Global Sustainability Core Equity Fund
Portfolio of Investments as at 30 November 2016 (continued)
Dimensional Fund Advisors Annual Report and Audited Financial Statements, 30 November 2016 193
Shares (000's)
Value (000's)
USD
% of Net Asset Value
Common Stock (continued)
United Kingdom - 4.76% (continued)
2 Hunting PLC 11 0.01
1 IG Group Holdings PLC 10 0.01
1 IMI PLC 11 0.01
1 Inchcape PLC 9 0.01
6 Indivior PLC 23 0.02
8 Informa PLC 62 0.07
2 Inmarsat PLC 21 0.02
1 Intertek Group PLC 30 0.03
3 Investec PLC 17 0.02
15 ITV PLC 31 0.03
6 J Sainsbury PLC 17 0.02
2 John Wood Group PLC 17 0.02
1 Johnson Matthey PLC 51 0.05
2 Jupiter Fund Management PLC 10 0.01
1 Just Eat PLC 11 0.01
8 Kingfisher PLC 37 0.04
31 Legal & General Group PLC 92 0.10
111 Lloyds Banking Group PLC 80 0.08
1 London Stock Exchange Group PLC 22 0.02
6 Marks & Spencer Group PLC 26 0.03
3 Meggitt PLC 20 0.02
2 Micro Focus International PLC 50 0.05
3 Mitie Group PLC 7 0.01
1 Mondi PLC 23 0.02
4 Moneysupermarket.com Group PLC 15 0.02
7 National Grid PLC 75 0.08
– Next PLC 23 0.02
3 Pearson PLC 27 0.03
1 Pennon Group PLC 9 0.01
3 Persimmon PLC 56 0.06
– Phoenix Group Holdings 3 –
1 Provident Financial PLC 27 0.03
7 Prudential PLC 131 0.15
1 Reckitt Benckiser Group PLC 118 0.12
3 Regus PLC 8 0.01
4 RELX PLC 70 0.07
3 Rentokil Initial PLC 8 0.01
1 Rightmove PLC 25 0.03
317 Rolls Royce Holdings PLC – –
7 Rolls-Royce Holdings PLC (voting rights) 58 0.06
4 Royal Mail PLC 24 0.03
– RPC Group PLC 2 –
5 RSA Insurance Group PLC 35 0.04
3 Sage Group PLC 22 0.02
1 Schroders PLC 23 0.02
1 Severn Trent PLC 39 0.04
1 Shire PLC 80 0.08
5 Sky PLC 44 0.05
4 Smith & Nephew PLC 52 0.05
3 Smiths Group PLC 52 0.05
1 Spectris PLC 18 0.02
1 Sports Direct International PLC 4 –
6 SSE PLC 106 0.11
3 St James's Place PLC 33 0.03
11 Standard Life PLC 46 0.05
16 Taylor Wimpey PLC 30 0.03
26 Tesco PLC 67 0.07
1 Travis Perkins PLC 22 0.02
1 UBM PLC 9 0.01
3 Unilever PLC 136 0.15
3 United Utilities Group PLC 28 0.03
1 Victrex PLC 19 0.02
41 Vodafone Group PLC 100 0.10
Shares (000's)
Value (000's)
USD
% of Net Asset Value
Common Stock (continued)
United Kingdom - 4.76% (continued)
– Weir Group PLC 6 0.01
– Whitbread PLC 17 0.02
2 William Hill PLC 8 0.01
16 Wm Morrison Supermarkets PLC 44 0.05
1 Wolseley PLC 47 0.05
5 Worldpay Group PLC 16 0.02
4 WPP PLC 87 0.09
– WS Atkins PLC 8 0.01
4,539 4.76
United States - 47.83%
1 3M Co 108 0.11
2 AbbVie Inc 114 0.12
1 ABM Industries Inc 35 0.04
2 Accenture PLC 181 0.19
1 ACCO Brands Corp 14 0.01
1 ACI Worldwide Inc 9 0.01
2 Activision Blizzard Inc 73 0.08
– Acuity Brands Inc 42 0.04
– Acxiom Corp 9 0.01
1 Adobe Systems Inc 62 0.07
– Advance Auto Parts Inc 38 0.04
– Advanced Drainage Systems Inc 2 –
– AdvanSix Inc 1 –
1 AECOM 25 0.03
1 Aerojet Rocketdyne Holdings Inc 20 0.02
2 Aetna Inc 232 0.24
– Affiliated Managers Group Inc 47 0.05
2 Aflac Inc 117 0.12
– AGCO Corp 26 0.03
1 Agilent Technologies Inc 64 0.07
1 Air Lease Corp 35 0.04
– Air Methods Corp 10 0.01
1 Aircastle Ltd 21 0.02
– Akamai Technologies Inc 22 0.02
1 Alaska Air Group Inc 41 0.04
1 Albemarle Corp 62 0.07
– Alere Inc 6 0.01
– Alexander & Baldwin Inc 18 0.02
– Alexion Pharmaceuticals Inc 37 0.04
– Align Technology Inc 36 0.04
– Alkermes PLC 11 0.01
– Alleghany Corp 72 0.08
– Allegion PLC 12 0.01
– Allergan plc 78 0.08
– Alliance Data Systems Corp 52 0.05
1 Allied World Assurance Co Holdings AG 28 0.03
– Allison Transmission Holdings Inc 13 0.01
1 Allscripts Healthcare Solutions Inc 9 0.01
1 Allstate Corp 74 0.08
3 Ally Financial Inc 64 0.07
– Alnylam Pharmaceuticals Inc 13 0.01
1 Alon USA Energy Inc 5 0.01
– Alphabet Inc, Class A 349 0.37
– Alphabet Inc, Class C 341 0.36
1 Amazon.com Inc 731 0.77
– AMC Networks Inc 17 0.02
– Amdocs Ltd 19 0.02
– AMERCO 34 0.04
1 American Eagle Outfitters Inc 12 0.01
– American Equity Investment Life Holding Co 8 0.01
3 American Express Co 228 0.24
1 American Financial Group Inc 49 0.05
4 American International Group Inc 243 0.26

Global Sustainability Core Equity Fund
Portfolio of Investments as at 30 November 2016 (continued)
Dimensional Fund Advisors Annual Report and Audited Financial Statements, 30 November 2016 194
Shares (000's)
Value (000's)
USD
% of Net Asset Value
Common Stock (continued)
United States - 47.83% (continued)
1 American States Water Co 21 0.02
1 American Water Works Co Inc 85 0.09
1 Ameriprise Financial Inc 100 0.10
– Amerisafe Inc 13 0.01
– AmerisourceBergen Corp 25 0.03
1 AMETEK Inc 34 0.04
2 Amgen Inc 258 0.27
1 Amkor Technology Inc 15 0.02
– AMN Healthcare Services Inc 9 0.01
– AmTrust Financial Services Inc 10 0.01
1 ANSYS Inc 55 0.06
1 Anthem Inc 159 0.17
– AO Smith Corp 19 0.02
1 Aon PLC 114 0.12
22 Apple Inc 2,413 2.53
– Applied Industrial Technologies Inc 18 0.02
2 Applied Materials Inc 64 0.07
– AptarGroup Inc 22 0.02
1 Aqua America Inc 31 0.03
1 Aramark 25 0.03
1 Arch Capital Group Ltd 54 0.06
– Arista Networks Inc 17 0.02
– Armstrong Flooring Inc 1 –
1 ARRIS International PLC 28 0.03
1 Arrow Electronics Inc 43 0.05
1 Arthur J Gallagher & Co 51 0.05
– Artisan Partners Asset Management Inc 2 –
– Asbury Automotive Group Inc 12 0.01
1 Ascena Retail Group Inc 5 0.01
– Aspen Insurance Holdings Ltd 10 0.01
– Aspen Technology Inc 14 0.01
1 Associated Banc-Corp 22 0.02
– Assurant Inc 22 0.02
1 Assured Guaranty Ltd 31 0.03
1 Astoria Financial Corp 20 0.02
– Astronics Corp 7 0.01
– Astronics Corp, Class B 1 –
16 AT&T Inc 599 0.63
1 Atmos Energy Corp 55 0.06
– Atwood Oceanics Inc 1 –
– Autodesk Inc 36 0.04
– Autoliv Inc 40 0.04
1 Automatic Data Processing Inc 104 0.11
– AutoNation Inc 19 0.02
– AutoZone Inc 78 0.08
– Avery Dennison Corp 31 0.03
– Avis Budget Group Inc 6 0.01
1 Avnet Inc 41 0.04
5 Avon Products Inc 25 0.03
1 Axalta Coating Systems Ltd 39 0.04
– Axis Capital Holdings Ltd 24 0.03
– AZZ Inc 13 0.01
– B/E Aerospace Inc 19 0.02
1 Baker Hughes Inc 73 0.08
1 Ball Corp 48 0.05
– BancFirst Corp 19 0.02
1 BancorpSouth Inc 14 0.01
14 Bank of America Corp 299 0.31
– Bank of Hawaii Corp 25 0.03
2 Bank of New York Mellon Corp 77 0.08
1 Bank of the Ozarks Inc 24 0.03
– BankUnited Inc 12 0.01
– Barnes Group Inc 18 0.02
Shares (000's)
Value (000's)
USD
% of Net Asset Value
Common Stock (continued)
United States - 47.83% (continued)
1 BB&T Corp 39 0.04
– Beacon Roofing Supply Inc 14 0.01
– Becton Dickinson and Co 52 0.05
1 Bed Bath & Beyond Inc 43 0.05
– Bemis Co Inc 20 0.02
1 Beneficial Bancorp Inc 11 0.01
– Berry Plastics Group Inc 16 0.02
2 Best Buy Co Inc 97 0.10
1 BGC Partners Inc 11 0.01
1 Biogen Inc 202 0.21
– BioMarin Pharmaceutical Inc 30 0.03
1 Black Knight Financial Services Inc 20 0.02
– Blackbaud Inc 10 0.01
1 Blackhawk Network Holdings Inc 18 0.02
– BlackRock Inc 128 0.13
1 BMC Stock Holdings Inc 12 0.01
1 BNC Bancorp 15 0.02
– Booz Allen Hamilton Holding Corp 14 0.01
1 BorgWarner Inc 35 0.04
2 Boston Scientific Corp 48 0.05
– Brink's Co 19 0.02
2 Bristol-Myers Squibb Co 85 0.09
– Broadridge Financial Solutions Inc 30 0.03
2 Brocade Communications Systems Inc 27 0.03
1 Brown & Brown Inc 26 0.03
– Brown-Forman Corp, Class A 20 0.02
– Brown-Forman Corp, Class B 18 0.02
– Brunswick Corp 9 0.01
– Burlington Stores Inc 16 0.02
– BWX Technologies Inc 16 0.02
1 CA Inc 44 0.05
– Cabela's Inc 6 0.01
– Cable One Inc 19 0.02
2 Cadence Design Systems Inc 40 0.04
1 CalAtlantic Group Inc 20 0.02
– Caleres Inc 13 0.01
1 Capital One Financial Corp 94 0.10
1 Capitol Federal Financial Inc 13 0.01
1 Cardinal Health Inc 82 0.09
– Carlisle Cos Inc 36 0.04
1 CarMax Inc 69 0.07
– Carter's Inc 18 0.02
– Casey's General Stores Inc 24 0.03
2 Caterpillar Inc 174 0.18
– Cathay General Bancorp 11 0.01
– CBOE Holdings Inc 25 0.03
2 CBRE Group Inc 70 0.07
2 CBS Corp 93 0.10
1 CDK Global Inc 39 0.04
– CEB Inc 18 0.02
1 Celanese Corp 68 0.07
2 Celgene Corp 228 0.24
1 Centene Corp 75 0.08
2 CenterPoint Energy Inc 51 0.05
1 Cerner Corp 39 0.04
1 CH Robinson Worldwide Inc 49 0.05
3 Charles Schwab Corp 113 0.12
– Charter Communications Inc 127 0.13
– Chemical Financial Corp 21 0.02
1 Chemtura Corp 18 0.02
– Chicago Bridge & Iron Co NV 14 0.01
1 Chico's FAS Inc 12 0.01
– Children's Place Inc 11 0.01

Global Sustainability Core Equity Fund
Portfolio of Investments as at 30 November 2016 (continued)
Dimensional Fund Advisors Annual Report and Audited Financial Statements, 30 November 2016 195
Shares (000's)
Value (000's)
USD
% of Net Asset Value
Common Stock (continued)
United States - 47.83% (continued)
– Chipotle Mexican Grill Inc 15 0.02
1 Chubb Ltd 111 0.12
1 Church & Dwight Co Inc 36 0.04
1 Ciena Corp 11 0.01
1 Cigna Corp 86 0.09
1 Cincinnati Financial Corp 47 0.05
1 Cinemark Holdings Inc 22 0.02
– Cintas Corp 35 0.04
15 Cisco Systems Inc 442 0.46
1 CIT Group Inc 37 0.04
6 Citigroup Inc 355 0.37
2 Citizens Financial Group Inc 52 0.05
1 Citrix Systems Inc 49 0.05
– Civeo Corp – –
– Clorox Co 36 0.04
1 CME Group Inc 91 0.10
1 Coach Inc 31 0.03
– Coca-Cola Bottling Co Consolidated 5 0.01
7 Coca-Cola Co 294 0.31
1 Cogent Communications Holdings Inc 23 0.02
1 Cognizant Technology Solutions Corp 59 0.06
– Cohen & Steers Inc 2 –
– Coherent Inc 26 0.03
– Colfax Corp 15 0.02
1 Colgate-Palmolive Co 90 0.09
– Columbia Banking System Inc 16 0.02
– Columbia Sportswear Co 17 0.02
11 Comcast Corp 731 0.77
– Commerce Bancshares Inc 14 0.01
– CommerceHub Inc, Series A 1 –
– CommerceHub Inc, Series C 1 –
1 CommScope Holding Co Inc 38 0.04
– Community Bank System Inc 6 0.01
– Computer Sciences Corp 28 0.03
1 Consolidated Communications Holdings Inc 26 0.03
1 Consolidated Edison Inc 57 0.06
– Constellation Brands Inc 53 0.06
– Cooper Cos Inc 44 0.05
– Copa Holdings SA 18 0.02
– Copart Inc 16 0.02
– Core Laboratories NV 29 0.03
1 Costco Wholesale Corp 195 0.20
3 Coty Inc 61 0.06
– CR Bard Inc 57 0.06
– Crane Co 17 0.02
– Crown Holdings Inc 24 0.03
1 CST Brands Inc 29 0.03
– CSX Corp 14 0.01
– Cullen/Frost Bankers Inc 25 0.03
– Cummins Inc 68 0.07
– Curtiss-Wright Corp 20 0.02
– CVB Financial Corp 2 –
– CVR Energy Inc 5 0.01
4 CVS Health Corp 343 0.36
– Dana Inc 8 0.01
1 Danaher Corp 41 0.04
1 DaVita Inc 53 0.06
– Deckers Outdoor Corp 12 0.01
1 Deere & Co 89 0.09
– Delek US Holdings Inc 5 0.01
– Dell Technologies Inc 24 0.03
– Delphi Automotive PLC 16 0.02
– Deluxe Corp 11 0.01
Shares (000's)
Value (000's)
USD
% of Net Asset Value
Common Stock (continued)
United States - 47.83% (continued)
– Dentsply Sirona Inc 20 0.02
– DexCom Inc 8 0.01
1 Diamond Offshore Drilling Inc 9 0.01
1 Dick's Sporting Goods Inc 35 0.04
– Dillard's Inc 7 0.01
2 Discover Financial Services 109 0.11
1 Discovery Communications Inc, Class A 37 0.04
2 Discovery Communications Inc, Class C 50 0.05
1 DISH Network Corp 33 0.03
1 Dollar General Corp 52 0.05
– Dollar Tree Inc 35 0.04
– Domino's Pizza Inc 75 0.08
– Donaldson Co Inc 13 0.01
– Donnelley Financial Solutions Inc 1 –
1 Dover Corp 49 0.05
1 Dow Chemical Co 62 0.07
2 DR Horton Inc 54 0.06
1 Dr Pepper Snapple Group Inc 54 0.06
– Dril-Quip Inc 6 0.01
– DST Systems Inc 10 0.01
– DSW Inc 10 0.01
– Dun & Bradstreet Corp 12 0.01
1 Dunkin' Brands Group Inc 27 0.03
– Dycom Industries Inc 15 0.02
1 E*TRADE Financial Corp 47 0.05
– Eagle Bancorp Inc 7 0.01
1 East West Bancorp Inc 41 0.04
1 Eaton Corp PLC 77 0.08
– Eaton Vance Corp 13 0.01
2 eBay Inc 64 0.07
– EchoStar Corp 15 0.02
1 Ecolab Inc 113 0.12
– Edgewell Personal Care Co 25 0.03
1 Edison International 72 0.08
– Edwards Lifesciences Corp 41 0.04
1 EI du Pont de Nemours & Co 79 0.08
1 Electronic Arts Inc 52 0.05
– Electronics For Imaging Inc 4 –
2 Emerson Electric Co 105 0.11
– Employers Holdings Inc 13 0.01
1 Endo International PLC 8 0.01
– Endurance Specialty Holdings Ltd 28 0.03
– EnerSys 18 0.02
– Enstar Group Ltd 22 0.02
– Entegris Inc 3 –
1 Envision Healthcare Holdings Inc 12 0.01
– EP Energy Corp – –
1 Equifax Inc 63 0.07
– Erie Indemnity Co 12 0.01
– Essendant Inc 6 0.01
1 Estee Lauder Cos Inc 59 0.06
– Esterline Technologies Corp 8 0.01
1 EverBank Financial Corp 11 0.01
– Everest Re Group Ltd 77 0.08
2 Eversource Energy 86 0.09
1 EW Scripps Co 21 0.02
– Expedia Inc 24 0.03
1 Expeditors International of Washington Inc 57 0.06
1 Express Inc 8 0.01
4 Express Scripts Holding Co 269 0.28
– F5 Networks Inc 44 0.05
2 Facebook Inc 181 0.19
– FactSet Research Systems Inc 16 0.02

Global Sustainability Core Equity Fund
Portfolio of Investments as at 30 November 2016 (continued)
Dimensional Fund Advisors Annual Report and Audited Financial Statements, 30 November 2016 196
Shares (000's)
Value (000's)
USD
% of Net Asset Value
Common Stock (continued)
United States - 47.83% (continued)
– Fair Isaac Corp 11 0.01
1 Fastenal Co 55 0.06
– FCB Financial Holdings Inc 10 0.01
– Federated Investors Inc 11 0.01
– FedEx Corp 59 0.06
1 Fidelity National Information Services Inc 66 0.07
2 Fifth Third Bancorp 48 0.05
1 Finisar Corp 20 0.02
– First American Financial Corp 11 0.01
2 First Horizon National Corp 31 0.03
– First Midwest Bancorp Inc 7 0.01
1 First Republic Bank 41 0.04
1 Fiserv Inc 58 0.06
– Flagstar Bancorp Inc 7 0.01
– FleetCor Technologies Inc 33 0.03
2 Flex Ltd 33 0.03
– FLIR Systems Inc 13 0.01
1 Flowserve Corp 37 0.04
1 Fluor Corp 68 0.07
2 FMC Technologies Inc 61 0.06
1 FNB Corp 11 0.01
2 FNF Group 56 0.06
– FNFV Group 2 –
1 Foot Locker Inc 47 0.05
14 Ford Motor Co 170 0.18
– Fortinet Inc 11 0.01
1 Fortive Corp 32 0.03
– Fortune Brands Home & Security Inc 24 0.03
– Fossil Group Inc 3 –
1 Franklin Resources Inc 47 0.05
5 Freeport-McMoRan Inc 80 0.08
8 Frontier Communications Corp 28 0.03
– FTI Consulting Inc 20 0.02
1 Fulton Financial Corp 13 0.01
1 GameStop Corp 15 0.02
– Gannett Co Inc 3 –
1 Gap Inc 32 0.03
1 Garmin Ltd 51 0.05
– Gartner Inc 21 0.02
1 GATX Corp 27 0.03
– GCP Applied Technologies Inc 10 0.01
17 General Electric Co 509 0.53
4 General Motors Co 134 0.14
– Genesco Inc 12 0.01
– Genpact Ltd 6 0.01
1 Gentex Corp 14 0.01
– Genuine Parts Co 41 0.04
3 Genworth Financial Inc 11 0.01
3 Gilead Sciences Inc 253 0.27
– Global Payments Inc 27 0.03
– GNC Holdings Inc 5 0.01
1 Goldman Sachs Group Inc 192 0.20
– GoPro Inc 4 –
– Graco Inc 11 0.01
– Granite Construction Inc 21 0.02
2 Graphic Packaging Holding Co 23 0.02
1 Great Western Bancorp Inc 21 0.02
– Group 1 Automotive Inc 15 0.02
– Guess? Inc 6 0.01
– Hain Celestial Group Inc 18 0.02
– Hancock Holding Co 6 0.01
1 Hanesbrands Inc 19 0.02
– Hanover Insurance Group Inc 10 0.01
Shares (000's)
Value (000's)
USD
% of Net Asset Value
Common Stock (continued)
United States - 47.83% (continued)
1 Harley-Davidson Inc 59 0.06
1 Harman International Industries Inc 74 0.08
1 Harris Corp 61 0.06
2 Hartford Financial Services Group Inc 77 0.08
1 Hasbro Inc 79 0.08
1 HB Fuller Co 23 0.02
1 HD Supply Holdings Inc 40 0.04
1 Healthcare Services Group Inc 20 0.02
– Helen of Troy Ltd 17 0.02
1 Helmerich & Payne Inc 40 0.04
– Henry Schein Inc 24 0.03
1 Herbalife Ltd 27 0.03
– Hexcel Corp 16 0.02
1 Hilltop Holdings Inc 17 0.02
1 HollyFrontier Corp 26 0.03
1 Hologic Inc 57 0.06
3 Home Depot Inc 349 0.37
1 Honeywell International Inc 168 0.18
– Horizon Pharma Plc 5 0.01
– Howard Hughes Corp 19 0.02
– HSN Inc 4 –
– Hubbell Inc 39 0.04
– Humana Inc 64 0.07
– Huntington Ingalls Industries Inc 61 0.06
– Huntsman Corp 9 0.01
– Huron Consulting Group Inc 12 0.01
– IDEX Corp 30 0.03
– IDEXX Laboratories Inc 53 0.06
1 IHS Markit Ltd 38 0.04
1 Illinois Tool Works Inc 73 0.08
– Incyte Corp 45 0.05
1 Ingersoll-Rand PLC 70 0.07
– Ingevity Corp 7 0.01
1 Ingram Micro Inc 23 0.02
8 Intel Corp 273 0.29
1 Interactive Brokers Group Inc 22 0.02
1 Intercontinental Exchange Inc 54 0.06
– International Bancshares Corp 16 0.02
1 International Business Machines Corp 198 0.21
– International Flavors & Fragrances Inc 44 0.05
1 International Game Technology PLC 28 0.03
1 International Paper Co 30 0.03
3 Interpublic Group of Cos Inc 71 0.07
1 Intuit Inc 66 0.07
– Intuitive Surgical Inc 64 0.07
1 Invesco Ltd 43 0.05
1 Investors Bancorp Inc 12 0.01
– ITT Inc 10 0.01
1 Ixia 7 0.01
– J Alexander's Holdings Inc – –
1 Jabil Circuit Inc 16 0.02
– Jack Henry & Associates Inc 29 0.03
1 Jacobs Engineering Group Inc 63 0.07
1 Janus Capital Group Inc 12 0.01
– Jazz Pharmaceuticals PLC 10 0.01
– JB Hunt Transport Services Inc 22 0.02
1 JetBlue Airways Corp 20 0.02
– JM Smucker Co 43 0.05
– John Wiley & Sons Inc 11 0.01
6 Johnson & Johnson 717 0.75
1 Johnson Controls International PLC 51 0.05
– Jones Lang LaSalle Inc 26 0.03
– Joy Global Inc 5 0.01
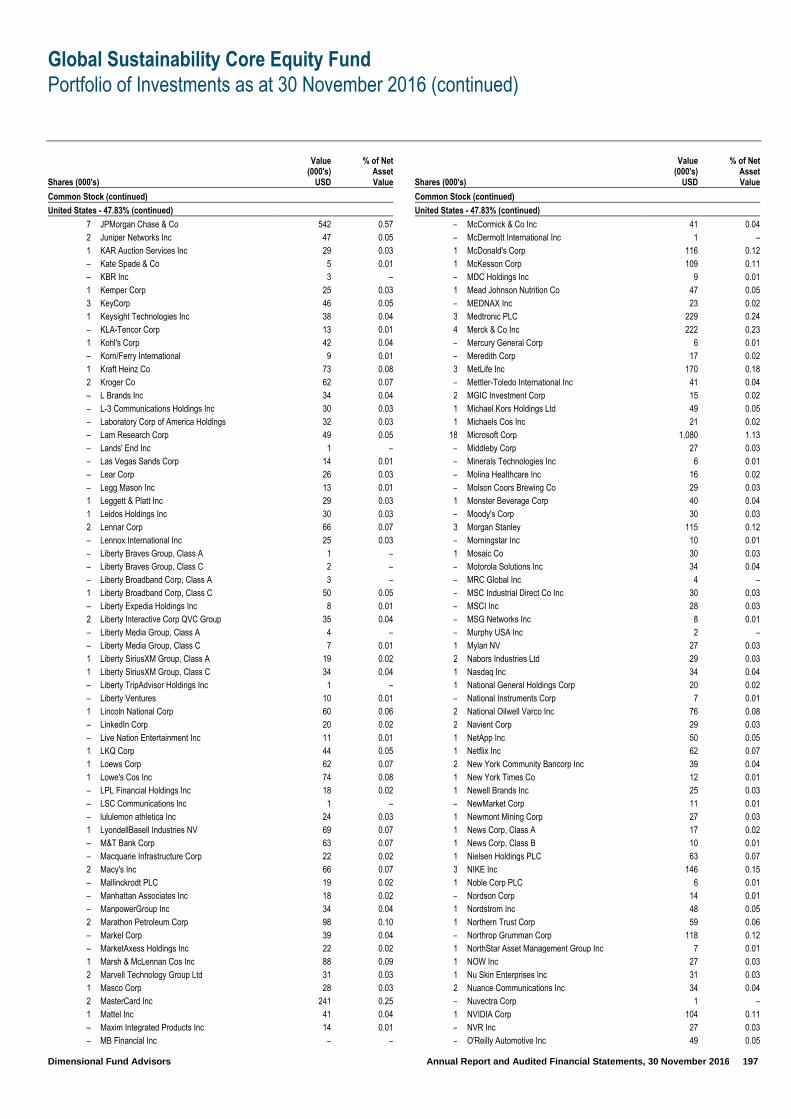
Global Sustainability Core Equity Fund
Portfolio of Investments as at 30 November 2016 (continued)
Dimensional Fund Advisors Annual Report and Audited Financial Statements, 30 November 2016 197
Shares (000's)
Value (000's)
USD
% of Net Asset Value
Common Stock (continued)
United States - 47.83% (continued)
7 JPMorgan Chase & Co 542 0.57
2 Juniper Networks Inc 47 0.05
1 KAR Auction Services Inc 29 0.03
– Kate Spade & Co 5 0.01
– KBR Inc 3 –
1 Kemper Corp 25 0.03
3 KeyCorp 46 0.05
1 Keysight Technologies Inc 38 0.04
– KLA-Tencor Corp 13 0.01
1 Kohl's Corp 42 0.04
– Korn/Ferry International 9 0.01
1 Kraft Heinz Co 73 0.08
2 Kroger Co 62 0.07
– L Brands Inc 34 0.04
– L-3 Communications Holdings Inc 30 0.03
– Laboratory Corp of America Holdings 32 0.03
– Lam Research Corp 49 0.05
– Lands' End Inc 1 –
– Las Vegas Sands Corp 14 0.01
– Lear Corp 26 0.03
– Legg Mason Inc 13 0.01
1 Leggett & Platt Inc 29 0.03
1 Leidos Holdings Inc 30 0.03
2 Lennar Corp 66 0.07
– Lennox International Inc 25 0.03
– Liberty Braves Group, Class A 1 –
– Liberty Braves Group, Class C 2 –
– Liberty Broadband Corp, Class A 3 –
1 Liberty Broadband Corp, Class C 50 0.05
– Liberty Expedia Holdings Inc 8 0.01
2 Liberty Interactive Corp QVC Group 35 0.04
– Liberty Media Group, Class A 4 –
– Liberty Media Group, Class C 7 0.01
1 Liberty SiriusXM Group, Class A 19 0.02
1 Liberty SiriusXM Group, Class C 34 0.04
– Liberty TripAdvisor Holdings Inc 1 –
– Liberty Ventures 10 0.01
1 Lincoln National Corp 60 0.06
– LinkedIn Corp 20 0.02
– Live Nation Entertainment Inc 11 0.01
1 LKQ Corp 44 0.05
1 Loews Corp 62 0.07
1 Lowe's Cos Inc 74 0.08
– LPL Financial Holdings Inc 18 0.02
– LSC Communications Inc 1 –
– lululemon athletica Inc 24 0.03
1 LyondellBasell Industries NV 69 0.07
– M&T Bank Corp 63 0.07
– Macquarie Infrastructure Corp 22 0.02
2 Macy's Inc 66 0.07
– Mallinckrodt PLC 19 0.02
– Manhattan Associates Inc 18 0.02
– ManpowerGroup Inc 34 0.04
2 Marathon Petroleum Corp 98 0.10
– Markel Corp 39 0.04
– MarketAxess Holdings Inc 22 0.02
1 Marsh & McLennan Cos Inc 88 0.09
2 Marvell Technology Group Ltd 31 0.03
1 Masco Corp 28 0.03
2 MasterCard Inc 241 0.25
1 Mattel Inc 41 0.04
– Maxim Integrated Products Inc 14 0.01
– MB Financial Inc – –
Shares (000's)
Value (000's)
USD
% of Net Asset Value
Common Stock (continued)
United States - 47.83% (continued)
– McCormick & Co Inc 41 0.04
– McDermott International Inc 1 –
1 McDonald's Corp 116 0.12
1 McKesson Corp 109 0.11
– MDC Holdings Inc 9 0.01
1 Mead Johnson Nutrition Co 47 0.05
– MEDNAX Inc 23 0.02
3 Medtronic PLC 229 0.24
4 Merck & Co Inc 222 0.23
– Mercury General Corp 6 0.01
– Meredith Corp 17 0.02
3 MetLife Inc 170 0.18
– Mettler-Toledo International Inc 41 0.04
2 MGIC Investment Corp 15 0.02
1 Michael Kors Holdings Ltd 49 0.05
1 Michaels Cos Inc 21 0.02
18 Microsoft Corp 1,080 1.13
– Middleby Corp 27 0.03
– Minerals Technologies Inc 6 0.01
– Molina Healthcare Inc 16 0.02
– Molson Coors Brewing Co 29 0.03
1 Monster Beverage Corp 40 0.04
– Moody's Corp 30 0.03
3 Morgan Stanley 115 0.12
– Morningstar Inc 10 0.01
1 Mosaic Co 30 0.03
– Motorola Solutions Inc 34 0.04
– MRC Global Inc 4 –
– MSC Industrial Direct Co Inc 30 0.03
– MSCI Inc 28 0.03
– MSG Networks Inc 8 0.01
– Murphy USA Inc 2 –
1 Mylan NV 27 0.03
2 Nabors Industries Ltd 29 0.03
1 Nasdaq Inc 34 0.04
1 National General Holdings Corp 20 0.02
– National Instruments Corp 7 0.01
2 National Oilwell Varco Inc 76 0.08
2 Navient Corp 29 0.03
1 NetApp Inc 50 0.05
1 Netflix Inc 62 0.07
2 New York Community Bancorp Inc 39 0.04
1 New York Times Co 12 0.01
1 Newell Brands Inc 25 0.03
– NewMarket Corp 11 0.01
1 Newmont Mining Corp 27 0.03
1 News Corp, Class A 17 0.02
1 News Corp, Class B 10 0.01
1 Nielsen Holdings PLC 63 0.07
3 NIKE Inc 146 0.15
1 Noble Corp PLC 6 0.01
– Nordson Corp 14 0.01
1 Nordstrom Inc 48 0.05
1 Northern Trust Corp 59 0.06
– Northrop Grumman Corp 118 0.12
1 NorthStar Asset Management Group Inc 7 0.01
1 NOW Inc 27 0.03
1 Nu Skin Enterprises Inc 31 0.03
2 Nuance Communications Inc 34 0.04
– Nuvectra Corp 1 –
1 NVIDIA Corp 104 0.11
– NVR Inc 27 0.03
– O'Reilly Automotive Inc 49 0.05
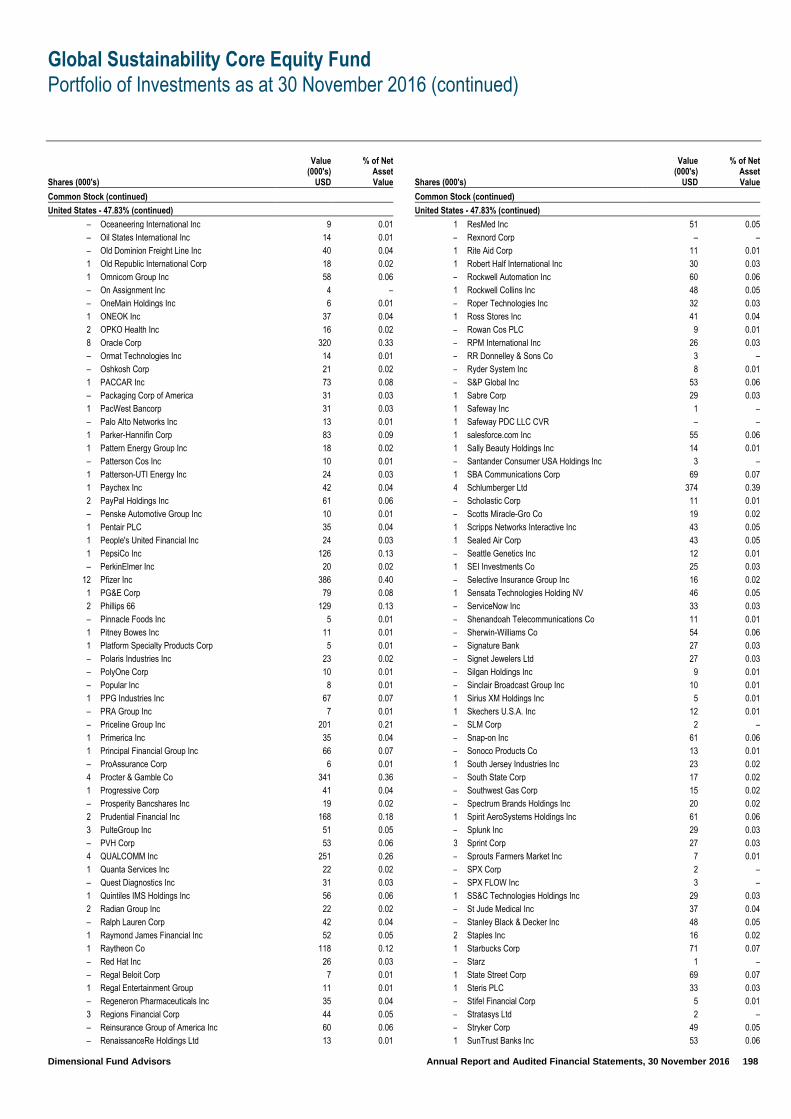
Global Sustainability Core Equity Fund
Portfolio of Investments as at 30 November 2016 (continued)
Dimensional Fund Advisors Annual Report and Audited Financial Statements, 30 November 2016 198
Shares (000's)
Value (000's)
USD
% of Net Asset Value
Common Stock (continued)
United States - 47.83% (continued)
– Oceaneering International Inc 9 0.01
– Oil States International Inc 14 0.01
– Old Dominion Freight Line Inc 40 0.04
1 Old Republic International Corp 18 0.02
1 Omnicom Group Inc 58 0.06
– On Assignment Inc 4 –
– OneMain Holdings Inc 6 0.01
1 ONEOK Inc 37 0.04
2 OPKO Health Inc 16 0.02
8 Oracle Corp 320 0.33
– Ormat Technologies Inc 14 0.01
– Oshkosh Corp 21 0.02
1 PACCAR Inc 73 0.08
– Packaging Corp of America 31 0.03
1 PacWest Bancorp 31 0.03
– Palo Alto Networks Inc 13 0.01
1 Parker-Hannifin Corp 83 0.09
1 Pattern Energy Group Inc 18 0.02
– Patterson Cos Inc 10 0.01
1 Patterson-UTI Energy Inc 24 0.03
1 Paychex Inc 42 0.04
2 PayPal Holdings Inc 61 0.06
– Penske Automotive Group Inc 10 0.01
1 Pentair PLC 35 0.04
1 People's United Financial Inc 24 0.03
1 PepsiCo Inc 126 0.13
– PerkinElmer Inc 20 0.02
12 Pfizer Inc 386 0.40
1 PG&E Corp 79 0.08
2 Phillips 66 129 0.13
– Pinnacle Foods Inc 5 0.01
1 Pitney Bowes Inc 11 0.01
1 Platform Specialty Products Corp 5 0.01
– Polaris Industries Inc 23 0.02
– PolyOne Corp 10 0.01
– Popular Inc 8 0.01
1 PPG Industries Inc 67 0.07
– PRA Group Inc 7 0.01
– Priceline Group Inc 201 0.21
1 Primerica Inc 35 0.04
1 Principal Financial Group Inc 66 0.07
– ProAssurance Corp 6 0.01
4 Procter & Gamble Co 341 0.36
1 Progressive Corp 41 0.04
– Prosperity Bancshares Inc 19 0.02
2 Prudential Financial Inc 168 0.18
3 PulteGroup Inc 51 0.05
– PVH Corp 53 0.06
4 QUALCOMM Inc 251 0.26
1 Quanta Services Inc 22 0.02
– Quest Diagnostics Inc 31 0.03
1 Quintiles IMS Holdings Inc 56 0.06
2 Radian Group Inc 22 0.02
– Ralph Lauren Corp 42 0.04
1 Raymond James Financial Inc 52 0.05
1 Raytheon Co 118 0.12
– Red Hat Inc 26 0.03
– Regal Beloit Corp 7 0.01
1 Regal Entertainment Group 11 0.01
– Regeneron Pharmaceuticals Inc 35 0.04
3 Regions Financial Corp 44 0.05
– Reinsurance Group of America Inc 60 0.06
– RenaissanceRe Holdings Ltd 13 0.01
Shares (000's)
Value (000's)
USD
% of Net Asset Value
Common Stock (continued)
United States - 47.83% (continued)
1 ResMed Inc 51 0.05
– Rexnord Corp – –
1 Rite Aid Corp 11 0.01
1 Robert Half International Inc 30 0.03
– Rockwell Automation Inc 60 0.06
1 Rockwell Collins Inc 48 0.05
– Roper Technologies Inc 32 0.03
1 Ross Stores Inc 41 0.04
– Rowan Cos PLC 9 0.01
– RPM International Inc 26 0.03
– RR Donnelley & Sons Co 3 –
– Ryder System Inc 8 0.01
– S&P Global Inc 53 0.06
1 Sabre Corp 29 0.03
1 Safeway Inc 1 –
1 Safeway PDC LLC CVR – –
1 salesforce.com Inc 55 0.06
1 Sally Beauty Holdings Inc 14 0.01
– Santander Consumer USA Holdings Inc 3 –
1 SBA Communications Corp 69 0.07
4 Schlumberger Ltd 374 0.39
– Scholastic Corp 11 0.01
– Scotts Miracle-Gro Co 19 0.02
1 Scripps Networks Interactive Inc 43 0.05
1 Sealed Air Corp 43 0.05
– Seattle Genetics Inc 12 0.01
1 SEI Investments Co 25 0.03
– Selective Insurance Group Inc 16 0.02
1 Sensata Technologies Holding NV 46 0.05
– ServiceNow Inc 33 0.03
– Shenandoah Telecommunications Co 11 0.01
– Sherwin-Williams Co 54 0.06
– Signature Bank 27 0.03
– Signet Jewelers Ltd 27 0.03
– Silgan Holdings Inc 9 0.01
– Sinclair Broadcast Group Inc 10 0.01
1 Sirius XM Holdings Inc 5 0.01
1 Skechers U.S.A. Inc 12 0.01
– SLM Corp 2 –
– Snap-on Inc 61 0.06
– Sonoco Products Co 13 0.01
1 South Jersey Industries Inc 23 0.02
– South State Corp 17 0.02
– Southwest Gas Corp 15 0.02
– Spectrum Brands Holdings Inc 20 0.02
1 Spirit AeroSystems Holdings Inc 61 0.06
– Splunk Inc 29 0.03
3 Sprint Corp 27 0.03
– Sprouts Farmers Market Inc 7 0.01
– SPX Corp 2 –
– SPX FLOW Inc 3 –
1 SS&C Technologies Holdings Inc 29 0.03
– St Jude Medical Inc 37 0.04
– Stanley Black & Decker Inc 48 0.05
2 Staples Inc 16 0.02
1 Starbucks Corp 71 0.07
– Starz 1 –
1 State Street Corp 69 0.07
1 Steris PLC 33 0.03
– Stifel Financial Corp 5 0.01
– Stratasys Ltd 2 –
– Stryker Corp 49 0.05
1 SunTrust Banks Inc 53 0.06

Global Sustainability Core Equity Fund
Portfolio of Investments as at 30 November 2016 (continued)
Dimensional Fund Advisors Annual Report and Audited Financial Statements, 30 November 2016 199
Shares (000's)
Value (000's)
USD
% of Net Asset Value
Common Stock (continued)
United States - 47.83% (continued)
1 Superior Energy Services Inc 12 0.01
– SVB Financial Group 45 0.05
1 Symantec Corp 24 0.03
5 Synchrony Financial 160 0.17
1 Synopsys Inc 51 0.05
– Synovus Financial Corp 15 0.02
– Syntel Inc 1 –
1 Sysco Corp 56 0.06
1 T Rowe Price Group Inc 55 0.06
2 T-Mobile US Inc 95 0.10
– Tailored Brands Inc 4 –
1 Target Corp 89 0.09
– Taro Pharmaceutical Industries Ltd 11 0.01
1 TD Ameritrade Holding Corp 35 0.04
– TE Connectivity Ltd 32 0.03
– Team Health Holdings Inc 9 0.01
– Teekay Corp 2 –
2 TEGNA Inc 44 0.05
– Teledyne Technologies Inc 12 0.01
– Teleflex Inc 35 0.04
1 Telephone & Data Systems Inc 16 0.02
– Tempur Sealy International Inc 13 0.01
– Tenneco Inc 1 –
1 Teradata Corp 16 0.02
1 Teradyne Inc 24 0.03
– Terex Corp 15 0.02
– Tesla Motors Inc 17 0.02
1 Tesoro Corp 73 0.08
1 Thermo Fisher Scientific Inc 100 0.10
– Thor Industries Inc 30 0.03
– Tidewater Inc – –
1 Tiffany & Co 63 0.07
– Time Inc 4 –
3 Time Warner Inc 276 0.29
1 TJX Cos Inc 110 0.11
1 Toll Brothers Inc 19 0.02
– TopBuild Corp 4 –
1 Torchmark Corp 64 0.07
– Toro Co 18 0.02
1 Total System Services Inc 39 0.04
– Tractor Supply Co 30 0.03
– TransDigm Group Inc 59 0.06
1 Transocean Ltd 15 0.02
1 TransUnion 26 0.03
2 Travelers Cos Inc 173 0.18
1 Travelport Worldwide Ltd 7 0.01
– TreeHouse Foods Inc 14 0.01
2 TRI Pointe Group Inc 20 0.02
1 Trimble Inc 34 0.04
1 TriNet Group Inc 28 0.03
– Trinity Industries Inc 10 0.01
– TripAdvisor Inc 18 0.02
– Triumph Group Inc 8 0.01
– Tupperware Brands Corp 6 0.01
6 Twenty-First Century Fox Inc, Class A 170 0.18
2 Twenty-First Century Fox Inc, Class B 56 0.06
1 Twitter Inc 21 0.02
1 UGI Corp 36 0.04
– Ulta Salon Cosmetics & Fragrance Inc 49 0.05
– Ultimate Software Group Inc 14 0.01
1 Umpqua Holdings Corp 12 0.01
1 Under Armour Inc, Class A 19 0.02
– Under Armour Inc, Class C 9 0.01
Shares (000's)
Value (000's)
USD
% of Net Asset Value
Common Stock (continued)
United States - 47.83% (continued)
1 Union Pacific Corp 51 0.05
– United Bankshares Inc 9 0.01
– United Natural Foods Inc 9 0.01
1 United Parcel Service Inc 85 0.09
1 United Rentals Inc 62 0.07
3 United Technologies Corp 273 0.29
– United Therapeutics Corp 25 0.03
4 UnitedHealth Group Inc 607 0.64
1 Univar Inc 13 0.01
1 Unum Group 54 0.06
– Urban Outfitters Inc 9 0.01
– USANA Health Sciences Inc 24 0.03
2 Valero Energy Corp 117 0.12
1 Validus Holdings Ltd 38 0.04
– Valspar Corp 16 0.02
– Vantiv Inc 23 0.02
– Varian Medical Systems Inc 31 0.03
– VeriFone Systems Inc 3 –
– VeriSign Inc 33 0.03
1 Verisk Analytics Inc 68 0.07
– Veritiv Corp 1 –
14 Verizon Communications Inc 703 0.75
– Vertex Pharmaceuticals Inc 15 0.02
1 VF Corp 30 0.03
1 Viacom Inc 50 0.05
– ViaSat Inc 14 0.01
5 Visa Inc 407 0.44
1 Voya Financial Inc 44 0.05
1 VWR Corp 22 0.02
– WABCO Holdings Inc 19 0.02
– Wabtec Corp 34 0.04
5 Wal-Mart Stores Inc 361 0.38
2 Walgreens Boots Alliance Inc 189 0.20
3 Walt Disney Co 344 0.37
– Waters Corp 25 0.03
– Watsco Inc 13 0.01
4 Weatherford International PLC 21 0.02
1 Webster Financial Corp 30 0.03
– WellCare Health Plans Inc 41 0.04
10 Wells Fargo & Co 539 0.57
1 Wendy's Co 9 0.01
– WESCO International Inc 18 0.02
1 Western Refining Inc 20 0.02
2 Western Union Co 45 0.05
– Westlake Chemical Corp 11 0.01
1 WestRock Co 41 0.04
– Whirlpool Corp 24 0.03
1 WhiteWave Foods Co 28 0.03
2 Whole Foods Market Inc 60 0.06
– Williams-Sonoma Inc 16 0.02
1 Willis Towers Watson PLC 69 0.07
– Windstream Holdings Inc 2 –
– Workday Inc 18 0.02
– World Fuel Services Corp 11 0.01
1 WR Berkley Corp 47 0.05
– WR Grace & Co 10 0.01
– WW Grainger Inc 84 0.09
– Wyndham Worldwide Corp 14 0.01
– Wynn Resorts Ltd 15 0.02
4 Xerox Corp 37 0.04
– Xilinx Inc 25 0.03
1 XL Group Ltd 40 0.04
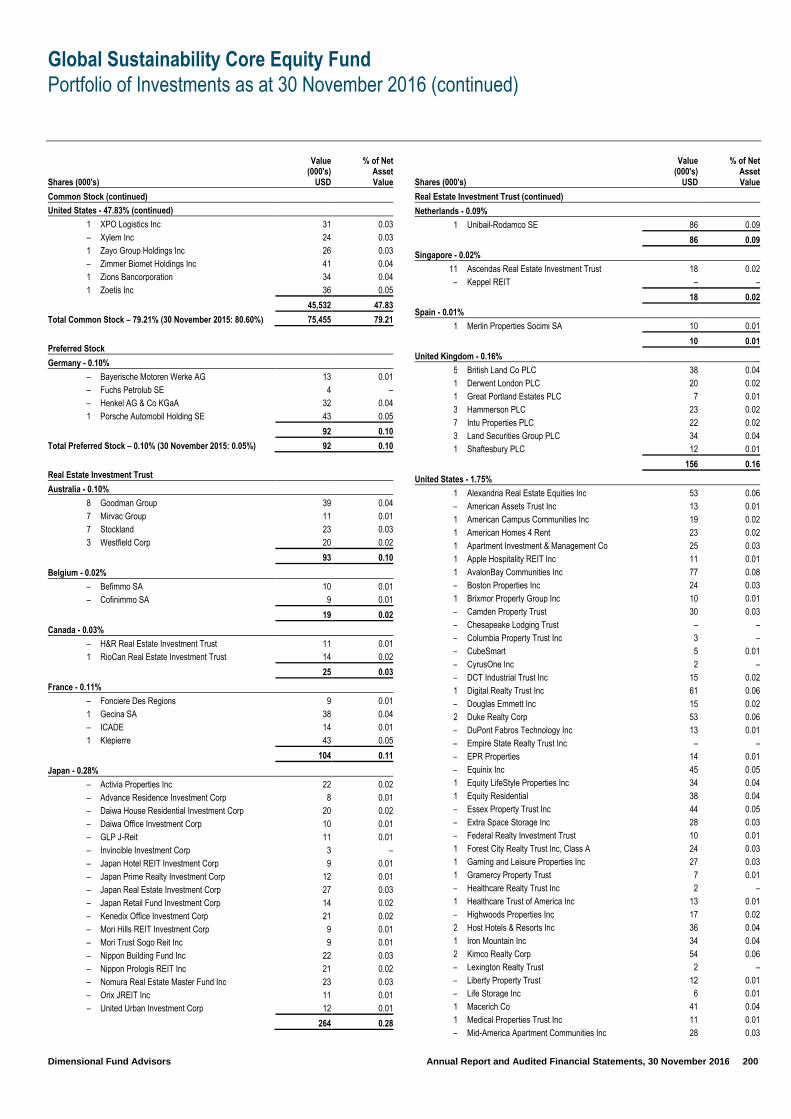
Global Sustainability Core Equity Fund
Portfolio of Investments as at 30 November 2016 (continued)
Dimensional Fund Advisors Annual Report and Audited Financial Statements, 30 November 2016 200
Shares (000's)
Value (000's)
USD
% of Net Asset Value
Common Stock (continued)
United States - 47.83% (continued)
1 XPO Logistics Inc 31 0.03
– Xylem Inc 24 0.03
1 Zayo Group Holdings Inc 26 0.03
– Zimmer Biomet Holdings Inc 41 0.04
1 Zions Bancorporation 34 0.04
1 Zoetis Inc 36 0.05
45,532 47.83
Total Common Stock – 79.21% (30 November 2015: 80.60%) 75,455 79.21
Preferred Stock
Germany - 0.10%
– Bayerische Motoren Werke AG 13 0.01
– Fuchs Petrolub SE 4 –
– Henkel AG & Co KGaA 32 0.04
1 Porsche Automobil Holding SE 43 0.05
92 0.10
Total Preferred Stock – 0.10% (30 November 2015: 0.05%) 92 0.10
Real Estate Investment Trust
Australia - 0.10%
8 Goodman Group 39 0.04
7 Mirvac Group 11 0.01
7 Stockland 23 0.03
3 Westfield Corp 20 0.02
93 0.10
Belgium - 0.02%
– Befimmo SA 10 0.01
– Cofinimmo SA 9 0.01
19 0.02
Canada - 0.03%
– H&R Real Estate Investment Trust 11 0.01
1 RioCan Real Estate Investment Trust 14 0.02
25 0.03
France - 0.11%
– Fonciere Des Regions 9 0.01
1 Gecina SA 38 0.04
– ICADE 14 0.01
1 Klepierre 43 0.05
104 0.11
Japan - 0.28%
– Activia Properties Inc 22 0.02
– Advance Residence Investment Corp 8 0.01
– Daiwa House Residential Investment Corp 20 0.02
– Daiwa Office Investment Corp 10 0.01
– GLP J-Reit 11 0.01
– Invincible Investment Corp 3 –
– Japan Hotel REIT Investment Corp 9 0.01
– Japan Prime Realty Investment Corp 12 0.01
– Japan Real Estate Investment Corp 27 0.03
– Japan Retail Fund Investment Corp 14 0.02
– Kenedix Office Investment Corp 21 0.02
– Mori Hills REIT Investment Corp 9 0.01
– Mori Trust Sogo Reit Inc 9 0.01
– Nippon Building Fund Inc 22 0.03
– Nippon Prologis REIT Inc 21 0.02
– Nomura Real Estate Master Fund Inc 23 0.03
– Orix JREIT Inc 11 0.01
– United Urban Investment Corp 12 0.01
264 0.28
Shares (000's)
Value (000's)
USD
% of Net Asset Value
Real Estate Investment Trust (continued)
Netherlands - 0.09%
1 Unibail-Rodamco SE 86 0.09
86 0.09
Singapore - 0.02%
11 Ascendas Real Estate Investment Trust 18 0.02
– Keppel REIT – –
18 0.02
Spain - 0.01%
1 Merlin Properties Socimi SA 10 0.01
10 0.01
United Kingdom - 0.16%
5 British Land Co PLC 38 0.04
1 Derwent London PLC 20 0.02
1 Great Portland Estates PLC 7 0.01
3 Hammerson PLC 23 0.02
7 Intu Properties PLC 22 0.02
3 Land Securities Group PLC 34 0.04
1 Shaftesbury PLC 12 0.01
156 0.16
United States - 1.75%
1 Alexandria Real Estate Equities Inc 53 0.06
– American Assets Trust Inc 13 0.01
1 American Campus Communities Inc 19 0.02
1 American Homes 4 Rent 23 0.02
1 Apartment Investment & Management Co 25 0.03
1 Apple Hospitality REIT Inc 11 0.01
1 AvalonBay Communities Inc 77 0.08
– Boston Properties Inc 24 0.03
1 Brixmor Property Group Inc 10 0.01
– Camden Property Trust 30 0.03
– Chesapeake Lodging Trust – –
– Columbia Property Trust Inc 3 –
– CubeSmart 5 0.01
– CyrusOne Inc 2 –
– DCT Industrial Trust Inc 15 0.02
1 Digital Realty Trust Inc 61 0.06
– Douglas Emmett Inc 15 0.02
2 Duke Realty Corp 53 0.06
– DuPont Fabros Technology Inc 13 0.01
– Empire State Realty Trust Inc – –
– EPR Properties 14 0.01
– Equinix Inc 45 0.05
1 Equity LifeStyle Properties Inc 34 0.04
1 Equity Residential 38 0.04
– Essex Property Trust Inc 44 0.05
– Extra Space Storage Inc 28 0.03
– Federal Realty Investment Trust 10 0.01
1 Forest City Realty Trust Inc, Class A 24 0.03
1 Gaming and Leisure Properties Inc 27 0.03
1 Gramercy Property Trust 7 0.01
– Healthcare Realty Trust Inc 2 –
1 Healthcare Trust of America Inc 13 0.01
– Highwoods Properties Inc 17 0.02
2 Host Hotels & Resorts Inc 36 0.04
1 Iron Mountain Inc 34 0.04
2 Kimco Realty Corp 54 0.06
– Lexington Realty Trust 2 –
– Liberty Property Trust 12 0.01
– Life Storage Inc 6 0.01
1 Macerich Co 41 0.04
1 Medical Properties Trust Inc 11 0.01
– Mid-America Apartment Communities Inc 28 0.03
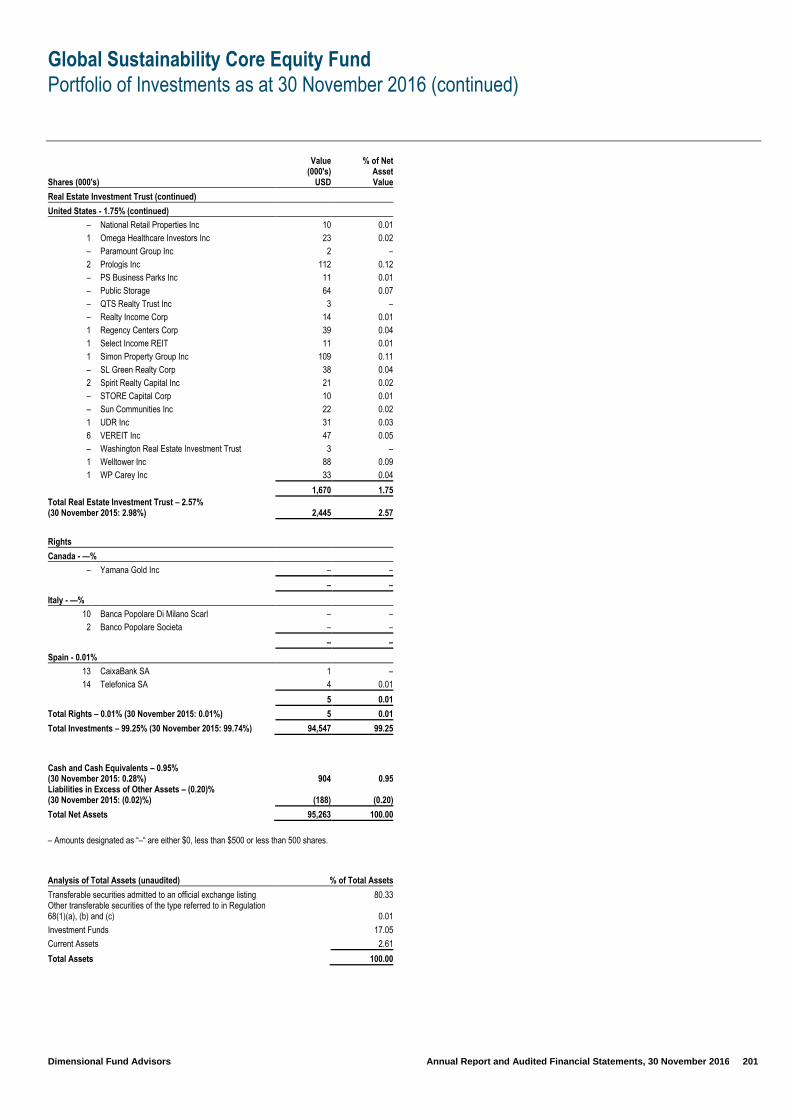
Global Sustainability Core Equity Fund
Portfolio of Investments as at 30 November 2016 (continued)
Dimensional Fund Advisors Annual Report and Audited Financial Statements, 30 November 2016 201
Shares (000's)
Value (000's)
USD
% of Net Asset Value
Real Estate Investment Trust (continued)
United States - 1.75% (continued)
– National Retail Properties Inc 10 0.01
1 Omega Healthcare Investors Inc 23 0.02
– Paramount Group Inc 2 –
2 Prologis Inc 112 0.12
– PS Business Parks Inc 11 0.01
– Public Storage 64 0.07
– QTS Realty Trust Inc 3 –
– Realty Income Corp 14 0.01
1 Regency Centers Corp 39 0.04
1 Select Income REIT 11 0.01
1 Simon Property Group Inc 109 0.11
– SL Green Realty Corp 38 0.04
2 Spirit Realty Capital Inc 21 0.02
– STORE Capital Corp 10 0.01
– Sun Communities Inc 22 0.02
1 UDR Inc 31 0.03
6 VEREIT Inc 47 0.05
– Washington Real Estate Investment Trust 3 –
1 Welltower Inc 88 0.09
1 WP Carey Inc 33 0.04
1,670 1.75 Total Real Estate Investment Trust – 2.57% (30 November 2015: 2.98%) 2,445 2.57
Rights
Canada - —%
– Yamana Gold Inc – –
– –
Italy - —%
10 Banca Popolare Di Milano Scarl – –
2 Banco Popolare Societa – –
– –
Spain - 0.01%
13 CaixaBank SA 1 –
14 Telefonica SA 4 0.01
5 0.01
Total Rights – 0.01% (30 November 2015: 0.01%) 5 0.01
Total Investments – 99.25% (30 November 2015: 99.74%) 94,547 99.25
Cash and Cash Equivalents – 0.95% (30 November 2015: 0.28%) 904 0.95 Liabilities in Excess of Other Assets – (0.20)% (30 November 2015: (0.02)%) (188) (0.20)
Total Net Assets 95,263 100.00
– Amounts designated as “–“ are either $0, less than $500 or less than 500 shares.
Analysis of Total Assets (unaudited) % of Total Assets
Transferable securities admitted to an official exchange listing 80.33 Other transferable securities of the type referred to in Regulation 68(1)(a), (b) and (c) 0.01
Investment Funds 17.05
Current Assets 2.61
Total Assets 100.00
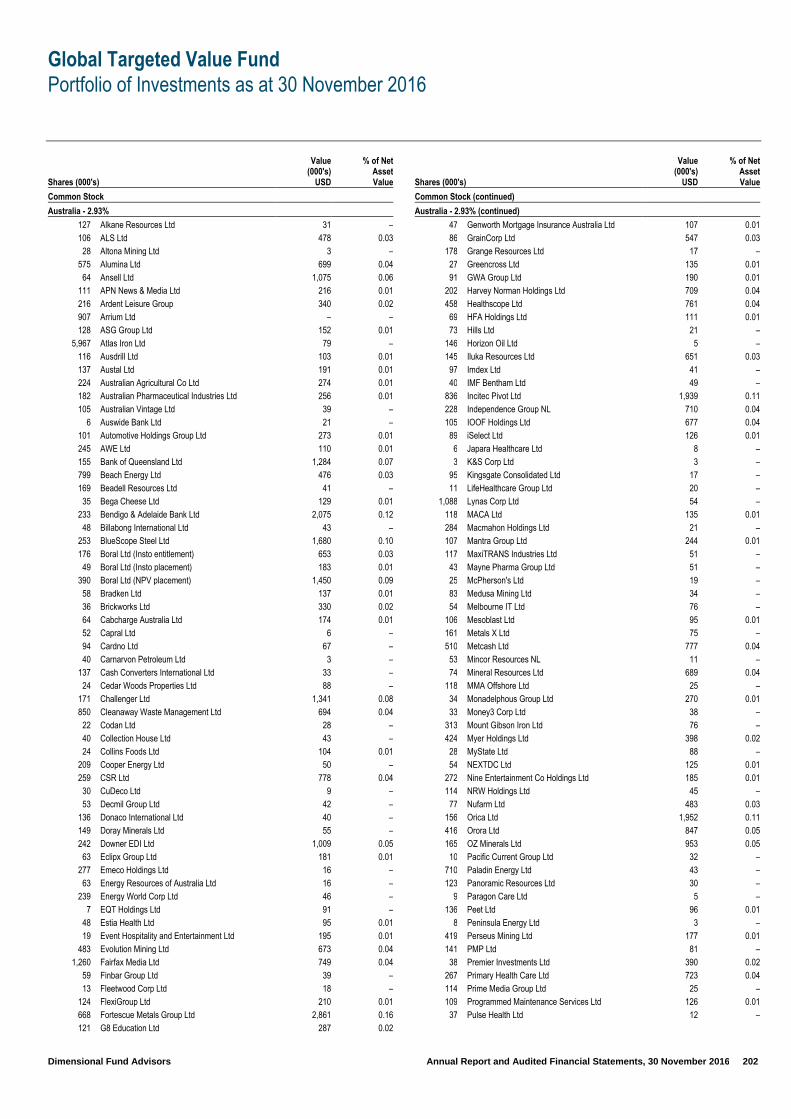
Global Targeted Value Fund
Portfolio of Investments as at 30 November 2016
Dimensional Fund Advisors Annual Report and Audited Financial Statements, 30 November 2016 202
Shares (000's)
Value (000's)
USD
% of Net Asset Value
Common Stock
Australia - 2.93%
127 Alkane Resources Ltd 31 –
106 ALS Ltd 478 0.03
28 Altona Mining Ltd 3 –
575 Alumina Ltd 699 0.04
64 Ansell Ltd 1,075 0.06
111 APN News & Media Ltd 216 0.01
216 Ardent Leisure Group 340 0.02
907 Arrium Ltd – –
128 ASG Group Ltd 152 0.01
5,967 Atlas Iron Ltd 79 –
116 Ausdrill Ltd 103 0.01
137 Austal Ltd 191 0.01
224 Australian Agricultural Co Ltd 274 0.01
182 Australian Pharmaceutical Industries Ltd 256 0.01
105 Australian Vintage Ltd 39 –
6 Auswide Bank Ltd 21 –
101 Automotive Holdings Group Ltd 273 0.01
245 AWE Ltd 110 0.01
155 Bank of Queensland Ltd 1,284 0.07
799 Beach Energy Ltd 476 0.03
169 Beadell Resources Ltd 41 –
35 Bega Cheese Ltd 129 0.01
233 Bendigo & Adelaide Bank Ltd 2,075 0.12
48 Billabong International Ltd 43 –
253 BlueScope Steel Ltd 1,680 0.10
176 Boral Ltd (Insto entitlement) 653 0.03
49 Boral Ltd (Insto placement) 183 0.01
390 Boral Ltd (NPV placement) 1,450 0.09
58 Bradken Ltd 137 0.01
36 Brickworks Ltd 330 0.02
64 Cabcharge Australia Ltd 174 0.01
52 Capral Ltd 6 –
94 Cardno Ltd 67 –
40 Carnarvon Petroleum Ltd 3 –
137 Cash Converters International Ltd 33 –
24 Cedar Woods Properties Ltd 88 –
171 Challenger Ltd 1,341 0.08
850 Cleanaway Waste Management Ltd 694 0.04
22 Codan Ltd 28 –
40 Collection House Ltd 43 –
24 Collins Foods Ltd 104 0.01
209 Cooper Energy Ltd 50 –
259 CSR Ltd 778 0.04
30 CuDeco Ltd 9 –
53 Decmil Group Ltd 42 –
136 Donaco International Ltd 40 –
149 Doray Minerals Ltd 55 –
242 Downer EDI Ltd 1,009 0.05
63 Eclipx Group Ltd 181 0.01
277 Emeco Holdings Ltd 16 –
63 Energy Resources of Australia Ltd 16 –
239 Energy World Corp Ltd 46 –
7 EQT Holdings Ltd 91 –
48 Estia Health Ltd 95 0.01
19 Event Hospitality and Entertainment Ltd 195 0.01
483 Evolution Mining Ltd 673 0.04
1,260 Fairfax Media Ltd 749 0.04
59 Finbar Group Ltd 39 –
13 Fleetwood Corp Ltd 18 –
124 FlexiGroup Ltd 210 0.01
668 Fortescue Metals Group Ltd 2,861 0.16
121 G8 Education Ltd 287 0.02
Shares (000's)
Value (000's)
USD
% of Net Asset Value
Common Stock (continued)
Australia - 2.93% (continued)
47 Genworth Mortgage Insurance Australia Ltd 107 0.01
86 GrainCorp Ltd 547 0.03
178 Grange Resources Ltd 17 –
27 Greencross Ltd 135 0.01
91 GWA Group Ltd 190 0.01
202 Harvey Norman Holdings Ltd 709 0.04
458 Healthscope Ltd 761 0.04
69 HFA Holdings Ltd 111 0.01
73 Hills Ltd 21 –
146 Horizon Oil Ltd 5 –
145 Iluka Resources Ltd 651 0.03
97 Imdex Ltd 41 –
40 IMF Bentham Ltd 49 –
836 Incitec Pivot Ltd 1,939 0.11
228 Independence Group NL 710 0.04
105 IOOF Holdings Ltd 677 0.04
89 iSelect Ltd 126 0.01
6 Japara Healthcare Ltd 8 –
3 K&S Corp Ltd 3 –
95 Kingsgate Consolidated Ltd 17 –
11 LifeHealthcare Group Ltd 20 –
1,088 Lynas Corp Ltd 54 –
118 MACA Ltd 135 0.01
284 Macmahon Holdings Ltd 21 –
107 Mantra Group Ltd 244 0.01
117 MaxiTRANS Industries Ltd 51 –
43 Mayne Pharma Group Ltd 51 –
25 McPherson's Ltd 19 –
83 Medusa Mining Ltd 34 –
54 Melbourne IT Ltd 76 –
106 Mesoblast Ltd 95 0.01
161 Metals X Ltd 75 –
510 Metcash Ltd 777 0.04
53 Mincor Resources NL 11 –
74 Mineral Resources Ltd 689 0.04
118 MMA Offshore Ltd 25 –
34 Monadelphous Group Ltd 270 0.01
33 Money3 Corp Ltd 38 –
313 Mount Gibson Iron Ltd 76 –
424 Myer Holdings Ltd 398 0.02
28 MyState Ltd 88 –
54 NEXTDC Ltd 125 0.01
272 Nine Entertainment Co Holdings Ltd 185 0.01
114 NRW Holdings Ltd 45 –
77 Nufarm Ltd 483 0.03
156 Orica Ltd 1,952 0.11
416 Orora Ltd 847 0.05
165 OZ Minerals Ltd 953 0.05
10 Pacific Current Group Ltd 32 –
710 Paladin Energy Ltd 43 –
123 Panoramic Resources Ltd 30 –
9 Paragon Care Ltd 5 –
136 Peet Ltd 96 0.01
8 Peninsula Energy Ltd 3 –
419 Perseus Mining Ltd 177 0.01
141 PMP Ltd 81 –
38 Premier Investments Ltd 390 0.02
267 Primary Health Care Ltd 723 0.04
114 Prime Media Group Ltd 25 –
109 Programmed Maintenance Services Ltd 126 0.01
37 Pulse Health Ltd 12 –

Global Targeted Value Fund
Portfolio of Investments as at 30 November 2016 (continued)
Dimensional Fund Advisors Annual Report and Audited Financial Statements, 30 November 2016 203
Shares (000's)
Value (000's)
USD
% of Net Asset Value
Common Stock (continued)
Australia - 2.93% (continued)
239 Qantas Airways Ltd 582 0.03
360 Qube Holdings Ltd 627 0.03
210 Ramelius Resources Ltd 76 –
58 RCR Tomlinson Ltd 107 0.01
11 Reject Shop Ltd 64 –
157 Resolute Mining Ltd 141 0.01
55 Retail Food Group Ltd 249 0.01
94 Ridley Corp Ltd 87 –
4 Ruralco Holdings Ltd 9 –
95 SAI Global Ltd 332 0.02
16 Salmat Ltd 6 –
43 Sandfire Resources NL 182 0.01
620 Santos Ltd 1,826 0.10
35 Select Harvests Ltd 160 0.01
468 Senex Energy Ltd 86 –
61 Service Stream Ltd 43 –
45 Seven Group Holdings Ltd 284 0.02
509 Seven West Media Ltd 258 0.01
558 Sigma Pharmaceuticals Ltd 508 0.03
187 Silver Lake Resources Ltd 81 –
85 Sims Metal Management Ltd 776 0.04
779 Sino Gas & Energy Holdings Ltd 61 –
108 Slater & Gordon Ltd 26 –
28 SMS Management & Technology Ltd 24 –
356 Southern Cross Media Group Ltd 354 0.02
377 Spotless Group Holdings Ltd 256 0.01
344 Star Entertainment Grp Ltd 1,340 0.08
322 Steadfast Group Ltd 491 0.03
529 Sundance Energy Australia Ltd 69 –
59 Sunland Group Ltd 66 –
9 Tabcorp Holdings Ltd 33 –
67 Tassal Group Ltd 188 0.01
79 Ten Network Holdings Ltd 60 –
145 TFS Corp Ltd 165 0.01
1,005 Tiger Resources Ltd 25 –
19 Toro Energy Ltd 1 –
92 Tox Free Solutions Ltd 159 0.01
368 Treasury Wine Estates Ltd 2,936 0.17
307 Troy Resources Ltd 65 –
89 UGL Ltd 208 0.01
48 Villa World Ltd 79 –
27 Village Roadshow Ltd 86 –
280 Virgin Australia Holdings Ltd 45 –
365 Virgin Australia International Holdings – –
23 Virtus Health Ltd 97 0.01
205 Vocus Communications Ltd 629 0.03
46 Watpac Ltd 30 –
6 Webster Ltd 6 –
98 Western Areas Ltd 212 0.01
81 Westgold Resources Ltd 81 –
293 Whitehaven Coal Ltd 589 0.03
106 WorleyParsons Ltd 684 0.04
219 WPP AUNZ Ltd 155 0.01
54,970 2.93
Austria - 0.37%
1 Agrana Beteiligungs AG 89 –
16 Austria Technologie & Systemtechnik AG 169 0.01
5 FACC AG 29 –
60 OMV AG 1,933 0.11
5 POLYTEC Holding AG 44 –
84 Raiffeisen Bank International AG 1,518 0.09
6 Strabag SE 216 0.01
Shares (000's)
Value (000's)
USD
% of Net Asset Value
Common Stock (continued)
Austria - 0.37% (continued)
62 UNIQA Insurance Group AG 427 0.02
13 Vienna Insurance Group AG Wiener Versicherung Gruppe 259 0.01
35 voestalpine AG 1,313 0.07
51 Wienerberger AG 910 0.05
– Wolford AG 12 –
6,919 0.37
Belgium - 0.55%
8 Ackermans & van Haaren NV 1,045 0.07
102 Ageas 3,789 0.21
59 AGFA-Gevaert NV 271 0.01
– Atenor 5 –
– Banque Nationale de Belgique 202 0.01
5 Barco NV 367 0.02
15 Bekaert SA 624 0.03
2 Cie d'Entreprises CFE 167 0.01
1 Cie Immobiliere de Belgique SA 51 –
14 D'ieteren SA 549 0.03
31 Deceuninck NV 81 –
44 Euronav NV 326 0.02
21 Exmar NV 146 0.01
8 Gimv NV 420 0.02
1 Jensen-Group NV 31 –
35 Nyrstar NV 242 0.01
28 Ontex Group NV 751 0.04
13 Orange Belgium SA 264 0.01
– Picanol 36 –
1 RealDolmen 33 –
22 Recticel SA 132 0.01
– Resilux 48 –
2 Roularta Media Group NV 44 –
4 Sioen Industries NV 131 0.01
2 Sipef SA 124 0.01
13 Tessenderlo Chemie NV 441 0.02
9 ThromboGenics NV 25 –
28 Viohalco SA 33 –
10,378 0.55
Canada - 4.15%
26 5N Plus Inc 35 –
4 Acadian Timber Corp 48 –
78 Advantage Oil & Gas Ltd 566 0.03
27 Aecon Group Inc 310 0.02
75 Africa Oil Corp 106 0.01
38 AGF Management Ltd 151 0.01
4 AGT Food & Ingredients Inc 101 0.01
123 Alacer Gold Corp 225 0.01
110 Alamos Gold Inc 702 0.04
14 Alaris Royalty Corp 226 0.01
5 Algoma Central Corp 47 –
81 Algonquin Power & Utilities Corp 674 0.04
21 Altius Minerals Corp 195 0.01
30 Amaya Inc 438 0.02
80 Argonaut Gold Inc 147 0.01
105 Asanko Gold Inc 368 0.02
206 Athabasca Oil Corp 208 0.01
31 ATS Automation Tooling Systems Inc 245 0.01
46 AuRico Metals Inc 33 –
10 AutoCanada Inc 147 0.01
3 Avigilon Corp 28 –
453 B2Gold Corp 1,096 0.06
36 Banro Corp 7 –
107 Baytex Energy Corp 459 0.02
76 Bellatrix Exploration Ltd 60 –
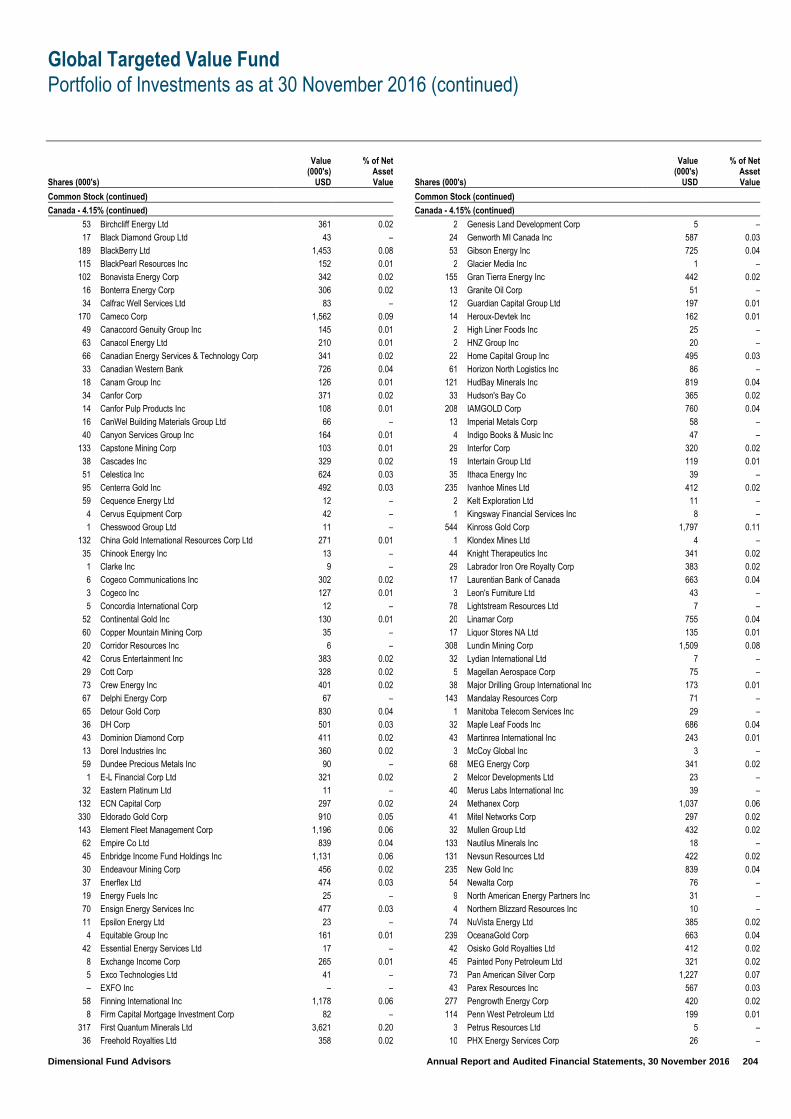
Global Targeted Value Fund
Portfolio of Investments as at 30 November 2016 (continued)
Dimensional Fund Advisors Annual Report and Audited Financial Statements, 30 November 2016 204
Shares (000's)
Value (000's)
USD
% of Net Asset Value
Common Stock (continued)
Canada - 4.15% (continued)
53 Birchcliff Energy Ltd 361 0.02
17 Black Diamond Group Ltd 43 –
189 BlackBerry Ltd 1,453 0.08
115 BlackPearl Resources Inc 152 0.01
102 Bonavista Energy Corp 342 0.02
16 Bonterra Energy Corp 306 0.02
34 Calfrac Well Services Ltd 83 –
170 Cameco Corp 1,562 0.09
49 Canaccord Genuity Group Inc 145 0.01
63 Canacol Energy Ltd 210 0.01
66 Canadian Energy Services & Technology Corp 341 0.02
33 Canadian Western Bank 726 0.04
18 Canam Group Inc 126 0.01
34 Canfor Corp 371 0.02
14 Canfor Pulp Products Inc 108 0.01
16 CanWel Building Materials Group Ltd 66 –
40 Canyon Services Group Inc 164 0.01
133 Capstone Mining Corp 103 0.01
38 Cascades Inc 329 0.02
51 Celestica Inc 624 0.03
95 Centerra Gold Inc 492 0.03
59 Cequence Energy Ltd 12 –
4 Cervus Equipment Corp 42 –
1 Chesswood Group Ltd 11 –
132 China Gold International Resources Corp Ltd 271 0.01
35 Chinook Energy Inc 13 –
1 Clarke Inc 9 –
6 Cogeco Communications Inc 302 0.02
3 Cogeco Inc 127 0.01
5 Concordia International Corp 12 –
52 Continental Gold Inc 130 0.01
60 Copper Mountain Mining Corp 35 –
20 Corridor Resources Inc 6 –
42 Corus Entertainment Inc 383 0.02
29 Cott Corp 328 0.02
73 Crew Energy Inc 401 0.02
67 Delphi Energy Corp 67 –
65 Detour Gold Corp 830 0.04
36 DH Corp 501 0.03
43 Dominion Diamond Corp 411 0.02
13 Dorel Industries Inc 360 0.02
59 Dundee Precious Metals Inc 90 –
1 E-L Financial Corp Ltd 321 0.02
32 Eastern Platinum Ltd 11 –
132 ECN Capital Corp 297 0.02
330 Eldorado Gold Corp 910 0.05
143 Element Fleet Management Corp 1,196 0.06
62 Empire Co Ltd 839 0.04
45 Enbridge Income Fund Holdings Inc 1,131 0.06
30 Endeavour Mining Corp 456 0.02
37 Enerflex Ltd 474 0.03
19 Energy Fuels Inc 25 –
70 Ensign Energy Services Inc 477 0.03
11 Epsilon Energy Ltd 23 –
4 Equitable Group Inc 161 0.01
42 Essential Energy Services Ltd 17 –
8 Exchange Income Corp 265 0.01
5 Exco Technologies Ltd 41 –
– EXFO Inc – –
58 Finning International Inc 1,178 0.06
8 Firm Capital Mortgage Investment Corp 82 –
317 First Quantum Minerals Ltd 3,621 0.20
36 Freehold Royalties Ltd 358 0.02
Shares (000's)
Value (000's)
USD
% of Net Asset Value
Common Stock (continued)
Canada - 4.15% (continued)
2 Genesis Land Development Corp 5 –
24 Genworth MI Canada Inc 587 0.03
53 Gibson Energy Inc 725 0.04
2 Glacier Media Inc 1 –
155 Gran Tierra Energy Inc 442 0.02
13 Granite Oil Corp 51 –
12 Guardian Capital Group Ltd 197 0.01
14 Heroux-Devtek Inc 162 0.01
2 High Liner Foods Inc 25 –
2 HNZ Group Inc 20 –
22 Home Capital Group Inc 495 0.03
61 Horizon North Logistics Inc 86 –
121 HudBay Minerals Inc 819 0.04
33 Hudson's Bay Co 365 0.02
208 IAMGOLD Corp 760 0.04
13 Imperial Metals Corp 58 –
4 Indigo Books & Music Inc 47 –
29 Interfor Corp 320 0.02
19 Intertain Group Ltd 119 0.01
35 Ithaca Energy Inc 39 –
235 Ivanhoe Mines Ltd 412 0.02
2 Kelt Exploration Ltd 11 –
1 Kingsway Financial Services Inc 8 –
544 Kinross Gold Corp 1,797 0.11
1 Klondex Mines Ltd 4 –
44 Knight Therapeutics Inc 341 0.02
29 Labrador Iron Ore Royalty Corp 383 0.02
17 Laurentian Bank of Canada 663 0.04
3 Leon's Furniture Ltd 43 –
78 Lightstream Resources Ltd 7 –
20 Linamar Corp 755 0.04
17 Liquor Stores NA Ltd 135 0.01
308 Lundin Mining Corp 1,509 0.08
32 Lydian International Ltd 7 –
5 Magellan Aerospace Corp 75 –
38 Major Drilling Group International Inc 173 0.01
143 Mandalay Resources Corp 71 –
1 Manitoba Telecom Services Inc 29 –
32 Maple Leaf Foods Inc 686 0.04
43 Martinrea International Inc 243 0.01
3 McCoy Global Inc 3 –
68 MEG Energy Corp 341 0.02
2 Melcor Developments Ltd 23 –
40 Merus Labs International Inc 39 –
24 Methanex Corp 1,037 0.06
41 Mitel Networks Corp 297 0.02
32 Mullen Group Ltd 432 0.02
133 Nautilus Minerals Inc 18 –
131 Nevsun Resources Ltd 422 0.02
235 New Gold Inc 839 0.04
54 Newalta Corp 76 –
9 North American Energy Partners Inc 31 –
4 Northern Blizzard Resources Inc 10 –
74 NuVista Energy Ltd 385 0.02
239 OceanaGold Corp 663 0.04
42 Osisko Gold Royalties Ltd 412 0.02
45 Painted Pony Petroleum Ltd 321 0.02
73 Pan American Silver Corp 1,227 0.07
43 Parex Resources Inc 567 0.03
277 Pengrowth Energy Corp 420 0.02
114 Penn West Petroleum Ltd 199 0.01
3 Petrus Resources Ltd 5 –
10 PHX Energy Services Corp 26 –
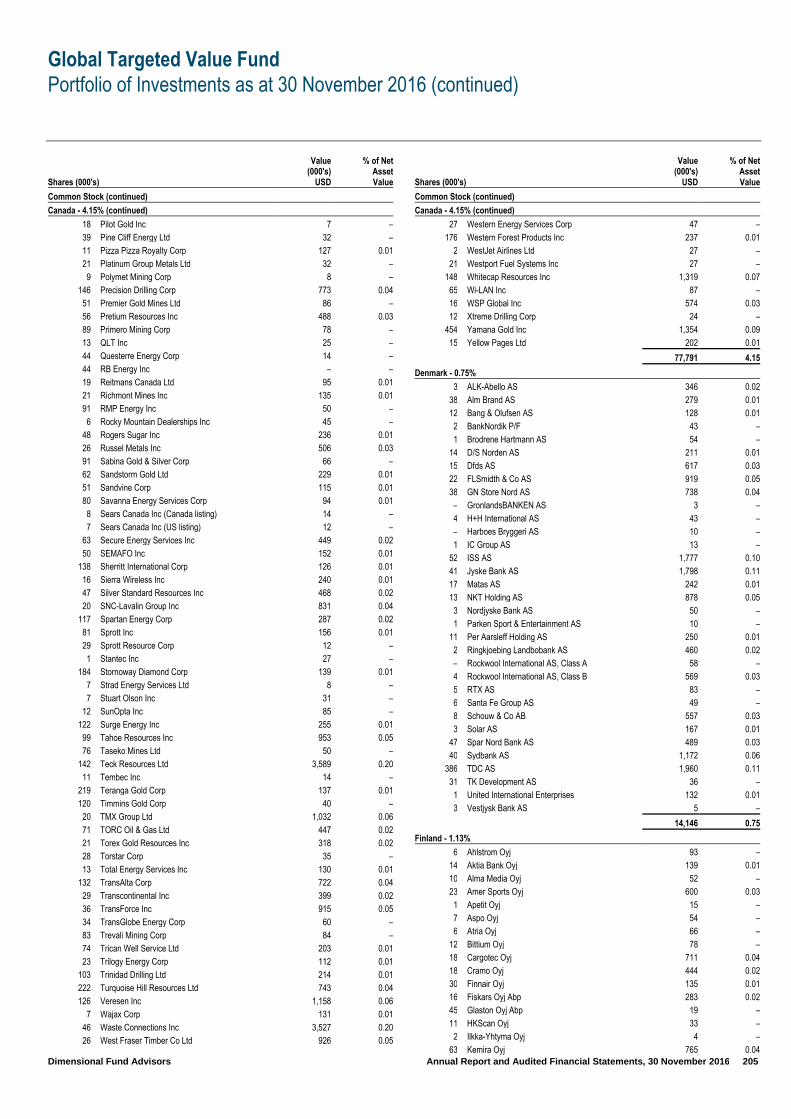
Global Targeted Value Fund
Portfolio of Investments as at 30 November 2016 (continued)
Dimensional Fund Advisors Annual Report and Audited Financial Statements, 30 November 2016 205
Shares (000's)
Value (000's)
USD
% of Net Asset Value
Common Stock (continued)
Canada - 4.15% (continued)
18 Pilot Gold Inc 7 –
39 Pine Cliff Energy Ltd 32 –
11 Pizza Pizza Royalty Corp 127 0.01
21 Platinum Group Metals Ltd 32 –
9 Polymet Mining Corp 8 –
146 Precision Drilling Corp 773 0.04
51 Premier Gold Mines Ltd 86 –
56 Pretium Resources Inc 488 0.03
89 Primero Mining Corp 78 –
13 QLT Inc 25 –
44 Questerre Energy Corp 14 –
44 RB Energy Inc – –
19 Reitmans Canada Ltd 95 0.01
21 Richmont Mines Inc 135 0.01
91 RMP Energy Inc 50 –
6 Rocky Mountain Dealerships Inc 45 –
48 Rogers Sugar Inc 236 0.01
26 Russel Metals Inc 506 0.03
91 Sabina Gold & Silver Corp 66 –
62 Sandstorm Gold Ltd 229 0.01
51 Sandvine Corp 115 0.01
80 Savanna Energy Services Corp 94 0.01
8 Sears Canada Inc (Canada listing) 14 –
7 Sears Canada Inc (US listing) 12 –
63 Secure Energy Services Inc 449 0.02
50 SEMAFO Inc 152 0.01
138 Sherritt International Corp 126 0.01
16 Sierra Wireless Inc 240 0.01
47 Silver Standard Resources Inc 468 0.02
20 SNC-Lavalin Group Inc 831 0.04
117 Spartan Energy Corp 287 0.02
81 Sprott Inc 156 0.01
29 Sprott Resource Corp 12 –
1 Stantec Inc 27 –
184 Stornoway Diamond Corp 139 0.01
7 Strad Energy Services Ltd 8 –
7 Stuart Olson Inc 31 –
12 SunOpta Inc 85 –
122 Surge Energy Inc 255 0.01
99 Tahoe Resources Inc 953 0.05
76 Taseko Mines Ltd 50 –
142 Teck Resources Ltd 3,589 0.20
11 Tembec Inc 14 –
219 Teranga Gold Corp 137 0.01
120 Timmins Gold Corp 40 –
20 TMX Group Ltd 1,032 0.06
71 TORC Oil & Gas Ltd 447 0.02
21 Torex Gold Resources Inc 318 0.02
28 Torstar Corp 35 –
13 Total Energy Services Inc 130 0.01
132 TransAlta Corp 722 0.04
29 Transcontinental Inc 399 0.02
36 TransForce Inc 915 0.05
34 TransGlobe Energy Corp 60 –
83 Trevali Mining Corp 84 –
74 Trican Well Service Ltd 203 0.01
23 Trilogy Energy Corp 112 0.01
103 Trinidad Drilling Ltd 214 0.01
222 Turquoise Hill Resources Ltd 743 0.04
126 Veresen Inc 1,158 0.06
7 Wajax Corp 131 0.01
46 Waste Connections Inc 3,527 0.20
26 West Fraser Timber Co Ltd 926 0.05
Shares (000's)
Value (000's)
USD
% of Net Asset Value
Common Stock (continued)
Canada - 4.15% (continued)
27 Western Energy Services Corp 47 –
176 Western Forest Products Inc 237 0.01
2 WestJet Airlines Ltd 27 –
21 Westport Fuel Systems Inc 27 –
148 Whitecap Resources Inc 1,319 0.07
65 Wi-LAN Inc 87 –
16 WSP Global Inc 574 0.03
12 Xtreme Drilling Corp 24 –
454 Yamana Gold Inc 1,354 0.09
15 Yellow Pages Ltd 202 0.01
77,791 4.15
Denmark - 0.75%
3 ALK-Abello AS 346 0.02
38 Alm Brand AS 279 0.01
12 Bang & Olufsen AS 128 0.01
2 BankNordik P/F 43 –
1 Brodrene Hartmann AS 54 –
14 D/S Norden AS 211 0.01
15 Dfds AS 617 0.03
22 FLSmidth & Co AS 919 0.05
38 GN Store Nord AS 738 0.04
– GronlandsBANKEN AS 3 –
4 H+H International AS 43 –
– Harboes Bryggeri AS 10 –
1 IC Group AS 13 –
52 ISS AS 1,777 0.10
41 Jyske Bank AS 1,798 0.11
17 Matas AS 242 0.01
13 NKT Holding AS 878 0.05
3 Nordjyske Bank AS 50 –
1 Parken Sport & Entertainment AS 10 –
11 Per Aarsleff Holding AS 250 0.01
2 Ringkjoebing Landbobank AS 460 0.02
– Rockwool International AS, Class A 58 –
4 Rockwool International AS, Class B 569 0.03
5 RTX AS 83 –
6 Santa Fe Group AS 49 –
8 Schouw & Co AB 557 0.03
3 Solar AS 167 0.01
47 Spar Nord Bank AS 489 0.03
40 Sydbank AS 1,172 0.06
386 TDC AS 1,960 0.11
31 TK Development AS 36 –
1 United International Enterprises 132 0.01
3 Vestjysk Bank AS 5 –
14,146 0.75
Finland - 1.13%
6 Ahlstrom Oyj 93 –
14 Aktia Bank Oyj 139 0.01
10 Alma Media Oyj 52 –
23 Amer Sports Oyj 600 0.03
1 Apetit Oyj 15 –
7 Aspo Oyj 54 –
6 Atria Oyj 66 –
12 Bittium Oyj 78 –
18 Cargotec Oyj 711 0.04
18 Cramo Oyj 444 0.02
30 Finnair Oyj 135 0.01
16 Fiskars Oyj Abp 283 0.02
45 Glaston Oyj Abp 19 –
11 HKScan Oyj 33 –
2 Ilkka-Yhtyma Oyj 4 –
63 Kemira Oyj 765 0.04

Global Targeted Value Fund
Portfolio of Investments as at 30 November 2016 (continued)
Dimensional Fund Advisors Annual Report and Audited Financial Statements, 30 November 2016 206
Shares (000's)
Value (000's)
USD
% of Net Asset Value
Common Stock (continued)
Finland - 1.13% (continued)
7 Kesko Oyj, Class A 312 0.02
27 Kesko Oyj, Class B 1,329 0.07
7 Lassila & Tikanoja Oyj 133 0.01
3 Lemminkainen Oyj 70 –
97 Metsa Board Oyj 630 0.03
52 Metso Oyj 1,461 0.08
3 Munksjo Oyj 52 –
40 Neste Oyj 1,636 0.10
24 Nokian Renkaat Oyj 863 0.05
3 Olvi Oyj 90 –
179 Outokumpu Oyj 1,383 0.07
61 Outotec Oyj 325 0.02
6 PKC Group Oyj 85 –
16 Poyry Oyj 51 –
52 Raisio Oyj 187 0.01
37 Ramirent Oyj 263 0.01
3 Rapala VMC Oyj 14 –
46 Sanoma Oyj 374 0.02
8 SRV Group Oyj 42 –
17 Stockmann Oyj Abp 115 0.01
2 Stockmann Oyj Abp, Class A 11 –
278 Stora Enso Oyj 2,688 0.15
337 Talvivaara Mining Co PLC 2 –
6 Teleste Oyj 55 –
189 UPM-Kymmene Oyj 4,327 0.24
3 Vaisala Oyj 102 0.01
54 Valmet Oyj 829 0.04
40 YIT Oyj 323 0.02
21,243 1.13
France - 2.25%
5 Actia Group 39 –
11 Albioma SA 170 0.01
34 Alstom SA 923 0.05
15 Altamir 187 0.01
5 APRIL SA 62 –
23 Archos 29 –
32 Arkema SA 3,063 0.17
4 Assystem 118 0.01
20 Atos SE 2,071 0.12
1 Aubay 31 –
1 Ausy 50 –
3 Axway Software SA 86 –
11 Beneteau SA 145 0.01
5 Bigben Interactive 36 –
1 Bollore SA 2 –
211 Bollore SA (voting rights) 693 0.04
6 Bonduelle SCA 157 0.01
9 Bourbon Corp 100 0.01
– Burelle SA 69 –
24 Casino Guichard Perrachon SA 1,073 0.07
1 Catering International Services 12 –
2 Cegedim SA 39 –
2 Cegid Group – –
12 CGG SA 166 0.01
12 Chargeurs SA 194 0.01
4 Cie des Alpes 74 –
26 CNP Assurances 457 0.02
36 Coface SA 211 0.01
49 Derichebourg SA 156 0.01
22 Eiffage SA 1,476 0.09
29 Elior Group 602 0.03
16 Elis SA 247 0.01
3 Eramet 200 0.01
Shares (000's)
Value (000's)
USD
% of Net Asset Value
Common Stock (continued)
France - 2.25% (continued)
1 Esso SA Francaise 51 –
71 Etablissements Maurel et Prom 310 0.02
6 Euler Hermes Group 463 0.02
33 Eutelsat Communications SA 585 0.03
1 Exel Industries 55 –
2 Faiveley Transport SA 210 0.01
27 Faurecia 982 0.05
– Fleury Michon SA 29 –
4 GL Events 64 –
2 Groupe Crit 98 0.01
5 Groupe Fnac SA 369 0.02
3 Groupe Open 75 –
6 Haulotte Group SA 87 –
69 Havas SA 554 0.03
1 HiPay Group SA 8 –
14 Imerys SA 975 0.05
5 Interparfums SA 136 0.01
20 IPSOS 568 0.03
6 Jacquet Metal Service 112 0.01
20 Korian SA 510 0.03
49 Lagardere SCA 1,210 0.06
1 Laurent-Perrier 43 –
2 Le Noble Age 80 –
– Linedata Services 8 –
6 LISI 184 0.01
5 Manitou BF SA 81 –
1 Manutan International 49 –
8 Mersen SA 152 0.01
11 METabolic EXplorer SA 29 –
5 MGI Coutier 126 0.01
3 Naturex 280 0.01
19 Neopost SA 568 0.03
14 Nexans SA 738 0.04
18 Nexity SA 846 0.05
3 Nicox 24 –
5 NRJ Group 49 –
– Oeneo SA 2 –
19 Onxeo SA 47 –
7 Parrot SA 65 –
4 PCAS 43 –
2 Pierre & Vacances SA 95 0.01
1 Plastivaloire 79 –
1 PSB Industries SA 43 –
12 Rallye SA 206 0.01
155 Rexel SA 2,393 0.14
4 Rothschild & Co 99 0.01
2 Savencia SA 171 0.01
80 SCOR SE 2,538 0.14
1 Seche Environnement SA 35 –
15 Sequana SA 21 –
– Societe Internationale de Plantations d'Heveas SA 15 –
6 Sopra Steria Group 642 0.03
7 SPIE SA 127 0.01
1 Stallergenes Greer PLC 46 –
30 Ste Industrielle d'Aviation Latecoere SA 109 0.01
1 Stef SA 93 –
300 STMicroelectronics NV 3,054 0.17
2 Store Electronic 44 –
3 Sword Group 82 –
3 Synergie SA 116 0.01
9 Tarkett SA 302 0.02
54 Technip SA 3,771 0.21
4 Teleperformance 413 0.02
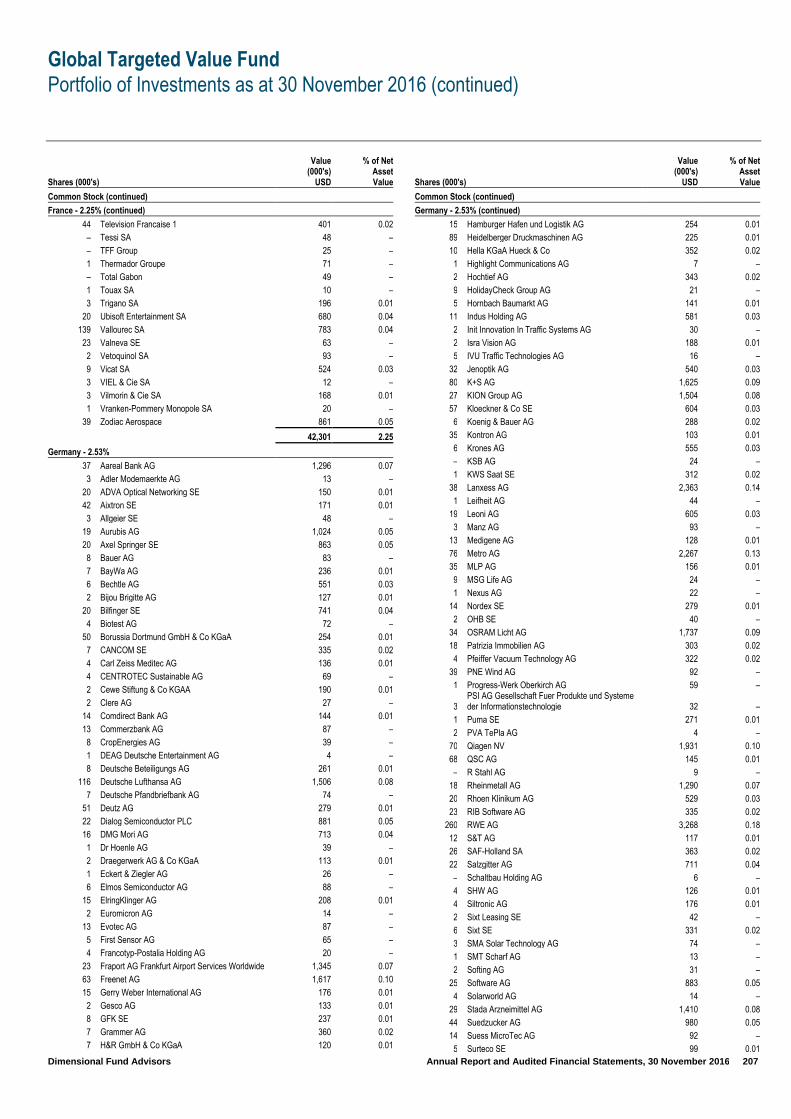
Global Targeted Value Fund
Portfolio of Investments as at 30 November 2016 (continued)
Dimensional Fund Advisors Annual Report and Audited Financial Statements, 30 November 2016 207
Shares (000's)
Value (000's)
USD
% of Net Asset Value
Common Stock (continued)
France - 2.25% (continued)
44 Television Francaise 1 401 0.02
– Tessi SA 48 –
– TFF Group 25 –
1 Thermador Groupe 71 –
– Total Gabon 49 –
1 Touax SA 10 –
3 Trigano SA 196 0.01
20 Ubisoft Entertainment SA 680 0.04
139 Vallourec SA 783 0.04
23 Valneva SE 63 –
2 Vetoquinol SA 93 –
9 Vicat SA 524 0.03
3 VIEL & Cie SA 12 –
3 Vilmorin & Cie SA 168 0.01
1 Vranken-Pommery Monopole SA 20 –
39 Zodiac Aerospace 861 0.05
42,301 2.25
Germany - 2.53%
37 Aareal Bank AG 1,296 0.07
3 Adler Modemaerkte AG 13 –
20 ADVA Optical Networking SE 150 0.01
42 Aixtron SE 171 0.01
3 Allgeier SE 48 –
19 Aurubis AG 1,024 0.05
20 Axel Springer SE 863 0.05
8 Bauer AG 83 –
7 BayWa AG 236 0.01
6 Bechtle AG 551 0.03
2 Bijou Brigitte AG 127 0.01
20 Bilfinger SE 741 0.04
4 Biotest AG 72 –
50 Borussia Dortmund GmbH & Co KGaA 254 0.01
7 CANCOM SE 335 0.02
4 Carl Zeiss Meditec AG 136 0.01
4 CENTROTEC Sustainable AG 69 –
2 Cewe Stiftung & Co KGAA 190 0.01
2 Clere AG 27 –
14 Comdirect Bank AG 144 0.01
13 Commerzbank AG 87 –
8 CropEnergies AG 39 –
1 DEAG Deutsche Entertainment AG 4 –
8 Deutsche Beteiligungs AG 261 0.01
116 Deutsche Lufthansa AG 1,506 0.08
7 Deutsche Pfandbriefbank AG 74 –
51 Deutz AG 279 0.01
22 Dialog Semiconductor PLC 881 0.05
16 DMG Mori AG 713 0.04
1 Dr Hoenle AG 39 –
2 Draegerwerk AG & Co KGaA 113 0.01
1 Eckert & Ziegler AG 26 –
6 Elmos Semiconductor AG 88 –
15 ElringKlinger AG 208 0.01
2 Euromicron AG 14 –
13 Evotec AG 87 –
5 First Sensor AG 65 –
4 Francotyp-Postalia Holding AG 20 –
23 Fraport AG Frankfurt Airport Services Worldwide 1,345 0.07
63 Freenet AG 1,617 0.10
15 Gerry Weber International AG 176 0.01
2 Gesco AG 133 0.01
8 GFK SE 237 0.01
7 Grammer AG 360 0.02
7 H&R GmbH & Co KGaA 120 0.01
Shares (000's)
Value (000's)
USD
% of Net Asset Value
Common Stock (continued)
Germany - 2.53% (continued)
15 Hamburger Hafen und Logistik AG 254 0.01
89 Heidelberger Druckmaschinen AG 225 0.01
10 Hella KGaA Hueck & Co 352 0.02
1 Highlight Communications AG 7 –
2 Hochtief AG 343 0.02
9 HolidayCheck Group AG 21 –
5 Hornbach Baumarkt AG 141 0.01
11 Indus Holding AG 581 0.03
2 Init Innovation In Traffic Systems AG 30 –
2 Isra Vision AG 188 0.01
5 IVU Traffic Technologies AG 16 –
32 Jenoptik AG 540 0.03
80 K+S AG 1,625 0.09
27 KION Group AG 1,504 0.08
57 Kloeckner & Co SE 604 0.03
6 Koenig & Bauer AG 288 0.02
35 Kontron AG 103 0.01
6 Krones AG 555 0.03
– KSB AG 24 –
1 KWS Saat SE 312 0.02
38 Lanxess AG 2,363 0.14
1 Leifheit AG 44 –
19 Leoni AG 605 0.03
3 Manz AG 93 –
13 Medigene AG 128 0.01
76 Metro AG 2,267 0.13
35 MLP AG 156 0.01
9 MSG Life AG 24 –
1 Nexus AG 22 –
14 Nordex SE 279 0.01
2 OHB SE 40 –
34 OSRAM Licht AG 1,737 0.09
18 Patrizia Immobilien AG 303 0.02
4 Pfeiffer Vacuum Technology AG 322 0.02
39 PNE Wind AG 92 –
1 Progress-Werk Oberkirch AG 59 –
3 PSI AG Gesellschaft Fuer Produkte und Systeme der Informationstechnologie 32 –
1 Puma SE 271 0.01
2 PVA TePla AG 4 –
70 Qiagen NV 1,931 0.10
68 QSC AG 145 0.01
– R Stahl AG 9 –
18 Rheinmetall AG 1,290 0.07
20 Rhoen Klinikum AG 529 0.03
23 RIB Software AG 335 0.02
260 RWE AG 3,268 0.18
12 S&T AG 117 0.01
26 SAF-Holland SA 363 0.02
22 Salzgitter AG 711 0.04
– Schaltbau Holding AG 6 –
4 SHW AG 126 0.01
4 Siltronic AG 176 0.01
2 Sixt Leasing SE 42 –
6 Sixt SE 331 0.02
3 SMA Solar Technology AG 74 –
1 SMT Scharf AG 13 –
2 Softing AG 31 –
25 Software AG 883 0.05
4 Solarworld AG 14 –
29 Stada Arzneimittel AG 1,410 0.08
44 Suedzucker AG 980 0.05
14 Suess MicroTec AG 92 –
5 Surteco SE 99 0.01
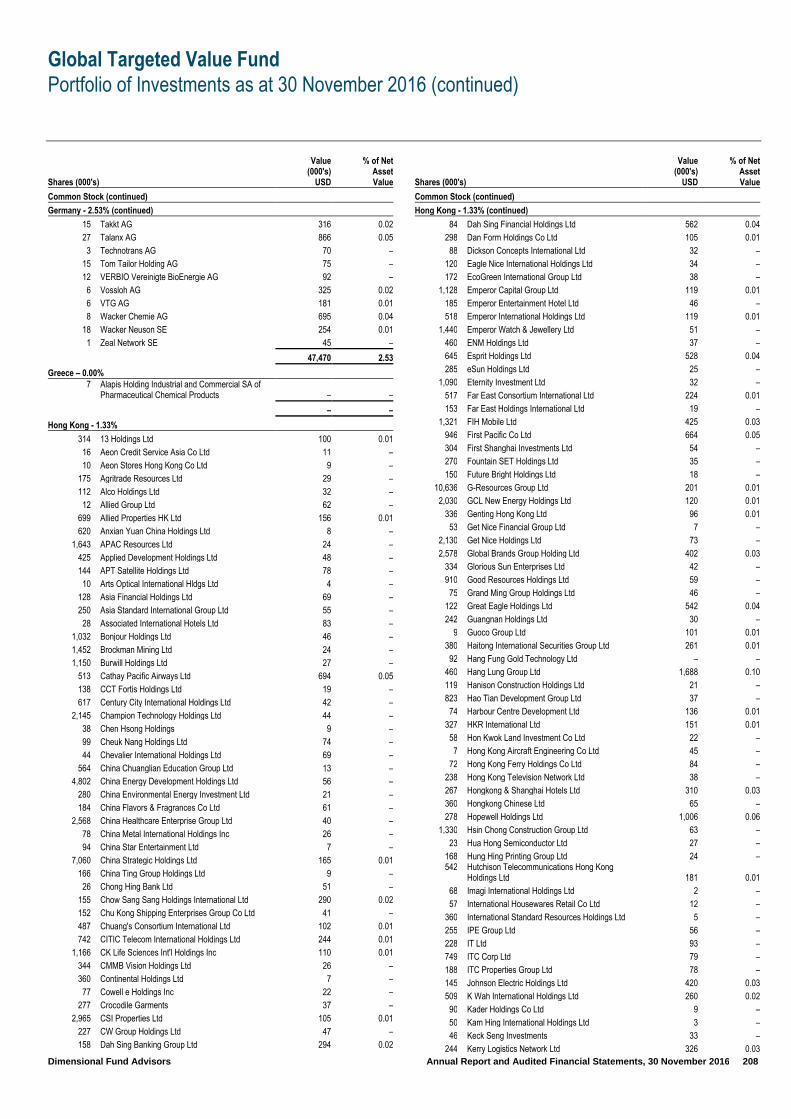
Global Targeted Value Fund
Portfolio of Investments as at 30 November 2016 (continued)
Dimensional Fund Advisors Annual Report and Audited Financial Statements, 30 November 2016 208
Shares (000's)
Value (000's)
USD
% of Net Asset Value
Common Stock (continued)
Germany - 2.53% (continued)
15 Takkt AG 316 0.02
27 Talanx AG 866 0.05
3 Technotrans AG 70 –
15 Tom Tailor Holding AG 75 –
12 VERBIO Vereinigte BioEnergie AG 92 –
6 Vossloh AG 325 0.02
6 VTG AG 181 0.01
8 Wacker Chemie AG 695 0.04
18 Wacker Neuson SE 254 0.01
1 Zeal Network SE 45 –
47,470 2.53
Greece – 0.00% 7
Alapis Holding Industrial and Commercial SA of Pharmaceutical Chemical Products – –
– –
Hong Kong - 1.33%
314 13 Holdings Ltd 100 0.01
16 Aeon Credit Service Asia Co Ltd 11 –
10 Aeon Stores Hong Kong Co Ltd 9 –
175 Agritrade Resources Ltd 29 –
112 Alco Holdings Ltd 32 –
12 Allied Group Ltd 62 –
699 Allied Properties HK Ltd 156 0.01
620 Anxian Yuan China Holdings Ltd 8 –
1,643 APAC Resources Ltd 24 –
425 Applied Development Holdings Ltd 48 –
144 APT Satellite Holdings Ltd 78 –
10 Arts Optical International Hldgs Ltd 4 –
128 Asia Financial Holdings Ltd 69 –
250 Asia Standard International Group Ltd 55 –
28 Associated International Hotels Ltd 83 –
1,032 Bonjour Holdings Ltd 46 –
1,452 Brockman Mining Ltd 24 –
1,150 Burwill Holdings Ltd 27 –
513 Cathay Pacific Airways Ltd 694 0.05
138 CCT Fortis Holdings Ltd 19 –
617 Century City International Holdings Ltd 42 –
2,145 Champion Technology Holdings Ltd 44 –
38 Chen Hsong Holdings 9 –
99 Cheuk Nang Holdings Ltd 74 –
44 Chevalier International Holdings Ltd 69 –
564 China Chuanglian Education Group Ltd 13 –
4,802 China Energy Development Holdings Ltd 56 –
280 China Environmental Energy Investment Ltd 21 –
184 China Flavors & Fragrances Co Ltd 61 –
2,568 China Healthcare Enterprise Group Ltd 40 –
78 China Metal International Holdings Inc 26 –
94 China Star Entertainment Ltd 7 –
7,060 China Strategic Holdings Ltd 165 0.01
166 China Ting Group Holdings Ltd 9 –
26 Chong Hing Bank Ltd 51 –
155 Chow Sang Sang Holdings International Ltd 290 0.02
152 Chu Kong Shipping Enterprises Group Co Ltd 41 –
487 Chuang's Consortium International Ltd 102 0.01
742 CITIC Telecom International Holdings Ltd 244 0.01
1,166 CK Life Sciences Int'l Holdings Inc 110 0.01
344 CMMB Vision Holdings Ltd 26 –
360 Continental Holdings Ltd 7 –
77 Cowell e Holdings Inc 22 –
277 Crocodile Garments 37 –
2,965 CSI Properties Ltd 105 0.01
227 CW Group Holdings Ltd 47 –
158 Dah Sing Banking Group Ltd 294 0.02
Shares (000's)
Value (000's)
USD
% of Net Asset Value
Common Stock (continued)
Hong Kong - 1.33% (continued)
84 Dah Sing Financial Holdings Ltd 562 0.04
298 Dan Form Holdings Co Ltd 105 0.01
88 Dickson Concepts International Ltd 32 –
120 Eagle Nice International Holdings Ltd 34 –
172 EcoGreen International Group Ltd 38 –
1,128 Emperor Capital Group Ltd 119 0.01
185 Emperor Entertainment Hotel Ltd 46 –
518 Emperor International Holdings Ltd 119 0.01
1,440 Emperor Watch & Jewellery Ltd 51 –
460 ENM Holdings Ltd 37 –
645 Esprit Holdings Ltd 528 0.04
285 eSun Holdings Ltd 25 –
1,090 Eternity Investment Ltd 32 –
517 Far East Consortium International Ltd 224 0.01
153 Far East Holdings International Ltd 19 –
1,321 FIH Mobile Ltd 425 0.03
946 First Pacific Co Ltd 664 0.05
304 First Shanghai Investments Ltd 54 –
270 Fountain SET Holdings Ltd 35 –
150 Future Bright Holdings Ltd 18 –
10,636 G-Resources Group Ltd 201 0.01
2,030 GCL New Energy Holdings Ltd 120 0.01
336 Genting Hong Kong Ltd 96 0.01
53 Get Nice Financial Group Ltd 7 –
2,130 Get Nice Holdings Ltd 73 –
2,578 Global Brands Group Holding Ltd 402 0.03
334 Glorious Sun Enterprises Ltd 42 –
910 Good Resources Holdings Ltd 59 –
75 Grand Ming Group Holdings Ltd 46 –
122 Great Eagle Holdings Ltd 542 0.04
242 Guangnan Holdings Ltd 30 –
9 Guoco Group Ltd 101 0.01
380 Haitong International Securities Group Ltd 261 0.01
92 Hang Fung Gold Technology Ltd – –
460 Hang Lung Group Ltd 1,688 0.10
119 Hanison Construction Holdings Ltd 21 –
823 Hao Tian Development Group Ltd 37 –
74 Harbour Centre Development Ltd 136 0.01
327 HKR International Ltd 151 0.01
58 Hon Kwok Land Investment Co Ltd 22 –
7 Hong Kong Aircraft Engineering Co Ltd 45 –
72 Hong Kong Ferry Holdings Co Ltd 84 –
238 Hong Kong Television Network Ltd 38 –
267 Hongkong & Shanghai Hotels Ltd 310 0.03
360 Hongkong Chinese Ltd 65 –
278 Hopewell Holdings Ltd 1,006 0.06
1,330 Hsin Chong Construction Group Ltd 63 –
23 Hua Hong Semiconductor Ltd 27 –
168 Hung Hing Printing Group Ltd 24 – 542
Hutchison Telecommunications Hong Kong Holdings Ltd 181 0.01
68 Imagi International Holdings Ltd 2 –
57 International Housewares Retail Co Ltd 12 –
360 International Standard Resources Holdings Ltd 5 –
255 IPE Group Ltd 56 –
228 IT Ltd 93 –
749 ITC Corp Ltd 79 –
188 ITC Properties Group Ltd 78 –
145 Johnson Electric Holdings Ltd 420 0.03
509 K Wah International Holdings Ltd 260 0.02
90 Kader Holdings Co Ltd 9 –
50 Kam Hing International Holdings Ltd 3 –
46 Keck Seng Investments 33 –
244 Kerry Logistics Network Ltd 326 0.03

Global Targeted Value Fund
Portfolio of Investments as at 30 November 2016 (continued)
Dimensional Fund Advisors Annual Report and Audited Financial Statements, 30 November 2016 209
Shares (000's)
Value (000's)
USD
% of Net Asset Value
Common Stock (continued)
Hong Kong - 1.33% (continued)
323 Kerry Properties Ltd 922 0.06
100 Kingmaker Footwear Holdings Ltd 27 –
175 Kong Sun Holdings Ltd 3 –
180 Kowloon Development Co Ltd 174 0.01
22 Kwoon Chung Bus Holdings Ltd 12 –
8,779 Lai Sun Development Co Ltd 170 0.01
375 Lai Sun Garment International Ltd 74 –
5,710 Landing International Development Ltd 141 0.01
160 Landsea Green Properties Co Ltd 12 –
820 Lerado Financial Group Company Ltd 24 –
412 Li & Fung Ltd 180 0.01
158 Lifestyle International Holdings Ltd 202 0.01
916 Lippo China Resources Ltd 28 –
124 Lippo Ltd 77 –
388 Lisi Group Holdings Ltd 40 –
80 Liu Chong Hing Investment Ltd 113 0.01
103 Luen Thai Holdings Ltd 43 –
137 Luk Fook Holdings International Ltd 396 0.03
72 Lung Kee Bermuda Holdings 25 –
985 Macau Legend Development Ltd 217 0.01
822 Magnificent Hotel Investment Ltd 19 –
254 Man Sang International Ltd 20 –
3,240 Mason Financial Holdings Ltd 79 –
2,315 Master Glory Group Ltd 134 0.01
211 Melco International Development Ltd 339 0.02
190 Midland Holdings Ltd 60 –
66 Ming Fai International Holdings Ltd 10 –
94 Miramar Hotel & Investment 213 0.01
1,480 Mongolian Mining Corp 48 –
66 National Electronic Holdings 8 –
126 Neo-Neon Holdings Ltd 20 –
263 Neptune Group Ltd 12 –
12,936 NetMind Financial Holdings Ltd 106 0.01
698 New Times Energy Corp Ltd 21 –
400 NewOcean Energy Holdings Ltd 110 0.01
222 Next Digital Ltd 11 –
342 Nine Express Ltd 22 –
8 NWS Holdings Ltd 14 –
200 O Luxe Holdings Ltd 19 – 560
Orange Sky Golden Harvest Entertainment Holdings Ltd 40 –
105 Orient Overseas International Ltd 416 0.03
278 Oriental Watch Holdings 61 –
946 Pacific Andes International Holdings Ltd 3 –
1,638 Pacific Basin Shipping Ltd 266 0.01
148 Paliburg Holdings Ltd 44 –
152 Paradise Entertainment Ltd 29 –
716 Pearl Oriental Oil Ltd 26 –
246 Pico Far East Holdings Ltd 77 –
42 Playmates Holdings Ltd 52 –
352 Playmates Toys Ltd 59 –
695 Polytec Asset Holdings Ltd 53 –
152 Public Financial Holdings Ltd 67 –
1,017 PYI Corp Ltd 21 –
163 Regal Hotels International Holdings Ltd 90 –
24 Safety Godown Co Ltd 59 –
210 SAS Dragon Holdings Ltd 40 –
74 SEA Holdings Ltd 188 0.01
3,380 SEEC Media Group Ltd 61 –
714 Shangri-La Asia Ltd 776 0.05
14 Shun Ho Property Investments Ltd 5 –
771 Shun Tak Holdings Ltd 284 0.02
156 Sing Tao News Corp Ltd 20 –
642 Singamas Container Holdings Ltd 72 –
Shares (000's)
Value (000's)
USD
% of Net Asset Value
Common Stock (continued)
Hong Kong - 1.33% (continued)
153 Sitoy Group Holdings Ltd 39 –
671 SJM Holdings Ltd 543 0.04
2,130 Skyway Securities Group Ltd 50 –
103 SOCAM Development Ltd 35 –
42 Soundwill Holdings Ltd 76 –
368 South China Holdings Co Ltd 22 –
198 Stella International Holdings Ltd 335 0.02
333 Sun Hung Kai & Co Ltd 207 0.01
153 TAI Cheung Holdings Ltd 131 0.01
42 Tan Chong International Ltd 13 –
163 Tao Heung Holdings Ltd 45 –
118 Television Broadcasts Ltd 421 0.03
296 Texwinca Holdings Ltd 216 0.01
112 Transport International Holdings Ltd 333 0.02
422 Trinity Ltd 32 –
162 TSC Group Holdings Ltd 22 –
192 Tsui Wah Holdings Ltd 32 –
282 United Laboratories International Holdings Ltd 152 0.01
192 United Photovoltaics Group Ltd 17 –
676 Up Energy Development Group Ltd 8 –
134 Vantage International Holdings Ltd 21 –
107 Varitronix International Ltd 47 –
344 Vedan International Holdings Ltd 44 –
1,022 Victory City International Holdings Ltd 38 –
326 VST Holdings Ltd 108 0.01
2,660 Wang On Group Ltd 24 –
232 Win Hanverky Holdings Ltd 41 –
440 Winfull Group Holdings Ltd 11 –
39 Wing On Co International Ltd 117 0.01
205 Wing Tai Properties Ltd 123 0.01
62 Wong's International Holdings Ltd 22 –
186 Wong's Kong King International 24 –
248 Xinyi Glass Holdings Ltd 185 0.01
19 YGM Trading Ltd 18 –
84 Yue Yuen Industrial Holdings Ltd 302 0.02
2,104 Yugang International Ltd 38 –
24,857 1.33
Ireland - 0.19%
8,077 Bank of Ireland 1,720 0.10
164 C&C Group PLC 601 0.03
7 FBD Holdings PLC 47 –
26 IFG Group PLC 45 –
4 Paddy Power Betfair PLC 378 0.02
35 Smurfit Kappa Group PLC 805 0.04
3,596 0.19
Israel - 0.30%
59 Africa Israel Investments Ltd 8 –
1 Albaad Massuot Yitzhak 11 –
3 Allot Communications Ltd 14 –
– Alrov Properties and Lodgings Ltd – –
9 Ashtrom Properties Ltd 34 –
3 AudioCodes Ltd 17 –
16 Cellcom Israel Ltd 134 0.01
18 Ceragon Networks Ltd 41 –
9 Clal Insurance Enterprises Holdings Ltd 110 0.01
1 Delek Group Ltd 141 0.01
5 Delta-Galil Industries Ltd 150 0.01
125 El Al Israel Airlines 102 0.01
4 Electra Consumer Products 1970 Ltd 58 –
1 Electra Ltd 106 0.01
4 Elron Electronic Industries Ltd 18 –
4 Equital Ltd 74 –
24 First International Bank Of Israel Ltd 323 0.02
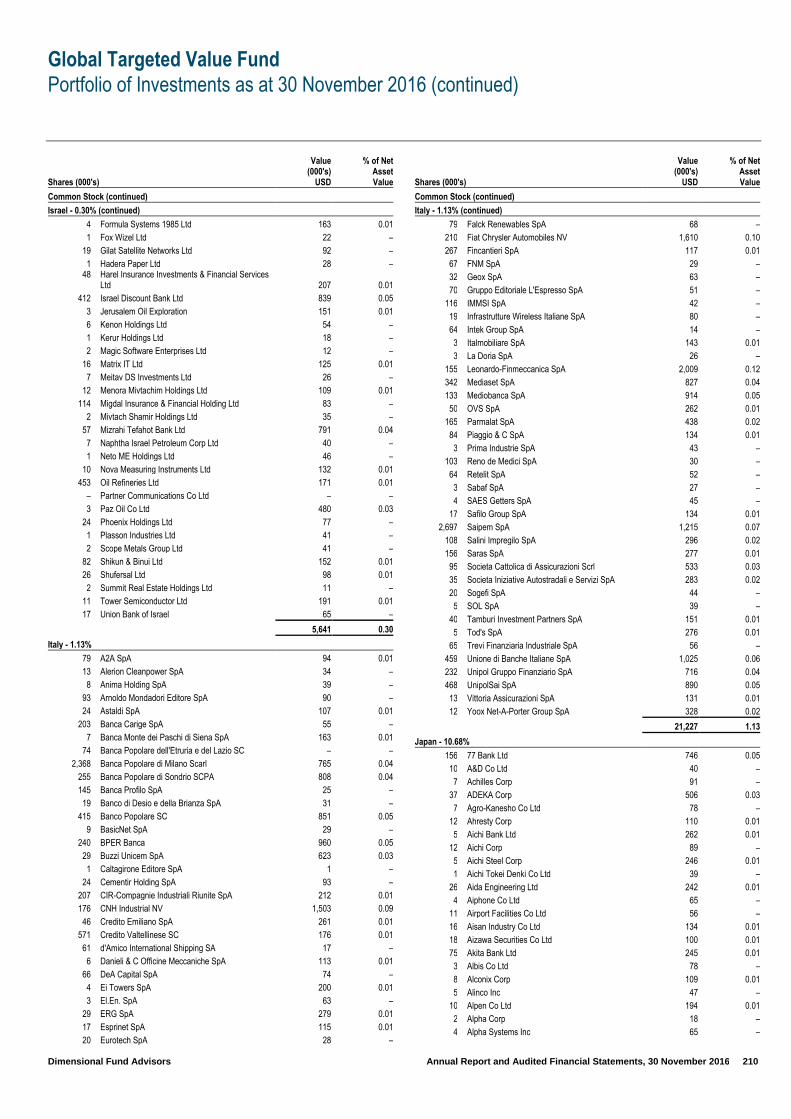
Global Targeted Value Fund
Portfolio of Investments as at 30 November 2016 (continued)
Dimensional Fund Advisors Annual Report and Audited Financial Statements, 30 November 2016 210
Shares (000's)
Value (000's)
USD
% of Net Asset Value
Common Stock (continued)
Israel - 0.30% (continued)
4 Formula Systems 1985 Ltd 163 0.01
1 Fox Wizel Ltd 22 –
19 Gilat Satellite Networks Ltd 92 –
1 Hadera Paper Ltd 28 – 48
Harel Insurance Investments & Financial Services Ltd 207 0.01
412 Israel Discount Bank Ltd 839 0.05
3 Jerusalem Oil Exploration 151 0.01
6 Kenon Holdings Ltd 54 –
1 Kerur Holdings Ltd 18 –
2 Magic Software Enterprises Ltd 12 –
16 Matrix IT Ltd 125 0.01
7 Meitav DS Investments Ltd 26 –
12 Menora Mivtachim Holdings Ltd 109 0.01
114 Migdal Insurance & Financial Holding Ltd 83 –
2 Mivtach Shamir Holdings Ltd 35 –
57 Mizrahi Tefahot Bank Ltd 791 0.04
7 Naphtha Israel Petroleum Corp Ltd 40 –
1 Neto ME Holdings Ltd 46 –
10 Nova Measuring Instruments Ltd 132 0.01
453 Oil Refineries Ltd 171 0.01
– Partner Communications Co Ltd – –
3 Paz Oil Co Ltd 480 0.03
24 Phoenix Holdings Ltd 77 –
1 Plasson Industries Ltd 41 –
2 Scope Metals Group Ltd 41 –
82 Shikun & Binui Ltd 152 0.01
26 Shufersal Ltd 98 0.01
2 Summit Real Estate Holdings Ltd 11 –
11 Tower Semiconductor Ltd 191 0.01
17 Union Bank of Israel 65 –
5,641 0.30
Italy - 1.13%
79 A2A SpA 94 0.01
13 Alerion Cleanpower SpA 34 –
8 Anima Holding SpA 39 –
93 Arnoldo Mondadori Editore SpA 90 –
24 Astaldi SpA 107 0.01
203 Banca Carige SpA 55 –
7 Banca Monte dei Paschi di Siena SpA 163 0.01
74 Banca Popolare dell'Etruria e del Lazio SC – –
2,368 Banca Popolare di Milano Scarl 765 0.04
255 Banca Popolare di Sondrio SCPA 808 0.04
145 Banca Profilo SpA 25 –
19 Banco di Desio e della Brianza SpA 31 –
415 Banco Popolare SC 851 0.05
9 BasicNet SpA 29 –
240 BPER Banca 960 0.05
29 Buzzi Unicem SpA 623 0.03
1 Caltagirone Editore SpA 1 –
24 Cementir Holding SpA 93 –
207 CIR-Compagnie Industriali Riunite SpA 212 0.01
176 CNH Industrial NV 1,503 0.09
46 Credito Emiliano SpA 261 0.01
571 Credito Valtellinese SC 176 0.01
61 d'Amico International Shipping SA 17 –
6 Danieli & C Officine Meccaniche SpA 113 0.01
66 DeA Capital SpA 74 –
4 Ei Towers SpA 200 0.01
3 El.En. SpA 63 –
29 ERG SpA 279 0.01
17 Esprinet SpA 115 0.01
20 Eurotech SpA 28 –
Shares (000's)
Value (000's)
USD
% of Net Asset Value
Common Stock (continued)
Italy - 1.13% (continued)
79 Falck Renewables SpA 68 –
210 Fiat Chrysler Automobiles NV 1,610 0.10
267 Fincantieri SpA 117 0.01
67 FNM SpA 29 –
32 Geox SpA 63 –
70 Gruppo Editoriale L'Espresso SpA 51 –
116 IMMSI SpA 42 –
19 Infrastrutture Wireless Italiane SpA 80 –
64 Intek Group SpA 14 –
3 Italmobiliare SpA 143 0.01
3 La Doria SpA 26 –
155 Leonardo-Finmeccanica SpA 2,009 0.12
342 Mediaset SpA 827 0.04
133 Mediobanca SpA 914 0.05
50 OVS SpA 262 0.01
165 Parmalat SpA 438 0.02
84 Piaggio & C SpA 134 0.01
3 Prima Industrie SpA 43 –
103 Reno de Medici SpA 30 –
64 Retelit SpA 52 –
3 Sabaf SpA 27 –
4 SAES Getters SpA 45 –
17 Safilo Group SpA 134 0.01
2,697 Saipem SpA 1,215 0.07
108 Salini Impregilo SpA 296 0.02
156 Saras SpA 277 0.01
95 Societa Cattolica di Assicurazioni Scrl 533 0.03
35 Societa Iniziative Autostradali e Servizi SpA 283 0.02
20 Sogefi SpA 44 –
5 SOL SpA 39 –
40 Tamburi Investment Partners SpA 151 0.01
5 Tod's SpA 276 0.01
65 Trevi Finanziaria Industriale SpA 56 –
459 Unione di Banche Italiane SpA 1,025 0.06
232 Unipol Gruppo Finanziario SpA 716 0.04
468 UnipolSai SpA 890 0.05
13 Vittoria Assicurazioni SpA 131 0.01
12 Yoox Net-A-Porter Group SpA 328 0.02
21,227 1.13
Japan - 10.68%
156 77 Bank Ltd 746 0.05
10 A&D Co Ltd 40 –
7 Achilles Corp 91 –
37 ADEKA Corp 506 0.03
7 Agro-Kanesho Co Ltd 78 –
12 Ahresty Corp 110 0.01
5 Aichi Bank Ltd 262 0.01
12 Aichi Corp 89 –
5 Aichi Steel Corp 246 0.01
1 Aichi Tokei Denki Co Ltd 39 –
26 Aida Engineering Ltd 242 0.01
4 Aiphone Co Ltd 65 –
11 Airport Facilities Co Ltd 56 –
16 Aisan Industry Co Ltd 134 0.01
18 Aizawa Securities Co Ltd 100 0.01
75 Akita Bank Ltd 245 0.01
3 Albis Co Ltd 78 –
8 Alconix Corp 109 0.01
5 Alinco Inc 47 –
10 Alpen Co Ltd 194 0.01
2 Alpha Corp 18 –
4 Alpha Systems Inc 65 –
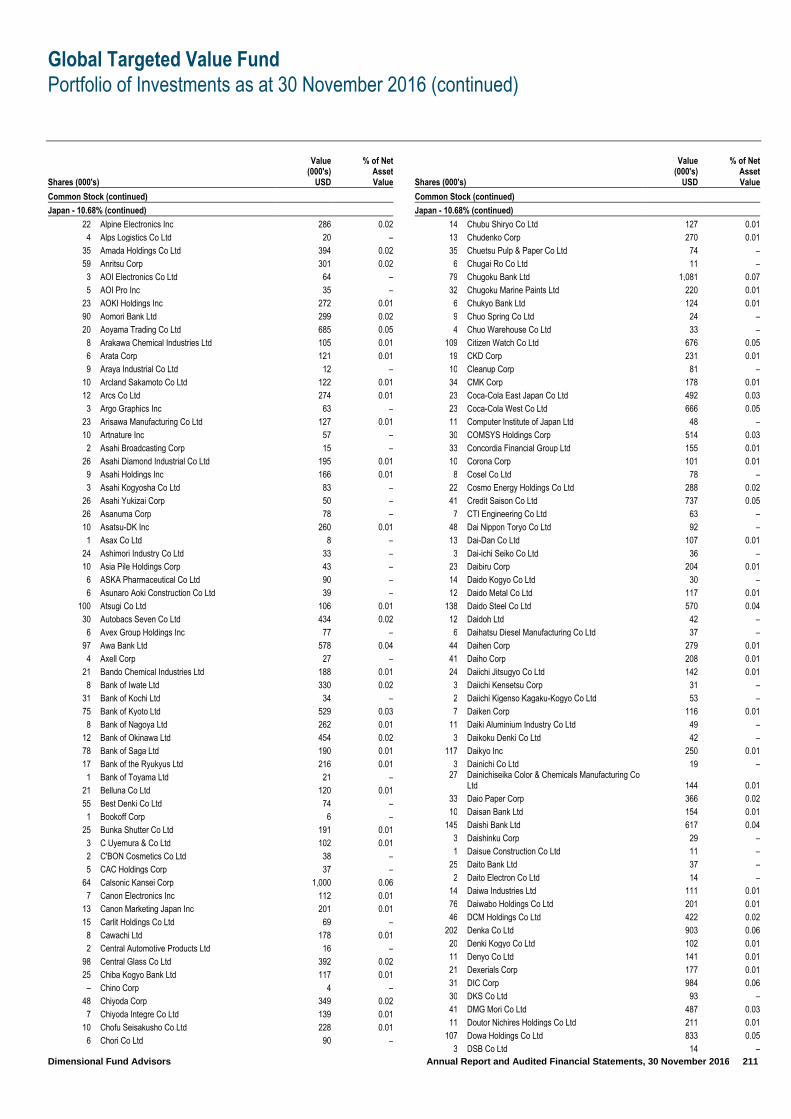
Global Targeted Value Fund
Portfolio of Investments as at 30 November 2016 (continued)
Dimensional Fund Advisors Annual Report and Audited Financial Statements, 30 November 2016 211
Shares (000's)
Value (000's)
USD
% of Net Asset Value
Common Stock (continued)
Japan - 10.68% (continued)
22 Alpine Electronics Inc 286 0.02
4 Alps Logistics Co Ltd 20 –
35 Amada Holdings Co Ltd 394 0.02
59 Anritsu Corp 301 0.02
3 AOI Electronics Co Ltd 64 –
5 AOI Pro Inc 35 –
23 AOKI Holdings Inc 272 0.01
90 Aomori Bank Ltd 299 0.02
20 Aoyama Trading Co Ltd 685 0.05
8 Arakawa Chemical Industries Ltd 105 0.01
6 Arata Corp 121 0.01
9 Araya Industrial Co Ltd 12 –
10 Arcland Sakamoto Co Ltd 122 0.01
12 Arcs Co Ltd 274 0.01
3 Argo Graphics Inc 63 –
23 Arisawa Manufacturing Co Ltd 127 0.01
10 Artnature Inc 57 –
2 Asahi Broadcasting Corp 15 –
26 Asahi Diamond Industrial Co Ltd 195 0.01
9 Asahi Holdings Inc 166 0.01
3 Asahi Kogyosha Co Ltd 83 –
26 Asahi Yukizai Corp 50 –
26 Asanuma Corp 78 –
10 Asatsu-DK Inc 260 0.01
1 Asax Co Ltd 8 –
24 Ashimori Industry Co Ltd 33 –
10 Asia Pile Holdings Corp 43 –
6 ASKA Pharmaceutical Co Ltd 90 –
6 Asunaro Aoki Construction Co Ltd 39 –
100 Atsugi Co Ltd 106 0.01
30 Autobacs Seven Co Ltd 434 0.02
6 Avex Group Holdings Inc 77 –
97 Awa Bank Ltd 578 0.04
4 Axell Corp 27 –
21 Bando Chemical Industries Ltd 188 0.01
8 Bank of Iwate Ltd 330 0.02
31 Bank of Kochi Ltd 34 –
75 Bank of Kyoto Ltd 529 0.03
8 Bank of Nagoya Ltd 262 0.01
12 Bank of Okinawa Ltd 454 0.02
78 Bank of Saga Ltd 190 0.01
17 Bank of the Ryukyus Ltd 216 0.01
1 Bank of Toyama Ltd 21 –
21 Belluna Co Ltd 120 0.01
55 Best Denki Co Ltd 74 –
1 Bookoff Corp 6 –
25 Bunka Shutter Co Ltd 191 0.01
3 C Uyemura & Co Ltd 102 0.01
2 C'BON Cosmetics Co Ltd 38 –
5 CAC Holdings Corp 37 –
64 Calsonic Kansei Corp 1,000 0.06
7 Canon Electronics Inc 112 0.01
13 Canon Marketing Japan Inc 201 0.01
15 Carlit Holdings Co Ltd 69 –
8 Cawachi Ltd 178 0.01
2 Central Automotive Products Ltd 16 –
98 Central Glass Co Ltd 392 0.02
25 Chiba Kogyo Bank Ltd 117 0.01
– Chino Corp 4 –
48 Chiyoda Corp 349 0.02
7 Chiyoda Integre Co Ltd 139 0.01
10 Chofu Seisakusho Co Ltd 228 0.01
6 Chori Co Ltd 90 –
Shares (000's)
Value (000's)
USD
% of Net Asset Value
Common Stock (continued)
Japan - 10.68% (continued)
14 Chubu Shiryo Co Ltd 127 0.01
13 Chudenko Corp 270 0.01
35 Chuetsu Pulp & Paper Co Ltd 74 –
6 Chugai Ro Co Ltd 11 –
79 Chugoku Bank Ltd 1,081 0.07
32 Chugoku Marine Paints Ltd 220 0.01
6 Chukyo Bank Ltd 124 0.01
9 Chuo Spring Co Ltd 24 –
4 Chuo Warehouse Co Ltd 33 –
109 Citizen Watch Co Ltd 676 0.05
19 CKD Corp 231 0.01
10 Cleanup Corp 81 –
34 CMK Corp 178 0.01
23 Coca-Cola East Japan Co Ltd 492 0.03
23 Coca-Cola West Co Ltd 666 0.05
11 Computer Institute of Japan Ltd 48 –
30 COMSYS Holdings Corp 514 0.03
33 Concordia Financial Group Ltd 155 0.01
10 Corona Corp 101 0.01
8 Cosel Co Ltd 78 –
22 Cosmo Energy Holdings Co Ltd 288 0.02
41 Credit Saison Co Ltd 737 0.05
7 CTI Engineering Co Ltd 63 –
48 Dai Nippon Toryo Co Ltd 92 –
13 Dai-Dan Co Ltd 107 0.01
3 Dai-ichi Seiko Co Ltd 36 –
23 Daibiru Corp 204 0.01
14 Daido Kogyo Co Ltd 30 –
12 Daido Metal Co Ltd 117 0.01
138 Daido Steel Co Ltd 570 0.04
12 Daidoh Ltd 42 –
6 Daihatsu Diesel Manufacturing Co Ltd 37 –
44 Daihen Corp 279 0.01
41 Daiho Corp 208 0.01
24 Daiichi Jitsugyo Co Ltd 142 0.01
3 Daiichi Kensetsu Corp 31 –
2 Daiichi Kigenso Kagaku-Kogyo Co Ltd 53 –
7 Daiken Corp 116 0.01
11 Daiki Aluminium Industry Co Ltd 49 –
3 Daikoku Denki Co Ltd 42 –
117 Daikyo Inc 250 0.01
3 Dainichi Co Ltd 19 – 27
Dainichiseika Color & Chemicals Manufacturing Co Ltd 144 0.01
33 Daio Paper Corp 366 0.02
10 Daisan Bank Ltd 154 0.01
145 Daishi Bank Ltd 617 0.04
3 Daishinku Corp 29 –
1 Daisue Construction Co Ltd 11 –
25 Daito Bank Ltd 37 –
2 Daito Electron Co Ltd 14 –
14 Daiwa Industries Ltd 111 0.01
76 Daiwabo Holdings Co Ltd 201 0.01
46 DCM Holdings Co Ltd 422 0.02
202 Denka Co Ltd 903 0.06
20 Denki Kogyo Co Ltd 102 0.01
11 Denyo Co Ltd 141 0.01
21 Dexerials Corp 177 0.01
31 DIC Corp 984 0.06
30 DKS Co Ltd 93 –
41 DMG Mori Co Ltd 487 0.03
11 Doutor Nichires Holdings Co Ltd 211 0.01
107 Dowa Holdings Co Ltd 833 0.05
3 DSB Co Ltd 14 –

Global Targeted Value Fund
Portfolio of Investments as at 30 November 2016 (continued)
Dimensional Fund Advisors Annual Report and Audited Financial Statements, 30 November 2016 212
Shares (000's)
Value (000's)
USD
% of Net Asset Value
Common Stock (continued)
Japan - 10.68% (continued)
4 Dunlop Sports Co Ltd 37 –
18 Duskin Co Ltd 365 0.02
3 Dydo Drinco Inc 164 0.01
5 Dynic Corp 7 –
8 Eagle Industry Co Ltd 113 0.01
37 Ebara Corp 969 0.06
4 Ebara Jitsugyo Co Ltd 48 –
35 EDION Corp 339 0.02
13 Ehime Bank Ltd 161 0.01
11 Eidai Co Ltd 47 –
60 Eighteenth Bank Ltd 181 0.01
10 Eizo Corp 288 0.02
5 Elematec Corp 80 –
4 Endo Lighting Corp 28 –
1 Enplas Corp 38 –
8 ESPEC Corp 93 –
3 Excel Co Ltd 43 –
15 Exedy Corp 427 0.02
7 F-Tech Inc 75 –
2 Faith Inc 21 –
2 FALCO HOLDINGS Co Ltd 27 –
8 FamilyMart UNY Holdings Co Ltd 474 0.03
15 FCC Co Ltd 264 0.01
67 Feed One Co Ltd 89 –
13 Ferrotec Corp 150 0.01
113 FIDEA Holdings Co Ltd 192 0.01
9 Fields Corp 112 0.01
4 First Juken Co Ltd 56 –
9 FJ Next Co Ltd 56 –
13 Foster Electric Co Ltd 237 0.01
13 France Bed Holdings Co Ltd 104 0.01
7 Fuji Co Ltd 143 0.01
8 Fuji Corp Ltd 50 –
13 Fuji Kiko Co Ltd 49 –
31 Fuji Machine Manufacturing Co Ltd 350 0.02
17 Fuji Media Holdings Inc 236 0.01
22 Fuji Oil Co Ltd 64 –
21 Fuji Oil Holdings Inc 406 0.02
1 Fuji Pharma Co Ltd 16 –
7 Fuji Soft Inc 169 0.01
5 Fujibo Holdings Inc 160 0.01
14 Fujikura Kasei Co Ltd 77 –
126 Fujikura Ltd 691 0.05
8 Fujikura Rubber Ltd 47 –
8 Fujimi Inc 138 0.01
7 Fujimori Kogyo Co Ltd 174 0.01
29 Fujisash Co Ltd 28 –
3 Fujishoji Co Ltd 31 –
21 Fujitec Co Ltd 233 0.01
5 Fujitsu Frontech Ltd 57 –
3 FuKoKu Co Ltd 19 –
9 Fukuda Corp 91 –
120 Fukui Bank Ltd 296 0.02
362 Fukuoka Financial Group Inc 1,594 0.10
112 Fukushima Bank Ltd 92 –
67 Fukuyama Transporting Co Ltd 368 0.02
8 Funai Electric Co Ltd 65 –
6 Furukawa Battery Co Ltd 43 –
125 Furukawa Co Ltd 230 0.01
30 Furukawa Electric Co Ltd 940 0.06
10 Furuno Electric Co Ltd 67 –
4 Furusato Industries Ltd 56 –
2 Fuso Pharmaceutical Industries Ltd 58 –
Shares (000's)
Value (000's)
USD
% of Net Asset Value
Common Stock (continued)
Japan - 10.68% (continued)
18 Futaba Corp 285 0.02
24 Futaba Industrial Co Ltd 149 0.01
8 Fuyo General Lease Co Ltd 378 0.02
9 G-Tekt Corp 163 0.01
29 Gakken Holdings Co Ltd 84 –
8 Gecoss Corp 69 –
12 Geo Holdings Corp 132 0.01
– Geomatec Co Ltd 1 –
4 Globeride Inc 58 –
18 Glory Ltd 594 0.04
6 Godo Steel Ltd 109 0.01
8 Goldcrest Co Ltd 163 0.01
3 Grandy House Corp 10 –
137 GS Yuasa Corp 558 0.03
24 GSI Creos Corp 25 –
2 Gun-Ei Chemical Industry Co Ltd 53 –
183 Gunma Bank Ltd 944 0.06
65 Gunze Ltd 217 0.01
11 H-One Co Ltd 101 0.01
38 H2O Retailing Corp 583 0.04
199 Hachijuni Bank Ltd 1,084 0.07
2 Hagihara Industries Inc 38 –
4 Hagiwara Electric Co Ltd 73 –
1 Hakudo Co Ltd 11 –
6 Hakuto Co Ltd 49 –
7 Hamakyorex Co Ltd 124 0.01
19 HANEDA ZENITH HOLDINGS Co Ltd 53 –
81 Hanwa Co Ltd 530 0.03
10 Happinet Corp 113 0.01
8 Harima Chemicals Group Inc 50 –
3 Haruyama Trading Co Ltd 23 –
19 Heiwa Corp 421 0.02
19 Heiwa Real Estate Co Ltd 268 0.01
12 Heiwado Co Ltd 246 0.01
13 Helios Techno Holding Co Ltd 52 –
10 HI-LEX CORP 242 0.01
8 Hibiya Engineering Ltd 119 0.01
6 Hirakawa Hewtech Corp 75 –
4 Hirano Tecseed Co Ltd 39 –
240 Hiroshima Bank Ltd 1,075 0.07
1 Hiroshima Electric Railway Co Ltd 4 –
11 Hisaka Works Ltd 76 –
20 Hitachi Capital Corp 505 0.03
7 Hitachi Chemical Co Ltd 145 0.01
24 Hitachi Construction Machinery Co Ltd 508 0.03
25 Hitachi Koki Co Ltd 229 0.01
17 Hitachi Maxell Ltd 293 0.02
16 Hitachi Transport System Ltd 321 0.02
78 Hitachi Zosen Corp 417 0.02
3 Hodogaya Chemical Co Ltd 79 –
5 Hogy Medical Co Ltd 277 0.01
15 Hokkan Holdings Ltd 54 –
12 Hokko Chemical Industry Co Ltd 39 –
137 Hokkoku Bank Ltd 480 0.03
11 Hokuetsu Bank Ltd 246 0.01
9 Hokuetsu Industries Co Ltd 62 –
59 Hokuetsu Kishu Paper Co Ltd 341 0.02
58 Hokuhoku Financial Group Inc 947 0.06
29 Hokuriku Electric Industry Co Ltd 33 –
5 Hokuriku Electrical Construction Co Ltd 37 –
7 Honeys Co Ltd 73 –
17 Hoosiers Holdings 90 –
32 Hosiden Corp 263 0.01
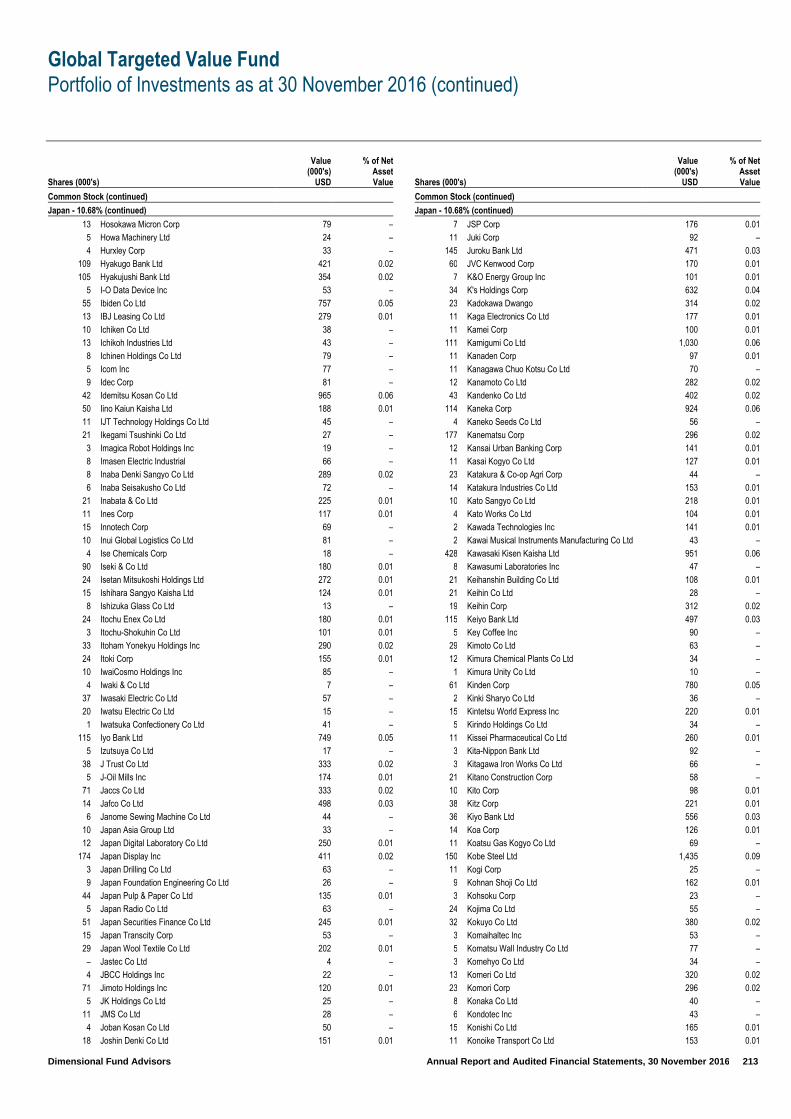
Global Targeted Value Fund
Portfolio of Investments as at 30 November 2016 (continued)
Dimensional Fund Advisors Annual Report and Audited Financial Statements, 30 November 2016 213
Shares (000's)
Value (000's)
USD
% of Net Asset Value
Common Stock (continued)
Japan - 10.68% (continued)
13 Hosokawa Micron Corp 79 –
5 Howa Machinery Ltd 24 –
4 Hurxley Corp 33 –
109 Hyakugo Bank Ltd 421 0.02
105 Hyakujushi Bank Ltd 354 0.02
5 I-O Data Device Inc 53 –
55 Ibiden Co Ltd 757 0.05
13 IBJ Leasing Co Ltd 279 0.01
10 Ichiken Co Ltd 38 –
13 Ichikoh Industries Ltd 43 –
8 Ichinen Holdings Co Ltd 79 –
5 Icom Inc 77 –
9 Idec Corp 81 –
42 Idemitsu Kosan Co Ltd 965 0.06
50 Iino Kaiun Kaisha Ltd 188 0.01
11 IJT Technology Holdings Co Ltd 45 –
21 Ikegami Tsushinki Co Ltd 27 –
3 Imagica Robot Holdings Inc 19 –
8 Imasen Electric Industrial 66 –
8 Inaba Denki Sangyo Co Ltd 289 0.02
6 Inaba Seisakusho Co Ltd 72 –
21 Inabata & Co Ltd 225 0.01
11 Ines Corp 117 0.01
15 Innotech Corp 69 –
10 Inui Global Logistics Co Ltd 81 –
4 Ise Chemicals Corp 18 –
90 Iseki & Co Ltd 180 0.01
24 Isetan Mitsukoshi Holdings Ltd 272 0.01
15 Ishihara Sangyo Kaisha Ltd 124 0.01
8 Ishizuka Glass Co Ltd 13 –
24 Itochu Enex Co Ltd 180 0.01
3 Itochu-Shokuhin Co Ltd 101 0.01
33 Itoham Yonekyu Holdings Inc 290 0.02
24 Itoki Corp 155 0.01
10 IwaiCosmo Holdings Inc 85 –
4 Iwaki & Co Ltd 7 –
37 Iwasaki Electric Co Ltd 57 –
20 Iwatsu Electric Co Ltd 15 –
1 Iwatsuka Confectionery Co Ltd 41 –
115 Iyo Bank Ltd 749 0.05
5 Izutsuya Co Ltd 17 –
38 J Trust Co Ltd 333 0.02
5 J-Oil Mills Inc 174 0.01
71 Jaccs Co Ltd 333 0.02
14 Jafco Co Ltd 498 0.03
6 Janome Sewing Machine Co Ltd 44 –
10 Japan Asia Group Ltd 33 –
12 Japan Digital Laboratory Co Ltd 250 0.01
174 Japan Display Inc 411 0.02
3 Japan Drilling Co Ltd 63 –
9 Japan Foundation Engineering Co Ltd 26 –
44 Japan Pulp & Paper Co Ltd 135 0.01
5 Japan Radio Co Ltd 63 –
51 Japan Securities Finance Co Ltd 245 0.01
15 Japan Transcity Corp 53 –
29 Japan Wool Textile Co Ltd 202 0.01
– Jastec Co Ltd 4 –
4 JBCC Holdings Inc 22 –
71 Jimoto Holdings Inc 120 0.01
5 JK Holdings Co Ltd 25 –
11 JMS Co Ltd 28 –
4 Joban Kosan Co Ltd 50 –
18 Joshin Denki Co Ltd 151 0.01
Shares (000's)
Value (000's)
USD
% of Net Asset Value
Common Stock (continued)
Japan - 10.68% (continued)
7 JSP Corp 176 0.01
11 Juki Corp 92 –
145 Juroku Bank Ltd 471 0.03
60 JVC Kenwood Corp 170 0.01
7 K&O Energy Group Inc 101 0.01
34 K's Holdings Corp 632 0.04
23 Kadokawa Dwango 314 0.02
11 Kaga Electronics Co Ltd 177 0.01
11 Kamei Corp 100 0.01
111 Kamigumi Co Ltd 1,030 0.06
11 Kanaden Corp 97 0.01
11 Kanagawa Chuo Kotsu Co Ltd 70 –
12 Kanamoto Co Ltd 282 0.02
43 Kandenko Co Ltd 402 0.02
114 Kaneka Corp 924 0.06
4 Kaneko Seeds Co Ltd 56 –
177 Kanematsu Corp 296 0.02
12 Kansai Urban Banking Corp 141 0.01
11 Kasai Kogyo Co Ltd 127 0.01
23 Katakura & Co-op Agri Corp 44 –
14 Katakura Industries Co Ltd 153 0.01
10 Kato Sangyo Co Ltd 218 0.01
4 Kato Works Co Ltd 104 0.01
2 Kawada Technologies Inc 141 0.01
2 Kawai Musical Instruments Manufacturing Co Ltd 43 –
428 Kawasaki Kisen Kaisha Ltd 951 0.06
8 Kawasumi Laboratories Inc 47 –
21 Keihanshin Building Co Ltd 108 0.01
21 Keihin Co Ltd 28 –
19 Keihin Corp 312 0.02
115 Keiyo Bank Ltd 497 0.03
5 Key Coffee Inc 90 –
29 Kimoto Co Ltd 63 –
12 Kimura Chemical Plants Co Ltd 34 –
1 Kimura Unity Co Ltd 10 –
61 Kinden Corp 780 0.05
2 Kinki Sharyo Co Ltd 36 –
15 Kintetsu World Express Inc 220 0.01
5 Kirindo Holdings Co Ltd 34 –
11 Kissei Pharmaceutical Co Ltd 260 0.01
3 Kita-Nippon Bank Ltd 92 –
3 Kitagawa Iron Works Co Ltd 66 –
21 Kitano Construction Corp 58 –
10 Kito Corp 98 0.01
38 Kitz Corp 221 0.01
36 Kiyo Bank Ltd 556 0.03
14 Koa Corp 126 0.01
11 Koatsu Gas Kogyo Co Ltd 69 –
150 Kobe Steel Ltd 1,435 0.09
11 Kogi Corp 25 –
9 Kohnan Shoji Co Ltd 162 0.01
3 Kohsoku Corp 23 –
24 Kojima Co Ltd 55 –
32 Kokuyo Co Ltd 380 0.02
3 Komaihaltec Inc 53 –
5 Komatsu Wall Industry Co Ltd 77 –
3 Komehyo Co Ltd 34 –
13 Komeri Co Ltd 320 0.02
23 Komori Corp 296 0.02
8 Konaka Co Ltd 40 –
6 Kondotec Inc 43 –
15 Konishi Co Ltd 165 0.01
11 Konoike Transport Co Ltd 153 0.01

Global Targeted Value Fund
Portfolio of Investments as at 30 November 2016 (continued)
Dimensional Fund Advisors Annual Report and Audited Financial Statements, 30 November 2016 214
Shares (000's)
Value (000's)
USD
% of Net Asset Value
Common Stock (continued)
Japan - 10.68% (continued)
1 Kosaido Co Ltd 4 –
9 Kosei Securities Co Ltd 13 –
35 Krosaki Harima Corp 98 0.01
2 KRS Corp 37 –
4 KU Holdings Co Ltd 32 –
20 Kumiai Chemical Industry Co Ltd 122 0.01
93 Kurabo Industries Ltd 189 0.01
7 Kureha Corp 306 0.02
6 Kurimoto Ltd 125 0.01
2 Kuriyama Holdings Corp 25 –
14 Kuroda Electric Co Ltd 290 0.02
100 KYB Corp 461 0.02
31 Kyodo Printing Co Ltd 104 0.01
10 Kyoei Steel Ltd 190 0.01
15 Kyokuto Boeki Kaisha Ltd 30 –
16 Kyokuto Kaihatsu Kogyo Co Ltd 211 0.01
8 Kyokuto Securities Co Ltd 113 0.01
3 Kyokuyo Co Ltd 76 –
17 KYORIN Holdings Inc 360 0.02
20 Kyoritsu Printing Co Ltd 54 –
17 Kyosan Electric Manufacturing Co Ltd 57 –
6 Kyowa Electronic Instruments Co Ltd 23 –
33 Kyowa Exeo Corp 473 0.03
8 Kyowa Leather Cloth Co Ltd 54 –
132 Kyushu Financial Group Inc 885 0.06
3 Land Business Co Ltd 7 –
10 Laox Co Ltd 65 –
2 LEC Inc 70 –
21 Lintec Corp 444 0.02
2 Lonseal 43 –
13 Look Inc 20 –
19 Macnica Fuji Electronics Holdings Inc 232 0.01
52 Maeda Corp 487 0.03
26 Maeda Road Construction Co Ltd 450 0.02
7 Maezawa Kasei Industries Co Ltd 72 –
5 Maezawa Kyuso Industries Co Ltd 64 –
52 Makino Milling Machine Co Ltd 374 0.02
3 Mamiya-Op Co Ltd 36 –
4 Mars Engineering Corp 80 –
14 Marubun Corp 82 –
43 Marudai Food Co Ltd 178 0.01
4 Marufuji Sheet Piling Co Ltd 8 –
2 Maruka Machinery Co Ltd 24 –
4 Maruwa Co Ltd 123 0.01
10 Maruyama Manufacturing Co Inc 17 –
4 Maruzen CHI Holdings Co Ltd 11 –
7 Maruzen Co Ltd 67 –
21 Maruzen Showa Unyu Co Ltd 82 –
8 Matsuda Sangyo Co Ltd 98 0.01
8 Matsui Construction Co Ltd 78 –
15 Max Co Ltd 177 0.01
2 Maxvalu Nishinihon Co Ltd 27 –
4 Maxvalu Tokai Co Ltd 58 –
390 Mebuki Financial Group Inc 1,439 0.09
6 Megachips Corp 143 0.01
85 Meidensha Corp 275 0.01
2 Meiji Electric Industries Co Ltd 23 –
5 Meiji Shipping Co Ltd 17 –
5 Meiko Electronics Co Ltd 28 –
21 Meisei Industrial Co Ltd 101 0.01
6 Meito Sangyo Co Ltd 76 –
11 Meiwa Corp 36 –
9 Meiwa Estate Co Ltd 52 –
Shares (000's)
Value (000's)
USD
% of Net Asset Value
Common Stock (continued)
Japan - 10.68% (continued)
5 Melco Holdings Inc 131 0.01
57 Michinoku Bank Ltd 109 0.01
5 Mie Bank Ltd 103 0.01
19 Mie Kotsu Group Holdings Inc 66 –
5 Mikuni Corp 16 –
5 Mimaki Egineering Co Ltd 26 –
7 Mimasu Semiconductor Industry Co Ltd 81 –
7 Minato Bank Ltd 127 0.01
6 Ministop Co Ltd 105 0.01
1 Miraial Co Ltd 11 –
31 Mirait Holdings Corp 295 0.02
17 Misawa Homes Co Ltd 149 0.01
7 Mitani Corp 191 0.01
7 Mitani Sangyo Co Ltd 20 –
21 Mito Securities Co Ltd 55 –
17 Mitsuba Corp 245 0.01
89 Mitsubishi Gas Chemical Co Inc 1,369 0.08
32 Mitsubishi Kakoki Kaisha Ltd 59 –
25 Mitsubishi Logistics Corp 342 0.02
53 Mitsubishi Materials Corp 1,583 0.09
12 Mitsubishi Nichiyu Forklift Co Ltd 81 –
17 Mitsubishi Paper Mills Ltd 114 0.01
4 Mitsubishi Shokuhin Co Ltd 107 0.01
71 Mitsubishi Steel Manufacturing Co Ltd 142 0.01
158 Mitsubishi UFJ Lease & Finance Co Ltd 740 0.05
20 Mitsuboshi Belting Ltd 177 0.01
70 Mitsui Chemicals Inc 330 0.02
344 Mitsui Engineering & Shipbuilding Co Ltd 502 0.03
10 Mitsui High-Tec Inc 58 –
15 Mitsui Home Co Ltd 61 –
8 Mitsui Matsushima Co Ltd 94 0.01
290 Mitsui Mining & Smelting Co Ltd 684 0.05
554 Mitsui OSK Lines Ltd 1,450 0.09
8 Mitsui Sugar Co Ltd 159 0.01
44 Mitsui-Soko Holdings Co Ltd 130 0.01
39 Mitsumi Electric Co Ltd 230 0.01
15 Mitsuuroko Group Holdings Co Ltd 94 0.01
27 Miyaji Engineering Group Inc 48 –
75 Miyazaki Bank Ltd 240 0.01
34 Miyoshi Oil & Fat Co Ltd 42 –
42 Mizuno Corp 205 0.01
12 Modec Inc 182 0.01
98 Monex Group Inc 234 0.01
4 MORESCO Corp 50 –
12 Morita Holdings Corp 173 0.01
4 Morito Co Ltd 29 –
17 Morozoff Ltd 68 –
4 Mory Industries Inc 69 –
13 Mr Max Corp 47 –
3 Murakami Corp 67 –
10 Musashi Seimitsu Industry Co Ltd 256 0.01
16 Musashino Bank Ltd 422 0.02
5 Mutoh Holdings Co Ltd 12 –
6 NAC Co Ltd 47 –
61 Nachi-Fujikoshi Corp 238 0.01
5 Nafco Co Ltd 79 –
5 Nagano Bank Ltd 87 –
6 Nagano Keiki Co Ltd 36 –
52 Nagase & Co Ltd 661 0.05
18 Nakabayashi Co Ltd 40 –
– Nakamuraya Co Ltd 8 –
3 Nakano Corp 15 –
2 Nakano Refrigerators Co Ltd 50 –
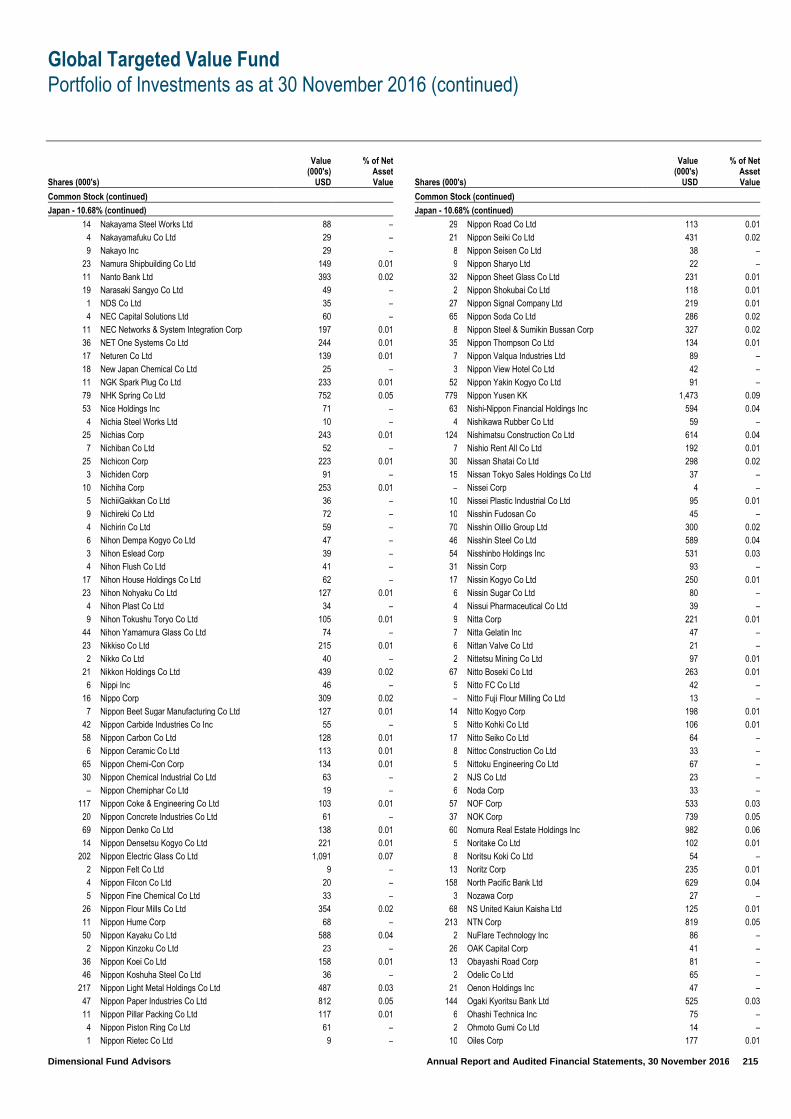
Global Targeted Value Fund
Portfolio of Investments as at 30 November 2016 (continued)
Dimensional Fund Advisors Annual Report and Audited Financial Statements, 30 November 2016 215
Shares (000's)
Value (000's)
USD
% of Net Asset Value
Common Stock (continued)
Japan - 10.68% (continued)
14 Nakayama Steel Works Ltd 88 –
4 Nakayamafuku Co Ltd 29 –
9 Nakayo Inc 29 –
23 Namura Shipbuilding Co Ltd 149 0.01
11 Nanto Bank Ltd 393 0.02
19 Narasaki Sangyo Co Ltd 49 –
1 NDS Co Ltd 35 –
4 NEC Capital Solutions Ltd 60 –
11 NEC Networks & System Integration Corp 197 0.01
36 NET One Systems Co Ltd 244 0.01
17 Neturen Co Ltd 139 0.01
18 New Japan Chemical Co Ltd 25 –
11 NGK Spark Plug Co Ltd 233 0.01
79 NHK Spring Co Ltd 752 0.05
53 Nice Holdings Inc 71 –
4 Nichia Steel Works Ltd 10 –
25 Nichias Corp 243 0.01
7 Nichiban Co Ltd 52 –
25 Nichicon Corp 223 0.01
3 Nichiden Corp 91 –
10 Nichiha Corp 253 0.01
5 NichiiGakkan Co Ltd 36 –
9 Nichireki Co Ltd 72 –
4 Nichirin Co Ltd 59 –
6 Nihon Dempa Kogyo Co Ltd 47 –
3 Nihon Eslead Corp 39 –
4 Nihon Flush Co Ltd 41 –
17 Nihon House Holdings Co Ltd 62 –
23 Nihon Nohyaku Co Ltd 127 0.01
4 Nihon Plast Co Ltd 34 –
9 Nihon Tokushu Toryo Co Ltd 105 0.01
44 Nihon Yamamura Glass Co Ltd 74 –
23 Nikkiso Co Ltd 215 0.01
2 Nikko Co Ltd 40 –
21 Nikkon Holdings Co Ltd 439 0.02
6 Nippi Inc 46 –
16 Nippo Corp 309 0.02
7 Nippon Beet Sugar Manufacturing Co Ltd 127 0.01
42 Nippon Carbide Industries Co Inc 55 –
58 Nippon Carbon Co Ltd 128 0.01
6 Nippon Ceramic Co Ltd 113 0.01
65 Nippon Chemi-Con Corp 134 0.01
30 Nippon Chemical Industrial Co Ltd 63 –
– Nippon Chemiphar Co Ltd 19 –
117 Nippon Coke & Engineering Co Ltd 103 0.01
20 Nippon Concrete Industries Co Ltd 61 –
69 Nippon Denko Co Ltd 138 0.01
14 Nippon Densetsu Kogyo Co Ltd 221 0.01
202 Nippon Electric Glass Co Ltd 1,091 0.07
2 Nippon Felt Co Ltd 9 –
4 Nippon Filcon Co Ltd 20 –
5 Nippon Fine Chemical Co Ltd 33 –
26 Nippon Flour Mills Co Ltd 354 0.02
11 Nippon Hume Corp 68 –
50 Nippon Kayaku Co Ltd 588 0.04
2 Nippon Kinzoku Co Ltd 23 –
36 Nippon Koei Co Ltd 158 0.01
46 Nippon Koshuha Steel Co Ltd 36 –
217 Nippon Light Metal Holdings Co Ltd 487 0.03
47 Nippon Paper Industries Co Ltd 812 0.05
11 Nippon Pillar Packing Co Ltd 117 0.01
4 Nippon Piston Ring Co Ltd 61 –
1 Nippon Rietec Co Ltd 9 –
Shares (000's)
Value (000's)
USD
% of Net Asset Value
Common Stock (continued)
Japan - 10.68% (continued)
29 Nippon Road Co Ltd 113 0.01
21 Nippon Seiki Co Ltd 431 0.02
8 Nippon Seisen Co Ltd 38 –
9 Nippon Sharyo Ltd 22 –
32 Nippon Sheet Glass Co Ltd 231 0.01
2 Nippon Shokubai Co Ltd 118 0.01
27 Nippon Signal Company Ltd 219 0.01
65 Nippon Soda Co Ltd 286 0.02
8 Nippon Steel & Sumikin Bussan Corp 327 0.02
35 Nippon Thompson Co Ltd 134 0.01
7 Nippon Valqua Industries Ltd 89 –
3 Nippon View Hotel Co Ltd 42 –
52 Nippon Yakin Kogyo Co Ltd 91 –
779 Nippon Yusen KK 1,473 0.09
63 Nishi-Nippon Financial Holdings Inc 594 0.04
4 Nishikawa Rubber Co Ltd 59 –
124 Nishimatsu Construction Co Ltd 614 0.04
7 Nishio Rent All Co Ltd 192 0.01
30 Nissan Shatai Co Ltd 298 0.02
15 Nissan Tokyo Sales Holdings Co Ltd 37 –
– Nissei Corp 4 –
10 Nissei Plastic Industrial Co Ltd 95 0.01
10 Nisshin Fudosan Co 45 –
70 Nisshin Oillio Group Ltd 300 0.02
46 Nisshin Steel Co Ltd 589 0.04
54 Nisshinbo Holdings Inc 531 0.03
31 Nissin Corp 93 –
17 Nissin Kogyo Co Ltd 250 0.01
6 Nissin Sugar Co Ltd 80 –
4 Nissui Pharmaceutical Co Ltd 39 –
9 Nitta Corp 221 0.01
7 Nitta Gelatin Inc 47 –
6 Nittan Valve Co Ltd 21 –
2 Nittetsu Mining Co Ltd 97 0.01
67 Nitto Boseki Co Ltd 263 0.01
5 Nitto FC Co Ltd 42 –
– Nitto Fuji Flour Milling Co Ltd 13 –
14 Nitto Kogyo Corp 198 0.01
5 Nitto Kohki Co Ltd 106 0.01
17 Nitto Seiko Co Ltd 64 –
8 Nittoc Construction Co Ltd 33 –
5 Nittoku Engineering Co Ltd 67 –
2 NJS Co Ltd 23 –
6 Noda Corp 33 –
57 NOF Corp 533 0.03
37 NOK Corp 739 0.05
60 Nomura Real Estate Holdings Inc 982 0.06
5 Noritake Co Ltd 102 0.01
8 Noritsu Koki Co Ltd 54 –
13 Noritz Corp 235 0.01
158 North Pacific Bank Ltd 629 0.04
3 Nozawa Corp 27 –
68 NS United Kaiun Kaisha Ltd 125 0.01
213 NTN Corp 819 0.05
2 NuFlare Technology Inc 86 –
26 OAK Capital Corp 41 –
13 Obayashi Road Corp 81 –
2 Odelic Co Ltd 65 –
21 Oenon Holdings Inc 47 –
144 Ogaki Kyoritsu Bank Ltd 525 0.03
6 Ohashi Technica Inc 75 –
2 Ohmoto Gumi Co Ltd 14 –
10 Oiles Corp 177 0.01

Global Targeted Value Fund
Portfolio of Investments as at 30 November 2016 (continued)
Dimensional Fund Advisors Annual Report and Audited Financial Statements, 30 November 2016 216
Shares (000's)
Value (000's)
USD
% of Net Asset Value
Common Stock (continued)
Japan - 10.68% (continued)
75 Oita Bank Ltd 271 0.01
17 Okabe Co Ltd 153 0.01
8 Okamoto Machine Tool Works Ltd 10 –
21 Okamura Corp 179 0.01
66 Okasan Securities Group Inc 387 0.02
26 OKK Corp 27 –
52 OKUMA Corp 465 0.02
44 Okumura Corp 259 0.01
22 Okura Industrial Co Ltd 99 0.01
10 Okuwa Co Ltd 103 0.01
3 Olympic Group Corp 17 –
5 ONO Sokki Co Ltd 36 –
9 Onoken Co Ltd 93 –
61 Onward Holdings Co Ltd 403 0.02
21 Organo Corp 87 –
8 Origin Electric Co Ltd 21 –
10 Osaka Organic Chemical Industry Ltd 69 –
33 Osaka Soda Co Ltd 136 0.01
7 Osaka Steel Co Ltd 125 0.01
14 Osaki Electric Co Ltd 142 0.01
9 Otsuka Kagu Ltd 101 0.01
5 OUG Holdings Inc 11 –
7 Oyo Corp 87 –
19 Pacific Industrial Co Ltd 245 0.01
71 Pacific Metals Co Ltd 240 0.01
4 Pack Corp 87 –
15 Paltac Corporation 333 0.02
32 PanaHome Corp 229 0.01
8 Panasonic Industrial Devices SUNX Co Ltd 48 –
10 Parco Co Ltd 93 –
10 Paris Miki Holdings Inc 37 –
15 PC Depot Corp 73 –
6 Pegasus Sewing Machine Manufacturing Co Ltd 37 –
4 Piolax Inc 213 0.01
137 Pioneer Corp 287 0.02
1 Plant Co Ltd 10 –
13 Pocket Card Co Ltd 67 –
52 Press Kogyo Co Ltd 229 0.01
57 Prospect Co Ltd 21 –
4 Proto Corp 43 –
21 PS Mitsubishi Construction Co Ltd 69 –
5 Punch Industry Co Ltd 40 –
43 Rasa Industries Ltd 50 –
7 Raysum Co Ltd 50 –
8 Renesas Easton Co Ltd 32 –
87 Rengo Co Ltd 518 0.03
5 Renown Inc 4 –
11 Rheon Automatic Machinery Co Ltd 85 –
46 Rhythm Watch Co Ltd 75 –
6 Riberesute Corp 40 –
7 Ricoh Leasing Co Ltd 207 0.01
6 Right On Co Ltd 52 –
4 Riken Corp 159 0.01
5 Riken Keiki Co Ltd 68 –
13 Riken Technos Corp 63 –
1 Riken Vitamin Co Ltd 27 –
5 Rion Co Ltd 70 –
10 Riso Kagaku Corp 173 0.01
1 Roland DG Corp 28 –
30 Round One Corp 207 0.01
71 Ryobi Ltd 288 0.02
15 Ryoden Corp 98 0.01
13 Ryosan Co Ltd 392 0.02
Shares (000's)
Value (000's)
USD
% of Net Asset Value
Common Stock (continued)
Japan - 10.68% (continued)
11 Ryoyo Electro Corp 137 0.01
– S&B Foods Inc 17 –
36 Sakai Chemical Industry Co Ltd 114 0.01
20 Sakai Heavy Industries Ltd 49 –
4 Sakai Moving Service Co Ltd 83 –
3 Sakai Ovex Co Ltd 48 –
16 Sakata INX Corp 208 0.01
17 Sala Corp 96 0.01
4 SAMTY Co Ltd 41 –
1 San Holdings Inc 15 –
31 San-Ai Oil Co Ltd 213 0.01
57 San-In Godo Bank Ltd 443 0.02
66 Sanden Holdings Corp 213 0.01
4 Sanei Architecture Planning Co Ltd 53 –
15 Sangetsu Corp 269 0.01
61 Sanken Electric Co Ltd 263 0.01
20 Sanki Engineering Co Ltd 170 0.01
2 Sanko Metal Industrial Co Ltd 56 –
10 Sankyo Seiko Co Ltd 32 –
12 Sankyo Tateyama Inc 160 0.01
101 Sankyu Inc 595 0.04
12 Sanoh Industrial Co Ltd 80 –
16 Sanoyas Holdings Corp 43 –
2 Sansei Technologies Inc 16 –
7 Sansha Electric Manufacturing Co Ltd 30 –
11 Sanshin Electronics Co Ltd 94 0.01
1 Sanyei Corp 37 –
6 Sanyo Chemical Industries Ltd 247 0.01
23 Sanyo Denki Co Ltd 150 0.01
8 Sanyo Engineering & Construction Inc 44 –
4 Sanyo Housing Nagoya Co Ltd 30 –
61 Sanyo Shokai Ltd 85 –
44 Sanyo Special Steel Co Ltd 223 0.01
5 Sanyo Trading Co Ltd 73 –
9 Sata Construction Co Ltd 35 –
4 Sato Shoji Corp 31 –
4 Satori Electric Co Ltd 24 –
13 Sawada Holdings Co Ltd 95 0.01
17 Saxa Holdings Inc 33 –
100 SBI Holdings Inc 1,273 0.08
6 SBS Holdings Inc 45 –
9 Scroll Corp 27 –
1 Secom Joshinetsu Co Ltd 26 –
3 Seibu Electric Industry Co Ltd 51 –
18 Seika Corp 52 –
11 Seikitokyu Kogyo Co Ltd 51 –
73 Seiko Holdings Corp 261 0.01
69 Seino Holdings Co Ltd 771 0.05
22 Seiren Co Ltd 285 0.02
12 Sekisui Jushi Corp 181 0.01
13 Sekisui Plastics Co Ltd 92 –
37 Senko Co Ltd 265 0.01
4 Senshu Electric Co Ltd 65 –
114 Senshu Ikeda Holdings Inc 500 0.03
12 Senshukai Co Ltd 79 –
2 Shibaura Electronics Co Ltd 40 –
25 Shibaura Mechatronics Corp 58 –
28 Shibusawa Warehouse Co Ltd 83 –
5 Shibuya Corp 96 0.01
101 Shiga Bank Ltd 533 0.03
31 Shikibo Ltd 38 –
92 Shikoku Bank Ltd 239 0.01
19 Shikoku Chemicals Corp 167 0.01

Global Targeted Value Fund
Portfolio of Investments as at 30 November 2016 (continued)
Dimensional Fund Advisors Annual Report and Audited Financial Statements, 30 November 2016 217
Shares (000's)
Value (000's)
USD
% of Net Asset Value
Common Stock (continued)
Japan - 10.68% (continued)
13 Shima Seiki Manufacturing Ltd 386 0.02
24 Shimachu Co Ltd 623 0.04
1 Shimane Bank Ltd 11 –
5 Shimizu Bank Ltd 143 0.01
6 Shimojima Co Ltd 53 –
7 Shin Nippon Air Technologies Co Ltd 76 –
19 Shin-Etsu Polymer Co Ltd 124 0.01
27 Shinagawa Refractories Co Ltd 60 –
31 Shindengen Electric Manufacturing Co Ltd 119 0.01
7 Shinkawa Ltd 41 –
32 Shinko Electric Industries Co Ltd 200 0.01
17 Shinko Plantech Co Ltd 123 0.01
12 Shinko Shoji Co Ltd 125 0.01
42 Shinmaywa Industries Ltd 359 0.02
10 Shinnihon Corp 85 –
836 Shinsei Bank Ltd 1,362 0.08
3 Shinsho Corp 54 –
1 Shinwa Co Ltd 12 –
2 Shizuki Electric Co Inc 11 –
26 Shizuoka Gas Co Ltd 180 0.01
7 Shobunsha Publications Inc 38 –
6 Shoei Foods Corp 95 0.01
7 Shofu Inc 77 –
6 Showa Aircraft Industry Co Ltd 53 –
26 Showa Corp 155 0.01
74 Showa Denko KK 1,008 0.06
35 Showa Sangyo Co Ltd 180 0.01
15 Showa Shell Sekiyu KK 136 0.01
3 Sinanen Holdings Co Ltd 56 –
69 Sinfonia Technology Co Ltd 149 0.01
7 Sinko Industries Ltd 78 –
24 Sintokogio Ltd 192 0.01
3 SK-Electronics Co Ltd 20 –
68 SKY Perfect JSAT Holdings Inc 329 0.02
21 SMK Corp 80 –
8 SNT Corp 42 –
5 Soda Nikka Co Ltd 22 –
20 Sodick Co Ltd 157 0.01
3 Soft99 Corp 21 –
602 Sojitz Corp 1,547 0.09
5 Soken Chemical & Engineering Co Ltd 48 –
1 Sotoh Co Ltd 12 –
1 SPK Corp 19 –
3 ST Corp 38 –
3 Starzen Co Ltd 108 0.01
2 Step Co Ltd 26 –
4 Sugimoto & Co Ltd 59 –
20 Suminoe Textile Co Ltd 43 –
32 Sumiseki Holdings Inc 27 –
83 Sumitomo Bakelite Co Ltd 454 0.02
11 Sumitomo Densetsu Co Ltd 123 0.01
52 Sumitomo Forestry Co Ltd 717 0.05
261 Sumitomo Heavy Industries Ltd 1,602 0.10
157 Sumitomo Osaka Cement Co Ltd 559 0.04
20 Sumitomo Precision Products Co Ltd 61 –
1 Sumitomo Real Estate Sales Co Ltd 17 –
21 Sumitomo Riko Co Ltd 191 0.01
64 Sumitomo Rubber Industries Ltd 1,073 0.07
4 Sumitomo Seika Chemicals Co Ltd 137 0.01
67 Sumitomo Warehouse Co Ltd 348 0.02
4 Sun-Wa Technos Corp 31 –
8 Suncall Corp 38 –
139 SWCC Showa Holdings Co Ltd 104 0.01
Shares (000's)
Value (000's)
USD
% of Net Asset Value
Common Stock (continued)
Japan - 10.68% (continued)
11 T Hasegawa Co Ltd 190 0.01
27 T RAD Co Ltd 58 –
10 T&K Toka Co Ltd 89 –
18 Tabuchi Electric Co Ltd 59 –
16 Tachi-S Co Ltd 242 0.01
8 Tachibana Eletech Co Ltd 93 –
4 Tachikawa Corp 29 –
44 Tadano Ltd 477 0.03
14 Taihei Dengyo Kaisha Ltd 136 0.01
477 Taiheiyo Cement Corp 1,512 0.09
38 Taiheiyo Kouhatsu Inc 32 –
6 Taiho Kogyo Co Ltd 89 –
10 Taikisha Ltd 259 0.01
23 Taiko Bank Ltd 53 –
2 Taisei Lamick Co Ltd 57 –
55 Taiyo Yuden Co Ltd 607 0.04
4 Takachiho Koheki Co Ltd 36 –
15 Takagi Securities Co Ltd 24 –
5 Takamatsu Construction Group Co Ltd 110 0.01
2 Takano Co Ltd 15 –
7 Takaoka Toko Co Ltd 120 0.01
17 Takara Standard Co Ltd 276 0.01
8 Takasago International Corp 207 0.01
17 Takasago Thermal Engineering Co Ltd 233 0.01
20 Takashima & Co Ltd 33 –
145 Takashimaya Co Ltd 1,216 0.07
13 Takata Corp 68 –
4 Take And Give Needs Co Ltd 28 –
4 TAKEBISHI Corp 33 –
14 Takeei Corp 108 0.01
2 Taki Chemical Co Ltd 14 –
3 Takigami Steel Construction Co Ltd 12 –
8 Takihyo Co Ltd 30 –
23 Takiron Co Ltd 102 0.01
15 Takisawa Machine Tool Co Ltd 20 –
5 Takuma Co Ltd 42 –
4 Tama Home Co Ltd 21 –
9 Tamron Co Ltd 156 0.01
42 Tamura Corp 164 0.01
27 Tatsuta Electric Wire and Cable Co Ltd 112 0.01
13 Tayca Corp 70 –
5 TBK Co Ltd 21 –
2 Techno Medica Co Ltd 38 –
2 Techno Ryowa Ltd 11 –
53 Teijin Ltd 988 0.06
7 Teikoku Sen-I Co Ltd 100 0.01
31 Teikoku Tsushin Kogyo Co Ltd 46 –
8 Tenma Corp 128 0.01
7 Tigers Polymer Corp 44 –
33 TIS Inc 698 0.05
4 TKC Corp 101 0.01
11 Toa Corp (Hyogo) 91 –
9 Toa Corp (Tokyo) 149 0.01
25 Toa Oil Co Ltd 33 –
30 Toa Road Corp 84 –
3 Toabo Corp 14 –
49 Toagosei Co Ltd 478 0.03
1 Tobu Store Co Ltd 17 –
5 Tocalo Co Ltd 107 0.01
31 Tochigi Bank Ltd 136 0.01
88 Toda Corp 498 0.03
31 Toda Kogyo Corp 78 –
32 Toei Co Ltd 260 0.01

Global Targeted Value Fund
Portfolio of Investments as at 30 November 2016 (continued)
Dimensional Fund Advisors Annual Report and Audited Financial Statements, 30 November 2016 218
Shares (000's)
Value (000's)
USD
% of Net Asset Value
Common Stock (continued)
Japan - 10.68% (continued)
19 Toenec Corp 89 –
8 Togami Electric Manufacturing Co Ltd 31 –
93 Toho Bank Ltd 339 0.02
3 Toho Co Ltd 61 –
21 Toho Holdings Co Ltd 414 0.02
51 Toho Zinc Co Ltd 198 0.01
35 Tohoku Bank Ltd 46 –
8 Tohokushinsha Film Corp 47 –
1 Tohto Suisan Co Ltd 17 –
106 Tokai Carbon Co Ltd 357 0.02
23 Tokai Lease Co Ltd 40 –
23 Tokai Rika Co Ltd 465 0.02
86 Tokai Tokyo Financial Holdings Inc 450 0.02
5 Tokushu Tokai Paper Co Ltd 162 0.01
18 Tokyo Broadcasting System Holdings Inc 292 0.02
37 Tokyo Dome Corp 386 0.02
2 Tokyo Electron Device Ltd 29 –
10 Tokyo Energy & Systems Inc 84 –
31 Tokyo Keiki Inc 59 –
14 Tokyo Ohka Kogyo Co Ltd 472 0.03
10 Tokyo Rakutenchi Co Ltd 44 –
6 Tokyo Sangyo Co Ltd 24 –
33 Tokyo Steel Manufacturing Co Ltd 243 0.01
19 Tokyo Tekko Co Ltd 78 –
40 Tokyo Theatres Co Inc 65 –
13 Tokyo TY Financial Group Inc 441 0.02
59 Tokyotokeiba Co Ltd 145 0.01
45 Tokyu Fudosan Holdings Corp 259 0.01
9 Tokyu Recreation Co Ltd 61 –
22 Toli Corp 74 –
5 Tomato Bank Ltd 74 –
1 Tomen Devices Corp 20 –
9 Tomoe Corp 29 –
4 Tomoe Engineering Co Ltd 47 –
36 Tomoku Co Ltd 102 0.01
77 TOMONY Holdings Inc 402 0.02
37 Tonami Holdings Co Ltd 113 0.01
23 Toppan Forms Co Ltd 223 0.01
13 Topre Corp 299 0.02
10 Topy Industries Ltd 250 0.01
5 Torex Semiconductor Ltd 65 –
9 Torigoe Co Ltd 61 –
8 Torii Pharmaceutical Co Ltd 176 0.01
5 Torishima Pump Manufacturing Co Ltd 49 –
16 Tosei Corp 117 0.01
54 Toshiba Machine Co Ltd 205 0.01
16 Toshiba Plant Systems & Services Corp 246 0.01
23 Tosho Printing Co Ltd 94 0.01
111 Tosoh Corp 758 0.05
2 Totech Corp 27 –
3 Tottori Bank Ltd 42 –
3 Toukei Computer Co Ltd 53 –
169 Towa Bank Ltd 161 0.01
7 Towa Corp 83 –
4 Towa Pharmaceutical Co Ltd 134 0.01
28 Toyo Construction Co Ltd 103 0.01
7 Toyo Corp 55 –
4 Toyo Denki Seizo KK 52 –
48 Toyo Engineering Corp 135 0.01
88 Toyo Ink SC Holdings Co Ltd 405 0.02
58 Toyo Kanetsu KK 181 0.01
20 Toyo Kohan Co Ltd 65 –
10 Toyo Machinery & Metal Co Ltd 39 –
Shares (000's)
Value (000's)
USD
% of Net Asset Value
Common Stock (continued)
Japan - 10.68% (continued)
34 Toyo Securities Co Ltd 71 –
78 Toyo Seikan Group Holdings Ltd 1,483 0.08
7 Toyo Tanso Co Ltd 110 0.01
38 Toyo Tire & Rubber Co Ltd 476 0.03
25 Toyo Wharf & Warehouse Co Ltd 41 –
334 Toyobo Co Ltd 506 0.03
29 Toyoda Gosei Co Ltd 629 0.04
8 TPR Co Ltd 213 0.01
20 TS Tech Co Ltd 540 0.03
39 TSI Holdings Co Ltd 224 0.01
50 Tsubakimoto Chain Co 400 0.02
4 Tsubakimoto Kogyo Co Ltd 12 –
16 Tsudakoma Corp 22 –
21 Tsugami Corp 117 0.01
7 Tsukada Global Holdings Inc 43 –
12 Tsukishima Kikai Co Ltd 133 0.01
47 Tsukuba Bank Ltd 141 0.01
7 Tsurumi Manufacturing Co Ltd 106 0.01
5 Tsutsumi Jewelry Co Ltd 75 –
8 TTK Co Ltd 34 –
12 TV Asahi Holdings Corp 222 0.01
6 Tv Tokyo Holdings Corp 125 0.01
13 U-Shin Ltd 83 –
134 UACJ Corp 390 0.02
512 Ube Industries Ltd 1,080 0.07
20 Uchida Yoko Co Ltd 80 –
11 Uchiyama Holdings Co Ltd 40 –
15 Ueki Corp 30 –
8 UKC Holdings Corp 150 0.01
20 Uniden Holdings Corp 28 –
3 Union Tool Co 67 –
20 Unipres Corp 397 0.02
23 United Super Markets Holdings Inc 188 0.01
9 Universal Entertainment Corp 232 0.01
7 Unizo Holdings Co Ltd 205 0.01
53 Ushio Inc 653 0.04
11 Utoc Corp 41 –
1 Village Vanguard Co Ltd 11 –
19 Vital KSK Holdings Inc 165 0.01
3 Vitec Holdings Co Ltd 31 –
49 Wacoal Holdings Corp 574 0.04
65 Wakachiku Construction Co Ltd 93 –
18 Wakita & Co Ltd 151 0.01
6 Warabeya Nichiyo Holdings Co Ltd 129 0.01
24 Wood One Co Ltd 57 –
14 Xebio Holdings Co Ltd 216 0.01
7 Y A C Co Ltd 81 –
3 Yachiyo Industry Co Ltd 25 –
13 Yahagi Construction Co Ltd 115 0.01
4 Yaizu Suisankagaku Industry Co Ltd 32 –
13 Yamabiko Corp 156 0.01
70 Yamagata Bank Ltd 291 0.02
95 Yamaguchi Financial Group Inc 1,000 0.06
7 Yamaichi Electronics Co Ltd 69 –
65 Yamanashi Chuo Bank Ltd 291 0.02
4 Yamatane Corp 48 –
7 Yamato Corp 32 –
5 Yamato International Inc 19 –
20 Yamato Kogyo Co Ltd 561 0.04
2 Yamaya Corp 28 –
2 Yamazawa Co Ltd 26 –
24 Yamazen Corp 189 0.01
6 Yashima Denki Co Ltd 29 –
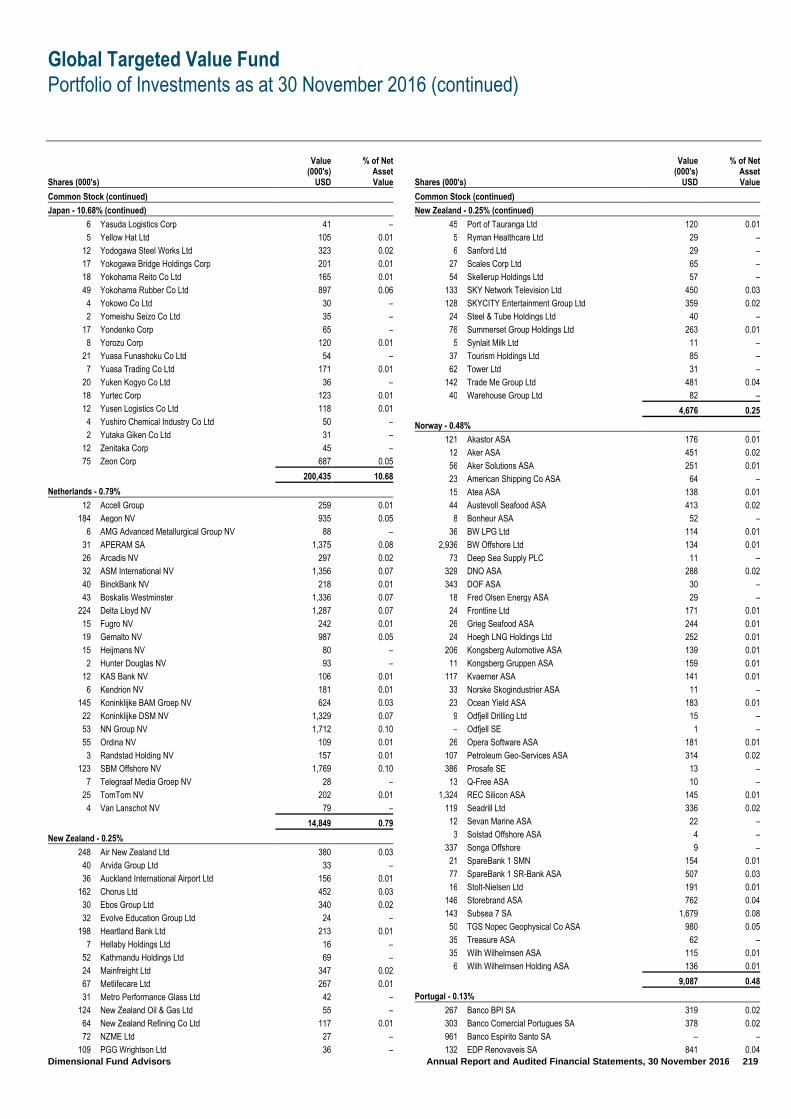
Global Targeted Value Fund
Portfolio of Investments as at 30 November 2016 (continued)
Dimensional Fund Advisors Annual Report and Audited Financial Statements, 30 November 2016 219
Shares (000's)
Value (000's)
USD
% of Net Asset Value
Common Stock (continued)
Japan - 10.68% (continued)
6 Yasuda Logistics Corp 41 –
5 Yellow Hat Ltd 105 0.01
12 Yodogawa Steel Works Ltd 323 0.02
17 Yokogawa Bridge Holdings Corp 201 0.01
18 Yokohama Reito Co Ltd 165 0.01
49 Yokohama Rubber Co Ltd 897 0.06
4 Yokowo Co Ltd 30 –
2 Yomeishu Seizo Co Ltd 35 –
17 Yondenko Corp 65 –
8 Yorozu Corp 120 0.01
21 Yuasa Funashoku Co Ltd 54 –
7 Yuasa Trading Co Ltd 171 0.01
20 Yuken Kogyo Co Ltd 36 –
18 Yurtec Corp 123 0.01
12 Yusen Logistics Co Ltd 118 0.01
4 Yushiro Chemical Industry Co Ltd 50 –
2 Yutaka Giken Co Ltd 31 –
12 Zenitaka Corp 45 –
75 Zeon Corp 687 0.05
200,435 10.68
Netherlands - 0.79%
12 Accell Group 259 0.01
184 Aegon NV 935 0.05
6 AMG Advanced Metallurgical Group NV 88 –
31 APERAM SA 1,375 0.08
26 Arcadis NV 297 0.02
32 ASM International NV 1,356 0.07
40 BinckBank NV 218 0.01
43 Boskalis Westminster 1,336 0.07
224 Delta Lloyd NV 1,287 0.07
15 Fugro NV 242 0.01
19 Gemalto NV 987 0.05
15 Heijmans NV 80 –
2 Hunter Douglas NV 93 –
12 KAS Bank NV 106 0.01
6 Kendrion NV 181 0.01
145 Koninklijke BAM Groep NV 624 0.03
22 Koninklijke DSM NV 1,329 0.07
53 NN Group NV 1,712 0.10
55 Ordina NV 109 0.01
3 Randstad Holding NV 157 0.01
123 SBM Offshore NV 1,769 0.10
7 Telegraaf Media Groep NV 28 –
25 TomTom NV 202 0.01
4 Van Lanschot NV 79 –
14,849 0.79
New Zealand - 0.25%
248 Air New Zealand Ltd 380 0.03
40 Arvida Group Ltd 33 –
36 Auckland International Airport Ltd 156 0.01
162 Chorus Ltd 452 0.03
30 Ebos Group Ltd 340 0.02
32 Evolve Education Group Ltd 24 –
198 Heartland Bank Ltd 213 0.01
7 Hellaby Holdings Ltd 16 –
52 Kathmandu Holdings Ltd 69 –
24 Mainfreight Ltd 347 0.02
67 Metlifecare Ltd 267 0.01
31 Metro Performance Glass Ltd 42 –
124 New Zealand Oil & Gas Ltd 55 –
64 New Zealand Refining Co Ltd 117 0.01
72 NZME Ltd 27 –
109 PGG Wrightson Ltd 36 –
Shares (000's)
Value (000's)
USD
% of Net Asset Value
Common Stock (continued)
New Zealand - 0.25% (continued)
45 Port of Tauranga Ltd 120 0.01
5 Ryman Healthcare Ltd 29 –
6 Sanford Ltd 29 –
27 Scales Corp Ltd 65 –
54 Skellerup Holdings Ltd 57 –
133 SKY Network Television Ltd 450 0.03
128 SKYCITY Entertainment Group Ltd 359 0.02
24 Steel & Tube Holdings Ltd 40 –
76 Summerset Group Holdings Ltd 263 0.01
5 Synlait Milk Ltd 11 –
37 Tourism Holdings Ltd 85 –
62 Tower Ltd 31 –
142 Trade Me Group Ltd 481 0.04
40 Warehouse Group Ltd 82 –
4,676 0.25
Norway - 0.48%
121 Akastor ASA 176 0.01
12 Aker ASA 451 0.02
56 Aker Solutions ASA 251 0.01
23 American Shipping Co ASA 64 –
15 Atea ASA 138 0.01
44 Austevoll Seafood ASA 413 0.02
8 Bonheur ASA 52 –
36 BW LPG Ltd 114 0.01
2,936 BW Offshore Ltd 134 0.01
73 Deep Sea Supply PLC 11 –
329 DNO ASA 288 0.02
343 DOF ASA 30 –
18 Fred Olsen Energy ASA 29 –
24 Frontline Ltd 171 0.01
26 Grieg Seafood ASA 244 0.01
24 Hoegh LNG Holdings Ltd 252 0.01
206 Kongsberg Automotive ASA 139 0.01
11 Kongsberg Gruppen ASA 159 0.01
117 Kvaerner ASA 141 0.01
33 Norske Skogindustrier ASA 11 –
23 Ocean Yield ASA 183 0.01
9 Odfjell Drilling Ltd 15 –
– Odfjell SE 1 –
26 Opera Software ASA 181 0.01
107 Petroleum Geo-Services ASA 314 0.02
386 Prosafe SE 13 –
13 Q-Free ASA 10 –
1,324 REC Silicon ASA 145 0.01
119 Seadrill Ltd 336 0.02
12 Sevan Marine ASA 22 –
3 Solstad Offshore ASA 4 –
337 Songa Offshore 9 –
21 SpareBank 1 SMN 154 0.01
77 SpareBank 1 SR-Bank ASA 507 0.03
16 Stolt-Nielsen Ltd 191 0.01
146 Storebrand ASA 762 0.04
143 Subsea 7 SA 1,679 0.08
50 TGS Nopec Geophysical Co ASA 980 0.05
35 Treasure ASA 62 –
35 Wilh Wilhelmsen ASA 115 0.01
6 Wilh Wilhelmsen Holding ASA 136 0.01
9,087 0.48
Portugal - 0.13%
267 Banco BPI SA 319 0.02
303 Banco Comercial Portugues SA 378 0.02
961 Banco Espirito Santo SA – –
132 EDP Renovaveis SA 841 0.04
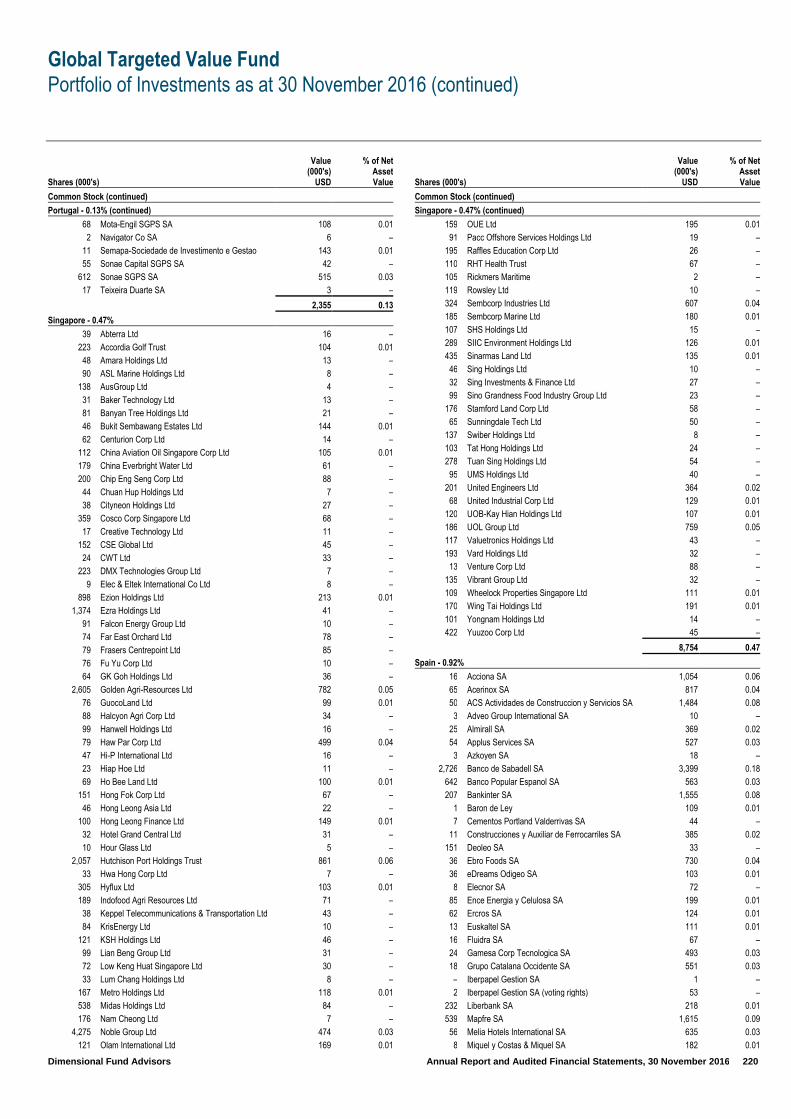
Global Targeted Value Fund
Portfolio of Investments as at 30 November 2016 (continued)
Dimensional Fund Advisors Annual Report and Audited Financial Statements, 30 November 2016 220
Shares (000's)
Value (000's)
USD
% of Net Asset Value
Common Stock (continued)
Portugal - 0.13% (continued)
68 Mota-Engil SGPS SA 108 0.01
2 Navigator Co SA 6 –
11 Semapa-Sociedade de Investimento e Gestao 143 0.01
55 Sonae Capital SGPS SA 42 –
612 Sonae SGPS SA 515 0.03
17 Teixeira Duarte SA 3 –
2,355 0.13
Singapore - 0.47%
39 Abterra Ltd 16 –
223 Accordia Golf Trust 104 0.01
48 Amara Holdings Ltd 13 –
90 ASL Marine Holdings Ltd 8 –
138 AusGroup Ltd 4 –
31 Baker Technology Ltd 13 –
81 Banyan Tree Holdings Ltd 21 –
46 Bukit Sembawang Estates Ltd 144 0.01
62 Centurion Corp Ltd 14 –
112 China Aviation Oil Singapore Corp Ltd 105 0.01
179 China Everbright Water Ltd 61 –
200 Chip Eng Seng Corp Ltd 88 –
44 Chuan Hup Holdings Ltd 7 –
38 Cityneon Holdings Ltd 27 –
359 Cosco Corp Singapore Ltd 68 –
17 Creative Technology Ltd 11 –
152 CSE Global Ltd 45 –
24 CWT Ltd 33 –
223 DMX Technologies Group Ltd 7 –
9 Elec & Eltek International Co Ltd 8 –
898 Ezion Holdings Ltd 213 0.01
1,374 Ezra Holdings Ltd 41 –
91 Falcon Energy Group Ltd 10 –
74 Far East Orchard Ltd 78 –
79 Frasers Centrepoint Ltd 85 –
76 Fu Yu Corp Ltd 10 –
64 GK Goh Holdings Ltd 36 –
2,605 Golden Agri-Resources Ltd 782 0.05
76 GuocoLand Ltd 99 0.01
88 Halcyon Agri Corp Ltd 34 –
99 Hanwell Holdings Ltd 16 –
79 Haw Par Corp Ltd 499 0.04
47 Hi-P International Ltd 16 –
23 Hiap Hoe Ltd 11 –
69 Ho Bee Land Ltd 100 0.01
151 Hong Fok Corp Ltd 67 –
46 Hong Leong Asia Ltd 22 –
100 Hong Leong Finance Ltd 149 0.01
32 Hotel Grand Central Ltd 31 –
10 Hour Glass Ltd 5 –
2,057 Hutchison Port Holdings Trust 861 0.06
33 Hwa Hong Corp Ltd 7 –
305 Hyflux Ltd 103 0.01
189 Indofood Agri Resources Ltd 71 –
38 Keppel Telecommunications & Transportation Ltd 43 –
84 KrisEnergy Ltd 10 –
121 KSH Holdings Ltd 46 –
99 Lian Beng Group Ltd 31 –
72 Low Keng Huat Singapore Ltd 30 –
33 Lum Chang Holdings Ltd 8 –
167 Metro Holdings Ltd 118 0.01
538 Midas Holdings Ltd 84 –
176 Nam Cheong Ltd 7 –
4,275 Noble Group Ltd 474 0.03
121 Olam International Ltd 169 0.01
Shares (000's)
Value (000's)
USD
% of Net Asset Value
Common Stock (continued)
Singapore - 0.47% (continued)
159 OUE Ltd 195 0.01
91 Pacc Offshore Services Holdings Ltd 19 –
195 Raffles Education Corp Ltd 26 –
110 RHT Health Trust 67 –
105 Rickmers Maritime 2 –
119 Rowsley Ltd 10 –
324 Sembcorp Industries Ltd 607 0.04
185 Sembcorp Marine Ltd 180 0.01
107 SHS Holdings Ltd 15 –
289 SIIC Environment Holdings Ltd 126 0.01
435 Sinarmas Land Ltd 135 0.01
46 Sing Holdings Ltd 10 –
32 Sing Investments & Finance Ltd 27 –
99 Sino Grandness Food Industry Group Ltd 23 –
176 Stamford Land Corp Ltd 58 –
65 Sunningdale Tech Ltd 50 –
137 Swiber Holdings Ltd 8 –
103 Tat Hong Holdings Ltd 24 –
278 Tuan Sing Holdings Ltd 54 –
95 UMS Holdings Ltd 40 –
201 United Engineers Ltd 364 0.02
68 United Industrial Corp Ltd 129 0.01
120 UOB-Kay Hian Holdings Ltd 107 0.01
186 UOL Group Ltd 759 0.05
117 Valuetronics Holdings Ltd 43 –
193 Vard Holdings Ltd 32 –
13 Venture Corp Ltd 88 –
135 Vibrant Group Ltd 32 –
109 Wheelock Properties Singapore Ltd 111 0.01
170 Wing Tai Holdings Ltd 191 0.01
101 Yongnam Holdings Ltd 14 –
422 Yuuzoo Corp Ltd 45 –
8,754 0.47
Spain - 0.92%
16 Acciona SA 1,054 0.06
65 Acerinox SA 817 0.04
50 ACS Actividades de Construccion y Servicios SA 1,484 0.08
3 Adveo Group International SA 10 –
25 Almirall SA 369 0.02
54 Applus Services SA 527 0.03
3 Azkoyen SA 18 –
2,726 Banco de Sabadell SA 3,399 0.18
642 Banco Popular Espanol SA 563 0.03
207 Bankinter SA 1,555 0.08
1 Baron de Ley 109 0.01
7 Cementos Portland Valderrivas SA 44 –
11 Construcciones y Auxiliar de Ferrocarriles SA 385 0.02
151 Deoleo SA 33 –
36 Ebro Foods SA 730 0.04
36 eDreams Odigeo SA 103 0.01
8 Elecnor SA 72 –
85 Ence Energia y Celulosa SA 199 0.01
62 Ercros SA 124 0.01
13 Euskaltel SA 111 0.01
16 Fluidra SA 67 –
24 Gamesa Corp Tecnologica SA 493 0.03
18 Grupo Catalana Occidente SA 551 0.03
– Iberpapel Gestion SA 1 –
2 Iberpapel Gestion SA (voting rights) 53 –
232 Liberbank SA 218 0.01
539 Mapfre SA 1,615 0.09
56 Melia Hotels International SA 635 0.03
8 Miquel y Costas & Miquel SA 182 0.01

Global Targeted Value Fund
Portfolio of Investments as at 30 November 2016 (continued)
Dimensional Fund Advisors Annual Report and Audited Financial Statements, 30 November 2016 221
Shares (000's)
Value (000's)
USD
% of Net Asset Value
Common Stock (continued)
Spain - 0.92% (continued)
106 NH Hotel Group SA 411 0.02
71 Obrascon Huarte Lain SA 194 0.01
23 Papeles y Cartones de Europa SA 124 0.01
6 Pescanova SA – –
25 Quabit Inmobiliaria SA 49 –
31 Realia Business SA 29 –
173 Sacyr SA 361 0.02
23 Talgo SA 116 0.01
16 Tecnocom Telecomunicaciones y Energia SA 66 –
65 Tubacex SA 182 0.01
38 Tubos Reunidos SA 34 –
4 Vidrala SA 225 0.01
33 Vocento SA 39 –
17,351 0.92
Sweden - 1.05%
9 AAK AB 523 0.04
45 Acando AB 119 0.01
2 AddNode Group AB 10 –
23 AF AB 404 0.02
4 Arise AB 10 –
11 B&B Tools AB 230 0.01
2 BE Group AB 8 –
7 Beijer Alma AB 171 0.01
– Beijer Electronics AB 2 –
8 Beijer Ref AB 203 0.01
70 BillerudKorsnas AB 1,163 0.07
13 Biotage AB 67 –
8 Bjorn Borg AB 28 –
39 Boliden AB 1,012 0.06
1 Bonava AB 15 –
29 Bonava AB, Shares B 375 0.02
11 Bulten AB 102 0.01
25 Bure Equity AB 263 0.01
23 Byggmax Group AB 142 0.01
3 Cavotec SA 8 –
112 Cloetta AB 354 0.02
51 Com Hem Holding AB 452 0.02
15 Concordia Maritime AB 22 –
9 Doro AB 52 –
15 Duni AB 184 0.01
18 Dustin Group AB 118 0.01
11 East Capital Explorer AB 77 –
4 Elanders AB 41 –
46 Elekta AB 384 0.02
– Elos Medtech AB 3 –
6 Eltel AB 33 –
3 Enea AB 30 –
40 Getinge AB 607 0.03
24 Granges AB 226 0.01
19 Gunnebo AB 83 –
11 Haldex AB 139 0.01
14 HIQ International AB 89 –
9 Hoist Finance AB 85 –
22 Holmen AB 752 0.04
7 Husqvarna AB, Class A 54 –
95 Husqvarna AB, Class B 706 0.04
25 Inwido AB 243 0.01
21 JM AB 570 0.03
25 KappAhl AB 120 0.01
6 KNOW IT AB 57 –
34 Lindab International AB 284 0.02
21 Loomis AB 565 0.03
4 Medivir AB 31 –
Shares (000's)
Value (000's)
USD
% of Net Asset Value
Common Stock (continued)
Sweden - 1.05% (continued)
10 Mekonomen AB 175 0.01
18 Modern Times Group MTG AB 480 0.03
12 MQ Holding AB 47 –
135 Net Insight AB 108 0.01
25 New Wave Group AB 126 0.01
46 Nibe Industrier AB 338 0.02
27 Nobia AB 222 0.01
8 Nolato AB 219 0.01
27 Nordnet AB 112 0.01
78 Opus Group AB 54 –
5 Pandox AB 70 –
70 Peab AB 542 0.03
85 Pricer AB 78 –
32 Qliro Group AB 33 –
92 Ratos AB 379 0.02
15 Recipharm AB 202 0.01
41 Rezidor Hotel Group AB 146 0.01
51 Rottneros AB 42 –
21 Saab AB 795 0.04
15 Scandi Standard AB 87 –
5 Semcon AB 23 –
8 SkiStar AB 147 0.01
16 SSAB AB 61 –
101 SSAB AB, Class A 389 0.02
91 SSAB AB, Class B 294 0.02
224 SSAB AB, Class B (Sweden listing) 727 0.04
20 Sweco AB 399 0.02
10 Swedol AB 25 –
4 Systemair AB 55 –
14 Tele2 AB 110 0.01
123 Tele2 AB, Class B 941 0.06
21 Thule Group AB 289 0.02
5 Transcom Worldwide AB 37 –
39 Trelleborg AB 718 0.04
19,686 1.05
Switzerland - 1.94%
23 AFG Arbonia-Forster Holding AG 353 0.02
8 Allreal Holding AG 1,102 0.06
2 Alpiq Holding AG 138 0.01
2 ALSO Holding AG 131 0.01
41 Aryzta AG 1,748 0.09
1 Bachem Holding AG 95 0.01
27 Baloise Holding AG 3,306 0.18
3 Bank Coop AG 107 0.01
– Banque Cantonale de Geneve 110 0.01
1 Banque Cantonale Vaudoise 685 0.04
1 Basler Kantonalbank 93 –
1 Bell AG 226 0.01
4 Bellevue Group AG 65 –
2 Berner Kantonalbank AG 392 0.02
4 Bobst Group SA 285 0.02
3 Bucher Industries AG 749 0.04
2 Calida Holding AG 52 –
– Carlo Gavazzi Holding AG 37 –
7 Cembra Money Bank AG 497 0.03
– Cham Paper Holding AG 20 –
6 Charles Voegele Holding AG 38 –
– Cicor Technologies 13 –
1 Cie Financiere Tradition SA 104 0.01
139 Clariant AG 2,250 0.12
1 Conzzeta AG 412 0.02
2 DKSH Holding AG 138 0.01
11 Dufry AG 1,366 0.07
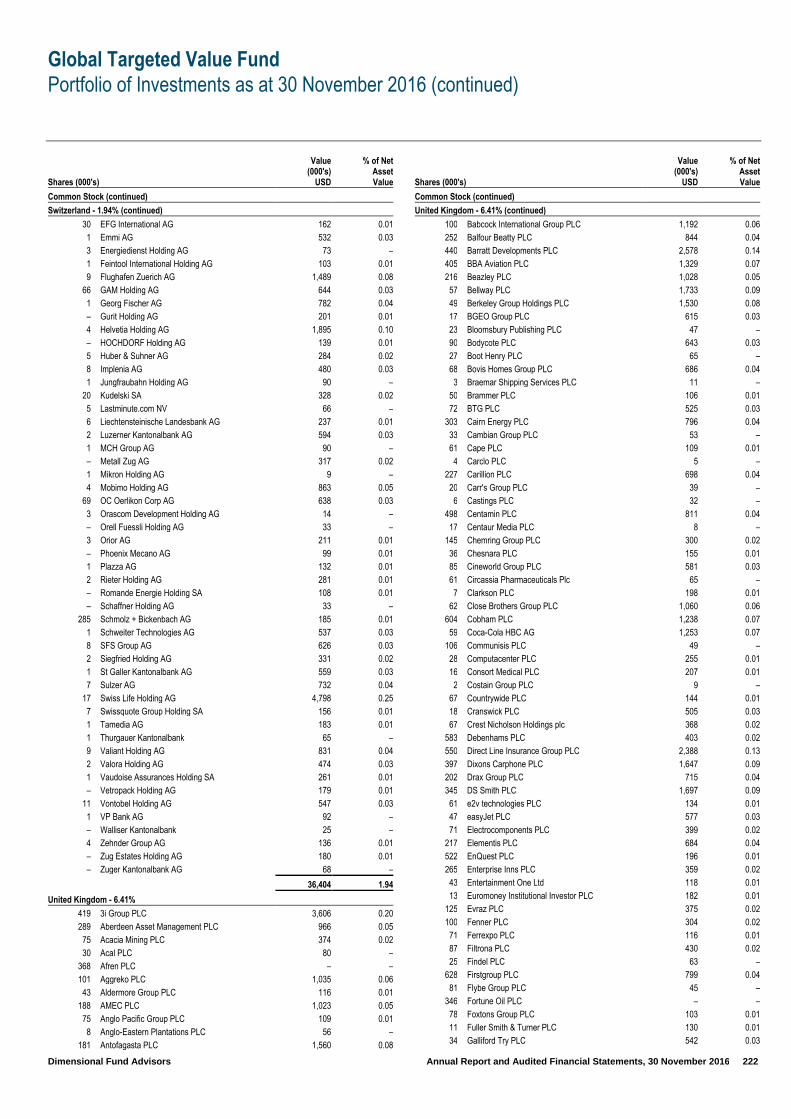
Global Targeted Value Fund
Portfolio of Investments as at 30 November 2016 (continued)
Dimensional Fund Advisors Annual Report and Audited Financial Statements, 30 November 2016 222
Shares (000's)
Value (000's)
USD
% of Net Asset Value
Common Stock (continued)
Switzerland - 1.94% (continued)
30 EFG International AG 162 0.01
1 Emmi AG 532 0.03
3 Energiedienst Holding AG 73 –
1 Feintool International Holding AG 103 0.01
9 Flughafen Zuerich AG 1,489 0.08
66 GAM Holding AG 644 0.03
1 Georg Fischer AG 782 0.04
– Gurit Holding AG 201 0.01
4 Helvetia Holding AG 1,895 0.10
– HOCHDORF Holding AG 139 0.01
5 Huber & Suhner AG 284 0.02
8 Implenia AG 480 0.03
1 Jungfraubahn Holding AG 90 –
20 Kudelski SA 328 0.02
5 Lastminute.com NV 66 –
6 Liechtensteinische Landesbank AG 237 0.01
2 Luzerner Kantonalbank AG 594 0.03
1 MCH Group AG 90 –
– Metall Zug AG 317 0.02
1 Mikron Holding AG 9 –
4 Mobimo Holding AG 863 0.05
69 OC Oerlikon Corp AG 638 0.03
3 Orascom Development Holding AG 14 –
– Orell Fuessli Holding AG 33 –
3 Orior AG 211 0.01
– Phoenix Mecano AG 99 0.01
1 Plazza AG 132 0.01
2 Rieter Holding AG 281 0.01
– Romande Energie Holding SA 108 0.01
– Schaffner Holding AG 33 –
285 Schmolz + Bickenbach AG 185 0.01
1 Schweiter Technologies AG 537 0.03
8 SFS Group AG 626 0.03
2 Siegfried Holding AG 331 0.02
1 St Galler Kantonalbank AG 559 0.03
7 Sulzer AG 732 0.04
17 Swiss Life Holding AG 4,798 0.25
7 Swissquote Group Holding SA 156 0.01
1 Tamedia AG 183 0.01
1 Thurgauer Kantonalbank 65 –
9 Valiant Holding AG 831 0.04
2 Valora Holding AG 474 0.03
1 Vaudoise Assurances Holding SA 261 0.01
– Vetropack Holding AG 179 0.01
11 Vontobel Holding AG 547 0.03
1 VP Bank AG 92 –
– Walliser Kantonalbank 25 –
4 Zehnder Group AG 136 0.01
– Zug Estates Holding AG 180 0.01
– Zuger Kantonalbank AG 68 –
36,404 1.94
United Kingdom - 6.41%
419 3i Group PLC 3,606 0.20
289 Aberdeen Asset Management PLC 966 0.05
75 Acacia Mining PLC 374 0.02
30 Acal PLC 80 –
368 Afren PLC – –
101 Aggreko PLC 1,035 0.06
43 Aldermore Group PLC 116 0.01
188 AMEC PLC 1,023 0.05
75 Anglo Pacific Group PLC 109 0.01
8 Anglo-Eastern Plantations PLC 56 –
181 Antofagasta PLC 1,560 0.08
Shares (000's)
Value (000's)
USD
% of Net Asset Value
Common Stock (continued)
United Kingdom - 6.41% (continued)
100 Babcock International Group PLC 1,192 0.06
252 Balfour Beatty PLC 844 0.04
440 Barratt Developments PLC 2,578 0.14
405 BBA Aviation PLC 1,329 0.07
216 Beazley PLC 1,028 0.05
57 Bellway PLC 1,733 0.09
49 Berkeley Group Holdings PLC 1,530 0.08
17 BGEO Group PLC 615 0.03
23 Bloomsbury Publishing PLC 47 –
90 Bodycote PLC 643 0.03
27 Boot Henry PLC 65 –
68 Bovis Homes Group PLC 686 0.04
3 Braemar Shipping Services PLC 11 –
50 Brammer PLC 106 0.01
72 BTG PLC 525 0.03
303 Cairn Energy PLC 796 0.04
33 Cambian Group PLC 53 –
61 Cape PLC 109 0.01
4 Carclo PLC 5 –
227 Carillion PLC 698 0.04
20 Carr's Group PLC 39 –
6 Castings PLC 32 –
498 Centamin PLC 811 0.04
17 Centaur Media PLC 8 –
145 Chemring Group PLC 300 0.02
36 Chesnara PLC 155 0.01
85 Cineworld Group PLC 581 0.03
61 Circassia Pharmaceuticals Plc 65 –
7 Clarkson PLC 198 0.01
62 Close Brothers Group PLC 1,060 0.06
604 Cobham PLC 1,238 0.07
59 Coca-Cola HBC AG 1,253 0.07
106 Communisis PLC 49 –
28 Computacenter PLC 255 0.01
16 Consort Medical PLC 207 0.01
2 Costain Group PLC 9 –
67 Countrywide PLC 144 0.01
18 Cranswick PLC 505 0.03
67 Crest Nicholson Holdings plc 368 0.02
583 Debenhams PLC 403 0.02
550 Direct Line Insurance Group PLC 2,388 0.13
397 Dixons Carphone PLC 1,647 0.09
202 Drax Group PLC 715 0.04
345 DS Smith PLC 1,697 0.09
61 e2v technologies PLC 134 0.01
47 easyJet PLC 577 0.03
71 Electrocomponents PLC 399 0.02
217 Elementis PLC 684 0.04
522 EnQuest PLC 196 0.01
265 Enterprise Inns PLC 359 0.02
43 Entertainment One Ltd 118 0.01
13 Euromoney Institutional Investor PLC 182 0.01
125 Evraz PLC 375 0.02
100 Fenner PLC 304 0.02
71 Ferrexpo PLC 116 0.01
87 Filtrona PLC 430 0.02
25 Findel PLC 63 –
628 Firstgroup PLC 799 0.04
81 Flybe Group PLC 45 –
346 Fortune Oil PLC – –
78 Foxtons Group PLC 103 0.01
11 Fuller Smith & Turner PLC 130 0.01
34 Galliford Try PLC 542 0.03

Global Targeted Value Fund
Portfolio of Investments as at 30 November 2016 (continued)
Dimensional Fund Advisors Annual Report and Audited Financial Statements, 30 November 2016 223
Shares (000's)
Value (000's)
USD
% of Net Asset Value
Common Stock (continued)
United Kingdom - 6.41% (continued)
5 GAME Digital PLC 3 –
62 Gem Diamonds Ltd 84 –
16 Genus PLC 371 0.02
602 GKN PLC 2,332 0.12
93 Grafton Group PLC 613 0.03
143 Greene King PLC 1,228 0.07
4 GVC Holdings PLC 29 –
97 Halfords Group PLC 417 0.02
37 Headlam Group PLC 218 0.01
49 Helical PLC 177 0.01
409 Henderson Group PLC 1,184 0.06
18 Hill & Smith Holdings PLC 284 0.02
119 Hiscox Ltd 1,560 0.08
115 Hochschild Mining PLC 313 0.02
4 HSS Hire Group PLC 5 –
74 Hunting PLC 504 0.03
119 Huntsworth PLC 58 –
26 Imagination Technologies Group PLC 74 –
177 Inchcape PLC 1,345 0.07
144 Informa PLC 1,173 0.06
122 Intermediate Capital Group PLC 1,036 0.06
61 International Ferro Metals Ltd – –
74 International Personal Finance PLC 259 0.01
59 Interserve PLC 222 0.01
280 Investec PLC 1,818 0.10
124 IP Group PLC 216 0.01
760 J Sainsbury PLC 2,195 0.12
8 James Fisher & Sons PLC 155 0.01
7 Jimmy Choo PLC 12 –
163 John Wood Group PLC 1,685 0.09
55 Johnson Matthey PLC 2,162 0.12
142 JRP Group PLC 236 0.01
99 KAZ Minerals PLC 450 0.02
34 Keller Group PLC 335 0.02
40 Kier Group PLC 691 0.04
364 Ladbrokes PLC 564 0.03
122 Laird PLC 236 0.01
90 Lamprell PLC 98 0.01
95 Lancashire Holdings Ltd 765 0.04
53 Lavendon Group PLC 144 0.01
135 Lonmin PLC 253 0.01
141 Lookers PLC 185 0.01
94 Low & Bonar PLC 79 –
695 Man Group PLC 986 0.05
188 Management Consulting Group PLC 46 –
679 Marks & Spencer Group PLC 2,788 0.16
68 Marshalls PLC 252 0.01
299 Marston's PLC 503 0.03
22 McColl's Retail Group PLC 48 –
49 Mears Group PLC 288 0.02
340 Meggitt PLC 2,009 0.11
880 Melrose Industries PLC 2,016 0.11
60 Millennium & Copthorne Hotels PLC 322 0.02
107 Mitchells & Butlers PLC 305 0.02
167 Mitie Group PLC 429 0.02
3 MJ Gleeson PLC 19 –
17 Morgan Sindall Group PLC 152 0.01
19 Mothercare PLC 26 –
70 N Brown Group PLC 176 0.01
179 National Express Group PLC 795 0.04
4 Norcros PLC 8 –
67 Northgate PLC 351 0.02
28 Novae Group PLC 285 0.02
Shares (000's)
Value (000's)
USD
% of Net Asset Value
Common Stock (continued)
United Kingdom - 6.41% (continued)
20 OneSavings Bank PLC 79 –
353 Ophir Energy PLC 351 0.02
9 Oxford Instruments PLC 71 –
129 Paragon Group of Cos PLC 588 0.03
169 Paysafe Group PLC 821 0.04
740 Pendragon PLC 282 0.02
110 Persimmon PLC 2,341 0.12
243 Petra Diamonds Ltd 501 0.03
1,099 Petropavlovsk PLC 98 0.01
99 Pets at Home Group PLC 264 0.01
168 Phoenix Group Holdings 1,486 0.08
71 Playtech PLC 767 0.04
70 Polypipe Group PLC 268 0.01
3 Porvair PLC 15 –
376 Premier Foods PLC 208 0.01
257 Premier Oil PLC 192 0.01
19 Punch Taverns PLC 28 –
81 PZ Cussons PLC 314 0.02
28 Randgold Resources Ltd 2,042 0.11
50 Rank Group PLC 122 0.01
1 REA Holdings PLC 4 –
107 Redrow PLC 547 0.03
37 Renold PLC 20 –
2 Ricardo PLC 24 –
412 Royal Mail PLC 2,415 0.13
26 RPC Group PLC 353 0.02
108 RPS Group PLC 253 0.01
315 RSA Insurance Group PLC 2,126 0.11
1 S&U PLC 19 –
13 Saga PLC 31 –
5 Savills PLC 41 –
27 SDL PLC 143 0.01
196 Senior PLC 453 0.02
5 Servelec Group PLC 14 –
95 Severfield PLC 89 –
254 Shanks Group PLC 289 0.02
26 Shawbrook Group PLC 81 –
269 SIG PLC 300 0.02
135 Smiths Group PLC 2,389 0.13
99 Soco International PLC 171 0.01
49 Spectris PLC 1,252 0.07
240 Speedy Hire PLC 133 0.01
41 Spire Healthcare Group PLC 180 0.01
254 Spirent Communications PLC 255 0.01
40 Sportech PLC 38 –
34 Sports Direct International PLC 136 0.01
52 St Ives PLC 79 –
96 St Modwen Properties PLC 337 0.02
96 Stobart Group Ltd 191 0.01
32 Stock Spirits Group PLC 68 –
166 Tate & Lyle PLC 1,401 0.07
1,001 Taylor Wimpey PLC 1,852 0.10
107 Travis Perkins PLC 1,801 0.10
29 Tribal Group PLC 20 –
28 Trifast PLC 67 –
145 Trinity Mirror PLC 143 0.01
80 TT Electronics PLC 138 0.01
117 Tullett Prebon PLC 652 0.03
439 Tullow Oil PLC 1,643 0.09
3 Tyman PLC 10 –
58 U & I Group PLC 118 0.01
142 UBM PLC 1,265 0.07
47 UDG Healthcare PLC 387 0.02
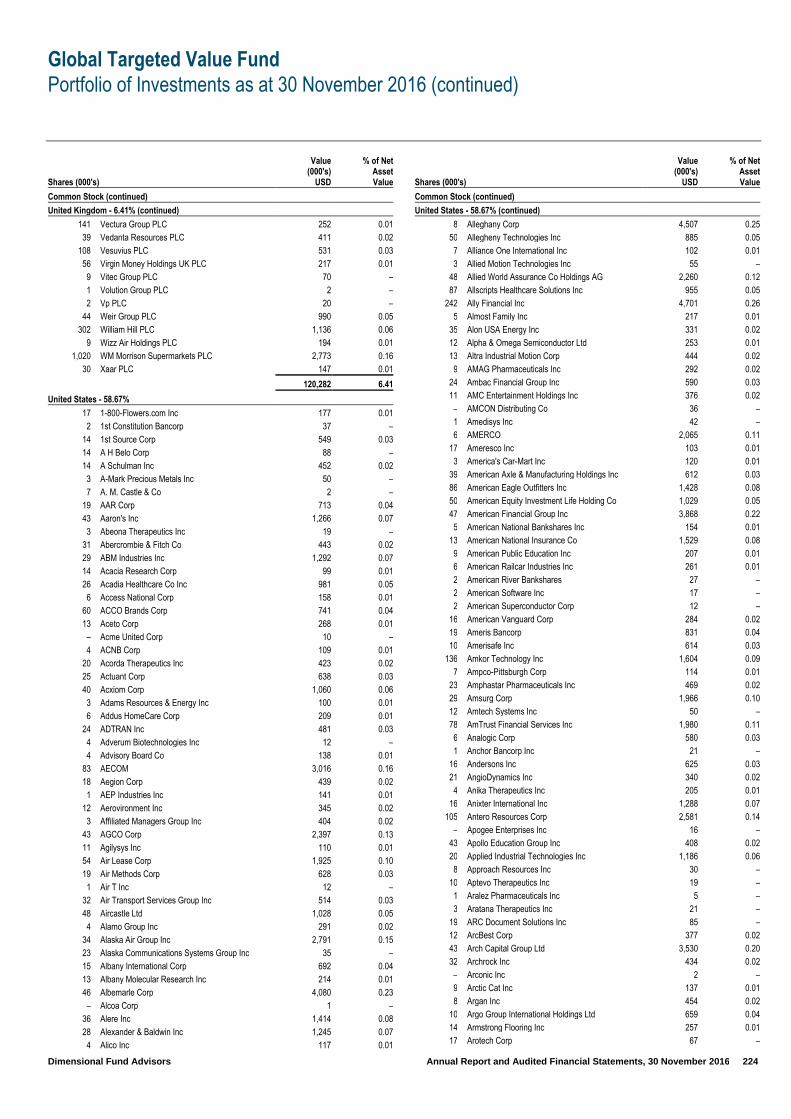
Global Targeted Value Fund
Portfolio of Investments as at 30 November 2016 (continued)
Dimensional Fund Advisors Annual Report and Audited Financial Statements, 30 November 2016 224
Shares (000's)
Value (000's)
USD
% of Net Asset Value
Common Stock (continued)
United Kingdom - 6.41% (continued)
141 Vectura Group PLC 252 0.01
39 Vedanta Resources PLC 411 0.02
108 Vesuvius PLC 531 0.03
56 Virgin Money Holdings UK PLC 217 0.01
9 Vitec Group PLC 70 –
1 Volution Group PLC 2 –
2 Vp PLC 20 –
44 Weir Group PLC 990 0.05
302 William Hill PLC 1,136 0.06
9 Wizz Air Holdings PLC 194 0.01
1,020 WM Morrison Supermarkets PLC 2,773 0.16
30 Xaar PLC 147 0.01
120,282 6.41
United States - 58.67%
17 1-800-Flowers.com Inc 177 0.01
2 1st Constitution Bancorp 37 –
14 1st Source Corp 549 0.03
14 A H Belo Corp 88 –
14 A Schulman Inc 452 0.02
3 A-Mark Precious Metals Inc 50 –
7 A. M. Castle & Co 2 –
19 AAR Corp 713 0.04
43 Aaron's Inc 1,266 0.07
3 Abeona Therapeutics Inc 19 –
31 Abercrombie & Fitch Co 443 0.02
29 ABM Industries Inc 1,292 0.07
14 Acacia Research Corp 99 0.01
26 Acadia Healthcare Co Inc 981 0.05
6 Access National Corp 158 0.01
60 ACCO Brands Corp 741 0.04
13 Aceto Corp 268 0.01
– Acme United Corp 10 –
4 ACNB Corp 109 0.01
20 Acorda Therapeutics Inc 423 0.02
25 Actuant Corp 638 0.03
40 Acxiom Corp 1,060 0.06
3 Adams Resources & Energy Inc 100 0.01
6 Addus HomeCare Corp 209 0.01
24 ADTRAN Inc 481 0.03
4 Adverum Biotechnologies Inc 12 –
4 Advisory Board Co 138 0.01
83 AECOM 3,016 0.16
18 Aegion Corp 439 0.02
1 AEP Industries Inc 141 0.01
12 Aerovironment Inc 345 0.02
3 Affiliated Managers Group Inc 404 0.02
43 AGCO Corp 2,397 0.13
11 Agilysys Inc 110 0.01
54 Air Lease Corp 1,925 0.10
19 Air Methods Corp 628 0.03
1 Air T Inc 12 –
32 Air Transport Services Group Inc 514 0.03
48 Aircastle Ltd 1,028 0.05
4 Alamo Group Inc 291 0.02
34 Alaska Air Group Inc 2,791 0.15
23 Alaska Communications Systems Group Inc 35 –
15 Albany International Corp 692 0.04
13 Albany Molecular Research Inc 214 0.01
46 Albemarle Corp 4,080 0.23
– Alcoa Corp 1 –
36 Alere Inc 1,414 0.08
28 Alexander & Baldwin Inc 1,245 0.07
4 Alico Inc 117 0.01
Shares (000's)
Value (000's)
USD
% of Net Asset Value
Common Stock (continued)
United States - 58.67% (continued)
8 Alleghany Corp 4,507 0.25
50 Allegheny Technologies Inc 885 0.05
7 Alliance One International Inc 102 0.01
3 Allied Motion Technologies Inc 55 –
48 Allied World Assurance Co Holdings AG 2,260 0.12
87 Allscripts Healthcare Solutions Inc 955 0.05
242 Ally Financial Inc 4,701 0.26
5 Almost Family Inc 217 0.01
35 Alon USA Energy Inc 331 0.02
12 Alpha & Omega Semiconductor Ltd 253 0.01
13 Altra Industrial Motion Corp 444 0.02
9 AMAG Pharmaceuticals Inc 292 0.02
24 Ambac Financial Group Inc 590 0.03
11 AMC Entertainment Holdings Inc 376 0.02
– AMCON Distributing Co 36 –
1 Amedisys Inc 42 –
6 AMERCO 2,065 0.11
17 Ameresco Inc 103 0.01
3 America's Car-Mart Inc 120 0.01
39 American Axle & Manufacturing Holdings Inc 612 0.03
86 American Eagle Outfitters Inc 1,428 0.08
50 American Equity Investment Life Holding Co 1,029 0.05
47 American Financial Group Inc 3,868 0.22
5 American National Bankshares Inc 154 0.01
13 American National Insurance Co 1,529 0.08
9 American Public Education Inc 207 0.01
6 American Railcar Industries Inc 261 0.01
2 American River Bankshares 27 –
2 American Software Inc 17 –
2 American Superconductor Corp 12 –
16 American Vanguard Corp 284 0.02
19 Ameris Bancorp 831 0.04
10 Amerisafe Inc 614 0.03
136 Amkor Technology Inc 1,604 0.09
7 Ampco-Pittsburgh Corp 114 0.01
23 Amphastar Pharmaceuticals Inc 469 0.02
29 Amsurg Corp 1,966 0.10
12 Amtech Systems Inc 50 –
78 AmTrust Financial Services Inc 1,980 0.11
6 Analogic Corp 580 0.03
1 Anchor Bancorp Inc 21 –
16 Andersons Inc 625 0.03
21 AngioDynamics Inc 340 0.02
4 Anika Therapeutics Inc 205 0.01
16 Anixter International Inc 1,288 0.07
105 Antero Resources Corp 2,581 0.14
– Apogee Enterprises Inc 16 –
43 Apollo Education Group Inc 408 0.02
20 Applied Industrial Technologies Inc 1,186 0.06
8 Approach Resources Inc 30 –
10 Aptevo Therapeutics Inc 19 –
1 Aralez Pharmaceuticals Inc 5 –
3 Aratana Therapeutics Inc 21 –
19 ARC Document Solutions Inc 85 –
12 ArcBest Corp 377 0.02
43 Arch Capital Group Ltd 3,530 0.20
32 Archrock Inc 434 0.02
– Arconic Inc 2 –
9 Arctic Cat Inc 137 0.01
8 Argan Inc 454 0.02
10 Argo Group International Holdings Ltd 659 0.04
14 Armstrong Flooring Inc 257 0.01
17 Arotech Corp 67 –

Global Targeted Value Fund
Portfolio of Investments as at 30 November 2016 (continued)
Dimensional Fund Advisors Annual Report and Audited Financial Statements, 30 November 2016 225
Shares (000's)
Value (000's)
USD
% of Net Asset Value
Common Stock (continued)
United States - 58.67% (continued)
72 ARRIS International PLC 2,061 0.11
48 Arrow Electronics Inc 3,277 0.17
7 Arrow Financial Corp 264 0.01
83 Ascena Retail Group Inc 503 0.03
8 Ascent Capital Group Inc 143 0.01
22 Ashland Global Holdings Inc 2,474 0.13
32 Aspen Insurance Holdings Ltd 1,617 0.09
84 Associated Banc-Corp 1,917 0.10
34 Assurant Inc 2,923 0.16
74 Assured Guaranty Ltd 2,649 0.14
11 Asta Funding Inc 95 0.01
12 Astec Industries Inc 768 0.04
49 Astoria Financial Corp 808 0.04
3 AstroNova Inc 41 –
9 Atlantic Coast Financial Corp 62 –
4 Atlanticus Holdings Corp 13 –
14 Atlas Air Worldwide Holdings Inc 695 0.04
8 Atlas Financial Holdings Inc 138 0.01
8 ATN International Inc 599 0.03
32 Atwood Oceanics Inc 305 0.02
4 Autobytel 53 –
25 Autoliv Inc 2,542 0.14
48 AutoNation Inc 2,165 0.12
12 AV Homes Inc 187 0.01
2 Aviat Networks Inc 31 –
1 Avid Technology Inc 5 –
16 Aviragen Therapeutics Inc 23 –
30 Avis Budget Group Inc 1,139 0.06
67 Avnet Inc 3,073 0.16
76 AVX Corp 1,150 0.06
10 Aware Inc 58 –
16 Axcelis Technologies Inc 217 0.01
49 Axis Capital Holdings Ltd 2,963 0.16
17 AXT Inc 81 –
11 AZZ Inc 735 0.04
27 Babcock & Wilcox Enterprises Inc 435 0.02
8 Baldwin & Lyons Inc 207 0.01
4 Ball Corp 331 0.02
14 Ballantyne Strong Inc 102 0.01
19 Banc of California Inc 291 0.02
8 BancFirst Corp 629 0.03
27 Bancorp Inc 186 0.01
50 BancorpSouth Inc 1,440 0.08
25 Bank Mutual Corp 224 0.01
8 Bank of Commerce Holdings 65 –
19 Bank of Hawaii Corp 1,550 0.08
3 Bank of Marin Bancorp 213 0.01
– Bank of the Ozarks Inc 11 –
14 BankFinancial Corp 195 0.01
53 Bankrate Inc 539 0.03
43 BankUnited Inc 1,537 0.08
20 Banner Corp 1,045 0.06
4 Bar Harbor Bankshares 156 0.01
26 Barnes & Noble Education Inc 292 0.02
37 Barnes & Noble Inc 461 0.02
27 Barnes Group Inc 1,250 0.07
2 Bassett Furniture Industries Inc 61 –
– BBX Capital Corp 5 –
9 BCB Bancorp Inc 107 0.01
27 Beacon Roofing Supply Inc 1,261 0.07
19 Beazer Homes USA Inc 257 0.01
9 bebe stores inc 5 –
47 Bed Bath & Beyond Inc 2,089 0.11
Shares (000's)
Value (000's)
USD
% of Net Asset Value
Common Stock (continued)
United States - 58.67% (continued)
4 Bel Fuse Inc 131 0.01
7 Belden Inc 547 0.03
51 Belmond Ltd 665 0.04
14 Bemis Co Inc 706 0.04
16 Benchmark Electronics Inc 463 0.02
42 Beneficial Bancorp Inc 734 0.04
18 Berkshire Hills Bancorp Inc 602 0.03
16 Best Buy Co Inc 724 0.04
12 Big 5 Sporting Goods Corp 238 0.01
– Big Lots Inc 16 –
1 Biglari Holdings Inc 561 0.03
16 Bill Barrett Corp 129 0.01
11 Bio-Rad Laboratories Inc 1,958 0.10
9 BioScrip Inc 10 –
7 BJ's Restaurants Inc 267 0.01
10 Black Box Corp 155 0.01
12 Black Diamond Inc 74 –
28 Blackhawk Network Holdings Inc 1,003 0.05
27 Blucora Inc 380 0.02
16 Blue Hills Bancorp Inc 273 0.01
16 BMC Stock Holdings Inc 297 0.02
24 BNC Bancorp 717 0.04
7 Boingo Wireless Inc 91 –
18 Boise Cascade Co 410 0.02
27 BOK Financial Corp 2,182 0.12
5 Bon-Ton Stores Inc 9 –
97 BorgWarner Inc 3,446 0.19
46 Boston Private Financial Holdings Inc 692 0.04
– Boston Scientific Corp 7 –
24 Brady Corp 870 0.05
7 Bravo Brio Restaurant Group Inc 27 –
7 Bridge Bancorp Inc 229 0.01
32 Bridgepoint Education Inc 326 0.02
22 Briggs & Stratton Corp 465 0.02
15 Bristow Group Inc 233 0.01
8 Broadwind Energy Inc 31 –
242 Brocade Communications Systems Inc 2,986 0.16
101 Brookdale Senior Living Inc 1,169 0.06
39 Brookline Bancorp Inc 587 0.03
40 Brooks Automation Inc 650 0.03
56 Brown & Brown Inc 2,408 0.13
9 Bryn Mawr Bank Corp 346 0.02
4 BSB Bancorp Inc 104 0.01
7 Bsquare Corp 40 –
10 Build-A-Bear Workshop Inc 137 0.01
67 Bunge Ltd 4,588 0.25
2 C&F Financial Corp 90 –
32 Cabela's Inc 2,007 0.11
23 Cabot Corp 1,162 0.06
13 Cabot Microelectronics Corp 763 0.04
13 CACI International Inc 1,680 0.09
23 Caesars Entertainment Corp 174 0.01
10 CafePress Inc 31 –
12 CAI International Inc 103 0.01
9 Cal-Maine Foods Inc 362 0.02
10 Calamos Asset Management Inc 71 –
66 CalAtlantic Group Inc 2,199 0.12
20 Caleres Inc 651 0.03
27 Calgon Carbon Corp 481 0.03
10 Calix Inc 77 –
50 Callaway Golf Co 605 0.03
11 Callon Petroleum Co 200 0.01
156 Calpine Corp 1,742 0.09
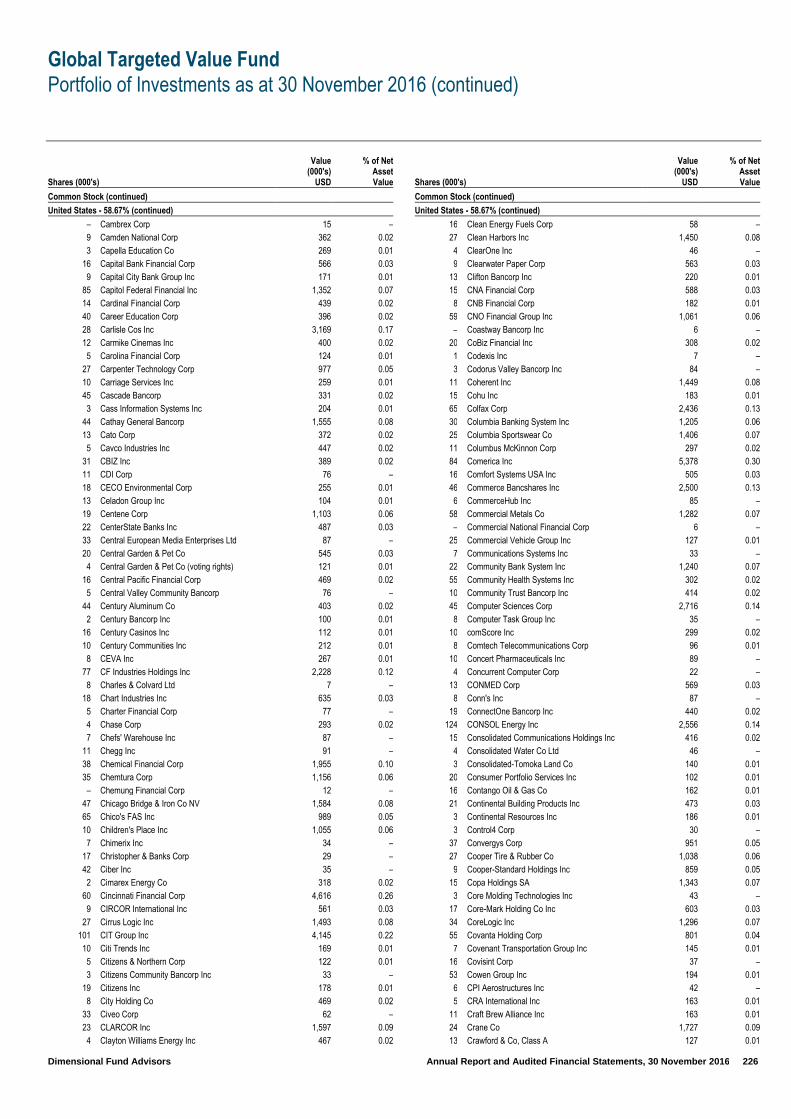
Global Targeted Value Fund
Portfolio of Investments as at 30 November 2016 (continued)
Dimensional Fund Advisors Annual Report and Audited Financial Statements, 30 November 2016 226
Shares (000's)
Value (000's)
USD
% of Net Asset Value
Common Stock (continued)
United States - 58.67% (continued)
– Cambrex Corp 15 –
9 Camden National Corp 362 0.02
3 Capella Education Co 269 0.01
16 Capital Bank Financial Corp 566 0.03
9 Capital City Bank Group Inc 171 0.01
85 Capitol Federal Financial Inc 1,352 0.07
14 Cardinal Financial Corp 439 0.02
40 Career Education Corp 396 0.02
28 Carlisle Cos Inc 3,169 0.17
12 Carmike Cinemas Inc 400 0.02
5 Carolina Financial Corp 124 0.01
27 Carpenter Technology Corp 977 0.05
10 Carriage Services Inc 259 0.01
45 Cascade Bancorp 331 0.02
3 Cass Information Systems Inc 204 0.01
44 Cathay General Bancorp 1,555 0.08
13 Cato Corp 372 0.02
5 Cavco Industries Inc 447 0.02
31 CBIZ Inc 389 0.02
11 CDI Corp 76 –
18 CECO Environmental Corp 255 0.01
13 Celadon Group Inc 104 0.01
19 Centene Corp 1,103 0.06
22 CenterState Banks Inc 487 0.03
33 Central European Media Enterprises Ltd 87 –
20 Central Garden & Pet Co 545 0.03
4 Central Garden & Pet Co (voting rights) 121 0.01
16 Central Pacific Financial Corp 469 0.02
5 Central Valley Community Bancorp 76 –
44 Century Aluminum Co 403 0.02
2 Century Bancorp Inc 100 0.01
16 Century Casinos Inc 112 0.01
10 Century Communities Inc 212 0.01
8 CEVA Inc 267 0.01
77 CF Industries Holdings Inc 2,228 0.12
8 Charles & Colvard Ltd 7 –
18 Chart Industries Inc 635 0.03
5 Charter Financial Corp 77 –
4 Chase Corp 293 0.02
7 Chefs' Warehouse Inc 87 –
11 Chegg Inc 91 –
38 Chemical Financial Corp 1,955 0.10
35 Chemtura Corp 1,156 0.06
– Chemung Financial Corp 12 –
47 Chicago Bridge & Iron Co NV 1,584 0.08
65 Chico's FAS Inc 989 0.05
10 Children's Place Inc 1,055 0.06
7 Chimerix Inc 34 –
17 Christopher & Banks Corp 29 –
42 Ciber Inc 35 –
2 Cimarex Energy Co 318 0.02
60 Cincinnati Financial Corp 4,616 0.26
9 CIRCOR International Inc 561 0.03
27 Cirrus Logic Inc 1,493 0.08
101 CIT Group Inc 4,145 0.22
10 Citi Trends Inc 169 0.01
5 Citizens & Northern Corp 122 0.01
3 Citizens Community Bancorp Inc 33 –
19 Citizens Inc 178 0.01
8 City Holding Co 469 0.02
33 Civeo Corp 62 –
23 CLARCOR Inc 1,597 0.09
4 Clayton Williams Energy Inc 467 0.02
Shares (000's)
Value (000's)
USD
% of Net Asset Value
Common Stock (continued)
United States - 58.67% (continued)
16 Clean Energy Fuels Corp 58 –
27 Clean Harbors Inc 1,450 0.08
4 ClearOne Inc 46 –
9 Clearwater Paper Corp 563 0.03
13 Clifton Bancorp Inc 220 0.01
15 CNA Financial Corp 588 0.03
8 CNB Financial Corp 182 0.01
59 CNO Financial Group Inc 1,061 0.06
– Coastway Bancorp Inc 6 –
20 CoBiz Financial Inc 308 0.02
1 Codexis Inc 7 –
3 Codorus Valley Bancorp Inc 84 –
11 Coherent Inc 1,449 0.08
15 Cohu Inc 183 0.01
65 Colfax Corp 2,436 0.13
30 Columbia Banking System Inc 1,205 0.06
25 Columbia Sportswear Co 1,406 0.07
11 Columbus McKinnon Corp 297 0.02
84 Comerica Inc 5,378 0.30
16 Comfort Systems USA Inc 505 0.03
46 Commerce Bancshares Inc 2,500 0.13
6 CommerceHub Inc 85 –
58 Commercial Metals Co 1,282 0.07
– Commercial National Financial Corp 6 –
25 Commercial Vehicle Group Inc 127 0.01
7 Communications Systems Inc 33 –
22 Community Bank System Inc 1,240 0.07
55 Community Health Systems Inc 302 0.02
10 Community Trust Bancorp Inc 414 0.02
45 Computer Sciences Corp 2,716 0.14
8 Computer Task Group Inc 35 –
10 comScore Inc 299 0.02
8 Comtech Telecommunications Corp 96 0.01
10 Concert Pharmaceuticals Inc 89 –
4 Concurrent Computer Corp 22 –
13 CONMED Corp 569 0.03
8 Conn's Inc 87 –
19 ConnectOne Bancorp Inc 440 0.02
124 CONSOL Energy Inc 2,556 0.14
15 Consolidated Communications Holdings Inc 416 0.02
4 Consolidated Water Co Ltd 46 –
3 Consolidated-Tomoka Land Co 140 0.01
20 Consumer Portfolio Services Inc 102 0.01
16 Contango Oil & Gas Co 162 0.01
21 Continental Building Products Inc 473 0.03
3 Continental Resources Inc 186 0.01
3 Control4 Corp 30 –
37 Convergys Corp 951 0.05
27 Cooper Tire & Rubber Co 1,038 0.06
9 Cooper-Standard Holdings Inc 859 0.05
15 Copa Holdings SA 1,343 0.07
3 Core Molding Technologies Inc 43 –
17 Core-Mark Holding Co Inc 603 0.03
34 CoreLogic Inc 1,296 0.07
55 Covanta Holding Corp 801 0.04
7 Covenant Transportation Group Inc 145 0.01
16 Covisint Corp 37 –
53 Cowen Group Inc 194 0.01
6 CPI Aerostructures Inc 42 –
5 CRA International Inc 163 0.01
11 Craft Brew Alliance Inc 163 0.01
24 Crane Co 1,727 0.09
13 Crawford & Co, Class A 127 0.01
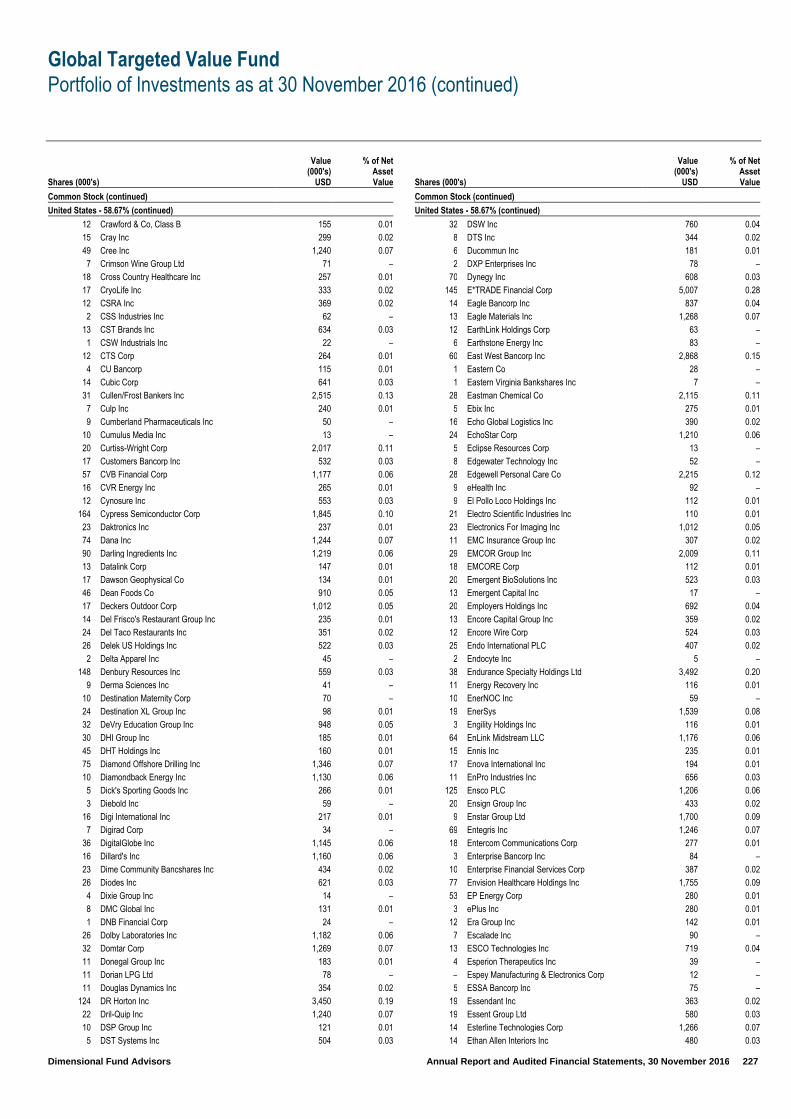
Global Targeted Value Fund
Portfolio of Investments as at 30 November 2016 (continued)
Dimensional Fund Advisors Annual Report and Audited Financial Statements, 30 November 2016 227
Shares (000's)
Value (000's)
USD
% of Net Asset Value
Common Stock (continued)
United States - 58.67% (continued)
12 Crawford & Co, Class B 155 0.01
15 Cray Inc 299 0.02
49 Cree Inc 1,240 0.07
7 Crimson Wine Group Ltd 71 –
18 Cross Country Healthcare Inc 257 0.01
17 CryoLife Inc 333 0.02
12 CSRA Inc 369 0.02
2 CSS Industries Inc 62 –
13 CST Brands Inc 634 0.03
1 CSW Industrials Inc 22 –
12 CTS Corp 264 0.01
4 CU Bancorp 115 0.01
14 Cubic Corp 641 0.03
31 Cullen/Frost Bankers Inc 2,515 0.13
7 Culp Inc 240 0.01
9 Cumberland Pharmaceuticals Inc 50 –
10 Cumulus Media Inc 13 –
20 Curtiss-Wright Corp 2,017 0.11
17 Customers Bancorp Inc 532 0.03
57 CVB Financial Corp 1,177 0.06
16 CVR Energy Inc 265 0.01
12 Cynosure Inc 553 0.03
164 Cypress Semiconductor Corp 1,845 0.10
23 Daktronics Inc 237 0.01
74 Dana Inc 1,244 0.07
90 Darling Ingredients Inc 1,219 0.06
13 Datalink Corp 147 0.01
17 Dawson Geophysical Co 134 0.01
46 Dean Foods Co 910 0.05
17 Deckers Outdoor Corp 1,012 0.05
14 Del Frisco's Restaurant Group Inc 235 0.01
24 Del Taco Restaurants Inc 351 0.02
26 Delek US Holdings Inc 522 0.03
2 Delta Apparel Inc 45 –
148 Denbury Resources Inc 559 0.03
9 Derma Sciences Inc 41 –
10 Destination Maternity Corp 70 –
24 Destination XL Group Inc 98 0.01
32 DeVry Education Group Inc 948 0.05
30 DHI Group Inc 185 0.01
45 DHT Holdings Inc 160 0.01
75 Diamond Offshore Drilling Inc 1,346 0.07
10 Diamondback Energy Inc 1,130 0.06
5 Dick's Sporting Goods Inc 266 0.01
3 Diebold Inc 59 –
16 Digi International Inc 217 0.01
7 Digirad Corp 34 –
36 DigitalGlobe Inc 1,145 0.06
16 Dillard's Inc 1,160 0.06
23 Dime Community Bancshares Inc 434 0.02
26 Diodes Inc 621 0.03
4 Dixie Group Inc 14 –
8 DMC Global Inc 131 0.01
1 DNB Financial Corp 24 –
26 Dolby Laboratories Inc 1,182 0.06
32 Domtar Corp 1,269 0.07
11 Donegal Group Inc 183 0.01
11 Dorian LPG Ltd 78 –
11 Douglas Dynamics Inc 354 0.02
124 DR Horton Inc 3,450 0.19
22 Dril-Quip Inc 1,240 0.07
10 DSP Group Inc 121 0.01
5 DST Systems Inc 504 0.03
Shares (000's)
Value (000's)
USD
% of Net Asset Value
Common Stock (continued)
United States - 58.67% (continued)
32 DSW Inc 760 0.04
8 DTS Inc 344 0.02
6 Ducommun Inc 181 0.01
2 DXP Enterprises Inc 78 –
70 Dynegy Inc 608 0.03
145 E*TRADE Financial Corp 5,007 0.28
14 Eagle Bancorp Inc 837 0.04
13 Eagle Materials Inc 1,268 0.07
12 EarthLink Holdings Corp 63 –
6 Earthstone Energy Inc 83 –
60 East West Bancorp Inc 2,868 0.15
1 Eastern Co 28 –
1 Eastern Virginia Bankshares Inc 7 –
28 Eastman Chemical Co 2,115 0.11
5 Ebix Inc 275 0.01
16 Echo Global Logistics Inc 390 0.02
24 EchoStar Corp 1,210 0.06
5 Eclipse Resources Corp 13 –
8 Edgewater Technology Inc 52 –
28 Edgewell Personal Care Co 2,215 0.12
9 eHealth Inc 92 –
9 El Pollo Loco Holdings Inc 112 0.01
21 Electro Scientific Industries Inc 110 0.01
23 Electronics For Imaging Inc 1,012 0.05
11 EMC Insurance Group Inc 307 0.02
29 EMCOR Group Inc 2,009 0.11
18 EMCORE Corp 112 0.01
20 Emergent BioSolutions Inc 523 0.03
13 Emergent Capital Inc 17 –
20 Employers Holdings Inc 692 0.04
13 Encore Capital Group Inc 359 0.02
12 Encore Wire Corp 524 0.03
25 Endo International PLC 407 0.02
2 Endocyte Inc 5 –
38 Endurance Specialty Holdings Ltd 3,492 0.20
11 Energy Recovery Inc 116 0.01
10 EnerNOC Inc 59 –
19 EnerSys 1,539 0.08
3 Engility Holdings Inc 116 0.01
64 EnLink Midstream LLC 1,176 0.06
15 Ennis Inc 235 0.01
17 Enova International Inc 194 0.01
11 EnPro Industries Inc 656 0.03
125 Ensco PLC 1,206 0.06
20 Ensign Group Inc 433 0.02
9 Enstar Group Ltd 1,700 0.09
69 Entegris Inc 1,246 0.07
18 Entercom Communications Corp 277 0.01
3 Enterprise Bancorp Inc 84 –
10 Enterprise Financial Services Corp 387 0.02
77 Envision Healthcare Holdings Inc 1,755 0.09
53 EP Energy Corp 280 0.01
3 ePlus Inc 280 0.01
12 Era Group Inc 142 0.01
7 Escalade Inc 90 –
13 ESCO Technologies Inc 719 0.04
4 Esperion Therapeutics Inc 39 –
– Espey Manufacturing & Electronics Corp 12 –
5 ESSA Bancorp Inc 75 –
19 Essendant Inc 363 0.02
19 Essent Group Ltd 580 0.03
14 Esterline Technologies Corp 1,266 0.07
14 Ethan Allen Interiors Inc 480 0.03

Global Targeted Value Fund
Portfolio of Investments as at 30 November 2016 (continued)
Dimensional Fund Advisors Annual Report and Audited Financial Statements, 30 November 2016 228
Shares (000's)
Value (000's)
USD
% of Net Asset Value
Common Stock (continued)
United States - 58.67% (continued)
– Evans Bancorp Inc 13 –
59 EverBank Financial Corp 1,144 0.06
26 Everest Re Group Ltd 5,567 0.31
37 Everi Holdings Inc 79 –
18 Everyday Health Inc 190 0.01
8 Evolving Systems Inc 33 –
28 EW Scripps Co 480 0.03
7 Exactech Inc 173 0.01
30 Exar Corp 299 0.02
9 ExlService Holdings Inc 432 0.02
37 Express Inc 497 0.03
17 Exterran Corp 337 0.02
6 Extreme Networks Inc 24 –
18 Fabrinet 784 0.04
4 Farmers Capital Bank Corp 156 0.01
4 Farmers National Banc Corp 51 –
9 FARO Technologies Inc 321 0.02
7 FBL Financial Group Inc 534 0.03
19 FCB Financial Holdings Inc 845 0.05
5 Federal Agricultural Mortgage Corp 248 0.01
33 Federal Signal Corp 525 0.03
35 Federal-Mogul Holdings Corp 331 0.02
9 Federated National Holding Co 155 0.01
29 Ferroglobe PLC 335 0.02
29 Ferroglobe PLC Warranty Insurance Trust – –
13 Fidelity & Guaranty Life 302 0.02
15 Fidelity Southern Corp 340 0.02
7 Financial Institutions Inc 210 0.01
53 Finisar Corp 1,774 0.09
23 Finish Line Inc 518 0.03
14 First Acceptance Corp 18 –
53 First American Financial Corp 1,983 0.11
6 First Bancorp Inc 182 0.01
117 First BanCorp/Puerto Rico 695 0.04
12 First Bancorp/Southern Pines NC 293 0.02
21 First Busey Corp 568 0.03
5 First Business Financial Services Inc 119 0.01
6 First Citizens BancShares Inc 2,046 0.11
50 First Commonwealth Financial Corp 632 0.03
10 First Community Bancshares Inc 295 0.02
10 First Connecticut Bancorp Inc 209 0.01
6 First Defiance Financial Corp 256 0.01
32 First Financial Bancorp 849 0.05
6 First Financial Corp 285 0.02
8 First Financial Northwest Inc 131 0.01
2 First Foundation Inc 63 –
108 First Horizon National Corp 2,068 0.11
12 First Interstate BancSystem Inc 450 0.02
22 First Merchants Corp 763 0.04
3 First Mid-Illinois Bancshares Inc 79 –
47 First Midwest Bancorp Inc 1,139 0.06
10 First NBC Bank Holding Co 67 –
12 First of Long Island Corp 296 0.02
– First Savings Financial Group Inc 8 –
51 First Solar Inc 1,553 0.08
1 First South Bancorp Inc 13 –
6 First United Corp 73 –
1 First US Bancshares Inc 13 –
6 FirstCash Inc 282 0.02
5 Five Star Quality Care Inc 12 –
32 Flagstar Bancorp Inc 896 0.05
245 Flex Ltd 3,489 0.20
4 Flexsteel Industries Inc 230 0.01
Shares (000's)
Value (000's)
USD
% of Net Asset Value
Common Stock (continued)
United States - 58.67% (continued)
62 FLIR Systems Inc 2,219 0.12
61 Flowers Foods Inc 942 0.05
63 Fluor Corp 3,388 0.19
17 Flushing Financial Corp 441 0.02
3 FMC Corp 168 0.01
91 FMC Technologies Inc 3,107 0.17
118 FNB Corp 1,802 0.10
64 FNF Group 2,040 0.11
21 FNFV Group 270 0.01
21 Forestar Group Inc 279 0.01
40 FormFactor Inc 447 0.02
53 Forum Energy Technologies Inc 1,143 0.06
16 Forward Air Corp 769 0.04
8 Fossil Group Inc 281 0.01
30 Frank's International NV 379 0.02
8 Franklin Covey Co 162 0.01
22 Franklin Electric Co Inc 860 0.05
21 Fred's Inc 207 0.01
9 FreightCar America Inc 136 0.01
8 Frequency Electronics Inc 85 –
26 Fresh Del Monte Produce Inc 1,609 0.09
4 Friedman Industries Inc 23 –
634 Frontier Communications Corp 2,313 0.12
5 FRP Holdings Inc 206 0.01
2 FS Bancorp Inc 55 –
15 FTD Cos Inc 353 0.02
23 FTI Consulting Inc 992 0.05
13 Fuel Tech Inc 16 –
96 Fulton Financial Corp 1,710 0.09
21 FutureFuel Corp 294 0.02
1 G&K Services Inc 97 0.01
12 G-III Apparel Group Ltd 319 0.02
3 Gaia Inc 27 –
30 Gain Capital Holdings Inc 195 0.01
58 GameStop Corp 1,424 0.08
51 Gannett Co Inc 491 0.03
36 GasLog Ltd 561 0.03
34 Gastar Exploration Inc 44 –
20 GATX Corp 1,084 0.06
6 Gencor Industries Inc 81 –
28 General Cable Corp 527 0.03
18 General Communication Inc 298 0.02
12 Genesco Inc 743 0.04
30 Genesee & Wyoming Inc 2,322 0.12
– Genesis Healthcare Inc 1 –
7 Genie Energy Ltd 43 –
139 Gentex Corp 2,573 0.14
184 Genworth Financial Inc 788 0.04
5 Geospace Technologies Corp 105 0.01
7 Gerber Scientific Inc – –
8 German American Bancorp Inc 384 0.02
16 Gibraltar Industries Inc 702 0.04
26 GigPeak Inc 70 –
40 Glacier Bancorp Inc 1,376 0.07
– Global Eagle Entertainment Inc 3 –
7 Global Indemnity Ltd 276 0.01
6 Global Power Equipment Group Inc 21 –
3 GlobalSCAPE Inc 11 –
11 Globus Medical Inc 233 0.01
4 GNC Holdings Inc 56 –
7 Gold Resource Corp 29 –
9 Golden Ocean Group Ltd 37 –
12 Goldfield Corp 50 –

Global Targeted Value Fund
Portfolio of Investments as at 30 November 2016 (continued)
Dimensional Fund Advisors Annual Report and Audited Financial Statements, 30 November 2016 229
Shares (000's)
Value (000's)
USD
% of Net Asset Value
Common Stock (continued)
United States - 58.67% (continued)
111 Goodyear Tire & Rubber Co 3,401 0.19
2 Gordmans Stores Inc 1 –
13 Gorman-Rupp Co 383 0.02
10 GP Strategies Corp 252 0.01
5 Graham Corp 112 0.01
2 Graham Holdings Co 1,214 0.06
24 Grand Canyon Education Inc 1,382 0.07
21 Granite Construction Inc 1,231 0.07
35 Gray Television Inc 356 0.02
38 Great Lakes Dredge & Dock Corp 160 0.01
8 Great Southern Bancorp Inc 388 0.02
1 Great Western Bancorp Inc 40 –
11 Green Brick Partners Inc 98 0.01
27 Green Dot Corp 651 0.03
22 Green Plains Inc 596 0.03
6 Greenbrier Cos Inc 222 0.01
2 Greene County Bancorp Inc 34 –
5 Greenhill & Co Inc 144 0.01
19 Greenlight Capital Re Ltd 425 0.02
14 Greif Inc, Class A 728 0.04
7 Greif Inc, Class B 487 0.03
3 Griffin Industrial Realty Inc 99 0.01
20 Griffon Corp 467 0.02
11 Group 1 Automotive Inc 772 0.04
22 GrubHub Inc 829 0.04
11 GSI Technology Inc 61 –
12 Guaranty Bancorp 265 0.01
44 Guess? Inc 680 0.04
10 Gulfmark Offshore Inc 13 –
53 Gulfport Energy Corp 1,355 0.07
1 Hackett Group Inc 25 –
25 Haemonetics Corp 985 0.05
46 Hain Celestial Group Inc 1,814 0.10
7 Hallador Energy Co 65 –
14 Hallmark Financial Services Inc 151 0.01
28 Halyard Health Inc 1,052 0.06
44 Hancock Holding Co 1,829 0.10
1 Handy & Harman Ltd 17 –
17 Hanger Inc 162 0.01
16 Hanmi Financial Corp 486 0.03
24 Hanover Insurance Group Inc 2,079 0.11
6 Hardinge Inc 69 –
32 Harman International Industries Inc 3,515 0.20
5 Harmonic Inc 21 –
2 Harsco Corp 26 –
33 Harte-Hanks Inc 50 –
17 Harvard Bioscience Inc 43 –
10 Haverty Furniture Cos Inc 211 0.01
12 Hawaiian Holdings Inc 612 0.03
6 Hawaiian Telcom Holdco Inc 143 0.01
5 Hawkins Inc 234 0.01
7 Haynes International Inc 326 0.02
23 HB Fuller Co 1,092 0.06
5 HCI Group Inc 162 0.01
1 Headwaters Inc 12 –
15 HealthStream Inc 375 0.02
17 Healthways Inc 403 0.02
6 Heartland Express Inc 127 0.01
12 Heartland Financial USA Inc 521 0.03
175 Hecla Mining Co 1,067 0.06
8 Heidrick & Struggles International Inc 180 0.01
13 Helen of Troy Ltd 1,147 0.06
60 Helix Energy Solutions Group Inc 622 0.03
Shares (000's)
Value (000's)
USD
% of Net Asset Value
Common Stock (continued)
United States - 58.67% (continued)
57 Helmerich & Payne Inc 4,329 0.24
4 Hemisphere Media Group Inc 47 –
10 Herc Holdings Inc 407 0.02
19 Heritage Commerce Corp 241 0.01
17 Heritage Financial Corp 376 0.02
10 Heritage Insurance Holdings Inc 140 0.01
19 Heritage Oaks Bancorp 192 0.01
11 Heritage-Crystal Clean Inc 187 0.01
31 Hertz Global Holdings Inc 774 0.04
11 hhgregg Inc 17 –
18 Hill International Inc 70 –
27 Hill-Rom Holdings Inc 1,447 0.08
1 Hillenbrand Inc 37 –
58 Hilltop Holdings Inc 1,624 0.09
1 Hingham Institution for Savings 191 0.01
41 HMS Holdings Corp 754 0.04
86 HollyFrontier Corp 2,467 0.13
7 Hologic Inc 283 0.02
2 Home Bancorp Inc 80 –
56 Home BancShares Inc 1,446 0.08
14 HomeStreet Inc 421 0.02
10 HomeTrust Bancshares Inc 231 0.01
6 Hooker Furniture Corp 159 0.01
73 Hope Bancorp Inc 1,457 0.08
2 HopFed Bancorp Inc 24 –
18 Horace Mann Educators Corp 740 0.04
12 Horizon Bancorp 268 0.01
77 Horizon Pharma PLC 1,523 0.08
14 Hornbeck Offshore Services Inc 71 –
54 Houghton Mifflin Harcourt Co 602 0.03
9 Houston Wire & Cable Co 54 –
18 Howard Hughes Corp 2,050 0.11
17 Hub Group Inc 717 0.04
2 Hubbell Inc 172 0.01
8 Hudson Global Inc 12 –
14 Hudson Technologies Inc 109 0.01
563 Huntington Bancshares Inc 7,017 0.38
110 Huntsman Corp 2,152 0.11
5 Hurco Cos Inc 163 0.01
11 Huron Consulting Group Inc 578 0.03
3 Huttig Building Products Inc 16 –
10 Hyatt Hotels Corp 530 0.03
6 Hyster-Yale Materials Handling Inc 363 0.02
17 IAC/InterActiveCorp 1,170 0.06
22 Iberiabank Corp 1,796 0.10
10 ICF International Inc 565 0.03
21 Iconix Brand Group Inc 187 0.01
7 ICU Medical Inc 1,010 0.05
1 ID Systems Inc 6 –
11 IDT Corp 232 0.01
1 IEC Electronics Corp 5 –
4 IES Holdings Inc 80 –
34 II-VI Inc 1,015 0.05
20 ILG Inc 366 0.02
12 Imation Corp 12 –
31 Impax Laboratories Inc 448 0.02
9 Independence Holding Co 188 0.01
13 Independent Bank Corp 867 0.05
14 Independent Bank Corp/MI 272 0.01
10 Independent Bank Group Inc 609 0.03
9 Infinera Corp 75 –
8 InfuSystem Holdings Inc 14 –
6 Ingles Markets Inc 269 0.01

Global Targeted Value Fund
Portfolio of Investments as at 30 November 2016 (continued)
Dimensional Fund Advisors Annual Report and Audited Financial Statements, 30 November 2016 230
Shares (000's)
Value (000's)
USD
% of Net Asset Value
Common Stock (continued)
United States - 58.67% (continued)
73 Ingram Micro Inc 2,748 0.15
3 Ingredion Inc 407 0.02
23 InnerWorkings Inc 214 0.01
4 Innodata Inc 10 –
10 Innophos Holdings Inc 521 0.03
13 Innospec Inc 836 0.04
1 Inphi Corp 48 –
16 Inseego Corp 36 –
16 Insight Enterprises Inc 572 0.03
7 Insteel Industries Inc 273 0.01
13 Integer Holdings Corp 368 0.02
11 Inteliquent Inc 258 0.01
16 Inter Parfums Inc 558 0.03
17 Internap Corp 18 –
39 International Bancshares Corp 1,507 0.08
108 International Game Technology PLC 2,795 0.15
14 International Speedway Corp 503 0.03
67 Intersil Corp 1,475 0.08
14 Intevac Inc 88 –
9 INTL. FCStone Inc 379 0.02
32 Intralinks Holdings Inc 359 0.02
20 Intrawest Resorts Holdings Inc 356 0.02
20 Intrepid Potash Inc 27 –
17 Invacare Corp 193 0.01
47 InvenSense Inc 360 0.02
16 Investment Technology Group Inc 290 0.02
174 Investors Bancorp Inc 2,360 0.13
1 Investors Title Co 123 0.01
3 ION Geophysical Corp 26 –
5 iPass Inc 9 –
5 IRIDEX Corp 85 –
19 Iridium Communications Inc 167 0.01
12 iRobot Corp 673 0.04
16 Itron Inc 1,019 0.05
38 ITT Inc 1,542 0.08
41 Ixia 562 0.03
17 IXYS Corp 204 0.01
10 J Alexander's Holdings Inc 90 –
88 Jabil Circuit Inc 1,865 0.10
64 Jacobs Engineering Group Inc 3,988 0.22
3 JAKKS Pacific Inc 23 –
10 James River Group Holdings Ltd 372 0.02
96 Janus Capital Group Inc 1,296 0.07
124 JC Penney Co Inc 1,171 0.06
132 JetBlue Airways Corp 2,660 0.14
4 John B Sanfilippo & Son Inc 268 0.01
22 John Wiley & Sons Inc 1,198 0.06
2 Johnson Outdoors Inc 84 –
14 Jones Lang LaSalle Inc 1,446 0.08
40 Joy Global Inc 1,125 0.06
27 Juniper Networks Inc 734 0.04
3 Juniper Pharmaceuticals Inc 17 –
22 K12 Inc 325 0.02
6 Kaiser Aluminum Corp 497 0.03
27 Kansas City Southern 2,415 0.13
49 KapStone Paper and Packaging Corp 1,000 0.05
14 KB Home 222 0.01
65 KBR Inc 1,078 0.06
56 KCG Holdings Inc 787 0.04
39 Kearny Financial Corp 595 0.03
18 Kelly Services Inc 359 0.02
21 Kemet Corp 117 0.01
29 Kemper Corp 1,191 0.06
Shares (000's)
Value (000's)
USD
% of Net Asset Value
Common Stock (continued)
United States - 58.67% (continued)
22 Kennametal Inc 745 0.04
52 Kennedy-Wilson Holdings Inc 1,108 0.06
1 Key Technology Inc 15 –
6 Key Tronic Corp 43 –
62 KeyCorp 1,077 0.06
6 KEYW Holding Corp 80 –
17 Kimball Electronics Inc 302 0.02
12 Kimball International Inc 183 0.01
8 Kindred Biosciences Inc 34 –
44 Kindred Healthcare Inc 291 0.02
3 Kingstone Cos Inc 37 –
28 Kirby Corp 1,769 0.09
7 Kirkland's Inc 100 0.01
30 KLX Inc 1,179 0.06
5 KMG Chemicals Inc 173 0.01
35 Knight Transportation Inc 1,211 0.06
37 Knowles Corp 585 0.03
76 Kohl's Corp 4,114 0.23
5 Kona Grill Inc 61 –
22 Korn/Ferry International 551 0.03
146 Kosmos Energy Ltd 774 0.04
16 Kraton Corp 508 0.03
37 Kratos Defense & Security Solutions Inc 269 0.01
32 Kronos Worldwide Inc 402 0.02
37 Kulicke & Soffa Industries Inc 567 0.03
11 KVH Industries Inc 124 0.01
26 L-3 Communications Holdings Inc 4,083 0.23
68 La Quinta Holdings Inc 822 0.04
26 La-Z-Boy Inc 706 0.04
88 Ladenburg Thalmann Financial Services Inc 212 0.01
4 Lake Sunapee Bank Group 77 –
23 Lakeland Bancorp Inc 410 0.02
13 Lakeland Financial Corp 541 0.03
18 Landec Corp 251 0.01
1 Landmark Bancorp Inc/Manhattan KS 24 –
6 Lands' End Inc 101 0.01
46 Lattice Semiconductor Corp 322 0.02
– Lawson Products Inc 8 –
8 Layne Christensen Co 82 –
7 LB Foster Co 83 –
5 LCNB Corp 113 0.01
13 Leaf Group Ltd 83 –
19 Leap Wireless International Inc – –
32 Lear Corp 4,191 0.23
25 LegacyTexas Financial Group Inc 982 0.05
59 Legg Mason Inc 1,884 0.10
11 LendingClub Corp 62 –
89 Lennar Corp, Class A 3,797 0.21
7 Lennar Corp, Class B 228 0.01
101 Leucadia National Corp 2,225 0.12
9 LHC Group Inc 372 0.02
11 Libbey Inc 205 0.01
18 Liberty Expedia Holdings Inc 798 0.04
50 Liberty Interactive Corp QVC Group 1,042 0.06
36 Liberty TripAdvisor Holdings Inc 575 0.03
27 Liberty Ventures 1,062 0.06
23 LifePoint Health Inc 1,262 0.07
8 Lifetime Brands Inc 129 0.01
34 Limelight Networks Inc 73 –
5 Limoneira Co 86 –
3 Lincoln Educational Services Corp 5 –
2 Lincoln National Corp 134 0.01
4 Lindsay Corp 320 0.02
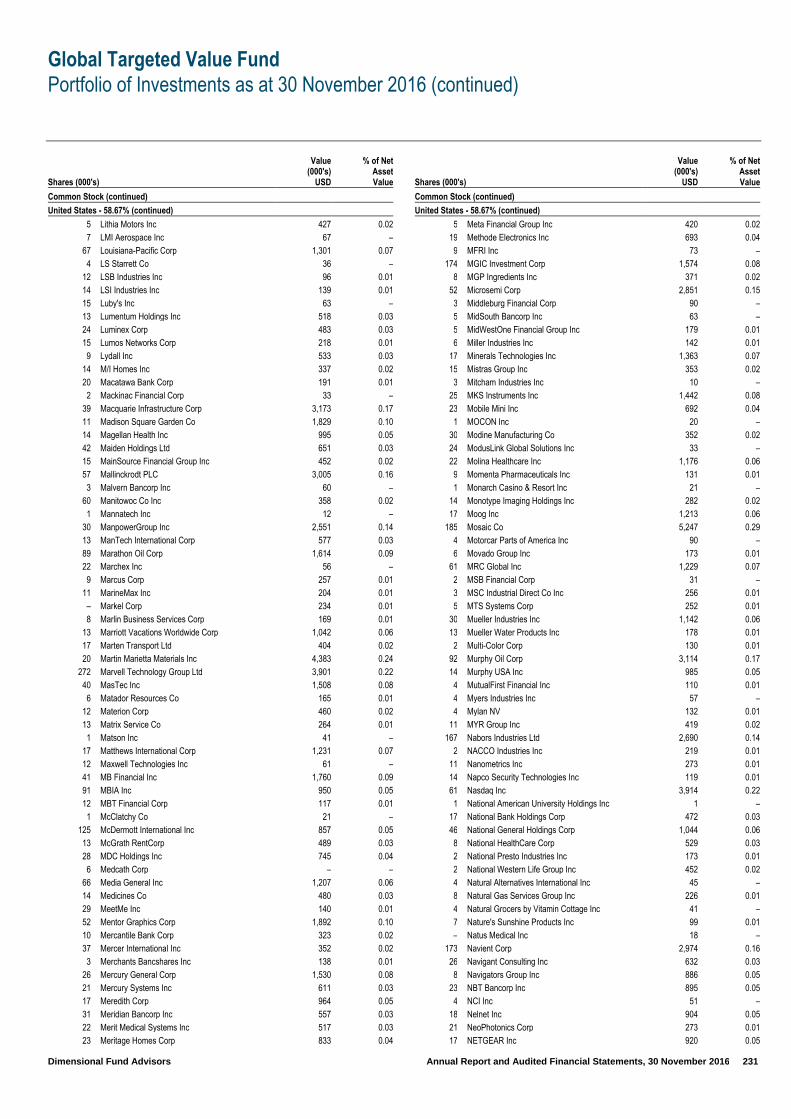
Global Targeted Value Fund
Portfolio of Investments as at 30 November 2016 (continued)
Dimensional Fund Advisors Annual Report and Audited Financial Statements, 30 November 2016 231
Shares (000's)
Value (000's)
USD
% of Net Asset Value
Common Stock (continued)
United States - 58.67% (continued)
5 Lithia Motors Inc 427 0.02
7 LMI Aerospace Inc 67 –
67 Louisiana-Pacific Corp 1,301 0.07
4 LS Starrett Co 36 –
12 LSB Industries Inc 96 0.01
14 LSI Industries Inc 139 0.01
15 Luby's Inc 63 –
13 Lumentum Holdings Inc 518 0.03
24 Luminex Corp 483 0.03
15 Lumos Networks Corp 218 0.01
9 Lydall Inc 533 0.03
14 M/I Homes Inc 337 0.02
20 Macatawa Bank Corp 191 0.01
2 Mackinac Financial Corp 33 –
39 Macquarie Infrastructure Corp 3,173 0.17
11 Madison Square Garden Co 1,829 0.10
14 Magellan Health Inc 995 0.05
42 Maiden Holdings Ltd 651 0.03
15 MainSource Financial Group Inc 452 0.02
57 Mallinckrodt PLC 3,005 0.16
3 Malvern Bancorp Inc 60 –
60 Manitowoc Co Inc 358 0.02
1 Mannatech Inc 12 –
30 ManpowerGroup Inc 2,551 0.14
13 ManTech International Corp 577 0.03
89 Marathon Oil Corp 1,614 0.09
22 Marchex Inc 56 –
9 Marcus Corp 257 0.01
11 MarineMax Inc 204 0.01
– Markel Corp 234 0.01
8 Marlin Business Services Corp 169 0.01
13 Marriott Vacations Worldwide Corp 1,042 0.06
17 Marten Transport Ltd 404 0.02
20 Martin Marietta Materials Inc 4,383 0.24
272 Marvell Technology Group Ltd 3,901 0.22
40 MasTec Inc 1,508 0.08
6 Matador Resources Co 165 0.01
12 Materion Corp 460 0.02
13 Matrix Service Co 264 0.01
1 Matson Inc 41 –
17 Matthews International Corp 1,231 0.07
12 Maxwell Technologies Inc 61 –
41 MB Financial Inc 1,760 0.09
91 MBIA Inc 950 0.05
12 MBT Financial Corp 117 0.01
1 McClatchy Co 21 –
125 McDermott International Inc 857 0.05
13 McGrath RentCorp 489 0.03
28 MDC Holdings Inc 745 0.04
6 Medcath Corp – –
66 Media General Inc 1,207 0.06
14 Medicines Co 480 0.03
29 MeetMe Inc 140 0.01
52 Mentor Graphics Corp 1,892 0.10
10 Mercantile Bank Corp 323 0.02
37 Mercer International Inc 352 0.02
3 Merchants Bancshares Inc 138 0.01
26 Mercury General Corp 1,530 0.08
21 Mercury Systems Inc 611 0.03
17 Meredith Corp 964 0.05
31 Meridian Bancorp Inc 557 0.03
22 Merit Medical Systems Inc 517 0.03
23 Meritage Homes Corp 833 0.04
Shares (000's)
Value (000's)
USD
% of Net Asset Value
Common Stock (continued)
United States - 58.67% (continued)
5 Meta Financial Group Inc 420 0.02
19 Methode Electronics Inc 693 0.04
9 MFRI Inc 73 –
174 MGIC Investment Corp 1,574 0.08
8 MGP Ingredients Inc 371 0.02
52 Microsemi Corp 2,851 0.15
3 Middleburg Financial Corp 90 –
5 MidSouth Bancorp Inc 63 –
5 MidWestOne Financial Group Inc 179 0.01
6 Miller Industries Inc 142 0.01
17 Minerals Technologies Inc 1,363 0.07
15 Mistras Group Inc 353 0.02
3 Mitcham Industries Inc 10 –
25 MKS Instruments Inc 1,442 0.08
23 Mobile Mini Inc 692 0.04
1 MOCON Inc 20 –
30 Modine Manufacturing Co 352 0.02
24 ModusLink Global Solutions Inc 33 –
22 Molina Healthcare Inc 1,176 0.06
9 Momenta Pharmaceuticals Inc 131 0.01
1 Monarch Casino & Resort Inc 21 –
14 Monotype Imaging Holdings Inc 282 0.02
17 Moog Inc 1,213 0.06
185 Mosaic Co 5,247 0.29
4 Motorcar Parts of America Inc 90 –
6 Movado Group Inc 173 0.01
61 MRC Global Inc 1,229 0.07
2 MSB Financial Corp 31 –
3 MSC Industrial Direct Co Inc 256 0.01
5 MTS Systems Corp 252 0.01
30 Mueller Industries Inc 1,142 0.06
13 Mueller Water Products Inc 178 0.01
2 Multi-Color Corp 130 0.01
92 Murphy Oil Corp 3,114 0.17
14 Murphy USA Inc 985 0.05
4 MutualFirst Financial Inc 110 0.01
4 Myers Industries Inc 57 –
4 Mylan NV 132 0.01
11 MYR Group Inc 419 0.02
167 Nabors Industries Ltd 2,690 0.14
2 NACCO Industries Inc 219 0.01
11 Nanometrics Inc 273 0.01
14 Napco Security Technologies Inc 119 0.01
61 Nasdaq Inc 3,914 0.22
1 National American University Holdings Inc 1 –
17 National Bank Holdings Corp 472 0.03
46 National General Holdings Corp 1,044 0.06
8 National HealthCare Corp 529 0.03
2 National Presto Industries Inc 173 0.01
2 National Western Life Group Inc 452 0.02
4 Natural Alternatives International Inc 45 –
8 Natural Gas Services Group Inc 226 0.01
4 Natural Grocers by Vitamin Cottage Inc 41 –
7 Nature's Sunshine Products Inc 99 0.01
– Natus Medical Inc 18 –
173 Navient Corp 2,974 0.16
26 Navigant Consulting Inc 632 0.03
8 Navigators Group Inc 886 0.05
23 NBT Bancorp Inc 895 0.05
4 NCI Inc 51 –
18 Nelnet Inc 904 0.05
21 NeoPhotonics Corp 273 0.01
17 NETGEAR Inc 920 0.05
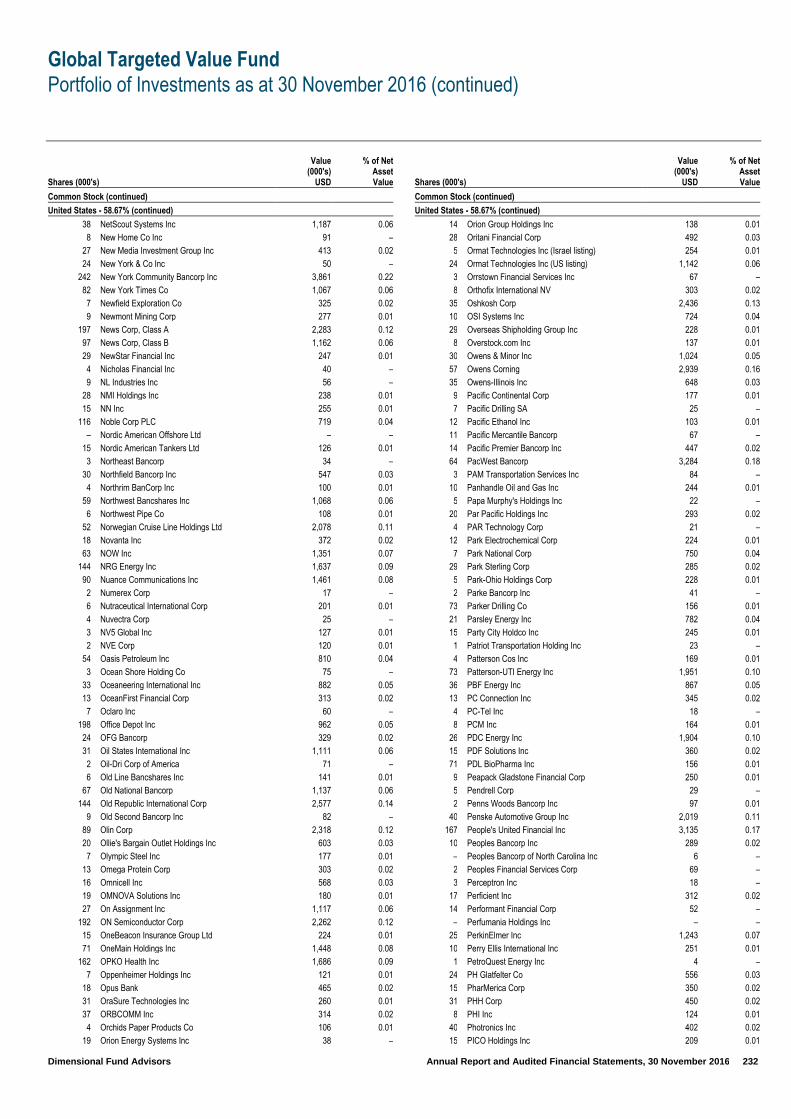
Global Targeted Value Fund
Portfolio of Investments as at 30 November 2016 (continued)
Dimensional Fund Advisors Annual Report and Audited Financial Statements, 30 November 2016 232
Shares (000's)
Value (000's)
USD
% of Net Asset Value
Common Stock (continued)
United States - 58.67% (continued)
38 NetScout Systems Inc 1,187 0.06
8 New Home Co Inc 91 –
27 New Media Investment Group Inc 413 0.02
24 New York & Co Inc 50 –
242 New York Community Bancorp Inc 3,861 0.22
82 New York Times Co 1,067 0.06
7 Newfield Exploration Co 325 0.02
9 Newmont Mining Corp 277 0.01
197 News Corp, Class A 2,283 0.12
97 News Corp, Class B 1,162 0.06
29 NewStar Financial Inc 247 0.01
4 Nicholas Financial Inc 40 –
9 NL Industries Inc 56 –
28 NMI Holdings Inc 238 0.01
15 NN Inc 255 0.01
116 Noble Corp PLC 719 0.04
– Nordic American Offshore Ltd – –
15 Nordic American Tankers Ltd 126 0.01
3 Northeast Bancorp 34 –
30 Northfield Bancorp Inc 547 0.03
4 Northrim BanCorp Inc 100 0.01
59 Northwest Bancshares Inc 1,068 0.06
6 Northwest Pipe Co 108 0.01
52 Norwegian Cruise Line Holdings Ltd 2,078 0.11
18 Novanta Inc 372 0.02
63 NOW Inc 1,351 0.07
144 NRG Energy Inc 1,637 0.09
90 Nuance Communications Inc 1,461 0.08
2 Numerex Corp 17 –
6 Nutraceutical International Corp 201 0.01
4 Nuvectra Corp 25 –
3 NV5 Global Inc 127 0.01
2 NVE Corp 120 0.01
54 Oasis Petroleum Inc 810 0.04
3 Ocean Shore Holding Co 75 –
33 Oceaneering International Inc 882 0.05
13 OceanFirst Financial Corp 313 0.02
7 Oclaro Inc 60 –
198 Office Depot Inc 962 0.05
24 OFG Bancorp 329 0.02
31 Oil States International Inc 1,111 0.06
2 Oil-Dri Corp of America 71 –
6 Old Line Bancshares Inc 141 0.01
67 Old National Bancorp 1,137 0.06
144 Old Republic International Corp 2,577 0.14
9 Old Second Bancorp Inc 82 –
89 Olin Corp 2,318 0.12
20 Ollie's Bargain Outlet Holdings Inc 603 0.03
7 Olympic Steel Inc 177 0.01
13 Omega Protein Corp 303 0.02
16 Omnicell Inc 568 0.03
19 OMNOVA Solutions Inc 180 0.01
27 On Assignment Inc 1,117 0.06
192 ON Semiconductor Corp 2,262 0.12
15 OneBeacon Insurance Group Ltd 224 0.01
71 OneMain Holdings Inc 1,448 0.08
162 OPKO Health Inc 1,686 0.09
7 Oppenheimer Holdings Inc 121 0.01
18 Opus Bank 465 0.02
31 OraSure Technologies Inc 260 0.01
37 ORBCOMM Inc 314 0.02
4 Orchids Paper Products Co 106 0.01
19 Orion Energy Systems Inc 38 –
Shares (000's)
Value (000's)
USD
% of Net Asset Value
Common Stock (continued)
United States - 58.67% (continued)
14 Orion Group Holdings Inc 138 0.01
28 Oritani Financial Corp 492 0.03
5 Ormat Technologies Inc (Israel listing) 254 0.01
24 Ormat Technologies Inc (US listing) 1,142 0.06
3 Orrstown Financial Services Inc 67 –
8 Orthofix International NV 303 0.02
35 Oshkosh Corp 2,436 0.13
10 OSI Systems Inc 724 0.04
29 Overseas Shipholding Group Inc 228 0.01
8 Overstock.com Inc 137 0.01
30 Owens & Minor Inc 1,024 0.05
57 Owens Corning 2,939 0.16
35 Owens-Illinois Inc 648 0.03
9 Pacific Continental Corp 177 0.01
7 Pacific Drilling SA 25 –
12 Pacific Ethanol Inc 103 0.01
11 Pacific Mercantile Bancorp 67 –
14 Pacific Premier Bancorp Inc 447 0.02
64 PacWest Bancorp 3,284 0.18
3 PAM Transportation Services Inc 84 –
10 Panhandle Oil and Gas Inc 244 0.01
5 Papa Murphy's Holdings Inc 22 –
20 Par Pacific Holdings Inc 293 0.02
4 PAR Technology Corp 21 –
12 Park Electrochemical Corp 224 0.01
7 Park National Corp 750 0.04
29 Park Sterling Corp 285 0.02
5 Park-Ohio Holdings Corp 228 0.01
2 Parke Bancorp Inc 41 –
73 Parker Drilling Co 156 0.01
21 Parsley Energy Inc 782 0.04
15 Party City Holdco Inc 245 0.01
1 Patriot Transportation Holding Inc 23 –
4 Patterson Cos Inc 169 0.01
73 Patterson-UTI Energy Inc 1,951 0.10
36 PBF Energy Inc 867 0.05
13 PC Connection Inc 345 0.02
4 PC-Tel Inc 18 –
8 PCM Inc 164 0.01
26 PDC Energy Inc 1,904 0.10
15 PDF Solutions Inc 360 0.02
71 PDL BioPharma Inc 156 0.01
9 Peapack Gladstone Financial Corp 250 0.01
5 Pendrell Corp 29 –
2 Penns Woods Bancorp Inc 97 0.01
40 Penske Automotive Group Inc 2,019 0.11
167 People's United Financial Inc 3,135 0.17
10 Peoples Bancorp Inc 289 0.02
– Peoples Bancorp of North Carolina Inc 6 –
2 Peoples Financial Services Corp 69 –
3 Perceptron Inc 18 –
17 Perficient Inc 312 0.02
14 Performant Financial Corp 52 –
– Perfumania Holdings Inc – –
25 PerkinElmer Inc 1,243 0.07
10 Perry Ellis International Inc 251 0.01
1 PetroQuest Energy Inc 4 –
24 PH Glatfelter Co 556 0.03
15 PharMerica Corp 350 0.02
31 PHH Corp 450 0.02
8 PHI Inc 124 0.01
40 Photronics Inc 402 0.02
15 PICO Holdings Inc 209 0.01
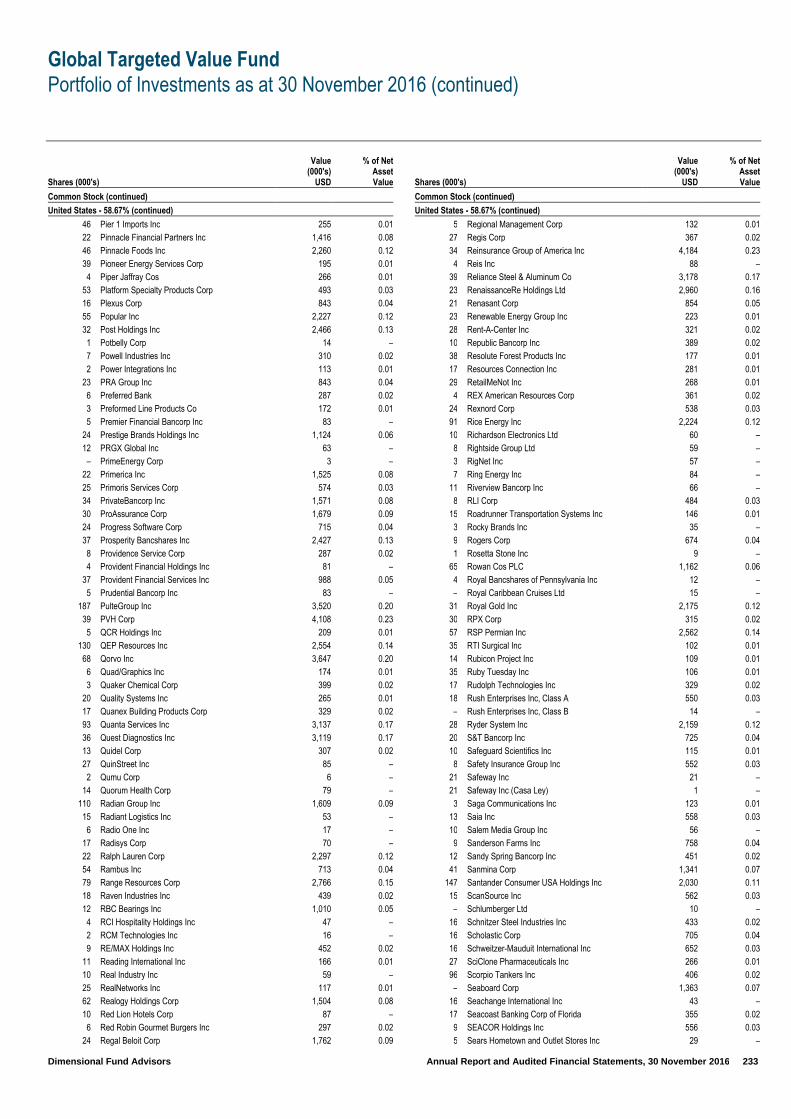
Global Targeted Value Fund
Portfolio of Investments as at 30 November 2016 (continued)
Dimensional Fund Advisors Annual Report and Audited Financial Statements, 30 November 2016 233
Shares (000's)
Value (000's)
USD
% of Net Asset Value
Common Stock (continued)
United States - 58.67% (continued)
46 Pier 1 Imports Inc 255 0.01
22 Pinnacle Financial Partners Inc 1,416 0.08
46 Pinnacle Foods Inc 2,260 0.12
39 Pioneer Energy Services Corp 195 0.01
4 Piper Jaffray Cos 266 0.01
53 Platform Specialty Products Corp 493 0.03
16 Plexus Corp 843 0.04
55 Popular Inc 2,227 0.12
32 Post Holdings Inc 2,466 0.13
1 Potbelly Corp 14 –
7 Powell Industries Inc 310 0.02
2 Power Integrations Inc 113 0.01
23 PRA Group Inc 843 0.04
6 Preferred Bank 287 0.02
3 Preformed Line Products Co 172 0.01
5 Premier Financial Bancorp Inc 83 –
24 Prestige Brands Holdings Inc 1,124 0.06
12 PRGX Global Inc 63 –
– PrimeEnergy Corp 3 –
22 Primerica Inc 1,525 0.08
25 Primoris Services Corp 574 0.03
34 PrivateBancorp Inc 1,571 0.08
30 ProAssurance Corp 1,679 0.09
24 Progress Software Corp 715 0.04
37 Prosperity Bancshares Inc 2,427 0.13
8 Providence Service Corp 287 0.02
4 Provident Financial Holdings Inc 81 –
37 Provident Financial Services Inc 988 0.05
5 Prudential Bancorp Inc 83 –
187 PulteGroup Inc 3,520 0.20
39 PVH Corp 4,108 0.23
5 QCR Holdings Inc 209 0.01
130 QEP Resources Inc 2,554 0.14
68 Qorvo Inc 3,647 0.20
6 Quad/Graphics Inc 174 0.01
3 Quaker Chemical Corp 399 0.02
20 Quality Systems Inc 265 0.01
17 Quanex Building Products Corp 329 0.02
93 Quanta Services Inc 3,137 0.17
36 Quest Diagnostics Inc 3,119 0.17
13 Quidel Corp 307 0.02
27 QuinStreet Inc 85 –
2 Qumu Corp 6 –
14 Quorum Health Corp 79 –
110 Radian Group Inc 1,609 0.09
15 Radiant Logistics Inc 53 –
6 Radio One Inc 17 –
17 Radisys Corp 70 –
22 Ralph Lauren Corp 2,297 0.12
54 Rambus Inc 713 0.04
79 Range Resources Corp 2,766 0.15
18 Raven Industries Inc 439 0.02
12 RBC Bearings Inc 1,010 0.05
4 RCI Hospitality Holdings Inc 47 –
2 RCM Technologies Inc 16 –
9 RE/MAX Holdings Inc 452 0.02
11 Reading International Inc 166 0.01
10 Real Industry Inc 59 –
25 RealNetworks Inc 117 0.01
62 Realogy Holdings Corp 1,504 0.08
10 Red Lion Hotels Corp 87 –
6 Red Robin Gourmet Burgers Inc 297 0.02
24 Regal Beloit Corp 1,762 0.09
Shares (000's)
Value (000's)
USD
% of Net Asset Value
Common Stock (continued)
United States - 58.67% (continued)
5 Regional Management Corp 132 0.01
27 Regis Corp 367 0.02
34 Reinsurance Group of America Inc 4,184 0.23
4 Reis Inc 88 –
39 Reliance Steel & Aluminum Co 3,178 0.17
23 RenaissanceRe Holdings Ltd 2,960 0.16
21 Renasant Corp 854 0.05
23 Renewable Energy Group Inc 223 0.01
28 Rent-A-Center Inc 321 0.02
10 Republic Bancorp Inc 389 0.02
38 Resolute Forest Products Inc 177 0.01
17 Resources Connection Inc 281 0.01
29 RetailMeNot Inc 268 0.01
4 REX American Resources Corp 361 0.02
24 Rexnord Corp 538 0.03
91 Rice Energy Inc 2,224 0.12
10 Richardson Electronics Ltd 60 –
8 Rightside Group Ltd 59 –
3 RigNet Inc 57 –
7 Ring Energy Inc 84 –
11 Riverview Bancorp Inc 66 –
8 RLI Corp 484 0.03
15 Roadrunner Transportation Systems Inc 146 0.01
3 Rocky Brands Inc 35 –
9 Rogers Corp 674 0.04
1 Rosetta Stone Inc 9 –
65 Rowan Cos PLC 1,162 0.06
4 Royal Bancshares of Pennsylvania Inc 12 –
– Royal Caribbean Cruises Ltd 15 –
31 Royal Gold Inc 2,175 0.12
30 RPX Corp 315 0.02
57 RSP Permian Inc 2,562 0.14
35 RTI Surgical Inc 102 0.01
14 Rubicon Project Inc 109 0.01
35 Ruby Tuesday Inc 106 0.01
17 Rudolph Technologies Inc 329 0.02
18 Rush Enterprises Inc, Class A 550 0.03
– Rush Enterprises Inc, Class B 14 –
28 Ryder System Inc 2,159 0.12
20 S&T Bancorp Inc 725 0.04
10 Safeguard Scientifics Inc 115 0.01
8 Safety Insurance Group Inc 552 0.03
21 Safeway Inc 21 –
21 Safeway Inc (Casa Ley) 1 –
3 Saga Communications Inc 123 0.01
13 Saia Inc 558 0.03
10 Salem Media Group Inc 56 –
9 Sanderson Farms Inc 758 0.04
12 Sandy Spring Bancorp Inc 451 0.02
41 Sanmina Corp 1,341 0.07
147 Santander Consumer USA Holdings Inc 2,030 0.11
15 ScanSource Inc 562 0.03
– Schlumberger Ltd 10 –
16 Schnitzer Steel Industries Inc 433 0.02
16 Scholastic Corp 705 0.04
16 Schweitzer-Mauduit International Inc 652 0.03
27 SciClone Pharmaceuticals Inc 266 0.01
96 Scorpio Tankers Inc 406 0.02
– Seaboard Corp 1,363 0.07
16 Seachange International Inc 43 –
17 Seacoast Banking Corp of Florida 355 0.02
9 SEACOR Holdings Inc 556 0.03
5 Sears Hometown and Outlet Stores Inc 29 –

Global Targeted Value Fund
Portfolio of Investments as at 30 November 2016 (continued)
Dimensional Fund Advisors Annual Report and Audited Financial Statements, 30 November 2016 234
Shares (000's)
Value (000's)
USD
% of Net Asset Value
Common Stock (continued)
United States - 58.67% (continued)
4 SeaSpine Holdings Corp 31 –
7 SeaWorld Entertainment Inc 120 0.01
8 Security National Financial Corp 57 –
3 Select Bancorp Inc 25 –
73 Select Medical Holdings Corp 891 0.05
29 Selective Insurance Group Inc 1,173 0.06
29 SemGroup Corp 1,045 0.06
18 Semtech Corp 501 0.03
5 Seneca Foods Corp 192 0.01
1 Sensient Technologies Corp 95 0.01
4 Sequential Brands Group Inc 21 –
9 Service Corp International 249 0.01
28 ServiceSource International Inc 168 0.01
19 Shenandoah Telecommunications Co 542 0.03
10 Shiloh Industries Inc 69 –
34 Ship Finance International Ltd 495 0.03
9 Shoe Carnival Inc 246 0.01
6 Shore Bancshares Inc 85 –
34 ShoreTel Inc 237 0.01
17 Shutterfly Inc 873 0.05
7 SI Financial Group Inc 92 –
7 Sierra Bancorp 164 0.01
1 SIFCO Industries Inc 11 –
14 Sigma Designs Inc 108 0.01
21 Signet Jewelers Ltd 1,877 0.10
18 Silicon Laboratories Inc 1,219 0.06
17 Simmons First National Corp 1,013 0.05
25 Simpson Manufacturing Co Inc 1,159 0.06
18 Sinclair Broadcast Group Inc 579 0.03
1 Skechers U.S.A. Inc 23 –
1 Skyline Corp 11 –
26 SkyWest Inc 951 0.05
192 SLM Corp 1,937 0.10
32 SM Energy Co 1,256 0.07
13 Smart & Final Stores Inc 175 0.01
48 Snyder's-Lance Inc 1,800 0.10
20 Sonic Automotive Inc 414 0.02
42 Sonoco Products Co 2,294 0.12
23 Sonus Networks Inc 136 0.01
24 Sotheby's 945 0.05
12 South State Corp 1,055 0.06
3 Southern First Bancshares Inc 83 –
3 Southern Missouri Bancorp Inc 98 0.01
8 Southern National Bancorp of Virginia Inc 115 0.01
13 Southside Bancshares Inc 514 0.03
10 Southwest Bancorp Inc 217 0.01
9 Southwestern Energy Co 101 0.01
11 SP Plus Corp 311 0.02
2 Span-America Medical Systems Inc 30 –
22 Spartan Motors Inc 196 0.01
18 SpartanNash Co 668 0.04
4 Sparton Corp 94 0.01
21 Speedway Motorsports Inc 439 0.02
27 Spirit AeroSystems Holdings Inc 1,582 0.08
31 Spirit Airlines Inc 1,706 0.09
13 Spok Holdings Inc 228 0.01
– Sprint Corp 3 –
21 SPX Corp 521 0.03
24 SPX FLOW Inc 750 0.04
1 SS&C Technologies Holdings Inc 16 –
5 St Joe Co 107 0.01
15 Stage Stores Inc 67 –
12 Standard Motor Products Inc 580 0.03
Shares (000's)
Value (000's)
USD
% of Net Asset Value
Common Stock (continued)
United States - 58.67% (continued)
5 Standex International Corp 467 0.02
1 Stanley Furniture Co Inc 1 –
343 Staples Inc 3,318 0.19
2 StarTek Inc 17 –
24 State Auto Financial Corp 621 0.03
15 State Bank Financial Corp 381 0.02
13 State National Cos Inc 181 0.01
117 Steel Dynamics Inc 4,155 0.23
44 Steelcase Inc 692 0.04
1 Stemline Therapeutics Inc 11 –
12 Stepan Co 940 0.05
15 Stericycle Inc 1,116 0.06
10 Steris PLC 648 0.03
68 Sterling Bancorp 1,554 0.08
8 Sterling Construction Co Inc 69 –
12 Stewart Information Services Corp 592 0.03
33 Stifel Financial Corp 1,622 0.09
65 Stillwater Mining Co 984 0.05
9 Stock Yards Bancorp Inc 384 0.02
3 Stonegate Bank 133 0.01
20 Stratasys Ltd 366 0.02
2 Strattec Security Corp 71 –
3 Stratus Properties Inc 90 –
4 Suffolk Bancorp 162 0.01
4 Summit Financial Group Inc 86 –
– Summit State Bank 4 –
9 Sun Bancorp Inc 212 0.01
29 SunCoke Energy Inc 331 0.02
47 SunPower Corp 320 0.02
24 Super Micro Computer Inc 650 0.03
81 Superior Energy Services Inc 1,391 0.07
13 Superior Industries International Inc 332 0.02
8 Superior Uniform Group Inc 146 0.01
9 Supreme Industries Inc 122 0.01
– Sussex Bancorp 4 –
20 SVB Financial Group 3,167 0.17
22 Swift Transportation Co 539 0.03
21 Sykes Enterprises Inc 597 0.03
5 Synalloy Corp 54 –
10 Synaptics Inc 533 0.03
22 Synchronoss Technologies Inc 1,070 0.06
84 Synergy Resources Corp 800 0.04
19 SYNNEX Corp 2,244 0.12
64 Synovus Financial Corp 2,492 0.13
10 Syntel Inc 194 0.01
23 Systemax Inc 197 0.01
9 Tailored Brands Inc 168 0.01
4 Tandy Leather Factory Inc 27 –
13 Tangoe Inc 105 0.01
82 Targa Resources Corp 4,367 0.24
7 Taro Pharmaceutical Industries Ltd 705 0.04
2 Taylor Morrison Home Corp 42 –
89 TCF Financial Corp 1,551 0.08
13 Team Inc 453 0.02
18 Tech Data Corp 1,550 0.08
13 TechTarget Inc 113 0.01
14 Teekay Corp 108 0.01
47 Teekay Tankers Ltd 110 0.01
102 TEGNA Inc 2,277 0.12
12 Tejon Ranch Co 312 0.02
16 Teledyne Technologies Inc 2,032 0.11
9 Teleflex Inc 1,393 0.07
11 Telenav Inc 67 –
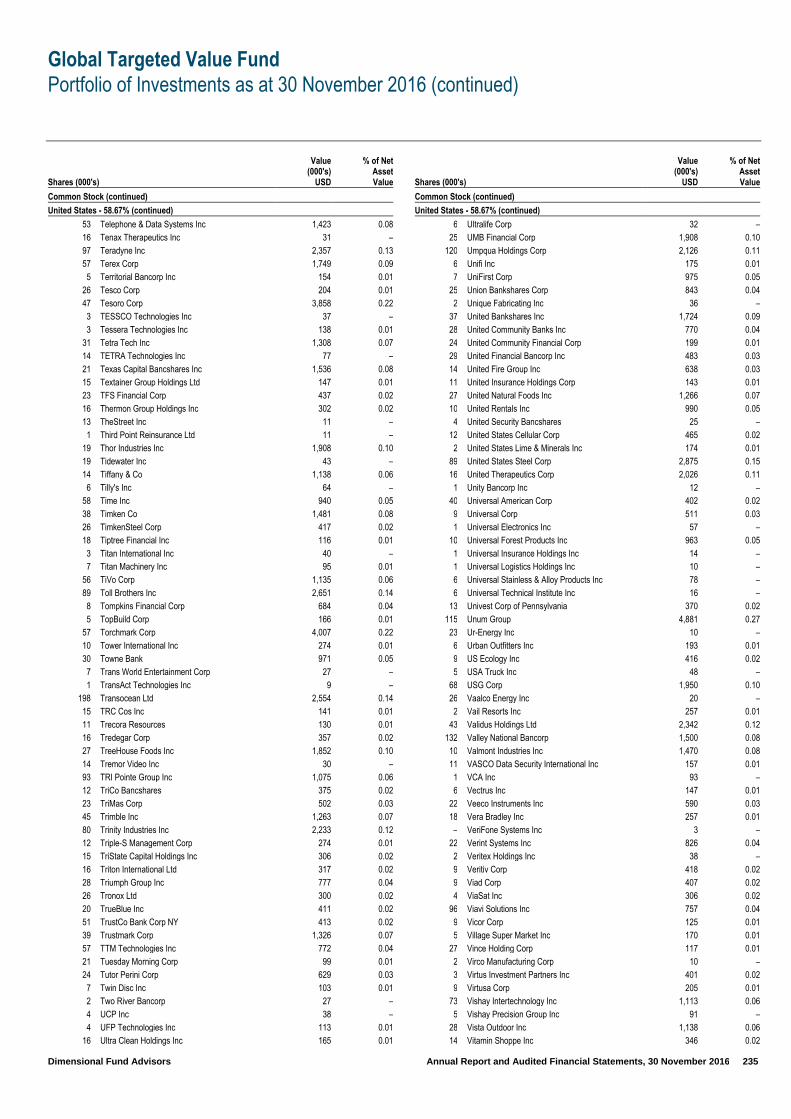
Global Targeted Value Fund
Portfolio of Investments as at 30 November 2016 (continued)
Dimensional Fund Advisors Annual Report and Audited Financial Statements, 30 November 2016 235
Shares (000's)
Value (000's)
USD
% of Net Asset Value
Common Stock (continued)
United States - 58.67% (continued)
53 Telephone & Data Systems Inc 1,423 0.08
16 Tenax Therapeutics Inc 31 –
97 Teradyne Inc 2,357 0.13
57 Terex Corp 1,749 0.09
5 Territorial Bancorp Inc 154 0.01
26 Tesco Corp 204 0.01
47 Tesoro Corp 3,858 0.22
3 TESSCO Technologies Inc 37 –
3 Tessera Technologies Inc 138 0.01
31 Tetra Tech Inc 1,308 0.07
14 TETRA Technologies Inc 77 –
21 Texas Capital Bancshares Inc 1,536 0.08
15 Textainer Group Holdings Ltd 147 0.01
23 TFS Financial Corp 437 0.02
16 Thermon Group Holdings Inc 302 0.02
13 TheStreet Inc 11 –
1 Third Point Reinsurance Ltd 11 –
19 Thor Industries Inc 1,908 0.10
19 Tidewater Inc 43 –
14 Tiffany & Co 1,138 0.06
6 Tilly's Inc 64 –
58 Time Inc 940 0.05
38 Timken Co 1,481 0.08
26 TimkenSteel Corp 417 0.02
18 Tiptree Financial Inc 116 0.01
3 Titan International Inc 40 –
7 Titan Machinery Inc 95 0.01
56 TiVo Corp 1,135 0.06
89 Toll Brothers Inc 2,651 0.14
8 Tompkins Financial Corp 684 0.04
5 TopBuild Corp 166 0.01
57 Torchmark Corp 4,007 0.22
10 Tower International Inc 274 0.01
30 Towne Bank 971 0.05
7 Trans World Entertainment Corp 27 –
1 TransAct Technologies Inc 9 –
198 Transocean Ltd 2,554 0.14
15 TRC Cos Inc 141 0.01
11 Trecora Resources 130 0.01
16 Tredegar Corp 357 0.02
27 TreeHouse Foods Inc 1,852 0.10
14 Tremor Video Inc 30 –
93 TRI Pointe Group Inc 1,075 0.06
12 TriCo Bancshares 375 0.02
23 TriMas Corp 502 0.03
45 Trimble Inc 1,263 0.07
80 Trinity Industries Inc 2,233 0.12
12 Triple-S Management Corp 274 0.01
15 TriState Capital Holdings Inc 306 0.02
16 Triton International Ltd 317 0.02
28 Triumph Group Inc 777 0.04
26 Tronox Ltd 300 0.02
20 TrueBlue Inc 411 0.02
51 TrustCo Bank Corp NY 413 0.02
39 Trustmark Corp 1,326 0.07
57 TTM Technologies Inc 772 0.04
21 Tuesday Morning Corp 99 0.01
24 Tutor Perini Corp 629 0.03
7 Twin Disc Inc 103 0.01
2 Two River Bancorp 27 –
4 UCP Inc 38 –
4 UFP Technologies Inc 113 0.01
16 Ultra Clean Holdings Inc 165 0.01
Shares (000's)
Value (000's)
USD
% of Net Asset Value
Common Stock (continued)
United States - 58.67% (continued)
6 Ultralife Corp 32 –
25 UMB Financial Corp 1,908 0.10
120 Umpqua Holdings Corp 2,126 0.11
6 Unifi Inc 175 0.01
7 UniFirst Corp 975 0.05
25 Union Bankshares Corp 843 0.04
2 Unique Fabricating Inc 36 –
37 United Bankshares Inc 1,724 0.09
28 United Community Banks Inc 770 0.04
24 United Community Financial Corp 199 0.01
29 United Financial Bancorp Inc 483 0.03
14 United Fire Group Inc 638 0.03
11 United Insurance Holdings Corp 143 0.01
27 United Natural Foods Inc 1,266 0.07
10 United Rentals Inc 990 0.05
4 United Security Bancshares 25 –
12 United States Cellular Corp 465 0.02
2 United States Lime & Minerals Inc 174 0.01
89 United States Steel Corp 2,875 0.15
16 United Therapeutics Corp 2,026 0.11
1 Unity Bancorp Inc 12 –
40 Universal American Corp 402 0.02
9 Universal Corp 511 0.03
1 Universal Electronics Inc 57 –
10 Universal Forest Products Inc 963 0.05
1 Universal Insurance Holdings Inc 14 –
1 Universal Logistics Holdings Inc 10 –
6 Universal Stainless & Alloy Products Inc 78 –
6 Universal Technical Institute Inc 16 –
13 Univest Corp of Pennsylvania 370 0.02
115 Unum Group 4,881 0.27
23 Ur-Energy Inc 10 –
6 Urban Outfitters Inc 193 0.01
9 US Ecology Inc 416 0.02
5 USA Truck Inc 48 –
68 USG Corp 1,950 0.10
26 Vaalco Energy Inc 20 –
2 Vail Resorts Inc 257 0.01
43 Validus Holdings Ltd 2,342 0.12
132 Valley National Bancorp 1,500 0.08
10 Valmont Industries Inc 1,470 0.08
11 VASCO Data Security International Inc 157 0.01
1 VCA Inc 93 –
6 Vectrus Inc 147 0.01
22 Veeco Instruments Inc 590 0.03
18 Vera Bradley Inc 257 0.01
– VeriFone Systems Inc 3 –
22 Verint Systems Inc 826 0.04
2 Veritex Holdings Inc 38 –
9 Veritiv Corp 418 0.02
9 Viad Corp 407 0.02
4 ViaSat Inc 306 0.02
96 Viavi Solutions Inc 757 0.04
9 Vicor Corp 125 0.01
5 Village Super Market Inc 170 0.01
27 Vince Holding Corp 117 0.01
2 Virco Manufacturing Corp 10 –
3 Virtus Investment Partners Inc 401 0.02
9 Virtusa Corp 205 0.01
73 Vishay Intertechnology Inc 1,113 0.06
5 Vishay Precision Group Inc 91 –
28 Vista Outdoor Inc 1,138 0.06
14 Vitamin Shoppe Inc 346 0.02

Global Targeted Value Fund
Portfolio of Investments as at 30 November 2016 (continued)
Dimensional Fund Advisors Annual Report and Audited Financial Statements, 30 November 2016 236
Shares (000's)
Value (000's)
USD
% of Net Asset Value
Common Stock (continued)
United States - 58.67% (continued)
4 Vivint Solar Inc 12 –
75 Vonage Holdings Corp 497 0.03
11 VOXX International Corp 54 –
104 Voya Financial Inc 4,047 0.23
6 VSE Corp 244 0.01
2 Vulcan Materials Co 280 0.01
62 VWR Corp 1,696 0.09
34 Wabash National Corp 476 0.03
4 Waddell & Reed Financial Inc 82 –
17 Walker & Dunlop Inc 503 0.03
50 Washington Federal Inc 1,636 0.09
8 Washington Trust Bancorp Inc 420 0.02
4 WashingtonFirst Bankshares Inc 120 0.01
16 Waterstone Financial Inc 284 0.02
12 Watts Water Technologies Inc 825 0.04
2 Wayside Technology Group Inc 40 –
14 WCI Communities Inc 319 0.02
334 Weatherford International PLC 1,705 0.09
50 Webster Financial Corp 2,497 0.13
15 Weis Markets Inc 824 0.04
21 WellCare Health Plans Inc 2,887 0.15
119 Wendy's Co 1,490 0.08
37 Werner Enterprises Inc 1,000 0.05
23 WesBanco Inc 903 0.05
56 Wesco Aircraft Holdings Inc 829 0.04
23 WESCO International Inc 1,537 0.08
9 West Bancorporation Inc 203 0.01
13 West Marine Inc 125 0.01
11 Westamerica Bancorporation 707 0.04
18 Westell Technologies Inc 10 –
47 Western Alliance Bancorp 2,218 0.12
15 Western Digital Corp 942 0.05
10 Western New England Bancorp Inc 87 –
51 Western Refining Inc 1,838 0.10
30 Westlake Chemical Corp 1,748 0.09
46 WestRock Co 2,380 0.13
7 WEX Inc 827 0.04
5 Weyco Group Inc 158 0.01
3 White Mountains Insurance Group Ltd 2,280 0.12
90 Whiting Petroleum Corp 1,100 0.06
26 Whole Foods Market Inc 784 0.04
39 Willbros Group Inc 101 0.01
3 Willdan Group Inc 82 –
14 William Lyon Homes 268 0.01
2 Willis Lease Finance Corp 41 –
40 Windstream Holdings Inc 297 0.02
14 Winnebago Industries Inc 438 0.02
27 Wintrust Financial Corp 1,758 0.09
49 Wolverine World Wide Inc 1,095 0.06
28 Woodward Inc 1,884 0.12
33 World Fuel Services Corp 1,479 0.08
29 Worthington Industries Inc 1,615 0.09
184 WPX Energy Inc 2,853 0.15
57 WR Berkley Corp 3,503 0.20
15 WSFS Financial Corp 652 0.03
32 Xcerra Corp 204 0.01
31 Xenith Bankshares Inc 78 –
529 Xerox Corp 4,951 0.27
91 XL Group Ltd 3,291 0.18
12 XO Group Inc 225 0.01
3 Xplore Technologies Corp 6 –
59 XPO Logistics Inc 2,617 0.14
23 Yadkin Financial Corp 749 0.04
Shares (000's)
Value (000's)
USD
% of Net Asset Value
Common Stock (continued)
United States - 58.67% (continued)
7 YuMe Inc 25 –
11 ZAGG Inc 71 –
3 Zedge Inc 11 –
8 Zillow Group Inc 295 0.02
108 Zions Bancorporation 4,300 0.24
– Zogenix Inc 5 –
14 Zumiez Inc 347 0.02
1,100,731 58.67
Total Common Stock - 99.40% (30 November 2015: 99.72%) 1,865,149 99.40
Preferred Stock
Germany - 0.08%
12 Biotest AG 160 0.01
4 Draegerwerk AG & Co KGaA 321 0.02
20 Jungheinrich AG 511 0.02
8 Sixt SE 308 0.02
1 STO SE & Co KGaA 123 0.01
5 Villeroy & Boch AG 72 –
1,495 0.08
Total Preferred Stock – 0.08% (30 November 2015: 0.07%) 1,495 0.08
Total Corporate Bonds – 0.00% (30 November 2015: 0.01%) – –
Rights
Australia – 0.00%
176 Boral Ltd – –
– –
Austria – 0.00%
11 Intercell AG – –
– –
Canada – 0.00%
28 Yamana Gold Inc 7 –
7 –
Italy – 0.00%
2,368 Banca Popolare di Milano Scarl – –
415 Banco Popolare Societa – –
– –
Singapore – 0.00%
45 ASL Marine Holdings Ltd – –
– –
United States – 0.00%
68 Community Health Systems Inc 1 –
1 Overstock.com Inc – –
1 –
Total Rights – 0.00% (30 November 2015: 0.00%) 8 –
Warrants
Israel – 0.00%
– Tower Semiconductor Ltd – –
– –
Singapore – 0.00%
115 Ezion Holdings Ltd 6 –
6 –
United States – 0.00%
13 Central European Media Enterprises Ltd – –
– –
Total Warrants – 0.00% (30 November 2015: 0.00%) 6 –
Total Investments – 99.48% (30 November 2015: 99.80%) 1,866,658 99.48
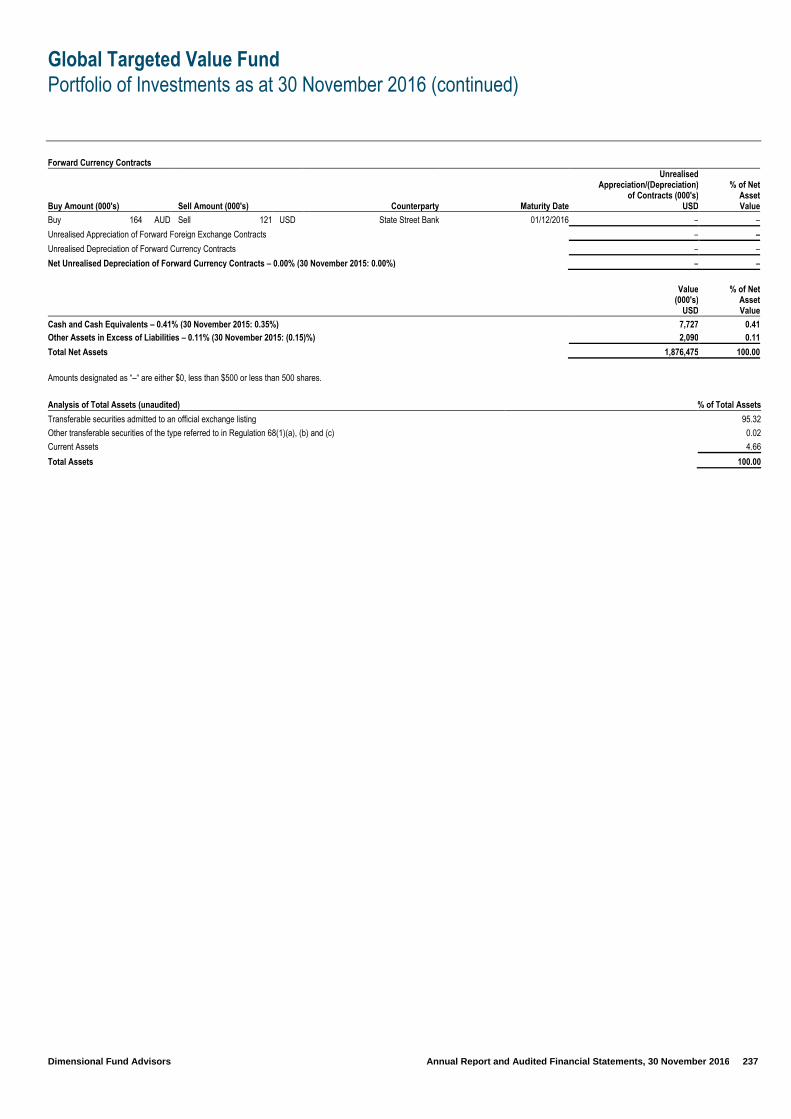
Global Targeted Value Fund
Portfolio of Investments as at 30 November 2016 (continued)
Dimensional Fund Advisors Annual Report and Audited Financial Statements, 30 November 2016 237
Forward Currency Contracts
Buy Amount (000's) Sell Amount (000's) Counterparty Maturity Date
Unrealised Appreciation/(Depreciation)
of Contracts (000's) USD
% of Net Asset Value
Buy 164 AUD Sell 121 USD State Street Bank 01/12/2016 – –
Unrealised Appreciation of Forward Foreign Exchange Contracts – –
Unrealised Depreciation of Forward Currency Contracts – –
Net Unrealised Depreciation of Forward Currency Contracts – 0.00% (30 November 2015: 0.00%) – –
Value (000's)
USD
% of Net Asset Value
Cash and Cash Equivalents – 0.41% (30 November 2015: 0.35%) 7,727 0.41 Other Assets in Excess of Liabilities – 0.11% (30 November 2015: (0.15)%) 2,090 0.11
Total Net Assets 1,876,475 100.00
Amounts designated as “–“ are either $0, less than $500 or less than 500 shares.
Analysis of Total Assets (unaudited) % of Total Assets
Transferable securities admitted to an official exchange listing 95.32
Other transferable securities of the type referred to in Regulation 68(1)(a), (b) and (c) 0.02
Current Assets 4.66
Total Assets 100.00

Global Ultra Short Fixed Income Fund
Portfolio of Investments as at 30 November 2016
Dimensional Fund Advisors Annual Report and Audited Financial Statements, 30 November 2016 238
Face Value (000's)
Coupon Rate %
Maturity Date
Value (000's) GBP
% of Net Asset Value
Corporate Bonds
Australia - 8.31%
9,000
Australia & New Zealand Banking Group Ltd 1.256 10/01/2017 7,197 1.52
1,350
Australia & New Zealand Banking Group Ltd 1.250 13/06/2017 1,079 0.23
3,500
Australia & New Zealand Banking Group Ltd 1.500 16/01/2018 2,793 0.59
1,000
Australia & New Zealand Banking Group Ltd 1.450 15/05/2018 796 0.17
4,485 Commonwealth Bank of Australia 1.625 12/03/2018 3,584 0.76
1,300 Commonwealth Bank of Australia 4.250 6/04/2018 1,168 0.25
10,000 Commonwealth Bank of Australia 1.375 6/09/2018 7,937 1.68
5,000 National Australia Bank Ltd 1.875 23/07/2018 4,004 0.84
2,450 National Australia Bank Ltd 2.300 25/07/2018 1,978 0.42
5,000 Westpac Banking Corp 1.241 19/05/2017 4,000 0.84
2,490 Westpac Banking Corp 1.301 1/12/2017 1,992 0.42
3,500 Westpac Banking Corp 1.500 1/12/2017 2,798 0.59
39,326 8.31
Austria - 1.35%
8,000 Oesterreichische Kontrollbank AG 0.750 19/05/2017 6,384 1.35
6,384 1.35
Canada – 11.03%
6,000 Bank of Montreal 1.131 14/07/2017 4,796 1.01
9,000 Bank of Montreal 1.554 16/03/2018 7,191 1.52
2,000 Bank of Montreal 1.400 10/04/2018 1,595 0.34
2,919 Bank of Nova Scotia 1.100 13/12/2016 2,333 0.49
4,000 Bank of Nova Scotia 1.186 11/04/2017 3,199 0.68
8,000 Bank of Nova Scotia 1.250 11/04/2017 6,395 1.35
604 Bank of Nova Scotia 1.315 11/06/2018 484 0.10
8,845 Royal Bank of Canada 1.212 23/01/2017 7,073 1.49
141 Royal Bank of Canada 1.000 27/04/2017 113 0.02
2,000 Royal Bank of Canada 1.400 13/10/2017 1,599 0.34
1,100 Royal Bank of Canada 1.500 7/06/2018 877 0.18
2,859 Royal Bank of Canada 2.200 27/07/2018 2,304 0.49
1,000 Royal Bank of Canada 1.800 30/07/2018 800 0.17 2,680
Toronto-Dominion Bank 1.124 2/05/2017 2,143 0.45
7,200 Toronto-Dominion Bank 1.625 13/03/2018 5,763 1.22
3,000 Toronto-Dominion Bank 1.400 30/04/2018 2,392 0.51
3,000 Toronto-Dominion Bank 1.750 23/07/2018 2,402 0.51
979 Total Capital Canada Ltd 1.450 15/01/2018 782 0.16
52,241 11.03
Finland - 1.18%
4,000 Nordea Bank Finland PLC 1.610 2/05/2018 3,204 0.68
3,000 Nordea Bank Finland PLC 1.331 7/11/2018 2,397 0.50
5,601 1.18
France – 0.97%
756 Sanofi 1.250 10/04/2018 603 0.13 5,000
Total Capital International SA 1.550 28/06/2017 4,002 0.84
4,605 0.97
Germany – 10.45%
9,200 Erste Abwicklungsanstalt 1.000 27/02/2017 7,353 1.55
Face Value (000's)
Coupon Rate %
Maturity Date
Value (000's) GBP
% of Net Asset Value
Corporate Bonds (continued)
Germany – 10.45% (continued)
5,000 Erste Abwicklungsanstalt 1.125 12/02/2018 3,982 0.84
4,571 Kreditanstalt fuer Wiederaufbau 1.000 26/01/2018 3,645 0.77
10,000 Kreditanstalt fuer Wiederaufbau 1.000 7/09/2018 7,950 1.68
3,000
Landeskreditbank Baden-Wuerttemberg Foerderbank 1.625 25/04/2017 2,403 0.51
1,075
Landeskreditbank Baden-Wuerttemberg Foerderbank 0.582 18/07/2017 1,076 0.23
11,600
Landeskreditbank Baden-Wuerttemberg Foerderbank 1.000 23/04/2018 9,230 1.95
1,316 Landwirtschaftliche Rentenbank 2.375 13/09/2017 1,062 0.22
11,000 NRW Bank 1.000 22/05/2017 8,790 1.86
5,000 NRW Bank 1.375 20/08/2018 3,991 0.84
49,482 10.45
Japan - 0.64%
3,805 Nippon Telegraph & Telephone Corp 1.400 18/07/2017 3,043 0.64
3,043 0.64
Netherlands – 8.85%
11,800 Bank Nederlandse Gemeenten NV 0.875 21/02/2017 9,429 1.99
2,200 Bank Nederlandse Gemeenten NV 1.000 12/02/2018 1,752 0.37
2,000 Bank Nederlandse Gemeenten NV 1.375 19/03/2018 1,599 0.34
1,000 Bank Nederlandse Gemeenten NV 1.125 25/05/2018 796 0.17
10,000 Cooperatieve Rabobank UA 1.411 16/08/2017 8,009 1.69
2,750 Cooperatieve Rabobank UA 1.700 19/03/2018 2,199 0.46
5,000 Nederlandse Waterschapsbank NV 1.250 16/01/2018 3,993 0.84
9,000 Nederlandse Waterschapsbank NV 1.500 16/04/2018 7,206 1.52
2,000 Nederlandse Waterschapsbank NV 0.875 13/07/2018 1,585 0.34
4,643 Shell International Finance BV 1.250 10/11/2017 3,714 0.79
2,000 Shell International Finance BV 1.900 10/08/2018 1,609 0.34
41,891 8.85
Norway – 1.29%
6,000 Statoil ASA 3.125 17/08/2017 4,857 1.02
1,600 Statoil ASA 1.200 17/01/2018 1,275 0.27
6,132 1.29
Supranational – 6.09%
4,710 EUROFIMA 5.000 3/04/2017 3,816 0.81 8,000
European Bank for Reconstruction & Development 1.000 16/02/2017 6,393 1.35
2,000 European Investment Bank 0.598 22/02/2017 2,001 0.42
4,000 European Investment Bank 1.125 15/09/2017 3,196 0.68
1,800 European Investment Bank 1.000 15/06/2018 1,432 0.30
2,500 Inter-American Development Bank 1.250 16/01/2018 1,999 0.42
12,500 Nordic Investment Bank 1.125 19/03/2018 9,980 2.11
28,817 6.09
Sweden – 3.74%
1,000 Nordea Bank AB 3.125 20/03/2017 804 0.17
5,000 Nordea Bank AB 1.697 17/09/2018 4,025 0.85

Global Ultra Short Fixed Income Fund
Portfolio of Investments as at 30 November 2016 (continued)
Dimensional Fund Advisors Annual Report and Audited Financial Statements, 30 November 2016 239
Face Value (000's)
Coupon Rate %
Maturity Date
Value (000's) GBP
% of Net Asset Value
Corporate Bonds (continued)
Sweden – 3.74% (continued)
919 Nordea Bank AB 1.875 17/09/2018 736 0.16
281 Nordea Bank AB 1.875 17/09/2018 225 0.05 5,000
Svensk Exportkredit AB 5.125 1/03/2017 4,034 0.85
4,000 Svensk Exportkredit AB 1.750 30/05/2017 3,208 0.68
4,450 Svensk Exportkredit AB 1.125 5/04/2018 3,546 0.75
1,385 Svenska Handelsbanken AB 2.875 4/04/2017 1,113 0.23
17,691 3.74
United Kingdom - 0.29%
1,700
Network Rail Infrastructure Finance PLC 0.750 3/10/2017 1,354 0.29
1,354 0.29
United States – 19.04%
7,350 Apple Inc 1.050 5/05/2017 5,879 1.24
1,750 Apple Inc 0.900 12/05/2017 1,399 0.29 3,307
Berkshire Hathaway Finance Corp 1.600 15/05/2017 2,650 0.56
3,900 Berkshire Hathaway Finance Corp 1.450 7/03/2018 3,121 0.66
1,500 Berkshire Hathaway Finance Corp 1.496 7/03/2018 1,206 0.25
2,300 Berkshire Hathaway Inc 1.031 6/08/2018 1,840 0.39
4,600 Chevron Corp 1.344 9/11/2017 3,680 0.78
2,300 Chevron Corp 1.345 15/11/2017 1,840 0.39
800 Chevron Corp 1.365 2/03/2018 639 0.13
8,765 Chevron Corp 1.411 16/05/2018 7,036 1.49
1,500 Cisco Systems Inc 1.100 3/03/2017 1,200 0.25
7,750 Cisco Systems Inc 1.400 28/02/2018 6,198 1.31
3,900 Cisco Systems Inc 1.650 15/06/2018 3,129 0.66
3,300 Coca-Cola Co 1.150 1/04/2018 2,635 0.56
12,950 Exxon Mobil Corp 0.921 15/03/2017 10,348 2.19
2,000 Exxon Mobil Corp 0.981 1/03/2018 1,597 0.34
1,796 Exxon Mobil Corp 1.305 6/03/2018 1,435 0.30
5,000 General Electric Co 5.250 6/12/2017 4,159 0.88
47,000 General Electric Co 2.625 16/01/2018 4,193 0.89
1,200 General Electric Co 1.625 2/04/2018 962 0.20
4,500 Merck & Co Inc 1.007 10/02/2017 3,597 0.76
5,000 Merck & Co Inc 1.269 18/05/2018 4,009 0.85
1,520 Nestle Holdings Inc 1.375 21/06/2017 1,217 0.26
1,710 Nestle Holdings Inc 1.375 24/07/2018 1,364 0.29
1,300 Pfizer Inc 1.100 15/05/2017 1,039 0.22 1,460
Precision Castparts Corp 1.250 15/01/2018 1,165 0.25
3,300 Toyota Motor Credit Corp 1.250 5/10/2017 2,639 0.56
3,191 Toyota Motor Credit Corp 1.450 12/01/2018 2,550 0.54
2,433 Toyota Motor Credit Corp 1.200 6/04/2018 1,937 0.41
6,000 Toyota Motor Credit Corp 1.244 6/04/2018 4,808 1.01
800 Toyota Motor Credit Corp 1.338 13/07/2018 642 0.13
90,113 19.04
Total Corporate Bonds – 73.23% (30 November 2015: 61.78%) 346,680 73.23
Government Bonds
Canada – 3.24%
1,843 Province of Manitoba Canada 1.300 3/04/2017 1,474 0.31
4,616 Province of Ontario Canada 3.150 15/12/2017 3,758 0.79
2,000 Province of Ontario Canada 1.200 14/02/2018 1,595 0.34
3,000 Province of Ontario Canada 3.000 16/07/2018 2,457 0.52
Face Value (000's)
Coupon Rate %
Maturity Date
Value (000's) GBP
% of Net Asset Value
Government Bonds (continued)
Canada – 3.24% (continued)
7,500 Province of Ontario Canada 2.000 27/09/2018 6,049 1.28
15,333 3.24
Denmark – 2.61%
6,598 Kommunekredit 1.125 16/01/2018 5,265 1.11
4,900 Kommunekredit 1.125 15/03/2018 3,907 0.83
4,000 Kommunekredit 1.250 27/08/2018 3,190 0.67
12,362 2.61
Finland – 1.99%
11,800 Municipality Finance PLC 1.125 17/04/2018 9,407 1.99
9,407 1.99
France – 1.78%
7,600 Caisse des Depots et Consignations 1.250 4/06/2018 6,053 1.28
3,000 Caisse des Depots et Consignations 1.500 13/11/2018 2,396 0.50
8,449 1.78
Germany – 2.49%
14,800 State of North Rhine-Westphalia 1.250 20/02/2018 11,808 2.49
11,808 2.49
Japan – 1.52%
9,000 Development Bank of Japan Inc 1.500 13/03/2017 7,188 1.52
7,188 1.52
Norway – 2.58%
7,000 Kommunalbanken AS 1.375 8/06/2017 5,602 1.18
8,300 Kommunalbanken AS 1.125 23/05/2018 6,609 1.40
12,211 2.58
Singapore – 2.69%
14,000 Singapore Government Bond 0.500 1/04/2018 7,748 1.64
8,500 Singapore Government Bond 4.000 1/09/2018 4,978 1.05
12,726 2.69
Sweden – 2.34%
5,000 Kommuninvest I Sverige AB 1.000 24/10/2017 3,990 0.84
80,000 Kommuninvest I Sverige AB 1.000 20/06/2018 7,076 1.50
11,066 2.34
United Kingdom – 1.08%
5,000 United Kingdom Gilt 1.250 22/07/2018 5,093 1.08
5,093 1.08
United States – 3.13%
2,000 Federal National Mortgage Association 0.875 8/02/2018 1,596 0.34
11,500 United States Treasury Note 0.875 15/10/2017 9,195 1.94
5,000 United States Treasury Note 1.375 30/06/2018 4,017 0.85
14,808 3.13
Total Government Bonds – 25.45% (30 November 2015: 38.12%) 120,451 25.45
Total Investments - 98.68% (30 November 2015: 99.90%) 467,131 98.68
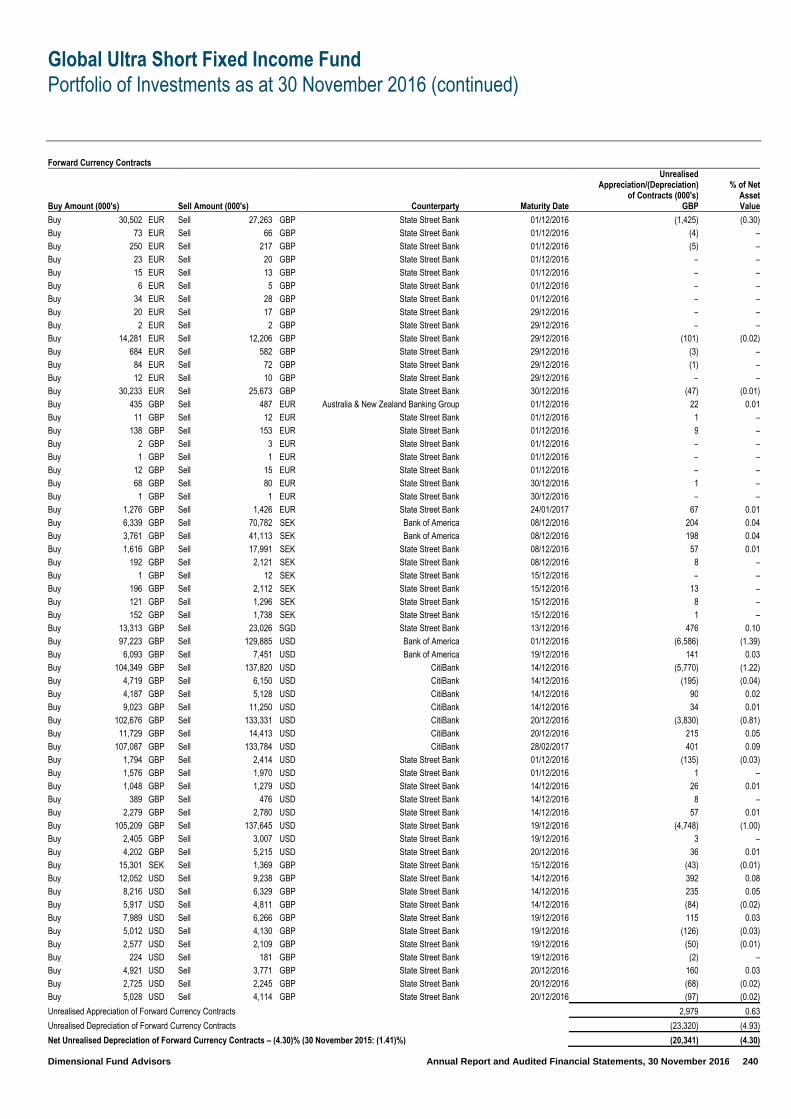
Global Ultra Short Fixed Income Fund
Portfolio of Investments as at 30 November 2016 (continued)
Dimensional Fund Advisors Annual Report and Audited Financial Statements, 30 November 2016 240
Forward Currency Contracts
Buy Amount (000's) Sell Amount (000's) Counterparty Maturity Date
Unrealised Appreciation/(Depreciation)
of Contracts (000's) GBP
% of Net Asset Value
Buy 30,502 EUR Sell 27,263 GBP State Street Bank 01/12/2016 (1,425) (0.30)
Buy 73 EUR Sell 66 GBP State Street Bank 01/12/2016 (4) –
Buy 250 EUR Sell 217 GBP State Street Bank 01/12/2016 (5) –
Buy 23 EUR Sell 20 GBP State Street Bank 01/12/2016 – –
Buy 15 EUR Sell 13 GBP State Street Bank 01/12/2016 – –
Buy 6 EUR Sell 5 GBP State Street Bank 01/12/2016 – –
Buy 34 EUR Sell 28 GBP State Street Bank 01/12/2016 – –
Buy 20 EUR Sell 17 GBP State Street Bank 29/12/2016 – –
Buy 2 EUR Sell 2 GBP State Street Bank 29/12/2016 – –
Buy 14,281 EUR Sell 12,206 GBP State Street Bank 29/12/2016 (101) (0.02)
Buy 684 EUR Sell 582 GBP State Street Bank 29/12/2016 (3) –
Buy 84 EUR Sell 72 GBP State Street Bank 29/12/2016 (1) –
Buy 12 EUR Sell 10 GBP State Street Bank 29/12/2016 – –
Buy 30,233 EUR Sell 25,673 GBP State Street Bank 30/12/2016 (47) (0.01)
Buy 435 GBP Sell 487 EUR Australia & New Zealand Banking Group 01/12/2016 22 0.01
Buy 11 GBP Sell 12 EUR State Street Bank 01/12/2016 1 –
Buy 138 GBP Sell 153 EUR State Street Bank 01/12/2016 9 –
Buy 2 GBP Sell 3 EUR State Street Bank 01/12/2016 – –
Buy 1 GBP Sell 1 EUR State Street Bank 01/12/2016 – –
Buy 12 GBP Sell 15 EUR State Street Bank 01/12/2016 – –
Buy 68 GBP Sell 80 EUR State Street Bank 30/12/2016 1 –
Buy 1 GBP Sell 1 EUR State Street Bank 30/12/2016 – –
Buy 1,276 GBP Sell 1,426 EUR State Street Bank 24/01/2017 67 0.01
Buy 6,339 GBP Sell 70,782 SEK Bank of America 08/12/2016 204 0.04
Buy 3,761 GBP Sell 41,113 SEK Bank of America 08/12/2016 198 0.04
Buy 1,616 GBP Sell 17,991 SEK State Street Bank 08/12/2016 57 0.01
Buy 192 GBP Sell 2,121 SEK State Street Bank 08/12/2016 8 –
Buy 1 GBP Sell 12 SEK State Street Bank 15/12/2016 – –
Buy 196 GBP Sell 2,112 SEK State Street Bank 15/12/2016 13 –
Buy 121 GBP Sell 1,296 SEK State Street Bank 15/12/2016 8 –
Buy 152 GBP Sell 1,738 SEK State Street Bank 15/12/2016 1 –
Buy 13,313 GBP Sell 23,026 SGD State Street Bank 13/12/2016 476 0.10
Buy 97,223 GBP Sell 129,885 USD Bank of America 01/12/2016 (6,586) (1.39)
Buy 6,093 GBP Sell 7,451 USD Bank of America 19/12/2016 141 0.03
Buy 104,349 GBP Sell 137,820 USD CitiBank 14/12/2016 (5,770) (1.22)
Buy 4,719 GBP Sell 6,150 USD CitiBank 14/12/2016 (195) (0.04)
Buy 4,187 GBP Sell 5,128 USD CitiBank 14/12/2016 90 0.02
Buy 9,023 GBP Sell 11,250 USD CitiBank 14/12/2016 34 0.01
Buy 102,676 GBP Sell 133,331 USD CitiBank 20/12/2016 (3,830) (0.81)
Buy 11,729 GBP Sell 14,413 USD CitiBank 20/12/2016 215 0.05
Buy 107,087 GBP Sell 133,784 USD CitiBank 28/02/2017 401 0.09
Buy 1,794 GBP Sell 2,414 USD State Street Bank 01/12/2016 (135) (0.03)
Buy 1,576 GBP Sell 1,970 USD State Street Bank 01/12/2016 1 –
Buy 1,048 GBP Sell 1,279 USD State Street Bank 14/12/2016 26 0.01
Buy 389 GBP Sell 476 USD State Street Bank 14/12/2016 8 –
Buy 2,279 GBP Sell 2,780 USD State Street Bank 14/12/2016 57 0.01
Buy 105,209 GBP Sell 137,645 USD State Street Bank 19/12/2016 (4,748) (1.00)
Buy 2,405 GBP Sell 3,007 USD State Street Bank 19/12/2016 3 –
Buy 4,202 GBP Sell 5,215 USD State Street Bank 20/12/2016 36 0.01
Buy 15,301 SEK Sell 1,369 GBP State Street Bank 15/12/2016 (43) (0.01)
Buy 12,052 USD Sell 9,238 GBP State Street Bank 14/12/2016 392 0.08
Buy 8,216 USD Sell 6,329 GBP State Street Bank 14/12/2016 235 0.05
Buy 5,917 USD Sell 4,811 GBP State Street Bank 14/12/2016 (84) (0.02)
Buy 7,989 USD Sell 6,266 GBP State Street Bank 19/12/2016 115 0.03
Buy 5,012 USD Sell 4,130 GBP State Street Bank 19/12/2016 (126) (0.03)
Buy 2,577 USD Sell 2,109 GBP State Street Bank 19/12/2016 (50) (0.01)
Buy 224 USD Sell 181 GBP State Street Bank 19/12/2016 (2) –
Buy 4,921 USD Sell 3,771 GBP State Street Bank 20/12/2016 160 0.03
Buy 2,725 USD Sell 2,245 GBP State Street Bank 20/12/2016 (68) (0.02)
Buy 5,028 USD Sell 4,114 GBP State Street Bank 20/12/2016 (97) (0.02)
Unrealised Appreciation of Forward Currency Contracts 2,979 0.63
Unrealised Depreciation of Forward Currency Contracts (23,320) (4.93)
Net Unrealised Depreciation of Forward Currency Contracts – (4.30)% (30 November 2015: (1.41)%) (20,341) (4.30)
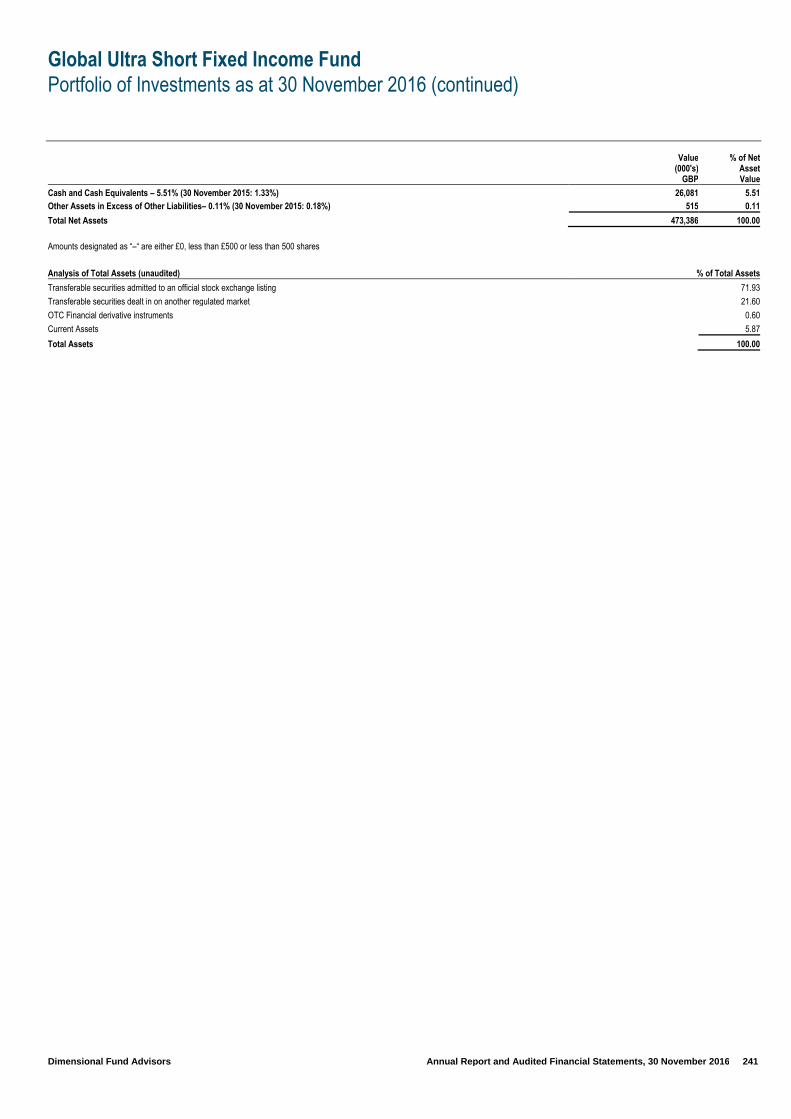
Global Ultra Short Fixed Income Fund
Portfolio of Investments as at 30 November 2016 (continued)
Dimensional Fund Advisors Annual Report and Audited Financial Statements, 30 November 2016 241
Value (000's)
GBP
% of Net Asset Value
Cash and Cash Equivalents – 5.51% (30 November 2015: 1.33%) 26,081 5.51 Other Assets in Excess of Other Liabilities– 0.11% (30 November 2015: 0.18%) 515 0.11
Total Net Assets 473,386 100.00
Amounts designated as “–“ are either £0, less than £500 or less than 500 shares
Analysis of Total Assets (unaudited) % of Total Assets
Transferable securities admitted to an official stock exchange listing 71.93
Transferable securities dealt in on another regulated market 21.60
OTC Financial derivative instruments 0.60
Current Assets 5.87
Total Assets 100.00

Global Value Fund
Portfolio of Investments as at 30 November 2016
Dimensional Fund Advisors Annual Report and Audited Financial Statements, 30 November 2016 242
Shares (000's)
Value (000's)
USD
% of Net Asset Value
Common Stock
Australia - 2.84%
38 Australia & New Zealand Banking Group Ltd 789 0.63
6 Bank of Queensland Ltd 53 0.04
13 Bendigo & Adelaide Bank Ltd 111 0.09
60 BHP Billiton Ltd 1,124 0.90
6 BlueScope Steel Ltd 41 0.03
2 Boral Ltd (Insto placement) 8 0.01
23 Boral Ltd (NPV placement) 86 0.07
54 Fortescue Metals Group Ltd 233 0.18
23 Incitec Pivot Ltd 53 0.04
1 National Australia Bank Ltd 26 0.02
22 Origin Energy Ltd 98 0.08
17 QBE Insurance Group Ltd 136 0.11
1 Rio Tinto Ltd 25 0.02
16 Santos Ltd 48 0.04
69 South32 Ltd 137 0.11
8 Star Entertainment Grp Ltd 32 0.03
25 Suncorp Group Ltd 227 0.18
15 Woodside Petroleum Ltd 326 0.26
3,553 2.84
Austria - 0.06%
3 OMV AG 80 0.06
80 0.06
Belgium - 0.19%
1 Ageas 42 0.03
1 KBC Group NV 38 0.03
1 Proximus SADP 8 0.01
1 Solvay SA 123 0.10
– UCB SA 14 0.01
– Umicore SA 17 0.01
242 0.19
Canada - 3.67%
2 AltaGas Ltd 56 0.04
7 Bank of Montreal 487 0.39
3 BlackBerry Ltd 21 0.02
2 Cameco Corp 17 0.01
6 Canadian Natural Resources Ltd 202 0.16
9 Cenovus Energy Inc 140 0.11
16 Crescent Point Energy Corp 200 0.16
3 ECN Capital Corp 6 0.01
7 Eldorado Gold Corp 18 0.02
3 Element Fleet Management Corp 23 0.02
2 Empire Co Ltd 33 0.03
2 Enbridge Income Fund Holdings Inc 54 0.04
8 Encana Corp 100 0.08
1 Fairfax Financial Holdings Ltd 249 0.20
7 First Quantum Minerals Ltd 74 0.06
10 Goldcorp Inc 136 0.11
10 Husky Energy Inc 117 0.09
2 Imperial Oil Ltd 86 0.07 2
Industrial Alliance Insurance & Financial Services Inc 81 0.06
35 Kinross Gold Corp 116 0.09
5 Magna International Inc 200 0.16
20 Manulife Financial Corp 345 0.28
9 Sun Life Financial Inc 356 0.28
26 Suncor Energy Inc 818 0.65
9 Teck Resources Ltd 229 0.18
6 Tourmaline Oil Corp 161 0.13
10 Turquoise Hill Resources Ltd 32 0.03
7 Valeant Pharmaceuticals International Inc 117 0.09
2 WSP Global Inc 64 0.05
Shares (000's)
Value (000's)
USD
% of Net Asset Value
Common Stock (continued)
Canada - 3.67% (continued)
21 Yamana Gold Inc 64 0.05
4,602 3.67
Denmark - 0.69%
– AP Moller - Maersk AS, Class A 35 0.03
– AP Moller - Maersk AS, Class B 74 0.06
1 Carlsberg AS 68 0.05
4 Danske Bank AS 124 0.10
4 DSV AS 169 0.13
4 ISS AS 118 0.09
4 Vestas Wind Systems AS 283 0.23
871 0.69
Finland - 0.35%
3 Fortum Oyj 40 0.03
13 Nokia Oyj 59 0.05
10 Stora Enso Oyj 97 0.08
11 UPM-Kymmene Oyj 243 0.19
439 0.35
France - 3.77%
12 AXA SA 289 0.23
9 BNP Paribas SA 497 0.40
– Bollore SA (non-voting rights) – –
3 Bollore SA (voting rights) 9 0.01
4 Bouygues SA 151 0.12
2 Casino Guichard Perrachon SA 83 0.07
9 Cie de Saint-Gobain 382 0.31
3 CNP Assurances 54 0.04
8 Credit Agricole SA 85 0.07
6 Electricite de France SA 66 0.05
20 Engie SA 248 0.20
9 Natixis SA 43 0.03
29 Orange SA 416 0.33
12 Peugeot SA 175 0.14
3 Renault SA 239 0.19
2 SCOR SE 68 0.05
7 Societe Generale SA 318 0.25
17 STMicroelectronics NV 172 0.14
22 Total SA 1,072 0.86
19 Vivendi SA 356 0.28
4,723 3.77
Germany - 2.56%
3 Allianz SE 533 0.43
5 Bayerische Motoren Werke AG 403 0.32
12 Daimler AG 811 0.65
16 Deutsche Bank AG 257 0.21
4 Deutsche Lufthansa AG 53 0.04
53 E.ON SE 349 0.28
1 HeidelbergCement AG 102 0.08
1 Lanxess AG 35 0.03
1 Linde AG 132 0.11
2 Metro AG 43 0.03
1 Muenchener Rueckversicherungs-Gesellschaft AG 128 0.10
14 RWE AG 175 0.14
1 Talanx AG 26 0.02
10 Telefonica Deutschland Holding AG 40 0.03
5 Uniper SE 66 0.05
– Volkswagen AG 56 0.04
3,209 2.56
Hong Kong - 1.04%
20 Cathay Pacific Airways Ltd 27 0.02
30 CK Hutchison Holdings Ltd 365 0.29

Global Value Fund
Portfolio of Investments as at 30 November 2016 (continued)
Dimensional Fund Advisors Annual Report and Audited Financial Statements, 30 November 2016 243
Shares (000's)
Value (000's)
USD
% of Net Asset Value
Common Stock (continued)
Hong Kong - 1.04% (continued)
2 Guoco Group Ltd 22 0.02
20 Hang Lung Group Ltd 73 0.06
17 Hang Lung Properties Ltd 38 0.03
7 Henderson Land Development Co Ltd 39 0.03
17 Kerry Properties Ltd 49 0.04
135 New World Development Co Ltd 150 0.12
12 Shangri-La Asia Ltd 13 0.01
8 Sino Land Co Ltd 12 0.01
13 Sun Hung Kai Properties Ltd 170 0.14
12 Swire Pacific Ltd, Class A 120 0.10
18 Swire Pacific Ltd, Class B 31 0.02
11 Wharf Holdings Ltd 81 0.06
18 Wheelock & Co Ltd 107 0.09
1,297 1.04
Ireland - 0.19%
199 Bank of Ireland 42 0.04
5 CRH PLC 190 0.15
232 0.19
Israel - 0.22%
– Azrieli Group Ltd 20 0.02
11 Bank Hapoalim BM 67 0.05
17 Bank Leumi Le-Israel BM 69 0.06
11 Israel Chemicals Ltd 42 0.03
3 Mizrahi Tefahot Bank Ltd 41 0.03
1 Teva Pharmaceutical Industries Ltd 37 0.03
276 0.22
Italy - 0.41%
7 Fiat Chrysler Automobiles NV 56 0.04
61 Intesa Sanpaolo SpA 133 0.11
2 Mediobanca SpA 15 0.01
177 Telecom Italia SpA 133 0.11
82 UniCredit SpA 176 0.14
513 0.41
Japan - 9.32%
8 Aeon Co Ltd 107 0.09
3 Aisin Seiki Co Ltd 117 0.09
2 Amada Holdings Co Ltd 27 0.02
1 Aoyama Trading Co Ltd 34 0.03
23 Asahi Glass Co Ltd 151 0.12
17 Asahi Kasei Corp 154 0.12
2 Bank of Kyoto Ltd 14 0.01
2 Brother Industries Ltd 28 0.02
5 Calsonic Kansei Corp 78 0.06
1 Canon Marketing Japan Inc 10 0.01
8 Chiba Bank Ltd 48 0.04
1 Chugoku Bank Ltd 15 0.01
1 Credit Saison Co Ltd 13 0.01
4 Dai Nippon Printing Co Ltd 38 0.03
8 Dai-ichi Life Holdings Inc 138 0.11
22 Daiwa Securities Group Inc 135 0.11
10 Denka Co Ltd 45 0.04
4 Denso Corp 169 0.14
2 DIC Corp 57 0.05
2 Ebara Corp 53 0.04
5 FUJIFILM Holdings Corp 180 0.14
4 Fujitsu Ltd 24 0.02
6 Fukuoka Financial Group Inc 26 0.02
1 Glory Ltd 30 0.02
4 Gunma Bank Ltd 21 0.02
2 Hachijuni Bank Ltd 14 0.01
3 Hankyu Hanshin Holdings Inc 86 0.07
2 Heiwa Corp 35 0.03
Shares (000's)
Value (000's)
USD
% of Net Asset Value
Common Stock (continued)
Japan - 9.32% (continued)
3 Hiroshima Bank Ltd 13 0.01
1 Hitachi Capital Corp 30 0.02
2 Hitachi Construction Machinery Co Ltd 52 0.04
61 Hitachi Ltd 332 0.26
5 Hitachi Metals Ltd 65 0.05
20 Honda Motor Co Ltd 599 0.48
1 Idemitsu Kosan Co Ltd 14 0.01
3 Iida Group Holdings Co Ltd 55 0.04
11 Inpex Corp 109 0.09
3 Isetan Mitsukoshi Holdings Ltd 38 0.03
17 ITOCHU Corp 233 0.19
5 J Front Retailing Co Ltd 79 0.06
8 JFE Holdings Inc 117 0.09
3 JGC Corp 52 0.04
4 JSR Corp 63 0.05
5 JTEKT Corp 83 0.07
16 JX Holdings Inc 62 0.05
3 Kamigumi Co Ltd 28 0.02
7 Kaneka Corp 57 0.05
32 Kawasaki Heavy Industries Ltd 103 0.08
14 Kawasaki Kisen Kaisha Ltd 31 0.02
2 Kinden Corp 23 0.02
7 Kobe Steel Ltd 67 0.05
10 Konica Minolta Inc 99 0.08
8 Kuraray Co Ltd 115 0.09
1 Kyocera Corp 63 0.05
2 Kyushu Financial Group Inc 15 0.01
1 LIXIL Group Corp 23 0.02
37 Marubeni Corp 207 0.17
13 Mazda Motor Corp 214 0.17
3 Medipal Holdings Corp 39 0.03
38 Mitsubishi Chemical Holdings Corp 244 0.20
6 Mitsubishi Corp 129 0.10
4 Mitsubishi Gas Chemical Co Inc 69 0.06
38 Mitsubishi Heavy Industries Ltd 171 0.14
2 Mitsubishi Materials Corp 75 0.06
68 Mitsubishi UFJ Financial Group Inc 412 0.33
11 Mitsubishi UFJ Lease & Finance Co Ltd 53 0.04
7 Mitsui & Co Ltd 90 0.07
21 Mitsui Chemicals Inc 99 0.08
1 Mitsui Fudosan Co Ltd 24 0.02
26 Mitsui OSK Lines Ltd 68 0.05
199 Mizuho Financial Group Inc 359 0.29
4 MS&AD Insurance Group Holdings Inc 127 0.10
59 NEC Corp 156 0.12
4 NGK Spark Plug Co Ltd 88 0.07
5 NHK Spring Co Ltd 50 0.04
3 Nikon Corp 40 0.03
1 Nippo Corp 19 0.02
3 Nippon Electric Glass Co Ltd 16 0.01
19 Nippon Express Co Ltd 99 0.08
2 Nippon Paper Industries Co Ltd 40 0.03
1 Nippon Shokubai Co Ltd 37 0.03
10 Nippon Steel & Sumitomo Metal Corp 227 0.18
36 Nippon Yusen KK 68 0.05
30 Nissan Motor Co Ltd 285 0.23
2 NOK Corp 45 0.04
14 Nomura Holdings Inc 78 0.06
3 Nomura Real Estate Holdings Inc 46 0.04
5 NSK Ltd 56 0.04
19 Oji Holdings Corp 79 0.06
15 ORIX Corp 245 0.20
55 Resona Holdings Inc 268 0.21

Global Value Fund
Portfolio of Investments as at 30 November 2016 (continued)
Dimensional Fund Advisors Annual Report and Audited Financial Statements, 30 November 2016 244
Shares (000's)
Value (000's)
USD
% of Net Asset Value
Common Stock (continued)
Japan - 9.32% (continued)
15 Ricoh Co Ltd 123 0.10
1 Rohm Co Ltd 44 0.04
1 Sankyo Co Ltd 19 0.02
5 SBI Holdings Inc 61 0.05
1 Sega Sammy Holdings Inc 15 0.01
2 Seino Holdings Co Ltd 22 0.02
4 Sekisui House Ltd 68 0.05
8 Shinsei Bank Ltd 13 0.01
5 Shizuoka Bank Ltd 41 0.03
9 Sojitz Corp 24 0.02
4 Sompo Holdings Inc 136 0.11
2 Sony Financial Holdings Inc 26 0.02
36 Sumitomo Chemical Co Ltd 168 0.13
5 Sumitomo Corp 56 0.04
9 Sumitomo Electric Industries Ltd 126 0.10
2 Sumitomo Forestry Co Ltd 33 0.03
13 Sumitomo Heavy Industries Ltd 80 0.06
4 Sumitomo Metal Mining Co Ltd 54 0.04
11 Sumitomo Mitsui Financial Group Inc 422 0.34
3 Sumitomo Mitsui Trust Holdings Inc 97 0.08
4 Sumitomo Rubber Industries Ltd 65 0.05
– Suzuken Co Ltd Japan 12 0.01
9 T&D Holdings Inc 113 0.09
27 Taiheiyo Cement Corp 86 0.07
5 Takashimaya Co Ltd 42 0.03
2 THK Co Ltd 39 0.03
3 Tokio Marine Holdings Inc 118 0.09
3 Tokyo Tatemono Co Ltd 35 0.03
5 Tokyu Fudosan Holdings Corp 32 0.03
5 Toppan Printing Co Ltd 46 0.04
13 Tosoh Corp 89 0.07
3 Toyo Seikan Group Holdings Ltd 48 0.04
2 Toyoda Gosei Co Ltd 40 0.03
1 Toyota Industries Corp 62 0.05
3 Toyota Motor Corp 154 0.12
5 Toyota Tsusho Corp 122 0.10
6 Ube Industries Ltd 13 0.01
15 Yamada Denki Co Ltd 81 0.07
2 Yamaguchi Financial Group Inc 21 0.02
3 Yokohama Rubber Co Ltd 46 0.04
11,681 9.32
Netherlands - 1.45%
3 Aegon NV 16 0.01
22 ArcelorMittal 166 0.13
1 Coca-Cola European Partners PLC 26 0.02
2 Gemalto NV 79 0.07
36 ING Groep NV 492 0.40
10 Koninklijke Ahold Delhaize NV 204 0.16
7 Koninklijke DSM NV 391 0.31
12 Koninklijke Philips NV 341 0.27
3 NN Group NV 103 0.08
1,818 1.45
New Zealand - 0.06%
11 Fletcher Building Ltd 81 0.06
81 0.06
Norway - 0.30%
12 DNB ASA 179 0.14
14 Norsk Hydro ASA 65 0.05
2 Statoil ASA 35 0.03
2 Subsea 7 SA 28 0.02
2 Yara International ASA 68 0.06
375 0.30
Shares (000's)
Value (000's)
USD
% of Net Asset Value
Common Stock (continued)
Portugal - 0.01%
2 EDP Renovaveis SA 16 0.01
16 0.01
Singapore - 0.37%
14 CapitaLand Ltd 31 0.03
9 City Developments Ltd 52 0.04
11 DBS Group Holdings Ltd 128 0.10
39 Keppel Corp Ltd 149 0.12
9 Sembcorp Industries Ltd 17 0.02
6 Singapore Airlines Ltd 41 0.03
17 Wilmar International Ltd 42 0.03
460 0.37
Spain - 1.07%
105 Banco de Sabadell SA 131 0.10
191 Banco Santander SA 873 0.70
55 CaixaBank SA 160 0.13
13 Repsol SA 176 0.14
1,340 1.07
Sweden - 0.91%
1 Getinge AB 10 0.01
1 Holmen AB 20 0.02
3 Millicom International Cellular SA 114 0.09
36 Nordea Bank AB 379 0.30
10 Skandinaviska Enskilda Banken AB 100 0.08
2 Svenska Handelsbanken AB 34 0.03
5 Swedbank AB 108 0.09
49 Telefonaktiebolaget LM Ericsson 255 0.20
21 Telia Co AB 79 0.06
2 Trelleborg AB 40 0.03
1,139 0.91
Switzerland - 2.74%
4 Adecco Group AG 254 0.20
1 Baloise Holding AG 72 0.06
7 Cie Financiere Richemont SA 446 0.36
8 Clariant AG 133 0.11
7 Credit Suisse Group AG 96 0.08
1 Dufry AG 113 0.09
1 Flughafen Zuerich AG 99 0.08
3 LafargeHolcim Ltd 142 0.11
9 Novartis AG 654 0.52
1 Swatch Group AG (Bearer) 212 0.17
1 Swatch Group AG (Registered) 60 0.05
– Swiss Life Holding AG 125 0.10
4 Swiss Re AG 363 0.29
17 UBS Group AG 266 0.21
1 Zurich Insurance Group AG 393 0.31
3,428 2.74
United Kingdom - 6.88%
5 3i Group PLC 46 0.04
13 Anglo American PLC 200 0.16
13 Antofagasta PLC 110 0.09
38 Aviva PLC 211 0.17
68 Barclays PLC 182 0.14
16 Barratt Developments PLC 91 0.07
64 BP PLC 373 0.30
188 Glencore PLC 658 0.52
197 HSBC Holdings PLC 1,558 1.24
42 J Sainsbury PLC 123 0.10
69 Kingfisher PLC 305 0.24
708 Lloyds Banking Group PLC 512 0.41
25 Pearson PLC 246 0.20
13 Royal Bank of Scotland Group PLC 32 0.03
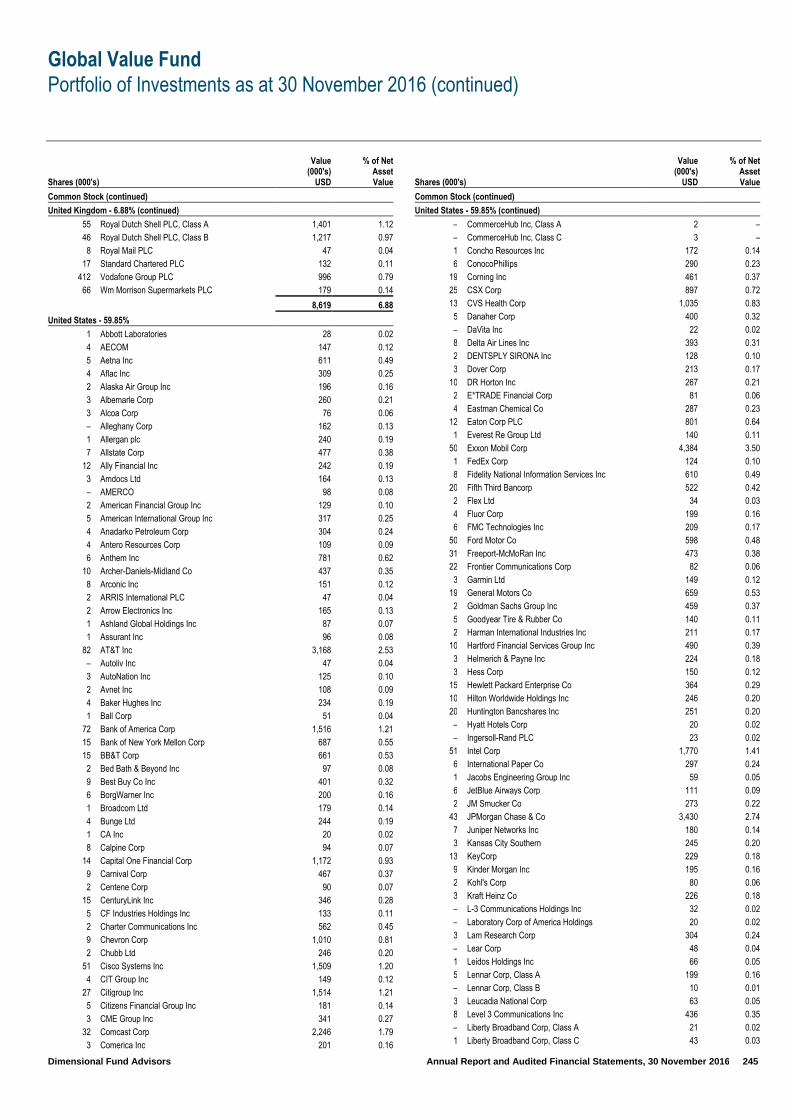
Global Value Fund
Portfolio of Investments as at 30 November 2016 (continued)
Dimensional Fund Advisors Annual Report and Audited Financial Statements, 30 November 2016 245
Shares (000's)
Value (000's)
USD
% of Net Asset Value
Common Stock (continued)
United Kingdom - 6.88% (continued)
55 Royal Dutch Shell PLC, Class A 1,401 1.12
46 Royal Dutch Shell PLC, Class B 1,217 0.97
8 Royal Mail PLC 47 0.04
17 Standard Chartered PLC 132 0.11
412 Vodafone Group PLC 996 0.79
66 Wm Morrison Supermarkets PLC 179 0.14
8,619 6.88
United States - 59.85%
1 Abbott Laboratories 28 0.02
4 AECOM 147 0.12
5 Aetna Inc 611 0.49
4 Aflac Inc 309 0.25
2 Alaska Air Group Inc 196 0.16
3 Albemarle Corp 260 0.21
3 Alcoa Corp 76 0.06
– Alleghany Corp 162 0.13
1 Allergan plc 240 0.19
7 Allstate Corp 477 0.38
12 Ally Financial Inc 242 0.19
3 Amdocs Ltd 164 0.13
– AMERCO 98 0.08
2 American Financial Group Inc 129 0.10
5 American International Group Inc 317 0.25
4 Anadarko Petroleum Corp 304 0.24
4 Antero Resources Corp 109 0.09
6 Anthem Inc 781 0.62
10 Archer-Daniels-Midland Co 437 0.35
8 Arconic Inc 151 0.12
2 ARRIS International PLC 47 0.04
2 Arrow Electronics Inc 165 0.13
1 Ashland Global Holdings Inc 87 0.07
1 Assurant Inc 96 0.08
82 AT&T Inc 3,168 2.53
– Autoliv Inc 47 0.04
3 AutoNation Inc 125 0.10
2 Avnet Inc 108 0.09
4 Baker Hughes Inc 234 0.19
1 Ball Corp 51 0.04
72 Bank of America Corp 1,516 1.21
15 Bank of New York Mellon Corp 687 0.55
15 BB&T Corp 661 0.53
2 Bed Bath & Beyond Inc 97 0.08
9 Best Buy Co Inc 401 0.32
6 BorgWarner Inc 200 0.16
1 Broadcom Ltd 179 0.14
4 Bunge Ltd 244 0.19
1 CA Inc 20 0.02
8 Calpine Corp 94 0.07
14 Capital One Financial Corp 1,172 0.93
9 Carnival Corp 467 0.37
2 Centene Corp 90 0.07
15 CenturyLink Inc 346 0.28
5 CF Industries Holdings Inc 133 0.11
2 Charter Communications Inc 562 0.45
9 Chevron Corp 1,010 0.81
2 Chubb Ltd 246 0.20
51 Cisco Systems Inc 1,509 1.20
4 CIT Group Inc 149 0.12
27 Citigroup Inc 1,514 1.21
5 Citizens Financial Group Inc 181 0.14
3 CME Group Inc 341 0.27
32 Comcast Corp 2,246 1.79
3 Comerica Inc 201 0.16
Shares (000's)
Value (000's)
USD
% of Net Asset Value
Common Stock (continued)
United States - 59.85% (continued)
– CommerceHub Inc, Class A 2 –
– CommerceHub Inc, Class C 3 –
1 Concho Resources Inc 172 0.14
6 ConocoPhillips 290 0.23
19 Corning Inc 461 0.37
25 CSX Corp 897 0.72
13 CVS Health Corp 1,035 0.83
5 Danaher Corp 400 0.32
– DaVita Inc 22 0.02
8 Delta Air Lines Inc 393 0.31
2 DENTSPLY SIRONA Inc 128 0.10
3 Dover Corp 213 0.17
10 DR Horton Inc 267 0.21
2 E*TRADE Financial Corp 81 0.06
4 Eastman Chemical Co 287 0.23
12 Eaton Corp PLC 801 0.64
1 Everest Re Group Ltd 140 0.11
50 Exxon Mobil Corp 4,384 3.50
1 FedEx Corp 124 0.10
8 Fidelity National Information Services Inc 610 0.49
20 Fifth Third Bancorp 522 0.42
2 Flex Ltd 34 0.03
4 Fluor Corp 199 0.16
6 FMC Technologies Inc 209 0.17
50 Ford Motor Co 598 0.48
31 Freeport-McMoRan Inc 473 0.38
22 Frontier Communications Corp 82 0.06
3 Garmin Ltd 149 0.12
19 General Motors Co 659 0.53
2 Goldman Sachs Group Inc 459 0.37
5 Goodyear Tire & Rubber Co 140 0.11
2 Harman International Industries Inc 211 0.17
10 Hartford Financial Services Group Inc 490 0.39
3 Helmerich & Payne Inc 224 0.18
3 Hess Corp 150 0.12
15 Hewlett Packard Enterprise Co 364 0.29
10 Hilton Worldwide Holdings Inc 246 0.20
20 Huntington Bancshares Inc 251 0.20
– Hyatt Hotels Corp 20 0.02
– Ingersoll-Rand PLC 23 0.02
51 Intel Corp 1,770 1.41
6 International Paper Co 297 0.24
1 Jacobs Engineering Group Inc 59 0.05
6 JetBlue Airways Corp 111 0.09
2 JM Smucker Co 273 0.22
43 JPMorgan Chase & Co 3,430 2.74
7 Juniper Networks Inc 180 0.14
3 Kansas City Southern 245 0.20
13 KeyCorp 229 0.18
9 Kinder Morgan Inc 195 0.16
2 Kohl's Corp 80 0.06
3 Kraft Heinz Co 226 0.18
– L-3 Communications Holdings Inc 32 0.02
– Laboratory Corp of America Holdings 20 0.02
3 Lam Research Corp 304 0.24
– Lear Corp 48 0.04
1 Leidos Holdings Inc 66 0.05
5 Lennar Corp, Class A 199 0.16
– Lennar Corp, Class B 10 0.01
3 Leucadia National Corp 63 0.05
8 Level 3 Communications Inc 436 0.35
– Liberty Broadband Corp, Class A 21 0.02
1 Liberty Broadband Corp, Class C 43 0.03

Global Value Fund
Portfolio of Investments as at 30 November 2016 (continued)
Dimensional Fund Advisors Annual Report and Audited Financial Statements, 30 November 2016 246
Shares (000's)
Value (000's)
USD
% of Net Asset Value
Common Stock (continued)
United States - 59.85% (continued)
– Liberty Expedia Holdings Inc 19 0.01
12 Liberty Interactive Corp QVC Group 249 0.20
1 Liberty Ventures 25 0.02
2 Lincoln National Corp 122 0.10
3 Loews Corp 132 0.10
2 M&T Bank Corp 357 0.28
1 Macquarie Infrastructure Corp 55 0.04
7 Macy's Inc 289 0.23
3 Mallinckrodt PLC 148 0.12
1 ManpowerGroup Inc 59 0.05
7 Marathon Oil Corp 122 0.10
12 Marathon Petroleum Corp 571 0.45
4 Marvell Technology Group Ltd 52 0.04
1 MEDNAX Inc 80 0.06
13 Medtronic PLC 924 0.74
4 MetLife Inc 210 0.17
15 MGM Resorts International 439 0.35
28 Micron Technology Inc 537 0.43
– Mohawk Industries Inc 14 0.01
1 Molson Coors Brewing Co 140 0.11
7 Mondelez International Inc 283 0.23
12 Morgan Stanley 508 0.40
9 Mosaic Co 246 0.20
1 Murphy Oil Corp 45 0.04
10 Mylan NV 363 0.29
3 National Oilwell Varco Inc 113 0.09
4 NetApp Inc 162 0.13
4 New York Community Bancorp Inc 62 0.05
4 Newell Brands Inc 194 0.15
14 Newmont Mining Corp 455 0.36
2 News Corp, Class A 27 0.02
1 News Corp, Class B 10 0.01
4 Noble Energy Inc 153 0.12
8 Norfolk Southern Corp 805 0.64
4 Norwegian Cruise Line Holdings Ltd 173 0.14
8 Nucor Corp 523 0.42
3 Occidental Petroleum Corp 200 0.16
3 Owens Corning 142 0.11
1 PACCAR Inc 56 0.04
3 Pentair PLC 186 0.15
– PerkinElmer Inc 12 0.01
1 Perrigo Co PLC 66 0.05
54 Pfizer Inc 1,729 1.38
6 Phillips 66 467 0.37
3 Pinnacle Foods Inc 161 0.13
1 Pioneer Natural Resources Co 239 0.19
4 PNC Financial Services Group Inc 422 0.34
1 Post Holdings Inc 95 0.08
8 Principal Financial Group Inc 452 0.36
8 Prudential Financial Inc 808 0.64
9 PulteGroup Inc 173 0.14
2 PVH Corp 222 0.18
2 Qorvo Inc 128 0.10
4 Quest Diagnostics Inc 325 0.26
1 Ralph Lauren Corp 121 0.10
1 Range Resources Corp 47 0.04
22 Regions Financial Corp 291 0.23
– Reinsurance Group of America Inc 58 0.05
2 Reliance Steel & Aluminum Co 139 0.11
7 Republic Services Inc 377 0.30
4 Reynolds American Inc 212 0.17
Shares (000's)
Value (000's)
USD
% of Net Asset Value
Common Stock (continued)
United States - 59.85% (continued)
5 Royal Caribbean Cruises Ltd 405 0.32
1 Royal Gold Inc 40 0.03
13 Southwest Airlines Co 612 0.49
13 Sprint Corp 99 0.08
1 SS&C Technologies Holdings Inc 42 0.03
16 Staples Inc 157 0.13
7 State Street Corp 534 0.43
2 Steel Dynamics Inc 68 0.05
1 Steris PLC 43 0.03
9 SunTrust Banks Inc 465 0.37
5 Symantec Corp 130 0.10
4 T-Mobile US Inc 218 0.17
4 Targa Resources Corp 229 0.18
5 TEGNA Inc 115 0.09
2 Tesoro Corp 182 0.14
2 Thermo Fisher Scientific Inc 345 0.27
11 Time Warner Inc 994 0.79
3 Travelers Cos Inc 337 0.27
– TreeHouse Foods Inc 33 0.03
8 Tyson Foods Inc 433 0.34
3 Union Pacific Corp 312 0.25
9 United Continental Holdings Inc 593 0.47
1 United Rentals Inc 143 0.11
– Universal Health Services Inc 11 0.01
4 Unum Group 160 0.13
8 Valero Energy Corp 486 0.39
– Voya Financial Inc 16 0.01
13 Wal-Mart Stores Inc 898 0.72
5 Weatherford International PLC 26 0.02
25 Wells Fargo & Co 1,335 1.06
7 Western Digital Corp 468 0.37
1 Westlake Chemical Corp 85 0.07
4 WestRock Co 220 0.17
– Whirlpool Corp 22 0.02
18 Xerox Corp 169 0.13
3 XL Group Ltd 120 0.10
4 Yahoo! Inc 152 0.12
3 Zimmer Biomet Holdings Inc 275 0.22
2 Zions Bancorporation 65 0.05
75,013 59.85
Total Common Stock – 98.95% 124,007 98.95
Preferred Stock
Germany - 0.36%
1 Bayerische Motoren Werke AG 49 0.04
1 Porsche Automobil Holding SE 63 0.05
2 Volkswagen AG 331 0.27
443 0.36
Total Preferred Stock – 0.36% 443 0.36
Rights
Australia
7 Boral Ltd – –
– –
Canada
2 Yamana Gold Inc 1 –
1 –
`
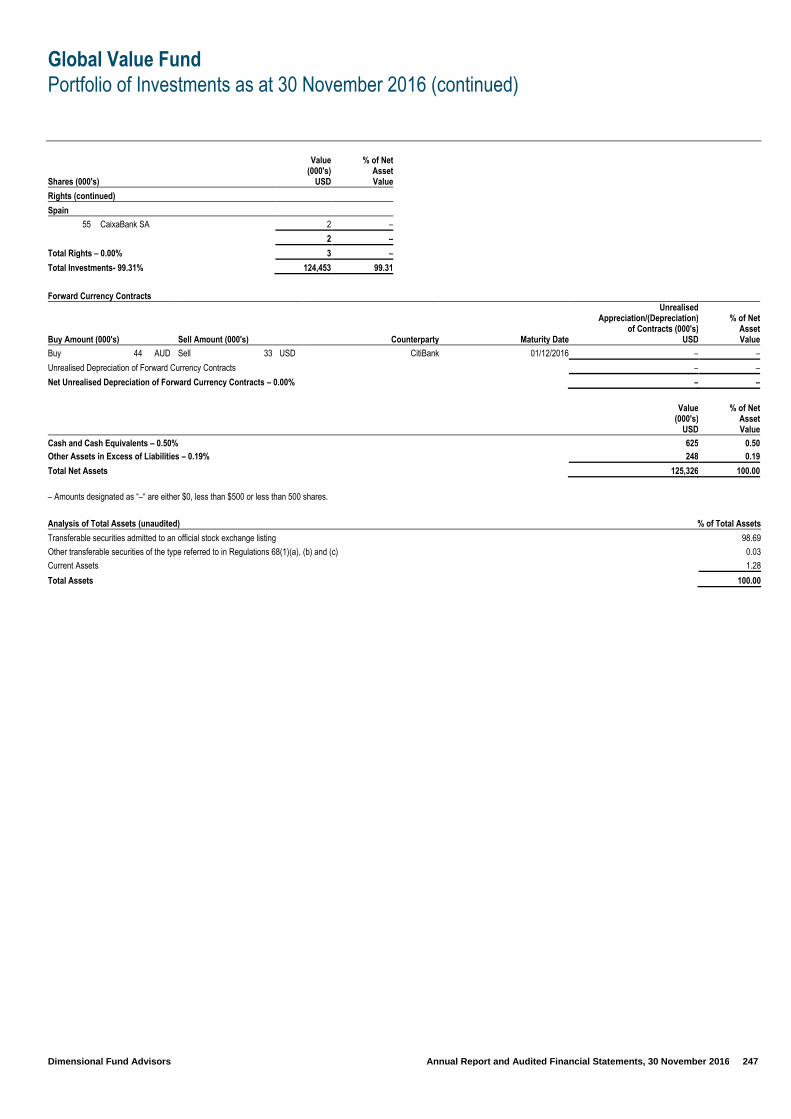
Global Value Fund
Portfolio of Investments as at 30 November 2016 (continued)
Dimensional Fund Advisors Annual Report and Audited Financial Statements, 30 November 2016 247
Shares (000's)
Value (000's)
USD
% of Net Asset Value
Rights (continued)
Spain
55 CaixaBank SA 2 –
2 –
Total Rights – 0.00% 3 –
Total Investments- 99.31% 124,453 99.31
Forward Currency Contracts
Buy Amount (000's) Sell Amount (000's) Counterparty Maturity Date
Unrealised Appreciation/(Depreciation)
of Contracts (000's) USD
% of Net Asset Value
Buy 44 AUD Sell 33 USD CitiBank 01/12/2016 – –
Unrealised Depreciation of Forward Currency Contracts – –
Net Unrealised Depreciation of Forward Currency Contracts – 0.00% – –
Value (000's)
USD
% of Net Asset Value
Cash and Cash Equivalents – 0.50% 625 0.50 Other Assets in Excess of Liabilities – 0.19% 248 0.19
Total Net Assets 125,326 100.00
– Amounts designated as “–“ are either $0, less than $500 or less than 500 shares.
Analysis of Total Assets (unaudited) % of Total Assets
Transferable securities admitted to an official stock exchange listing 98.69
Other transferable securities of the type referred to in Regulations 68(1)(a), (b) and (c) 0.03
Current Assets 1.28
Total Assets 100.00

Pacific Basin Small Companies Fund
Portfolio of Investments as at 30 November 2016
Dimensional Fund Advisors Annual Report and Audited Financial Statements, 30 November 2016 248
Shares (000's)
Value (000's)
USD
% of Net Asset Value
Common Stock
Australia - 16.17%
– AAT Corp Ltd – –
13 Acrux Ltd 3 –
82 Adelaide Brighton Ltd 311 0.48
21 AED Oil Ltd – –
8 Ainsworth Game Technology Ltd 11 0.02
48 Alkane Resources Ltd 12 0.02
33 ALS Ltd 148 0.23
4 Altium Ltd 24 0.04
54 Altona Mining Ltd 5 0.01
65 Alumina Ltd 80 0.12
20 AMA Group Ltd 15 0.02
7 Amaysim Australia Ltd 10 0.02
12 Ansell Ltd 196 0.30
7 AP Eagers Ltd 49 0.08
28 APN News & Media Ltd 54 0.08
4 Appen Ltd 8 0.01
5 ARB Corp Ltd 59 0.09
62 Ardent Leisure Group 97 0.15
215 Arrium Ltd – –
1 ArtSpark Holdings Inc 19 0.03
25 Asaleo Care Ltd 28 0.04
19 ASG Group Ltd 22 0.03
4 AUB Group Ltd 33 0.05
38 Austal Ltd 53 0.08
34 Australian Agricultural Co Ltd 42 0.06
42 Australian Pharmaceutical Industries Ltd 59 0.09
8 Australian Property Systems Ltd 31 0.05
4 Auswide Bank Ltd 13 0.02
13 Automotive Holdings Group Ltd 35 0.05
70 Avanco Resources Ltd 4 0.01
27 Aveo Group 62 0.10
19 AVJennings Ltd 9 0.01
68 AWE Ltd 31 0.05
23 Bank of Queensland Ltd 192 0.30
17 Bapcor Ltd 64 0.10
164 Beach Energy Ltd 98 0.15
63 Beadell Resources Ltd 15 0.02
12 Bega Cheese Ltd 44 0.07
8 Bell Financial Group Ltd 4 0.01
5 Bellamy's Australia Ltd 48 0.07
11 Billabong International Ltd 10 0.02
2 Blackmores Ltd 167 0.26
3 Blue Sky Alternative Investments Ltd 18 0.03
11 BlueScope Steel Ltd 72 0.11
129 Boart Longyear Ltd 12 0.02
14 Bradken Ltd 33 0.05
16 Breville Group Ltd 107 0.16
4 Brickworks Ltd 36 0.06
12 BT Investment Management Ltd 97 0.15
7 Cabcharge Australia Ltd 19 0.03
36 Capitol Health Ltd 3 –
16 Cardno Ltd 12 0.02
92 Carnarvon Petroleum Ltd 7 0.01
14 carsales.com Ltd 107 0.16
25 Cash Converters International Ltd 6 0.01
– CDS Technologies Ltd – –
4 Cedar Woods Properties Ltd 16 0.02
79 Cleanaway Waste Management Ltd 64 0.10
14 Codan Ltd 18 0.03
8 Collection House Ltd 8 0.01
4 Collins Foods Ltd 18 0.03
14 Compass Resources Ltd – –
Shares (000's)
Value (000's)
USD
% of Net Asset Value
Common Stock (continued)
Australia - 16.17% (continued)
76 Cooper Energy Ltd 18 0.03
4 Corporate Travel Management Ltd 56 0.09
7 Costa Group Holdings Ltd 16 0.02
17 Cover-More Group Ltd 16 0.02
4 Credit Corp Group Ltd 46 0.07
20 CSG Ltd 11 0.02
35 CSR Ltd 104 0.16
17 CuDeco Ltd 5 0.01
28 Data#3 Ltd 34 0.05
12 Decmil Group Ltd 9 0.01
33 Donaco International Ltd 10 0.02
29 Downer EDI Ltd 121 0.19
26 DuluxGroup Ltd 112 0.17
11 DWS Ltd 11 0.02
11 Eclipx Group Ltd 33 0.05
17 Elders Ltd 50 0.08
69 Energy World Corp Ltd 13 0.02
1 EQT Holdings Ltd 14 0.02
11 ERM Power Ltd 9 0.01
8 Estia Health Ltd 16 0.02
8 Event Hospitality and Entertainment Ltd 79 0.12
80 Evolution Mining Ltd 112 0.17
153 Fairfax Media Ltd 91 0.14
249 FAR Ltd 12 0.02
14 Finbar Group Ltd 9 0.01
18 FlexiGroup Ltd 30 0.05
3 Flight Centre Travel Group Ltd 85 0.13
22 G8 Education Ltd 53 0.08
6 GBST Holdings Ltd 16 0.03
4 Genworth Mortgage Insurance Australia Ltd 8 0.01
17 GrainCorp Ltd 111 0.17
6 Greencross Ltd 31 0.05
7 GUD Holdings Ltd 54 0.08
19 GWA Group Ltd 40 0.06
10 Hansen Technologies Ltd 33 0.05
96 Healthscope Ltd 160 0.25
12 HFA Holdings Ltd 19 0.03
17 Hills Ltd 5 0.01
27 Iluka Resources Ltd 120 0.18
26 Imdex Ltd 11 0.02
16 IMF Bentham Ltd 19 0.03
43 Independence Group NL 133 0.21
73 Infigen Energy 49 0.08
31 Infomedia Ltd 17 0.03
5 Integrated Research Ltd 9 0.01
6 InvoCare Ltd 55 0.08
24 IOOF Holdings Ltd 152 0.23
8 IRESS Ltd 66 0.10
9 iSelect Ltd 13 0.02
15 iSentia Group Ltd 27 0.04
16 Japara Healthcare Ltd 23 0.04
7 JB Hi-Fi Ltd 144 0.22
30 Jupiter Mines Ltd – –
15 Karoon Gas Australia Ltd 21 0.03
25 Kingsgate Consolidated Ltd 5 0.01
47 Liquefied Natural Gas Ltd 21 0.03
198 Lynas Corp Ltd 10 0.02
13 MACA Ltd 15 0.02
27 Macquarie Atlas Roads Group 95 0.15
10 Magellan Financial Group Ltd 162 0.25
14 Mantra Group Ltd 31 0.05
16 MaxiTRANS Industries Ltd 7 0.01

Pacific Basin Small Companies Fund
Portfolio of Investments as at 30 November 2016 (continued)
Dimensional Fund Advisors Annual Report and Audited Financial Statements, 30 November 2016 249
Shares (000's)
Value (000's)
USD
% of Net Asset Value
Common Stock (continued)
Australia - 16.17% (continued)
79 Mayne Pharma Group Ltd 93 0.14
4 McMillan Shakespeare Ltd 29 0.04
8 Melbourne IT Ltd 11 0.02
12 Mesoblast Ltd 11 0.02
22 Metals X Ltd 11 0.02
67 Metcash Ltd 102 0.16
20 Michael Hill International Ltd 22 0.04
30 Mincor Resources NL 6 0.01
9 Mineral Resources Ltd 87 0.13
24 MMA Offshore Ltd 5 0.01
3 MNF Group Ltd 11 0.02
4 Monadelphous Group Ltd 29 0.04
12 Monash IVF Group Ltd 18 0.03
16 Money3 Corp Ltd 18 0.03
42 Morning Star Gold NL – –
9 Mortgage Choice Ltd 14 0.02
53 Mount Gibson Iron Ltd 13 0.02
65 Myer Holdings Ltd 61 0.09
17 MYOB Group Ltd 45 0.07
2 MyState Ltd 6 0.01
18 Navitas Ltd 68 0.11
7 NetComm Wireless Ltd 12 0.02
12 New Hope Corp Ltd 14 0.02
10 NEXTDC Ltd 24 0.04
26 nib holdings Ltd 94 0.14
44 Nine Entertainment Co Holdings Ltd 30 0.05
35 Northern Star Resources Ltd 91 0.14
13 Nufarm Ltd 81 0.12
20 OFX Group Ltd 24 0.04
13 oOh!media Ltd 40 0.06
8 Orocobre Ltd 26 0.04
71 Orora Ltd 145 0.22
3 OrotonGroup Ltd 5 0.01
21 OZ Minerals Ltd 120 0.19
12 Pact Group Holdings Ltd 59 0.09
80 Paladin Energy Ltd 5 0.01
24 Peet Ltd 17 0.03
5 Peninsula Energy Ltd 2 –
3 Perpetual Ltd 117 0.18
69 Perseus Mining Ltd 29 0.04
14 Platinum Asset Management Ltd 57 0.09
47 PMP Ltd 27 0.04
8 Premier Investments Ltd 85 0.13
303 Prima Biomed Ltd 8 0.01
46 Primary Health Care Ltd 123 0.19
– Prime AET&D Holdings No 1 Pty Ltd – –
23 Prime Media Group Ltd 5 0.01
3 Pro Medicus Ltd 11 0.02
36 Programmed Maintenance Services Ltd 42 0.06
64 Qube Holdings Ltd 112 0.17
47 Ramelius Resources Ltd 17 0.03
24 RCG Corp Ltd 24 0.04
11 RCR Tomlinson Ltd 20 0.03
7 Reckon Ltd 8 0.01
– Reece Ltd 3 –
5 Regis Healthcare Ltd 16 0.02
30 Regis Resources Ltd 63 0.10
3 Reject Shop Ltd 16 0.02
71 Resolute Mining Ltd 63 0.10
5 Retail Food Group Ltd 25 0.04
17 Ridley Corp Ltd 16 0.02
12 SAI Global Ltd 43 0.07
11 Salmat Ltd 4 0.01
Shares (000's)
Value (000's)
USD
% of Net Asset Value
Common Stock (continued)
Australia - 16.17% (continued)
9 Sandfire Resources NL 38 0.06
42 Saracen Mineral Holdings Ltd 29 0.04
6 SeaLink Travel Group Ltd 19 0.03
4 Select Harvests Ltd 18 0.03
69 Senex Energy Ltd 13 0.02
6 Servcorp Ltd 33 0.05
13 Service Stream Ltd 9 0.01
5 Seven Group Holdings Ltd 34 0.05
72 Seven West Media Ltd 37 0.06
6 SG Fleet Group Ltd 14 0.02
74 Sigma Pharmaceuticals Ltd 68 0.10
2 Silver Chef Ltd 12 0.02
50 Silver Lake Resources Ltd 21 0.03
9 Sims Metal Management Ltd 81 0.12
4 Sirtex Medical Ltd 83 0.13
16 Slater & Gordon Ltd 4 0.01
2 SmartGroup Corp Ltd 8 0.01
7 SMS Management & Technology Ltd 6 0.01
45 Southern Cross Media Group Ltd 45 0.07
111 Spark Infrastructure Group 184 0.28
20 Specialty Fashion Group Ltd 7 0.01
11 SpeedCast International Ltd 26 0.04
73 Spotless Group Holdings Ltd 49 0.08
47 St Barbara Ltd 75 0.12
49 Star Entertainment Grp Ltd 190 0.29
56 Steadfast Group Ltd 86 0.13
76 Sundance Energy Australia Ltd 10 0.02
15 Sunland Group Ltd 17 0.03
12 Super Retail Group Ltd 85 0.13
6 Syrah Resources Ltd 11 0.02
41 Tabcorp Holdings Ltd 142 0.22
10 Tassal Group Ltd 27 0.04
18 Technology One Ltd 77 0.12
32 Ten Network Holdings Ltd 24 0.04
17 TFS Corp Ltd 19 0.03
6 Thorn Group Ltd 7 0.01
111 Tiger Resources Ltd 3 –
20 Tox Free Solutions Ltd 34 0.05
22 Treasury Wine Estates Ltd 176 0.27
39 Troy Resources Ltd 8 0.01
18 UGL Ltd 43 0.07
9 Villa World Ltd 15 0.02
5 Village Roadshow Ltd 17 0.03
102 Virgin Australia Holdings Ltd 16 0.03
211 Virgin Australia International Holdings – –
7 Virtus Health Ltd 28 0.04
9 Vita Group Ltd 18 0.03
30 Vocus Communications Ltd 91 0.14
20 Watpac Ltd 13 0.02
12 Webjet Ltd 89 0.14
24 Western Areas Ltd 52 0.08
11 Westgold Resources Ltd 11 0.02
44 Whitehaven Coal Ltd 89 0.14
15 WorleyParsons Ltd 99 0.15
28 WPP AUNZ Ltd 20 0.03
10,488 16.17
Hong Kong - 8.93%
39 13 Holdings Ltd 12 0.02
26 Aeon Credit Service Asia Co Ltd 18 0.03
13 Aeon Stores Hong Kong Co Ltd 12 0.02
105 Agritrade Resources Ltd 18 0.03
32 Alco Holdings Ltd 9 0.01
7 Allied Group Ltd 38 0.06
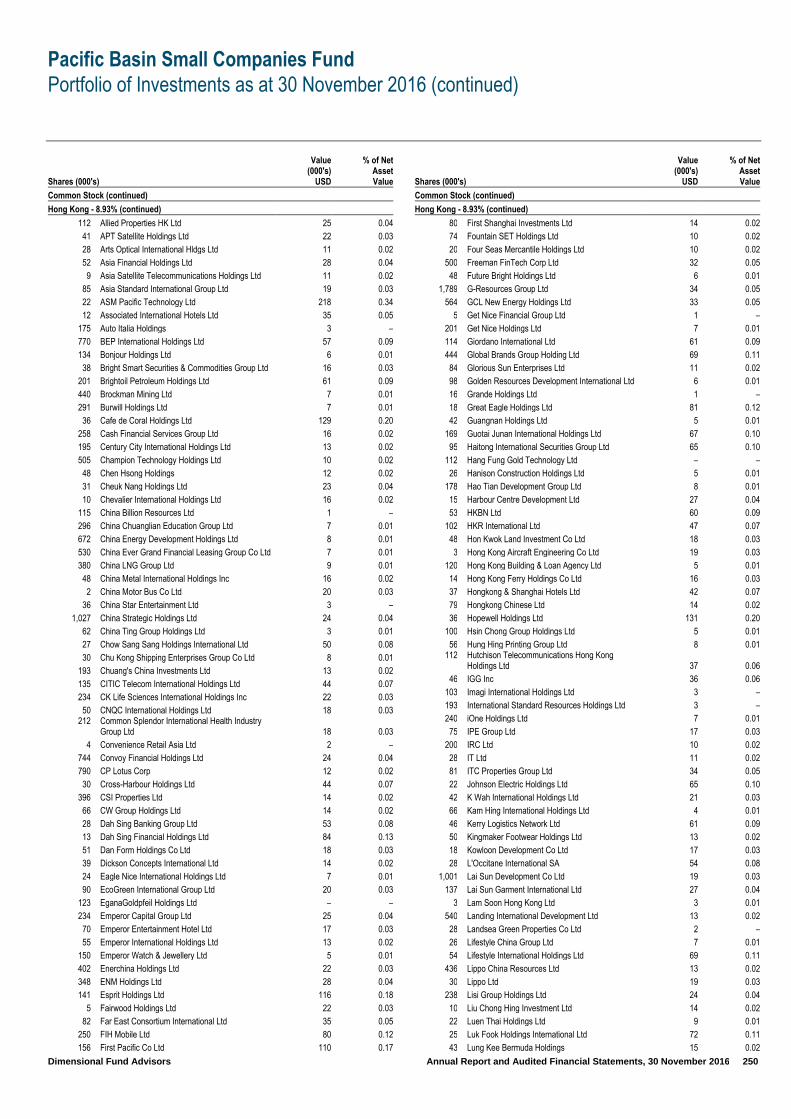
Pacific Basin Small Companies Fund
Portfolio of Investments as at 30 November 2016 (continued)
Dimensional Fund Advisors Annual Report and Audited Financial Statements, 30 November 2016 250
Shares (000's)
Value (000's)
USD
% of Net Asset Value
Common Stock (continued)
Hong Kong - 8.93% (continued)
112 Allied Properties HK Ltd 25 0.04
41 APT Satellite Holdings Ltd 22 0.03
28 Arts Optical International Hldgs Ltd 11 0.02
52 Asia Financial Holdings Ltd 28 0.04
9 Asia Satellite Telecommunications Holdings Ltd 11 0.02
85 Asia Standard International Group Ltd 19 0.03
22 ASM Pacific Technology Ltd 218 0.34
12 Associated International Hotels Ltd 35 0.05
175 Auto Italia Holdings 3 –
770 BEP International Holdings Ltd 57 0.09
134 Bonjour Holdings Ltd 6 0.01
38 Bright Smart Securities & Commodities Group Ltd 16 0.03
201 Brightoil Petroleum Holdings Ltd 61 0.09
440 Brockman Mining Ltd 7 0.01
291 Burwill Holdings Ltd 7 0.01
36 Cafe de Coral Holdings Ltd 129 0.20
258 Cash Financial Services Group Ltd 16 0.02
195 Century City International Holdings Ltd 13 0.02
505 Champion Technology Holdings Ltd 10 0.02
48 Chen Hsong Holdings 12 0.02
31 Cheuk Nang Holdings Ltd 23 0.04
10 Chevalier International Holdings Ltd 16 0.02
115 China Billion Resources Ltd 1 –
296 China Chuanglian Education Group Ltd 7 0.01
672 China Energy Development Holdings Ltd 8 0.01
530 China Ever Grand Financial Leasing Group Co Ltd 7 0.01
380 China LNG Group Ltd 9 0.01
48 China Metal International Holdings Inc 16 0.02
2 China Motor Bus Co Ltd 20 0.03
36 China Star Entertainment Ltd 3 –
1,027 China Strategic Holdings Ltd 24 0.04
62 China Ting Group Holdings Ltd 3 0.01
27 Chow Sang Sang Holdings International Ltd 50 0.08
30 Chu Kong Shipping Enterprises Group Co Ltd 8 0.01
193 Chuang's China Investments Ltd 13 0.02
135 CITIC Telecom International Holdings Ltd 44 0.07
234 CK Life Sciences International Holdings Inc 22 0.03
50 CNQC International Holdings Ltd 18 0.03 212
Common Splendor International Health Industry Group Ltd 18 0.03
4 Convenience Retail Asia Ltd 2 –
744 Convoy Financial Holdings Ltd 24 0.04
790 CP Lotus Corp 12 0.02
30 Cross-Harbour Holdings Ltd 44 0.07
396 CSI Properties Ltd 14 0.02
66 CW Group Holdings Ltd 14 0.02
28 Dah Sing Banking Group Ltd 53 0.08
13 Dah Sing Financial Holdings Ltd 84 0.13
51 Dan Form Holdings Co Ltd 18 0.03
39 Dickson Concepts International Ltd 14 0.02
24 Eagle Nice International Holdings Ltd 7 0.01
90 EcoGreen International Group Ltd 20 0.03
123 EganaGoldpfeil Holdings Ltd – –
234 Emperor Capital Group Ltd 25 0.04
70 Emperor Entertainment Hotel Ltd 17 0.03
55 Emperor International Holdings Ltd 13 0.02
150 Emperor Watch & Jewellery Ltd 5 0.01
402 Enerchina Holdings Ltd 22 0.03
348 ENM Holdings Ltd 28 0.04
141 Esprit Holdings Ltd 116 0.18
5 Fairwood Holdings Ltd 22 0.03
82 Far East Consortium International Ltd 35 0.05
250 FIH Mobile Ltd 80 0.12
156 First Pacific Co Ltd 110 0.17
Shares (000's)
Value (000's)
USD
% of Net Asset Value
Common Stock (continued)
Hong Kong - 8.93% (continued)
80 First Shanghai Investments Ltd 14 0.02
74 Fountain SET Holdings Ltd 10 0.02
20 Four Seas Mercantile Holdings Ltd 10 0.02
500 Freeman FinTech Corp Ltd 32 0.05
48 Future Bright Holdings Ltd 6 0.01
1,789 G-Resources Group Ltd 34 0.05
564 GCL New Energy Holdings Ltd 33 0.05
5 Get Nice Financial Group Ltd 1 –
201 Get Nice Holdings Ltd 7 0.01
114 Giordano International Ltd 61 0.09
444 Global Brands Group Holding Ltd 69 0.11
84 Glorious Sun Enterprises Ltd 11 0.02
98 Golden Resources Development International Ltd 6 0.01
16 Grande Holdings Ltd 1 –
18 Great Eagle Holdings Ltd 81 0.12
42 Guangnan Holdings Ltd 5 0.01
169 Guotai Junan International Holdings Ltd 67 0.10
95 Haitong International Securities Group Ltd 65 0.10
112 Hang Fung Gold Technology Ltd – –
26 Hanison Construction Holdings Ltd 5 0.01
178 Hao Tian Development Group Ltd 8 0.01
15 Harbour Centre Development Ltd 27 0.04
53 HKBN Ltd 60 0.09
102 HKR International Ltd 47 0.07
48 Hon Kwok Land Investment Co Ltd 18 0.03
3 Hong Kong Aircraft Engineering Co Ltd 19 0.03
120 Hong Kong Building & Loan Agency Ltd 5 0.01
14 Hong Kong Ferry Holdings Co Ltd 16 0.03
37 Hongkong & Shanghai Hotels Ltd 42 0.07
79 Hongkong Chinese Ltd 14 0.02
36 Hopewell Holdings Ltd 131 0.20
100 Hsin Chong Group Holdings Ltd 5 0.01
56 Hung Hing Printing Group Ltd 8 0.01 112
Hutchison Telecommunications Hong Kong Holdings Ltd 37 0.06
46 IGG Inc 36 0.06
103 Imagi International Holdings Ltd 3 –
193 International Standard Resources Holdings Ltd 3 –
240 iOne Holdings Ltd 7 0.01
75 IPE Group Ltd 17 0.03
200 IRC Ltd 10 0.02
28 IT Ltd 11 0.02
81 ITC Properties Group Ltd 34 0.05
22 Johnson Electric Holdings Ltd 65 0.10
42 K Wah International Holdings Ltd 21 0.03
66 Kam Hing International Holdings Ltd 4 0.01
46 Kerry Logistics Network Ltd 61 0.09
50 Kingmaker Footwear Holdings Ltd 13 0.02
18 Kowloon Development Co Ltd 17 0.03
28 L'Occitane International SA 54 0.08
1,001 Lai Sun Development Co Ltd 19 0.03
137 Lai Sun Garment International Ltd 27 0.04
3 Lam Soon Hong Kong Ltd 3 0.01
540 Landing International Development Ltd 13 0.02
28 Landsea Green Properties Co Ltd 2 –
26 Lifestyle China Group Ltd 7 0.01
54 Lifestyle International Holdings Ltd 69 0.11
436 Lippo China Resources Ltd 13 0.02
30 Lippo Ltd 19 0.03
238 Lisi Group Holdings Ltd 24 0.04
10 Liu Chong Hing Investment Ltd 14 0.02
22 Luen Thai Holdings Ltd 9 0.01
25 Luk Fook Holdings International Ltd 72 0.11
43 Lung Kee Bermuda Holdings 15 0.02

Pacific Basin Small Companies Fund
Portfolio of Investments as at 30 November 2016 (continued)
Dimensional Fund Advisors Annual Report and Audited Financial Statements, 30 November 2016 251
Shares (000's)
Value (000's)
USD
% of Net Asset Value
Common Stock (continued)
Hong Kong - 8.93% (continued)
141 Macau Legend Development Ltd 31 0.05
306 Magnificent Hotel Investment Ltd 7 0.01
81 Man Wah Holdings Ltd 56 0.09
760 Mason Financial Holdings Ltd 18 0.03
512 Master Glory Group Ltd 30 0.05
71 Matrix Holdings Ltd 27 0.04
64 Melco International Development Ltd 103 0.16
36 Midland Holdings Ltd 11 0.02
55 Ming Fai International Holdings Ltd 9 0.01
13 Miramar Hotel & Investment 30 0.05
94 NagaCorp Ltd 58 0.09
1,720 NetMind Financial Holdings Ltd 14 0.02
138 New Times Energy Corp Ltd 4 0.01
78 NewOcean Energy Holdings Ltd 21 0.03
242 O Luxe Holdings Ltd 22 0.03
19 Orient Overseas International Ltd 74 0.11
75 Oriental Watch Holdings 16 0.03
381 Pacific Andes International Holdings Ltd 1 –
242 Pacific Basin Shipping Ltd 39 0.06
43 Pacific Textiles Holdings Ltd 50 0.08
62 Paliburg Holdings Ltd 18 0.03
52 Paradise Entertainment Ltd 10 0.02
178 Peace Mark Holdings Ltd – –
70 Pico Far East Holdings Ltd 22 0.03
7 Playmates Holdings Ltd 9 0.01
48 Playmates Toys Ltd 8 0.01
125 Polytec Asset Holdings Ltd 10 0.02
36 Public Financial Holdings Ltd 16 0.02
263 PYI Corp Ltd 5 0.01
28 Regal Hotels International Holdings Ltd 16 0.02
170 Rentian Technology Holdings Ltd 11 0.02
192 Sa Sa International Holdings Ltd 86 0.13
4 Safety Godown Co Ltd 10 0.02
52 SAS Dragon Holdings Ltd 10 0.02
16 SEA Holdings Ltd 41 0.06
30 Shangri-La Asia Ltd 33 0.05
45 Shenwan Hongyuan HK Ltd 25 0.04
125 Shougang Concord Grand Group Ltd 4 0.01
6 Shun Ho Property Investments Ltd 2 –
152 Shun Tak Holdings Ltd 56 0.09
89 Silver Base Group Holdings Ltd 6 0.01
350 Sincere Watch Hong Kong Ltd 10 0.02
54 Sing Tao News Corp Ltd 7 0.01
138 Singamas Container Holdings Ltd 15 0.02
20 SIS International Holdings 10 0.02
70 SITC International Holdings Co Ltd 43 0.07
20 Sitoy Group Holdings Ltd 5 0.01
206 Skyway Securities Group Ltd 5 0.01
30 SmarTone Telecommunications Holdings Ltd 41 0.06
28 SOCAM Development Ltd 9 0.01
214 Solomon Systech International Ltd 9 0.01
8 Soundwill Holdings Ltd 15 0.02
29 Stella International Holdings Ltd 48 0.07
28 Success Universe Group Ltd 1 –
57 Sun Hung Kai & Co Ltd 36 0.06
110 Symphony Holdings Ltd 10 0.02
22 TAI Cheung Holdings Ltd 19 0.03
78 Tan Chong International Ltd 24 0.04
32 Tao Heung Holdings Ltd 9 0.01
20 Television Broadcasts Ltd 73 0.11
108 Texwinca Holdings Ltd 79 0.12
560 Titan Petrochemicals Group Ltd 7 0.01
92 Tom Group Ltd 22 0.03
Shares (000's)
Value (000's)
USD
% of Net Asset Value
Common Stock (continued)
Hong Kong - 8.93% (continued)
78 Tradelink Electronic Commerce Ltd 16 0.03
22 Transport International Holdings Ltd 66 0.10
62 Trinity Ltd 5 0.01
44 TSC Group Holdings Ltd 6 0.01
54 Tsui Wah Holdings Ltd 9 0.01
41 United Laboratories International Holdings Ltd 22 0.03
150 Up Energy Development Group Ltd 2 –
172 Upbest Group Ltd 26 0.04
74 Value Partners Group Ltd 67 0.10
29 Varitronix International Ltd 13 0.02
160 Vedan International Holdings Ltd 20 0.03
145 Victory City International Holdings Ltd 5 0.01
52 Vitasoy International Holdings Ltd 107 0.17
46 VST Holdings Ltd 15 0.02
10 VTech Holdings Ltd 126 0.19
70 Wai Kee Holdings Ltd 23 0.04
50 Win Hanverky Holdings Ltd 9 0.01
11 Wing On Co International Ltd 33 0.05
63 Wing Tai Properties Ltd 38 0.06
15 Xinyi Automobile Glass Hong Kong Enterprises Ltd 3 –
118 Xinyi Glass Holdings Ltd 88 0.14
56 Yeebo International Holdings Ltd 25 0.04
9 YGM Trading Ltd 8 0.01
64 YT Realty Group Ltd 25 0.04
5,792 8.93
Japan - 55.60%
25 77 Bank Ltd 119 0.18
4 Accordia Golf Co Ltd 38 0.06
2 Achilles Corp 22 0.03
2 Adastria Co Ltd 53 0.08
13 ADEKA Corp 173 0.27
1 Advan Co Ltd 11 0.02
1 Aeon Delight Co Ltd 33 0.05
– Aeon Fantasy Co Ltd 8 0.01
1 Ahresty Corp 7 0.01
2 Ai Holdings Corp 49 0.08
8 Aica Kogyo Co Ltd 208 0.32
– Aichi Bank Ltd 23 0.04
6 Aichi Corp 44 0.07
2 Aichi Steel Corp 74 0.11
1 Aichi Tokei Denki Co Ltd 15 0.02
9 Aida Engineering Ltd 88 0.14
1 Ain Holdings Inc 70 0.11
4 Aisan Industry Co Ltd 33 0.05
3 Aizawa Securities Co Ltd 19 0.03
5 Akebono Brake Industry Co Ltd 14 0.02
13 Akita Bank Ltd 42 0.07
– Alconix Corp 6 0.01
1 Alpen Co Ltd 19 0.03
1 Alpha Corp 9 0.01
8 Alpine Electronics Inc 105 0.16
2 Alps Logistics Co Ltd 9 0.01
1 Altech Corp 16 0.02
10 Amano Corp 168 0.26
– Amiyaki Tei Co Ltd 10 0.02
1 Amuse Inc 12 0.02
3 Anest Iwata Corp 27 0.04
1 Anicom Holdings Inc 33 0.05
21 Anritsu Corp 109 0.17
5 AOKI Holdings Inc 57 0.09
27 Aomori Bank Ltd 90 0.14
4 Aoyama Trading Co Ltd 144 0.22
2 Arakawa Chemical Industries Ltd 22 0.03
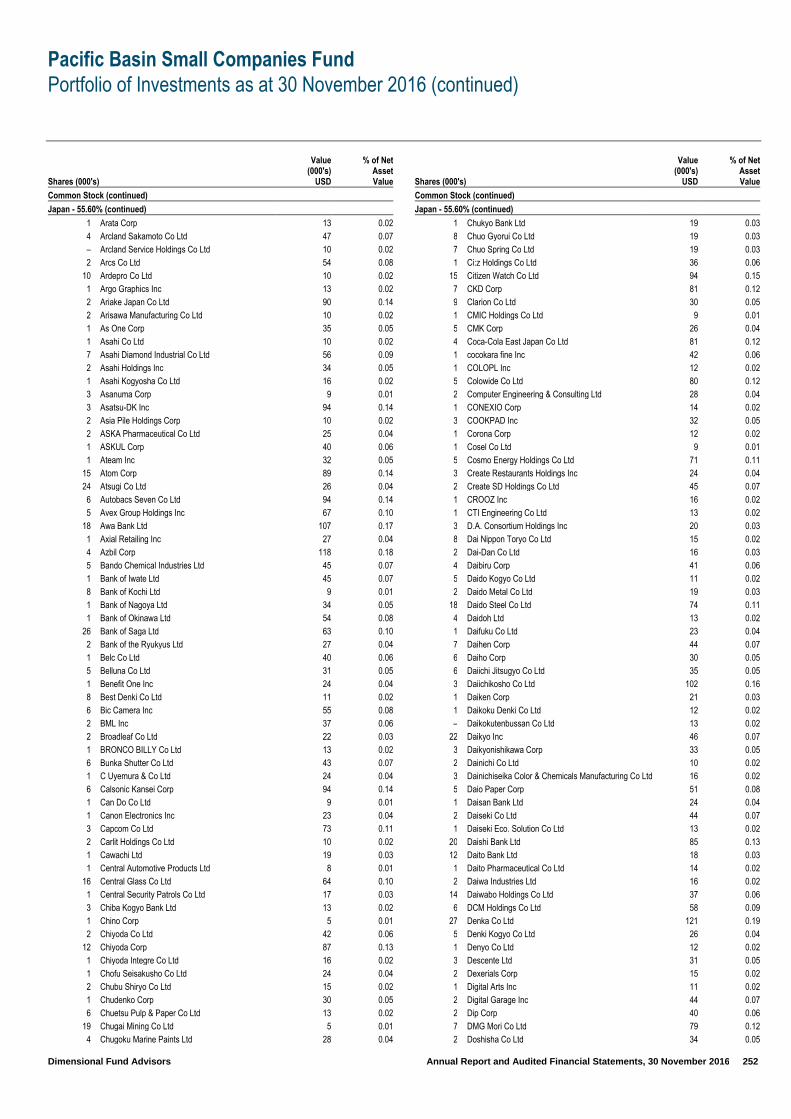
Pacific Basin Small Companies Fund
Portfolio of Investments as at 30 November 2016 (continued)
Dimensional Fund Advisors Annual Report and Audited Financial Statements, 30 November 2016 252
Shares (000's)
Value (000's)
USD
% of Net Asset Value
Common Stock (continued)
Japan - 55.60% (continued)
1 Arata Corp 13 0.02
4 Arcland Sakamoto Co Ltd 47 0.07
– Arcland Service Holdings Co Ltd 10 0.02
2 Arcs Co Ltd 54 0.08
10 Ardepro Co Ltd 10 0.02
1 Argo Graphics Inc 13 0.02
2 Ariake Japan Co Ltd 90 0.14
2 Arisawa Manufacturing Co Ltd 10 0.02
1 As One Corp 35 0.05
1 Asahi Co Ltd 10 0.02
7 Asahi Diamond Industrial Co Ltd 56 0.09
2 Asahi Holdings Inc 34 0.05
1 Asahi Kogyosha Co Ltd 16 0.02
3 Asanuma Corp 9 0.01
3 Asatsu-DK Inc 94 0.14
2 Asia Pile Holdings Corp 10 0.02
2 ASKA Pharmaceutical Co Ltd 25 0.04
1 ASKUL Corp 40 0.06
1 Ateam Inc 32 0.05
15 Atom Corp 89 0.14
24 Atsugi Co Ltd 26 0.04
6 Autobacs Seven Co Ltd 94 0.14
5 Avex Group Holdings Inc 67 0.10
18 Awa Bank Ltd 107 0.17
1 Axial Retailing Inc 27 0.04
4 Azbil Corp 118 0.18
5 Bando Chemical Industries Ltd 45 0.07
1 Bank of Iwate Ltd 45 0.07
8 Bank of Kochi Ltd 9 0.01
1 Bank of Nagoya Ltd 34 0.05
1 Bank of Okinawa Ltd 54 0.08
26 Bank of Saga Ltd 63 0.10
2 Bank of the Ryukyus Ltd 27 0.04
1 Belc Co Ltd 40 0.06
5 Belluna Co Ltd 31 0.05
1 Benefit One Inc 24 0.04
8 Best Denki Co Ltd 11 0.02
6 Bic Camera Inc 55 0.08
2 BML Inc 37 0.06
2 Broadleaf Co Ltd 22 0.03
1 BRONCO BILLY Co Ltd 13 0.02
6 Bunka Shutter Co Ltd 43 0.07
1 C Uyemura & Co Ltd 24 0.04
6 Calsonic Kansei Corp 94 0.14
1 Can Do Co Ltd 9 0.01
1 Canon Electronics Inc 23 0.04
3 Capcom Co Ltd 73 0.11
2 Carlit Holdings Co Ltd 10 0.02
1 Cawachi Ltd 19 0.03
1 Central Automotive Products Ltd 8 0.01
16 Central Glass Co Ltd 64 0.10
1 Central Security Patrols Co Ltd 17 0.03
3 Chiba Kogyo Bank Ltd 13 0.02
1 Chino Corp 5 0.01
2 Chiyoda Co Ltd 42 0.06
12 Chiyoda Corp 87 0.13
1 Chiyoda Integre Co Ltd 16 0.02
1 Chofu Seisakusho Co Ltd 24 0.04
2 Chubu Shiryo Co Ltd 15 0.02
1 Chudenko Corp 30 0.05
6 Chuetsu Pulp & Paper Co Ltd 13 0.02
19 Chugai Mining Co Ltd 5 0.01
4 Chugoku Marine Paints Ltd 28 0.04
Shares (000's)
Value (000's)
USD
% of Net Asset Value
Common Stock (continued)
Japan - 55.60% (continued)
1 Chukyo Bank Ltd 19 0.03
8 Chuo Gyorui Co Ltd 19 0.03
7 Chuo Spring Co Ltd 19 0.03
1 Ci:z Holdings Co Ltd 36 0.06
15 Citizen Watch Co Ltd 94 0.15
7 CKD Corp 81 0.12
9 Clarion Co Ltd 30 0.05
1 CMIC Holdings Co Ltd 9 0.01
5 CMK Corp 26 0.04
4 Coca-Cola East Japan Co Ltd 81 0.12
1 cocokara fine Inc 42 0.06
1 COLOPL Inc 12 0.02
5 Colowide Co Ltd 80 0.12
2 Computer Engineering & Consulting Ltd 28 0.04
1 CONEXIO Corp 14 0.02
3 COOKPAD Inc 32 0.05
1 Corona Corp 12 0.02
1 Cosel Co Ltd 9 0.01
5 Cosmo Energy Holdings Co Ltd 71 0.11
3 Create Restaurants Holdings Inc 24 0.04
2 Create SD Holdings Co Ltd 45 0.07
1 CROOZ Inc 16 0.02
1 CTI Engineering Co Ltd 13 0.02
3 D.A. Consortium Holdings Inc 20 0.03
8 Dai Nippon Toryo Co Ltd 15 0.02
2 Dai-Dan Co Ltd 16 0.03
4 Daibiru Corp 41 0.06
5 Daido Kogyo Co Ltd 11 0.02
2 Daido Metal Co Ltd 19 0.03
18 Daido Steel Co Ltd 74 0.11
4 Daidoh Ltd 13 0.02
1 Daifuku Co Ltd 23 0.04
7 Daihen Corp 44 0.07
6 Daiho Corp 30 0.05
6 Daiichi Jitsugyo Co Ltd 35 0.05
3 Daiichikosho Co Ltd 102 0.16
1 Daiken Corp 21 0.03
1 Daikoku Denki Co Ltd 12 0.02
– Daikokutenbussan Co Ltd 13 0.02
22 Daikyo Inc 46 0.07
3 Daikyonishikawa Corp 33 0.05
2 Dainichi Co Ltd 10 0.02
3 Dainichiseika Color & Chemicals Manufacturing Co Ltd 16 0.02
5 Daio Paper Corp 51 0.08
1 Daisan Bank Ltd 24 0.04
2 Daiseki Co Ltd 44 0.07
1 Daiseki Eco. Solution Co Ltd 13 0.02
20 Daishi Bank Ltd 85 0.13
12 Daito Bank Ltd 18 0.03
1 Daito Pharmaceutical Co Ltd 14 0.02
2 Daiwa Industries Ltd 16 0.02
14 Daiwabo Holdings Co Ltd 37 0.06
6 DCM Holdings Co Ltd 58 0.09
27 Denka Co Ltd 121 0.19
5 Denki Kogyo Co Ltd 26 0.04
1 Denyo Co Ltd 12 0.02
3 Descente Ltd 31 0.05
2 Dexerials Corp 15 0.02
1 Digital Arts Inc 11 0.02
2 Digital Garage Inc 44 0.07
2 Dip Corp 40 0.06
7 DMG Mori Co Ltd 79 0.12
2 Doshisha Co Ltd 34 0.05
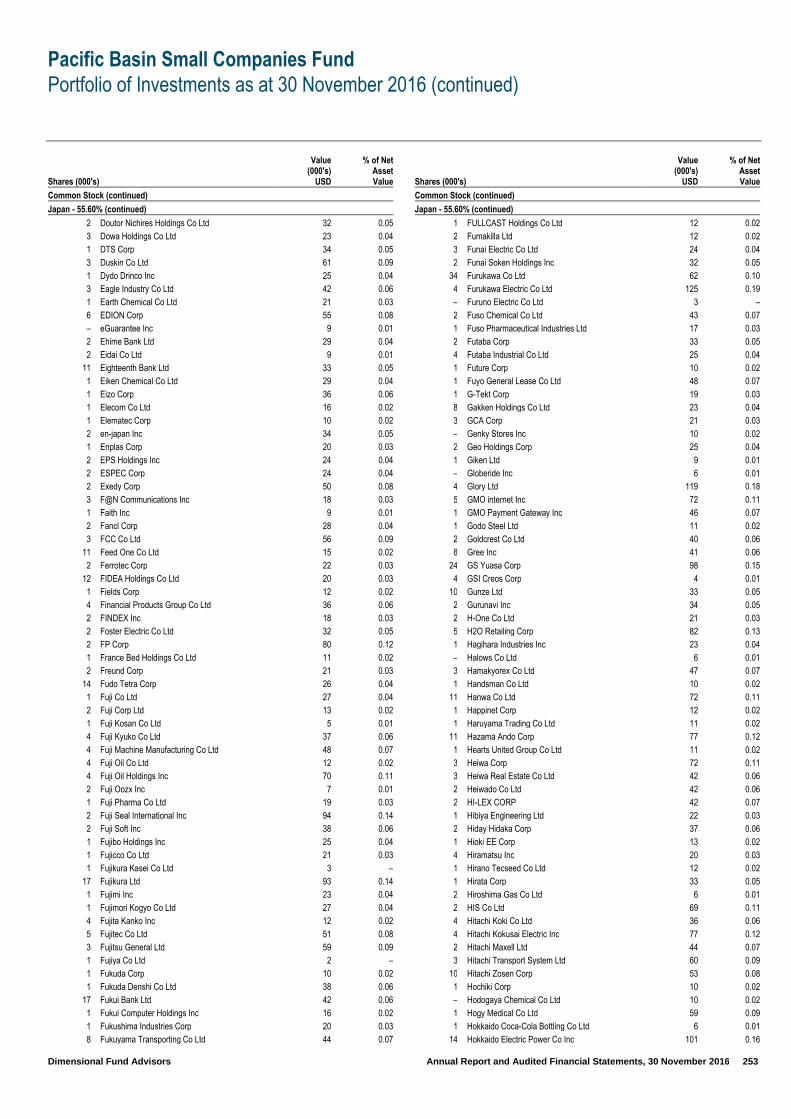
Pacific Basin Small Companies Fund
Portfolio of Investments as at 30 November 2016 (continued)
Dimensional Fund Advisors Annual Report and Audited Financial Statements, 30 November 2016 253
Shares (000's)
Value (000's)
USD
% of Net Asset Value
Common Stock (continued)
Japan - 55.60% (continued)
2 Doutor Nichires Holdings Co Ltd 32 0.05
3 Dowa Holdings Co Ltd 23 0.04
1 DTS Corp 34 0.05
3 Duskin Co Ltd 61 0.09
1 Dydo Drinco Inc 25 0.04
3 Eagle Industry Co Ltd 42 0.06
1 Earth Chemical Co Ltd 21 0.03
6 EDION Corp 55 0.08
– eGuarantee Inc 9 0.01
2 Ehime Bank Ltd 29 0.04
2 Eidai Co Ltd 9 0.01
11 Eighteenth Bank Ltd 33 0.05
1 Eiken Chemical Co Ltd 29 0.04
1 Eizo Corp 36 0.06
1 Elecom Co Ltd 16 0.02
1 Elematec Corp 10 0.02
2 en-japan Inc 34 0.05
1 Enplas Corp 20 0.03
2 EPS Holdings Inc 24 0.04
2 ESPEC Corp 24 0.04
2 Exedy Corp 50 0.08
3 F@N Communications Inc 18 0.03
1 Faith Inc 9 0.01
2 Fancl Corp 28 0.04
3 FCC Co Ltd 56 0.09
11 Feed One Co Ltd 15 0.02
2 Ferrotec Corp 22 0.03
12 FIDEA Holdings Co Ltd 20 0.03
1 Fields Corp 12 0.02
4 Financial Products Group Co Ltd 36 0.06
2 FINDEX Inc 18 0.03
2 Foster Electric Co Ltd 32 0.05
2 FP Corp 80 0.12
1 France Bed Holdings Co Ltd 11 0.02
2 Freund Corp 21 0.03
14 Fudo Tetra Corp 26 0.04
1 Fuji Co Ltd 27 0.04
2 Fuji Corp Ltd 13 0.02
1 Fuji Kosan Co Ltd 5 0.01
4 Fuji Kyuko Co Ltd 37 0.06
4 Fuji Machine Manufacturing Co Ltd 48 0.07
4 Fuji Oil Co Ltd 12 0.02
4 Fuji Oil Holdings Inc 70 0.11
2 Fuji Oozx Inc 7 0.01
1 Fuji Pharma Co Ltd 19 0.03
2 Fuji Seal International Inc 94 0.14
2 Fuji Soft Inc 38 0.06
1 Fujibo Holdings Inc 25 0.04
1 Fujicco Co Ltd 21 0.03
1 Fujikura Kasei Co Ltd 3 –
17 Fujikura Ltd 93 0.14
1 Fujimi Inc 23 0.04
1 Fujimori Kogyo Co Ltd 27 0.04
4 Fujita Kanko Inc 12 0.02
5 Fujitec Co Ltd 51 0.08
3 Fujitsu General Ltd 59 0.09
1 Fujiya Co Ltd 2 –
1 Fukuda Corp 10 0.02
1 Fukuda Denshi Co Ltd 38 0.06
17 Fukui Bank Ltd 42 0.06
1 Fukui Computer Holdings Inc 16 0.02
1 Fukushima Industries Corp 20 0.03
8 Fukuyama Transporting Co Ltd 44 0.07
Shares (000's)
Value (000's)
USD
% of Net Asset Value
Common Stock (continued)
Japan - 55.60% (continued)
1 FULLCAST Holdings Co Ltd 12 0.02
2 Fumakilla Ltd 12 0.02
3 Funai Electric Co Ltd 24 0.04
2 Funai Soken Holdings Inc 32 0.05
34 Furukawa Co Ltd 62 0.10
4 Furukawa Electric Co Ltd 125 0.19
– Furuno Electric Co Ltd 3 –
2 Fuso Chemical Co Ltd 43 0.07
1 Fuso Pharmaceutical Industries Ltd 17 0.03
2 Futaba Corp 33 0.05
4 Futaba Industrial Co Ltd 25 0.04
1 Future Corp 10 0.02
1 Fuyo General Lease Co Ltd 48 0.07
1 G-Tekt Corp 19 0.03
8 Gakken Holdings Co Ltd 23 0.04
3 GCA Corp 21 0.03
– Genky Stores Inc 10 0.02
2 Geo Holdings Corp 25 0.04
1 Giken Ltd 9 0.01
– Globeride Inc 6 0.01
4 Glory Ltd 119 0.18
5 GMO internet Inc 72 0.11
1 GMO Payment Gateway Inc 46 0.07
1 Godo Steel Ltd 11 0.02
2 Goldcrest Co Ltd 40 0.06
8 Gree Inc 41 0.06
24 GS Yuasa Corp 98 0.15
4 GSI Creos Corp 4 0.01
10 Gunze Ltd 33 0.05
2 Gurunavi Inc 34 0.05
2 H-One Co Ltd 21 0.03
5 H2O Retailing Corp 82 0.13
1 Hagihara Industries Inc 23 0.04
– Halows Co Ltd 6 0.01
3 Hamakyorex Co Ltd 47 0.07
1 Handsman Co Ltd 10 0.02
11 Hanwa Co Ltd 72 0.11
1 Happinet Corp 12 0.02
1 Haruyama Trading Co Ltd 11 0.02
11 Hazama Ando Corp 77 0.12
1 Hearts United Group Co Ltd 11 0.02
3 Heiwa Corp 72 0.11
3 Heiwa Real Estate Co Ltd 42 0.06
2 Heiwado Co Ltd 42 0.06
2 HI-LEX CORP 42 0.07
1 Hibiya Engineering Ltd 22 0.03
2 Hiday Hidaka Corp 37 0.06
1 Hioki EE Corp 13 0.02
4 Hiramatsu Inc 20 0.03
1 Hirano Tecseed Co Ltd 12 0.02
1 Hirata Corp 33 0.05
2 Hiroshima Gas Co Ltd 6 0.01
2 HIS Co Ltd 69 0.11
4 Hitachi Koki Co Ltd 36 0.06
4 Hitachi Kokusai Electric Inc 77 0.12
2 Hitachi Maxell Ltd 44 0.07
3 Hitachi Transport System Ltd 60 0.09
10 Hitachi Zosen Corp 53 0.08
1 Hochiki Corp 10 0.02
– Hodogaya Chemical Co Ltd 10 0.02
1 Hogy Medical Co Ltd 59 0.09
1 Hokkaido Coca-Cola Bottling Co Ltd 6 0.01
14 Hokkaido Electric Power Co Inc 101 0.16
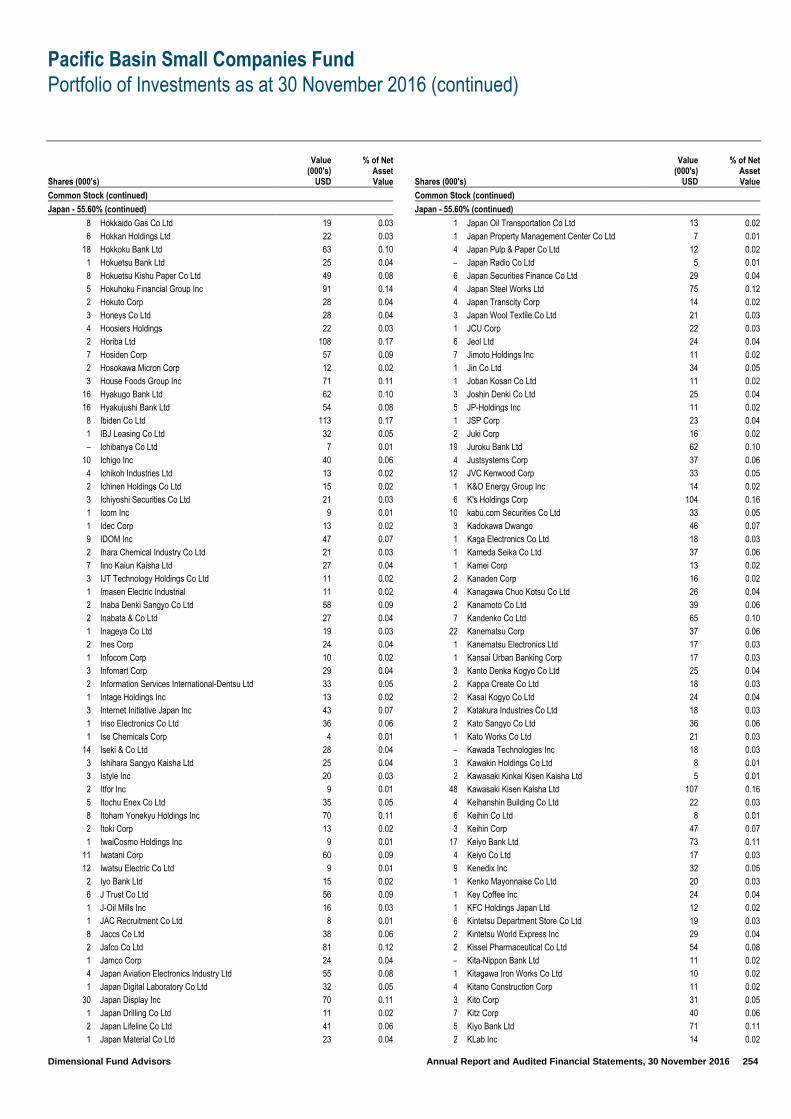
Pacific Basin Small Companies Fund
Portfolio of Investments as at 30 November 2016 (continued)
Dimensional Fund Advisors Annual Report and Audited Financial Statements, 30 November 2016 254
Shares (000's)
Value (000's)
USD
% of Net Asset Value
Common Stock (continued)
Japan - 55.60% (continued)
8 Hokkaido Gas Co Ltd 19 0.03
6 Hokkan Holdings Ltd 22 0.03
18 Hokkoku Bank Ltd 63 0.10
1 Hokuetsu Bank Ltd 25 0.04
8 Hokuetsu Kishu Paper Co Ltd 49 0.08
5 Hokuhoku Financial Group Inc 91 0.14
2 Hokuto Corp 28 0.04
3 Honeys Co Ltd 28 0.04
4 Hoosiers Holdings 22 0.03
2 Horiba Ltd 108 0.17
7 Hosiden Corp 57 0.09
2 Hosokawa Micron Corp 12 0.02
3 House Foods Group Inc 71 0.11
16 Hyakugo Bank Ltd 62 0.10
16 Hyakujushi Bank Ltd 54 0.08
8 Ibiden Co Ltd 113 0.17
1 IBJ Leasing Co Ltd 32 0.05
– Ichibanya Co Ltd 7 0.01
10 Ichigo Inc 40 0.06
4 Ichikoh Industries Ltd 13 0.02
2 Ichinen Holdings Co Ltd 15 0.02
3 Ichiyoshi Securities Co Ltd 21 0.03
1 Icom Inc 9 0.01
1 Idec Corp 13 0.02
9 IDOM Inc 47 0.07
2 Ihara Chemical Industry Co Ltd 21 0.03
7 Iino Kaiun Kaisha Ltd 27 0.04
3 IJT Technology Holdings Co Ltd 11 0.02
1 Imasen Electric Industrial 11 0.02
2 Inaba Denki Sangyo Co Ltd 58 0.09
2 Inabata & Co Ltd 27 0.04
1 Inageya Co Ltd 19 0.03
2 Ines Corp 24 0.04
1 Infocom Corp 10 0.02
3 Infomart Corp 29 0.04
2 Information Services International-Dentsu Ltd 33 0.05
1 Intage Holdings Inc 13 0.02
3 Internet Initiative Japan Inc 43 0.07
1 Iriso Electronics Co Ltd 36 0.06
1 Ise Chemicals Corp 4 0.01
14 Iseki & Co Ltd 28 0.04
3 Ishihara Sangyo Kaisha Ltd 25 0.04
3 Istyle Inc 20 0.03
2 Itfor Inc 9 0.01
5 Itochu Enex Co Ltd 35 0.05
8 Itoham Yonekyu Holdings Inc 70 0.11
2 Itoki Corp 13 0.02
1 IwaiCosmo Holdings Inc 9 0.01
11 Iwatani Corp 60 0.09
12 Iwatsu Electric Co Ltd 9 0.01
2 Iyo Bank Ltd 15 0.02
6 J Trust Co Ltd 56 0.09
1 J-Oil Mills Inc 16 0.03
1 JAC Recruitment Co Ltd 8 0.01
8 Jaccs Co Ltd 38 0.06
2 Jafco Co Ltd 81 0.12
1 Jamco Corp 24 0.04
4 Japan Aviation Electronics Industry Ltd 55 0.08
1 Japan Digital Laboratory Co Ltd 32 0.05
30 Japan Display Inc 70 0.11
1 Japan Drilling Co Ltd 11 0.02
2 Japan Lifeline Co Ltd 41 0.06
1 Japan Material Co Ltd 23 0.04
Shares (000's)
Value (000's)
USD
% of Net Asset Value
Common Stock (continued)
Japan - 55.60% (continued)
1 Japan Oil Transportation Co Ltd 13 0.02
1 Japan Property Management Center Co Ltd 7 0.01
4 Japan Pulp & Paper Co Ltd 12 0.02
– Japan Radio Co Ltd 5 0.01
6 Japan Securities Finance Co Ltd 29 0.04
4 Japan Steel Works Ltd 75 0.12
4 Japan Transcity Corp 14 0.02
3 Japan Wool Textile Co Ltd 21 0.03
1 JCU Corp 22 0.03
6 Jeol Ltd 24 0.04
7 Jimoto Holdings Inc 11 0.02
1 Jin Co Ltd 34 0.05
1 Joban Kosan Co Ltd 11 0.02
3 Joshin Denki Co Ltd 25 0.04
5 JP-Holdings Inc 11 0.02
1 JSP Corp 23 0.04
2 Juki Corp 16 0.02
19 Juroku Bank Ltd 62 0.10
4 Justsystems Corp 37 0.06
12 JVC Kenwood Corp 33 0.05
1 K&O Energy Group Inc 14 0.02
6 K's Holdings Corp 104 0.16
10 kabu.com Securities Co Ltd 33 0.05
3 Kadokawa Dwango 46 0.07
1 Kaga Electronics Co Ltd 18 0.03
1 Kameda Seika Co Ltd 37 0.06
1 Kamei Corp 13 0.02
2 Kanaden Corp 16 0.02
4 Kanagawa Chuo Kotsu Co Ltd 26 0.04
2 Kanamoto Co Ltd 39 0.06
7 Kandenko Co Ltd 65 0.10
22 Kanematsu Corp 37 0.06
1 Kanematsu Electronics Ltd 17 0.03
1 Kansai Urban Banking Corp 17 0.03
3 Kanto Denka Kogyo Co Ltd 25 0.04
2 Kappa Create Co Ltd 18 0.03
2 Kasai Kogyo Co Ltd 24 0.04
2 Katakura Industries Co Ltd 18 0.03
2 Kato Sangyo Co Ltd 36 0.06
1 Kato Works Co Ltd 21 0.03
– Kawada Technologies Inc 18 0.03
3 Kawakin Holdings Co Ltd 8 0.01
2 Kawasaki Kinkai Kisen Kaisha Ltd 5 0.01
48 Kawasaki Kisen Kaisha Ltd 107 0.16
4 Keihanshin Building Co Ltd 22 0.03
6 Keihin Co Ltd 8 0.01
3 Keihin Corp 47 0.07
17 Keiyo Bank Ltd 73 0.11
4 Keiyo Co Ltd 17 0.03
9 Kenedix Inc 32 0.05
1 Kenko Mayonnaise Co Ltd 20 0.03
1 Key Coffee Inc 24 0.04
1 KFC Holdings Japan Ltd 12 0.02
6 Kintetsu Department Store Co Ltd 19 0.03
2 Kintetsu World Express Inc 29 0.04
2 Kissei Pharmaceutical Co Ltd 54 0.08
– Kita-Nippon Bank Ltd 11 0.02
1 Kitagawa Iron Works Co Ltd 10 0.02
4 Kitano Construction Corp 11 0.02
3 Kito Corp 31 0.05
7 Kitz Corp 40 0.06
5 Kiyo Bank Ltd 71 0.11
2 KLab Inc 14 0.02

Pacific Basin Small Companies Fund
Portfolio of Investments as at 30 November 2016 (continued)
Dimensional Fund Advisors Annual Report and Audited Financial Statements, 30 November 2016 255
Shares (000's)
Value (000's)
USD
% of Net Asset Value
Common Stock (continued)
Japan - 55.60% (continued)
10 KNT-CT Holdings Co Ltd 13 0.02
2 Koa Corp 23 0.04
3 Koatsu Gas Kogyo Co Ltd 19 0.03
1 Kobe Bussan Co Ltd 19 0.03
2 Kohnan Shoji Co Ltd 44 0.07
6 Koike Sanso Kogyo Co Ltd 14 0.02
5 Kojima Co Ltd 11 0.02
5 Kokuyo Co Ltd 64 0.10
1 Komatsu Wall Industry Co Ltd 13 0.02
2 Komeri Co Ltd 53 0.08
3 Komori Corp 40 0.06
1 Kondotec Inc 7 0.01
2 Konishi Co Ltd 27 0.04
2 Konoike Transport Co Ltd 25 0.04
1 Koshidaka Holdings Co Ltd 18 0.03
1 Kotobuki Spirits Co Ltd 30 0.05
– Kourakuen Holdings Corp 4 0.01
8 Krosaki Harima Corp 22 0.03
– KRS Corp 2 –
32 Kumagai Gumi Co Ltd 83 0.13
4 Kumiai Chemical Industry Co Ltd 27 0.04
1 Kura Corp 34 0.05
10 Kurabo Industries Ltd 20 0.03
1 Kureha Corp 41 0.06
1 Kurimoto Ltd 15 0.02
2 Kuroda Electric Co Ltd 45 0.07
1 Kusuri no Aoki Holdings Co Ltd 43 0.07
10 KYB Corp 46 0.07
5 Kyodo Printing Co Ltd 17 0.03
1 Kyoei Steel Ltd 27 0.04
2 Kyokuto Kaihatsu Kogyo Co Ltd 24 0.04
1 Kyokuto Securities Co Ltd 21 0.03
– Kyokuyo Co Ltd 9 0.01
3 KYORIN Holdings Inc 68 0.10
1 Kyoritsu Maintenance Co Ltd 76 0.12
5 Kyowa Exeo Corp 74 0.11
3 Kyudenko Corp 76 0.12
10 Kyushu Financial Group Inc 66 0.10
1 LAC Co Ltd 11 0.02
2 Laox Co Ltd 13 0.02
1 Lasertec Corp 24 0.04
– LEC Inc 12 0.02
18 Leopalace21 Corp 97 0.15
1 Life Corp 26 0.04
1 Linical Co Ltd 7 0.01
3 Lintec Corp 67 0.10
3 Look Inc 5 0.01
1 M&A Capital Partners Co Ltd 21 0.03
2 Macnica Fuji Electronics Holdings Inc 25 0.04
8 Maeda Corp 75 0.12
1 Maeda Kosen Co Ltd 15 0.02
4 Maeda Road Construction Co Ltd 69 0.11
6 Makino Milling Machine Co Ltd 43 0.07
1 Mamezou Holdings Co Ltd 10 0.02
1 Mandom Corp 43 0.07
2 Mani Inc 39 0.06
– Mars Engineering Corp 2 –
6 Marudai Food Co Ltd 25 0.04
2 Maruha Nichiro Corp 64 0.10
2 Marusan Securities Co Ltd 14 0.02
1 Maruwa Co Ltd 25 0.04
1 Maruwa Unyu Kikan Co Ltd 13 0.02
1 Maruzen Co Ltd 10 0.02
Shares (000's)
Value (000's)
USD
% of Net Asset Value
Common Stock (continued)
Japan - 55.60% (continued)
4 Maruzen Showa Unyu Co Ltd 16 0.02
3 Marvelous Inc 18 0.03
1 Matsui Construction Co Ltd 12 0.02
2 Matsuya Co Ltd 17 0.03
1 Matsuya Foods Co Ltd 18 0.03
2 Max Co Ltd 24 0.04
3 MCJ Co Ltd 24 0.04
2 MEC Co Ltd 14 0.02
2 Medical System Network Co Ltd 7 0.01
20 Meidensha Corp 65 0.10
2 Meiko Network Japan Co Ltd 15 0.02
2 Meisei Industrial Co Ltd 12 0.02
2 Meitec Corp 68 0.10
1 Meito Sangyo Co Ltd 13 0.02
1 Melco Holdings Inc 28 0.04
– Menicon Co Ltd 3 –
1 METAWATER Co Ltd 18 0.03
13 Michinoku Bank Ltd 25 0.04
4 Micronics Japan Co Ltd 40 0.06
1 Mie Bank Ltd 16 0.02
4 Mie Kotsu Group Holdings Inc 14 0.02
1 Milbon Co Ltd 27 0.04
3 Mimasu Semiconductor Industry Co Ltd 33 0.05
1 Minato Bank Ltd 24 0.04
2 Ministop Co Ltd 28 0.04
4 Mirait Holdings Corp 40 0.06
1 Miroku Jyoho Service Co Ltd 17 0.03
1 Misawa Homes Co Ltd 13 0.02
1 Mitani Corp 33 0.05
6 Mito Securities Co Ltd 16 0.02
3 Mitsuba Corp 40 0.06
5 Mitsubishi Nichiyu Forklift Co Ltd 35 0.05
3 Mitsubishi Paper Mills Ltd 18 0.03
1 Mitsubishi Pencil Co Ltd 58 0.09
– Mitsubishi Research Institute Inc 11 0.02
1 Mitsubishi Shokuhin Co Ltd 23 0.04
14 Mitsubishi Steel Manufacturing Co Ltd 28 0.04
3 Mitsuboshi Belting Ltd 27 0.04
53 Mitsui Engineering & Shipbuilding Co Ltd 77 0.12
1 Mitsui High-Tec Inc 8 0.01
4 Mitsui Home Co Ltd 16 0.02
40 Mitsui Mining & Smelting Co Ltd 94 0.15
1 Mitsui Sugar Co Ltd 29 0.04
8 Mitsui-Soko Holdings Co Ltd 24 0.04
6 Mitsumi Electric Co Ltd 37 0.06
4 Mitsumura Printing Co Ltd 7 0.01
13 Miyazaki Bank Ltd 42 0.06
8 Mizuno Corp 39 0.06
1 Mochida Pharmaceutical Co Ltd 63 0.10
1 Modec Inc 19 0.03
16 Monex Group Inc 39 0.06
– Monogatari Corp 8 0.01
2 Morinaga & Co Ltd 95 0.15
12 Morinaga Milk Industry Co Ltd 82 0.13
2 Morita Holdings Corp 33 0.05
3 Morozoff Ltd 12 0.02
– Mory Industries Inc 7 0.01
4 MTI Ltd 26 0.04
2 Musashi Seimitsu Industry Co Ltd 63 0.10
2 Musashino Bank Ltd 54 0.08
1 N Field Co Ltd 14 0.02
10 Nachi-Fujikoshi Corp 39 0.06
1 Nafco Co Ltd 12 0.02
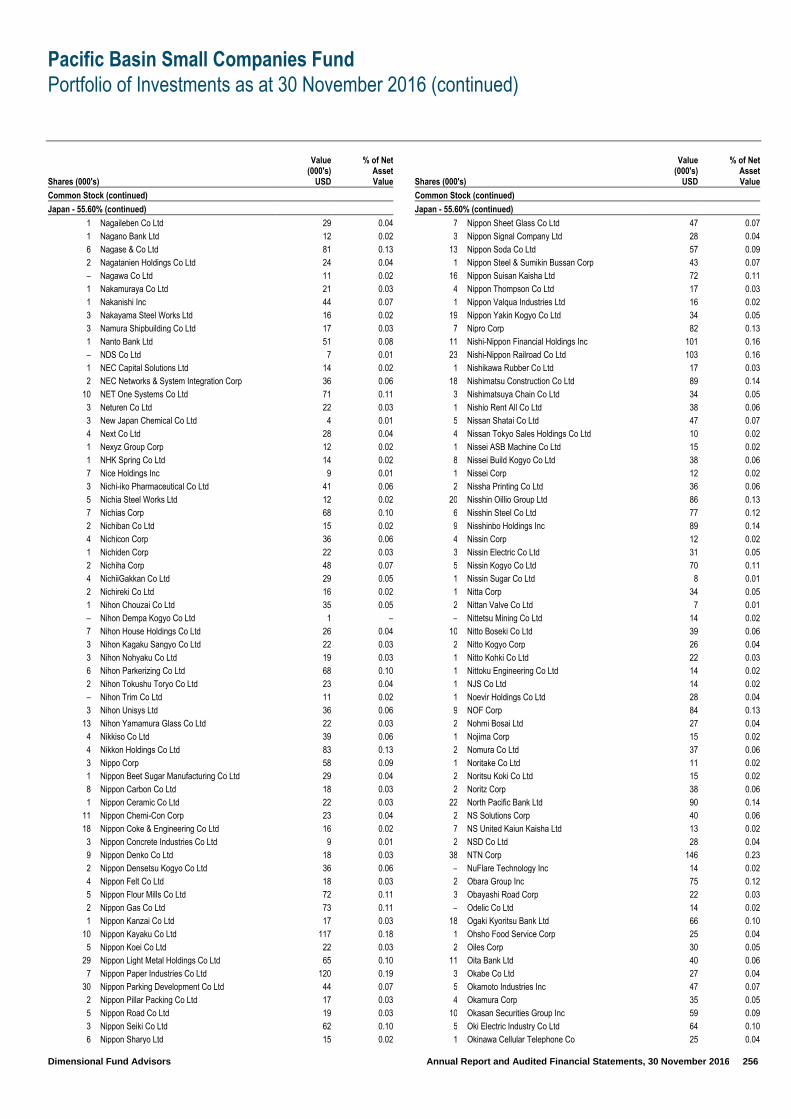
Pacific Basin Small Companies Fund
Portfolio of Investments as at 30 November 2016 (continued)
Dimensional Fund Advisors Annual Report and Audited Financial Statements, 30 November 2016 256
Shares (000's)
Value (000's)
USD
% of Net Asset Value
Common Stock (continued)
Japan - 55.60% (continued)
1 Nagaileben Co Ltd 29 0.04
1 Nagano Bank Ltd 12 0.02
6 Nagase & Co Ltd 81 0.13
2 Nagatanien Holdings Co Ltd 24 0.04
– Nagawa Co Ltd 11 0.02
1 Nakamuraya Co Ltd 21 0.03
1 Nakanishi Inc 44 0.07
3 Nakayama Steel Works Ltd 16 0.02
3 Namura Shipbuilding Co Ltd 17 0.03
1 Nanto Bank Ltd 51 0.08
– NDS Co Ltd 7 0.01
1 NEC Capital Solutions Ltd 14 0.02
2 NEC Networks & System Integration Corp 36 0.06
10 NET One Systems Co Ltd 71 0.11
3 Neturen Co Ltd 22 0.03
3 New Japan Chemical Co Ltd 4 0.01
4 Next Co Ltd 28 0.04
1 Nexyz Group Corp 12 0.02
1 NHK Spring Co Ltd 14 0.02
7 Nice Holdings Inc 9 0.01
3 Nichi-iko Pharmaceutical Co Ltd 41 0.06
5 Nichia Steel Works Ltd 12 0.02
7 Nichias Corp 68 0.10
2 Nichiban Co Ltd 15 0.02
4 Nichicon Corp 36 0.06
1 Nichiden Corp 22 0.03
2 Nichiha Corp 48 0.07
4 NichiiGakkan Co Ltd 29 0.05
2 Nichireki Co Ltd 16 0.02
1 Nihon Chouzai Co Ltd 35 0.05
– Nihon Dempa Kogyo Co Ltd 1 –
7 Nihon House Holdings Co Ltd 26 0.04
3 Nihon Kagaku Sangyo Co Ltd 22 0.03
3 Nihon Nohyaku Co Ltd 19 0.03
6 Nihon Parkerizing Co Ltd 68 0.10
2 Nihon Tokushu Toryo Co Ltd 23 0.04
– Nihon Trim Co Ltd 11 0.02
3 Nihon Unisys Ltd 36 0.06
13 Nihon Yamamura Glass Co Ltd 22 0.03
4 Nikkiso Co Ltd 39 0.06
4 Nikkon Holdings Co Ltd 83 0.13
3 Nippo Corp 58 0.09
1 Nippon Beet Sugar Manufacturing Co Ltd 29 0.04
8 Nippon Carbon Co Ltd 18 0.03
1 Nippon Ceramic Co Ltd 22 0.03
11 Nippon Chemi-Con Corp 23 0.04
18 Nippon Coke & Engineering Co Ltd 16 0.02
3 Nippon Concrete Industries Co Ltd 9 0.01
9 Nippon Denko Co Ltd 18 0.03
2 Nippon Densetsu Kogyo Co Ltd 36 0.06
4 Nippon Felt Co Ltd 18 0.03
5 Nippon Flour Mills Co Ltd 72 0.11
2 Nippon Gas Co Ltd 73 0.11
1 Nippon Kanzai Co Ltd 17 0.03
10 Nippon Kayaku Co Ltd 117 0.18
5 Nippon Koei Co Ltd 22 0.03
29 Nippon Light Metal Holdings Co Ltd 65 0.10
7 Nippon Paper Industries Co Ltd 120 0.19
30 Nippon Parking Development Co Ltd 44 0.07
2 Nippon Pillar Packing Co Ltd 17 0.03
5 Nippon Road Co Ltd 19 0.03
3 Nippon Seiki Co Ltd 62 0.10
6 Nippon Sharyo Ltd 15 0.02
Shares (000's)
Value (000's)
USD
% of Net Asset Value
Common Stock (continued)
Japan - 55.60% (continued)
7 Nippon Sheet Glass Co Ltd 47 0.07
3 Nippon Signal Company Ltd 28 0.04
13 Nippon Soda Co Ltd 57 0.09
1 Nippon Steel & Sumikin Bussan Corp 43 0.07
16 Nippon Suisan Kaisha Ltd 72 0.11
4 Nippon Thompson Co Ltd 17 0.03
1 Nippon Valqua Industries Ltd 16 0.02
19 Nippon Yakin Kogyo Co Ltd 34 0.05
7 Nipro Corp 82 0.13
11 Nishi-Nippon Financial Holdings Inc 101 0.16
23 Nishi-Nippon Railroad Co Ltd 103 0.16
1 Nishikawa Rubber Co Ltd 17 0.03
18 Nishimatsu Construction Co Ltd 89 0.14
3 Nishimatsuya Chain Co Ltd 34 0.05
1 Nishio Rent All Co Ltd 38 0.06
5 Nissan Shatai Co Ltd 47 0.07
4 Nissan Tokyo Sales Holdings Co Ltd 10 0.02
1 Nissei ASB Machine Co Ltd 15 0.02
8 Nissei Build Kogyo Co Ltd 38 0.06
1 Nissei Corp 12 0.02
2 Nissha Printing Co Ltd 36 0.06
20 Nisshin Oillio Group Ltd 86 0.13
6 Nisshin Steel Co Ltd 77 0.12
9 Nisshinbo Holdings Inc 89 0.14
4 Nissin Corp 12 0.02
3 Nissin Electric Co Ltd 31 0.05
5 Nissin Kogyo Co Ltd 70 0.11
1 Nissin Sugar Co Ltd 8 0.01
1 Nitta Corp 34 0.05
2 Nittan Valve Co Ltd 7 0.01
– Nittetsu Mining Co Ltd 14 0.02
10 Nitto Boseki Co Ltd 39 0.06
2 Nitto Kogyo Corp 26 0.04
1 Nitto Kohki Co Ltd 22 0.03
1 Nittoku Engineering Co Ltd 14 0.02
1 NJS Co Ltd 14 0.02
1 Noevir Holdings Co Ltd 28 0.04
9 NOF Corp 84 0.13
2 Nohmi Bosai Ltd 27 0.04
1 Nojima Corp 15 0.02
2 Nomura Co Ltd 37 0.06
1 Noritake Co Ltd 11 0.02
2 Noritsu Koki Co Ltd 15 0.02
2 Noritz Corp 38 0.06
22 North Pacific Bank Ltd 90 0.14
2 NS Solutions Corp 40 0.06
7 NS United Kaiun Kaisha Ltd 13 0.02
2 NSD Co Ltd 28 0.04
38 NTN Corp 146 0.23
– NuFlare Technology Inc 14 0.02
2 Obara Group Inc 75 0.12
3 Obayashi Road Corp 22 0.03
– Odelic Co Ltd 14 0.02
18 Ogaki Kyoritsu Bank Ltd 66 0.10
1 Ohsho Food Service Corp 25 0.04
2 Oiles Corp 30 0.05
11 Oita Bank Ltd 40 0.06
3 Okabe Co Ltd 27 0.04
5 Okamoto Industries Inc 47 0.07
4 Okamura Corp 35 0.05
10 Okasan Securities Group Inc 59 0.09
5 Oki Electric Industry Co Ltd 64 0.10
1 Okinawa Cellular Telephone Co 25 0.04

Pacific Basin Small Companies Fund
Portfolio of Investments as at 30 November 2016 (continued)
Dimensional Fund Advisors Annual Report and Audited Financial Statements, 30 November 2016 257
Shares (000's)
Value (000's)
USD
% of Net Asset Value
Common Stock (continued)
Japan - 55.60% (continued)
2 Okinawa Electric Power Co Inc 44 0.07
10 OKUMA Corp 89 0.14
10 Okumura Corp 59 0.09
5 Okura Industrial Co Ltd 22 0.03
2 Okuwa Co Ltd 21 0.03
2 Olympic Group Corp 12 0.02
1 Onoken Co Ltd 11 0.02
12 Onward Holdings Co Ltd 79 0.12
2 Open House Co Ltd 60 0.09
1 Optex Co Ltd 25 0.04
6 Osaka Soda Co Ltd 25 0.04
1 Osaka Steel Co Ltd 15 0.02
1 OSAKA Titanium Technologies Co Ltd 17 0.03
2 Osaki Electric Co Ltd 20 0.03
6 OSG Corp 112 0.17
11 OSJB Holdings Corp 22 0.03
1 Otsuka Kagu Ltd 10 0.02
1 Outsourcing Inc 32 0.05
2 Oyo Corp 20 0.03
2 Pacific Industrial Co Ltd 28 0.04
11 Pacific Metals Co Ltd 37 0.06
1 Pack Corp 18 0.03
1 PAL GROUP Holdings Co Ltd 16 0.02
2 Paltac Corp 48 0.07
5 PanaHome Corp 36 0.06
1 Paramount Bed Holdings Co Ltd 41 0.06
3 Parco Co Ltd 24 0.04
3 Paris Miki Holdings Inc 14 0.02
3 Pasona Group Inc 20 0.03
2 PC Depot Corp 8 0.01
21 Penta-Ocean Construction Co Ltd 105 0.16
1 PIA Corp 16 0.02
2 Pilot Corp 80 0.12
1 Piolax Inc 42 0.07
23 Pioneer Corp 49 0.08
1 Plenus Co Ltd 25 0.04
1 Poletowin Pitcrew Holdings Inc 10 0.02
7 Press Kogyo Co Ltd 31 0.05
2 Pressance Corp 30 0.05
3 Prestige International Inc 23 0.04
11 Prima Meat Packers Ltd 39 0.06
1 Pronexus Inc 13 0.02
1 Qol Co Ltd 14 0.02
3 Raito Kogyo Co Ltd 39 0.06
9 Rasa Industries Ltd 10 0.02
2 Relia Inc 17 0.03
– Relo Group Inc 28 0.04
13 Rengo Co Ltd 77 0.12
– Retail Partners Co Ltd 1 –
9 Rhythm Watch Co Ltd 15 0.02
1 Ricoh Leasing Co Ltd 28 0.04
2 Right On Co Ltd 15 0.02
1 Riken Corp 26 0.04
1 Riken Keiki Co Ltd 16 0.02
1 Riken Technos Corp 6 0.01
1 Riken Vitamin Co Ltd 27 0.04
1 Ringer Hut Co Ltd 20 0.03
3 Riso Kagaku Corp 56 0.09
2 Riso Kyoiku Co Ltd 12 0.02
1 Rock Field Co Ltd 15 0.02
6 Rohto Pharmaceutical Co Ltd 90 0.14
2 Rokko Butter Co Ltd 33 0.05
1 Roland DG Corp 15 0.02
Shares (000's)
Value (000's)
USD
% of Net Asset Value
Common Stock (continued)
Japan - 55.60% (continued)
– Rorze Corp 6 0.01
5 Round One Corp 32 0.05
1 Royal Holdings Co Ltd 24 0.04
10 Ryobi Ltd 41 0.06
5 Ryoden Corp 33 0.05
2 Ryosan Co Ltd 61 0.09
1 Ryoyo Electro Corp 13 0.02
1 S Foods Inc 26 0.04
– S&B Foods Inc 4 0.01
2 Sac's Bar Holdings Inc 21 0.03
22 Saibu Gas Co Ltd 48 0.07
3 Saizeriya Co Ltd 78 0.12
4 Sakai Chemical Industry Co Ltd 13 0.02
5 Sakai Heavy Industries Ltd 12 0.02
1 Sakai Moving Service Co Ltd 23 0.04
3 Sakata INX Corp 37 0.06
2 Sakata Seed Corp 47 0.07
2 Sakura Internet Inc 19 0.03
2 SAMTY Co Ltd 16 0.02
1 San Holdings Inc 15 0.02
1 San-A Co Ltd 53 0.08
4 San-Ai Oil Co Ltd 28 0.04
9 San-In Godo Bank Ltd 70 0.11
9 Sanden Holdings Corp 29 0.04
3 Sangetsu Corp 53 0.08
8 Sanken Electric Co Ltd 34 0.05
3 Sanki Engineering Co Ltd 22 0.03
4 Sankyo Seiko Co Ltd 12 0.02
2 Sankyo Tateyama Inc 23 0.04
19 Sankyu Inc 112 0.17
2 Sanoh Industrial Co Ltd 10 0.02
4 Sanrio Co Ltd 64 0.10
2 Sanshin Electronics Co Ltd 16 0.02
8 Sanwa Holdings Corp 77 0.12
1 Sanyo Chemical Industries Ltd 26 0.04
3 Sanyo Denki Co Ltd 19 0.03
6 Sanyo Electric Railway Co Ltd 31 0.05
10 Sanyo Shokai Ltd 14 0.02
7 Sanyo Special Steel Co Ltd 35 0.05
4 Sapporo Holdings Ltd 103 0.16
2 Sato Holdings Corp 34 0.05
1 Sato Restaurant Systems Co Ltd 9 0.01
3 Sawada Holdings Co Ltd 21 0.03
3 SBS Holdings Inc 27 0.04
1 Secom Joshinetsu Co Ltd 26 0.04
1 Seibu Electric Industry Co Ltd 18 0.03
8 Seika Corp 23 0.04
3 Seikagaku Corp 37 0.06
2 Seikitokyu Kogyo Co Ltd 11 0.02
9 Seiko Holdings Corp 32 0.05
5 Seino Holdings Co Ltd 57 0.09
4 Seiren Co Ltd 47 0.07
2 Sekisui Jushi Corp 35 0.05
1 Sekisui Plastics Co Ltd 7 0.01
5 Senko Co Ltd 36 0.06
– Senshu Electric Co Ltd 6 0.01
17 Senshu Ikeda Holdings Inc 76 0.12
2 Senshukai Co Ltd 11 0.02
6 Septeni Holdings Co Ltd 18 0.03
6 Shibusawa Warehouse Co Ltd 18 0.03
1 Shibuya Corp 22 0.03
3 Shidax Corp 10 0.02
16 Shiga Bank Ltd 84 0.13
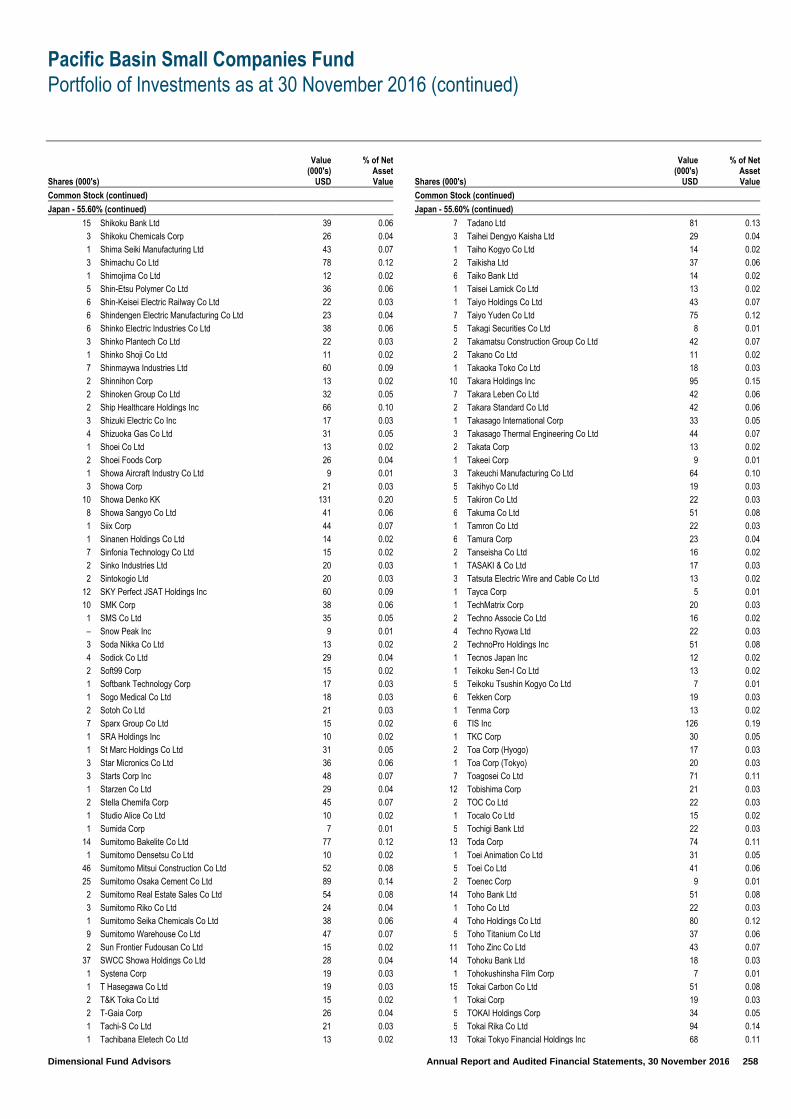
Pacific Basin Small Companies Fund
Portfolio of Investments as at 30 November 2016 (continued)
Dimensional Fund Advisors Annual Report and Audited Financial Statements, 30 November 2016 258
Shares (000's)
Value (000's)
USD
% of Net Asset Value
Common Stock (continued)
Japan - 55.60% (continued)
15 Shikoku Bank Ltd 39 0.06
3 Shikoku Chemicals Corp 26 0.04
1 Shima Seiki Manufacturing Ltd 43 0.07
3 Shimachu Co Ltd 78 0.12
1 Shimojima Co Ltd 12 0.02
5 Shin-Etsu Polymer Co Ltd 36 0.06
6 Shin-Keisei Electric Railway Co Ltd 22 0.03
6 Shindengen Electric Manufacturing Co Ltd 23 0.04
6 Shinko Electric Industries Co Ltd 38 0.06
3 Shinko Plantech Co Ltd 22 0.03
1 Shinko Shoji Co Ltd 11 0.02
7 Shinmaywa Industries Ltd 60 0.09
2 Shinnihon Corp 13 0.02
2 Shinoken Group Co Ltd 32 0.05
2 Ship Healthcare Holdings Inc 66 0.10
3 Shizuki Electric Co Inc 17 0.03
4 Shizuoka Gas Co Ltd 31 0.05
1 Shoei Co Ltd 13 0.02
2 Shoei Foods Corp 26 0.04
1 Showa Aircraft Industry Co Ltd 9 0.01
3 Showa Corp 21 0.03
10 Showa Denko KK 131 0.20
8 Showa Sangyo Co Ltd 41 0.06
1 Siix Corp 44 0.07
1 Sinanen Holdings Co Ltd 14 0.02
7 Sinfonia Technology Co Ltd 15 0.02
2 Sinko Industries Ltd 20 0.03
2 Sintokogio Ltd 20 0.03
12 SKY Perfect JSAT Holdings Inc 60 0.09
10 SMK Corp 38 0.06
1 SMS Co Ltd 35 0.05
– Snow Peak Inc 9 0.01
3 Soda Nikka Co Ltd 13 0.02
4 Sodick Co Ltd 29 0.04
2 Soft99 Corp 15 0.02
1 Softbank Technology Corp 17 0.03
1 Sogo Medical Co Ltd 18 0.03
2 Sotoh Co Ltd 21 0.03
7 Sparx Group Co Ltd 15 0.02
1 SRA Holdings Inc 10 0.02
1 St Marc Holdings Co Ltd 31 0.05
3 Star Micronics Co Ltd 36 0.06
3 Starts Corp Inc 48 0.07
1 Starzen Co Ltd 29 0.04
2 Stella Chemifa Corp 45 0.07
1 Studio Alice Co Ltd 10 0.02
1 Sumida Corp 7 0.01
14 Sumitomo Bakelite Co Ltd 77 0.12
1 Sumitomo Densetsu Co Ltd 10 0.02
46 Sumitomo Mitsui Construction Co Ltd 52 0.08
25 Sumitomo Osaka Cement Co Ltd 89 0.14
2 Sumitomo Real Estate Sales Co Ltd 54 0.08
3 Sumitomo Riko Co Ltd 24 0.04
1 Sumitomo Seika Chemicals Co Ltd 38 0.06
9 Sumitomo Warehouse Co Ltd 47 0.07
2 Sun Frontier Fudousan Co Ltd 15 0.02
37 SWCC Showa Holdings Co Ltd 28 0.04
1 Systena Corp 19 0.03
1 T Hasegawa Co Ltd 19 0.03
2 T&K Toka Co Ltd 15 0.02
2 T-Gaia Corp 26 0.04
1 Tachi-S Co Ltd 21 0.03
1 Tachibana Eletech Co Ltd 13 0.02
Shares (000's)
Value (000's)
USD
% of Net Asset Value
Common Stock (continued)
Japan - 55.60% (continued)
7 Tadano Ltd 81 0.13
3 Taihei Dengyo Kaisha Ltd 29 0.04
1 Taiho Kogyo Co Ltd 14 0.02
2 Taikisha Ltd 37 0.06
6 Taiko Bank Ltd 14 0.02
1 Taisei Lamick Co Ltd 13 0.02
1 Taiyo Holdings Co Ltd 43 0.07
7 Taiyo Yuden Co Ltd 75 0.12
5 Takagi Securities Co Ltd 8 0.01
2 Takamatsu Construction Group Co Ltd 42 0.07
2 Takano Co Ltd 11 0.02
1 Takaoka Toko Co Ltd 18 0.03
10 Takara Holdings Inc 95 0.15
7 Takara Leben Co Ltd 42 0.06
2 Takara Standard Co Ltd 42 0.06
1 Takasago International Corp 33 0.05
3 Takasago Thermal Engineering Co Ltd 44 0.07
2 Takata Corp 13 0.02
1 Takeei Corp 9 0.01
3 Takeuchi Manufacturing Co Ltd 64 0.10
5 Takihyo Co Ltd 19 0.03
5 Takiron Co Ltd 22 0.03
6 Takuma Co Ltd 51 0.08
1 Tamron Co Ltd 22 0.03
6 Tamura Corp 23 0.04
2 Tanseisha Co Ltd 16 0.02
1 TASAKI & Co Ltd 17 0.03
3 Tatsuta Electric Wire and Cable Co Ltd 13 0.02
1 Tayca Corp 5 0.01
1 TechMatrix Corp 20 0.03
2 Techno Associe Co Ltd 16 0.02
4 Techno Ryowa Ltd 22 0.03
2 TechnoPro Holdings Inc 51 0.08
1 Tecnos Japan Inc 12 0.02
1 Teikoku Sen-I Co Ltd 13 0.02
5 Teikoku Tsushin Kogyo Co Ltd 7 0.01
6 Tekken Corp 19 0.03
1 Tenma Corp 13 0.02
6 TIS Inc 126 0.19
1 TKC Corp 30 0.05
2 Toa Corp (Hyogo) 17 0.03
1 Toa Corp (Tokyo) 20 0.03
7 Toagosei Co Ltd 71 0.11
12 Tobishima Corp 21 0.03
2 TOC Co Ltd 22 0.03
1 Tocalo Co Ltd 15 0.02
5 Tochigi Bank Ltd 22 0.03
13 Toda Corp 74 0.11
1 Toei Animation Co Ltd 31 0.05
5 Toei Co Ltd 41 0.06
2 Toenec Corp 9 0.01
14 Toho Bank Ltd 51 0.08
1 Toho Co Ltd 22 0.03
4 Toho Holdings Co Ltd 80 0.12
5 Toho Titanium Co Ltd 37 0.06
11 Toho Zinc Co Ltd 43 0.07
14 Tohoku Bank Ltd 18 0.03
1 Tohokushinsha Film Corp 7 0.01
15 Tokai Carbon Co Ltd 51 0.08
1 Tokai Corp 19 0.03
5 TOKAI Holdings Corp 34 0.05
5 Tokai Rika Co Ltd 94 0.14
13 Tokai Tokyo Financial Holdings Inc 68 0.11
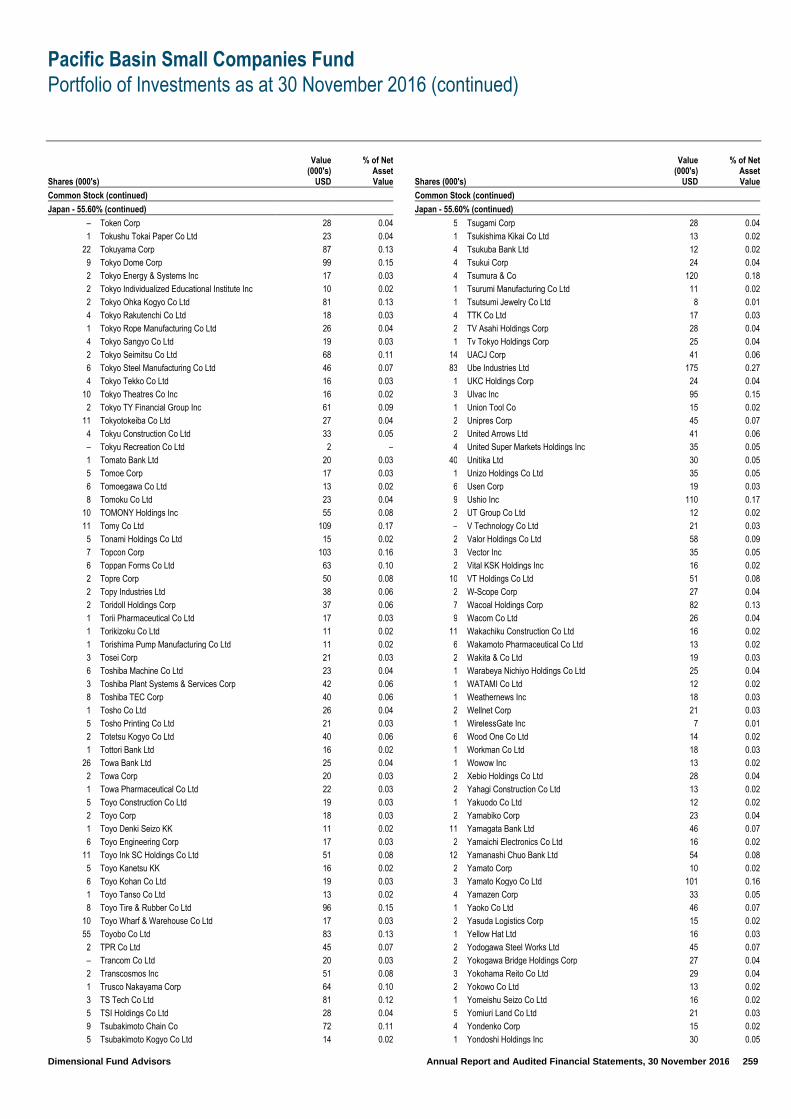
Pacific Basin Small Companies Fund
Portfolio of Investments as at 30 November 2016 (continued)
Dimensional Fund Advisors Annual Report and Audited Financial Statements, 30 November 2016 259
Shares (000's)
Value (000's)
USD
% of Net Asset Value
Common Stock (continued)
Japan - 55.60% (continued)
– Token Corp 28 0.04
1 Tokushu Tokai Paper Co Ltd 23 0.04
22 Tokuyama Corp 87 0.13
9 Tokyo Dome Corp 99 0.15
2 Tokyo Energy & Systems Inc 17 0.03
2 Tokyo Individualized Educational Institute Inc 10 0.02
2 Tokyo Ohka Kogyo Co Ltd 81 0.13
4 Tokyo Rakutenchi Co Ltd 18 0.03
1 Tokyo Rope Manufacturing Co Ltd 26 0.04
4 Tokyo Sangyo Co Ltd 19 0.03
2 Tokyo Seimitsu Co Ltd 68 0.11
6 Tokyo Steel Manufacturing Co Ltd 46 0.07
4 Tokyo Tekko Co Ltd 16 0.03
10 Tokyo Theatres Co Inc 16 0.02
2 Tokyo TY Financial Group Inc 61 0.09
11 Tokyotokeiba Co Ltd 27 0.04
4 Tokyu Construction Co Ltd 33 0.05
– Tokyu Recreation Co Ltd 2 –
1 Tomato Bank Ltd 20 0.03
5 Tomoe Corp 17 0.03
6 Tomoegawa Co Ltd 13 0.02
8 Tomoku Co Ltd 23 0.04
10 TOMONY Holdings Inc 55 0.08
11 Tomy Co Ltd 109 0.17
5 Tonami Holdings Co Ltd 15 0.02
7 Topcon Corp 103 0.16
6 Toppan Forms Co Ltd 63 0.10
2 Topre Corp 50 0.08
2 Topy Industries Ltd 38 0.06
2 Toridoll Holdings Corp 37 0.06
1 Torii Pharmaceutical Co Ltd 17 0.03
1 Torikizoku Co Ltd 11 0.02
1 Torishima Pump Manufacturing Co Ltd 11 0.02
3 Tosei Corp 21 0.03
6 Toshiba Machine Co Ltd 23 0.04
3 Toshiba Plant Systems & Services Corp 42 0.06
8 Toshiba TEC Corp 40 0.06
1 Tosho Co Ltd 26 0.04
5 Tosho Printing Co Ltd 21 0.03
2 Totetsu Kogyo Co Ltd 40 0.06
1 Tottori Bank Ltd 16 0.02
26 Towa Bank Ltd 25 0.04
2 Towa Corp 20 0.03
1 Towa Pharmaceutical Co Ltd 22 0.03
5 Toyo Construction Co Ltd 19 0.03
2 Toyo Corp 18 0.03
1 Toyo Denki Seizo KK 11 0.02
6 Toyo Engineering Corp 17 0.03
11 Toyo Ink SC Holdings Co Ltd 51 0.08
5 Toyo Kanetsu KK 16 0.02
6 Toyo Kohan Co Ltd 19 0.03
1 Toyo Tanso Co Ltd 13 0.02
8 Toyo Tire & Rubber Co Ltd 96 0.15
10 Toyo Wharf & Warehouse Co Ltd 17 0.03
55 Toyobo Co Ltd 83 0.13
2 TPR Co Ltd 45 0.07
– Trancom Co Ltd 20 0.03
2 Transcosmos Inc 51 0.08
1 Trusco Nakayama Corp 64 0.10
3 TS Tech Co Ltd 81 0.12
5 TSI Holdings Co Ltd 28 0.04
9 Tsubakimoto Chain Co 72 0.11
5 Tsubakimoto Kogyo Co Ltd 14 0.02
Shares (000's)
Value (000's)
USD
% of Net Asset Value
Common Stock (continued)
Japan - 55.60% (continued)
5 Tsugami Corp 28 0.04
1 Tsukishima Kikai Co Ltd 13 0.02
4 Tsukuba Bank Ltd 12 0.02
4 Tsukui Corp 24 0.04
4 Tsumura & Co 120 0.18
1 Tsurumi Manufacturing Co Ltd 11 0.02
1 Tsutsumi Jewelry Co Ltd 8 0.01
4 TTK Co Ltd 17 0.03
2 TV Asahi Holdings Corp 28 0.04
1 Tv Tokyo Holdings Corp 25 0.04
14 UACJ Corp 41 0.06
83 Ube Industries Ltd 175 0.27
1 UKC Holdings Corp 24 0.04
3 Ulvac Inc 95 0.15
1 Union Tool Co 15 0.02
2 Unipres Corp 45 0.07
2 United Arrows Ltd 41 0.06
4 United Super Markets Holdings Inc 35 0.05
40 Unitika Ltd 30 0.05
1 Unizo Holdings Co Ltd 35 0.05
6 Usen Corp 19 0.03
9 Ushio Inc 110 0.17
2 UT Group Co Ltd 12 0.02
– V Technology Co Ltd 21 0.03
2 Valor Holdings Co Ltd 58 0.09
3 Vector Inc 35 0.05
2 Vital KSK Holdings Inc 16 0.02
10 VT Holdings Co Ltd 51 0.08
2 W-Scope Corp 27 0.04
7 Wacoal Holdings Corp 82 0.13
9 Wacom Co Ltd 26 0.04
11 Wakachiku Construction Co Ltd 16 0.02
6 Wakamoto Pharmaceutical Co Ltd 13 0.02
2 Wakita & Co Ltd 19 0.03
1 Warabeya Nichiyo Holdings Co Ltd 25 0.04
1 WATAMI Co Ltd 12 0.02
1 Weathernews Inc 18 0.03
2 Wellnet Corp 21 0.03
1 WirelessGate Inc 7 0.01
6 Wood One Co Ltd 14 0.02
1 Workman Co Ltd 18 0.03
1 Wowow Inc 13 0.02
2 Xebio Holdings Co Ltd 28 0.04
2 Yahagi Construction Co Ltd 13 0.02
1 Yakuodo Co Ltd 12 0.02
2 Yamabiko Corp 23 0.04
11 Yamagata Bank Ltd 46 0.07
2 Yamaichi Electronics Co Ltd 16 0.02
12 Yamanashi Chuo Bank Ltd 54 0.08
2 Yamato Corp 10 0.02
3 Yamato Kogyo Co Ltd 101 0.16
4 Yamazen Corp 33 0.05
1 Yaoko Co Ltd 46 0.07
2 Yasuda Logistics Corp 15 0.02
1 Yellow Hat Ltd 16 0.03
2 Yodogawa Steel Works Ltd 45 0.07
2 Yokogawa Bridge Holdings Corp 27 0.04
3 Yokohama Reito Co Ltd 29 0.04
2 Yokowo Co Ltd 13 0.02
1 Yomeishu Seizo Co Ltd 16 0.02
5 Yomiuri Land Co Ltd 21 0.03
4 Yondenko Corp 15 0.02
1 Yondoshi Holdings Inc 30 0.05
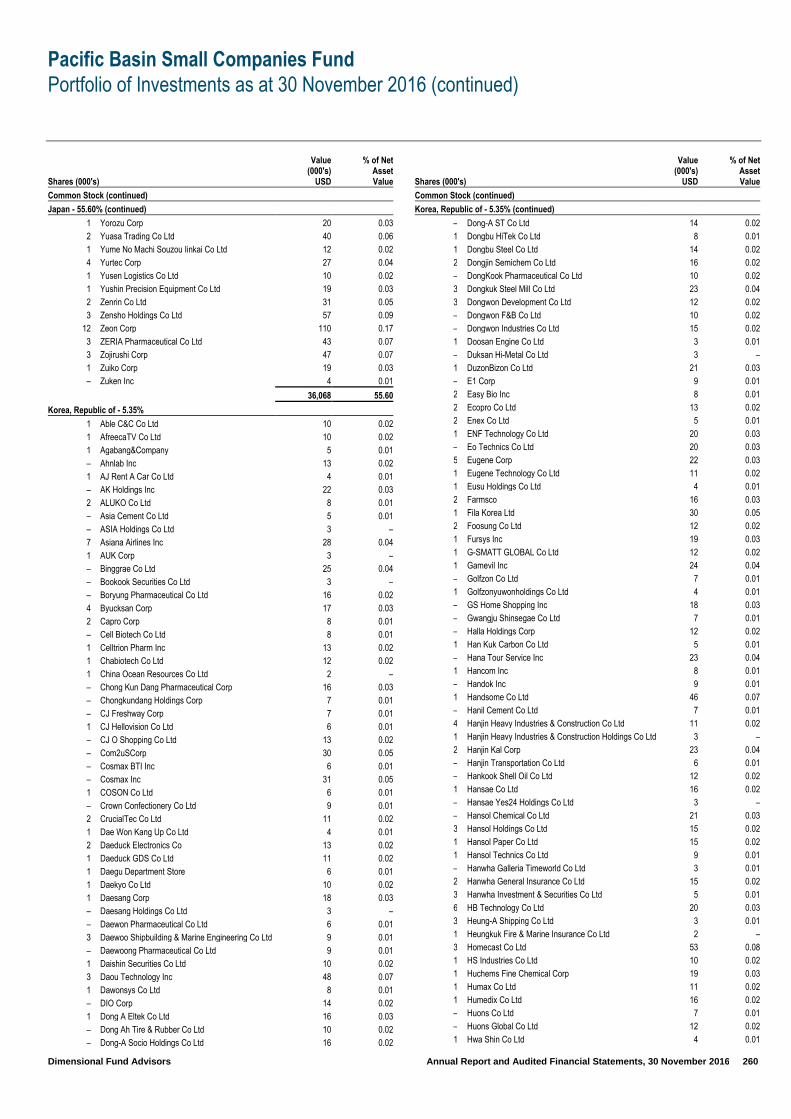
Pacific Basin Small Companies Fund
Portfolio of Investments as at 30 November 2016 (continued)
Dimensional Fund Advisors Annual Report and Audited Financial Statements, 30 November 2016 260
Shares (000's)
Value (000's)
USD
% of Net Asset Value
Common Stock (continued)
Japan - 55.60% (continued)
1 Yorozu Corp 20 0.03
2 Yuasa Trading Co Ltd 40 0.06
1 Yume No Machi Souzou Iinkai Co Ltd 12 0.02
4 Yurtec Corp 27 0.04
1 Yusen Logistics Co Ltd 10 0.02
1 Yushin Precision Equipment Co Ltd 19 0.03
2 Zenrin Co Ltd 31 0.05
3 Zensho Holdings Co Ltd 57 0.09
12 Zeon Corp 110 0.17
3 ZERIA Pharmaceutical Co Ltd 43 0.07
3 Zojirushi Corp 47 0.07
1 Zuiko Corp 19 0.03
– Zuken Inc 4 0.01
36,068 55.60
Korea, Republic of - 5.35%
1 Able C&C Co Ltd 10 0.02
1 AfreecaTV Co Ltd 10 0.02
1 Agabang&Company 5 0.01
– Ahnlab Inc 13 0.02
1 AJ Rent A Car Co Ltd 4 0.01
– AK Holdings Inc 22 0.03
2 ALUKO Co Ltd 8 0.01
– Asia Cement Co Ltd 5 0.01
– ASIA Holdings Co Ltd 3 –
7 Asiana Airlines Inc 28 0.04
1 AUK Corp 3 –
– Binggrae Co Ltd 25 0.04
– Bookook Securities Co Ltd 3 –
– Boryung Pharmaceutical Co Ltd 16 0.02
4 Byucksan Corp 17 0.03
2 Capro Corp 8 0.01
– Cell Biotech Co Ltd 8 0.01
1 Celltrion Pharm Inc 13 0.02
1 Chabiotech Co Ltd 12 0.02
1 China Ocean Resources Co Ltd 2 –
– Chong Kun Dang Pharmaceutical Corp 16 0.03
– Chongkundang Holdings Corp 7 0.01
– CJ Freshway Corp 7 0.01
1 CJ Hellovision Co Ltd 6 0.01
– CJ O Shopping Co Ltd 13 0.02
– Com2uSCorp 30 0.05
– Cosmax BTI Inc 6 0.01
– Cosmax Inc 31 0.05
1 COSON Co Ltd 6 0.01
– Crown Confectionery Co Ltd 9 0.01
2 CrucialTec Co Ltd 11 0.02
1 Dae Won Kang Up Co Ltd 4 0.01
2 Daeduck Electronics Co 13 0.02
1 Daeduck GDS Co Ltd 11 0.02
1 Daegu Department Store 6 0.01
1 Daekyo Co Ltd 10 0.02
1 Daesang Corp 18 0.03
– Daesang Holdings Co Ltd 3 –
– Daewon Pharmaceutical Co Ltd 6 0.01
3 Daewoo Shipbuilding & Marine Engineering Co Ltd 9 0.01
– Daewoong Pharmaceutical Co Ltd 9 0.01
1 Daishin Securities Co Ltd 10 0.02
3 Daou Technology Inc 48 0.07
1 Dawonsys Co Ltd 8 0.01
– DIO Corp 14 0.02
1 Dong A Eltek Co Ltd 16 0.03
– Dong Ah Tire & Rubber Co Ltd 10 0.02
– Dong-A Socio Holdings Co Ltd 16 0.02
Shares (000's)
Value (000's)
USD
% of Net Asset Value
Common Stock (continued)
Korea, Republic of - 5.35% (continued)
– Dong-A ST Co Ltd 14 0.02
1 Dongbu HiTek Co Ltd 8 0.01
1 Dongbu Steel Co Ltd 14 0.02
2 Dongjin Semichem Co Ltd 16 0.02
– DongKook Pharmaceutical Co Ltd 10 0.02
3 Dongkuk Steel Mill Co Ltd 23 0.04
3 Dongwon Development Co Ltd 12 0.02
– Dongwon F&B Co Ltd 10 0.02
– Dongwon Industries Co Ltd 15 0.02
1 Doosan Engine Co Ltd 3 0.01
– Duksan Hi-Metal Co Ltd 3 –
1 DuzonBizon Co Ltd 21 0.03
– E1 Corp 9 0.01
2 Easy Bio Inc 8 0.01
2 Ecopro Co Ltd 13 0.02
2 Enex Co Ltd 5 0.01
1 ENF Technology Co Ltd 20 0.03
– Eo Technics Co Ltd 20 0.03
5 Eugene Corp 22 0.03
1 Eugene Technology Co Ltd 11 0.02
1 Eusu Holdings Co Ltd 4 0.01
2 Farmsco 16 0.03
1 Fila Korea Ltd 30 0.05
2 Foosung Co Ltd 12 0.02
1 Fursys Inc 19 0.03
1 G-SMATT GLOBAL Co Ltd 12 0.02
1 Gamevil Inc 24 0.04
– Golfzon Co Ltd 7 0.01
1 Golfzonyuwonholdings Co Ltd 4 0.01
– GS Home Shopping Inc 18 0.03
– Gwangju Shinsegae Co Ltd 7 0.01
– Halla Holdings Corp 12 0.02
1 Han Kuk Carbon Co Ltd 5 0.01
– Hana Tour Service Inc 23 0.04
1 Hancom Inc 8 0.01
– Handok Inc 9 0.01
1 Handsome Co Ltd 46 0.07
– Hanil Cement Co Ltd 7 0.01
4 Hanjin Heavy Industries & Construction Co Ltd 11 0.02
1 Hanjin Heavy Industries & Construction Holdings Co Ltd 3 –
2 Hanjin Kal Corp 23 0.04
– Hanjin Transportation Co Ltd 6 0.01
– Hankook Shell Oil Co Ltd 12 0.02
1 Hansae Co Ltd 16 0.02
– Hansae Yes24 Holdings Co Ltd 3 –
– Hansol Chemical Co Ltd 21 0.03
3 Hansol Holdings Co Ltd 15 0.02
1 Hansol Paper Co Ltd 15 0.02
1 Hansol Technics Co Ltd 9 0.01
– Hanwha Galleria Timeworld Co Ltd 3 0.01
2 Hanwha General Insurance Co Ltd 15 0.02
3 Hanwha Investment & Securities Co Ltd 5 0.01
6 HB Technology Co Ltd 20 0.03
3 Heung-A Shipping Co Ltd 3 0.01
1 Heungkuk Fire & Marine Insurance Co Ltd 2 –
3 Homecast Co Ltd 53 0.08
1 HS Industries Co Ltd 10 0.02
1 Huchems Fine Chemical Corp 19 0.03
1 Humax Co Ltd 11 0.02
1 Humedix Co Ltd 16 0.02
– Huons Co Ltd 7 0.01
– Huons Global Co Ltd 12 0.02
1 Hwa Shin Co Ltd 4 0.01
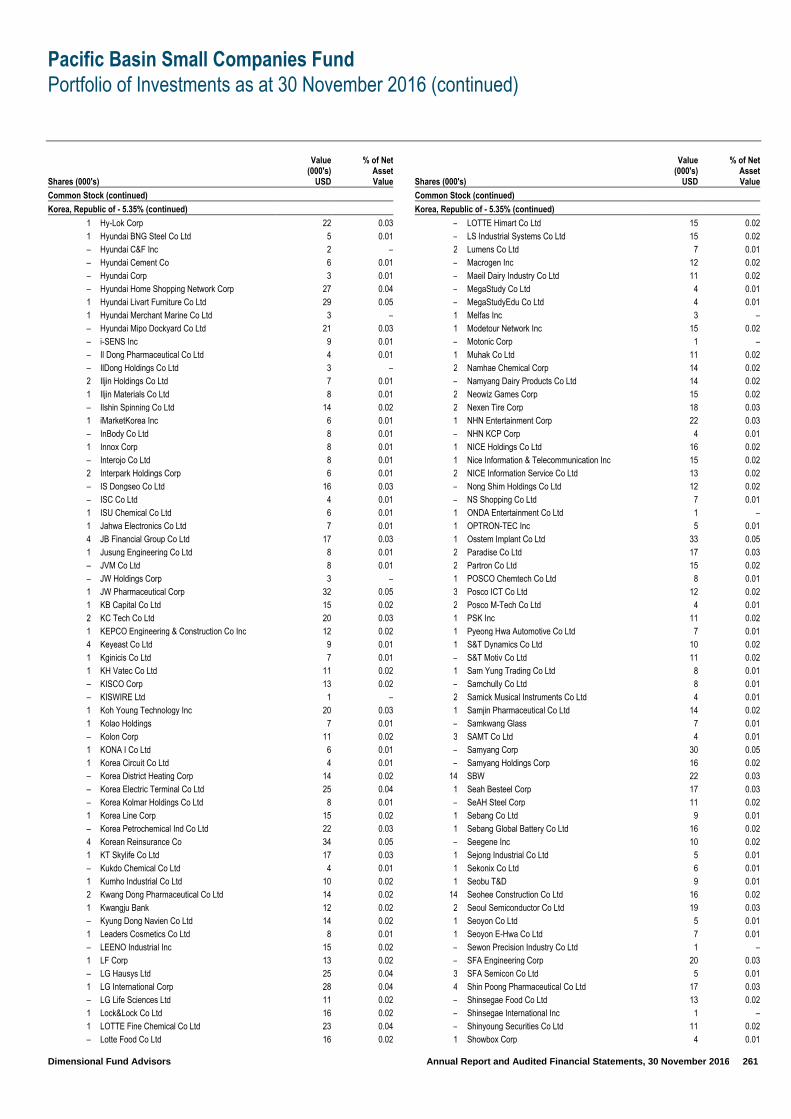
Pacific Basin Small Companies Fund
Portfolio of Investments as at 30 November 2016 (continued)
Dimensional Fund Advisors Annual Report and Audited Financial Statements, 30 November 2016 261
Shares (000's)
Value (000's)
USD
% of Net Asset Value
Common Stock (continued)
Korea, Republic of - 5.35% (continued)
1 Hy-Lok Corp 22 0.03
1 Hyundai BNG Steel Co Ltd 5 0.01
– Hyundai C&F Inc 2 –
– Hyundai Cement Co 6 0.01
– Hyundai Corp 3 0.01
– Hyundai Home Shopping Network Corp 27 0.04
1 Hyundai Livart Furniture Co Ltd 29 0.05
1 Hyundai Merchant Marine Co Ltd 3 –
– Hyundai Mipo Dockyard Co Ltd 21 0.03
– i-SENS Inc 9 0.01
– Il Dong Pharmaceutical Co Ltd 4 0.01
– IlDong Holdings Co Ltd 3 –
2 Iljin Holdings Co Ltd 7 0.01
1 Iljin Materials Co Ltd 8 0.01
– Ilshin Spinning Co Ltd 14 0.02
1 iMarketKorea Inc 6 0.01
– InBody Co Ltd 8 0.01
1 Innox Corp 8 0.01
– Interojo Co Ltd 8 0.01
2 Interpark Holdings Corp 6 0.01
– IS Dongseo Co Ltd 16 0.03
– ISC Co Ltd 4 0.01
1 ISU Chemical Co Ltd 6 0.01
1 Jahwa Electronics Co Ltd 7 0.01
4 JB Financial Group Co Ltd 17 0.03
1 Jusung Engineering Co Ltd 8 0.01
– JVM Co Ltd 8 0.01
– JW Holdings Corp 3 –
1 JW Pharmaceutical Corp 32 0.05
1 KB Capital Co Ltd 15 0.02
2 KC Tech Co Ltd 20 0.03
1 KEPCO Engineering & Construction Co Inc 12 0.02
4 Keyeast Co Ltd 9 0.01
1 Kginicis Co Ltd 7 0.01
1 KH Vatec Co Ltd 11 0.02
– KISCO Corp 13 0.02
– KISWIRE Ltd 1 –
1 Koh Young Technology Inc 20 0.03
1 Kolao Holdings 7 0.01
– Kolon Corp 11 0.02
1 KONA I Co Ltd 6 0.01
1 Korea Circuit Co Ltd 4 0.01
– Korea District Heating Corp 14 0.02
– Korea Electric Terminal Co Ltd 25 0.04
– Korea Kolmar Holdings Co Ltd 8 0.01
1 Korea Line Corp 15 0.02
– Korea Petrochemical Ind Co Ltd 22 0.03
4 Korean Reinsurance Co 34 0.05
1 KT Skylife Co Ltd 17 0.03
– Kukdo Chemical Co Ltd 4 0.01
1 Kumho Industrial Co Ltd 10 0.02
2 Kwang Dong Pharmaceutical Co Ltd 14 0.02
1 Kwangju Bank 12 0.02
– Kyung Dong Navien Co Ltd 14 0.02
1 Leaders Cosmetics Co Ltd 8 0.01
– LEENO Industrial Inc 15 0.02
1 LF Corp 13 0.02
– LG Hausys Ltd 25 0.04
1 LG International Corp 28 0.04
– LG Life Sciences Ltd 11 0.02
1 Lock&Lock Co Ltd 16 0.02
1 LOTTE Fine Chemical Co Ltd 23 0.04
– Lotte Food Co Ltd 16 0.02
Shares (000's)
Value (000's)
USD
% of Net Asset Value
Common Stock (continued)
Korea, Republic of - 5.35% (continued)
– LOTTE Himart Co Ltd 15 0.02
– LS Industrial Systems Co Ltd 15 0.02
2 Lumens Co Ltd 7 0.01
– Macrogen Inc 12 0.02
– Maeil Dairy Industry Co Ltd 11 0.02
– MegaStudy Co Ltd 4 0.01
– MegaStudyEdu Co Ltd 4 0.01
1 Melfas Inc 3 –
1 Modetour Network Inc 15 0.02
– Motonic Corp 1 –
1 Muhak Co Ltd 11 0.02
2 Namhae Chemical Corp 14 0.02
– Namyang Dairy Products Co Ltd 14 0.02
2 Neowiz Games Corp 15 0.02
2 Nexen Tire Corp 18 0.03
1 NHN Entertainment Corp 22 0.03
– NHN KCP Corp 4 0.01
1 NICE Holdings Co Ltd 16 0.02
1 Nice Information & Telecommunication Inc 15 0.02
2 NICE Information Service Co Ltd 13 0.02
– Nong Shim Holdings Co Ltd 12 0.02
– NS Shopping Co Ltd 7 0.01
1 ONDA Entertainment Co Ltd 1 –
1 OPTRON-TEC Inc 5 0.01
1 Osstem Implant Co Ltd 33 0.05
2 Paradise Co Ltd 17 0.03
2 Partron Co Ltd 15 0.02
1 POSCO Chemtech Co Ltd 8 0.01
3 Posco ICT Co Ltd 12 0.02
2 Posco M-Tech Co Ltd 4 0.01
1 PSK Inc 11 0.02
1 Pyeong Hwa Automotive Co Ltd 7 0.01
1 S&T Dynamics Co Ltd 10 0.02
– S&T Motiv Co Ltd 11 0.02
1 Sam Yung Trading Co Ltd 8 0.01
– Samchully Co Ltd 8 0.01
2 Samick Musical Instruments Co Ltd 4 0.01
1 Samjin Pharmaceutical Co Ltd 14 0.02
– Samkwang Glass 7 0.01
3 SAMT Co Ltd 4 0.01
– Samyang Corp 30 0.05
– Samyang Holdings Corp 16 0.02
14 SBW 22 0.03
1 Seah Besteel Corp 17 0.03
– SeAH Steel Corp 11 0.02
1 Sebang Co Ltd 9 0.01
1 Sebang Global Battery Co Ltd 16 0.02
– Seegene Inc 10 0.02
1 Sejong Industrial Co Ltd 5 0.01
1 Sekonix Co Ltd 6 0.01
1 Seobu T&D 9 0.01
14 Seohee Construction Co Ltd 16 0.02
2 Seoul Semiconductor Co Ltd 19 0.03
1 Seoyon Co Ltd 5 0.01
1 Seoyon E-Hwa Co Ltd 7 0.01
– Sewon Precision Industry Co Ltd 1 –
– SFA Engineering Corp 20 0.03
3 SFA Semicon Co Ltd 5 0.01
4 Shin Poong Pharmaceutical Co Ltd 17 0.03
– Shinsegae Food Co Ltd 13 0.02
– Shinsegae International Inc 1 –
– Shinyoung Securities Co Ltd 11 0.02
1 Showbox Corp 4 0.01
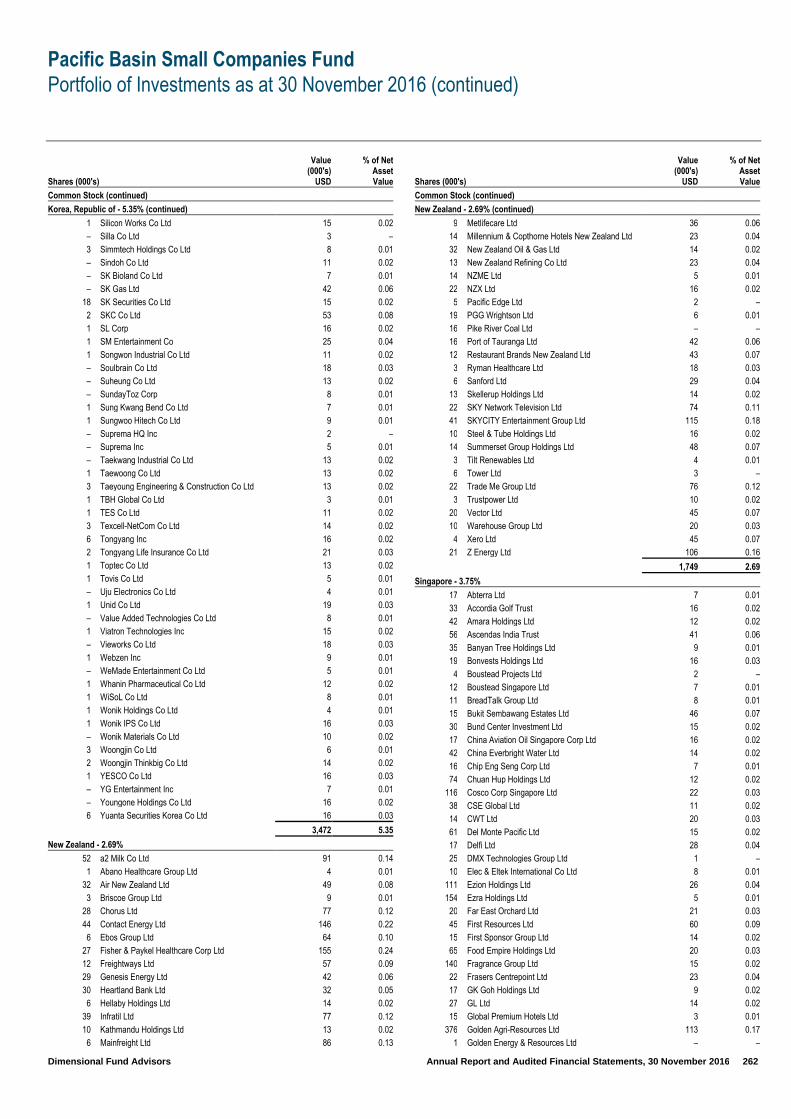
Pacific Basin Small Companies Fund
Portfolio of Investments as at 30 November 2016 (continued)
Dimensional Fund Advisors Annual Report and Audited Financial Statements, 30 November 2016 262
Shares (000's)
Value (000's)
USD
% of Net Asset Value
Common Stock (continued)
Korea, Republic of - 5.35% (continued)
1 Silicon Works Co Ltd 15 0.02
– Silla Co Ltd 3 –
3 Simmtech Holdings Co Ltd 8 0.01
– Sindoh Co Ltd 11 0.02
– SK Bioland Co Ltd 7 0.01
– SK Gas Ltd 42 0.06
18 SK Securities Co Ltd 15 0.02
2 SKC Co Ltd 53 0.08
1 SL Corp 16 0.02
1 SM Entertainment Co 25 0.04
1 Songwon Industrial Co Ltd 11 0.02
– Soulbrain Co Ltd 18 0.03
– Suheung Co Ltd 13 0.02
– SundayToz Corp 8 0.01
1 Sung Kwang Bend Co Ltd 7 0.01
1 Sungwoo Hitech Co Ltd 9 0.01
– Suprema HQ Inc 2 –
– Suprema Inc 5 0.01
– Taekwang Industrial Co Ltd 13 0.02
1 Taewoong Co Ltd 13 0.02
3 Taeyoung Engineering & Construction Co Ltd 13 0.02
1 TBH Global Co Ltd 3 0.01
1 TES Co Ltd 11 0.02
3 Texcell-NetCom Co Ltd 14 0.02
6 Tongyang Inc 16 0.02
2 Tongyang Life Insurance Co Ltd 21 0.03
1 Toptec Co Ltd 13 0.02
1 Tovis Co Ltd 5 0.01
– Uju Electronics Co Ltd 4 0.01
1 Unid Co Ltd 19 0.03
– Value Added Technologies Co Ltd 8 0.01
1 Viatron Technologies Inc 15 0.02
– Vieworks Co Ltd 18 0.03
1 Webzen Inc 9 0.01
– WeMade Entertainment Co Ltd 5 0.01
1 Whanin Pharmaceutical Co Ltd 12 0.02
1 WiSoL Co Ltd 8 0.01
1 Wonik Holdings Co Ltd 4 0.01
1 Wonik IPS Co Ltd 16 0.03
– Wonik Materials Co Ltd 10 0.02
3 Woongjin Co Ltd 6 0.01
2 Woongjin Thinkbig Co Ltd 14 0.02
1 YESCO Co Ltd 16 0.03
– YG Entertainment Inc 7 0.01
– Youngone Holdings Co Ltd 16 0.02
6 Yuanta Securities Korea Co Ltd 16 0.03
3,472 5.35
New Zealand - 2.69%
52 a2 Milk Co Ltd 91 0.14
1 Abano Healthcare Group Ltd 4 0.01
32 Air New Zealand Ltd 49 0.08
3 Briscoe Group Ltd 9 0.01
28 Chorus Ltd 77 0.12
44 Contact Energy Ltd 146 0.22
6 Ebos Group Ltd 64 0.10
27 Fisher & Paykel Healthcare Corp Ltd 155 0.24
12 Freightways Ltd 57 0.09
29 Genesis Energy Ltd 42 0.06
30 Heartland Bank Ltd 32 0.05
6 Hellaby Holdings Ltd 14 0.02
39 Infratil Ltd 77 0.12
10 Kathmandu Holdings Ltd 13 0.02
6 Mainfreight Ltd 86 0.13
Shares (000's)
Value (000's)
USD
% of Net Asset Value
Common Stock (continued)
New Zealand - 2.69% (continued)
9 Metlifecare Ltd 36 0.06
14 Millennium & Copthorne Hotels New Zealand Ltd 23 0.04
32 New Zealand Oil & Gas Ltd 14 0.02
13 New Zealand Refining Co Ltd 23 0.04
14 NZME Ltd 5 0.01
22 NZX Ltd 16 0.02
5 Pacific Edge Ltd 2 –
19 PGG Wrightson Ltd 6 0.01
16 Pike River Coal Ltd – –
16 Port of Tauranga Ltd 42 0.06
12 Restaurant Brands New Zealand Ltd 43 0.07
3 Ryman Healthcare Ltd 18 0.03
6 Sanford Ltd 29 0.04
13 Skellerup Holdings Ltd 14 0.02
22 SKY Network Television Ltd 74 0.11
41 SKYCITY Entertainment Group Ltd 115 0.18
10 Steel & Tube Holdings Ltd 16 0.02
14 Summerset Group Holdings Ltd 48 0.07
3 Tilt Renewables Ltd 4 0.01
6 Tower Ltd 3 –
22 Trade Me Group Ltd 76 0.12
3 Trustpower Ltd 10 0.02
20 Vector Ltd 45 0.07
10 Warehouse Group Ltd 20 0.03
4 Xero Ltd 45 0.07
21 Z Energy Ltd 106 0.16
1,749 2.69
Singapore - 3.75%
17 Abterra Ltd 7 0.01
33 Accordia Golf Trust 16 0.02
42 Amara Holdings Ltd 12 0.02
56 Ascendas India Trust 41 0.06
35 Banyan Tree Holdings Ltd 9 0.01
19 Bonvests Holdings Ltd 16 0.03
4 Boustead Projects Ltd 2 –
12 Boustead Singapore Ltd 7 0.01
11 BreadTalk Group Ltd 8 0.01
15 Bukit Sembawang Estates Ltd 46 0.07
30 Bund Center Investment Ltd 15 0.02
17 China Aviation Oil Singapore Corp Ltd 16 0.02
42 China Everbright Water Ltd 14 0.02
16 Chip Eng Seng Corp Ltd 7 0.01
74 Chuan Hup Holdings Ltd 12 0.02
116 Cosco Corp Singapore Ltd 22 0.03
38 CSE Global Ltd 11 0.02
14 CWT Ltd 20 0.03
61 Del Monte Pacific Ltd 15 0.02
17 Delfi Ltd 28 0.04
25 DMX Technologies Group Ltd 1 –
10 Elec & Eltek International Co Ltd 8 0.01
111 Ezion Holdings Ltd 26 0.04
154 Ezra Holdings Ltd 5 0.01
20 Far East Orchard Ltd 21 0.03
45 First Resources Ltd 60 0.09
15 First Sponsor Group Ltd 14 0.02
65 Food Empire Holdings Ltd 20 0.03
140 Fragrance Group Ltd 15 0.02
22 Frasers Centrepoint Ltd 23 0.04
17 GK Goh Holdings Ltd 9 0.02
27 GL Ltd 14 0.02
15 Global Premium Hotels Ltd 3 0.01
376 Golden Agri-Resources Ltd 113 0.17
1 Golden Energy & Resources Ltd – –

Pacific Basin Small Companies Fund
Portfolio of Investments as at 30 November 2016 (continued)
Dimensional Fund Advisors Annual Report and Audited Financial Statements, 30 November 2016 263
Shares (000's)
Value (000's)
USD
% of Net Asset Value
Common Stock (continued)
Singapore - 3.75% (continued)
42 GSH Corp Ltd 14 0.02
29 Halcyon Agri Corp Ltd 11 0.02
97 Hanwell Holdings Ltd 15 0.02
12 Haw Par Corp Ltd 76 0.12
32 Hiap Hoe Ltd 15 0.02
12 Ho Bee Land Ltd 17 0.03
9 Hong Leong Asia Ltd 4 0.01
23 Hong Leong Finance Ltd 34 0.05
28 Hotel Grand Central Ltd 27 0.04
24 Hour Glass Ltd 11 0.02
30 Hutchison Port Holdings Trust 13 0.02
59 Hwa Hong Corp Ltd 13 0.02
35 Hyflux Ltd 12 0.02
27 Indofood Agri Resources Ltd 10 0.02
26 Innovalues Ltd 17 0.03
6 Isetan Singapore Ltd 16 0.02
24 Japfa Ltd 15 0.02
90 Jurong Technologies Industrial Corp Ltd – –
16 k1 Ventures Ltd 10 0.02
175 Keppel Infrastructure Trust 59 0.09
14 Keppel Telecommunications & Transportation Ltd 16 0.03
32 Low Keng Huat Singapore Ltd 13 0.02
28 M1 Ltd 38 0.06
7 Mandarin Oriental International Ltd 9 0.01
23 Metro Holdings Ltd 17 0.03
63 Mewah International Inc 14 0.02
77 Midas Holdings Ltd 12 0.02
64 Nam Cheong Ltd 3 –
889 Noble Group Ltd 99 0.15
14 NSL Ltd 16 0.02
19 OUE Ltd 23 0.04
13 Pan-United Corp Ltd 5 0.01
35 Q&M Dental Group Singapore Ltd 17 0.03
9 QAF Ltd 8 0.01
61 Raffles Education Corp Ltd 8 0.01
47 Raffles Medical Group Ltd 48 0.08
46 RHT Health Trust 28 0.04
30 Riverstone Holdings Ltd 19 0.03
30 SATS Ltd 102 0.16
18 SBS Transit Ltd 25 0.04
52 Sembcorp Industries Ltd 98 0.15
51 Sembcorp Marine Ltd 49 0.08
24 Sheng Siong Group Ltd 17 0.03
17 SIA Engineering Co Ltd 41 0.06
76 SIIC Environment Holdings Ltd 33 0.05
146 Sinarmas Land Ltd 45 0.07
52 Sing Holdings Ltd 11 0.02
108 Singapore Post Ltd 112 0.17
21 Sino Grandness Food Industry Group Ltd 5 0.01
54 Stamford Land Corp Ltd 18 0.03
11 Sunningdale Tech Ltd 8 0.01
33 Super Group Ltd 29 0.05
34 Tat Hong Holdings Ltd 8 0.01
26 Tuan Sing Holdings Ltd 5 0.01
31 UMS Holdings Ltd 13 0.02
30 United Engineers Ltd 55 0.08
5 United Industrial Corp Ltd 10 0.02
5 United Overseas Insurance Ltd 18 0.03
32 UOB-Kay Hian Holdings Ltd 29 0.04
21 UOL Group Ltd 84 0.13
42 Vard Holdings Ltd 7 0.01
16 Venture Corp Ltd 106 0.16
24 Vibrant Group Ltd 6 0.01
Shares (000's)
Value (000's)
USD
% of Net Asset Value
Common Stock (continued)
Singapore - 3.75% (continued)
20 Wheelock Properties Singapore Ltd 20 0.03
32 Wing Tai Holdings Ltd 36 0.06
23 Yongnam Holdings Ltd 3 0.01
2,431 3.75
Taiwan - 7.40%
8 A-DATA Technology Co Ltd 14 0.02
16 AcBel Polytech Inc 11 0.02
37 Accton Technology Corp 50 0.08
4 ACES Electronic Co Ltd 3 –
2 Acter Co Ltd 6 0.01
3 Actron Technology Corp 9 0.01
3 Adlink Technology Inc 5 0.01
2 Advanced Ceramic X Corp 15 0.02
6 Advanced International Multitech Co Ltd 4 0.01
4 Advanced Wireless Semiconductor Co 6 0.01
15 ALI Corp 8 0.01
15 Alpha Networks Inc 9 0.01
12 Ambassador Hotel 9 0.01
72 AmTRAN Technology Co Ltd 50 0.08
11 Arcadyan Technology Corp 20 0.03
23 Ardentec Corp 17 0.03
8 Asia Optical Co Inc 8 0.01
3 Asia Polymer Corp 1 –
21 Asia Vital Components Co Ltd 16 0.02
1 ASPEED Technology Inc 15 0.02
2 ASROCK Inc 2 –
7 Aten International Co Ltd 17 0.03
9 Audix Corp 10 0.02
11 Aurora Corp 17 0.03
2 AV Tech Corp 1 –
49 Bank of Kaohsiung Co Ltd 14 0.02
8 Basso Industry Corp 19 0.03
40 BES Engineering Corp 8 0.01
2 Bioteque Corp 6 0.01
4 Bizlink Holding Inc 17 0.03
5 Boardtek Electronics Corp 5 0.01
3 Bright Led Electronics Corp 1 –
130 Capital Securities Corp 36 0.06
15 Career Technology MFG. Co Ltd 8 0.01
30 Cathay Real Estate Development Co Ltd 18 0.03
13 ChainQui Construction Development Co Ltd 7 0.01
14 Charoen Pokphand Enterprise 20 0.03
5 Chaun-Choung Technology Corp 18 0.03
4 CHC Resources Corp 6 0.01
48 Cheng Loong Corp 18 0.03
30 Cheng Uei Precision Industry Co Ltd 34 0.05
37 Chia Hsin Cement Corp 10 0.02
5 Chien Kuo Construction Co Ltd 1 –
6 Chilisin Electronics Corp 13 0.02
18 Chin-Poon Industrial Co Ltd 35 0.05
59 China Bills Finance Corp 24 0.04
2 China Ecotek Corp 3 –
31 China Electric Manufacturing Corp 7 0.01
46 China Man-Made Fiber Corp 12 0.02
19 China Metal Products 20 0.03
21 China Motor Corp 18 0.03
91 China Petrochemical Development Corp 27 0.04
11 China Steel Chemical Corp 38 0.06
38 China Synthetic Rubber Corp 33 0.05
27 Chipbond Technology Corp 38 0.06
13 ChipMOS Technologies Inc 10 0.02
7 Chong Hong Construction Co Ltd 13 0.02
9 Chroma ATE Inc 23 0.03

Pacific Basin Small Companies Fund
Portfolio of Investments as at 30 November 2016 (continued)
Dimensional Fund Advisors Annual Report and Audited Financial Statements, 30 November 2016 264
Shares (000's)
Value (000's)
USD
% of Net Asset Value
Common Stock (continued)
Taiwan - 7.40% (continued)
73 Chung Hung Steel Corp 24 0.04
18 Chung-Hsin Electric & Machinery Manufacturing Corp 10 0.02
453 Chunghwa Picture Tubes Ltd 19 0.03
1 Cleanaway Co Ltd 5 0.01
16 Clevo Co 14 0.02
75 CMC Magnetics Corp 8 0.01
71 Compeq Manufacturing Co Ltd 34 0.05
28 Concord Securities Co Ltd 6 0.01
3 Continental Holdings Corp 1 –
30 Coretronic Corp 32 0.05
2 Cub Elecparts Inc 14 0.02
5 Cyberlink Corp 11 0.02
20 CyberTAN Technology Inc 12 0.02
30 D-Link Corp 10 0.01
5 Depo Auto Parts Ind Co Ltd 13 0.02
2 Dynacolor Inc 3 –
12 Dynamic Electronics Co Ltd 3 –
6 Dynapack International Technology Corp 7 0.01
57 E Ink Holdings Inc 41 0.06
6 E-LIFE MALL Corp 11 0.02
18 E-Ton Solar Tech Co Ltd 5 0.01
21 Eastern Media International Corp 5 0.01
12 Elan Microelectronics Corp 13 0.02
3 Elite Advanced Laser Corp 10 0.02
7 Elite Material Co Ltd 19 0.03
9 Elite Semiconductor Memory Technology Inc 8 0.01
18 Elitegroup Computer Systems Co Ltd 7 0.01
2 eMemory Technology Inc 20 0.03
3 Ennoconn Corp 44 0.07
35 EnTie Commercial Bank Co Ltd 14 0.02
30 Epistar Corp 22 0.03
27 Eternal Materials Co Ltd 28 0.04
23 Etron Technology Inc 8 0.01
33 Evergreen International Storage & Transport Corp 14 0.02
24 Everlight Chemical Industrial Corp 15 0.02
37 Everlight Electronics Co Ltd 54 0.08
29 Far Eastern Department Stores Ltd 15 0.02
62 Far Eastern International Bank 18 0.03
8 Faraday Technology Corp 7 0.01
31 Federal Corp 12 0.02
19 Feng Hsin Steel Co Ltd 27 0.04
16 First Insurance Co Ltd 7 0.01
20 First Steamship Co Ltd 5 0.01
13 FLEXium Interconnect Inc 35 0.05
5 Flytech Technology Co Ltd 14 0.02
10 FocalTech Systems Co Ltd 11 0.02
7 Formosa Advanced Technologies Co Ltd 5 0.01
2 Formosa International Hotels Corp 12 0.02
18 Formosan Rubber Group Inc 9 0.01
9 Formosan Union Chemical 5 0.01
16 Gemtek Technology Corp 11 0.02
8 General Interface Solution Holding Ltd 23 0.04
40 Gigabyte Technology Co Ltd 53 0.08
2 Gigasolar Materials Corp 23 0.04
8 Gigastorage Corp 6 0.01
1 Ginko International Co Ltd 9 0.01
30 Gintech Energy Corp 16 0.02
15 Global Brands Manufacture Ltd 6 0.01
4 Global Mixed Mode Technology Inc 9 0.01
7 Global Unichip Corp 17 0.03
6 Globalwafers Co Ltd 18 0.03
18 Gloria Material Technology Corp 10 0.02
58 Goldsun Building Materials Co Ltd 12 0.02
Shares (000's)
Value (000's)
USD
% of Net Asset Value
Common Stock (continued)
Taiwan - 7.40% (continued)
32 Grand Pacific Petrochemical 21 0.03
6 Grape King Bio Ltd 45 0.07
12 Great China Metal Industry 9 0.01
29 Great Taipei Gas Co Ltd 22 0.03
17 Great Wall Enterprise Co Ltd 16 0.02
8 Greatek Electronics Inc 10 0.02
81 HannStar Display Corp 23 0.04
6 Harvatek Corp 2 –
15 Hey Song Corp 15 0.02
5 Hiroca Holdings Ltd 15 0.02
2 Holiday Entertainment Co Ltd 3 –
9 Holtek Semiconductor Inc 14 0.02
11 Holy Stone Enterprise Co Ltd 11 0.02
18 Horizon Securities Co Ltd 3 –
6 Hota Industrial Manufacturing Co Ltd 22 0.03
15 Hsin Kuang Steel Co Ltd 11 0.02
4 Hu Lane Associate Inc 16 0.02
12 HUA ENG Wire & Cable Co Ltd 3 –
9 Huaku Development Co Ltd 17 0.03
14 Hung Poo Real Estate Development Corp 12 0.02
19 Hung Sheng Construction Ltd 10 0.02
1 Huxen Corp 1 –
15 I-Chiun Precision Industry Co Ltd 4 0.01
8 I-Sheng Electric Wire & Cable Co Ltd 11 0.02
6 Ibase Technology Inc 12 0.02
13 Ichia Technologies Inc 6 0.01
8 IEI Integration Corp 12 0.02
7 ITE Technology Inc 7 0.01
17 ITEQ Corp 17 0.03
7 Jess-Link Products Co Ltd 6 0.01
6 Johnson Health Tech Co Ltd 9 0.01
5 Kaori Heat Treatment Co Ltd 9 0.01
6 Kerry TJ Logistics Co Ltd 8 0.01
14 Kindom Construction Corp 9 0.01
28 King Yuan Electronics Co Ltd 23 0.04
18 King's Town Bank Co Ltd 15 0.02
6 Kinik Co 10 0.02
98 Kinpo Electronics 35 0.05
6 Kinsus Interconnect Technology Corp 13 0.02
4 Kung Long Batteries Industrial Co Ltd 18 0.03
9 Kuo Toong International Co Ltd 5 0.01
30 Kuoyang Construction Co Ltd 12 0.02
9 KYE Systems Corp 2 –
4 Land Mark Optoelectronics Corp 34 0.05
19 LCY Chemical Corp 22 0.03
39 Lealea Enterprise Co Ltd 10 0.02
23 Lextar Electronics Corp 9 0.01
3 Li Cheng Enterprise Co Ltd 11 0.02
6 Li Peng Enterprise Co Ltd 1 –
35 Lien Hwa Industrial Corp 24 0.04
9 Lite-On Semiconductor Corp 6 0.01
21 Long Bon International Co Ltd 12 0.02
45 Long Chen Paper Co Ltd 23 0.04
2 Lotes Co Ltd 6 0.01
11 Lung Yen Life Service Corp 19 0.03
2 Macauto Industrial Co Ltd 11 0.02
149 Macronix International 19 0.03
6 Makalot Industrial Co Ltd 24 0.04
37 Masterlink Securities Corp 10 0.02
6 Mayer Steel Pipe Corp 3 –
11 Mercuries & Associates Holding Ltd 8 0.01
19 Mercuries Life Insurance Co Ltd 10 0.02
12 Merry Electronics Co Ltd 45 0.07

Pacific Basin Small Companies Fund
Portfolio of Investments as at 30 November 2016 (continued)
Dimensional Fund Advisors Annual Report and Audited Financial Statements, 30 November 2016 265
Shares (000's)
Value (000's)
USD
% of Net Asset Value
Common Stock (continued)
Taiwan - 7.40% (continued)
18 Microbio Co Ltd 12 0.02
6 MIN AIK Technology Co Ltd 6 0.01
14 Mirle Automation Corp 17 0.03
20 Mitac Holdings Corp 21 0.03
22 Motech Industries Inc 19 0.03
6 Namchow Chemical Industrial Co Ltd 12 0.02
18 Nan Kang Rubber Tire Co Ltd 16 0.02
11 Nan Ya Printed Circuit Board Corp 8 0.01
34 Neo Solar Power Corp 16 0.02
3 Newmax Technology Co Ltd 2 –
18 Nien Hsing Textile Co Ltd 14 0.02
3 On-Bright Electronics Inc 19 0.03
48 OptoTech Corp 21 0.03
39 Orient Semiconductor Electronics Ltd 14 0.02
25 Oriental Union Chemical Corp 18 0.03
19 Pan Jit International Inc 9 0.01
3 Parade Technologies Ltd 32 0.05
3 PChome Online Inc 23 0.04
2 Pixart Imaging Inc 4 0.01
4 Posiflex Technology Inc 25 0.04
49 President Securities Corp 17 0.03
11 Primax Electronics Ltd 16 0.02
50 Prince Housing & Development Corp 17 0.03
5 Promate Electronic Co Ltd 5 0.01
147 Qisda Corp 71 0.11
21 Radiant Opto-Electronics Corp 38 0.06
45 Radium Life Tech Co Ltd 14 0.02
20 Rechi Precision Co Ltd 20 0.03
31 Rich Development Co Ltd 8 0.01
77 Ritek Corp 12 0.02
11 Run Long Construction Co Ltd 11 0.02
35 Sampo Corp 20 0.03
15 San Fang Chemical Industry Co Ltd 17 0.03
3 San Shing Fastech Corp 5 0.01
7 Sanyang Motor Co Ltd 5 0.01
23 Sercomm Corp 59 0.09
13 Shihlin Electric & Engineering Corp 16 0.02
5 Shin Zu Shing Co Ltd 13 0.02
30 Shining Building Business Co Ltd 11 0.02
10 Shinkong Insurance Co Ltd 8 0.01
67 Shinkong Synthetic Fibers Corp 19 0.03
23 Sigurd Microelectronics Corp 17 0.03
7 Simplo Technology Co Ltd 21 0.03
9 Sinbon Electronics Co Ltd 20 0.03
9 Sincere Navigation Corp 6 0.01
2 Sinmag Equipment Corp 10 0.02
34 Sino-American Silicon Products Inc 31 0.05
3 Sinon Corp 1 –
7 Sirtec International Co Ltd 9 0.01
7 Sitronix Technology Corp 25 0.04
3 Soft-World International Corp 6 0.01
22 Solar Applied Materials Technology Co 5 0.01
18 Solartech Energy Corp 8 0.01
8 Sonix Technology Co Ltd 8 0.01
3 Sporton International Inc 17 0.03
2 St Shine Optical Co Ltd 38 0.06
5 Sunny Friend Environmental Technology Co Ltd 18 0.03
1 Sunonwealth Electric Machine Industry Co Ltd 1 –
4 Sunspring Metal Corp 5 0.01
20 Sunty Development Co Ltd 7 0.01
17 Supreme Electronics Co Ltd 14 0.02
3 Swancor Holding Co Ltd 7 0.01
3 Sweeten Real Estate Development Co Ltd 1 –
Shares (000's)
Value (000's)
USD
% of Net Asset Value
Common Stock (continued)
Taiwan - 7.40% (continued)
5 Syncmold Enterprise Corp 9 0.01
33 TA Chen Stainless Pipe 19 0.03
9 Tah Hsin Industrial Corp 7 0.01
67 Taichung Commercial Bank Co Ltd 19 0.03
8 Taiflex Scientific Co Ltd 8 0.01
42 Tainan Spinning Co Ltd 16 0.02
4 Taiwan Acceptance Corp 10 0.01
22 Taiwan Cogeneration Corp 15 0.02
11 Taiwan Fire & Marine Insurance Co Ltd 7 0.01
12 Taiwan FU Hsing Industrial Co Ltd 15 0.02
10 Taiwan Hon Chuan Enterprise Co Ltd 17 0.03
65 Taiwan Kolin Co Ltd – –
23 Taiwan Land Development Corp 7 0.01
8 Taiwan Paiho Ltd 25 0.04
16 Taiwan PCB Techvest Co Ltd 16 0.02
10 Taiwan Semiconductor Co Ltd 10 0.02
19 Taiwan Shin Kong Security Co Ltd 23 0.04
28 Taiwan Styrene Monomer 18 0.03
11 Taiwan Surface Mounting Technology Corp 9 0.01
35 Taiwan TEA Corp 16 0.02
12 Taiwan Union Technology Corp 12 0.02
71 Tatung Co Ltd 22 0.03
5 TCI Co Ltd 27 0.04
9 Test Research Inc 11 0.02
50 Ton Yi Industrial Corp 21 0.03
8 Tong Hsing Electronic Industries Ltd 23 0.04
8 Tong Yang Industry Co Ltd 17 0.03
9 Topco Scientific Co Ltd 22 0.03
6 Topoint Technology Co Ltd 4 0.01
4 Toung Loong Textile Manufacturing 10 0.02
13 TPK Holding Co Ltd 22 0.03
18 Transasia Airways Corp 2 –
11 Tripod Technology Corp 25 0.04
1 TrueLight Corp 2 –
27 TSRC Corp 27 0.04
10 TTY Biopharm Co Ltd 31 0.05
26 Tung Ho Steel Enterprise Corp 18 0.03
8 TXC Corp 10 0.02
14 Tyntek Corp 5 0.01
15 U-Ming Marine Transport Corp 12 0.02
122 Unimicron Technology Corp 46 0.07
1 Union Bank Of Taiwan – –
4 Union Insurance Co Ltd 2 –
17 Unitech Printed Circuit Board Corp 5 0.01
14 United Integrated Services Co Ltd 21 0.03
18 Unity Opto Technology Co Ltd 7 0.01
18 Universal Cement Corp 14 0.02
17 Unizyx Holding Corp 8 0.01
44 UPC Technology Corp 17 0.03
29 USI Corp 14 0.02
18 Visual Photonics Epitaxy Co Ltd 26 0.04
5 Vivotek Inc 12 0.02
21 Wafer Works Corp 6 0.01
26 Walsin Lihwa Corp 11 0.02
22 Walsin Technology Corp 25 0.04
14 Walton Advanced Engineering Inc 5 0.01
104 Waterland Financial Holdings Co Ltd 27 0.04
19 Weikeng Industrial Co Ltd 10 0.02
9 Win Semiconductors Corp 26 0.04
51 Winbond Electronics Corp 16 0.02
8 Wisdom Marine Lines Co Ltd 7 0.01
12 Wistron NeWeb Corp 36 0.06
3 Wowprime Corp 13 0.02
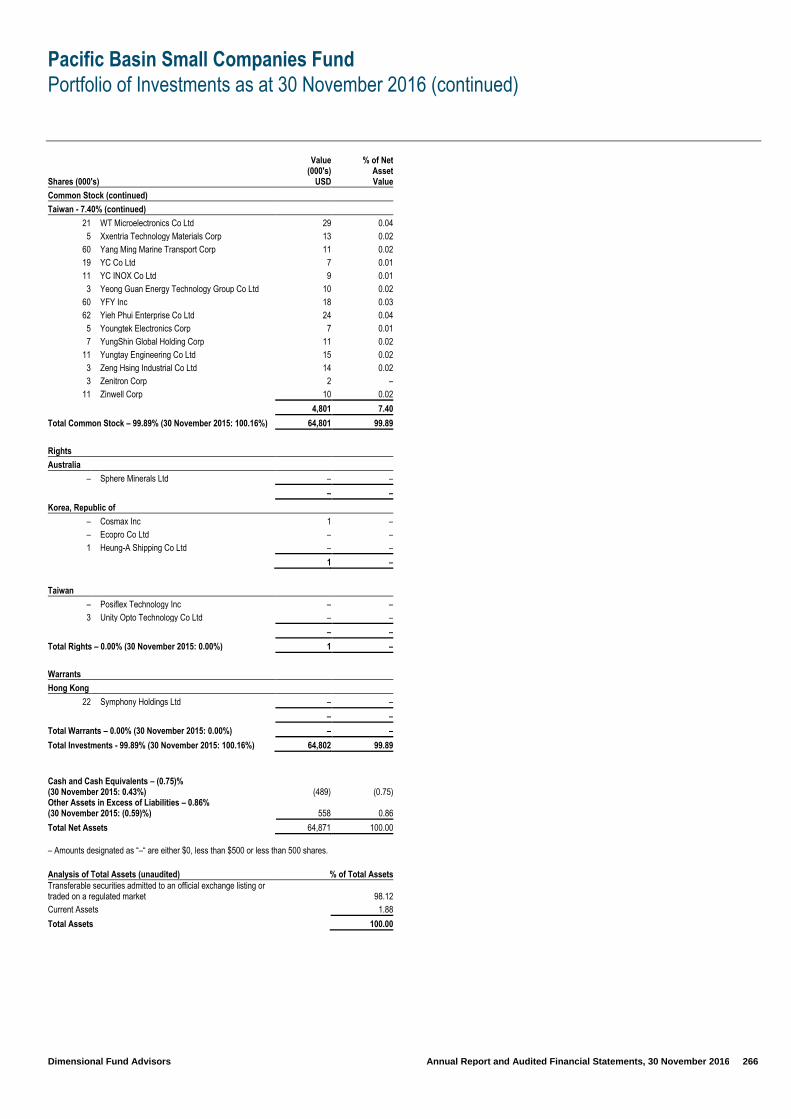
Pacific Basin Small Companies Fund
Portfolio of Investments as at 30 November 2016 (continued)
Dimensional Fund Advisors Annual Report and Audited Financial Statements, 30 November 2016 266
Shares (000's)
Value (000's)
USD
% of Net Asset Value
Common Stock (continued)
Taiwan - 7.40% (continued)
21 WT Microelectronics Co Ltd 29 0.04
5 Xxentria Technology Materials Corp 13 0.02
60 Yang Ming Marine Transport Corp 11 0.02
19 YC Co Ltd 7 0.01
11 YC INOX Co Ltd 9 0.01
3 Yeong Guan Energy Technology Group Co Ltd 10 0.02
60 YFY Inc 18 0.03
62 Yieh Phui Enterprise Co Ltd 24 0.04
5 Youngtek Electronics Corp 7 0.01
7 YungShin Global Holding Corp 11 0.02
11 Yungtay Engineering Co Ltd 15 0.02
3 Zeng Hsing Industrial Co Ltd 14 0.02
3 Zenitron Corp 2 –
11 Zinwell Corp 10 0.02
4,801 7.40
Total Common Stock – 99.89% (30 November 2015: 100.16%) 64,801 99.89
Rights
Australia
– Sphere Minerals Ltd – –
– –
Korea, Republic of
– Cosmax Inc 1 –
– Ecopro Co Ltd – –
1 Heung-A Shipping Co Ltd – –
1 –
Taiwan
– Posiflex Technology Inc – –
3 Unity Opto Technology Co Ltd – –
– –
Total Rights – 0.00% (30 November 2015: 0.00%) 1 –
Warrants
Hong Kong
22 Symphony Holdings Ltd – –
– –
Total Warrants – 0.00% (30 November 2015: 0.00%) – –
Total Investments - 99.89% (30 November 2015: 100.16%) 64,802 99.89
Cash and Cash Equivalents – (0.75)% (30 November 2015: 0.43%) (489) (0.75) Other Assets in Excess of Liabilities – 0.86% (30 November 2015: (0.59)%) 558 0.86
Total Net Assets 64,871 100.00
– Amounts designated as “–“ are either $0, less than $500 or less than 500 shares.
Analysis of Total Assets (unaudited) % of Total Assets
Transferable securities admitted to an official exchange listing or traded on a regulated market 98.12
Current Assets 1.88
Total Assets 100.00
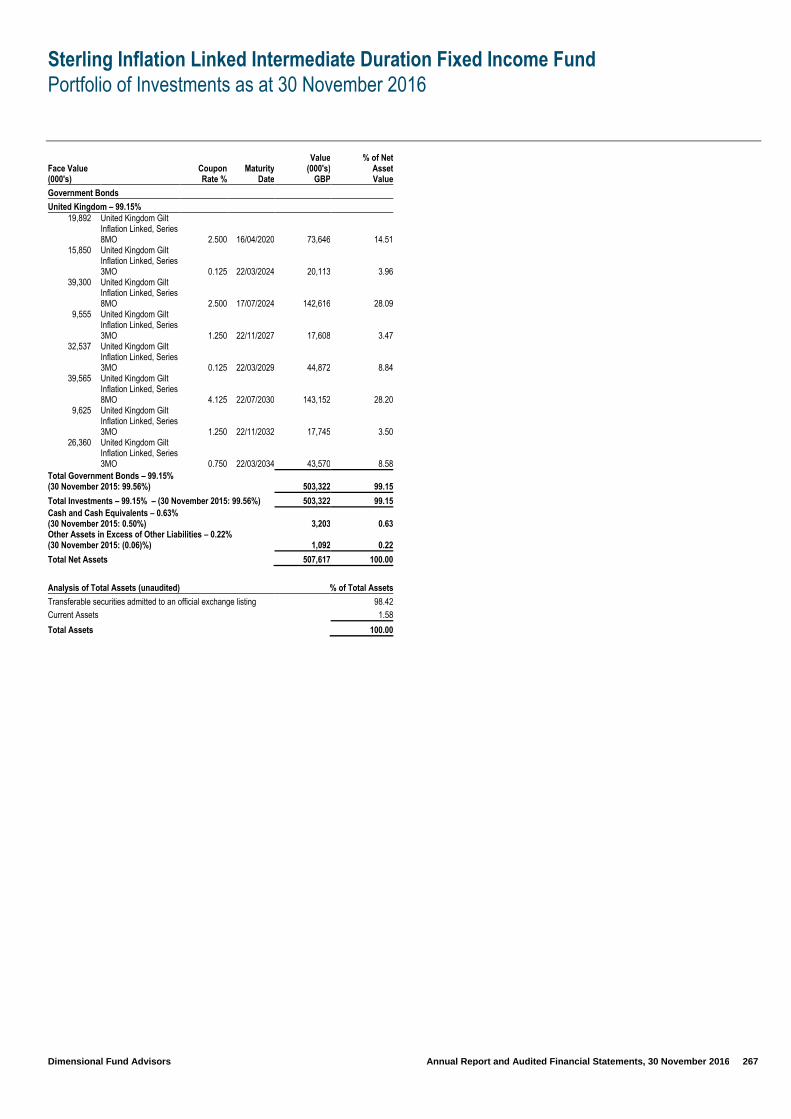
Sterling Inflation Linked Intermediate Duration Fixed Income Fund
Portfolio of Investments as at 30 November 2016
Dimensional Fund Advisors Annual Report and Audited Financial Statements, 30 November 2016 267
Face Value (000's)
Coupon Rate %
Maturity Date
Value (000's)
GBP
% of Net Asset Value
Government Bonds
United Kingdom – 99.15%
19,892 United Kingdom Gilt Inflation Linked, Series 8MO 2.500 16/04/2020 73,646 14.51
15,850 United Kingdom Gilt Inflation Linked, Series 3MO 0.125 22/03/2024 20,113 3.96
39,300 United Kingdom Gilt Inflation Linked, Series 8MO 2.500 17/07/2024 142,616 28.09
9,555 United Kingdom Gilt Inflation Linked, Series 3MO 1.250 22/11/2027 17,608 3.47
32,537 United Kingdom Gilt Inflation Linked, Series 3MO 0.125 22/03/2029 44,872 8.84
39,565 United Kingdom Gilt Inflation Linked, Series 8MO 4.125 22/07/2030 143,152 28.20
9,625 United Kingdom Gilt Inflation Linked, Series 3MO 1.250 22/11/2032 17,745 3.50
26,360 United Kingdom Gilt Inflation Linked, Series 3MO 0.750 22/03/2034 43,570 8.58
Total Government Bonds – 99.15% (30 November 2015: 99.56%) 503,322 99.15
Total Investments – 99.15% – (30 November 2015: 99.56%) 503,322 99.15
Cash and Cash Equivalents – 0.63% (30 November 2015: 0.50%) 3,203 0.63 Other Assets in Excess of Other Liabilities – 0.22% (30 November 2015: (0.06)%) 1,092 0.22
Total Net Assets 507,617 100.00
Analysis of Total Assets (unaudited) % of Total Assets
Transferable securities admitted to an official exchange listing 98.42
Current Assets 1.58
Total Assets 100.00

U.S. Core Equity Fund
Portfolio of Investments as at 30 November 2016
Dimensional Fund Advisors Annual Report and Audited Financial Statements, 30 November 2016 268
Shares (000's)
Value (000's)
USD
% of Net Asset Value
Common Stock
Basic Materials - 2.95%
– A Schulman Inc 1 0.01
– Aceto Corp 1 0.01
– Air Products & Chemicals Inc 6 0.10
– AK Steel Holding Corp 1 0.01
– Albemarle Corp 6 0.10
– Alcoa Corp 1 0.01
– Ashland Global Holdings Inc 3 0.05
– Axalta Coating Systems Ltd 2 0.04
– Balchem Corp 3 0.05
– Cabot Corp 3 0.05
– Calgon Carbon Corp 1 0.01
– Carpenter Technology Corp 2 0.04
– Celanese Corp 8 0.11
– Century Aluminum Co 1 0.01
– CF Industries Holdings Inc 5 0.08
– Chemours Co 1 0.01
– Chemtura Corp 1 0.01
– Clearwater Paper Corp 1 0.01
– Coeur Mining Inc 1 0.01
– Commercial Metals Co 3 0.05
– Compass Minerals International Inc 3 0.05
– Domtar Corp 3 0.05
– Dow Chemical Co 2 0.03
– Eastman Chemical Co 9 0.12
– EI du Pont de Nemours & Co 2 0.03
– Ferro Corp 2 0.03
– Ferroglobe PLC 2 0.03
– FMC Corp 3 0.05
– Freeport-McMoRan Inc 8 0.11
– GCP Applied Technologies Inc 2 0.04
– HB Fuller Co 3 0.05
– Hecla Mining Co 2 0.04
– Huntsman Corp 6 0.10
– Ingevity Corp 1 0.01
– Innophos Holdings Inc 1 0.01
– Innospec Inc 1 0.01
– International Flavors & Fragrances Inc 2 0.04
– International Paper Co 3 0.05
– Kraton Corp 1 0.01
– LyondellBasell Industries NV 7 0.10
– Materion Corp 1 0.01
– Mercer International Inc 1 0.01
– Minerals Technologies Inc 3 0.04
– Monsanto Co 2 0.04
– Mosaic Co 4 0.07
– Neenah Paper Inc 3 0.04
– NewMarket Corp 4 0.06
– Newmont Mining Corp 5 0.06
– Nucor Corp 9 0.12
– Olin Corp 4 0.06
– Orchids Paper Products Co 1 0.01
– PH Glatfelter Co 1 0.01
– PolyOne Corp 3 0.04
– PPG Industries Inc 4 0.07
– Praxair Inc 7 0.10
– Quaker Chemical Corp 1 0.01
– Reliance Steel & Aluminum Co 3 0.04
– Royal Gold Inc 4 0.07
– RPM International Inc 1 0.01
– Schnitzer Steel Industries Inc 1 0.01
– Schweitzer-Mauduit International Inc 1 0.02
– Sensient Technologies Corp 4 0.07
– Sherwin-Williams Co 3 0.04
Shares (000's)
Value (000's)
USD
% of Net Asset Value
Common Stock (continued)
Basic Materials - 2.95% (continued)
– Steel Dynamics Inc 4 0.06
– Stepan Co 1 0.01
– Stillwater Mining Co 1 0.01
– United States Steel Corp 2 0.03
– Univar Inc 3 0.04
– Valspar Corp 1 0.01
– Westlake Chemical Corp 1 0.01
– WR Grace & Co 3 0.04
200 2.95
Communications - 10.26%
– ADTRAN Inc 1 0.02
– Alphabet Inc, Class A 35 0.52
– Alphabet Inc, Class C 37 0.55
– Amazon.com Inc 42 0.63
– AMC Networks Inc 2 0.03
– Arista Networks Inc 1 0.01
– ARRIS International PLC 2 0.03
3 AT&T Inc 121 1.80
– ATN International Inc 1 0.01
– Bankrate Inc 1 0.01
– Blucora Inc 1 0.01
– Cable One Inc 3 0.05
– CBS Corp 4 0.07
– CDW Corp 2 0.04
1 CenturyLink Inc 13 0.20
– Charter Communications Inc 12 0.19
– Ciena Corp 3 0.05
– Cincinnati Bell Inc 1 0.01
2 Cisco Systems Inc 63 0.94
– Cogent Communications Holdings Inc 1 0.01
1 Comcast Corp 42 0.63
– CommScope Holding Co Inc 1 0.01
– Consolidated Communications Holdings Inc 2 0.03
– DigitalGlobe Inc 2 0.03
– Discovery Communications Inc, Class A 3 0.05
– Discovery Communications Inc, Class C 5 0.08
– DISH Network Corp 2 0.04
– EarthLink Holdings Corp 1 0.01
– eBay Inc 4 0.07
– EchoStar Corp 2 0.03
– Entercom Communications Corp 1 0.01
– Entravision Communications Corp 1 0.01
– EW Scripps Co 1 0.01
– Expedia Inc 3 0.05
– F5 Networks Inc 2 0.03
– Facebook Inc 26 0.38
– FactSet Research Systems Inc 2 0.03
– Finisar Corp 5 0.08
1 Frontier Communications Corp 4 0.07
– FTD Cos Inc 1 0.01
– Gannett Co Inc 1 0.01
– General Communication Inc 1 0.01
– Global Eagle Entertainment Inc 1 0.01
– Gray Television Inc 1 0.01
– GrubHub Inc 1 0.01
– GTT Communications Inc 1 0.01
– Houghton Mifflin Harcourt Co 2 0.03
– IAC/InterActiveCorp 1 0.01
– IDT Corp 1 0.01
– Infinera Corp 1 0.01
– Inteliquent Inc 1 0.01

U.S. Core Equity Fund
Portfolio of Investments as at 30 November 2016 (continued)
Dimensional Fund Advisors Annual Report and Audited Financial Statements, 30 November 2016 269
Shares (000's)
Value (000's)
USD
% of Net Asset Value
Common Stock (continued)
Communications - 10.26% (continued)
– InterDigital Inc 2 0.03
– Interpublic Group of Cos Inc 2 0.03
– Ixia 1 0.01
– John Wiley & Sons Inc 3 0.04
– Juniper Networks Inc 6 0.10
– Level 3 Communications Inc 2 0.03
– Liberty Broadband Corp 5 0.08
– Liberty Expedia Holdings Inc 1 0.01
– Liberty SiriusXM Group, Class A 1 0.01
– Liberty SiriusXM Group, Class C 1 0.01
– Liberty Ventures 2 0.03
– LinkedIn Corp 1 0.01
– Liquidity Services Inc 1 0.01
– LogMeIn Inc 1 0.01
– Meredith Corp 2 0.03
– Motorola Solutions Inc 3 0.05
– MSG Networks Inc 1 0.01
– Netflix Inc 2 0.04
– NETGEAR Inc 1 0.01
– NeuStar Inc 1 0.01
– New Media Investment Group Inc 1 0.01
– New York Times Co 2 0.03
– News Corp, Class A 2 0.03
– News Corp, Class B 1 0.01
– NIC Inc 1 0.01
– Oclaro Inc 1 0.01
– Omnicom Group Inc 3 0.04
– Palo Alto Networks Inc 1 0.01
– Perficient Inc 1 0.01
– Plantronics Inc 2 0.03
– Priceline Group Inc 7 0.10
– Proofpoint Inc 1 0.01
– RetailMeNot Inc 1 0.01
– Scholastic Corp 2 0.03
– Scripps Networks Interactive Inc 1 0.01
– Shenandoah Telecommunications Co 1 0.01
– ShoreTel Inc 1 0.01
– Shutterfly Inc 2 0.03
– Sinclair Broadcast Group Inc 3 0.04
– Sirius XM Holdings Inc 1 0.01
– Spok Holdings Inc 1 0.01
– Sprint Corp 3 0.04
– Symantec Corp 5 0.07
– T-Mobile US Inc 8 0.13
– TEGNA Inc 6 0.10
– Telephone & Data Systems Inc 3 0.05
– Time Inc 1 0.01
– Time Warner Inc 11 0.17
– TiVo Corp 2 0.03
– TripAdvisor Inc 1 0.01
– Twenty-First Century Fox Inc, Class A 7 0.10
– Twenty-First Century Fox Inc, Class B 3 0.05
– Twitter Inc 4 0.07
– Ubiquiti Networks Inc 2 0.03
– United States Cellular Corp 1 0.01
– VASCO Data Security International Inc 1 0.01
– VeriSign Inc 2 0.03
1 Verizon Communications Inc 27 0.41
– Viacom Inc 12 0.19
– ViaSat Inc 4 0.06
– Vonage Holdings Corp 2 0.03
– Walt Disney Co 38 0.56
– Web.com Group Inc 1 0.01
Shares (000's)
Value (000's)
USD
% of Net Asset Value
Common Stock (continued)
Communications - 10.26% (continued)
– WebMD Health Corp 2 0.03
– West Corp 1 0.01
– Windstream Holdings Inc 1 0.01
– XO Group Inc 1 0.01
– Yahoo! Inc 2 0.03
– Zillow Group Inc 1 0.01
695 10.26
Consumer, Cyclical - 14.81%
– Abercrombie & Fitch Co 1 0.01
– Adient PLC 1 0.01
– Advance Auto Parts Inc 4 0.07
– Alaska Air Group Inc 10 0.14
– Allegiant Travel Co 2 0.03
– Allison Transmission Holdings Inc 2 0.03
– AMC Entertainment Holdings Inc 1 0.01
– American Airlines Group Inc 4 0.07
– American Axle & Manufacturing Holdings Inc 3 0.05
– American Eagle Outfitters Inc 6 0.10
– American Woodmark Corp 2 0.04
– Anixter International Inc 3 0.05
– Asbury Automotive Group Inc 2 0.04
– Ascena Retail Group Inc 1 0.02
– Autoliv Inc 5 0.08
– AutoNation Inc 6 0.10
– AutoZone Inc 3 0.05
– AV Homes Inc 1 0.01
– Beacon Roofing Supply Inc 3 0.05
– Bed Bath & Beyond Inc 9 0.13
– Belmond Ltd 1 0.01
– Best Buy Co Inc 12 0.17
– Big Lots Inc 3 0.05
– Biglari Holdings Inc 1 0.01
– BJ's Restaurants Inc 1 0.01
– Bloomin' Brands Inc 3 0.05
– BMC Stock Holdings Inc 1 0.01
– Bob Evans Farms Inc 1 0.01
– Bojangles' Inc 1 0.01
– BorgWarner Inc 4 0.07
– Brinker International Inc 3 0.05
– Brunswick Corp 5 0.08
– Buckle Inc 1 0.01
– Buffalo Wild Wings Inc 3 0.05
– Burlington Stores Inc 1 0.01
– Cabela's Inc 2 0.04
– CalAtlantic Group Inc 4 0.07
– Caleres Inc 2 0.04
– Callaway Golf Co 1 0.01
– CarMax Inc 9 0.13
– Carnival Corp 6 0.10
– Carrols Restaurant Group Inc 1 0.01
– Carter's Inc 4 0.07
– Casey's General Stores Inc 6 0.10
– Cato Corp 1 0.01
– Cavco Industries Inc 1 0.01
– Cheesecake Factory Inc 3 0.05
– Chico's FAS Inc 2 0.04
– Children's Place Inc 3 0.05
– Chipotle Mexican Grill Inc 2 0.04
– Choice Hotels International Inc 3 0.05
– Chuy's Holdings Inc 1 0.02
– Cinemark Holdings Inc 6 0.10
– ClubCorp Holdings Inc 1 0.01
– Coach Inc 6 0.10

U.S. Core Equity Fund
Portfolio of Investments as at 30 November 2016 (continued)
Dimensional Fund Advisors Annual Report and Audited Financial Statements, 30 November 2016 270
Shares (000's)
Value (000's)
USD
% of Net Asset Value
Common Stock (continued)
Consumer, Cyclical - 14.81% (continued)
– Columbia Sportswear Co 4 0.07
– Cooper Tire & Rubber Co 2 0.04
– Cooper-Standard Holdings Inc 2 0.04
– Copa Holdings SA 3 0.05
– Copart Inc 2 0.04
– Core-Mark Holding Co Inc 2 0.04
– Costco Wholesale Corp 11 0.16
– Cracker Barrel Old Country Store Inc 4 0.07
– CST Brands Inc 2 0.04
– CVS Health Corp 34 0.50
– Dana Inc 4 0.07
– Darden Restaurants Inc 3 0.05
– Dave & Buster's Entertainment Inc 2 0.04
– Deckers Outdoor Corp 2 0.04
– Del Taco Restaurants Inc 1 0.02
– Delphi Automotive PLC 2 0.04
– Delta Air Lines Inc 23 0.33
– Denny's Corp 1 0.01
– Dick's Sporting Goods Inc 4 0.07
– Dillard's Inc 3 0.05
– DineEquity Inc 2 0.04
– Dolby Laboratories Inc 3 0.04
– Dollar General Corp 5 0.08
– Dollar Tree Inc 5 0.08
– Domino's Pizza Inc 3 0.05
– Dorman Products Inc 3 0.05
– Douglas Dynamics Inc 1 0.02
– DR Horton Inc 6 0.10
– DSW Inc 2 0.04
– DTS Inc 1 0.01
– Dunkin' Brands Group Inc 3 0.05
– Essendant Inc 1 0.01
– Ethan Allen Interiors Inc 1 0.01
– Express Inc 1 0.01
– Ezcorp Inc 1 0.01
– Fastenal Co 3 0.05
– Fiesta Restaurant Group Inc 1 0.02
– Finish Line Inc 1 0.01
– FirstCash Inc 1 0.01
– Five Below Inc 1 0.01
– Foot Locker Inc 7 0.11
2 Ford Motor Co 24 0.34
– Fossil Group Inc 2 0.04
– Fox Factory Holding Corp 1 0.02
– Francesca's Holdings Corp 1 0.02
– Fred's Inc 1 0.02
– G&K Services Inc 1 0.01
– G-III Apparel Group Ltd 1 0.01
– GameStop Corp 1 0.01
– Gap Inc 9 0.13
1 General Motors Co 27 0.39
– Genesco Inc 1 0.02
– Gentherm Inc 1 0.02
– Genuine Parts Co 12 0.17
– GNC Holdings Inc 1 0.01
– Goodyear Tire & Rubber Co 6 0.10
– Guess? Inc 1 0.01
– H&E Equipment Services Inc 1 0.01
– Hanesbrands Inc 3 0.05
– Harley-Davidson Inc 3 0.05
– Harman International Industries Inc 2 0.04
– Hasbro Inc 3 0.05
– Hawaiian Holdings Inc 4 0.07
Shares (000's)
Value (000's)
USD
% of Net Asset Value
Common Stock (continued)
Consumer, Cyclical - 14.81% (continued)
– HD Supply Holdings Inc 2 0.04
– Herman Miller Inc 3 0.05
– Hilton Worldwide Holdings Inc 3 0.05
– HNI Corp 1 0.01
– Home Depot Inc 22 0.31
– HSN Inc 1 0.01
– Hyatt Hotels Corp 1 0.01
– Iconix Brand Group Inc 1 0.01
– ILG Inc 2 0.03
– Ingram Micro Inc 2 0.03
– Installed Building Products Inc 1 0.01
– Interface Inc 1 0.01
– International Game Technology PLC 3 0.05
– Intrawest Resorts Holdings Inc 1 0.01
– iRobot Corp 1 0.01
– Jack in the Box Inc 2 0.04
– JC Penney Co Inc 4 0.07
– JetBlue Airways Corp 5 0.08
– Kate Spade & Co 3 0.05
– Kimball International Inc 1 0.02
– Knoll Inc 2 0.04
– Kohl's Corp 7 0.10
– L Brands Inc 2 0.04
– La Quinta Holdings Inc 1 0.01
– La-Z-Boy Inc 1 0.01
– Las Vegas Sands Corp 3 0.05
– Lear Corp 8 0.13
– Leggett & Platt Inc 2 0.04
– Lennar Corp 5 0.08
– LGI Homes Inc 1 0.02
– Liberty Interactive Corp QVC Group 5 0.08
– Liberty TripAdvisor Holdings Inc 1 0.01
– Lions Gate Entertainment Corp 2 0.04
– Lithia Motors Inc 3 0.05
– LKQ Corp 6 0.10
– Lowe's Cos Inc 8 0.13
– lululemon athletica Inc 2 0.03
– Lumber Liquidators Holdings Inc 1 0.01
– Macy's Inc 13 0.18
– Madison Square Garden Co 3 0.04
– Marriott International Inc 3 0.04
– Marriott Vacations Worldwide Corp 2 0.03
– Mattel Inc 2 0.03
– McDonald's Corp 15 0.21
– MDC Holdings Inc 1 0.01
– Meritage Homes Corp 1 0.01
– Meritor Inc 1 0.01
– MGM Resorts International 3 0.04
– Michael Kors Holdings Ltd 2 0.03
– Michaels Cos Inc 1 0.01
– Mobile Mini Inc 1 0.01
– Modine Manufacturing Co 1 0.01
– Mohawk Industries Inc 8 0.12
– MSC Industrial Direct Co Inc 3 0.04
– National CineMedia Inc 1 0.01
– Nautilus Inc 1 0.01
– Newell Brands Inc 4 0.06
– NIKE Inc 11 0.15
– Nordstrom Inc 3 0.04
– Norwegian Cruise Line Holdings Ltd 5 0.06
– Nu Skin Enterprises Inc 3 0.04
– O'Reilly Automotive Inc 4 0.06
1 Office Depot Inc 3 0.04

U.S. Core Equity Fund
Portfolio of Investments as at 30 November 2016 (continued)
Dimensional Fund Advisors Annual Report and Audited Financial Statements, 30 November 2016 271
Shares (000's)
Value (000's)
USD
% of Net Asset Value
Common Stock (continued)
Consumer, Cyclical - 14.81% (continued)
– Ollie's Bargain Outlet Holdings Inc 2 0.03
– Oxford Industries Inc 1 0.01
– PACCAR Inc 10 0.14
– Panera Bread Co 3 0.04
– Papa John's International Inc 1 0.01
– Party City Holdco Inc 2 0.03
– PC Connection Inc 1 0.01
– Penske Automotive Group Inc 5 0.07
– PetMed Express Inc 1 0.01
– Polaris Industries Inc 2 0.03
– Pool Corp 3 0.04
– Popeyes Louisiana Kitchen Inc 1 0.01
– PriceSmart Inc 1 0.01
– PulteGroup Inc 4 0.06
– PVH Corp 5 0.07
– Ralph Lauren Corp 3 0.04
– Red Robin Gourmet Burgers Inc 1 0.01
– Regal Entertainment Group 1 0.01
– Restoration Hardware Holdings Inc 1 0.01
– Rite Aid Corp 1 0.01
– Ross Stores Inc 4 0.06
– Royal Caribbean Cruises Ltd 4 0.06
– Ruth's Hospitality Group Inc 1 0.01
– Sally Beauty Holdings Inc 2 0.03
– ScanSource Inc 1 0.01
– Scotts Miracle-Gro Co 1 0.01
– SeaWorld Entertainment Inc 1 0.01
– Select Comfort Corp 1 0.01
– Signet Jewelers Ltd 4 0.06
– Six Flags Entertainment Corp 1 0.01
– Skechers U.S.A. Inc 4 0.06
– SkyWest Inc 2 0.03
– Sonic Corp 1 0.01
– Southwest Airlines Co 8 0.12
– Spirit Airlines Inc 5 0.06
– Standard Motor Products Inc 1 0.01
– Staples Inc 2 0.03
– Starbucks Corp 12 0.17
– Steelcase Inc 1 0.01
– Steven Madden Ltd 2 0.03
– Target Corp 14 0.20
– Taylor Morrison Home Corp 1 0.01
– Tempur Sealy International Inc 2 0.03
– Tenneco Inc 3 0.04
– Tesla Motors Inc 1 0.01
– Texas Roadhouse Inc 2 0.03
– Thor Industries Inc 5 0.06
– Tiffany & Co 6 0.08
– Tile Shop Holdings Inc 1 0.01
– TJX Cos Inc 7 0.10
– Toll Brothers Inc 4 0.06
– Toro Co 2 0.03
– Tower International Inc 1 0.01
– Tractor Supply Co 3 0.04
– TRI Pointe Group Inc 2 0.03
– Triton International Ltd 2 0.03
– Tupperware Brands Corp 2 0.03
– Ulta Salon Cosmetics & Fragrance Inc 5 0.07
– Under Armour Inc, Class A 1 0.01
– Under Armour Inc, Class C 1 0.01
– UniFirst Corp 3 0.04
– United Continental Holdings Inc 14 0.20
– Universal Electronics Inc 1 0.01
Shares (000's)
Value (000's)
USD
% of Net Asset Value
Common Stock (continued)
Consumer, Cyclical - 14.81% (continued)
– Urban Outfitters Inc 5 0.06
– Vail Resorts Inc 1 0.01
– Vera Bradley Inc 1 0.01
– Veritiv Corp 1 0.01
– VF Corp 3 0.04
– Vista Outdoor Inc 3 0.04
– Visteon Corp 3 0.04
– Vitamin Shoppe Inc 1 0.01
– Wabash National Corp 1 0.01
– WABCO Holdings Inc 1 0.01
1 Wal-Mart Stores Inc 56 0.82
– Walgreens Boots Alliance Inc 32 0.46
– Watsco Inc 1 0.01
– WCI Communities Inc 1 0.01
– Wendy's Co 3 0.04
– Wesco Aircraft Holdings Inc 1 0.01
– WESCO International Inc 3 0.04
– Whirlpool Corp 10 0.14
– William Lyon Homes 1 0.01
– Williams-Sonoma Inc 7 0.10
– Winmark Corp 1 0.01
– Winnebago Industries Inc 1 0.01
– Wolverine World Wide Inc 2 0.03
– World Fuel Services Corp 3 0.04
– WW Grainger Inc 4 0.06
– Wyndham Worldwide Corp 2 0.03
– Wynn Resorts Ltd 3 0.04
– Yum China Holdings Inc 1 0.01
– Yum! Brands Inc 2 0.03
– Zumiez Inc 1 0.01
1,003 14.81
Consumer, Non-Cyclical - 19.34%
– Aaron's Inc 2 0.03
– Abaxis Inc 1 0.01
– Abbott Laboratories 18 0.27
– AbbVie Inc 14 0.21
– ABIOMED Inc 1 0.01
– ABM Industries Inc 2 0.04
– Acadia Healthcare Co Inc 3 0.05
– ACADIA Pharmaceuticals Inc 1 0.01
– ACCO Brands Corp 1 0.01
– Achillion Pharmaceuticals Inc 1 0.01
– Acorda Therapeutics Inc 1 0.01
– Aetna Inc 20 0.31
– Air Methods Corp 1 0.01
– Akorn Inc 4 0.07
– Alere Inc 1 0.01
– Alexion Pharmaceuticals Inc 1 0.01
– Align Technology Inc 1 0.01
– Alkermes PLC 1 0.01
– Allergan plc 17 0.26
– Altria Group Inc 18 0.27
– Amedisys Inc 1 0.01
– AMERCO 1 0.01
– AmerisourceBergen Corp 2 0.03
– Amgen Inc 22 0.33
– AMN Healthcare Services Inc 2 0.04
– Amphastar Pharmaceuticals Inc 1 0.01
– Amsurg Corp 2 0.03
– Analogic Corp 1 0.01
– Andersons Inc 1 0.01
– AngioDynamics Inc 1 0.01
– Anika Therapeutics Inc 1 0.01
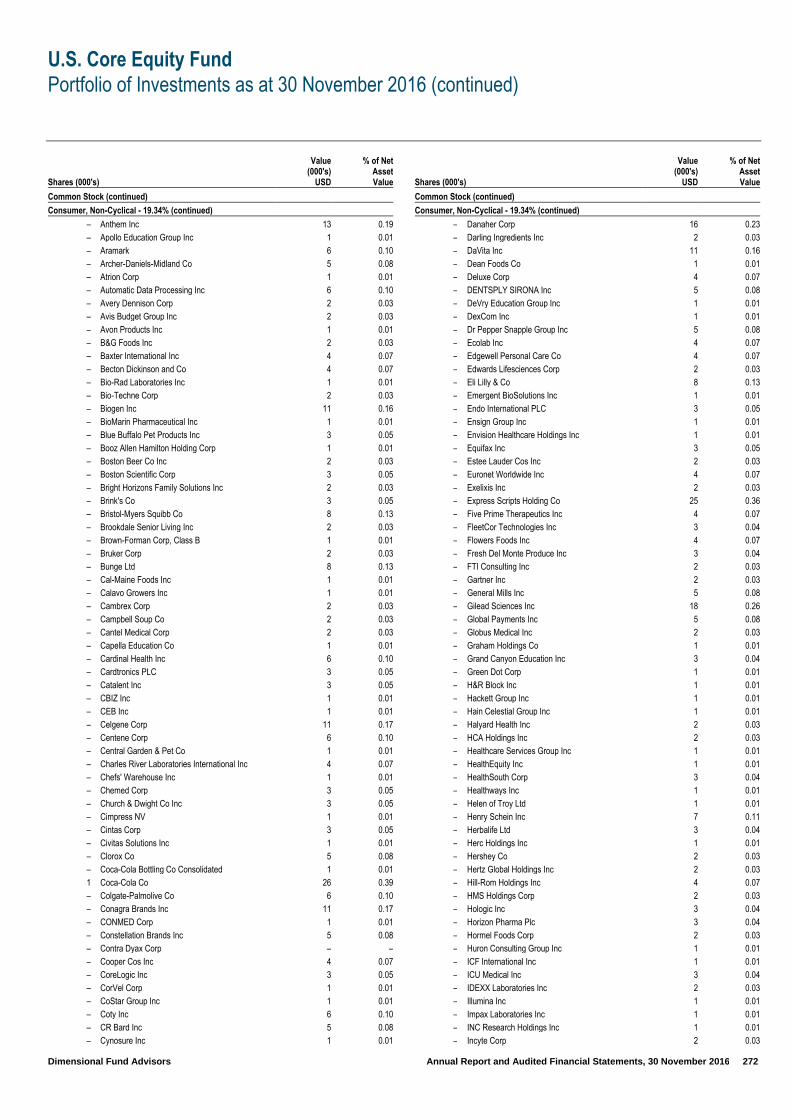
U.S. Core Equity Fund
Portfolio of Investments as at 30 November 2016 (continued)
Dimensional Fund Advisors Annual Report and Audited Financial Statements, 30 November 2016 272
Shares (000's)
Value (000's)
USD
% of Net Asset Value
Common Stock (continued)
Consumer, Non-Cyclical - 19.34% (continued)
– Anthem Inc 13 0.19
– Apollo Education Group Inc 1 0.01
– Aramark 6 0.10
– Archer-Daniels-Midland Co 5 0.08
– Atrion Corp 1 0.01
– Automatic Data Processing Inc 6 0.10
– Avery Dennison Corp 2 0.03
– Avis Budget Group Inc 2 0.03
– Avon Products Inc 1 0.01
– B&G Foods Inc 2 0.03
– Baxter International Inc 4 0.07
– Becton Dickinson and Co 4 0.07
– Bio-Rad Laboratories Inc 1 0.01
– Bio-Techne Corp 2 0.03
– Biogen Inc 11 0.16
– BioMarin Pharmaceutical Inc 1 0.01
– Blue Buffalo Pet Products Inc 3 0.05
– Booz Allen Hamilton Holding Corp 1 0.01
– Boston Beer Co Inc 2 0.03
– Boston Scientific Corp 3 0.05
– Bright Horizons Family Solutions Inc 2 0.03
– Brink's Co 3 0.05
– Bristol-Myers Squibb Co 8 0.13
– Brookdale Senior Living Inc 2 0.03
– Brown-Forman Corp, Class B 1 0.01
– Bruker Corp 2 0.03
– Bunge Ltd 8 0.13
– Cal-Maine Foods Inc 1 0.01
– Calavo Growers Inc 1 0.01
– Cambrex Corp 2 0.03
– Campbell Soup Co 2 0.03
– Cantel Medical Corp 2 0.03
– Capella Education Co 1 0.01
– Cardinal Health Inc 6 0.10
– Cardtronics PLC 3 0.05
– Catalent Inc 3 0.05
– CBIZ Inc 1 0.01
– CEB Inc 1 0.01
– Celgene Corp 11 0.17
– Centene Corp 6 0.10
– Central Garden & Pet Co 1 0.01
– Charles River Laboratories International Inc 4 0.07
– Chefs' Warehouse Inc 1 0.01
– Chemed Corp 3 0.05
– Church & Dwight Co Inc 3 0.05
– Cimpress NV 1 0.01
– Cintas Corp 3 0.05
– Civitas Solutions Inc 1 0.01
– Clorox Co 5 0.08
– Coca-Cola Bottling Co Consolidated 1 0.01
1 Coca-Cola Co 26 0.39
– Colgate-Palmolive Co 6 0.10
– Conagra Brands Inc 11 0.17
– CONMED Corp 1 0.01
– Constellation Brands Inc 5 0.08
– Contra Dyax Corp – –
– Cooper Cos Inc 4 0.07
– CoreLogic Inc 3 0.05
– CorVel Corp 1 0.01
– CoStar Group Inc 1 0.01
– Coty Inc 6 0.10
– CR Bard Inc 5 0.08
– Cynosure Inc 1 0.01
Shares (000's)
Value (000's)
USD
% of Net Asset Value
Common Stock (continued)
Consumer, Non-Cyclical - 19.34% (continued)
– Danaher Corp 16 0.23
– Darling Ingredients Inc 2 0.03
– DaVita Inc 11 0.16
– Dean Foods Co 1 0.01
– Deluxe Corp 4 0.07
– DENTSPLY SIRONA Inc 5 0.08
– DeVry Education Group Inc 1 0.01
– DexCom Inc 1 0.01
– Dr Pepper Snapple Group Inc 5 0.08
– Ecolab Inc 4 0.07
– Edgewell Personal Care Co 4 0.07
– Edwards Lifesciences Corp 2 0.03
– Eli Lilly & Co 8 0.13
– Emergent BioSolutions Inc 1 0.01
– Endo International PLC 3 0.05
– Ensign Group Inc 1 0.01
– Envision Healthcare Holdings Inc 1 0.01
– Equifax Inc 3 0.05
– Estee Lauder Cos Inc 2 0.03
– Euronet Worldwide Inc 4 0.07
– Exelixis Inc 2 0.03
– Express Scripts Holding Co 25 0.36
– Five Prime Therapeutics Inc 4 0.07
– FleetCor Technologies Inc 3 0.04
– Flowers Foods Inc 4 0.07
– Fresh Del Monte Produce Inc 3 0.04
– FTI Consulting Inc 2 0.03
– Gartner Inc 2 0.03
– General Mills Inc 5 0.08
– Gilead Sciences Inc 18 0.26
– Global Payments Inc 5 0.08
– Globus Medical Inc 2 0.03
– Graham Holdings Co 1 0.01
– Grand Canyon Education Inc 3 0.04
– Green Dot Corp 1 0.01
– H&R Block Inc 1 0.01
– Hackett Group Inc 1 0.01
– Hain Celestial Group Inc 1 0.01
– Halyard Health Inc 2 0.03
– HCA Holdings Inc 2 0.03
– Healthcare Services Group Inc 1 0.01
– HealthEquity Inc 1 0.01
– HealthSouth Corp 3 0.04
– Healthways Inc 1 0.01
– Helen of Troy Ltd 1 0.01
– Henry Schein Inc 7 0.11
– Herbalife Ltd 3 0.04
– Herc Holdings Inc 1 0.01
– Hershey Co 2 0.03
– Hertz Global Holdings Inc 2 0.03
– Hill-Rom Holdings Inc 4 0.07
– HMS Holdings Corp 2 0.03
– Hologic Inc 3 0.04
– Horizon Pharma Plc 3 0.04
– Hormel Foods Corp 2 0.03
– Huron Consulting Group Inc 1 0.01
– ICF International Inc 1 0.01
– ICU Medical Inc 3 0.04
– IDEXX Laboratories Inc 2 0.03
– Illumina Inc 1 0.01
– Impax Laboratories Inc 1 0.01
– INC Research Holdings Inc 1 0.01
– Incyte Corp 2 0.03

U.S. Core Equity Fund
Portfolio of Investments as at 30 November 2016 (continued)
Dimensional Fund Advisors Annual Report and Audited Financial Statements, 30 November 2016 273
Shares (000's)
Value (000's)
USD
% of Net Asset Value
Common Stock (continued)
Consumer, Non-Cyclical - 19.34% (continued)
– Ingredion Inc 6 0.10
– Insperity Inc 1 0.01
– Integer Holdings Corp 1 0.01
– Integra LifeSciences Holdings Corp 2 0.03
– Inter Parfums Inc 1 0.01
– Intra-Cellular Therapies Inc 1 0.01
– Intrexon Corp 1 0.01
– Intuitive Surgical Inc 3 0.04
– J&J Snack Foods Corp 2 0.03
– Jazz Pharmaceuticals PLC 5 0.08
– JM Smucker Co 6 0.10
– John B Sanfilippo & Son Inc 1 0.01
1 Johnson & Johnson 62 0.91
– Juno Therapeutics Inc 2 0.03
– K12 Inc 1 0.01
– KAR Auction Services Inc 4 0.07
– Kellogg Co 3 0.04
– Kelly Services Inc 1 0.01
– Kforce Inc 1 0.01
– Kimberly-Clark Corp 5 0.08
– Korn/Ferry International 1 0.01
– Kraft Heinz Co 11 0.17
– Kroger Co 5 0.08
– Laboratory Corp of America Holdings 8 0.13
– Lancaster Colony Corp 3 0.04
– LHC Group Inc 1 0.01
– LifePoint Health Inc 1 0.01
– LivaNova PLC 1 0.01
– Live Nation Entertainment Inc 1 0.01
– LSC Communications Inc 1 0.01
– Luminex Corp 1 0.01
– Macquarie Infrastructure Corp 1 0.01
– Mallinckrodt PLC 3 0.04
– ManpowerGroup Inc 3 0.04
– MarketAxess Holdings Inc 1 0.01
– Masimo Corp 1 0.01
– Matthews International Corp 1 0.01
– McCormick & Co Inc 3 0.04
– McGrath RentCorp 1 0.01
– McKesson Corp 8 0.13
– Mead Johnson Nutrition Co 3 0.04
– Medifast Inc 1 0.01
– MEDNAX Inc 4 0.07
– Medtronic PLC 21 0.31
1 Merck & Co Inc 35 0.51
– Meridian Bioscience Inc 1 0.01
– Merit Medical Systems Inc 1 0.01
– MGP Ingredients Inc 1 0.01
– Molina Healthcare Inc 4 0.07
– Molson Coors Brewing Co 5 0.08
– Mondelez International Inc 14 0.20
– Monro Muffler Brake Inc 1 0.01
– Monster Beverage Corp 1 0.01
– Moody's Corp 2 0.03
– Morningstar Inc 2 0.03
– Mylan NV 7 0.11
– Myriad Genetics Inc 1 0.01
– National Beverage Corp 1 0.01
– Natus Medical Inc 1 0.01
– Neurocrine Biosciences Inc 1 0.01
– Nielsen Holdings PLC 9 0.14
– Nutrisystem Inc 1 0.01
– NuVasive Inc 2 0.03
Shares (000's)
Value (000's)
USD
% of Net Asset Value
Common Stock (continued)
Consumer, Non-Cyclical - 19.34% (continued)
– Omega Protein Corp 1 0.01
– On Assignment Inc 2 0.03
– OPKO Health Inc 1 0.01
– Owens & Minor Inc 2 0.03
– PAREXEL International Corp 2 0.03
– Patterson Cos Inc 5 0.08
– PayPal Holdings Inc 6 0.10
– PepsiCo Inc 20 0.29
– Perrigo Co PLC 5 0.08
2 Pfizer Inc 79 1.16
– PharMerica Corp 1 0.01
– Philip Morris International Inc 16 0.23
– Pilgrim's Pride Corp 2 0.03
– Pinnacle Foods Inc 4 0.07
– Post Holdings Inc 4 0.07
– PRA Health Sciences Inc 2 0.03
– Premier Inc 1 0.01
– Prestige Brands Holdings Inc 2 0.03
1 Procter & Gamble Co 45 0.66
– Providence Service Corp 1 0.01
– Quanta Services Inc 4 0.07
– Quest Diagnostics Inc 7 0.11
– Quintiles IMS Holdings Inc 2 0.03
– RadNet Inc 1 0.01
– Regeneron Pharmaceuticals Inc 3 0.04
– Rent-A-Center Inc 1 0.01
– ResMed Inc 1 0.01
– Resources Connection Inc 1 0.01
– Revlon Inc 1 0.01
– Reynolds American Inc 2 0.03
– Robert Half International Inc 2 0.03
– Rollins Inc 1 0.01
– RPX Corp 1 0.01
– RR Donnelley & Sons Co 2 0.03
– S&P Global Inc 4 0.07
– Sabre Corp 2 0.03
– Sanderson Farms Inc 2 0.03
– Seaboard Corp 4 0.07
– Select Medical Holdings Corp 2 0.03
– Seneca Foods Corp 1 0.01
– Service Corp International 2 0.03
– ServiceMaster Global Holdings Inc 1 0.01
– Smart & Final Stores Inc 1 0.01
– Snyder's-Lance Inc 3 0.04
– SP Plus Corp 1 0.01
– SpartanNash Co 2 0.03
– Spectrum Brands Holdings Inc 1 0.01
– Sprouts Farmers Market Inc 4 0.07
– St Jude Medical Inc 3 0.04
– Steris PLC 2 0.03
– Strayer Education Inc 1 0.01
– Stryker Corp 5 0.08
– Sucampo Pharmaceuticals Inc 1 0.01
– Supervalu Inc 1 0.01
– Surgical Care Affiliates Inc 3 0.04
– Sysco Corp 4 0.07
– Taro Pharmaceutical Industries Ltd 1 0.01
– Team Health Holdings Inc 1 0.01
– Team Inc 1 0.01
– Tenet Healthcare Corp 3 0.04
– TESARO Inc 1 0.01
– Textainer Group Holdings Ltd 1 0.01
– Thermo Fisher Scientific Inc 18 0.26
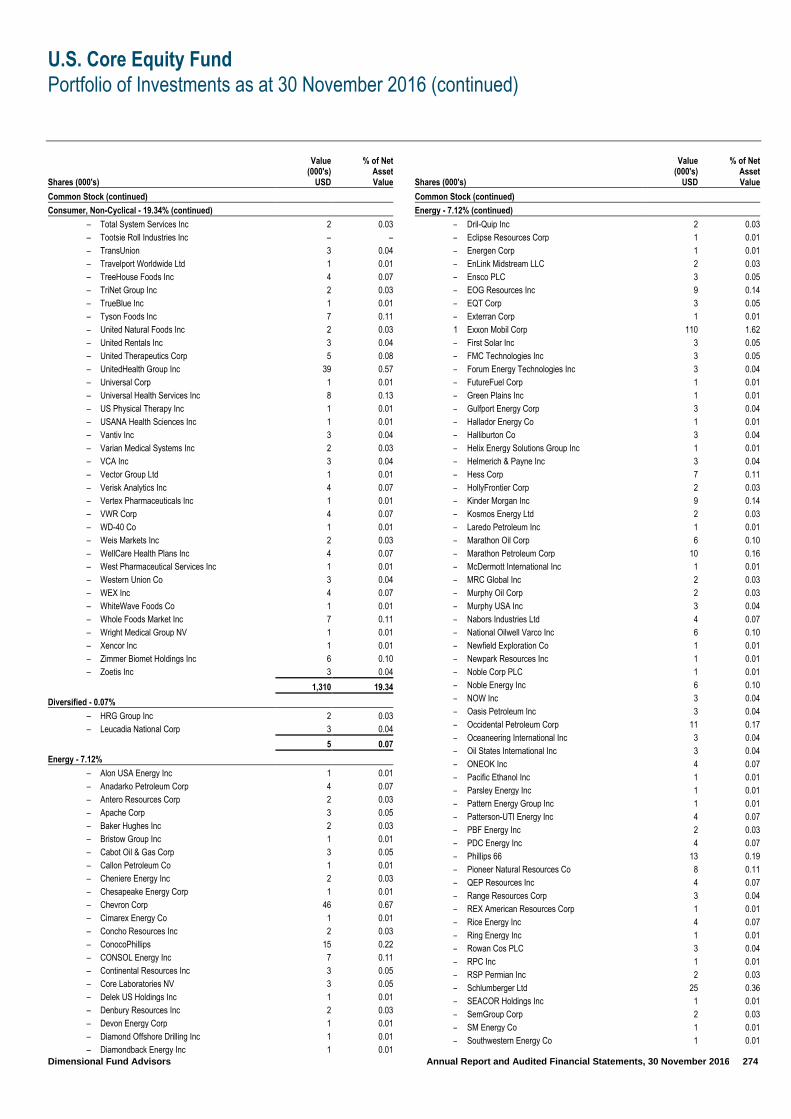
U.S. Core Equity Fund
Portfolio of Investments as at 30 November 2016 (continued)
Dimensional Fund Advisors Annual Report and Audited Financial Statements, 30 November 2016 274
Shares (000's)
Value (000's)
USD
% of Net Asset Value
Common Stock (continued)
Consumer, Non-Cyclical - 19.34% (continued)
– Total System Services Inc 2 0.03
– Tootsie Roll Industries Inc – –
– TransUnion 3 0.04
– Travelport Worldwide Ltd 1 0.01
– TreeHouse Foods Inc 4 0.07
– TriNet Group Inc 2 0.03
– TrueBlue Inc 1 0.01
– Tyson Foods Inc 7 0.11
– United Natural Foods Inc 2 0.03
– United Rentals Inc 3 0.04
– United Therapeutics Corp 5 0.08
– UnitedHealth Group Inc 39 0.57
– Universal Corp 1 0.01
– Universal Health Services Inc 8 0.13
– US Physical Therapy Inc 1 0.01
– USANA Health Sciences Inc 1 0.01
– Vantiv Inc 3 0.04
– Varian Medical Systems Inc 2 0.03
– VCA Inc 3 0.04
– Vector Group Ltd 1 0.01
– Verisk Analytics Inc 4 0.07
– Vertex Pharmaceuticals Inc 1 0.01
– VWR Corp 4 0.07
– WD-40 Co 1 0.01
– Weis Markets Inc 2 0.03
– WellCare Health Plans Inc 4 0.07
– West Pharmaceutical Services Inc 1 0.01
– Western Union Co 3 0.04
– WEX Inc 4 0.07
– WhiteWave Foods Co 1 0.01
– Whole Foods Market Inc 7 0.11
– Wright Medical Group NV 1 0.01
– Xencor Inc 1 0.01
– Zimmer Biomet Holdings Inc 6 0.10
– Zoetis Inc 3 0.04
1,310 19.34
Diversified - 0.07%
– HRG Group Inc 2 0.03
– Leucadia National Corp 3 0.04
5 0.07
Energy - 7.12%
– Alon USA Energy Inc 1 0.01
– Anadarko Petroleum Corp 4 0.07
– Antero Resources Corp 2 0.03
– Apache Corp 3 0.05
– Baker Hughes Inc 2 0.03
– Bristow Group Inc 1 0.01
– Cabot Oil & Gas Corp 3 0.05
– Callon Petroleum Co 1 0.01
– Cheniere Energy Inc 2 0.03
– Chesapeake Energy Corp 1 0.01
– Chevron Corp 46 0.67
– Cimarex Energy Co 1 0.01
– Concho Resources Inc 2 0.03
– ConocoPhillips 15 0.22
– CONSOL Energy Inc 7 0.11
– Continental Resources Inc 3 0.05
– Core Laboratories NV 3 0.05
– Delek US Holdings Inc 1 0.01
– Denbury Resources Inc 2 0.03
– Devon Energy Corp 1 0.01
– Diamond Offshore Drilling Inc 1 0.01
– Diamondback Energy Inc 1 0.01
Shares (000's)
Value (000's)
USD
% of Net Asset Value
Common Stock (continued)
Energy - 7.12% (continued)
– Dril-Quip Inc 2 0.03
– Eclipse Resources Corp 1 0.01
– Energen Corp 1 0.01
– EnLink Midstream LLC 2 0.03
– Ensco PLC 3 0.05
– EOG Resources Inc 9 0.14
– EQT Corp 3 0.05
– Exterran Corp 1 0.01
1 Exxon Mobil Corp 110 1.62
– First Solar Inc 3 0.05
– FMC Technologies Inc 3 0.05
– Forum Energy Technologies Inc 3 0.04
– FutureFuel Corp 1 0.01
– Green Plains Inc 1 0.01
– Gulfport Energy Corp 3 0.04
– Hallador Energy Co 1 0.01
– Halliburton Co 3 0.04
– Helix Energy Solutions Group Inc 1 0.01
– Helmerich & Payne Inc 3 0.04
– Hess Corp 7 0.11
– HollyFrontier Corp 2 0.03
– Kinder Morgan Inc 9 0.14
– Kosmos Energy Ltd 2 0.03
– Laredo Petroleum Inc 1 0.01
– Marathon Oil Corp 6 0.10
– Marathon Petroleum Corp 10 0.16
– McDermott International Inc 1 0.01
– MRC Global Inc 2 0.03
– Murphy Oil Corp 2 0.03
– Murphy USA Inc 3 0.04
– Nabors Industries Ltd 4 0.07
– National Oilwell Varco Inc 6 0.10
– Newfield Exploration Co 1 0.01
– Newpark Resources Inc 1 0.01
– Noble Corp PLC 1 0.01
– Noble Energy Inc 6 0.10
– NOW Inc 3 0.04
– Oasis Petroleum Inc 3 0.04
– Occidental Petroleum Corp 11 0.17
– Oceaneering International Inc 3 0.04
– Oil States International Inc 3 0.04
– ONEOK Inc 4 0.07
– Pacific Ethanol Inc 1 0.01
– Parsley Energy Inc 1 0.01
– Pattern Energy Group Inc 1 0.01
– Patterson-UTI Energy Inc 4 0.07
– PBF Energy Inc 2 0.03
– PDC Energy Inc 4 0.07
– Phillips 66 13 0.19
– Pioneer Natural Resources Co 8 0.11
– QEP Resources Inc 4 0.07
– Range Resources Corp 3 0.04
– REX American Resources Corp 1 0.01
– Rice Energy Inc 4 0.07
– Ring Energy Inc 1 0.01
– Rowan Cos PLC 3 0.04
– RPC Inc 1 0.01
– RSP Permian Inc 2 0.03
– Schlumberger Ltd 25 0.36
– SEACOR Holdings Inc 1 0.01
– SemGroup Corp 2 0.03
– SM Energy Co 1 0.01
– Southwestern Energy Co 1 0.01
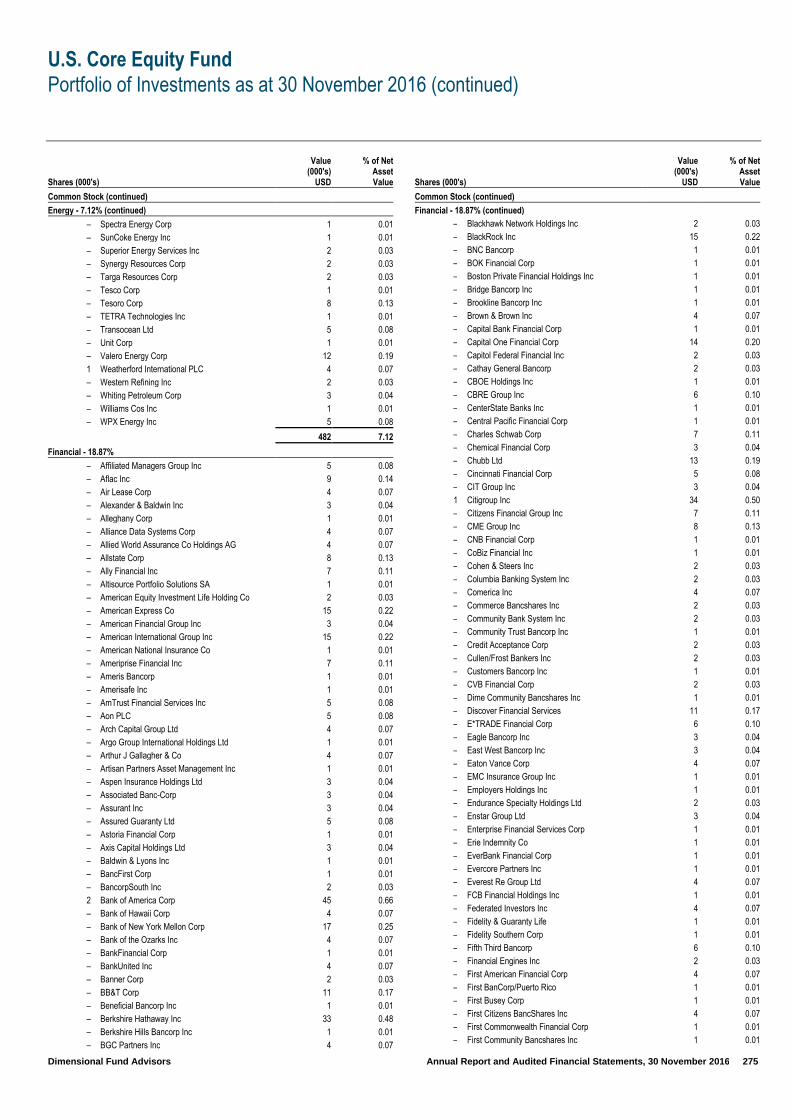
U.S. Core Equity Fund
Portfolio of Investments as at 30 November 2016 (continued)
Dimensional Fund Advisors Annual Report and Audited Financial Statements, 30 November 2016 275
Shares (000's)
Value (000's)
USD
% of Net Asset Value
Common Stock (continued)
Energy - 7.12% (continued)
– Spectra Energy Corp 1 0.01
– SunCoke Energy Inc 1 0.01
– Superior Energy Services Inc 2 0.03
– Synergy Resources Corp 2 0.03
– Targa Resources Corp 2 0.03
– Tesco Corp 1 0.01
– Tesoro Corp 8 0.13
– TETRA Technologies Inc 1 0.01
– Transocean Ltd 5 0.08
– Unit Corp 1 0.01
– Valero Energy Corp 12 0.19
1 Weatherford International PLC 4 0.07
– Western Refining Inc 2 0.03
– Whiting Petroleum Corp 3 0.04
– Williams Cos Inc 1 0.01
– WPX Energy Inc 5 0.08
482 7.12
Financial - 18.87%
– Affiliated Managers Group Inc 5 0.08
– Aflac Inc 9 0.14
– Air Lease Corp 4 0.07
– Alexander & Baldwin Inc 3 0.04
– Alleghany Corp 1 0.01
– Alliance Data Systems Corp 4 0.07
– Allied World Assurance Co Holdings AG 4 0.07
– Allstate Corp 8 0.13
– Ally Financial Inc 7 0.11
– Altisource Portfolio Solutions SA 1 0.01
– American Equity Investment Life Holding Co 2 0.03
– American Express Co 15 0.22
– American Financial Group Inc 3 0.04
– American International Group Inc 15 0.22
– American National Insurance Co 1 0.01
– Ameriprise Financial Inc 7 0.11
– Ameris Bancorp 1 0.01
– Amerisafe Inc 1 0.01
– AmTrust Financial Services Inc 5 0.08
– Aon PLC 5 0.08
– Arch Capital Group Ltd 4 0.07
– Argo Group International Holdings Ltd 1 0.01
– Arthur J Gallagher & Co 4 0.07
– Artisan Partners Asset Management Inc 1 0.01
– Aspen Insurance Holdings Ltd 3 0.04
– Associated Banc-Corp 3 0.04
– Assurant Inc 3 0.04
– Assured Guaranty Ltd 5 0.08
– Astoria Financial Corp 1 0.01
– Axis Capital Holdings Ltd 3 0.04
– Baldwin & Lyons Inc 1 0.01
– BancFirst Corp 1 0.01
– BancorpSouth Inc 2 0.03
2 Bank of America Corp 45 0.66
– Bank of Hawaii Corp 4 0.07
– Bank of New York Mellon Corp 17 0.25
– Bank of the Ozarks Inc 4 0.07
– BankFinancial Corp 1 0.01
– BankUnited Inc 4 0.07
– Banner Corp 2 0.03
– BB&T Corp 11 0.17
– Beneficial Bancorp Inc 1 0.01
– Berkshire Hathaway Inc 33 0.48
– Berkshire Hills Bancorp Inc 1 0.01
– BGC Partners Inc 4 0.07
Shares (000's)
Value (000's)
USD
% of Net Asset Value
Common Stock (continued)
Financial - 18.87% (continued) – Blackhawk Network Holdings Inc 2 0.03
– BlackRock Inc 15 0.22
– BNC Bancorp 1 0.01
– BOK Financial Corp 1 0.01
– Boston Private Financial Holdings Inc 1 0.01
– Bridge Bancorp Inc 1 0.01
– Brookline Bancorp Inc 1 0.01
– Brown & Brown Inc 4 0.07
– Capital Bank Financial Corp 1 0.01
– Capital One Financial Corp 14 0.20
– Capitol Federal Financial Inc 2 0.03
– Cathay General Bancorp 2 0.03
– CBOE Holdings Inc 1 0.01
– CBRE Group Inc 6 0.10
– CenterState Banks Inc 1 0.01
– Central Pacific Financial Corp 1 0.01
– Charles Schwab Corp 7 0.11
– Chemical Financial Corp 3 0.04
– Chubb Ltd 13 0.19
– Cincinnati Financial Corp 5 0.08
– CIT Group Inc 3 0.04
1 Citigroup Inc 34 0.50
– Citizens Financial Group Inc 7 0.11
– CME Group Inc 8 0.13
– CNB Financial Corp 1 0.01
– CoBiz Financial Inc 1 0.01
– Cohen & Steers Inc 2 0.03
– Columbia Banking System Inc 2 0.03
– Comerica Inc 4 0.07
– Commerce Bancshares Inc 2 0.03
– Community Bank System Inc 2 0.03
– Community Trust Bancorp Inc 1 0.01
– Credit Acceptance Corp 2 0.03
– Cullen/Frost Bankers Inc 2 0.03
– Customers Bancorp Inc 1 0.01
– CVB Financial Corp 2 0.03
– Dime Community Bancshares Inc 1 0.01
– Discover Financial Services 11 0.17
– E*TRADE Financial Corp 6 0.10
– Eagle Bancorp Inc 3 0.04
– East West Bancorp Inc 3 0.04
– Eaton Vance Corp 4 0.07
– EMC Insurance Group Inc 1 0.01
– Employers Holdings Inc 1 0.01
– Endurance Specialty Holdings Ltd 2 0.03
– Enstar Group Ltd 3 0.04
– Enterprise Financial Services Corp 1 0.01
– Erie Indemnity Co 1 0.01
– EverBank Financial Corp 1 0.01
– Evercore Partners Inc 1 0.01
– Everest Re Group Ltd 4 0.07
– FCB Financial Holdings Inc 1 0.01
– Federated Investors Inc 4 0.07
– Fidelity & Guaranty Life 1 0.01
– Fidelity Southern Corp 1 0.01
– Fifth Third Bancorp 6 0.10
– Financial Engines Inc 2 0.03
– First American Financial Corp 4 0.07
– First BanCorp/Puerto Rico 1 0.01
– First Busey Corp 1 0.01
– First Citizens BancShares Inc 4 0.07
– First Commonwealth Financial Corp 1 0.01
– First Community Bancshares Inc 1 0.01
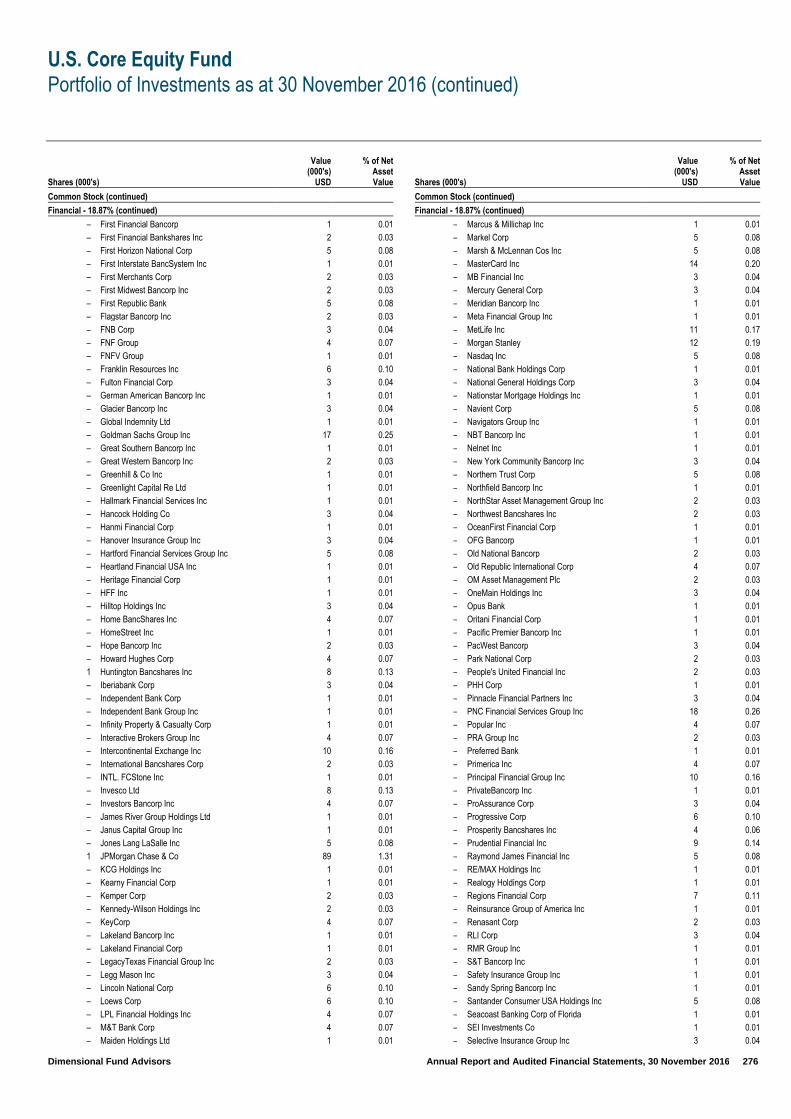
U.S. Core Equity Fund
Portfolio of Investments as at 30 November 2016 (continued)
Dimensional Fund Advisors Annual Report and Audited Financial Statements, 30 November 2016 276
Shares (000's)
Value (000's)
USD
% of Net Asset Value
Common Stock (continued)
Financial - 18.87% (continued)
– First Financial Bancorp 1 0.01
– First Financial Bankshares Inc 2 0.03
– First Horizon National Corp 5 0.08
– First Interstate BancSystem Inc 1 0.01
– First Merchants Corp 2 0.03
– First Midwest Bancorp Inc 2 0.03
– First Republic Bank 5 0.08
– Flagstar Bancorp Inc 2 0.03
– FNB Corp 3 0.04
– FNF Group 4 0.07
– FNFV Group 1 0.01
– Franklin Resources Inc 6 0.10
– Fulton Financial Corp 3 0.04
– German American Bancorp Inc 1 0.01
– Glacier Bancorp Inc 3 0.04
– Global Indemnity Ltd 1 0.01
– Goldman Sachs Group Inc 17 0.25
– Great Southern Bancorp Inc 1 0.01
– Great Western Bancorp Inc 2 0.03
– Greenhill & Co Inc 1 0.01
– Greenlight Capital Re Ltd 1 0.01
– Hallmark Financial Services Inc 1 0.01
– Hancock Holding Co 3 0.04
– Hanmi Financial Corp 1 0.01
– Hanover Insurance Group Inc 3 0.04
– Hartford Financial Services Group Inc 5 0.08
– Heartland Financial USA Inc 1 0.01
– Heritage Financial Corp 1 0.01
– HFF Inc 1 0.01
– Hilltop Holdings Inc 3 0.04
– Home BancShares Inc 4 0.07
– HomeStreet Inc 1 0.01
– Hope Bancorp Inc 2 0.03
– Howard Hughes Corp 4 0.07
1 Huntington Bancshares Inc 8 0.13
– Iberiabank Corp 3 0.04
– Independent Bank Corp 1 0.01
– Independent Bank Group Inc 1 0.01
– Infinity Property & Casualty Corp 1 0.01
– Interactive Brokers Group Inc 4 0.07
– Intercontinental Exchange Inc 10 0.16
– International Bancshares Corp 2 0.03
– INTL. FCStone Inc 1 0.01
– Invesco Ltd 8 0.13
– Investors Bancorp Inc 4 0.07
– James River Group Holdings Ltd 1 0.01
– Janus Capital Group Inc 1 0.01
– Jones Lang LaSalle Inc 5 0.08
1 JPMorgan Chase & Co 89 1.31
– KCG Holdings Inc 1 0.01
– Kearny Financial Corp 1 0.01
– Kemper Corp 2 0.03
– Kennedy-Wilson Holdings Inc 2 0.03
– KeyCorp 4 0.07
– Lakeland Bancorp Inc 1 0.01
– Lakeland Financial Corp 1 0.01
– LegacyTexas Financial Group Inc 2 0.03
– Legg Mason Inc 3 0.04
– Lincoln National Corp 6 0.10
– Loews Corp 6 0.10
– LPL Financial Holdings Inc 4 0.07
– M&T Bank Corp 4 0.07
– Maiden Holdings Ltd 1 0.01
Shares (000's)
Value (000's)
USD
% of Net Asset Value
Common Stock (continued)
Financial - 18.87% (continued)
– Marcus & Millichap Inc 1 0.01
– Markel Corp 5 0.08
– Marsh & McLennan Cos Inc 5 0.08
– MasterCard Inc 14 0.20
– MB Financial Inc 3 0.04
– Mercury General Corp 3 0.04
– Meridian Bancorp Inc 1 0.01
– Meta Financial Group Inc 1 0.01
– MetLife Inc 11 0.17
– Morgan Stanley 12 0.19
– Nasdaq Inc 5 0.08
– National Bank Holdings Corp 1 0.01
– National General Holdings Corp 3 0.04
– Nationstar Mortgage Holdings Inc 1 0.01
– Navient Corp 5 0.08
– Navigators Group Inc 1 0.01
– NBT Bancorp Inc 1 0.01
– Nelnet Inc 1 0.01
– New York Community Bancorp Inc 3 0.04
– Northern Trust Corp 5 0.08
– Northfield Bancorp Inc 1 0.01
– NorthStar Asset Management Group Inc 2 0.03
– Northwest Bancshares Inc 2 0.03
– OceanFirst Financial Corp 1 0.01
– OFG Bancorp 1 0.01
– Old National Bancorp 2 0.03
– Old Republic International Corp 4 0.07
– OM Asset Management Plc 2 0.03
– OneMain Holdings Inc 3 0.04
– Opus Bank 1 0.01
– Oritani Financial Corp 1 0.01
– Pacific Premier Bancorp Inc 1 0.01
– PacWest Bancorp 3 0.04
– Park National Corp 2 0.03
– People's United Financial Inc 2 0.03
– PHH Corp 1 0.01
– Pinnacle Financial Partners Inc 3 0.04
– PNC Financial Services Group Inc 18 0.26
– Popular Inc 4 0.07
– PRA Group Inc 2 0.03
– Preferred Bank 1 0.01
– Primerica Inc 4 0.07
– Principal Financial Group Inc 10 0.16
– PrivateBancorp Inc 1 0.01
– ProAssurance Corp 3 0.04
– Progressive Corp 6 0.10
– Prosperity Bancshares Inc 4 0.06
– Prudential Financial Inc 9 0.14
– Raymond James Financial Inc 5 0.08
– RE/MAX Holdings Inc 1 0.01
– Realogy Holdings Corp 1 0.01
– Regions Financial Corp 7 0.11
– Reinsurance Group of America Inc 1 0.01
– Renasant Corp 2 0.03
– RLI Corp 3 0.04
– RMR Group Inc 1 0.01
– S&T Bancorp Inc 1 0.01
– Safety Insurance Group Inc 1 0.01
– Sandy Spring Bancorp Inc 1 0.01
– Santander Consumer USA Holdings Inc 5 0.08
– Seacoast Banking Corp of Florida 1 0.01
– SEI Investments Co 1 0.01
– Selective Insurance Group Inc 3 0.04

U.S. Core Equity Fund
Portfolio of Investments as at 30 November 2016 (continued)
Dimensional Fund Advisors Annual Report and Audited Financial Statements, 30 November 2016 277
Shares (000's)
Value (000's)
USD
% of Net Asset Value
Common Stock (continued)
Financial - 18.87% (continued)
– ServisFirst Bancshares Inc 1 0.01
– Signature Bank 4 0.06
– Simmons First National Corp 2 0.03
1 SLM Corp 5 0.08
– South State Corp 2 0.03
– Southside Bancshares Inc 1 0.01
– State Bank Financial Corp 1 0.01
– State National Cos Inc 1 0.01
– State Street Corp 6 0.10
– Sterling Bancorp 3 0.04
– Stewart Information Services Corp 1 0.01
– Stifel Financial Corp 3 0.04
– Stock Yards Bancorp Inc 1 0.01
– SunTrust Banks Inc 8 0.13
– SVB Financial Group 4 0.06
– Synchrony Financial 12 0.19
– Synovus Financial Corp 5 0.08
– T Rowe Price Group Inc 5 0.08
– TCF Financial Corp 4 0.06
– TD Ameritrade Holding Corp 2 0.03
– Texas Capital Bancshares Inc 3 0.04
– TFS Financial Corp 1 0.01
– Third Point Reinsurance Ltd 1 0.01
– Torchmark Corp 5 0.08
– Towne Bank 2 0.03
– Travelers Cos Inc 17 0.25
– TriCo Bancshares 1 0.01
– TriState Capital Holdings Inc 1 0.01
– TrustCo Bank Corp NY 1 0.01
– Trustmark Corp 2 0.03
– UMB Financial Corp 3 0.04
– Umpqua Holdings Corp 4 0.06
– Union Bankshares Corp 2 0.03
– United Bankshares Inc 3 0.04
– United Community Banks Inc 2 0.03
– United Financial Bancorp Inc 1 0.01
– United Fire Group Inc 1 0.01
– Universal Insurance Holdings Inc 1 0.01
– Univest Corp of Pennsylvania 1 0.01
– Unum Group 6 0.10
1 US Bancorp 27 0.39
– Validus Holdings Ltd 4 0.06
– Valley National Bancorp 3 0.04
– Visa Inc 23 0.33
– Voya Financial Inc 3 0.04
– Waddell & Reed Financial Inc 2 0.03
– Walker & Dunlop Inc 1 0.01
– Washington Federal Inc 3 0.04
– Washington Trust Bancorp Inc 1 0.01
– Waterstone Financial Inc 1 0.01
– Webster Financial Corp 4 0.06
1 Wells Fargo & Co 78 1.15
– Western Alliance Bancorp 5 0.08
– White Mountains Insurance Group Ltd 2 0.03
– Willis Towers Watson PLC 7 0.11
– Wintrust Financial Corp 4 0.06
– WisdomTree Investments Inc 1 0.01
– WR Berkley Corp 5 0.08
– WSFS Financial Corp 1 0.01
– XL Group Ltd 4 0.07
– Zions Bancorporation 3 0.04
1,278 18.87
Shares (000's)
Value (000's)
USD
% of Net Asset Value
Common Stock (continued)
Industrial - 13.24%
– 3M Co 15 0.22
– AAON Inc 1 0.01
– Acuity Brands Inc 3 0.04
– Advanced Drainage Systems Inc 1 0.01
– Advanced Energy Industries Inc 2 0.03
– AECOM 3 0.04
– AEP Industries Inc 1 0.01
– Aerojet Rocketdyne Holdings Inc 1 0.01
– AGCO Corp 7 0.11
– Agilent Technologies Inc 6 0.10
– Air Transport Services Group Inc 1 0.01
– Alamo Group Inc 2 0.03
– Albany International Corp 3 0.04
– Allegion PLC 2 0.03
– Altra Industrial Motion Corp 1 0.01
– AMETEK Inc 7 0.11
– Amphenol Corp 3 0.04
– AO Smith Corp 1 0.01
– Apogee Enterprises Inc 2 0.03
– Applied Industrial Technologies Inc 3 0.04
– AptarGroup Inc 5 0.08
– ArcBest Corp 1 0.01
– Arconic Inc 1 0.01
– Argan Inc 1 0.01
– Armstrong World Industries Inc 1 0.01
– Arrow Electronics Inc 7 0.11
– Astec Industries Inc 1 0.01
– Astronics Corp 1 0.01
– Atlas Air Worldwide Holdings Inc 1 0.01
– Avnet Inc 3 0.04
– AVX Corp 2 0.03
– B/E Aerospace Inc 1 0.01
– Babcock & Wilcox Enterprises Inc 1 0.01
– Badger Meter Inc 1 0.01
– Ball Corp 6 0.10
– Barnes Group Inc 3 0.04
– Belden Inc 4 0.07
– Bemis Co Inc 6 0.10
– Berry Plastics Group Inc 2 0.03
– Boise Cascade Co 1 0.01
– Brady Corp 2 0.03
– Builders FirstSource Inc 1 0.01
– BWX Technologies Inc 2 0.03
– Carlisle Cos Inc 4 0.07
– Caterpillar Inc 12 0.17
– CH Robinson Worldwide Inc 3 0.04
– Chart Industries Inc 1 0.01
– Chase Corp 1 0.01
– Chicago Bridge & Iron Co NV 3 0.04
– CIRCOR International Inc 2 0.03
– CLARCOR Inc 4 0.07
– Clean Harbors Inc 4 0.07
– Cognex Corp 1 0.01
– Coherent Inc 3 0.04
– Colfax Corp 6 0.10
– Comfort Systems USA Inc 1 0.01
– Continental Building Products Inc 1 0.01
– Corning Inc 5 0.08
– Covanta Holding Corp 2 0.03
– Crane Co 4 0.07
– Cree Inc 2 0.03
– Crown Holdings Inc 2 0.03
– CSX Corp 15 0.22

U.S. Core Equity Fund
Portfolio of Investments as at 30 November 2016 (continued)
Dimensional Fund Advisors Annual Report and Audited Financial Statements, 30 November 2016 278
Shares (000's)
Value (000's)
USD
% of Net Asset Value
Common Stock (continued)
Industrial - 13.24% (continued)
– Cubic Corp 1 0.01
– Cummins Inc 5 0.08
– Curtiss-Wright Corp 3 0.04
– Deere & Co 7 0.11
– DHT Holdings Inc 1 0.01
– Donaldson Co Inc 1 0.01
– Dover Corp 7 0.11
– Drew Industries Inc 4 0.07
– Dycom Industries Inc 4 0.07
– Eagle Materials Inc 5 0.08
– Eaton Corp PLC 10 0.14
– Echo Global Logistics Inc 1 0.01
– EMCOR Group Inc 7 0.11
– Emerson Electric Co 5 0.08
– Encore Wire Corp 1 0.01
– Energizer Holdings Inc 1 0.01
– EnerSys 4 0.07
– ESCO Technologies Inc 1 0.01
– Esterline Technologies Corp 1 0.01
– Expeditors International of Washington Inc 2 0.03
– Exponent Inc 2 0.03
– Fabrinet 1 0.01
– FARO Technologies Inc 1 0.01
– Federal Signal Corp 1 0.01
– FedEx Corp 13 0.19
– Fitbit Inc 1 0.01
– Flex Ltd 6 0.10
– FLIR Systems Inc 5 0.08
– Flowserve Corp 4 0.07
– Fluor Corp 4 0.07
– Fortive Corp 1 0.01
– Fortune Brands Home & Security Inc 5 0.08
– Forward Air Corp 1 0.01
– Franklin Electric Co Inc 2 0.03
– Garmin Ltd 4 0.07
– Generac Holdings Inc 2 0.03
– General Cable Corp 1 0.01
1 General Electric Co 30 0.44
– Genesee & Wyoming Inc 7 0.11
– Gentex Corp 4 0.07
– Gibraltar Industries Inc 1 0.01
– GoPro Inc 1 0.01
– Graco Inc 3 0.04
– Granite Construction Inc 2 0.03
– Graphic Packaging Holding Co 6 0.10
– Greif Inc, Class A 1 0.01
– Greif Inc, Class B 2 0.03
– Harris Corp 9 0.13
– Harsco Corp 2 0.03
– Haynes International Inc 1 0.01
– Heartland Express Inc 3 0.04
– HEICO Corp 1 0.01
– HEICO Corp, Class A 1 0.01
– Hexcel Corp 6 0.10
– Hillenbrand Inc 2 0.03
– Honeywell International Inc 13 0.19
– Hub Group Inc 2 0.03
– Hubbell Inc 5 0.08
– Huntington Ingalls Industries Inc 4 0.07
– Hyster-Yale Materials Handling Inc 1 0.01
– IDEX Corp 3 0.04
– II-VI Inc 2 0.03
– Illinois Tool Works Inc 5 0.08
Shares (000's)
Value (000's)
USD
% of Net Asset Value
Common Stock (continued)
Industrial - 13.24% (continued)
– Ingersoll-Rand PLC 8 0.13
– Insteel Industries Inc 1 0.01
– Itron Inc 3 0.04
– ITT Inc 4 0.07
– Jabil Circuit Inc 5 0.08
– Jacobs Engineering Group Inc 3 0.04
– JB Hunt Transport Services Inc 3 0.04
– John Bean Technologies Corp 2 0.03
– Johnson Controls International PLC 2 0.03
– Joy Global Inc 1 0.01
– Kadant Inc 1 0.01
– Kansas City Southern 6 0.10
– KapStone Paper and Packaging Corp 2 0.03
– KBR Inc 3 0.04
– Kennametal Inc 1 0.01
– Keysight Technologies Inc 4 0.07
– Kirby Corp 4 0.07
– KLX Inc 2 0.03
– Knight Transportation Inc 4 0.07
– Knowles Corp 2 0.03
– Kratos Defense & Security Solutions Inc 1 0.01
– L-3 Communications Holdings Inc 4 0.07
– Landstar System Inc 3 0.04
– Lennox International Inc 2 0.03
– Lincoln Electric Holdings Inc 4 0.07
– Lindsay Corp 1 0.01
– Littelfuse Inc 2 0.03
– Louisiana-Pacific Corp 2 0.03
– Lydall Inc 1 0.01
– Manitowoc Co Inc 1 0.01
– Manitowoc Foodservice Inc 1 0.01
– Marten Transport Ltd 1 0.01
– Martin Marietta Materials Inc 6 0.10
– Masco Corp 2 0.03
– MasTec Inc 3 0.04
– Matson Inc 3 0.04
– Mesa Laboratories Inc 1 0.01
– Methode Electronics Inc 1 0.01
– Mettler-Toledo International Inc 3 0.04
– Middleby Corp 1 0.01
– Mistras Group Inc 1 0.01
– Moog Inc 3 0.04
– MSA Safety Inc 2 0.03
– Mueller Industries Inc 2 0.03
– Mueller Water Products Inc 3 0.04
– Multi-Color Corp 1 0.01
– National Instruments Corp 3 0.04
– NCI Building Systems Inc 1 0.01
– Nordson Corp 1 0.01
– Norfolk Southern Corp 14 0.20
– Northrop Grumman Corp 6 0.10
– Novanta Inc 1 0.01
– Old Dominion Freight Line Inc 5 0.08
– Oshkosh Corp 5 0.08
– OSI Systems Inc 1 0.01
– Overseas Shipholding Group Inc 1 0.01
– Owens Corning 5 0.08
– Owens-Illinois Inc 1 0.01
– Packaging Corp of America 2 0.03
– Park-Ohio Holdings Corp 1 0.01
– Parker-Hannifin Corp 4 0.07
– Patrick Industries Inc 2 0.03
– Pentair PLC 5 0.08
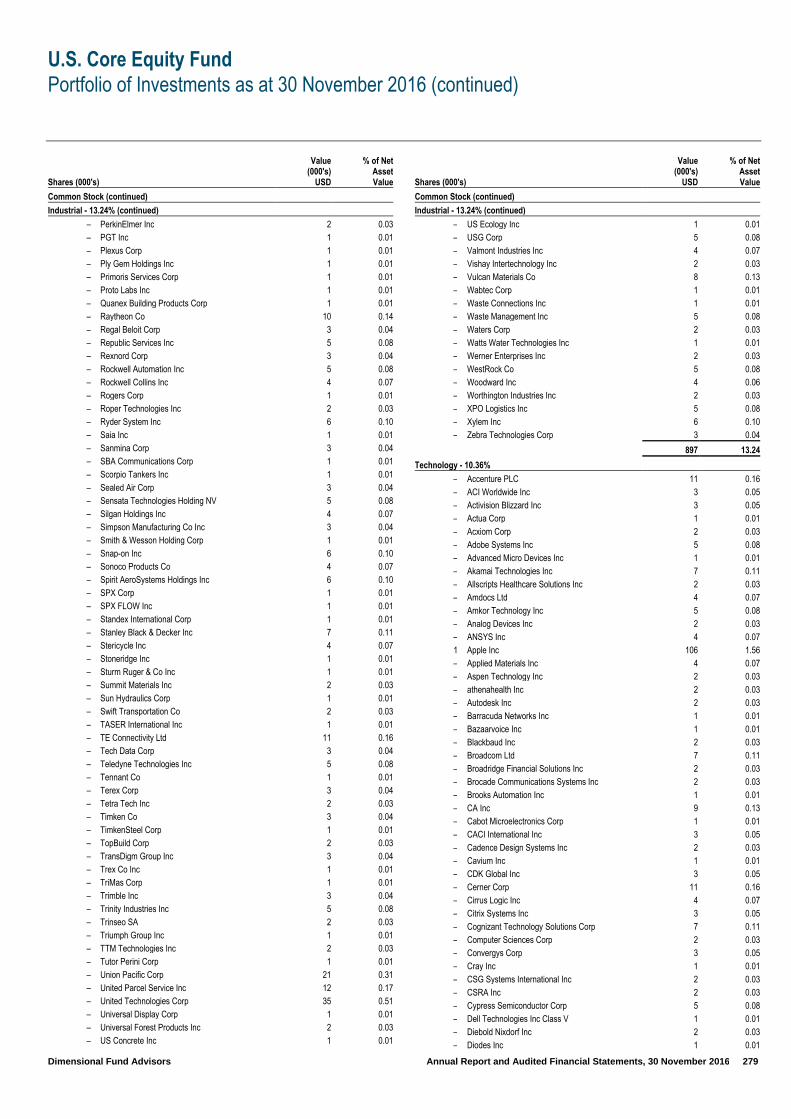
U.S. Core Equity Fund
Portfolio of Investments as at 30 November 2016 (continued)
Dimensional Fund Advisors Annual Report and Audited Financial Statements, 30 November 2016 279
Shares (000's)
Value (000's)
USD
% of Net Asset Value
Common Stock (continued)
Industrial - 13.24% (continued)
– PerkinElmer Inc 2 0.03
– PGT Inc 1 0.01
– Plexus Corp 1 0.01
– Ply Gem Holdings Inc 1 0.01
– Primoris Services Corp 1 0.01
– Proto Labs Inc 1 0.01
– Quanex Building Products Corp 1 0.01
– Raytheon Co 10 0.14
– Regal Beloit Corp 3 0.04
– Republic Services Inc 5 0.08
– Rexnord Corp 3 0.04
– Rockwell Automation Inc 5 0.08
– Rockwell Collins Inc 4 0.07
– Rogers Corp 1 0.01
– Roper Technologies Inc 2 0.03
– Ryder System Inc 6 0.10
– Saia Inc 1 0.01
– Sanmina Corp 3 0.04
– SBA Communications Corp 1 0.01
– Scorpio Tankers Inc 1 0.01
– Sealed Air Corp 3 0.04
– Sensata Technologies Holding NV 5 0.08
– Silgan Holdings Inc 4 0.07
– Simpson Manufacturing Co Inc 3 0.04
– Smith & Wesson Holding Corp 1 0.01
– Snap-on Inc 6 0.10
– Sonoco Products Co 4 0.07
– Spirit AeroSystems Holdings Inc 6 0.10
– SPX Corp 1 0.01
– SPX FLOW Inc 1 0.01
– Standex International Corp 1 0.01
– Stanley Black & Decker Inc 7 0.11
– Stericycle Inc 4 0.07
– Stoneridge Inc 1 0.01
– Sturm Ruger & Co Inc 1 0.01
– Summit Materials Inc 2 0.03
– Sun Hydraulics Corp 1 0.01
– Swift Transportation Co 2 0.03
– TASER International Inc 1 0.01
– TE Connectivity Ltd 11 0.16
– Tech Data Corp 3 0.04
– Teledyne Technologies Inc 5 0.08
– Tennant Co 1 0.01
– Terex Corp 3 0.04
– Tetra Tech Inc 2 0.03
– Timken Co 3 0.04
– TimkenSteel Corp 1 0.01
– TopBuild Corp 2 0.03
– TransDigm Group Inc 3 0.04
– Trex Co Inc 1 0.01
– TriMas Corp 1 0.01
– Trimble Inc 3 0.04
– Trinity Industries Inc 5 0.08
– Trinseo SA 2 0.03
– Triumph Group Inc 1 0.01
– TTM Technologies Inc 2 0.03
– Tutor Perini Corp 1 0.01
– Union Pacific Corp 21 0.31
– United Parcel Service Inc 12 0.17
– United Technologies Corp 35 0.51
– Universal Display Corp 1 0.01
– Universal Forest Products Inc 2 0.03
– US Concrete Inc 1 0.01
Shares (000's)
Value (000's)
USD
% of Net Asset Value
Common Stock (continued)
Industrial - 13.24% (continued)
– US Ecology Inc 1 0.01
– USG Corp 5 0.08
– Valmont Industries Inc 4 0.07
– Vishay Intertechnology Inc 2 0.03
– Vulcan Materials Co 8 0.13
– Wabtec Corp 1 0.01
– Waste Connections Inc 1 0.01
– Waste Management Inc 5 0.08
– Waters Corp 2 0.03
– Watts Water Technologies Inc 1 0.01
– Werner Enterprises Inc 2 0.03
– WestRock Co 5 0.08
– Woodward Inc 4 0.06
– Worthington Industries Inc 2 0.03
– XPO Logistics Inc 5 0.08
– Xylem Inc 6 0.10
– Zebra Technologies Corp 3 0.04
897 13.24
Technology - 10.36%
– Accenture PLC 11 0.16
– ACI Worldwide Inc 3 0.05
– Activision Blizzard Inc 3 0.05
– Actua Corp 1 0.01
– Acxiom Corp 2 0.03
– Adobe Systems Inc 5 0.08
– Advanced Micro Devices Inc 1 0.01
– Akamai Technologies Inc 7 0.11
– Allscripts Healthcare Solutions Inc 2 0.03
– Amdocs Ltd 4 0.07
– Amkor Technology Inc 5 0.08
– Analog Devices Inc 2 0.03
– ANSYS Inc 4 0.07
1 Apple Inc 106 1.56
– Applied Materials Inc 4 0.07
– Aspen Technology Inc 2 0.03
– athenahealth Inc 2 0.03
– Autodesk Inc 2 0.03
– Barracuda Networks Inc 1 0.01
– Bazaarvoice Inc 1 0.01
– Blackbaud Inc 2 0.03
– Broadcom Ltd 7 0.11
– Broadridge Financial Solutions Inc 2 0.03
– Brocade Communications Systems Inc 2 0.03
– Brooks Automation Inc 1 0.01
– CA Inc 9 0.13
– Cabot Microelectronics Corp 1 0.01
– CACI International Inc 3 0.05
– Cadence Design Systems Inc 2 0.03
– Cavium Inc 1 0.01
– CDK Global Inc 3 0.05
– Cerner Corp 11 0.16
– Cirrus Logic Inc 4 0.07
– Citrix Systems Inc 3 0.05
– Cognizant Technology Solutions Corp 7 0.11
– Computer Sciences Corp 2 0.03
– Convergys Corp 3 0.05
– Cray Inc 1 0.01
– CSG Systems International Inc 2 0.03
– CSRA Inc 2 0.03
– Cypress Semiconductor Corp 5 0.08
– Dell Technologies Inc Class V 1 0.01
– Diebold Nixdorf Inc 2 0.03
– Diodes Inc 1 0.01

U.S. Core Equity Fund
Portfolio of Investments as at 30 November 2016 (continued)
Dimensional Fund Advisors Annual Report and Audited Financial Statements, 30 November 2016 280
Shares (000's)
Value (000's)
USD
% of Net Asset Value
Common Stock (continued)
Technology - 10.36% (continued)
– Donnelley Financial Solutions Inc 1 0.01
– DST Systems Inc 4 0.07
– Dun & Bradstreet Corp 2 0.03
– Electronic Arts Inc 3 0.05
– Electronics For Imaging Inc 2 0.03
– Engility Holdings Inc 1 0.01
– Entegris Inc 3 0.05
– EPAM Systems Inc 1 0.01
– ExlService Holdings Inc 1 0.01
– Fair Isaac Corp 2 0.03
– Fidelity National Information Services Inc 7 0.11
– Fiserv Inc 3 0.05
– FormFactor Inc 1 0.01
– Genpact Ltd 3 0.05
– Globant SA 1 0.01
– Guidewire Software Inc 1 0.01
– Hewlett Packard Enterprise Co 8 0.13
– HP Inc 3 0.05
– Inovalon Holdings Inc 1 0.01
– Integrated Device Technology Inc 2 0.03
2 Intel Corp 67 0.98
– International Business Machines Corp 20 0.29
– Intersil Corp 1 0.01
– Intuit Inc 4 0.07
– InvenSense Inc 1 0.01
– IPG Photonics Corp 3 0.05
– j2 Global Inc 4 0.07
– Jack Henry & Associates Inc 1 0.01
– KLA-Tencor Corp 1 0.01
– Kulicke & Soffa Industries Inc 1 0.01
– Lam Research Corp 5 0.08
– Leidos Holdings Inc 5 0.08
– Linear Technology Corp 1 0.01
– Manhattan Associates Inc 2 0.03
– ManTech International Corp 1 0.01
– Marvell Technology Group Ltd 3 0.05
– Maxim Integrated Products Inc 2 0.03
– MAXIMUS Inc 3 0.04
– MaxLinear Inc 1 0.01
– Mentor Graphics Corp 1 0.01
– Mercury Systems Inc 1 0.01
– Microchip Technology Inc 2 0.03
– Micron Technology Inc 8 0.13
– Microsemi Corp 1 0.01
1 Microsoft Corp 67 0.98
– MicroStrategy Inc 1 0.01
– MKS Instruments Inc 3 0.04
– Monolithic Power Systems Inc 1 0.01
– Monotype Imaging Holdings Inc 1 0.01
– MSCI Inc 2 0.03
– MTS Systems Corp 1 0.01
– NCR Corp 4 0.07
– NetApp Inc 6 0.10
– NetScout Systems Inc 3 0.04
– Nuance Communications Inc 4 0.07
– NVIDIA Corp 5 0.08
– Omnicell Inc 1 0.01
– ON Semiconductor Corp 6 0.10
1 Oracle Corp 26 0.38
– Paychex Inc 3 0.04
– Paycom Software Inc 1 0.01
– Pegasystems Inc 1 0.01
– Photronics Inc 1 0.01
Shares (000's)
Value (000's)
USD
% of Net Asset Value
Common Stock (continued)
Technology - 10.36% (continued)
– Pitney Bowes Inc 2 0.03
– Power Integrations Inc 1 0.01
– Progress Software Corp 1 0.01
– Qorvo Inc 3 0.04
– QUALCOMM Inc 21 0.31
– Qualys Inc 1 0.01
– Red Hat Inc 3 0.04
– Rudolph Technologies Inc 1 0.01
– salesforce.com Inc 2 0.03
– Science Applications International Corp 3 0.04
– Seagate Technology PLC 3 0.04
– Semtech Corp 2 0.03
– ServiceNow Inc 1 0.01
– Silicon Laboratories Inc 1 0.01
– Skyworks Solutions Inc 12 0.17
– Splunk Inc 1 0.01
– SS&C Technologies Holdings Inc 3 0.04
– Stratasys Ltd 1 0.01
– Super Micro Computer Inc 2 0.03
– Sykes Enterprises Inc 1 0.01
– Synaptics Inc 2 0.03
– Synchronoss Technologies Inc 2 0.03
– SYNNEX Corp 5 0.08
– Synopsys Inc 4 0.07
– Syntel Inc 1 0.01
– Tableau Software Inc 1 0.01
– Take-Two Interactive Software Inc 2 0.03
– TeleTech Holdings Inc 1 0.01
– Teradata Corp 4 0.07
– Teradyne Inc 4 0.07
– Tessera Technologies Inc 2 0.03
– Texas Instruments Inc 12 0.17
– Tyler Technologies Inc 1 0.01
– Ultimate Software Group Inc 1 0.01
– Ultratech Inc 1 0.01
– Veeco Instruments Inc 1 0.01
– VeriFone Systems Inc 2 0.03
– Verint Systems Inc 2 0.03
– Virtusa Corp 1 0.01
– VMware Inc 1 0.01
– Western Digital Corp 6 0.10
– Workday Inc 1 0.01
– Xerox Corp 4 0.07
– Xilinx Inc 3 0.04
1 Zynga Inc 2 0.03
702 10.36
Utilities - 2.05%
– AES Corp 2 0.04
– ALLETE Inc 3 0.05
– Alliant Energy Corp 2 0.04
– Ameren Corp 2 0.04
– American Electric Power Co Inc 3 0.05
– American States Water Co 1 0.01
– American Water Works Co Inc 3 0.05
– Aqua America Inc 1 0.01
– Atmos Energy Corp 2 0.04
– Avangrid Inc 1 0.01
– Avista Corp 1 0.01
– Black Hills Corp 2 0.04
– California Water Service Group 1 0.01
– Calpine Corp 5 0.08
– CenterPoint Energy Inc 2 0.04
– Chesapeake Utilities Corp 1 0.01
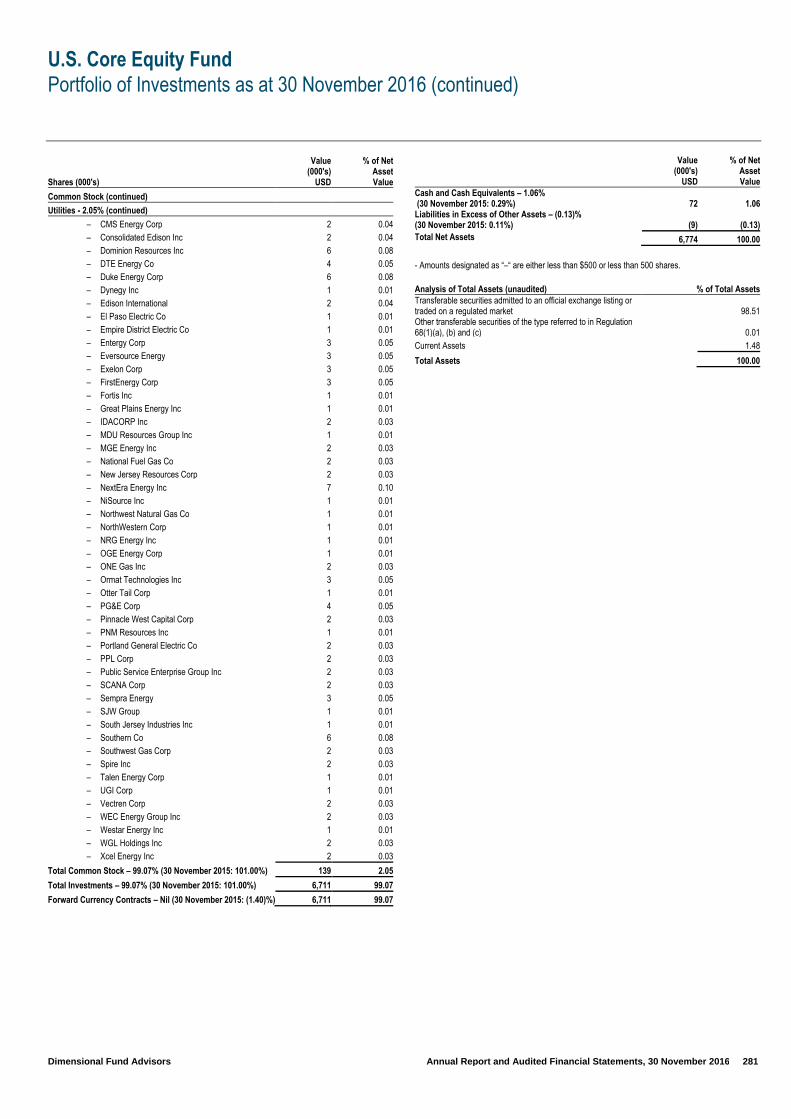
U.S. Core Equity Fund
Portfolio of Investments as at 30 November 2016 (continued)
Dimensional Fund Advisors Annual Report and Audited Financial Statements, 30 November 2016 281
Shares (000's)
Value (000's)
USD
% of Net Asset Value
Common Stock (continued)
Utilities - 2.05% (continued)
– CMS Energy Corp 2 0.04
– Consolidated Edison Inc 2 0.04
– Dominion Resources Inc 6 0.08
– DTE Energy Co 4 0.05
– Duke Energy Corp 6 0.08
– Dynegy Inc 1 0.01
– Edison International 2 0.04
– El Paso Electric Co 1 0.01
– Empire District Electric Co 1 0.01
– Entergy Corp 3 0.05
– Eversource Energy 3 0.05
– Exelon Corp 3 0.05
– FirstEnergy Corp 3 0.05
– Fortis Inc 1 0.01
– Great Plains Energy Inc 1 0.01
– IDACORP Inc 2 0.03
– MDU Resources Group Inc 1 0.01
– MGE Energy Inc 2 0.03
– National Fuel Gas Co 2 0.03
– New Jersey Resources Corp 2 0.03
– NextEra Energy Inc 7 0.10
– NiSource Inc 1 0.01
– Northwest Natural Gas Co 1 0.01
– NorthWestern Corp 1 0.01
– NRG Energy Inc 1 0.01
– OGE Energy Corp 1 0.01
– ONE Gas Inc 2 0.03
– Ormat Technologies Inc 3 0.05
– Otter Tail Corp 1 0.01
– PG&E Corp 4 0.05
– Pinnacle West Capital Corp 2 0.03
– PNM Resources Inc 1 0.01
– Portland General Electric Co 2 0.03
– PPL Corp 2 0.03
– Public Service Enterprise Group Inc 2 0.03
– SCANA Corp 2 0.03
– Sempra Energy 3 0.05
– SJW Group 1 0.01
– South Jersey Industries Inc 1 0.01
– Southern Co 6 0.08
– Southwest Gas Corp 2 0.03
– Spire Inc 2 0.03
– Talen Energy Corp 1 0.01
– UGI Corp 1 0.01
– Vectren Corp 2 0.03
– WEC Energy Group Inc 2 0.03
– Westar Energy Inc 1 0.01
– WGL Holdings Inc 2 0.03
– Xcel Energy Inc 2 0.03
Total Common Stock – 99.07% (30 November 2015: 101.00%) 139 2.05
Total Investments – 99.07% (30 November 2015: 101.00%) 6,711 99.07
Forward Currency Contracts – Nil (30 November 2015: (1.40)%) 6,711 99.07
Value (000's)
USD
% of Net Asset Value
Cash and Cash Equivalents – 1.06% (30 November 2015: 0.29%) 72 1.06 Liabilities in Excess of Other Assets – (0.13)% (30 November 2015: 0.11%) (9) (0.13)
Total Net Assets 6,774 100.00
- Amounts designated as “–“ are either less than $500 or less than 500 shares.
Analysis of Total Assets (unaudited) % of Total Assets Transferable securities admitted to an official exchange listing or traded on a regulated market 98.51 Other transferable securities of the type referred to in Regulation 68(1)(a), (b) and (c) 0.01
Current Assets 1.48
Total Assets 100.00
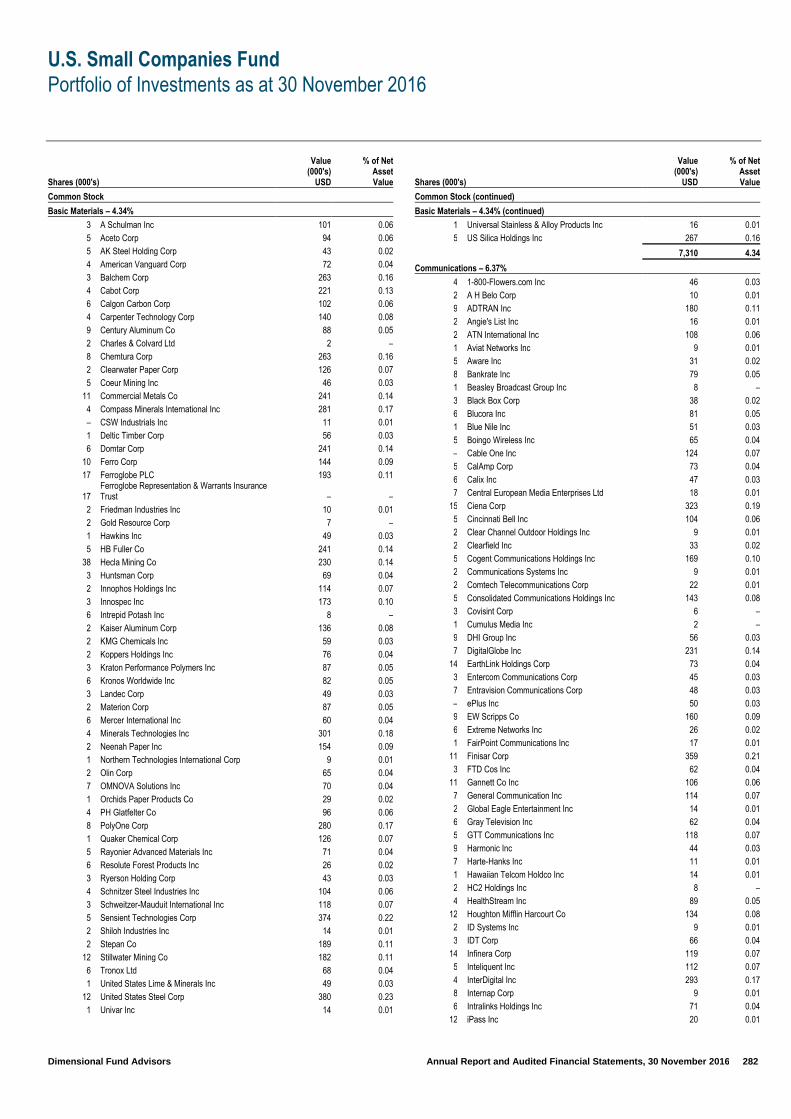
U.S. Small Companies Fund
Portfolio of Investments as at 30 November 2016
Dimensional Fund Advisors Annual Report and Audited Financial Statements, 30 November 2016 282
Shares (000's)
Value (000's)
USD
% of Net Asset Value
Common Stock
Basic Materials – 4.34%
3 A Schulman Inc 101 0.06
5 Aceto Corp 94 0.06
5 AK Steel Holding Corp 43 0.02
4 American Vanguard Corp 72 0.04
3 Balchem Corp 263 0.16
4 Cabot Corp 221 0.13
6 Calgon Carbon Corp 102 0.06
4 Carpenter Technology Corp 140 0.08
9 Century Aluminum Co 88 0.05
2 Charles & Colvard Ltd 2 –
8 Chemtura Corp 263 0.16
2 Clearwater Paper Corp 126 0.07
5 Coeur Mining Inc 46 0.03
11 Commercial Metals Co 241 0.14
4 Compass Minerals International Inc 281 0.17
– CSW Industrials Inc 11 0.01
1 Deltic Timber Corp 56 0.03
6 Domtar Corp 241 0.14
10 Ferro Corp 144 0.09
17 Ferroglobe PLC 193 0.11
17 Ferroglobe Representation & Warrants Insurance Trust – –
2 Friedman Industries Inc 10 0.01
2 Gold Resource Corp 7 –
1 Hawkins Inc 49 0.03
5 HB Fuller Co 241 0.14
38 Hecla Mining Co 230 0.14
3 Huntsman Corp 69 0.04
2 Innophos Holdings Inc 114 0.07
3 Innospec Inc 173 0.10
6 Intrepid Potash Inc 8 –
2 Kaiser Aluminum Corp 136 0.08
2 KMG Chemicals Inc 59 0.03
2 Koppers Holdings Inc 76 0.04
3 Kraton Performance Polymers Inc 87 0.05
6 Kronos Worldwide Inc 82 0.05
3 Landec Corp 49 0.03
2 Materion Corp 87 0.05
6 Mercer International Inc 60 0.04
4 Minerals Technologies Inc 301 0.18
2 Neenah Paper Inc 154 0.09
1 Northern Technologies International Corp 9 0.01
2 Olin Corp 65 0.04
7 OMNOVA Solutions Inc 70 0.04
1 Orchids Paper Products Co 29 0.02
4 PH Glatfelter Co 96 0.06
8 PolyOne Corp 280 0.17
1 Quaker Chemical Corp 126 0.07
5 Rayonier Advanced Materials Inc 71 0.04
6 Resolute Forest Products Inc 26 0.02
3 Ryerson Holding Corp 43 0.03
4 Schnitzer Steel Industries Inc 104 0.06
3 Schweitzer-Mauduit International Inc 118 0.07
5 Sensient Technologies Corp 374 0.22
2 Shiloh Industries Inc 14 0.01
2 Stepan Co 189 0.11
12 Stillwater Mining Co 182 0.11
6 Tronox Ltd 68 0.04
1 United States Lime & Minerals Inc 49 0.03
12 United States Steel Corp 380 0.23
1 Univar Inc 14 0.01
Shares (000's)
Value (000's)
USD
% of Net Asset Value
Common Stock (continued)
Basic Materials – 4.34% (continued)
1 Universal Stainless & Alloy Products Inc 16 0.01
5 US Silica Holdings Inc 267 0.16
7,310 4.34
Communications – 6.37%
4 1-800-Flowers.com Inc 46 0.03
2 A H Belo Corp 10 0.01
9 ADTRAN Inc 180 0.11
2 Angie's List Inc 16 0.01
2 ATN International Inc 108 0.06
1 Aviat Networks Inc 9 0.01
5 Aware Inc 31 0.02
8 Bankrate Inc 79 0.05
1 Beasley Broadcast Group Inc 8 –
3 Black Box Corp 38 0.02
6 Blucora Inc 81 0.05
1 Blue Nile Inc 51 0.03
5 Boingo Wireless Inc 65 0.04
– Cable One Inc 124 0.07
5 CalAmp Corp 73 0.04
6 Calix Inc 47 0.03
7 Central European Media Enterprises Ltd 18 0.01
15 Ciena Corp 323 0.19
5 Cincinnati Bell Inc 104 0.06
2 Clear Channel Outdoor Holdings Inc 9 0.01
2 Clearfield Inc 33 0.02
5 Cogent Communications Holdings Inc 169 0.10
2 Communications Systems Inc 9 0.01
2 Comtech Telecommunications Corp 22 0.01
5 Consolidated Communications Holdings Inc 143 0.08
3 Covisint Corp 6 –
1 Cumulus Media Inc 2 –
9 DHI Group Inc 56 0.03
7 DigitalGlobe Inc 231 0.14
14 EarthLink Holdings Corp 73 0.04
3 Entercom Communications Corp 45 0.03
7 Entravision Communications Corp 48 0.03
– ePlus Inc 50 0.03
9 EW Scripps Co 160 0.09
6 Extreme Networks Inc 26 0.02
1 FairPoint Communications Inc 17 0.01
11 Finisar Corp 359 0.21
3 FTD Cos Inc 62 0.04
11 Gannett Co Inc 106 0.06
7 General Communication Inc 114 0.07
2 Global Eagle Entertainment Inc 14 0.01
6 Gray Television Inc 62 0.04
5 GTT Communications Inc 118 0.07
9 Harmonic Inc 44 0.03
7 Harte-Hanks Inc 11 0.01
1 Hawaiian Telcom Holdco Inc 14 0.01
2 HC2 Holdings Inc 8 –
4 HealthStream Inc 89 0.05
12 Houghton Mifflin Harcourt Co 134 0.08
2 ID Systems Inc 9 0.01
3 IDT Corp 66 0.04
14 Infinera Corp 119 0.07
5 Inteliquent Inc 112 0.07
4 InterDigital Inc 293 0.17
8 Internap Corp 9 0.01
6 Intralinks Holdings Inc 71 0.04
12 iPass Inc 20 0.01
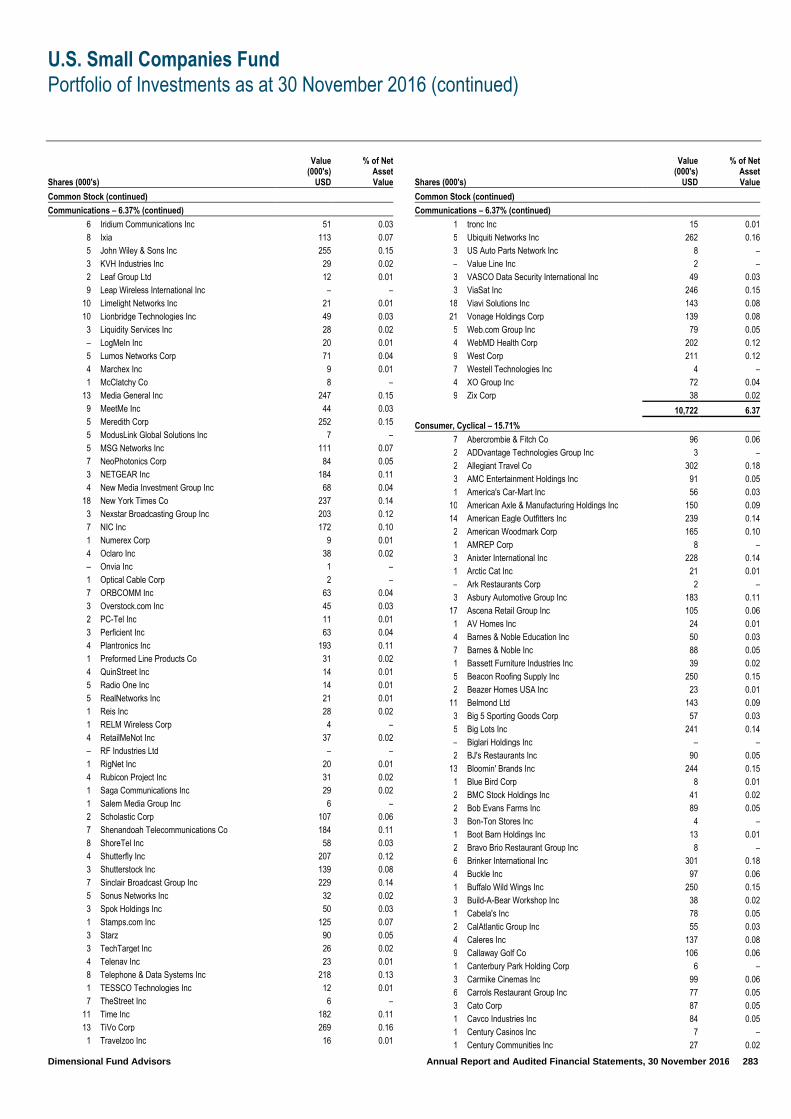
U.S. Small Companies Fund
Portfolio of Investments as at 30 November 2016 (continued)
Dimensional Fund Advisors Annual Report and Audited Financial Statements, 30 November 2016 283
Shares (000's)
Value (000's)
USD
% of Net Asset Value
Common Stock (continued)
Communications – 6.37% (continued)
6 Iridium Communications Inc 51 0.03
8 Ixia 113 0.07
5 John Wiley & Sons Inc 255 0.15
3 KVH Industries Inc 29 0.02
2 Leaf Group Ltd 12 0.01
9 Leap Wireless International Inc – –
10 Limelight Networks Inc 21 0.01
10 Lionbridge Technologies Inc 49 0.03
3 Liquidity Services Inc 28 0.02
– LogMeIn Inc 20 0.01
5 Lumos Networks Corp 71 0.04
4 Marchex Inc 9 0.01
1 McClatchy Co 8 –
13 Media General Inc 247 0.15
9 MeetMe Inc 44 0.03
5 Meredith Corp 252 0.15
5 ModusLink Global Solutions Inc 7 –
5 MSG Networks Inc 111 0.07
7 NeoPhotonics Corp 84 0.05
3 NETGEAR Inc 184 0.11
4 New Media Investment Group Inc 68 0.04
18 New York Times Co 237 0.14
3 Nexstar Broadcasting Group Inc 203 0.12
7 NIC Inc 172 0.10
1 Numerex Corp 9 0.01
4 Oclaro Inc 38 0.02
– Onvia Inc 1 –
1 Optical Cable Corp 2 –
7 ORBCOMM Inc 63 0.04
3 Overstock.com Inc 45 0.03
2 PC-Tel Inc 11 0.01
3 Perficient Inc 63 0.04
4 Plantronics Inc 193 0.11
1 Preformed Line Products Co 31 0.02
4 QuinStreet Inc 14 0.01
5 Radio One Inc 14 0.01
5 RealNetworks Inc 21 0.01
1 Reis Inc 28 0.02
1 RELM Wireless Corp 4 –
4 RetailMeNot Inc 37 0.02
– RF Industries Ltd – –
1 RigNet Inc 20 0.01
4 Rubicon Project Inc 31 0.02
1 Saga Communications Inc 29 0.02
1 Salem Media Group Inc 6 –
2 Scholastic Corp 107 0.06
7 Shenandoah Telecommunications Co 184 0.11
8 ShoreTel Inc 58 0.03
4 Shutterfly Inc 207 0.12
3 Shutterstock Inc 139 0.08
7 Sinclair Broadcast Group Inc 229 0.14
5 Sonus Networks Inc 32 0.02
3 Spok Holdings Inc 50 0.03
1 Stamps.com Inc 125 0.07
3 Starz 90 0.05
3 TechTarget Inc 26 0.02
4 Telenav Inc 23 0.01
8 Telephone & Data Systems Inc 218 0.13
1 TESSCO Technologies Inc 12 0.01
7 TheStreet Inc 6 –
11 Time Inc 182 0.11
13 TiVo Corp 269 0.16
1 Travelzoo Inc 16 0.01
Shares (000's)
Value (000's)
USD
% of Net Asset Value
Common Stock (continued)
Communications – 6.37% (continued)
1 tronc Inc 15 0.01
5 Ubiquiti Networks Inc 262 0.16
3 US Auto Parts Network Inc 8 –
– Value Line Inc 2 –
3 VASCO Data Security International Inc 49 0.03
3 ViaSat Inc 246 0.15
18 Viavi Solutions Inc 143 0.08
21 Vonage Holdings Corp 139 0.08
5 Web.com Group Inc 79 0.05
4 WebMD Health Corp 202 0.12
9 West Corp 211 0.12
7 Westell Technologies Inc 4 –
4 XO Group Inc 72 0.04
9 Zix Corp 38 0.02
10,722 6.37
Consumer, Cyclical – 15.71%
7 Abercrombie & Fitch Co 96 0.06
2 ADDvantage Technologies Group Inc 3 –
2 Allegiant Travel Co 302 0.18
3 AMC Entertainment Holdings Inc 91 0.05
1 America's Car-Mart Inc 56 0.03
10 American Axle & Manufacturing Holdings Inc 150 0.09
14 American Eagle Outfitters Inc 239 0.14
2 American Woodmark Corp 165 0.10
1 AMREP Corp 8 –
3 Anixter International Inc 228 0.14
1 Arctic Cat Inc 21 0.01
– Ark Restaurants Corp 2 –
3 Asbury Automotive Group Inc 183 0.11
17 Ascena Retail Group Inc 105 0.06
1 AV Homes Inc 24 0.01
4 Barnes & Noble Education Inc 50 0.03
7 Barnes & Noble Inc 88 0.05
1 Bassett Furniture Industries Inc 39 0.02
5 Beacon Roofing Supply Inc 250 0.15
2 Beazer Homes USA Inc 23 0.01
11 Belmond Ltd 143 0.09
3 Big 5 Sporting Goods Corp 57 0.03
5 Big Lots Inc 241 0.14
– Biglari Holdings Inc – –
2 BJ's Restaurants Inc 90 0.05
13 Bloomin' Brands Inc 244 0.15
1 Blue Bird Corp 8 0.01
2 BMC Stock Holdings Inc 41 0.02
2 Bob Evans Farms Inc 89 0.05
3 Bon-Ton Stores Inc 4 –
1 Boot Barn Holdings Inc 13 0.01
2 Bravo Brio Restaurant Group Inc 8 –
6 Brinker International Inc 301 0.18
4 Buckle Inc 97 0.06
1 Buffalo Wild Wings Inc 250 0.15
3 Build-A-Bear Workshop Inc 38 0.02
1 Cabela's Inc 78 0.05
2 CalAtlantic Group Inc 55 0.03
4 Caleres Inc 137 0.08
9 Callaway Golf Co 106 0.06
1 Canterbury Park Holding Corp 6 –
3 Carmike Cinemas Inc 99 0.06
6 Carrols Restaurant Group Inc 77 0.05
3 Cato Corp 87 0.05
1 Cavco Industries Inc 84 0.05
1 Century Casinos Inc 7 –
1 Century Communities Inc 27 0.02
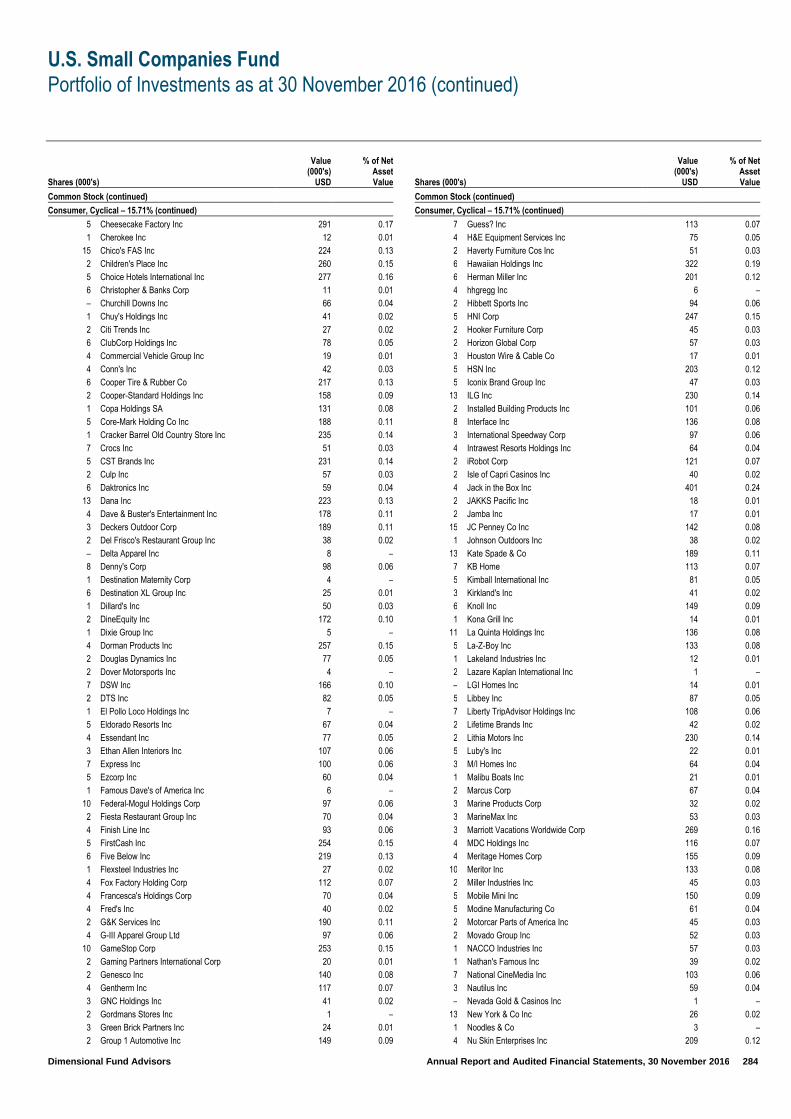
U.S. Small Companies Fund
Portfolio of Investments as at 30 November 2016 (continued)
Dimensional Fund Advisors Annual Report and Audited Financial Statements, 30 November 2016 284
Shares (000's)
Value (000's)
USD
% of Net Asset Value
Common Stock (continued)
Consumer, Cyclical – 15.71% (continued)
5 Cheesecake Factory Inc 291 0.17
1 Cherokee Inc 12 0.01
15 Chico's FAS Inc 224 0.13
2 Children's Place Inc 260 0.15
5 Choice Hotels International Inc 277 0.16
6 Christopher & Banks Corp 11 0.01
– Churchill Downs Inc 66 0.04
1 Chuy's Holdings Inc 41 0.02
2 Citi Trends Inc 27 0.02
6 ClubCorp Holdings Inc 78 0.05
4 Commercial Vehicle Group Inc 19 0.01
4 Conn's Inc 42 0.03
6 Cooper Tire & Rubber Co 217 0.13
2 Cooper-Standard Holdings Inc 158 0.09
1 Copa Holdings SA 131 0.08
5 Core-Mark Holding Co Inc 188 0.11
1 Cracker Barrel Old Country Store Inc 235 0.14
7 Crocs Inc 51 0.03
5 CST Brands Inc 231 0.14
2 Culp Inc 57 0.03
6 Daktronics Inc 59 0.04
13 Dana Inc 223 0.13
4 Dave & Buster's Entertainment Inc 178 0.11
3 Deckers Outdoor Corp 189 0.11
2 Del Frisco's Restaurant Group Inc 38 0.02
– Delta Apparel Inc 8 –
8 Denny's Corp 98 0.06
1 Destination Maternity Corp 4 –
6 Destination XL Group Inc 25 0.01
1 Dillard's Inc 50 0.03
2 DineEquity Inc 172 0.10
1 Dixie Group Inc 5 –
4 Dorman Products Inc 257 0.15
2 Douglas Dynamics Inc 77 0.05
2 Dover Motorsports Inc 4 –
7 DSW Inc 166 0.10
2 DTS Inc 82 0.05
1 El Pollo Loco Holdings Inc 7 –
5 Eldorado Resorts Inc 67 0.04
4 Essendant Inc 77 0.05
3 Ethan Allen Interiors Inc 107 0.06
7 Express Inc 100 0.06
5 Ezcorp Inc 60 0.04
1 Famous Dave's of America Inc 6 –
10 Federal-Mogul Holdings Corp 97 0.06
2 Fiesta Restaurant Group Inc 70 0.04
4 Finish Line Inc 93 0.06
5 FirstCash Inc 254 0.15
6 Five Below Inc 219 0.13
1 Flexsteel Industries Inc 27 0.02
4 Fox Factory Holding Corp 112 0.07
4 Francesca's Holdings Corp 70 0.04
4 Fred's Inc 40 0.02
2 G&K Services Inc 190 0.11
4 G-III Apparel Group Ltd 97 0.06
10 GameStop Corp 253 0.15
2 Gaming Partners International Corp 20 0.01
2 Genesco Inc 140 0.08
4 Gentherm Inc 117 0.07
3 GNC Holdings Inc 41 0.02
2 Gordmans Stores Inc 1 –
3 Green Brick Partners Inc 24 0.01
2 Group 1 Automotive Inc 149 0.09
Shares (000's)
Value (000's)
USD
% of Net Asset Value
Common Stock (continued)
Consumer, Cyclical – 15.71% (continued)
7 Guess? Inc 113 0.07
4 H&E Equipment Services Inc 75 0.05
2 Haverty Furniture Cos Inc 51 0.03
6 Hawaiian Holdings Inc 322 0.19
6 Herman Miller Inc 201 0.12
4 hhgregg Inc 6 –
2 Hibbett Sports Inc 94 0.06
5 HNI Corp 247 0.15
2 Hooker Furniture Corp 45 0.03
2 Horizon Global Corp 57 0.03
3 Houston Wire & Cable Co 17 0.01
5 HSN Inc 203 0.12
5 Iconix Brand Group Inc 47 0.03
13 ILG Inc 230 0.14
2 Installed Building Products Inc 101 0.06
8 Interface Inc 136 0.08
3 International Speedway Corp 97 0.06
4 Intrawest Resorts Holdings Inc 64 0.04
2 iRobot Corp 121 0.07
2 Isle of Capri Casinos Inc 40 0.02
4 Jack in the Box Inc 401 0.24
2 JAKKS Pacific Inc 18 0.01
2 Jamba Inc 17 0.01
15 JC Penney Co Inc 142 0.08
1 Johnson Outdoors Inc 38 0.02
13 Kate Spade & Co 189 0.11
7 KB Home 113 0.07
5 Kimball International Inc 81 0.05
3 Kirkland's Inc 41 0.02
6 Knoll Inc 149 0.09
1 Kona Grill Inc 14 0.01
11 La Quinta Holdings Inc 136 0.08
5 La-Z-Boy Inc 133 0.08
1 Lakeland Industries Inc 12 0.01
2 Lazare Kaplan International Inc 1 –
– LGI Homes Inc 14 0.01
5 Libbey Inc 87 0.05
7 Liberty TripAdvisor Holdings Inc 108 0.06
2 Lifetime Brands Inc 42 0.02
2 Lithia Motors Inc 230 0.14
5 Luby's Inc 22 0.01
3 M/I Homes Inc 64 0.04
1 Malibu Boats Inc 21 0.01
2 Marcus Corp 67 0.04
3 Marine Products Corp 32 0.02
3 MarineMax Inc 53 0.03
3 Marriott Vacations Worldwide Corp 269 0.16
4 MDC Holdings Inc 116 0.07
4 Meritage Homes Corp 155 0.09
10 Meritor Inc 133 0.08
2 Miller Industries Inc 45 0.03
5 Mobile Mini Inc 150 0.09
5 Modine Manufacturing Co 61 0.04
2 Motorcar Parts of America Inc 45 0.03
2 Movado Group Inc 52 0.03
1 NACCO Industries Inc 57 0.03
1 Nathan's Famous Inc 39 0.02
7 National CineMedia Inc 103 0.06
3 Nautilus Inc 59 0.04
– Nevada Gold & Casinos Inc 1 –
13 New York & Co Inc 26 0.02
1 Noodles & Co 3 –
4 Nu Skin Enterprises Inc 209 0.12

U.S. Small Companies Fund
Portfolio of Investments as at 30 November 2016 (continued)
Dimensional Fund Advisors Annual Report and Audited Financial Statements, 30 November 2016 285
Shares (000's)
Value (000's)
USD
% of Net Asset Value
Common Stock (continued)
Consumer, Cyclical – 15.71% (continued)
57 Office Depot Inc 279 0.17
1 Oxford Industries Inc 111 0.07
4 Papa John's International Inc 383 0.23
4 PC Connection Inc 109 0.07
3 PCM Inc 52 0.03
4 Penn National Gaming Inc 49 0.03
2 Penske Automotive Group Inc 97 0.06
1 Perfumania Holdings Inc 2 –
2 Perry Ellis International Inc 49 0.03
3 PetMed Express Inc 56 0.03
2 PICO Holdings Inc 30 0.02
10 Pier 1 Imports Inc 55 0.03
7 Pinnacle Entertainment Inc 92 0.06
2 Pool Corp 218 0.13
2 Popeyes Louisiana Kitchen Inc 141 0.08
2 Potbelly Corp 26 0.02
3 PriceSmart Inc 288 0.17
1 RCI Hospitality Holdings Inc 18 0.01
2 Reading International Inc 35 0.02
3 Red Lion Hotels Corp 29 0.02
1 Red Robin Gourmet Burgers Inc 74 0.04
9 Regal Entertainment Group 210 0.13
5 Regis Corp 73 0.04
1 Rocky Brands Inc 8 –
7 Ruby Tuesday Inc 21 0.01
3 Rush Enterprises Inc 89 0.05
4 Ruth's Hospitality Group Inc 70 0.04
3 ScanSource Inc 98 0.06
9 SeaWorld Entertainment Inc 151 0.09
5 Select Comfort Corp 117 0.07
– Sequential Brands Group Inc 2 –
2 Shoe Carnival Inc 63 0.04
1 Skyline Corp 19 0.01
5 SkyWest Inc 188 0.11
4 Sonic Automotive Inc 75 0.05
6 Sonic Corp 144 0.09
5 Spartan Motors Inc 44 0.03
4 Speedway Motorsports Inc 76 0.05
3 Spirit Airlines Inc 153 0.09
3 Sportsman's Warehouse Holdings Inc 27 0.02
4 Stage Stores Inc 17 0.01
3 Standard Motor Products Inc 138 0.08
4 Stanley Furniture Co Inc 3 –
9 Steelcase Inc 141 0.08
5 Stein Mart Inc 24 0.01
7 Steven Madden Ltd 250 0.15
– Strattec Security Corp 6 –
4 Superior Industries International Inc 94 0.06
2 Superior Uniform Group Inc 38 0.02
3 Supreme Industries Inc 44 0.03
4 Systemax Inc 33 0.02
1 Tandy Leather Factory Inc 8 0.01
3 Taylor Morrison Home Corp 69 0.04
5 Tenneco Inc 288 0.17
7 Texas Roadhouse Inc 337 0.20
5 Thor Industries Inc 469 0.28
5 Tile Shop Holdings Inc 101 0.06
2 Tilly's Inc 18 0.01
7 Titan International Inc 81 0.05
2 Titan Machinery Inc 25 0.02
2 Tower International Inc 63 0.04
3 Town Sports International Holdings Inc 6 –
5 Trans World Entertainment Corp 17 0.01
Shares (000's)
Value (000's)
USD
% of Net Asset Value
Common Stock (continued)
Consumer, Cyclical – 15.71% (continued)
16 TRI Pointe Group Inc 186 0.11
4 Triton International Ltd 69 0.04
5 Tuesday Morning Corp 22 0.01
5 Tupperware Brands Corp 272 0.16
3 Unifi Inc 80 0.05
1 UniFirst Corp 154 0.09
2 Universal Electronics Inc 119 0.07
1 Urban Outfitters Inc 19 0.01
4 Vera Bradley Inc 55 0.03
1 Veritiv Corp 25 0.02
4 Vince Holding Corp 17 0.01
3 Virco Manufacturing Corp 13 0.01
4 Vista Outdoor Inc 168 0.10
4 Visteon Corp 279 0.17
3 Vitamin Shoppe Inc 71 0.04
3 VOXX International Corp 13 0.01
6 Wabash National Corp 88 0.05
2 WCI Communities Inc 38 0.02
27 Wendy's Co 346 0.21
11 Wesco Aircraft Holdings Inc 160 0.10
3 WESCO International Inc 222 0.13
4 West Marine Inc 34 0.02
– Weyco Group Inc 14 0.01
2 William Lyon Homes 36 0.02
– Wingstop Inc 11 0.01
1 Winmark Corp 67 0.04
3 Winnebago Industries Inc 113 0.07
11 Wolverine World Wide Inc 237 0.14
3 World Fuel Services Corp 125 0.07
4 Zumiez Inc 105 0.06
26,463 15.71
Consumer, Non-Cyclical – 16.03%
7 Aaron's Inc 211 0.13
3 Abaxis Inc 154 0.09
6 ABM Industries Inc 263 0.16
11 ACCO Brands Corp 134 0.08
9 Accuray Inc 45 0.03
1 Acme United Corp 14 0.01
3 Acorda Therapeutics Inc 66 0.04
2 Adamas Pharmaceuticals Inc 26 0.02
2 Addus HomeCare Corp 86 0.05
– Adeptus Health Inc 2 –
4 Advisory Board Co 141 0.08
5 Air Methods Corp 154 0.09
3 Akebia Therapeutics Inc 22 0.01
2 Akorn Inc 44 0.03
3 Albany Molecular Research Inc 52 0.03
2 Alere Inc 59 0.04
1 Alico Inc 19 0.01
1 Alliance HealthCare Services Inc 7 –
1 Alliance One International Inc 15 0.01
1 Almost Family Inc 51 0.03
1 AMAG Pharmaceuticals Inc 27 0.02
3 Amedisys Inc 129 0.08
– AMERCO 139 0.08
2 American Public Education Inc 44 0.03
5 AMN Healthcare Services Inc 161 0.10
1 Amphastar Pharmaceuticals Inc 24 0.01
1 Amsurg Corp 86 0.05
1 Analogic Corp 121 0.07
3 Andersons Inc 113 0.07
4 AngioDynamics Inc 61 0.04
– ANI Pharmaceuticals Inc 24 0.01

U.S. Small Companies Fund
Portfolio of Investments as at 30 November 2016 (continued)
Dimensional Fund Advisors Annual Report and Audited Financial Statements, 30 November 2016 286
Shares (000's)
Value (000's)
USD
% of Net Asset Value
Common Stock (continued)
Consumer, Non-Cyclical – 16.03% (continued)
2 Anika Therapeutics Inc 85 0.05
11 Apollo Education Group Inc 107 0.06
2 Aptevo Therapeutics Inc 4 –
1 Aralez Pharmaceuticals Inc 4 –
6 ARC Document Solutions Inc 25 0.01
1 Ardelyx Inc 15 0.01
– Arrhythmia Research Technology Inc 2 –
1 Ascent Capital Group Inc 22 0.01
1 AstroNova Inc 14 0.01
– Atrion Corp 121 0.07
1 Aviragen Therapeutics Inc 2 –
– Avis Budget Group Inc 15 0.01
32 Avon Products Inc 171 0.10
6 B&G Foods Inc 269 0.16
1 Barrett Business Services Inc 53 0.03
1 BioSpecifics Technologies Corp 43 0.03
3 BioTelemetry Inc 67 0.04
1 Boston Beer Co Inc 146 0.09
3 Bovie Medical Corp 13 0.01
8 Bridgepoint Education Inc 83 0.05
– Bridgford Foods Corp 5 –
1 Bright Horizons Family Solutions Inc 51 0.03
5 Brink's Co 214 0.13
3 Brookdale Senior Living Inc 30 0.02
3 Bruker Corp 58 0.03
2 CAI International Inc 20 0.01
4 Cal-Maine Foods Inc 168 0.10
2 Calavo Growers Inc 86 0.05
4 Cambium Learning Group Inc 21 0.01
3 Cambrex Corp 167 0.10
5 Cantel Medical Corp 425 0.25
1 Capella Education Co 97 0.06
3 Capital Senior Living Corp 49 0.03
2 Cara Therapeutics Inc 16 0.01
5 Cardtronics PLC 236 0.14
8 Career Education Corp 83 0.05
3 Carriage Services Inc 68 0.04
9 Catalent Inc 215 0.13
– Catalyst Biosciences Inc – –
6 CBIZ Inc 79 0.05
1 CCA Industries Inc 3 –
3 CDI Corp 21 0.01
4 CEB Inc 205 0.12
5 Central Garden & Pet Co (non-voting rights) 140 0.08
2 Central Garden & Pet Co (voting rights) 53 0.03
2 Charles River Laboratories International Inc 146 0.09
3 Chefs' Warehouse Inc 33 0.02
2 Chemed Corp 264 0.16
3 Cimpress NV 273 0.16
1 Civeo Corp 1 –
1 Coca-Cola Bottling Co Consolidated 114 0.07
1 Collectors Universe Inc 15 0.01
2 Command Security Corp 5 –
2 Concert Pharmaceuticals Inc 21 0.01
3 CONMED Corp 108 0.06
4 CoreLogic Inc 152 0.09
2 CorVel Corp 72 0.04
1 CRA International Inc 42 0.03
3 Craft Brew Alliance Inc 51 0.03
3 Cross Country Healthcare Inc 50 0.03
4 CryoLife Inc 87 0.05
1 CSS Industries Inc 27 0.02
4 Cumberland Pharmaceuticals Inc 21 0.01
Shares (000's)
Value (000's)
USD
% of Net Asset Value
Common Stock (continued)
Consumer, Non-Cyclical – 16.03% (continued)
2 Cutera Inc 33 0.02
3 Cynosure Inc 156 0.09
16 Darling Ingredients Inc 219 0.13
10 Dean Foods Co 189 0.11
5 Deluxe Corp 315 0.19
6 Depomed Inc 114 0.07
6 DeVry Education Group Inc 192 0.11
– Dicerna Pharmaceuticals Inc – –
4 Digirad Corp 20 0.01
2 Diplomat Pharmacy Inc 31 0.02
3 Edgewater Technology Inc 21 0.01
4 Emergent BioSolutions Inc 100 0.06
6 Ennis Inc 88 0.05
4 Ensign Group Inc 96 0.06
7 Enzo Biochem Inc 50 0.03
– Epizyme Inc 2 –
7 Everi Holdings Inc 16 0.01
2 Exactech Inc 50 0.03
2 Farmer Brothers Co 80 0.05
1 Five Prime Therapeutics Inc 82 0.05
5 Five Star Quality Care Inc 12 0.01
2 Forrester Research Inc 96 0.06
3 Franklin Covey Co 52 0.03
5 Fresh Del Monte Produce Inc 297 0.18
4 FTI Consulting Inc 176 0.10
1 Genesis Healthcare Inc 4 –
7 Globus Medical Inc 148 0.09
– Graham Holdings Co 20 0.01
5 Grand Canyon Education Inc 276 0.16
7 Great Lakes Dredge & Dock Corp 30 0.02
5 Green Dot Corp 125 0.07
5 Hackett Group Inc 92 0.05
6 Haemonetics Corp 220 0.13
4 Halyard Health Inc 163 0.10
6 Harvard Bioscience Inc 15 0.01
7 Healthcare Services Group Inc 290 0.17
2 HealthEquity Inc 94 0.06
1 HealthSouth Corp 42 0.03
4 Healthways Inc 83 0.05
2 Heidrick & Struggles International Inc 42 0.02
3 Helen of Troy Ltd 246 0.15
3 Herc Holdings Inc 105 0.06
5 Hill-Rom Holdings Inc 264 0.16
10 HMS Holdings Corp 176 0.10
2 Horizon Pharma Plc 42 0.03
5 Hudson Global Inc 7 –
2 Huron Consulting Group Inc 110 0.07
2 ICF International Inc 86 0.05
2 ICU Medical Inc 235 0.14
3 Ignyta Inc 18 0.01
7 Impax Laboratories Inc 98 0.06
5 INC Research Holdings Inc 246 0.15
1 Ingles Markets Inc 41 0.02
2 Inogen Inc 97 0.06
3 Insperity Inc 193 0.11
4 Insys Therapeutics Inc 50 0.03
3 Integer Holdings Corp 79 0.05
4 Integra LifeSciences Holdings Corp 307 0.18
4 Inter Parfums Inc 137 0.08
4 Intersections Inc 9 0.01
3 Invacare Corp 37 0.02
2 Inventure Foods Inc 18 0.01
1 IRIDEX Corp 7 –
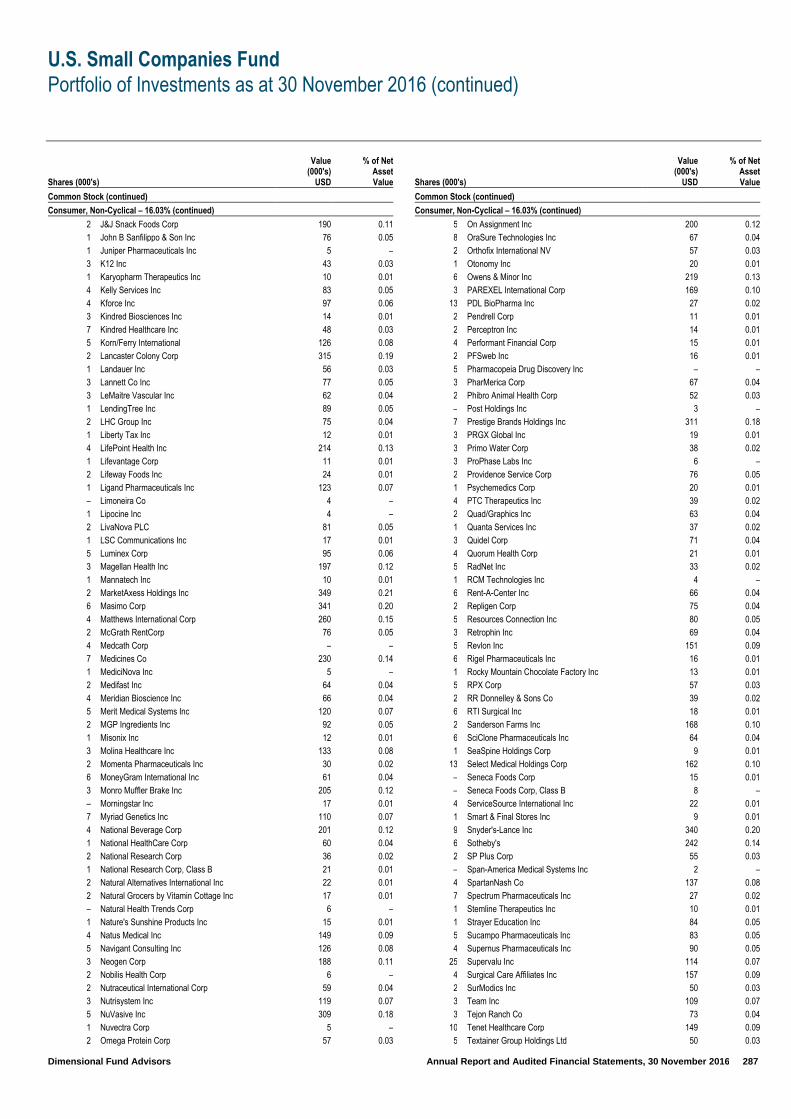
U.S. Small Companies Fund
Portfolio of Investments as at 30 November 2016 (continued)
Dimensional Fund Advisors Annual Report and Audited Financial Statements, 30 November 2016 287
Shares (000's)
Value (000's)
USD
% of Net Asset Value
Common Stock (continued)
Consumer, Non-Cyclical – 16.03% (continued)
2 J&J Snack Foods Corp 190 0.11
1 John B Sanfilippo & Son Inc 76 0.05
1 Juniper Pharmaceuticals Inc 5 –
3 K12 Inc 43 0.03
1 Karyopharm Therapeutics Inc 10 0.01
4 Kelly Services Inc 83 0.05
4 Kforce Inc 97 0.06
3 Kindred Biosciences Inc 14 0.01
7 Kindred Healthcare Inc 48 0.03
5 Korn/Ferry International 126 0.08
2 Lancaster Colony Corp 315 0.19
1 Landauer Inc 56 0.03
3 Lannett Co Inc 77 0.05
3 LeMaitre Vascular Inc 62 0.04
1 LendingTree Inc 89 0.05
2 LHC Group Inc 75 0.04
1 Liberty Tax Inc 12 0.01
4 LifePoint Health Inc 214 0.13
1 Lifevantage Corp 11 0.01
2 Lifeway Foods Inc 24 0.01
1 Ligand Pharmaceuticals Inc 123 0.07
– Limoneira Co 4 –
1 Lipocine Inc 4 –
2 LivaNova PLC 81 0.05
1 LSC Communications Inc 17 0.01
5 Luminex Corp 95 0.06
3 Magellan Health Inc 197 0.12
1 Mannatech Inc 10 0.01
2 MarketAxess Holdings Inc 349 0.21
6 Masimo Corp 341 0.20
4 Matthews International Corp 260 0.15
2 McGrath RentCorp 76 0.05
4 Medcath Corp – –
7 Medicines Co 230 0.14
1 MediciNova Inc 5 –
2 Medifast Inc 64 0.04
4 Meridian Bioscience Inc 66 0.04
5 Merit Medical Systems Inc 120 0.07
2 MGP Ingredients Inc 92 0.05
1 Misonix Inc 12 0.01
3 Molina Healthcare Inc 133 0.08
2 Momenta Pharmaceuticals Inc 30 0.02
6 MoneyGram International Inc 61 0.04
3 Monro Muffler Brake Inc 205 0.12
– Morningstar Inc 17 0.01
7 Myriad Genetics Inc 110 0.07
4 National Beverage Corp 201 0.12
1 National HealthCare Corp 60 0.04
2 National Research Corp 36 0.02
1 National Research Corp, Class B 21 0.01
2 Natural Alternatives International Inc 22 0.01
2 Natural Grocers by Vitamin Cottage Inc 17 0.01
– Natural Health Trends Corp 6 –
1 Nature's Sunshine Products Inc 15 0.01
4 Natus Medical Inc 149 0.09
5 Navigant Consulting Inc 126 0.08
3 Neogen Corp 188 0.11
2 Nobilis Health Corp 6 –
2 Nutraceutical International Corp 59 0.04
3 Nutrisystem Inc 119 0.07
5 NuVasive Inc 309 0.18
1 Nuvectra Corp 5 –
2 Omega Protein Corp 57 0.03
Shares (000's)
Value (000's)
USD
% of Net Asset Value
Common Stock (continued)
Consumer, Non-Cyclical – 16.03% (continued)
5 On Assignment Inc 200 0.12
8 OraSure Technologies Inc 67 0.04
2 Orthofix International NV 57 0.03
1 Otonomy Inc 20 0.01
6 Owens & Minor Inc 219 0.13
3 PAREXEL International Corp 169 0.10
13 PDL BioPharma Inc 27 0.02
2 Pendrell Corp 11 0.01
2 Perceptron Inc 14 0.01
4 Performant Financial Corp 15 0.01
2 PFSweb Inc 16 0.01
5 Pharmacopeia Drug Discovery Inc – –
3 PharMerica Corp 67 0.04
2 Phibro Animal Health Corp 52 0.03
– Post Holdings Inc 3 –
7 Prestige Brands Holdings Inc 311 0.18
3 PRGX Global Inc 19 0.01
3 Primo Water Corp 38 0.02
3 ProPhase Labs Inc 6 –
2 Providence Service Corp 76 0.05
1 Psychemedics Corp 20 0.01
4 PTC Therapeutics Inc 39 0.02
2 Quad/Graphics Inc 63 0.04
1 Quanta Services Inc 37 0.02
3 Quidel Corp 71 0.04
4 Quorum Health Corp 21 0.01
5 RadNet Inc 33 0.02
1 RCM Technologies Inc 4 –
6 Rent-A-Center Inc 66 0.04
2 Repligen Corp 75 0.04
5 Resources Connection Inc 80 0.05
3 Retrophin Inc 69 0.04
5 Revlon Inc 151 0.09
6 Rigel Pharmaceuticals Inc 16 0.01
1 Rocky Mountain Chocolate Factory Inc 13 0.01
5 RPX Corp 57 0.03
2 RR Donnelley & Sons Co 39 0.02
6 RTI Surgical Inc 18 0.01
2 Sanderson Farms Inc 168 0.10
6 SciClone Pharmaceuticals Inc 64 0.04
1 SeaSpine Holdings Corp 9 0.01
13 Select Medical Holdings Corp 162 0.10
– Seneca Foods Corp 15 0.01
– Seneca Foods Corp, Class B 8 –
4 ServiceSource International Inc 22 0.01
1 Smart & Final Stores Inc 9 0.01
9 Snyder's-Lance Inc 340 0.20
6 Sotheby's 242 0.14
2 SP Plus Corp 55 0.03
– Span-America Medical Systems Inc 2 –
4 SpartanNash Co 137 0.08
7 Spectrum Pharmaceuticals Inc 27 0.02
1 Stemline Therapeutics Inc 10 0.01
1 Strayer Education Inc 84 0.05
5 Sucampo Pharmaceuticals Inc 83 0.05
4 Supernus Pharmaceuticals Inc 90 0.05
25 Supervalu Inc 114 0.07
4 Surgical Care Affiliates Inc 157 0.09
2 SurModics Inc 50 0.03
3 Team Inc 109 0.07
3 Tejon Ranch Co 73 0.04
10 Tenet Healthcare Corp 149 0.09
5 Textainer Group Holdings Ltd 50 0.03
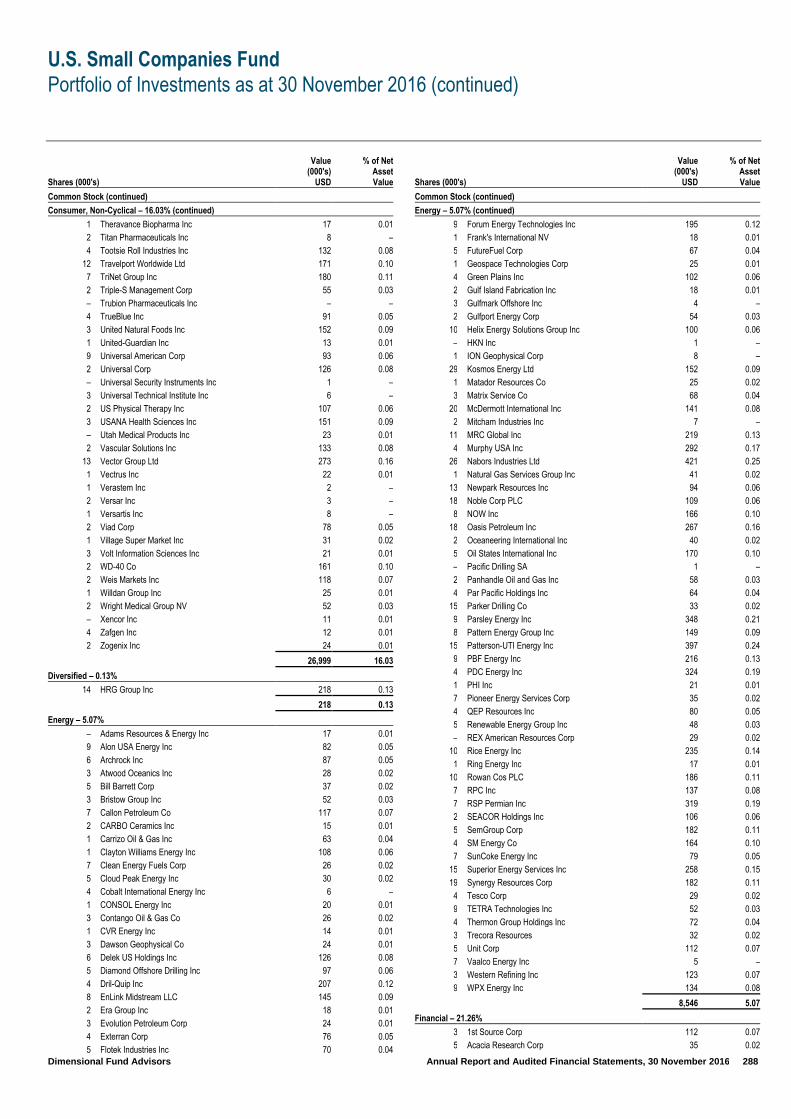
U.S. Small Companies Fund
Portfolio of Investments as at 30 November 2016 (continued)
Dimensional Fund Advisors Annual Report and Audited Financial Statements, 30 November 2016 288
Shares (000's)
Value (000's)
USD
% of Net Asset Value
Common Stock (continued)
Consumer, Non-Cyclical – 16.03% (continued)
1 Theravance Biopharma Inc 17 0.01
2 Titan Pharmaceuticals Inc 8 –
4 Tootsie Roll Industries Inc 132 0.08
12 Travelport Worldwide Ltd 171 0.10
7 TriNet Group Inc 180 0.11
2 Triple-S Management Corp 55 0.03
– Trubion Pharmaceuticals Inc – –
4 TrueBlue Inc 91 0.05
3 United Natural Foods Inc 152 0.09
1 United-Guardian Inc 13 0.01
9 Universal American Corp 93 0.06
2 Universal Corp 126 0.08
– Universal Security Instruments Inc 1 –
3 Universal Technical Institute Inc 6 –
2 US Physical Therapy Inc 107 0.06
3 USANA Health Sciences Inc 151 0.09
– Utah Medical Products Inc 23 0.01
2 Vascular Solutions Inc 133 0.08
13 Vector Group Ltd 273 0.16
1 Vectrus Inc 22 0.01
1 Verastem Inc 2 –
2 Versar Inc 3 –
1 Versartis Inc 8 –
2 Viad Corp 78 0.05
1 Village Super Market Inc 31 0.02
3 Volt Information Sciences Inc 21 0.01
2 WD-40 Co 161 0.10
2 Weis Markets Inc 118 0.07
1 Willdan Group Inc 25 0.01
2 Wright Medical Group NV 52 0.03
– Xencor Inc 11 0.01
4 Zafgen Inc 12 0.01
2 Zogenix Inc 24 0.01
26,999 16.03
Diversified – 0.13%
14 HRG Group Inc 218 0.13
218 0.13
Energy – 5.07%
– Adams Resources & Energy Inc 17 0.01
9 Alon USA Energy Inc 82 0.05
6 Archrock Inc 87 0.05
3 Atwood Oceanics Inc 28 0.02
5 Bill Barrett Corp 37 0.02
3 Bristow Group Inc 52 0.03
7 Callon Petroleum Co 117 0.07
2 CARBO Ceramics Inc 15 0.01
1 Carrizo Oil & Gas Inc 63 0.04
1 Clayton Williams Energy Inc 108 0.06
7 Clean Energy Fuels Corp 26 0.02
5 Cloud Peak Energy Inc 30 0.02
4 Cobalt International Energy Inc 6 –
1 CONSOL Energy Inc 20 0.01
3 Contango Oil & Gas Co 26 0.02
1 CVR Energy Inc 14 0.01
3 Dawson Geophysical Co 24 0.01
6 Delek US Holdings Inc 126 0.08
5 Diamond Offshore Drilling Inc 97 0.06
4 Dril-Quip Inc 207 0.12
8 EnLink Midstream LLC 145 0.09
2 Era Group Inc 18 0.01
3 Evolution Petroleum Corp 24 0.01
4 Exterran Corp 76 0.05
5 Flotek Industries Inc 70 0.04
Shares (000's)
Value (000's)
USD
% of Net Asset Value
Common Stock (continued)
Energy – 5.07% (continued)
9 Forum Energy Technologies Inc 195 0.12
1 Frank's International NV 18 0.01
5 FutureFuel Corp 67 0.04
1 Geospace Technologies Corp 25 0.01
4 Green Plains Inc 102 0.06
2 Gulf Island Fabrication Inc 18 0.01
3 Gulfmark Offshore Inc 4 –
2 Gulfport Energy Corp 54 0.03
10 Helix Energy Solutions Group Inc 100 0.06
– HKN Inc 1 –
1 ION Geophysical Corp 8 –
29 Kosmos Energy Ltd 152 0.09
1 Matador Resources Co 25 0.02
3 Matrix Service Co 68 0.04
20 McDermott International Inc 141 0.08
2 Mitcham Industries Inc 7 –
11 MRC Global Inc 219 0.13
4 Murphy USA Inc 292 0.17
26 Nabors Industries Ltd 421 0.25
1 Natural Gas Services Group Inc 41 0.02
13 Newpark Resources Inc 94 0.06
18 Noble Corp PLC 109 0.06
8 NOW Inc 166 0.10
18 Oasis Petroleum Inc 267 0.16
2 Oceaneering International Inc 40 0.02
5 Oil States International Inc 170 0.10
– Pacific Drilling SA 1 –
2 Panhandle Oil and Gas Inc 58 0.03
4 Par Pacific Holdings Inc 64 0.04
15 Parker Drilling Co 33 0.02
9 Parsley Energy Inc 348 0.21
8 Pattern Energy Group Inc 149 0.09
15 Patterson-UTI Energy Inc 397 0.24
9 PBF Energy Inc 216 0.13
4 PDC Energy Inc 324 0.19
1 PHI Inc 21 0.01
7 Pioneer Energy Services Corp 35 0.02
4 QEP Resources Inc 80 0.05
5 Renewable Energy Group Inc 48 0.03
– REX American Resources Corp 29 0.02
10 Rice Energy Inc 235 0.14
1 Ring Energy Inc 17 0.01
10 Rowan Cos PLC 186 0.11
7 RPC Inc 137 0.08
7 RSP Permian Inc 319 0.19
2 SEACOR Holdings Inc 106 0.06
5 SemGroup Corp 182 0.11
4 SM Energy Co 164 0.10
7 SunCoke Energy Inc 79 0.05
15 Superior Energy Services Inc 258 0.15
19 Synergy Resources Corp 182 0.11
4 Tesco Corp 29 0.02
9 TETRA Technologies Inc 52 0.03
4 Thermon Group Holdings Inc 72 0.04
3 Trecora Resources 32 0.02
5 Unit Corp 112 0.07
7 Vaalco Energy Inc 5 –
3 Western Refining Inc 123 0.07
9 WPX Energy Inc 134 0.08
8,546 5.07
Financial – 21.26%
3 1st Source Corp 112 0.07
5 Acacia Research Corp 35 0.02
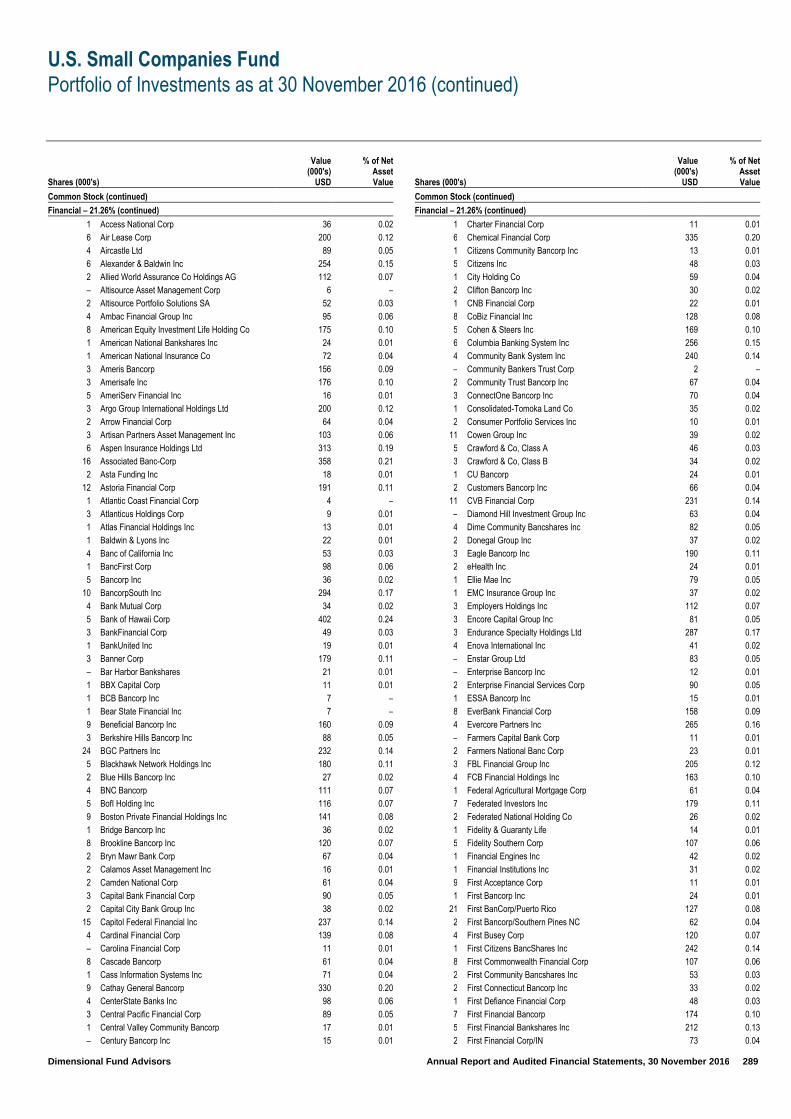
U.S. Small Companies Fund
Portfolio of Investments as at 30 November 2016 (continued)
Dimensional Fund Advisors Annual Report and Audited Financial Statements, 30 November 2016 289
Shares (000's)
Value (000's)
USD
% of Net Asset Value
Common Stock (continued)
Financial – 21.26% (continued)
1 Access National Corp 36 0.02
6 Air Lease Corp 200 0.12
4 Aircastle Ltd 89 0.05
6 Alexander & Baldwin Inc 254 0.15
2 Allied World Assurance Co Holdings AG 112 0.07
– Altisource Asset Management Corp 6 –
2 Altisource Portfolio Solutions SA 52 0.03
4 Ambac Financial Group Inc 95 0.06
8 American Equity Investment Life Holding Co 175 0.10
1 American National Bankshares Inc 24 0.01
1 American National Insurance Co 72 0.04
3 Ameris Bancorp 156 0.09
3 Amerisafe Inc 176 0.10
5 AmeriServ Financial Inc 16 0.01
3 Argo Group International Holdings Ltd 200 0.12
2 Arrow Financial Corp 64 0.04
3 Artisan Partners Asset Management Inc 103 0.06
6 Aspen Insurance Holdings Ltd 313 0.19
16 Associated Banc-Corp 358 0.21
2 Asta Funding Inc 18 0.01
12 Astoria Financial Corp 191 0.11
1 Atlantic Coast Financial Corp 4 –
3 Atlanticus Holdings Corp 9 0.01
1 Atlas Financial Holdings Inc 13 0.01
1 Baldwin & Lyons Inc 22 0.01
4 Banc of California Inc 53 0.03
1 BancFirst Corp 98 0.06
5 Bancorp Inc 36 0.02
10 BancorpSouth Inc 294 0.17
4 Bank Mutual Corp 34 0.02
5 Bank of Hawaii Corp 402 0.24
3 BankFinancial Corp 49 0.03
1 BankUnited Inc 19 0.01
3 Banner Corp 179 0.11
– Bar Harbor Bankshares 21 0.01
1 BBX Capital Corp 11 0.01
1 BCB Bancorp Inc 7 –
1 Bear State Financial Inc 7 –
9 Beneficial Bancorp Inc 160 0.09
3 Berkshire Hills Bancorp Inc 88 0.05
24 BGC Partners Inc 232 0.14
5 Blackhawk Network Holdings Inc 180 0.11
2 Blue Hills Bancorp Inc 27 0.02
4 BNC Bancorp 111 0.07
5 BofI Holding Inc 116 0.07
9 Boston Private Financial Holdings Inc 141 0.08
1 Bridge Bancorp Inc 36 0.02
8 Brookline Bancorp Inc 120 0.07
2 Bryn Mawr Bank Corp 67 0.04
2 Calamos Asset Management Inc 16 0.01
2 Camden National Corp 61 0.04
3 Capital Bank Financial Corp 90 0.05
2 Capital City Bank Group Inc 38 0.02
15 Capitol Federal Financial Inc 237 0.14
4 Cardinal Financial Corp 139 0.08
– Carolina Financial Corp 11 0.01
8 Cascade Bancorp 61 0.04
1 Cass Information Systems Inc 71 0.04
9 Cathay General Bancorp 330 0.20
4 CenterState Banks Inc 98 0.06
3 Central Pacific Financial Corp 89 0.05
1 Central Valley Community Bancorp 17 0.01
– Century Bancorp Inc 15 0.01
Shares (000's)
Value (000's)
USD
% of Net Asset Value
Common Stock (continued)
Financial – 21.26% (continued)
1 Charter Financial Corp 11 0.01
6 Chemical Financial Corp 335 0.20
1 Citizens Community Bancorp Inc 13 0.01
5 Citizens Inc 48 0.03
1 City Holding Co 59 0.04
2 Clifton Bancorp Inc 30 0.02
1 CNB Financial Corp 22 0.01
8 CoBiz Financial Inc 128 0.08
5 Cohen & Steers Inc 169 0.10
6 Columbia Banking System Inc 256 0.15
4 Community Bank System Inc 240 0.14
– Community Bankers Trust Corp 2 –
2 Community Trust Bancorp Inc 67 0.04
3 ConnectOne Bancorp Inc 70 0.04
1 Consolidated-Tomoka Land Co 35 0.02
2 Consumer Portfolio Services Inc 10 0.01
11 Cowen Group Inc 39 0.02
5 Crawford & Co, Class A 46 0.03
3 Crawford & Co, Class B 34 0.02
1 CU Bancorp 24 0.01
2 Customers Bancorp Inc 66 0.04
11 CVB Financial Corp 231 0.14
– Diamond Hill Investment Group Inc 63 0.04
4 Dime Community Bancshares Inc 82 0.05
2 Donegal Group Inc 37 0.02
3 Eagle Bancorp Inc 190 0.11
2 eHealth Inc 24 0.01
1 Ellie Mae Inc 79 0.05
1 EMC Insurance Group Inc 37 0.02
3 Employers Holdings Inc 112 0.07
3 Encore Capital Group Inc 81 0.05
3 Endurance Specialty Holdings Ltd 287 0.17
4 Enova International Inc 41 0.02
– Enstar Group Ltd 83 0.05
– Enterprise Bancorp Inc 12 0.01
2 Enterprise Financial Services Corp 90 0.05
1 ESSA Bancorp Inc 15 0.01
8 EverBank Financial Corp 158 0.09
4 Evercore Partners Inc 265 0.16
– Farmers Capital Bank Corp 11 0.01
2 Farmers National Banc Corp 23 0.01
3 FBL Financial Group Inc 205 0.12
4 FCB Financial Holdings Inc 163 0.10
1 Federal Agricultural Mortgage Corp 61 0.04
7 Federated Investors Inc 179 0.11
2 Federated National Holding Co 26 0.02
1 Fidelity & Guaranty Life 14 0.01
5 Fidelity Southern Corp 107 0.06
1 Financial Engines Inc 42 0.02
1 Financial Institutions Inc 31 0.02
9 First Acceptance Corp 11 0.01
1 First Bancorp Inc 24 0.01
21 First BanCorp/Puerto Rico 127 0.08
2 First Bancorp/Southern Pines NC 62 0.04
4 First Busey Corp 120 0.07
1 First Citizens BancShares Inc 242 0.14
8 First Commonwealth Financial Corp 107 0.06
2 First Community Bancshares Inc 53 0.03
2 First Connecticut Bancorp Inc 33 0.02
1 First Defiance Financial Corp 48 0.03
7 First Financial Bancorp 174 0.10
5 First Financial Bankshares Inc 212 0.13
2 First Financial Corp/IN 73 0.04
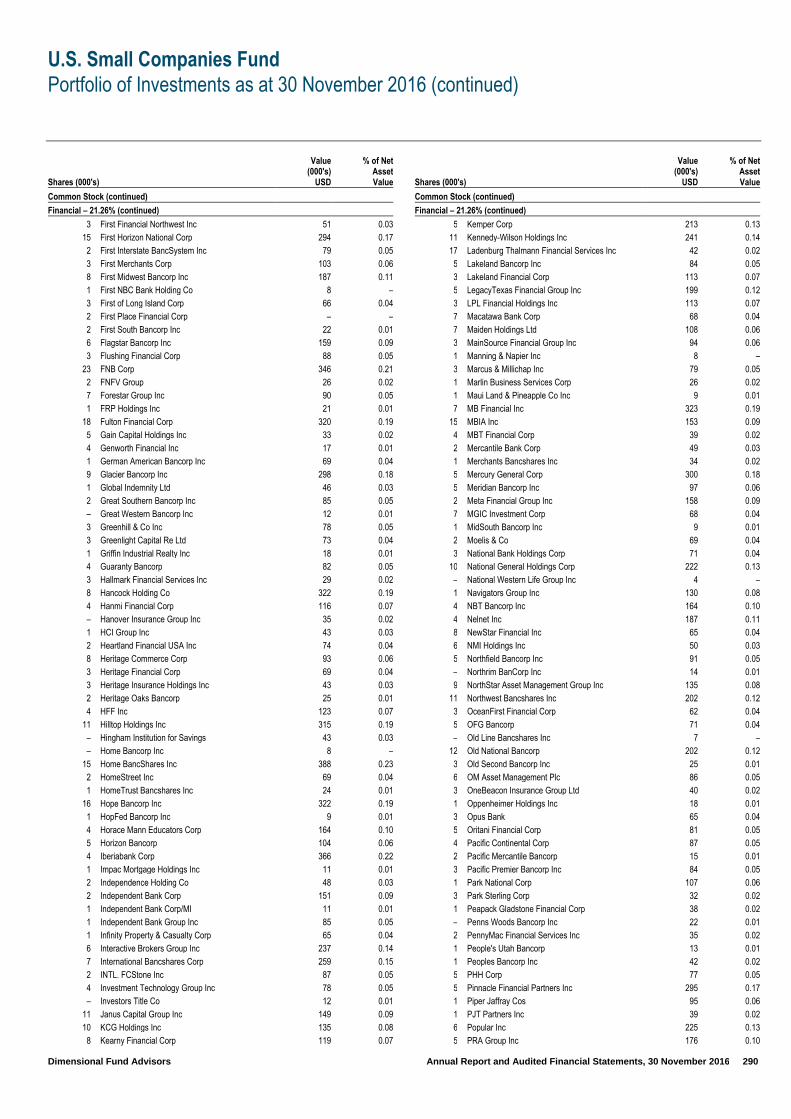
U.S. Small Companies Fund
Portfolio of Investments as at 30 November 2016 (continued)
Dimensional Fund Advisors Annual Report and Audited Financial Statements, 30 November 2016 290
Shares (000's)
Value (000's)
USD
% of Net Asset Value
Common Stock (continued)
Financial – 21.26% (continued)
3 First Financial Northwest Inc 51 0.03
15 First Horizon National Corp 294 0.17
2 First Interstate BancSystem Inc 79 0.05
3 First Merchants Corp 103 0.06
8 First Midwest Bancorp Inc 187 0.11
1 First NBC Bank Holding Co 8 –
3 First of Long Island Corp 66 0.04
2 First Place Financial Corp – –
2 First South Bancorp Inc 22 0.01
6 Flagstar Bancorp Inc 159 0.09
3 Flushing Financial Corp 88 0.05
23 FNB Corp 346 0.21
2 FNFV Group 26 0.02
7 Forestar Group Inc 90 0.05
1 FRP Holdings Inc 21 0.01
18 Fulton Financial Corp 320 0.19
5 Gain Capital Holdings Inc 33 0.02
4 Genworth Financial Inc 17 0.01
1 German American Bancorp Inc 69 0.04
9 Glacier Bancorp Inc 298 0.18
1 Global Indemnity Ltd 46 0.03
2 Great Southern Bancorp Inc 85 0.05
– Great Western Bancorp Inc 12 0.01
3 Greenhill & Co Inc 78 0.05
3 Greenlight Capital Re Ltd 73 0.04
1 Griffin Industrial Realty Inc 18 0.01
4 Guaranty Bancorp 82 0.05
3 Hallmark Financial Services Inc 29 0.02
8 Hancock Holding Co 322 0.19
4 Hanmi Financial Corp 116 0.07
– Hanover Insurance Group Inc 35 0.02
1 HCI Group Inc 43 0.03
2 Heartland Financial USA Inc 74 0.04
8 Heritage Commerce Corp 93 0.06
3 Heritage Financial Corp 69 0.04
3 Heritage Insurance Holdings Inc 43 0.03
2 Heritage Oaks Bancorp 25 0.01
4 HFF Inc 123 0.07
11 Hilltop Holdings Inc 315 0.19
– Hingham Institution for Savings 43 0.03
– Home Bancorp Inc 8 –
15 Home BancShares Inc 388 0.23
2 HomeStreet Inc 69 0.04
1 HomeTrust Bancshares Inc 24 0.01
16 Hope Bancorp Inc 322 0.19
1 HopFed Bancorp Inc 9 0.01
4 Horace Mann Educators Corp 164 0.10
5 Horizon Bancorp 104 0.06
4 Iberiabank Corp 366 0.22
1 Impac Mortgage Holdings Inc 11 0.01
2 Independence Holding Co 48 0.03
2 Independent Bank Corp 151 0.09
1 Independent Bank Corp/MI 11 0.01
1 Independent Bank Group Inc 85 0.05
1 Infinity Property & Casualty Corp 65 0.04
6 Interactive Brokers Group Inc 237 0.14
7 International Bancshares Corp 259 0.15
2 INTL. FCStone Inc 87 0.05
4 Investment Technology Group Inc 78 0.05
– Investors Title Co 12 0.01
11 Janus Capital Group Inc 149 0.09
10 KCG Holdings Inc 135 0.08
8 Kearny Financial Corp 119 0.07
Shares (000's)
Value (000's)
USD
% of Net Asset Value
Common Stock (continued)
Financial – 21.26% (continued)
5 Kemper Corp 213 0.13
11 Kennedy-Wilson Holdings Inc 241 0.14
17 Ladenburg Thalmann Financial Services Inc 42 0.02
5 Lakeland Bancorp Inc 84 0.05
3 Lakeland Financial Corp 113 0.07
5 LegacyTexas Financial Group Inc 199 0.12
3 LPL Financial Holdings Inc 113 0.07
7 Macatawa Bank Corp 68 0.04
7 Maiden Holdings Ltd 108 0.06
3 MainSource Financial Group Inc 94 0.06
1 Manning & Napier Inc 8 –
3 Marcus & Millichap Inc 79 0.05
1 Marlin Business Services Corp 26 0.02
1 Maui Land & Pineapple Co Inc 9 0.01
7 MB Financial Inc 323 0.19
15 MBIA Inc 153 0.09
4 MBT Financial Corp 39 0.02
2 Mercantile Bank Corp 49 0.03
1 Merchants Bancshares Inc 34 0.02
5 Mercury General Corp 300 0.18
5 Meridian Bancorp Inc 97 0.06
2 Meta Financial Group Inc 158 0.09
7 MGIC Investment Corp 68 0.04
1 MidSouth Bancorp Inc 9 0.01
2 Moelis & Co 69 0.04
3 National Bank Holdings Corp 71 0.04
10 National General Holdings Corp 222 0.13
– National Western Life Group Inc 4 –
1 Navigators Group Inc 130 0.08
4 NBT Bancorp Inc 164 0.10
4 Nelnet Inc 187 0.11
8 NewStar Financial Inc 65 0.04
6 NMI Holdings Inc 50 0.03
5 Northfield Bancorp Inc 91 0.05
– Northrim BanCorp Inc 14 0.01
9 NorthStar Asset Management Group Inc 135 0.08
11 Northwest Bancshares Inc 202 0.12
3 OceanFirst Financial Corp 62 0.04
5 OFG Bancorp 71 0.04
– Old Line Bancshares Inc 7 –
12 Old National Bancorp 202 0.12
3 Old Second Bancorp Inc 25 0.01
6 OM Asset Management Plc 86 0.05
3 OneBeacon Insurance Group Ltd 40 0.02
1 Oppenheimer Holdings Inc 18 0.01
3 Opus Bank 65 0.04
5 Oritani Financial Corp 81 0.05
4 Pacific Continental Corp 87 0.05
2 Pacific Mercantile Bancorp 15 0.01
3 Pacific Premier Bancorp Inc 84 0.05
1 Park National Corp 107 0.06
3 Park Sterling Corp 32 0.02
1 Peapack Gladstone Financial Corp 38 0.02
– Penns Woods Bancorp Inc 22 0.01
2 PennyMac Financial Services Inc 35 0.02
1 People's Utah Bancorp 13 0.01
1 Peoples Bancorp Inc 42 0.02
5 PHH Corp 77 0.05
5 Pinnacle Financial Partners Inc 295 0.17
1 Piper Jaffray Cos 95 0.06
1 PJT Partners Inc 39 0.02
6 Popular Inc 225 0.13
5 PRA Group Inc 176 0.10
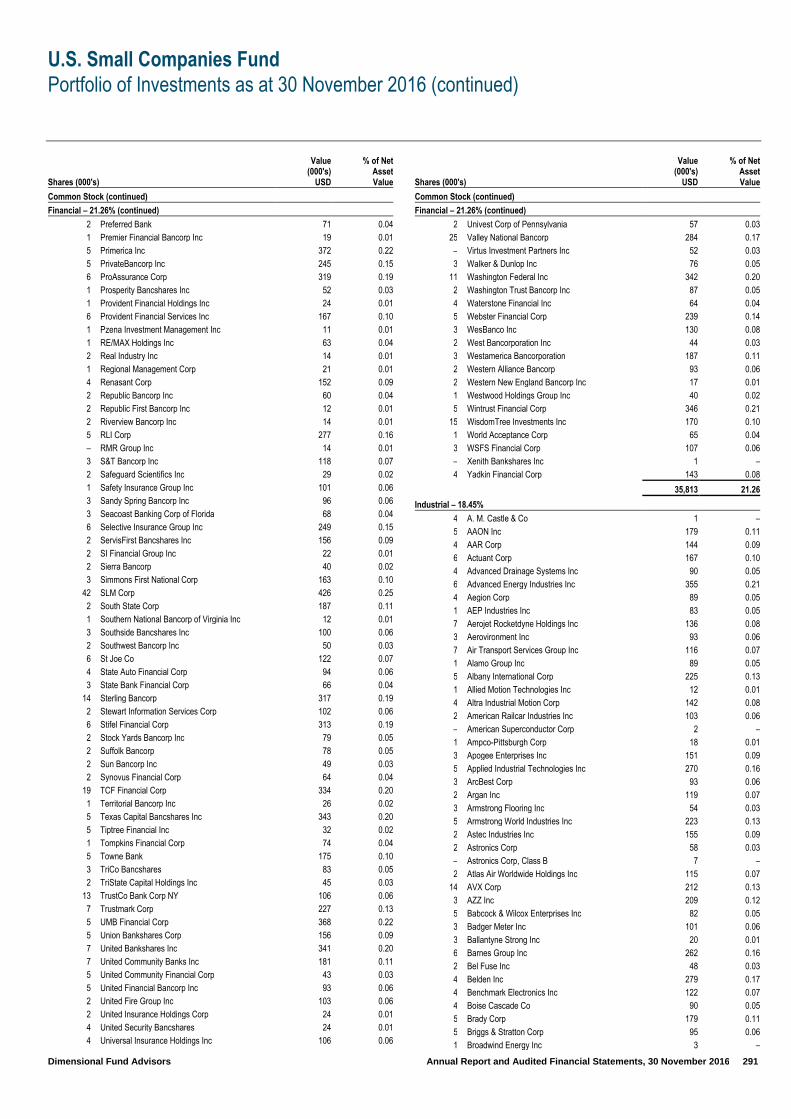
U.S. Small Companies Fund
Portfolio of Investments as at 30 November 2016 (continued)
Dimensional Fund Advisors Annual Report and Audited Financial Statements, 30 November 2016 291
Shares (000's)
Value (000's)
USD
% of Net Asset Value
Common Stock (continued)
Financial – 21.26% (continued)
2 Preferred Bank 71 0.04
1 Premier Financial Bancorp Inc 19 0.01
5 Primerica Inc 372 0.22
5 PrivateBancorp Inc 245 0.15
6 ProAssurance Corp 319 0.19
1 Prosperity Bancshares Inc 52 0.03
1 Provident Financial Holdings Inc 24 0.01
6 Provident Financial Services Inc 167 0.10
1 Pzena Investment Management Inc 11 0.01
1 RE/MAX Holdings Inc 63 0.04
2 Real Industry Inc 14 0.01
1 Regional Management Corp 21 0.01
4 Renasant Corp 152 0.09
2 Republic Bancorp Inc 60 0.04
2 Republic First Bancorp Inc 12 0.01
2 Riverview Bancorp Inc 14 0.01
5 RLI Corp 277 0.16
– RMR Group Inc 14 0.01
3 S&T Bancorp Inc 118 0.07
2 Safeguard Scientifics Inc 29 0.02
1 Safety Insurance Group Inc 101 0.06
3 Sandy Spring Bancorp Inc 96 0.06
3 Seacoast Banking Corp of Florida 68 0.04
6 Selective Insurance Group Inc 249 0.15
2 ServisFirst Bancshares Inc 156 0.09
2 SI Financial Group Inc 22 0.01
2 Sierra Bancorp 40 0.02
3 Simmons First National Corp 163 0.10
42 SLM Corp 426 0.25
2 South State Corp 187 0.11
1 Southern National Bancorp of Virginia Inc 12 0.01
3 Southside Bancshares Inc 100 0.06
2 Southwest Bancorp Inc 50 0.03
6 St Joe Co 122 0.07
4 State Auto Financial Corp 94 0.06
3 State Bank Financial Corp 66 0.04
14 Sterling Bancorp 317 0.19
2 Stewart Information Services Corp 102 0.06
6 Stifel Financial Corp 313 0.19
2 Stock Yards Bancorp Inc 79 0.05
2 Suffolk Bancorp 78 0.05
2 Sun Bancorp Inc 49 0.03
2 Synovus Financial Corp 64 0.04
19 TCF Financial Corp 334 0.20
1 Territorial Bancorp Inc 26 0.02
5 Texas Capital Bancshares Inc 343 0.20
5 Tiptree Financial Inc 32 0.02
1 Tompkins Financial Corp 74 0.04
5 Towne Bank 175 0.10
3 TriCo Bancshares 83 0.05
2 TriState Capital Holdings Inc 45 0.03
13 TrustCo Bank Corp NY 106 0.06
7 Trustmark Corp 227 0.13
5 UMB Financial Corp 368 0.22
5 Union Bankshares Corp 156 0.09
7 United Bankshares Inc 341 0.20
7 United Community Banks Inc 181 0.11
5 United Community Financial Corp 43 0.03
5 United Financial Bancorp Inc 93 0.06
2 United Fire Group Inc 103 0.06
2 United Insurance Holdings Corp 24 0.01
4 United Security Bancshares 24 0.01
4 Universal Insurance Holdings Inc 106 0.06
Shares (000's)
Value (000's)
USD
% of Net Asset Value
Common Stock (continued)
Financial – 21.26% (continued)
2 Univest Corp of Pennsylvania 57 0.03
25 Valley National Bancorp 284 0.17
– Virtus Investment Partners Inc 52 0.03
3 Walker & Dunlop Inc 76 0.05
11 Washington Federal Inc 342 0.20
2 Washington Trust Bancorp Inc 87 0.05
4 Waterstone Financial Inc 64 0.04
5 Webster Financial Corp 239 0.14
3 WesBanco Inc 130 0.08
2 West Bancorporation Inc 44 0.03
3 Westamerica Bancorporation 187 0.11
2 Western Alliance Bancorp 93 0.06
2 Western New England Bancorp Inc 17 0.01
1 Westwood Holdings Group Inc 40 0.02
5 Wintrust Financial Corp 346 0.21
15 WisdomTree Investments Inc 170 0.10
1 World Acceptance Corp 65 0.04
3 WSFS Financial Corp 107 0.06
– Xenith Bankshares Inc 1 –
4 Yadkin Financial Corp 143 0.08
35,813 21.26
Industrial – 18.45%
4 A. M. Castle & Co 1 –
5 AAON Inc 179 0.11
4 AAR Corp 144 0.09
6 Actuant Corp 167 0.10
4 Advanced Drainage Systems Inc 90 0.05
6 Advanced Energy Industries Inc 355 0.21
4 Aegion Corp 89 0.05
1 AEP Industries Inc 83 0.05
7 Aerojet Rocketdyne Holdings Inc 136 0.08
3 Aerovironment Inc 93 0.06
7 Air Transport Services Group Inc 116 0.07
1 Alamo Group Inc 89 0.05
5 Albany International Corp 225 0.13
1 Allied Motion Technologies Inc 12 0.01
4 Altra Industrial Motion Corp 142 0.08
2 American Railcar Industries Inc 103 0.06
– American Superconductor Corp 2 –
1 Ampco-Pittsburgh Corp 18 0.01
3 Apogee Enterprises Inc 151 0.09
5 Applied Industrial Technologies Inc 270 0.16
3 ArcBest Corp 93 0.06
2 Argan Inc 119 0.07
3 Armstrong Flooring Inc 54 0.03
5 Armstrong World Industries Inc 223 0.13
2 Astec Industries Inc 155 0.09
2 Astronics Corp 58 0.03
– Astronics Corp, Class B 7 –
2 Atlas Air Worldwide Holdings Inc 115 0.07
14 AVX Corp 212 0.13
3 AZZ Inc 209 0.12
5 Babcock & Wilcox Enterprises Inc 82 0.05
3 Badger Meter Inc 101 0.06
3 Ballantyne Strong Inc 20 0.01
6 Barnes Group Inc 262 0.16
2 Bel Fuse Inc 48 0.03
4 Belden Inc 279 0.17
4 Benchmark Electronics Inc 122 0.07
4 Boise Cascade Co 90 0.05
5 Brady Corp 179 0.11
5 Briggs & Stratton Corp 95 0.06
1 Broadwind Energy Inc 3 –
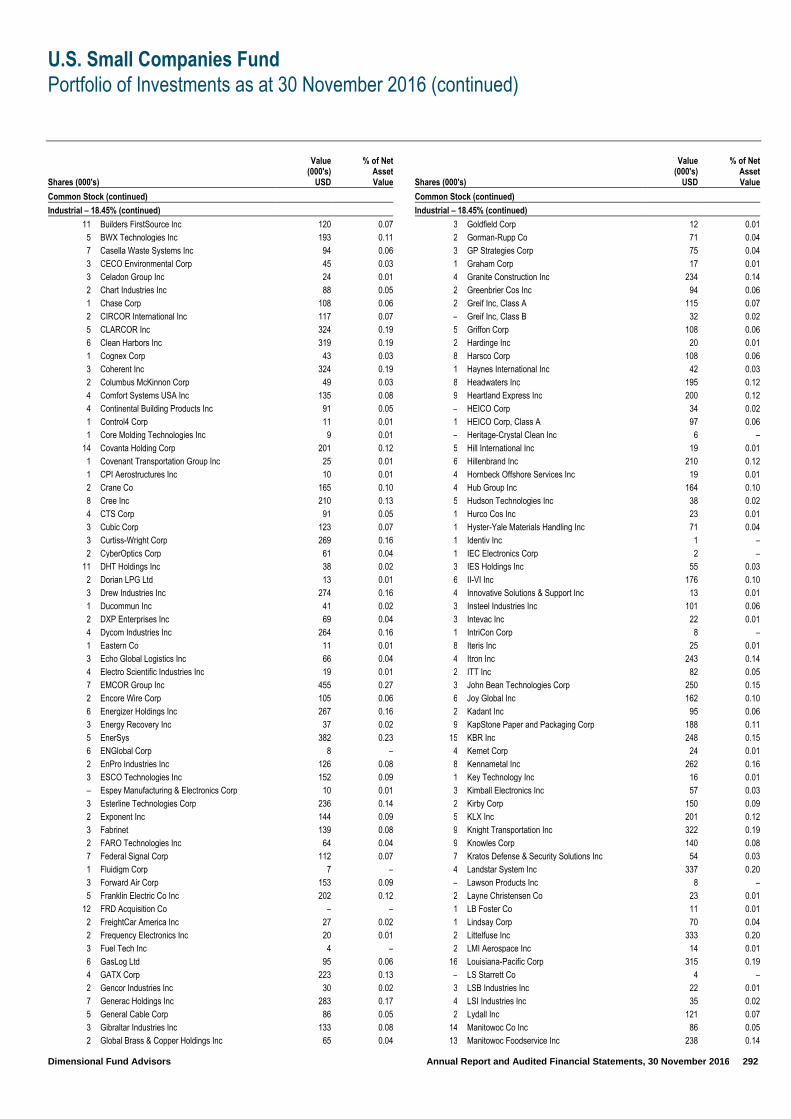
U.S. Small Companies Fund
Portfolio of Investments as at 30 November 2016 (continued)
Dimensional Fund Advisors Annual Report and Audited Financial Statements, 30 November 2016 292
Shares (000's)
Value (000's)
USD
% of Net Asset Value
Common Stock (continued)
Industrial – 18.45% (continued)
11 Builders FirstSource Inc 120 0.07
5 BWX Technologies Inc 193 0.11
7 Casella Waste Systems Inc 94 0.06
3 CECO Environmental Corp 45 0.03
3 Celadon Group Inc 24 0.01
2 Chart Industries Inc 88 0.05
1 Chase Corp 108 0.06
2 CIRCOR International Inc 117 0.07
5 CLARCOR Inc 324 0.19
6 Clean Harbors Inc 319 0.19
1 Cognex Corp 43 0.03
3 Coherent Inc 324 0.19
2 Columbus McKinnon Corp 49 0.03
4 Comfort Systems USA Inc 135 0.08
4 Continental Building Products Inc 91 0.05
1 Control4 Corp 11 0.01
1 Core Molding Technologies Inc 9 0.01
14 Covanta Holding Corp 201 0.12
1 Covenant Transportation Group Inc 25 0.01
1 CPI Aerostructures Inc 10 0.01
2 Crane Co 165 0.10
8 Cree Inc 210 0.13
4 CTS Corp 91 0.05
3 Cubic Corp 123 0.07
3 Curtiss-Wright Corp 269 0.16
2 CyberOptics Corp 61 0.04
11 DHT Holdings Inc 38 0.02
2 Dorian LPG Ltd 13 0.01
3 Drew Industries Inc 274 0.16
1 Ducommun Inc 41 0.02
2 DXP Enterprises Inc 69 0.04
4 Dycom Industries Inc 264 0.16
1 Eastern Co 11 0.01
3 Echo Global Logistics Inc 66 0.04
4 Electro Scientific Industries Inc 19 0.01
7 EMCOR Group Inc 455 0.27
2 Encore Wire Corp 105 0.06
6 Energizer Holdings Inc 267 0.16
3 Energy Recovery Inc 37 0.02
5 EnerSys 382 0.23
6 ENGlobal Corp 8 –
2 EnPro Industries Inc 126 0.08
3 ESCO Technologies Inc 152 0.09
– Espey Manufacturing & Electronics Corp 10 0.01
3 Esterline Technologies Corp 236 0.14
2 Exponent Inc 144 0.09
3 Fabrinet 139 0.08
2 FARO Technologies Inc 64 0.04
7 Federal Signal Corp 112 0.07
1 Fluidigm Corp 7 –
3 Forward Air Corp 153 0.09
5 Franklin Electric Co Inc 202 0.12
12 FRD Acquisition Co – –
2 FreightCar America Inc 27 0.02
2 Frequency Electronics Inc 20 0.01
3 Fuel Tech Inc 4 –
6 GasLog Ltd 95 0.06
4 GATX Corp 223 0.13
2 Gencor Industries Inc 30 0.02
7 Generac Holdings Inc 283 0.17
5 General Cable Corp 86 0.05
3 Gibraltar Industries Inc 133 0.08
2 Global Brass & Copper Holdings Inc 65 0.04
Shares (000's)
Value (000's)
USD
% of Net Asset Value
Common Stock (continued)
Industrial – 18.45% (continued)
3 Goldfield Corp 12 0.01
2 Gorman-Rupp Co 71 0.04
3 GP Strategies Corp 75 0.04
1 Graham Corp 17 0.01
4 Granite Construction Inc 234 0.14
2 Greenbrier Cos Inc 94 0.06
2 Greif Inc, Class A 115 0.07
– Greif Inc, Class B 32 0.02
5 Griffon Corp 108 0.06
2 Hardinge Inc 20 0.01
8 Harsco Corp 108 0.06
1 Haynes International Inc 42 0.03
8 Headwaters Inc 195 0.12
9 Heartland Express Inc 200 0.12
– HEICO Corp 34 0.02
1 HEICO Corp, Class A 97 0.06
– Heritage-Crystal Clean Inc 6 –
5 Hill International Inc 19 0.01
6 Hillenbrand Inc 210 0.12
4 Hornbeck Offshore Services Inc 19 0.01
4 Hub Group Inc 164 0.10
5 Hudson Technologies Inc 38 0.02
1 Hurco Cos Inc 23 0.01
1 Hyster-Yale Materials Handling Inc 71 0.04
1 Identiv Inc 1 –
1 IEC Electronics Corp 2 –
3 IES Holdings Inc 55 0.03
6 II-VI Inc 176 0.10
4 Innovative Solutions & Support Inc 13 0.01
3 Insteel Industries Inc 101 0.06
3 Intevac Inc 22 0.01
1 IntriCon Corp 8 –
8 Iteris Inc 25 0.01
4 Itron Inc 243 0.14
2 ITT Inc 82 0.05
3 John Bean Technologies Corp 250 0.15
6 Joy Global Inc 162 0.10
2 Kadant Inc 95 0.06
9 KapStone Paper and Packaging Corp 188 0.11
15 KBR Inc 248 0.15
4 Kemet Corp 24 0.01
8 Kennametal Inc 262 0.16
1 Key Technology Inc 16 0.01
3 Kimball Electronics Inc 57 0.03
2 Kirby Corp 150 0.09
5 KLX Inc 201 0.12
9 Knight Transportation Inc 322 0.19
9 Knowles Corp 140 0.08
7 Kratos Defense & Security Solutions Inc 54 0.03
4 Landstar System Inc 337 0.20
– Lawson Products Inc 8 –
2 Layne Christensen Co 23 0.01
1 LB Foster Co 11 0.01
1 Lindsay Corp 70 0.04
2 Littelfuse Inc 333 0.20
2 LMI Aerospace Inc 14 0.01
16 Louisiana-Pacific Corp 315 0.19
– LS Starrett Co 4 –
3 LSB Industries Inc 22 0.01
4 LSI Industries Inc 35 0.02
2 Lydall Inc 121 0.07
14 Manitowoc Co Inc 86 0.05
13 Manitowoc Foodservice Inc 238 0.14

U.S. Small Companies Fund
Portfolio of Investments as at 30 November 2016 (continued)
Dimensional Fund Advisors Annual Report and Audited Financial Statements, 30 November 2016 293
Shares (000's)
Value (000's)
USD
% of Net Asset Value
Common Stock (continued)
Industrial – 18.45% (continued)
3 Marten Transport Ltd 77 0.05
8 MasTec Inc 288 0.17
5 Matson Inc 188 0.11
– Mesa Laboratories Inc 40 0.02
4 Methode Electronics Inc 153 0.09
2 MFRI Inc 13 0.01
3 Mistras Group Inc 65 0.04
1 MOCON Inc 9 0.01
4 Moog Inc 267 0.16
4 MSA Safety Inc 248 0.15
6 Mueller Industries Inc 222 0.13
17 Mueller Water Products Inc 231 0.14
1 Multi-Color Corp 87 0.05
4 Myers Industries Inc 58 0.03
3 MYR Group Inc 96 0.06
5 Napco Security Technologies Inc 41 0.02
1 National Presto Industries Inc 50 0.03
7 NCI Building Systems Inc 121 0.07
5 NL Industries Inc 34 0.02
3 NN Inc 51 0.03
2 Northwest Pipe Co 30 0.02
3 Novanta Inc 60 0.04
1 NV5 Global Inc 33 0.02
– NVE Corp 14 0.01
1 Olympic Steel Inc 31 0.02
1 Omega Flex Inc 45 0.03
1 Orion Energy Systems Inc 2 –
3 Orion Group Holdings Inc 29 0.02
3 Oshkosh Corp 179 0.11
2 OSI Systems Inc 168 0.10
2 PAM Transportation Services Inc 38 0.02
2 Park Electrochemical Corp 36 0.02
1 Park-Ohio Holdings Corp 54 0.03
1 Patrick Industries Inc 96 0.06
– Patriot Transportation Holding Inc 1 –
6 PGT Inc 72 0.04
4 Plexus Corp 195 0.12
5 Ply Gem Holdings Inc 83 0.05
1 Powell Industries Inc 35 0.02
5 Primoris Services Corp 115 0.07
2 Proto Labs Inc 128 0.08
4 Quanex Building Products Corp 69 0.04
3 Radiant Logistics Inc 9 0.01
4 Raven Industries Inc 89 0.05
2 RBC Bearings Inc 205 0.12
3 Regal Beloit Corp 194 0.12
10 Rexnord Corp 226 0.13
4 Roadrunner Transportation Systems Inc 41 0.02
2 Rogers Corp 136 0.08
2 Saia Inc 90 0.05
9 Sanmina Corp 279 0.17
21 Scorpio Tankers Inc 88 0.05
9 Ship Finance International Ltd 134 0.08
1 SIFCO Industries Inc 9 0.01
4 Silgan Holdings Inc 176 0.10
5 Simpson Manufacturing Co Inc 241 0.14
5 Smith & Wesson Holding Corp 127 0.08
1 Sparton Corp 29 0.02
4 SPX Corp 95 0.06
4 SPX FLOW Inc 128 0.08
2 Standex International Corp 146 0.09
2 Sterling Construction Co Inc 19 0.01
4 Stoneridge Inc 70 0.04
Shares (000's)
Value (000's)
USD
% of Net Asset Value
Common Stock (continued)
Industrial – 18.45% (continued)
2 Sturm Ruger & Co Inc 101 0.06
3 Sun Hydraulics Corp 133 0.08
8 SunPower Corp 56 0.03
8 Swift Transportation Co 206 0.12
1 Synalloy Corp 9 0.01
5 TASER International Inc 149 0.09
3 Tech Data Corp 281 0.17
3 Teekay Corp 26 0.02
9 Teekay Tankers Ltd 21 0.01
1 Teledyne Technologies Inc 101 0.06
2 Tennant Co 147 0.09
6 Terex Corp 193 0.11
7 Tetra Tech Inc 280 0.17
2 Tidewater Inc 3 –
8 Timken Co 315 0.19
4 TimkenSteel Corp 69 0.04
1 TopBuild Corp 24 0.01
3 TRC Cos Inc 31 0.02
2 Tredegar Corp 45 0.03
4 Trex Co Inc 256 0.15
5 TriMas Corp 98 0.06
4 Trinseo SA 255 0.15
4 Triumph Group Inc 117 0.07
10 TTM Technologies Inc 138 0.08
5 Tutor Perini Corp 134 0.08
2 Twin Disc Inc 25 0.01
4 Ultralife Corp 19 0.01
1 Universal Display Corp 27 0.02
2 Universal Forest Products Inc 222 0.13
2 Universal Logistics Holdings Inc 34 0.02
1 US Concrete Inc 77 0.05
2 US Ecology Inc 115 0.07
2 USA Truck Inc 14 0.01
2 Valmont Industries Inc 276 0.16
4 Vicor Corp 55 0.03
14 Vishay Intertechnology Inc 211 0.13
2 Vishay Precision Group Inc 38 0.02
1 VSE Corp 45 0.03
3 Watts Water Technologies Inc 206 0.12
7 Werner Enterprises Inc 192 0.11
– Willis Lease Finance Corp 11 0.01
3 Woodward Inc 204 0.12
7 Worthington Industries Inc 381 0.23
1 Xerium Technologies Inc 4 –
3 XPO Logistics Inc 143 0.09
5 YRC Worldwide Inc 58 0.03
4 ZAGG Inc 24 0.01
31,070 18.45
Technology - 8.68%
13 ACI Worldwide Inc 249 0.15
7 Actua Corp 94 0.06
12 Acxiom Corp 328 0.19
4 Agilysys Inc 36 0.02
21 Allscripts Healthcare Solutions Inc 228 0.14
3 Alpha & Omega Semiconductor Ltd 73 0.04
2 Ambarella Inc 99 0.06
4 American Software Inc 42 0.03
23 Amkor Technology Inc 272 0.16
2 Amtech Systems Inc 10 0.01
3 Aspen Technology Inc 154 0.09
7 Avid Technology Inc 30 0.02
4 Axcelis Technologies Inc 59 0.04
7 AXT Inc 35 0.02
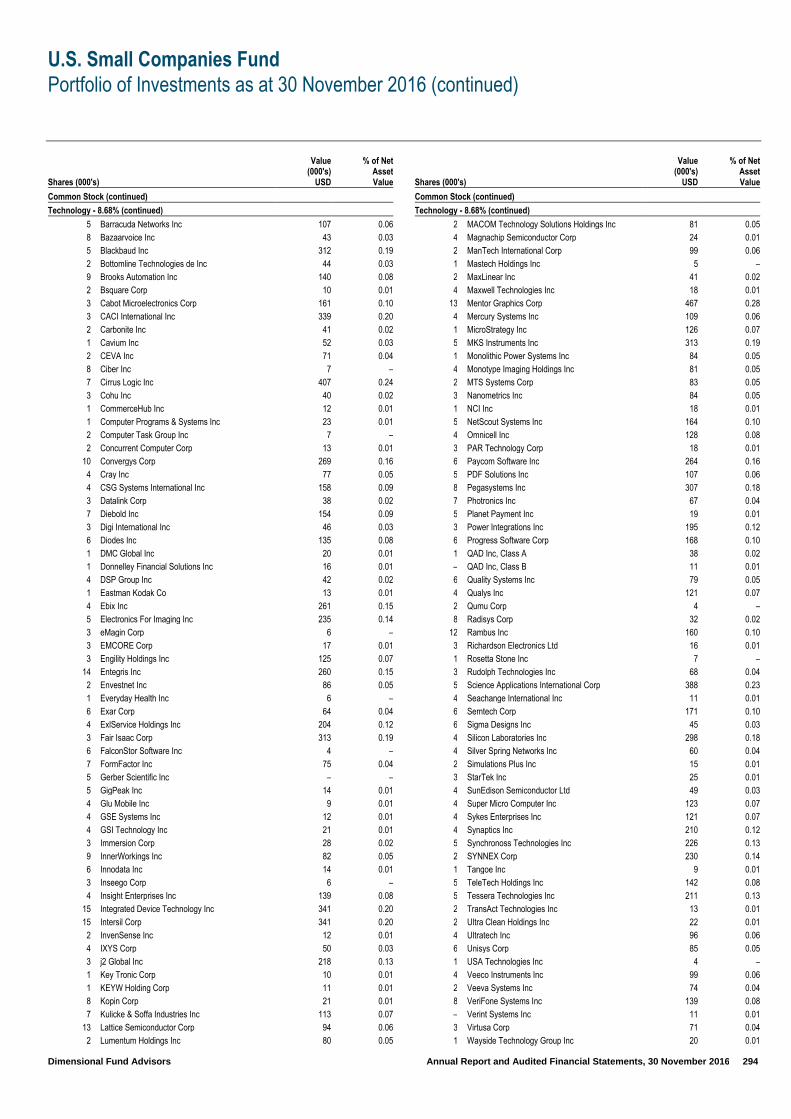
U.S. Small Companies Fund
Portfolio of Investments as at 30 November 2016 (continued)
Dimensional Fund Advisors Annual Report and Audited Financial Statements, 30 November 2016 294
Shares (000's)
Value (000's)
USD
% of Net Asset Value
Common Stock (continued)
Technology - 8.68% (continued)
5 Barracuda Networks Inc 107 0.06
8 Bazaarvoice Inc 43 0.03
5 Blackbaud Inc 312 0.19
2 Bottomline Technologies de Inc 44 0.03
9 Brooks Automation Inc 140 0.08
2 Bsquare Corp 10 0.01
3 Cabot Microelectronics Corp 161 0.10
3 CACI International Inc 339 0.20
2 Carbonite Inc 41 0.02
1 Cavium Inc 52 0.03
2 CEVA Inc 71 0.04
8 Ciber Inc 7 –
7 Cirrus Logic Inc 407 0.24
3 Cohu Inc 40 0.02
1 CommerceHub Inc 12 0.01
1 Computer Programs & Systems Inc 23 0.01
2 Computer Task Group Inc 7 –
2 Concurrent Computer Corp 13 0.01
10 Convergys Corp 269 0.16
4 Cray Inc 77 0.05
4 CSG Systems International Inc 158 0.09
3 Datalink Corp 38 0.02
7 Diebold Inc 154 0.09
3 Digi International Inc 46 0.03
6 Diodes Inc 135 0.08
1 DMC Global Inc 20 0.01
1 Donnelley Financial Solutions Inc 16 0.01
4 DSP Group Inc 42 0.02
1 Eastman Kodak Co 13 0.01
4 Ebix Inc 261 0.15
5 Electronics For Imaging Inc 235 0.14
3 eMagin Corp 6 –
3 EMCORE Corp 17 0.01
3 Engility Holdings Inc 125 0.07
14 Entegris Inc 260 0.15
2 Envestnet Inc 86 0.05
1 Everyday Health Inc 6 –
6 Exar Corp 64 0.04
4 ExlService Holdings Inc 204 0.12
3 Fair Isaac Corp 313 0.19
6 FalconStor Software Inc 4 –
7 FormFactor Inc 75 0.04
5 Gerber Scientific Inc – –
5 GigPeak Inc 14 0.01
4 Glu Mobile Inc 9 0.01
4 GSE Systems Inc 12 0.01
4 GSI Technology Inc 21 0.01
3 Immersion Corp 28 0.02
9 InnerWorkings Inc 82 0.05
6 Innodata Inc 14 0.01
3 Inseego Corp 6 –
4 Insight Enterprises Inc 139 0.08
15 Integrated Device Technology Inc 341 0.20
15 Intersil Corp 341 0.20
2 InvenSense Inc 12 0.01
4 IXYS Corp 50 0.03
3 j2 Global Inc 218 0.13
1 Key Tronic Corp 10 0.01
1 KEYW Holding Corp 11 0.01
8 Kopin Corp 21 0.01
7 Kulicke & Soffa Industries Inc 113 0.07
13 Lattice Semiconductor Corp 94 0.06
2 Lumentum Holdings Inc 80 0.05
Shares (000's)
Value (000's)
USD
% of Net Asset Value
Common Stock (continued)
Technology - 8.68% (continued)
2 MACOM Technology Solutions Holdings Inc 81 0.05
4 Magnachip Semiconductor Corp 24 0.01
2 ManTech International Corp 99 0.06
1 Mastech Holdings Inc 5 –
2 MaxLinear Inc 41 0.02
4 Maxwell Technologies Inc 18 0.01
13 Mentor Graphics Corp 467 0.28
4 Mercury Systems Inc 109 0.06
1 MicroStrategy Inc 126 0.07
5 MKS Instruments Inc 313 0.19
1 Monolithic Power Systems Inc 84 0.05
4 Monotype Imaging Holdings Inc 81 0.05
2 MTS Systems Corp 83 0.05
3 Nanometrics Inc 84 0.05
1 NCI Inc 18 0.01
5 NetScout Systems Inc 164 0.10
4 Omnicell Inc 128 0.08
3 PAR Technology Corp 18 0.01
6 Paycom Software Inc 264 0.16
5 PDF Solutions Inc 107 0.06
8 Pegasystems Inc 307 0.18
7 Photronics Inc 67 0.04
5 Planet Payment Inc 19 0.01
3 Power Integrations Inc 195 0.12
6 Progress Software Corp 168 0.10
1 QAD Inc, Class A 38 0.02
– QAD Inc, Class B 11 0.01
6 Quality Systems Inc 79 0.05
4 Qualys Inc 121 0.07
2 Qumu Corp 4 –
8 Radisys Corp 32 0.02
12 Rambus Inc 160 0.10
3 Richardson Electronics Ltd 16 0.01
1 Rosetta Stone Inc 7 –
3 Rudolph Technologies Inc 68 0.04
5 Science Applications International Corp 388 0.23
4 Seachange International Inc 11 0.01
6 Semtech Corp 171 0.10
6 Sigma Designs Inc 45 0.03
4 Silicon Laboratories Inc 298 0.18
4 Silver Spring Networks Inc 60 0.04
2 Simulations Plus Inc 15 0.01
3 StarTek Inc 25 0.01
4 SunEdison Semiconductor Ltd 49 0.03
4 Super Micro Computer Inc 123 0.07
4 Sykes Enterprises Inc 121 0.07
4 Synaptics Inc 210 0.12
5 Synchronoss Technologies Inc 226 0.13
2 SYNNEX Corp 230 0.14
1 Tangoe Inc 9 0.01
5 TeleTech Holdings Inc 142 0.08
5 Tessera Technologies Inc 211 0.13
2 TransAct Technologies Inc 13 0.01
2 Ultra Clean Holdings Inc 22 0.01
4 Ultratech Inc 96 0.06
6 Unisys Corp 85 0.05
1 USA Technologies Inc 4 –
4 Veeco Instruments Inc 99 0.06
2 Veeva Systems Inc 74 0.04
8 VeriFone Systems Inc 139 0.08
– Verint Systems Inc 11 0.01
3 Virtusa Corp 71 0.04
1 Wayside Technology Group Inc 20 0.01

U.S. Small Companies Fund
Portfolio of Investments as at 30 November 2016 (continued)
Dimensional Fund Advisors Annual Report and Audited Financial Statements, 30 November 2016 295
Shares (000's)
Value (000's)
USD
% of Net Asset Value
Common Stock (continued)
Technology - 8.68% (continued)
7 Xcerra Corp 43 0.03
1 Zedge Inc 3 –
76 Zynga Inc 217 0.13
14,615 8.68
Utilities – 3.69%
6 ALLETE Inc 350 0.21
3 Ameresco Inc 16 0.01
5 American States Water Co 223 0.13
1 Artesian Resources Corp 30 0.02
12 Atlantic Power Corp 31 0.02
6 Avista Corp 257 0.15
5 Black Hills Corp 302 0.18
5 California Water Service Group 167 0.10
1 Chesapeake Utilities Corp 91 0.05
1 Connecticut Water Service Inc 57 0.03
2 Consolidated Water Co Ltd 18 0.01
1 Delta Natural Gas Co Inc 26 0.02
5 Dynegy Inc 44 0.03
4 El Paso Electric Co 189 0.11
5 Empire District Electric Co 172 0.10
4 EnerNOC Inc 24 0.01
1 Gas Natural Inc 12 0.01
2 Genie Energy Ltd 14 0.01
6 Hawaiian Electric Industries Inc 185 0.11
3 IDACORP Inc 245 0.15
4 MGE Energy Inc 208 0.12
2 Middlesex Water Co 94 0.06
8 New Jersey Resources Corp 291 0.17
3 Northwest Natural Gas Co 157 0.09
5 NorthWestern Corp 261 0.16
6 NRG Yield Inc 86 0.05
4 NRG Yield Inc, Class A 53 0.03
5 ONE Gas Inc 299 0.18
4 Ormat Technologies Inc 208 0.12
4 Otter Tail Corp 143 0.09
8 PNM Resources Inc 267 0.16
5 Portland General Electric Co 225 0.13
1 RGC Resources Inc 21 0.01
2 SJW Corp 92 0.05
8 South Jersey Industries Inc 248 0.15
4 Southwest Gas Corp 329 0.20
4 Spire Inc 277 0.16
2 Unitil Corp 79 0.05
5 WGL Holdings Inc 358 0.21
2 York Water Co 75 0.04
6,224 3.69
Total Common Stock – 99.73% (30 November 2015: 99.34%) 167,980 99.73
Total Investments – 99.73% (30 November 2015: 99.34%) 167,980 99.73
Cash and Cash Equivalents – (0.54)% (30 November 2015: 0.76%) (913) (0.54) Assets in Excess of Other Liabilities – 0.81% (30 November 2015: (0.10)%) 1,366 0.81
Total Net Assets 168,433 100.00
– Amounts designated as “–“ are either $0, less than $500 or less than 500 shares.
Analysis of Total Assets (unaudited) % of Total Assets
Transferable securities admitted to an official exchange listing 92.59
Current Assets 7.41
Total Assets 100.00
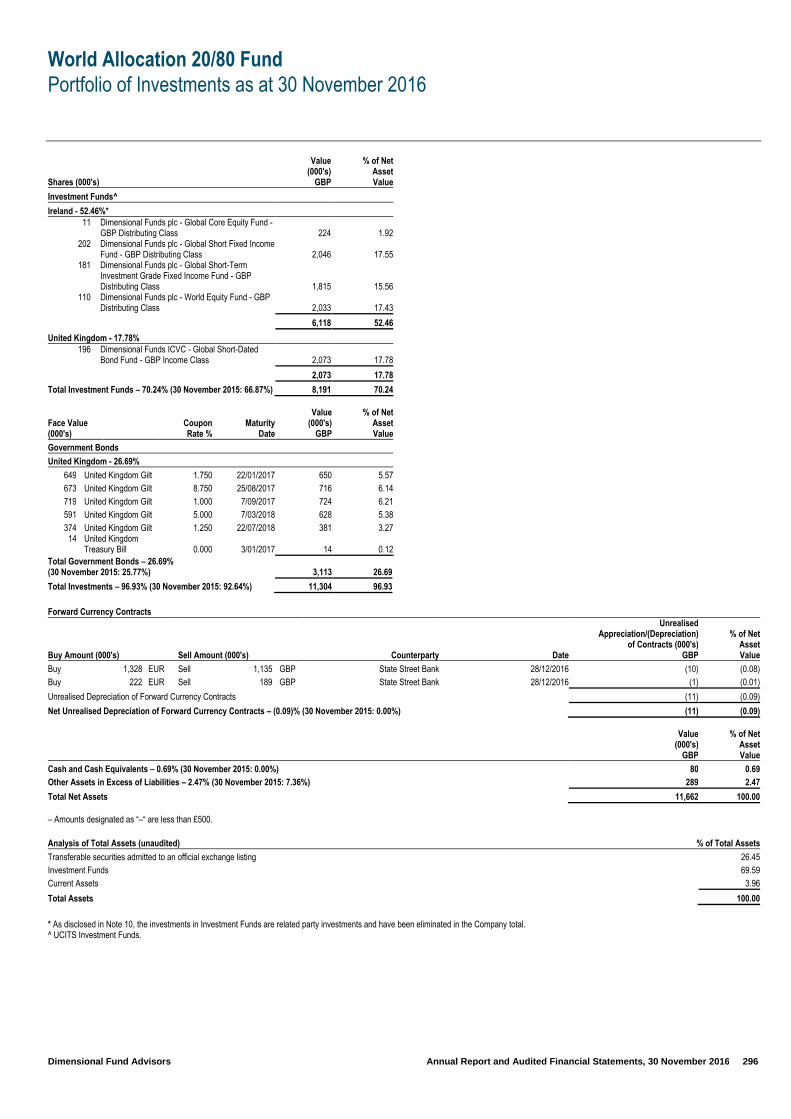
World Allocation 20/80 Fund
Portfolio of Investments as at 30 November 2016
Dimensional Fund Advisors Annual Report and Audited Financial Statements, 30 November 2016 296
Shares (000's)
Value (000's)
GBP
% of Net Asset Value
Investment Funds^
Ireland - 52.46%* 11
Dimensional Funds plc - Global Core Equity Fund - GBP Distributing Class 224 1.92
202 Dimensional Funds plc - Global Short Fixed Income Fund - GBP Distributing Class 2,046 17.55
181
Dimensional Funds plc - Global Short-Term Investment Grade Fixed Income Fund - GBP Distributing Class 1,815 15.56
110 Dimensional Funds plc - World Equity Fund - GBP Distributing Class 2,033 17.43
6,118 52.46
United Kingdom - 17.78% 196
Dimensional Funds ICVC - Global Short-Dated Bond Fund - GBP Income Class 2,073 17.78
2,073 17.78
Total Investment Funds – 70.24% (30 November 2015: 66.87%) 8,191 70.24
Face Value (000's)
Coupon Rate %
Maturity Date
Value (000's)
GBP
% of Net Asset Value
Government Bonds
United Kingdom - 26.69%
649 United Kingdom Gilt 1.750 22/01/2017 650 5.57
673 United Kingdom Gilt 8.750 25/08/2017 716 6.14
719 United Kingdom Gilt 1.000 7/09/2017 724 6.21
591 United Kingdom Gilt 5.000 7/03/2018 628 5.38
374 United Kingdom Gilt 1.250 22/07/2018 381 3.27 14 United Kingdom
Treasury Bill 0.000 3/01/2017 14 0.12
Total Government Bonds – 26.69% (30 November 2015: 25.77%) 3,113 26.69
Total Investments – 96.93% (30 November 2015: 92.64%) 11,304 96.93
Forward Currency Contracts
Buy Amount (000's) Sell Amount (000's) Counterparty Date
Unrealised Appreciation/(Depreciation)
of Contracts (000's) GBP
% of Net Asset Value
Buy 1,328 EUR Sell 1,135 GBP State Street Bank 28/12/2016 (10) (0.08)
Buy 222 EUR Sell 189 GBP State Street Bank 28/12/2016 (1) (0.01)
Unrealised Depreciation of Forward Currency Contracts (11) (0.09)
Net Unrealised Depreciation of Forward Currency Contracts – (0.09)% (30 November 2015: 0.00%) (11) (0.09)
Value (000's)
GBP
% of Net Asset Value
Cash and Cash Equivalents – 0.69% (30 November 2015: 0.00%) 80 0.69 Other Assets in Excess of Liabilities – 2.47% (30 November 2015: 7.36%) 289 2.47
Total Net Assets 11,662 100.00 – Amounts designated as “–“ are less than £500.
Analysis of Total Assets (unaudited) % of Total Assets
Transferable securities admitted to an official exchange listing 26.45
Investment Funds 69.59
Current Assets 3.96
Total Assets 100.00
* As disclosed in Note 10, the investments in Investment Funds are related party investments and have been eliminated in the Company total. ^ UCITS Investment Funds.

World Allocation 40/60 Fund
Portfolio of Investments as at 30 November 2016 (continued)
Dimensional Fund Advisors Annual Report and Audited Financial Statements, 30 November 2016 297
Shares (000's)
Value (000's)
GBP
% of Net Asset Value
Investment Funds^
Ireland - 81.06%*
1,493
Dimensional Funds plc - Global Core Equity Fund - GBP Distributing Class 29,115 13.78
3,101
Dimensional Funds plc - Global Short Fixed Income Fund - GBP Distributing Class 31,418 14.87
2,508
Dimensional Funds plc - Global Short-Term Investment Grade Fixed Income Fund - GBP Distributing Class 25,107 11.89
487
Dimensional Funds plc - Global Targeted Value Fund - GBP Distributing Class 10,547 4.99
3,800
Dimensional Funds plc - Global Ultra Short Fixed Income Fund - GBP Distributing Class 37,884 17.93
2,007
Dimensional Funds plc - World Equity Fund - GBP Distributing Class 37,192 17.60
171,263 81.06
United Kingdom - 18.05%
200 Dimensional Funds ICVC - Emerging Markets Core Equity Fund - GBP Income Class 6,346 3.00
3,002 Dimensional Funds ICVC - Global Short-Dated Bond Fund - GBP Income Class 31,788 15.05
38,134 18.05
Total Investment Funds – 99.11% (30 November 2015: 99.78%) 209,397 99.11
Total Investments – 99.11% (30 November 2015: 99.78%) 209,397 99.11
Forward Currency Contracts
Buy Amount (000's) Sell Amount (000's) Counterparty Maturity Date
Unrealised Appreciation/(Depreciation)
of Contracts (000's) GBP
% of Net Asset Value
Buy 872 EUR Sell 746 GBP State Street Bank 28/12/2016 (6) –
Buy 143 EUR Sell 122 GBP State Street Bank 28/12/2016 (1) –
Unrealised Depreciation of Forward Currency Contracts (7) –
Net Unrealised Depreciation of Forward Currency Contracts – 0.00% (30 November 2015: Nil) (7) –
Value (000's)
GBP
% of Net Asset Value
Cash and Cash Equivalents – 0.55% (30 November 2015: 0.67%) 1,174 0.55 Other Assets in Excess of Liabilities – 0.34% (30 November 2015: (0.45)%) 721 0.34
Total Net Assets 211,285 100.00
– Amounts designated as “–“ are less than £500.
Analysis of Total Assets (unaudited) % of Total Assets
Investment Funds 98.16
Current Assets 1.84
Total Assets 100.00
* As disclosed in Note 10, the investments in Investment Funds are related party investments and have been eliminated in the Company total. ^ UCITS Investment Funds.
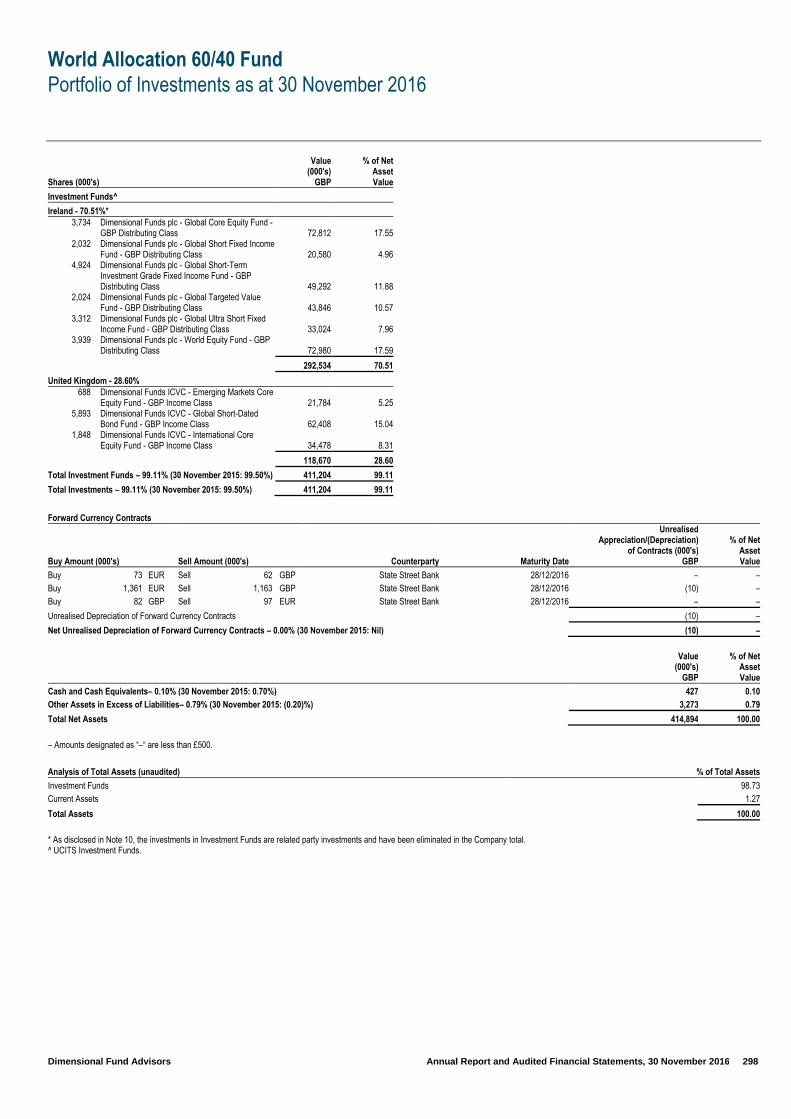
World Allocation 60/40 Fund
Portfolio of Investments as at 30 November 2016
Dimensional Fund Advisors Annual Report and Audited Financial Statements, 30 November 2016 298
Shares (000's)
Value (000's)
GBP
% of Net Asset Value
Investment Funds^
Ireland - 70.51%* 3,734
Dimensional Funds plc - Global Core Equity Fund - GBP Distributing Class 72,812 17.55
2,032 Dimensional Funds plc - Global Short Fixed Income Fund - GBP Distributing Class 20,580 4.96
4,924
Dimensional Funds plc - Global Short-Term Investment Grade Fixed Income Fund - GBP Distributing Class 49,292 11.88
2,024 Dimensional Funds plc - Global Targeted Value Fund - GBP Distributing Class 43,846 10.57
3,312 Dimensional Funds plc - Global Ultra Short Fixed Income Fund - GBP Distributing Class 33,024 7.96
3,939 Dimensional Funds plc - World Equity Fund - GBP Distributing Class 72,980 17.59
292,534 70.51
United Kingdom - 28.60% 688
Dimensional Funds ICVC - Emerging Markets Core Equity Fund - GBP Income Class 21,784 5.25
5,893 Dimensional Funds ICVC - Global Short-Dated Bond Fund - GBP Income Class 62,408 15.04
1,848 Dimensional Funds ICVC - International Core Equity Fund - GBP Income Class 34,478 8.31
118,670 28.60
Total Investment Funds – 99.11% (30 November 2015: 99.50%) 411,204 99.11
Total Investments – 99.11% (30 November 2015: 99.50%) 411,204 99.11
Forward Currency Contracts
Buy Amount (000's) Sell Amount (000's) Counterparty Maturity Date
Unrealised Appreciation/(Depreciation)
of Contracts (000's) GBP
% of Net Asset Value
Buy 73 EUR Sell 62 GBP State Street Bank 28/12/2016 – –
Buy 1,361 EUR Sell 1,163 GBP State Street Bank 28/12/2016 (10) –
Buy 82 GBP Sell 97 EUR State Street Bank 28/12/2016 – –
Unrealised Depreciation of Forward Currency Contracts (10) –
Net Unrealised Depreciation of Forward Currency Contracts – 0.00% (30 November 2015: Nil) (10) –
Value (000's)
GBP
% of Net Asset Value
Cash and Cash Equivalents– 0.10% (30 November 2015: 0.70%) 427 0.10 Other Assets in Excess of Liabilities– 0.79% (30 November 2015: (0.20)%) 3,273 0.79
Total Net Assets 414,894 100.00
– Amounts designated as “–“ are less than £500.
Analysis of Total Assets (unaudited) % of Total Assets
Investment Funds 98.73
Current Assets 1.27
Total Assets 100.00
* As disclosed in Note 10, the investments in Investment Funds are related party investments and have been eliminated in the Company total. ^ UCITS Investment Funds.

World Allocation 80/20 Fund
Portfolio of Investments as at 30 November 2016
Dimensional Fund Advisors Annual Report and Audited Financial Statements, 30 November 2016 299
Shares (000's)
Value (000's)
GBP
% of Net Asset Value
Investment Funds^
Ireland - 61.32%* 301
Dimensional Funds plc - Global Core Equity Fund - GBP Distributing Class 5,862 17.48
329
Dimensional Funds plc - Global Short-Term Investment Grade Fixed Income Fund - GBP Distributing Class 3,292 9.82
255 Dimensional Funds plc - Global Targeted Value Fund - GBP Distributing Class 5,530 16.49
317 Dimensional Funds plc - World Equity Fund - GBP Distributing Class 5,878 17.53
20,562 61.32
United Kingdom - 36.91% 76
Dimensional Funds ICVC - Emerging Markets Core Equity Fund - GBP Income Class 2,393 7.14
315 Dimensional Funds ICVC - Global Short-Dated Bond Fund - GBP Income Class 3,334 9.94
321 Dimensional Funds ICVC - International Core Equity Fund - GBP Income Class 5,986 17.85
49 Dimensional Funds ICVC - UK Core Equity Fund - GBP Income Class 664 1.98
12,377 36.91
Total Investment Funds – 98.23% (30 November 2015: 99.57%) 32,939 98.23
Total Investments – 98.23% (30 November 2015: 99.57%) 32,939 98.23
Forward Currency Contracts
Buy Amount (000's) Sell Amount (000's) Counterparty Maturity Date
Unrealised Appreciation/(Depreciation)
of Contracts (000's) GBP
% of Net Asset Value
Buy 222 EUR Sell 190 GBP State Street Bank 28/12/2016 (2) (0.01)
Buy 11 EUR Sell 10 GBP State Street Bank 28/12/2016 – –
Unrealised Depreciation of Forward Currency Contracts (2) (0.01)
Net Unrealised Depreciation of Forward Currency Contracts – (0.01)% (30 November 2015: Nil) (2) (0.01)
Value (000's)
GBP
% of Net Asset Value
Cash and Cash Equivalents – 1.14% (30 November 2015: 4.79%) 383 1.14 Other Assets in Excess of Liabilities – 0.64% (30 November 2015 (4.36)%) 215 0.64
Total Net Assets 33,535 100.00 – Amounts designated as “–“ are less than £500.
Analysis of Total Assets (unaudited) % of Total Assets
Investment Funds 96.72
Current Assets 3.28
Total Assets 100.00
* As disclosed in Note 10, the investments in Investment Funds are related party investments and have been eliminated in the Company total. ^ UCITS Investment Funds.
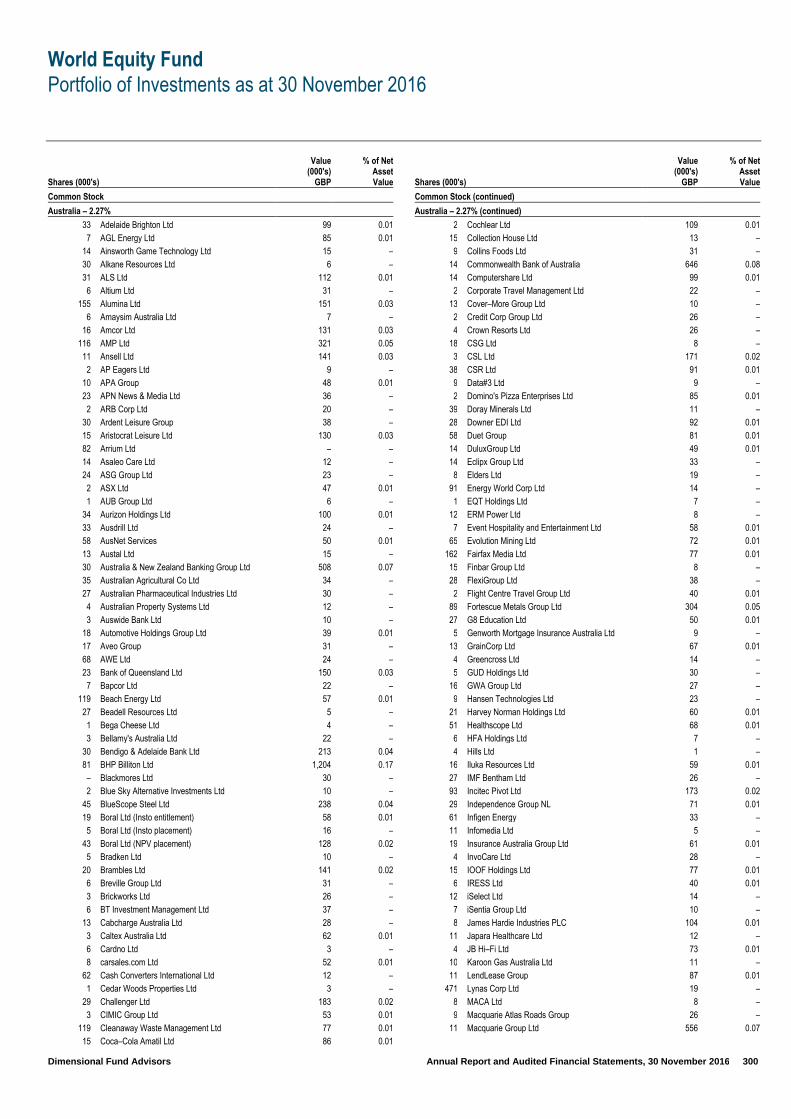
World Equity Fund
Portfolio of Investments as at 30 November 2016
Dimensional Fund Advisors Annual Report and Audited Financial Statements, 30 November 2016 300
Shares (000's)
Value (000's)
GBP
% of Net Asset Value
Common Stock
Australia – 2.27%
33 Adelaide Brighton Ltd 99 0.01
7 AGL Energy Ltd 85 0.01
14 Ainsworth Game Technology Ltd 15 –
30 Alkane Resources Ltd 6 –
31 ALS Ltd 112 0.01
6 Altium Ltd 31 –
155 Alumina Ltd 151 0.03
6 Amaysim Australia Ltd 7 –
16 Amcor Ltd 131 0.03
116 AMP Ltd 321 0.05
11 Ansell Ltd 141 0.03
2 AP Eagers Ltd 9 –
10 APA Group 48 0.01
23 APN News & Media Ltd 36 –
2 ARB Corp Ltd 20 –
30 Ardent Leisure Group 38 –
15 Aristocrat Leisure Ltd 130 0.03
82 Arrium Ltd – –
14 Asaleo Care Ltd 12 –
24 ASG Group Ltd 23 –
2 ASX Ltd 47 0.01
1 AUB Group Ltd 6 –
34 Aurizon Holdings Ltd 100 0.01
33 Ausdrill Ltd 24 –
58 AusNet Services 50 0.01
13 Austal Ltd 15 –
30 Australia & New Zealand Banking Group Ltd 508 0.07
35 Australian Agricultural Co Ltd 34 –
27 Australian Pharmaceutical Industries Ltd 30 –
4 Australian Property Systems Ltd 12 –
3 Auswide Bank Ltd 10 –
18 Automotive Holdings Group Ltd 39 0.01
17 Aveo Group 31 –
68 AWE Ltd 24 –
23 Bank of Queensland Ltd 150 0.03
7 Bapcor Ltd 22 –
119 Beach Energy Ltd 57 0.01
27 Beadell Resources Ltd 5 –
1 Bega Cheese Ltd 4 –
3 Bellamy's Australia Ltd 22 –
30 Bendigo & Adelaide Bank Ltd 213 0.04
81 BHP Billiton Ltd 1,204 0.17
– Blackmores Ltd 30 –
2 Blue Sky Alternative Investments Ltd 10 –
45 BlueScope Steel Ltd 238 0.04
19 Boral Ltd (Insto entitlement) 58 0.01
5 Boral Ltd (Insto placement) 16 –
43 Boral Ltd (NPV placement) 128 0.02
5 Bradken Ltd 10 –
20 Brambles Ltd 141 0.02
6 Breville Group Ltd 31 –
3 Brickworks Ltd 26 –
6 BT Investment Management Ltd 37 –
13 Cabcharge Australia Ltd 28 –
3 Caltex Australia Ltd 62 0.01
6 Cardno Ltd 3 –
8 carsales.com Ltd 52 0.01
62 Cash Converters International Ltd 12 –
1 Cedar Woods Properties Ltd 3 –
29 Challenger Ltd 183 0.02
3 CIMIC Group Ltd 53 0.01
119 Cleanaway Waste Management Ltd 77 0.01
15 Coca–Cola Amatil Ltd 86 0.01
Shares (000's)
Value (000's)
GBP
% of Net Asset Value
Common Stock (continued)
Australia – 2.27% (continued)
2 Cochlear Ltd 109 0.01
15 Collection House Ltd 13 –
9 Collins Foods Ltd 31 –
14 Commonwealth Bank of Australia 646 0.08
14 Computershare Ltd 99 0.01
2 Corporate Travel Management Ltd 22 –
13 Cover–More Group Ltd 10 –
2 Credit Corp Group Ltd 26 –
4 Crown Resorts Ltd 26 –
18 CSG Ltd 8 –
3 CSL Ltd 171 0.02
38 CSR Ltd 91 0.01
9 Data#3 Ltd 9 –
2 Domino's Pizza Enterprises Ltd 85 0.01
39 Doray Minerals Ltd 11 –
28 Downer EDI Ltd 92 0.01
58 Duet Group 81 0.01
14 DuluxGroup Ltd 49 0.01
14 Eclipx Group Ltd 33 –
8 Elders Ltd 19 –
91 Energy World Corp Ltd 14 –
1 EQT Holdings Ltd 7 –
12 ERM Power Ltd 8 –
7 Event Hospitality and Entertainment Ltd 58 0.01
65 Evolution Mining Ltd 72 0.01
162 Fairfax Media Ltd 77 0.01
15 Finbar Group Ltd 8 –
28 FlexiGroup Ltd 38 –
2 Flight Centre Travel Group Ltd 40 0.01
89 Fortescue Metals Group Ltd 304 0.05
27 G8 Education Ltd 50 0.01
5 Genworth Mortgage Insurance Australia Ltd 9 –
13 GrainCorp Ltd 67 0.01
4 Greencross Ltd 14 –
5 GUD Holdings Ltd 30 –
16 GWA Group Ltd 27 –
9 Hansen Technologies Ltd 23 –
21 Harvey Norman Holdings Ltd 60 0.01
51 Healthscope Ltd 68 0.01
6 HFA Holdings Ltd 7 –
4 Hills Ltd 1 –
16 Iluka Resources Ltd 59 0.01
27 IMF Bentham Ltd 26 –
93 Incitec Pivot Ltd 173 0.02
29 Independence Group NL 71 0.01
61 Infigen Energy 33 –
11 Infomedia Ltd 5 –
19 Insurance Australia Group Ltd 61 0.01
4 InvoCare Ltd 28 –
15 IOOF Holdings Ltd 77 0.01
6 IRESS Ltd 40 0.01
12 iSelect Ltd 14 –
7 iSentia Group Ltd 10 –
8 James Hardie Industries PLC 104 0.01
11 Japara Healthcare Ltd 12 –
4 JB Hi–Fi Ltd 73 0.01
10 Karoon Gas Australia Ltd 11 –
11 LendLease Group 87 0.01
471 Lynas Corp Ltd 19 –
8 MACA Ltd 8 –
9 Macquarie Atlas Roads Group 26 –
11 Macquarie Group Ltd 556 0.07
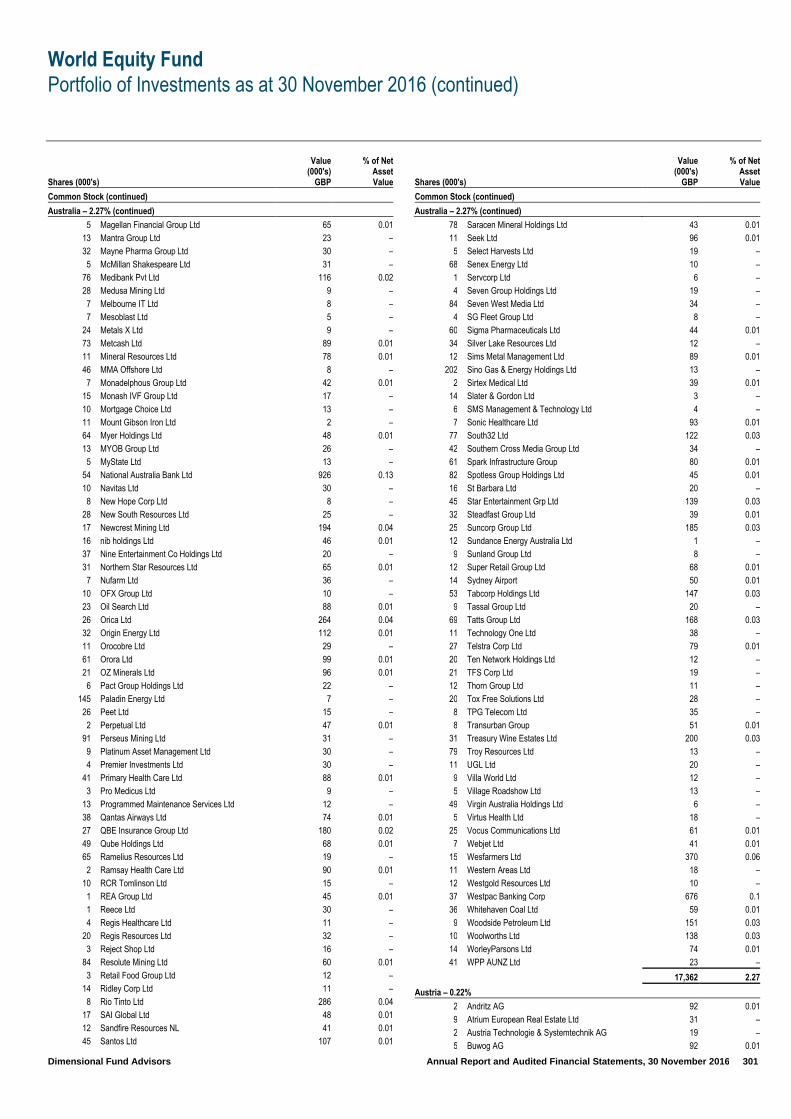
World Equity Fund
Portfolio of Investments as at 30 November 2016 (continued)
Dimensional Fund Advisors Annual Report and Audited Financial Statements, 30 November 2016 301
Shares (000's)
Value (000's)
GBP
% of Net Asset Value
Common Stock (continued)
Australia – 2.27% (continued)
5 Magellan Financial Group Ltd 65 0.01
13 Mantra Group Ltd 23 –
32 Mayne Pharma Group Ltd 30 –
5 McMillan Shakespeare Ltd 31 –
76 Medibank Pvt Ltd 116 0.02
28 Medusa Mining Ltd 9 –
7 Melbourne IT Ltd 8 –
7 Mesoblast Ltd 5 –
24 Metals X Ltd 9 –
73 Metcash Ltd 89 0.01
11 Mineral Resources Ltd 78 0.01
46 MMA Offshore Ltd 8 –
7 Monadelphous Group Ltd 42 0.01
15 Monash IVF Group Ltd 17 –
10 Mortgage Choice Ltd 13 –
11 Mount Gibson Iron Ltd 2 –
64 Myer Holdings Ltd 48 0.01
13 MYOB Group Ltd 26 –
5 MyState Ltd 13 –
54 National Australia Bank Ltd 926 0.13
10 Navitas Ltd 30 –
8 New Hope Corp Ltd 8 –
28 New South Resources Ltd 25 –
17 Newcrest Mining Ltd 194 0.04
16 nib holdings Ltd 46 0.01
37 Nine Entertainment Co Holdings Ltd 20 –
31 Northern Star Resources Ltd 65 0.01
7 Nufarm Ltd 36 –
10 OFX Group Ltd 10 –
23 Oil Search Ltd 88 0.01
26 Orica Ltd 264 0.04
32 Origin Energy Ltd 112 0.01
11 Orocobre Ltd 29 –
61 Orora Ltd 99 0.01
21 OZ Minerals Ltd 96 0.01
6 Pact Group Holdings Ltd 22 –
145 Paladin Energy Ltd 7 –
26 Peet Ltd 15 –
2 Perpetual Ltd 47 0.01
91 Perseus Mining Ltd 31 –
9 Platinum Asset Management Ltd 30 –
4 Premier Investments Ltd 30 –
41 Primary Health Care Ltd 88 0.01
3 Pro Medicus Ltd 9 –
13 Programmed Maintenance Services Ltd 12 –
38 Qantas Airways Ltd 74 0.01
27 QBE Insurance Group Ltd 180 0.02
49 Qube Holdings Ltd 68 0.01
65 Ramelius Resources Ltd 19 –
2 Ramsay Health Care Ltd 90 0.01
10 RCR Tomlinson Ltd 15 –
1 REA Group Ltd 45 0.01
1 Reece Ltd 30 –
4 Regis Healthcare Ltd 11 –
20 Regis Resources Ltd 32 –
3 Reject Shop Ltd 16 –
84 Resolute Mining Ltd 60 0.01
3 Retail Food Group Ltd 12 –
14 Ridley Corp Ltd 11 –
8 Rio Tinto Ltd 286 0.04
17 SAI Global Ltd 48 0.01
12 Sandfire Resources NL 41 0.01
45 Santos Ltd 107 0.01
Shares (000's)
Value (000's)
GBP
% of Net Asset Value
Common Stock (continued)
Australia – 2.27% (continued)
78 Saracen Mineral Holdings Ltd 43 0.01
11 Seek Ltd 96 0.01
5 Select Harvests Ltd 19 –
68 Senex Energy Ltd 10 –
1 Servcorp Ltd 6 –
4 Seven Group Holdings Ltd 19 –
84 Seven West Media Ltd 34 –
4 SG Fleet Group Ltd 8 –
60 Sigma Pharmaceuticals Ltd 44 0.01
34 Silver Lake Resources Ltd 12 –
12 Sims Metal Management Ltd 89 0.01
202 Sino Gas & Energy Holdings Ltd 13 –
2 Sirtex Medical Ltd 39 0.01
14 Slater & Gordon Ltd 3 –
6 SMS Management & Technology Ltd 4 –
7 Sonic Healthcare Ltd 93 0.01
77 South32 Ltd 122 0.03
42 Southern Cross Media Group Ltd 34 –
61 Spark Infrastructure Group 80 0.01
82 Spotless Group Holdings Ltd 45 0.01
16 St Barbara Ltd 20 –
45 Star Entertainment Grp Ltd 139 0.03
32 Steadfast Group Ltd 39 0.01
25 Suncorp Group Ltd 185 0.03
12 Sundance Energy Australia Ltd 1 –
9 Sunland Group Ltd 8 –
12 Super Retail Group Ltd 68 0.01
14 Sydney Airport 50 0.01
53 Tabcorp Holdings Ltd 147 0.03
9 Tassal Group Ltd 20 –
69 Tatts Group Ltd 168 0.03
11 Technology One Ltd 38 –
27 Telstra Corp Ltd 79 0.01
20 Ten Network Holdings Ltd 12 –
21 TFS Corp Ltd 19 –
12 Thorn Group Ltd 11 –
20 Tox Free Solutions Ltd 28 –
8 TPG Telecom Ltd 35 –
8 Transurban Group 51 0.01
31 Treasury Wine Estates Ltd 200 0.03
79 Troy Resources Ltd 13 –
11 UGL Ltd 20 –
9 Villa World Ltd 12 –
5 Village Roadshow Ltd 13 –
49 Virgin Australia Holdings Ltd 6 –
5 Virtus Health Ltd 18 –
25 Vocus Communications Ltd 61 0.01
7 Webjet Ltd 41 0.01
15 Wesfarmers Ltd 370 0.06
11 Western Areas Ltd 18 –
12 Westgold Resources Ltd 10 –
37 Westpac Banking Corp 676 0.1
36 Whitehaven Coal Ltd 59 0.01
9 Woodside Petroleum Ltd 151 0.03
10 Woolworths Ltd 138 0.03
14 WorleyParsons Ltd 74 0.01
41 WPP AUNZ Ltd 23 –
17,362 2.27
Austria – 0.22%
2 Andritz AG 92 0.01
9 Atrium European Real Estate Ltd 31 –
2 Austria Technologie & Systemtechnik AG 19 –
5 Buwog AG 92 0.01

World Equity Fund
Portfolio of Investments as at 30 November 2016 (continued)
Dimensional Fund Advisors Annual Report and Audited Financial Statements, 30 November 2016 302
Shares (000's)
Value (000's)
GBP
% of Net Asset Value
Common Stock (continued)
Austria – 0.22% (continued)
5 CA Immobilien Anlagen AG 66 0.01
3 Conwert Immobilien Invest SE 46 0.01
– DO & CO AG 12 –
4 Erste Group Bank AG 80 0.01
2 EVN AG 16 –
42 Immofinanz AG 69 0.01
1 Lenzing AG 58 0.01
1 Mayr Melnhof Karton AG 56 0.01
– Oberbank AG 11 –
1 Oesterreichische Post AG 24 –
10 OMV AG 257 0.04
1 Palfinger AG 23 –
1 POLYTEC Holding AG 11 –
1 Porr Ag 17 –
8 Raiffeisen Bank International AG 123 0.03
1 RHI AG 23 –
– Rosenbauer International AG 5 –
4 S IMMO AG 30 –
– Schoeller–Bleckmann Oilfield Equipment AG 28 –
1 Semperit AG Holding 25 –
1 Strabag SE 14 –
7 Telekom Austria AG 32 –
9 UNIQA Insurance Group AG 49 0.01
4 Verbund AG 49 0.01
2 Vienna Insurance Group AG Wiener Versicherung Gruppe 35 –
7 voestalpine AG 213 0.04
7 Wienerberger AG 94 0.01
1 Zumtobel Group AG 12 –
1,712 0.22
Belgium – 0.47%
1 Ablynx NV 6 –
1 Ackermans & van Haaren NV 130 0.02
10 Ageas 306 0.04
14 AGFA–Gevaert NV 50 0.01
11 Anheuser–Busch InBev SA 900 0.12
– Atenor 4 –
– Banque Nationale de Belgique 21 –
1 Barco NV 55 0.01
3 Bekaert SA 86 0.01
3 bpost SA 59 0.01
– Celyad SA 5 –
– Cie d'Entreprises CFE 33 –
– Cie Immobiliere de Belgique SA 9 –
5 Colruyt SA 210 0.04
2 D'ieteren SA 54 0.01
4 Deceuninck NV 8 –
3 Econocom Group SA 39 0.01
1 Elia System Operator SA 56 0.01
7 Euronav NV 43 0.01
1 EVS Broadcast Equipment SA 26 –
1 Exmar NV 7 –
3 Fagron 25 –
1 Galapagos NV 62 0.01
2 Gimv NV 67 0.01
1 Ion Beam Applications 35 –
3 KBC Group NV 163 0.02
1 Kinepolis Group NV 20 –
– Lotus Bakeries 10 –
1 Melexis NV 28 –
6 Nyrstar NV 32 –
4 Ontex Group NV 94 0.01
3 Orange Belgium SA 43 0.01
Shares (000's)
Value (000's)
GBP
% of Net Asset Value
Common Stock (continued)
Belgium – 0.47% (continued)
– Picanol 1 –
7 Proximus SADP 163 0.02
4 Recticel SA 19 –
– Resilux 9 –
1 Sioen Industries NV 18 –
– Sipef SA 7 –
2 Solvay SA 153 0.02
2 Telenet Group Holding NV 70 0.01
2 Tessenderlo Chemie NV 46 0.01
– ThromboGenics NV 1 –
2 UCB SA 112 0.01
5 Umicore SA 261 0.04
– Van de Velde NV 19 –
2 Viohalco SA 2 –
3,567 0.47
Bermuda – —%
339 Hanny Holdings Ltd 16 –
– Nordic American Offshore Limited – –
16 –
Brazil – 0.69%
10 AES Tiete Energia SA 33 –
9 Aliansce Shopping Centers SA 31 –
6 Alupar Investimento SA 23 –
18 Ambev SA 72 0.01
11 Ambev SA, ADR 44 0.01
3 Arezzo Industria e Comercio SA 19 –
10 B2W Cia Digital 26 –
5 Banco Bradesco SA 31 –
24 Banco do Brasil SA 162 0.03
6 Banco Santander Brasil SA 40 0.01
8 BB Seguridade Participacoes SA 56 0.01 95
BM&FBovespa SA – Bolsa de Valores Mercadorias e Futuros 372 0.06
27 BR Malls Participacoes SA 68 0.01
1 Braskem SA, ADR 14 –
10 BRF SA 126 0.03
6 BTG Pactual Group 23 –
44 CCR SA 154 0.03
11 Centrais Eletricas Brasileiras SA 66 0.01
8 CETIP SA – Mercados Organizados 83 0.01 9
Cia de Saneamento Basico do Estado de Sao Paulo 65 0.01
2 Cia de Saneamento de Minas Gerais–COPASA 18 –
15 Cia Hering 58 0.01
58 Cia Siderurgica Nacional SA 168 0.03
9 Cielo SA 62 0.01
6 Cosan SA Industria e Comercio 57 0.01
6 CPFL Energia SA 36 –
4 CVC Brasil Operadora e Agencia de Viagens SA 24 – 19
Cyrela Brazil Realty SA Empreendimentos e Participacoes 41 0.01
– Dimed SA Distribuidora da Medicamentos 33 –
13 Direcional Engenharia SA 15 –
20 Duratex SA 32 –
14 EcoRodovias Infraestrutura e Logistica SA 26 –
16 EDP – Energias do Brasil SA 54 0.01
17 Embraer SA 66 0.01
4 Embraer SA, ADR 68 0.01
5 Engie Brasil Energia SA 44 0.01
7 Equatorial Energia SA 92 0.01
16 Estacio Participacoes SA 65 0.01
26 Even Construtora e Incorporadora SA 25 –
6 Ez Tec Empreendimentos e Participacoes SA 20 –
7 Fibria Celulose SA 53 0.01

World Equity Fund
Portfolio of Investments as at 30 November 2016 (continued)
Dimensional Fund Advisors Annual Report and Audited Financial Statements, 30 November 2016 303
Shares (000's)
Value (000's)
GBP
% of Net Asset Value
Common Stock (continued)
Brazil – 0.69% (continued)
5 Fleury SA 46 0.01
31 Gafisa SA 15 –
12 Gerdau SA 27 –
30 Gerdau SA, ADR 98 0.01
5 Grendene SA 20 –
1 Guararapes Confeccoes SA 13 –
12 Hypermarcas SA 71 0.01
4 Iguatemi Empresa de Shopping Centers SA 24 –
12 International Meal Co Alimentacao SA 16 –
7 Iochpe Maxion SA 21 –
4 Itau Unibanco Holding SA 26 –
34 JBS SA 79 0.01
4 JSL SA 10 –
2 Kepler Weber SA 8 –
7 Klabin SA 28 –
74 Kroton Educacional SA 250 0.03
7 Light SA 25 –
4 Linx SA 16 –
11 Localiza Rent a Car SA 87 0.01
8 Lojas Americanas SA 24 –
32 Lojas Renner SA 167 0.03
2 M Dias Branco SA 64 0.01
3 Magnesita Refratarios SA 16 –
4 Mahle–Metal Leve SA 18 –
25 Marfrig Global Foods SA 38 –
14 Mills Estruturas e Servicos de Engenharia SA 12 –
6 Minerva SA 17 –
23 MRV Engenharia e Participacoes SA 62 0.01
3 Multiplan Empreendimentos Imobiliarios SA 36 –
2 Multiplus SA 14 –
9 Natura Cosmeticos SA 53 0.01
14 Odontoprev SA 37 –
72 Petroleo Brasileiro SA 311 0.05
6 Porto Seguro SA 43 0.01
14 QGEP Participacoes SA 18 –
16 Qualicorp SA 71 0.01
7 Raia Drogasil SA 104 0.01
5 Restoque Comercio e Confeccoes de Roupas SA 5 –
24 Rumo Logistica Operadora Multimodal SA 36 –
16 Santos Brasil Participacoes SA 10 –
2 Sao Carlos Empreendimentos e Participacoes SA 10 –
4 Sao Martinho SA 51 0.01
5 SLC Agricola SA 17 –
2 Smiles SA 18 –
19 Sul America SA 83 0.01
27 TIM Participacoes SA 53 0.01
8 TOTVS SA 42 0.01
10 Transmissora Alianca de Energia Eletrica SA 43 0.01
8 Ultrapar Participacoes SA 129 0.02
13 Usinas Siderurgicas de Minas Gerais SA 26 –
18 Vale SA 117 0.02 5
Valid Solucoes e Servicos de Seguranca em Meios de Pagamento e Identificacao SA 29 –
11 Via Varejo SA 25 –
11 WEG SA 39 0.01
5,283 0.69
Canada – 3.11%
2 Absolute Software Corp 9 –
1 Acadian Timber Corp 8 –
13 Advantage Oil & Gas Ltd 76 0.01
4 Aecon Group Inc 34 –
22 Africa Oil Corp 25 –
1 Ag Growth International Inc 27 –
Shares (000's)
Value (000's)
GBP
% of Net Asset Value
Common Stock (continued)
Canada – 3.11% (continued)
6 AGF Management Ltd 20 –
5 Agnico Eagle Mines Ltd 155 0.03
2 Agrium Inc 153 0.03
2 AGT Food & Ingredients Inc 35 –
9 Aimia Inc 44 0.01
2 Air Canada 18 –
1 AirBoss of America Corp 9 –
18 Alacer Gold Corp 27 –
19 Alamos Gold Inc 98 0.01
3 Alaris Royalty Corp 39 0.01
1 Algoma Central Corp 10 –
13 Algonquin Power & Utilities Corp 87 0.01
3 Alimentation Couche–Tard Inc 103 0.01
9 AltaGas Ltd 176 0.03
3 Altius Minerals Corp 25 –
2 Altus Group Ltd 41 0.01
6 Amaya Inc 70 0.01
3 Andrew Peller Ltd 22 –
9 ARC Resources Ltd 132 0.03
12 Argonaut Gold Inc 18 –
13 Asanko Gold Inc 35 –
2 Atco Ltd 55 0.01
20 Athabasca Oil Corp 16 –
5 ATS Automation Tooling Systems Inc 32 –
5 AuRico Metals Inc 3 –
2 AutoCanada Inc 18 –
1 Avigilon Corp 11 –
57 B2Gold Corp 110 0.01
1 Badger Daylighting Ltd 19 –
10 Bank of Montreal 546 0.08
14 Bank of Nova Scotia 618 0.09
31 Banro Corp 5 –
3 Barrick Gold Corp 41 0.01
14 Baytex Energy Corp 48 0.01
1 BCE Inc 29 –
8 Bellatrix Exploration Ltd 5 –
7 Birchcliff Energy Ltd 39 0.01
3 Bird Construction Inc 19 –
2 Black Diamond Group Ltd 5 –
27 BlackBerry Ltd 169 0.03
15 BlackPearl Resources Inc 16 –
56 Bombardier Inc 63 0.01
16 Bonavista Energy Corp 42 0.01
2 Bonterra Energy Corp 37 –
3 Boralex Inc 34 –
4 Brookfield Asset Management Inc 114 0.01
1 BRP Inc 15 –
11 CAE Inc 126 0.03
11 Calfrac Well Services Ltd 21 –
1 Calian Group Ltd 10 –
2 Callidus Capital Corp 17 –
12 Cameco Corp 89 0.01
9 Canaccord Genuity Group Inc 22 –
10 Canacol Energy Ltd 27 –
7 Canadian Energy Services & Technology Corp 27 –
5 Canadian Imperial Bank of Commerce 346 0.06
5 Canadian National Railway Co 274 0.05
24 Canadian Natural Resources Ltd 645 0.09
1 Canadian Pacific Railway Ltd 78 0.01
2 Canadian Tire Corp Ltd 129 0.02
2 Canadian Utilities Ltd 39 0.01
5 Canadian Western Bank 95 0.01
4 Canam Group Inc 25 –
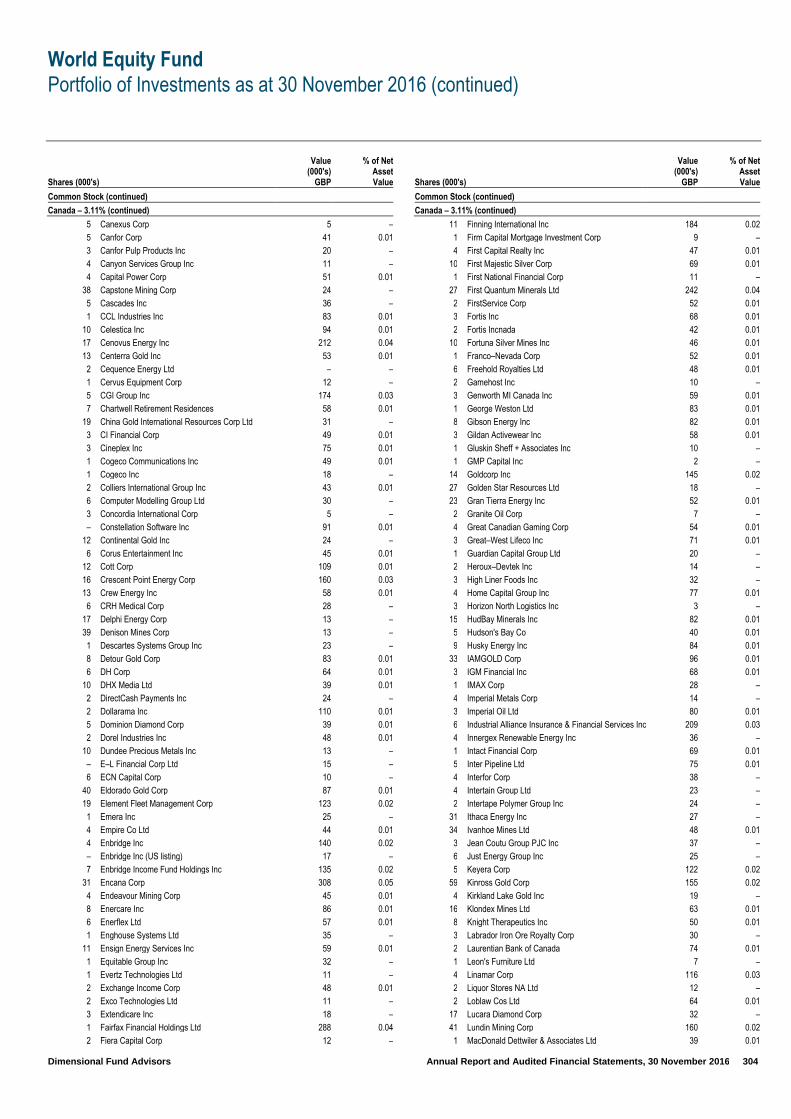
World Equity Fund
Portfolio of Investments as at 30 November 2016 (continued)
Dimensional Fund Advisors Annual Report and Audited Financial Statements, 30 November 2016 304
Shares (000's)
Value (000's)
GBP
% of Net Asset Value
Common Stock (continued)
Canada – 3.11% (continued)
5 Canexus Corp 5 –
5 Canfor Corp 41 0.01
3 Canfor Pulp Products Inc 20 –
4 Canyon Services Group Inc 11 –
4 Capital Power Corp 51 0.01
38 Capstone Mining Corp 24 –
5 Cascades Inc 36 –
1 CCL Industries Inc 83 0.01
10 Celestica Inc 94 0.01
17 Cenovus Energy Inc 212 0.04
13 Centerra Gold Inc 53 0.01
2 Cequence Energy Ltd – –
1 Cervus Equipment Corp 12 –
5 CGI Group Inc 174 0.03
7 Chartwell Retirement Residences 58 0.01
19 China Gold International Resources Corp Ltd 31 –
3 CI Financial Corp 49 0.01
3 Cineplex Inc 75 0.01
1 Cogeco Communications Inc 49 0.01
1 Cogeco Inc 18 –
2 Colliers International Group Inc 43 0.01
6 Computer Modelling Group Ltd 30 –
3 Concordia International Corp 5 –
– Constellation Software Inc 91 0.01
12 Continental Gold Inc 24 –
6 Corus Entertainment Inc 45 0.01
12 Cott Corp 109 0.01
16 Crescent Point Energy Corp 160 0.03
13 Crew Energy Inc 58 0.01
6 CRH Medical Corp 28 –
17 Delphi Energy Corp 13 –
39 Denison Mines Corp 13 –
1 Descartes Systems Group Inc 23 –
8 Detour Gold Corp 83 0.01
6 DH Corp 64 0.01
10 DHX Media Ltd 39 0.01
2 DirectCash Payments Inc 24 –
2 Dollarama Inc 110 0.01
5 Dominion Diamond Corp 39 0.01
2 Dorel Industries Inc 48 0.01
10 Dundee Precious Metals Inc 13 –
– E–L Financial Corp Ltd 15 –
6 ECN Capital Corp 10 –
40 Eldorado Gold Corp 87 0.01
19 Element Fleet Management Corp 123 0.02
1 Emera Inc 25 –
4 Empire Co Ltd 44 0.01
4 Enbridge Inc 140 0.02
– Enbridge Inc (US listing) 17 –
7 Enbridge Income Fund Holdings Inc 135 0.02
31 Encana Corp 308 0.05
4 Endeavour Mining Corp 45 0.01
8 Enercare Inc 86 0.01
6 Enerflex Ltd 57 0.01
1 Enghouse Systems Ltd 35 –
11 Ensign Energy Services Inc 59 0.01
1 Equitable Group Inc 32 –
1 Evertz Technologies Ltd 11 –
2 Exchange Income Corp 48 0.01
2 Exco Technologies Ltd 11 –
3 Extendicare Inc 18 –
1 Fairfax Financial Holdings Ltd 288 0.04
2 Fiera Capital Corp 12 –
Shares (000's)
Value (000's)
GBP
% of Net Asset Value
Common Stock (continued)
Canada – 3.11% (continued)
11 Finning International Inc 184 0.02
1 Firm Capital Mortgage Investment Corp 9 –
4 First Capital Realty Inc 47 0.01
10 First Majestic Silver Corp 69 0.01
1 First National Financial Corp 11 –
27 First Quantum Minerals Ltd 242 0.04
2 FirstService Corp 52 0.01
3 Fortis Inc 68 0.01
2 Fortis Incnada 42 0.01
10 Fortuna Silver Mines Inc 46 0.01
1 Franco–Nevada Corp 52 0.01
6 Freehold Royalties Ltd 48 0.01
2 Gamehost Inc 10 –
3 Genworth MI Canada Inc 59 0.01
1 George Weston Ltd 83 0.01
8 Gibson Energy Inc 82 0.01
3 Gildan Activewear Inc 58 0.01
1 Gluskin Sheff + Associates Inc 10 –
1 GMP Capital Inc 2 –
14 Goldcorp Inc 145 0.02
27 Golden Star Resources Ltd 18 –
23 Gran Tierra Energy Inc 52 0.01
2 Granite Oil Corp 7 –
4 Great Canadian Gaming Corp 54 0.01
3 Great–West Lifeco Inc 71 0.01
1 Guardian Capital Group Ltd 20 –
2 Heroux–Devtek Inc 14 –
3 High Liner Foods Inc 32 –
4 Home Capital Group Inc 77 0.01
3 Horizon North Logistics Inc 3 –
15 HudBay Minerals Inc 82 0.01
5 Hudson's Bay Co 40 0.01
9 Husky Energy Inc 84 0.01
33 IAMGOLD Corp 96 0.01
3 IGM Financial Inc 68 0.01
1 IMAX Corp 28 –
4 Imperial Metals Corp 14 –
3 Imperial Oil Ltd 80 0.01
6 Industrial Alliance Insurance & Financial Services Inc 209 0.03
4 Innergex Renewable Energy Inc 36 –
1 Intact Financial Corp 69 0.01
5 Inter Pipeline Ltd 75 0.01
4 Interfor Corp 38 –
4 Intertain Group Ltd 23 –
2 Intertape Polymer Group Inc 24 –
31 Ithaca Energy Inc 27 –
34 Ivanhoe Mines Ltd 48 0.01
3 Jean Coutu Group PJC Inc 37 –
6 Just Energy Group Inc 25 –
5 Keyera Corp 122 0.02
59 Kinross Gold Corp 155 0.02
4 Kirkland Lake Gold Inc 19 –
16 Klondex Mines Ltd 63 0.01
8 Knight Therapeutics Inc 50 0.01
3 Labrador Iron Ore Royalty Corp 30 –
2 Laurentian Bank of Canada 74 0.01
1 Leon's Furniture Ltd 7 –
4 Linamar Corp 116 0.03
2 Liquor Stores NA Ltd 12 –
2 Loblaw Cos Ltd 64 0.01
17 Lucara Diamond Corp 32 –
41 Lundin Mining Corp 160 0.02
1 MacDonald Dettwiler & Associates Ltd 39 0.01

World Equity Fund
Portfolio of Investments as at 30 November 2016 (continued)
Dimensional Fund Advisors Annual Report and Audited Financial Statements, 30 November 2016 305
Shares (000's)
Value (000's)
GBP
% of Net Asset Value
Common Stock (continued)
Canada – 3.11% (continued)
1 Magellan Aerospace Corp 12 –
7 Magna International Inc 212 0.03
– Mainstreet Equity Corp 8 –
7 Major Drilling Group International Inc 26 –
35 Mandalay Resources Corp 14 –
2 Manitoba Telecom Services Inc 48 0.01
21 Manulife Financial Corp 296 0.04
5 Maple Leaf Foods Inc 81 0.01
6 Martinrea International Inc 26 –
3 Medical Facilities Corp 27 –
4 MEG Energy Corp 15 –
2 Melcor Developments Ltd 17 –
8 Merus Labs International Inc 6 –
3 Methanex Corp 108 0.01
6 Metro Inc 151 0.02
5 Mitel Networks Corp 30 –
– Morguard Corp 31 –
3 Morneau Shepell Inc 37 –
1 MTY Food Group Inc 35 –
6 Mullen Group Ltd 60 0.01
14 National Bank of Canada 414 0.06
12 Nevsun Resources Ltd 31 –
3 New Flyer Industries Inc 70 0.01
34 New Gold Inc 97 0.01
5 Newalta Corp 5 –
1 Norbord Inc 20 –
2 North West Co Inc 29 –
6 Northern Blizzard Resources Inc 13 –
16 Northern Dynasty Minerals Ltd 15 –
4 Northland Power Inc 58 0.01
13 NuVista Energy Ltd 52 0.01
40 OceanaGold Corp 90 0.01
1 Onex Corp 59 0.01
2 Open Text Corp 90 0.01
6 Osisko Gold Royalties Ltd 43 0.01
7 Painted Pony Petroleum Ltd 37 –
8 Pan American Silver Corp 109 0.01
– Paramount Resources Ltd 2 –
7 Parex Resources Inc 68 0.01
3 Parkland Fuel Corp 56 0.01
3 Pason Systems Inc 27 –
2 Pembina Pipeline Corp 56 0.01
42 Pengrowth Energy Corp 51 0.01
35 Penn West Petroleum Ltd 48 0.01
5 Peyto Exploration & Development Corp 91 0.01
– PHX Energy Services Corp 1 –
29 Pine Cliff Energy Ltd 19 –
2 Pizza Pizza Royalty Corp 20 –
3 Platinum Group Metals Ltd 4 –
12 Potash Corp of Saskatchewan Inc 176 0.03
– PrairieSky Royalty Ltd 9 –
23 Precision Drilling Corp 96 0.01
6 Premier Gold Mines Ltd 9 –
2 Premium Brands Holdings Corp 63 0.01
7 Pretium Resources Inc 48 0.01
11 Primero Mining Corp 7 –
2 Pure Technologies Ltd 7 –
2 Quebecor Inc 45 0.01
8 Raging River Exploration Inc 51 0.01
2 Reitmans Canada Ltd 9 –
2 Restaurant Brands International Inc 88 0.01
2 Richelieu Hardware Ltd 28 –
5 Richmont Mines Inc 26 –
Shares (000's)
Value (000's)
GBP
% of Net Asset Value
Common Stock (continued)
Canada – 3.11% (continued)
2 Ritchie Bros Auctioneers Inc 70 0.01
6 RMP Energy Inc 2 –
2 Rogers Communications Inc 56 0.01
8 Rogers Sugar Inc 29 –
14 Royal Bank of Canada (Canada listing) 741 0.1
3 Royal Bank of Canada (US listing) 145 0.02
4 Russel Metals Inc 59 0.01
16 Sabina Gold & Silver Corp 9 –
11 Sandstorm Gold Ltd 34 –
13 Sandvine Corp 23 –
2 Saputo Inc 61 0.01
3 Savanna Energy Services Corp 3 –
2 Seabridge Gold Inc 14 –
1 Sears Canada Inc (US listing) 1 –
12 Secure Energy Services Inc 67 0.01
23 SEMAFO Inc 57 0.01
5 Seven Generations Energy Ltd 83 0.01
8 Shaw Communications Inc 129 0.02
3 ShawCor Ltd 57 0.01
39 Sherritt International Corp 28 –
2 Sienna Senior Living Inc 16 –
2 Sierra Wireless Inc 27 –
9 Silver Standard Resources Inc 69 0.01
6 Silver Wheaton Corp 90 0.01
6 SNC–Lavalin Group Inc 207 0.03
21 Spartan Energy Corp 41 0.01
4 Sprott Inc 6 –
5 Stantec Inc 102 0.01
1 Stella–Jones Inc 24 –
46 Stornoway Diamond Corp 28 –
8 Student Transportation Inc 36 –
5 Sun Life Financial Inc 153 0.02
21 Suncor Energy Inc 544 0.07
5 SunOpta Inc 28 –
9 Superior Plus Corp 62 0.01
21 Surge Energy Inc 35 –
14 Tahoe Resources Inc 108 0.01
3 Taseko Mines Ltd 2 –
10 Teck Resources Ltd 207 0.03
1 TELUS Corp 27 –
30 Teranga Gold Corp 15 –
2 Thomson Reuters Corp 86 0.01
3 TMX Group Ltd 104 0.01
9 TORC Oil & Gas Ltd 44 0.01
4 Torex Gold Resources Inc 47 0.01
3 Toromont Industries Ltd 71 0.01
22 Toronto–Dominion Bank 836 0.11
1 Torstar Corp 1 –
1 Total Energy Services Inc 11 –
11 Tourmaline Oil Corp 235 0.03
18 TransAlta Corp 79 0.01
4 TransAlta Renewables Inc 31 –
10 TransCanada Corp 366 0.05
5 Transcontinental Inc 53 0.01
6 TransForce Inc 123 0.02
4 TransGlobe Energy Corp 5 –
21 Trevali Mining Corp 17 –
5 Trican Well Service Ltd 11 –
6 Trilogy Energy Corp 23 –
14 Trinidad Drilling Ltd 24 –
52 Turquoise Hill Resources Ltd 138 0.02
4 Uni–Select Inc 69 0.01
1 Valeant Pharmaceuticals International Inc 16 –

World Equity Fund
Portfolio of Investments as at 30 November 2016 (continued)
Dimensional Fund Advisors Annual Report and Audited Financial Statements, 30 November 2016 306
Shares (000's)
Value (000's)
GBP
% of Net Asset Value
Common Stock (continued)
Canada – 3.11% (continued)
– Valeant Pharmaceuticals International Inc (US listing) 1 –
2 Valener Inc 28 –
20 Veresen Inc 146 0.02
3 Vermilion Energy Inc 105 0.01
1 Wajax Corp 16 –
4 Waste Connections Inc 242 0.03
4 West Fraser Timber Co Ltd 122 0.02
5 Western Energy Services Corp 6 –
27 Western Forest Products Inc 30 –
1 WestJet Airlines Ltd 15 –
6 Westshore Terminals Investment Corp 97 0.01
21 Whitecap Resources Inc 152 0.02
22 Wi–LAN Inc 23 –
1 Winpak Ltd 39 0.01
4 WSP Global Inc 113 0.01
57 Yamana Gold Inc 137 0.02
2 Yellow Pages Ltd 25 –
2 ZCL Composites Inc 14 –
23,825 3.11
Chile – 0.14%
44 AES Gener SA 12 –
47 Aguas Andinas SA 24 –
– Banco de Chile, ADR 21 –
1 Banco de Credito e Inversiones 55 0.02
3 Banco Santander Chile, ADR 52 0.02
10 Banmedica SA 16 –
25 Besalco SA 8 –
6 CAP SA 35 –
13 Cencosud SA 30 –
2 Cia Cervecerias Unidas SA 15 –
1 Cia Cervecerias Unidas SA, ADR 20 –
300 Cia Sud Americana de Vapores SA 6 –
206 Colbun SA 31 –
11 Empresa Nacional de Telecomunicaciones SA 97 0.02
29 Empresas CMPC SA 47 0.01
6 Empresas COPEC SA 43 0.01
7 Enel Americas SA, ADR 48 0.01
7 Enel Chile SA, ADR 28 –
19 Enel Generacion Chile SA 9 –
1 Enel Generacion Chile SA, ADR 11 –
15 Engie Energia Chile SA 19 –
66 Grupo Security SA 19 –
23 Inversiones Aguas Metropolitanas SA 31 –
2 Inversiones La Construccion SA 16 –
7,742 Itau CorpBanca 50 0.01
1 Itau CorpBanca, ADR 11 –
19 Latam Airlines Group SA 133 0.03
53 Multiexport Foods SA 12 –
21 Parque Arauco SA 39 0.01
40 Ripley Corp SA 19 –
4 SACI Falabella 25 –
14 Salfacorp SA 8 –
169 Sociedad Matriz SAAM SA 11 –
2 Sociedad Quimica y Minera de Chile SA, ADR 36 –
22 SONDA SA 34 –
20 Vina Concha y Toro SA 25 –
1,096 0.14
China (Hong Kong) – 2.74%
38 361 Degrees International Ltd 12 –
14 AAC Technologies Holdings Inc 101 0.01
102 Agile Group Holdings Ltd 46 0.01
452 Agricultural Bank of China Ltd 151 0.03
Shares (000's)
Value (000's)
GBP
% of Net Asset Value
Common Stock (continued)
China (Hong Kong) – 2.74% (continued)
88 Air China Ltd 48 0.01
41 Ajisen China Holdings Ltd 14 –
40 Alibaba Health Information Technology Ltd 18 –
210 Alibaba Pictures Group Ltd 32 –
106 Aluminum Corp of China Ltd 38 –
34 AMVIG Holdings Ltd 10 –
60 Angang Steel Co Ltd 27 –
30 Anhui Conch Cement Co Ltd 68 0.01
18 Anhui Expressway Co Ltd 12 –
43 ANTA Sports Products Ltd 100 0.01
304 AVIC International Holding HK Ltd 16 –
16 AVIC International Holdings Ltd 7 –
66 AviChina Industry & Technology Co Ltd 36 –
72 BAIC Motor Corp Ltd 55 0.01
1,094 Bank of China Ltd 397 0.06
25 Bank of Chongqing Co Ltd 16 –
150 Bank of Communications Co Ltd 92 0.01
9 Baoxin Auto Group Ltd 2 –
24 Baoye Group Co Ltd 14 –
126 BBMG Corp 39 0.01
102 Beijing Capital International Airport Co Ltd 80 0.01
106 Beijing Capital Land Ltd 33 –
15 Beijing Enterprises Holdings Ltd 55 0.01
168 Beijing Enterprises Medical & Health Group Ltd 7 –
148 Beijing Enterprises Water Group Ltd 85 0.01
42 Beijing Jingneng Clean Energy Co Ltd 10 –
84 Beijing North Star Co Ltd 22 –
264 Beijing Properties Holdings Ltd 11 –
346 Belle International Holdings Ltd 159 0.03
30 Best Pacific International Holdings Ltd 20 –
12 Biostime International Holdings Ltd 30 –
10 Bloomage BioTechnology Corp Ltd 13 –
13 Boer Power Holdings Ltd 5 –
140 Bosideng International Holdings Ltd 11 –
120 Brilliance China Automotive Holdings Ltd 134 0.03
9 BYD Co Ltd 43 0.01
47 BYD Electronic International Co Ltd 33 –
98 C C Land Holdings Ltd 22 –
55 Canvest Environmental Protection Group Co Ltd 20 –
60 CAR Inc 50 0.01
76 Central China Real Estate Ltd 15 –
95 Central China Securities Co Ltd 45 0.01
168 CGN Meiya Power Holdings Co Ltd 21 –
95 CGN Power Co Ltd 23 –
19 Changshouhua Food Co Ltd 8 –
46 Chaowei Power Holdings Ltd 34 –
88 China Aerospace International Holdings Ltd 9 –
146 China Agri–Industries Holdings Ltd 47 0.01
42 China All Access Holdings Ltd 11 –
71 China Aoyuan Property Group Ltd 13 –
186 China BlueChemical Ltd 34 –
264 China Cinda Asset Management Co Ltd 76 0.01
205 China CITIC Bank Corp Ltd 107 0.01
49 China Coal Energy Co Ltd 20 –
79 China Communications Construction Co Ltd 75 0.01
100 China Communications Services Corp Ltd 47 0.01
56 China Conch Venture Holdings Ltd 82 0.01
2,313 China Construction Bank Corp 1,378 0.19
97 China Datang Corp Renewable Power Co Ltd 7 –
179 China Dongxiang Group Co Ltd 29 –
180 China Dynamics Holdings Ltd 5 –
52 China Eastern Airlines Corp Ltd 20 – 152
China Electronics Optics Valley Union Holding Co Ltd 13 –

World Equity Fund
Portfolio of Investments as at 30 November 2016 (continued)
Dimensional Fund Advisors Annual Report and Audited Financial Statements, 30 November 2016 307
Shares (000's)
Value (000's)
GBP
% of Net Asset Value
Common Stock (continued)
China (Hong Kong) – 2.74% (continued)
79 China Everbright Bank Co Ltd 30 –
74 China Everbright International Ltd 72 0.01
64 China Everbright Ltd 103 0.01
306 China Evergrande Group 167 0.03
182 China Fiber Optic Network System Group Ltd 13 –
52 China Foods Ltd 18 –
92 China Galaxy Securities Co Ltd 72 0.01
92 China Gas Holdings Ltd 97 0.01
78 China Harmony New Energy Auto Holding Ltd 25 –
113 China Hongqiao Group Ltd 83 0.01
88 China Huishan Dairy Holdings Co Ltd 26 –
33 China Huiyuan Juice Group Ltd 10 – 25
China International Marine Containers Group Co Ltd 31 –
192 China Jinmao Holdings Group Ltd 41 0.01
69 China Lesso Group Holdings Ltd 40 0.01
32 China Life Insurance Co Ltd, Class H 74 0.01
24 China Lilang Ltd 11 –
92 China Longyuan Power Group Corp Ltd 58 0.01
360 China LotSynergy Holdings Ltd 11 –
29 China Machinery Engineering Corp 15 –
26 China Maple Leaf Educational Systems Ltd 13 –
75 China Medical System Holdings Ltd 100 0.01
69 China Mengniu Dairy Co Ltd 113 0.01
76 China Merchants Bank Co Ltd 150 0.03
64 China Merchants Land Ltd 8 –
68 China Merchants Port Holdings Co Ltd 137 0.03
89 China Minsheng Banking Corp Ltd 80 0.01
98 China Mobile Ltd 851 0.11
194 China Modern Dairy Holdings Ltd 41 0.01
198 China National Building Material Co Ltd 80 0.01
65 China National Materials Co Ltd 12 –
264 China Oil & Gas Group Ltd 17 –
98 China Oilfield Services Ltd 75 0.01
88 China Overseas Grand Oceans Group Ltd 26 –
104 China Overseas Land & Investment Ltd 239 0.04
35 China Overseas Property Holdings Ltd 5 –
8 China Pacific Insurance Group Co Ltd 26 –
732 China Petroleum & Chemical Corp 420 0.06
94 China Pioneer Pharma Holdings Ltd 27 –
126 China Power International Development Ltd 37 –
24 China Power New Energy Development Co Ltd 11 –
47 China Railway Construction Corp Ltd 53 0.01
80 China Railway Group Ltd 58 0.01
252 China Rare Earth Holdings Ltd 16 –
82 China Resources Beer Holdings Co Ltd 138 0.03
138 China Resources Cement Holdings Ltd 47 0.01
50 China Resources Gas Group Ltd 118 0.03
98 China Resources Land Ltd 190 0.03 13
China Resources Phoenix Healthcare Holdings Co Ltd 16 –
56 China Resources Power Holdings Co Ltd 74 0.01
109 China SCE Property Holdings Ltd 29 –
53 China Shanshui Cement Group Ltd 6 –
111 China Shengmu Organic Milk Ltd 26 –
33 China Shenhua Energy Co Ltd 54 0.01
13 China Shineway Pharmaceutical Group Ltd 11 –
14 China Singyes Solar Technologies Holdings Ltd 5 –
162 China South City Holdings Ltd 30 –
142 China Southern Airlines Co Ltd 65 0.01
78 China State Construction International Holdings Ltd 101 0.02
141 China Suntien Green Energy Corp Ltd 15 –
89 China Taiping Insurance Holdings Co Ltd 162 0.03
106 China Telecom Corp Ltd 41 0.01
Shares (000's)
Value (000's)
GBP
% of Net Asset Value
Common Stock (continued)
China (Hong Kong) – 2.74% (continued)
14 China Tian Lun Gas Holdings Ltd 10 – 104
China Traditional Chinese Medicine Holdings Co Ltd 42 0.01
186 China Travel International Investment Hong Kong Ltd 43 0.01
350 China Unicom Hong Kong Ltd 338 0.05
42 China Vanke Co Ltd 102 0.02
54 China Water Affairs Group Ltd 31 –
100 China Water Industry Group Ltd 13 –
148 China Yurun Food Group Ltd 19 –
39 China ZhengTong Auto Services Holdings Ltd 9 –
85 China Zhongwang Holdings Ltd 31 –
66 Chinasoft International Ltd 26 –
152 Chongqing Machinery & Electric Co Ltd 15 –
175 Chongqing Rural Commercial Bank Co Ltd 87 0.02
48 Chu Kong Shipping Enterprises Group Co Ltd 10 –
148 CIFI Holdings Group Co Ltd 35 –
62 CIMC Enric Holdings Ltd 22 –
159 CITIC Ltd 195 0.04
354 CITIC Resources Holdings Ltd 38 –
29 CITIC Securities Co Ltd 53 0.01
114 Citychamp Watch & Jewellery Group Ltd 22 –
14 Clear Media Ltd 10 –
441 CNOOC Ltd 463 0.07
17 Cogobuy Group 21 –
91 Comba Telecom Systems Holdings Ltd 13 –
360 Concord New Energy Group Ltd 15 –
33 Consun Pharmaceutical Group Ltd 15 –
248 Coolpad Group Ltd 22 –
42 COSCO International Holdings Ltd 16 –
69 Cosco Shipping Development Co Ltd 13 –
80 COSCO Shipping Energy Transpor 38 –
55 COSCO Shipping Ports Ltd 46 0.01
45 Cosmo Lady China Holdings Co Ltd 14 –
373 Country Garden Holdings Co Ltd 167 0.03
464 CP Pokphand Co Ltd 44 0.01
24 CPMC Holdings Ltd 9 –
22 CRRC Corp Ltd 17 –
206 CSPC Pharmaceutical Group Ltd 177 0.03
166 CT Environmental Group Ltd 32 –
81 Dah Chong Hong Holdings Ltd 26 –
129 Dalian Port PDA Co Ltd 19 –
128 Daphne International Holdings Ltd 12 –
106 Datang International Power Generation Co Ltd 23 –
16 Dawnrays Pharmaceutical Holdings Ltd 8 –
142 Differ Group Holding Co Ltd 9 –
36 Digital China Holdings Ltd 23 –
11 Dongfang Electric Corp Ltd 7 –
74 Dongfeng Motor Group Co Ltd 60 0.01
12 Dongjiang Environmental 17 –
35 Dongyue Group Ltd 2 –
18 ENN Energy Holdings Ltd 66 0.01
64 EVA Precision Industrial Holdings Ltd 6 –
143 Fantasia Holdings Group Co Ltd 15 –
99 Far East Horizon Ltd 71 0.01
40 First Tractor Co Ltd 19 –
36 Fosun International Ltd 42 0.01
30 Fu Shou Yuan International Group Ltd 15 –
41 Fufeng Group Ltd 15 –
31 Fuguiniao Co Ltd 12 –
218 Fullshare Holdings Ltd 93 0.02
206 Future Land Development Holdings Ltd 30 –

World Equity Fund
Portfolio of Investments as at 30 November 2016 (continued)
Dimensional Fund Advisors Annual Report and Audited Financial Statements, 30 November 2016 308
Shares (000's)
Value (000's)
GBP
% of Net Asset Value
Common Stock (continued)
China (Hong Kong) – 2.74% (continued)
20 Fuyao Glass Industry Group Co Ltd 49 0.01
933 GCL–Poly Energy Holdings Ltd 100 0.01
310 Geely Automobile Holdings Ltd 255 0.04
394 Gemdale Properties & Investment Corp Ltd 20 –
11 GF Securities Co Ltd 21 –
177 Glorious Property Holdings Ltd 21 –
40 Golden Eagle Retail Group Ltd 46 0.01
210 Golden Meditech Holdings Ltd 21 –
29 Goldlion Holdings Ltd 9 –
703 GOME Electrical Appliances Holding Ltd 73 0.01
60 Goodbaby International Holdings Ltd 22 –
47 Great Wall Motor Co Ltd 35 –
77 Greatview Aseptic Packaging Co Ltd 33 –
41 Greenland Hong Kong Holdings Ltd 9 –
33 Greentown China Holdings Ltd 22 –
42 Guangdong Investment Ltd 47 0.01
70 Guangshen Railway Co Ltd 30 –
10 Guangzhou Automobile Group Co Ltd 10 – 12
Guangzhou Baiyunshan Pharmaceutical Holdings Co Ltd 23 –
75 Guangzhou R&F Properties Co Ltd 76 0.01
30 Guolian Securities Co Ltd 13 –
61 Haichang Ocean Park Holdings Ltd 12 –
39 Haier Electronics Group Co Ltd 52 0.01
24 Haitian International Holdings Ltd 38 –
54 Haitong Securities Co Ltd 84 0.02
38 Harbin Bank Co Ltd 9 –
88 Harbin Electric Co Ltd 33 –
13 Hengan International Group Co Ltd 82 0.02
112 Hengdeli Holdings Ltd 10 –
102 Hi Sun Technology China Ltd 13 –
56 Hilong Holding Ltd 12 –
223 Honghua Group Ltd 18 –
1 Hopewell Highway Infrastructure Ltd – –
54 Hopson Development Holdings Ltd 39 0.01
48 HOSA International Ltd 13 –
462 Hua Han Health Industry Holdings Ltd 25 –
11 Hua Hong Semiconductor Ltd 10 –
128 Huabao International Holdings Ltd 43 0.01
82 Huadian Fuxin Energy Corp Ltd 15 –
62 Huadian Power International Corp Ltd 21 –
44 Huaneng Power International Inc 22 –
316 Huaneng Renewables Corp Ltd 82 0.02
10 Huatai Securities Co Ltd 18 –
46 Huishang Bank Corp Ltd 19 –
82 Hydoo International Holding Ltd 6 –
1,701 Industrial & Commercial Bank of China Ltd 830 0.12
83 Intime Retail Group Co Ltd 55 0.01
98 Jiangnan Group Ltd 12 –
36 Jiangsu Expressway Co Ltd 38 –
79 Jiangxi Copper Co Ltd 96 0.02
176 Joy City Property Ltd 21 –
32 Ju Teng International Holdings Ltd 9 –
74 K Wah International Holdings Ltd 31 –
41 Kingboard Chemical Holdings Ltd 92 0.02
49 Kingboard Laminates Holdings Ltd 35 –
62 Kingdee International Software Group Co Ltd 21 –
156 Ko Yo Chemical Group Ltd 4 –
280 Kunlun Energy Co Ltd 163 0.03
76 KWG Property Holding Ltd 34 –
68 Lee & Man Paper Manufacturing Ltd 42 0.01
28 Lee's Pharmaceutical Holdings Ltd 20 –
398 Lenovo Group Ltd 197 0.04
190 Leyou Technologies Holdings Ltd 30 –
Shares (000's)
Value (000's)
GBP
% of Net Asset Value
Common Stock (continued)
China (Hong Kong) – 2.74% (continued)
62 Li Ning Co Ltd 37 –
54 Lianhua Supermarket Holdings Co Ltd 20 –
36 Lifestyle China Group Ltd 7 –
78 Lifetech Scientific Corp 16 –
3 Livzon Pharmaceutical Group Inc 13 –
60 Logan Property Holdings Co Ltd 20 –
94 Longfor Properties Co Ltd 96 0.02
104 Lonking Holdings Ltd 17 –
52 Luye Pharma Group Ltd 28 –
64 Maanshan Iron & Steel Co Ltd 13 –
72 Metallurgical Corp of China Ltd 21 –
17 Microport Scientific Corp 10 –
16 Min Xin Holdings Ltd 13 –
154 Mingfa Group International Co Ltd 11 –
166 Minmetals Land Ltd 17 –
40 Minth Group Ltd 105 0.01
136 MMG Ltd 30 –
554 Munsun Capital Group Ltd 13 –
7 New China Life Insurance Co Ltd 29 –
58 Nexteer Automotive Group Ltd 58 0.01
106 Nine Dragons Paper Holdings Ltd 74 0.01
550 North Mining Shares Co Ltd 10 –
72 Pacific Online Ltd 16 –
52 PAX Global Technology Ltd 28 –
420 Peace Map Holding Ltd 7 –
134 People's Insurance Co Group of China Ltd 45 0.01
356 PetroChina Co Ltd 194 0.04
40 Phoenix Satellite Television Holdings Ltd 6 –
130 PICC Property & Casualty Co Ltd 174 0.03
87 Ping An Insurance Group Co of China Ltd 382 0.06
2 Poly Culture Group Corp Ltd 4 –
130 Poly Property Group Co Ltd 32 –
156 Pou Sheng International Holdings Ltd 38 –
70 Powerlong Real Estate Holdings Ltd 16 –
50 PW Medtech Group Ltd 13 –
30 Qingdao Port International Co Ltd 13 –
40 Qingling Motors Co Ltd 10 –
17 Qinhuangdao Port Co Ltd 3 –
2 Qinqin Foodstuffs Group Cayman Co Ltd – –
79 Real Nutriceutical Group Ltd 5 –
60 Redco Properties Group Ltd 17 –
9 Red Star Macalline Group Corp Ltd 7 –
972 Renhe Commercial Holdings Co Ltd 20 –
525 REXLot Holdings Ltd 7 –
23 Road King Infrastructure Ltd 15 – 66
Sany Heavy Equipment International Holdings Co Ltd 9 –
1,046 Semiconductor Manufacturing International Corp 113 0.01
15 Shandong Chenming Paper Holdings Ltd 12 –
104 Shandong Weigao Group Medical Polymer Co Ltd 57 0.01
8 Shanghai Fosun Pharmaceutical Group Co Ltd 19 – 28
Shanghai Fudan–Zhangjiang Bio–Pharmaceutical Co Ltd 18 –
28 Shanghai Industrial Holdings Ltd 63 0.01
74 Shanghai Industrial Urban Development Group Ltd 16 – 82
Shanghai Jin Jiang International Hotels Group Co Ltd 18 –
24 Shanghai Pharmaceuticals Holding Co Ltd 48 0.01
29 Shengjing Bank Co Ltd 24 –
74 Shenguan Holdings Group Ltd 5 –
20 Shenzhen Expressway Co Ltd 15 –
49 Shenzhen International Holdings Ltd 58 0.01
177 Shenzhen Investment Ltd 62 0.01
10 Shenzhou International Group Holdings Ltd 49 0.01
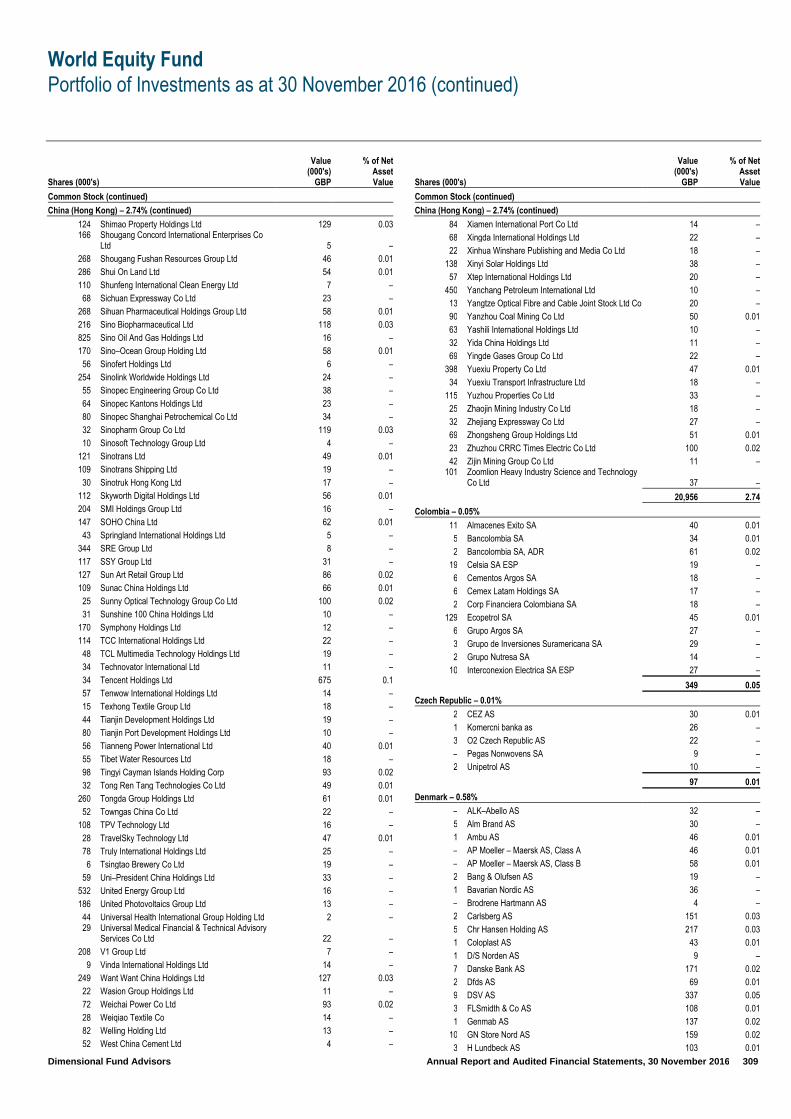
World Equity Fund
Portfolio of Investments as at 30 November 2016 (continued)
Dimensional Fund Advisors Annual Report and Audited Financial Statements, 30 November 2016 309
Shares (000's)
Value (000's)
GBP
% of Net Asset Value
Common Stock (continued)
China (Hong Kong) – 2.74% (continued)
124 Shimao Property Holdings Ltd 129 0.03 166
Shougang Concord International Enterprises Co Ltd 5 –
268 Shougang Fushan Resources Group Ltd 46 0.01
286 Shui On Land Ltd 54 0.01
110 Shunfeng International Clean Energy Ltd 7 –
68 Sichuan Expressway Co Ltd 23 –
268 Sihuan Pharmaceutical Holdings Group Ltd 58 0.01
216 Sino Biopharmaceutical Ltd 118 0.03
825 Sino Oil And Gas Holdings Ltd 16 –
170 Sino–Ocean Group Holding Ltd 58 0.01
56 Sinofert Holdings Ltd 6 –
254 Sinolink Worldwide Holdings Ltd 24 –
55 Sinopec Engineering Group Co Ltd 38 –
64 Sinopec Kantons Holdings Ltd 23 –
80 Sinopec Shanghai Petrochemical Co Ltd 34 –
32 Sinopharm Group Co Ltd 119 0.03
10 Sinosoft Technology Group Ltd 4 –
121 Sinotrans Ltd 49 0.01
109 Sinotrans Shipping Ltd 19 –
30 Sinotruk Hong Kong Ltd 17 –
112 Skyworth Digital Holdings Ltd 56 0.01
204 SMI Holdings Group Ltd 16 –
147 SOHO China Ltd 62 0.01
43 Springland International Holdings Ltd 5 –
344 SRE Group Ltd 8 –
117 SSY Group Ltd 31 –
127 Sun Art Retail Group Ltd 86 0.02
109 Sunac China Holdings Ltd 66 0.01
25 Sunny Optical Technology Group Co Ltd 100 0.02
31 Sunshine 100 China Holdings Ltd 10 –
170 Symphony Holdings Ltd 12 –
114 TCC International Holdings Ltd 22 –
48 TCL Multimedia Technology Holdings Ltd 19 –
34 Technovator International Ltd 11 –
34 Tencent Holdings Ltd 675 0.1
57 Tenwow International Holdings Ltd 14 –
15 Texhong Textile Group Ltd 18 –
44 Tianjin Development Holdings Ltd 19 –
80 Tianjin Port Development Holdings Ltd 10 –
56 Tianneng Power International Ltd 40 0.01
55 Tibet Water Resources Ltd 18 –
98 Tingyi Cayman Islands Holding Corp 93 0.02
32 Tong Ren Tang Technologies Co Ltd 49 0.01
260 Tongda Group Holdings Ltd 61 0.01
52 Towngas China Co Ltd 22 –
108 TPV Technology Ltd 16 –
28 TravelSky Technology Ltd 47 0.01
78 Truly International Holdings Ltd 25 –
6 Tsingtao Brewery Co Ltd 19 –
59 Uni–President China Holdings Ltd 33 –
532 United Energy Group Ltd 16 –
186 United Photovoltaics Group Ltd 13 –
44 Universal Health International Group Holding Ltd 2 – 29
Universal Medical Financial & Technical Advisory Services Co Ltd 22 –
208 V1 Group Ltd 7 –
9 Vinda International Holdings Ltd 14 –
249 Want Want China Holdings Ltd 127 0.03
22 Wasion Group Holdings Ltd 11 –
72 Weichai Power Co Ltd 93 0.02
28 Weiqiao Textile Co 14 –
82 Welling Holding Ltd 13 –
52 West China Cement Ltd 4 –
Shares (000's)
Value (000's)
GBP
% of Net Asset Value
Common Stock (continued)
China (Hong Kong) – 2.74% (continued)
84 Xiamen International Port Co Ltd 14 –
68 Xingda International Holdings Ltd 22 –
22 Xinhua Winshare Publishing and Media Co Ltd 18 –
138 Xinyi Solar Holdings Ltd 38 –
57 Xtep International Holdings Ltd 20 –
450 Yanchang Petroleum International Ltd 10 –
13 Yangtze Optical Fibre and Cable Joint Stock Ltd Co 20 –
90 Yanzhou Coal Mining Co Ltd 50 0.01
63 Yashili International Holdings Ltd 10 –
32 Yida China Holdings Ltd 11 –
69 Yingde Gases Group Co Ltd 22 –
398 Yuexiu Property Co Ltd 47 0.01
34 Yuexiu Transport Infrastructure Ltd 18 –
115 Yuzhou Properties Co Ltd 33 –
25 Zhaojin Mining Industry Co Ltd 18 –
32 Zhejiang Expressway Co Ltd 27 –
69 Zhongsheng Group Holdings Ltd 51 0.01
23 Zhuzhou CRRC Times Electric Co Ltd 100 0.02
42 Zijin Mining Group Co Ltd 11 – 101
Zoomlion Heavy Industry Science and Technology Co Ltd 37 –
20,956 2.74
Colombia – 0.05%
11 Almacenes Exito SA 40 0.01
5 Bancolombia SA 34 0.01
2 Bancolombia SA, ADR 61 0.02
19 Celsia SA ESP 19 –
6 Cementos Argos SA 18 –
6 Cemex Latam Holdings SA 17 –
2 Corp Financiera Colombiana SA 18 –
129 Ecopetrol SA 45 0.01
6 Grupo Argos SA 27 –
3 Grupo de Inversiones Suramericana SA 29 –
2 Grupo Nutresa SA 14 –
10 Interconexion Electrica SA ESP 27 –
349 0.05
Czech Republic – 0.01%
2 CEZ AS 30 0.01
1 Komercni banka as 26 –
3 O2 Czech Republic AS 22 –
– Pegas Nonwovens SA 9 –
2 Unipetrol AS 10 –
97 0.01
Denmark – 0.58%
– ALK–Abello AS 32 –
5 Alm Brand AS 30 –
1 Ambu AS 46 0.01
– AP Moeller – Maersk AS, Class A 46 0.01
– AP Moeller – Maersk AS, Class B 58 0.01
2 Bang & Olufsen AS 19 –
1 Bavarian Nordic AS 36 –
– Brodrene Hartmann AS 4 –
2 Carlsberg AS 151 0.03
5 Chr Hansen Holding AS 217 0.03
1 Coloplast AS 43 0.01
1 D/S Norden AS 9 –
7 Danske Bank AS 171 0.02
2 Dfds AS 69 0.01
9 DSV AS 337 0.05
3 FLSmidth & Co AS 108 0.01
1 Genmab AS 137 0.02
10 GN Store Nord AS 159 0.02
3 H Lundbeck AS 103 0.01
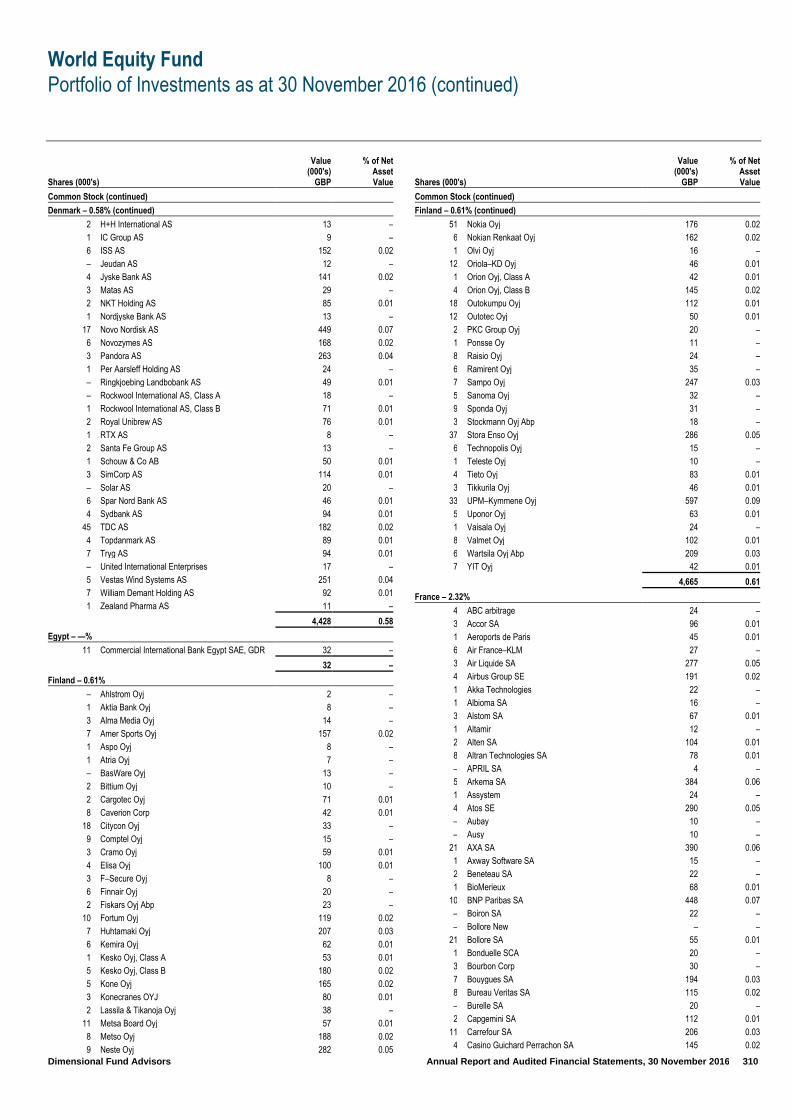
World Equity Fund
Portfolio of Investments as at 30 November 2016 (continued)
Dimensional Fund Advisors Annual Report and Audited Financial Statements, 30 November 2016 310
Shares (000's)
Value (000's)
GBP
% of Net Asset Value
Common Stock (continued)
Denmark – 0.58% (continued)
2 H+H International AS 13 –
1 IC Group AS 9 –
6 ISS AS 152 0.02
– Jeudan AS 12 –
4 Jyske Bank AS 141 0.02
3 Matas AS 29 –
2 NKT Holding AS 85 0.01
1 Nordjyske Bank AS 13 –
17 Novo Nordisk AS 449 0.07
6 Novozymes AS 168 0.02
3 Pandora AS 263 0.04
1 Per Aarsleff Holding AS 24 –
– Ringkjoebing Landbobank AS 49 0.01
– Rockwool International AS, Class A 18 –
1 Rockwool International AS, Class B 71 0.01
2 Royal Unibrew AS 76 0.01
1 RTX AS 8 –
2 Santa Fe Group AS 13 –
1 Schouw & Co AB 50 0.01
3 SimCorp AS 114 0.01
– Solar AS 20 –
6 Spar Nord Bank AS 46 0.01
4 Sydbank AS 94 0.01
45 TDC AS 182 0.02
4 Topdanmark AS 89 0.01
7 Tryg AS 94 0.01
– United International Enterprises 17 –
5 Vestas Wind Systems AS 251 0.04
7 William Demant Holding AS 92 0.01
1 Zealand Pharma AS 11 –
4,428 0.58
Egypt – —%
11 Commercial International Bank Egypt SAE, GDR 32 –
32 –
Finland – 0.61%
– Ahlstrom Oyj 2 –
1 Aktia Bank Oyj 8 –
3 Alma Media Oyj 14 –
7 Amer Sports Oyj 157 0.02
1 Aspo Oyj 8 –
1 Atria Oyj 7 –
– BasWare Oyj 13 –
2 Bittium Oyj 10 –
2 Cargotec Oyj 71 0.01
8 Caverion Corp 42 0.01
18 Citycon Oyj 33 –
9 Comptel Oyj 15 –
3 Cramo Oyj 59 0.01
4 Elisa Oyj 100 0.01
3 F–Secure Oyj 8 –
6 Finnair Oyj 20 –
2 Fiskars Oyj Abp 23 –
10 Fortum Oyj 119 0.02
7 Huhtamaki Oyj 207 0.03
6 Kemira Oyj 62 0.01
1 Kesko Oyj, Class A 53 0.01
5 Kesko Oyj, Class B 180 0.02
5 Kone Oyj 165 0.02
3 Konecranes OYJ 80 0.01
2 Lassila & Tikanoja Oyj 38 –
11 Metsa Board Oyj 57 0.01
8 Metso Oyj 188 0.02
9 Neste Oyj 282 0.05
Shares (000's)
Value (000's)
GBP
% of Net Asset Value
Common Stock (continued)
Finland – 0.61% (continued)
51 Nokia Oyj 176 0.02
6 Nokian Renkaat Oyj 162 0.02
1 Olvi Oyj 16 –
12 Oriola–KD Oyj 46 0.01
1 Orion Oyj, Class A 42 0.01
4 Orion Oyj, Class B 145 0.02
18 Outokumpu Oyj 112 0.01
12 Outotec Oyj 50 0.01
2 PKC Group Oyj 20 –
1 Ponsse Oy 11 –
8 Raisio Oyj 24 –
6 Ramirent Oyj 35 –
7 Sampo Oyj 247 0.03
5 Sanoma Oyj 32 –
9 Sponda Oyj 31 –
3 Stockmann Oyj Abp 18 –
37 Stora Enso Oyj 286 0.05
6 Technopolis Oyj 15 –
1 Teleste Oyj 10 –
4 Tieto Oyj 83 0.01
3 Tikkurila Oyj 46 0.01
33 UPM–Kymmene Oyj 597 0.09
5 Uponor Oyj 63 0.01
1 Vaisala Oyj 24 –
8 Valmet Oyj 102 0.01
6 Wartsila Oyj Abp 209 0.03
7 YIT Oyj 42 0.01
4,665 0.61
France – 2.32%
4 ABC arbitrage 24 –
3 Accor SA 96 0.01
1 Aeroports de Paris 45 0.01
6 Air France–KLM 27 –
3 Air Liquide SA 277 0.05
4 Airbus Group SE 191 0.02
1 Akka Technologies 22 –
1 Albioma SA 16 –
3 Alstom SA 67 0.01
1 Altamir 12 –
2 Alten SA 104 0.01
8 Altran Technologies SA 78 0.01
– APRIL SA 4 –
5 Arkema SA 384 0.06
1 Assystem 24 –
4 Atos SE 290 0.05
– Aubay 10 –
– Ausy 10 –
21 AXA SA 390 0.06
1 Axway Software SA 15 –
2 Beneteau SA 22 –
1 BioMerieux 68 0.01
10 BNP Paribas SA 448 0.07
– Boiron SA 22 –
– Bollore New – –
21 Bollore SA 55 0.01
1 Bonduelle SCA 20 –
3 Bourbon Corp 30 –
7 Bouygues SA 194 0.03
8 Bureau Veritas SA 115 0.02
– Burelle SA 20 –
2 Capgemini SA 112 0.01
11 Carrefour SA 206 0.03
4 Casino Guichard Perrachon SA 145 0.02
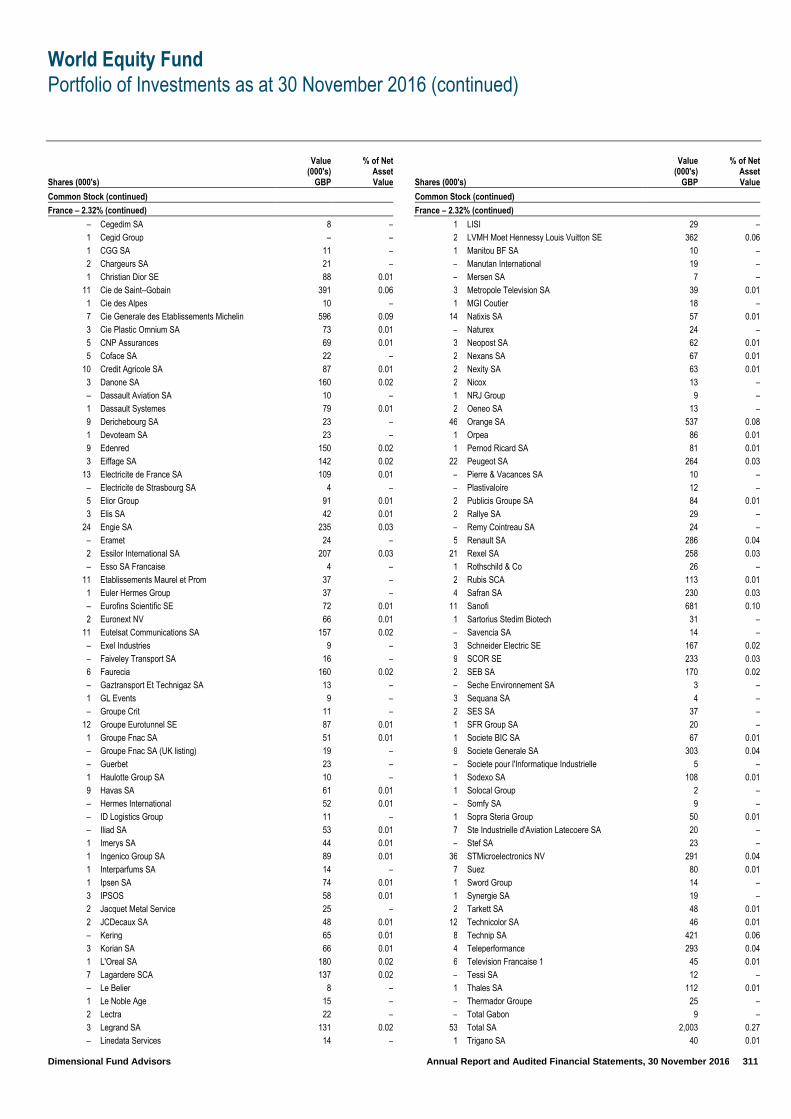
World Equity Fund
Portfolio of Investments as at 30 November 2016 (continued)
Dimensional Fund Advisors Annual Report and Audited Financial Statements, 30 November 2016 311
Shares (000's)
Value (000's)
GBP
% of Net Asset Value
Common Stock (continued)
France – 2.32% (continued)
– Cegedim SA 8 –
1 Cegid Group – –
1 CGG SA 11 –
2 Chargeurs SA 21 –
1 Christian Dior SE 88 0.01
11 Cie de Saint–Gobain 391 0.06
1 Cie des Alpes 10 –
7 Cie Generale des Etablissements Michelin 596 0.09
3 Cie Plastic Omnium SA 73 0.01
5 CNP Assurances 69 0.01
5 Coface SA 22 –
10 Credit Agricole SA 87 0.01
3 Danone SA 160 0.02
– Dassault Aviation SA 10 –
1 Dassault Systemes 79 0.01
9 Derichebourg SA 23 –
1 Devoteam SA 23 –
9 Edenred 150 0.02
3 Eiffage SA 142 0.02
13 Electricite de France SA 109 0.01
– Electricite de Strasbourg SA 4 –
5 Elior Group 91 0.01
3 Elis SA 42 0.01
24 Engie SA 235 0.03
– Eramet 24 –
2 Essilor International SA 207 0.03
– Esso SA Francaise 4 –
11 Etablissements Maurel et Prom 37 –
1 Euler Hermes Group 37 –
– Eurofins Scientific SE 72 0.01
2 Euronext NV 66 0.01
11 Eutelsat Communications SA 157 0.02
– Exel Industries 9 –
– Faiveley Transport SA 16 –
6 Faurecia 160 0.02
– Gaztransport Et Technigaz SA 13 –
1 GL Events 9 –
– Groupe Crit 11 –
12 Groupe Eurotunnel SE 87 0.01
1 Groupe Fnac SA 51 0.01
– Groupe Fnac SA (UK listing) 19 –
– Guerbet 23 –
1 Haulotte Group SA 10 –
9 Havas SA 61 0.01
– Hermes International 52 0.01
– ID Logistics Group 11 –
– Iliad SA 53 0.01
1 Imerys SA 44 0.01
1 Ingenico Group SA 89 0.01
1 Interparfums SA 14 –
1 Ipsen SA 74 0.01
3 IPSOS 58 0.01
2 Jacquet Metal Service 25 –
2 JCDecaux SA 48 0.01
– Kering 65 0.01
3 Korian SA 66 0.01
1 L'Oreal SA 180 0.02
7 Lagardere SCA 137 0.02
– Le Belier 8 –
1 Le Noble Age 15 –
2 Lectra 22 –
3 Legrand SA 131 0.02
– Linedata Services 14 –
Shares (000's)
Value (000's)
GBP
% of Net Asset Value
Common Stock (continued)
France – 2.32% (continued)
1 LISI 29 –
2 LVMH Moet Hennessy Louis Vuitton SE 362 0.06
1 Manitou BF SA 10 –
– Manutan International 19 –
– Mersen SA 7 –
3 Metropole Television SA 39 0.01
1 MGI Coutier 18 –
14 Natixis SA 57 0.01
– Naturex 24 –
3 Neopost SA 62 0.01
2 Nexans SA 67 0.01
2 Nexity SA 63 0.01
2 Nicox 13 –
1 NRJ Group 9 –
2 Oeneo SA 13 –
46 Orange SA 537 0.08
1 Orpea 86 0.01
1 Pernod Ricard SA 81 0.01
22 Peugeot SA 264 0.03
– Pierre & Vacances SA 10 –
– Plastivaloire 12 –
2 Publicis Groupe SA 84 0.01
2 Rallye SA 29 –
– Remy Cointreau SA 24 –
5 Renault SA 286 0.04
21 Rexel SA 258 0.03
1 Rothschild & Co 26 –
2 Rubis SCA 113 0.01
4 Safran SA 230 0.03
11 Sanofi 681 0.10
1 Sartorius Stedim Biotech 31 –
– Savencia SA 14 –
3 Schneider Electric SE 167 0.02
9 SCOR SE 233 0.03
2 SEB SA 170 0.02
– Seche Environnement SA 3 –
3 Sequana SA 4 –
2 SES SA 37 –
1 SFR Group SA 20 –
1 Societe BIC SA 67 0.01
9 Societe Generale SA 303 0.04
– Societe pour l'Informatique Industrielle 5 –
1 Sodexo SA 108 0.01
1 Solocal Group 2 –
– Somfy SA 9 –
1 Sopra Steria Group 50 0.01
7 Ste Industrielle d'Aviation Latecoere SA 20 –
– Stef SA 23 –
36 STMicroelectronics NV 291 0.04
7 Suez 80 0.01
1 Sword Group 14 –
1 Synergie SA 19 –
2 Tarkett SA 48 0.01
12 Technicolor SA 46 0.01
8 Technip SA 421 0.06
4 Teleperformance 293 0.04
6 Television Francaise 1 45 0.01
– Tessi SA 12 –
1 Thales SA 112 0.01
– Thermador Groupe 25 –
– Total Gabon 9 –
53 Total SA 2,003 0.27
1 Trigano SA 40 0.01
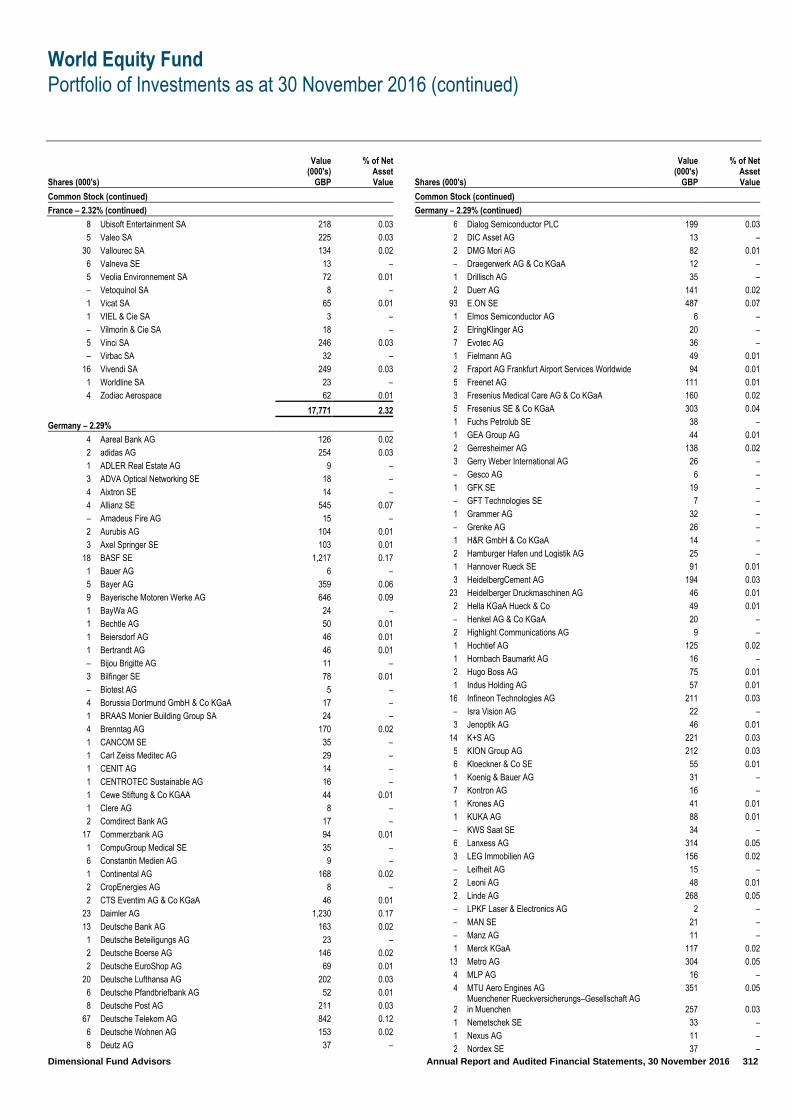
World Equity Fund
Portfolio of Investments as at 30 November 2016 (continued)
Dimensional Fund Advisors Annual Report and Audited Financial Statements, 30 November 2016 312
Shares (000's)
Value (000's)
GBP
% of Net Asset Value
Common Stock (continued)
France – 2.32% (continued)
8 Ubisoft Entertainment SA 218 0.03
5 Valeo SA 225 0.03
30 Vallourec SA 134 0.02
6 Valneva SE 13 –
5 Veolia Environnement SA 72 0.01
– Vetoquinol SA 8 –
1 Vicat SA 65 0.01
1 VIEL & Cie SA 3 –
– Vilmorin & Cie SA 18 –
5 Vinci SA 246 0.03
– Virbac SA 32 –
16 Vivendi SA 249 0.03
1 Worldline SA 23 –
4 Zodiac Aerospace 62 0.01
17,771 2.32
Germany – 2.29%
4 Aareal Bank AG 126 0.02
2 adidas AG 254 0.03
1 ADLER Real Estate AG 9 –
3 ADVA Optical Networking SE 18 –
4 Aixtron SE 14 –
4 Allianz SE 545 0.07
– Amadeus Fire AG 15 –
2 Aurubis AG 104 0.01
3 Axel Springer SE 103 0.01
18 BASF SE 1,217 0.17
1 Bauer AG 6 –
5 Bayer AG 359 0.06
9 Bayerische Motoren Werke AG 646 0.09
1 BayWa AG 24 –
1 Bechtle AG 50 0.01
1 Beiersdorf AG 46 0.01
1 Bertrandt AG 46 0.01
– Bijou Brigitte AG 11 –
3 Bilfinger SE 78 0.01
– Biotest AG 5 –
4 Borussia Dortmund GmbH & Co KGaA 17 –
1 BRAAS Monier Building Group SA 24 –
4 Brenntag AG 170 0.02
1 CANCOM SE 35 –
1 Carl Zeiss Meditec AG 29 –
1 CENIT AG 14 –
1 CENTROTEC Sustainable AG 16 –
1 Cewe Stiftung & Co KGAA 44 0.01
1 Clere AG 8 –
2 Comdirect Bank AG 17 –
17 Commerzbank AG 94 0.01
1 CompuGroup Medical SE 35 –
6 Constantin Medien AG 9 –
1 Continental AG 168 0.02
2 CropEnergies AG 8 –
2 CTS Eventim AG & Co KGaA 46 0.01
23 Daimler AG 1,230 0.17
13 Deutsche Bank AG 163 0.02
1 Deutsche Beteiligungs AG 23 –
2 Deutsche Boerse AG 146 0.02
2 Deutsche EuroShop AG 69 0.01
20 Deutsche Lufthansa AG 202 0.03
6 Deutsche Pfandbriefbank AG 52 0.01
8 Deutsche Post AG 211 0.03
67 Deutsche Telekom AG 842 0.12
6 Deutsche Wohnen AG 153 0.02
8 Deutz AG 37 –
Shares (000's)
Value (000's)
GBP
% of Net Asset Value
Common Stock (continued)
Germany – 2.29% (continued)
6 Dialog Semiconductor PLC 199 0.03
2 DIC Asset AG 13 –
2 DMG Mori AG 82 0.01
– Draegerwerk AG & Co KGaA 12 –
1 Drillisch AG 35 –
2 Duerr AG 141 0.02
93 E.ON SE 487 0.07
1 Elmos Semiconductor AG 6 –
2 ElringKlinger AG 20 –
7 Evotec AG 36 –
1 Fielmann AG 49 0.01
2 Fraport AG Frankfurt Airport Services Worldwide 94 0.01
5 Freenet AG 111 0.01
3 Fresenius Medical Care AG & Co KGaA 160 0.02
5 Fresenius SE & Co KGaA 303 0.04
1 Fuchs Petrolub SE 38 –
1 GEA Group AG 44 0.01
2 Gerresheimer AG 138 0.02
3 Gerry Weber International AG 26 –
– Gesco AG 6 –
1 GFK SE 19 –
– GFT Technologies SE 7 –
1 Grammer AG 32 –
– Grenke AG 26 –
1 H&R GmbH & Co KGaA 14 –
2 Hamburger Hafen und Logistik AG 25 –
1 Hannover Rueck SE 91 0.01
3 HeidelbergCement AG 194 0.03
23 Heidelberger Druckmaschinen AG 46 0.01
2 Hella KGaA Hueck & Co 49 0.01
– Henkel AG & Co KGaA 20 –
2 Highlight Communications AG 9 –
1 Hochtief AG 125 0.02
1 Hornbach Baumarkt AG 16 –
2 Hugo Boss AG 75 0.01
1 Indus Holding AG 57 0.01
16 Infineon Technologies AG 211 0.03
– Isra Vision AG 22 –
3 Jenoptik AG 46 0.01
14 K+S AG 221 0.03
5 KION Group AG 212 0.03
6 Kloeckner & Co SE 55 0.01
1 Koenig & Bauer AG 31 –
7 Kontron AG 16 –
1 Krones AG 41 0.01
1 KUKA AG 88 0.01
– KWS Saat SE 34 –
6 Lanxess AG 314 0.05
3 LEG Immobilien AG 156 0.02
– Leifheit AG 15 –
2 Leoni AG 48 0.01
2 Linde AG 268 0.05
– LPKF Laser & Electronics AG 2 –
– MAN SE 21 –
– Manz AG 11 –
1 Merck KGaA 117 0.02
13 Metro AG 304 0.05
4 MLP AG 16 –
4 MTU Aero Engines AG 351 0.05
2 Muenchener Rueckversicherungs–Gesellschaft AG in Muenchen 257 0.03
1 Nemetschek SE 33 –
1 Nexus AG 11 –
2 Nordex SE 37 –
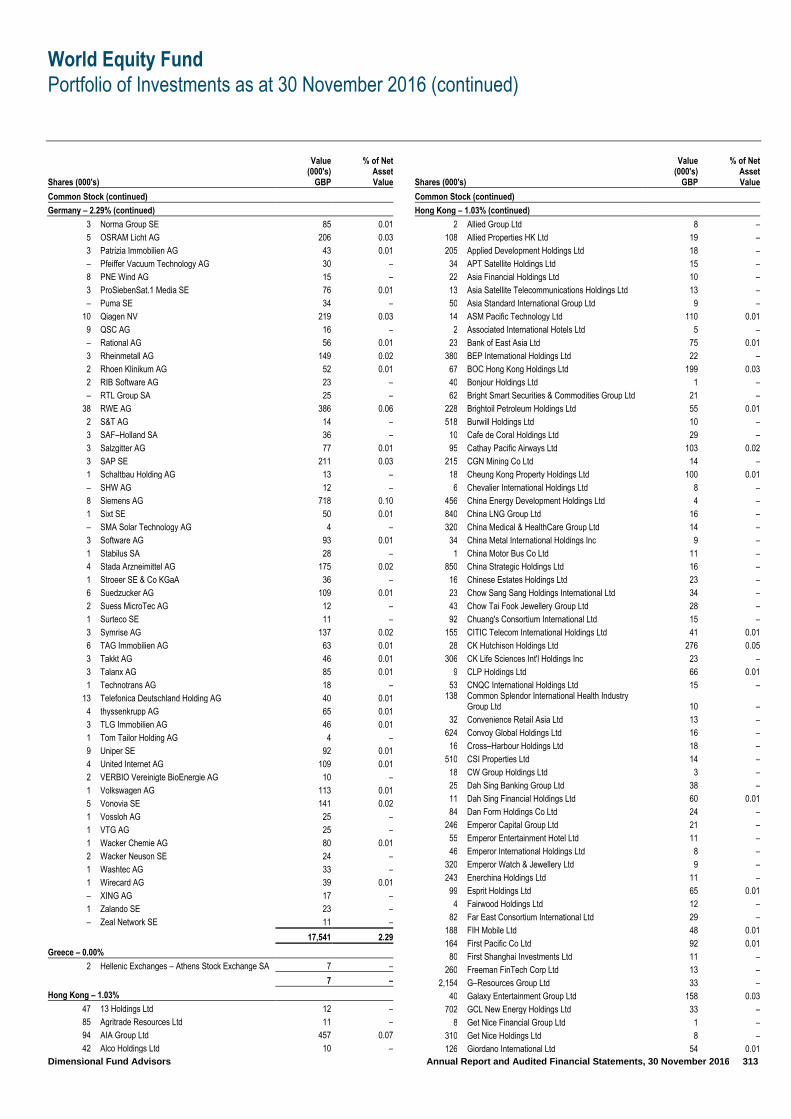
World Equity Fund
Portfolio of Investments as at 30 November 2016 (continued)
Dimensional Fund Advisors Annual Report and Audited Financial Statements, 30 November 2016 313
Shares (000's)
Value (000's)
GBP
% of Net Asset Value
Common Stock (continued)
Germany – 2.29% (continued)
3 Norma Group SE 85 0.01
5 OSRAM Licht AG 206 0.03
3 Patrizia Immobilien AG 43 0.01
– Pfeiffer Vacuum Technology AG 30 –
8 PNE Wind AG 15 –
3 ProSiebenSat.1 Media SE 76 0.01
– Puma SE 34 –
10 Qiagen NV 219 0.03
9 QSC AG 16 –
– Rational AG 56 0.01
3 Rheinmetall AG 149 0.02
2 Rhoen Klinikum AG 52 0.01
2 RIB Software AG 23 –
– RTL Group SA 25 –
38 RWE AG 386 0.06
2 S&T AG 14 –
3 SAF–Holland SA 36 –
3 Salzgitter AG 77 0.01
3 SAP SE 211 0.03
1 Schaltbau Holding AG 13 –
– SHW AG 12 –
8 Siemens AG 718 0.10
1 Sixt SE 50 0.01
– SMA Solar Technology AG 4 –
3 Software AG 93 0.01
1 Stabilus SA 28 –
4 Stada Arzneimittel AG 175 0.02
1 Stroeer SE & Co KGaA 36 –
6 Suedzucker AG 109 0.01
2 Suess MicroTec AG 12 –
1 Surteco SE 11 –
3 Symrise AG 137 0.02
6 TAG Immobilien AG 63 0.01
3 Takkt AG 46 0.01
3 Talanx AG 85 0.01
1 Technotrans AG 18 –
13 Telefonica Deutschland Holding AG 40 0.01
4 thyssenkrupp AG 65 0.01
3 TLG Immobilien AG 46 0.01
1 Tom Tailor Holding AG 4 –
9 Uniper SE 92 0.01
4 United Internet AG 109 0.01
2 VERBIO Vereinigte BioEnergie AG 10 –
1 Volkswagen AG 113 0.01
5 Vonovia SE 141 0.02
1 Vossloh AG 25 –
1 VTG AG 25 –
1 Wacker Chemie AG 80 0.01
2 Wacker Neuson SE 24 –
1 Washtec AG 33 –
1 Wirecard AG 39 0.01
– XING AG 17 –
1 Zalando SE 23 –
– Zeal Network SE 11 –
17,541 2.29
Greece – 0.00%
2 Hellenic Exchanges – Athens Stock Exchange SA 7 –
7 –
Hong Kong – 1.03%
47 13 Holdings Ltd 12 –
85 Agritrade Resources Ltd 11 –
94 AIA Group Ltd 457 0.07
42 Alco Holdings Ltd 10 –
Shares (000's)
Value (000's)
GBP
% of Net Asset Value
Common Stock (continued)
Hong Kong – 1.03% (continued)
2 Allied Group Ltd 8 –
108 Allied Properties HK Ltd 19 –
205 Applied Development Holdings Ltd 18 –
34 APT Satellite Holdings Ltd 15 –
22 Asia Financial Holdings Ltd 10 –
13 Asia Satellite Telecommunications Holdings Ltd 13 –
50 Asia Standard International Group Ltd 9 –
14 ASM Pacific Technology Ltd 110 0.01
2 Associated International Hotels Ltd 5 –
23 Bank of East Asia Ltd 75 0.01
380 BEP International Holdings Ltd 22 –
67 BOC Hong Kong Holdings Ltd 199 0.03
40 Bonjour Holdings Ltd 1 –
62 Bright Smart Securities & Commodities Group Ltd 21 –
228 Brightoil Petroleum Holdings Ltd 55 0.01
518 Burwill Holdings Ltd 10 –
10 Cafe de Coral Holdings Ltd 29 –
95 Cathay Pacific Airways Ltd 103 0.02
215 CGN Mining Co Ltd 14 –
18 Cheung Kong Property Holdings Ltd 100 0.01
6 Chevalier International Holdings Ltd 8 –
456 China Energy Development Holdings Ltd 4 –
840 China LNG Group Ltd 16 –
320 China Medical & HealthCare Group Ltd 14 –
34 China Metal International Holdings Inc 9 –
1 China Motor Bus Co Ltd 11 –
850 China Strategic Holdings Ltd 16 –
16 Chinese Estates Holdings Ltd 23 –
23 Chow Sang Sang Holdings International Ltd 34 –
43 Chow Tai Fook Jewellery Group Ltd 28 –
92 Chuang's Consortium International Ltd 15 –
155 CITIC Telecom International Holdings Ltd 41 0.01
28 CK Hutchison Holdings Ltd 276 0.05
306 CK Life Sciences Int'l Holdings Inc 23 –
9 CLP Holdings Ltd 66 0.01
53 CNQC International Holdings Ltd 15 – 138
Common Splendor International Health Industry Group Ltd 10 –
32 Convenience Retail Asia Ltd 13 –
624 Convoy Global Holdings Ltd 16 –
16 Cross–Harbour Holdings Ltd 18 –
510 CSI Properties Ltd 14 –
18 CW Group Holdings Ltd 3 –
25 Dah Sing Banking Group Ltd 38 –
11 Dah Sing Financial Holdings Ltd 60 0.01
84 Dan Form Holdings Co Ltd 24 –
246 Emperor Capital Group Ltd 21 –
55 Emperor Entertainment Hotel Ltd 11 –
46 Emperor International Holdings Ltd 8 –
320 Emperor Watch & Jewellery Ltd 9 –
243 Enerchina Holdings Ltd 11 –
99 Esprit Holdings Ltd 65 0.01
4 Fairwood Holdings Ltd 12 –
82 Far East Consortium International Ltd 29 –
188 FIH Mobile Ltd 48 0.01
164 First Pacific Co Ltd 92 0.01
80 First Shanghai Investments Ltd 11 –
260 Freeman FinTech Corp Ltd 13 –
2,154 G–Resources Group Ltd 33 –
40 Galaxy Entertainment Group Ltd 158 0.03
702 GCL New Energy Holdings Ltd 33 –
8 Get Nice Financial Group Ltd 1 –
310 Get Nice Holdings Ltd 8 –
126 Giordano International Ltd 54 0.01
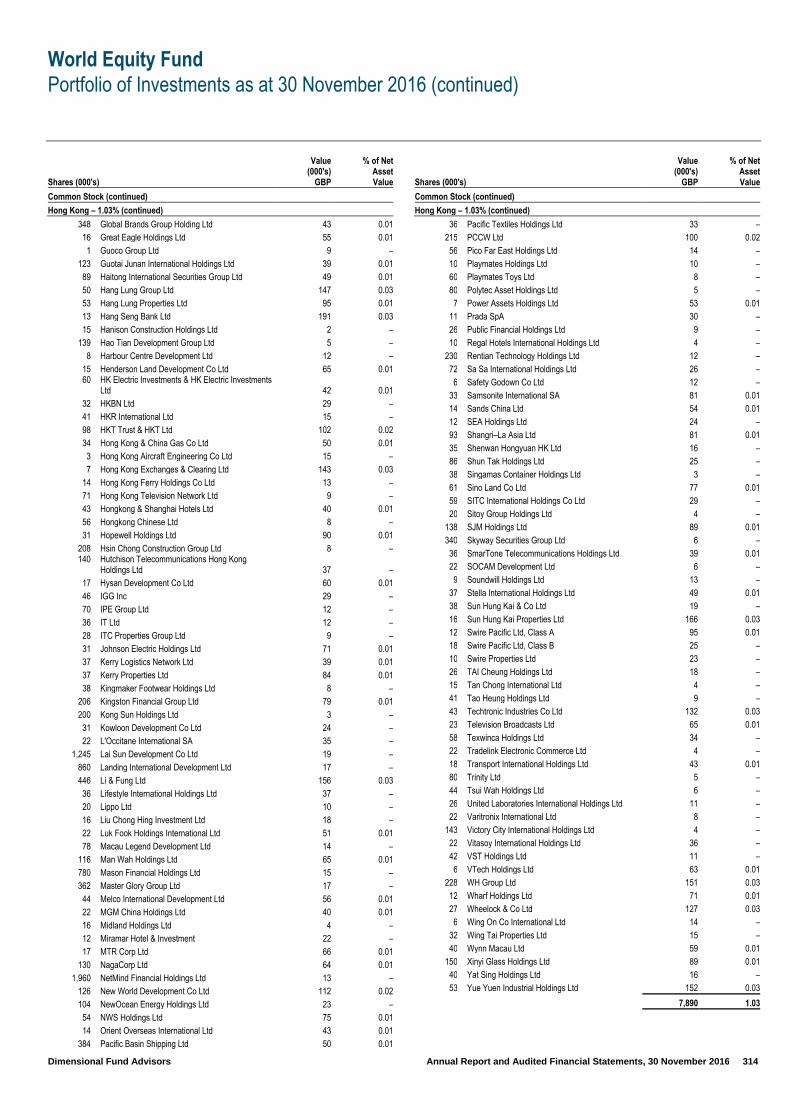
World Equity Fund
Portfolio of Investments as at 30 November 2016 (continued)
Dimensional Fund Advisors Annual Report and Audited Financial Statements, 30 November 2016 314
Shares (000's)
Value (000's)
GBP
% of Net Asset Value
Common Stock (continued)
Hong Kong – 1.03% (continued)
348 Global Brands Group Holding Ltd 43 0.01
16 Great Eagle Holdings Ltd 55 0.01
1 Guoco Group Ltd 9 –
123 Guotai Junan International Holdings Ltd 39 0.01
89 Haitong International Securities Group Ltd 49 0.01
50 Hang Lung Group Ltd 147 0.03
53 Hang Lung Properties Ltd 95 0.01
13 Hang Seng Bank Ltd 191 0.03
15 Hanison Construction Holdings Ltd 2 –
139 Hao Tian Development Group Ltd 5 –
8 Harbour Centre Development Ltd 12 –
15 Henderson Land Development Co Ltd 65 0.01 60
HK Electric Investments & HK Electric Investments Ltd 42 0.01
32 HKBN Ltd 29 –
41 HKR International Ltd 15 –
98 HKT Trust & HKT Ltd 102 0.02
34 Hong Kong & China Gas Co Ltd 50 0.01
3 Hong Kong Aircraft Engineering Co Ltd 15 –
7 Hong Kong Exchanges & Clearing Ltd 143 0.03
14 Hong Kong Ferry Holdings Co Ltd 13 –
71 Hong Kong Television Network Ltd 9 –
43 Hongkong & Shanghai Hotels Ltd 40 0.01
56 Hongkong Chinese Ltd 8 –
31 Hopewell Holdings Ltd 90 0.01
208 Hsin Chong Construction Group Ltd 8 – 140
Hutchison Telecommunications Hong Kong Holdings Ltd 37 –
17 Hysan Development Co Ltd 60 0.01
46 IGG Inc 29 –
70 IPE Group Ltd 12 –
36 IT Ltd 12 –
28 ITC Properties Group Ltd 9 –
31 Johnson Electric Holdings Ltd 71 0.01
37 Kerry Logistics Network Ltd 39 0.01
37 Kerry Properties Ltd 84 0.01
38 Kingmaker Footwear Holdings Ltd 8 –
206 Kingston Financial Group Ltd 79 0.01
200 Kong Sun Holdings Ltd 3 –
31 Kowloon Development Co Ltd 24 –
22 L'Occitane International SA 35 –
1,245 Lai Sun Development Co Ltd 19 –
860 Landing International Development Ltd 17 –
446 Li & Fung Ltd 156 0.03
36 Lifestyle International Holdings Ltd 37 –
20 Lippo Ltd 10 –
16 Liu Chong Hing Investment Ltd 18 –
22 Luk Fook Holdings International Ltd 51 0.01
78 Macau Legend Development Ltd 14 –
116 Man Wah Holdings Ltd 65 0.01
780 Mason Financial Holdings Ltd 15 –
362 Master Glory Group Ltd 17 –
44 Melco International Development Ltd 56 0.01
22 MGM China Holdings Ltd 40 0.01
16 Midland Holdings Ltd 4 –
12 Miramar Hotel & Investment 22 –
17 MTR Corp Ltd 66 0.01
130 NagaCorp Ltd 64 0.01
1,960 NetMind Financial Holdings Ltd 13 –
126 New World Development Co Ltd 112 0.02
104 NewOcean Energy Holdings Ltd 23 –
54 NWS Holdings Ltd 75 0.01
14 Orient Overseas International Ltd 43 0.01
384 Pacific Basin Shipping Ltd 50 0.01
Shares (000's)
Value (000's)
GBP
% of Net Asset Value
Common Stock (continued)
Hong Kong – 1.03% (continued)
36 Pacific Textiles Holdings Ltd 33 –
215 PCCW Ltd 100 0.02
56 Pico Far East Holdings Ltd 14 –
10 Playmates Holdings Ltd 10 –
60 Playmates Toys Ltd 8 –
80 Polytec Asset Holdings Ltd 5 –
7 Power Assets Holdings Ltd 53 0.01
11 Prada SpA 30 –
26 Public Financial Holdings Ltd 9 –
10 Regal Hotels International Holdings Ltd 4 –
230 Rentian Technology Holdings Ltd 12 –
72 Sa Sa International Holdings Ltd 26 –
6 Safety Godown Co Ltd 12 –
33 Samsonite International SA 81 0.01
14 Sands China Ltd 54 0.01
12 SEA Holdings Ltd 24 –
93 Shangri–La Asia Ltd 81 0.01
35 Shenwan Hongyuan HK Ltd 16 –
86 Shun Tak Holdings Ltd 25 –
38 Singamas Container Holdings Ltd 3 –
61 Sino Land Co Ltd 77 0.01
59 SITC International Holdings Co Ltd 29 –
20 Sitoy Group Holdings Ltd 4 –
138 SJM Holdings Ltd 89 0.01
340 Skyway Securities Group Ltd 6 –
36 SmarTone Telecommunications Holdings Ltd 39 0.01
22 SOCAM Development Ltd 6 –
9 Soundwill Holdings Ltd 13 –
37 Stella International Holdings Ltd 49 0.01
38 Sun Hung Kai & Co Ltd 19 –
16 Sun Hung Kai Properties Ltd 166 0.03
12 Swire Pacific Ltd, Class A 95 0.01
18 Swire Pacific Ltd, Class B 25 –
10 Swire Properties Ltd 23 –
26 TAI Cheung Holdings Ltd 18 –
15 Tan Chong International Ltd 4 –
41 Tao Heung Holdings Ltd 9 –
43 Techtronic Industries Co Ltd 132 0.03
23 Television Broadcasts Ltd 65 0.01
58 Texwinca Holdings Ltd 34 –
22 Tradelink Electronic Commerce Ltd 4 –
18 Transport International Holdings Ltd 43 0.01
80 Trinity Ltd 5 –
44 Tsui Wah Holdings Ltd 6 –
26 United Laboratories International Holdings Ltd 11 –
22 Varitronix International Ltd 8 –
143 Victory City International Holdings Ltd 4 –
22 Vitasoy International Holdings Ltd 36 –
42 VST Holdings Ltd 11 –
6 VTech Holdings Ltd 63 0.01
228 WH Group Ltd 151 0.03
12 Wharf Holdings Ltd 71 0.01
27 Wheelock & Co Ltd 127 0.03
6 Wing On Co International Ltd 14 –
32 Wing Tai Properties Ltd 15 –
40 Wynn Macau Ltd 59 0.01
150 Xinyi Glass Holdings Ltd 89 0.01
40 Yat Sing Holdings Ltd 16 –
53 Yue Yuen Industrial Holdings Ltd 152 0.03
7,890 1.03

World Equity Fund
Portfolio of Investments as at 30 November 2016 (continued)
Dimensional Fund Advisors Annual Report and Audited Financial Statements, 30 November 2016 315
Shares (000's)
Value (000's)
GBP
% of Net Asset Value
Common Stock (continued)
Hungary – 0.03%
30 Magyar Telekom Telecommunications PLC 40 0.01
2 MOL Hungarian Oil & Gas PLC 93 0.01
2 OTP Bank PLC 53 0.01
2 Richter Gedeon Nyrt 28 –
214 0.03
India – 1.19%
– 3M India Ltd 9 –
2 Aarti Industries 15 –
– Abbott India Ltd 10 –
2 ACC Ltd 33 –
22 Adani Enterprises Ltd 18 –
13 Adani Ports & Special Economic Zone Ltd 43 0.01
49 Adani Power Ltd 16 –
11 Aditya Birla Fashion and Retail Ltd 17 –
2 Aditya Birla Nuvo Ltd 30 –
9 Aegis Logistics Ltd 15 –
2 AIA Engineering Ltd 28 –
1 Ajanta Pharma Ltd 12 –
– Akzo Nobel India Ltd 8 –
1 Alembic Pharmaceuticals Ltd 8 –
22 Allahabad Bank 18 –
4 Allcargo Logistics Ltd 9 –
1 Amara Raja Batteries Ltd 14 –
18 Ambuja Cements Ltd 44 0.01
2 Apollo Hospitals Enterprise Ltd 35 –
20 Apollo Tyres Ltd 44 0.01
8 Arvind Ltd 35 –
17 Ashok Leyland Ltd 15 –
4 Asian Paints Ltd 48 0.01
1 Atul Ltd 21 –
8 Aurobindo Pharma Ltd 67 0.02
27 Axis Bank Ltd 146 0.03
2 Bajaj Auto Ltd 47 0.01
2 Bajaj Corp Ltd 10 –
5 Bajaj Finance Ltd 57 0.01
2 Bajaj Finserv Ltd 79 0.02
2 Bajaj Holdings & Investment Ltd 42 0.01
3 Balkrishna Industries Ltd 31 –
12 Balrampur Chini Mills Ltd 17 –
21 Bank of Baroda 40 0.01
24 Bank of India 34 –
2 Bata India Ltd 10 –
1 BEML Ltd 5 –
5 Berger Paints India Ltd 12 –
2 Bharat Electronics Ltd 33 –
4 Bharat Financial Inclusion Ltd 35 –
7 Bharat Forge Ltd 76 0.02
7 Bharat Heavy Electricals Ltd 11 –
4 Bharat Petroleum Corp Ltd 29 –
25 Bharti Airtel Ltd 95 0.02
3 Biocon Ltd 31 –
1 Birla Corp Ltd 11 –
– Blue Dart Express Ltd 6 –
– Bosch Ltd 12 –
– Britannia Industries Ltd 18 –
9 Cadila Healthcare Ltd 42 0.01
14 Cairn India Ltd 42 0.01
1 Can Fin Homes Ltd 22 –
5 Canara Bank 18 –
2 Capital First Ltd 16 –
6 Carborundum Universal Ltd 19 –
3 Castrol India Ltd 15 –
Shares (000's)
Value (000's)
GBP
% of Net Asset Value
Common Stock (continued)
India – 1.19% (continued)
2 Ceat Ltd 23 –
1 Century Textiles & Industries Ltd 10 –
5 CESC Ltd 32 –
18 Chennai Super Kings Cricket Ltd – –
2 Cholamandalam Investment and Finance Co Ltd 27 –
16 Cipla Ltd 107 0.02
3 Colgate–Palmolive India Ltd 35 –
2 Container Corp Of India Ltd 30 –
6 Coromandel International Ltd 19 –
5 Cox & Kings Ltd 10 –
1 Credit Analysis & Research Ltd 18 –
– CRISIL Ltd 13 –
12 Crompton Greaves Consumer Electricals Ltd 22 –
12 Crompton Greaves Ltd 11 –
2 Cummins India Ltd 16 –
1 Cyient Ltd 8 –
9 Dabur India Ltd 31 –
1 Dalmia Bharat Ltd 20 –
2 DB Corp Ltd 10 –
11 DCB Bank Ltd 15 –
7 DEN Networks Ltd 5 –
14 Dewan Housing Finance Corp Ltd 41 0.02
1 Dhanuka Agritech Ltd 11 –
12 Dish TV India Ltd 13 –
3 Divi's Laboratories Ltd 35 –
13 DLF Ltd 17 –
1 Dr Reddy's Laboratories Ltd 48 0.02
1 Dr Reddy's Laboratories Ltd, ADR 20 –
1 eClerx Services Ltd 16 –
18 Edelweiss Financial Services Ltd 21 –
– Eicher Motors Ltd 37 –
6 EID Parry India Ltd 17 –
9 EIH Ltd 11 –
1 Emami Ltd 12 –
8 Engineers India Ltd 26 –
9 Escorts Ltd 35 –
4 Essel Propack Ltd 13 –
3 Eveready Industries India Ltd 8 –
8 Exide Industries Ltd 17 –
– FAG Bearings India Ltd 9 –
46 Federal Bank Ltd 38 –
4 Finolex Cables Ltd 19 –
2 Finolex Industries Ltd 13 –
9 Fortis Healthcare Ltd 18 –
13 Future Enterprises Ltd 2 –
13 Future Retail Ltd 18 –
14 GAIL India Ltd 70 0.02
5 Gateway Distriparks Ltd 13 –
3 GE T&D India Ltd 12 –
3 GHCL Ltd 8 –
– Gillette India Ltd 20 –
– GlaxoSmithKline Consumer Healthcare Ltd 17 –
– GlaxoSmithKline Pharmaceuticals Ltd 14 –
6 Glenmark Pharmaceuticals Ltd 66 0.02
104 GMR Infrastructure Ltd 15 –
1 Godfrey Phillips India Ltd 11 –
3 Godrej Consumer Products Ltd 49 0.02
3 Godrej Industries Ltd 16 –
4 Godrej Properties Ltd 14 –
2 Great Eastern Shipping Co Ltd 7 –
5 Greaves Cotton Ltd 8 –
3 Greenply Industries Ltd 10 –
2 Grindwell Norton Ltd 8 –
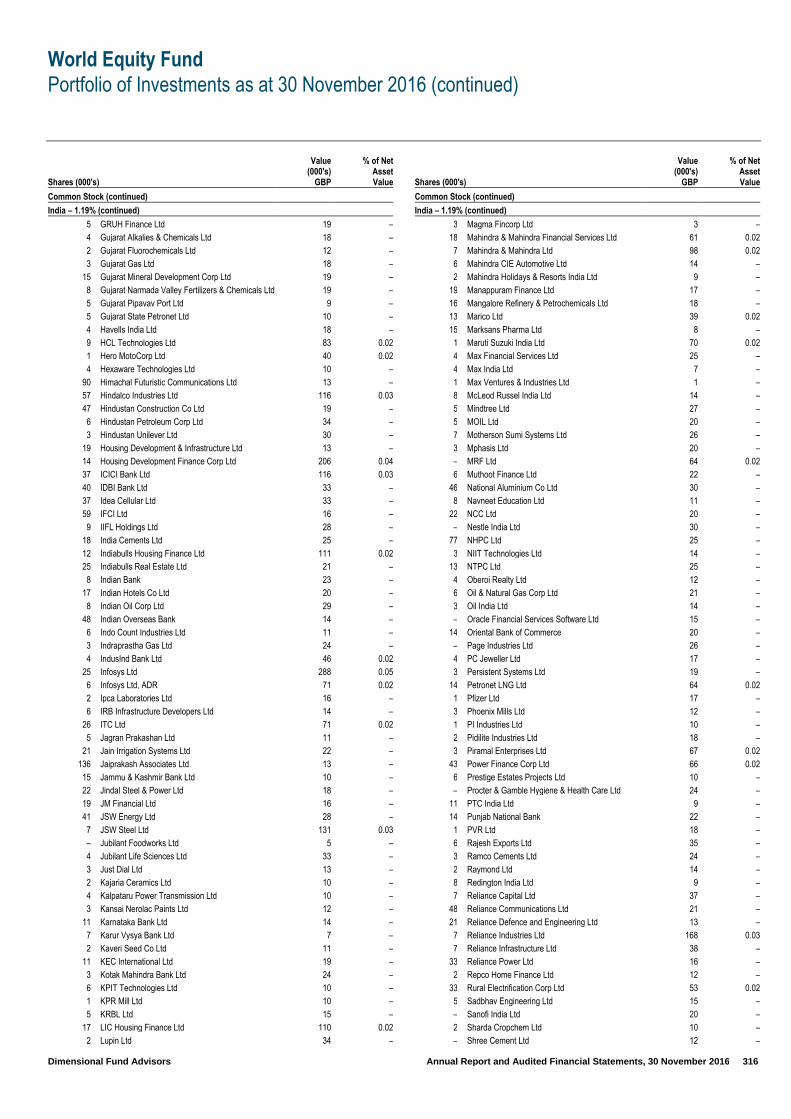
World Equity Fund
Portfolio of Investments as at 30 November 2016 (continued)
Dimensional Fund Advisors Annual Report and Audited Financial Statements, 30 November 2016 316
Shares (000's)
Value (000's)
GBP
% of Net Asset Value
Common Stock (continued)
India – 1.19% (continued)
5 GRUH Finance Ltd 19 –
4 Gujarat Alkalies & Chemicals Ltd 18 –
2 Gujarat Fluorochemicals Ltd 12 –
3 Gujarat Gas Ltd 18 –
15 Gujarat Mineral Development Corp Ltd 19 –
8 Gujarat Narmada Valley Fertilizers & Chemicals Ltd 19 –
5 Gujarat Pipavav Port Ltd 9 –
5 Gujarat State Petronet Ltd 10 –
4 Havells India Ltd 18 –
9 HCL Technologies Ltd 83 0.02
1 Hero MotoCorp Ltd 40 0.02
4 Hexaware Technologies Ltd 10 –
90 Himachal Futuristic Communications Ltd 13 –
57 Hindalco Industries Ltd 116 0.03
47 Hindustan Construction Co Ltd 19 –
6 Hindustan Petroleum Corp Ltd 34 –
3 Hindustan Unilever Ltd 30 –
19 Housing Development & Infrastructure Ltd 13 –
14 Housing Development Finance Corp Ltd 206 0.04
37 ICICI Bank Ltd 116 0.03
40 IDBI Bank Ltd 33 –
37 Idea Cellular Ltd 33 –
59 IFCI Ltd 16 –
9 IIFL Holdings Ltd 28 –
18 India Cements Ltd 25 –
12 Indiabulls Housing Finance Ltd 111 0.02
25 Indiabulls Real Estate Ltd 21 –
8 Indian Bank 23 –
17 Indian Hotels Co Ltd 20 –
8 Indian Oil Corp Ltd 29 –
48 Indian Overseas Bank 14 –
6 Indo Count Industries Ltd 11 –
3 Indraprastha Gas Ltd 24 –
4 IndusInd Bank Ltd 46 0.02
25 Infosys Ltd 288 0.05
6 Infosys Ltd, ADR 71 0.02
2 Ipca Laboratories Ltd 16 –
6 IRB Infrastructure Developers Ltd 14 –
26 ITC Ltd 71 0.02
5 Jagran Prakashan Ltd 11 –
21 Jain Irrigation Systems Ltd 22 –
136 Jaiprakash Associates Ltd 13 –
15 Jammu & Kashmir Bank Ltd 10 –
22 Jindal Steel & Power Ltd 18 –
19 JM Financial Ltd 16 –
41 JSW Energy Ltd 28 –
7 JSW Steel Ltd 131 0.03
– Jubilant Foodworks Ltd 5 –
4 Jubilant Life Sciences Ltd 33 –
3 Just Dial Ltd 13 –
2 Kajaria Ceramics Ltd 10 –
4 Kalpataru Power Transmission Ltd 10 –
3 Kansai Nerolac Paints Ltd 12 –
11 Karnataka Bank Ltd 14 –
7 Karur Vysya Bank Ltd 7 –
2 Kaveri Seed Co Ltd 11 –
11 KEC International Ltd 19 –
3 Kotak Mahindra Bank Ltd 24 –
6 KPIT Technologies Ltd 10 –
1 KPR Mill Ltd 10 –
5 KRBL Ltd 15 –
17 LIC Housing Finance Ltd 110 0.02
2 Lupin Ltd 34 –
Shares (000's)
Value (000's)
GBP
% of Net Asset Value
Common Stock (continued)
India – 1.19% (continued)
3 Magma Fincorp Ltd 3 –
18 Mahindra & Mahindra Financial Services Ltd 61 0.02
7 Mahindra & Mahindra Ltd 98 0.02
6 Mahindra CIE Automotive Ltd 14 –
2 Mahindra Holidays & Resorts India Ltd 9 –
19 Manappuram Finance Ltd 17 –
16 Mangalore Refinery & Petrochemicals Ltd 18 –
13 Marico Ltd 39 0.02
15 Marksans Pharma Ltd 8 –
1 Maruti Suzuki India Ltd 70 0.02
4 Max Financial Services Ltd 25 –
4 Max India Ltd 7 –
1 Max Ventures & Industries Ltd 1 –
8 McLeod Russel India Ltd 14 –
5 Mindtree Ltd 27 –
5 MOIL Ltd 20 –
7 Motherson Sumi Systems Ltd 26 –
3 Mphasis Ltd 20 –
– MRF Ltd 64 0.02
6 Muthoot Finance Ltd 22 –
46 National Aluminium Co Ltd 30 –
8 Navneet Education Ltd 11 –
22 NCC Ltd 20 –
– Nestle India Ltd 30 –
77 NHPC Ltd 25 –
3 NIIT Technologies Ltd 14 –
13 NTPC Ltd 25 –
4 Oberoi Realty Ltd 12 –
6 Oil & Natural Gas Corp Ltd 21 –
3 Oil India Ltd 14 –
– Oracle Financial Services Software Ltd 15 –
14 Oriental Bank of Commerce 20 –
– Page Industries Ltd 26 –
4 PC Jeweller Ltd 17 –
3 Persistent Systems Ltd 19 –
14 Petronet LNG Ltd 64 0.02
1 Pfizer Ltd 17 –
3 Phoenix Mills Ltd 12 –
1 PI Industries Ltd 10 –
2 Pidilite Industries Ltd 18 –
3 Piramal Enterprises Ltd 67 0.02
43 Power Finance Corp Ltd 66 0.02
6 Prestige Estates Projects Ltd 10 –
– Procter & Gamble Hygiene & Health Care Ltd 24 –
11 PTC India Ltd 9 –
14 Punjab National Bank 22 –
1 PVR Ltd 18 –
6 Rajesh Exports Ltd 35 –
3 Ramco Cements Ltd 24 –
2 Raymond Ltd 14 –
8 Redington India Ltd 9 –
7 Reliance Capital Ltd 37 –
48 Reliance Communications Ltd 21 –
21 Reliance Defence and Engineering Ltd 13 –
7 Reliance Industries Ltd 168 0.03
7 Reliance Infrastructure Ltd 38 –
33 Reliance Power Ltd 16 –
2 Repco Home Finance Ltd 12 –
33 Rural Electrification Corp Ltd 53 0.02
5 Sadbhav Engineering Ltd 15 –
– Sanofi India Ltd 20 –
2 Sharda Cropchem Ltd 10 –
– Shree Cement Ltd 12 –
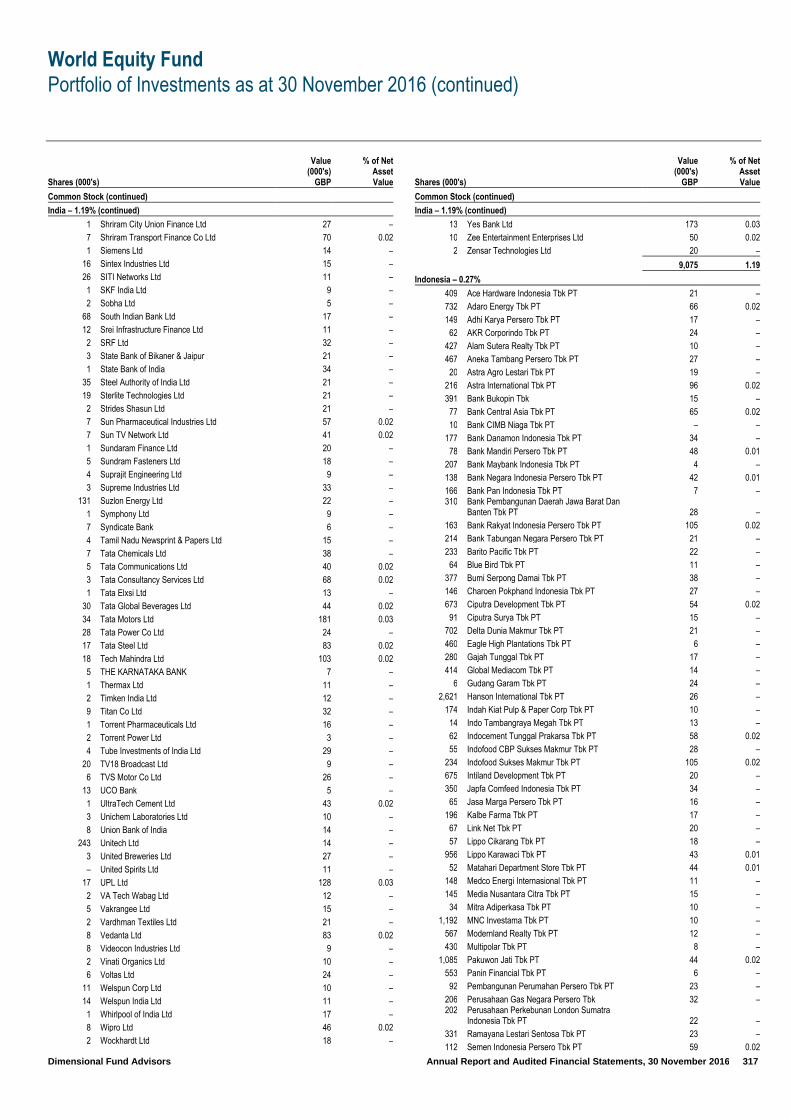
World Equity Fund
Portfolio of Investments as at 30 November 2016 (continued)
Dimensional Fund Advisors Annual Report and Audited Financial Statements, 30 November 2016 317
Shares (000's)
Value (000's)
GBP
% of Net Asset Value
Common Stock (continued)
India – 1.19% (continued)
1 Shriram City Union Finance Ltd 27 –
7 Shriram Transport Finance Co Ltd 70 0.02
1 Siemens Ltd 14 –
16 Sintex Industries Ltd 15 –
26 SITI Networks Ltd 11 –
1 SKF India Ltd 9 –
2 Sobha Ltd 5 –
68 South Indian Bank Ltd 17 –
12 Srei Infrastructure Finance Ltd 11 –
2 SRF Ltd 32 –
3 State Bank of Bikaner & Jaipur 21 –
1 State Bank of India 34 –
35 Steel Authority of India Ltd 21 –
19 Sterlite Technologies Ltd 21 –
2 Strides Shasun Ltd 21 –
7 Sun Pharmaceutical Industries Ltd 57 0.02
7 Sun TV Network Ltd 41 0.02
1 Sundaram Finance Ltd 20 –
5 Sundram Fasteners Ltd 18 –
4 Suprajit Engineering Ltd 9 –
3 Supreme Industries Ltd 33 –
131 Suzlon Energy Ltd 22 –
1 Symphony Ltd 9 –
7 Syndicate Bank 6 –
4 Tamil Nadu Newsprint & Papers Ltd 15 –
7 Tata Chemicals Ltd 38 –
5 Tata Communications Ltd 40 0.02
3 Tata Consultancy Services Ltd 68 0.02
1 Tata Elxsi Ltd 13 –
30 Tata Global Beverages Ltd 44 0.02
34 Tata Motors Ltd 181 0.03
28 Tata Power Co Ltd 24 –
17 Tata Steel Ltd 83 0.02
18 Tech Mahindra Ltd 103 0.02
5 THE KARNATAKA BANK 7 –
1 Thermax Ltd 11 –
2 Timken India Ltd 12 –
9 Titan Co Ltd 32 –
1 Torrent Pharmaceuticals Ltd 16 –
2 Torrent Power Ltd 3 –
4 Tube Investments of India Ltd 29 –
20 TV18 Broadcast Ltd 9 –
6 TVS Motor Co Ltd 26 –
13 UCO Bank 5 –
1 UltraTech Cement Ltd 43 0.02
3 Unichem Laboratories Ltd 10 –
8 Union Bank of India 14 –
243 Unitech Ltd 14 –
3 United Breweries Ltd 27 –
– United Spirits Ltd 11 –
17 UPL Ltd 128 0.03
2 VA Tech Wabag Ltd 12 –
5 Vakrangee Ltd 15 –
2 Vardhman Textiles Ltd 21 –
8 Vedanta Ltd 83 0.02
8 Videocon Industries Ltd 9 –
2 Vinati Organics Ltd 10 –
6 Voltas Ltd 24 –
11 Welspun Corp Ltd 10 –
14 Welspun India Ltd 11 –
1 Whirlpool of India Ltd 17 –
8 Wipro Ltd 46 0.02
2 Wockhardt Ltd 18 –
Shares (000's)
Value (000's)
GBP
% of Net Asset Value
Common Stock (continued)
India – 1.19% (continued)
13 Yes Bank Ltd 173 0.03
10 Zee Entertainment Enterprises Ltd 50 0.02
2 Zensar Technologies Ltd 20 –
9,075 1.19
Indonesia – 0.27%
409 Ace Hardware Indonesia Tbk PT 21 –
732 Adaro Energy Tbk PT 66 0.02
149 Adhi Karya Persero Tbk PT 17 –
62 AKR Corporindo Tbk PT 24 –
427 Alam Sutera Realty Tbk PT 10 –
467 Aneka Tambang Persero Tbk PT 27 –
20 Astra Agro Lestari Tbk PT 19 –
216 Astra International Tbk PT 96 0.02
391 Bank Bukopin Tbk 15 –
77 Bank Central Asia Tbk PT 65 0.02
10 Bank CIMB Niaga Tbk PT – –
177 Bank Danamon Indonesia Tbk PT 34 –
78 Bank Mandiri Persero Tbk PT 48 0.01
207 Bank Maybank Indonesia Tbk PT 4 –
138 Bank Negara Indonesia Persero Tbk PT 42 0.01
166 Bank Pan Indonesia Tbk PT 7 – 310
Bank Pembangunan Daerah Jawa Barat Dan Banten Tbk PT 28 –
163 Bank Rakyat Indonesia Persero Tbk PT 105 0.02
214 Bank Tabungan Negara Persero Tbk PT 21 –
233 Barito Pacific Tbk PT 22 –
64 Blue Bird Tbk PT 11 –
377 Bumi Serpong Damai Tbk PT 38 –
146 Charoen Pokphand Indonesia Tbk PT 27 –
673 Ciputra Development Tbk PT 54 0.02
91 Ciputra Surya Tbk PT 15 –
702 Delta Dunia Makmur Tbk PT 21 –
460 Eagle High Plantations Tbk PT 6 –
280 Gajah Tunggal Tbk PT 17 –
414 Global Mediacom Tbk PT 14 –
6 Gudang Garam Tbk PT 24 –
2,621 Hanson International Tbk PT 26 –
174 Indah Kiat Pulp & Paper Corp Tbk PT 10 –
14 Indo Tambangraya Megah Tbk PT 13 –
62 Indocement Tunggal Prakarsa Tbk PT 58 0.02
55 Indofood CBP Sukses Makmur Tbk PT 28 –
234 Indofood Sukses Makmur Tbk PT 105 0.02
675 Intiland Development Tbk PT 20 –
350 Japfa Comfeed Indonesia Tbk PT 34 –
65 Jasa Marga Persero Tbk PT 16 –
196 Kalbe Farma Tbk PT 17 –
67 Link Net Tbk PT 20 –
57 Lippo Cikarang Tbk PT 18 –
956 Lippo Karawaci Tbk PT 43 0.01
52 Matahari Department Store Tbk PT 44 0.01
148 Medco Energi Internasional Tbk PT 11 –
145 Media Nusantara Citra Tbk PT 15 –
34 Mitra Adiperkasa Tbk PT 10 –
1,192 MNC Investama Tbk PT 10 –
567 Modernland Realty Tbk PT 12 –
430 Multipolar Tbk PT 8 –
1,085 Pakuwon Jati Tbk PT 44 0.02
553 Panin Financial Tbk PT 6 –
92 Pembangunan Perumahan Persero Tbk PT 23 –
206 Perusahaan Gas Negara Persero Tbk 32 – 202
Perusahaan Perkebunan London Sumatra Indonesia Tbk PT 22 –
331 Ramayana Lestari Sentosa Tbk PT 23 –
112 Semen Indonesia Persero Tbk PT 59 0.02
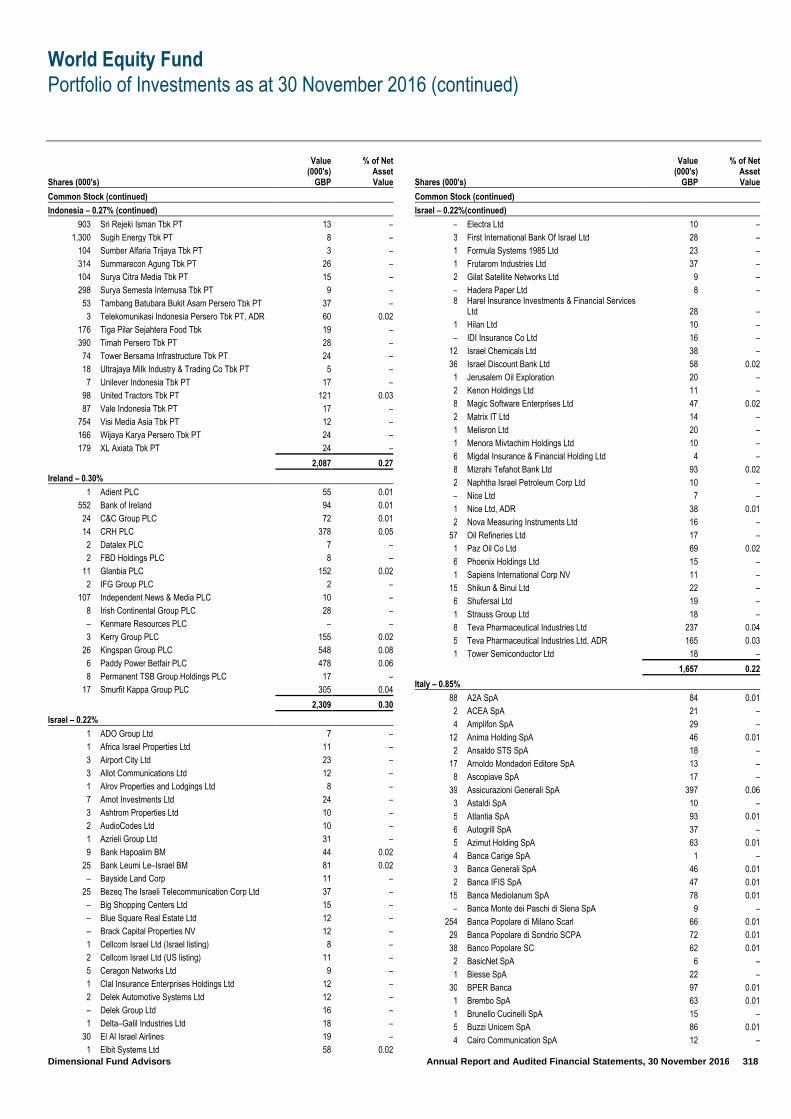
World Equity Fund
Portfolio of Investments as at 30 November 2016 (continued)
Dimensional Fund Advisors Annual Report and Audited Financial Statements, 30 November 2016 318
Shares (000's)
Value (000's)
GBP
% of Net Asset Value
Common Stock (continued)
Indonesia – 0.27% (continued)
903 Sri Rejeki Isman Tbk PT 13 –
1,300 Sugih Energy Tbk PT 8 –
104 Sumber Alfaria Trijaya Tbk PT 3 –
314 Summarecon Agung Tbk PT 26 –
104 Surya Citra Media Tbk PT 15 –
298 Surya Semesta Internusa Tbk PT 9 –
53 Tambang Batubara Bukit Asam Persero Tbk PT 37 –
3 Telekomunikasi Indonesia Persero Tbk PT, ADR 60 0.02
176 Tiga Pilar Sejahtera Food Tbk 19 –
390 Timah Persero Tbk PT 28 –
74 Tower Bersama Infrastructure Tbk PT 24 –
18 Ultrajaya Milk Industry & Trading Co Tbk PT 5 –
7 Unilever Indonesia Tbk PT 17 –
98 United Tractors Tbk PT 121 0.03
87 Vale Indonesia Tbk PT 17 –
754 Visi Media Asia Tbk PT 12 –
166 Wijaya Karya Persero Tbk PT 24 –
179 XL Axiata Tbk PT 24 –
2,087 0.27
Ireland – 0.30%
1 Adient PLC 55 0.01
552 Bank of Ireland 94 0.01
24 C&C Group PLC 72 0.01
14 CRH PLC 378 0.05
2 Datalex PLC 7 –
2 FBD Holdings PLC 8 –
11 Glanbia PLC 152 0.02
2 IFG Group PLC 2 –
107 Independent News & Media PLC 10 –
8 Irish Continental Group PLC 28 –
– Kenmare Resources PLC – –
3 Kerry Group PLC 155 0.02
26 Kingspan Group PLC 548 0.08
6 Paddy Power Betfair PLC 478 0.06
8 Permanent TSB Group Holdings PLC 17 –
17 Smurfit Kappa Group PLC 305 0.04
2,309 0.30
Israel – 0.22%
1 ADO Group Ltd 7 –
1 Africa Israel Properties Ltd 11 –
3 Airport City Ltd 23 –
3 Allot Communications Ltd 12 –
1 Alrov Properties and Lodgings Ltd 8 –
7 Amot Investments Ltd 24 –
3 Ashtrom Properties Ltd 10 –
2 AudioCodes Ltd 10 –
1 Azrieli Group Ltd 31 –
9 Bank Hapoalim BM 44 0.02
25 Bank Leumi Le–Israel BM 81 0.02
– Bayside Land Corp 11 –
25 Bezeq The Israeli Telecommunication Corp Ltd 37 –
– Big Shopping Centers Ltd 15 –
– Blue Square Real Estate Ltd 12 –
– Brack Capital Properties NV 12 –
1 Cellcom Israel Ltd (Israel listing) 8 –
2 Cellcom Israel Ltd (US listing) 11 –
5 Ceragon Networks Ltd 9 –
1 Clal Insurance Enterprises Holdings Ltd 12 –
2 Delek Automotive Systems Ltd 12 –
– Delek Group Ltd 16 –
1 Delta–Galil Industries Ltd 18 –
30 El Al Israel Airlines 19 –
1 Elbit Systems Ltd 58 0.02
Shares (000's)
Value (000's)
GBP
% of Net Asset Value
Common Stock (continued)
Israel – 0.22%(continued)
– Electra Ltd 10 –
3 First International Bank Of Israel Ltd 28 –
1 Formula Systems 1985 Ltd 23 –
1 Frutarom Industries Ltd 37 –
2 Gilat Satellite Networks Ltd 9 –
– Hadera Paper Ltd 8 – 8
Harel Insurance Investments & Financial Services Ltd 28 –
1 Hilan Ltd 10 –
– IDI Insurance Co Ltd 16 –
12 Israel Chemicals Ltd 38 –
36 Israel Discount Bank Ltd 58 0.02
1 Jerusalem Oil Exploration 20 –
2 Kenon Holdings Ltd 11 –
8 Magic Software Enterprises Ltd 47 0.02
2 Matrix IT Ltd 14 –
1 Melisron Ltd 20 –
1 Menora Mivtachim Holdings Ltd 10 –
6 Migdal Insurance & Financial Holding Ltd 4 –
8 Mizrahi Tefahot Bank Ltd 93 0.02
2 Naphtha Israel Petroleum Corp Ltd 10 –
– Nice Ltd 7 –
1 Nice Ltd, ADR 38 0.01
2 Nova Measuring Instruments Ltd 16 –
57 Oil Refineries Ltd 17 –
1 Paz Oil Co Ltd 69 0.02
6 Phoenix Holdings Ltd 15 –
1 Sapiens International Corp NV 11 –
15 Shikun & Binui Ltd 22 –
6 Shufersal Ltd 19 –
1 Strauss Group Ltd 18 –
8 Teva Pharmaceutical Industries Ltd 237 0.04
5 Teva Pharmaceutical Industries Ltd, ADR 165 0.03
1 Tower Semiconductor Ltd 18 –
1,657 0.22
Italy – 0.85%
88 A2A SpA 84 0.01
2 ACEA SpA 21 –
4 Amplifon SpA 29 –
12 Anima Holding SpA 46 0.01
2 Ansaldo STS SpA 18 –
17 Arnoldo Mondadori Editore SpA 13 –
8 Ascopiave SpA 17 –
39 Assicurazioni Generali SpA 397 0.06
3 Astaldi SpA 10 –
5 Atlantia SpA 93 0.01
6 Autogrill SpA 37 –
5 Azimut Holding SpA 63 0.01
4 Banca Carige SpA 1 –
3 Banca Generali SpA 46 0.01
2 Banca IFIS SpA 47 0.01
15 Banca Mediolanum SpA 78 0.01
– Banca Monte dei Paschi di Siena SpA 9 –
254 Banca Popolare di Milano Scarl 66 0.01
29 Banca Popolare di Sondrio SCPA 72 0.01
38 Banco Popolare SC 62 0.01
2 BasicNet SpA 6 –
1 Biesse SpA 22 –
30 BPER Banca 97 0.01
1 Brembo SpA 63 0.01
1 Brunello Cucinelli SpA 15 –
5 Buzzi Unicem SpA 86 0.01
4 Cairo Communication SpA 12 –

World Equity Fund
Portfolio of Investments as at 30 November 2016 (continued)
Dimensional Fund Advisors Annual Report and Audited Financial Statements, 30 November 2016 319
Shares (000's)
Value (000's)
GBP
% of Net Asset Value
Common Stock (continued)
Italy – 0.85% (continued)
4 Cementir Holding SpA 13 –
10 Cerved Information Solutions SpA 63 0.01
30 CIR–Compagnie Industriali Riunite SpA 24 –
49 CNH Industrial NV 335 0.04
6 Credito Emiliano SpA 25 –
60 Credito Valtellinese SC 15 –
28 d'Amico International Shipping SA 6 –
1 Danieli & C Officine Meccaniche SpA 18 –
2 Datalogic SpA 21 –
16 Davide Campari–Milano SpA 123 0.02
2 De' Longhi SpA 42 0.01
8 DeA Capital SpA 7 –
1 DiaSorin SpA 44 0.01
1 Ei Towers SpA 42 0.01
1 El.En. SpA 24 –
59 Enel SpA 189 0.02
52 Eni SpA 577 0.09
5 ERG SpA 39 0.01
3 Esprinet SpA 15 –
15 Falck Renewables SpA 11 –
3 Ferrari NV 138 0.02
75 Fiat Chrysler Automobiles NV 458 0.06
30 Fincantieri SpA 10 –
11 FinecoBank Banca Fineco SpA 45 0.01
5 Geox SpA 8 –
17 Gruppo Editoriale L'Espresso SpA 10 –
2 Gruppo MutuiOnline SpA 13 –
29 Hera SpA 48 0.01
1 Industria Macchine Automatiche SpA 30 –
6 Interpump Group SpA 80 0.01
113 Intesa Sanpaolo SpA 199 0.03
34 Iren SpA 40 0.01
4 Italgas SpA 12 –
– Italmobiliare SpA 16 –
1 La Doria SpA 9 –
18 Leonardo–Finmeccanica SpA 186 0.02
1 Luxottica Group SpA 49 0.01
2 Maire Tecnimont SpA 4 –
1 MARR SpA 21 –
60 Mediaset SpA 116 0.02
30 Mediobanca SpA 164 0.02
5 Moleskine SpA 9 –
6 Moncler SpA 83 0.01
7 OVS SpA 31 –
20 Parmalat SpA 42 0.01
13 Piaggio & C SpA 16 –
6 Prysmian SpA 123 0.02
3 Recordati SpA 62 0.01
– Reply SpA 23 –
2 SAES Getters SpA 14 –
3 Safilo Group SpA 19 –
258 Saipem SpA 93 0.01
25 Salini Impregilo SpA 56 0.01
2 Salvatore Ferragamo SpA 38 –
36 Saras SpA 51 0.01
15 Snai SpA 15 –
22 Snam SpA 67 0.01
12 Societa Cattolica di Assicurazioni SCRL 52 0.01
5 Societa Iniziative Autostradali e Servizi SpA 34 –
4 Sogefi SpA 8 –
3 SOL SpA 21 –
4 Tamburi Investment Partners SpA 12 –
367 Telecom Italia SpA 221 0.03
Shares (000's)
Value (000's)
GBP
% of Net Asset Value
Common Stock (continued)
Italy – 0.85% (continued)
5 Tenaris SA 62 0.01
25 Terna Rete Elettrica Nazionale SpA 88 0.01
228 Tiscali SpA 8 –
1 Tod's SpA 44 0.01
10 Trevi Finanziaria Industriale SpA 7 –
63 UniCredit SpA 107 0.01
27 Unione di Banche Italiane SpA 49 0.01
31 Unipol Gruppo Finanziario SpA 77 0.01
82 UnipolSai SpA 125 0.02
2 Vittoria Assicurazioni SpA 18 –
2 Yoox Net–A–Porter Group SpA 47 0.01
6,521 0.85
Japan – 8.75%
24 77 Bank Ltd 92 0.01
– ABC–Mart Inc 19 –
3 Accordia Golf Co Ltd 29 –
1 Achilles Corp 13 –
3 Acom Co Ltd 11 –
2 Adastria Co Ltd 45 0.01
6 ADEKA Corp 61 0.01
2 Advan Co Ltd 12 –
5 Advantest Corp 54 0.01
24 Aeon Co Ltd 261 0.04
2 Aeon Delight Co Ltd 35 –
1 Aeon Fantasy Co Ltd 24 –
5 AEON Financial Service Co Ltd 67 0.01
4 Aeon Mall Co Ltd 46 0.01
2 Ahresty Corp 18 –
2 Ai Holdings Corp 30 –
3 Aica Kogyo Co Ltd 62 0.01
1 Aichi Bank Ltd 23 –
3 Aichi Corp 16 –
1 Aichi Steel Corp 22 –
– Aichi Tokei Denki Co Ltd 10 –
5 Aida Engineering Ltd 35 –
1 Ain Holdings Inc 56 0.01
1 Aiphone Co Ltd 13 –
11 Air Water Inc 152 0.03
2 Aisan Industry Co Ltd 12 –
6 Aisin Seiki Co Ltd 221 0.04
3 Aizawa Securities Co Ltd 14 –
5 Ajinomoto Co Inc 71 0.01
8 Akebono Brake Industry Co Ltd 17 –
10 Akita Bank Ltd 26 –
1 Albis Co Ltd 14 –
2 Alconix Corp 18 –
4 Alfresa Holdings Corp 50 0.01
2 Alinco Inc 11 –
1 Alpen Co Ltd 20 –
1 Alpha Systems Inc 9 –
4 Alpine Electronics Inc 41 0.01
10 Alps Electric Co Ltd 197 0.04
1 Altech Corp 13 –
6 Amada Holdings Co Ltd 58 0.01
4 Amano Corp 51 0.01
1 Amiyaki Tei Co Ltd 14 –
1 Amuse Inc 14 –
9 ANA Holdings Inc 20 –
2 Anest Iwata Corp 14 –
1 Anicom Holdings Inc 19 –
10 Anritsu Corp 42 0.01
– AOI Electronics Co Ltd 6 –
3 AOKI Holdings Inc 30 –

World Equity Fund
Portfolio of Investments as at 30 November 2016 (continued)
Dimensional Fund Advisors Annual Report and Audited Financial Statements, 30 November 2016 320
Shares (000's)
Value (000's)
GBP
% of Net Asset Value
Common Stock (continued)
Japan – 8.75% (continued)
11 Aomori Bank Ltd 29 –
3 Aoyama Trading Co Ltd 82 0.01
25 Aozora Bank Ltd 69 0.01
1 Arakawa Chemical Industries Ltd 9 –
1 Arata Corp 10 –
2 Arcland Sakamoto Co Ltd 23 –
2 Arcs Co Ltd 29 –
1 Argo Graphics Inc 11 –
– Ariake Japan Co Ltd 16 –
5 Arisawa Manufacturing Co Ltd 24 –
1 Artnature Inc 6 –
– As One Corp 7 –
3 Asahi Diamond Industrial Co Ltd 19 –
30 Asahi Glass Co Ltd 157 0.03
3 Asahi Group Holdings Ltd 89 0.01
2 Asahi Holdings Inc 23 –
2 Asahi Intecc Co Ltd 47 0.01
55 Asahi Kasei Corp 400 0.06
1 Asahi Kogyosha Co Ltd 12 –
11 Asahi Yukizai Corp 17 –
7 Asanuma Corp 17 –
2 Asatsu–DK Inc 47 0.01
5 Asics Corp 82 0.01
1 ASKA Pharmaceutical Co Ltd 13 –
– ASKUL Corp 9 –
11 Astellas Pharma Inc 120 0.03
1 Ateam Inc 19 –
2 Atom Corp 11 –
22 Atsugi Co Ltd 19 –
4 Autobacs Seven Co Ltd 42 0.01
4 Avex Group Holdings Inc 40 0.01
15 Awa Bank Ltd 71 0.01
1 Axial Retailing Inc 22 –
2 Azbil Corp 35 –
3 Bandai Namco Holdings Inc 67 0.01
3 Bando Chemical Industries Ltd 21 –
1 Bank of Iwate Ltd 26 –
18 Bank of Kyoto Ltd 102 0.01
1 Bank of Nagoya Ltd 30 –
2 Bank of Okinawa Ltd 54 0.01
14 Bank of Saga Ltd 27 –
1 Bank of the Ryukyus Ltd 10 –
1 Belc Co Ltd 17 –
4 Belluna Co Ltd 16 –
1 Benefit One Inc 13 –
4 Benesse Holdings Inc 87 0.01
6 Bic Camera Inc 41 0.01
– Biofermin Pharmaceutical Co Ltd 8 –
1 BML Inc 22 –
1 Bourbon Corp 11 –
11 Bridgestone Corp 343 0.05
1 Broadleaf Co Ltd 12 –
17 Brother Industries Ltd 234 0.04
3 Bunka Shutter Co Ltd 18 –
– C Uyemura & Co Ltd 13 –
2 CAC Holdings Corp 12 –
1 Calbee Inc 23 –
11 Calsonic Kansei Corp 137 0.03
1 Canon Electronics Inc 17 –
11 Canon Inc 249 0.04
2 Canon Marketing Japan Inc 29 –
3 Capcom Co Ltd 49 0.01
10 Casio Computer Co Ltd 104 0.01
Shares (000's)
Value (000's)
GBP
% of Net Asset Value
Common Stock (continued)
Japan – 8.75% (continued)
1 Cawachi Ltd 25 –
14 Central Glass Co Ltd 45 0.01
1 Central Japan Railway Co 112 0.01
1 Central Sports Co Ltd 11 –
16 Chiba Bank Ltd 78 0.01
4 Chiba Kogyo Bank Ltd 16 –
1 Chiyoda Co Ltd 15 –
10 Chiyoda Corp 58 0.01
1 Chiyoda Integre Co Ltd 15 –
2 Chofu Seisakusho Co Ltd 28 –
1 Chori Co Ltd 17 –
7 Chubu Electric Power Co Inc 82 0.01
3 Chubu Shiryo Co Ltd 22 –
3 Chudenko Corp 42 0.01
7 Chuetsu Pulp & Paper Co Ltd 12 –
1 Chugai Pharmaceutical Co Ltd 14 –
6 Chugai Ro Co Ltd 9 –
10 Chugoku Bank Ltd 105 0.01
4 Chugoku Electric Power Co Inc 37 –
3 Chugoku Marine Paints Ltd 17 –
1 Chukyo Bank Ltd 17 –
1 Ci:z Holdings Co Ltd 12 –
16 Citizen Watch Co Ltd 81 0.01
3 CKD Corp 27 –
9 Clarion Co Ltd 24 –
2 Cleanup Corp 12 –
1 CMIC Holdings Co Ltd 12 –
7 CMK Corp 30 –
4 Coca–Cola East Japan Co Ltd 66 0.01
4 Coca–Cola West Co Ltd 84 0.01
1 cocokara fine Inc 24 –
5 COLOPL Inc 31 –
2 Colowide Co Ltd 20 –
1 Computer Engineering & Consulting Ltd 15 –
5 COMSYS Holdings Corp 68 0.01
24 Concordia Financial Group Ltd 90 0.01
2 CONEXIO Corp 21 –
3 COOKPAD Inc 20 –
2 Corona Corp 18 –
2 Cosel Co Ltd 17 –
4 Cosmo Energy Holdings Co Ltd 45 0.01
– Cosmos Pharmaceutical Corp 29 –
3 Create Restaurants Holdings Inc 19 –
2 Create SD Holdings Co Ltd 26 –
8 Credit Saison Co Ltd 112 0.01
1 Cresco Ltd 11 –
1 CTI Engineering Co Ltd 9 –
2 CyberAgent Inc 39 0.01
4 D.A. Consortium Holdings Inc 22 –
11 Dai Nippon Printing Co Ltd 81 0.01
16 Dai Nippon Toryo Co Ltd 25 –
2 Dai–Dan Co Ltd 13 –
11 Dai–ichi Life Holdings Inc 148 0.03
3 Daibiru Corp 22 –
7 Daicel Corp 59 0.01
2 Daido Metal Co Ltd 15 –
19 Daido Steel Co Ltd 63 0.01
3 Daidoh Ltd 7 –
4 Daifuku Co Ltd 61 0.01
5 Daihen Corp 25 –
4 Daiho Corp 16 –
5 Daiichi Jitsugyo Co Ltd 24 –
1 Daiichi Kigenso Kagaku–Kogyo Co Ltd 16 –

World Equity Fund
Portfolio of Investments as at 30 November 2016 (continued)
Dimensional Fund Advisors Annual Report and Audited Financial Statements, 30 November 2016 321
Shares (000's)
Value (000's)
GBP
% of Net Asset Value
Common Stock (continued)
Japan – 8.75% (continued)
4 Daiichi Sankyo Co Ltd 66 0.01
2 Daiichikosho Co Ltd 66 0.01
1 Daiken Corp 17 –
4 Daiki Aluminium Industry Co Ltd 14 –
2 Daikin Industries Ltd 151 0.03
13 Daikyo Inc 22 –
4 Daikyonishikawa Corp 38 – 5
Dainichiseika Color & Chemicals Manufacturing Co Ltd 21 –
4 Daio Paper Corp 35 –
2 Daisan Bank Ltd 19 –
2 Daiseki Co Ltd 31 –
22 Daishi Bank Ltd 75 0.01
1 Daito Pharmaceutical Co Ltd 11 –
1 Daito Trust Construction Co Ltd 108 0.01
7 Daiwa House Industry Co Ltd 164 0.03
2 Daiwa Industries Ltd 12 –
12 Daiwa Securities Group Inc 57 0.01
12 Daiwabo Holdings Co Ltd 25 –
5 DCM Holdings Co Ltd 39 0.01
4 DeNA Co Ltd 89 0.01
26 Denka Co Ltd 93 0.01
4 Denki Kogyo Co Ltd 16 –
6 Denso Corp 222 0.04
2 Dentsu Inc 75 0.01
1 Denyo Co Ltd 12 –
3 Descente Ltd 26 –
6 DIC Corp 159 0.03
1 Digital Arts Inc 14 –
2 Digital Garage Inc 21 –
1 Dip Corp 20 –
1 Disco Corp 86 0.01
6 DKS Co Ltd 15 –
6 DMG Mori Co Ltd 60 0.01
1 Don Quijote Holdings Co Ltd 43 0.01
2 Doshisha Co Ltd 22 –
2 Doutor Nichires Holdings Co Ltd 31 –
17 Dowa Holdings Co Ltd 106 0.01
1 DTS Corp 23 –
2 Dunlop Sports Co Ltd 13 –
3 Duskin Co Ltd 53 0.01
1 Dydo Drinco Inc 24 –
2 Eagle Industry Co Ltd 18 –
2 East Japan Railway Co 112 0.01
5 Ebara Corp 114 0.01
1 Eco's Co Ltd 8 –
5 EDION Corp 36 –
1 eGuarantee Inc 9 –
3 Ehime Bank Ltd 25 –
8 Eighteenth Bank Ltd 19 –
1 Eiken Chemical Co Ltd 21 –
1 Eisai Co Ltd 31 –
1 Eizo Corp 29 –
2 Elecom Co Ltd 22 –
1 Electric Power Development Co Ltd 25 –
1 Elematec Corp 10 –
1 en–japan Inc 16 –
1 Endo Lighting Corp 7 –
1 Enplas Corp 21 –
3 EPS Holdings Inc 25 –
1 eRex Co Ltd 14 –
2 ESPEC Corp 16 –
2 Exedy Corp 38 –
1 Ezaki Glico Co Ltd 34 –
Shares (000's)
Value (000's)
GBP
% of Net Asset Value
Common Stock (continued)
Japan – 8.75% (continued)
3 F@N Communications Inc 15 –
2 FamilyMart UNY Holdings Co Ltd 121 0.02
1 FANUC Corp 148 0.03
– Fast Retailing Co Ltd 103 0.01
2 FCC Co Ltd 34 –
2 Ferrotec Corp 22 –
14 FIDEA Holdings Co Ltd 19 –
1 Fields Corp 10 –
3 Financial Products Group Co Ltd 17 –
1 FINDEX Inc 8 –
1 Foster Electric Co Ltd 21 –
1 FP Corp 56 0.01
2 France Bed Holdings Co Ltd 10 –
10 Fudo Tetra Corp 15 –
1 Fuji Co Ltd 17 –
2 Fuji Corp Ltd 10 –
37 Fuji Electric Co Ltd 147 0.03
4 Fuji Heavy Industries Ltd 139 0.03
3 Fuji Kyuko Co Ltd 22 –
5 Fuji Machine Manufacturing Co Ltd 47 0.01
4 Fuji Media Holdings Inc 43 0.01
5 Fuji Oil Co Ltd 12 –
3 Fuji Oil Holdings Inc 50 0.01
1 Fuji Pharma Co Ltd 19 –
1 Fuji Seal International Inc 36 –
2 Fuji Soft Inc 34 –
1 Fujibo Holdings Inc 23 –
3 FUJIFILM Holdings Corp 99 0.01
2 Fujikura Kasei Co Ltd 10 –
16 Fujikura Ltd 70 0.01
2 Fujikura Rubber Ltd 10 –
2 Fujimi Inc 25 –
1 Fujimori Kogyo Co Ltd 18 –
6 Fujita Kanko Inc 14 –
3 Fujitec Co Ltd 28 –
1 Fujitsu Frontech Ltd 14 –
4 Fujitsu General Ltd 63 0.01
86 Fujitsu Ltd 415 0.06
2 Fukuda Corp 16 –
1 Fukuda Denshi Co Ltd 22 –
17 Fukui Bank Ltd 34 –
19 Fukuoka Financial Group Inc 68 0.01
16 Fukushima Bank Ltd 10 –
1 Fukushima Industries Corp 21 –
7 Fukuyama Transporting Co Ltd 31 –
3 Fumakilla Ltd 14 –
2 Funai Electric Co Ltd 12 –
2 Furukawa Battery Co Ltd 11 –
15 Furukawa Co Ltd 22 –
4 Furukawa Electric Co Ltd 107 0.02
2 Furuno Electric Co Ltd 13 –
1 Furusato Industries Ltd 9 –
1 Fuso Chemical Co Ltd 16 –
1 Fuso Pharmaceutical Industries Ltd 10 –
2 Futaba Corp 28 –
6 Futaba Industrial Co Ltd 29 –
2 Future Corp 11 –
1 Fuyo General Lease Co Ltd 38 –
1 G–7 Holdings Inc 10 –
2 G–Tekt Corp 30 –
6 Gakken Holdings Co Ltd 14 –
2 GCA Corp 14 –
1 Gecoss Corp 3 –

World Equity Fund
Portfolio of Investments as at 30 November 2016 (continued)
Dimensional Fund Advisors Annual Report and Audited Financial Statements, 30 November 2016 322
Shares (000's)
Value (000's)
GBP
% of Net Asset Value
Common Stock (continued)
Japan – 8.75% (continued)
1 Genky Stores Inc 28 –
2 Geo Holdings Corp 20 –
1 Globeride Inc 13 –
3 Glory Ltd 82 0.01
4 GMO internet Inc 48 0.01
– GMO Payment Gateway Inc 13 –
1 Genky Stores Inc 28 –
1 Godo Steel Ltd 17 –
1 Goldcrest Co Ltd 21 –
5 Gree Inc 22 –
25 GS Yuasa Corp 81 0.01
1 Gun–Ei Chemical Industry Co Ltd 17 –
17 GungHo Online Entertainment Inc 30 –
27 Gunma Bank Ltd 111 0.02
5 Gunze Ltd 13 –
2 Gurunavi Inc 26 –
1 H–One Co Ltd 11 –
5 H2O Retailing Corp 65 0.01
23 Hachijuni Bank Ltd 99 0.01
1 Hagiwara Electric Co Ltd 12 –
2 Hakuhodo DY Holdings Inc 18 –
2 Hakuto Co Ltd 13 –
1 Halows Co Ltd 12 –
1 Hamakyorex Co Ltd 14 –
1 Hamamatsu Photonics KK 15 –
5 Hankyu Hanshin Holdings Inc 125 0.03
10 Hanwa Co Ltd 52 0.01
2 Happinet Corp 18 –
1 Harmonic Drive Systems Inc 21 –
13 Haseko Corp 108 0.02
15 Hazama Ando Corp 84 0.01
4 Heiwa Corp 62 0.01
3 Heiwa Real Estate Co Ltd 37 –
2 Heiwado Co Ltd 26 –
1 HI–LEX CORP 26 –
2 Hibiya Engineering Ltd 20 –
1 Hiday Hidaka Corp 11 –
1 Hikari Tsushin Inc 43 0.01
11 Hino Motors Ltd 90 0.01
1 Hirano Tecseed Co Ltd/Kinzoku 9 –
– Hirose Electric Co Ltd 19 –
26 Hiroshima Bank Ltd 93 0.01
4 Hiroshima Gas Co Ltd 8 –
3 HIS Co Ltd 69 0.01
2 Hisaka Works Ltd 9 –
1 Hisamitsu Pharmaceutical Co Inc 23 –
4 Hitachi Capital Corp 87 0.01
7 Hitachi Chemical Co Ltd 123 0.03
7 Hitachi Construction Machinery Co Ltd 114 0.02
3 Hitachi High–Technologies Corp 96 0.01
3 Hitachi Koki Co Ltd 19 –
2 Hitachi Kokusai Electric Inc 29 –
134 Hitachi Ltd 582 0.09
3 Hitachi Maxell Ltd 44 0.01
11 Hitachi Metals Ltd 115 0.03
3 Hitachi Transport System Ltd 50 0.01
12 Hitachi Zosen Corp 51 0.01
2 Hochiki Corp 15 –
1 Hodogaya Chemical Co Ltd 20 –
1 Hogy Medical Co Ltd 33 –
8 Hokkaido Electric Power Co Inc 49 0.01
4 Hokkan Holdings Ltd 11 –
17 Hokkoku Bank Ltd 48 0.01
Shares (000's)
Value (000's)
GBP
% of Net Asset Value
Common Stock (continued)
Japan – 8.75% (continued)
1 Hokuetsu Bank Ltd 16 –
2 Hokuetsu Industries Co Ltd 9 –
7 Hokuetsu Kishu Paper Co Ltd 34 –
7 Hokuhoku Financial Group Inc 90 0.01
4 Hokuriku Electric Power Co 34 –
2 Hokuto Corp 23 –
29 Honda Motor Co Ltd 684 0.1
2 Honeys Co Ltd 18 –
5 Hoosiers Holdings 19 –
1 Horiba Ltd 43 0.01
– Hoshizaki Corp 27 –
3 Hosiden Corp 22 –
4 Hosokawa Micron Corp 19 –
3 House Foods Group Inc 40 0.01
2 Hoya Corp 71 0.01
4 Hulic Co Ltd 30 –
16 Hyakugo Bank Ltd 49 0.01
19 Hyakujushi Bank Ltd 51 0.01
7 Ibiden Co Ltd 75 0.01
2 IBJ Leasing Co Ltd 29 –
– Ichibanya Co Ltd 3 –
9 Ichigo Inc 27 –
3 Ichiken Co Ltd 9 –
1 Ichinen Holdings Co Ltd 10 –
2 Ichiyoshi Securities Co Ltd 12 –
1 Icom Inc 7 –
1 Idec Corp 9 –
3 Idemitsu Kosan Co Ltd 48 0.01
5 IDOM Inc 19 –
2 Ihara Chemical Industry Co Ltd 15 –
95 IHI Corp 214 0.04
4 Iida Group Holdings Co Ltd 58 0.01
7 Iino Kaiun Kaisha Ltd 20 –
2 Imasen Electric Industrial 12 –
1 Inaba Denki Sangyo Co Ltd 38 –
1 Inaba Seisakusho Co Ltd 10 –
3 Inabata & Co Ltd 23 –
1 Inageya Co Ltd 14 –
2 Infocom Corp 21 –
2 Infomart Corp 18 –
1 Information Services International–Dentsu Ltd 14 –
18 Inpex Corp 141 0.03
1 Intage Holdings Inc 12 –
3 Internet Initiative Japan Inc 29 –
3 Inui Global Logistics Co Ltd 16 –
1 Iriso Electronics Co Ltd 29 –
15 Iseki & Co Ltd 24 –
10 Isetan Mitsukoshi Holdings Ltd 89 0.01
2 Ishihara Sangyo Kaisha Ltd 14 –
27 Isuzu Motors Ltd 262 0.04
3 Ito En Ltd 72 0.01
13 ITOCHU Corp 147 0.03
3 Itochu Enex Co Ltd 21 –
2 Itochu Techno–Solutions Corp 39 0.01
– Itochu–Shokuhin Co Ltd 12 –
5 Itoham Yonekyu Holdings Inc 35 –
2 Itoki Corp 13 –
1 IwaiCosmo Holdings Inc 7 –
8 Iwasaki Electric Co Ltd 10 –
15 Iwatani Corp 65 0.01
– Iwatsuka Confectionery Co Ltd 5 –
13 Iyo Bank Ltd 70 0.01
1 Izumi Co Ltd 42 0.01
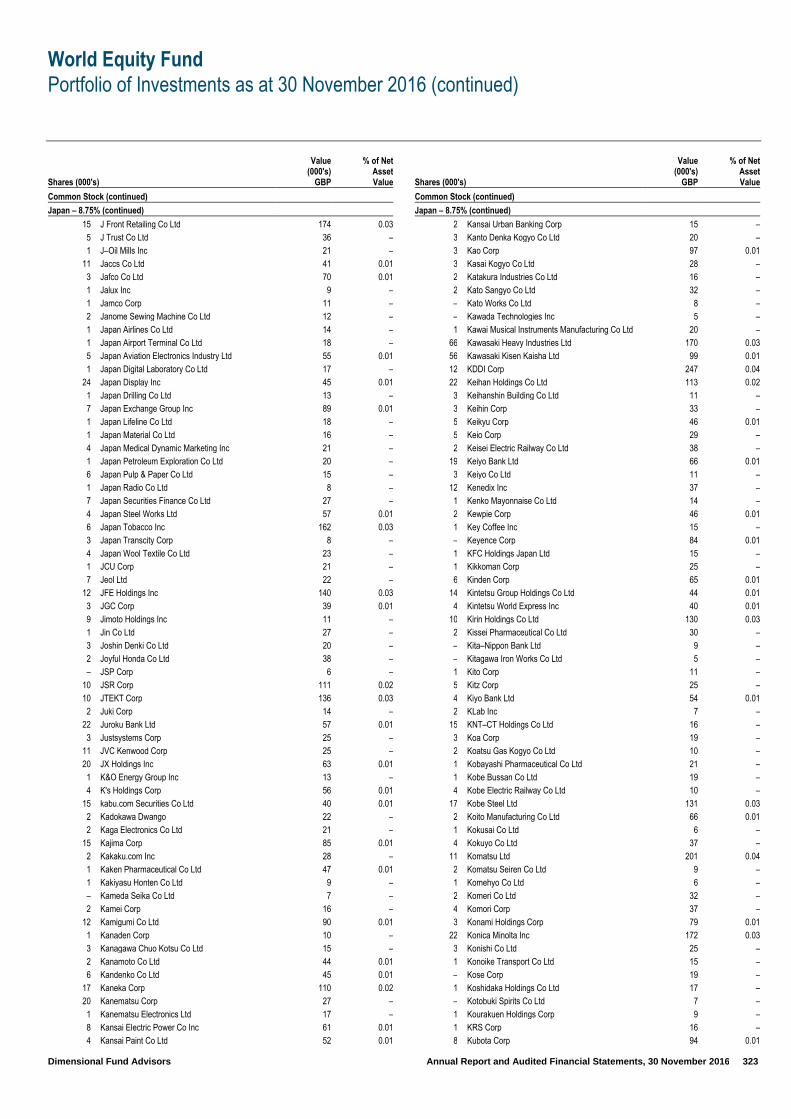
World Equity Fund
Portfolio of Investments as at 30 November 2016 (continued)
Dimensional Fund Advisors Annual Report and Audited Financial Statements, 30 November 2016 323
Shares (000's)
Value (000's)
GBP
% of Net Asset Value
Common Stock (continued)
Japan – 8.75% (continued)
15 J Front Retailing Co Ltd 174 0.03
5 J Trust Co Ltd 36 –
1 J–Oil Mills Inc 21 –
11 Jaccs Co Ltd 41 0.01
3 Jafco Co Ltd 70 0.01
1 Jalux Inc 9 –
1 Jamco Corp 11 –
2 Janome Sewing Machine Co Ltd 12 –
1 Japan Airlines Co Ltd 14 –
1 Japan Airport Terminal Co Ltd 18 –
5 Japan Aviation Electronics Industry Ltd 55 0.01
1 Japan Digital Laboratory Co Ltd 17 –
24 Japan Display Inc 45 0.01
1 Japan Drilling Co Ltd 13 –
7 Japan Exchange Group Inc 89 0.01
1 Japan Lifeline Co Ltd 18 –
1 Japan Material Co Ltd 16 –
4 Japan Medical Dynamic Marketing Inc 21 –
1 Japan Petroleum Exploration Co Ltd 20 –
6 Japan Pulp & Paper Co Ltd 15 –
1 Japan Radio Co Ltd 8 –
7 Japan Securities Finance Co Ltd 27 –
4 Japan Steel Works Ltd 57 0.01
6 Japan Tobacco Inc 162 0.03
3 Japan Transcity Corp 8 –
4 Japan Wool Textile Co Ltd 23 –
1 JCU Corp 21 –
7 Jeol Ltd 22 –
12 JFE Holdings Inc 140 0.03
3 JGC Corp 39 0.01
9 Jimoto Holdings Inc 11 –
1 Jin Co Ltd 27 –
3 Joshin Denki Co Ltd 20 –
2 Joyful Honda Co Ltd 38 –
– JSP Corp 6 –
10 JSR Corp 111 0.02
10 JTEKT Corp 136 0.03
2 Juki Corp 14 –
22 Juroku Bank Ltd 57 0.01
3 Justsystems Corp 25 –
11 JVC Kenwood Corp 25 –
20 JX Holdings Inc 63 0.01
1 K&O Energy Group Inc 13 –
4 K's Holdings Corp 56 0.01
15 kabu.com Securities Co Ltd 40 0.01
2 Kadokawa Dwango 22 –
2 Kaga Electronics Co Ltd 21 –
15 Kajima Corp 85 0.01
2 Kakaku.com Inc 28 –
1 Kaken Pharmaceutical Co Ltd 47 0.01
1 Kakiyasu Honten Co Ltd 9 –
– Kameda Seika Co Ltd 7 –
2 Kamei Corp 16 –
12 Kamigumi Co Ltd 90 0.01
1 Kanaden Corp 10 –
3 Kanagawa Chuo Kotsu Co Ltd 15 –
2 Kanamoto Co Ltd 44 0.01
6 Kandenko Co Ltd 45 0.01
17 Kaneka Corp 110 0.02
20 Kanematsu Corp 27 –
1 Kanematsu Electronics Ltd 17 –
8 Kansai Electric Power Co Inc 61 0.01
4 Kansai Paint Co Ltd 52 0.01
Shares (000's)
Value (000's)
GBP
% of Net Asset Value
Common Stock (continued)
Japan – 8.75% (continued)
2 Kansai Urban Banking Corp 15 –
3 Kanto Denka Kogyo Co Ltd 20 –
3 Kao Corp 97 0.01
3 Kasai Kogyo Co Ltd 28 –
2 Katakura Industries Co Ltd 16 –
2 Kato Sangyo Co Ltd 32 –
– Kato Works Co Ltd 8 –
– Kawada Technologies Inc 5 –
1 Kawai Musical Instruments Manufacturing Co Ltd 20 –
66 Kawasaki Heavy Industries Ltd 170 0.03
56 Kawasaki Kisen Kaisha Ltd 99 0.01
12 KDDI Corp 247 0.04
22 Keihan Holdings Co Ltd 113 0.02
3 Keihanshin Building Co Ltd 11 –
3 Keihin Corp 33 –
5 Keikyu Corp 46 0.01
5 Keio Corp 29 –
2 Keisei Electric Railway Co Ltd 38 –
19 Keiyo Bank Ltd 66 0.01
3 Keiyo Co Ltd 11 –
12 Kenedix Inc 37 –
1 Kenko Mayonnaise Co Ltd 14 –
2 Kewpie Corp 46 0.01
1 Key Coffee Inc 15 –
– Keyence Corp 84 0.01
1 KFC Holdings Japan Ltd 15 –
1 Kikkoman Corp 25 –
6 Kinden Corp 65 0.01
14 Kintetsu Group Holdings Co Ltd 44 0.01
4 Kintetsu World Express Inc 40 0.01
10 Kirin Holdings Co Ltd 130 0.03
2 Kissei Pharmaceutical Co Ltd 30 –
– Kita–Nippon Bank Ltd 9 –
– Kitagawa Iron Works Co Ltd 5 –
1 Kito Corp 11 –
5 Kitz Corp 25 –
4 Kiyo Bank Ltd 54 0.01
2 KLab Inc 7 –
15 KNT–CT Holdings Co Ltd 16 –
3 Koa Corp 19 –
2 Koatsu Gas Kogyo Co Ltd 10 –
1 Kobayashi Pharmaceutical Co Ltd 21 –
1 Kobe Bussan Co Ltd 19 –
4 Kobe Electric Railway Co Ltd 10 –
17 Kobe Steel Ltd 131 0.03
2 Koito Manufacturing Co Ltd 66 0.01
1 Kokusai Co Ltd 6 –
4 Kokuyo Co Ltd 37 –
11 Komatsu Ltd 201 0.04
2 Komatsu Seiren Co Ltd 9 –
1 Komehyo Co Ltd 6 –
2 Komeri Co Ltd 32 –
4 Komori Corp 37 –
3 Konami Holdings Corp 79 0.01
22 Konica Minolta Inc 172 0.03
3 Konishi Co Ltd 25 –
1 Konoike Transport Co Ltd 15 –
– Kose Corp 19 –
1 Koshidaka Holdings Co Ltd 17 –
– Kotobuki Spirits Co Ltd 7 –
1 Kourakuen Holdings Corp 9 –
1 KRS Corp 16 –
8 Kubota Corp 94 0.01

World Equity Fund
Portfolio of Investments as at 30 November 2016 (continued)
Dimensional Fund Advisors Annual Report and Audited Financial Statements, 30 November 2016 324
Shares (000's)
Value (000's)
GBP
% of Net Asset Value
Common Stock (continued)
Japan – 8.75% (continued)
23 Kumagai Gumi Co Ltd 48 0.01
4 Kumiai Chemical Industry Co Ltd 18 –
1 Kura Corp 27 –
12 Kurabo Industries Ltd 20 –
11 Kuraray Co Ltd 127 0.03
1 Kureha Corp 36 –
1 Kurimoto Ltd 10 –
5 Kurita Water Industries Ltd 90 0.01
2 Kuroda Electric Co Ltd 34 –
1 Kusuri no Aoki Holdings Co Ltd 20 –
15 KYB Corp 55 0.01
4 Kyocera Corp 142 0.03
4 Kyodo Printing Co Ltd 11 –
2 Kyoei Steel Ltd 22 –
3 Kyokuto Kaihatsu Kogyo Co Ltd 30 –
1 Kyokuto Securities Co Ltd 8 –
1 Kyokuyo Co Ltd 11 –
2 KYORIN Holdings Inc 39 0.01
1 Kyoritsu Maintenance Co Ltd 49 0.01
8 Kyosan Electric Manufacturing Co Ltd 22 –
5 Kyowa Exeo Corp 53 0.01
3 Kyowa Hakko Kirin Co Ltd 37 –
3 Kyudenko Corp 68 0.01
4 Kyushu Electric Power Co Inc 32 –
17 Kyushu Financial Group Inc 89 0.01
2 LAC Co Ltd 13 –
1 Laox Co Ltd 5 –
2 Lasertec Corp 22 –
1 Lawson Inc 56 0.01
11 Leopalace21 Corp 50 0.01
1 Life Corp 11 –
1 Linical Co Ltd 9 –
3 Lintec Corp 45 0.01
6 Lion Corp 78 0.01
9 LIXIL Group Corp 161 0.03
2 M3 Inc 42 0.01
2 Macnica Fuji Electronics Holdings Inc 18 –
6 Maeda Corp 45 0.01
2 Maeda Kosen Co Ltd 13 –
4 Maeda Road Construction Co Ltd 55 0.01
2 Maezawa Kasei Industries Co Ltd 18 –
1 Maezawa Kyuso Industries Co Ltd 9 –
5 Makino Milling Machine Co Ltd 29 –
1 Makita Corp 82 0.01
– Mandom Corp 14 –
1 Mani Inc 17 –
– Mars Engineering Corp 4 –
38 Marubeni Corp 167 0.03
2 Marubun Corp 10 –
4 Marudai Food Co Ltd 13 –
3 Maruha Nichiro Corp 65 0.01
7 Marui Group Co Ltd 78 0.01
2 Maruichi Steel Tube Ltd 49 0.01
1 Maruwa Co Ltd 28 –
3 Maruzen Showa Unyu Co Ltd 9 –
2 Marvelous Inc 11 –
1 Matsuda Sangyo Co Ltd 9 –
2 Matsui Construction Co Ltd 14 –
4 Matsui Securities Co Ltd 23 –
1 Matsumotokiyoshi Holdings Co Ltd 42 0.01
4 Matsuya Co Ltd 25 –
2 Max Co Ltd 19 –
27 Mazda Motor Corp 359 0.06
Shares (000's)
Value (000's)
GBP
% of Net Asset Value
Common Stock (continued)
Japan – 8.75% (continued)
– McDonald's Holdings Co Japan Ltd 9 –
20 Mebuki Financial Group Inc 59 0.01
3 Medical System Network Co Ltd 9 –
7 Medipal Holdings Corp 86 0.01
3 Megachips Corp 50 0.01
1 Megmilk Snow Brand Co Ltd 27 –
12 Meidensha Corp 31 –
1 MEIJI Holdings Co Ltd 70 0.01
2 Meiko Network Japan Co Ltd 11 –
1 Meisei Industrial Co Ltd 4 –
1 Meitec Corp 30 –
1 Melco Holdings Inc 23 –
1 METAWATER Co Ltd 10 –
11 Michinoku Bank Ltd 17 –
3 Micronics Japan Co Ltd 19 –
1 Mie Bank Ltd 16 –
3 Mie Kotsu Group Holdings Inc 8 –
1 Milbon Co Ltd 19 –
2 Mimasu Semiconductor Industry Co Ltd 22 –
1 Minato Bank Ltd 14 –
23 Minebea Co Ltd 186 0.03
1 Ministop Co Ltd 15 –
2 Miraca Holdings Inc 58 0.01
3 Mirait Holdings Corp 25 –
2 Miroku Jyoho Service Co Ltd 29 –
3 Misawa Homes Co Ltd 21 –
6 MISUMI Group Inc 81 0.01
1 Mitani Corp 18 –
1 Mitani Sekisan Co Ltd 13 –
6 Mito Securities Co Ltd 12 –
3 Mitsuba Corp 37 –
82 Mitsubishi Chemical Holdings Corp 423 0.07
15 Mitsubishi Corp 259 0.04
38 Mitsubishi Electric Corp 424 0.07
7 Mitsubishi Estate Co Ltd 121 0.03
12 Mitsubishi Gas Chemical Co Inc 141 0.03
73 Mitsubishi Heavy Industries Ltd 264 0.04
7 Mitsubishi Logistics Corp 77 0.01
8 Mitsubishi Materials Corp 191 0.03
35 Mitsubishi Motors Corp 132 0.03
3 Mitsubishi Nichiyu Forklift Co Ltd 15 –
2 Mitsubishi Paper Mills Ltd 8 –
1 Mitsubishi Pencil Co Ltd 29 –
1 Mitsubishi Research Institute Inc 11 –
1 Mitsubishi Shokuhin Co Ltd 21 –
8 Mitsubishi Steel Manufacturing Co Ltd 13 –
1 Mitsubishi Tanabe Pharma Corp 20 –
133 Mitsubishi UFJ Financial Group Inc 638 0.09
33 Mitsubishi UFJ Lease & Finance Co Ltd 124 0.03
2 Mitsuboshi Belting Ltd 14 –
19 Mitsui & Co Ltd 205 0.04
60 Mitsui Chemicals Inc 226 0.04
48 Mitsui Engineering & Shipbuilding Co Ltd 56 0.01
6 Mitsui Fudosan Co Ltd 115 0.03
3 Mitsui High–Tec Inc 16 –
3 Mitsui Home Co Ltd 10 –
2 Mitsui Matsushima Co Ltd 17 –
42 Mitsui Mining & Smelting Co Ltd 79 0.01
65 Mitsui OSK Lines Ltd 136 0.03
1 Mitsui Sugar Co Ltd 20 –
9 Mitsui–Soko Holdings Co Ltd 21 –
5 Mitsumi Electric Co Ltd 26 –
1 Miura Co Ltd 15 –
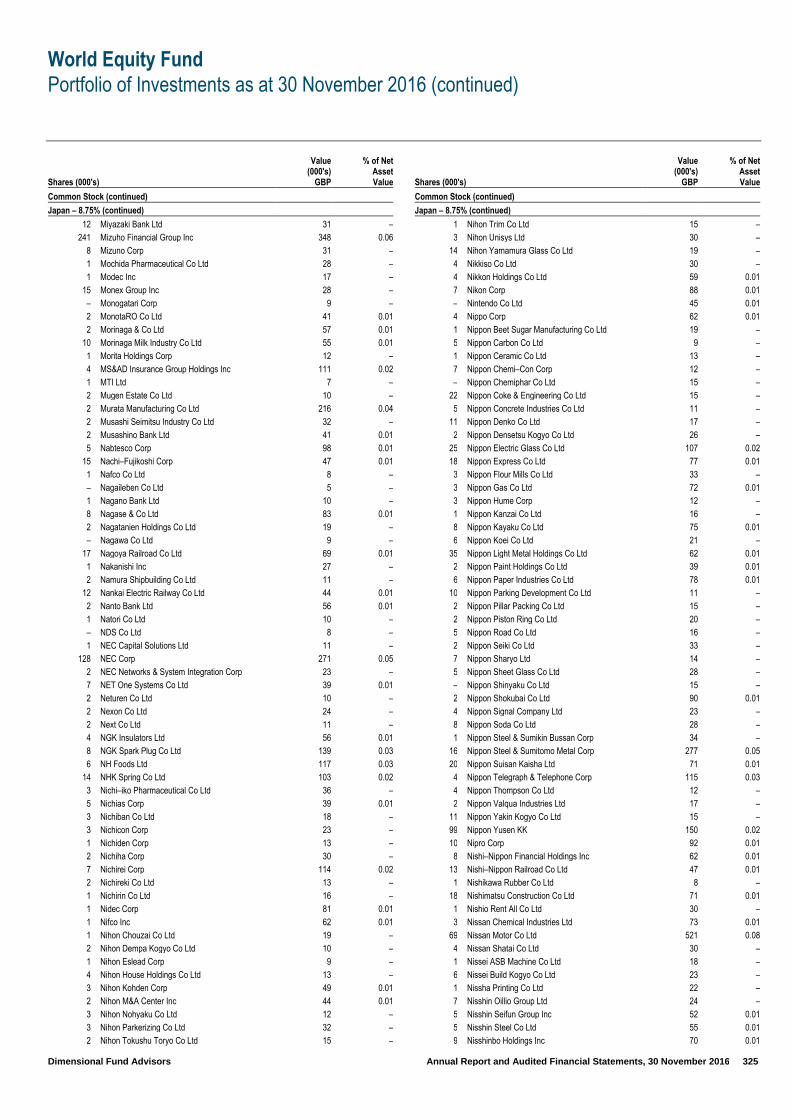
World Equity Fund
Portfolio of Investments as at 30 November 2016 (continued)
Dimensional Fund Advisors Annual Report and Audited Financial Statements, 30 November 2016 325
Shares (000's)
Value (000's)
GBP
% of Net Asset Value
Common Stock (continued)
Japan – 8.75% (continued)
12 Miyazaki Bank Ltd 31 –
241 Mizuho Financial Group Inc 348 0.06
8 Mizuno Corp 31 –
1 Mochida Pharmaceutical Co Ltd 28 –
1 Modec Inc 17 –
15 Monex Group Inc 28 –
– Monogatari Corp 9 –
2 MonotaRO Co Ltd 41 0.01
2 Morinaga & Co Ltd 57 0.01
10 Morinaga Milk Industry Co Ltd 55 0.01
1 Morita Holdings Corp 12 –
4 MS&AD Insurance Group Holdings Inc 111 0.02
1 MTI Ltd 7 –
2 Mugen Estate Co Ltd 10 –
2 Murata Manufacturing Co Ltd 216 0.04
2 Musashi Seimitsu Industry Co Ltd 32 –
2 Musashino Bank Ltd 41 0.01
5 Nabtesco Corp 98 0.01
15 Nachi–Fujikoshi Corp 47 0.01
1 Nafco Co Ltd 8 –
– Nagaileben Co Ltd 5 –
1 Nagano Bank Ltd 10 –
8 Nagase & Co Ltd 83 0.01
2 Nagatanien Holdings Co Ltd 19 –
– Nagawa Co Ltd 9 –
17 Nagoya Railroad Co Ltd 69 0.01
1 Nakanishi Inc 27 –
2 Namura Shipbuilding Co Ltd 11 –
12 Nankai Electric Railway Co Ltd 44 0.01
2 Nanto Bank Ltd 56 0.01
1 Natori Co Ltd 10 –
– NDS Co Ltd 8 –
1 NEC Capital Solutions Ltd 11 –
128 NEC Corp 271 0.05
2 NEC Networks & System Integration Corp 23 –
7 NET One Systems Co Ltd 39 0.01
2 Neturen Co Ltd 10 –
2 Nexon Co Ltd 24 –
2 Next Co Ltd 11 –
4 NGK Insulators Ltd 56 0.01
8 NGK Spark Plug Co Ltd 139 0.03
6 NH Foods Ltd 117 0.03
14 NHK Spring Co Ltd 103 0.02
3 Nichi–iko Pharmaceutical Co Ltd 36 –
5 Nichias Corp 39 0.01
3 Nichiban Co Ltd 18 –
3 Nichicon Corp 23 –
1 Nichiden Corp 13 –
2 Nichiha Corp 30 –
7 Nichirei Corp 114 0.02
2 Nichireki Co Ltd 13 –
1 Nichirin Co Ltd 16 –
1 Nidec Corp 81 0.01
1 Nifco Inc 62 0.01
1 Nihon Chouzai Co Ltd 19 –
2 Nihon Dempa Kogyo Co Ltd 10 –
1 Nihon Eslead Corp 9 –
4 Nihon House Holdings Co Ltd 13 –
3 Nihon Kohden Corp 49 0.01
2 Nihon M&A Center Inc 44 0.01
3 Nihon Nohyaku Co Ltd 12 –
3 Nihon Parkerizing Co Ltd 32 –
2 Nihon Tokushu Toryo Co Ltd 15 –
Shares (000's)
Value (000's)
GBP
% of Net Asset Value
Common Stock (continued)
Japan – 8.75% (continued)
1 Nihon Trim Co Ltd 15 –
3 Nihon Unisys Ltd 30 –
14 Nihon Yamamura Glass Co Ltd 19 –
4 Nikkiso Co Ltd 30 –
4 Nikkon Holdings Co Ltd 59 0.01
7 Nikon Corp 88 0.01
– Nintendo Co Ltd 45 0.01
4 Nippo Corp 62 0.01
1 Nippon Beet Sugar Manufacturing Co Ltd 19 –
5 Nippon Carbon Co Ltd 9 –
1 Nippon Ceramic Co Ltd 13 –
7 Nippon Chemi–Con Corp 12 –
– Nippon Chemiphar Co Ltd 15 –
22 Nippon Coke & Engineering Co Ltd 15 –
5 Nippon Concrete Industries Co Ltd 11 –
11 Nippon Denko Co Ltd 17 –
2 Nippon Densetsu Kogyo Co Ltd 26 –
25 Nippon Electric Glass Co Ltd 107 0.02
18 Nippon Express Co Ltd 77 0.01
3 Nippon Flour Mills Co Ltd 33 –
3 Nippon Gas Co Ltd 72 0.01
3 Nippon Hume Corp 12 –
1 Nippon Kanzai Co Ltd 16 –
8 Nippon Kayaku Co Ltd 75 0.01
6 Nippon Koei Co Ltd 21 –
35 Nippon Light Metal Holdings Co Ltd 62 0.01
2 Nippon Paint Holdings Co Ltd 39 0.01
6 Nippon Paper Industries Co Ltd 78 0.01
10 Nippon Parking Development Co Ltd 11 –
2 Nippon Pillar Packing Co Ltd 15 –
2 Nippon Piston Ring Co Ltd 20 –
5 Nippon Road Co Ltd 16 –
2 Nippon Seiki Co Ltd 33 –
7 Nippon Sharyo Ltd 14 –
5 Nippon Sheet Glass Co Ltd 28 –
– Nippon Shinyaku Co Ltd 15 –
2 Nippon Shokubai Co Ltd 90 0.01
4 Nippon Signal Company Ltd 23 –
8 Nippon Soda Co Ltd 28 –
1 Nippon Steel & Sumikin Bussan Corp 34 –
16 Nippon Steel & Sumitomo Metal Corp 277 0.05
20 Nippon Suisan Kaisha Ltd 71 0.01
4 Nippon Telegraph & Telephone Corp 115 0.03
4 Nippon Thompson Co Ltd 12 –
2 Nippon Valqua Industries Ltd 17 –
11 Nippon Yakin Kogyo Co Ltd 15 –
99 Nippon Yusen KK 150 0.02
10 Nipro Corp 92 0.01
8 Nishi–Nippon Financial Holdings Inc 62 0.01
13 Nishi–Nippon Railroad Co Ltd 47 0.01
1 Nishikawa Rubber Co Ltd 8 –
18 Nishimatsu Construction Co Ltd 71 0.01
1 Nishio Rent All Co Ltd 30 –
3 Nissan Chemical Industries Ltd 73 0.01
69 Nissan Motor Co Ltd 521 0.08
4 Nissan Shatai Co Ltd 30 –
1 Nissei ASB Machine Co Ltd 18 –
6 Nissei Build Kogyo Co Ltd 23 –
1 Nissha Printing Co Ltd 22 –
7 Nisshin Oillio Group Ltd 24 –
5 Nisshin Seifun Group Inc 52 0.01
5 Nisshin Steel Co Ltd 55 0.01
9 Nisshinbo Holdings Inc 70 0.01

World Equity Fund
Portfolio of Investments as at 30 November 2016 (continued)
Dimensional Fund Advisors Annual Report and Audited Financial Statements, 30 November 2016 326
Shares (000's)
Value (000's)
GBP
% of Net Asset Value
Common Stock (continued)
Japan – 8.75% (continued)
7 Nissin Corp 17 –
3 Nissin Electric Co Ltd 26 –
1 Nissin Foods Holdings Co Ltd 29 –
3 Nissin Kogyo Co Ltd 30 –
2 Nissin Sugar Co Ltd 17 –
1 Nitori Holdings Co Ltd 58 0.01
1 Nitta Corp 27 –
– Nittetsu Mining Co Ltd 15 –
12 Nitto Boseki Co Ltd 38 –
3 Nitto Denko Corp 158 0.03
2 Nitto Kogyo Corp 18 –
1 Nitto Kohki Co Ltd 10 –
1 Nittoku Engineering Co Ltd 12 –
– Noevir Holdings Co Ltd 8 –
6 NOF Corp 45 0.01
2 Nohmi Bosai Ltd 22 –
2 Nojima Corp 15 –
8 NOK Corp 121 0.03
2 Nomura Co Ltd 22 –
42 Nomura Holdings Inc 185 0.03
9 Nomura Real Estate Holdings Inc 121 0.03
1 Nomura Research Institute Ltd 38 –
1 Noritake Co Ltd 15 –
4 Noritsu Koki Co Ltd 19 –
2 Noritz Corp 32 –
21 North Pacific Bank Ltd 67 0.01
2 NS Solutions Corp 35 –
5 NS United Kaiun Kaisha Ltd 7 –
2 NSD Co Ltd 19 –
22 NSK Ltd 192 0.04
31 NTN Corp 95 0.01
1 NTT Data Corp 52 0.01
18 NTT DOCOMO Inc 332 0.05
3 NTT Urban Development Corp 22 –
– NuFlare Technology Inc 15 –
4 OAK Capital Corp 5 –
1 Obara Group Inc 48 0.01
11 Obayashi Corp 86 0.01
3 Obayashi Road Corp 15 –
1 Obic Co Ltd 21 –
3 Odakyu Electric Railway Co Ltd 43 0.01
6 Oenon Holdings Inc 11 –
20 Ogaki Kyoritsu Bank Ltd 58 0.01
1 Ohashi Technica Inc 13 –
1 Ohsho Food Service Corp 17 –
1 Oiles Corp 19 –
5 Oita Bank Ltd 14 –
26 Oji Holdings Corp 86 0.01
3 Okabe Co Ltd 22 –
2 Okamoto Industries Inc 15 –
4 Okamura Corp 27 –
12 Okasan Securities Group Inc 56 0.01
6 Oki Electric Industry Co Ltd 64 0.01
1 Okinawa Cellular Telephone Co 17 –
2 Okinawa Electric Power Co Inc 24 –
9 OKUMA Corp 64 0.01
9 Okumura Corp 42 0.01
2 Okuwa Co Ltd 16 –
2 Olympus Corp 47 0.01
3 Omron Corp 100 0.02
1 Ono Pharmaceutical Co Ltd 9 –
1 Onoken Co Ltd 9 –
7 Onward Holdings Co Ltd 37 –
Shares (000's)
Value (000's)
GBP
% of Net Asset Value
Common Stock (continued)
Japan – 8.75% (continued)
3 Open House Co Ltd 54 0.01
1 Optex Co Ltd 20 –
– Oracle Corp Japan 16 –
5 Organo Corp 17 –
11 Orient Corp 16 –
1 Oriental Land Co Ltd 46 0.01
29 ORIX Corp 364 0.06
16 Osaka Gas Co Ltd 50 0.01
6 Osaka Soda Co Ltd 20 –
1 Osaka Steel Co Ltd 12 –
3 Osaki Electric Co Ltd 24 –
6 OSG Corp 89 0.01
9 OSJB Holdings Corp 16 –
1 Otsuka Corp 39 0.01
1 Otsuka Holdings Co Ltd 33 –
2 Otsuka Kagu Ltd 14 –
1 Outsourcing Inc 20 –
2 Oyo Corp 18 –
3 Pacific Industrial Co Ltd 33 –
11 Pacific Metals Co Ltd 30 –
1 Pack Corp 15 –
1 PAL GROUP Holdings Co Ltd 15 –
2 Paltac Corporation 38 –
5 PanaHome Corp 29 –
46 Panasonic Corp 385 0.06
1 Paraca Inc 11 –
1 Paramount Bed Holdings Co Ltd 30 –
2 Parco Co Ltd 15 –
3 Park24 Co Ltd 62 0.01
6 Pasco Corp 15 –
2 Pasona Group Inc 12 –
4 PC Depot Corp 15 –
20 Penta–Ocean Construction Co Ltd 80 0.01
1 PeptiDream Inc 36 –
3 Pigeon Corp 51 0.01
2 Pilot Corp 57 0.01
1 Piolax Inc 29 –
26 Pioneer Corp 44 0.01
2 Plenus Co Ltd 25 –
– Pola Orbis Holdings Inc 25 –
3 Poletowin Pitcrew Holdings Inc 16 –
7 Press Kogyo Co Ltd 24 –
2 Pressance Corp 24 –
5 Prestige International Inc 28 –
8 Prima Meat Packers Ltd 22 –
2 Pronexus Inc 15 –
1 Proto Corp 5 –
1 Qol Co Ltd 10 –
3 Raito Kogyo Co Ltd 22 –
6 Rakuten Inc 46 0.01
3 Raysum Co Ltd 14 –
1 Relia Inc 9 –
1 Relo Group Inc 55 0.01
13 Rengo Co Ltd 62 0.01
66 Resona Holdings Inc 258 0.04
3 Resorttrust Inc 41 0.01
1 Retail Partners Co Ltd 6 –
13 Rhythm Watch Co Ltd 17 –
23 Ricoh Co Ltd 150 0.03
1 Ricoh Leasing Co Ltd 17 –
1 Right On Co Ltd 10 –
1 Riken Corp 18 –
1 Riken Keiki Co Ltd 14 –
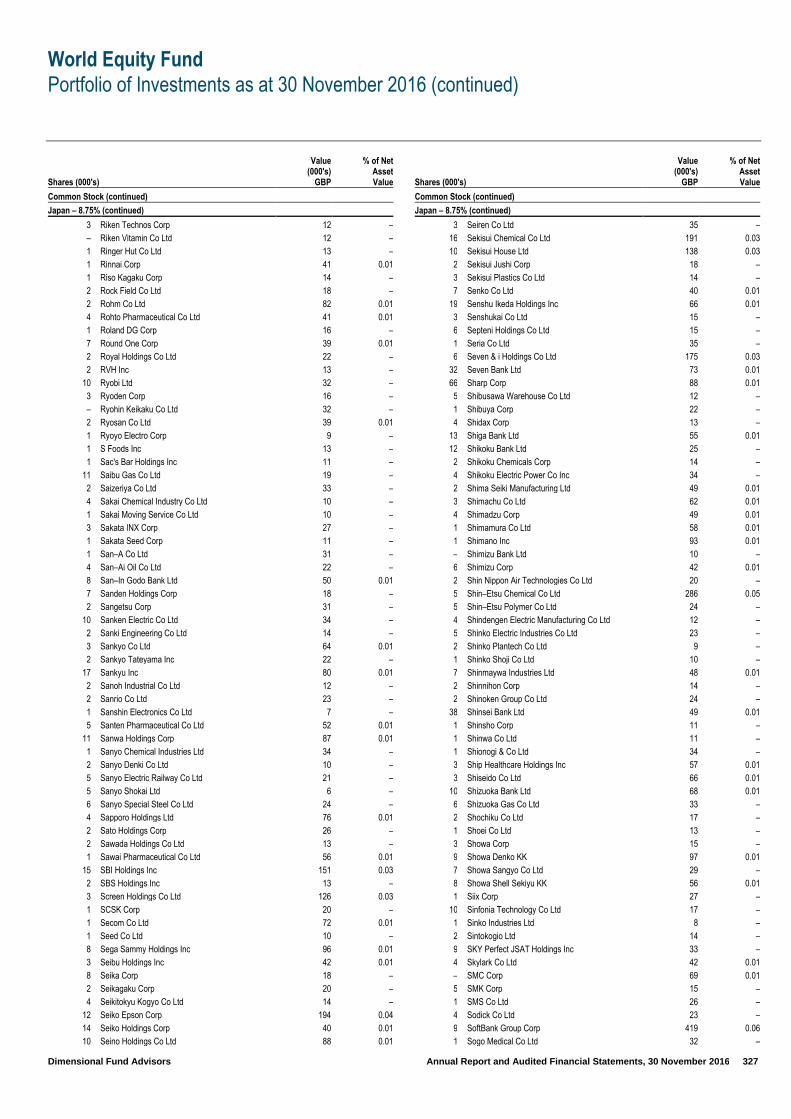
World Equity Fund
Portfolio of Investments as at 30 November 2016 (continued)
Dimensional Fund Advisors Annual Report and Audited Financial Statements, 30 November 2016 327
Shares (000's)
Value (000's)
GBP
% of Net Asset Value
Common Stock (continued)
Japan – 8.75% (continued)
3 Riken Technos Corp 12 –
– Riken Vitamin Co Ltd 12 –
1 Ringer Hut Co Ltd 13 –
1 Rinnai Corp 41 0.01
1 Riso Kagaku Corp 14 –
2 Rock Field Co Ltd 18 –
2 Rohm Co Ltd 82 0.01
4 Rohto Pharmaceutical Co Ltd 41 0.01
1 Roland DG Corp 16 –
7 Round One Corp 39 0.01
2 Royal Holdings Co Ltd 22 –
2 RVH Inc 13 –
10 Ryobi Ltd 32 –
3 Ryoden Corp 16 –
– Ryohin Keikaku Co Ltd 32 –
2 Ryosan Co Ltd 39 0.01
1 Ryoyo Electro Corp 9 –
1 S Foods Inc 13 –
1 Sac's Bar Holdings Inc 11 –
11 Saibu Gas Co Ltd 19 –
2 Saizeriya Co Ltd 33 –
4 Sakai Chemical Industry Co Ltd 10 –
1 Sakai Moving Service Co Ltd 10 –
3 Sakata INX Corp 27 –
1 Sakata Seed Corp 11 –
1 San–A Co Ltd 31 –
4 San–Ai Oil Co Ltd 22 –
8 San–In Godo Bank Ltd 50 0.01
7 Sanden Holdings Corp 18 –
2 Sangetsu Corp 31 –
10 Sanken Electric Co Ltd 34 –
2 Sanki Engineering Co Ltd 14 –
3 Sankyo Co Ltd 64 0.01
2 Sankyo Tateyama Inc 22 –
17 Sankyu Inc 80 0.01
2 Sanoh Industrial Co Ltd 12 –
2 Sanrio Co Ltd 23 –
1 Sanshin Electronics Co Ltd 7 –
5 Santen Pharmaceutical Co Ltd 52 0.01
11 Sanwa Holdings Corp 87 0.01
1 Sanyo Chemical Industries Ltd 34 –
2 Sanyo Denki Co Ltd 10 –
5 Sanyo Electric Railway Co Ltd 21 –
5 Sanyo Shokai Ltd 6 –
6 Sanyo Special Steel Co Ltd 24 –
4 Sapporo Holdings Ltd 76 0.01
2 Sato Holdings Corp 26 –
2 Sawada Holdings Co Ltd 13 –
1 Sawai Pharmaceutical Co Ltd 56 0.01
15 SBI Holdings Inc 151 0.03
2 SBS Holdings Inc 13 –
3 Screen Holdings Co Ltd 126 0.03
1 SCSK Corp 20 –
1 Secom Co Ltd 72 0.01
1 Seed Co Ltd 10 –
8 Sega Sammy Holdings Inc 96 0.01
3 Seibu Holdings Inc 42 0.01
8 Seika Corp 18 –
2 Seikagaku Corp 20 –
4 Seikitokyu Kogyo Co Ltd 14 –
12 Seiko Epson Corp 194 0.04
14 Seiko Holdings Corp 40 0.01
10 Seino Holdings Co Ltd 88 0.01
Shares (000's)
Value (000's)
GBP
% of Net Asset Value
Common Stock (continued)
Japan – 8.75% (continued)
3 Seiren Co Ltd 35 –
16 Sekisui Chemical Co Ltd 191 0.03
10 Sekisui House Ltd 138 0.03
2 Sekisui Jushi Corp 18 –
3 Sekisui Plastics Co Ltd 14 –
7 Senko Co Ltd 40 0.01
19 Senshu Ikeda Holdings Inc 66 0.01
3 Senshukai Co Ltd 15 –
6 Septeni Holdings Co Ltd 15 –
1 Seria Co Ltd 35 –
6 Seven & i Holdings Co Ltd 175 0.03
32 Seven Bank Ltd 73 0.01
66 Sharp Corp 88 0.01
5 Shibusawa Warehouse Co Ltd 12 –
1 Shibuya Corp 22 –
4 Shidax Corp 13 –
13 Shiga Bank Ltd 55 0.01
12 Shikoku Bank Ltd 25 –
2 Shikoku Chemicals Corp 14 –
4 Shikoku Electric Power Co Inc 34 –
2 Shima Seiki Manufacturing Ltd 49 0.01
3 Shimachu Co Ltd 62 0.01
4 Shimadzu Corp 49 0.01
1 Shimamura Co Ltd 58 0.01
1 Shimano Inc 93 0.01
– Shimizu Bank Ltd 10 –
6 Shimizu Corp 42 0.01
2 Shin Nippon Air Technologies Co Ltd 20 –
5 Shin–Etsu Chemical Co Ltd 286 0.05
5 Shin–Etsu Polymer Co Ltd 24 –
4 Shindengen Electric Manufacturing Co Ltd 12 –
5 Shinko Electric Industries Co Ltd 23 –
2 Shinko Plantech Co Ltd 9 –
1 Shinko Shoji Co Ltd 10 –
7 Shinmaywa Industries Ltd 48 0.01
2 Shinnihon Corp 14 –
2 Shinoken Group Co Ltd 24 –
38 Shinsei Bank Ltd 49 0.01
1 Shinsho Corp 11 –
1 Shinwa Co Ltd 11 –
1 Shionogi & Co Ltd 34 –
3 Ship Healthcare Holdings Inc 57 0.01
3 Shiseido Co Ltd 66 0.01
10 Shizuoka Bank Ltd 68 0.01
6 Shizuoka Gas Co Ltd 33 –
2 Shochiku Co Ltd 17 –
1 Shoei Co Ltd 13 –
3 Showa Corp 15 –
9 Showa Denko KK 97 0.01
7 Showa Sangyo Co Ltd 29 –
8 Showa Shell Sekiyu KK 56 0.01
1 Siix Corp 27 –
10 Sinfonia Technology Co Ltd 17 –
1 Sinko Industries Ltd 8 –
2 Sintokogio Ltd 14 –
9 SKY Perfect JSAT Holdings Inc 33 –
4 Skylark Co Ltd 42 0.01
– SMC Corp 69 0.01
5 SMK Corp 15 –
1 SMS Co Ltd 26 –
4 Sodick Co Ltd 23 –
9 SoftBank Group Corp 419 0.06
1 Sogo Medical Co Ltd 32 –
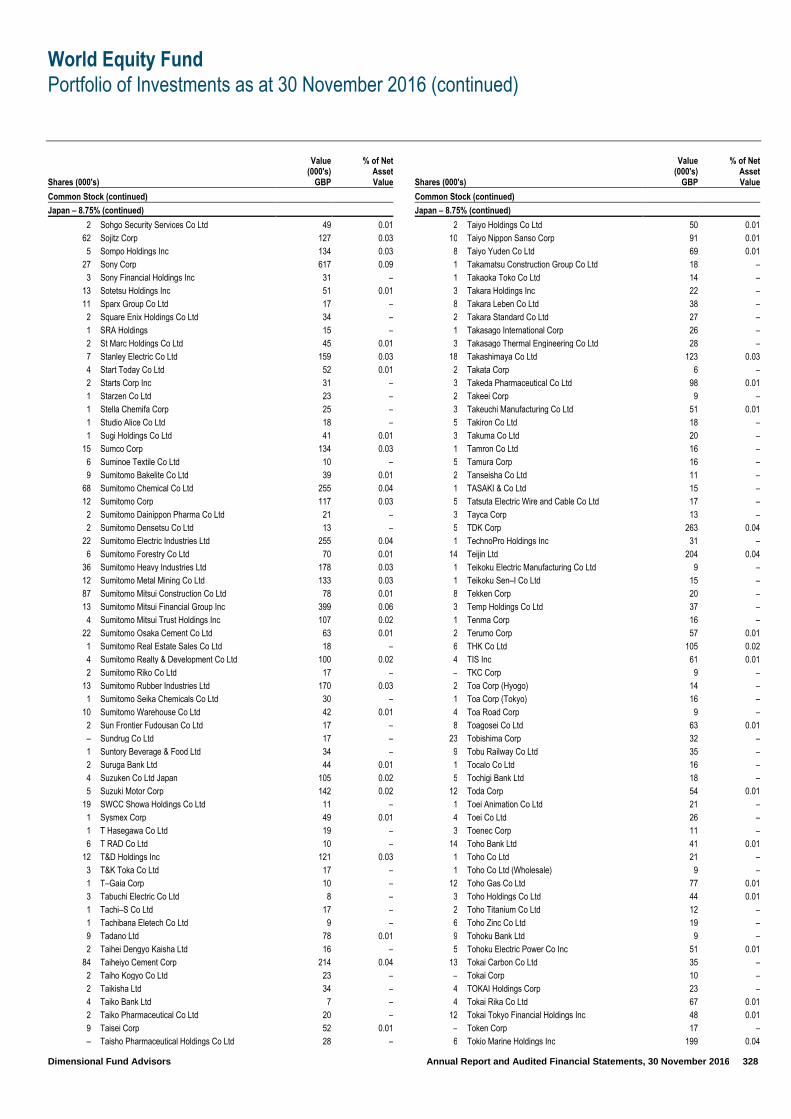
World Equity Fund
Portfolio of Investments as at 30 November 2016 (continued)
Dimensional Fund Advisors Annual Report and Audited Financial Statements, 30 November 2016 328
Shares (000's)
Value (000's)
GBP
% of Net Asset Value
Common Stock (continued)
Japan – 8.75% (continued)
2 Sohgo Security Services Co Ltd 49 0.01
62 Sojitz Corp 127 0.03
5 Sompo Holdings Inc 134 0.03
27 Sony Corp 617 0.09
3 Sony Financial Holdings Inc 31 –
13 Sotetsu Holdings Inc 51 0.01
11 Sparx Group Co Ltd 17 –
2 Square Enix Holdings Co Ltd 34 –
1 SRA Holdings 15 –
2 St Marc Holdings Co Ltd 45 0.01
7 Stanley Electric Co Ltd 159 0.03
4 Start Today Co Ltd 52 0.01
2 Starts Corp Inc 31 –
1 Starzen Co Ltd 23 –
1 Stella Chemifa Corp 25 –
1 Studio Alice Co Ltd 18 –
1 Sugi Holdings Co Ltd 41 0.01
15 Sumco Corp 134 0.03
6 Suminoe Textile Co Ltd 10 –
9 Sumitomo Bakelite Co Ltd 39 0.01
68 Sumitomo Chemical Co Ltd 255 0.04
12 Sumitomo Corp 117 0.03
2 Sumitomo Dainippon Pharma Co Ltd 21 –
2 Sumitomo Densetsu Co Ltd 13 –
22 Sumitomo Electric Industries Ltd 255 0.04
6 Sumitomo Forestry Co Ltd 70 0.01
36 Sumitomo Heavy Industries Ltd 178 0.03
12 Sumitomo Metal Mining Co Ltd 133 0.03
87 Sumitomo Mitsui Construction Co Ltd 78 0.01
13 Sumitomo Mitsui Financial Group Inc 399 0.06
4 Sumitomo Mitsui Trust Holdings Inc 107 0.02
22 Sumitomo Osaka Cement Co Ltd 63 0.01
1 Sumitomo Real Estate Sales Co Ltd 18 –
4 Sumitomo Realty & Development Co Ltd 100 0.02
2 Sumitomo Riko Co Ltd 17 –
13 Sumitomo Rubber Industries Ltd 170 0.03
1 Sumitomo Seika Chemicals Co Ltd 30 –
10 Sumitomo Warehouse Co Ltd 42 0.01
2 Sun Frontier Fudousan Co Ltd 17 –
– Sundrug Co Ltd 17 –
1 Suntory Beverage & Food Ltd 34 –
2 Suruga Bank Ltd 44 0.01
4 Suzuken Co Ltd Japan 105 0.02
5 Suzuki Motor Corp 142 0.02
19 SWCC Showa Holdings Co Ltd 11 –
1 Sysmex Corp 49 0.01
1 T Hasegawa Co Ltd 19 –
6 T RAD Co Ltd 10 –
12 T&D Holdings Inc 121 0.03
3 T&K Toka Co Ltd 17 –
1 T–Gaia Corp 10 –
3 Tabuchi Electric Co Ltd 8 –
1 Tachi–S Co Ltd 17 –
1 Tachibana Eletech Co Ltd 9 –
9 Tadano Ltd 78 0.01
2 Taihei Dengyo Kaisha Ltd 16 –
84 Taiheiyo Cement Corp 214 0.04
2 Taiho Kogyo Co Ltd 23 –
2 Taikisha Ltd 34 –
4 Taiko Bank Ltd 7 –
2 Taiko Pharmaceutical Co Ltd 20 –
9 Taisei Corp 52 0.01
– Taisho Pharmaceutical Holdings Co Ltd 28 –
Shares (000's)
Value (000's)
GBP
% of Net Asset Value
Common Stock (continued)
Japan – 8.75% (continued)
2 Taiyo Holdings Co Ltd 50 0.01
10 Taiyo Nippon Sanso Corp 91 0.01
8 Taiyo Yuden Co Ltd 69 0.01
1 Takamatsu Construction Group Co Ltd 18 –
1 Takaoka Toko Co Ltd 14 –
3 Takara Holdings Inc 22 –
8 Takara Leben Co Ltd 38 –
2 Takara Standard Co Ltd 27 –
1 Takasago International Corp 26 –
3 Takasago Thermal Engineering Co Ltd 28 –
18 Takashimaya Co Ltd 123 0.03
2 Takata Corp 6 –
3 Takeda Pharmaceutical Co Ltd 98 0.01
2 Takeei Corp 9 –
3 Takeuchi Manufacturing Co Ltd 51 0.01
5 Takiron Co Ltd 18 –
3 Takuma Co Ltd 20 –
1 Tamron Co Ltd 16 –
5 Tamura Corp 16 –
2 Tanseisha Co Ltd 11 –
1 TASAKI & Co Ltd 15 –
5 Tatsuta Electric Wire and Cable Co Ltd 17 –
3 Tayca Corp 13 –
5 TDK Corp 263 0.04
1 TechnoPro Holdings Inc 31 –
14 Teijin Ltd 204 0.04
1 Teikoku Electric Manufacturing Co Ltd 9 –
1 Teikoku Sen–I Co Ltd 15 –
8 Tekken Corp 20 –
3 Temp Holdings Co Ltd 37 –
1 Tenma Corp 16 –
2 Terumo Corp 57 0.01
6 THK Co Ltd 105 0.02
4 TIS Inc 61 0.01
– TKC Corp 9 –
2 Toa Corp (Hyogo) 14 –
1 Toa Corp (Tokyo) 16 –
4 Toa Road Corp 9 –
8 Toagosei Co Ltd 63 0.01
23 Tobishima Corp 32 –
9 Tobu Railway Co Ltd 35 –
1 Tocalo Co Ltd 16 –
5 Tochigi Bank Ltd 18 –
12 Toda Corp 54 0.01
1 Toei Animation Co Ltd 21 –
4 Toei Co Ltd 26 –
3 Toenec Corp 11 –
14 Toho Bank Ltd 41 0.01
1 Toho Co Ltd 21 –
1 Toho Co Ltd (Wholesale) 9 –
12 Toho Gas Co Ltd 77 0.01
3 Toho Holdings Co Ltd 44 0.01
2 Toho Titanium Co Ltd 12 –
6 Toho Zinc Co Ltd 19 –
9 Tohoku Bank Ltd 9 –
5 Tohoku Electric Power Co Inc 51 0.01
13 Tokai Carbon Co Ltd 35 –
– Tokai Corp 10 –
4 TOKAI Holdings Corp 23 –
4 Tokai Rika Co Ltd 67 0.01
12 Tokai Tokyo Financial Holdings Inc 48 0.01
– Token Corp 17 –
6 Tokio Marine Holdings Inc 199 0.04

World Equity Fund
Portfolio of Investments as at 30 November 2016 (continued)
Dimensional Fund Advisors Annual Report and Audited Financial Statements, 30 November 2016 329
Shares (000's)
Value (000's)
GBP
% of Net Asset Value
Common Stock (continued)
Japan – 8.75% (continued)
1 Tokushu Tokai Paper Co Ltd 20 –
10 Tokuyama Corp 32 –
2 Tokyo Broadcasting System Holdings Inc 20 –
3 Tokyo Century Corp 89 0.01
5 Tokyo Dome Corp 37 –
17 Tokyo Electric Power Co Holdings Inc 50 0.01
2 Tokyo Electron Ltd 118 0.03
3 Tokyo Energy & Systems Inc 20 –
26 Tokyo Gas Co Ltd 90 0.01
2 Tokyo Individualized Educational Institute Inc 10 –
3 Tokyo Ohka Kogyo Co Ltd 70 0.01
1 Tokyo Rope Manufacturing Co Ltd 15 –
2 Tokyo Seimitsu Co Ltd 48 0.01
5 Tokyo Steel Manufacturing Co Ltd 30 –
10 Tokyo Tatemono Co Ltd 100 0.02
2 Tokyo TY Financial Group Inc 62 0.01
9 Tokyotokeiba Co Ltd 18 –
6 Tokyu Construction Co Ltd 39 0.01
11 Tokyu Corp 65 0.01
23 Tokyu Fudosan Holdings Corp 108 0.02
1 Tomato Bank Ltd 9 –
5 Tomoku Co Ltd 11 –
8 TOMONY Holdings Inc 35 –
5 Tomy Co Ltd 43 0.01
5 Tonami Holdings Co Ltd 12 –
8 TonenGeneral Sekiyu KK 62 0.01
9 Topcon Corp 104 0.02
4 Toppan Forms Co Ltd 32 –
10 Toppan Printing Co Ltd 76 0.01
2 Topre Corp 38 –
2 Topy Industries Ltd 35 –
13 Toray Industries Inc 82 0.01
2 Toridoll Holdings Corp 28 –
1 Torii Pharmaceutical Co Ltd 18 –
2 Torishima Pump Manufacturing Co Ltd 11 –
3 Tosei Corp 16 –
8 Toshiba Corp 25 –
9 Toshiba Machine Co Ltd 27 –
2 Toshiba Plant Systems & Services Corp 23 –
12 Toshiba TEC Corp 48 0.01
5 Tosho Printing Co Ltd 16 –
41 Tosoh Corp 224 0.04
1 Totetsu Kogyo Co Ltd 26 –
2 TOTO Ltd 68 0.02
1 Tottori Bank Ltd 8 –
3 Tow Co Ltd 12 –
20 Towa Bank Ltd 15 –
3 Towa Corp 29 –
1 Towa Pharmaceutical Co Ltd 23 –
7 Toyo Construction Co Ltd 19 –
2 Toyo Corp 16 –
9 Toyo Engineering Corp 20 –
10 Toyo Ink SC Holdings Co Ltd 37 –
10 Toyo Kanetsu KK 25 –
3 Toyo Kohan Co Ltd 7 –
3 Toyo Securities Co Ltd 5 –
3 Toyo Seikan Group Holdings Ltd 43 0.01
1 Toyo Suisan Kaisha Ltd 37 –
1 Toyo Tanso Co Ltd 11 –
9 Toyo Tire & Rubber Co Ltd 86 0.02
55 Toyobo Co Ltd 67 0.02
6 Toyoda Gosei Co Ltd 109 0.02
4 Toyota Boshoku Corp 76 0.02
Shares (000's)
Value (000's)
GBP
% of Net Asset Value
Common Stock (continued)
Japan – 8.75% (continued)
2 Toyota Industries Corp 67 0.02
58 Toyota Motor Corp 2,736 0.37
10 Toyota Tsusho Corp 210 0.04
2 TPR Co Ltd 43 0.01
1 Trancom Co Ltd 20 –
1 Transcosmos Inc 27 –
1 Trend Micro Inc 38 –
1 Trusco Nakayama Corp 33 –
4 TS Tech Co Ltd 77 0.01
6 TSI Holdings Co Ltd 27 –
11 Tsubakimoto Chain Co 70 0.01
3 Tsugami Corp 13 –
2 Tsukishima Kikai Co Ltd 14 –
7 Tsukuba Bank Ltd 16 –
3 Tsukui Corp 16 –
3 Tsumura & Co 61 0.01
– Tsuruha Holdings Inc 33 –
1 Tsurumi Manufacturing Co Ltd 16 –
1 Tsutsumi Jewelry Co Ltd 10 –
1 TV Asahi Holdings Corp 21 –
1 Tv Tokyo Holdings Corp 22 –
20 UACJ Corp 47 0.02
71 Ube Industries Ltd 120 0.03
1 UKC Holdings Corp 10 –
3 Ulvac Inc 71 0.02
2 Unicharm Corp 41 0.01
– Union Tool Co 4 –
2 Unipres Corp 34 –
2 United Arrows Ltd 41 0.01
3 United Super Markets Holdings Inc 20 –
30 Unitika Ltd 18 –
1 Universal Entertainment Corp 28 –
1 Unizo Holdings Co Ltd 21 –
2 Usen Corp 5 –
8 Ushio Inc 73 0.02
2 USS Co Ltd 30 –
1 V Technology Co Ltd 42 0.01
3 Valor Holdings Co Ltd 50 0.02
2 Vital KSK Holdings Inc 14 –
7 VT Holdings Co Ltd 27 –
1 W–Scope Corp 11 –
6 Wacoal Holdings Corp 56 0.02
11 Wacom Co Ltd 24 –
19 Wakachiku Construction Co Ltd 22 –
3 Wakita & Co Ltd 20 –
1 Warabeya Nichiyo Holdings Co Ltd 20 –
2 WATAMI Co Ltd 18 –
1 Weathernews Inc 14 –
1 Welcia Holdings Co Ltd 25 –
3 West Holdings Corp 22 –
1 West Japan Railway Co 47 0.02
1 Wowow Inc 15 –
2 Xebio Holdings Co Ltd 19 –
2 Yahagi Construction Co Ltd 17 –
11 Yahoo Japan Corp 32 –
1 Yakult Honsha Co Ltd 32 –
2 Yamabiko Corp 19 –
9 Yamada Denki Co Ltd 39 0.01
9 Yamagata Bank Ltd 30 –
12 Yamaguchi Financial Group Inc 101 0.02
5 Yamaha Corp 113 0.02
12 Yamaha Motor Co Ltd 228 0.04
3 Yamaichi Electronics Co Ltd 22 –
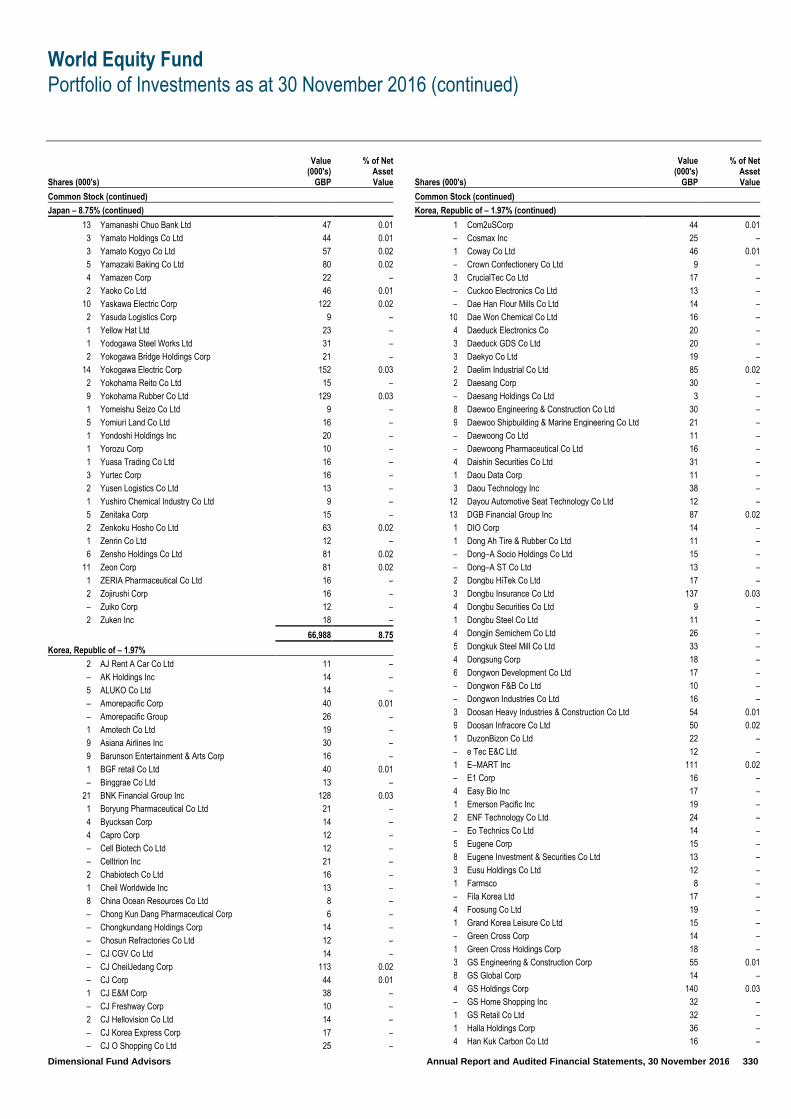
World Equity Fund
Portfolio of Investments as at 30 November 2016 (continued)
Dimensional Fund Advisors Annual Report and Audited Financial Statements, 30 November 2016 330
Shares (000's)
Value (000's)
GBP
% of Net Asset Value
Common Stock (continued)
Japan – 8.75% (continued)
13 Yamanashi Chuo Bank Ltd 47 0.01
3 Yamato Holdings Co Ltd 44 0.01
3 Yamato Kogyo Co Ltd 57 0.02
5 Yamazaki Baking Co Ltd 80 0.02
4 Yamazen Corp 22 –
2 Yaoko Co Ltd 46 0.01
10 Yaskawa Electric Corp 122 0.02
2 Yasuda Logistics Corp 9 –
1 Yellow Hat Ltd 23 –
1 Yodogawa Steel Works Ltd 31 –
2 Yokogawa Bridge Holdings Corp 21 –
14 Yokogawa Electric Corp 152 0.03
2 Yokohama Reito Co Ltd 15 –
9 Yokohama Rubber Co Ltd 129 0.03
1 Yomeishu Seizo Co Ltd 9 –
5 Yomiuri Land Co Ltd 16 –
1 Yondoshi Holdings Inc 20 –
1 Yorozu Corp 10 –
1 Yuasa Trading Co Ltd 16 –
3 Yurtec Corp 16 –
2 Yusen Logistics Co Ltd 13 –
1 Yushiro Chemical Industry Co Ltd 9 –
5 Zenitaka Corp 15 –
2 Zenkoku Hosho Co Ltd 63 0.02
1 Zenrin Co Ltd 12 –
6 Zensho Holdings Co Ltd 81 0.02
11 Zeon Corp 81 0.02
1 ZERIA Pharmaceutical Co Ltd 16 –
2 Zojirushi Corp 16 –
– Zuiko Corp 12 –
2 Zuken Inc 18 –
66,988 8.75
Korea, Republic of – 1.97%
2 AJ Rent A Car Co Ltd 11 –
– AK Holdings Inc 14 –
5 ALUKO Co Ltd 14 –
– Amorepacific Corp 40 0.01
– Amorepacific Group 26 –
1 Amotech Co Ltd 19 –
9 Asiana Airlines Inc 30 –
9 Barunson Entertainment & Arts Corp 16 –
1 BGF retail Co Ltd 40 0.01
– Binggrae Co Ltd 13 –
21 BNK Financial Group Inc 128 0.03
1 Boryung Pharmaceutical Co Ltd 21 –
4 Byucksan Corp 14 –
4 Capro Corp 12 –
– Cell Biotech Co Ltd 12 –
– Celltrion Inc 21 –
2 Chabiotech Co Ltd 16 –
1 Cheil Worldwide Inc 13 –
8 China Ocean Resources Co Ltd 8 –
– Chong Kun Dang Pharmaceutical Corp 6 –
– Chongkundang Holdings Corp 14 –
– Chosun Refractories Co Ltd 12 –
– CJ CGV Co Ltd 14 –
– CJ CheilJedang Corp 113 0.02
– CJ Corp 44 0.01
1 CJ E&M Corp 38 –
– CJ Freshway Corp 10 –
2 CJ Hellovision Co Ltd 14 –
– CJ Korea Express Corp 17 –
– CJ O Shopping Co Ltd 25 –
Shares (000's)
Value (000's)
GBP
% of Net Asset Value
Common Stock (continued)
Korea, Republic of – 1.97% (continued)
1 Com2uSCorp 44 0.01
– Cosmax Inc 25 –
1 Coway Co Ltd 46 0.01
– Crown Confectionery Co Ltd 9 –
3 CrucialTec Co Ltd 17 –
– Cuckoo Electronics Co Ltd 13 –
– Dae Han Flour Mills Co Ltd 14 –
10 Dae Won Chemical Co Ltd 16 –
4 Daeduck Electronics Co 20 –
3 Daeduck GDS Co Ltd 20 –
3 Daekyo Co Ltd 19 –
2 Daelim Industrial Co Ltd 85 0.02
2 Daesang Corp 30 –
– Daesang Holdings Co Ltd 3 –
8 Daewoo Engineering & Construction Co Ltd 30 –
9 Daewoo Shipbuilding & Marine Engineering Co Ltd 21 –
– Daewoong Co Ltd 11 –
– Daewoong Pharmaceutical Co Ltd 16 –
4 Daishin Securities Co Ltd 31 –
1 Daou Data Corp 11 –
3 Daou Technology Inc 38 –
12 Dayou Automotive Seat Technology Co Ltd 12 –
13 DGB Financial Group Inc 87 0.02
1 DIO Corp 14 –
1 Dong Ah Tire & Rubber Co Ltd 11 –
– Dong–A Socio Holdings Co Ltd 15 –
– Dong–A ST Co Ltd 13 –
2 Dongbu HiTek Co Ltd 17 –
3 Dongbu Insurance Co Ltd 137 0.03
4 Dongbu Securities Co Ltd 9 –
1 Dongbu Steel Co Ltd 11 –
4 Dongjin Semichem Co Ltd 26 –
5 Dongkuk Steel Mill Co Ltd 33 –
4 Dongsung Corp 18 –
6 Dongwon Development Co Ltd 17 –
– Dongwon F&B Co Ltd 10 –
– Dongwon Industries Co Ltd 16 –
3 Doosan Heavy Industries & Construction Co Ltd 54 0.01
9 Doosan Infracore Co Ltd 50 0.02
1 DuzonBizon Co Ltd 22 –
– e Tec E&C Ltd 12 –
1 E–MART Inc 111 0.02
– E1 Corp 16 –
4 Easy Bio Inc 17 –
1 Emerson Pacific Inc 19 –
2 ENF Technology Co Ltd 24 –
– Eo Technics Co Ltd 14 –
5 Eugene Corp 15 –
8 Eugene Investment & Securities Co Ltd 13 –
3 Eusu Holdings Co Ltd 12 –
1 Farmsco 8 –
– Fila Korea Ltd 17 –
4 Foosung Co Ltd 19 –
1 Grand Korea Leisure Co Ltd 15 –
– Green Cross Corp 14 –
1 Green Cross Holdings Corp 18 –
3 GS Engineering & Construction Corp 55 0.01
8 GS Global Corp 14 –
4 GS Holdings Corp 140 0.03
– GS Home Shopping Inc 32 –
1 GS Retail Co Ltd 32 –
1 Halla Holdings Corp 36 –
4 Han Kuk Carbon Co Ltd 16 –

World Equity Fund
Portfolio of Investments as at 30 November 2016 (continued)
Dimensional Fund Advisors Annual Report and Audited Financial Statements, 30 November 2016 331
Shares (000's)
Value (000's)
GBP
% of Net Asset Value
Common Stock (continued)
Korea, Republic of – 1.97% (continued)
7 Hana Financial Group Inc 146 0.03
1 Hana Tour Service Inc 26 –
1 Handsome Co Ltd 15 –
– Hanil Cement Co Ltd 8 –
6 Hanjin Heavy Industries & Construction Co Ltd 14 –
2 Hanjin Kal Corp 29 –
– Hanjin Transportation Co Ltd 9 –
– Hankook Shell Oil Co Ltd 9 –
4 Hankook Tire Co Ltd 143 0.03
– Hanmi Pharm Co Ltd 16 –
– Hanmi Science Co ltd 10 –
4 Hanon Systems 28 –
1 Hansae Co Ltd 8 –
2 Hansae Yes24 Holdings Co Ltd 12 –
– Hansol Chemical Co Ltd 14 –
3 Hansol Holdings Co Ltd 11 –
1 Hansol Paper Co Ltd 7 –
1 Hansol Technics Co Ltd 12 –
– Hanssem Co Ltd 50 0.02
6 Hanwha Chemical Corp 96 0.02
4 Hanwha General Insurance Co Ltd 22 –
14 Hanwha Investment & Securities Co Ltd 20 –
7 Hanwha Life Insurance Co Ltd 31 –
2 Hanwha Techwin Co Ltd 49 0.01
5 Harim Holdings Co Ltd 14 –
1 Hite Jinro Co Ltd 19 –
2 HMC Investment Securities Co Ltd 12 –
1 Hotel Shilla Co Ltd 22 –
4 HS Industries Co Ltd 28 –
1 HS R&A Co Ltd 15 –
1 Huchems Fine Chemical Corp 18 –
2 Humax Co Ltd 17 –
1 Huons Global Co Ltd 21 –
1 Hy–Lok Corp 12 –
1 Hyosung Corp 94 0.02
– Hyundai C&F Inc 4 –
1 Hyundai Cement Co 9 –
1 Hyundai Corp 7 –
1 Hyundai Department Store Co Ltd 68 0.02
2 Hyundai Development Co–Engineering & Construction 50 0.02
– Hyundai Elevator Co Ltd 17 –
5 Hyundai Engineering & Construction Co Ltd 131 0.03
3 Hyundai Engineering Plastics Co Ltd 17 –
– Hyundai Glovis Co Ltd 40 0.01
1 Hyundai Greenfood Co Ltd 13 –
1 Hyundai Heavy Industries Co Ltd 99 0.02
– Hyundai Home Shopping Network Corp 17 –
6 Hyundai Hy Communications & Network Co Ltd 16 –
1 Hyundai Livart Furniture Co Ltd 16 –
5 Hyundai Marine & Fire Insurance Co Ltd 124 0.03
1 Hyundai Merchant Marine Co Ltd 3 –
1 Hyundai Mipo Dockyard Co Ltd 29 –
1 Hyundai Mobis Co Ltd 149 0.03
3 Hyundai Motor Co 262 0.04
2 Hyundai Rotem Co Ltd 22 –
3 Hyundai Steel Co 101 0.02
1 Hyundai Wia Corp 57 0.01
4 Iljin Display Co Ltd 11 –
2 Iljin Holdings Co Ltd 9 –
– Ilshin Spinning Co Ltd 11 –
2 iMarketKorea Inc 12 –
1 InBody Co Ltd 10 –
9 Industrial Bank of Korea 85 0.02
Shares (000's)
Value (000's)
GBP
% of Net Asset Value
Common Stock (continued)
Korea, Republic of – 1.97% (continued)
3 Interpark Holdings Corp 10 –
1 IS Dongseo Co Ltd 32 –
2 ISU Chemical Co Ltd 17 –
5 IsuPetasys Co Ltd 14 –
2 Jahwa Electronics Co Ltd 19 –
9 JB Financial Group Co Ltd 34 –
6 Jcontentree Corp 14 –
3 Jusung Engineering Co Ltd 18 –
2 JW Holdings Corp 12 –
1 Kakao Corp 30 –
1 Kangwon Land Inc 20 –
1 KB Capital Co Ltd 15 –
6 KB Financial Group Inc 160 0.03
3 KB Insurance Co Ltd 60 0.01
2 KC Tech Co Ltd 22 –
– KCC Corp 95 0.02
1 KEPCO Engineering & Construction Co Inc 20 –
1 KEPCO Plant Service & Engineering Co Ltd 33 –
2 KH Vatec Co Ltd 16 –
5 Kia Motors Corp 131 0.03
– KISCO Corp 12 –
– KISWIRE Ltd 7 –
1 KIWOOM Securities Co Ltd 36 –
1 Koh Young Technology Inc 23 –
– Kolon Corp 15 –
1 Kolon Industries Inc 63 0.01
1 Komipharm International Co Ltd 20 –
1 KONA I Co Ltd 8 –
1 Korea Electric Power Corp 30 –
1 Korea Electric Power Corp, ADR 11 –
– Korea Electric Terminal Co Ltd 16 –
1 Korea Gas Corp 18 –
1 Korea Information & Communications Co Ltd 10 –
3 Korea Investment Holdings Co Ltd 80 0.02
– Korea Kolmar Co Ltd 15 –
– Korea Kolmar Holdings Co Ltd 8 –
1 Korea Line Corp 16 –
– Korea Petrochemical Ind Co Ltd 26 –
1 Korea United Pharm Inc 17 –
– Korea Zinc Co Ltd 16 –
3 Korean Air Lines Co Ltd 65 0.01
7 Korean Reinsurance Co 54 0.01
1 KT Corp 16 –
1 KT Skylife Co Ltd 18 –
1 KT&G Corp 87 0.02
– Kukdo Chemical Co Ltd 12 –
3 Kumho Industrial Co Ltd 20 –
1 Kumho Petrochemical Co Ltd 52 0.01
6 Kumho Tire Co Inc 35 –
– Kumkang Kind Co Ltd 1 –
2 Kwang Dong Pharmaceutical Co Ltd 12 –
3 Kwangju Bank 18 –
2 Kyobo Securities Co Ltd 15 –
1 Kyungbang Ltd 12 –
– KyungDong City Gas Co Ltd 3 –
2 Leadcorp Inc 9 –
– Leaders Cosmetics Co Ltd 4 –
– LEENO Industrial Inc 11 –
1 LF Corp 16 –
1 LG Chem Ltd 107 0.02
2 LG Corp 65 0.02
10 LG Display Co Ltd 201 0.04
11 LG Display Co Ltd, ADR 103 0.02
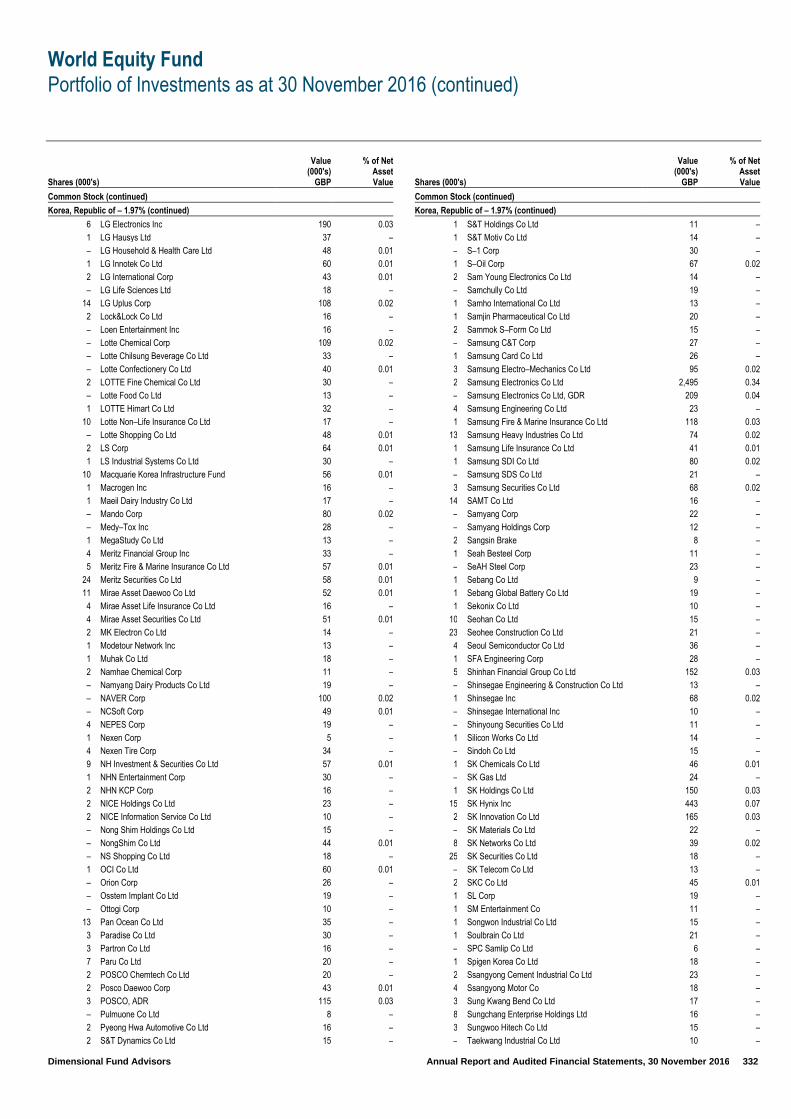
World Equity Fund
Portfolio of Investments as at 30 November 2016 (continued)
Dimensional Fund Advisors Annual Report and Audited Financial Statements, 30 November 2016 332
Shares (000's)
Value (000's)
GBP
% of Net Asset Value
Common Stock (continued)
Korea, Republic of – 1.97% (continued)
6 LG Electronics Inc 190 0.03
1 LG Hausys Ltd 37 –
– LG Household & Health Care Ltd 48 0.01
1 LG Innotek Co Ltd 60 0.01
2 LG International Corp 43 0.01
– LG Life Sciences Ltd 18 –
14 LG Uplus Corp 108 0.02
2 Lock&Lock Co Ltd 16 –
– Loen Entertainment Inc 16 –
– Lotte Chemical Corp 109 0.02
– Lotte Chilsung Beverage Co Ltd 33 –
– Lotte Confectionery Co Ltd 40 0.01
2 LOTTE Fine Chemical Co Ltd 30 –
– Lotte Food Co Ltd 13 –
1 LOTTE Himart Co Ltd 32 –
10 Lotte Non–Life Insurance Co Ltd 17 –
– Lotte Shopping Co Ltd 48 0.01
2 LS Corp 64 0.01
1 LS Industrial Systems Co Ltd 30 –
10 Macquarie Korea Infrastructure Fund 56 0.01
1 Macrogen Inc 16 –
1 Maeil Dairy Industry Co Ltd 17 –
– Mando Corp 80 0.02
– Medy–Tox Inc 28 –
1 MegaStudy Co Ltd 13 –
4 Meritz Financial Group Inc 33 –
5 Meritz Fire & Marine Insurance Co Ltd 57 0.01
24 Meritz Securities Co Ltd 58 0.01
11 Mirae Asset Daewoo Co Ltd 52 0.01
4 Mirae Asset Life Insurance Co Ltd 16 –
4 Mirae Asset Securities Co Ltd 51 0.01
2 MK Electron Co Ltd 14 –
1 Modetour Network Inc 13 –
1 Muhak Co Ltd 18 –
2 Namhae Chemical Corp 11 –
– Namyang Dairy Products Co Ltd 19 –
– NAVER Corp 100 0.02
– NCSoft Corp 49 0.01
4 NEPES Corp 19 –
1 Nexen Corp 5 –
4 Nexen Tire Corp 34 –
9 NH Investment & Securities Co Ltd 57 0.01
1 NHN Entertainment Corp 30 –
2 NHN KCP Corp 16 –
2 NICE Holdings Co Ltd 23 –
2 NICE Information Service Co Ltd 10 –
– Nong Shim Holdings Co Ltd 15 –
– NongShim Co Ltd 44 0.01
– NS Shopping Co Ltd 18 –
1 OCI Co Ltd 60 0.01
– Orion Corp 26 –
– Osstem Implant Co Ltd 19 –
– Ottogi Corp 10 –
13 Pan Ocean Co Ltd 35 –
3 Paradise Co Ltd 30 –
3 Partron Co Ltd 16 –
7 Paru Co Ltd 20 –
2 POSCO Chemtech Co Ltd 20 –
2 Posco Daewoo Corp 43 0.01
3 POSCO, ADR 115 0.03
– Pulmuone Co Ltd 8 –
2 Pyeong Hwa Automotive Co Ltd 16 –
2 S&T Dynamics Co Ltd 15 –
Shares (000's)
Value (000's)
GBP
% of Net Asset Value
Common Stock (continued)
Korea, Republic of – 1.97% (continued)
1 S&T Holdings Co Ltd 11 –
1 S&T Motiv Co Ltd 14 –
– S–1 Corp 30 –
1 S–Oil Corp 67 0.02
2 Sam Young Electronics Co Ltd 14 –
– Samchully Co Ltd 19 –
1 Samho International Co Ltd 13 –
1 Samjin Pharmaceutical Co Ltd 20 –
2 Sammok S–Form Co Ltd 15 –
– Samsung C&T Corp 27 –
1 Samsung Card Co Ltd 26 –
3 Samsung Electro–Mechanics Co Ltd 95 0.02
2 Samsung Electronics Co Ltd 2,495 0.34
– Samsung Electronics Co Ltd, GDR 209 0.04
4 Samsung Engineering Co Ltd 23 –
1 Samsung Fire & Marine Insurance Co Ltd 118 0.03
13 Samsung Heavy Industries Co Ltd 74 0.02
1 Samsung Life Insurance Co Ltd 41 0.01
1 Samsung SDI Co Ltd 80 0.02
– Samsung SDS Co Ltd 21 –
3 Samsung Securities Co Ltd 68 0.02
14 SAMT Co Ltd 16 –
– Samyang Corp 22 –
– Samyang Holdings Corp 12 –
2 Sangsin Brake 8 –
1 Seah Besteel Corp 11 –
– SeAH Steel Corp 23 –
1 Sebang Co Ltd 9 –
1 Sebang Global Battery Co Ltd 19 –
1 Sekonix Co Ltd 10 –
10 Seohan Co Ltd 15 –
23 Seohee Construction Co Ltd 21 –
4 Seoul Semiconductor Co Ltd 36 –
1 SFA Engineering Corp 28 –
5 Shinhan Financial Group Co Ltd 152 0.03
– Shinsegae Engineering & Construction Co Ltd 13 –
1 Shinsegae Inc 68 0.02
– Shinsegae International Inc 10 –
– Shinyoung Securities Co Ltd 11 –
1 Silicon Works Co Ltd 14 –
– Sindoh Co Ltd 15 –
1 SK Chemicals Co Ltd 46 0.01
– SK Gas Ltd 24 –
1 SK Holdings Co Ltd 150 0.03
15 SK Hynix Inc 443 0.07
2 SK Innovation Co Ltd 165 0.03
– SK Materials Co Ltd 22 –
8 SK Networks Co Ltd 39 0.02
25 SK Securities Co Ltd 18 –
– SK Telecom Co Ltd 13 –
2 SKC Co Ltd 45 0.01
1 SL Corp 19 –
1 SM Entertainment Co 11 –
1 Songwon Industrial Co Ltd 15 –
1 Soulbrain Co Ltd 21 –
– SPC Samlip Co Ltd 6 –
1 Spigen Korea Co Ltd 18 –
2 Ssangyong Cement Industrial Co Ltd 23 –
4 Ssangyong Motor Co 18 –
3 Sung Kwang Bend Co Ltd 17 –
8 Sungchang Enterprise Holdings Ltd 16 –
3 Sungwoo Hitech Co Ltd 15 –
– Taekwang Industrial Co Ltd 10 –
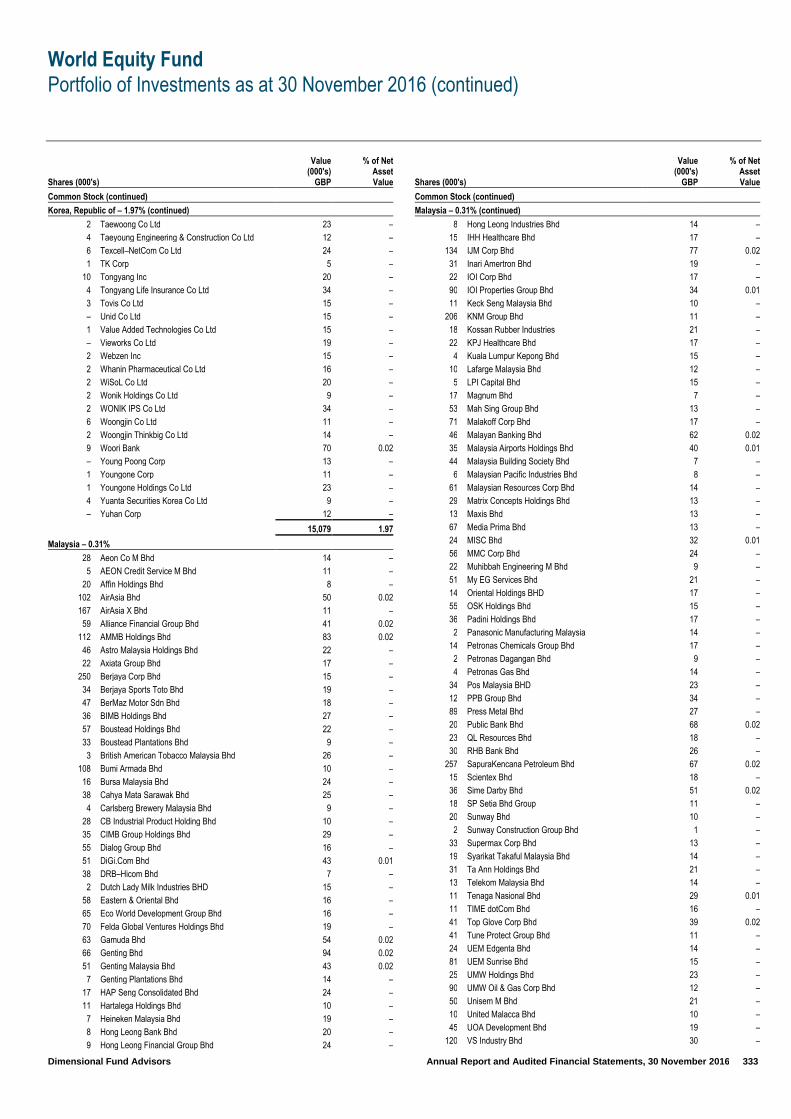
World Equity Fund
Portfolio of Investments as at 30 November 2016 (continued)
Dimensional Fund Advisors Annual Report and Audited Financial Statements, 30 November 2016 333
Shares (000's)
Value (000's)
GBP
% of Net Asset Value
Common Stock (continued)
Korea, Republic of – 1.97% (continued)
2 Taewoong Co Ltd 23 –
4 Taeyoung Engineering & Construction Co Ltd 12 –
6 Texcell–NetCom Co Ltd 24 –
1 TK Corp 5 –
10 Tongyang Inc 20 –
4 Tongyang Life Insurance Co Ltd 34 –
3 Tovis Co Ltd 15 –
– Unid Co Ltd 15 –
1 Value Added Technologies Co Ltd 15 –
– Vieworks Co Ltd 19 –
2 Webzen Inc 15 –
2 Whanin Pharmaceutical Co Ltd 16 –
2 WiSoL Co Ltd 20 –
2 Wonik Holdings Co Ltd 9 –
2 WONIK IPS Co Ltd 34 –
6 Woongjin Co Ltd 11 –
2 Woongjin Thinkbig Co Ltd 14 –
9 Woori Bank 70 0.02
– Young Poong Corp 13 –
1 Youngone Corp 11 –
1 Youngone Holdings Co Ltd 23 –
4 Yuanta Securities Korea Co Ltd 9 –
– Yuhan Corp 12 –
15,079 1.97
Malaysia – 0.31%
28 Aeon Co M Bhd 14 –
5 AEON Credit Service M Bhd 11 –
20 Affin Holdings Bhd 8 –
102 AirAsia Bhd 50 0.02
167 AirAsia X Bhd 11 –
59 Alliance Financial Group Bhd 41 0.02
112 AMMB Holdings Bhd 83 0.02
46 Astro Malaysia Holdings Bhd 22 –
22 Axiata Group Bhd 17 –
250 Berjaya Corp Bhd 15 –
34 Berjaya Sports Toto Bhd 19 –
47 BerMaz Motor Sdn Bhd 18 –
36 BIMB Holdings Bhd 27 –
57 Boustead Holdings Bhd 22 –
33 Boustead Plantations Bhd 9 –
3 British American Tobacco Malaysia Bhd 26 –
108 Bumi Armada Bhd 10 –
16 Bursa Malaysia Bhd 24 –
38 Cahya Mata Sarawak Bhd 25 –
4 Carlsberg Brewery Malaysia Bhd 9 –
28 CB Industrial Product Holding Bhd 10 –
35 CIMB Group Holdings Bhd 29 –
55 Dialog Group Bhd 16 –
51 DiGi.Com Bhd 43 0.01
38 DRB–Hicom Bhd 7 –
2 Dutch Lady Milk Industries BHD 15 –
58 Eastern & Oriental Bhd 16 –
65 Eco World Development Group Bhd 16 –
70 Felda Global Ventures Holdings Bhd 19 –
63 Gamuda Bhd 54 0.02
66 Genting Bhd 94 0.02
51 Genting Malaysia Bhd 43 0.02
7 Genting Plantations Bhd 14 –
17 HAP Seng Consolidated Bhd 24 –
11 Hartalega Holdings Bhd 10 –
7 Heineken Malaysia Bhd 19 –
8 Hong Leong Bank Bhd 20 –
9 Hong Leong Financial Group Bhd 24 –
Shares (000's)
Value (000's)
GBP
% of Net Asset Value
Common Stock (continued)
Malaysia – 0.31% (continued)
8 Hong Leong Industries Bhd 14 –
15 IHH Healthcare Bhd 17 –
134 IJM Corp Bhd 77 0.02
31 Inari Amertron Bhd 19 –
22 IOI Corp Bhd 17 –
90 IOI Properties Group Bhd 34 0.01
11 Keck Seng Malaysia Bhd 10 –
206 KNM Group Bhd 11 –
18 Kossan Rubber Industries 21 –
22 KPJ Healthcare Bhd 17 –
4 Kuala Lumpur Kepong Bhd 15 –
10 Lafarge Malaysia Bhd 12 –
5 LPI Capital Bhd 15 –
17 Magnum Bhd 7 –
53 Mah Sing Group Bhd 13 –
71 Malakoff Corp Bhd 17 –
46 Malayan Banking Bhd 62 0.02
35 Malaysia Airports Holdings Bhd 40 0.01
44 Malaysia Building Society Bhd 7 –
6 Malaysian Pacific Industries Bhd 8 –
61 Malaysian Resources Corp Bhd 14 –
29 Matrix Concepts Holdings Bhd 13 –
13 Maxis Bhd 13 –
67 Media Prima Bhd 13 –
24 MISC Bhd 32 0.01
56 MMC Corp Bhd 24 –
22 Muhibbah Engineering M Bhd 9 –
51 My EG Services Bhd 21 –
14 Oriental Holdings BHD 17 –
55 OSK Holdings Bhd 15 –
36 Padini Holdings Bhd 17 –
2 Panasonic Manufacturing Malaysia 14 –
14 Petronas Chemicals Group Bhd 17 –
2 Petronas Dagangan Bhd 9 –
4 Petronas Gas Bhd 14 –
34 Pos Malaysia BHD 23 –
12 PPB Group Bhd 34 –
89 Press Metal Bhd 27 –
20 Public Bank Bhd 68 0.02
23 QL Resources Bhd 18 –
30 RHB Bank Bhd 26 –
257 SapuraKencana Petroleum Bhd 67 0.02
15 Scientex Bhd 18 –
36 Sime Darby Bhd 51 0.02
18 SP Setia Bhd Group 11 –
20 Sunway Bhd 10 –
2 Sunway Construction Group Bhd 1 –
33 Supermax Corp Bhd 13 –
19 Syarikat Takaful Malaysia Bhd 14 –
31 Ta Ann Holdings Bhd 21 –
13 Telekom Malaysia Bhd 14 –
11 Tenaga Nasional Bhd 29 0.01
11 TIME dotCom Bhd 16 –
41 Top Glove Corp Bhd 39 0.02
41 Tune Protect Group Bhd 11 –
24 UEM Edgenta Bhd 14 –
81 UEM Sunrise Bhd 15 –
25 UMW Holdings Bhd 23 –
90 UMW Oil & Gas Corp Bhd 12 –
50 Unisem M Bhd 21 –
10 United Malacca Bhd 10 –
45 UOA Development Bhd 19 –
120 VS Industry Bhd 30 –

World Equity Fund
Portfolio of Investments as at 30 November 2016 (continued)
Dimensional Fund Advisors Annual Report and Audited Financial Statements, 30 November 2016 334
Shares (000's)
Value (000's)
GBP
% of Net Asset Value
Common Stock (continued)
Malaysia – 0.31% (continued)
58 WCT Holdings Bhd 18 –
18 Westports Holdings Bhd 14 –
31 Yinson Holdings Bhd 16 –
287 YTL Corp Bhd 74 0.02
69 YTL Power International Bhd 17 –
2,403 0.31
Mexico – 0.39%
126 Alfa SAB de CV 133 0.02
35 Alpek SAB de CV 39 0.01
29 Alsea SAB de CV 69 0.01
149 America Movil SAB de CV 72 0.01
13 Arca Continental SAB de CV 56 0.01
48 Axtel SAB de CV 8 –
14 Banregio Grupo Financiero SAB de CV 60 0.01
25 Bolsa Mexicana de Valores SAB de CV 26 –
420 Cemex SAB de CV 261 0.04
11 Coca–Cola Femsa SAB de CV 57 0.01
51 Consorcio ARA SAB de CV 14 –
45 Controladora Vuela Cia de Aviacion SAB de CV 53 0.01 1
Controladora Vuela Cia de Aviacion SAB de CV, ADR 13 –
17 Corp Actinver SAB de CV 8 –
29 Corp Inmobiliaria Vesta SAB de CV 28 –
1 Corporativo Fragua SAB de CV 7 –
13 Credito Real SAB de CV SOFOM ER 15 –
2 El Puerto de Liverpool SAB de CV 11 –
18 Fomento Economico Mexicano SAB de CV 111 0.01
– Fomento Economico Mexicano SAB de CV, ADR 17 –
44 Genomma Lab Internacional SAB de CV 38 –
65 Gentera SAB de CV 82 0.01
7 Gruma SAB de CV 71 0.01
22 Grupo Aeromexico SAB de CV 30 –
10 Grupo Aeroportuario del Centro Norte SAB de CV 36 –
7 Grupo Aeroportuario del Pacifico SAB de CV 49 0.01
5 Grupo Aeroportuario del Sureste SAB de CV 54 0.01
28 Grupo Bimbo SAB de CV 51 0.01
16 Grupo Carso SAB de CV 47 0.01
22 Grupo Comercial Chedraui SA de CV 32 –
2 Grupo Elektra SAB DE CV 23 –
9 Grupo Famsa SAB de CV 2 –
42 Grupo Financiero Banorte SAB de CV 160 0.03
46 Grupo Financiero Inbursa SAB de CV 50 0.01
7 Grupo Financiero Interacciones SA de CV 20 –
30 Grupo Financiero Santander Mexico SAB de CV 34 –
18 Grupo Herdez SAB de CV 29 –
7 Grupo Industrial Saltillo SAB de CV 10 –
6 Grupo KUO SAB De CV 8 –
12 Grupo Lala SAB de CV 15 –
70 Grupo Mexico SAB de CV 153 0.03
10 Grupo Rotoplas SAB de CV 11 –
19 Grupo Sanborns SAB de CV 17 –
15 Grupo Simec SAB de CV 45 0.01
43 Grupo Televisa SAB 142 0.02
17 Hoteles City Express SAB de CV 10 –
15 Industrias Bachoco SAB de CV 48 0.01
10 Industrias CH SAB de CV 47 0.01
6 Industrias Penoles SAB de CV 95 0.01
6 Infraestructura Energetica Nova SAB de CV 21 –
31 Kimberly–Clark de Mexico SAB de CV 44 0.01
16 La Comer SAB de CV 10 –
21 Megacable Holdings SAB de CV 52 0.01
72 Mexichem SAB de CV 136 0.02
Shares (000's)
Value (000's)
GBP
% of Net Asset Value
Common Stock (continued)
Mexico – 0.39% (continued)
14 Minera Frisco SAB de CV 8 –
47 OHL Mexico SAB de CV 32 –
9 Organizacion Cultiba SAB de CV 7 –
13 Organizacion Soriana SAB de CV 23 – 7
Promotora y Operadora de Infraestructura SAB de CV 51 0.01
8 Qualitas Controladora SAB de CV 9 –
47 Telesites SAB de CV 22 –
72 TV Azteca SAB de CV 9 –
8 Vitro SAB de CV 16 –
31 Wal–Mart de Mexico SAB de CV 46 0.01
2,953 0.39
Netherlands – 0.88%
7 Aalberts Industries NV 181 0.02
2 Accell Group 27 –
40 Aegon NV 163 0.02
9 Akzo Nobel NV 438 0.07
4 Altice NV, Class A 55 0.01
1 Altice NV, Class B 11 –
2 AMG Advanced Metallurgical Group NV 26 –
1 Amsterdam Commodities NV 18 –
3 APERAM SA 124 0.02
4 Arcadis NV 38 –
34 ArcelorMittal 203 0.03
4 ASM International NV 120 0.02
– ASML Holding NV 8 –
1 ASML Holding NV (Netherlands listing) 107 0.01
3 BE Semiconductor Industries NV 68 0.01
2 Beter Bed Holding NV 22 –
6 BinckBank NV 27 –
6 Boskalis Westminster 156 0.02
1 Brunel International NV 15 –
2 Coca–Cola European Partners PLC 62 0.01
4 Corbion NV 74 0.01
34 Delta Lloyd NV 158 0.02
3 Fugro NV 41 0.01
4 Gemalto NV 181 0.02
1 GrandVision NV 11 –
2 Heijmans NV 9 –
3 Heineken NV 195 0.03
– Hunter Douglas NV 16 –
2 IMCD Group NV 80 0.01
31 ING Groep NV 342 0.05
1 KAS Bank NV 6 –
1 Kendrion NV 14 –
50 Koninklijke Ahold Delhaize NV 789 0.10
18 Koninklijke BAM Groep NV 62 0.01
4 Koninklijke DSM NV 214 0.03
119 Koninklijke KPN NV 273 0.04
21 Koninklijke Philips NV 481 0.07
5 Koninklijke Vopak NV 173 0.02
6 NN Group NV 163 0.02
1 NXP Semiconductors NV 88 0.01
17 Ordina NV 26 –
25 PostNL NV 97 0.01
6 Randstad Holding NV 249 0.03
12 RELX NV 154 0.02
14 SBM Offshore NV 166 0.02
2 Sligro Food Group NV 49 0.01
2 TKH Group NV 67 0.01
4 TomTom NV 24 –
9 Unilever NV 295 0.04
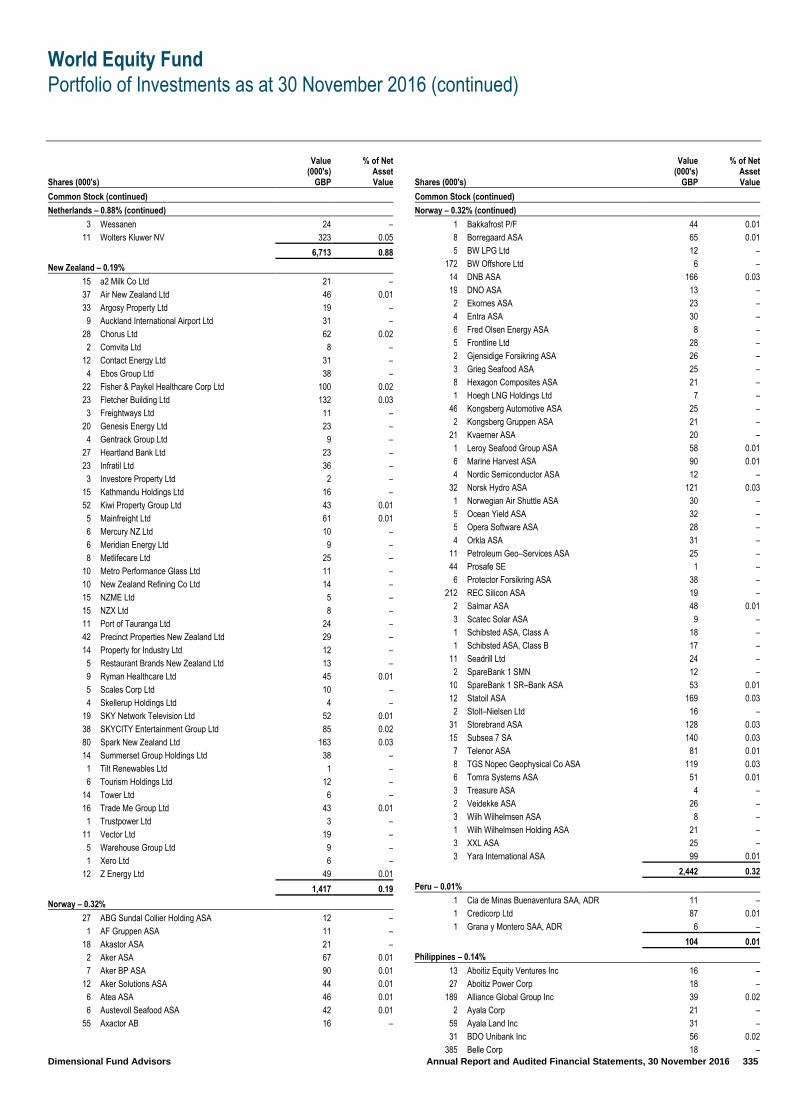
World Equity Fund
Portfolio of Investments as at 30 November 2016 (continued)
Dimensional Fund Advisors Annual Report and Audited Financial Statements, 30 November 2016 335
Shares (000's)
Value (000's)
GBP
% of Net Asset Value
Common Stock (continued)
Netherlands – 0.88% (continued)
3 Wessanen 24 –
11 Wolters Kluwer NV 323 0.05
6,713 0.88
New Zealand – 0.19%
15 a2 Milk Co Ltd 21 –
37 Air New Zealand Ltd 46 0.01
33 Argosy Property Ltd 19 –
9 Auckland International Airport Ltd 31 –
28 Chorus Ltd 62 0.02
2 Comvita Ltd 8 –
12 Contact Energy Ltd 31 –
4 Ebos Group Ltd 38 –
22 Fisher & Paykel Healthcare Corp Ltd 100 0.02
23 Fletcher Building Ltd 132 0.03
3 Freightways Ltd 11 –
20 Genesis Energy Ltd 23 –
4 Gentrack Group Ltd 9 –
27 Heartland Bank Ltd 23 –
23 Infratil Ltd 36 –
3 Investore Property Ltd 2 –
15 Kathmandu Holdings Ltd 16 –
52 Kiwi Property Group Ltd 43 0.01
5 Mainfreight Ltd 61 0.01
6 Mercury NZ Ltd 10 –
6 Meridian Energy Ltd 9 –
8 Metlifecare Ltd 25 –
10 Metro Performance Glass Ltd 11 –
10 New Zealand Refining Co Ltd 14 –
15 NZME Ltd 5 –
15 NZX Ltd 8 –
11 Port of Tauranga Ltd 24 –
42 Precinct Properties New Zealand Ltd 29 –
14 Property for Industry Ltd 12 –
5 Restaurant Brands New Zealand Ltd 13 –
9 Ryman Healthcare Ltd 45 0.01
5 Scales Corp Ltd 10 –
4 Skellerup Holdings Ltd 4 –
19 SKY Network Television Ltd 52 0.01
38 SKYCITY Entertainment Group Ltd 85 0.02
80 Spark New Zealand Ltd 163 0.03
14 Summerset Group Holdings Ltd 38 –
1 Tilt Renewables Ltd 1 –
6 Tourism Holdings Ltd 12 –
14 Tower Ltd 6 –
16 Trade Me Group Ltd 43 0.01
1 Trustpower Ltd 3 –
11 Vector Ltd 19 –
5 Warehouse Group Ltd 9 –
1 Xero Ltd 6 –
12 Z Energy Ltd 49 0.01
1,417 0.19
Norway – 0.32%
27 ABG Sundal Collier Holding ASA 12 –
1 AF Gruppen ASA 11 –
18 Akastor ASA 21 –
2 Aker ASA 67 0.01
7 Aker BP ASA 90 0.01
12 Aker Solutions ASA 44 0.01
6 Atea ASA 46 0.01
6 Austevoll Seafood ASA 42 0.01
55 Axactor AB 16 –
Shares (000's)
Value (000's)
GBP
% of Net Asset Value
Common Stock (continued)
Norway – 0.32% (continued)
1 Bakkafrost P/F 44 0.01
8 Borregaard ASA 65 0.01
5 BW LPG Ltd 12 –
172 BW Offshore Ltd 6 –
14 DNB ASA 166 0.03
19 DNO ASA 13 –
2 Ekornes ASA 23 –
4 Entra ASA 30 –
6 Fred Olsen Energy ASA 8 –
5 Frontline Ltd 28 –
2 Gjensidige Forsikring ASA 26 –
3 Grieg Seafood ASA 25 –
8 Hexagon Composites ASA 21 –
1 Hoegh LNG Holdings Ltd 7 –
46 Kongsberg Automotive ASA 25 –
2 Kongsberg Gruppen ASA 21 –
21 Kvaerner ASA 20 –
1 Leroy Seafood Group ASA 58 0.01
6 Marine Harvest ASA 90 0.01
4 Nordic Semiconductor ASA 12 –
32 Norsk Hydro ASA 121 0.03
1 Norwegian Air Shuttle ASA 30 –
5 Ocean Yield ASA 32 –
5 Opera Software ASA 28 –
4 Orkla ASA 31 –
11 Petroleum Geo–Services ASA 25 –
44 Prosafe SE 1 –
6 Protector Forsikring ASA 38 –
212 REC Silicon ASA 19 –
2 Salmar ASA 48 0.01
3 Scatec Solar ASA 9 –
1 Schibsted ASA, Class A 18 –
1 Schibsted ASA, Class B 17 –
11 Seadrill Ltd 24 –
2 SpareBank 1 SMN 12 –
10 SpareBank 1 SR–Bank ASA 53 0.01
12 Statoil ASA 169 0.03
2 Stolt–Nielsen Ltd 16 –
31 Storebrand ASA 128 0.03
15 Subsea 7 SA 140 0.03
7 Telenor ASA 81 0.01
8 TGS Nopec Geophysical Co ASA 119 0.03
6 Tomra Systems ASA 51 0.01
3 Treasure ASA 4 –
2 Veidekke ASA 26 –
3 Wilh Wilhelmsen ASA 8 –
1 Wilh Wilhelmsen Holding ASA 21 –
3 XXL ASA 25 –
3 Yara International ASA 99 0.01
2,442 0.32
Peru – 0.01%
1 Cia de Minas Buenaventura SAA, ADR 11 –
1 Credicorp Ltd 87 0.01
1 Grana y Montero SAA, ADR 6 –
104 0.01
Philippines – 0.14%
13 Aboitiz Equity Ventures Inc 16 –
27 Aboitiz Power Corp 18 –
189 Alliance Global Group Inc 39 0.02
2 Ayala Corp 21 –
59 Ayala Land Inc 31 –
31 BDO Unibank Inc 56 0.02
385 Belle Corp 18 –

World Equity Fund
Portfolio of Investments as at 30 November 2016 (continued)
Dimensional Fund Advisors Annual Report and Audited Financial Statements, 30 November 2016 336
Shares (000's)
Value (000's)
GBP
% of Net Asset Value
Common Stock (continued)
Philippines – 0.14% (continued)
108 Bloomberry Resorts Corp 11 –
10 Cebu Air Inc 16 –
5 China Banking Corp 3 –
73 Cosco Capital Inc 10 –
94 D&L Industries Inc 17 –
177 DMCI Holdings Inc 39 0.02
130 Emperador Inc 15 –
572 Energy Development Corp 47 0.02
690 Filinvest Land Inc 19 –
75 First Gen Corp 26 –
25 First Philippine Holdings Corp 27 –
2 Globe Telecom Inc 35 –
1 GT Capital Holdings Inc 27 –
29 International Container Terminal Services Inc 34 –
9 JG Summit Holdings Inc 10 –
6 Jollibee Foods Corp 21 –
195 Lopez Holdings Corp 24 –
87 LT Group Inc 18 –
4 Manila Electric Co 15 –
43 Manila Water Co Inc 20 –
489 Megaworld Corp 29 –
417 Metro Pacific Investments Corp 42 0.02
11 Metropolitan Bank & Trust Co 13 –
85 Petron Corp 13 –
93 Philex Mining Corp 12 –
21 Philippine National Bank 19 –
– PLDT Inc 7 –
– PLDT Inc, ADR 10 –
28 Puregold Price Club Inc 18 –
13 Rizal Commercial Banking Corp 7 –
70 Robinsons Land Corp 29 –
20 Robinsons Retail Holdings Inc 24 –
30 San Miguel Corp 40 0.02
20 Security Bank Corp 59 0.02
12 Semirara Mining & Power Corp 25 –
24 SM Prime Holdings Inc 10 –
13 Union Bank of the Philippines 15 –
3 Universal Robina Corp 8 –
337 Vista Land & Lifescapes Inc 27 –
1,040 0.14
Poland – 0.17%
3 Alior Bank SA 26 –
– Amica SA 13 –
5 Asseco Poland SA 51 0.02
38 Bank Millennium SA 38 –
1 Bank Pekao SA 20 –
– Bank Zachodni WBK SA 15 –
7 Boryszew SA 10 –
– Budimex SA 19 –
1 CCC SA 19 –
3 CD Projekt SA 31 –
– ComArch SA 11 –
7 Cyfrowy Polsat SA 30 –
17 Enea SA 30 –
4 Energa SA 6 –
2 Eurocash SA 14 –
1 Fabryki Mebli Forte SA 11 –
12 Globe Trade Centre SA 18 –
2 Grupa Azoty SA 21 –
1 Grupa Kety SA 55 0.02
7 Grupa Lotos SA 48 0.02
– ING Bank Slaski SA 12 –
– Inter Cars SA 11 –
Shares (000's)
Value (000's)
GBP
% of Net Asset Value
Common Stock (continued)
Poland – 0.17% (continued)
8 Jastrzebska Spolka Weglowa SA 130 0.03
3 Kernel Holding SA 40 0.01
2 KGHM Polska Miedz SA 39 0.01
1 KRUK SA 21 –
– LPP SA 11 –
– mBank SA 26 –
25 Netia SA 22 –
24 Orange Polska SA 25 –
2 Orbis SA 27 –
2 Pfleiderer Group SA 13 –
39 PGE Polska Grupa Energetyczna SA 69 0.02
1 PKP Cargo SA 9 –
10 Polski Koncern Naftowy Orlen SA 143 0.03
11 Polskie Gornictwo Naftowe i Gazownictwo SA 11 –
10 Powszechna Kasa Oszczednosci Bank Polski SA 47 0.01
5 Powszechny Zaklad Ubezpieczen SA 29 –
16 Stalexport Autostrady SA 11 –
– Stalprodukt SA 16 –
32 Synthos SA 27 –
63 Tauron Polska Energia SA 32 –
2 Warsaw Stock Exchange 16 –
1,273 0.17
Portugal – 0.10%
6 Altri SGPS SA 17 –
41 Banco BPI SA 39 0.01
21 Banco Comercial Portugues SA 21 –
45 Banco Espirito Santo SA – –
6 CTT–Correios de Portugal SA 31 –
23 EDP – Energias de Portugal SA 52 0.01
16 EDP Renovaveis SA 79 0.01
18 Galp Energia SGPS SA 196 0.03
9 Jeronimo Martins SGPS SA 108 0.01
9 Mota–Engil SGPS SA 11 –
16 Navigator Co SA 41 0.01
13 NOS SGPS SA 57 0.01
10 REN – Redes Energeticas Nacionais SGPS SA 21 –
2 Semapa–Sociedade de Investimento e Gestao 19 –
65 Sonae SGPS SA 44 0.01
736 0.10
Russia – 0.11%
35 Gazprom PJSC, ADR 129 0.03
2 Lukoil PJSC, ADR 92 0.02
8 Magnitogorsk Iron & Steel OJSC, GDR 42 0.01
2 MegaFon PJSC, GDR 17 –
3 MMC Norilsk Nickel PJSC, ADR 45 0.01
– Novatek OJSC 25 –
2 Novolipetsk Steel PJSC, GDR 31 –
2 PhosAgro PJSC, GDR 27 –
6 Rosneft PJSC, GDR 25 –
1 Rostelecom PJSC, ADR 8 –
27 RusHydro PJSC, ADR 30 –
20 Sberbank of Russia PJSC, ADR 159 0.03
3 Severstal PJSC, GDR 35 –
3 Tatneft PJSC, ADR 81 0.01
4 TMK PJSC, GDR 16 –
13 VimpelCom Ltd, ADR 36 –
23 VTB Bank PJSC, GDR 38 –
1 X5 Retail Group NV, GDR 15 –
851 0.11
Singapore – 0.41%
51 Accordia Golf Trust 19 –
24 Ascendas India Trust 14 –
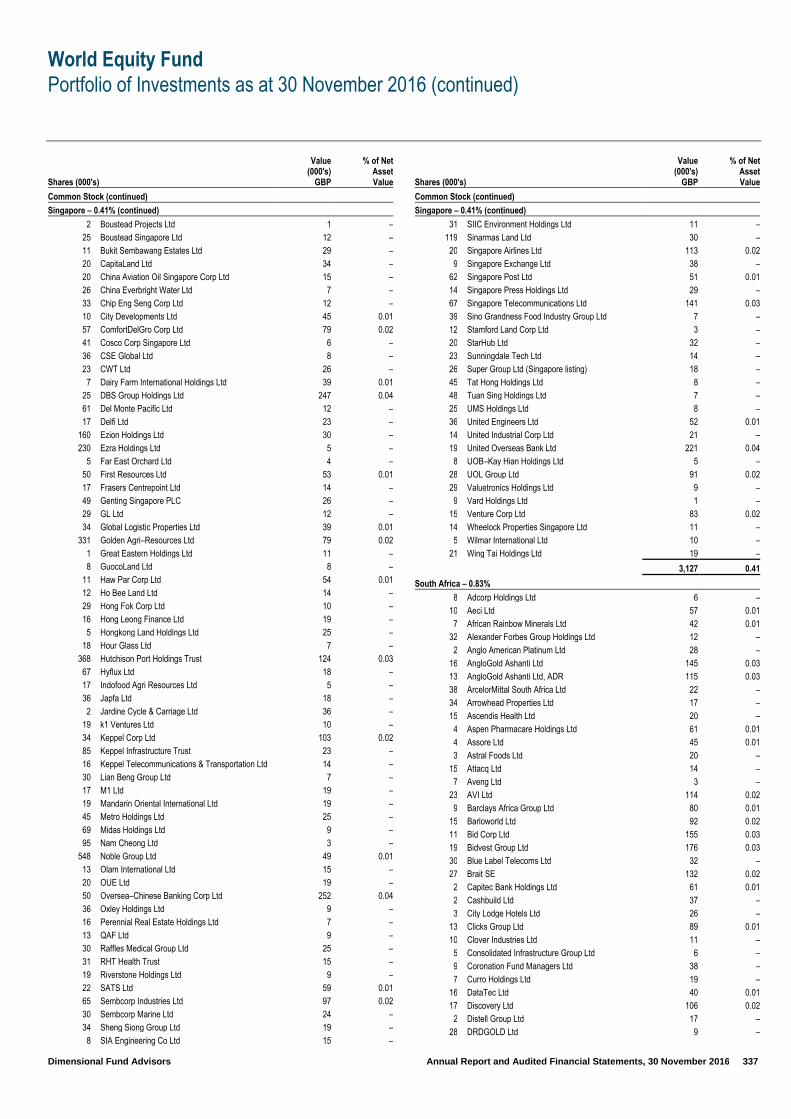
World Equity Fund
Portfolio of Investments as at 30 November 2016 (continued)
Dimensional Fund Advisors Annual Report and Audited Financial Statements, 30 November 2016 337
Shares (000's)
Value (000's)
GBP
% of Net Asset Value
Common Stock (continued)
Singapore – 0.41% (continued)
2 Boustead Projects Ltd 1 –
25 Boustead Singapore Ltd 12 –
11 Bukit Sembawang Estates Ltd 29 –
20 CapitaLand Ltd 34 –
20 China Aviation Oil Singapore Corp Ltd 15 –
26 China Everbright Water Ltd 7 –
33 Chip Eng Seng Corp Ltd 12 –
10 City Developments Ltd 45 0.01
57 ComfortDelGro Corp Ltd 79 0.02
41 Cosco Corp Singapore Ltd 6 –
36 CSE Global Ltd 8 –
23 CWT Ltd 26 –
7 Dairy Farm International Holdings Ltd 39 0.01
25 DBS Group Holdings Ltd 247 0.04
61 Del Monte Pacific Ltd 12 –
17 Delfi Ltd 23 –
160 Ezion Holdings Ltd 30 –
230 Ezra Holdings Ltd 5 –
5 Far East Orchard Ltd 4 –
50 First Resources Ltd 53 0.01
17 Frasers Centrepoint Ltd 14 –
49 Genting Singapore PLC 26 –
29 GL Ltd 12 –
34 Global Logistic Properties Ltd 39 0.01
331 Golden Agri–Resources Ltd 79 0.02
1 Great Eastern Holdings Ltd 11 –
8 GuocoLand Ltd 8 –
11 Haw Par Corp Ltd 54 0.01
12 Ho Bee Land Ltd 14 –
29 Hong Fok Corp Ltd 10 –
16 Hong Leong Finance Ltd 19 –
5 Hongkong Land Holdings Ltd 25 –
18 Hour Glass Ltd 7 –
368 Hutchison Port Holdings Trust 124 0.03
67 Hyflux Ltd 18 –
17 Indofood Agri Resources Ltd 5 –
36 Japfa Ltd 18 –
2 Jardine Cycle & Carriage Ltd 36 –
19 k1 Ventures Ltd 10 –
34 Keppel Corp Ltd 103 0.02
85 Keppel Infrastructure Trust 23 –
16 Keppel Telecommunications & Transportation Ltd 14 –
30 Lian Beng Group Ltd 7 –
17 M1 Ltd 19 –
19 Mandarin Oriental International Ltd 19 –
45 Metro Holdings Ltd 25 –
69 Midas Holdings Ltd 9 –
95 Nam Cheong Ltd 3 –
548 Noble Group Ltd 49 0.01
13 Olam International Ltd 15 –
20 OUE Ltd 19 –
50 Oversea–Chinese Banking Corp Ltd 252 0.04
36 Oxley Holdings Ltd 9 –
16 Perennial Real Estate Holdings Ltd 7 –
13 QAF Ltd 9 –
30 Raffles Medical Group Ltd 25 –
31 RHT Health Trust 15 –
19 Riverstone Holdings Ltd 9 –
22 SATS Ltd 59 0.01
65 Sembcorp Industries Ltd 97 0.02
30 Sembcorp Marine Ltd 24 –
34 Sheng Siong Group Ltd 19 –
8 SIA Engineering Co Ltd 15 –
Shares (000's)
Value (000's)
GBP
% of Net Asset Value
Common Stock (continued)
Singapore – 0.41% (continued)
31 SIIC Environment Holdings Ltd 11 –
119 Sinarmas Land Ltd 30 –
20 Singapore Airlines Ltd 113 0.02
9 Singapore Exchange Ltd 38 –
62 Singapore Post Ltd 51 0.01
14 Singapore Press Holdings Ltd 29 –
67 Singapore Telecommunications Ltd 141 0.03
39 Sino Grandness Food Industry Group Ltd 7 –
12 Stamford Land Corp Ltd 3 –
20 StarHub Ltd 32 –
23 Sunningdale Tech Ltd 14 –
26 Super Group Ltd (Singapore listing) 18 –
45 Tat Hong Holdings Ltd 8 –
48 Tuan Sing Holdings Ltd 7 –
25 UMS Holdings Ltd 8 –
36 United Engineers Ltd 52 0.01
14 United Industrial Corp Ltd 21 –
19 United Overseas Bank Ltd 221 0.04
8 UOB–Kay Hian Holdings Ltd 5 –
28 UOL Group Ltd 91 0.02
29 Valuetronics Holdings Ltd 9 –
9 Vard Holdings Ltd 1 –
15 Venture Corp Ltd 83 0.02
14 Wheelock Properties Singapore Ltd 11 –
5 Wilmar International Ltd 10 –
21 Wing Tai Holdings Ltd 19 –
3,127 0.41
South Africa – 0.83%
8 Adcorp Holdings Ltd 6 –
10 Aeci Ltd 57 0.01
7 African Rainbow Minerals Ltd 42 0.01
32 Alexander Forbes Group Holdings Ltd 12 –
2 Anglo American Platinum Ltd 28 –
16 AngloGold Ashanti Ltd 145 0.03
13 AngloGold Ashanti Ltd, ADR 115 0.03
38 ArcelorMittal South Africa Ltd 22 –
34 Arrowhead Properties Ltd 17 –
15 Ascendis Health Ltd 20 –
4 Aspen Pharmacare Holdings Ltd 61 0.01
4 Assore Ltd 45 0.01
3 Astral Foods Ltd 20 –
15 Attacq Ltd 14 –
7 Aveng Ltd 3 –
23 AVI Ltd 114 0.02
9 Barclays Africa Group Ltd 80 0.01
15 Barloworld Ltd 92 0.02
11 Bid Corp Ltd 155 0.03
19 Bidvest Group Ltd 176 0.03
30 Blue Label Telecoms Ltd 32 –
27 Brait SE 132 0.02
2 Capitec Bank Holdings Ltd 61 0.01
2 Cashbuild Ltd 37 –
3 City Lodge Hotels Ltd 26 –
13 Clicks Group Ltd 89 0.01
10 Clover Industries Ltd 11 –
5 Consolidated Infrastructure Group Ltd 6 –
9 Coronation Fund Managers Ltd 38 –
7 Curro Holdings Ltd 19 –
16 DataTec Ltd 40 0.01
17 Discovery Ltd 106 0.02
2 Distell Group Ltd 17 –
28 DRDGOLD Ltd 9 –

World Equity Fund
Portfolio of Investments as at 30 November 2016 (continued)
Dimensional Fund Advisors Annual Report and Audited Financial Statements, 30 November 2016 338
Shares (000's)
Value (000's)
GBP
% of Net Asset Value
Common Stock (continued)
South Africa – 0.83% (continued)
9 EOH Holdings Ltd 80 0.01
12 Exxaro Resources Ltd 68 0.01
4 Famous Brands Ltd 38 –
58 FirstRand Ltd 165 0.03
18 Foschini Group Ltd 152 0.03
31 Gold Fields Ltd 77 0.01
40 Gold Fields Ltd, ADR 97 0.01
36 Grindrod Ltd 28 –
9 Group Five Ltd 12 –
23 Harmony Gold Mining Co Ltd 42 0.01
4 Holdsport Ltd 13 –
2 Hudaco Industries Ltd 14 –
44 Impala Platinum Holdings Ltd 111 0.02
12 Imperial Holdings Ltd 116 0.02
7 Investec Ltd 37 –
2 Invicta Holdings Ltd 7 –
7 JSE Ltd 65 0.01
84 KAP Industrial Holdings Ltd 36 –
3 Kumba Iron Ore Ltd 33 –
7 Lewis Group Ltd 14 –
9 Liberty Holdings Ltd 58 0.01
49 Life Healthcare Group Holdings Ltd 87 0.01
10 Massmart Holdings Ltd 65 0.01
6 Metair Investments Ltd 8 –
75 MMI Holdings Ltd 93 0.01
2 Mondi Ltd 34 –
12 Mpact Ltd 22 –
6 Mr Price Group Ltd 49 0.01
21 MTN Group Ltd 134 0.02
21 Murray & Roberts Holdings Ltd 13 –
26 Nampak Ltd 24 –
1 Naspers Ltd 121 0.02
5 Nedbank Group Ltd 69 0.01
57 Netcare Ltd 101 0.01
2 New Europe Property Investments PLC 17 –
25 Northam Platinum Ltd 59 0.01
2 Oceana Group Ltd 17 –
11 Octodec Investments Ltd 13 –
4 Omnia Holdings Ltd 37 –
15 Peregrine Holdings Ltd 23 –
14 Pick n Pay Stores Ltd 52 0.01
6 Pinnacle Holdings Ltd 5 –
7 Pioneer Foods Group Ltd 64 0.01
120 PPC Ltd 37 –
2 PSG Group Ltd 17 –
8 Raubex Group Ltd 10 –
12 RCL Foods Ltd 8 –
9 Reunert Ltd 32 –
11 Rhodes Food Group Pty Ltd 15 –
8 Royal Bafokeng Platinum Ltd 16 –
54 Sanlam Ltd 188 0.02
3 Santam Ltd 39 0.01
41 Sappi Ltd 195 0.03
1 Sasol Ltd 26 –
11 Sasol Ltd, ADR 239 0.03
10 Shoprite Holdings Ltd 105 0.01
21 Sibanye Gold Ltd 35 –
7 SPAR Group Ltd 70 0.01
6 Spur Corp Ltd 12 –
30 Standard Bank Group Ltd 259 0.03
32 Steinhoff International Holdings NV 119 0.02
9 Sun International Ltd 41 0.01
25 Super Group Ltd (South Africa listing) 57 0.01
Shares (000's)
Value (000's)
GBP
% of Net Asset Value
Common Stock (continued)
South Africa – 0.83% (continued)
19 Telkom SA SOC Ltd 76 0.01
8 Tiger Brands Ltd 177 0.02
10 Tongaat Hulett Ltd 75 0.01
29 Transaction Capital Ltd 26 –
8 Trencor Ltd 15 –
26 Truworths International Ltd 104 0.01
31 Tsogo Sun Holdings Ltd 49 0.01
2 Vodacom Group Ltd 13 –
3 Wilson Bayly Holmes–Ovcon Ltd 21 –
18 Woolworths Holdings Ltd 66 0.01
6,359 0.83
Spain – 0.78%
5 Abertis Infraestructuras SA 48 0.01
2 Acciona SA 130 0.02
8 Acerinox SA 82 0.01
9 ACS Actividades de Construccion y Servicios SA 207 0.03
– Aena SA 48 0.01
5 Almirall SA 54 0.01
6 Amadeus IT Group SA 209 0.03
8 Applus Services SA 59 0.01
2 Atresmedia Corp de Medios de Comunicacion SA 18 –
59 Banco Bilbao Vizcaya Argentaria SA 290 0.04
290 Banco de Sabadell SA 289 0.04
69 Banco Popular Espanol SA 48 0.01
147 Banco Santander SA 537 0.07
120 Bankia SA 85 0.01
24 Bankinter SA 146 0.02
– Baron de Ley 5 –
3 Bolsas y Mercados Espanoles SHMSF SA 79 0.01
44 CaixaBank SA 103 0.01
1 Cellnex Telecom SA 14 –
2 Cia de Distribucion Integral Logista Holdings SA 30 –
5 CIE Automotive SA 69 0.01
2 Construcciones y Auxiliar de Ferrocarriles SA 45 0.01
27 Distribuidora Internacional de Alimentacion SA 97 0.01
5 Duro Felguera SA 4 –
4 Ebro Foods SA 72 0.01
6 eDreams Odigeo SA 13 –
2 Elecnor SA 14 –
10 Enagas SA 198 0.03
13 Ence Energia y Celulosa SA 24 –
6 Endesa SA 101 0.01
17 Ercros SA 27 –
19 Faes Farma SA 54 0.01
5 Ferrovial SA 64 0.01
3 Fluidra SA 12 –
16 Gamesa Corp Tecnologica SA 260 0.03
15 Gas Natural SDG SA 199 0.03
5 Grifols SA 78 0.01
3 Grupo Catalana Occidente SA 61 0.01
79 Iberdrola SA 380 0.05
1 Iberpapel Gestion SA 9 –
– Iberpapel Gestion SA – –
3 Indra Sistemas SA 28 –
5 Industria de Diseno Textil SA 148 0.02
9 Inmobiliaria Colonial SA 48 0.01
1 Laboratorios Farmaceuticos Rovi SA 6 –
23 Liberbank SA 18 –
66 Mapfre SA 159 0.02
10 Mediaset Espana Comunicacion SA 85 0.01
6 Melia Hotels International SA 57 0.01
1 Miquel y Costas & Miquel SA 22 –
9 NH Hotel Group SA 28 –

World Equity Fund
Portfolio of Investments as at 30 November 2016 (continued)
Dimensional Fund Advisors Annual Report and Audited Financial Statements, 30 November 2016 339
Shares (000's)
Value (000's)
GBP
% of Net Asset Value
Common Stock (continued)
Spain – 0.78% (continued)
1 Nmas1 Dinamia SA 4 –
11 Obrascon Huarte Lain SA 23 –
3 Papeles y Cartones de Europa SA 13 –
3 Pharma Mar SA 7 –
2 Promotora de Informaciones SA 10 –
14 Prosegur Cia de Seguridad SA 71 0.01
7 Red Electrica Corp SA 94 0.01
25 Repsol SA 265 0.03
24 Sacyr SA 40 0.01
2 Saeta Yield SA 16 –
2 Tecnicas Reunidas SA 51 0.01
44 Telefonica SA 293 0.04
12 Tubacex SA 27 –
2 Tubos Reunidos SA 1 –
1 Vidrala SA 51 0.01
3 Viscofan SA 104 0.01
8 Zardoya Otis SA 49 0.01
5,980 0.78
Sweden – 0.98%
1 AAK AB 55 0.01
12 Acando AB 26 –
1 AddLife AB 8 –
2 AddTech AB 24 –
3 AF AB 44 0.01
4 Alfa Laval AB 47 0.01
11 Assa Abloy AB 170 0.03
4 Atlas Copco AB, Class A 88 0.01
2 Atlas Copco AB, Class B 47 0.01
1 Atrium Ljungberg AB 15 –
1 Avanza Bank Holding AB 32 –
3 Axfood AB 32 –
1 B&B Tools AB 21 –
2 Beijer Alma AB 30 –
1 Beijer Ref AB 17 –
4 Betsson AB 32 –
4 Bilia AB 64 0.01
12 BillerudKorsnas AB 163 0.03
1 BioGaia AB 20 –
17 Boliden AB 345 0.05
– Bonava AB 3 –
5 Bonava AB, Shares B 51 0.01
2 Bulten AB 14 –
5 Bure Equity AB 42 0.01
3 Byggmax Group AB 17 –
9 Castellum AB 100 0.02
3 Clas Ohlson AB 34 –
12 Cloetta AB 31 –
8 Com Hem Holding AB 60 0.01
3 Concentric AB 29 –
1 Dios Fastigheter AB 6 –
2 Doro AB 10 –
1 Duni AB 14 –
3 Dustin Group AB 13 –
1 East Capital Explorer AB 4 –
1 Elanders AB 12 –
4 Electrolux AB 73 0.01
6 Elekta AB 42 0.01
1 Enea AB 9 –
5 Fabege AB 67 0.01
1 Fagerhult AB 10 –
3 Fastighets AB Balder 47 0.01
11 Fingerprint Cards AB 79 0.01
7 Getinge AB 91 0.01
Shares (000's)
Value (000's)
GBP
% of Net Asset Value
Common Stock (continued)
Sweden – 0.98% (continued)
3 Granges AB 19 –
2 Gunnebo AB 9 –
4 Haldex AB 43 0.01
8 Hemfosa Fastigheter AB 59 0.01
5 Hennes & Mauritz AB 119 0.03
2 Hexagon AB 70 0.01
14 Hexpol AB 96 0.02
4 HIQ International AB 21 –
4 Holmen AB 99 0.02
5 Hufvudstaden AB 65 0.01
3 Husqvarna AB, Class A 17 –
25 Husqvarna AB, Class B 149 0.02
2 ICA Gruppen AB 37 –
5 Indutrade AB 76 0.01
2 Intrum Justitia AB 57 0.01
3 Inwido AB 21 –
1 ITAB Shop Concept AB 6 –
5 JM AB 112 0.02
6 KappAhl AB 23 –
27 Klovern AB 22 –
2 KNOW IT AB 14 –
8 Kungsleden AB 39 0.01
4 Lagercrantz Group AB 26 –
1 Lifco AB 10 –
4 Lindab International AB 27 –
5 Loomis AB 96 0.01
2 Lundin Petroleum AB 33 –
2 Medivir AB 15 –
1 Mekonomen AB 20 –
4 Millicom International Cellular SA 122 0.02
3 Modern Times Group MTG AB 63 0.01
4 MQ Holding AB 12 –
3 Mycronic AB 27 –
5 NCC AB 93 0.01
6 NetEnt AB 38 –
2 New Wave Group AB 8 –
14 Nibe Industrier AB 83 0.01
7 Nobia AB 48 0.01
2 Nolato AB 41 0.01
21 Nordea Bank AB 173 0.03
7 Nordnet AB 23 –
34 Opus Group AB 19 –
1 Oriflame Holding AG 20 –
1 Pandox AB 14 –
15 Peab AB 92 0.01
17 Pricer AB 13 –
1 Proact IT Group AB 9 –
12 Qliro Group AB 10 –
13 Ratos AB 42 0.01
2 RaySearch Laboratories AB 24 –
2 Recipharm AB 20 –
6 Rezidor Hotel Group AB 17 –
3 Saab AB 89 0.01
2 Sagax AB 14 –
16 Sandvik AB 151 0.02
8 SAS AB 10 –
5 Scandi Standard AB 25 –
1 Sectra AB 11 –
9 Securitas AB 100 0.01
18 Skandinaviska Enskilda Banken AB 142 0.02
5 Skanska AB 91 0.01
1 SKF AB, Class A 12 –
15 SKF AB, Class B 218 0.03
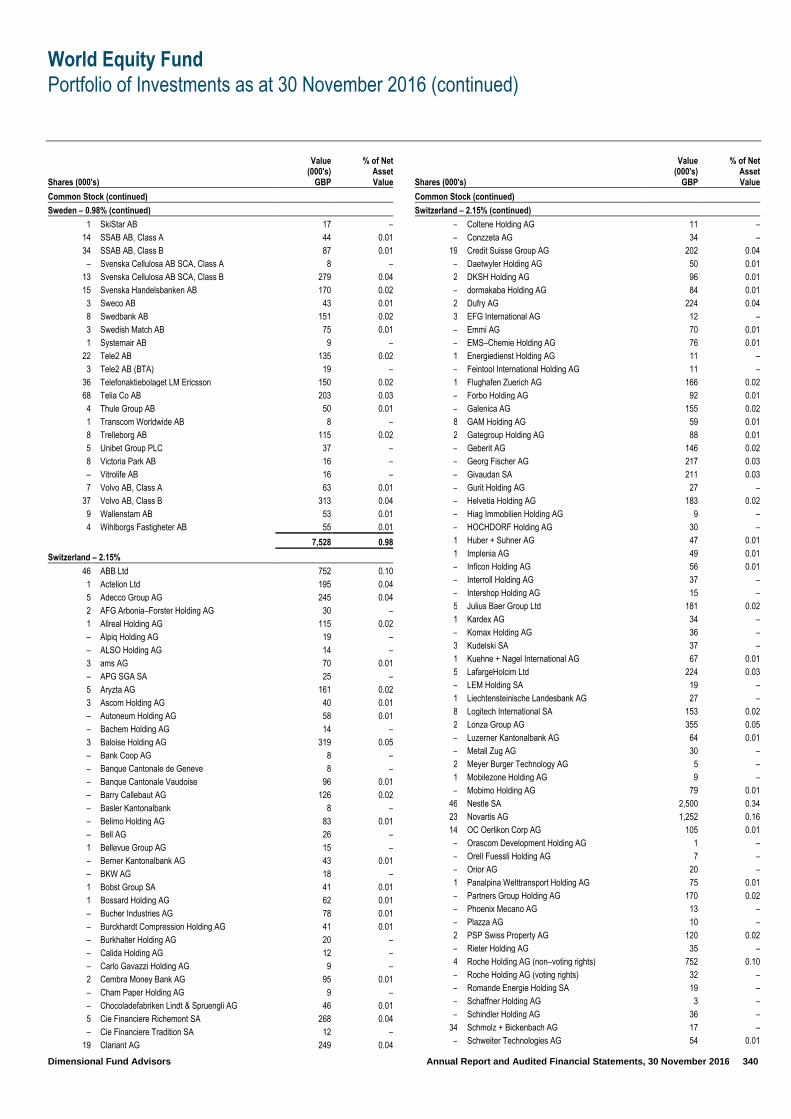
World Equity Fund
Portfolio of Investments as at 30 November 2016 (continued)
Dimensional Fund Advisors Annual Report and Audited Financial Statements, 30 November 2016 340
Shares (000's)
Value (000's)
GBP
% of Net Asset Value
Common Stock (continued)
Sweden – 0.98% (continued)
1 SkiStar AB 17 –
14 SSAB AB, Class A 44 0.01
34 SSAB AB, Class B 87 0.01
– Svenska Cellulosa AB SCA, Class A 8 –
13 Svenska Cellulosa AB SCA, Class B 279 0.04
15 Svenska Handelsbanken AB 170 0.02
3 Sweco AB 43 0.01
8 Swedbank AB 151 0.02
3 Swedish Match AB 75 0.01
1 Systemair AB 9 –
22 Tele2 AB 135 0.02
3 Tele2 AB (BTA) 19 –
36 Telefonaktiebolaget LM Ericsson 150 0.02
68 Telia Co AB 203 0.03
4 Thule Group AB 50 0.01
1 Transcom Worldwide AB 8 –
8 Trelleborg AB 115 0.02
5 Unibet Group PLC 37 –
8 Victoria Park AB 16 –
– Vitrolife AB 16 –
7 Volvo AB, Class A 63 0.01
37 Volvo AB, Class B 313 0.04
9 Wallenstam AB 53 0.01
4 Wihlborgs Fastigheter AB 55 0.01
7,528 0.98
Switzerland – 2.15%
46 ABB Ltd 752 0.10
1 Actelion Ltd 195 0.04
5 Adecco Group AG 245 0.04
2 AFG Arbonia–Forster Holding AG 30 –
1 Allreal Holding AG 115 0.02
– Alpiq Holding AG 19 –
– ALSO Holding AG 14 –
3 ams AG 70 0.01
– APG SGA SA 25 –
5 Aryzta AG 161 0.02
3 Ascom Holding AG 40 0.01
– Autoneum Holding AG 58 0.01
– Bachem Holding AG 14 –
3 Baloise Holding AG 319 0.05
– Bank Coop AG 8 –
– Banque Cantonale de Geneve 8 –
– Banque Cantonale Vaudoise 96 0.01
– Barry Callebaut AG 126 0.02
– Basler Kantonalbank 8 –
– Belimo Holding AG 83 0.01
– Bell AG 26 –
1 Bellevue Group AG 15 –
– Berner Kantonalbank AG 43 0.01
– BKW AG 18 –
1 Bobst Group SA 41 0.01
1 Bossard Holding AG 62 0.01
– Bucher Industries AG 78 0.01
– Burckhardt Compression Holding AG 41 0.01
– Burkhalter Holding AG 20 –
– Calida Holding AG 12 –
– Carlo Gavazzi Holding AG 9 –
2 Cembra Money Bank AG 95 0.01
– Cham Paper Holding AG 9 –
– Chocoladefabriken Lindt & Spruengli AG 46 0.01
5 Cie Financiere Richemont SA 268 0.04
– Cie Financiere Tradition SA 12 –
19 Clariant AG 249 0.04
Shares (000's)
Value (000's)
GBP
% of Net Asset Value
Common Stock (continued)
Switzerland – 2.15% (continued)
– Coltene Holding AG 11 –
– Conzzeta AG 34 –
19 Credit Suisse Group AG 202 0.04
– Daetwyler Holding AG 50 0.01
2 DKSH Holding AG 96 0.01
– dormakaba Holding AG 84 0.01
2 Dufry AG 224 0.04
3 EFG International AG 12 –
– Emmi AG 70 0.01
– EMS–Chemie Holding AG 76 0.01
1 Energiedienst Holding AG 11 –
– Feintool International Holding AG 11 –
1 Flughafen Zuerich AG 166 0.02
– Forbo Holding AG 92 0.01
– Galenica AG 155 0.02
8 GAM Holding AG 59 0.01
2 Gategroup Holding AG 88 0.01
– Geberit AG 146 0.02
– Georg Fischer AG 217 0.03
– Givaudan SA 211 0.03
– Gurit Holding AG 27 –
– Helvetia Holding AG 183 0.02
– Hiag Immobilien Holding AG 9 –
– HOCHDORF Holding AG 30 –
1 Huber + Suhner AG 47 0.01
1 Implenia AG 49 0.01
– Inficon Holding AG 56 0.01
– Interroll Holding AG 37 –
– Intershop Holding AG 15 –
5 Julius Baer Group Ltd 181 0.02
1 Kardex AG 34 –
– Komax Holding AG 36 –
3 Kudelski SA 37 –
1 Kuehne + Nagel International AG 67 0.01
5 LafargeHolcim Ltd 224 0.03
– LEM Holding SA 19 –
1 Liechtensteinische Landesbank AG 27 –
8 Logitech International SA 153 0.02
2 Lonza Group AG 355 0.05
– Luzerner Kantonalbank AG 64 0.01
– Metall Zug AG 30 –
2 Meyer Burger Technology AG 5 –
1 Mobilezone Holding AG 9 –
– Mobimo Holding AG 79 0.01
46 Nestle SA 2,500 0.34
23 Novartis AG 1,252 0.16
14 OC Oerlikon Corp AG 105 0.01
– Orascom Development Holding AG 1 –
– Orell Fuessli Holding AG 7 –
– Orior AG 20 –
1 Panalpina Welttransport Holding AG 75 0.01
– Partners Group Holding AG 170 0.02
– Phoenix Mecano AG 13 –
– Plazza AG 10 –
2 PSP Swiss Property AG 120 0.02
– Rieter Holding AG 35 –
4 Roche Holding AG (non–voting rights) 752 0.10
– Roche Holding AG (voting rights) 32 –
– Romande Energie Holding SA 19 –
– Schaffner Holding AG 3 –
– Schindler Holding AG 36 –
34 Schmolz + Bickenbach AG 17 –
– Schweiter Technologies AG 54 0.01

World Equity Fund
Portfolio of Investments as at 30 November 2016 (continued)
Dimensional Fund Advisors Annual Report and Audited Financial Statements, 30 November 2016 341
Shares (000's)
Value (000's)
GBP
% of Net Asset Value
Common Stock (continued)
Switzerland – 2.15% (continued)
1 SFS Group AG 70 0.01
– SGS SA 115 0.02
– Siegfried Holding AG 37 –
– Sika AG 395 0.05
2 Sonova Holding AG 207 0.03
– St Galler Kantonalbank AG 53 0.01
– Straumann Holding AG 109 0.01
1 Sulzer AG 74 0.01
3 Sunrise Communications Group AG 135 0.02
1 Swatch Group AG (BR) 163 0.02
1 Swatch Group AG (REG) 50 0.01
1 Swiss Life Holding AG 218 0.03
2 Swiss Prime Site AG 161 0.02
3 Swiss Re AG 250 0.03
1 Swisscom AG 179 0.02
1 Swissquote Group Holding SA 14 –
1 Syngenta AG 441 0.06
– Tamedia AG 15 –
1 Tecan Group AG 78 0.01
3 Temenos Group AG 141 0.02
– Thurgauer Kantonalbank 9 –
– u–blox Holding AG 45 0.01
32 UBS Group AG 402 0.05
1 Valiant Holding AG 65 0.01
– Valora Holding AG 57 0.01
– Vaudoise Assurances Holding SA 19 –
– Vetropack Holding AG 20 –
2 Vontobel Holding AG 74 0.01
– VP Bank AG 16 –
– VZ Holding AG 27 –
– Walliser Kantonalbank 20 –
– Warteck Invest AG 17 –
– Ypsomed Holding AG 21 –
1 Zehnder Group AG 15 –
– Zug Estates Holding AG 10 –
– Zuger Kantonalbank AG 31 –
1 Zurich Insurance Group AG 294 0.04
16,486 2.15
Taiwan – 1.76%
26 A–DATA Technology Co Ltd 35 –
22 Ability Enterprise Co Ltd 9 –
37 AcBel Polytech Inc 21 –
49 Accton Technology Corp 53 0.02
139 Acer Inc 47 0.01
8 Actron Technology Corp 20 –
11 Adlink Technology Inc 14 –
122 Advanced Semiconductor Engineering Inc 105 0.02
12 Advanced Wireless Semiconductor Co 14 –
3 Advantech Co Ltd 19 –
53 AGV Products Corp 10 –
5 Airtac International Group 30 –
50 ALI Corp 21 –
23 Altek Corp 12 –
24 Ambassador Hotel 14 –
37 AmTRAN Technology Co Ltd 20 –
16 Apex Biotechnology Corp 17 –
22 Ardentec Corp 13 –
79 Asia Cement Corp 55 0.02
30 Asia Optical Co Inc 23 –
73 Asia Pacific Telecom Co Ltd 18 –
46 Asia Polymer Corp 21 –
37 Asia Vital Components Co Ltd 22 –
2 ASPEED Technology Inc 23 –
Shares (000's)
Value (000's)
GBP
% of Net Asset Value
Common Stock (continued)
Taiwan – 1.76% (continued)
13 Asustek Computer Inc 86 0.02
9 Aten International Co Ltd 18 –
439 AU Optronics Corp 126 0.03
13 Basso Industry Corp 24 –
86 BES Engineering Corp 14 –
6 Bizlink Holding Inc 23 –
21 Boardtek Electronics Corp 16 –
141 Capital Securities Corp 32 –
36 Career Technology MFG. Co Ltd 16 –
9 Casetek Holdings Ltd 20 –
27 Catcher Technology Co Ltd 156 0.03
76 Cathay Financial Holding Co Ltd 89 0.02
57 Cathay Real Estate Development Co Ltd 26 –
72 Chailease Holding Co Ltd 99 0.02
128 Chang Hwa Commercial Bank Ltd 55 0.02
32 Charoen Pokphand Enterprise 37 –
8 Chaun–Choung Technology Corp 23 –
7 CHC Resources Corp 9 –
93 Cheng Loong Corp 28 –
17 Cheng Shin Rubber Industry Co Ltd 26 –
35 Cheng Uei Precision Industry Co Ltd 32 –
20 Chicony Electronics Co Ltd 38 –
18 Chicony Power Technology Co Ltd 23 –
14 Chilisin Electronics Corp 25 –
41 Chimei Materials Technology Corp 12 –
24 Chin–Poon Industrial Co Ltd 37 –
242 China Airlines Ltd 58 0.02
69 China Bills Finance Corp 22 –
34 China Chemical & Pharmaceutical Co Ltd 15 –
272 China Development Financial Holding Corp 54 0.02
53 China General Plastics Corp 36 –
156 China Life Insurance Co Ltd 132 0.03
84 China Man–Made Fiber Corp 18 –
15 China Metal Products 13 –
49 China Motor Corp 33 –
168 China Petrochemical Development Corp 40 0.01
6 China Steel Chemical Corp 17 –
125 China Steel Corp 78 0.02
35 China Synthetic Rubber Corp 24 –
27 Chipbond Technology Corp 30 –
28 ChipMOS TECHNOLOGIES INC 18 –
6 Chlitina Holding Ltd 21 –
13 Chong Hong Construction Co Ltd 19 –
17 Chroma ATE Inc 34 –
58 Chun Yuan Steel 18 –
62 Chung Hung Steel Corp 16 –
65 Chung Hwa Pulp Corp 14 –
37 Chung–Hsin Electric & Machinery Manufacturing Corp 16 –
2 Chunghwa Precision Test Tech Co Ltd 59 0.02
15 Chunghwa Telecom Co Ltd 40 0.01
1 Chunghwa Telecom Co Ltd, ADR 15 –
2 Cleanaway Co Ltd 8 –
42 Clevo Co 29 –
258 CMC Magnetics Corp 23 –
236 Compal Electronics Inc 107 0.02
81 Compeq Manufacturing Co Ltd 31 –
34 Coretronic Corp 29 –
15 Coxon Precise Industrial Co Ltd 12 –
42 CSBC Corp Taiwan 14 –
272 CTBC Financial Holding Co Ltd 119 0.03
20 CTCI Corp 25 –
4 Cub Elecparts Inc 25 –
7 Cyberlink Corp 12 –
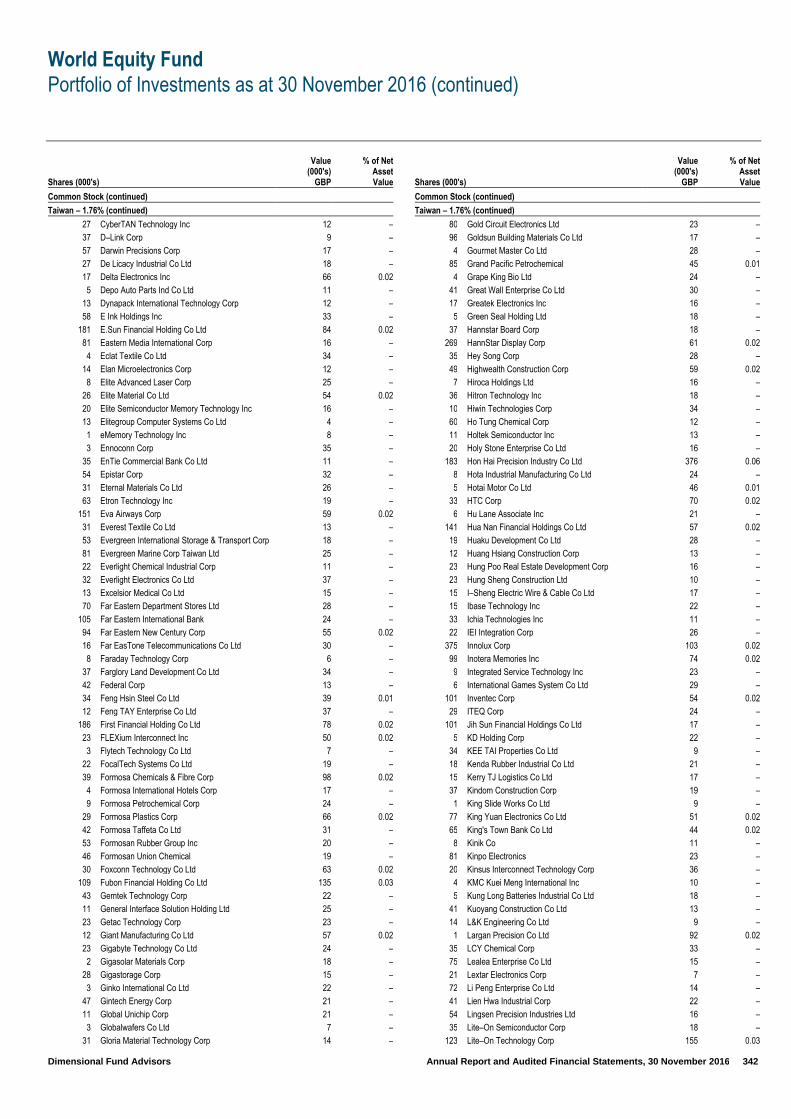
World Equity Fund
Portfolio of Investments as at 30 November 2016 (continued)
Dimensional Fund Advisors Annual Report and Audited Financial Statements, 30 November 2016 342
Shares (000's)
Value (000's)
GBP
% of Net Asset Value
Common Stock (continued)
Taiwan – 1.76% (continued)
27 CyberTAN Technology Inc 12 –
37 D–Link Corp 9 –
57 Darwin Precisions Corp 17 –
27 De Licacy Industrial Co Ltd 18 –
17 Delta Electronics Inc 66 0.02
5 Depo Auto Parts Ind Co Ltd 11 –
13 Dynapack International Technology Corp 12 –
58 E Ink Holdings Inc 33 –
181 E.Sun Financial Holding Co Ltd 84 0.02
81 Eastern Media International Corp 16 –
4 Eclat Textile Co Ltd 34 –
14 Elan Microelectronics Corp 12 –
8 Elite Advanced Laser Corp 25 –
26 Elite Material Co Ltd 54 0.02
20 Elite Semiconductor Memory Technology Inc 16 –
13 Elitegroup Computer Systems Co Ltd 4 –
1 eMemory Technology Inc 8 –
3 Ennoconn Corp 35 –
35 EnTie Commercial Bank Co Ltd 11 –
54 Epistar Corp 32 –
31 Eternal Materials Co Ltd 26 –
63 Etron Technology Inc 19 –
151 Eva Airways Corp 59 0.02
31 Everest Textile Co Ltd 13 –
53 Evergreen International Storage & Transport Corp 18 –
81 Evergreen Marine Corp Taiwan Ltd 25 –
22 Everlight Chemical Industrial Corp 11 –
32 Everlight Electronics Co Ltd 37 –
13 Excelsior Medical Co Ltd 15 –
70 Far Eastern Department Stores Ltd 28 –
105 Far Eastern International Bank 24 –
94 Far Eastern New Century Corp 55 0.02
16 Far EasTone Telecommunications Co Ltd 30 –
8 Faraday Technology Corp 6 –
37 Farglory Land Development Co Ltd 34 –
42 Federal Corp 13 –
34 Feng Hsin Steel Co Ltd 39 0.01
12 Feng TAY Enterprise Co Ltd 37 –
186 First Financial Holding Co Ltd 78 0.02
23 FLEXium Interconnect Inc 50 0.02
3 Flytech Technology Co Ltd 7 –
22 FocalTech Systems Co Ltd 19 –
39 Formosa Chemicals & Fibre Corp 98 0.02
4 Formosa International Hotels Corp 17 –
9 Formosa Petrochemical Corp 24 –
29 Formosa Plastics Corp 66 0.02
42 Formosa Taffeta Co Ltd 31 –
53 Formosan Rubber Group Inc 20 –
46 Formosan Union Chemical 19 –
30 Foxconn Technology Co Ltd 63 0.02
109 Fubon Financial Holding Co Ltd 135 0.03
43 Gemtek Technology Corp 22 –
11 General Interface Solution Holding Ltd 25 –
23 Getac Technology Corp 23 –
12 Giant Manufacturing Co Ltd 57 0.02
23 Gigabyte Technology Co Ltd 24 –
2 Gigasolar Materials Corp 18 –
28 Gigastorage Corp 15 –
3 Ginko International Co Ltd 22 –
47 Gintech Energy Corp 21 –
11 Global Unichip Corp 21 –
3 Globalwafers Co Ltd 7 –
31 Gloria Material Technology Corp 14 –
Shares (000's)
Value (000's)
GBP
% of Net Asset Value
Common Stock (continued)
Taiwan – 1.76% (continued)
80 Gold Circuit Electronics Ltd 23 –
96 Goldsun Building Materials Co Ltd 17 –
4 Gourmet Master Co Ltd 28 –
85 Grand Pacific Petrochemical 45 0.01
4 Grape King Bio Ltd 24 –
41 Great Wall Enterprise Co Ltd 30 –
17 Greatek Electronics Inc 16 –
5 Green Seal Holding Ltd 18 –
37 Hannstar Board Corp 18 –
269 HannStar Display Corp 61 0.02
35 Hey Song Corp 28 –
49 Highwealth Construction Corp 59 0.02
7 Hiroca Holdings Ltd 16 –
36 Hitron Technology Inc 18 –
10 Hiwin Technologies Corp 34 –
60 Ho Tung Chemical Corp 12 –
11 Holtek Semiconductor Inc 13 –
20 Holy Stone Enterprise Co Ltd 16 –
183 Hon Hai Precision Industry Co Ltd 376 0.06
8 Hota Industrial Manufacturing Co Ltd 24 –
5 Hotai Motor Co Ltd 46 0.01
33 HTC Corp 70 0.02
6 Hu Lane Associate Inc 21 –
141 Hua Nan Financial Holdings Co Ltd 57 0.02
19 Huaku Development Co Ltd 28 –
12 Huang Hsiang Construction Corp 13 –
23 Hung Poo Real Estate Development Corp 16 –
23 Hung Sheng Construction Ltd 10 –
15 I–Sheng Electric Wire & Cable Co Ltd 17 –
15 Ibase Technology Inc 22 –
33 Ichia Technologies Inc 11 –
22 IEI Integration Corp 26 –
375 Innolux Corp 103 0.02
99 Inotera Memories Inc 74 0.02
9 Integrated Service Technology Inc 23 –
6 International Games System Co Ltd 29 –
101 Inventec Corp 54 0.02
29 ITEQ Corp 24 –
101 Jih Sun Financial Holdings Co Ltd 17 –
5 KD Holding Corp 22 –
34 KEE TAI Properties Co Ltd 9 –
18 Kenda Rubber Industrial Co Ltd 21 –
15 Kerry TJ Logistics Co Ltd 17 –
37 Kindom Construction Corp 19 –
1 King Slide Works Co Ltd 9 –
77 King Yuan Electronics Co Ltd 51 0.02
65 King's Town Bank Co Ltd 44 0.02
8 Kinik Co 11 –
81 Kinpo Electronics 23 –
20 Kinsus Interconnect Technology Corp 36 –
4 KMC Kuei Meng International Inc 10 –
5 Kung Long Batteries Industrial Co Ltd 18 –
41 Kuoyang Construction Co Ltd 13 –
14 L&K Engineering Co Ltd 9 –
1 Largan Precision Co Ltd 92 0.02
35 LCY Chemical Corp 33 –
75 Lealea Enterprise Co Ltd 15 –
21 Lextar Electronics Corp 7 –
72 Li Peng Enterprise Co Ltd 14 –
41 Lien Hwa Industrial Corp 22 –
54 Lingsen Precision Industries Ltd 16 –
35 Lite–On Semiconductor Corp 18 –
123 Lite–On Technology Corp 155 0.03

World Equity Fund
Portfolio of Investments as at 30 November 2016 (continued)
Dimensional Fund Advisors Annual Report and Audited Financial Statements, 30 November 2016 343
Shares (000's)
Value (000's)
GBP
% of Net Asset Value
Common Stock (continued)
Taiwan – 1.76% (continued)
36 Long Bon International Co Ltd 16 –
75 Long Chen Paper Co Ltd 30 –
244 Macronix International 25 –
9 Makalot Industrial Co Ltd 29 –
32 Masterlink Securities Corp 7 –
14 MediaTek Inc 77 0.02
85 Mega Financial Holding Co Ltd 49 0.02
44 Mercuries & Associates Holding Ltd 25 –
49 Mercuries Life Insurance Co Ltd 21 –
13 Merida Industry Co Ltd 46 0.01
24 Merry Electronics Co Ltd 73 0.02
44 Micro–Star International Co Ltd 94 0.02
27 Microbio Co Ltd 15 –
9 Microlife Corp 16 –
18 MIN AIK Technology Co Ltd 14 –
4 Mirle Automation Corp 4 –
21 Mitac Holdings Corp 17 –
23 Motech Industries Inc 15 –
8 Nak Sealing Technologies Corp 16 –
14 Namchow Chemical Industrial Co Ltd 23 –
23 Nan Kang Rubber Tire Co Ltd 17 –
39 Nan Ya Plastics Corp 66 0.02
28 Nan Ya Printed Circuit Board Corp 17 –
26 Nantex Industry Co Ltd 14 –
23 Nanya Technology Corp 26 –
26 Neo Solar Power Corp 10 –
21 Nien Hsing Textile Co Ltd 13 –
3 Nien Made Enterprise Co Ltd 27 –
26 Novatek Microelectronics Corp 69 0.02
73 OptoTech Corp 26 –
61 Orient Semiconductor Electronics Ltd 18 –
40 Oriental Union Chemical Corp 22 –
9 Pacific Hospital Supply Co Ltd 19 –
42 Pan Jit International Inc 16 –
19 Pan–International Industrial Corp 11 –
4 Parade Technologies Ltd 34 –
4 PChome Online Inc 26 –
93 Pegatron Corp 177 0.03
4 Phison Electronics Corp 24 –
11 Pixart Imaging Inc 18 –
36 Pou Chen Corp 36 –
43 Powertech Technology Inc 88 0.02
1 Poya International Co Ltd 10 –
6 President Chain Store Corp 36 –
70 President Securities Corp 20 –
19 Primax Electronics Ltd 22 –
50 Prince Housing & Development Corp 14 –
146 Qisda Corp 56 0.02
65 Quanta Computer Inc 97 0.02
33 Quanta Storage Inc 23 –
17 Radiant Opto–Electronics Corp 25 –
35 Radium Life Tech Co Ltd 9 –
19 Realtek Semiconductor Corp 47 0.01
28 Rechi Precision Co Ltd 23 –
38 Rich Development Co Ltd 8 –
162 Ritek Corp 21 –
35 Ruentex Development Co Ltd 33 –
10 Ruentex Industries Ltd 15 –
24 Run Long Construction Co Ltd 20 –
48 Sampo Corp 22 –
17 San Fang Chemical Industry Co Ltd 15 –
11 San Shing Fastech Corp 15 –
28 Sanyang Motor Co Ltd 15 –
Shares (000's)
Value (000's)
GBP
% of Net Asset Value
Common Stock (continued)
Taiwan – 1.76% (continued)
21 Sercomm Corp 43 0.01
17 Shihlin Electric & Engineering Corp 17 –
404 Shin Kong Financial Holding Co Ltd 83 0.02
7 Shin Zu Shing Co Ltd 15 –
28 Shinkong Insurance Co Ltd 19 –
47 Shinkong Synthetic Fibers Corp 11 –
27 Sigurd Microelectronics Corp 16 –
3 Silergy Corp 36 –
18 Siliconware Precision Industries Co Ltd 21 –
20 Simplo Technology Co Ltd 47 0.02
19 Sinbon Electronics Co Ltd 31 –
30 Sincere Navigation Corp 15 –
37 Sino–American Silicon Products Inc 27 –
382 SinoPac Financial Holdings Co Ltd 87 0.02
17 Sirtec International Co Ltd 17 –
6 Sitronix Technology Corp 17 –
12 Soft–World International Corp 19 –
31 Solar Applied Materials Technology Co 5 –
2 Sporton International Inc 9 –
2 St Shine Optical Co Ltd 31 –
12 Standard Foods Corp 23 –
53 Sunplus Technology Co Ltd 15 –
4 Swancor Holding Co Ltd 7 –
17 Syncmold Enterprise Corp 25 –
55 Synnex Technology International Corp 45 0.01
16 Systex Corp 22 –
32 TA Chen Stainless Pipe 15 –
101 Taichung Commercial Bank Co Ltd 23 –
3 TaiDoc Technology Corp 8 –
23 Taiflex Scientific Co Ltd 19 –
4 TaiMed Biologics Inc 18 –
79 Tainan Spinning Co Ltd 24 –
204 Taishin Financial Holding Co Ltd 60 0.02
11 Taiwan Acceptance Corp 21 –
282 Taiwan Business Bank 57 0.02
98 Taiwan Cement Corp 90 0.02
32 Taiwan Cogeneration Corp 18 –
154 Taiwan Cooperative Financial Holding Co Ltd 54 0.02
3 Taiwan FamilyMart Co Ltd 16 –
38 Taiwan Fertilizer Co Ltd 39 0.01
19 Taiwan FU Hsing Industrial Co Ltd 19 –
60 Taiwan Glass Industry Corp 20 –
29 Taiwan Hon Chuan Enterprise Co Ltd 39 0.01
84 Taiwan Land Development Corp 21 –
7 Taiwan Mobile Co Ltd 19 –
10 Taiwan Paiho Ltd 24 –
27 Taiwan PCB Techvest Co Ltd 21 –
8 Taiwan Secom Co Ltd 17 –
33 Taiwan Semiconductor Co Ltd 27 –
182 Taiwan Semiconductor Manufacturing Co Ltd 836 0.12
4 Taiwan Semiconductor Manufacturing Co Ltd, ADR 83 0.02
16 Taiwan Shin Kong Security Co Ltd 16 –
49 Taiwan Styrene Monomer 26 –
26 Taiwan Surface Mounting Technology Corp 17 –
39 Taiwan TEA Corp 14 –
24 Taiwan Union Technology Corp 19 –
140 Tatung Co Ltd 34 –
102 Teco Electric and Machinery Co Ltd 68 0.02
12 Test Research Inc 12 –
11 Thinking Electronic Industrial Co Ltd 17 –
16 Thye Ming Industrial Co Ltd 14 –
28 Ton Yi Industrial Corp 10 –
12 Tong Hsing Electronic Industries Ltd 29 –

World Equity Fund
Portfolio of Investments as at 30 November 2016 (continued)
Dimensional Fund Advisors Annual Report and Audited Financial Statements, 30 November 2016 344
Shares (000's)
Value (000's)
GBP
% of Net Asset Value
Common Stock (continued)
Taiwan – 1.76% (continued)
17 Tong Yang Industry Co Ltd 29 –
26 Tong–Tai Machine & Tool Co Ltd 14 –
6 TOPBI International Holdings Ltd 16 –
15 Topco Scientific Co Ltd 29 –
9 Toung Loong Textile Manufacturing 17 –
26 TPK Holding Co Ltd 35 –
5 Transcend Information Inc 11 –
23 Tripod Technology Corp 42 0.01
9 TrueLight Corp 12 –
24 TSRC Corp 19 –
8 TTY Biopharm Co Ltd 20 –
48 Tung Ho Steel Enterprise Corp 26 –
3 Tung Thih Electronic Co Ltd 21 –
16 TXC Corp 16 –
33 TYC Brother Industrial Co Ltd 28 –
50 Tyntek Corp 14 –
45 U–Ming Marine Transport Corp 29 –
35 Uni–President Enterprises Corp 48 0.02
83 Unimicron Technology Corp 25 –
69 Union Bank Of Taiwan 16 –
50 Unitech Printed Circuit Board Corp 12 –
25 United Integrated Services Co Ltd 30 –
643 United Microelectronics Corp 181 0.03
35 Unity Opto Technology Co Ltd 11 –
29 Universal Cement Corp 18 –
36 Unizyx Holding Corp 13 –
77 UPC Technology Corp 24 –
73 USI Corp 29 –
31 Vanguard International Semiconductor Corp 47 0.02
17 Visual Photonics Epitaxy Co Ltd 19 –
2 Voltronic Power Technology Corp 22 –
21 Wah Lee Industrial Corp 24 –
187 Walsin Lihwa Corp 63 0.02
51 Walsin Technology Corp 46 0.01
52 Wan Hai Lines Ltd 22 –
182 Waterland Financial Holdings Co Ltd 37 –
36 Weikeng Industrial Co Ltd 15 –
19 Win Semiconductors Corp 42 0.01
255 Winbond Electronics Corp 63 0.02
10 Wisdom Marine Lines Co Ltd 7 –
152 Wistron Corp 87 0.02
11 Wistron NeWeb Corp 25 –
4 Wowprime Corp 14 –
70 WPG Holdings Ltd 69 0.02
38 WT Microelectronics Co Ltd 43 0.01
32 WUS Printed Circuit Co Ltd 13 –
13 XAC Automation Corp 19 –
4 Xxentria Technology Materials Corp 8 –
16 Yageo Corp 25 –
96 Yang Ming Marine Transport Corp 14 –
40 YC Co Ltd 12 –
22 YC INOX Co Ltd 15 –
5 Yeong Guan Energy Technology Group Co Ltd 14 –
64 YFY Inc 15 –
83 Yieh Phui Enterprise Co Ltd 26 –
172 Yuanta Financial Holding Co Ltd 50 0.02
45 Yulon Motor Co Ltd 31 –
10 Yung Chi Paint & Varnish Manufacturing Co Ltd 19 –
14 YungShin Global Holding Corp 16 –
25 Yungtay Engineering Co Ltd 28 –
6 Zeng Hsing Industrial Co Ltd 23 –
30 Zhen Ding Technology Holding Ltd 49 0.02
Shares (000's)
Value (000's)
GBP
% of Net Asset Value
Common Stock (continued)
Taiwan – 1.76% (continued)
19 Zinwell Corp 15 –
13,436 1.76
Thailand – 0.29%
4 Advanced Info Service PCL 12 –
9 AEON Thana Sinsap Thailand PCL 20 –
3 Airports of Thailand PCL 31 0.01
149 AP Thailand PCL 23 –
163 Asia Aviation PCL, NVDR 24 –
44 Bangchak Petroleum PCL 33 0.01
22 Bangkok Airways PCL 12 –
13 Bangkok Aviation Fuel Services PCL 10 –
3 Bangkok Bank PCL 10 –
103 Bangkok Chain Hospital PCL 32 0.01
38 Bangkok Dusit Medical Services PCL 20 –
194 Bangkok Expressway & Metro PCL 33 0.01
445 Bangkok Land PCL 17 –
14 Bangkok Life Assurance PCL, NVDR 16 –
35 Banpu PCL 15 –
76 Beauty Community PCL 19 –
15 BEC World PCL 6 –
17 Berli Jucker PCL 19 –
4 Bumrungrad Hospital PCL 18 –
9 Central Pattana PCL 12 –
27 Central Plaza Hotel PCL 25 –
72 Charoen Pokphand Foods PCL 46 0.02
282 CK Power PCL 23 –
18 CP ALL PCL 25 –
10 Delta Electronics Thailand PCL 16 –
66 Eastern Polymer Group PCL 20 – 33
Eastern Water Resources Development and Management PCL 8 –
5 Electricity Generating PCL 21 –
32 Energy Absolute PCL 21 –
123 Energy Earth PCL 13 –
134 Esso Thailand PCL 40 0.02
53 GFPT PCL 17 –
25 Global Power Synergy Co Ltd 20 –
10 Glow Energy PCL 18 –
34 Hana Microelectronics PCL 24 –
122 Home Product Center PCL 28 –
78 Indorama Ventures PCL 58 0.02
12 Intouch Holdings PCL 13 –
376 IRPC PCL 40 0.02
52 Jasmine International PCL 9 –
16 Kasikornbank PCL 60 0.02
14 KCE Electronics PCL 36 0.01
189 Khon Kaen Sugar Industry PCL 17 –
22 Kiatnakin Bank PCL 27 –
98 Krung Thai Bank PCL 38 0.02
7 Krungthai Card PCL 24 –
90 Land & Houses PCL, NVDR 19 –
517 LH Financial Group PCL 20 –
59 LPN Development PCL 13 –
27 Major Cineplex Group PCL 19 –
43 MBK PCL 14 –
21 Minor International PCL 18 –
8 MK Restaurants Group PCL 10 –
54 Pruksa Real Estate PCL 18 –
39 PTG Energy PCL 28 –
42 PTT Exploration & Production PCL 77 0.02
30 PTT Global Chemical PCL 42 0.02
28 PTT PCL 221 0.04
319 Quality Houses PCL 18 –

World Equity Fund
Portfolio of Investments as at 30 November 2016 (continued)
Dimensional Fund Advisors Annual Report and Audited Financial Statements, 30 November 2016 345
Shares (000's)
Value (000's)
GBP
% of Net Asset Value
Common Stock (continued)
Thailand – 0.29% (continued)
17 Ratchaburi Electricity Generating Holding PCL 18 –
31 Samart Corp PCL 9 –
602 Sansiri PCL 22 –
2 Siam Cement PCL 18 –
2 Siam City Cement PCL 13 –
9 Siam Commercial Bank PCL 30 –
7 Siam Global House PCL 3 –
40 Sino–Thai Engineering & Construction PCL 26 –
18 SPCG PCL 9 –
48 Sri Trang Agro–Industry PCL 18 –
36 STP & I PCL 9 –
34 Supalai PCL 17 –
53 Thai Airways International PCL 29 –
34 Thai Oil PCL 56 0.02
68 Thai Reinsurance PCL 3 –
68 Thai Union Group PCL 31 0.01
19 Thai Vegetable Oil PCL 16 –
20 Thaicom PCL 9 –
19 Thanachart Capital PCL 19 –
90 Thoresen Thai Agencies PCL 20 –
24 Tipco Asphalt PCL 10 –
9 Tisco Financial Group PCL 11 –
748 TMB Bank PCL 34 0.01
35 Total Access Communication PCL 26 –
383 TPI Polene PCL 20 –
51 TTW PCL 12 –
49 Unique Engineering & Construction PCL 20 –
74 Vanachai Group PCL 23 –
145 VGI Global Media PCL 17 –
342 Vibhavadi Medical Center PCL 22 –
268 WHA Corp PCL 18 –
18 Workpoint Entertainment PCL 16 –
2,190 0.29
Turkey – 0.12%
9 Adana Cimento Sanayii TAS 13 –
25 Akbank TAS 43 0.01
4 Akcansa Cimento AS 11 –
7 Aksa Akrilik Kimya Sanayii AS 14 –
24 Aksa Enerji Uretim AS 16 –
35 Albaraka Turk Katilim Bankasi AS 10 –
2 Anadolu Efes Biracilik Ve Malt Sanayii AS 8 –
7 Arcelik AS 31 0.01
– Anselsan Elektronik Sanayi – –
5 Aygaz AS 14 –
8 Besiktas Futbol Yatirimlari Sanayi ve Ticaret AS 7 –
2 BIM Birlesik Magazalar AS 21 0.01
5 Bolu Cimento Sanayii AS 7 –
1 Boyner Perakende Ve Tekstil Yatirimlari AS 10 –
3 Cimsa Cimento Sanayi VE Ticaret AS 11 –
1 Coca–Cola Icecek AS 11 –
109 Dogan Sirketler Grubu Holding AS 17 –
5 Dogus Otomotiv Servis ve Ticaret AS 9 – 24
EIS Eczacibasi Ilac ve Sinai ve Finansal Yatirimlar Sanayi ve Ticaret AS 16 –
36 Eregli Demir ve Celik Fabrikalari TAS 39 0.01
2 Ford Otomotiv Sanayi AS 13 –
1 Goltas Goller Bolgesi Cimento Sanayi ve Ticaret A.S. 12 –
7 Gubre Fabrikalari TAS 7 –
57 Kardemir Karabuk Demir Celik Sanayi ve Ticaret AS 14 – 22
Kardemir Karabuk Demir Celik Sanayi ve Ticaret AS, Class A 6 –
12 KOC Holding AS 34 –
4 Koza Altin Isletmeleri AS 16 –
22 Koza Anadolu Metal Madencilik Isletmeleri AS 11 –
Shares (000's)
Value (000's)
GBP
% of Net Asset Value
Common Stock (continued)
Turkey – 0.12% (continued)
3 Migros Ticaret AS 14 –
11 NET Holding AS 8 –
5 Nuh Cimento Sanayi AS 10 –
– Otokar Otomotiv Ve Savunma Sanayi A.S. 13 –
3 Pegasus Hava Tasimaciligi AS 8 –
26 Petkim Petrokimya Holding AS 22 0.01
31 Sekerbank TAS 8 –
17 Soda Sanayii AS 18 –
8 Tat Gida Sanayi AS 10 –
3 TAV Havalimanlari Holding AS 8 –
11 Tekfen Holding AS 16 –
37 Trakya Cam Sanayii AS 24 0.01
3 Tupras Turkiye Petrol Rafinerileri AS 49 0.01
27 Turk Hava Yollari AO 30 0.01
11 Turkcell Iletisim Hizmetleri AS 23 0.01
31 Turkiye Garanti Bankasi AS 52 0.01
13 Turkiye Halk Bankasi AS 27 0.01
18 Turkiye Is Bankasi 20 –
73 Turkiye Sinai Kalkinma Bankasi AS 21 –
41 Turkiye Sise ve Cam Fabrikalari AS 32 –
49 Turkiye Vakiflar Bankasi TAO 47 0.01
3 Ulker Biskuvi Sanayi AS 13 –
10 Vestel Elektronik Sanayi ve Ticaret AS 15 –
19 Yapi ve Kredi Bankasi AS 14 –
923 0.12
United Kingdom – 5.59%
54 3i Group PLC 369 0.06
1 4imprint Group PLC 10 –
11 888 Holdings PLC 23 –
8 A.G. Barr PLC 41 0.01
27 AA PLC 70 0.01
45 Aberdeen Asset Management PLC 122 0.02
14 Acacia Mining PLC 57 0.01
4 Acal PLC 9 –
6 Admiral Group PLC 113 0.01
35 Afren PLC – –
14 Aggreko PLC 119 0.02
19 AMEC PLC 83 0.01
29 Anglo American PLC 349 0.05
11 Anglo Pacific Group PLC 12 –
2 Anglo–Eastern Plantations PLC 10 –
26 Antofagasta PLC 180 0.02
12 Arrow Global Group PLC 34 –
22 Ashmore Group PLC 60 0.01
23 Ashtead Group PLC 357 0.06
2 Associated British Foods PLC 39 0.01
11 AstraZeneca PLC 467 0.07
24 Auto Trader Group PLC 96 0.01
4 Aveva Group PLC 71 0.01
68 Aviva PLC 305 0.04
3 Avon Rubber PLC 33 –
29 B&M European Value Retail SA 73 0.01
29 Babcock International Group PLC 279 0.04
42 BAE Systems PLC 254 0.03
31 Balfour Beatty PLC 84 0.01
150 Barclays PLC 322 0.04
52 Barratt Developments PLC 245 0.03
58 BBA Aviation PLC 151 0.02
33 Beazley PLC 127 0.02
9 Bellway PLC 215 0.03
13 Berendsen PLC 119 0.02
8 Berkeley Group Holdings PLC 207 0.03
2 BGEO Group PLC 67 0.01
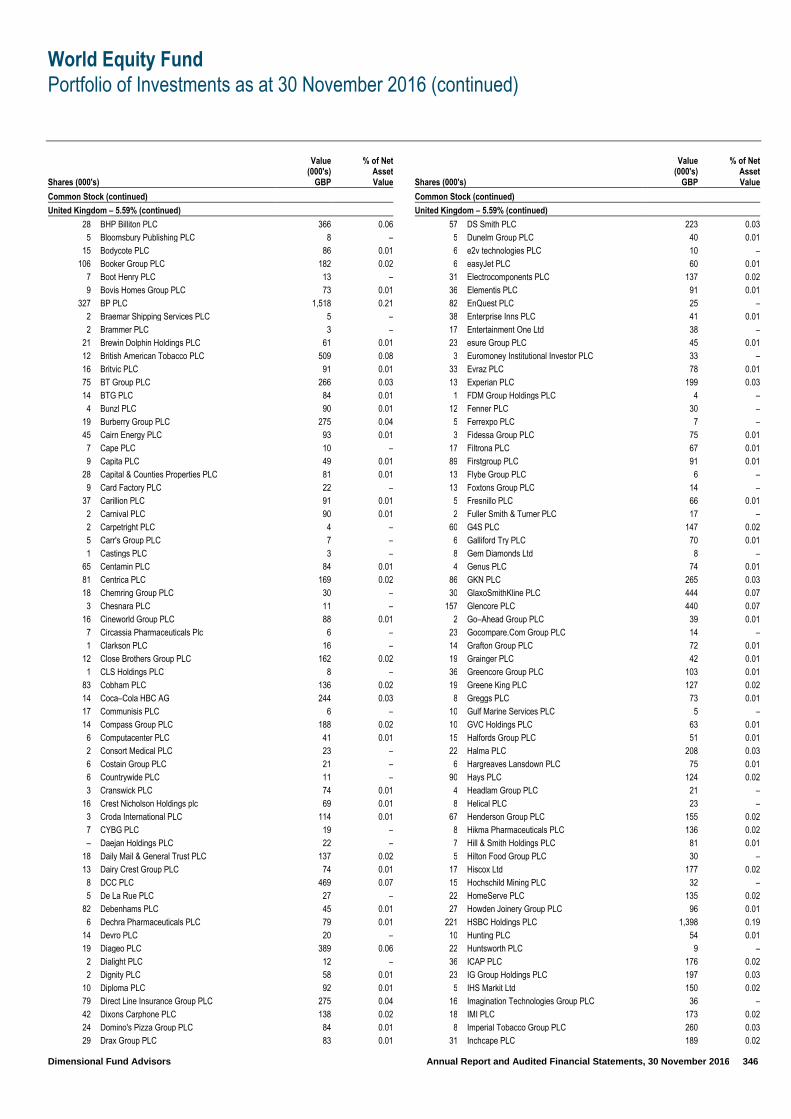
World Equity Fund
Portfolio of Investments as at 30 November 2016 (continued)
Dimensional Fund Advisors Annual Report and Audited Financial Statements, 30 November 2016 346
Shares (000's)
Value (000's)
GBP
% of Net Asset Value
Common Stock (continued)
United Kingdom – 5.59% (continued)
28 BHP Billiton PLC 366 0.06
5 Bloomsbury Publishing PLC 8 –
15 Bodycote PLC 86 0.01
106 Booker Group PLC 182 0.02
7 Boot Henry PLC 13 –
9 Bovis Homes Group PLC 73 0.01
327 BP PLC 1,518 0.21
2 Braemar Shipping Services PLC 5 –
2 Brammer PLC 3 –
21 Brewin Dolphin Holdings PLC 61 0.01
12 British American Tobacco PLC 509 0.08
16 Britvic PLC 91 0.01
75 BT Group PLC 266 0.03
14 BTG PLC 84 0.01
4 Bunzl PLC 90 0.01
19 Burberry Group PLC 275 0.04
45 Cairn Energy PLC 93 0.01
7 Cape PLC 10 –
9 Capita PLC 49 0.01
28 Capital & Counties Properties PLC 81 0.01
9 Card Factory PLC 22 –
37 Carillion PLC 91 0.01
2 Carnival PLC 90 0.01
2 Carpetright PLC 4 –
5 Carr's Group PLC 7 –
1 Castings PLC 3 –
65 Centamin PLC 84 0.01
81 Centrica PLC 169 0.02
18 Chemring Group PLC 30 –
3 Chesnara PLC 11 –
16 Cineworld Group PLC 88 0.01
7 Circassia Pharmaceuticals Plc 6 –
1 Clarkson PLC 16 –
12 Close Brothers Group PLC 162 0.02
1 CLS Holdings PLC 8 –
83 Cobham PLC 136 0.02
14 Coca–Cola HBC AG 244 0.03
17 Communisis PLC 6 –
14 Compass Group PLC 188 0.02
6 Computacenter PLC 41 0.01
2 Consort Medical PLC 23 –
6 Costain Group PLC 21 –
6 Countrywide PLC 11 –
3 Cranswick PLC 74 0.01
16 Crest Nicholson Holdings plc 69 0.01
3 Croda International PLC 114 0.01
7 CYBG PLC 19 –
– Daejan Holdings PLC 22 –
18 Daily Mail & General Trust PLC 137 0.02
13 Dairy Crest Group PLC 74 0.01
8 DCC PLC 469 0.07
5 De La Rue PLC 27 –
82 Debenhams PLC 45 0.01
6 Dechra Pharmaceuticals PLC 79 0.01
14 Devro PLC 20 –
19 Diageo PLC 389 0.06
2 Dialight PLC 12 –
2 Dignity PLC 58 0.01
10 Diploma PLC 92 0.01
79 Direct Line Insurance Group PLC 275 0.04
42 Dixons Carphone PLC 138 0.02
24 Domino's Pizza Group PLC 84 0.01
29 Drax Group PLC 83 0.01
Shares (000's)
Value (000's)
GBP
% of Net Asset Value
Common Stock (continued)
United Kingdom – 5.59% (continued)
57 DS Smith PLC 223 0.03
5 Dunelm Group PLC 40 0.01
6 e2v technologies PLC 10 –
6 easyJet PLC 60 0.01
31 Electrocomponents PLC 137 0.02
36 Elementis PLC 91 0.01
82 EnQuest PLC 25 –
38 Enterprise Inns PLC 41 0.01
17 Entertainment One Ltd 38 –
23 esure Group PLC 45 0.01
3 Euromoney Institutional Investor PLC 33 –
33 Evraz PLC 78 0.01
13 Experian PLC 199 0.03
1 FDM Group Holdings PLC 4 –
12 Fenner PLC 30 –
5 Ferrexpo PLC 7 –
3 Fidessa Group PLC 75 0.01
17 Filtrona PLC 67 0.01
89 Firstgroup PLC 91 0.01
13 Flybe Group PLC 6 –
13 Foxtons Group PLC 14 –
5 Fresnillo PLC 66 0.01
2 Fuller Smith & Turner PLC 17 –
60 G4S PLC 147 0.02
6 Galliford Try PLC 70 0.01
8 Gem Diamonds Ltd 8 –
4 Genus PLC 74 0.01
86 GKN PLC 265 0.03
30 GlaxoSmithKline PLC 444 0.07
157 Glencore PLC 440 0.07
2 Go–Ahead Group PLC 39 0.01
23 Gocompare.Com Group PLC 14 –
14 Grafton Group PLC 72 0.01
19 Grainger PLC 42 0.01
36 Greencore Group PLC 103 0.01
19 Greene King PLC 127 0.02
8 Greggs PLC 73 0.01
10 Gulf Marine Services PLC 5 –
10 GVC Holdings PLC 63 0.01
15 Halfords Group PLC 51 0.01
22 Halma PLC 208 0.03
6 Hargreaves Lansdown PLC 75 0.01
90 Hays PLC 124 0.02
4 Headlam Group PLC 21 –
8 Helical PLC 23 –
67 Henderson Group PLC 155 0.02
8 Hikma Pharmaceuticals PLC 136 0.02
7 Hill & Smith Holdings PLC 81 0.01
5 Hilton Food Group PLC 30 –
17 Hiscox Ltd 177 0.02
15 Hochschild Mining PLC 32 –
22 HomeServe PLC 135 0.02
27 Howden Joinery Group PLC 96 0.01
221 HSBC Holdings PLC 1,398 0.19
10 Hunting PLC 54 0.01
22 Huntsworth PLC 9 –
36 ICAP PLC 176 0.02
23 IG Group Holdings PLC 197 0.03
5 IHS Markit Ltd 150 0.02
16 Imagination Technologies Group PLC 36 –
18 IMI PLC 173 0.02
8 Imperial Tobacco Group PLC 260 0.03
31 Inchcape PLC 189 0.02
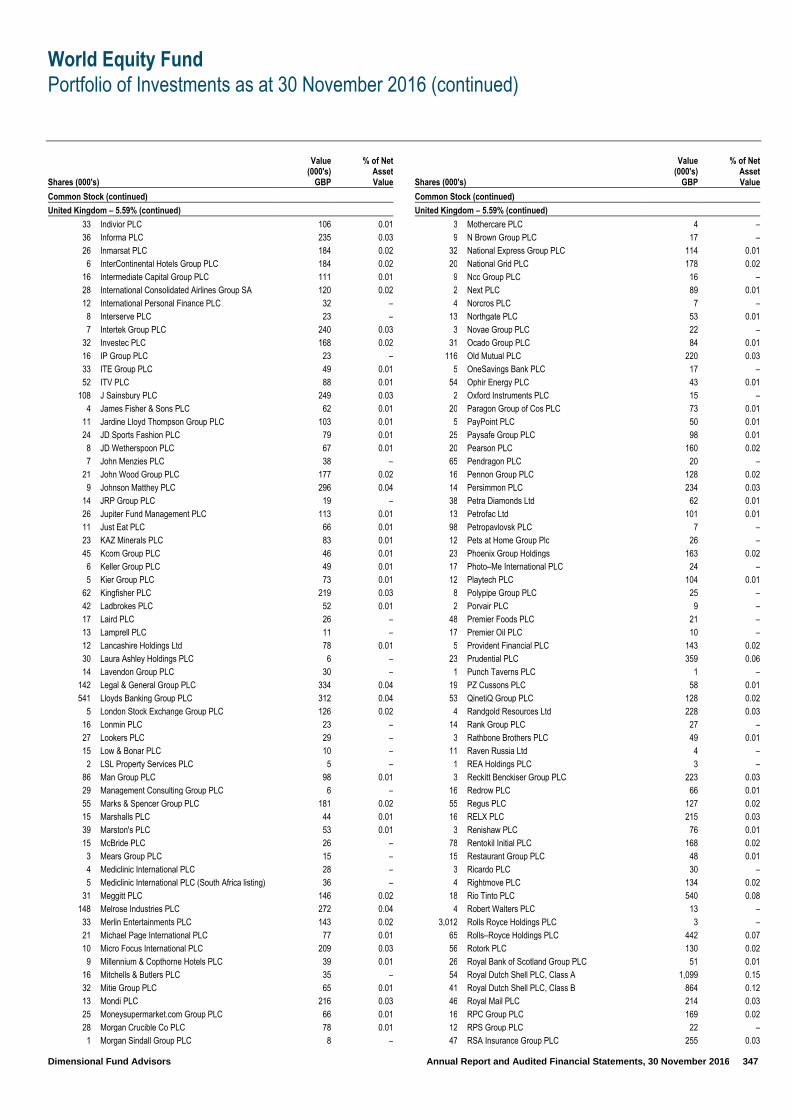
World Equity Fund
Portfolio of Investments as at 30 November 2016 (continued)
Dimensional Fund Advisors Annual Report and Audited Financial Statements, 30 November 2016 347
Shares (000's)
Value (000's)
GBP
% of Net Asset Value
Common Stock (continued)
United Kingdom – 5.59% (continued)
33 Indivior PLC 106 0.01
36 Informa PLC 235 0.03
26 Inmarsat PLC 184 0.02
6 InterContinental Hotels Group PLC 184 0.02
16 Intermediate Capital Group PLC 111 0.01
28 International Consolidated Airlines Group SA 120 0.02
12 International Personal Finance PLC 32 –
8 Interserve PLC 23 –
7 Intertek Group PLC 240 0.03
32 Investec PLC 168 0.02
16 IP Group PLC 23 –
33 ITE Group PLC 49 0.01
52 ITV PLC 88 0.01
108 J Sainsbury PLC 249 0.03
4 James Fisher & Sons PLC 62 0.01
11 Jardine Lloyd Thompson Group PLC 103 0.01
24 JD Sports Fashion PLC 79 0.01
8 JD Wetherspoon PLC 67 0.01
7 John Menzies PLC 38 –
21 John Wood Group PLC 177 0.02
9 Johnson Matthey PLC 296 0.04
14 JRP Group PLC 19 –
26 Jupiter Fund Management PLC 113 0.01
11 Just Eat PLC 66 0.01
23 KAZ Minerals PLC 83 0.01
45 Kcom Group PLC 46 0.01
6 Keller Group PLC 49 0.01
5 Kier Group PLC 73 0.01
62 Kingfisher PLC 219 0.03
42 Ladbrokes PLC 52 0.01
17 Laird PLC 26 –
13 Lamprell PLC 11 –
12 Lancashire Holdings Ltd 78 0.01
30 Laura Ashley Holdings PLC 6 –
14 Lavendon Group PLC 30 –
142 Legal & General Group PLC 334 0.04
541 Lloyds Banking Group PLC 312 0.04
5 London Stock Exchange Group PLC 126 0.02
16 Lonmin PLC 23 –
27 Lookers PLC 29 –
15 Low & Bonar PLC 10 –
2 LSL Property Services PLC 5 –
86 Man Group PLC 98 0.01
29 Management Consulting Group PLC 6 –
55 Marks & Spencer Group PLC 181 0.02
15 Marshalls PLC 44 0.01
39 Marston's PLC 53 0.01
15 McBride PLC 26 –
3 Mears Group PLC 15 –
4 Mediclinic International PLC 28 –
5 Mediclinic International PLC (South Africa listing) 36 –
31 Meggitt PLC 146 0.02
148 Melrose Industries PLC 272 0.04
33 Merlin Entertainments PLC 143 0.02
21 Michael Page International PLC 77 0.01
10 Micro Focus International PLC 209 0.03
9 Millennium & Copthorne Hotels PLC 39 0.01
16 Mitchells & Butlers PLC 35 –
32 Mitie Group PLC 65 0.01
13 Mondi PLC 216 0.03
25 Moneysupermarket.com Group PLC 66 0.01
28 Morgan Crucible Co PLC 78 0.01
1 Morgan Sindall Group PLC 8 –
Shares (000's)
Value (000's)
GBP
% of Net Asset Value
Common Stock (continued)
United Kingdom – 5.59% (continued)
3 Mothercare PLC 4 –
9 N Brown Group PLC 17 –
32 National Express Group PLC 114 0.01
20 National Grid PLC 178 0.02
9 Ncc Group PLC 16 –
2 Next PLC 89 0.01
4 Norcros PLC 7 –
13 Northgate PLC 53 0.01
3 Novae Group PLC 22 –
31 Ocado Group PLC 84 0.01
116 Old Mutual PLC 220 0.03
5 OneSavings Bank PLC 17 –
54 Ophir Energy PLC 43 0.01
2 Oxford Instruments PLC 15 –
20 Paragon Group of Cos PLC 73 0.01
5 PayPoint PLC 50 0.01
25 Paysafe Group PLC 98 0.01
20 Pearson PLC 160 0.02
65 Pendragon PLC 20 –
16 Pennon Group PLC 128 0.02
14 Persimmon PLC 234 0.03
38 Petra Diamonds Ltd 62 0.01
13 Petrofac Ltd 101 0.01
98 Petropavlovsk PLC 7 –
12 Pets at Home Group Plc 26 –
23 Phoenix Group Holdings 163 0.02
17 Photo–Me International PLC 24 –
12 Playtech PLC 104 0.01
8 Polypipe Group PLC 25 –
2 Porvair PLC 9 –
48 Premier Foods PLC 21 –
17 Premier Oil PLC 10 –
5 Provident Financial PLC 143 0.02
23 Prudential PLC 359 0.06
1 Punch Taverns PLC 1 –
19 PZ Cussons PLC 58 0.01
53 QinetiQ Group PLC 128 0.02
4 Randgold Resources Ltd 228 0.03
14 Rank Group PLC 27 –
3 Rathbone Brothers PLC 49 0.01
11 Raven Russia Ltd 4 –
1 REA Holdings PLC 3 –
3 Reckitt Benckiser Group PLC 223 0.03
16 Redrow PLC 66 0.01
55 Regus PLC 127 0.02
16 RELX PLC 215 0.03
3 Renishaw PLC 76 0.01
78 Rentokil Initial PLC 168 0.02
15 Restaurant Group PLC 48 0.01
3 Ricardo PLC 30 –
4 Rightmove PLC 134 0.02
18 Rio Tinto PLC 540 0.08
4 Robert Walters PLC 13 –
3,012 Rolls Royce Holdings PLC 3 –
65 Rolls–Royce Holdings PLC 442 0.07
56 Rotork PLC 130 0.02
26 Royal Bank of Scotland Group PLC 51 0.01
54 Royal Dutch Shell PLC, Class A 1,099 0.15
41 Royal Dutch Shell PLC, Class B 864 0.12
46 Royal Mail PLC 214 0.03
16 RPC Group PLC 169 0.02
12 RPS Group PLC 22 –
47 RSA Insurance Group PLC 255 0.03

World Equity Fund
Portfolio of Investments as at 30 November 2016 (continued)
Dimensional Fund Advisors Annual Report and Audited Financial Statements, 30 November 2016 348
Shares (000's)
Value (000's)
GBP
% of Net Asset Value
Common Stock (continued)
United Kingdom – 5.59% (continued)
21 Saga PLC 41 0.01
23 Sage Group PLC 152 0.02
10 Savills PLC 70 0.01
4 Schroders PLC 101 0.01
2 Schroders PLC (non–voting rights) 31 –
5 SDL PLC 20 –
35 Senior PLC 65 0.01
6 Sepura PLC 1 –
53 Serco Group PLC 70 0.01
2 Servelec Group PLC 5 –
14 Severfield PLC 10 –
5 Severn Trent PLC 110 0.01
41 Shanks Group PLC 38 –
6 Shire PLC 280 0.04
– Shire PLC, ADR 8 –
38 SIG PLC 34 –
17 Sky PLC 136 0.02
16 Smith & Nephew PLC 176 0.02
21 Smiths Group PLC 302 0.04
9 Smiths News PLC 13 –
17 Soco International PLC 24 –
8 Spectris PLC 160 0.02
41 Speedy Hire PLC 18 –
5 Spirax–Sarco Engineering PLC 214 0.03
11 Spire Healthcare Group PLC 38 –
25 Spirent Communications PLC 20 –
11 Sportech PLC 8 –
14 Sports Direct International PLC 44 0.01
27 SSE PLC 403 0.06
17 SSP Group PLC 62 0.01
2 St Ives PLC 3 –
17 St James's Place PLC 156 0.02
15 St Modwen Properties PLC 42 0.01
13 Stagecoach Group PLC 26 –
39 Standard Chartered PLC 247 0.03
31 Standard Life PLC 106 0.01
6 SThree PLC 17 –
7 Stobart Group Ltd 12 –
4 SuperGroup PLC 65 0.01
24 Synthomer PLC 87 0.01
28 TalkTalk Telecom Group PLC 44 0.01
3 Tarsus Group PLC 8 –
23 Tate & Lyle PLC 158 0.02
143 Taylor Wimpey PLC 212 0.03
1 Ted Baker PLC 26 –
7 Telecom Plus PLC 81 0.01
181 Tesco PLC 377 0.06
106 Thomas Cook Group PLC 89 0.01
5 Topps Tiles PLC 4 –
13 Travis Perkins PLC 172 0.02
23 Trinity Mirror PLC 18 –
15 TT Electronics PLC 21 –
9 TUI AG 94 0.01
17 Tullett Prebon PLC 76 0.01
49 Tullow Oil PLC 146 0.02
4 U & I Group PLC 6 –
21 UBM PLC 150 0.02
13 UDG Healthcare PLC 88 0.01
5 Ultra Electronics Holdings PLC 105 0.01
8 Unilever PLC 254 0.03
13 UNITE Group PLC 72 0.01
10 United Utilities Group PLC 88 0.01
22 Vectura Group PLC 32 –
Shares (000's)
Value (000's)
GBP
% of Net Asset Value
Common Stock (continued)
4 Vedanta Resources PLC 30 –
19 Vesuvius PLC 73 0.01
7 Victrex PLC 118 0.02
10 Virgin Money Holdings UK PLC 31 –
2 Vitec Group PLC 14 –
418 Vodafone Group PLC 807 0.12
4 Volution Group PLC 6 –
1 Vp PLC 7 –
10 Weir Group PLC 189 0.02
5 WH Smith PLC 71 0.01
2 Whitbread PLC 68 0.01
61 William Hill PLC 185 0.02
10 Wincanton PLC 22 –
– Wizz Air Holdings Plc 7 –
134 Wm Morrison Supermarkets PLC 291 0.04
4 Wolseley PLC 192 0.03
20 WPP PLC 341 0.04
8 WS Atkins PLC 115 0.02
3 Xaar PLC 12 –
1 XP Power Ltd 19 –
6 Zoopla Property Group PLC 21 –
42,768 5.59
United States – 50.74%
3 1–800–Flowers.com Inc 22 –
1 1st Constitution Bancorp 13 –
2 1st Source Corp 54 0.01
1 3D Systems Corp 9 –
3 3M Co 463 0.06
2 A H Belo Corp 9 –
2 A Schulman Inc 61 0.01
1 A–Mark Precious Metals Inc 13 –
3 AAON Inc 80 0.01
3 AAR Corp 74 0.01
5 Aaron's Inc 121 0.02
1 Abaxis Inc 49 0.01
17 Abbott Laboratories 522 0.08
10 AbbVie Inc 462 0.06
4 Abercrombie & Fitch Co 49 0.01
1 ABIOMED Inc 83 0.01
4 ABM Industries Inc 140 0.02
6 Abraxas Petroleum Corp 11 –
2 Acacia Research Corp 10 –
4 Acadia Healthcare Co Inc 112 0.01
2 ACADIA Pharmaceuticals Inc 39 0.01
4 Accenture PLC 349 0.05
2 Access National Corp 34 –
7 ACCO Brands Corp 72 0.01
3 Accuray Inc 12 –
2 Aceto Corp 33 –
6 Achillion Pharmaceuticals Inc 18 –
9 ACI Worldwide Inc 133 0.02
1 Acorda Therapeutics Inc 25 –
18 Activision Blizzard Inc 525 0.08
4 Actua Corp 42 0.01
4 Actuant Corp 74 0.01
1 Acuity Brands Inc 121 0.02
4 Acxiom Corp 92 0.01
1 Adamas Pharmaceuticals Inc 13 –
– Adams Resources & Energy Inc 13 –
1 Addus HomeCare Corp 19 –
1 Adobe Systems Inc 81 0.01
3 ADTRAN Inc 45 0.01
1 Advance Auto Parts Inc 125 0.02

World Equity Fund
Portfolio of Investments as at 30 November 2016 (continued)
Dimensional Fund Advisors Annual Report and Audited Financial Statements, 30 November 2016 349
Shares (000's)
Value (000's)
GBP
% of Net Asset Value
Common Stock (continued)
United States – 50.74% (continued)
3 Advanced Drainage Systems Inc 51 0.01
3 Advanced Energy Industries Inc 123 0.02
11 Advanced Micro Devices Inc 79 0.01
– AdvanSix Inc 3 –
2 Advisory Board Co 51 0.01
10 AECOM 305 0.04
2 Aegion Corp 46 0.01
– AEP Industries Inc 38 –
3 Aerojet Rocketdyne Holdings Inc 57 0.01
2 Aerovironment Inc 50 0.01
17 AES Corp 158 0.02
7 Aetna Inc 700 0.1
3 Affiliated Managers Group Inc 412 0.05
13 Aflac Inc 717 0.1
6 AGCO Corp 250 0.03
8 Agilent Technologies Inc 287 0.04
2 Agilysys Inc 17 –
3 AgroFresh Solutions Inc 7 –
8 Air Lease Corp 232 0.03
3 Air Methods Corp 78 0.01
4 Air Products & Chemicals Inc 445 0.06
6 Air Transport Services Group Inc 72 0.01
6 Aircastle Ltd 101 0.01
7 AK Steel Holding Corp 50 0.01
6 Akamai Technologies Inc 321 0.04
2 Akebia Therapeutics Inc 13 –
10 Akorn Inc 162 0.02
– Alamo Group Inc 12 –
9 Alaska Air Group Inc 588 0.09
2 Albany International Corp 71 0.01
1 Albany Molecular Research Inc 7 –
6 Albemarle Corp 401 0.05
4 Alcoa Corp 83 0.01
3 Alere Inc 98 0.01
3 Alexander & Baldwin Inc 121 0.02
1 Alexion Pharmaceuticals Inc 65 0.01
1 Alico Inc 14 –
1 Align Technology Inc 96 0.01
2 Alkermes PLC 83 0.01
1 Alleghany Corp 298 0.04
3 Allegheny Technologies Inc 47 0.01
– Allegiant Travel Co 52 0.01
3 Allegion PLC 154 0.02
4 Allergan plc 560 0.08
2 ALLETE Inc 113 0.01
1 Alliance Data Systems Corp 152 0.02
1 Alliance One International Inc 16 –
6 Alliant Energy Corp 171 0.02
1 Allied Motion Technologies Inc 14 –
6 Allied World Assurance Co Holdings AG 225 0.03
11 Allison Transmission Holdings Inc 285 0.04
12 Allscripts Healthcare Solutions Inc 106 0.01
8 Allstate Corp 448 0.06
36 Ally Financial Inc 553 0.08
1 Almost Family Inc 35 –
1 Alnylam Pharmaceuticals Inc 35 –
4 Alon USA Energy Inc 33 –
2 Alpha & Omega Semiconductor Ltd 33 –
2 Alphabet Inc, Class A 986 0.14
2 Alphabet Inc, Class C 1,109 0.15
– Altisource Portfolio Solutions SA 6 –
2 Altra Industrial Motion Corp 62 0.01
12 Altria Group Inc 609 0.09
Shares (000's)
Value (000's)
GBP
% of Net Asset Value
Common Stock (continued)
United States – 50.74% (continued)
3 Amazon.com Inc 1,969 0.27
4 Ambac Financial Group Inc 72 0.01
1 Ambarella Inc 39 0.01
2 AMC Entertainment Holdings Inc 41 0.01
2 AMC Networks Inc 69 0.01
8 Amdocs Ltd 367 0.05
2 Amedisys Inc 57 0.01
2 AMERCO 421 0.06
3 Ameren Corp 106 0.01
2 Ameresco Inc 7 –
1 America's Car–Mart Inc 22 –
6 American Airlines Group Inc 235 0.03
7 American Axle & Manufacturing Holdings Inc 89 0.01
14 American Eagle Outfitters Inc 189 0.02
3 American Electric Power Co Inc 165 0.02
5 American Equity Investment Life Holding Co 90 0.01
26 American Express Co 1,502 0.21
5 American Financial Group Inc 347 0.05
13 American International Group Inc 642 0.09
1 American National Bankshares Inc 17 –
2 American National Insurance Co 176 0.02
2 American Public Education Inc 34 –
1 American Railcar Industries Inc 29 –
2 American Software Inc 14 –
2 American States Water Co 63 0.01
2 American Vanguard Corp 34 –
2 American Water Works Co Inc 117 0.02
1 American Woodmark Corp 86 0.01
6 Ameriprise Financial Inc 587 0.09
3 Ameris Bancorp 106 0.01
1 Amerisafe Inc 61 0.01
2 AmerisourceBergen Corp 130 0.02
1 Ames National Corp 12 –
8 AMETEK Inc 300 0.04
6 Amgen Inc 697 0.1
1 Amicus Therapeutics Inc 6 –
15 Amkor Technology Inc 140 0.02
4 AMN Healthcare Services Inc 107 0.01
1 Ampco–Pittsburgh Corp 13 –
4 Amphastar Pharmaceuticals Inc 70 0.01
4 Amphenol Corp 212 0.03
4 Amsurg Corp 227 0.03
2 Amtech Systems Inc 6 –
12 AmTrust Financial Services Inc 235 0.03
7 Anadarko Petroleum Corp 404 0.05
4 Analog Devices Inc 224 0.03
1 Analogic Corp 73 0.01
2 Andersons Inc 59 0.01
2 Angie's List Inc 11 –
4 AngioDynamics Inc 53 0.01
1 Anika Therapeutics Inc 41 0.01
2 Anixter International Inc 154 0.02
4 ANSYS Inc 302 0.04
16 Antero Resources Corp 315 0.04
5 Anthem Inc 614 0.09
5 AO Smith Corp 204 0.03
4 Aon PLC 340 0.04
4 Apache Corp 212 0.03
2 Apogee Enterprises Inc 91 0.01
5 Apollo Education Group Inc 35 –
60 Apple Inc 5,322 0.71
2 Applied Industrial Technologies Inc 107 0.01
15 Applied Materials Inc 392 0.05
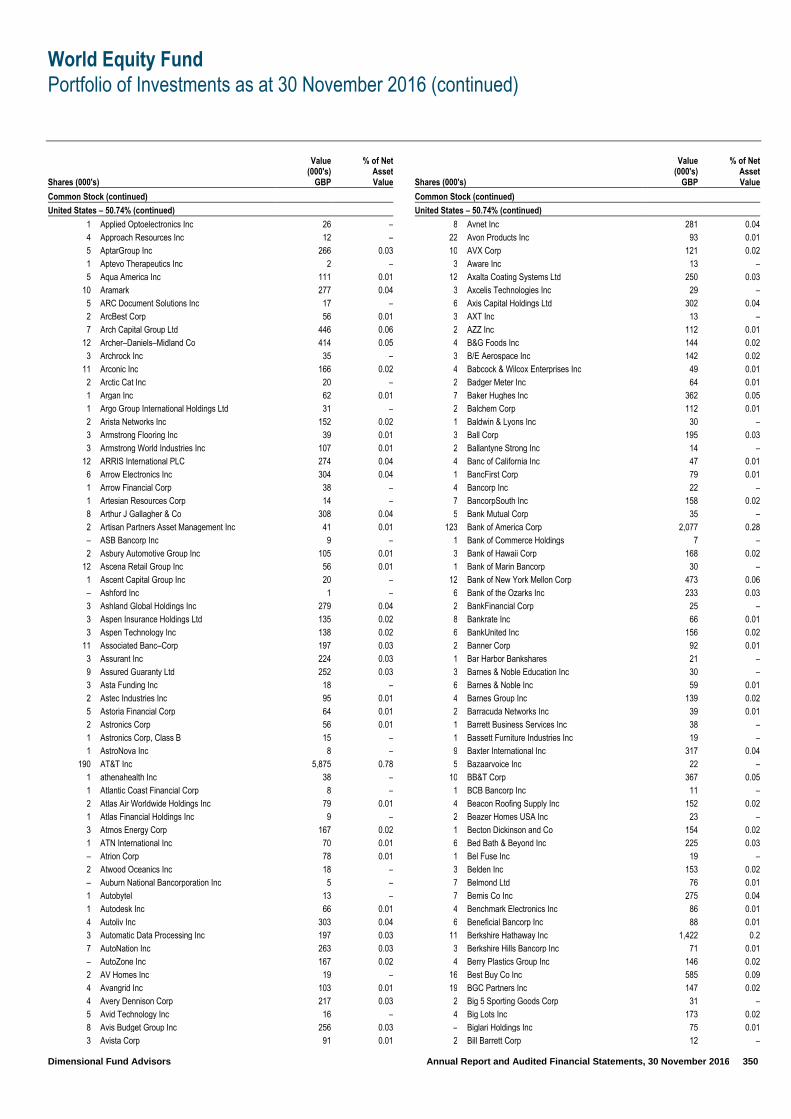
World Equity Fund
Portfolio of Investments as at 30 November 2016 (continued)
Dimensional Fund Advisors Annual Report and Audited Financial Statements, 30 November 2016 350
Shares (000's)
Value (000's)
GBP
% of Net Asset Value
Common Stock (continued)
United States – 50.74% (continued)
1 Applied Optoelectronics Inc 26 –
4 Approach Resources Inc 12 –
5 AptarGroup Inc 266 0.03
1 Aptevo Therapeutics Inc 2 –
5 Aqua America Inc 111 0.01
10 Aramark 277 0.04
5 ARC Document Solutions Inc 17 –
2 ArcBest Corp 56 0.01
7 Arch Capital Group Ltd 446 0.06
12 Archer–Daniels–Midland Co 414 0.05
3 Archrock Inc 35 –
11 Arconic Inc 166 0.02
2 Arctic Cat Inc 20 –
1 Argan Inc 62 0.01
1 Argo Group International Holdings Ltd 31 –
2 Arista Networks Inc 152 0.02
3 Armstrong Flooring Inc 39 0.01
3 Armstrong World Industries Inc 107 0.01
12 ARRIS International PLC 274 0.04
6 Arrow Electronics Inc 304 0.04
1 Arrow Financial Corp 38 –
1 Artesian Resources Corp 14 –
8 Arthur J Gallagher & Co 308 0.04
2 Artisan Partners Asset Management Inc 41 0.01
– ASB Bancorp Inc 9 –
2 Asbury Automotive Group Inc 105 0.01
12 Ascena Retail Group Inc 56 0.01
1 Ascent Capital Group Inc 20 –
– Ashford Inc 1 –
3 Ashland Global Holdings Inc 279 0.04
3 Aspen Insurance Holdings Ltd 135 0.02
3 Aspen Technology Inc 138 0.02
11 Associated Banc–Corp 197 0.03
3 Assurant Inc 224 0.03
9 Assured Guaranty Ltd 252 0.03
3 Asta Funding Inc 18 –
2 Astec Industries Inc 95 0.01
5 Astoria Financial Corp 64 0.01
2 Astronics Corp 56 0.01
1 Astronics Corp, Class B 15 –
1 AstroNova Inc 8 –
190 AT&T Inc 5,875 0.78
1 athenahealth Inc 38 –
1 Atlantic Coast Financial Corp 8 –
2 Atlas Air Worldwide Holdings Inc 79 0.01
1 Atlas Financial Holdings Inc 9 –
3 Atmos Energy Corp 167 0.02
1 ATN International Inc 70 0.01
– Atrion Corp 78 0.01
2 Atwood Oceanics Inc 18 –
– Auburn National Bancorporation Inc 5 –
1 Autobytel 13 –
1 Autodesk Inc 66 0.01
4 Autoliv Inc 303 0.04
3 Automatic Data Processing Inc 197 0.03
7 AutoNation Inc 263 0.03
– AutoZone Inc 167 0.02
2 AV Homes Inc 19 –
4 Avangrid Inc 103 0.01
4 Avery Dennison Corp 217 0.03
5 Avid Technology Inc 16 –
8 Avis Budget Group Inc 256 0.03
3 Avista Corp 91 0.01
Shares (000's)
Value (000's)
GBP
% of Net Asset Value
Common Stock (continued)
United States – 50.74% (continued)
8 Avnet Inc 281 0.04
22 Avon Products Inc 93 0.01
10 AVX Corp 121 0.02
3 Aware Inc 13 –
12 Axalta Coating Systems Ltd 250 0.03
3 Axcelis Technologies Inc 29 –
6 Axis Capital Holdings Ltd 302 0.04
3 AXT Inc 13 –
2 AZZ Inc 112 0.01
4 B&G Foods Inc 144 0.02
3 B/E Aerospace Inc 142 0.02
4 Babcock & Wilcox Enterprises Inc 49 0.01
2 Badger Meter Inc 64 0.01
7 Baker Hughes Inc 362 0.05
2 Balchem Corp 112 0.01
1 Baldwin & Lyons Inc 30 –
3 Ball Corp 195 0.03
2 Ballantyne Strong Inc 14 –
4 Banc of California Inc 47 0.01
1 BancFirst Corp 79 0.01
4 Bancorp Inc 22 –
7 BancorpSouth Inc 158 0.02
5 Bank Mutual Corp 35 –
123 Bank of America Corp 2,077 0.28
1 Bank of Commerce Holdings 7 –
3 Bank of Hawaii Corp 168 0.02
1 Bank of Marin Bancorp 30 –
12 Bank of New York Mellon Corp 473 0.06
6 Bank of the Ozarks Inc 233 0.03
2 BankFinancial Corp 25 –
8 Bankrate Inc 66 0.01
6 BankUnited Inc 156 0.02
2 Banner Corp 92 0.01
1 Bar Harbor Bankshares 21 –
3 Barnes & Noble Education Inc 30 –
6 Barnes & Noble Inc 59 0.01
4 Barnes Group Inc 139 0.02
2 Barracuda Networks Inc 39 0.01
1 Barrett Business Services Inc 38 –
1 Bassett Furniture Industries Inc 19 –
9 Baxter International Inc 317 0.04
5 Bazaarvoice Inc 22 –
10 BB&T Corp 367 0.05
1 BCB Bancorp Inc 11 –
4 Beacon Roofing Supply Inc 152 0.02
2 Beazer Homes USA Inc 23 –
1 Becton Dickinson and Co 154 0.02
6 Bed Bath & Beyond Inc 225 0.03
1 Bel Fuse Inc 19 –
3 Belden Inc 153 0.02
7 Belmond Ltd 76 0.01
7 Bemis Co Inc 275 0.04
4 Benchmark Electronics Inc 86 0.01
6 Beneficial Bancorp Inc 88 0.01
11 Berkshire Hathaway Inc 1,422 0.2
3 Berkshire Hills Bancorp Inc 71 0.01
4 Berry Plastics Group Inc 146 0.02
16 Best Buy Co Inc 585 0.09
19 BGC Partners Inc 147 0.02
2 Big 5 Sporting Goods Corp 31 –
4 Big Lots Inc 173 0.02
– Biglari Holdings Inc 75 0.01
2 Bill Barrett Corp 12 –

World Equity Fund
Portfolio of Investments as at 30 November 2016 (continued)
Dimensional Fund Advisors Annual Report and Audited Financial Statements, 30 November 2016 351
Shares (000's)
Value (000's)
GBP
% of Net Asset Value
Common Stock (continued)
United States – 50.74% (continued)
2 Bio–Rad Laboratories Inc 231 0.03
1 Bio–Techne Corp 116 0.02
1 Biogen Inc 283 0.04
1 BioMarin Pharmaceutical Inc 68 0.01
2 BioScrip Inc 2 –
1 BioSpecifics Technologies Corp 24 –
3 BioTelemetry Inc 47 0.01
2 BJ's Restaurants Inc 54 0.01
2 Black Box Corp 21 –
5 Black Diamond Inc 23 –
2 Black Hills Corp 106 0.01
2 Black Knight Financial Services Inc 44 0.01
2 Blackbaud Inc 101 0.01
3 Blackhawk Network Holdings Inc 77 0.01
1 BlackRock Inc 442 0.06
11 Bloomin' Brands Inc 157 0.02
4 Blucora Inc 47 0.01
1 Blue Bird Corp 9 –
8 Blue Buffalo Pet Products Inc 158 0.02
3 Blue Hills Bancorp Inc 37 –
1 Blue Nile Inc 19 –
– Bluebird Bio Inc 21 –
4 BMC Stock Holdings Inc 61 0.01
4 BNC Bancorp 90 0.01
2 Bob Evans Farms Inc 62 0.01
2 BofI Holding Inc 38 –
4 Boingo Wireless Inc 36 –
3 Boise Cascade Co 47 0.01
4 BOK Financial Corp 284 0.04
2 Boot Barn Holdings Inc 24 –
6 Booz Allen Hamilton Holding Corp 168 0.02
16 BorgWarner Inc 466 0.06
1 Boston Beer Co Inc 83 0.01
7 Boston Private Financial Holdings Inc 79 0.01
10 Boston Scientific Corp 159 0.02
1 Bottomline Technologies de Inc 28 –
3 Brady Corp 81 0.01
1 Bravo Brio Restaurant Group Inc 4 –
1 Bridge Bancorp Inc 39 0.01
5 Bridgepoint Education Inc 39 0.01
3 Briggs & Stratton Corp 43 0.01
4 Bright Horizons Family Solutions Inc 222 0.03
5 Brink's Co 147 0.02
3 Brinker International Inc 112 0.01
4 Bristol–Myers Squibb Co 192 0.03
2 Bristow Group Inc 22 –
2 Broadcom Ltd 250 0.03
4 Broadridge Financial Solutions Inc 188 0.02
29 Brocade Communications Systems Inc 288 0.04
13 Brookdale Senior Living Inc 118 0.02
5 Brookline Bancorp Inc 65 0.01
5 Brooks Automation Inc 61 0.01
7 Brown & Brown Inc 250 0.03
1 Brown–Forman Corp, Class A 35 –
2 Brown–Forman Corp, Class B 78 0.01
4 Bruker Corp 64 0.01
6 Brunswick Corp 259 0.03
1 Bryn Mawr Bank Corp 36 –
1 BSB Bancorp Inc 17 –
1 Buckle Inc 22 –
1 Buffalo Wild Wings Inc 188 0.02
2 Build–A–Bear Workshop Inc 19 –
3 Builders FirstSource Inc 27 –
Shares (000's)
Value (000's)
GBP
% of Net Asset Value
Common Stock (continued)
United States – 50.74% (continued)
8 Bunge Ltd 455 0.06
2 Burlington Stores Inc 148 0.02
5 BWX Technologies Inc 163 0.02
– C&F Financial Corp 10 –
17 CA Inc 425 0.06
4 Cabela's Inc 214 0.03
– Cable One Inc 116 0.02
3 Cabot Corp 141 0.02
1 Cabot Microelectronics Corp 64 0.01
6 Cabot Oil & Gas Corp 104 0.01
2 CACI International Inc 155 0.02
7 Cadence Design Systems Inc 155 0.02
3 CAI International Inc 19 –
3 Cal–Maine Foods Inc 106 0.01
2 Calamos Asset Management Inc 9 –
1 CalAmp Corp 13 –
8 CalAtlantic Group Inc 214 0.03
1 Calavo Growers Inc 52 0.01
3 Caleres Inc 91 0.01
3 Calgon Carbon Corp 48 0.01
3 California Water Service Group 69 0.01
5 Calix Inc 28 –
8 Callaway Golf Co 73 0.01
5 Callon Petroleum Co 75 0.01
29 Calpine Corp 254 0.03
3 Cambium Learning Group Inc 10 –
3 Cambrex Corp 105 0.01
1 Camden National Corp 40 0.01
4 Campbell Soup Co 171 0.02
2 Cantel Medical Corp 102 0.01
1 Capella Education Co 80 0.01
2 Capital Bank Financial Corp 60 0.01
2 Capital City Bank Group Inc 25 –
10 Capital One Financial Corp 646 0.09
2 Capital Senior Living Corp 24 –
10 Capitol Federal Financial Inc 125 0.02
1 CARBO Ceramics Inc 4 –
1 Carbonite Inc 9 –
3 Cardinal Financial Corp 72 0.01
4 Cardinal Health Inc 200 0.03
4 Cardtronics PLC 150 0.02
1 Care.com Inc 6 –
5 Career Education Corp 42 0.01
3 Carlisle Cos Inc 297 0.04
11 CarMax Inc 518 0.08
1 Carmike Cinemas Inc 35 –
13 Carnival Corp 539 0.08
1 Carolina Financial Corp 27 –
4 Carpenter Technology Corp 104 0.01
1 Carriage Services Inc 29 –
5 Carrizo Oil & Gas Inc 160 0.02
4 Carrols Restaurant Group Inc 38 –
3 Carter's Inc 248 0.03
6 Cascade Bancorp 36 –
3 Casella Waste Systems Inc 32 –
3 Casey's General Stores Inc 299 0.04
1 Cass Information Systems Inc 35 –
9 Catalent Inc 163 0.02
12 Caterpillar Inc 893 0.13
6 Cathay General Bancorp 158 0.02
2 Cato Corp 51 0.01
– Cavco Industries Inc 35 –
1 Cavium Inc 42 0.01

World Equity Fund
Portfolio of Investments as at 30 November 2016 (continued)
Dimensional Fund Advisors Annual Report and Audited Financial Statements, 30 November 2016 352
Shares (000's)
Value (000's)
GBP
% of Net Asset Value
Common Stock (continued)
United States – 50.74% (continued)
5 CBIZ Inc 50 0.01
3 CBOE Holdings Inc 147 0.02
21 CBRE Group Inc 496 0.06
1 CBS Corp, Class A (voting rights) 28 –
9 CBS Corp, Class B (non–voting rights) 448 0.06
3 CDI Corp 16 –
5 CDK Global Inc 213 0.03
5 CDW Corp 214 0.03
1 CEB Inc 66 0.01
3 CECO Environmental Corp 37 –
3 Celadon Group Inc 22 –
6 Celanese Corp 410 0.05
4 Celgene Corp 409 0.05
5 Centene Corp 250 0.03
11 CenterPoint Energy Inc 208 0.03
3 CenterState Banks Inc 62 0.01
4 Central European Media Enterprises Ltd 8 –
3 Central Garden & Pet Co 71 0.01
2 Central Pacific Financial Corp 52 0.01
1 Central Valley Community Bancorp 13 –
– Centrue Financial Corp 5 –
8 Century Aluminum Co 58 0.01
– Century Bancorp Inc 18 –
2 Century Casinos Inc 9 –
2 Century Communities Inc 31 –
28 CenturyLink Inc 532 0.08
6 Cerner Corp 241 0.03
1 CEVA Inc 25 –
7 CF Industries Holdings Inc 161 0.02
4 CH Robinson Worldwide Inc 218 0.03
3 Charles River Laboratories International Inc 173 0.02
12 Charles Schwab Corp 382 0.05
3 Chart Industries Inc 80 0.01
3 Charter Communications Inc 590 0.09
1 Charter Financial Corp 14 –
1 Chase Corp 55 0.01
3 Cheesecake Factory Inc 148 0.02
1 Chefs' Warehouse Inc 11 –
1 Chemed Corp 143 0.02
5 Chemical Financial Corp 198 0.03
5 Chemtura Corp 124 0.02
– Chemung Financial Corp 10 –
6 Cheniere Energy Inc 207 0.03
3 Cheniere Energy Partners LP Holdings LLC 47 0.01
1 Cherokee Inc 6 –
34 Chesapeake Energy Corp 192 0.03
1 Chesapeake Utilities Corp 54 0.01
24 Chevron Corp 2,129 0.29
6 Chicago Bridge & Iron Co NV 151 0.02
9 Chico's FAS Inc 104 0.01
1 Children's Place Inc 116 0.02
– Chipotle Mexican Grill Inc 111 0.01
2 Choice Hotels International Inc 86 0.01
7 Christopher & Banks Corp 9 –
5 Chubb Ltd 542 0.08
4 Church & Dwight Co Inc 155 0.02
1 Churchill Downs Inc 96 0.01
1 Chuy's Holdings Inc 25 –
5 Ciber Inc 3 –
8 Ciena Corp 144 0.02
3 Cigna Corp 304 0.04
1 Cimarex Energy Co 130 0.02
1 Cimpress NV 77 0.01
Shares (000's)
Value (000's)
GBP
% of Net Asset Value
Common Stock (continued)
United States – 50.74% (continued)
2 Cincinnati Bell Inc 33 –
4 Cincinnati Financial Corp 220 0.03
8 Cinemark Holdings Inc 261 0.03
2 Cintas Corp 178 0.02
1 CIRCOR International Inc 51 0.01
4 Cirrus Logic Inc 176 0.02
61 Cisco Systems Inc 1,451 0.2
11 CIT Group Inc 345 0.05
1 Citi Trends Inc 18 –
37 Citigroup Inc 1,661 0.23
1 Citizens & Northern Corp 19 –
11 Citizens Financial Group Inc 292 0.04
– Citizens Holding Co 9 –
1 Citizens Inc 10 –
2 Citrix Systems Inc 150 0.02
1 City Holding Co 63 0.01
2 Civeo Corp 3 –
1 Civista Bancshares Inc 11 –
4 Civitas Solutions Inc 52 0.01
3 CLARCOR Inc 154 0.02
1 Clayton Williams Energy Inc 72 0.01
6 Clean Energy Fuels Corp 18 –
4 Clean Harbors Inc 170 0.02
5 Clear Channel Outdoor 20 –
1 ClearOne Inc 4 –
1 Clearwater Paper Corp 69 0.01
9 Cliffs Natural Resources Inc 64 0.01
2 Clifton Bancorp Inc 23 –
2 Clorox Co 179 0.02
1 Cloud Peak Energy Inc 7 –
7 ClubCorp Holdings Inc 69 0.01
5 CME Group Inc 474 0.06
3 CMS Energy Corp 104 0.01
5 CNA Financial Corp 148 0.02
1 CNB Financial Corp 22 –
3 CNO Financial Group Inc 39 0.01
8 Coach Inc 241 0.03
12 Cobalt International Energy Inc 12 –
3 CoBiz Financial Inc 32 –
1 Coca–Cola Bottling Co Consolidated 70 0.01
28 Coca–Cola Co 888 0.13
1 Codorus Valley Bancorp Inc 20 –
7 Coeur Mining Inc 51 0.01
2 Cogent Communications Holdings Inc 66 0.01
2 Cognex Corp 95 0.01
6 Cognizant Technology Solutions Corp 247 0.03
4 Cohen & Steers Inc 117 0.02
1 Coherent Inc 144 0.02
2 Cohu Inc 19 –
9 Colfax Corp 256 0.03
5 Colgate–Palmolive Co 240 0.03
1 Collectors Universe Inc 16 –
4 Columbia Banking System Inc 131 0.02
4 Columbia Sportswear Co 181 0.02
1 Columbus McKinnon Corp 21 –
67 Comcast Corp 3,726 0.5
7 Comerica Inc 376 0.05
3 Comfort Systems USA Inc 67 0.01
7 Commerce Bancshares Inc 302 0.04
1 CommerceHub Inc 11 –
– CommerceHub Inc, Series A 6 –
8 Commercial Metals Co 143 0.02
3 Commercial Vehicle Group Inc 11 –
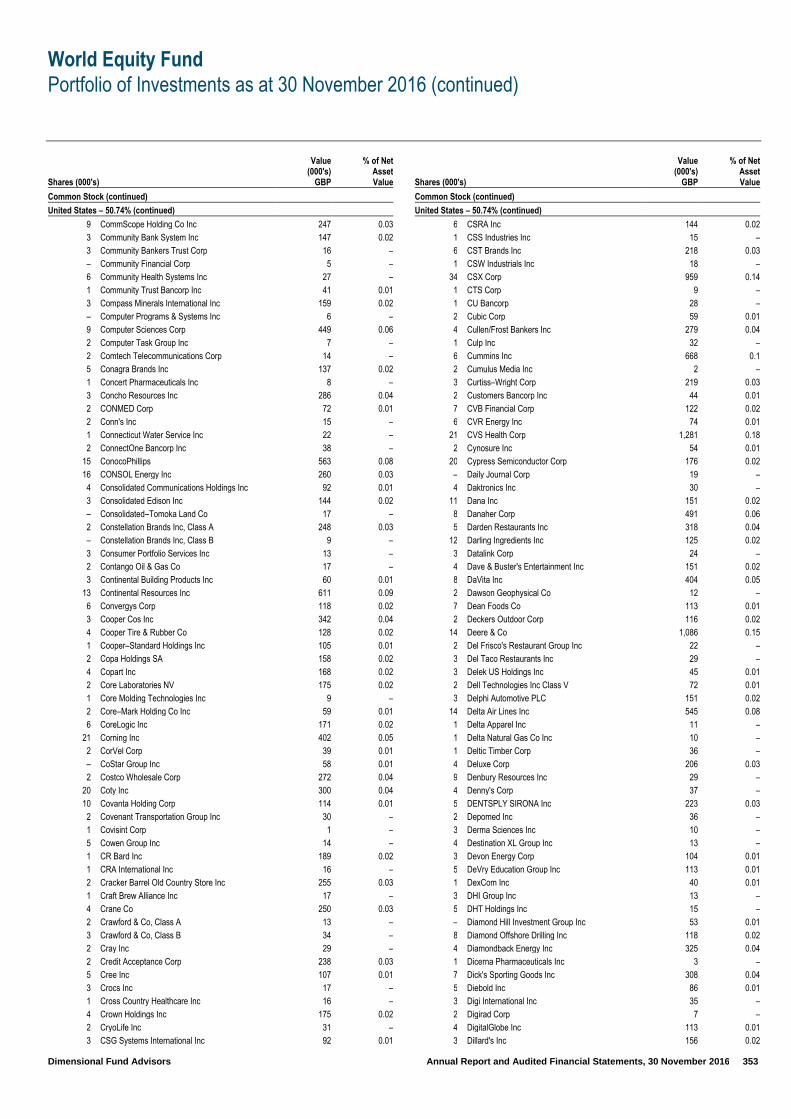
World Equity Fund
Portfolio of Investments as at 30 November 2016 (continued)
Dimensional Fund Advisors Annual Report and Audited Financial Statements, 30 November 2016 353
Shares (000's)
Value (000's)
GBP
% of Net Asset Value
Common Stock (continued)
United States – 50.74% (continued)
9 CommScope Holding Co Inc 247 0.03
3 Community Bank System Inc 147 0.02
3 Community Bankers Trust Corp 16 –
– Community Financial Corp 5 –
6 Community Health Systems Inc 27 –
1 Community Trust Bancorp Inc 41 0.01
3 Compass Minerals International Inc 159 0.02
– Computer Programs & Systems Inc 6 –
9 Computer Sciences Corp 449 0.06
2 Computer Task Group Inc 7 –
2 Comtech Telecommunications Corp 14 –
5 Conagra Brands Inc 137 0.02
1 Concert Pharmaceuticals Inc 8 –
3 Concho Resources Inc 286 0.04
2 CONMED Corp 72 0.01
2 Conn's Inc 15 –
1 Connecticut Water Service Inc 22 –
2 ConnectOne Bancorp Inc 38 –
15 ConocoPhillips 563 0.08
16 CONSOL Energy Inc 260 0.03
4 Consolidated Communications Holdings Inc 92 0.01
3 Consolidated Edison Inc 144 0.02
– Consolidated–Tomoka Land Co 17 –
2 Constellation Brands Inc, Class A 248 0.03
– Constellation Brands Inc, Class B 9 –
3 Consumer Portfolio Services Inc 13 –
2 Contango Oil & Gas Co 17 –
3 Continental Building Products Inc 60 0.01
13 Continental Resources Inc 611 0.09
6 Convergys Corp 118 0.02
3 Cooper Cos Inc 342 0.04
4 Cooper Tire & Rubber Co 128 0.02
1 Cooper–Standard Holdings Inc 105 0.01
2 Copa Holdings SA 158 0.02
4 Copart Inc 168 0.02
2 Core Laboratories NV 175 0.02
1 Core Molding Technologies Inc 9 –
2 Core–Mark Holding Co Inc 59 0.01
6 CoreLogic Inc 171 0.02
21 Corning Inc 402 0.05
2 CorVel Corp 39 0.01
– CoStar Group Inc 58 0.01
2 Costco Wholesale Corp 272 0.04
20 Coty Inc 300 0.04
10 Covanta Holding Corp 114 0.01
2 Covenant Transportation Group Inc 30 –
1 Covisint Corp 1 –
5 Cowen Group Inc 14 –
1 CR Bard Inc 189 0.02
1 CRA International Inc 16 –
2 Cracker Barrel Old Country Store Inc 255 0.03
1 Craft Brew Alliance Inc 17 –
4 Crane Co 250 0.03
2 Crawford & Co, Class A 13 –
3 Crawford & Co, Class B 34 –
2 Cray Inc 29 –
2 Credit Acceptance Corp 238 0.03
5 Cree Inc 107 0.01
3 Crocs Inc 17 –
1 Cross Country Healthcare Inc 16 –
4 Crown Holdings Inc 175 0.02
2 CryoLife Inc 31 –
3 CSG Systems International Inc 92 0.01
Shares (000's)
Value (000's)
GBP
% of Net Asset Value
Common Stock (continued)
United States – 50.74% (continued)
6 CSRA Inc 144 0.02
1 CSS Industries Inc 15 –
6 CST Brands Inc 218 0.03
1 CSW Industrials Inc 18 –
34 CSX Corp 959 0.14
1 CTS Corp 9 –
1 CU Bancorp 28 –
2 Cubic Corp 59 0.01
4 Cullen/Frost Bankers Inc 279 0.04
1 Culp Inc 32 –
6 Cummins Inc 668 0.1
2 Cumulus Media Inc 2 –
3 Curtiss–Wright Corp 219 0.03
2 Customers Bancorp Inc 44 0.01
7 CVB Financial Corp 122 0.02
6 CVR Energy Inc 74 0.01
21 CVS Health Corp 1,281 0.18
2 Cynosure Inc 54 0.01
20 Cypress Semiconductor Corp 176 0.02
– Daily Journal Corp 19 –
4 Daktronics Inc 30 –
11 Dana Inc 151 0.02
8 Danaher Corp 491 0.06
5 Darden Restaurants Inc 318 0.04
12 Darling Ingredients Inc 125 0.02
3 Datalink Corp 24 –
4 Dave & Buster's Entertainment Inc 151 0.02
8 DaVita Inc 404 0.05
2 Dawson Geophysical Co 12 –
7 Dean Foods Co 113 0.01
2 Deckers Outdoor Corp 116 0.02
14 Deere & Co 1,086 0.15
2 Del Frisco's Restaurant Group Inc 22 –
3 Del Taco Restaurants Inc 29 –
3 Delek US Holdings Inc 45 0.01
2 Dell Technologies Inc Class V 72 0.01
3 Delphi Automotive PLC 151 0.02
14 Delta Air Lines Inc 545 0.08
1 Delta Apparel Inc 11 –
1 Delta Natural Gas Co Inc 10 –
1 Deltic Timber Corp 36 –
4 Deluxe Corp 206 0.03
9 Denbury Resources Inc 29 –
4 Denny's Corp 37 –
5 DENTSPLY SIRONA Inc 223 0.03
2 Depomed Inc 36 –
3 Derma Sciences Inc 10 –
4 Destination XL Group Inc 13 –
3 Devon Energy Corp 104 0.01
5 DeVry Education Group Inc 113 0.01
1 DexCom Inc 40 0.01
3 DHI Group Inc 13 –
5 DHT Holdings Inc 15 –
– Diamond Hill Investment Group Inc 53 0.01
8 Diamond Offshore Drilling Inc 118 0.02
4 Diamondback Energy Inc 325 0.04
1 Dicerna Pharmaceuticals Inc 3 –
7 Dick's Sporting Goods Inc 308 0.04
5 Diebold Inc 86 0.01
3 Digi International Inc 35 –
2 Digirad Corp 7 –
4 DigitalGlobe Inc 113 0.01
3 Dillard's Inc 156 0.02
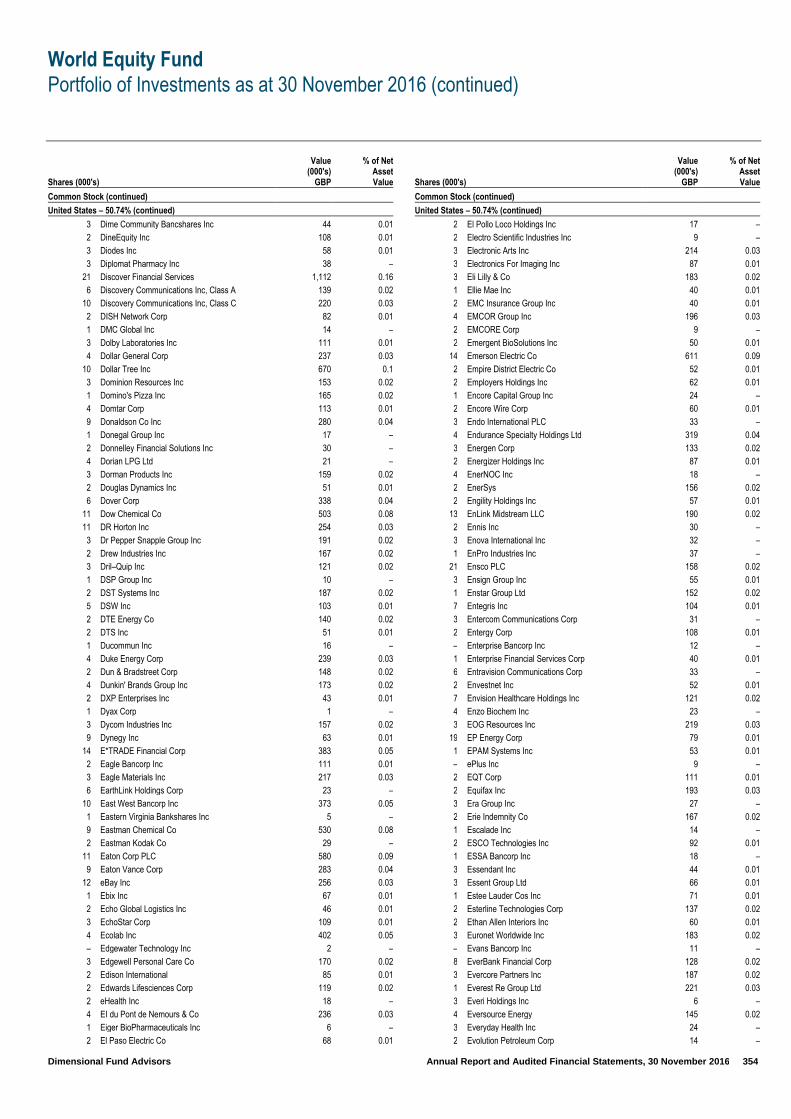
World Equity Fund
Portfolio of Investments as at 30 November 2016 (continued)
Dimensional Fund Advisors Annual Report and Audited Financial Statements, 30 November 2016 354
Shares (000's)
Value (000's)
GBP
% of Net Asset Value
Common Stock (continued)
United States – 50.74% (continued)
3 Dime Community Bancshares Inc 44 0.01
2 DineEquity Inc 108 0.01
3 Diodes Inc 58 0.01
3 Diplomat Pharmacy Inc 38 –
21 Discover Financial Services 1,112 0.16
6 Discovery Communications Inc, Class A 139 0.02
10 Discovery Communications Inc, Class C 220 0.03
2 DISH Network Corp 82 0.01
1 DMC Global Inc 14 –
3 Dolby Laboratories Inc 111 0.01
4 Dollar General Corp 237 0.03
10 Dollar Tree Inc 670 0.1
3 Dominion Resources Inc 153 0.02
1 Domino's Pizza Inc 165 0.02
4 Domtar Corp 113 0.01
9 Donaldson Co Inc 280 0.04
1 Donegal Group Inc 17 –
2 Donnelley Financial Solutions Inc 30 –
4 Dorian LPG Ltd 21 –
3 Dorman Products Inc 159 0.02
2 Douglas Dynamics Inc 51 0.01
6 Dover Corp 338 0.04
11 Dow Chemical Co 503 0.08
11 DR Horton Inc 254 0.03
3 Dr Pepper Snapple Group Inc 191 0.02
2 Drew Industries Inc 167 0.02
3 Dril–Quip Inc 121 0.02
1 DSP Group Inc 10 –
2 DST Systems Inc 187 0.02
5 DSW Inc 103 0.01
2 DTE Energy Co 140 0.02
2 DTS Inc 51 0.01
1 Ducommun Inc 16 –
4 Duke Energy Corp 239 0.03
2 Dun & Bradstreet Corp 148 0.02
4 Dunkin' Brands Group Inc 173 0.02
2 DXP Enterprises Inc 43 0.01
1 Dyax Corp 1 –
3 Dycom Industries Inc 157 0.02
9 Dynegy Inc 63 0.01
14 E*TRADE Financial Corp 383 0.05
2 Eagle Bancorp Inc 111 0.01
3 Eagle Materials Inc 217 0.03
6 EarthLink Holdings Corp 23 –
10 East West Bancorp Inc 373 0.05
1 Eastern Virginia Bankshares Inc 5 –
9 Eastman Chemical Co 530 0.08
2 Eastman Kodak Co 29 –
11 Eaton Corp PLC 580 0.09
9 Eaton Vance Corp 283 0.04
12 eBay Inc 256 0.03
1 Ebix Inc 67 0.01
2 Echo Global Logistics Inc 46 0.01
3 EchoStar Corp 109 0.01
4 Ecolab Inc 402 0.05
– Edgewater Technology Inc 2 –
3 Edgewell Personal Care Co 170 0.02
2 Edison International 85 0.01
2 Edwards Lifesciences Corp 119 0.02
2 eHealth Inc 18 –
4 EI du Pont de Nemours & Co 236 0.03
1 Eiger BioPharmaceuticals Inc 6 –
2 El Paso Electric Co 68 0.01
Shares (000's)
Value (000's)
GBP
% of Net Asset Value
Common Stock (continued)
United States – 50.74% (continued)
2 El Pollo Loco Holdings Inc 17 –
2 Electro Scientific Industries Inc 9 –
3 Electronic Arts Inc 214 0.03
3 Electronics For Imaging Inc 87 0.01
3 Eli Lilly & Co 183 0.02
1 Ellie Mae Inc 40 0.01
2 EMC Insurance Group Inc 40 0.01
4 EMCOR Group Inc 196 0.03
2 EMCORE Corp 9 –
2 Emergent BioSolutions Inc 50 0.01
14 Emerson Electric Co 611 0.09
2 Empire District Electric Co 52 0.01
2 Employers Holdings Inc 62 0.01
1 Encore Capital Group Inc 24 –
2 Encore Wire Corp 60 0.01
3 Endo International PLC 33 –
4 Endurance Specialty Holdings Ltd 319 0.04
3 Energen Corp 133 0.02
2 Energizer Holdings Inc 87 0.01
4 EnerNOC Inc 18 –
2 EnerSys 156 0.02
2 Engility Holdings Inc 57 0.01
13 EnLink Midstream LLC 190 0.02
2 Ennis Inc 30 –
3 Enova International Inc 32 –
1 EnPro Industries Inc 37 –
21 Ensco PLC 158 0.02
3 Ensign Group Inc 55 0.01
1 Enstar Group Ltd 152 0.02
7 Entegris Inc 104 0.01
3 Entercom Communications Corp 31 –
2 Entergy Corp 108 0.01
– Enterprise Bancorp Inc 12 –
1 Enterprise Financial Services Corp 40 0.01
6 Entravision Communications Corp 33 –
2 Envestnet Inc 52 0.01
7 Envision Healthcare Holdings Inc 121 0.02
4 Enzo Biochem Inc 23 –
3 EOG Resources Inc 219 0.03
19 EP Energy Corp 79 0.01
1 EPAM Systems Inc 53 0.01
– ePlus Inc 9 –
2 EQT Corp 111 0.01
2 Equifax Inc 193 0.03
3 Era Group Inc 27 –
2 Erie Indemnity Co 167 0.02
1 Escalade Inc 14 –
2 ESCO Technologies Inc 92 0.01
1 ESSA Bancorp Inc 18 –
3 Essendant Inc 44 0.01
3 Essent Group Ltd 66 0.01
1 Estee Lauder Cos Inc 71 0.01
2 Esterline Technologies Corp 137 0.02
2 Ethan Allen Interiors Inc 60 0.01
3 Euronet Worldwide Inc 183 0.02
– Evans Bancorp Inc 11 –
8 EverBank Financial Corp 128 0.02
3 Evercore Partners Inc 187 0.02
1 Everest Re Group Ltd 221 0.03
3 Everi Holdings Inc 6 –
4 Eversource Energy 145 0.02
3 Everyday Health Inc 24 –
2 Evolution Petroleum Corp 14 –

World Equity Fund
Portfolio of Investments as at 30 November 2016 (continued)
Dimensional Fund Advisors Annual Report and Audited Financial Statements, 30 November 2016 355
Shares (000's)
Value (000's)
GBP
% of Net Asset Value
Common Stock (continued)
United States – 50.74% (continued)
5 EW Scripps Co 71 0.01
1 Exactech Inc 20 –
6 Exar Corp 45 0.01
6 Exelon Corp 151 0.02
2 ExlService Holdings Inc 65 0.01
1 ExOne Co 9 –
3 Expedia Inc 300 0.04
7 Expeditors International of Washington Inc 281 0.04
2 Exponent Inc 82 0.01
6 Express Inc 63 0.01
12 Express Scripts Holding Co 702 0.10
8 Extended Stay America Inc 103 0.01
3 Exterran Corp 47 0.01
1 Extreme Networks Inc 4 –
40 Exxon Mobil Corp 2,791 0.37
5 Ezcorp Inc 46 0.01
2 F5 Networks Inc 229 0.03
2 Fabrinet 83 0.01
7 Facebook Inc 675 0.10
1 FactSet Research Systems Inc 159 0.02
1 Fair Isaac Corp 106 0.01
14 Fairmount Santrol Holdings Inc 110 0.01
2 FairPoint Communications Inc 27 –
1 Farmer Brothers Co 31 –
1 Farmers Capital Bank Corp 19 –
3 Farmers National Banc Corp 25 –
1 FARO Technologies Inc 32 –
3 Fastenal Co 109 0.01
1 FBL Financial Group Inc 49 0.01
3 FCB Financial Holdings Inc 90 0.01
1 Federal Agricultural Mortgage Corp 26 –
4 Federal Signal Corp 45 0.01
6 Federal–Mogul Holdings Corp 49 0.01
8 Federated Investors Inc 175 0.02
1 Federated National Holding Co 17 –
5 FedEx Corp 789 0.11
6 Ferro Corp 75 0.01
12 Ferroglobe PLC 106 0.01 12
Ferroglobe Representation & Warrants Insurance Trust – –
3 Fidelity & Guaranty Life 50 0.01
8 Fidelity National Information Services Inc 472 0.06
2 Fidelity Southern Corp 32 –
2 Fiesta Restaurant Group Inc 44 0.01
23 Fifth Third Bancorp 484 0.06
3 Financial Engines Inc 84 0.01
1 Financial Institutions Inc 27 –
7 Finisar Corp 183 0.02
3 Finish Line Inc 55 0.01
1 FireEye Inc 14 –
8 First American Financial Corp 231 0.03
1 First Bancorp Inc 19 –
15 First BanCorp/Puerto Rico 72 0.01
1 First Bancorp/Southern Pines NC 26 –
3 First Busey Corp 68 0.01
– First Business Financial Services Inc 8 –
– First Capital Inc 11 –
1 First Citizens BancShares Inc 212 0.03
6 First Commonwealth Financial Corp 63 0.01
1 First Community Bancshares Inc 27 –
1 First Connecticut Bancorp Inc 18 –
1 First Defiance Financial Corp 31 –
5 First Financial Bancorp 98 0.01
4 First Financial Bankshares Inc 132 0.02
Shares (000's)
Value (000's)
GBP
% of Net Asset Value
Common Stock (continued)
United States – 50.74% (continued)
– First Financial Corp/IN 13 –
1 First Financial Northwest Inc 15 –
2 First Foundation Inc 35 –
16 First Horizon National Corp 242 0.03
2 First Interstate BancSystem Inc 48 0.01
3 First Merchants Corp 75 0.01
1 First Mid–Illinois Bancshares Inc 19 –
6 First Midwest Bancorp Inc 111 0.01
1 First NBC Bank Holding Co 6 –
2 First of Long Island Corp 42 0.01
3 First Republic Bank 196 0.03
3 First Solar Inc 69 0.01
3 FirstCash Inc 119 0.02
5 FirstEnergy Corp 120 0.02
3 Fiserv Inc 243 0.03
1 Fitbit Inc 8 –
3 Five Below Inc 82 0.01
2 Five Prime Therapeutics Inc 108 0.01
2 Five Star Quality Care Inc 4 –
5 Flagstar Bancorp Inc 101 0.01
2 FleetCor Technologies Inc 282 0.04
36 Flex Ltd 409 0.05
1 Flexsteel Industries Inc 22 –
8 FLIR Systems Inc 222 0.03
1 Flotek Industries Inc 12 –
12 Flowers Foods Inc 151 0.02
8 Flowserve Corp 312 0.04
3 Fluidigm Corp 13 –
7 Fluor Corp 305 0.04
2 Flushing Financial Corp 39 0.01
6 FMC Corp 255 0.03
13 FMC Technologies Inc 351 0.05
14 FNB Corp 170 0.02
16 FNF Group 399 0.05
5 FNFV Group 47 0.01
8 Foot Locker Inc 449 0.06
118 Ford Motor Co 1,125 0.16
3 Forestar Group Inc 35 –
5 FormFactor Inc 44 0.01
1 Forrester Research Inc 33 –
1 Fortinet Inc 34 –
5 Fortive Corp 199 0.03
6 Fortune Brands Home & Security Inc 275 0.04
6 Forum Energy Technologies Inc 107 0.01
2 Forward Air Corp 66 0.01
1 Fossil Group Inc 38 –
3 Fox Factory Holding Corp 68 0.01
4 Francesca's Holdings Corp 53 0.01
8 Frank's International NV 81 0.01
1 Franklin Covey Co 17 –
2 Franklin Electric Co Inc 78 0.01
10 Franklin Resources Inc 307 0.04
2 Fred's Inc 19 –
50 Freeport–McMoRan Inc 614 0.09
1 FreightCar America Inc 8 –
1 Frequency Electronics Inc 12 –
3 Fresh Del Monte Produce Inc 132 0.02
62 Frontier Communications Corp 181 0.02
1 FRP Holdings Inc 20 –
2 FTD Cos Inc 33 –
3 FTI Consulting Inc 105 0.01
12 Fulton Financial Corp 170 0.02
3 FutureFuel Corp 36 –

World Equity Fund
Portfolio of Investments as at 30 November 2016 (continued)
Dimensional Fund Advisors Annual Report and Audited Financial Statements, 30 November 2016 356
Shares (000's)
Value (000's)
GBP
% of Net Asset Value
Common Stock (continued)
United States – 50.74% (continued)
1 G&K Services Inc 114 0.01
3 G–III Apparel Group Ltd 58 0.01
3 Gain Capital Holdings Inc 17 –
1 GAMCO Investors Inc 20 –
9 GameStop Corp 179 0.02
8 Gannett Co Inc 61 0.01
11 Gap Inc 215 0.03
10 Garmin Ltd 413 0.05
1 Gartner Inc 100 0.01
3 GasLog Ltd 43 0.01
3 Gastar Exploration Inc 3 –
2 GATX Corp 76 0.01
4 GCP Applied Technologies Inc 80 0.01
1 Gencor Industries Inc 11 –
4 Generac Holdings Inc 140 0.02
4 General Cable Corp 61 0.01
3 General Communication Inc 37 –
63 General Electric Co 1,539 0.21
10 General Mills Inc 478 0.06
42 General Motors Co 1,166 0.16
1 Genesco Inc 73 0.01
4 Genesee & Wyoming Inc 242 0.03
2 Genie Energy Ltd 9 –
3 Genocea Biosciences Inc 11 –
5 Genpact Ltd 102 0.01
20 Gentex Corp 301 0.04
2 Gentherm Inc 60 0.01
2 Genuine Parts Co 179 0.02
15 Genworth Financial Inc 50 0.01
1 Geospace Technologies Corp 22 –
1 German American Bancorp Inc 42 0.01
2 Gibraltar Industries Inc 76 0.01
7 GigPeak Inc 15 –
8 Gilead Sciences Inc 484 0.06
5 Glacier Bancorp Inc 143 0.02
1 Global Brass & Copper Holdings Inc 23 –
2 Global Eagle Entertainment Inc 12 –
1 Global Indemnity Ltd 25 –
4 Global Payments Inc 233 0.03
1 GlobalSCAPE Inc 3 –
1 Globant SA 16 –
4 Globus Medical Inc 69 0.01
5 GNC Holdings Inc 60 0.01
2 GoDaddy Inc 58 0.01
4 Gold Resource Corp 12 –
1 Golden Ocean Group Ltd 3 –
6 Goldfield Corp 20 –
5 Goldman Sachs Group Inc 871 0.12
20 Goodyear Tire & Rubber Co 492 0.06
2 Gorman–Rupp Co 38 –
1 GP Strategies Corp 23 –
4 Graco Inc 269 0.04
1 Graham Corp 13 –
– Graham Holdings Co 135 0.02
4 Grand Canyon Education Inc 163 0.02
2 Granite Construction Inc 113 0.01
25 Graphic Packaging Holding Co 251 0.03
5 Gray Television Inc 38 –
3 Great Lakes Dredge & Dock Corp 12 –
6 Great Plains Energy Inc 119 0.02
1 Great Southern Bancorp Inc 30 –
1 Great Western Bancorp Inc 33 –
1 Green Bancorp Inc 7 –
Shares (000's)
Value (000's)
GBP
% of Net Asset Value
Common Stock (continued)
United States – 50.74% (continued)
3 Green Brick Partners Inc 20 –
4 Green Dot Corp 73 0.01
3 Green Plains Inc 66 0.01
1 Greenbrier Cos Inc 31 –
– Greene County Bancorp Inc 5 –
2 Greenhill & Co Inc 43 0.01
2 Greenlight Capital Re Ltd 44 0.01
2 Greif Inc, Class A 92 0.01
1 Greif Inc, Class B 62 0.01
1 Griffon Corp 15 –
1 Group 1 Automotive Inc 64 0.01
4 GrubHub Inc 112 0.01
3 GSI Technology Inc 15 –
3 GTT Communications Inc 63 0.01
1 Guaranty Bancorp 25 –
6 Guess? Inc 75 0.01
2 Guidewire Software Inc 80 0.01
1 Gulf Island Fabrication Inc 11 –
1 Gulfmark Offshore Inc 1 –
9 Gulfport Energy Corp 175 0.02
3 H&E Equipment Services Inc 46 0.01
8 H&R Block Inc 145 0.02
3 Hackett Group Inc 40 0.01
3 Haemonetics Corp 82 0.01
6 Hain Celestial Group Inc 174 0.02
4 Halliburton Co 179 0.02
1 Hallmark Financial Services Inc 9 –
3 Halyard Health Inc 97 0.01
5 Hancock Holding Co 177 0.02
1 Handy & Harman Ltd 17 –
5 Hanesbrands Inc 95 0.01
2 Hanger Inc 18 –
3 Hanmi Financial Corp 61 0.01
3 Hanover Insurance Group Inc 201 0.03
2 Hardinge Inc 15 –
8 Harley–Davidson Inc 383 0.05
4 Harman International Industries Inc 393 0.05
6 Harmonic Inc 22 –
4 Harris Corp 343 0.04
7 Harsco Corp 79 0.01
2 Harte–Hanks Inc 3 –
11 Hartford Financial Services Group Inc 428 0.06
2 Harvard Bioscience Inc 4 –
6 Hasbro Inc 380 0.05
1 Haverty Furniture Cos Inc 19 –
3 Hawaiian Electric Industries Inc 62 0.01
4 Hawaiian Holdings Inc 170 0.02
1 Hawaiian Telcom Holdco Inc 10 –
1 Hawkins Inc 39 0.01
1 Haynes International Inc 31 –
3 HB Fuller Co 102 0.01
3 HCA Holdings Inc 143 0.02
1 HCI Group Inc 18 –
6 HD Supply Holdings Inc 181 0.02
6 Headwaters Inc 110 0.01
1 Healthcare Services Group Inc 38 –
2 HealthEquity Inc 58 0.01
7 HealthSouth Corp 236 0.03
2 HealthStream Inc 44 0.01
2 Healthways Inc 43 0.01
6 Heartland Express Inc 105 0.01
2 Heartland Financial USA Inc 53 0.01
25 Hecla Mining Co 123 0.02
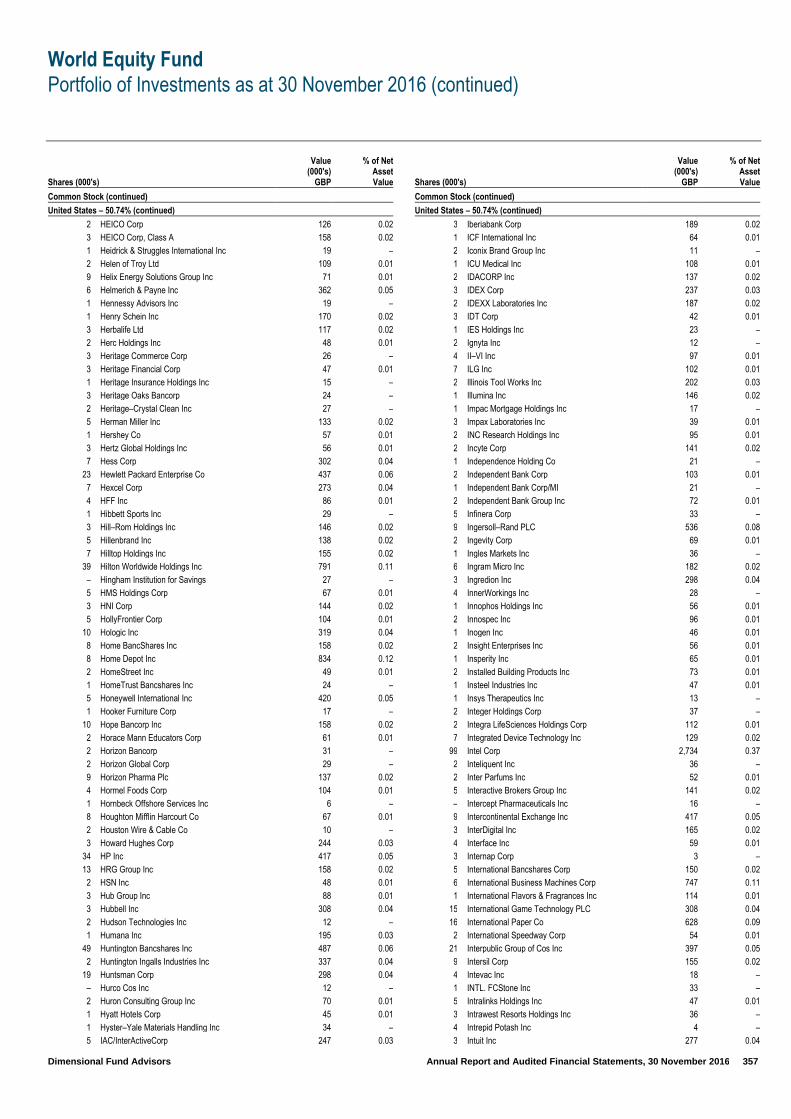
World Equity Fund
Portfolio of Investments as at 30 November 2016 (continued)
Dimensional Fund Advisors Annual Report and Audited Financial Statements, 30 November 2016 357
Shares (000's)
Value (000's)
GBP
% of Net Asset Value
Common Stock (continued)
United States – 50.74% (continued)
2 HEICO Corp 126 0.02
3 HEICO Corp, Class A 158 0.02
1 Heidrick & Struggles International Inc 19 –
2 Helen of Troy Ltd 109 0.01
9 Helix Energy Solutions Group Inc 71 0.01
6 Helmerich & Payne Inc 362 0.05
1 Hennessy Advisors Inc 19 –
1 Henry Schein Inc 170 0.02
3 Herbalife Ltd 117 0.02
2 Herc Holdings Inc 48 0.01
3 Heritage Commerce Corp 26 –
3 Heritage Financial Corp 47 0.01
1 Heritage Insurance Holdings Inc 15 –
3 Heritage Oaks Bancorp 24 –
2 Heritage–Crystal Clean Inc 27 –
5 Herman Miller Inc 133 0.02
1 Hershey Co 57 0.01
3 Hertz Global Holdings Inc 56 0.01
7 Hess Corp 302 0.04
23 Hewlett Packard Enterprise Co 437 0.06
7 Hexcel Corp 273 0.04
4 HFF Inc 86 0.01
1 Hibbett Sports Inc 29 –
3 Hill–Rom Holdings Inc 146 0.02
5 Hillenbrand Inc 138 0.02
7 Hilltop Holdings Inc 155 0.02
39 Hilton Worldwide Holdings Inc 791 0.11
– Hingham Institution for Savings 27 –
5 HMS Holdings Corp 67 0.01
3 HNI Corp 144 0.02
5 HollyFrontier Corp 104 0.01
10 Hologic Inc 319 0.04
8 Home BancShares Inc 158 0.02
8 Home Depot Inc 834 0.12
2 HomeStreet Inc 49 0.01
1 HomeTrust Bancshares Inc 24 –
5 Honeywell International Inc 420 0.05
1 Hooker Furniture Corp 17 –
10 Hope Bancorp Inc 158 0.02
2 Horace Mann Educators Corp 61 0.01
2 Horizon Bancorp 31 –
2 Horizon Global Corp 29 –
9 Horizon Pharma Plc 137 0.02
4 Hormel Foods Corp 104 0.01
1 Hornbeck Offshore Services Inc 6 –
8 Houghton Mifflin Harcourt Co 67 0.01
2 Houston Wire & Cable Co 10 –
3 Howard Hughes Corp 244 0.03
34 HP Inc 417 0.05
13 HRG Group Inc 158 0.02
2 HSN Inc 48 0.01
3 Hub Group Inc 88 0.01
3 Hubbell Inc 308 0.04
2 Hudson Technologies Inc 12 –
1 Humana Inc 195 0.03
49 Huntington Bancshares Inc 487 0.06
2 Huntington Ingalls Industries Inc 337 0.04
19 Huntsman Corp 298 0.04
– Hurco Cos Inc 12 –
2 Huron Consulting Group Inc 70 0.01
1 Hyatt Hotels Corp 45 0.01
1 Hyster–Yale Materials Handling Inc 34 –
5 IAC/InterActiveCorp 247 0.03
Shares (000's)
Value (000's)
GBP
% of Net Asset Value
Common Stock (continued)
United States – 50.74% (continued)
3 Iberiabank Corp 189 0.02
1 ICF International Inc 64 0.01
2 Iconix Brand Group Inc 11 –
1 ICU Medical Inc 108 0.01
2 IDACORP Inc 137 0.02
3 IDEX Corp 237 0.03
2 IDEXX Laboratories Inc 187 0.02
3 IDT Corp 42 0.01
1 IES Holdings Inc 23 –
2 Ignyta Inc 12 –
4 II–VI Inc 97 0.01
7 ILG Inc 102 0.01
2 Illinois Tool Works Inc 202 0.03
1 Illumina Inc 146 0.02
1 Impac Mortgage Holdings Inc 17 –
3 Impax Laboratories Inc 39 0.01
2 INC Research Holdings Inc 95 0.01
2 Incyte Corp 141 0.02
1 Independence Holding Co 21 –
2 Independent Bank Corp 103 0.01
1 Independent Bank Corp/MI 21 –
2 Independent Bank Group Inc 72 0.01
5 Infinera Corp 33 –
9 Ingersoll–Rand PLC 536 0.08
2 Ingevity Corp 69 0.01
1 Ingles Markets Inc 36 –
6 Ingram Micro Inc 182 0.02
3 Ingredion Inc 298 0.04
4 InnerWorkings Inc 28 –
1 Innophos Holdings Inc 56 0.01
2 Innospec Inc 96 0.01
1 Inogen Inc 46 0.01
2 Insight Enterprises Inc 56 0.01
1 Insperity Inc 65 0.01
2 Installed Building Products Inc 73 0.01
1 Insteel Industries Inc 47 0.01
1 Insys Therapeutics Inc 13 –
2 Integer Holdings Corp 37 –
2 Integra LifeSciences Holdings Corp 112 0.01
7 Integrated Device Technology Inc 129 0.02
99 Intel Corp 2,734 0.37
2 Inteliquent Inc 36 –
2 Inter Parfums Inc 52 0.01
5 Interactive Brokers Group Inc 141 0.02
– Intercept Pharmaceuticals Inc 16 –
9 Intercontinental Exchange Inc 417 0.05
3 InterDigital Inc 165 0.02
4 Interface Inc 59 0.01
3 Internap Corp 3 –
5 International Bancshares Corp 150 0.02
6 International Business Machines Corp 747 0.11
1 International Flavors & Fragrances Inc 114 0.01
15 International Game Technology PLC 308 0.04
16 International Paper Co 628 0.09
2 International Speedway Corp 54 0.01
21 Interpublic Group of Cos Inc 397 0.05
9 Intersil Corp 155 0.02
4 Intevac Inc 18 –
1 INTL. FCStone Inc 33 –
5 Intralinks Holdings Inc 47 0.01
3 Intrawest Resorts Holdings Inc 36 –
4 Intrepid Potash Inc 4 –
3 Intuit Inc 277 0.04
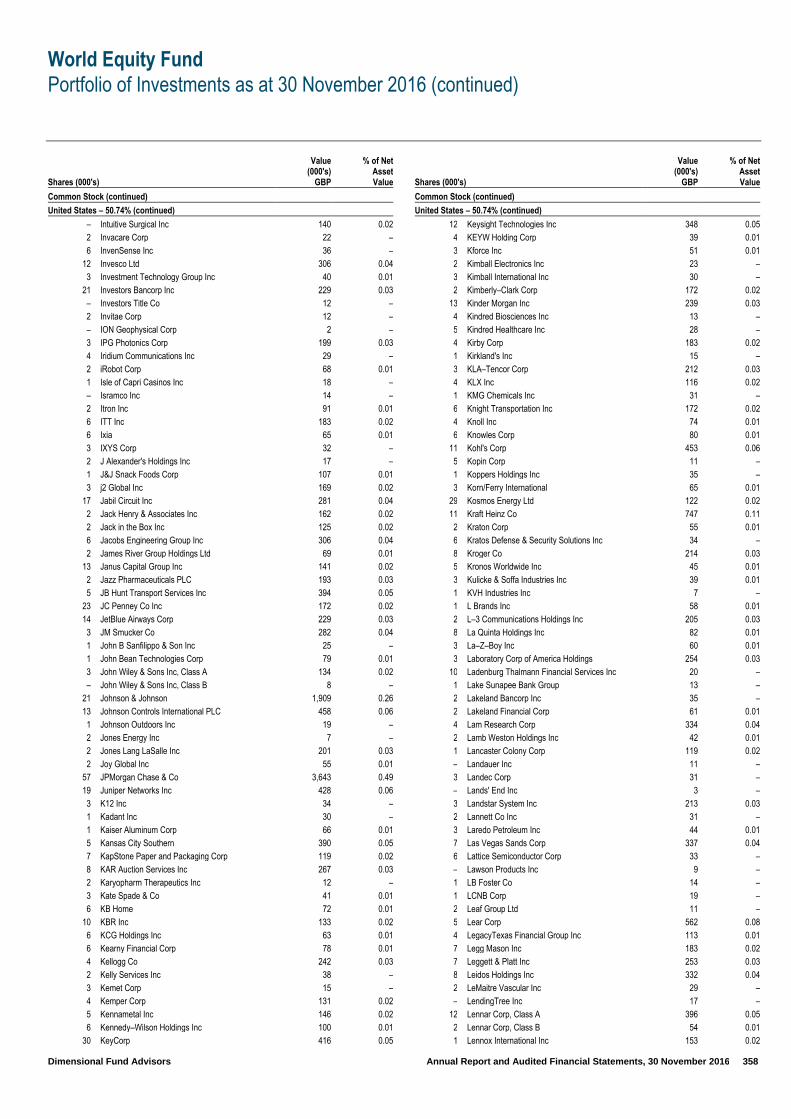
World Equity Fund
Portfolio of Investments as at 30 November 2016 (continued)
Dimensional Fund Advisors Annual Report and Audited Financial Statements, 30 November 2016 358
Shares (000's)
Value (000's)
GBP
% of Net Asset Value
Common Stock (continued)
United States – 50.74% (continued)
– Intuitive Surgical Inc 140 0.02
2 Invacare Corp 22 –
6 InvenSense Inc 36 –
12 Invesco Ltd 306 0.04
3 Investment Technology Group Inc 40 0.01
21 Investors Bancorp Inc 229 0.03
– Investors Title Co 12 –
2 Invitae Corp 12 –
– ION Geophysical Corp 2 –
3 IPG Photonics Corp 199 0.03
4 Iridium Communications Inc 29 –
2 iRobot Corp 68 0.01
1 Isle of Capri Casinos Inc 18 –
– Isramco Inc 14 –
2 Itron Inc 91 0.01
6 ITT Inc 183 0.02
6 Ixia 65 0.01
3 IXYS Corp 32 –
2 J Alexander's Holdings Inc 17 –
1 J&J Snack Foods Corp 107 0.01
3 j2 Global Inc 169 0.02
17 Jabil Circuit Inc 281 0.04
2 Jack Henry & Associates Inc 162 0.02
2 Jack in the Box Inc 125 0.02
6 Jacobs Engineering Group Inc 306 0.04
2 James River Group Holdings Ltd 69 0.01
13 Janus Capital Group Inc 141 0.02
2 Jazz Pharmaceuticals PLC 193 0.03
5 JB Hunt Transport Services Inc 394 0.05
23 JC Penney Co Inc 172 0.02
14 JetBlue Airways Corp 229 0.03
3 JM Smucker Co 282 0.04
1 John B Sanfilippo & Son Inc 25 –
1 John Bean Technologies Corp 79 0.01
3 John Wiley & Sons Inc, Class A 134 0.02
– John Wiley & Sons Inc, Class B 8 –
21 Johnson & Johnson 1,909 0.26
13 Johnson Controls International PLC 458 0.06
1 Johnson Outdoors Inc 19 –
2 Jones Energy Inc 7 –
2 Jones Lang LaSalle Inc 201 0.03
2 Joy Global Inc 55 0.01
57 JPMorgan Chase & Co 3,643 0.49
19 Juniper Networks Inc 428 0.06
3 K12 Inc 34 –
1 Kadant Inc 30 –
1 Kaiser Aluminum Corp 66 0.01
5 Kansas City Southern 390 0.05
7 KapStone Paper and Packaging Corp 119 0.02
8 KAR Auction Services Inc 267 0.03
2 Karyopharm Therapeutics Inc 12 –
3 Kate Spade & Co 41 0.01
6 KB Home 72 0.01
10 KBR Inc 133 0.02
6 KCG Holdings Inc 63 0.01
6 Kearny Financial Corp 78 0.01
4 Kellogg Co 242 0.03
2 Kelly Services Inc 38 –
3 Kemet Corp 15 –
4 Kemper Corp 131 0.02
5 Kennametal Inc 146 0.02
6 Kennedy–Wilson Holdings Inc 100 0.01
30 KeyCorp 416 0.05
Shares (000's)
Value (000's)
GBP
% of Net Asset Value
Common Stock (continued)
United States – 50.74% (continued)
12 Keysight Technologies Inc 348 0.05
4 KEYW Holding Corp 39 0.01
3 Kforce Inc 51 0.01
2 Kimball Electronics Inc 23 –
3 Kimball International Inc 30 –
2 Kimberly–Clark Corp 172 0.02
13 Kinder Morgan Inc 239 0.03
4 Kindred Biosciences Inc 13 –
5 Kindred Healthcare Inc 28 –
4 Kirby Corp 183 0.02
1 Kirkland's Inc 15 –
3 KLA–Tencor Corp 212 0.03
4 KLX Inc 116 0.02
1 KMG Chemicals Inc 31 –
6 Knight Transportation Inc 172 0.02
4 Knoll Inc 74 0.01
6 Knowles Corp 80 0.01
11 Kohl's Corp 453 0.06
5 Kopin Corp 11 –
1 Koppers Holdings Inc 35 –
3 Korn/Ferry International 65 0.01
29 Kosmos Energy Ltd 122 0.02
11 Kraft Heinz Co 747 0.11
2 Kraton Corp 55 0.01
6 Kratos Defense & Security Solutions Inc 34 –
8 Kroger Co 214 0.03
5 Kronos Worldwide Inc 45 0.01
3 Kulicke & Soffa Industries Inc 39 0.01
1 KVH Industries Inc 7 –
1 L Brands Inc 58 0.01
2 L–3 Communications Holdings Inc 205 0.03
8 La Quinta Holdings Inc 82 0.01
3 La–Z–Boy Inc 60 0.01
3 Laboratory Corp of America Holdings 254 0.03
10 Ladenburg Thalmann Financial Services Inc 20 –
1 Lake Sunapee Bank Group 13 –
2 Lakeland Bancorp Inc 35 –
2 Lakeland Financial Corp 61 0.01
4 Lam Research Corp 334 0.04
2 Lamb Weston Holdings Inc 42 0.01
1 Lancaster Colony Corp 119 0.02
– Landauer Inc 11 –
3 Landec Corp 31 –
– Lands' End Inc 3 –
3 Landstar System Inc 213 0.03
2 Lannett Co Inc 31 –
3 Laredo Petroleum Inc 44 0.01
7 Las Vegas Sands Corp 337 0.04
6 Lattice Semiconductor Corp 33 –
– Lawson Products Inc 9 –
1 LB Foster Co 14 –
1 LCNB Corp 19 –
2 Leaf Group Ltd 11 –
5 Lear Corp 562 0.08
4 LegacyTexas Financial Group Inc 113 0.01
7 Legg Mason Inc 183 0.02
7 Leggett & Platt Inc 253 0.03
8 Leidos Holdings Inc 332 0.04
2 LeMaitre Vascular Inc 29 –
– LendingTree Inc 17 –
12 Lennar Corp, Class A 396 0.05
2 Lennar Corp, Class B 54 0.01
1 Lennox International Inc 153 0.02
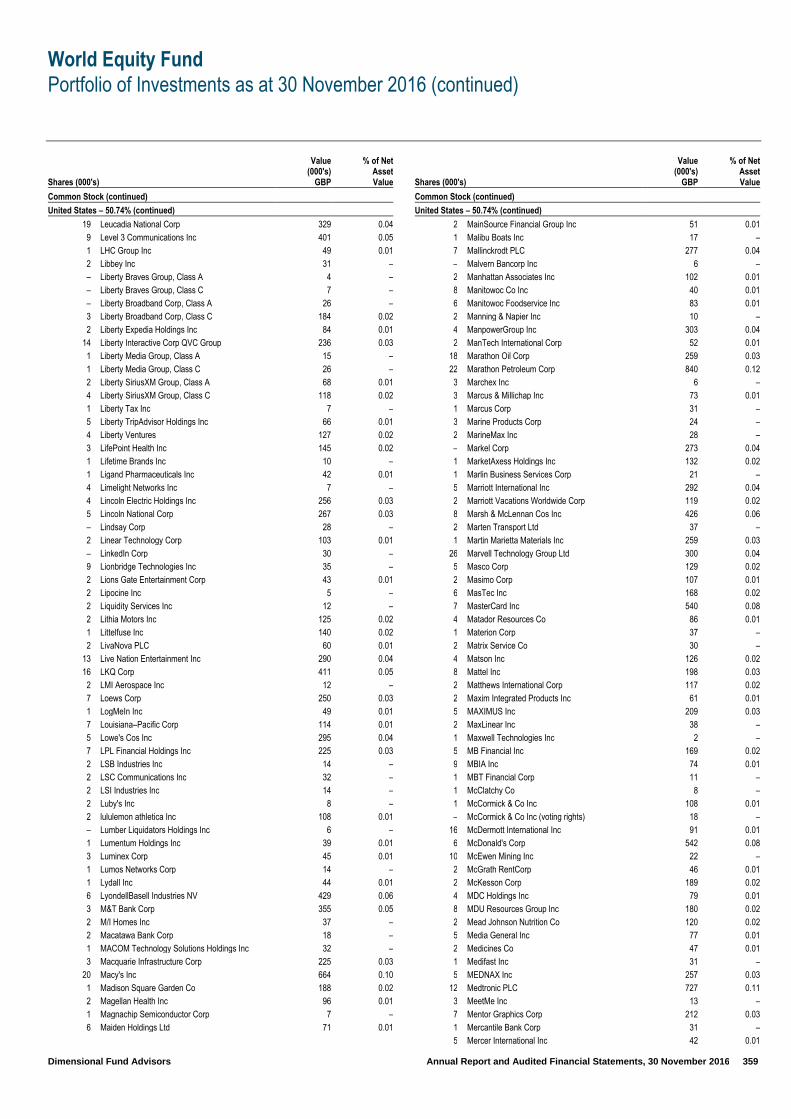
World Equity Fund
Portfolio of Investments as at 30 November 2016 (continued)
Dimensional Fund Advisors Annual Report and Audited Financial Statements, 30 November 2016 359
Shares (000's)
Value (000's)
GBP
% of Net Asset Value
Common Stock (continued)
United States – 50.74% (continued)
19 Leucadia National Corp 329 0.04
9 Level 3 Communications Inc 401 0.05
1 LHC Group Inc 49 0.01
2 Libbey Inc 31 –
– Liberty Braves Group, Class A 4 –
– Liberty Braves Group, Class C 7 –
– Liberty Broadband Corp, Class A 26 –
3 Liberty Broadband Corp, Class C 184 0.02
2 Liberty Expedia Holdings Inc 84 0.01
14 Liberty Interactive Corp QVC Group 236 0.03
1 Liberty Media Group, Class A 15 –
1 Liberty Media Group, Class C 26 –
2 Liberty SiriusXM Group, Class A 68 0.01
4 Liberty SiriusXM Group, Class C 118 0.02
1 Liberty Tax Inc 7 –
5 Liberty TripAdvisor Holdings Inc 66 0.01
4 Liberty Ventures 127 0.02
3 LifePoint Health Inc 145 0.02
1 Lifetime Brands Inc 10 –
1 Ligand Pharmaceuticals Inc 42 0.01
4 Limelight Networks Inc 7 –
4 Lincoln Electric Holdings Inc 256 0.03
5 Lincoln National Corp 267 0.03
– Lindsay Corp 28 –
2 Linear Technology Corp 103 0.01
– LinkedIn Corp 30 –
9 Lionbridge Technologies Inc 35 –
2 Lions Gate Entertainment Corp 43 0.01
2 Lipocine Inc 5 –
2 Liquidity Services Inc 12 –
2 Lithia Motors Inc 125 0.02
1 Littelfuse Inc 140 0.02
2 LivaNova PLC 60 0.01
13 Live Nation Entertainment Inc 290 0.04
16 LKQ Corp 411 0.05
2 LMI Aerospace Inc 12 –
7 Loews Corp 250 0.03
1 LogMeIn Inc 49 0.01
7 Louisiana–Pacific Corp 114 0.01
5 Lowe's Cos Inc 295 0.04
7 LPL Financial Holdings Inc 225 0.03
2 LSB Industries Inc 14 –
2 LSC Communications Inc 32 –
2 LSI Industries Inc 14 –
2 Luby's Inc 8 –
2 lululemon athletica Inc 108 0.01
– Lumber Liquidators Holdings Inc 6 –
1 Lumentum Holdings Inc 39 0.01
3 Luminex Corp 45 0.01
1 Lumos Networks Corp 14 –
1 Lydall Inc 44 0.01
6 LyondellBasell Industries NV 429 0.06
3 M&T Bank Corp 355 0.05
2 M/I Homes Inc 37 –
2 Macatawa Bank Corp 18 –
1 MACOM Technology Solutions Holdings Inc 32 –
3 Macquarie Infrastructure Corp 225 0.03
20 Macy's Inc 664 0.10
1 Madison Square Garden Co 188 0.02
2 Magellan Health Inc 96 0.01
1 Magnachip Semiconductor Corp 7 –
6 Maiden Holdings Ltd 71 0.01
Shares (000's)
Value (000's)
GBP
% of Net Asset Value
Common Stock (continued)
United States – 50.74% (continued)
2 MainSource Financial Group Inc 51 0.01
1 Malibu Boats Inc 17 –
7 Mallinckrodt PLC 277 0.04
– Malvern Bancorp Inc 6 –
2 Manhattan Associates Inc 102 0.01
8 Manitowoc Co Inc 40 0.01
6 Manitowoc Foodservice Inc 83 0.01
2 Manning & Napier Inc 10 –
4 ManpowerGroup Inc 303 0.04
2 ManTech International Corp 52 0.01
18 Marathon Oil Corp 259 0.03
22 Marathon Petroleum Corp 840 0.12
3 Marchex Inc 6 –
3 Marcus & Millichap Inc 73 0.01
1 Marcus Corp 31 –
3 Marine Products Corp 24 –
2 MarineMax Inc 28 –
– Markel Corp 273 0.04
1 MarketAxess Holdings Inc 132 0.02
1 Marlin Business Services Corp 21 –
5 Marriott International Inc 292 0.04
2 Marriott Vacations Worldwide Corp 119 0.02
8 Marsh & McLennan Cos Inc 426 0.06
2 Marten Transport Ltd 37 –
1 Martin Marietta Materials Inc 259 0.03
26 Marvell Technology Group Ltd 300 0.04
5 Masco Corp 129 0.02
2 Masimo Corp 107 0.01
6 MasTec Inc 168 0.02
7 MasterCard Inc 540 0.08
4 Matador Resources Co 86 0.01
1 Materion Corp 37 –
2 Matrix Service Co 30 –
4 Matson Inc 126 0.02
8 Mattel Inc 198 0.03
2 Matthews International Corp 117 0.02
2 Maxim Integrated Products Inc 61 0.01
5 MAXIMUS Inc 209 0.03
2 MaxLinear Inc 38 –
1 Maxwell Technologies Inc 2 –
5 MB Financial Inc 169 0.02
9 MBIA Inc 74 0.01
1 MBT Financial Corp 11 –
1 McClatchy Co 8 –
1 McCormick & Co Inc 108 0.01
– McCormick & Co Inc (voting rights) 18 –
16 McDermott International Inc 91 0.01
6 McDonald's Corp 542 0.08
10 McEwen Mining Inc 22 –
2 McGrath RentCorp 46 0.01
2 McKesson Corp 189 0.02
4 MDC Holdings Inc 79 0.01
8 MDU Resources Group Inc 180 0.02
2 Mead Johnson Nutrition Co 120 0.02
5 Media General Inc 77 0.01
2 Medicines Co 47 0.01
1 Medifast Inc 31 –
5 MEDNAX Inc 257 0.03
12 Medtronic PLC 727 0.11
3 MeetMe Inc 13 –
7 Mentor Graphics Corp 212 0.03
1 Mercantile Bank Corp 31 –
5 Mercer International Inc 42 0.01

World Equity Fund
Portfolio of Investments as at 30 November 2016 (continued)
Dimensional Fund Advisors Annual Report and Audited Financial Statements, 30 November 2016 360
Shares (000's)
Value (000's)
GBP
% of Net Asset Value
Common Stock (continued)
United States – 50.74% (continued)
1 Merchants Bancshares Inc 35 –
50 Merck & Co Inc 2,462 0.33
4 Mercury General Corp 180 0.02
3 Mercury Systems Inc 64 0.01
3 Meredith Corp 142 0.02
4 Meridian Bancorp Inc 50 0.01
3 Meridian Bioscience Inc 41 0.01
3 Merit Medical Systems Inc 56 0.01
3 Meritage Homes Corp 87 0.01
5 Meritor Inc 50 0.01
– Mesa Laboratories Inc 20 –
1 Meta Financial Group Inc 37 –
2 Methode Electronics Inc 62 0.01
12 MetLife Inc 529 0.08
– Mettler–Toledo International Inc 125 0.02
2 MGE Energy Inc 85 0.01
24 MGIC Investment Corp 175 0.02
23 MGM Resorts International 538 0.08
2 MGP Ingredients Inc 57 0.01
6 Michael Kors Holdings Ltd 220 0.03
7 Michaels Cos Inc 133 0.02
2 Microchip Technology Inc 123 0.02
32 Micron Technology Inc 494 0.06
6 Microsemi Corp 247 0.03
69 Microsoft Corp 3,333 0.45
1 MicroStrategy Inc 85 0.01
1 Middleburg Financial Corp 20 –
2 Middleby Corp 259 0.03
1 Middlesex Water Co 20 –
1 MidSouth Bancorp Inc 10 –
1 MidWestOne Financial Group Inc 19 –
1 Miller Industries Inc 18 –
2 MiMedx Group Inc 16 –
2 Minerals Technologies Inc 151 0.02
2 Mistras Group Inc 34 –
3 MKS Instruments Inc 152 0.02
3 Mobile Mini Inc 73 0.01
4 Modine Manufacturing Co 41 0.01
7 ModusLink Global Solutions Inc 7 –
1 Moelis & Co 14 –
2 Mohawk Industries Inc 294 0.04
4 Molina Healthcare Inc 152 0.02
3 Molson Coors Brewing Co 270 0.04
1 Momenta Pharmaceuticals Inc 7 –
1 Monarch Casino & Resort Inc 18 –
14 Mondelez International Inc 477 0.06
2 MoneyGram International Inc 16 –
2 Monotype Imaging Holdings Inc 36 –
2 Monro Muffler Brake Inc 89 0.01
3 Monsanto Co 256 0.03
5 Monster Beverage Corp 167 0.02
1 Moody's Corp 84 0.01
3 Moog Inc 145 0.02
18 Morgan Stanley 585 0.09
3 Morningstar Inc 168 0.02
21 Mosaic Co 483 0.06
1 Motorcar Parts of America Inc 23 –
2 Motorola Solutions Inc 107 0.01
– Movado Group Inc 10 –
8 MRC Global Inc 124 0.02
3 MSA Safety Inc 125 0.02
3 MSC Industrial Direct Co Inc 248 0.03
3 MSCI Inc 184 0.02
Shares (000's)
Value (000's)
GBP
% of Net Asset Value
Common Stock (continued)
United States – 50.74% (continued)
4 MSG Networks Inc 60 0.01
1 MTS Systems Corp 50 0.01
4 Mueller Industries Inc 115 0.02
13 Mueller Water Products Inc 135 0.02
1 Multi–Color Corp 69 0.01
12 Murphy Oil Corp 318 0.04
3 Murphy USA Inc 180 0.02
– MutualFirst Financial Inc 11 –
3 Myers Industries Inc 34 –
11 Mylan NV 336 0.04
2 MYR Group Inc 52 0.01
3 Myriad Genetics Inc 35 –
19 Nabors Industries Ltd 249 0.03
– NACCO Industries Inc 23 –
1 Nanometrics Inc 17 –
2 Napco Security Technologies Inc 11 –
4 Nasdaq Inc 214 0.03
– Nathan's Famous Inc 10 –
2 National Bank Holdings Corp 44 0.01
2 National Beverage Corp 72 0.01
4 National CineMedia Inc 46 0.01
4 National Fuel Gas Co 166 0.02
7 National General Holdings Corp 129 0.02
1 National HealthCare Corp 54 0.01
7 National Instruments Corp 159 0.02
8 National Oilwell Varco Inc 253 0.03
– National Presto Industries Inc 23 –
2 National Research Corp 23 –
– National Western Life Group Inc 39 0.01
3 Nationstar Mortgage Holdings Inc 45 0.01
1 Natural Alternatives International Inc 13 –
1 Natural Gas Services Group Inc 19 –
1 Natural Grocers by Vitamin Cottage Inc 10 –
2 Nature's Sunshine Products Inc 19 –
2 Natus Medical Inc 65 0.01
2 Nautilus Inc 33 –
25 Navient Corp 343 0.04
3 Navigant Consulting Inc 62 0.01
1 Navigators Group Inc 84 0.01
2 Navistar International Corp 59 0.01
3 NBT Bancorp Inc 92 0.01
5 NCI Building Systems Inc 70 0.01
1 NCI Inc 15 –
8 NCR Corp 254 0.03
1 Neenah Paper Inc 81 0.01
2 Nelnet Inc 85 0.01
1 Neogen Corp 66 0.01
2 NeoGenomics Inc 16 –
2 NeoPhotonics Corp 22 –
15 NetApp Inc 429 0.06
1 Netflix Inc 103 0.01
2 NETGEAR Inc 75 0.01
8 NetScout Systems Inc 196 0.03
1 Neurocrine Biosciences Inc 38 –
3 NeuStar Inc 56 0.01
2 New Home Co Inc 16 –
4 New Jersey Resources Corp 96 0.01
4 New Media Investment Group Inc 45 0.01
4 New York & Co Inc 7 –
20 New York Community Bancorp Inc 252 0.03
9 New York Times Co 97 0.01
8 Newell Brands Inc 296 0.04
3 Newfield Exploration Co 119 0.02

World Equity Fund
Portfolio of Investments as at 30 November 2016 (continued)
Dimensional Fund Advisors Annual Report and Audited Financial Statements, 30 November 2016 361
Shares (000's)
Value (000's)
GBP
% of Net Asset Value
Common Stock (continued)
United States – 50.74% (continued)
– NewMarket Corp 144 0.02
16 Newmont Mining Corp 421 0.06
8 Newpark Resources Inc 47 0.01
19 News Corp, Class A 176 0.02
10 News Corp, Class B 99 0.01
4 NewStar Financial Inc 26 –
1 Nexstar Broadcasting Group Inc 43 0.01
2 NextEra Energy Inc 193 0.03
2 NIC Inc 49 0.01
7 Nielsen Holdings PLC 229 0.03
6 NIKE Inc 257 0.03
8 NiSource Inc 149 0.02
1 NL Industries Inc 7 –
3 NMI Holdings Inc 22 –
2 NN Inc 30 –
13 Noble Corp PLC 66 0.01
9 Noble Energy Inc 279 0.04
2 Noodles & Co 6 –
4 Nordic American Tankers Ltd 27 –
2 Nordson Corp 186 0.02
4 Nordstrom Inc 197 0.03
11 Norfolk Southern Corp 913 0.13
7 Northern Trust Corp 469 0.06
4 Northfield Bancorp Inc 52 0.01
1 Northrim BanCorp Inc 14 –
2 Northrop Grumman Corp 498 0.08
9 NorthStar Asset Management Group Inc 103 0.01
8 Northwest Bancshares Inc 114 0.01
1 Northwest Natural Gas Co 63 0.01
1 Northwest Pipe Co 20 –
2 NorthWestern Corp 85 0.01
8 Norwegian Cruise Line Holdings Ltd 265 0.03
2 Novanta Inc 38 –
7 NOW Inc 124 0.02
21 NRG Energy Inc 188 0.02
2 NRG Yield Inc, Class A 21 –
3 NRG Yield Inc, Class C 38 –
4 Nu Skin Enterprises Inc 147 0.02
14 Nuance Communications Inc 181 0.02
9 Nucor Corp 446 0.07
3 Numerex Corp 17 –
1 Nutraceutical International Corp 16 –
1 Nutrisystem Inc 35 –
3 NuVasive Inc 135 0.02
1 Nuvectra Corp 3 –
1 NV5 Global Inc 23 –
– NVE Corp 16 –
6 NVIDIA Corp 443 0.06
– NVR Inc 249 0.03
2 O'Reilly Automotive Inc 330 0.04
12 Oasis Petroleum Inc 145 0.02
8 Occidental Petroleum Corp 432 0.06
– Ocean Shore Holding Co 7 –
7 Oceaneering International Inc 142 0.02
2 OceanFirst Financial Corp 35 –
2 Oclaro Inc 17 –
1 Ocwen Financial Corp 3 –
18 Office Depot Inc 70 0.01
4 OFG Bancorp 44 0.01
5 OGE Energy Corp 130 0.02
4 Oil States International Inc 102 0.01
– Oil–Dri Corp of America 13 –
5 Old Dominion Freight Line Inc 363 0.05
Shares (000's)
Value (000's)
GBP
% of Net Asset Value
Common Stock (continued)
United States – 50.74% (continued)
– Old Line Bancshares Inc 8 –
9 Old National Bancorp 126 0.02
18 Old Republic International Corp 256 0.03
2 Old Second Bancorp Inc 13 –
11 Olin Corp 228 0.03
2 Ollie's Bargain Outlet Holdings Inc 58 0.01
1 Olympic Steel Inc 18 –
6 OM Asset Management Plc 67 0.01
– Omega Flex Inc 16 –
2 Omega Protein Corp 29 –
2 Omnicell Inc 52 0.01
4 Omnicom Group Inc 255 0.03
4 OMNOVA Solutions Inc 28 –
3 On Assignment Inc 109 0.01
29 ON Semiconductor Corp 269 0.04
2 ONE Gas Inc 116 0.02
1 OneBeacon Insurance Group Ltd 16 –
9 OneMain Holdings Inc 151 0.02
7 ONEOK Inc 326 0.04
27 OPKO Health Inc 220 0.03
1 Oppenheimer Holdings Inc 7 –
3 Opus Bank 53 0.01
82 Oracle Corp 2,640 0.36
5 OraSure Technologies Inc 33 –
5 ORBCOMM Inc 32 –
1 Orchids Paper Products Co 23 –
2 Orion Group Holdings Inc 19 –
3 Oritani Financial Corp 45 0.01
1 Ormat Technologies Inc (Israel listing) 34 –
3 Ormat Technologies Inc (US listing) 113 0.01
1 Orrstown Financial Services Inc 11 –
1 Orthofix International NV 31 –
5 Oshkosh Corp 283 0.04
1 OSI Systems Inc 71 0.01
3 Otonomy Inc 37 –
2 Otter Tail Corp 57 0.01
2 OvaScience Inc 6 –
2 Overstock.com Inc 23 –
4 Owens & Minor Inc 109 0.01
7 Owens Corning 270 0.04
7 Owens–Illinois Inc 110 0.01
1 Oxford Industries Inc 70 0.01
12 PACCAR Inc 580 0.09
2 Pacific Continental Corp 29 –
1 Pacific Drilling SA 2 –
2 Pacific Ethanol Inc 10 –
3 Pacific Mercantile Bancorp 15 –
2 Pacific Premier Bancorp Inc 52 0.01
4 Packaging Corp of America 286 0.04
8 PacWest Bancorp 334 0.04
– Palo Alto Networks Inc 45 0.01
– PAM Transportation Services Inc 6 –
1 Panera Bread Co 158 0.02
2 Panhandle Oil and Gas Inc 32 –
2 Papa John's International Inc 112 0.01
2 Par Pacific Holdings Inc 27 –
4 PAREXEL International Corp 198 0.03
1 Park Electrochemical Corp 14 –
1 Park National Corp 103 0.01
5 Park Sterling Corp 37 –
1 Park–Ohio Holdings Corp 27 –
1 Parke Bancorp Inc 10 –
13 Parker Drilling Co 22 –
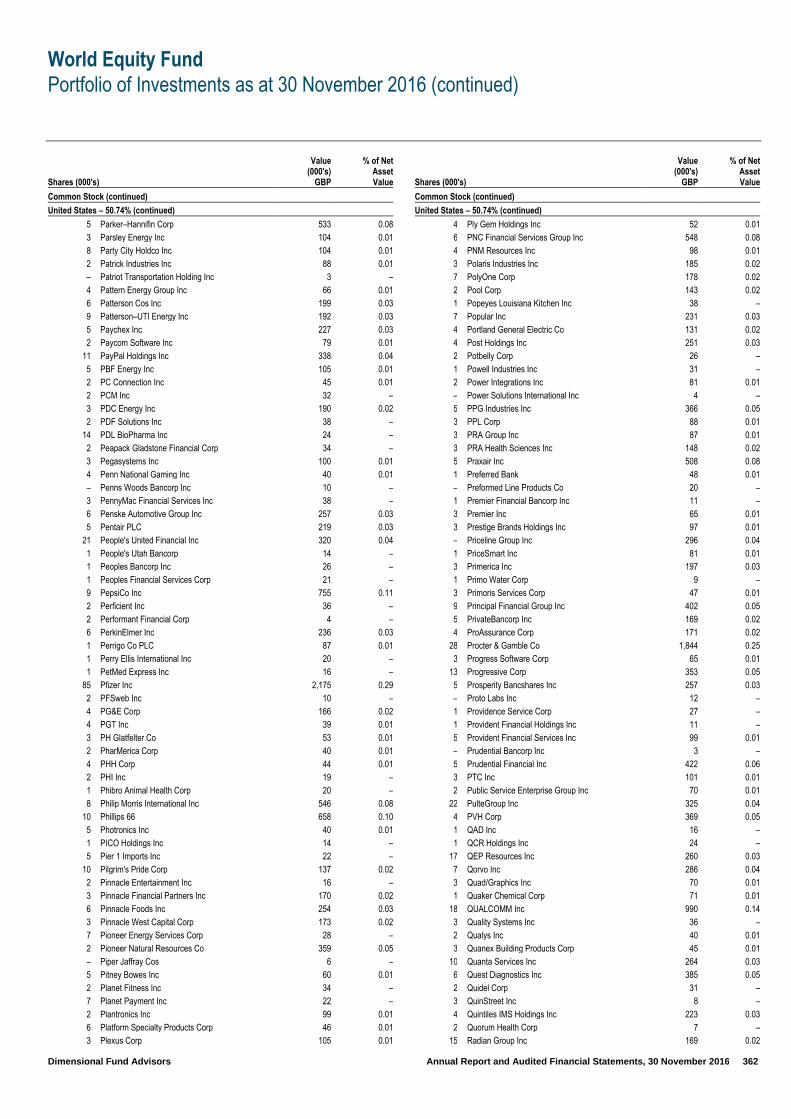
World Equity Fund
Portfolio of Investments as at 30 November 2016 (continued)
Dimensional Fund Advisors Annual Report and Audited Financial Statements, 30 November 2016 362
Shares (000's)
Value (000's)
GBP
% of Net Asset Value
Common Stock (continued)
United States – 50.74% (continued)
5 Parker–Hannifin Corp 533 0.08
3 Parsley Energy Inc 104 0.01
8 Party City Holdco Inc 104 0.01
2 Patrick Industries Inc 88 0.01
– Patriot Transportation Holding Inc 3 –
4 Pattern Energy Group Inc 66 0.01
6 Patterson Cos Inc 199 0.03
9 Patterson–UTI Energy Inc 192 0.03
5 Paychex Inc 227 0.03
2 Paycom Software Inc 79 0.01
11 PayPal Holdings Inc 338 0.04
5 PBF Energy Inc 105 0.01
2 PC Connection Inc 45 0.01
2 PCM Inc 32 –
3 PDC Energy Inc 190 0.02
2 PDF Solutions Inc 38 –
14 PDL BioPharma Inc 24 –
2 Peapack Gladstone Financial Corp 34 –
3 Pegasystems Inc 100 0.01
4 Penn National Gaming Inc 40 0.01
– Penns Woods Bancorp Inc 10 –
3 PennyMac Financial Services Inc 38 –
6 Penske Automotive Group Inc 257 0.03
5 Pentair PLC 219 0.03
21 People's United Financial Inc 320 0.04
1 People's Utah Bancorp 14 –
1 Peoples Bancorp Inc 26 –
1 Peoples Financial Services Corp 21 –
9 PepsiCo Inc 755 0.11
2 Perficient Inc 36 –
2 Performant Financial Corp 4 –
6 PerkinElmer Inc 236 0.03
1 Perrigo Co PLC 87 0.01
1 Perry Ellis International Inc 20 –
1 PetMed Express Inc 16 –
85 Pfizer Inc 2,175 0.29
2 PFSweb Inc 10 –
4 PG&E Corp 166 0.02
4 PGT Inc 39 0.01
3 PH Glatfelter Co 53 0.01
2 PharMerica Corp 40 0.01
4 PHH Corp 44 0.01
2 PHI Inc 19 –
1 Phibro Animal Health Corp 20 –
8 Philip Morris International Inc 546 0.08
10 Phillips 66 658 0.10
5 Photronics Inc 40 0.01
1 PICO Holdings Inc 14 –
5 Pier 1 Imports Inc 22 –
10 Pilgrim's Pride Corp 137 0.02
2 Pinnacle Entertainment Inc 16 –
3 Pinnacle Financial Partners Inc 170 0.02
6 Pinnacle Foods Inc 254 0.03
3 Pinnacle West Capital Corp 173 0.02
7 Pioneer Energy Services Corp 28 –
2 Pioneer Natural Resources Co 359 0.05
– Piper Jaffray Cos 6 –
5 Pitney Bowes Inc 60 0.01
2 Planet Fitness Inc 34 –
7 Planet Payment Inc 22 –
2 Plantronics Inc 99 0.01
6 Platform Specialty Products Corp 46 0.01
3 Plexus Corp 105 0.01
Shares (000's)
Value (000's)
GBP
% of Net Asset Value
Common Stock (continued)
United States – 50.74% (continued)
4 Ply Gem Holdings Inc 52 0.01
6 PNC Financial Services Group Inc 548 0.08
4 PNM Resources Inc 98 0.01
3 Polaris Industries Inc 185 0.02
7 PolyOne Corp 178 0.02
2 Pool Corp 143 0.02
1 Popeyes Louisiana Kitchen Inc 38 –
7 Popular Inc 231 0.03
4 Portland General Electric Co 131 0.02
4 Post Holdings Inc 251 0.03
2 Potbelly Corp 26 –
1 Powell Industries Inc 31 –
2 Power Integrations Inc 81 0.01
– Power Solutions International Inc 4 –
5 PPG Industries Inc 366 0.05
3 PPL Corp 88 0.01
3 PRA Group Inc 87 0.01
3 PRA Health Sciences Inc 148 0.02
5 Praxair Inc 508 0.08
1 Preferred Bank 48 0.01
– Preformed Line Products Co 20 –
1 Premier Financial Bancorp Inc 11 –
3 Premier Inc 65 0.01
3 Prestige Brands Holdings Inc 97 0.01
– Priceline Group Inc 296 0.04
1 PriceSmart Inc 81 0.01
3 Primerica Inc 197 0.03
1 Primo Water Corp 9 –
3 Primoris Services Corp 47 0.01
9 Principal Financial Group Inc 402 0.05
5 PrivateBancorp Inc 169 0.02
4 ProAssurance Corp 171 0.02
28 Procter & Gamble Co 1,844 0.25
3 Progress Software Corp 65 0.01
13 Progressive Corp 353 0.05
5 Prosperity Bancshares Inc 257 0.03
– Proto Labs Inc 12 –
1 Providence Service Corp 27 –
1 Provident Financial Holdings Inc 11 –
5 Provident Financial Services Inc 99 0.01
– Prudential Bancorp Inc 3 –
5 Prudential Financial Inc 422 0.06
3 PTC Inc 101 0.01
2 Public Service Enterprise Group Inc 70 0.01
22 PulteGroup Inc 325 0.04
4 PVH Corp 369 0.05
1 QAD Inc 16 –
1 QCR Holdings Inc 24 –
17 QEP Resources Inc 260 0.03
7 Qorvo Inc 286 0.04
3 Quad/Graphics Inc 70 0.01
1 Quaker Chemical Corp 71 0.01
18 QUALCOMM Inc 990 0.14
3 Quality Systems Inc 36 –
2 Qualys Inc 40 0.01
3 Quanex Building Products Corp 45 0.01
10 Quanta Services Inc 264 0.03
6 Quest Diagnostics Inc 385 0.05
2 Quidel Corp 31 –
3 QuinStreet Inc 8 –
4 Quintiles IMS Holdings Inc 223 0.03
2 Quorum Health Corp 7 –
15 Radian Group Inc 169 0.02

World Equity Fund
Portfolio of Investments as at 30 November 2016 (continued)
Dimensional Fund Advisors Annual Report and Audited Financial Statements, 30 November 2016 363
Shares (000's)
Value (000's)
GBP
% of Net Asset Value
Common Stock (continued)
United States – 50.74% (continued)
3 Radiant Logistics Inc 10 –
4 Radisys Corp 13 –
3 RadNet Inc 16 –
3 Ralph Lauren Corp 255 0.03
6 Rambus Inc 62 0.01
12 Range Resources Corp 339 0.04
2 Raven Industries Inc 42 0.01
7 Raymond James Financial Inc 408 0.05
3 Rayonier Advanced Materials Inc 30 –
3 Raytheon Co 349 0.05
1 RBC Bearings Inc 88 0.01
1 RE/MAX Holdings Inc 53 0.01
1 Reading International Inc 9 –
2 Real Industry Inc 7 –
3 RealNetworks Inc 11 –
7 Realogy Holdings Corp 129 0.02
1 Red Hat Inc 87 0.01
2 Red Lion Hotels Corp 14 –
1 Red Robin Gourmet Burgers Inc 39 0.01
3 Regal Beloit Corp 173 0.02
6 Regal Entertainment Group 106 0.01
– Regeneron Pharmaceuticals Inc 141 0.02
1 Regional Management Corp 26 –
25 Regions Financial Corp 270 0.04
3 Regis Corp 29 –
3 Reinsurance Group of America Inc 337 0.04
1 Reis Inc 14 –
5 Reliance Steel & Aluminum Co 314 0.04
3 RenaissanceRe Holdings Ltd 294 0.04
3 Renasant Corp 102 0.01
3 Renewable Energy Group Inc 26 –
4 Rent–A–Center Inc 39 0.01
1 Republic Bancorp Inc 30 –
15 Republic Services Inc 659 0.10
6 ResMed Inc 301 0.04
7 Resolute Forest Products Inc 27 –
3 Resources Connection Inc 34 –
1 Restoration Hardware Holdings Inc 19 –
4 RetailMeNot Inc 26 –
2 Retrophin Inc 38 –
3 Revlon Inc 62 0.01
1 REX American Resources Corp 41 0.01
7 Rexnord Corp 128 0.02
20 Reynolds American Inc 855 0.12
13 Rice Energy Inc 254 0.03
5 Rigel Pharmaceuticals Inc 10 –
– Rightside Group Ltd 3 –
1 RigNet Inc 13 –
2 Ring Energy Inc 24 –
7 Rite Aid Corp 44 0.01
– Riverview Bancorp Inc 1 –
2 RLI Corp 107 0.01
1 RMR Group Inc 39 0.01
2 Roadrunner Transportation Systems Inc 16 –
6 Robert Half International Inc 228 0.03
2 Rockwell Automation Inc 200 0.03
2 Rockwell Collins Inc 167 0.02
1 Rogers Corp 74 0.01
6 Rollins Inc 156 0.02
2 Roper Technologies Inc 321 0.04
4 Ross Stores Inc 242 0.03
8 Rowan Cos PLC 118 0.02
Shares (000's)
Value (000's)
GBP
% of Net Asset Value
Common Stock (continued)
United States – 50.74% (continued)
4 Royal Caribbean Cruises Ltd 287 0.04
4 Royal Gold Inc 249 0.03
11 RPC Inc 174 0.02
5 RPM International Inc 220 0.03
3 RPX Corp 26 –
6 RR Donnelley & Sons Co 86 0.01
7 RSP Permian Inc 247 0.03
7 RTI Surgical Inc 17 –
2 Rubicon Project Inc 13 –
4 Ruby Tuesday Inc 11 –
3 Rudolph Technologies Inc 44 0.01
2 Rush Enterprises Inc, Class A 56 0.01
3 Ruth's Hospitality Group Inc 41 0.01
5 Ryder System Inc 299 0.04
1 Ryerson Holding Corp 15 –
3 S&P Global Inc 323 0.04
2 S&T Bancorp Inc 69 0.01
7 Sabre Corp 135 0.02
1 Safeguard Scientifics Inc 13 –
1 Safety Insurance Group Inc 62 0.01
3 Safeway Inc 2 –
3 Safeway PDC LLC CVR – –
– Saga Communications Inc 8 –
2 Saia Inc 63 0.01
3 Salem Media Group Inc 12 –
2 salesforce.com Inc 89 0.01
4 Sally Beauty Holdings Inc 82 0.01
2 Sanderson Farms Inc 99 0.01
2 Sandy Spring Bancorp Inc 45 0.01
4 Sangamo BioSciences Inc 9 –
4 Sanmina Corp 116 0.02
24 Santander Consumer USA Holdings Inc 269 0.04
1 SBA Communications Corp 102 0.01
3 SCANA Corp 153 0.02
2 ScanSource Inc 52 0.01
13 Schlumberger Ltd 897 0.13
2 Schnitzer Steel Industries Inc 54 0.01
2 Scholastic Corp 63 0.01
2 Schweitzer–Mauduit International Inc 80 0.01
3 SciClone Pharmaceuticals Inc 22 –
3 Science Applications International Corp 198 0.03
8 Scorpio Tankers Inc 28 –
5 Scotts Miracle–Gro Co 348 0.05
4 Scripps Networks Interactive Inc 209 0.03
– Seaboard Corp 219 0.03
2 Seachange International Inc 3 –
3 Seacoast Banking Corp of Florida 45 0.01
1 SEACOR Holdings Inc 45 0.01
12 Seagate Technology PLC 376 0.05
6 Sealed Air Corp 203 0.03
1 Sears Hometown and Outlet Stores Inc 6 –
1 SeaSpine Holdings Corp 6 –
1 Seattle Genetics Inc 67 0.01
7 SeaWorld Entertainment Inc 89 0.01
6 SEI Investments Co 241 0.03
1 Select Bancorp Inc 10 –
4 Select Comfort Corp 81 0.01
10 Select Medical Holdings Corp 99 0.01
4 Selective Insurance Group Inc 129 0.02
4 SemGroup Corp 102 0.01
1 Sempra Energy 118 0.02
3 Semtech Corp 71 0.01
1 Seneca Foods Corp 21 –

World Equity Fund
Portfolio of Investments as at 30 November 2016 (continued)
Dimensional Fund Advisors Annual Report and Audited Financial Statements, 30 November 2016 364
Shares (000's)
Value (000's)
GBP
% of Net Asset Value
Common Stock (continued)
United States – 50.74% (continued)
12 Sensata Technologies Holding NV 344 0.04
2 Sensient Technologies Corp 124 0.02
1 Sequential Brands Group Inc 6 –
16 Service Corp International 344 0.04
6 ServiceMaster Global Holdings Inc 176 0.02
1 ServiceNow Inc 56 0.01
3 ServiceSource International Inc 16 –
1 ServisFirst Bancshares Inc 81 0.01
1 Shake Shack Inc 18 –
3 Shenandoah Telecommunications Co 78 0.01
1 Sherwin–Williams Co 230 0.03
1 Shiloh Industries Inc 3 –
3 Ship Finance International Ltd 35 –
1 Shoe Carnival Inc 26 –
1 Shore Bancshares Inc 13 –
3 ShoreTel Inc 17 –
2 Shutterfly Inc 85 0.01
– Shutterstock Inc 15 –
1 SI Financial Group Inc 7 –
1 Sierra Bancorp 15 –
2 Sigma Designs Inc 11 –
2 Signature Bank 181 0.02
3 Signet Jewelers Ltd 217 0.03
4 Silgan Holdings Inc 178 0.02
2 Silicon Laboratories Inc 101 0.01
3 Silver Spring Networks Inc 30 –
1 Silvercrest Asset Management Group Inc 10 –
2 Simmons First National Corp 106 0.01
3 Simpson Manufacturing Co Inc 111 0.01
5 Sinclair Broadcast Group Inc 139 0.02
49 Sirius XM Holdings Inc 180 0.02
4 Six Flags Entertainment Corp 161 0.02
1 SJW Group 49 0.01
4 Skechers U.S.A. Inc 66 0.01
3 SkyWest Inc 91 0.01
2 Skyworks Solutions Inc 153 0.02
33 SLM Corp 263 0.03
6 SM Energy Co 184 0.02
5 Smith & Wesson Holding Corp 88 0.01
4 Snap–on Inc 498 0.08
7 Snyder's–Lance Inc 209 0.03
2 Sonic Automotive Inc 34 –
2 Sonic Corp 39 0.01
7 Sonoco Products Co 314 0.04
4 Sonus Networks Inc 18 –
3 Sotheby's 103 0.01
4 South Jersey Industries Inc 100 0.01
2 South State Corp 121 0.02
4 Southern Co 150 0.02
18 Southern Copper Corp 471 0.06
1 Southern First Bancshares Inc 15 –
– Southern Missouri Bancorp Inc 9 –
2 Southern National Bancorp of Virginia Inc 20 –
2 Southside Bancshares Inc 50 0.01
15 Southwest Airlines Co 556 0.08
1 Southwest Bancorp Inc 19 –
2 Southwest Gas Corp 130 0.02
27 Southwestern Energy Co 244 0.03
2 SP Plus Corp 35 –
1 Spark Energy Inc 14 –
3 Spartan Motors Inc 18 –
2 SpartanNash Co 52 0.01
1 Sparton Corp 10 –
Shares (000's)
Value (000's)
GBP
% of Net Asset Value
Common Stock (continued)
United States – 50.74% (continued)
3 Spectra Energy Corp 104 0.01
3 Spectrum Brands Holdings Inc 245 0.03
6 Spectrum Pharmaceuticals Inc 18 –
3 Speedway Motorsports Inc 50 0.01
2 Spire Inc 97 0.01
8 Spirit AeroSystems Holdings Inc 392 0.05
5 Spirit Airlines Inc 219 0.03
1 Splunk Inc 64 0.01
1 Spok Holdings Inc 17 –
2 Sportsman's Warehouse Holdings Inc 12 –
114 Sprint Corp 715 0.10
5 Sprouts Farmers Market Inc 87 0.01
3 SPX Corp 60 0.01
3 SPX FLOW Inc 78 0.01
10 SS&C Technologies Holdings Inc 250 0.03
5 St Joe Co 87 0.01
5 St Jude Medical Inc 287 0.04
1 Stage Stores Inc 4 –
– Stamps.com Inc 25 –
2 Standard Motor Products Inc 71 0.01
1 Standex International Corp 49 0.01
5 Stanley Black & Decker Inc 472 0.06
20 Staples Inc 156 0.02
9 Starbucks Corp 433 0.06
2 Starz 66 0.01
3 State Auto Financial Corp 54 0.01
3 State Bank Financial Corp 55 0.01
2 State National Cos Inc 18 –
6 State Street Corp 350 0.05
12 Steel Dynamics Inc 351 0.05
6 Steelcase Inc 69 0.01
4 Stein Mart Inc 17 –
2 Stemline Therapeutics Inc 22 –
2 Stepan Co 115 0.02
2 Stericycle Inc 105 0.01
5 Steris PLC 238 0.03
9 Sterling Bancorp 157 0.02
2 Sterling Construction Co Inc 16 –
4 Steven Madden Ltd 107 0.01
2 Stewart Information Services Corp 63 0.01
4 Stifel Financial Corp 168 0.02
8 Stillwater Mining Co 100 0.01
2 Stock Yards Bancorp Inc 54 0.01
1 Stonegate Bank 28 –
3 Stoneridge Inc 38 –
2 Stratasys Ltd 22 –
– Strattec Security Corp 6 –
1 Stratus Properties Inc 19 –
1 Strayer Education Inc 53 0.01
2 Stryker Corp 155 0.02
2 Sturm Ruger & Co Inc 70 0.01
3 Sucampo Pharmaceuticals Inc 38 –
1 Suffolk Bancorp 27 –
1 Summit Financial Group Inc 14 –
2 Sun Bancorp Inc 28 –
2 Sun Hydraulics Corp 57 0.01
5 SunCoke Energy Inc 43 0.01
2 SunEdison Semiconductor Ltd 18 –
6 SunPower Corp 31 –
6 SunTrust Banks Inc 263 0.03
3 Super Micro Computer Inc 57 0.01
11 Superior Energy Services Inc 147 0.02
1 Superior Industries International Inc 28 –
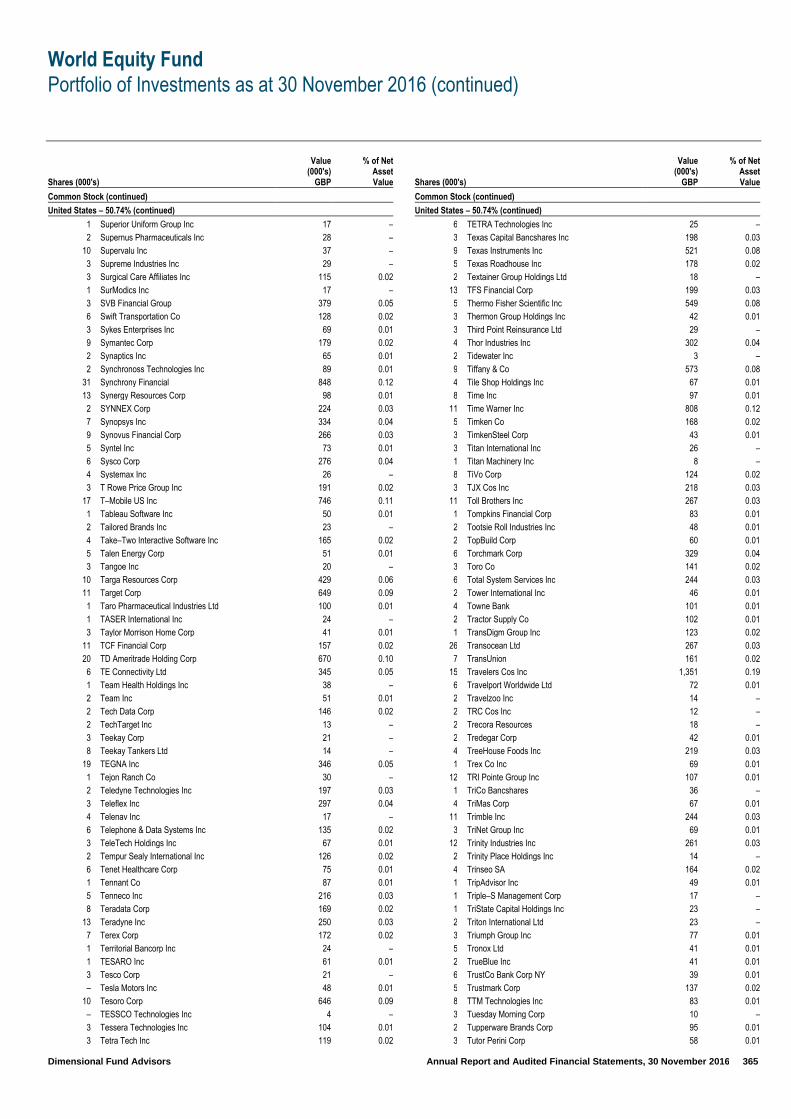
World Equity Fund
Portfolio of Investments as at 30 November 2016 (continued)
Dimensional Fund Advisors Annual Report and Audited Financial Statements, 30 November 2016 365
Shares (000's)
Value (000's)
GBP
% of Net Asset Value
Common Stock (continued)
United States – 50.74% (continued)
1 Superior Uniform Group Inc 17 –
2 Supernus Pharmaceuticals Inc 28 –
10 Supervalu Inc 37 –
3 Supreme Industries Inc 29 –
3 Surgical Care Affiliates Inc 115 0.02
1 SurModics Inc 17 –
3 SVB Financial Group 379 0.05
6 Swift Transportation Co 128 0.02
3 Sykes Enterprises Inc 69 0.01
9 Symantec Corp 179 0.02
2 Synaptics Inc 65 0.01
2 Synchronoss Technologies Inc 89 0.01
31 Synchrony Financial 848 0.12
13 Synergy Resources Corp 98 0.01
2 SYNNEX Corp 224 0.03
7 Synopsys Inc 334 0.04
9 Synovus Financial Corp 266 0.03
5 Syntel Inc 73 0.01
6 Sysco Corp 276 0.04
4 Systemax Inc 26 –
3 T Rowe Price Group Inc 191 0.02
17 T–Mobile US Inc 746 0.11
1 Tableau Software Inc 50 0.01
2 Tailored Brands Inc 23 –
4 Take–Two Interactive Software Inc 165 0.02
5 Talen Energy Corp 51 0.01
3 Tangoe Inc 20 –
10 Targa Resources Corp 429 0.06
11 Target Corp 649 0.09
1 Taro Pharmaceutical Industries Ltd 100 0.01
1 TASER International Inc 24 –
3 Taylor Morrison Home Corp 41 0.01
11 TCF Financial Corp 157 0.02
20 TD Ameritrade Holding Corp 670 0.10
6 TE Connectivity Ltd 345 0.05
1 Team Health Holdings Inc 38 –
2 Team Inc 51 0.01
2 Tech Data Corp 146 0.02
2 TechTarget Inc 13 –
3 Teekay Corp 21 –
8 Teekay Tankers Ltd 14 –
19 TEGNA Inc 346 0.05
1 Tejon Ranch Co 30 –
2 Teledyne Technologies Inc 197 0.03
3 Teleflex Inc 297 0.04
4 Telenav Inc 17 –
6 Telephone & Data Systems Inc 135 0.02
3 TeleTech Holdings Inc 67 0.01
2 Tempur Sealy International Inc 126 0.02
6 Tenet Healthcare Corp 75 0.01
1 Tennant Co 87 0.01
5 Tenneco Inc 216 0.03
8 Teradata Corp 169 0.02
13 Teradyne Inc 250 0.03
7 Terex Corp 172 0.02
1 Territorial Bancorp Inc 24 –
1 TESARO Inc 61 0.01
3 Tesco Corp 21 –
– Tesla Motors Inc 48 0.01
10 Tesoro Corp 646 0.09
– TESSCO Technologies Inc 4 –
3 Tessera Technologies Inc 104 0.01
3 Tetra Tech Inc 119 0.02
Shares (000's)
Value (000's)
GBP
% of Net Asset Value
Common Stock (continued)
United States – 50.74% (continued)
6 TETRA Technologies Inc 25 –
3 Texas Capital Bancshares Inc 198 0.03
9 Texas Instruments Inc 521 0.08
5 Texas Roadhouse Inc 178 0.02
2 Textainer Group Holdings Ltd 18 –
13 TFS Financial Corp 199 0.03
5 Thermo Fisher Scientific Inc 549 0.08
3 Thermon Group Holdings Inc 42 0.01
3 Third Point Reinsurance Ltd 29 –
4 Thor Industries Inc 302 0.04
2 Tidewater Inc 3 –
9 Tiffany & Co 573 0.08
4 Tile Shop Holdings Inc 67 0.01
8 Time Inc 97 0.01
11 Time Warner Inc 808 0.12
5 Timken Co 168 0.02
3 TimkenSteel Corp 43 0.01
3 Titan International Inc 26 –
1 Titan Machinery Inc 8 –
8 TiVo Corp 124 0.02
3 TJX Cos Inc 218 0.03
11 Toll Brothers Inc 267 0.03
1 Tompkins Financial Corp 83 0.01
2 Tootsie Roll Industries Inc 48 0.01
2 TopBuild Corp 60 0.01
6 Torchmark Corp 329 0.04
3 Toro Co 141 0.02
6 Total System Services Inc 244 0.03
2 Tower International Inc 46 0.01
4 Towne Bank 101 0.01
2 Tractor Supply Co 102 0.01
1 TransDigm Group Inc 123 0.02
26 Transocean Ltd 267 0.03
7 TransUnion 161 0.02
15 Travelers Cos Inc 1,351 0.19
6 Travelport Worldwide Ltd 72 0.01
2 Travelzoo Inc 14 –
2 TRC Cos Inc 12 –
2 Trecora Resources 18 –
2 Tredegar Corp 42 0.01
4 TreeHouse Foods Inc 219 0.03
1 Trex Co Inc 69 0.01
12 TRI Pointe Group Inc 107 0.01
1 TriCo Bancshares 36 –
4 TriMas Corp 67 0.01
11 Trimble Inc 244 0.03
3 TriNet Group Inc 69 0.01
12 Trinity Industries Inc 261 0.03
2 Trinity Place Holdings Inc 14 –
4 Trinseo SA 164 0.02
1 TripAdvisor Inc 49 0.01
1 Triple–S Management Corp 17 –
1 TriState Capital Holdings Inc 23 –
2 Triton International Ltd 23 –
3 Triumph Group Inc 77 0.01
5 Tronox Ltd 41 0.01
2 TrueBlue Inc 41 0.01
6 TrustCo Bank Corp NY 39 0.01
5 Trustmark Corp 137 0.02
8 TTM Technologies Inc 83 0.01
3 Tuesday Morning Corp 10 –
2 Tupperware Brands Corp 95 0.01
3 Tutor Perini Corp 58 0.01

World Equity Fund
Portfolio of Investments as at 30 November 2016 (continued)
Dimensional Fund Advisors Annual Report and Audited Financial Statements, 30 November 2016 366
Shares (000's)
Value (000's)
GBP
% of Net Asset Value
Common Stock (continued)
United States – 50.74% (continued)
21 Twenty–First Century Fox Inc, Class A 482 0.06
15 Twenty–First Century Fox Inc, Class B 336 0.04
1 Twin Disc Inc 14 –
5 Twitter Inc 68 0.01
1 Tyler Technologies Inc 74 0.01
12 Tyson Foods Inc 553 0.08
3 Ubiquiti Networks Inc 134 0.02
1 UFP Technologies Inc 12 –
8 UGI Corp 299 0.04
1 Ulta Salon Cosmetics & Fragrance Inc 195 0.03
– Ultimate Software Group Inc 74 0.01
3 Ultra Clean Holdings Inc 24 –
2 Ultratech Inc 38 –
3 UMB Financial Corp 211 0.03
15 Umpqua Holdings Corp 217 0.03
2 Under Armour Inc, Class A 48 0.01
2 Under Armour Inc, Class C 48 0.01
1 Unifi Inc 23 –
1 UniFirst Corp 124 0.02
3 Union Bankshares Corp 90 0.01
12 Union Pacific Corp 959 0.14
2 Unisys Corp 24 –
4 Unit Corp 79 0.01
5 United Bankshares Inc 192 0.03
6 United Community Banks Inc 123 0.02
4 United Community Financial Corp 29 –
15 United Continental Holdings Inc 831 0.12
3 United Financial Bancorp Inc 40 0.01
2 United Fire Group Inc 75 0.01
1 United Insurance Holdings Corp 15 –
3 United Natural Foods Inc 131 0.02
4 United Parcel Service Inc 360 0.05
7 United Rentals Inc 560 0.08
3 United States Cellular Corp 92 0.01
– United States Lime & Minerals Inc 17 –
11 United States Steel Corp 288 0.04
18 United Technologies Corp 1,569 0.22
3 United Therapeutics Corp 305 0.04
22 UnitedHealth Group Inc 2,808 0.38
1 Unitil Corp 20 –
10 Univar Inc 199 0.03
7 Universal American Corp 53 0.01
2 Universal Corp 66 0.01
2 Universal Display Corp 70 0.01
1 Universal Electronics Inc 41 0.01
1 Universal Forest Products Inc 101 0.01
4 Universal Health Services Inc 369 0.05
2 Universal Insurance Holdings Inc 36 –
1 Universal Logistics Holdings Inc 14 –
2 Univest Corp of Pennsylvania 47 0.01
10 Unum Group 354 0.05
9 Urban Outfitters Inc 233 0.03
28 US Bancorp 1,121 0.16
1 US Concrete Inc 58 0.01
2 US Ecology Inc 70 0.01
1 US Physical Therapy Inc 50 0.01
1 US Silica Holdings Inc 57 0.01
– USA Truck Inc 3 –
2 USANA Health Sciences Inc 104 0.01
8 USG Corp 192 0.03
– Utah Medical Products Inc 16 –
2 Vail Resorts Inc 243 0.03
14 Valero Energy Corp 703 0.10
Shares (000's)
Value (000's)
GBP
% of Net Asset Value
Common Stock (continued)
United States – 50.74% (continued)
6 Validus Holdings Ltd 242 0.03
18 Valley National Bancorp 165 0.02
1 Valmont Industries Inc 150 0.02
1 Valspar Corp 96 0.01
3 Vantiv Inc 118 0.02
4 Varian Medical Systems Inc 285 0.04
2 VASCO Data Security International Inc 26 –
1 Vascular Solutions Inc 31 –
5 VCA Inc 272 0.04
5 Vector Group Ltd 91 0.01
4 Vectren Corp 140 0.02
1 Vectrus Inc 13 –
3 Veeco Instruments Inc 57 0.01
2 Veeva Systems Inc 59 0.01
3 Vera Bradley Inc 32 –
7 VeriFone Systems Inc 97 0.01
3 Verint Systems Inc 87 0.01
2 VeriSign Inc 97 0.01
2 Verisk Analytics Inc 162 0.02
1 Veritex Holdings Inc 10 –
1 Veritiv Corp 46 0.01
95 Verizon Communications Inc 3,800 0.51
2 Versartis Inc 16 –
2 Versum Materials Inc 38 –
– Vertex Pharmaceuticals Inc 27 –
3 VF Corp 133 0.02
2 Viacom Inc, Class A 67 0.01
8 Viacom Inc, Class B 235 0.03
1 Viad Corp 39 0.01
3 ViaSat Inc 148 0.02
15 Viavi Solutions Inc 96 0.01
2 Vicor Corp 20 –
1 Village Super Market Inc 17 –
3 Vince Holding Corp 11 –
1 Virtus Investment Partners Inc 49 0.01
1 Virtusa Corp 23 –
14 Visa Inc 866 0.12
9 Vishay Intertechnology Inc 109 0.01
4 Vista Outdoor Inc 129 0.02
2 Visteon Corp 144 0.02
2 Vitamin Shoppe Inc 34 –
1 VMware Inc 74 0.01
11 Vonage Holdings Corp 57 0.01
2 VOXX International Corp 9 –
6 Voya Financial Inc 186 0.02
1 VSE Corp 22 –
3 Vulcan Materials Co 323 0.04
7 VWR Corp 153 0.02
2 W&T Offshore Inc 3 –
5 Wabash National Corp 51 0.01
2 WABCO Holdings Inc 118 0.02
4 Wabtec Corp 244 0.03
2 Waddell & Reed Financial Inc 38 –
66 Wal–Mart Stores Inc 3,691 0.49
13 Walgreens Boots Alliance Inc 869 0.12
2 Walker & Dunlop Inc 57 0.01
33 Walt Disney Co 2,594 0.35
6 Washington Federal Inc 151 0.02
1 Washington Trust Bancorp Inc 50 0.01
1 WashingtonFirst Bankshares Inc 18 –
8 Waste Management Inc 434 0.06
1 Waters Corp 131 0.02
3 Waterstone Financial Inc 36 –

World Equity Fund
Portfolio of Investments as at 30 November 2016 (continued)
Dimensional Fund Advisors Annual Report and Audited Financial Statements, 30 November 2016 367
Shares (000's)
Value (000's)
GBP
% of Net Asset Value
Common Stock (continued)
United States – 50.74% (continued)
2 Watsco Inc 234 0.03
2 Watts Water Technologies Inc 95 0.01
2 WCI Communities Inc 29 –
1 WD–40 Co 58 0.01
26 Weatherford International PLC 107 0.01
4 Web.com Group Inc 45 0.01
1 WebMD Health Corp 41 0.01
6 Webster Financial Corp 246 0.03
3 WEC Energy Group Inc 130 0.02
1 Weight Watchers International Inc 9 –
2 Weis Markets Inc 75 0.01
3 WellCare Health Plans Inc 285 0.04
95 Wells Fargo & Co 4,004 0.53
22 Wendy's Co 217 0.03
5 Werner Enterprises Inc 99 0.01
3 WesBanco Inc 89 0.01
8 Wesco Aircraft Holdings Inc 90 0.01
3 WESCO International Inc 176 0.02
1 West Bancorporation Inc 14 –
4 West Corp 74 0.01
2 West Marine Inc 14 –
2 West Pharmaceutical Services Inc 119 0.02
1 Westamerica Bancorporation 47 0.01
2 Westar Energy Inc 92 0.01
7 Western Alliance Bancorp 266 0.03
8 Western Digital Corp 416 0.05
1 Western New England Bancorp Inc 9 –
7 Western Refining Inc 214 0.03
15 Western Union Co 252 0.03
9 Westlake Chemical Corp 444 0.06
7 WestRock Co 282 0.04
1 Westwood Holdings Group Inc 38 –
2 WEX Inc 183 0.02
1 Weyco Group Inc 11 –
2 WGL Holdings Inc 114 0.01
3 Whirlpool Corp 410 0.05
– White Mountains Insurance Group Ltd 248 0.03
2 WhiteWave Foods Co 90 0.01
19 Whiting Petroleum Corp 186 0.02
22 Whole Foods Market Inc 530 0.08
6 Willbros Group Inc 12 –
1 Willdan Group Inc 11 –
3 William Lyon Homes 42 0.01
3 Williams Cos Inc 82 0.01
3 Williams–Sonoma Inc 129 0.02
3 Willis Towers Watson PLC 269 0.04
7 Windstream Holdings Inc 40 0.01
1 Wingstop Inc 34 –
– Winmark Corp 18 –
2 Winnebago Industries Inc 47 0.01
4 Wintrust Financial Corp 190 0.02
5 WisdomTree Investments Inc 42 0.01
7 Wolverine World Wide Inc 120 0.02
3 Woodward Inc 186 0.02
1 Workday Inc 48 0.01
1 World Acceptance Corp 23 –
5 World Fuel Services Corp 174 0.02
3 World Wrestling Entertainment Inc 38 –
4 Worthington Industries Inc 159 0.02
23 WPX Energy Inc 292 0.04
6 WR Berkley Corp 314 0.04
2 WR Grace & Co 115 0.02
Shares (000's)
Value (000's)
GBP
% of Net Asset Value
Common Stock (continued)
United States – 50.74% (continued)
6 Wright Medical Group NV 109 0.01
2 WSFS Financial Corp 75 0.01
1 WW Grainger Inc 219 0.03
3 Wyndham Worldwide Corp 190 0.02
3 Wynn Resorts Ltd 219 0.03
3 Xcel Energy Inc 96 0.01
4 Xcerra Corp 18 –
2 Xencor Inc 37 –
11 Xenith Bankshares Inc 22 –
53 Xerox Corp 398 0.05
3 Xilinx Inc 114 0.01
6 XL Group Ltd 177 0.02
1 XO Group Inc 19 –
7 XPO Logistics Inc 263 0.03
6 Xylem Inc 230 0.03
3 Yadkin Financial Corp 85 0.01
8 Yahoo! Inc 255 0.03
– York Water Co 14 –
2 YRC Worldwide Inc 19 –
4 Yum China Holdings Inc 79 0.01
4 Yum! Brands Inc 179 0.03
5 YuMe Inc 14 –
2 ZAGG Inc 12 –
8 Zayo Group Holdings Inc 225 0.03
3 Zebra Technologies Corp 218 0.03
– Zedge Inc 1 –
2 Zillow Group Inc, Class A 68 0.01
6 Zillow Group Inc, Class C 166 0.02
2 Zimmer Biomet Holdings Inc 184 0.02
11 Zions Bancorporation 336 0.04
4 Zix Corp 13 –
5 Zoetis Inc 212 0.03
2 Zogenix Inc 21 –
2 Zumiez Inc 44 0.01
46 Zynga Inc 105 0.01
388,204 50.74
Total Common Stock – 96.38% (30 November 2015: 96.82%) 737,460 96.38
Preferred Stock
Brazil – 0.26%
7 Alpargatas SA 18 –
9 Banco ABC Brasil SA 28 –
33 Banco Bradesco SA 228 0.03
13 Banco do Estado do Rio Grande do Sul SA 34 –
3 Braskem SA 18 –
14 Centrais Eletricas Brasileiras SA 96 0.01
10 Cia Brasileira de Distribuicao 131 0.02
1 Cia de Gas de Sao Paulo – COMGAS 15 –
8 Cia de Saneamento do Parana 20 –
2 Cia de Transmissao de Energia Eletrica Paulista 31 –
34 Cia Energetica de Minas Gerais 64 0.01
11 Cia Energetica de Sao Paulo 32 –
4 Cia Paranaense de Energia 30 – 6
Eletropaulo Metropolitana Eletricidade de Sao Paulo SA 12 –
18 Gerdau SA 56 0.01
57 Itau Unibanco Holding SA 477 0.07
19 Lojas Americanas SA 75 0.01
39 Marcopolo SA 24 –
94 Petroleo Brasileiro SA 355 0.06
27 Randon SA Implementos e Participacoes 22 –
13 Suzano Papel e Celulose SA 40 0.01
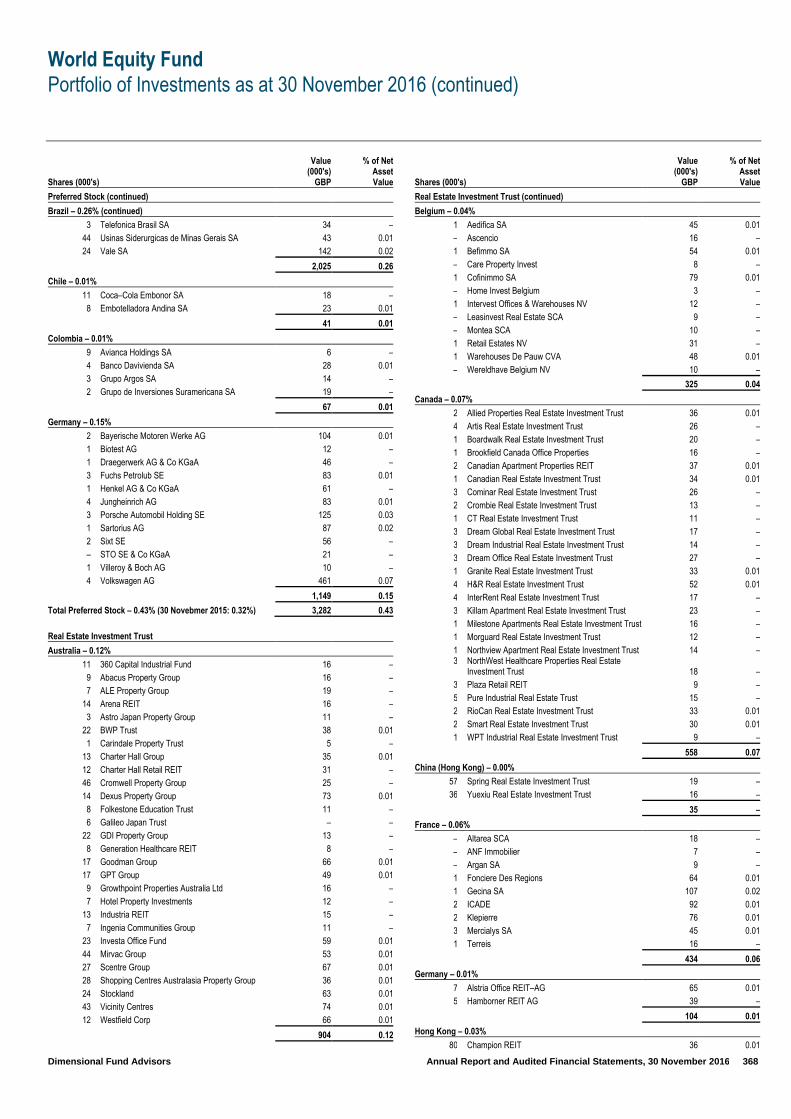
World Equity Fund
Portfolio of Investments as at 30 November 2016 (continued)
Dimensional Fund Advisors Annual Report and Audited Financial Statements, 30 November 2016 368
Shares (000's)
Value (000's)
GBP
% of Net Asset Value
Preferred Stock (continued)
Brazil – 0.26% (continued)
3 Telefonica Brasil SA 34 –
44 Usinas Siderurgicas de Minas Gerais SA 43 0.01
24 Vale SA 142 0.02
2,025 0.26
Chile – 0.01%
11 Coca–Cola Embonor SA 18 –
8 Embotelladora Andina SA 23 0.01
41 0.01
Colombia – 0.01%
9 Avianca Holdings SA 6 –
4 Banco Davivienda SA 28 0.01
3 Grupo Argos SA 14 –
2 Grupo de Inversiones Suramericana SA 19 –
67 0.01
Germany – 0.15%
2 Bayerische Motoren Werke AG 104 0.01
1 Biotest AG 12 –
1 Draegerwerk AG & Co KGaA 46 –
3 Fuchs Petrolub SE 83 0.01
1 Henkel AG & Co KGaA 61 –
4 Jungheinrich AG 83 0.01
3 Porsche Automobil Holding SE 125 0.03
1 Sartorius AG 87 0.02
2 Sixt SE 56 –
– STO SE & Co KGaA 21 –
1 Villeroy & Boch AG 10 –
4 Volkswagen AG 461 0.07
1,149 0.15
Total Preferred Stock – 0.43% (30 Novebmer 2015: 0.32%) 3,282 0.43
Real Estate Investment Trust
Australia – 0.12%
11 360 Capital Industrial Fund 16 –
9 Abacus Property Group 16 –
7 ALE Property Group 19 –
14 Arena REIT 16 –
3 Astro Japan Property Group 11 –
22 BWP Trust 38 0.01
1 Carindale Property Trust 5 –
13 Charter Hall Group 35 0.01
12 Charter Hall Retail REIT 31 –
46 Cromwell Property Group 25 –
14 Dexus Property Group 73 0.01
8 Folkestone Education Trust 11 –
6 Galileo Japan Trust – –
22 GDI Property Group 13 –
8 Generation Healthcare REIT 8 –
17 Goodman Group 66 0.01
17 GPT Group 49 0.01
9 Growthpoint Properties Australia Ltd 16 –
7 Hotel Property Investments 12 –
13 Industria REIT 15 –
7 Ingenia Communities Group 11 –
23 Investa Office Fund 59 0.01
44 Mirvac Group 53 0.01
27 Scentre Group 67 0.01
28 Shopping Centres Australasia Property Group 36 0.01
24 Stockland 63 0.01
43 Vicinity Centres 74 0.01
12 Westfield Corp 66 0.01
904 0.12
Shares (000's)
Value (000's)
GBP
% of Net Asset Value
Real Estate Investment Trust (continued)
Belgium – 0.04%
1 Aedifica SA 45 0.01
– Ascencio 16 –
1 Befimmo SA 54 0.01
– Care Property Invest 8 –
1 Cofinimmo SA 79 0.01
– Home Invest Belgium 3 –
1 Intervest Offices & Warehouses NV 12 –
– Leasinvest Real Estate SCA 9 –
– Montea SCA 10 –
1 Retail Estates NV 31 –
1 Warehouses De Pauw CVA 48 0.01
– Wereldhave Belgium NV 10 –
325 0.04
Canada – 0.07%
2 Allied Properties Real Estate Investment Trust 36 0.01
4 Artis Real Estate Investment Trust 26 –
1 Boardwalk Real Estate Investment Trust 20 –
1 Brookfield Canada Office Properties 16 –
2 Canadian Apartment Properties REIT 37 0.01
1 Canadian Real Estate Investment Trust 34 0.01
3 Cominar Real Estate Investment Trust 26 –
2 Crombie Real Estate Investment Trust 13 –
1 CT Real Estate Investment Trust 11 –
3 Dream Global Real Estate Investment Trust 17 –
3 Dream Industrial Real Estate Investment Trust 14 –
3 Dream Office Real Estate Investment Trust 27 –
1 Granite Real Estate Investment Trust 33 0.01
4 H&R Real Estate Investment Trust 52 0.01
4 InterRent Real Estate Investment Trust 17 –
3 Killam Apartment Real Estate Investment Trust 23 –
1 Milestone Apartments Real Estate Investment Trust 16 –
1 Morguard Real Estate Investment Trust 12 –
1 Northview Apartment Real Estate Investment Trust 14 – 3
NorthWest Healthcare Properties Real Estate Investment Trust 18 –
3 Plaza Retail REIT 9 –
5 Pure Industrial Real Estate Trust 15 –
2 RioCan Real Estate Investment Trust 33 0.01
2 Smart Real Estate Investment Trust 30 0.01
1 WPT Industrial Real Estate Investment Trust 9 –
558 0.07
China (Hong Kong) – 0.00%
57 Spring Real Estate Investment Trust 19 –
36 Yuexiu Real Estate Investment Trust 16 –
35 –
France – 0.06%
– Altarea SCA 18 –
– ANF Immobilier 7 –
– Argan SA 9 –
1 Fonciere Des Regions 64 0.01
1 Gecina SA 107 0.02
2 ICADE 92 0.01
2 Klepierre 76 0.01
3 Mercialys SA 45 0.01
1 Terreis 16 –
434 0.06
Germany – 0.01%
7 Alstria Office REIT–AG 65 0.01
5 Hamborner REIT AG 39 –
104 0.01
Hong Kong – 0.03%
80 Champion REIT 36 0.01

World Equity Fund
Portfolio of Investments as at 30 November 2016 (continued)
Dimensional Fund Advisors Annual Report and Audited Financial Statements, 30 November 2016 369
Shares (000's)
Value (000's)
GBP
% of Net Asset Value
Real Estate Investment Trust (continued)
Hong Kong – 0.03% (continued)
46 Fortune Real Estate Investment Trust 43 0.01
18 Link REIT 103 0.01
81 Prosperity REIT 26 –
42 Regal Real Estate Investment Trust 9 –
59 Sunlight Real Estate Investment Trust 29 –
246 0.03
Ireland – 0.00%
31 Hibernia REIT PLC 31 –
31 –
Israel – 0.00%
3 Summit Real Estate Holdings Ltd 16 –
16 –
Italy – 0.01%
62 Beni Stabili SpA SIIQ 27 0.01
21 Immobiliare Grande Distribuzione SIIQ SpA 11 –
38 0.01
Japan – 0.22%
– Activia Properties Inc 56 0.01
– Advance Residence Investment Corp 46 0.01
– AEON REIT Investment Corp 31 –
– Comforia Residential REIT Inc 34 –
– Daiwa House Residential Investment Corp 48 0.01
– Daiwa Office Investment Corp 28 –
– Frontier Real Estate Investment Corp 53 0.01
– Fukuoka REIT Corp 36 –
– Global One Real Estate Investment Corp 30 –
– GLP J–Reit 41 0.01
– Hankyu Reit Inc 21 –
– Heiwa Real Estate REIT Inc 28 –
– Hoshino Resorts REIT Inc 34 –
– Ichigo Office REIT Investment 34 –
– Industrial & Infrastructure Fund Investment Corp 52 0.01
1 Invincible Investment Corp 42 0.01
– Japan Excellent Inc 47 0.01
– Japan Hotel REIT Investment Corp 56 0.01
– Japan Logistics Fund Inc 54 0.01
– Japan Prime Realty Investment Corp 49 0.01
– Japan Real Estate Investment Corp 48 0.01
– Japan Rental Housing Investments Inc 34 –
– Japan Retail Fund Investment Corp 34 –
– Kenedix Office Investment Corp 64 0.01
– Kenedix Residential Investment Corp 27 –
– Kenedix Retail REIT Corp 31 –
– MCUBS MidCity Investment Corp 29 –
– Mori Hills REIT Investment Corp 40 0.01
– Mori Trust Sogo Reit Inc 42 0.01
– Nippon Accommodations Fund Inc 56 0.01
– Nippon Building Fund Inc 45 0.01
– Nippon Prologis REIT Inc 18 –
– Nippon REIT Investment Corp 25 –
– Nomura Real Estate Master Fund Inc 62 0.01
– Orix JREIT Inc 38 0.01
– Premier Investment Corp 44 0.01
– Sekisui House REIT Inc 34 –
– Sekisui House SI Residential Investment Corp 30 –
– SIA Reit Inc 13 –
– Starts Proceed Investment Corp 16 –
– Tokyu REIT Inc 38 0.01
– United Urban Investment Corp 54 0.01
1,642 0.22
Malaysia – 0.01%
56 Axis Real Estate Investment Trust 17 –
Shares (000's)
Value (000's)
GBP
% of Net Asset Value
Real Estate Investment Trust (continued)
Malaysia – 0.01% (continued)
52 Capitaland Malaysia Mall Trust 14 –
68 IGB Real Estate Investment Trust 20 0.01
12 KLCCP Stapled Group 16 –
45 Pavilion Real Estate Investment Trust 15 –
62 Sunway Real Estate Investment Trust 19 –
101 0.01
Mexico – 0.03%
11 Asesor de Activos Prisma SAPI de CV 5 –
26 Concentradora Fibra Danhos SA de CV 33 0.01
19 Concentradora Fibra Hotelera Mexicana SA de CV 11 –
17 Fibra Shop Portafolios Inmobiliarios SAPI de CV 9 –
64 Fibra Uno Administracion SA de CV 78 0.01 43
Macquarie Mexico Real Estate Management SA de CV 35 0.01
28 PLA Administradora Industrial S de RL de CV 31 –
202 0.03
Netherlands – 0.05%
2 Eurocommercial Properties NV 74 0.01
6 NSI NV 18 –
1 Unibail–Rodamco SE 162 0.02
1 Vastned Retail NV 27 0.01
2 Wereldhave NV 67 0.01
348 0.05
New Zealand – 0.01%
46 Goodman Property Trust 33 0.01
11 Stride Property Group 11 –
25 Vital Healthcare Property Trust 29 –
73 0.01
Singapore – 0.11%
25 AIMS AMP Capital Industrial REIT 18 –
28 Ascendas Hospitality Trust 11 –
30 Ascendas Real Estate Investment Trust 40 0.01
48 Ascott Residence Trust 31 0.01
50 Cache Logistics Trust 23 –
35 Cambridge Industrial Trust 11 –
73 CapitaLand Commercial Trust 62 0.01
25 CapitaLand Mall Trust 27 –
37 CapitaLand Retail China Trust 29 0.01
30 CDL Hospitality Trusts 22 –
57 Far East Hospitality Trust 19 –
26 First Real Estate Investment Trust 18 –
31 Frasers Centrepoint Trust 33 0.01
41 Frasers Commercial Trust 29 0.01
40 Frasers Hospitality Trust 14 –
27 Keppel DC REIT 18 –
74 Keppel REIT 43 0.01
75 Lippo Malls Indonesia Retail Trust 16 –
53 Mapletree Commercial Trust 43 0.01
79 Mapletree Greater China Commercial Trust 42 0.01
53 Mapletree Industrial Trust 47 0.01
47 Mapletree Logistics Trust 27 –
48 OUE Hospitality Trust 17 –
18 Parkway Life Real Estate Investment Trust 25 – 17
Sabana Shari'ah Compliant Industrial Real Estate Investment Trust 5 –
43 Soilbuild Business Space REIT 15 –
35 SPH REIT 19 –
61 Starhill Global REIT 26 –
83 Suntec Real Estate Investment Trust 78 0.01
808 0.11
South Africa – 0.05%
31 Delta Property Fund Ltd 13 –
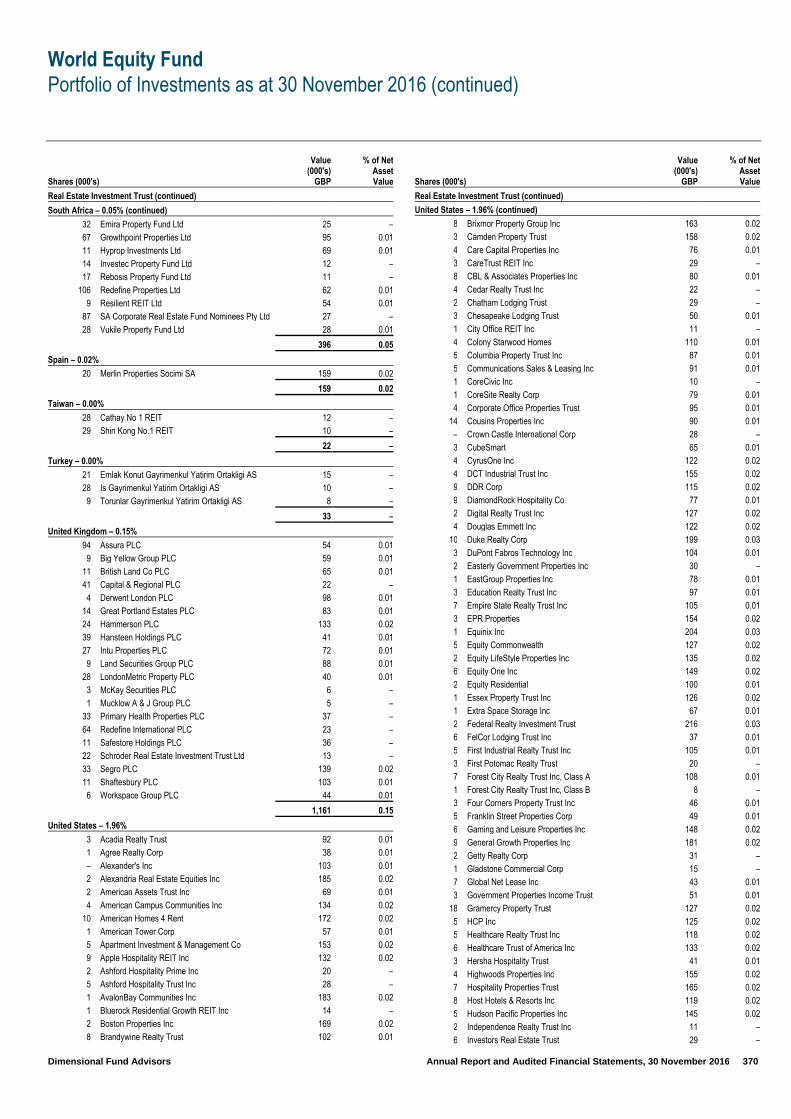
World Equity Fund
Portfolio of Investments as at 30 November 2016 (continued)
Dimensional Fund Advisors Annual Report and Audited Financial Statements, 30 November 2016 370
Shares (000's)
Value (000's)
GBP
% of Net Asset Value
Real Estate Investment Trust (continued)
South Africa – 0.05% (continued)
32 Emira Property Fund Ltd 25 –
67 Growthpoint Properties Ltd 95 0.01
11 Hyprop Investments Ltd 69 0.01
14 Investec Property Fund Ltd 12 –
17 Rebosis Property Fund Ltd 11 –
106 Redefine Properties Ltd 62 0.01
9 Resilient REIT Ltd 54 0.01
87 SA Corporate Real Estate Fund Nominees Pty Ltd 27 –
28 Vukile Property Fund Ltd 28 0.01
396 0.05
Spain – 0.02%
20 Merlin Properties Socimi SA 159 0.02
159 0.02
Taiwan – 0.00%
28 Cathay No 1 REIT 12 –
29 Shin Kong No.1 REIT 10 –
22 –
Turkey – 0.00%
21 Emlak Konut Gayrimenkul Yatirim Ortakligi AS 15 –
28 Is Gayrimenkul Yatirim Ortakligi AS 10 –
9 Torunlar Gayrimenkul Yatirim Ortakligi AS 8 –
33 –
United Kingdom – 0.15%
94 Assura PLC 54 0.01
9 Big Yellow Group PLC 59 0.01
11 British Land Co PLC 65 0.01
41 Capital & Regional PLC 22 –
4 Derwent London PLC 98 0.01
14 Great Portland Estates PLC 83 0.01
24 Hammerson PLC 133 0.02
39 Hansteen Holdings PLC 41 0.01
27 Intu Properties PLC 72 0.01
9 Land Securities Group PLC 88 0.01
28 LondonMetric Property PLC 40 0.01
3 McKay Securities PLC 6 –
1 Mucklow A & J Group PLC 5 –
33 Primary Health Properties PLC 37 –
64 Redefine International PLC 23 –
11 Safestore Holdings PLC 36 –
22 Schroder Real Estate Investment Trust Ltd 13 –
33 Segro PLC 139 0.02
11 Shaftesbury PLC 103 0.01
6 Workspace Group PLC 44 0.01
1,161 0.15
United States – 1.96%
3 Acadia Realty Trust 92 0.01
1 Agree Realty Corp 38 0.01
– Alexander's Inc 103 0.01
2 Alexandria Real Estate Equities Inc 185 0.02
2 American Assets Trust Inc 69 0.01
4 American Campus Communities Inc 134 0.02
10 American Homes 4 Rent 172 0.02
1 American Tower Corp 57 0.01
5 Apartment Investment & Management Co 153 0.02
9 Apple Hospitality REIT Inc 132 0.02
2 Ashford Hospitality Prime Inc 20 –
5 Ashford Hospitality Trust Inc 28 –
1 AvalonBay Communities Inc 183 0.02
1 Bluerock Residential Growth REIT Inc 14 –
2 Boston Properties Inc 169 0.02
8 Brandywine Realty Trust 102 0.01
Shares (000's)
Value (000's)
GBP
% of Net Asset Value
Real Estate Investment Trust (continued)
United States – 1.96% (continued)
8 Brixmor Property Group Inc 163 0.02
3 Camden Property Trust 158 0.02
4 Care Capital Properties Inc 76 0.01
3 CareTrust REIT Inc 29 –
8 CBL & Associates Properties Inc 80 0.01
4 Cedar Realty Trust Inc 22 –
2 Chatham Lodging Trust 29 –
3 Chesapeake Lodging Trust 50 0.01
1 City Office REIT Inc 11 –
4 Colony Starwood Homes 110 0.01
5 Columbia Property Trust Inc 87 0.01
5 Communications Sales & Leasing Inc 91 0.01
1 CoreCivic Inc 10 –
1 CoreSite Realty Corp 79 0.01
4 Corporate Office Properties Trust 95 0.01
14 Cousins Properties Inc 90 0.01
– Crown Castle International Corp 28 –
3 CubeSmart 65 0.01
4 CyrusOne Inc 122 0.02
4 DCT Industrial Trust Inc 155 0.02
9 DDR Corp 115 0.02
9 DiamondRock Hospitality Co 77 0.01
2 Digital Realty Trust Inc 127 0.02
4 Douglas Emmett Inc 122 0.02
10 Duke Realty Corp 199 0.03
3 DuPont Fabros Technology Inc 104 0.01
2 Easterly Government Properties Inc 30 –
1 EastGroup Properties Inc 78 0.01
3 Education Realty Trust Inc 97 0.01
7 Empire State Realty Trust Inc 105 0.01
3 EPR Properties 154 0.02
1 Equinix Inc 204 0.03
5 Equity Commonwealth 127 0.02
2 Equity LifeStyle Properties Inc 135 0.02
6 Equity One Inc 149 0.02
2 Equity Residential 100 0.01
1 Essex Property Trust Inc 126 0.02
1 Extra Space Storage Inc 67 0.01
2 Federal Realty Investment Trust 216 0.03
6 FelCor Lodging Trust Inc 37 0.01
5 First Industrial Realty Trust Inc 105 0.01
3 First Potomac Realty Trust 20 –
7 Forest City Realty Trust Inc, Class A 108 0.01
1 Forest City Realty Trust Inc, Class B 8 –
3 Four Corners Property Trust Inc 46 0.01
5 Franklin Street Properties Corp 49 0.01
6 Gaming and Leisure Properties Inc 148 0.02
9 General Growth Properties Inc 181 0.02
2 Getty Realty Corp 31 –
1 Gladstone Commercial Corp 15 –
7 Global Net Lease Inc 43 0.01
3 Government Properties Income Trust 51 0.01
18 Gramercy Property Trust 127 0.02
5 HCP Inc 125 0.02
5 Healthcare Realty Trust Inc 118 0.02
6 Healthcare Trust of America Inc 133 0.02
3 Hersha Hospitality Trust 41 0.01
4 Highwoods Properties Inc 155 0.02
7 Hospitality Properties Trust 165 0.02
8 Host Hotels & Resorts Inc 119 0.02
5 Hudson Pacific Properties Inc 145 0.02
2 Independence Realty Trust Inc 11 –
6 Investors Real Estate Trust 29 –
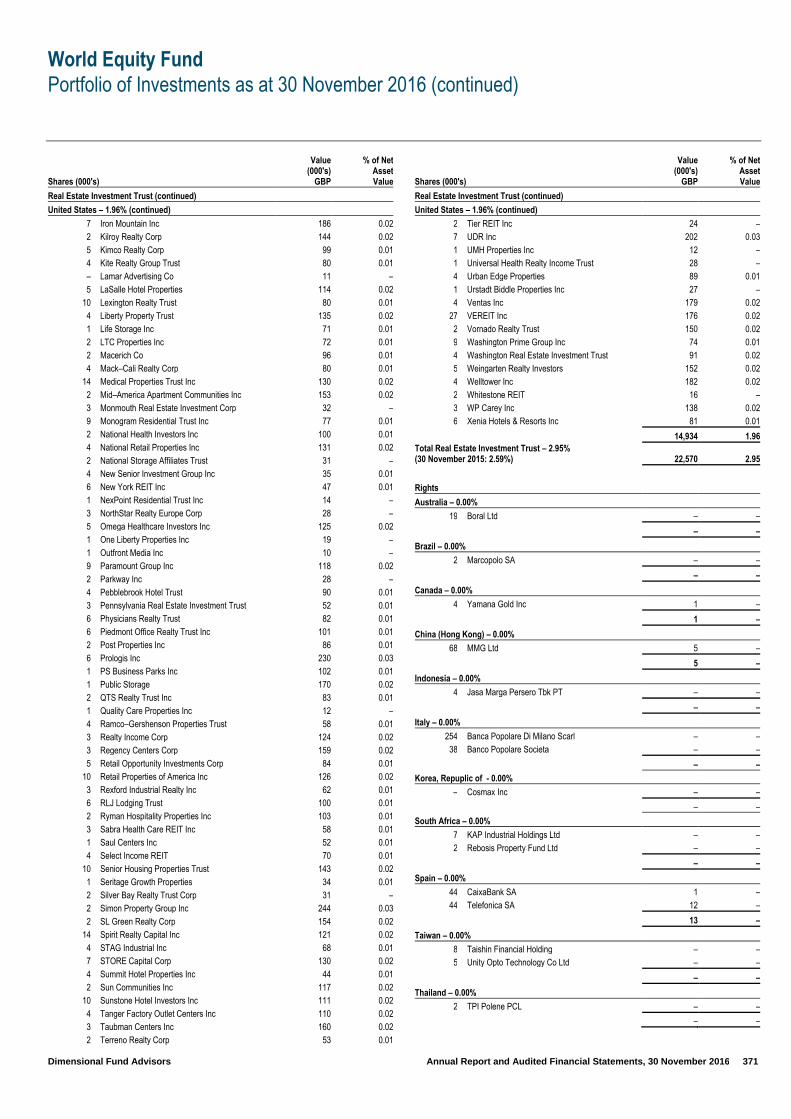
World Equity Fund
Portfolio of Investments as at 30 November 2016 (continued)
Dimensional Fund Advisors Annual Report and Audited Financial Statements, 30 November 2016 371
Shares (000's)
Value (000's)
GBP
% of Net Asset Value
Real Estate Investment Trust (continued)
United States – 1.96% (continued)
7 Iron Mountain Inc 186 0.02
2 Kilroy Realty Corp 144 0.02
5 Kimco Realty Corp 99 0.01
4 Kite Realty Group Trust 80 0.01
– Lamar Advertising Co 11 –
5 LaSalle Hotel Properties 114 0.02
10 Lexington Realty Trust 80 0.01
4 Liberty Property Trust 135 0.02
1 Life Storage Inc 71 0.01
2 LTC Properties Inc 72 0.01
2 Macerich Co 96 0.01
4 Mack–Cali Realty Corp 80 0.01
14 Medical Properties Trust Inc 130 0.02
2 Mid–America Apartment Communities Inc 153 0.02
3 Monmouth Real Estate Investment Corp 32 –
9 Monogram Residential Trust Inc 77 0.01
2 National Health Investors Inc 100 0.01
4 National Retail Properties Inc 131 0.02
2 National Storage Affiliates Trust 31 –
4 New Senior Investment Group Inc 35 0.01
6 New York REIT Inc 47 0.01
1 NexPoint Residential Trust Inc 14 –
3 NorthStar Realty Europe Corp 28 –
5 Omega Healthcare Investors Inc 125 0.02
1 One Liberty Properties Inc 19 –
1 Outfront Media Inc 10 –
9 Paramount Group Inc 118 0.02
2 Parkway Inc 28 –
4 Pebblebrook Hotel Trust 90 0.01
3 Pennsylvania Real Estate Investment Trust 52 0.01
6 Physicians Realty Trust 82 0.01
6 Piedmont Office Realty Trust Inc 101 0.01
2 Post Properties Inc 86 0.01
6 Prologis Inc 230 0.03
1 PS Business Parks Inc 102 0.01
1 Public Storage 170 0.02
2 QTS Realty Trust Inc 83 0.01
1 Quality Care Properties Inc 12 –
4 Ramco–Gershenson Properties Trust 58 0.01
3 Realty Income Corp 124 0.02
3 Regency Centers Corp 159 0.02
5 Retail Opportunity Investments Corp 84 0.01
10 Retail Properties of America Inc 126 0.02
3 Rexford Industrial Realty Inc 62 0.01
6 RLJ Lodging Trust 100 0.01
2 Ryman Hospitality Properties Inc 103 0.01
3 Sabra Health Care REIT Inc 58 0.01
1 Saul Centers Inc 52 0.01
4 Select Income REIT 70 0.01
10 Senior Housing Properties Trust 143 0.02
1 Seritage Growth Properties 34 0.01
2 Silver Bay Realty Trust Corp 31 –
2 Simon Property Group Inc 244 0.03
2 SL Green Realty Corp 154 0.02
14 Spirit Realty Capital Inc 121 0.02
4 STAG Industrial Inc 68 0.01
7 STORE Capital Corp 130 0.02
4 Summit Hotel Properties Inc 44 0.01
2 Sun Communities Inc 117 0.02
10 Sunstone Hotel Investors Inc 111 0.02
4 Tanger Factory Outlet Centers Inc 110 0.02
3 Taubman Centers Inc 160 0.02
2 Terreno Realty Corp 53 0.01
Shares (000's)
Value (000's)
GBP
% of Net Asset Value
Real Estate Investment Trust (continued)
United States – 1.96% (continued)
2 Tier REIT Inc 24 –
7 UDR Inc 202 0.03
1 UMH Properties Inc 12 –
1 Universal Health Realty Income Trust 28 –
4 Urban Edge Properties 89 0.01
1 Urstadt Biddle Properties Inc 27 –
4 Ventas Inc 179 0.02
27 VEREIT Inc 176 0.02
2 Vornado Realty Trust 150 0.02
9 Washington Prime Group Inc 74 0.01
4 Washington Real Estate Investment Trust 91 0.02
5 Weingarten Realty Investors 152 0.02
4 Welltower Inc 182 0.02
2 Whitestone REIT 16 –
3 WP Carey Inc 138 0.02
6 Xenia Hotels & Resorts Inc 81 0.01
14,934 1.96 Total Real Estate Investment Trust – 2.95% (30 November 2015: 2.59%) 22,570 2.95
Rights
Australia – 0.00%
19 Boral Ltd – –
– –
Brazil – 0.00%
2 Marcopolo SA – –
– –
Canada – 0.00%
4 Yamana Gold Inc 1 –
1 –
China (Hong Kong) – 0.00%
68 MMG Ltd 5 –
5 –
Indonesia – 0.00%
4 Jasa Marga Persero Tbk PT – –
– –
Italy – 0.00%
254 Banca Popolare Di Milano Scarl – –
38 Banco Popolare Societa – –
– –
Korea, Repuplic of - 0.00%
– Cosmax Inc – –
– –
South Africa – 0.00%
7 KAP Industrial Holdings Ltd – –
2 Rebosis Property Fund Ltd – –
– –
Spain – 0.00%
44 CaixaBank SA 1 –
44 Telefonica SA 12 –
13 –
Taiwan – 0.00%
8 Taishin Financial Holding – –
5 Unity Opto Technology Co Ltd – –
– –
Thailand – 0.00%
2 TPI Polene PCL – –
– –
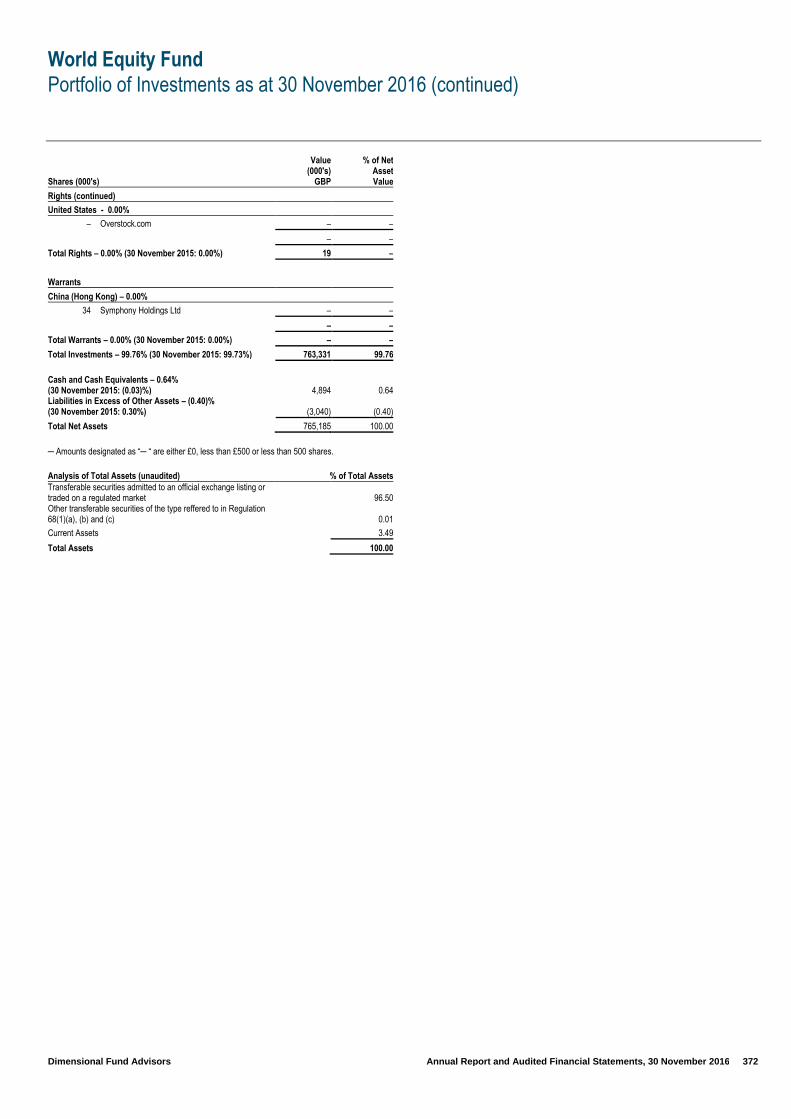
World Equity Fund
Portfolio of Investments as at 30 November 2016 (continued)
Dimensional Fund Advisors Annual Report and Audited Financial Statements, 30 November 2016 372
Shares (000's)
Value (000's)
GBP
% of Net Asset Value
Rights (continued)
United States - 0.00%
– Overstock.com – –
– –
Total Rights – 0.00% (30 November 2015: 0.00%) 19 –
Warrants
China (Hong Kong) – 0.00%
34 Symphony Holdings Ltd – –
– –
Total Warrants – 0.00% (30 November 2015: 0.00%) – –
Total Investments – 99.76% (30 November 2015: 99.73%) 763,331 99.76
Cash and Cash Equivalents – 0.64% (30 November 2015: (0.03)%) 4,894 0.64 Liabilities in Excess of Other Assets – (0.40)% (30 November 2015: 0.30%) (3,040) (0.40)
Total Net Assets 765,185 100.00
– Amounts designated as “– “ are either £0, less than £500 or less than 500 shares.
Analysis of Total Assets (unaudited) % of Total Assets Transferable securities admitted to an official exchange listing or traded on a regulated market 96.50 Other transferable securities of the type reffered to in Regulation 68(1)(a), (b) and (c) 0.01
Current Assets 3.49
Total Assets 100.00
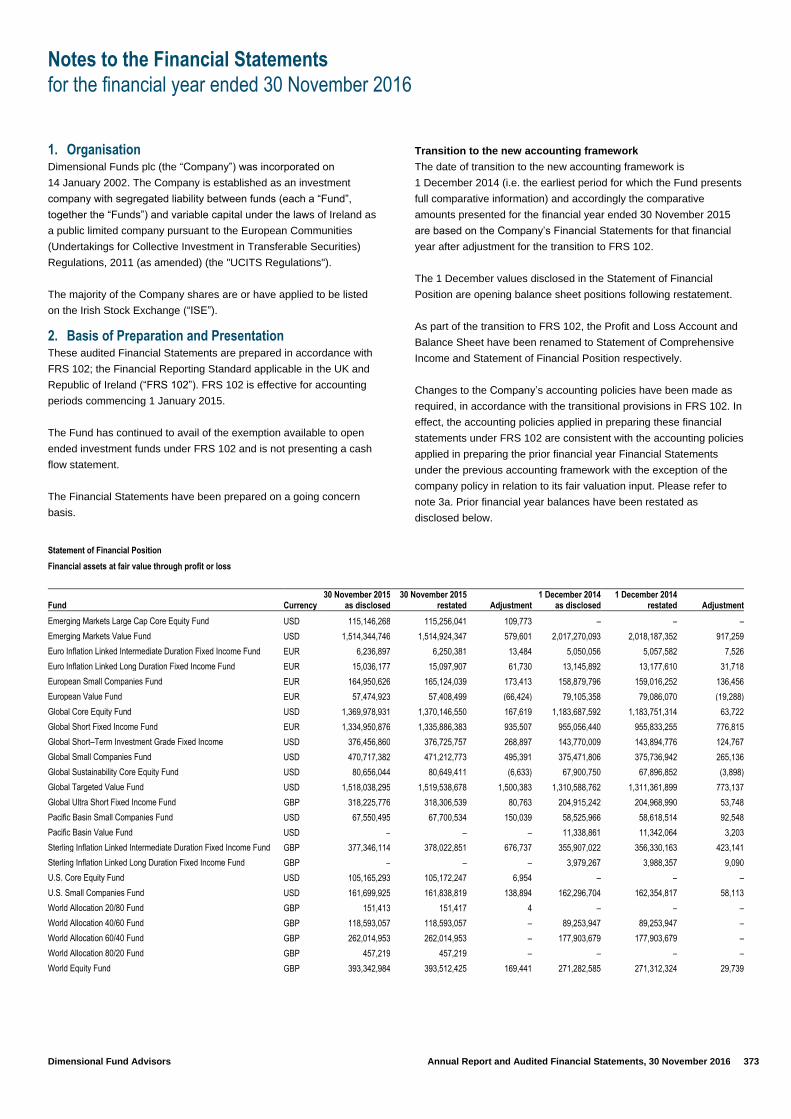
Notes to the Financial Statements
for the financial year ended 30 November 2016
Dimensional Fund Advisors Annual Report and Audited Financial Statements, 30 November 2016 373
1. Organisation Dimensional Funds plc (the “Company”) was incorporated on
14 January 2002. The Company is established as an investment
company with segregated liability between funds (each a “Fund”,
together the “Funds”) and variable capital under the laws of Ireland as
a public limited company pursuant to the European Communities
(Undertakings for Collective Investment in Transferable Securities)
Regulations, 2011 (as amended) (the "UCITS Regulations").
The majority of the Company shares are or have applied to be listed
on the Irish Stock Exchange (“ISE”).
2. Basis of Preparation and Presentation These audited Financial Statements are prepared in accordance with
FRS 102; the Financial Reporting Standard applicable in the UK and
Republic of Ireland (“FRS 102”). FRS 102 is effective for accounting
periods commencing 1 January 2015.
The Fund has continued to avail of the exemption available to open
ended investment funds under FRS 102 and is not presenting a cash
flow statement.
The Financial Statements have been prepared on a going concern
basis.
Transition to the new accounting framework
The date of transition to the new accounting framework is
1 December 2014 (i.e. the earliest period for which the Fund presents
full comparative information) and accordingly the comparative
amounts presented for the financial year ended 30 November 2015
are based on the Company’s Financial Statements for that financial
year after adjustment for the transition to FRS 102.
The 1 December values disclosed in the Statement of Financial
Position are opening balance sheet positions following restatement.
As part of the transition to FRS 102, the Profit and Loss Account and
Balance Sheet have been renamed to Statement of Comprehensive
Income and Statement of Financial Position respectively.
Changes to the Company’s accounting policies have been made as
required, in accordance with the transitional provisions in FRS 102. In
effect, the accounting policies applied in preparing these financial
statements under FRS 102 are consistent with the accounting policies
applied in preparing the prior financial year Financial Statements
under the previous accounting framework with the exception of the
company policy in relation to its fair valuation input. Please refer to
note 3a. Prior financial year balances have been restated as
disclosed below.
Statement of Financial Position
Financial assets at fair value through profit or loss
Fund Currency 30 November 2015
as disclosed 30 November 2015
restated Adjustment 1 December 2014
as disclosed 1 December 2014
restated Adjustment
Emerging Markets Large Cap Core Equity Fund USD 115,146,268 115,256,041 109,773 – – –
Emerging Markets Value Fund USD 1,514,344,746 1,514,924,347 579,601 2,017,270,093 2,018,187,352 917,259
Euro Inflation Linked Intermediate Duration Fixed Income Fund EUR 6,236,897 6,250,381 13,484 5,050,056 5,057,582 7,526
Euro Inflation Linked Long Duration Fixed Income Fund EUR 15,036,177 15,097,907 61,730 13,145,892 13,177,610 31,718
European Small Companies Fund EUR 164,950,626 165,124,039 173,413 158,879,796 159,016,252 136,456
European Value Fund EUR 57,474,923 57,408,499 (66,424) 79,105,358 79,086,070 (19,288)
Global Core Equity Fund USD 1,369,978,931 1,370,146,550 167,619 1,183,687,592 1,183,751,314 63,722
Global Short Fixed Income Fund EUR 1,334,950,876 1,335,886,383 935,507 955,056,440 955,833,255 776,815
Global Short–Term Investment Grade Fixed Income USD 376,456,860 376,725,757 268,897 143,770,009 143,894,776 124,767
Global Small Companies Fund USD 470,717,382 471,212,773 495,391 375,471,806 375,736,942 265,136
Global Sustainability Core Equity Fund USD 80,656,044 80,649,411 (6,633) 67,900,750 67,896,852 (3,898)
Global Targeted Value Fund USD 1,518,038,295 1,519,538,678 1,500,383 1,310,588,762 1,311,361,899 773,137
Global Ultra Short Fixed Income Fund GBP 318,225,776 318,306,539 80,763 204,915,242 204,968,990 53,748
Pacific Basin Small Companies Fund USD 67,550,495 67,700,534 150,039 58,525,966 58,618,514 92,548
Pacific Basin Value Fund USD – – – 11,338,861 11,342,064 3,203
Sterling Inflation Linked Intermediate Duration Fixed Income Fund GBP 377,346,114 378,022,851 676,737 355,907,022 356,330,163 423,141
Sterling Inflation Linked Long Duration Fixed Income Fund GBP – – – 3,979,267 3,988,357 9,090
U.S. Core Equity Fund USD 105,165,293 105,172,247 6,954 – – –
U.S. Small Companies Fund USD 161,699,925 161,838,819 138,894 162,296,704 162,354,817 58,113
World Allocation 20/80 Fund GBP 151,413 151,417 4 – – –
World Allocation 40/60 Fund GBP 118,593,057 118,593,057 – 89,253,947 89,253,947 –
World Allocation 60/40 Fund GBP 262,014,953 262,014,953 – 177,903,679 177,903,679 –
World Allocation 80/20 Fund GBP 457,219 457,219 – – – –
World Equity Fund GBP 393,342,984 393,512,425 169,441 271,282,585 271,312,324 29,739

Notes to the Financial Statements
for the financial year ended 30 November 2016 (continued)
Dimensional Fund Advisors Annual Report and Audited Financial Statements, 30 November 2016 374
2. Basis of Preparation and Presentation (continued) Statement of Comprehensive Income
Net gain/(loss) on financial assets at fair value through profit or loss
Fund Currency
Financial year ended 30 November 2015
as disclosed
Financial year ended 30 November 2015
restated Adjustment
Emerging Markets Large Cap Core Equity Fund USD (36,957,942) (36,848,169) 109,773
Emerging Markets Value Fund USD (433,451,905) (433,789,563) (337,658)
Euro Inflation Linked Intermediate Duration Fixed Income Fund EUR 253,875 259,833 5,958
Euro Inflation Linked Long Duration Fixed Income Fund EUR 781,633 811,645 30,012
European Small Companies Fund EUR 33,748,537 33,785,494 36,957
European Value Fund EUR 933,790 886,654 (47,136)
Global Core Equity Fund USD (33,039,845) (32,935,948) 103,897
Global Short Fixed Income Fund EUR 52,865,821 53,024,513 158,692
Global Short–Term Investment Grade Fixed Income USD (21,940,902) (21,796,772) 144,130
Global Small Companies Fund USD 3,352,105 3,582,360 230,255
Global Sustainability Core Equity Fund USD (1,571,512) (1,574,247) (2,735)
Global Targeted Value Fund USD (23,684,118) (22,956,872) 727,246
Global Ultra Short Fixed Income Fund GBP (3,758,510) (3,731,495) 27,015
Pacific Basin Small Companies Fund USD 1,911,292 1,968,783 57,491
Pacific Basin Value Fund USD 169,758 166,555 (3,203)
Sterling Inflation Linked Intermediate Duration Fixed Income Fund GBP (6,774,542) (6,520,946) 253,596
Sterling Inflation Linked Long Duration Fixed Income Fund GBP (136,361) (145,451) (9,090)
U.S. Core Equity Fund USD (2,650,720) (2,643,766) 6,954
U.S. Small Companies Fund USD 5,597,029 5,677,810 80,781
World Allocation 20/80 Fund GBP (40) (36) 4
World Allocation 40/60 Fund GBP 21,883 21,883 –
World Allocation 60/40 Fund GBP (126,069) (126,069) –
World Allocation 80/20 Fund GBP 4,130 4,130 –
World Equity Fund GBP (3,870,746) (3,731,044) 139,702
On initial application of FRS 102, in accounting for its financial
instruments a reporting entity is required to apply either a) the full
requirements of FRS 102 relating to “Basic Financial Instruments”
and Other Financial Instruments Issues, b) the recognition and
measurement provisions of IAS 39 Financial Instruments: Recognition
and Measurement and only the disclosure requirements of FRS 102
relating to “Basic Financial Instruments” and “Other Financial”
Instruments, or c) the recognition and measurement provisions of
IFRS 9 Financial Instruments and only the disclosure requirements of
FRS 102 relating to “Basic Financial Instruments” and “Other
Financial Instruments”. The Company has chosen to implement the
recognition and measurement provisions of IAS 39 Financial
Instruments: Recognition and only the disclosure requirements of
FRS 102 relating to “Basic Financial Instruments” and “Other
Financial Instruments”.
3. Significant Accounting Policies These Financial Statements are the first set of Financial Statements
prepared under the new accounting framework FRS 102. However as
mentioned in the transition section, the accounting polices applied in
preparing these Financial Statements are consistent with the
accounting policies in preparing the prior annual Financial
Statements, with the exception of the Company implementing the
recognition and measurement provisions of IAS 39 Financial
Instruments: Recognition and Measurement.
The Company changed its fair valuation input to utilise last traded
market price for financial assets. Where the last traded price is not
within the bid ask spread, management will determine the point within
the bid ask spread which is most representative of fair value. Prior to
1 December 2015, the accrued market price used for financial assets
held by the Company was the current bid price.
The Company makes estimates and assumptions that affect the
reported amounts of assets and liabilities. Estimates and judgements
are continually evaluated and are based on historical experience and
other factors. Estimates and assumptions used may include the use
of valuation techniques for the purposes of determining the fair value
of financial instruments that are not quoted in active markets, such as
unlisted equities and investment in other investment funds. Fair
values of such instruments are determined by using valuation
techniques as discussed in note 3(a).
a) Investments at Fair Value
(i) Classification
The Company has classified its investments at fair value
through profit or loss.
Notes to the Financial Statements
for the financial year ended 30 November 2016 (continued)
Dimensional Fund Advisors Annual Report and Audited Financial Statements, 30 November 2016 375
3. Significant Accounting Policies (continued) a) Investments at Fair Value (continued)
(ii) Recognition/Derecognition
Purchases and sales of investments are recognised on trade
date i.e. the date on which the Company commits to
purchase or sell the asset. Investments are initially
recognised at fair value and transaction costs for all financial
assets carried at fair value through profit or loss are
expensed as incurred.
Investments are derecognised when the rights to receive
cash flows from the investments have expired or the
Company has transferred substantially all risks and rewards
of ownership.
(iii) Measurement
The Company recognises financial assets and financial
liabilities on the date it becomes a party to the contractual
provisions of the instrument. A regular purchase of financial
assets is recognised using trade date accounting. From this
date any gains and losses arising from changes in fair value
of the financial assets or financial liabilities are recorded.
Profits and losses on the disposal of investments are
computed on a first-in, first-out basis and are included in the
Statement of Comprehensive Income. Unrealised gains and
losses on investments are recognised in the Statement of
Comprehensive Income.
(iv) Fair value estimation
In preparing the financial statements, the assets and liabilities
of each Fund were valued at the respective valuation point for
each Fund on 30 November 2016.
Equity and fixed income securities
For financial statements purposes the quoted market price
used for financial assets held by the Company is the current
last traded price with the exception of bonds where the
quoted market price can be last traded price or quoted mid
price depending on the bond type. When the Company holds
derivatives with offsetting market risks it uses mid-market
prices as a basis for establishing fair values for the offsetting
risk positions and applies the bid or asking price to the net
open position, as appropriate.
Unlisted securities
Unlisted securities, if any, are valued at their probable
realisation value determined with care and in good faith by
the Administrator in consultation with the Investment
Manager, who is approved for that purpose by the
Depositary. When a “readily available market quotation” for a
security is not available, the Company employs “fair value”
methodologies to price securities.
The fair valuation process requires the Investment Committee
of the Investment Manager (the “Investment Committee”) to
make a determination as to the value of a particular security
or group of securities depending on the particular facts and
circumstances involved. The Funds do not invest in any
unlisted securities other than certain unlisted warrants and
rights that have been received as a result of corporate
actions.
Investee Funds
The Company’s investments in other funds (“Investee
Funds”) are subject to the terms and conditions of the
respective Investee Funds’ offering documentation. The
investments in Investee Funds are primarily valued on the
unaudited Net Asset Value at 30 November 2016 of such
units for each Investee Fund, as determined by the Investee
Funds’ administrators.
Forward Currency Contracts
Forward Currency Contracts are measured at fair value
based on the closing prices of the Forward Currency
Contracts contract rates on the relevant foreign exchange
market on a daily basis. Realised and unrealised gains and/or
losses are reported in the Statement of Comprehensive
Income.
Futures
Futures are measured at fair value based on their quoted
daily settlement prices. Realised and unrealised gains and/or
losses are reported in the Statement of Comprehensive
Income.
b) Income
Interest income and expense are recognised in the Statement of
Comprehensive Income for all debt instruments using the
effective interest method. The effective interest rate is the rate
that exactly discounts estimated future cash payments or receipts
throughout the expected life of the financial instrument, or a
shorter period where appropriate, to the net carrying amount of
the financial asset or financial liability. Dividend income is
recorded on the ex-dividend date gross of withholding taxes and
is disclosed separately in the Statement of Comprehensive
Income, net of any tax credits.
c) Expense Recognition
All expenses are taken to the Statement of Comprehensive
Income on an accruals basis. Costs and expenses incurred in the
operation of a Fund are borne out of the assets of the relevant
Fund. The Investment Manager may, at its discretion, contribute
directly towards the expenses attributable to the establishment
and/or operation of any particular Fund and/or the marketing,
distribution and/or sale of shares and may from time to time at its
sole discretion waive any or all of the management fees in
respect of any particular payment period.
Notes to the Financial Statements
for the financial year ended 30 November 2016 (continued)
Dimensional Fund Advisors Annual Report and Audited Financial Statements, 30 November 2016 376
3. Significant Accounting Policies (continued) d) Foreign Currency Translation
Functional and presentational currency: Items included in the
Company’s financial statements are measured using the currency
of the primary economic environment in which it operates (the
“functional currency”). This is the Euro for Euro Inflation Linked
Intermediate Duration Fixed Income Fund, Euro Inflation Linked
Long Duration Fixed Income Fund, European Small Companies
Fund, European Value Fund and Global Short Fixed Income
Fund, Sterling for Global Ultra Short Fixed Income Fund, Sterling
Inflation Linked Intermediate Duration Fixed Income Fund,
Sterling Inflation Linked Long Duration Fixed Income Fund, World
Allocation 20/80 Fund, World Allocation 40/60 Fund, World
Allocation 60/40 Fund, World Allocation 80/20 Fund, World Equity
Fund and U.S. Dollars for Emerging Markets Large Cap Core
Equity Fund, Emerging Markets Value Fund, Global Core Equity
Fund, Global Short-Term Investment Grade Fixed Income Fund,
Global Small Companies Fund, Global Sustainability Core Equity
Fund, Global Targeted Value Fund, Global Value Fund, Pacific
Basin Small Companies Fund, Pacific Basin Value Fund, U.S.
Core Equity Fund and U.S. Small Companies Fund. The
Company has adopted the functional currency of each Fund as
the presentation currency for the financial statements. The
Company Statement of Financial Position, Statement of
Comprehensive Income and Statement of Changes in Net Assets
Attributable to Holders of Redeemable Shares are presented in
Euro.
Purchases and sales of securities, and income and expenses are
translated at the rate of exchange quoted on the respective date
that such transactions are recorded. All assets and liabilities
denominated in foreign currencies are translated at the rate of
exchange at the latest available rate at the Valuation Point.
Foreign exchange gains and losses resulting from both the
settlement of such transactions and from the translation at period
end exchange rates of monetary assets and liabilities
denominated in foreign currencies are recognised in the
Statement of Comprehensive Income.
e) Redeemable Shares
Redeemable shares are redeemable at the shareholder’s option
and are classified as financial liabilities. Any distribution on these
redeemable shares is recognised in the Statement of Changes.
The redeemable shares can be put back to the Company at any
time for cash equal to a proportionate share of the Company’s net
asset value (“NAV”). The redeemable shares are carried at the
redemption amount that is payable at the Statement of Financial
Position date if the shareholders exercised their right to put the
shares back to the Company.
f) NAV per Share
The NAV per share of the relevant class of the Fund is calculated
by dividing that proportion of the NAV of the Fund which is
attributable to the relevant class by the total number of shares of
the relevant class in issue at the relevant valuation point.
The NAV per share presented in note 15 is calculated in
accordance with the prospectus.
g) Distributions
The Company’s distribution policy is disclosed in note 14.
Dividends paid by a Fund are recorded by that Fund on the ex-
dividend date and are disclosed separately in the Statement of
Changes. Proposed distributions to holders of redeemable shares
are recognised in the Statement of Changes when such dividends
are appropriately authorised.
h) Income Equalisation
The Company may operate an equalisation account in respect of
certain classes of shares in each of the Funds. This arrangement
is intended to ensure that the income per redeemable share
which is distributed in respect of the distribution period is not
affected by changes in the number of redeemable shares in issue
during that period. The calculation of equalisation is based on net
income and represents the income portion of the price of
subscriptions/redemptions of redeemable shares. Refer to note
14 for disclosure of income equalisation adjustments on dividends
during the financial year.
i) Forward Currency Contracts
A forward currency contract involves an obligation to purchase or
sell a specific currency at a future date at a price set at the time
the contract is made. Forward currency contracts are valued by
reference to the forward price at which a new forward contract of
the same size and maturity could be affected at the valuation
date. The unrealised gain or loss on open forward currency
contracts is calculated as the difference between the contract rate
and this forward price and recognised in the Statement of
Comprehensive Income. Where a forward currency contract is
purchased to hedge the currency risk of a specific class, which is
issued in a currency other than the base currency of the
respective Fund, all gains or losses on that contract are allocated
to that class. Refer to the individual Funds’ Portfolio of
Investments for disclosure of forward currency contracts held at
30 November 2016.
j) Taxation
As disclosed in note 7, generally the Company is not subject to
Irish tax on income, profits or capital gains or other taxes payable.
However, income from investments held by the Company may be
subject to withholding taxes or capital gains taxes in jurisdictions
other than the Company’s country of domicile. Taxes incurred by
the Funds are recorded in the Statement of Comprehensive
Income within withholding tax on dividends and other taxation.
k) Securities Lending Income
The Company has appointed State Street Bank International
GmbH, London Branch, as securities lending agent. Certain
Funds may lend securities through State Street Bank
International GmbH, London Branch, as securities lending agent
to brokers, dealers and other financial organisations to earn
additional income.
Notes to the Financial Statements
for the financial year ended 30 November 2016 (continued)
Dimensional Fund Advisors Annual Report and Audited Financial Statements, 30 November 2016 377
3. Significant Accounting Policies (continued) k) Securities Lending Income (continued) Certain Funds may lend securities through State Street Bank
International GmbH, London Branch, as securities lending agent
to brokers, dealers and other financial organisations to earn
additional income.
Income earned from securities lending activities is accounted for
on an accruals basis.
As referred to in note 4 any cash collateral received in relation to
securities lending activities is presented on the face of the
Statement of Financial Position.
Cash received as collateral is recorded as an asset on the
Statement of Financial Position and is valued at fair value. A
related liability to repay the collateral is recorded as a liability on
the Statement of Financial Position and is also valued at its fair
value in line with the requirement of FRS 102.
l) Transaction Costs
Transaction costs are incremental costs that are directly
attributable to the acquisition, issue or disposal of a financial
asset or financial liability. An incremental cost is one that would
not have been incurred if the entity had not acquired, issued or
disposed of the financial instrument. When a financial asset or
financial liability is recognised initially, an entity shall measure it at
its fair value through profit or loss with transaction costs for such
instruments being recognised directly in the Statement of
Comprehensive Income.
Transaction costs charged by the Depositary on the settlement of
purchases and sales of investments are disclosed within sub-
custodian fees in the Statement of Comprehensive Income for
each Fund.
Transaction costs on purchases and sales of equities, collective
investment funds, futures contracts and options are included in
net gain/(loss) on financial assets and financial liabilities at fair
value through profit or loss in the Statement of Comprehensive
Income for each Fund. These costs are included in note 6 “Fees
and Expenses -Transaction Costs” for each Fund.
Transaction costs on the purchase and sale of bonds and forward
currency contracts are included in the purchase and sale price of
the investment. These costs cannot be practically or reliably
gathered as they are embedded in the cost of the investment and
cannot be separately verified or disclosed.
m) Futures
A future contract involves an obligation to purchase a specific
security at a future date at a price set at the time the contract is
made. Future contracts are valued by reference to the current
price at which a new futures contract could be affected at the
valuation date.
The unrealised gain or loss on open futures contracts is
calculated as the difference between the contract price and the
current market price and recognised in the Statement of
Comprehensive Income. Refer to the individual funds portfolio for
disclosure of futures contracts held at 30 November 2016.
4. Lending of Securities The Company has appointed State Street Bank International GmbH,
London Branch as securities lending agent (the “securities lending
agent”).
Each security loan is collateralised with collateral assets in an amount
greater than the current market value of the loaned securities. There
is a risk of delay in receiving collateral or in recovering the securities
loaned or even loss of rights in collateral should the borrower fail
financially.
However, in the event of default or bankruptcy by the other party to
the agreement, realisation and/or retention of the collateral may be
subject to legal proceedings. In the event that the borrower fails to
return loaned securities, and collateral being maintained by the fund
in question is insufficient to cover the value of loaned securities and
provided such collateral insufficiency is not the result of investment
losses, the securities lending agent has agreed to pay the amount of
the shortfall to the respective fund or, at the option of the securities
lending agent, to replace the securities.
Subject to each fund’s investment policy, any cash collateral received
by a fund from securities on loan may be invested in securities of the
U.S. government or its agencies, repurchase agreements
collateralised by securities of the U.S. government or its agencies,
time deposits and registered and unregistered money market funds.
Agencies include both agency debentures and agency mortgage
backed securities.
As at 30 November 2016, USD97,000,000 (30 November 2015:
USD398,000,000) of the total cash collateral received by the funds
(as disclosed on the Statement of Financial Position and in the tables
below) was re-invested in repurchase agreements with approved
counterparties Citigroup, JP Morgan and Merrill Lynch (30 November
2015: Citigroup and Merrill Lynch). Not all of the cash collateral
received at 30 November 2016 was re-invested due to a timing
difference between the cut-off point for receipt of cash collateral and
the cut–off point for re-investment (30 November 2015: All of the cash
collateral received at 30 November 2015 was reinvested. Due to a
timing difference between the cut-off point for receipt of cash
collateral and the cut-off point for re-investment at 30 November
2015, the re-investment value exceeded the cash collateral received).
The fair value of these repurchase agreements as at 30 November
2016 was USD98,940,892 (30 November 2015 was
USD398,000,000). These agreements were entered into on 30
November 2016 and matured on 1 December 2016 (30 November
2015: entered into on 27 November 2015 and matured on 1
December 2015).
In addition, each fund will be able to terminate the loan at any time
and will receive reasonable interest on the loan, as well as amounts
equal to any dividends, interest or other distributions on the loaned
securities.
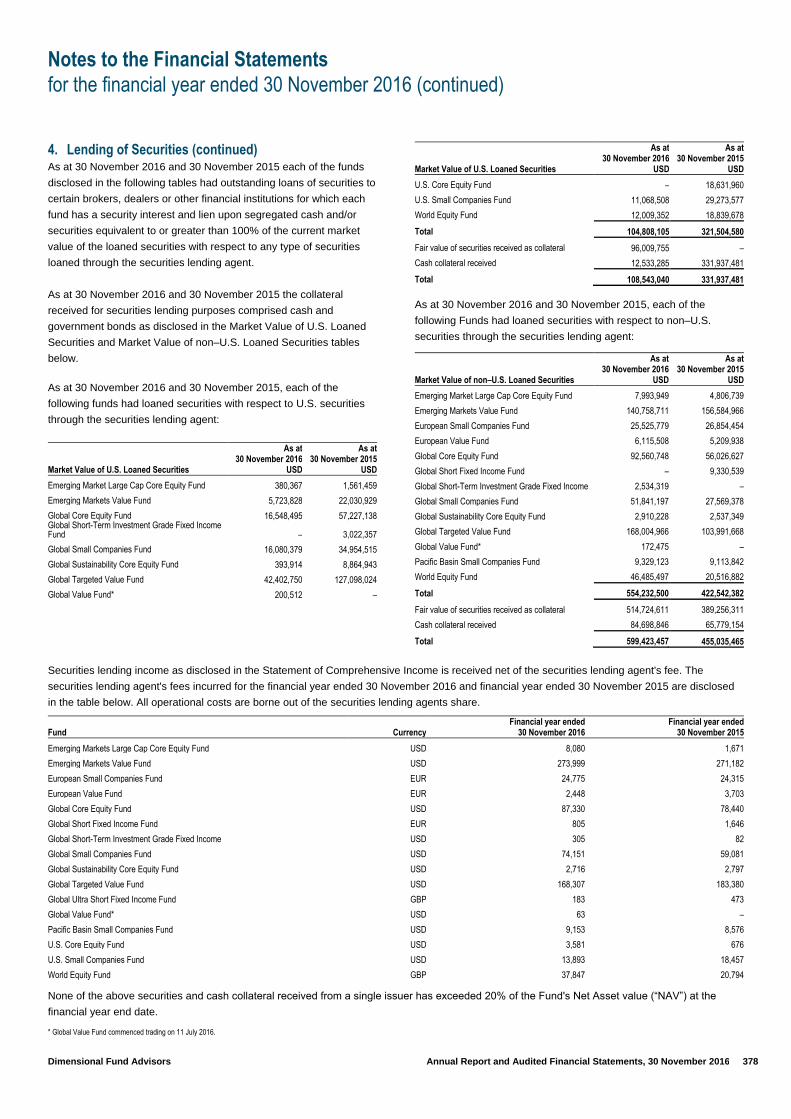
Notes to the Financial Statements
for the financial year ended 30 November 2016 (continued)
Dimensional Fund Advisors Annual Report and Audited Financial Statements, 30 November 2016 378
4. Lending of Securities (continued) As at 30 November 2016 and 30 November 2015 each of the funds
disclosed in the following tables had outstanding loans of securities to
certain brokers, dealers or other financial institutions for which each
fund has a security interest and lien upon segregated cash and/or
securities equivalent to or greater than 100% of the current market
value of the loaned securities with respect to any type of securities
loaned through the securities lending agent.
As at 30 November 2016 and 30 November 2015 the collateral
received for securities lending purposes comprised cash and
government bonds as disclosed in the Market Value of U.S. Loaned
Securities and Market Value of non–U.S. Loaned Securities tables
below.
As at 30 November 2016 and 30 November 2015, each of the
following funds had loaned securities with respect to U.S. securities
through the securities lending agent:
Market Value of U.S. Loaned Securities
As at 30 November 2016
USD
As at 30 November 2015
USD
Emerging Market Large Cap Core Equity Fund 380,367 1,561,459
Emerging Markets Value Fund 5,723,828 22,030,929
Global Core Equity Fund 16,548,495 57,227,138 Global Short-Term Investment Grade Fixed Income Fund – 3,022,357
Global Small Companies Fund 16,080,379 34,954,515
Global Sustainability Core Equity Fund 393,914 8,864,943
Global Targeted Value Fund 42,402,750 127,098,024
Global Value Fund* 200,512 –
Market Value of U.S. Loaned Securities
As at 30 November 2016
USD
As at 30 November 2015
USD
U.S. Core Equity Fund – 18,631,960
U.S. Small Companies Fund 11,068,508 29,273,577
World Equity Fund 12,009,352 18,839,678
Total 104,808,105 321,504,580
Fair value of securities received as collateral 96,009,755 –
Cash collateral received 12,533,285 331,937,481
Total 108,543,040 331,937,481
As at 30 November 2016 and 30 November 2015, each of the
following Funds had loaned securities with respect to non–U.S.
securities through the securities lending agent:
Market Value of non–U.S. Loaned Securities
As at 30 November 2016
USD
As at 30 November 2015
USD
Emerging Market Large Cap Core Equity Fund 7,993,949 4,806,739
Emerging Markets Value Fund 140,758,711 156,584,966
European Small Companies Fund 25,525,779 26,854,454
European Value Fund 6,115,508 5,209,938
Global Core Equity Fund 92,560,748 56,026,627
Global Short Fixed Income Fund – 9,330,539
Global Short-Term Investment Grade Fixed Income 2,534,319 –
Global Small Companies Fund 51,841,197 27,569,378
Global Sustainability Core Equity Fund 2,910,228 2,537,349
Global Targeted Value Fund 168,004,966 103,991,668
Global Value Fund* 172,475 –
Pacific Basin Small Companies Fund 9,329,123 9,113,842
World Equity Fund 46,485,497 20,516,882
Total 554,232,500 422,542,382
Fair value of securities received as collateral 514,724,611 389,256,311
Cash collateral received 84,698,846 65,779,154
Total 599,423,457 455,035,465
Securities lending income as disclosed in the Statement of Comprehensive Income is received net of the securities lending agent's fee. The
securities lending agent's fees incurred for the financial year ended 30 November 2016 and financial year ended 30 November 2015 are disclosed
in the table below. All operational costs are borne out of the securities lending agents share.
Fund Currency Financial year ended
30 November 2016 Financial year ended
30 November 2015
Emerging Markets Large Cap Core Equity Fund USD 8,080 1,671
Emerging Markets Value Fund USD 273,999 271,182
European Small Companies Fund EUR 24,775 24,315
European Value Fund EUR 2,448 3,703
Global Core Equity Fund USD 87,330 78,440
Global Short Fixed Income Fund EUR 805 1,646
Global Short-Term Investment Grade Fixed Income USD 305 82
Global Small Companies Fund USD 74,151 59,081
Global Sustainability Core Equity Fund USD 2,716 2,797
Global Targeted Value Fund USD 168,307 183,380
Global Ultra Short Fixed Income Fund GBP 183 473
Global Value Fund* USD 63 –
Pacific Basin Small Companies Fund USD 9,153 8,576
U.S. Core Equity Fund USD 3,581 676
U.S. Small Companies Fund USD 13,893 18,457
World Equity Fund GBP 37,847 20,794
None of the above securities and cash collateral received from a single issuer has exceeded 20% of the Fund's Net Asset value (“NAV”) at the
financial year end date. * Global Value Fund commenced trading on 11 July 2016.
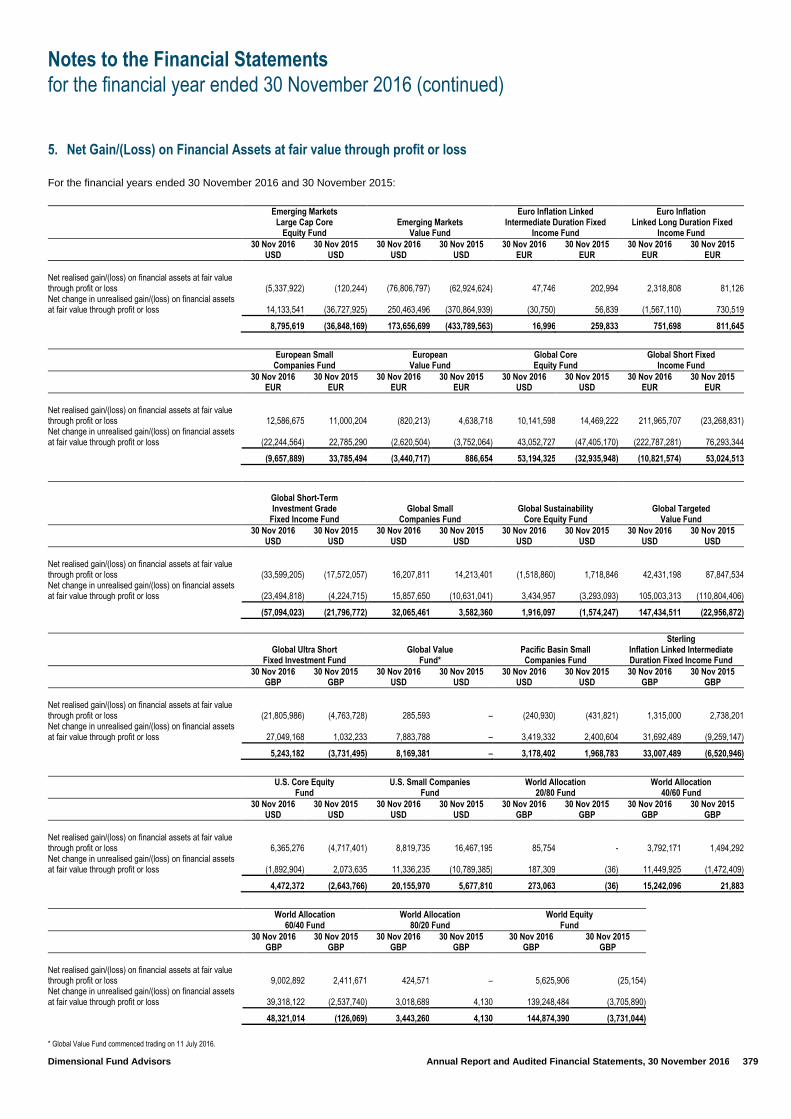
Notes to the Financial Statements
for the financial year ended 30 November 2016 (continued)
Dimensional Fund Advisors Annual Report and Audited Financial Statements, 30 November 2016 379
5. Net Gain/(Loss) on Financial Assets at fair value through profit or loss
For the financial years ended 30 November 2016 and 30 November 2015:
Emerging Markets Large Cap Core
Equity Fund Emerging Markets
Value Fund
Euro Inflation Linked Intermediate Duration Fixed
Income Fund
Euro Inflation Linked Long Duration Fixed
Income Fund
30 Nov 2016
USD 30 Nov 2015
USD 30 Nov 2016
USD 30 Nov 2015
USD 30 Nov 2016
EUR 30 Nov 2015
EUR 30 Nov 2016
EUR 30 Nov 2015
EUR
Net realised gain/(loss) on financial assets at fair value through profit or loss (5,337,922) (120,244) (76,806,797) (62,924,624) 47,746 202,994 2,318,808 81,126 Net change in unrealised gain/(loss) on financial assets at fair value through profit or loss 14,133,541 (36,727,925) 250,463,496 (370,864,939) (30,750) 56,839 (1,567,110) 730,519
8,795,619 (36,848,169) 173,656,699 (433,789,563) 16,996 259,833 751,698 811,645
European Small
Companies Fund European
Value Fund Global Core Equity Fund
Global Short Fixed Income Fund
30 Nov 2016
EUR 30 Nov 2015
EUR 30 Nov 2016
EUR 30 Nov 2015
EUR 30 Nov 2016
USD 30 Nov 2015
USD 30 Nov 2016
EUR 30 Nov 2015
EUR
Net realised gain/(loss) on financial assets at fair value through profit or loss 12,586,675 11,000,204 (820,213) 4,638,718 10,141,598 14,469,222 211,965,707 (23,268,831) Net change in unrealised gain/(loss) on financial assets at fair value through profit or loss (22,244,564) 22,785,290 (2,620,504) (3,752,064) 43,052,727 (47,405,170) (222,787,281) 76,293,344
(9,657,889) 33,785,494 (3,440,717) 886,654 53,194,325 (32,935,948) (10,821,574) 53,024,513
Global Short-Term Investment Grade
Fixed Income Fund Global Small
Companies Fund Global Sustainability
Core Equity Fund Global Targeted
Value Fund
30 Nov 2016
USD 30 Nov 2015
USD 30 Nov 2016
USD 30 Nov 2015
USD 30 Nov 2016
USD 30 Nov 2015
USD 30 Nov 2016
USD 30 Nov 2015
USD
Net realised gain/(loss) on financial assets at fair value through profit or loss (33,599,205) (17,572,057) 16,207,811 14,213,401 (1,518,860) 1,718,846 42,431,198 87,847,534 Net change in unrealised gain/(loss) on financial assets at fair value through profit or loss (23,494,818) (4,224,715) 15,857,650 (10,631,041) 3,434,957 (3,293,093) 105,003,313 (110,804,406)
(57,094,023) (21,796,772) 32,065,461 3,582,360 1,916,097 (1,574,247) 147,434,511 (22,956,872)
Global Ultra Short
Fixed Investment Fund Global Value
Fund* Pacific Basin Small Companies Fund
Sterling Inflation Linked Intermediate Duration Fixed Income Fund
30 Nov 2016
GBP 30 Nov 2015
GBP 30 Nov 2016
USD 30 Nov 2015
USD 30 Nov 2016
USD 30 Nov 2015
USD 30 Nov 2016
GBP 30 Nov 2015
GBP
Net realised gain/(loss) on financial assets at fair value through profit or loss (21,805,986) (4,763,728) 285,593 – (240,930) (431,821) 1,315,000 2,738,201 Net change in unrealised gain/(loss) on financial assets at fair value through profit or loss 27,049,168 1,032,233 7,883,788 – 3,419,332 2,400,604 31,692,489 (9,259,147)
5,243,182 (3,731,495) 8,169,381 – 3,178,402 1,968,783 33,007,489 (6,520,946)
U.S. Core Equity
Fund U.S. Small Companies
Fund World Allocation
20/80 Fund World Allocation
40/60 Fund
30 Nov 2016
USD 30 Nov 2015
USD 30 Nov 2016
USD 30 Nov 2015
USD 30 Nov 2016
GBP 30 Nov 2015
GBP 30 Nov 2016
GBP 30 Nov 2015
GBP
Net realised gain/(loss) on financial assets at fair value through profit or loss 6,365,276 (4,717,401) 8,819,735 16,467,195 85,754 - 3,792,171 1,494,292 Net change in unrealised gain/(loss) on financial assets at fair value through profit or loss (1,892,904) 2,073,635 11,336,235 (10,789,385) 187,309 (36) 11,449,925 (1,472,409)
4,472,372 (2,643,766) 20,155,970 5,677,810 273,063 (36) 15,242,096 21,883
World Allocation
60/40 Fund World Allocation
80/20 Fund World Equity
Fund
30 Nov 2016
GBP 30 Nov 2015
GBP 30 Nov 2016
GBP 30 Nov 2015
GBP 30 Nov 2016
GBP 30 Nov 2015
GBP
Net realised gain/(loss) on financial assets at fair value through profit or loss 9,002,892 2,411,671 424,571 – 5,625,906 (25,154) Net change in unrealised gain/(loss) on financial assets at fair value through profit or loss 39,318,122 (2,537,740) 3,018,689 4,130 139,248,484 (3,705,890)
48,321,014 (126,069) 3,443,260 4,130 144,874,390 (3,731,044)
* Global Value Fund commenced trading on 11 July 2016.
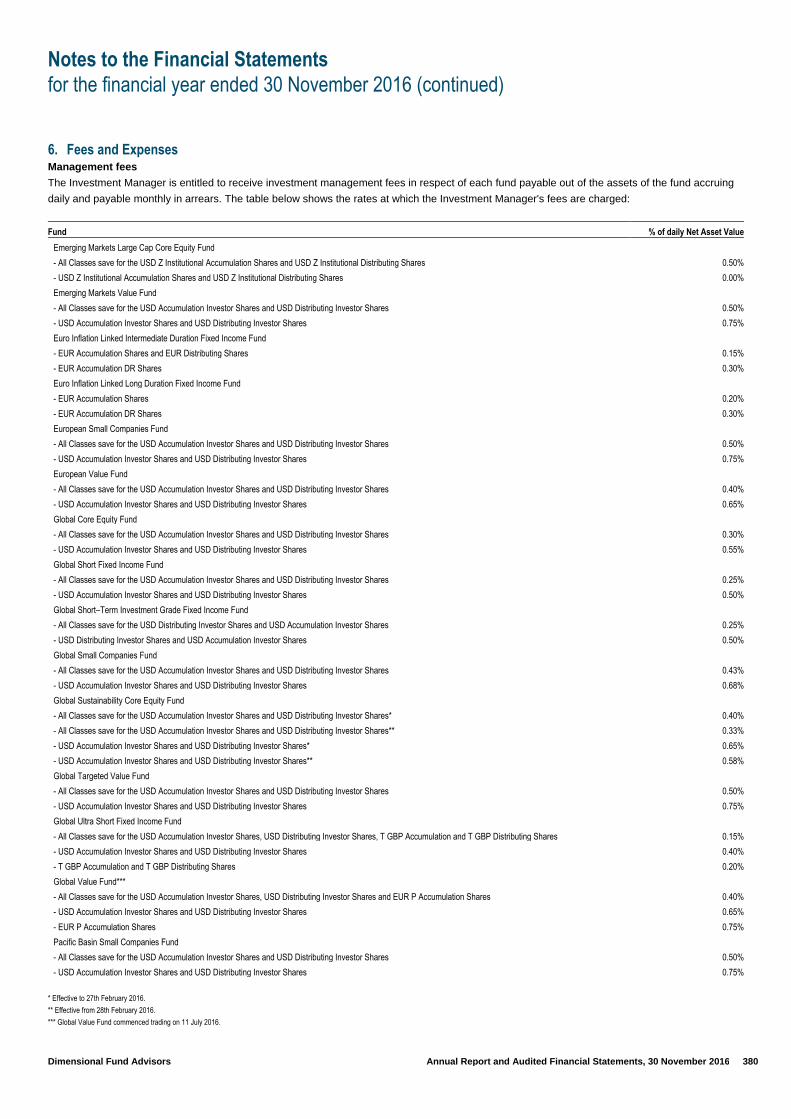
Notes to the Financial Statements
for the financial year ended 30 November 2016 (continued)
Dimensional Fund Advisors Annual Report and Audited Financial Statements, 30 November 2016 380
6. Fees and Expenses Management fees
The Investment Manager is entitled to receive investment management fees in respect of each fund payable out of the assets of the fund accruing
daily and payable monthly in arrears. The table below shows the rates at which the Investment Manager's fees are charged:
Fund % of daily Net Asset Value
Emerging Markets Large Cap Core Equity Fund
- All Classes save for the USD Z Institutional Accumulation Shares and USD Z Institutional Distributing Shares 0.50%
- USD Z Institutional Accumulation Shares and USD Z Institutional Distributing Shares 0.00%
Emerging Markets Value Fund
- All Classes save for the USD Accumulation Investor Shares and USD Distributing Investor Shares 0.50%
- USD Accumulation Investor Shares and USD Distributing Investor Shares 0.75%
Euro Inflation Linked Intermediate Duration Fixed Income Fund
- EUR Accumulation Shares and EUR Distributing Shares 0.15%
- EUR Accumulation DR Shares 0.30%
Euro Inflation Linked Long Duration Fixed Income Fund
- EUR Accumulation Shares 0.20%
- EUR Accumulation DR Shares 0.30%
European Small Companies Fund
- All Classes save for the USD Accumulation Investor Shares and USD Distributing Investor Shares 0.50%
- USD Accumulation Investor Shares and USD Distributing Investor Shares 0.75%
European Value Fund
- All Classes save for the USD Accumulation Investor Shares and USD Distributing Investor Shares 0.40%
- USD Accumulation Investor Shares and USD Distributing Investor Shares 0.65%
Global Core Equity Fund
- All Classes save for the USD Accumulation Investor Shares and USD Distributing Investor Shares 0.30%
- USD Accumulation Investor Shares and USD Distributing Investor Shares 0.55%
Global Short Fixed Income Fund
- All Classes save for the USD Accumulation Investor Shares and USD Distributing Investor Shares 0.25%
- USD Accumulation Investor Shares and USD Distributing Investor Shares 0.50%
Global Short–Term Investment Grade Fixed Income Fund
- All Classes save for the USD Distributing Investor Shares and USD Accumulation Investor Shares 0.25%
- USD Distributing Investor Shares and USD Accumulation Investor Shares 0.50%
Global Small Companies Fund
- All Classes save for the USD Accumulation Investor Shares and USD Distributing Investor Shares 0.43%
- USD Accumulation Investor Shares and USD Distributing Investor Shares 0.68%
Global Sustainability Core Equity Fund
- All Classes save for the USD Accumulation Investor Shares and USD Distributing Investor Shares* 0.40%
- All Classes save for the USD Accumulation Investor Shares and USD Distributing Investor Shares** 0.33%
- USD Accumulation Investor Shares and USD Distributing Investor Shares* 0.65%
- USD Accumulation Investor Shares and USD Distributing Investor Shares** 0.58%
Global Targeted Value Fund
- All Classes save for the USD Accumulation Investor Shares and USD Distributing Investor Shares 0.50%
- USD Accumulation Investor Shares and USD Distributing Investor Shares 0.75%
Global Ultra Short Fixed Income Fund
- All Classes save for the USD Accumulation Investor Shares, USD Distributing Investor Shares, T GBP Accumulation and T GBP Distributing Shares 0.15%
- USD Accumulation Investor Shares and USD Distributing Investor Shares 0.40%
- T GBP Accumulation and T GBP Distributing Shares 0.20%
Global Value Fund***
- All Classes save for the USD Accumulation Investor Shares, USD Distributing Investor Shares and EUR P Accumulation Shares 0.40%
- USD Accumulation Investor Shares and USD Distributing Investor Shares 0.65%
- EUR P Accumulation Shares 0.75%
Pacific Basin Small Companies Fund
- All Classes save for the USD Accumulation Investor Shares and USD Distributing Investor Shares 0.50%
- USD Accumulation Investor Shares and USD Distributing Investor Shares 0.75%
* Effective to 27th February 2016.
** Effective from 28th February 2016.
*** Global Value Fund commenced trading on 11 July 2016.
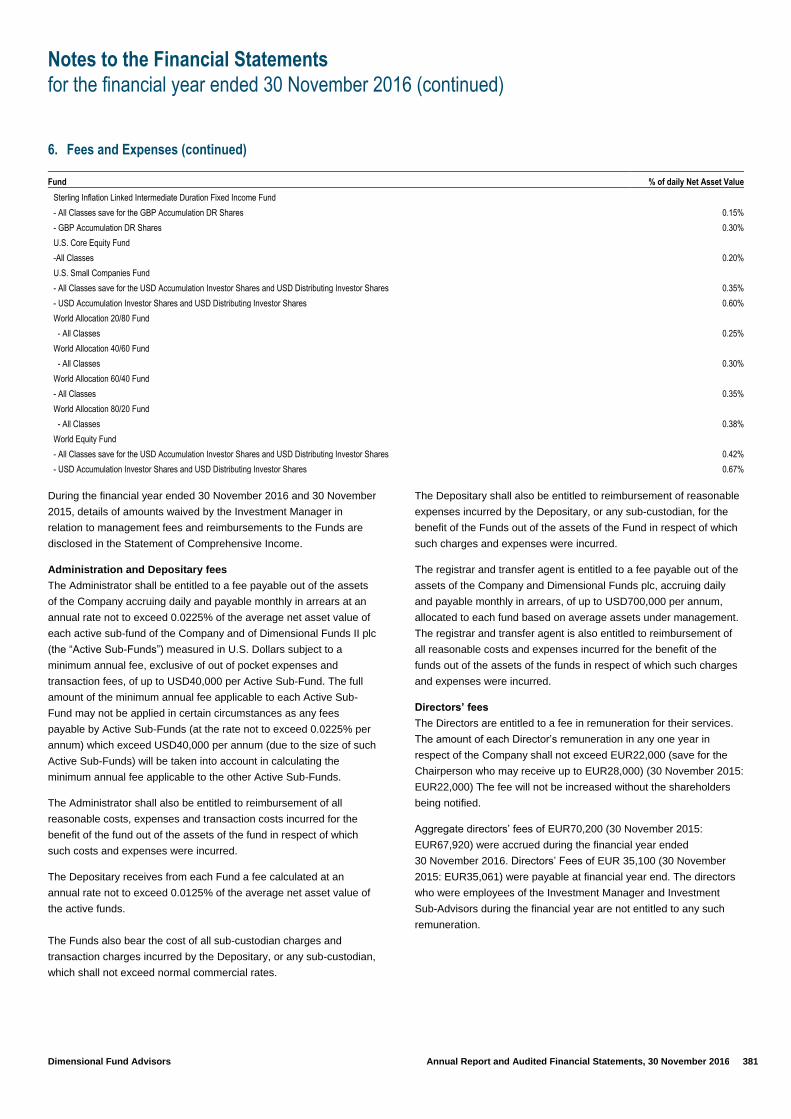
Notes to the Financial Statements
for the financial year ended 30 November 2016 (continued)
Dimensional Fund Advisors Annual Report and Audited Financial Statements, 30 November 2016 381
6. Fees and Expenses (continued)
Fund % of daily Net Asset Value
Sterling Inflation Linked Intermediate Duration Fixed Income Fund
- All Classes save for the GBP Accumulation DR Shares 0.15%
- GBP Accumulation DR Shares 0.30%
U.S. Core Equity Fund
-All Classes 0.20%
U.S. Small Companies Fund
- All Classes save for the USD Accumulation Investor Shares and USD Distributing Investor Shares 0.35%
- USD Accumulation Investor Shares and USD Distributing Investor Shares 0.60%
World Allocation 20/80 Fund
- All Classes 0.25%
World Allocation 40/60 Fund
- All Classes 0.30%
World Allocation 60/40 Fund
- All Classes 0.35%
World Allocation 80/20 Fund
- All Classes 0.38%
World Equity Fund
- All Classes save for the USD Accumulation Investor Shares and USD Distributing Investor Shares 0.42%
- USD Accumulation Investor Shares and USD Distributing Investor Shares 0.67%
During the financial year ended 30 November 2016 and 30 November
2015, details of amounts waived by the Investment Manager in
relation to management fees and reimbursements to the Funds are
disclosed in the Statement of Comprehensive Income.
Administration and Depositary fees
The Administrator shall be entitled to a fee payable out of the assets
of the Company accruing daily and payable monthly in arrears at an
annual rate not to exceed 0.0225% of the average net asset value of
each active sub-fund of the Company and of Dimensional Funds II plc
(the “Active Sub-Funds”) measured in U.S. Dollars subject to a
minimum annual fee, exclusive of out of pocket expenses and
transaction fees, of up to USD40,000 per Active Sub-Fund. The full
amount of the minimum annual fee applicable to each Active Sub-
Fund may not be applied in certain circumstances as any fees
payable by Active Sub-Funds (at the rate not to exceed 0.0225% per
annum) which exceed USD40,000 per annum (due to the size of such
Active Sub-Funds) will be taken into account in calculating the
minimum annual fee applicable to the other Active Sub-Funds.
The Administrator shall also be entitled to reimbursement of all
reasonable costs, expenses and transaction costs incurred for the
benefit of the fund out of the assets of the fund in respect of which
such costs and expenses were incurred.
The Depositary receives from each Fund a fee calculated at an
annual rate not to exceed 0.0125% of the average net asset value of
the active funds.
The Funds also bear the cost of all sub-custodian charges and
transaction charges incurred by the Depositary, or any sub-custodian,
which shall not exceed normal commercial rates.
The Depositary shall also be entitled to reimbursement of reasonable
expenses incurred by the Depositary, or any sub-custodian, for the
benefit of the Funds out of the assets of the Fund in respect of which
such charges and expenses were incurred.
The registrar and transfer agent is entitled to a fee payable out of the
assets of the Company and Dimensional Funds plc, accruing daily
and payable monthly in arrears, of up to USD700,000 per annum,
allocated to each fund based on average assets under management.
The registrar and transfer agent is also entitled to reimbursement of
all reasonable costs and expenses incurred for the benefit of the
funds out of the assets of the funds in respect of which such charges
and expenses were incurred.
Directors’ fees
The Directors are entitled to a fee in remuneration for their services.
The amount of each Director’s remuneration in any one year in
respect of the Company shall not exceed EUR22,000 (save for the
Chairperson who may receive up to EUR28,000) (30 November 2015:
EUR22,000) The fee will not be increased without the shareholders
being notified.
Aggregate directors’ fees of EUR70,200 (30 November 2015:
EUR67,920) were accrued during the financial year ended
30 November 2016. Directors’ Fees of EUR 35,100 (30 November
2015: EUR35,061) were payable at financial year end. The directors
who were employees of the Investment Manager and Investment
Sub-Advisors during the financial year are not entitled to any such
remuneration.
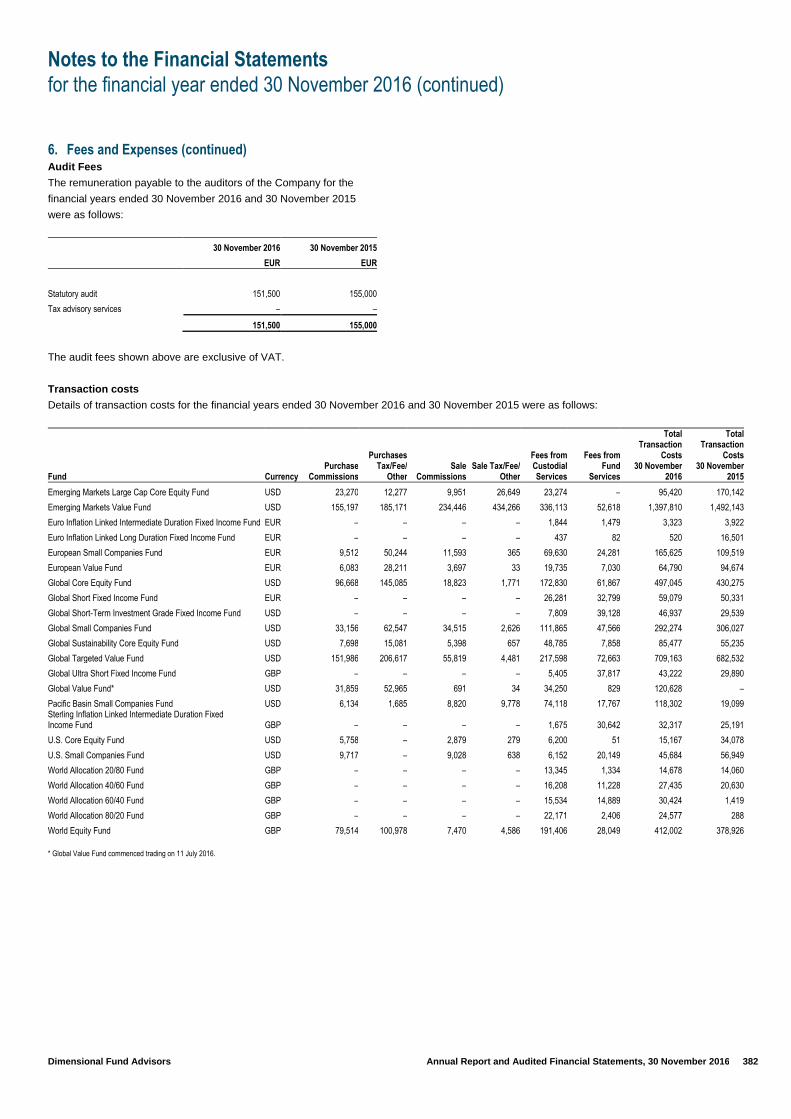
Notes to the Financial Statements
for the financial year ended 30 November 2016 (continued)
Dimensional Fund Advisors Annual Report and Audited Financial Statements, 30 November 2016 382
6. Fees and Expenses (continued) Audit Fees
The remuneration payable to the auditors of the Company for the
financial years ended 30 November 2016 and 30 November 2015
were as follows:
30 November 2016 30 November 2015
EUR EUR
Statutory audit 151,500 155,000
Tax advisory services – –
151,500 155,000
The audit fees shown above are exclusive of VAT.
Transaction costs
Details of transaction costs for the financial years ended 30 November 2016 and 30 November 2015 were as follows:
Fund Currency Purchase
Commissions
Purchases Tax/Fee/
Other Sale
Commissions Sale Tax/Fee/
Other
Fees from Custodial Services
Fees from Fund
Services
Total Transaction
Costs 30 November
2016
Total Transaction
Costs 30 November
2015
Emerging Markets Large Cap Core Equity Fund USD 23,270 12,277 9,951 26,649 23,274 – 95,420 170,142
Emerging Markets Value Fund USD 155,197 185,171 234,446 434,266 336,113 52,618 1,397,810 1,492,143
Euro Inflation Linked Intermediate Duration Fixed Income Fund EUR – – – – 1,844 1,479 3,323 3,922
Euro Inflation Linked Long Duration Fixed Income Fund EUR – – – – 437 82 520 16,501
European Small Companies Fund EUR 9,512 50,244 11,593 365 69,630 24,281 165,625 109,519
European Value Fund EUR 6,083 28,211 3,697 33 19,735 7,030 64,790 94,674
Global Core Equity Fund USD 96,668 145,085 18,823 1,771 172,830 61,867 497,045 430,275
Global Short Fixed Income Fund EUR – – – – 26,281 32,799 59,079 50,331
Global Short-Term Investment Grade Fixed Income Fund USD – – – – 7,809 39,128 46,937 29,539
Global Small Companies Fund USD 33,156 62,547 34,515 2,626 111,865 47,566 292,274 306,027
Global Sustainability Core Equity Fund USD 7,698 15,081 5,398 657 48,785 7,858 85,477 55,235
Global Targeted Value Fund USD 151,986 206,617 55,819 4,481 217,598 72,663 709,163 682,532
Global Ultra Short Fixed Income Fund GBP – – – – 5,405 37,817 43,222 29,890
Global Value Fund* USD 31,859 52,965 691 34 34,250 829 120,628 –
Pacific Basin Small Companies Fund USD 6,134 1,685 8,820 9,778 74,118 17,767 118,302 19,099 Sterling Inflation Linked Intermediate Duration Fixed Income Fund GBP – – – – 1,675 30,642 32,317 25,191
U.S. Core Equity Fund USD 5,758 – 2,879 279 6,200 51 15,167 34,078
U.S. Small Companies Fund USD 9,717 – 9,028 638 6,152 20,149 45,684 56,949
World Allocation 20/80 Fund GBP – – – – 13,345 1,334 14,678 14,060
World Allocation 40/60 Fund GBP – – – – 16,208 11,228 27,435 20,630
World Allocation 60/40 Fund GBP – – – – 15,534 14,889 30,424 1,419
World Allocation 80/20 Fund GBP – – – – 22,171 2,406 24,577 288
World Equity Fund GBP 79,514 100,978 7,470 4,586 191,406 28,049 412,002 378,926 * Global Value Fund commenced trading on 11 July 2016.
Notes to the Financial Statements
for the financial year ended 30 November 2016 (continued)
Dimensional Fund Advisors Annual Report and Audited Financial Statements, 30 November 2016 383
7. Taxation Under current law and practice the Company qualifies as an
investment undertaking as defined in Section 739B of the Taxes
Consolidation Act, 1997, as amended. On that basis, it is not
chargeable to Irish tax on its income or gains. However, Irish tax may
arise on the happening of a "chargeable event". A chargeable event
includes any distribution payments to shareholders, any encashment,
redemption, cancellation or transfer of shares and the holding of
shares at the end of each eight year period beginning with the
acquisition of such shares.
No Irish tax will arise on the Company in respect of chargeable
events in respect of:
a) a shareholder who is neither Irish resident nor ordinarily resident
in Ireland for tax purposes, at the time of the chargeable event,
provided appropriate valid declarations in accordance with the
provisions of the Taxes Consolidation Act, 1997, as amended,
are held by the Company or the Company has been authorised
by the Irish Revenue to make gross payments in the absence of
appropriate declarations; and
b) certain exempted Irish tax resident shareholders who have
provided the Company with the necessary signed statutory
declarations.
Dividends, interest and capital gains (if any) received on investments
made by the Company may be subject to taxes imposed by the
country from which the investment income/gains are received and
such taxes may not be recoverable by the Company or its
shareholders.
Capital gains, dividends and interest received on investments may be
subject to withholding taxes imposed by the country of origin and
such taxes may not be recoverable by the Fund or its shareholders.
The Company may incur capital gains taxes for income earned from
transactions in foreign jurisdictions. For the financial year ended
30 November 2016 the Company incurred capital gains taxes of
EUR400,252 (30 November 2015: EUR372,865).
8. Cash and Cash Equivalents The cash balances as disclosed in the Statement of Financial
Position were held at State Street Custodial Services (Ireland) Limited
as at 30 November 2016 and 30 November 2015. Cash and cash
equivalents comprise cash balances valued at their face value with
interest accrued, where applicable.
In March 2015, the Central Bank introduced Investor Money
Regulations (“IMR”). These regulations, which are effective from 1
July 2016, detail material changes to the current rules in relation to
investor money, and are designed to increase transparency and
enhance investor protection.
In response to these regulations, cash accounts held with a third
party banking entity for collection of subscriptions and payment of
redemptions are now deemed to be assets of the Company.
As at 30 November 2016, USD 170,037,309 was held in a Bank of
America account. This was for a subscription for 19,956,565 shares,
trade date 30 November 2016. In line with the IMR Regulations, this
has been reflected in the Statement of Financial Position as at 30
November 2016. Refer to note 18 for further detail.
Cash collateral received relates to collateral received for securities on
loan and is held by State Street Bank International GmbH, London
Branch as at 30 November 2016 and 30 November 2015.
A U.S. Dollar discretionary line of credit of USD50 million was put in
place for the Company and Dimensional Funds II plc. This line of
credit was renewed effective 2 June 2015, however it was not
renewed in 2016 and expired on 31 May 2016.
9. Share Capital The authorised share capital of the Company is 500,000,030,000
shares of no par value divided into 30,000 Subscriber Shares of no
par value and 500,000,000,000 shares (the “Shares”) of no par value.
The Subscriber Shares entitle the holders to attend and vote at
general meetings of the Company but do not entitle the holders to
participate in the profits or assets of the Company except for a return
of capital on a winding–up. The Subscriber Shares are not included in
the calculation of the NAV per redeemable share.
As at 30 November 2016 and 30 November 2015 Dimensional Fund
Advisors LP, Peter Blessing, David G. Booth, Dermot S.L. Butler,
Arthur Barlow and Catherine L. Newell held one subscriber share
each (fully paid–up) in the Company.
Shares entitle the holders to attend and vote at general meetings of
the Company and to participate equally (subject to any differences
between fees, charges and expenses applicable to different classes
in the profits and assets of the Company on the terms and conditions
set out in the prospectus. The Funds have the ability to issue multiple
classes of redeemable shares. Each redeemable share within a class
represents an identical legal interest in the Funds and has identical
rights.
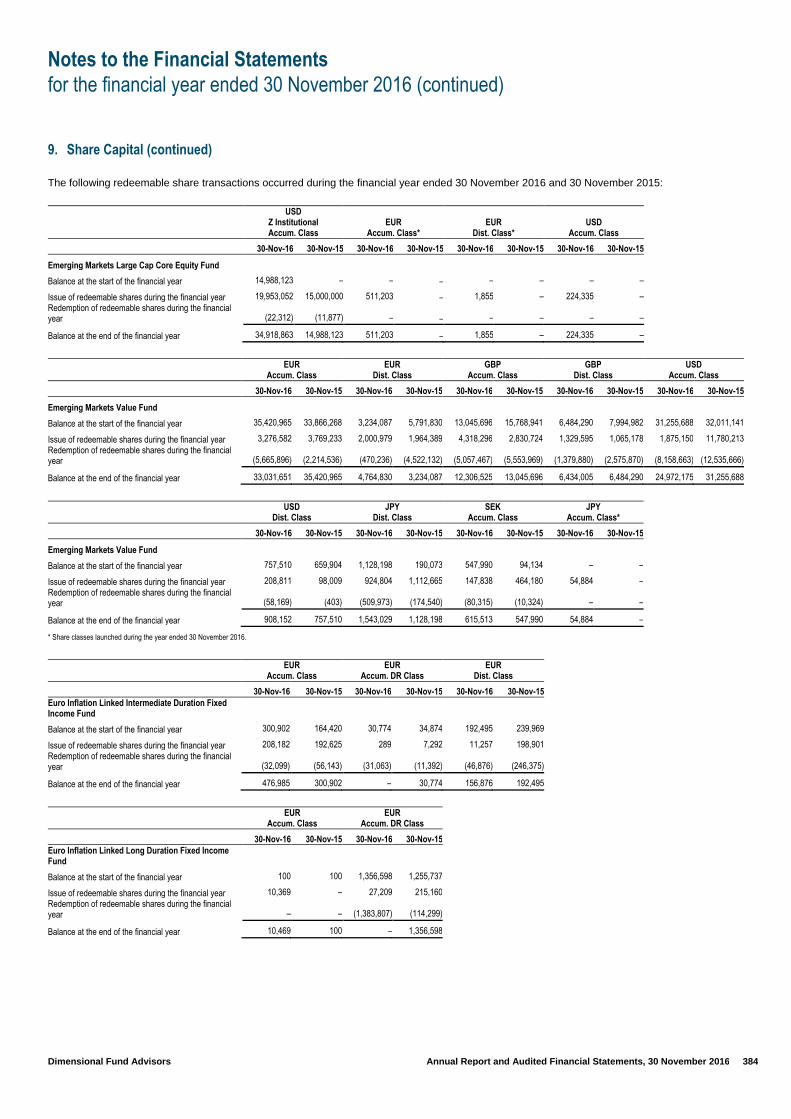
Notes to the Financial Statements
for the financial year ended 30 November 2016 (continued)
Dimensional Fund Advisors Annual Report and Audited Financial Statements, 30 November 2016 384
9. Share Capital (continued)
The following redeemable share transactions occurred during the financial year ended 30 November 2016 and 30 November 2015:
USD Z Institutional Accum. Class
EUR Accum. Class*
EUR Dist. Class*
USD Accum. Class
30-Nov-16 30-Nov-15 30-Nov-16 30-Nov-15 30-Nov-16 30-Nov-15 30-Nov-16 30-Nov-15
Emerging Markets Large Cap Core Equity Fund
Balance at the start of the financial year 14,988,123 – – – – – – –
Issue of redeemable shares during the financial year 19,953,052 15,000,000 511,203 – 1,855 – 224,335 –
Redemption of redeemable shares during the financial year (22,312) (11,877) – – – – – –
Balance at the end of the financial year 34,918,863 14,988,123 511,203 – 1,855 – 224,335 –
EUR
Accum. Class EUR
Dist. Class GBP
Accum. Class GBP
Dist. Class USD
Accum. Class
30-Nov-16 30-Nov-15 30-Nov-16 30-Nov-15 30-Nov-16 30-Nov-15 30-Nov-16 30-Nov-15 30-Nov-16 30-Nov-15
Emerging Markets Value Fund
Balance at the start of the financial year 35,420,965 33,866,268 3,234,087 5,791,830 13,045,696 15,768,941 6,484,290 7,994,982 31,255,688 32,011,141
Issue of redeemable shares during the financial year 3,276,582 3,769,233 2,000,979 1,964,389 4,318,296 2,830,724 1,329,595 1,065,178 1,875,150 11,780,213
Redemption of redeemable shares during the financial year (5,665,896) (2,214,536) (470,236) (4,522,132) (5,057,467) (5,553,969) (1,379,880) (2,575,870) (8,158,663) (12,535,666)
Balance at the end of the financial year 33,031,651 35,420,965 4,764,830 3,234,087 12,306,525 13,045,696 6,434,005 6,484,290 24,972,175 31,255,688
USD
Dist. Class JPY
Dist. Class SEK
Accum. Class JPY
Accum. Class*
30-Nov-16 30-Nov-15 30-Nov-16 30-Nov-15 30-Nov-16 30-Nov-15 30-Nov-16 30-Nov-15
Emerging Markets Value Fund
Balance at the start of the financial year 757,510 659,904 1,128,198 190,073 547,990 94,134 – –
Issue of redeemable shares during the financial year 208,811 98,009 924,804 1,112,665 147,838 464,180 54,884 –
Redemption of redeemable shares during the financial year (58,169) (403) (509,973) (174,540) (80,315) (10,324) – –
Balance at the end of the financial year 908,152 757,510 1,543,029 1,128,198 615,513 547,990 54,884 –
* Share classes launched during the year ended 30 November 2016.
EUR
Accum. Class EUR
Accum. DR Class EUR
Dist. Class
30-Nov-16 30-Nov-15 30-Nov-16 30-Nov-15 30-Nov-16 30-Nov-15
Euro Inflation Linked Intermediate Duration Fixed Income Fund
Balance at the start of the financial year 300,902 164,420 30,774 34,874 192,495 239,969
Issue of redeemable shares during the financial year 208,182 192,625 289 7,292 11,257 198,901
Redemption of redeemable shares during the financial year (32,099) (56,143) (31,063) (11,392) (46,876) (246,375)
Balance at the end of the financial year 476,985 300,902 – 30,774 156,876 192,495
EUR
Accum. Class EUR
Accum. DR Class
30-Nov-16 30-Nov-15 30-Nov-16 30-Nov-15
Euro Inflation Linked Long Duration Fixed Income Fund
Balance at the start of the financial year 100 100 1,356,598 1,255,737
Issue of redeemable shares during the financial year 10,369 – 27,209 215,160
Redemption of redeemable shares during the financial year – – (1,383,807) (114,299)
Balance at the end of the financial year 10,469 100 – 1,356,598
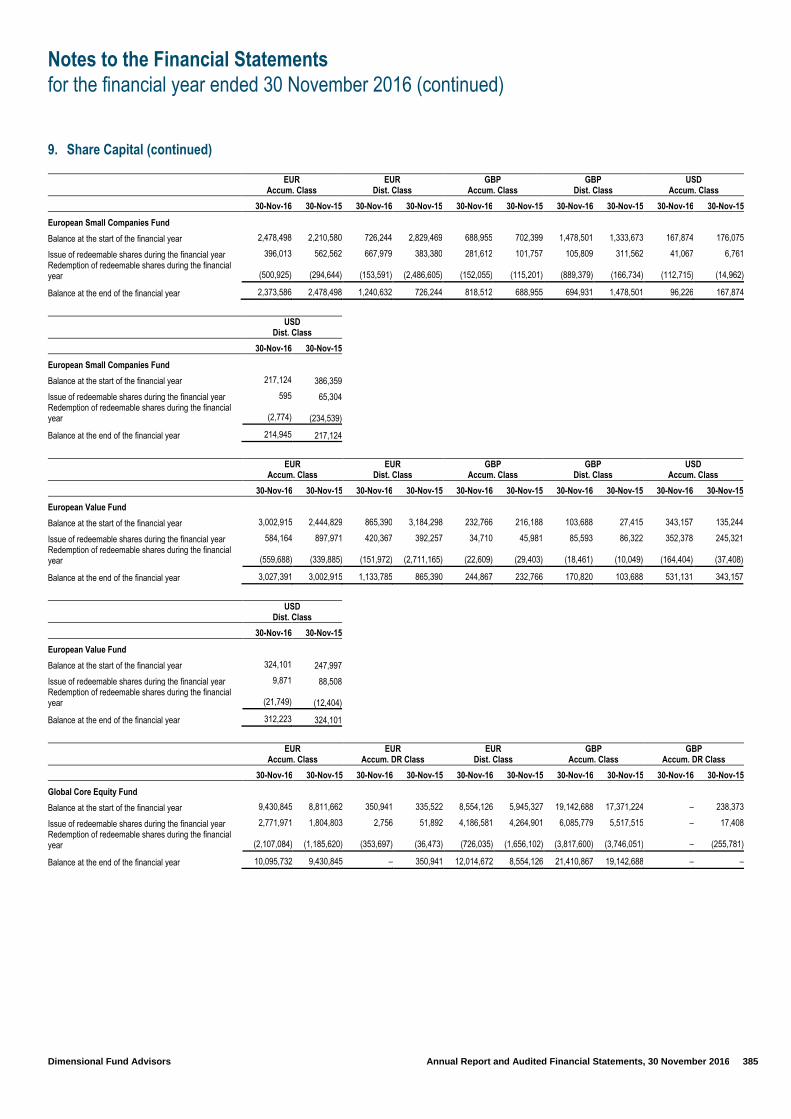
Notes to the Financial Statements
for the financial year ended 30 November 2016 (continued)
Dimensional Fund Advisors Annual Report and Audited Financial Statements, 30 November 2016 385
9. Share Capital (continued)
EUR
Accum. Class EUR
Dist. Class GBP
Accum. Class GBP
Dist. Class USD
Accum. Class
30-Nov-16 30-Nov-15 30-Nov-16 30-Nov-15 30-Nov-16 30-Nov-15 30-Nov-16 30-Nov-15 30-Nov-16 30-Nov-15
European Small Companies Fund
Balance at the start of the financial year 2,478,498 2,210,580 726,244 2,829,469 688,955 702,399 1,478,501 1,333,673 167,874 176,075
Issue of redeemable shares during the financial year 396,013 562,562 667,979 383,380 281,612 101,757 105,809 311,562 41,067 6,761
Redemption of redeemable shares during the financial year (500,925) (294,644) (153,591) (2,486,605) (152,055) (115,201) (889,379) (166,734) (112,715) (14,962)
Balance at the end of the financial year 2,373,586 2,478,498 1,240,632 726,244 818,512 688,955 694,931 1,478,501 96,226 167,874
USD
Dist. Class
30-Nov-16 30-Nov-15
European Small Companies Fund
Balance at the start of the financial year 217,124 386,359
Issue of redeemable shares during the financial year 595 65,304 Redemption of redeemable shares during the financial year (2,774) (234,539)
Balance at the end of the financial year 214,945 217,124
EUR
Accum. Class EUR
Dist. Class GBP
Accum. Class GBP
Dist. Class USD
Accum. Class
30-Nov-16 30-Nov-15 30-Nov-16 30-Nov-15 30-Nov-16 30-Nov-15 30-Nov-16 30-Nov-15 30-Nov-16 30-Nov-15
European Value Fund
Balance at the start of the financial year 3,002,915 2,444,829 865,390 3,184,298 232,766 216,188 103,688 27,415 343,157 135,244
Issue of redeemable shares during the financial year 584,164 897,971 420,367 392,257 34,710 45,981 85,593 86,322 352,378 245,321
Redemption of redeemable shares during the financial year (559,688) (339,885) (151,972) (2,711,165) (22,609) (29,403) (18,461) (10,049) (164,404) (37,408)
Balance at the end of the financial year 3,027,391 3,002,915 1,133,785 865,390 244,867 232,766 170,820 103,688 531,131 343,157
USD
Dist. Class
30-Nov-16 30-Nov-15
European Value Fund
Balance at the start of the financial year 324,101 247,997
Issue of redeemable shares during the financial year 9,871 88,508 Redemption of redeemable shares during the financial year (21,749) (12,404)
Balance at the end of the financial year 312,223 324,101
EUR
Accum. Class EUR
Accum. DR Class EUR
Dist. Class GBP
Accum. Class GBP
Accum. DR Class
30-Nov-16 30-Nov-15 30-Nov-16 30-Nov-15 30-Nov-16 30-Nov-15 30-Nov-16 30-Nov-15 30-Nov-16 30-Nov-15
Global Core Equity Fund
Balance at the start of the financial year 9,430,845 8,811,662 350,941 335,522 8,554,126 5,945,327 19,142,688 17,371,224 – 238,373
Issue of redeemable shares during the financial year 2,771,971 1,804,803 2,756 51,892 4,186,581 4,264,901 6,085,779 5,517,515 – 17,408
Redemption of redeemable shares during the financial year (2,107,084) (1,185,620) (353,697) (36,473) (726,035) (1,656,102) (3,817,600) (3,746,051) – (255,781)
Balance at the end of the financial year 10,095,732 9,430,845 – 350,941 12,014,672 8,554,126 21,410,867 19,142,688 – –
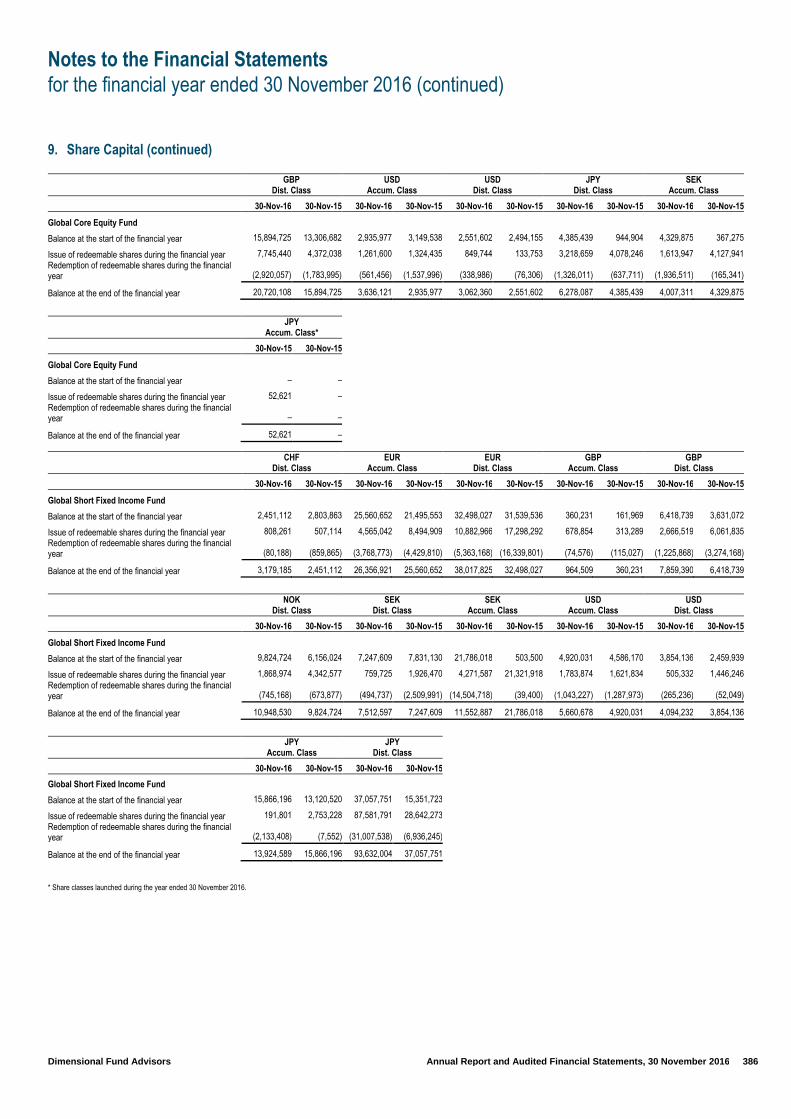
Notes to the Financial Statements
for the financial year ended 30 November 2016 (continued)
Dimensional Fund Advisors Annual Report and Audited Financial Statements, 30 November 2016 386
9. Share Capital (continued)
GBP
Dist. Class USD
Accum. Class USD
Dist. Class JPY
Dist. Class SEK
Accum. Class
30-Nov-16 30-Nov-15 30-Nov-16 30-Nov-15 30-Nov-16 30-Nov-15 30-Nov-16 30-Nov-15 30-Nov-16 30-Nov-15
Global Core Equity Fund
Balance at the start of the financial year 15,894,725 13,306,682 2,935,977 3,149,538 2,551,602 2,494,155 4,385,439 944,904 4,329,875 367,275
Issue of redeemable shares during the financial year 7,745,440 4,372,038 1,261,600 1,324,435 849,744 133,753 3,218,659 4,078,246 1,613,947 4,127,941
Redemption of redeemable shares during the financial year (2,920,057) (1,783,995) (561,456) (1,537,996) (338,986) (76,306) (1,326,011) (637,711) (1,936,511) (165,341)
Balance at the end of the financial year 20,720,108 15,894,725 3,636,121 2,935,977 3,062,360 2,551,602 6,278,087 4,385,439 4,007,311 4,329,875
JPY
Accum. Class*
30-Nov-15 30-Nov-15
Global Core Equity Fund
Balance at the start of the financial year – –
Issue of redeemable shares during the financial year 52,621 –
Redemption of redeemable shares during the financial year – –
Balance at the end of the financial year 52,621 –
CHF
Dist. Class EUR
Accum. Class EUR
Dist. Class GBP
Accum. Class GBP
Dist. Class
30-Nov-16 30-Nov-15 30-Nov-16 30-Nov-15 30-Nov-16 30-Nov-15 30-Nov-16 30-Nov-15 30-Nov-16 30-Nov-15
Global Short Fixed Income Fund
Balance at the start of the financial year 2,451,112 2,803,863 25,560,652 21,495,553 32,498,027 31,539,536 360,231 161,969 6,418,739 3,631,072
Issue of redeemable shares during the financial year 808,261 507,114 4,565,042 8,494,909 10,882,966 17,298,292 678,854 313,289 2,666,519 6,061,835
Redemption of redeemable shares during the financial year (80,188) (859,865) (3,768,773) (4,429,810) (5,363,168) (16,339,801) (74,576) (115,027) (1,225,868) (3,274,168)
Balance at the end of the financial year 3,179,185 2,451,112 26,356,921 25,560,652 38,017,825 32,498,027 964,509 360,231 7,859,390 6,418,739
NOK
Dist. Class SEK
Dist. Class SEK
Accum. Class USD
Accum. Class USD
Dist. Class
30-Nov-16 30-Nov-15 30-Nov-16 30-Nov-15 30-Nov-16 30-Nov-15 30-Nov-16 30-Nov-15 30-Nov-16 30-Nov-15
Global Short Fixed Income Fund
Balance at the start of the financial year 9,824,724 6,156,024 7,247,609 7,831,130 21,786,018 503,500 4,920,031 4,586,170 3,854,136 2,459,939
Issue of redeemable shares during the financial year 1,868,974 4,342,577 759,725 1,926,470 4,271,587 21,321,918 1,783,874 1,621,834 505,332 1,446,246
Redemption of redeemable shares during the financial year (745,168) (673,877) (494,737) (2,509,991) (14,504,718) (39,400) (1,043,227) (1,287,973) (265,236) (52,049)
Balance at the end of the financial year 10,948,530 9,824,724 7,512,597 7,247,609 11,552,887 21,786,018 5,660,678 4,920,031 4,094,232 3,854,136
JPY
Accum. Class JPY
Dist. Class
30-Nov-16 30-Nov-15 30-Nov-16 30-Nov-15
Global Short Fixed Income Fund
Balance at the start of the financial year 15,866,196 13,120,520 37,057,751 15,351,723
Issue of redeemable shares during the financial year 191,801 2,753,228 87,581,791 28,642,273
Redemption of redeemable shares during the financial year (2,133,408) (7,552) (31,007,538) (6,936,245)
Balance at the end of the financial year 13,924,589 15,866,196 93,632,004 37,057,751
* Share classes launched during the year ended 30 November 2016.
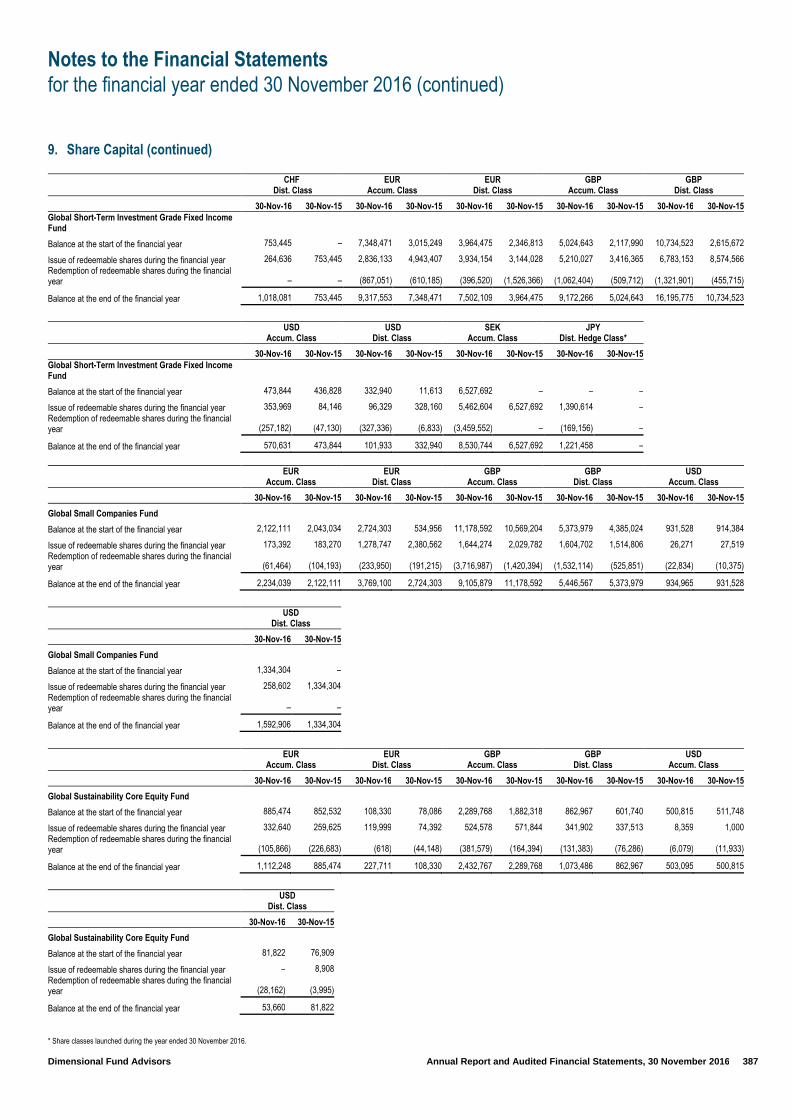
Notes to the Financial Statements
for the financial year ended 30 November 2016 (continued)
Dimensional Fund Advisors Annual Report and Audited Financial Statements, 30 November 2016 387
9. Share Capital (continued)
CHF
Dist. Class EUR
Accum. Class EUR
Dist. Class GBP
Accum. Class GBP
Dist. Class
30-Nov-16 30-Nov-15 30-Nov-16 30-Nov-15 30-Nov-16 30-Nov-15 30-Nov-16 30-Nov-15 30-Nov-16 30-Nov-15
Global Short-Term Investment Grade Fixed Income Fund
Balance at the start of the financial year 753,445 – 7,348,471 3,015,249 3,964,475 2,346,813 5,024,643 2,117,990 10,734,523 2,615,672
Issue of redeemable shares during the financial year 264,636 753,445 2,836,133 4,943,407 3,934,154 3,144,028 5,210,027 3,416,365 6,783,153 8,574,566
Redemption of redeemable shares during the financial year – – (867,051) (610,185) (396,520) (1,526,366) (1,062,404) (509,712) (1,321,901) (455,715)
Balance at the end of the financial year 1,018,081 753,445 9,317,553 7,348,471 7,502,109 3,964,475 9,172,266 5,024,643 16,195,775 10,734,523
USD
Accum. Class USD
Dist. Class SEK
Accum. Class JPY
Dist. Hedge Class*
30-Nov-16 30-Nov-15 30-Nov-16 30-Nov-15 30-Nov-16 30-Nov-15 30-Nov-16 30-Nov-15
Global Short-Term Investment Grade Fixed Income Fund
Balance at the start of the financial year 473,844 436,828 332,940 11,613 6,527,692 – – –
Issue of redeemable shares during the financial year 353,969 84,146 96,329 328,160 5,462,604 6,527,692 1,390,614 –
Redemption of redeemable shares during the financial year (257,182) (47,130) (327,336) (6,833) (3,459,552) – (169,156) –
Balance at the end of the financial year 570,631 473,844 101,933 332,940 8,530,744 6,527,692 1,221,458 –
EUR
Accum. Class EUR
Dist. Class GBP
Accum. Class GBP
Dist. Class USD
Accum. Class
30-Nov-16 30-Nov-15 30-Nov-16 30-Nov-15 30-Nov-16 30-Nov-15 30-Nov-16 30-Nov-15 30-Nov-16 30-Nov-15
Global Small Companies Fund
Balance at the start of the financial year 2,122,111 2,043,034 2,724,303 534,956 11,178,592 10,569,204 5,373,979 4,385,024 931,528 914,384
Issue of redeemable shares during the financial year 173,392 183,270 1,278,747 2,380,562 1,644,274 2,029,782 1,604,702 1,514,806 26,271 27,519
Redemption of redeemable shares during the financial year (61,464) (104,193) (233,950) (191,215) (3,716,987) (1,420,394) (1,532,114) (525,851) (22,834) (10,375)
Balance at the end of the financial year 2,234,039 2,122,111 3,769,100 2,724,303 9,105,879 11,178,592 5,446,567 5,373,979 934,965 931,528
USD
Dist. Class
30-Nov-16 30-Nov-15
Global Small Companies Fund
Balance at the start of the financial year 1,334,304 –
Issue of redeemable shares during the financial year 258,602 1,334,304
Redemption of redeemable shares during the financial year – –
Balance at the end of the financial year 1,592,906 1,334,304
EUR
Accum. Class EUR
Dist. Class GBP
Accum. Class GBP
Dist. Class USD
Accum. Class
30-Nov-16 30-Nov-15 30-Nov-16 30-Nov-15 30-Nov-16 30-Nov-15 30-Nov-16 30-Nov-15 30-Nov-16 30-Nov-15
Global Sustainability Core Equity Fund
Balance at the start of the financial year 885,474 852,532 108,330 78,086 2,289,768 1,882,318 862,967 601,740 500,815 511,748
Issue of redeemable shares during the financial year 332,640 259,625 119,999 74,392 524,578 571,844 341,902 337,513 8,359 1,000
Redemption of redeemable shares during the financial year (105,866) (226,683) (618) (44,148) (381,579) (164,394) (131,383) (76,286) (6,079) (11,933)
Balance at the end of the financial year 1,112,248 885,474 227,711 108,330 2,432,767 2,289,768 1,073,486 862,967 503,095 500,815
USD
Dist. Class
30-Nov-16 30-Nov-15
Global Sustainability Core Equity Fund
Balance at the start of the financial year 81,822 76,909
Issue of redeemable shares during the financial year – 8,908
Redemption of redeemable shares during the financial year (28,162) (3,995)
Balance at the end of the financial year 53,660 81,822
* Share classes launched during the year ended 30 November 2016.
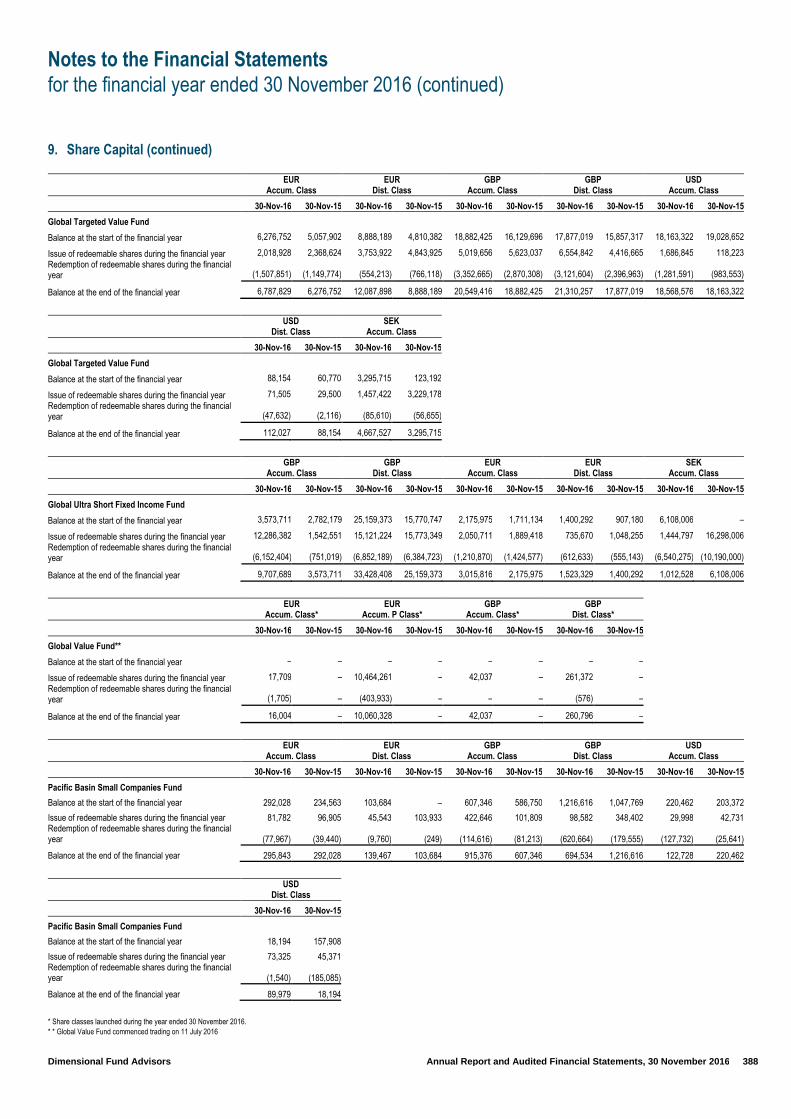
Notes to the Financial Statements
for the financial year ended 30 November 2016 (continued)
Dimensional Fund Advisors Annual Report and Audited Financial Statements, 30 November 2016 388
9. Share Capital (continued)
EUR
Accum. Class EUR
Dist. Class GBP
Accum. Class GBP
Dist. Class USD
Accum. Class
30-Nov-16 30-Nov-15 30-Nov-16 30-Nov-15 30-Nov-16 30-Nov-15 30-Nov-16 30-Nov-15 30-Nov-16 30-Nov-15
Global Targeted Value Fund
Balance at the start of the financial year 6,276,752 5,057,902 8,888,189 4,810,382 18,882,425 16,129,696 17,877,019 15,857,317 18,163,322 19,028,652
Issue of redeemable shares during the financial year 2,018,928 2,368,624 3,753,922 4,843,925 5,019,656 5,623,037 6,554,842 4,416,665 1,686,845 118,223
Redemption of redeemable shares during the financial year (1,507,851) (1,149,774) (554,213) (766,118) (3,352,665) (2,870,308) (3,121,604) (2,396,963) (1,281,591) (983,553)
Balance at the end of the financial year 6,787,829 6,276,752 12,087,898 8,888,189 20,549,416 18,882,425 21,310,257 17,877,019 18,568,576 18,163,322
USD
Dist. Class SEK
Accum. Class
30-Nov-16 30-Nov-15 30-Nov-16 30-Nov-15
Global Targeted Value Fund
Balance at the start of the financial year 88,154 60,770 3,295,715 123,192
Issue of redeemable shares during the financial year 71,505 29,500 1,457,422 3,229,178
Redemption of redeemable shares during the financial year (47,632) (2,116) (85,610) (56,655)
Balance at the end of the financial year 112,027 88,154 4,667,527 3,295,715
GBP
Accum. Class GBP
Dist. Class EUR
Accum. Class EUR
Dist. Class SEK
Accum. Class
30-Nov-16 30-Nov-15 30-Nov-16 30-Nov-15 30-Nov-16 30-Nov-15 30-Nov-16 30-Nov-15 30-Nov-16 30-Nov-15
Global Ultra Short Fixed Income Fund
Balance at the start of the financial year 3,573,711 2,782,179 25,159,373 15,770,747 2,175,975 1,711,134 1,400,292 907,180 6,108,006 –
Issue of redeemable shares during the financial year 12,286,382 1,542,551 15,121,224 15,773,349 2,050,711 1,889,418 735,670 1,048,255 1,444,797 16,298,006
Redemption of redeemable shares during the financial year (6,152,404) (751,019) (6,852,189) (6,384,723) (1,210,870) (1,424,577) (612,633) (555,143) (6,540,275) (10,190,000)
Balance at the end of the financial year 9,707,689 3,573,711 33,428,408 25,159,373 3,015,816 2,175,975 1,523,329 1,400,292 1,012,528 6,108,006
EUR
Accum. Class* EUR
Accum. P Class* GBP
Accum. Class* GBP
Dist. Class*
30-Nov-16 30-Nov-15 30-Nov-16 30-Nov-15 30-Nov-16 30-Nov-15 30-Nov-16 30-Nov-15
Global Value Fund**
Balance at the start of the financial year – – – – – – – –
Issue of redeemable shares during the financial year 17,709 – 10,464,261 – 42,037 – 261,372 –
Redemption of redeemable shares during the financial year (1,705) – (403,933) – – – (576) –
Balance at the end of the financial year 16,004 – 10,060,328 – 42,037 – 260,796 –
EUR
Accum. Class EUR
Dist. Class GBP
Accum. Class GBP
Dist. Class USD
Accum. Class
30-Nov-16 30-Nov-15 30-Nov-16 30-Nov-15 30-Nov-16 30-Nov-15 30-Nov-16 30-Nov-15 30-Nov-16 30-Nov-15
Pacific Basin Small Companies Fund
Balance at the start of the financial year 292,028 234,563 103,684 – 607,346 586,750 1,216,616 1,047,769 220,462 203,372
Issue of redeemable shares during the financial year 81,782 96,905 45,543 103,933 422,646 101,809 98,582 348,402 29,998 42,731 Redemption of redeemable shares during the financial year (77,967) (39,440) (9,760) (249) (114,616) (81,213) (620,664) (179,555) (127,732) (25,641)
Balance at the end of the financial year 295,843 292,028 139,467 103,684 915,376 607,346 694,534 1,216,616 122,728 220,462
USD
Dist. Class
30-Nov-16 30-Nov-15
Pacific Basin Small Companies Fund
Balance at the start of the financial year 18,194 157,908
Issue of redeemable shares during the financial year 73,325 45,371 Redemption of redeemable shares during the financial year (1,540) (185,085)
Balance at the end of the financial year 89,979 18,194
* Share classes launched during the year ended 30 November 2016.
* * Global Value Fund commenced trading on 11 July 2016

Notes to the Financial Statements
for the financial year ended 30 November 2016 (continued)
Dimensional Fund Advisors Annual Report and Audited Financial Statements, 30 November 2016 389
9. Share Capital (continued)
GBP
Accum. Class GBP
Accum. DR Class GBP
Dist. Class
30-Nov-16 30-Nov-15 30-Nov-16 30-Nov-15 30-Nov-16 30-Nov-15
Sterling Inflation Linked Intermediate Duration Fixed Income Fund
Balance at the start of the financial year 16,221,043 12,691,471 – 69,263 15,796,989 17,339,972
Issue of redeemable shares during the financial year 5,419,675 5,967,320 – 4,366 6,461,366 5,096,483 Redemption of redeemable shares during the financial year (1,931,305) (2,437,748) – (73,629) (2,608,793) (6,639,466)
Balance at the end of the financial year 19,709,413 16,221,043 – – 19,649,562 15,796,989
EUR
Accum. Class USD
Accum. Class
30-Nov-16 30-Nov-15 30-Nov-16 30-Nov-15
U.S. Core Equity Fund
Balance at the start of the financial year 9,138,680 – 100 –
Issue of redeemable shares during the financial year – 9,138,680 573,067 100 Redemption of redeemable shares during the financial year (9,138,680) – – –
Balance at the end of the financial year – 9,138,680 573,167 100
EUR
Accum. Class GBP
Accum. Class GBP
Dist. Class USD
Accum. Class USD
Dist. Class
30-Nov-16 30-Nov-15 30-Nov-16 30-Nov-15 30-Nov-16 30-Nov-15 30-Nov-16 30-Nov-15 30-Nov-16 30-Nov-15
U.S. Small Companies Fund
Balance at the start of the financial year 1,906,092 1,420,551 896,134 924,465 1,083,289 1,426,430 1,075,690 716,978 77,512 734,436
Issue of redeemable shares during the financial year 280,122 686,085 166,608 115,217 112,797 112,194 270,739 600,179 46,091 83,268 Redemption of redeemable shares during the financial year (286,642) (200,544) (177,974) (143,548) (345,362) (455,335) (457,240) (241,467) (12,890) (740,192)
Balance at the end of the financial year 1,899,572 1,906,092 884,768 896,134 850,724 1,083,289 889,189 1,075,690 110,713 77,512
GBP
Accum. Class GBP
Dist. Class EUR
Accum. Class*
30-Nov-16 30-Nov-15 30-Nov-16 30-Nov-15 30-Nov-16 30-Nov-15
World Allocation 20/80 Fund
Balance at the start of the financial year 11,168 – 5,100 – – –
Issue of redeemable shares during the financial year 881,709 11,168 96,164 5,100 195,537 – Redemption of redeemable shares during the financial year (46,207) – (6,692) – (6,973) –
Balance at the end of the financial year 846,670 11,168 94,572 5,100 188,564 –
GBP
Accum. Class GBP
Dist. Class EUR
Accum. Class*
30-Nov-16 30-Nov-15 30-Nov-16 30-Nov-15 30-Nov-16 30-Nov-15
World Allocation 40/60 Fund
Balance at the start of the financial year 7,281,757 5,621,485 1,999,281 1,468,238 – –
Issue of redeemable shares during the financial year 5,635,311 2,738,767 1,499,674 820,994 177,489 – Redemption of redeemable shares during the financial year (1,259,258) (1,078,495) (431,757) (289,951) (16,642) –
Balance at the end of the financial year 11,657,810 7,281,757 3,067,198 1,999,281 160,847 –
GBP Accum. Class
GBP Dist. Class
EUR Accum. Class*
30-Nov-16 30-Nov-15 30-Nov-16 30-Nov-15 30-Nov-16 30-Nov-15
World Allocation 60/40 Fund
Balance at the start of the financial year 14,351,118 9,758,563 4,758,832 3,423,626 – –
Issue of redeemable shares during the financial year 7,592,858 6,118,137 1,982,249 1,828,327 345,001 – Redemption of redeemable shares during the financial year (2,362,639) (1,525,582) (704,222) (493,121) (30,677) –
Balance at the end of the financial year 19,581,337 14,351,118 6,036,859 4,758,832 314,324 –
* Share classes launched during the year ended 30 November 2016.

Notes to the Financial Statements
for the financial year ended 30 November 2016 (continued)
Dimensional Fund Advisors Annual Report and Audited Financial Statements, 30 November 2016 390
9. Share Capital (continued)
GBP Accum. Class
GBP Dist. Class
EUR Accum. Class*
30-Nov-16 30-Nov-15 30-Nov-16 30-Nov-15 30-Nov-16 30-Nov-15
World Allocation 80/20 Fund
Balance at the start of the financial year 17,761 – 27,553 – – –
Issue of redeemable shares during the financial year 2,612,568 17,761 186,432 27,553 111,999 – Redemption of redeemable shares during the financial year (221,347) – (7,345) – (5,484) –
Balance at the end of the financial year 2,408,982 17,761 206,640 27,553 106,515 –
EUR
Accum. Class EUR
Dist. Class GBP
Accum. Class GBP
Dist. Class USD
Dist. Class
30-Nov-16 30-Nov-15 30-Nov-16 30-Nov-15 30-Nov-16 30-Nov-15 30-Nov-16 30-Nov-15 30-Nov-16 30-Nov-15
World Equity Fund
Balance at the start of the financial year 9,661,662 7,218,267 3,568,919 2,556,352 8,882,206 4,999,983 6,067,565 5,086,432 782,000 –
Issue of redeemable shares during the financial year 2,784,977 9,097,163 1,913,618 1,752,448 6,495,205 5,102,555 7,870,843 2,277,717 383,989 782,000 Redemption of redeemable shares during the financial year (1,011,249) (6,653,768) (377,972) (739,881) (2,581,193) (1,220,332) (896,821) (1,296,584) – –
Balance at the end of the financial year 11,435,390 9,661,662 5,104,565 3,568,919 12,796,218 8,882,206 13,041,587 6,067,565 1,165,989 782,000
SEK
Accum.Class*
30-Nov-16 30-Nov-15
World Equity Fund
Balance at the start of the financial year – –
Issue of redeemable shares during the financial year 4,038,442 – Redemption of redeemable shares during the financial year (51,158) –
Balance at the end of the financial year 3,987,284 –
* Share classes launched during the year ended 30 November 2016.
10. Related Party Transactions The related parties to the Fund are the directors, the Investment Manager, the Investment Sub–Advisors and the shareholders with significant
holdings of at least 20% of the Fund.
As at 30 November 2016 and November 2015, David Salisbury held shares in each of the following Funds:
Fund 30 November 2016 30 November 2015
Emerging Markets Value Fund 1,102 GBP Accumulation Class 1,102 GBP Accumulation Class
European Small Companies Fund 1,125 GBP Accumulation Class 1,125 GBP Accumulation Class
Global Short Fixed Income Fund 85,515 USD Distributing Class 85,515 USD Distributing Class
Global Short–Term Investment Grade Fixed Income Fund 25,274 GBP Distributing Class 25,274 GBP Distributing Class
Global Ultra Short Fixed Income Fund 63,276 GBP Distributing Class 63,276 GBP Distributing Class
Pacific Basin Small Companies Fund 1,089 GBP Accumulation Class 1,089 GBP Accumulation Class
U.S. Small Companies Fund 1,008 GBP Accumulation Class 1,008 GBP Accumulation Class
As 30 November 2016 and 30 November 2015, the Investment Manager, Dimensional Fund Advisors Ltd held shares in each of the following
Funds:
Fund 30 November 2016 30 November 2015
Emerging Markets Value Fund 1,150 SEK Accumulation Class 1,150 SEK Accumulation Class
Emerging Markets Large Cap Core Equity Fund 100 EUR Distributing Class -
Euro Inflation Linked Long Duration Fixed Income Fund 10,469 EUR Accumulation Class 100 EUR Accumulation Class
Global Core Equity Fund 1,150 SEK Accumulation Class 1,150 SEK Accumulation Class
Global Short Fixed Income Fund 1,150 SEK Accumulation Class 1,150 SEK Accumulation Class
Global Short–Term Investment Grade Fixed Income Fund – 100 USD Distributing Class
Global Short–Term Investment Grade Fixed Income Fund 1,150 SEK Accumulation Class 1,150 SEK Accumulation Class

Notes to the Financial Statements
for the financial year ended 30 November 2016 (continued)
Dimensional Fund Advisors Annual Report and Audited Financial Statements, 30 November 2016 391
10. Related Party Transactions (continued)
Fund 30 November 2016 30 November 2015
Global Sustainability Core Equity Fund – 100 EUR Distributing Class
Global Sustainability Core Equity Fund 100 USD Accumulation Class 100 USD Accumulation Class
Global Sustainability Core Equity Fund 100 USD Distributing Class 100 USD Distributing Class
Global Targeted Value Fund 1,150 SEK Accumulation Class 1,150 SEK Accumulation Class
Global Ultra Short Fixed Income Fund 95,785 GBP Accumulation Class 481,232 GBP Accumulation Class
Global Ultra Short Fixed Income Fund 1,150 SEK Accumulation Class 1,150 SEK Accumulation Class
U.S. Core Equity Fund 187,084 USD Accumulation Class 100 USD Accumulation Class
World Allocation 20/80 Fund – 100 GBP Accumulation Class
World Allocation 20/80 Fund – 100 GBP Distributing Class
World Allocation 80/20 Fund – 100 GBP Accumulation Class
World Allocation 80/20 Fund – 100 GBP Distributing Class
As at 30 November 2016, Global Sustainability Core Equity Fund, World Allocation 20/80 Fund, World Allocation 40/60 Fund, World Allocation
60/40 Fund and World Allocation 80/20 Fund invested in other Funds of the Company and also other related funds which have appointed the same
Investment Manager, Investment Sub-Advisor or other related party entity to provide investment management services to the Company, as
disclosed in the Portfolio of Investments. The management fees in relation to the underlying funds have been waived by the Investment Manager,
and these waivers are disclosed in the Statement of Comprehensive Income.
The following directors are also directors of entities in which certain Funds have made investments: Arthur Barlow, David G. Booth, Catherine L.
Newell, Eduardo Repetto, John Romiza.
In the opinion of the directors, the Investment Manager and the Investment Sub-Advisors are related parties under FRS 102. Fees earned by these
parties and the amounts due at 30 November 2016 and 30 November 2015 are disclosed in the Statement of Comprehensive Income and
Statement of Financial Position respectively.
Management fees waived and reimbursed during the period are disclosed in the Statement of Comprehensive Income.
The following tables detail the number of shareholders with significant holdings of at least 20 percent of the relevant Fund and the aggregate value
and percentage of that holding as at 30 November 2016 and 30 November 2015. One or more of the shareholders may be omnibus accounts,
which typically hold shares for the benefit of several other underlying investors.
30 November 2016
Fund Number of Significant
Shareholders of the Fund Value of Holding Aggregate Shareholding
as a % Fund NAV
Emerging Markets Large Cap Core Equity Fund 1 USD297,508,713 97.39
Euro Inflation Linked Intermediate Duration Fixed Income Fund 1 EUR3,940,952 50.88
Euro Inflation Linked Long Duration Fixed Income Fund 1 EUR123,925 100.00
European Value Fund 1 EUR14,365,606 23.45
Global Small Companies Fund 1 USD106,321,194 21.96
Global Sustainability Core Equity Fund 1 USD27,186,407 28.54
Global Value Fund 2 USD104,272,341 83.20
Sterling Inflation Linked Intermediate Duration Fixed Income Fund 1 GBP206,289,282 40.64
U.S. Core Equity Fund 2 USD6,206,491 91.63
World Allocation 20/80 Fund 1 GBP2,635,983 22.60
World Allocation 40/60 Fund 1 GBP56,408,048 26.70
World Allocation 60/40 Fund 1 GBP121,397,505 29.26
World Allocation 80/20 Fund 2 GBP24,415,131 72.80

Notes to the Financial Statements
for the financial year ended 30 November 2016 (continued)
Dimensional Fund Advisors Annual Report and Audited Financial Statements, 30 November 2016 392
10. Related Party Transactions (continued) 30 November 2015
Fund Number of Significant
Shareholders of the Fund Value of Holding Aggregate Shareholding
as a % Fund NAV
Emerging Markets Large Cap Core Equity Fund 1 USD 115,677,118 100.00%
Euro Inflation Linked Intermediate Duration Fixed Income Fund 1 EUR 2,021,735 31.87%
Euro Inflation Linked Long Duration Fixed Income Fund 1 EUR 15,192,556 100.00%
European Value Fund 1 EUR 13,605,211 23.73%
Global Small Companies Fund 1 USD 95,269,919 20.20%
Global Sustainability Core Equity Fund 1 USD 22,819,257 28.22%
Pacific Basin Small Companies Fund 1 USD 13,623,942 20.16%
Sterling Inflation Linked Intermediate Duration Fixed Income Fund 1 GBP 143,146,610 37.70%
U.S. Core Equity Fund 1 USD 104,131,462 100.00%
World Allocation 20/80 Fund 2 GBP 161,226 98.80%
World Allocation 60/40 Fund 2 GBP 118,417,374 44.97%
World Allocation 80/20 Fund 2 GBP 310,936 67.69%
World Equity Fund 1 GBP 80,019,567 20.28%
Cross Holdings
As at the Statement of Financial Position date a number of funds invested in other funds of the Company. Details of these cross investments are
outlined below. The impact of these cross–investment transactions have been eliminated from the total column of the Statement of Financial
Position, Statement of Comprehensive Income and the Statement of Changes in Net Assets Attributable to Holders of Redeemable Shares.
Global Sustainability Core Equity Fund held the following investments as at 30 November 2016 and related gains and losses on funds within the
Company during the financial year ended 30 November 2016:
Fund Global Small
Companies Fund USD
Issue of shares 2,590,000
Redemption of shares –
Fair value of investment funds 16,550,291 Net realised gain/(loss) in on financial assets at fair value through profit or loss –
Dividend Income 228,773 Movement in Net unrealised gain on financial assets at fair value through profit or loss 950,825
World Allocation 40/60 Fund held the following investments as at 30 November 2016 and related gains and losses on funds within the Company
during the financial year ended 30 November 2016:
Fund European Small
Companies Fund Global Core Equity Fund
Global Short Fixed Income
Fund
Global Short–Term Investment
Grade Fixed Income Fund
Global Targeted Value Fund
Global Ultra Short Fixed
Income Fund Pacific Basin Small
Companies Fund GBP GBP GBP GBP GBP GBP GBP
Issue of shares – 17,349,834 14,590,239 11,434,589 4,732,679 17,170,665 –
Redemption of shares (4,024,397) (1,732,146) (550,000) (250,000) (2,408,551) (300,000) (2,353,324)
Fair value of investment funds – 29,115,204 31,418,161 25,106,718 10,546,772 37,883,933 – Net realised gain/(loss) on financial assets at fair value through profit or loss 445,189 457,576 15,221 1,346 735,832 599 179,854
Dividend Income – 466,245 407,457 385,310 124,483 275,743 – Movement in Net unrealised gain/(loss) on financial assets at fair value through profit or loss (393,232) 4,439,172 (225,380) (158,589) 2,042,166 (187,431) (197,913)

Notes to the Financial Statements
for the financial year ended 30 November 2016 (continued)
Dimensional Fund Advisors Annual Report and Audited Financial Statements, 30 November 2016 393
10. Related Party Transactions (continued) Cross Holdings (continued)
World Allocation 40/60 Fund held the following investments as at 30 November 2016 and related gains and losses on funds within the Company
during the financial year ended 30 November 2016:
Fund World Equity
Fund
GBP
Issue of shares 26,471,543
Redemption of shares (831,785)
Fair value of investment funds 37,191,918
Net realised gain/(loss) in on financial assets at fair value through profit or loss 189,162
Dividend Income 530,891
Movement in Net unrealised gain on financial assets at fair value through profit or loss 7,116,904
World Allocation 60/40 Fund held the following investments as at 30 November 2016 and related gains and losses on funds within the Company
during the financial year ended 30 November 2016:
Fund European Small
Companies Fund Global Core Equity Fund
Global Short Fixed Income
Fund
Global Short–Term Investment
Grade Fixed Income Fund
Global Targeted Value Fund
Global Ultra Short Fixed
Income Fund Pacific Basin Small
Companies Fund GBP GBP GBP GBP GBP GBP GBP
Issue of shares – 32,301,722 7,861,120 20,635,473 21,958,965 13,266,029 –
Redemption of shares (13,312,075) (155,459) (912,598) (2,282,468) (5,701,450) (850,653) (7,224,423)
Fair value of investment funds – 72,811,688 20,579,773 49,292,427 43,846,107 33,023,586 – Net realised gain/(loss) on financial assets at fair value through profit or loss 1,452,312 39,196 1,120 21,393 1,764,749 1,703 296,675
Dividend Income – 1,203,794 272,378 772,704 512,821 244,739 – Movement in Net unrealised gain/(loss) on financial assets at fair value through profit or loss (1,145,918) 13,414,024 (112,491) (276,820) 9,369,607 (159,469) (427,220)
World Allocation 60/40 Fund held the following investments as at 30 November 2016 and related gains and losses on funds within the Company
during the financial year ended 30 November 2016:
Fund World Equity
Fund
GBP
Issue of shares 50,106,147
Redemption of shares (37,812)
Fair value of investment funds 72,980,485
Net realised gain/(loss) in on financial assets at fair value through profit or loss 8,120
Dividend Income 1,056,724
Movement in Net unrealised gain on financial assets at fair value through profit or loss 15,162,481
World Allocation 80/20 Fund held the following investments as at 30 November 2016 and related gains and losses on funds within the Company
during the financial year ended 30 November 2016:
Fund Global Core Equity Fund
Global Short–Term Investment Grade
Fixed Income Fund Global Targeted
Value Fund World Equity
Fund GBP GBP GBP GBP
Issue of shares 5,484,098 3,425,426 5,074,162 5,210,039
Redemption of shares (363,317) (130,802) (585,830) (158,536)
Fair value of investment funds 5,862,366 3,291,596 5,530,021 5,877,938 Net realised gain/(loss) on financial assets at fair value through profit or loss 67,350 2,088 150,776 29,877
Dividend Income 84,591 41,023 54,447 73,790 Movement in Net unrealised gain/(loss) on financial assets at fair value through profit or loss 592,205 (50,622) 817,475 714,968
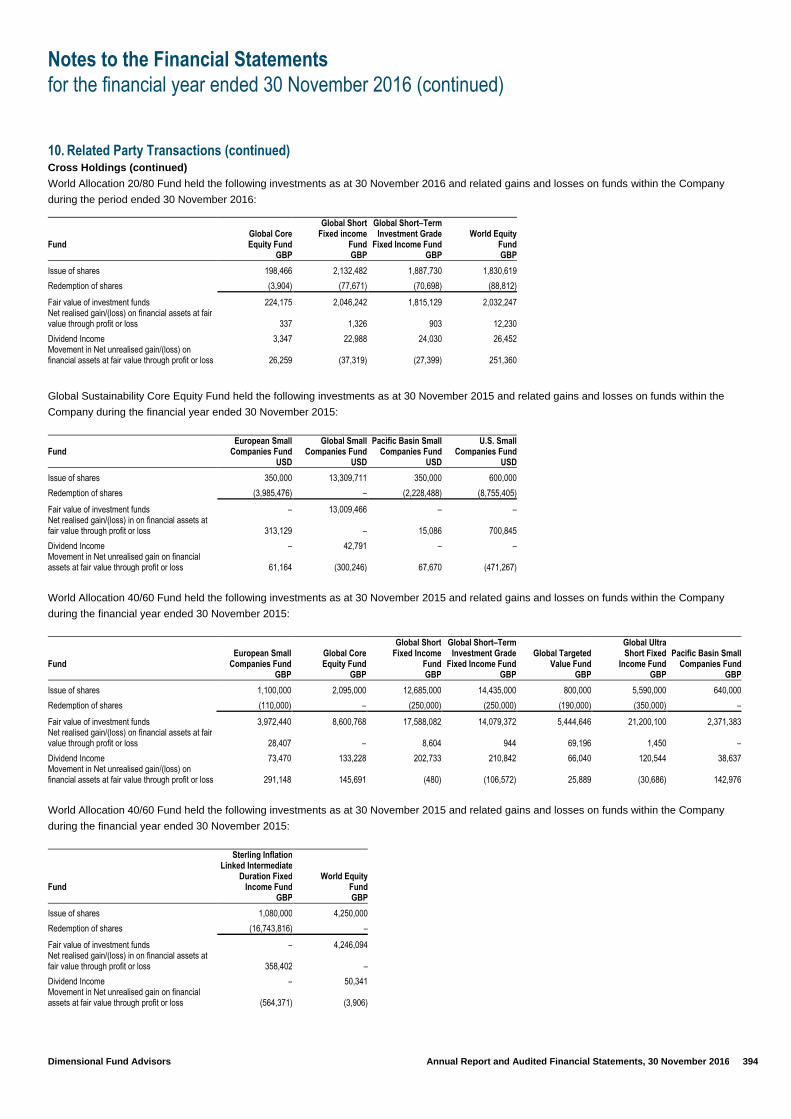
Notes to the Financial Statements
for the financial year ended 30 November 2016 (continued)
Dimensional Fund Advisors Annual Report and Audited Financial Statements, 30 November 2016 394
10. Related Party Transactions (continued) Cross Holdings (continued)
World Allocation 20/80 Fund held the following investments as at 30 November 2016 and related gains and losses on funds within the Company
during the period ended 30 November 2016:
Fund Global Core Equity Fund
Global Short Fixed income
Fund
Global Short–Term Investment Grade
Fixed Income Fund World Equity
Fund GBP GBP GBP GBP
Issue of shares 198,466 2,132,482 1,887,730 1,830,619
Redemption of shares (3,904) (77,671) (70,698) (88,812)
Fair value of investment funds 224,175 2,046,242 1,815,129 2,032,247 Net realised gain/(loss) on financial assets at fair value through profit or loss 337 1,326 903 12,230
Dividend Income 3,347 22,988 24,030 26,452 Movement in Net unrealised gain/(loss) on financial assets at fair value through profit or loss 26,259 (37,319) (27,399) 251,360
Global Sustainability Core Equity Fund held the following investments as at 30 November 2015 and related gains and losses on funds within the
Company during the financial year ended 30 November 2015:
Fund European Small
Companies Fund Global Small
Companies Fund Pacific Basin Small
Companies Fund U.S. Small
Companies Fund USD USD USD USD
Issue of shares 350,000 13,309,711 350,000 600,000
Redemption of shares (3,985,476) – (2,228,488) (8,755,405)
Fair value of investment funds – 13,009,466 – – Net realised gain/(loss) in on financial assets at fair value through profit or loss 313,129 – 15,086 700,845
Dividend Income – 42,791 – – Movement in Net unrealised gain on financial assets at fair value through profit or loss 61,164 (300,246) 67,670 (471,267)
World Allocation 40/60 Fund held the following investments as at 30 November 2015 and related gains and losses on funds within the Company
during the financial year ended 30 November 2015:
Fund European Small
Companies Fund Global Core Equity Fund
Global Short Fixed Income
Fund
Global Short–Term Investment Grade
Fixed Income Fund Global Targeted
Value Fund
Global Ultra Short Fixed
Income Fund Pacific Basin Small
Companies Fund GBP GBP GBP GBP GBP GBP GBP
Issue of shares 1,100,000 2,095,000 12,685,000 14,435,000 800,000 5,590,000 640,000
Redemption of shares (110,000) – (250,000) (250,000) (190,000) (350,000) –
Fair value of investment funds 3,972,440 8,600,768 17,588,082 14,079,372 5,444,646 21,200,100 2,371,383 Net realised gain/(loss) on financial assets at fair value through profit or loss 28,407 – 8,604 944 69,196 1,450 –
Dividend Income 73,470 133,228 202,733 210,842 66,040 120,544 38,637 Movement in Net unrealised gain/(loss) on financial assets at fair value through profit or loss 291,148 145,691 (480) (106,572) 25,889 (30,686) 142,976
World Allocation 40/60 Fund held the following investments as at 30 November 2015 and related gains and losses on funds within the Company
during the financial year ended 30 November 2015:
Fund
Sterling Inflation Linked Intermediate
Duration Fixed Income Fund
World Equity Fund
GBP GBP
Issue of shares 1,080,000 4,250,000
Redemption of shares (16,743,816) –
Fair value of investment funds – 4,246,094
Net realised gain/(loss) in on financial assets at fair value through profit or loss 358,402 –
Dividend Income – 50,341
Movement in Net unrealised gain on financial assets at fair value through profit or loss (564,371) (3,906)
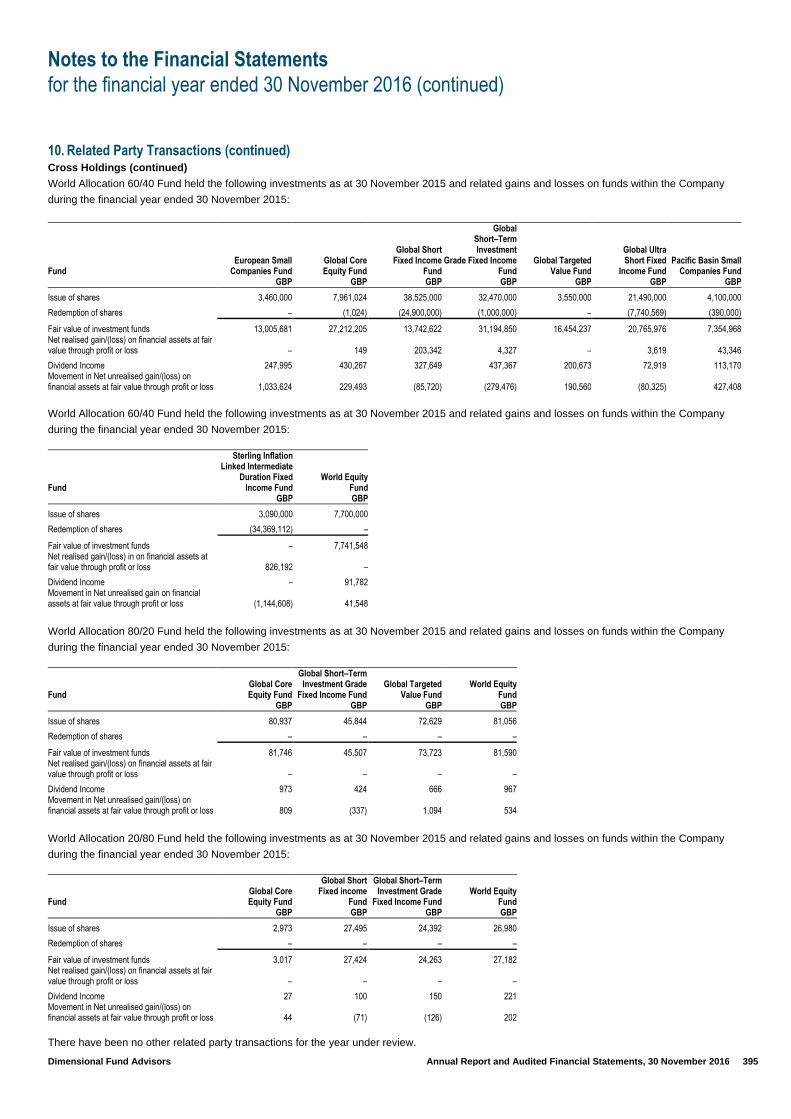
Notes to the Financial Statements
for the financial year ended 30 November 2016 (continued)
Dimensional Fund Advisors Annual Report and Audited Financial Statements, 30 November 2016 395
10. Related Party Transactions (continued) Cross Holdings (continued)
World Allocation 60/40 Fund held the following investments as at 30 November 2015 and related gains and losses on funds within the Company
during the financial year ended 30 November 2015:
Fund European Small
Companies Fund Global Core Equity Fund
Global Short Fixed Income
Fund
Global Short–Term Investment
Grade Fixed Income Fund
Global Targeted Value Fund
Global Ultra Short Fixed
Income Fund Pacific Basin Small
Companies Fund GBP GBP GBP GBP GBP GBP GBP
Issue of shares 3,460,000 7,961,024 38,525,000 32,470,000 3,550,000 21,490,000 4,100,000
Redemption of shares – (1,024) (24,900,000) (1,000,000) – (7,740,569) (390,000)
Fair value of investment funds 13,005,681 27,212,205 13,742,622 31,194,850 16,454,237 20,765,976 7,354,968 Net realised gain/(loss) on financial assets at fair value through profit or loss – 149 203,342 4,327 – 3,619 43,346
Dividend Income 247,995 430,267 327,649 437,367 200,673 72,919 113,170 Movement in Net unrealised gain/(loss) on financial assets at fair value through profit or loss 1,033,624 229,493 (85,720) (279,476) 190,560 (80,325) 427,408
World Allocation 60/40 Fund held the following investments as at 30 November 2015 and related gains and losses on funds within the Company
during the financial year ended 30 November 2015:
Fund
Sterling Inflation Linked Intermediate
Duration Fixed Income Fund
World Equity Fund
GBP GBP
Issue of shares 3,090,000 7,700,000
Redemption of shares (34,369,112) –
Fair value of investment funds – 7,741,548
Net realised gain/(loss) in on financial assets at fair value through profit or loss 826,192 –
Dividend Income – 91,782
Movement in Net unrealised gain on financial assets at fair value through profit or loss (1,144,608) 41,548
World Allocation 80/20 Fund held the following investments as at 30 November 2015 and related gains and losses on funds within the Company
during the financial year ended 30 November 2015:
Fund Global Core Equity Fund
Global Short–Term Investment Grade
Fixed Income Fund Global Targeted
Value Fund World Equity
Fund GBP GBP GBP GBP
Issue of shares 80,937 45,844 72,629 81,056
Redemption of shares – – – –
Fair value of investment funds 81,746 45,507 73,723 81,590 Net realised gain/(loss) on financial assets at fair value through profit or loss – – – –
Dividend Income 973 424 666 967 Movement in Net unrealised gain/(loss) on financial assets at fair value through profit or loss 809 (337) 1,094 534
World Allocation 20/80 Fund held the following investments as at 30 November 2015 and related gains and losses on funds within the Company
during the financial year ended 30 November 2015:
Fund Global Core Equity Fund
Global Short Fixed income
Fund
Global Short–Term Investment Grade
Fixed Income Fund World Equity
Fund GBP GBP GBP GBP
Issue of shares 2,973 27,495 24,392 26,980
Redemption of shares – – – –
Fair value of investment funds 3,017 27,424 24,263 27,182 Net realised gain/(loss) on financial assets at fair value through profit or loss – – – –
Dividend Income 27 100 150 221 Movement in Net unrealised gain/(loss) on financial assets at fair value through profit or loss 44 (71) (126) 202
There have been no other related party transactions for the year under review.
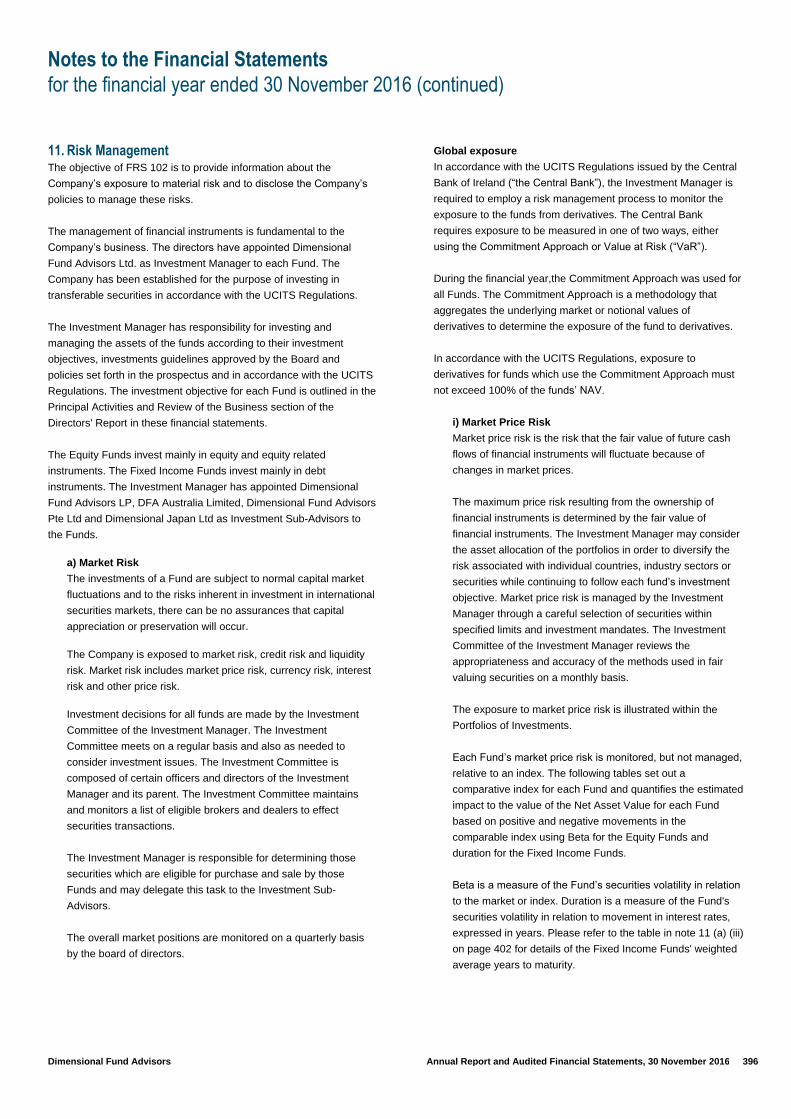
Notes to the Financial Statements
for the financial year ended 30 November 2016 (continued)
Dimensional Fund Advisors Annual Report and Audited Financial Statements, 30 November 2016 396
11. Risk Management The objective of FRS 102 is to provide information about the
Company’s exposure to material risk and to disclose the Company’s
policies to manage these risks.
The management of financial instruments is fundamental to the
Company’s business. The directors have appointed Dimensional
Fund Advisors Ltd. as Investment Manager to each Fund. The
Company has been established for the purpose of investing in
transferable securities in accordance with the UCITS Regulations.
The Investment Manager has responsibility for investing and
managing the assets of the funds according to their investment
objectives, investments guidelines approved by the Board and
policies set forth in the prospectus and in accordance with the UCITS
Regulations. The investment objective for each Fund is outlined in the
Principal Activities and Review of the Business section of the
Directors' Report in these financial statements.
The Equity Funds invest mainly in equity and equity related
instruments. The Fixed Income Funds invest mainly in debt
instruments. The Investment Manager has appointed Dimensional
Fund Advisors LP, DFA Australia Limited, Dimensional Fund Advisors
Pte Ltd and Dimensional Japan Ltd as Investment Sub-Advisors to
the Funds.
a) Market Risk
The investments of a Fund are subject to normal capital market
fluctuations and to the risks inherent in investment in international
securities markets, there can be no assurances that capital
appreciation or preservation will occur.
The Company is exposed to market risk, credit risk and liquidity
risk. Market risk includes market price risk, currency risk, interest
risk and other price risk.
Investment decisions for all funds are made by the Investment
Committee of the Investment Manager. The Investment
Committee meets on a regular basis and also as needed to
consider investment issues. The Investment Committee is
composed of certain officers and directors of the Investment
Manager and its parent. The Investment Committee maintains
and monitors a list of eligible brokers and dealers to effect
securities transactions.
The Investment Manager is responsible for determining those
securities which are eligible for purchase and sale by those
Funds and may delegate this task to the Investment Sub-
Advisors.
The overall market positions are monitored on a quarterly basis
by the board of directors.
Global exposure
In accordance with the UCITS Regulations issued by the Central
Bank of Ireland (“the Central Bank”), the Investment Manager is
required to employ a risk management process to monitor the
exposure to the funds from derivatives. The Central Bank
requires exposure to be measured in one of two ways, either
using the Commitment Approach or Value at Risk (“VaR”).
During the financial year,the Commitment Approach was used for
all Funds. The Commitment Approach is a methodology that
aggregates the underlying market or notional values of
derivatives to determine the exposure of the fund to derivatives.
In accordance with the UCITS Regulations, exposure to
derivatives for funds which use the Commitment Approach must
not exceed 100% of the funds’ NAV.
i) Market Price Risk
Market price risk is the risk that the fair value of future cash
flows of financial instruments will fluctuate because of
changes in market prices.
The maximum price risk resulting from the ownership of
financial instruments is determined by the fair value of
financial instruments. The Investment Manager may consider
the asset allocation of the portfolios in order to diversify the
risk associated with individual countries, industry sectors or
securities while continuing to follow each fund’s investment
objective. Market price risk is managed by the Investment
Manager through a careful selection of securities within
specified limits and investment mandates. The Investment
Committee of the Investment Manager reviews the
appropriateness and accuracy of the methods used in fair
valuing securities on a monthly basis.
The exposure to market price risk is illustrated within the
Portfolios of Investments.
Each Fund’s market price risk is monitored, but not managed,
relative to an index. The following tables set out a
comparative index for each Fund and quantifies the estimated
impact to the value of the Net Asset Value for each Fund
based on positive and negative movements in the
comparable index using Beta for the Equity Funds and
duration for the Fixed Income Funds.
Beta is a measure of the Fund’s securities volatility in relation
to the market or index. Duration is a measure of the Fund's
securities volatility in relation to movement in interest rates,
expressed in years. Please refer to the table in note 11 (a) (iii)
on page 402 for details of the Fixed Income Funds' weighted
average years to maturity.
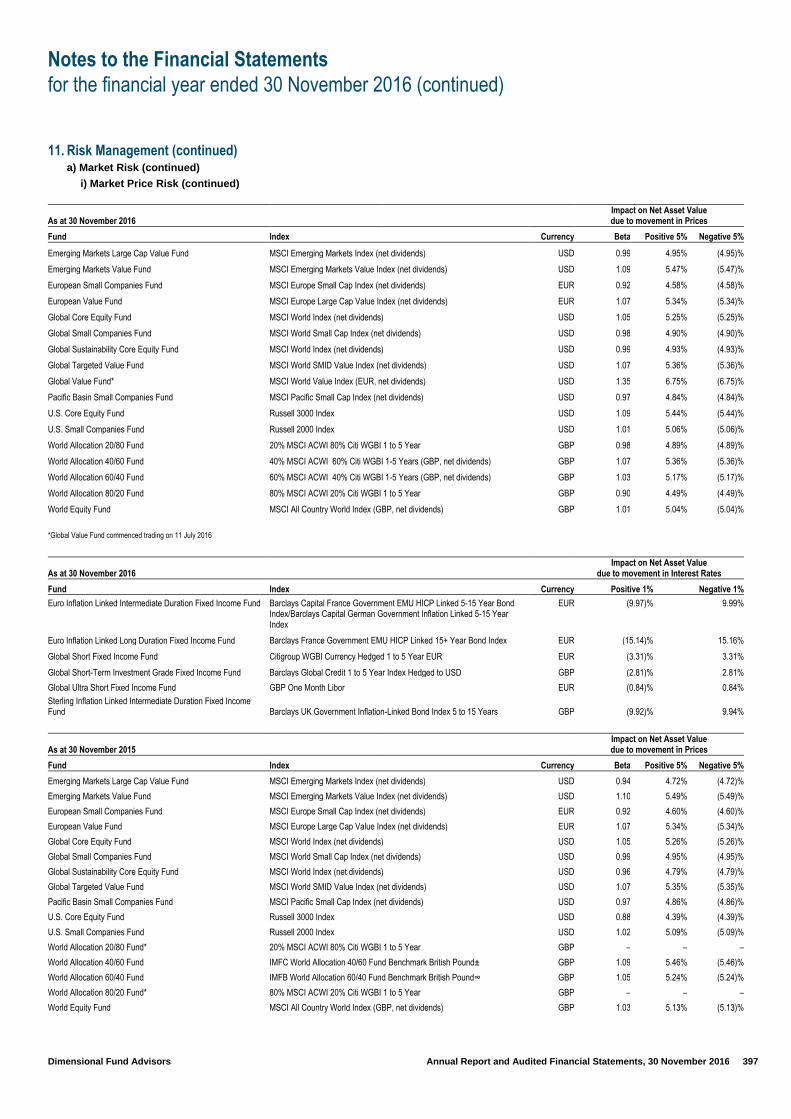
Notes to the Financial Statements
for the financial year ended 30 November 2016 (continued)
Dimensional Fund Advisors Annual Report and Audited Financial Statements, 30 November 2016 397
11. Risk Management (continued) a) Market Risk (continued)
i) Market Price Risk (continued)
As at 30 November 2016 Impact on Net Asset Value due to movement in Prices
Fund Index Currency Beta Positive 5% Negative 5%
Emerging Markets Large Cap Value Fund MSCI Emerging Markets Index (net dividends) USD 0.99 4.95% (4.95)%
Emerging Markets Value Fund MSCI Emerging Markets Value Index (net dividends) USD 1.09 5.47% (5.47)%
European Small Companies Fund MSCI Europe Small Cap Index (net dividends) EUR 0.92 4.58% (4.58)%
European Value Fund MSCI Europe Large Cap Value Index (net dividends) EUR 1.07 5.34% (5.34)%
Global Core Equity Fund MSCI World Index (net dividends) USD 1.05 5.25% (5.25)%
Global Small Companies Fund MSCI World Small Cap Index (net dividends) USD 0.98 4.90% (4.90)%
Global Sustainability Core Equity Fund MSCI World Index (net dividends) USD 0.99 4.93% (4.93)%
Global Targeted Value Fund MSCI World SMID Value Index (net dividends) USD 1.07 5.36% (5.36)%
Global Value Fund* MSCI World Value Index (EUR, net dividends) USD 1.35 6.75% (6.75)%
Pacific Basin Small Companies Fund MSCI Pacific Small Cap Index (net dividends) USD 0.97 4.84% (4.84)%
U.S. Core Equity Fund Russell 3000 Index USD 1.09 5.44% (5.44)%
U.S. Small Companies Fund Russell 2000 Index USD 1.01 5.06% (5.06)%
World Allocation 20/80 Fund 20% MSCI ACWI 80% Citi WGBI 1 to 5 Year GBP 0.98 4.89% (4.89)%
World Allocation 40/60 Fund 40% MSCI ACWI 60% Citi WGBI 1-5 Years (GBP, net dividends) GBP 1.07 5.36% (5.36)%
World Allocation 60/40 Fund 60% MSCI ACWI 40% Citi WGBI 1-5 Years (GBP, net dividends) GBP 1.03 5.17% (5.17)%
World Allocation 80/20 Fund 80% MSCI ACWI 20% Citi WGBI 1 to 5 Year GBP 0.90 4.49% (4.49)%
World Equity Fund MSCI All Country World Index (GBP, net dividends) GBP 1.01 5.04% (5.04)%
*Global Value Fund commenced trading on 11 July 2016
As at 30 November 2016 Impact on Net Asset Value
due to movement in Interest Rates
Fund Index Currency Positive 1% Negative 1%
Euro Inflation Linked Intermediate Duration Fixed Income Fund Barclays Capital France Government EMU HICP Linked 5-15 Year Bond Index/Barclays Capital German Government Inflation Linked 5-15 Year Index
EUR (9.97)% 9.99%
Euro Inflation Linked Long Duration Fixed Income Fund Barclays France Government EMU HICP Linked 15+ Year Bond Index EUR (15.14)% 15.16%
Global Short Fixed Income Fund Citigroup WGBI Currency Hedged 1 to 5 Year EUR EUR (3.31)% 3.31%
Global Short-Term Investment Grade Fixed Income Fund Barclays Global Credit 1 to 5 Year Index Hedged to USD GBP (2.81)% 2.81%
Global Ultra Short Fixed Income Fund GBP One Month Libor EUR (0.84)% 0.84%
Sterling Inflation Linked Intermediate Duration Fixed Income Fund Barclays UK Government Inflation-Linked Bond Index 5 to 15 Years GBP (9.92)% 9.94%
As at 30 November 2015 Impact on Net Asset Value due to movement in Prices
Fund Index Currency Beta Positive 5% Negative 5%
Emerging Markets Large Cap Value Fund MSCI Emerging Markets Index (net dividends) USD 0.94 4.72% (4.72)%
Emerging Markets Value Fund MSCI Emerging Markets Value Index (net dividends) USD 1.10 5.49% (5.49)%
European Small Companies Fund MSCI Europe Small Cap Index (net dividends) EUR 0.92 4.60% (4.60)%
European Value Fund MSCI Europe Large Cap Value Index (net dividends) EUR 1.07 5.34% (5.34)%
Global Core Equity Fund MSCI World Index (net dividends) USD 1.05 5.26% (5.26)%
Global Small Companies Fund MSCI World Small Cap Index (net dividends) USD 0.99 4.95% (4.95)%
Global Sustainability Core Equity Fund MSCI World Index (net dividends) USD 0.96 4.79% (4.79)%
Global Targeted Value Fund MSCI World SMID Value Index (net dividends) USD 1.07 5.35% (5.35)%
Pacific Basin Small Companies Fund MSCI Pacific Small Cap Index (net dividends) USD 0.97 4.86% (4.86)%
U.S. Core Equity Fund Russell 3000 Index USD 0.88 4.39% (4.39)%
U.S. Small Companies Fund Russell 2000 Index USD 1.02 5.09% (5.09)%
World Allocation 20/80 Fund* 20% MSCI ACWI 80% Citi WGBI 1 to 5 Year GBP – – –
World Allocation 40/60 Fund IMFC World Allocation 40/60 Fund Benchmark British Pound± GBP 1.09 5.46% (5.46)%
World Allocation 60/40 Fund IMFB World Allocation 60/40 Fund Benchmark British Pound∞ GBP 1.05 5.24% (5.24)%
World Allocation 80/20 Fund* 80% MSCI ACWI 20% Citi WGBI 1 to 5 Year GBP – – –
World Equity Fund MSCI All Country World Index (GBP, net dividends) GBP 1.03 5.13% (5.13)%

Notes to the Financial Statements
for the financial year ended 30 November 2016 (continued)
Dimensional Fund Advisors Annual Report and Audited Financial Statements, 30 November 2016 398
11. Risk Management (continued) a) Market Risk (continued)
i) Market Price Risk (continued)
As at 30 November 2015 Impact on Net Asset Value
due to movement in Interest Rates
Fund Index Currency Positive 1% Negative 1%
Euro Inflation Linked Intermediate Duration Fixed Income Fund Barclays Capital France Government EMU HICP Linked 5-15 Year Bond Index/Barclays Capital German Government Inflation Linked 5-15 Year Index
EUR (9.78)% 9.78%
Euro Inflation Linked Long Duration Fixed Income Fund Barclays France Government EMU HICP Linked 15+ Year Bond Index EUR (15.12)% 15.16%
Global Short Fixed Income Fund Citigroup WGBI Currency Hedged 1 to 5 Year EUR EUR (3.64)% 3.64%
Global Short-Term Investment Grade Fixed Income Fund Barclays Global Credit 1 to 5 Year Index Hedged to USD GBP (2.88)% 2.88%
Global Ultra Short Fixed Income Fund GBP One Month Libor EUR (0.91)% 0.91%
Sterling Inflation Linked Intermediate Duration Fixed Income Fund Barclays UK Government Inflation-Linked Bond Index 5 to 15 Years GBP (9.79)% 9.57%
* These Funds launched during the financial year and there was insufficient data to calculate Beta and % impact on Net Asset Value due to movement in Prices. ∞ January 1999 - Present: IMFC World Allocation 60/40 Fund Benchmark (GBP): 45% MSCI All Country World Index (GBP, Net Div) and 55% Citigroup World Government Bond Index 1-5 Years (hedged to GBP). ± January 1999 - Present: IMFC World Allocation 40/60 Fund Benchmark (GBP) 40% MSCI All Country World Index (GBP, Net Div) and 60% Citigroup World Government Bond Index 1-5Years (hedged to GBP).
Sensitivity analysis as presented in these financial statements
is subject to limitations for example:
the sensitivities are based on historical data and
cannot take account of the fact that future market price
movements and future performance, correlations
between markets and levels of market liquidity in
conditions of market stress may bear no relation to
historical patterns;
the market price risk information is a relative estimate
of risk rather than a precise and accurate number;
the market price information represents a hypothetical
outcome and is not intended to be predictive; and
future market conditions could vary significantly from
those experienced.
ii) Foreign Currency Risk
Since securities may be denominated in a foreign currency
and may require settlement in foreign currencies and pay
interest and/or a dividend in foreign currencies, changes in the
relationship of these foreign currencies to the functional
currency in respect of the funds can significantly affect the
value of the investments and earnings of the Funds. Monetary
assets and liabilities denominated in foreign currencies are
translated to the functional currency of each fund at the foreign
currency closing exchange rate ruling at the Statement of
Financial Position date. Foreign currency exchange
differences arising on translation and realised gains and
losses on disposals or settlements of monetary assets and
liabilities are recognised in the Statement of Comprehensive
Income. Non-monetary assets and liabilities denominated in
foreign currencies that are measured at fair value are
translated to the functional currency of each fund at the foreign
currency exchange rates ruling at the dates that the values
were determined.
Foreign investments may also subject the funds to foreign
government exchange restrictions, expropriation, taxation, or
other political, social or economic developments, all of which
could affect the market and/or credit risk of the investments.
A fund may ‘cross-hedge’ on foreign currency exposure by
selling a related foreign currency into the functional currency of
the Fund. The Investment Manager does not actively manage
the currency exposure of the equity funds.
Euro Inflation Linked Intermediate Duration Fixed Income
Fund, Euro Inflation Linked Long Duration Fixed Income Fund,
Sterling Inflation Linked Intermediate Duration Fixed Income
Fund, World Allocation 20/80 Fund and World Allocation
80/20 Fund have only base currency denominated
investments and as such are not exposed to the significant
fluctuations in currency exchange rates. Global Short Fixed
Income Fund, Global Short-Term Investment Grade Fixed
Income Fund, Global Small Companies Fund, Global
Sustainability Core Equity Fund, Global Ultra Short Fixed
Income Fund and World Equity Fund held forward contracts as
at 30 November 2016 as disclosed in the Portfolio of
Investments and have no significant residual foreign currency
exposure.
All assets and liabilities held by the Funds are monetary
assets and liabilities except for investments in equity type
instruments which are defined as non-monetary assets under
FRS 102.
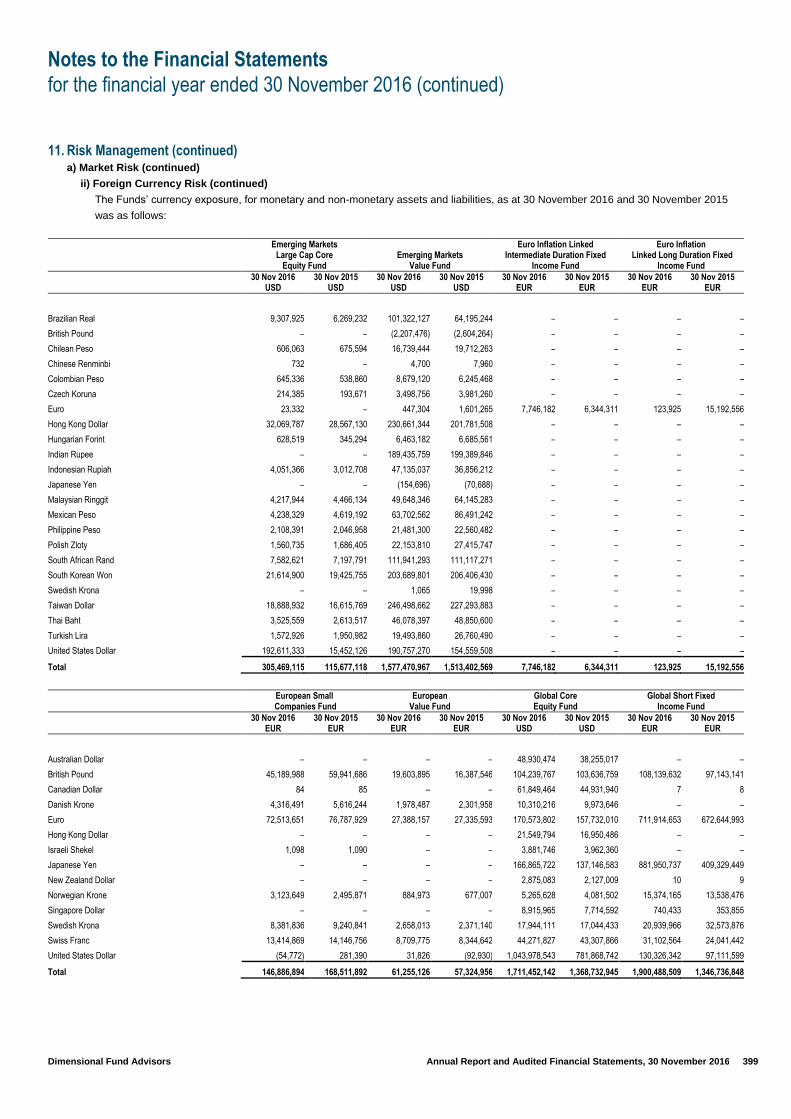
Notes to the Financial Statements
for the financial year ended 30 November 2016 (continued)
Dimensional Fund Advisors Annual Report and Audited Financial Statements, 30 November 2016 399
11. Risk Management (continued) a) Market Risk (continued)
ii) Foreign Currency Risk (continued)
The Funds’ currency exposure, for monetary and non-monetary assets and liabilities, as at 30 November 2016 and 30 November 2015
was as follows:
Emerging Markets Large Cap Core
Equity Fund Emerging Markets
Value Fund
Euro Inflation Linked Intermediate Duration Fixed
Income Fund
Euro Inflation Linked Long Duration Fixed
Income Fund
30 Nov 2016
USD 30 Nov 2015
USD 30 Nov 2016
USD 30 Nov 2015
USD 30 Nov 2016
EUR 30 Nov 2015
EUR 30 Nov 2016
EUR 30 Nov 2015
EUR
Brazilian Real 9,307,925 6,269,232 101,322,127 64,195,244 – – – –
British Pound – – (2,207,476) (2,604,264) – – – –
Chilean Peso 606,063 675,594 16,739,444 19,712,263 – – – –
Chinese Renminbi 732 – 4,700 7,960 – – – –
Colombian Peso 645,336 538,860 8,679,120 6,245,468 – – – –
Czech Koruna 214,385 193,671 3,498,756 3,981,260 – – – –
Euro 23,332 – 447,304 1,601,265 7,746,182 6,344,311 123,925 15,192,556
Hong Kong Dollar 32,069,787 28,567,130 230,661,344 201,781,508 – – – –
Hungarian Forint 628,519 345,294 6,463,182 6,685,561 – – – –
Indian Rupee – – 189,435,759 199,389,846 – – – –
Indonesian Rupiah 4,051,366 3,012,708 47,135,037 36,856,212 – – – –
Japanese Yen – – (154,696) (70,688) – – – –
Malaysian Ringgit 4,217,944 4,466,134 49,648,346 64,145,283 – – – –
Mexican Peso 4,238,329 4,619,192 63,702,562 86,491,242 – – – –
Philippine Peso 2,108,391 2,046,958 21,481,300 22,560,482 – – – –
Polish Zloty 1,560,735 1,686,405 22,153,810 27,415,747 – – – –
South African Rand 7,582,621 7,197,791 111,941,293 111,117,271 – – – –
South Korean Won 21,614,900 19,425,755 203,689,801 206,406,430 – – – –
Swedish Krona – – 1,065 19,998 – – – –
Taiwan Dollar 18,888,932 16,615,769 246,498,662 227,293,883 – – – –
Thai Baht 3,525,559 2,613,517 46,078,397 48,850,600 – – – –
Turkish Lira 1,572,926 1,950,982 19,493,860 26,760,490 – – – –
United States Dollar 192,611,333 15,452,126 190,757,270 154,559,508 – – – –
Total 305,469,115 115,677,118 1,577,470,967 1,513,402,569 7,746,182 6,344,311 123,925 15,192,556
European Small
Companies Fund European
Value Fund Global Core Equity Fund
Global Short Fixed Income Fund
30 Nov 2016
EUR 30 Nov 2015
EUR 30 Nov 2016
EUR 30 Nov 2015
EUR 30 Nov 2016
USD 30 Nov 2015
USD 30 Nov 2016
EUR 30 Nov 2015
EUR
Australian Dollar – – – – 48,930,474 38,255,017 – –
British Pound 45,189,988 59,941,686 19,603,895 16,387,546 104,239,767 103,636,759 108,139,632 97,143,141
Canadian Dollar 84 85 – – 61,849,464 44,931,940 7 8
Danish Krone 4,316,491 5,616,244 1,978,487 2,301,958 10,310,216 9,973,646 – –
Euro 72,513,651 76,787,929 27,388,157 27,335,593 170,573,802 157,732,010 711,914,653 672,644,993
Hong Kong Dollar – – – – 21,549,794 16,950,486 – –
Israeli Shekel 1,098 1,090 – – 3,881,746 3,962,360 – –
Japanese Yen – – – – 166,865,722 137,146,583 881,950,737 409,329,449
New Zealand Dollar – – – – 2,875,083 2,127,009 10 9
Norwegian Krone 3,123,649 2,495,871 884,973 677,007 5,265,628 4,081,502 15,374,165 13,538,476
Singapore Dollar – – – – 8,915,965 7,714,592 740,433 353,855
Swedish Krona 8,381,836 9,240,841 2,658,013 2,371,140 17,944,111 17,044,433 20,939,966 32,573,876
Swiss Franc 13,414,869 14,146,756 8,709,775 8,344,642 44,271,827 43,307,866 31,102,564 24,041,442
United States Dollar (54,772) 281,390 31,826 (92,930) 1,043,978,543 781,868,742 130,326,342 97,111,599
Total 146,886,894 168,511,892 61,255,126 57,324,956 1,711,452,142 1,368,732,945 1,900,488,509 1,346,736,848
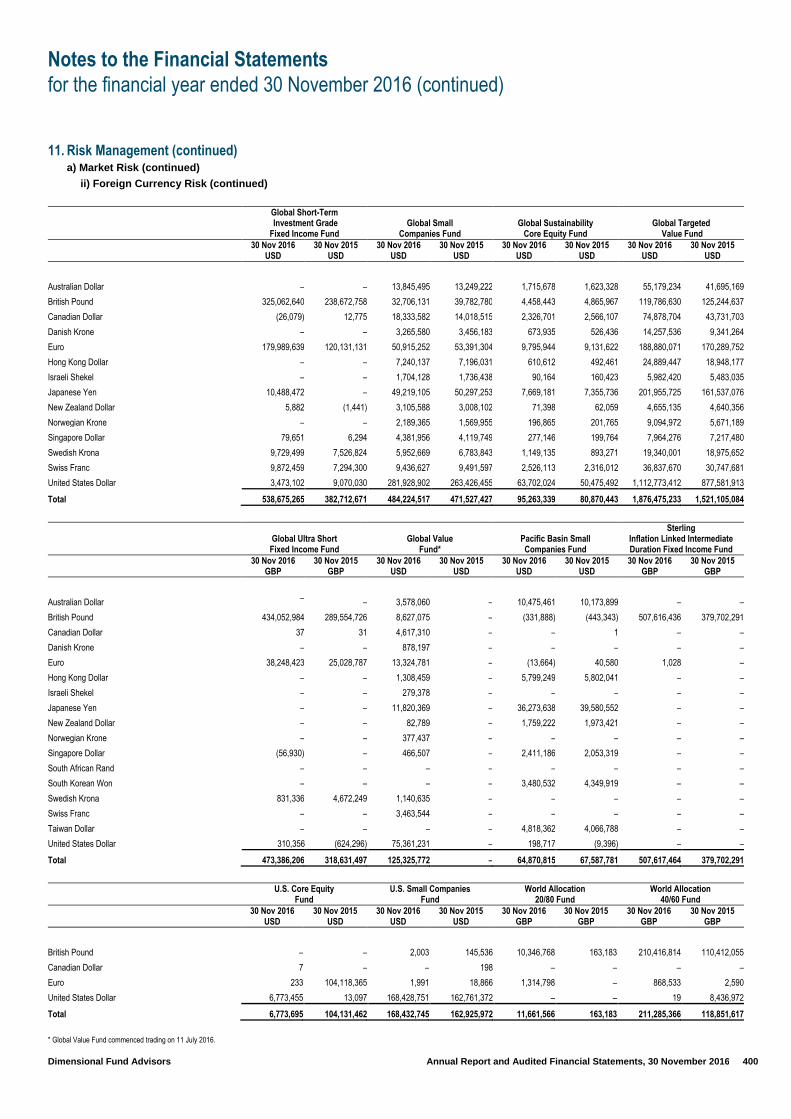
Notes to the Financial Statements
for the financial year ended 30 November 2016 (continued)
Dimensional Fund Advisors Annual Report and Audited Financial Statements, 30 November 2016 400
11. Risk Management (continued) a) Market Risk (continued)
ii) Foreign Currency Risk (continued)
Global Short-Term Investment Grade Fixed Income Fund
Global Small Companies Fund
Global Sustainability Core Equity Fund
Global Targeted Value Fund
30 Nov 2016
USD 30 Nov 2015
USD 30 Nov 2016
USD 30 Nov 2015
USD 30 Nov 2016
USD 30 Nov 2015
USD 30 Nov 2016
USD 30 Nov 2015
USD
Australian Dollar – – 13,845,495 13,249,222 1,715,678 1,623,328 55,179,234 41,695,169
British Pound 325,062,640 238,672,758 32,706,131 39,782,780 4,458,443 4,865,967 119,786,630 125,244,637
Canadian Dollar (26,079) 12,775 18,333,582 14,018,515 2,326,701 2,566,107 74,878,704 43,731,703
Danish Krone – – 3,265,580 3,456,183 673,935 526,436 14,257,536 9,341,264
Euro 179,989,639 120,131,131 50,915,252 53,391,304 9,795,944 9,131,622 188,880,071 170,289,752
Hong Kong Dollar – – 7,240,137 7,196,031 610,612 492,461 24,889,447 18,948,177
Israeli Shekel – – 1,704,128 1,736,438 90,164 160,423 5,982,420 5,483,035
Japanese Yen 10,488,472 – 49,219,105 50,297,253 7,669,181 7,355,736 201,955,725 161,537,076
New Zealand Dollar 5,882 (1,441) 3,105,588 3,008,102 71,398 62,059 4,655,135 4,640,356
Norwegian Krone – – 2,189,365 1,569,955 196,865 201,765 9,094,972 5,671,189
Singapore Dollar 79,651 6,294 4,381,956 4,119,749 277,146 199,764 7,964,276 7,217,480
Swedish Krona 9,729,499 7,526,824 5,952,669 6,783,843 1,149,135 893,271 19,340,001 18,975,652
Swiss Franc 9,872,459 7,294,300 9,436,627 9,491,597 2,526,113 2,316,012 36,837,670 30,747,681
United States Dollar 3,473,102 9,070,030 281,928,902 263,426,455 63,702,024 50,475,492 1,112,773,412 877,581,913
Total 538,675,265 382,712,671 484,224,517 471,527,427 95,263,339 80,870,443 1,876,475,233 1,521,105,084
Global Ultra Short Fixed Income Fund
Global Value Fund*
Pacific Basin Small Companies Fund
Sterling Inflation Linked Intermediate Duration Fixed Income Fund
30 Nov 2016
GBP 30 Nov 2015
GBP 30 Nov 2016
USD 30 Nov 2015
USD 30 Nov 2016
USD 30 Nov 2015
USD 30 Nov 2016
GBP 30 Nov 2015
GBP
Australian Dollar –
– 3,578,060 – 10,475,461 10,173,899 – –
British Pound 434,052,984 289,554,726 8,627,075 – (331,888) (443,343) 507,616,436 379,702,291
Canadian Dollar 37 31 4,617,310 – – 1 – –
Danish Krone – – 878,197 – – – – –
Euro 38,248,423 25,028,787 13,324,781 – (13,664) 40,580 1,028 –
Hong Kong Dollar – – 1,308,459 – 5,799,249 5,802,041 – –
Israeli Shekel – – 279,378 – – – – –
Japanese Yen – – 11,820,369 – 36,273,638 39,580,552 – –
New Zealand Dollar – – 82,789 – 1,759,222 1,973,421 – –
Norwegian Krone – – 377,437 – – – – –
Singapore Dollar (56,930) – 466,507 – 2,411,186 2,053,319 – –
South African Rand – – – – – – – –
South Korean Won – – – – 3,480,532 4,349,919 – –
Swedish Krona 831,336 4,672,249 1,140,635 – – – – –
Swiss Franc – – 3,463,544 – – – – –
Taiwan Dollar – – – – 4,818,362 4,066,788 – –
United States Dollar 310,356 (624,296) 75,361,231 – 198,717 (9,396) – –
Total 473,386,206 318,631,497 125,325,772 – 64,870,815 67,587,781 507,617,464 379,702,291
U.S. Core Equity
Fund U.S. Small Companies
Fund World Allocation
20/80 Fund World Allocation
40/60 Fund
30 Nov 2016
USD 30 Nov 2015
USD 30 Nov 2016
USD 30 Nov 2015
USD 30 Nov 2016
GBP 30 Nov 2015
GBP 30 Nov 2016
GBP 30 Nov 2015
GBP
British Pound – – 2,003 145,536 10,346,768 163,183 210,416,814 110,412,055
Canadian Dollar 7 – – 198 – – – –
Euro 233 104,118,365 1,991 18,866 1,314,798 – 868,533 2,590
United States Dollar 6,773,455 13,097 168,428,751 162,761,372 – – 19 8,436,972
Total 6,773,695 104,131,462 168,432,745 162,925,972 11,661,566 163,183 211,285,366 118,851,617
* Global Value Fund commenced trading on 11 July 2016.

Notes to the Financial Statements
for the financial year ended 30 November 2016 (continued)
Dimensional Fund Advisors Annual Report and Audited Financial Statements, 30 November 2016 401
11. Risk Management (continued) a) Market Risk (continued)
ii) Foreign Currency Risk (continued)
World Allocation
60/40 Fund World Allocation
80/20 Fund World Equity
Fund
30 Nov 2016
GBP 30 Nov 2015
GBP 30 Nov 2016
GBP 30 Nov 2015
GBP 30 Nov 2016
GBP 30 Nov 2015
GBP
Australian Dollar – – – – 18,740,503 10,168,166
Brazilian Real – – – – 7,194,529 2,798,973
British Pound 413,717,313 236,998,572 33,328,922 459,343 44,410,538 30,913,129
Canadian Dollar – – – – 23,948,949 11,695,809
Chilean Peso – – – – 776,153 370,397
Chinese Renminbi – – – – 622 –
Colombian Peso – – – – 355,404 119,982
Czech Koruna – – – – 100,516 43,240
Danish Krone – – – – 4,446,865 2,696,856
Euro 1,176,693 1,677 201,874 – 68,624,316 43,110,336
Hong Kong Dollar – – – – 29,263,638 16,065,015
Hungarian Forint – – – – 215,944 92,680
Indian Rupee – – – – 8,699,171 4,008,329
Indonesia Rupiah – – – – 2,030,028 957,636
Israeli Shekel – – – – 1,421,958 954,515
Japanese Yen – – – – 69,032,717 36,971,301
Malaysian Ringgit – – – – 2,509,356 1,433,405
Mexican Peso – – – – 3,131,061 1,872,886
New Zealand Dollar – – – – 1,490,556 861,275
Norwegian Krone – – – – 2,458,148 1,307,216
Philippine Peso – – – – 1,042,436 552,840
Polish Zloty – – – – 1,278,658 580,798
Singapore Dollar – – – – 3,747,175 2,347,142
South African Rand – – – – 6,354,798 3,079,657
South Korean Won – – – – 14,907,121 8,035,078
Swedish Krona – – – – 7,561,628 4,857,366
Swiss Franc – – – – 16,642,594 10,685,219
Taiwan Dollar – – – – 13,364,820 6,678,772
Thai Baht – – – – 2,204,035 1,052,474
Turkish Lira – – – – 957,825 689,974
United States Dollar 72 26,329,012 4,663 – 408,273,247 189,554,574
Total 414,894,078 263,329,261 33,535,459 459,343 765,185,309 394,555,040

Notes to the Financial Statements
for the financial year ended 30 November 2016 (continued)
Dimensional Fund Advisors Annual Report and Audited Financial Statements, 30 November 2016 402
11. Risk Management (continued) a) Market Risk (continued)
ii) Foreign Currency Risk (continued)
The following table sets out a sensitivity analysis in relation to foreign currency risk and its effect on the Net Asset Value of each Fund where foreign
currency risk is deemed significant (greater than 10% of Net Asset Value for the Funds exposed to emerging and developing countries and 5% for
all other Funds). Sensitivity analysis is calculated based on +/-10% for the Funds exposed to emerging and developing countries and based on at
+/-5% on all other investments and cash. Other net assets/(liabilities) are not significant and are assumed unchanged. All other market parameters
have also been assumed unchanged.
Impact on Net Asset Value due
to movement in foreign exchange
30 November 2016 30 November 2015
Fund Currency Positive 10% Negative 10% Positive 10% Negative 10%
Emerging Markets Large Cap Core Equity Fund Hong Kong Dollar 1.05% (1.05)% 2.47% (2.46)%
South Korean Won 0.71% (0.71)% 1.68% (1.68)%
Taiwan Dollar 0.62% (1.39)% 1.44% (1.44)%
Emerging Markets Value Fund Hong Kong Dollar 1.46% (1.46)% 1.33% (1.33)%
Indian Rupee 1.20% (1.20)% 1.32% (1.32)%
South Korean Won 1.29% (1.29)% 1.36% (1.36)%
Taiwan Dollar 1.56% (1.56)% 1.50% (1.50)%
Impact on Net Asset Value due
to movement in foreign exchange
30 November 2016 30 November 2015
Fund Currency Positive 5% Negative 5% Positive 5% Negative 5%
European Small Companies Fund British Pound 1.54% (1.54)% 1.78% (1.78)%
Swedish Krona 0.29% (0.29)% 0.27% (0.27)%
Swiss Franc 0.46% (0.46)% 0.42% (0.42)%
European Value Fund British Pound 1.60% (1.60)% 1.43% (1.43)%
Swiss Franc 0.71% (0.71)% 0.73% (0.73)%
Global Core Equity Fund British Pound 0.30% (0.30)% 0.38% (0.38)%
Euro 0.50% (0.50)% 0.58% (0.58)%
Japanese Yen 0.49% (0.49)% 0.50% (0.50)%
Global Short Fixed Income Fund British Pound 0.28% (0.28)% 0.36% (0.36)%
Japanese Yen 2.32% (2.32)% 1.52% (1.52)%
United States Dollar 0.34% (0.34)% 0.36% (0.36)%
Global Short-Term Investment Grade Fixed Income Fund British Pound 3.02% (3.02)% 3.12% (3.12)%
Euro 1.67% (1.67)% 1.57% (1.57)%
Global Small Companies Fund British Pound 0.34% (0.34)% 0.42% (0.42)%
Euro 0.53% (0.53)% 0.57% (0.57)%
Japanese Yen 0.51% (0.51)% 0.53% (0.53)%
Global Sustainability Core Equity Fund British Pound – – 0.30% (0.30)%
Euro 0.51% (0.51)% 0.56% (0.56)%
Japanese Yen 0.40% (0.40)% 0.45% (0.45)%
Global Targeted Value Fund British Pound 0.32% (0.32)% 0.41% (0.41)%
Euro 0.50% (0.50)% 0.56% (0.56)%
Japanese Yen 0.54% (0.54)% 0.53% (0.53)%

Notes to the Financial Statements
for the financial year ended 30 November 2016 (continued)
Dimensional Fund Advisors Annual Report and Audited Financial Statements, 30 November 2016 403
11. Risk Management (continued) a) Market Risk (continued)
ii) Foreign Currency Risk (continued)
Impact on Net Asset Value due
to movement in foreign exchange
30 November 2016 30 November 2015
Fund Currency Positive 5% Negative 5% Positive 5% Negative 5%
Global Ultra Short Fixed Income Fund Euro 0.40% (0.40)%
0.39% (0.39)%
Global Value Fund* British Pound 0.34% (0.34)% – –
Euro 0.53% (0.53)% – –
Japanese Yen 0.47% (0.47)% – –
Pacific Basin Small Companies Fund Australian Dollar 0.81% (0.81)% – –
Hong Kong Dollar 0.45% (0.45)% – –
Japanese Yen 2.80% (2.80)% – –
South Korean Won 0.27% (0.27)% – –
Taiwan Dollar 0.37% (0.37)% – –
U.S. Core Equity Fund Euro – – 5.00% (5.00)%
World Allocation 20/80 Fund Euro 0.56% (0.56)% – –
World Allocation 40/60 Fund United States Dollar – – – –
World Allocation 60/40 Fund United States Dollar – – 0.50% (0.50)%
World Equity Fund Euro 0.45% (0.45)% 0.55% (0.55)%
Japanese Yen 0.45% (0.45)% 0.47% (0.47)%
United States Dollar 2.67% (2.67)% 2.40% (2.40)% Sensitivity analysis set out above, should not be used as an indication of future performance.
* Global Value Fund commenced trading on 11 July 2016.
iii) Interest Rate Risk
The majority of the Company’s financial assets and financial
liabilities are non-interest bearing, as a result the Company is
not subject to a significant amount of risk due to the
fluctuations in the prevailing levels of market interest rates,
except for the Fixed Income funds which invest in mainly debt
securities. Any excess cash and cash equivalents are
invested in short-term market interest rates earning a rate
under Libor or invested in money market funds.
The fixed-income investments in which a fund may invest are
interest rate sensitive and may be subject to price volatility
due to such factors including, but not limited to, changes in
interest rates, market perception of the creditworthiness of
the issuer and general market liquidity.
The magnitude of these fluctuations will be greater when the
maturity of the outstanding investments is longer. An increase
in interest rates will generally reduce the value of fixed-
income securities, while a decline in interest rates will
generally increase the value of fixed-income securities.
The interest rate risk in the Fixed Income funds is managed
by (a) limiting the maturity of any individual security to 2 years
for Global Ultra Short Fixed Income Fund, 5 years for Global
Short Fixed Income Fund and 20 years for Euro Inflation
Linked Intermediate Duration Fixed Income Fund and Sterling
Inflation Linked Intermediate Duration Fixed Income Fund
and (b) not using leverage.
The estimated impact to the value of the Net Asset Value due
to movement in interest rates has been disclosed in the
market price risk tables on pages 397 and 398.
The weighted average yield to maturity and weighted average years to maturity on fixed income securities held by the Fixed Income Funds as at
30 November 2016 and 30 November 2015 is outlined below:
30 November 2016 30 November 2015
Currency Weighted Average
Yield* Weighted Average
Years to Maturity Weighted Average
Yield* Weighted Average
Years to Maturity
Euro Inflation Linked Intermediate Duration Fixed Income Fund
Euro (0.56)% 10.22 (0.56)% 10.70
Euro Inflation Linked Long Duration Fixed Income Fund
Euro (0.31)% 16.06 (0.25)% 17.23
Global Short Fixed Income Fund
Euro 0.01% 3.72 1.58% 3.83
* Yield is based on real yield which includes adjustments for inflation and not the nominal yield.
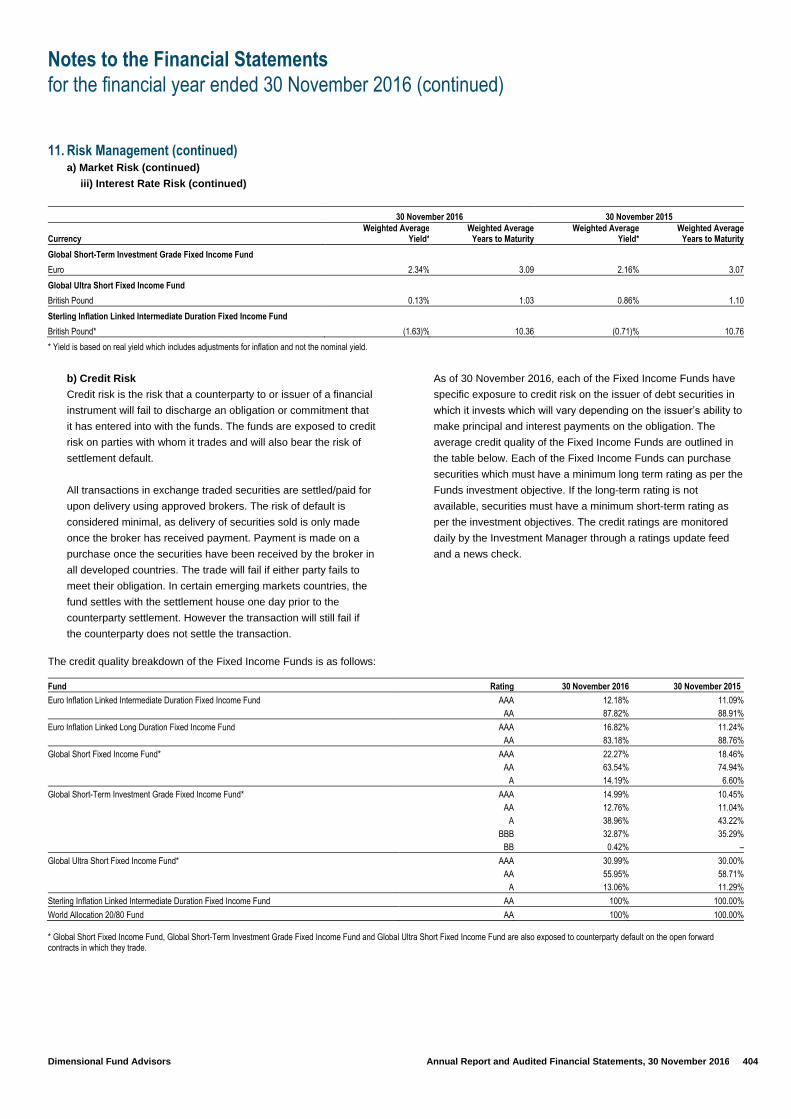
Notes to the Financial Statements
for the financial year ended 30 November 2016 (continued)
Dimensional Fund Advisors Annual Report and Audited Financial Statements, 30 November 2016 404
11. Risk Management (continued) a) Market Risk (continued)
iii) Interest Rate Risk (continued)
30 November 2016 30 November 2015
Currency Weighted Average
Yield* Weighted Average
Years to Maturity Weighted Average
Yield* Weighted Average
Years to Maturity
Global Short-Term Investment Grade Fixed Income Fund
Euro 2.34% 3.09 2.16% 3.07
Global Ultra Short Fixed Income Fund
British Pound 0.13% 1.03 0.86% 1.10
Sterling Inflation Linked Intermediate Duration Fixed Income Fund
British Pound* (1.63)% 10.36 (0.71)% 10.76
* Yield is based on real yield which includes adjustments for inflation and not the nominal yield.
b) Credit Risk
Credit risk is the risk that a counterparty to or issuer of a financial
instrument will fail to discharge an obligation or commitment that
it has entered into with the funds. The funds are exposed to credit
risk on parties with whom it trades and will also bear the risk of
settlement default.
All transactions in exchange traded securities are settled/paid for
upon delivery using approved brokers. The risk of default is
considered minimal, as delivery of securities sold is only made
once the broker has received payment. Payment is made on a
purchase once the securities have been received by the broker in
all developed countries. The trade will fail if either party fails to
meet their obligation. In certain emerging markets countries, the
fund settles with the settlement house one day prior to the
counterparty settlement. However the transaction will still fail if
the counterparty does not settle the transaction.
As of 30 November 2016, each of the Fixed Income Funds have
specific exposure to credit risk on the issuer of debt securities in
which it invests which will vary depending on the issuer’s ability to
make principal and interest payments on the obligation. The
average credit quality of the Fixed Income Funds are outlined in
the table below. Each of the Fixed Income Funds can purchase
securities which must have a minimum long term rating as per the
Funds investment objective. If the long-term rating is not
available, securities must have a minimum short-term rating as
per the investment objectives. The credit ratings are monitored
daily by the Investment Manager through a ratings update feed
and a news check.
The credit quality breakdown of the Fixed Income Funds is as follows:
Fund Rating 30 November 2016 30 November 2015
Euro Inflation Linked Intermediate Duration Fixed Income Fund AAA 12.18% 11.09%
AA 87.82% 88.91%
Euro Inflation Linked Long Duration Fixed Income Fund AAA 16.82% 11.24%
AA 83.18% 88.76%
Global Short Fixed Income Fund* AAA 22.27% 18.46%
AA 63.54% 74.94%
A 14.19% 6.60%
Global Short-Term Investment Grade Fixed Income Fund* AAA 14.99% 10.45%
AA 12.76% 11.04%
A 38.96% 43.22%
BBB 32.87% 35.29%
BB 0.42% –
Global Ultra Short Fixed Income Fund* AAA 30.99% 30.00%
AA 55.95% 58.71%
A 13.06% 11.29%
Sterling Inflation Linked Intermediate Duration Fixed Income Fund AA 100% 100.00%
World Allocation 20/80 Fund AA 100% 100.00%
* Global Short Fixed Income Fund, Global Short-Term Investment Grade Fixed Income Fund and Global Ultra Short Fixed Income Fund are also exposed to counterparty default on the open forward contracts in which they trade.
Notes to the Financial Statements
for the financial year ended 30 November 2016 (continued)
Dimensional Fund Advisors Annual Report and Audited Financial Statements, 30 November 2016 405
11. Risk Management (continued) b) Credit Risk (continued)
Transactions involving derivative financial instruments are with
counterparties with whom the Company has master netting
agreements which provide for the net settlement for contracts
with the same counterparty in the event of default. The credit risk
associated with derivative financial assets subject to a master
netting arrangement is eliminated only to the extent that financial
liabilities due to the same counterparty will be settled after the
assets are realised. All forward exchange currency contracts are
traded with counterparties. Detail of credit risk associated with
security lending is disclosed in note 4 of these financial
statements.
The Investment Manager's approved list of counterparties is
generally limited to the most highly rated and recognised dealers
in their sectors. The Investment Manager performs ongoing
monitoring of this list. Counterparty/issuer risk is monitored on an
ongoing basis in the following manner:
Approved broker selection - the trading system only permits
trading with approved brokers. New brokers are added,
subject to a formal review process that includes a review of
the broker’s creditworthiness, financial strength, ability to
enter into legally enforceable arrangements and standing in
the financial community.
Broker monitoring - performed through a variety of ongoing
activities, including the assessment of certain regulatory
filings and financial statements.
Measurement and monitoring of counterparty or issuer
trade exposure - a daily review of outstanding positions is
performed.
The risk exposure of a fund to a counterparty to an Over the
Counter (“OTC”) derivative may not exceed 10% of net assets.
The Company's Depositary is State Street Custodial Services
(Ireland) Limited (“the Depositary”). The Depositary has
appointed State Street Bank and Trust Company (“the Sub-
Custodian”) as its global Sub-Custodian.
All of the Company’s assets are held by the Depositary and the
Sub-Custodian. The Company’s non-cash assets are maintained
by the Depositary in segregated accounts so that in the event of
the Depositary’s insolvency or bankruptcy the Company’s non-
cash assets are segregated and protected and this further
reduces counterparty risk. While cash held by the Depositary or
any depositary will be identifiable as belonging to the Fund, the
Company will be exposed to the credit risk of the Depositary or
any depositary where cash is deposited. In the event of the
insolvency of the Depositary or any depositary, the Company will
be treated as a general creditor of the Depositary or other
depositary in relation to cash holdings of the Company.
Bankruptcy or insolvency of the Depositary may cause the Funds’
rights with respect to the cash held by the Depositary to be
delayed or limited. The long term credit rating of the parent
company of the Depositary and Sub-Custodian, State Street
Corporation, as at 30 November 2016 is A1 (30 November 2015:
A2). If the credit quality or financial position of the Depositary
deteriorated significantly the Investment Manager would consider
moving the custodian relationship to another bank. As at 30
November 2016 and 30 November 2015 the total amount of
financial assets exposed to credit risk approximates to their
carrying value in the Statement of Financial Position.
The Company has granted a continuing security interest by way
of a charge over the assets of each sub-fund to the Depositary
and its affiliates, pursuant to the Depositary Agreement dated 27
July 2016 between the Company, the Depositary and State Street
Bank and Trust Company, as continuing security for payment,
discharge and performance of the obligations of the relevant sub-
fund.
For efficient portfolio management purposes, each fund may
enter into securities lending agreements subject to the conditions
and limits set out in the UCITS Regulations.
Until the expiry of the security lending transactions, collateral
obtained such contracts or transactions:
(i) must be marked to market daily;
(ii) must equal or exceed, in value at all times, the value of
the amount invested or securities loaned as disclosed in
note 4;
(iii) must be transferred to the trustee or its agent; and
(iv) immediately be available to the relevant Fund without
recourse to the counterparty in the event of default of that
counterparty.
The Funds participate in security lending which is executed
through State Street Bank International GmbH Limited, London
Branch as the securities lending agent. As such the Funds are
exposed to an underlying exposure to the credit risk and risk that
the borrower may default. The Funds benefit from a borrower
default indemnity provided by State Street Bank and Trust
Company. A list of eligible borrowers is maintained by State
Street Bank International GmbH Limited, London Branch.
Minimum credit rating of an eligible borrower is AA by Standard &
Poors or its equivalent or if loan is indemnified no minimum
rating. If the credit rating falls below the minimum credit rating
State Street Bank International GmbH Limited, London Branch
can terminate the securities lending arrangement.
Collateral is held and monitored by State Street Bank
International GmbH, London Branch with the Depositary
undertaking an overview of this on a periodic basis.

Notes to the Financial Statements
for the financial year ended 30 November 2016 (continued)
Dimensional Fund Advisors Annual Report and Audited Financial Statements, 30 November 2016 406
11. Risk Management (continued) (c) Liquidity Risk
Numerous emerging market countries have recently experienced
serious and potentially continuing, economic and political
problems. Stock markets in many emerging countries are
relatively small and risky. Investors are often limited in their
investment and divestment activities.
Additional restrictions may be imposed under emergency
conditions. Emerging Market securities may decline or fluctuate
because of economic and political actions of emerging market
governments and less regulated or liquid securities markets.
Investors holding the securities are also exposed to the possibility
that an Emerging Market currency will fluctuate against the base
currency of the relevant fund.
The legislative framework in emerging market countries for the
purchase and sale of investments and in relation to the beneficial
interests in those investments may be relatively new and
untested. There can be no assurance regarding how the courts or
agencies of emerging market countries will react to questions
arising from the funds’ investments in such countries and
arrangements contemplated in relation thereto.
The Company is exposed to daily cash redemptions of
redeemable shares. It therefore invests the majority of its assets
in investments that are traded in an active market and can be
readily disposed of; it invests only a limited proportion of its
assets in investments not actively traded on a stock exchange.
The Company’s listed securities are considered readily realisable
as they are listed on recognised and established stock
exchanges. The Administrator monitors subscription and
redemption volumes and notifies the Investment Manager of
significant movements and unusual trends as appropriate.
If outstanding redemption requests from shareholders of any fund
for any dealing day exceed in the aggregate more than 10% of all
the outstanding shares of that fund, the directors shall be entitled
at their discretion to refuse to redeem such excess shares. If the
directors refuse to redeem shares for these reasons, the requests
for redemption on such date shall be reduced rateably and the
Company shall treat the balance of such redemption requests as
if they were received on each subsequent dealing day until all the
shares to which the original request related have been redeemed.
The Company does not engage in leverage activities. A U.S.
Dollar discretionary line of credit of USD50 million was put in
place for the Company and Dimensional Funds II plc. This line of
credit was renewed effective 2 June 2015, however it was not
renewed in 2016 and expired on 31 May 2016.
d) Fair Value Estimation
The fair value of the financial instruments traded in active markets
such as publicly traded derivatives and trading securities is based
on quoted market prices at the Statement of Financial Position
date. The quoted market price at the valuation point used for
bonds traded on a regulated market held by the Company can be
last traded price or quoted mid price depending on the bond type.
Securities other than bonds which are traded on a regulated
market will be issued at the last traded prices at the relevant
valuation point. When a “readily available market quotation” for a
security is not available, the Company employs “fair value”
methodologies to price securities. As a general principle, fair
value is the price that the Fund might reasonably expect to
receive upon a current sale. The fair valuation process requires
the Investment Manager or the Investment Manager’s Sub–
Advisors to make a determination in good faith as to the value of
a particular security or group of securities depending on the
particular facts and circumstances involved. Circumstances in
which a market quotation is not readily available may include,
trading suspensions prior to the close of the relevant market;
events that unexpectedly close entire markets such as natural
disasters, power blackouts, or similar major events; market
holidays; or volume of trading in a security.
When determining the fair value of a security, the Investment
Manager or the Investment Manager’s Sub–Advisors may
consider all relevant methods, including but not limited to any one
or all of the following pricing methods:
1. A multiple of earnings;
2. A discount from market of a similar freely traded security;
3. A discounted cash–flow analysis;
4. The book value or a multiple thereof;
5. A risk premium/yield analysis;
6. Yield to maturity; or
7. Fundamental investment analysis.
Investments measured and reported at fair value are classified
and disclosed in one of the following fair value hierarchy levels
based on the significance of the inputs used in measuring its fair
value. These levels are the updated fair value hierarchy levels per
amended FRS 102 which is effective for the periods commencing
on or after 1 January 2017 and the Company is early adopting.
Level 1 inputs are unadjusted quoted prices in active markets for
identical assets or liabilities that the reporting entity has the ability
to access at the valuation date. An active market for the asset or
liability is a market in which transactions for the asset or liability
occur with sufficient frequency and volume to provide pricing
information on an ongoing basis.
Level 2 inputs are inputs other than quoted prices in active
markets included within level 1 that are observable for the asset
or liability, either directly or indirectly. Fair value is determined
through the use of models or other valuation methodologies.
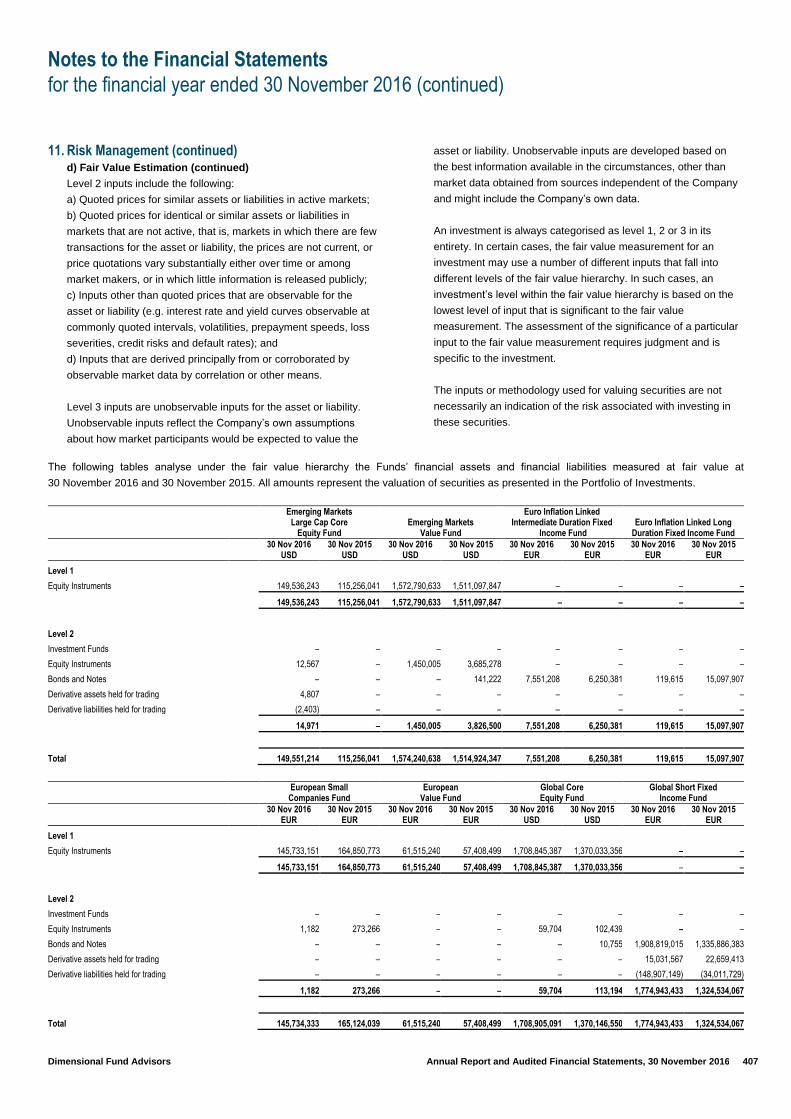
Notes to the Financial Statements
for the financial year ended 30 November 2016 (continued)
Dimensional Fund Advisors Annual Report and Audited Financial Statements, 30 November 2016 407
11. Risk Management (continued) d) Fair Value Estimation (continued)
Level 2 inputs include the following:
a) Quoted prices for similar assets or liabilities in active markets;
b) Quoted prices for identical or similar assets or liabilities in
markets that are not active, that is, markets in which there are few
transactions for the asset or liability, the prices are not current, or
price quotations vary substantially either over time or among
market makers, or in which little information is released publicly;
c) Inputs other than quoted prices that are observable for the
asset or liability (e.g. interest rate and yield curves observable at
commonly quoted intervals, volatilities, prepayment speeds, loss
severities, credit risks and default rates); and
d) Inputs that are derived principally from or corroborated by
observable market data by correlation or other means.
Level 3 inputs are unobservable inputs for the asset or liability.
Unobservable inputs reflect the Company’s own assumptions
about how market participants would be expected to value the
asset or liability. Unobservable inputs are developed based on
the best information available in the circumstances, other than
market data obtained from sources independent of the Company
and might include the Company’s own data.
An investment is always categorised as level 1, 2 or 3 in its
entirety. In certain cases, the fair value measurement for an
investment may use a number of different inputs that fall into
different levels of the fair value hierarchy. In such cases, an
investment’s level within the fair value hierarchy is based on the
lowest level of input that is significant to the fair value
measurement. The assessment of the significance of a particular
input to the fair value measurement requires judgment and is
specific to the investment.
The inputs or methodology used for valuing securities are not
necessarily an indication of the risk associated with investing in
these securities.
The following tables analyse under the fair value hierarchy the Funds’ financial assets and financial liabilities measured at fair value at
30 November 2016 and 30 November 2015. All amounts represent the valuation of securities as presented in the Portfolio of Investments.
Emerging Markets Large Cap Core
Equity Fund Emerging Markets
Value Fund
Euro Inflation Linked Intermediate Duration Fixed
Income Fund Euro Inflation Linked Long
Duration Fixed Income Fund
30 Nov 2016
USD 30 Nov 2015
USD 30 Nov 2016
USD 30 Nov 2015
USD 30 Nov 2016
EUR 30 Nov 2015
EUR 30 Nov 2016
EUR 30 Nov 2015
EUR
Level 1
Equity Instruments 149,536,243 115,256,041 1,572,790,633 1,511,097,847 – – – –
149,536,243 115,256,041 1,572,790,633 1,511,097,847 – – – –
Level 2
Investment Funds – – – – – – – –
Equity Instruments 12,567 – 1,450,005 3,685,278 – – – –
Bonds and Notes – – – 141,222 7,551,208 6,250,381 119,615 15,097,907
Derivative assets held for trading 4,807 – – – – – – –
Derivative liabilities held for trading (2,403) – – – – – – –
14,971 – 1,450,005 3,826,500 7,551,208 6,250,381 119,615 15,097,907
Total 149,551,214 115,256,041 1,574,240,638 1,514,924,347 7,551,208 6,250,381 119,615 15,097,907
European Small Companies Fund
European Value Fund
Global Core Equity Fund
Global Short Fixed Income Fund
30 Nov 2016
EUR 30 Nov 2015
EUR 30 Nov 2016
EUR 30 Nov 2015
EUR 30 Nov 2016
USD 30 Nov 2015
USD 30 Nov 2016
EUR 30 Nov 2015
EUR
Level 1
Equity Instruments 145,733,151 164,850,773 61,515,240 57,408,499 1,708,845,387 1,370,033,356 – –
145,733,151 164,850,773 61,515,240 57,408,499 1,708,845,387 1,370,033,356 – –
Level 2
Investment Funds – – – – – – – –
Equity Instruments 1,182 273,266 – – 59,704 102,439 – –
Bonds and Notes – – – – – 10,755 1,908,819,015 1,335,886,383
Derivative assets held for trading – – – – – – 15,031,567 22,659,413
Derivative liabilities held for trading – – – – – – (148,907,149) (34,011,729)
1,182 273,266 – – 59,704 113,194 1,774,943,433 1,324,534,067
Total 145,734,333 165,124,039 61,515,240 57,408,499 1,708,905,091 1,370,146,550 1,774,943,433 1,324,534,067

Notes to the Financial Statements
for the financial year ended 30 November 2016 (continued)
Dimensional Fund Advisors Annual Report and Audited Financial Statements, 30 November 2016 408
11. Risk Management (continued) d) Fair Value Estimation (continued)
Global Short–Term Investment Grade
Fixed Income Fund Global Small
Companies Fund Global Sustainability
Core Equity Fund Global Targeted
Value Fund
30 Nov 2016
USD 30 Nov 2015
USD 30 Nov 2016
USD 30 Nov 2015
USD 30 Nov 2016
USD 30 Nov 2015
USD 30 Nov 2016
USD 30 Nov 2015
USD
Level 1
Equity Instruments – – 483,171,678 471,025,561 77,997,207 67,639,945 1,866,612,274 1,518,583,500
– – 483,171,678 471,025,561 77,997,207 67,639,945 1,866,612,274 1,518,583,500
Level 2
Investment Funds – – – – 16,550,291 13,009,466 – –
Equity Instruments – – 19,633 178,939 – – 45,830 864,634
Bonds and Notes 533,868,961 376,725,757 – 8,273 – – – 90,544
Derivative assets held for trading 6,567,672 2,095,183 – 154 – 61 – –
Derivative liabilities held for trading (15,011,346) (3,363,756) – – – – (293) –
525,425,287 375,457,184 19,633 187,366 16,550,291 13,009,527 45,537 955,178
Total 525,425,287 375,457,184 483,191,311 471,212,927 94,547,498 80,649,472 1,866,657,811 1,519,538,678
Global Ultra Short Fixed Income Fund
Global Value Fund
Pacific Basin Small Companies Fund
Sterling Inflation Linked Intermediate Duration Fixed
Income Fund
30 Nov 2016
GBP 30 Nov 2015
GBP 30 Nov 2016
USD 30 Nov 2015
USD 30 Nov 2016
USD 30 Nov 2015
USD 30 Nov 2016
GBP 30 Nov 2015
GBP
Level 1
Equity Instruments – – 124,453,216 – 64,784,402 67,678,442 – –
– – 124,453,216 – 64,784,402 67,678,442 – –
Level 2
Investment Funds – – – – – – – –
Equity Instruments – – – – 17,311 22,092 – –
Bonds and Notes 467,131,261 318,306,539 – – – – 503,322,004 378,022,851
Derivative assets held for trading 2,979,129 42,887 – – – – – –
Derivative liabilities held for trading (23,319,558) (4,523,897) (76) – – – – –
446,790,832 313,825,529 (76) – 17,311 22,092 503,322,004 378,022,851
Total 446,790,832 313,825,529 124,453,140 – 64,801,713 67,700,534 503,322,004 378,022,851
U.S. Core Equity
Fund U.S. Small Companies
Fund World Allocation
20/80 Fund World Allocation
40/60 Fund
30 Nov 2016
USD 30 Nov 2015
USD 30 Nov 2016
USD 30 Nov 2015
USD 30 Nov 2016
GBP 30 Nov 2015
GBP 30 Nov 2016
GBP 30 Nov 2015
GBP
Level 1
Equity Instruments 6,710,917 105,172,247 167,979,748 161,811,775 – – – –
6,710,917 105,172,247 167,979,748 161,811,775 – – – –
Level 2
Investment Funds – – – – 8,191,077 109,288 209,396,647 118,593,057
Equity Instruments 444 – 591 25,536 – – – –
Bonds and Notes – – – 1508 3,113,107 42,129 – –
Derivative liabilities held for trading – – – – – – – –
Derivative liabilities held for trading – (1,459,746) – – (10,602) – (6,952) –
444 (1,459,746) 591 27,044 11,293,582 151,417 209,389,695 118,593,057
Total 6,711,361 103,712,501 167,980,339 161,838,819 11,293,582 151,417 209,389,695 118,593,057

Notes to the Financial Statements
for the financial year ended 30 November 2016 (continued)
Dimensional Fund Advisors Annual Report and Audited Financial Statements, 30 November 2016 409
11. Risk Management (continued) d) Fair Value Estimation (continued)
World Allocation
60/40 Fund World Allocation
80/20 Fund World Equity
Fund
30 Nov 2016
GBP 30 Nov 2015
GBP 30 Nov 2016
GBP 30 Nov 2015
GBP 30 Nov 2016
GBP 30 Nov 2015
GBP
Level 1
Equity Instruments – – – – 763,210,728 393,367,339
– – – – 763,210,728 393,367,339
Level 2
Investment Funds 411,203,827 262,014,953 32,939,435 457,219 – –
Equity Instruments – – – – 120,517 145,086
Bonds and Notes – – – – – –
Derivative liabilities held for trading 401 – – – –
Derivative liabilities held for trading (10,333) – (1,678) – (2,267) (322)
411,193,895 262,014,953 32,937,757 457,219 118,250 144,764
411,193,895 262,014,953 32,937,757 457,219 763,328,978 393,512,103
There were no level 3 securities held during the financial years ended 30 November 2015 and 30 November 2016.
There were no transfers between levels during the financial years ended 30 November 2015 and 30 November 2016.
12. Foreign Exchange Rates The following exchange rates were used to convert the investments and
other assets and liabilities denominated in currencies other than the
respective Fund’s base currency at 30 November 2016 and 30
November 2015:
Exchange Rates against Euro 30 November 2016 30 November 2015
Canadian Dollar 1.4237 1.4110
Danish Krone 7.4405 7.4604
Israeli Shekel 4.0606 4.0905
Japanese Yen 121.2521 130.0613
New Zealand Dollar 1.4965 1.6051
Norwegian Krone 9.0232 9.1820
Pound Sterling 0.8471 0.7015
Singapore Dollar 1.5191 1.4903
Swedish Krona 9.7748 9.2150
Swiss Franc 1.0775 1.0870
US Dollar 1.0598 1.0565
Exchange Rates against Pound Sterling 30 November 2016 30 November 2015
Australian Dollar 1.6944 2.0825
Brazilian Real 4.2316 5.8271
Canadian Dollar 1.6807 2.0113
Chilean Peso 845.8047 1,070.3092
Colombian Peso 3,847.0008 4,736.0788
Czech Koruna 31.9355 38.5395
Danish Krone 8.7839 10.6346
Euro 1.1805 1.4255
Hong Kong Dollar 9.7049 11.6775
Hungarian Forint 369.3215 443.1557
Indian Rupee 85.6433 100.3890
Exchange Rates against Pound Sterling (continued) 30 November 2016 30 November 2015
Indonesian Rupiah 16,956.8824 20,836.8789
Israeli Shekel 4.7937 5.8309
Japanese Yen 143.1435 185.4008
Malaysian Ringgit 5.5879 6.4220
Mexican Nuevo Peso 25.7447 24.9685
New Zealand Dollar 1.7667 2.2880
Norwegian Krone 10.6523 13.0888
Philippine Peso 62.2222 70.9975
Polish Zloty 5.2587 6.0862
Singapore Dollar 1.7934 2.1244
South African Rand 17.6138 21.7722
South Korean Won 1,462.7149 1,744.1379
Swedish Krona 11.5396 13.1359
Swiss Franc 1.2721 1.5495
Taiwan Dollar 39.8795 49.1621
Thai Baht 44.6422 53.9786
Turkish Lira 4.2987 4.3876
US Dollar 1.2512 1.5061
Exchange Rates against US Dollar 30 November 2016 30 November 2015
Australian Dollar 1.3542 1.3827
Brazilian Real 3.3821 3.8690
Canadian Dollar 1.3433 1.3355
Chilean Peso 675.9950 710.6500
Chinese Yuan Renminbi 6.8870 6.3981
Colombian Peso 3,074.6500 3,144.6000
Czech Koruna 25.5239 25.5890
Danish Krone 7.0204 7.0611
Euro 0.9435 0.9465
Hong Kong Dollar 7.7565 7.7535
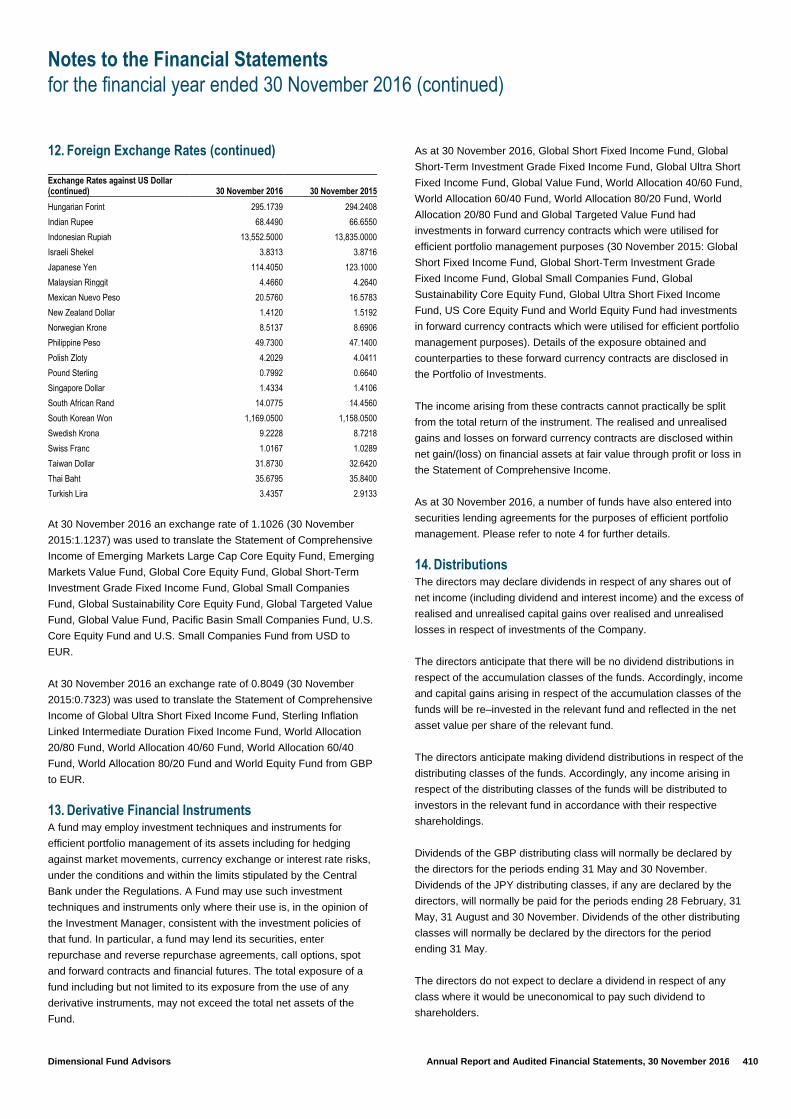
Notes to the Financial Statements
for the financial year ended 30 November 2016 (continued)
Dimensional Fund Advisors Annual Report and Audited Financial Statements, 30 November 2016 410
12. Foreign Exchange Rates (continued)
Exchange Rates against US Dollar (continued) 30 November 2016 30 November 2015
Hungarian Forint 295.1739 294.2408
Indian Rupee 68.4490 66.6550
Indonesian Rupiah 13,552.5000 13,835.0000
Israeli Shekel 3.8313 3.8716
Japanese Yen 114.4050 123.1000
Malaysian Ringgit 4.4660 4.2640
Mexican Nuevo Peso 20.5760 16.5783
New Zealand Dollar 1.4120 1.5192
Norwegian Krone 8.5137 8.6906
Philippine Peso 49.7300 47.1400
Polish Zloty 4.2029 4.0411
Pound Sterling 0.7992 0.6640
Singapore Dollar 1.4334 1.4106
South African Rand 14.0775 14.4560
South Korean Won 1,169.0500 1,158.0500
Swedish Krona 9.2228 8.7218
Swiss Franc 1.0167 1.0289
Taiwan Dollar 31.8730 32.6420
Thai Baht 35.6795 35.8400
Turkish Lira 3.4357 2.9133
At 30 November 2016 an exchange rate of 1.1026 (30 November
2015:1.1237) was used to translate the Statement of Comprehensive
Income of Emerging Markets Large Cap Core Equity Fund, Emerging
Markets Value Fund, Global Core Equity Fund, Global Short-Term
Investment Grade Fixed Income Fund, Global Small Companies
Fund, Global Sustainability Core Equity Fund, Global Targeted Value
Fund, Global Value Fund, Pacific Basin Small Companies Fund, U.S.
Core Equity Fund and U.S. Small Companies Fund from USD to
EUR.
At 30 November 2016 an exchange rate of 0.8049 (30 November
2015:0.7323) was used to translate the Statement of Comprehensive
Income of Global Ultra Short Fixed Income Fund, Sterling Inflation
Linked Intermediate Duration Fixed Income Fund, World Allocation
20/80 Fund, World Allocation 40/60 Fund, World Allocation 60/40
Fund, World Allocation 80/20 Fund and World Equity Fund from GBP
to EUR.
13. Derivative Financial Instruments A fund may employ investment techniques and instruments for
efficient portfolio management of its assets including for hedging
against market movements, currency exchange or interest rate risks,
under the conditions and within the limits stipulated by the Central
Bank under the Regulations. A Fund may use such investment
techniques and instruments only where their use is, in the opinion of
the Investment Manager, consistent with the investment policies of
that fund. In particular, a fund may lend its securities, enter
repurchase and reverse repurchase agreements, call options, spot
and forward contracts and financial futures. The total exposure of a
fund including but not limited to its exposure from the use of any
derivative instruments, may not exceed the total net assets of the
Fund.
As at 30 November 2016, Global Short Fixed Income Fund, Global
Short-Term Investment Grade Fixed Income Fund, Global Ultra Short
Fixed Income Fund, Global Value Fund, World Allocation 40/60 Fund,
World Allocation 60/40 Fund, World Allocation 80/20 Fund, World
Allocation 20/80 Fund and Global Targeted Value Fund had
investments in forward currency contracts which were utilised for
efficient portfolio management purposes (30 November 2015: Global
Short Fixed Income Fund, Global Short-Term Investment Grade
Fixed Income Fund, Global Small Companies Fund, Global
Sustainability Core Equity Fund, Global Ultra Short Fixed Income
Fund, US Core Equity Fund and World Equity Fund had investments
in forward currency contracts which were utilised for efficient portfolio
management purposes). Details of the exposure obtained and
counterparties to these forward currency contracts are disclosed in
the Portfolio of Investments.
The income arising from these contracts cannot practically be split
from the total return of the instrument. The realised and unrealised
gains and losses on forward currency contracts are disclosed within
net gain/(loss) on financial assets at fair value through profit or loss in
the Statement of Comprehensive Income.
As at 30 November 2016, a number of funds have also entered into
securities lending agreements for the purposes of efficient portfolio
management. Please refer to note 4 for further details.
14. Distributions The directors may declare dividends in respect of any shares out of
net income (including dividend and interest income) and the excess of
realised and unrealised capital gains over realised and unrealised
losses in respect of investments of the Company.
The directors anticipate that there will be no dividend distributions in
respect of the accumulation classes of the funds. Accordingly, income
and capital gains arising in respect of the accumulation classes of the
funds will be re–invested in the relevant fund and reflected in the net
asset value per share of the relevant fund.
The directors anticipate making dividend distributions in respect of the
distributing classes of the funds. Accordingly, any income arising in
respect of the distributing classes of the funds will be distributed to
investors in the relevant fund in accordance with their respective
shareholdings.
Dividends of the GBP distributing class will normally be declared by
the directors for the periods ending 31 May and 30 November.
Dividends of the JPY distributing classes, if any are declared by the
directors, will normally be paid for the periods ending 28 February, 31
May, 31 August and 30 November. Dividends of the other distributing
classes will normally be declared by the directors for the period
ending 31 May.
The directors do not expect to declare a dividend in respect of any
class where it would be uneconomical to pay such dividend to
shareholders.

Notes to the Financial Statements
for the financial year ended 30 November 2016 (continued)
Dimensional Fund Advisors Annual Report and Audited Financial Statements, 30 November 2016 411
14. Distributions (continued) Distributions for the financial year ended 30 November 2016 and 30 November 2015 were as follows:
Emerging Markets
Value Fund European Small
Companies Fund European
Value Fund
30 Nov 2016
USD 30 Nov 2015
USD 30 Nov 2016
EUR 30 Nov 2015
EUR 30 Nov 2016
EUR 30 Nov 2015
EUR
Gross distribution for the financial year 3,921,102 3,893,117 936,557 1,261,851 707,145 559,307
Add: Income deducted on cancellation of shares 364,825 708,730 118,785 279,991 46,002 230,787
Deduct: Income received on issue of shares (489,504) (504,481) (182,064) (186,935) (125,608) (123,659)
Net distribution for the financial year 3,796,423 4,097,366 873,278 1,354,907 627,539 666,435
Global Core Equity Fund
Global Short Fixed Income Fund
Global Short–Term Investment Grade Fixed Income Fund
30 Nov 2016
USD 30 Nov 2015
USD 30 Nov 2016
EUR 30 Nov 2015
EUR 30 Nov 2016
USD 30 Nov 2015
USD
Gross distribution for the financial year 14,170,844 9,772,233 18,711,409 12,076,554 5,032,916 3,055,026
Add: Income deducted on cancellation of shares 916,479 634,971 2,958,390 1,575,755 232,425 119,586
Deduct: Income received on issue of shares (2,568,223) (1,780,781) (6,743,109) (3,027,524) (1,240,087) (1,017,058)
Net distribution for the financial year 12,519,100 8,626,423 14,926,690 10,624,785 4,025,254 2,157,554
Global Small
Companies Fund Global Sustainability
Core Equity Fund Global Targeted
Value Fund
30 Nov 2016
USD 30 Nov 2015
USD 30 Nov 2016
USD 30 Nov 2015
USD 30 Nov 2016
USD 30 Nov 2015
USD
Gross distribution for the financial year 2,871,019 2,074,377 372,394 229,395 9,710,510 7,489,165
Add: Income deducted on cancellation of shares 369,560 89,362 20,198 7,388 714,586 455,316
Deduct: Income received on issue of shares (471,463) (328,488) (67,732) (39,830) (1,308,120) (1,145,821)
Net distribution for the financial year 2,769,116 1,835,251 324,860 196,953 9,116,976 6,798,660
Global Ultra Short
Fixed Income Fund Global Value
Fund* Pacific Basin Small Companies Fund
30 Nov 2016
GBP 30 Nov 2015
GBP 30 Nov 2016
USD 30 Nov 2015
USD 30 Nov 2016
USD 30 Nov 2015
USD
Gross distribution for the financial year 2,592,043 1,337,647 15,129 – 473,668 612,204
Add: Income deducted on cancellation of shares 205,357 208,446 15 – 37,987 58,980
Deduct: Income received on issue of shares (636,940) (550,430) (8,533) – (36,418) (96,965)
Net distribution for the financial year 2,160,460 995,663 6,611 – 475,237 574,219
Sterling Inflation Linked Intermediate Duration Fixed
Income Fund U.S. Small Companies
Fund World Allocation
20/80 Fund
30 Nov 2016
GBP 30 Nov 2015
GBP 30 Nov 2016
USD 30 Nov 2015
USD 30 Nov 2016
GBP 30 Nov 2015
GBP
Gross distribution for the financial year 3,105,613 2,865,574 239,441 299,403 10,323 249
Add: Income deducted on cancellation of shares 195,790 413,344 47,112 100,808 348 –
Deduct: Income received on issue of shares (577,695) (420,515) (16,115) (21,723) (2,546) –
Net distribution for the financial year 2,723,708 2,858,403 270,438 378,488 8,125 249
World Allocation
40/60 Fund World Allocation
60/40 Fund World Allocation
80/20 Fund
30 Nov 2016
GBP 30 Nov 2015
GBP 30 Nov 2016
GBP 30 Nov 2015
GBP 30 Nov 2016
GBP 30 Nov 2015
GBP
Gross distribution for the financial year 595,378 328,048 1,369,476 949,723 35,687 1,702
Add: Income deducted on cancellation of shares 23,894 18,762 53,730 47,189 573 –
Deduct: Income received on issue of shares (110,527) (48,414) (154,948) (162,897) (12,993) 132
Net distribution for the financial year 508,745 298,396 1,268,258 834,015 23,267 1,834
*Global Value Fund commenced trading on 11 July 2016.
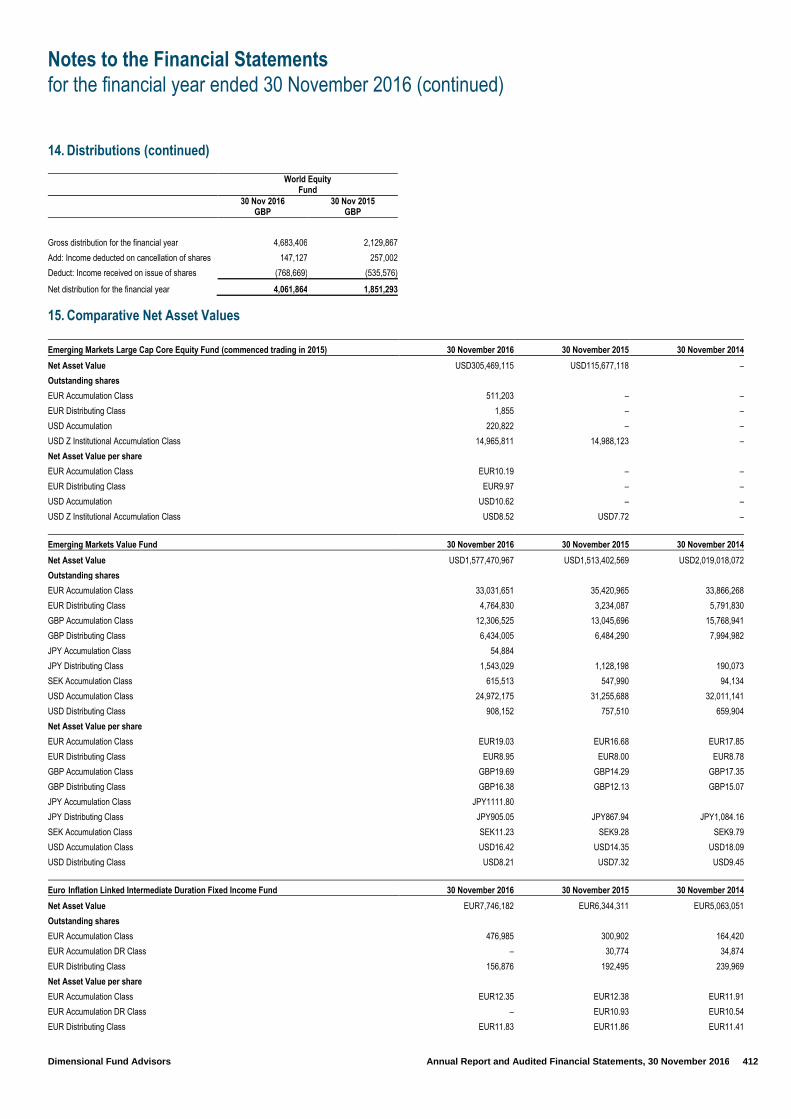
Notes to the Financial Statements
for the financial year ended 30 November 2016 (continued)
Dimensional Fund Advisors Annual Report and Audited Financial Statements, 30 November 2016 412
14. Distributions (continued)
World Equity
Fund
30 Nov 2016
GBP 30 Nov 2015
GBP
Gross distribution for the financial year 4,683,406 2,129,867
Add: Income deducted on cancellation of shares 147,127 257,002
Deduct: Income received on issue of shares (768,669) (535,576)
Net distribution for the financial year 4,061,864 1,851,293
15. Comparative Net Asset Values Emerging Markets Large Cap Core Equity Fund (commenced trading in 2015) 30 November 2016 30 November 2015 30 November 2014
Net Asset Value USD305,469,115 USD115,677,118 –
Outstanding shares
EUR Accumulation Class 511,203 – –
EUR Distributing Class 1,855 – –
USD Accumulation 220,822 – –
USD Z Institutional Accumulation Class 14,965,811 14,988,123 –
Net Asset Value per share
EUR Accumulation Class EUR10.19 – –
EUR Distributing Class EUR9.97 – –
USD Accumulation USD10.62 – –
USD Z Institutional Accumulation Class USD8.52 USD7.72 –
Emerging Markets Value Fund 30 November 2016 30 November 2015 30 November 2014
Net Asset Value USD1,577,470,967 USD1,513,402,569 USD2,019,018,072
Outstanding shares
EUR Accumulation Class 33,031,651 35,420,965 33,866,268
EUR Distributing Class 4,764,830 3,234,087 5,791,830
GBP Accumulation Class 12,306,525 13,045,696 15,768,941
GBP Distributing Class 6,434,005 6,484,290 7,994,982
JPY Accumulation Class 54,884
JPY Distributing Class 1,543,029 1,128,198 190,073
SEK Accumulation Class 615,513 547,990 94,134
USD Accumulation Class 24,972,175 31,255,688 32,011,141
USD Distributing Class 908,152 757,510 659,904
Net Asset Value per share
EUR Accumulation Class EUR19.03 EUR16.68 EUR17.85
EUR Distributing Class EUR8.95 EUR8.00 EUR8.78
GBP Accumulation Class GBP19.69 GBP14.29 GBP17.35
GBP Distributing Class GBP16.38 GBP12.13 GBP15.07
JPY Accumulation Class JPY1111.80
JPY Distributing Class JPY905.05 JPY867.94 JPY1,084.16
SEK Accumulation Class SEK11.23 SEK9.28 SEK9.79
USD Accumulation Class USD16.42 USD14.35 USD18.09
USD Distributing Class USD8.21 USD7.32 USD9.45
Euro Inflation Linked Intermediate Duration Fixed Income Fund 30 November 2016 30 November 2015 30 November 2014
Net Asset Value EUR7,746,182 EUR6,344,311 EUR5,063,051
Outstanding shares
EUR Accumulation Class 476,985 300,902 164,420
EUR Accumulation DR Class – 30,774 34,874
EUR Distributing Class 156,876 192,495 239,969
Net Asset Value per share
EUR Accumulation Class EUR12.35 EUR12.38 EUR11.91
EUR Accumulation DR Class – EUR10.93 EUR10.54
EUR Distributing Class EUR11.83 EUR11.86 EUR11.41
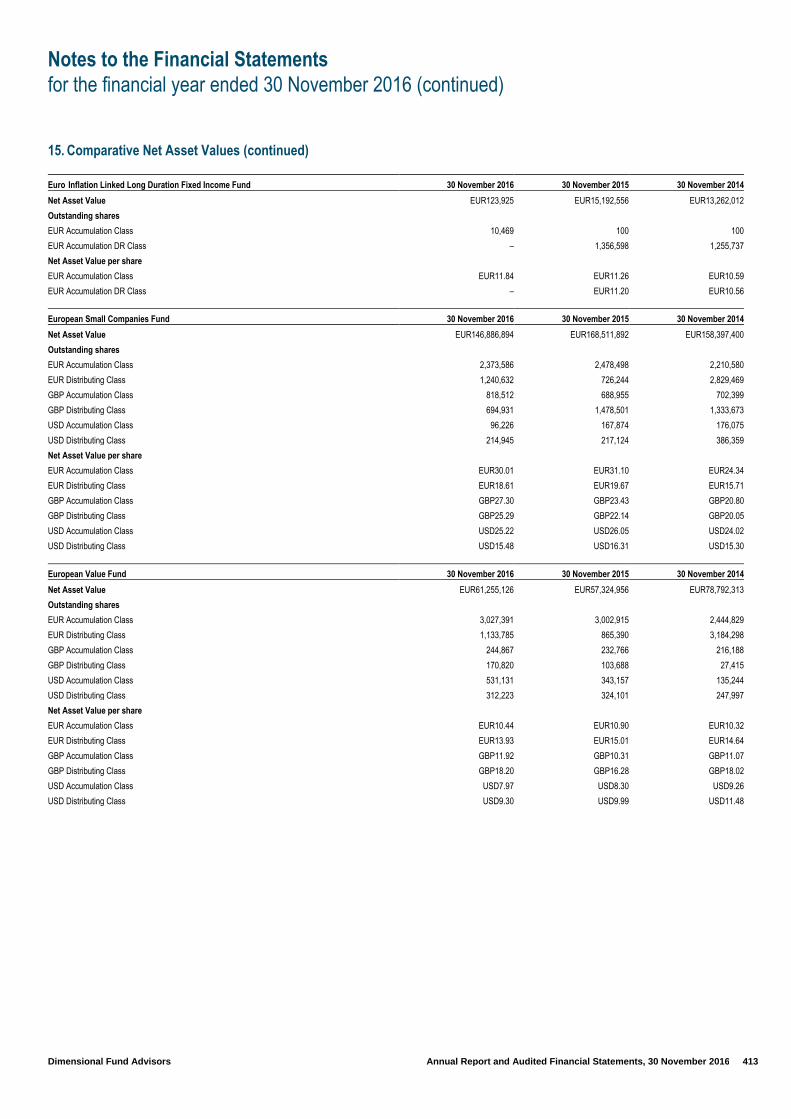
Notes to the Financial Statements
for the financial year ended 30 November 2016 (continued)
Dimensional Fund Advisors Annual Report and Audited Financial Statements, 30 November 2016 413
15. Comparative Net Asset Values (continued) Euro Inflation Linked Long Duration Fixed Income Fund 30 November 2016 30 November 2015 30 November 2014
Net Asset Value EUR123,925 EUR15,192,556 EUR13,262,012
Outstanding shares
EUR Accumulation Class 10,469 100 100
EUR Accumulation DR Class – 1,356,598 1,255,737
Net Asset Value per share
EUR Accumulation Class EUR11.84 EUR11.26 EUR10.59
EUR Accumulation DR Class – EUR11.20 EUR10.56
European Small Companies Fund 30 November 2016 30 November 2015 30 November 2014
Net Asset Value EUR146,886,894 EUR168,511,892 EUR158,397,400
Outstanding shares
EUR Accumulation Class 2,373,586 2,478,498 2,210,580
EUR Distributing Class 1,240,632 726,244 2,829,469
GBP Accumulation Class 818,512 688,955 702,399
GBP Distributing Class 694,931 1,478,501 1,333,673
USD Accumulation Class 96,226 167,874 176,075
USD Distributing Class 214,945 217,124 386,359
Net Asset Value per share
EUR Accumulation Class EUR30.01 EUR31.10 EUR24.34
EUR Distributing Class EUR18.61 EUR19.67 EUR15.71
GBP Accumulation Class GBP27.30 GBP23.43 GBP20.80
GBP Distributing Class GBP25.29 GBP22.14 GBP20.05
USD Accumulation Class USD25.22 USD26.05 USD24.02
USD Distributing Class USD15.48 USD16.31 USD15.30
European Value Fund 30 November 2016 30 November 2015 30 November 2014
Net Asset Value EUR61,255,126 EUR57,324,956 EUR78,792,313
Outstanding shares
EUR Accumulation Class 3,027,391 3,002,915 2,444,829
EUR Distributing Class 1,133,785 865,390 3,184,298
GBP Accumulation Class 244,867 232,766 216,188
GBP Distributing Class 170,820 103,688 27,415
USD Accumulation Class 531,131 343,157 135,244
USD Distributing Class 312,223 324,101 247,997
Net Asset Value per share
EUR Accumulation Class EUR10.44 EUR10.90 EUR10.32
EUR Distributing Class EUR13.93 EUR15.01 EUR14.64
GBP Accumulation Class GBP11.92 GBP10.31 GBP11.07
GBP Distributing Class GBP18.20 GBP16.28 GBP18.02
USD Accumulation Class USD7.97 USD8.30 USD9.26
USD Distributing Class USD9.30 USD9.99 USD11.48

Notes to the Financial Statements
for the financial year ended 30 November 2016 (continued)
Dimensional Fund Advisors Annual Report and Audited Financial Statements, 30 November 2016 414
15. Comparative Net Asset Values (continued) Global Core Equity Fund 30 November 2016 30 November 2015 30 November 2014
Net Asset Value USD1,711,452,142 USD1,368,732,945 USD1,186,583,479
Outstanding shares
EUR Accumulation Class 10,095,732 9,430,845 8,811,662
EUR Accumulation DR Class – 350,941 335,522
EUR Distributing Class 12,014,672 8,554,126 5,945,327
GBP Accumulation Class 21,410,867 19,142,688 17,371,224
GBP Distributing Class 20,720,108 15,894,725 13,306,682
USD Accumulation Class 3,636,121 2,935,977 3,149,538
USD Distributing Class 3,062,360 2,551,602 2,494,155
JPY Accumulation Class 52,621 – –
JPY Distributing Class 6,278,087 4,385,439 944,904
SEK Accumulation Class 4,007,311 4,329,875 367,275
Net Asset Value per share
EUR Accumulation Class EUR21.67 EUR20.78 EUR17.81
EUR Accumulation DR Class – EUR14.80 EUR12.68
EUR Distributing Class EUR18.13 EUR17.68 EUR15.40
GBP Accumulation Class GBP21.72 GBP17.26 GBP16.77
GBP Distributing Class GBP19.50 GBP15.77 GBP15.57
USD Accumulation Class USD15.86 USD15.16 USD15.30
USD Distributing Class USD12.04 USD11.70 USD12.00
JPY Accumulation Class JPY1143.01 – –
JPY Distributing Class JPY1104.23 JPY1,155.78 JPY1,146.25
SEK Accumulation Class SEK12.81 SEK11.59 SEK9.92
Global Short Fixed Income Fund 30 November 2016 30 November 2015 30 November 2014
Net Asset Value EUR1,900,488,509 EUR1,346,736,848 EUR961,160,269
Outstanding shares
CHF Distributing Class 3,179,185 2,451,112 2,803,863
EUR Accumulation Class 26,356,921 25,560,652 21,495,553
EUR Distributing Class 38,017,825 32,498,027 31,539,536
GBP Accumulation Class 964,509 360,231 161,969
GBP Distributing Class 7,859,390 6,418,739 3,631,072
JPY Accumulation Class 13,924,589 15,866,196 13,120,520
NOK Distributing Class 10,948,530 9,824,724 6,156,024
SEK Accumulation Class 11,552,887 21,786,018 503,500
SEK Distributing Class 7,512,597 7,247,609 7,831,130
USD Accumulation Class 5,660,678 4,920,031 4,586,170
USD Distributing Class 4,094,232 3,854,136 2,459,939
JPY Distributing Class 93,632,004 37,057,751 15,351,723
Net Asset Value per share
CHF Distributing Class CHF10.53 CHF10.68 CHF10.82
EUR Accumulation Class EUR13.48 EUR13.40 EUR13.27
EUR Distributing Class EUR10.10 EUR10.18 EUR10.24
GBP Accumulation Class GBP10.62 GBP10.44 GBP10.26
GBP Distributing Class GBP10.13 GBP10.11 GBP10.08
JPY Accumulation Class JPY1042.27 JPY1,037.12 JPY1,027.74
NOK Distributing Class NOK12.70 NOK12.62 NOK12.53
SEK Accumulation Class SEK10.15 SEK10.12 SEK10.00
SEK Distributing Class SEK10.84 SEK10.96 SEK11.02
USD Accumulation Class USD12.61 USD12.38 USD12.21
USD Distributing Class USD10.14 USD10.09 USD10.09
JPY Distributing Class JPY987.01 JPY998.23 JPY1,006.18

Notes to the Financial Statements
for the financial year ended 30 November 2016 (continued)
Dimensional Fund Advisors Annual Report and Audited Financial Statements, 30 November 2016 415
15. Comparative Net Asset Values (continued)
Global Short–Term Investment Grade Fixed Income Fund 30 November 2016 30 November 2015 30 November 2014
Net Asset Value USD538,675,265 USD382,712,671 USD146,497,174
Outstanding shares
CHF Distributing Class 1,018,081 753,445 –
EUR Accumulation Class 9,317,553 7,348,471 3,015,249
EUR Distributing Class 7,502,109 3,964,475 2,346,813
GBP Accumulation Class 9,172,266 5,024,643 2,117,990
GBP Distributing Class 16,195,775 10,734,523 2,615,672
JPY Distributing Class 1,221,458 – –
SEK Accumulation Class 8,530,744 6,527,692 –
USD Accumulation Class 570,631 473,844 436,828
USD Distributing Class 101,933 332,940 11,613
Net Asset Value per share
CHF Distributing Class CHF9.82 CHF9.97 –
EUR Accumulation Class EUR10.22 EUR10.14 EUR10.10
EUR Distributing Class EUR9.82 EUR9.90 EUR10.02
GBP Accumulation Class GBP10.47 GBP10.27 GBP10.16
GBP Distributing Class GBP10.01 GBP10.01 GBP10.05
JPY Distributing Class JPY979.67 – –
SEK Accumulation Class SEK10.09 SEK10.02 –
USD Accumulation Class USD10.45 USD10.24 USD10.16
USD Distributing Class USD10.06 USD10.02 USD10.07
Global Small Companies Fund 30 November 2016 30 November 2015 30 November 2014
Net Asset Value USD484,224,517 USD471,527,427 USD377,397,703
Outstanding shares
EUR Accumulation Class 2,234,039 2,122,111 2,043,034
EUR Distributing Class 3,769,100 2,724,303 534,956
GBP Accumulation Class 9,105,879 11,178,592 10,569,204
GBP Distributing Class 5,446,567 5,373,979 4,385,024
USD Accumulation Class 934,965 931,528 914,384
USD Distributing Class 1,592,906 1,334,304 –
Net Asset Value per share
EUR Accumulation Class EUR20.06 EUR18.63 EUR15.49
EUR Distributing Class EUR17.71 EUR16.68 EUR14.03
GBP Accumulation Class GBP18.83 GBP14.48 GBP13.65
GBP Distributing Class GBP17.78 GBP13.87 GBP13.24
USD Accumulation Class USD14.69 USD13.61 USD13.32
USD Distributing Class USD10.39 USD9.75 –
Global Sustainability Core Equity Fund 30 November 2016 30 November 2015 30 November 2014
Net Asset Value USD95,263,339 USD80,870,443 USD68,198,138
Outstanding shares
EUR Accumulation Class 1,112,248 885,474 852,532
EUR Distributing Class 227,711 108,330 78,086
GBP Accumulation Class 2,432,767 2,289,768 1,882,318
GBP Distributing Class 1,073,486 862,967 601,740
USD Accumulation Class 503,095 500,815 511,748
USD Distributing Class 53,660 81,822 76,909
Net Asset Value per share
EUR Accumulation Class EUR15.44 EUR14.97 EUR12.77
EUR Distributing Class EUR14.74 EUR14.51 EUR12.54
GBP Accumulation Class GBP15.39 GBP12.36 GBP11.96
GBP Distributing Class GBP14.66 GBP11.96 GBP11.73
USD Accumulation Class USD12.57 USD12.15 USD12.21
USD Distributing Class USD12.00 USD11.78 USD11.99
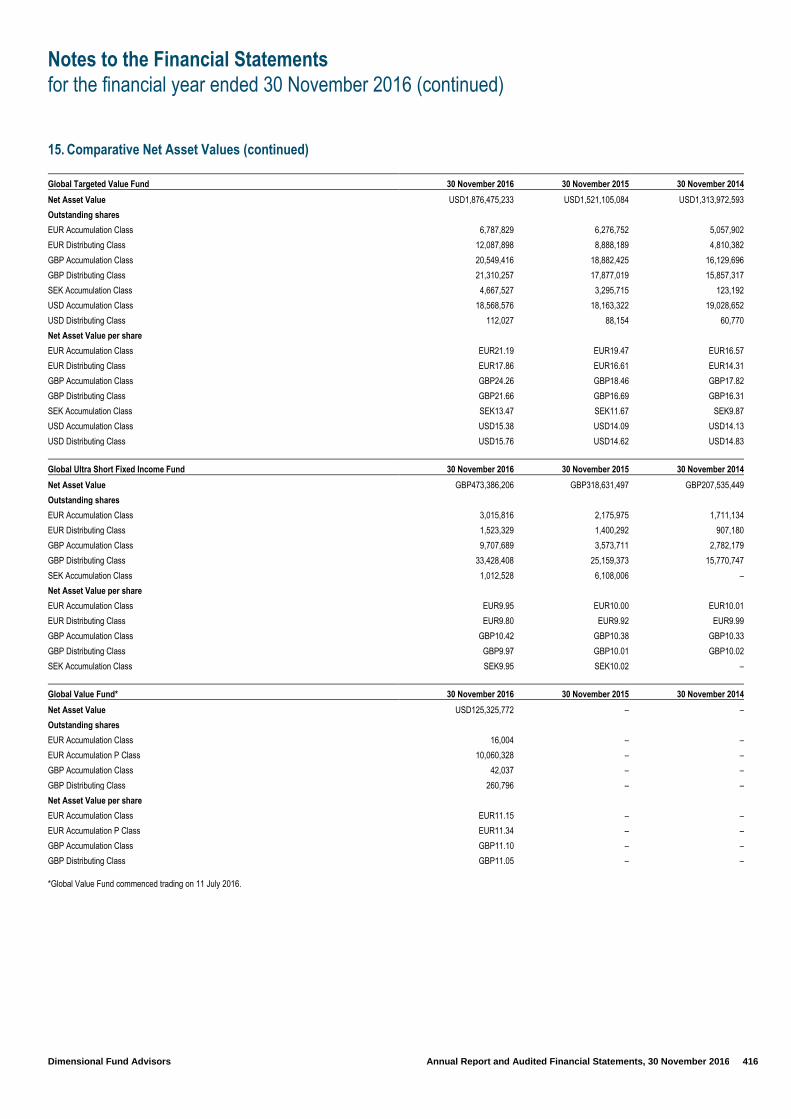
Notes to the Financial Statements
for the financial year ended 30 November 2016 (continued)
Dimensional Fund Advisors Annual Report and Audited Financial Statements, 30 November 2016 416
15. Comparative Net Asset Values (continued)
Global Targeted Value Fund 30 November 2016 30 November 2015 30 November 2014
Net Asset Value USD1,876,475,233 USD1,521,105,084 USD1,313,972,593
Outstanding shares
EUR Accumulation Class 6,787,829 6,276,752 5,057,902
EUR Distributing Class 12,087,898 8,888,189 4,810,382
GBP Accumulation Class 20,549,416 18,882,425 16,129,696
GBP Distributing Class 21,310,257 17,877,019 15,857,317
SEK Accumulation Class 4,667,527 3,295,715 123,192
USD Accumulation Class 18,568,576 18,163,322 19,028,652
USD Distributing Class 112,027 88,154 60,770
Net Asset Value per share
EUR Accumulation Class EUR21.19 EUR19.47 EUR16.57
EUR Distributing Class EUR17.86 EUR16.61 EUR14.31
GBP Accumulation Class GBP24.26 GBP18.46 GBP17.82
GBP Distributing Class GBP21.66 GBP16.69 GBP16.31
SEK Accumulation Class SEK13.47 SEK11.67 SEK9.87
USD Accumulation Class USD15.38 USD14.09 USD14.13
USD Distributing Class USD15.76 USD14.62 USD14.83
Global Ultra Short Fixed Income Fund 30 November 2016 30 November 2015 30 November 2014
Net Asset Value GBP473,386,206 GBP318,631,497 GBP207,535,449
Outstanding shares
EUR Accumulation Class 3,015,816 2,175,975 1,711,134
EUR Distributing Class 1,523,329 1,400,292 907,180
GBP Accumulation Class 9,707,689 3,573,711 2,782,179
GBP Distributing Class 33,428,408 25,159,373 15,770,747
SEK Accumulation Class 1,012,528 6,108,006 –
Net Asset Value per share
EUR Accumulation Class EUR9.95 EUR10.00 EUR10.01
EUR Distributing Class EUR9.80 EUR9.92 EUR9.99
GBP Accumulation Class GBP10.42 GBP10.38 GBP10.33
GBP Distributing Class GBP9.97 GBP10.01 GBP10.02
SEK Accumulation Class SEK9.95 SEK10.02 –
Global Value Fund* 30 November 2016 30 November 2015 30 November 2014
Net Asset Value USD125,325,772 – –
Outstanding shares
EUR Accumulation Class 16,004 – –
EUR Accumulation P Class 10,060,328 – –
GBP Accumulation Class 42,037 – –
GBP Distributing Class 260,796 – –
Net Asset Value per share
EUR Accumulation Class EUR11.15 – –
EUR Accumulation P Class EUR11.34 – –
GBP Accumulation Class GBP11.10 – –
GBP Distributing Class GBP11.05 – –
*Global Value Fund commenced trading on 11 July 2016.
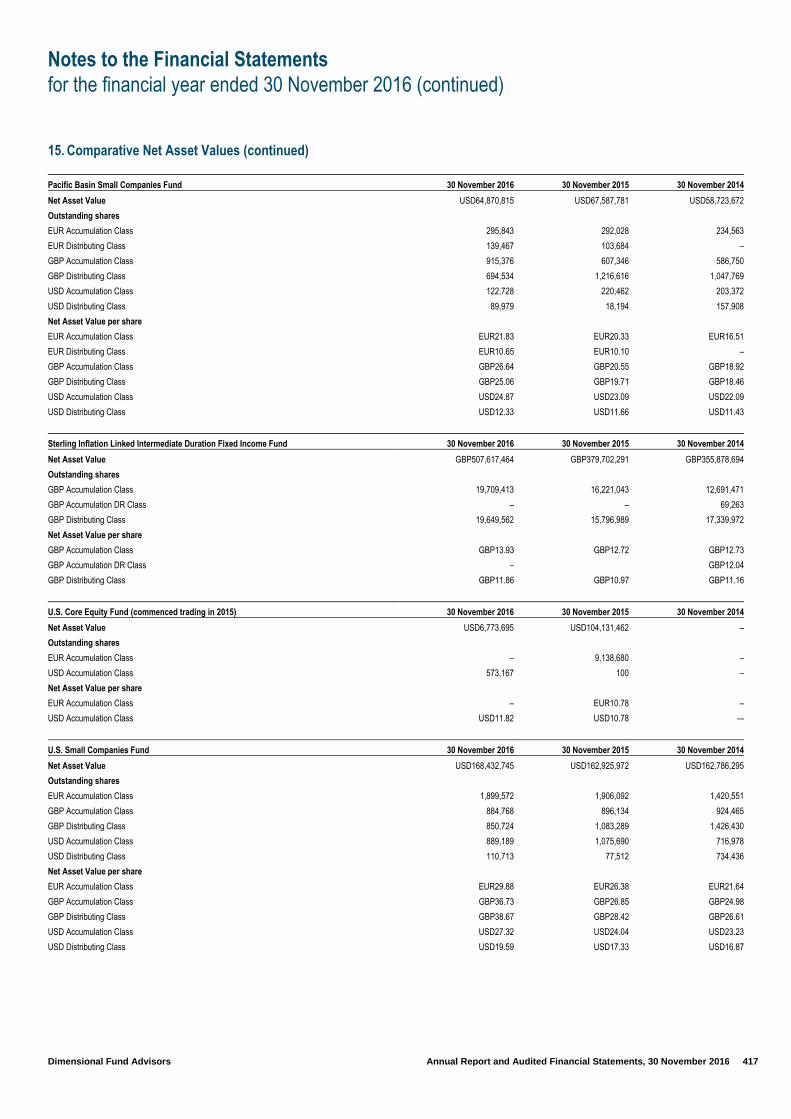
Notes to the Financial Statements
for the financial year ended 30 November 2016 (continued)
Dimensional Fund Advisors Annual Report and Audited Financial Statements, 30 November 2016 417
15. Comparative Net Asset Values (continued)
Pacific Basin Small Companies Fund 30 November 2016 30 November 2015 30 November 2014
Net Asset Value USD64,870,815 USD67,587,781 USD58,723,672
Outstanding shares
EUR Accumulation Class 295,843 292,028 234,563
EUR Distributing Class 139,467 103,684 –
GBP Accumulation Class 915,376 607,346 586,750
GBP Distributing Class 694,534 1,216,616 1,047,769
USD Accumulation Class 122,728 220,462 203,372
USD Distributing Class 89,979 18,194 157,908
Net Asset Value per share
EUR Accumulation Class EUR21.83 EUR20.33 EUR16.51
EUR Distributing Class EUR10.65 EUR10.10 –
GBP Accumulation Class GBP26.64 GBP20.55 GBP18.92
GBP Distributing Class GBP25.06 GBP19.71 GBP18.46
USD Accumulation Class USD24.87 USD23.09 USD22.09
USD Distributing Class USD12.33 USD11.66 USD11.43
Sterling Inflation Linked Intermediate Duration Fixed Income Fund 30 November 2016 30 November 2015 30 November 2014
Net Asset Value GBP507,617,464 GBP379,702,291 GBP355,878,694
Outstanding shares
GBP Accumulation Class 19,709,413 16,221,043 12,691,471
GBP Accumulation DR Class – – 69,263
GBP Distributing Class 19,649,562 15,796,989 17,339,972
Net Asset Value per share
GBP Accumulation Class GBP13.93 GBP12.72 GBP12.73
GBP Accumulation DR Class – GBP12.04
GBP Distributing Class GBP11.86 GBP10.97 GBP11.16
U.S. Core Equity Fund (commenced trading in 2015) 30 November 2016 30 November 2015 30 November 2014
Net Asset Value USD6,773,695 USD104,131,462 –
Outstanding shares
EUR Accumulation Class – 9,138,680 –
USD Accumulation Class 573,167 100 –
Net Asset Value per share
EUR Accumulation Class – EUR10.78 –
USD Accumulation Class USD11.82 USD10.78 –-
U.S. Small Companies Fund 30 November 2016 30 November 2015 30 November 2014
Net Asset Value USD168,432,745 USD162,925,972 USD162,786,295
Outstanding shares
EUR Accumulation Class 1,899,572 1,906,092 1,420,551
GBP Accumulation Class 884,768 896,134 924,465
GBP Distributing Class 850,724 1,083,289 1,426,430
USD Accumulation Class 889,189 1,075,690 716,978
USD Distributing Class 110,713 77,512 734,436
Net Asset Value per share
EUR Accumulation Class EUR29.88 EUR26.38 EUR21.64
GBP Accumulation Class GBP36.73 GBP26.85 GBP24.98
GBP Distributing Class GBP38.67 GBP28.42 GBP26.61
USD Accumulation Class USD27.32 USD24.04 USD23.23
USD Distributing Class USD19.59 USD17.33 USD16.87
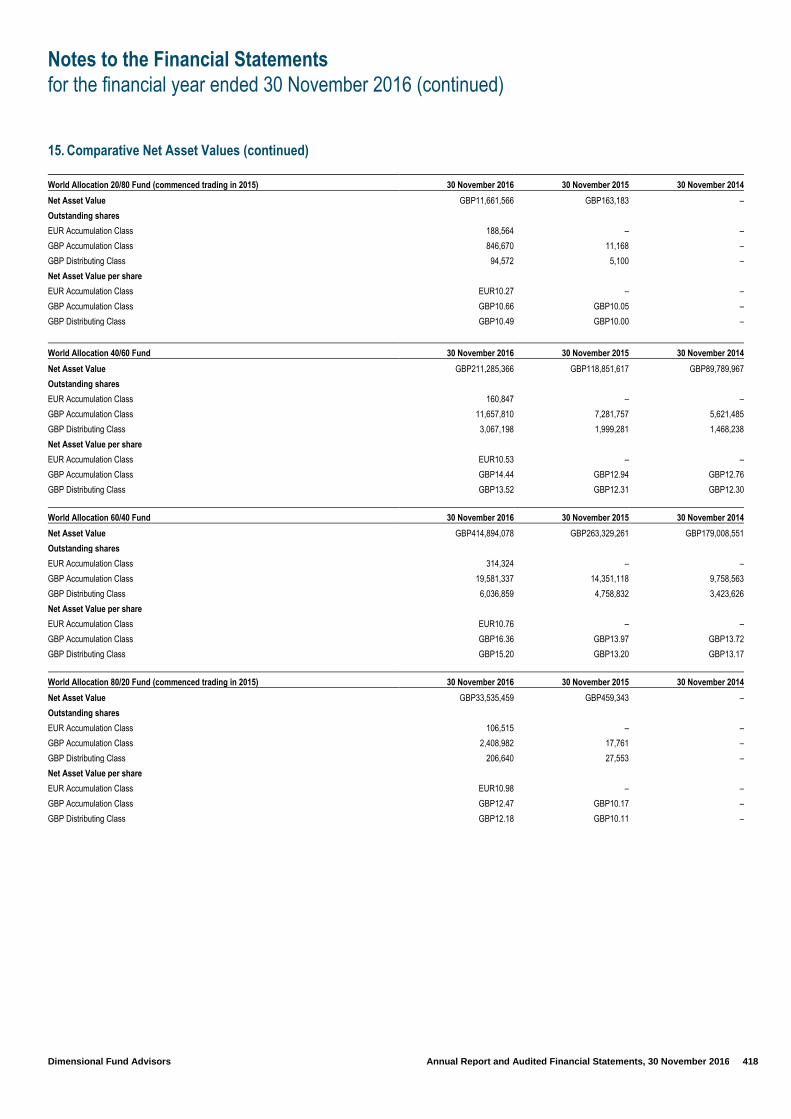
Notes to the Financial Statements
for the financial year ended 30 November 2016 (continued)
Dimensional Fund Advisors Annual Report and Audited Financial Statements, 30 November 2016 418
15. Comparative Net Asset Values (continued)
World Allocation 20/80 Fund (commenced trading in 2015) 30 November 2016 30 November 2015 30 November 2014
Net Asset Value GBP11,661,566 GBP163,183 –
Outstanding shares
EUR Accumulation Class 188,564 – –
GBP Accumulation Class 846,670 11,168 –
GBP Distributing Class 94,572 5,100 –
Net Asset Value per share
EUR Accumulation Class EUR10.27 – –
GBP Accumulation Class GBP10.66 GBP10.05 –
GBP Distributing Class GBP10.49 GBP10.00 –
World Allocation 40/60 Fund 30 November 2016 30 November 2015 30 November 2014
Net Asset Value GBP211,285,366 GBP118,851,617 GBP89,789,967
Outstanding shares
EUR Accumulation Class 160,847 – –
GBP Accumulation Class 11,657,810 7,281,757 5,621,485
GBP Distributing Class 3,067,198 1,999,281 1,468,238
Net Asset Value per share
EUR Accumulation Class EUR10.53 – –
GBP Accumulation Class GBP14.44 GBP12.94 GBP12.76
GBP Distributing Class GBP13.52 GBP12.31 GBP12.30
World Allocation 60/40 Fund 30 November 2016 30 November 2015 30 November 2014
Net Asset Value GBP414,894,078 GBP263,329,261 GBP179,008,551
Outstanding shares
EUR Accumulation Class 314,324 – –
GBP Accumulation Class 19,581,337 14,351,118 9,758,563
GBP Distributing Class 6,036,859 4,758,832 3,423,626
Net Asset Value per share
EUR Accumulation Class EUR10.76 – –
GBP Accumulation Class GBP16.36 GBP13.97 GBP13.72
GBP Distributing Class GBP15.20 GBP13.20 GBP13.17
World Allocation 80/20 Fund (commenced trading in 2015) 30 November 2016 30 November 2015 30 November 2014
Net Asset Value GBP33,535,459 GBP459,343 –
Outstanding shares
EUR Accumulation Class 106,515 – –
GBP Accumulation Class 2,408,982 17,761 –
GBP Distributing Class 206,640 27,553 –
Net Asset Value per share
EUR Accumulation Class EUR10.98 – –
GBP Accumulation Class GBP12.47 GBP10.17 –
GBP Distributing Class GBP12.18 GBP10.11 –
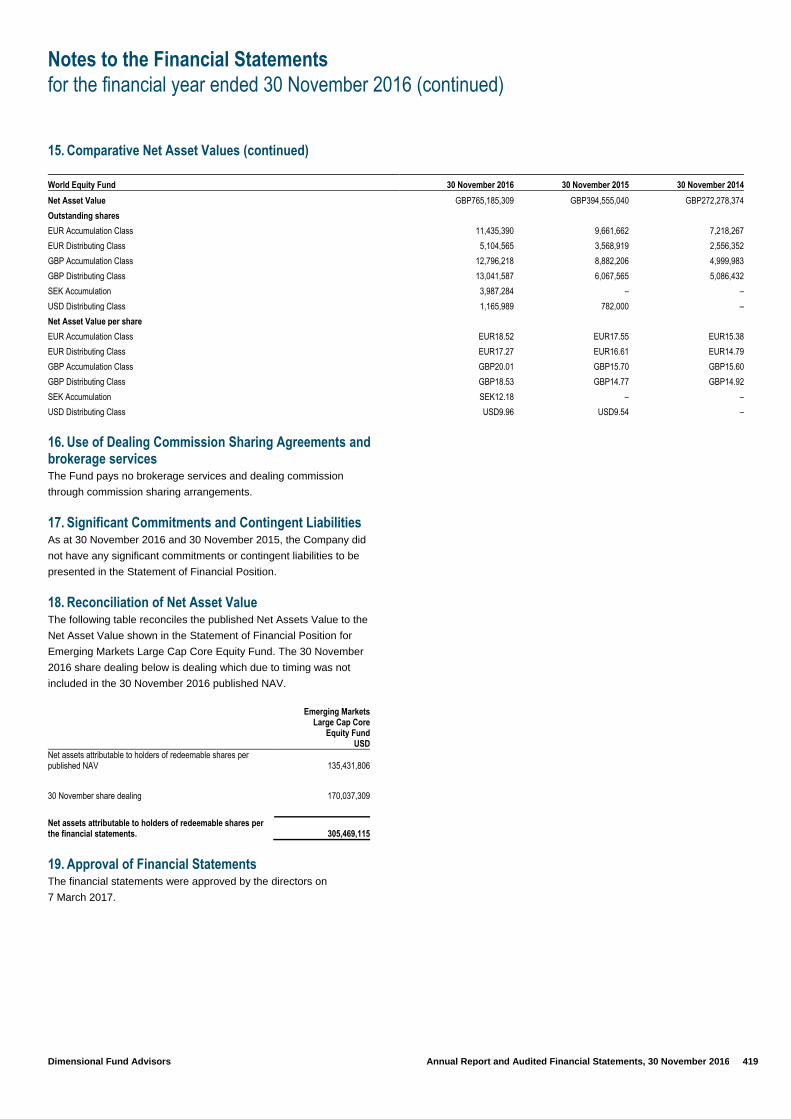
Notes to the Financial Statements
for the financial year ended 30 November 2016 (continued)
Dimensional Fund Advisors Annual Report and Audited Financial Statements, 30 November 2016 419
15. Comparative Net Asset Values (continued)
World Equity Fund 30 November 2016 30 November 2015 30 November 2014
Net Asset Value GBP765,185,309 GBP394,555,040 GBP272,278,374
Outstanding shares
EUR Accumulation Class 11,435,390 9,661,662 7,218,267
EUR Distributing Class 5,104,565 3,568,919 2,556,352
GBP Accumulation Class 12,796,218 8,882,206 4,999,983
GBP Distributing Class 13,041,587 6,067,565 5,086,432
SEK Accumulation 3,987,284 – –
USD Distributing Class 1,165,989 782,000 –
Net Asset Value per share
EUR Accumulation Class EUR18.52 EUR17.55 EUR15.38
EUR Distributing Class EUR17.27 EUR16.61 EUR14.79
GBP Accumulation Class GBP20.01 GBP15.70 GBP15.60
GBP Distributing Class GBP18.53 GBP14.77 GBP14.92
SEK Accumulation SEK12.18 – –
USD Distributing Class USD9.96 USD9.54 –
16. Use of Dealing Commission Sharing Agreements and brokerage services The Fund pays no brokerage services and dealing commission
through commission sharing arrangements.
17. Significant Commitments and Contingent Liabilities
As at 30 November 2016 and 30 November 2015, the Company did
not have any significant commitments or contingent liabilities to be
presented in the Statement of Financial Position.
18. Reconciliation of Net Asset Value
The following table reconciles the published Net Assets Value to the
Net Asset Value shown in the Statement of Financial Position for
Emerging Markets Large Cap Core Equity Fund. The 30 November
2016 share dealing below is dealing which due to timing was not
included in the 30 November 2016 published NAV.
Emerging Markets Large Cap Core
Equity Fund USD
Net assets attributable to holders of redeemable shares per published NAV 135,431,806
30 November share dealing 170,037,309
Net assets attributable to holders of redeemable shares per the financial statements. 305,469,115
19. Approval of Financial Statements The financial statements were approved by the directors on
7 March 2017.
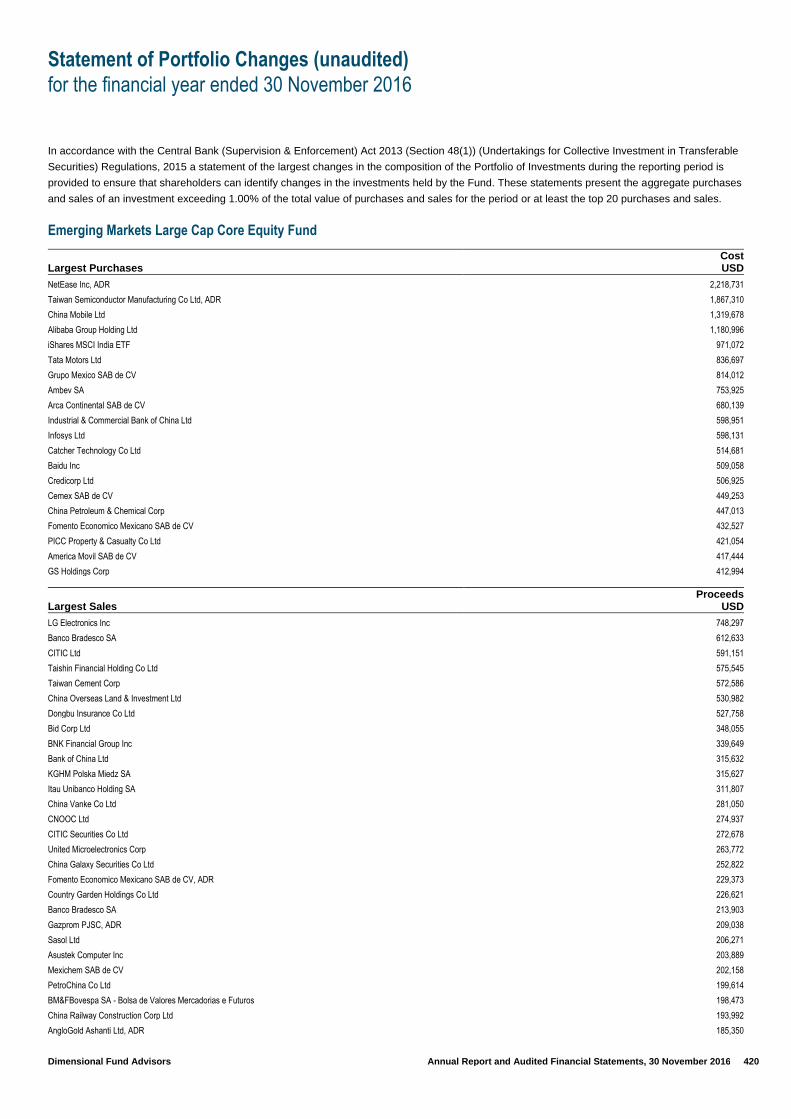
Statement of Portfolio Changes (unaudited)
for the financial year ended 30 November 2016
Dimensional Fund Advisors Annual Report and Audited Financial Statements, 30 November 2016 420
In accordance with the Central Bank (Supervision & Enforcement) Act 2013 (Section 48(1)) (Undertakings for Collective Investment in Transferable
Securities) Regulations, 2015 a statement of the largest changes in the composition of the Portfolio of Investments during the reporting period is
provided to ensure that shareholders can identify changes in the investments held by the Fund. These statements present the aggregate purchases
and sales of an investment exceeding 1.00% of the total value of purchases and sales for the period or at least the top 20 purchases and sales.
Emerging Markets Large Cap Core Equity Fund
Largest Purchases Cost USD
NetEase Inc, ADR 2,218,731
Taiwan Semiconductor Manufacturing Co Ltd, ADR 1,867,310
China Mobile Ltd 1,319,678
Alibaba Group Holding Ltd 1,180,996
iShares MSCI India ETF 971,072
Tata Motors Ltd 836,697
Grupo Mexico SAB de CV 814,012
Ambev SA 753,925
Arca Continental SAB de CV 680,139
Industrial & Commercial Bank of China Ltd 598,951
Infosys Ltd 598,131
Catcher Technology Co Ltd 514,681
Baidu Inc 509,058
Credicorp Ltd 506,925
Cemex SAB de CV 449,253
China Petroleum & Chemical Corp 447,013
Fomento Economico Mexicano SAB de CV 432,527
PICC Property & Casualty Co Ltd 421,054
America Movil SAB de CV 417,444
GS Holdings Corp 412,994
Largest Sales Proceeds
USD
LG Electronics Inc 748,297
Banco Bradesco SA 612,633
CITIC Ltd 591,151
Taishin Financial Holding Co Ltd 575,545
Taiwan Cement Corp 572,586
China Overseas Land & Investment Ltd 530,982
Dongbu Insurance Co Ltd 527,758
Bid Corp Ltd 348,055
BNK Financial Group Inc 339,649
Bank of China Ltd 315,632
KGHM Polska Miedz SA 315,627
Itau Unibanco Holding SA 311,807
China Vanke Co Ltd 281,050
CNOOC Ltd 274,937
CITIC Securities Co Ltd 272,678
United Microelectronics Corp 263,772
China Galaxy Securities Co Ltd 252,822
Fomento Economico Mexicano SAB de CV, ADR 229,373
Country Garden Holdings Co Ltd 226,621
Banco Bradesco SA 213,903
Gazprom PJSC, ADR 209,038
Sasol Ltd 206,271
Asustek Computer Inc 203,889
Mexichem SAB de CV 202,158
PetroChina Co Ltd 199,614
BM&FBovespa SA - Bolsa de Valores Mercadorias e Futuros 198,473
China Railway Construction Corp Ltd 193,992
AngloGold Ashanti Ltd, ADR 185,350

Statement of Portfolio Changes (unaudited)
for the financial year ended 30 November 2016 (continued)
Dimensional Fund Advisors Annual Report and Audited Financial Statements, 30 November 2016 421
Emerging Markets Value Fund
Largest Purchases Cost GBP
Hon Hai Precision Industry Co Ltd 12,473,419
MTN Group Ltd 10,730,817
CNOOC Ltd 9,949,011
China Construction Bank Corp 9,475,986
Hyundai Mobis Co Ltd 9,084,454
Kia Motors Corp 6,837,536
China Petroleum & Chemical Corp 6,666,165
Axis Bank Ltd 5,113,322
Cathay Financial Holding Co Ltd 4,948,019
SK Hynix Inc 4,235,628
SK Innovation Co Ltd 4,160,170
JBS SA 3,765,126
Turkiye Garanti Bankasi AS 3,638,127
PetroChina Co Ltd 3,625,591
Samsung Life Insurance Co Ltd 3,340,066
Mahindra & Mahindra Ltd 3,289,892
CITIC Ltd 3,113,388
LUKOIL PJSC 2,925,576
Grupo Mexico SAB de CV 2,707,614
Standard Bank Group Ltd 2,589,289
Largest Sales Proceeds
GBP
Fomento Economico Mexicano SAB de CV 11,118,254
Industrial & Commercial Bank of China Ltd 7,821,193
Kroton Educacional SA 7,401,800
CNOOC Ltd 6,255,265
ICICI Bank Ltd 6,082,277
Akbank TAS 5,817,527
POSCO 5,709,351
AngloGold Ashanti Ltd 5,664,135
SK Hynix Inc 5,518,049
Gazprom PJSC 5,266,074
Banco do Brasil SA 4,999,344
Fomento Economico Mexicano SAB de CV 4,744,819
AngloGold Ashanti Ltd 4,695,316
CIMB Group Holdings Bhd 4,653,385
PTT PCL 4,486,228
China Petroleum & Chemical Corp 4,384,564
Vale SA 4,319,475
Grupo Financiero Banorte SAB de CV 4,137,769
SK Holdings Co Ltd 3,929,013
Samsung Life Insurance Co Ltd 3,815,803

Statement of Portfolio Changes (unaudited)
for the financial year ended 30 November 2016 (continued)
Dimensional Fund Advisors Annual Report and Audited Financial Statements, 30 November 2016 422
Euro Inflation Linked Intermediate Duration Fixed Income Fund
Largest Purchases Cost EUR
France Government Bond OAT 3.150% due 25/07/2032 605,500
France Government Bond OAT 0.700% due 25/07/2030 592,477
France Government Bond OAT 1.850% due 25/07/2027 444,115
France Government Bond OAT 0.250% due 25/07/2024 435,964
Deutsche Bundesrepublik Inflation Linked Bond 0.100% due 15/04/2023 251,338
France Government Bond OAT 1.100% due 25/07/2022 48,528
Largest Sales Proceeds
EUR
France Government Bond OAT 2.250% due 25/07/2020 284,360
France Government Bond OAT 0.700% due 25/07/2030 209,817
France Government Bond OAT 3.150% due 25/07/2032 208,843
France Government Bond OAT 0.250% due 25/07/2024 134,036
France Government Bond OAT 1.850% due 25/07/2027 101,747
France Government Bond OAT 1.100% due 25/07/2022 36,165
Deutsche Bundesrepublik Inflation Linked Bond 0.100% due 15/04/2023 34,435
Euro Inflation Linked Long Duration Fixed Income Fund
Largest Purchases Cost EUR
France Government Bond OAT 0.700% due 25/07/2030 183,315
France Government Bond OAT 1.800% due 25/07/2040 162,630
France Government Bond OAT 3.150% due 25/07/2032 16,261
Deutsche Bundesrepublik Inflation Linked Bond 0.500% due 15/04/2030 13,430
France Government Bond OAT 1.850% due 25/07/2027 11,167
Largest Sales Proceeds
EUR
France Government Bond OAT 1.800% due 25/07/2040 4,642,572
France Government Bond OAT 3.150% due 25/07/2032 4,323,178
France Government Bond OAT 1.850% due 25/07/2027 2,881,119
France Government Bond OAT 0.700% due 25/07/2030 2,063,642
Deutsche Bundesrepublik Inflation Linked Bond 0.500% due 15/04/2030 1,745,719
France Government Bond OAT 0.250% due 25/07/2024 371,176

Statement of Portfolio Changes (unaudited)
for the financial year ended 30 November 2016 (continued)
Dimensional Fund Advisors Annual Report and Audited Financial Statements, 30 November 2016 423
European Small Companies Fund
Largest Purchases Cost EUR
TDC AS 479,429
Smurfit Kappa Group PLC 462,070
Aggreko PLC 461,858
IMI PLC 432,899
G4S PLC 392,596
Boskalis Westminster 372,981
Tullow Oil PLC 358,245
Andritz AG 352,334
Weir Group PLC 349,622
Gemalto NV 330,008
Merlin Properties Socimi SA 317,716
Hugo Boss AG 312,690
Qiagen NV 312,177
Cobham PLC 305,521
K+S AG 290,785
Aryzta AG 289,597
Mediaset SpA 285,218
Rightmove PLC 281,822
Baloise Holding AG 280,597
B&M European Value Retail SA 271,035
Cellnex Telecom SA 270,211
Paysafe Group PLC 262,385
STMicroelectronics NV 255,372
Largest Sales Proceeds
EUR
Genmab AS 1,291,158
Paddy Power Betfair PLC 1,236,234
DCC PLC 1,034,914
Rightmove PLC 722,838
Informa PLC 714,674
Elisa Oyj 669,507
Straumann Holding AG 619,857
Umicore SA 420,775
Howden Joinery Group PLC 367,725
Arkema SA 359,905
Swiss Prime Site AG 343,985
Kingspan Group PLC 343,631
Fastighets AB Balder 330,421
Bellway PLC 317,011
Castellum AB 291,521
Eurofins Scientific SE 279,936
Teleperformance 274,659
Hufvudstaden AB 272,158
Eiffage SA 272,039
IG Group Holdings PLC 271,815
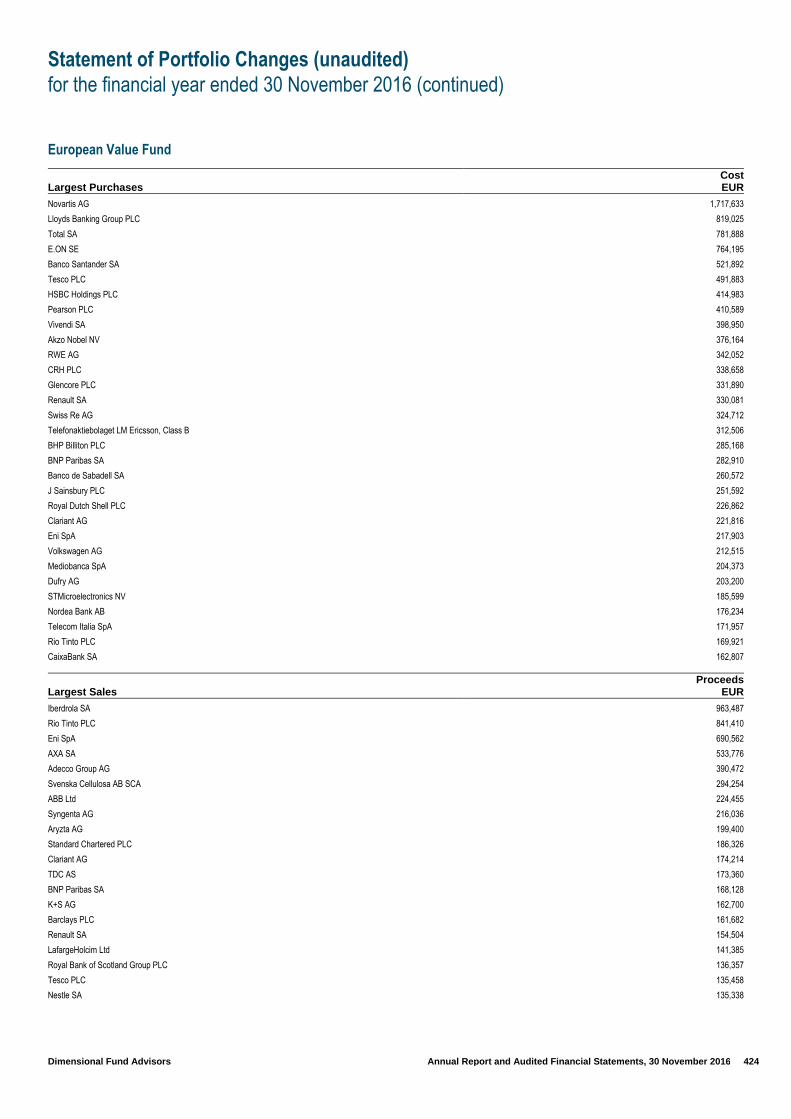
Statement of Portfolio Changes (unaudited)
for the financial year ended 30 November 2016 (continued)
Dimensional Fund Advisors Annual Report and Audited Financial Statements, 30 November 2016 424
European Value Fund
Largest Purchases Cost EUR
Novartis AG 1,717,633
Lloyds Banking Group PLC 819,025
Total SA 781,888
E.ON SE 764,195
Banco Santander SA 521,892
Tesco PLC 491,883
HSBC Holdings PLC 414,983
Pearson PLC 410,589
Vivendi SA 398,950
Akzo Nobel NV 376,164
RWE AG 342,052
CRH PLC 338,658
Glencore PLC 331,890
Renault SA 330,081
Swiss Re AG 324,712
Telefonaktiebolaget LM Ericsson, Class B 312,506
BHP Billiton PLC 285,168
BNP Paribas SA 282,910
Banco de Sabadell SA 260,572
J Sainsbury PLC 251,592
Royal Dutch Shell PLC 226,862
Clariant AG 221,816
Eni SpA 217,903
Volkswagen AG 212,515
Mediobanca SpA 204,373
Dufry AG 203,200
STMicroelectronics NV 185,599
Nordea Bank AB 176,234
Telecom Italia SpA 171,957
Rio Tinto PLC 169,921
CaixaBank SA 162,807
Largest Sales Proceeds
EUR
Iberdrola SA 963,487
Rio Tinto PLC 841,410
Eni SpA 690,562
AXA SA 533,776
Adecco Group AG 390,472
Svenska Cellulosa AB SCA 294,254
ABB Ltd 224,455
Syngenta AG 216,036
Aryzta AG 199,400
Standard Chartered PLC 186,326
Clariant AG 174,214
TDC AS 173,360
BNP Paribas SA 168,128
K+S AG 162,700
Barclays PLC 161,682
Renault SA 154,504
LafargeHolcim Ltd 141,385
Royal Bank of Scotland Group PLC 136,357
Tesco PLC 135,458
Nestle SA 135,338
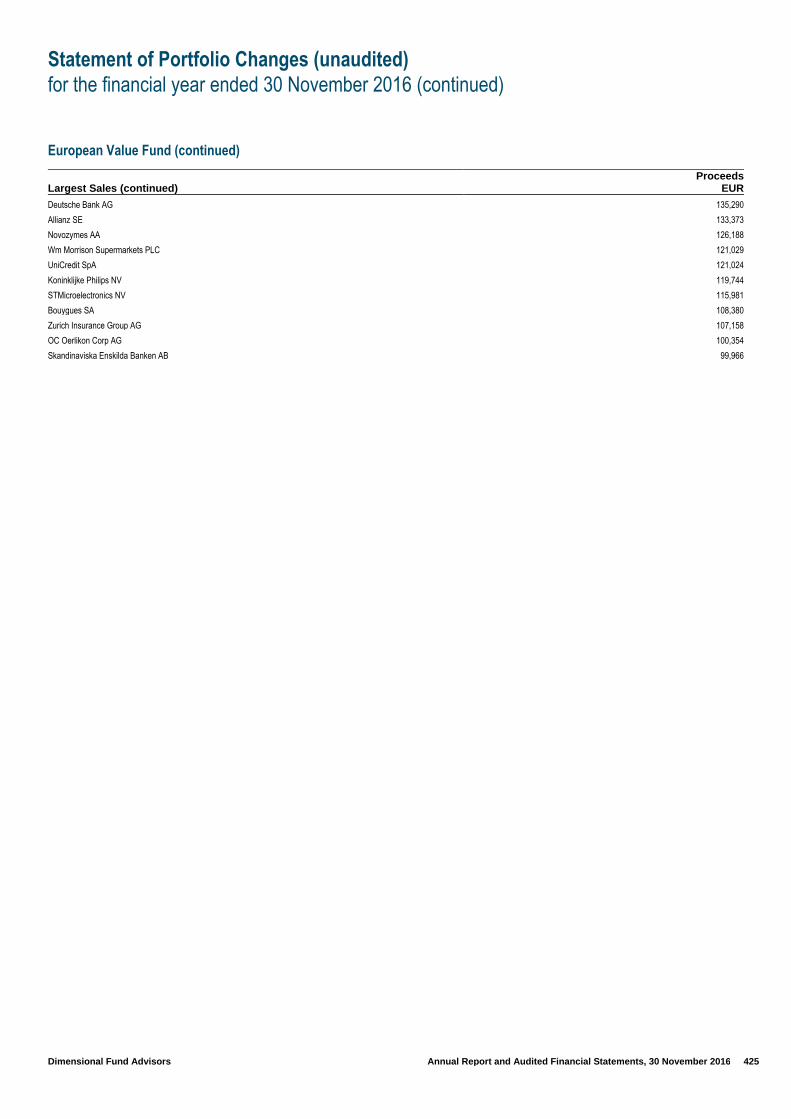
Statement of Portfolio Changes (unaudited)
for the financial year ended 30 November 2016 (continued)
Dimensional Fund Advisors Annual Report and Audited Financial Statements, 30 November 2016 425
European Value Fund (continued)
Largest Sales (continued) Proceeds
EUR
Deutsche Bank AG 135,290
Allianz SE 133,373
Novozymes AA 126,188
Wm Morrison Supermarkets PLC 121,029
UniCredit SpA 121,024
Koninklijke Philips NV 119,744
STMicroelectronics NV 115,981
Bouygues SA 108,380
Zurich Insurance Group AG 107,158
OC Oerlikon Corp AG 100,354
Skandinaviska Enskilda Banken AB 99,966

Statement of Portfolio Changes (unaudited)
for the financial year ended 30 November 2016 (continued)
Dimensional Fund Advisors Annual Report and Audited Financial Statements, 30 November 2016 426
Global Core Equity Fund
Largest Purchases Cost USD
AT&T Inc 3,647,571
Merck & Co Inc 2,584,949
Apple Inc 2,443,141
General Electric Co 2,231,946
JPMorgan Chase & Co 2,121,409
Facebook Inc 2,076,698
CVS Health Corp 1,742,494
Nestle SA 1,742,488
Pfizer Inc 1,740,397
Amazon.com Inc 1,570,199
Microsoft Corp 1,524,203
Berkshire Hathaway Inc 1,358,270
Intel Corp 1,317,510
Walt Disney Co 1,266,662
Mondelez International Inc 1,183,477
Banco Santander SA 1,134,290
Ford Motor Co 1,067,993
Johnson & Johnson 1,058,444
E.ON SE 1,003,160
Westpac Banking Corp 930,017
Largest Sales Proceeds
USD
Exxon Mobil Corp 2,811,375
Royal Dutch Shell Plc 1,564,641
Mondelez International Inc 1,532,662
EOG Resources Inc 1,189,090
Schlumberger Ltd 1,130,142
Chevron Corp 1,125,725
Pfizer Inc 1,088,819
Liberty Global Plc 808,209
Bank of America Corp 770,522
Sanofi 760,241
Banco Santander SA 746,385
Synchrony Financial 727,599
Citigroup Inc 674,946
Prudential Financial Inc 613,605
Woodside Petroleum Ltd 609,022
Banco Bilbao Vizcaya Argentaria SA 599,860
ConocoPhillips 563,728
Newcrest Mining Ltd 548,592
ABB Ltd 545,728
American International Group Inc 498,922

Statement of Portfolio Changes (unaudited)
for the financial year ended 30 November 2016 (continued)
Dimensional Fund Advisors Annual Report and Audited Financial Statements, 30 November 2016 427
Global Short Fixed Income Fund
Largest Purchases Cost EUR
United States Treasury Note 1.375% due 30/04/2021 89,575,199
United States Treasury Note 1.250% due 31/03/2021 87,796,723
United Kingdom Gilt 1.500% due 22/01/2021 66,125,647
Berkshire Hathaway Inc 2.200% due 15/03/2021 49,252,653
GE Capital International Funding Co 2.342% due 15/11/2020 47,869,016
Singapore Government Bond 2.250% due 01/06/2021 46,652,264
Kreditanstalt fuer Wiederaufbau 1.375% due 01/02/2021 37,341,047
Exxon Mobil Corp 2.222% due 01/03/2021 35,078,246
Cooperatieve Rabobank UA 2.500% due 19/01/2021 33,798,719
Apple Inc 2.250% due 23/02/2021 33,200,082
Export Development Canada 1.000% due 15/12/2020 33,000,971
Finland Government International Bond 1.625% due 15/12/2020 32,908,808
Microsoft Corp 2.000% due 03/11/2020 32,270,521
Bank of Nova Scotia 2.450% due 22/03/2021 30,635,116
Asian Development Bank 1.625% due 16/03/2021 27,541,686
Province of Ontario Canada 4.400% due 14/04/2020 27,014,572
Province of Quebec Canada 3.500% due 29/07/2020 26,262,436
Kommuninvest I Sverige AB 2.500% due 01/12/2020 25,976,086
United Kingdom Gilt 2.000% due 22/07/2020 25,881,988
Network Rail Infrastructure Finance PLC 4.625% due 21/07/2020 23,529,197
Pfizer Inc 1.950% due 03/06/2021 22,111,383
Toyota Motor Credit Corp 1.900% due 08/04/2021 21,426,273
Nordea Bank AB 2.250% due 27/05/2021 19,815,951
Royal Bank of Canada 2.350% due 30/10/2020 19,321,582
International Bank for Reconstruction & Development 2.125% due 01/11/2020 18,781,040
Shell International Finance BV 1.875% due 10/05/2021 18,295,946
Coca-Cola Co 1.875% due 27/10/2020 18,216,433
International Bank for Reconstruction & Development 1.375% due 24/05/2021 17,873,024
Cisco Systems Inc 2.200% due 28/02/2021 16,251,789
Toronto-Dominion Bank 2.125% due 07/04/2021 15,847,622
Sweden Government Bond 5.000% due 01/12/2020 15,558,299
Largest Sales Proceeds
EUR
United States Treasury Note1.375% due 30/04/2021 89,172,302
United States Treasury Note 1.250% due 31/03/2021 87,062,036
United Kingdom Gilt 4.750% due 07/03/2020 49,888,032
GE Capital International Funding Co 0.964% due 15/04/2016 41,496,816
United Kingdom Gilt 2.000% due 22/07/2020 24,086,199
Singapore Government Bond 2.500% due 01/06/2019 20,325,155
Berkshire Hathaway Inc 2.100% due 14/08/2019 19,497,677
Municipality Finance PLC 1.750% due 21/05/2019 19,192,552
Apple Inc 2.100% due 06/05/2019 19,178,675
International Business Machines Corp 1.950% due 12/02/2019 19,139,534
International Bank for Reconstruction & Development 2.125% due 01/11/2020 18,949,127
Bank Nederlandse Gemeenten NV 1.875% due 07/12/2018 17,332,074
Sweden Government Bond 5.000% due 01/12/2020 15,445,042
FMS Wertmanagement AoeR 1.875% due 07/12/2018 14,320,521
United States Treasury Note 1.375% due 31/05/2021 13,588,501
Svensk Exportkredit AB 1.875% due 17/06/2019 13,564,081
GE Capital International Funding Co 2.342% due 15/11/2020 13,498,210
Pfizer Inc 2.100% due 15/05/2019 12,540,658
Japan Bank for International Cooperation1.750% due 28/05/2020 12,525,392
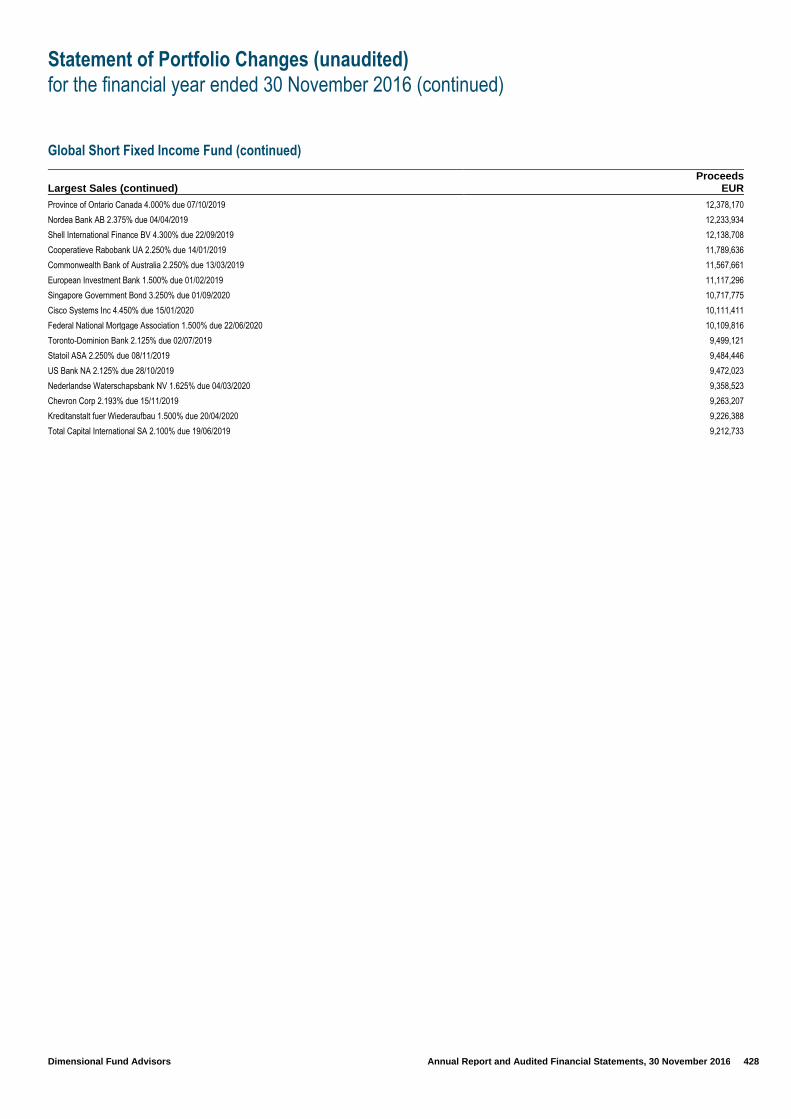
Statement of Portfolio Changes (unaudited)
for the financial year ended 30 November 2016 (continued)
Dimensional Fund Advisors Annual Report and Audited Financial Statements, 30 November 2016 428
Global Short Fixed Income Fund (continued)
Largest Sales (continued) Proceeds
EUR
Province of Ontario Canada 4.000% due 07/10/2019 12,378,170
Nordea Bank AB 2.375% due 04/04/2019 12,233,934
Shell International Finance BV 4.300% due 22/09/2019 12,138,708
Cooperatieve Rabobank UA 2.250% due 14/01/2019 11,789,636
Commonwealth Bank of Australia 2.250% due 13/03/2019 11,567,661
European Investment Bank 1.500% due 01/02/2019 11,117,296
Singapore Government Bond 3.250% due 01/09/2020 10,717,775
Cisco Systems Inc 4.450% due 15/01/2020 10,111,411
Federal National Mortgage Association 1.500% due 22/06/2020 10,109,816
Toronto-Dominion Bank 2.125% due 02/07/2019 9,499,121
Statoil ASA 2.250% due 08/11/2019 9,484,446
US Bank NA 2.125% due 28/10/2019 9,472,023
Nederlandse Waterschapsbank NV 1.625% due 04/03/2020 9,358,523
Chevron Corp 2.193% due 15/11/2019 9,263,207
Kreditanstalt fuer Wiederaufbau 1.500% due 20/04/2020 9,226,388
Total Capital International SA 2.100% due 19/06/2019 9,212,733
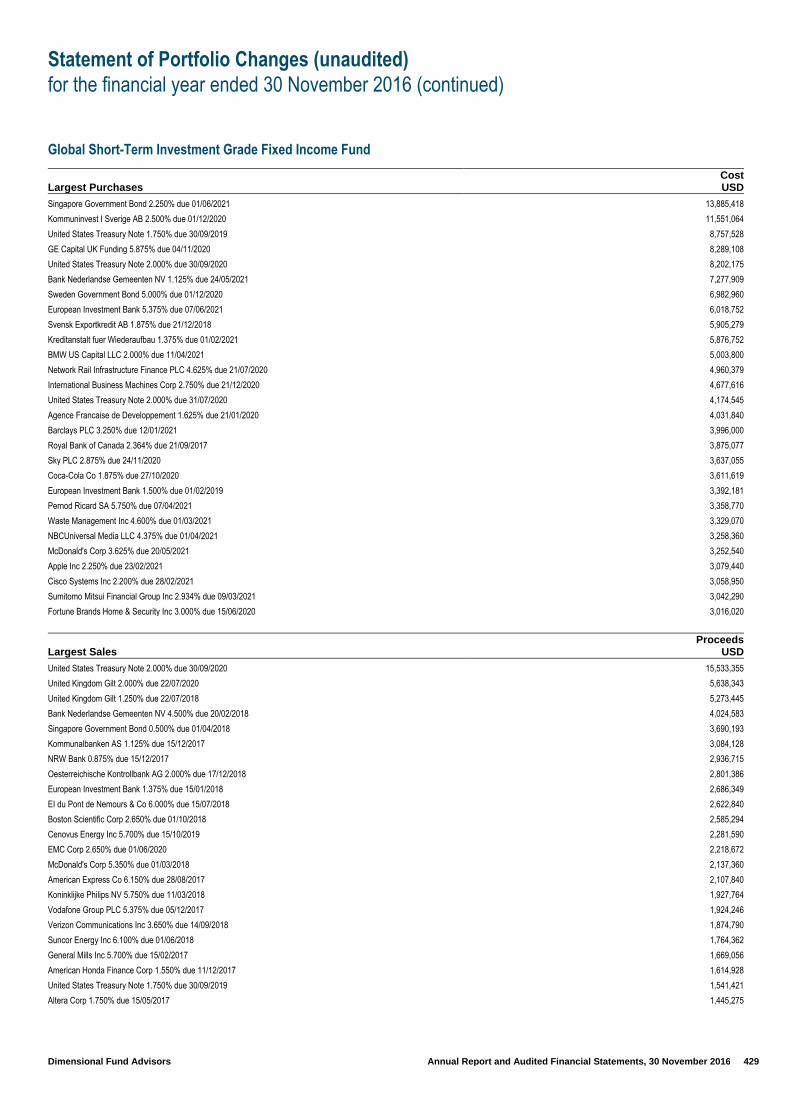
Statement of Portfolio Changes (unaudited)
for the financial year ended 30 November 2016 (continued)
Dimensional Fund Advisors Annual Report and Audited Financial Statements, 30 November 2016 429
Global Short-Term Investment Grade Fixed Income Fund
Largest Purchases Cost USD
Singapore Government Bond 2.250% due 01/06/2021 13,885,418
Kommuninvest I Sverige AB 2.500% due 01/12/2020 11,551,064
United States Treasury Note 1.750% due 30/09/2019 8,757,528
GE Capital UK Funding 5.875% due 04/11/2020 8,289,108
United States Treasury Note 2.000% due 30/09/2020 8,202,175
Bank Nederlandse Gemeenten NV 1.125% due 24/05/2021 7,277,909
Sweden Government Bond 5.000% due 01/12/2020 6,982,960
European Investment Bank 5.375% due 07/06/2021 6,018,752
Svensk Exportkredit AB 1.875% due 21/12/2018 5,905,279
Kreditanstalt fuer Wiederaufbau 1.375% due 01/02/2021 5,876,752
BMW US Capital LLC 2.000% due 11/04/2021 5,003,800
Network Rail Infrastructure Finance PLC 4.625% due 21/07/2020 4,960,379
International Business Machines Corp 2.750% due 21/12/2020 4,677,616
United States Treasury Note 2.000% due 31/07/2020 4,174,545
Agence Francaise de Developpement 1.625% due 21/01/2020 4,031,840
Barclays PLC 3.250% due 12/01/2021 3,996,000
Royal Bank of Canada 2.364% due 21/09/2017 3,875,077
Sky PLC 2.875% due 24/11/2020 3,637,055
Coca-Cola Co 1.875% due 27/10/2020 3,611,619
European Investment Bank 1.500% due 01/02/2019 3,392,181
Pernod Ricard SA 5.750% due 07/04/2021 3,358,770
Waste Management Inc 4.600% due 01/03/2021 3,329,070
NBCUniversal Media LLC 4.375% due 01/04/2021 3,258,360
McDonald's Corp 3.625% due 20/05/2021 3,252,540
Apple Inc 2.250% due 23/02/2021 3,079,440
Cisco Systems Inc 2.200% due 28/02/2021 3,058,950
Sumitomo Mitsui Financial Group Inc 2.934% due 09/03/2021 3,042,290
Fortune Brands Home & Security Inc 3.000% due 15/06/2020 3,016,020
Largest Sales Proceeds
USD
United States Treasury Note 2.000% due 30/09/2020 15,533,355
United Kingdom Gilt 2.000% due 22/07/2020 5,638,343
United Kingdom Gilt 1.250% due 22/07/2018 5,273,445
Bank Nederlandse Gemeenten NV 4.500% due 20/02/2018 4,024,583
Singapore Government Bond 0.500% due 01/04/2018 3,690,193
Kommunalbanken AS 1.125% due 15/12/2017 3,084,128
NRW Bank 0.875% due 15/12/2017 2,936,715
Oesterreichische Kontrollbank AG 2.000% due 17/12/2018 2,801,386
European Investment Bank 1.375% due 15/01/2018 2,686,349
EI du Pont de Nemours & Co 6.000% due 15/07/2018 2,622,840
Boston Scientific Corp 2.650% due 01/10/2018 2,585,294
Cenovus Energy Inc 5.700% due 15/10/2019 2,281,590
EMC Corp 2.650% due 01/06/2020 2,218,672
McDonald's Corp 5.350% due 01/03/2018 2,137,360
American Express Co 6.150% due 28/08/2017 2,107,840
Koninklijke Philips NV 5.750% due 11/03/2018 1,927,764
Vodafone Group PLC 5.375% due 05/12/2017 1,924,246
Verizon Communications Inc 3.650% due 14/09/2018 1,874,790
Suncor Energy Inc 6.100% due 01/06/2018 1,764,362
General Mills Inc 5.700% due 15/02/2017 1,669,056
American Honda Finance Corp 1.550% due 11/12/2017 1,614,928
United States Treasury Note 1.750% due 30/09/2019 1,541,421
Altera Corp 1.750% due 15/05/2017 1,445,275
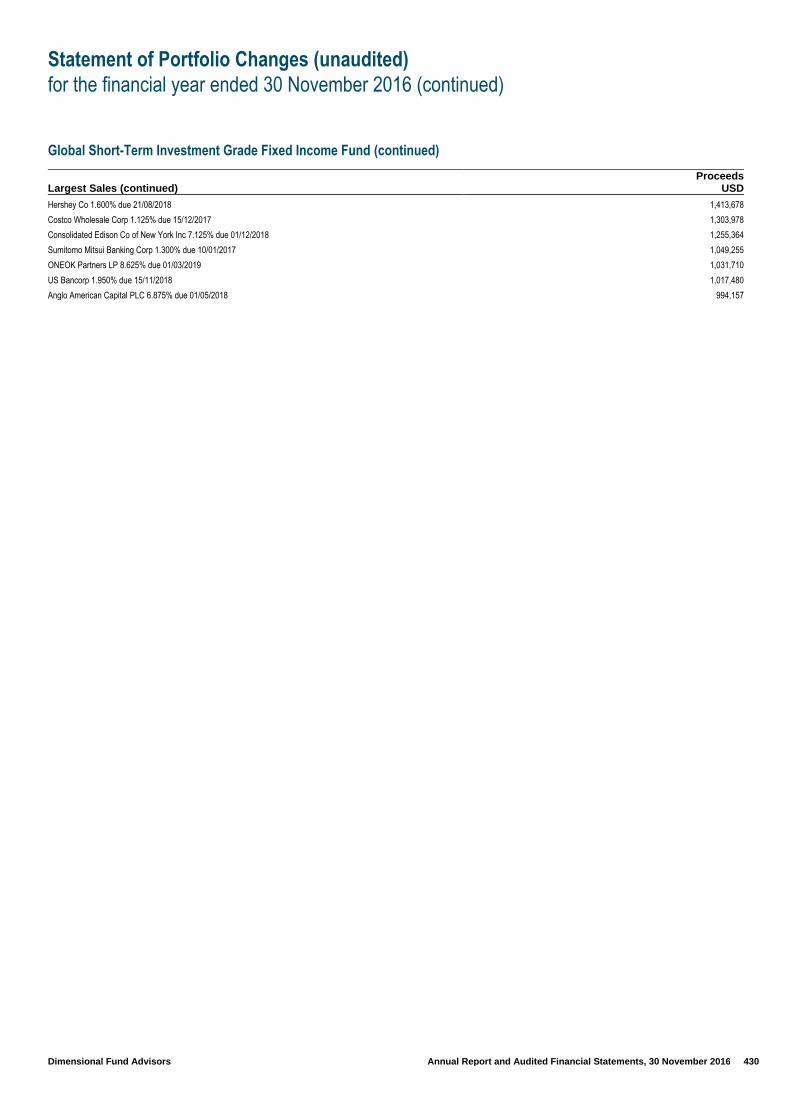
Statement of Portfolio Changes (unaudited)
for the financial year ended 30 November 2016 (continued)
Dimensional Fund Advisors Annual Report and Audited Financial Statements, 30 November 2016 430
Global Short-Term Investment Grade Fixed Income Fund (continued)
Largest Sales (continued) Proceeds
USD
Hershey Co 1.600% due 21/08/2018 1,413,678
Costco Wholesale Corp 1.125% due 15/12/2017 1,303,978
Consolidated Edison Co of New York Inc 7.125% due 01/12/2018 1,255,364
Sumitomo Mitsui Banking Corp 1.300% due 10/01/2017 1,049,255
ONEOK Partners LP 8.625% due 01/03/2019 1,031,710
US Bancorp 1.950% due 15/11/2018 1,017,480
Anglo American Capital PLC 6.875% due 01/05/2018 994,157

Statement of Portfolio Changes (unaudited)
for the financial year ended 30 November 2016 (continued)
Dimensional Fund Advisors Annual Report and Audited Financial Statements, 30 November 2016 431
Global Small Companies Fund
Largest Purchases Cost USD
Howard Hughes Corp 501,488
Technip SA 497,169
Realogy Holdings Corp 470,679
Axis Capital Holdings Ltd 442,581
Williams-Sonoma Inc 422,586
Toll Brothers Inc 421,067
STORE Capital Corp 418,471
East West Bancorp Inc 416,821
Allison Transmission Holdings Inc 413,567
Skechers U.S.A. Inc 406,312
ACADIA Pharmaceuticals Inc 403,848
Banco Popolare SC 403,236
TEGNA Inc 402,492
Computer Sciences Corp 396,961
Aggreko Plc 386,360
First Solar Inc 383,026
Intercept Pharmaceuticals Inc 382,781
B/E Aerospace Inc 382,289
B/E Aerospace Inc 373,595
Weatherford International Plc 371,230
Largest Sales Proceeds
USD
DCC Plc 1,038,979
Paddy Power Betfair Plc 724,978
Steel Dynamics Inc 688,386
Technip SA 645,253
Baloise Holding AG 636,783
Genmab AS 631,630
Arkema SA 627,847
National Retail Properties Inc 619,365
Pinnacle Foods Inc 601,962
Equity LifeStyle Properties Inc 596,345
Nomura Real Estate Master Fund Inc 590,997
Swiss Prime Site AG 578,203
Align Technology Inc 569,573
Rightmove Plc 555,724
Diamondback Energy Inc 549,061
Arista Networks Inc 542,799
ACADIA Pharmaceuticals Inc 538,009
Herbalife Ltd 536,384
Berkeley Group Holdings Plc 531,713
Spirit Realty Capital Inc 531,231
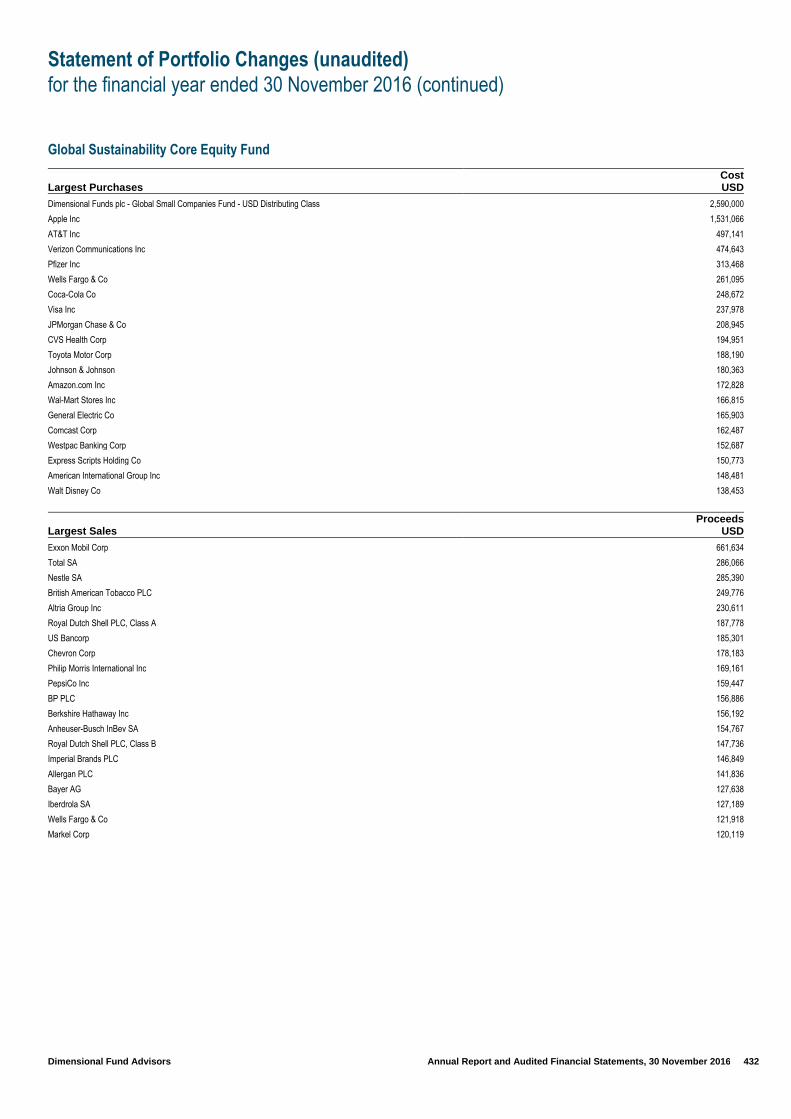
Statement of Portfolio Changes (unaudited)
for the financial year ended 30 November 2016 (continued)
Dimensional Fund Advisors Annual Report and Audited Financial Statements, 30 November 2016 432
Global Sustainability Core Equity Fund
Largest Purchases Cost USD
Dimensional Funds plc - Global Small Companies Fund - USD Distributing Class 2,590,000
Apple Inc 1,531,066
AT&T Inc 497,141
Verizon Communications Inc 474,643
Pfizer Inc 313,468
Wells Fargo & Co 261,095
Coca-Cola Co 248,672
Visa Inc 237,978
JPMorgan Chase & Co 208,945
CVS Health Corp 194,951
Toyota Motor Corp 188,190
Johnson & Johnson 180,363
Amazon.com Inc 172,828
Wal-Mart Stores Inc 166,815
General Electric Co 165,903
Comcast Corp 162,487
Westpac Banking Corp 152,687
Express Scripts Holding Co 150,773
American International Group Inc 148,481
Walt Disney Co 138,453
Largest Sales Proceeds
USD
Exxon Mobil Corp 661,634
Total SA 286,066
Nestle SA 285,390
British American Tobacco PLC 249,776
Altria Group Inc 230,611
Royal Dutch Shell PLC, Class A 187,778
US Bancorp 185,301
Chevron Corp 178,183
Philip Morris International Inc 169,161
PepsiCo Inc 159,447
BP PLC 156,886
Berkshire Hathaway Inc 156,192
Anheuser-Busch InBev SA 154,767
Royal Dutch Shell PLC, Class B 147,736
Imperial Brands PLC 146,849
Allergan PLC 141,836
Bayer AG 127,638
Iberdrola SA 127,189
Wells Fargo & Co 121,918
Markel Corp 120,119
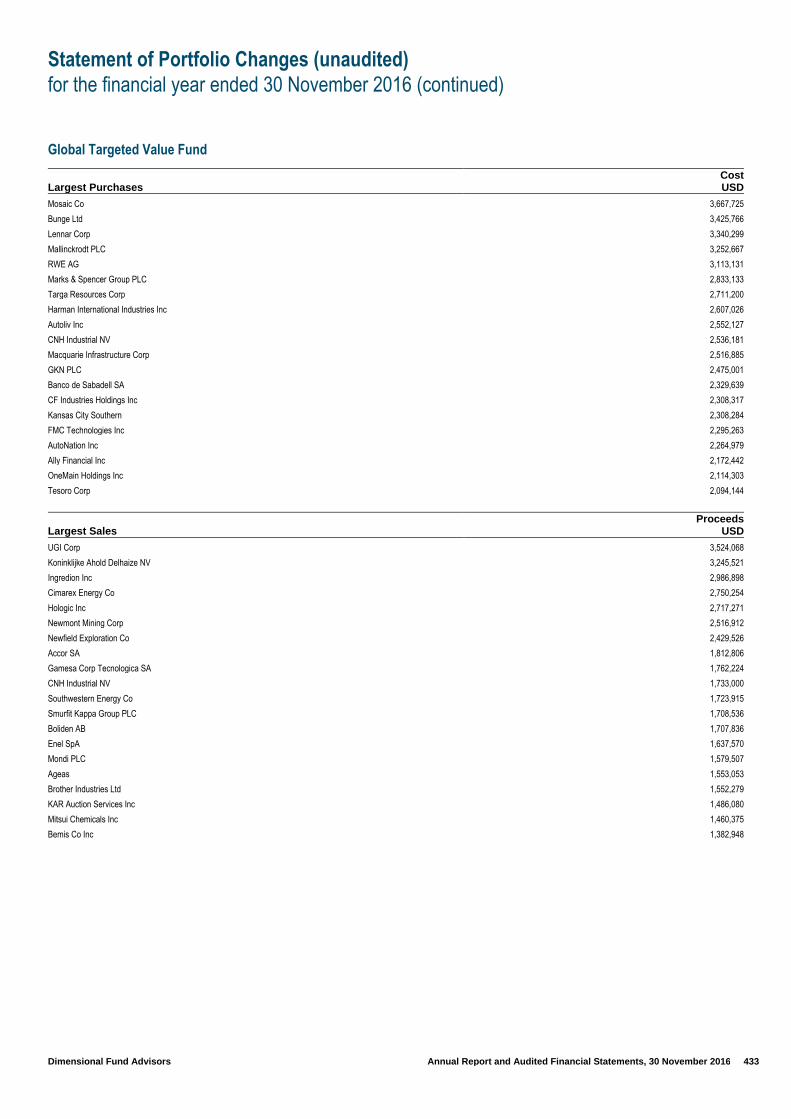
Statement of Portfolio Changes (unaudited)
for the financial year ended 30 November 2016 (continued)
Dimensional Fund Advisors Annual Report and Audited Financial Statements, 30 November 2016 433
Global Targeted Value Fund
Largest Purchases Cost USD
Mosaic Co 3,667,725
Bunge Ltd 3,425,766
Lennar Corp 3,340,299
Mallinckrodt PLC 3,252,667
RWE AG 3,113,131
Marks & Spencer Group PLC 2,833,133
Targa Resources Corp 2,711,200
Harman International Industries Inc 2,607,026
Autoliv Inc 2,552,127
CNH Industrial NV 2,536,181
Macquarie Infrastructure Corp 2,516,885
GKN PLC 2,475,001
Banco de Sabadell SA 2,329,639
CF Industries Holdings Inc 2,308,317
Kansas City Southern 2,308,284
FMC Technologies Inc 2,295,263
AutoNation Inc 2,264,979
Ally Financial Inc 2,172,442
OneMain Holdings Inc 2,114,303
Tesoro Corp 2,094,144
Largest Sales Proceeds
USD
UGI Corp 3,524,068
Koninklijke Ahold Delhaize NV 3,245,521
Ingredion Inc 2,986,898
Cimarex Energy Co 2,750,254
Hologic Inc 2,717,271
Newmont Mining Corp 2,516,912
Newfield Exploration Co 2,429,526
Accor SA 1,812,806
Gamesa Corp Tecnologica SA 1,762,224
CNH Industrial NV 1,733,000
Southwestern Energy Co 1,723,915
Smurfit Kappa Group PLC 1,708,536
Boliden AB 1,707,836
Enel SpA 1,637,570
Mondi PLC 1,579,507
Ageas 1,553,053
Brother Industries Ltd 1,552,279
KAR Auction Services Inc 1,486,080
Mitsui Chemicals Inc 1,460,375
Bemis Co Inc 1,382,948

Statement of Portfolio Changes (unaudited)
for the financial year ended 30 November 2016 (continued)
Dimensional Fund Advisors Annual Report and Audited Financial Statements, 30 November 2016 434
Global Ultra Short Fixed Income Fund
Largest Purchases Cost GBP
United States Treasury Note 0.875% due 15/04/2017 35,020,002
United Kingdom Gilt 4.000% due 07/09/2016 23,231,780
United Kingdom Gilt 1.000% due 07/09/2017 11,102,030
State of North Rhine-Westphalia 1.250% due 20/02/2018 10,235,096
Nordic Investment Bank 1.125% due 19/03/2018 8,599,224
Kreditanstalt fuer Wiederaufbau 1.000% due 07/09/2018 8,143,536
Municipality Finance Plc 1.125% due 17/04/2018 8,140,765
Landeskreditbank Baden-Wuerttemberg Foerderbank 1.000% due 23/04/2018 8,019,426
Singapore Government Bond 0.500% due 01/04/2018 7,767,851
Commonwealth Bank of Australia 1.375% due 06/09/2018 7,630,966
Kommuninvest I Sverige AB 1.000% due 20/06/2018 7,506,483
United Kingdom Gilt 1.750% due 22/01/2017 6,485,888
Kommunalbanken AS 1.125% due 23/05/2018 6,244,630
Chevron Corp 1.411% due 16/05/2018 6,225,200
Nederlandse Waterschapsbank NV 1.500% due 16/04/2018 6,179,792
Province of Ontario Canada 2.000% due 27/09/2018 6,119,509
Caisse des Depots et Consignations 1.250% due 04/06/2018 6,107,080
Cisco Systems Inc 1.400% due 28/02/2018 5,754,725
Bank of Nova Scotia 1.250% due 11/04/2017 5,637,510
Toronto Dominion Bank 1.625% due 13/03/2018 5,235,594
United Kingdom Gilt 1.250% due 22/07/2018 5,105,550
Singapore Government Bond 4.000% due 01/09/2018 5,068,996
Toyota Motor Credit Corp 1.244% due 06/04/2018 4,850,572
Kommunekredit 1.125% due 16/01/2018 4,615,005
General Electric Co 2.625% due 16/01/2018 4,406,074
National Australia Bank Ltd 1.875% due 23/07/2018 4,119,829
Nordea Bank AB 1.697% due 17/09/2018 4,114,989
NRW Bank 1.375% due 20/08/2018 4,045,951
United States Treasury Note 1.375% due 30/06/2018 3,840,092
General Electric Co 5.250% due 06/12/2017 3,687,172
Cooperatieve Rabobank UA 1.700% due 19/03/2018 3,623,564
Total Capital International SA 1.550% due 28/06/2017 3,535,158
Merck & Co Inc 1.269% due 18/05/2018 3,531,148
Largest Sales Proceeds
GBP
United States Treasury Note 0.875% due 15/04/2017 35,260,763
United Kingdom Gilt 4.000% due 07/09/2016 23,198,560
United Kingdom Gilt 1.000% due 07/09/2017 11,099,640
United Kingdom Gilt 1.750% due 22/01/2017 10,020,105
United States Treasury Note 0.750% due 30/06/2017 9,143,089
GE Capital International Funding 0.964% due 15/04/2016 7,362,313
Chevron Corp 1.016% due 22/02/2017 6,469,565
Berkshire Hathaway Finance Corp 1.026% due 10/01/2017 5,609,014
Toronto Dominion Bank 2.500% due 14/07/2016 5,109,095
Federal Home Loan Banks 2.000% due 09/09/2016 4,960,811
Hydro-Quebec 2.000% due 30/06/2016 4,802,715
Province of British Columbia 2.100% due 18/05/2016 4,607,568
Kommuninvest I Sverige AB 0.875% due 13/12/2016 4,603,382
FMS Wertmanagement AoeR 0.625% due 18/04/2016 4,527,342
International Business Machines Corp 1.250% due 06/02/2017 4,459,231
Japan Bank for International Cooperation 2.250% due 13/07/2016 4,181,878
Kreditanstalt fuer Wiederaufbau 0.750% due 17/03/2017 4,154,705
Federal National Mortgage Association 0.875% due 28/08/2017 4,128,478
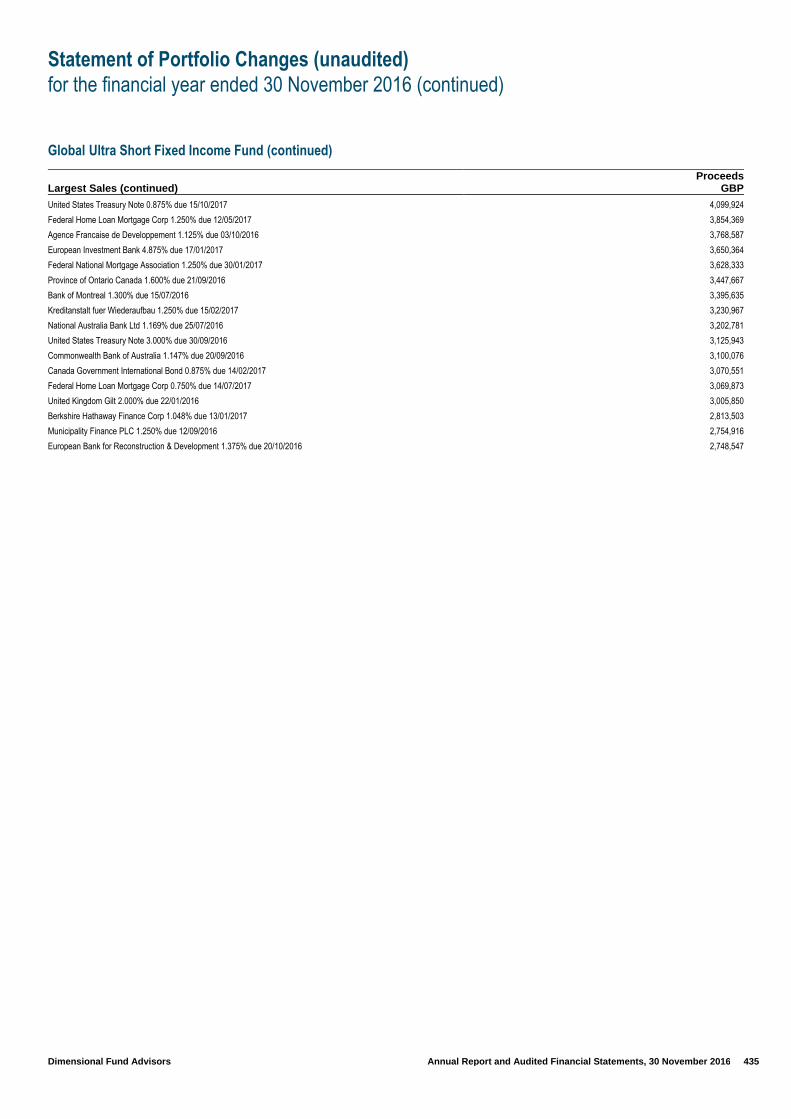
Statement of Portfolio Changes (unaudited)
for the financial year ended 30 November 2016 (continued)
Dimensional Fund Advisors Annual Report and Audited Financial Statements, 30 November 2016 435
Global Ultra Short Fixed Income Fund (continued)
Largest Sales (continued) Proceeds
GBP
United States Treasury Note 0.875% due 15/10/2017 4,099,924
Federal Home Loan Mortgage Corp 1.250% due 12/05/2017 3,854,369
Agence Francaise de Developpement 1.125% due 03/10/2016 3,768,587
European Investment Bank 4.875% due 17/01/2017 3,650,364
Federal National Mortgage Association 1.250% due 30/01/2017 3,628,333
Province of Ontario Canada 1.600% due 21/09/2016 3,447,667
Bank of Montreal 1.300% due 15/07/2016 3,395,635
Kreditanstalt fuer Wiederaufbau 1.250% due 15/02/2017 3,230,967
National Australia Bank Ltd 1.169% due 25/07/2016 3,202,781
United States Treasury Note 3.000% due 30/09/2016 3,125,943
Commonwealth Bank of Australia 1.147% due 20/09/2016 3,100,076
Canada Government International Bond 0.875% due 14/02/2017 3,070,551
Federal Home Loan Mortgage Corp 0.750% due 14/07/2017 3,069,873
United Kingdom Gilt 2.000% due 22/01/2016 3,005,850
Berkshire Hathaway Finance Corp 1.048% due 13/01/2017 2,813,503
Municipality Finance PLC 1.250% due 12/09/2016 2,754,916
European Bank for Reconstruction & Development 1.375% due 20/10/2016 2,748,547
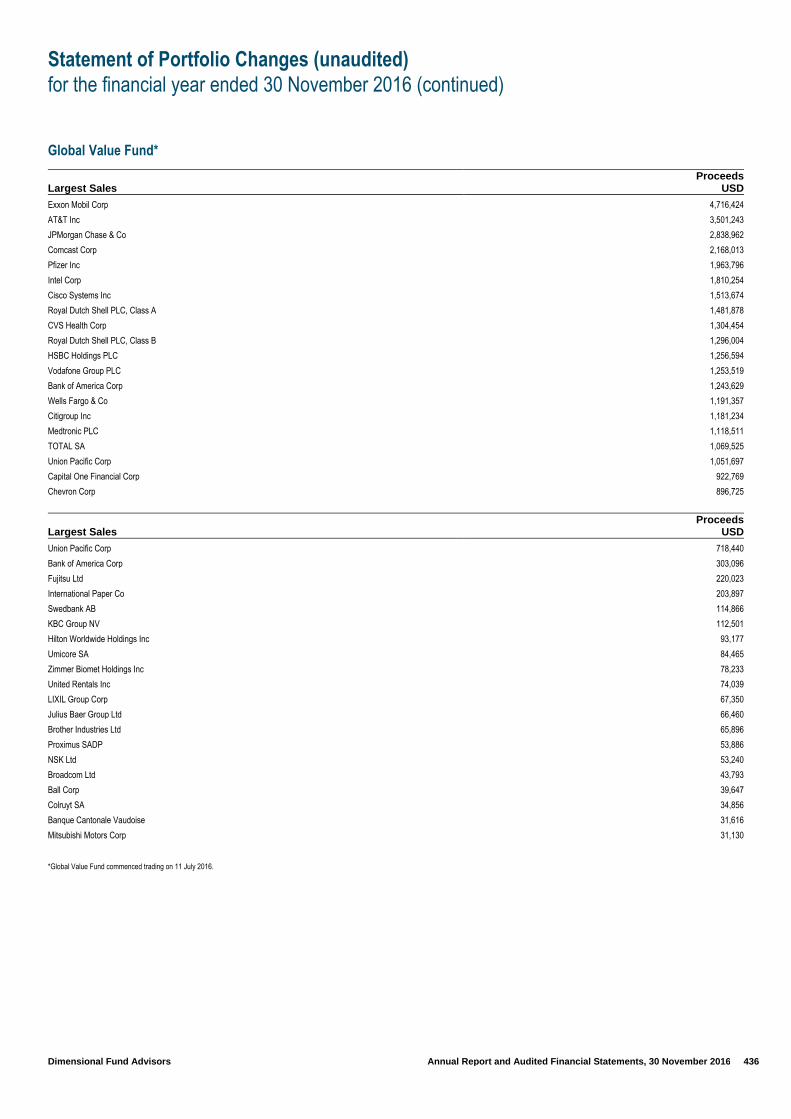
Statement of Portfolio Changes (unaudited)
for the financial year ended 30 November 2016 (continued)
Dimensional Fund Advisors Annual Report and Audited Financial Statements, 30 November 2016 436
Global Value Fund*
Largest Sales Proceeds
USD
Exxon Mobil Corp 4,716,424
AT&T Inc 3,501,243
JPMorgan Chase & Co 2,838,962
Comcast Corp 2,168,013
Pfizer Inc 1,963,796
Intel Corp 1,810,254
Cisco Systems Inc 1,513,674
Royal Dutch Shell PLC, Class A 1,481,878
CVS Health Corp 1,304,454
Royal Dutch Shell PLC, Class B 1,296,004
HSBC Holdings PLC 1,256,594
Vodafone Group PLC 1,253,519
Bank of America Corp 1,243,629
Wells Fargo & Co 1,191,357
Citigroup Inc 1,181,234
Medtronic PLC 1,118,511
TOTAL SA 1,069,525
Union Pacific Corp 1,051,697
Capital One Financial Corp 922,769
Chevron Corp 896,725
Largest Sales Proceeds
USD
Union Pacific Corp 718,440
Bank of America Corp 303,096
Fujitsu Ltd 220,023
International Paper Co 203,897
Swedbank AB 114,866
KBC Group NV 112,501
Hilton Worldwide Holdings Inc 93,177
Umicore SA 84,465
Zimmer Biomet Holdings Inc 78,233
United Rentals Inc 74,039
LIXIL Group Corp 67,350
Julius Baer Group Ltd 66,460
Brother Industries Ltd 65,896
Proximus SADP 53,886
NSK Ltd 53,240
Broadcom Ltd 43,793
Ball Corp 39,647
Colruyt SA 34,856
Banque Cantonale Vaudoise 31,616
Mitsubishi Motors Corp 31,130
*Global Value Fund commenced trading on 11 July 2016.
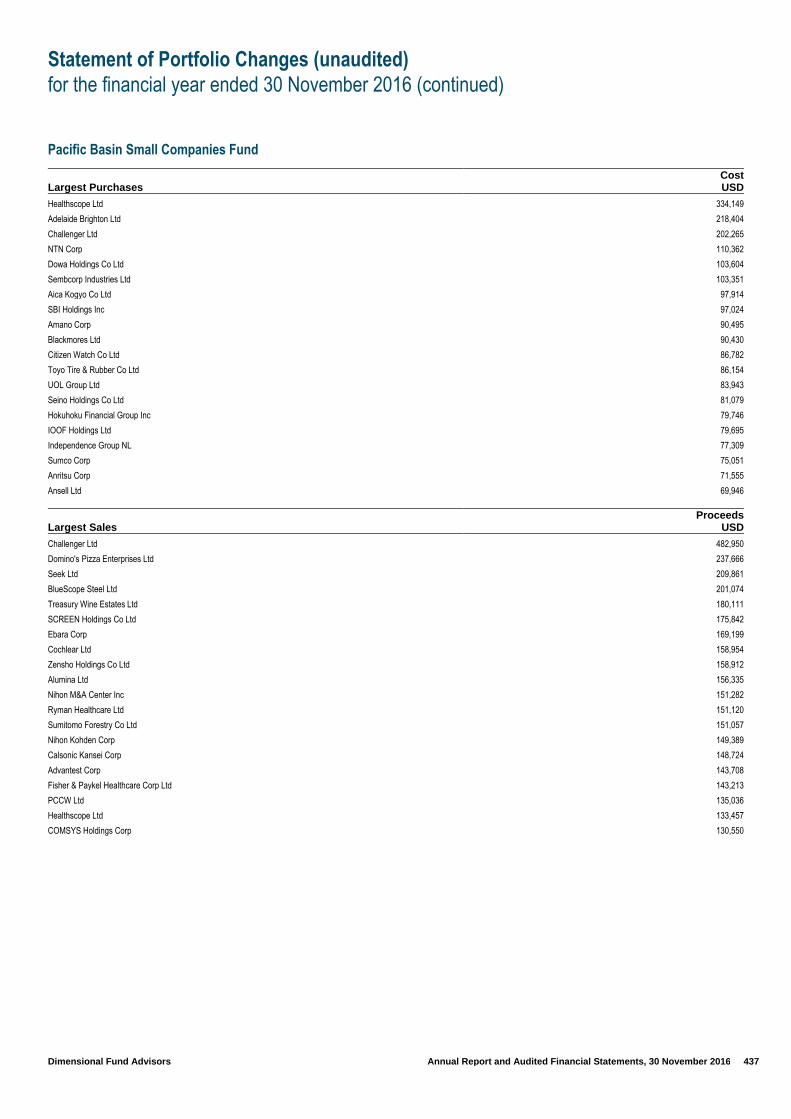
Statement of Portfolio Changes (unaudited)
for the financial year ended 30 November 2016 (continued)
Dimensional Fund Advisors Annual Report and Audited Financial Statements, 30 November 2016 437
Pacific Basin Small Companies Fund
Largest Purchases Cost USD
Healthscope Ltd 334,149
Adelaide Brighton Ltd 218,404
Challenger Ltd 202,265
NTN Corp 110,362
Dowa Holdings Co Ltd 103,604
Sembcorp Industries Ltd 103,351
Aica Kogyo Co Ltd 97,914
SBI Holdings Inc 97,024
Amano Corp 90,495
Blackmores Ltd 90,430
Citizen Watch Co Ltd 86,782
Toyo Tire & Rubber Co Ltd 86,154
UOL Group Ltd 83,943
Seino Holdings Co Ltd 81,079
Hokuhoku Financial Group Inc 79,746
IOOF Holdings Ltd 79,695
Independence Group NL 77,309
Sumco Corp 75,051
Anritsu Corp 71,555
Ansell Ltd 69,946
Largest Sales Proceeds
USD
Challenger Ltd 482,950
Domino's Pizza Enterprises Ltd 237,666
Seek Ltd 209,861
BlueScope Steel Ltd 201,074
Treasury Wine Estates Ltd 180,111
SCREEN Holdings Co Ltd 175,842
Ebara Corp 169,199
Cochlear Ltd 158,954
Zensho Holdings Co Ltd 158,912
Alumina Ltd 156,335
Nihon M&A Center Inc 151,282
Ryman Healthcare Ltd 151,120
Sumitomo Forestry Co Ltd 151,057
Nihon Kohden Corp 149,389
Calsonic Kansei Corp 148,724
Advantest Corp 143,708
Fisher & Paykel Healthcare Corp Ltd 143,213
PCCW Ltd 135,036
Healthscope Ltd 133,457
COMSYS Holdings Corp 130,550

Statement of Portfolio Changes (unaudited)
for the financial year ended 30 November 2016 (continued)
Dimensional Fund Advisors Annual Report and Audited Financial Statements, 30 November 2016 438
Sterling Inflation Linked Intermediate Duration Fixed Income Fund
Largest Purchases Cost GBP
United Kingdom Gilt Inflation Linked, Series 8MO 2.500% due 17/07/2024 27,217,860
United Kingdom Gilt Inflation Linked, Series 3MO 0.750% due 22/03/2034 26,231,101
United Kingdom Gilt Inflation Linked, Series 8MO 4.125% due 22/07/2030 25,796,394
United Kingdom Gilt Inflation Linked, Series 3MO 0.125% due 22/03/2029 15,937,697
United Kingdom Gilt Inflation Linked, Series 8MO 2.500% due 16/04/2020 9,260,133
United Kingdom Gilt Inflation Linked, Series 3MO 1.250% due 22/11/2027 4,652,269
United Kingdom Gilt Inflation Linked, Series 3MO 1.250% due 22/11/2032 1,972,280
Largest Sales Proceeds
GBP
United Kingdom Gilt Inflation Linked, Series 3MO 1.875% due 22/11/2022 5,633,694
United Kingdom Gilt Inflation Linked, Series 3MO 0.125% due 22/03/2029 4,976,173
United Kingdom Gilt Inflation Linked, Series 3MO 0.125% due 22/03/2024 4,310,856
United Kingdom Gilt Inflation Linked, Series 3MO 1.250% due 22/11/2027 3,249,587
United Kingdom Gilt Inflation Linked, Series 8MO 4.125% due 22/07/2030 497,493
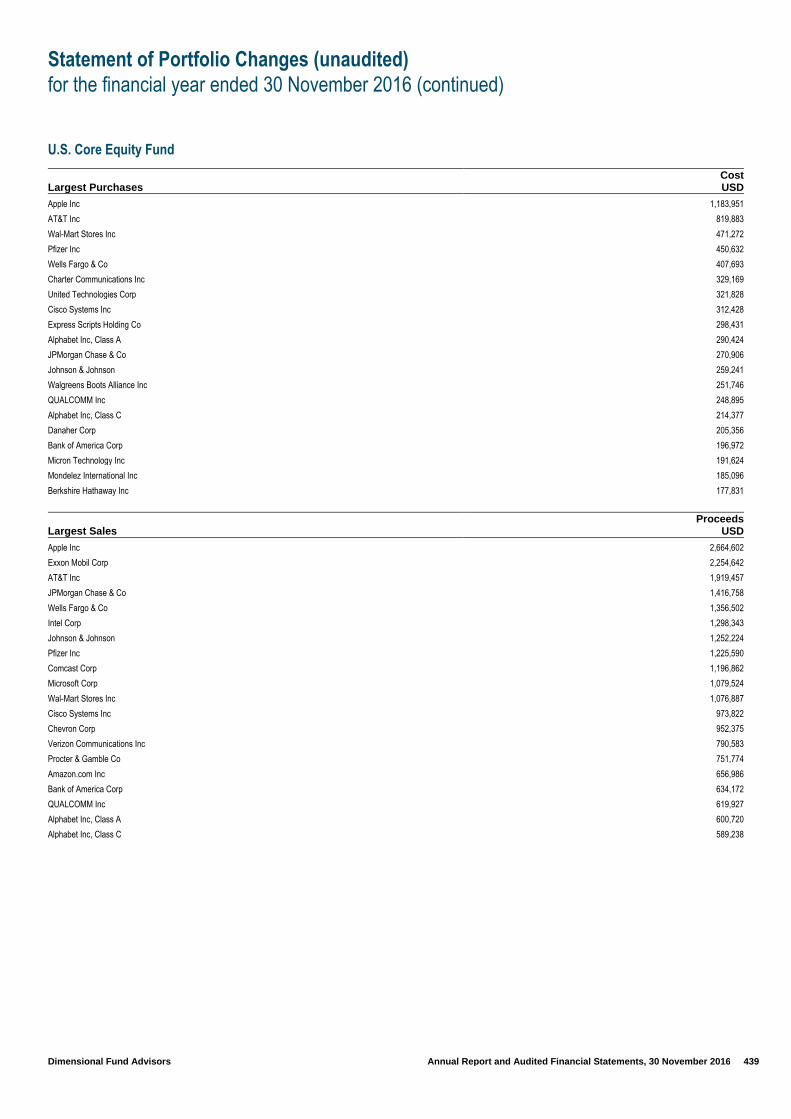
Statement of Portfolio Changes (unaudited)
for the financial year ended 30 November 2016 (continued)
Dimensional Fund Advisors Annual Report and Audited Financial Statements, 30 November 2016 439
U.S. Core Equity Fund
Largest Purchases Cost USD
Apple Inc 1,183,951
AT&T Inc 819,883
Wal-Mart Stores Inc 471,272
Pfizer Inc 450,632
Wells Fargo & Co 407,693
Charter Communications Inc 329,169
United Technologies Corp 321,828
Cisco Systems Inc 312,428
Express Scripts Holding Co 298,431
Alphabet Inc, Class A 290,424
JPMorgan Chase & Co 270,906
Johnson & Johnson 259,241
Walgreens Boots Alliance Inc 251,746
QUALCOMM Inc 248,895
Alphabet Inc, Class C 214,377
Danaher Corp 205,356
Bank of America Corp 196,972
Micron Technology Inc 191,624
Mondelez International Inc 185,096
Berkshire Hathaway Inc 177,831
Largest Sales Proceeds
USD
Apple Inc 2,664,602
Exxon Mobil Corp 2,254,642
AT&T Inc 1,919,457
JPMorgan Chase & Co 1,416,758
Wells Fargo & Co 1,356,502
Intel Corp 1,298,343
Johnson & Johnson 1,252,224
Pfizer Inc 1,225,590
Comcast Corp 1,196,862
Microsoft Corp 1,079,524
Wal-Mart Stores Inc 1,076,887
Cisco Systems Inc 973,822
Chevron Corp 952,375
Verizon Communications Inc 790,583
Procter & Gamble Co 751,774
Amazon.com Inc 656,986
Bank of America Corp 634,172
QUALCOMM Inc 619,927
Alphabet Inc, Class A 600,720
Alphabet Inc, Class C 589,238

Statement of Portfolio Changes (unaudited)
for the financial year ended 30 November 2016 (continued)
Dimensional Fund Advisors Annual Report and Audited Financial Statements, 30 November 2016 440
U.S. Small Companies Fund
Largest Purchases Cost USD
Aspen Technology Inc 315,762
VeriFone Systems Inc 312,820
GameStop Corp 299,053
Federated Investors Inc 292,953
SLM Corp 280,676
Tenet Healthcare Corp 276,117
Visteon Corp 268,310
Kate Spade & Co 255,800
Catalent Inc 253,021
Nabors Industries Ltd 250,189
INC Research Holdings Inc 235,879
Prosperity Bancshares Inc 229,207
Allied World Assurance Co Holdings AG 228,190
Cree Inc 223,671
Energizer Holdings Inc 223,544
Trinseo SA 217,309
Timken Co 217,219
United States Steel Corp 217,177
First Horizon National Corp 215,949
RR Donnelley & Sons Co 214,858
Largest Sales Proceeds
USD
JetBlue Airways Corp 498,069
Vail Resorts Inc 457,308
Manhattan Associates Inc 433,340
MarketAxess Holdings Inc 424,639
EPAM Systems Inc 411,428
Burlington Stores Inc 384,104
FEI Co 376,626
Piedmont Natural Gas Co Inc 349,344
Microsemi Corp 336,773
Columbia Sportswear Co 331,652
Euronet Worldwide Inc 328,023
Allied World Assurance Co Holdings AG 313,930
Aspen Technology Inc 284,342
Take-Two Interactive Software Inc 282,149
GrubHub Inc 281,554
KeyCorp 279,326
HealthSouth Corp 273,901
Cognex Corp 272,418
Avangrid Inc 272,080
Centene Corp 268,278
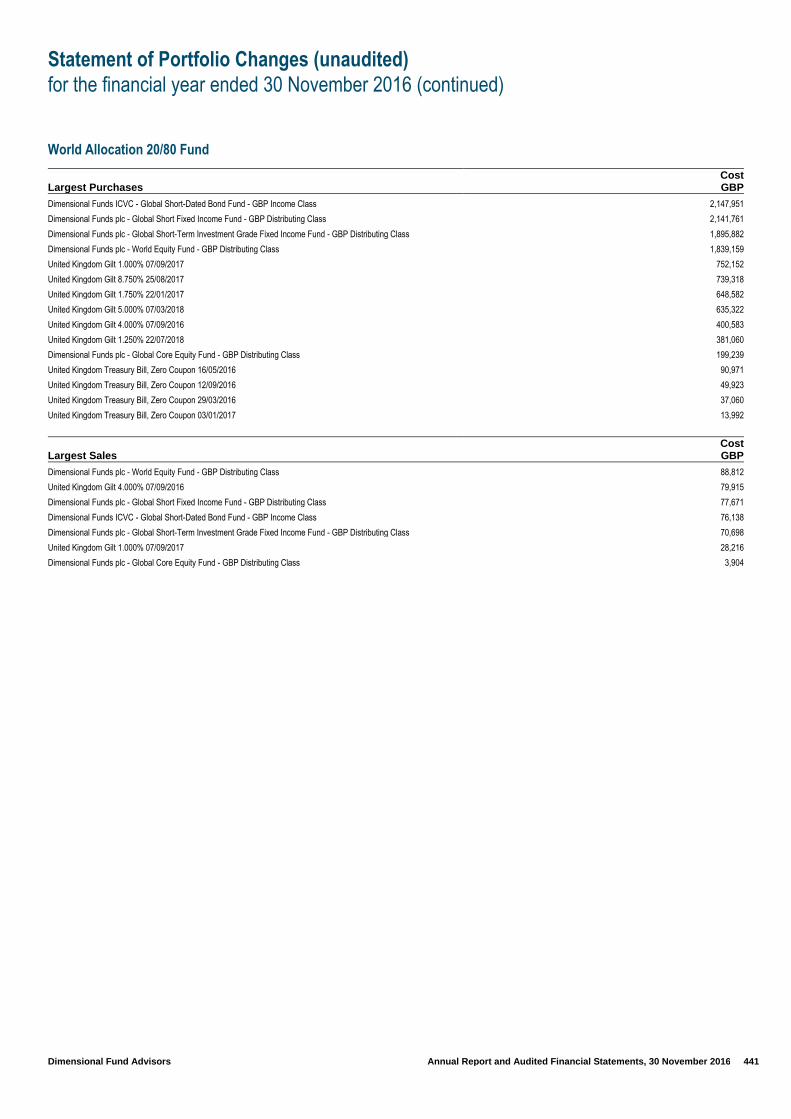
Statement of Portfolio Changes (unaudited)
for the financial year ended 30 November 2016 (continued)
Dimensional Fund Advisors Annual Report and Audited Financial Statements, 30 November 2016 441
World Allocation 20/80 Fund
Largest Purchases Cost GBP
Dimensional Funds ICVC - Global Short-Dated Bond Fund - GBP Income Class 2,147,951
Dimensional Funds plc - Global Short Fixed Income Fund - GBP Distributing Class 2,141,761
Dimensional Funds plc - Global Short-Term Investment Grade Fixed Income Fund - GBP Distributing Class 1,895,882
Dimensional Funds plc - World Equity Fund - GBP Distributing Class 1,839,159
United Kingdom Gilt 1.000% 07/09/2017 752,152
United Kingdom Gilt 8.750% 25/08/2017 739,318
United Kingdom Gilt 1.750% 22/01/2017 648,582
United Kingdom Gilt 5.000% 07/03/2018 635,322
United Kingdom Gilt 4.000% 07/09/2016 400,583
United Kingdom Gilt 1.250% 22/07/2018 381,060
Dimensional Funds plc - Global Core Equity Fund - GBP Distributing Class 199,239
United Kingdom Treasury Bill, Zero Coupon 16/05/2016 90,971
United Kingdom Treasury Bill, Zero Coupon 12/09/2016 49,923
United Kingdom Treasury Bill, Zero Coupon 29/03/2016 37,060
United Kingdom Treasury Bill, Zero Coupon 03/01/2017 13,992
Largest Sales Cost GBP
Dimensional Funds plc - World Equity Fund - GBP Distributing Class 88,812
United Kingdom Gilt 4.000% 07/09/2016 79,915
Dimensional Funds plc - Global Short Fixed Income Fund - GBP Distributing Class 77,671
Dimensional Funds ICVC - Global Short-Dated Bond Fund - GBP Income Class 76,138
Dimensional Funds plc - Global Short-Term Investment Grade Fixed Income Fund - GBP Distributing Class 70,698
United Kingdom Gilt 1.000% 07/09/2017 28,216
Dimensional Funds plc - Global Core Equity Fund - GBP Distributing Class 3,904
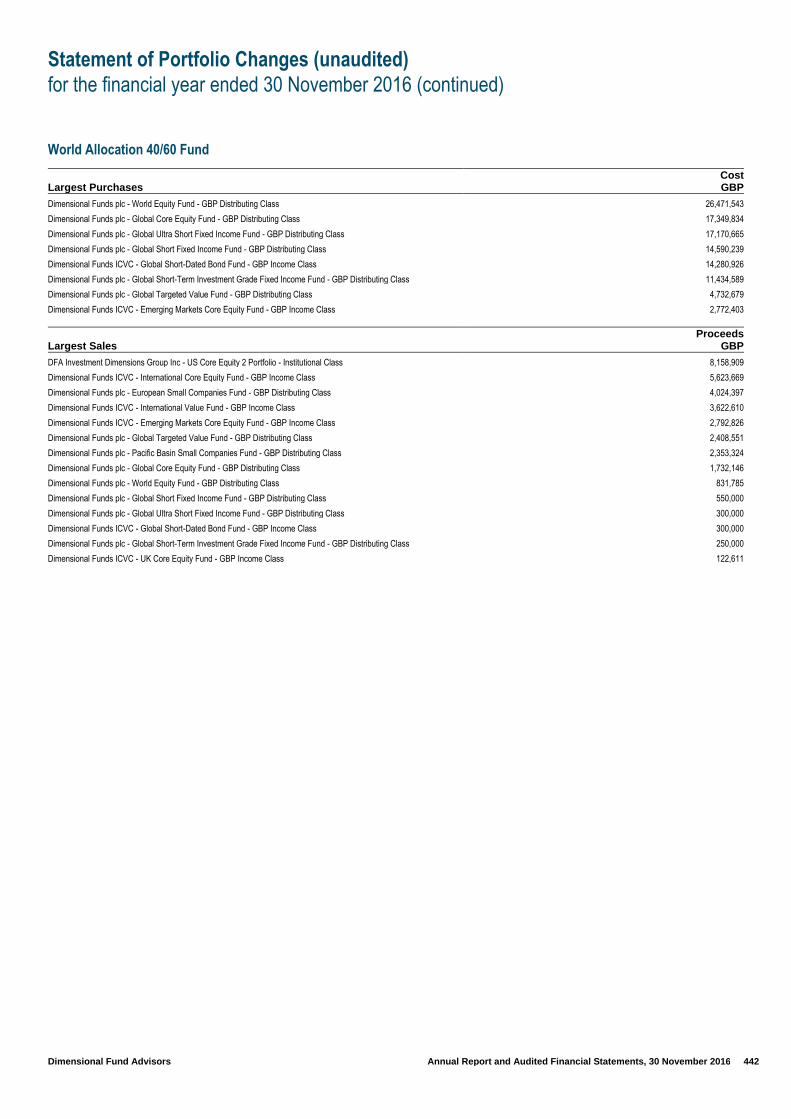
Statement of Portfolio Changes (unaudited)
for the financial year ended 30 November 2016 (continued)
Dimensional Fund Advisors Annual Report and Audited Financial Statements, 30 November 2016 442
World Allocation 40/60 Fund
Largest Purchases Cost GBP
Dimensional Funds plc - World Equity Fund - GBP Distributing Class 26,471,543
Dimensional Funds plc - Global Core Equity Fund - GBP Distributing Class 17,349,834
Dimensional Funds plc - Global Ultra Short Fixed Income Fund - GBP Distributing Class 17,170,665
Dimensional Funds plc - Global Short Fixed Income Fund - GBP Distributing Class 14,590,239
Dimensional Funds ICVC - Global Short-Dated Bond Fund - GBP Income Class 14,280,926
Dimensional Funds plc - Global Short-Term Investment Grade Fixed Income Fund - GBP Distributing Class 11,434,589
Dimensional Funds plc - Global Targeted Value Fund - GBP Distributing Class 4,732,679
Dimensional Funds ICVC - Emerging Markets Core Equity Fund - GBP Income Class 2,772,403
Largest Sales Proceeds
GBP
DFA Investment Dimensions Group Inc - US Core Equity 2 Portfolio - Institutional Class 8,158,909
Dimensional Funds ICVC - International Core Equity Fund - GBP Income Class 5,623,669
Dimensional Funds plc - European Small Companies Fund - GBP Distributing Class 4,024,397
Dimensional Funds ICVC - International Value Fund - GBP Income Class 3,622,610
Dimensional Funds ICVC - Emerging Markets Core Equity Fund - GBP Income Class 2,792,826
Dimensional Funds plc - Global Targeted Value Fund - GBP Distributing Class 2,408,551
Dimensional Funds plc - Pacific Basin Small Companies Fund - GBP Distributing Class 2,353,324
Dimensional Funds plc - Global Core Equity Fund - GBP Distributing Class 1,732,146
Dimensional Funds plc - World Equity Fund - GBP Distributing Class 831,785
Dimensional Funds plc - Global Short Fixed Income Fund - GBP Distributing Class 550,000
Dimensional Funds plc - Global Ultra Short Fixed Income Fund - GBP Distributing Class 300,000
Dimensional Funds ICVC - Global Short-Dated Bond Fund - GBP Income Class 300,000
Dimensional Funds plc - Global Short-Term Investment Grade Fixed Income Fund - GBP Distributing Class 250,000
Dimensional Funds ICVC - UK Core Equity Fund - GBP Income Class 122,611

Statement of Portfolio Changes (unaudited)
for the financial year ended 30 November 2016 (continued)
Dimensional Fund Advisors Annual Report and Audited Financial Statements, 30 November 2016 443
World Allocation 60/40 Fund
Largest Purchases Cost GBP
Dimensional Funds plc - World Equity Fund - GBP Distributing Class 50,106,147
Dimensional Funds plc - Global Core Equity Fund - GBP Distributing Class 32,301,722
Dimensional Funds ICVC - Global Short-Dated Bond Fund - GBP Income Class 25,934,539
Dimensional Funds plc - Global Targeted Value Fund - GBP Distributing Class 21,958,965
Dimensional Funds plc - Global Short-Term Investment Grade Fixed Income Fund - GBP Distributing Class 20,635,472
Dimensional Funds plc - Global Ultra Short Fixed Income Fund - GBP Distributing Class 13,266,029
Dimensional Funds ICVC - International Core Equity Fund - GBP Income Class 13,154,395
Dimensional Funds plc - Global Short Fixed Income Fund - GBP Distributing Class 7,861,119
Dimensional Funds ICVC - Emerging Markets Core Equity Fund - GBP Income Class 7,804,941
Largest Sales Proceeds
GBP
DFA Investment Dimensions Group Inc - US Core Equity 2 Portfolio - Institutional Class 25,505,307
Dimensional Funds ICVC - International Value Fund - GBP Income Class 13,703,255
Dimensional Funds plc - European Small Companies Fund - GBP Distributing Class 13,312,075
Dimensional Funds ICVC - International Core Equity Fund - GBP Income Class 9,623,561
Dimensional Funds ICVC - Emerging Markets Core Equity Fund - GBP Income Class 8,699,357
Dimensional Funds plc - Pacific Basin Small Companies Fund - GBP Distributing Class 7,224,423
Dimensional Funds plc - Global Targeted Value Fund - GBP Distributing Class 5,701,450
Dimensional Funds ICVC - Global Short-Dated Bond Fund - GBP Income Class 2,350,251
Dimensional Funds plc - Global Short-Term Investment Grade Fixed Income Fund - GBP Distributing Class 2,282,468
Dimensional Funds ICVC - UK Core Equity Fund - GBP Income Class 1,372,949
Dimensional Funds plc - Global Short Fixed Income Fund - GBP Distributing Class 912,598
Dimensional Funds plc - Global Ultra Short Fixed Income Fund - GBP Distributing Class 850,653
Dimensional Funds plc - Global Core Equity Fund - GBP Distributing Class 155,459
Dimensional Funds plc - World Equity Fund - GBP Distributing Class 37,812
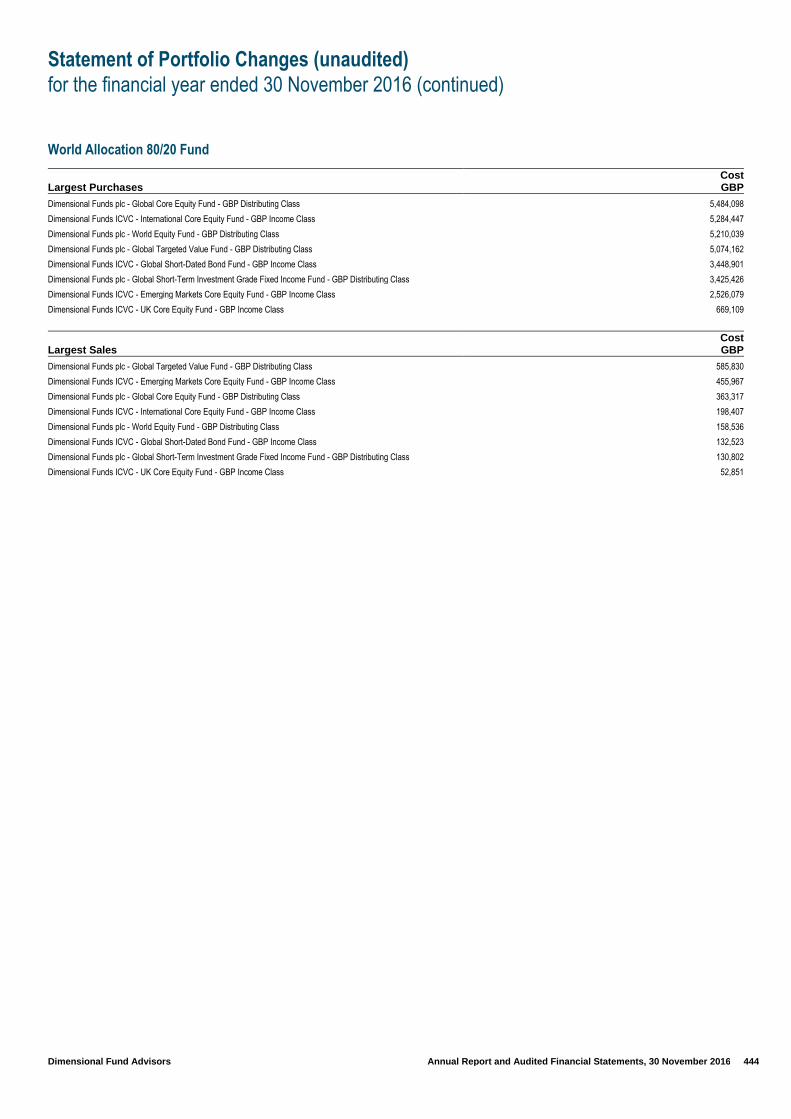
Statement of Portfolio Changes (unaudited)
for the financial year ended 30 November 2016 (continued)
Dimensional Fund Advisors Annual Report and Audited Financial Statements, 30 November 2016 444
World Allocation 80/20 Fund
Largest Purchases Cost GBP
Dimensional Funds plc - Global Core Equity Fund - GBP Distributing Class 5,484,098
Dimensional Funds ICVC - International Core Equity Fund - GBP Income Class 5,284,447
Dimensional Funds plc - World Equity Fund - GBP Distributing Class 5,210,039
Dimensional Funds plc - Global Targeted Value Fund - GBP Distributing Class 5,074,162
Dimensional Funds ICVC - Global Short-Dated Bond Fund - GBP Income Class 3,448,901
Dimensional Funds plc - Global Short-Term Investment Grade Fixed Income Fund - GBP Distributing Class 3,425,426
Dimensional Funds ICVC - Emerging Markets Core Equity Fund - GBP Income Class 2,526,079
Dimensional Funds ICVC - UK Core Equity Fund - GBP Income Class 669,109
Largest Sales Cost GBP
Dimensional Funds plc - Global Targeted Value Fund - GBP Distributing Class 585,830
Dimensional Funds ICVC - Emerging Markets Core Equity Fund - GBP Income Class 455,967
Dimensional Funds plc - Global Core Equity Fund - GBP Distributing Class 363,317
Dimensional Funds ICVC - International Core Equity Fund - GBP Income Class 198,407
Dimensional Funds plc - World Equity Fund - GBP Distributing Class 158,536
Dimensional Funds ICVC - Global Short-Dated Bond Fund - GBP Income Class 132,523
Dimensional Funds plc - Global Short-Term Investment Grade Fixed Income Fund - GBP Distributing Class 130,802
Dimensional Funds ICVC - UK Core Equity Fund - GBP Income Class 52,851
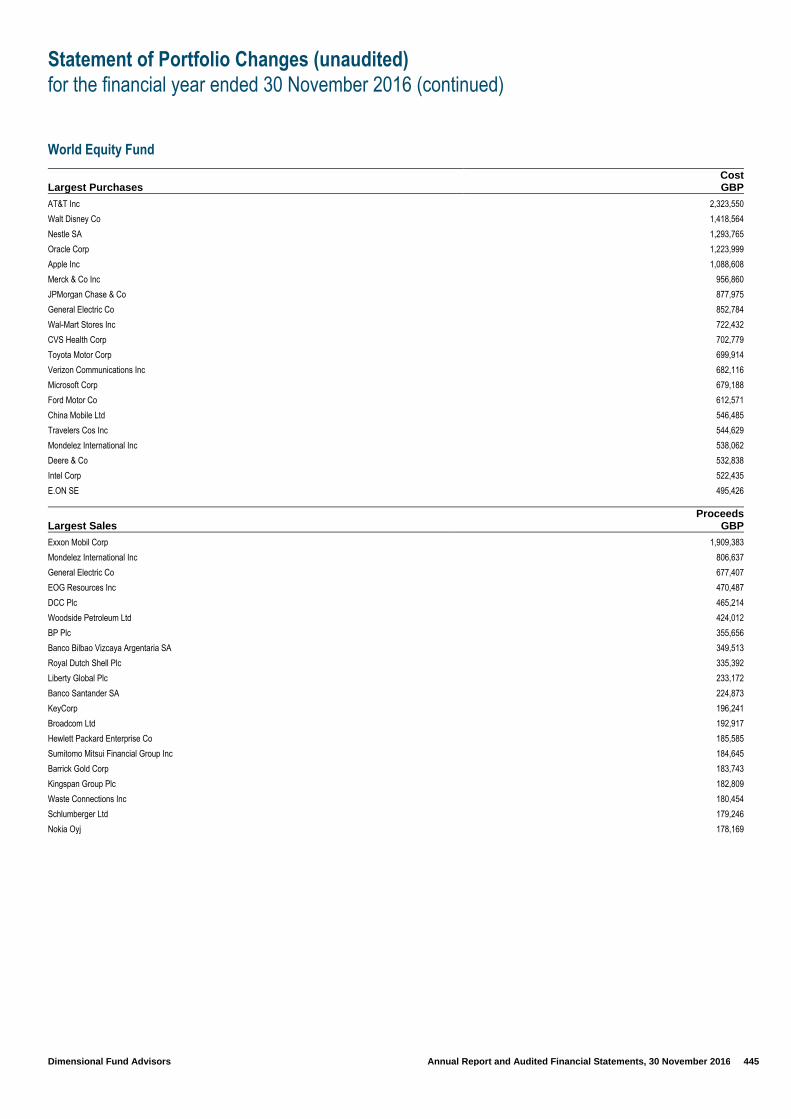
Statement of Portfolio Changes (unaudited)
for the financial year ended 30 November 2016 (continued)
Dimensional Fund Advisors Annual Report and Audited Financial Statements, 30 November 2016 445
World Equity Fund
Largest Purchases Cost GBP
AT&T Inc 2,323,550
Walt Disney Co 1,418,564
Nestle SA 1,293,765
Oracle Corp 1,223,999
Apple Inc 1,088,608
Merck & Co Inc 956,860
JPMorgan Chase & Co 877,975
General Electric Co 852,784
Wal-Mart Stores Inc 722,432
CVS Health Corp 702,779
Toyota Motor Corp 699,914
Verizon Communications Inc 682,116
Microsoft Corp 679,188
Ford Motor Co 612,571
China Mobile Ltd 546,485
Travelers Cos Inc 544,629
Mondelez International Inc 538,062
Deere & Co 532,838
Intel Corp 522,435
E.ON SE 495,426
Largest Sales Proceeds
GBP
Exxon Mobil Corp 1,909,383
Mondelez International Inc 806,637
General Electric Co 677,407
EOG Resources Inc 470,487
DCC Plc 465,214
Woodside Petroleum Ltd 424,012
BP Plc 355,656
Banco Bilbao Vizcaya Argentaria SA 349,513
Royal Dutch Shell Plc 335,392
Liberty Global Plc 233,172
Banco Santander SA 224,873
KeyCorp 196,241
Broadcom Ltd 192,917
Hewlett Packard Enterprise Co 185,585
Sumitomo Mitsui Financial Group Inc 184,645
Barrick Gold Corp 183,743
Kingspan Group Plc 182,809
Waste Connections Inc 180,454
Schlumberger Ltd 179,246
Nokia Oyj 178,169

Remuneration Policy (unaudited)
Dimensional Fund Advisors Annual Report and Audited Financial Statements, 30 November 2016 446
In accordance with the European Communities (UCITS) Regulations 2011, as amended, the Company adopted a remuneration policy which in the
case of the Company, only applies to certain Directors as it has no employees.
The Directors of the Company who are separately employed by the Investment Manager or its affiliated entities do not receive remuneration from
the Company for acting in their capacity as Directors. The other 3 members of the Board of Directors receive a fixed fee only and do not receive
performance-based or variable remuneration. The fixed fees payable to such members of the Board of Directors are set at a level based on
considerations including, without limitation, the market rate, the qualifications and contribution required in view of the nature, scope and complexity
of the Company’s activities, the extent of the responsibilities and the number of board meetings and is subject to review from time to time. The
aggregate amount of remuneration paid to those Directors for the financial year was EUR70,200.
The Company's remuneration policy was adopted by the Board of Directors during the course of the year to which this report relates, the first annual
review has not occurred and there have been no material changes to the policy since it was adopted.
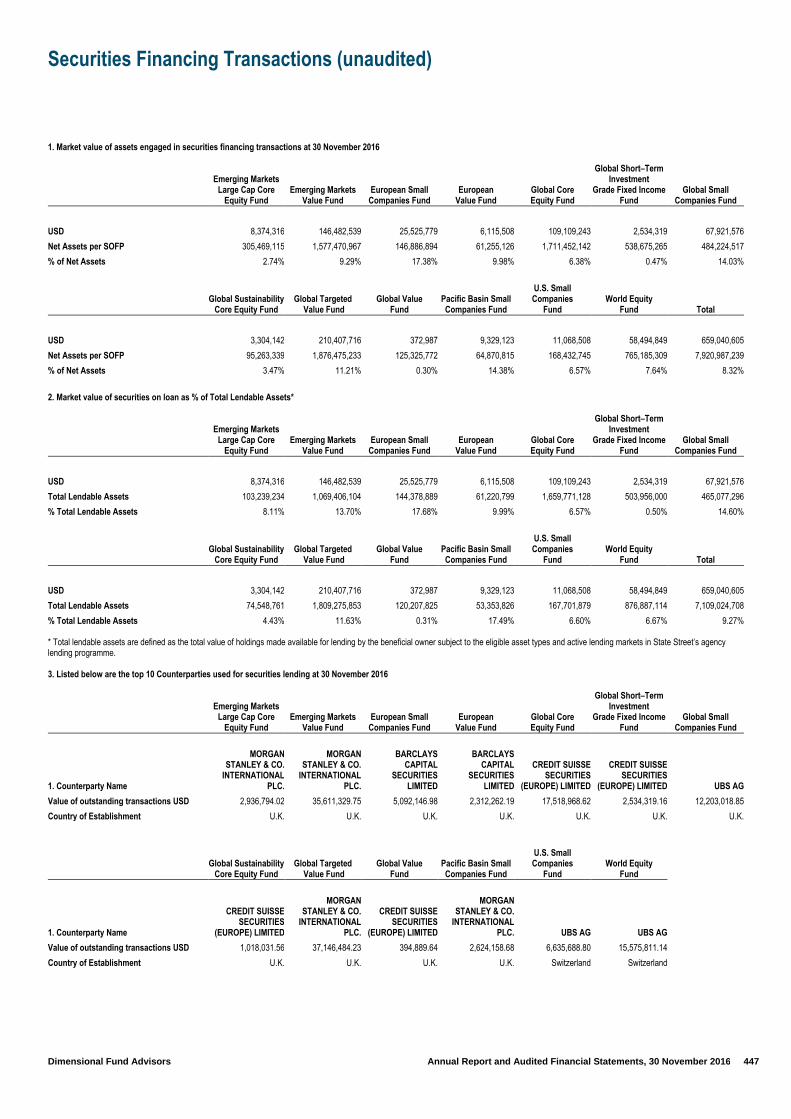
Securities Financing Transactions (unaudited)
Dimensional Fund Advisors Annual Report and Audited Financial Statements, 30 November 2016 447
1. Market value of assets engaged in securities financing transactions at 30 November 2016
Emerging Markets Large Cap Core
Equity Fund Emerging Markets
Value Fund European Small
Companies Fund European
Value Fund Global Core Equity Fund
Global Short–Term Investment
Grade Fixed Income Fund
Global Small Companies Fund
USD 8,374,316 146,482,539 25,525,779 6,115,508 109,109,243 2,534,319 67,921,576
Net Assets per SOFP 305,469,115 1,577,470,967 146,886,894 61,255,126 1,711,452,142 538,675,265 484,224,517
% of Net Assets 2.74% 9.29% 17.38% 9.98% 6.38% 0.47% 14.03%
Global Sustainability
Core Equity Fund Global Targeted
Value Fund Global Value
Fund Pacific Basin Small Companies Fund
U.S. Small Companies
Fund World Equity
Fund Total
USD 3,304,142 210,407,716 372,987 9,329,123 11,068,508 58,494,849 659,040,605
Net Assets per SOFP 95,263,339 1,876,475,233 125,325,772 64,870,815 168,432,745 765,185,309 7,920,987,239
% of Net Assets 3.47% 11.21% 0.30% 14.38% 6.57% 7.64% 8.32%
2. Market value of securities on loan as % of Total Lendable Assets*
Emerging Markets Large Cap Core
Equity Fund Emerging Markets
Value Fund European Small
Companies Fund European
Value Fund Global Core Equity Fund
Global Short–Term Investment
Grade Fixed Income Fund
Global Small Companies Fund
USD 8,374,316 146,482,539 25,525,779 6,115,508 109,109,243 2,534,319 67,921,576
Total Lendable Assets 103,239,234 1,069,406,104 144,378,889 61,220,799 1,659,771,128 503,956,000 465,077,296
% Total Lendable Assets 8.11% 13.70% 17.68% 9.99% 6.57% 0.50% 14.60%
Global Sustainability
Core Equity Fund Global Targeted
Value Fund Global Value
Fund Pacific Basin Small Companies Fund
U.S. Small Companies
Fund World Equity
Fund Total
USD 3,304,142 210,407,716 372,987 9,329,123 11,068,508 58,494,849 659,040,605
Total Lendable Assets 74,548,761 1,809,275,853 120,207,825 53,353,826 167,701,879 876,887,114 7,109,024,708
% Total Lendable Assets 4.43% 11.63% 0.31% 17.49% 6.60% 6.67% 9.27% * Total lendable assets are defined as the total value of holdings made available for lending by the beneficial owner subject to the eligible asset types and active lending markets in State Street’s agency lending programme. 3. Listed below are the top 10 Counterparties used for securities lending at 30 November 2016
Emerging Markets Large Cap Core
Equity Fund Emerging Markets
Value Fund European Small
Companies Fund European
Value Fund Global Core Equity Fund
Global Short–Term Investment
Grade Fixed Income Fund
Global Small Companies Fund
1. Counterparty Name
MORGAN STANLEY & CO.
INTERNATIONAL PLC.
MORGAN STANLEY & CO.
INTERNATIONAL PLC.
BARCLAYS CAPITAL
SECURITIES LIMITED
BARCLAYS CAPITAL
SECURITIES LIMITED
CREDIT SUISSE SECURITIES
(EUROPE) LIMITED
CREDIT SUISSE SECURITIES
(EUROPE) LIMITED UBS AG
Value of outstanding transactions USD 2,936,794.02 35,611,329.75 5,092,146.98 2,312,262.19 17,518,968.62 2,534,319.16 12,203,018.85
Country of Establishment U.K. U.K. U.K. U.K. U.K. U.K. U.K.
Global Sustainability
Core Equity Fund Global Targeted
Value Fund Global Value
Fund Pacific Basin Small Companies Fund
U.S. Small Companies
Fund World Equity
Fund
1. Counterparty Name
CREDIT SUISSE SECURITIES
(EUROPE) LIMITED
MORGAN STANLEY & CO.
INTERNATIONAL PLC.
CREDIT SUISSE SECURITIES
(EUROPE) LIMITED
MORGAN STANLEY & CO.
INTERNATIONAL PLC. UBS AG UBS AG
Value of outstanding transactions USD 1,018,031.56 37,146,484.23 394,889.64 2,624,158.68 6,635,688.80 15,575,811.14
Country of Establishment U.K. U.K. U.K. U.K. Switzerland Switzerland
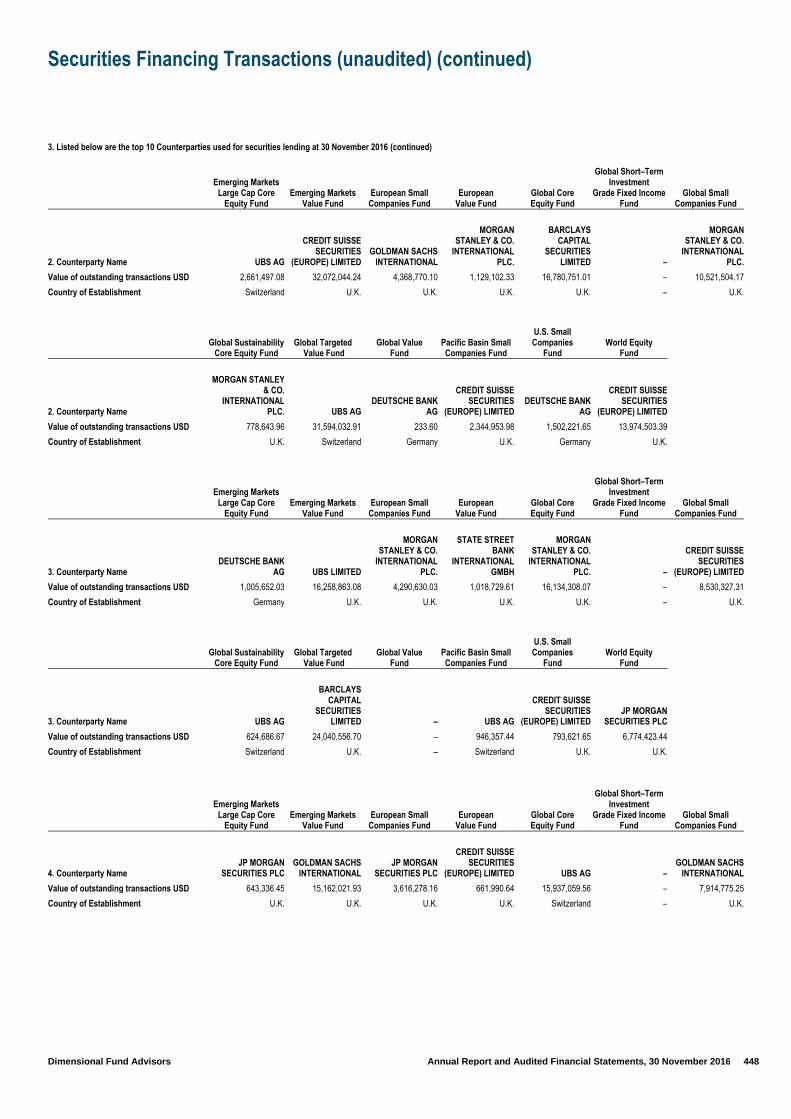
Securities Financing Transactions (unaudited) (continued)
Dimensional Fund Advisors Annual Report and Audited Financial Statements, 30 November 2016 448
3. Listed below are the top 10 Counterparties used for securities lending at 30 November 2016 (continued)
Emerging Markets Large Cap Core
Equity Fund Emerging Markets
Value Fund European Small
Companies Fund European
Value Fund Global Core Equity Fund
Global Short–Term Investment
Grade Fixed Income Fund
Global Small Companies Fund
2. Counterparty Name UBS AG
CREDIT SUISSE SECURITIES
(EUROPE) LIMITED GOLDMAN SACHS
INTERNATIONAL
MORGAN STANLEY & CO.
INTERNATIONAL PLC.
BARCLAYS CAPITAL
SECURITIES LIMITED –
MORGAN STANLEY & CO.
INTERNATIONAL PLC.
Value of outstanding transactions USD 2,661,497.08 32,072,044.24 4,368,770.10 1,129,102.33 16,780,751.01 – 10,521,504.17
Country of Establishment Switzerland U.K. U.K. U.K. U.K. – U.K.
Global Sustainability
Core Equity Fund Global Targeted
Value Fund Global Value
Fund Pacific Basin Small Companies Fund
U.S. Small Companies
Fund World Equity
Fund
2. Counterparty Name
MORGAN STANLEY & CO.
INTERNATIONAL PLC. UBS AG
DEUTSCHE BANK AG
CREDIT SUISSE SECURITIES
(EUROPE) LIMITED DEUTSCHE BANK
AG
CREDIT SUISSE SECURITIES
(EUROPE) LIMITED
Value of outstanding transactions USD 778,643.96 31,594,032.91 233.60 2,344,953.98 1,502,221.65 13,974,503.39
Country of Establishment U.K. Switzerland Germany U.K. Germany U.K.
Emerging Markets Large Cap Core
Equity Fund Emerging Markets
Value Fund European Small
Companies Fund European
Value Fund Global Core Equity Fund
Global Short–Term Investment
Grade Fixed Income Fund
Global Small Companies Fund
3. Counterparty Name DEUTSCHE BANK
AG UBS LIMITED
MORGAN STANLEY & CO.
INTERNATIONAL PLC.
STATE STREET BANK
INTERNATIONAL GMBH
MORGAN STANLEY & CO.
INTERNATIONAL PLC. –
CREDIT SUISSE SECURITIES
(EUROPE) LIMITED
Value of outstanding transactions USD 1,005,652.03 16,258,863.08 4,290,630.03 1,018,729.61 16,134,308.07 – 8,530,327.31
Country of Establishment Germany U.K. U.K. U.K. U.K. – U.K.
Global Sustainability
Core Equity Fund Global Targeted
Value Fund Global Value
Fund Pacific Basin Small Companies Fund
U.S. Small Companies
Fund World Equity
Fund
3. Counterparty Name UBS AG
BARCLAYS CAPITAL
SECURITIES LIMITED – UBS AG
CREDIT SUISSE SECURITIES
(EUROPE) LIMITED JP MORGAN
SECURITIES PLC
Value of outstanding transactions USD 624,686.67 24,040,556.70 – 946,357.44 793,621.65 6,774,423.44
Country of Establishment Switzerland U.K. – Switzerland U.K. U.K.
Emerging Markets Large Cap Core
Equity Fund Emerging Markets
Value Fund European Small
Companies Fund European
Value Fund Global Core Equity Fund
Global Short–Term Investment
Grade Fixed Income Fund
Global Small Companies Fund
4. Counterparty Name JP MORGAN
SECURITIES PLC GOLDMAN SACHS
INTERNATIONAL JP MORGAN
SECURITIES PLC
CREDIT SUISSE SECURITIES
(EUROPE) LIMITED UBS AG – GOLDMAN SACHS
INTERNATIONAL
Value of outstanding transactions USD 643,336.45 15,162,021.93 3,616,278.16 661,990.64 15,937,059.56 – 7,914,775.25
Country of Establishment U.K. U.K. U.K. U.K. Switzerland – U.K.

Securities Financing Transactions (unaudited) (continued)
Dimensional Fund Advisors Annual Report and Audited Financial Statements, 30 November 2016 449
3. Listed below are the top 10 Counterparties used for securities lending at 30 November 2016 (continued)
Global Sustainability
Core Equity Fund Global Targeted
Value Fund Global Value
Fund Pacific Basin Small Companies Fund
U.S. Small Companies
Fund World Equity
Fund
4. Counterparty Name
STATE STREET BANK
INTERNATIONAL GMBH
GOLDMAN SACHS INTERNATIONAL –
MERRILL LYNCH INTERNATIONAL
CITIGROUP GLOBAL MARKETS
LIMITED
STATE STREET BANK
INTERNATIONAL GMBH
Value of outstanding transactions USD 279,735.63 23,591,841.87 – 731,034.52 583,039.95 5,378,875.38
Country of Establishment U.K. U.K. – U.K. U.K. U.K.
Emerging Markets Large Cap Core
Equity Fund Emerging Markets
Value Fund European Small
Companies Fund European
Value Fund Global Core Equity Fund
Global Short–Term Investment
Grade Fixed Income Fund
Global Small Companies Fund
5. Counterparty Name GOLDMAN SACHS
INTERNATIONAL JP MORGAN
SECURITIES PLC
CITIGROUP GLOBAL MARKETS
LIMITED UBS AG GOLDMAN SACHS
INTERNATIONAL –
BARCLAYS CAPITAL
SECURITIES LIMITED
Value of outstanding transactions USD 567,256.83 9,972,961.40 1,613,461.18 247,683.95 9,617,140.67 – 6,690,532.46
Country of Establishment U.K. U.K. U.K. Switzerland U.K. – U.K.
Global Sustainability
Core Equity Fund Global Targeted
Value Fund Global Value
Fund Pacific Basin Small Companies Fund
U.S. Small Companies
Fund World Equity
Fund
5. Counterparty Name DEUTSCHE BANK
AG
CREDIT SUISSE SECURITIES
(EUROPE) LIMITED – JP MORGAN
SECURITIES PLC
BARCLAYS CAPITAL
SECURITIES LIMITED
CITIGROUP GLOBAL MARKETS
LIMITED
Value of outstanding transactions USD 234,843.28 19,895,112.98 – 699,184.21 472,153.92 4,352,649.53
Country of Establishment Germany U.K. – U.K. U.K. U.K.
Emerging Markets Large Cap Core
Equity Fund Emerging Markets
Value Fund European Small
Companies Fund European
Value Fund Global Core Equity Fund
Global Short–Term Investment
Grade Fixed Income Fund
Global Small Companies Fund
6. Counterparty Name UBS LIMITED DEUTSCHE BANK
AG UBS AG SOCIETE
GENERALE SA
STATE STREET BANK
INTERNATIONAL GMBH –
JP MORGAN SECURITIES PLC
Value of outstanding transactions USD 386,850.29 7,795,800.80 1,537,270.10 185,394.50 7,345,347.55 – 4,667,005.25
Country of Establishment U.K. Germany Switzerland France U.K. – U.K.
Global Sustainability
Core Equity Fund Global Targeted
Value Fund Global Value
Fund Pacific Basin Small Companies Fund
U.S. Small Companies
Fund World Equity
Fund
6. Counterparty Name
CITIGROUP GLOBAL MARKETS
LIMITED JP MORGAN
SECURITIES PLC – MACQUARIE BANK
LIMITED
MORGAN STANLEY & CO.
INTERNATIONAL PLC.
DEUTSCHE BANK AG
Value of outstanding transactions USD 116,922.73 18,386,200.38 – 359,346.91 453,350.50 4,282,789.69
Country of Establishment U.K. U.K. – Australia U.K. Germany

Securities Financing Transactions (unaudited) (continued)
Dimensional Fund Advisors Annual Report and Audited Financial Statements, 30 November 2016 450
3. Listed below are the top 10 Counterparties used for securities lending at 30 November 2016 (continued)
Emerging Markets Large Cap Core
Equity Fund Emerging Markets
Value Fund European Small
Companies Fund European
Value Fund Global Core Equity Fund
Global Short–Term Investment
Grade Fixed Income Fund
Global Small Companies Fund
7. Counterparty Name
CITIGROUP GLOBAL MARKETS
LIMITED UBS AG MERRILL LYNCH INTERNATIONAL
GOLDMAN SACHS INTERNATIONAL
JP MORGAN SECURITIES PLC –
DEUTSCHE BANK AG
Value of outstanding transactions USD 93,317.99 7,795,410.20 1,107,766.87 180,311.76 6,424,343.52 – 4,038,748.59
Country of Establishment U.K. Switzerland U.K. U.K. U.K. – Germany
Global Sustainability
Core Equity Fund Global Targeted
Value Fund Global Value
Fund Pacific Basin Small Companies Fund
U.S. Small Companies
Fund World Equity
Fund
7. Counterparty Name SOCIETE
GENERALE SA
CITIGROUP GLOBAL MARKETS
LIMITED – DEUTSCHE BANK
AG SOCIETE
GENERALE SA MERRILL LYNCH INTERNATIONAL
Value of outstanding transactions USD 70,456.38 13,457,984.75 – 351,766.81 378,129.50 2,110,630.87
Country of Establishment France U.K. – Germany France U.K.
Emerging Markets Large Cap Core
Equity Fund Emerging Markets
Value Fund European Small
Companies Fund European
Value Fund Global Core Equity Fund
Global Short–Term Investment
Grade Fixed Income Fund
Global Small Companies Fund
8. Counterparty Name MERRILL LYNCH INTERNATIONAL
CITIGROUP GLOBAL MARKETS
LIMITED DEUTSCHE BANK
AG JP MORGAN
SECURITIES PLC
CITIGROUP GLOBAL MARKETS
LIMITED –
CITIGROUP GLOBAL MARKETS
LIMITED
Value of outstanding transactions USD 51,592.87 5,620,793.65 955,700.33 179,148.01 4,643,665.24 – 3,660,112.73
Country of Establishment U.K. U.K. Germany U.K. U.K. – U.K.
Global Sustainability
Core Equity Fund Global Targeted
Value Fund Global Value
Fund Pacific Basin Small Companies Fund
U.S. Small Companies
Fund World Equity
Fund
8. Counterparty Name ABN AMRO BANK
N.V. DEUTSCHE BANK
AG –
CITIGROUP GLOBAL MARKETS
LIMITED HSBC BANK PLC MACQUARIE BANK
LIMITED
Value of outstanding transactions USD 64,612.37 11,477,890.16 – 225,509.22 188,478.05 1,905,863.61
Country of Establishment Netherlands Germany – U.K. U.K. Australia
Emerging Markets Large Cap Core
Equity Fund Emerging Markets
Value Fund European Small
Companies Fund European
Value Fund Global Core Equity Fund
Global Short–Term Investment
Grade Fixed Income Fund
Global Small Companies Fund
9. Counterparty Name
CREDIT SUISSE SECURITIES
(EUROPE) LIMITED MERRILL LYNCH INTERNATIONAL
CREDIT SUISSE SECURITIES
(EUROPE) LIMITED MERRILL LYNCH INTERNATIONAL
DEUTSCHE BANK AG –
STATE STREET BANK
INTERNATIONAL GMBH
Value of outstanding transactions USD 37,340.63 5,616,739.33 857,209.28 139,058.44 3,896,483.28 – 2,415,662.53
Country of Establishment U.K. U.K. U.K. U.K. Germany – U.K.
Global Sustainability
Core Equity Fund Global Targeted
Value Fund Global Value
Fund Pacific Basin Small Companies Fund
U.S. Small Companies
Fund World Equity
Fund
9. Counterparty Name HSBC BANK PLC
STATE STREET BANK
INTERNATIONAL GMBH –
SOCIETE GENERALE SA
JP MORGAN SECURITIES PLC
BNP PARIBAS ARBITRAGE SNC
Value of outstanding transactions USD 62,410.76 10,837,860.97 – 223,245.25 132,464.75 1,885,797.59
Country of Establishment U.K. U.K. – France U.K. France

Securities Financing Transactions (unaudited) (continued)
Dimensional Fund Advisors Annual Report and Audited Financial Statements, 30 November 2016 451
3. Listed below are the top 10 Counterparties used for securities lending at 30 November 2016 (continued)
Emerging Markets Large Cap Core
Equity Fund Emerging Markets
Value Fund European Small
Companies Fund European
Value Fund Global Core Equity Fund
Global Short–Term Investment
Grade Fixed Income Fund
Global Small Companies Fund
10. Counterparty Name – BNP PARIBAS
ARBITRAGE SNC BNP PARIBAS
ARBITRAGE SNC BNP PARIBAS
ARBITRAGE SNC HSBC BANK PLC – BNP PARIBAS
ARBITRAGE SNC
Value of outstanding transactions USD – 4,665,090.52 668,275.20 52,385.60 2,270,738.05 – 1,863,235.45
Country of Establishment – France France France U.K. – France
8,383,638.19 140,571,054.90 24,107,508.23 6,106,067.03 100,568,805.57 2,534,319.16 62,504,922.59
Global Sustainability
Core Equity Fund Global Targeted
Value Fund Global Value
Fund Pacific Basin Small Companies Fund
U.S. Small Companies
Fund World Equity
Fund
10. Counterparty Name MERRILL LYNCH INTERNATIONAL
MERRILL LYNCH INTERNATIONAL –
STATE STREET BANK
INTERNATIONAL GMBH –
SOCIETE GENERALE SA
Value of outstanding transactions USD 46,690.77 4,758,452.84 – 213,200.52 – 1,112,664.21
Country of Establishment U.K. U.K. – U.K. – France
3,297,034.11 195,186,417.79 395,123.24 8,718,757.54 11,139,148.77 57,354,008.85 4. Settlement/clearing for securities lending:
Emerging Markets Large Cap Core
Equity Fund Emerging Markets
Value Fund European Small
Companies Fund European
Value Fund Global Core Equity Fund
Global Short–Term Investment
Grade Fixed Income Fund
Global Small Companies Fund
Bilateral
Arrangement
Bilateral arrangement and Tri-party arrangement
Bilateral arrangement and Tri-party arrangement
Bilateral arrangement and Tri-party arrangement
Bilateral arrangement and Tri-party arrangement
Bilateral arrangement and Tri-party arrangement
Bilateral arrangement and Tri-party arrangement
Global Sustainability
Core Equity Fund Global Targeted
Value Fund Global Value
Fund Pacific Basin Small Companies Fund
U.S. Small Companies
Fund World Equity
Fund
Bilateral arrangement and Tri-party arrangement
Bilateral arrangement and Tri-party arrangement
Bilateral Arrangement
Bilateral arrangement and Tri-party arrangement
Bilateral Arrangement
Bilateral arrangement and Tri-party arrangement
5. Maturity tenor of the SFTs (USD)
Emerging Markets Large Cap Core
Equity Fund Emerging Markets
Value Fund European Small
Companies Fund European
Value Fund Global Core Equity Fund
Global Short–Term Investment
Grade Fixed Income Fund
Global Small Companies Fund
Open Open Open Open Open Open Open
Global Sustainability
Core Equity Fund Global Targeted
Value Fund Global Value
Fund Pacific Basin Small Companies Fund
U.S. Small Companies
Fund World Equity
Fund
Open Open Open Open Open Open
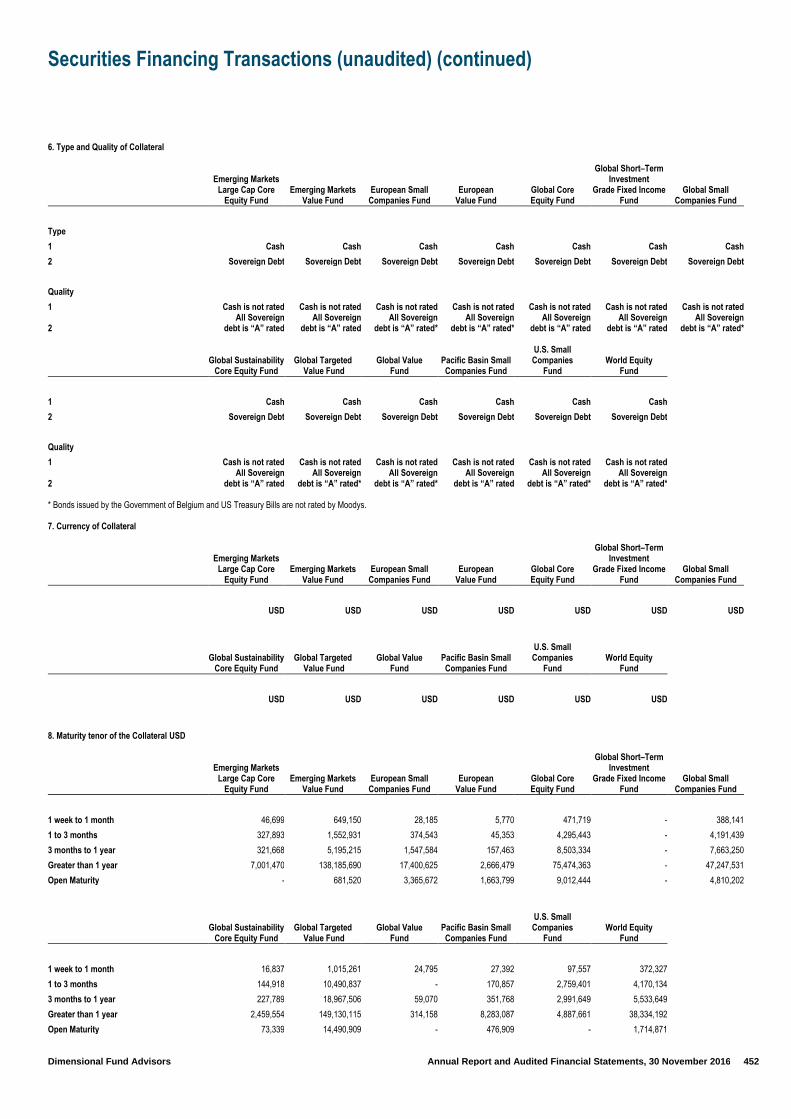
Securities Financing Transactions (unaudited) (continued)
Dimensional Fund Advisors Annual Report and Audited Financial Statements, 30 November 2016 452
6. Type and Quality of Collateral
Emerging Markets Large Cap Core
Equity Fund Emerging Markets
Value Fund European Small
Companies Fund European
Value Fund Global Core Equity Fund
Global Short–Term Investment
Grade Fixed Income Fund
Global Small Companies Fund
Type
1 Cash Cash Cash Cash Cash Cash Cash
2 Sovereign Debt Sovereign Debt Sovereign Debt Sovereign Debt Sovereign Debt Sovereign Debt Sovereign Debt
Quality
1 Cash is not rated Cash is not rated Cash is not rated Cash is not rated Cash is not rated Cash is not rated Cash is not rated
2 All Sovereign
debt is “A” rated All Sovereign
debt is “A” rated All Sovereign
debt is “A” rated* All Sovereign
debt is “A” rated* All Sovereign
debt is “A” rated All Sovereign
debt is “A” rated All Sovereign
debt is “A” rated*
Global Sustainability
Core Equity Fund Global Targeted
Value Fund Global Value
Fund Pacific Basin Small Companies Fund
U.S. Small Companies
Fund World Equity
Fund
1 Cash Cash Cash Cash Cash Cash
2 Sovereign Debt Sovereign Debt Sovereign Debt Sovereign Debt Sovereign Debt Sovereign Debt
Quality
1 Cash is not rated Cash is not rated Cash is not rated Cash is not rated Cash is not rated Cash is not rated
2 All Sovereign
debt is “A” rated All Sovereign
debt is “A” rated* All Sovereign
debt is “A” rated* All Sovereign
debt is “A” rated All Sovereign
debt is “A” rated* All Sovereign
debt is “A” rated* * Bonds issued by the Government of Belgium and US Treasury Bills are not rated by Moodys. 7. Currency of Collateral
Emerging Markets Large Cap Core
Equity Fund Emerging Markets
Value Fund European Small
Companies Fund European
Value Fund Global Core Equity Fund
Global Short–Term Investment
Grade Fixed Income Fund
Global Small Companies Fund
USD USD USD USD USD USD USD
Global Sustainability
Core Equity Fund Global Targeted
Value Fund Global Value
Fund Pacific Basin Small Companies Fund
U.S. Small Companies
Fund World Equity
Fund
USD USD USD USD USD USD
8. Maturity tenor of the Collateral USD
Emerging Markets Large Cap Core
Equity Fund Emerging Markets
Value Fund European Small
Companies Fund European
Value Fund Global Core Equity Fund
Global Short–Term Investment
Grade Fixed Income Fund
Global Small Companies Fund
1 week to 1 month 46,699 649,150 28,185 5,770 471,719 - 388,141
1 to 3 months 327,893 1,552,931 374,543 45,353 4,295,443 - 4,191,439
3 months to 1 year 321,668 5,195,215 1,547,584 157,463 8,503,334 - 7,663,250
Greater than 1 year 7,001,470 138,185,690 17,400,625 2,666,479 75,474,363 - 47,247,531
Open Maturity - 681,520 3,365,672 1,663,799 9,012,444 - 4,810,202
Global Sustainability
Core Equity Fund Global Targeted
Value Fund Global Value
Fund Pacific Basin Small Companies Fund
U.S. Small Companies
Fund World Equity
Fund
1 week to 1 month 16,837 1,015,261 24,795 27,392 97,557 372,327
1 to 3 months 144,918 10,490,837 - 170,857 2,759,401 4,170,134
3 months to 1 year 227,789 18,967,506 59,070 351,768 2,991,649 5,533,649
Greater than 1 year 2,459,554 149,130,115 314,158 8,283,087 4,887,661 38,334,192
Open Maturity 73,339 14,490,909 - 476,909 - 1,714,871

Securities Financing Transactions (unaudited) (continued)
Dimensional Fund Advisors Annual Report and Audited Financial Statements, 30 November 2016 453
9. Ten largest Collateral Issuers (Stock Collateral)
Emerging Markets Large Cap Core
Equity Fund Emerging Markets
Value Fund European Small
Companies Fund European
Value Fund Global Core Equity Fund
Global Short–Term Investment
Grade Fixed Income Fund
Global Small Companies Fund
1. Collateral Issuer
Bundesrepublik Deutschland
04/01/2028
United States Treasury Note/Bond
31/01/2018
Bundesrepublik Deutschland
04/01/2028
Bundesrepublik Deutschland
04/01/2028
United Kingdom Gilt Inflation Linked
26/01/2035 –
United Kingdom Gilt Inflation Linked
26/01/2035
Value of collateral USD 557,849 10,564,177 1,056,804 367,259 4,742,201 – 2,108,327
Global Sustainability
Core Equity Fund Global Targeted
Value Fund Global Value
Fund Pacific Basin Small Companies Fund
U.S. Small Companies
Fund World Equity
Fund
1. Collateral Issuer
United Kingdom Gilt Inflation Linked
26/01/2035
Bundesrepublik Deutschland
04/01/2028
United Kingdom Gilt Inflation Linked
22/03/2040
United Kingdom Gilt Inflation Linked
26/01/2035
United States Treasury Floating
Rate Note 30/04/2017
United Kingdom Gilt Inflation Linked
16/04/2020
Value of collateral USD 278,750 7,096,366 173,939 844,114 1,278,417 3,527,238
Emerging Markets Large Cap Core
Equity Fund Emerging Markets
Value Fund European Small
Companies Fund European
Value Fund Global Core Equity Fund
Global Short–Term Investment
Grade Fixed Income Fund
Global Small Companies Fund
2. Collateral Issuer
United Kingdom Gilt Inflation Linked
22/11/2047
United States Treasury Inflation
Indexed Bonds 15/01/2025
Bundesobligation 07/04/2017
French Republic Government Bond
OAT 25/05/2018
United Kingdom Gilt Inflation Linked
16/04/2020 –
United Kingdom Gilt Inflation Linked
16/04/2020
Value of collateral USD 341,546 9,880,935 835,322 352,539 4,667,611 – 2,030,801
Global Sustainability
Core Equity Fund Global Targeted
Value Fund Global Value
Fund Pacific Basin Small Companies Fund
U.S. Small Companies
Fund World Equity
Fund
2. Collateral Issuer
United Kingdom Gilt Inflation Linked
16/04/2020 United Kingdom Gilt
22/01/2060
United States Treasury Inflation
Indexed Bonds 15/02/2042
United Kingdom Gilt Inflation Linked
16/04/2020
United States Treasury Bill
16/02/2017
United Kingdom Gilt Inflation Linked
26/01/2035
Value of collateral USD 275,019 5,368,125 55,078 815,175 1,274,560 3,323,066
Emerging Markets Large Cap Core
Equity Fund Emerging Markets
Value Fund European Small
Companies Fund European
Value Fund Global Core Equity Fund
Global Short–Term Investment
Grade Fixed Income Fund
Global Small Companies Fund
3. Collateral Issuer
United States Treasury Note/Bond
31/01/2020
United States Treasury Inflation
Indexed Bonds 15/01/2028
French Republic Government Bond
OAT 25/05/2018 United Kingdom Gilt
22/07/2068
Bundesrepublik Deutschland
04/01/2028 –
Bundesrepublik Deutschland
04/01/2028
Value of collateral USD 307,323 7,681,829 823,874 327,861 3,144,745 – 1,985,850
Global Sustainability
Core Equity Fund Global Targeted
Value Fund Global Value
Fund Pacific Basin Small Companies Fund
U.S. Small Companies
Fund World Equity
Fund
3. Collateral Issuer
United Kingdom Gilt Inflation Linked
22/03/2040 Bundesobligation
07/04/2017
United States Treasury Bill
27/04/2017
United Kingdom Gilt Inflation Linked
22/03/2040
United States Treasury Floating
Rate Note 31/07/2017
United Kingdom Gilt Inflation Linked
22/03/2040
Value of collateral USD 180,003 4,617,523 36,571 524,169 1,145,853 2,415,903

Securities Financing Transactions (unaudited) (continued)
Dimensional Fund Advisors Annual Report and Audited Financial Statements, 30 November 2016 454
9. Ten largest Collateral Issuers (Stock Collateral) (continued)
Emerging Markets Large Cap Core
Equity Fund Emerging Markets
Value Fund European Small
Companies Fund European
Value Fund Global Core Equity Fund
Global Short–Term Investment
Grade Fixed Income Fund
Global Small Companies Fund
4. Collateral Issuer United Kingdom Gilt
22/01/2060
United Kingdom Gilt Inflation Linked
26/01/2035 United Kingdom Gilt
07/12/2049
Kingdom of Belgium Government Bond
22/06/2018
United Kingdom Gilt Inflation Linked
22/03/2040 –
United States Treasury Bill
16/02/2017
Value of collateral USD 304,766 7,639,808 722,788 326,055 3,117,690 – 1,536,978
Global Sustainability
Core Equity Fund Global Targeted
Value Fund Global Value
Fund Pacific Basin Small Companies Fund
U.S. Small Companies
Fund World Equity
Fund
4. Collateral Issuer
United Kingdom Gilt Inflation Linked
22/11/2022
United Kingdom Gilt Inflation Linked
26/01/2035
United States Treasury Note/Bond
15/02/2025
United Kingdom Gilt Inflation Linked
22/11/2022
United States Treasury Bill
00/01/1900
French Republic Government Bond
OAT 25/10/2038
Value of collateral USD 135,586 4,560,438 25,717 396,414 835,720 1,943,190
Emerging Markets Large Cap Core
Equity Fund Emerging Markets
Value Fund European Small
Companies Fund European
Value Fund Global Core Equity Fund
Global Short–Term Investment
Grade Fixed Income Fund
Global Small Companies Fund
5. Collateral Issuer
United Kingdom Gilt Inflation Linked
22/03/2062
United Kingdom Gilt Inflation Linked
16/04/2020 United Kingdom Gilt
22/07/2068
Canadian Government Bond
01/08/2018
Bundesrepublik Deutschland
04/01/2037 –
United States Treasury Floating
Rate Note 30/04/2017
Value of collateral USD 280,492 7,553,634 591,854 324,015 2,559,446 – 1,497,998
Global Sustainability
Core Equity Fund Global Targeted
Value Fund Global Value
Fund Pacific Basin Small Companies Fund
U.S. Small Companies
Fund World Equity
Fund
5. Collateral Issuer United Kingdom Gilt
22/01/2060
United Kingdom Gilt Inflation Linked
22/11/2047
United States Treasury Bill
00/01/1900
United Kingdom Gilt Inflation Linked
22/11/2047
United States Treasury Inflation
Indexed Bonds 15/01/2025
United Kingdom Gilt Inflation Linked
22/11/2022
Value of collateral USD 103,897 4,304,024 24,795 315,276 535,302 1,799,269
Emerging Markets Large Cap Core
Equity Fund Emerging Markets
Value Fund European Small
Companies Fund European
Value Fund Global Core Equity Fund
Global Short–Term Investment
Grade Fixed Income Fund
Global Small Companies Fund
6. Collateral Issuer
French Republic Government Bond
OAT 25/10/2021
United States Treasury Note/Bond
31/05/2021
Kingdom of Belgium Government Bond
22/06/2018 United Kingdom Gilt
07/12/2049
United Kingdom Gilt Inflation Linked
22/11/2022 – Bundesobligation
07/04/2017
Value of collateral USD 246,078 5,275,182 548,725 261,015 2,337,769 – 1,480,149
Global Sustainability
Core Equity Fund Global Targeted
Value Fund Global Value
Fund Pacific Basin Small Companies Fund
U.S. Small Companies
Fund World Equity
Fund
6. Collateral Issuer
United Kingdom Gilt Inflation Linked
22/11/2047
United Kingdom Gilt Inflation Linked
16/04/2020
United Kingdom Gilt Inflation Linked
22/11/2017 United Kingdom Gilt
22/01/2060
United States Treasury Inflation
Indexed Bonds 15/07/2022
Bundesrepublik Deutschland
04/01/2028
Value of collateral USD 83,351 4,216,399 17,975 307,076 441,607 1,550,312
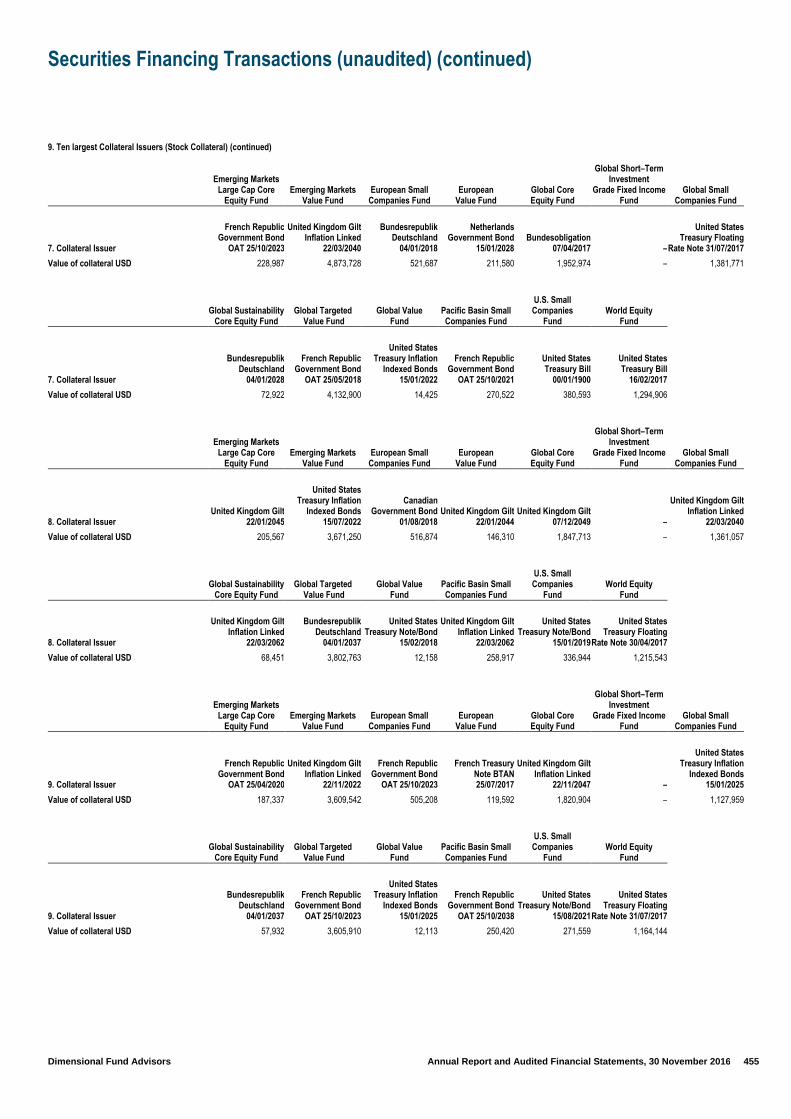
Securities Financing Transactions (unaudited) (continued)
Dimensional Fund Advisors Annual Report and Audited Financial Statements, 30 November 2016 455
9. Ten largest Collateral Issuers (Stock Collateral) (continued)
Emerging Markets Large Cap Core
Equity Fund Emerging Markets
Value Fund European Small
Companies Fund European
Value Fund Global Core Equity Fund
Global Short–Term Investment
Grade Fixed Income Fund
Global Small Companies Fund
7. Collateral Issuer
French Republic Government Bond
OAT 25/10/2023
United Kingdom Gilt Inflation Linked
22/03/2040
Bundesrepublik Deutschland
04/01/2018
Netherlands Government Bond
15/01/2028 Bundesobligation
07/04/2017 –
United States Treasury Floating
Rate Note 31/07/2017
Value of collateral USD 228,987 4,873,728 521,687 211,580 1,952,974 – 1,381,771
Global Sustainability
Core Equity Fund Global Targeted
Value Fund Global Value
Fund Pacific Basin Small Companies Fund
U.S. Small Companies
Fund World Equity
Fund
7. Collateral Issuer
Bundesrepublik Deutschland
04/01/2028
French Republic Government Bond
OAT 25/05/2018
United States Treasury Inflation
Indexed Bonds 15/01/2022
French Republic Government Bond
OAT 25/10/2021
United States Treasury Bill
00/01/1900
United States Treasury Bill
16/02/2017
Value of collateral USD 72,922 4,132,900 14,425 270,522 380,593 1,294,906
Emerging Markets Large Cap Core
Equity Fund Emerging Markets
Value Fund European Small
Companies Fund European
Value Fund Global Core Equity Fund
Global Short–Term Investment
Grade Fixed Income Fund
Global Small Companies Fund
8. Collateral Issuer United Kingdom Gilt
22/01/2045
United States Treasury Inflation
Indexed Bonds 15/07/2022
Canadian Government Bond
01/08/2018 United Kingdom Gilt
22/01/2044 United Kingdom Gilt
07/12/2049 –
United Kingdom Gilt Inflation Linked
22/03/2040
Value of collateral USD 205,567 3,671,250 516,874 146,310 1,847,713 – 1,361,057
Global Sustainability
Core Equity Fund Global Targeted
Value Fund Global Value
Fund Pacific Basin Small Companies Fund
U.S. Small Companies
Fund World Equity
Fund
8. Collateral Issuer
United Kingdom Gilt Inflation Linked
22/03/2062
Bundesrepublik Deutschland
04/01/2037
United States Treasury Note/Bond
15/02/2018
United Kingdom Gilt Inflation Linked
22/03/2062
United States Treasury Note/Bond
15/01/2019
United States Treasury Floating
Rate Note 30/04/2017
Value of collateral USD 68,451 3,802,763 12,158 258,917 336,944 1,215,543
Emerging Markets Large Cap Core
Equity Fund Emerging Markets
Value Fund European Small
Companies Fund European
Value Fund Global Core Equity Fund
Global Short–Term Investment
Grade Fixed Income Fund
Global Small Companies Fund
9. Collateral Issuer
French Republic Government Bond
OAT 25/04/2020
United Kingdom Gilt Inflation Linked
22/11/2022
French Republic Government Bond
OAT 25/10/2023
French Treasury Note BTAN 25/07/2017
United Kingdom Gilt Inflation Linked
22/11/2047 –
United States Treasury Inflation
Indexed Bonds 15/01/2025
Value of collateral USD 187,337 3,609,542 505,208 119,592 1,820,904 – 1,127,959
Global Sustainability
Core Equity Fund Global Targeted
Value Fund Global Value
Fund Pacific Basin Small Companies Fund
U.S. Small Companies
Fund World Equity
Fund
9. Collateral Issuer
Bundesrepublik Deutschland
04/01/2037
French Republic Government Bond
OAT 25/10/2023
United States Treasury Inflation
Indexed Bonds 15/01/2025
French Republic Government Bond
OAT 25/10/2038
United States Treasury Note/Bond
15/08/2021
United States Treasury Floating
Rate Note 31/07/2017
Value of collateral USD 57,932 3,605,910 12,113 250,420 271,559 1,164,144

Securities Financing Transactions (unaudited) (continued)
Dimensional Fund Advisors Annual Report and Audited Financial Statements, 30 November 2016 456
9. Ten largest Collateral Issuers (Stock Collateral) (continued)
Emerging Markets Large Cap Core
Equity Fund Emerging Markets
Value Fund European Small
Companies Fund European
Value Fund Global Core Equity Fund
Global Short–Term Investment
Grade Fixed Income Fund
Global Small Companies Fund
10. Collateral Issuer United Kingdom Gilt
22/07/2018
United States Treasury Note/Bond
31/12/2020
French Republic Government Bond
OAT 25/11/2019 United Kingdom Gilt
22/01/2060 United Kingdom Gilt
22/01/2060 – United Kingdom Gilt
22/01/2060
Value of collateral USD 185,979 3,285,083 486,947 107,483 1,765,069 – 1,120,907
Global Sustainability
Core Equity Fund Global Targeted
Value Fund Global Value
Fund Pacific Basin Small Companies Fund
U.S. Small Companies
Fund World Equity
Fund
10. Collateral Issuer
French Republic Government Bond
OAT 25/10/2021
United States Treasury Bill
16/02/2017
United States Treasury Note/Bond
15/05/2019
French Republic Government Bond
OAT 25/04/2020
United States Treasury Note/Bond
31/05/2023
French Republic Government Bond
OAT 25/05/2018
Value of collateral USD 57,391 3,604,159 7,665 244,725 265,840 898,794
10. Re-investment of Collateral received As at 30 November 2016 USD97,000,000 of the total cash collateral received by the funds was reinvested at a company level in repurchase agreements with approved counterparties Citigroup, JP Morgan and Merrill Lynch. 11. Safe-keeping of Collateral received
Emerging Markets Large Cap Core
Equity Fund Emerging Markets
Value Fund European Small
Companies Fund European
Value Fund Global Core Equity Fund
Global Short–Term Investment
Grade Fixed Income Fund
Global Small Companies Fund
No. of Depositaries 1 1 1 1 1 1 1
Depositary State Street State Street State Street State Street State Street State Street State Street
Global Sustainability
Core Equity Fund Global Targeted
Value Fund Global Value
Fund Pacific Basin Small Companies Fund
U.S. Small Companies
Fund World Equity
Fund
No. of Depositaries 1 1 1 1 1 1
Depositary State Street State Street State Street State Street State Street State Street
12. Returns and costs of the SFTs Please refer to the Statement of Comprehensive Income and Note 4 for details of income and associated costs.

Dimensional Funds plc is structured as an umbrella fund with segregated liability between sub-funds, established as an open- ended investment company with variable capital and limited liability under the laws of Ireland with registration number 352043. Dimensional Funds plc qualifi es and is authorised by the Central Bank of Ireland as an undertaking for collective investments in transferable securities (UCITS).
The value of investments and any income from them may fall as well as rise and past performance is not a guarantee of future results. This is not a prospectus. Prospective investors should receive a prospectus, which should be read carefully before investing in the Company. Prospectuses are available to download from http://eu.dimensional.com.
AMERICAS
Austin, Charlotte, Santa Monica, Toronto, VancouverEUROPE
London, Amsterdam, BerlinASIA PACIFIC
Sydney, Melbourne, Singapore, Tokyo
eu.dimensional.com