annual report and audited financial statements
149
AVIVA INVESTORS SOCIÉTÉ D’INVESTISSEMENT À CAPITAL VARIABLE (SICAV) ANNUAL REPORT AND AUDITED FINANCIAL STATEMENTS R.C.S. Luxembourg B 32.640 31 December 2014 avivainvestors.com
-
Upload
khangminh22 -
Category
Documents
-
view
0 -
download
0
Transcript of annual report and audited financial statements

AVIVA INVESTORSSOCIÉTÉ D’INVESTISSEMENT À CAPITAL VARIABLE (SICAV)ANNUAL REPORT AND AUDITED FINANCIAL STATEMENTS
R.C.S. Luxembourg B 32.640
31 December 2014
avivainvestors.com

Contents
Director’s Report 5
Investment Manager’s Report 6
Management and Administration 7
Audit Report 8
Aviva Investors – Asian Equity Income Fund 9
Aviva Investors – Asian High Yield Bond Fund 11
Aviva Investors – Dynamic Master Fund 13
Aviva Investors – Emerging Europe Equity Fund 14
Aviva Investors – Emerging Markets Bond Fund 15
Aviva Investors – Emerging Markets Corporate Bond Fund 20
Aviva Investors – Emerging Markets Equity Income Fund 24
Aviva Investors – Emerging Markets Equity Small Cap Fund 26
Aviva Investors – Emerging Markets Local Currency Bond Fund 28
Aviva Investors – European Corporate Bond Fund 32
Aviva Investors – European Equity Fund 36
Aviva Investors – European Equity Income Fund 38
Aviva Investors – European Real Estate Securities Fund 40
Aviva Investors – Global Aggregate Bond Fund 42
Aviva Investors – Global Bond Absolute Return Fund 54
Aviva Investors – Global Convertibles Absolute Return Fund 58
Aviva Investors – Global Convertibles Fund 62
Aviva Investors – Global Emerging Markets Index Fund 66
Aviva Investors – Global High Yield Bond Fund 77
Aviva Investors – Long Term European Bond Fund 84
Aviva Investors – Multi-Strategy Target Return Fund 86
Aviva Investors – Short Duration Global High Yield Bond Fund 91
This report does not constitute an offer of shares. Subscriptions are only valid if made on the basisof the current prospectus and the Key Investor Information Documents (“KIID”) supplemented by thelast available annual report and the latest semi-annual report if published after such an annual report.Investors are hereby urged to read the entire prospectus, particularly the description of special risks.Past performance is not necessarily indicative of future returns. Copies of the prospectus, KIID, annualreport, semi-annual report and details of changes in investments for the sub-funds are available free ofcharge from the registered office of the Fund, 2 rue du Fort Bourbon, L-1249 Luxembourg, Grand Duchyof Luxembourg.

Aviva Investors – Short Term European Bond Fund 95
Aviva Investors – UK Opportunities Fund 96
Aviva Investors – US Equity Income Fund 97
Statement of Net Assets 98
Statistics 101
Statement of Changes in Shares Outstanding 108
Statement of Operations and Changes in Net Assets 115
Notes to the Financial Statements 123
Other Information – Unaudited 136
Information for Investors in Switzerland 137

AVIVA INVESTORS – ANNUAL REPORT AND AUDITED FINANCIAL STATEMENTS avivainvestors.com 5
DIRECTOR’S REPORT
Dear Shareholder,
The Directors of Aviva Investors SICAV (the “Fund”) have pleasure in presenting the annual report and audited financial statements to shareholders for the year ending 31 December 2014.
At the year end, the total net assets of the Sub-funds (the “Sub-funds”) of Aviva Investors SICAV (the “Company”) were EUR 7,735,977,631 compared to EUR 8,839,517,569 on 31 December 2013 , representing a decrease of 12%.
The Board of Directors adheres to the Association of the Luxembourg Fund Industry (“ALFI”) code of conduct for Luxembourg investment funds. The code of conduct sets a framework of high-level principles and best practice recommendations for the governance of Luxembourg investment funds.
The Board of Directors
Luxembourg, 23 March 2015

AVIVA INVESTORS – ANNUAL REPORT AND AUDITED FINANCIAL STATEMENTS avivainvestors.com 6
Global economy makes steady progressWe expect solid economic growth and subdued inflation to drive up the price of equities, corporate bonds and commercial property in 2015.
The world economy looks to be in reasonable shape as we enter a new year which augurs well for a continued rally in riskier asset classes such as shares. Global economic output is expected to expand by around 3.5 per cent in 2015, which would be close to its historical average. However, with already-low rates of inflation set to fall further following a plunge in commodity prices in 2014, the environment for bonds is not going to be particularly unfriendly either. Yes, bond returns are likely to be low, but at least for now there is no reason to expect sharp price falls.
Developed markets to outperformWe expect the US dollar will continue to strengthen against most other currencies. We also expect ‘developed’ equity markets to continue outperforming ‘emerging’ ones, as developing economies have historically struggled in times of a rising dollar.
But as in 2014, this relatively favourable overall picture for global growth masks some significant regional variations. Economies, and hence monetary policy, are likely to remain de-synchronised. While interest rates are likely to rise in both the US and UK, further monetary easing is on the cards in Europe, Japan and possibly China too.
US recovery gathers paceThe US is set to be the best-performing developed economy over the next few years, having grown strongly in the second half of 2014 as rising employment and higher asset prices boosted consumer spending.
Growth was relatively balanced with exporters performing well despite a surging US dollar and a slowdown in many key export markets. The unemployment rate dipped below six per cent for the first time since 2008 while the inflation outlook remains subdued, enabling the US central bank to keep interest rates low.
European deflation threatsAs we look into 2015 one of the key risks is another difficult year for the euro zone, where policymakers are struggling to tackle chronically high unemployment and fend off deflation. Although there are signs of a slight pick-up in growth during the second half of 2014, especially in ‘peripheral’ economies like Spain and Ireland, German and French output is worryingly weak. The currency bloc faces very anaemic growth without more radical action from policymakers.
* All market returns in British Pounds
Note: The figures stated in this report are historical and not necessarily indicative of future performance.
INVESTMENT MANAGER’S REPORT

AVIVA INVESTORS – ANNUAL REPORT AND AUDITED FINANCIAL STATEMENTS avivainvestors.com 7
MANAGEMENT AND ADMINISTRATION
Registered Office 2 rue du Fort Bourbon L - 1249 Luxembourg Grand Duchy of Luxembourg
Board of Directors
ChairmanEmmanuel Babinet CEO of Aviva Investors Luxembourg Aviva Investors Luxembourg S.A.2 rue du Fort Bourbon L - 1249 Luxembourg Grand Duchy of Luxembourg
DirectorsJacques Elvinger Partner Elvinger Hoss & Prussen 2, Place Winston Churchill L-1340 Luxembourg Grand Duchy of Luxembourg
Mark FlahertyAviva Investors Luxembourg S.A. 2 rue du Fort Bourbon L- 1249 Luxembourg Grand Duchy of Luxembourg
Edward Potter (until 17 November 2014) Managing Director – Business Development EMEA Aviva Investors Global Services Limited 1, Poultry London EC2R 8EJ United Kingdom
Timothy Lucas Head of Investment Services Aviva Investors Global Services Limited 1, Poultry London EC2R 8EJ United Kingdom
Representative and Paying Agent in SwitzerlandBNP Paribas Securities Services, Paris Succursale de Zurich Selnaustrasse 16 8002 Zurich Switzerland
Management Company Domiciliary Agent Aviva Investors Luxembourg S.A. 2 rue du Fort Bourbon L - 1249 Luxembourg Grand Duchy of Luxembourg
Investment ManagerAviva Investors Global Services Limited (*) 1, Poultry London EC2R 8EJ United Kingdom Sub-Investment Managers (**) for the sub-fund Aviva Investors - US Equity Income Fund River Road Asset Management LLC The Meidinger Tower 462 South Fourth Street, Suite 1600 Louisville, KY40202 United States of America
for the sub-fund Aviva Investors - Asian High Yield Bond Fund Aviva Investors Asia Pte Ltd 6 Temasek Boulevard #32-03 Suntec Tower 4 Singapore 038986
for the sub-funds Aviva Investors - Long Term European Bond Fund and Aviva Investors – Short Term European Bond Fund Aviva Investors France 24-26, rue de la Pépinière 75008 Paris
for the sub-funds Aviva Investors - Global High Yield Bond Fund and Aviva Investors – Short Duration Global High Yield Bond Fund Aviva Investors Americas LLC 225 W. Wacker Drive Suite 1750 Chicago, IL 60606
Registrar And Transfer Agent RBC Investor Services Bank S.A. (*) 14, Porte de France L-4360 Esch-sur-Alzette Grand Duchy of Luxembourg
AdministratorJ.P. Morgan Bank Luxembourg S.A. (*) European Bank and Business Centre 6, route de Trèves L-2633 Senningerberg Grand Duchy of Luxembourg
Listing AgentJ.P. Morgan Bank Luxembourg S.A. European Bank and Business Centre 6, route de Trèves L-2633 Senningerberg Grand Duchy of Luxembourg
CustodianJ.P. Morgan Bank Luxembourg S.A. European Bank and Business Centre 6, route de Trèves L-2633 Senningerberg Grand Duchy of Luxembourg
AuditorPricewaterhouseCoopers, Société coopérative 2, rue Gerhard Mercator L- 1014 Luxembourg Grand Duchy of Luxembourg
Legal AdviserElvinger, Hoss & Prussen 2, Place Winston Churchill L-1340 Luxembourg Grand Duchy of Luxembourg
(*) Subject to the responsibility and oversight of Aviva Investors Luxembourg S.A.(**) Subject to the responsability and oversight of Aviva Investors Global Services Limited

AUDIT REPORT
To the Shareholders olAVIVA INVESTORs
We hav€ audited the accompanying financial statements of AVIVA INVESIORS and of each of rts sub-funds, which comprise the statementof net assets and the portfolio oi investments and other net assets as at 31 December 2014 and the gtatement of operations and changes in
net assets ior the year then ended, and a summary of signrficant accounting policies and other explanatory notes to the tinancial statemenG-
Responsibility of the Board of Directors of the SICAV for the financial statements
Ihe Board of Dire(to6 of the SICAV is responsible for the preparation and fair presentation oi these .financial statements in accordance withLuxembourg legal and regulatory requirements relating to the preparation of the financial statements and for such internal control as the Boardof Directors of the sICAV determines is necessary to enable the preparation of financial statements that are free from material misstatement.whether due to fraud or error.
Responsibility of the "Rdviseur d'entrep ses agre("
Our responsibility is to express an opinion on these financial statements based on our audit. We conducted our audit in accordance withInternational Standards on Auditing as adopted for Luxembourg by the "Commission de Surveillance du Secteur Financier". Those standardsrequire thdt we comply with ethical requirements and plan and perform the audit to obtain reasonable assurance about whether the financialstatements ar€ free from material misstatement.
An audit involves performing procedures to obtain audit evidence about the amounts and disclosures in the {lnancial statements. The proceduresselected depend on the iudgment of the "Reviseur d'entreprises agr6e", rncluding the assessment of the risks of rnaterial misstatement of thefinancial statements, whether due to fraud or error In making those risk assessments, the "R6viseur d'entreprises agre6" considers internalcontrol relevant to the entity's preparation and fair presentation of the frnancial statements in order to design audit procedures that areappropriate in the circomstances, but not for the purpose of expressing an opinion on the effectiveness of the entity! internal control. An auditalso includes evaluating the appropriateness of accounting policies used and the reasonableness oi accouhting estimates made by the Board
of Drrectors of the SICAV as well as evaluating the overall presentation of the trnancial statements,
We believe that the audit eviderice we have obtained is sufficient and appropriate to provide a basis for our audit opinion.
Opinion
In our opinion, the financial statements give a true and fair v,ew of the financial position o{ AVIVA INVESTORS and of each of its sub-fundsas of 3l Decembet 2014, and of the results of their operations and changes in their net assets for the year then ended in accordance withLuxembourg legal and regulatory requirements relating to the preparation of the firtancial statements.
other matte6
Supplementary information included in the annual report has been reviewed in the context o{ our mandate but has not been subject to specificaudit procedures carried out in accordance with the standards described akrove. Consequently, we express no opinion on such information.However, we have no observation to make concerning such information in the contexi o{ the financial statemenB taken as a whole.
Luxembourg, 2 April 201 5
oopers, Soci6t6 cooperative, 2 rue Gerhai'd Mercator, B.P. 1443, L-1014 LuxembourgT. +352 494848 1 , F.+352 494844 29OO, wr,w. pwc lu
Cabinet de rdvision ag166. Expert-comptable (autorisatjon gouvernementale n"10028256)R.C.S. Luxembouro B 65 477 - ryA 1U254825,l8
Iwc
PricewaterhouseCoopers, Socr€te cooperative
AVIVA INVE'TOR5 - ANNUAL REPORT AND AUDITED FINANCIAL
'TATEMENTSavrvarnve5to Ts. cotTl

AVIVA INVESTORS – ANNUAL REPORT AND AUDITED FINANCIAL STATEMENTS avivainvestors.com 9
AVIVA INVESTORS – ASIAN EQUITY INCOME FUNDPortfolio of Investments and Other Net Assets as at 31 December 2014
Number of shares or Principal Amount
Transferable Securities andMoney Market Instruments Admitted to an Official Exchange Listing
Market Value
USD
% Net Assets
Cayman Islands 3,091,749 3.12
HKD 1,979,400 Evergrande Real Estate 801,047 0.81
HKD 489,000 Shimao Property 1,091,980 1.10
HKD 1,701,779 SOHO China 1,198,722 1.21
China 13,965,597 14.09
HKD 6,788,674 Bank of China 'H' 3,814,502 3.85
HKD 903,100 China BlueChemical 'H' 319,026 0.32
HKD 831,179 China Communications Construction 'H' 997,724 1.01
HKD 1,447,777 China Minsheng Banking 'H' 1,899,025 1.91
HKD 1,897,877 China Petroleum & Chemical 'H' 1,529,710 1.54
HKD 1,120,750 Guangzhou R&F Properties 'H' 1,374,054 1.39
HKD 5,512,524 Industrial & Commercial Bank of China 'H' 4,031,556 4.07
Hong Kong 18,645,126 18.81
HKD 399,500 BOC Hong Kong 1,337,474 1.35
HKD 124,441 Cheung Kong 2,089,561 2.11
HKD 265,427 China Mobile 3,102,445 3.13
HKD 1,365,355 CNOOC 1,838,258 1.85
HKD 1,015,934 Guangdong Investment 1,323,046 1.34
HKD 57,600 Hang Seng Bank 960,954 0.97
HKD 146,200 Hutchison Whampoa 1,682,726 1.70
HKD 195,000 Link REIT 1,221,740 1.23
HKD 3,491,212 PCCW 2,383,077 2.40
HKD 151,100 Power Assets 1,466,096 1.48
HKD 779,688 SJM 1,239,749 1.25
India 8,719,114 8.80
USD 73,304 Citigroup Warrants - Bank of Baroda 27/02/2015
1,254,326 1.27
USD 139,333 Citigroup Warrants - Cairn India 27/02/2015
527,530 0.53
USD 294,891 Citigroup Warrants - Coal India 27/02/2015
1,781,914 1.80
USD 20,000 Citigroup Warrants - Hero MotoCorp 27/02/2015
983,896 0.99
USD 502,872 Citigroup Warrants - NTPC 27/02/2015 1,142,873 1.15
USD 157,261 Citigroup Warrants - Tata Motors 27/02/2015
1,234,452 1.25
USD 56,588 Infosys ADR 1,794,123 1.81
Indonesia 3,832,710 3.87
IDR 1,248,700 Indofood Sukses Makmur 678,985 0.69
IDR 1,893,900 Perusahaan Gas Negara Persero 914,930 0.92
IDR 9,696,230 Telekomunikasi Indonesia Persero 2,238,795 2.26
Number of shares or Principal Amount
Transferable Securities andMoney Market Instruments Admitted to an Official Exchange Listing
Market Value
USD
% Net Assets
Malaysia 5,265,286 5.31
MYR 213,542 Berjaya Sports Toto 215,257 0.22
MYR 38,200 British American Tobacco Malaysia 706,544 0.71
MYR 343,800 Malayan Banking 900,868 0.91
MYR 559,700 Tenaga Nasional 2,210,220 2.23
MYR 227,000 UMW 710,646 0.72
MYR 1,144,200 YTL 521,751 0.52
Philippines 642,365 0.65
PHP 378,800 Aboitiz Power 360,486 0.36
PHP 7,355 Globe Telecom 281,879 0.29
Singapore 6,189,308 6.25
SGD 344,000 Ascendas Real Estate Investment Trust REIT
619,061 0.63
SGD 435,000 CapitaMall Trust REIT 667,857 0.67
USD 1,704,900 Hutchison Port Trust 1,171,667 1.18
SGD 137,500 Keppel 917,421 0.93
SGD 483,123 Sembcorp Industries 1,618,171 1.63
SGD 1,317,700 Yangzijiang Shipbuilding 1,195,131 1.21
South Korea 16,669,723 16.82
KRW 20,723 Dongbu Insurance 1,036,843 1.05
KRW 22,250 Hite Jinro 470,413 0.47
KRW 39,693 Hyundai Marine & Fire Insurance 936,698 0.95
KRW 13,293 Hyundai Motor 2,033,419 2.05
KRW 59,244 Industrial Bank of Korea 757,050 0.76
KRW 30,409 Kia Motors 1,442,604 1.46
KRW 18,182 KT&G 1,259,325 1.27
KRW 2,963 POSCO 741,370 0.75
KRW 4,903 Samsung Electronics 5,901,636 5.95
KRW 5,657 SK Telecom 1,379,588 1.39
KRW 9,291 Woongjin Coway 710,777 0.72
Taiwan 15,204,239 15.34
TWD 108,000 Asustek Computer 1,182,116 1.19
TWD 104,000 Catcher Technology 808,836 0.82
TWD 268,380 Chicony Electronics 751,128 0.76
TWD 1,537,852 Fubon Financial 2,466,539 2.49
TWD 1,869,993 Mega Financial 1,444,546 1.46
TWD 367,000 Quanta Computer 917,813 0.92
TWD 863,000 Taiwan Cement 1,182,866 1.19
TWD 265,000 Taiwan Mobile 874,096 0.88
TWD 1,254,018 Taiwan Semiconductor Manufacturing
5,576,299 5.63
The accompanying notes form an integral part of these financial statements.

AVIVA INVESTORS – ANNUAL REPORT AND AUDITED FINANCIAL STATEMENTS avivainvestors.com 10
AVIVA INVESTORS – ASIAN EQUITY INCOME FUND (CONTINUED)Portfolio of Investments and Other Net Assets as at 31 December 2014
Number of shares or Principal Amount
Transferable Securities andMoney Market Instruments Admitted to an Official Exchange Listing
Market Value
USD
% Net Assets
Thailand 4,094,292 4.13
THB 81,800 Advanced Info Service (Foreign) Registered 625,310 0.63
THB 1,753,844 Krung Thai Bank (Foreign) 1,212,764 1.22
THB 144,500 PTT (Foreign) 1,425,236 1.44
THB 532,152 PTT Global Chemical (Foreign) 830,982 0.84
United Kingdom 1,951,142 1.97
HKD 204,800 HSBC 1,951,142 1.97
Total Transferable Securities andMoney Market Instruments Admittedto an Official Exchange Listing
98,270,651 99.16
Total Investments 98,270,651 99.16
Other Net Assets 832,298 0.84
Net Asset Value 99,102,949 100.00
Geographic Breakdown (as a percentage of Net Assets) % Net Assets
Cayman Islands 3.12
China 14.09
Hong Kong 18.81
India 8.8
Indonesia 3.87
Malaysia 5.31
Philippines 0.65
Singapore 6.25
South Korea 16.82
Taiwan 15.34
Thailand 4.13
United Kingdom 1.97
Total 99.16

AVIVA INVESTORS – ANNUAL REPORT AND AUDITED FINANCIAL STATEMENTS avivainvestors.com 11
AVIVA INVESTORS – ASIAN HIGH YIELD BOND FUNDPortfolio of Investments and Other Net Assets as at 31 December 2014
Number of shares or Principal Amount
Transferable Securities and Money Market Instruments Admitted to an Official Exchange Listing
Market Value
USD
% Net Assets
Bangladesh 2,700,391 2.57
USD 2,700,000 Banglalink Digital Communications RegS 8.625% 06/05/2019
2,700,391 2.57
Bermuda 1,128,465 1.07
USD 1,000,000 Pacnet RegS 9% 12/18 1,128,465 1.07
British Virgin Islands 7,155,803 6.81
USD 600,000 Big Will Investments EMTN 10.875% 29/04/2016
626,079 0.60
USD 400,000 Caifu Holdings RegS 8.75% 24/01/2020
372,088 0.35
USD 750,000 China Resources Power East Foundation variable perpetual
781,740 0.74
USD 1,650,000 Estate Sky RegS 6.5% 16/01/2018 1,582,960 1.51
USD 1,800,000 Oceanwide Real Estate International Holdings 11.75% 08/09/2019
1,855,233 1.77
USD 750,000 Road King Infrastructure Finance 2012 RegS 9.875% 18/09/2017
791,111 0.75
USD 750,000 Trillion Chance 8.5% 10/01/2019 704,507 0.67
USD 250,000 Yingde Gases Investment RegS 7.25% 28/02/2020
211,250 0.20
USD 250,000 Yingde Gases Investment RegS 8.125% 22/04/2018
230,835 0.22
Cayman Islands 48,969,853 46.60
USD 2,500,000 Agile Property RegS 8.875% 28/04/2017 2,438,475 2.32
USD 950,000 China Automation 7.75% 20/04/2016 945,863 0.90
USD 1,250,000 China Hongqiao Group 6.875% 03/05/2018
1,190,256 1.13
USD 1,972,000 China Hongqiao Group RegS 7.625% 26/06/2017
1,980,237 1.88
USD 250,000 China SCE Property RegS 11.5% 14/11/2017
254,484 0.24
USD 1,650,000 China Shanshui Cement RegS 8.5% 25/05/2016
1,676,936 1.60
USD 2,500,000 CIFI 12.25% 15/04/2018 2,728,775 2.60
USD 900,000 Country Garden RegS 11.125% 23/02/2018
957,271 0.91
USD 1,750,000 Country Garden RegS 7.25% 04/04/2021 1,686,422 1.60
USD 250,000 Country Garden RegS 7.5% 10/01/2023 239,020 0.23
USD 900,000 Country Garden RegS 7.875% 27/05/2019
923,607 0.88
USD 650,000 Future Land Development Holdings 10.25% 21/07/2019
627,656 0.60
USD 1,500,000 Geely Automobile Holdings RegS 5.25% 06/10/2019
1,474,462 1.40
CNH 1,500,000 Greentown China Holdings 5.625% 13/05/2016
236,110 0.22
USD 900,000 KWG Property Holding 8.25% 05/08/2019
839,727 0.80
USD 1,250,000 KWG Property RegS 8.975% 14/01/2019 1,194,250 1.14
USD 1,250,000 Logan Property Holdings 9.75% 08/12/2017
1,228,756 1.17
USD 1,750,000 Logan Property RegS 11.25% 04/06/2019 1,744,578 1.66
Number of shares or Principal Amount
Transferable Securities and Money Market Instruments Admitted to an Official Exchange Listing
Market Value
USD
% Net Assets
CNH 1,000,000 Longfor Properties 6.75% 28/05/2018 161,413 0.15
USD 1,200,000 Longfor Properties EMTN 6.875% 18/10/2019
1,228,656 1.17
USD 900,000 Maoye Internationals RegS 7.75% 19/05/2017
885,443 0.84
USD 1,550,000 MCE Finance RegS 5% 15/02/2021 1,445,608 1.38
USD 4,500,000 Metropolitan Light International EMTN 5.25% 17/01/2018
4,560,930 4.34
USD 150,000 MIE RegS 7.5% 25/04/2019 116,447 0.11
USD 350,000 Parkson Retail Group 4.5% 03/05/2018 323,461 0.31
USD 4,850,000 PHBS 6.625% perpetual 4,887,466 4.65
USD 2,250,000 Shimao Property 6.625% 14/01/2020 2,213,764 2.11
USD 900,000 Shui On Development Holding 8.7% 24/11/2017
893,007 0.85
USD 2,900,000 Shui On Development RegS variable perpetual
2,884,543 2.75
USD 3,000,000 Sunac China RegS 12.5% 16/10/2017 3,269,970 3.11
USD 750,000 Texhong Textile 6.5% 18/01/2019 715,643 0.68
USD 950,000 Wuzhou International Holdings RegS 13.75% 26/09/2018
1,005,480 0.96
USD 250,000 Yuzhou Properties 8.75% 04/10/2018 245,729 0.23
USD 1,250,000 Yuzhou Properties 9% 08/12/2019 1,227,350 1.17
USD 500,000 Yuzhou Properties RegS 11.75% 25/10/2017
538,058 0.51
Hong Kong 4,928,724 4.69
USD 4,350,000 Citic Pacific RegS variable perpetual 4,928,724 4.69
India 2,046,913 1.95
USD 1,700,000 ICICI Bank RegS variable 30/04/2022 1,760,477 1.68
USD 300,000 JSW Steel 4.75% 12/11/2019 286,436 0.27
Indonesia 1,876,420 1.78
USD 2,000,000 Gajah Tunggal RegS 7.75% 06/02/2018
1,876,420 1.78
Jersey 2,146,100 2.04
USD 2,250,000 West China Cement 6.5% 11/09/2019
2,146,100 2.04
Netherlands 4,997,316 4.76
USD 1,250,000 Comfeed Finance RegS 6% 02/05/2018
1,180,606 1.12
USD 500,000 Indosat Palapa RegS 7.375% 29/07/2020
529,470 0.51
USD 1,200,000 Jababeka International RegS 7.5% 24/09/2019
1,177,890 1.12
USD 2,000,000 Royal Capital variable perpetual 2,109,350 2.01
Philippines 7,716,624 7.34
USD 250,000 International Container Terminal Services 7.375% 17/03/2020
284,351 0.27
USD 3,350,000 Petron RegS variable perpetual 3,484,519 3.31
USD 1,400,000 San Miguel EMTN 4.875% 26/04/2023
1,293,411 1.23
USD 2,600,000 SMC Global Powers variable perpetual
2,654,343 2.53
The accompanying notes form an integral part of these financial statements.

AVIVA INVESTORS – ANNUAL REPORT AND AUDITED FINANCIAL STATEMENTS avivainvestors.com 12
AVIVA INVESTORS – ASIAN HIGH YIELD BOND FUND (CONTINUED)Portfolio of Investments and Other Net Assets as at 31 December 2014
Number of shares or Principal Amount
Transferable Securities and Money Market Instruments Admitted to an Official Exchange Listing
Market Value
USD
% Net Assets
Singapore 10,067,172 9.58
USD 1,600,000 ABJA Investment 5.95% 31/07/2024 1,605,200 1.53
USD 1,500,000 Marquee Land Pte RegS 9.75% 05/08/2019
1,484,633 1.41
USD 2,000,000 MPM Global 6.75% 19/09/2019 1,983,410 1.89
USD 1,100,000 STATS ChipPAC RegS 4.5% 20/03/2018
1,095,820 1.04
USD 750,000 TBG Global RegS 4.625% 03/04/2018
741,574 0.71
USD 750,000 Theta Capital 7% 16/05/2019 769,586 0.73
USD 1,550,000 TML 5.750% 07/05/2021 1,596,666 1.52
USD 750,000 Yanlord Land RegS 10.625% 29/03/2018
790,283 0.75
Thailand 1,021,745 0.97
USD 1,000,000 Krung Thai Bank EMTN variable 26/12/2024
1,021,745 0.97
United Kingdom 2,632,684 2.51
USD 700,000 Vedanta Resources RegS 6% 31/01/2019
684,653 0.65
USD 1,950,000 Vedanta Resources RegS 8.25% 07/06/2021
1,948,031 1.86
Total Transferable Securities and Money Market Instruments Admitted to an Offcial Exchange Listing
97,388,210 92.67
Number of shares or Principal Amount
Transferable Securities andMoney Market Instruments dealton another Regulated Market
Market Value
USD
% Net Assets
Bermuda 1,420,706 1.36
USD 1,400,000 GCX RegS 7% 01/08/2019 1,420,706 1.36
Cayman Islands 2,418,084 2.30
CNH 11,500,000 361 Degrees 7.5% 12/09/2017 1,808,344 1.72
CNH 1,000,000 Callable Notes 10.5% 14/01/2016 159,427 0.15
CNH 2,800,000 Future Land 9.75% 23/04/2016 450,313 0.43
Total Transferable Securities and Money Market Instruments dealt on another Regulated Market
3,838,790 3.66
Number of shares or Principal Amount
Other Transferable Securities not dealt on another Regulated Market
Market Value
USD
% Net Assets
Netherlands 367,367 0.35
USD 550,000 Indo Energy Finance RegS 6.375% 24/01/2023 367,367 0.35
Total Other Transferable Securities not dealt on another Regulated Market
367,367 0.35
Total Investments 101,594,367 96.68
Other Net Assets 3,492,632 3.32
Net Asset Value 105,086,999 100.00
Geographic Breakdown (as a percentage of Net Assets) % Net Assets
Bangladesh 2.57
Bermuda 2.43
British Virgin Islands 6.81
Cayman Islands 48.90
Hong Kong 4.69
India 1.95
Indonesia 1.78
Jersey 2.04
Netherlands 5.11
Philippines 7.34
Singapore 9.58
Thailand 0.97
United Kingdom 2.51
Total 96.68

AVIVA INVESTORS – ANNUAL REPORT AND AUDITED FINANCIAL STATEMENTS avivainvestors.com 13
AVIVA INVESTORS – DYNAMIC MASTER FUNDPortfolio of Investments and Other Net Assets as at 31 December 2014
Number of shares or Principal Amount
Transferable Securities and Money Market Instruments admitted to an Official Exchange Listing
Market Value
EUR
% Net Assets
France 11,826,485 26.05
EUR 25,059 Lyxor - ETF Euro Corporate Bond 3,547,352 7.81
EUR 18,832 Lyxor - ETF MSCI USA 3,113,494 6.86
EUR 165,911 Lyxor ETF Euro Stoxx 50 5,165,639 11.38
Germany 2,056,663 4.54
EUR 92,726 iShares Dow Jones - UBS Commodity Swap
2,056,663 4.54
Ireland 15,275,607 33.65
EUR 89,793 iShares Core Euro Stoxx ETF 7,783,257 17.15
EUR 15,470 iShares Euro Inflation Linked Government Bond
3,072,033 6.77
EUR 43,111 iShares FTSE - EPRA European Property Index Fund
1,386,881 3.05
EUR 116,760 iShares S&P 500 ETF 1,998,114 4.40
EUR 31,700 Vanguard S&P 500 ETF 1,035,322 2.28
Luxembourg 11,463,434 25.25
EUR 69,656 db x-trackers - MSCI Emerging Market Total Return Index ETF
2,159,336 4.76
EUR 166,703 db x-trackers - MSCI Japan Total Return Index ETF
6,156,342 13.56
Number of shares or Principal Amount
Transferable Securities and Money Market Instruments admitted to an Official Exchange Listing
Market Value
EUR
% Net Assets
EUR 14,353 db x-trackers II - iBoxx Sovereigns Eurozone Total Return Index ETF
3,147,756 6.93
Total Transferable Securities andMoney Market Instruments Admittedto an Official Exchange Listing
40,622,189 89.49
Number of shares or Principal Amount
Open Ended Investment Funds Market Value
EUR
% Net Assets
France 4,253,396 9.37
EUR 7 Aviva Investors Aviva Investors Monetaire
14,778 0.03
EUR 205 Aviva Investors Valeurs Europe 4,238,618 9.34
Luxembourg 11,437 0.03
EUR 1 BNP Paribas InstiCash EUR 141 0.00
EUR 1 JPMorgan Liquidity Funds- Euro Liquidity Fund
11,296 0.03
Total Open Ended Investment Funds 4,264,833 9.40
Total Investments 44,887,022 98.89
Other Net Assets 505,311 1.11
Net Asset Value 45,392,333 100.00
The accompanying notes form an integral part of these financial statements.
Geographic Breakdown (as a percentage of Net Assets) % Net Assets
France 35.42
Germany 4.54
Ireland 33.65
Luxembourg 25.28
Total 98.89

AVIVA INVESTORS – ANNUAL REPORT AND AUDITED FINANCIAL STATEMENTS avivainvestors.com 14
AVIVA INVESTORS – EMERGING EUROPE EQUITY FUNDPortfolio of Investments and Other Net Assets as at 31 December 2014
Number of shares or Principal Amount
Transferable Securities and Money Market Instruments Admitted to an Official Exchange Listing
Market Value
EUR
% Net Assets
Bulgaria 302,445 0.94
BGN 242,795 Advance Terrafund REIT 302,445 0.94
Cyprus 398,253 1.24
USD 44,500 Avangardco Investments GDR 72,190 0.23
NOK 129,178 ProSafe 326,063 1.01
Czech Republic 2,548,544 7.93
CZK 16,704 CEZ 356,230 1.11
CZK 9,870 Komercni Banka 1,686,430 5.25
CZK 1,297 Philip Morris 505,884 1.57
Estonia 822,457 2.56
EUR 230,200 Olympic Entertainment 390,189 1.21
EUR 642,300 Tallink 432,268 1.35
Finland 188,037 0.58
EUR 44,047 YIT 188,037 0.58
Greece 227,630 0.71
EUR 26,000 OPAP 227,630 0.71
Hungary 1,869,072 5.81
HUF 12,529 MOL Hungarian Oil & Gas 456,817 1.42
HUF 117,440 OTP Bank 1,412,255 4.39
Lithuania 531,773 1.65
EUR 202,195 Apranga 531,773 1.65
Poland 15,601,657 48.52
PLN 10,880 AmRest 252,945 0.79
PLN 96,318 Asseco Poland 1,145,347 3.56
PLN 30,542 Bank Pekao 1,266,277 3.94
PLN 19,825 Budimex 653,246 2.03
PLN 153,632 Cyfrowy Polsat 838,201 2.61
PLN 28,006 ING Bank Slaski 910,761 2.83
PLN 827 LPP 1,391,476 4.33
PLN 60,464 PGE 266,370 0.83
PLN 108,256 Polski Koncern Naftowy Orlen 1,232,272 3.83
PLN 1,068,859 Polskie Gornictwo Naftowe i Gazownictwo
1,107,878 3.44
PLN 154,375 Powszechna Kasa Oszczednosci Bank Polski
1,284,035 3.99
PLN 16,837 Powszechny Zaklad Ubezpieczen 1,904,011 5.92
PLN 100,656 Stomil Sanok 1,175,737 3.66
PLN 577,552 Synthos 551,605 1.72
PLN 163,831 Tauron Polska Energia 192,682 0.60
PLN 380,259 TVN 1,428,814 4.44
Number of shares or Principal Amount
Transferable Securities and Money Market Instruments Admitted to an Official Exchange Listing
Market Value
EUR
% Net Assets
Romania 3,118,437 9.70
RON 3,393,820 Banca Transilvania 1,442,710 4.49
RON 3,741,998 Fondul Proprietatea 747,372 2.32
RON 10,185,803 OMV Petrom 928,355 2.89
Slovenia 1,560,230 4.85
EUR 23,234 Krka dd Novo mesto 1,387,070 4.31
EUR 1,200 Telekom Slovenije 173,160 0.54
Turkey 3,277,279 10.19
TRY 276,677 Enka Insaat ve Sanayi 515,934 1.60
TRY 38,017 Koza Altin Isletmeleri 209,989 0.65
TRY 106,900 TAV Havalimanlari Holding 722,733 2.25
TRY 77,244 Tofas Turk Otomobil Fabrikasi 434,853 1.35
TRY 256,900 Turk Telekomunikasyon 659,779 2.05
TRY 19,000 Turk Traktor ve Ziraat Makineleri 516,678 1.61
TRY 31,404 Yazicilar Holding 'B' 217,313 0.68
Total Transferable Securities andMoney Market Instruments Admittedto an Official Exchange Listing
30,445,814 94.68
Total Investments 30,445,814 94.68
Other Net Assets 1,712,376 5.32
Net Asset Value 32,158,190 100.00
Geographic Breakdown (as a percentage of Net Assets) % Net Assets
Bulgaria 0.94
Cyprus 1.24
Czech Republic 7.93
Estonia 2.56
Finland 0.58
Greece 0.71
Hungary 5.81
Lithuania 1.65
Poland 48.52
Romania 9.70
Slovenia 4.85
Turkey 10.19
Total 94.68
The accompanying notes form an integral part of these financial statements.

AVIVA INVESTORS – ANNUAL REPORT AND AUDITED FINANCIAL STATEMENTS avivainvestors.com 15
AVIVA INVESTORS – EMERGING MARKETS BOND FUNDPortfolio of Investments and Other Net Assets as at 31 December 2014
Number of shares or Principal Amount
Transferable Securities and Money Market Instruments Admitted to an Official Exchange Listing
Market Value
USD
% Net Assets
Azerbaijan 4,953,025 0.37
USD 5,000,000 Republic of Azerbaijan RegS 4.75% 18/03/2024
4,953,025 0.37
Bahrain 16,035,089 1.19
USD 16,700,000 Bahrain Government International RegS 6% 19/09/2044
16,035,089 1.19
Brazil 62,630,792 4.64
EUR 6,345,000 Brazilian Government 2.875% 01/04/2021
7,486,387 0.55
USD 12,513,000 Brazilian Government 4.25% 07/01/2025
12,606,847 0.93
USD 12,600,000 Brazilian Government 4.875% 22/01/2021
13,450,500 1.00
USD 19,300,000 Brazilian Government 5% 27/01/2045
18,986,858 1.41
USD 8,000,000 Brazilian Government 7.125% 20/01/2037
10,100,200 0.75
British Virgin Islands 20,472,200 1.52
USD 20,000,000 Sinopec Group Overseas Development 2012 RegS 3.9% 17/05/2022
20,472,200 1.52
Cayman Islands 20,244,500 1.50
USD 20,000,000 ADCB Finance Cayman GMTN 3% 04/03/2019
20,244,500 1.50
Chile 23,466,952 1.74
USD 6,247,000 Chile Government 3.125% 27/03/2025
6,231,382 0.46
USD 10,000,000 Chile Government 3.625% 30/10/2042
9,086,250 0.67
USD 8,000,000 Empresa Nacional del Petroleo RegS 4.75% 06/12/2021
8,149,320 0.61
Colombia 28,368,217 2.10
USD 11,000,000 Colombia Government 4% 26/02/2024
11,272,800 0.83
USD 15,123,000 Colombia Government 5.625% 26/02/2044
17,095,417 1.27
Croatia 26,380,630 1.95
EUR 5,500,000 Croatia Government 3.875% 30/05/2022
6,841,623 0.51
USD 9,120,000 Croatia Government RegS 6.75% 05/11/2019
10,032,000 0.74
USD 9,120,000 Hrvatska Elektroprivreda RegS 6% 09/11/2017
9,507,007 0.70
Dominican Republic 17,105,746 1.27
USD 8,000,000 Dominican Republic RegS 5.875% 18/04/2024
8,207,920 0.61
USD 8,050,000 Dominican Republic RegS 7.5% 06/05/2021
8,897,826 0.66
Number of shares or Principal Amount
Transferable Securities and Money Market Instruments Admitted to an Official Exchange Listing
Market Value
USD
% Net Assets
El Salvador 4,694,082 0.35
USD 2,000,000 El Salvador Government RegS 5.875% 30/01/2025
1,972,310 0.15
USD 1,500,000 El Salvador Government RegS 7.375% 01/12/2019
1,648,912 0.12
USD 1,000,000 El Salvador Government RegS 7.65% 15/06/2035
1,072,860 0.08
Hungary 50,073,158 3.71
USD 11,182,000 Hungary Government 4% 25/03/2019
11,520,144 0.86
USD 18,316,000 Hungary Government 5.375% 25/03/2024
19,889,253 1.47
USD 13,344,000 Hungary Government 5.75% 22/11/2023
14,845,200 1.10
USD 3,383,000 Hungary Government 6.25% 29/01/2020
3,818,561 0.28
Indonesia 120,777,682 8.94
EUR 5,315,000 Indonesia Government RegS 2.875% 08/07/2021
6,564,520 0.49
USD 24,400,000 Indonesia Government RegS 3.375% 15/04/2023
23,238,072 1.72
USD 8,500,000 Indonesia Government RegS 3.75% 25/04/2022
8,413,385 0.62
USD 18,313,000 Indonesia Government RegS 4.875% 05/05/2021
19,476,425 1.44
USD 5,240,000 Indonesia Government RegS 5.25% 17/01/2042
5,315,325 0.39
USD 15,000,000 Indonesia Government RegS 5.875% 13/03/2020
16,662,525 1.23
USD 6,210,000 Indonesia Government RegS 6.625% 17/02/2037
7,293,024 0.54
USD 3,150,000 Indonesia Government RegS 7.75% 17/01/2038
4,150,314 0.31
USD 6,900,000 Pertamina Persero RegS 6% 03/05/2042
6,795,361 0.50
USD 12,876,000 Pertamina Persero RegS 6.45% 30/05/2044
13,463,661 1.00
USD 3,550,000 Pertamina Persero RegS 6.5% 27/05/2041
3,705,667 0.28
USD 5,500,000 Perusahaan Penerbit RegS 4% 21/11/2018
5,699,403 0.42
Ivory Coast 9,624,684 0.71
USD 4,004,000 Ivory Coast Government RegS 5.375% 23/07/2024
3,848,004 0.28
USD 6,000,000 Ivory Coast Government RegS step coupon 31/12/2032
5,776,680 0.43
Jordania 2,521,850 0.19
USD 2,500,000 Jordan Government RegS 3.875% 12/11/2015
2,521,850 0.19
The accompanying notes form an integral part of these financial statements.

AVIVA INVESTORS – ANNUAL REPORT AND AUDITED FINANCIAL STATEMENTS avivainvestors.com 16
AVIVA INVESTORS – EMERGING MARKETS BOND FUND (CONTINUED)Portfolio of Investments and Other Net Assets as at 31 December 2014
Number of shares or Principal Amount
Transferable Securities and Money Market Instruments Admitted to an Official Exchange Listing
Market Value
USD
% Net Assets
Kazakhstan 39,252,323 2.91
USD 9,790,000 KazMunayGas National RegS 5.75% 30/04/2043
8,253,215 0.61
USD 3,000,000 KazMunayGas National RegS 6.375% 09/04/2021
3,043,680 0.23
USD 7,000,000 KazMunayGas National RegS 7% 05/05/2020
7,304,850 0.54
USD 18,800,000 KazMunayGas National RegS 9.125% 02/07/2018
20,650,578 1.53
Kenya 63,635 0.00
USD 60,000 Kenya Government RegS 6.875% 24/06/2024
63,635 0.00
Lebanon 34,981,825 2.59
USD 2,500,000 Lebanon Government EMTN 5.15% 12/11/2018
2,502,938 0.19
USD 3,350,000 Lebanon Government EMTN 6.1% 04/10/2022
3,419,680 0.25
USD 10,830,000 Lebanon Government GMTN 5% 12/10/2017
10,967,920 0.81
USD 4,200,000 Lebanon Government GMTN 6.375% 09/03/2020
4,390,827 0.33
USD 7,500,000 Lebanon Government GMTN 6.6% 27/11/2026
7,687,725 0.57
USD 5,275,000 Lebanon Government RegS 8.25% 12/04/2021
6,012,735 0.44
Lithuania 23,428,208 1.73
USD 8,000,000 Lithuania Government RegS 6.125% 09/03/2021
9,331,600 0.69
USD 3,667,000 Lithuania Government RegS 6.625% 01/02/2022
4,437,088 0.33
USD 8,000,000 Lithuania Government RegS 7.375% 11/02/2020
9,659,520 0.71
Mexico 136,773,771 10.12
USD 12,597,000 Mexico Government 3.6% 30/01/2025
12,603,928 0.93
USD 10,000,000 Mexico Government 3.625% 15/03/2022
10,219,000 0.76
USD 10,060,000 Mexico Government 4% 02/10/2023 10,535,335 0.78
USD 39,308,000 Mexico Government 4.75% 08/03/2044
41,037,552 3.04
USD 12,963,000 Mexico Government 5.55% 21/01/2045
15,070,330 1.11
USD 12,092,000 Mexico Government 6.05% 11/01/2040
14,839,907 1.10
USD 19,000,000 Petroleos Mexicanos 3.5% 30/01/2023
18,127,520 1.34
EUR 10,812,000 United Mexican States EMTN 3.625% 09/04/2029
14,340,199 1.06
Morocco 7,023,353 0.52
EUR 5,655,000 Morocco Government 3.5% 19/06/2024
7,023,353 0.52
Number of shares or Principal Amount
Transferable Securities and Money Market Instruments Admitted to an Official Exchange Listing
Market Value
USD
% Net Assets
Panama 28,848,354 2.14
USD 1,791,000 Panama Government 4.3% 29/04/2053
1,678,266 0.12
USD 12,533,000 Panama Government 5.2% 30/01/2020
13,880,298 1.03
USD 7,844,000 Panama Government 6.7% 26/01/2036
10,058,165 0.75
USD 2,510,000 Panama Government 7.125% 29/01/2026
3,231,625 0.24
Peru 11,800,250 0.87
USD 10,000,000 Peruvian Government 5.625% 18/11/2050
11,800,250 0.87
Philippines 58,420,931 4.32
USD 6,060,000 Philippine Government 10.625% 16/03/2025
9,772,568 0.72
USD 22,000,000 Philippine Government International Bond 5.5% 30/03/2026
26,200,240 1.94
USD 3,000,000 Power Sector Assets & Liabilities Management RegS 6.875% 02/11/2016
3,284,385 0.24
USD 14,650,000 Power Sector Assets & Liabilities Management RegS 7.39% 02/12/2024
19,163,738 1.42
Poland 46,998,125 3.48
USD 12,750,000 Poland Government 3% 17/03/2023 12,723,225 0.94
USD 21,600,000 Poland Government 4% 22/01/2024 23,031,000 1.71
USD 10,000,000 Poland Government 5% 23/03/2022 11,243,900 0.83
Romania 43,646,911 3.23
EUR 19,000,000 Romanian Government EMTN 3.625% 24/04/2024
25,242,235 1.87
USD 16,846,000 Romanian Government RegS 4.875% 22/01/2024
18,404,676 1.36
Russia 108,990,078 8.07
USD 5,975,000 Russian Foreign RegS 12.75% 24/06/2028
8,648,962 0.64
USD 16,200,000 Russian Foreign RegS 4.5% 04/04/2022
14,320,719 1.06
USD 82,304,356 Russian Foreign RegS step coupon 31/03/2030
86,020,397 6.37
Senegal 1,993,860 0.15
USD 1,800,000 Senegal Government RegS 8.75% 13/05/2021
1,993,860 0.15
Serbia 26,617,605 1.97
USD 25,444,000 Republic of Serbia RegS 5.875% 03/12/2018
26,617,605 1.97
South Africa 16,181,037 1.20
USD 11,000,000 South Africa Government 4.665% 17/01/2024
11,425,700 0.85
ZAR 45,000,000 Transnet EMTN 13.5% 18/04/2028 4,755,337 0.35

AVIVA INVESTORS – ANNUAL REPORT AND AUDITED FINANCIAL STATEMENTS avivainvestors.com 17
AVIVA INVESTORS – EMERGING MARKETS BOND FUND (CONTINUED)Portfolio of Investments and Other Net Assets as at 31 December 2014
Number of shares or Principal Amount
Transferable Securities and Money Market Instruments Admitted to an Official Exchange Listing
Market Value
USD
% Net Assets
Sri Lanka 22,889,953 1.69
USD 4,100,000 Bank of Ceylon RegS 6.875% 03/05/2017
4,286,140 0.32
USD 17,837,000 Sri Lanka Government RegS 6% 14/01/2019
18,603,813 1.37
Supranational 3,108,750 0.23
USD 3,000,000 African Export-Import Bank EMTN 5.75% 27/07/2016
3,108,750 0.23
Turkey 95,057,577 7.04
USD 16,000,000 Turkey Government 3.25% 23/03/2023
15,170,800 1.12
EUR 7,500,000 Turkey Government 4.125% 11/04/2023
9,868,445 0.73
USD 6,200,000 Turkey Government 6.25% 26/09/2022
7,094,660 0.53
USD 14,000,000 Turkey Government 6.625% 17/02/2045
17,305,260 1.28
USD 5,000,000 Turkey Government 7% 11/03/2019 5,721,750 0.42
USD 9,850,000 Turkey Government 7.375% 05/02/2025
12,311,269 0.91
USD 14,500,000 Turkey Government 7.5% 07/11/2019
17,075,925 1.27
USD 10,200,000 Turkiye Halk Bankasi RegS 4.875% 19/07/2017
10,509,468 0.78
Ukraine 18,932,350 1.39
USD 14,200,000 Ukraine Government RegS 6.25% 17/06/2016
9,297,450 0.69
USD 7,500,000 Ukraine Government RegS 6.875% 23/09/2015
5,259,900 0.38
USD 7,000,000 Ukraine Government RegS 9.25% 24/07/2017
4,375,000 0.32
Venezuela 56,801,039 4.20
USD 8,357,600 Petroleos de Venezuela RegS 5.5% 12/04/2037
2,981,281 0.22
USD 24,814,200 Petroleos de Venezuela RegS 8.5% 02/11/2017
14,235,038 1.05
USD 9,409,600 Petroleos de Venezuela RegS 9.75% 17/05/2035
4,237,096 0.31
USD 15,500,000 Venezuela Government 9.25% 15/09/2027
7,517,500 0.56
USD 5,354,200 Venezuela Government RegS 11.75% 21/10/2026
2,636,944 0.19
USD 7,953,500 Venezuela Government RegS 12.75% 23/08/2022
4,155,704 0.31
USD 7,500,000 Venezuela Government RegS 7% 31/03/2038
3,099,375 0.23
USD 19,733,100 Venezuela Government RegS 7.75% 13/10/2019
8,238,569 0.61
Number of shares or Principal Amount
Transferable Securities and Money Market Instruments Admitted to an Official Exchange Listing
Market Value
USD
% Net Assets
USD 21,328,200 Venezuela Government RegS 9% 07/05/2023
9,699,532 0.72
Zambia 4,399,940 0.32
USD 4,000,000 Zambia Government International RegS 8.5% 14/04/2024
4,399,940 0.32
Total Transferable Securities andMoney Market Instruments Admittedto an Official Exchange Listing
1,193,558,482 88.35
Number of shares or Principal Amount
Transferable Securities and Money Market Instruments dealt on another Regulated Market
Market Value
USD
% Net Assets
Canada 3,737,817 0.28
USD 4,292,000 Pacific Rubiales Energy RegS 7.25% 12/12/2021
3,737,817 0.28
Cayman Islands 9,887,114 0.73
USD 11,648,000 Odebrecht Finance RegS 7.125% 26/06/2042
9,887,114 0.73
Chile 2,419,332 0.18
USD 2,386,000 Banco del Estado de Chile RegS 3.875% 08/02/2022
2,419,332 0.18
Mexico 79,688,359 5.90
USD 21,150,000 Petroleos Mexicanos 4.875% 24/01/2022
22,131,149 1.64
USD 14,830,000 Petroleos Mexicanos 5.5% 21/01/2021
16,101,969 1.19
USD 8,500,000 Petroleos Mexicanos 5.5% 27/06/2044
8,680,838 0.64
USD 12,502,000 Petroleos Mexicanos 6.375% 23/01/2045
14,217,649 1.05
USD 16,150,000 Petroleos Mexicanos 6.5% 02/06/2041
18,556,754 1.38
Netherlands 9,594,940 0.71
USD 9,620,000 Republic of Angola Via Northern Lights III RegS 7% 16/08/2019
9,594,940 0.71
Venezuela 18,264,379 1.35
USD 27,066,564 Petroleos de Venezuela RegS 6% 15/11/2026
10,144,548 0.75
USD 18,345,133 Petroleos de Venezuela RegS 9% 17/11/2021
8,119,831 0.60
Total Transferable Securities and Money Market Instruments dealt on another Regulated Market
123,591,941 9.15
Total Investments 1,317,150,423 97.50
Other Net Assets 33,807,141 2.50
Net Asset Value 1,350,957,564 100.00

AVIVA INVESTORS – ANNUAL REPORT AND AUDITED FINANCIAL STATEMENTS avivainvestors.com 18
AVIVA INVESTORS – EMERGING MARKETS BOND FUND (CONTINUED)Portfolio of Investments and Other Net Assets as at 31 December 2014
Geographic Breakdown (as a percentage of Net Assets) % Net Assets
Azerbaijan 0.37
Bahrain 1.19
Brazil 4.64
British Virgin Islands 1.52
Canada 0.28
Cayman Islands 2.23
Chile 1.92
Colombia 2.10
Croatia 1.95
Dominican Republic 1.27
El Salvador 0.35
Hungary 3.71
Indonesia 8.94
Ivory Coast 0.71
Jordania 0.19
Kazakhstan 2.91
Kenya 0.00
Lebanon 2.59
Lithuania 1.73
Mexico 16.02
Morocco 0.52
Netherlands 0.71
Panama 2.14
Peru 0.87
Philippines 4.32
Poland 3.48
Romania 3.23
Russia 8.07
Senegal 0.15
Serbia 1.97
South Africa 1.20
Sri Lanka 1.69
Supranational 0.23
Turkey 7.04
Ukraine 1.39
Venezuela 5.55
Zambia 0.32
Total 97.50
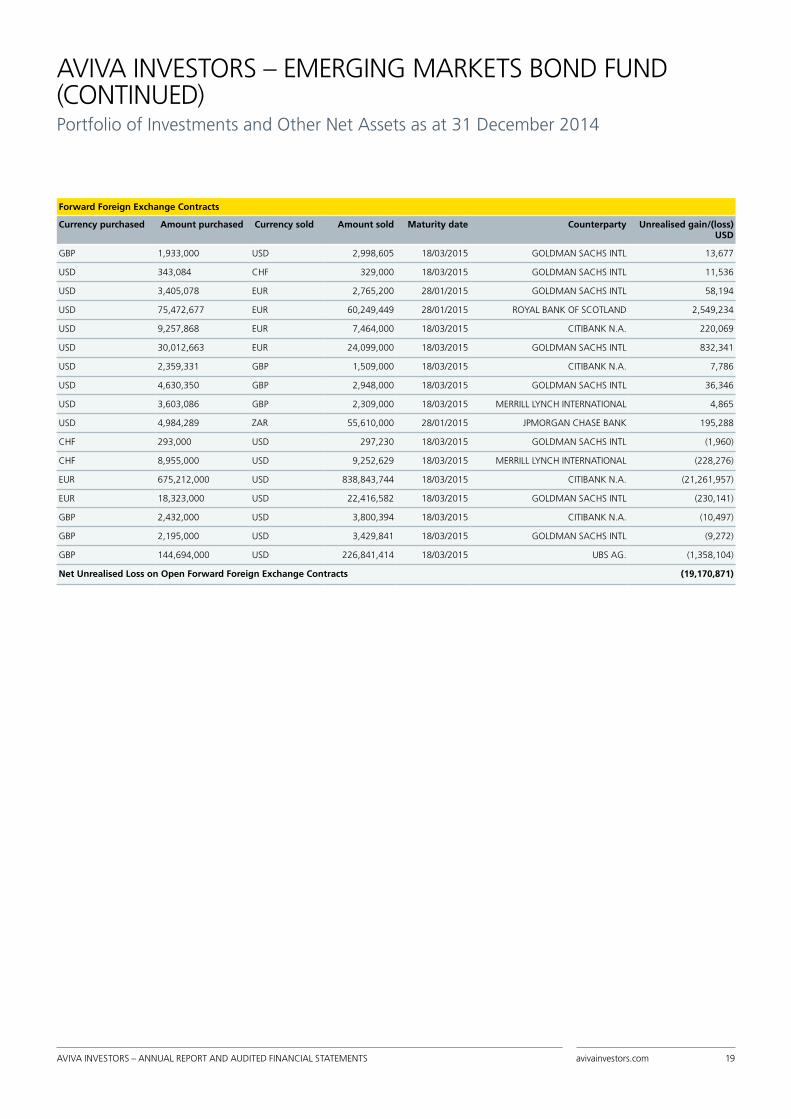
AVIVA INVESTORS – ANNUAL REPORT AND AUDITED FINANCIAL STATEMENTS avivainvestors.com 19
AVIVA INVESTORS – EMERGING MARKETS BOND FUND (CONTINUED)Portfolio of Investments and Other Net Assets as at 31 December 2014
Forward Foreign Exchange Contracts
Currency purchased Amount purchased Currency sold Amount sold Maturity date Counterparty Unrealised gain/(loss) USD
GBP 1,933,000 USD 2,998,605 18/03/2015 GOLDMAN SACHS INTL 13,677
USD 343,084 CHF 329,000 18/03/2015 GOLDMAN SACHS INTL 11,536
USD 3,405,078 EUR 2,765,200 28/01/2015 GOLDMAN SACHS INTL 58,194
USD 75,472,677 EUR 60,249,449 28/01/2015 ROYAL BANK OF SCOTLAND 2,549,234
USD 9,257,868 EUR 7,464,000 18/03/2015 CITIBANK N.A. 220,069
USD 30,012,663 EUR 24,099,000 18/03/2015 GOLDMAN SACHS INTL 832,341
USD 2,359,331 GBP 1,509,000 18/03/2015 CITIBANK N.A. 7,786
USD 4,630,350 GBP 2,948,000 18/03/2015 GOLDMAN SACHS INTL 36,346
USD 3,603,086 GBP 2,309,000 18/03/2015 MERRILL LYNCH INTERNATIONAL 4,865
USD 4,984,289 ZAR 55,610,000 28/01/2015 JPMORGAN CHASE BANK 195,288
CHF 293,000 USD 297,230 18/03/2015 GOLDMAN SACHS INTL (1,960)
CHF 8,955,000 USD 9,252,629 18/03/2015 MERRILL LYNCH INTERNATIONAL (228,276)
EUR 675,212,000 USD 838,843,744 18/03/2015 CITIBANK N.A. (21,261,957)
EUR 18,323,000 USD 22,416,582 18/03/2015 GOLDMAN SACHS INTL (230,141)
GBP 2,432,000 USD 3,800,394 18/03/2015 CITIBANK N.A. (10,497)
GBP 2,195,000 USD 3,429,841 18/03/2015 GOLDMAN SACHS INTL (9,272)
GBP 144,694,000 USD 226,841,414 18/03/2015 UBS AG. (1,358,104)
Net Unrealised Loss on Open Forward Foreign Exchange Contracts (19,170,871)

AVIVA INVESTORS – ANNUAL REPORT AND AUDITED FINANCIAL STATEMENTS avivainvestors.com 20
AVIVA INVESTORS – EMERGING MARKETS CORPORATE BOND FUNDPortfolio of Investments and Other Net Assets as at 31 December 2014
Number of shares or Principal Amount
Transferable Securities and Money Market Instruments Admitted to an Official Exchange Listing
Market Value
USD
% Net Assets
Brazil 3,728,064 1.93
USD 1,711,000 Samarco Mineracao RegS 5.75% 24/10/2023
1,647,274 0.85
USD 2,000,000 Votorantim Cimentos RegS 7.25% 05/04/2041
2,080,790 1.08
British Virgin Islands 3,654,100 1.89
USD 2,000,000 PCCW-HKT Capital No 5 RegS 3.75% 08/03/2023
1,972,510 1.02
USD 1,500,000 Wanda Properties International 7.25% 29/01/2024
1,681,590 0.87
Cayman Islands 30,249,969 15.68
USD 2,000,000 ADCB Finance Cayman GMTN 3% 04/03/2019
2,024,450 1.05
USD 2,500,000 AKCB Finance EMTN 3.25% 22/10/2018
2,537,400 1.32
USD 1,500,000 China Overseas Finance Cayman II 5.5% 10/11/2020
1,624,695 0.84
USD 1,250,000 Country Garden 10.5% 11/08/2015 1,297,631 0.67
USD 2,000,000 DP World Sukuk RegS 6.25% 02/07/2017
2,177,980 1.13
USD 3,300,000 Hutchison Whampoa International 10 RegS variable perpetual
3,391,063 1.76
USD 2,000,000 Metropolitan Light International EMTN 5.25% 17/01/2018
2,027,080 1.05
USD 1,400,000 MIE RegS 7.5% 25/04/2019 1,086,841 0.56
USD 4,500,000 QNB Finance 2.875% 29/04/2020 4,469,557 2.32
USD 2,500,000 RAKFUNDING Cayman EMTN 3.25% 24/06/2019
2,532,912 1.31
USD 1,795,000 Saudi Electricity Global Sukuk RegS 3 5.5% 08/04/2044
1,938,600 1.00
USD 1,000,000 Shimao Property 6.625% 14/01/2020
983,895 0.51
USD 1,000,000 Sun Hung Kai Properties Capital Market EMTN 3.625% 16/01/2023
1,003,745 0.52
USD 1,000,000 Sunac China RegS 12.5% 16/10/2017
1,089,990 0.57
USD 2,000,000 Tingyi Cayman Islands RegS 3.875% 20/06/2017
2,064,130 1.07
Chile 5,980,995 3.10
USD 3,000,000 Corpbanca RegS 3.875% 22/09/2019
3,016,530 1.56
USD 3,000,000 Empresa Electrica Angamos RegS 4.875% 25/05/2029
2,964,465 1.54
Colombia 5,315,272 2.76
USD 1,000,000 Banco de Bogota RegS 5% 15/01/2017
1,043,620 0.54
USD 2,200,000 Bancolombia 5.95% 03/06/2021 2,358,532 1.23
USD 2,000,000 Oleoducto Central RegS 4% 07/05/2021
1,913,120 0.99
Number of shares or Principal Amount
Transferable Securities and Money Market Instruments Admitted to an Official Exchange Listing
Market Value
USD
% Net Assets
Croatia 1,303,044 0.68
USD 1,250,000 Hrvatska Elektroprivreda RegS 6% 09/11/2017
1,303,044 0.68
Hong Kong 3,530,519 1.83
USD 2,300,000 Bank of East Asia EMTN variable 04/05/2022
2,461,609 1.28
USD 1,000,000 Swire Properties MTN Financing EMTN 4.375% 18/06/2022
1,068,910 0.55
India 3,407,359 1.77
USD 1,250,000 ICICI Bank RegS variable 30/04/2022 1,294,469 0.67
USD 2,000,000 ICICI Bank/Dubai RegS 4.7% 21/02/2018
2,112,890 1.10
Israel 3,655,335 1.90
USD 1,500,000 Delek & Avner Tamar Bond 144A 5.412% 30/12/2025
1,502,865 0.78
USD 2,000,000 Israel Electric RegS 6.7% 10/02/2017 2,152,470 1.12
Kazakhstan 1,933,246 1.00
USD 1,760,000 KazMunayGas National RegS 9.125% 02/07/2018
1,933,246 1.00
Luxembourg 2,069,230 1.07
USD 2,000,000 Altice Financing 144A 7.875% 15/12/2019
2,069,230 1.07
Malaysia 6,732,767 3.49
USD 1,500,000 Cagamas Global EMTN 2.745% 10/12/2019
1,492,167 0.77
USD 3,000,000 Malayan Banking EMTN variable 20/09/2022
3,020,820 1.57
USD 2,000,000 Petronas Capital RegS 5.25% 12/08/2019
2,219,780 1.15
Mexico 12,488,249 6.47
USD 4,000,000 BBVA Bancomer/Texas RegS 6.75% 30/09/2022
4,421,800 2.29
USD 2,500,000 Cemex RegS 7.25% 15/01/2021 2,628,487 1.36
USD 1,250,000 Grupo Televisa 6% 15/05/2018 1,393,262 0.72
USD 4,000,000 Tenedora Nemak RegS 5.5% 28/02/2023
4,044,700 2.10
Morocco 3,156,735 1.64
USD 3,000,000 OCP RegS 5.625% 25/04/2024 3,156,735 1.64
Netherlands 4,964,508 2.57
USD 1,500,000 Bharti Airtel International Netherlands RegS 5.35% 20/05/2024
1,630,208 0.84
USD 1,000,000 Indo Energy Finance RegS 7% 07/05/2018
785,440 0.41
USD 500,000 Indosat Palapa RegS 7.375% 29/07/2020
529,470 0.27
USD 2,000,000 SABIC Capital II RegS 2.625% 03/10/2018
2,019,390 1.05
The accompanying notes form an integral part of these financial statements.

AVIVA INVESTORS – ANNUAL REPORT AND AUDITED FINANCIAL STATEMENTS avivainvestors.com 21
Number of shares or Principal Amount
Transferable Securities and Money Market Instruments Admitted to an Official Exchange Listing
Market Value
USD
% Net Assets
Oman 3,027,720 1.57
USD 3,000,000 National Bank Of Oman EMTN 3.125% 07/10/2019
3,027,720 1.57
Panama 2,016,030 1.04
USD 2,000,000 Global Bank RegS 5.125% 30/10/2019
2,016,030 1.04
Peru 7,225,168 3.75
USD 2,500,000 Banco Internacional del Peru RegS variable 19/03/2029
2,666,750 1.38
USD 1,500,000 BBVA Banco Continental RegS variable 22/09/2029
1,523,558 0.79
USD 3,000,000 Union Andina de Cementos RegS 5.875% 30/10/2021
3,034,860 1.58
Philippines 1,385,798 0.72
USD 1,500,000 San Miguel EMTN 4.875% 26/04/2023
1,385,798 0.72
Singapore 5,617,133 2.91
USD 2,000,000 CMT EMTN 3.731% 21/03/2018 2,091,650 1.08
USD 2,500,000 Oversea-Chinese Banking RegS variable 11/03/2023
2,527,725 1.31
USD 500,000 STATS ChipPAC RegS 5.375% 31/03/2016
503,375 0.26
USD 500,000 TBG Global RegS 4.625% 03/04/2018
494,383 0.26
Sri Lanka 782,674 0.41
USD 700,000 National Savings Bank RegS 8.875% 18/09/2018
782,674 0.41
Thailand 1,538,925 0.80
USD 1,500,000 PTT Global Chemical RegS 4.25% 19/09/2022
1,538,925 0.80
Turkey 11,796,726 6.12
USD 1,750,000 Akbank RegS 6.5% 09/03/2018 1,896,676 0.98
USD 2,000,000 Finansbank/Turkey RegS 6.25% 30/04/2019
2,073,070 1.08
USD 3,000,000 Turk Telekomunikasyon RegS 4.875% 19/06/2024
3,023,268 1.57
EUR 2,250,000 Turkiye Garanti Bankasi GMTN 3.375% 08/07/2019
2,743,032 1.42
USD 2,000,000 Turkiye Halk Bankasi RegS 4.875% 19/07/2017
2,060,680 1.07
United Arab Emirates 3,014,475 1.56
USD 3,000,000 Emirates EMTN 3.25% 19/11/2019 3,014,475 1.56
United Kingdom 978,075 0.51
USD 1,000,000 Vedanta Resources RegS 6% 31/01/2019
978,075 0.51
United States of America 5,108,605 2.65
USD 1,000,000 Cemex Finance RegS 9.375% 12/10/2022
1,125,695 0.58
USD 2,000,000 Reliance USA RegS 5.4% 14/02/2022
2,188,020 1.14
Number of shares or Principal Amount
Transferable Securities and Money Market Instruments Admitted to an Official Exchange Listing
Market Value
USD
% Net Assets
USD 2,000,000 Southern Copper 5.25% 08/11/2042
1,794,890 0.93
Venezuela 446,286 0.23
USD 1,251,100 Petroleos de Venezuela RegS 5.5% 12/04/2037
446,286 0.23
Total Transferable Securities andMoney Market Instruments Admittedto an Official Exchange Listing
135,107,007 70.05
Number of shares or Principal Amount
Transferable Securities andMoney Market Instruments dealton another Regulated Market
Market Value
USD
% Net Assets
Canada 4,572,120 2.37
USD 5,250,000 Pacific Rubiales Energy RegS 7.25% 12/12/2021
4,572,120 2.37
Cayman Islands 6,368,322 3.30
USD 2,000,000 Banco Continental via Continental Senior Trustees Cayman RegS 5.5% 18/11/2020
2,158,150 1.12
USD 4,960,000 Odebrecht Finance RegS 7.125% 26/06/2042
4,210,172 2.18
Chile 8,560,318 4.44
USD 3,000,000 Inversiones CMPC RegS 4.75% 15/09/2024
3,015,375 1.56
USD 2,000,000 Banco de Credito e Inversiones RegS 3% 13/09/2017
2,038,890 1.06
USD 1,487,000 Banco del Estado de Chile RegS 3.875% 08/02/2022
1,507,773 0.78
USD 2,000,000 Banco Santander Chile RegS 3.875% 20/09/2022
1,998,280 1.04
Mauritius 2,366,148 1.23
USD 2,400,000 MTN Mauritius Investments RegS 4.755% 11/11/2024
2,366,148 1.23
Mexico 8,442,932 4.38
USD 1,800,000 Alpek RegS 4.5% 20/11/2022 1,816,659 0.94
USD 4,000,000 Mexichem RegS 6.75% 19/09/2042 4,172,860 2.17
USD 2,500,000 Mexico Generadora de Energia RegS 5.5% 06/12/2032
2,453,413 1.27
Peru 7,721,281 4.00
USD 2,000,000 Banco de Credito del Peru/Panama RegS variable 24/04/2027
2,120,230 1.10
USD 2,000,000 Banco Internacional del Peru RegS 5.75% 07/10/2020
2,159,200 1.12
USD 3,585,000 Transportadora de Gas del Peru RegS 4.25% 30/04/2028
3,441,851 1.78
Qatar 3,223,964 1.67
USD 2,722,000 Ras Laffan Liquefied Natural Gas III RegS 6.75% 30/09/2019
3,223,964 1.67
Spain 1,106,075 0.57
USD 1,000,000 Cemex Ena Luxembourg RegS 9.875% 30/04/2019
1,106,075 0.57
AVIVA INVESTORS – EMERGING MARKETS CORPORATE BOND FUND (CONTINUED)Portfolio of Investments and Other Net Assets as at 31 December 2014

AVIVA INVESTORS – ANNUAL REPORT AND AUDITED FINANCIAL STATEMENTS avivainvestors.com 22
AVIVA INVESTORS – EMERGING MARKETS CORPORATE BOND FUND (CONTINUED)Portfolio of Investments and Other Net Assets as at 31 December 2014
Number of shares or Principal Amount
Transferable Securities andMoney Market Instruments dealton another Regulated Market
Market Value
USD
% Net Assets
Thailand 2,072,090 1.07
USD 2,000,000 Bangkok Bank/Hong Kong RegS 3.875% 27/09/2022
2,072,090 1.07
United Arab Emirates 3,102,000 1.61
USD 2,750,000 Dolphin Energy RegS 5.5% 15/12/2021
3,102,000 1.61
Venezuela 725,752 0.38
USD 1,936,371 Petroleos de Venezuela RegS 6% 15/11/2026
725,752 0.38
Number of shares or Principal Amount
Transferable Securities andMoney Market Instruments dealton another Regulated Market
Market Value
USD
% Net Assets
Total Transferable Securities andMoney Market Instruments dealton another Regulated Market
48,261,002 25.02
Total Investments 183,368,009 95.07
Other Net Assets 9,503,766 4.93
Net Asset Value 192,871,775 100.00
Geographic Breakdown (as a percentage of Net Assets) % Net Assets
Brazil 1.93
British Virgin Islands 1.89
Canada 2.37
Cayman Islands 18.98
Chile 7.54
Colombia 2.76
Croatia 0.68
Hong Kong 1.83
India 1.77
Israel 1.90
Kazakhstan 1.00
Luxembourg 1.07
Malaysia 3.49
Mauritius 1.23
Mexico 10.85
Morocco 1.64
Netherlands 2.57
Oman 1.57
Panama 1.04
Peru 7.75
Philippines 0.72
Qatar 1.67
Singapore 2.91
Spain 0.57
Sri Lanka 0.41
Thailand 1.87
Turkey 6.12
United Arab Emirates 3.17
United Kingdom 0.51
United States of America 2.65
Venezuela 0.61
Total 95.07

AVIVA INVESTORS – ANNUAL REPORT AND AUDITED FINANCIAL STATEMENTS avivainvestors.com 23
Forward Foreign Exchange Contracts
Currency purchased Amount purchased Currency sold Amount sold Maturity date Counterparty Unrealised gain/(loss) USD
USD 2,455,233 EUR 1,960,000 28/01/2015 ROYAL BANK OF SCOTLAND 82,929
USD 1,036,921 EUR 836,000 18/03/2015 CITIBANK N.A. 24,649
USD 1,588,458 EUR 1,269,000 18/03/2015 GOLDMAN SACHS INTL 51,887
USD 998,799 EUR 801,000 18/03/2015 UBS AG. 28,907
EUR 160,247,000 USD 199,117,634 18/03/2015 CITIBANK N.A. (5,082,237)
EUR 1,198,000 USD 1,470,253 18/03/2015 GOLDMAN SACHS INTL (19,652)
Net Unrealised Loss on Open Forward Foreign Exchange Contracts (4,913,517)
AVIVA INVESTORS – EMERGING MARKETS CORPORATE BOND FUND (CONTINUED)Portfolio of Investments and Other Net Assets as at 31 December 2014

AVIVA INVESTORS – ANNUAL REPORT AND AUDITED FINANCIAL STATEMENTS avivainvestors.com 24
AVIVA INVESTORS – EMERGING MARKETS EQUITY INCOME FUNDPortfolio of Investments and Other Net Assets as at 31 December 2014
Number of shares or Principal Amount
Transferable Securities and Money Market Instruments Admitted to an Official Exchange Listing
Market Value
USD
% Net Assets
Bermuda 5,113,777 0.94
HKD 801,468 First Pacific /Hong Kong 793,732 0.15
HKD 301,000 VTech Holdings 4,320,045 0.79
Brazil 43,455,860 7.97
BRL 674,776 AES Tiete Preference 4,635,246 0.85
BRL 702,481 Banco do Brasil 6,293,576 1.15
BRL 1,139,459 CCR 6,603,478 1.21
BRL 406,892 Cielo 6,356,252 1.17
BRL 90 Embratel Participacoes - -
BRL 453,758 Ez Tec Empreendimentos e Participacoes
3,754,573 0.69
BRL 300,635 Grendene 1,742,828 0.32
BRL 90 Nova Embrapar Participacoes 3 -
BRL 479,429 Sul America 2,315,803 0.42
BRL 382,710 Transmissora Alianca de Energia Eletrica
2,712,458 0.50
BRL 264,656 Ultrapar Participacoes 5,122,968 0.94
USD 477,596 Vale ADR 3,918,675 0.72
Cayman Islands 9,817,360 1.80
HKD 2,971,011 Shenzhou International 9,817,360 1.80
Chile 2,014,732 0.37
CLP 17,357,185 Banco de Chile 2,014,732 0.37
China 50,085,818 9.18
HKD 32,555,985 Bank of China 'H' 18,303,912 3.36
HKD 13,273,553 China Petroleum & Chemical 'H' 10,706,342 1.96
HKD 3,166,092 Guangzhou R&F Properties 'H' 3,882,671 0.71
HKD 5,332,000 Huaneng Power International 'H' 7,219,482 1.32
HKD 9,279,843 Industrial & Commercial Bank of China 'H'
6,790,990 1.25
HKD 2,730,000 Zhejiang Expressway 'H' 3,182,421 0.58
Colombia 2,722,400 0.50
USD 160,377 Ecopetrol ADR 2,722,400 0.50
Czech Republic 4,545,286 0.83
CZK 21,984 Komercni Banka 4,545,286 0.83
Hong Kong 24,296,089 4.45
HKD 1,305,336 China Mobile 15,271,296 2.80
HKD 3,508,000 SJM 5,582,148 1.02
HKD 591,300 Television Broadcasts 3,442,645 0.63
Number of shares or Principal Amount
Transferable Securities and Money Market Instruments Admitted to an Official Exchange Listing
Market Value
USD
% Net Assets
India 48,398,391 8.87
USD 749,628 Citigroup Warrants - Cairn India 27/02/2015
2,838,173 0.52
USD 1,462,143 Citigroup Warrants - Coal India 27/02/2015
8,835,175 1.62
USD 277,926 Citigroup Warrants - Infosys 27/02/2015
8,681,964 1.59
USD 2,426,940 Citigroup Warrants - NTPC 27/02/2015
5,515,686 1.01
USD 240,572 Citigroup Warrants - Tata Motors 27/02/2015
1,888,418 0.35
INR 748,616 ITC 4,371,498 0.80
INR 1,027,440 Oil & Natural Gas 5,552,465 1.02
INR 1,364,864 Tata Motors 10,715,012 1.96
Indonesia 19,725,217 3.62
IDR 13,343,000 Astra International 7,985,869 1.46
IDR 1,262,000 Indo Tambangraya Megah 1,567,947 0.29
IDR 9,230,500 Perusahaan Gas Negara Persero 4,462,464 0.82
IDR 24,700,500 Telekomunikasi Indonesia Persero 5,708,937 1.05
Malaysia 17,262,933 3.16
MYR 1,423,000 Berjaya Sports Toto 1,434,599 0.26
MYR 1,617,748 Malayan Banking 4,240,429 0.78
MYR 9,122,638 Sunway 8,570,818 1.57
MYR 2,566,974 Sunway Warrants 17/08/2016 578,147 0.10
MYR 1,237,700 Telekom Malaysia 2,438,940 0.45
Mexico 17,529,844 3.21
MXN 889,438 Fomento Economico Mexicano 7,859,652 1.44
MXN 1,072,139 Grupo Financiero Santander Mexico 'B'
2,239,601 0.41
MXN 1,444,526 Grupo Mexico 'B' 4,164,598 0.76
MXN 1,513,358 Kimberly-Clark de Mexico 'A' 3,265,993 0.60
Philippines 11,914,347 2.19
PHP 6,352,900 Aboitiz Power 6,081,997 1.12
PHP 151,200 Globe Telecom 5,832,350 1.07
Poland 12,511,682 2.29
PLN 91,434 Powszechny Zaklad Ubezpieczen 12,511,682 2.29
Russia 10,057,308 1.84
USD 749,333 Gazprom ADR 3,482,712 0.64
USD 52,264 Lukoil ADR 2,072,268 0.38
USD 155,721 MMC Norilsk Nickel ADR 2,205,788 0.40
USD 311,818 Mobile Telesystems ADR 2,296,540 0.42
The accompanying notes form an integral part of these financial statements.

AVIVA INVESTORS – ANNUAL REPORT AND AUDITED FINANCIAL STATEMENTS avivainvestors.com 25
AVIVA INVESTORS – EMERGING MARKETS EQUITY INCOME FUND (CONTINUED)Portfolio of Investments and Other Net Assets as at 31 December 2014
Number of shares or Principal Amount
Transferable Securities and Money Market Instruments Admitted to an Official Exchange Listing
Market Value
USD
% Net Assets
Singapore 3,940,457 0.72
SGD 5,247,738 Religare Health Trust 3,940,457 0.72
South Africa 58,121,302 10.65
ZAR 346,034 Bidvest 9,089,683 1.67
ZAR 1,876,000 Life Healthcare 6,930,761 1.27
ZAR 1,646,479 MMI 4,276,754 0.78
ZAR 427,549 MTN 8,174,386 1.50
ZAR 271,627 Remgro 5,963,409 1.09
ZAR 120,406 Sasol 4,496,250 0.82
ZAR 2,752,024 Steinhoff International 14,118,433 2.59
ZAR 159,077 Tiger Brands 5,071,626 0.93
South Korea 58,975,262 10.81
KRW 77,783 Dongbu Insurance 3,895,696 0.71
KRW 37,904 Hyundai Motor 5,819,315 1.07
KRW 26,705 Hyundai Motor Preference 3,261,744 0.60
KRW 242,666 Industrial Bank of Korea 3,107,423 0.57
KRW 107,339 KT&G 7,426,767 1.36
KRW 12,863 POSCO 3,227,014 0.59
KRW 15,699 Samsung Electronics 18,946,207 3.47
KRW 38,868 SK Telecom 9,494,662 1.74
KRW 49,500 Woongjin Coway 3,796,434 0.70
Taiwan 67,582,301 12.40
TWD 1,274,973 Chicony Electronics 3,572,523 0.66
TWD 1,993,243 Farglory Land Development 2,382,595 0.44
TWD 1,890,849 Hon Hai Precision Industry 5,256,347 0.96
TWD 2,504,800 Huaku Development 4,513,903 0.83
TWD 1,713,531 Lite-On Technology 1,975,045 0.36
TWD 10,979,200 Mega Financial 8,485,759 1.56
TWD 4,558,000 Pou Chen 5,542,091 1.02
TWD 1,645,000 Taiwan Cement 2,256,526 0.41
TWD 6,212,681 Taiwan Semiconductor Manufacturing
27,670,238 5.07
TWD 4,023,925 WT Microelectronics 5,927,274 1.09
Thailand 26,322,020 4.83
THB 916,700 Advanced Info Service (Foreign) Registered
7,007,600 1.29
THB 1,981,700 Delta Electronics (Foreign) 4,238,971 0.78
THB 4,342,917 Kiatnakin Bank (Foreign) 5,197,640 0.95
THB 6,967,933 Krung Thai Bank (Foreign) 4,818,251 0.88
THB 45,356,800 Quality Houses (Foreign) 5,059,558 0.93
Number of shares or Principal Amount
Transferable Securities and Money Market Instruments Admitted to an Official Exchange Listing
Market Value
USD
% Net Assets
Turkey 17,912,154 3.28
TRY 2,786,400 Emlak Konut Gayrimenkul Yatirim Ortakligi AS
3,307,565 0.61
TRY 414,881 Ford Otomotiv Sanayi 5,794,403 1.06
TRY 479,314 TAV Havalimanlari Holding 3,921,241 0.72
TRY 148,575 Turk Traktor ve Ziraat Makineleri 4,888,945 0.89
United Kingdom 12,812,130 2.35
HKD 811,600 HSBC 7,736,775 1.42
USD 109,759 HSBC Bank 0% 23/02/2015 5,075,355 0.93
Total Transferable Securities andMoney Market Instruments Admittedto an Official Exchange Listing
525,116,670 96.26
Total Investments 525,116,670 96.26
Other Net Assets 20,380,357 3.74
Net Asset Value 545,497,027 100.00
Geographic Breakdown (as a percentage of Net Assets) % Net Assets
Bermuda 0.94
Brazil 7.97
Cayman Islands 1.80
Chile 0.37
China 9.18
Colombia 0.50
Czech Republic 0.83
Hong Kong 4.45
India 8.87
Indonesia 3.62
Malaysia 3.16
Mexico 3.21
Philippines 2.19
Poland 2.29
Russia 1.84
Singapore 0.72
South Africa 10.65
South Korea 10.81
Taiwan 12.40
Thailand 4.83
Turkey 3.28
United Kingdom 2.35
Total 96.26

AVIVA INVESTORS – ANNUAL REPORT AND AUDITED FINANCIAL STATEMENTS avivainvestors.com 26
AVIVA INVESTORS – EMERGING MARKETS EQUITY SMALL CAP FUNDPortfolio of Investments and Other Net Assets as at 31 December 2014
Number of shares or Principal Amount
Transferable Securities and Money Market Instruments Admitted to an Official Exchange Listing
Market Value
USD
% Net Assets
Austria 2,154,040 1.86
EUR 120,523 CAT Oil 2,154,040 1.86
Bermuda 4,022,739 3.47
HKD 893,000 Huabao International Holdings 730,500 0.63
HKD 229,400 VTech Holdings 3,292,239 2.84
Brazil 1,461,959 1.26
BRL 119,541 Cia Ferro Ligas da Bahia-Ferbasa Preference
389,446 0.34
BRL 417,126 Eternit 512,345 0.44
BRL 96,628 Grendene 560,168 0.48
Cayman Islands 5,583,958 4.82
HKD 3,176,000 Aupu Group Holding 581,293 0.50
HKD 2,985,000 Evergreen International 305,935 0.26
HKD 1,620,306 Haitian International 3,437,226 2.97
HKD 1,454,000 Tianneng Power International 387,872 0.34
USD 25,674 WuXi PharmaTech Cayman ADR 871,632 0.75
Chile 691,563 0.60
CLP 459,080 Administradora de Fondos de Pensiones Habitat
691,563 0.60
China 600,673 0.52
USD 201,100 Lao Feng Xiang 'B' 600,673 0.52
Cyprus 372,069 0.32
NOK 121,817 ProSafe 372,069 0.32
Czech Republic 635,744 0.55
CZK 1,347 Philip Morris 635,744 0.55
Hong Kong 739,416 0.64
HKD 559,000 Pacific Textiles 739,416 0.64
India 14,234,710 12.29
INR 1,050,228 Apollo Tyres 3,713,834 3.21
INR 125,570 CCL Products India 329,524 0.28
INR 552,612 Finolex Cables 2,288,628 1.98
INR 971,826 Hexaware Technologies 3,071,023 2.65
INR 210,076 Torrent Pharmaceuticals 3,780,356 3.26
INR 18,402 TTK Prestige 1,051,345 0.91
Indonesia 2,853,720 2.46
IDR 2,718,000 AKR Corporindo 900,487 0.78
IDR 15,961,500 Summarecon Agung 1,953,233 1.68
Malaysia 6,113,509 5.28
MYR 594,500 Carlsberg Brewery Malaysia 1,997,962 1.72
MYR 1,727,800 Hartalega 3,465,085 2.99
MYR 156,460 Hartalega Warrants 29/05/2015 122,608 0.11
MYR 1,252,300 Padini Holdings 527,854 0.46
Number of shares or Principal Amount
Transferable Securities and Money Market Instruments Admitted to an Official Exchange Listing
Market Value
USD
% Net Assets
Mexico 4,377,310 3.78
MXN 733,006 Genomma Lab Internacional 'B' 1,392,188 1.20
MXN 1,492,789 Qualitas Controladora Preference 2,985,122 2.58
Philippines 4,406,177 3.80
PHP 105,634,022 Filinvest Land 3,591,187 3.10
PHP 767,720 Rizal Commercial Banking 814,990 0.70
Poland 1,002,181 0.87
PLN 867,173 Synthos 1,002,181 0.87
Romania 944,091 0.82
RON 3,906,409 Fondul Proprietatea 944,091 0.82
Russia 579,273 0.50
USD 1,103,393 Aeroflot - Russian Airlines 579,273 0.50
Singapore 1,751,038 1.51
SGD 3,200,190 Eu Yan Sang International 1,751,038 1.51
South Africa 8,554,285 7.39
ZAR 1,197,102 Grindrod 2,314,268 2.00
ZAR 57,910 Hudaco Industries 483,078 0.42
ZAR 770,891 Life Healthcare 2,848,007 2.46
ZAR 985,438 Super Group/South Africa 2,908,932 2.51
South Korea 14,280,200 12.33
KRW 270,907 DGB Financial 2,774,542 2.40
KRW 56,585 DGB Financial Rights 13/01/2015 57,916 0.05
KRW 16,945 GS Home Shopping 3,408,875 2.94
KRW 126,870 IDIS 1,627,538 1.41
KRW 150,480 Intelligent Digital Integrated Securities
1,692,415 1.46
KRW 27,508 Nice Information & Telecommunication
613,713 0.53
KRW 63,776 Samjin Pharmaceutical 1,242,673 1.07
KRW 269,065 Sungwoo Hitech 2,862,528 2.47
Sri Lanka 5,654,549 4.88
LKR 1,283,083 John Keells 2,437,075 2.10
LKR 57,699 John Keells Warrants 12/11/2015 30,301 0.03
LKR 57,699 John Keells Warrants 11/11/2016 31,774 0.03
LKR 1,664,275 National Development Bank 3,155,399 2.72
Taiwan 15,130,512 13.07
TWD 1,867,400 Asia Polymer 1,424,617 1.23
TWD 186,000 Macauto Industrial 665,567 0.58
TWD 1,278,000 Powertech Technology 2,190,991 1.89
TWD 255,460 Sinmag Equipment 1,547,414 1.34
TWD 2,082,308 Taiwan Surface Mounting Technology
2,757,141 2.38
TWD 553,435 Test Research 891,432 0.77
The accompanying notes form an integral part of these financial statements.

AVIVA INVESTORS – ANNUAL REPORT AND AUDITED FINANCIAL STATEMENTS avivainvestors.com 27
AVIVA INVESTORS – EMERGING MARKETS EQUITY SMALL CAP FUND (CONTINUED)Portfolio of Investments and Other Net Assets as at 31 December 2014
Number of shares or Principal Amount
Transferable Securities and Money Market Instruments Admitted to an Official Exchange Listing
Market Value
USD
% Net Assets
TWD 2,064,571 WT Microelectronics 3,038,238 2.62
TWD 1,352,676 Youngtek Electronics 2,615,112 2.26
Thailand 8,880,704 7.67
THB 538,600 KCE Electronics (Foreign) 558,654 0.48
THB 1,865,000 Kiatnakin Bank (Foreign) 2,232,048 1.93
THB 9,652,800 MCS Steel (Foreign) 1,577,015 1.36
THB 11,880,800 Quality Houses (Foreign) 1,325,305 1.15
THB 517,900 Thai Stanley Electric (Foreign) 3,187,682 2.75
Turkey 9,211,402 7.95
TRY 194,343 Ford Otomotiv Sanayi 2,714,276 2.34
TRY 93,247 Turk Traktor ve Ziraat Makineleri 3,068,346 2.65
TRY 874,577 Turkiye Sise ve Cam Fabrikalari 1,356,151 1.17
TRY 260,850 Ulker Biskuvi Sanayi 2,072,629 1.79
United Kingdom 618,710 0.54
GBP 40,000 Al Noor Hospitals Group 618,710 0.54
Total Transferable Securities andMoney Market Instruments Admittedto an Official Exchange Listing
114,854,532 99.18
Total Investments 114,854,532 99.18
Other Net Assets 946,266 0.82
Net Asset Value 115,800,798 100.00
Geographic Breakdown (as a percentage of Net Assets) % Net Assets
Austria 1.86
Bermuda 3.47
Brazil 1.26
Cayman Islands 4.82
Chile 0.60
China 0.52
Cyprus 0.32
Czech Republic 0.55
Hong Kong 0.64
India 12.29
Indonesia 2.46
Malaysia 5.28
Mexico 3.78
Philippines 3.80
Poland 0.87
Romania 0.82
Russia 0.50
Singapore 1.51
South Africa 7.39
South Korea 12.33
Sri Lanka 4.88
Taiwan 13.07
Thailand 7.67
Turkey 7.95
United Kingdom 0.54
Total 99.18

AVIVA INVESTORS – ANNUAL REPORT AND AUDITED FINANCIAL STATEMENTS avivainvestors.com 28
AVIVA INVESTORS – EMERGING MARKETS LOCAL CURRENCY BOND FUNDPortfolio of Investments and Other Net Assets as at 31 December 2014
Number of shares or Principal Amount
Transferable Securities and Money Market Instruments Admitted to an Official Exchange Listing
Market Value
EUR
% Net Assets
Brazil 63,417,223 10.54
BRL 5,500,000 Brazil Letras do Tesouro Nacional 0% 01/01/2017
13,423,046 2.23
BRL 2,640,300 Brazil Notas do Tesouro Nacional Serie 'B' 6% 15/08/2018
20,938,367 3.48
BRL 6,100,000 Brazil Notas do Tesouro Nacional Series 'F' 10% 01/01/2018
18,689,159 3.11
BRL 3,500,000 Brazil Notas do Tesouro Nacional Series 'F' 10% 01/01/2021
10,366,651 1.72
Colombia 43,452,492 7.22
COP 53,815,800,000 Colombian TES 6% 28/04/2028 16,326,901 2.71
COP 15,543,700,000 Colombian TES 7% 04/05/2022 5,464,238 0.91
COP 23,779,200,000 Colombian TES 7.25% 15/06/2016
8,533,247 1.42
COP 6,630,600,000 Colombian TES 7.5% 26/08/2026 2,316,743 0.38
COP 26,077,700,000 Colombian TES 10% 24/07/2024 10,811,363 1.80
Hungary 35,733,899 5.95
HUF 7,054,360,000 Hungary Government 6% 24/11/2023
26,568,357 4.42
HUF 2,350,000,000 Hungary Government 7% 24/06/2022
9,165,542 1.53
Indonesia 46,209,340 7.68
IDR 100,000,000,000 Indonesia Treasury 7% 15/05/2027
6,140,032 1.02
IDR 230,761,000,000 Indonesia Treasury 8.375% 15/03/2024
16,033,156 2.67
IDR 255,780,000,000 Indonesia Treasury 8.375% 15/03/2034
17,286,066 2.87
IDR 50,000,000 Indonesia Treasury 10.25% 15/07/2022
3,764 0.00
IDR 21,963,000,000 Indonesia Treasury 10.5% 15/08/2030
1,750,054 0.29
IDR 61,500,000,000 Indonesia Treasury 11% 15/09/2025
4,996,268 0.83
Mexico 70,868,653 11.78
MXN 199,400,000 Mexican Bonos 6.5% 10/06/2021 11,775,677 1.96
MXN 296,568,100 Mexican Bonos 6.5% 09/06/2022 17,468,765 2.90
MXN 142,400,000 Mexican Bonos 7.5% 03/06/2027 8,937,088 1.49
MXN 41,860,000 Mexican Bonos 7.75% 13/11/2042
2,707,219 0.45
MXN 108,800,000 Mexican Bonos 8.5% 18/11/2038 7,551,684 1.25
MXN 304,130,600 Mexican Bonos 10% 05/12/2024 22,428,220 3.73
Number of shares or Principal Amount
Transferable Securities and Money Market Instruments Admitted to an Official Exchange Listing
Market Value
EUR
% Net Assets
Poland 50,777,649 8.44
PLN 100,403,000 Poland Government 2.5% 25/07/2018
23,733,394 3.94
PLN 44,000,000 Poland Government 4% 25/10/2023
11,540,269 1.92
PLN 34,295,000 Poland Government 5.5% 25/10/2019
9,194,849 1.53
PLN 21,895,000 Poland Government 5.75% 23/09/2022
6,309,137 1.05
Romania 14,126,198 2.36
RON 20,000,000 Romania Government 5.6% 28/11/2018
4,993,422 0.84
RON 35,000,000 Romania Government 5.85% 26/04/2023
9,132,776 1.52
Russia 26,065,355 4.33
RUB 471,848,000 Russian Federal Bond 7% 16/08/2023
4,403,083 0.73
RUB 665,377,000 Russian Federal Bond - OFZ 6.2% 31/01/2018
7,240,029 1.20
RUB 262,870,000 Russian Federal Bond - OFZ 6.9% 03/08/2016
3,217,838 0.54
RUB 470,000,000 Russian Federal Bond - OFZ 7.5% 15/03/2018
5,259,769 0.87
RUB 260,000,000 Russian Federal Bond - OFZ 7.6% 14/04/2021
2,560,500 0.43
RUB 148,992,000 Russian Federal Bond - OFZ 7.6% 20/07/2022
1,428,294 0.24
RUB 200,000,000 Russian Federal Bond - OFZ 8.15% 03/02/2027
1,955,842 0.32
South Africa 53,648,159 8.92
ZAR 38,130,457 South Africa Government - CPI Linked 2.75% 31/01/2022
3,689,398 0.62
ZAR 274,443,325 South Africa Government 6.25% 31/03/2036
15,222,204 2.53
ZAR 200,000,000 South Africa Government 6.5% 28/02/2041
11,188,043 1.86
ZAR 79,468,856 South Africa Government 8% 21/12/2018
5,835,231 0.97
ZAR 88,120,429 South Africa Government 10.5% 21/12/2026
7,578,245 1.26
ZAR 56,650,000 Transnet EMTN 13.5% 18/04/2028
4,947,268 0.82
ZAR 72,040,000 Transnet RegS 9.5% 13/05/2021 5,187,770 0.86
The accompanying notes form an integral part of these financial statements.

AVIVA INVESTORS – ANNUAL REPORT AND AUDITED FINANCIAL STATEMENTS avivainvestors.com 29
Number of shares or Principal Amount
Transferable Securities and Money Market Instruments Admitted to an Official Exchange Listing
Market Value
EUR
% Net Assets
Thailand 42,803,905 7.12
THB 208,800,000 Thailand Government 1.2% 14/07/2021
5,361,565 0.89
THB 218,434,000 Thailand Government 3.45% 08/03/2019
5,710,643 0.95
THB 40,000,000 Thailand Government 3.8% 14/06/2041
1,015,048 0.17
THB 831,426,000 Thailand Government 3.875% 13/06/2019
22,214,378 3.69
THB 326,202,000 Thailand Government 4.125% 18/11/2016
8,502,271 1.42
Turkey 53,308,979 8.86
TRY 15,600,863 Turkey Government 3% 21/07/2021
7,820,109 1.30
TRY 22,500 Turkey Government 4.5% 11/02/2015
11,553 0.00
TRY 40,873,856 Turkey Government 6.3% 14/02/2018
13,842,347 2.30
TRY 22,690,403 Turkey Government 8.5% 14/09/2022
8,271,891 1.38
TRY 28,302,705 Turkey Government 9% 27/01/2016
10,066,000 1.67
TRY 35,023,000 Turkey Government 9% 24/07/2024
13,297,079 2.21
Total Transferable Securities andMoney Market Instruments Admittedto an Official Exchange Listing
500,411,852 83.20
Number of shares or Principal Amount
Transferable Securities and Money Market Instruments dealt on another Regulated Market
Market Value
EUR
% Net Assets
Malaysia 62,949,484 10.47
MYR 81,752,000 Malaysia Government 3.26% 01/03/2018
19,001,572 3.16
MYR 27,426,000 Malaysia Government 3.394% 15/03/2017
6,447,996 1.07
MYR 72,900,000 Malaysia Government 4.012% 15/09/2017
17,384,356 2.89
MYR 45,550,000 Malaysia Government 4.16% 15/07/2021
10,838,072 1.80
MYR 39,073,000 Malaysia Government 4.181% 15/07/2024
9,276,206 1.55
MYR 5,000 Malaysia Government 5.248% 15/09/2028
1,282 0.00
Number of shares or Principal Amount
Transferable Securities and Money Market Instruments dealt on another Regulated Market
Market Value
EUR
% Net Assets
Peru 7,074,088 1.18
PEN 25,434,000 Peruvian Government RegS 5.7% 12/08/2024
7,074,088 1.18
Total Transferable Securities andMoney Market Instruments dealton another Regulated Market
70,023,572 11.65
Number of shares or Principal Amount
Other Transferable Securitiesnot dealt on anotherRegulated Market
Market Value
EUR
% Net Assets
Peru 6,157,840 1.02
PEN 29,000 Peruvian Government RegS 6.9% 12/08/2037
8,343 0.00
PEN 20,756,000 Peruvian Government RegS 6.95% 12/08/2031
6,149,497 1.02
Total Other Transferable Securities not dealton another Regulated Market
6,157,840 1.02
Total Investments 576,593,264 95.87
Other Net Assets 24,857,131 4.13
Net Asset Value 601,450,395 100.00
Geographic Breakdown (as a percentage of Net Assets) % Net Assets
Brazil 10.54
Colombia 7.22
Hungary 5.95
Indonesia 7.68
Malaysia 10.47
Mexico 11.78
Peru 2.20
Poland 8.44
Romania 2.36
Russia 4.33
South Africa 8.92
Thailand 7.12
Turkey 8.86
Total 95.87
AVIVA INVESTORS – EMERGING MARKETS LOCAL CURRENCY BOND FUND (CONTINUED)Portfolio of Investments and Other Net Assets as at 31 December 2014

AVIVA INVESTORS – ANNUAL REPORT AND AUDITED FINANCIAL STATEMENTS avivainvestors.com 30
Forward Foreign Exchange Contracts
Currency purchased Amount purchased Currency sold Amount sold Maturity date Counterparty Unrealised gain/(loss) EUR
COP 5,109,784,323 USD 2,117,124 28/01/2015 GOLDMAN SACHS INTL 26,350
ILS 60,306,074 USD 15,332,767 28/01/2015 BNP PARIBAS S.A. 135,866
THB 51,736,849 USD 1,568,796 28/01/2015 JPMORGAN CHASE BANK 1,473
USD 4,290,291 BRL 11,139,740 28/01/2015 CITIBANK N.A. 102,837
USD 32,234,380 COP 70,045,307,217 28/01/2015 MORGAN STANLEY INT 2,293,118
USD 22,657,923 EUR 18,400,655 28/01/2015 BARCLAYS 319,352
USD 15,432,212 EUR 12,319,455 28/01/2015 ROYAL BANK OF SCOTLAND 430,660
USD 29,724,494 HUF 7,374,624,889 28/01/2015 HSBC BANK PLC 1,225,969
USD 13,274,922 HUF 3,295,618,920 28/01/2015 STANDARD CHARTERED BANK 540,807
USD 30,516,059 ILS 117,309,223 28/01/2015 ROYAL BANK OF SCOTLAND 306,027
USD 29,183,093 MXN 410,546,649 28/01/2015 CITIBANK N.A. 1,131,858
USD 6,723,341 MXN 95,129,296 28/01/2015 GOLDMAN SACHS INTL 230,225
USD 5,320,605 MYR 17,990,028 28/01/2015 JPMORGAN CHASE BANK 159,612
USD 4,916,956 PEN 14,490,270 28/01/2015 GOLDMAN SACHS INTL 64,356
USD 15,154,227 PLN 51,324,685 28/01/2015 CITIBANK N.A. 595,442
USD 3,073,163 RUB 146,454,962 28/01/2015 BARCLAYS 521,782
USD 8,533,048 ZAR 96,559,378 28/01/2015 GOLDMAN SACHS INTL 179,769
CLP 9,689,765,296 USD 16,014,817 28/01/2015 MORGAN STANLEY INT (70,737)
COP 4,926,248,567 USD 2,116,996 28/01/2015 CITIBANK N.A. (37,318)
COP 34,623,067,947 USD 15,245,737 28/01/2015 STANDARD CHARTERED BANK (565,409)
HUF 5,492,061,670 USD 22,531,304 28/01/2015 STANDARD CHARTERED BANK (1,239,155)
IDR 234,638,851,652 USD 19,185,515 28/01/2015 GOLDMAN SACHS INTL (309,040)
ILS 57,003,149 USD 14,772,822 28/01/2015 UBS AG. (102,763)
INR 1,539,211,474 USD 24,603,764 28/01/2015 HSBC BANK PLC (294,836)
JPY 850,442,478 USD 7,289,682 28/01/2015 HSBC BANK PLC (161,139)
JPY 837,276,280 USD 7,214,876 28/01/2015 UBS AG. (190,081)
MXN 290,614,601 USD 21,270,190 28/01/2015 ROYAL BANK OF SCOTLAND (1,307,083)
NGN 1,246,400,731 USD 6,859,663 28/01/2015 STANDARD CHARTERED BANK (132,701)
PLN 39,895,834 USD 11,811,060 28/01/2015 BARCLAYS (488,742)
PLN 45,760,368 USD 13,594,525 28/01/2015 CITIBANK N.A. (599,652)
TRY 24,249,371 USD 10,692,514 28/01/2015 JPMORGAN CHASE BANK (312,809)
USD 2,095,710 CLP 1,293,786,391 28/01/2015 CITIBANK N.A. (25,754)
USD 2,095,810 CLP 1,300,345,337 28/01/2015 GOLDMAN SACHS INTL (34,580)
USD 15,016,820 KRW 16,781,296,239 28/01/2015 HSBC BANK PLC (271,311)
USD 7,084,038 MXN 105,017,327 28/01/2015 MORGAN STANLEY INT (25,222)
USD 19,674,709 PHP 889,454,256 28/01/2015 BARCLAYS (137,778)
ZAR 182,244,965 USD 16,334,500 28/01/2015 JPMORGAN CHASE BANK (528,767)
Net Unrealised Gain on Open Forward Foreign Exchange Contracts 1,430,626
AVIVA INVESTORS – EMERGING MARKETS LOCAL CURRENCY BOND FUND (CONTINUED)Portfolio of Investments and Other Net Assets as at 31 December 2014

AVIVA INVESTORS – ANNUAL REPORT AND AUDITED FINANCIAL STATEMENTS avivainvestors.com 31
Interest Rate Swap Contracts
Nominal Value Description Currency Maturity date Counterparty Unrealised gain/(loss) EUR
210,000,000 IRS ZAR Pay Floating JIBAR 3 Month Received Fixed 7.105% 18/11/2019
ZAR 18/11/2019 NOMURA INTERNATIONAL
(155,505)
61,000,000 IRS ILS Pay Floating TELBOR01 3 Month Received Fixed 1.12% 21/11/2019
ILS 21/11/2019 NOMURA INTERNATIONAL
(133,748)
Net Unrealised Loss on Interest Rate Swap Contracts (289,253)
AVIVA INVESTORS – EMERGING MARKETS LOCAL CURRENCY BOND FUND (CONTINUED)Portfolio of Investments and Other Net Assets as at 31 December 2014

AVIVA INVESTORS – ANNUAL REPORT AND AUDITED FINANCIAL STATEMENTS avivainvestors.com 32
AVIVA INVESTORS – EUROPEAN CORPORATE BOND FUNDPortfolio of Investments and Other Net Assets as at 31 December 2014
Number of shares or Principal Amount
Transferable Securities and Money Market Instruments Admitted to an Official Exchange Listing
Market Value
EUR
% Net Assets
Australia 1,947,152 2.11
EUR 230,000 BHP Billiton Finance EMTN 2.25% 25/09/2020
250,134 0.27
EUR 305,000 BHP Billiton Finance EMTN 6.375% 04/04/2016
328,265 0.36
EUR 180,000 National Australia Bank EMTN 2.75% 08/08/2022
205,554 0.22
EUR 850,000 National Australia Bank GMTN 2% 12/11/2020
919,796 1.00
EUR 205,000 Telstra EMTN 3.5% 21/09/2022 243,403 0.26
Belgium 1,314,004 1.41
EUR 710,000 Anheuser-Busch EMTN 2.875% 25/09/2024
811,054 0.88
EUR 450,000 Anheuser-Busch EMTN 4% 26/04/2018
502,950 0.53
Cayman Islands 4,084,913 4.43
EUR 718,000 Hutchison Whampoa Finance 14 1.375% 31/10/2021
726,500 0.79
EUR 1,650,000 Principal Financial Global Funding II EMTN 4.5% 26/01/2017
1,777,380 1.93
GBP 750,000 Thames Water Utilities Cayman Finance EMTN variable 21/07/2025
1,035,369 1.12
GBP 390,000 Yorkshire Water Services Bradford Finance variable 24/04/2025
545,664 0.59
Denmark 475,514 0.51
EUR 460,000 Danske Bank EMTN variable 19/05/2026
475,514 0.51
France 14,920,222 16.17
EUR 300,000 Alstom EMTN 3.875% 02/03/2016 312,469 0.34
EUR 300,000 Autoroutes du Sud de la France EMTN 4% 24/09/2018
338,378 0.37
EUR 1,220,000 AXA EMTN variable perpetual 1,232,200 1.34
EUR 795,000 Banque PSA Finance EMTN 4.25% 25/02/2016
824,698 0.89
EUR 535,000 BNP Paribas EMTN 2.375% 20/05/2024
595,848 0.65
EUR 305,000 Carrefour EMTN 1.875% 19/12/2017
317,836 0.34
EUR 800,000 Casino Guichard Perrachon EMTN 3.994% 09/03/2020
917,956 0.99
EUR 400,000 Credit Agricole EMTN 3.125% 17/07/2023
469,111 0.51
EUR 900,000 Electricite de France EMTN 3.875% 18/01/2022
1,092,041 1.18
EUR 500,000 Electricite de France EMTN 4.625% 11/09/2024
650,577 0.70
EUR 500,000 Electricite de France EMTN 5% 05/02/2018
571,324 0.62
Number of shares or Principal Amount
Transferable Securities and Money Market Instruments Admitted to an Official Exchange Listing
Market Value
EUR
% Net Assets
EUR 245,000 GDF Suez EMTN 3% 01/02/2023 286,322 0.31
EUR 200,000 Kering EMTN 2.5% 15/07/2020 218,164 0.24
EUR 730,000 Orange variable perpetual 803,876 0.87
EUR 700,000 Sanofi EMTN 1.75% 10/09/2026 730,355 0.79
EUR 425,000 Sanofi EMTN 4.5% 18/05/2016 450,121 0.49
EUR 400,000 Schneider Electric EMTN 3.75% 12/07/2018
447,086 0.48
EUR 500,000 Societe Des Autoroutes Paris-Rhin-Rhone EMTN 1.125% 15/01/2021
503,583 0.55
EUR 1,300,000 Solvay Finance variable perpetual 1,429,584 1.55
EUR 800,000 Total Capital International EMTN 2.875% 19/11/2025
923,940 1.00
EUR 1,000,000 Veolia Environnement variable perpetual
1,032,825 1.12
EUR 729,000 WPP Finance EMTN 2.25% 22/09/2026
771,928 0.84
Germany 9,680,081 10.49
EUR 115,000 BASF 2% 05/12/2022 125,870 0.14
EUR 1,650,000 Germany (Bund) 2% 04/01/2022 1,858,104 2.01
EUR 2,910,000 Germany (Bund) 4.25% 04/07/2018 3,352,749 3.63
EUR 1,650,000 KFW 3.375% 18/01/2021 1,958,127 2.12
EUR 1,000,000 KFW EMTN 0.625% 12/02/2018 1,019,649 1.11
EUR 566,000 SAP EMTN 1.75% 22/02/2027 585,854 0.63
EUR 700,000 Volkswagen Leasing EMTN 2.375% 06/09/2022
779,728 0.85
Ireland 2,704,139 2.93
EUR 526,000 GE Capital European Funding EMTN 2.25% 20/07/2020
573,878 0.62
EUR 175,000 GE Capital European Funding EMTN 2.625% 15/03/2023
198,681 0.22
EUR 400,000 GE Capital European Funding EMTN 3.75% 04/04/2016
417,903 0.45
EUR 1,395,000 GE Capital European Funding EMTN 4.25% 01/03/2017
1,513,677 1.64
Italy 5,368,279 5.82
EUR 200,000 Atlantia EMTN 4.5% 08/02/2019 230,303 0.25
EUR 200,000 Eni 4.125% 16/09/2019 231,507 0.25
EUR 374,000 Eni EMTN 3.25% 10/07/2023 435,599 0.47
EUR 400,000 Eni EMTN 4.25% 03/02/2020 468,456 0.51
EUR 1,350,000 Intesa Sanpaolo EMTN 4% 09/11/2017
1,468,060 1.59
EUR 620,000 Intesa Sanpaolo EMTN 6.625% 13/09/2023
763,313 0.83
EUR 1,021,000 Snam EMTN 2.375% 30/06/2017 1,066,470 1.16
EUR 650,000 UniCredit EMTN variable 28/10/2025 704,571 0.76
The accompanying notes form an integral part of these financial statements.

AVIVA INVESTORS – ANNUAL REPORT AND AUDITED FINANCIAL STATEMENTS avivainvestors.com 33
AVIVA INVESTORS – EUROPEAN CORPORATE BOND FUND (CONTINUED)Portfolio of Investments and Other Net Assets as at 31 December 2014
Number of shares or Principal Amount
Transferable Securities and Money Market Instruments Admitted to an Official Exchange Listing
Market Value
EUR
% Net Assets
Luxembourg 1,651,702 1.79
EUR 298,000 Gazprom OAO Via Gaz Capital EMTN 3.389% 20/03/2020
253,672 0.28
EUR 400,000 Holcim US Finance EMTN 2.625% 07/09/2020
438,021 0.47
EUR 975,000 Wind Acquisition Finance RegS 4% 15/07/2020
960,009 1.04
Mexico 911,115 0.99
EUR 785,000 America Movil EMTN 4.125% 25/10/2019
911,115 0.99
Netherlands 9,147,773 9.91
EUR 950,000 ABN AMRO Bank EMTN 2.125% 26/11/2020
1,030,876 1.12
EUR 520,000 ABN AMRO Bank EMTN 4.75% 11/01/2019
609,725 0.66
EUR 250,000 Alliander EMTN 2.875% 14/06/2024 290,225 0.31
EUR 650,000 BMW Finance EMTN 3.625% 29/01/2018
715,125 0.77
EUR 750,000 British American Tobacco The Netherlands EMTN 4% 07/07/2020
885,913 0.96
EUR 825,000 Deutsche Telekom International Finance EMTN 6% 20/01/2017
920,206 1.00
EUR 160,000 Deutsche Telekom International Finance EMTN 7.5% 24/01/2033
286,915 0.31
EUR 1,009,000 Eneco Holding variable perpetual 1,011,891 1.10
EUR 400,000 Gas Natural Fenosa Finance variable perpetual
411,850 0.45
EUR 410,000 Heineken EMTN 2% 06/04/2021 438,219 0.47
EUR 628,000 Nomura Europe Finance EMTN 1.5% 12/05/2021
634,778 0.69
EUR 900,000 Swiss Reinsurance variable perpetual 942,750 1.02
EUR 900,000 Telefonica Europe variable perpetual 969,300 1.05
Netherlands Antilles 381,395 0.41
EUR 350,000 Teva Pharmaceutical Finance IV EMTN 2.875% 15/04/2019
381,395 0.41
Norway 1,582,505 1.71
EUR 750,000 DNB Bank RegS 4.375% 24/02/2021 916,639 0.99
USD 843,000 Statoil 2.45% 17/01/2023 665,866 0.72
Spain 2,803,435 3.04
EUR 1,000,000 Abertis Infraestructuras 2.5% 27/02/2025
1,073,296 1.16
EUR 300,000 Abertis Infraestructuras 4.75% 25/10/2019
355,734 0.39
EUR 300,000 Telefonica Emisiones EMTN 5.811% 05/09/2017
341,814 0.37
EUR 450,000 Telefonica Emisiones GMTN 3.661% 18/09/2017
487,614 0.53
EUR 500,000 Telefonica Emisiones RegS 4.75% 07/02/2017
544,977 0.59
Number of shares or Principal Amount
Transferable Securities and Money Market Instruments Admitted to an Official Exchange Listing
Market Value
EUR
% Net Assets
Supranational 4,103,404 4.45
EUR 1,885,000 European Investment Bank 1.5% 15/04/2021
2,025,845 2.20
EUR 1,584,000 European Investment Bank EMTN 4.125% 15/04/2024
2,077,559 2.25
Sweden 660,372 0.72
EUR 180,000 Atlas Copco EMTN 2.625% 15/03/2019
196,641 0.22
EUR 460,000 Volvo Treasury variable 10/03/2078 463,731 0.50
Switzerland 913,558 0.99
EUR 910,000 UBS Jersey variable perpetual 913,558 0.99
United Arab Emirates 839,182 0.91
EUR 825,000 Glencore Finance Dubai EMTN 1.75% 19/05/2016
839,182 0.91
United Kingdom 11,793,943 12.78
GBP 375,000 Barclays Bank variable perpetual 641,171 0.69
EUR 341,000 FCE Bank EMTN 1.875% 18/04/2019
355,267 0.39
GBP 360,000 Grainger 5% 16/12/2020 474,856 0.51
GBP 148,000 LBG Capital No.2 15% 21/12/2019 265,443 0.29
EUR 425,000 Lloyds Bank EMTN 4.625% 02/02/2017
462,637 0.50
EUR 650,000 Old Mutual EMTN variable perpetual 656,601 0.71
GBP 230,000 Principality Building Society EMTN variable 08/07/2016
271,182 0.29
EUR 840,000 Royal Bank of Scotland EMTN 5.375% 30/09/2019
1,021,249 1.11
EUR 450,000 Royal Bank of Scotland variable perpetual
473,344 0.51
USD 600,000 Royal Bank of Scotland variable perpetual
521,597 0.57
EUR 750,000 Severn Trent Utilities Finance EMTN 5.25% 11/03/2016
792,817 0.86
GBP 390,000 Standard Chartered EMTN 4.375% 18/01/2038
527,585 0.57
EUR 450,000 Tesco EMTN 5.125% 10/04/2047 462,110 0.50
GBP 1,760,000 United Kingdom Gilt 2.25% 07/09/2023
2,376,562 2.58
GBP 1,512,443 United Kingdom Gilt 3.25% 22/01/2044
2,247,014 2.43
EUR 190,000 Vodafone EMTN 5.375% 06/06/2022 244,508 0.27
United States of America 11,082,891 12.01
GBP 285,000 American International 6.765% 15/11/2017
418,257 0.45
EUR 850,000 American International variable 15/03/2067
888,539 0.96
GBP 450,000 Citigroup EMTN 5.15% 21/05/2026 693,734 0.75
USD 1,125,000 General Motors 5.2% 01/04/2045 979,681 1.06

AVIVA INVESTORS – ANNUAL REPORT AND AUDITED FINANCIAL STATEMENTS avivainvestors.com 34
AVIVA INVESTORS – EUROPEAN CORPORATE BOND FUND (CONTINUED)Portfolio of Investments and Other Net Assets as at 31 December 2014
Number of shares or Principal Amount
Transferable Securities and Money Market Instruments Admitted to an Official Exchange Listing
Market Value
EUR
% Net Assets
EUR 950,000 Goldman Sachs EMTN 3.25% 01/02/2023
1,082,848 1.17
GBP 640,000 Goldman Sachs EMTN 4.25% 29/01/2026
894,198 0.97
EUR 1,011,000 Jefferies EMTN 2.375% 20/05/2020 1,029,838 1.12
EUR 2,500,000 Lehman Brothers EMTN 4.625% 14/03/2019
25,250 0.03
EUR 1,100,000 Metropolitan Life Global Funding I EMTN 4.625% 16/05/2017
1,209,275 1.31
EUR 735,000 Metropolitan Life Global Funding I GMTN 1.25% 17/09/2021
751,693 0.82
EUR 920,000 Morgan Stanley GMTN 2.375% 31/03/2021
988,310 1.07
GBP 530,000 National Capital Trust I RegS variable perpetual
720,511 0.78
EUR 155,000 Philip Morris International 2.75% 19/03/2025
174,510 0.19
EUR 310,000 Procter & Gamble RegS 2% 16/08/2022
337,982 0.37
EUR 235,000 SABMiller EMTN 1.875% 20/01/2020
248,349 0.27
EUR 630,000 Wells Fargo & Co EMTN 1.125% 29/10/2021
639,916 0.69
Total Transferable Securities and Money Market Instruments Admitted to an Official Exchange Listing
86,365,579 93.58
Number of shares or Principal Amount
Transferable Securities and Money Market Instruments dealt on another Regulated Market
Market Value
EUR
% Net Assets
Australia 164,736 0.18
USD 195,000 Commonwealth Bank of Australia 144A 2.25% 16/03/2017
164,736 0.18
France 581,945 0.63
USD 690,000 BNP Paribas 3.25% 03/03/2023 581,945 0.63
Italy 379,961 0.41
USD 420,000 Intesa Sanpaolo 5.25% 12/01/2024 379,961 0.41
United Kingdom 514,570 0.56
USD 350,000 BAT International Finance 144A 3.25% 07/06/2022
292,263 0.32
USD 267,000 Jaguar Land Rover Automotive 144A 4.25% 15/11/2019
222,307 0.24
United States of America 619,614 0.67
USD 646,000 Massachusetts Institute of Technology 4.678% 01/07/2114
619,614 0.67
Total Transferable Securities and Money Market Instruments dealt on another Regulated Market
2,260,826 2.45
Total Investments 88,626,405 96.03
Other Net Assets 3,665,858 3.97
Net Asset Value 92,292,263 100.00
Geographic Breakdown (as a percentage of Net Assets) % Net Assets
Australia 2.29
Belgium 1.41
Cayman Islands 4.43
Denmark 0.51
France 16.80
Germany 10.49
Ireland 2.93
Italy 6.23
Luxembourg 1.79
Mexico 0.99
Netherlands 9.91
Netherlands Antilles 0.41
Norway 1.71
Spain 3.04
Supranational 4.45
Sweden 0.72
Switzerland 0.99
United Arab Emirates 0.91
United Kingdom 13.34
United States of America 12.68
Total 96.03

AVIVA INVESTORS – ANNUAL REPORT AND AUDITED FINANCIAL STATEMENTS avivainvestors.com 35
Forward Foreign Exchange Contracts
Currency purchased Amount purchased Currency sold Amount sold Maturity date Counterparty Unrealised gain/(loss) EUR
GBP 3,202,565 EUR 4,085,410 06/02/2015 CITIBANK N.A. 38,881
USD 596,588 EUR 476,325 06/02/2015 ROYAL BANK OF CANADA 16,532
EUR 253,648 GBP 200,000 06/02/2015 NOMURA INTERNATIONAL PLC (3,914)
EUR 837,308 GBP 659,379 06/02/2015 ROYAL BANK OF CANADA (11,847)
EUR 63,156 GBP 50,000 06/02/2015 SOCIETE GENERALE (1,234)
EUR 14,478,556 GBP 11,347,713 06/02/2015 UBS AG. (135,128)
EUR 963,859 USD 1,200,000 06/02/2015 HSBC BANK PLC (27,493)
EUR 40,196 USD 50,000 06/02/2015 ROYAL BANK OF CANADA (1,110)
EUR 5,333,877 USD 6,679,939 06/02/2015 UBS AG. (184,600)
Net Unrealised Loss on Open Forward Foreign Exchange Contracts (309,913)
Futures Contracts
Quantity Currency Description Maturity date Commitment Counterparty Unrealised gain/(loss) EUR
(13) EUR EURO-BOBL FUTURE 06/03/2015 (1,693,640) J.P. MORGAN (9,620)
78 EUR EURO-BUND FUTURE 06/03/2015 12,157,860 J.P. MORGAN 197,080
(71) GBP LONG GILT FUTURE 27/03/2015 (10,935,728) J.P. MORGAN (244,386)
26 USD US 10 YEAR NOTE FUTURE 20/03/2015 2,723,609 J.P. MORGAN 11,918
(58) USD US 5 YEAR NOTE FUTURE 31/03/2015 (5,698,467) J.P. MORGAN 4,681
(18) USD US LONG BOND FUTURE 20/03/2015 (2,150,660) J.P. MORGAN (46,718)
(7) USD US ULTRA BOND FUTURE 20/03/2015 (955,500) J.P. MORGAN (19,040)
Net Unrealised Loss on Open Futures Contracts (106,085)
Credit Default Swap Contracts
Buy/Sell Nominal Value Description Currency Maturity date Counterparty Unrealised gain/(loss) EUR
Buy 1,250,000 CDS EUR Commerzbank 4% 16/09/2020 EUR 20/03/2019 CREDIT SUISSE (17,718)
Sell 530,000 ITRX EUR Crossover Series 22 20/12/2019 EUR 20/12/2019 MORGAN STANLEY INT
37,011
Net Unrealised Gain on Credit Default Swap Contracts 19,293
AVIVA INVESTORS – EUROPEAN CORPORATE BOND FUND (CONTINUED)Portfolio of Investments and Other Net Assets as at 31 December 2014

AVIVA INVESTORS – ANNUAL REPORT AND AUDITED FINANCIAL STATEMENTS avivainvestors.com 36
AVIVA INVESTORS – EUROPEAN EQUITY FUNDPortfolio of Investments and Other Net Assets as at 31 December 2014
Number of shares or Principal Amount
Transferable Securities and Money Market Instruments Admitted to an Official Exchange Listing
Market Value
EUR
% Net Assets
Austria 1,157,189 0.92
EUR 25,370 Andritz 1,157,189 0.92
Belgium 2,967,957 2.36
EUR 147,000 Ablynx 1,331,820 1.06
EUR 69,394 Ontex 1,636,137 1.30
Denmark 9,315,839 7.41
DKK 28,471 Bavarian Nordic 754,183 0.60
DKK 42,286 Chr Hansen 1,558,252 1.24
DKK 36,852 Genmab 1,782,632 1.42
DKK 98,809 Novo Nordisk 3,453,378 2.75
DKK 50,647 Novozymes 'B' 1,767,394 1.40
France 22,578,848 17.96
EUR 65,151 AXA 1,251,551 1.00
EUR 53,891 BNP Paribas 2,653,189 2.11
EUR 124,770 Coface 1,364,360 1.08
EUR 21,047 Essilor International 1,949,478 1.55
EUR 49,133 Legrand 2,139,374 1.70
EUR 21,030 Pernod-Ricard 1,939,702 1.54
EUR 34,913 Publicis Groupe 2,082,735 1.66
EUR 119,872 Rexel 1,780,998 1.42
EUR 44,008 Schneider Electric 2,664,024 2.12
EUR 27,658 Sodexo 2,245,276 1.79
EUR 29,220 Technip 1,445,367 1.15
EUR 66,321 Worldline 1,062,794 0.84
Germany 28,616,142 22.76
EUR 36,910 Bayer Registered 4,188,362 3.33
EUR 18,747 Bayerische Motoren Werke 1,684,699 1.34
EUR 39,432 Brenntag 1,844,038 1.47
EUR 49,762 Deutsche Boerse 2,944,418 2.34
EUR 59,192 Fresenius & Co KGaA 2,553,987 2.03
EUR 136,639 Infineon Technologies 1,205,566 0.96
EUR 134,180 Medigene 504,248 0.40
EUR 20,054 Morphosys 1,545,060 1.23
EUR 17,681 MTU Aero Engines 1,272,236 1.01
EUR 104,921 SAP 6,120,042 4.87
EUR 31,903 Stabilus 807,146 0.64
EUR 49,848 United Internet Registered 1,867,680 1.49
EUR 11,236 Volkswagen Preference 2,078,660 1.65
Ireland 7,678,649 6.11
EUR 127,200 Glanbia 1,621,800 1.29
EUR 32,675 Kerry 'A' 1,877,179 1.49
EUR 25,289 Paddy Power 1,726,986 1.38
EUR 250,440 Ryanair 2,452,684 1.95
Number of shares or Principal Amount
Transferable Securities and Money Market Instruments Admitted to an Official Exchange Listing
Market Value
EUR
% Net Assets
Italy 6,246,120 4.97
EUR 430,413 Anima 1,791,379 1.43
EUR 119,577 Azimut 2,155,375 1.71
EUR 270,986 Cerved Information Solutions 1,190,712 0.95
CHF 50,820 Newron Pharmaceuticals 1,108,654 0.88
Netherlands 7,761,546 6.17
EUR 39,185 IMCD 1,101,490 0.88
EUR 223,241 ING 2,418,258 1.92
EUR 129,967 Unilever 4,241,798 3.37
Norway 1,766,569 1.41
NOK 168,839 Opera Software 1,766,569 1.41
Spain 5,122,330 4.07
EUR 66,869 Amadeus IT 'A' 2,209,686 1.75
EUR 95,837 Applus Services 839,532 0.67
EUR 309,189 Bankinter 2,073,112 1.65
Switzerland 25,782,948 20.51
CHF 142,334 ABB Registered 2,501,924 1.99
CHF 8,771 Basilea Pharmaceutica Registered 672,068 0.54
CHF 43,708 Companhia Financiere Richemont Registered
3,227,118 2.57
CHF 1,134,476 Evolva 1,245,468 0.99
CHF 36,711 Roche 8,239,140 6.55
CHF 824 SGS Registered 1,401,127 1.11
CHF 14,092 Sonova Registered 1,721,115 1.37
CHF 7,597 Syngenta Registered 2,020,932 1.61
CHF 91,031 Temenos Registered 2,689,972 2.14
CHF 145,261 UBS Group 2,064,084 1.64
United Kingdom 5,857,931 4.66
GBP 119,225 4d pharma 729,749 0.58
GBP 189,649 Circassia Pharmaceuticals 677,845 0.54
GBP 351,098 Immupharma 230,734 0.18
GBP 16,452,188 Oxford Biomedica 1,113,001 0.88
GBP 4,201,226 Oxford Pharmascience Group 185,417 0.15
GBP 81,668 Silence Therapeutics 218,891 0.17
GBP 274,639 Skyepharma 1,189,088 0.95
GBP 775,762 Vectura 1,279,531 1.02
GBP 15,111,869 Verona Pharma 233,675 0.19
Total Transferable Securities and Money Market Instruments Admitted to an Official Exchange Listing
124,852,068 99.31
Total Investments 124,852,068 99.31
Other Net Assets 865,109 0.69
Net Asset Value 125,717,177 100.00
The accompanying notes form an integral part of these financial statements.

AVIVA INVESTORS – ANNUAL REPORT AND AUDITED FINANCIAL STATEMENTS avivainvestors.com 37
AVIVA INVESTORS – EUROPEAN EQUITY FUND (CONTINUED)Portfolio of Investments and Other Net Assets as at 31 December 2014
Geographic Breakdown (as a percentage of Net Assets) % Net Assets
Austria 0.92
Belgium 2.36
Denmark 7.41
France 17.96
Germany 22.76
Ireland 6.11
Italy 4.97
Netherlands 6.17
Norway 1.41
Spain 4.07
Switzerland 20.51
United Kingdom 4.66
Total 99.31

AVIVA INVESTORS – ANNUAL REPORT AND AUDITED FINANCIAL STATEMENTS avivainvestors.com 38
AVIVA INVESTORS – EUROPEAN EQUITY INCOME FUNDPortfolio of Investments and Other Net Assets as at 31 December 2014
The accompanying notes form an integral part of these financial statements.
Number of shares or Principal Amount
Transferable Securities and Money Market Instruments Admitted to an Official Exchange Listing
Market Value
EUR
% Net Assets
Austria 3,200,574 1.94
EUR 79,007 Oesterreichische Post 3,200,574 1.94
Belgium 1,936,913 1.17
EUR 50,267 Colruyt 1,936,913 1.17
Finland 10,631,420 6.43
EUR 193,952 Fortum 3,486,287 2.11
EUR 143,942 Nokian Renkaat 2,921,303 1.77
EUR 276,648 Stora Enso Registered 2,056,186 1.24
EUR 159,210 UPM-Kymmene 2,167,644 1.31
France 33,607,989 20.32
EUR 79,610 BNP Paribas 3,919,399 2.37
EUR 54,828 Cap Gemini 3,260,347 1.97
EUR 98,068 Carrefour 2,479,895 1.50
EUR 174,954 Coface 1,913,122 1.16
EUR 71,336 Gaztransport Et Technigaz 3,477,273 2.10
EUR 53,171 Legrand 2,315,198 1.40
EUR 44,042 Neopost 2,070,415 1.25
EUR 156,675 Total 6,661,429 4.03
EUR 91,811 Vinci 4,178,548 2.53
EUR 161,081 Vivendi 3,332,363 2.01
Germany 26,644,380 16.11
EUR 37,282 Allianz 5,148,644 3.11
EUR 57,609 BASF 4,038,103 2.44
EUR 56,801 Bayer Registered 6,445,494 3.90
EUR 59,711 Deutsche Boerse 3,533,100 2.14
EUR 305,222 Deutsche Telekom Registered 4,060,979 2.45
EUR 18,476 Volkswagen Preference 3,418,060 2.07
Italy 6,837,676 4.13
EUR 918,287 Enel 3,394,907 2.05
EUR 237,187 Eni 3,442,769 2.08
Netherlands 15,356,725 9.29
EUR 69,409 Airbus 2,869,195 1.73
EUR 170,844 Reed Elsevier 3,388,264 2.05
EUR 183,285 Unilever 5,981,964 3.62
EUR 122,922 Wolters Kluwer 3,117,302 1.89
Number of shares or Principal Amount
Transferable Securities and Money Market Instruments Admitted to an Official Exchange Listing
Market Value
EUR
% Net Assets
Norway 2,816,605 1.71
NOK 168,558 Telenor 2,816,605 1.71
Portugal 3,193,438 1.93
EUR 991,751 EDP - Energias de Portugal 3,193,438 1.93
Spain 10,306,412 6.23
EUR 281,942 Bankinter 1,890,421 1.14
EUR 399,901 Distribuidora Internacional de Alimentacion
2,253,442 1.36
EUR 143,953 Gas Natural SDG 2,994,222 1.81
EUR 197,693 Repsol 3,078,080 1.86
EUR 197,693 Repsol Rights 08/01/2015 90,247 0.06
Sweden 10,821,265 6.54
SEK 267,787 Sandvik 2,160,513 1.31
SEK 225,571 Swedbank 'A' 4,654,263 2.81
SEK 402,351 Telefonaktiebolaget LM Ericsson 'B' 4,006,489 2.42
Switzerland 37,728,933 22.81
CHF 273,591 ABB Registered 4,809,139 2.91
CHF 62,299 Cembra Money Bank 2,848,715 1.72
CHF 113,748 Novartis Registered 8,734,265 5.28
CHF 51,233 Roche 11,498,348 6.95
CHF 49,486 Swiss Re 3,443,827 2.08
CHF 6,022 Swisscom Registered 2,618,171 1.58
CHF 265,771 UBS Group 3,776,468 2.29
Total Transferable Securities andMoney Market Instruments Admittedto an Official Exchange Listing
163,082,330 98.61
Total Investments 163,082,330 98.61
Other Net Assets 2,291,059 1.39
Net Asset Value 165,373,389 100.00

AVIVA INVESTORS – ANNUAL REPORT AND AUDITED FINANCIAL STATEMENTS avivainvestors.com 39
AVIVA INVESTORS – EUROPEAN EQUITY INCOME FUND (CONTINUED)Portfolio of Investments and Other Net Assets as at 31 December 2014
Geographic Breakdown (as a percentage of Net Assets) % Net Assets
Austria 1.94
Belgium 1.17
Finland 6.43
France 20.32
Germany 16.11
Italy 4.13
Netherlands 9.29
Norway 1.71
Portugal 1.93
Spain 6.23
Sweden 6.54
Switzerland 22.81
Total 98.61

AVIVA INVESTORS – ANNUAL REPORT AND AUDITED FINANCIAL STATEMENTS avivainvestors.com 40
AVIVA INVESTORS – EUROPEAN REAL ESTATE SECURITIES FUNDPortfolio of Investments and Other Net Assets as at 31 December 2014
Number of shares or Principal Amount
Transferable Securities and Money Market Instruments Admitted to an Official Exchange Listing
Market Value
EUR
% Net Assets
Finland 1,065,309 1.94
EUR 412,112 Citycon 1,065,309 1.94
France 5,911,708 10.73
EUR 7,034 Fonciere Des Regions REIT 540,739 0.98
EUR 10,427 ICADE REIT 692,509 1.26
EUR 17,860 Mercialys REIT 327,508 0.59
EUR 20,439 Unibail-Rodamco REIT 4,350,952 7.90
Germany 1,901,443 3.45
EUR 27,210 Alstria Office REIT 280,059 0.51
EUR 16,556 LEG Immobilien 1,026,555 1.86
EUR 144,569 Westgrund 594,829 1.08
Ireland 1,119,686 2.03
EUR 449,035 Green REIT 574,316 1.04
EUR 500,914 Hibernia REIT 545,370 0.99
Italy 431,672 0.78
EUR 627,098 Beni Stabili REIT 362,463 0.66
EUR 107,937 Immobiliare Grande Distribuzione REIT
69,209 0.12
Netherlands 1,783,878 3.24
EUR 25,330 Corio REIT 1,030,298 1.87
EUR 13,219 Wereldhave REIT 753,483 1.37
EUR 10 Wereldhave Rights 11/12/2014 97 -
Norway 182,407 0.33
NOK 21,597 Entra 182,407 0.33
Spain 4,135,405 7.51
EUR 195,403 Hispania Activos Inmobiliarios 2,125,008 3.86
EUR 131,455 Lar Espana Real Estate Socimi REIT 1,159,433 2.10
EUR 85,524 Merlin Properties Socimi REIT 850,964 1.55
Sweden 4,306,718 7.82
SEK 78,819 Castellum 1,017,213 1.85
SEK 55,000 D Carnegie & Co 262,151 0.48
SEK 57,095 Fabege 606,959 1.10
SEK 41,158 Hemfosa Fastigheter 715,833 1.30
SEK 13,064 Hufvudstaden 'A' 140,121 0.25
SEK 103,722 Wihlborgs Fastigheter 1,564,441 2.84
Number of shares or Principal Amount
Transferable Securities and Money Market Instruments Admitted to an Official Exchange Listing
Market Value
EUR
% Net Assets
United Kingdom 28,209,834 51.20
GBP 414,314 British Land REIT 4,148,232 7.53
GBP 316,883 Capital & Counties Properties 1,490,609 2.71
GBP 59,864 Derwent London REIT 2,334,634 4.24
GBP 172,457 Development Securities 497,507 0.90
GBP 258,886 Great Portland Estates REIT 2,464,441 4.47
GBP 313,837 Hammerson REIT 2,448,673 4.44
GBP 443,811 Hansteen Holdings REIT 616,494 1.12
GBP 65,123 Helical Bar 317,938 0.58
GBP 326,265 Land Securities REIT 4,872,663 8.84
GBP 42,211 Safestore REIT 126,870 0.23
GBP 310,568 Segro REIT 1,484,915 2.70
GBP 266,795 Shaftesbury REIT 2,687,559 4.88
GBP 498,061 ST. Modwen Properties 2,489,515 4.52
GBP 347,164 Urban & Civic 1,109,427 2.01
GBP 113,394 Workspace REIT 1,120,357 2.03
Total Transferable Securities andMoney Market Instruments Admittedto an Official Exchange Listing
49,048,060 89.03
Number of shares or Principal Amount
Total Transferable Securities andMoney Market Instruments dealton another Regulated Market
Market Value
EUR
% Net Assets
France 4,922,521 8.93
EUR 23,124 Merrill Lynch Warrants - Unibail-Rodamco 26/06/2015
4,922,521 8.93
Total Transferable Securities andMoney Market Instruments dealton another Regulated Market
4,922,521 8.93
Total Investments 53,970,581 97.96
Other Net Assets 1,122,869 2.04
Net Asset Value 55,093,450 100.00
The accompanying notes form an integral part of these financial statements.

AVIVA INVESTORS – ANNUAL REPORT AND AUDITED FINANCIAL STATEMENTS avivainvestors.com 41
AVIVA INVESTORS – EUROPEAN REAL ESTATE SECURITIES FUND (CONTINUED)Portfolio of Investments and Other Net Assets as at 31 December 2014
Geographic Breakdown (as a percentage of Net Assets) % Net Assets
Finland 1.94
France 19.66
Germany 3.45
Ireland 2.03
Italy 0.78
Netherlands 3.24
Norway 0.33
Spain 7.51
Sweden 7.82
United Kingdom 51.20
Total 97.96

AVIVA INVESTORS – ANNUAL REPORT AND AUDITED FINANCIAL STATEMENTS avivainvestors.com 42
AVIVA INVESTORS – GLOBAL AGGREGATE BOND FUNDPortfolio of Investments and Other Net Assets as at 31 December 2014
Number of shares of Principal Amount
Transferable Securities and Money Market Instruments Admitted to an Official Exchange Listing
Market Value
EUR
% Net assets
Australia 2,347,422 1.45
AUD 1,378,000 Australia Government 3.75% 21/04/2037
989,849 0.61
AUD 1,311,000 Australia Government 5.25% 15/03/2019
994,790 0.61
EUR 280,000 National Australia Bank GMTN 2% 12/11/2020
302,992 0.19
AUD 60,000 Telstra 7.75% 15/07/2020 49,565 0.03
EUR 10,000 Westpac Banking EMTN 2.125% 16/02/2016
10,226 0.01
Austria 947,729 0.59
EUR 518,000 Austria Government 1 1.65% 21/10/2024
564,173 0.35
EUR 381,000 Austria Government Bond 0.25% 18/10/2019
383,556 0.24
Belgium 1,444,853 0.89
EUR 968,000 Belgium Government 2.25% 22/06/2023
1,094,143 0.67
EUR 285,000 Belgium Government 3% 22/06/2034
350,710 0.22
Bermuda 144,399 0.09
USD 160,000 Allied World Assurance 7.5% 01/08/2016
144,399 0.09
Canada 3,312,197 2.05
CAD 500,000 Canada Housing Trust No 1 1.7% 15/12/2017
360,660 0.22
CAD 1,050,000 Canada Housing Trust No 1 2.05% 15/06/2017
763,889 0.47
CAD 1,352,000 Canada Housing Trust No 1 2.55% 15/03/2025
984,110 0.61
CAD 300,000 Canada Housing Trust No 1 3.15% 15/09/2023
230,800 0.14
CAD 620,000 Canadian Government 1% 01/05/2016
442,419 0.28
USD 645,000 Province of Ontario Canada 1.1% 25/10/2017
530,319 0.33
Cayman Islands 1,176,205 0.73
EUR 225,000 Hutchison Whampoa Finance 14 1.375% 31/10/2021
227,664 0.14
EUR 450,000 Principal Financial Global Funding II EMTN 4.5% 26/01/2017
483,932 0.30
GBP 220,000 Thames Water Utilities Cayman Finance EMTN variable 21/07/2025
303,708 0.19
GBP 115,000 Yorkshire Water Services Bradford Finance variable 24/04/2025
160,901 0.10
Chile 138,021 0.09
USD 155,000 Chile Government 3.875% 05/08/2020
138,021 0.09
Number of shares of Principal Amount
Transferable Securities and Money Market Instruments Admitted to an Official Exchange Listing
Market Value
EUR
% Net assets
Denmark 692,923 0.43
GBP 160,000 Danske Bank EMTN variable perpetual
211,946 0.13
DKK 3,310,000 Denmark Government 1.5% 15/11/2023
480,977 0.30
France 8,835,696 5.46
EUR 514,000 AXA EMTN variable perpetual 519,140 0.32
EUR 100,000 Banque PSA Finance EMTN 4.25% 25/02/2016
103,736 0.06
EUR 126,000 BNP Paribas EMTN 2.375% 20/05/2024
140,331 0.09
GBP 150,000 BNP Paribas variable perpetual 197,617 0.12
EUR 340,000 Caisse d'Amortissement de la Dette Sociale 3.375% 25/04/2021
403,958 0.25
EUR 200,000 Casino Guichard Perrachon EMTN 3.994% 09/03/2020
229,489 0.14
EUR 1,681,000 France Government OAT 0.25% 25/11/2016
1,690,388 1.04
EUR 1,631,000 France Government OAT 1% 25/11/2018
1,691,159 1.05
EUR 1,140,000 France Government OAT 1.75% 25/11/2024
1,240,271 0.77
EUR 817,018 France Government OAT 3.25% 25/05/2045
1,072,524 0.66
EUR 260,000 Reseau Ferre de France EMTN 4.45% 27/11/2017
292,534 0.18
EUR 200,000 Sanofi EMTN 1.75% 10/09/2026 208,673 0.13
EUR 208,000 Sanofi EMTN 4.5% 18/05/2016 220,294 0.14
EUR 100,000 Societe Des Autoroutes Paris-Rhin-Rhone EMTN 1.125% 15/01/2021
100,717 0.06
EUR 350,000 Solvay Finance variable perpetual 384,888 0.24
EUR 100,000 Total Capital International EMTN 2.875% 19/11/2025
115,493 0.07
EUR 212,000 WPP Finance EMTN 2.25% 22/09/2026
224,484 0.14
Germany 8,570,283 5.29
EUR 3,045,000 Bundesobligation 0.25% 11/10/2019
3,079,891 1.90
EUR 792,000 Bundesrepublik Deutschland 1% 15/08/2024
825,885 0.51
EUR 669,000 Bundesrepublik Deutschland 4.25% 04/07/2039
1,082,136 0.67
EUR 665,000 Germany (Bund) 4.25% 04/07/2018
766,178 0.47
AUD 871,000 KFW 3.75% 10/08/2017 606,692 0.37
CAD 325,000 KFW 4.7% 02/06/2037 274,026 0.17
EUR 689,000 KFW EMTN 0.05% 30/11/2017 690,370 0.43
The accompanying notes form an integral part of these financial statements.

AVIVA INVESTORS – ANNUAL REPORT AND AUDITED FINANCIAL STATEMENTS avivainvestors.com 43
Number of shares of Principal Amount
Transferable Securities and Money Market Instruments Admitted to an Official Exchange Listing
Market Value
EUR
% Net assets
EUR 600,000 KFW EMTN 0.625% 12/02/2018 611,789 0.38
CAD 123,000 KFW EMTN 5.15% 15/12/2017 97,044 0.06
EUR 300,000 NRW Bank EMTN 4.25% 29/04/2019
354,098 0.22
EUR 176,000 SAP EMTN 1.75% 22/02/2027 182,174 0.11
Indonesia 293,600 0.18
USD 320,000 Indonesia Government 144A 5.875% 13/03/2020
293,600 0.18
Ireland 479,311 0.30
EUR 404,000 Ireland Government 3.4% 18/03/2024
479,311 0.30
Italy 7,442,007 4.60
EUR 200,000 Intesa Sanpaolo EMTN 4% 09/11/2017
217,490 0.14
EUR 240,000 Intesa Sanpaolo EMTN 6.625% 13/09/2023
295,476 0.18
EUR 1,613,000 Italy Buoni Poliennali Del Tesoro 1.65% 23/04/2020
1,655,711 1.02
EUR 1,073,000 Italy Buoni Poliennali Del Tesoro 4.5% 01/05/2023
1,308,302 0.81
EUR 1,639,000 Italy Buoni Poliennali Del Tesoro 4.75% 01/06/2017
1,800,764 1.11
EUR 841,000 Italy Buoni Poliennali Del Tesoro 5% 01/09/2040
1,114,580 0.69
EUR 280,000 Snam EMTN 2.375% 30/06/2017 292,470 0.18
EUR 700,000 UniCredit EMTN variable 28/10/2025
757,214 0.47
Japan 26,873,757 16.60
JPY 79,500,000 Japan Government Five Year 0.2% 20/03/2017
550,728 0.34
JPY 1,011,700,000 Japan Government Five Year 0.2% 20/09/2018
7,026,178 4.34
JPY 641,750,000 Japan Government Five Year 0.3% 20/09/2016
4,448,393 2.75
JPY 338,150,000 Japan Government Ten Year 0.6% 20/06/2024
2,399,584 1.48
JPY 138,450,000 Japan Government Ten Year 1.5% 20/06/2019
1,017,488 0.63
JPY 75,000,000 Japan Government Ten Year 1.9% 20/06/2017
541,459 0.33
JPY 357,600,000 Japan Government Ten Year Bond 0.6% 20/03/2023
2,547,317 1.57
JPY 245,550,000 Japan Government Twenty Year 1.5% 20/03/2034
1,837,620 1.14
JPY 24,700,000 Japan Government Twenty Year 2.1% 20/09/2024
199,510 0.12
JPY 5,050,000 Japan Government Thirty Year 2.2% 20/09/2039
42,301 0.03
Number of shares of Principal Amount
Transferable Securities and Money Market Instruments Admitted to an Official Exchange Listing
Market Value
EUR
% Net assets
JPY 20,400,000 Japan Government Twenty Year 2.4% 20/06/2028
174,243 0.11
JPY 830,750,000 Japan Government Twenty Year Bond 1.4% 20/09/2034
6,086,960 3.76
JPY 250,000 Japan Government Twenty Year Bond 2.5% 21/12/2020
1,976 -
Luxembourg 216,634 0.13
EUR 220,000 Wind Acquisition Finance RegS 4% 15/07/2020
216,634 0.13
Mexico 1,338,977 0.83
EUR 189,000 America Movil EMTN 4.125% 25/10/2019
219,364 0.14
MXN 9,100,000 Mexican Bonos 6.5% 10/06/2021 538,377 0.33
USD 50,000 Mexican Bonos 6.75% 27/09/2034 54,171 0.03
USD 400,000 Mexican Bonos GMTN 3.5% 21/01/2021
338,333 0.21
USD 210,000 Mexico Government 5.625% 15/01/2017
188,732 0.12
Netherlands 4,830,634 2.98
EUR 400,000 Bank Nederlandse Gemeenten EMTN 2.25% 17/07/2023
453,062 0.28
EUR 267,000 BMW Finance EMTN 3.625% 29/01/2018
293,751 0.18
EUR 319,000 Eneco Holding variable perpetual 319,914 0.20
EUR 100,000 Gas Natural Fenosa Finance variable perpetual
102,850 0.06
USD 210,000 LYB International Finance 4.875% 15/03/2044
181,147 0.11
EUR 524,000 Netherlands Government 0.25% 15/01/2020
527,935 0.33
EUR 1,204,000 Netherlands Government 2% 15/07/2024
1,350,563 0.83
EUR 205,000 Nomura Europe Finance EMTN 1.5% 12/05/2021
207,212 0.13
EUR 200,000 Swiss Reinsurance variable perpetual
209,500 0.13
EUR 1,100,000 Telefonica Europe variable perpetual
1,184,700 0.73
Netherlands Antilles 224,478 0.14
EUR 206,000 Teva Pharmaceutical Finance IV EMTN 2.875% 15/04/2019
224,478 0.14
New Zealand 165,792 0.10
NZD 264,000 New Zealand Government 3% 15/04/2020
165,792 0.10
Norway 293,325 0.18
EUR 240,000 DNB Bank RegS 4.375% 24/02/2021
293,325 0.18
AVIVA INVESTORS – GLOBAL AGGREGATE BOND FUND (CONTINUED)Portfolio of Investments and Other Net Assets as at 31 December 2014

AVIVA INVESTORS – ANNUAL REPORT AND AUDITED FINANCIAL STATEMENTS avivainvestors.com 44
Number of shares of Principal Amount
Transferable Securities and Money Market Instruments Admitted to an Official Exchange Listing
Market Value
EUR
% Net assets
Peru 97,723 0.06
USD 100,000 Peruvian Government 5.625% 18/11/2050
97,723 0.06
Poland 1,246,452 0.77
PLN 2,043,000 Poland Government 5.5% 25/04/2015
481,007 0.30
PLN 2,098,000 Poland Government 5.5% 25/10/2019
562,338 0.35
EUR 150,000 Poland Government EMTN 5.25% 20/01/2025
203,107 0.12
Singapore 440,796 0.27
SGD 696,000 Singapore Government 2.25% 01/06/2021
440,796 0.27
Slovakia 180,910 0.11
EUR 157,000 Slovakia Government 3% 28/02/2023
180,910 0.11
Slovenia 50,592 0.03
EUR 49,000 Slovenia Government 2.25% 25/03/2022
50,592 0.03
South Africa 334,036 0.21
ZAR 4,694,000 South Africa Government 7.75% 28/02/2023
334,036 0.21
Spain 2,829,361 1.75
EUR 200,000 Abertis Infraestructuras 2.5% 27/02/2025
214,659 0.13
EUR 1,166,000 Spain Government 4% 30/04/2020 1,352,991 0.84
EUR 270,000 Spain Government 5.15% 31/10/2044
387,836 0.24
EUR 491,000 Spain Government 5.9% 30/07/2026
691,243 0.43
USD 75,000 Telefonica Emisiones 5.134% 27/04/2020
68,694 0.04
EUR 100,000 Telefonica Emisiones EMTN 5.811% 05/09/2017
113,938 0.07
Supranational 2,360,251 1.46
EUR 390,000 European Investment Bank 1.5% 15/07/2020
417,831 0.26
EUR 925,000 European Investment Bank 1.5% 15/04/2021
994,115 0.61
EUR 554,000 European Investment Bank EMTN 4.125% 15/04/2024
726,621 0.45
SEK 1,705,000 European Investment Bank EMTN 5% 01/12/2020
221,684 0.14
Sweden 987,095 0.61
USD 430,000 Nordea Bank 144A variable perpetual
352,896 0.22
SEK 5,125,000 Sweden Government 4.25% 12/03/2019
634,199 0.39
Number of shares of Principal Amount
Transferable Securities and Money Market Instruments Admitted to an Official Exchange Listing
Market Value
EUR
% Net assets
Switzerland 412,230 0.25
USD 500,000 Credit Suisse/New York GMTN 1.375% 26/05/2017
412,230 0.25
United Arab Emirates 223,782 0.14
EUR 220,000 Xstrata Finance Dubai EMTN 1.75% 19/05/2016
223,782 0.14
United Kingdom 15,168,318 9.37
GBP 805,000 Barclays Bank variable perpetual 1,366,655 0.84
GBP 720,000 Barclays EMTN 10% 21/05/2021 1,231,621 0.76
GBP 120,000 Eversholt Funding EMTN 6.697% 22/02/2035
205,329 0.13
EUR 200,000 FCE Bank EMTN 1.875% 18/04/2019
208,367 0.13
GBP 170,000 Grainger 5% 16/12/2020 223,231 0.14
USD 200,000 HSBC Holdings variable perpetual 166,067 0.10
GBP 140,000 Investec Bank EMTN 9.625% 17/02/2022
213,734 0.13
GBP 100,000 LBG Capital No.2 15% 21/12/2019 178,469 0.11
GBP 200,000 Motability Operations EMTN 5.25% 28/09/2016
276,227 0.17
EUR 150,000 Old Mutual EMTN variable perpetual
151,460 0.09
GBP 90,000 Principality Building Society EMTN variable 08/07/2016
109,926 0.07
EUR 270,000 Royal Bank of Scotland EMTN 5.375% 30/09/2019
328,259 0.20
EUR 1,350,000 Royal Bank of Scotland variable perpetual
1,419,836 0.88
GBP 200,000 Standard Chartered EMTN 4.375% 18/01/2038
270,557 0.17
GBP 168,286 Tesco Property Finance 4 RegS 5.801% 13/10/2040
215,193 0.13
GBP 1,358,000 United Kingdom Gilt 2% 22/07/2020
1,812,017 1.12
GBP 248,000 United Kingdom Gilt 2.5% 26/07/2016
1,052,915 0.65
GBP 669,000 United Kingdom Gilt 2.75% 07/09/2024
938,182 0.58
GBP 2,559,000 United Kingdom Gilt 3.25% 22/01/2044
3,802,329 2.35
GBP 580,000 Virgin Media Secured Finance RegS 5.5% 15/01/2025
773,536 0.48
USD 270,000 WPP Finance 2010 3.75% 19/09/2024
224,408 0.14
United States of America 37,626,535 23.24
USD 160,000 Aetna 3.5% 15/11/2024 134,673 0.08
USD 11,559 Ally Auto Receivables Trust 0.74% 15/04/2016
9,555 0.01
AVIVA INVESTORS – GLOBAL AGGREGATE BOND FUND (CONTINUED)Portfolio of Investments and Other Net Assets as at 31 December 2014

AVIVA INVESTORS – ANNUAL REPORT AND AUDITED FINANCIAL STATEMENTS avivainvestors.com 45
Number of shares of Principal Amount
Transferable Securities and Money Market Instruments Admitted to an Official Exchange Listing
Market Value
EUR
% Net assets
USD 265,000 Ally Financial 3.125% 15/01/2016 220,642 0.14
USD 530,000 American Honda Finance MTN 2.25% 15/08/2019
439,695 0.27
USD 155,000 American International 3.375% 15/08/2020
133,234 0.08
GBP 229,000 American International 6.765% 15/11/2017
336,073 0.21
EUR 200,000 American International variable 15/03/2067
209,400 0.13
USD 280,000 Bank of America 2.65% 01/04/2019
233,325 0.14
USD 310,000 Bank of America GMTN 6.4% 28/08/2017
285,612 0.18
USD 545,000 BB&T 2.45% 15/01/2020 449,088 0.28
USD 225,000 Boardwalk Pipelines 5.75% 15/09/2019
201,417 0.12
USD 100,000 Burlington Northern Santa 3.85% 01/09/2023
87,328 0.05
USD 85,000 Burlington Northern Santa 4.9% 01/04/2044
79,299 0.05
USD 105,000 Burlington Northern Santa Fe 4.55% 01/09/2044
93,521 0.06
USD 250,000 Capital One Bank USA 1.3% 05/06/2017
204,946 0.13
USD 285,000 Cardinal Health 2.4% 15/11/2019 235,029 0.15
USD 325,000 Citigroup 2.55% 08/04/2019 270,622 0.17
USD 375,000 Citigroup 6.125% 21/11/2017 345,909 0.21
USD 135,000 CNA Financial 3.95% 15/05/2024 113,025 0.07
USD 205,000 CNH Capital 6.25% 01/11/2016 178,309 0.11
USD 360,000 ConocoPhillips 2.875% 15/11/2021 300,930 0.19
USD 185,000 Consolidated Edison Co of New York 4.625% 01/12/2054
168,240 0.10
USD 75,000 Credit Suisse First Boston Mortgage Securities variable 15/08/2038
63,283 0.04
USD 85,425 Credit Suisse First Boston Mortgage Securities variable 15/08/2038
71,559 0.04
USD 180,000 Crown Castle GS V/Crown Castle GS III 3.849% 15/04/2023
148,019 0.09
USD 310,000 Energy Transfer Partners 4.15% 01/10/2020
262,964 0.16
USD 616,975 Fannie Mae Pool 3.5% 01/09/2042 532,283 0.33
USD 257,294 Fannie Mae Pool 3.5% 01/10/2042 222,029 0.14
USD 633,240 Fannie Mae Pool 3.5% 01/02/2043 546,469 0.34
USD 1,139,778 Fannie Mae Pool 3.5% 01/08/2043 983,586 0.61
USD 304,967 Fannie Mae Pool 3.5% 01/01/2044 263,167 0.16
USD 492,484 Fannie Mae Pool 3.5% 01/01/2044 424,873 0.26
USD 2,254,729 Fannie Mae Pool 4% 01/02/2044 2,010,364 1.24
Number of shares of Principal Amount
Transferable Securities and Money Market Instruments Admitted to an Official Exchange Listing
Market Value
EUR
% Net assets
USD 1,009,659 Fannie Mae Pool 4% 01/08/2044 891,883 0.55
USD 2,754,402 Fannie Mae Pool 4.5% 01/11/2044 2,485,824 1.54
USD 115,000 Federal Realty Investment Trust 4.5% 01/12/2044
99,316 0.06
USD 25,000 Ford Motor 6.5% 01/08/2018 23,654 0.01
USD 200,000 Ford Motor Credit 3.664% 08/09/2024
165,948 0.10
USD 200,000 Ford Motor Credit 5% 15/05/2018 179,727 0.11
USD 2,860,879 Freddie Mac Gold Pool 3.5% 01/12/2043
2,468,134 1.52
USD 733,896 Freddie Mac Gold Pool 4% 01/11/2043
653,712 0.40
USD 0 Freddie Mac Gold Pool 4.5% 01/03/2044
- -
USD 2,195,000 General Motors 5.2% 01/04/2045 1,918,278 1.18
USD 4,677,280 GNMA 2012-58 IO variable 16/02/2053
286,999 0.18
USD 11,920,880 GNMA 2014-75 IO variable 16/08/2054
643,194 0.40
USD 3,176,429 GNMA 2014-73 IO variable 16/04/2056
176,303 0.11
USD 155,000 Goldman Sachs 2.55% 23/10/2019 127,769 0.08
USD 315,000 Goldman Sachs 5.625% 15/01/2017
279,299 0.17
USD 300,000 Goldman Sachs 6.25% 01/09/2017 276,023 0.17
GBP 150,000 Goldman Sachs EMTN 4.25% 29/01/2026
209,578 0.13
USD 8,207,988 Government National Mortgage Association variable 16/06/2052
450,959 0.28
USD 11,858,585 Government National Mortgage Association variable 16/02/2054
661,094 0.41
USD 12,297,939 Government National Mortgage Association variable 16/10/2054
438,322 0.27
USD 9,081,112 Government National Mortgage Association variable 16/01/2055
381,965 0.24
USD 12,425,005 Government National Mortgage Association variable 16/01/2055
429,143 0.26
USD 7,232,245 Government National Mortgage Association variable 16/05/2055
370,867 0.23
USD 270,000 Health Care REIT 4.95% 15/01/2021
245,672 0.15
USD 250,000 HSBC Bank 6% 09/08/2017 228,539 0.14
USD 165,000 Interpublic Group of Cos 4% 15/03/2022
139,791 0.09
EUR 239,000 Jefferies EMTN 2.375% 20/05/2020
243,453 0.15
USD 15,000 JP Morgan Chase Commercial Mortgage Securities Care UK Health & Social Care variable 15/12/2044
12,831 0.01
AVIVA INVESTORS – GLOBAL AGGREGATE BOND FUND (CONTINUED)Portfolio of Investments and Other Net Assets as at 31 December 2014
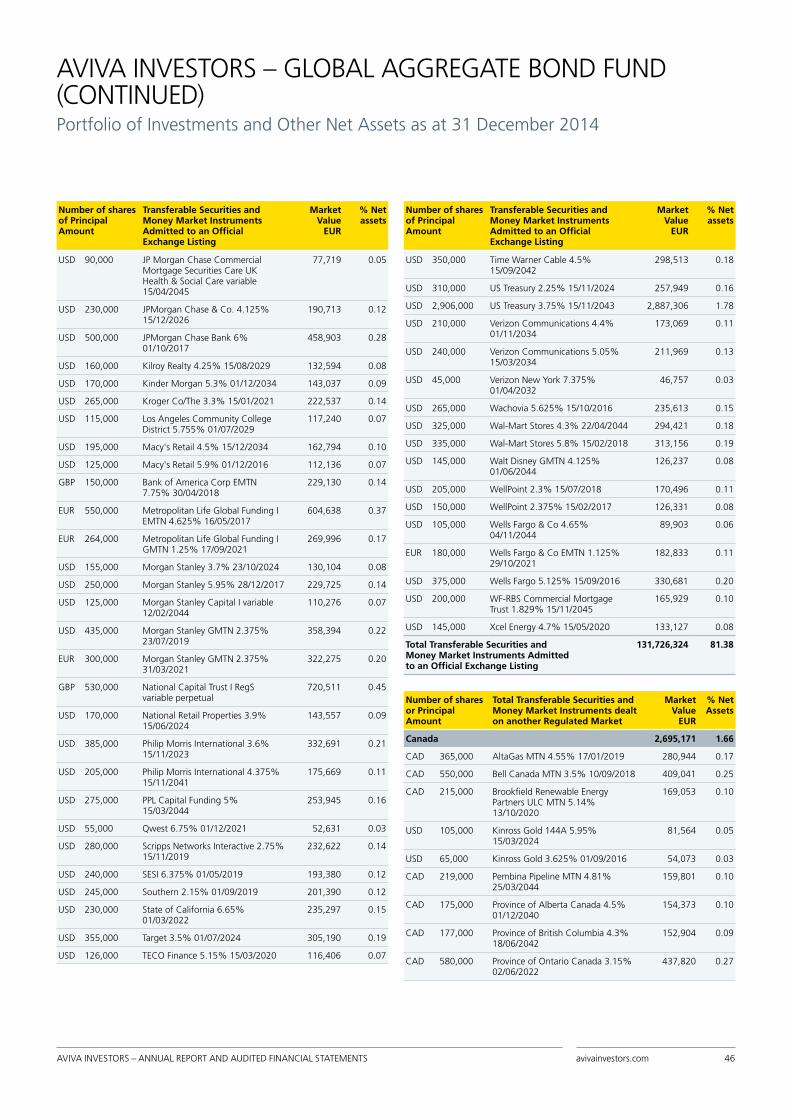
AVIVA INVESTORS – ANNUAL REPORT AND AUDITED FINANCIAL STATEMENTS avivainvestors.com 46
Number of shares of Principal Amount
Transferable Securities and Money Market Instruments Admitted to an Official Exchange Listing
Market Value
EUR
% Net assets
USD 90,000 JP Morgan Chase Commercial Mortgage Securities Care UK Health & Social Care variable 15/04/2045
77,719 0.05
USD 230,000 JPMorgan Chase & Co. 4.125% 15/12/2026
190,713 0.12
USD 500,000 JPMorgan Chase Bank 6% 01/10/2017
458,903 0.28
USD 160,000 Kilroy Realty 4.25% 15/08/2029 132,594 0.08
USD 170,000 Kinder Morgan 5.3% 01/12/2034 143,037 0.09
USD 265,000 Kroger Co/The 3.3% 15/01/2021 222,537 0.14
USD 115,000 Los Angeles Community College District 5.755% 01/07/2029
117,240 0.07
USD 195,000 Macy's Retail 4.5% 15/12/2034 162,794 0.10
USD 125,000 Macy's Retail 5.9% 01/12/2016 112,136 0.07
GBP 150,000 Bank of America Corp EMTN 7.75% 30/04/2018
229,130 0.14
EUR 550,000 Metropolitan Life Global Funding I EMTN 4.625% 16/05/2017
604,638 0.37
EUR 264,000 Metropolitan Life Global Funding I GMTN 1.25% 17/09/2021
269,996 0.17
USD 155,000 Morgan Stanley 3.7% 23/10/2024 130,104 0.08
USD 250,000 Morgan Stanley 5.95% 28/12/2017 229,725 0.14
USD 125,000 Morgan Stanley Capital I variable 12/02/2044
110,276 0.07
USD 435,000 Morgan Stanley GMTN 2.375% 23/07/2019
358,394 0.22
EUR 300,000 Morgan Stanley GMTN 2.375% 31/03/2021
322,275 0.20
GBP 530,000 National Capital Trust I RegS variable perpetual
720,511 0.45
USD 170,000 National Retail Properties 3.9% 15/06/2024
143,557 0.09
USD 385,000 Philip Morris International 3.6% 15/11/2023
332,691 0.21
USD 205,000 Philip Morris International 4.375% 15/11/2041
175,669 0.11
USD 275,000 PPL Capital Funding 5% 15/03/2044
253,945 0.16
USD 55,000 Qwest 6.75% 01/12/2021 52,631 0.03
USD 280,000 Scripps Networks Interactive 2.75% 15/11/2019
232,622 0.14
USD 240,000 SESI 6.375% 01/05/2019 193,380 0.12
USD 245,000 Southern 2.15% 01/09/2019 201,390 0.12
USD 230,000 State of California 6.65% 01/03/2022
235,297 0.15
USD 355,000 Target 3.5% 01/07/2024 305,190 0.19
USD 126,000 TECO Finance 5.15% 15/03/2020 116,406 0.07
Number of shares of Principal Amount
Transferable Securities and Money Market Instruments Admitted to an Official Exchange Listing
Market Value
EUR
% Net assets
USD 350,000 Time Warner Cable 4.5% 15/09/2042
298,513 0.18
USD 310,000 US Treasury 2.25% 15/11/2024 257,949 0.16
USD 2,906,000 US Treasury 3.75% 15/11/2043 2,887,306 1.78
USD 210,000 Verizon Communications 4.4% 01/11/2034
173,069 0.11
USD 240,000 Verizon Communications 5.05% 15/03/2034
211,969 0.13
USD 45,000 Verizon New York 7.375% 01/04/2032
46,757 0.03
USD 265,000 Wachovia 5.625% 15/10/2016 235,613 0.15
USD 325,000 Wal-Mart Stores 4.3% 22/04/2044 294,421 0.18
USD 335,000 Wal-Mart Stores 5.8% 15/02/2018 313,156 0.19
USD 145,000 Walt Disney GMTN 4.125% 01/06/2044
126,237 0.08
USD 205,000 WellPoint 2.3% 15/07/2018 170,496 0.11
USD 150,000 WellPoint 2.375% 15/02/2017 126,331 0.08
USD 105,000 Wells Fargo & Co 4.65% 04/11/2044
89,903 0.06
EUR 180,000 Wells Fargo & Co EMTN 1.125% 29/10/2021
182,833 0.11
USD 375,000 Wells Fargo 5.125% 15/09/2016 330,681 0.20
USD 200,000 WF-RBS Commercial Mortgage Trust 1.829% 15/11/2045
165,929 0.10
USD 145,000 Xcel Energy 4.7% 15/05/2020 133,127 0.08
Total Transferable Securities andMoney Market Instruments Admittedto an Official Exchange Listing
131,726,324 81.38
Number of shares or Principal Amount
Total Transferable Securities andMoney Market Instruments dealton another Regulated Market
Market Value
EUR
% Net Assets
Canada 2,695,171 1.66
CAD 365,000 AltaGas MTN 4.55% 17/01/2019 280,944 0.17
CAD 550,000 Bell Canada MTN 3.5% 10/09/2018 409,041 0.25
CAD 215,000 Brookfield Renewable Energy Partners ULC MTN 5.14% 13/10/2020
169,053 0.10
USD 105,000 Kinross Gold 144A 5.95% 15/03/2024
81,564 0.05
USD 65,000 Kinross Gold 3.625% 01/09/2016 54,073 0.03
CAD 219,000 Pembina Pipeline MTN 4.81% 25/03/2044
159,801 0.10
CAD 175,000 Province of Alberta Canada 4.5% 01/12/2040
154,373 0.10
CAD 177,000 Province of British Columbia 4.3% 18/06/2042
152,904 0.09
CAD 580,000 Province of Ontario Canada 3.15% 02/06/2022
437,820 0.27
AVIVA INVESTORS – GLOBAL AGGREGATE BOND FUND (CONTINUED)Portfolio of Investments and Other Net Assets as at 31 December 2014

AVIVA INVESTORS – ANNUAL REPORT AND AUDITED FINANCIAL STATEMENTS avivainvestors.com 47
Number of shares or Principal Amount
Total Transferable Securities andMoney Market Instruments dealton another Regulated Market
Market Value
EUR
% Net Assets
CAD 480,000 Province of Quebec Canada 4.5% 01/12/2017
372,447 0.23
USD 170,000 Suncor Energy 3.6% 01/12/2024 139,113 0.09
USD 205,000 Xstrata Finance Canada 144A 4.95% 15/11/2021
178,989 0.11
USD 130,000 Yamana Gold 4.95% 15/07/2024 105,049 0.07
Luxembourg 10,900,566 6.73
EUR 10,900 Aviva Investors Global Bond perpetual
10,900,566 6.73
Malaysia 234,842 0.14
MYR 973,000 Malaysia Government 4.378% 29/11/2019
234,842 0.14
Mexico 316,144 0.20
USD 220,000 Petroleos Mexicanos 3.5% 18/07/2018
184,538 0.12
USD 140,000 Petroleos Mexicanos 6.375% 23/01/2045
131,606 0.08
United States of America 12,085,852 7.47
USD 165,000 21st Century Fox America 144A 3.7% 15/09/2024
140,540 0.09
USD 230,000 Air Lease 2.125% 15/01/2018 187,224 0.12
USD 120,000 Allstate variable 15/05/2037 104,541 0.06
USD 200,000 Bayer US Finance 144A 3.375% 08/10/2024
168,535 0.10
USD 75,000 Boardwalk Pipelines 4.95% 15/12/2024
61,741 0.04
USD 205,000 Brown & Brown 4.2% 15/09/2024 171,671 0.11
USD 205,000 Celgene 1.9% 15/08/2017 170,119 0.11
USD 60,000 County of Clark Airport System Revenue 6.82% 01/07/2045
72,769 0.04
USD 158,507 CVS Pass-Through Trust Series 144A 4.163% 11/08/2036
135,507 0.08
USD 448,651 Fannie Mae Pool 3.5% 01/10/2042 387,163 0.24
USD 304,414 Fannie Mae Pool 3.5% 01/03/2043 262,699 0.16
USD 754,594 Fannie Mae Pool 3.5% 01/07/2043 651,178 0.40
USD 196,197 Fannie Mae Pool 3.5% 01/03/2044 169,324 0.10
USD 431,720 Fannie Mae Pool 3.5% 01/09/2044 372,589 0.23
USD 2,600,000 Fannie Mae Pool 5% 25/01/2044* 2,374,240 1.47
USD 510,000 Fifth Third Bank 1.15% 18/11/2016 420,857 0.26
USD 300,000 Georgia-Pacific 144A 3.163% 15/11/2021
249,779 0.15
USD 120,000 Gilead 2.35% 01/02/2020 99,822 0.06
USD 80,000 Gilead 4.5% 01/02/2045 70,958 0.04
USD 130,000 Glencore Funding 144A 4.625% 29/04/2024
108,390 0.07
USD 5,046,704 Government National Mortgage Association variable 16/06/2038
403,945 0.25
Number of shares or Principal Amount
Total Transferable Securities andMoney Market Instruments dealton another Regulated Market
Market Value
EUR
% Net Assets
USD 3,927,209 Government National Mortgage Association variable 16/03/2047
198,472 0.12
USD 7,814,092 Government National Mortgage Association variable 16/02/2052
386,013 0.24
USD 10,256,425 Government National Mortgage Association variable 16/05/2055
527,451 0.33
USD 6,463,825 Government National Mortgage Association variable 16/03/2056
408,721 0.25
USD 255,000 INVISTA Finance 144A 4.25% 15/10/2019
211,789 0.13
USD 185,000 Ipalco Enterprises 144A 7.25% 01/04/2016
161,391 0.10
USD 210,000 John Deere Capital MTN 1.55% 15/12/2017
173,661 0.11
USD 205,000 JPMorgan Chase & Co variable perpetual
169,414 0.11
USD 140,000 Los Angeles Unified School District 6.758% 01/07/2034
161,324 0.10
USD 228,000 Massachusetts Institute of Technology 4.678% 01/07/2114
219,238 0.14
USD 305,000 Medtronic 144A 4.625% 15/03/2045
274,374 0.17
USD 125,000 Microsoft 5.3% 08/02/2041 127,221 0.08
USD 255,000 Niagara Mohawk Power 144A 3.508% 01/10/2024
217,478 0.13
USD 280,000 PAA Finance 4.9% 15/02/2045 236,078 0.15
USD 185,000 Progressive variable 15/06/2037 166,001 0.10
USD 195,000 Puget Energy 6.5% 15/12/2020 189,621 0.12
USD 120,000 RLI 4.875% 15/09/2023 104,670 0.07
USD 505,000 Roche Holdings 144A 1.35% 29/09/2017
416,936 0.26
USD 265,000 Rockies Express Pipeline 144A 3.9% 15/04/2015
218,452 0.13
USD 180,000 Santa Clara Valley Transportation Authority 5.876% 01/04/2032
182,730 0.11
USD 200 US Treasury 1.75% 15/05/2023 161 -
USD 170,000 Viacom 4.85% 15/12/2034 144,226 0.09
USD 230,000 Walgreens Boots Alliance 3.3% 18/11/2021
191,683 0.12
USD 175,000 Walgreens Boots Alliance 4.8% 18/11/2044
153,098 0.09
USD 75,000 WM Wrigley 144A 1.4% 21/10/2016
62,058 0.04
Total Transferable Securities andMoney Market Instruments dealton another Regulated Market
26,232,575 16.20
Total Investments 157,958,899 97.58
Other Net Assets 3,913,520 2.42
Net Asset Value 161,872,419 100.00
AVIVA INVESTORS – GLOBAL AGGREGATE BOND FUND (CONTINUED)Portfolio of Investments and Other Net Assets as at 31 December 2014
*refer to note 2.2 (12)

AVIVA INVESTORS – ANNUAL REPORT AND AUDITED FINANCIAL STATEMENTS avivainvestors.com 48
Geographic Breakdown (as a percentage of Net Assets) % Net Assets
Australia 1.45
Austria 0.59
Belgium 0.89
Bermuda 0.09
Canada 3.71
Cayman Islands 0.73
Chile 0.09
Denmark 0.43
France 5.46
Germany 5.29
Indonesia 0.18
Ireland 0.30
Italy 4.60
Japan 16.60
Luxembourg 6.86
Malaysia 0.14
Mexico 1.03
Netherlands 2.98
Netherlands Antilles 0.14
New Zealand 0.10
Norway 0.18
Peru 0.06
Poland 0.77
Singapore 0.27
Slovakia 0.11
Slovenia 0.03
South Africa 0.21
Spain 1.75
Supranational 1.46
Sweden 0.61
Switzerland 0.25
United Arab Emirates 0.14
United Kingdom 9.37
United States of America 30.71
Total 97.58
AVIVA INVESTORS – GLOBAL AGGREGATE BOND FUND (CONTINUED)Portfolio of Investments and Other Net Assets as at 31 December 2014

AVIVA INVESTORS – ANNUAL REPORT AND AUDITED FINANCIAL STATEMENTS avivainvestors.com 49
Forward Foreign Exchange Contracts
Currency purchased Amount purchased Currency sold Amount sold Maturity date Counterparty Unrealised gain/(loss) EUR
AUD 10,151,000 EUR 6,824,367 06/02/2015 UBS AG. 22,165
EUR 1,815,203 AUD 2,672,861 09/01/2015 BNP PARIBAS S.A. 8,190
EUR 575,129 AUD 840,000 09/01/2015 MERRILL LYNCH INTERNATIONAL 7,239
EUR 33,920 AUD 50,000 09/01/2015 UBS AG. 117
EUR 473,991 DKK 3,526,000 09/01/2015 MERRILL LYNCH INTERNATIONAL 471
EUR 570,290 MXN 9,719,000 09/01/2015 BARCLAYS 25,530
EUR 1,083,202 PLN 4,550,000 09/01/2015 BARCLAYS 24,856
EUR 233,366 SEK 2,160,000 09/01/2015 CITIBANK N.A. 5,347
EUR 652,683 SEK 6,044,000 09/01/2015 MORGAN STANLEY INT 14,652
EUR 54,545 SEK 506,000 09/01/2015 ROYAL BANK OF SCOTLAND 1,130
EUR 352,179 ZAR 4,857,000 09/01/2015 CREDIT SUISSE 5,438
GBP 876,000 EUR 1,103,605 09/01/2015 CITIBANK N.A. 25,105
GBP 331,000 EUR 421,272 09/01/2015 JPMORGAN CHASE BANK 5,215
GBP 838,000 EUR 1,071,992 09/01/2015 MERRILL LYNCH INTERNATIONAL 7,756
GBP 308,000 EUR 387,124 09/01/2015 ROYAL BANK OF CANADA 9,729
GBP 420,347 EUR 529,044 09/01/2015 ROYAL BANK OF SCOTLAND 12,566
GBP 80,439,000 EUR 100,956,235 09/01/2015 SOCIETE GENERALE 2,687,978
GBP 859,000 EUR 1,079,342 09/01/2015 UBS AG. 27,464
GBP 83,012,000 EUR 106,318,913 06/02/2015 UBS AG. 584,669
JPY 126,582,000 EUR 863,442 09/01/2015 GOLDMAN SACHS INTL 9,052
JPY 26,539,758 EUR 180,000 09/01/2015 UBS AG. 2,931
KRW 34,744,000 USD 31,170 09/01/2015 NATIONAL WESTMINSTER BANK 460
NZD 4,767,403 AUD 4,420,000 27/01/2015 NOMURA INTERNATIONAL PLC 87,540
NZD 865,000 EUR 538,540 09/01/2015 UBS AG. 19,935
USD 125,581 EUR 101,000 09/01/2015 CITIBANK N.A. 2,777
USD 2,395,000 EUR 1,913,263 09/01/2015 GOLDMAN SACHS INTL 65,901
USD 1,632,112 EUR 1,340,762 09/01/2015 MORGAN STANLEY INT 7,971
USD 2,853,323 EUR 2,277,000 09/01/2015 ROYAL BANK OF CANADA 80,909
USD 3,196 EUR 2,597 09/01/2015 ROYAL BANK OF SCOTLAND 44
USD 492,945 EUR 404,000 09/01/2015 SOCIETE GENERALE 3,356
USD 1,647,655 EUR 1,328,590 09/01/2015 UBS AG. 32,987
USD 2,089,904 EUR 1,690,000 12/01/2015 ROYAL BANK OF SCOTLAND 36,979
USD 2,589,890 EUR 2,082,000 16/01/2015 GOLDMAN SACHS INTL 58,048
USD 295,670 MYR 995,000 09/01/2015 SOCIETE GENERALE 9,295
AUD 10,265,000 EUR 6,990,059 09/01/2015 ROYAL BANK OF CANADA (50,311)
AUD 4,420,000 NZD 4,870,619 27/01/2015 NOMURA INTERNATIONAL PLC (154,032)
EUR 411,910 AUD 626,000 09/01/2015 NOMURA INTERNATIONAL PLC (11,303)
AVIVA INVESTORS – GLOBAL AGGREGATE BOND FUND (CONTINUED)Portfolio of Investments and Other Net Assets as at 31 December 2014

AVIVA INVESTORS – ANNUAL REPORT AND AUDITED FINANCIAL STATEMENTS avivainvestors.com 50
AVIVA INVESTORS – GLOBAL AGGREGATE BOND FUND (CONTINUED)Portfolio of Investments and Other Net Assets as at 31 December 2014
Forward Foreign Exchange Contracts
Currency purchased Amount purchased Currency sold Amount sold Maturity date Counterparty Unrealised gain/(loss) EUR
EUR 6,915,575 AUD 10,265,000 09/01/2015 UBS AG. (24,174)
EUR 1,494,357 CAD 2,104,000 09/01/2015 MERRILL LYNCH INTERNATIONAL (6,667)
EUR 3,813,255 CAD 5,430,709 09/01/2015 SOCIETE GENERALE (61,090)
EUR 7,482 GBP 5,864 09/01/2015 GOLDMAN SACHS INTL (74)
EUR 10,146,488 GBP 8,050,000 09/01/2015 MERRILL LYNCH INTERNATIONAL (225,793)
EUR 5,102,835 GBP 4,054,571 09/01/2015 MORGAN STANLEY INT (121,408)
EUR 106,972,315 GBP 83,487,000 09/01/2015 UBS AG. (599,191)
EUR 24,478,703 JPY 3,593,729,000 09/01/2015 BNP PARIBAS S.A. (291,847)
EUR 2,640,953 JPY 389,432,887 09/01/2015 CREDIT SUISSE (43,297)
EUR 11,943 JPY 1,759,098 09/01/2015 GOLDMAN SACHS INTL (182)
EUR 704,777 JPY 105,000,000 09/01/2015 ROYAL BANK OF CANADA (18,958)
EUR 124,526 JPY 18,404,000 09/01/2015 ROYAL BANK OF SCOTLAND (2,328)
EUR 664,737 NZD 1,065,000 09/01/2015 NOMURA INTERNATIONAL PLC (22,865)
EUR 439,036 SGD 712,000 09/01/2015 MERRILL LYNCH INTERNATIONAL (4,927)
EUR 49,000 USD 60,925 09/01/2015 CITIBANK N.A. (1,347)
EUR 551,000 USD 683,582 09/01/2015 JPMORGAN CHASE BANK (13,894)
EUR 3,709,874 USD 4,614,000 09/01/2015 MERRILL LYNCH INTERNATIONAL (103,012)
EUR 1,694,836 USD 2,086,000 09/01/2015 MORGAN STANLEY INT (28,978)
EUR 2,693,777 USD 3,356,726 09/01/2015 ROYAL BANK OF CANADA (80,130)
EUR 98,200 USD 122,000 09/01/2015 ROYAL BANK OF SCOTLAND (2,617)
EUR 47,007,000 USD 58,695,014 09/01/2015 SOCIETE GENERALE (1,496,981)
EUR 2,024,269 USD 2,488,160 09/01/2015 UBS AG. (31,880)
EUR 2,082,000 USD 2,613,533 16/01/2015 DEUTSCHE BANK AG (77,583)
INR 162,138,000 USD 2,593,586 16/01/2015 BARCLAYS (26,954)
NOK 7,554,845 SEK 7,895,000 20/01/2015 SOCIETE GENERALE (1,134)
USD 2,513,767 INR 162,138,000 16/01/2015 STANDARD CHARTERED BANK (39,000)
USD 123,811 KRW 137,903,000 09/01/2015 SOCIETE GENERALE (1,749)
Net Unrealised Gain on Open Forward Foreign Exchange Contracts 350,096
(Continued)

AVIVA INVESTORS – ANNUAL REPORT AND AUDITED FINANCIAL STATEMENTS avivainvestors.com 51
Futures Contracts
Quantity Currency Description Maturity date Commitment Counterparty Unrealised gain/(loss) EUR
(14) AUD AUSTRALIA 10 YEAR BOND FUTURE
16/03/2015 (1,213,292) J.P. MORGAN (11,389)
(13) EUR EURO-BOBL FUTURE 06/03/2015 (1,693,640) J.P. MORGAN (9,750)
3 EUR EURO-BOBL FUTURE 06/03/2015 390,840 J.P. MORGAN 2,190
16 EUR EURO-BTP FUTURE 06/03/2015 2,169,600 J.P. MORGAN 29,280
8 EUR EURO-BUND FUTURE 06/03/2015 1,246,960 J.P. MORGAN 18,400
(3) EUR EURO-BUND FUTURE 06/03/2015 (467,610) J.P. MORGAN (8,730)
(13) EUR EURO-BUND FUTURE 06/03/2015 (2,026,310) J.P. MORGAN (25,220)
14 KRW KOREA 10 YEAR BOND FUTURE 17/03/2015 1,273,449 J.P. MORGAN 7,892
(3) GBP LONG GILT FUTURE 27/03/2015 (462,073) J.P. MORGAN (11,037)
(5) GBP LONG GILT FUTURE 27/03/2015 (770,122) J.P. MORGAN (18,395)
3 CHF SWISS 10 YEAR BOND FUTURE 06/03/2015 403,579 J.P. MORGAN (1,179)
6 USD US 10 YEAR NOTE FUTURE 20/03/2015 628,719 J.P. MORGAN 2,944
22 USD US 10 YEAR NOTE FUTURE 20/03/2015 2,305,302 J.P. MORGAN (17,690)
48 USD US 2 YEAR NOTE FUTURE 31/03/2015 8,671,129 J.P. MORGAN (15,160)
(11) USD US 5 YEAR NOTE FUTURE 31/03/2015 (1,081,134) J.P. MORGAN 498
95 USD US 5 YEAR NOTE FUTURE 31/03/2015 9,337,069 J.P. MORGAN (17,406)
(36) USD US 5 YEAR NOTE FUTURE 31/03/2015 (3,538,258) J.P. MORGAN (949)
(3) USD US LONG BOND FUTURE 20/03/2015 (358,405) J.P. MORGAN (6,353)
(9) USD US ULTRA BOND FUTURE 20/03/2015 (1,228,617) J.P. MORGAN (24,597)
(2) USD US ULTRA BOND FUTURE 20/03/2015 (273,026) J.P. MORGAN (5,466)
Net Unrealised Loss on Open Futures Contracts (112,117)
OTC Options Contracts
Buy/Sell Quantity/Nominal amount
Description Currency Maturity date Counterparty Commitment Market Value EUR
Buy 345,000 BNP Paribas Swaption CALL 3.6% 6M LIBOR
GBP 16/04/2029 BNP PARIBAS SA 1,242,000 19,899
Total OTC Options Contracts at Market Value 19,899
Credit Default Swap Contracts
Buy/Sell Nominal Value Description Currency Maturity date Counterparty Unrealised gain/(loss) EUR
Buy 100,000 CDS EUR Commerzbank 3.875% 20/12/2019 EUR 20/12/2019 JP MORGAN (945)
Buy 340,000 CDS EUR Commerzbank 4% 20/03/2019 EUR 20/03/2019 CREDIT SUISSE (4,750)
Sell 210,000 ITRX Crossover Series 22 20/12/2019 EUR 20/12/2019 MORGAN STANLEY INT
14,342
Net Unrealised Gain on Credit Default Swap Contracts 8,647
AVIVA INVESTORS – GLOBAL AGGREGATE BOND FUND (CONTINUED)Portfolio of Investments and Other Net Assets as at 31 December 2014

AVIVA INVESTORS – ANNUAL REPORT AND AUDITED FINANCIAL STATEMENTS avivainvestors.com 52
Interest Rate Swap Contracts
Nominal Value Description Currency Maturity date Counterparty Unrealised gain/(loss) EUR
30,000,000 IRS EUR Pay Floating EURIBOR 3 Month+0.027% Received Floating EURIBOR 6 Month 30/06/2041
EUR 30/06/2041 DEUTSCHE BANK AG
(44,596)
18,450,000 IRS EUR Pay Fixed 0.8000% Received Floating EURIBOR 6 Month 12/11/2019
EUR 12/11/2019 JP MORGAN (31,197)
4,855,000 IRS USD Pay Fixed 2.59% Received Floating LIBOR 3 Month 23/07/2024
USD 23/07/2024 DEUTSCHE BANK AG
(166,584)
1,120,000 IRS USD Pay Floating LIBOR 3 MonthReceived Fixed 3.24% 23/07/2044
USD 23/07/2044 DEUTSCHE BANK AG
123,663
4,470,000 IRS USD Pay Floating LIBOR 3 Month Received Fixed 1.785% 23/07/2019
USD 23/07/2019 DEUTSCHE BANK AG
41,001
1,810,000 IRS USD Pay Floating LIBOR 3 Month Received Fixed 1.1841% 09/10/2019
USD 09/10/2019 DEUTSCHE BANK AG
13,133
350,000 IRS USD Pay Floating LIBOR 3 Month Received Fixed 3.1% 09/10/2044
USD 09/10/2044 DEUTSCHE BANK AG
27,954
1,770,000 IRS USD Pay Fixed 2.54% Received Floating LIBOR 3 Month 09/10/2024
USD 09/10/2024 DEUTSCHE BANK AG
(44,937)
6,240,000 IRS USD Pay Fixed 1.5675% Received Floating LIBOR 3 Month 24/11/2017
USD 24/11/2017 CITI GLOBAL 8,254
6,180,000 IRS USD Pay Fixed 0.724% Received Floating LIBOR 3 Month 24/11/2016
USD 24/11/2016 CITI GLOBAL 8,397
1,395,000 IRS USD Pay Fixed 2.44% Received Floating LIBOR 3 Month 24/11/2024
USD 24/11/2024 CITI GLOBAL (20,950)
5,140,000 IRS USD Pay Floating LIBOR 3 MonthReceived Fixed 1.743% 24/11/2019
USD 24/11/2019 CITI GLOBAL 5,847
12,370,000 IRS USD Pay Floating LIBOR 3 MonthReceived Fixed 1.128% 24/11/2016
USD 24/11/2016 CITI GLOBAL (11,511)
5,870,000 IRS ILS Pay Floating TELBOR 3 Month Received Fixed 1.12% 21/11/2019
ILS 21/11/2019 NOMURA INTERNATIONAL
(11,662)
173,686,000 IRS SEK Pay Floating STIBOR 3 Month Received Fixed 1.44% 12/11/2019
SEK 12/11/2019 JP MORGAN 44,326
14,690,000 IRS ZAR Pay Floating JIBAR 3 Month Received Fixed 7.03% 19/11/2019
ZAR 19/11/2019 NOMURA INTERNATIONAL
(12,834)
245,550,000 IRS JPY Pay Fixed 1.60% Received Floating LIBOR 6 Month 20/03/2034
JPY 20/03/2034 UBS (163,616)
132,400,000 IRS JPY Pay Floating LIBOR 6 Month Received Fixed 0.17750% 07/11/2017
JPY 07/11/2017 NOMURA INTERNATIONAL
609
132,400,000 IRS JPY Pay Floating LIBOR 6 Month Received Fixed 1.34250% 07/11/2034
JPY 07/11/2034 NOMURA INTERNATIONAL
39,819
264,800,000 IRS JPY Pay Fixed 0.4150% Received Floating LIBOR 6 Month 07/11/2021
JPY 07/11/2021 NOMURA INTERNATIONAL
(12,489)
52,000,000 IRS CNY Pay Floating CNREPOFIX 1 Week Received Fixed 3.20% 23/12/2016
CNY 23/12/2016 JP MORGAN (37,803)
Net Unrealised Loss on Interest Rate Swap Contracts (245,176)
AVIVA INVESTORS – GLOBAL AGGREGATE BOND FUND (CONTINUED)Portfolio of Investments and Other Net Assets as at 31 December 2014

AVIVA INVESTORS – ANNUAL REPORT AND AUDITED FINANCIAL STATEMENTS avivainvestors.com 53
Inflation Swap Contracts
Nominal Value Description Currency Maturity date Counterparty Unrealised gain/(loss) EUR
9,500,000 Receive floating rate 1 month HICPXT Pay fixed rate 0.38% 23/12/2018
EUR 23/12/2018 CITI GLOBAL 3,680
4,100,000 Pay floating rate 1 month HICPXT Receive fixed rate 1.02% 23/12/2023
EUR 23/12/2023 CITI GLOBAL (11,037)
835,000 Receive floating rate 1 month United Kingdom RPI Pay fixed rate 3.555% 23/10/2044
GBP 23/10/2044 BNP PARIBAS (74,231)
2,950,000 Pay floating rate 1 month United Kingdom RPI Receive fixed rate 3.1675% 23/10/2024
GBP 23/10/2024 BNP PARIBAS 66,505
3,060,000 Pay floating rate 1 month United Kingdom RPI Receive fixed rate 3.38% 03/11/2029
GBP 03/11/2029 JP MORGAN 113,003
875,000 Pay floating rate 1 month United Kingdom RPI Receive fixed rate 3.38% 03/11/2029
GBP 03/11/2029 JP MORGAN 32,313
875,000 Receive floating rate 1 month United Kingdom RPI Pay fixed rate 3.558% 03/11/2044
GBP 03/11/2044 JP MORGAN (75,145)
3,060,000 Receive floating rate 1 month United Kingdom RPI Pay fixed rate 3.143% 03/11/2024
GBP 03/11/2024 JP MORGAN (46,469)
Net Unrealised Gain on Inflation Swap Contracts 8,619
AVIVA INVESTORS – GLOBAL AGGREGATE BOND FUND (CONTINUED)Portfolio of Investments and Other Net Assets as at 31 December 2014
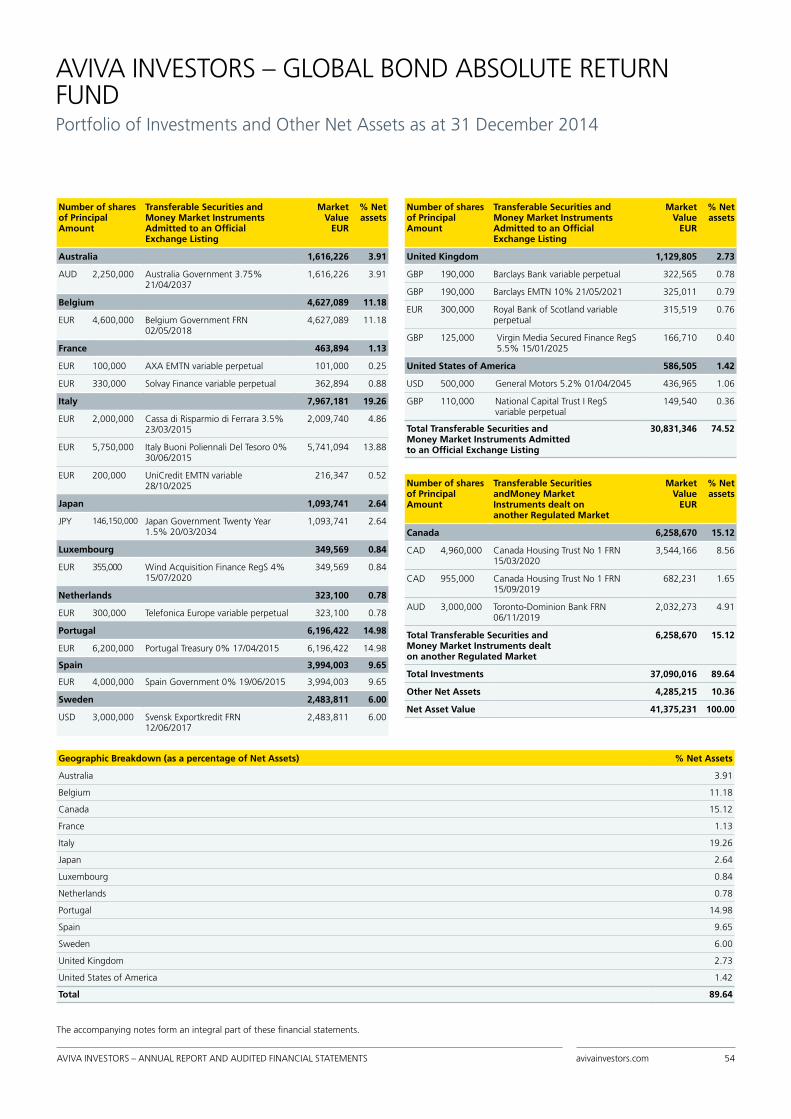
AVIVA INVESTORS – ANNUAL REPORT AND AUDITED FINANCIAL STATEMENTS avivainvestors.com 54
AVIVA INVESTORS – GLOBAL BOND ABSOLUTE RETURN FUNDPortfolio of Investments and Other Net Assets as at 31 December 2014
Number of shares of Principal Amount
Transferable Securities and Money Market Instruments Admitted to an Official Exchange Listing
Market Value
EUR
% Net assets
Australia 1,616,226 3.91
AUD 2,250,000 Australia Government 3.75% 21/04/2037
1,616,226 3.91
Belgium 4,627,089 11.18
EUR 4,600,000 Belgium Government FRN 02/05/2018
4,627,089 11.18
France 463,894 1.13
EUR 100,000 AXA EMTN variable perpetual 101,000 0.25
EUR 330,000 Solvay Finance variable perpetual 362,894 0.88
Italy 7,967,181 19.26
EUR 2,000,000 Cassa di Risparmio di Ferrara 3.5% 23/03/2015
2,009,740 4.86
EUR 5,750,000 Italy Buoni Poliennali Del Tesoro 0% 30/06/2015
5,741,094 13.88
EUR 200,000 UniCredit EMTN variable 28/10/2025
216,347 0.52
Japan 1,093,741 2.64
JPY 146,150,000 Japan Government Twenty Year 1.5% 20/03/2034
1,093,741 2.64
Luxembourg 349,569 0.84
EUR 355,000 Wind Acquisition Finance RegS 4% 15/07/2020
349,569 0.84
Netherlands 323,100 0.78
EUR 300,000 Telefonica Europe variable perpetual 323,100 0.78
Portugal 6,196,422 14.98
EUR 6,200,000 Portugal Treasury 0% 17/04/2015 6,196,422 14.98
Spain 3,994,003 9.65
EUR 4,000,000 Spain Government 0% 19/06/2015 3,994,003 9.65
Sweden 2,483,811 6.00
USD 3,000,000 Svensk Exportkredit FRN 12/06/2017
2,483,811 6.00
Number of shares of Principal Amount
Transferable Securities and Money Market Instruments Admitted to an Official Exchange Listing
Market Value
EUR
% Net assets
United Kingdom 1,129,805 2.73
GBP 190,000 Barclays Bank variable perpetual 322,565 0.78
GBP 190,000 Barclays EMTN 10% 21/05/2021 325,011 0.79
EUR 300,000 Royal Bank of Scotland variable perpetual
315,519 0.76
GBP 125,000 Virgin Media Secured Finance RegS 5.5% 15/01/2025
166,710 0.40
United States of America 586,505 1.42
USD 500,000 General Motors 5.2% 01/04/2045 436,965 1.06
GBP 110,000 National Capital Trust I RegS variable perpetual
149,540 0.36
Total Transferable Securities andMoney Market Instruments Admittedto an Official Exchange Listing
30,831,346 74.52
Number of shares of Principal Amount
Transferable Securities andMoney Market Instruments dealt on another Regulated Market
Market Value
EUR
% Net assets
Canada 6,258,670 15.12
CAD 4,960,000 Canada Housing Trust No 1 FRN 15/03/2020
3,544,166 8.56
CAD 955,000 Canada Housing Trust No 1 FRN 15/09/2019
682,231 1.65
AUD 3,000,000 Toronto-Dominion Bank FRN 06/11/2019
2,032,273 4.91
Total Transferable Securities andMoney Market Instruments dealton another Regulated Market
6,258,670 15.12
Total Investments 37,090,016 89.64
Other Net Assets 4,285,215 10.36
Net Asset Value 41,375,231 100.00
The accompanying notes form an integral part of these financial statements.
Geographic Breakdown (as a percentage of Net Assets) % Net Assets
Australia 3.91
Belgium 11.18
Canada 15.12
France 1.13
Italy 19.26
Japan 2.64
Luxembourg 0.84
Netherlands 0.78
Portugal 14.98
Spain 9.65
Sweden 6.00
United Kingdom 2.73
United States of America 1.42
Total 89.64

AVIVA INVESTORS – ANNUAL REPORT AND AUDITED FINANCIAL STATEMENTS avivainvestors.com 55
AVIVA INVESTORS – GLOBAL BOND ABSOLUTE RETURN FUND (CONTINUED)Portfolio of Investments and Other Net Assets as at 31 December 2014
Forward Foreign Exchange Contracts
Currency purchased Amount purchased Currency sold Amount sold Maturity date Counterparty Unrealised gain/(loss) EUR
EUR 40,051 AUD 59,000 09/01/2015 CITIBANK N.A. 165
EUR 3,702,738 AUD 5,408,000 09/01/2015 MERRILL LYNCH INTERNATIONAL 46,609
EUR 41,164 AUD 60,000 09/01/2015 STANDARD CHARTERED BANK 599
EUR 20,204 SEK 187,000 09/01/2015 BARCLAYS 463
GBP 42,000 EUR 53,062 09/01/2015 DEUTSCHE BANK AG 1,055
GBP 3,000 EUR 3,792 09/01/2015 HSBC BANK PLC 74
GBP 19,000 EUR 23,988 09/01/2015 SOCIETE GENERALE 493
NZD 1,855,189 AUD 1,720,000 27/01/2015 NOMURA INTERNATIONAL PLC 34,065
NZD 992,000 EUR 617,608 09/01/2015 UBS AG. 22,862
USD 35,000 EUR 28,562 09/01/2015 GOLDMAN SACHS INTL 361
USD 6,000 EUR 4,828 09/01/2015 JPMORGAN CHASE BANK 130
USD 501,000 EUR 402,045 09/01/2015 ROYAL BANK OF SCOTLAND 11,968
USD 1,063,501 EUR 860,000 12/01/2015 ROYAL BANK OF SCOTLAND 18,818
USD 987,691 EUR 794,000 16/01/2015 GOLDMAN SACHS INTL 22,137
AUD 30,000 EUR 20,582 09/01/2015 STANDARD CHARTERED BANK (300)
AUD 1,720,000 NZD 1,895,354 27/01/2015 NOMURA INTERNATIONAL PLC (59,940)
EUR 43,814 AUD 66,000 09/01/2015 JPMORGAN CHASE BANK (806)
EUR 4,204,582 CAD 5,919,000 09/01/2015 MERRILL LYNCH INTERNATIONAL (18,117)
EUR 31,598 GBP 25,000 09/01/2015 HSBC BANK PLC (614)
EUR 86,970 GBP 69,000 09/01/2015 MERRILL LYNCH INTERNATIONAL (1,935)
EUR 968,607 GBP 769,000 09/01/2015 ROYAL BANK OF SCOTLAND (22,236)
EUR 18,878 GBP 15,000 09/01/2015 SOCIETE GENERALE (450)
EUR 20,223 GBP 16,000 09/01/2015 UBS AG. (393)
EUR 1,003,990 JPY 147,394,000 09/01/2015 BNP PARIBAS S.A. (11,955)
EUR 626,787 NZD 1,004,000 09/01/2015 NOMURA INTERNATIONAL PLC (21,431)
EUR 19,735 USD 24,000 09/01/2015 CITIBANK N.A. (98)
EUR 360,496 USD 448,000 09/01/2015 JPMORGAN CHASE BANK (9,719)
EUR 2,516,668 USD 3,130,000 09/01/2015 MERRILL LYNCH INTERNATIONAL (69,880)
EUR 413,280 USD 515,000 09/01/2015 ROYAL BANK OF SCOTLAND (12,302)
EUR 794,000 USD 996,707 16/01/2015 DEUTSCHE BANK AG (29,588)
INR 61,796,000 USD 988,499 16/01/2015 BARCLAYS (10,273)
NOK 2,913,806 SEK 3,045,000 20/01/2015 SOCIETE GENERALE (437)
USD 958,078 INR 61,796,000 16/01/2015 STANDARD CHARTERED BANK (14,864)
Net Unrealised Loss on Open Forward Foreign Exchange Contracts (125,539)

AVIVA INVESTORS – ANNUAL REPORT AND AUDITED FINANCIAL STATEMENTS avivainvestors.com 56
Futures Contracts
Quantity Currency Description Maturity date Commitment Counterparty Unrealised gain/(loss) EUR
(35) AUD AUSTRALIA 10 YEAR BOND FUTURE
16/03/2015 (3,033,231) J.P. MORGAN (28,472)
10 EUR EURO-BTP FUTURE 06/03/2015 1,356,000 J.P. MORGAN 18,840
(1) EUR EURO-BUND FUTURE 06/03/2015 (155,870) J.P. MORGAN (2,910)
(8) EUR EURO-BUND FUTURE 06/03/2015 (1,246,960) J.P. MORGAN (15,520)
(1) GBP LONG GILT FUTURE 27/03/2015 (154,024) J.P. MORGAN (3,679)
(3) USD US ULTRA BOND FUTURE 20/03/2015 (409,539) J.P. MORGAN (8,199)
Net Unrealised Loss on Open Futures Contracts (39,940)
OTC Options Contracts
Buy/Sell Quantity/Nominal amount
Description Currency Maturity date Counterparty Commitment Market Value EUR
Buy 225,000 BNP Paribas Swaption CALL 3.6% 6M LIBOR
GBP 16/04/2029 BNP PARIBAS SA 810,000 12,978
Buy 160,000 JP Morgan Swaption CALL 3.16% 6M LIBOR
GBP 13/08/2029 JP MORGAN SECURITIES PLC
505,600 11,429
Total OTC Options Contracts at Market Value 24,407
Interest Rate Swap Contracts
Nominal Value Description Currency Maturity date Counterparty Unrealised gain/(loss) EUR
146,150,000 IRS JPY Pay Fixed 1.6% Received Floating LIBOR 6 Month 20/03/2034
JPY 20/03/2034 UBS (97,384)
20,000,000 IRS CNY Pay Floating CNREPOFIX 1 Week Received Fixed 3.20% 23/12/2016
CNY 23/12/2016 JP MORGAN (14,540)
830,000 IRS USD Pay Floating LIBOR 3 Month Received Fixed 3.24% 23/07/2044
USD 23/07/2044 DEUTSCHE BANK AG 91,643
3,315,000 IRS USD Pay Floating LIBOR 3 Month Received Fixed 1.785% 23/07/2019
USD 23/07/2019 DEUTSCHE BANK AG 30,407
3,595,000 IRS USD Pay Fixed 2.59% Received Floating LIBOR 3 Month 23/07/2024
USD 23/07/2024 DEUTSCHE BANK AG (123,350)
86,375,000 IRS JPY Pay Floating LIBOR 6 Month Received Fixed 1.3425% 07/11/2034
JPY 07/11/2034 NOMURA INTERNATIONAL
25,977
86,375,000 IRS JPY Pay Floating LIBOR 6 Month Received Fixed 0.1775% 07/11/2017
JPY 07/11/2017 NOMURA INTERNATIONAL
397
172,750,000 IRS JPY Pay Fixed 0.4125% Received Floating LIBOR 6 Month 07/11/2021
JPY 07/11/2021 NOMURA INTERNATIONAL
(8,147)
12,972,000 IRS EUR Pay Fixed 0.8% Received Floating EURIBOR 6 Month 12/11/2019
EUR 12/11/2019 JP MORGAN (21,934)
122,120,000 IRS SEK Pay Floating STIBOR 3 Month Received Fixed 1.44% 12/11/2019
SEK 12/11/2019 JP MORGAN 31,166
9,540,000 IRS ZAR Pay Floating JIBAR 3 Month Received Fixed 7.03% 19/11/2019
ZAR 19/11/2019 NOMURA INTERNATIONAL
(8,335)
3,805,000 IRS ILS Pay Floating TELBOR01 3 Month Received Fixed 1.12% 21/11/2019
ILS 21/11/2019 NOMURA INTERNATIONAL
(7,558)
4,135,000 IRS USD Pay Fixed 1.5675% Received Floating LIBOR 3 Month 24/11/2017
USD 24/11/2017 CITI GLOBAL 5,470
4,080,000 IRS USD Pay Fixed 0.724% Received Floating LIBOR 3 Month 24/11/2016
USD 24/11/2016 CITI GLOBAL 5,543
915,000 IRS USD Pay Fixed 2.44% Received Floating LIBOR 3 Month 24/11/2024
USD 24/11/2024 CITI GLOBAL (13,742)
AVIVA INVESTORS – GLOBAL BOND ABSOLUTE RETURN FUND (CONTINUED)Portfolio of Investments and Other Net Assets as at 31 December 2014

AVIVA INVESTORS – ANNUAL REPORT AND AUDITED FINANCIAL STATEMENTS avivainvestors.com 57
Interest Rate Swap Contracts
Nominal Value Description Currency Maturity date Counterparty Unrealised gain/(loss) EUR
3,390,000 IRS USD Pay Floating LIBOR 3 Month Received Fixed 1.743% 24/11/2019
USD 24/11/2019 CITI GLOBAL 3,856
8,165,000 IRS USD Pay Floating LIBOR 3 Month Received Fixed 1.128% 24/11/2016
USD 24/11/2016 CITI GLOBAL (7,598)
Net Unrealised Loss on Interest Rate Swap Contracts (108,129)
Inflation Swap Contracts
Nominal Value Description Currency Maturity date Counterparty Unrealised gain/(loss) EUR
590,000 Receive floating rate 1 month United Kingdom RPI Pay fixed rate 3.555% 23/10/2044
GBP 23/10/2044 BNP PARIBAS (52,451)
2,100,000 Pay floating rate 1 month United Kingdom RPI Receive fixed rate 3.1675% 23/10/2024
GBP 23/10/2024 BNP PARIBAS 47,343
2,170,000 Pay floating rate 1 month United Kingdom RPI Receive fixed rate 3.38% 03/11/2029
GBP 03/11/2029 JP MORGAN 80,135
620,000 Pay floating rate 1 month United Kingdom RPI Receive fixed rate 3.38% 03/11/2029
GBP 03/11/2029 JP MORGAN 22,896
2,170,000 Receive floating rate 1 month United Kingdom RPI Pay fixed rate 3.143% 03/11/2024
GBP 03/11/2024 JP MORGAN (32,954)
620,000 Receive floating rate 1 month United Kingdom RPI Pay fixed rate 3.558% 03/11/2044
GBP 03/11/2044 JP MORGAN (53,245)
2,800,000 Pay floating rate 1 month HICPXT Receive fixed rate 1.02% 23/12/2023
EUR 23/12/2023 CITI GLOBAL (7,538)
6,500,000 Receive floating rate 1 month HICPXT Pay fixed rate 0.38% 23/12/2018
EUR 23/12/2018 CITI GLOBAL 2,519
Net Unrealised Gain on Inflation Swap Contracts 6,705
AVIVA INVESTORS – GLOBAL BOND ABSOLUTE RETURN FUND (CONTINUED)Portfolio of Investments and Other Net Assets as at 31 December 2014
(continued)

AVIVA INVESTORS – ANNUAL REPORT AND AUDITED FINANCIAL STATEMENTS avivainvestors.com 58
AVIVA INVESTORS – GLOBAL CONVERTIBLES ABSOLUTE RETURN FUNDPortfolio of Investments and Other Net Assets as at 31 December 2014
The accompanying notes form an integral part of these financial statements.
Number of shares of Principal Amount
Transferable Securities and Money Market Instruments Admitted to an Official Exchange Listing
Market Value
USD
% Net assets
Australia 13,434,352 3.30
AUD 6,000,000 Beach Energy 3.95% 03/04/2017 4,888,569 1.20
AUD 10,000,000 Novion Property Group 5.75% 04/07/2016
8,545,783 2.10
Bermuda 8,818,137 2.17
CNY 45,000,000 China Daye Non-Ferrous Metals Mining 0.5% 30/05/2018
6,754,932 1.66
HKD 18,000,000 REXLot Holdings 4.5% 17/04/2019 2,063,205 0.51
British Virgin Islands 47,576,745 11.70
USD 8,000,000 Asia View 1.5% 08/08/2019 7,914,120 1.95
USD 8,000,000 Crotona Assets 4% 14/04/2019 7,795,400 1.92
USD 16,000,000 Newford Capital 0% 12/05/2016 17,172,000 4.22
USD 6,000,000 PB Issuer No 2 1.75% 12/04/2016 5,776,380 1.42
HKD 30,000,000 Shine Power International 0% 28/07/2019
3,731,175 0.92
HKD 40,000,000 Tong Jie 0% 18/02/2018 5,187,670 1.27
Canada 3,720,000 0.92
USD 4,000,000 Just Energy 6.5% 29/07/2019 3,720,000 0.92
Cayman Islands 48,439,570 11.92
HKD 109,000,000 China Overseas Grand Oceans Finance Cayman step coupon 2% 21/03/2017
14,046,092 3.46
HKD 20,000,000 China Precious Metal Resources 7.25% 04/02/2018
1,431,362 0.35
USD 3,000,000 Haitian International 2% 13/02/2019
3,004,770 0.74
HKD 40,000,000 Kingsoft 1.25% 11/04/2019 4,646,099 1.14
HKD 10,000,000 Shenzhou International 0.5% 18/06/2019
1,274,170 0.31
CNH 32,900,000 Shui On Land 4.5% 29/09/2015 5,261,292 1.30
USD 7,000,000 Siem Industries 1% 12/09/2019 6,420,785 1.58
USD 14,000,000 Soufun 144A 2% 15/12/18 12,355,000 3.04
India 1,484,100 0.36
USD 2,000,000 Jaiprakash Associates 5.75% 08/09/2017
1,484,100 0.36
Jersey 22,445,605 5.52
EUR 4,000,000 Magnolia Finance variable perpetual
4,664,815 1.15
USD 10,000,000 Vedanta Resources Jersey 5.5% 13/07/2016
9,787,950 2.41
USD 8,000,000 Vedanta Resources Jersey II 4% 30/03/2017
7,992,840 1.96
Malaysia 16,792,345 4.13
USD 17,000,000 Pulai Capital 0% 22/03/2019 16,792,345 4.13
Number of shares of Principal Amount
Transferable Securities and Money Market Instruments Admitted to an Official Exchange Listing
Market Value
USD
% Net assets
Mauritius 9,674,750 2.38
USD 10,000,000 Golden Agri-Resources RegS 2.5% 04/10/2017
9,674,750 2.38
Netherlands 7,689,880 1.89
USD 8,000,000 Lukoil International Finance 2.625% 16/06/2015
7,689,880 1.89
Singapore 8,255,735 2.03
SGD 3,000,000 CapitaLand RegS 1.85% 19/06/2020
2,143,955 0.53
SGD 8,000,000 CapitaLand RegS 2.875% 03/09/2016
6,111,780 1.50
South Korea 4,317,500 1.06
USD 5,000,000 Celltrion 2.75% 27/03/2018 4,317,500 1.06
Sweden 5,673,278 1.40
SEK 44,000,000 SAS AB 7.5% 01/04/2015 5,673,278 1.40
Taiwan 2,989,185 0.74
USD 3,000,000 Far Eastern International Bank 0% 07/02/2018
2,989,185 0.74
Thailand 4,061,040 1.00
USD 4,000,000 CP Foods 0.5% 15/01/2019 4,061,040 1.00
United Kingdom 4,077,426 1.00
GBP 2,400,000 SVG Capital 8.25% 05/06/2016 4,077,426 1.00
United States of America 108,489,600 26.69
USD 15,000,000 American Energy - Utica 144A 3.5% 01/03/2021
10,875,000 2.68
USD 10,000,000 Annaly Capital Management 5% 15/05/2015
10,062,500 2.48
USD 10,000 Barnes & Noble 7.75% 18/08/2021 14,102,900 3.47
USD 2,250,000 BPZ Resources 6.5% 01/03/2015 1,402,560 0.35
USD 3,000,000 Dealertrack Technologies 1.5% 15/03/2017
3,957,600 0.97
USD 5,000,000 Endologix 2.25% 15/12/2018 4,921,875 1.21
USD 5,000,000 Ezcorp 144A 2.125% 15/06/2019 4,745,300 1.17
USD 10,000,000 Hologic step coupon 15/12/2043 11,072,250 2.72
USD 5,000,000 Insulet 2% 15/06/2019 6,046,125 1.49
USD 10,000,000 Integra LifeSciences 1.625% 15/12/2016
10,693,750 2.63
USD 2,000,000 Sequenom 5% 01/10/2017 2,047,940 0.50
USD 5,000,000 Titan Machinery 3.75% 01/05/2019
3,590,625 0.88
USD 15,000,000 Volcano 1.75% 01/12/2017 14,896,875 3.66
USD 10,000,000 WebMD Health 2.25% 31/03/2016 10,074,300 2.48
Total Transferable Securities andMoney Market InstrumentsAdmitted to an OfficialExchange Listing
317,939,248 78.21

AVIVA INVESTORS – ANNUAL REPORT AND AUDITED FINANCIAL STATEMENTS avivainvestors.com 59
AVIVA INVESTORS – GLOBAL CONVERTIBLES ABSOLUTE RETURN FUND (CONTINUED)Portfolio of Investments and Other Net Assets as at 31 December 2014
Number of shares of Principal Amount
Other Transferable Securities not dealt on another Regulated Market
Market Value
USD
% Net assets
Bermuda 3,248,190 0.80
USD 3,300,000 Ship Finance International 3.75% 10/02/2016
3,248,190 0.80
Cayman Islands 20,380,425 5.01
USD 5,000,000 Home Inns & Hotels Management 2% 15/12/2015
4,926,625 1.21
USD 5,000,000 Qihoo 360 Technology 144A 0.5% 15/08/2020
4,353,800 1.07
USD 12,000,000 SINA 1% 01/12/2018 11,100,000 2.73
United States of America 41,407,643 10.19
USD 2,769,231 Brammo 'B' Preference* 1,052,308 0.26
USD 1,333,333 Brammo 'D' Preference* 1,000,000 0.25
USD 2,400,000 Brammo 'D' Warrants* 312,000 0.08
Number of shares of Principal Amount
Other Transferable Securities not dealt on another Regulated Market
Market Value
USD
% Net assets
USD 6,000,000 Encore Capital 3% 01/07/2020 6,783,960 1.67
USD 10,000,000 Ixia 3% 15/12/2015 10,042,500 2.47
USD 2,800,000 KEYW Holding 2.5% 15/07/2019 2,514,750 0.62
USD 5,000,000 ServiceSource International 1.5% 01/08/2018
3,753,125 0.92
USD 4,000,000 TESARO 3% 01/10/2021 4,952,500 1.22
USD 9,600,000 Twitter 144A 1% 15/09/2021 8,379,312 2.06
USD 2,500,000 Violin Memory 4.25% 01/10/2019 2,617,188 0.64
Total Other Transferable Securities not dealton another Regulated Market
65,036,258 16.00
Total Investments 382,975,506 94.21
Other Net Assets 23,553,174 5.79
Net Asset Value 406,528,680 100.00
Geographic Breakdown (as a percentage of Net Assets) % Net Assets
Australia 3.30
Bermuda 2.97
British Virgin Islands 11.70
Canada 0.92
Cayman Islands 16.93
India 0.36
Jersey 5.52
Malaysia 4.13
Mauritius 2.38
Netherlands 1.89
Singapore 2.03
South Korea 1.06
Sweden 1.40
Taiwan 0.74
Thailand 1.00
United Kingdom 1.00
United States of America 36.88
Total 94.21
*As at 31 December 2014, the security was fair valued in good faith by the Board of Directors. (note 2.2 (11)).

AVIVA INVESTORS – ANNUAL REPORT AND AUDITED FINANCIAL STATEMENTS avivainvestors.com 60
AVIVA INVESTORS – GLOBAL CONVERTIBLES ABSOLUTE RETURN FUND (CONTINUED)Portfolio of Investments and Other Net Assets as at 31 December 2014
Forward Foreign Exchange Contracts
Currency purchased Amount purchased Currency sold Amount sold Maturity date Counterparty Unrealised gain/(loss) USD
GBP 1,608,000 USD 2,500,106 16/01/2015 ROYAL BANK OF SCOTLAND 6,951
USD 11,898,383 AUD 14,528,000 16/01/2015 GOLDMAN SACHS INTL 19,141
USD 20,034,830 EUR 16,066,000 16/01/2015 GOLDMAN SACHS INTL 591,721
USD 7,456,714 EUR 6,082,000 16/01/2015 UBS AG. 96,265
USD 1,807,308 GBP 1,156,000 16/01/2015 CITIBANK N.A. 4,971
USD 4,146,794 GBP 2,656,000 16/01/2015 MERRILL LYNCH INTERNATIONAL 5,786
USD 5,921,514 SEK 44,825,000 16/01/2015 NOMURA INTERNATIONAL PLC 195,260
USD 18,771,652 SGD 24,627,000 16/01/2015 HSBC BANK PLC 193,085
CHF 4,559,000 USD 4,717,362 16/01/2015 GOLDMAN SACHS INTL (128,597)
CHF 49,000 USD 49,574 16/01/2015 UBS AG. (254)
EUR 66,907,000 USD 83,132,951 16/01/2015 GOLDMAN SACHS INTL (2,161,955)
GBP 115,836,000 USD 180,853,936 16/01/2015 MERRILL LYNCH INTERNATIONAL (252,345)
USD 906,116 CAD 1,051,000 16/01/2015 UBS AG. (1,086)
Net Unrealised Loss on Open Forward Foreign Exchange Contracts (1,431,057)
Listed Options Contracts
Buy/Sell Quantity/Nominal amount
Description Currency Maturity date Counterparty Commitment Market Value USD
Sell 200 SPX INDEX P1700 20/03/2015 USD 20/03/2015 UBS 34,000,000 126,000
Sell 200 SPX INDEX P1550 19/06/2015 USD 19/06/2015 UBS 31,000,000 215,000
Total Listed Options Contracts at Market Value 341,000
Total Return Swap Contracts
Nominal Value Description Currency Maturity date Counterparty Unrealised gain/(loss) USD
2,824,756 TRS Receive NVIDIA 1% 01/12/2018 Paid Floating USD LIBOR 1 Month +1 %
USD 11/06/2015 CITIBANK 83,776
4,144,306 TRS Receive Workday 0.75% 15/07/2018 Paid Floating USD LIBOR 1 Month +0.35 %
USD 09/07/2015 DEUTSCHE BANK AG L
72,563
4,485,680 TRS Receive SOITEC 6.75% 18/09/2018 Paid Floating EUR EURIBOR 1 Month
EUR 18/11/2015 CITIBANK (8,596)
9,245,647 TRS Receive Qihoo 360 Technology 2.5% 15/09/2018 Paid Floating USD LIBOR 1 Month +0.85 %
USD 14/07/2015 DEUTSCHE BANK AG L
74,487
40,244,166 TRS Receive Logo Star 1.5% 22/11/2018 Paid Floating HKD HIBOR 3 Month +0.35 %
HKD 18/09/2015 DEUTSCHE BANK AG L
1,921
2,441,475 TRS Receive Energy XXI 3% 15/12/2018 Paid Floating USD LIBOR 1 Month +1 %
USD 11/06/2015 CITIBANK (218,323)
2,749,667 TRS Receive HealthSouth 2% 01/12/2043 Paid Floating USD LIBOR 1 Month +.35 %
USD 14/07/2015 DEUTSCHE BANK AG L
57,639
6,148,425 TRS Receive Vipshop Holdings 1.5% 15/03/2019 Paid Floating USD LIBOR 1 Month +0.35 %
USD 09/07/2015 DEUTSCHE BANK AG L
(140,261)
4,570,133 TRS Receive E-House China Holdings 2.75% 15/12/2018 Paid Floating USD LIBOR 1 Month +0.35 %
USD 09/07/2015 DEUTSCHE BANK AG L
(78,725)
6,544,750 TRS Receive Intel 2.95% 15/12/2035 Paid Floating USD LIBOR 1 Month +0.75 %
USD 11/06/2015 CITIBANK 88,260
2,994,436 TRS Receive Ship Finance International 3.75% 10/02/2016 Paid Floating USD LIBOR 1 Month +1 %
USD 11/06/2015 CITIBANK 37,497
6,192,155 TRS Receive Xilinx 2.625% 15/06/2017 Paid Floating USD LIBOR 1 Month +0.85 %
USD 09/07/2015 DEUTSCHE BANK AG L
(140,651)

AVIVA INVESTORS – ANNUAL REPORT AND AUDITED FINANCIAL STATEMENTS avivainvestors.com 61
AVIVA INVESTORS – GLOBAL CONVERTIBLES ABSOLUTE RETURN FUND (CONTINUED) Portfolio of Investments and Other Net Assets as at 31 December 2014
Total Return Swap Contracts
Nominal Value Description Currency Maturity date Counterparty Unrealised gain/(loss) USD
5,661,588 TRS Receive MGM Resorts International 4.25% 15/04/2015 Paid Floating USD LIBOR 1 Month +0.75 %
USD 11/06/2015 CITIBANK 281,937
1,844,396 TRS Receive Sequenom 5% 01/10/2017 Paid Floating USD LIBOR 1 Month
USD 09/07/2015 DEUTSCHE BANK AG L
4,151
3,351,148 TRS Receive Medicines 1.375% 01/06/2017 Paid Floating USD LIBOR 1 Month +0.85 %
USD 14/07/2015 DEUTSCHE BANK 154,267
1,356,680 TRS Receive Vivus 4.5% 01/05/2020 Paid Floating USD LIBOR 1 Month +1.5 %
USD 11/06/2015 CITIBANK (28,798)
5,031,500 TRS Receive Bristow Group 3% 15/06/2038 Paid Floating USD LIBOR 1 Month +0.75 %
USD 11/06/2015 CITIBANK 198,804
4,155,664 TRS Receive Stillwater Mining 1.75% 15/10/2032 Paid Floating USD LIBOR 1 Month +0.75 %
USD 09/07/2015 DEUTSCHE BANK AG L
194,059
2,983,821 TRS Receive Theravance 2.125% 15/01/2023 Paid Floating USD LIBOR 1 Month +0.75 %
USD 14/07/2015 DEUTSCHE BANK 174,191
2,897,423 TRS Receive Ctrip.com International 1.25% 15/10/2018 Paid Floating USD LIBOR 1 Month +1 %
USD 16/06/2015 CITIBANK 35,191
9,780,652 TRS Receive Cardtronics 1% 01/12/2020 Paid Floating USD LIBOR 1 Month +1. %
USD 11/06/2015 CITIBANK 175,992
813,825 TRS Receive Energy XXI 3% 15/12/2018 Paid Floating USD LIBOR 1 Month +1 %
USD 11/06/2015 CITIBANK (72,770)
5,031,500 TRS Receive Bristow Group 3% 15/06/2038 Paid Floating USD LIBOR 1 Month +0.75 %
USD 11/06/2015 CITIBANK 198,804
2,975,198 TRS Receive Cobalt International Energy 2.625% 01/12/2019 Paid Floating USD LIBOR 1 Month +0.85 %
USD 09/07/2015 DEUTSCHE BANK AG L
136,094
5,936,663 TRS Receive Stillwater Mining 1.75% 15/10/2032 Paid Floating USD LIBOR 1 Month +0.85 %
USD 09/07/2015 DEUTSCHE BANK AG L
277,029
14,413,169 TRS Receive SunEdison 2.75% 01/01/2021 Paid Floating USD LIBOR 1 Month +0.85 %
USD 11/06/2015 CITIBANK 427,375
745,955 TRS Receive Theravance 2.125% 15/01/2023 Paid Floating USD LIBOR 1 Month +0.85 %
USD 09/07/2015 DEUTSCHE BANK 43,523
2,824,756 TRS Receive NVIDIA 1% 01/12/2018 Paid Floating USD LIBOR 1 Month +1 %
USD 11/06/2015 CITIBANK 83,776
2,897,423 TRS Receive Ctrip.com International 1.25% 15/10/2018 Paid Floating USD LIBOR 1 Month +1 %
USD 11/06/2015 CITIBANK 35,191
Net Unrealised Gain on Total Return Swap Contracts 2,148,403
Total Return Swap on Contracts for Difference
Nominal Value
Description Currency Maturity date Counterparty Unrealised gain/(loss) USD
889,700 Receives weighted average financing on short basketPays performance on basket of equity contractfor difference
EUR 18/11/2015 Citibank 576,851
46,297,154 Receives weighted average financing on short basketPays performance on basket of equity contractfor difference
USD 16/06/2015 Citibank (2,878,227)
20,401,539 Receives weighted average financing on short basketPays performance on basket of equity contractfor difference
HKD 18/09/2015 Deutsche Bank (202)
42,240,824 Receives weighted average financing on short basketPays performance on basket of equity contractfor difference
USD 22/06/2015 Deutsche Bank (1,351,257)
Net Unrealised Loss on Total Return Swap on Contracts for Difference (3,652,835)
(continued)

AVIVA INVESTORS – ANNUAL REPORT AND AUDITED FINANCIAL STATEMENTS avivainvestors.com 62
AVIVA INVESTORS – GLOBAL CONVERTIBLES FUNDPortfolio of Investments and Other Net Assets as at 31 December 2014
Number of shares of Principal Amount
Transferable Securities and Money Market Instruments Admitted to an Official Exchange Listing
Market Value
USD
% Net assets
Austria 56,762,150 3.09
EUR 6,000,000 Immofinanz 1.5% 11/09/2019 7,595,000 0.41
EUR 12,000,000 Steinhoff Finance Holdings 4% 30/01/2021
18,682,712 1.02
EUR 18,000,000 Steinhoff Finance Holding 4.5% 31/03/2018
30,484,438 1.66
Bermuda 11,215,000 0.61
USD 100,000 Bunge 4.875% perpetual 11,215,000 0.61
British Virgin Islands 21,748,610 1.18
USD 7,000,000 Asia View 1.5% 08/08/2019 6,924,855 0.38
HKD 100,000,000 Logo Star 1.5% 22/11/2018 14,823,755 0.80
Cayman Islands 62,079,153 3.38
USD 12,000,000 China Overseas Finance Investment Cayman IV 0% 04/02/2021
12,967,140 0.71
USD 21,500,000 ENN Energy 0% 26/02/2018 23,581,415 1.28
USD 5,500,000 Semiconductor Manufacturing International 0% 07/11/2018
5,908,375 0.32
HKD 154,000,000 Shenzhou International 0.5% 18/06/2019
19,622,223 1.07
China 29,781,028 1.62
CNY 123,000,000 Bank of China step coupon 1.7% 02/06/2016
29,781,028 1.62
France 66,250,842 3.60
EUR 28,492,700 Assystem variable perpetual 9,498,059 0.52
EUR 11,600,000 Misarte 3.25% 01/01/2016 24,767,896 1.35
EUR 547,400 Technip 0.25% 01/01/2017 630,236 0.03
EUR 9,900,000 Unibail-Rodamco 0.75% 01/01/2018
31,354,651 1.70
Germany 62,491,975 3.40
EUR 16,000,000 Deutsche Post 0.6% 06/12/2019 26,802,704 1.46
EUR 14,000,000 Fresenius & Co. KGaA 0% 24/09/2019
19,057,101 1.04
EUR 7,200,000 LEG Immobilien 0.5% 01/07/2021 10,554,240 0.57
EUR 5,000,000 RAG-Stiftung 0% 31/12/2018 6,077,930 0.33
Hong Kong 17,871,675 0.97
USD 15,000,000 HKEx International 0.5% 23/10/2017
17,871,675 0.97
India 6,085,710 0.33
USD 6,000,000 Larsen & Toubro 0.675% 22/10/2019
6,085,710 0.33
Italy 33,543,681 1.83
EUR 7,000,000 Azimut Holding 2.125% 25/11/2020
9,364,861 0.51
EUR 4,400,000 Beni Stabili 3.375% 17/01/2018 6,028,321 0.33
EUR 2,200,000 Prysmian 1.25% 08/03/2018 2,711,093 0.15
Number of shares of Principal Amount
Transferable Securities and Money Market Instruments Admitted to an Official Exchange Listing
Market Value
USD
% Net assets
EUR 12,500,000 Schematrentaquattro 0.25% 29/11/2016
15,439,406 0.84
Japan 168,959,183 9.19
JPY 200,000,000 ABC-Mart 0% 05/02/2018 2,180,149 0.12
JPY 2,500,000,000 Asics 0% 01/03/2019 25,356,458 1.38
JPY 350,000,000 Ebara 0% 19/03/2018 3,455,628 0.19
JPY 2,000,000,000 Fukuyama Transporting 0% 22/03/2017
20,837,983 1.13
JPY 1,210,000,000 GS Yuasa 0% 13/03/2019 10,053,057 0.55
USD 8,700,000 Gunma Bank 0% 11/10/2019 9,399,915 0.51
USD 6,500,000 Joyo Bank 0% 24/04/2019 6,386,250 0.35
JPY 1,000,000,000 Kawasaki Kisen Kaisha 0% 26/09/2018
9,813,086 0.53
JPY 1,000,000,000 Nagoya Railroad 0% 11/12/2024 8,706,118 0.47
JPY 1,750,000,000 SBI 0% 02/11/2017 15,694,024 0.85
JPY 2,000,000,000 Square Enix Holdings 0% 04/02/2015
16,988,198 0.93
JPY 850,000,000 Teijin 0% 10/12/2021 7,732,061 0.42
JPY 950,000,000 Terumo 0% 06/12/2021 8,310,153 0.45
JPY 1,300,000,000 Toray Industries 0% 31/08/2021 13,713,241 0.75
JPY 1,210,000,000 Yamada Denki 0% 28/06/2019 10,332,862 0.56
Jersey 9,422,828 0.51
GBP 5,500,000 Derwent London Capital Jersey 1.125% 24/07/2019
9,422,828 0.51
Luxembourg 28,504,959 1.55
USD 11,000,000 Aperam 0.625% 08/07/2021 10,985,480 0.60
EUR 8,900,000 FF Group Finance Luxembourg 1.75% 03/07/2019
9,773,271 0.53
EUR 5,500,000 GBL Verwaltung 1.25% 07/02/2017
7,746,208 0.42
Malaysia 38,453,423 2.09
USD 25,400,000 Cahaya Capital 0% 18/09/2021 25,766,522 1.40
SGD 16,050,000 Indah Capital RegS 0% 24/10/2018 12,686,901 0.69
Netherlands 123,782,197 6.73
EUR 20,000,000 ACS Actividades Finance 2.625% 22/10/2018
26,862,989 1.46
USD 8,500,000 Fiat Chrysler Automobiles 7.875% 15/12/2016
9,092,195 0.49
EUR 7,000,000 OCI 3.875% 25/09/2018 9,145,479 0.50
USD 21,000,000 Qiagen 0.375% 19/03/2019 22,067,955 1.20
USD 45,000,000 Siemens Financieringsmaatschappij 1.65% 16/08/2019
51,229,800 2.79
EUR 4,000,000 Volkswagen International Finance RegS 5.5% 09/11/2015
5,383,779 0.29
The accompanying notes form an integral part of these financial statements.

AVIVA INVESTORS – ANNUAL REPORT AND AUDITED FINANCIAL STATEMENTS avivainvestors.com 63
*As at 31 December 2014, the security was fair valued in good faith by the Board of Directors. (note 2.2 (11))
AVIVA INVESTORS – GLOBAL CONVERTIBLES FUND (CONTINUED)Portfolio of Investments and Other Net Assets as at 31 December 2014
Number of shares of Principal Amount
Transferable Securities and Money Market Instruments Admitted to an Official Exchange Listing
Market Value
USD
% Net assets
Norway 18,127,154 0.99
EUR 12,500,000 Marine Harvest 0.875% 06/05/2019
18,127,154 0.99
Singapore 19,985,578 1.09
SGD 23,000,000 Ruby Assets 1.6% 01/02/2017 19,985,578 1.09
South Korea 18,090,797 0.98
KRW 20,000,000,000 Lotte Shopping 0% 24/01/2018 18,090,797 0.98
Spain 52,173,876 2.84
EUR 6,000,000 Acciona 3% 30/01/2019 7,866,571 0.43
EUR 20,000,000 Criteria CaixaHolding 1% 25/11/2017
27,595,311 1.50
EUR 9,000,000 International Consolidated Airlines Group 1.75% 31/05/2018
16,711,994 0.91
Sweden 16,128,126 0.88
SEK 114,000,000 Industrivarden 0% 15/05/2019 16,128,126 0.88
Taiwan 8,703,160 0.48
USD 8,000,000 Siliconware Precision Industries 0% 31/10/2019
8,703,160 0.48
Thailand 5,076,300 0.28
USD 5,000,000 CP Foods Holdings 0.5% 15/01/2019
5,076,300 0.28
United Arab Emirates 69,952,295 3.81
EUR 27,500,000 Aabar Investments RegS 4% 27/05/2016
39,756,283 2.16
USD 19,600,000 DP World 1.75% 19/06/2024 20,908,006 1.14
USD 8,400,000 National Bank of Abu Dhabi 1% 12/03/2018
9,288,006 0.51
United States of America 37,711,675 2.05
USD 180,000 Alcoa Preference 9,211,500 0.50
USD 121,500 American Tower Preference 14,063,625 0.76
USD 114,000 T-Mobile Preference 6,011,220 0.33
USD 166,000 Tyson Foods Preference 8,425,330 0.46
Total Transferable Securities andMoney Market Instruments Admittedto an Official Exchange Listing
982,901,375 53.48
Number of shares of Principal Amount
Transferable Securities andMoney Market Instruments dealt on another Regulated Market
Market Value
USD
% Net assets
Bermuda 22,486,565 1.22
USD 11,000,000 Jazz Investments I 144A 1.875% 15/08/2021
12,580,315 0.68
USD 10,000,000 Ship Finance International 3.25% 01/02/2018
9,906,250 0.54
Cayman Islands 49,670,830 2.70
USD 11,000,000 Ctrip.com International 1.25% 15/10/2018
10,779,010 0.59
Number of shares of Principal Amount
Transferable Securities andMoney Market Instruments dealt on another Regulated Market
Market Value
USD
% Net assets
USD 31,500,000 Qihoo 360 Technology 144A 0.5% 15/08/2020
27,428,940 1.49
USD 9,600,000 Vipshop Holdings 1.5% 15/03/2019 11,462,880 0.62
Japan 55,692,531 3.03
JPY 410,000,000 CYBERDYNE 0% 12/12/2017 3,813,210 0.21
JPY 940,000,000 K's Holdings 0% 20/12/2019 8,378,815 0.46
USD 6,000,000 Mitsui OSK Lines 0% 24/04/2018 5,597,010 0.30
JPY 2,300,000,000 NH Foods 0% 26/09/2018 24,247,884 1.32
JPY 1,270,000,000 OSG 0% 04/04/2022 13,655,612 0.74
Jersey 8,813,855 0.48
GBP 5,500,000 Carillion Finance Jersey 2.5% 19/12/2019
8,813,855 0.48
Mexico 4,685,000 0.26
USD 4,000,000 Cemex 3.25% 15/03/2016 4,685,000 0.26
Netherlands 24,525,000 1.33
USD 24,000,000 NXP Semiconductor 144A 1% 01/12/2019
24,525,000 1.33
United States of America 601,533,588 32.73
USD 12,000,000 Akamai Technologies 144A 0% 15/02/2019
12,532,560 0.68
USD 9,000,000 BioMarin Pharmaceutical 1.5% 15/10/2020
11,075,625 0.60
USD 2,539,063 Brammo 'C' Preference* 1,091,797 0.06
USD 130,209 Brammo 'C' Warrants 02/07/2022* - -
USD 3,333,333 Brammo 'D' Preference* 2,500,000 0.14
USD 6,000,000 Brammo 'D' Warrants* 780,000 0.04
USD 9,000,000 Cepheid 144A 1.25% 01/02/2021 9,917,370 0.54
USD 24,000,000 Citrix Systems 144A 0.5% 15/04/2019
25,215,000 1.37
USD 6,500,000 HealthSouth 2% 01/12/2043 7,296,250 0.40
USD 11,000,000 Hologic step coupon 2% 15/12/2037
13,839,375 0.75
USD 8,000,000 Hologic step coupon 15/12/2043 8,857,800 0.48
USD 9,060,000 Integra LifeSciences 1.625% 15/12/2016
9,688,537 0.53
USD 28,000,000 Intel 2.95% 15/12/2035 37,311,820 2.03
USD 15,000,000 Jarden 144A 1.125% 15/03/2034 17,025,000 0.93
USD 12,000,000 JDS Uniphase 0.625% 15/08/2033 12,653,100 0.69
USD 13,000,000 Lam Research 1.25% 15/05/2018 18,584,995 1.01
USD 31,000,000 Liberty Media 1.375% 15/10/2023 30,864,375 1.68
USD 28,200,000 LinkedIn 144A 0.5% 01/11/2019 29,944,029 1.63
USD 10,000,000 Molina Healthcare 1.625% 15/08/2044
11,149,400 0.61
USD 15,000,000 NetSuite 0.25% 01/06/2018 16,865,625 0.92
USD 31,500,000 NVIDIA 1% 01/12/2018 36,677,813 2.00

AVIVA INVESTORS – ANNUAL REPORT AND AUDITED FINANCIAL STATEMENTS avivainvestors.com 64
AVIVA INVESTORS – GLOBAL CONVERTIBLES FUND (CONTINUED)Portfolio of Investments and Other Net Assets as at 31 December 2014
Number of shares of Principal Amount
Transferable Securities andMoney Market Instruments dealt on another Regulated Market
Market Value
USD
% Net assets
USD 12,000,000 Palo Alto Networks 144A 0% 01/07/2019
15,150,000 0.82
USD 15,000,000 Priceline 1% 15/03/2018 19,978,350 1.09
USD 8,000,000 Priceline Group 144A 0.9% 15/09/2021
7,656,640 0.42
USD 15,000,000 Red Hat 144A 0.25% 01/10/2019 17,812,500 0.97
USD 9,000,000 Restoration Hardware 144A 0% 15/06/2019
9,351,900 0.51
USD 23,500,000 Salesforce.com 0.25% 01/04/2018 26,943,338 1.47
USD 34,983,000 SanDisk 144A 0.5% 15/10/2020 42,744,853 2.33
USD 11,500,000 SolarCity 144A 1.625% 01/11/2019 10,451,258 0.57
USD 11,300,000 SunEdison 144A 0.25% 15/01/2020 10,918,908 0.59
USD 5,000,000 SunPower 144A 0.875% 01/06/2021
4,504,450 0.24
USD 43,000,000 Tesla Motors 0.25% 01/03/2019 40,124,375 2.18
USD 17,500,000 Toll Brothers Finance 0.5% 15/09/2032
17,921,750 0.97
USD 30,000,000 Twitter 144A 1% 15/09/2021 26,185,350 1.42
Number of shares of Principal Amount
Transferable Securities andMoney Market Instruments dealt on another Regulated Market
Market Value
USD
% Net assets
USD 3,000,000 Workday 0.75% 15/07/2018 3,588,195 0.19
USD 30,000,000 Yahoo 0% 01/12/2018 34,331,250 1.87
Total Transferable Securities andMoney Market Instruments dealton another Regulated Market
767,407,369 41.75
Number of shares of Principal Amount
Other Transferable Securities not dealt on another Regulated Market
Market Value
USD
% Net assets
United States of America 4,567,500 0.25
USD 6,300,000 American Energy - Utica LLC 144A 3.5% 01/03/2021
4,567,500 0.25
Total Other Transferable Securities not dealt on another Regulated Market
4,567,500 0.25
Total Investments 1,754,876,244 95.48
Other Net Assets 83,105,302 4.52
Net Asset Value 1,837,981,546 100.00
Geographic Breakdown (as a percentage of Net Assets) % Net Assets
Austria 3.09
Bermuda 1.83
British Virgin Islands 1.18
Cayman Islands 6.08
China 1.62
France 3.60
Germany 3.40
Hong Kong 0.97
India 0.33
Italy 1.83
Japan 12.22
Jersey 0.99
Luxembourg 1.55
Malaysia 2.09
Mexico 0.26
Netherlands 8.06
Norway 0.99
Singapore 1.09
South Korea 0.98
Spain 2.84
Sweden 0.88
Taiwan 0.48
Thailand 0.28
United Arab Emirates 3.81
United States of America 35.03
Total 95.48
*As at 31 December 2014, the security was fair valued in good faith by the Board of Directors. (note 2.2 (11)).

AVIVA INVESTORS – ANNUAL REPORT AND AUDITED FINANCIAL STATEMENTS avivainvestors.com 65
AVIVA INVESTORS – GLOBAL CONVERTIBLES FUND (CONTINUED)Portfolio of Investments and Other Net Assets as at 31 December 2014
Forward Foreign Exchange Contracts
Currency purchased Amount purchased Currency sold Amount sold Maturity date Counterparty Unrealised gain/(loss) USD
CHF 42,291 SEK 331,500 16/01/2015 ROYAL BANK OF SCOTLAND 218
EUR 3,788,373 SEK 35,674,500 16/01/2015 BARCLAYS 27,390
GBP 50,582,643 EUR 63,649,184 16/01/2015 BARCLAYS 1,835,754
GBP 10,581,713 JPY 1,965,581,723 16/01/2015 CITIBANK N.A. 102,336
GBP 882,115 SEK 10,457,471 16/01/2015 MORGAN STANLEY INT 39,409
GBP 3,319,758 SGD 6,818,773 16/01/2015 HSBC BANK PLC 31,812
JPY 1,617,942,007 CHF 13,170,000 16/01/2015 BARCLAYS 239,968
JPY 5,144,000 CHF 42,333 16/01/2015 CMB.TS 299
JPY 626,171,000 EUR 4,291,988 16/01/2015 MERRILL LYNCH INTERNATIONAL 28,990
USD 13,815,239 CHF 13,348,008 16/01/2015 GOLDMAN SACHS INTL 380,084
USD 30,500 CHF 29,397 16/01/2015 MERRILL LYNCH INTERNATIONAL 911
USD 4,054,500 EUR 3,255,468 16/01/2015 ROYAL BANK OF CANADA 114,725
USD 1,986,500 GBP 1,269,066 16/01/2015 MERRILL LYNCH INTERNATIONAL 7,881
USD 100,320,595 JPY 11,904,593,570 16/01/2015 CITIBANK N.A. 1,019,237
USD 16,271,140 JPY 1,908,237,000 16/01/2015 UBS AG. 353,711
USD 12,477,893 SEK 94,455,831 16/01/2015 NOMURA INTERNATIONAL PLC 411,454
CHF 982,426 EUR 818,037 16/01/2015 ROYAL BANK OF CANADA (1,150)
CHF 36,808 GBP 24,000 16/01/2015 ROYAL BANK OF CANADA (370)
CHF 52,008 GBP 34,400 16/01/2015 ROYAL BANK OF SCOTLAND (1,286)
CHF 198,737 JPY 24,414,927 16/01/2015 BARCLAYS (3,621)
CHF 55,844 SGD 75,904 16/01/2015 CMB.TS (1,053)
CHF 28,308,162 USD 29,295,051 16/01/2015 GOLDMAN SACHS INTL (802,068)
CHF 32,874 USD 33,500 16/01/2015 UBS AG. (411)
EUR 6,665,502 GBP 5,297,141 16/01/2015 BARCLAYS (192,245)
EUR 24,683,066 JPY 3,641,055,854 16/01/2015 CITIBANK N.A. (500,120)
EUR 34,519,681 SGD 56,315,063 16/01/2015 HSBC BANK PLC (708,195)
EUR 290,099,240 USD 360,452,657 16/01/2015 GOLDMAN SACHS INTL (9,373,930)
EUR 21,042,500 USD 25,804,144 16/01/2015 MERRILL LYNCH INTERNATIONAL (338,465)
EUR 16,056,446 USD 19,574,927 16/01/2015 UBS AG. (143,381)
GBP 7,461,500 USD 11,721,808 16/01/2015 JPMORGAN CHASE BANK (88,474)
GBP 108,178,898 USD 168,898,956 16/01/2015 MERRILL LYNCH INTERNATIONAL (235,664)
GBP 2,062,830 USD 3,221,000 16/01/2015 UBS AG. (4,811)
JPY 1,838,951,730 GBP 9,900,000 16/01/2015 CITIBANK N.A. (95,743)
JPY 332,248,000 GBP 1,803,590 16/01/2015 UBS AG. (40,580)
SEK 85,881,581 EUR 9,120,000 16/01/2015 BARCLAYS (65,938)
SGD 50,588,613 USD 38,560,598 16/01/2015 HSBC BANK PLC (396,635)
USD 16,978,163 KRW 18,709,086,500 16/01/2015 STANDARD CHARTERED BANK (147,667)
Net Unrealised Loss on Open Forward Foreign Exchange Contracts (8,547,628)

AVIVA INVESTORS – ANNUAL REPORT AND AUDITED FINANCIAL STATEMENTS avivainvestors.com 66
AVIVA INVESTORS – GLOBAL EMERGING MARKETS INDEX FUNDPortfolio of Investments and Other Net Assets as at 31 December 2014
The accompanying notes form an integral part of these financial statements.
Number of shares or Principal Amount
Transferable Securities and Money Market Instruments Admitted to an Official Exchange Listing
Market Value
USD
% Net assets
Bermuda 5,950,276 1.12
HKD 338,000 Alibaba Health Information Technology
220,924 0.04
HKD 464,000 Beijing Enterprises Water 317,469 0.06
HKD 432,000 Brilliance China Automotive 692,093 0.13
HKD 274,000 China Gas 432,804 0.08
HKD 128,000 China Resources Gas 330,105 0.06
HKD 234,000 COSCO Pacific 332,345 0.06
USD 9,340 Credicorp 1,498,323 0.28
HKD 1,453,000 GOME Electrical Appliances 216,282 0.04
HKD 110,000 Haier Electronics 261,958 0.05
HKD 1,724,000 Hanergy Thin Film Power 625,690 0.12
HKD 446,000 Kunlun Energy 422,136 0.08
HKD 239,000 Nine Dragons Paper 209,732 0.04
HKD 582,000 Sihuan Pharmaceutical 390,415 0.08
Brazil 46,761,073 8.83
BRL 14,810 AES Tiete Preference 101,734 0.02
BRL 650,305 AMBEV 4,008,445 0.76
BRL 15,800 B2W Cia Digital 133,559 0.02
BRL 89,390 Banco Bradesco 1,157,813 0.22
BRL 290,593 Banco Bradesco Preference 3,839,300 0.73
BRL 122,290 Banco do Brasil 1,095,605 0.21
BRL 26,430 Banco do Estado do Rio Grande do Sul 'B' Preference
144,469 0.03
BRL 57,740 Banco Santander Brasil 291,285 0.06
BRL 86,130 BB Seguridade Participacoes 1,041,874 0.20
BRL 269,970 BM&FBovespa 999,870 0.19
BRL 58,990 BR Malls Participacoes 364,499 0.07
BRL 31,500 Bradespar Preference 168,923 0.03
BRL 21,300 Braskem 'A' Preference 140,387 0.03
BRL 90,400 BRF - Brasil Foods 2,155,766 0.41
BRL 125,880 CCR 729,509 0.14
BRL 39,830 Centrais Eletricas Brasileiras 86,831 0.02
BRL 33,080 Centrais Eletricas Brasileiras 'B' Preference
102,107 0.02
BRL 26,994 CETIP - Mercados Organizados 327,041 0.06
BRL 19,712 Cia Brasileira de Distribuicao Grupo Pao de Acucar Preference
729,764 0.14
BRL 49,090 Cia de Saneamento Basico do Estado de Sao Paulo
313,946 0.06
BRL 101,657 Cia Energetica de Minas Gerais Preference
503,658 0.09
Number of shares or Principal Amount
Transferable Securities and Money Market Instruments Admitted to an Official Exchange Listing
Market Value
USD
% Net assets
BRL 23,250 Cia Energetica de Sao Paulo 'B' Preference
235,413 0.04
BRL 14,100 Cia Paranaense de Energia Preference
190,081 0.04
BRL 104,640 Cia Siderurgica Nacional 219,853 0.04
BRL 100,282 Cielo 1,566,553 0.30
BRL 16,800 Cosan Logistica 17,886 -
BRL 16,800 Cosan SA Industria e Comercio 182,176 0.03
BRL 33,460 CPFL Energia 234,253 0.04
BRL 40,540 Cyrela Brazil Realty SA Empreendimentos e Participacoes
168,980 0.03
BRL 41,109 Duratex 124,493 0.02
BRL 24,560 EcoRodovias Infraestrutura e Logistica
98,168 0.02
BRL 34,910 EDP - Energias do Brasil 117,803 0.02
BRL 85,010 Embraer 781,758 0.15
BRL 38,120 Estacio Participacoes 341,233 0.06
BRL 34,800 Fibria Celulose 426,392 0.08
BRL 123,300 Gerdau Preference 444,134 0.08
BRL 48,050 Hypermarcas 301,872 0.06
BRL 381,833 Itau Unibanco Preference 4,977,245 0.94
BRL 452,883 Itausa-Investimentos Itau Preference 1,602,349 0.30
BRL 105,650 JBS 445,938 0.08
BRL 71,600 Klabin 391,642 0.07
BRL 189,708 Kroton Educacional 1,104,406 0.21
BRL 19,180 Localiza Rent a Car 256,796 0.05
BRL 23,537 Lojas Americanas 115,640 0.02
BRL 72,933 Lojas Americanas Preference 472,465 0.09
BRL 17,920 Lojas Renner 514,942 0.10
BRL 4,990 M Dias Branco 171,793 0.03
BRL 38,800 Metalurgica Gerdau Preference 164,574 0.03
BRL 11,750 Multiplan Empreendimentos Imobiliarios
209,212 0.04
BRL 23,780 Natura Cosmeticos 285,598 0.05
BRL 38,930 Odontoprev 145,647 0.03
BRL 20,534 Oi Preference 66,665 0.01
BRL 411,390 Petroleo Brasileiro 1,484,947 0.28
BRL 584,250 Petroleo Brasileiro Preference 2,203,411 0.42
BRL 16,580 Porto Seguro 190,207 0.04
BRL 27,640 Qualicorp 286,413 0.05
BRL 31,470 Raia Drogasil 300,588 0.06
BRL 54,800 Souza Cruz 398,188 0.07
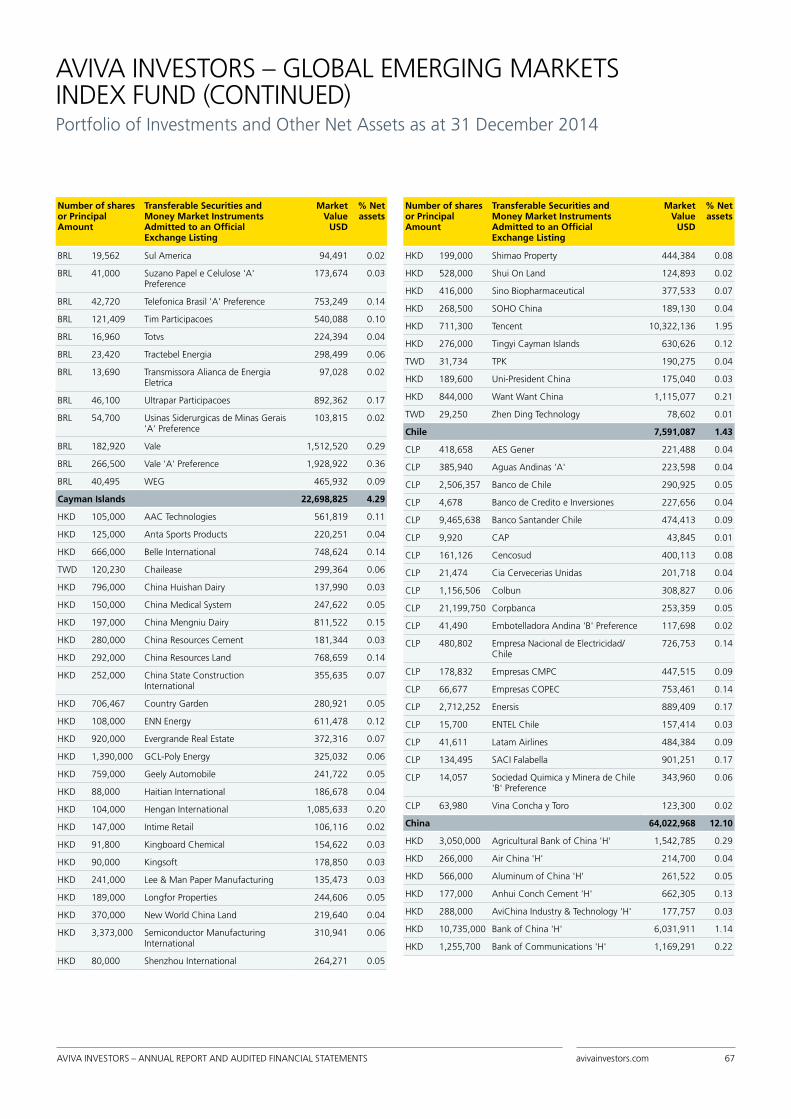
AVIVA INVESTORS – ANNUAL REPORT AND AUDITED FINANCIAL STATEMENTS avivainvestors.com 67
AVIVA INVESTORS – GLOBAL EMERGING MARKETS INDEX FUND (CONTINUED)Portfolio of Investments and Other Net Assets as at 31 December 2014
Number of shares or Principal Amount
Transferable Securities and Money Market Instruments Admitted to an Official Exchange Listing
Market Value
USD
% Net assets
BRL 19,562 Sul America 94,491 0.02
BRL 41,000 Suzano Papel e Celulose 'A' Preference
173,674 0.03
BRL 42,720 Telefonica Brasil 'A' Preference 753,249 0.14
BRL 121,409 Tim Participacoes 540,088 0.10
BRL 16,960 Totvs 224,394 0.04
BRL 23,420 Tractebel Energia 298,499 0.06
BRL 13,690 Transmissora Alianca de Energia Eletrica
97,028 0.02
BRL 46,100 Ultrapar Participacoes 892,362 0.17
BRL 54,700 Usinas Siderurgicas de Minas Gerais 'A' Preference
103,815 0.02
BRL 182,920 Vale 1,512,520 0.29
BRL 266,500 Vale 'A' Preference 1,928,922 0.36
BRL 40,495 WEG 465,932 0.09
Cayman Islands 22,698,825 4.29
HKD 105,000 AAC Technologies 561,819 0.11
HKD 125,000 Anta Sports Products 220,251 0.04
HKD 666,000 Belle International 748,624 0.14
TWD 120,230 Chailease 299,364 0.06
HKD 796,000 China Huishan Dairy 137,990 0.03
HKD 150,000 China Medical System 247,622 0.05
HKD 197,000 China Mengniu Dairy 811,522 0.15
HKD 280,000 China Resources Cement 181,344 0.03
HKD 292,000 China Resources Land 768,659 0.14
HKD 252,000 China State Construction International
355,635 0.07
HKD 706,467 Country Garden 280,921 0.05
HKD 108,000 ENN Energy 611,478 0.12
HKD 920,000 Evergrande Real Estate 372,316 0.07
HKD 1,390,000 GCL-Poly Energy 325,032 0.06
HKD 759,000 Geely Automobile 241,722 0.05
HKD 88,000 Haitian International 186,678 0.04
HKD 104,000 Hengan International 1,085,633 0.20
HKD 147,000 Intime Retail 106,116 0.02
HKD 91,800 Kingboard Chemical 154,622 0.03
HKD 90,000 Kingsoft 178,850 0.03
HKD 241,000 Lee & Man Paper Manufacturing 135,473 0.03
HKD 189,000 Longfor Properties 244,606 0.05
HKD 370,000 New World China Land 219,640 0.04
HKD 3,373,000 Semiconductor Manufacturing International
310,941 0.06
HKD 80,000 Shenzhou International 264,271 0.05
Number of shares or Principal Amount
Transferable Securities and Money Market Instruments Admitted to an Official Exchange Listing
Market Value
USD
% Net assets
HKD 199,000 Shimao Property 444,384 0.08
HKD 528,000 Shui On Land 124,893 0.02
HKD 416,000 Sino Biopharmaceutical 377,533 0.07
HKD 268,500 SOHO China 189,130 0.04
HKD 711,300 Tencent 10,322,136 1.95
HKD 276,000 Tingyi Cayman Islands 630,626 0.12
TWD 31,734 TPK 190,275 0.04
HKD 189,600 Uni-President China 175,040 0.03
HKD 844,000 Want Want China 1,115,077 0.21
TWD 29,250 Zhen Ding Technology 78,602 0.01
Chile 7,591,087 1.43
CLP 418,658 AES Gener 221,488 0.04
CLP 385,940 Aguas Andinas 'A' 223,598 0.04
CLP 2,506,357 Banco de Chile 290,925 0.05
CLP 4,678 Banco de Credito e Inversiones 227,656 0.04
CLP 9,465,638 Banco Santander Chile 474,413 0.09
CLP 9,920 CAP 43,845 0.01
CLP 161,126 Cencosud 400,113 0.08
CLP 21,474 Cia Cervecerias Unidas 201,718 0.04
CLP 1,156,506 Colbun 308,827 0.06
CLP 21,199,750 Corpbanca 253,359 0.05
CLP 41,490 Embotelladora Andina 'B' Preference 117,698 0.02
CLP 480,802 Empresa Nacional de Electricidad/ Chile
726,753 0.14
CLP 178,832 Empresas CMPC 447,515 0.09
CLP 66,677 Empresas COPEC 753,461 0.14
CLP 2,712,252 Enersis 889,409 0.17
CLP 15,700 ENTEL Chile 157,414 0.03
CLP 41,611 Latam Airlines 484,384 0.09
CLP 134,495 SACI Falabella 901,251 0.17
CLP 14,057 Sociedad Quimica y Minera de Chile 'B' Preference
343,960 0.06
CLP 63,980 Vina Concha y Toro 123,300 0.02
China 64,022,968 12.10
HKD 3,050,000 Agricultural Bank of China 'H' 1,542,785 0.29
HKD 266,000 Air China 'H' 214,700 0.04
HKD 566,000 Aluminum of China 'H' 261,522 0.05
HKD 177,000 Anhui Conch Cement 'H' 662,305 0.13
HKD 288,000 AviChina Industry & Technology 'H' 177,757 0.03
HKD 10,735,000 Bank of China 'H' 6,031,911 1.14
HKD 1,255,700 Bank of Communications 'H' 1,169,291 0.22

AVIVA INVESTORS – ANNUAL REPORT AND AUDITED FINANCIAL STATEMENTS avivainvestors.com 68
AVIVA INVESTORS – GLOBAL EMERGING MARKETS INDEX FUND (CONTINUED)Portfolio of Investments and Other Net Assets as at 31 December 2014
Number of shares or Principal Amount
Transferable Securities and Money Market Instruments Admitted to an Official Exchange Listing
Market Value
USD
% Net assets
HKD 168,000 BBMG 'H' 140,505 0.03
HKD 274,000 Beijing Capital International Airport 'H'
220,716 0.04
HKD 74,000 Byd 'H' 288,025 0.05
HKD 580,000 China Cinda Asset Management 'H' 282,549 0.05
HKD 1,174,200 China Citic Bank 'H' 940,457 0.18
HKD 589,000 China Coal Energy 'H' 368,550 0.07
HKD 635,000 China Communications Construction 'H'
762,236 0.14
HKD 349,200 China Communications Services 'H' 164,058 0.03
HKD 9,962,000 China Construction Bank 'H' 8,164,713 1.54
HKD 378,000 China COSCO 'H' 186,783 0.04
HKD 222,000 China Galaxy Securities 'H' 278,446 0.05
HKD 71,800 China International Marine Containers 'H'
159,987 0.03
HKD 1,061,000 China Life Insurance 'H' 4,152,822 0.79
HKD 383,000 China Longyuan Power 'H' 396,958 0.07
HKD 650,513 China Merchants Bank 'H' 1,632,397 0.31
HKD 895,800 China Minsheng Banking 'H' 1,175,006 0.22
HKD 412,000 China National Building Material 'H' 400,352 0.08
HKD 242,000 China Oilfield Services 'H' 419,282 0.08
HKD 374,400 China Pacific Insurance 'H' 1,895,489 0.36
HKD 3,525,400 China Petroleum & Chemical 'H' 2,841,512 0.54
HKD 283,000 China Railway Construction 'H' 360,819 0.07
HKD 554,000 China Railway 'H' 455,508 0.09
HKD 470,000 China Shenhua Energy 'H' 1,387,291 0.26
HKD 550,000 China Shipping Container Lines 'H' 173,301 0.03
HKD 1,966,000 China Telecom 'H' 1,144,988 0.22
HKD 182,700 China Vanke 'H' 406,640 0.08
HKD 123,000 Chongqing Changan Automobile 'B' 278,481 0.05
HKD 335,000 Chongqing Rural Commercial Bank 'H'
208,158 0.04
HKD 147,000 CITIC Securities 'H' 553,010 0.10
HKD 266,000 CSR 'H' 357,761 0.07
HKD 436,000 Datang International Power Generation 'H'
235,759 0.04
HKD 390,000 Dongfeng Motor 'H' 553,556 0.10
HKD 148,000 Great Wall Motor 'H' 838,184 0.16
HKD 318,000 Guangzhou Automobile 'H' 289,106 0.05
HKD 134,000 Guangzhou R&F Properties 'H' 164,286 0.03
HKD 186,000 Haitong Securities 'H' 467,460 0.09
HKD 460,000 Huaneng Power International 'H' 622,436 0.12
HKD 10,190,000 Industrial & Commercial Bank of China 'H'
7,452,405 1.41
USD 155,700 Inner Mongolia Yitai Coal 'B' 222,855 0.04
Number of shares or Principal Amount
Transferable Securities and Money Market Instruments Admitted to an Official Exchange Listing
Market Value
USD
% Net assets
HKD 178,000 Jiangsu Expressway 'H' 213,433 0.04
HKD 191,000 Jiangxi Copper 'H' 326,619 0.06
HKD 96,500 New China Life Insurance 'H' 485,468 0.09
HKD 689,000 People's Insurance of China 'H' 321,845 0.06
HKD 2,916,000 PetroChina 'H' 3,227,232 0.61
HKD 495,326 PICC Property & Casualty 'H' 963,143 0.18
HKD 357,500 Ping An Insurance 'H' 3,640,091 0.69
HKD 244,000 Shandong Weigao Medical Polymer 'H'
197,376 0.04
HKD 414,000 Shanghai Electric 'H' 220,095 0.04
HKD 56,000 Shanghai Fosun Pharmaceutical 'H' 200,982 0.04
HKD 98,900 Shanghai Pharmaceuticals 'H' 222,336 0.04
HKD 136,000 Sinopec Engineering 'H' 91,859 0.02
HKD 511,000 Sinopec Shanghai Petrochemical 'H' 150,182 0.03
HKD 142,400 Sinopharm 'H' 504,250 0.10
HKD 252,000 Sinotrans 'H' 168,647 0.03
HKD 52,000 Tsingtao Brewery 'H' 352,341 0.07
HKD 67,200 Weichai Power 'H' 283,152 0.05
HKD 258,000 Yanzhou Coal Mining 'H' 218,631 0.04
HKD 210,000 Zhejiang Expressway 'H' 244,706 0.05
HKD 76,000 Zhuzhou CSR Times Electric 'H' 442,729 0.08
HKD 863,000 Zijin Mining 'H' 244,174 0.05
HKD 92,240 ZTE 'H' 200,559 0.04
Colombia 4,018,042 0.76
COP 29,518 Almacenes Exito 355,483 0.07
COP 13,350 Banco Davivienda Preference 157,571 0.03
COP 59,324 Bancolombia Preference 713,186 0.13
COP 56,578 Cementos Argos 238,192 0.05
COP 11,922 Corp Financiera Colombiana 198,307 0.04
COP 693,100 Ecopetrol 602,252 0.11
COP 40,795 Grupo Argos 349,500 0.07
COP 17,164 Grupo Argos Preference 146,976 0.03
COP 220,000 Grupo Aval Acciones y Valores Preference
117,105 0.02
COP 14,030 Grupo de Iersiones Suramericana Preference
233,784 0.04
COP 34,374 Grupo de Inversiones Suramericana 576,396 0.11
COP 50,902 Interconexion Electrica 181,846 0.03
COP 120,000 Isagen 147,444 0.03
Czech Republic 1,061,025 0.20
CZK 23,650 CEZ 610,301 0.12
CZK 2,180 Komercni Banka 450,724 0.08
France 36,760,556 6.95
EUR 2,279,450 Lyxor - ETF MSCI India 36,760,556 6.95

AVIVA INVESTORS – ANNUAL REPORT AND AUDITED FINANCIAL STATEMENTS avivainvestors.com 69
AVIVA INVESTORS – GLOBAL EMERGING MARKETS INDEX FUND (CONTINUED)Portfolio of Investments and Other Net Assets as at 31 December 2014
Number of shares or Principal Amount
Transferable Securities and Money Market Instruments Admitted to an Official Exchange Listing
Market Value
USD
% Net assets
Greece 2,481,434 0.47
EUR 546,110 Alpha Bank 302,325 0.06
EUR 800,000 Eurobank Ergasias 181,508 0.03
EUR 5,420 Folli Follie 173,209 0.03
EUR 35,920 Hellenic Telecommunications Organization
395,966 0.08
EUR 14,939 JUMBO 152,479 0.03
EUR 198,160 National Bank of Greece 344,089 0.07
EUR 32,050 OPAP 339,537 0.06
EUR 305,600 Piraeus Bank 335,955 0.06
EUR 17,000 Public Power 109,951 0.02
EUR 6,340 Titan Cement 146,415 0.03
Hong Kong 23,747,926 4.49
HKD 75,000 Beijing Enterprises 586,855 0.11
HKD 308,100 China Agri-Industries 126,700 0.02
HKD 126,000 China Everbright 300,451 0.06
HKD 341,000 China Everbright International 509,194 0.10
HKD 162,000 China Merchants International 546,028 0.10
HKD 848,000 China Mobile 9,911,854 1.87
HKD 580,000 China Overseas Land & Investment 1,724,627 0.33
HKD 168,000 China Resources Enterprise 351,926 0.07
HKD 274,000 China Resources Power 709,755 0.13
HKD 332,000 China South City 151,015 0.03
HKD 148,104 China Taiping Insurance 424,487 0.08
HKD 824,000 China Unicom Hong Kong 1,102,284 0.21
HKD 310,000 Citic Pacific 528,276 0.10
HKD 2,468,000 CNOOC 3,322,815 0.63
HKD 240,000 CSPC Pharmaceutical 211,280 0.04
HKD 185,000 Far East Horizon 182,102 0.03
HKD 230,000 Fosun International 301,165 0.06
HKD 426,000 Franshion Properties China 121,371 0.02
HKD 358,000 Guangdong Investment 466,222 0.09
HKD 890,000 Lenovo 1,171,957 0.22
HKD 71,000 Shanghai Industrial 213,243 0.04
HKD 470,000 Sino-Ocean Land 267,843 0.05
HKD 335,000 Sun Art Retail 332,962 0.06
HKD 952,280 Yuexiu Property 183,514 0.04
Hungary 985,226 0.19
HUF 6,132 MOL Hungarian Oil & Gas 270,540 0.05
HUF 30,136 OTP Bank 438,517 0.09
HUF 20,490 Richter Gedeon Nyrt 276,169 0.05
Number of shares or Principal Amount
Transferable Securities and Money Market Instruments Admitted to an Official Exchange Listing
Market Value
USD
% Net assets
Indonesia 14,492,437 2.74
IDR 2,070,000 Adaro Energy 173,165 0.03
IDR 65,500 Astra Agro Lestari 128,498 0.03
IDR 2,795,800 Astra International 1,671,177 0.32
IDR 1,702,700 Bank Central Asia 1,801,070 0.34
IDR 534,715 Bank Danamon Indonesia 193,914 0.04
IDR 1,297,888 Bank Mandiri Persero 1,125,103 0.21
IDR 1,070,500 Bank Negara Indonesia Persero 525,481 0.10
IDR 1,533,300 Bank Rakyat Indonesia Persero 1,438,894 0.27
IDR 1,081,400 Charoen Pokphand Indonesia 329,350 0.06
IDR 975,000 Global Mediacom 111,898 0.02
IDR 70,500 Gudang Garam 343,967 0.06
IDR 58,000 Indo Tambangraya Megah 71,964 0.01
IDR 211,300 Indocement Tunggal Prakarsa 427,168 0.08
IDR 167,400 Indofood CBP Sukses Makmur 177,407 0.03
IDR 643,400 Indofood Sukses Makmur 349,851 0.07
IDR 287,000 Jasa Marga Persero 162,611 0.03
IDR 2,913,400 Kalbe Farma 427,956 0.08
IDR 2,815,200 Lippo Karawaci 231,107 0.04
IDR 209,400 Matahari Department Store 252,182 0.05
IDR 695,000 Media Nusantara Citra 142,119 0.03
IDR 1,498,700 Perusahaan Gas Negara Persero 724,011 0.14
IDR 425,600 Semen Gresik Persero 557,163 0.11
IDR 695,000 Surya Citra Media 196,988 0.04
IDR 113,000 Tambang Batubara Bukit Asam Persero
114,099 0.02
IDR 6,647,700 Telekomunikasi Indonesia Persero 1,534,910 0.29
IDR 265,000 Tower Bersama Infrastructure 207,163 0.04
IDR 223,600 Unilever Indonesia 582,364 0.11
IDR 231,696 United Tractors 323,989 0.06
IDR 425,000 XL Axiata 166,868 0.03
Luxembourg 315,326 0.06
ZAR 46,370 Brait 315,326 0.06
Malaysia 18,920,865 3.57
MYR 196,700 AirAsia 153,181 0.03
MYR 158,800 Alliance Financial 213,942 0.04
MYR 243,000 AMMB 458,609 0.09
MYR 223,800 Astro 194,158 0.04
MYR 365,200 Axiata 738,082 0.14
MYR 101,267 Berjaya Sports Toto 102,080 0.02
MYR 18,400 British American Tobacco Malaysia 340,325 0.06

AVIVA INVESTORS – ANNUAL REPORT AND AUDITED FINANCIAL STATEMENTS avivainvestors.com 70
AVIVA INVESTORS – GLOBAL EMERGING MARKETS INDEX FUND (CONTINUED)Portfolio of Investments and Other Net Assets as at 31 December 2014
Number of shares or Principal Amount
Transferable Securities and Money Market Instruments Admitted to an Official Exchange Listing
Market Value
USD
% Net assets
MYR 294,400 Bumi Armada 91,223 0.02
MYR 708,600 CIMB 1,125,342 0.21
MYR 544,320 Dialog 234,015 0.04
MYR 429,500 DiGi.Com 758,104 0.14
MYR 153,500 Felda Global Ventures 93,945 0.02
MYR 250,900 Gamuda 359,130 0.07
MYR 293,600 Genting 745,001 0.14
MYR 426,100 Genting Malaysia 493,974 0.09
MYR 32,700 Genting Plantations 94,004 0.02
MYR 80,960 Hong Leong Bank 323,528 0.06
MYR 30,200 Hong Leong Financial 143,042 0.03
MYR 350,200 IHH Healthcare 481,576 0.09
MYR 160,100 IJM 301,603 0.06
MYR 415,700 IOI 569,898 0.11
MYR 166,833 IOI Properties Group 115,140 0.02
MYR 68,900 Kuala Lumpur Kepong 447,606 0.08
MYR 56,000 Lafarge Malayan Cement 156,729 0.03
MYR 625,800 Malayan Banking 1,639,799 0.31
MYR 79,400 Malaysia Airports 153,497 0.03
MYR 259,200 Maxis 507,872 0.10
MYR 163,500 MISC 337,989 0.06
MYR 401,800 Petronas Chemicals 624,906 0.12
MYR 35,600 Petronas Dagangan 173,890 0.03
MYR 87,000 Petronas Gas 550,611 0.10
MYR 68,000 PPB 277,853 0.05
MYR 337,310 Public Bank 1,761,974 0.33
MYR 90,700 RHB Capital 197,714 0.04
MYR 516,000 Sapurakencana Petroleum 341,308 0.06
MYR 396,300 Sime Darby 1,043,413 0.20
MYR 157,300 Telekom Malaysia 309,827 0.06
MYR 389,700 Tenaga Nasional 1,538,901 0.29
MYR 212,500 UEM Land 86,218 0.02
MYR 77,000 UMW 241,056 0.04
MYR 693,533 YTL 316,248 0.06
MYR 198,220 YTL Power International 83,552 0.02
Mexico 25,752,939 4.87
MXN 400,910 Alfa 'A' 902,607 0.17
MXN 4,657,430 America Movil 'L' 5,155,174 0.97
MXN 49,230 Arca Continental 309,814 0.06
MXN 1,670,320 Cemex 1,718,510 0.32
MXN 60,650 Coca-Cola Femsa 'L' 525,388 0.10
Number of shares or Principal Amount
Transferable Securities and Money Market Instruments Admitted to an Official Exchange Listing
Market Value
USD
% Net assets
MXN 157,010 Compartamos 314,345 0.06
MXN 55,610 Controladora Comercial Mexicana 199,543 0.04
MXN 26,900 El Puerto de Liverpool 271,094 0.05
MXN 317,920 Fibra Uno Administracion REIT 937,168 0.18
MXN 268,660 Fomento Economico Mexicano 2,374,054 0.45
MXN 110,710 Genomma Lab Internacional 'B' 210,270 0.04
MXN 42,430 Grupo Aeroportuario del Pacifico 'B' 268,733 0.05
MXN 28,450 Grupo Aeroportuario del Sureste 'B' 373,736 0.07
MXN 236,250 Grupo Bimbo 'A' 651,782 0.12
MXN 81,600 Grupo Carso 'A1' 402,720 0.08
MXN 48,100 Grupo Comercial Chedraui 'B' 141,708 0.03
MXN 356,050 Grupo Financiero Banorte 1,947,317 0.37
MXN 334,880 Grupo Financiero Inbursa 857,775 0.16
MXN 262,180 Grupo Financiero Santander Mexico 'B'
547,670 0.10
MXN 535,255 Grupo Mexico 'B' 1,543,151 0.29
MXN 367,120 Grupo Televisa 2,498,027 0.47
MXN 19,990 Industrias Penoles 388,204 0.07
MXN 222,410 Kimberly-Clark de Mexico 'A' 479,985 0.09
MXN 140,679 Mexichem 426,769 0.08
MXN 93,260 Minera Frisco 134,166 0.03
MXN 99,400 OHL Mexico 183,698 0.04
MXN 35,000 Promotora y Operadora de Infraestructura
412,575 0.08
MXN 726,600 Wal-Mart de Mexico 'V' 1,576,956 0.30
Peru 261,748 0.05
USD 27,890 Cia de Minas Buenaventura ADR 261,748 0.05
Philippines 6,698,608 1.27
PHP 256,500 Aboitiz Equity Ventures 300,979 0.06
PHP 150,000 Aboitiz Power 142,748 0.03
PHP 322,900 Alliance Global 161,735 0.03
PHP 22,992 Ayala 355,017 0.07
PHP 973,000 Ayala Land 730,141 0.14
PHP 172,761 Bank of the Philippine Islands 364,481 0.07
PHP 226,888 BDO Unibank 556,213 0.11
PHP 550,200 DMCI Holdings 192,853 0.04
PHP 1,173,600 Energy Development 215,973 0.04
PHP 4,600 Globe Telecom 176,294 0.03
PHP 126,440 International Container Terminal Services
323,481 0.06
PHP 319,000 JG Summit 477,525 0.09
PHP 60,190 Jollibee Foods 284,890 0.05
PHP 1,000,000 Metro Pacific Investments 102,534 0.02

AVIVA INVESTORS – ANNUAL REPORT AND AUDITED FINANCIAL STATEMENTS avivainvestors.com 71
AVIVA INVESTORS – GLOBAL EMERGING MARKETS INDEX FUND (CONTINUED)Portfolio of Investments and Other Net Assets as at 31 December 2014
Number of shares or Principal Amount
Transferable Securities and Money Market Instruments Admitted to an Official Exchange Listing
Market Value
USD
% Net assets
PHP 43,149 Metropolitan Bank & Trust 79,902 0.02
PHP 13,440 Philippine Long Distance Telephone 872,087 0.16
PHP 26,425 SM Investments 478,838 0.09
PHP 891,175 SM Prime 338,852 0.06
PHP 125,230 Universal Robina 544,065 0.10
Poland 8,224,192 1.55
PLN 3,015 Alior Bank 66,199 0.01
PLN 4,790 Bank Handlowy w Warszawie 143,855 0.03
PLN 60,930 Bank Millennium 142,462 0.03
PLN 18,387 Bank Pekao 922,456 0.17
PLN 4,030 Bank Zachodni WBK 422,628 0.08
PLN 2,114 BRE Bank 296,374 0.05
PLN 3,180 CCC 119,720 0.02
PLN 25,000 Cyfrowy Polsat 165,048 0.03
PLN 20,000 Enea 85,952 0.02
PLN 28,600 Energa 185,513 0.04
PLN 10,730 Eurocash 114,641 0.02
PLN 5,820 Grupa Azoty 102,849 0.02
PLN 3,946 Grupa Lotos 29,912 -
PLN 9,320 Grupa Lotos 66,883 0.01
PLN 20,096 KGHM Polska Miedz 614,846 0.12
PLN 130 LPP 264,677 0.05
PLN 109,613 PGE 584,325 0.11
PLN 46,041 Polski Koncern Naftowy Orlen 634,165 0.12
PLN 254,022 Polskie Gornictwo Naftowe i Gazownictwo
318,600 0.06
PLN 125,572 Powszechna Kasa Oszczednosci Bank Polski
1,263,851 0.24
PLN 8,051 Powszechny Zaklad Ubezpieczen 1,101,686 0.21
PLN 75,000 Synthos 86,676 0.02
PLN 163,744 Tauron Polska Energia 233,031 0.04
PLN 109,881 Telekomunikacja Polska 257,843 0.05
Russia 17,573,654 3.32
USD 200 AK Transneft Preference 413,730 0.08
USD 833,570 Gazprom ADR 3,874,225 0.73
USD 71,907 Lukoil ADR 2,851,113 0.54
USD 37,316 Magnit GDR Registered 1,694,706 0.32
USD 12,720 MegaFon GDR Registered 176,108 0.03
USD 83,275 MMC Norilsk Nickel ADR 1,179,590 0.22
USD 74,110 Mobile Telesystems ADR 545,820 0.10
USD 13,074 NovaTek GDR Registered 1,024,675 0.19
USD 170,858 Rosneft GDR Registered 596,807 0.11
USD 26,150 Rostelecom ADR 234,435 0.04
Number of shares or Principal Amount
Transferable Securities and Money Market Instruments Admitted to an Official Exchange Listing
Market Value
USD
% Net assets
USD 163,230 RusHydro ADR 151,967 0.03
EUR 384,800 Sberbank of Russia ADR 1,558,568 0.29
USD 28,089 Severstal GDR Registered 252,801 0.06
USD 17,682 Sistema GDR Registered 90,443 0.02
USD 188,309 Surgutneftegas ADR 797,677 0.15
USD 33,910 Tatneft ADR 829,947 0.16
USD 39,040 Uralkali GDR Registered 458,720 0.09
USD 371,476 VTB Bank GDR Registered 842,322 0.16
South Africa 41,189,068 7.78
ZAR 178,031 African Bank Investments 4,771 -
ZAR 15,470 African Rainbow Minerals 158,916 0.03
ZAR 6,676 Anglo American Platinum 197,105 0.04
ZAR 54,124 AngloGold Ashanti 473,695 0.09
ZAR 44,124 Aspen Pharmacare 1,550,037 0.29
ZAR 5,120 Assore 65,733 0.01
ZAR 48,040 Barclays Africa 758,819 0.14
ZAR 30,460 Barloworld 254,633 0.05
ZAR 42,329 Bidvest 1,111,906 0.21
ZAR 31,400 Coronation Fund Managers 312,351 0.06
ZAR 42,467 Discovery 406,380 0.08
ZAR 19,876 Exxaro Resources 177,649 0.03
ZAR 439,577 FirstRand 1,919,605 0.36
ZAR 28,047 Foschini 322,733 0.06
ZAR 106,461 Gold Fields 480,875 0.09
ZAR 307,892 Growthpoint Properties REIT 731,356 0.14
ZAR 74,126 Impala Platinum 485,619 0.09
ZAR 26,976 Imperial 430,065 0.08
ZAR 36,540 Investec 308,634 0.06
ZAR 8,554 Kumba Iron Ore 177,790 0.03
ZAR 16,778 Liberty 177,885 0.03
ZAR 134,610 Life Healthcare 497,308 0.09
ZAR 15,577 Massmart 192,222 0.04
ZAR 53,410 Mediclinic International 465,714 0.09
ZAR 157,700 MMI 409,628 0.08
ZAR 34,250 Mr Price 694,355 0.13
ZAR 229,760 MTN 4,392,823 0.83
ZAR 82,280 Nampak 309,952 0.06
ZAR 54,908 Naspers 7,202,696 1.36
ZAR 28,507 Nedbank 611,094 0.12
ZAR 137,470 Netcare 451,252 0.09
ZAR 34,473 Pick n Pay Stores 157,782 0.03
ZAR 75,414 PPC 179,690 0.03

AVIVA INVESTORS – ANNUAL REPORT AND AUDITED FINANCIAL STATEMENTS avivainvestors.com 72
AVIVA INVESTORS – GLOBAL EMERGING MARKETS INDEX FUND (CONTINUED)Portfolio of Investments and Other Net Assets as at 31 December 2014
Number of shares or Principal Amount
Transferable Securities and Money Market Instruments Admitted to an Official Exchange Listing
Market Value
USD
% Net assets
ZAR 447,203 Redefine Properties REIT 412,847 0.08
ZAR 66,447 Remgro 1,458,804 0.28
ZAR 33,870 Resilient Property Income Fund 246,089 0.05
ZAR 97,908 RMB 541,810 0.10
ZAR 97,980 RMI 346,736 0.07
ZAR 253,048 Sanlam 1,530,045 0.29
ZAR 75,109 Sappi 273,460 0.05
ZAR 75,672 Sasol 2,825,775 0.53
ZAR 61,410 Shoprite 892,426 0.17
ZAR 23,980 Spar 333,538 0.06
ZAR 167,641 Standard Bank/South Africa 2,078,567 0.39
ZAR 281,590 Steinhoff International 1,444,613 0.27
ZAR 23,363 Tiger Brands 744,849 0.14
ZAR 52,667 Truworths International 352,320 0.07
ZAR 65,340 Tsogo Sun Holdings 162,972 0.03
ZAR 53,386 Vodacom 590,194 0.11
ZAR 133,003 Woolworths/South Africa 882,950 0.17
South Korea 77,010,473 14.55
KRW 459 Amorepacific 926,050 0.17
KRW 390 AMOREPACIFIC 354,026 0.07
KRW 27,591 BS Financial 364,747 0.07
KRW 9,355 Celltrion 329,916 0.06
KRW 13,210 Cheil Worldwide 207,002 0.04
KRW 2,080 CJ 295,153 0.06
KRW 1,124 CJ CheilJedang 313,390 0.06
KRW 4,079 Daelim Industrial 243,428 0.05
KRW 15,230 Daewoo Engineering & Construction 81,438 0.02
KRW 6,680 Daewoo International 190,937 0.04
KRW 23,938 Daewoo Securities 213,192 0.04
KRW 14,020 Daewoo Shipbuilding & Marine Engineering
237,163 0.04
KRW 2,000 Daum Kakao 224,299 0.04
KRW 18,520 DGB Financial 189,676 0.04
KRW 4,018 DGB Financial Rights 13/01/2015 4,113 -
KRW 6,100 Dongbu Insurance 305,204 0.06
KRW 6,982 Doosan Heavy Industries & Construction
149,662 0.03
KRW 19,760 Doosan Infracore 173,964 0.03
KRW 2,996 E-Mart 553,717 0.10
KRW 6,838 GS 248,682 0.05
KRW 6,922 GS Engineering & Construction 145,963 0.03
KRW 5,360 Halla Visteon Climatentrol 235,486 0.04
KRW 39,523 Hana Financial 1,148,978 0.22
Number of shares or Principal Amount
Transferable Securities and Money Market Instruments Admitted to an Official Exchange Listing
Market Value
USD
% Net assets
KRW 8,635 Hankook Tire 412,711 0.08
KRW 12,340 Hanwha Chemical 132,065 0.02
KRW 3,410 Hite Jinro 72,095 0.01
KRW 4,610 Hotel Shilla 382,117 0.07
KRW 3,156 Hyosung 195,644 0.04
KRW 2,188 Hyundai Department Store 244,812 0.05
KRW 8,290 Hyundai Development 290,524 0.06
KRW 10,329 Hyundai Engineering & Construction 394,543 0.07
KRW 1,923 Hyundai Glovis 509,965 0.10
KRW 6,002 Hyundai Heavy Industries 625,322 0.12
KRW 1,427 Hyundai Hysco 94,367 0.02
KRW 8,980 Hyundai Marine & Fire Insurance 211,915 0.04
KRW 10,550 Hyundai Merchant Marine 95,962 0.02
KRW 1,609 Hyundai Mipo Dockyard 101,822 0.02
KRW 9,467 Hyundai Mobis 2,025,398 0.38
KRW 21,428 Hyundai Motor 3,277,824 0.62
KRW 5,399 Hyundai Motor Preference 658,166 0.12
KRW 3,427 Hyundai Motor Preference 390,966 0.07
KRW 10,037 Hyundai Steel 578,596 0.11
KRW 2,220 Hyundai Wia 354,385 0.07
KRW 23,690 Industrial Bank of Korea 302,723 0.06
KRW 13,820 Kangwon Land 381,838 0.07
KRW 53,380 KB Financial 1,752,865 0.33
KRW 697 KCC 330,052 0.06
KRW 2,800 KEPCO Plant Service & Engineering 202,890 0.04
KRW 36,409 Kia Motors 1,727,245 0.33
KRW 5,560 Korea Aeroce Industries 200,719 0.04
KRW 36,850 Korea Electric Power 1,428,911 0.27
KRW 3,880 Korea Gas 174,472 0.03
KRW 5,712 Korea Investment 251,560 0.05
KRW 31,160 Korea Life Insurance 235,176 0.04
KRW 1,175 Korea Zinc 429,431 0.08
KRW 4,588 Korean Air Lines 198,027 0.04
KRW 9,905 KT 280,975 0.05
KRW 15,766 KT&G 1,091,988 0.21
KRW 2,010 Kumho Petro chemical 146,951 0.03
KRW 13,536 LG 752,065 0.14
KRW 6,405 LG Chem 1,052,283 0.20
KRW 1,120 LG Chem Preference 142,730 0.03
KRW 33,380 LG Display 1,019,000 0.19
KRW 15,266 LG Electronics 820,106 0.15
KRW 1,347 LG Household & Health Care 762,929 0.14

AVIVA INVESTORS – ANNUAL REPORT AND AUDITED FINANCIAL STATEMENTS avivainvestors.com 73
AVIVA INVESTORS – GLOBAL EMERGING MARKETS INDEX FUND (CONTINUED)Portfolio of Investments and Other Net Assets as at 31 December 2014
Number of shares or Principal Amount
Transferable Securities and Money Market Instruments Admitted to an Official Exchange Listing
Market Value
USD
% Net assets
KRW 1,626 LG Innotek 166,214 0.03
KRW 30,700 LG Uplus 321,317 0.06
KRW 2,132 Lotte Chemical 309,549 0.06
KRW 100 Lotte Confectionery 161,970 0.03
KRW 1,614 Lotte Shopping 399,901 0.08
KRW 2,596 LS 128,157 0.02
KRW 2,203 LS Industrial Systems 119,757 0.02
KRW 3,868 Mirae Asset Securities 150,920 0.03
KRW 3,895 Naver 2,519,562 0.48
KRW 2,244 NCSoft 371,007 0.07
KRW 2,448 OCI 174,208 0.03
KRW 520 Orion/Republic of South Korea 478,447 0.09
KRW 3,000 Paradise 64,212 0.01
KRW 9,031 POSCO 2,259,638 0.43
KRW 2,455 S1/Korea 158,859 0.03
KRW 17,824 Samsung C&T 994,975 0.19
KRW 4,955 Samsung Card 199,055 0.04
KRW 8,576 Samsung Electro-Mechanics 425,815 0.08
KRW 15,355 Samsung Electronics 18,482,484 3.49
KRW 2,859 Samsung Electronics Preference 2,669,674 0.50
KRW 4,399 Samsung Engineering 151,327 0.03
KRW 4,607 Samsung Fire & Marine Insurance 1,184,391 0.22
KRW 23,050 Samsung Heavy Industries 416,719 0.08
KRW 8,606 Samsung Life Insurance 913,187 0.17
KRW 7,599 Samsung SDI 800,244 0.15
KRW 3,740 Samsung SDS 999,522 0.19
KRW 8,963 Samsung Securities 362,604 0.07
KRW 58,964 Shinhan Financial 2,380,471 0.45
KRW 987 Shinsegae 162,510 0.03
KRW 3,681 SK 547,082 0.10
KRW 2,780 SK C&C 539,766 0.10
KRW 79,850 SK Hynix 3,449,857 0.65
KRW 8,126 SK Innovation 626,698 0.12
KRW 18,190 SK Networks 147,438 0.03
KRW 1,385 SK Telecom 337,764 0.06
KRW 5,460 S-Oil 239,581 0.05
KRW 7,750 Woongjin Coway 592,888 0.11
KRW 43,671 Woori Bank 398,309 0.08
KRW 17,049 Woori Investment & Securities 157,897 0.03
KRW 1,145 Yuhan 176,176 0.03
Spain 163,480 0.03
COP 24,450 Cemex Latam 163,480 0.03
Number of shares or Principal Amount
Transferable Securities and Money Market Instruments Admitted to an Official Exchange Listing
Market Value
USD
% Net assets
Taiwan 65,629,620 12.40
TWD 354,000 Acer 238,499 0.05
TWD 862,091 Advanced Semiconductor Engineering
1,036,576 0.20
TWD 44,527 Advantech 329,443 0.06
TWD 313,425 Asia Cement 386,771 0.07
TWD 237,000 Asia Pacific Telecom 130,985 0.02
TWD 96,620 Asustek Computer 1,057,556 0.20
TWD 1,237,000 AU Optronics 633,891 0.12
TWD 89,000 Catcher Technology 692,177 0.13
TWD 1,152,016 Cathay Financial 1,708,468 0.32
TWD 654,898 Chang Hwa Commercial Bank 375,373 0.07
TWD 232,421 Cheng Shin Rubber Industry 546,527 0.10
TWD 66,195 Chicony Electronics 185,263 0.04
TWD 381,098 China Airlines 174,494 0.03
TWD 1,870,056 China Development Financial 595,708 0.11
TWD 343,688 China Life Insurance/Taiwan 285,459 0.05
TWD 78,000 China Motor 69,020 0.01
TWD 1,640,242 China Steel 1,363,072 0.26
TWD 524,800 Chunghwa Telecom 1,559,066 0.29
TWD 72,122 Clevo 112,903 0.02
TWD 599,000 Compal Electronics 419,850 0.08
TWD 1,897,300 CTBC Financial 1,231,118 0.23
TWD 87,000 CTCI 138,543 0.03
TWD 254,000 Delta Electronics 1,514,521 0.29
TWD 799,429 E.Sun Financial 496,240 0.09
TWD 23,920 Eclat Textile 243,172 0.05
TWD 120,000 Epistar 238,563 0.05
TWD 238,600 Eva Airways 167,255 0.03
TWD 35,142 Eva Airways Rights 26/01/2015 5,755 -
TWD 244,898 Evergreen Marine/Taiwan 173,253 0.03
TWD 145,075 Far Eastern Department Stores 129,152 0.02
TWD 451,703 Far Eastern New Century 447,490 0.08
TWD 229,000 Far EasTone Telecommunications 526,918 0.10
TWD 54,181 Farglory Land Development 64,702 0.01
TWD 1,022,897 First Financial 602,527 0.11
TWD 457,030 Formosa Chemicals & Fibre 966,123 0.18
TWD 5,519 Formosa International Hotels 58,881 0.01
TWD 164,000 Formosa Petrochemical 355,519 0.07
TWD 574,480 Formosa Plastics 1,309,422 0.25
TWD 111,000 Formosa Taffeta 110,291 0.02
TWD 126,873 Foxconn Technology 342,263 0.06
TWD 954,885 Fubon Financial 1,531,527 0.29

AVIVA INVESTORS – ANNUAL REPORT AND AUDITED FINANCIAL STATEMENTS avivainvestors.com 74
AVIVA INVESTORS – GLOBAL EMERGING MARKETS INDEX FUND (CONTINUED)Portfolio of Investments and Other Net Assets as at 31 December 2014
Number of shares or Principal Amount
Transferable Securities and Money Market Instruments Admitted to an Official Exchange Listing
Market Value
USD
% Net assets
TWD 39,000 Giant Manufacturing 346,242 0.07
TWD 5,000 Hermes Microvision 251,974 0.05
TWD 72,000 Highwealth Construction 145,292 0.03
TWD 26,040 Hiwin Technologies 218,160 0.04
TWD 1,726,212 Hon Hai Precision Industry 4,792,701 0.91
TWD 35,000 Hotai Motor 526,960 0.10
TWD 93,500 HTC 418,907 0.08
TWD 802,884 Hua Nan Financial 450,046 0.09
TWD 1,047,866 Innolux 508,963 0.10
TWD 200,000 Inotera Memories 317,253 0.06
TWD 333,315 Inventec 224,563 0.04
TWD 39,000 Kinsus Interconnect Technology 130,283 0.02
TWD 14,000 Largan Precision 1,058,044 0.20
TWD 299,111 Lite-On Technology 344,448 0.07
TWD 194,992 MediaTek 2,844,591 0.54
TWD 1,313,671 Mega Financial 1,014,794 0.19
TWD 30,450 Merida Industry 206,363 0.04
TWD 661,550 Nan Ya Plastics 1,366,794 0.26
TWD 78,000 Novatek Microelectronics 438,229 0.08
TWD 229,000 Pegatron 527,606 0.10
TWD 19,000 Phison Electronics 131,320 0.02
TWD 296,000 Pou Chen 359,435 0.07
TWD 96,600 Powertech Technology 165,610 0.03
TWD 82,000 President Chain Store 634,879 0.12
TWD 357,000 Quanta Computer 892,805 0.17
TWD 63,010 Radiant Opto-Electronics 202,508 0.04
TWD 66,162 Realtek Semiconductor 222,055 0.04
TWD 89,812 Ruentex Development 142,933 0.03
TWD 73,179 Ruentex Industries 154,240 0.03
TWD 30,784 ScinoPharm Taiwan 54,558 0.01
TWD 987,545 Shin Kong Financial 281,206 0.05
TWD 425,000 Siliconware Precision Industries 643,511 0.12
TWD 39,020 Simplo Technology 195,082 0.04
TWD 1,018,098 SinoPac Financial 417,793 0.08
TWD 47,360 Standard Foods 104,914 0.02
TWD 176,000 Synnex Technology International 256,296 0.05
TWD 1,077,095 Taishin Financial 443,506 0.08
TWD 495,130 Taiwan Business Bank 143,826 0.03
TWD 471,000 Taiwan Cement 645,574 0.12
TWD 812,240 Taiwan Cooperative Financial 418,093 0.08
TWD 109,000 Taiwan Fertilizer 192,198 0.04
TWD 139,139 Taiwan Glass Industry 108,448 0.02
Number of shares or Principal Amount
Transferable Securities and Money Market Instruments Admitted to an Official Exchange Listing
Market Value
USD
% Net assets
TWD 231,400 Taiwan Mobile 763,267 0.14
TWD 3,402,000 Taiwan Semiconductor Manufacturing
15,127,830 2.86
TWD 258,000 Teco Electric and Machinery 245,953 0.05
TWD 28,000 Transcend Information 87,342 0.02
TWD 90,132 TSRC 96,831 0.02
TWD 63,000 U-Ming Marine Transport 99,317 0.02
TWD 192,000 Unimicron Technology 146,321 0.03
TWD 657,820 Uni-President Enterprises 1,042,732 0.20
TWD 1,725,000 United Microelectronics 805,517 0.15
TWD 107,000 Vanguard International Semiconductor
177,052 0.03
TWD 472,000 Walsin Lihwa 148,745 0.03
TWD 309,868 Wistron 280,805 0.05
TWD 194,520 WPG 226,476 0.04
TWD 206,300 Yang Ming Marine Transport 109,733 0.02
TWD 1,263,558 Yuanta Financial 614,199 0.12
TWD 109,000 Yulon Motor 160,161 0.03
Thailand 12,711,401 2.40
THB 144,600 Advanced Info Service (Foreign) Registered
1,105,377 0.21
THB 68,000 Airports of Thailand (Foreign) 583,891 0.11
THB 84,900 Bangkok Bank 504,133 0.09
THB 94,600 Bangkok Bank (Foreign) Registered 562,180 0.11
THB 453,000 Bangkok Dusit Medical Services (Foreign) Registered
238,204 0.05
THB 156,000 Banpu (Foreign) Registered 118,304 0.02
THB 140,600 BEC World (Foreign) 218,486 0.04
THB 200,000 Central Pattana (Foreign) 277,356 0.05
THB 447,200 Charoen Pokphand Foods (Foreign) 372,100 0.07
THB 611,600 CP ALL (Foreign) 787,737 0.15
THB 79,700 Glow Energy (Foreign) 215,905 0.04
THB 290,999 Home Product Center (Foreign) 72,750 0.01
THB 139,800 Indorama Ventures (Foreign) 85,622 0.02
THB 1 Indorama Ventures Warrants 24/08/2018
- -
THB 1,400,000 IRPC (Foreign) 130,638 0.02
THB 101,700 Kasikornbank 709,530 0.13
THB 171,900 Kasikornbank (Foreign) 1,199,308 0.23
THB 501,425 Krung Thai Bank (Foreign) 346,730 0.07
THB 250,000 Minor International (Foreign) 246,011 0.05
THB 12,500 Minor International Warrants 31/12/2049
1,854 -
THB 145,600 PTT (Foreign) 1,436,085 0.27

AVIVA INVESTORS – ANNUAL REPORT AND AUDITED FINANCIAL STATEMENTS avivainvestors.com 75
AVIVA INVESTORS – GLOBAL EMERGING MARKETS INDEX FUND (CONTINUED)Portfolio of Investments and Other Net Assets as at 31 December 2014
Number of shares or Principal Amount
Transferable Securities and Money Market Instruments Admitted to an Official Exchange Listing
Market Value
USD
% Net assets
THB 183,589 PTT Exploration & Production (Foreign)
626,379 0.12
THB 212,221 PTT Global Chemical (Foreign) 331,394 0.06
THB 2,500 Siam Cement 34,122 0.01
THB 50,400 Siam Cement (Foreign) Registered 687,379 0.13
THB 237,600 Siam Commercial Bank (Foreign) 1,316,188 0.25
THB 95,500 Thai Oil (Foreign) 122,278 0.02
THB 1,125,563 True (Foreign) 381,460 0.07
Turkey 9,444,216 1.78
TRY 258,329 Akbank 957,511 0.18
TRY 30,367 Anadolu Efes Biracilik Ve Malt Sanayii
294,545 0.06
TRY 33,944 Arcelik 218,162 0.04
TRY 30,312 BIM Birlesik Magazalar 647,991 0.12
TRY 8,186 Coca-Cola Icecek 176,571 0.03
TRY 299,940 Emlak Konut Gayrimenkul Yatirim Ortakligi AS REIT
356,040 0.07
TRY 67,166 Enka Insaat ve Sanayi 151,556 0.03
TRY 163,503 Eregli Demir ve Celik Fabrikalari 311,584 0.06
TRY 10,070 Ford Otomotiv Sanayi 140,642 0.03
TRY 119,611 Haci Omer Sabanci 518,813 0.10
TRY 92,912 KOC 490,841 0.09
TRY 23,320 TAV Havalimanlari Holding 190,780 0.04
TRY 17,940 Tofas Turk Otomobil Fabrikasi 122,209 0.02
TRY 16,625 Tupras Turkiye Petrol Rafinerileri 393,624 0.07
TRY 80,898 Turk Hava Yollari 333,593 0.06
TRY 65,295 Turk Telekomunikasyon 202,917 0.04
TRY 109,827 Turkcell Iletisim Hizmetleri 672,985 0.13
TRY 331,517 Turkiye Garanti Bankasi 1,336,562 0.25
TRY 89,150 Turkiye Halk Bankasi 529,123 0.10
TRY 224,650 Turkiye Is Bankasi 'C' 632,797 0.12
TRY 79,411 Turkiye Sise ve Cam Fabrikalari 123,138 0.02
TRY 109,920 Turkiye Vakiflar Bankasi 229,691 0.04
TRY 18,410 Ulker Biskuvi Sanayi 146,280 0.03
TRY 127,421 Yapi ve Kredi Bankasi 266,261 0.05
Number of shares or Principal Amount
Transferable Securities and Money Market Instruments Admitted to an Official Exchange Listing
Market Value
USD
% Net assets
United Arab Emirates 3,315,135 0.63
AED 152,340 Abu Dhabi Commercial Bank 288,048 0.06
AED 448,110 Aldar Properties 320,253 0.06
AED 149,580 Arabtec 119,526 0.02
USD 24,600 DP World 517,338 0.10
AED 302,250 Dubai Financial Market 164,168 0.03
AED 69,970 Dubai Islamic Bank 131,539 0.03
AED 484,560 Emaar Properties 962,392 0.18
AED 107,730 First Gulf Bank 496,414 0.09
AED 83,810 National Bank of Abu Dhabi 315,457 0.06
United Kingdom 4,522,193 0.85
USD 22,710 HSBC Bank 0% 06/02/2017 769,826 0.14
USD 126,040 HSBC Bank 0% 31/01/2017 1,530,605 0.29
USD 27,260 HSBC Bank 0% 23/02/2015 424,043 0.08
USD 21,750 HSBC Bank 0% 07/03/2016 249,942 0.05
USD 6,070 HSBC Bank 0% 24/09/2015 313,434 0.06
USD 20,770 HSBC Bank 0% 04/05/2015 385,823 0.07
USD 18,350 HSBC Bank 0% 23/02/2015 848,520 0.16
United States of America 766,054 0.14
USD 5,115 iShares MSCI Qatar Capped ETF 122,197 0.02
USD 22,687 Southern Copper 643,857 0.12
Total Transferable Securities andMoney Market Instruments Admittedto an Official Exchange Listing
523,069,847 98.82
Number of shares or Principal Amount
Other Transferable Securities not dealt on another Regulated Market
Market Value
USD
% Net assets
Cayman Islands - -
HKD 604,000 Chaoda Modern Agriculture* - -
Total Other Transferable Securities not dealt on another Regulated Market
- -
Total Investments 523,069,847 98.82
Other Net Assets 6,239,349 1.18
Net Asset Value 529,309,196 100.00
*As at 31 December 2014, the security was fair valued in good faith by the Board of Directors. (note 2.2 (11)).

AVIVA INVESTORS – ANNUAL REPORT AND AUDITED FINANCIAL STATEMENTS avivainvestors.com 76
AVIVA INVESTORS – GLOBAL EMERGING MARKETS INDEX FUND (CONTINUED)Portfolio of Investments and Other Net Assets as at 31 December 2014
Geographic Breakdown (as a percentage of Net Assets) % Net Assets
Bermuda 1.12
Brazil 8.83
Cayman Islands 4.29
Chile 1.43
China 12.10
Colombia 0.76
Czech Republic 0.20
France 6.95
Greece 0.47
Hong Kong 4.49
Hungary 0.19
Indonesia 2.74
Luxembourg 0.06
Malaysia 3.57
Mexico 4.87
Peru 0.05
Philippines 1.27
Poland 1.55
Russia 3.32
South Africa 7.78
South Korea 14.55
Spain 0.03
Taiwan 12.40
Thailand 2.40
Turkey 1.78
United Arab Emirates 0.63
United Kingdom 0.85
United States of America 0.14
Total 98.82

AVIVA INVESTORS – ANNUAL REPORT AND AUDITED FINANCIAL STATEMENTS avivainvestors.com 77
AVIVA INVESTORS – GLOBAL HIGH YIELD BOND FUNDPortfolio of Investments and Other Net Assets as at 31 December 2014
The accompanying notes form an integral part of these financial statements.
Number of shares or Principal Amount
Transferable Securities and Money Market Instruments Admitted to an Official Exchange Listing
Market Value
USD
% Net assets
Belgium 4,717,677 0.31
EUR 3,700,000 Ontex RegS 4.75% 15/11/2021 4,717,677 0.31
Cayman Islands 15,245,559 1.01
GBP 9,802,000 Brakes Capital RegS 7.125% 15/12/2018
15,245,559 1.01
Finland 4,549,925 0.30
EUR 3,986,000 Paroc RegS 6.25% 15/05/2020 4,549,925 0.30
France 51,191,595 3.38
EUR 3,966,000 3AB Optique Developpement RegS 5.625% 15/04/2019
4,332,998 0.29
EUR 3,200,000 Accor variable perpetual 3,860,698 0.25
USD 4,593,000 CMA CGM 144A 8.5% 15/04/2017 4,685,273 0.31
GBP 6,112,000 Credit Agricole variable perpetual 9,376,510 0.62
EUR 4,246,000 Financiere Quick SAS RegS FRN 15/04/2019
4,657,327 0.31
EUR 4,000,000 Holding Medi-Partenaires RegS 7% 15/05/2020
5,142,591 0.34
EUR 2,105,000 Labeyrie Fine Foods RegS 5.625% 15/03/2021
2,581,784 0.17
EUR 2,500,000 Lafarge EMTN 6.625% 29/11/2018 3,538,655 0.23
USD 7,660,000 Numericable 144A 6% 15/05/2022 7,744,796 0.51
EUR 4,200,000 Numericable RegS 5.375% 15/05/2022
5,270,963 0.35
Germany 16,370,519 1.08
EUR 3,000,000 HP Pelzer Holding RegS 7.5% 15/07/2021
3,810,587 0.25
EUR 4,179,000 Pfleiderer GmbH RegS 7.875% 01/08/2019
4,840,418 0.32
EUR 3,000,000 ThyssenKrupp EMTN 3.125% 25/10/2019
3,830,607 0.25
EUR 3,000,000 Unitymedia Hessen & Co RegS 5.5% 15/09/2022
3,888,907 0.26
Italy 5,391,088 0.35
EUR 4,600,000 UniCredit variable perpetual 5,391,088 0.35
Jersey 49,036,429 3.23
GBP 2,300,000 AA Bond RegS 9.5% 31/07/2019 3,956,683 0.26
GBP 12,591,000 CPUK Finance EMTN 11.625% 28/02/2018
21,047,726 1.39
GBP 11,220,000 Galaxy Bidco RegS 6.375% 15/11/2020
17,136,141 1.13
GBP 4,260,000 Hastings Insurance Finance RegS 8% 21/10/2020
6,895,879 0.45
Luxembourg 57,241,141 3.78
EUR 4,500,000 Altice RegS 7.25% 15/05/2022 5,548,112 0.36
USD 12,970,000 ArcelorMittal 6% 01/03/2021 13,481,796 0.89
Number of shares or Principal Amount
Transferable Securities and Money Market Instruments Admitted to an Official Exchange Listing
Market Value
USD
% Net assets
EUR 698,000 Auris Luxembourg II RegS 8% 15/01/2023
869,953 0.06
EUR 3,000,000 Fiat Chrysler Finance Europe GMTN 4.75% 15/07/2022
3,882,318 0.26
EUR 10,032,000 Magnolia RegS 9% 01/08/2020 11,667,006 0.77
EUR 4,902,000 Matterhorn Financing RegS 9% 15/04/2019
6,044,367 0.40
USD 3,920,000 Wind Acquisition Finance 144A 4.75% 15/07/2020
3,723,118 0.24
USD 1,565,000 Wind Acquisition Finance 144A 6.5% 30/04/2020
1,606,081 0.11
EUR 4,842,000 Wind Acquisition Finance RegS 7% 23/04/2021
5,757,495 0.38
EUR 4,000,000 Wind Acquisition Finance RegS FRN 15/07/2020
4,660,895 0.31
Netherlands 47,871,269 3.16
EUR 4,200,000 Deutsche Annington Finance variable 08/04/2074
5,347,196 0.35
EUR 6,200,000 LGE HoldCo RegS 7.125% 15/05/2024
8,301,343 0.55
EUR 3,000,000 PortAventura Entertainment Barcelona RegS 7.25% 01/12/2020
3,762,541 0.25
EUR 8,078,000 Samvardhana Motherson Automotive Systems RegS 4.125% 15/07/2021
9,625,132 0.64
EUR 14,096,000 Univeg RegS 7.875% 15/11/2020 16,238,135 1.07
EUR 3,500,000 UPC Holding RegS 6.375% 15/09/2022
4,596,922 0.30
Sweden 20,672,940 1.36
USD 4,043,000 Nordea Bank 144A variable perpetual 4,012,718 0.26
EUR 13,770,000 SSAB EMTN 3.875% 10/04/2019 16,660,222 1.10
Switzerland 4,829,050 0.32
USD 5,000,000 Credit Suisse 144A variable perpetual 4,829,050 0.32
United Kingdom 137,512,221 9.07
GBP 3,715,000 Anglian Water Osprey Financing EMTN 7% 31/01/2018
6,187,062 0.41
GBP 9,800,000 Bakkavor Finance RegS 8.25% 15/02/2018
15,670,383 1.03
GBP 2,900,000 Barclays Bank variable perpetual 5,999,896 0.40
EUR 4,320,000 Barclays variable perpetual 5,466,570 0.36
GBP 4,735,000 Care UK Health & Social Care RegS FRN 15/07/2019
6,982,703 0.46
USD 5,000,000 EnQuest 144A 7% 15/04/2022 3,150,000 0.21
GBP 3,100,000 Enterprise Inns 6% 06/10/2023 4,688,665 0.31
GBP 4,900,000 HSS Financing RegS 6.75% 01/08/2019
7,942,882 0.52
GBP 4,925,000 Keystone Financing RegS 9.5% 15/10/2019
7,564,116 0.50

AVIVA INVESTORS – ANNUAL REPORT AND AUDITED FINANCIAL STATEMENTS avivainvestors.com 78
AVIVA INVESTORS – GLOBAL HIGH YIELD BOND FUND (CONTINUED)Portfolio of Investments and Other Net Assets as at 31 December 2014
Number of shares or Principal Amount
Transferable Securities and Money Market Instruments Admitted to an Official Exchange Listing
Market Value
USD
% Net assets
GBP 4,284,000 Matalan Finance RegS 6.875% 01/06/2019
6,445,231 0.43
GBP 7,697,000 Odeon & UCI Finco RegS 9% 01/08/2018
11,296,216 0.75
GBP 10,375,000 Premier Foods Finance RegS 6.5% 15/03/2021
13,995,235 0.92
GBP 2,127,405 Priory Group No 3 RegS 7% 15/02/2018
3,453,491 0.23
GBP 7,000,000 R&R Ice Cream RegS 5.5% 15/05/2020
10,687,123 0.70
EUR 3,300,000 Royal Bank of Scotland 5.5% perpetual
3,816,647 0.25
USD 7,500,000 Royal Bank of Scotland 6.125% 15/12/2022
8,138,887 0.54
USD 9,700,000 Vedanta Resources 144A 9.5% 18/07/2018
10,500,832 0.69
GBP 3,418,000 Virgin Media Secured Finance RegS 5.5% 15/01/2025
5,526,282 0.36
United States of America 207,396,074 13.68
USD 4,100,000 AES 8% 01/06/2020 4,667,563 0.31
USD 3,860,000 Alcoa 5.125% 01/10/2024 4,086,852 0.27
USD 4,340,000 Ally Financial 3.5% 27/01/2019 4,290,502 0.28
USD 500,000 Ally Financial 6.25% 01/12/2017 540,472 0.04
USD 3,593,000 Ally Financial 7.5% 15/09/2020 4,207,493 0.28
USD 3,253,000 Ally Financial 8% 15/03/2020 3,847,014 0.25
USD 5,991,000 American Axle & Manufacturing 6.25% 15/03/2021
6,274,254 0.41
USD 3,275,000 American Axle & Manufacturing 6.625% 15/10/2022
3,488,252 0.23
USD 1,500,000 Bill Barrett 7% 15/10/2022 1,215,000 0.08
USD 4,542,000 Bill Barrett 7.625% 01/10/2019 4,114,303 0.27
USD 9,205,000 Calpine 5.375% 15/01/2023 9,314,309 0.61
USD 175,800 Capital One Financial Preference 4,569,666 0.30
USD 6,731,000 CenturyLink 5.625% 01/04/2020 7,012,861 0.46
USD 4,995,000 Chemtura 5.75% 15/07/2021 4,895,100 0.32
Number of shares or Principal Amount
Transferable Securities and Money Market Instruments Admitted to an Official Exchange Listing
Market Value
USD
% Net assets
USD 7,000,000 Chesapeake Energy 4.875% 15/04/2022
6,880,720 0.45
USD 8,150,000 CNH Capital 3.625% 15/04/2018 8,114,221 0.54
USD 8,633,000 Concho Resources 6.5% 15/01/2022 9,065,556 0.60
USD 438,000 DPL 6.5% 15/10/2016 465,360 0.03
USD 7,625,000 Gannett 5.125% 15/10/2019 7,853,750 0.52
USD 5,000,000 HCA 5% 15/03/2024 5,138,425 0.34
USD 9,000,000 HCA 5.875% 01/05/2023 9,476,190 0.63
USD 7,280,000 HCA 5.875% 15/03/2022 7,991,584 0.53
USD 550,000 HCA 7.69% 15/06/2025 621,500 0.04
USD 5,725,000 HCA 7.75% 15/05/2021 6,136,084 0.41
USD 5,814,000 Hecla Mining 6.875% 01/05/2021 5,145,913 0.34
USD 1,000,000 Lennar 4.5% 15/06/2019 1,011,915 0.07
USD 3,495,000 MarkWest Energy Partners LP / MarkWest Energy Finance 4.875% 01/12/2024
3,407,625 0.23
USD 6,145,000 Masco 5.95% 15/03/2022 6,827,740 0.45
USD 1,850,000 Masco 7.125% 15/03/2020 2,151,448 0.14
USD 3,750,000 MGM Resorts International 6.625% 15/12/2021
3,962,494 0.26
USD 9,325,000 NuStar Logistics 4.8% 01/09/2020 9,105,629 0.60
USD 8,000,000 Resolute Forest Products 5.875% 15/05/2023
7,604,880 0.50
USD 9,640,000 Reynolds Issuer 5.75% 15/10/2020 9,905,004 0.65
USD 9,620,000 Sprint 7.125% 15/06/2024 9,025,676 0.60
USD 4,000,000 Sprint 7.25% 15/09/2021 3,970,000 0.26
USD 1,421,000 Sprint Capital 6.875% 15/11/2028 1,267,646 0.08
USD 5,895,000 T-Mobile USA 6.625% 01/04/2023 6,071,791 0.40
USD 5,850,000 T-Mobile USA 6.625% 15/11/2020 6,032,725 0.40
USD 7,110,000 Toll Brothers Finance 5.875% 15/02/2022
7,638,557 0.50
Total Transferable Securities andMoney Market Instruments Admittedto an Official Exchange Listing
622,025,487 41.03

AVIVA INVESTORS – ANNUAL REPORT AND AUDITED FINANCIAL STATEMENTS avivainvestors.com 79
AVIVA INVESTORS – GLOBAL HIGH YIELD BOND FUND (CONTINUED)Portfolio of Investments and Other Net Assets as at 31 December 2014
Number of shares or Principal Amount
Transferable Securities and Money Market Instruments dealt in on another Regulated Market
Market Value
USD
% Net assets
Bermuda 11,472,372 0.76
USD 8,400,000 Aircastle 6.25% 01/12/2019 8,896,566 0.59
USD 2,322,000 Aircastle 7.625% 15/04/2020 2,575,806 0.17
Canada 67,883,446 4.48
USD 6,685,000 Eldorado Gold 144A 6.125% 15/12/2020
6,517,875 0.43
USD 970,000 Garda World Security 144A 7.25% 15/11/2021
965,150 0.07
USD 7,820,000 Garda World Security 144A 7.25% 15/11/2021
7,780,900 0.51
USD 13,225,000 IAMGOLD 144A 6.75% 01/10/2020 10,027,195 0.66
USD 7,075,000 KGHM International 144A 7.75% 15/06/2019
7,322,625 0.48
USD 5,200,000 Kinross Gold 144A 5.95% 15/03/2024
4,932,174 0.33
USD 4,665,000 MDC Partners 144A 6.75% 01/04/2020
4,787,456 0.32
USD 1,795,000 Taseko Mines 7.75% 15/04/2019 1,624,475 0.11
USD 10,850,000 Thompson Creek Metals 7.375% 01/06/2018
8,837,596 0.58
USD 6,000,000 Ultra Petroleum 144A 6.125% 01/10/2024
5,190,000 0.34
USD 9,800,000 Valeant Pharmaceuticals International 144A 5.625% 01/12/2021
9,898,000 0.65
Ireland 14,327,231 0.94
USD 3,675,000 AerCap Ireland Capital/AerCap Global Aviation Trust 144A 3.75% 15/05/2019
3,652,031 0.24
USD 10,240,000 AerCap Ireland Capital/AerCap Global Aviation Trust 144A 5% 01/10/2021
10,675,200 0.70
Luxembourg 34,489,884 2.27
USD 395,000 Beverage Packaging Holdings II 144A 5.625% 15/12/2016
389,075 0.02
USD 3,515,000 Beverage Packaging Holdings II 144A 6% 15/06/2017
3,442,486 0.23
USD 15,000,000 Consolidated Energy Finance 144A 6.75% 15/10/2019
14,700,000 0.97
USD 3,880,000 Intelsat Jackson 6.625% 15/12/2022 3,949,918 0.26
USD 4,750,000 Intelsat Jackson 7.25% 15/10/2020 5,022,246 0.33
USD 6,815,000 Intelsat Luxembourg 6.75% 01/06/2018
6,986,159 0.46
United Kingdom 3,420,463 0.23
USD 3,395,000 Jaguar Land Rover Automotive 144A 4.25% 15/11/2019
3,420,463 0.23
Number of shares or Principal Amount
Transferable Securities and Money Market Instruments dealt in on another Regulated Market
Market Value
USD
% Net assets
United States of America 668,470,422 44.09
USD 825,000 Acadia Healthcare 5.125% 01/07/2022
816,750 0.05
USD 5,181,000 Acadia Healthcare 6.125% 15/03/2021
5,325,032 0.35
USD 2,526,000 Acadia Healthcare 12.875% 01/11/2018
2,854,380 0.19
USD 5,710,000 Access Midstream Partners/ACMP Finance 6.125% 15/07/2022
6,120,806 0.40
USD 3,850,000 AECOM Technology 144A 5.875% 15/10/2024
3,955,875 0.26
USD 3,200,000 Alliance Data Systems 144A 5.375% 01/08/2022
3,168,000 0.21
USD 8,350,000 Alliance Data Systems 144A 6.375% 01/04/2020
8,569,188 0.56
USD 11,505,000 Alphabet Holding 7.75% 01/11/2017
9,781,551 0.64
USD 6,015,000 AMC Entertainment 5.875% 15/02/2022
6,135,300 0.40
USD 425,000 AMC Entertainment 9.75% 01/12/2020
464,580 0.03
USD 11,550,000 American Achievement 144A 10.875% 15/04/2016
11,102,438 0.73
USD 830,000 American Axle & Manufacturing 5.125% 15/02/2019
847,272 0.06
USD 13,140,000 Antero Resources 144A 5.125% 01/12/2022
12,537,794 0.83
USD 10,000,000 Avaya 144A 7% 01/04/2019 9,825,000 0.65
USD 9,000,000 Basic Energy Services 7.75% 15/02/2019
7,110,000 0.47
USD 2,210,000 Blue Racer Midstream/Blue Racer Finance 144A 6.125% 15/11/2022
2,127,125 0.14
USD 6,150,000 BMC Software Finance 144A 8.125% 15/07/2021
5,811,750 0.38
USD 5,370,000 Building Materials 144A 5.375% 15/11/2024
5,383,425 0.35
USD 5,000,000 CCO/CCO Capital 6.5% 30/04/2021 5,275,150 0.35
USD 370,000 CCO/CCO Capital 6.625% 31/01/2022
394,557 0.03
USD 5,300,000 CCO/CCO Capital 7.375% 01/06/2020
5,645,905 0.37
USD 2,355,000 CDW Finance 5.5% 01/12/2024 2,363,831 0.16
USD 8,000,000 Century Communities 144A 6.875% 15/05/2022
8,000,000 0.53
USD 3,270,000 Cequel Communications 144A 5.125% 15/12/2021
3,171,900 0.21

AVIVA INVESTORS – ANNUAL REPORT AND AUDITED FINANCIAL STATEMENTS avivainvestors.com 80
AVIVA INVESTORS – GLOBAL HIGH YIELD BOND FUND (CONTINUED)Portfolio of Investments and Other Net Assets as at 31 December 2014
Number of shares or Principal Amount
Transferable Securities and Money Market Instruments dealt in on another Regulated Market
Market Value
USD
% Net assets
USD 7,300,000 Cequel Communications 144A 6.375% 15/09/2020
7,592,000 0.50
USD 11,400,000 Chrysler/CG Co-Issuer 8.25% 15/06/2021
12,683,013 0.84
USD 7,375,000 Citi variable perpetual 7,302,873 0.48
USD 2,690,000 Clear Channel Worldwide 6.5% 15/11/2022
2,750,525 0.18
USD 2,900,000 Clear Channel Worldwide 6.5% 15/11/2022
3,011,824 0.20
USD 6,340,000 CNO Financial 144A 6.375% 01/10/2020
6,720,400 0.44
USD 5,900,000 Consolidated Communications Finance 10.875% 01/06/2020
6,689,125 0.44
USD 9,155,000 CoreLogic/United States 7.25% 01/06/2021
9,612,750 0.63
USD 8,000,000 Cott Beverages 144A 6.75% 01/01/2020
8,000,000 0.53
USD 4,425,000 Crescent Resources 144A 10.25% 15/08/2017
4,767,938 0.31
USD 11,076,000 CyrusOne Finance 6.375% 15/11/2022
11,879,010 0.78
USD 5,240,000 DISH DBS 7.875% 01/09/2019 5,961,862 0.39
USD 4,200,000 DJO Finance 9.75% 15/10/2017 4,221,000 0.28
USD 11,940,000 FGI Operating 7.875% 01/05/2020 10,925,100 0.72
USD 3,784,000 First Data 11.75% 15/08/2021 4,388,740 0.29
USD 6,945,000 First Data 12.625% 15/01/2021 8,279,516 0.55
USD 3,980,000 Fresenius Medical Care US Finance II 144A 4.125% 15/10/2020
4,019,800 0.26
USD 8,445,000 Frontier Communications 6.25% 15/09/2021
8,551,576 0.56
USD 800,000 Gannett 144A 5.5% 15/09/2024 804,000 0.05
USD 17,930,000 General Motors 4.875% 02/10/2023
19,115,263 1.26
USD 15,970,000 GLP Capital 4.875% 01/11/2020 16,460,838 1.09
USD 4,625,000 Goodyear Tire & Rubber 8.25% 15/08/2020
4,950,461 0.33
USD 3,530,000 Greystar Real Estate Partners 144A 8.25% 01/12/2022
3,609,425 0.24
USD 3,810,000 Guitar Center 144A 6.5% 15/04/2019
3,331,845 0.22
USD 7,490,000 Huntsman International 144A 5.125% 15/11/2022
7,396,375 0.49
USD 7,655,000 iHeartCommunications 9% 15/12/2019
7,554,987 0.50
USD 8,350,000 IHS 144A 5% 01/11/2022 8,308,250 0.55
USD 7,775,000 INVISTA Finance 144A 4.25% 15/10/2019
7,813,875 0.51
USD 2,400,000 Ipalco Enterprises 5% 01/05/2018 2,530,236 0.17
USD 9,950,000 Jefferies LoanCore 144A 6.875% 01/06/2020
9,154,000 0.60
Number of shares or Principal Amount
Transferable Securities and Money Market Instruments dealt in on another Regulated Market
Market Value
USD
% Net assets
USD 9,165,000 JPMorgan Chase & Co variable perpetual
9,200,744 0.61
USD 6,375,000 Kinder Morgan 144A 5.625% 15/11/2023
6,828,753 0.45
USD 7,375,000 Landry's 144A 9.375% 01/05/2020 7,854,375 0.52
USD 2,485,000 Lennar 4.125% 01/12/2018 2,518,535 0.17
USD 1,000,000 Level 3 Communications 8.875% 01/06/2019
1,059,845 0.07
USD 5,978,000 Level 3 Financing 8.125% 01/07/2019
6,343,166 0.42
USD 3,964,000 Linn Energy Finance 6.5% 15/05/2019
3,349,580 0.22
USD 6,765,000 Linn Energy Finance 7.75% 01/02/2021
5,750,656 0.38
USD 8,475,000 Live Nation Entertainment 144A 5.375% 15/06/2022
8,517,375 0.56
USD 8,500,000 Mediacom/Mediacom Capital 7.25% 15/02/2022
9,116,250 0.60
USD 7,125,000 MGM Resorts International 8.625% 01/02/2019
8,105,436 0.53
USD 5,270,000 Micron Technology 144A 5.5% 01/02/2025
5,355,638 0.35
USD 4,208,000 Midstates Petroleum/Midstates Petroleum 10.75% 01/10/2020
2,293,360 0.15
USD 3,030,000 MSCI144A 5.25% 15/11/2024 3,151,200 0.21
USD 4,185,000 Navient 5% 26/10/2020 4,116,994 0.27
USD 3,925,000 NBTY 9% 01/10/2018 3,973,729 0.26
USD 7,795,000 Neiman Marcus 144A 8.75% 15/10/2021
8,301,675 0.55
USD 5,000,000 New Academy Finance 144A 8% 15/06/2018
4,987,500 0.33
USD 5,553,000 Nuance Communications 144A 5.375% 15/08/2020
5,608,530 0.37
USD 4,090,000 OneMain Financial Holdings 144A 6.75% 15/12/2019
4,182,025 0.28
USD 5,355,000 Peninsula Gaming 144A 8.375% 15/02/2018
5,542,425 0.37
USD 1,445,000 Penn Virginia Resource Partners 6.5% 15/05/2021
1,459,450 0.10
USD 4,489,000 Penn Virginia Resource Partners 8.375% 01/06/2020
4,814,453 0.32
USD 10,552,000 Physio-Control International 144A 9.875% 15/01/2019
11,237,880 0.74
USD 11,735,000 Plastipak 144A 6.5% 01/10/2021 11,793,675 0.78
USD 2,872,000 Potlatch 7.5% 01/11/2019 3,302,800 0.22
USD 6,250,000 RJS Power Holdings 144A 5.125% 15/07/2019
6,203,125 0.41
USD 8,540,000 Roundy's Supermarkets 144A 10.25% 15/12/2020
7,472,500 0.49
USD 1,600,000 RSP Permian 144A 6.625% 01/10/2022
1,496,000 0.10

AVIVA INVESTORS – ANNUAL REPORT AND AUDITED FINANCIAL STATEMENTS avivainvestors.com 81
AVIVA INVESTORS – GLOBAL HIGH YIELD BOND FUND (CONTINUED)Portfolio of Investments and Other Net Assets as at 31 December 2014
Number of shares or Principal Amount
Transferable Securities and Money Market Instruments dealt in on another Regulated Market
Market Value
USD
% Net assets
USD 7,180,000 Sanchez Energy 144A 6.125% 15/01/2023
6,049,150 0.40
USD 5,000,000 Signode Industrial Lux/Signode Industrial US 144A 6.375% 01/05/2022
4,850,000 0.32
USD 4,835,000 Sirius XM Radio 144A 6% 15/07/2024
4,955,875 0.33
USD 7,695,000 Six Flags Entertainment 144A 5.25% 15/01/2021
7,733,475 0.51
USD 2,600,000 SM Energy 6.5% 01/01/2023 2,516,787 0.17
USD 3,500,000 SM Energy 6.5% 15/11/2021 3,412,500 0.22
USD 8,600,000 Sprint Nextel 144A 9% 15/11/2018 9,803,140 0.65
USD 6,545,000 Standard Pacific 8.375% 15/01/2021
7,472,885 0.49
USD 2,718,000 Summit Materials 10.5% 31/01/2020
3,030,570 0.20
USD 7,695,000 Targa Resources Partners Finance 144A 4.125% 15/11/2019
7,502,625 0.49
USD 16,500,000 Tenet Healthcare 144A 5% 01/03/2019
16,561,875 1.09
USD 1,210,000 Tesoro Logistics 144A 5.5% 15/10/2019
1,211,004 0.08
USD 12,661,000 Townsquare 144A 9% 01/04/2019 13,547,270 0.89
USD 4,500,000 United Rentals North America 7.625% 15/04/2022
4,940,933 0.33
USD 10,650,000 Universal Health Services 144A 4.75% 01/08/2022
10,871,840 0.72
USD 2,092,000 Univision Communications 144A 6.75% 15/09/2022
2,243,670 0.15
USD 12,262,000 Vector 7.75% 15/02/2021 12,951,738 0.85
USD 10,475,000 WESCO Distribution 5.375% 15/12/2021
10,553,563 0.70
USD 10,900,000 Westmoreland Coal 144A 8.75% 01/01/2022
10,763,750 0.71
USD 1,985,000 WideOpenWest Finance 10.25% 15/07/2019
2,079,288 0.14
USD 1,000,000 Windstream 7.5% 01/06/2022 1,007,880 0.07
USD 5,000,000 Windstream 7.75% 15/10/2020 5,253,000 0.35
USD 5,375,000 WR Grace 144A 5.125% 01/10/2021
5,522,813 0.36
USD 4,007,000 Zayo Capital 10.125% 01/07/2020 4,522,901 0.30
Total Transferable Securities andMoney Market Instruments dealton another Regulated Market
800,063,818 52.77
Number of shares or Principal Amount
Other Transferable Securities not dealt on another Regulated Market
Market Value
USD
% Net assets
United Kingdom 19,076,666 1.26
EUR 15,386,000 Algeco Scotsman Global Finance RegS 9% 15/10/2018
19,076,666 1.26
Total Other Transferable Securitiesnot dealt on anotherRegulated Market
19,076,666 1.26
Total Investments 1,441,165,971 95.06
Other Net Assets 74,960,714 4.94
Net Asset Value 1,516,126,685 100.00
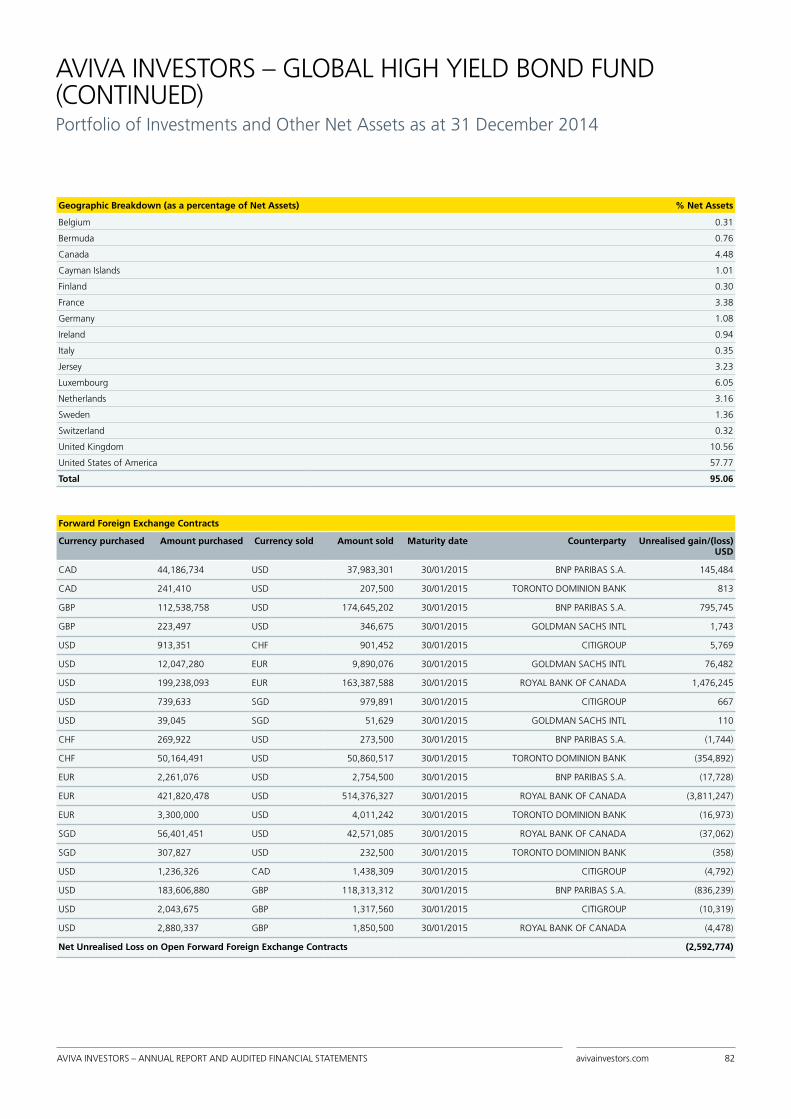
AVIVA INVESTORS – ANNUAL REPORT AND AUDITED FINANCIAL STATEMENTS avivainvestors.com 82
AVIVA INVESTORS – GLOBAL HIGH YIELD BOND FUND (CONTINUED)Portfolio of Investments and Other Net Assets as at 31 December 2014
Geographic Breakdown (as a percentage of Net Assets) % Net Assets
Belgium 0.31
Bermuda 0.76
Canada 4.48
Cayman Islands 1.01
Finland 0.30
France 3.38
Germany 1.08
Ireland 0.94
Italy 0.35
Jersey 3.23
Luxembourg 6.05
Netherlands 3.16
Sweden 1.36
Switzerland 0.32
United Kingdom 10.56
United States of America 57.77
Total 95.06
Forward Foreign Exchange Contracts
Currency purchased Amount purchased Currency sold Amount sold Maturity date Counterparty Unrealised gain/(loss) USD
CAD 44,186,734 USD 37,983,301 30/01/2015 BNP PARIBAS S.A. 145,484
CAD 241,410 USD 207,500 30/01/2015 TORONTO DOMINION BANK 813
GBP 112,538,758 USD 174,645,202 30/01/2015 BNP PARIBAS S.A. 795,745
GBP 223,497 USD 346,675 30/01/2015 GOLDMAN SACHS INTL 1,743
USD 913,351 CHF 901,452 30/01/2015 CITIGROUP 5,769
USD 12,047,280 EUR 9,890,076 30/01/2015 GOLDMAN SACHS INTL 76,482
USD 199,238,093 EUR 163,387,588 30/01/2015 ROYAL BANK OF CANADA 1,476,245
USD 739,633 SGD 979,891 30/01/2015 CITIGROUP 667
USD 39,045 SGD 51,629 30/01/2015 GOLDMAN SACHS INTL 110
CHF 269,922 USD 273,500 30/01/2015 BNP PARIBAS S.A. (1,744)
CHF 50,164,491 USD 50,860,517 30/01/2015 TORONTO DOMINION BANK (354,892)
EUR 2,261,076 USD 2,754,500 30/01/2015 BNP PARIBAS S.A. (17,728)
EUR 421,820,478 USD 514,376,327 30/01/2015 ROYAL BANK OF CANADA (3,811,247)
EUR 3,300,000 USD 4,011,242 30/01/2015 TORONTO DOMINION BANK (16,973)
SGD 56,401,451 USD 42,571,085 30/01/2015 ROYAL BANK OF CANADA (37,062)
SGD 307,827 USD 232,500 30/01/2015 TORONTO DOMINION BANK (358)
USD 1,236,326 CAD 1,438,309 30/01/2015 CITIGROUP (4,792)
USD 183,606,880 GBP 118,313,312 30/01/2015 BNP PARIBAS S.A. (836,239)
USD 2,043,675 GBP 1,317,560 30/01/2015 CITIGROUP (10,319)
USD 2,880,337 GBP 1,850,500 30/01/2015 ROYAL BANK OF CANADA (4,478)
Net Unrealised Loss on Open Forward Foreign Exchange Contracts (2,592,774)
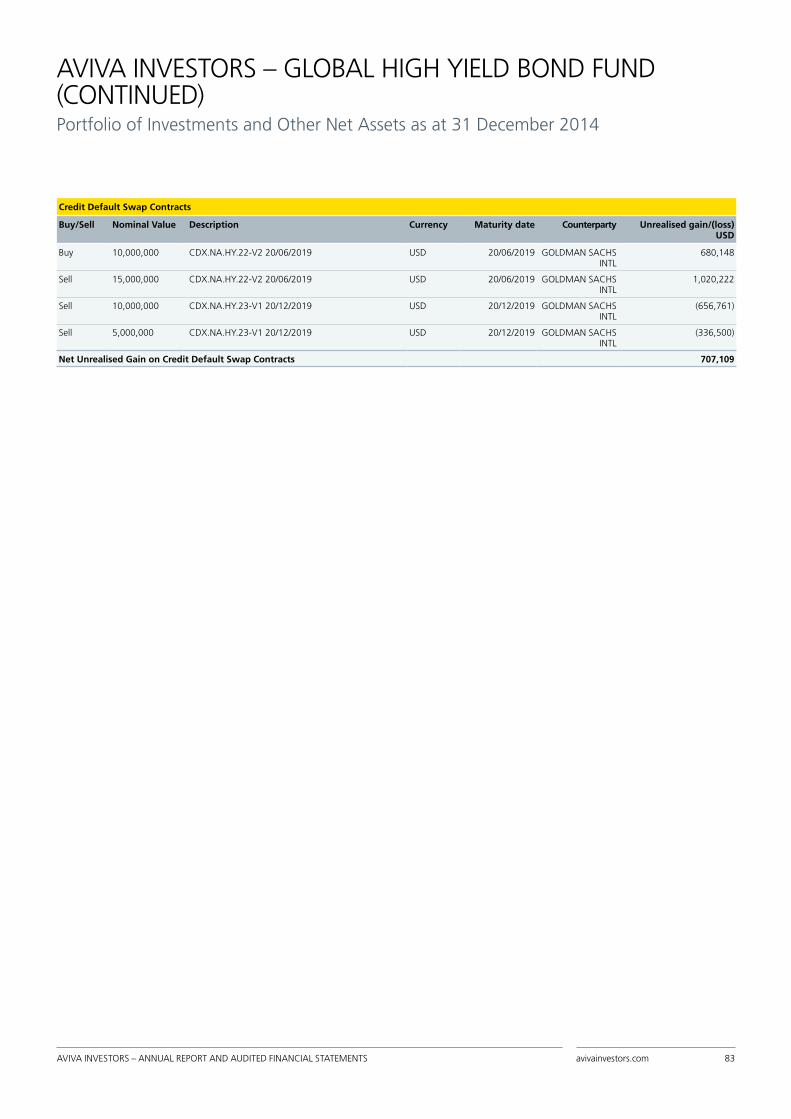
AVIVA INVESTORS – ANNUAL REPORT AND AUDITED FINANCIAL STATEMENTS avivainvestors.com 83
AVIVA INVESTORS – GLOBAL HIGH YIELD BOND FUND (CONTINUED)Portfolio of Investments and Other Net Assets as at 31 December 2014
Credit Default Swap Contracts
Buy/Sell Nominal Value Description Currency Maturity date Counterparty Unrealised gain/(loss) USD
Buy 10,000,000 CDX.NA.HY.22-V2 20/06/2019 USD 20/06/2019 GOLDMAN SACHS INTL
680,148
Sell 15,000,000 CDX.NA.HY.22-V2 20/06/2019 USD 20/06/2019 GOLDMAN SACHS INTL
1,020,222
Sell 10,000,000 CDX.NA.HY.23-V1 20/12/2019 USD 20/12/2019 GOLDMAN SACHS INTL
(656,761)
Sell 5,000,000 CDX.NA.HY.23-V1 20/12/2019 USD 20/12/2019 GOLDMAN SACHS INTL
(336,500)
Net Unrealised Gain on Credit Default Swap Contracts 707,109
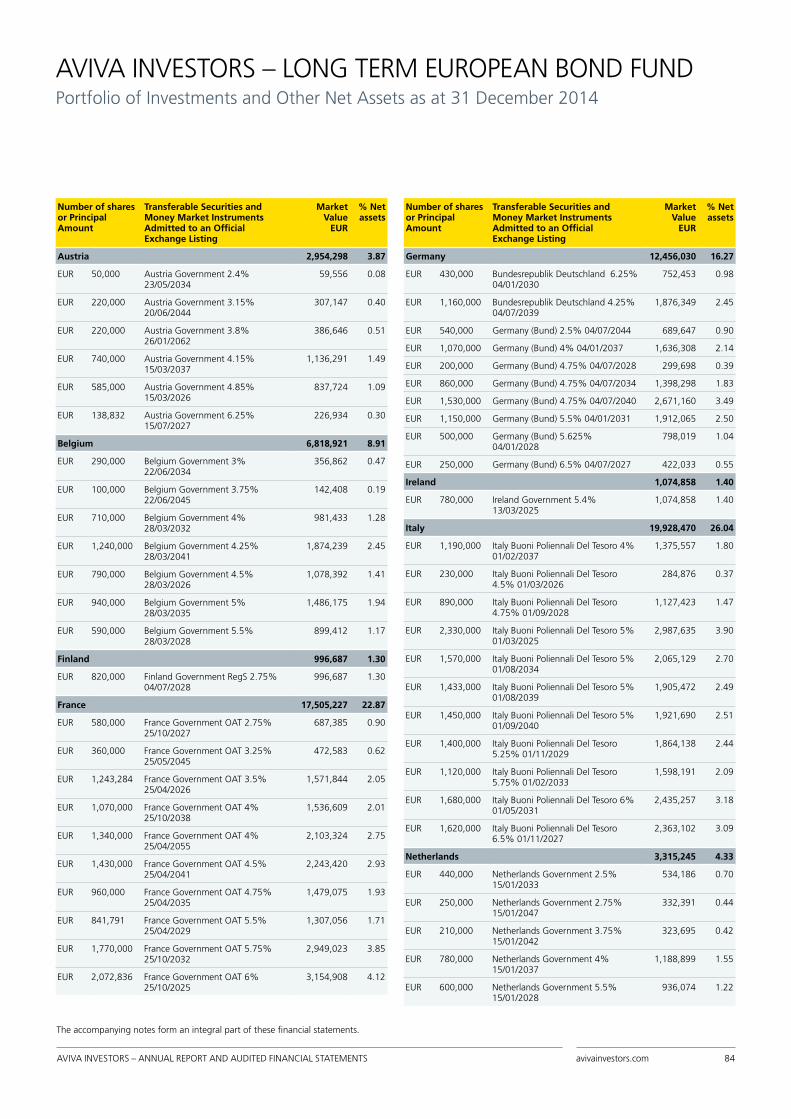
AVIVA INVESTORS – ANNUAL REPORT AND AUDITED FINANCIAL STATEMENTS avivainvestors.com 84
AVIVA INVESTORS – LONG TERM EUROPEAN BOND FUNDPortfolio of Investments and Other Net Assets as at 31 December 2014
Number of shares or Principal Amount
Transferable Securities and Money Market Instruments Admitted to an Official Exchange Listing
Market Value
EUR
% Net assets
Austria 2,954,298 3.87
EUR 50,000 Austria Government 2.4% 23/05/2034
59,556 0.08
EUR 220,000 Austria Government 3.15% 20/06/2044
307,147 0.40
EUR 220,000 Austria Government 3.8% 26/01/2062
386,646 0.51
EUR 740,000 Austria Government 4.15% 15/03/2037
1,136,291 1.49
EUR 585,000 Austria Government 4.85% 15/03/2026
837,724 1.09
EUR 138,832 Austria Government 6.25% 15/07/2027
226,934 0.30
Belgium 6,818,921 8.91
EUR 290,000 Belgium Government 3% 22/06/2034
356,862 0.47
EUR 100,000 Belgium Government 3.75% 22/06/2045
142,408 0.19
EUR 710,000 Belgium Government 4% 28/03/2032
981,433 1.28
EUR 1,240,000 Belgium Government 4.25% 28/03/2041
1,874,239 2.45
EUR 790,000 Belgium Government 4.5% 28/03/2026
1,078,392 1.41
EUR 940,000 Belgium Government 5% 28/03/2035
1,486,175 1.94
EUR 590,000 Belgium Government 5.5% 28/03/2028
899,412 1.17
Finland 996,687 1.30
EUR 820,000 Finland Government RegS 2.75% 04/07/2028
996,687 1.30
France 17,505,227 22.87
EUR 580,000 France Government OAT 2.75% 25/10/2027
687,385 0.90
EUR 360,000 France Government OAT 3.25% 25/05/2045
472,583 0.62
EUR 1,243,284 France Government OAT 3.5% 25/04/2026
1,571,844 2.05
EUR 1,070,000 France Government OAT 4% 25/10/2038
1,536,609 2.01
EUR 1,340,000 France Government OAT 4% 25/04/2055
2,103,324 2.75
EUR 1,430,000 France Government OAT 4.5% 25/04/2041
2,243,420 2.93
EUR 960,000 France Government OAT 4.75% 25/04/2035
1,479,075 1.93
EUR 841,791 France Government OAT 5.5% 25/04/2029
1,307,056 1.71
EUR 1,770,000 France Government OAT 5.75% 25/10/2032
2,949,023 3.85
EUR 2,072,836 France Government OAT 6% 25/10/2025
3,154,908 4.12
Number of shares or Principal Amount
Transferable Securities and Money Market Instruments Admitted to an Official Exchange Listing
Market Value
EUR
% Net assets
Germany 12,456,030 16.27
EUR 430,000 Bundesrepublik Deutschland 6.25% 04/01/2030
752,453 0.98
EUR 1,160,000 Bundesrepublik Deutschland 4.25% 04/07/2039
1,876,349 2.45
EUR 540,000 Germany (Bund) 2.5% 04/07/2044 689,647 0.90
EUR 1,070,000 Germany (Bund) 4% 04/01/2037 1,636,308 2.14
EUR 200,000 Germany (Bund) 4.75% 04/07/2028 299,698 0.39
EUR 860,000 Germany (Bund) 4.75% 04/07/2034 1,398,298 1.83
EUR 1,530,000 Germany (Bund) 4.75% 04/07/2040 2,671,160 3.49
EUR 1,150,000 Germany (Bund) 5.5% 04/01/2031 1,912,065 2.50
EUR 500,000 Germany (Bund) 5.625% 04/01/2028
798,019 1.04
EUR 250,000 Germany (Bund) 6.5% 04/07/2027 422,033 0.55
Ireland 1,074,858 1.40
EUR 780,000 Ireland Government 5.4% 13/03/2025
1,074,858 1.40
Italy 19,928,470 26.04
EUR 1,190,000 Italy Buoni Poliennali Del Tesoro 4% 01/02/2037
1,375,557 1.80
EUR 230,000 Italy Buoni Poliennali Del Tesoro 4.5% 01/03/2026
284,876 0.37
EUR 890,000 Italy Buoni Poliennali Del Tesoro 4.75% 01/09/2028
1,127,423 1.47
EUR 2,330,000 Italy Buoni Poliennali Del Tesoro 5% 01/03/2025
2,987,635 3.90
EUR 1,570,000 Italy Buoni Poliennali Del Tesoro 5% 01/08/2034
2,065,129 2.70
EUR 1,433,000 Italy Buoni Poliennali Del Tesoro 5% 01/08/2039
1,905,472 2.49
EUR 1,450,000 Italy Buoni Poliennali Del Tesoro 5% 01/09/2040
1,921,690 2.51
EUR 1,400,000 Italy Buoni Poliennali Del Tesoro 5.25% 01/11/2029
1,864,138 2.44
EUR 1,120,000 Italy Buoni Poliennali Del Tesoro 5.75% 01/02/2033
1,598,191 2.09
EUR 1,680,000 Italy Buoni Poliennali Del Tesoro 6% 01/05/2031
2,435,257 3.18
EUR 1,620,000 Italy Buoni Poliennali Del Tesoro 6.5% 01/11/2027
2,363,102 3.09
Netherlands 3,315,245 4.33
EUR 440,000 Netherlands Government 2.5% 15/01/2033
534,186 0.70
EUR 250,000 Netherlands Government 2.75% 15/01/2047
332,391 0.44
EUR 210,000 Netherlands Government 3.75% 15/01/2042
323,695 0.42
EUR 780,000 Netherlands Government 4% 15/01/2037
1,188,899 1.55
EUR 600,000 Netherlands Government 5.5% 15/01/2028
936,074 1.22
The accompanying notes form an integral part of these financial statements.

AVIVA INVESTORS – ANNUAL REPORT AND AUDITED FINANCIAL STATEMENTS avivainvestors.com 85
AVIVA INVESTORS – LONG TERM EUROPEAN BOND FUND (CONTINUED)Portfolio of Investments and Other Net Assets as at 31 December 2014
Number of shares or Principal Amount
Transferable Securities and Money Market Instruments Admitted to an Official Exchange Listing
Market Value
EUR
% Net assets
Spain 9,258,683 12.10
EUR 130,000 Spain Government 4% 31/10/2064 158,019 0.21
EUR 1,070,000 Spain Government 4.2% 31/01/2037
1,344,404 1.76
EUR 790,000 Spain Government 4.65% 30/07/2025
1,009,682 1.32
EUR 880,000 Spain Government 4.7% 30/07/2041
1,183,364 1.55
EUR 360,000 Spain Government 4.9% 30/07/2040
498,721 0.65
EUR 980,000 Spain Government 5.15% 31/10/2028
1,316,369 1.72
Number of shares or Principal Amount
Transferable Securities and Money Market Instruments Admitted to an Official Exchange Listing
Market Value
EUR
% Net assets
EUR 440,000 Spain Government 5.15% 31/10/2044
632,029 0.82
EUR 1,128,000 Spain Government 5.75% 30/07/2032
1,664,889 2.17
EUR 1,000,000 Spain Government 6% 31/01/2029 1,451,206 1.90
Total Transferable Securities and Money Market Instruments Admitted to an Official Exchange Listing
74,308,419 97.09
Total Investments 74,308,419 97.09
Other Net Assets 2,228,942 2.91
Net Asset Value 76,537,361 100.00
Geographic Breakdown (as a percentage of Net Assets) % Net Assets
Austria 3.87
Belgium 8.91
Finland 1.30
France 22.87
Germany 16.27
Ireland 1.40
Italy 26.04
Netherlands 4.33
Spain 12.10
Total 97.09

AVIVA INVESTORS – ANNUAL REPORT AND AUDITED FINANCIAL STATEMENTS avivainvestors.com 86
AVIVA INVESTORS – MULTI-STRATEGY TARGET RETURN FUNDPortfolio of Investments and Other Net Assets as at 31 December 2014
Number of shares or Principal Amount
Transferable Securities and Money Market Instruments Admitted to an Official Exchange Listing
Market Value
EUR
% Net assets
Brazil 12,407,524 4.53
BRL 4,311,600 Brazil Notas do Tesouro Nacional Serie 'F' 10% 01/01/2019
12,407,524 4.53
Ireland 1,300,797 0.47
GBP 45,263 iShares MSCI Turkey ETF 1,300,797 0.47
Luxembourg 2,482,458 0.90
GBP 2,054 Aviva Investors Sicav - Emerging Europe Equity
2,482,458 0.90
United States of America 1,500,998 0.55
USD 1,989,774 Government National Mortgage Association variable 16/12/2054
1,500,998 0.55
Total Transferable Securities and Money Market Instruments Admitted to an Official Exchange Listing
17,691,777 6.45
Number of shares or Principal Amount
Transferable Securities and Money Market Instruments dealt on another Regulated Market
Market Value
EUR
% Net assets
Finland 8,000,000 2.92
EUR 8,000,000 Nordea Bank 0.020% 18/03/2015 8,000,000 2.92
France 43,999,042 16.06
EUR 2,500,000 Banque Fédérative 0% 02/01/2015 2,499,872 0.91
EUR 1,500,000 Banque Fédérative 0% 02/03/2015 1,499,790 0.55
EUR 8,000,000 Banque Fédérative 0.020% 18/03/2015
8,000,000 2.92
EUR 9,000,000 Crédit Agricole 0.020% 20/04/2015 9,000,000 3.29
EUR 9,000,000 LMA 0% 19/01/2015 8,999,520 3.28
EUR 2,000,000 LMA 0% 19/01/2015 1,999,860 0.73
EUR 8,000,000 Natixis 0.050% 18/03/2015 8,000,000 2.92
EUR 4,000,000 Natixis 0.080% 02/03/2015 4,000,000 1.46
Ireland 23,498,946 8.58
EUR 5,000,000 GE Capital 0% 04/03/2015 4,999,750 1.83
EUR 7,000,000 GE Capital 0% 11/03/2015 6,999,402 2.55
EUR 11,500,000 Regency Assets 0% 15/01/2015 11,499,794 4.20
Japan 8,999,584 3.28
EUR 3,500,000 Bank of Tokyo-Mitsubishi 0% 12/01/2015
3,499,929 1.27
EUR 1,500,000 Mizuho 0% 19/01/2015 1,499,933 0.55
EUR 4,000,000 Norinchukin Bank 0% 13/01/2015 3,999,722 1.46
Malta 11,999,833 4.38
EUR 12,000,000 BMW Malta Finance 0% 12/01/2015 11,999,833 4.38
Sweden 4,599,913 1.68
EUR 1,600,000 Nordea Bank 0% 16/01/2015 1,599,913 0.58
EUR 3,000,000 Nordea Bank 0.010% 23/01/2015 3,000,000 1.10
Switzerland 2,500,000 0.91
EUR 2,500,000 Credit Suisse 0.080% 05/01/2015 2,500,000 0.91
Number of shares or Principal Amount
Transferable Securities and Money Market Instruments dealt on another Regulated Market
Market Value
EUR
% Net assets
United Kingdom 84,498,595 30.83
EUR 12,000,000 Abbey National 0% 23/01/2015 12,000,103 4.38
EUR 10,000,000 Credit Suisse 0% 18/03/2015 9,999,000 3.65
EUR 6,500,000 Mizuho 0.020% 12/01/2015 6,500,029 2.37
EUR 500,000 Mizuho 0.025% 06/01/2015 500,000 0.18
EUR 3,500,000 Mizuho 0.060% 11/03/2015 3,500,000 1.28
EUR 8,000,000 Norinchukin Bank 0% 06/02/2015 7,999,591 2.92
EUR 12,000,000 Standard Chartered Bank 0.010% 18/03/2015
12,000,000 4.38
EUR 4,000,000 Sumitomo Bank 0% 11/03/2015 4,000,000 1.46
EUR 5,000,000 Sumitomo Bank 0.020% 06/02/2015 4,999,872 1.82
EUR 3,000,000 Sumitomo Mitsui 0% 15/01/2015 3,000,000 1.09
EUR 12,000,000 Svenska Handelsbank 0.010% 19/01/2015
12,000,000 4.38
EUR 8,000,000 The Bank of Tokyo-Mitsubish 0.020% 18/03/2015
8,000,000 2.92
United States of America 22,498,471 8.21
EUR 8,000,000 Procter & Gamble 0% 23/01/2015 7,999,858 2.92
EUR 2,500,000 Procter & Gamble 0% 02/03/2015 2,499,875 0.91
EUR 8,000,000 Sheffield Receivables 0% 17/02/2015
7,999,493 2.92
EUR 4,000,000 Sheffield Receivables 0% 17/02/2015
3,999,245 1.46
Total Transferable Securities and Money Market Instruments dealt on another Regulated Market
210,594,384 76.85
Total Investments 228,286,161 83.30
Other Net Assets 45,750,814 16.70
Net Asset Value 274,036,975 100.00
The accompanying notes form an integral part of these financial statements.

AVIVA INVESTORS – ANNUAL REPORT AND AUDITED FINANCIAL STATEMENTS avivainvestors.com 87
AVIVA INVESTORS – MULTI-STRATEGY TARGET RETURN FUND (CONTINUED)Portfolio of Investments and Other Net Assets as at 31 December 2014
Geographic Breakdown (as a percentage of Net Assets) % Net Assets
Brazil 4.53
Finland 2.92
France 16.06
Ireland 9.05
Japan 3.28
Luxembourg 0.90
Malta 4.38
Sweden 1.68
Switzerland 0.91
United Kingdom 30.83
United States of America 8.76
Total 83.30
Forward Foreign Exchange Contracts
Currency purchased Amount purchased Currency sold Amount sold Maturity date Counterparty Unrealised gain/(loss) EUR
GBP 26,471,000 EUR 33,416,379 18/03/2015 GOLDMAN SACHS INTL 651,349
GBP 185,000 EUR 235,398 18/03/2015 NATIONAL WESTMINSTER BANK 2,694
GBP 218,000 EUR 277,606 18/03/2015 UBS AG. 2,956
INR 735,955,770 USD 11,451,000 19/03/2015 STANDARD CHARTERED BANK 39,924
USD 8,700,000 AUD 10,539,208 19/03/2015 NOMURA INTERNATIONAL PLC 99,786
USD 7,535,000 AUD 9,239,866 19/03/2015 UBS AG. 11,168
USD 13,000 EUR 10,619 18/03/2015 CMB.TS 117
USD 850,000 EUR 684,036 18/03/2015 GOLDMAN SACHS INTL 17,949
USD 43,646,749 EUR 35,123,080 19/03/2015 BARCLAYS 922,907
USD 4,563,238 EUR 3,600,000 27/04/2015 HSBC BANK PLC 167,104
USD 8,658,500 GBP 5,541,135 19/03/2015 GOLDMAN SACHS INTL 19,469
USD 7,375,000 GBP 4,697,745 19/03/2015 UBS AG. 44,890
USD 6,392,000 JPY 757,060,809 19/03/2015 NOMURA INTERNATIONAL PLC 60,692
USD 8,550,000 MXN 123,817,680 19/03/2015 SOCIETE GENERALE 155,352
EUR 494,170 GBP 393,000 18/03/2015 UBS AG. (11,614)
EUR 6,834,596 USD 8,493,695 18/03/2015 BARCLAYS (180,047)
EUR 5,630 USD 7,000 18/03/2015 CMB.TS (151)
EUR 4,830 USD 6,000 18/03/2015 GOLDMAN SACHS INTL (126)
EUR 6,049,444 USD 7,540,000 18/03/2015 SOCIETE GENERALE (177,577)
EUR 1,347,893 USD 1,675,000 19/03/2015 BARCLAYS (35,418)
INR 288,975,165 USD 4,588,364 27/04/2015 HSBC BANK PLC (85,389)
USD 7,421,365 BRL 20,480,000 18/03/2015 CITIBANK N.A. (111,720)
USD 7,575,556 BRL 20,600,000 18/03/2015 GOLDMAN SACHS INTL (20,947)
USD 362,634 BRL 1,000,000 18/03/2015 STANDARD CHARTERED BANK (5,238)
USD 7,535,000 MXN 112,703,534 19/03/2015 BNP PARIBAS S.A. (63,020)
Net Unrealised Gain on Open Forward Foreign Exchange Contracts 1,505,110

AVIVA INVESTORS – ANNUAL REPORT AND AUDITED FINANCIAL STATEMENTS avivainvestors.com 88
Futures Contracts
Quantity Currency Description Maturity date Commitment Counterparty Unrealised gain/(loss) USD
21 EUR DAX INDEX FUTURE 20/03/2015 5,167,838 J.P. MORGAN 128,100
63 GBP FTSE 100 IDX EQUITY INDEX FUTURE
20/03/2015 5,295,013 J.P. MORGAN 238,773
130 EUR EURO-BTP FUTURE 06/03/2015 17,628,000 J.P. MORGAN 216,740
130 EUR FTSE/MIB INDEX FUTURE EQUITY INDEX FUTURE
20/03/2015 12,394,850 J.P. MORGAN 207,350
(117) EUR IBEX 35 INDEX FUTURE 16/01/2015 (11,985,831) J.P. MORGAN (103,311)
221 KRW KOREA 10YRS BND FUTURE 17/03/2015 20,102,299 J.P. MORGAN 201,941
76 USD NASDAQ 100 E-MINI FUTURE 20/03/2015 5,316,954 J.P. MORGAN 59,227
(124) USD RUSSELL 2000 MINI INDEX FUTURE 20/03/2015 (12,304,186) J.P. MORGAN (624,538)
253 USD S&P EMINI INDEX FUTURE 20/03/2015 21,457,068 J.P. MORGAN 817,537
(439) EUR SHORT EURO-BTP FUTURE 06/03/2015 (48,891,430) J.P. MORGAN (69,202)
(341) EUR STOXX 600 TECH EQUITY INDEX FUTURE
20/03/2015 (5,282,090) J.P. MORGAN (284,274)
380 EUR SX5E DIVIDEND INDEX FUTURE 18/12/2020 3,773,400 J.P. MORGAN (131,490)
246 EUR SX5E DIVIDEND INDEX FUTURE 21/12/2018 2,536,260 J.P. MORGAN (94,250)
247 EUR SX5E DIVIDEND INDEX FUTURE 20/12/2019 2,489,760 J.P. MORGAN (99,690)
Net Unrealised Gain on Open Futures Contracts 462,913
OTC Options Contracts
Buy/Sell Quantity/Nominal amount
Description Currency Maturity date Counterparty Commitment Market Value EUR
Buy 4,568,150 BNP Paribas Swaption CALL 3.5% 6M LIBOR
GBP 02/07/2029 BNP PARIBAS SA 15,988,525 275,484
Buy 18,000,000 Goldman Sachs Swaption CALL 2.599% 6M LIBOR
GBP 12/12/2029 GOLDMAN SACHS INTL
46,782,000 1,718,190
Buy 625,000 JP Morgan Swaption CALL 3.05% 6M LIBOR
GBP 28/08/2029 JP MORGAN SECURITIES PLC
1,906,250 47,147
Buy 2,630,000 JP Morgan Swaption CALL 3.2375% 6M LIBOR
GBP 05/09/2029 JP MORGAN SECURITIES PLC
8,514,625 180,157
Buy 443,000 JP Morgan Swaption CALL 3.19% 6M LIBOR
GBP 17/09/2029 JP MORGAN SECURITIES PLC
1,413,170 30,293
Buy 2,300,000 JP Morgan Swaption CALL 3.12% 6M LIBOR
GBP 08/10/2029 JP MORGAN SECURITIES PLC
7,176,000 167,100
Buy 620,000 JP Morgan Swaption CALL 3% 6M LIBOR
GBP 07/11/2029 JP MORGAN SECURITIES PLC
1,860,000 47,858
Buy 1,275,000 JP Morgan Swaption CALL 2.91% 6M LIBOR
GBP 19/11/2029 JP MORGAN SECURITIES PLC
3,710,250 103,167
Buy 7,800,000 JP Morgan Swaption CALL 2.685% 6M LIBOR
GBP 03/12/2029 JP MORGAN SECURITIES PLC
20,943,000 711,446
Total OTC Options Contracts at Market Value 3,280,842
AVIVA INVESTORS – MULTI-STRATEGY TARGET RETURN FUND (CONTINUED)Portfolio of Investments and Other Net Assets as at 31 December 2014

AVIVA INVESTORS – ANNUAL REPORT AND AUDITED FINANCIAL STATEMENTS avivainvestors.com 89
Listed Options Contracts
Buy/Sell Quantity/Nominal amount
Description Currency Maturity date Counterparty Commitment Market Value EUR
Buy (1,067,000) Currency Option USD/GBP P 1.72% 01/07/2016
GBP 01/07/2016 DEUTSCHE BANK AG (1,835,240) (12,335)
Buy (5,737,000) Currency Option BRL/EUR C 4.6% 13/10/2017
EUR 13/10/2017 GOLDMAN SACHS INTL
(26,390,200) (465,875)
Buy (370,000) Currency Option BRL/EUR C 4.7% 09/11/2017
EUR 09/11/2017 GOLDMAN SACHS INTL
(1,739,000) (29,129)
Buy (545,000) Currency Option BRL/EUR C 4.88% 16/11/2017
EUR 16/11/2017 GOLDMAN SACHS INTL
(2,659,600) (38,279)
Buy (4,250,000) Currency Option BRL/EUR C 4.75% 30/11/2017
EUR 30/11/2017 GOLDMAN SACHS INTL
(20,187,500) (333,667)
Buy (2,000,000) Currency Option USD/GBP C 1.58% 01/12/2016
GBP 01/12/2016 DEUTSCHE BANK AG (3,160,000) (107,267)
Buy (9,750,000) Currency Option BRL/EUR C 5% 14/12/2017
EUR 14/12/2017 GOLDMAN SACHS INTL
(48,750,000) (663,912)
Buy (2,900,000) Currency Option USD/GBP C 1.58% 14/12/2015
GBP 14/12/2015 CITI GLOBAL MARKETS LIMITED
(4,582,000) (92,702)
Sell 3,201,000 Currency Option USD/GBP P 1.6% 01/07/2016
GBP 01/07/2016 DEUTSCHE BANK AG 5,121,600 230,806
Sell 4,590,000 Currency Option BRL/EUR P 3.9% 13/10/2017
EUR 13/10/2017 GOLDMAN SACHS INTL
17,901,000 263,422
Sell 300,000 Currency Option BRL/EUR P 4.1% 09/11/2017
EUR 09/11/2017 GOLDMAN SACHS INTL
1,230,000 23,873
Sell 432,000 Currency Option BRL/EUR P 4.28% 16/11/2017
EUR 16/11/2017 GOLDMAN SACHS INTL
1,848,960 44,783
Sell 3,400,000 Currency Option BRL/EUR P 4.2% 30/11/2017
EUR 30/11/2017 GOLDMAN SACHS INTL
14,280,000 308,859
Sell 6,000,000 Currency Option USD/GBP P 1.46% 01/12/2016
GBP 01/12/2016 DEUTSCHE BANK AG 8,760,000 191,216
Sell 7,800,000 Currency Option BRL/EUR P 4.4% 14/12/2017
EUR 14/12/2017 GOLDMAN SACHS INTL
34,320,000 919,221
Sell 8,700,000 Currency Option USD/GBP P 1.46% 14/12/2015
GBP 14/12/2015 CITI GLOBAL MARKETS LIMITED
12,702,000 147,838
Buy 1,001 NIKKIE INDEX C24000 09/12/2016
JPY 09/12/2016 UBS 12,012,000,000 1,624,877
Buy (4,334) ISHARES FTSE A50 CHINA IDX ETF C15
HKD 30/12/2015 UBS (325,050,000) (1,986,006)
Buy 4,334 ISHARES FTSE A50 CHINA IDX ETF C12.5
HKD 30/12/2015 UBS 270,875,000 3,972,013
Buy 819 EURO STOXX INDEX C 4400 20-12-2019
EUR 20/12/2019 UBS 36,036,000 914,823
Total Listed Options Contracts at Market Value 4,912,559
AVIVA INVESTORS – MULTI-STRATEGY TARGET RETURN FUND (CONTINUED)Portfolio of Investments and Other Net Assets as at 31 December 2014

AVIVA INVESTORS – ANNUAL REPORT AND AUDITED FINANCIAL STATEMENTS avivainvestors.com 90
AVIVA INVESTORS – MULTI-STRATEGY TARGET RETURN FUND (CONTINUED)Portfolio of Investments and Other Net Assets as at 31 December 2014
Interest Rate Swap Contracts
Nominal Value Description Currency Maturity date Counterparty Unrealised gain/(loss) EUR
15,800,000 IRS AUD Pay Floating BBR 6 Month Received Fixed 4.6875% 02/07/2024
AUD 02/07/2024 JP MORGAN 474,667
2,000,000 IRS AUD Pay Floating BBR 6 Month Received Fixed 4.315% 28/08/2024
AUD 28/08/2024 JP MORGAN 37,581
6,550,000 IRS AUD Pay Floating BBR 6 Month Received Fixed 4.42% 07/10/2024
AUD 07/10/2024 JP MORGAN 138,512
12,176,236 IRS EUR Pay Floating EURIBOR 6 Month Received Fixed 1.22% 10/10/2021
EUR 10/10/2021 CITI GLOBAL 148,777
1,500,000 IRS AUD Pay Floating BBR 6 Month Received Fixed 4.325% 10/11/2024
AUD 10/11/2024 JP MORGAN 27,080
1,660,000 IRS EUR Pay Floating EURIBOR 6 Month Received Fixed 1.05% 20/11/2021
EUR 20/11/2021 JP MORGAN 10,713
1,950,000 IRS AUD Pay Floating BBR 6 Month Received Fixed 4.27% 19/11/2024
AUD 19/11/2024 JP MORGAN 31,996
8,700,000 IRS EUR Pay Floating EURIBOR 6 Month Received Fixed 0.955% 03/12/2021
EUR 03/12/2021 GOLDMAN SACHS INTL
29,657
17,000,000 IRS AUD Pay Floating BBR 6 Month Received Fixed 4.0475% 02/12/2024
AUD 02/12/2024 JP MORGAN 171,637
494,277,778 IRS MXN Pay Floating TIIE 4 Week Received Fixed 6.645% 02/12/2020
MXN 02/12/2020 DEUTSCHE BANK AG (42,324)
20,680,000 IRS EUR Pay Floating EURIBOR 6 Month Received Fixed 0.923% 17/12/2021
EUR 17/12/2021 GOLDMAN SACHS INTL
45,865
42,600,000 IRS AUD Pay Floating BBR 6 Month Received Fixed 3.84% 13/12/2024
AUD 13/12/2024 JP MORGAN 180,358
530,000,000 IRS MXN Pay Floating TIIE 4 Week Received Fixed 6.680 % 23/12/2020
MXN 23/12/2020 DEUTSCHE BANK AG (35,411)
Net Unrealised Gain on Interest Rate Swap Contracts 1,219,108
Equity Variance Swap
Buy/Sell Nominal Value Description Currency Maturity date Counterparty Unrealised gain/(loss) EUR
Buy 1,538 Euro Stoxx 50 Index 16/12/2016 EUR 16/12/2016 SOCIETE GENERALE 95,141
Buy 2,269,100 Euro Stoxx 50 Index 16/12/2016 EUR 16/12/2016 JP MORGAN 29,584
Buy 2,414,068 KOSPI 200 Index 10/12/2015 KRW 10/12/2015 CITI GLOBAL (94,362)
Buy 60,341,199,000 KOSPI 200 Index 10/12/2015 KRW 10/12/2015 SOCIETE GENERALE (190,637)
Buy 2,030 S&P 500 Index 16/12/2016 USD 16/12/2016 SOCIETE GENERALE 65,553
Buy 3,041,400 S&P 500 Index 16/12/2016 USD 16/12/2016 JP MORGAN (14,814)
Buy 2,067 S&P 500 Index 18/12/2015 USD 18/12/2015 CITI GLOBAL 148,377
Buy 52,000,000 S&P 500 Index 18/12/2015 USD 18/12/2015 SOCIETE GENERALE 156,561
Net Unrealised Gain on Equity Variance Swaps 195,403

AVIVA INVESTORS – ANNUAL REPORT AND AUDITED FINANCIAL STATEMENTS avivainvestors.com 91
AVIVA INVESTORS – SHORT DURATION GLOBAL HIGH YIELD BOND FUNDPortfolio of Investments and Other Net Assets as at 31 December 2014
Number of shares or Principal Amount
Transferable Securities and Money Market Instruments Admitted to an Official Exchange Listing
Market Value USD
% Net assets
Cayman Islands 7,005,305 1.56
GBP 4,504,000 Brakes Capital RegS 7.125% 15/12/2018
7,005,305 1.56
Finland 3,182,500 0.71
EUR 2,764,000 Paroc Group Oy RegS FRN 15/05/2020
3,182,500 0.71
France 19,482,468 4.32
EUR 934,000 3AB Optique Developpement RegS 5.625% 15/04/2019
1,020,429 0.23
USD 1,257,000 CMA CGM 144A 8.5% 15/04/2017 1,282,253 0.28
EUR 1,254,000 Financiere Quick SAS RegS FRN 15/04/2019
1,375,480 0.31
EUR 1,190,000 Labco RegS 8.5% 15/01/2018 1,504,095 0.33
EUR 1,370,000 Lafarge EMTN 6.625% 29/11/2018 1,939,183 0.43
USD 6,250,000 Numericable Group 144A 4.875% 15/05/2019
6,192,531 1.37
EUR 4,400,000 Peugeot EMTN 6.5% 18/01/2019 6,168,497 1.37
Germany 7,528,832 1.67
EUR 2,500,000 Heidelberger Druckmaschinen RegS 9.25% 15/04/2018
3,111,568 0.69
EUR 1,201,000 Pfleiderer GmbH RegS 7.875% 01/08/2019
1,391,085 0.31
EUR 2,370,000 ThyssenKrupp EMTN 3.125% 25/10/2019
3,026,179 0.67
Italy 2,529,225 0.56
EUR 2,070,000 Snai RegS 7.625% 15/06/2018 2,529,225 0.56
Jersey 7,924,856 1.76
GBP 1,400,000 AA Bond RegS 9.5% 31/07/2019 2,408,416 0.54
GBP 3,300,000 CPUK Finance EMTN 11.625% 28/02/2018
5,516,440 1.22
Luxembourg 21,876,359 4.85
USD 7,000,000 ArcelorMittal 5% 25/02/2017 7,268,800 1.61
EUR 1,429,000 CNH Industrial Finance Europe GMTN 2.75% 18/03/2019
1,756,793 0.39
EUR 1,500,000 Fiat Chrysler Finance Europe GMTN 6.75% 14/10/2019
2,087,000 0.46
EUR 2,900,000 Finmeccanica EMTN 4.375% 05/12/2017
3,786,911 0.84
EUR 2,244,000 Galapagos RegS FRN 15/06/2021 2,683,406 0.60
EUR 3,482,000 Matterhorn Financing RegS 9% 15/04/2019
4,293,449 0.95
Netherlands 16,290,670 3.61
EUR 2,060,000 General Motors Financial International EMTN 1.875% 15/10/2019
2,536,363 0.56
EUR 4,656,000 Hydra Dutch Holdings 2 RegS FRN 15/04/2019
5,138,652 1.14
EUR 2,637,000 LGE HoldCo RegS 7.125% 15/05/2024
3,530,749 0.78
Number of shares or Principal Amount
Transferable Securities and Money Market Instruments Admitted to an Official Exchange Listing
Market Value USD
% Net assets
EUR 4,150,000 Schaeffler Finance RegS 3.25% 15/05/2019
5,084,906 1.13
Spain 6,376,585 1.41
EUR 5,250,000 Abengoa EMTN 8.5% 31/03/2016 6,376,585 1.41
Sweden 4,302,378 0.95
EUR 3,556,000 SSAB EMTN 3.875% 10/04/2019 4,302,378 0.95
United Kingdom 39,343,360 8.73
GBP 3,322,000 Anglian Water Osprey Financing EMTN 7% 31/01/2018
5,532,549 1.23
GBP 1,390,000 Care UK Health & Social Care RegS FRN 15/07/2019
2,049,832 0.45
GBP 4,000,000 Heathrow Finance EMTN 7.125% 01/03/2017
6,740,544 1.49
USD 5,000,000 Ineos Finance 144A 8.375% 15/02/2019
5,343,750 1.19
GBP 1,870,000 Keystone Financing RegS 9.5% 15/10/2019
2,872,060 0.64
GBP 2,744,000 Matalan Finance RegS 6.875% 01/06/2019
4,128,318 0.92
GBP 1,353,000 Odeon & UCI Finco RegS 9% 01/08/2018
1,985,680 0.44
GBP 3,918,098 Priory Group No 3 RegS 7% 15/02/2018
6,360,387 1.41
USD 4,000,000 Vedanta Resources 144A 9.5% 18/07/2018
4,330,240 0.96
United States of America 55,146,575 12.23
USD 2,000,000 Ally Financial 5.5% 15/02/2017 2,107,990 0.47
USD 3,000,000 Ally Financial 6.25% 01/12/2017 3,242,835 0.72
USD 1,358,000 Bill Barrett 7.625% 01/10/2019 1,230,124 0.27
USD 5,000,000 Cablevision Systems 8.625% 15/09/2017
5,578,700 1.24
EUR 4,500,000 Chesapeake Energy 6.25% 15/01/2017
5,718,439 1.27
USD 6,000,000 CIT 4.25% 15/08/2017 6,116,280 1.36
USD 6,251,000 CNH Capital 6.25% 01/11/2016 6,589,617 1.46
USD 967,000 DPL 6.5% 15/10/2016 1,027,404 0.23
USD 1,000,000 Fresenius Medical Care US Finance 144A 6.5% 15/09/2018
1,105,000 0.24
USD 6,220,000 HCA 7.75% 15/05/2021 6,666,627 1.48
USD 1,500,000 Lennar 4.75% 15/12/2017 1,545,000 0.34
USD 2,940,000 Lennar 5.6% 31/05/2015 2,989,774 0.66
USD 7,250,000 MetroPCS Wireless 6.625% 15/11/2020
7,476,454 1.66
USD 3,630,000 Tesoro 4.25% 01/10/2017 3,752,331 0.83
Total Transferable Securities andMoney Market Instruments Admittedto an Official Exchange Listing
190,989,113 42.36
The accompanying notes form an integral part of these financial statements.
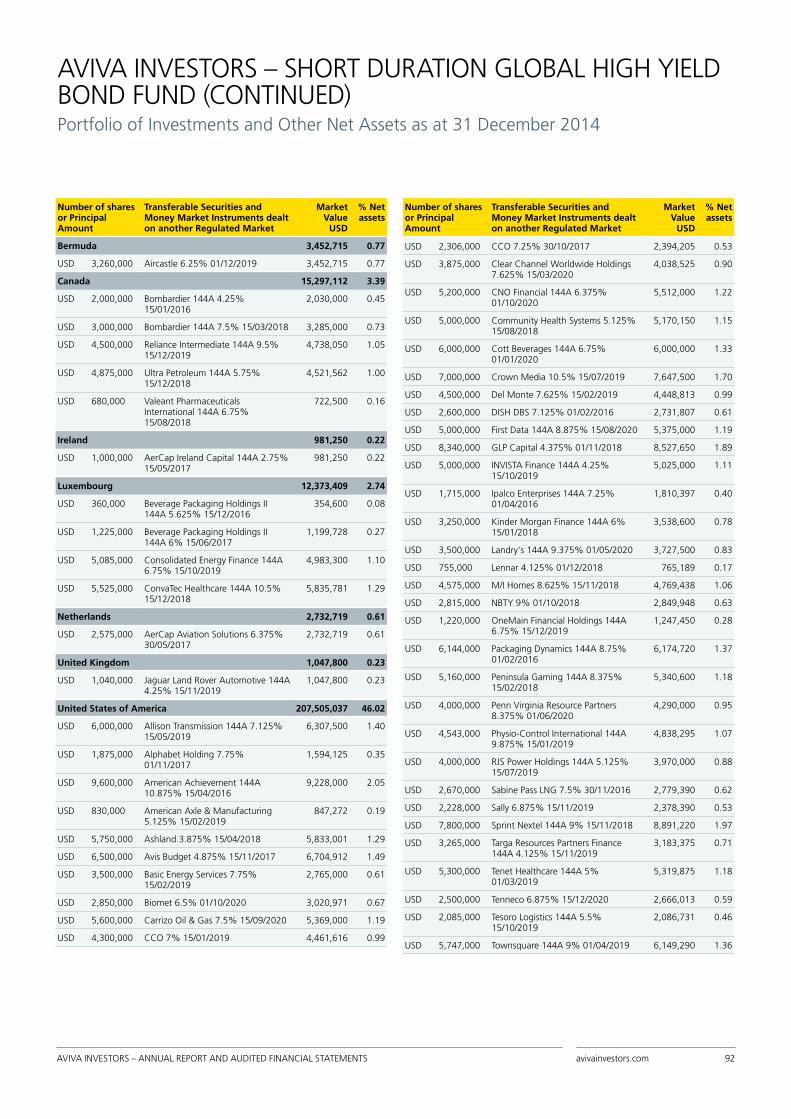
AVIVA INVESTORS – ANNUAL REPORT AND AUDITED FINANCIAL STATEMENTS avivainvestors.com 92
Number of shares or Principal Amount
Transferable Securities and Money Market Instruments dealt on another Regulated Market
Market Value
USD
% Net assets
Bermuda 3,452,715 0.77
USD 3,260,000 Aircastle 6.25% 01/12/2019 3,452,715 0.77
Canada 15,297,112 3.39
USD 2,000,000 Bombardier 144A 4.25% 15/01/2016
2,030,000 0.45
USD 3,000,000 Bombardier 144A 7.5% 15/03/2018 3,285,000 0.73
USD 4,500,000 Reliance Intermediate 144A 9.5% 15/12/2019
4,738,050 1.05
USD 4,875,000 Ultra Petroleum 144A 5.75% 15/12/2018
4,521,562 1.00
USD 680,000 Valeant Pharmaceuticals International 144A 6.75% 15/08/2018
722,500 0.16
Ireland 981,250 0.22
USD 1,000,000 AerCap Ireland Capital 144A 2.75% 15/05/2017
981,250 0.22
Luxembourg 12,373,409 2.74
USD 360,000 Beverage Packaging Holdings II 144A 5.625% 15/12/2016
354,600 0.08
USD 1,225,000 Beverage Packaging Holdings II 144A 6% 15/06/2017
1,199,728 0.27
USD 5,085,000 Consolidated Energy Finance 144A 6.75% 15/10/2019
4,983,300 1.10
USD 5,525,000 ConvaTec Healthcare 144A 10.5% 15/12/2018
5,835,781 1.29
Netherlands 2,732,719 0.61
USD 2,575,000 AerCap Aviation Solutions 6.375% 30/05/2017
2,732,719 0.61
United Kingdom 1,047,800 0.23
USD 1,040,000 Jaguar Land Rover Automotive 144A 4.25% 15/11/2019
1,047,800 0.23
United States of America 207,505,037 46.02
USD 6,000,000 Allison Transmission 144A 7.125% 15/05/2019
6,307,500 1.40
USD 1,875,000 Alphabet Holding 7.75% 01/11/2017
1,594,125 0.35
USD 9,600,000 American Achievement 144A 10.875% 15/04/2016
9,228,000 2.05
USD 830,000 American Axle & Manufacturing 5.125% 15/02/2019
847,272 0.19
USD 5,750,000 Ashland 3.875% 15/04/2018 5,833,001 1.29
USD 6,500,000 Avis Budget 4.875% 15/11/2017 6,704,912 1.49
USD 3,500,000 Basic Energy Services 7.75% 15/02/2019
2,765,000 0.61
USD 2,850,000 Biomet 6.5% 01/10/2020 3,020,971 0.67
USD 5,600,000 Carrizo Oil & Gas 7.5% 15/09/2020 5,369,000 1.19
USD 4,300,000 CCO 7% 15/01/2019 4,461,616 0.99
Number of shares or Principal Amount
Transferable Securities and Money Market Instruments dealt on another Regulated Market
Market Value
USD
% Net assets
USD 2,306,000 CCO 7.25% 30/10/2017 2,394,205 0.53
USD 3,875,000 Clear Channel Worldwide Holdings 7.625% 15/03/2020
4,038,525 0.90
USD 5,200,000 CNO Financial 144A 6.375% 01/10/2020
5,512,000 1.22
USD 5,000,000 Community Health Systems 5.125% 15/08/2018
5,170,150 1.15
USD 6,000,000 Cott Beverages 144A 6.75% 01/01/2020
6,000,000 1.33
USD 7,000,000 Crown Media 10.5% 15/07/2019 7,647,500 1.70
USD 4,500,000 Del Monte 7.625% 15/02/2019 4,448,813 0.99
USD 2,600,000 DISH DBS 7.125% 01/02/2016 2,731,807 0.61
USD 5,000,000 First Data 144A 8.875% 15/08/2020 5,375,000 1.19
USD 8,340,000 GLP Capital 4.375% 01/11/2018 8,527,650 1.89
USD 5,000,000 INVISTA Finance 144A 4.25% 15/10/2019
5,025,000 1.11
USD 1,715,000 Ipalco Enterprises 144A 7.25% 01/04/2016
1,810,397 0.40
USD 3,250,000 Kinder Morgan Finance 144A 6% 15/01/2018
3,538,600 0.78
USD 3,500,000 Landry's 144A 9.375% 01/05/2020 3,727,500 0.83
USD 755,000 Lennar 4.125% 01/12/2018 765,189 0.17
USD 4,575,000 M/I Homes 8.625% 15/11/2018 4,769,438 1.06
USD 2,815,000 NBTY 9% 01/10/2018 2,849,948 0.63
USD 1,220,000 OneMain Financial Holdings 144A 6.75% 15/12/2019
1,247,450 0.28
USD 6,144,000 Packaging Dynamics 144A 8.75% 01/02/2016
6,174,720 1.37
USD 5,160,000 Peninsula Gaming 144A 8.375% 15/02/2018
5,340,600 1.18
USD 4,000,000 Penn Virginia Resource Partners 8.375% 01/06/2020
4,290,000 0.95
USD 4,543,000 Physio-Control International 144A 9.875% 15/01/2019
4,838,295 1.07
USD 4,000,000 RJS Power Holdings 144A 5.125% 15/07/2019
3,970,000 0.88
USD 2,670,000 Sabine Pass LNG 7.5% 30/11/2016 2,779,390 0.62
USD 2,228,000 Sally 6.875% 15/11/2019 2,378,390 0.53
USD 7,800,000 Sprint Nextel 144A 9% 15/11/2018 8,891,220 1.97
USD 3,265,000 Targa Resources Partners Finance 144A 4.125% 15/11/2019
3,183,375 0.71
USD 5,300,000 Tenet Healthcare 144A 5% 01/03/2019
5,319,875 1.18
USD 2,500,000 Tenneco 6.875% 15/12/2020 2,666,013 0.59
USD 2,085,000 Tesoro Logistics 144A 5.5% 15/10/2019
2,086,731 0.46
USD 5,747,000 Townsquare 144A 9% 01/04/2019 6,149,290 1.36
AVIVA INVESTORS – SHORT DURATION GLOBAL HIGH YIELD BOND FUND (CONTINUED)Portfolio of Investments and Other Net Assets as at 31 December 2014

AVIVA INVESTORS – ANNUAL REPORT AND AUDITED FINANCIAL STATEMENTS avivainvestors.com 93
Number of shares or Principal Amount
Transferable Securities and Money Market Instruments dealt on another Regulated Market
Market Value
USD
% Net assets
USD 5,000,000 Univision Communications 144A 7.875% 01/11/2020
5,362,500 1.19
USD 1,056,000 Valeant Pharmaceuticals International 144A 6.875% 01/12/2018
1,093,224 0.24
USD 1,800,000 Valeant Pharmaceuticals International 144A 7% 01/10/2020
1,908,000 0.42
USD 4,715,000 WideOpenWest Finance 10.25% 15/07/2019
4,938,963 1.10
USD 4,535,000 Windstream 7.75% 15/10/2020 4,764,471 1.06
USD 2,925,000 Wynn Las Vegas 7.875% 01/05/2020
3,082,862 0.68
USD 4,838,000 Zayo Capital 8.125% 01/01/2020 5,146,423 1.14
USD 1,267,000 Zayo Capital 10.125% 01/07/2020 1,430,126 0.32
Total Transferable Securities andMoney Market Instruments dealton another Regulated Market
243,390,042 53.98
Number of shares or Principal Amount
Other Transferable Securitiesnot dealt on anotherRegulated Market
Market Value
USD
% Net assets
United Kingdom 9,000,228 1.99
EUR 7,259,000 Algeco Scotsman Global Finance RegS 9% 15/10/2018
9,000,228 1.99
Total Other Transferable Securitiesnot dealt on another Regulated Market
9,000,228 1.99
Total Investments 443,379,383 98.33
Other Net Assets 7,519,267 1.67
Net Asset Value 450,898,650 100.00
AVIVA INVESTORS – SHORT DURATION GLOBAL HIGH YIELD BOND FUND (CONTINUED)Portfolio of Investments and Other Net Assets as at 31 December 2014
Geographic Breakdown (as a percentage of Net Assets) % Net Assets
Bermuda 0.77
Canada 3.39
Cayman Islands 1.56
Finland 0.71
France 4.32
Germany 1.67
Ireland 0.22
Italy 0.56
Jersey 1.76
Luxembourg 7.59
Netherlands 4.22
Spain 1.41
Sweden 0.95
United Kingdom 10.95
United States of America 58.25
Total 98.33

AVIVA INVESTORS – ANNUAL REPORT AND AUDITED FINANCIAL STATEMENTS avivainvestors.com 94
AVIVA INVESTORS – SHORT DURATION GLOBAL HIGH YIELD BOND FUND (CONTINUED)Portfolio of Investments and Other Net Assets as at 31 December 2014
Forward Foreign Exchange Contracts
Currency purchased Amount purchased Currency sold Amount sold Maturity date Counterparty Unrealised gain/(loss) USD
GBP 22,404,684 USD 34,769,157 30/01/2015 BNP PARIBAS S.A. 158,357
USD 569,434 CHF 562,077 30/01/2015 CITIGROUP 3,535
USD 9,230,780 EUR 7,577,530 30/01/2015 GOLDMAN SACHS INTL 59,053
USD 83,697,948 EUR 68,637,506 30/01/2015 ROYAL BANK OF CANADA 620,156
USD 5,003,990 EUR 4,109,959 30/01/2015 TORONTO DOMINION BANK 29,358
CHF 24,108,031 USD 24,442,527 30/01/2015 TORONTO DOMINION BANK (170,554)
EUR 326,049,961 USD 397,591,843 30/01/2015 ROYAL BANK OF CANADA (2,945,937)
USD 41,234,120 GBP 26,570,602 30/01/2015 BNP PARIBAS S.A. (187,801)
USD 404,282 GBP 260,658 30/01/2015 CITIGROUP (2,068)
USD 4,526,354 GBP 2,908,000 30/01/2015 ROYAL BANK OF CANADA (7,037)
Net Unrealised Loss on Open Forward Foreign Exchange Contracts (2,442,938)
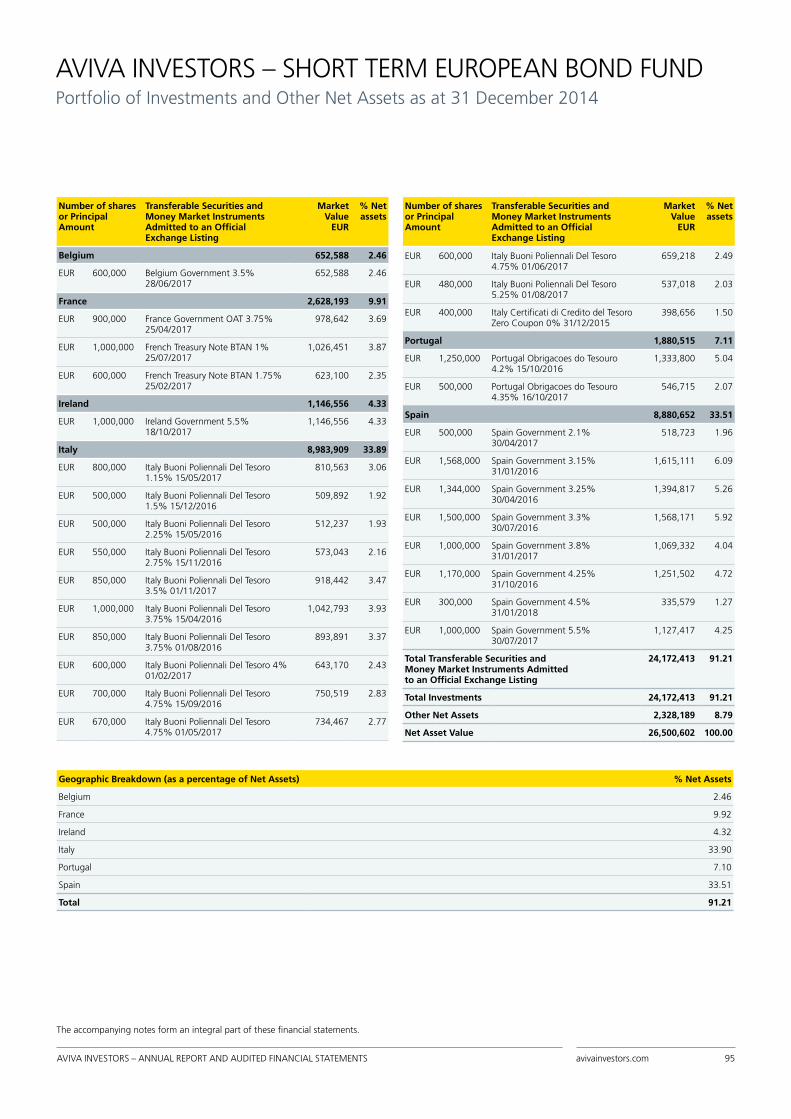
AVIVA INVESTORS – ANNUAL REPORT AND AUDITED FINANCIAL STATEMENTS avivainvestors.com 95
AVIVA INVESTORS – SHORT TERM EUROPEAN BOND FUNDPortfolio of Investments and Other Net Assets as at 31 December 2014
Number of shares or Principal Amount
Transferable Securities and Money Market Instruments Admitted to an Official Exchange Listing
Market Value
EUR
% Net assets
Belgium 652,588 2.46
EUR 600,000 Belgium Government 3.5% 28/06/2017
652,588 2.46
France 2,628,193 9.91
EUR 900,000 France Government OAT 3.75% 25/04/2017
978,642 3.69
EUR 1,000,000 French Treasury Note BTAN 1% 25/07/2017
1,026,451 3.87
EUR 600,000 French Treasury Note BTAN 1.75% 25/02/2017
623,100 2.35
Ireland 1,146,556 4.33
EUR 1,000,000 Ireland Government 5.5% 18/10/2017
1,146,556 4.33
Italy 8,983,909 33.89
EUR 800,000 Italy Buoni Poliennali Del Tesoro 1.15% 15/05/2017
810,563 3.06
EUR 500,000 Italy Buoni Poliennali Del Tesoro 1.5% 15/12/2016
509,892 1.92
EUR 500,000 Italy Buoni Poliennali Del Tesoro 2.25% 15/05/2016
512,237 1.93
EUR 550,000 Italy Buoni Poliennali Del Tesoro 2.75% 15/11/2016
573,043 2.16
EUR 850,000 Italy Buoni Poliennali Del Tesoro 3.5% 01/11/2017
918,442 3.47
EUR 1,000,000 Italy Buoni Poliennali Del Tesoro 3.75% 15/04/2016
1,042,793 3.93
EUR 850,000 Italy Buoni Poliennali Del Tesoro 3.75% 01/08/2016
893,891 3.37
EUR 600,000 Italy Buoni Poliennali Del Tesoro 4% 01/02/2017
643,170 2.43
EUR 700,000 Italy Buoni Poliennali Del Tesoro 4.75% 15/09/2016
750,519 2.83
EUR 670,000 Italy Buoni Poliennali Del Tesoro 4.75% 01/05/2017
734,467 2.77
Number of shares or Principal Amount
Transferable Securities and Money Market Instruments Admitted to an Official Exchange Listing
Market Value
EUR
% Net assets
EUR 600,000 Italy Buoni Poliennali Del Tesoro 4.75% 01/06/2017
659,218 2.49
EUR 480,000 Italy Buoni Poliennali Del Tesoro 5.25% 01/08/2017
537,018 2.03
EUR 400,000 Italy Certificati di Credito del Tesoro Zero Coupon 0% 31/12/2015
398,656 1.50
Portugal 1,880,515 7.11
EUR 1,250,000 Portugal Obrigacoes do Tesouro 4.2% 15/10/2016
1,333,800 5.04
EUR 500,000 Portugal Obrigacoes do Tesouro 4.35% 16/10/2017
546,715 2.07
Spain 8,880,652 33.51
EUR 500,000 Spain Government 2.1% 30/04/2017
518,723 1.96
EUR 1,568,000 Spain Government 3.15% 31/01/2016
1,615,111 6.09
EUR 1,344,000 Spain Government 3.25% 30/04/2016
1,394,817 5.26
EUR 1,500,000 Spain Government 3.3% 30/07/2016
1,568,171 5.92
EUR 1,000,000 Spain Government 3.8% 31/01/2017
1,069,332 4.04
EUR 1,170,000 Spain Government 4.25% 31/10/2016
1,251,502 4.72
EUR 300,000 Spain Government 4.5% 31/01/2018
335,579 1.27
EUR 1,000,000 Spain Government 5.5% 30/07/2017
1,127,417 4.25
Total Transferable Securities andMoney Market Instruments Admittedto an Official Exchange Listing
24,172,413 91.21
Total Investments 24,172,413 91.21
Other Net Assets 2,328,189 8.79
Net Asset Value 26,500,602 100.00
The accompanying notes form an integral part of these financial statements.
Geographic Breakdown (as a percentage of Net Assets) % Net Assets
Belgium 2.46
France 9.92
Ireland 4.32
Italy 33.90
Portugal 7.10
Spain 33.51
Total 91.21

AVIVA INVESTORS – ANNUAL REPORT AND AUDITED FINANCIAL STATEMENTS avivainvestors.com 96
AVIVA INVESTORS – UK OPPORTUNITIES FUND Portfolio of Investments and Other Net Assets as at 31 December 2014
Number of shares or Principal Amount
Transferable Securities and Money Market Instruments Admitted to an Official Exchange Listing
Market Value
GBP
% Net assets
Ireland 713,788 2.25
GBP 184,251 UDG Healthcare 713,788 2.25
Jersey 1,081,899 3.41
GBP 222,547 Glencore Xstrata 664,859 2.10
GBP 9,193 Shire 417,040 1.31
Luxembourg 112,320 0.35
GBP 39,000 B&M European Value Retail 112,320 0.35
United Kingdom 29,242,928 92.08
GBP 90,404 AO World 254,442 0.80
GBP 104,300 Aviva 505,803 1.59
GBP 262,798 Barclays 640,176 2.02
GBP 28,479 Berkeley 706,849 2.23
GBP 29,000 BG Group 250,836 0.79
GBP 130,082 Blinkx 34,797 0.11
GBP 75,922 blur 48,970 0.15
GBP 292,847 BP 1,203,015 3.79
GBP 38,061 British American Tobacco 1,332,230 4.19
GBP 388,837 BT Group 1,562,930 4.92
GBP 21,283 Bunzl 375,539 1.18
GBP 149,792 Compass Group 1,650,708 5.20
GBP 116,755 Dixons Carphone 539,408 1.70
GBP 439,818 DS Smith 1,413,575 4.45
GBP 43,339 easyJet 722,895 2.28
GBP 86,949 Essentra 637,771 2.01
GBP 48,249 Foxtons 77,017 0.24
GBP 125,659 GKN 432,393 1.36
GBP 58,755 GlaxoSmithKline 809,203 2.55
Number of shares or Principal Amount
Transferable Securities and Money Market Instruments Admitted to an Official Exchange Listing
Market Value
GBP
% Net assets
GBP 327,976 HSBC Holdings 1,996,226 6.29
GBP 1,105,128 IDOX 439,288 1.38
GBP 755,807 ITV 1,627,252 5.12
GBP 203,255 Lavendon Group 357,221 1.12
GBP 44,170 London Stock Exchange 979,249 3.08
GBP 115,568 Melrose Industries 308,278 0.97
GBP 161,641 Moneysupermarket.com 377,028 1.19
GBP 139,009 Paragon 580,154 1.83
GBP 261,539 Peoples Operator Holdings 358,308 1.13
GBP 102,745 Prudential 1,533,469 4.83
GBP 91,191 Restaurant 600,037 1.89
GBP 40,021 Rio Tinto 1,200,430 3.78
GBP 85,151 Royal Dutch Shell 'B' 1,901,209 5.99
GBP 117,387 Sage 546,847 1.72
GBP 15,483 Smith & Nephew 183,783 0.58
GBP 28,572 Standard Chartered 275,191 0.87
GBP 7,758,857 Strategic Minerals 27,156 0.08
GBP 706,474 Tritax Big Box REIT 762,109 2.40
GBP 858,670 Vertu Motors 508,762 1.60
GBP 336,731 Vodafone 749,816 2.36
GBP 15,356 Whitbread 732,558 2.31
Total Transferable Securities and Money Market Instruments Admittedto an Official Exchange Listing
31,150,935 98.09
Total Investments 31,150,935 98.09
Other Net Assets 607,041 1.91
Net Asset Value 31,757,976 100.00
The accompanying notes form an integral part of these financial statements.
Geographic Breakdown (as a percentage of Net Assets) % Net Assets
Ireland 2.25
Jersey 3.41
Luxembourg 0.35
United Kingdom 92.08
Total 98.09

AVIVA INVESTORS – ANNUAL REPORT AND AUDITED FINANCIAL STATEMENTS avivainvestors.com 97
AVIVA INVESTORS – US EQUITY INCOME FUNDPortfolio of Investments and Other Net Assets as at 31 December 2014
Number of shares or Principal Amount
Transferable Securities and Money Market Instruments Admitted to an Official Exchange Listing
Market Value
USD
% Net assets
Bermuda 2,979,031 2.80
USD 40,495 Aircastle 881,171 0.83
USD 18,157 PartnerRe 2,097,860 1.97
Canada 6,210,683 5.84
USD 62,590 Rogers Communications 'B' 2,441,010 2.30
USD 62,171 Shaw Communications 'B' 1,683,280 1.58
USD 51,446 Thomson Reuters 2,086,393 1.96
United Kingdom 1,672,152 1.57
USD 40,949 Unilever ADR 1,672,152 1.57
United States of America 94,667,565 88.87
USD 15,861 ABM Industries 460,603 0.43
USD 85,999 ADT 3,147,133 2.95
USD 14,286 Becton Dickinson and Co 2,023,683 1.90
USD 25,327 Bemis 1,162,889 1.09
USD 1,671 BlackRock 605,245 0.57
USD 40,600 Bob Evans Farms 2,107,546 1.98
USD 19,914 Chevron 2,247,394 2.11
USD 49,998 Cinemark 1,792,678 1.68
USD 21,662 CME 'A' 1,947,739 1.83
USD 13,562 Compass Minerals International 1,193,049 1.12
USD 19,490 CyrusOne REIT 553,808 0.52
USD 26,592 Emerson Electric 1,664,792 1.56
USD 13,007 Energizer Holdings 1,703,202 1.60
USD 48,000 Geo Group REIT 1,974,720 1.85
USD 43,417 Hasbro 2,400,960 2.25
USD 10,950 Innophos 654,536 0.61
USD 103,579 Intel 3,823,619 3.59
USD 103,085 Iron Mountain REIT 4,061,034 3.81
USD 29,764 j2 Global 1,869,923 1.76
USD 19,804 Kimberly-Clark 2,317,464 2.18
Number of shares or Principal Amount
Transferable Securities and Money Market Instruments Admitted to an Official Exchange Listing
Market Value
USD
% Net assets
USD 41,739 Kohl's 2,579,053 2.42
USD 84,985 Microsoft 4,014,267 3.77
USD 30,742 Molson Coors Brewing 'B' 2,313,950 2.17
USD 35,554 Motorola Solutions 2,404,162 2.26
USD 50,066 National Fuel Gas 3,560,444 3.34
USD 31,188 National Oilwell Varco 2,052,014 1.93
USD 22,872 Nucor 1,134,108 1.07
USD 37,650 Occidental Petroleum 3,037,414 2.85
USD 30,775 Omnicom Group 2,408,913 2.26
USD 46,146 Owens & Minor 1,643,028 1.54
USD 13,401 PepsiCo 1,280,868 1.20
USD 38,622 PNC Financial Services 3,565,004 3.35
USD 6,446 Procter & Gamble 594,192 0.56
USD 37,884 QUALCOMM 2,846,793 2.67
USD 42,841 Quest Diagnostics 2,911,903 2.73
USD 49,026 Republic Services 2,000,506 1.88
USD 63,578 Sysco 2,568,233 2.41
USD 31,169 Target 2,378,818 2.23
USD 23,494 United Parcel Service 'B' 2,641,078 2.48
USD 56,697 US Ban 2,583,399 2.43
USD 64,387 Verizon Communications 3,031,662 2.85
USD 13,026 Wal-Mart Stores 1,129,615 1.06
USD 40,876 Wells Fargo 2,266,370 2.13
USD 111,622 Western Union 2,009,754 1.89
Total Transferable Securities andMoney Market Instruments Admittedto an Official Exchange Listing
105,529,431 99.08
Total Investments 105,529,431 99.08
Other Net Assets 984,369 0.92
Net Asset Value 106,513,800 100.00
The accompanying notes form an integral part of these financial statements.
Geographic Breakdown (as a percentage of Net Assets) % Net Assets
Bermuda 2.80
Canada 5.84
United Kingdom 1.57
United States of America 88.87
Total 99.08

AVIVA INVESTORS – ANNUAL REPORT AND AUDITED FINANCIAL STATEMENTS avivainvestors.com 98
STATEMENT OF NET ASSETSas at 31 December 2014
Aviva Investors -Asian Equity Income Fund
USD
Aviva Investors -Asian High Yield
Bond Fund USD
Aviva Investors -Dynamic Master
Fund EUR
Aviva Investors -Emerging Europe
Equity Fund*EUR
Investment portfolio at cost 94,729,702 102,506,134 41,649,511 27,821,404
Unrealised gain/(loss) 3,540,949 (911,767) 3,237,511 2,624,410
Investment portfolio at market value (note 2.2) 98,270,651 101,594,367 44,887,022 30,445,814
Cash at bank 721,980 1,714,177 484,273 2,009,518
Unrealised gain on futures contracts (note 2.2) - - - -
Unrealised gain on forward foreign exchange contracts (note 2.2) - - - -
Unrealised gain on swaps contracts (note 2.2) - - - -
Options purchased at market value (note 2.2) - - - -
Waiver fee Receivable (note 8) - - 53,120 -
Other assets 280,737 1,843,304 314,602 174,569
Total assets 99,273,368 105,151,848 45,739,017 32,629,901
Bank overdraft - (37,293) - -
Unrealised loss on futures contracts (note 2.2) - - - -
Unrealised loss on forward foreign exchange contracts (note 2.2) - - - -
Unrealised loss on swaps contracts (note 2.2) - - - -
Written options at market value (note 2.2) - - - -
Other liabilities (170,419) (27,556) (346,684) (471,711)
Total liabilities (170,419) (64,849) (346,684) (471,711)
Total Net Assets 99,102,949 105,086,999 45,392,333 32,158,190
Aviva Investors - Emerging Markets
Bond FundUSD
Aviva Investors -Emerging Markets
Corporate Bond Fund USD
Aviva Investors -Emerging Markets
Equity Income Fund USD
Aviva Investors -Emerging Markets
Equity Small Cap Fund
USD
Aviva Investors -Emerging Markets
Local CurrencyBond Fund
EUR
Investment portfolio at cost 1,370,978,272 186,651,702 515,143,238 98,880,903 613,211,272
Unrealised gain/(loss) (53,827,849) (3,283,693) 9,973,432 15,973,629 (36,618,008)
Investment portfolio at market value (note 2.2) 1,317,150,423 183,368,009 525,116,670 114,854,532 576,593,264
Cash at bank 33,120,922 12,351,563 19,085,701 961,178 25,235,757
Unrealised gain on futures contracts (note 2.2) - - - - -
Unrealised gain on forward foreign exchange contracts (note 2.2) 3,929,336 188,372 - - 8,265,503
Unrealised gain on swaps contracts (note 2.2) - - - - -
Options purchased at market value (note 2.2) - - - - -
Waiver fee Receivable (note 8) - - - - -
Other assets 21,715,047 2,117,547 1,791,717 156,878 9,103,882
Total assets 1,375,915,728 198,025,491 545,994,088 115,972,588 619,198,406
Bank overdraft (196) - - - (9,872,118)
Unrealised loss on futures contracts (note 2.2) - - - - -
Unrealised loss on forward foreign exchange contracts (note 2.2) (23,100,207) (5,101,889) - - (6,834,877)
Unrealised loss on swaps contracts (note 2.2) - - - - (289,253)
Written options at market value (note 2.2) - - - - -
Other liabilities (1,857,761) (51,827) (497,061) (171,790) (751,763)
Total liabilities (24,958,164) (5,153,716) (497,061) (171,790) (17,748,011)
Total Net Assets 1,350,957,564 192,871,775 545,497,027 115,800,798 601,450,395
* Please refer to note 1. The accompanying notes form an integral part of the financial statements

AVIVA INVESTORS – ANNUAL REPORT AND AUDITED FINANCIAL STATEMENTS avivainvestors.com 99
STATEMENT OF NET ASSETS (CONTINUED)as at 31 December 2014
Aviva Investors -EuropeanCorporate
Bond Fund EUR
Aviva Investors -European
Equity FundEUR
Aviva Investors - European Equity
Income Fund EUR
Aviva Investors -European
Real Estate Securities Fund
EUR
Investment portfolio at cost 86,840,347 98,791,446 134,098,369 42,643,421
Unrealised gain/(loss) 1,786,058 26,060,622 28,983,961 11,327,160
Investment portfolio at market value (note 2.2) 88,626,405 124,852,068 163,082,330 53,970,581
Cash at bank 4,732,876 1,293,789 1,872,029 994,279
Unrealised gain on futures contracts (note 2.2) 213,679 - - -
Unrealised gain on forward foreign exchange contracts (note 2.2) 55,413 - - -
Unrealised gain on swaps contracts (note 2.2) 37,011 - - -
Options purchased at market value (note 2.2) - - - -
Waiver fee Receivable (note 8) - - - -
Other assets 1,853,215 78,846 561,647 293,603
Total assets 95,518,599 126,224,703 165,516,006 55,258,463
Bank overdraft - - - -
Unrealised loss on futures contracts (note 2.2) (319,764) - - -
Unrealised loss on forward foreign exchange contracts (note 2.2) (365,326) - - -
Unrealised loss on swaps contracts (note 2.2) (17,718) - - -
Written options at market value (note 2.2) - - - -
Other liabilities (2,523,528) (507,526) (142,617) (165,013)
Total liabilities (3,226,336) (507,526) (142,617) (165,013)
Total Net Assets 92,292,263 125,717,177 165,373,389 55,093,450
Aviva Investors -Global Aggregate
Bond FundEUR
Aviva Investors -Global Bond
Absolute Return FundEUR
Aviva Investors -Global Convertibles
Absolute Return FundUSD
Aviva Investors -Global
Convertibles FundUSD
Investment portfolio at cost 152,050,092 36,699,886 396,590,454 1,759,303,142
Unrealised gain/(loss) 5,908,807 390,130 (13,614,948) (4,426,898)
Investment portfolio at market value (note 2.2) 157,958,899 37,090,016 382,975,506 1,754,876,244
Cash at bank 5,450,537 4,121,369 31,940,440 86,271,585
Unrealised gain on futures contracts (note 2.2) 61,204 18,840 - -
Unrealised gain on forward foreign exchange contracts (note 2.2) 3,893,802 159,799 1,113,180 4,594,179
Unrealised gain on swaps contracts (note 2.2) 542,846 347,352 3,413,379 -
Options purchased at market value (note 2.2) 19,899 24,407 341,000 -
Waiver fee Receivable (note 8) - - - -
Other assets 1,469,315 6,172,556 2,291,017 8,874,010
Total assets 169,396,502 47,934,339 422,074,522 1,854,616,018
Bank overdraft (566,116) (2) (6,860,223) -
Unrealised loss on futures contracts (note 2.2) (173,321) (58,780) - -
Unrealised loss on forward foreign exchange contracts (note 2.2) (3,543,706) (285,338) (2,544,237) (13,141,807)
Unrealised loss on swaps contracts (note 2.2) (770,756) (448,776) (4,917,812) -
Written options at market value (note 2.2) - - - -
Other liabilities (2,470,184) (5,766,212) (1,223,570) (3,492,665)
Total liabilities (7,524,083) (6,559,108) (15,545,842) (16,634,472)
Total Net Assets 161,872,419 41,375,231 406,528,680 1,837,981,546
The accompanying notes form an integral part of these financial statements.

AVIVA INVESTORS – ANNUAL REPORT AND AUDITED FINANCIAL STATEMENTS avivainvestors.com 100
STATEMENT OF NET ASSETS (CONTINUED)as at 31 December 2014
Aviva Investors -Global Emerging
Markets Index FundUSD
Aviva Investors -Global High
YieldBond Fund
USD
Aviva Investors -Long Term
European Bond Fund EUR
Aviva Investors - Multi-Strategy Target Return
FundEUR
Aviva Investors -Short Duration
Global High YieldBond Fund
USD
Investment portfolio at cost 584,750,052 1,493,682,004 63,407,052 228,609,747 466,119,601
Unrealised gain/(loss) (61,680,205) (52,516,033) 10,901,367 (323,585) (22,740,218)
Investment portfolio at market value (note 2.2) 523,069,847 1,441,165,971 74,308,419 228,286,162 443,379,383
Cash at bank 5,215,102 51,462,232 1,038,148 33,611,763 6,958,407
Unrealised gain on futures contracts (note 2.2) - - - 1,869,668 -
Unrealised gain on forward foreign exchange contracts (note 2.2) - 2,503,058 - 2,196,357 870,459
Unrealised gain on swaps contracts (note 2.2) - 1,700,370 - 1,792,059 -
Options purchased at market value (note 2.2) - - - 11,922,573 -
Waiver fee Receivable (note 8) - - - 21,384 -
Other assets 1,223,456 27,884,369 1,349,481 680,247 8,253,343
Total assets 529,508,405 1,524,716,000 76,696,048 280,380,213 459,461,592
Bank overdraft - - - - -
Unrealised loss on futures contracts (note 2.2) - - - (1,406,755) -
Unrealised loss on forward foreign exchange contracts (note 2.2)
- (5,095,832) - (691,247) (3,313,397)
Unrealised loss on swaps contracts (note 2.2) - (993,261) - (377,548) -
Written options at market value (note 2.2) - - - (3,729,172) -
Other liabilities (199,209) (2,500,222) (158,687) (138,516) (5,249,545)
Total liabilities (199,209) (8,589,315) (158,687) (6,343,238) (8,562,942)
Total Net Assets 529,309,196 1,516,126,685 76,537,361 274,036,975 450,898,650
Aviva Investors -Short Term
EuropeanBond Fund
EUR
Aviva Investors - UK Opportunities
Fund*GBP
Aviva Investors -US Equity
Income Fund USD
CombinedEUR
Investment portfolio at cost 24,251,477 26,722,999 93,127,049 7,503,901,170
Unrealised gain/(loss) (79,064) 4,427,936 12,402,382 (81,508,758)
Investment portfolio at market value (note 2.2) 24,172,413 31,150,935 105,529,431 7,422,392,412
Cash at bank 2,045,525 793,448 1,863,689 291,901,584
Unrealised gain on futures contracts (note 2.2) - - - 2,163,391
Unrealised gain on forward foreign exchange contracts (note 2.2) - - - 25,478,795
Unrealised gain on swaps contracts (note 2.2) - - - 6,945,507
Options purchased at market value (note 2.2) - - - 12,248,697
Waiver fee Receivable (note 8) - - - 74,504
Other assets 323,562 91,822 1,157,273 86,616,743
Total assets 26,541,500 32,036,205 108,550,393 7,847,821,633
Bank overdraft - - - (16,138,825)
Unrealised loss on futures contracts (note 2.2) - - - (1,958,620)
Unrealised loss on forward foreign exchange contracts (note 2.2) - - - (54,941,460)
Unrealised loss on swaps contracts (note 2.2) - - - (6,789,235)
Written options at market value (note 2.2) - - - (3,729,172)
Other liabilities (40,898) (278,229) (2,036,593) (28,286,690)
Total liabilities (40,898) (278,229) (2,036,593) (111,844,002)
Total Net Assets 26,500,602 31,757,976 106,513,800 7,735,977,631
* Please refer to note 1. The accompanying notes form an integral part of these financial statements.

AVIVA INVESTORS – ANNUAL REPORT AND AUDITED FINANCIAL STATEMENTS avivainvestors.com 101
* Please refer to note 1. The accompanying notes form an integral part of the financial statements
STATISTICS
31 December 2014 31 December 2013 31 December 2012
American Equity Fund* - Net asset value per:
A Share Class Accumulation - 12.5441 9.4655
B Share Class Accumulation - 7.1455 5.4053
C Share Class Accumulation - 17.5126 13.3139
I Share Class Accumulation - 199.7104 149.4319
Z Share Class Accumulation - 1,506.7630 1,117.4515
Total Net Assets in USD - 165,764,364 135,479,324
Asian Equity Income Fund - Net asset value per:
A Share Class Accumulation 13.3517 12.7309 12.5487
B Share Class Accumulation 5.8538 5.5956 5.5293
B Share Class Dividend 5.5128 5.3118 5.2733
C Share Class Accumulation - 26.0877 25.9079
I Share Class Accumulation 314.9287 297.7733 291.0444
V Share Class Accumulation 959.6167 - -
Z Share Class Accumulation 1,176.6189 1,102.6361 1,068.1739
Total Net Assets in USD 99,102,949 132,603,842 98,566,107
Asian High Yield Bond Fund - Net asset value per:
A Share Class Accumulation 11.0583 10.6541 -
I Share Class Accumulation 111.6097 106.7470 -
Z Share Class Accumulation 1,127.5661 1071.0782 -
Total Net Assets in USD 105,086,999 65,728,508 -
Dynamic Master Fund - Net asset value per:
F Share Class Accumulation 127.3895 117.3782 106.5760
Total Net Assets in EUR 45,392,333 27,213,446 11,824,523
Emerging Europe Equity Fund - Net asset value per:
A Share Class Accumulation 8.3233 8.6942 8.5243
B Share Class Accumulation 4.2234 4.4221 4.3466
B Share Class Dividend 3.8785 4.0999 4.1109
C Share Class Accumulation - 27.2591 26.9275
I Share Class Accumulation 300.9058 311.3616 302.4095
R Share Class Dividend GBP 11.9039 12.3205 -
Z Share Class Accumulation 971.8000 - -
Z Share Class Accumulation GBP 1,229.4900 - -
ZY Share Class Accumulation GBP 1,208.5662 - -
Total Net Assets in EUR 32,158,190 39,454,211 55,852,894
Emerging Markets Bond Fund - Net asset value per:
A Share Class Accumulation 11.6630 11.2734 12.2109
A Share Class Accumulation Hedged EUR 12.2755 13.5554 14.0724
B Share Class Accumulation 10.2382 9.9210 10.7729
B Share Class Dividend 9.9696 10.2608 11.8021
B Share Class Dividend Hedged EUR 11.4664 13.4719 14.8421
C Share Class Accumulation - 19.2670 21.0263
F Share Class Accumulation 97.4480 - -
I Share Class Accumulation 224.4563 215.4587 231.7610

AVIVA INVESTORS – ANNUAL REPORT AND AUDITED FINANCIAL STATEMENTS avivainvestors.com 102
STATISTICS (CONTINUED)
31 December 2014 31 December 2013 31 December 2012
Emerging Markets Bond Fund (Continued) - Net asset value per :
I Share Class Accumulation Hedged CHF 96.9317 104.4070 -
I Share Class Accumulation Hedged EUR 141.0562 154.6861 159.4700
I Share Class Accumulation Hedged GBP 158.8261 162.1100 -
R Share Class Dividend GBP 16.5980 16.1726 -
V Share Class Accumulation 1,235.5382 1,177.2676 1,257.1773
V Share Class Accumulation EUR 1,811.7093 1,726.2653 1,843.7685
Z Share Class Accumulation 1,234.9492 1,176.7113 1,256.4129
Z Share Class Accumulation Hedged EUR 1,260.4989 1,372.1100 1,602.9988
Z Share Class Dividend Hedged EUR 1,226.7875 1,411.9869 1,524.5335
Z Share Class Accumulation Hedged GBP 1,794.3477 1,817.5423 1,901.8958
Total Net Assets in USD 1,350,957,564 1,473,812,417 2,074,125,755
Emerging Markets Corporate Bond Fund - Net asset value per:
I Share Class Accumulation 102.7400 - -
I Share Class Accumulation Hedged EUR 124.0300 - -
Z Share Class Dividend Hedged EUR 1,178.3262 1,341.0757 1,340.4464
Total Net Assets in USD 192,871,775 173,833,680 167,272,316
Emerging Markets Equity Income Fund - Net asset value per:
A Share Class Accumulation 10.4486 10.7651 11.2386
B Share Class Accumulation 3.5780 3.6956 3.8678
B Share Class Accumulation EUR 11.4345 11.8103 12.3606
B Share Class Dividend 3.3555 3.5007 3.7094
C Share Class Accumulation - 31.4086 33.0368
I Share Class Accumulation 354.6565 361.9664 374.3332
IY Share Class Accumulation 91.0360 - -
R Share Class Dividend GBP 15.4488 15.8381 -
Z Share Class Accumulation 922.1994 931.9384 954.2854
Z Share Class Dividend 985.6200 - -
Total Net Assets in USD 545,497,027 707,900,849 696,551,375
Emerging Markets Equity Small Cap Fund - Net asset value per:
A Share Class Accumulation 11.1789 11.5070 10.4774
B Share Class Accumulation 9.9799 10.2985 9.4009
B Share Class Accumulation EUR 16.0977 16.6116 15.1637
B Share Class Dividend 10.7135 11.1259 10.2218
F Share Class Accumulation 94.4120 - -
I Share Class Accumulation 156.6614 159.7436 144.0895
R Share Class Dividend 10.2972 10.5012 -
R Share Class Dividend GBP 16.2951 16.6442 -
Z Share Class Accumulation 1,075.8571 1,086.2179 970.1270
Total Net Assets in USD 115,800,798 130,331,512 129,765,123
Emerging Markets Local Currency Bond Fund - Net asset value per:
A Share Class Accumulation 14.3009 13.4084 15.1674
A Share Class Dividend 9.8555 - -
B Share Class Accumulation 14.0908 13.2439 15.0188
The accompanying notes form an integral part of the financial statements.

AVIVA INVESTORS – ANNUAL REPORT AND AUDITED FINANCIAL STATEMENTS avivainvestors.com 103
STATISTICS (CONTINUED)
31 December 2014 31 December 2013 31 December 2012
Emerging Markets Local Currency Bond Fund (Continued) - Net asset value per:
B Share Class Accumulation USD 8.5181 8.0062 9.0792
B Share Class Dividend 7.6614 7.7550 9.4937
B Share Class Dividend USD 6.0837 6.1630 7.5509
C Share Class Accumulation - 12.7680 14.5518
I Share Class Accumulation 152.3161 141.8162 159.3099
I Share Class Accumulation USD 72.0915 67.1218 -
I Share Class Dividend 90.7386 88.5620 99.6919
I Share Class Dividend GBP 125.8948 122.8827 144.1984
R Share Class Dividend GBP 10.9050 10.6013 -
Z Share Class Accumulation 1,134.0886 1,048.1294 1,168.7388
Z Share Class Dividend - 922.7998 1,081.7818
Total Net Assets in EUR 601,450,395 632,295,778 840,242,716
European Corporate Bond Fund - Net asset value per:
A Share Class Accumulation 13.2791 12.3681 12.0816
B Share Class Accumulation 3.4480 3.2178 3.1496
B Share Class Dividend 1.8847 1.8010 1.8109
C Share Class Accumulation - 15.2077 14.9300
I Share Class Accumulation 178.2940 165.1630 160.4628
Z Share Class Accumulation 1,285.3780 1,183.7032 1,143.2569
Total Net Assets in EUR 92,292,263 78,814,192 76,961,261
European Equity Fund - Net asset value per:
A Share Class Accumulation 10.8249 10.0403 8.2265
B Share Class Accumulation 7.5543 7.0243 5.7697
B Share Class Dividend - 6.8607 5.6593
C Share Class Accumulation - 18.2149 15.0365
I Share Class Accumulation 185.2690 170.3968 138.4412
Z Share Class Accumulation 1,507.2945 1,374.0203 1,106.4657
Total Net Assets in EUR 125,717,177 151,567,025 132,244,444
European Equity Income Fund - Net asset value per:
A Share Class Accumulation 13.4427 12.9473 10.4290
B Share Class Accumulation 11.1587 10.7744 8.7005
C Share Class Accumulation - 24.5906 19.9566
I Share Class Accumulation 270.3789 258.2264 206.2546
Z Share Class Accumulation 1,454.7152 1,377.0252 1,090.1474
Total Net Assets in EUR 165,373,389 188,662,732 161,758,228
European Real Estate Securities Fund - Net asset value per:
A Share Class Accumulation 9.2080 7.5500 6.8298
B Share Class Accumulation 11.6887 9.6091 8.7143
B Share Class Dividend 10.5099 8.6607 7.9801
C Share Class Accumulation - 18.7499 17.0890
I Share Class Accumulation 260.0301 211.4430 189.6480
Z Share Class Dividend 1,192.1284 - -
Total Net Assets in EUR 55,093,450 71,045,553 103,062,731
The accompanying notes form an integral part of the financial statements.

AVIVA INVESTORS – ANNUAL REPORT AND AUDITED FINANCIAL STATEMENTS avivainvestors.com 104
STATISTICS (CONTINUED)
31 December 2014 31 December 2013 31 December 2012
Global Aggregate Bond Fund - Net asset value per:
B Share Class Accumulation 11.4931 10.7202 10.8794
B Share Class Accumulation USD 8.1838 7.6382 7.7528
B Share Class Dividend 10.5620 10.1388 10.5750
B Share Class Dividend USD 7.6856 7.3844 7.7205
I Share Class Accumulation 125.9847 116.7022 117.5160
I Share Class Accumulation Hedged GBP 139.9290 120.6152 124.0421
I Share Class Dividend Hedged AUD 87.7067 77.9084 94.8088
Z Share Class Accumulation 1,177.7542 1,085.8950 1,087.0900
Z Share Class Accumulation Hedged GBP 1,495.4407 1,282.4402 1,311.1211
Total Net Assets in EUR 161,872,419 102,994,084 204,815,247
Global Bond Absolute Return Fund - Net asset value per:
I Share Class Accumulation 100.0290 99.5034 -
Z Share Class Accumulation Hedged GBP - 1,203.0231 -
Z Share Class Accumulation 1,000.0717 - -
Total Net Assets in EUR 41,375,231 24,298,927 -
Global Convertibles Absolute Return Fund - Net asset value per:
A Share Class Accumulation Hedged EUR 13.0467 15.0773 13.7224
F Share Class Accumulation 96.8850 - -
I Share Class Accumulation 123.3029 123.9383 116.8766
I Share Class Dividend 96.8728 - -
I Share Class Accumulation Hedged CHF 97.6662 - -
I Share Class Accumulation Hedged EUR 146.6567 168.1324 151.8618
I Share Class Dividend Hedged EUR 130.9972 151.6494 137.6340
I Share Class Dividend Hedged GBP 186.8014 200.9453 186.1371
Z Share Class Accumulation 1,171.3687 1,163.0138 1,080.2556
Z Share Class Accumulation Hedged EUR - - 1,415.8692
Z Share Class Accumulation Hedged GBP 1,834.5387 1,930.9946 1,755.7052
Total Net Assets in USD 406,528,680 416,552,468 250,609,805
Global Convertibles Fund - Net asset value per:
A Share Class Accumulation 13.2988 13.7089 12.1684
A Share Class Accumulation Hedged CHF 10.7140 11.6944 -
A Share Class Accumulation Hedged EUR 14.5693 16.1484 13.7159
A Share Class Dividend GBP 23.1841 23.9538 21.3769
A Share Class Dividend Hedged GBP 17.3837 17.9932 15.6928
B Share Class Accumulation 9.2315 9.5407 8.4897
B Share Class Accumulation Hedged EUR 15.5075 17.2313 14.6722
B Share Class Dividend 10.1322 10.6699 9.6858
C Share Class Accumulation - 19.0273 17.0162
I Share Class Accumulation 207.4202 212.3373 187.1738
I Share Class Accumulation EUR 144.2741 147.6943 130.1914
I Share Class Accumulation GBP 178.8583 183.1001 161.4014
I Share Class Accumulation Hedged CHF 108.3492 117.4359 -
The accompanying notes form an integral part of the financial statements.

AVIVA INVESTORS – ANNUAL REPORT AND AUDITED FINANCIAL STATEMENTS avivainvestors.com 105
STATISTICS (CONTINUED)
31 December 2014 31 December 2013 31 December 2012
Global Convertibles Fund (Continued) - Net asset value per:
I Share Class Accumulation Hedged EUR 147.2968 162.1319 136.7569
I Share Class Dividend GBP 238.9679 246.8209 220.2023
I Share Class Dividend Hedged GBP 191.5200 198.1116 172.7000
R Share Class Dividend 9.8656 - -
R Share Class Dividend Hedged EUR 12.6240 - -
R Share Class Dividend Hedged GBP 17.6429 18.2184 -
Z Share Class Accumulation 1,143.5857 1,162.0797 1,016.1900
Z Share Class Accumulation Hedged EUR 1,520.9075 1,661.7472 1,391.3480
Z Share Class Accumulation Hedged GBP 1,981.2559 2,017.1538 1,725.2781
Z Share Class Dividend Hedged EUR 1,338.1534 1,485.4066 -
Total Net Assets in USD 1,837,981,546 2,706,429,891 1,928,318,992
Global Credit Absolute Return Fund* - Net asset value per:
A Share Class Accumulation - - 10.6225
B Share Class Accumulation - - 10.8012
I Share Class Accumulation - 109.5796 107.1120
I Share Class Accumulation Hedged GBP - 123.4352 123.5560
Z Share Class Accumulation - 1,071.0509 1,036.9591
Z Share Class Accumulation Hedged GBP - 1,362.2116 1,347.3335
Total Net Assets in EUR - 225,195,134 217,711,309
Global Emerging Markets Index Fund - Net asset value per:
I Share Class Accumulation 94.0211 96.4510 99.3545
Z Share Class Accumulation 956.1070 976.5090 1,001.4914
Total Net Assets in USD 529,309,196 595,588,020 538,014,145
Global Enhanced Equity Income Fund* - Net asset value per:
Z Share Class Accumulation Hedged GBP - 1,872.1097 -
Total Net Assets in USD - 59,533,090 -
Global Equity Income Fund* - Net asset value per:
A Share Class Accumulation - 14.5423 12.7154
B Share Class Accumulation - 12.5451 10.9966
C Share Class Accumulation - 11.9113 10.4933
I Share Class Accumulation - 151.7237 131.5494
Total Net Assets in EUR - 63,300,882 56,280,727
Global High Yield Bond Fund - Net asset value per:
A Share Class Accumulation 18.4209 18.0061 17.0268
A Share Class Accumulation Hedged SGD 10.7274 11.0034 10.7624
A Share Class Accumulation Hedged CHF 12.5218 13.7171 12.6349
A Share Class Accumulation Hedged EUR 21.1333 23.5511 21.3300
A Share Class Dividend 10.2132 10.6147 10.6716
A Share Class Dividend Hedged SGD 8.0722 8.8084 9.1641
A Share Class Dividend Hedged GBP 23.1601 25.5115 25.0941
B Share Class Accumulation 13.1583 12.8941 12.2234
B Share Class Accumulation Hedged EUR 16.2362 18.1391 16.4696
B Share Class Dividend 10.1937 10.6134 10.6971
B Share Class Dividend Hedged EUR 13.0162 15.2707 14.5806
F Share Class Accumulation 99.6750 - -
* Please refer to note 1. The accompanying notes form an integral part of the financial statements.

AVIVA INVESTORS – ANNUAL REPORT AND AUDITED FINANCIAL STATEMENTS avivainvestors.com 106
STATISTICS (CONTINUED)
31 December 2014 31 December 2013 31 December 2012
Global High Yield Bond Fund (Continued) - Net asset value per:
I Share Class Accumulation 192.0348 186.4125 175.0556
I Share Class Accumulation Hedged CAD 130.9747 137.4695 136.7004
I Share Class Accumulation Hedged EUR 220.3636 243.8767 219.3503
I Share Class Accumulation Hedged GBP 188.6699 194.1442 178.4040
I Share Class Dividend 109.2476 112.5775 112.2900
I Share Class Dividend Hedged CHF 109.3295 126.0531 122.3299
I Share Class Dividend Hedged EUR 131.0898 153.7497 146.6963
I Share Class Dividend Hedged GBP 169.7764 184.8755 174.3079
M Share Class Accumulation 107.4041 103.9899 -
M Share Class Accumulation Hedged CHF 107.6323 116.7897 -
M Share Class Accumulation Hedged EUR 129.7900 143.2657 -
M Share Class Accumulation Hedged GBP 173.0040 177.4360 162.6680
R Share Class Dividend Hedged GBP 16.1187 17.4319 -
Z Share Class Accumulation 1,310.7616 1,263.0098 1,177.3252
Z Share Class Accumulation Hedged EUR - - 1,360.7144
Z Share Class Accumulation Hedged GBP 2,066.8181 2,111.1139 1,925.3675
Z Share Class Dividend EUR - 1,408.1968 1,405.8068
Z Share Class Dividend Hedged EUR 1,284.3255 1,509.4041 1,442.6535
Total Net Assets in USD 1,516,126,685 2,449,389,519 2,206,236,656
Japanese Equity Fund* - Net asset value per:
A Share Class Accumulation - 1,246.0720 831.3453
B Share Class Accumulation - 98.3358 65.7710
C Share Class Accumulation - 2,225.4600 1,495.9293
I Share Class Accumulation - 25,786.2278 17,059.5619
Z Share Class Accumulation - 161,328.9070 105,786.7512
Total Net Assets in JPY - 4,791,121,853 3,342,936,601
Long Term European Bond Fund - Net asset value per:
A Share Class Accumulation 16.1402 12.6448 12.5258
B Share Class Accumulation 87.8275 68.9445 68.4328
B Share Class Dividend 68.2710 55.0737 56.1595
C Share Class Accumulation - 15.5379 15.4689
Z Share Class Accumulation 1,583.9304 1,226.9269 1,201.6852
Total Net Assets in EUR 76,537,361 80,098,384 76,215,720
Multi-Strategy Target Return Fund - Net asset value per:
A Share Class Accumulation 10.4066 - -
A Share Class Accumulation USD - - -
F Share Class Accumulation Hedged USD 86.7110 - -
I Share Class Accumulation 104.5110 - -
I Share Class Accumulation Hedged GBP 134.2647 - -
I Share Class Accumulation USD 76.3727 - -
I Share Class Accumulation Hedged USD 85.9995 - -
J Share Class Accumulation - - -
Z Share Class Accumulation 1,048.4001 - -
Total Net Assets in EUR 274,036,975 - -
* Please refer to note 1. The accompanying notes form an integral part of the financial statements.

AVIVA INVESTORS – ANNUAL REPORT AND AUDITED FINANCIAL STATEMENTS avivainvestors.com 107
STATISTICS (CONTINUED)
31 December 2014 31 December 2013 31 December 2012
Short Duration Global High Yield Bond Fund - Net asset value per:
A Share Class Accumulation 9.9194 - -
I Share Class Accumulation 113.2937 111.8372 106.2253
I Share Class Accumulation Hedged CHF 99.5473 - -
I Share Class Accumulation Hedged GBP - 174.9348 162.6810
I Share Class Accumulation Hedged EUR 121.4593 - -
I Share Class Dividend Hedged EUR 123.0029 146.4772 139.6575
Z Share Class Dividend Hedged EUR 1,171.6720 1,398.4654 1,351.9823
Z Share Class Accumulation Hedged GBP 1,780.9233 1,852.8089 1,712.6298
Total Net Assets in USD 450,898,650 576,856,781 575,883,941
Short Term European Bond Fund - Net asset value per:
A Share Class Accumulation 11.6252 11.5153 11.3816
B Share Class Accumulation 14.4706 14.3631 14.2247
B Share Class Dividend 9.0879 9.1849 9.2700
C Share Class Accumulation - 12.0745 11.9941
Total Net Assets in EUR 26,500,602 35,289,491 34,476,000
UK Opportunities Fund - Net asset value per:
A Share Class Dividend 14.0680 14.0833 11.4127
B Share Class Accumulation 5.1370 5.0660 4.0319
C Share Class Accumulation - 20.1403 16.1096
I Share Class Accumulation 233.5427 227.8052 179.3360
R Share Class Dividend 11.7894 11.7236 -
Z Share Class Accumulation 1,402.6755 1,356.0939 1,058.1178
Total Net Assets in GBP 31,757,976 41,678,015 28,217,292
US Equity Income Fund - Net asset value per:
A Share Class Accumulation 11.1176 - -
B Share Class Accumulation 11.0810 - -
I Share Class Accumulation 147.8647 133.3945 102.0050
I Share Class Dividend 112.0999 - -
Z Share Class Accumulation 1,321.0400 1,180.9200 -
Z Share Class Accumulation EUR - - 1,297.5072
Total Net Assets in USD 106,513,800 40,734,915 6,488,556
The accompanying notes form an integral part of the financial statements.

AVIVA INVESTORS – ANNUAL REPORT AND AUDITED FINANCIAL STATEMENTS avivainvestors.com 108
STATEMENT OF CHANGES IN SHARES OUTSTANDINGFor the year ended 31 December 2014
Shares at the start of the year
Number of shares issued
Number of shares
redeemed
Shares at the end of the year
American Equity Fund
A Share Class Accumulation 2,757,102 - (2,757,102) -
B Share Class Accumulation 7,141,158 - (7,141,158) -
C Share Class Accumulation 327,774 - (327,774) -
I Share Class Accumulation 13,049 - (13,049) -
Z Share Class Accumulation 47,655 - (47,655) -
Asian Equity Income Fund
A Share Class Accumulation 1,806,096 1,129,283 (1,496,355) 1,439,024
B Share Class Accumulation 2,994,064 678,497 (1,820,649) 1,851,912
B Share Class Dividend 184 1,817 - 2,001
C Share Class Accumulation 90,185 7,127 (97,312) -
I Share Class Accumulation 1,021 64,176 (64,019) 1,178
V Share Class Accumulation - 7,920 (5,930) 1,990
Z Share Class Accumulation 81,803 990 (26,057) 56,736
Asian High Yield Bond Fund
A Share Class Accumulation 100 344,746 (306,099) 38,747
I Share Class Accumulation 10 51,283 (28,924) 22,369
Z Share Class Accumulation 61,365 34,841 (5,602) 90,604
Dynamic Master Fund
F Share Class Accumulation 231,844 161,199 (36,716) 356,327
Emerging Europe Equity Fund
A Share Class Accumulation 953,786 38,053 (61,455) 930,384
B Share Class Accumulation 3,951,864 2,204,306 (1,393,698) 4,762,472
B Share Class Dividend 3,872 15 (78) 3,809
C Share Class Accumulation 390,737 22,981 (413,718) -
I Share Class Accumulation 9,692 3,296 (12,024) 964
R Share Class Dividend GBP 100 - - 100
Z Share Class Accumulation - 1 - 1
Z Share Class Accumulation GBP - 1,704 (1,703) 1
ZY Share Class Accumulation GBP - 3,303 - 3,303
Emerging Markets Bond Fund
A Share Class Accumulation 2,307,958 3,811,828 (5,879,480) 240,306
A Share Class Accumulation Hedged EUR 871,244 115,646 (873,620) 113,270
B Share Class Accumulation 2,298,431 6,540,149 (6,934,367) 1,904,213
B Share Class Dividend 6,717,897 4,482,753 (5,439,220) 5,761,430
B Share Class Dividend Hedged EUR 5,919 6 (1,819) 4,106
C Share Class Accumulation 109,926 19,342 (129,268) -
F Share Class Accumulation - 10 - 10
I Share Class Accumulation 600,592 595,698 (574,466) 621,824
I Share Class Accumulation Hedged CHF 58,617 48,208 (14,295) 92,530
I Share Class Accumulation Hedged EUR 101,237 84,185 (68,847) 116,575
I Share Class Accumulation Hedged GBP 10 245,101 (130,869) 114,242
The accompanying notes form an integral part of the financial statements.

AVIVA INVESTORS – ANNUAL REPORT AND AUDITED FINANCIAL STATEMENTS avivainvestors.com 109
STATEMENT OF CHANGES IN SHARES OUTSTANDING (CONTINUED)For the year ended 31 December 2014
Shares at the start of the year
Number of shares issued
Number of shares
redeemed
Shares at the end of the year
Emerging Markets Bond Fund (continued)
R Share Class Dividend GBP 100 - - 100
V Share Class Accumulation 91,402 33,924 (50,068) 75,258
V Share Class Accumulation EUR 1,750 66 (275) 1,541
Z Share Class Accumulation 882 71 (495) 458
Z Share Class Accumulation Hedged EUR 1 36,320 (17,649) 18,672
Z Share Class Accumulation Hedged GBP 145,921 - (30,244) 115,677
Z Share Class Dividend Hedged EUR 576,482 80,280 (37,903) 618,859
Emerging Markets Corporate Bond Fund
I Share Class Accumulation - 10 - 10
I Share Class Accumulation Hedged EUR - 10 - 10
Z Share Class Dividend Hedged EUR 129,623 34,058 - 163,681
Emerging Markets Equity Income Fund
A Share Class Accumulation 1,689,437 226,019 (335,551) 1,579,905
B Share Class Accumulation 3,892,428 1,202,163 (1,397,690) 3,696,901
B Share Class Accumulation EUR 1,091,908 16,091 (279,671) 828,328
B Share Class Dividend 5,018 346 (5,076) 288
C Share Class Accumulation 84,779 5,147 (89,926) -
I Share Class Accumulation 216,251 10,825 (195,489) 31,587
IY Share Class Accumulation - 710,873 - 710,873
R Share Class Dividend GBP 100 - - 100
Z Share Class Accumulation 623,942 6,732 (163,997) 466,677
Z Share Class Dividend - 1 - 1
Emerging Markets Equity Small Cap Fund
A Share Class Accumulation 41,433 35,582 (23,489) 53,526
B Share Class Accumulation 1,082,265 383,857 (730,533) 735,589
B Share Class Accumulation EUR 1,085,657 232,832 (577,518) 740,971
B Share Class Dividend 93 - - 93
F Share Class Accumulation - 10 - 10
I Share Class Accumulation 66,470 163,808 (56,852) 173,426
R Share Class Dividend 100 - - 100
R Share Class Dividend GBP 100 3,610 - 3,710
Z Share Class Accumulation 82,905 4,673 (23,721) 63,857
Emerging Markets Local Currency Bond Fund
A Share Class Accumulation 66,699 2,340,112 (515,408) 1,891,403
A Share Class Dividend - 100 - 100
B Share Class Accumulation 54,830 1,032,434 (93,483) 993,781
B Share Class Accumulation USD 469,313 1,181,676 (1,596,045) 54,944
B Share Class Dividend 515,190 1,185,764 (260,222) 1,440,732
B Share Class Dividend USD 4,703,658 3,474,635 (4,264,482) 3,913,811
C Share Class Accumulation 761,147 56,607 (817,754) -
The accompanying notes form an integral part of the financial statements.

AVIVA INVESTORS – ANNUAL REPORT AND AUDITED FINANCIAL STATEMENTS avivainvestors.com 110
STATEMENT OF CHANGES IN SHARES OUTSTANDING (CONTINUED)For the year ended 31 December 2014
Shares at the start of the year
Number of shares issued
Number of shares
redeemed
Shares at the end of the year
Emerging Markets Local Currency Bond Fund (continued)
I Share Class Accumulation 828,436 375,917 (449,630) 754,723
I Share Class Accumulation USD 8,700 254,671 (262,171) 1,200
I Share Class Dividend 113,356 - - 113,356
I Share Class Dividend GBP 76,480 140,654 (119,152) 97,982
R Share Class Dividend GBP 100 - - 100
Z Share Class Accumulation 391,191 61 (49,642) 341,610
Z Share Class Dividend 39,759 104 (39,863) -
European Corporate Bond Fund
A Share Class Accumulation 2,185,262 94,197 (452,013) 1,827,446
B Share Class Accumulation 2,255,688 2,801,446 (1,931,436) 3,125,698
B Share Class Dividend 1,116,224 2,036,433 (507,629) 2,645,028
C Share Class Accumulation 244,434 30,859 (275,293) -
I Share Class Accumulation 66,034 208,934 (101,004) 173,964
Z Share Class Accumulation 23,565 862 (7,898) 16,529
European Equity Fund
A Share Class Accumulation 3,496,614 87,148 (812,729) 2,771,033
B Share Class Accumulation 12,624,748 1,496,810 (3,696,293) 10,425,265
B Share Class Dividend 30,618 - (30,618) -
C Share Class Accumulation 162,986 20,541 (183,527) -
I Share Class Accumulation 4,546 2,713 (3,200) 4,059
Z Share Class Accumulation 17,341 1,720 (8,304) 10,757
European Equity Income Fund
A Share Class Accumulation 1,832,126 77,011 (462,211) 1,446,926
B Share Class Accumulation 814,248 371,451 (68,716) 1,116,983
C Share Class Accumulation 115,549 42,090 (157,639) -
I Share Class Accumulation 703 8,930 (3,045) 6,588
Z Share Class Accumulation 111,215 1,060 (21,757) 90,518
European Real Estate Securities Fund
A Share Class Accumulation 2,680,229 369,862 (514,670) 2,535,421
B Share Class Accumulation 834,387 1,709,643 (1,330,288) 1,213,742
B Share Class Dividend 2,044,703 17,444 (2,062,044) 103
C Share Class Accumulation 131,100 66,361 (197,461) -
I Share Class Accumulation 107,005 101,493 (196,142) 12,356
Z Share Class Dividend - 16,468 (4,434) 12,034
Global Aggregate Bond Fund
B Share Class Accumulation 100 73,014 (72,973) 141
B Share Class Accumulation USD 2,660 533 (2,758) 435
B Share Class Dividend 337 1,938 (1,928) 347
B Share Class Dividend USD 306 11,675 (5,114) 6,867
I Share Class Accumulation 9 177,015 (171,375) 5,649
I Share Class Accumulation Hedged GBP 216,400 239,124 (174,149) 281,375
I Share Class Dividend Hedged AUD 87,243 4,125 (12,914) 78,454
The accompanying notes form an integral part of the financial statements.

AVIVA INVESTORS – ANNUAL REPORT AND AUDITED FINANCIAL STATEMENTS avivainvestors.com 111
STATEMENT OF CHANGES IN SHARES OUTSTANDING (CONTINUED)For the year ended 31 December 2014
Shares at the start of the year
Number of shares issued
Number of shares
redeemed
Shares at the end of the year
Global Aggregate Bond Fund (Continued)
Z Share Class Accumulation 1 52,124 (12,177) 39,948
Z Share Class Accumulation Hedged GBP 54,635 935 (10,234) 45,336
Global Bond Absolute Return Fund
I Share Class Accumulation 110,000 230,822 (36,182) 304,640
Z Share class Accumulation - 10,901 - 10,901
Z Share Class Accumulation Hedged GBP 11,100 - (11,100) -
Global Convertibles Absolute Return Fund
A Share Class Accumulation Hedged EUR 23,461 1,644,614 (265,834) 1,402,241
F Share Class Accumulation - 10 - 10
I Share Class Accumulation 750,797 397,026 (323,664) 824,159
I Share Class Accumulation Hedged CHF - 122,513 (75,261) 47,252
I Share Class Accumulation Hedged EUR 355,829 597,833 (665,631) 288,031
I Share Class Dividend - 1,512 - 1,512
I Share Class Dividend Hedged EUR 4,175 24,750 (4,475) 24,450
I Share Class Dividend Hedged GBP 47,840 43,654 (11,947) 79,547
Z Share Class Accumulation 43,912 8,447 (5,025) 47,334
Z Share Class Accumulation Hedged GBP 104,611 7,706 (21,776) 90,541
Global Convertibles Fund
A Share Class Accumulation 5,474,666 2,112,097 (2,795,483) 4,791,280
A Share Class Accumulation Hedged CHF 114,488 207,295 (165,683) 156,100
A Share Class Accumulation Hedged EUR 1,698,377 1,592,924 (2,344,116) 947,185
A Share Class Dividend GBP 37,216 1,511 (11,951) 26,776
A Share Class Dividend Hedged GBP 327,325 39,675 (93,601) 273,399
B Share Class Accumulation 12,072,539 10,316,623 (20,780,591) 1,608,571
B Share Class Accumulation Hedged EUR 1,269,429 227,788 (1,350,201) 147,016
B Share Class Dividend 680,880 597,210 (1,179,921) 98,169
C Share Class Accumulation 255,086 35,222 (290,308) -
I Share Class Accumulation 1,247,574 2,016,102 (2,082,969) 1,180,707
I Share Class Accumulation EUR 221,162 - - 221,162
I Share Class Accumulation GBP 831,517 124,055 (6,143) 949,429
I Share Class Accumulation Hedged CHF 92,170 36,721 (116,891) 12,000
I Share Class Accumulation Hedged EUR 1,928,045 709,032 (1,498,939) 1,138,138
I Share Class Dividend GBP 13,146 27,840 (8,343) 32,643
I Share Class Dividend Hedged GBP 1,390,672 229,917 (768,450) 852,139
R Share Class Dividend - 63,333 (34,043) 29,290
R Share Class Dividend Hedged EUR - 100 - 100
R Share Class Dividend Hedged GBP 9,789 86,971 (12,521) 84,239
Z Share Class Accumulation 659,761 35,024 (86,443) 608,342
Z Share Class Accumulation Hedged EUR 7,107 1,048 (7,508) 647
Z Share Class Accumulation Hedged GBP 219,942 - (185,398) 34,544
Z Share Class Dividend Hedged EUR 116,010 102,873 (83,000) 135,883
The accompanying notes form an integral part of the financial statements.

AVIVA INVESTORS – ANNUAL REPORT AND AUDITED FINANCIAL STATEMENTS avivainvestors.com 112
STATEMENT OF CHANGES IN SHARES OUTSTANDING (CONTINUED)For the year ended 31 December 2014
Shares at the start of the year
Number of shares issued
Number of shares
redeemed
Shares at the end of the year
Global Credit Absolute Return Fund*
I Share Class Accumulation 178 - (178) -
I Share Class Accumulation Hedged GBP 33,355 - (33,355) -
Z Share Class Accumulation 5,168 - (5,168) -
Z Share Class Accumulation Hedged GBP 158,216 - (158,216) -
Global Emerging Markets Index Fund
I Share Class Accumulation 59,728 17,069 (17,861) 58,936
Z Share Class Accumulation 604,016 26,508 (82,711) 547,813
Global Enhanced Equity Income Fund*
Z Share Class Accumulation Hedged GBP 31,800 - (31,800) -
Global Equity Income Fund*
A Share Class Accumulation 1,347,932 - (1,347,932) -
B Share Class Accumulation 1,916,798 23 (1,916,821) -
C Share Class Accumulation 39,245 - (39,245) -
I Share Class Accumulation 126,447 - (126,447) -
Global High Yield Bond Fund
A Share Class Accumulation 19,523,674 9,096,361 (19,221,052) 9,398,983
A Share Class Accumulation Hedged CHF 5,163,767 1,491,208 (3,886,786) 2,768,189
A Share Class Accumulation Hedged EUR 8,977,647 2,213,723 (8,775,702) 2,415,668
A Share Class Accumulation Hedged SGD 1,800,138 649,436 (1,449,193) 1,000,381
A Share Class Dividend 9,640,178 9,361,609 (9,758,411) 9,243,376
A Share Class Dividend Hedged GBP 923,372 148,214 (641,277) 430,309
A Share Class Dividend Hedged SGD 3,791,988 2,408,749 (2,320,203) 3,880,534
B Share Class Accumulation 3,204,340 4,892,604 (7,361,141) 735,803
B Share Class Accumulation Hedged EUR 39,230 16,985 (39,611) 16,604
B Share Class Dividend 13,533,951 7,683,938 (15,209,886) 6,008,003
B Share Class Dividend Hedged EUR 450,446 191,755 (346,220) 295,981
F Share Class Accumulation - 10 - 10
I Share Class Accumulation 1,899,981 1,511,391 (1,805,598) 1,605,774
I Share Class Accumulation Hedged CAD 297,848 8,120 (20,170) 285,798
I Share Class Accumulation Hedged EUR 1,263,884 637,343 (832,976) 1,068,251
I Share Class Accumulation Hedged GBP 23,490 116,304 (38,393) 101,401
I Share Class Dividend 122,641 69,181 (178,354) 13,468
I Share Class Dividend Hedged CHF 461,307 64,194 (464,787) 60,714
I Share Class Dividend Hedged EUR 121,223 37,794 (155,982) 3,035
I Share Class Dividend Hedged GBP 602,046 30,284 (275,778) 356,552
M Share Class Accumulation 613,782 180,981 (370,633) 424,130
M Share Class Accumulation Hedged CHF 49,711 48,290 (17,176) 80,825
M Share Class Accumulation Hedged EUR 74,684 39,477 (32,453) 81,708
M Share Class Accumulation Hedged GBP 10 - - 10
R Share Class Dividend Hedged GBP 1,205 65,817 (12,597) 54,425
Z Share Class Accumulation 17,833 9,190 (17,587) 9,436
* Please refer to note 1. The accompanying notes form an integral part of the financial statements.

AVIVA INVESTORS – ANNUAL REPORT AND AUDITED FINANCIAL STATEMENTS avivainvestors.com 113
STATEMENT OF CHANGES IN SHARES OUTSTANDING (CONTINUED)For the year ended 31 December 2014
Shares at the start of the year
Number of shares issued
Number of shares
redeemed
Shares at the end of the year
Global High Yield Bond Fund (continued)
Z Share Class Accumulation Hedged GBP 81,484 2,237 (42,973) 40,748
Z Share Class Dividend EUR 8,712 - (8,712) -
Z Share Class Dividend Hedged EUR 163,610 51,736 (56,428) 158,918
Japanese Equity Fund
A Share Class Accumulation 1,501,315 - (1,501,315) -
B Share Class Accumulation 6,526,354 - (6,526,354) -
C Share Class Accumulation 60,064 - (60,064) -
I Share Class Accumulation 20,628 - (20,628) -
Z Share Class Accumulation 9,998 - (9,998) -
Long Term European Bond Fund
A Share Class Accumulation 1,725,888 3,656,510 (3,259,832) 2,122,566
B Share Class Accumulation 458,513 221,451 (450,003) 229,961
B Share Class Dividend 411 11,963 (1,499) 10,875
C Share Class Accumulation 171,164 103,513 (274,677) -
Z Share Class Accumulation 19,545 751 (6,824) 13,472
Multi-Strategy Target Return Fund
A Share Class Accumulation - 604 - 604
A Share Class Accumulation USD - 100 (100) -
F Share Class Accumulation Hedged USD - 10 - 10
I Share Class Accumulation - 1,468,227 - 1,468,227
I Share Class Accumulation Hedged GBP - 254,310 (4) 254,306
I Share Class Accumulation Hedged USD - 8,446 (286) 8,160
I Share Class Accumulation USD - 31,410 (2,974) 28,436
J Share Class Accumulation - 1 (1) -
Z Share Class Accumulation - 79,750 (42) 79,708
Short Duration Global High Yield Bond Fund
A Share Class Accumulation - 100 - 100
I Share Class Accumulation 11,690 56,555 (6,951) 61,294
I Share Class Accumulation Hedged CHF - 257,270 (16,607) 240,663
I Share Class Accumulation Hedged GBP 106,946 57,025 (163,971) -
I Share Class Dividend Hedged EUR 785,019 194,014 (686,642) 292,391
I Share Class Accumulation Hedged EUR - 909,239 (248,720) 660,519
Z Share Class Dividend Hedged EUR 224,809 48,611 (43,935) 229,485
Z Share Class Accumulation Hedged GBP 68,796 473 (49,659) 19,610
Short Term European Bond Fund
A Share Class Accumulation 1,831,900 244,405 (301,904) 1,774,401
B Share Class Accumulation 943,577 288,449 (836,179) 395,847
B Share Class Dividend 8,057 8,957 (1,100) 15,914
C Share Class Accumulation 47,040 4,182 (51,222) -
The accompanying notes form an integral part of the financial statements.

AVIVA INVESTORS – ANNUAL REPORT AND AUDITED FINANCIAL STATEMENTS avivainvestors.com 114
Shares at the start of the year
Number of shares issued
Number of shares
redeemed
Shares at the end of the year
UK Opportunities Fund
A Share Class Dividend 46,958 332 (23,565) 23,725
B Share Class Accumulation 4,177,518 1,439,431 (2,570,994) 3,045,955
C Share Class Accumulation 54,791 11,655 (66,446) -
I Share Class Accumulation 15,694 1,859 (3,203) 14,350
R Share Class Dividend 58,404 4,399 (2,782) 60,021
Z Share Class Accumulation 10,685 174 (2,505) 8,354
US Equity Income Fund
A Share Class Accumulation - 2,701,174 (624,042) 2,077,132
B Share Class Accumulation - 3,202,750 (522,060) 2,680,690
I Share Class Accumulation 305,363 182,013 (150,950) 336,426
I Share Class Dividend - 35,410 - 35,410
Z Share Class Accumulation 1 - - 1
STATEMENT OF CHANGES IN SHARES OUTSTANDING (CONTINUED)For the year ended 31 December 2014
The accompanying notes form an integral part of these financial statements.

AVIVA INVESTORS – ANNUAL REPORT AND AUDITED FINANCIAL STATEMENTS avivainvestors.com 115
STATEMENT OF OPERATIONS AND CHANGES IN NET ASSETSFor the year ended 31 December 2014
Aviva Investors -American
Equity Fund* USD
Aviva Investors -Asian EquityIncome Fund
USD
Aviva Investors -Asian High Yield
Bond FundUSD
Aviva Investors -Dynamic Master
FundEUR
Aviva Investors -Emerging Europe
Equity FundEUR
Income
Bank interest - 22 4 - 82
Bond and other interest - - 6,151,011 - -
Net dividend 125,253 4,373,117 - 485,977 1,111,504
Interest on swaps - - - - -
Security lending (note 10) - 1,818 - - 9,096
Other income 15,104 - - 3,381 -
Total Income 140,357 4,374,957 6,151,015 489,358 1,120,682
Expenses
Management fees (note 4) (87,310) (575,218) (12,224) (124,896) (549,804)
Custodian fees (note 5) (7,531) (146,798) (56,929) (48,752) (88,298)
Administration, Domiciliary and Transfer Agency fees (notes 4,6,7)
(11,844) (78,549) (7,094) (47,730) (65,562)
Distribution fees (note 4) (12,657) (38,573) - - (92,108)
Audit and legal fees (165) (9,616) (10,626) (3,609) (2,875)
Performance fee (note 4) - - - - -
Bank and interest charges (245) (3,543) (1,144) (795) (1,451)
Interest on swaps - - - - -
Luxembourg tax (note 9) (3,024) (26,537) (9,350) (17,005) (13,479)
Other professional expenses (6,350) (91,652) (24,025) (9,695) (22,076)
Total Expenses (129,126) (970,486) (121,392) (252,482) (835,653)
Net investment income/(loss) 11,231 3,404,471 6,029,623 236,876 285,029
Net realised gain/(loss) :
- on investment portfolio 37,724,420 3,197,134 (722,166) 1,232,244 886,721
- on forward foreign exchange contracts (32) (83,842) (3,980) 351 12,073
- on futures contracts - - - - -
- on options contracts - - - - -
- on swaps contracts - - - - -
Net changes in unrealised appreciation / depreciation :
- on investment portfolio (42,154,754) (1,058,152) (2,247,910) 1,654,441 (2,773,559)
- on forward foreign exchange contracts - - - - -
- on futures contracts - - - - -
- on options contracts - - - - -
- on swaps contracts - - - - -
Result on operations for the year (4,419,135) 5,459,611 3,055,567 3,123,912 (1,589,736)
Net receipts from subscription of shares - 49,860,519 48,998,666 19,605,784 18,181,407
Net payments from redemption of shares (161,345,229) (88,821,014) (12,695,742) (4,550,809) (23,887,540)
Dividend Distribution (note 11) - (9) - - (152)
Change in Total Net Assets for the year (165,764,364) (33,500,893) 39,358,491 18,178,887 (7,296,021)
Net Assets at the beginning of the year 165,764,364 132,603,842 65,728,508 27,213,446 39,454,211
Foreign exchange valuation movement - - - - -
Total Net Assets - 99,102,949 105,086,999 45,392,333 32,158,190
* Please refer to note 1. The accompanying notes form an integral part of these financial statements.

AVIVA INVESTORS – ANNUAL REPORT AND AUDITED FINANCIAL STATEMENTS avivainvestors.com 116
STATEMENT OF OPERATIONS AND CHANGES IN NET ASSETS (CONTINUED)For the year ended 31 December 2014
Aviva Investors -Emerging Markets
Bond FundUSD
Aviva Investors -Emerging Markets
Corporate BondFundUSD
Aviva Investors -Emerging Markets
Equity Income FundUSD
Aviva Investors -Emerging Markets
Equity SmallCap Fund
USD
Income
Bank interest 13,460 4 3,370 216
Bond and other interest 86,934,085 9,147,487 1,657 -
Net dividend - - 21,125,625 3,462,822
Interest on swaps - - - -
Security lending (note 10) 404,737 - 1,055 1,261
Other income - - - -
Total Income 87,352,282 9,147,491 21,131,707 3,464,299
Expenses
Management fees (note 4) (2,682,741) (13) (1,417,112) (613,892)
Custodian fees (note 5) (616,694) (98,687) (624,194) (220,070)
Administration, Domiciliary and Transfer Agency fees (notes 4,6,7) (524,429) (3,820) (199,823) (85,006)
Distribution fees (note 4) (259,566) - (71,144) (55,117)
Audit and legal fees (145,249) (18,904) (48,516) (11,467)
Performance fee (note 4) - - - -
Bank and interest charges (53,666) (3,071) (18,093) (3,890)
Interest on swaps - - - -
Luxembourg tax (note 9) (206,401) (20,929) (78,010) (22,097)
Other professional expenses (329,709) (45,822) (164,640) (62,453)
Total Expenses (4,818,455) (191,246) (2,621,532) (1,073,992)
Net investment income/(loss) 82,533,827 8,956,245 18,510,175 2,390,307
Net realised gain/(loss) :
- on investment portfolio 6,411,711 (1,927,339) 790,898 6,191,923
- on forward foreign exchange contracts (95,760,134) (19,713,179) 72,878 (55,137)
- on futures contracts - - - -
- on options contracts - - - -
- on swaps contracts - - - -
Net changes in unrealised appreciation / depreciation :
- on investment portfolio (23,945,717) 763,852 (25,410,310) (9,710,229)
- on forward foreign exchange contracts (21,041,834) (4,781,918) - -
- on futures contracts - - - -
- on options contracts - - - -
- on swaps contracts - - - -
Result on operations for the year (51,802,147) (16,702,339) (6,036,359) (1,183,136)
Net receipts from subscription of shares 560,998,463 44,537,512 80,032,507 39,590,388
Net payments from redemption of shares (581,144,318) - (236,399,771) (52,937,954)
Dividend Distribution (note 11) (50,906,851) (8,797,078) (199) (12)
Change in Total Net Assets for the year (122,854,853) 19,038,095 (162,403,822) (14,530,714)
Net Assets at the beginning of the year 1,473,812,417 173,833,680 707,900,849 130,331,512
Foreign exchange valuation movement - - - -
Total Net Assets 1,350,957,564 192,871,775 545,497,027 115,800,798
The accompanying notes form an integral part of these financial statements.

AVIVA INVESTORS – ANNUAL REPORT AND AUDITED FINANCIAL STATEMENTS avivainvestors.com 117
STATEMENT OF OPERATIONS AND CHANGES IN NET ASSETS (CONTINUED)For the year ended 31 December 2014
Aviva Investors -Emerging Markets
Local Currency Bond Fund
EUR
Aviva Investors -EuropeanCorporate
Bond FundEUR
Aviva Investors -European
Equity Fund EUR
Aviva Investors -European Equity
Income FundEUR
Income
Bank interest 37,426 1,693 163 1
Bond and other interest 34,953,514 3,262,143 - -
Net dividend - - 1,868,000 4,676,141
Interest on swaps - 6,699 - -
Security lending (note 10) - - 56,976 107,021
Other income - - - -
Total Income 34,990,940 3,270,535 1,925,139 4,783,163
Expenses
Management fees (note 4) (1,617,588) (487,223) (1,823,119) (510,707)
Custodian fees (note 5) (656,474) (70,420) (95,877) (101,074)
Administration, Domiciliary and Transfer Agency fees (notes 4,6,7) (327,567) (119,792) (238,328) (69,019)
Distribution fees (note 4) (161,611) (36,540) (235,521) (43,959)
Audit and legal fees (56,298) (8,738) (11,129) (14,344)
Performance fee (note 4) - - - -
Bank and interest charges (14,905) (1,574) (9,501) (10,801)
Interest on swaps - (12,743) - -
Luxembourg tax (note 9) (87,612) (25,529) (62,436) (30,609)
Other professional expenses (172,769) (32,495) (72,863) (38,621)
Total Expenses (3,094,824) (795,054) (2,548,774) (819,134)
Net investment income/(loss) 31,896,116 2,475,481 (623,635) 3,964,029
Net realised gain/(loss) :
- on investment portfolio (34,782,950) 3,868,642 16,579,708 18,526,735
- on forward foreign exchange contracts 4,371,807 (1,297,351) 39,540 (3,146)
- on futures contracts - (626,867) - -
- on options contracts - - - -
- on swaps contracts - (142,093) - -
Net changes in unrealised appreciation / depreciation :
- on investment portfolio 43,525,232 2,840,846 (5,974,316) (13,400,714)
- on forward foreign exchange contracts 1,969,115 (234,245) - -
- on futures contracts - (150,572) - -
- on options contracts - - - -
- on swaps contracts (289,253) 19,293 - -
Result on operations for the year 46,690,067 6,753,134 10,021,297 9,086,904
Net receipts from subscription of shares 183,683,528 51,585,563 15,099,156 10,183,352
Net payments from redemption of shares (256,619,650) (44,813,682) (50,970,301) (42,559,599)
Dividend Distribution (note 11) (4,599,328) (46,944) - -
Change in Total Net Assets for the year (30,845,383) 13,478,071 (25,849,848) (23,289,343)
Net Assets at the beginning of the year 632,295,778 78,814,192 151,567,025 188,662,732
Foreign exchange valuation movement - - - -
Total Net Assets 601,450,395 92,292,263 125,717,177 165,373,389
The accompanying notes form an integral part of these financial statements.

AVIVA INVESTORS – ANNUAL REPORT AND AUDITED FINANCIAL STATEMENTS avivainvestors.com 118
STATEMENT OF OPERATIONS AND CHANGES IN NET ASSETS (CONTINUED)For the year ended 31 December 2014
Aviva Investors -European Real
Estate Securities FundEUR
Aviva Investors -Global
AggregateBond Fund
EUR
Aviva Investors -Global Bond
AbsoluteReturn Fund
EUR
Aviva Investors -Global Convertibles
AbsoluteReturn Fund
USD
Income
Bank interest 6,172 1,501 742 19,807
Bond and other interest - 3,712,178 630,776 10,399,240
Net dividend 1,770,719 - - 540,478
Interest on swaps - 8,146 3,333 951,740
Security lending (note 10) 7,061 - - -
Other income - - - -
Total Income 1,783,952 3,721,825 634,851 11,911,265
Expenses
Management fees (note 4) (698,456) (113,200) (64,520) (2,066,589)
Custodian fees (note 5) (54,204) (142,370) (38,834) (337,342)
Administration, Domiciliary and Transfer Agency fees (notes 4,6,7) (98,639) (45,933) (32,427) (375,474)
Distribution fees (note 4) (56,571) (162) - -
Audit and legal fees (4,939) (14,550) (4,201) (46,433)
Performance fee (note 4) - (1,235) (99) (795,939)
Bank and interest charges (4,898) (3,168) (909) (11,606)
Interest on swaps - (37,796) (15,893) (2,546,467)
Luxembourg tax (note 9) (19,583) (14,753) (3,736) (62,171)
Other professional expenses (23,619) (46,398) (9,033) (135,616)
Total Expenses (960,909) (419,565) (169,652) (6,377,637)
Net investment income/(loss) 823,043 3,302,260 465,199 5,533,628
Net realised gain/(loss) :
- on investment portfolio 12,887,246 2,360,226 445,829 16,223,760
- on forward foreign exchange contracts (84,081) 2,331,168 45,922 (19,639,849)
- on futures contracts - (45,862) (748,978) -
- on options contracts - (6,721) (3,817) (3,513,288)
- on swaps contracts - (105,304) (29,530) (1,999,441)
Net changes in unrealised appreciation / depreciation :
- on investment portfolio (873,731) 10,802,987 704,617 (19,992,732)
- on forward foreign exchange contracts - (1,007,976) (188,604) (5,063,962)
- on futures contracts - (146,794) (92,171) -
- on options contracts - (9,086) (9,341) (397,000)
- on swaps contracts - (179,213) (122,340) 1,452,222
Result on operations for the year 12,752,477 17,295,685 466,786 (27,396,662)
Net receipts from subscription of shares 62,104,697 115,226,427 34,350,642 226,866,592
Net payments from redemption of shares (90,657,381) (73,475,830) (17,741,124) (209,398,916)
Dividend Distribution (note 11) (151,896) (167,947) - (94,802)
Change in Total Net Assets for the year (15,952,103) 58,878,335 17,076,304 (10,023,788)
Net Assets at the beginning of the year 71,045,553 102,994,084 24,298,927 416,552,468
Foreign exchange valuation movement - - - -
Total Net Assets 55,093,450 161,872,419 41,375,231 406,528,680
The accompanying notes form an integral part of these financial statements.

AVIVA INVESTORS – ANNUAL REPORT AND AUDITED FINANCIAL STATEMENTS avivainvestors.com 119
STATEMENT OF OPERATIONS AND CHANGES IN NET ASSETS (CONTINUED)For the year ended 31 December 2014
Aviva Investors -Global
Convertibles FundUSD
Aviva Investors -Global Credit
Absolute Return Fund*
EUR
Aviva Investors -Global Emerging
Markets Index FundUSD
Aviva Investors -Global Enhanced
Equity Income Fund*
USD
Income
Bank interest 22,364 415 10,940 189
Bond and other interest 36,676,735 307,515 - -
Net dividend 2,254,948 - 13,388,870 40,153
Interest on swaps - - - -
Security lending (note 10) 1,103,043 - 105 -
Other income - 33,078 - 988
Total Income 40,057,090 341,008 13,399,915 41,330
Expenses
Management fees (note 4) (9,643,889) (1,369) (16,328) -
Custodian fees (note 5) (957,367) (3,520) (593,003) (5,186)Administration, Domiciliary and Transfer Agency fees (notes 4,6,7) (2,084,893) (11,269) (12,514) (320)
Distribution fees (note 4) (232,550) - - -
Audit and legal fees (232,373) (2,327) (49,687) (85)
Performance fee (note 4) - (19,062) - -
Bank and interest charges (147,543) (16,167) (9,719) (1,291)
Interest on swaps - (60,833) - -
Luxembourg tax (note 9) (355,010) - (60,920) (1,102)
Other professional expenses (479,996) (852) (137,665) (1,151)
Total Expenses (14,133,621) (115,399) (879,836) (9,135)
Net investment income/(loss) 25,923,469 225,609 12,520,079 32,195
Net realised gain/(loss) :
- on investment portfolio 76,147,382 1,528,895 (15,016,375) 1,260,445
- on forward foreign exchange contracts (16,043,142) 5,420,088 58,208 1,200,063
- on futures contracts - 505,214 - -
- on options contracts - - - 61,466
- on swaps contracts - (2,758,166) - -
Net changes in unrealised appreciation / depreciation :
- on investment portfolio (127,774,752) (2,781,265) (12,972,436) (3,232,560)
- on forward foreign exchange contracts (23,675,988) (2,602,870) - (1,129,744)
- on futures contracts - (960,688) - -
- on options contracts - - - 23,286
- on swaps contracts - 2,801,671 - -
Result on operations for the year (65,423,031) 1,378,488 (15,410,524) (1,784,849)
Net receipts from subscription of shares 1,000,045,429 - 28,122,043 -
Net payments from redemption of shares (1,797,744,087) (226,573,622) (78,990,343) (57,748,241)
Dividend Distribution (note 11) (5,326,656) - - -
Change in Total Net Assets for the year (868,448,345) (225,195,134) (66,278,824) (59,533,090)
Net Assets at the beginning of the year 2,706,429,891 225,195,134 595,588,020 59,533,090
Foreign exchange valuation movement - - - -
Total Net Assets 1,837,981,546 - 529,309,196 -
* Please refer to note 1. The accompanying notes form an integral part of these financial statements.
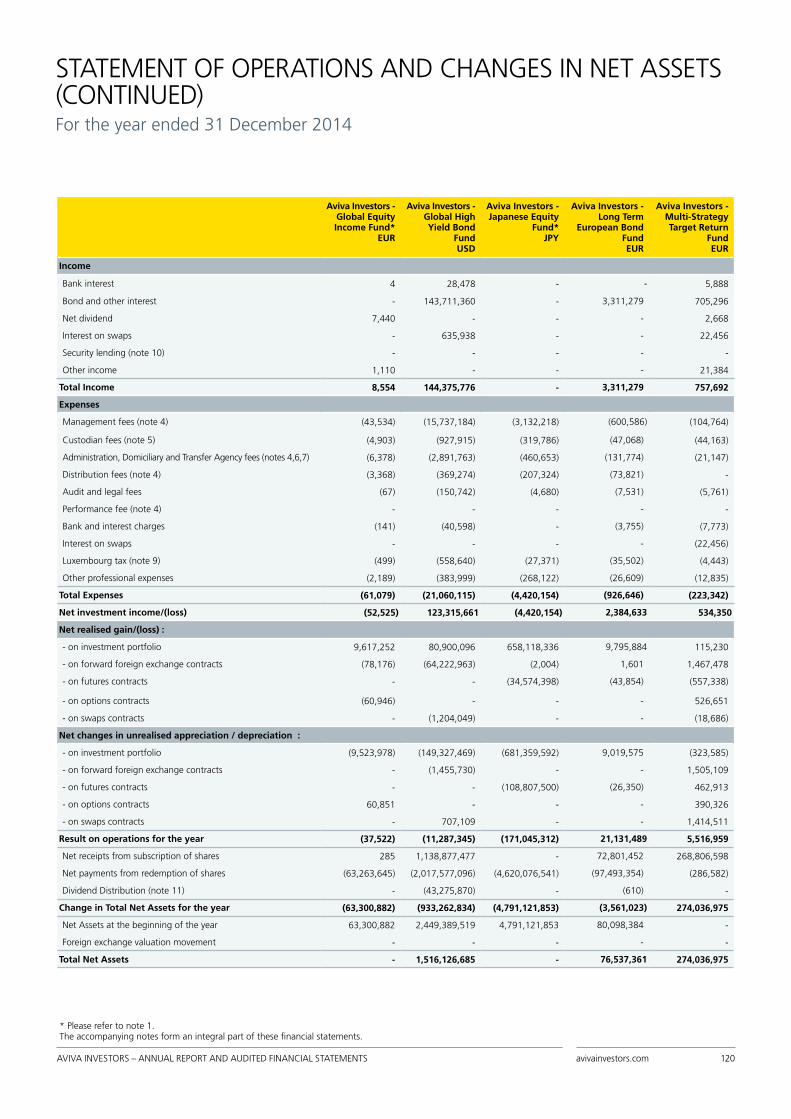
AVIVA INVESTORS – ANNUAL REPORT AND AUDITED FINANCIAL STATEMENTS avivainvestors.com 120
STATEMENT OF OPERATIONS AND CHANGES IN NET ASSETS (CONTINUED)For the year ended 31 December 2014
Aviva Investors -Global EquityIncome Fund*
EUR
Aviva Investors -Global High Yield Bond
FundUSD
Aviva Investors - Japanese Equity
Fund*JPY
Aviva Investors -Long Term
European Bond Fund EUR
Aviva Investors - Multi-Strategy Target Return
FundEUR
Income
Bank interest 4 28,478 - - 5,888
Bond and other interest - 143,711,360 - 3,311,279 705,296
Net dividend 7,440 - - - 2,668
Interest on swaps - 635,938 - - 22,456
Security lending (note 10) - - - - -
Other income 1,110 - - - 21,384
Total Income 8,554 144,375,776 - 3,311,279 757,692
Expenses
Management fees (note 4) (43,534) (15,737,184) (3,132,218) (600,586) (104,764)
Custodian fees (note 5) (4,903) (927,915) (319,786) (47,068) (44,163)
Administration, Domiciliary and Transfer Agency fees (notes 4,6,7) (6,378) (2,891,763) (460,653) (131,774) (21,147)
Distribution fees (note 4) (3,368) (369,274) (207,324) (73,821) -
Audit and legal fees (67) (150,742) (4,680) (7,531) (5,761)
Performance fee (note 4) - - - - -
Bank and interest charges (141) (40,598) - (3,755) (7,773)
Interest on swaps - - - - (22,456)
Luxembourg tax (note 9) (499) (558,640) (27,371) (35,502) (4,443)
Other professional expenses (2,189) (383,999) (268,122) (26,609) (12,835)
Total Expenses (61,079) (21,060,115) (4,420,154) (926,646) (223,342)
Net investment income/(loss) (52,525) 123,315,661 (4,420,154) 2,384,633 534,350
Net realised gain/(loss) :
- on investment portfolio 9,617,252 80,900,096 658,118,336 9,795,884 115,230
- on forward foreign exchange contracts (78,176) (64,222,963) (2,004) 1,601 1,467,478
- on futures contracts - - (34,574,398) (43,854) (557,338)
- on options contracts (60,946) - - - 526,651
- on swaps contracts - (1,204,049) - - (18,686)
Net changes in unrealised appreciation / depreciation :
- on investment portfolio (9,523,978) (149,327,469) (681,359,592) 9,019,575 (323,585)
- on forward foreign exchange contracts - (1,455,730) - - 1,505,109
- on futures contracts - - (108,807,500) (26,350) 462,913
- on options contracts 60,851 - - - 390,326
- on swaps contracts - 707,109 - - 1,414,511
Result on operations for the year (37,522) (11,287,345) (171,045,312) 21,131,489 5,516,959
Net receipts from subscription of shares 285 1,138,877,477 - 72,801,452 268,806,598
Net payments from redemption of shares (63,263,645) (2,017,577,096) (4,620,076,541) (97,493,354) (286,582)
Dividend Distribution (note 11) - (43,275,870) - (610) -
Change in Total Net Assets for the year (63,300,882) (933,262,834) (4,791,121,853) (3,561,023) 274,036,975
Net Assets at the beginning of the year 63,300,882 2,449,389,519 4,791,121,853 80,098,384 -
Foreign exchange valuation movement - - - - -
Total Net Assets - 1,516,126,685 - 76,537,361 274,036,975
* Please refer to note 1. The accompanying notes form an integral part of these financial statements.
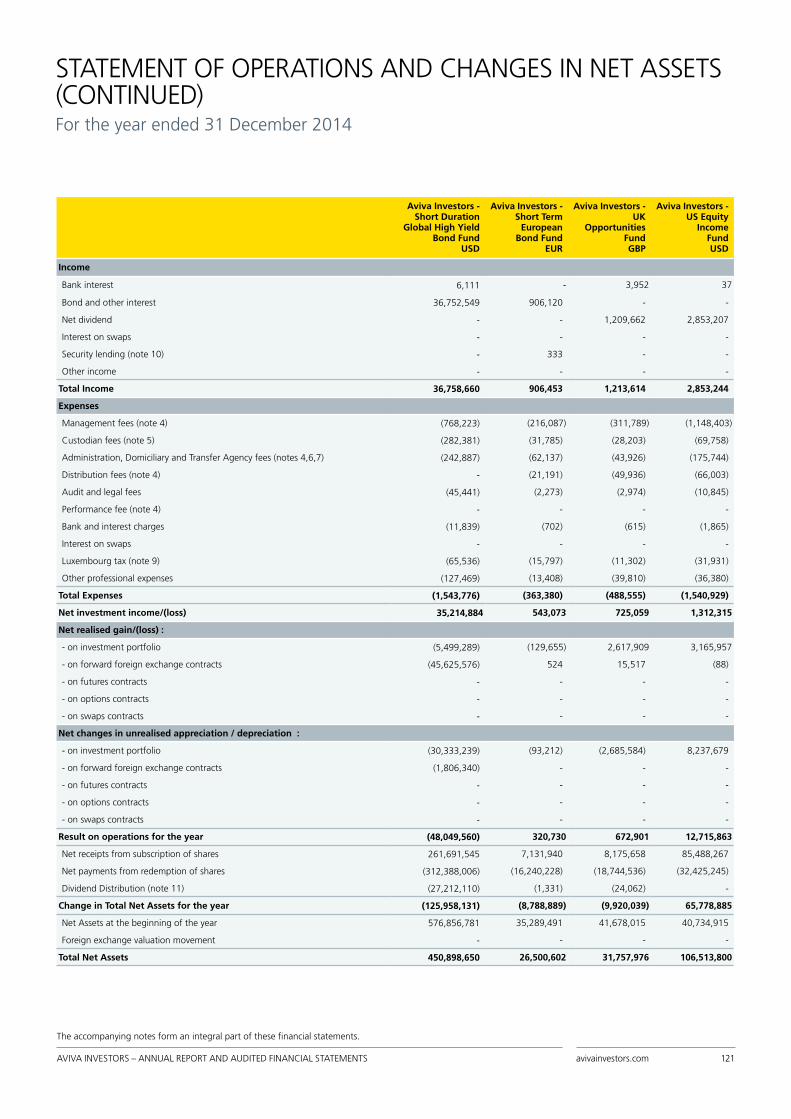
AVIVA INVESTORS – ANNUAL REPORT AND AUDITED FINANCIAL STATEMENTS avivainvestors.com 121
STATEMENT OF OPERATIONS AND CHANGES IN NET ASSETS (CONTINUED)For the year ended 31 December 2014
Aviva Investors -Short Duration
Global High Yield Bond Fund
USD
Aviva Investors -Short Term
EuropeanBond Fund
EUR
Aviva Investors -UK
Opportunities Fund GBP
Aviva Investors -US Equity
Income Fund USD
Income
Bank interest 6,111 - 3,952 37
Bond and other interest 36,752,549 906,120 - -
Net dividend - - 1,209,662 2,853,207
Interest on swaps - - - -
Security lending (note 10) - 333 - -
Other income - - - -
Total Income 36,758,660 906,453 1,213,614 2,853,244
Expenses
Management fees (note 4) (768,223) (216,087) (311,789) (1,148,403)
Custodian fees (note 5) (282,381) (31,785) (28,203) (69,758)
Administration, Domiciliary and Transfer Agency fees (notes 4,6,7) (242,887) (62,137) (43,926) (175,744)
Distribution fees (note 4) - (21,191) (49,936) (66,003)
Audit and legal fees (45,441) (2,273) (2,974) (10,845)
Performance fee (note 4) - - - -
Bank and interest charges (11,839) (702) (615) (1,865)
Interest on swaps - - - -
Luxembourg tax (note 9) (65,536) (15,797) (11,302) (31,931)
Other professional expenses (127,469) (13,408) (39,810) (36,380)
Total Expenses (1,543,776) (363,380) (488,555) (1,540,929)
Net investment income/(loss) 35,214,884 543,073 725,059 1,312,315
Net realised gain/(loss) :
- on investment portfolio (5,499,289) (129,655) 2,617,909 3,165,957
- on forward foreign exchange contracts (45,625,576) 524 15,517 (88)
- on futures contracts - - - -
- on options contracts - - - -
- on swaps contracts - - - -
Net changes in unrealised appreciation / depreciation :
- on investment portfolio (30,333,239) (93,212) (2,685,584) 8,237,679
- on forward foreign exchange contracts (1,806,340) - - -
- on futures contracts - - - -
- on options contracts - - - -
- on swaps contracts - - - -
Result on operations for the year (48,049,560) 320,730 672,901 12,715,863
Net receipts from subscription of shares 261,691,545 7,131,940 8,175,658 85,488,267
Net payments from redemption of shares (312,388,006) (16,240,228) (18,744,536) (32,425,245)
Dividend Distribution (note 11) (27,212,110) (1,331) (24,062) -
Change in Total Net Assets for the year (125,958,131) (8,788,889) (9,920,039) 65,778,885
Net Assets at the beginning of the year 576,856,781 35,289,491 41,678,015 40,734,915
Foreign exchange valuation movement - - - -
Total Net Assets 450,898,650 26,500,602 31,757,976 106,513,800
The accompanying notes form an integral part of these financial statements.

AVIVA INVESTORS – ANNUAL REPORT AND AUDITED FINANCIAL STATEMENTS avivainvestors.com 122
STATEMENT OF OPERATIONS AND CHANGES IN NET ASSETS (CONTINUED)For the year ended 31 December 2014
CombinedEUR
Income
Bank interest 145,958
Bond and other interest 320,329,419
Net dividend 51,286,641
Interest on swaps 1,352,765
Security lending (note 10) 1,430,090
Other income 72,252
Total Income 374,617,125
Expenses
Management fees (note 4) (36,114,048)
Custodian fees (note 5) (5,552,121)
Administration, Domiciliary and Transfer Agency fees (notes 4,6,7) (6,869,846)
Distribution fees (note 4) (1,703,759)
Audit and legal fees (787,258)
Performance fee (note 4) (678,197)
Bank and interest charges (331,971)
Interest on swaps (2,254,239)
Luxembourg tax (note 9) (1,586,776)
Other professional expenses (2,211,758)
Total Expenses (58,089,973)
Net investment income/(loss) 316,527,152
Net realised gain/(loss) :
- on investment portfolio 223,443,993
- on forward foreign exchange contracts (202,476,825)
- on futures contracts (1,755,999)
- on options contracts (2,397,578)
- on swaps contracts (5,701,291)
Net changes in unrealised appreciation / depreciation :
- on investment portfolio (338,295,041)
- on forward foreign exchange contracts (49,283,038)
- on futures contracts (1,663,651)
- on options contracts 123,895
- on swaps contracts 5,429,240
Result on operations for the year (56,049,143)
Net receipts from subscription of shares 3,815,667,884
Net payments from redemption of shares (5,725,973,583)
Dividend Distribution (note 11) (117,076,560)
Change in Total Net Assets for the year (2,083,431,402)
Net Assets at the beginning of the year 8,839,517,569
Foreign exchange valuation movement 979,891,464
Total Net Assets 7,735,977,631
The accompanying notes form an integral part of these financial statements.

AVIVA INVESTORS – ANNUAL REPORT AND AUDITED FINANCIAL STATEMENTS avivainvestors.com 123
NOTES TO THE FINANCIAL STATEMENTS as at 31 December 2014
1. GeneralAviva Investors (the ”Fund”) is a Variable Capital Investment Company (Société d’Investissement à Capital Variable) established in the Grand Duchy of Luxembourg under Part I of the law of 17 December 2010, as amended (UCITS IV). The Fund was incorporated in Luxembourg on 16 January 1990 for an unlimited period.
The Company is structured to provide both institutional and individual investors with a choice of investment portfolios, each offering different investment objectives designed to meet specific risk expectations and diversification requirements.
As at 31 December 2014, the Fund comprises 25 active Sub-Funds. The Fund operates as an open ended investment Fund.
During the year ended 31 December 2014, the following Sub-Funds or Share Classes were launched:
Sub-Fund Name Share Class Class Currency Base Currency Date
Asian Equity Income Fund V USD USD 28 July 2014
Emerging Markets Bond Fund F USD USD 6 August 2014
Emerging Markets Corporate Bond Fund I USD USD 18 March 2014
Emerging Markets Corporate Bond Fund I Hedge EUR USD 18 March 2014
Emerging Markets Equity Small Cap Fund F USD USD 6 August 2014
Emerging Markets Equity Income Fund Iy USD USD 28 July 2014
Emerging Markets Equity Income Fund Zx USD USD 3 April 2014
Emerging Markets Local Currency Bond Fund Ax EUR EUR 21 August 2014
Emerging Europe Equity Fund Z EUR EUR 28 July 2014
Emerging Europe Equity Fund Z GBP EUR 28 July 2014
Emerging Europe Equity Fund Zy GBP EUR 1 October 2014
European Real Estate Securities Fund Zx EUR EUR 14 March 2014
Global Bond Absolute Return Fund Z EUR EUR 31 July 2014
Global Convertibles Absolute Return Fund F USD USD 6 August 2014
Global Convertibles Absolute Return Fund Ix USD USD 29 August 2014
Global Convertibles Absolute Return Fund I Hedge CHF USD 21 March 2014
Global Convertibles Fund Rx USD USD 5 February 2014
Global Convertibles Fund Rx Hedge EUR USD 5 February 2014
Global High Yield Bond Fund F USD USD 6 August 2014
Multi-Strategy Target Return Fund A EUR EUR 1 July 2014
Multi-Strategy Target Return Fund I EUR EUR 1 July 2014
Multi-Strategy Target Return Fund J EUR EUR 8 October 2014
Multi-Strategy Target Return Fund Z EUR EUR 1 July 2014
Multi-Strategy Target Return Fund A USD USD EUR 1 July 2014
Multi-Strategy Target Return Fund I USD USD EUR 1 July 2014
Multi-Strategy Target Return Fund F Hedge USD EUR 6 August 2014
Multi-Strategy Target Return Fund I Hedge USD EUR 31 July 2014
Multi-Strategy Target Return Fund I Hedge GBP EUR 31 July 2014
Short Duration Global High Yield Bond Fund A USD USD 14 August 2014
Short Duration Global High Yield Bond Fund I Hedge EUR USD 24 February 2014
Short Duration Global High Yield Bond Fund I Hedge CHF USD 4 April 2014
US Equity Income Fund A USD USD 10 January 2014
US Equity Income Fund B USD USD 10 January 2014
US Equity Income Fund Ix USD USD 10 January 2014

AVIVA INVESTORS – ANNUAL REPORT AND AUDITED FINANCIAL STATEMENTS avivainvestors.com 124
NOTES TO THE FINANCIAL STATEMENTS (CONTINUED) as at 31 December 2014
Sub-Fund Name Share Class Currency Class Date
Global High Yield Bond Fund Zx EUR 15 January 2014
Global Credit Absolute Return Fund I EUR 24 January 2014
Global Credit Absolute Return Fund Z EUR 24 January 2014
Global Credit Absolute Return Fund I Hedge GBP 24 January 2014
Global Credit Absolute Return Fund Z Hedge GBP 24 January 2014
Global Equity Income Fund A EUR 24 January 2014
Global Equity Income Fund B EUR 24 January 2014
Global Equity Income Fund C EUR 24 January 2014
Global Equity Income Fund I EUR 24 January 2014
Global Enhanced Equity Income Fund Z Hedge GBP 28 January 2014
American Equity Fund A USD 31 January 2014
American Equity Fund B USD 31 January 2014
American Equity Fund C USD 31 January 2014
American Equity Fund I USD 31 January 2014
American Equity Fund Z USD 31 January 2014
Japanese Equity Fund A JPY 31 January 2014
Japanese Equity Fund B JPY 31 January 2014
Japanese Equity Fund C JPY 31 January 2014
Japanese Equity Fund I JPY 31 January 2014
Japanese Equity Fund Z JPY 31 January 2014
European Equity Fund Bx EUR 3 April 2014
Short Duration Global High Yield Bond Fund I Hedge GBP 16 June 2014
Global Bond Absolute Return Fund Z Hedge GBP 2 July 2014
Emerging Markets Local Currency Bond Fund Zx EUR 17 July 2014
Asian Equity Income Fund C USD 1 October 2014
Emerging Markets Bond Fund C USD 1 October 2014
Emerging Markets Equity Income Fund C USD 1 October 2014
Emerging Markets Local Currency Bond Fund C EUR 1 October 2014
Emerging Europe Equity Fund C EUR 1 October 2014
European Corporate Bond Fund C EUR 1 October 2014
European Equity Fund C EUR 1 October 2014
European Real Estate Securities Fund C EUR 1 October 2014
European Equity Income Fund C EUR 1 October 2014
Global Convertibles Fund C USD 1 October 2014
Long Term European Bond Fund C EUR 1 October 2014
Short Term European Bond Fund C EUR 1 October 2014
UK Opportunities Fund C GBP 1 October 2014
Multi-Strategy Target Return Fund A USD USD 9 October 2014
Multi-Strategy Target Return Fund J EUR USD 9 December 2014
1. General (continued) During the year ended 31 December 2014, the following Share Classes were closed:
The following Sub-Funds were fully redeemed as at 31 December 2014: Global Credit Absolute Return Fund on 24 January 2014Global Equity Income Fund on 24 January 2014Global Enhanced Equity Income Fund on 28 January 2014American Equity Fund on 31 January 2014Japanese Equity Fund on 31 January 2014 During the year ended 31 December 2014, the following Sub-Funds changed their name as follows:European Convergence Equity Fund changed its name into Emerging Europe Equity Fund on 10 March 2014UK Equity Focus Fund changed its name into UK Opportunities Fund on 10 March 2014

AVIVA INVESTORS – ANNUAL REPORT AND AUDITED FINANCIAL STATEMENTS avivainvestors.com 125
1. General (continued) Currency A, B, F, I, J, K, M, R, V and Z Share Classes may be available in various currencies (each a “Class Currency”) other than the reference currency of the Sub-Fund. Where offered in a currency other than the reference currency of the relevant Sub-Fund, a Share Class is designated as such.
Dividend PolicyIt is intended that all share classes with an “ X” in the designation will distribute on an annual basis or on a monthly or quarterly basis if determined by the Board. Full details of distributions are disclosed in Note 11.
Payment is made in the currency in which the relevant Share Class is denominated.
Hedged Share ClassesIn accordance with the provisions of the current prospectus, the Fund may offer share classes in a Sub-Fund in a currency other than the Sub-Fund reference currency or in relation to the currencies in which the underlying assets of the Sub-Fund are denominated. The respective Sub-Fund has the ability to hedge such share classes in relation to the Sub-Fund reference currency. Where hedging of this kind is undertaken the latter is designated as such by a reference to “hedged” or (“h”). The Sub-Fund will engage for the exclusive account of such share-classes, in forward foreign exchange contracts, currency futures, currency options or currency swaps, in order to preserve the value of the share class in its reference currency against its value in the Sub-Fund currency or against the currencies in which the underlying assets of the Sub-Funds are denominated.
Where undertaken, the effects of this hedging is reflected in the Net Asset Value and, therefore, in the performance of the currency classes. As a result, currency hedging may impact the Net Asset Value of one class as compared to the Net Asset Value of a class denominated in another currency. Any profit or loss resulting directly from the forward foreign exchange contracts, currency futures, currency options or currency swaps used to create the hedge is borne by the relevant currency class in relation to which they have been incurred.
Swing PricingA Sub-Fund may suffer dilution of the Net Asset Value per Share due to investors buying or selling Shares at a price that does not reflect the dealing and other costs that arise when security trades are undertaken by the Investment Manager to accommodate cash inflows or outflows.
In order to counter this impact, a swing pricing mechanism has been adopted to protect the interests of shareholders of the Fund. On any dealing day, if net inflows or outflows are in excess of the threshold Board of Directors of the Fund, the Net Asset Value per Share would be adjusted upwards or downwards to reflect net inflows and the net outflows respectively. The net inflows and net outflows will be determined by the Board of Directors of the Fund based on the latest available information at the time of calculation of the Net Asset Value per Share.
The swing pricing mechanism may be applied across all Sub-Funds and Share Classes. The extent of the price adjustment will be set by the Management Company, approved by the Board of Directors of the Fund, to reflect dealing and other costs. Such adjustment may vary from Sub-Fund to Sub-Fund and will not exceed 2% of the original Net Asset Value per Share unless exceptional market conditions occur. The NAV per share as disclosed in the statistical information is the published NAV per share whereas the total net assets disclosed in the Statement of Net Assets is the total net asset value excluding any period end swing adjustment.
As at year end, no swing pricing was applied on the NAV per share of Aviva Investors sub-funds.
2. Summary of significant accounting policiesThe financial statements are prepared and presented in accordance with generally accepted accounting principles in Luxembourg for investment funds. The preparation of financial statements requires management to make estimates and assumptions that may affect the amounts reported in the financial statements and the accompanying notes. Actual results may differ from those estimates.
2.1 Foreign currenciesThe financial statements of each Sub-Fund of the Fund are expressed in the currency of the Sub-Fund and its accounting records are maintained in that currency. Assets and liabilities in other currencies are translated into the currency of the Sub-Fund using the exchange rate in effect at the Balance Sheet date. Income and expenses in other currencies are translated into the currency of the Sub-Fund at the exchange rate in effect on the date of the transaction.
The resulting exchange differences are recorded in the Statement of Operations and Changes in Net Assets in the “net realised gain/(loss) on foreign exchange”.
The combined financial statements of the Fund represent the sum of the financial statements of each Sub-Fund. The combined financial statements are presented for information purposes only in Euro and British Pound by translating the financial statements of each Sub-Fund using the exchange rates prevailing at the Balance Sheet date.
NOTES TO THE FINANCIAL STATEMENTS (CONTINUED) as at 31 December 2014

AVIVA INVESTORS – ANNUAL REPORT AND AUDITED FINANCIAL STATEMENTS avivainvestors.com 126
NOTES TO THE FINANCIAL STATEMENTS (CONTINUED) as at 31 December 2014
2. Summary of significant accounting policies (continued) 2.1 Foreign currencies (continued)
The exchange rates used to combine the Sub-Funds as at 31 December 2014 were:
1 EUR = 0.7760 GBP 1 GBP = 1.2886 EUR
1 EUR = 145.0789 JPY 1 GBP = 186.9463 JPY
1 EUR = 1.2100 USD 1 GBP = 1.5592 USD
1 EUR = 1.4786 AUD 1 GBP = 1.9054 AUD
1 EUR = 1.6034 SGD 1 GBP = 2.0662 SGD
1 EUR = 1.4015 CAD 1 GBP = 1.8060 CAD
1 EUR = 1.2024 CHF 1 GBP = 1.5493 CHF
The exchange difference resulting from the translation of net assets at the beginning of the year using the year end rates is recognised in the Statement of Operation and Changes in Net Assets under the caption “Foreign exchange valuation movement”.
2.2 Valuation of assetsThe value of the assets of the Fund is determined as follows:
(1) The value of any cash in hand or on deposit, bills and demand notes and accounts receivable, prepaid expenses, cash dividends and interest declared or accrued as aforesaid and not yet received shall be deemed to be the full amount thereof, unless in any case the same is unlikely to be received in full, in which case the value thereof shall be arrived at after making such discount as the Board of Directors may consider appropriate in such case to reflect the true value thereof;
(2) The value of securities, Money Market Instruments and/or financial derivative instruments which are quoted or dealt in on any stock exchange is based on the last available price provided that where securities, Money Market Instruments and/or financial derivative instruments are quoted on any stock exchange operating on the basis of separate bid and offer prices mid-market valuations may, as the Board may decide, be applied;
(3) Money Market Instruments with an initial or residual maturity of less than 3 months are valued using an amortized cost method if the Board of Directors determines that amortized cost is the closest price to the probable realization value of the instrument. This involves valuing the instrument at its cost and thereafter assuming a constant amortization to maturity of any discount or premium. The Board of Directors ensures, that the value of Money Market Instruments using the amortized cost method does not materially differ from their fair market value.
The accrued interest receivable is recognized as part of “Other assets”.
(4) In the event that any of the securities held in the Fund’s portfolio on the relevant dealing day are not quoted or dealt in on any stock exchange or regulated market or if, with respect to securities quoted or dealt in on any stock exchange or regulated market, the price as determined pursuant to sub-paragraphs (2) or (3) is not representative of the fair market value of the relevant securities, the value of such securities is determined based on the reasonably foreseeable sales price determined prudently and in good faith by or under the Board of Directors supervision.
(5) Shares in open-ended UCIs and/or UCITS are valued on the basis of their last Net Asset Value, as reported by such undertakings.
(6) The financial derivative instruments which are not listed on any official stock exchange or traded on any other regulated market are valued in a reliable and verifiable manner on a daily basis and in accordance with market practice, as further detailed below.
(7) Futures
The Fund on behalf of a Sub-Fund may enter into financial futures contracts as part of its investment strategy. Upon entering into a futures contract, the Fund is required to deposit with a broker an amount (“initial margin”) equal to a certain percentage of the purchase price indicated in the futures contract. Initial margin is included as part of “Cash at bank” in the Statement of Net Assets. Subsequent payments (“variation margin”) are made or received by the Sub-Fund each day, depending on the daily fluctuations in the value of the underlying futures contracts. These subsequent payments are recorded for financial reporting purposes as unrealised result by the Sub-Fund. When entering into a closing transaction, the Sub-Fund will realise, for book purposes, a gain or loss equal to the difference between the values

AVIVA INVESTORS – ANNUAL REPORT AND AUDITED FINANCIAL STATEMENTS avivainvestors.com 127
NOTES TO THE FINANCIAL STATEMENTS (CONTINUED) as at 31 December 2014
of the futures contract to sell and the futures contract to buy. Futures contracts are valued at the last sale price or, in the absence of a sale, the mean between the closing bid and asked quotation or if no bid or asked prices are available, at the last bid price. Certain risks may arise upon entering into futures contracts from the contingency of imperfect market conditions. Please refer to the Portfolio of Investments for the details of the contracts outstanding as at 31 December 2014.
(8) Forward foreign exchange contracts
All Sub-Funds in connection with the portfolio purchases and sales of securities denominated in a foreign currency or share-class hedging, may enter into forward foreign exchange contracts for the purposes of hedging foreign currency exchange risks. Contracts are recorded at market value based on the exchange rate of the underlying currency on the valuation day. Certain risks may arise upon entering into these contracts from the potential inability of counterparties to meet the terms of their contracts. Please refer to the Portfolio of Investments for the details of the contracts outstanding as at 31 December 2014.
(9) Swaps contracts
A swap is an agreement that obliges two parties to exchange a series of cashflows at specified intervals based upon or calculated by reference to changes in specified prices or rates for a specified amount of an underlying asset. The payment flows are usually netted against each other at the brokers’ level, with the difference being paid by one party to the other, if authorised by the dedicated ISDA agreements. Risks may arise as a result of the failure of counterparty to the swap contract to comply with the terms of the swap contract. The loss incurred by the failure of a counterparty is generally limited to the net payment to be received by the Fund, and/or the termination value at the end of the contract. Therefore, the Fund considers the creditworthiness of each counterparty to a swap contract in evaluating potential credit risk. Additionally, risks may arise from unanticipated movements in interest rates or in the value of the underlying securities or indices.
Interest received from and interest paid on swap contracts are, respectively, included as part of “Income – Interest on swaps” and “Expenses – Interest on Swaps” in the Statement of Operations and Changes in Net Assets.
The cashflows received and paid by the Sub-Fund in connection with swap contracts are converted to present value on the valuation date corresponding to the maturity of these cashflows. The value of the swap contracts is the difference between these two present value conversions. Please refer to the Portfolio of Investments for the details of the contracts outstanding as at 31 December 2014.
(10) Options
Options that are not traded on a regulated market or any other regulated market are valued at their liquidation value determined in accordance with the rules set in good faith by the Board of Directors according to standard criteria for each type of contract. Please refer to the Portfolio of Investments for the details of the options contracts outstanding and margin deposits as at 31 December 2014.
(11) Fair value
Events may occur between the determination of an investment’s last available price and the determination of the Fund’s Net Asset Value per Share at the valuation point that may, in the opinion of the Directors, mean that the last available price does not reflect the fair market value of the investment. In such circumstances the price of such investment shall be adjusted in accordance with the procedures adopted from time to time by the Directors in their discretion. The sub-funds with fair valued securities as at year end:
Sub-Fund Name Currency Market value of fair valued securities % Net Assets
Global Convertibles Absolute Return Fund USD 2,364,308 0.59
Global Convertibles Fund USD 4,371,797 0.24
Global Emerging Markets Index Fund USD 0 0
2. Summary of significant accounting policies (continued) 2.2 Valuation of assets (continued)
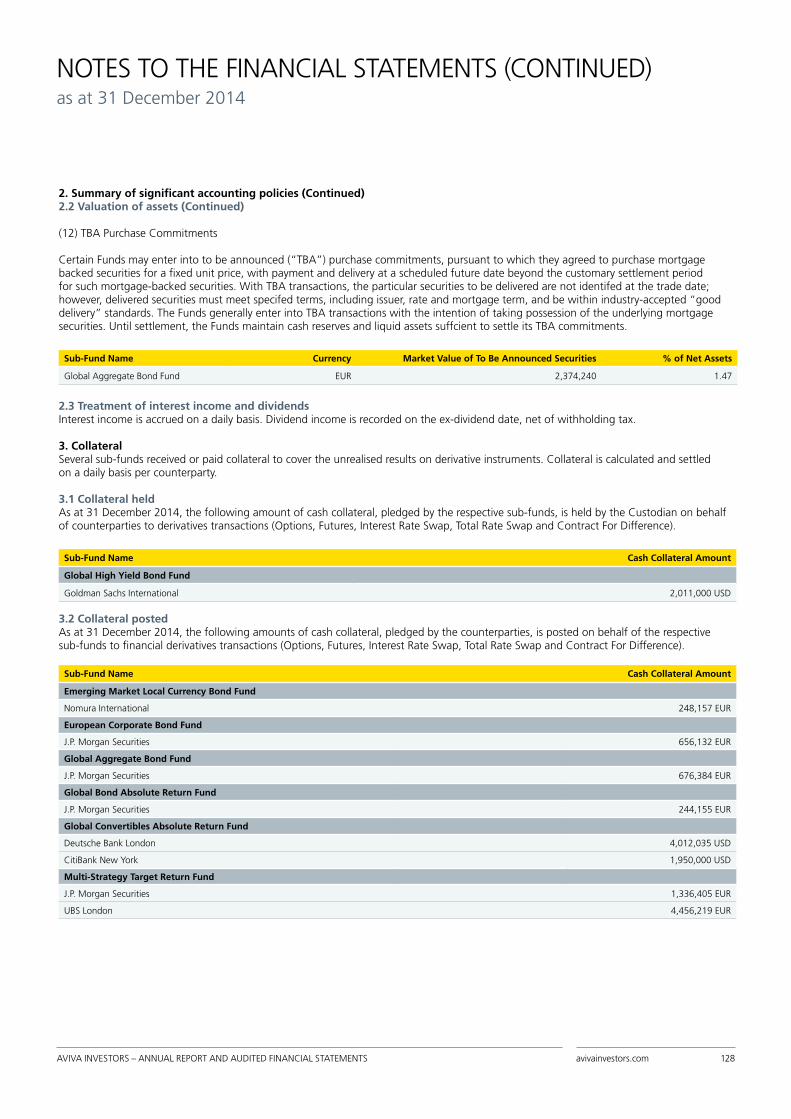
AVIVA INVESTORS – ANNUAL REPORT AND AUDITED FINANCIAL STATEMENTS avivainvestors.com 128
NOTES TO THE FINANCIAL STATEMENTS (CONTINUED) as at 31 December 2014
2. Summary of significant accounting policies (Continued)2.2 Valuation of assets (Continued)
(12) TBA Purchase Commitments
Certain Funds may enter into to be announced (“TBA”) purchase commitments, pursuant to which they agreed to purchase mortgage backed securities for a fixed unit price, with payment and delivery at a scheduled future date beyond the customary settlement period for such mortgage-backed securities. With TBA transactions, the particular securities to be delivered are not identifed at the trade date; however, delivered securities must meet specifed terms, including issuer, rate and mortgage term, and be within industry-accepted “good delivery” standards. The Funds generally enter into TBA transactions with the intention of taking possession of the underlying mortgage securities. Until settlement, the Funds maintain cash reserves and liquid assets suffcient to settle its TBA commitments.
Sub-Fund Name Currency Market Value of To Be Announced Securities % of Net Assets
Global Aggregate Bond Fund EUR 2,374,240 1.47
2.3 Treatment of interest income and dividendsInterest income is accrued on a daily basis. Dividend income is recorded on the ex-dividend date, net of withholding tax.
3. Collateral Several sub-funds received or paid collateral to cover the unrealised results on derivative instruments. Collateral is calculated and settled on a daily basis per counterparty.
3.1 Collateral heldAs at 31 December 2014, the following amount of cash collateral, pledged by the respective sub-funds, is held by the Custodian on behalf of counterparties to derivatives transactions (Options, Futures, Interest Rate Swap, Total Rate Swap and Contract For Difference).
Sub-Fund Name Cash Collateral Amount
Global High Yield Bond Fund
Goldman Sachs International 2,011,000 USD
3.2 Collateral postedAs at 31 December 2014, the following amounts of cash collateral, pledged by the counterparties, is posted on behalf of the respective sub-funds to financial derivatives transactions (Options, Futures, Interest Rate Swap, Total Rate Swap and Contract For Difference).
Sub-Fund Name Cash Collateral Amount
Emerging Market Local Currency Bond Fund
Nomura International 248,157 EUR
European Corporate Bond Fund
J.P. Morgan Securities 656,132 EUR
Global Aggregate Bond Fund
J.P. Morgan Securities 676,384 EUR
Global Bond Absolute Return Fund
J.P. Morgan Securities 244,155 EUR
Global Convertibles Absolute Return Fund
Deutsche Bank London 4,012,035 USD
CitiBank New York 1,950,000 USD
Multi-Strategy Target Return Fund
J.P. Morgan Securities 1,336,405 EUR
UBS London 4,456,219 EUR

AVIVA INVESTORS – ANNUAL REPORT AND AUDITED FINANCIAL STATEMENTS avivainvestors.com 129
NOTES TO THE FINANCIAL STATEMENTS (CONTINUED) as at 31 December 2014
4. Related parties4.1 Domiciliary feesAs remuneration for services as domiciliary agent, the Management Company receives a fixed annual fee from Sub-Funds as per Management Company service agreement. The fees are calculated and accrued each dealing day and are payable monthly in arrears.
4.2 Management Company and Investment Advisor 4.2.1 Management feesThe Management Company receives from the Fund a management fee payable in arrears at the end of each month calculated at the rate detailed below:
Sub-Fund Name A Share Class
B Share Class
C Share Class*
F Share Class
I Share Class
M Share Class
R Share Class
American Equity Fund (closed on 31 January 2014) 1.50% p.a. 1.50% p.a. 1.50% p.a. - 0.75% p.a. - 0.75% p.a.
Asian Equity Income Fund 1.50% p.a. 1.50% p.a. 1.50% p.a. - 0.75% p.a. - 0.75% p.a.
Asian High Yield Bond Fund 1.20% p.a. 1.20% p.a. 1.20% p.a. - 0.60% p.a. - 0.60% p.a.
Dynamic Master Fund - - - 0.35% p.a. - - -
Emerging Europe Equity Fund 1.70% p.a. 1.70% p.a. 1.70% p.a. - 0.85% p.a. - 0.85% p.a.
Emerging Markets Bond Fund 1.20% p.a. 1.20% p.a. 1.20% p.a. - 0.60% p.a. - 0.60% p.a.
Emerging Markets Corporate Bond Fund 1.60% p.a. 1.60% p.a. 1.60% p.a. - 0.80% p.a. - 0.80% p.a.
Emerging Markets Equity Income Fund 1.70% p.a. 1.70% p.a. 1.70% p.a. - 0.85% p.a. - 0.85% p.a.
Emerging Markets Equity Small Cap Fund 1.70% p.a. 1.70% p.a. 1.70% p.a. - 0.85% p.a. - 0.85% p.a.
Emerging Markets Local Currency Bond Fund 1.20% p.a. 1.20% p.a. 1.20% p.a. - 0.60% p.a. - 0.60% p.a.
European Corporate Bond Fund 0.90% p.a. 0.90% p.a. 0.90% p.a. - 0.45% p.a. - 0.45% p.a.
European Equity Fund 1.50% p.a. 1.50% p.a. 1.50% p.a. - 0.75% p.a. - 0.75% p.a.
European Equity Income Fund 1.50% p.a. 1.50% p.a. 1.50% p.a. - 0.75% p.a. - 0.75% p.a.
European Real Estate Securities Fund 1.50% p.a. 1.50% p.a. 1.50% p.a. - 0.75% p.a. - 0.75% p.a.
Global Aggregate Bond Fund 0.70% p.a. 0.70% p.a. 0.70% p.a. - 0.35% p.a. - 0.35% p.a.
Global Bond Absolute Return Fund 0.60% p.a. 0.60% p.a. 0.60% p.a. - 0.30% p.a. - 0.30% p.a.
Global Convertibles Absolute Return Fund 1.50% p.a. 1.50% p.a. 1.50% p.a. - 0.75% p.a. - 0.75% p.a.
Global Convertibles Fund 1.20% p.a. 1.20% p.a. 1.20% p.a. - 0.60% p.a. - 0.60% p.a.
Global Credit Absolute Return Fund (closed on 24 January 2014) 1.00% p.a. 1.00% p.a. 1.00% p.a. - 0.50% p.a. - 0.50% p.a.
Global Emerging Markets Index Fund 0.60% p.a. 0.60% p.a. 0.60% p.a. - 0.30% p.a. - 0.30% p.a.
Global Enhanced Equity Income Fund (closed on 28 January 2014) 1.50% p.a. 1.50% p.a. 1.50% p.a. - 0.75% p.a. - 0.75% p.a.
Global Equity Income Fund (closed on 24 January 2014) 1.50% p.a. 1.50% p.a. 1.50% p.a. - 0.75% p.a. - 0.75% p.a.
Global High Yield Bond Fund 1.20% p.a. 1.20% p.a. 1.20% p.a. - 0.60% p.a. 0.60% p.a. 0.60% p.a.
Japanese Equity Fund (closed on 31 January 2014) 1.50% p.a. 1.50% p.a. 1.50% p.a. - 0.75% p.a. - 0.75% p.a.
Long Term European Bond Fund 0.90% p.a. 0.90% p.a. 0.90% p.a. - 0.45% p.a. - 0.45% p.a.
Multi-Strategy Target Return Fund 1.50% p.a. 1.50% p.a. - 0.75% p.a. - 0.75% p.a.
Short Duration Global High Yield Bond Fund 0.90% p.a. 0.90% p.a. 0.90% p.a. - 0.45% p.a. - 0.45% p.a.
Short Term European Bond Fund 0.70% p.a. 0.70% p.a. 0.70% p.a. - 0.35% p.a. - 0.35% p.a.
UK Opportunities Fund 1.50% p.a. 1.50% p.a. 1.50% p.a. - 0.75% p.a. - 0.75% p.a.
US Equity Income Fund 1.50% p.a. 1.50% p.a. 1.50% p.a. - 0.75% p.a. - 0.75% p.a.
During the year management fees were changed as following:Emerging Markets Corporate Bond Fund fees were increased from 1.20% p.a. to 1.60% p.a. for A, B, C share classes and 0.60% p.a. to 0.80% p.a. for I and R share classes on 11 April 2014.Global Aggregate Bond Fund fees were decreased from 0.90% p.a. to 0.70% p.a. for A, B, C share classes and 0.45% p.a. to 0.35% p.a. for I and R share classes on 14 March 2014.
*All C share classes were transfered to relevant B share classes on 1 October 2014.

AVIVA INVESTORS – ANNUAL REPORT AND AUDITED FINANCIAL STATEMENTS avivainvestors.com 130
NOTES TO THE FINANCIAL STATEMENTS (CONTINUED) as at 31 December 2014
4. Related parties (Continued) 4.2.2 Distribution feeThe Distributor receives from the Fund a distribution fee payable in arrears at the end of each month calculated at the rate detailed below:
Sub-Fund Name B Share Class C Share Class*
American Equity Fund (closed on 31 January 2014) 0.25% p.a. 0.75% p.a.
Asian Equity Income Fund 0.25% p.a. 0.75% p.a.
Asian High Yield Bond Fund 0.25% p.a. 0.75% p.a.
Emerging Europe Equity Fund 0.25% p.a. 0.75% p.a.
Emerging Markets Bond Fund 0.25% p.a. 0.75% p.a.
Emerging Markets Corporate Bond Fund 0.25% p.a. 0.75% p.a.
Emerging Markets Equity Income Fund 0.25% p.a. 0.75% p.a.
Emerging Markets Equity Small Cap Fund 0.25% p.a. 0.75% p.a.
Emerging Markets Local Currency Bond Fund 0.25% p.a. 0.75% p.a.
European Corporate Bond Fund 0.20% p.a. 0.50% p.a.
European Equity Fund 0.25% p.a. 0.75% p.a.
European Equity Income Fund 0.25% p.a. 0.75% p.a.
European Real Estate Securities Fund 0.25% p.a. 0.75% p.a.
Global Aggregate Bond Fund 0.20% p.a. 0.50% p.a.
Global Bond Absolute Return Fund 0.20% p.a. 0.50% p.a.
Global Convertibles Absolute Return Fund 0.25% p.a. 0.75% p.a.
Global Convertibles Fund 0.25% p.a. 0.75% p.a.
Global Credit Absolute Return Fund (closed on 24 January 2014) 0.20% p.a. 0.75% p.a.
Global Emerging Markets Index Fund 0.20% p.a. 0.50% p.a.
Global Enhanced Equity Income Fund (closed on 28 January 2014) 0.25% p.a. 0.75% p.a.
Global Equity Income Fund (closed on 24 January 2014) 0.25% p.a. 0.75% p.a.
Global High Yield Bond Fund 0.25% p.a. 0.75% p.a.
Japanese Equity Fund (closed on 31 January 2014) 0.25% p.a. 0.75% p.a.
Long Term European Bond Fund 0.20% p.a. 0.50% p.a.
Multi-Strategy Target Return Fund 0.25% p.a. -
Short Duration Global High Yield Bond Fund 0.20% p.a. 0.50% p.a.
Short Term European Bond Fund 0.20% p.a. 0.50% p.a.
UK Opportunities Fund 0.25% p.a. 0.75% p.a.
US Equity Income Fund 0.25% p.a. 0.75% p.a.
V and Z share classes are not subject to any Management and Distribution fees. F, J and M Share Classes may be subject to management and distribution fees up to the management and distribution fees applicable to I Share Class. A, I and R share classes are not subject to any Distribution fee.
*All C share classes were transfered to relevant B share classes on 1 October 2014.

AVIVA INVESTORS – ANNUAL REPORT AND AUDITED FINANCIAL STATEMENTS avivainvestors.com 131
NOTES TO THE FINANCIAL STATEMENTS (CONTINUED) as at 31 December 2014
4. Related parties (Continued) 4.2.3 Performance feePursuant to the Investment Management Agreement, the Investment Manager is entitled to receive a performance fee. If a Performance Fee is applicable to a Sub-Fund it is disclosed in Appendix D “Sub-Funds in Issue” of the prospectus for the relevant Sub-Fund. A performance fee is payable in the event of out-performance, that is if the increase in the Net Asset Value of the relevant Sub-Fund during the relevant performance period exceeds the increase in the relevant benchmark of the relevant Sub-Fund over the same period, on an annualised basis.
Unless otherwise stated in Appendix D “Sub-Funds in Issue” of the prospectus, the Company will apply at all times the high watermark principle (the “High Watermark Principle”) when calculating the Performance Fee. The High Watermark Principle establishes a Net Asset Value below which Performance Fees will not be paid. This level is called the High Watermark level and is set at the Net Asset Value at which the last Performance Fee was paid or at the Net Asset Value at which the Share Class was launched if no Performance Fee has ever been paid on that Class.
The benchmark index and performance fee rate used for performance fee calculation purposes on the Sub-Funds are as follows:
Sub-Fund Name Benchmark Performance fee rate %
Global Aggregate Bond Fund Barclays Capital Global Aggregate Index EUR 10%
Global Bond Absolute Return Fund Euro Over Night Index Average 10%
Global Convertibles Absolute Return Fund Net positive return over the previous 3 months 10%
Global Credit Absolute Return Fund (closed on 24 January 2014) Three Month Euribor 20%
5. Custodian fees The Fund and its respective sub-funds pay custodian fees to J.P. Morgan Bank Luxembourg S.A. in respect of its activities as Custodian (including safekeeping, accounting and transaction activities). These fees are to remunerate the Custodian for the safekeeping and transaction costs applicable to each Sub-Fund. The fees will vary in respect of each Sub-Fund depending on the value of the assets held by the Custodian and the volume of trading in that Sub-Fund and should not exceed a maximum of 0.20% per annum.
6. Registrar and Transfer Agent feesThe Fund pays fees to RBC Investor Services Bank S.A. in respect of its activities as Registrar and Transfer Agent (including maintenance, shareholder services, transaction, dividend process, trailer fees and commission handling activities). These fees are payable monthly in arrears.
The Fund pays the Registrar and Transfer Agent a fee and reasonable out-of-pocket expenses, from 0.0003% to 0.069% per annum of the aggregate average daily Net Asset Value per applicable Share Class.
7. Administration feesThe Fund and its respective sub-funds pay the charges and reasonable out-of-pocket expenses of the Management Company acting as administrator and domiciliary agent (the “Administration Fees”).
The Share Classes (except the M, Z, J and V Share Classes) of the Sub-Funds shall be subject to an Administration Fee of a maximum 0.125% per annum of the aggregate average daily Net Asset Value per Share Class.
The fund pays the administrator fees for its services estimated to 0.05% per annum of the average NAV in period. Such fees are payable monthly.
8. Fee waiverThe Dynamic Master Fund, notwithstanding the fees explained above, the Sub-Fund seeks to preserve its Shareholders from fluctuations in its operating and administrative expenses and has agreed with the Management Company that on the fifth anniversary of the launch date the excess of any such expenses incurred above 20 basis points of the Sub-Fund’s aggregate average Net Asset Value per annum annualised over the said five year period will be borne by the Management Company, notwithstanding the fact that the Administration Fees, custodian fees and other expenses in any one year, in the five year period, may exceed 20 basis points of the Sub-Fund’s aggregate average Net Asset Value. As at 31 December 2014 the waivable amount was EUR 53,120, and is included as part of “Other income”.
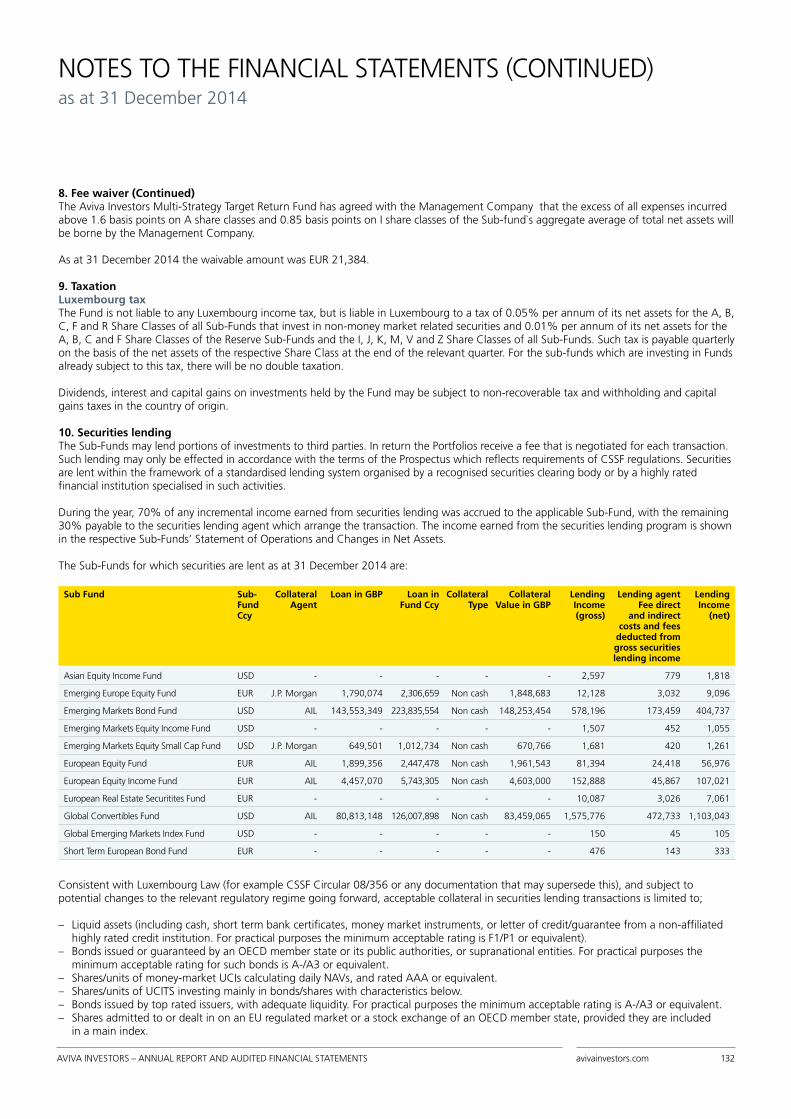
AVIVA INVESTORS – ANNUAL REPORT AND AUDITED FINANCIAL STATEMENTS avivainvestors.com 132
NOTES TO THE FINANCIAL STATEMENTS (CONTINUED) as at 31 December 2014
8. Fee waiver (Continued) The Aviva Investors Multi-Strategy Target Return Fund has agreed with the Management Company that the excess of all expenses incurred above 1.6 basis points on A share classes and 0.85 basis points on I share classes of the Sub-fund`s aggregate average of total net assets will be borne by the Management Company.
As at 31 December 2014 the waivable amount was EUR 21,384.
9. TaxationLuxembourg taxThe Fund is not liable to any Luxembourg income tax, but is liable in Luxembourg to a tax of 0.05% per annum of its net assets for the A, B, C, F and R Share Classes of all Sub-Funds that invest in non-money market related securities and 0.01% per annum of its net assets for the A, B, C and F Share Classes of the Reserve Sub-Funds and the I, J, K, M, V and Z Share Classes of all Sub-Funds. Such tax is payable quarterly on the basis of the net assets of the respective Share Class at the end of the relevant quarter. For the sub-funds which are investing in Funds already subject to this tax, there will be no double taxation.
Dividends, interest and capital gains on investments held by the Fund may be subject to non-recoverable tax and withholding and capital gains taxes in the country of origin.
10. Securities lendingThe Sub-Funds may lend portions of investments to third parties. In return the Portfolios receive a fee that is negotiated for each transaction. Such lending may only be effected in accordance with the terms of the Prospectus which reflects requirements of CSSF regulations. Securities are lent within the framework of a standardised lending system organised by a recognised securities clearing body or by a highly rated financial institution specialised in such activities.
During the year, 70% of any incremental income earned from securities lending was accrued to the applicable Sub-Fund, with the remaining 30% payable to the securities lending agent which arrange the transaction. The income earned from the securities lending program is shown in the respective Sub-Funds’ Statement of Operations and Changes in Net Assets.
The Sub-Funds for which securities are lent as at 31 December 2014 are:
Sub Fund Sub-Fund Ccy
Collateral Agent
Loan in GBP Loan in Fund Ccy
Collateral Type
Collateral Value in GBP
Lending Income (gross)
Lending agent Fee direct
and indirect costs and fees
deducted from gross securities lending income
Lending Income
(net)
Asian Equity Income Fund USD - - - - - 2,597 779 1,818
Emerging Europe Equity Fund EUR J.P. Morgan 1,790,074 2,306,659 Non cash 1,848,683 12,128 3,032 9,096
Emerging Markets Bond Fund USD AIL 143,553,349 223,835,554 Non cash 148,253,454 578,196 173,459 404,737
Emerging Markets Equity Income Fund USD - - - - - 1,507 452 1,055
Emerging Markets Equity Small Cap Fund USD J.P. Morgan 649,501 1,012,734 Non cash 670,766 1,681 420 1,261
European Equity Fund EUR AIL 1,899,356 2,447,478 Non cash 1,961,543 81,394 24,418 56,976
European Equity Income Fund EUR AIL 4,457,070 5,743,305 Non cash 4,603,000 152,888 45,867 107,021
European Real Estate Securitites Fund EUR - - - - - 10,087 3,026 7,061
Global Convertibles Fund USD AIL 80,813,148 126,007,898 Non cash 83,459,065 1,575,776 472,733 1,103,043
Global Emerging Markets Index Fund USD - - - - - 150 45 105
Short Term European Bond Fund EUR - - - - - 476 143 333
Consistent with Luxembourg Law (for example CSSF Circular 08/356 or any documentation that may supersede this), and subject to potential changes to the relevant regulatory regime going forward, acceptable collateral in securities lending transactions is limited to;
– Liquid assets (including cash, short term bank certificates, money market instruments, or letter of credit/guarantee from a non-affiliated highly rated credit institution. For practical purposes the minimum acceptable rating is F1/P1 or equivalent).
– Bonds issued or guaranteed by an OECD member state or its public authorities, or supranational entities. For practical purposes the minimum acceptable rating for such bonds is A-/A3 or equivalent.
– Shares/units of money-market UCIs calculating daily NAVs, and rated AAA or equivalent. – Shares/units of UCITS investing mainly in bonds/shares with characteristics below. – Bonds issued by top rated issuers, with adequate liquidity. For practical purposes the minimum acceptable rating is A-/A3 or equivalent. – Shares admitted to or dealt in on an EU regulated market or a stock exchange of an OECD member state, provided they are included
in a main index.

AVIVA INVESTORS – ANNUAL REPORT AND AUDITED FINANCIAL STATEMENTS avivainvestors.com 133
NOTES TO THE FINANCIAL STATEMENTS (CONTINUED) as at 31 December 2014
10. Securities lending (Continued) Permitted reinvestment of cash collateral is confined to fully collateralised reverse repo transactions or AAA-rated money market funds. Securities received as collateral are subject to a minimum level of over-collateralisation of 102.5% of the underlying securities loan value.
11. Dividends Distribution For classes of Shares entitled to distribution, dividends, if any, will be declared and distributed on a monthly, quarterly and annual basis. As at 31 December 2014, the Board of Directors approved to pay out the following dividends:
Monthly Dividend Distributions
Sub-Fund Name Share Class Class Currency Distribution Rate
Emerging Markets Bond Fund Bx USD 0.052321
Emerging Markets Bond Fund Bx Hedge EUR 0.049170
Emerging Markets Local Currency Bond Fund Bx EUR 0.047500
Emerging Markets Local Currency Bond Fund Bx USD USD 0.051000
Global Aggregate Bond Fund Bx EUR 0.025000
Global Aggregate Bond Fund Bx USD USD 0.025000
Global Convertibles Fund Bx USD 0.016700
Global High Yield Bond Fund Ax USD 0.054160
Global High Yield Bond Fund Ax GBP Hedge GBP 0.078384
Global High Yield Bond Fund Ax SGD Hedge SGD 0.057264
Global High Yield Bond Fund Bx USD 0.053486
Pay date being ex date + 5 business days (the “Pay Date”), ex date being the next business day after the record day (the “Ex-date”) and recorddate being the last business day of the month (the “Record Date”).” As per Board of Directors approval, the following changes in distribution rates were changed in January 2014.Emerging Markets Local Currency Bond Fund - Bx Share Class distribution rate was changed from 0.055843 to 0.0475Emerging Markets Local Currency Bond Fund - Bx USD Share Class distribution rate was changed from 0.059484 to 0.051 Quarterly Dividend Distributions
Sub-Fund Name Share Class Class Currency Distribution Rate Ex-Date Pay Date
Emerging Markets Corporate Bond Fund Zx Hedge EUR 12.721915 1 October 14 15 October 14
Emerging Markets Bond Fund Zx Hedge EUR 15.621856 1 October 14 15 October 14
Global High Yield Bond Fund Zx Hedge EUR 19.238882 1 October 14 15 October 14
Short Duration Global High Yield Bond Fund Zx Hedge EUR 16.648156 1 October 14 15 October 14
Global Convertibles Fund Zx Hedge EUR 4.345558 1 October 14 15 October 14
Emerging Markets Local Currency Bond Fund Zx EUR 13.345555 1 July 14 15 July 14
Emerging Markets Corporate Bond Fund Zx Hedge EUR 11.972695 1 July 14 15 July 14
Emerging Markets Bond Fund Zx Hedge EUR 14.004469 1 July 14 15 July 14
Global High Yield Bond Fund Zx Hedge EUR 18.010626 1 July 14 15 July 14
Short Duration Global High Yield Bond Fund Zx Hedge EUR 16.016417 1 July 14 15 July 14
Global Convertibles Fund Zx Hedge EUR 3.931256 1 July 14 15 July 14
Emerging Markets Local Currency Bond Fund Zx EUR 12.936337 1 April 14 15 April 14
Emerging Markets Corporate Bond Fund Zx Hedge EUR 11.206948 1 April 14 15 April 14
Emerging Markets Bond Fund Zx Hedge EUR 14.335578 1 April 14 15 April 14
Global High Yield Bond Fund Zx Hedge EUR 18.187920 1 April 14 15 April 14
Short Duration Global High Yield Bond Fund Zx Hedge EUR 16.568705 1 April 14 15 April 14
Global Convertibles Fund Zx Hedge EUR 4.733714 1 April 14 15 April 14
Emerging Markets Local Currency Bond Fund Zx EUR 11.365247 2 January 14 16 January 14

AVIVA INVESTORS – ANNUAL REPORT AND AUDITED FINANCIAL STATEMENTS avivainvestors.com 134
NOTES TO THE FINANCIAL STATEMENTS (CONTINUED) as at 31 December 2014
Sub-Fund Name Share Class Class Currency Distribution Rate Ex-Date Pay Date
Global High Yield Bond Fund Zx EUR 17.065154 2 January 14 16 January 14
Emerging Markets Corporate Bond Fund Zx Hedge EUR 11.148048 2 January 14 16 January 14
Emerging Markets Bond Fund Zx Hedge EUR 14.042587 2 January 14 16 January 14
Global High Yield Bond Fund Zx Hedge EUR 18.076842 2 January 14 16 January 14
Short Duration Global High Yield Bond Fund Zx Hedge EUR 15.931414 2 January 14 16 January 14
Global Convertibles Fund Zx Hedge EUR 4.296022 2 January 14 16 January 14 Annual Dividends Distribution
Sub-Fund Name Share Class Class Currency Distribution Rate Ex-Date Pay Date
Asian Equity Income Fund Bx USD 0.051330 2 January 14 16 January 14
Emerging Markets Bond Fund Rx GBP GBP 0.137754 2 January 14 16 January 14
Emerging Markets Equity Income Fund Bx USD 0.038814 2 January 14 16 January 14
Emerging Markets Equity Income Fund Rx GBP GBP 0.027032 2 January 14 16 January 14
Emerging Markets Equity Small Cap Fund Bx USD 0.083460 2 January 14 16 January 14
Emerging Markets Equity Small Cap Fund Rx USD 0.016112 2 January 14 16 January 14
Emerging Markets Equity Small Cap Fund Rx GBP GBP 0.010680 2 January 14 16 January 14
Emerging Markets Local Currency Bond Fund Ix EUR 4.087630 2 January 14 16 January 14
Emerging Markets Local Currency Bond Fund Ix GBP GBP 4.721607 2 January 14 16 January 14
Emerging Markets Local Currency Bond Fund Rx GBP 0.376117 2 January 14 16 January 14
European Convergence Equity Fund Bx EUR 0.038863 2 January 14 16 January 14
European Convergence Equity Fund Rx GBP GBP 0.015630 2 January 14 16 January 14
European Corporate Bond Fund Bx EUR 0.042056 2 January 14 16 January 14
European Real Estate Securities Fund Bx EUR 0.074288 2 January 14 16 January 14
Global Aggregate Bond Fund Ix Hedge AUD 2.950775 2 January 14 16 January 14
Global Convertibles Absolute Return Fund Ix Hedge EUR 1.040271 2 January 14 16 January 14
Global Convertibles Absolute Return Fund Ix Hedge GBP 1.120230 2 January 14 16 January 14
Global Convertibles Fund Ax GBP GBP 0.032916 2 January 14 16 January 14
Global Convertibles Fund Ax Hedge GBP 0.023294 2 January 14 16 January 14
Global Convertibles Fund Ix GBP GBP 1.315149 2 January 14 16 January 14
Global Convertibles Fund Ix Hedge GBP 1.001373 2 January 14 16 January 14
Global Convertibles Fund Rx Hedge GBP 0.068965 2 January 14 16 January 14
Global High Yield Bond Fund Bx Hedge EUR 0.524570 2 January 14 16 January 14
Global High Yield Bond Fund Ix USD 6.529888 2 January 14 16 January 14
Global High Yield Bond Fund Ix Hedge EUR 6.240848 2 January 14 16 January 14
Global High Yield Bond Fund Ix Hedge GBP 6.093725 2 January 14 16 January 14
Global High Yield Bond Fund Ix Hedge CHF 6.256152 2 January 14 16 January 14
Global High Yield Bond Fund Rx Hedge GBP 0.502332 2 January 14 16 January 14
Long Term European Bond Fund Bx EUR 1.483373 2 January 14 16 January 14
Short Duration Global High Yield Bond Fund Ix Hedge EUR 5.862344 2 January 14 16 January 14
Short Term European Bond Fund Bx EUR 0.165218 2 January 14 16 January 14
UK Equity Focus Fund Ax GBP 0.243659 2 January 14 16 January 14
UK Equity Focus Fund Rx GBP 0.216080 2 January 14 16 January 14
11. Dividends Distribution (Continued)

AVIVA INVESTORS – ANNUAL REPORT AND AUDITED FINANCIAL STATEMENTS avivainvestors.com 135
NOTES TO THE FINANCIAL STATEMENTS (CONTINUED) as at 31 December 2014
12. Transaction CostTransaction costs are incremental costs that are directly attributable to the acquisition, issue or disposal of a financial asset or financial liability. An incremental cost is one that would not have been incurred if the entity had not acquired, issued or disposed of the financial asset or liability. Transaction costs include transaction costs paid to custodians and sub-custodians, and identifiable brokerage charges, commissions, transaction related taxes and other market charges. For the year ended 31 December 2014, the Sub-Funds incurred transactions costs as detailed below:
Sub-Fund Name Base Currency Total
American Equity Fund USD 32,957
Asian Equity Income Fund USD 397,301
Asian High Yield Bond Fund USD 8,748
Dynamic Master Fund EUR 31,600
Emerging Europe Equity Fund EUR 33,810
Emerging Markets Bond Fund USD 14,482
Emerging Markets Corporate Bond Fund USD 8,133
Emerging Markets Equity Income Fund USD 1,154,406
Emerging Markets Equity Small Cap Fund USD 181,434
Emerging Markets Local Currency Bond EUR 38,768
European Corporate Bond Fund EUR 4,346
European Equity Fund EUR 236,110
European Equity Income Fund EUR 213,631
European Real Estate Securities Fund EUR 216,982
Global Aggregate Bond Fund EUR 29,468
Sub-Fund Name Base Currency Total
Global Bond Absolute Return Fund EUR 2,366
Global Convertibles Absolute Return Fund USD 6,418
Global Convertibles Fund USD 27,151
Global Credit Absolute Return Fund EUR -
Global Emerging Markets Index Fund USD 248,313
Global Enhanced Equity Income Fund USD 12,067
Global Equity Income Fund EUR 11,450
Global High Yield Bond Fund USD 18,648
Japanese Equity Fund JPY 6,633,975
Long Term European Bond Fund EUR 4,458
Multi-Strategy Target Return Fund EUR 1,398
Short Duration Global High Yield Bond Fund USD 5,392
Short Term European Bond Fund EUR 1,218
UK Opportunities Fund GBP 70,451
US Equity Income Fund USD 76,616

AVIVA INVESTORS – ANNUAL REPORT AND AUDITED FINANCIAL STATEMENTS avivainvestors.com 136
OTHER INFORMATION – UNAUDITEDas at 31 December 2014
1. The VaR & Leverage 1.1 The VaR
As at 31 December 2014, it has been determined to use the Value-at-Risk (VaR) approach for the following sub-funds to calculate global exposure. Please see details in the table below. All other sub-funds calculate global exposure using the commitment approach.
UCITS Sub-fund Method Profile Approach
Internal Limits
Average Actual
2014
High VaR
Low VaR
Av. VaR VaR Benchmark
High
VaR Benchmark
Low
Av. VaR Benchmark
Aviva Investors Global Aggregate Bond Fund
AH Relative VaR bmk*2
400% 231% -0.31% -0.45% -0.34% -0.29% -0.36% -0.31%
Aviva Investors Global Bond Absolute Return Fund
AH Absolute VaR 20%
2500% 277% -0.06% -0.34% -0.11% N/A N/A N/A
Aviva Investors Global Convertibles Absolute Return Fund
CMC Absolute VaR 12%
160% 218% -0.20% -1.07% -0.43% N/A N/A N/A
Aviva Investors Multi-Strategy Target Return Fund
CMC Absolute VaR 20%
700% 213% -0.32% -0.97% -0.62% N/A N/A N/A
The VaR risk model is based on the:
- Monte Carlo (CMC) simulation methodology. This method for calculating VaR contains no standard distribution assumptions and attempts to accurately capture extreme risk events. The approach models every security individually and their derivatives.
- Historical Method (AH): The Historical VaR model does not assume a form for the distribution of the portfolio returns. The VaR number is measured directly as a percentile from the histogram of portfolio parametric returns.
There is a pricing function which supports full re-pricing of bonds and derivatives, covers multiple risk factors and uses 250 days of factor returns.
The calculation of the absolute and relative VaR is carried out in accordance with the following parameters:
(a) one-tailed confdence interval of 99%
(b) holding period equivalent to 1 month (20 business days)
(c) effective observation period (history) of risk factors of at least 1 year (250 business days) unless a shorter observation period is justifed by a signifcant increase in price volatility (for instance extreme market conditions) – in practice AIGSL uses an effective observation period of 250 business days.
(d) quarterly data set updates, or more frequent when market prices are subject to material changes
(e) at least daily calculation
Reference Portfolio for Relative VaR
A benchmark index is used for the calculation of the relative VaR on the 4 sub-funds below:
Emerging Markets Bond Fund J.P. Morgan Global Emerging Markets Bonds Index Emerging Markets Local Currency Bond Fund J.P. Morgan GBI-EM Global Diversified Global Aggregate Bond Fund Barclays Capital Global Aggregate Index EUR hedged European Corporate Bond Fund iBoxx EUR European Corporate Bond Index
In December 2014 method of global exposure calculation was changed from commitment approach to relative VaR for AI Emerging Markets Local Currency Bond Fund.
Leverage Calculation The leverage is the total amount of financial derivatives instruments (“FDI”) commitments out of Sub Fund Total Net Assets. It is here calculated under sum of notional method which consists in leverage calculation without any netting arrangement.

AVIVA INVESTORS – ANNUAL REPORT AND AUDITED FINANCIAL STATEMENTS avivainvestors.com 137
INFORMATION FOR INVESTORS IN SWITZERLAND (UNAUDITED)as at 31 December 2014
2. Total Expenses Ratio (TER)
Sub-Fund name Share Class ISIN Total Expenses Total ExpenseRatio
Performance feein % of total NAV
Aviva Investors - American Equity Fund
American Equity Fund A - USD (closed on 31 January 2014) LU0274939809 29,269.37 1.86 0.00
American Equity Fund B - USD (closed on 31 January 2014) LU0010019148 74,968.53 2.00 0.00
American Equity Fund C - USD (closed on 31 January 2014) LU0144884995 10,514.95 2.31 0.00
American Equity Fund I - USD (closed on 31 January 2014) LU0160787866 864.76 0.95 0.00
American Equity Fund Z - USD (closed on 31 January 2014) LU0560706565 0.00 0.00 0.00
Aviva Investors - Asian Equity Income Fund
Asian Equity Income Fund A - USD LU0274939718 468,005.41 1.95 0.00
Asian Equity Income Fund B - USD LU0010019817 256,387.60 2.20 0.00
Asian Equity Income Fund Bx - USD LU0206564840 49.58 2.51 0.00
Asian Equity Income Fund C - USD (closed on 01 October 2014) LU0144885026 33,917.99 2.62 0.00
Asian Equity Income Fund I - USD LU0160787940 33,276.92 1.06 0.00
Asian Equity Income Fund V - USD LU1088029019 6,012.78 0.29 0.00
Asian Equity Income Fund Z - USD LU0560706995 171,319.63 0.23 0.00
Aviva Investors - Asian High Yield Bond Fund
Asian High Yield Bond Fund A - USD LU0939950159 7,415.31 1.49 0.00
Asian High Yield Bond Fund I - USD LU0939950316 9,215.53 0.83 0.00
Asian High Yield Bond Fund Z - USD LU0939950589 104,762.37 0.12 0.00
Aviva Investors - Emerging Europe Equity Fund
Emerging Europe Equity Fund A - EUR LU0274937183 184,388.41 2.29 0.00
Emerging Europe Equity Fund B - EUR LU0083327972 432,051.05 2.56 0.00
Emerging Europe Equity Fund Bx - EUR LU0206567355 388.31 2.54 0.00
Emerging Europe Equity Fund C - EUR (closed on 01 October 2014) LU0144885968 196,965.64 2.97 0.00
Emerging Europe Equity Fund I - EUR LU0160773130 17,419.17 1.33 0.00
Emerging Europe Equity Fund Rx - GBP LU0965944456 15.25 1.25 0.00
Emerging Europe Equity Fund Z - EUR LU1088028045 1.48 0.36 0.00
Emerging Europe Equity Fund Z - GBP LU1088028128 805.68 0.22 0.00
Emerging Europe Equity Fund Zy - GBP LU1114366575 3,087.25 0.66 0.00
Aviva Investors - Emerging Markets Bond Fund
Emerging Markets Bond Fund A - USD LU0274939478 270,001.33 1.52 0.00
Emerging Markets Bond Fund B - USD LU0180621863 462,622.23 1.76 0.00
Emerging Markets Bond Fund Bx - USD LU0206569211 1,291,664.57 1.77 0.00
Emerging Markets Bond Fund C - USD (closed on 01 October 2014) LU0180621434 33,292.28 2.26 0.00
Emerging Markets Bond Fund F - USD LU1088028557 0.14 0.03 0.00
Emerging Markets Bond Fund HEDGED CLASS A USD - EUR LU0401379044 93,778.40 1.52 0.00
Emerging Markets Bond Fund HEDGED CLASS Bx USD - EUR LU0726752743 1,029.11 1.76 0.00
Emerging Markets Bond Fund HEDGED CLASS I USD - CHF LU0923982770 82,921.03 0.81 0.00
Emerging Markets Bond Fund HEDGED CLASS I USD - EUR LU0401379127 168,429.73 0.81 0.00
Emerging Markets Bond Fund HEDGED CLASS I USD - GBP LU0981924250 167,565.22 0.84 0.00
Emerging Markets Bond Fund HEDGED CLASS Z USD - EUR LU0656943528 21,479.98 0.08 0.00
Emerging Markets Bond Fund HEDGED CLASS Zx USD - EUR LU0725747298 701,000.69 0.08 0.00
Emerging Markets Bond Fund HEDGED CLASS Z USD - GBP LU0532757456 197,900.05 0.08 0.00
Emerging Markets Bond Fund I - USD LU0180621947 1,203,090.95 0.81 0.00

AVIVA INVESTORS – ANNUAL REPORT AND AUDITED FINANCIAL STATEMENTS avivainvestors.com 138
Sub-Fund name Share Class ISIN Total Expenses Total ExpenseRatio
Performance feein % of total NAV
Aviva Investors - Emerging Markets Bond Fund (continued)
Emerging Markets Bond Fund Rx - GBP LU0965944886 15.93 0.95 0.00
Emerging Markets Bond Fund V - USD LU0631496246 104,713.43 0.08 0.00
Emerging Markets Bond Fund V - EUR LU0613544419 2,292.20 0.08 0.00
Emerging Markets Bond Fund Z - USD LU0560707613 582.91 0.08 0.00
Aviva Investors - Emerging Markets Equity Income Fund
Emerging Markets Equity Income Fund A - USD LU0274940138 375,697.43 2.10 0.00
Emerging Markets Equity Income Fund B - EUR LU0280564351 251,853.24 2.34 0.00
Emerging Markets Equity Income Fund B - USD LU0047882062 315,777.03 2.34 0.00
Emerging Markets Equity Income Fund Bx - USD LU0206567199 117.03 2.26 0.00
Emerging Markets Equity Income Fund C - USD (closed on 01 October 2014) LU0144885539 38,971.66 2.82 0.00
Emerging Markets Equity Income Fund I - USD LU0160791975 872,947.15 1.11 0.00
Emerging Markets Equity Income Fund Iy - USD LU1088029282 31,100.25 1.52 0.00
Emerging Markets Equity Income Fund Rx - GBP LU0965944704 20.19 1.28 0.00
Emerging Markets Equity Income Fund Z - USD LU0560707704 726,580.68 0.16 0.00
Emerging Markets Equity Income Fund Zx - USD LU1048560632 1.13 0.16 0.00
Aviva Investors - Emerging Markets Equity Small Cap Fund
Emerging Markets Equity Small Cap Fund A - USD LU0300873303 12,323.71 2.17 0.00
Emerging Markets Equity Small Cap Fund B - EUR LU0280563387 314,104.33 2.41 0.00
Emerging Markets Equity Small Cap Fund B - USD LU0300873642 219,619.07 2.42 0.00
Emerging Markets Equity Small Cap Fund Bx - USD LU0300873725 24.45 2.33 0.00
Emerging Markets Equity Small Cap Fund F - USD LU1088028631 1.21 0.31 0.00
Emerging Markets Equity Small Cap Fund I - USD LU0300874459 334,121.93 1.22 0.00
Emerging Markets Equity Small Cap Fund Rx - USD LU0965944530 11.34 1.05 0.00
Emerging Markets Equity Small Cap Fund Rx - GBP LU0965944613 572.89 1.30 0.00
Emerging Markets Equity Small Cap Fund Z - USD LU0560707456 191,513.30 0.23 0.00
Aviva Investors - Emerging Markets Local Currency Bond Fund
Emerging Markets Local Currency Bond Fund A - EUR LU0273494806 186,737.11 1.58 0.00
Emerging Markets Local Currency Bond Fund Ax - EUR LU1099408798 4.60 1.26 0.00
Emerging Markets Local Currency Bond Fund B - EUR LU0273496686 65,999.33 1.88 0.00
Emerging Markets Local Currency Bond Fund B - USD LU0490651758 39,438.78 1.87 0.00
Emerging Markets Local Currency Bond Fund Bx - EUR LU0274935138 130,636.39 1.84 0.00
Emerging Markets Local Currency Bond Fund Bx - USD LU0459039664 557,142.65 1.83 0.00
Emerging Markets Local Currency Bond Fund C - EUR (closed on 17 July 2014) LU0273497221 167,373.79 2.33 0.00
Emerging Markets Local Currency Bond Fund I - EUR LU0273498039 1,086,469.67 0.88 0.00
Emerging Markets Local Currency Bond Fund I - USD LU0401379556 14,453.54 0.88 0.00
Emerging Markets Local Currency Bond Fund Ix - EUR LU0861996451 90,366.42 0.90 0.00
Emerging Markets Local Currency Bond Fund Ix - GBP LU0280564948 106,123.02 0.87 0.00
Emerging Markets Local Currency Bond Fund Rx - GBP LU0880135222 9.29 0.86 0.00
Emerging Markets Local Currency Bond Fund Z - EUR LU0560707969 630,324.15 0.15 0.00
Emerging Markets Local Currency Bond Fund Zx - EUR (closed on 17 July 2014) LU0725747371 15,104.09 0.16 0.00
INFORMATION FOR INVESTORS IN SWITZERLAND (UNAUDITED) (CONTINUED)as at 31 December 2014
2. Total Expense Ratio (TER) (Continued)

AVIVA INVESTORS – ANNUAL REPORT AND AUDITED FINANCIAL STATEMENTS avivainvestors.com 139
Sub-Fund name Share Class ISIN Total Expenses Total ExpenseRatio
Performance feein % of total NAV
Aviva Investors - European Corporate Bond Fund
European Corporate Bond Fund A - EUR LU0274933786 323,035.65 1.26 0.00
European Corporate Bond Fund B - EUR LU0137992961 121,164.52 1.47 0.00
European Corporate Bond Fund Bx - EUR LU0010020823 48,601.10 1.49 0.00
European Corporate Bond Fund C - EUR (closed on 01 October 2014) LU0160767082 47,514.32 1.75 0.00
European Corporate Bond Fund I - EUR LU0160771357 210,358.92 0.71 0.00
European Corporate Bond Fund Z - EUR LU0560708850 31,537.17 0.13 0.00
Aviva Investors - European Equity Fund
European Equity Fund A - EUR LU0274934750 591,027.16 1.88 0.00
European Equity Fund B - EUR LU0010019577 1,866,464.89 2.14 0.00
European Equity Fund Bx - EUR (closed on 03 April 2014) LU0206565144 1,146.13 2.03 0.00
European Equity Fund C - EUR (closed on 01 October 2014) LU0144886263 56,556.82 2.59 0.00
European Equity Fund I - EUR LU0160772918 5,717.47 1.06 0.00
European Equity Fund Z - EUR LU0560709072 25,390.54 0.15 0.00
Aviva Investors - European Equity Income Fund
European Equity Income Fund A - EUR LU0274935054 390,795.91 1.83 0.00
European Equity Income Fund B - EUR LU0157818666 206,530.80 2.09 0.00
European Equity Income Fund C - EUR (closed on 01 October 2014) LU0157819557 66,461.47 2.58 0.00
European Equity Income Fund I - EUR LU0160781745 7,185.96 1.04 0.00
European Equity Income Fund Z - EUR LU0560709155 145,038.34 0.10 0.00
Aviva Investors - European Real Estate Securities Fund
European Real Estate Securities Fund A - EUR LU0274935567 407,796.58 1.86 0.00
European Real Estate Securities Fund B - EUR LU0160768213 247,286.06 2.13 0.00
European Real Estate Securities Fund Bx - EUR LU0162920101 77,725.88 2.12 0.00
European Real Estate Securities Fund C - EUR (closed on 01 October 2014) LU0160767249 63,996.28 2.59 0.00
European Real Estate Securities Fund I - EUR LU0160782800 144,682.14 1.01 0.00
European Real Estate Securities Fund Zx - EUR LU1040397157 15,700.02 0.14 0.00
Aviva Investors - Global Aggregate Bond Fund
Global Aggregate Bond Fund B - EUR LU0428042740 401.62 1.28 0.00
Global Aggregate Bond Fund B - USD LU0562506468 133.56 1.42 0.00
Global Aggregate Bond Fund Bx - EUR LU0432678927 156.31 1.32 0.00
Global Aggregate Bond Fund Bx - USD LU0562507193 365.34 1.32 0.00
Global Aggregate Bond Fund I - EUR LU0395743221 12,467.68 0.67 0.07
Global Aggregate Bond Fund Z - EUR LU0560709585 51,412.70 0.16 0.00
Global Aggregate Bond Fund HEDGED CLASS I EUR - GBP LU0432679149 150,307.87 0.68 0.00
Global Aggregate Bond Fund HEDGED CLASS Z EUR - GBP LU0553627182 117,284.19 0.16 0.00
Global Aggregate Bond Fund HEDGED CLASS Ix EUR - AUD LU0439828699 46,928.71 0.67 0.00
Aviva Investors - Global Bond Absolute Return Fund
Global Bond Absolute Return Fund I - USD LU0747473295 131,851.20 0.61 0.00
Global Bond Absolute Return Fund Z - EUR LU0747473451 7,595.41 0.16 0.00
Global Bond Absolute Return Fund HEDGED CLASS GBP - EUR (closed on 02 July 2014) LU0818740184 13,419.93 0.21 0.00
INFORMATION FOR INVESTORS IN SWITZERLAND (UNAUDITED) (CONTINUED)as at 31 December 2014
2. Total Expense Ratio (TER) (Continued)

AVIVA INVESTORS – ANNUAL REPORT AND AUDITED FINANCIAL STATEMENTS avivainvestors.com 140
INFORMATION FOR INVESTORS IN SWITZERLAND (UNAUDITED) (CONTINUED)as at 31 December 2014
Sub-Fund name Share Class ISIN Total Expenses Total ExpenseRatio
Performance feein % of total NAV
Aviva Investors - Global Convertibles Absolute Return Fund
Global Convertibles Absolute Return Fund F - USD LU1088028987 0.31 0.07 0.00
Global Convertibles Absolute Return Fund I - USD LU0459997697 1,186,076.33 1.00 0.32
Global Convertibles Absolute Return Fund Ix - USD LU0459997770 327.52 1.07 0.00
Global Convertibles Absolute Return Fund Z - USD LU0560710161 63,836.38 0.12 0.00
Global Convertibles Absolute Return Fund HEDGED CLASS A USD - EUR LU0459998232 309,340.80 1.86 0.14
Global Convertibles Absolute Return Fund HEDGED CLASS I USD - CHF LU0630373545 58,263.29 1.00 0.10
Global Convertibles Absolute Return Fund HEDGED CLASS I USD - EUR LU0459998588 1,028,669.58 0.99 0.34
Global Convertibles Absolute Return Fund HEDGED CLASS Ix USD - EUR LU0643905549 17,393.07 0.99 0.13
Global Convertibles Absolute Return Fund HEDGED CLASS Ix USD - GBP LU0459999123 145,400.98 1.02 0.30
Global Convertibles Absolute Return Fund HEDGED CLASS Z USD - GBP LU0560709825 222,803.24 0.12 0.00
Aviva Investors - Global Convertibles Fund
Global Convertibles Fund Ax - GBP LU0280567370 12,570.98 1.51 0.00
Global Convertibles Fund A - USD LU0274938744 1,100,750.56 1.52 0.00
Global Convertibles Fund B - USD LU0144879052 1,143,163.11 1.77 0.00
Global Convertibles Fund Bx - USD LU0401378400 55,422.70 1.73 0.00
Global Convertibles Fund C - USD (closed on 01 October 2014) LU0144879219 81,671.21 2.26 0.00
Global Convertibles Fund I - EUR LU0280568188 269,850.92 0.83 0.00
Global Convertibles Fund I - GBP LU0837066355 1,409,227.46 0.83 0.00
Global Convertibles Fund I - USD LU0160787601 3,820,033.53 0.80 0.00
Global Convertibles Fund Ix - GBP LU0280568428 54,245.58 0.83 0.00
Global Convertibles Fund Rx - USD LU1011493662 4,830.53 0.86 0.00
Global Convertibles Fund Z - USD LU0675046311 586,847.30 0.08 0.00
Global Convertibles Fund HEDGED CLASS A USD - CHF LU0401378319 19,342.84 1.50 0.00
Global Convertibles Fund HEDGED CLASS I USD - CHF LU0401378822 74,852.66 0.80 0.00
Global Convertibles Fund HEDGED CLASS I USD - EUR LU0280568261 2,282,627.84 0.81 0.00
Global Convertibles Fund HEDGED CLASS Z USD - EUR LU0560710591 4,000.14 0.08 0.00
Global Convertibles Fund HEDGED CLASS Zx USD - EUR LU0905156674 145,270.92 0.08 0.00
Global Convertibles Fund HEDGED CLASS A USD - EUR LU0280566992 504,459.61 1.52 0.00
Global Convertibles Fund HEDGED CLASS B USD - EUR LU0280567701 254,312.15 1.76 0.00
Global Convertibles Fund HEDGED CLASS Ax USD - GBP LU0367993077 80,429.57 1.51 0.00
Global Convertibles Fund HEDGED CLASS Ix USD - GBP LU0367993150 1,964,482.79 0.81 0.00
Global Convertibles Fund HEDGED CLASS Rx USD - EUR LU1011494041 7.51 0.60 0.00
Global Convertibles Fund HEDGED CLASS Rx USD - GBP LU0880135149 5,647.66 0.87 0.00
Global Convertibles Fund HEDGED CLASS Z USD - GBP LU0560710757 196,987.89 0.08 0.00
Aviva Investors - Global Credit Absolute Return Fund
Global Credit Absolute Return Fund I - EUR (closed on 24 January 2014) LU0580118940 11.11 0.84 0.33
Global Credit Absolute Return Fund HEDGED CLASS I EUR - GBP (closed on 24 January 2014)
LU0864198824 2,339.27 0.83 0.35
Global Credit Absolute Return Fund Z - EUR (closed on 24 January 2014) LU0580119914 798.06 0.21 0.00
Global Credit Absolute Return Fund HEDGED CLASS Z EUR - GBP (closed on 24 January 2014)
LU0580120250 31,231.17 0.21 0.00
2. Total Expense Ratio (TER) (Continued)

AVIVA INVESTORS – ANNUAL REPORT AND AUDITED FINANCIAL STATEMENTS avivainvestors.com 141
INFORMATION FOR INVESTORS IN SWITZERLAND (UNAUDITED) (CONTINUED)as at 31 December 2014
Sub-Fund name Share Class ISIN Total Expenses Total ExpenseRatio
Performance feein % of total NAV
Aviva Investors - Global Emerging Markets Index Fund
Global Emerging Markets Index Fund I - USD LU0514066991 32,264.66 0.57 0.00
Global Emerging Markets Index Fund Z - USD LU0537606781 846,923.53 0.15 0.00
Aviva Investors - Global Enhanced Equity Income Fund
Global Enhanced Equity Income Fund HEDGED CLASS Z USD - GBP (closed on 28 January 2014)
LU0939951041 1,115.35 0.03 0.00
Aviva Investors - Global Equity Income Fund
Global Equity Income Fund A - EUR (closed on 24 January 2014) LU0367991881 21,699.71 2.09 0.00
Global Equity Income Fund B - EUR (closed on 24 January 2014) LU0428042823 25,836.42 2.06 0.00
Global Equity Income Fund C - EUR (closed on 24 January 2014) LU0785707844 789.82 2.63 0.00
Global Equity Income Fund I - EUR (closed on 24 January 2014) LU0367992269 11,501.40 1.15 0.00
Aviva Investors - Global High Yield Bond Fund
Global High Yield Bond Fund A - USD LU0367993317 4,195,489.36 1.51 0.00
Global High Yield Bond Fund Ax - USD LU0752094010 1,577,364.17 1.53 0.00
Global High Yield Bond Fund B - USD LU0562505734 561,331.96 1.76 0.00
Global High Yield Bond Fund Bx - USD LU0562505817 1,924,702.99 1.77 0.00
Global High Yield Bond Fund F - USD LU1088029100 0.19 0.04 0.00
Global High Yield Bond Fund I - USD LU0367993663 3,666,294.64 0.83 0.00
Global High Yield Bond Fund Ix - USD LU0650814238 90,634.74 0.8 0.00
Global High Yield Bond Fund M - USD LU0938923728 322,415.32 0.57 0.00
Global High Yield Bond Fund Z - USD LU0616814850 6,765.30 0.06 0.00
Global High Yield Bond Fund Zx - EUR (closed on 15 January 2014) LU0727606112 383.74 0.08 0.00
Global High Yield Bond Fund HEDGED CLASS A USD - SGD LU0520002626 231,491.59 1.52 0.00
Global High Yield Bond Fund HEDGED CLASS Ax USD - SGD LU0520002972 548,455.09 1.52 0.00
Global High Yield Bond Fund HEDGED CLASS Ax USD - GBP LU0397833129 269,614.86 1.51 0.00
Global High Yield Bond Fund HEDGED CLASS A USD - CHF LU0693856568 967,116.73 1.51 0.00
Global High Yield Bond Fund HEDGED CLASS Ah USD - EUR LU0367993408 2,338,184.18 1.52 0.00
Global High Yield Bond Fund HEDGED CLASS I USD - CAD LU0497137546 335,021.92 0.84 0.00
Global High Yield Bond Fund HEDGED CLASS I USD - GBP LU0766450869 52,842.00 0.84 0.00
Global High Yield Bond Fund HEDGED CLASS Ix USD - CHF LU0649528386 251,852.30 0.79 0.00
Global High Yield Bond Fund HEDGED CLASS Ix USD - EUR LU0650813693 113,569.34 0.81 0.00
Global High Yield Bond Fund HEDGED CLASS Ix USD - GBP LU0397835769 719,537.14 0.83 0.00
Global High Yield Bond Fund HEDGED CLASS Ih USD - EUR LU0367993747 2,403,825.70 0.81 0.00
Global High Yield Bond Fund HEDGED CLASS M USD - CHF LU0938924023 34,865.53 0.55 0.00
Global High Yield Bond Fund HEDGED CLASS B USD - EUR LU0432679735 7,264.09 1.76 0.00
Global High Yield Bond Fund HEDGED CLASS Bx USD - EUR LU0641126270 116,023.84 1.76 0.00
Global High Yield Bond Fund HEDGED CLASS M USD - EUR LU0938923561 55,498.78 0.56 0.00
Global High Yield Bond Fund HEDGED CLASS M USD - GBP LU0864203509 9.11 0.49 0.00
Global High Yield Bond Fund HEDGED CLASS Rx USD - GBP LU0880134928 1,589.92 0.89 0.00
Global High Yield Bond Fund HEDGED CLASS Zx USD - EUR LU0725747025 173,452.62 0.08 0.00
Global High Yield Bond Fund HEDGED CLASS Z USD - GBP LU0553627935 94,040.57 0.08 0.00
Aviva Investors - Japanese Equity Fund
Japanese Equity Fund A - JPY (closed on 31 January 2014) LU0274940484 2,662,240.03 1.92 0.00
Japanese Equity Fund B - JPY (closed on 31 January 2014) LU0010019734 1,046,188.80 1.99 0.00
2. Total Expense Ratio (TER) (Continued)

AVIVA INVESTORS – ANNUAL REPORT AND AUDITED FINANCIAL STATEMENTS avivainvestors.com 142
Sub-Fund name Share Class ISIN Total Expenses Total ExpenseRatio
Performance feein % of total NAV
Aviva Investors - Japanese Equity Fund (continued)
Japanese Equity Fund C - JPY (closed on 31 January 2014) LU0144890968 269,562.89 2.52 0.00
Japanese Equity Fund I - JPY (closed on 31 January 2014) LU0160793161 149,173.16 1.10 0.00
Japanese Equity Fund Z - JPY (closed on 31 January 2014) LU0560711052 212,342.14 0.15 0.00
Aviva Investors - Long Term European Bond Fund
Long Term European Bond Fund A - EUR LU0274933604 416,908.85 1.23 0.00
Long Term European Bond Fund B - EUR LU0044652708 437,752.92 1.43 0.00
Long Term European Bond Fund Bx - EUR LU0044654233 2,655.75 1.45 0.00
Long Term European Bond Fund C - EUR (closed on 01 October 2014) LU0160769534 44,062.54 1.74 0.00
Long Term European Bond Fund Z - EUR LU0560711219 23,040.24 0.10 0.00
Aviva Investors - Multi-Strategy Target Return Fund
Multi-Strategy Target Return Fund A - EUR LU1074209328 50.42 1.63 0.00
Multi-Strategy Target Return Fund A - USD (closed on 09 October 2014) LU1074209591 3.23 1.54 0.00
Multi-Strategy Target Return Fund HEDGED CLASS F USD - EUR LU1082045599 0.71 0.20 0.00
Multi-Strategy Target Return Fund I - EUR LU1074209757 83,633.38 1.01 0.00
Multi-Strategy Target Return Fund HEDGED CLASS I GBP - EUR LU1084540324 30,066.08 0.92 0.00
Multi-Strategy Target Return Fund I - USD LU1074209831 2,893.69 0.89 0.00
Multi-Strategy Target Return Fund HEDGED CLASS I USD - EUR LU1074210094 2,083.55 0.83 0.00
Multi-Strategy Target Return Fund J - EUR (closed on 09 December 2014) LU1117823853 1.89 1.06 0.00
Multi-Strategy Target Return Fund Z - EUR LU1074210177 53,254.41 0.17 0.00
Aviva Investors - Short Duration Global High Yield Bond Fund
Short Duration Global High Yield Bond Fund A - USD LU1088029878 3.27 0.86 0.00
Short Duration Global High Yield Bond Fund I - USD LU0747473022 19,952.03 0.71 0.00
Short Duration Global High Yield Bond Fund HEDGED CLASS I USD - CHF LU1044012950 133,178.30 0.68 0.00
Short Duration Global High Yield Bond Fund HEDGED CLASS I USD - EUR LU1028903703 332,936.38 0.69 0.00
Short Duration Global High Yield Bond Fund HEDGED CLASS I USD - GBP (closed on 16 June 2014)
LU0864199129 46,170.68 0.60 0.00
Short Duration Global High Yield Bond Fund HEDGED CLASS Z USD - GBP LU0790111180 69,265.74 0.09 0.00
Short Duration Global High Yield Bond Fund HEDGED CLASS Ix USD - EUR LU0756178793 638,170.73 0.67 0.00
Short Duration Global High Yield Bond Fund HEDGED CLASS ZX USD- EUR LU0747472990 302,635.58 0.09 0.00
Aviva Investors - Short Term European Bond Fund
Short Term European Bond Fund A - EUR LU0274938660 232,872.17 1.11 0.00
Short Term European Bond Fund B - EUR LU0089594716 122,158.09 1.29 0.00
Short Term European Bond Fund Bx - EUR LU0089594807 1,413.02 1.33 0.00
Short Term European Bond Fund C - EUR (closed on 01 October 2014) LU0160766431 6,784.22 1.57 0.00
Aviva Investors - UK Opportunities Fund
UK Opportunities Fund Ax - GBP LU0274937936 8,441.02 1.93 0.00
UK Opportunities Fund B - GBP LU0010020310 385,600.10 2.20 0.00
UK Opportunities Fund C - GBP (closed on 01 October 2014) LU0144892311 21,686.12 2.62 0.00
UK Opportunities Fund I - GBP LU0160960752 37,760.51 1.11 0.00
UK Opportunities Fund Rx - GBP LU0880135065 7,707.30 1.15 0.00
UK Opportunities Fund Z - GBP LU0560712530 27,322.96 0.22 0.00
INFORMATION FOR INVESTORS IN SWITZERLAND (UNAUDITED) (CONTINUED)as at 31 December 2014
2. Total Expense Ratio (TER) (Continued)

AVIVA INVESTORS – ANNUAL REPORT AND AUDITED FINANCIAL STATEMENTS avivainvestors.com 143
Sub-Fund name Share Class ISIN Total Expenses Total ExpenseRatio
Performance feein % of total NAV
Aviva Investors - US Equity Income Fund
US Equity Income Fund A - USD LU0837066439 419,104.01 1.84 0.00
US Equity Income Fund B - USD LU1005247751 558,882.82 2.10 0.00
US Equity Income Fund I - USD LU0837066512 530,312.01 1.02 0.00
US Equity Income Fund Ix - USD LU0957618282 32,628.75 1.03 0.00
US Equity Income Fund Z - USD LU0905151360 1.61 0.13 0.00
3. Portfolio Turnover Ratio (PTR)
Portfolio Turnover in %
Aviva Investors – American Equity Fund (closed on 31 January 2014) 62.09%
Aviva Investors – Asian Equity Income Fund -9.51%
Aviva Investors – Asian High Yield Bond Fund 208.89%
Aviva Investors – Emerging Europe Equity Fund -89.36%
Aviva Investors – Emerging Markets Bond Fund 149.45%
Aviva Investors – Emerging Markets Equity Income Fund 16.97%
Aviva Investors – Emerging Markets Equity Small Cap Fund -24.69%
Aviva Investors – Emerging Markets Local Currency Bond Fund 104.48%
Aviva Investors – European Corporate Bond Fund 201.35%
Aviva Investors – European Equity Fund 52.07%
Aviva Investors – European Equity Income Fund 42.13%
Aviva Investors – European Real Estate Securities Fund -38.94%
Aviva Investors – Global Aggregate Bond Fund 488.02%
Aviva Investors – Global Convertibles Absolute Return Fund 93.08%
Aviva Investors – Global Convertibles Fund 135.57%
Aviva Investors – Global Credit Absolute Return Fund (closed on 24 January 2014) 81.41%
Aviva Investors – Global Emerging Markets Index Fund 0.28%
Aviva Investors – Global Enhanced Equity Income Fund (closed on 28 January 2014) 87.62%
Aviva Investors – Global Equity Income Fund (closed on 24 January 2014) -52.37%
Aviva Investors – Global High Yield Bond Fund 31.35%
Aviva Investors – Japanese Equity (closed on 31 January 2014) -3.48%
Aviva Investors – Long Term European Bond Fund 10.20%
Aviva Investors – Multi-Strategy Target Return Fund -295.80%
Aviva Investors – Short Duration Global High Yield Bond Fund 3.60%
Aviva Investors – Short Term European Bond Fund 52.57%
Aviva Investors – UK Opportunities Fund -7.38%
Aviva Investors – US Equity Income Fund 38.07%
PTR was calculated in accordance with the applicable SFAMA guidelines.
INFORMATION FOR INVESTORS IN SWITZERLAND (UNAUDITED) (CONTINUED)as at 31 December 2014
2. Total Expense Ratio (TER) (Continued)
Aviva Investors - TER was calculated in accordance with the applicable SFAMA guidelines.
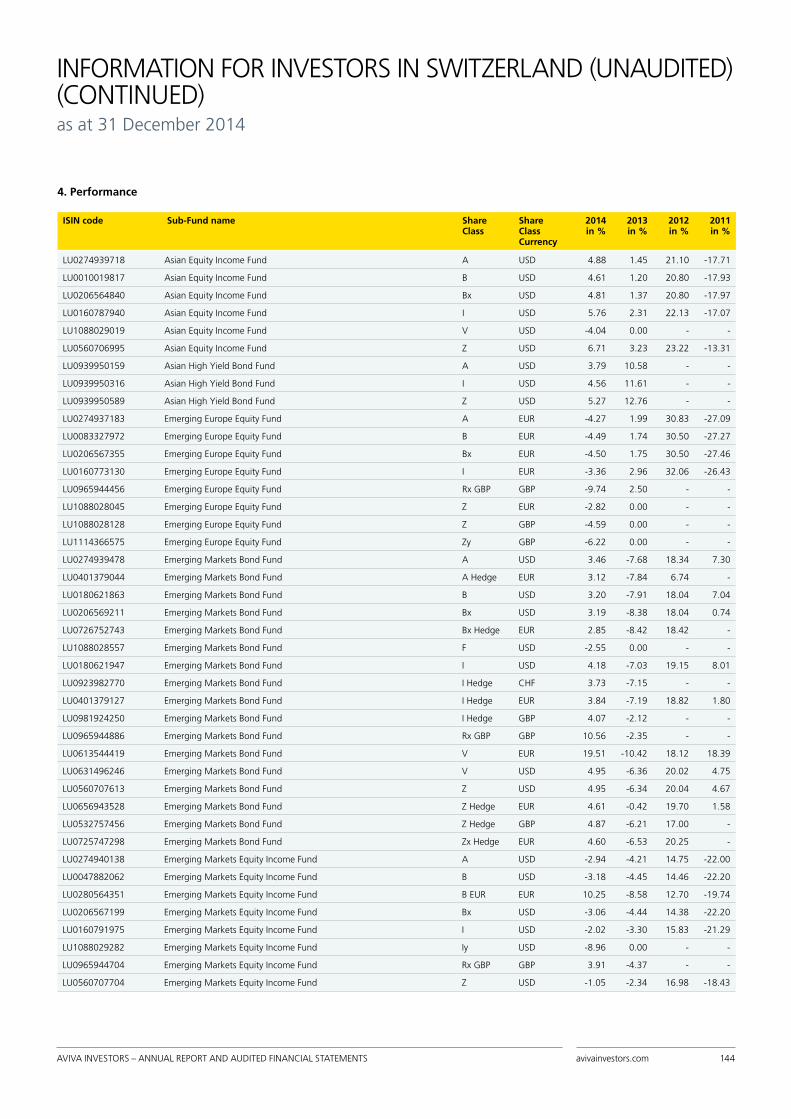
AVIVA INVESTORS – ANNUAL REPORT AND AUDITED FINANCIAL STATEMENTS avivainvestors.com 144
4. Performance
ISIN code Sub-Fund name Share Class
Share Class Currency
2014 in %
2013 in %
2012 in %
2011 in %
LU0274939718 Asian Equity Income Fund A USD 4.88 1.45 21.10 -17.71
LU0010019817 Asian Equity Income Fund B USD 4.61 1.20 20.80 -17.93
LU0206564840 Asian Equity Income Fund Bx USD 4.81 1.37 20.80 -17.97
LU0160787940 Asian Equity Income Fund I USD 5.76 2.31 22.13 -17.07
LU1088029019 Asian Equity Income Fund V USD -4.04 0.00 - -
LU0560706995 Asian Equity Income Fund Z USD 6.71 3.23 23.22 -13.31
LU0939950159 Asian High Yield Bond Fund A USD 3.79 10.58 - -
LU0939950316 Asian High Yield Bond Fund I USD 4.56 11.61 - -
LU0939950589 Asian High Yield Bond Fund Z USD 5.27 12.76 - -
LU0274937183 Emerging Europe Equity Fund A EUR -4.27 1.99 30.83 -27.09
LU0083327972 Emerging Europe Equity Fund B EUR -4.49 1.74 30.50 -27.27
LU0206567355 Emerging Europe Equity Fund Bx EUR -4.50 1.75 30.50 -27.46
LU0160773130 Emerging Europe Equity Fund I EUR -3.36 2.96 32.06 -26.43
LU0965944456 Emerging Europe Equity Fund Rx GBP GBP -9.74 2.50 - -
LU1088028045 Emerging Europe Equity Fund Z EUR -2.82 0.00 - -
LU1088028128 Emerging Europe Equity Fund Z GBP -4.59 0.00 - -
LU1114366575 Emerging Europe Equity Fund Zy GBP -6.22 0.00 - -
LU0274939478 Emerging Markets Bond Fund A USD 3.46 -7.68 18.34 7.30
LU0401379044 Emerging Markets Bond Fund A Hedge EUR 3.12 -7.84 6.74 -
LU0180621863 Emerging Markets Bond Fund B USD 3.20 -7.91 18.04 7.04
LU0206569211 Emerging Markets Bond Fund Bx USD 3.19 -8.38 18.04 0.74
LU0726752743 Emerging Markets Bond Fund Bx Hedge EUR 2.85 -8.42 18.42 -
LU1088028557 Emerging Markets Bond Fund F USD -2.55 0.00 - -
LU0180621947 Emerging Markets Bond Fund I USD 4.18 -7.03 19.15 8.01
LU0923982770 Emerging Markets Bond Fund I Hedge CHF 3.73 -7.15 - -
LU0401379127 Emerging Markets Bond Fund I Hedge EUR 3.84 -7.19 18.82 1.80
LU0981924250 Emerging Markets Bond Fund I Hedge GBP 4.07 -2.12 - -
LU0965944886 Emerging Markets Bond Fund Rx GBP GBP 10.56 -2.35 - -
LU0613544419 Emerging Markets Bond Fund V EUR 19.51 -10.42 18.12 18.39
LU0631496246 Emerging Markets Bond Fund V USD 4.95 -6.36 20.02 4.75
LU0560707613 Emerging Markets Bond Fund Z USD 4.95 -6.34 20.04 4.67
LU0656943528 Emerging Markets Bond Fund Z Hedge EUR 4.61 -0.42 19.70 1.58
LU0532757456 Emerging Markets Bond Fund Z Hedge GBP 4.87 -6.21 17.00 -
LU0725747298 Emerging Markets Bond Fund Zx Hedge EUR 4.60 -6.53 20.25 -
LU0274940138 Emerging Markets Equity Income Fund A USD -2.94 -4.21 14.75 -22.00
LU0047882062 Emerging Markets Equity Income Fund B USD -3.18 -4.45 14.46 -22.20
LU0280564351 Emerging Markets Equity Income Fund B EUR EUR 10.25 -8.58 12.70 -19.74
LU0206567199 Emerging Markets Equity Income Fund Bx USD -3.06 -4.44 14.38 -22.20
LU0160791975 Emerging Markets Equity Income Fund I USD -2.02 -3.30 15.83 -21.29
LU1088029282 Emerging Markets Equity Income Fund Iy USD -8.96 0.00 - -
LU0965944704 Emerging Markets Equity Income Fund Rx GBP GBP 3.91 -4.37 - -
LU0560707704 Emerging Markets Equity Income Fund Z USD -1.05 -2.34 16.98 -18.43
INFORMATION FOR INVESTORS IN SWITZERLAND (UNAUDITED) (CONTINUED)as at 31 December 2014

AVIVA INVESTORS – ANNUAL REPORT AND AUDITED FINANCIAL STATEMENTS avivainvestors.com 145
ISIN code Sub-Fund name Share Class
Share Class Currency
2014 in %
2013 in %
2012 in %
2011 in %
LU1048560632 Emerging Markets Equity Income Fund Zx USD -1.44 0.00 - -
LU0300873303 Emerging Markets Equity Small Cap Fund A USD -2.85 9.83 19.78 -24.67
LU0300873642 Emerging Markets Equity Small Cap Fund B USD -3.09 9.55 19.49 -24.86
LU0280563387 Emerging Markets Equity Small Cap Fund B EUR EUR 10.35 4.81 17.65 -22.48
LU0300873725 Emerging Markets Equity Small Cap Fund Bx USD -2.98 9.73 19.52 -24.85
LU1088028631 Emerging Markets Equity Small Cap Fund F USD -5.59 0.00 - -
LU0300874459 Emerging Markets Equity Small Cap Fund I USD -1.93 10.86 20.92 -24.00
LU0965944530 Emerging Markets Equity Small Cap Fund Rx USD -1.79 5.01 - -
LU0965944613 Emerging Markets Equity Small Cap Fund Rx GBP GBP 4.10 0.49 - -
LU0560707456 Emerging Markets Equity Small Cap Fund Z USD -0.95 11.97 22.12 -20.56
LU0273494806 Emerging Markets Local Currency Bond Fund A EUR 6.66 -11.60 12.23 -0.59
LU1099408798 Emerging Markets Local Currency Bond Fund Ax EUR -1.58 0.00 - -
LU0273496686 Emerging Markets Local Currency Bond Fund B EUR 6.39 -11.82 11.95 -0.78
LU0490651758 Emerging Markets Local Currency Bond Fund B USD USD -6.57 -7.83 13.70 -3.89
LU0274935138 Emerging Markets Local Currency Bond Fund Bx EUR 6.39 -12.44 11.95 -7.80
LU0459039664 Emerging Markets Local Currency Bond Fund Bx USD USD -6.56 -8.47 13.70 -10.50
LU0273498039 Emerging Markets Local Currency Bond Fund I EUR 7.40 -10.98 13.01 0.05
LU0401379556 Emerging Markets Local Currency Bond Fund I USD USD -5.68 -7.51 - -
LU0861996451 Emerging Markets Local Currency Bond Fund Ix EUR 7.40 -11.16 -0.31 -
LU0280564948 Emerging Markets Local Currency Bond Fund Ix GBP GBP 0.19 -8.70 9.73 -6.61
LU0880135222 Emerging Markets Local Currency Bond Fund Rx GBP 0.22 -11.80 - -
LU0560707969 Emerging Markets Local Currency Bond Fund Z EUR 8.20 -10.32 13.85 2.66
LU0274933786 European Corporate Bond Fund A EUR 7.37 2.37 14.27 0.18
LU0137992961 European Corporate Bond Fund B EUR 7.15 2.17 14.04 -0.02
LU0010020823 European Corporate Bond Fund Bx EUR 7.15 2.17 14.03 -3.44
LU0160771357 European Corporate Bond Fund I EUR 7.95 2.93 14.88 0.67
LU0560708850 European Corporate Bond Fund Z EUR 8.59 3.54 15.56 -1.07
LU0274934750 European Equity Fund A EUR 7.81 22.05 23.45 -15.43
LU0010019577 European Equity Fund B EUR 7.55 21.74 23.14 -15.63
LU0160772918 European Equity Fund I EUR 8.73 23.08 24.49 -14.76
LU0560709072 European Equity Fund Z EUR 9.70 24.18 25.60 -11.90
LU0274935054 European Equity Income Fund A EUR 3.83 24.15 14.64 -9.56
LU0157818666 European Equity Income Fund B EUR 3.57 23.84 14.35 -9.83
LU0160781745 European Equity Income Fund I EUR 4.71 25.20 15.61 -8.89
LU0560709155 European Equity Income Fund Z EUR 5.64 26.32 16.64 -6.54
LU0274935567 European Real Estate Securities Fund A EUR 21.96 10.54 23.98 -11.12
LU0160768213 European Real Estate Securities Fund B EUR 21.64 10.27 23.68 -11.34
LU0162920101 European Real Estate Securities Fund Bx EUR 0.00 10.27 23.68 -11.59
LU0160782800 European Real Estate Securities Fund I EUR 22.98 11.49 25.03 -10.41
LU1040397157 European Real Estate Securities Fund Zx EUR 19.21 0.00 - -
LU0428042740 Global Aggregate Bond Fund B EUR 7.21 -1.46 4.13 4.48
INFORMATION FOR INVESTORS IN SWITZERLAND (UNAUDITED) (CONTINUED)as at 31 December 2014
4. Performance (Continued)

AVIVA INVESTORS – ANNUAL REPORT AND AUDITED FINANCIAL STATEMENTS avivainvestors.com 146
ISIN code Sub-Fund name Share Class
Share Class Currency
2014 in %
2013 in %
2012 in %
2011 in %
LU0562506468 Global Aggregate Bond Fund B USD USD -5.91 2.97 2.21 -
LU0432678927 Global Aggregate Bond Fund Bx EUR 7.23 -1.55 4.21 4.63
LU0562507193 Global Aggregate Bond Fund Bx USD USD -5.84 2.76 3.36 -
LU0395743221 Global Aggregate Bond Fund I EUR 7.95 -0.69 5.02 5.39
LU0432679149 Global Aggregate Bond Fund I Hedge GBP 8.21 -0.26 0.61 -
LU0439828699 Global Aggregate Bond Fund Ix Hedge AUD 10.80 -0.33 9.05 5.61
LU0560709585 Global Aggregate Bond Fund Z EUR 8.46 -0.11 5.65 2.89
LU0553627182 Global Aggregate Bond Fund Z Hedge GBP 8.77 0.33 6.34 -
LU0459998232 Global Convertibles Absolute Return Fund A Hedge EUR -1.46 5.12 11.52 -6.67
LU1088028987 Global Convertibles Absolute Return Fund F USD -3.11 0.00 - -
LU0459997697 Global Convertibles Absolute Return Fund I USD -0.51 6.04 12.42 -3.01
LU0630373545 Global Convertibles Absolute Return Fund I Hedge CHF -2.95 0.00 - -
LU0459998588 Global Convertibles Absolute Return Fund I Hedge EUR -0.67 5.93 12.22 -3.54
LU0459997770 Global Convertibles Absolute Return Fund Ix USD -3.13 0.00 - -
LU0643905549 Global Convertibles Absolute Return Fund Ix Hedge EUR -0.69 5.86 12.25 -6.38
LU0459999123 Global Convertibles Absolute Return Fund Ix Hedge GBP -0.33 6.28 12.49 -3.34
LU0560710161 Global Convertibles Absolute Return Fund Z USD 0.72 7.66 14.12 -5.34
LU0560709825 Global Convertibles Absolute Return Fund Z Hedge GBP 0.92 7.94 14.22 -5.44
LU0274938744 Global Convertibles Fund A USD -2.99 12.66 9.34 -5.26
LU0401378319 Global Convertibles Fund A Hedge CHF 2.36 4.00 - -
LU0280566992 Global Convertibles Fund A Hedge EUR 2.74 12.65 9.89 -5.13
LU0280567370 Global Convertibles Fund Ax GBP GBP 3.04 10.57 4.54 -5.60
LU0367993077 Global Convertibles Fund Ax Hedge GBP 2.84 13.11 10.17 -5.40
LU0144879052 Global Convertibles Fund B USD -3.24 12.38 9.07 -5.49
LU0280567701 Global Convertibles Fund B Hedge EUR 2.48 12.37 9.40 -5.16
LU0401378400 Global Convertibles Fund Bx USD -3.23 12.18 9.09 -9.32
LU0160787601 Global Convertibles Fund I USD -2.32 13.44 10.10 -4.65
LU0280568188 Global Convertibles Fund I EUR EUR 11.24 8.54 -1.25 -
LU0837066355 Global Convertibles Fund I GBP GBP 3.76 11.34 -0.71 -
LU0401378822 Global Convertibles Fund I Hedge CHF 3.08 4.44 - -
LU0280568261 Global Convertibles Fund I Hedge EUR 3.46 13.43 10.65 -4.53
LU0280568428 Global Convertibles Fund Ix GBP GBP 3.75 11.34 5.26 -6.12
LU0367993150 Global Convertibles Fund Ix Hedge GBP 3.55 13.90 10.93 -5.26
LU1011493662 Global Convertibles Fund Rx USD -1.34 0.00 - -
LU1011494041 Global Convertibles Fund Rx Hedge EUR 4.33 0.00 - -
LU0880135149 Global Convertibles Fund Rx Hedge GBP 3.52 10.00 - -
LU0675046311 Global Convertibles Fund Z USD -1.59 14.36 4.35 -2.61
LU0560710591 Global Convertibles Fund Z Hedge EUR 4.22 14.27 11.47 -5.33
LU0560710757 Global Convertibles Fund Z Hedge GBP 4.33 14.75 11.76 -5.03
LU0905156674 Global Convertibles Fund Zx Hedge EUR 4.22 8.63 - -
LU0514066991 Global Emerging Markets Index Fund I USD -2.52 -2.92 17.32 -18.08
INFORMATION FOR INVESTORS IN SWITZERLAND (UNAUDITED) (CONTINUED)as at 31 December 2014
4. Performance (Continued)

AVIVA INVESTORS – ANNUAL REPORT AND AUDITED FINANCIAL STATEMENTS avivainvestors.com 147
ISIN code Sub-Fund name Share Class
Share Class Currency
2014 in %
2013 in %
2012 in %
2011 in %
LU0537606781 Global Emerging Markets Index Fund Z USD -2.09 -2.49 17.84 -17.80
LU0367993317 Global High Yield Bond Fund A USD 2.30 5.75 14.78 5.14
LU0693856568 Global High Yield Bond Fund A Hedge CHF 1.99 5.48 14.02 1.44
LU0367993408 Global High Yield Bond Fund A Hedge EUR 2.18 5.64 14.34 5.10
LU0520002626 Global High Yield Bond Fund A Hedge SGD 2.32 5.68 14.59 4.61
LU0752094010 Global High Yield Bond Fund Ax USD 2.31 5.22 9.51 -
LU0397833129 Global High Yield Bond Fund Ax Hedge GBP 2.51 5.88 14.86 -2.81
LU0520002972 Global High Yield Bond Fund Ax Hedge SGD 2.33 5.05 14.58 -3.27
LU0562505734 Global High Yield Bond Fund B USD 2.05 5.49 14.50 4.94
LU0432679735 Global High Yield Bond Fund B Hedge EUR 1.93 5.38 14.06 5.08
LU0562505817 Global High Yield Bond Fund Bx USD 2.05 4.96 14.49 -1.72
LU0641126270 Global High Yield Bond Fund Bx Hedge EUR 1.89 5.42 14.05 -0.37
LU1088029100 Global High Yield Bond Fund F USD -0.32 0.00 - -
LU0367993663 Global High Yield Bond Fund I USD 3.02 6.49 15.58 5.80
LU0497137546 Global High Yield Bond Fund I Hedge CAD 3.86 7.31 16.13 5.82
LU0367993747 Global High Yield Bond Fund I Hedge EUR 2.90 6.38 15.13 5.77
LU0766450869 Global High Yield Bond Fund I Hedge GBP 3.23 6.80 9.75 -
LU0650814238 Global High Yield Bond Fund Ix USD 3.02 6.52 15.58 -0.34
LU0649528386 Global High Yield Bond Fund Ix Hedge CHF 2.63 6.26 14.79 0.18
LU0650813693 Global High Yield Bond Fund Ix Hedge EUR 2.85 6.43 15.12 -0.65
LU0397835769 Global High Yield Bond Fund Ix Hedge GBP 3.18 6.84 7.23 -
LU0938923728 Global High Yield Bond Fund M USD 3.28 3.99 - -
LU0938924023 Global High Yield Bond Fund M Hedge CHF 2.97 3.87 - -
LU0938923561 Global High Yield Bond Fund M Hedge EUR 3.16 3.97 - -
LU0864203509 Global High Yield Bond Fund M Hedge GBP 3.57 7.05 0.07 -
LU0880134928 Global High Yield Bond Fund Rx Hedge GBP 3.14 5.25 - -
LU0616814850 Global High Yield Bond Fund Z USD 3.78 7.28 16.44 1.11
LU0553627935 Global High Yield Bond Fund Z Hedge GBP 3.99 7.61 16.52 1.66
LU0725747025 Global High Yield Bond Fund Zx Hedge EUR 5.37 7.17 15.08 -
LU0274933604 Long Term European Bond Fund A EUR 27.64 0.95 16.40 0.94
LU0044652708 Long Term European Bond Fund B EUR 27.39 0.75 16.17 0.74
LU0044654233 Long Term European Bond Fund Bx EUR 27.38 0.75 16.17 -2.38
LU0560711219 Long Term European Bond Fund Z EUR 29.10 2.10 17.72 2.08
LU1074209328 Multi-Strategy Target Return Fund A EUR 4.07 0.00 - -
LU1082045599 Multi-Strategy Target Return Fund F Hedge USD 4.93 0.00 - -
LU1074209757 Multi-Strategy Target Return Fund I EUR 4.51 0.00 - -
LU1084540324 Multi-Strategy Target Return Fund I Hedge GBP 4.20 0.00 - -
LU1074210094 Multi-Strategy Target Return Fund I Hedge USD 4.06 0.00 - -
LU1074209831 Multi-Strategy Target Return Fund I USD USD -7.59 0.00 - -
LU1074210177 Multi-Strategy Target Return Fund Z EUR 4.84 0.00 - -
LU1088029878 Short Duration Global High Yield Bond Fund A USD -0.81 0.00 - -
LU0747473022 Short Duration Global High Yield Bond Fund I USD 1.30 5.28 - -
LU1044012950 Short Duration Global High Yield Bond Fund I Hedge CHF -1.08 0.00 - -
LU1028903703 Short Duration Global High Yield Bond Fund I Hedge EUR 0.38 0.00 - -
INFORMATION FOR INVESTORS IN SWITZERLAND (UNAUDITED) (CONTINUED)as at 31 December 2014
4. Performance (Continued)

AVIVA INVESTORS – ANNUAL REPORT AND AUDITED FINANCIAL STATEMENTS avivainvestors.com 148
ISIN code Sub-Fund name Share Class
Share Class Currency
2014 in %
2013 in %
2012 in %
2011 in %
LU0756178793 Short Duration Global High Yield Bond Fund Ix Hedge EUR 1.21 5.16 - -
LU0790111180 Short Duration Global High Yield Bond Fund Z Hedge GBP 2.10 6.18 - -
LU0747472990 Short Duration Global High Yield Bond Fund Zx Hedge EUR 3.49 5.78 - -
LU0274938660 Short Term European Bond Fund A EUR 0.95 1.17 2.61 0.82
LU0089594716 Short Term European Bond Fund B EUR 0.75 0.97 2.40 0.63
LU0089594807 Short Term European Bond Fund Bx EUR 0.75 0.97 2.40 -2.28
LU0274937936 UK Opportunities Fund Ax GBP 1.66 25.96 12.34 -4.02
LU0010020310 UK Opportunities Fund B GBP 1.40 25.65 12.05 -2.20
LU0160960752 UK Opportunities Fund I GBP 2.52 27.03 13.28 -1.19
LU0880135065 UK Opportunities Fund Rx GBP 2.47 17.24 - -
LU0560712530 UK Opportunities Fund Z GBP 3.43 28.16 14.29 -7.42
LU0837066439 US Equity Income Fund A USD 11.18 0.00 - -
LU1005247751 US Equity Income Fund B USD 10.81 0.00 - -
LU0837066512 US Equity Income Fund I USD 10.85 30.77 - -
LU0957618282 US Equity Income Fund Ix USD 12.10 0.00 - -
LU0905151360 US Equity Income Fund Z USD 11.87 18.09 - - Past performance is not an indication of the current or future performance. The performance data do not take into account the commissions on the issue and redemption of shares. Performance figures was calculated in accordance with the applicable SFAMA guidelines.
INFORMATION FOR INVESTORS IN SWITZERLAND (UNAUDITED) (CONTINUED)as at 31 December 2014
4. Performance (Continued)

avivainvestors.com
Aviva Investors Luxembourg S.A.PO Box 1375L-1013 LuxembourgTel + (352) 40 28 20 1www.avivainvestors.comRegistered address: 2 rue du Fort Bourbon, L-1249 Luxembourg, Grand Duchy of Luxembourg.R.C.S. Luxembourg B 25.708
MC2357-V015-352210-XX/XXXX/XXXXXX