AXA ROSENBERG EQUITY ALPHA TRUST UNAUDITED ...
155
AXA ROSENBERG EQUITY ALPHA TRUST UNAUDITED CONDENSED FINANCIAL STATEMENTS FOR THE SIX MONTH PERIOD ENDED September 30, 2021 (A UCITS umbrella open-ended Unit Trust authorised by the Central Bank of Ireland pursuant to the provisions of the UCITS Regulations)
-
Upload
khangminh22 -
Category
Documents
-
view
1 -
download
0
Transcript of AXA ROSENBERG EQUITY ALPHA TRUST UNAUDITED ...

AXA ROSENBERG EQUITY ALPHA TRUST
UNAUDITED CONDENSED FINANCIAL STATEMENTS
FOR THE SIX MONTH PERIOD ENDED September 30, 2021
(A UCITS umbrella open-ended Unit Trust authorised by the Central Bank of Irelandpursuant to the provisions of the UCITS Regulations)

Directory 1
Investment Manager’s ReportAXA Rosenberg All-Country Asia Pacific Ex-Japan Equity Alpha Fund 2AXA Rosenberg All Country Asia Pacific Ex-Japan Small Cap Alpha Fund 4AXA Rosenberg Eurobloc Equity Alpha Fund 7AXA Rosenberg Global Emerging Markets Equity Alpha Fund 10AXA Rosenberg Global Equity Alpha Fund 13AXA Rosenberg Global Small Cap Alpha Fund 16AXA Rosenberg Japan Enhanced Index Equity Alpha Fund 19AXA Rosenberg Japan Equity Alpha Fund 21AXA Rosenberg Japan Small Cap Alpha Fund 24AXA Rosenberg Pacific Ex-Japan Equity Alpha Fund 27AXA Rosenberg Pan-European Enhanced Index Equity Alpha Fund 30AXA Rosenberg Pan-European Equity Alpha Fund 32AXA Rosenberg US Enhanced Index Equity Alpha Fund 35AXA Rosenberg US Equity Alpha Fund 39
Primary Statements:Statement of Comprehensive Income 42Statement of Financial Position 50Statement of Changes in Net Assets Attributable to Holders of Redeemable Participating Units 58
Notes to the Financial Statements 62
Schedule of InvestmentsAXA Rosenberg All-Country Asia Pacific Ex-Japan Equity Alpha Fund 84AXA Rosenberg All Country Asia Pacific Ex-Japan Small Cap Alpha Fund 85AXA Rosenberg Eurobloc Equity Alpha Fund 89AXA Rosenberg Global Emerging Markets Equity Alpha Fund 91AXA Rosenberg Global Equity Alpha Fund 95AXA Rosenberg Global Small Cap Alpha Fund 99AXA Rosenberg Japan Equity Alpha Fund 105AXA Rosenberg Japan Small Cap Alpha Fund 109AXA Rosenberg Pacific Ex-Japan Equity Alpha Fund 113AXA Rosenberg Pan-European Equity Alpha Fund 115AXA Rosenberg US Enhanced Index Equity Alpha Fund 118AXA Rosenberg US Equity Alpha Fund 124
Statement of Major Portfolio Changes 129Other Information 143Securities Financing Transactions Regulation Disclosure 146
AXA ROSENBERG EQUITY ALPHA TRUST
Contents

Manager Directors* of the Manager Trustee
AXA Rosenberg Management David Cooke (Ireland) State Street Custodial ServicesIreland Limited Kevin O’Brien (Ireland)** (Ireland) Limited
78 Sir John Rogerson’s Quay Gideon Smith (UK) 78 Sir John Rogerson’s QuayDublin 2 Josephine Tubbs (UK) Dublin 2Ireland Jean-Louis Laforge (France) Ireland
Peter Warner (UK)
Investment Managerand Master Distributor
Administrator, Registrarand Transfer Agent Independent Auditors
AXA Investment ManagersUK Limited
22 BishopsgateLondon EC2N 4BQ
United Kingdom
State Street Fund Services(Ireland) Limited
78 Sir John Rogerson’s QuayDublin 2Ireland
PricewaterhouseCoopersChartered Accountants and Registered
AuditorsOrmonde Business Park
Dublin RoadKilkennyIreland
Sub-Investment Managers Legal Advisers to the Trust Secretary
AXA Rosenberg InvestmentManagement LLC
4 Orinda Way Building EOrinda CA 94563
United States
William Fry2 Grand Canal Square
Dublin 2Ireland
Tudor Trust Limited33 Sir John Rogerson’s Quay
Dublin 2Ireland
AXA Investment Managers Asia(Singapore) Ltd.
1 George Street #14-02/03Singapore 049145
Singapore
*All Directors are Non-Executive Directors.**Independent Director.
AXA ROSENBERG EQUITY ALPHA TRUST
Directory
1
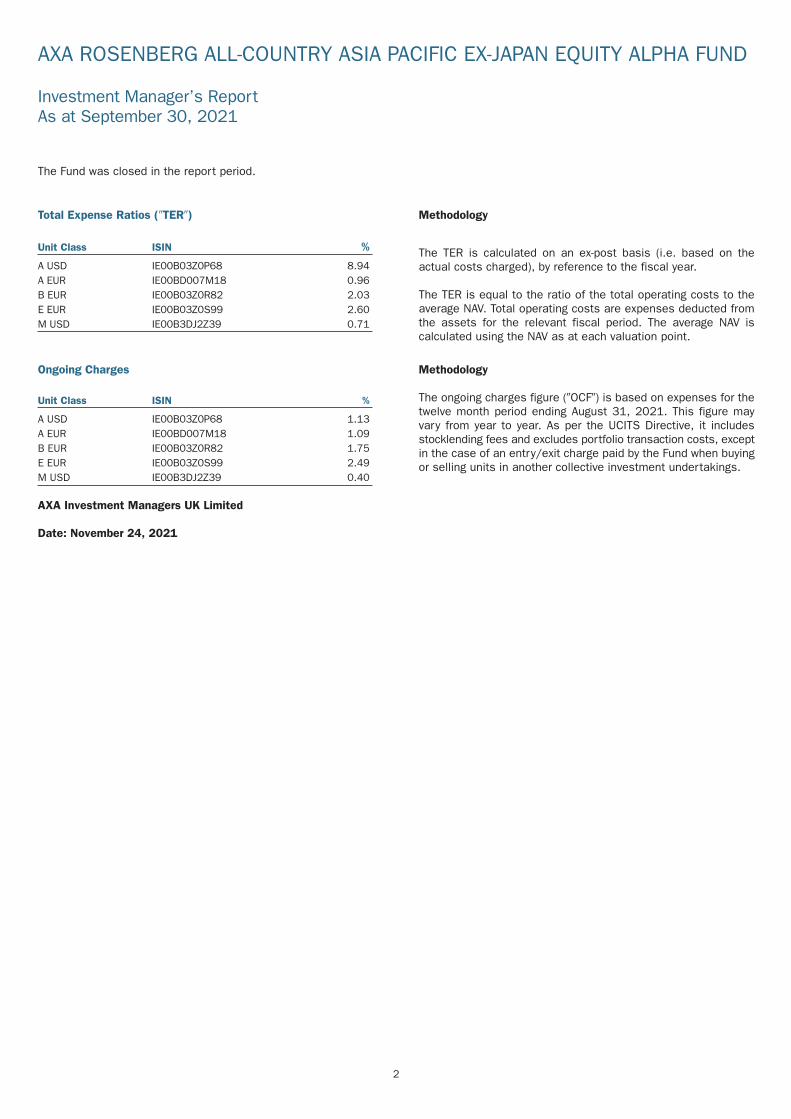
The Fund was closed in the report period.
Total Expense Ratios (�TER�)
Unit Class ISIN %
A USD IE00B03Z0P68 8.94A EUR IE00BD007M18 0.96B EUR IE00B03Z0R82 2.03E EUR IE00B03Z0S99 2.60M USD IE00B3DJ2Z39 0.71
Methodology
The TER is calculated on an ex-post basis (i.e. based on theactual costs charged), by reference to the fiscal year.
The TER is equal to the ratio of the total operating costs to theaverage NAV. Total operating costs are expenses deducted fromthe assets for the relevant fiscal period. The average NAV iscalculated using the NAV as at each valuation point.
Ongoing Charges
Unit Class ISIN %
A USD IE00B03Z0P68 1.13A EUR IE00BD007M18 1.09B EUR IE00B03Z0R82 1.75E EUR IE00B03Z0S99 2.49M USD IE00B3DJ2Z39 0.40
Methodology
The ongoing charges figure (�OCF�) is based on expenses for thetwelve month period ending August 31, 2021. This figure mayvary from year to year. As per the UCITS Directive, it includesstocklending fees and excludes portfolio transaction costs, exceptin the case of an entry/exit charge paid by the Fund when buyingor selling units in another collective investment undertakings.
AXA Investment Managers UK Limited
Date: November 24, 2021
AXA ROSENBERG ALL-COUNTRY ASIA PACIFIC EX-JAPAN EQUITY ALPHA FUND
Investment Manager’s ReportAs at September 30, 2021
2

September 30, 2021** March 31, 2021 September 30, 2020
Class A USDNAV of Unit Class - $12,393 $9,846Number of Units Outstanding - 366 367NAV per Unit - $33.86 $26.83
Class A EURNAV of Unit Class - €3,672 €3,367,818Number of Units Outstanding - 200 231,057NAV per Unit - €18.36 €14.58
Class B EURNAV of Unit Class - €856,146 €716,701Number of Units Outstanding - 32,018 33,643NAV per Unit - €26.74 €21.30
Class E EURNAV of Unit Class - €955,117 €648,364Number of Units Outstanding - 41,932 35,601NAV per Unit - €22.78 €18.21
Class M USDNAV of Unit Class - $11,855,020 $10,828,889Number of Units Outstanding - 314,254 363,548NAV per Unit - $37.72 $29.79
*dealing NAV.**The Fund, including all share classes in issue during the period, terminated with a final dealing day on July 30, 2021.
AXA ROSENBERG ALL-COUNTRY ASIA PACIFIC EX-JAPAN EQUITY ALPHA FUND
NAV* tableAs at September 30, 2021
3

The Fund underperformed its benchmark index in the first half of the report period. The focus on attractively valued stocks based on higherearnings yields weighed heavily on returns but was offset to some extent by the exposure to stocks trading at low multiples of net assets.Positive contributions came from the Fund’s positive exposure to momentum and quality, measured by its exposures to stocks whoseearnings beat market expectations.
Sector-wise, the overweight to materials and underweight to real estate were accretive to returns. Top stock picks came from within thematerials sector, including above-benchmark positions in YFY, Nantex Industry, Mineral Resources and Finolex Industries, which were drivenby rising commodity prices. Stock selection in aggregate was challenged, particularly within the transport industry. Not holding positionsin HMM, Yang Ming Marine and Wan Hai featured among the largest stock detractors from returns as shipping companies benefited frominvestors’ bullish sentiment for the industry driven by continued signs of recovery in the global economy.
Underperformance was compounded in the second half of the report period. Although the focus on identifying attractively valued stocksbased on higher earnings yields and cheaper book assets contributed positively, this was offset by the exposure to higher dividend yieldingstocks. With oil prices rising to a three-year high and worries over an electricity supply shortfall, the underweight to electrical utilities andthe energy sector detracted from relative returns. Stock selection in aggregate was challenged and weak across several sectors includinghealthcare, industrials, technology and materials. The largest individual detractors to returns came from an overweight position in VtechHoldings, the Chinese electronics learning company’s share price declined on the regulatory assault in tech and education from Beijing.Within healthcare, the overweight position in Ansell, a protective equipment maker, saw its share price tumble despite announcing a surgein profit as virus concerns dampened their outlook with fears of supply disruptions.
Performance Summary
Performance summary – Class A Units 6 Months to30 September 2021
3 YearsAnnualised
5 YearsAnnualised
InceptionDate
AXA Rosenberg All Country Asia Pacific Ex-Japan Small Cap Alpha Fund (USD) 3.21% 9.51% 8.19% 30-Sep-99MSCI AC Asia Pacific ex-Japan Small Cap 7.39% 13.13% 8.23%Alpha (4.18%) (3.62%) (0.04%)
Past performance is not a reliable indicator of future results.
Performance calculations are net of fees, based on the reinvestment of dividends
The benchmark, when there is one could be calculated on the basis of net or gross dividend. Please refer to the Prospectus for moreinformation.
Data Source: Benchmark prices are obtained from the relevant benchmark provider. Net Asset Value (�NAV�) is calculated by the Administratorof the Trust.
TER
Unit Class ISIN %
A USD IE0008367009 1.12A EUR IE00BD008N99 1.08A EUR Hedged IE00BD008P14 1.14B USD IE0004334029 1.82B EUR IE0031069499 1.82E EUR IE0034277479 2.56
Methodology
The TER is calculated on an ex-post basis (i.e. based on theactual costs charged), by reference to the fiscal year.
The TER is equal to the ratio of the total operating costs to theaverage NAV. Total operating costs are expenses deducted fromthe assets for the relevant fiscal period. The average NAV iscalculated using the NAV as at each valuation point.
AXA ROSENBERG ALL COUNTRY ASIA PACIFIC EX-JAPAN SMALL CAP ALPHAFUNDInvestment Manager’s ReportAs at September 30, 2021
4

Ongoing Charges
Unit Class ISIN %
A USD IE0008367009 1.15A EUR IE00BD008N99 1.15A EUR Hedged IE00BD008P14 1.17B USD IE0004334029 1.85B EUR IE0031069499 1.84E EUR IE0034277479 2.59
Methodology
The OCF is based on expenses for the twelve month period endingAugust 31, 2021. This figure may vary from year to year. As perthe UCITS Directive, it includes stocklending fees and excludesportfolio transaction costs, except in the case of an entry/exitcharge paid by the Fund when buying or selling units in anothercollective investment undertakings.
AXA Investment Managers UK Limited
Date: November 24, 2021
AXA ROSENBERG ALL COUNTRY ASIA PACIFIC EX-JAPAN SMALL CAP ALPHAFUNDInvestment Manager’s Report (continued)As at September 30, 2021
5

September 30, 2021 March 31, 2021 September 30, 2020
Class A USDNAV of Unit Class $62,639,066 $62,956,246 $57,256,927Number of Units Outstanding 586,644 608,503 720,503NAV per Unit $106.78 $103.46 $79.47
Class A EURNAV of Unit Class €524,119 €5,449,366 €276,281Number of Units Outstanding 28,158 306,176 20,167NAV per Unit €18.61 €17.80 €13.70
Class A EUR HedgedNAV of Unit Class €1,922,703 €1,344,172 €1,039,396Number of Units Outstanding 138,091 99,157 99,157NAV per Unit €13.92 €13.56 €10.48
Class B USDNAV of Unit Class $18,848,952 $17,758,133 $16,373,169Number of Units Outstanding 167,174 161,975 193,757NAV per Unit $112.75 $109.63 $84.50
Class B EURNAV of Unit Class €41,751,263 €38,567,135 €30,378,664Number of Units Outstanding 432,485 416,319 424,271NAV per Unit €96.54 €92.64 €71.60
Class E EURNAV of Unit Class €6,288,328 €4,725,622 €3,662,467Number of Units Outstanding 73,547 57,429 57,399NAV per Unit €85.50 €82.29 €63.81
*dealing NAV.
AXA ROSENBERG ALL COUNTRY ASIA PACIFIC EX-JAPAN SMALL CAP ALPHAFUNDNAV* tableAs at September 30, 2021
6

The Fund marginally outperformed its benchmark index in the second quarter of 2021, net of fees and expenses applicable to the A EURshare class. Despite the headwinds to value seen this quarter, the balanced factor profile of the Fund meant that the exposure to higherquality companies with less earnings volatility and lower financial leverage was rewarded. Industry exposures offset these positives, however,and performance was hindered by overweighting insurance companies, which underperformed as a group over the quarter. Better rewardcame from underweighting utilities and autos.
Stock selection was positive over the quarter, notably within the industrials sector. The top-contributing stock here was Deutsche Post, withshares in the German postal business handsomely outperforming after the firm reported strong earnings for the first quarter that farsurpassed consensus expectations. In the consumer discretionary sector, not owning vehicle manufacturer Volkswagen boosted relativereturns after its shares stalled amid expectations that profitability would dip over the quarter. Less helpful this quarter was overweightingFrance-based IT services firm Atos, whose shares underperformed in response to weak Q1 sales data.
The Fund outperformed its benchmark index, net of fees and expenses applicable to the A EUR share class, in the third quarter of 2021.The fundamental risk factor profile of the Fund added the most value, with positive contributions from the exposure to stocks with near-termprice momentum and high levels of earnings delivery, as well as a tilt towards smaller companies.
Industry exposures were also modestly helpful, particularly among financials where holdings of banks and insurers added value. Indeed,the top stock contributor over the quarter was an above-benchmark holding of Dutch insurer Aegon, whose shares rallied after it announcedin August a dividend hike amid strong busines momentum across its key markets. Also holding multi-line insurer ASR Nederland overweightwas beneficial after it too reported similarly upbeat business momentum. Elsewhere, rising energy prices helped boost shares of Spanishenergy firm Repsol, which was also held overweight in the Fund. Less helpful for relative returns this quarter was not owning online paymentsfirm Adyen, which reported better-than-expected H1 results in August, sending its shares higher.
Performance Summary
Performance summary – Class A Units 6 Months to30 September 2021
3 YearsAnnualised
5 YearsAnnualised
InceptionDate
AXA Rosenberg Eurobloc Equity Alpha Fund (EUR) 7.66% 6.22% 7.12% 30-Sep-99MSCI EMU 6.12% 7.78% 8.78%Alpha 1.54% (1.56%) (1.66%)
Past performance is not a reliable indicator of future results.
Performance calculations are net of fees, based on the reinvestment of dividends.
The benchmark, when there is one could be calculated on the basis of net or gross dividend. Please refer to the Prospectus for moreinformation.
Data Source: Benchmark prices are obtained from the relevant benchmark provider. NAVs are calculated by the Administrator of the Trust.
TER
Unit Class ISIN %
A EUR IE0008366365 0.83B EUR IE0004352823 1.48E EUR IE0034279186 2.23M EUR IE00B24J4Z96 0.13
Methodology
The TER is calculated on an ex-post basis (i.e. based on theactual costs charged), by reference to the fiscal year.
The TER is equal to the ratio of the total operating costs to theaverage NAV. Total operating costs are expenses deducted fromthe assets for the relevant fiscal period. The average NAV iscalculated using the NAV as at each valuation point.
AXA ROSENBERG EUROBLOC EQUITY ALPHA FUND
Investment Manager’s ReportAs at September 30, 2021
7

Ongoing Charges
Unit Class ISIN %
A EUR IE0008366365 0.84B EUR IE0004352823 1.49E EUR IE0034279186 2.24M EUR IE00B24J4Z96 0.14
Methodology
The OCF is based on expenses for the twelve month period endingAugust 31, 2021. This figure may vary from year to year. As perthe UCITS Directive, it includes stocklending fees and excludesportfolio transaction costs, except in the case of an entry/exitcharge paid by the Fund when buying or selling units in anothercollective investment undertakings.
AXA Investment Managers UK Limited
Date: November 24, 2021
AXA ROSENBERG EUROBLOC EQUITY ALPHA FUND
Investment Manager’s Report (continued)As at September 30, 2021
8

September 30, 2021 March 31, 2021 September 30, 2020
Class A EURNAV of Unit Class €34,995,365 €24,860,528 €20,834,761Number of Units Outstanding 1,500,760 1,147,801 1,186,584NAV per Unit €23.32 €21.66 €17.56
Class B EURNAV of Unit Class €83,611,070 €80,087,793 €66,361,301Number of Units Outstanding 5,663,923 5,821,843 5,931,357NAV per Unit €14.76 €13.76 €11.19
Class E EURNAV of Unit Class €521,689 €537,717 €488,471Number of Units Outstanding 39,989 44,065 49,034NAV per Unit €13.05 €12.20 €9.96
Class M EURNAV of Unit Class €698,623 €646,638 €522,393Number of Units Outstanding 26,684 26,684 26,684NAV per Unit €26.18 €24.23 €19.58
*dealing NAV.
AXA ROSENBERG EUROBLOC EQUITY ALPHA FUND
NAV* tableAs at September 30, 2021
9

The Fund rose in value but underperformed its benchmark index over the period. At a factor level, the focus on attractively valued stocksbased on higher earnings yields weighed heavily on returns but was offset to some extent by the Fund’s positive exposure to momentum.
Stock selection was challenged within the consumer discretionary sector, with the overweight towards certain consumer-tech stocksdetracting as Chinese anti-trust investigations against technology companies weighed on sentiment. An above-benchmark position in NewOriental Education & Technology was among the largest individual detractors, as local governments began implementing new regulationson the private tutoring industry. Not owning a position in NIO also detracted from relative performance as renewed consumer appetite forelectric vehicles boosted the share prices of car manufacturers. By contrast, overweight positions in commodity producers and shippingcompanies, including Evergreen Marine, Tata Steel and Gazprom, lifted returns as they benefited from continued signs of global economicrecovery.
Moving into the third quarter of the year, the Fund modestly underperformed its benchmark index over the period. At a factor level, the focuson attractively valued stocks based on low multiples of net assets and towards higher earnings yield stocks provided positive contributionsbut was offset from the exposure to stocks with higher dividend yields.
The overweight exposure to financials and energy were accretive to returns given the rising interest rate environment and rising oil pricesto the latter sector. Above-benchmark positions in Gazprom and Fubon Financial were rewarded with the former the largest individual stockcontributor to returns over the period. Less helpful to excess returns was stock picking within the communication services sector, particularChinese-related tech companies which suffered from Beijing’s regulatory assault on the sector. Overweight positions in Iqiyi, Alibaba Groupand Tencent all featured among the bottom stock detractors to returns.
Performance Summary
Performance summary – Class A Units 6 Months to30 September 2021
3 YearsAnnualised
5 YearsAnnualised
InceptionDate
AXA Rosenberg Global Emerging Markets Equity Alpha Fund (USD) (5.76%) 6.61% 8.20% 30-Jun-06MSCI Emerging Markets Index (3.45%) 8.56% 9.23%Alpha (2.31%) (1.95%) (1.03%)
Past performance is not a reliable indicator of future results.
Performance calculations are net of fees, based on the reinvestment of dividends.
The benchmark, when there is one could be calculated on the basis of net or gross dividend. Please refer to the Prospectus for moreinformation.
Data Source: Benchmark prices are obtained from the relevant benchmark provider. NAVs are calculated by the Administrator of the Trust.
TER
Unit Class ISIN %
A USD IE00B101JY64 1.00A EUR IE00B54FKV65 0.99B USD IE00B101K096 1.64B EUR IE00B101K104 1.64E EUR Hedged IE00B4YSHS45 2.42M USD IE00B1P83M87 0.30S USD IE00BD5BFG91 0.53
Methodology
The TER is calculated on an ex-post basis (i.e. based on theactual costs charged), by reference to the fiscal year.
The TER is equal to the ratio of the total operating costs to theaverage NAV. Total operating costs are expenses deducted fromthe assets for the relevant fiscal period. The average NAV iscalculated using the NAV as at each valuation point.
AXA ROSENBERG GLOBAL EMERGING MARKETS EQUITY ALPHA FUND
Investment Manager’s ReportAs at September 30, 2021
10

Ongoing Charges
Unit Class ISIN %
A USD IE00B101JY64 1.00A EUR IE00B54FKV65 0.99B USD IE00B101K096 1.65B EUR IE00B101K104 1.66E EUR Hedged IE00B4YSHS45 2.43M USD IE00B1P83M87 0.27S USD IE00BD5BFG91 0.53
Methodology
The OCF is based on expenses for the twelve month period endingAugust 31, 2021. This figure may vary from year to year. As perthe UCITS Directive, it includes stocklending fees and excludesportfolio transaction costs, except in the case of an entry/exitcharge paid by the Fund when buying or selling units in anothercollective investment undertakings.
AXA Investment Managers UK Limited
Date: November 24, 2021
AXA ROSENBERG GLOBAL EMERGING MARKETS EQUITY ALPHA FUND
Investment Manager’s Report (continued)As at September 30, 2021
11

September 30, 2021 March 31, 2021 September 30, 2020
Class A USDNAV of Unit Class $6,748,210 $7,080,857 $4,223,818Number of Units Outstanding 332,748 329,019 236,056NAV per Unit $20.28 $21.52 $17.89
Class A EURNAV of Unit Class €3,827,447 €3,471,085 €2,345,138Number of Units Outstanding 253,775 219,958 178,353NAV per Unit €15.08 €15.78 €13.15
Class B USDNAV of Unit Class $87,192 $87,062 $66,429Number of Units Outstanding 4,861 4,559 4,171NAV per Unit $17.94 $19.10 $15.93
Class B EURNAV of Unit Class €48,915,298 €47,042,113 €39,114,705Number of Units Outstanding 2,493,173 2,283,775 2,271,031NAV per Unit €19.62 €20.60 €17.22
Class E EUR HedgedNAV of Unit Class €67,993 €77,991 €61,502Number of Units Outstanding 6,416 6,853 6,416NAV per Unit €10.60 €11.38 €9.59
Class M USDNAV of Unit Class $16,249,102 $20,252,869 $15,560,103Number of Units Outstanding 700,070 825,138 765,138NAV per Unit $23.21 $24.54 $20.34
Class S USDNAV of Unit Class $2,704,176 $2,863,168 $3,753,787Number of Units Outstanding 218,114 218,114 344,790NAV per Unit $12.40 $13.13 $10.89
*dealing NAV.
AXA ROSENBERG GLOBAL EMERGING MARKETS EQUITY ALPHA FUND
NAV* tableAs at September 30, 2021
12

After a strong first quarter for relative performance the Fund lagged its benchmark in the second. Factor exposures in aggregate contributedpositively, despite the underperformance of the value factor, with the positive quality and momentum exposures being rewarded. Industryexposures proved less helpful, and overweighting insurance while underweighting real estate weighed on returns, as did the overweightexposure to machinery manufacturers.
Residual stock-specific effects weighed most heavily on returns this quarter. The largest detractor was underweighting computer chip makerNVIDIA, shares of which rose strongly in response to a rise in demand for its products amid a global semiconductor shortage. Elsewhere,the overweight holding of Manulife Financial, a Canadian insurance firm, weighed on returns; despite hitting all-time highs in March, sharesslipped in Q2 on lacklustre first quarter earnings data. On a more positive note, overweighting Japan’s Fujitsu proved beneficial after sharesin the technology solutions firm rose strongly after releasing earnings data that gave indicated improving growth prospects and expandingmargins.
Set against an increasingly volatile backdrop for equity investors, the Fund underperformed in the third quarter of the year, driven entirelyby unrewarded stock selection. Despite a more challenging environment for valuation, the quality and momentum profile of the Fund wasrewarded, with the exposure to smaller companies also beneficial.
Stock selection amongst mining groups proved challenging this quarter, with overweight holdings of Fortescue Metals ad Rio Tinto the twolargest detractors from returns over the period amid declining metals prices. The overweight exposure to General Motors also weighed onreturns as shares lagged the benchmark as investors weighed the impact of computer chip shortages on slower production and ultimatelyearnings for auto makers. Underweighting Netflix was also unhelpful this quarter as shares in the streaming giant hit all-time highs followingreports that the new Squid Game series was set to become its most viewed show. More positive this quarter was the overweight allocationto software firm Oracle, which reported positive earnings data and expected growth through 2022, with growth in cloud computingcontributing to this. Similarly, the overweight holding of Monolithic Power Systems added value this quarter, as shares in the manufacturerof high-performance power solutions reported pandemic-induced robust demand in its computing and cloud storage/communicationsdivisions.
Performance Summary
Performance summary – Class A Units 6 Months to30 September 2021
3 YearsAnnualised
5 YearsAnnualised
InceptionDate
AXA Rosenberg Global Equity Alpha Fund (USD) 5.61% 9.40% 11.56% 30-Sep-99MSCI World 7.74% 13.10% 13.73%Alpha (2.13%) (3.70%) (2.17%)
Past performance is not a reliable indicator of future results.
Performance calculations are net of fees, based on the reinvestment of dividends.
The benchmark, when there is one could be calculated on the basis of net or gross dividend. Please refer to the Prospectus for moreinformation.
Data Source: Benchmark prices are obtained from the relevant benchmark provider. NAVs are calculated by the Administrator of the Trust.
TER
Unit Class ISIN %
A USD IE0008366811 0.81A EUR IE00B1VJ6602 0.82B USD IE0004318048 1.47B EUR IE0031069051 1.46B GBP IE00B1VJ6719 1.46E EUR IE0034277255 2.21M EUR IE00B24J5456 0.12
Methodology
The TER is calculated on an ex-post basis (i.e. based on theactual costs charged), by reference to the fiscal year.
The TER is equal to the ratio of the total operating costs to theaverage NAV. Total operating costs are expenses deducted fromthe assets for the relevant fiscal period. The average NAV iscalculated using the NAV as at each valuation point.
AXA ROSENBERG GLOBAL EQUITY ALPHA FUND
Investment Manager’s ReportAs at September 30, 2021
13

Ongoing Charges
Unit Class ISIN %
A USD IE0008366811 0.84A EUR IE00B1VJ6602 0.83B USD IE0004318048 1.49B EUR IE0031069051 1.48B GBP IE00B1VJ6719 1.46E EUR IE0034277255 2.24M EUR IE00B24J5456 0.13
Methodology
The OCF is based on expenses for the twelve month period endingAugust 31, 2021. This figure may vary from year to year. As perthe UCITS Directive, it includes stocklending fees and excludesportfolio transaction costs, except in the case of an entry/exitcharge paid by the Fund when buying or selling units in anothercollective investment undertakings.
AXA Investment Managers UK Limited
Date: November 24, 2021
AXA ROSENBERG GLOBAL EQUITY ALPHA FUND
Investment Manager’s Report (continued)As at September 30, 2021
14

September 30, 2021 March 31, 2021 September 30, 2020
Class A USDNAV of Unit Class $5,289,340 $3,426,573 $17,895,319Number of Units Outstanding 156,233 106,874 682,333NAV per Unit $33.86 $32.06 $26.23
Class A EURNAV of Unit Class €160,692,464 €157,980,491 €145,403,378Number of Units Outstanding 5,541,922 5,834,382 6,548,326NAV per Unit €29.00 €27.08 €22.20
Class B USDNAV of Unit Class $18,540,576 $18,563,524 $16,749,169Number of Units Outstanding 689,579 726,718 798,946NAV per Unit $26.89 $25.54 $20.96
Class B EURNAV of Unit Class €322,008,534 €283,720,397 €220,633,190Number of Units Outstanding 13,941,262 13,111,397 12,395,209NAV per Unit €23.10 €21.64 €17.80
Class B GBPNAV of Unit Class £32,471 £26,987 £24,937Number of Units Outstanding 1,705 1,526 1,610NAV per Unit £19.04 £17.68 £15.49
Class E EURNAV of Unit Class €3,779,200 €3,686,763 €2,963,349Number of Units Outstanding 187,974 195,003 189,851NAV per Unit €20.10 €18.91 €15.61
Class M EURNAV of Unit Class €764,271 €1,084,106 €1,143,632Number of Units Outstanding 22,681 34,573 44,644NAV per Unit €33.70 €31.36 €25.62
*dealing NAV.
AXA ROSENBERG GLOBAL EQUITY ALPHA FUND
NAV* tableAs at September 30, 2021
15

After a strong first quarter for relative performance, the Fund marginally underperformed its benchmark after fees and expenses in thesecond quarter. Relative performance weakened in June as market experienced a strong rotation. Stock selection added value during theperiod, helping to offset the negative effect of unrewarded factor exposures.
Factor exposures detracted due to the strong reversal away from value stocks at the end of the quarter, which led to a degree ofunderperformance given our bias to companies with attractive valuations. Industry exposures proved unhelpful, with underweight positionsin real estate investment trusts and pharmaceutical companies acting as a particular drag on relative performance.
At an individual stock level, the largest contributor to returns during the quarter was Charles River Laboratories, whose shares rose asinvestors reacted positively to a recent acquisition and as the stock joined the S&P 500 Index of large US companies. With the stockgraduating out of small cap indices, it was sold from the portfolio. Footwear firm Crocs was another large contributor after the companyreported better-than-expected quarterly results and raised its sales forecast. By contrast, the largest detractor from returns during thequarter was not owning theatre company AMC. AMC’s share price surged in June amid dramatic gains in what have been dubbed “memestocks” – firms experiencing significant increases in trading volume that appear to be driven more by social media attention than by companyfundamentals.
Moving into the third quarter, the Fund outperformed its benchmark. Stock selection was the primary driver of added value during the period,although style exposures also contributed positively, while industry exposures detracted modestly. From a style perspective, the positiveexposure to near-term price momentum was beneficial, with the value profile of the Fund also rewarded. Industry exposures detractedmodestly in aggregate, primarily in areas such as retail, textiles and apparel, which suffered from supply chain issues.
At stock level, the top contributor as an overweight position in Paylocity, a cloud-based provider of payroll and human capital managementsoftware solutions, which reported strong earnings growth during the quarter. Other positive contributors included an above-benchmarkposition in SPS commerce. The cloud-based supply chain management solutions firm continued to demonstrate an increase in demand forits services, which resulted in several upgrades from investment analysts. Similarly, a position in TriNet, which provides web-based payroll,tax and administration services was well rewarded after the firm reported earnings there were well above expectations.
Performance Summary
Performance summary – Class A Units 6 Months to30 September 2021
3 YearsAnnualised
5 YearsAnnualised
InceptionDate
AXA Rosenberg Global Small Cap Alpha Fund (USD) 4.03% 7.39% 8.29% 30-Sep-99MSCI World Small Cap 3.48% 10.86% 12.42%Alpha 0.55% (3.47%) (4.13%)
Past performance is not a reliable indicator of future results.
Performance calculations are net of fees, based on the reinvestment of dividends.
The benchmark, when there is one could be calculated on the basis of net or gross dividend. Please refer to the Prospectus for moreinformation.
Data Source: Benchmark prices are obtained from the relevant benchmark provider. NAVs are calculated by the Administrator of the Trust.
TER
Unit Class ISIN %
A USD IE0008366928 0.92A EUR IE00BD007P49 0.92AD EUR IE00BYJQVM56 0.83A GBP IE00BD04WY04 0.92A EUR Hedged IE00BD007Q55 0.94B USD IE0004324657 1.61B EUR IE0031069168 1.62E EUR IE0034277362 2.37M USD IE00B24J5340 0.14
Methodology
The TER is calculated on an ex-post basis (i.e. based on theactual costs charged), by reference to the fiscal year.
The TER is equal to the ratio of the total operating costs to theaverage NAV. Total operating costs are expenses deducted fromthe assets for the relevant fiscal period. The average NAV iscalculated using the NAV as at each valuation point.
AXA ROSENBERG GLOBAL SMALL CAP ALPHA FUND
Investment Manager’s ReportAs at September 30, 2021
16

Ongoing Charges
Unit Class ISIN %
A USD IE0008366928 0.88A EUR IE00BD007P49 0.85AD EUR IE00BYJQVM56 0.88A GBP IE00BD04WY04 0.88A EUR Hedged IE00BD007Q55 0.91B USD IE0004324657 1.58B EUR IE0031069168 1.58E EUR IE0034277362 2.32M USD IE00B24J5340 0.16
Methodology
The OCF is based on expenses for the twelve month period endingAugust 31, 2021. This figure may vary from year to year. As perthe UCITS Directive, it includes stocklending fees and excludesportfolio transaction costs, except in the case of an entry/exitcharge paid by the Fund when buying or selling units in anothercollective investment undertakings.
AXA Investment Managers UK Limited
Date: November 24, 2021
AXA ROSENBERG GLOBAL SMALL CAP ALPHA FUND
Investment Manager’s Report (continued)As at September 30, 2021
17

September 30, 2021 March 31, 2021 September 30, 2020
Class A USDNAV of Unit Class $163,323,371 $107,491,167 $78,903,368Number of Units Outstanding 2,724,791 1,865,652 1,882,700NAV per Unit $59.94 $57.62 $41.91
Class A EURNAV of Unit Class €407,895 €5,976,801 €1,723,336Number of Units Outstanding 20,879 322,588 127,473NAV per Unit €19.54 €18.53 €13.52
Class AD EURNAV of Unit Class €2,775 €2,629 €1,916Number of Units Outstanding 201 201 201NAV per Unit €13.83 €13.11 €9.55
Class A GBPNAV of Unit Class £180,008 £169,100 £131,271Number of Units Outstanding 8,950 8,950 8,950NAV per Unit £20.11 £18.89 £14.67
Class A EUR HedgedNAV of Unit Class €190,195 €3,109,845 €139,181Number of Units Outstanding 12,800 216,427 13,207NAV per Unit €14.86 €14.37 €10.54
Class B USDNAV of Unit Class $25,243,252 $24,419,037 $7,915,933Number of Units Outstanding 536,441 537,956 238,910NAV per Unit $47.06 $45.39 $33.13
Class B EURNAV of Unit Class €20,232,040 €19,684,364 €15,647,854Number of Units Outstanding 500,188 511,628 555,894NAV per Unit €40.45 €38.47 €28.15
Class E EURNAV of Unit Class €2,401,650 €2,176,747 €1,915,706Number of Units Outstanding 67,415 63,994 76,695NAV per Unit €35.63 €34.02 €24.98
Class M USDNAV of Unit Class $6,842 $62,064 $115,306Number of Units Outstanding 100 948 2,430NAV per Unit $68.42 $65.50 $47.46
*dealing NAV.
AXA ROSENBERG GLOBAL SMALL CAP ALPHA FUND
NAV* tableAs at September 30, 2021
18

The Fund was closed in the report period.
TER
Unit Class ISIN %
A JPY IE00B03Z0W36 0.40A EUR Hedged IE00BD007S79 0.43B JPY IE00B03Z0X43 0.75I JPY IE00BZ01QX26 0.34M JPY IE00B3DJ3054 0.15M EUR Hedged IE00BZB1J435 0.18
Methodology
The TER is calculated on an ex-post basis (i.e. based on theactual costs charged), by reference to the fiscal year.
The TER is equal to the ratio of the total operating costs to theaverage NAV. Total operating costs are expenses deducted fromthe assets for the relevant fiscal period. The average NAV iscalculated using the NAV as at each valuation point.
Ongoing Charges
Unit Class ISIN %
A JPY IE00B03Z0W36 0.49A EUR Hedged IE00BD007S79 0.50B JPY IE00B03Z0X43 0.93I JPY IE00BZ01QX26 0.39M JPY IE00B3DJ3054 0.14M EUR Hedged IE00BZB1J435 0.17
Methodology
The OCF is based on expenses for the twelve month period endingAugust 31, 2021. This figure may vary from year to year. As perthe UCITS Directive, it includes stocklending fees and excludesportfolio transaction costs, except in the case of an entry/exitcharge paid by the Fund when buying or selling units in anothercollective investment undertakings.
AXA Investment Managers UK Limited
Date: November 24, 2021
AXA ROSENBERG JAPAN ENHANCED INDEX EQUITY ALPHA FUND
Investment Manager’s ReportAs at September 30, 2021
19

September 30, 2021** March 31, 2021 September 30, 2020
Class A JPYNAV of Unit Class - ¥2,281,626,857 ¥2,221,272,349Number of Units Outstanding - 1,269,390 1,481,084NAV per Unit - ¥1,797.42 ¥1,499.76
Class A EUR HedgedNAV of Unit Class - €3,071,540 €7,449,155Number of Units Outstanding - 192,409 556,972NAV per Unit - €15.96 €13.37
Class B JPYNAV of Unit Class - ¥517,055,465 ¥467,784,788Number of Units Outstanding - 199,153 215,452NAV per Unit - ¥2,596.27 ¥2,171.18
Class I JPYNAV of Unit Class - ¥893,177,185 ¥540,317,193Number of Units Outstanding - 588,775 427,078NAV per Unit - ¥1,517.01 ¥1,265.15
Class M JPYNAV of Unit Class - ¥5,370,606,473 ¥4,473,416,909Number of Units Outstanding - 2,870,039 2,870,039NAV per Unit - ¥1,871.27 ¥1,558.66
Class M EUR HedgedNAV of Unit Class - €15,790,905 €9,401,981Number of Units Outstanding - 1,026,055 730,755NAV per Unit - €15.39 €12.87
*dealing NAV.**The Fund, including all share classes in issue during the period, terminated with a final dealing day on June 30, 2021.
AXA ROSENBERG JAPAN ENHANCED INDEX EQUITY ALPHA FUND
NAV* tableAs at September 30, 2021
20

The Fund modestly outperformed its benchmark index in the second quarter, net of fees and expenses applicable to the A JPY share class.Active style and industry exposures were the key drivers of the outperformance. From a factor perspective, the Fund benefited from itsexposure to high dividend yielding companies, which outperformed over the quarter. Although the reward to book to price deteriorated asthe quarter unfolded, earnings-based valuation measures held up better, which proved positive for the Fund. Exposure to some of the moreliquid companies at the top of the index was also well rewarded.
From an industry standpoint, the Fund benefited from its underweight exposure to interest-rate sensitive sectors of utilities and financials.Above-benchmark exposure to IT hardware also added to relative performance, as did exposure to export-driven areas of the market. Stockselection among industrials - which benefit from increased economic activity - provided the most positive contribution, with positions incompanies such has industrial conglomerate Hitachi and machinery group Ebara featuring among the largest positive stock contributors.A position in IT hardware firm Fujitsu provided the strongest contribution over the quarter after the company delivered earnings that werewell above expectations.
Stock selection though proved more of a challenge, most noticeably among consumer staples, real estate, and materials companies. Thelargest stock detractor came from a position in Eisai, held below benchmark weight, after shares in the pharmaceutical company jumpedpost the approval of its Alzheimer’s drug developed in partnership with Biogen Inc.
The Fund underperformed its benchmark in the third quarter of the year as a rotation in style and industry returns affected stock selection,which was the largest detractor from returns.
From a factor perspective, the Fund suffered the most from its exposure to attractively valued companies based on their earnings relativeto price, which went unrewarded. This effect was partly offset by a positive exposure to near-term price momentum as the performance ofthis factor reversed in September.
Industry exposures provided a stronger headwind for relative performance, with modest overweight exposures in the auto, software andinstruments detracting the most. Nevertheless, the Fund benefited from exposures to consumer goods such as cosmetics and informationservices.
Stock selection was particularly weak in areas affected by supply chain issues – a position in Aisin Corp, which produces components andsystems for the car industry - was the largest negative contributor over the quarter. Similarly, a position in Nintendo detracted as the companyalso highlighted struggles to secure enough components for its products given the global microchip shortage.
Performance Summary
Performance summary – Class A Units 6 Months to30 September 2021
3 YearsAnnualised
5 YearsAnnualised
InceptionDate
AXA Rosenberg Japan Equity Alpha Fund (JPY) 3.89% 3.00% 9.08% 30-Sep-99TOPIX 4.81% 5.83% 11.03%Alpha (0.92%) (2.83%) (1.95%)
Past performance is not a reliable indicator of future results.
Performance calculations are net of fees, based on the reinvestment of dividends.
The benchmark, when there is one could be calculated on the basis of net or gross dividend. Please refer to the Prospectus for moreinformation.
Data Source: Benchmark prices are obtained from the relevant benchmark provider. NAVs are calculated by the Administrator of the Trust.
AXA ROSENBERG JAPAN EQUITY ALPHA FUND
Investment Manager’s ReportAs at September 30, 2021
21
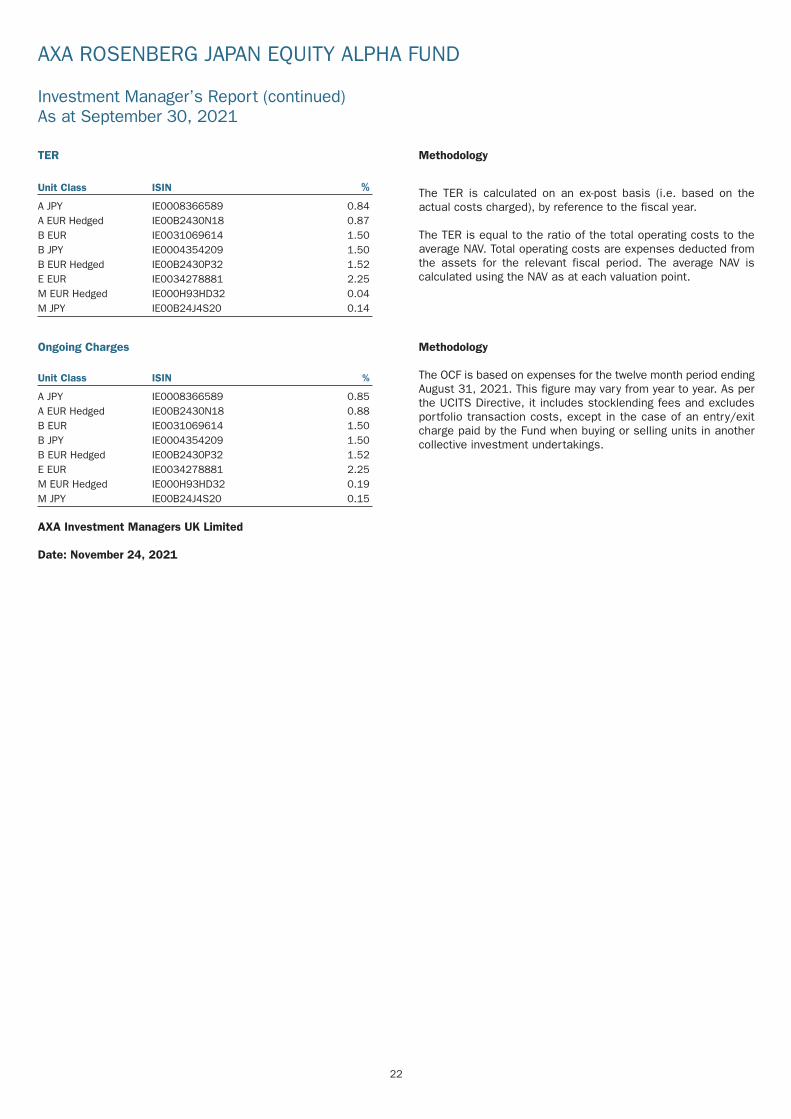
TER
Unit Class ISIN %
A JPY IE0008366589 0.84A EUR Hedged IE00B2430N18 0.87B EUR IE0031069614 1.50B JPY IE0004354209 1.50B EUR Hedged IE00B2430P32 1.52E EUR IE0034278881 2.25M EUR Hedged IE000H93HD32 0.04M JPY IE00B24J4S20 0.14
Methodology
The TER is calculated on an ex-post basis (i.e. based on theactual costs charged), by reference to the fiscal year.
The TER is equal to the ratio of the total operating costs to theaverage NAV. Total operating costs are expenses deducted fromthe assets for the relevant fiscal period. The average NAV iscalculated using the NAV as at each valuation point.
Ongoing Charges
Unit Class ISIN %
A JPY IE0008366589 0.85A EUR Hedged IE00B2430N18 0.88B EUR IE0031069614 1.50B JPY IE0004354209 1.50B EUR Hedged IE00B2430P32 1.52E EUR IE0034278881 2.25M EUR Hedged IE000H93HD32 0.19M JPY IE00B24J4S20 0.15
Methodology
The OCF is based on expenses for the twelve month period endingAugust 31, 2021. This figure may vary from year to year. As perthe UCITS Directive, it includes stocklending fees and excludesportfolio transaction costs, except in the case of an entry/exitcharge paid by the Fund when buying or selling units in anothercollective investment undertakings.
AXA Investment Managers UK Limited
Date: November 24, 2021
AXA ROSENBERG JAPAN EQUITY ALPHA FUND
Investment Manager’s Report (continued)As at September 30, 2021
22

September 30, 2021 March 31, 2021 September 30, 2020
Class A JPYNAV of Unit Class ¥5,939,160,720 ¥3,754,903,285 ¥3,098,281,595Number of Units Outstanding 4,261,756 2,799,317 2,809,300NAV per Unit ¥1,393.59 ¥1,341.36 ¥1,102.87
Class A EUR HedgedNAV of Unit Class €21,114 €20,348 €16,785Number of Units Outstanding 1,292 1,292 1,292NAV per Unit €16.34 €15.75 €12.99
Class B EURNAV of Unit Class €25,288,189 €26,009,076 €23,087,118Number of Units Outstanding 2,465,503 2,637,188 2,704,108NAV per Unit €10.26 €9.86 €8.54
Class B JPYNAV of Unit Class ¥1,280,643,779 ¥1,325,681,175 ¥1,119,507,852Number of Units Outstanding 958,987 1,027,995 1,052,443NAV per Unit ¥1,335.41 ¥1,289.58 ¥1,063.72
Class B EUR HedgedNAV of Unit Class €61,198 €59,174 €54,375Number of Units Outstanding 4,544 4,544 5,044NAV per Unit €13.47 €13.02 €10.78
Class E EURNAV of Unit Class €347,212 €352,622 €550,480Number of Units Outstanding 38,312 40,314 72,409NAV per Unit €9.06 €8.75 €7.60
Class M EUR Hedged**NAV of Unit Class €16,081,946 - -Number of Units Outstanding 1,538,767 - -NAV per Unit €10.45 - -
Class M JPYNAV of Unit Class ¥8,260,674,827 ¥4,464,143,741 ¥3,826,128,003Number of Units Outstanding 5,329,202 3,002,558 3,140,858NAV per Unit ¥1,550.08 ¥1,486.78 ¥1,218.18
*dealing NAV.**This unit class launched on June 23, 2021.
AXA ROSENBERG JAPAN EQUITY ALPHA FUND
NAV* tableAs at September 30, 2021
23

The Fund underperformed its benchmark in the second quarter of 2021, with industry exposures and stock selection the key drivers of theunderperformance.
From a factor perspective, the Fund benefited from its exposure to high dividend yielding companies, which outperformed over the quarter.Although the reward to book to price deteriorated as the quarter unfolded, earnings-based valuation measures held up better, proved positivefor the Fund. Exposure to some of the more liquid companies at the top of the index was also well rewarded.
From an industry standpoint, the Fund benefited from its above-benchmark exposure to a number of export-oriented areas such as cars andtrucks, industrials and instruments. Nevertheless, overweight exposure to industries oriented towards domestic consumption such as retailweighed on returns amid rising levels of COVID-19. Underweight exposure to REITs also provided a negative contribution over the quarter.
These positive and negative industry effects were mirrored in our stock selection result. The Fund benefited from positions in machinerygroup Ebara and semiconductor equipment manufacturer Ferrotec, which featured among the largest positive contributions. Nevertheless,stock selection proved particularly weak in domestic-oriented consumer discretionary and real estate areas. In the former, a position inBelluna, a mail-order company offering clothing and household goods, provided the largest negative contribution over the quarter. A positionin BeNext Yumeshin group, a staffing company, also detracted in the context of limited demand for staff as economic uncertainty persisted.
Moving into the third quarter of the year, the Fund outperformed its benchmark, net of fees and expenses applicable to the A JPY shareclass. Positive results from stock selection drove active returns while industry exposures modestly detracted.
Stock selection proved most positive in areas such as commercial and professional services and transportation. Indeed, the largest positivecontribution came from a position in shipping company Mitsui OSK Lines, which benefited from increased demand and higher shipping rates.
Selection within consumer areas proved more mixed, with positive outcomes from consumer durables and apparel but greater challengeswithin autos and general retailing. In the former group, the Fund’s overweight exposure in Globeride Inc, a manufacturer of sportingequipment, was well rewarded as investors responded positively to rising demand for the company’s products. Conversely, a position inYokohama rubber detracted the most - the tyre manufacturer was affected by cuts in vehicle production by some of its major customers.
Industry exposures provided a headwind for relative performance in areas such as metal products, machinery, and autos. Underweightexposure to some segments of the leisure industry such as restaurants and hotels also detracted as lockdown restrictions were slowly lifted,allowing for a bounce back in activity.
Performance Summary
Performance summary – Class A Units 6 Months to30 September 2021
3 YearsAnnualised
5 YearsAnnualised
InceptionDate
AXA Rosenberg Japan Small Cap Alpha Fund (JPY) 2.32% (0.78%) 7.75% 30-Sep-99MSCI Japan Small Cap 3.47% 3.99% 10.25%Alpha (1.15%) (4.77%) (2.50%)
Past performance is not a reliable indicator of future results.
Performance calculations are net of fees, based on the reinvestment of dividends.
The benchmark, when there is one could be calculated on the basis of net or gross dividend. Please refer to the Prospectus for moreinformation.
Data Source: Benchmark prices are obtained from the relevant benchmark provider. NAVs are calculated by the Administrator of the Trust.
TER
Unit Class ISIN %
A EUR IE00BD007T86 0.96A JPY IE0008366696 0.96A EUR Hedged IE00BD008K68 0.98B EUR IE0031069721 1.66B JPY IE0004354423 1.66E EUR IE0034256440 2.41M JPY IE00B24J4R13 0.16
Methodology
The TER is calculated on an ex-post basis (i.e. based on theactual costs charged), by reference to the fiscal year.
The TER is equal to the ratio of the total operating costs to theaverage NAV. Total operating costs are expenses deducted fromthe assets for the relevant fiscal period. The average NAV iscalculated using the NAV as at each valuation point.
AXA ROSENBERG JAPAN SMALL CAP ALPHA FUND
Investment Manager’s ReportAs at September 30, 2021
24

Ongoing Charges
Unit Class ISIN %
A EUR IE00BD007T86 0.98A JPY IE0008366696 0.98A EUR Hedged IE00BD008K68 1.00B EUR IE0031069721 1.68B JPY IE0004354423 1.68E EUR IE0034256440 2.43M JPY IE00B24J4R13 0.18
Methodology
The OCF is based on expenses for the twelve month period endingAugust 31, 2021. This figure may vary from year to year. As perthe UCITS Directive, it includes stocklending fees and excludesportfolio transaction costs, except in the case of an entry/exitcharge paid by the Fund when buying or selling units in anothercollective investment undertakings.
AXA Investment Managers UK Limited
Date: November 24, 2021
AXA ROSENBERG JAPAN SMALL CAP ALPHA FUND
Investment Manager’s Report (continued)As at September 30, 2021
25

September 30, 2021 March 31, 2021 September 30, 2020
Class A EURNAV of Unit Class €775,778 €784,628 €714,185Number of Units Outstanding 44,081 45,816 45,478NAV per Unit €17.60 €17.13 €15.70
Class A JPYNAV of Unit Class ¥244,888,101 ¥235,190,984 ¥223,325,292Number of Units Outstanding 89,617 88,068 95,711NAV per Unit ¥2,732.60 ¥2,670.56 ¥2,333.34
Class A EUR HedgedNAV of Unit Class €2,593,168 €2,538,371 €17,596Number of Units Outstanding 151,933 151,933 1,200NAV per Unit €17.07 €16.71 €14.66
Class B EURNAV of Unit Class €17,118,284 €17,424,091 €16,397,838Number of Units Outstanding 798,090 831,896 850,737NAV per Unit €21.45 €20.95 €19.27
Class B JPYNAV of Unit Class ¥3,495,857,853 ¥3,509,219,049 ¥3,189,531,011Number of Units Outstanding 1,250,222 1,279,654 1,326,542NAV per Unit ¥2,796.19 ¥2,742.32 ¥2,404.39
Class E EURNAV of Unit Class €443,555 €434,761 €403,679Number of Units Outstanding 23,303 23,303 23,427NAV per Unit €19.03 €18.66 €17.23
Class M JPYNAV of Unit Class ¥2,304,746,027 ¥2,243,417,788 ¥1,952,340,362Number of Units Outstanding 741,305 741,305 741,305NAV per Unit ¥3,109.04 ¥3,026.31 ¥2,633.65
*dealing NAV.
AXA ROSENBERG JAPAN SMALL CAP ALPHA FUND
NAV* tableAs at September 30, 2021
26

The Fund performed in line with its benchmark index, net of fees and expenses applicable to the A USD share class in the second quarterof the year. The focus on attractively valued stocks based on higher earnings yield weighed heavily on returns given the factor’sunderperformance, but the positive exposure to the momentum factor proved beneficial. Also accretive to returns was the tilt towards smallercompanies as such companies bettered the largest index names.
The Fund’s overweight to the materials sector contributed positively, specifically within the metals industry which was supported by risingprices in commodities and raw materials. Positions in Mineral Resources and Fortescue Metals featured among the top stock picks.However, stock selection in aggregate was challenged, driven largely by the financials sector. The largest individual stock detractor was theposition in China Minsheng Bank, whose share price declined after reporting weaker-than-expected annual earnings.
The Fund performed in-line with its benchmark index, net of fees and expenses applicable to the A USD share class for the third quarterof the year. The Fund’s factor footprint was well rewarded, exposure to value stocks based on book assets and higher earnings yield wasfavourable though offset by the exposure to higher dividend yielding stocks. From a quality factor perspective, the portfolio’s tilt towardsstocks with less varied earnings and stocks that were likely to beat their earnings expectations was rewarded. Significant contribution toexcess returns however came from the portfolio’s bias towards smaller companies which outperformed their larger counterparts.
The Fund’s underweight to retail and travel and entertainment contributed positively as rising covid infections dampened sentiment, notowning casino stocks Galaxy Entertainment and Sands China featured among the largest stock contributors to excess returns. Stockselection in healthcare and materials weighed on returns and the largest individual detractor to returns was from an above-benchmark inFortescue Metals. Share prices declined after China cut back on steel production leading to downgrades by analysts, also weighing on theshare price were key staff departures due to breaches of culture found during a strategic review.
Performance Summary
Performance summary – Class A Units 6 Months to30 September 2021
3 YearsAnnualised
5 YearsAnnualised
InceptionDate
AXA Rosenberg Pacific Ex-Japan Equity Alpha Fund (USD) 0.00% 6.32% 7.56% 30-Sep-99MSCI Pacific ex-Japan 0.16% 6.73% 7.73%Alpha (0.16%) (0.41%) (0.17%)
Past performance is not a reliable indicator of future results.
Performance calculations are net of fees, based on the reinvestment of dividends.
The benchmark, when there is one could be calculated on the basis of net or gross dividend. Please refer to the Prospectus for moreinformation.
Data Source: Benchmark prices are obtained from the relevant benchmark provider. NAVs are calculated by the Administrator of the Trust.
TER
Unit Class ISIN %
A USD IE0008366704 0.84A EUR IE00BD008L75 0.83B USD IE0004314401 1.49B EUR IE0031069382 1.48E EUR IE0034277032 2.23M USD IE00B24J4Q06 0.14M EUR IE00BRGCKX13 0.14
Methodology
The TER is calculated on an ex-post basis (i.e. based on theactual costs charged), by reference to the fiscal year.
The TER is equal to the ratio of the total operating costs to theaverage NAV. Total operating costs are expenses deducted fromthe assets for the relevant fiscal period. The average NAV iscalculated using the NAV as at each valuation point.
AXA ROSENBERG PACIFIC EX-JAPAN EQUITY ALPHA FUND
Investment Manager’s ReportAs at September 30, 2021
27

Ongoing Charges
Unit Class ISIN %
A USD IE0008366704 0.85A EUR IE00BD008L75 0.84B USD IE0004314401 1.50B EUR IE0031069382 1.50E EUR IE0034277032 2.25M USD IE00B24J4Q06 0.15M EUR IE00BRGCKX13 0.15
Methodology
The OCF is based on expenses for the twelve month period endingAugust 31, 2021. This figure may vary from year to year. As perthe UCITS Directive, it includes stocklending fees and excludesportfolio transaction costs, except in the case of an entry/exitcharge paid by the Fund when buying or selling units in anothercollective investment undertakings.
AXA Investment Managers UK Limited
Date: November 24, 2021
AXA ROSENBERG PACIFIC EX-JAPAN EQUITY ALPHA FUND
Investment Manager’s Report (continued)As at September 30, 2021
28

September 30, 2021 March 31, 2021 September 30, 2020
Class A USDNAV of Unit Class $22,849,100 $35,310,828 $27,720,151Number of Units Outstanding 451,134 697,169 698,851NAV per Unit $50.65 $50.65 $39.67
Class A EURNAV of Unit Class €3,421,072 €3,369,103 €2,298,241Number of Units Outstanding 219,606 219,328 190,594NAV per Unit €15.58 €15.36 €12.06
Class B USDNAV of Unit Class $21,944,695 $22,599,423 $18,882,211Number of Units Outstanding 449,986 461,919 491,219NAV per Unit $48.77 $48.93 $38.44
Class B EURNAV of Unit Class €27,117,106 €25,760,034 €20,200,044Number of Units Outstanding 647,499 621,741 619,132NAV per Unit €41.88 €41.43 €32.63
Class E EURNAV of Unit Class €721,983 €737,200 €587,171Number of Units Outstanding 19,485 20,038 20,192NAV per Unit €37.05 €36.79 €29.08
Class M USDNAV of Unit Class $44,905,218 $35,954,652 $28,059,753Number of Units Outstanding 791,785 636,210 636,210NAV per Unit $56.71 $56.51 $44.10
Class M EURNAV of Unit Class €14,444,719 €14,193,401 €13,253,272Number of Units Outstanding 900,182 900,182 1,074,797NAV per Unit €16.05 €15.77 €12.33
*dealing NAV.
AXA ROSENBERG PACIFIC EX-JAPAN EQUITY ALPHA FUND
NAV* tableAs at September 30, 2021
29

The Fund was closed in the report period.
TER
Unit Class ISIN %
A EUR IE0033609839 0.50B EUR IE0033609946 0.82M EUR IE00B3DJ3278 0.22S EUR IE00BD5BFH09 0.35
Methodology
The TER is calculated on an ex-post basis (i.e. based on theactual costs charged), by reference to the fiscal year.
The TER is equal to the ratio of the total operating costs to theaverage NAV. Total operating costs are expenses deducted fromthe assets for the relevant fiscal period. The average NAV iscalculated using the NAV as at each valuation point.
Ongoing Charges
Unit Class ISIN %
A EUR IE0033609839 0.52B EUR IE0033609946 0.97M EUR IE00B3DJ3278 0.17S EUR IE00BD5BFH09 0.29
Methodology
The OCF is based on expenses for the twelve month period endingAugust 31, 2021. This figure may vary from year to year. As perthe UCITS Directive, it includes stocklending fees and excludesportfolio transaction costs, except in the case of an entry/exitcharge paid by the Fund when buying or selling units in anothercollective investment undertakings.
AXA Investment Managers UK Limited
Date: November 24, 2021
AXA ROSENBERG PAN-EUROPEAN ENHANCED INDEX EQUITY ALPHA FUND
Investment Manager’s ReportAs at September 30, 2021
30

September 30, 2021** March 31, 2021 September 30, 2020
Class A EURNAV of Unit Class - €3,941,208 €3,316,597Number of Units Outstanding - 146,063 146,063NAV per Unit - €26.98 €22.71
Class B EURNAV of Unit Class - €6,318,404 €5,639,961Number of Units Outstanding - 239,661 253,647NAV per Unit - €26.36 €22.24
Class M EURNAV of Unit Class - €22,542,192 €20,036,503Number of Units Outstanding - 786,350 832,021NAV per Unit - €28.67 €24.08
Class S EURNAV of Unit Class - €3,052,800 €2,578,184Number of Units Outstanding - 260,539 261,750NAV per Unit - €11.72 €9.85
*dealing NAV.**The Fund, including all share classes in issue during the period, terminated with a final dealing day on June 30, 2021.
AXA ROSENBERG PAN-EUROPEAN ENHANCED INDEX EQUITY ALPHA FUND
NAV* tableAs at September 30, 2021
31

The Fund underperformed its benchmark index, in the second quarter of the year. Despite the headwinds to value seen in the quarter, thebalanced factor profile of the Fund meant that the exposure to higher quality companies with less earnings volatility and lower financialleverage was rewarded. Industry exposures and unrewarded residual stock selection offset these positives, however. Among industries,performance was hindered by underweighting the outperforming pharmaceutical group, while an overweight exposure to travel andentertainment was also unrewarded.
Stock selection was unrewarded in aggregate this quarter, particularly the selection of stocks from within the consumer discretionary sector.Here, an underweight to luxury goods firm LVMH was the top detractor from relative returns after shares rose in anticipation of a strongset of results for the first half of 2021, driven by robust demand for its products from the US and China. Elsewhere, underweighting foodproducer Nestlé also weighed on returns as its shares rose on the quarter due to continued positive business momentum and someupgrades from analysts. More positively, holding non-benchmark stock IMI was the top contributor over the quarter; shares in the UK-basedengineering company rose after management raised their growth outlook across its key business divisions.
Moving into the third quarter of the year the Fund underperformed its benchmark over the period. Industry exposures were modestlyunhelpful this quarter, particularly the overweight exposure to transport companies, but unrewarded stock selection was the largest detractorfrom relative returns. This was particularly the case within the industrials sector, where rising materials prices and supply chain issuesweighed on many stocks, including the overweight position in machinery firm Valmet. Similar concerns in addition to broader issuessurrounding the strength of ongoing global growth also put the brakes on the luxury goods sector and holding French luxury group Kering– owner of brands including Saint Laurent, Gucci and Alexander McQueen – weighed on returns this quarter.
Selection of financials helped stem the underperformance, and overweight positions in Dutch insurance firms Aegon and ASR Nederlandadded the most this quarter. Shares in Aegon rallied after it announced a dividend hike in August amid strong busines momentum acrossits key markets. ASR reported similarly upbeat business momentum.
Performance Summary
Performance summary – Class A Units 6 Months to30 September 2021
3 YearsAnnualised
5 YearsAnnualised
InceptionDate
AXA Rosenberg Pan-European Equity Alpha Fund (EUR) 5.99% 3.99% 4.50% 30-Sep-99MSCI Europe 7.25% 7.87% 8.17%Alpha (1.26%) (3.88%) (3.67%)
Past performance is not a reliable indicator of future results.
Performance calculations are net of fees, based on the reinvestment of dividends.
The benchmark, when there is one could be calculated on the basis of net or gross dividend. Please refer to the Prospectus for moreinformation.
Data Source: Benchmark prices are obtained from the relevant benchmark provider. NAVs are calculated by the Administrator of the Trust.
TER
Unit Class ISIN %
A USD IE00B07QVS54 0.85A EUR IE0008365730 0.85B EUR IE0004346098 1.51E EUR IE0034279525 2.22M EUR IE00B24J5126 0.13
Methodology
The TER is calculated on an ex-post basis (i.e. based on theactual costs charged), by reference to the fiscal year.
The TER is equal to the ratio of the total operating costs to theaverage NAV. Total operating costs are expenses deducted fromthe assets for the relevant fiscal period. The average NAV iscalculated using the NAV as at each valuation point.
AXA ROSENBERG PAN-EUROPEAN EQUITY ALPHA FUND
Investment Manager’s ReportAs at September 30, 2021
32

Ongoing Charges
Unit Class ISIN %
A USD IE00B07QVS54 0.88A EUR IE0008365730 0.91B EUR IE0004346098 1.56E EUR IE0034279525 2.31M EUR IE00B24J5126 0.20
Methodology
The OCF is based on expenses for the twelve month period endingAugust 31, 2021. This figure may vary from year to year. As perthe UCITS Directive, it includes stocklending fees and excludesportfolio transaction costs, except in the case of an entry/exitcharge paid by the Fund when buying or selling units in anothercollective investment undertakings.
AXA Investment Managers UK Limited
Date: November 24, 2021
AXA ROSENBERG PAN-EUROPEAN EQUITY ALPHA FUND
Investment Manager’s Report (continued)As at September 30, 2021
33

September 30, 2021 March 31, 2021 September 30, 2020
Class A USDNAV of Unit Class $4,581 $24,525 $20,283Number of Units Outstanding 200 1,120 1,120NAV per Unit $22.90 $21.90 $18.11
Class A EURNAV of Unit Class €31,350,164 €27,043,157 €26,493,400Number of Units Outstanding 1,609,803 1,472,480 1,740,185NAV per Unit €19.47 €18.37 €15.22
Class B EURNAV of Unit Class €7,733,854 €8,487,748 €7,770,384Number of Units Outstanding 565,065 655,447 721,523NAV per Unit €13.69 €12.95 €10.77
Class E EURNAV of Unit Class €18,404 €14,565 €13,160Number of Units Outstanding 1,522 1,268 1,373NAV per Unit €12.09 €11.48 €9.58
Class M EURNAV of Unit Class €10,278,814 €560,436 €496,380Number of Units Outstanding 471,573 27,358 29,334NAV per Unit €21.80 €20.48 €16.92
*dealing NAV.
AXA ROSENBERG PAN-EUROPEAN EQUITY ALPHA FUND
NAV* tableAs at September 30, 2021
34

After a positive first quarter for relative performance the Fund lagged its benchmark in the second. Factor exposures in aggregate contributedpositively, despite the underperformance of the value factor, with the positive quality and momentum exposures being rewarded. Industryexposures proved less helpful, and overweighting insurance and regional banks while underweighting real estate weighed on returns. Withgrowth-focused technology stocks rebounding, stock selection from within the sector was unrewarded this quarter, with an underweight tochip maker NVIDIA and overweight positions in both Hewlett Packard Enterprise unrewarded. Shares of the former rose strongly in responseto a rise in demand for its products amid a global semiconductor shortage, although holding rival chip maker AMD overweight helped offsetthis to a degree. Also beneficial this quarter was the overweight allocation to communication services firm Alphabet, owner of Google, whoseshares continued to reflect positive momentum in its business after reporting first quarter 2021 revenue growth of 34%, handsomely beatinginvestor expectations.
Set against am increasingly volatile backdrop for equity investors, the Fund underperformed in the third quarter of the year. With investorsseeking quality of earnings rather than those that were cheap relative to price, the above-benchmark exposure to the latter factor weighedon returns over the quarter. Also unhelpful was the tilt to smaller companies, which underperformed large in an increasingly risk-offenvironment.
Stock selection was also modestly unrewarded in this environment and the largest detractor this quarter was an overweight exposure toGeneral Motors, which lagged the benchmark as investors weighed the impact of computer chip shortages on slower production andultimately earnings for auto makers. Also unhelpful was an overweight to pharmaceuticals firm Bristol-Myers Squibb, shares in which fellover 11% in September as healthcare stocks in general were affected by concerns that President Biden’s plans to reduce healthcare costswould negatively impact the sector. More positive this quarter was the overweight allocation to software firm Oracle, which reported positiveearnings data and expected growth through 2022, with growth in cloud computing contributing to this. Similarly, the overweight holding ofMonolithic Power Systems added value this quarter, as shares in the manufacturer of high-performance power solutions reported pandemic-induced robust demand in its computing and cloud storage/communications divisions.
Performance Summary
Performance summary – Class A Units 6 Months to30 September 2021
3 YearsAnnualised
5 YearsAnnualised
InceptionDate
AXA Rosenberg US Enhanced Index Equity Alpha Fund (USD) 7.41% 14.38% 15.53% 03-Oct-07S&P 500 8.95% 15.32% 16.23%Alpha (1.54%) (0.94%) (0.70%)
Past performance is not a reliable indicator of future results.
Performance calculations are net of fees, based on the reinvestment of dividends.
The benchmark, when there is one could be calculated on the basis of net or gross dividend. Please refer to the Prospectus for moreinformation.
Data Source: Benchmark prices are obtained from the relevant benchmark provider. NAVs are calculated by the Administrator of the Trust.
TER
Unit Class ISIN %
A USD IE0033609615 0.42A EUR IE00BD008S45 0.42A GBP IE00BD008V73 0.42A EUR Hedged IE00BD008T51 0.44B USD IE0033609722 0.87B EUR IE00B530N462 0.87B EUR Hedged IE00BRGCKS69 0.90E EUR Hedged IE00BD008W80 1.65I USD IE00BZ01QS72 0.31I EUR IE00BZ01QT89 0.32M USD IE00B3DJ3161 0.07M EUR IE00BRGCKT76 0.07M EUR Hedged IE00BZB1J765 0.09
Methodology
The TER is calculated on an ex-post basis (i.e. based on theactual costs charged), by reference to the fiscal year.
The TER is equal to the ratio of the total operating costs to theaverage NAV. Total operating costs are expenses deducted fromthe assets for the relevant fiscal period. The average NAV iscalculated using the NAV as at each valuation point.
AXA ROSENBERG US ENHANCED INDEX EQUITY ALPHA FUND
Investment Manager’s ReportAs at September 30, 2021
35

Ongoing Charges
Unit Class ISIN %
A USD IE0033609615 0.43A EUR IE00BD008S45 0.43A GBP IE00BD008V73 0.43A EUR Hedged IE00BD008T51 0.45B USD IE0033609722 0.88B EUR IE00B530N462 0.88B EUR Hedged IE00BRGCKS69 0.91E EUR Hedged IE00BD008W80 1.64I USD IE00BZ01QS72 0.33I EUR IE00BZ01QT89 0.33M USD IE00B3DJ3161 0.08M EUR IE00BRGCKT76 0.08M EUR Hedged IE00BZB1J765 0.11
Methodology
The OCF is based on expenses for the twelve month period endingAugust 31, 2021. This figure may vary from year to year. As perthe UCITS Directive, it includes stocklending fees and excludesportfolio transaction costs, except in the case of an entry/exitcharge paid by the Fund when buying or selling units in anothercollective investment undertakings.
AXA Investment Managers UK Limited
Date: November 24, 2021
AXA ROSENBERG US ENHANCED INDEX EQUITY ALPHA FUND
Investment Manager’s Report (continued)As at September 30, 2021
36
September 30, 2021 March 31, 2021 September 30, 2020
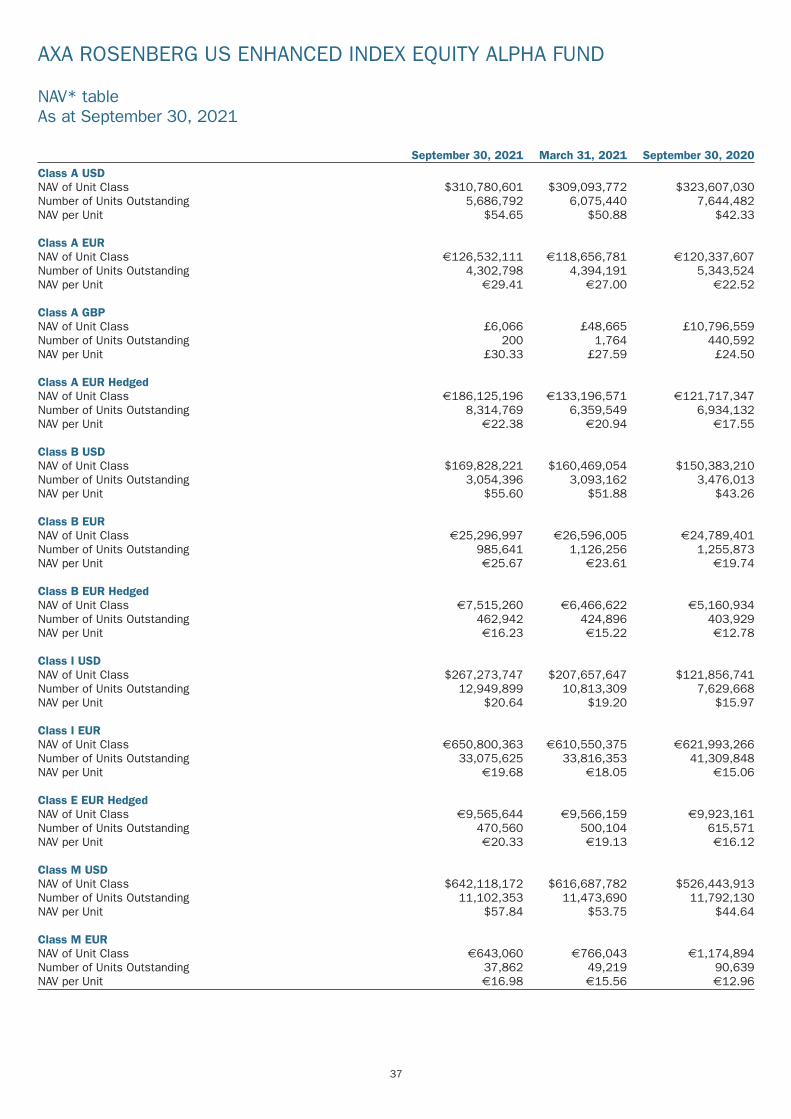
Class A USDNAV of Unit Class $310,780,601 $309,093,772 $323,607,030Number of Units Outstanding 5,686,792 6,075,440 7,644,482NAV per Unit $54.65 $50.88 $42.33
Class A EURNAV of Unit Class €126,532,111 €118,656,781 €120,337,607Number of Units Outstanding 4,302,798 4,394,191 5,343,524NAV per Unit €29.41 €27.00 €22.52
Class A GBPNAV of Unit Class £6,066 £48,665 £10,796,559Number of Units Outstanding 200 1,764 440,592NAV per Unit £30.33 £27.59 £24.50
Class A EUR HedgedNAV of Unit Class €186,125,196 €133,196,571 €121,717,347Number of Units Outstanding 8,314,769 6,359,549 6,934,132NAV per Unit €22.38 €20.94 €17.55
Class B USDNAV of Unit Class $169,828,221 $160,469,054 $150,383,210Number of Units Outstanding 3,054,396 3,093,162 3,476,013NAV per Unit $55.60 $51.88 $43.26
Class B EURNAV of Unit Class €25,296,997 €26,596,005 €24,789,401Number of Units Outstanding 985,641 1,126,256 1,255,873NAV per Unit €25.67 €23.61 €19.74
Class B EUR HedgedNAV of Unit Class €7,515,260 €6,466,622 €5,160,934Number of Units Outstanding 462,942 424,896 403,929NAV per Unit €16.23 €15.22 €12.78
Class I USDNAV of Unit Class $267,273,747 $207,657,647 $121,856,741Number of Units Outstanding 12,949,899 10,813,309 7,629,668NAV per Unit $20.64 $19.20 $15.97
Class I EURNAV of Unit Class €650,800,363 €610,550,375 €621,993,266Number of Units Outstanding 33,075,625 33,816,353 41,309,848NAV per Unit €19.68 €18.05 €15.06
Class E EUR HedgedNAV of Unit Class €9,565,644 €9,566,159 €9,923,161Number of Units Outstanding 470,560 500,104 615,571NAV per Unit €20.33 €19.13 €16.12
Class M USDNAV of Unit Class $642,118,172 $616,687,782 $526,443,913Number of Units Outstanding 11,102,353 11,473,690 11,792,130NAV per Unit $57.84 $53.75 $44.64
Class M EURNAV of Unit Class €643,060 €766,043 €1,174,894Number of Units Outstanding 37,862 49,219 90,639NAV per Unit €16.98 €15.56 €12.96
AXA ROSENBERG US ENHANCED INDEX EQUITY ALPHA FUND
NAV* tableAs at September 30, 2021
37

September 30, 2021 March 31, 2021 September 30, 2020
Class M EUR HedgedNAV of Unit Class €179,018,915 €179,729,914 €130,809,836Number of Units Outstanding 9,600,844 10,323,564 8,985,374NAV per Unit €18.65 €17.41 €14.56
*dealing NAV.
AXA ROSENBERG US ENHANCED INDEX EQUITY ALPHA FUND
NAV* table (continued)As at September 30, 2021
38

After a strong first quarter 2021 for relative performance the Fund lagged its benchmark in the second. Factor exposures in aggregatecontributed positively, despite the underperformance of the value factor, with the positive quality and momentum exposures being rewarded.Industry exposures proved less helpful, and overweighting insurance and regional banks while underweighting real estate weighed onreturns, as did the underweight exposure to semiconductors, which were resurgent amid a global shortage of computer chips. Indeed, withgrowth-focused technology stocks rebounding stock selection from within the sector was unrewarded this quarter, with an underweight tochip maker NVIDIA and overweight positions in both Hewlett Packard Enterprise and HP Inc unrewarded. Shares in the former fell after itissued revised earnings guidance mid-June, which caused some analysts to revise down their expectations for the stock. More positively,the top contributor this quarter was an overweight holding of distributed power firm Generac, whose shares hit an all-time high June amida significant increase in demand for its generators as heatwaves in the US saw utility firms warn of summer-time power outages.
Set against an increasingly volatile backdrop for equity investors, the Fund underperformed in the third quarter of the year. With investorsseeking quality of earnings rather than those that were cheap relative to price, the above-benchmark exposure to the latter factor weighedon returns over the quarter. Also unhelpful was the tilt to smaller companies, which underperformed large in an increasingly risk-offenvironment.
Stock selection was also modestly unrewarded in this environment and the largest detractor this quarter was an overweight exposure toGeneral Motors, which lagged the benchmark as investors weighed the impact of computer chip shortages on slower production andultimately earnings for auto makers. Similar sentiment weighed on the holding of computer firm HP, shares in which fell over the quarterdespite reporting positive earnings data in September, with investor focus shifting to expected increases in commodity and logistics costsin the fourth quarter of this year. Underweighting Netflix was also unhelpful this quarter as shares in the streaming giant hit all-time highsfollowing reports that the new Squid Game series was set to become its most viewed show. More positively, the overweight position in WestPharmaceutical Services – a provider or medical equipment including delivery systems for injectable drugs – was rewarded as the firmreported another quarter of growing earnings and improving margins. Finally, owning American International Group overweight also provedpositive after the property and casualty insurer reported one of its most profitable quarters in some time, causing its shares to rally asinvestors and analysts alike responding positively to the news.
Performance Summary
Performance summary – Class A Units 6 Months to30 September 2021
3 YearsAnnualised
5 YearsAnnualised
InceptionDate
AXA Rosenberg US Equity Alpha Fund (USD) 6.27% 12.31% 13.90% 30-Sep-99S&P 500 8.95% 15.32% 16.23%Alpha (2.68%) (3.01%) (2.33%)
Past performance is not a reliable indicator of future results.
Performance calculations are net of fees, based on the reinvestment of dividends.
The benchmark, when there is one could be calculated on the basis of net or gross dividend. Please refer to the Prospectus for moreinformation.
Data Source: Benchmark prices are obtained from the relevant benchmark provider. NAVs are calculated by the Administrator of the Trust.
TER
Unit Class ISIN %
A USD IE0008365516 0.78A EUR Hedged IE00B02YQP67 0.80B USD IE0004345025 1.43B EUR IE0031069275 1.43B EUR Hedged IE00B02YQR81 1.46E EUR Hedged IE00B02YQS98 2.20M USD IE00B24J4T37 0.08
Methodology
The TER is calculated on an ex-post basis (i.e. based on theactual costs charged), by reference to the fiscal year.
The TER is equal to the ratio of the total operating costs to theaverage NAV. Total operating costs are expenses deducted fromthe assets for the relevant fiscal period. The average NAV iscalculated using the NAV as at each valuation point.
AXA ROSENBERG US EQUITY ALPHA FUND
Investment Manager’s ReportAs at September 30, 2021
39

Ongoing Charges
Unit Class ISIN %
A USD IE0008365516 0.80A EUR Hedged IE00B02YQP67 0.82B USD IE0004345025 1.43B EUR IE0031069275 1.44B EUR Hedged IE00B02YQR81 1.47E EUR Hedged IE00B02YQS98 2.22M USD IE00B24J4T37 0.10
Methodology
The OCF is based on expenses for the twelve month period endingAugust 31, 2021. This figure may vary from year to year. As perthe UCITS Directive, it includes stocklending fees and excludesportfolio transaction costs, except in the case of an entry/exitcharge paid by the Fund when buying or selling units in anothercollective investment undertakings.
AXA Investment Managers UK Limited
Date: November 24, 2021
AXA ROSENBERG US EQUITY ALPHA FUND
Investment Manager’s Report (continued)As at September 30, 2021
40

September 30, 2021 March 31, 2021 September 30, 2020
Class A USDNAV of Unit Class $556,510,969 $427,892,246 $296,500,355Number of Units Outstanding 11,511,614 9,406,949 8,125,064NAV per Unit $48.34 $45.49 $36.49
Class A EUR HedgedNAV of Unit Class €73,474,114 €40,509,810 €28,292,752Number of Units Outstanding 2,557,069 1,491,086 1,288,589NAV per Unit €28.73 €27.17 €21.96
Class B USDNAV of Unit Class $34,150,491 $28,416,235 $13,421,556Number of Units Outstanding 987,556 870,496 510,864NAV per Unit $34.58 $32.64 $26.27
Class B EURNAV of Unit Class €93,975,014 €86,149,489 €86,552,457Number of Units Outstanding 3,180,501 3,132,205 3,900,286NAV per Unit €29.55 €27.50 €22.19
Class B EUR HedgedNAV of Unit Class €9,899,924 €9,483,117 €9,077,653Number of Units Outstanding 468,854 473,402 559,056NAV per Unit €21.12 €20.03 €16.24
Class E EUR HedgedNAV of Unit Class €3,340,415 €1,259,608 €913,412Number of Units Outstanding 109,374 43,304 38,613NAV per Unit €30.54 €29.09 €23.66
Class M USDNAV of Unit Class $271,111,534 $256,983,092 $207,024,961Number of Units Outstanding 5,017,123 5,072,027 5,111,009NAV per Unit $54.04 $50.67 $40.51
*dealing NAV.
AXA ROSENBERG US EQUITY ALPHA FUND
NAV* tableAs at September 30, 2021
41

Notes
AXA RosenbergAll-Country AsiaPacific Ex-Japan
Equity AlphaFund*
USD
AXA Rosenberg AllCountry Asia
Pacific Ex-JapanSmall Cap Alpha
FundUSD
AXA RosenbergEurobloc Equity
AlphaFundEUR
AXA RosenbergGlobal Emerging
MarketsEquity Alpha Fund
USDIncomeInterest income - - - -Dividend income 139,408 4,044,096 2,398,458 2,003,823Securities lending income 8 4 14 6,090 -Other income 882 - 10,619 1,009Net gain/(loss) on investments and foreign currency 4 96,311 3,887,963 6,518,336 (6,259,375)Total Net Income/(Loss) 236,605 7,932,073 8,933,503 (4,254,543)
ExpensesManagement fees 5 (8,998) (905,353) (681,173) (439,943)Custody fees 5 (18,774) (140,175) (15,788) (79,325)Administration fees 5 (41,771) (52,134) (23,870) (19,697)Audit fees (423) (2,370) (751) (1,203)Trustee fees 5 (347) (7,983) (5,851) (4,606)Legal and professional fees (31) (1,720) (1,084) (1,063)Other expenses (4,793) (58,166) (25,709) (15,759)Total Operating Expenses (75,137) (1,167,901) (754,226) (561,596)
Operating Profit/(Loss) 161,468 6,764,172 8,179,277 (4,816,139)
Finance CostInterest paid (24) (6,463) (3,404) (2,165)
(24) (6,463) (3,404) (2,165)
Profit/(Loss) for the financial period before tax 161,444 6,757,709 8,175,873 (4,818,304)Withholding tax on dividends and other investment income (14,484) (429,408) (183,117) (260,670)Capital gains tax 5,219 (1,152,169) - (314,673)
Net movement in net assets from operations attributable to holdersof redeemable participating units 152,179 5,176,132 7,992,756 (5,393,647)
*AXA Rosenberg All-Country Asia Pacific Ex-Japan Equity Alpha Fund terminated on July 30, 2021.
All amounts arose solely from continuing operations with the exception of AXA Rosenberg All Country Asia Pacific Ex-Japan Equity Alpha Fund, AXA Rosenberg Japan Enhanced Index Equity Alpha Fund and AXA Rosenberg Pan-EuropeanEnhanced Index Equity Alpha Fund, please refer to Note 2 of the financial statements for additional information. There were no recognised gains or losses other than those dealt with in the Statement of Comprehensive Income.
AXA ROSENBERG EQUITY ALPHA TRUST
Statement of Comprehensive IncomeFor the period ended September 30, 2021
The accompanying notes are an integral part of these financial statements.
42

Notes
AXA RosenbergGlobal Equity
Alpha FundUSD
AXA RosenbergGlobal Small Cap
Alpha FundUSD
AXA RosenbergJapan Enhanced
IndexEquity Alpha
Fund*JPY
AXA RosenbergJapan Equity
Alpha FundJPY
IncomeInterest income - 54,640 53,017 -Dividend income 6,963,077 2,391,034 12,023,108 220,870,293Securities lending income 8 34,781 5,092 - 1,273,781Other income 14,947 868 491,736 2,699,354Net gain/(loss) on investments and foreign currency 4 27,150,055 6,082,563 (63,376,312) 616,367,854Total Net Income/(Loss) 34,162,860 8,534,197 (50,808,451) 841,211,282
ExpensesManagement fees 5 (3,342,300) (1,055,928) (3,399,923) (48,080,686)Custody fees 5 (36,342) (17,772) (1,228,833) (2,194,738)Administration fees 5 (98,106) (54,167) (5,997,026) (4,455,622)Audit fees (5,437) (3,067) (212,701) (227,048)Trustee fees 5 (29,625) (10,871) (261,078) (844,570)Legal and professional fees (6,449) (1,523) (96,610) (17,078)Other expenses (110,480) (36,233) (747,590) (3,428,084)Total Operating Expenses (3,628,739) (1,179,561) (11,943,761) (59,247,826)
Operating Profit/(Loss) 30,534,121 7,354,636 (62,752,212) 781,963,456
Finance CostInterest paid (9,862) (16,413) (627,667) (862,652)
(9,862) (16,413) (627,667) (862,652)
Profit/(Loss) for the financial period before tax 30,524,259 7,338,223 (63,379,879) 781,100,804Withholding tax on dividends and other investment income (1,149,237) (444,940) (1,774,342) (33,130,554)
Net movement in net assets from operations attributable to holdersof redeemable participating units 29,375,022 6,893,283 (65,154,221) 747,970,250
*AXA Rosenberg Japan Enhanced Index Equity Alpha Fund terminated on June 30, 2021.
All amounts arose solely from continuing operations with the exception of AXA Rosenberg All Country Asia Pacific Ex-Japan Equity Alpha Fund, AXA Rosenberg Japan Enhanced Index Equity Alpha Fund and AXA Rosenberg Pan-EuropeanEnhanced Index Equity Alpha Fund, please refer to Note 2 of the financial statements for additional information. There were no recognised gains or losses other than those dealt with in the Statement of Comprehensive Income.
AXA ROSENBERG EQUITY ALPHA TRUST
Statement of Comprehensive Income (continued)For the period ended September 30, 2021
The accompanying notes are an integral part of these financial statements.
43

Notes
AXA RosenbergJapan Small Cap
Alpha FundJPY
AXA RosenbergPacific Ex-Japan
Equity AlphaFundUSD
AXA RosenbergPan-European
Enhanced IndexEquity Alpha
Fund*EUR
AXA RosenbergPan-EuropeanEquity Alpha
FundEUR
IncomeInterest income - - 684 -Dividend income 98,740,722 4,126,631 464,281 787,766Securities lending income 8 625,691 67 - 2,909Other income 1,496,927 3,448 - 9,690Net gain/(loss) on investments and foreign currency 4 149,548,560 (3,124,479) 1,668,756 1,604,955Total Net Income 250,411,900 1,005,667 2,133,721 2,405,320
ExpensesManagement fees 5 (45,350,307) (510,712) (16,841) (159,114)Custody fees 5 (1,647,734) (27,725) (6,847) (9,919)Administration fees 5 (2,712,456) (39,620) (31,457) (11,689)Audit fees (42,609) (1,177) (1,076) (209)Trustee fees 5 (429,455) (7,658) (885) (2,176)Legal and professional fees (89,641) (1,562) (261) 4,170Other expenses (1,776,323) (24,205) (5,226) (5,578)Total Operating Expenses (52,048,525) (612,659) (62,593) (184,515)
Operating Profit 198,363,375 393,008 2,071,128 2,220,805
Finance CostInterest paid (183,248) (2,666) (4,986) (2,937)
(183,248) (2,666) (4,986) (2,937)
Profit for the financial period before tax 198,180,127 390,342 2,066,142 2,217,868Withholding tax on dividends and other investment income (14,807,064) (65,694) (82,206) (60,003)
Net movement in net assets from operations attributable to holdersof redeemable participating units 183,373,063 324,648 1,983,936 2,157,865
*AXA Rosenberg Pan-European Enhanced Index Equity Alpha Fund terminated on June 30, 2021.
All amounts arose solely from continuing operations with the exception of AXA Rosenberg All Country Asia Pacific Ex-Japan Equity Alpha Fund, AXA Rosenberg Japan Enhanced Index Equity Alpha Fund and AXA Rosenberg Pan-EuropeanEnhanced Index Equity Alpha Fund, please refer to Note 2 of the financial statements for additional information. There were no recognised gains or losses other than those dealt with in the Statement of Comprehensive Income.
AXA ROSENBERG EQUITY ALPHA TRUST
Statement of Comprehensive Income (continued)For the period ended September 30, 2021
The accompanying notes are an integral part of these financial statements.
44
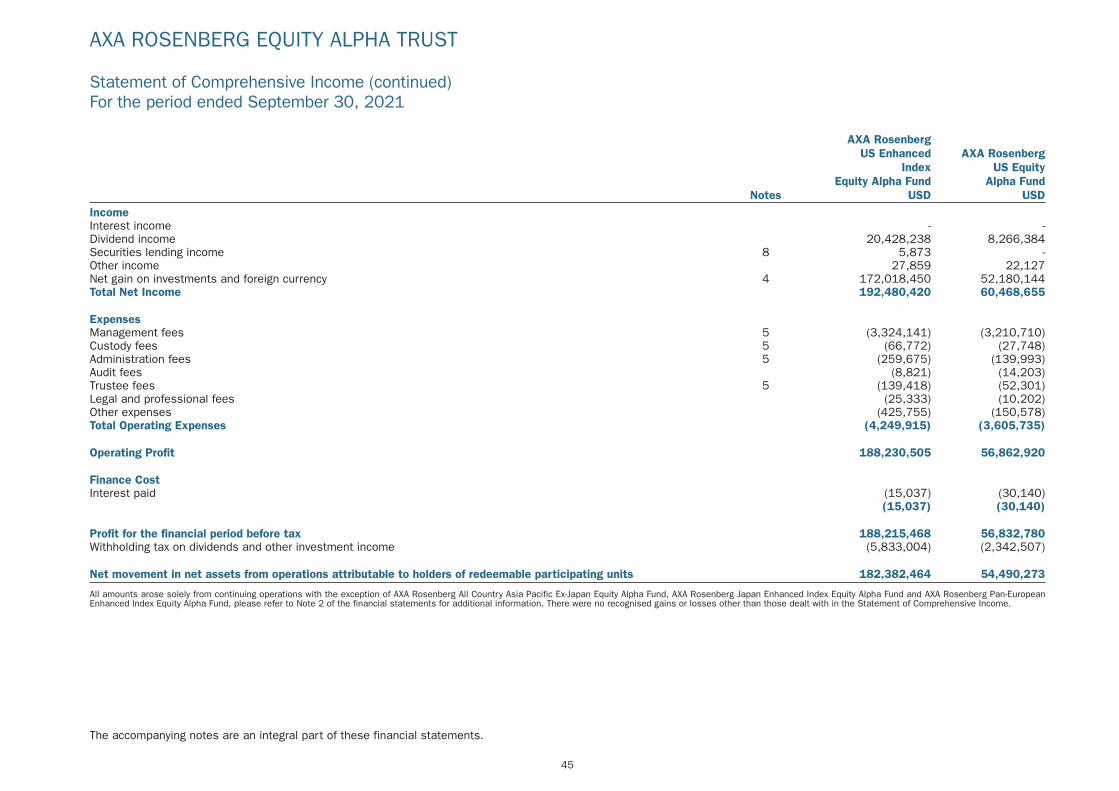
Notes
AXA RosenbergUS Enhanced
IndexEquity Alpha Fund
USD
AXA RosenbergUS Equity
Alpha FundUSD
IncomeInterest income - -Dividend income 20,428,238 8,266,384Securities lending income 8 5,873 -Other income 27,859 22,127Net gain on investments and foreign currency 4 172,018,450 52,180,144Total Net Income 192,480,420 60,468,655
ExpensesManagement fees 5 (3,324,141) (3,210,710)Custody fees 5 (66,772) (27,748)Administration fees 5 (259,675) (139,993)Audit fees (8,821) (14,203)Trustee fees 5 (139,418) (52,301)Legal and professional fees (25,333) (10,202)Other expenses (425,755) (150,578)Total Operating Expenses (4,249,915) (3,605,735)
Operating Profit 188,230,505 56,862,920
Finance CostInterest paid (15,037) (30,140)
(15,037) (30,140)
Profit for the financial period before tax 188,215,468 56,832,780Withholding tax on dividends and other investment income (5,833,004) (2,342,507)
Net movement in net assets from operations attributable to holders of redeemable participating units 182,382,464 54,490,273
All amounts arose solely from continuing operations with the exception of AXA Rosenberg All Country Asia Pacific Ex-Japan Equity Alpha Fund, AXA Rosenberg Japan Enhanced Index Equity Alpha Fund and AXA Rosenberg Pan-EuropeanEnhanced Index Equity Alpha Fund, please refer to Note 2 of the financial statements for additional information. There were no recognised gains or losses other than those dealt with in the Statement of Comprehensive Income.
AXA ROSENBERG EQUITY ALPHA TRUST
Statement of Comprehensive Income (continued)For the period ended September 30, 2021
The accompanying notes are an integral part of these financial statements.
45

Notes
AXA RosenbergAll-Country AsiaPacific Ex-Japan
Equity Alpha FundUSD
AXA Rosenberg AllCountry Asia
Pacific Ex-JapanSmall Cap Alpha
FundUSD
AXA RosenbergEurobloc Equity
AlphaFundEUR
AXA RosenbergGlobal Emerging
MarketsEquity Alpha Fund
USDIncomeInterest income - - - 135Dividend income 400,484 2,382,143 1,655,151 1,382,898Securities lending income 8 - 1,110 8,671 -Other income 27 3,380 1,883 962Net gain on investments and foreign currency 4 4,270,583 32,637,267 12,223,182 14,756,512Total Net Income 4,671,094 35,023,900 13,888,887 16,140,507
ExpensesManagement fees 5 (27,372) (595,787) (519,953) (305,604)Custody fees 5 (21,043) (109,480) (19,908) (42,994)Administration fees 5 (4,544) (31,263) (17,664) (12,371)Audit fees (482) (145) (2,034) (2,099)Trustee fees 5 (483) (4,015) (2,787) (2,660)Legal and professional fees (298) (1,504) (1,384) (936)Other expenses (12,440) (28,260) (16,512) (11,378)Total Operating Expenses (66,662) (770,454) (580,242) (378,042)
Operating Profit 4,604,432 34,253,446 13,308,645 15,762,465
Finance CostInterest paid (303) (1,514) (2,559) (3,014)
(303) (1,514) (2,559) (3,014)
Profit for the financial period before tax 4,604,129 34,251,932 13,306,086 15,759,451Withholding tax on dividends and other investment income (41,851) (262,378) (162,608) (177,657)Capital gains tax 24,999 (66) - 16,735
Net movement in net assets from operations attributable to holdersof redeemable participating units 4,587,277 33,989,488 13,143,478 15,598,529
All amounts arose solely from continuing operations. There were no recognised gains or losses other than those dealt with in the Statement of Comprehensive Income.
AXA ROSENBERG EQUITY ALPHA TRUST
Statement of Comprehensive Income (continued)For the period ended September 30, 2020
The accompanying notes are an integral part of these financial statements.
46

Notes
AXA RosenbergGlobal Equity
Alpha FundUSD
AXA RosenbergGlobal Small Cap
Alpha FundUSD
AXA RosenbergJapan Enhanced
IndexEquity Alpha Fund
JPY
AXA RosenbergJapan Equity
Alpha FundJPY
IncomeInterest income - 6,647 - -Dividend income 5,017,484 1,462,186 93,699,612 128,195,083Securities lending income 8 42,965 14,622 620,511 1,141,787Other income 6,437 - 235,007 169,537Net gain on investments and foreign currency 4 90,504,563 31,273,258 1,431,984,579 1,277,274,575Total Net Income 95,571,449 32,756,713 1,526,539,709 1,406,780,982
ExpensesManagement fees 5 (2,307,473) (590,926) (8,386,705) (37,251,866)Custody fees 5 (27,392) (25,377) (1,997,167) (1,643,306)Administration fees 5 (80,238) (39,226) (1,795,836) (2,969,474)Audit fees (12,549) (1,784) (157,811) (270,077)Trustee fees 5 (19,031) (4,377) (397,521) (409,211)Legal and professional fees (6,696) (1,708) (163,655) (93,131)Other expenses (93,683) (73,126) (1,748,259) (1,816,919)Total Operating Expenses (2,547,062) (736,524) (14,646,954) (44,453,984)
Operating Profit 93,024,387 32,020,189 1,511,892,755 1,362,326,998
Finance CostInterest paid (3,880) (4,020) (145,449) (121,484)
(3,880) (4,020) (145,449) (121,484)
Profit for the financial period before tax 93,020,507 32,016,169 1,511,747,306 1,362,205,514Withholding tax on dividends and other investment income (1,033,153) (199,444) (14,054,944) (19,229,259)
Net movement in net assets from operations attributable to holdersof redeemable participating units 91,987,354 31,816,725 1,497,692,362 1,342,976,255
All amounts arose solely from continuing operations. There were no recognised gains or losses other than those dealt with in the Statement of Comprehensive Income.
AXA ROSENBERG EQUITY ALPHA TRUST
Statement of Comprehensive Income (continued)For the period ended September 30, 2020
The accompanying notes are an integral part of these financial statements.
47

Notes
AXA RosenbergJapan Small Cap
Alpha FundJPY
AXA RosenbergPacific Ex-Japan
Equity AlphaFundUSD
AXA RosenbergPan-European
Enhanced IndexEquity Alpha Fund
EUR
AXA RosenbergPan-EuropeanEquity Alpha
FundEUR
IncomeInterest income - - - -Dividend income 79,459,994 2,680,194 475,356 584,371Securities lending income 8 1,089,247 366 1,478 3,415Other income 181,430 2,490 623 888Net gain on investments and foreign currency 4 1,065,356,281 26,333,188 3,223,036 3,490,971Total Net Income 1,146,086,952 29,016,238 3,700,493 4,079,645
ExpensesManagement fees 5 (38,760,578) (412,431) (30,355) (151,912)Custody fees 5 (1,632,850) (21,061) (8,960) (15,196)Administration fees 5 (2,633,764) (28,973) (6,285) (8,614)Audit fees (128,457) (3,013) (891) (439)Trustee fees 5 (256,901) (4,705) (1,344) (1,237)Legal and professional fees (117,032) (1,872) (500) (1,621)Other expenses (1,310,261) (22,612) (5,726) (6,345)Total Operating Expenses (44,839,843) (494,667) (54,061) (185,364)
Operating Profit 1,101,247,109 28,521,571 3,646,432 3,894,281
Finance CostInterest paid (93,282) (65) (920) (1,562)
(93,282) (65) (920) (1,562)
Profit for the financial period before tax 1,101,153,827 28,521,506 3,645,512 3,892,719Withholding tax on dividends and other investment income (11,914,385) (53,383) (56,103) (78,497)
Net movement in net assets from operations attributable to holdersof redeemable participating units 1,089,239,442 28,468,123 3,589,409 3,814,222
All amounts arose solely from continuing operations. There were no recognised gains or losses other than those dealt with in the Statement of Comprehensive Income.
AXA ROSENBERG EQUITY ALPHA TRUST
Statement of Comprehensive Income (continued)For the period ended September 30, 2020
The accompanying notes are an integral part of these financial statements.
48

Notes
AXA RosenbergUS Enhanced
IndexEquity Alpha Fund
USD
AXA RosenbergUS Equity
Alpha FundUSD
IncomeInterest income 390 -Dividend income 22,698,240 6,464,984Securities lending income 8 20,903 4,376Other income 42,921 12,357Net gain on investments and foreign currency 4 586,887,204 140,425,311Total Net Income 609,649,658 146,907,028
ExpensesManagement fees 5 (2,985,642) (1,793,729)Custody fees 5 (57,962) (18,383)Administration fees 5 (220,796) (103,617)Audit fees (60,120) (16,593)Trustee fees 5 (91,144) (24,135)Legal and professional fees (36,325) (9,646)Other expenses (458,494) (113,409)Total Operating Expenses (3,910,483) (2,079,512)
Operating Profit 605,739,175 144,827,516
Finance CostInterest paid (4,099) -
(4,099) -
Profit for the financial period before tax 605,735,076 144,827,516Withholding tax on dividends and other investment income (6,381,170) (1,786,360)
Net movement in net assets from operations attributable to holders of redeemable participating units 599,353,906 143,041,156
All amounts arose solely from continuing operations. There were no recognised gains or losses other than those dealt with in the Statement of Comprehensive Income.
AXA ROSENBERG EQUITY ALPHA TRUST
Statement of Comprehensive Income (continued)For the period ended September 30, 2020
The accompanying notes are an integral part of these financial statements.
49

AXA RosenbergAll-Country AsiaPacific Ex-Japan
Equity AlphaFund*
USD
AXA Rosenberg AllCountry Asia
Pacific Ex-JapanSmall Cap Alpha
FundUSD
AXA RosenbergEurobloc Equity
AlphaFundEUR
AXA RosenbergGlobal Emerging
MarketsEquity Alpha Fund
USDAssetsFinancial assets at fair value through profit or loss:Investments at fair value 18,755 138,991,589 119,408,935 86,540,320Unrealised gain on forward foreign currency exchange contracts - 2,341 - 178
Cash at bank 40,473 3,974,459 363,588 704,262Due from brokers - 14,766 - -Subscriptions receivable 853 1,901,639 - 13,237Dividends receivable - 334,337 247,979 153,437Securities lending income receivable - 7,156 7,446 -Total Assets 60,081 145,226,287 120,027,948 87,411,434
LiabilitiesFinancial liabilities at fair value through profit or loss:Unrealised loss on forward foreign currency exchange contracts - (50,001) - (1,966)
Bank overdraft - - - -Due to brokers (18,755) (1,314,579) - -Redemptions payable - (2,947,952) (56,141) (29,746)Accrued expenses (41,326) (914,508) (145,060) (386,037)Total Liabilities (excluding net assets attributable to holders ofredeemable participating units) (60,081) (5,227,040) (201,201) (417,749)
Net assets attributable to holders of redeemable participating units - 139,999,247 119,826,747 86,993,685
*AXA Rosenberg All-Country Asia Pacific Ex-Japan Equity Alpha Fund terminated on July 30, 2021.
AXA ROSENBERG EQUITY ALPHA TRUST
Statement of Financial PositionAs at September 30, 2021
The accompanying notes are an integral part of these financial statements.
50

AXA RosenbergGlobal Equity
Alpha FundUSD
AXA RosenbergGlobal Small Cap
Alpha FundUSD
AXA RosenbergJapan Enhanced
IndexEquity Alpha
Fund*JPY
AXA RosenbergJapan Equity
Alpha FundJPY
AssetsFinancial assets at fair value through profit or loss:Investments at fair value 583,607,346 212,587,053 - 20,557,723,267Unrealised gain on forward foreign currency exchange contracts - 62,007 - 239,647
Cash at bank 4,185,584 2,577,078 6,532,276 221,527,842Subscriptions receivable 583,765 487,775 - 3,962,993Dividends receivable 1,344,367 415,849 - 152,714,146Securities lending income receivable 40,186 15,009 - 1,638,987Total Assets 589,761,248 216,144,771 6,532,276 20,937,806,882
LiabilitiesFinancial liabilities at fair value through profit or loss:Unrealised loss on forward foreign currency exchange contracts - (66,588) - (14,539,800)
Bank overdraft - - - -Due to brokers - - - -Redemptions payable (525,838) (98,608) - (24,680,535)Accrued expenses (669,738) (235,708) (6,532,276) (12,999,892)Total Liabilities (excluding net assets attributable to holders ofredeemable participating units) (1,195,576) (400,904) (6,532,276) (52,220,227)
Net assets attributable to holders of redeemable participating units 588,565,672 215,743,867 - 20,885,586,655
*AXA Rosenberg Japan Enhanced Index Equity Alpha Fund terminated on June 30, 2021.
AXA ROSENBERG EQUITY ALPHA TRUST
Statement of Financial Position (continued)As at September 30, 2021
The accompanying notes are an integral part of these financial statements.
51

AXA RosenbergJapan Small Cap
Alpha FundJPY
AXA RosenbergPacific Ex-Japan
Equity AlphaFundUSD
AXA RosenbergPan-European
Enhanced IndexEquity Alpha
Fund*EUR
AXA RosenbergPan-EuropeanEquity Alpha
FundEUR
AssetsFinancial assets at fair value through profit or loss:Investments at fair value 8,641,158,400 141,011,181 - 49,058,268Unrealised gain on forward foreign currency exchange contracts 28,038 - - -
Cash at bank 72,282,787 1,334,472 32,966 271,141Due from brokers - 4,500 - -Subscriptions receivable 4,575,461 23,737 - 4,848Dividends receivable 65,467,101 458,690 - 103,091Securities lending income receivable 1,344,296 4,037 - 3,081Total Assets 8,784,856,083 142,836,617 32,966 49,440,429
LiabilitiesFinancial liabilities at fair value through profit or loss:Unrealised loss on forward foreign currency exchange contracts (2,305,327) - - -
Bank overdraft - - - -Due to brokers - - - -Redemptions payable (19,476,743) (50,040) - (18,336)Accrued expenses (11,025,399) (117,894) (32,966) (36,905)Total Liabilities (excluding net assets attributable to holders ofredeemable participating units) (32,807,469) (167,934) (32,966) (55,241)
Net assets attributable to holders of redeemable participating units 8,752,048,614 142,668,683 - 49,385,188
*AXA Rosenberg Pan-European Enhanced Index Equity Alpha Fund terminated on June 30, 2021.
AXA ROSENBERG EQUITY ALPHA TRUST
Statement of Financial Position (continued)As at September 30, 2021
The accompanying notes are an integral part of these financial statements.
52

AXA RosenbergUS Enhanced
IndexEquity Alpha Fund
USD
AXA RosenbergUS Equity
Alpha FundUSD
AssetsFinancial assets at fair value through profit or loss:Investments at fair value 2,750,317,879 1,067,061,563Unrealised gain on forward foreign currency exchange contracts 549,246 71,761
Cash at bank 13,848,046 7,847,849Subscriptions receivable 14,835,706 831,983Dividends receivable 1,400,773 692,515Securities lending income receivable 102,408 12,510Total Assets 2,781,054,058 1,076,518,181
LiabilitiesFinancial liabilities at fair value through profit or loss:Unrealised loss on forward foreign currency exchange contracts (10,332,870) (2,239,550)
Bank overdraft - -Due to brokers - -Redemptions payable (5,584,088) (2,368,946)Accrued expenses (1,195,809) (726,636)Total Liabilities (excluding net assets attributable to holders ofredeemable participating units) (17,112,767) (5,335,132)
Net assets attributable to holders of redeemable participating units 2,763,941,291 1,071,183,049
AXA ROSENBERG EQUITY ALPHA TRUST
Statement of Financial Position (continued)As at September 30, 2021
The accompanying notes are an integral part of these financial statements.
53
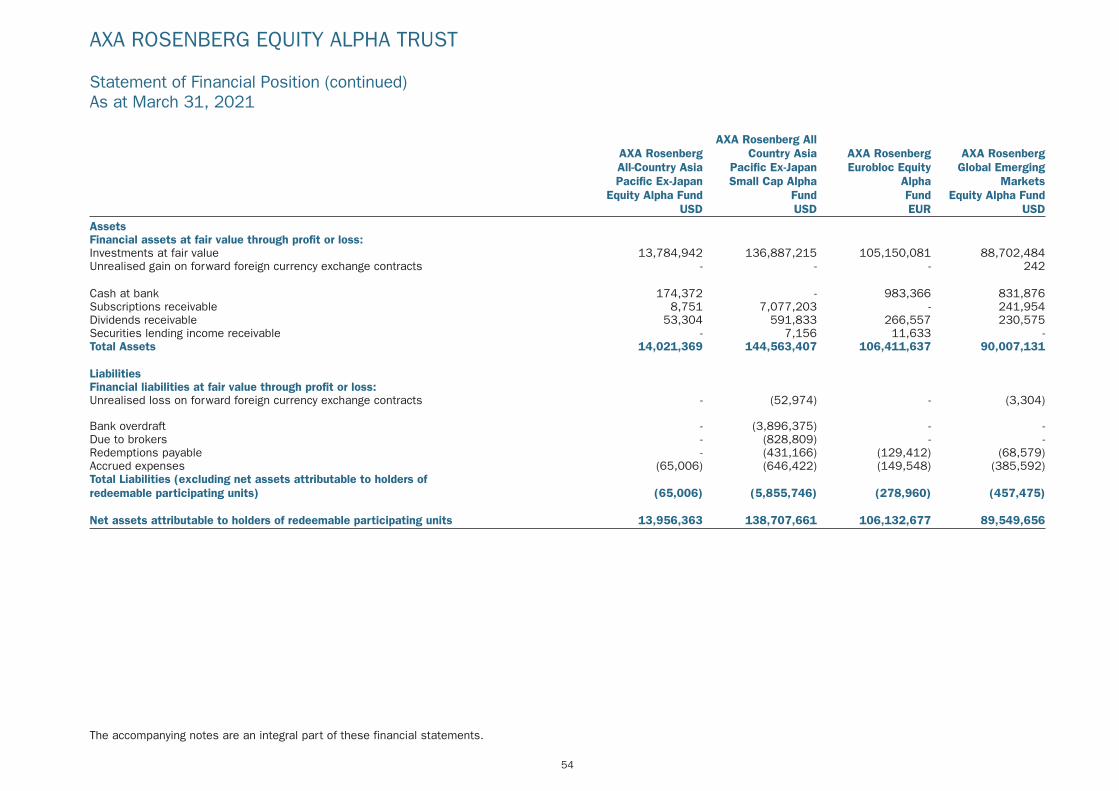
AXA RosenbergAll-Country AsiaPacific Ex-Japan
Equity Alpha FundUSD
AXA Rosenberg AllCountry Asia
Pacific Ex-JapanSmall Cap Alpha
FundUSD
AXA RosenbergEurobloc Equity
AlphaFundEUR
AXA RosenbergGlobal Emerging
MarketsEquity Alpha Fund
USDAssetsFinancial assets at fair value through profit or loss:Investments at fair value 13,784,942 136,887,215 105,150,081 88,702,484Unrealised gain on forward foreign currency exchange contracts - - - 242
Cash at bank 174,372 - 983,366 831,876Subscriptions receivable 8,751 7,077,203 - 241,954Dividends receivable 53,304 591,833 266,557 230,575Securities lending income receivable - 7,156 11,633 -Total Assets 14,021,369 144,563,407 106,411,637 90,007,131
LiabilitiesFinancial liabilities at fair value through profit or loss:Unrealised loss on forward foreign currency exchange contracts - (52,974) - (3,304)
Bank overdraft - (3,896,375) - -Due to brokers - (828,809) - -Redemptions payable - (431,166) (129,412) (68,579)Accrued expenses (65,006) (646,422) (149,548) (385,592)Total Liabilities (excluding net assets attributable to holders ofredeemable participating units) (65,006) (5,855,746) (278,960) (457,475)
Net assets attributable to holders of redeemable participating units 13,956,363 138,707,661 106,132,677 89,549,656
AXA ROSENBERG EQUITY ALPHA TRUST
Statement of Financial Position (continued)As at March 31, 2021
The accompanying notes are an integral part of these financial statements.
54

AXA RosenbergGlobal Equity
Alpha FundUSD
AXA RosenbergGlobal Small Cap
Alpha FundUSD
AXA RosenbergJapan Enhanced
IndexEquity Alpha Fund
JPY
AXA RosenbergJapan Equity
Alpha FundJPY
AssetsFinancial assets at fair value through profit or loss:Investments at fair value 542,992,101 166,136,555 11,208,436,595 12,850,437,613Unrealised gain on forward foreign currency exchange contracts - 1,425 68,515,914 288,181
Cash at bank 2,469,762 1,487,869 153,411,838 50,674,964Subscriptions receivable 508,459 1,360,595 457,930 6,115,158Dividends receivable 1,602,324 432,069 88,099,482 109,053,607Securities lending income receivable 47,274 16,129 - 2,155,615Total Assets 547,619,920 169,434,642 11,518,921,759 13,018,725,138
LiabilitiesFinancial liabilities at fair value through profit or loss:Unrealised loss on forward foreign currency exchange contracts - (97,633) (1,362,804) (4,593)
Bank overdraft - - - -Due to brokers - - - -Redemptions payable (217,948) (539,487) (2,612) (24,392,242)Accrued expenses (636,637) (215,976) (5,413,578) (15,663,278)Total Liabilities (excluding net assets attributable to holders ofredeemable participating units) (854,585) (853,096) (6,778,994) (40,060,113)
Net assets attributable to holders of redeemable participating units 546,765,335 168,581,546 11,512,142,765 12,978,665,025
AXA ROSENBERG EQUITY ALPHA TRUST
Statement of Financial Position (continued)As at March 31, 2021
The accompanying notes are an integral part of these financial statements.
55

AXA RosenbergJapan Small Cap
Alpha FundJPY
AXA RosenbergPacific Ex-Japan
Equity AlphaFundUSD
AXA RosenbergPan-European
Enhanced IndexEquity Alpha Fund
EUR
AXA RosenbergPan-EuropeanEquity Alpha
FundEUR
AssetsFinancial assets at fair value through profit or loss:Investments at fair value 8,579,407,815 144,157,308 35,637,656 35,795,690Unrealised gain on forward foreign currency exchange contracts 2,809,611 - - -
Cash at bank 105,640,513 997,839 70,392 144,104Subscriptions receivable 5,159,217 - - 47,761Dividends receivable 73,688,036 256,487 166,249 191,997Securities lending income receivable 1,711,951 4,043 1,456 2,763Total Assets 8,768,417,143 145,415,677 35,875,753 36,182,315
LiabilitiesFinancial liabilities at fair value through profit or loss:Unrealised loss on forward foreign currency exchange contracts - - - -
Bank overdraft - - - -Due to brokers - - - -Redemptions payable (16,803,882) (73,643) (3,594) -Accrued expenses (12,886,010) (129,901) (17,555) (55,542)Total Liabilities (excluding net assets attributable to holders ofredeemable participating units) (29,689,892) (203,544) (21,149) (55,542)
Net assets attributable to holders of redeemable participating units 8,738,727,251 145,212,133 35,854,604 36,126,773
AXA ROSENBERG EQUITY ALPHA TRUST
Statement of Financial Position (continued)As at March 31, 2021
The accompanying notes are an integral part of these financial statements.
56

AXA RosenbergUS Enhanced
IndexEquity Alpha Fund
USD
AXA RosenbergUS Equity
Alpha FundUSD
AssetsFinancial assets at fair value through profit or loss:Investments at fair value 2,577,004,565 868,845,751Unrealised gain on forward foreign currency exchange contracts 202,935 33,540
Cash at bank 18,019,349 -Subscriptions receivable 4,568,516 27,035,318Dividends receivable 1,239,074 620,706Securities lending income receivable 111,932 13,943Total Assets 2,601,146,371 896,549,258
LiabilitiesFinancial liabilities at fair value through profit or loss:Unrealised loss on forward foreign currency exchange contracts (12,905,118) (2,010,185)
Bank overdraft - (17,439,796)Due to brokers - -Redemptions payable (17,271,825) (1,736,682)Accrued expenses (1,173,029) (582,500)Total Liabilities (excluding net assets attributable to holders ofredeemable participating units) (31,349,972) (21,769,163)
Net assets attributable to holders of redeemable participating units 2,569,796,399 874,780,095
AXA ROSENBERG EQUITY ALPHA TRUST
Statement of Financial Position (continued)As at March 31, 2021
The accompanying notes are an integral part of these financial statements.
57
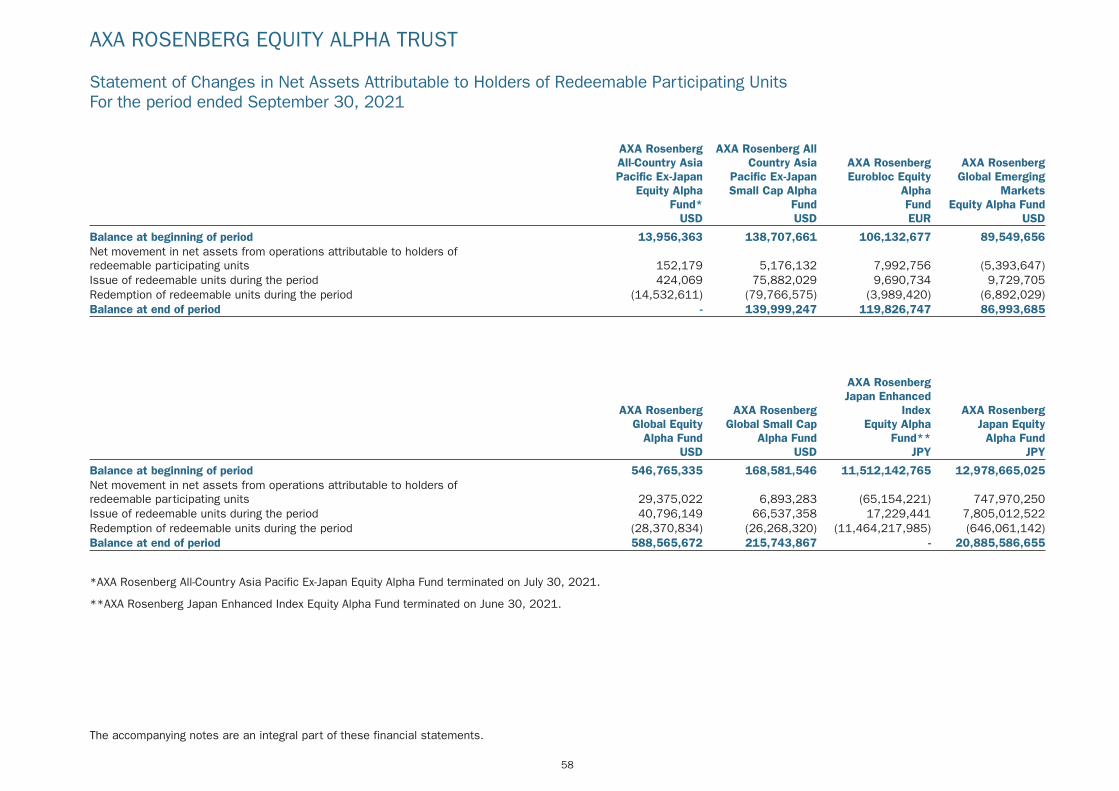
AXA RosenbergAll-Country AsiaPacific Ex-Japan
Equity AlphaFund*
USD
AXA Rosenberg AllCountry Asia
Pacific Ex-JapanSmall Cap Alpha
FundUSD
AXA RosenbergEurobloc Equity
AlphaFundEUR
AXA RosenbergGlobal Emerging
MarketsEquity Alpha Fund
USD
Balance at beginning of period 13,956,363 138,707,661 106,132,677 89,549,656Net movement in net assets from operations attributable to holders ofredeemable participating units 152,179 5,176,132 7,992,756 (5,393,647)Issue of redeemable units during the period 424,069 75,882,029 9,690,734 9,729,705Redemption of redeemable units during the period (14,532,611) (79,766,575) (3,989,420) (6,892,029)Balance at end of period - 139,999,247 119,826,747 86,993,685
AXA RosenbergGlobal Equity
Alpha FundUSD
AXA RosenbergGlobal Small Cap
Alpha FundUSD
AXA RosenbergJapan Enhanced
IndexEquity Alpha
Fund**JPY
AXA RosenbergJapan Equity
Alpha FundJPY
Balance at beginning of period 546,765,335 168,581,546 11,512,142,765 12,978,665,025Net movement in net assets from operations attributable to holders ofredeemable participating units 29,375,022 6,893,283 (65,154,221) 747,970,250Issue of redeemable units during the period 40,796,149 66,537,358 17,229,441 7,805,012,522Redemption of redeemable units during the period (28,370,834) (26,268,320) (11,464,217,985) (646,061,142)Balance at end of period 588,565,672 215,743,867 - 20,885,586,655
*AXA Rosenberg All-Country Asia Pacific Ex-Japan Equity Alpha Fund terminated on July 30, 2021.
**AXA Rosenberg Japan Enhanced Index Equity Alpha Fund terminated on June 30, 2021.
AXA ROSENBERG EQUITY ALPHA TRUST
Statement of Changes in Net Assets Attributable to Holders of Redeemable Participating UnitsFor the period ended September 30, 2021
The accompanying notes are an integral part of these financial statements.
58

AXA RosenbergJapan Small Cap
Alpha FundJPY
AXA RosenbergPacific Ex-Japan
Equity AlphaFundUSD
AXA RosenbergPan-European
Enhanced IndexEquity Alpha
Fund*EUR
AXA RosenbergPan-EuropeanEquity Alpha
FundEUR
Balance at beginning of period 8,738,727,251 145,212,133 35,854,604 36,126,773Net movement in net assets from operations attributable to holders ofredeemable participating units 183,373,063 324,648 1,983,936 2,157,865Issue of redeemable units during the period 190,584,014 13,654,160 492,727 17,258,198Redemption of redeemable units during the period (360,635,714) (16,522,258) (38,331,267) (6,157,648)Balance at end of period 8,752,048,614 142,668,683 - 49,385,188
AXA RosenbergUS Enhanced
IndexEquity Alpha Fund
USD
AXA RosenbergUS Equity
Alpha FundUSD
Balance at beginning of period 2,569,796,399 874,780,095Net movement in net assets from operations attributable to holders ofredeemable participating units 182,382,464 54,490,273Issue of redeemable units during the period 340,043,224 199,735,231Redemption of redeemable units during the period (328,280,796) (57,822,550)Balance at end of period 2,763,941,291 1,071,183,049
*AXA Rosenberg Pan-European Enhanced Index Equity Alpha Fund terminated on June 30, 2021.
AXA ROSENBERG EQUITY ALPHA TRUST
Statement of Changes in Net Assets Attributable to Holders of Redeemable Participating Units (continued)For the period ended September 30, 2021
The accompanying notes are an integral part of these financial statements.
59

AXA RosenbergAll-Country AsiaPacific Ex-Japan
Equity Alpha FundUSD
AXA Rosenberg AllCountry Asia
Pacific Ex-JapanSmall Cap Alpha
FundUSD
AXA RosenbergEurobloc Equity
AlphaFundEUR
AXA RosenbergGlobal Emerging
MarketsEquity Alpha Fund
USD
Balance at beginning of period 15,034,782 79,832,732 78,957,385 45,101,449Net movement in net assets from operations attributable to holders ofredeemable participating units 4,587,277 33,989,488 13,143,478 15,598,529Issue of redeemable units during the period 1,316,568 16,701,033 2,050,915 13,453,905Redemption of redeemable units during the period (4,549,875) (15,431,978) (5,944,851) (1,859,719)Balance at end of period 16,388,752 115,091,275 88,206,927 72,294,164
AXA RosenbergGlobal Equity
Alpha FundUSD
AXA RosenbergGlobal Small Cap
Alpha FundUSD
AXA RosenbergJapan Enhanced
IndexEquity Alpha Fund
JPY
AXA RosenbergJapan Equity
Alpha FundJPY
Balance at beginning of period 345,726,809 121,111,354 10,382,904,586 9,855,078,094Net movement in net assets from operations attributable to holders ofredeemable participating units 91,987,354 31,816,725 1,497,692,362 1,342,976,255Issue of redeemable units during the period 63,934,991 10,742,786 221,056,724 225,595,237Redemption of redeemable units during the period (32,923,406) (53,784,306) (2,313,537,569) (445,777,923)Balance at end of period 468,725,748 109,886,559 9,788,116,103 10,977,871,663
AXA ROSENBERG EQUITY ALPHA TRUST
Statement of Changes in Net Assets Attributable to Holders of Redeemable Participating Units (continued)For the period ended September 30, 2020
The accompanying notes are an integral part of these financial statements.
60
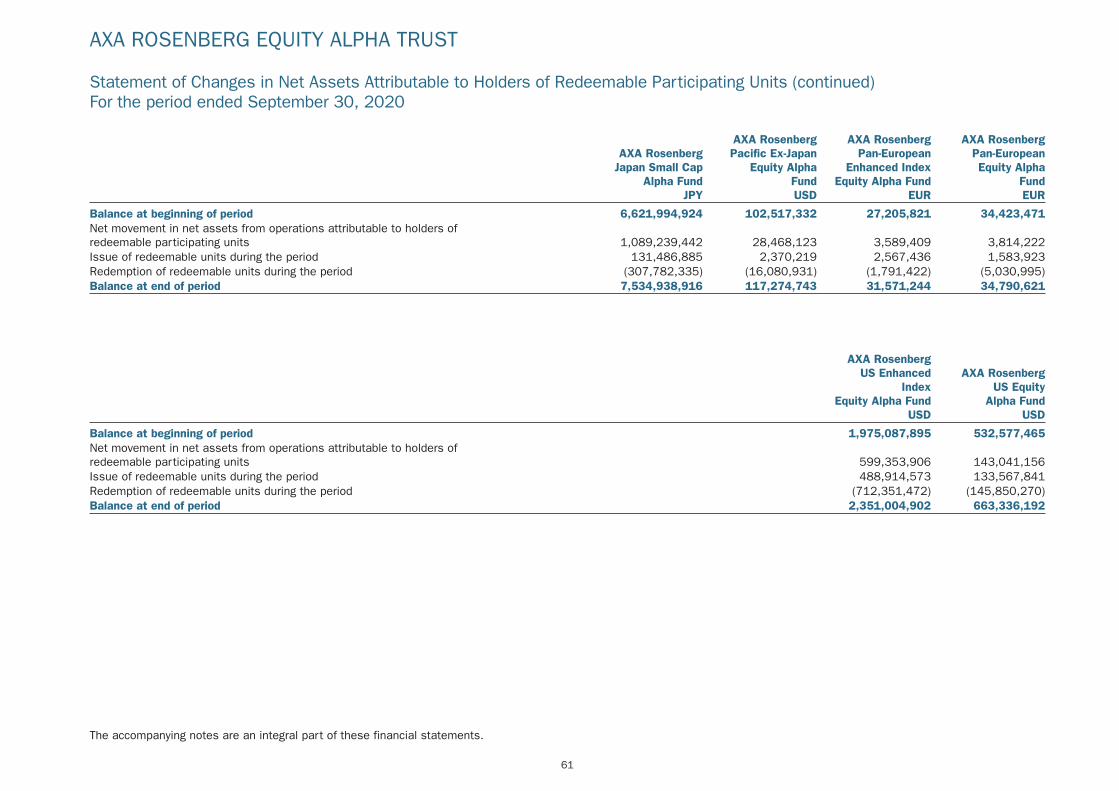
AXA RosenbergJapan Small Cap
Alpha FundJPY
AXA RosenbergPacific Ex-Japan
Equity AlphaFundUSD
AXA RosenbergPan-European
Enhanced IndexEquity Alpha Fund
EUR
AXA RosenbergPan-EuropeanEquity Alpha
FundEUR
Balance at beginning of period 6,621,994,924 102,517,332 27,205,821 34,423,471Net movement in net assets from operations attributable to holders ofredeemable participating units 1,089,239,442 28,468,123 3,589,409 3,814,222Issue of redeemable units during the period 131,486,885 2,370,219 2,567,436 1,583,923Redemption of redeemable units during the period (307,782,335) (16,080,931) (1,791,422) (5,030,995)Balance at end of period 7,534,938,916 117,274,743 31,571,244 34,790,621
AXA RosenbergUS Enhanced
IndexEquity Alpha Fund
USD
AXA RosenbergUS Equity
Alpha FundUSD
Balance at beginning of period 1,975,087,895 532,577,465Net movement in net assets from operations attributable to holders ofredeemable participating units 599,353,906 143,041,156Issue of redeemable units during the period 488,914,573 133,567,841Redemption of redeemable units during the period (712,351,472) (145,850,270)Balance at end of period 2,351,004,902 663,336,192
AXA ROSENBERG EQUITY ALPHA TRUST
Statement of Changes in Net Assets Attributable to Holders of Redeemable Participating Units (continued)For the period ended September 30, 2020
The accompanying notes are an integral part of these financial statements.
61

1. Organisation
AXA Rosenberg Equity Alpha Trust (the “Trust”) was created onSeptember 17, 1999 as an open-ended umbrella structure UnitTrust with segregated liability between its sub-funds (�Fund� or�Funds�) under a Deed of Trust and is authorised by the CentralBank of Ireland (the �Central Bank�) as an Undertaking forCollective Investment in Transferable Securities (�UCITS�). TheTrust may be divided into different Funds with one or more classof unit. Creation of any new Fund or class of unit will require theprior approval of the Central Bank.
The following Funds were trading during the period endedSeptember 30, 2021:
AXA Rosenberg All-Country Asia Pacific Ex-Japan Equity AlphaFund*AXA Rosenberg All Country Asia Pacific Ex-Japan Small Cap AlphaFundAXA Rosenberg Eurobloc Equity Alpha FundAXA Rosenberg Global Emerging Markets Equity Alpha FundAXA Rosenberg Global Equity Alpha FundAXA Rosenberg Global Small Cap Alpha FundAXA Rosenberg Japan Enhanced Index Equity Alpha Fund**AXA Rosenberg Japan Equity Alpha FundAXA Rosenberg Japan Small Cap Alpha FundAXA Rosenberg Pacific Ex-Japan Equity Alpha FundAXA Rosenberg Pan-European Enhanced Index Equity AlphaFund**AXA Rosenberg Pan-European Equity Alpha FundAXA Rosenberg US Enhanced Index Equity Alpha FundAXA Rosenberg US Equity Alpha Fund
*AXA Rosenberg All-Country Asia Pacific Ex-Japan Equity AlphaFund terminated on July 30, 2021.**AXA Rosenberg Japan Enhanced Index Equity Alpha Fund andAXA Rosenberg Pan-European Enhanced Index Equity Alpha Fundterminated on June 30, 2021.
2. Significant Accounting Policies
Statement of ComplianceThese condensed financial statements have been prepared inaccordance with the Financial Reporting Standard 104 ‘InterimFinancial Reporting’ (“FRS 104”) and the Irish statute comprisingthe European Communities (Undertakings for CollectiveInvestment in Transferable Securities) Regulations, 2011 (asamended) and the Central Bank’s (Supervision and Enforcement)Act 2013 (Section 48(1)) (Undertakings For Collective InvestmentIn Transferable Securities) Regulations 2019 (collectively the“UCITS Regulations”).
The condensed unaudited Financial Statements should be read inconjunction with the Trust’s annual audited Financial Statementsfor the year ended March 31, 2021, which have been prepared inaccordance with Financial Reporting Standard 102 (“FRS 102”)and the UCITS Regulations.
The financial statements of the below mentioned Funds havebeen prepared on a non-going concern basis.
1) AXA Rosenberg All Country Asia Pacific Ex-Japan Equity AlphaFund which the Board of Directors of the Manager had resolved toliquidate. The last dealing day was on July 30, 2021.
2) AXA Rosenberg Japan Enhanced Index Equity Alpha Fund whichthe Board of Directors of the Manager had resolved to liquidate.The last dealing day was on June 30, 2021.
3) AXA Rosenberg Pan-European Enhanced Index Equity AlphaFund which the Board of Directors of the Manager had resolved toliquidate. The last dealing day was on June 30, 2021.
The Trust has continued to avail of the exemption available toopen-ended investment funds under FRS 102 and is notpresenting a Cash Flow Statement.
Critical Accounting Estimates and AssumptionsManagement makes fair value estimation and assumptionsconcerning the future. The resulting accounting estimates will, bydefinition, seldom equal the related actual results.
Accounting PeriodThe interim accounting period end is September 30 each year.These financial statements cover the six month period toSeptember 30, 2021.
Historical Cost ConventionThe financial statements have been prepared under the historicalcost convention as modified by the revaluation of financial assetsand financial liabilities (including derivative financial instruments)at fair value through profit or loss.
3. Management
The Manager of the Trust is AXA Rosenberg Management IrelandLimited. Under the Trust Deed the Manager is entitled to fees,details of which are contained in Note 5.
The Manager has delegated the performance of the investmentmanagement functions of the Trust to the Investment Manager,who in turn has outsourced some of these functions to the Sub-Investment Managers, details of which are contained in Note 5 tothe condensed financial statements.
NOTES TO THE FINANCIAL STATEMENTS
For the period ended September 30, 2021
62

4. Gains/(Losses) on Investments and Foreign Currency
For the period ended September 30, 2021
FundBase
Currency
Unrealised gainon investments &
foreign currencySeptember 30, 2021
Realised gain/(loss)on investments &
foreign currencySeptember 30, 2021
Net gain oninvestments &
foreign currencySeptember 30, 2021
AXA Rosenberg All-Country Asia Pacific Ex-Japan Equity Alpha Fund* USD (3,368,045) 3,464,356 96,311AXA Rosenberg All Country Asia Pacific Ex-Japan Small Cap Alpha Fund USD (12,667,905) 16,555,868 3,887,963AXA Rosenberg Eurobloc Equity Alpha Fund EUR (2,008,433) 8,526,769 6,518,336AXA Rosenberg Global Emerging Markets Equity Alpha Fund USD (9,216,559) 2,957,184 (6,259,375)AXA Rosenberg Global Equity Alpha Fund USD (20,639,799) 47,789,854 27,150,055AXA Rosenberg Global Small Cap Alpha Fund USD (7,763,938) 13,846,501 6,082,563AXA Rosenberg Japan Enhanced Index Equity Alpha Fund** JPY (2,098,579,007) 2,035,202,695 (63,376,312)AXA Rosenberg Japan Equity Alpha Fund JPY 108,585,836 507,782,018 616,367,854AXA Rosenberg Japan Small Cap Alpha Fund JPY (133,355,532) 282,904,092 149,548,560AXA Rosenberg Pacific Ex-Japan Equity Alpha Fund USD (14,164,502) 11,040,023 (3,124,479)AXA Rosenberg Pan-European Enhanced Index Equity Alpha Fund** EUR (4,498,715) 6,167,471 1,668,756AXA Rosenberg Pan-European Equity Alpha Fund EUR (1,284,052) 2,889,007 1,604,955AXA Rosenberg US Enhanced Index Equity Alpha Fund USD (33,816,442) 205,834,892 172,018,450AXA Rosenberg US Equity Alpha Fund USD (22,697,925) 74,878,069 52,180,144
*AXA Rosenberg All-Country Asia Pacific Ex-Japan Equity Alpha Fund terminated on July 30, 2021.**AXA Rosenberg Japan Enhanced Index Equity Alpha Fund and AXA Rosenberg Pan-European Enhanced Index Equity Alpha Fundterminated on June 30, 2021.
For the period ended September 30, 2020
FundBase
Currency
Unrealised gainon investments &
foreign currencySeptember 30, 2020
Realised gain/(loss)on investments &
foreign currencySeptember 30, 2020
Net gain oninvestments &
foreign currencySeptember 30, 2020
AXA Rosenberg All-Country Asia Pacific Ex-Japan Equity Alpha Fund USD 3,387,739 882,844 4,270,583AXA Rosenberg All Country Asia Pacific Ex-Japan Small Cap Alpha Fund USD 28,543,188 4,094,079 32,637,267AXA Rosenberg Eurobloc Equity Alpha Fund EUR 12,986,502 (763,320) 12,223,182AXA Rosenberg Global Emerging Markets Equity Alpha Fund USD 12,243,343 2,513,169 14,756,512AXA Rosenberg Global Equity Alpha Fund USD 73,868,921 16,635,642 90,504,563AXA Rosenberg Global Small Cap Alpha Fund USD 37,044,791 (5,771,533) 31,273,258AXA Rosenberg Japan Enhanced Index Equity Alpha Fund JPY 1,436,476,659 (4,492,080) 1,431,984,579AXA Rosenberg Japan Equity Alpha Fund JPY 1,577,034,226 (299,759,651) 1,277,274,575AXA Rosenberg Japan Small Cap Alpha Fund JPY 1,299,170,896 (233,814,615) 1,065,356,281AXA Rosenberg Pacific Ex-Japan Equity Alpha Fund USD 26,921,886 (588,698) 26,333,188AXA Rosenberg Pan-European Enhanced Index Equity Alpha Fund EUR 4,150,354 (927,318) 3,223,036AXA Rosenberg Pan-European Equity Alpha Fund EUR 4,335,901 (844,930) 3,490,971AXA Rosenberg US Enhanced Index Equity Alpha Fund USD 483,741,234 103,145,970 586,887,204AXA Rosenberg US Equity Alpha Fund USD 90,678,829 49,746,482 140,425,311
NOTES TO THE FINANCIAL STATEMENTS
For the period ended September 30, 2021
63

5. Fees and Expenses
Management Fees
The Manager has entered into a Trust Deed with the Trustee. Under this Trust Deed, the Manager is entitled to a fee expressed as a percentage of the daily NAV of each respective unit class for theperiod where the relevant unit class was active during the year, which is calculated daily and payable monthly in arrears. The Manager will be responsible for discharging, from this fee, all fees of theInvestment Manager (who will in turn, discharge from its fees, the fees of any sub-investment managers). The out of pocket expenses of the Manager, Investment Manager and Sub-Investment Managerswill be borne by the Trust.
The annual rates below apply to the period ended September 30, 2021.
Fund A* A€ A$ B* B€ E€
A€
HedgedB€
HedgedE€
HedgedM€
Hedged M* M€ M£ A£ B£ AD€ I€ I$ I¥ S*
AXA Rosenberg All-Country Asia Pacific Ex-Japan Equity AlphaFund**
0.70% 0.70% - 1.35% 1.35% 1.35% 0.70% - - - 0.00% - - - - - - - - -
AXA Rosenberg All Country Asia Pacific Ex-Japan Small Cap AlphaFund
0.80% 0.80% - 1.50% 1.50% 1.50% 0.80% - - - 0.00% - - 0.80% - - - - - -
AXA Rosenberg Eurobloc Equity Alpha Fund 0.70% - - 1.35% - 1.35% - - - - 0.00% - - - - - - - - -AXA Rosenberg Global Emerging Markets Equity Alpha Fund 0.70% 0.70% - 1.35% 1.35% - - - 1.35% - 0.00% - 0.00% 0.70% - - - - - 0.25%AXA Rosenberg Global Equity Alpha Fund 0.70% 0.70% - 1.35% 1.35% 1.35% - - - - - 0.00% - 0.70% 1.35% - - - - -AXA Rosenberg Global Small Cap Alpha Fund 0.80% 0.80% - 1.50% 1.50% 1.50% 0.80% - - - 0.00% - - 0.80% - 0.80% - - - -AXA Rosenberg Japan Enhanced Index Equity Alpha Fund*** 0.35% - - 0.80% - - 0.35% - - 0.00% 0.00% - - - - - 0.25% - 0.25% -AXA Rosenberg Japan Equity Alpha Fund 0.70% - - 1.35% 1.35% 1.35% 0.70% 1.35% - 0.00% 0.00% - - - - - - - - -AXA Rosenberg Japan Small Cap Alpha Fund 0.80% 0.80% - 1.50% 1.50% 1.50% 0.80% - - - 0.00% - - 0.80% - - - - - -AXA Rosenberg Pacific Ex-Japan Equity Alpha Fund 0.70% 0.70% - 1.35% 1.35% 1.35% 0.70% - - - 0.00% 0.00% - - - - - - - -AXA Rosenberg Pan-European Enhanced Index Equity AlphaFund***
0.35% - - 0.80% - - - - - - 0.00% - - - - - 0.25% - - 0.125%
AXA Rosenberg Pan-European Equity Alpha Fund 0.70% - 0.70% 1.35% - 1.35% - - - - 0.00% - - - - - - - - -AXA Rosenberg US Enhanced Index Equity Alpha Fund 0.35% 0.35% - 0.80% 0.80% - 0.35% 0.80% 0.80% 0.00% 0.00% 0.00% - 0.35% - - 0.25% 0.25% - -AXA Rosenberg US Equity Alpha Fund 0.70% - - 1.35% 1.35% - 0.70% 1.35% 1.35% - 0.00% - - - - - - - - -
*Class is denominated in the Fund’s base currency.**AXA Rosenberg All-Country Asia Pacific Ex-Japan Equity Alpha Fund terminated on July 30, 2021.***AXA Rosenberg Japan Enhanced Index Equity Alpha Fund and AXA Rosenberg Pan-European Enhanced Index Equity Alpha Fund terminated on June 30, 2021.
NOTES TO THE FINANCIAL STATEMENTS
For the period ended September 30, 2021
64

5. Fees and Expenses (continued)
Administration FeesState Street Fund Services (Ireland) Limited, the Administrator,shall be entitled to a fee calculated as a percentage per annumof the NAV of each Fund paid out of the assets of the applicableFund. This annual fee is calculated based upon each Fund’s dailyaverage net assets and payable monthly in arrears in an amountof 0.03% for those Funds with less than USD100 million ofaverage net assets. For those Funds with over USD100 million ofaverage net assets, the rate is 0.0365% on the firstUSD200 million of average net assets, 0.02% on the nextUSD300 million of average net assets and 0.01% of average netassets above USD500 million.
The Administrator shall also be entitled to receive a transferagency fee of USD10 for each automated, or USD25 for eachmanual, transfer agency transaction including each subscription,redemption, transfer, conversion and distribution.
The Administrator shall also be entitled to be reimbursed for allproperly vouched reasonable expenses incurred by theAdministrator on behalf of the Trust.
Trustee and Custody FeesThe Trustee shall be entitled to fees calculated as a percentageper annum of the NAV of each Fund payable out of the assets ofeach Fund based on the average NAV of each Fund of 0.01% ofaverage net assets per annum, which is calculated daily andpayable monthly in arrears.
The Trustee shall be entitled to be reimbursed for all agreed sub-custodian fees, expenses and transaction charges (which will becharged at normal commercial rates), together with reasonableand properly vouched out-of-pocket expenses incurred by theTrustee in the performance of its duties under the Trust Deed outof the assets of each Fund.
Transaction costsFor the period ended September 30, 2021 and September 30, 2020 each Fund incurred transactions costs were as follows:
Fund Currency
Transaction Costsfor the period ended
September 30, 2021
Transaction Costsfor the period ended
September 30, 2020
AXA Rosenberg All-Country Asia Pacific Ex-Japan Equity Alpha Fund* USD 49,310 37,797AXA Rosenberg All Country Asia Pacific Ex-Japan Small Cap Alpha Fund USD 433,215 173,532AXA Rosenberg Eurobloc Equity Alpha Fund EUR 132,122 86,876AXA Rosenberg Global Emerging Markets Equity Alpha Fund USD 180,391 104,277AXA Rosenberg Global Equity Alpha Fund USD 187,739 154,956AXA Rosenberg Global Small Cap Alpha Fund USD 155,130 78,607AXA Rosenberg Japan Enhanced Index Equity Alpha Fund** JPY 5,284,700 3,660,663AXA Rosenberg Japan Equity Alpha Fund JPY 8,571,660 3,806,239AXA Rosenberg Japan Small Cap Alpha Fund JPY 3,816,213 2,833,843AXA Rosenberg Pacific Ex-Japan Equity Alpha Fund USD 167,364 90,179AXA Rosenberg Pan-European Enhanced Index Equity Alpha Fund** EUR 25,832 36,635AXA Rosenberg Pan-European Equity Alpha Fund EUR 93,490 42,289AXA Rosenberg US Enhanced Index Equity Alpha Fund USD 273,560 343,476AXA Rosenberg US Equity Alpha Fund USD 180,909 153,420
*AXA Rosenberg All-Country Asia Pacific Ex-Japan Equity Alpha Fund terminated on July 30, 2021.**AXA Rosenberg Japan Enhanced Index Equity Alpha Fund and AXA Rosenberg Pan-European Enhanced Index Equity Alpha Fund terminatedon June 30, 2021.
Distribution FeesThe Manager has appointed the Investment Manager as MasterDistributor for the Trust. The Distributor is entitled to a distributionfee in respect of all the active classes of units (except for classE), which will be payable by the Manager out of its own assets.The fee payable in respect of class E units shall be payable out ofthe assets attributable to the class E units of the relevant Fundonly. This distribution fee is calculated daily and paid monthly inarrears, at an annual rate of up to a maximum of 0.75% perannum on the relevant Units and calculated on the average dailyNAV of the relevant units.
6. Distributions
The Directors of the Manager are empowered to declare dividendson any class of units in respect of any Fund. Generally, it isintended that the classes of units shall be accumulating classesand, therefore, it is not intended to distribute dividends tounitholders in these classes. In the absence of such adeclaration, the net revenue from these classes will beaccumulated and reinvested on behalf of unitholders.
However, the Directors may create classes of units that aredistributing units. In respect of these units, the Directors haveresolved that distributions should be paid out of the interest anddividends earned by the relevant Funds, which are attributable tothe relevant distributing unit class. These dividends will bedeclared and paid as set out in the relevant Funds’ details (in theTrust’s Prospectus) which will also set out the relevant distributiondates and payment frequencies. Any distribution or other moniespayable in respect of any unit (excluding any fees) will be paid byCHAPS, SWIFT, telegraphic or federal wire transfer to the bankaccount of the relevant unitholder as indicated on the ApplicationForm for the units or as otherwise advised or agreed between theManager and the unitholder.
7. Soft Commissions and Directed Brokerage Services
During the period ended September 30, 2021 and the year endedMarch 31, 2021 the Trust did not enter into any soft commissionor directed brokerage services arrangements.
NOTES TO THE FINANCIAL STATEMENTS
For the period ended September 30, 2021
65

8. Securities Lending
The Trust may employ techniques and instruments relating totransferable securities for efficient portfolio managementpurposes including security lending arrangements.
The Funds may utilise stock lending agreements. In such atransaction, the Funds may temporarily transfer their securities toa borrower, with agreement by the borrower to return equivalentsecurities to the Funds. In entering into such a transaction a Fundwill be endeavouring to increase the returns of its portfolio ofsecurities by receiving a fee for lending its securities to theborrower, while retaining the securities potential for capitalappreciation.
The Manager on behalf of the Funds has appointed AXAInvestment Managers GS Ltd to act as its agent for the purposeof lending securities to brokers, dealers and other financialinstitutions. The agent earns a fee equal to 20% of the securitylending income earned on the transaction.
Securities lending income is received net of fees as shown in theStatement of Comprehensive Income for each Fund. Securitieslending income receivable is accounted for on an accruals basisand shown in the Statement of Financial Position.
Collateral received, can take the form of cash and highly-ratedgovernment debt. The collateral is maintained for the Funds at aminimum margin of 105% of the value of the security on loan andmarked to market daily. There was no cash collateral received asat September 30, 2021 and March 31, 2021.
As of September 30, 2021 the value of outstanding securities on loan, the value of collateral received and the % of collateral of value ofsecurities on loan recorded by the Funds were as follows:
September 30, 2021
Fund Currency
Value ofOuststandingSecurities on
LoanValue of
Collateral
% of Collateralof Value of Securities
on Loan
AXA Rosenberg Eurobloc Equity Alpha Fund EUR 6,910,229 7,407,985 107AXA Rosenberg Global Equity Alpha Fund USD 34,484,314 40,194,679 117AXA Rosenberg Global Small Cap Alpha Fund USD 4,710,574 5,189,058 110AXA Rosenberg Japan Equity Alpha Fund JPY 3,431,537,490 4,172,216,349 122AXA Rosenberg Japan Small Cap Alpha Fund JPY 346,188,499 419,827,334 121AXA Rosenberg Pan-European Equity Alpha Fund EUR 1,840,074 1,991,769 108AXA Rosenberg US Enhanced Index Equity Alpha Fund USD 63,038,316 66,202,011 105AXA Rosenberg US Equity Alpha Fund USD 17,598,477 18,481,689 105
*AXA Rosenberg Japan Enhanced Index Equity Alpha Fund and AXA Rosenberg Pan-European Enhanced Index Equity Alpha Fund terminatedon June 30, 2021.
As of March 31, 2021 the value of outstanding securities on loan, the value of collateral received and the % of collateral of value of securitieson loan recorded by the Funds was as follows:
March 31, 2021
Fund Currency
Value ofOuststandingSecurities on
LoanValue of
Collateral
% of Collateralof Value of Securities
on Loan
AXA Rosenberg Eurobloc Equity Alpha Fund EUR 3,300,960 3,590,285 109AXA Rosenberg Global Equity Alpha Fund USD 35,984,817 38,553,608 107AXA Rosenberg Global Small Cap Alpha Fund USD 2,908,995 3,184,230 109AXA Rosenberg Japan Enhanced Index Equity Alpha Fund JPY 1,568,541,912 1,696,993,417 108AXA Rosenberg Japan Equity Alpha Fund JPY 2,314,951,277 2,499,757,125 108AXA Rosenberg Japan Small Cap Alpha Fund JPY 511,067,791 559,180,168 109AXA Rosenberg Pan-European Enhanced Index Equity Alpha Fund EUR 2,099,199 2,271,462 108AXA Rosenberg Pan-European Equity Alpha Fund EUR 2,474,715 2,680,878 108AXA Rosenberg US Enhanced Index Equity Alpha Fund USD 29,710,550 31,615,539 106AXA Rosenberg US Equity Alpha Fund USD 1,048,813 1,115,654 106
NOTES TO THE FINANCIAL STATEMENTS
For the period ended September 30, 2021
66

8. Securities Lending (continued)
Collateral is marked to market daily and as such, it is reported to the Trustee and the Investment Manager on a daily basis. Details ofcollateral and amount of securities on loan are provided on pages 68 to 71. The tables below identify the counterparty names and percentageof collateral exposures as at September 30, 2021 and March 31, 2021.
Counterparties
Standard & PoorsCredit RatingSeptember 30,2021
% ofCollateral
September 30, 2021
Standard & PoorsCredit RatingMarch 31,2021
% ofCollateral
March 31, 2021
Barclays Capital Inc A 20.61 A 28.17Citigroup Global Markets Ltd A+ 16.92 A+ 8.86Credit Suisse AG A+ 0.10 A+ 0.93JPMorgan Securities Plc - - A+ 2.11Merrill Lynch International - - A+ 23.10MUFG Securities EMEA Plc - - A 20.41Natixis SA A 57.31 A+ 15.97Societe Generale SA A 1.38 - -UBS AG A+ 3.68 A+ 0.45
Total 100.00 100.00
NOTES TO THE FINANCIAL STATEMENTS
For the period ended September 30, 2021
67

8. Securities Lending (continued)
The table below details the value of securities on loan by Fund and by counterparty at September 30, 2021.
BarclaysCapital Inc
CitigroupGlobal
Markets LtdCredit
Suisse AG Natixis SASociete
Generale SA UBS AG Total
Standard & Poors Credit Rating Currency A A+ A+ A A A+
AXA Rosenberg Eurobloc Equity AlphaFund
EUR - - - 4,781,401 945,690 1,183,138 6,910,229
AXA Rosenberg Global Equity Alpha Fund USD 12,419,418 8,676,480 - 9,580,237 - 3,808,179 34,484,314AXA Rosenberg Global Small Cap AlphaFund
USD - 1,350,198 - 2,038,533 1,281,225 40,618 4,710,574
AXA Rosenberg Japan Equity Alpha Fund JPY 1,951,533,118 1,468,954,294 11,050,078 - - - 3,431,537,490AXA Rosenberg Japan Small Cap AlphaFund
JPY 116,837,309 220,125,580 9,225,610 - - - 346,188,499
AXA Rosenberg Pan-European EquityAlpha Fund
EUR - 42,144 - 1,378,904 - 419,026 1,840,074
AXA Rosenberg US Enhanced IndexEquity Alpha Fund
USD - - - 63,038,316 - - 63,038,316
AXA Rosenberg US Equity Alpha Fund USD - - - 17,598,477 - - 17,598,477
NOTES TO THE FINANCIAL STATEMENTS
For the period ended September 30, 2021
68

8. Securities Lending (continued)
The table below details the value of securities on loan by Fund and by counterparty at March 31, 2021.
BarclaysCapital Inc
CitigroupGlobal
Markets LtdCredit
Suisse AGJPMorgan
Securities PlcMerrill LynchInternational
MUFG SecuritiesEMEA Plc Natixis SA UBS AG Total
Standard & Poors Credit Rating Currency A A+ A+ A+ A+ A A+ A+
AXA Rosenberg Eurobloc Equity AlphaFund
EUR 1,343,056 135,329 - - - - 1,598,526 224,049 3,300,960
AXA Rosenberg Global Equity Alpha Fund USD 10,152,978 3,712,158 - 2,260,894 11,764,531 3,993,352 4,100,904 - 35,984,817AXA Rosenberg Global Small Cap AlphaFund
USD 271,218 1,054,739 133,235 - 146,210 - 1,161,666 141,927 2,908,995
AXA Rosenberg Japan Enhanced IndexEquity Alpha Fund
JPY 796,073,554 152,100,171 21,032,087 - 599,336,100 - - - 1,568,541,912
AXA Rosenberg Japan Equity Alpha Fund JPY 1,081,451,611 223,687,761 26,475,685 - 983,336,220 - - - 2,314,951,277AXA Rosenberg Japan Small Cap AlphaFund
JPY 99,881,077 196,238,905 34,119,968 - 180,827,841 - - - 511,067,791
AXA Rosenberg Pan-European EnhancedIndex Equity Alpha Fund
EUR 1,176,999 223,247 - 50,123 - - 648,830 - 2,099,199
AXA Rosenberg Pan-European EquityAlpha Fund
EUR 1,360,974 63,449 - 196,055 - - 801,209 53,028 2,474,715
AXA Rosenberg US Enhanced IndexEquity Alpha Fund
USD - - - - - 20,461,378 9,249,172 - 29,710,550
AXA Rosenberg US Equity Alpha Fund USD - - - - - - 1,048,813 - 1,048,813
NOTES TO THE FINANCIAL STATEMENTS
For the period ended September 30, 2021
69

8. Securities Lending (continued)
The table below details the value of collateral received for securities on loan by Fund and by counterparty at September 30, 2021.
BarclaysCapital Inc
CitigroupGlobal
Markets LtdCredit
Suisse AG Natixis SASociete
Generale SA UBS AG Total
Standard & Poors Credit Rating Currency A A+ A+ A A A+
AXA Rosenberg Eurobloc Equity AlphaFund
EUR - - - 5,021,365 996,965 1,389,655 7,407,985
AXA Rosenberg Global Equity Alpha Fund USD 15,058,885 10,601,857 - 10,061,039 - 4,472,898 40,194,679AXA Rosenberg Global Small Cap AlphaFund
USD - 1,649,817 - 2,140,841 1,350,692 47,708 5,189,058
AXA Rosenberg Japan Equity Alpha Fund JPY 2,366,287,557 1,794,926,445 11,002,347 - - - 4,172,216,349AXA Rosenberg Japan Small Cap AlphaFund
JPY 141,668,449 268,973,124 9,185,761 - - - 419,827,334
AXA Rosenberg Pan-European EquityAlpha Fund
EUR - 51,496 - 1,448,106 - 492,167 1,991,769
AXA Rosenberg US Enhanced IndexEquity Alpha Fund
USD - - - 66,202,011 - - 66,202,011
AXA Rosenberg US Equity Alpha Fund USD - - - 18,481,689 - - 18,481,689
NOTES TO THE FINANCIAL STATEMENTS
For the period ended September 30, 2021
70

8. Securities Lending (continued)
The table below details the value of collateral received for securities on loan by Fund and by counterparty at March 31, 2021.
BarclaysCapital Inc
CitigroupGlobal
Markets LtdCredit
Suisse AGJPMorgan
Securities PlcMerrill LynchInternational
MUFG SecuritiesEMEA Plc Natixis SA UBS AG Total
Standard & Poors Credit Rating Currency A A+ A+ A+ A+ A A+ A+
AXA Rosenberg Eurobloc Equity AlphaFund
EUR 1,468,119 146,542 - - - - 1,700,401 275,223 3,590,285
AXA Rosenberg Global Equity Alpha Fund USD 11,098,405 4,019,747 - 2,387,751 12,435,349 4,250,099 4,362,257 - 38,553,608AXA Rosenberg Global Small Cap AlphaFund
USD 296,473 1,142,135 181,032 - 154,547 - 1,235,699 174,344 3,184,230
AXA Rosenberg Japan Enhanced IndexEquity Alpha Fund
JPY 870,202,474 164,703,198 28,577,259 - 633,510,486 - - - 1,696,993,417
AXA Rosenberg Japan Equity Alpha Fund JPY 1,182,154,415 242,222,538 35,973,725 - 1,039,406,447 - - - 2,499,757,125AXA Rosenberg Japan Small Cap AlphaFund
JPY 109,181,821 212,499,268 46,360,361 - 191,138,718 - - - 559,180,168
AXA Rosenberg Pan-European EnhancedIndex Equity Alpha Fund
EUR 1,286,599 241,746 - 52,936 - - 690,181 - 2,271,462
AXA Rosenberg Pan-European EquityAlpha Fund
EUR 1,487,705 68,706 - 207,056 - - 852,271 65,140 2,680,878
AXA Rosenberg US Enhanced IndexEquity Alpha Fund
USD - - - - - 21,776,912 9,838,627 - 31,615,539
AXA Rosenberg US Equity Alpha Fund USD - - - - - - 1,115,654 - 1,115,654
NOTES TO THE FINANCIAL STATEMENTS
For the period ended September 30, 2021
71

9. Exchange Rates
The following exchange rates detail the foreign currency equivalentto USD1. These rates were used to translate assets and liabilitiesinto USD at September 30, 2021.
Currency Rate Currency Rate
Australian Dollar 1.3844 Malaysian Ringgit 4.1865Brazilian Real 5.4489 Mexican Peso 20.5445British Pound 0.7416 New Zealand Dollar 1.4496Canadian Dollar 1.2669 Norwegian Krone 8.7293Chilean Peso 812.2000 Philippine Peso 51.0100Chinese Yuan 6.4622 Polish Zloty 3.9713Colombian Peso 3,811.9300 Singapore Dollar 1.3576Czech Koruna 21.8672 South African Rand 15.0450Danish Krone 6.4161 South Korean Won 1,184.0000Euro 0.8629 Swedish Krona 8.7486Hong Kong Dollar 7.7847 Swiss Franc 0.9329Hungarian Forint 309.9487 Taiwan Dollar 27.8605Indian Rupee 74.2275 Thailand Baht 33.8350Indonesian Rupiah 14,312.5000 Turkish Lira 8.8843Israeli Shekel 3.2262 United Arab 3.6732Japanese Yen 111.5750 Emirates Dirham
The following exchange rates detail the foreign currency equivalentto EUR1. These rates were used to translate assets and liabilitiesinto EUR at September 30, 2021.
Currency Rate Currency Rate
British Pound 0.8595 Swedish Krona 10.1391Danish Krone 7.4359 Swiss Franc 1.0811Norwegian Krone 10.1168 US Dollar 1.1589
The following exchange rates detail the foreign currency equivalentto JPY1. These rates were used to translate assets and liabilitiesinto JPY at September 30, 2021.
Currency Rate Currency Rate
British Pound 0.0066 US Dollar 0.0090Euro 0.0077
The following exchange rates detail the foreign currency equivalentto USD1. These rates were used to translate assets and liabilitiesinto USD at March 31, 2021.
Currency Rate Currency Rate
Australian Dollar 1.3129 Malaysian Ringgit 4.1465Brazilian Real 5.6430 Mexican Peso 20.4605British Pound 0.7248 New Zealand Dollar 1.4279Canadian Dollar 1.2569 Norwegian Krone 8.5364Chilean Peso 718.4000 Philippine Peso 48.5375Chinese Yuan 6.5550 Polish Zloty 3.9460Colombian Peso 3,675.0000 Singapore Dollar 1.3436Czech Koruna 22.2242 South African Rand 14.7663Danish Krone 6.3280 South Korean Won 1,131.7500Euro 0.8508 Swedish Krona 8.7163Hong Kong Dollar 7.7745 Swiss Franc 0.9412Hungarian Forint 308.2150 Taiwan Dollar 28.5330Indian Rupee 73.1138 Thailand Baht 31.2500Indonesian Rupiah 14,525.0000 Turkish Lira 8.2763Israeli Shekel 3.3347 United Arab 3.6732Japanese Yen 110.5000 Emirates Dirham
The following exchange rates detail the foreign currency equivalentto EUR1. These rates were used to translate assets and liabilitiesinto EUR at March 31, 2021.
Currency Rate Currency Rate
British Pound 0.8519 Swedish Krona 10.2443Danish Krone 7.4372 Swiss Franc 1.1061Norwegian Krone 10.0328 United States Dollar 1.1753
The following exchange rates detail the foreign currency equivalentto JPY1. These rates were used to translate assets and liabilitiesinto JPY at March 31, 2021.
Currency Rate Currency Rate
British Pound 0.0066 United States Dollar 0.0090Euro 0.0077
10. Taxation
Under current law and practice the Trust qualifies as aninvestment undertaking as defined in Section 739B of the TaxesConsolidation Act, 1997, as amended. On that basis, it is notchargeable to Irish tax on its income or gains.
However, Irish tax may arise on the happening of a �chargeableevent�. A chargeable event includes any distribution payments tounitholders, any encashment, redemption, cancellation or transferof units and the holding of units at the end of each eight yearperiod beginning with the acquisition of such units. No Irish taxwill arise on the Trust in respect of chargeable events in respectof:
(a) a unitholder who is neither Irish resident nor ordinarilyresident in Ireland for tax purposes, at the time of thechargeable event, provided appropriate valid declarations inaccordance with the provisions of the Taxes ConsolidationAct, 1997, as amended, are held by the Trust or the Trusthas been authorised by the Irish Revenue to make grosspayments in the absence of appropriate declarations; and
(b) certain exempted Irish tax resident unitholders who haveprovided the Trust with the necessary signed statutorydeclarations.
Dividends, interest and capital gains (if any) received oninvestments made by the Trust may be subject to withholdingtaxes imposed by the country from which the investment income/gains are received and such taxes may not be recoverable by theTrust or its unitholders.
11. Accessibility to Information
Month-end portfolio listings can be made available to unitholders30 days after that date, in line with the Investment Manager’sdisclosure policy.
12. Transactions with Related Parties
In accordance with FRS 104 the following note summarises therelated parties and related party transactions during the periodended September 30, 2021 and the period ended September 30,2020.
NOTES TO THE FINANCIAL STATEMENTS
For the period ended September 30, 2021
72

12. Transactions with Related Parties (continued)
Transactions with Parties who have significant influencea) The Manager has entered into a Trust Deed with the Trustee.
Under this Trust Deed, the Manager is entitled to a feeexpressed as a percentage of the daily NAV of eachrespective class, which calculated daily and payable monthlyin arrears. The Manager will be responsible for discharging,from this fee, all fees of the Investment Manager (who will inturn, discharge from its fees, the fees of any Sub-InvestmentManagers). The Manager earned USD14,701,497(September 30, 2020: USD10,605,169) for the periodended September 30, 2021, of which USD2,475,593(March 31, 2021: USD2,158,772) was payable at period-end. Please refer to Note 5 to the financial statements foradditional information.
Transactions with Securities Lending Agentb) Please refer to Note 8 to the financial statements for details
of balances at year end the securities lending agent, AXAInvestment Managers GS Limited. Please refer to Statementof Comprehensive Income for details on the securitieslending income balances and to the Statements of FinancialPosition for details on the securities lending receivablebalances.
Directors’ Feesc) Directors’ fees for services rendered are paid by the
Manager, AXA Rosenberg Management Ireland Limited. Theamount charged during the period ended June 30, 2021 wasUSD32,242, (June 30, 2020: USD22,081), of which USDNil(December 31, 2020: USDNil) was payable at year-end.There were no other Director emoluments charged during theyear period ended June 30, 2021 and the year endedDecember 31, 2020. The amounts for the six month periodended June 30, are disclosed because these are sourcedfrom the latest available financial statements of theManager, which cover the year ended June 30, 2021 whichis the best available information at the time of approval ofthe Trust’s financial statements.
Transactions with Other Related Partiesd) Unitholdings held by related entities of the Manager at
September 30, 2021 are listed below.
NOTES TO THE FINANCIAL STATEMENTS
For the period ended September 30, 2021
73

12. Transactions with Related Parties (continued)
Transactions with Other Related Parties (continued)
Transactions with related entities of the Manager during the period ended September 30, 2021 are disclosed in below table:
Fund Currency Opening balance % of Ownership Subscriptions* Redemptions* Closing balance % of Ownership
Period endreceivable/(payable)for capital
transactions
AXA Rosenberg All-Country Asia Pacific Ex-Japan Equity Alpha Fund** USD 1,981,804 14.20 - (1,997,635) - - -
AXA Rosenberg All Country Asia Pacific Ex-Japan Small Cap Alpha Fund USD 49,782,180 35.89 2,140,967 (3,665,914) 48,537,740 34.67 -
AXA Rosenberg Eurobloc Equity Alpha Fund EUR 7,970,564 7.51 5,219,091 (5,892,042) 7,968,479 6.65 -
AXA Rosenberg Global Emerging Markets Equity Alpha Fund USD 62,828,039 70.16 6,662,700 (1,612,950) 64,723,301 74.40 13,237
AXA Rosenberg Global Equity Alpha Fund USD 228,985,325 41.88 27,749,538 (9,632,606) 263,147,712 44.71 373,833
AXA Rosenberg Global Small Cap Alpha Fund USD 18,729,409 11.11 6,108,514 (8,463,243) 11,369,702 5.27 110,426
AXA Rosenberg Japan Enhanced Index Equity Alpha Fund*** JPY 5,411,858,313 47.01 - (3,262,361,878) - - -
AXA Rosenberg Japan Equity Alpha Fund JPY 3,543,175,553 27.30 3,689,500,844 (31,408,853) 9,519,650,400 45.58 1,612,136
AXA Rosenberg Japan Small Cap Alpha Fund JPY 180,891,654 2.07 37,038 (3,410,401) 173,290,563 1.98 -
AXA Rosenberg Pacific Ex-Japan Equity Alpha Fund USD 53,510,670 36.85 2,750,145 (346,689) 55,612,254 38.98 11,468
AXA Rosenberg Pan-European Enhanced Index Equity Alpha Fund*** EUR 12,452,304 34.73 - (10,361,504) - - -
AXA Rosenberg Pan-European Equity Alpha Fund EUR 15,364,717 42.53 4,795,251 (1,210,677) 20,252,866 41.01 -
AXA Rosenberg US Enhanced Index Equity Alpha Fund USD 798,692,720 31.08 54,049,580 (102,010,545) 768,375,679 27.80 912,529
AXA Rosenberg US Equity Alpha Fund USD 257,010,392 29.38 34,315,303 (25,390,676) 289,862,135 27.06 395,411
*The subscription and redemption figures include transfers between unitholder accounts within the unit classes. The transfers are not included in the Statement of Changes in Net Assets Attributableto Holders of Redeemable Participating Units.**AXA Rosenberg All-Country Asia Pacific Ex-Japan Equity Alpha Fund terminated on July 30, 2021.***AXA Rosenberg Japan Enhanced Index Equity Alpha Fund and AXA Rosenberg Pan-European Enhanced Index Equity Alpha Fund terminated on June 30, 2021.
NOTES TO THE FINANCIAL STATEMENTS
For the period ended September 30, 2021
74

12. Transactions with Related Parties (continued)
Transactions with Other Related Parties (continued)
Transactions with related entities of the Manager during the year ended March 31, 2021 are disclosed in below table:
Fund Currency Opening balance % of Ownership Subscriptions* Redemptions* Closing balance % of Ownership
Year endreceivable/(payable)for capital
transactions
AXA Rosenberg All-Country Asia Pacific Ex-Japan Equity Alpha Fund USD 1,253,901 8.34 178,943 (515,905) 1,981,804 14.20 -
AXA Rosenberg All Country Asia Pacific Ex-Japan Small Cap Alpha Fund USD 38,016,347 47.62 1,331,305 (16,895,927) 49,782,180 35.89 -
AXA Rosenberg Eurobloc Equity Alpha Fund EUR 53,304,132 67.51 1,830,947 (57,873,596) 7,970,564 7.51 -
AXA Rosenberg Global Emerging Markets Equity Alpha Fund USD 40,762,690 90.38 19,649,357 (21,102,441) 62,828,039 70.16 240,123
AXA Rosenberg Global Equity Alpha Fund USD 155,957,364 45.11 55,499,195 (65,441,627) 228,985,325 41.88 397,482
AXA Rosenberg Global Small Cap Alpha Fund USD 3,996,676 3.30 4,939,211 (2,200,051) 18,729,409 11.11 3,729
AXA Rosenberg Japan Enhanced Index Equity Alpha Fund JPY 5,432,335,679 52.32 872,010,376 (2,580,306,345) 5,411,858,313 47.01 -
AXA Rosenberg Japan Equity Alpha Fund JPY 4,668,350,494 47.37 50,630,177 (2,547,710,022) 3,543,175,553 27.30 3,239,677
AXA Rosenberg Japan Small Cap Alpha Fund JPY 1,574,048,192 23.77 1,772,685 (1,677,592,296) 180,891,654 2.07 -
AXA Rosenberg Pacific Ex-Japan Equity Alpha Fund USD 50,838,346 49.59 3,587,820 (31,509,654) 53,510,670 36.85 -
AXA Rosenberg Pan-European Enhanced Index Equity Alpha Fund EUR 9,320,714 34.26 394,825 (391,078) 12,452,304 34.73 -
AXA Rosenberg Pan-European Equity Alpha Fund EUR 8,512,925 24.73 7,360,255 (2,518,352) 15,364,717 42.53 -
AXA Rosenberg US Enhanced Index Equity Alpha Fund USD 813,143,687 41.17 220,271,288 (777,191,980) 798,692,720 31.08 33,541
AXA Rosenberg US Equity Alpha Fund USD 171,543,201 32.21 184,960,093 (199,703,585) 257,010,392 29.38 669
*The subscription and redemption figures include transfers between unitholder accounts within the unit classes. The transfers are not included in the Statement of Changes in Net Assets Attributableto Holders of Redeemable Participating Units.
NOTES TO THE FINANCIAL STATEMENTS
For the period ended September 30, 2021
75

12. Transactions with Related Parties (continued)
Transactions with Other Related Parties (continued)
Transactions with the unitholders who are not related to the Manager with unitholdings in excess of 20% during the period ended September 30, 2021 are disclosed in below table:
Fund Currency Opening balance % of Ownership Subscriptions* Redemptions* Closing balance % of Ownership
Period endreceivable/(payable)for capital
transactions
AXA Rosenberg Eurobloc Equity Alpha Fund EUR 88,684,465 83.56 9,413,454 (2,759,979) 101,625,064 84.81 (45,414)
AXA Rosenberg Global Small Cap Alpha Fund USD 81,087,724 48.10 51,262,975 (33,000) 142,002,613 65.82 -
AXA Rosenberg Japan Small Cap Alpha Fund JPY 3,675,508,682 42.06 73,847,704 (116,899,842) 3,710,868,612 42.40 369,389
AXA Rosenberg Pacific Ex-Japan Equity Alpha Fund USD 63,254,405 43.56 30,685 (12,862,313) 31,829,383 22.31 8,313
AXA Rosenberg Pan-European Equity Alpha Fund EUR 41,792,052 28.78 2,402,294 (3,979,168) 14,494,553 29.35 3,121
*The subscription and redemption figures include transfers between unitholder accounts within the unit classes. The transfers are not included in the Statement of Changes in Net Assets Attributableto Holders of Redeemable Participating Units.
NOTES TO THE FINANCIAL STATEMENTS
For the period ended September 30, 2021
76

12. Transactions with Related Parties (continued)
Transactions with Other Related Parties (continued)
Transactions with the unitholders who are not related to the Manager with unitholdings in excess of 20% during the year ended March 31, 2021 are disclosed in below table:
Fund Currency Opening balance % of Ownership Subscriptions* Redemptions* Closing balance % of Ownership
Year endreceivable/(payable)for capital
transactions
AXA Rosenberg All-Country Asia Pacific Ex-Japan Equity Alpha Fund USD 5,012,597 33.34 654,720 (2,482,111) 7,371,751 52.82 -
AXA Rosenberg Eurobloc Equity Alpha Fund EUR 17,591,705 22.28 58,553,686 (6,195,651) 88,684,465 83.56 -
AXA Rosenberg Global Equity Alpha Fund USD 72,948,357 21.10 - - 109,571,773 20.04 -
AXA Rosenberg Global Small Cap Alpha Fund USD 24,222 0.02 75,561,212 - 81,087,724 48.10 -
AXA Rosenberg Japan Enhanced Index Equity Alpha Fund JPY - - 1,886,597,554 - 2,376,106,267 20.64 -
AXA Rosenberg Japan Equity Alpha Fund JPY - - 2,447,639,340 - 2,854,008,439 21.99 -
AXA Rosenberg Japan Small Cap Alpha Fund JPY 1,448,892,489 21.88 1,777,313,304 (222,799,177) 3,675,508,682 42.06 27,218
AXA Rosenberg Pacific Ex-Japan Equity Alpha Fund USD 32,774,791 31.97 24,664,527 (11,677,299) 63,254,405 43.56 -
AXA Rosenberg Pan-European Equity Alpha Fund EUR 17,734,972 51.52 1,276,834 (11,330,226) 14,331,491 39.67 2,569
AXA Rosenberg US Equity Alpha Fund USD - - 142,326,625 - 148,975,050 17.03 -
*The subscription and redemption figures include transfers between unitholder accounts within the unit classes. The transfers are not included in the Statement of Changes in Net Assets Attributableto Holders of Redeemable Participating Units.
There was no income distribution in relation to the transactions for the period ended September 30, 2021 and year ended March 31, 2021.
There was no investments in investment funds that are also managed by AXA during period ended September 30, 2021 and year ended March 31, 2021.
NOTES TO THE FINANCIAL STATEMENTS
For the period ended September 30, 2021
77

12. Transactions with Related Parties (continued)
Connected Persons
In accordance with Regulation 43 of the UCITS Regulations“Restrictions of transactions with connected persons” states that“A responsible person shall ensure that any transaction betweena UCITS and a connected person is conducted a) at arm’s length,and b) in the best interest of the unit-holders of the UCITS”. Suchtransactions must be in the best interests of the Trust’sunitholders.
Unitholders should refer to the Prospectus which identifies in theConflicts of Interest Section, many of the transactions withconnected persons and the general nature of the contractualarrangements with the principal connected parties but it is notexhaustive of all transactions with connected persons.
As required under UCITS Regulation 81.4, the Board of Directorsof the Manager, as responsible persons, are satisfied that thereare arrangements in place, evidenced by written procedures, toensure that the obligations that are prescribed by Regulation43(1) are applied to all transactions with a connected party; andall transactions with connected parties that were entered intoduring the period to which the report relates, complied with theobligations that are prescribed by Regulation 43(1).
Note 12 to the financial statements details related partytransactions in the period as required by the financial reportingstandards. However, Unitholders should understand that not all“connected persons” are related parties as such latter expressionis defined by those financial reporting standards. Details of feespaid to related parties and certain connected persons are set outin Notes 5 and 8 to the financial statements.
The following transactions are transactions with connectedpersons:
(i) Foreign exchange transactions with State Street Bank andTrust Company;
(ii) Stock lending activity with AXA Investment Managers GSLimited as agent for the Manager;
(iii) Belgian paying agent fees paid to AXA Bank Europe SA and(iv) the production of Key Information Documents in respect of
the Fund by Deloitte Luxembourg.
13. Financial Risks Management Process
Oversight and Implementation
The activities of the Trust expose it to various financial risks suchas market risk (including market price risk, interest rate risk, andcurrency risk), credit risk and liquidity risk. The Trust’s overall riskmanagement process focuses on the unpredictability of financialmarkets and seeks to minimise potential adverse effects on theTrust’s financial performance. The Trust’s financial riskmanagement objectives and policies are consistent with thosedisclosed in the Trust’s audited financial statements as at and forthe year ended March 31, 2021.
Fair Value Estimation
The Trust is required to classify financial assets and financialliabilities using a three-level fair value hierarchy for the inputsused in valuation techniques to measure fair value.
The Funds classify fair value measurements using a fair valuehierarchy that reflects the significance of the inputs used inmaking the measurements. The daily implementation of the fairvalue policy is delegated to the Administrator by the Manager. Thefair value hierarchy has the following levels:
• Level 1 - Quoted prices (unadjusted) in active markets foridentical assets or liabilities.
• Level 2 - Inputs other than quoted prices included within Level1 that are observable for the asset or liability, either directly(that is, as prices) or indirectly (that is, derived from prices).
• Level 3 - Inputs for the asset or liability that are not based onobservable market data (that is, unobservable inputs).
The level in the fair value hierarchy within which the fair valuemeasurement is categorised in its entirety is determined on thebasis of the lowest level input that is significant to the fair valuemeasurement in its entirety. For this purpose, the significance ofan input is assessed against the fair value measurement in itsentirety. If a fair value measurement uses observable inputs thatrequire significant adjustment based on unobservable inputs, thatmeasurement is a Level 3 measurement. Assessing thesignificance of a particular input to the fair value measurement inits entirety requires judgement, considering factors specific to theasset or liability.
The determination of what constitutes ‘observable’ requiressignificant judgement by the Manager. The Manager considersobservable data to be that market data that is readily available,regularly distributed or updated, reliable and verifiable, notproprietary, and provided by independent sources that are activelyinvolved in the relevant market.
Please refer to the tables below which disclose the fair valuehierarchy levels for the Funds as at September 30, 2021 andMarch 31, 2021.
NOTES TO THE FINANCIAL STATEMENTS
For the period ended September 30, 2021
78

13. Financial Risks Management Process (continued)
Fair Value Estimation (continued)
As at September 30, 2021, all of the Funds’ holdings are classified as Level 1 except for the following Funds:
AXA Rosenberg All-Country Asia Pacific Ex-Japan Equity Alpha Fund Level 1USD
Level 2USD
Level 3USD
TotalUSD
Financial Assets:Equities - - 18,755 18,755
Financial Assets - - 18,755 18,755
AXA Rosenberg All Country Asia Pacific Ex-Japan Small Cap Alpha Fund Level 1USD
Level 2USD
Level 3USD
TotalUSD
Financial Assets:Equities 138,352,774 - 636,727 138,989,501Warrants 2,086 - 2 2,088Open Forward Foreign Currency Exchange Contracts - 2,341 - 2,341
Financial Assets 138,354,860 2,341 636,729 138,993,930
Financial Liabilities:Open Forward Foreign Currency Exchange Contracts - (50,001) - (50,001)
Financial Liabilities - (50,001) - (50,001)
AXA Rosenberg Global Emerging Markets Equity Alpha Fund Level 1USD
Level 2USD
Level 3USD
TotalUSD
Financial Assets:Equities 83,218,337 - 125,658 83,343,995Investment Funds 3,196,325 - - 3,196,325Open Forward Foreign Currency Exchange Contracts - 178 - 178
Financial Assets 86,414,662 178 125,658 86,540,498
Financial Liabilities:Open Forward Foreign Currency Exchange Contracts - (1,966) - (1,966)
Financial Liabilities - (1,966) - (1,966)
AXA Rosenberg Global Small Cap Alpha Fund Level 1USD
Level 2USD
Level 3USD
TotalUSD
Financial Assets:Equities 212,587,053 - - 212,587,053Open Forward Foreign Currency Exchange Contracts - 62,007 - 62,007
Financial Assets 212,587,053 62,007 - 212,649,060
Financial Liabilities:Open Forward Foreign Currency Exchange Contracts - (66,588) - (66,588)
Financial Liabilities - (66,588) - (66,588)
AXA Rosenberg Japan Equity Alpha Fund Level 1JPY
Level 2JPY
Level 3JPY
TotalJPY
Financial Assets:Equities 20,557,723,267 - - 20,557,723,267Open Forward Foreign Currency Exchange Contracts - 239,647 - 239,647
Financial Assets 20,557,723,267 239,647 - 20,557,962,914
Financial Liabilities:Open Forward Foreign Currency Exchange Contracts - (14,539,800) - (14,539,800)
Financial Liabilities - (14,539,800) - (14,539,800)
NOTES TO THE FINANCIAL STATEMENTS
For the period ended September 30, 2021
79

13. Financial Risks Management Process (continued)
Fair Value Estimation (continued)
AXA Rosenberg Japan Small Cap Alpha Fund Level 1JPY
Level 2JPY
Level 3JPY
TotalJPY
Financial Assets:Equities 8,641,158,400 - - 8,641,158,400Open Forward Foreign Currency Exchange Contracts - 28,038 - 28,038
Financial Assets 8,641,158,400 28,038 - 8,641,186,438
Financial Liabilities:Open Forward Foreign Currency Exchange Contracts - (2,305,327) - (2,305,327)
Financial Liabilities - (2,305,327) - (2,305,327)
AXA Rosenberg Pacific Ex-Japan Equity Alpha Fund Level 1USD
Level 2USD
Level 3USD
TotalUSD
Financial Assets:Equities 140,571,380 - 439,801 141,011,181
Financial Assets 140,571,380 - 439,801 141,011,181
AXA Rosenberg US Enhanced Index Equity Alpha Fund Level 1USD
Level 2USD
Level 3USD
TotalUSD
Financial Assets:Equities 2,750,317,879 - - 2,750,317,879Open Forward Foreign Currency Exchange Contracts - 549,246 - 549,246
Financial Assets 2,750,317,879 549,246 - 2,750,867,125
Financial Liabilities:Open Forward Foreign Currency Exchange Contracts - (10,332,870) - (10,332,870)
Financial Liabilities - (10,332,870) - (10,332,870)
AXA Rosenberg US Equity Alpha Fund Level 1USD
Level 2USD
Level 3USD
TotalUSD
Financial Assets:Equities 1,067,061,563 - - 1,067,061,563Open Forward Foreign Currency Exchange Contracts - 71,761 - 71,761
Financial Assets 1,067,061,563 71,761 - 1,067,133,324
Financial Liabilities:Open Forward Foreign Currency Exchange Contracts - (2,239,550) - (2,239,550)
Financial Liabilities - (2,239,550) - (2,239,550)
As at March 31, 2021, all of the Funds’ holdings are classified as Level 1 except for the following Funds:
AXA Rosenberg All-Country Asia Pacific Ex-Japan Equity Alpha Fund Level 1USD
Level 2USD
Level 3USD
TotalUSD
Financial Assets:Equities 13,766,163 - 18,779 13,784,942
Financial Assets 13,766,163 - 18,779 13,784,942
AXA Rosenberg All Country Asia Pacific Ex-Japan Small Cap Alpha Fund Level 1USD
Level 2USD
Level 3USD
TotalUSD
Financial Assets:Equities 136,249,650 - 637,563 136,887,213Warrants - - 2 2
Financial Assets 136,249,650 - 637,565 136,887,215
Financial Liabilities:Open Forward Foreign Currency Exchange Contracts - (52,974) - (52,974)
Financial Liabilities - (52,974) - (52,974)
NOTES TO THE FINANCIAL STATEMENTS
For the period ended September 30, 2021
80

13. Financial Risks Management Process (continued)
Fair Value Estimation (continued)
AXA Rosenberg Global Emerging Markets Equity Alpha Fund Level 1USD
Level 2USD
Level 3USD
TotalUSD
Financial Assets:Equities 85,879,737 - 125,822 86,005,559Investment Funds 2,696,925 - - 2,696,925Open Forward Foreign Currency Exchange Contracts - 242 - 242
Financial Assets 88,576,662 242 125,822 88,702,726
Financial Liabilities:Open Forward Foreign Currency Exchange Contracts - (3,304) - (3,304)
Financial Liabilities - (3,304) - (3,304)
AXA Rosenberg Global Small Cap Alpha Fund Level 1USD
Level 2USD
Level 3USD
TotalUSD
Financial Assets:Equities 166,136,555 - - 166,136,555Open Forward Foreign Currency Exchange Contracts - 1,425 - 1,425
Financial Assets 166,136,555 1,425 - 166,137,980
Financial Liabilities:Open Forward Foreign Currency Exchange Contracts - (97,633) - (97,633)
Financial Liabilities - (97,633) - (97,633)
AXA Rosenberg Japan Enhanced Index Equity Alpha Fund Level 1JPY
Level 2JPY
Level 3JPY
TotalJPY
Financial Assets:Equities 11,208,436,595 - - 11,208,436,595Open Forward Foreign Currency Exchange Contracts - 68,515,914 - 68,515,914
Financial Assets 11,208,436,595 68,515,914 - 11,276,952,509
Financial Liabilities:Open Forward Foreign Currency Exchange Contracts - (1,362,804) - (1,362,804)
Financial Liabilities - (1,362,804) - (1,362,804)
AXA Rosenberg Japan Equity Alpha Fund Level 1JPY
Level 2JPY
Level 3JPY
TotalJPY
Financial Assets:Equities 12,850,437,613 - - 12,850,437,613Open Forward Foreign Currency Exchange Contracts - 288,181 - 288,181
Financial Assets 12,850,437,613 288,181 - 12,850,725,794
Financial Liabilities:Open Forward Foreign Currency Exchange Contracts - (4,593) - (4,593)
Financial Liabilities - (4,593) - (4,593)
AXA Rosenberg Japan Small Cap Alpha Fund Level 1JPY
Level 2JPY
Level 3JPY
TotalJPY
Financial Assets:Equities 8,579,407,815 - - 8,579,407,815Open Forward Foreign Currency Exchange Contracts - 2,809,611 - 2,809,611
Financial Assets 8,579,407,815 2,809,611 - 8,582,217,426
AXA Rosenberg Pacific Ex-Japan Equity Alpha Fund Level 1USD
Level 2USD
Level 3USD
TotalUSD
Financial Assets:Equities 143,716,930 - 440,378 144,157,308
Financial Assets 143,716,930 - 440,378 144,157,308
NOTES TO THE FINANCIAL STATEMENTS
For the period ended September 30, 2021
81

13. Financial Risks Management Process (continued)
Fair Value Estimation (continued)
AXA Rosenberg US Enhanced Index Equity Alpha Fund Level 1USD
Level 2USD
Level 3USD
TotalUSD
Financial Assets:Equities 2,577,004,565 - - 2,577,004,565Open Forward Foreign Currency Exchange Contracts - 202,935 - 202,935
Financial Assets 2,577,004,565 202,935 - 2,577,207,500
Financial Liabilities:Open Forward Foreign Currency Exchange Contracts - (12,905,118) - (12,905,118)
Financial Liabilities - (12,905,118) - (12,905,118)
AXA Rosenberg US Equity Alpha Fund Level 1USD
Level 2USD
Level 3USD
TotalUSD
Financial Assets:Equities 868,845,751 - - 868,845,751Open Forward Foreign Currency Exchange Contracts - 33,540 - 33,540
Financial Assets 868,845,751 33,540 - 868,879,291
Financial Liabilities:Open Forward Foreign Currency Exchange Contracts - (2,010,185) - (2,010,185)
Financial Liabilities - (2,010,185) - (2,010,185)
NOTES TO THE FINANCIAL STATEMENTS
For the period ended September 30, 2021
82

14. Seasonal and cyclical changes
The Funds has not been subject to seasonal or cyclical changesduring the period, please refer to the Investment Manager’sReport for further information.
15. Reconciliation to dealing NAV
No reconciliation required for period ended September 30, 2021.
For year ended March 31, 2021, the dealing NAV differed fromthe NAV per the financial statements. The difference related to:
- an investment which was fair valued post year end in accordancewith procedures established by and under the supervision of theBoard of Directors and reviewed by the Administrator inconjunction with the Depository. An adjustment had beenreflected in the financial statements of the relevant Funds toreflect this valuation as the market trading for this investment wassuspended on 30 March 2021; and
- an accrual for Capital gains tax included in the NAV per financialstatements. An adjustment had been reflected in the financialstatements of the relevant Funds to reflect the year end IndianCapital Gains Tax Accrual.
The table below reconciles the NAV as per the financial statements to the dealing NAV for these Funds for year ended 31 March 2021.
Currency
NAV perfinancial
statementsValuation
adjustment
Accrual ofCapital gains
tax
NAV ascalculated in
accordance withthe Prospectus
(dealing NAV)
AXA Rosenberg All-Country Asia Pacific Ex-Japan EquityAlpha Fund
USD 13,956,363 18,600 25,542 14,000,505
AXA Rosenberg All Country Asia Pacific Ex-Japan Small CapAlpha Fund
USD 138,707,661 631,450 241,663 139,580,774
AXA Rosenberg Global Emerging Markets Equity Alpha Fund USD 89,549,656 124,616 69,480 89,743,752AXA Rosenberg Pacific Ex-Japan Equity Alpha Fund USD 145,212,133 436,156 - 145,648,289
16. Significant Events and Material Changes to ProspectusDuring the Period
AXA Rosenberg All-Country Asia Pacific Ex-Japan Equity Alpha Fundterminated on July 30, 2021. Consequently, the financialstatements for this Fund has been prepared on a non-goingconcern basis.
AXA Rosenberg Japan Enhanced Index Equity Alpha Fund and AXARosenberg Pan-European Enhanced Index Equity Alpha Fundterminated on June 30, 2021. Consequently, the financialstatements for these Funds have been prepared on a non-goingconcern basis.
COVID-19Following the worldwide emergence of the COVID-19 virus inJanuary 2020 AXA Investment Managers has taken appropriate(and successful) measures as part of its Business Continuity Plan(“BCP”), which is an important part of its Operational Resilienceframework, in order to continue to provide a good level of servicesto its investors whilst the crisis lasts.
17. Post Statement of Financial Position Events
There have been no material post Statement of Financial Positionevents that would require disclosure or adjustment to thesefinancial statements.
18. Approval of Financial Statements
The financial statements were approved by the Directors of theManager on November 24, 2021.
NOTES TO THE FINANCIAL STATEMENTS
For the period ended September 30, 2021
83

Number ofShares
Fair ValueUSD
% ofNet
Assets
Equities - Nil (March 31, 2021: 98.77%)Australia - Nil (March 31, 2021: 11.24%)
China - Nil (March 31, 2021: 35.85%)
Hong Kong - Nil (March 31, 2021: 6.66%)Brilliance China Automotive HoldingsLtd 40,000 18,755 0.00
India - Nil (March 31, 2021: 9.55%)
Indonesia - Nil (March 31, 2021: 0.05%)
Korea - Nil (March 31, 2021: 14.92%)
Macau - Nil (March 31, 2021: 0.25%)
Malaysia - Nil (March 31, 2021: 0.33%)
New Zealand - Nil (March 31, 2021: 0.64%)
Singapore - Nil (March 31, 2021: 2.19%)
Taiwan - Nil (March 31, 2021: 14.70%)
Thailand - Nil (March 31, 2021: 2.39%)
Fair ValueUSD
% ofNet
Assets
Total financial assets at fair valuethrough profit or loss 18,755 0.00
Cash at bank 40,473 0.00
Other Net Liabilities (59,228) 0.00
Net Assets attributable toholders of redeemableparticipating units - 0.00
Analysis of Total Assets
% ofTotal
Assets
Transferable securities admitted to an official exchange listing 31.22Current Assets 68.78
Total Assets 100.00
AXA ROSENBERG ALL-COUNTRY ASIA PACIFIC EX-JAPAN EQUITY ALPHA FUND
Schedule of InvestmentsAs at September 30, 2021
84

Number ofShares
Fair ValueUSD
% ofNet
Assets
Equities - 99.28% (March 31, 2021: 98.69%)Australia - 21.62% (March 31, 2021: 19.01%)Ainsworth Game Technology Ltd 241,657 212,092 0.15ALS Ltd 213,275 1,953,471 1.40Ampol Ltd 3,651 73,713 0.05Ansell Ltd 71,128 1,754,347 1.25ARB Corp Ltd 51,573 1,823,572 1.30Bank of Queensland Ltd 202,935 1,372,817 0.98Bendigo & Adelaide Bank Ltd 62,207 424,413 0.30Brickworks Ltd 82,361 1,484,363 1.06Centuria Capital Group 48,294 119,133 0.09Champion Iron Ltd 199,392 694,949 0.50Charter Hall Group (REIT) 154,127 1,908,259 1.36City Chic Collective Ltd 60,559 285,216 0.20Clinuvel Pharmaceuticals Ltd 3,143 97,284 0.07CSR Ltd 84,235 340,136 0.24De Grey Mining Ltd 166,987 117,004 0.08Eagers Automotive Ltd 58,301 632,759 0.45Eclipx Group Ltd 144,685 258,148 0.18Emeco Holdings Ltd 513,412 390,334 0.28Estia Health Ltd 210,057 348,990 0.25EVENT Hospitality andEntertainment Ltd 8,433 92,836 0.07Genworth Mortgage InsuranceAustralia Ltd 174,444 281,002 0.20HT&E Ltd 182,032 212,358 0.15Image Resources NL 572,760 67,232 0.05Imugene Ltd 744,223 259,387 0.19Incitec Pivot Ltd 152,899 325,265 0.23JB Hi-Fi Ltd 24,994 821,566 0.59Mesoblast Ltd 261,698 316,165 0.23Metcash Ltd 641,965 1,824,752 1.30Mineral Resources Ltd 27,880 903,139 0.65Nufarm Ltd 116,633 403,136 0.29Oil Search Ltd 26,521 83,814 0.06OZ Minerals Ltd 31,977 518,794 0.37Pacific Current Group Ltd 43,618 233,155 0.17Pact Group Holdings Ltd 314,971 861,161 0.62Pendal Group Ltd 116,408 695,402 0.50Perseus Mining Ltd 1,160,923 1,178,223 0.84Qube Holdings Ltd 41,359 98,889 0.07Red 5 Ltd 1,439,816 221,011 0.16Reliance Worldwide Corp Ltd 395,158 1,480,019 1.06Resimac Group LTD 126,593 188,833 0.13Sandfire Resources Ltd 175,545 691,721 0.49Sims Ltd 158,865 1,529,700 1.09Sub Sandfire Resources 175,545 5,072 0.00Super Retail Group Ltd 188,993 1,662,803 1.19Viva Energy Group Ltd 549,035 945,880 0.68Zip Co Ltd 13,518 68,988 0.05
30,261,303 21.62
China - 3.83% (March 31, 2021: 3.46%)Asia Cement China Holdings Corp 137,000 109,024 0.08BAIC Motor Corp Ltd 1,851,000 640,805 0.46Chaowei Power Holdings Ltd 1,200,000 345,295 0.24China Harmony Auto Holding Ltd 444,500 234,394 0.17China Modern Dairy Holdings Ltd 421,000 79,769 0.06China Sanjiang Fine Chemicals CoLtd 609,000 212,788 0.15China Shineway PharmaceuticalGroup Ltd 85,000 81,018 0.06
Number ofShares
Fair ValueUSD
% ofNet
Assets
Consun Pharmaceutical Group Ltd 726,000 333,406 0.24Legend Holdings Corp 360,100 698,029 0.50Lonking Holdings Ltd 1,159,000 350,619 0.25NetDragon Websoft Holdings Ltd 588,500 1,331,272 0.95Sinotrans Ltd 200,000 78,488 0.05Xiamen International Port Co Ltd 544,000 59,748 0.04Xinhua Winshare Publishing andMedia Co Ltd 969,000 730,673 0.52Zhejiang Expressway Co Ltd 98,000 80,695 0.06
5,366,023 3.83
Hong Kong - 11.36% (March 31, 2021: 10.14%)APAC Resources Ltd 560,000 96,754 0.07Bright Smart Securities &Commodities Group Ltd 1,360,000 252,445 0.18Brilliance China AutomotiveHoldings Ltd 1,358,000 636,727 0.45Build King Holdings Ltd 800,000 101,225 0.07China Foods Ltd 916,000 330,646 0.24China Overseas Grand OceansGroup Ltd 2,152,000 1,315,861 0.94China Resources PharmaceuticalGroup Ltd 2,059,500 1,011,939 0.72Chinese Estates Holdings Ltd 181,500 68,430 0.05Crystal International Group Ltd 268,000 96,739 0.07Eagle Nice International HoldingsLtd 334,000 205,300 0.15Essex Bio-technology Ltd 530,000 391,816 0.28Genertec Universal Medical GroupCo Ltd 217,000 169,343 0.12Great Eagle Holdings Ltd 143,000 390,352 0.28G-Resources Group Ltd 382,000 143,532 0.10Haitong International SecuritiesGroup Ltd 1,295,000 341,024 0.24Hang Lung Group Ltd 573,000 1,337,428 0.96Hi Sun Technology China Ltd 2,097,000 342,108 0.24Hung Hing Printing Group Ltd 298,000 49,190 0.04Johnson Electric Holdings Ltd 502,500 1,074,114 0.77Kingboard Holdings Ltd 171,000 773,763 0.55Lee’s Pharmaceutical Holdings Ltd 533,000 265,314 0.19Luk Fook Holdings International Ltd 169,000 433,971 0.31Pacific Basin Shipping Ltd 2,361,000 1,096,390 0.78SAS Dragon Holdings Ltd 300,000 181,126 0.13Sinofert Holdings Ltd 2,298,000 397,039 0.28Skyworth Group Ltd 2,774,000 835,623 0.60Stella International Holdings Ltd 40,000 51,178 0.04Sun Hung Kai & Co Ltd 1,687,000 871,168 0.62TCL Electronics Holdings Ltd 1,241,000 620,129 0.44Texwinca Holdings Ltd 624,000 127,451 0.09United Laboratories InternationalHoldings Ltd 482,000 320,419 0.23Untrade Youyuan Holdings 643,000 - 0.00VSTECS Holdings Ltd 500,000 449,924 0.32VTech Holdings Ltd 117,000 855,559 0.61Yip’s Chemical Holdings Ltd 442,000 272,820 0.20
15,906,847 11.36
India - 15.32% (March 31, 2021: 15.06%)Ashoka Buildcon Ltd 273,499 363,026 0.26Canara Bank 426,793 992,559 0.71Century Enka Ltd 22,159 133,144 0.09CG Power & Industrial Solutions Ltd 67,972 112,382 0.08
AXA ROSENBERG ALL COUNTRY ASIA PACIFIC EX-JAPAN SMALL CAP ALPHAFUNDSchedule of InvestmentsAs at September 30, 2021
85

Number ofShares
Fair ValueUSD
% ofNet
Assets
Equities - 99.28% (March 31, 2021: 98.69%) (continued)India - 15.32% (March 31, 2021: 15.06%) (continued)Chambal Fertilizers and ChemicalsLtd 88,842 403,082 0.29Cochin Shipyard Ltd 39,642 193,837 0.14Coromandel International Ltd 56,177 601,295 0.43Cosmo Films Ltd 7,046 142,102 0.10EID Parry India Ltd 160,270 905,719 0.65Emami Ltd 14,723 113,263 0.08Exide Industries Ltd 178,316 428,388 0.31Federal Bank Ltd 94,198 106,885 0.08Finolex Industries Ltd 47,052 132,261 0.09GHCL Ltd 102,254 612,883 0.44Glenmark Pharmaceuticals Ltd 121,609 834,605 0.60Gujarat State Fertilizers &Chemicals Ltd 357,012 623,938 0.44JB Chemicals & PharmaceuticalsLtd 23,246 584,137 0.42Kalyani Steels Ltd 42,240 218,249 0.15Kirloskar Industries Ltd 4,816 109,726 0.08KPR Mill Ltd 86,845 499,408 0.36Mahanagar Gas Ltd 19,563 284,507 0.20Maharashtra Seamless Ltd 57,501 245,819 0.17Marksans Pharma Ltd 118,838 110,509 0.08NMDC Ltd 726,464 1,400,029 1.00Oracle Financial Services SoftwareLtd 27,430 1,677,155 1.20Pfizer Ltd 8,607 646,848 0.46Phillips Carbon Black Ltd 147,823 541,585 0.39PTC India Ltd 169,574 264,033 0.19Rajesh Exports Ltd 201,226 1,594,505 1.14REC Ltd 480,337 1,020,176 0.73Redington India Ltd 203,553 383,577 0.27SH Kelkar & Co Ltd 74,704 161,052 0.11Sharda Cropchem Ltd 77,632 344,848 0.25Sonata Software Ltd 34,276 407,085 0.29Sun TV Network Ltd 99,219 674,660 0.48Tata Chemicals Ltd 7,999 99,107 0.07Tata Steel BSL Ltd 1,040,671 1,187,846 0.85Union Bank of India 3,233,873 1,576,038 1.12Usha Martin Ltd 273,030 316,609 0.23Vardhman Textiles Ltd 16,246 404,796 0.29
21,451,673 15.32
Indonesia - Nil (March 31, 2021: 0.18%)
Korea - 13.33% (March 31, 2021: 17.46%)Aekyung Petrochemical Co Ltd 16,492 202,319 0.14Bioneer Corp 5,626 310,048 0.22BNK Financial Group Inc 65,902 491,482 0.35Cheil Worldwide Inc 26,727 514,111 0.37Chongkundang Holdings Corp 4,605 332,151 0.24CNH Co Ltd 31,938 89,084 0.06Daewon San Up Co Ltd 19,922 111,641 0.08Daishin Securities Co Ltd 52,182 911,202 0.65Daou Technology Inc 44,812 928,221 0.66DB Financial Investment Co Ltd 40,363 227,553 0.16DGB Financial Group Inc 191,941 1,608,965 1.15GS Holdings Corp 2,017 76,191 0.05Haesung Industrial Co Ltd 17,843 227,935 0.16Handsome Co Ltd 3,272 109,366 0.08Hanyang Securities Co Ltd 12,401 193,504 0.14
Number ofShares
Fair ValueUSD
% ofNet
Assets
HDC Holdings Co Ltd 56,861 527,069 0.38Hitejinro Holdings Co Ltd 18,486 220,536 0.16Hyosung TNC Corp 321 175,005 0.12Hyundai Glovis Co Ltd 2,016 283,926 0.20JB Financial Group Co Ltd 217,756 1,639,607 1.17Kangnam Jevisco Co Ltd 6,333 141,209 0.10Kangwon Land Inc 2,883 69,701 0.05Kolon Corp 9,658 320,370 0.23Korea Gas Corp 9,738 400,335 0.29LG Innotek Co Ltd 6,290 1,108,984 0.79LG Uplus Corp 4,990 63,323 0.05LOTTE Fine Chemical Co Ltd 17,280 1,331,757 0.95LS Corp 12,436 673,266 0.48LX Semicon Co Ltd 6,809 582,273 0.42Meritz Financial Group Inc 12,846 364,820 0.26Meritz Securities Co Ltd 273,657 1,145,245 0.82NEOWIZ Holdings Corp 5,686 115,377 0.08NH Investment & Securities Co Ltd 37,147 403,942 0.29Posco International Corp 53,129 1,071,330 0.77Sajodaerim Corp 6,310 149,356 0.11Shinyoung Securities Co Ltd 6,822 362,131 0.26SIMMTECH Holdings Co Ltd 48,024 117,525 0.08Unid Co Ltd 8,658 959,766 0.69Youngone Corp 2,458 91,864 0.07
18,652,490 13.33
Luxembourg - 0.05% (March 31, 2021: 0.06%)L’Occitane International SA 20,000 67,505 0.05
Macau - Nil (March 31, 2021: 0.17%)
Malaysia - 2.29% (March 31, 2021: 2.16%)Genting Malaysia Bhd 108,700 78,283 0.06Insas Bhd 251,600 59,647 0.04Magni-Tech Industries Bhd 441,533 222,006 0.16Malaysia Building Society Bhd 5,926,400 859,976 0.61MNRB Holdings Bhd 219,200 66,757 0.05OSK Holdings Bhd 1,910,400 392,438 0.28RCE Capital Bhd 271,700 209,624 0.15Sime Darby Bhd 2,339,100 1,273,892 0.91Syarikat Takaful Malaysia KeluargaBhd 47,300 47,622 0.03
3,210,245 2.29
New Zealand - 2.73% (March 31, 2021: 1.14%)Argosy Property Ltd 300,004 331,650 0.24Comvita Ltd 60,325 148,150 0.10Fletcher Building Ltd 73,974 366,658 0.26Hallenstein Glasson Holdings Ltd 51,266 245,439 0.17Heartland Group Holdings Ltd 502,786 806,419 0.58Property for Industry Ltd 427,320 866,673 0.62Skellerup Holdings Ltd 33,837 138,188 0.10SKYCITY Entertainment Group Ltd 36,456 80,100 0.06Warehouse Group Ltd 296,303 840,103 0.60
3,823,380 2.73
Philippines - 1.07% (March 31, 2021: 1.16%)China Banking Corp 377,300 178,443 0.13East West Banking Corp 412,500 72,173 0.05Ginebra San Miguel Inc 320,290 715,488 0.51Puregold Price Club Inc 606,400 528,119 0.38
1,494,223 1.07
AXA ROSENBERG ALL COUNTRY ASIA PACIFIC EX-JAPAN SMALL CAP ALPHAFUNDSchedule of Investments (continued)As at September 30, 2021
86

Number ofShares
Fair ValueUSD
% ofNet
Assets
Equities - 99.28% (March 31, 2021: 98.69%) (continued)Singapore - 4.56% (March 31, 2021: 4.81%)Avarga Ltd 536,000 111,535 0.08BRC Asia Ltd 143,800 156,235 0.11Bukit Sembawang Estates Ltd 54,200 193,628 0.14Civmec Ltd 249,600 107,095 0.08Dasin Retail Trust 278,000 77,302 0.06EC World (REIT) 846,100 497,028 0.35Fraser and Neave Ltd 77,000 79,688 0.06Frencken Group Ltd 126,500 216,641 0.15GP Industries Ltd 102,400 40,542 0.03Ho Bee Land Ltd 89,100 184,422 0.13Hong Leong Asia Ltd 686,700 408,449 0.29Hour Glass Ltd 233,200 268,826 0.19HRnetgroup Ltd 159,200 90,001 0.06Hutchison Port Holdings Trust 660,500 156,869 0.11IGG Inc 64,000 60,221 0.04InnoTek Ltd 188,200 111,248 0.08ISDN Holdings Ltd 343,600 158,816 0.11Japfa Ltd 752,000 380,819 0.27LHN Ltd 346,400 85,477 0.06Maxi-Cash Financial Services CorpLtd 646,100 81,619 0.06Multi-Chem Ltd 40,100 53,315 0.04Olam International Ltd 378,600 489,425 0.35QAF Ltd 86,700 55,561 0.04Riverstone Holdings Ltd 427,900 281,306 0.20Sabana Shari’ah CompliantIndustrial (REIT) 554,700 176,715 0.13Samudera Shipping Line Ltd 461,700 202,351 0.14Sheng Siong Group Ltd 75,400 81,920 0.06Silverlake Axis Ltd 946,100 203,841 0.15Straits Trading Co Ltd 142,800 324,498 0.23UOB-Kay Hian Holdings Ltd 107,900 124,384 0.09Valuemax Group Ltd 673,200 176,036 0.13Wing Tai Holdings Ltd 561,400 752,613 0.54
6,388,426 4.56
Taiwan - 20.42% (March 31, 2021: 19.91%)Acer Inc 95,000 84,479 0.06Ardentec Corp 477,000 1,002,435 0.72Basso Industry Corp 119,000 185,160 0.13Chicony Power Technology Co Ltd 251,000 604,065 0.43China Life Insurance Co Ltd 367,000 382,340 0.27China Motor Corp 104,000 275,113 0.20Chipbond Technology Corp 497,000 1,205,016 0.86ChipMOS Technologies Inc 688,000 1,179,778 0.84Compal Electronics Inc 1,565,000 1,327,080 0.95Edom Technology Co Ltd 214,500 223,466 0.16Everlight Electronics Co Ltd 388,000 665,688 0.48FocalTech Systems Co Ltd 86,000 479,227 0.34General Interface Solution HoldingLtd 318,000 1,089,467 0.78Global Brands Manufacture Ltd 524,000 625,836 0.45Global Mixed Mode Technology Inc 29,000 240,708 0.17Goldsun Building Materials Co Ltd 178,000 156,210 0.11Grand Pacific Petrochemical 1,070,000 1,110,883 0.79HannStar Display Corp 1,801,000 984,197 0.70Horizon Securities Co Ltd 284,000 181,192 0.13Innolux Corp 732,000 447,311 0.32International Games System Co Ltd 51,000 1,201,755 0.86ITE Technology Inc 64,000 228,567 0.16
Number ofShares
Fair ValueUSD
% ofNet
Assets
Kuo Yang Construction Co Ltd 390,000 367,456 0.26Long Bon International Co Ltd 337,000 218,635 0.16Medtecs International Corp Ltd 443,000 126,446 0.09Nantex Industry Co Ltd 122,000 400,018 0.29Pou Chen Corp 1,320,000 1,600,223 1.14Powertech Technology Inc 386,000 1,444,357 1.03Promate Electronic Co Ltd 175,000 244,185 0.17Sigurd Microelectronics Corp 481,000 1,026,380 0.73Sitronix Technology Corp 66,000 578,615 0.41Supreme Electronics Co Ltd 330,000 524,425 0.37Synnex Technology InternationalCorp 701,000 1,312,150 0.94Taiwan Surface MountingTechnology Corp 91,000 333,976 0.24Topco Scientific Co Ltd 175,000 865,248 0.62TXC Corp 302,000 1,135,461 0.81Unitech Computer Co Ltd 91,000 119,791 0.09UPC Technology Corp 1,283,000 1,170,843 0.84Wah Lee Industrial Corp 257,040 750,532 0.54WPG Holdings Ltd 319,000 555,606 0.40WT Microelectronics Co Ltd 741,000 1,610,436 1.15Yem Chio Co Ltd 559,342 321,726 0.23
28,586,482 20.42
Thailand - 2.57% (March 31, 2021: 3.97%)AP Thailand PCL - NVDR 3,134,900 757,435 0.54Haad Thip PCL - NVDR 154,500 159,249 0.12Kang Yong Electric PCL - NVDR 12,200 135,756 0.10Lalin Property PCL - NVDR 822,200 218,095 0.16Muramoto Electron Thailand PCL -NVDR 16,500 131,181 0.09Noble Development PCL - NVDR 1,227,000 234,811 0.17Regional Container Lines PCL -NVDR 84,100 116,512 0.08Siam Global House PCL - NVDR 159,900 98,534 0.07Siamgas & Petrochemicals PCL -NVDR 1,518,900 662,148 0.47SPCG PCL - NVDR 857,700 439,814 0.32Sri Trang Agro Industry PCL - NVDR 61,500 61,118 0.04Thai Oil PCL - NVDR 56,500 87,459 0.06Thai Rayon PCL - NVDR 18,700 28,049 0.02Thai Union Group PCL - NVDR 288,100 184,347 0.13Thantawan Industry PCL - NVDR 90,100 82,883 0.06Tisco Financial Group PCL - NVDR 73,800 199,850 0.14
3,597,241 2.57
United States - 0.13% (March 31, 2021: Nil)Coronado Global Resources Inc 197,482 183,663 0.13
Total Equities 138,989,501 99.28
Warrants - 0.00% (March 31, 2021: 0.00%)Hong Kong - 0.00% (March 31, 2021: Nil)APAC Resources Ltd 112,000 2,086 0.00
Singapore - 0.00% (March 31, 2021: 0.00%)Ezion Holdings Ltd 2,872,200 2 0.00
Total Warrants 2,088 0.00
Total value of Investmentsexcluding FinancialDerivative Instruments 138,991,589 99.28
AXA ROSENBERG ALL COUNTRY ASIA PACIFIC EX-JAPAN SMALL CAP ALPHAFUNDSchedule of Investments (continued)As at September 30, 2021
87

Financial Derivative Instruments - (0.03%) (March 31, 2021: (0.04%))Open Forward Foreign Currency Exchange Contracts* - (0.03%) (March 31, 2021: (0.04%))
Currency Sold Currency BoughtSettlementDate
UnrealisedGain/(Loss)
USD
% ofNet
AssetsEUR 85,951 USD 101,018 20 October 2021 1,375 0.00EUR 39,069 USD 46,258 20 October 2021 966 0.00USD 2,034,274 EUR 1,717,919 20 October 2021 (42,703) (0.03)USD 264,240 EUR 225,000 20 October 2021 (3,400) (0.00)USD 106,796 EUR 90,384 20 October 2021 (2,015) (0.00)USD 88,830 EUR 75,000 20 October 2021 (1,883) (0.00)
Unrealised gain on open forward foreign currency exchange contracts 2,341 0.00Unrealised loss on open forward foreign currency exchange contracts (50,001) (0.03)
Net unrealised loss on open forward foreign currency exchange contracts (47,660) (0.03)
Fair ValueUSD
% ofNet
Assets
Total financial assets at fair valuethrough profit or loss 138,943,929 99.25
Cash at bank 3,974,459 2.84
Other Net Liabilities (2,919,141) (2.09)
Net Assets attributable toholders of redeemableparticipating units 139,999,247 100.00
*The counterparty for the open forward foreign contracts is State StreetBank and Trust Company.
Abbreviations used:NVDR - Non-Voting Depository ReceiptREIT – Real Estate Investment Trust
Analysis of Total Assets
% ofTotal
Assets
Transferable securities admitted to an official exchange listing 95.71Current Assets 4.29
Total Assets 100.00
AXA ROSENBERG ALL COUNTRY ASIA PACIFIC EX-JAPAN SMALL CAP ALPHAFUNDSchedule of Investments (continued)As at September 30, 2021
88

Number ofShares
Fair ValueEUR
% ofNet
Assets
Equities - 99.65% (March 31, 2021: 99.07%)Austria - 2.73% (March 31, 2021: 1.89%)ANDRITZ AG 21,611 1,026,306 0.86OMV AG 28,170 1,464,277 1.22Palfinger AG 2,863 109,152 0.09Strabag SE 7,093 278,577 0.23Telekom Austria AG 12,310 91,833 0.08Vienna Insurance Group AG WienerVersicherung Gruppe 12,244 304,876 0.25
3,275,021 2.73
Belgium - 3.11% (March 31, 2021: 2.90%)Ageas SA 3,990 170,872 0.14Bekaert SA 2,654 95,464 0.08KBC Group NV 17,486 1,363,383 1.14Solvay SA 11,387 1,225,526 1.02UCB SA 1,869 180,714 0.15Umicore SA 13,495 691,349 0.58
3,727,308 3.11
Finland - 4.57% (March 31, 2021: 3.83%)Kemira OYJ 44,841 597,058 0.50Kesko OYJ 40,198 1,197,096 1.00Metsa Board OYJ 62,606 507,265 0.42Nokia OYJ 239,252 1,136,686 0.95Outokumpu OYJ 52,028 275,072 0.23TietoEVRY OYJ 24,956 648,357 0.54Uponor OYJ 8,387 180,237 0.15Valmet OYJ 29,887 937,854 0.78
5,479,625 4.57
France - 29.57% (March 31, 2021: 31.10%)Accor SA 12,335 381,645 0.32Amundi SA 13,626 992,995 0.83Arkema SA 9,220 1,055,229 0.88BNP Paribas SA 31,825 1,763,741 1.47Capgemini SE 8,626 1,553,758 1.30Carrefour SA 78,818 1,225,029 1.02Cie Generale des EtablissementsMichelin SCA 12,340 1,638,135 1.37Credit Agricole SA 5,369 64,138 0.05Dassault Systemes SE 16,260 739,302 0.62Electricite de France SA 72,970 794,461 0.66Elior Group SA 41,113 283,988 0.24EssilorLuxottica SA 5,470 906,160 0.76Fnac Darty SA 10,729 609,139 0.51IPSOS 29,085 1,145,222 0.96Kering SA 3,253 2,003,848 1.67La Francaise des Jeux SAEM 9,217 410,203 0.34Legrand SA 3,487 323,384 0.27L’Oreal SA 8,857 3,164,606 2.64LVMH Moet Hennessy Louis VuittonSE 6,414 3,977,642 3.32Metropole Television SA 27,612 495,635 0.42Pernod Ricard SA 2,364 450,874 0.38Publicis Groupe SA 25,773 1,501,277 1.25Rexel SA 43,126 722,792 0.60Sanofi 38,671 3,213,560 2.68Schneider Electric SE 18,644 2,682,499 2.24Societe BIC SA 16,967 866,589 0.72Societe Generale SA 34,090 926,992 0.77
Number ofShares
Fair ValueEUR
% ofNet
Assets
Sodexo SA 5,228 396,335 0.33Television Francaise 1 41,364 351,801 0.29TotalEnergies SE 19,140 791,152 0.66
35,432,131 29.57
Germany - 24.50% (March 31, 2021: 25.28%)adidas AG 4,002 1,091,846 0.91Allianz SE 15,406 3,013,260 2.51BASF SE 39,211 2,583,025 2.16Bayerische Motoren Werke AG 21,970 1,828,453 1.53Brenntag SE 13,152 1,059,920 0.88Covestro AG 24,891 1,478,028 1.23Daimler AG 36,198 2,794,486 2.33Deutsche Bank AG 35,159 389,105 0.33Deutsche Lufthansa AG 11,928 71,186 0.06Deutsche Post AG 43,046 2,356,768 1.97Deutsche Telekom AG 34,250 598,450 0.50Draegerwerk AG & Co KGaA 3,037 214,488 0.18E.ON SE 106,793 1,127,627 0.94Fresenius Medical Care AG & CoKGaA 1,260 76,759 0.06Fresenius SE & Co KGaA 1,402 58,316 0.05KION Group AG 11,161 903,706 0.75Kloeckner & Co SE 79,126 863,660 0.72LANXESS AG 6,777 399,165 0.33Merck KGaA 6,256 1,171,905 0.98SAP SE 35,246 4,128,716 3.45Sartorius AG 799 440,569 0.37Schaeffler AG 150,036 999,240 0.83Siemens AG 5,866 836,316 0.70Siemens Healthineers AG 2,054 115,599 0.10United Internet AG 22,466 756,767 0.63
29,357,360 24.50
Ireland - 3.11% (March 31, 2021: 2.48%)CRH PLC 44,242 1,794,677 1.50Flutter Entertainment PLC 5,309 909,432 0.76Glanbia PLC 8,544 121,496 0.10Smurfit Kappa Group PLC 19,709 893,507 0.75
3,719,112 3.11
Italy - 5.46% (March 31, 2021: 6.40%)Anima Holding SpA 133,161 552,086 0.46Autogrill SpA 44,544 314,748 0.26Azimut Holding SpA 51,850 1,232,215 1.03Banca Mediolanum SpA 38,760 363,181 0.30Enel SpA 15,043 100,495 0.09Eni SpA 11,624 134,525 0.11Interpump Group SpA 20,952 1,177,502 0.98Intesa Sanpaolo SpA 287,332 706,837 0.59Poste Italiane SpA 103,580 1,236,227 1.03Reply SpA 3,351 536,495 0.45UniCredit SpA 16,617 191,677 0.16
6,545,988 5.46
Luxemburg - Nil (March 31, 2021: 0.72%)
Netherlands - 15.84% (March 31, 2021: 15.97%)Adyen NV 218 527,015 0.44Aegon NV 287,985 1,284,989 1.07Airbus SE 9,090 1,046,441 0.87Akzo Nobel NV 3,447 325,224 0.27
AXA ROSENBERG EUROBLOC EQUITY ALPHA FUND
Schedule of InvestmentsAs at September 30, 2021
89

Number ofShares
Fair ValueEUR
% ofNet
Assets
Equities - 99.65% (March 31, 2021: 99.07%) (continued)Netherlands - 15.84% (March 31, 2021: 15.97%) (continued)Argenx SE 298 77,346 0.07ASML Holding NV 7,175 4,646,530 3.88ASR Nederland NV 28,000 1,106,420 0.92Basic-Fit NV 7,721 305,752 0.26CNH Industrial NV 51,581 758,885 0.63ING Groep NV 69,290 870,906 0.73Koninklijke Ahold Delhaize NV 68,564 1,970,358 1.64Koninklijke Philips NV 2,676 102,658 0.09Mediaset NV 131,462 326,683 0.27NN Group NV 32,795 1,484,302 1.24PostNL NV 33,639 140,376 0.12Randstad NV 19,278 1,119,473 0.93Signify NV 7,813 337,053 0.28STMicroelectronics NV 35,274 1,331,329 1.11Wolters Kluwer NV 13,358 1,222,257 1.02
18,983,997 15.84
Portugal - 0.62% (March 31, 2021: Nil)Jeronimo Martins SGPS SA 43,199 744,427 0.62
Spain - 10.14% (March 31, 2021: 8.50%)Acerinox SA 46,980 520,891 0.44ACS Actividades de Construccion yServicios SA 4,279 100,321 0.08Banco Bilbao Vizcaya Argentaria SA 390,293 2,231,500 1.86Banco Santander SA 755,200 2,368,496 1.98CIE Automotive SA 7,616 165,953 0.14Iberdrola SA 252,868 2,195,653 1.83Mapfre SA 504,656 951,150 0.79Melia Hotels International SA 42,602 273,974 0.23Repsol SA 146,295 1,652,548 1.38Telefonica SA 416,008 1,683,480 1.41
12,143,966 10.14
Fair ValueEUR
% ofNet
Assets
Total financial assets at fair valuethrough profit or loss 119,408,935 99.65
Cash at bank 363,588 0.30
Other Net Assets 54,224 0.05
Net Assets attributable toholders of redeemableparticipating units 119,826,747 100.00
Analysis of Total Assets
% ofTotal
Assets
Transferable securities admitted to an official exchange listing 99.48Current Assets 0.52
Total Assets 100.00
AXA ROSENBERG EUROBLOC EQUITY ALPHA FUND
Schedule of Investments (continued)As at September 30, 2021
90

Number ofShares
Fair ValueUSD
% ofNet
Assets
Equities - 95.81% (March 31, 2021: 96.04%)Brazil - 3.85% (March 31, 2021: 3.82%)Banco Bradesco SA (PreferenceShares) 146,800 560,781 0.64Banco BTG Pactual SA 5,600 15,853 0.02Banco BTG Pactual SA Unit 123,000 567,607 0.65Banco do Brasil SA 78,400 415,748 0.48Banco Santander Brasil SA 61,100 397,174 0.46Braskem SA (Preference Shares) 19,600 213,234 0.25Localiza Rent a Car SA 22,700 226,983 0.26Marfrig Global Foods SA 32,100 151,195 0.17Neoenergia SA 44,800 126,082 0.15Petroleo Brasileiro SA (PreferenceShares) 78,500 392,363 0.45Porto Seguro SA 11,500 104,428 0.12Usinas Siderurgicas de MinasGerais SA Usiminas (PreferenceShares) 58,800 173,900 0.20
3,345,348 3.85
Cayman Islands - Nil (March 31, 2021: 0.12%)
Chile - 0.46% (March 31, 2021: 0.99%)AntarChile SA 18,341 152,145 0.18CAP SA 7,441 78,972 0.09Cia Sud Americana de Vapores SA 2,407,061 169,209 0.19
400,326 0.46
China - 33.76% (March 31, 2021: 35.71%)Agile Group Holdings Ltd 27,892 26,066 0.03Agricultural Bank of China Ltd 2,849,000 978,987 1.13Alibaba Group Holding Ltd - ADR 21,200 3,138,448 3.61Autohome Inc - ADR 11,500 538,890 0.62BAIC Motor Corp Ltd 394,000 136,400 0.16Baidu Inc - ADR 3,100 476,424 0.55Bank of Beijing Co Ltd 659,800 445,676 0.51Bank of China Ltd 3,422,000 1,211,051 1.39Bank of Communications Co Ltd 1,605,000 951,498 1.09Bank of Guiyang Co Ltd 85,600 89,347 0.10Bank of Jiangsu Co Ltd 458,400 413,203 0.47Bluefocus IntelligentCommunications Group Co Ltd 112,300 97,578 0.11C&S Paper Co Ltd 35,831 95,841 0.11China CITIC Bank Corp Ltd 1,675,000 755,236 0.87China Communications ServicesCorp Ltd 292,000 161,667 0.19China Construction Bank Corp 2,170,000 1,552,658 1.78China Lesso Group Holdings Ltd 77,000 123,245 0.14China Life Insurance Co Ltd 76,000 124,866 0.14China National Accord MedicinesCorp Ltd 38,000 204,608 0.24China Railway Group Ltd 952,000 473,881 0.54China Yongda Automobiles ServicesHoldings Ltd 43,000 62,197 0.07Chongqing Zhifei Biological ProductsCo Ltd 6,400 157,466 0.18CNHTC Jinan Truck Co Ltd 31,920 73,179 0.08COSCO SHIPPING Holdings Co Ltd 215,800 330,714 0.38Daqo New Energy Corp - ADR 2,100 119,501 0.14Dongfeng Motor Group Co Ltd 388,000 345,901 0.40G-bits Network Technology XiamenCo Ltd 3,400 205,871 0.24
Number ofShares
Fair ValueUSD
% ofNet
Assets
Guangzhou Kingmed DiagnosticsGroup Co Ltd 20,000 316,969 0.36Hello Group Inc - ADR 9,100 96,233 0.11Huaxia Bank Co Ltd 486,400 419,625 0.48Industrial & Commercial Bank ofChina Ltd 2,146,000 1,192,276 1.37iQIYI Inc - ADR 30,400 244,264 0.28JCET Group Co Ltd 22,429 111,292 0.13Jiangsu Zhongtian Technology CoLtd 84,300 118,776 0.14JiuGui Liquor Co Ltd 3,600 138,011 0.16Legend Holdings Corp 108,500 210,320 0.24Li Auto Inc - ADR 13,500 354,848 0.41Li Ning Co Ltd 32,000 370,370 0.43Lonking Holdings Ltd 118,000 35,697 0.04Maccura Biotechnology Co Ltd 23,000 102,594 0.12Mango Excellent Media Co Ltd 32,300 217,902 0.25Meituan 47,200 1,494,582 1.72NetEase Inc - ADR 3,400 290,173 0.33NIO Inc - ADR 20,400 727,056 0.84Pinduoduo Inc - ADR 5,000 453,100 0.52Ping An Insurance Group Co ofChina Ltd 28,500 194,859 0.22RiseSun Real Estate DevelopmentCo Ltd 219,400 163,816 0.19Shanxi Xinghuacun Fen WineFactory Co Ltd 17,400 849,247 0.98Shenzhen Mindray Bio-MedicalElectronics Co Ltd 4,600 274,353 0.32Sino Wealth Electronic Ltd 11,900 114,882 0.13Sinopharm Group Co Ltd 137,200 358,216 0.41Sinotrans Ltd 589,000 231,147 0.27TangShan Port Group Co Ltd 281,230 120,767 0.14TCL Technology Group Corp 254,800 247,026 0.28Tencent Holdings Ltd 62,300 3,693,352 4.25Tianma Microelectronics Co Ltd 114,100 239,689 0.28Tongkun Group Co Ltd 100,277 340,378 0.39Weifu High-Technology Group Co Ltd(Group A) 45,000 144,043 0.17Weifu High-Technology Group Co Ltd(Group B) 18,933 36,335 0.04Wuxi Biologics Cayman Inc 85,500 1,388,820 1.60Xiaomi Corp 80,800 221,341 0.25XPeng Inc - ADR 9,900 351,945 0.40Zhejiang Expressway Co Ltd 104,000 85,635 0.10ZTE Corp 37,800 124,428 0.14
29,364,766 33.76
Columbia - 0.34% (March 31, 2021: 0.38%)Corp Financiera Colombiana SA 12,600 94,931 0.11Ecopetrol SA - ADR 14,200 203,557 0.23
298,488 0.34
Greece - 0.56% (March 31, 2021: 0.49%)FF Group 1,999 - 0.00Hellenic TelecommunicationsOrganization SA 21,705 407,134 0.47JUMBO SA 4,799 78,393 0.09
485,527 0.56
AXA ROSENBERG GLOBAL EMERGING MARKETS EQUITY ALPHA FUND
Schedule of InvestmentsAs at September 30, 2021
91

Number ofShares
Fair ValueUSD
% ofNet
Assets
Equities - 95.81% (March 31, 2021: 96.04%) (continued)Hong Kong - 1.66% (March 31, 2021: 1.28%)Brilliance China AutomotiveHoldings Ltd 268,000 125,658 0.14China Resources PharmaceuticalGroup Ltd 220,000 108,097 0.12Kingboard Holdings Ltd 24,000 108,598 0.13Kunlun Energy Co Ltd 360,000 375,740 0.43Lenovo Group Ltd 490,000 527,159 0.61Sinotruk Hong Kong Ltd 135,000 200,992 0.23
1,446,244 1.66
Hungary - 0.24% (March 31, 2021: 0.15%)MOL Hungarian Oil & Gas PLC 25,137 209,158 0.24
India - 11.06% (March 31, 2021: 11.34%)Axis Bank Ltd 36,230 374,344 0.43Canara Bank 67,144 156,151 0.18Cipla Ltd 10,131 134,050 0.15Emami Ltd 16,350 125,779 0.15GAIL India Ltd 193,103 412,793 0.48HCL Technologies Ltd 34,117 588,093 0.68Housing Development Finance CorpLtd 21,666 801,112 0.92ICICI Bank Ltd 67,969 642,673 0.74Indus Towers Ltd 98,515 406,456 0.47Infosys Ltd 36,590 827,554 0.95NMDC Ltd 132,794 255,918 0.29Oracle Financial Services SoftwareLtd 3,432 209,843 0.24Piramal Enterprises Ltd 10,458 366,078 0.42Power Grid Corp of India Ltd 232,065 591,906 0.68REC Ltd 101,243 215,028 0.25Reliance Industries Ltd 7,034 238,008 0.27Schaeffler India Ltd 1,466 150,496 0.17Sun Pharmaceutical Industries Ltd 66,551 733,000 0.84Tata Steel Ltd 36,142 626,152 0.72Tech Mahindra Ltd 34,530 642,697 0.74Union Bank of India 155,189 75,632 0.09Wipro Ltd 121,908 1,043,841 1.20
9,617,604 11.06
Indonesia - 0.09% (March 31, 2021: 0.22%)Bank CIMB Niaga Tbk PT 1,107,900 75,279 0.09
Korea - 10.30% (March 31, 2021: 13.27%)AMOREPACIFIC Group 2,823 117,247 0.14Cheil Worldwide Inc 2,920 56,168 0.06CJ CheilJedang Corp 723 250,211 0.29Doosan Heavy Industries &Construction Co Ltd 3,653 63,480 0.07Doosan Infracore Co Ltd 2,403 19,392 0.02GS Holdings Corp 3,659 138,217 0.16Hyundai Mobis Co Ltd 2,286 488,961 0.56Hyundai Motor Co 908 153,187 0.18Kia Corp 11,823 810,335 0.93LG Chem Ltd 1,251 820,440 0.94LG Display Co Ltd 18,372 294,433 0.34LG Innotek Co Ltd 1,338 235,902 0.27LS Corp 700 37,897 0.04Meritz Fire & Marine Insurance CoLtd 4,600 118,594 0.14
Number ofShares
Fair ValueUSD
% ofNet
Assets
NAVER Corp 613 201,011 0.23Posco International Corp 5,143 103,707 0.12Samsung Electronics Co Ltd 61,018 3,821,355 4.39SK Hynix Inc 10,236 892,624 1.03S-Oil Corp 2,561 239,012 0.28Youngone Corp 2,520 94,181 0.11
8,956,354 10.30
Malaysia - 0.94% (March 31, 2021: 0.13%)Hartalega Holdings Bhd 56,200 82,223 0.09IHH Healthcare Bhd 295,600 472,014 0.54Kossan Rubber Industries 140,000 77,583 0.09Sime Darby Bhd 196,400 106,961 0.12Supermax Corp Bhd 144,700 82,952 0.10
821,733 0.94
Mexico - 2.40% (March 31, 2021: 1.11%)Arca Continental SAB de CV 65,300 400,280 0.46Fomento Economico Mexicano SABde CV 77,700 677,665 0.78Grupo Bimbo SAB de CV 188,100 531,811 0.61Grupo Financiero Banorte SAB deCV 55,400 357,257 0.41Wal-Mart de Mexico SAB de CV 36,200 123,457 0.14
2,090,470 2.40
Netherlands - 0.44% (March 31, 2021: Nil)X5 Retail Group NV 11,873 385,694 0.44
Philippines - 0.17% (March 31, 2021: 0.39%)Puregold Price Club Inc 91,100 79,340 0.09San Miguel Food and Beverage Inc 29,950 44,476 0.05Vista Land & Lifescapes Inc 397,000 27,045 0.03
150,861 0.17
Poland - 0.81% (March 31, 2021: 1.41%)Cyfrowy Polsat SA 32,532 291,631 0.34Polski Koncern Naftowy ORLEN SA 19,971 412,520 0.47
704,151 0.81
Russia - 4.33% (March 31, 2021: 2.19%)Gazprom PJSC - ADR 185,172 1,839,684 2.11LUKOIL PJSC - ADR 10,211 966,778 1.11Novolipetsk Steel PJSC 11,270 335,846 0.39Surgutneftegas PJSC - ADR 124,685 624,048 0.72
3,766,356 4.33
South Africa - 3.85% (March 31, 2021: 3.69%)Absa Group Ltd 30,572 310,251 0.36African Rainbow Minerals Ltd 7,721 97,309 0.11Anglo American Platinum Ltd 1,215 105,346 0.12Bid Corp Ltd 8,736 187,175 0.22Bidvest Group Ltd 20,174 262,845 0.30Impala Platinum Holdings Ltd 32,368 369,473 0.42Investec Ltd 39,000 169,648 0.19Kumba Iron Ore Ltd 11,146 367,218 0.42MultiChoice Group 24,958 189,570 0.22Nedbank Group Ltd 26,139 304,112 0.35Netcare Ltd 88,000 94,902 0.11Old Mutual Ltd 285,096 314,089 0.36Sibanye Stillwater Ltd 134,023 414,496 0.48
AXA ROSENBERG GLOBAL EMERGING MARKETS EQUITY ALPHA FUND
Schedule of Investments (continued)As at September 30, 2021
92

Number ofShares
Fair ValueUSD
% ofNet
Assets
Equities - 95.81% (March 31, 2021: 96.04%) (continued)South Africa - 3.85% (March 31, 2021: 3.69%) (continued)Telkom SA SOC Ltd 15,000 44,003 0.05Woolworths Holdings Ltd 30,430 119,465 0.14
3,349,902 3.85
Taiwan - 15.73% (March 31, 2021: 14.52%)Acer Inc 170,000 151,173 0.17ASE Technology Holding Co Ltd 142,000 556,828 0.64Asustek Computer Inc 28,000 327,381 0.38AU Optronics Corp 538,000 341,313 0.39Cathay Financial Holding Co Ltd 406,000 844,482 0.97Compal Electronics Inc 269,000 228,105 0.26Evergreen Marine Corp Taiwan Ltd 131,000 591,276 0.68Fubon Financial Holding Co Ltd 399,300 1,099,990 1.26Fubon Financial Holding Co Ltd(Rights LV3) 8,417 - 0.00Fubon Financial Holding Co Ltd(Rights) 13,837 8,865 0.01Hon Hai Precision Industry Co Ltd 259,000 978,437 1.13Innolux Corp 391,000 238,932 0.27MediaTek Inc 20,000 650,024 0.75Nanya Technology Corp 140,000 331,401 0.38Novatek Microelectronics Corp 29,000 427,290 0.49Pegatron Corp 143,000 343,635 0.40Pou Chen Corp 163,000 197,603 0.23Powertech Technology Inc 44,000 164,642 0.19Shin Kong Financial Holding Co Ltd 755,000 252,430 0.29Synnex Technology InternationalCorp 85,000 159,105 0.18Taiwan SemiconductorManufacturing Co Ltd 234,000 4,875,613 5.60United Microelectronics Corp 157,000 360,936 0.42Winbond Electronics Corp 230,000 218,975 0.25Wistron Corp 168,000 165,676 0.19WPG Holdings Ltd 99,000 172,430 0.20
13,686,542 15.73
Number ofShares
Fair ValueUSD
% ofNet
Assets
Thailand - 2.22% (March 31, 2021: 2.05%)Krung Thai Bank PCL - NVDR 735,100 240,072 0.28PTT Global Chemical PCL - NVDR 204,500 381,530 0.44PTT PCL - NVDR 743,300 854,021 0.98Siam Cement PCL - NVDR 33,000 393,054 0.45Tisco Financial Group PCL - NVDR 23,000 62,284 0.07
1,930,961 2.22
Turkey - 1.52% (March 31, 2021: 1.86%)Akbank TAS 195,481 117,386 0.14Arcelik A/S 32,853 120,736 0.14BIM Birlesik Magazalar A/S 29,686 213,600 0.25KOC Holding A/S 93,589 238,601 0.27Turk Hava Yollari AO 35,156 55,222 0.06Turk Telekomunikasyon A/S 139,203 117,279 0.13Turkiye Garanti Bankasi A/S 222,637 231,427 0.27Turkiye Sise ve Cam Fabrikalari A/S 167,045 153,897 0.18Turkiye Vakiflar Bankasi TAO 190,318 69,943 0.08
1,318,091 1.52
United Arab Emirates - 1.08% (March 31, 2021: 0.92%)Emaar Development PJSC 168,650 177,229 0.20Emirates NBD Bank PJSC 198,392 762,911 0.88
940,140 1.08
Total Equities 83,343,995 95.81
Investment Funds - 3.67% (March 31, 2021: 3.01%)Ireland - 3.67% (March 31, 2021: 3.01%)Invesco MSCI Saudi Arabia UCITSETF 110,000 3,196,325 3.67
Total Investment Funds 3,196,325 3.67
Total value of Investmentsexcluding FinancialDerivative Instruments 86,540,320 99.48
Financial Derivative Instruments - (0.00%) (March 31, 2021: (0.00%))Open Forward Foreign Currency Exchange Contracts* - (0.00%) (March 31, 2021: (0.00%))
Currency Sold Currency BoughtSettlementDate
UnrealisedGain/(Loss)
USD
% ofNet
AssetsEUR 3,977 USD 4,710 20 October 2021 100 0.00EUR 3,105 USD 3,649 20 October 2021 50 0.00EUR 1,131 USD 1,339 20 October 2021 28 0.00USD 88,381 EUR 74,637 20 October 2021 (1,855) (0.00)USD 4,823 EUR 4,065 20 October 2021 (111) (0.00)
Unrealised gain on open forward foreign currency exchange contracts 178 0.00Unrealised loss on open forward foreign currency exchange contracts (1,966) (0.00)
Net unrealised loss on open forward foreign currency exchange contracts (1,788) (0.00)
AXA ROSENBERG GLOBAL EMERGING MARKETS EQUITY ALPHA FUND
Schedule of Investments (continued)As at September 30, 2021
93

Fair ValueUSD
% ofNet
Assets
Total financial assets at fair valuethrough profit or loss 86,538,532 99.48
Cash at bank 704,262 0.81
Other Net Liabilities (249,109) (0.29)
Net Assets attributable toholders of redeemableparticipating units 86,993,685 100.00
*The counterparty for the open forward foreign contracts is State StreetBank and Trust Company.
Abbreviations used:ADR – American Depository ReceiptNVDR - Non-Voting Depository Receipt
Analysis of Total Assets
% ofTotal
Assets
Transferable securities admitted to an official exchange listing 95.34Other transferable securities of the type referred to inRegulation 68(1)(a), (b) and (c) 0.01Investment Funds 3.65Current Assets 1.00
Total Assets 100.00
AXA ROSENBERG GLOBAL EMERGING MARKETS EQUITY ALPHA FUND
Schedule of Investments (continued)As at September 30, 2021
94

Number ofShares
Fair ValueUSD
% ofNet
Assets
Equities - 99.16% (March 31, 2021: 99.31%)Australia - 1.65% (March 31, 2021: 2.22%)ALS Ltd 48,921 448,087 0.08BlueScope Steel Ltd 58,475 866,119 0.15Charter Hall Group (REIT) 23,225 287,551 0.05Commonwealth Bank of Australia 9,286 699,182 0.12Fortescue Metals Group Ltd 246,941 2,669,425 0.45Goodman Group (REIT) 69,021 1,079,162 0.18Mineral Resources Ltd 19,608 635,177 0.11Rio Tinto Ltd 41,517 3,004,230 0.51
9,688,933 1.65
Austria - 0.39% (March 31, 2021: Nil)ANDRITZ AG 10,338 568,989 0.10OMV AG 28,916 1,741,964 0.29
2,310,953 0.39
Belgium - 0.46% (March 31, 2021: 0.20%)Solvay SA 11,499 1,434,293 0.25UCB SA 11,180 1,252,818 0.21
2,687,111 0.46
Bermuda - 0.20% (March 31, 2021: Nil)Orient Overseas International Ltd 66,500 1,153,658 0.20
Canada - 4.62% (March 31, 2021: 6.09%)Alimentation Couche-Tard Inc 24,100 921,787 0.16Bank of Montreal 32,600 3,257,041 0.55Canadian Tire Corp Ltd 6,900 964,235 0.16Canfor Corp 13,000 285,377 0.05CGI Inc 32,700 2,782,023 0.47Gildan Activewear Inc 10,600 389,201 0.07iA Financial Corp Inc 12,500 709,289 0.12Manulife Financial Corp 254,200 4,889,966 0.83National Bank of Canada 40,000 3,073,608 0.52Nutrien Ltd 42,700 2,769,087 0.47Royal Bank of Canada 52,000 5,174,141 0.88Toronto-Dominion Bank 30,000 1,986,344 0.34
27,202,099 4.62
Cayman Islands - 0.07% (March 31, 2021: 0.20%)Chow Tai Fook Jewellery Group Ltd 223,000 427,114 0.07
Denmark - 1.01% (March 31, 2021: 0.80%)AP Moller - Maersk A/S 657 1,704,937 0.29Carlsberg A/S 6,563 1,074,296 0.18Novo Nordisk A/S 32,688 3,164,563 0.54
5,943,796 1.01
Finland - 0.19% (March 31, 2021: Nil)Kesko OYJ 16,389 565,642 0.09Valmet OYJ 15,623 568,175 0.10
1,133,817 0.19
France - 2.11% (March 31, 2021: 2.37%)Kering SA 3,336 2,381,614 0.40L’Oreal SA 1,928 798,371 0.14Publicis Groupe SA 16,512 1,114,706 0.19Rexel SA 31,700 615,741 0.10Sanofi 20,498 1,974,137 0.34
Number ofShares
Fair ValueUSD
% ofNet
Assets
Schneider Electric SE 33,184 5,533,423 0.94
12,417,992 2.11
Germany - 2.13% (March 31, 2021: 2.37%)Allianz SE 14,762 3,346,236 0.57Bayerische Motoren Werke AG 12,249 1,181,460 0.20Brenntag SE 3,438 321,108 0.05Covestro AG 18,359 1,263,438 0.21Daimler AG 25,994 2,325,708 0.39Deutsche Post AG 6,999 444,104 0.08SAP SE 21,053 2,858,143 0.49Schaeffler AG 69,283 534,768 0.09Siemens AG 1,723 284,694 0.05
12,559,659 2.13
Hong Kong - 1.24% (March 31, 2021: 1.15%)Hong Kong Exchanges & ClearingLtd 48,500 2,988,008 0.51Kingboard Holdings Ltd 113,000 511,317 0.09SITC International Holdings Co Ltd 293,000 1,052,928 0.18Techtronic Industries Co Ltd 106,000 2,111,245 0.36Xinyi Glass Holdings Ltd 202,000 603,951 0.10
7,267,449 1.24
Ireland - 1.02% (March 31, 2021: 1.39%)CRH PLC 11,504 540,835 0.09DCC PLC 11,537 964,000 0.16Experian PLC 23,546 987,212 0.17Medtronic PLC 12,500 1,566,688 0.27Pentair PLC 13,200 959,046 0.16Seagate Technology Holdings PLC 3,800 313,614 0.05Smurfit Kappa Group PLC 12,809 672,998 0.12
6,004,393 1.02
Israel - 0.28% (March 31, 2021: 0.58%)Bank Leumi Le-Israel BM 168,604 1,435,628 0.24Plus500 Ltd 11,621 217,763 0.04
1,653,391 0.28
Italy - 0.54% (March 31, 2021: 0.41%)Banca Mediolanum SpA 51,632 560,690 0.10Interpump Group SpA 11,156 726,624 0.12Poste Italiane SpA 138,319 1,913,238 0.32
3,200,552 0.54
Japan - 9.66% (March 31, 2021: 8.61%)Aisin Corp 29,200 1,064,495 0.18Canon Inc 122,100 2,996,826 0.51Fujitsu Ltd 6,400 1,164,705 0.20Hitachi Ltd 40,900 2,431,823 0.41Honda Motor Co Ltd 161,500 5,004,582 0.85Idemitsu Kosan Co Ltd 13,700 362,223 0.06Inpex Corp 52,500 412,189 0.07JFE Holdings Inc 61,800 939,116 0.16Kajima Corp 46,300 598,176 0.10Kawasaki Kisen Kaisha Ltd 9,700 526,838 0.09KDDI Corp 82,400 2,729,558 0.46Mitsubishi Chemical Holdings Corp 158,200 1,452,264 0.25Mitsubishi Electric Corp 248,900 3,473,334 0.59Mitsubishi HC Capital Inc 99,600 525,338 0.09Mitsui & Co Ltd 214,300 4,736,400 0.81
AXA ROSENBERG GLOBAL EQUITY ALPHA FUND
Schedule of InvestmentsAs at September 30, 2021
95

Number ofShares
Fair ValueUSD
% ofNet
Assets
Equities - 99.16% (March 31, 2021: 99.31%) (continued)Japan - 9.66% (March 31, 2021: 8.61%) (continued)Mitsui Chemicals Inc 22,400 755,868 0.13Mitsui OSK Lines Ltd 12,500 845,844 0.14MS&AD Insurance Group HoldingsInc 62,500 2,105,366 0.36Nintendo Co Ltd 400 193,843 0.03Nippon Telegraph & Telephone Corp 184,700 5,109,357 0.87Nippon Yusen KK 18,800 1,421,268 0.24Nitto Denko Corp 17,400 1,246,812 0.21Nomura Holdings Inc 380,300 1,887,781 0.32Open House Co Ltd 13,200 784,369 0.13ORIX Corp 98,600 1,862,862 0.32Otsuka Holdings Co Ltd 10,900 468,483 0.08Sawai Group Holdings Co Ltd 4,600 213,766 0.04Sekisui House Ltd 77,200 1,627,548 0.28Sumitomo Chemical Co Ltd 151,000 791,033 0.13Sumitomo Electric Industries Ltd 44,600 597,898 0.10Sumitomo Forestry Co Ltd 18,400 353,570 0.06Sumitomo Heavy Industries Ltd 11,700 308,609 0.05Sumitomo Mitsui Financial Group Inc72,400 2,559,550 0.44Sumitomo Rubber Industries Ltd 27,400 349,944 0.06Teijin Ltd 22,000 314,497 0.05Tokyo Electron Ltd 1,800 802,518 0.14Tosoh Corp 28,600 521,247 0.09Toyo Seikan Group Holdings Ltd 19,900 236,678 0.04Toyo Tire Corp 14,500 260,305 0.04Toyota Boshoku Corp 19,400 345,836 0.06Toyota Motor Corp 109,000 1,956,041 0.33Yamada Holdings Co Ltd 52,100 219,700 0.04Yokohama Rubber Co Ltd 16,800 303,326 0.05
56,861,786 9.66
Liberia - Nil (March 31, 2021: 0.14%)
Macau - Nil (March 31, 2021: 0.20%)
Netherlands - 2.06% (March 31, 2021: 1.85%)Airbus SE 6,977 930,860 0.16Koninklijke Ahold Delhaize NV 135,605 4,516,369 0.77LyondellBasell Industries NV 42,400 3,978,180 0.67Randstad NV 12,096 814,063 0.14Signify NV 13,800 689,960 0.12Wolters Kluwer NV 11,232 1,191,085 0.20
12,120,517 2.06
New Zealand - 0.12% (March 31, 2021: 0.22%)Mainfreight Ltd 10,475 696,496 0.12
Norway - 0.21% (March 31, 2021: 0.24%)Gjensidige Forsikring ASA 55,396 1,229,859 0.21
Puerto Rico - 0.05% (March 31, 2021: Nil)EVERTEC Inc 6,600 301,851 0.05
Singapore - 1.12% (March 31, 2021: 0.33%)DBS Group Holdings Ltd 215,800 4,821,165 0.82Flex Ltd 34,500 610,133 0.10United Overseas Bank Ltd 60,800 1,157,018 0.20
6,588,316 1.12
Number ofShares
Fair ValueUSD
% ofNet
Assets
Spain - 1.30% (March 31, 2021: 0.76%)Banco Bilbao Vizcaya Argentaria SA 97,863 648,469 0.11Banco Santander SA 71,471 259,780 0.04Iberdrola SA 145,268 1,461,855 0.25Mapfre SA 311,828 681,136 0.12Repsol SA 114,725 1,501,922 0.26Telefonica SA 654,412 3,069,180 0.52
7,622,342 1.30
Sweden - 1.20% (March 31, 2021: 2.52%)Assa Abloy AB 11,527 336,776 0.06Atlas Copco AB 17,968 1,092,019 0.18Boliden AB 10,429 336,644 0.06Electrolux AB 21,286 491,971 0.08Getinge AB 28,367 1,135,517 0.19Sandvik AB 24,451 562,885 0.10Securitas AB 45,000 715,876 0.12Skanska AB 46,369 1,167,632 0.20SKF AB 52,549 1,246,369 0.21
7,085,689 1.20
Switzerland - 0.95% (March 31, 2021: 1.04%)Adecco Group AG 1,480 74,607 0.01Coca-Cola HBC AG 40,054 1,295,354 0.22Geberit AG 420 310,165 0.05Roche Holding AG 9,940 3,643,388 0.62SFS Group AG 2,124 289,507 0.05
5,613,021 0.95
United Kingdom - 3.52% (March 31, 2021: 3.98%)Coca-Cola Europacific Partners PLC 14,700 812,396 0.14Ferguson PLC 10,452 1,456,860 0.25GlaxoSmithKline PLC 156,712 2,965,633 0.50HSBC Holdings PLC 32,264 169,673 0.03IMI PLC 27,979 626,432 0.11Legal & General Group PLC 231,501 877,594 0.15Nielsen Holdings PLC 41,400 794,259 0.14Rio Tinto PLC 27,019 1,790,132 0.30Royal Dutch Shell PLC (Class AShares) 227,803 5,128,703 0.87Spirax-Sarco Engineering PLC 1,954 394,345 0.07Unilever PLC 42,577 2,302,296 0.39Unilever PLC (GBP) 28,200 1,522,935 0.26WPP PLC 137,202 1,850,426 0.31
20,691,684 3.52
United States - 63.06% (March 31, 2021: 61.64%)3M Co 12,900 2,263,305 0.38AbbVie Inc 60,100 6,480,583 1.10ABM Industries Inc 6,800 306,034 0.05Acuity Brands Inc 3,700 641,876 0.11Adobe Inc 12,200 7,021,527 1.19Advanced Micro Devices Inc 46,100 4,742,537 0.81AECOM 17,000 1,073,635 0.18AGCO Corp 7,100 869,715 0.15Alphabet Inc 4,900 13,094,784 2.22Amazon.com Inc 4,300 14,127,392 2.40Amdocs Ltd 14,200 1,075,437 0.18Apple Inc 163,500 23,108,272 3.93Applied Materials Inc 7,300 939,473 0.16AT&T Inc 231,100 6,243,166 1.06
AXA ROSENBERG GLOBAL EQUITY ALPHA FUND
Schedule of Investments (continued)As at September 30, 2021
96

Number ofShares
Fair ValueUSD
% ofNet
Assets
Equities - 99.16% (March 31, 2021: 99.31%) (continued)United States - 63.06% (March 31, 2021: 61.64%) (continued)Autodesk Inc 3,100 883,795 0.15Automatic Data Processing Inc 5,800 1,159,217 0.20AutoNation Inc 9,300 1,132,414 0.19Avnet Inc 8,400 310,632 0.05Bank of America Corp 56,200 2,384,847 0.41Becton Dickinson and Co 9,000 2,212,740 0.38Berkshire Hathaway Inc 9,200 2,510,588 0.43Best Buy Co Inc 8,800 930,204 0.16Booz Allen Hamilton Holding Corp 5,600 444,500 0.08Boyd Gaming Corp 11,700 739,967 0.13Bristol-Myers Squibb Co 95,200 5,631,556 0.96Broadridge Financial Solutions Inc 3,000 499,935 0.09Brown & Brown Inc 31,200 1,730,196 0.29Cadence Design Systems Inc 15,900 2,408,055 0.41Capital One Financial Corp 23,400 3,788,226 0.64Cardinal Health Inc 33,000 1,632,345 0.28Cerner Corp 4,200 296,100 0.05CH Robinson Worldwide Inc 3,700 321,956 0.05Chegg Inc 7,100 483,262 0.08Cincinnati Financial Corp 18,400 2,101,096 0.36Cisco Systems Inc 72,444 3,942,040 0.67Citigroup Inc 12,200 856,013 0.15Comfort Systems USA Inc 3,800 270,997 0.05ConocoPhillips 5,600 379,540 0.06Crane Co 5,700 540,617 0.09Crocs Inc 7,100 1,018,672 0.17Cummins Inc 20,100 4,515,967 0.77CVS Health Corp 4,700 398,678 0.07Deckers Outdoor Corp 2,600 936,806 0.16DENTSPLY SIRONA Inc 19,700 1,143,289 0.19Domino’s Pizza Inc 1,900 905,977 0.15Dropbox Inc 46,800 1,367,262 0.23Edison International 1,100 61,001 0.01Edwards Lifesciences Corp 11,800 1,335,760 0.23EMCOR Group Inc 5,700 657,837 0.11Entegris Inc 13,900 1,749,384 0.30Envista Holdings Corp 6,900 288,731 0.05EPAM Systems Inc 3,200 1,825,200 0.31Evercore Inc 4,300 574,996 0.10Expeditors International ofWashington Inc 19,300 2,299,595 0.39Facebook Inc 21,100 7,159,019 1.22Federated Hermes Inc 10,600 344,553 0.06Fidelity National InformationServices Inc 8,200 997,366 0.17FleetCor Technologies Inc 1,800 470,421 0.08Ford Motor Co 262,200 3,711,441 0.63Fortinet Inc 4,600 1,342,786 0.23Fox Factory Holding Corp 1,800 259,893 0.04Franklin Resources Inc 55,500 1,649,737 0.28Generac Holdings Inc 4,400 1,797,906 0.31General Motors Co 102,800 5,417,046 0.92Genpact Ltd 6,400 304,032 0.05Gilead Sciences Inc 78,600 5,489,424 0.93Global Payments Inc 4,400 693,484 0.12H&R Block Inc 20,400 510,102 0.09Hanesbrands Inc 24,000 411,720 0.07Henry Schein Inc 16,500 1,256,887 0.21Hewlett Packard Enterprise Co 173,800 2,479,257 0.42Hill-Rom Holdings Inc 5,400 810,027 0.14
Number ofShares
Fair ValueUSD
% ofNet
Assets
Houlihan Lokey Inc 7,200 663,336 0.11HP Inc 161,600 4,420,568 0.75Huntsman Corp 18,700 553,427 0.09IDEXX Laboratories Inc 7,300 4,539,213 0.77Intel Corp 69,400 3,697,285 0.63Intuit Inc 4,200 2,265,606 0.39Invesco Ltd 45,500 1,096,777 0.19Iron Mountain Inc (REIT) 29,900 1,298,706 0.22Jack Henry & Associates Inc 2,600 426,660 0.07Johnson & Johnson 23,900 3,858,296 0.66Jones Lang LaSalle Inc 3,400 843,523 0.14JPMorgan Chase & Co 26,900 4,404,202 0.75Kellogg Co 38,400 2,454,720 0.42KeyCorp 109,800 2,374,425 0.40Kroger Co 94,200 3,807,093 0.65Landstar System Inc 2,600 410,397 0.07LGI Homes Inc 1,700 241,689 0.04Lincoln National Corp 21,800 1,497,987 0.25Louisiana-Pacific Corp 10,900 669,097 0.11Lowe’s Cos Inc 23,500 4,764,860 0.81ManpowerGroup Inc 5,700 616,940 0.10MarketAxess Holdings Inc 4,400 1,850,376 0.31Masco Corp 30,300 1,683,013 0.29Mastercard Inc 9,800 3,405,941 0.58Medifast Inc 1,200 231,312 0.04Medpace Holdings Inc 3,700 700,503 0.12Merck & Co Inc 43,600 3,274,578 0.56Mettler-Toledo International Inc 3,100 4,268,312 0.73Micron Technology Inc 25,000 1,774,125 0.30Microsoft Corp 82,300 23,184,321 3.94Monolithic Power Systems Inc 5,200 2,520,180 0.43Moog Inc 3,200 244,096 0.04Mosaic Co 43,200 1,542,456 0.26NetApp Inc 12,700 1,140,396 0.19NortonLifeLock Inc 65,700 1,662,538 0.28Nucor Corp 9,900 974,704 0.17NVIDIA Corp 31,800 6,585,144 1.12Old Dominion Freight Line Inc 6,500 1,858,285 0.32Olin Corp 14,500 699,553 0.12Omnicom Group Inc 12,100 876,464 0.15OneMain Holdings Inc 12,200 674,721 0.11Oracle Corp 71,600 6,238,150 1.06Owens Corning 12,000 1,025,580 0.17PACCAR Inc 12,200 962,763 0.16Patterson Cos Inc 11,200 337,736 0.06Paychex Inc 6,200 697,159 0.12Paylocity Holding Corp 3,800 1,065,425 0.18Penske Automotive Group Inc 8,400 844,746 0.14Pfizer Inc 37,900 1,629,889 0.28Pool Corp 4,600 1,997,918 0.34PotlatchDeltic Corp (REIT) 7,000 361,060 0.06Power Integrations Inc 6,300 624,078 0.11Premier Inc 12,700 491,998 0.08Principal Financial Group Inc 28,500 1,834,830 0.31Prudential Financial Inc 26,200 2,756,502 0.47PVH Corp 2,600 267,111 0.05Qorvo Inc 9,500 1,587,830 0.27Quest Diagnostics Inc 6,000 871,620 0.15Regal Beloit Corp 4,300 646,226 0.11Regeneron Pharmaceuticals Inc 5,300 3,205,996 0.54Rent-A-Center Inc 5,500 309,018 0.05Repligen Corp 4,300 1,241,904 0.21
AXA ROSENBERG GLOBAL EQUITY ALPHA FUND
Schedule of Investments (continued)As at September 30, 2021
97

Number ofShares
Fair ValueUSD
% ofNet
Assets
Equities - 99.16% (March 31, 2021: 99.31%) (continued)United States - 63.06% (March 31, 2021: 61.64%) (continued)Robert Half International Inc 12,800 1,284,224 0.22S&P Global Inc 9,700 4,119,832 0.70Seagen Inc 11,200 1,901,368 0.32Sealed Air Corp 6,200 339,791 0.06ServiceNow Inc 9,100 5,660,564 0.96SiteOne Landscape Supply Inc 4,500 897,863 0.15SPS Commerce Inc 3,700 596,533 0.10STAAR Surgical Co 4,900 629,430 0.11Stanley Black & Decker Inc 3,700 648,629 0.11Steel Dynamics Inc 15,700 918,214 0.16Synchrony Financial 42,500 2,077,187 0.35Synopsys Inc 13,700 4,101,643 0.70T Rowe Price Group Inc 12,900 2,537,494 0.43Tandem Diabetes Care Inc 6,500 775,775 0.13TEGNA Inc 23,100 455,648 0.08Telephone and Data Systems Inc 12,100 235,769 0.04Teradyne Inc 16,800 1,833,636 0.31Tesla Inc 6,000 4,650,960 0.79TopBuild Corp 1,300 266,325 0.05Tractor Supply Co 2,500 506,663 0.09TriNet Group Inc 3,800 359,385 0.06TTEC Holdings Inc 4,700 439,333 0.07Ubiquiti Inc 3,000 894,795 0.15United Therapeutics Corp 2,700 498,488 0.08Uniti Group Inc (REIT) 24,100 297,997 0.05Veeva Systems Inc 5,400 1,555,848 0.26Verizon Communications Inc 53,200 2,873,066 0.49Vertex Pharmaceuticals Inc 18,900 3,428,932 0.58Vertiv Holdings Co 36,700 883,920 0.15Viatris Inc 138,200 1,873,301 0.32VICI Properties Inc (REIT) 52,000 1,477,060 0.25Visa Inc 18,400 4,097,588 0.70Vishay Intertechnology Inc 15,300 307,454 0.05West Pharmaceutical Services Inc 6,000 2,547,180 0.43Western Alliance Bancorp 10,300 1,120,279 0.19Western Digital Corp 35,100 1,981,570 0.34Weyerhaeuser Co (REIT) 18,600 661,509 0.11Whirlpool Corp 7,200 1,467,756 0.25Williams-Sonoma Inc 7,900 1,401,065 0.24Workday Inc 1,100 275,028 0.05YETI Holdings Inc 9,100 779,734 0.13Zebra Technologies Corp 1,300 669,838 0.11
371,144,868 63.06
Fair ValueUSD
% ofNet
Assets
Total financial assets at fair valuethrough profit or loss 583,607,346 99.16
Cash at bank 4,185,584 0.71
Other Net Assets 772,742 0.13
Net Assets attributable toholders of redeemableparticipating units 588,565,672 100.00
Abbreviations used:REIT – Real Estate Investment Trust
Analysis of Total Assets
% ofTotal
Assets
Transferable securities admitted to an official exchange listing 98.96Current Assets 1.04
Total Assets 100.00
AXA ROSENBERG GLOBAL EQUITY ALPHA FUND
Schedule of Investments (continued)As at September 30, 2021
98

Number ofShares
Fair ValueUSD
% ofNet
Assets
Equities - 98.53% (March 31, 2021: 98.55%)Australia - 3.43% (March 31, 2021: 3.54%)Accent Group Ltd 86,792 139,808 0.07ALS Ltd 106,120 971,996 0.45Centuria Office (REIT) 83,610 150,687 0.07Champion Iron Ltd 32,780 114,249 0.05Charter Hall Retail (REIT) 159,133 459,224 0.21Codan Ltd 21,236 195,583 0.09CSR Ltd 57,784 233,328 0.11Downer EDI Ltd 46,012 215,042 0.10EVENT Hospitality and EntertainmentLtd 9,198 101,257 0.05Flight Centre Travel Group Ltd 8,726 135,204 0.06Grange Resources Ltd 361,035 140,177 0.07Growthpoint Properties Australia Ltd(REIT) 142,995 428,147 0.20Harvey Norman Holdings Ltd 175,187 635,263 0.29JB Hi-Fi Ltd 10,322 339,290 0.16Metcash Ltd 272,709 775,161 0.36Mineral Resources Ltd 17,607 570,358 0.26Pact Group Holdings Ltd 50,039 136,811 0.06Sandfire Resources Ltd 43,903 172,996 0.08Seven West Media Ltd 760,812 225,325 0.10Sims Ltd 60,328 580,894 0.27Sub Sandfire Resources 43,903 1,269 0.00Super Retail Group Ltd 35,471 312,082 0.15Viva Energy Group Ltd 87,567 150,861 0.07Worley Ltd 26,658 190,639 0.09Zimplats Holdings Ltd 1,959 29,179 0.01
7,404,830 3.43
Austria - 0.70% (March 31, 2021: 0.81%)ANDRITZ AG 14,758 812,259 0.38Semperit AG Holding 4,635 163,838 0.07Vienna Insurance Group AG WienerVersicherung Gruppe 18,916 545,875 0.25
1,521,972 0.70
Belgium - 0.68% (March 31, 2021: 0.74%)AGFA-Gevaert NV 41,473 191,179 0.09Bekaert SA 11,514 479,989 0.22Econocom Group SA/NV 55,137 212,631 0.10Montea NV (REIT) 1,304 172,889 0.08Proximus SADP 10,278 204,196 0.10Telenet Group Holding NV 5,330 204,157 0.09
1,465,041 0.68
Bermuda - 0.14% (March 31, 2021: 0.17%)Assured Guaranty Ltd 6,600 309,045 0.14
Canada - 3.30% (March 31, 2021: 3.35%)ARC Resources Ltd 30,500 285,776 0.13Baytex Energy Corp 24,500 66,817 0.03Canadian Western Bank 26,900 779,173 0.36Canfor Corp 26,400 579,535 0.27Capstone Mining Corp 51,800 201,991 0.09Crescent Point Energy Corp 34,700 159,962 0.07E-L Financial Corp Ltd 300 219,758 0.10Enerplus Corp 23,800 190,685 0.09Equitable Group Inc 3,800 428,893 0.20First National Financial Corp 17,100 587,502 0.27H&R (REIT) 42,400 523,118 0.24
Number ofShares
Fair ValueUSD
% ofNet
Assets
iA Financial Corp Inc 9,600 544,734 0.25Interfor Corp 15,900 392,589 0.18Leon’s Furniture Ltd 11,300 207,340 0.10Martinrea International Inc 21,100 187,791 0.09NuVista Energy Ltd 84,300 342,031 0.16Paramount Resources Ltd 15,100 223,487 0.10Stantec Inc 5,300 248,736 0.12Stelco Holdings Inc 6,600 193,830 0.09Tamarack Valley Energy Ltd 119,200 301,564 0.14Vermilion Energy Inc 16,400 162,078 0.08Whitecap Resources Inc 54,000 299,443 0.14
7,126,833 3.30
Cayman Islands - 0.10% (March 31, 2021: Nil)Theravance Biopharma Inc 28,000 207,340 0.10
Denmark - 0.72% (March 31, 2021: 1.16%)Matas A/S 15,869 299,765 0.14Royal Unibrew A/S 2,846 343,280 0.16Spar Nord Bank A/S 46,775 546,405 0.25Sydbank A/S 12,209 366,397 0.17
1,555,847 0.72
Finland - 0.37% (March 31, 2021: 0.73%)Atria OYJ 11,292 139,899 0.07Outokumpu OYJ 58,163 356,386 0.17Scanfil OYJ 15,084 138,105 0.06Verkkokauppa.com OYJ 17,286 159,367 0.07
793,757 0.37
France - 2.38% (March 31, 2021: 2.73%)ALD SA 13,522 184,765 0.08Axway Software SA 3,768 119,872 0.05Criteo SA - ADR 6,600 242,022 0.11Eramet 2,510 191,410 0.09Fnac Darty SA 7,110 467,834 0.22Groupe LDLC 2,474 163,719 0.08IPSOS 14,916 680,671 0.31Mersen SA 5,685 210,507 0.10Metropole Television SA 24,928 518,581 0.24Nexans SA 2,897 271,536 0.13Rexel SA 59,440 1,154,563 0.53Sopra Steria Group 794 147,739 0.07Television Francaise 1 63,332 624,255 0.29Trigano SA 867 163,332 0.08
5,140,806 2.38
Germany - 2.91% (March 31, 2021: 2.31%)Aurubis AG 7,356 560,449 0.26Bilfinger SE 6,548 229,865 0.11Deutsche Lufthansa AG 5,656 39,120 0.02HUGO BOSS AG 3,501 211,801 0.10Jungheinrich AG (Preference shares) 5,935 277,817 0.13K+S AG 32,686 529,583 0.24Kloeckner & Co SE 33,937 429,301 0.20Krones AG 2,358 231,469 0.11LANXESS AG 3,881 264,925 0.12ProSiebenSat.1 Media SE 28,392 524,340 0.24PSI Software AG 1,560 67,979 0.03Rheinmetall AG 3,740 368,213 0.17Salzgitter AG 17,009 576,987 0.27
AXA ROSENBERG GLOBAL SMALL CAP ALPHA FUND
Schedule of InvestmentsAs at September 30, 2021
99

Number ofShares
Fair ValueUSD
% ofNet
Assets
Equities - 98.53% (March 31, 2021: 98.55%) (continued)Germany - 2.91% (March 31, 2021: 2.31%) (continued)Schaeffler AG 120,890 933,102 0.43Takkt AG 26,385 422,295 0.19United Internet AG 3,182 124,223 0.06VERBIO Vereinigte BioEnergie AG 3,645 240,367 0.11Wacker Chemie AG 1,345 251,121 0.12
6,282,957 2.91
Gibraltar - 0.28% (March 31, 2021: 0.33%)888 Holdings PLC 102,820 596,002 0.28
Greece - 0.13% (March 31, 2021: Nil)Star Bulk Carriers Corp 11,500 276,575 0.13
Hong Kong - 0.97% (March 31, 2021: 0.65%)Haitong International SecuritiesGroup Ltd 1,039,000 273,609 0.13Hi Sun Technology China Ltd 1,107,000 180,598 0.08K Wah International Holdings Ltd 824,000 336,072 0.15Kowloon Development Co Ltd 108,000 120,491 0.06Pacific Basin Shipping Ltd 513,000 238,224 0.11SITC International Holdings Co Ltd 48,000 172,493 0.08Skyworth Group Ltd 628,000 189,175 0.09Yip’s Chemical Holdings Ltd 300,000 185,172 0.09Yue Yuen Industrial Holdings Ltd 194,500 393,765 0.18
2,089,599 0.97
Ireland - 1.09% (March 31, 2021: 0.42%)Alkermes PLC 35,600 1,098,260 0.51Perrigo Co PLC 22,500 1,064,587 0.49Prothena Corp PLC 2,700 192,227 0.09
2,355,074 1.09
Israel - 0.94% (March 31, 2021: 0.69%)Clal Insurance Enterprises HoldingsLtd 14,580 311,313 0.15Delek Automotive Systems Ltd 8,250 104,834 0.05Delek Group Ltd 5,916 418,740 0.19Gazit-Globe Ltd 57,889 412,077 0.19Israel Discount Bank Ltd 39,819 211,428 0.10Magic Software Enterprises Ltd 15,069 300,250 0.14Phoenix Holdings Ltd 23,380 267,234 0.12
2,025,876 0.94
Italy - 0.60% (March 31, 2021: 0.77%)Anima Holding SpA 86,123 413,822 0.19Banco BPM SpA 67,957 214,460 0.10Brunello Cucinelli SpA 2,375 131,542 0.06Iren SpA 178,050 529,497 0.25
1,289,321 0.60
Japan - 10.35% (March 31, 2021: 9.89%)Activia Properties Inc (REIT) 51 209,119 0.10Adastria Co Ltd 10,200 187,865 0.09AEON Financial Service Co Ltd 15,300 196,229 0.09AEON Investment Corp (REIT) 312 419,309 0.19Aisan Industry Co Ltd 37,400 283,580 0.13Akatsuki Inc 4,200 121,022 0.06Amada Co Ltd 25,100 262,079 0.12Asahi Co Ltd 13,400 160,452 0.07
Number ofShares
Fair ValueUSD
% ofNet
Assets
Asics Corp 19,100 438,149 0.20Belluna Co Ltd 34,200 261,615 0.12Benefit One Inc 14,800 700,372 0.32BeNext-Yumeshin Group Co 11,600 136,247 0.06Daito Pharmaceutical Co Ltd 4,100 123,836 0.06Descente Ltd 4,700 165,232 0.08Digital Holdings Inc 14,500 241,851 0.11Doshisha Co Ltd 12,700 200,218 0.09EDION Corp 10,300 97,300 0.05Eiken Chemical Co Ltd 12,900 243,374 0.11Eizo Corp 4,800 184,235 0.09en Japan Inc 10,500 383,251 0.18Exedy Corp 14,200 217,629 0.10Fuji Corp 17,700 454,735 0.21Fujio Food Group Inc 2,100 26,510 0.01Furuno Electric Co Ltd 13,300 151,387 0.07Furuya Metal Co Ltd 3,100 241,582 0.11Globeride Inc 5,600 198,127 0.09GungHo Online Entertainment Inc 24,500 450,146 0.21Heiwado Co Ltd 20,600 402,769 0.19HIS Co Ltd 5,000 132,333 0.06Hulic Inc (REIT) 124 195,322 0.09Inageya Co Ltd 8,800 108,329 0.05Infocom Corp 5,700 121,867 0.06Infomart Corp 12,800 116,385 0.05Iyo Bank Ltd 24,700 127,512 0.06Izumi Co Ltd 7,400 247,385 0.11JAC Recruitment Co Ltd 17,600 346,558 0.16Japan Aviation Electronics IndustryLtd 16,600 243,030 0.11Japan Excellent Inc (REIT) 326 399,410 0.19Japan Metropolitan Fund Invest(REIT) 336 322,976 0.15Japan Prime Realty Investment(REIT) 145 527,302 0.24Kamei Corp 12,100 136,535 0.06Kenedix Office Investment Corp(REIT) 22 151,333 0.07Kenedix Retail Corp (REIT) 130 337,132 0.16Konica Minolta Inc 91,200 494,111 0.23Kyoei Steel Ltd 8,200 102,009 0.05Kyoritsu Maintenance Co Ltd 2,800 109,478 0.05Mitsui-Soko Holdings Co Ltd 9,400 212,980 0.10Mori Hills Investment Corp (REIT) 275 372,664 0.17NEC Networks & System IntegrationCorp 12,600 238,674 0.11NHK Spring Co Ltd 43,100 309,996 0.14Nojima Corp 11,500 296,789 0.14Noritsu Koki Co Ltd 5,900 134,789 0.06Noritz Corp 18,800 308,517 0.14NSD Co Ltd 21,100 386,542 0.18Open House Co Ltd 7,900 469,433 0.22Rakus Co Ltd 9,600 339,646 0.16Relia Inc 20,000 210,531 0.10Rengo Co Ltd 31,100 244,591 0.11Round One Corp 10,400 146,294 0.07Sanwa Holdings Corp 62,200 811,401 0.38Sawai Group Holdings Co Ltd 7,800 362,474 0.17Shibuya Corp 8,300 229,305 0.11Sumitomo Forestry Co Ltd 33,300 639,885 0.30Sumitomo Heavy Industries Ltd 5,300 139,797 0.06Sumitomo Riko Co Ltd 33,700 231,362 0.11
AXA ROSENBERG GLOBAL SMALL CAP ALPHA FUND
Schedule of Investments (continued)As at September 30, 2021
100

Number ofShares
Fair ValueUSD
% ofNet
Assets
Equities - 98.53% (March 31, 2021: 98.55%) (continued)Japan - 10.35% (March 31, 2021: 9.89%) (continued)Sumitomo Rubber Industries Ltd 34,000 434,237 0.20Taiyo Yuden Co Ltd 2,700 159,834 0.07Teijin Ltd 29,500 421,712 0.20Tokyo Ohka Kogyo Co Ltd 8,800 543,419 0.25Tomy Co Ltd 45,600 466,728 0.22Towa Pharmaceutical Co Ltd 12,500 355,702 0.16Toyo Seikan Group Holdings Ltd 43,600 518,550 0.24TS Tech Co Ltd 31,000 401,896 0.19United Urban Investment Co (REIT) 132 178,228 0.08ValueCommerce Co Ltd 9,200 393,314 0.18YAMABIKO Corp 11,000 122,545 0.06Yamada Holdings Co Ltd 59,800 252,170 0.12Yokohama Rubber Co Ltd 34,200 617,485 0.29
22,328,717 10.35
Jersey, Channel Islands - Nil (March 31, 2021: 0.08%)
Luxembourg - 0.08% (March 31, 2021: 0.20%)L’Occitane International SA 53,000 178,887 0.08
Macau - 0.02% (March 31, 2021: Nil)MGM China Holdings Ltd 75,600 47,052 0.02
Malta - 0.27% (March 31, 2021: 0.40%)Kindred Group PLC 38,051 573,904 0.27
Marshall Islands - 0.12% (March 31, 2021: Nil)DHT Holdings Inc 38,600 251,865 0.12
Monaco - Nil (March 31, 2021: 0.16%)
Netherlands - 0.91% (March 31, 2021: 0.95%)Aegon NV 164,251 849,380 0.39Heijmans NV 9,909 137,349 0.06PostNL NV 101,775 492,214 0.23Signify NV 9,814 490,672 0.23
1,969,615 0.91
New Zealand - 0.23% (March 31, 2021: 0.29%)Air New Zealand Ltd 68,174 76,659 0.03Fletcher Building Ltd 34,588 171,438 0.08Property for Industry Ltd 120,790 244,981 0.11Warehouse Group Ltd 4,470 12,674 0.01
505,752 0.23
Norway - 0.63% (March 31, 2021: 0.19%)ABG Sundal Collier Holding ASA 194,857 205,700 0.09Aker BP ASA 8,373 272,697 0.13DNO ASA 332,358 380,836 0.18FLEX LNG Ltd 20,541 369,675 0.17Odfjell Drilling Ltd 62,239 139,961 0.06
1,368,869 0.63
Portugal - 0.40% (March 31, 2021: 0.08%)Banco Comercial Portugues SA 3,610,424 656,308 0.30NOS SGPS SA 54,300 218,685 0.10
874,993 0.40
Number ofShares
Fair ValueUSD
% ofNet
Assets
Puerto Rico - 0.49% (March 31, 2021: 0.30%)EVERTEC Inc 20,600 942,141 0.44Popular Inc 1,500 116,587 0.05
1,058,728 0.49
Singapore - 0.40% (March 31, 2021: 0.40%)AEM Holdings Ltd 62,400 185,922 0.09BW LPG Ltd 28,921 159,162 0.07Flex Ltd 11,600 205,146 0.09Hong Leong Asia Ltd 383,200 227,928 0.11Singapore Airlines Ltd 21,500 79,738 0.04
857,896 0.40
Spain - 0.76% (March 31, 2021: 0.35%)Acciona SA 847 140,520 0.06Indra Sistemas SA 20,352 218,769 0.10Mapfre SA 589,939 1,288,622 0.60
1,647,911 0.76
Sweden - 2.13% (March 31, 2021: 2.39%)AcadeMedia AB 26,709 183,483 0.09Arjo AB 17,233 212,937 0.10Bergman & Beving AB 9,027 152,401 0.07Betsson AB 35,091 292,005 0.14Boliden AB 8,260 266,630 0.12Dios Fastigheter AB 15,737 154,068 0.07Dometic Group AB 13,042 197,712 0.09Dustin Group AB 16,413 177,055 0.08Getinge AB 12,308 492,683 0.23Intrum AB 17,219 469,911 0.22Inwido AB 13,393 224,121 0.10Lindab International AB 14,274 363,680 0.17Securitas AB 27,980 445,116 0.21SSAB AB 193,271 958,010 0.44
4,589,812 2.13
Switzerland - 1.46% (March 31, 2021: 1.65%)Basellandschaftliche Kantonalbank 215 211,347 0.10Medmix AG 8,334 392,199 0.18SFS Group AG 8,224 1,120,954 0.52Sulzer AG 8,334 797,128 0.37Valiant Holding AG 1,778 169,156 0.08Zehnder Group AG 4,237 450,112 0.21
3,140,896 1.46
United Kingdom - 5.63% (March 31, 2021: 5.95%)AO World PLC 45,146 132,276 0.06CMC Markets PLC 53,488 205,003 0.10Computacenter PLC 24,999 916,504 0.43Cushman & Wakefield PLC 27,800 517,358 0.24Dixons Carphone PLC 116,223 209,285 0.10Drax Group PLC 90,022 586,150 0.27easyJet PLC 9,817 87,760 0.04Ferrexpo PLC 147,787 652,206 0.30Georgia Capital PLC 21,642 174,211 0.08Greggs PLC 5,264 209,276 0.10IMI PLC 27,407 613,625 0.28IP Group PLC 274,556 517,536 0.24ITV PLC 131,669 189,386 0.09Johnson Matthey PLC 13,120 474,898 0.22Marks & Spencer Group PLC 288,011 712,701 0.33
AXA ROSENBERG GLOBAL SMALL CAP ALPHA FUND
Schedule of Investments (continued)As at September 30, 2021
101

Number ofShares
Fair ValueUSD
% ofNet
Assets
Equities - 98.53% (March 31, 2021: 98.55%) (continued)United Kingdom - 5.63% (March 31, 2021: 5.95%) (continued)Nielsen Holdings PLC 54,400 1,043,664 0.48OSB Group PLC 60,838 410,360 0.19Paragon Banking Group PLC 91,328 672,048 0.31Premier Foods PLC 203,827 320,727 0.15Quilter PLC 104,676 201,195 0.09Reach PLC 82,572 389,676 0.18Royal Mail PLC 168,612 957,363 0.44Serco Group PLC 239,858 433,535 0.20Synthomer PLC 97,258 652,673 0.30Travis Perkins PLC 18,403 381,076 0.18Virgin Money UK PLC 97,981 270,104 0.13Wincanton PLC 43,245 207,582 0.10
12,138,178 5.63
United States - 55.91% (March 31, 2021: 56.87%)Abercrombie & Fitch Co 17,700 666,670 0.31ABM Industries Inc 14,300 643,571 0.30Acuity Brands Inc 3,900 676,572 0.31AGCO Corp 9,500 1,163,702 0.54Alaska Air Group Inc 1,900 111,312 0.05Allscripts Healthcare Solutions Inc 34,000 454,410 0.21AMC Networks Inc 5,200 242,450 0.11Amdocs Ltd 14,600 1,105,731 0.51Ameresco Inc 2,900 169,563 0.08American Software Inc 9,100 216,216 0.10AMN Healthcare Services Inc 3,100 355,787 0.16Apple Hospitality Inc (REIT) 47,900 753,227 0.35ArcBest Corp 2,900 237,003 0.11Artesian Resources Corp 3,500 133,438 0.06Atkore Inc 4,300 373,778 0.17Aura Minerals Inc 15,300 165,156 0.08AutoNation Inc 2,200 267,883 0.12Avanos Medical Inc 15,600 487,032 0.23Aviat Networks Inc 4,600 151,363 0.07Belden Inc 11,000 641,025 0.30Biglari Holdings Inc 265 220,495 0.10BJ’s Wholesale Club Holdings Inc 18,800 1,032,402 0.48Bloomin’ Brands Inc 27,500 687,912 0.32Boise Cascade Co 8,700 469,800 0.22Boot Barn Holdings Inc 6,600 586,575 0.27BorgWarner Inc 4,300 185,782 0.09Boyd Gaming Corp 11,900 752,615 0.35Brightcove Inc 21,100 243,600 0.11BrightView Holdings Inc 10,200 150,501 0.07Brooks Automation Inc 9,000 921,555 0.43Bruker Corp 14,800 1,156,398 0.54Builders FirstSource Inc 10,800 558,954 0.26Camping World Holdings Inc 11,900 462,374 0.21Carter’s Inc 2,800 272,342 0.13Cerence Inc 2,600 250,081 0.12CEVA Inc 5,500 234,548 0.11ChannelAdvisor Corp 6,600 166,485 0.08Cheesecake Factory Inc 2,600 122,213 0.06Cinemark Holdings Inc 5,900 113,369 0.05Clarus Corp 8,100 207,725 0.10Clean Harbors Inc 11,600 1,205,182 0.56Colfax Corp 17,000 780,300 0.36Comerica Inc 2,800 225,442 0.10Comfort Systems USA Inc 10,300 734,544 0.34CommVault Systems Inc 9,200 693,082 0.32
Number ofShares
Fair ValueUSD
% ofNet
Assets
Computer Programs and SystemsInc 8,500 301,495 0.14ConnectOne Bancorp Inc 7,600 228,190 0.11Conn’s Inc 13,100 299,270 0.14Covenant Logistics Group Inc 9,800 271,460 0.13Crawford & Co 10,600 94,499 0.04Credit Acceptance Corp 700 409,265 0.19Crocs Inc 3,500 502,162 0.23CSG Systems International Inc 12,800 617,152 0.29Cullen/Frost Bankers Inc 1,500 177,870 0.08Deckers Outdoor Corp 4,000 1,441,240 0.67Del Taco Restaurants Inc 15,700 136,983 0.06Denali Therapeutics Inc 2,300 115,978 0.05Devon Energy Corp 3,600 127,800 0.06Dick’s Sporting Goods Inc 1,600 191,672 0.09Dine Brands Global Inc 6,000 486,960 0.23Diodes Inc 10,600 960,678 0.45Donnelley Financial Solutions Inc 12,300 426,502 0.20East West Bancorp Inc 5,300 411,094 0.19Easterly Government Properties Inc(REIT) 10,900 225,249 0.10Ecovyst Inc 43,800 511,365 0.24Edgewell Personal Care Co 7,500 272,213 0.13Editas Medicine Inc 3,700 151,867 0.07EMCOR Group Inc 10,800 1,246,428 0.58Ensign Group Inc 11,000 823,735 0.38Entegris Inc 12,200 1,535,431 0.71Entravision Communications Corp 38,000 269,990 0.12Envista Holdings Corp 27,000 1,129,815 0.52ePlus Inc 1,941 199,506 0.09Fair Isaac Corp 700 278,520 0.13Fiesta Restaurant Group Inc 8,800 96,492 0.04First American Financial Corp 6,300 422,446 0.20First Citizens BancShares Inc 1,100 928,482 0.43First Financial Bankshares Inc 3,500 160,773 0.07First Horizon Corp 10,800 175,986 0.08FNB Corp 11,100 129,038 0.06Foot Locker Inc 11,800 538,729 0.25Fox Factory Holding Corp 4,100 591,978 0.27FTI Consulting Inc 5,400 727,515 0.34Gaming and Leisure Properties Inc(REIT) 15,100 699,658 0.32Generac Holdings Inc 2,100 858,091 0.40Genpact Ltd 2,100 99,761 0.05Glacier Bancorp Inc 2,800 154,924 0.07GoPro Inc 47,600 445,774 0.21Greif Inc 5,400 348,867 0.16Griffon Corp 8,900 218,985 0.10Group 1 Automotive Inc 3,400 638,418 0.30Guess? Inc 17,000 357,255 0.17Hackett Group Inc 12,200 239,486 0.11Halozyme Therapeutics Inc 18,800 764,878 0.35Haverty Furniture Cos Inc 5,800 195,779 0.09Hawaiian Electric Industries Inc 9,500 387,838 0.18Hemisphere Media Group Inc 10,500 128,048 0.06Henry Schein Inc 11,500 876,012 0.41Herman Miller Inc 16,900 637,045 0.29Hill-Rom Holdings Inc 6,400 960,032 0.44HollyFrontier Corp 5,500 182,188 0.08Horizon Technology Finance Corp 9,600 155,808 0.07Huntsman Corp 35,600 1,053,582 0.49ICF International Inc 6,600 589,545 0.27
AXA ROSENBERG GLOBAL SMALL CAP ALPHA FUND
Schedule of Investments (continued)As at September 30, 2021
102

Number ofShares
Fair ValueUSD
% ofNet
Assets
Equities - 98.53% (March 31, 2021: 98.55%) (continued)United States - 55.91% (March 31, 2021: 56.87%) (continued)Integer Holdings Corp 4,300 383,947 0.18Iridium Communications Inc 4,900 195,241 0.09Iron Mountain Inc (REIT) 10,500 456,067 0.21Ironwood Pharmaceuticals Inc 21,300 278,391 0.13Jack in the Box Inc 6,500 632,937 0.29JetBlue Airways Corp 6,200 94,767 0.04Johnson Outdoors Inc 1,900 201,343 0.09Jones Lang LaSalle Inc 5,600 1,389,332 0.64Jounce Therapeutics Inc 29,100 216,650 0.10Kforce Inc 6,100 363,987 0.17Kilroy Realty Corp (REIT) 8,900 589,313 0.27Kimco Realty Corp (REIT) 40,700 844,728 0.39Kontoor Brands Inc 4,000 199,820 0.09Kulicke & Soffa Industries Inc 14,800 863,432 0.40Lamar Advertising Co (REIT) 2,600 294,892 0.14LGI Homes Inc 2,400 341,208 0.16Lifetime Brands Inc 12,400 225,246 0.10Liquidity Services Inc 9,200 198,536 0.09Malibu Boats Inc 2,400 167,796 0.08Manhattan Associates Inc 2,100 321,552 0.15ManpowerGroup Inc 4,700 508,704 0.24Marathon Oil Corp 23,900 326,833 0.15MarineMax Inc 4,200 203,574 0.09MasTec Inc 9,000 776,655 0.36Maximus Inc 2,400 199,740 0.09Medifast Inc 3,200 616,832 0.29Medpace Holdings Inc 6,400 1,211,680 0.56Merit Medical Systems Inc 2,600 186,797 0.09MGIC Investment Corp 28,200 421,731 0.20Minerals Technologies Inc 7,900 551,459 0.26Monolithic Power Systems Inc 400 193,860 0.09Moog Inc 9,400 717,032 0.33MYR Group Inc 4,000 398,600 0.18National Bank Holdings Corp 12,400 502,262 0.23National HealthCare Corp 4,500 315,270 0.15National Storage Affiliates Trust(REIT) 7,800 411,645 0.19Natus Medical Inc 11,100 278,555 0.13NetScout Systems Inc 5,600 151,004 0.07NexPoint Residential Trust Inc (REIT) 1,600 99,064 0.05NextGen Healthcare Inc 27,000 380,970 0.18Nu Skin Enterprises Inc 4,200 170,037 0.08Oceaneering International Inc 25,400 338,201 0.16Olin Corp 11,200 540,344 0.25Orthofix Medical Inc 3,200 122,128 0.06OSI Systems Inc 6,600 625,251 0.29Ovintiv Inc 9,100 299,251 0.14Owens & Minor Inc 17,700 553,744 0.26Patterson Cos Inc 26,600 802,123 0.37Paylocity Holding Corp 7,000 1,962,625 0.91PC Connection Inc 9,900 436,491 0.20Penske Automotive Group Inc 2,600 261,469 0.12Penumbra Inc 2,100 559,744 0.26Perficient Inc 7,900 914,583 0.42Piedmont Office Inc (REIT) 12,000 208,980 0.10Pinnacle Financial Partners Inc 1,400 131,775 0.06PJT Partners Inc 7,400 585,451 0.27Pool Corp 400 173,732 0.08Portland General Electric Co 7,600 357,238 0.17PotlatchDeltic Corp (REIT) 11,800 608,644 0.28
Number ofShares
Fair ValueUSD
% ofNet
Assets
Power Integrations Inc 10,500 1,040,130 0.48Premier Inc 28,300 1,096,342 0.51Primerica Inc 8,400 1,290,828 0.60Progress Software Corp 14,800 728,308 0.34Prosperity Bancshares Inc 3,500 249,008 0.12PVH Corp 2,100 215,744 0.10Qualys Inc 1,900 211,584 0.10Quanta Services Inc 12,200 1,389,397 0.64Ralph Lauren Corp 4,200 466,347 0.22Rambus Inc 36,100 801,600 0.37Range Resources Corp 11,400 258,039 0.12Regal Beloit Corp 6,900 1,036,966 0.48Rent-A-Center Inc 4,700 264,070 0.12Repay Holdings Corp 5,500 126,775 0.06Repligen Corp 3,100 895,326 0.41Resideo Technologies Inc 13,600 337,484 0.16Resources Connection Inc 19,500 307,418 0.14REX American Resources Corp 1,700 136,085 0.06RH 1,300 866,131 0.40Rimini Street Inc 19,800 190,971 0.09RLJ Lodging Trust (REIT) 39,000 579,345 0.27RMR Group Inc 5,500 184,085 0.09Rush Enterprises Inc 21,700 980,406 0.45Sabra Health Care Inc (REIT) 43,800 644,079 0.30ScanSource Inc 7,708 268,046 0.12Seres Therapeutics Inc 44,400 308,802 0.14Signature Bank 1,100 299,668 0.14Silgan Holdings Inc 14,500 556,147 0.26SiteOne Landscape Supply Inc 8,600 1,715,915 0.80SJW Group 5,900 389,724 0.18Smith & Wesson Brands Inc 8,200 170,109 0.08Sonic Automotive Inc 5,100 267,776 0.12South State Corp 2,000 149,370 0.07Southwestern Energy Co 30,900 171,341 0.08Spectrum Pharmaceuticals Inc 97,900 213,912 0.10Sprouts Farmers Market Inc 9,300 215,528 0.10SPS Commerce Inc 7,800 1,257,555 0.58SPX Corp 10,700 572,129 0.26STAAR Surgical Co 8,000 1,027,640 0.48Standard Motor Products Inc 6,500 284,148 0.13SuRo Capital Corp 14,600 188,194 0.09SYNNEX Corp 10,400 1,082,796 0.50Synovus Financial Corp 3,500 153,633 0.07TEGNA Inc 53,300 1,051,342 0.49Tempur Sealy International Inc 22,500 1,044,675 0.48Teradata Corp 20,900 1,198,510 0.56Terex Corp 13,300 559,863 0.26Timken Co 10,600 693,293 0.32TopBuild Corp 3,100 635,081 0.29Toro Co 3,700 360,510 0.17Tredegar Corp 18,800 228,890 0.11Trex Co Inc 14,100 1,438,270 0.67TriNet Group Inc 14,600 1,380,795 0.64TrueBlue Inc 9,600 259,920 0.12TTEC Holdings Inc 10,200 953,445 0.44UMH Properties Inc (REIT) 9,900 226,760 0.10UniFirst Corp 2,000 425,250 0.20United Therapeutics Corp 2,693 497,195 0.23Uniti Group Inc (REIT) 45,500 562,607 0.26Universal Electronics Inc 6,800 335,240 0.16Urstadt Biddle Properties Inc (REIT) 5,798 101,204 0.05US Foods Holding Corp 35,900 1,243,755 0.58
AXA ROSENBERG GLOBAL SMALL CAP ALPHA FUND
Schedule of Investments (continued)As at September 30, 2021
103

Number ofShares
Fair ValueUSD
% ofNet
Assets
Equities - 98.53% (March 31, 2021: 98.55%) (continued)United States - 55.91% (March 31, 2021: 56.87%) (continued)Valley National Bancorp 19,000 252,985 0.12Varex Imaging Corp 11,400 321,309 0.15Verint Systems Inc 15,600 698,802 0.32Vishay Intertechnology Inc 37,500 753,562 0.35Vista Outdoor Inc 5,200 209,794 0.10VSE Corp 3,200 154,496 0.07Webster Financial Corp 1,800 98,064 0.05Weis Markets Inc 6,000 315,360 0.15WESCO International Inc 3,400 392,207 0.18Western Alliance Bancorp 12,600 1,370,439 0.63WhiteHorse Finance Inc 12,800 194,688 0.09
Number ofShares
Fair ValueUSD
% ofNet
Assets
Williams-Sonoma Inc 3,500 620,725 0.29Wintrust Financial Corp 13,900 1,115,822 0.52World Fuel Services Corp 13,400 450,575 0.21XRAY-TWOLF HoldCo Corp 4,400 82,940 0.04YETI Holdings Inc 12,200 1,045,357 0.48Zions Bancorp 3,200 197,968 0.09Zumiez Inc 3,300 131,274 0.06
120,613,103 55.91
Total value of Investmentsexcluding FinancialDerivative Instruments 212,587,053 98.53
Financial Derivative Instruments - (0.00%) (March 31, 2021: (0.06%))Open Forward Foreign Currency Exchange Contracts* - (0.00%) (March 31, 2021: (0.06%))
Currency Sold Currency BoughtSettlementDate
UnrealisedGain/(Loss)
USD
% ofNet
AssetsEUR 2,137,362 USD 2,531,491 20 October 2021 53,664 0.03EUR 160,322 USD 190,179 20 October 2021 4,318 0.00EUR 140,471 USD 165,521 20 October 2021 2,675 0.00EUR 44,970 USD 53,245 20 October 2021 1,112 0.00EUR 8,900 USD 10,538 20 October 2021 220 0.00EUR 852 USD 1,006 20 October 2021 18 0.00USD 3,052,699 EUR 2,577,966 20 October 2021 (64,082) (0.03)USD 111,765 EUR 94,563 20 October 2021 (2,139) (0.00)USD 9,470 EUR 8,018 20 October 2021 (175) (0.00)USD 9,076 EUR 7,663 20 October 2021 (192) (0.00)
Unrealised gain on open forward foreign currency exchange contracts 62,007 0.03Unrealised loss on open forward foreign currency exchange contracts (66,588) (0.03)
Net unrealised loss on open forward foreign currency exchange contracts (4,581) (0.00)
Fair ValueUSD
% ofNet
Assets
Total financial assets at fair valuethrough profit or loss 212,582,472 98.53
Cash at bank 2,577,078 1.19
Other Net Assets 584,317 0.28
Net Assets attributable toholders of redeemableparticipating units 215,743,867 100.00
*The counterparty for the open forward foreign contracts is State StreetBank and Trust Company.
Abbreviations used:ADR – American Depository ReceiptREIT – Real Estate Investment Trust
Analysis of Total Assets
% ofTotal
Assets
Transferable securities admitted to an official exchange listing 98.35Over the counter financial derivative instruments 0.03Current Assets 1.62
Total Assets 100.00
AXA ROSENBERG GLOBAL SMALL CAP ALPHA FUND
Schedule of Investments (continued)As at September 30, 2021
104

Number ofShares
Fair ValueJPY
% ofNet
Assets
Equities - 98.43% (March 31, 2021: 99.01%)Aerospace and Defense - 0.09% (March 31, 2021: 0.42%)IHI Corp 6,900 19,806,450 0.09
Agriculture - 0.09% (March 31, 2021: Nil)Feed One Co Ltd 24,200 18,271,000 0.09
Airlines - Nil (March 31, 2021: 0.38%)
Auto Components - 6.93% (March 31, 2021: 3.52%)Aisin Corp 55,300 224,932,750 1.08Exedy Corp 30,700 52,497,000 0.25FCC Co Ltd 34,800 54,897,000 0.26JTEKT Corp 122,700 120,061,950 0.57KYB Corp 6,600 20,064,000 0.10Marujun Co Ltd 5,500 4,873,000 0.02NGK Insulators Ltd 71,300 135,683,900 0.65NGK Spark Plug Co Ltd 24,700 43,274,400 0.21Nichirin Co Ltd 3,600 6,390,000 0.03Sumitomo Electric Industries Ltd 144,900 216,734,175 1.04Sumitomo Riko Co Ltd 17,500 13,405,000 0.06Sumitomo Rubber Industries Ltd 96,800 137,940,000 0.66Toyo Tire Corp 59,200 118,577,600 0.57Toyota Boshoku Corp 56,400 112,179,600 0.54TS Tech Co Ltd 44,300 64,079,950 0.31Yokohama Rubber Co Ltd 60,700 122,280,150 0.58
1,447,870,475 6.93
Automobiles - 5.24% (March 31, 2021: 5.59%)Honda Motor Co Ltd 123,200 425,964,000 2.04Toyota Motor Corp 333,500 667,750,375 3.20
1,093,714,375 5.24
Banks - 5.27% (March 31, 2021: 4.63%)Hyakugo Bank Ltd 14,500 4,741,500 0.02Japan Post Bank Co Ltd 241,100 231,335,450 1.11Mitsubishi UFJ Financial Group Inc 846,000 556,921,800 2.66Mizuho Financial Group Inc 1,500 2,377,125 0.01Nanto Bank Ltd 9,200 18,487,400 0.09Sumitomo Mitsui Financial Group Inc72,900 287,554,050 1.38
1,101,417,325 5.27
Beverages - 0.57% (March 31, 2021: 0.55%)Suntory Beverage & Food Ltd 25,600 118,592,000 0.57
Biotechnology - 0.62% (March 31, 2021: 0.14%)Eiken Chemical Co Ltd 7,500 15,787,500 0.07Takara Bio Inc 36,200 114,573,000 0.55
130,360,500 0.62
Building Products - 1.21% (March 31, 2021: 1.59%)Cleanup Corp 7,700 4,485,250 0.02Daikin Industries Ltd 3,900 95,550,000 0.46Endo Lighting Corp 2,500 2,563,750 0.01Nichireki Co Ltd 15,200 20,732,800 0.10Noritz Corp 24,700 45,225,700 0.22Sanwa Holdings Corp 57,900 84,273,450 0.40
252,830,950 1.21
Chemicals - 4.35% (March 31, 2021: 5.33%)Asahi Kasei Corp 90,000 107,662,500 0.52C Uyemura & Co Ltd 7,000 31,762,500 0.15
Number ofShares
Fair ValueJPY
% ofNet
Assets
Kuraray Co Ltd 19,800 21,344,400 0.10Mitsubishi Chemical Holdings Corp 107,600 110,209,300 0.53Mitsui Chemicals Inc 5,400 20,331,000 0.10Nissan Chemical Corp 9,400 61,570,000 0.30Nitto Denko Corp 27,800 222,261,000 1.06Parker Corp 10,800 6,080,400 0.03Shin-Etsu Chemical Co Ltd 5,100 96,492,000 0.46Soken Chemical & Engineering CoLtd 4,700 10,448,100 0.05Sumitomo Chemical Co Ltd 352,800 206,211,600 0.99Tosoh Corp 6,600 13,421,100 0.06
907,793,900 4.35
Commercial Services and Supplies - 5.69% (March 31, 2021: 2.75%)Ajis Co Ltd 3,400 10,965,000 0.05Altech Corp 5,500 11,349,250 0.05Benefit One Inc 38,000 200,640,000 0.96BeNext-Yumeshin Group Co 20,400 26,734,200 0.13Creek & River Co Ltd 13,200 24,340,800 0.12Dai Nippon Printing Co Ltd 30,300 82,173,600 0.39FULLCAST Holdings Co Ltd 11,300 25,780,950 0.12Hakuhodo DY Holdings Inc 89,300 172,661,550 0.83JAC Recruitment Co Ltd 29,100 63,932,700 0.31Nihon M&A Center Inc 6,200 20,398,000 0.10Pasona Group Inc 5,700 18,111,750 0.09Recruit Holdings Co Ltd 69,547 475,771,027 2.28San Holdings Inc 3,000 4,546,500 0.02Subaru Enterprise Co Ltd 600 4,899,000 0.02TechnoPro Holdings Inc 13,900 47,121,000 0.22
1,189,425,327 5.69
Computers and Peripherals - 4.59% (March 31, 2021: 3.19%)Business Engineering Corp 1,000 3,402,500 0.02DTS Corp 19,500 50,193,000 0.24Ferrotec Holdings Corp 9,800 31,237,500 0.15Fujitsu Ltd 17,200 349,246,000 1.67JBCC Holdings Inc 17,400 27,961,800 0.13JFE Systems Inc 1,000 1,752,500 0.01NEC Networks & System IntegrationCorp 56,300 118,990,050 0.57Nomura Research Institute Ltd 44,000 182,490,000 0.87NSD Co Ltd 15,300 31,273,200 0.15Otsuka Corp 3,500 20,090,000 0.10Scala Inc 23,100 17,313,450 0.08SCSK Corp 53,100 125,554,950 0.60
959,504,950 4.59
Construction and Engineering - 0.63% (March 31, 2021: 0.59%)Chodai Co Ltd 8,300 18,521,450 0.09EJ Holdings Inc 5,300 7,094,050 0.03Miyaji Engineering Group Inc 6,300 16,364,250 0.08Taikisha Ltd 17,100 57,456,000 0.27TOA ROAD Corp 7,100 32,873,000 0.16
132,308,750 0.63
Containers and Packaging - 0.51% (March 31, 2021: 0.11%)Rengo Co Ltd 39,900 35,012,250 0.17Toyo Seikan Group Holdings Ltd 53,700 71,259,900 0.34
106,272,150 0.51
AXA ROSENBERG JAPAN EQUITY ALPHA FUND
Schedule of InvestmentsAs at September 30, 2021
105

Number ofShares
Fair ValueJPY
% ofNet
Assets
Equities - 98.43% (March 31, 2021: 99.01%) (continued)Distribution and Wholesale - 3.15% (March 31, 2021: 2.01%)Arata Corp 12,600 55,566,000 0.27Doshisha Co Ltd 30,500 53,649,500 0.26GSI Creos Corp 17,800 19,019,300 0.09Inabata & Co Ltd 28,500 49,419,000 0.24Mitsui & Co Ltd 137,400 338,828,400 1.62Mitsui-Soko Holdings Co Ltd 20,100 50,812,800 0.24Sala Corp 4,500 2,904,750 0.01Toyota Tsusho Corp 14,600 69,532,500 0.33Tsuzuki Denki Co Ltd 10,400 18,558,800 0.09
658,291,050 3.15
Diversified Financials - Nil (March 31, 2021: 2.05%)
Electrical Equipment - 1.05% (March 31, 2021: 3.53%)Amada Co Ltd 73,100 85,161,500 0.41Brother Industries Ltd 42,200 104,065,200 0.50Iwasaki Electric Co Ltd 6,100 12,489,750 0.06YAMABIKO Corp 14,200 17,650,600 0.08
219,367,050 1.05
Electronic Equipment and Instruments - 5.49% (March 31,2021: 6.44%)A&D Co Ltd 18,000 18,981,000 0.09Chiyoda Integre Co Ltd 7,400 15,121,900 0.07Furuno Electric Co Ltd 23,600 29,972,000 0.15Hochiki Corp 9,800 11,823,700 0.06Hoya Corp 27,700 484,542,250 2.32Murata Manufacturing Co Ltd 39,400 389,823,600 1.87Nidec Corp 6,600 81,922,500 0.39Taiyo Yuden Co Ltd 2,300 15,191,500 0.07Tokyo Seimitsu Co Ltd 9,600 44,280,000 0.21Tomen Devices Corp 2,000 10,910,000 0.05Wacom Co Ltd 61,100 43,625,400 0.21
1,146,193,850 5.49
Entertainment - Nil (March 31, 2021: 0.68%)
Food Products - 0.79% (March 31, 2021: 0.83%)Eco’s Co Ltd 13,300 26,174,400 0.13Heiwado Co Ltd 27,300 59,554,950 0.28Life Corp 4,700 21,103,000 0.10Morinaga Milk Industry Co Ltd 7,100 49,735,500 0.24Nitto Fuji Flour Milling Co Ltd 2,400 7,944,000 0.04
164,511,850 0.79
Health Care Equipment and Supplies - 1.17% (March 31, 2021: 0.28%)Fukuda Denshi Co Ltd 8,100 78,894,000 0.38Olympus Corp 23,200 56,909,600 0.27Techno Medica Co Ltd 2,200 3,777,400 0.02Terumo Corp 19,900 105,420,250 0.50
245,001,250 1.17
Home Builders - 0.82% (March 31, 2021: 0.97%)Haseko Corp 82,700 124,215,400 0.59Hinokiya Group Co Ltd 5,700 13,306,650 0.06Ichiken Co Ltd 1,700 3,316,700 0.02Open House Co Ltd 4,700 31,161,000 0.15
171,999,750 0.82
Number ofShares
Fair ValueJPY
% ofNet
Assets
Hotels, Restaurants and Leisure - 1.39% (March 31, 2021: 0.24%)Globeride Inc 16,600 65,528,500 0.31Shimano Inc 4,800 158,064,000 0.76Yamaha Motor Co Ltd 21,200 66,303,000 0.32
289,895,500 1.39
Household Durables - 4.07% (March 31, 2021: 4.45%)Eizo Corp 15,900 68,091,750 0.33Janome Sewing Machine Co Ltd 24,700 18,191,550 0.09Mitsubishi Pencil Co Ltd 3,500 5,040,000 0.02Panasonic Corp 111,800 155,178,400 0.74Pilot Corp 9,900 42,124,500 0.20Sony Group Corp 45,015 561,111,975 2.69
849,738,175 4.07
Insurance - 2.30% (March 31, 2021: Nil)Advance Create Co Ltd 11,700 12,390,300 0.06Dai-ichi Life Holdings Inc 70,100 173,462,450 0.83MS&AD Insurance Group HoldingsInc 78,200 293,914,700 1.41
479,767,450 2.30
Internet Software and Services - 1.12% (March 31, 2021: 1.52%)CyberAgent Inc 20,700 44,825,850 0.22Digital Holdings Inc 17,100 31,823,100 0.15en Japan Inc 22,100 90,002,250 0.43ValueCommerce Co Ltd 13,900 66,303,000 0.32
232,954,200 1.12
Machinery - 9.20% (March 31, 2021: 10.26%)Ebara Corp 6,000 33,330,000 0.16FANUC Corp 3,800 93,527,500 0.45Fuji Corp 15,800 45,290,700 0.22Hitachi Ltd 47,000 311,798,000 1.49Keyence Corp 6,700 447,057,500 2.14Komatsu Ltd 28,800 77,673,600 0.37Kubota Corp 23,200 55,517,600 0.27Maezawa Industries Inc 24,600 19,397,100 0.09Mitsubishi Electric Corp 172,500 268,582,500 1.29Nippon Sharyo Ltd 8,600 18,163,200 0.09Omron Corp 9,300 103,462,500 0.49SMC Corp 4,100 287,020,500 1.37Sumitomo Heavy Industries Ltd 41,700 122,723,100 0.59Tsugami Corp 11,100 18,942,150 0.09Tsurumi Manufacturing Co Ltd 10,600 18,640,100 0.09
1,921,126,050 9.20
Metals and Mining - 0.56% (March 31, 2021: 0.36%)Nippon Light Metal Holdings Co Ltd 38,900 76,068,950 0.36Onoken Co Ltd 15,600 26,052,000 0.13Tokyo Tekko Co Ltd 9,700 15,500,600 0.07
117,621,550 0.56
Office Electronics - 2.48% (March 31, 2021: 1.53%)Canon Inc 111,100 304,247,350 1.46Canon Marketing Japan Inc 42,100 109,649,450 0.52Konica Minolta Inc 172,100 104,034,450 0.50
517,931,250 2.48
Oil and Gas - 0.23% (March 31, 2021: 0.84%)Inpex Corp 54,100 47,391,600 0.23
AXA ROSENBERG JAPAN EQUITY ALPHA FUND
Schedule of Investments (continued)As at September 30, 2021
106

Number ofShares
Fair ValueJPY
% ofNet
Assets
Equities - 98.43% (March 31, 2021: 99.01%) (continued)Paper and Forest Products - 0.76% (March 31, 2021: 0.90%)Oji Holdings Corp 56,800 32,120,400 0.15Sumitomo Forestry Co Ltd 59,100 126,710,400 0.61
158,830,800 0.76
Personal Products - 0.77% (March 31, 2021: 0.31%)Earth Corp 9,800 66,787,000 0.32Pigeon Corp 31,700 82,467,550 0.40Soiken Holdings Inc 32,100 11,202,900 0.05
160,457,450 0.77
Pharmaceuticals - 6.38% (March 31, 2021: 7.57%)Astellas Pharma Inc 53,400 98,496,300 0.47Chugai Pharmaceutical Co Ltd 73,200 300,559,200 1.44Daiichi Sankyo Co Ltd 10,500 31,332,000 0.15Eisai Co Ltd 13,100 110,164,450 0.53Kaken Pharmaceutical Co Ltd 2,000 9,200,000 0.05Medipal Holdings Corp 32,100 67,650,750 0.32Nippon Shinyaku Co Ltd 3,600 33,462,000 0.16Ono Pharmaceutical Co Ltd 97,600 249,270,400 1.19Otsuka Holdings Co Ltd 58,600 281,016,300 1.35Takeda Pharmaceutical Co Ltd 21,300 78,863,250 0.38Towa Pharmaceutical Co Ltd 22,600 71,755,000 0.34
1,331,769,650 6.38
Real Estate - 1.42% (March 31, 2021: 2.90%)Hulic Co Ltd 137,300 171,419,050 0.82NAC Co Ltd 900 877,950 0.00Tokyo Tatemono Co Ltd 70,100 124,497,600 0.60
296,794,600 1.42
Retail - 3.90% (March 31, 2021: 7.07%)Adastria Co Ltd 19,500 40,072,500 0.19Aeon Kyushu Co Ltd 200 400,100 0.00Asahi Co Ltd 18,800 25,116,800 0.12Belluna Co Ltd 66,300 56,587,050 0.27EDION Corp 35,000 36,890,000 0.18Goldwin Inc 7,600 55,442,000 0.26H2O Retailing Corp 22,400 21,739,200 0.10Joshin Denki Co Ltd 19,800 50,004,900 0.24Kohnan Shoji Co Ltd 4,900 18,081,000 0.09Kojima Co Ltd 47,900 32,380,400 0.15Komatsu Wall Industry Co Ltd 4,100 7,974,500 0.04Makiya Co Ltd 2,500 2,151,250 0.01Maruzen CHI Holdings Co Ltd 60,300 23,305,950 0.11Matsumotokiyoshi Holdings Co Ltd 26,800 135,206,000 0.65MrMax Holdings Ltd 27,500 18,755,000 0.09New Art Holdings Co Ltd 1,500 1,819,500 0.01Nojima Corp 24,100 69,395,950 0.33Scroll Corp 26,500 23,015,250 0.11
Number ofShares
Fair ValueJPY
% ofNet
Assets
Yamada Holdings Co Ltd 291,100 136,962,550 0.66Yellow Hat Ltd 30,600 59,731,200 0.29
815,031,100 3.90
Semiconductor Equipment and Products - 3.59% (March 31,2021: 4.97%)Advantest Corp 18,800 188,752,000 0.90Lasertec Corp 4,800 122,688,000 0.59Tokyo Electron Ltd 8,800 437,756,000 2.10
749,196,000 3.59
Software - 2.29% (March 31, 2021: 1.03%)Akatsuki Inc 14,100 45,331,500 0.22CAC Holdings Corp 6,100 10,089,400 0.05Capcom Co Ltd 17,600 54,692,000 0.26GungHo Online Entertainment Inc 34,100 69,905,000 0.33Medical System Network Co Ltd 25,700 18,131,350 0.09Oracle Corp Japan 24,400 239,486,000 1.15Transcosmos Inc 10,900 39,975,750 0.19
477,611,000 2.29
Telecommunications - 4.67% (March 31, 2021: 5.48%)CONEXIO Corp 1,700 2,654,550 0.01KDDI Corp 27,800 102,748,800 0.49Nippon Telegraph & Telephone Corp 68,500 211,425,250 1.01SoftBank Corp 193,900 293,661,550 1.41SoftBank Group Corp 56,200 364,569,400 1.75
975,059,550 4.67
Textiles and Apparel - 0.97% (March 31, 2021: Nil)Asics Corp 38,800 99,308,600 0.48Teijin Ltd 64,700 103,196,500 0.49
202,505,100 0.97
Toys, Games and Hobbies - 2.16% (March 31, 2021: 2.71%)Nintendo Co Ltd 6,997 378,327,790 1.81Tomy Co Ltd 64,500 73,659,000 0.35
451,986,790 2.16
Transportation - 1.91% (March 31, 2021: 1.29%)Mitsui OSK Lines Ltd 6,000 45,300,000 0.22Nippon Yusen KK 14,400 121,464,000 0.58Senko Group Holdings Co Ltd 60,600 62,236,200 0.30SG Holdings Co Ltd 51,000 162,307,500 0.78Shin-Keisei Electric Railway Co Ltd 3,400 7,214,800 0.03
398,522,500 1.91
Total value of Investmentsexcluding FinancialDerivative Instruments 20,557,723,267 98.43
Financial Derivative Instruments - (0.07)% (March 31, 2021: 0.00%)Open Forward Foreign Currency Exchange Contracts* - (0.07)% (March 31, 2021: 0.00%)
Currency Sold Currency BoughtSettlementDate
UnrealisedGain/(Loss)
JPY
% ofNet
AssetsEUR 281,068 JPY 36,590,969 20 October 2021 239,176 0.00EUR 119 JPY 15,517 20 October 2021 102 0.00EUR 38 JPY 4,950 20 October 2021 33 0.00JPY 2,040,859,016 EUR 15,675,414 20 October 2021 (13,488,434) (0.06)
AXA ROSENBERG JAPAN EQUITY ALPHA FUND
Schedule of Investments (continued)As at September 30, 2021
107

Financial Derivative Instruments - (0.07)% (March 31, 2021: 0.00%) (continued)Open Forward Foreign Currency Exchange Contracts* - (0.07)% (March 31, 2021: 0.00%) (continued)
Currency Sold Currency BoughtSettlementDate
UnrealisedGain/(Loss)
JPY
% ofNet
AssetsJPY 98,734,345 EUR 755,826 20 October 2021 (979,991) (0.01)JPY 7,586,970 EUR 58,274 20 October 2021 (50,144) (0.00)JPY 2,576,370 EUR 19,789 20 October 2021 (17,028) (0.00)JPY 405,722 EUR 3,140 20 October 2021 336 0.00JPY 333,878 EUR 2,561 20 October 2021 (2,649) (0.00)JPY 130,755 EUR 1,007 20 October 2021 (513) (0.00)JPY 109,359 EUR 837 20 October 2021 (1,041) (0.00)
Unrealised gain on open forward foreign currency exchange contracts 239,647 0.00Unrealised loss on open forward foreign currency exchange contracts (14,539,800) (0.07)
Net unrealised loss on open forward foreign currency exchange contracts (14,300,153) (0.07)
Fair ValueJPY
% ofNet
Assets
Total financial assets at fair valuethrough profit or loss 20,543,423,114 98.36
Cash at bank 221,527,842 1.06
Other Net Assets 120,635,699 0.58
Net Assets attributable toholders of redeemableparticipating units 20,885,586,655 100.00
*The counterparty for the open forward foreign contracts is State StreetBank and Trust Company.
Analysis of Total Assets
% ofTotal
Assets
Transferable securities admitted to an official exchange listing 98.19Current Assets 1.81
Total Assets 100.00
AXA ROSENBERG JAPAN EQUITY ALPHA FUND
Schedule of Investments (continued)As at September 30, 2021
108

Number ofShares
Fair ValueJPY
% ofNet
Assets
Equities - 98.73% (March 31, 2021: 98.18%)Aerospace and Defense - 0.10% (March 31, 2021: 0.45%)IHI Corp 3,000 8,611,500 0.10
Agriculture - Nil (March 31, 2021: 0.10%)
Auto Components - 8.29% (March 31, 2021: 4.46%)Exedy Corp 43,500 74,385,000 0.85FCC Co Ltd 45,900 72,407,250 0.83JTEKT Corp 33,100 32,388,350 0.37KYB Corp 12,100 36,784,000 0.42Marujun Co Ltd 6,000 5,316,000 0.06Sumitomo Riko Co Ltd 57,300 43,891,800 0.50Sumitomo Rubber Industries Ltd 80,600 114,855,000 1.31Toyo Tire Corp 49,000 98,147,000 1.12Toyota Boshoku Corp 43,300 86,123,700 0.98TS Tech Co Ltd 33,600 48,602,400 0.56Yokohama Rubber Co Ltd 56,100 113,013,450 1.29
725,913,950 8.29
Automobiles - 0.60% (March 31, 2021: Nil)Kyokuto Kaihatsu Kogyo Co Ltd 31,800 52,167,900 0.60
Banks - 2.19% (March 31, 2021: 0.79%)AEON Financial Service Co Ltd 66,100 94,589,100 1.08Juroku Bank Ltd 22,900 50,047,950 0.57Nanto Bank Ltd 23,600 47,424,200 0.54
192,061,250 2.19
Beverages - 0.63% (March 31, 2021: 0.23%)DyDo Group Holdings Inc 9,700 55,290,000 0.63
Biotechnology - 1.42% (March 31, 2021: 0.46%)Eiken Chemical Co Ltd 26,000 54,730,000 0.62Takara Bio Inc 22,100 69,946,500 0.80
124,676,500 1.42
Building Products - 2.66% (March 31, 2021: 1.36%)Cleanup Corp 43,600 25,397,000 0.29Endo Lighting Corp 11,400 11,690,700 0.13Nichireki Co Ltd 6,300 8,593,200 0.10Noritz Corp 40,300 73,789,300 0.84Sanwa Holdings Corp 77,900 113,383,450 1.30
232,853,650 2.66
Chemicals - 4.21% (March 31, 2021: 4.19%)C Uyemura & Co Ltd 21,200 96,195,000 1.10Cemedine Co Ltd 4,500 3,750,750 0.04Denka Co Ltd 15,200 59,812,000 0.68JCU Corp 16,700 74,440,250 0.85Kuraray Co Ltd 102,100 110,063,800 1.26Parker Corp 10,000 5,630,000 0.07Soken Chemical & Engineering CoLtd 8,400 18,673,200 0.21
368,565,000 4.21
Commercial Services and Supplies - 7.16% (March 31, 2021: 6.31%)Ajis Co Ltd 8,600 27,735,000 0.32Altech Corp 3,800 7,841,300 0.09Benefit One Inc 22,700 119,856,000 1.37BeNext-Yumeshin Group Co 29,600 38,790,800 0.44Business Brain Showa-Ota Inc 4,800 8,611,200 0.10
Number ofShares
Fair ValueJPY
% ofNet
Assets
CMC Corp 3,200 4,304,000 0.05Creek & River Co Ltd 3,500 6,454,000 0.07FULLCAST Holdings Co Ltd 33,800 77,114,700 0.88JAC Recruitment Co Ltd 47,300 103,918,100 1.19Outsourcing Inc 14,100 28,552,500 0.33Pasona Group Inc 28,500 90,558,750 1.03Quick Co Ltd 800 1,126,000 0.01SHL-Japan Ltd 2,700 7,067,250 0.08TechnoPro Holdings Inc 27,000 91,530,000 1.05WDB Holdings Co Ltd 3,600 12,780,000 0.15
626,239,600 7.16
Computers and Peripherals - 5.65% (March 31, 2021: 3.04%)Business Engineering Corp 2,100 7,145,250 0.08DTS Corp 38,200 98,326,800 1.12Ferrotec Holdings Corp 29,700 94,668,750 1.08Infocom Corp 8,700 20,753,850 0.24JBCC Holdings Inc 10,000 16,070,000 0.19JFE Systems Inc 7,600 13,319,000 0.15NEC Networks & System IntegrationCorp 46,900 99,123,150 1.13NET One Systems Co Ltd 6,500 23,952,500 0.28NSD Co Ltd 35,500 72,562,000 0.83SHIFT Inc 700 16,621,500 0.19UT Group Co Ltd 9,400 31,725,000 0.36
494,267,800 5.65
Construction and Engineering - 1.36% (March 31, 2021: 2.14%)Miyaji Engineering Group Inc 6,000 15,585,000 0.18Nihon Dengi Co Ltd 2,800 10,682,000 0.12Taikisha Ltd 10,800 36,288,000 0.42Techno Ryowa Ltd 6,400 5,766,400 0.07Toenec Corp 12,700 46,577,250 0.53Yondenko Corp 2,200 3,801,600 0.04
118,700,250 1.36
Containers and Packaging - 2.30% (March 31, 2021: 1.67%)Fuji Seal International Inc 6,100 14,798,600 0.17Rengo Co Ltd 110,800 97,227,000 1.11Toyo Seikan Group Holdings Ltd 67,500 89,572,500 1.02
201,598,100 2.30
Distribution and Wholesale - 4.21% (March 31, 2021: 4.62%)Arata Corp 14,200 62,622,000 0.72Doshisha Co Ltd 36,700 64,555,300 0.74Inabata & Co Ltd 49,900 86,526,600 0.99Kamei Corp 3,700 4,658,300 0.05Mimasu Semiconductor Industry CoLtd 11,500 28,232,500 0.32Mitsui-Soko Holdings Co Ltd 28,400 71,795,200 0.82Sala Corp 53,200 34,340,600 0.39Tsuzuki Denki Co Ltd 8,800 15,703,600 0.18
368,434,100 4.21
Diversified Financials - Nil (March 31, 2021: 0.18%)
Electric Utilities - 0.32% (March 31, 2021: 0.42%)West Holdings Corp 5,600 27,804,000 0.32
Electrical Equipment - 1.17% (March 31, 2021: 3.63%)Amada Co Ltd 67,700 78,870,500 0.90Iwasaki Electric Co Ltd 9,000 18,427,500 0.21
AXA ROSENBERG JAPAN SMALL CAP ALPHA FUND
Schedule of InvestmentsAs at September 30, 2021
109

Number ofShares
Fair ValueJPY
% ofNet
Assets
Equities - 98.73% (March 31, 2021: 98.18%) (continued)Electrical Equipment - 1.17% (March 31, 2021: 3.63%) (continued)Nagoya Electric Works Co Ltd 3,000 5,520,000 0.06
102,818,000 1.17
Electronic Equipment and Instruments - 4.00% (March 31,2021: 5.53%)A&D Co Ltd 26,900 28,366,050 0.32Anritsu Corp 14,300 28,592,850 0.33Chiyoda Integre Co Ltd 3,000 6,130,500 0.07Furuno Electric Co Ltd 15,200 19,304,000 0.22Kaga Electronics Co Ltd 8,800 26,664,000 0.30Nitto Kogyo Corp 19,700 34,553,800 0.40Riken Keiki Co Ltd 5,600 17,178,000 0.20Taiyo Yuden Co Ltd 4,700 31,043,500 0.35Takaoka Toko Co Ltd 7,900 11,577,450 0.13Tokyo Seimitsu Co Ltd 20,600 95,017,500 1.09Wacom Co Ltd 72,900 52,050,600 0.59
350,478,250 4.00
Entertainment - Nil (March 31, 2021: 0.19%)
Food Products - 4.10% (March 31, 2021: 3.81%)Ebara Foods Industry Inc 16,600 42,105,900 0.48Eco’s Co Ltd 6,900 13,579,200 0.15Heiwado Co Ltd 39,200 85,514,800 0.98Inageya Co Ltd 5,500 7,554,250 0.09Life Corp 6,800 30,532,000 0.35Mammy Mart Corp 2,400 5,598,000 0.06Morinaga Milk Industry Co Ltd 14,700 102,973,500 1.18Nippon Suisan Kaisha Ltd 35,500 23,146,000 0.26Nitto Fuji Flour Milling Co Ltd 9,000 29,790,000 0.34S&B Foods Inc 3,900 17,969,250 0.21
358,762,900 4.10
Health Care Equipment and Supplies - 1.17% (March 31, 2021: 1.22%)A/S One Corp 500 8,180,000 0.09Fukuda Denshi Co Ltd 8,600 83,764,000 0.96Medikit Co Ltd 2,500 7,483,750 0.09Techno Medica Co Ltd 1,500 2,575,500 0.03
102,003,250 1.17
Health Care Providers and Services - 0.30% (March 31, 2021: Nil)BML Inc 3,900 16,545,750 0.19H.U. Group Holdings Inc 3,300 10,023,750 0.11
26,569,500 0.30
Home Builders - 2.13% (March 31, 2021: 1.04%)Haseko Corp 79,300 119,108,600 1.36Open House Co Ltd 10,200 67,626,000 0.77
186,734,600 2.13
Hotels, Restaurants and Leisure - 0.85% (March 31, 2021: 0.99%)Globeride Inc 18,800 74,213,000 0.85
Household Durables - 1.27% (March 31, 2021: 0.79%)Eizo Corp 16,800 71,946,000 0.82Janome Sewing Machine Co Ltd 23,100 17,013,150 0.20Mitsubishi Pencil Co Ltd 15,200 21,888,000 0.25
110,847,150 1.27
Number ofShares
Fair ValueJPY
% ofNet
Assets
Internet Software and Services - 3.01% (March 31, 2021: 2.43%)Digital Holdings Inc 27,300 50,805,300 0.58en Japan Inc 23,900 97,332,750 1.11Imagineer Co Ltd 11,900 12,120,150 0.14Proto Corp 5,500 8,459,000 0.10SMS Co Ltd 2,700 11,022,750 0.13ValueCommerce Co Ltd 17,500 83,475,000 0.95
263,214,950 3.01
Machinery - 5.28% (March 31, 2021: 7.56%)Daihen Corp 2,400 11,850,000 0.13Daiwa Industries Ltd 16,400 20,508,200 0.23Ebara Corp 3,400 18,887,000 0.22Fuji Corp 36,900 105,773,850 1.21Maezawa Industries Inc 20,900 16,479,650 0.19Nissei ASB Machine Co Ltd 5,600 21,560,000 0.25Obara Group Inc 12,800 50,016,000 0.57Organo Corp 2,900 19,952,000 0.23Sumitomo Heavy Industries Ltd 39,100 115,071,300 1.31Takeuchi Manufacturing Co Ltd 9,800 25,602,500 0.29Tsugami Corp 33,300 56,826,450 0.65
462,526,950 5.28
Metals and Mining - 1.37% (March 31, 2021: 1.41%)KFC Ltd 8,800 17,252,400 0.20Nippon Light Metal Holdings Co Ltd 44,800 87,606,400 1.00Onoken Co Ltd 8,900 14,863,000 0.17
119,721,800 1.37
Miscellaneous Manufacturers - Nil (March 31, 2021: 1.22%)
Office Electronics - 1.28% (March 31, 2021: Nil)Canon Marketing Japan Inc 21,800 56,778,100 0.65Konica Minolta Inc 91,700 55,432,650 0.63
112,210,750 1.28
Oil and Gas - 0.21% (March 31, 2021: 2.16%)Hokkaido Gas Co Ltd 12,000 18,594,000 0.21
Paper and Forest Products - 1.30% (March 31, 2021: 1.32%)Sumitomo Forestry Co Ltd 53,000 113,632,000 1.30
Personal Products - 1.71% (March 31, 2021: 0.70%)Artnature Inc 8,200 5,998,300 0.07Earth Corp 13,600 92,684,000 1.06Pigeon Corp 16,000 41,624,000 0.47Soiken Holdings Inc 26,800 9,353,200 0.11
149,659,500 1.71
Pharmaceuticals - 2.41% (March 31, 2021: 4.04%)Rohto Pharmaceutical Co Ltd 2,800 9,611,000 0.11Sawai Group Holdings Co Ltd 20,700 107,329,500 1.22Towa Pharmaceutical Co Ltd 29,700 94,297,500 1.08
211,238,000 2.41
Real Estate - 5.35% (March 31, 2021: 6.04%)Daiwa Office Investment Corp (REIT) 27 20,358,000 0.23Japan Metropolitan Fund Invest(REIT) 576 61,776,000 0.70Japan Prime Realty Investment(REIT) 164 66,543,000 0.76
AXA ROSENBERG JAPAN SMALL CAP ALPHA FUND
Schedule of Investments (continued)As at September 30, 2021
110

Number ofShares
Fair ValueJPY
% ofNet
Assets
Equities - 98.73% (March 31, 2021: 98.18%) (continued)Real Estate - 5.35% (March 31, 2021: 6.04%) (continued)Kenedix Office Investment Corp(REIT) 60 46,050,000 0.53Kenedix Retail Corp (REIT) 323 93,460,050 1.07Mori Hills Investment Corp (REIT) 114 17,236,800 0.20Starts Corp Inc 23,800 63,343,700 0.72Tokyo Tatemono Co Ltd 56,100 99,633,600 1.14
468,401,150 5.35
Retail - 10.39% (March 31, 2021: 15.16%)Adastria Co Ltd 27,000 55,485,000 0.63Aeon Kyushu Co Ltd 1,600 3,200,800 0.04Arcland Sakamoto Co Ltd 15,800 27,586,800 0.32Asahi Co Ltd 31,300 41,816,800 0.48Belluna Co Ltd 88,100 75,193,350 0.86Felissimo Corp 8,300 14,554,050 0.17Fuji Co Ltd 13,200 28,861,800 0.33Goldwin Inc 6,000 43,770,000 0.50H2O Retailing Corp 51,500 49,980,750 0.57Izumi Co Ltd 9,900 36,927,000 0.42Joshin Denki Co Ltd 24,300 61,369,650 0.70KFC Holdings Japan Ltd 8,100 23,899,050 0.27Komatsu Wall Industry Co Ltd 3,000 5,835,000 0.07Makiya Co Ltd 6,300 5,421,150 0.06Matsumotokiyoshi Holdings Co Ltd 24,800 125,116,000 1.43MrMax Holdings Ltd 22,900 15,617,800 0.18Nojima Corp 31,600 90,992,200 1.04Plenus Co Ltd 23,500 51,194,750 0.58Scroll Corp 22,900 19,888,650 0.23Yamada Holdings Co Ltd 185,100 87,089,550 0.99Yellow Hat Ltd 23,100 45,091,200 0.52
908,891,350 10.39
Semiconductor Equipment and Products - 0.79% (March 31,2021: 1.84%)Shinko Electric Industries Co Ltd 8,500 31,811,250 0.36Tokyo Ohka Kogyo Co Ltd 5,400 37,206,000 0.43
69,017,250 0.79
Number ofShares
Fair ValueJPY
% ofNet
Assets
Software - 2.94% (March 31, 2021: 2.49%)Akatsuki Inc 5,800 18,647,000 0.21CAC Holdings Corp 19,100 31,591,400 0.36Capcom Co Ltd 7,400 22,995,500 0.26GungHo Online Entertainment Inc 44,410 91,040,500 1.04Medical System Network Co Ltd 29,400 20,741,700 0.24Pro-Ship Inc 4,600 7,778,600 0.09Transcosmos Inc 17,700 64,914,750 0.74
257,709,450 2.94
Telecommunications - 0.18% (March 31, 2021: 0.47%)CONEXIO Corp 9,800 15,302,700 0.18
Textiles and Apparel - 2.01% (March 31, 2021: 0.62%)Asics Corp 28,800 73,713,600 0.84Teijin Ltd 64,200 102,399,000 1.17
176,112,600 2.01
Toys, Games and Hobbies - 1.07% (March 31, 2021: 0.92%)Tomy Co Ltd 81,800 93,415,600 1.07
Transportation - 3.34% (March 31, 2021: 2.18%)Kawasaki Kisen Kaisha Ltd 7,200 43,632,000 0.50Maruzen Showa Unyu Co Ltd 10,500 37,695,000 0.43Mitsui OSK Lines Ltd 14,200 107,210,000 1.23Senko Group Holdings Co Ltd 96,100 98,694,700 1.13Shin-Keisei Electric Railway Co Ltd 2,200 4,668,400 0.05
291,900,100 3.34
Total value of Investmentsexcluding FinancialDerivative Instruments 8,641,158,400 98.73
Financial Derivative Instruments - (0.02)% (March 31, 2021: 0.03%)Open Forward Foreign Currency Exchange Contracts* - (0.02)% (March 31, 2021: 0.03%)
Currency Sold Currency BoughtSettlementDate
UnrealisedGain/(Loss)
JPY
% ofNet
AssetsEUR 111,308 JPY 14,407,078 20 October 2021 11,151 0.00EUR 4,817 JPY 627,182 20 October 2021 4,099 0.00JPY 324,017,459 EUR 2,488,711 20 October 2021 (2,141,494) (0.02)JPY 16,506,238 EUR 126,358 20 October 2021 (163,833) (0.00)JPY 15,441,927 EUR 119,494 20 October 2021 12,788 0.00
Unrealised gain on open forward foreign currency exchange contracts 28,038 0.00Unrealised loss on open forward foreign currency exchange contracts (2,305,327) (0.02)
Net unrealised loss on open forward foreign currency exchange contracts (2,277,289) (0.02)
AXA ROSENBERG JAPAN SMALL CAP ALPHA FUND
Schedule of Investments (continued)As at September 30, 2021
111

Fair ValueJPY
% ofNet
Assets
Total financial assets at fair valuethrough profit or loss 8,638,881,111 98.71
Cash at bank 72,282,787 0.83
Other Net Assets 40,884,716 0.46
Net Assets attributable toholders of redeemableparticipating units 8,752,048,614 100.00
*The counterparty for the open forward foreign contracts is State StreetBank and Trust Company.
Abbreviations used:REIT– Real Estate Investment Trust
Analysis of Total Assets
% ofTotal
Assets
Transferable securities admitted to an official exchange listing 98.36Current Assets 1.64
Total Assets 100.00
AXA ROSENBERG JAPAN SMALL CAP ALPHA FUND
Schedule of Investments (continued)As at September 30, 2021
112

Number ofShares
Fair ValueUSD
% ofNet
Assets
Equities - 98.84% (March 31, 2021: 99.27%)Australia - 60.09% (March 31, 2021: 55.74%)Aeris Resources Ltd 496,318 58,259 0.04ALS Ltd 108,596 994,674 0.70Ansell Ltd 30,530 753,012 0.53ARB Corp Ltd 21,318 753,784 0.53ASX Ltd 37,747 2,209,000 1.55Atlas Arteria Ltd 201,336 944,601 0.66Australia & New Zealand BankingGroup Ltd 319,738 6,498,139 4.55Bank of Queensland Ltd 117,159 792,558 0.56BHP Group Ltd 146,446 3,972,767 2.78BlueScope Steel Ltd 113,611 1,682,782 1.18Brambles Ltd 299,135 2,325,023 1.63Brickworks Ltd 39,737 716,166 0.50Charter Hall Group (REIT) 80,482 996,454 0.70Charter Hall Long Wale (REIT) 164,766 587,953 0.41Commonwealth Bank of Australia 108,389 8,161,061 5.72CSL Ltd 24,957 5,285,450 3.70Dexus (REIT) 239,784 1,868,915 1.31Downer EDI Ltd 167,837 784,404 0.55Emeco Holdings Ltd 142,449 108,300 0.08Estia Health Ltd 68,496 113,800 0.08Fortescue Metals Group Ltd 183,476 1,983,370 1.39Genworth Mortgage InsuranceAustralia Ltd 108,766 175,205 0.12Goodman Group (REIT) 80,402 1,257,107 0.88GrainCorp Ltd 59,993 274,967 0.19Grange Resources Ltd 283,824 110,198 0.08Growthpoint Properties Australia Ltd(REIT) 202,348 605,859 0.42HT&E Ltd 72,465 84,537 0.06Incitec Pivot Ltd 427,239 908,875 0.64Macquarie Group Ltd 40,663 5,342,936 3.74Metcash Ltd 250,892 713,148 0.50Mineral Resources Ltd 26,885 870,907 0.61Mirvac Group (REIT) 859,698 1,856,799 1.30National Australia Bank Ltd 343,354 6,899,968 4.84Oil Search Ltd 177,999 562,527 0.39OZ Minerals Ltd 59,982 973,147 0.68Pact Group Holdings Ltd 90,175 246,547 0.17Pendal Group Ltd 77,881 465,248 0.33Perenti Global Ltd 184,626 110,026 0.08Perseus Mining Ltd 321,506 326,297 0.23QBE Insurance Group Ltd 279,125 2,346,927 1.65Qube Holdings Ltd 379,251 906,781 0.64Reliance Worldwide Corp Ltd 200,343 750,362 0.53Resolute Mining Ltd 289,377 87,271 0.06Sandfire Resources Ltd 46,167 181,917 0.13SEEK Ltd 42,597 956,946 0.67Service Stream Ltd 144,053 91,830 0.06Seven Group Holdings Ltd 65,559 979,570 0.69Sims Ltd 53,745 517,507 0.36SmartGroup Corp Ltd 33,952 232,499 0.16Sonic Healthcare Ltd 85,167 2,496,498 1.75Stockland (REIT) 539,354 1,747,367 1.22Sub Sandfire Resources 46,167 1,334 0.00Suncorp Group Ltd 107,263 973,554 0.68Super Retail Group Ltd 59,199 520,846 0.37Viva Energy Group Ltd 420,470 724,388 0.51Wesfarmers Ltd 34,259 1,380,140 0.97Westpac Banking Corp 162,985 3,059,861 2.14
Number ofShares
Fair ValueUSD
% ofNet
Assets
WiseTech Global Ltd 27,683 1,070,930 0.75Woodside Petroleum Ltd 118,322 2,039,312 1.43Woolworths Group Ltd 20,528 583,127 0.41Worley Ltd 98,857 706,953 0.50
85,730,690 60.09
China - 2.20% (March 31, 2021: 4.93%)BAIC Motor Corp Ltd 2,032,000 703,466 0.49China CITIC Bank Corp Ltd 1,562,000 704,286 0.49Dongfeng Motor Group Co Ltd 570,000 508,154 0.36Legend Holdings Corp 445,500 863,571 0.61Sinopharm Group Co Ltd 46,400 121,146 0.09Xinhua Winshare Publishing andMedia Co Ltd 309,000 233,001 0.16
3,133,624 2.20
Hong Kong - 25.53% (March 31, 2021: 27.37%)AIA Group Ltd 912,800 10,544,281 7.39Bank of East Asia Ltd 558,600 901,980 0.63BOCOM International Holdings CoLtd 500,000 114,970 0.08Bright Smart Securities &Commodities Group Ltd 442,000 82,045 0.06Brilliance China Automotive HoldingsLtd 938,000 439,801 0.31Canvest Environmental ProtectionGroup Co Ltd 467,000 257,656 0.18China Resources PharmaceuticalGroup Ltd 1,197,500 588,394 0.41Chinese Estates Holdings Ltd 292,500 110,280 0.08Chow Sang Sang HoldingsInternational Ltd 78,000 116,730 0.08Eagle Nice International Holdings Ltd54,000 33,192 0.02Fairwood Holdings Ltd 33,500 71,909 0.05Giordano International Ltd 246,000 47,717 0.03Great Eagle Holdings Ltd 50,000 136,487 0.10Haitong International SecuritiesGroup Ltd 1,755,000 462,160 0.32Hang Lung Group Ltd 335,000 781,917 0.55Hi Sun Technology China Ltd 48,000 7,831 0.01HKR International Ltd 158,400 62,162 0.04Hong Kong Exchanges & ClearingLtd 124,100 7,645,605 5.36Johnson Electric Holdings Ltd 237,000 506,597 0.36Karrie International Holdings Ltd 354,000 66,392 0.05Kerry Properties Ltd 288,000 761,190 0.53Kingboard Holdings Ltd 16,000 72,399 0.05Lenovo Group Ltd 1,384,000 1,488,956 1.04Liu Chong Hing Investment Ltd 10,000 10,045 0.01Luk Fook Holdings International Ltd 154,000 395,453 0.28Pacific Basin Shipping Ltd 324,000 150,458 0.11Power Assets Holdings Ltd 31,000 182,185 0.13Public Financial Holdings Ltd 158,000 49,422 0.03Regina Miracle InternationalHoldings Ltd 64,000 22,896 0.02Shenzhen Investment Ltd 134,000 33,652 0.02SmarTone TelecommunicationsHoldings Ltd 290,000 164,099 0.12Stella International Holdings Ltd 63,000 80,605 0.06Sun Hung Kai & Co Ltd 520,000 268,528 0.19Sun Hung Kai Properties Ltd 242,500 3,036,448 2.13Swire Pacific Ltd 234,500 1,395,466 0.98
AXA ROSENBERG PACIFIC EX-JAPAN EQUITY ALPHA FUND
Schedule of InvestmentsAs at September 30, 2021
113

Number ofShares
Fair ValueUSD
% ofNet
Assets
Equities - 98.84% (March 31, 2021: 99.27%) (continued)Hong Kong - 25.53% (March 31, 2021: 27.37%) (continued)Swire Properties Ltd 681,200 1,711,608 1.20Techtronic Industries Co Ltd 109,000 2,170,997 1.52Texhong Textile Group Ltd 240,000 346,836 0.24Texwinca Holdings Ltd 338,000 69,036 0.05United Laboratories InternationalHoldings Ltd 482,000 320,419 0.22VSTECS Holdings Ltd 256,000 230,361 0.16VTech Holdings Ltd 41,100 300,542 0.21Xinyi Glass Holdings Ltd 30,000 89,696 0.06Yip’s Chemical Holdings Ltd 144,000 88,883 0.06
36,418,286 25.53
Macau - 0.02% (March 31, 2021: 0.28%)MGM China Holdings Ltd 46,800 29,127 0.02
New Zealand - 2.83% (March 31, 2021: 3.48%)Argosy Property Ltd 146,971 162,474 0.11Fletcher Building Ltd 172,470 854,860 0.60Hallenstein Glasson Holdings Ltd 15,317 73,331 0.05Heartland Group Holdings Ltd 151,740 243,376 0.17Meridian Energy Ltd 424,551 1,443,882 1.01Property for Industry Ltd 125,878 255,301 0.18Spark New Zealand Ltd 229,354 755,500 0.53Warehouse Group Ltd 90,514 256,633 0.18
4,045,357 2.83
Singapore - 8.14% (March 31, 2021: 7.47%)Centurion Corp Ltd 69,500 17,022 0.01Dasin Retail Trust 205,000 57,003 0.04DBS Group Holdings Ltd 221,100 4,939,572 3.46EC World (REIT) 64,900 38,125 0.03Frencken Group Ltd 52,000 89,054 0.06Great Eastern Holdings Ltd 3,400 53,595 0.04Hong Leong Asia Ltd 152,300 90,588 0.06Hour Glass Ltd 65,000 74,930 0.05Olam International Ltd 263,300 340,374 0.24Oversea-Chinese Banking Corp Ltd 220,200 1,864,466 1.31Sabana Shari’ah CompliantIndustrial (REIT) 258,300 82,288 0.06Straits Trading Co Ltd 86,700 197,017 0.14United Overseas Bank Ltd 186,900 3,556,689 2.49Wing Tai Holdings Ltd 160,300 214,898 0.15
11,615,621 8.14
Taiwan - 0.03% (March 31, 2021: Nil)Medtecs International Corp Ltd 134,800 38,476 0.03
Total Equities 141,011,181 98.84
Warrants - 0.00% (March 31, 2021: 0.00%)Singapore - 0.00% (March 31, 2021: 0.00%)Ezion Holdings Ltd 196,800 - 0.00
Total Warrants - 0.00
Fair ValueUSD
% ofNet
Assets
Total financial assets at fair valuethrough profit or loss 141,011,181 98.84
Cash at bank 1,334,472 0.94
Other Net Assets 323,030 0.22
Net Assets attributable toholders of redeemableparticipating units 142,668,683 100.00
Abbreviations used:REIT – Real Estate Investment Trust
Analysis of Total Assets
% ofTotal
Assets
Transferable securities admitted to an official exchange listing 98.72Current Assets 1.28
Total Assets 100.00
AXA ROSENBERG PACIFIC EX-JAPAN EQUITY ALPHA FUND
Schedule of Investments (continued)As at September 30, 2021
114

Number ofShares
Fair ValueEUR
% ofNet
Assets
Equities - 99.34% (March 31, 2021: 99.08%)Austria - 1.77% (March 31, 2021: 1.39%)ANDRITZ AG 9,337 443,414 0.90OMV AG 5,005 260,160 0.53Palfinger AG 940 35,837 0.07Telekom Austria AG 17,845 133,124 0.27
872,535 1.77
Belgium - 2.19% (March 31, 2021: 2.13%)Colruyt SA 2,099 92,367 0.19KBC Group NV 2,750 214,417 0.43Solvay SA 4,299 462,680 0.94UCB SA 1,378 133,239 0.27Umicore SA 3,448 176,641 0.36
1,079,344 2.19
Denmark - 4.64% (March 31, 2021: 2.93%)AP Moller - Maersk A/S 224 501,564 1.02Carlsberg A/S 3,231 456,346 0.92Coloplast A/S 3,094 420,248 0.85Novo Nordisk A/S 10,081 842,101 1.70Sydbank A/S 2,823 73,100 0.15
2,293,359 4.64
Finland - 2.51% (March 31, 2021: 2.74%)Kemira OYJ 2,315 30,824 0.06Kesko OYJ 14,941 444,943 0.90Metsa Board OYJ 5,879 47,634 0.10Nokia OYJ 55,377 263,096 0.53Nordea Bank Abp 3,887 43,397 0.09TietoEVRY OYJ 1,566 40,685 0.08Valmet OYJ 11,749 368,684 0.75
1,239,263 2.51
France - 15.37% (March 31, 2021: 17.70%)Accor SA 3,843 118,902 0.24Amundi SA 2,685 195,669 0.40Arkema SA 1,355 155,080 0.31BNP Paribas SA 5,938 329,084 0.67Capgemini SE 1,034 186,249 0.38Carrefour SA 27,827 432,501 0.88Cie Generale des EtablissementsMichelin SCA 3,865 513,079 1.04Electricite de France SA 25,698 279,787 0.57EssilorLuxottica SA 1,027 170,133 0.34Hermes International 69 82,541 0.17IPSOS 11,940 470,138 0.95Kering SA 956 588,896 1.19La Francaise des Jeux SAEM 2,885 128,397 0.26L’Oreal SA 2,479 885,747 1.79LVMH Moet Hennessy Louis VuittonSE 1,295 803,094 1.63Metropole Television SA 8,923 160,168 0.32Publicis Groupe SA 8,048 468,796 0.95Sanofi 9,766 811,555 1.64Schneider Electric SE 2,165 311,500 0.63Societe BIC SA 4,031 205,883 0.42Sodexo SA 1,458 110,531 0.22Sopra Steria Group 229 36,766 0.07TotalEnergies SE 3,541 146,367 0.30
7,590,863 15.37
Number ofShares
Fair ValueEUR
% ofNet
Assets
Germany - 12.45% (March 31, 2021: 12.29%)adidas AG 690 188,249 0.38Allianz SE 3,935 769,647 1.56BASF SE 10,841 714,151 1.45Bayerische Motoren Werke AG 6,453 537,051 1.09Brenntag SE 517 41,665 0.08Covestro AG 8,546 507,462 1.03Daimler AG 10,304 795,469 1.61Deutsche Lufthansa AG 3,255 19,426 0.04Deutsche Post AG 12,905 706,549 1.43Draegerwerk AG & Co KGaA 631 44,564 0.09E.ON SE 11,258 118,873 0.24KION Group AG 1,555 125,908 0.26Kloeckner & Co SE 12,760 139,275 0.28Merck KGaA 1,459 273,307 0.55SAP SE 7,586 888,624 1.80Sartorius AG 80 44,112 0.09Schaeffler AG 25,507 169,877 0.34Siemens Healthineers AG 629 35,400 0.07United Internet AG 824 27,756 0.06
6,147,365 12.45
Gibraltar - 0.22% (March 31, 2021: 0.17%)888 Holdings PLC 21,259 106,328 0.22
Ireland - 4.06% (March 31, 2021: 2.81%)CRH PLC 10,082 408,977 0.83Dalata Hotel Group PLC 11,082 45,159 0.09DCC PLC 6,533 471,012 0.95Experian PLC 16,965 613,737 1.24Flutter Entertainment PLC 1,313 224,917 0.46Smurfit Kappa Group PLC 5,336 241,908 0.49
2,005,710 4.06
Isle of Man - 0.35% (March 31, 2021: Nil)Entain PLC 7,065 175,118 0.35
Italy - 3.53% (March 31, 2021: 3.42%)Anima Holding SpA 10,550 43,740 0.09Autogrill SpA 12,742 90,035 0.18Azimut Holding SpA 20,384 484,426 0.98Banca Generali SpA 1,036 39,326 0.08Banca Mediolanum SpA 16,536 154,942 0.31Interpump Group SpA 4,424 248,629 0.50Intesa Sanpaolo SpA 35,774 88,004 0.18Poste Italiane SpA 39,473 471,110 0.95Reply SpA 577 92,378 0.19UnipolSai Assicurazioni SpA 13,234 32,331 0.07
1,744,921 3.53
Luxemburg - Nil (March 31, 2021: 0.46%)
Malta - 0.19% (March 31, 2021: 0.37%)Kambi Group PLC 1,270 26,179 0.05Kindred Group PLC 5,361 69,768 0.14
95,947 0.19
Netherlands - 7.66% (March 31, 2021: 8.18%)Aegon NV 78,338 349,544 0.71ASML Holding NV 1,007 652,133 1.32ASR Nederland NV 12,528 495,044 1.00Basic-Fit NV 2,956 117,058 0.24
AXA ROSENBERG PAN-EUROPEAN EQUITY ALPHA FUND
Schedule of InvestmentsAs at September 30, 2021
115

Number ofShares
Fair ValueEUR
% ofNet
Assets
Equities - 99.34% (March 31, 2021: 99.08%) (continued)Netherlands - 7.66% (March 31, 2021: 8.18%) (continued)Flow Traders 4,157 138,719 0.28ING Groep NV 8,535 107,277 0.22Koninklijke Ahold Delhaize NV 22,261 639,726 1.29Mediaset NV 15,081 37,476 0.08NN Group NV 8,463 383,035 0.78Randstad NV 6,930 402,425 0.81Wolters Kluwer NV 5,028 460,062 0.93
3,782,499 7.66
Norway - 1.97% (March 31, 2021: 1.07%)Equinor ASA 22,968 505,196 1.02Gjensidige Forsikring ASA 22,630 433,508 0.88Sparebank 1 Oestlandet 2,759 35,426 0.07
974,130 1.97
Portugal - 0.31% (March 31, 2021: Nil)Banco Comercial Portugues SA 258,182 40,496 0.08Jeronimo Martins SGPS SA 6,431 110,822 0.23
151,318 0.31
Spain - 6.83% (March 31, 2021: 5.10%)Acciona SA 728 104,213 0.21Banco Bilbao Vizcaya Argentaria SA 114,507 654,694 1.32Banco Santander SA 235,762 739,409 1.50Iberdrola SA 60,382 524,297 1.06Mapfre SA 49,963 94,168 0.19Melia Hotels International SA 17,334 111,475 0.23NH Hotel Group SA 12,831 43,465 0.09Red Electrica Corp SA 9,586 165,886 0.34Repsol SA 35,157 397,133 0.80Telefonica SA 133,028 538,331 1.09
3,373,071 6.83
Sweden - 6.79% (March 31, 2021: 8.28%)Assa Abloy AB 14,089 355,173 0.72Atlas Copco AB 3,924 205,776 0.42Axfood AB 13,586 281,458 0.57Betsson AB 11,334 81,379 0.17Bilia AB 3,918 61,422 0.12Boliden AB 6,593 183,631 0.37Evolution AB 1,624 213,797 0.43Getinge AB 10,579 365,393 0.74Pandox AB 5,106 70,201 0.14Sandvik AB 1,904 37,820 0.08Skanska AB 20,345 442,050 0.90SKF AB 22,513 460,735 0.93SkiStar AB 4,042 72,495 0.15SSAB AB 97,542 417,187 0.84Svenska Handelsbanken AB 10,777 104,442 0.21
3,352,959 6.79
Switzerland - 12.83% (March 31, 2021: 11.86%)Adecco Group AG 5,194 225,920 0.46Alcon Inc 7,782 547,411 1.11Bucher Industries AG 417 171,988 0.35Cie Financiere Richemont SA 1,371 123,528 0.25Coca-Cola HBC AG 16,599 463,191 0.94Geberit AG 584 372,128 0.75Julius Baer Group Ltd 663 38,212 0.08
Number ofShares
Fair ValueEUR
% ofNet
Assets
Kuehne + Nagel International AG 997 294,500 0.60Logitech International SA 493 37,962 0.08Nestle SA 4,450 463,800 0.94Novartis AG 11,706 831,938 1.68Roche Holding AG 4,736 1,497,842 3.03SFS Group AG 3,801 447,031 0.90UBS Group AG 50,430 699,570 1.42Zehnder Group AG 1,323 121,271 0.24
6,336,292 12.83
United Kingdom - 15.67% (March 31, 2021: 18.18%)3i Group PLC 2,936 43,765 0.09AstraZeneca PLC 4,327 450,908 0.91Auto Trader Group PLC 5,652 38,711 0.08Barclays PLC 295,054 650,914 1.32BP PLC 29,005 114,826 0.23Compass Group PLC 15,340 271,943 0.55Diageo PLC 2,014 84,488 0.17Domino’s Pizza Group PLC 19,807 91,323 0.19Ferguson PLC 2,580 310,294 0.63Ferrexpo PLC 26,054 99,211 0.20GlaxoSmithKline PLC 36,309 592,877 1.20Greggs PLC 2,037 69,876 0.14HSBC Holdings PLC 73,287 332,550 0.67IMI PLC 15,479 299,033 0.61InterContinental Hotels Group PLC 2,456 135,882 0.28J D Wetherspoon PLC 6,113 74,321 0.15Kingfisher PLC 101,314 396,695 0.80Legal & General Group PLC 115,551 377,963 0.77Lloyds Banking Group PLC 186,340 100,949 0.20Mitchells & Butlers PLC 25,322 69,791 0.14Natwest Group PLC 14,836 38,810 0.08Rio Tinto PLC 2,221 126,970 0.26Royal Dutch Shell PLC 34,560 671,363 1.36Royal Mail PLC 7,737 37,905 0.08Serco Group PLC 175,021 272,958 0.55Spectris PLC 2,061 92,855 0.19Spirax-Sarco Engineering PLC 2,302 400,860 0.81SSP Group PLC 25,344 81,735 0.17Trainline PLC 20,790 84,947 0.17Unilever PLC 3,538 165,074 0.33Unilever PLC (GBP) 18,916 881,449 1.78Whitbread PLC 3,485 134,469 0.27WPP PLC 12,162 141,531 0.29
7,737,246 15.67
Fair ValueEUR
% ofNet
Assets
Total financial assets at fair valuethrough profit or loss 49,058,268 99.34
Cash at bank 271,141 0.55
Other Net Assets 55,779 0.11
Net Assets attributable toholders of redeemableparticipating units 49,385,188 100.00
AXA ROSENBERG PAN-EUROPEAN EQUITY ALPHA FUND
Schedule of Investments (continued)As at September 30, 2021
116

Analysis of Total Assets
% ofTotal
Assets
Transferable securities admitted to an official exchange listing 99.23Current Assets 0.77
Total Assets 100.00
AXA ROSENBERG PAN-EUROPEAN EQUITY ALPHA FUND
Schedule of Investments (continued)As at September 30, 2021
117

Number ofShares
Fair ValueUSD
% ofNet
Assets
Equities - 99.51% (March 31, 2021: 100.28%)Aerospace and Defense - Nil (March 31, 2021: 0.62%)
Agriculture - 0.54% (March 31, 2021: 0.55%)Archer-Daniels-Midland Co 248,900 14,937,734 0.54
Airlines - 0.07% (March 31, 2021: 0.24%)Alaska Air Group Inc 32,400 1,898,154 0.07
Auto Components - Nil (March 31, 2021: 0.33%)
Automobiles - 3.56% (March 31, 2021: 3.00%)Cummins Inc 60,400 13,570,370 0.49Ford Motor Co 1,235,500 17,488,503 0.63General Motors Co 394,100 20,767,099 0.75PACCAR Inc 157,200 12,405,438 0.45Tesla Inc 44,000 34,107,040 1.24
98,338,450 3.56
Banks - 4.18% (March 31, 2021: 4.89%)Bank of America Corp 456,700 19,380,064 0.70Citigroup Inc 124,700 8,749,575 0.32Citizens Financial Group Inc 90,900 4,271,846 0.15Comerica Inc 90,900 7,318,814 0.26Goldman Sachs Group Inc 21,600 8,163,288 0.30JPMorgan Chase & Co 190,000 31,107,750 1.13KeyCorp 543,800 11,759,675 0.43Morgan Stanley 96,600 9,398,214 0.34PNC Financial Services Group Inc 25,400 4,968,113 0.18Truist Financial Corp 96,600 5,662,209 0.20US Bancorp 78,800 4,682,296 0.17
115,461,844 4.18
Beverages - 0.92% (March 31, 2021: 0.96%)Coca-Cola Co 247,500 12,982,613 0.47PepsiCo Inc 82,900 12,468,989 0.45
25,451,602 0.92
Biotechnology - 2.57% (March 31, 2021: 1.21%)Amgen Inc 37,986 8,076,014 0.29Gilead Sciences Inc 308,900 21,573,576 0.78Illumina Inc 8,400 3,405,612 0.12Incyte Corp 84,100 5,783,557 0.21Moderna Inc 17,400 6,698,739 0.24Regeneron Pharmaceuticals Inc 15,400 9,315,537 0.34Vertex Pharmaceuticals Inc 89,600 16,255,680 0.59
71,108,715 2.57
Building Products - 0.33% (March 31, 2021: 0.38%)Masco Corp 164,400 9,131,598 0.33
Chemicals - 1.28% (March 31, 2021: 1.29%)CF Industries Holdings Inc 46,400 2,589,352 0.09Linde PLC 29,400 8,624,784 0.31LyondellBasell Industries NV 125,700 11,793,802 0.43Mosaic Co 230,000 8,212,150 0.30Sherwin-Williams Co 14,700 4,112,619 0.15
35,332,707 1.28
Commercial Services and Supplies - 3.64% (March 31, 2021: 2.91%)Automatic Data Processing Inc 40,100 8,014,586 0.29FleetCor Technologies Inc 11,100 2,900,930 0.10Global Payments Inc 29,100 4,586,451 0.16
Number ofShares
Fair ValueUSD
% ofNet
Assets
MarketAxess Holdings Inc 20,900 8,789,286 0.32Nielsen Holdings PLC 322,900 6,194,837 0.22Omnicom Group Inc 136,300 9,872,890 0.36PayPal Holdings Inc 69,800 18,158,470 0.66Pentair PLC 105,300 7,650,572 0.28Robert Half International Inc 95,400 9,571,482 0.35S&P Global Inc 58,700 24,931,357 0.90
100,670,861 3.64
Computers and Peripherals - 7.90% (March 31, 2021: 8.65%)Accenture PLC 36,200 11,578,389 0.42Apple Inc 1,158,700 163,764,864 5.93Cognizant Technology SolutionsCorp 126,800 9,409,194 0.34Hewlett Packard Enterprise Co 795,600 11,349,234 0.41HP Inc 461,400 12,621,597 0.46Western Digital Corp 167,600 9,461,858 0.34
218,185,136 7.90
Containers and Packaging - 0.22% (March 31, 2021: 0.20%)Sealed Air Corp 110,200 6,039,511 0.22
Distribution and Wholesale - 0.69% (March 31, 2021: 0.35%)LKQ Corp 152,500 7,674,563 0.28Pool Corp 26,400 11,466,312 0.41
19,140,875 0.69
Diversified Financials - 5.21% (March 31, 2021: 3.83%)American Express Co 39,063 6,541,881 0.24BlackRock Inc 9,000 7,545,780 0.27Capital One Financial Corp 124,800 20,203,872 0.73Franklin Resources Inc 272,100 8,088,173 0.29Invesco Ltd 275,600 6,643,338 0.24Mastercard Inc 71,200 24,745,204 0.90Raymond James Financial Inc 116,100 10,710,225 0.39Synchrony Financial 255,700 12,497,338 0.45T Rowe Price Group Inc 69,900 13,749,679 0.50Visa Inc 136,900 30,486,945 1.10Western Union Co 131,400 2,656,251 0.10
143,868,686 5.21
Electric Utilities - 0.90% (March 31, 2021: 1.06%)Edison International 203,400 11,279,547 0.41NextEra Energy Inc 125,200 9,828,826 0.35Southern Co 61,900 3,835,634 0.14
24,944,007 0.90
Electrical Equipment - 0.76% (March 31, 2021: 1.92%)Snap-on Inc 40,600 8,482,761 0.31Stanley Black & Decker Inc 71,400 12,516,777 0.45
20,999,538 0.76
Electronic Equipment and Instruments - 1.34% (March 31,2021: 0.72%)Honeywell International Inc 44,900 9,532,046 0.35Keysight Technologies Inc 79,300 13,028,593 0.47Mettler-Toledo International Inc 10,500 14,457,187 0.52
37,017,826 1.34
Energy Equipment and Services - Nil (March 31, 2021: 0.17%)
AXA ROSENBERG US ENHANCED INDEX EQUITY ALPHA FUND
Schedule of InvestmentsAs at September 30, 2021
118

Number ofShares
Fair ValueUSD
% ofNet
Assets
Equities - 99.51% (March 31, 2021: 100.28%) (continued)Entertainment - Nil (March 31, 2021: 0.09%)
Food Products - 1.30% (March 31, 2021: 2.37%)Kellogg Co 159,300 10,183,253 0.37Kroger Co 202,800 8,196,162 0.30Mondelez International Inc 91,400 5,314,453 0.19Tyson Foods Inc 156,300 12,339,103 0.44
36,032,971 1.30
Health Care Equipment and Supplies - 4.31% (March 31, 2021: 4.28%)Abbott Laboratories 106,000 12,520,190 0.45Boston Scientific Corp 83,600 3,626,986 0.13Danaher Corp 36,400 11,074,882 0.40DENTSPLY SIRONA Inc 125,300 7,271,786 0.26Edwards Lifesciences Corp 183,600 20,783,520 0.75Henry Schein Inc 101,800 7,754,615 0.28IDEXX Laboratories Inc 27,500 17,099,775 0.62Intuitive Surgical Inc 7,100 7,056,158 0.26Medtronic PLC 76,700 9,613,194 0.35Stryker Corp 19,000 5,009,635 0.18Thermo Fisher Scientific Inc 22,900 13,079,449 0.47West Pharmaceutical Services Inc 10,200 4,330,206 0.16
119,220,396 4.31
Health Care Providers and Services - 1.67% (March 31, 2021: 1.39%)Anthem Inc 15,100 5,627,695 0.20HCA Healthcare Inc 15,000 3,639,675 0.13Laboratory Corp of AmericaHoldings 24,100 6,785,234 0.25Quest Diagnostics Inc 51,200 7,437,824 0.27UnitedHealth Group Inc 58,000 22,663,210 0.82
46,153,638 1.67
Home Builders - 0.35% (March 31, 2021: Nil)NVR Inc 710 3,409,278 0.12PulteGroup Inc 134,800 6,187,994 0.23
9,597,272 0.35
Hotels, Restaurants and Leisure - 0.06% (March 31, 2021: 0.67%)Las Vegas Sands Corp 47,900 1,752,901 0.06
Household Durables - 0.32% (March 31, 2021: 0.52%)Whirlpool Corp 43,500 8,867,693 0.32
Insurance - 4.53% (March 31, 2021: 5.09%)Aon PLC 12,800 3,657,216 0.13Berkshire Hathaway Inc 124,100 33,865,649 1.23Chubb Ltd 26,300 4,564,234 0.16Cincinnati Financial Corp 88,300 10,082,977 0.36Everest Re Group Ltd 32,400 8,124,462 0.29Lincoln National Corp 143,900 9,888,088 0.36Loews Corp 169,000 9,111,635 0.33Marsh & McLennan Cos Inc 28,900 4,375,027 0.16MetLife Inc 147,700 9,116,782 0.33Principal Financial Group Inc 174,300 11,221,434 0.41Prudential Financial Inc 138,700 14,592,627 0.53Unum Group 259,400 6,501,861 0.24
125,101,992 4.53
Number ofShares
Fair ValueUSD
% ofNet
Assets
Internet Software and Services - 10.81% (March 31, 2021: 11.29%)Alphabet Inc 40,100 107,163,440 3.88Amazon.com Inc 31,500 103,491,360 3.74Booking Holdings Inc 2,500 5,939,563 0.22Facebook Inc 166,500 56,491,785 2.04Netflix Inc 25,000 15,256,250 0.55NortonLifeLock Inc 416,500 10,539,532 0.38
298,881,930 10.81
Machinery - 0.50% (March 31, 2021: 0.94%)Caterpillar Inc 34,700 6,658,583 0.24Deere & Co 21,600 7,239,240 0.26
13,897,823 0.50
Media - 1.42% (March 31, 2021: 1.91%)Charter Communications Inc 8,500 6,181,880 0.23Comcast Corp 273,000 15,267,525 0.55Walt Disney Co 104,700 17,709,481 0.64
39,158,886 1.42
Metals and Mining - 0.28% (March 31, 2021: 0.24%)Nucor Corp 77,600 7,640,108 0.28
Miscellaneous Manufacturers - 1.41% (March 31, 2021: 1.62%)3M Co 140,200 24,598,090 0.89Eaton Corp PLC 23,300 3,479,622 0.12General Electric Co 64,025 6,594,255 0.24Illinois Tool Works Inc 21,200 4,380,238 0.16
39,052,205 1.41
Office Electronics - 0.25% (March 31, 2021: Nil)Zebra Technologies Corp 13,400 6,904,484 0.25
Oil and Gas - 1.37% (March 31, 2021: 2.40%)APA Corp 98,000 2,099,650 0.07Chevron Corp 116,400 11,811,690 0.43ConocoPhillips 130,100 8,817,527 0.32Exxon Mobil Corp 257,200 15,127,218 0.55
37,856,085 1.37
Personal Products - 0.88% (March 31, 2021: 1.63%)Estee Lauder Cos Inc 13,500 4,047,975 0.15Procter & Gamble Co 145,000 20,267,375 0.73
24,315,350 0.88
Pharmaceuticals - 7.23% (March 31, 2021: 5.75%)AbbVie Inc 332,300 35,831,909 1.30Becton Dickinson and Co 82,700 20,332,622 0.74Bristol-Myers Squibb Co 462,500 27,359,187 0.99Cardinal Health Inc 172,400 8,527,766 0.31Cigna Corp 22,300 4,464,795 0.16CVS Health Corp 110,500 9,373,163 0.34Eli Lilly & Co 48,500 11,201,803 0.40Johnson & Johnson 159,500 25,748,882 0.93Merck & Co Inc 369,700 27,766,318 1.00Pfizer Inc 321,200 13,813,206 0.50Viatris Inc 749,200 10,155,406 0.37Zoetis Inc 27,400 5,318,203 0.19
199,893,260 7.23
AXA ROSENBERG US ENHANCED INDEX EQUITY ALPHA FUND
Schedule of Investments (continued)As at September 30, 2021
119

Number ofShares
Fair ValueUSD
% ofNet
Assets
Equities - 99.51% (March 31, 2021: 100.28%) (continued)Real Estate - 1.09% (March 31, 2021: 0.97%)American Tower Corp (REIT) 25,600 6,792,576 0.25Crown Castle International Corp(REIT) 24,800 4,297,220 0.15Equinix Inc (REIT) 5,200 4,106,726 0.15Iron Mountain Inc (REIT) 160,700 6,980,004 0.25Prologis Inc (REIT) 46,200 5,792,787 0.21Weyerhaeuser Co (REIT) 62,900 2,237,039 0.08
30,206,352 1.09
Retail - 4.32% (March 31, 2021: 3.03%)Best Buy Co Inc 20,800 2,198,664 0.08Costco Wholesale Corp 28,300 12,719,152 0.46Domino’s Pizza Inc 20,600 9,822,698 0.36Home Depot Inc 64,500 21,173,737 0.77Lowe’s Cos Inc 151,900 30,799,244 1.11McDonald’s Corp 48,100 11,596,669 0.42Starbucks Corp 70,000 7,722,750 0.28Target Corp 33,400 7,638,246 0.28TJX Cos Inc 69,300 4,569,989 0.16Walmart Inc 80,000 11,147,600 0.40
119,388,749 4.32
Semiconductor Equipment and Products - 6.65% (March 31,2021: 5.99%)Advanced Micro Devices Inc 200,200 20,595,575 0.75Analog Devices Inc 21,400 3,583,965 0.13Applied Materials Inc 53,000 6,820,835 0.25Broadcom Inc 24,500 11,883,725 0.43Intel Corp 550,200 29,311,905 1.06Lam Research Corp 8,900 5,064,145 0.18Micron Technology Inc 246,600 17,499,969 0.63Monolithic Power Systems Inc 24,600 11,922,390 0.43NVIDIA Corp 227,100 47,027,868 1.70QUALCOMM Inc 72,000 9,286,920 0.34Teradyne Inc 87,100 9,506,529 0.34Texas Instruments Inc 58,800 11,299,890 0.41
183,803,716 6.65
Software - 11.52% (March 31, 2021: 11.38%)Activision Blizzard Inc 45,600 3,529,212 0.13Adobe Inc 58,300 33,553,690 1.21Autodesk Inc 12,600 3,592,197 0.13
Number ofShares
Fair ValueUSD
% ofNet
Assets
Cadence Design Systems Inc 46,700 7,072,715 0.26Fidelity National InformationServices Inc 56,900 6,920,747 0.25Fiserv Inc 41,100 4,459,761 0.16Intuit Inc 15,600 8,415,108 0.30Jack Henry & Associates Inc 14,600 2,395,860 0.09Microsoft Corp 553,300 155,867,376 5.64Oracle Corp 380,900 33,185,913 1.20Paychex Inc 38,700 4,351,622 0.16salesforce.com Inc 55,600 15,076,496 0.55ServiceNow Inc 38,800 24,135,152 0.87Synopsys Inc 52,800 15,807,792 0.57
318,363,641 11.52
Telecommunications - 2.71% (March 31, 2021: 2.82%)AT&T Inc 1,315,100 35,527,426 1.29Cisco Systems Inc 239,400 13,026,951 0.47Lumen Technologies Inc 722,600 8,949,401 0.32T-Mobile US Inc 33,700 4,304,838 0.16Verizon Communications Inc 240,400 12,982,802 0.47
74,791,418 2.71
Textiles and Apparel - 0.68% (March 31, 2021: 0.54%)Hanesbrands Inc 342,500 5,875,588 0.21NIKE Inc 76,100 11,052,764 0.40PVH Corp 18,000 1,849,230 0.07
18,777,582 0.68
Transportation - 1.74% (March 31, 2021: 2.08%)CH Robinson Worldwide Inc 93,000 8,092,395 0.29CSX Corp 137,400 4,084,215 0.15Expeditors International ofWashington Inc 101,400 12,081,810 0.44FedEx Corp 15,400 3,376,219 0.12Norfolk Southern Corp 15,300 3,660,066 0.13Union Pacific Corp 42,900 8,409,258 0.30United Parcel Service Inc 46,300 8,428,220 0.31
48,132,183 1.74
Total value of Investmentsexcluding FinancialDerivative Instruments 2,750,317,879 99.51
Financial Derivative Instruments - (0.36)% (March 31, 2021: (0.49)%)Open Forward Foreign Currency Exchange Contracts* - (0.36)% (March 31, 2021: (0.49)%)
Currency Sold Currency BoughtSettlementDate
UnrealisedGain/(Loss)
USD
% ofNet
AssetsEUR 7,835,127 USD 9,163,431 20 October 2021 80,229 0.00EUR 7,552,474 USD 8,859,429 20 October 2021 103,904 0.00EUR 4,915,122 USD 5,826,459 20 October 2021 128,396 0.00EUR 2,884,934 USD 3,415,805 20 October 2021 71,323 0.00EUR 2,678,166 USD 3,170,988 20 October 2021 66,211 0.00EUR 1,165,000 USD 1,363,601 20 October 2021 13,025 0.00EUR 1,090,951 USD 1,292,123 20 October 2021 27,391 0.00EUR 709,803 USD 840,466 20 October 2021 17,596 0.00EUR 360,029 USD 423,190 20 October 2021 5,811 0.00EUR 356,433 USD 421,107 20 October 2021 7,897 0.00EUR 166,478 USD 196,901 20 October 2021 3,904 0.00EUR 151,740 USD 179,322 20 October 2021 3,411 0.00
AXA ROSENBERG US ENHANCED INDEX EQUITY ALPHA FUND
Schedule of Investments (continued)As at September 30, 2021
120

Financial Derivative Instruments - (0.36)% (March 31, 2021: (0.49)%) (continued)Open Forward Foreign Currency Exchange Contracts* - (0.36)% (March 31, 2021: (0.49)%) (continued)
Currency Sold Currency BoughtSettlementDate
UnrealisedGain/(Loss)
USD
% ofNet
AssetsEUR 148,815 USD 176,200 20 October 2021 3,679 0.00EUR 106,395 USD 125,973 20 October 2021 2,630 0.00EUR 104,471 USD 123,079 20 October 2021 1,967 0.00EUR 102,800 USD 120,041 20 October 2021 866 0.00EUR 74,731 USD 88,002 20 October 2021 1,367 0.00EUR 69,585 USD 81,448 20 October 2021 778 0.00EUR 53,296 USD 63,042 20 October 2021 1,256 0.00EUR 52,095 USD 61,294 20 October 2021 900 0.00EUR 43,468 USD 51,278 20 October 2021 887 0.00EUR 40,926 USD 48,662 20 October 2021 1,217 0.00EUR 40,072 USD 47,324 20 October 2021 869 0.00EUR 25,808 USD 30,377 20 October 2021 457 0.00EUR 21,305 USD 25,158 20 October 2021 460 0.00EUR 20,740 USD 24,434 20 October 2021 390 0.00EUR 20,000 USD 23,685 20 October 2021 499 0.00EUR 18,000 USD 21,314 20 October 2021 446 0.00EUR 15,559 USD 18,272 20 October 2021 234 0.00EUR 14,047 USD 16,476 20 October 2021 192 0.00EUR 14,000 USD 16,496 20 October 2021 266 0.00EUR 13,026 USD 15,234 20 October 2021 133 0.00EUR 7,453 USD 8,806 20 October 2021 165 0.00EUR 6,997 USD 8,310 20 October 2021 198 0.00EUR 5,283 USD 6,243 20 October 2021 119 0.00EUR 4,129 USD 4,858 20 October 2021 71 0.00EUR 3,043 USD 3,599 20 October 2021 72 0.00EUR 1,000 USD 1,176 20 October 2021 17 0.00EUR 641 USD 752 20 October 2021 10 0.00EUR 195 USD 229 20 October 2021 3 0.00USD 226,832,249 EUR 191,557,023 20 October 2021 (4,761,653) (0.17)USD 208,002,716 EUR 175,655,716 20 October 2021 (4,366,384) (0.16)USD 12,391,374 EUR 10,464,362 20 October 2021 (260,119) (0.01)USD 9,743,269 EUR 8,245,952 20 October 2021 (183,799) (0.01)USD 9,196,570 EUR 7,839,304 20 October 2021 (108,524) (0.00)USD 8,751,299 EUR 7,390,364 20 October 2021 (183,707) (0.01)USD 5,025,782 EUR 4,279,443 20 October 2021 (64,657) (0.00)USD 4,774,906 EUR 4,011,670 20 October 2021 (124,208) (0.00)USD 3,288,556 EUR 2,798,197 20 October 2021 (44,627) (0.00)USD 1,570,409 EUR 1,326,305 20 October 2021 (32,834) (0.00)USD 1,141,458 EUR 965,881 20 October 2021 (21,719) (0.00)USD 956,532 EUR 815,379 20 October 2021 (11,270) (0.00)USD 672,849 EUR 571,035 20 October 2021 (10,852) (0.00)USD 669,743 EUR 566,346 20 October 2021 (13,182) (0.00)USD 667,456 EUR 563,690 20 October 2021 (13,974) (0.00)USD 643,871 EUR 542,148 20 October 2021 (15,363) (0.00)USD 623,782 EUR 527,471 20 October 2021 (12,289) (0.00)USD 567,538 EUR 479,876 20 October 2021 (11,221) (0.00)USD 526,433 EUR 445,802 20 October 2021 (9,618) (0.00)USD 417,544 EUR 355,226 20 October 2021 (5,733) (0.00)USD 398,223 EUR 340,224 20 October 2021 (3,804) (0.00)USD 395,508 EUR 336,494 20 October 2021 (5,413) (0.00)USD 387,809 EUR 329,764 20 October 2021 (5,517) (0.00)USD 348,525 EUR 293,117 20 October 2021 (8,716) (0.00)USD 322,391 EUR 271,957 20 October 2021 (7,114) (0.00)USD 319,494 EUR 274,980 20 October 2021 (712) (0.00)USD 271,867 EUR 231,876 20 October 2021 (3,055) (0.00)USD 267,318 EUR 226,148 20 October 2021 (5,146) (0.00)USD 248,653 EUR 211,823 20 October 2021 (3,088) (0.00)USD 227,229 EUR 193,172 20 October 2021 (3,286) (0.00)USD 201,407 EUR 170,246 20 October 2021 (4,042) (0.00)USD 164,796 EUR 140,492 20 October 2021 (1,924) (0.00)USD 139,181 EUR 117,923 20 October 2021 (2,474) (0.00)USD 133,722 EUR 113,154 20 October 2021 (2,544) (0.00)USD 130,350 EUR 111,628 20 October 2021 (940) (0.00)
AXA ROSENBERG US ENHANCED INDEX EQUITY ALPHA FUND
Schedule of Investments (continued)As at September 30, 2021
121

Financial Derivative Instruments - (0.36)% (March 31, 2021: (0.49)%) (continued)Open Forward Foreign Currency Exchange Contracts* - (0.36)% (March 31, 2021: (0.49)%) (continued)
Currency Sold Currency BoughtSettlementDate
UnrealisedGain/(Loss)
USD
% ofNet
AssetsUSD 104,661 EUR 88,218 20 October 2021 (2,391) (0.00)USD 99,764 EUR 85,137 20 October 2021 (1,065) (0.00)USD 92,788 EUR 78,585 20 October 2021 (1,685) (0.00)USD 83,688 EUR 70,762 20 October 2021 (1,655) (0.00)USD 76,129 EUR 64,902 20 October 2021 (889) (0.00)USD 71,109 EUR 60,046 20 October 2021 (1,498) (0.00)USD 65,610 EUR 55,309 20 October 2021 (1,490) (0.00)USD 52,999 EUR 44,868 20 October 2021 (984) (0.00)USD 51,444 EUR 43,501 20 October 2021 (1,013) (0.00)USD 49,119 EUR 41,361 20 October 2021 (1,169) (0.00)USD 44,316 EUR 37,903 20 October 2021 (376) (0.00)USD 39,685 EUR 33,819 20 October 2021 (479) (0.00)USD 33,668 EUR 28,700 20 October 2021 (397) (0.00)USD 27,593 EUR 23,327 20 October 2021 (550) (0.00)USD 25,382 EUR 21,370 20 October 2021 (607) (0.00)USD 23,455 EUR 19,860 20 October 2021 (431) (0.00)USD 15,430 EUR 13,197 20 October 2021 (131) (0.00)USD 12,983 EUR 10,963 20 October 2021 (273) (0.00)USD 11,777 EUR 9,947 20 October 2021 (246) (0.00)USD 10,714 EUR 9,103 20 October 2021 (161) (0.00)USD 10,304 EUR 8,723 20 October 2021 (191) (0.00)USD 10,203 EUR 8,628 20 October 2021 (201) (0.00)USD 9,864 EUR 8,379 20 October 2021 (150) (0.00)USD 9,073 EUR 7,707 20 October 2021 (138) (0.00)USD 9,002 EUR 7,580 20 October 2021 (214) (0.00)USD 6,419 EUR 5,458 20 October 2021 (91) (0.00)USD 6,417 EUR 5,446 20 October 2021 (104) (0.00)USD 6,134 EUR 5,245 20 October 2021 (54) (0.00)USD 6,106 EUR 5,164 20 October 2021 (120) (0.00)USD 5,684 EUR 4,845 20 October 2021 (67) (0.00)USD 4,684 EUR 4,032 20 October 2021 (10) (0.00)USD 3,901 EUR 3,328 20 October 2021 (44) (0.00)USD 3,262 EUR 2,780 20 October 2021 (39) (0.00)USD 3,254 EUR 2,740 20 October 2021 (78) (0.00)USD 2,349 EUR 2,000 20 October 2021 (30) (0.00)USD 2,260 EUR 1,919 20 October 2021 (35) (0.00)USD 2,177 EUR 1,841 20 October 2021 (43) (0.00)USD 2,135 EUR 1,800 20 October 2021 (49) (0.00)USD 1,985 EUR 1,680 20 October 2021 (38) (0.00)USD 1,983 EUR 1,670 20 October 2021 (47) (0.00)USD 1,819 EUR 1,528 20 October 2021 (47) (0.00)USD 1,275 EUR 1,080 20 October 2021 (23) (0.00)USD 936 EUR 787 20 October 2021 (23) (0.00)USD 846 EUR 720 20 October 2021 (12) (0.00)USD 496 EUR 418 20 October 2021 (11) (0.00)USD 253 EUR 214 20 October 2021 (6) (0.00)USD 215 EUR 182 20 October 2021 (4) (0.00)USD 95 EUR 80 20 October 2021 (2) (0.00)USD 47 EUR 40 20 October 2021 (1) (0.00)USD 7 EUR 6 20 October 2021 - (0.00)USD 5 EUR 4 20 October 2021 - (0.00)USD 4 EUR 3 20 October 2021 - (0.00)USD 2 EUR 2 20 October 2021 - (0.00)
Unrealised gain on open forward foreign currency exchange contracts 549,246 0.00Unrealised loss on open forward foreign currency exchange contracts (10,332,870) (0.36)
Net unrealised loss on open forward foreign currency exchange contracts (9,783,624) (0.36)
AXA ROSENBERG US ENHANCED INDEX EQUITY ALPHA FUND
Schedule of Investments (continued)As at September 30, 2021
122

Fair ValueUSD
% ofNet
Assets
Total financial assets at fair valuethrough profit or loss 2,740,534,255 99.15
Cash at bank 13,848,046 0.50
Other Net Assets 9,558,990 0.35
Net Assets attributable toholders of redeemableparticipating units 2,763,941,291 100.00
*The counterparty for the open forward foreign contracts is State StreetBank and Trust Company.
Abbreviations used:REIT– Real Estate Investment Trust
Analysis of Total Assets
% ofTotal
Assets
Transferable securities admitted to an official exchange listing 98.89Over the counter financial derivative instruments 0.02Current Assets 1.09
Total Assets 100.00
AXA ROSENBERG US ENHANCED INDEX EQUITY ALPHA FUND
Schedule of Investments (continued)As at September 30, 2021
123

Number ofShares
Fair ValueUSD
% ofNet
Assets
Equities - 99.61% (March 31, 2021: 99.32%)Agriculture - 0.59% (March 31, 2021: 0.91%)Archer-Daniels-Midland Co 105,300 6,319,580 0.59
Airlines - Nil (March 31, 2021: 0.27%)
Automobiles - 4.69% (March 31, 2021: 3.85%)Cummins Inc 60,700 13,637,772 1.27Ford Motor Co 700,500 9,915,578 0.92General Motors Co 276,700 14,580,706 1.36PACCAR Inc 10,500 828,608 0.08Tesla Inc 14,600 11,317,336 1.06
50,280,000 4.69
Banks - 2.86% (March 31, 2021: 4.35%)Bank of America Corp 164,000 6,959,340 0.65Citigroup Inc 30,500 2,140,033 0.20JPMorgan Chase & Co 71,700 11,739,082 1.09KeyCorp 395,800 8,559,175 0.80New York Community Bancorp Inc 99,400 1,279,775 0.12
30,677,405 2.86
Beverages - 0.41% (March 31, 2021: 0.47%)Coca-Cola Europacific Partners PLC 78,900 4,360,409 0.41
Biotechnology - 2.70% (March 31, 2021: 1.38%)Gilead Sciences Inc 137,000 9,568,080 0.89Regeneron Pharmaceuticals Inc 2,200 1,330,791 0.13Seagen Inc 52,600 8,929,639 0.83Vertex Pharmaceuticals Inc 50,200 9,107,535 0.85
28,936,045 2.70
Building Products - 0.34% (March 31, 2021: 1.99%)Owens Corning 43,100 3,683,542 0.34
Chemicals - 1.95% (March 31, 2021: 0.43%)Huntsman Corp 161,400 4,776,633 0.44LyondellBasell Industries NV 157,300 14,758,672 1.38Mosaic Co 39,200 1,399,636 0.13
20,934,941 1.95
Commercial Services and Supplies - 3.81% (March 31, 2021: 1.18%)Automatic Data Processing Inc 14,100 2,818,096 0.26FleetCor Technologies Inc 3,900 1,019,246 0.10Global Payments Inc 10,200 1,607,622 0.15MarketAxess Holdings Inc 11,300 4,752,102 0.44Omnicom Group Inc 195,200 14,139,312 1.32S&P Global Inc 38,700 16,436,857 1.54
40,773,235 3.81
Computers and Peripherals - 11.23% (March 31, 2021: 11.17%)Amdocs Ltd 166,000 12,572,010 1.17Apple Inc 455,000 64,307,425 6.00Genpact Ltd 10,700 508,304 0.05Hewlett Packard Enterprise Co 976,100 13,924,066 1.30HP Inc 534,100 14,610,305 1.36NetApp Inc 14,500 1,302,028 0.12TTEC Holdings Inc 11,300 1,056,268 0.10Western Digital Corp 213,300 12,041,851 1.13
120,322,257 11.23
Number ofShares
Fair ValueUSD
% ofNet
Assets
Distribution and Wholesale - 1.30% (March 31, 2021: 0.09%)Copart Inc 7,300 1,012,437 0.10Pool Corp 29,700 12,899,601 1.20
13,912,038 1.30
Diversified Financials - 4.83% (March 31, 2021: 2.39%)Capital One Financial Corp 65,100 10,539,039 0.98Evercore Inc 9,600 1,283,712 0.12Franklin Resources Inc 207,500 6,167,937 0.58Mastercard Inc 25,100 8,723,379 0.81OneMain Holdings Inc 31,100 1,719,986 0.16Synchrony Financial 76,900 3,758,488 0.35T Rowe Price Group Inc 44,900 8,832,054 0.83Visa Inc 48,200 10,733,899 1.00
51,758,494 4.83
Electric Utilities - 0.18% (March 31, 2021: 1.00%)Edison International 9,074 503,199 0.05Exelon Corp 28,700 1,387,214 0.13
1,890,413 0.18
Electrical Equipment - 1.19% (March 31, 2021: 2.13%)Emerson Electric Co 110,900 10,444,008 0.97Stanley Black & Decker Inc 13,200 2,314,026 0.22
12,758,034 1.19
Electronic Equipment and Instruments - 1.52% (March 31,2021: 0.65%)Agilent Technologies Inc 56,500 8,899,032 0.83Mettler-Toledo International Inc 5,400 7,435,125 0.69
16,334,157 1.52
Energy Equipment and Services - Nil (March 31, 2021: 0.22%)
Entertainment - Nil (March 31, 2021: 0.23%)
Food Products - 2.36% (March 31, 2021: 3.67%)Kellogg Co 156,900 10,029,832 0.94Kroger Co 376,200 15,204,123 1.42
25,233,955 2.36
Health Care Equipment and Supplies - 4.59% (March 31, 2021: 3.65%)Baxter International Inc 94,900 7,631,383 0.71DENTSPLY SIRONA Inc 43,000 2,495,505 0.23Edwards Lifesciences Corp 32,700 3,701,640 0.35Henry Schein Inc 13,300 1,013,128 0.09Hill-Rom Holdings Inc 11,000 1,650,055 0.15IDEXX Laboratories Inc 15,000 9,327,150 0.87Medtronic PLC 54,400 6,818,224 0.64Novocure Ltd 5,300 615,436 0.06STAAR Surgical Co 19,600 2,517,718 0.24Tandem Diabetes Care Inc 38,900 4,642,715 0.43West Pharmaceutical Services Inc 20,600 8,745,318 0.82
49,158,272 4.59
Health Care Providers and Services - 1.08% (March 31, 2021: 1.28%)Encompass Health Corp 23,800 1,786,547 0.17Laboratory Corp of America Holdings 9,300 2,618,369 0.24Molina Healthcare Inc 3,900 1,058,577 0.10Quest Diagnostics Inc 19,700 2,861,819 0.27
AXA ROSENBERG US EQUITY ALPHA FUND
Schedule of InvestmentsAs at September 30, 2021
124

Number ofShares
Fair ValueUSD
% ofNet
Assets
Equities - 99.61% (March 31, 2021: 99.32%) (continued)Health Care Providers and Services - 1.08% (March 31, 2021: 1.28%)(continued)UnitedHealth Group Inc 8,200 3,204,109 0.30
11,529,421 1.08
Home Builders - 0.07% (March 31, 2021: 1.17%)Meritage Homes Corp 7,700 747,247 0.07
Hotels, Restaurants and Leisure - Nil (March 31, 2021: 0.73%)
Household Durables - 0.47% (March 31, 2021: 0.30%)Whirlpool Corp 24,600 5,014,833 0.47
Insurance - 4.95% (March 31, 2021: 7.09%)Berkshire Hathaway Inc 52,000 14,190,280 1.33Brown & Brown Inc 129,900 7,203,605 0.67Cincinnati Financial Corp 105,300 12,024,207 1.12Markel Corp 1,550 1,855,993 0.17Principal Financial Group Inc 231,100 14,878,218 1.39Prudential Financial Inc 27,600 2,903,796 0.27
53,056,099 4.95
Internet Software and Services - 10.87% (March 31, 2021: 10.93%)Alphabet Inc 14,500 38,749,872 3.62Amazon.com Inc 12,379 40,670,462 3.79Facebook Inc 67,800 23,003,862 2.15NortonLifeLock Inc 554,400 14,029,092 1.31
116,453,288 10.87
Machinery - 0.53% (March 31, 2021: 0.76%)AGCO Corp 45,900 5,622,521 0.53
Media - Nil (March 31, 2021: 0.93%)
Metals and Mining - 0.89% (March 31, 2021: 0.48%)Nucor Corp 96,800 9,530,444 0.89
Miscellaneous Manufacturers - 1.53% (March 31, 2021: 0.45%)3M Co 93,100 16,334,395 1.53
Oil and Gas - 1.54% (March 31, 2021: 2.67%)Chevron Corp 33,500 3,399,413 0.32ConocoPhillips 45,800 3,104,095 0.29Devon Energy Corp 37,200 1,320,600 0.12EOG Resources Inc 22,200 1,781,772 0.16Exxon Mobil Corp 96,700 5,687,410 0.53Phillips 66 17,800 1,246,445 0.12
16,539,735 1.54
Paper and Forest Products - 0.11% (March 31, 2021: Nil)International Paper Co 21,000 1,174,215 0.11
Personal Products - Nil (March 31, 2021: 1.21%)
Pharmaceuticals - 7.12% (March 31, 2021: 5.61%)AbbVie Inc 128,900 13,899,287 1.30Becton Dickinson and Co 23,900 5,876,054 0.55Bristol-Myers Squibb Co 186,300 11,020,576 1.03Cardinal Health Inc 150,600 7,449,429 0.69CVS Health Corp 11,700 992,453 0.09Johnson & Johnson 68,100 10,993,723 1.03Merck & Co Inc 153,100 11,498,575 1.07Perrigo Co PLC 17,300 818,550 0.08
Number ofShares
Fair ValueUSD
% ofNet
Assets
Pfizer Inc 138,500 5,956,193 0.55Viatris Inc 575,500 7,800,902 0.73
76,305,742 7.12
Real Estate - 0.78% (March 31, 2021: 0.97%)American Tower Corp (REIT) 4,800 1,273,608 0.12CBRE Group Inc 13,300 1,294,622 0.12Gaming and Leisure Properties Inc(REIT) 459 21,268 0.00Iron Mountain Inc (REIT) 58,100 2,523,573 0.23VICI Properties Inc (REIT) 82,000 2,329,210 0.22Weyerhaeuser Co (REIT) 26,600 946,029 0.09
8,388,310 0.78
Retail - 3.23% (March 31, 2021: 3.06%)AutoNation Inc 41,900 5,101,953 0.48Best Buy Co Inc 12,100 1,279,031 0.12Domino’s Pizza Inc 12,400 5,912,692 0.55Lowe’s Cos Inc 89,800 18,207,848 1.70Tractor Supply Co 20,400 4,134,366 0.38
34,635,890 3.23
Semiconductor Equipment and Products - 5.16% (March 31,2021: 6.09%)Advanced Micro Devices Inc 127,900 13,157,712 1.23Entegris Inc 36,200 4,555,951 0.43Intel Corp 196,700 10,479,193 0.98Monolithic Power Systems Inc 29,000 14,054,850 1.31NVIDIA Corp 31,200 6,460,896 0.60QUALCOMM Inc 13,000 1,676,805 0.16Teradyne Inc 44,600 4,867,867 0.45
55,253,274 5.16
Software - 12.17% (March 31, 2021: 11.20%)Adobe Inc 36,100 20,776,813 1.94Broadridge Financial Solutions Inc 6,200 1,033,199 0.09Cadence Design Systems Inc 11,800 1,787,110 0.17Cerner Corp 41,100 2,897,550 0.27Dropbox Inc 157,400 4,598,441 0.43Fidelity National InformationServices Inc 20,000 2,432,600 0.23Jack Henry & Associates Inc 5,100 836,910 0.08Microsoft Corp 231,500 65,214,707 6.09Oracle Corp 213,300 18,583,763 1.73Paychex Inc 13,600 1,529,252 0.14ServiceNow Inc 8,500 5,287,340 0.49Synopsys Inc 13,900 4,161,521 0.39Veeva Systems Inc 4,400 1,267,728 0.12
130,406,934 12.17
Telecommunications - 2.42% (March 31, 2021: 2.48%)AT&T Inc 591,000 15,965,865 1.49Cisco Systems Inc 34,053 1,852,994 0.17Verizon Communications Inc 149,718 8,085,521 0.76
25,904,380 2.42
Textiles and Apparel - 0.63% (March 31, 2021: 0.76%)Crocs Inc 28,700 4,117,732 0.39PVH Corp 6,300 647,231 0.06Under Armour Inc 48,300 974,453 0.09
AXA ROSENBERG US EQUITY ALPHA FUND
Schedule of Investments (continued)As at September 30, 2021
125

Number ofShares
Fair ValueUSD
% ofNet
Assets
Equities - 99.61% (March 31, 2021: 99.32%) (continued)Textiles and Apparel - 0.63% (March 31, 2021: 0.76%) (continued)VF Corp 14,400 964,728 0.09
6,704,144 0.63
Transportation - 1.51% (March 31, 2021: 1.12%)Expeditors International ofWashington Inc 95,000 11,319,250 1.06Old Dominion Freight Line Inc 13,700 3,916,693 0.37
Number ofShares
Fair ValueUSD
% ofNet
Assets
United Parcel Service Inc 4,900 891,971 0.08
16,127,914 1.51
Total value of Investmentsexcluding FinancialDerivative Instruments 1,067,061,563 99.61
Financial Derivative Instruments - (0.20)% (March 31, 2021: (0.22)%)Open Forward Foreign Currency Exchange Contracts* - (0.20)% (March 31, 2021: (0.22)%)
Currency Sold Currency BoughtSettlementDate
UnrealisedGain/(Loss)
USD
% ofNet
AssetsEUR 1,199,491 USD 1,422,871 20 October 2021 32,310 0.00EUR 1,026,109 USD 1,214,929 20 October 2021 25,368 0.00EUR 177,953 USD 211,343 20 October 2021 5,043 0.00EUR 155,647 USD 184,288 20 October 2021 3,848 0.00EUR 61,531 USD 71,492 20 October 2021 159 0.00EUR 40,408 USD 47,669 20 October 2021 824 0.00EUR 40,252 USD 47,659 20 October 2021 995 0.00EUR 25,122 USD 29,681 20 October 2021 557 0.00EUR 21,142 USD 25,041 20 October 2021 531 0.00EUR 18,173 USD 21,382 20 October 2021 314 0.00EUR 17,373 USD 20,186 20 October 2021 45 0.00EUR 15,216 USD 17,968 20 October 2021 328 0.00EUR 12,884 USD 15,064 20 October 2021 128 0.00EUR 10,763 USD 12,649 20 October 2021 172 0.00EUR 8,096 USD 9,534 20 October 2021 148 0.00EUR 6,363 USD 7,430 20 October 2021 54 0.00EUR 5,844 USD 6,860 20 October 2021 85 0.00EUR 5,333 USD 6,307 20 October 2021 125 0.00EUR 5,179 USD 6,118 20 October 2021 114 0.00EUR 4,273 USD 5,034 20 October 2021 80 0.00EUR 4,187 USD 4,972 20 October 2021 119 0.00EUR 3,932 USD 4,613 20 October 2021 54 0.00EUR 3,626 USD 4,254 20 October 2021 50 0.00EUR 3,557 USD 4,234 20 October 2021 110 0.00EUR 2,838 USD 3,364 20 October 2021 74 0.00EUR 2,834 USD 3,335 20 October 2021 50 0.00EUR 1,393 USD 1,638 20 October 2021 24 0.00EUR 641 USD 754 20 October 2021 11 0.00EUR 546 USD 646 20 October 2021 13 0.00EUR 537 USD 628 20 October 2021 5 0.00EUR 454 USD 536 20 October 2021 10 0.00EUR 443 USD 524 20 October 2021 10 0.00EUR 115 USD 136 20 October 2021 3 0.00USD 78,562,974 EUR 66,345,458 20 October 2021 (1,649,191) (0.15)USD 12,223,996 EUR 10,323,013 20 October 2021 (256,606) (0.02)USD 4,115,439 EUR 3,497,813 20 October 2021 (60,451) (0.00)USD 3,922,868 EUR 3,319,474 20 October 2021 (74,627) (0.01)USD 3,714,880 EUR 3,137,170 20 October 2021 (77,983) (0.01)USD 3,033,328 EUR 2,558,874 20 October 2021 (66,844) (0.01)USD 993,865 EUR 841,559 20 October 2021 (18,252) (0.00)USD 303,116 EUR 256,944 20 October 2021 (5,242) (0.00)USD 267,746 EUR 228,260 20 October 2021 (3,126) (0.00)USD 220,155 EUR 185,567 20 October 2021 (5,029) (0.00)USD 161,593 EUR 137,589 20 October 2021 (2,086) (0.00)USD 102,924 EUR 87,429 20 October 2021 (1,568) (0.00)USD 84,177 EUR 71,164 20 October 2021 (1,677) (0.00)USD 82,724 EUR 70,032 20 October 2021 (1,537) (0.00)USD 73,611 EUR 62,819 20 October 2021 (786) (0.00)USD 69,736 EUR 59,009 20 October 2021 (1,327) (0.00)
AXA ROSENBERG US EQUITY ALPHA FUND
Schedule of Investments (continued)As at September 30, 2021
126

Financial Derivative Instruments - (0.20)% (March 31, 2021: (0.22)%) (continued)Open Forward Foreign Currency Exchange Contracts* - (0.20)% (March 31, 2021: (0.22)%) (continued)
Currency Sold Currency BoughtSettlementDate
UnrealisedGain/(Loss)
USD
% ofNet
AssetsUSD 64,275 EUR 54,220 20 October 2021 (1,418) (0.00)USD 62,869 EUR 53,081 20 October 2021 (1,333) (0.00)USD 61,301 EUR 52,261 20 October 2021 (716) (0.00)USD 60,180 EUR 51,082 20 October 2021 (962) (0.00)USD 50,748 EUR 42,954 20 October 2021 (952) (0.00)USD 37,373 EUR 31,602 20 October 2021 (736) (0.00)USD 35,406 EUR 30,173 20 October 2021 (427) (0.00)USD 28,551 EUR 24,178 20 October 2021 (522) (0.00)USD 28,263 EUR 23,934 20 October 2021 (516) (0.00)USD 27,722 EUR 23,433 20 October 2021 (556) (0.00)USD 26,109 EUR 21,985 20 October 2021 (622) (0.00)USD 24,277 EUR 20,503 20 October 2021 (508) (0.00)USD 22,985 EUR 19,653 20 October 2021 (201) (0.00)USD 19,683 EUR 16,670 20 October 2021 (357) (0.00)USD 19,643 EUR 16,726 20 October 2021 (253) (0.00)USD 18,132 EUR 15,491 20 October 2021 (173) (0.00)USD 17,434 EUR 14,805 20 October 2021 (271) (0.00)USD 17,343 EUR 14,800 20 October 2021 (185) (0.00)USD 16,757 EUR 14,136 20 October 2021 (369) (0.00)USD 16,555 EUR 13,996 20 October 2021 (330) (0.00)USD 15,661 EUR 13,202 20 October 2021 (356) (0.00)USD 14,870 EUR 12,663 20 October 2021 (191) (0.00)USD 12,852 EUR 11,007 20 October 2021 (93) (0.00)USD 12,026 EUR 10,170 20 October 2021 (237) (0.00)USD 11,967 EUR 10,183 20 October 2021 (162) (0.00)USD 9,327 EUR 7,915 20 October 2021 (150) (0.00)USD 8,122 EUR 6,924 20 October 2021 (95) (0.00)USD 7,306 EUR 6,247 20 October 2021 (64) (0.00)USD 7,096 EUR 6,012 20 October 2021 (126) (0.00)USD 5,932 EUR 5,068 20 October 2021 (57) (0.00)USD 5,018 EUR 4,297 20 October 2021 (36) (0.00)USD 4,066 EUR 3,466 20 October 2021 (47) (0.00)USD 3,132 EUR 2,663 20 October 2021 (45) (0.00)USD 2,856 EUR 2,412 20 October 2021 (60) (0.00)USD 1,854 EUR 1,559 20 October 2021 (46) (0.00)USD 878 EUR 739 20 October 2021 (21) (0.00)USD 569 EUR 485 20 October 2021 (7) (0.00)USD 290 EUR 245 20 October 2021 (6) (0.00)USD 183 EUR 155 20 October 2021 (3) (0.00)USD 174 EUR 148 20 October 2021 (2) (0.00)USD 128 EUR 108 20 October 2021 (3) (0.00)USD 104 EUR 88 20 October 2021 (1) (0.00)USD 72 EUR 61 20 October 2021 (1) (0.00)USD 67 EUR 57 20 October 2021 (1) (0.00)USD 64 EUR 54 20 October 2021 (1) (0.00)USD 2 EUR 2 20 October 2021 - (0.00)
Unrealised gain on open forward foreign currency exchange contracts 71,761 0.00Unrealised loss on open forward foreign currency exchange contracts (2,239,550) (0.20)
Net unrealised loss on open forward foreign currency exchange contracts (2,167,789) (0.20)
AXA ROSENBERG US EQUITY ALPHA FUND
Schedule of Investments (continued)As at September 30, 2021
127

Fair ValueUSD
% ofNet
Assets
Total financial assets at fair valuethrough profit or loss 1,064,893,774 99.41
Cash at bank 7,847,849 0.73
Other Net Liabilities (1,558,574) (0.14)
Net Assets attributable toholders of redeemableparticipating units 1,071,183,049 100.00
*The counterparty for the open forward foreign contracts is State StreetBank and Trust Company.
Abbreviations used:REIT– Real Estate Investment Trust
Analysis of Total Assets
% ofTotal
Assets
Transferable securities admitted to an official exchange listing 99.12Over the counter financial derivative instruments 0.01Current Assets 0.87
Total Assets 100.00
AXA ROSENBERG US EQUITY ALPHA FUND
Schedule of Investments (continued)As at September 30, 2021
128

Listed below are all largest cumulative investment purchases and sales in excess of 1% of total purchases and sales for the period ended September 30, 2021.If there are fewer than twenty purchases or twenty sales that are greater than 1%, those purchases and such number of the next largest purchases/sales sothat at least twenty purchases/sales are disclosed.
Major Purchases SharesCostUSD
Agricultural Bank of China Ltd 379,000 153,107Cathay Financial Holding Co Ltd 78,000 140,650China Construction Bank Corp 164,000 137,569BHP Group Ltd 3,700 135,113National Australia Bank Ltd 5,586 115,057CTBC Financial Holding Co Ltd 134,000 108,808Quanta Computer Inc 31,000 107,694Sun Hung Kai Properties Ltd 7,000 107,362Rio Tinto Ltd 1,161 106,995Industrial & Commercial Bank of China Ltd 163,000 106,474Shenzhen Mindray Bio-Medical ElectronicsCo Ltd
1,200 89,529
Pinduoduo Inc - ADR 700 88,995Tata Consultancy Services Ltd 1,965 83,103Australia & New Zealand Banking GroupLtd
3,564 77,482
Ping An Insurance Group Co of China Ltd 7,500 76,626NetEase Inc - ADR 700 75,694Woodside Petroleum Ltd 4,139 73,185China Overseas Land & Investment Ltd 26,000 66,680Lenovo Group Ltd 58,000 66,645SITC International Holdings Co Ltd 18,000 61,674Tata Steel Ltd 4,002 61,339SEEK Ltd 2,587 61,173AU Optronics Corp 77,000 60,648Dongfeng Motor Group Co Ltd 64,000 60,050Acer Inc 50,000 59,214LG Display Co Ltd 2,765 57,380Industrial Bank Co Ltd 16,400 55,428Tongkun Group Co Ltd 15,600 54,453Novatek Microelectronics Corp 3,000 52,260COSCO SHIPPING Holdings Co Ltd 33,500 51,611China Taiping Insurance Holdings Co Ltd 27,000 50,925Macquarie Group Ltd 390 46,617Zoomlion Heavy Industry Science andTechnology Co Ltd
31,000 44,827
Seazen Group Ltd 46,000 44,306United Microelectronics Corp 26,000 44,102Colgate-Palmolive India Ltd 1,933 43,444China Medical System Holdings Ltd 19,000 43,367
Major Sales SharesProceeds
USDTaiwan Semiconductor Manufacturing CoLtd
43,000 911,870
Tencent Holdings Ltd 11,000 828,024Alibaba Group Holding Ltd - ADR 3,600 811,769Samsung Electronics Co Ltd 6,354 452,348Hong Kong Exchanges & Clearing Ltd 4,900 298,862Infosys Ltd 13,210 272,789Rio Tinto Ltd 3,036 268,283China Construction Bank Corp 345,000 266,206Wesfarmers Ltd 6,039 258,212SK Hynix Inc 2,308 252,278Tata Consultancy Services Ltd 5,277 235,049Shanxi Xinghuacun Fen Wine Factory CoLtd
3,620 233,712
Fortescue Metals Group Ltd 13,530 231,645Hon Hai Precision Industry Co Ltd 57,000 230,526Macquarie Group Ltd 1,812 211,406Bank of China Ltd 588,000 210,432Bank of Communications Co Ltd 315,000 207,274Luzhou Laojiao Co Ltd 5,700 205,517LG Electronics Inc 1,322 187,233Fubon Financial Holding Co Ltd 71,000 185,402
*AXA Rosenberg All-Country Asia Pacific Ex-Japan Equity Alpha Fund terminated on July 30, 2021.
AXA ROSENBERG ALL-COUNTRY ASIA PACIFIC EX-JAPAN EQUITY ALPHAFUND*Statement of Major Portfolio Changes for the Accounting Period to September 30, 2021
129

Listed below are all largest cumulative investment purchases and sales in excess of 1% of total purchases and sales for the period ended September 30, 2021.If there are fewer than twenty purchases or twenty sales that are greater than 1%, those purchases and such number of the next largest purchases/sales sothat at least twenty purchases/sales are disclosed.
Major Purchases SharesCostUSD
King Yuan Electronics Co Ltd 1,337,000 2,111,395Charter Hall Group (REIT) 154,127 2,020,433Boral Ltd 423,496 1,982,777Brickworks Ltd 100,008 1,807,610Oracle Financial Services Software Ltd 35,332 1,769,412Bank of Queensland Ltd 271,117 1,766,457Lonking Holdings Ltd 4,014,000 1,727,554REC Ltd 936,467 1,655,992Compal Electronics Inc 1,726,000 1,615,132Yue Yuen Industrial Holdings Ltd 631,000 1,610,971NetDragon Websoft Holdings Ltd 560,500 1,563,176Heartland Group Holdings Ltd 1,052,992 1,554,050Coromandel International Ltd 132,371 1,506,656Union Bank of India 3,233,873 1,500,276BNK Financial Group Inc 247,085 1,499,729Metcash Ltd 509,462 1,473,505Hang Lung Group Ltd 573,000 1,468,393Sitronix Technology Corp 142,000 1,415,883Union Bank Of Taiwan 3,356,000 1,407,829Capital Securities Corp 2,334,000 1,399,986
Major Sales SharesProceeds
USDBoral Ltd 522,152 2,738,361King Yuan Electronics Co Ltd 1,337,000 2,168,418Mineral Resources Ltd 50,270 2,043,964YFY Inc 1,406,000 1,855,808JB Hi-Fi Ltd 51,003 1,836,515Seven Group Holdings Ltd 111,732 1,779,868OZ Minerals Ltd 88,274 1,614,388Shin Kong Financial Holding Co Ltd 4,315,000 1,525,608Elan Microelectronics Corp 233,000 1,495,917USI Corp 1,177,000 1,492,874Hindustan Petroleum Corp Ltd 433,202 1,488,034VTech Holdings Ltd 156,700 1,453,240Nantex Industry Co Ltd 301,000 1,449,075Union Bank Of Taiwan 3,356,000 1,436,305nib holdings Ltd 276,326 1,407,411Capital Securities Corp 2,502,000 1,405,930Genertec Universal Medical Group Co Ltd 1,569,000 1,369,199ENNOSTAR Inc 479,000 1,364,848Persistent Systems Ltd 35,224 1,364,446Yue Yuen Industrial Holdings Ltd 631,000 1,347,739
AXA ROSENBERG ALL COUNTRY ASIA PACIFIC EX-JAPAN SMALL CAP ALPHAFUNDStatement of Major Portfolio Changes for the Accounting Period to September 30, 2021
130

Listed below are all largest cumulative investment purchases and sales in excess of 1% of total purchases and sales for the period ended September 30, 2021.If there are fewer than twenty purchases or twenty sales that are greater than 1%, those purchases and such number of the next largest purchases/sales sothat at least twenty purchases/sales are disclosed.
Major Purchases SharesCostEUR
Koninklijke Ahold Delhaize NV 68,564 1,693,076Societe Generale SA 63,636 1,618,476Cie Generale des Etablissements MichelinSCA
12,340 1,600,652
SAP SE 12,356 1,510,371Telefonica SA 392,289 1,480,233ASML Holding NV 2,682 1,470,200Aegon NV 398,959 1,440,237Merck KGaA 7,214 1,336,171Sanofi 14,750 1,308,153ASR Nederland NV 34,471 1,307,247Banco Santander SA 402,153 1,214,118KBC Group NV 17,486 1,211,499Schaeffler AG (Preference Shares) 150,036 1,167,877KION Group AG 13,465 1,166,684Nokia OYJ 239,252 1,127,253E.ON SE 106,793 1,109,622Brenntag SE 13,152 1,088,536Azimut Holding SpA 51,850 1,080,854Interpump Group SpA 20,952 1,073,006Capgemini SE 6,714 1,028,856Airbus SE 9,090 1,021,456Societe BIC SA 16,967 1,004,531Arkema SA 9,220 995,411Smurfit Kappa Group PLC 19,709 970,045Stora Enso OYJ 62,910 943,654Kesko OYJ 24,132 794,674Umicore SA 13,495 792,396Kloeckner & Co SE 79,126 789,273United Internet AG 22,466 780,365Orange SA 74,861 773,657Electricite de France SA 72,970 763,808Dassault Systemes SE 4,139 757,518ArcelorMittal SA 29,798 756,728Jeronimo Martins SGPS SA 43,199 756,486ANDRITZ AG 15,997 748,243TietoEVRY OYJ 24,956 734,616Telecom Italia SpA 1,658,678 718,726
Major Sales SharesProceeds
EURASML Holding NV 5,416 3,392,339Siemens AG 23,739 3,389,846Pernod Ricard SA 10,147 1,870,354ASM International NV 4,641 1,580,970Akzo Nobel NV 14,219 1,472,369AXA SA 67,231 1,465,021Orange SA 140,457 1,322,053Stora Enso OYJ 80,783 1,305,716Enel SpA 153,294 1,275,479Vivendi SE 41,008 1,153,668Credit Agricole SA 89,620 1,124,998Atos SE 20,453 1,100,548Aegon NV 259,539 1,047,781Telecom Italia SpA 2,742,936 1,030,743Henkel AG & Co KGaA (Preference Shares) 11,315 981,615SAP SE 7,691 972,511Infineon Technologies AG 29,065 955,565BNP Paribas SA 17,453 923,934ArcelorMittal SA 34,420 879,522UPM-Kymmene OYJ 25,809 854,584Ageas SA 17,634 852,573Proximus SADP 50,700 846,655Red Electrica Corp SA 52,678 837,982Kesko OYJ 31,924 820,016Metropole Television SA 44,995 810,516Aurubis AG 12,171 798,028Societe Generale SA 29,546 780,578Koninklijke Philips NV 17,086 778,601Bechtle AG 4,712 778,519Eni SpA 72,497 755,279TietoEVRY OYJ 27,923 753,164Banca Generali SpA 23,914 749,149LVMH Moet Hennessy Louis Vuitton SE 1,182 726,521Sopra Steria Group 4,229 699,547Jungheinrich AG (Preference shares) 16,204 678,506
AXA ROSENBERG EUROBLOC EQUITY ALPHA FUND
Statement of Major Portfolio Changes for the Accounting Period to September 30, 2021
131

Listed below are all largest cumulative investment purchases and sales in excess of 1% of total purchases and sales for the period ended September 30, 2021.If there are fewer than twenty purchases or twenty sales that are greater than 1%, those purchases and such number of the next largest purchases/sales sothat at least twenty purchases/sales are disclosed.
Major Purchases SharesCostUSD
Gazprom PJSC - ADR 239,907 1,527,001MediaTek Inc 44,000 1,513,325Tata Consultancy Services Ltd 32,153 1,415,334NAVER Corp 3,576 1,284,888Industrial & Commercial Bank of China Ltd 2,146,000 1,210,713Wuxi Biologics Cayman Inc 81,000 1,200,701HCL Technologies Ltd 84,990 1,184,877Li Ning Co Ltd 81,500 961,183PTT PCL - NVDR 743,300 956,488Evergreen Marine Corp Taiwan Ltd 224,000 851,528NIO Inc - ADR 20,400 792,336Agricultural Bank of China Ltd 2,043,000 774,304Fomento Economico Mexicano SAB de CV 93,200 754,971Emirates NBD Bank PJSC 198,392 737,626China Construction Bank Corp 834,000 699,676CSPC Pharmaceutical Group Ltd 456,000 692,303Ecopetrol SA - ADR 51,600 683,820Hyundai Mobis Co Ltd 2,845 662,812CTBC Financial Holding Co Ltd 809,000 656,832Banco BTG Pactual SA Unit 123,000 641,991
Major Sales SharesProceeds
USDTata Consultancy Services Ltd 51,459 2,248,566HCL Technologies Ltd 125,892 1,759,701Infosys Ltd 75,650 1,649,245United Microelectronics Corp 611,000 1,286,651Naspers Ltd 6,379 1,278,938Luzhou Laojiao Co Ltd 29,900 1,124,502NAVER Corp 2,963 1,017,358MediaTek Inc 28,000 934,024LG Electronics Inc 6,597 906,232BeiGene Ltd - ADR 2,900 872,687Alibaba Group Holding Ltd - ADR 4,300 852,670WEG SA 98,600 813,786Tencent Holdings Ltd 13,300 793,360Hon Hai Precision Industry Co Ltd 195,000 762,478Samsung Electronics Co Ltd 11,569 758,882Telefonica Brasil SA 92,500 740,058Ecopetrol SA - ADR 55,300 732,867Gazprom PJSC - ADR 92,514 716,849KB Financial Group Inc 15,652 703,868CTBC Financial Holding Co Ltd 809,000 653,208Baoshan Iron & Steel Co Ltd 379,100 650,498Industrial Bank Co Ltd 178,100 645,129Shinhan Financial Group Co Ltd 19,019 634,553New Oriental Education & TechnologyGroup Inc - ADR
83,600 623,986
AXA ROSENBERG GLOBAL EMERGING MARKETS EQUITY ALPHA FUND
Statement of Major Portfolio Changes for the Accounting Period to September 30, 2021
132

Listed below are all largest cumulative investment purchases and sales in excess of 1% of total purchases and sales for the period ended September 30, 2021.If there are fewer than twenty purchases or twenty sales that are greater than 1%, those purchases and such number of the next largest purchases/sales sothat at least twenty purchases/sales are disclosed.
Major Purchases SharesCostUSD
Adobe Inc 21,000 11,797,027NVIDIA Corp 28,200 6,764,914AT&T Inc 231,100 6,524,105Bristol-Myers Squibb Co 90,800 6,047,051Cummins Inc 20,100 4,961,097Capital One Financial Corp 28,500 4,944,757DBS Group Holdings Ltd 215,800 4,905,600Mitsui & Co Ltd 214,300 4,903,267JPMorgan Chase & Co 29,000 4,471,480Synopsys Inc 13,700 4,376,783S&P Global Inc 9,700 4,323,659Visa Inc 18,400 4,166,132LyondellBasell Industries NV 42,400 4,091,492Koninklijke Ahold Delhaize NV 135,605 4,061,346Mastercard Inc 9,800 3,779,438Nutrien Ltd 62,700 3,744,445AbbVie Inc 32,500 3,565,404Regeneron Pharmaceuticals Inc 5,300 3,402,533Gilead Sciences Inc 47,400 3,210,840Berkshire Hathaway Inc 11,700 3,209,846
Major Sales SharesProceeds
USDASML Holding NV 8,361 6,480,316Adobe Inc 11,600 5,539,337Bank of Montreal 52,100 5,368,593General Mills Inc 76,900 4,580,761eBay Inc 71,300 4,449,205Netflix Inc 8,300 4,384,182Facebook Inc 13,000 4,314,444Bank of New York Mellon Corp 77,800 4,206,671Telefonaktiebolaget LM Ericsson 336,016 3,949,857Walt Disney Co 20,100 3,764,548Autodesk Inc 10,700 3,459,453Colgate-Palmolive Co 42,200 3,284,006Mitsubishi UFJ Financial Group Inc 550,500 3,176,565Thermo Fisher Scientific Inc 6,300 3,176,451Arthur J Gallagher & Co 22,400 3,157,306SAP SE 20,962 3,112,733American International Group Inc 54,900 2,926,858Akzo Nobel NV 22,659 2,863,210Hartford Financial Services Group Inc 41,600 2,721,353UnitedHealth Group Inc 6,900 2,686,694
AXA ROSENBERG GLOBAL EQUITY ALPHA FUND
Statement of Major Portfolio Changes for the Accounting Period to September 30, 2021
133

Listed below are all largest cumulative investment purchases and sales in excess of 1% of total purchases and sales for the period ended September 30, 2021.If there are fewer than twenty purchases or twenty sales that are greater than 1%, those purchases and such number of the next largest purchases/sales sothat at least twenty purchases/sales are disclosed.
Major Purchases SharesCostUSD
Williams-Sonoma Inc 9,600 1,579,822Entegris Inc 12,200 1,495,470SYNNEX Corp 12,100 1,412,333Primerica Inc 8,400 1,332,201Toro Co 11,500 1,277,384Rexel SA 59,440 1,248,827US Foods Holding Corp 35,900 1,245,852Bruker Corp 14,800 1,184,155Quanta Services Inc 12,200 1,179,100Jabil Inc 22,100 1,167,793Envista Holdings Corp 27,000 1,155,161Medpace Holdings Inc 6,400 1,154,753Jones Lang LaSalle Inc 5,600 1,153,852Kilroy Realty Corp (REIT) 16,500 1,113,250Schaeffler AG (Preference Shares) 120,890 1,110,530STAAR Surgical Co 8,000 1,102,379Premier Inc 28,300 1,075,501BJ’s Wholesale Club Holdings Inc 18,800 1,055,472Intrum AB 34,548 1,042,806Credit Acceptance Corp 2,400 1,040,658
Major Sales SharesProceeds
USDCharles River Laboratories InternationalInc
5,400 1,913,590
Williams-Sonoma Inc 11,000 1,794,000Toro Co 14,200 1,581,866First Solar Inc 14,500 1,365,963Snap-on Inc 5,500 1,288,524Evercore Inc 9,000 1,287,364Atos SE 18,944 1,260,501M&G PLC 394,946 1,246,035First American Financial Corp 18,300 1,231,629Louisiana-Pacific Corp 20,500 1,231,058Jabil Inc 22,100 1,197,964LPL Financial Holdings Inc 8,600 1,188,290Outfront Media Inc (REIT) 49,200 1,151,786Casino Guichard Perrachon SA 35,341 1,132,332NetScout Systems Inc 41,300 1,129,553Builders FirstSource Inc 26,400 1,107,245Interactive Brokers Group Inc 15,700 1,047,505SYNNEX Corp 8,200 997,206Avnet Inc 24,900 982,576Credit Acceptance Corp 1,700 981,276
AXA ROSENBERG GLOBAL SMALL CAP ALPHA FUND
Statement of Major Portfolio Changes for the Accounting Period to September 30, 2021
134

Listed below are all largest cumulative investment purchases and sales in excess of 1% of total purchases and sales for the period ended September 30, 2021.If there are fewer than twenty purchases or twenty sales that are greater than 1%, those purchases and such number of the next largest purchases/sales sothat at least twenty purchases/sales are disclosed.
Major Purchases SharesCostJPY
Mitsubishi Electric Corp 47,000 79,158,744Hakuhodo DY Holdings Inc 38,800 73,889,180SoftBank Corp 49,100 70,612,693Kao Corp 8,200 59,167,944Rengo Co Ltd 54,700 52,149,657Nippon Yusen KK 10,800 48,456,320Japan Post Insurance Co Ltd 21,000 45,392,479Senko Group Holdings Co Ltd 41,600 43,101,007NSD Co Ltd 22,700 41,960,297Nippon Light Metal Holdings Co Ltd 18,100 39,701,961Tokai Tokyo Financial Holdings Inc 91,000 37,870,642ENEOS Holdings Inc 76,400 36,690,008Sompo Holdings Inc 7,900 35,028,24477 Bank Ltd 25,700 34,695,463Murata Manufacturing Co Ltd 3,500 31,889,913Chugai Pharmaceutical Co Ltd 7,200 30,918,972Life Corp 7,800 28,667,097TOMONY Holdings Inc 91,900 27,804,336Shimano Inc 1,100 27,489,743Itochu Enex Co Ltd 25,100 27,486,873Arcland Sakamoto Co Ltd 18,800 27,382,315Kyokuto Kaihatsu Kogyo Co Ltd 15,500 27,199,153GungHo Online Entertainment Inc 11,700 26,838,104Nabtesco Corp 5,100 26,098,325Sumitomo Realty & Development Co Ltd 7,000 25,657,995Scroll Corp 23,600 25,292,360A&D Co Ltd 16,700 23,772,287MS&AD Insurance Group Holdings Inc 7,400 23,756,775Hyakugo Bank Ltd 74,600 23,223,479Nitori Holdings Co Ltd 1,200 23,015,902Asahi Co Ltd 14,700 22,737,689Sumitomo Chemical Co Ltd 38,800 22,471,939TechnoPro Holdings Inc 2,400 21,517,633Miyazaki Bank Ltd 10,200 21,016,883Furuno Electric Co Ltd 17,100 19,962,272Bandai Namco Holdings Inc 2,500 19,766,328Kamei Corp 16,700 19,355,413Nexon Co Ltd 7,400 19,338,199Toyo Construction Co Ltd 33,300 18,791,813Shikoku Bank Ltd 26,700 18,528,127Juroku Bank Ltd 9,100 18,067,630MrMax Holdings Ltd 25,400 18,030,792
Major Sales SharesProceeds
JPYToyota Motor Corp 39,300 382,403,846Sony Group Corp 28,288 299,672,272SoftBank Group Corp 32,800 256,952,492Honda Motor Co Ltd 62,600 217,764,119Tokyo Electron Ltd 4,400 212,568,210Nintendo Co Ltd 3,203 205,186,666Keyence Corp 3,600 202,491,236Fujitsu Ltd 8,900 164,685,860Murata Manufacturing Co Ltd 19,600 161,083,261Sumitomo Chemical Co Ltd 261,600 154,202,526Mitsubishi UFJ Financial Group Inc 238,900 143,429,779Mitsubishi Electric Corp 80,500 137,573,466Advantest Corp 12,100 123,749,389Nitto Denko Corp 14,200 123,204,329Otsuka Holdings Co Ltd 27,300 122,287,204Daito Trust Construction Co Ltd 10,100 121,582,400Recruit Holdings Co Ltd 21,900 121,442,857Chugai Pharmaceutical Co Ltd 27,400 119,126,852SMC Corp 1,800 117,686,239SoftBank Corp 79,500 115,121,204
*AXA Rosenberg Japan Enhanced Index Equity Alpha Fund terminated on June 30, 2021.
AXA ROSENBERG JAPAN ENHANCED INDEX EQUITY ALPHA FUND*
Statement of Major Portfolio Changes for the Accounting Period to September 30, 2021
135

Listed below are all largest cumulative investment purchases and sales in excess of 1% of total purchases and sales for the period ended September 30, 2021.If there are fewer than twenty purchases or twenty sales that are greater than 1%, those purchases and such number of the next largest purchases/sales sothat at least twenty purchases/sales are disclosed.
Major Purchases SharesCostJPY
Mizuho Financial Group Inc 227,200 373,340,678Toyota Motor Corp 38,000 372,801,709SoftBank Corp 242,600 354,737,462Mitsui & Co Ltd 137,400 339,640,378Nippon Telegraph & Telephone Corp 112,200 324,066,547Mitsubishi UFJ Financial Group Inc 535,200 319,757,792SMC Corp 4,000 314,989,853Recruit Holdings Co Ltd 44,000 280,402,481MS&AD Insurance Group Holdings Inc 78,200 256,114,472Sumitomo Electric Industries Ltd 159,000 249,992,831Oracle Corp Japan 26,500 237,931,930Murata Manufacturing Co Ltd 27,000 233,295,533Hoya Corp 14,700 215,739,464Keyence Corp 3,300 198,756,260Kubota Corp 81,800 187,668,383Mitsubishi Chemical Holdings Corp 197,900 184,826,309Nippon Yusen KK 37,800 182,147,839Nintendo Co Ltd 3,100 180,535,820Dai-ichi Life Holdings Inc 79,700 168,676,911Nabtesco Corp 32,900 160,225,290Chugai Pharmaceutical Co Ltd 36,500 155,835,153
Major Sales SharesProceeds
JPYMizuho Financial Group Inc 225,700 364,948,941Nippon Telegraph & Telephone Corp 116,300 354,554,776Nippon Yusen KK 23,400 220,418,852SMC Corp 3,200 214,824,200SoftBank Corp 133,800 190,224,365Daiwa House Industry Co Ltd 53,000 189,167,724ORIX Corp 86,800 171,326,997Kubota Corp 73,900 164,418,184Nabtesco Corp 32,900 156,693,988Toyota Tsusho Corp 29,400 154,919,520Nomura Holdings Inc 259,400 148,898,440Toyota Motor Corp 14,200 140,223,761Murata Manufacturing Co Ltd 15,000 136,692,916TDK Corp 10,700 135,466,541Daito Trust Construction Co Ltd 10,900 131,212,689Astellas Pharma Inc 61,100 117,231,490AEON Financial Service Co Ltd 85,500 114,479,729Ryohin Keikaku Co Ltd 46,100 112,485,132Ebara Corp 20,000 110,126,727Isuzu Motors Ltd 73,000 109,661,062Sumitomo Mitsui Trust Holdings Inc 29,400 105,276,686Kirin Holdings Co Ltd 52,100 101,980,253Mabuchi Motor Co Ltd 24,700 97,758,388MonotaRO Co Ltd 36,900 95,014,433Hitachi Ltd 14,300 94,276,106Sugi Holdings Co Ltd 11,900 92,678,129Welcia Holdings Co Ltd 24,900 92,223,057Tokio Marine Holdings Inc 17,000 90,717,794FANUC Corp 3,300 90,213,505Mitsubishi Chemical Holdings Corp 90,300 85,229,868
AXA ROSENBERG JAPAN EQUITY ALPHA FUND
Statement of Major Portfolio Changes for the Accounting Period to September 30, 2021
136

Listed below are all largest cumulative investment purchases and sales in excess of 1% of total purchases and sales for the period ended September 30, 2021.If there are fewer than twenty purchases or twenty sales that are greater than 1%, those purchases and such number of the next largest purchases/sales sothat at least twenty purchases/sales are disclosed.
Major Purchases SharesCostJPY
FCC Co Ltd 79,300 134,603,977Matsumotokiyoshi Holdings Co Ltd 24,800 120,926,930Mitsui OSK Lines Ltd 27,300 118,794,866Teijin Ltd 64,200 115,902,362Kuraray Co Ltd 102,100 107,541,249NEC Networks & System Integration Corp 46,900 103,385,981Yamada Holdings Co Ltd 169,100 87,430,145Morinaga Milk Industry Co Ltd 14,700 87,361,601Toyo Tire Corp 41,600 85,476,432Takara Bio Inc 27,600 85,446,419KYB Corp 21,500 82,249,944Pasona Group Inc 33,900 80,974,023Asics Corp 28,800 79,063,264Noritz Corp 40,300 75,341,181Juroku Bank Ltd 37,000 73,190,705Toyota Boshoku Corp 32,100 72,666,280Kyokuto Kaihatsu Kogyo Co Ltd 41,100 71,943,959Eizo Corp 16,800 71,643,845Nippon Light Metal Holdings Co Ltd 31,400 68,875,225Yokohama Rubber Co Ltd 32,100 68,185,059TechnoPro Holdings Inc 15,500 67,763,946Haseko Corp 44,500 67,451,315Starts Corp Inc 23,800 66,672,754Earth Corp 9,700 62,247,047Arata Corp 14,200 60,323,128Konica Minolta Inc 91,700 58,852,196Canon Marketing Japan Inc 21,800 57,830,865Asahi Co Ltd 41,400 57,785,108Nanto Bank Ltd 30,700 56,975,683Exedy Corp 33,600 56,930,524Kojima Co Ltd 61,300 56,865,108Toyo Seikan Group Holdings Ltd 36,000 55,531,536Digital Holdings Inc 27,300 54,598,722Hyakugo Bank Ltd 173,800 54,077,349Wacom Co Ltd 72,900 51,559,757H2O Retailing Corp 51,500 49,128,033Pigeon Corp 16,000 48,739,302Sumitomo Rubber Industries Ltd 30,100 46,101,362
Major Sales SharesProceeds
JPYEbara Corp 27,000 148,864,125Kaken Pharmaceutical Co Ltd 22,800 114,754,529Sugi Holdings Co Ltd 14,100 109,811,901Kohnan Shoji Co Ltd 27,100 102,150,056Anritsu Corp 45,900 95,539,582Mitsui OSK Lines Ltd 13,100 95,365,882Benefit One Inc 23,400 94,782,061Goldwin Inc 14,100 93,653,727EDION Corp 81,600 88,038,454Kanematsu Corp 59,400 87,103,709Shoei Co Ltd 18,100 79,994,556Sundrug Co Ltd 21,300 79,866,007Meidensha Corp 34,400 76,959,245FCC Co Ltd 44,400 75,720,013Mabuchi Motor Co Ltd 18,900 75,637,752Matsumotokiyoshi Holdings Co Ltd 15,300 70,601,335Japan Petroleum Exploration Co Ltd 39,000 70,186,047Pasona Group Inc 32,600 69,130,732TOKAI Holdings Corp 73,000 65,155,836Kyoei Steel Ltd 45,000 64,732,317Hamakyorex Co Ltd 20,100 60,893,768Exedy Corp 36,100 59,418,091BeNEXT Group Inc 44,100 56,485,816Hyakugo Bank Ltd 173,800 56,403,563Izumi Co Ltd 13,000 54,891,526Hosiden Corp 48,700 54,721,853Dai-Dan Co Ltd 20,500 53,712,674YAMABIKO Corp 42,800 52,639,745Nisshin Oillio Group Ltd 16,700 51,183,350Shinko Electric Industries Co Ltd 14,700 51,111,769Takeuchi Manufacturing Co Ltd 19,500 50,773,013IHI Corp 17,600 46,855,310
AXA ROSENBERG JAPAN SMALL CAP ALPHA FUND
Statement of Major Portfolio Changes for the Accounting Period to September 30, 2021
137
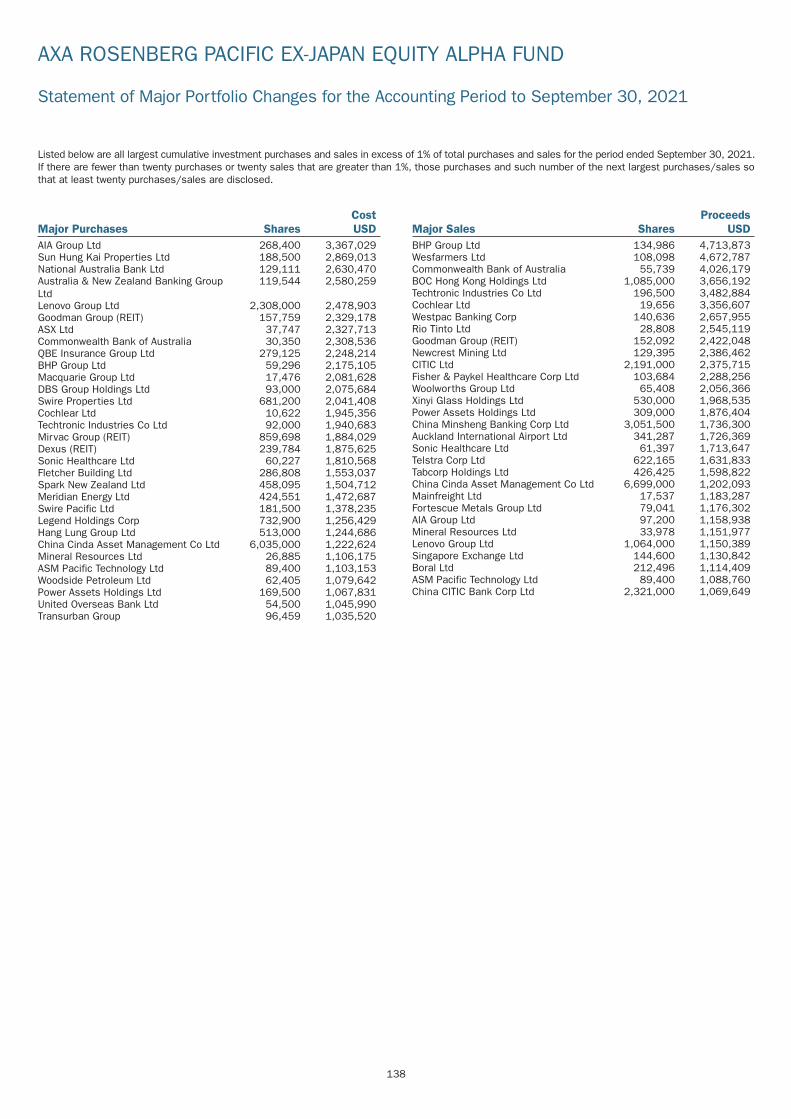
Listed below are all largest cumulative investment purchases and sales in excess of 1% of total purchases and sales for the period ended September 30, 2021.If there are fewer than twenty purchases or twenty sales that are greater than 1%, those purchases and such number of the next largest purchases/sales sothat at least twenty purchases/sales are disclosed.
Major Purchases SharesCostUSD
AIA Group Ltd 268,400 3,367,029Sun Hung Kai Properties Ltd 188,500 2,869,013National Australia Bank Ltd 129,111 2,630,470Australia & New Zealand Banking GroupLtd
119,544 2,580,259
Lenovo Group Ltd 2,308,000 2,478,903Goodman Group (REIT) 157,759 2,329,178ASX Ltd 37,747 2,327,713Commonwealth Bank of Australia 30,350 2,308,536QBE Insurance Group Ltd 279,125 2,248,214BHP Group Ltd 59,296 2,175,105Macquarie Group Ltd 17,476 2,081,628DBS Group Holdings Ltd 93,000 2,075,684Swire Properties Ltd 681,200 2,041,408Cochlear Ltd 10,622 1,945,356Techtronic Industries Co Ltd 92,000 1,940,683Mirvac Group (REIT) 859,698 1,884,029Dexus (REIT) 239,784 1,875,625Sonic Healthcare Ltd 60,227 1,810,568Fletcher Building Ltd 286,808 1,553,037Spark New Zealand Ltd 458,095 1,504,712Meridian Energy Ltd 424,551 1,472,687Swire Pacific Ltd 181,500 1,378,235Legend Holdings Corp 732,900 1,256,429Hang Lung Group Ltd 513,000 1,244,686China Cinda Asset Management Co Ltd 6,035,000 1,222,624Mineral Resources Ltd 26,885 1,106,175ASM Pacific Technology Ltd 89,400 1,103,153Woodside Petroleum Ltd 62,405 1,079,642Power Assets Holdings Ltd 169,500 1,067,831United Overseas Bank Ltd 54,500 1,045,990Transurban Group 96,459 1,035,520
Major Sales SharesProceeds
USDBHP Group Ltd 134,986 4,713,873Wesfarmers Ltd 108,098 4,672,787Commonwealth Bank of Australia 55,739 4,026,179BOC Hong Kong Holdings Ltd 1,085,000 3,656,192Techtronic Industries Co Ltd 196,500 3,482,884Cochlear Ltd 19,656 3,356,607Westpac Banking Corp 140,636 2,657,955Rio Tinto Ltd 28,808 2,545,119Goodman Group (REIT) 152,092 2,422,048Newcrest Mining Ltd 129,395 2,386,462CITIC Ltd 2,191,000 2,375,715Fisher & Paykel Healthcare Corp Ltd 103,684 2,288,256Woolworths Group Ltd 65,408 2,056,366Xinyi Glass Holdings Ltd 530,000 1,968,535Power Assets Holdings Ltd 309,000 1,876,404China Minsheng Banking Corp Ltd 3,051,500 1,736,300Auckland International Airport Ltd 341,287 1,726,369Sonic Healthcare Ltd 61,397 1,713,647Telstra Corp Ltd 622,165 1,631,833Tabcorp Holdings Ltd 426,425 1,598,822China Cinda Asset Management Co Ltd 6,699,000 1,202,093Mainfreight Ltd 17,537 1,183,287Fortescue Metals Group Ltd 79,041 1,176,302AIA Group Ltd 97,200 1,158,938Mineral Resources Ltd 33,978 1,151,977Lenovo Group Ltd 1,064,000 1,150,389Singapore Exchange Ltd 144,600 1,130,842Boral Ltd 212,496 1,114,409ASM Pacific Technology Ltd 89,400 1,088,760China CITIC Bank Corp Ltd 2,321,000 1,069,649
AXA ROSENBERG PACIFIC EX-JAPAN EQUITY ALPHA FUND
Statement of Major Portfolio Changes for the Accounting Period to September 30, 2021
138

Listed below are all largest cumulative investment purchases and sales in excess of 1% of total purchases and sales for the period ended September 30, 2021.If there are fewer than twenty purchases or twenty sales that are greater than 1%, those purchases and such number of the next largest purchases/sales sothat at least twenty purchases/sales are disclosed.
Major Purchases SharesCostEUR
Bayerische Motoren Werke AG 3,127 275,951Roche Holding AG 936 264,120Orange SA 24,638 257,741Kingfisher PLC 53,905 226,915Capgemini SE 1,353 207,334Banco Santander SA 62,004 206,426Kering SA 287 197,784Compass Group PLC 10,536 182,778BHP Group PLC 6,488 168,770Johnson Matthey PLC 3,503 131,448Barclays PLC 59,419 131,003National Grid PLC 10,814 114,546Danone SA 1,908 111,220ASM International NV 406 93,681Telecom Italia SpA 208,480 92,456Skanska AB 3,916 90,021Deutsche Boerse AG 584 86,520Koninklijke Ahold Delhaize NV 3,399 81,306Henkel AG & Co KGaA (Preference Shares) 839 81,236Heineken NV 800 78,850Engie SA 5,640 74,186KION Group AG 841 71,557Nokia OYJ 17,459 71,488AP Moller - Maersk A/S 34 71,213UniCredit SpA 6,563 67,260Edenred 1,410 66,531Koninklijke Philips NV 1,294 65,494Cellnex Telecom SA 1,356 62,126ArcelorMittal SA 2,406 59,962Fresenius SE & Co KGaA 1,291 57,330Worldline SA 733 54,570Kerry Group PLC 488 54,479SAP SE 475 53,176NN Group NV 1,115 47,379E.ON SE 4,623 46,434
Major Sales SharesProceeds
EURRoche Holding AG 4,007 1,215,403ASML Holding NV 1,847 1,053,318Nestle SA 9,937 1,048,901L’Oreal SA 1,844 700,377Siemens AG 5,063 697,798LVMH Moet Hennessy Louis Vuitton SE 1,036 691,498SAP SE 5,781 673,814Allianz SE 3,015 648,059Novartis AG 8,059 615,107Novo Nordisk A/S 8,499 583,217Rio Tinto PLC 8,158 570,862Kering SA 673 497,696Royal Dutch Shell PLC (Class A Shares) 28,378 480,244Diageo PLC 12,127 478,899UBS Group AG 36,331 473,829Unilever PLC (GBP) 9,367 465,417Iberdrola SA 44,601 464,872Daimler AG 5,808 452,056Schneider Electric SE 3,270 439,596Pernod Ricard SA 2,424 437,583Sanofi 4,889 425,844
*AXA Rosenberg Pan-European Enhanced Index Equity Alpha Fund terminated on June 30, 2021.
AXA ROSENBERG PAN-EUROPEAN ENHANCED INDEX EQUITY ALPHA FUND*
Statement of Major Portfolio Changes for the Accounting Period to September 30, 2021
139

Listed below are all largest cumulative investment purchases and sales in excess of 1% of total purchases and sales for the period ended September 30, 2021.If there are fewer than twenty purchases or twenty sales that are greater than 1%, those purchases and such number of the next largest purchases/sales sothat at least twenty purchases/sales are disclosed.
Major Purchases SharesCostEUR
Novartis AG 11,706 926,764Nestle SA 8,527 852,263Skanska AB 36,044 839,722Kering SA 1,094 773,089Kingfisher PLC 182,266 772,253LVMH Moet Hennessy Louis Vuitton SE 1,208 772,014Daimler AG 9,993 753,724Roche Holding AG 2,229 696,281Orange SA 70,822 693,296Deutsche Post AG 11,571 671,883GlaxoSmithKline PLC 36,309 642,110Experian PLC 16,965 564,722Rio Tinto PLC 7,977 560,459Alcon Inc 7,782 554,333Banco Santander SA 168,551 549,887Koninklijke Ahold Delhaize NV 22,261 545,867SAP SE 4,028 508,831Equinor ASA 28,192 502,491Cie Generale des Etablissements MichelinSCA
3,865 501,339
Sanofi 5,325 476,077Coca-Cola HBC AG 16,599 471,210Kesko OYJ 14,941 463,908Unilever PLC (GBP) 9,106 457,861Telefonica SA 116,507 449,175Allianz SE 2,148 448,968AstraZeneca PLC 4,327 441,836Royal Dutch Shell PLC (Class A Shares) 25,987 441,589Cie Financiere Richemont SA 4,283 441,581Spirax-Sarco Engineering PLC 2,302 429,661
Major Sales SharesProceeds
EUROrange SA 97,662 957,183Siemens AG 5,684 810,159ASML Holding NV 1,056 624,748Royal Dutch Shell PLC (Class A Shares) 35,795 606,007Pernod Ricard SA 3,241 594,780Novartis AG 8,067 590,784Daimler AG 7,606 589,097Akzo Nobel NV 5,656 575,760Rio Tinto PLC 9,362 557,322Schneider Electric SE 3,612 522,874Telefonaktiebolaget LM Ericsson 51,827 502,671Ageas SA 9,522 448,379Nestle SA 4,077 427,813Telecom Italia SpA 1,131,748 427,172Kesko OYJ 16,586 426,036Aviva PLC 84,073 407,420Cie Financiere Richemont SA 4,268 403,306Logitech International SA 3,938 402,437SAP SE 3,287 395,602Credit Agricole SA 31,854 394,978AstraZeneca PLC 4,391 378,384Skanska AB 15,699 366,757Sonova Holding AG 1,065 359,933Diageo PLC 8,919 351,046Kingfisher PLC 80,952 349,396Credit Suisse Group AG 39,490 341,418Enel SpA 39,892 336,096BNP Paribas SA 6,101 322,977
AXA ROSENBERG PAN-EUROPEAN EQUITY ALPHA FUND
Statement of Major Portfolio Changes for the Accounting Period to September 30, 2021
140

Listed below are all largest cumulative investment purchases and sales in excess of 1% of total purchases and sales for the period ended September 30, 2021.If there are fewer than twenty purchases or twenty sales that are greater than 1%, those purchases and such number of the next largest purchases/sales sothat at least twenty purchases/sales are disclosed.
Major Purchases SharesCostUSD
Adobe Inc 91,800 51,454,957PACCAR Inc 311,700 26,069,507Microsoft Corp 99,200 25,594,493AT&T Inc 899,000 25,355,126Keysight Technologies Inc 159,000 25,329,616Accenture PLC 79,700 24,898,224Bristol-Myers Squibb Co 327,500 22,029,026AbbVie Inc 175,800 20,110,139Edwards Lifesciences Corp 183,600 20,081,3363M Co 107,100 19,309,027IDEXX Laboratories Inc 27,500 18,278,436S&P Global Inc 41,000 18,055,884Intuit Inc 34,500 17,722,028NVIDIA Corp 83,900 17,622,096Teradyne Inc 140,400 17,023,340Synopsys Inc 52,800 16,937,443Capital One Financial Corp 98,100 16,253,107Lowe’s Cos Inc 82,400 16,110,008ServiceNow Inc 27,500 16,099,232Cummins Inc 60,400 15,064,789Lumen Technologies Inc 1,168,500 15,013,922MarketAxess Holdings Inc 32,900 14,729,706Intel Corp 269,700 14,337,338T Rowe Price Group Inc 69,900 14,320,741Becton Dickinson and Co 53,200 13,660,978Lennar Corp 125,000 12,919,262Micron Technology Inc 179,400 12,911,956Synchrony Financial 255,700 12,871,211LKQ Corp 255,700 12,704,531Merck & Co Inc 164,000 12,589,608Vertex Pharmaceuticals Inc 64,300 12,516,400Viatris Inc 881,300 12,387,939Tyson Foods Inc 156,300 11,813,920Western Digital Corp 167,600 11,800,574Edison International 203,400 11,717,793Advanced Micro Devices Inc 139,000 11,553,850
Major Sales SharesProceeds
USDMicrosoft Corp 180,300 49,164,493Adobe Inc 61,400 31,371,787Cisco Systems Inc 513,400 28,464,187Accenture PLC 79,900 25,831,794Medtronic PLC 174,700 22,391,7413M Co 106,600 21,430,488Autodesk Inc 73,300 20,283,356Emerson Electric Co 199,700 19,377,197Intuit Inc 34,600 18,658,557Netflix Inc 34,000 18,647,113Colgate-Palmolive Co 232,100 18,645,536Bank of New York Mellon Corp 335,200 18,124,373Progressive Corp 184,200 17,871,548General Mills Inc 249,400 15,128,676Facebook Inc 43,000 14,444,594American International Group Inc 261,200 13,787,476Advanced Micro Devices Inc 133,400 13,648,010Hartford Financial Services Group Inc 204,100 13,539,333Arthur J Gallagher & Co 95,400 13,361,227Moody’s Corp 35,700 13,311,313Old Dominion Freight Line Inc 50,800 13,196,072State Street Corp 153,800 12,873,840International Business Machines Corp 90,800 12,845,320PACCAR Inc 154,500 12,498,986NVIDIA Corp 18,700 12,014,958Generac Holdings Inc 28,800 12,001,711Lennar Corp 125,000 11,799,277Cooper Cos Inc 26,700 11,673,410Edison International 192,800 11,598,358SVB Financial Group 20,329 11,590,341
AXA ROSENBERG US ENHANCED INDEX EQUITY ALPHA FUND
Statement of Major Portfolio Changes for the Accounting Period to September 30, 2021
141

Listed below are all largest cumulative investment purchases and sales in excess of 1% of total purchases and sales for the period ended September 30, 2021.If there are fewer than twenty purchases or twenty sales that are greater than 1%, those purchases and such number of the next largest purchases/sales sothat at least twenty purchases/sales are disclosed.
Major Purchases SharesCostUSD
Adobe Inc 52,600 29,518,642S&P Global Inc 38,700 17,054,498AT&T Inc 591,000 16,668,387LyondellBasell Industries NV 157,300 16,021,374Cummins Inc 60,700 15,169,519NortonLifeLock Inc 554,400 14,675,726Berkshire Hathaway Inc 52,000 14,057,933Pool Corp 29,700 13,758,749Western Digital Corp 213,300 13,599,4573M Co 72,900 13,143,119Cincinnati Financial Corp 105,300 12,625,295Omnicom Group Inc 168,100 12,038,330Capital One Financial Corp 65,100 11,293,545Prudential Financial Inc 105,800 10,969,336Visa Inc 48,200 10,911,193Edwards Lifesciences Corp 92,500 10,433,464Viatris Inc 709,100 10,193,862Lennar Corp 98,400 10,170,043Lowe’s Cos Inc 51,600 10,088,306Mastercard Inc 25,100 9,688,229Agilent Technologies Inc 56,500 9,659,743T Rowe Price Group Inc 44,900 9,198,416Monolithic Power Systems Inc 21,500 8,838,448Cardinal Health Inc 145,000 8,672,356Apple Inc 65,000 8,425,854HP Inc 278,800 8,251,866Seagen Inc 52,600 8,195,812AbbVie Inc 73,200 8,150,691Advanced Micro Devices Inc 81,300 7,792,685NVIDIA Corp 33,300 7,674,415Vertex Pharmaceuticals Inc 37,900 7,377,474Baker Hughes Co 289,500 7,370,690West Pharmaceutical Services Inc 21,800 7,168,550
Major Sales SharesProceeds
USDAmerican International Group Inc 225,500 11,903,047Prudential Financial Inc 116,400 11,443,901NVIDIA Corp 19,000 11,351,193Best Buy Co Inc 99,000 11,312,395Cisco Systems Inc 198,200 11,042,815Generac Holdings Inc 26,600 11,028,203Bank of New York Mellon Corp 201,600 10,900,577Applied Materials Inc 87,700 10,836,008eBay Inc 153,975 10,727,174Colgate-Palmolive Co 140,000 10,670,984Adobe Inc 20,600 9,837,099Arthur J Gallagher & Co 69,800 9,775,824DR Horton Inc 106,900 9,684,849Western Union Co 405,600 9,393,648Lennar Corp 98,400 9,288,391Edison International 162,226 9,246,608Take-Two Interactive Software Inc 51,800 8,998,784First American Financial Corp 145,400 8,987,327Equitable Holdings Inc 265,300 8,901,884Johnson Controls International PLC 121,900 8,559,421Walt Disney Co 44,000 8,214,987UnitedHealth Group Inc 21,000 8,176,688Clorox Co 45,200 8,150,002Seagate Technology Holdings PLC 81,500 8,033,927Allstate Corp 66,200 8,022,591Netflix Inc 14,700 7,860,697Baker Hughes Co 356,800 7,752,649Avantor Inc 211,600 7,614,091Autodesk Inc 27,400 7,582,980General Mills Inc 125,300 7,484,256Hartford Financial Services Group Inc 117,300 7,447,724Masco Corp 127,100 7,402,355International Business Machines Corp 51,900 7,342,204Qorvo Inc 37,600 7,198,926Edwards Lifesciences Corp 59,800 7,043,094State Street Corp 80,300 6,724,657Kraft Heinz Co 146,100 5,827,110
AXA ROSENBERG US EQUITY ALPHA FUND
Statement of Major Portfolio Changes for the Accounting Period to September 30, 2021
142

One PlatformBNP Paribas Securities Services Luxembourg33 Rue de GasperichHowald-EsperangeL-2085Luxembourg
Investors that have been approved by the Manager as beingeligible to the One Platform and have completed an applicationform with BNP Paribas Securities Services Luxembourg shouldsend their trade orders (subscriptions, redemptions and switches)by post to the above address.
AustriaPaying Agent:Erste Bank der oesterreichischen Sparkassen AGAm Belvedere 11100 WienAustria
Investors should note that equalisation is applied for the purposeof annual tax reporting, in line with local requirements. Annualfigures for those applicable Funds are published on the website ofthe OeKB (www.profitweb.at) and/or on www.axa-im.at.
BelgiumPaying Agent:CACEIS Belgium SAAvenue du Port 86 C b3201000 BruxellesBelgium
Investors should note that the annual reported income for thoseFunds registered in Belgium is available on the website(s)www.axa.be and/or www.axa-im.be, the Belgian website ofwww.axa-im.com.
DenmarkInformation Agent:StockRate Asset Management NSSdr. Jernbanevej 18D3400 HillerødDenmark
FrancePaying Agent:BNP Paribas Securities Services3 Rue d’Antin75002 ParisFrance
GermanyInformation Agent:AXA Investment Managers Deutschland GmbHBleichstrasse 2-460313 Frankfurt am MainGermany
The management regulations, the prospectus, the KIID, the semi-annual reports, the audited annual reports as well as a copylisting the changes in the portfolio during the period under reviewcan be obtained free of charge from the German InformationAgent.
Investors should note that equalisation is applied for the purposeof annual tax reporting, in line with local requirements. Annualfigures for those applicable Funds are published on the website ofthe Federal Gazette (www.bundesanzeiger.de) and/or onwww.axa-im.de.
ItalyPaying Agent:Societè Generale Securities Services S.p.A.Via Santa Chiara, n.1910122 TorinoItaly
Paying Agent:Banca Monte dei Paschi di Siena S.p.APiazza Salimbeni, n.353100 SienaItaly
Paying Agent:Allfunds Bank S.A.U. Milan BranchVia Bocchetto, 620123 MilanoItaly
Paying Agent:RBC Investor and Treasury ServicesSuccursale di MilanoVia Vittor Pisani, 2620124 MilanoItaly
LuxembourgPaying Agent:State Street Luxembourg S.C.A.49 Avenue J-F KennedyL-1855Luxembourg
SwitzerlandSwiss Paying Agent:Credit Suisse AGParadeplatz 8CH-8001 ZurichSwitzerland
OTHER INFORMATION
Additional Regulatory Disclosure: Tax Reporting, Platforms And Appointed AgentsAs at September 30, 2021
143

Swiss Representative:First Independent Fund Services AGKlausstrasse 33CH-8008 ZurichSwitzerland
Investors should note that equalisation is applied for the purposeof annual tax reporting, in line with local requirements. AnnualSwiss income tax values for applicable Funds are published onthe website of the Swiss Federal Tax Administration(www.ictax.admin.ch).
The Trust Deed, the Prospectus, the KIID, the semi-annual reportand the audited annual reports as well as a copy listing thechanges in the portfolio during the period under review can beobtained free of charge from the Swiss representative. Investorsshould note that only launched Funds are authorised inSwitzerland.
TaiwanMaster Agent:Capital Gateway Securities Investment Consulting Enterprise9F, No.171, Sung-De Rd.Taipei City 110Taiwan
United KingdomFacilities Agent:AXA Investment Managers UK Limited22 BishopsgateLondon EC2N 4BQUnited Kingdom
Investors should note that equalisation is applied for the purposeof annual tax reporting, in line with local requirements. Reportableincome and distributions for those Funds with UK ReportingStatus are published on www.axa-im.co.uk.
European Union Taxation of Savings Income DirectiveThe investment policy of the Funds in the Prospectus state thatthe Funds are intended to be �fully invested� in equities. Anypotential direct or indirect investment in interest bearingsecurities (see Schedule of Investments) remain below the 15%and 25% thresholds stipulated by the Directive.
The Sub-Investment ManagersThe Investment Manager may delegate some or all of theinvestment decision making authority for some or all of the Fundsto one or more of the following Sub-Investment Managerspursuant to the sub-investment management agreementsbetween the Investment Manager and the relevant Sub-Investment Managers as described in the section on “MaterialContracts” in the Prospectus. The Sub-Investment Managers areas follows:
• The Sub-Investment Manager in the United States is AXARosenberg Investment Management LLC, an SEC registered,quantitative equity investment adviser.
• The Sub-Investment Manager in Singapore is AXA InvestmentManagers Asia (Singapore) Ltd which is authorised andregulated by the Monetary Authority of Singapore.
OTHER INFORMATION (continued)
Additional Regulatory Disclosure: Tax Reporting, Platforms And Appointed Agents (continued)As at September 30, 2021
144

The Sub-Investment Managers (continued)
Sub-funds: Sub-Investment Manager(s):
AXA Rosenberg All-Country Asia Pacific Ex-Japan Equity Alpha Fund* AXA Investment Managers Asia (Singapore) LtdAXA Rosenberg All Country Asia Pacific Ex-Japan Small Cap AlphaFund
AXA Investment Managers Asia (Singapore) Ltd
AXA Rosenberg Global Emerging Markets Equity Alpha Fund AXA Investment Managers Asia (Singapore) LtdAXA Investment Management LLC
AXA Rosenberg Global Equity Alpha Fund AXA Investment Managers Asia (Singapore) LtdAXA Rosenberg Investment Management LLC
AXA Rosenberg Global Small Cap Alpha Fund AXA Investment Managers Asia (Singapore) LtdAXA Rosenberg Investment Management LLC
AXA Rosenberg Japan Enhanced Index Equity Alpha Fund** AXA Investment Managers Asia (Singapore) LtdAXA Rosenberg Japan Equity Alpha Fund AXA Investment Managers Asia (Singapore) LtdAXA Rosenberg Japan Small Cap Alpha Fund AXA Investment Managers Asia (Singapore) LtdAXA Rosenberg Pacific Ex-Japan Equity Alpha Fund AXA Investment Managers Asia (Singapore) LtdAXA Rosenberg US Enhanced Index Equity Alpha Fund AXA Rosenberg Investment Management LLCAXA Rosenberg US Equity Alpha Fund AXA Rosenberg Investment Management LLC
*AXA Rosenberg All-Country Asia Pacific Ex-Japan Equity Alpha Fund terminated on July 30, 2021.**AXA Rosenberg Japan Enhanced Index Equity Alpha Fund terminated on June 30, 2021.
OTHER INFORMATION (continued)
Additional Regulatory Disclosure: Tax Reporting, Platforms And Appointed Agents (continued)As at September 30, 2021
145
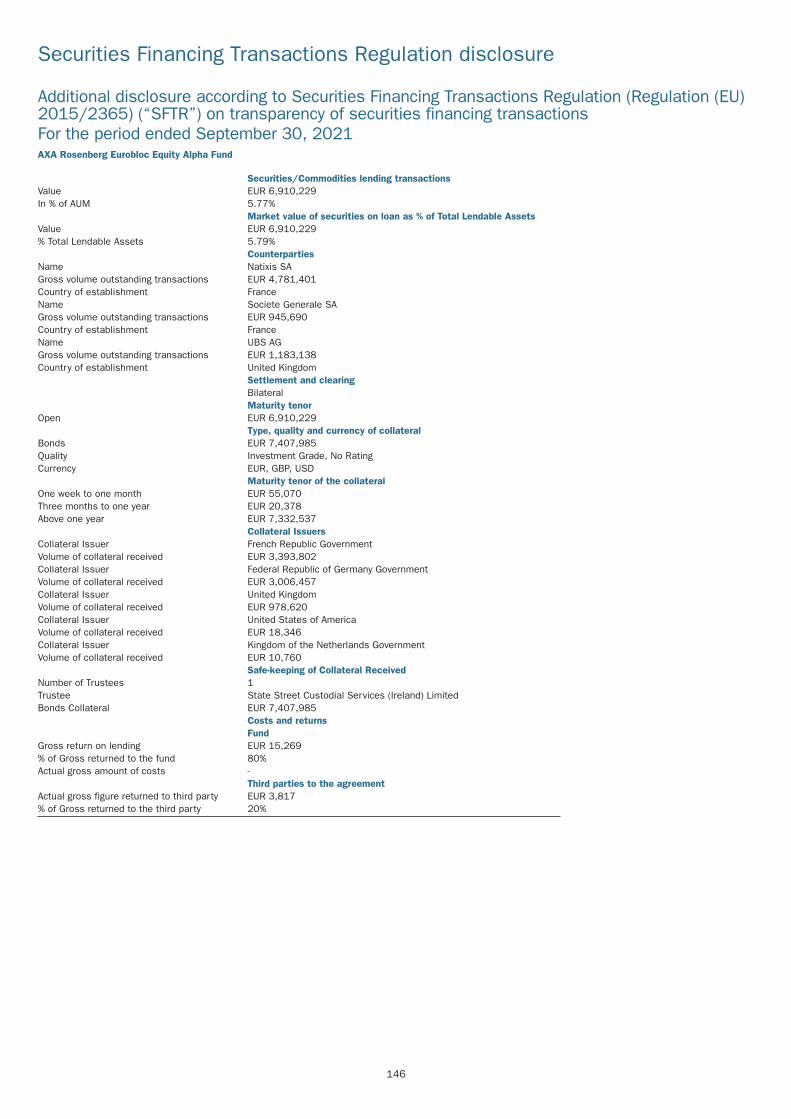
AXA Rosenberg Eurobloc Equity Alpha Fund
Securities/Commodities lending transactionsValue EUR 6,910,229In % of AUM 5.77%
Market value of securities on loan as % of Total Lendable AssetsValue EUR 6,910,229% Total Lendable Assets 5.79%
CounterpartiesName Natixis SAGross volume outstanding transactions EUR 4,781,401Country of establishment FranceName Societe Generale SAGross volume outstanding transactions EUR 945,690Country of establishment FranceName UBS AGGross volume outstanding transactions EUR 1,183,138Country of establishment United Kingdom
Settlement and clearingBilateralMaturity tenor
Open EUR 6,910,229Type, quality and currency of collateral
Bonds EUR 7,407,985Quality Investment Grade, No RatingCurrency EUR, GBP, USD
Maturity tenor of the collateralOne week to one month EUR 55,070Three months to one year EUR 20,378Above one year EUR 7,332,537
Collateral IssuersCollateral Issuer French Republic GovernmentVolume of collateral received EUR 3,393,802Collateral Issuer Federal Republic of Germany GovernmentVolume of collateral received EUR 3,006,457Collateral Issuer United KingdomVolume of collateral received EUR 978,620Collateral Issuer United States of AmericaVolume of collateral received EUR 18,346Collateral Issuer Kingdom of the Netherlands GovernmentVolume of collateral received EUR 10,760
Safe-keeping of Collateral ReceivedNumber of Trustees 1Trustee State Street Custodial Services (Ireland) LimitedBonds Collateral EUR 7,407,985
Costs and returnsFund
Gross return on lending EUR 15,269% of Gross returned to the fund 80%Actual gross amount of costs -
Third parties to the agreementActual gross figure returned to third party EUR 3,817% of Gross returned to the third party 20%
Securities Financing Transactions Regulation disclosure
Additional disclosure according to Securities Financing Transactions Regulation (Regulation (EU)2015/2365) (“SFTR”) on transparency of securities financing transactionsFor the period ended September 30, 2021
146

AXA Rosenberg Global Equity Alpha Fund
Securities/Commodities lending transactionsValue USD 34,484,314In % of AUM 5.86%
Market value of securities on loan as % of Total Lendable AssetsValue USD 34,484,314% Total Lendable Assets 5.91%
CounterpartiesName Barclays Capital IncGross volume outstanding transactions USD 12,419,418Country of establishment United KingdomName Citigroup Global Markets LtdGross volume outstanding transactions USD 8,676,480Country of establishment United KingdomName Natixis SAGross volume outstanding transactions USD 9,580,237Country of establishment FranceName UBS AGGross volume outstanding transactions USD 3,808,179Country of establishment United Kingdom
Settlement and clearingBilateralMaturity tenor
Open USD 34,484,314Type, quality and currency of collateral
Bonds USD 40,194,679Quality Investment Grade, No RatingCurrency EUR
Maturity tenor of the collateralOne week to one month USD 164,655Three months to one year USD 152,072Above one year USD 39,877,952
Collateral IssuersCollateral Issuer French Republic GovernmentVolume of collateral received USD 33,355,252Collateral Issuer Federal Republic of Germany GovernmentVolume of collateral received USD 6,534,273Collateral Issuer Kingdom of the Netherlands GovernmentVolume of collateral received USD 305,154
Safe-keeping of Collateral ReceivedNumber of Trustees 1Trustee State Street Custodial Services (Ireland) LimitedBonds Collateral USD 40,194,679
Costs and returnsFund
Gross return on lending USD 48,148% of Gross returned to the fund 80%Actual gross amount of costs -
Third parties to the agreementActual gross figure returned to third party USD 12,037% of Gross returned to the third party 20%
Securities Financing Transactions Regulation disclosure (continued)
Additional disclosure according to Securities Financing Transactions Regulation (Regulation (EU)2015/2365) (“SFTR”) on transparency of securities financing transactions (continued)For the period ended September 30, 2021
147

AXA Rosenberg Global Small Cap Alpha Fund
Securities/Commodities lending transactionsValue USD 4,710,574In % of AUM 2.18%
Market value of securities on loan as % of Total Lendable AssetsValue USD 4,710,574% Total Lendable Assets 2.22%
CounterpartiesName Citigroup Global Markets LtdGross volume outstanding transactions USD 1,350,198Country of establishment United KingdomName Natixis SAGross volume outstanding transactions USD 2,038,533Country of establishment FranceName Societe Generale SAGross volume outstanding transactions USD 1,281,225Country of establishment FranceName UBS AGGross volume outstanding transactions USD 40,618Country of establishment United Kingdom
Settlement and clearingBilateralMaturity tenor
Open USD 4,710,574Type, quality and currency of collateral
Bonds USD 5,189,058Quality Investment Grade, No RatingCurrency EUR, GBP, USD
Maturity tenor of the collateralOne week to one month USD 5,956Three months to one year USD 15,109Above one year USD 5,167,993
Collateral IssuersCollateral Issuer French Republic GovernmentVolume of collateral received USD 2,672,524Collateral Issuer United KingdomVolume of collateral received UDS 1,325,837Collateral Issuer Federal Republic of Germany GovernmentVolume of collateral received USD 1,117,123Collateral Issuer Kingdom of the Netherlands GovernmentVolume of collateral received USD 48,719Collateral Issuer United States of AmericaVolume of collateral received USD 24,855
Safe-keeping of Collateral ReceivedNumber of Trustees 1Trustee State Street Custodial Services (Ireland) LimitedBonds Collateral USD 5,189,058
Costs and returnsFund
Gross return on lending USD 8,133% of Gross returned to the fund 80%Actual gross amount of costs -
Third parties to the agreementActual gross figure returned to third party USD 2,033% of Gross returned to the third party 20%
Securities Financing Transactions Regulation disclosure (continued)
Additional disclosure according to Securities Financing Transactions Regulation (Regulation (EU)2015/2365) (“SFTR”) on transparency of securities financing transactions (continued)For the period ended September 30, 2021
148

AXA Rosenberg Japan Equity Alpha Fund
Securities/Commodities lending transactionsValue JPY 3,431,537,490In % of AUM 16.43%
Market value of securities on loan as % of Total Lendable AssetsValue JPY 3,431,537,490% Total Lendable Assets 16.69%
CounterpartiesName Barclays Capital IncGross volume outstanding transactions JPY 1,951,533,118Country of establishment United KingdomName Citigroup Global Markets LtdGross volume outstanding transactions JPY 1,468,954,294Country of establishment United KingdomName Credit Suisse AGGross volume outstanding transactions JPY 11,050,078Country of establishment Ireland
Settlement and clearingBilateralMaturity tenor
Open JPY 3,431,537,490Type, quality and currency of collateral
Bonds JPY 4,172,216,349Quality Investment Grade, No RatingCurrency EUR
Maturity tenor of the collateralThree months to one year JPY 17,981,891Above one year JPY 4,154,234,458
Collateral IssuersCollateral Issuer French Republic GovernmentVolume of collateral received JPY 4,124,202,971Collateral Issuer Kingdom of the Netherlands GovernmentVolume of collateral received 48,013,378
Safe-keeping of Collateral ReceivedNumber of Trustees 1Trustee State Street Custodial Services (Ireland) LimitedBonds Collateral JPY 4,172,216,349
Costs and returnsFund
Gross return on lending JPY 2,559,868% of Gross returned to the fund 80%Actual gross amount of costs -
Third parties to the agreementActual gross figure returned to third party JPY 639,967% of Gross returned to the third party 20%
Securities Financing Transactions Regulation disclosure (continued)
Additional disclosure according to Securities Financing Transactions Regulation (Regulation (EU)2015/2365) (“SFTR”) on transparency of securities financing transactions (continued)For the period ended September 30, 2021
149

AXA Rosenberg Japan Small Cap Alpha Fund
Securities/Commodities lending transactionsValue JPY 346,188,499In % of AUM 3.96%
Market value of securities on loan as % of Total Lendable AssetsValue JPY 346,188,499% Total Lendable Assets 4.01%
CounterpartiesName Barclays Capital IncGross volume outstanding transactions JPY 116,837,309Country of establishment United KingdomName Citigroup Global Markets LtdGross volume outstanding transactions JPY 220,125,580Country of establishment United KingdomName Credit Suisse AGGross volume outstanding transactions JPY 9,225,610Country of establishment Ireland
Settlement and clearingBilateralMaturity tenor
Open JPY 346,188,499Type, quality and currency of collateral
Bonds JPY 419,827,334Quality Investment Grade, No RatingCurrency EUR
Maturity tenor of the collateralThree months to one year JPY 1,705,125Above one year JPY 418,122,209
Collateral IssuersCollateral Issuer French Republic GovernmentVolume of collateral received JPY 412,632,438Collateral Issuer Kingdom of the Netherlands GovernmentVolume of collateral received JPY 7,194,896
Safe-keeping of Collateral ReceivedNumber of Trustees 1Trustee State Street Custodial Services (Ireland) LimitedBonds Collateral JPY 419,827,334
Costs and returnsFund
Gross return on lending JPY 938,149% of Gross returned to the fund 80%Actual gross amount of costs -
Third parties to the agreementActual gross figure returned to third party JPY 234,537% of Gross returned to the third party 20%
Securities Financing Transactions Regulation disclosure (continued)
Additional disclosure according to Securities Financing Transactions Regulation (Regulation (EU)2015/2365) (“SFTR”) on transparency of securities financing transactions (continued)For the period ended September 30, 2021
150

AXA Rosenberg Pan-European Equity Alpha Fund
Securities/Commodities lending transactionsValue EUR 1,840,074In % of AUM 3.73%
Market value of securities on loan as % of Total Lendable AssetsValue EUR 1,840,074% Total Lendable Assets 3.75%
CounterpartiesName Citigroup Global Markets LtdGross volume outstanding transactions EUR 42,144Country of establishment United KingdomName Natixis SAGross volume outstanding transactions EUR 1,378,904Country of establishment FranceName UBS AGGross volume outstanding transactions EUR 419,026Country of establishment United Kingdom
Settlement and clearingBilateralMaturity tenor
Open EUR 1,840,074Type, quality and currency of collateral
Bonds EUR 1,991,769Quality Investment Grade, No RatingCurrency EUR
Maturity tenor of the collateralOne week to one month EUR 18,822Three months to one year EUR 6,077Above one year EUR 1,966,870
Collateral IssuersCollateral Issuer French Republic GovernmentVolume of collateral received EUR 1,092,629Collateral Issuer Federal Republic of Germany GovernmentVolume of collateral received EUR 894,659Collateral Issuer Kingdom of the Netherlands GovernmentVolume of collateral received EUR 4,481
Safe-keeping of Collateral ReceivedNumber of Trustees 1Trustee State Street Custodial Services (Ireland) LimitedBonds Collateral EUR 1,991,769
Costs and returnsFund
Gross return on lending EUR 4,755% of Gross returned to the fund 80%Actual gross amount of costs -
Third parties to the agreementActual gross figure returned to third party EUR 1,189% of Gross returned to the third party 20%
Securities Financing Transactions Regulation disclosure (continued)
Additional disclosure according to Securities Financing Transactions Regulation (Regulation (EU)2015/2365) (“SFTR”) on transparency of securities financing transactions (continued)For the period ended September 30, 2021
151

AXA Rosenberg US Enhanced Index Equity Alpha Fund
Securities/Commodities lending transactionsValue USD 63,038,316In % of AUM 2.28%
Market value of securities on loan as % of Total Lendable AssetsValue USD 63,038,316% Total Lendable Assets 2.29%
CounterpartiesName Natixis SAGross volume outstanding transactions USD 63,038,316Country of establishment France
Settlement and clearingBilateralMaturity tenor
Open USD 63,038,316Type, quality and currency of collateral
Bonds USD 66,202,011Quality Investment Grade, No RatingCurrency EUR
Maturity tenor of the collateralOne week to one month USD 136,716Three months to one year USD 268,670Above one year USD 65,796,625
Collateral IssuersCollateral Issuer Federal Republic of Germany GovernmentVolume of collateral received USD 34,099,269Collateral Issuer French Republic GovernmentVolume of collateral received USD 31,960,879Collateral Issuer Kingdom of the Netherlands GovernmentVolume of collateral received USD 141,863
Safe-keeping of Collateral ReceivedNumber of Trustees 1Trustee State Street Custodial Services (Ireland) LimitedBonds Collateral USD 66,202,011
Costs and returnsFund
Gross return on lending USD 16,701% of Gross returned to the fund 80%Actual gross amount of costs -
Third parties to the agreementActual gross figure returned to third party USD 4,175% of Gross returned to the third party 20%
Securities Financing Transactions Regulation disclosure (continued)
Additional disclosure according to Securities Financing Transactions Regulation (Regulation (EU)2015/2365) (“SFTR”) on transparency of securities financing transactions (continued)For the period ended September 30, 2021
152

AXA Rosenberg US Equity Alpha Fund
Securities/Commodities lending transactionsValue USD 17,598,477In % of AUM 1.64%
Market value of securities on loan as % of Total Lendable AssetsValue USD 17,598,477% Total Lendable Assets 1.65%
CounterpartiesName Natixis SAGross volume outstanding transactions USD 17,598,477Country of establishment France
Settlement and clearingBilateralMaturity tenor
Open USD 17,598,477Type, quality and currency of collateral
Bonds USD 18,481,689Quality Investment Grade, No RatingCurrency EUR
Maturity tenor of the collateralOne week to one month USD 38,167Three months to one year USD 75,005Above one year USD 18,368,517
Collateral IssuersCollateral Issuer Federal Republic of Germany GovernmentVolume of collateral received USD 9,519,531Collateral Issuer French Republic GovernmentVolume of collateral received USD 8,922,554Collateral Issuer Kingdom of the Netherlands GovernmentVolume of collateral received 39,604
Safe-keeping of Collateral ReceivedNumber of Trustees 1Trustee State Street Custodial Services (Ireland) LimitedBonds Collateral USD 18,481,689
Costs and returnsFund
Gross return on lending USD 2,690% of Gross returned to the fund 80%Actual gross amount of costs -
Third parties to the agreementActual gross figure returned to third party USD 673% of Gross returned to the third party 20%
Securities Financing Transactions Regulation disclosure (continued)
Additional disclosure according to Securities Financing Transactions Regulation (Regulation (EU)2015/2365) (“SFTR”) on transparency of securities financing transactions (continued)For the period ended September 30, 2021
153