FY2017 Unaudited Annual Financial Report TX GLO and VLB
176
George P. Bush Commissioner & Chairman
-
Upload
khangminh22 -
Category
Documents
-
view
4 -
download
0
Transcript of FY2017 Unaudited Annual Financial Report TX GLO and VLB
George P. BushCommissioner & Chairman
TEXAS GENERAL LAND OFFICE
VETERANS' LAND BOARD
FINANCIAL REPORTING STAFF
Kenny McLeskeyFinancial Management, Chief Financial Officer
Viktoriya JensenFinancial Reporting & Accounting Director
Teri GoodwinFinancial Reporting & Accounting Manager
UNAUDITED ANNUAL FINANCIAL REPORTAUGUST 31, 2017
Team LeadPatricia Carrington
AccountantJessica Johnston, CPA
Linda GuerreroAccountant
AccountantRuby Sadeghiani
Grant Coordinator
Eva DormanAccountant
Brandon MyersAccountant
Nicole Maddox
TABLE OF CONTENTS
INTRODUCTIONLetter of Transmittal…………………………..…………….………………………………………………………….……………………………………………… 3
GENERAL PURPOSE FINANCIAL STATEMENTSExhibit:I Combined Balance Sheet/Statement of Net Position Governmental Funds………………………………………………… 6II Combined Statement of Revenues, Expenditures, and Changes in Fund
Balances/Statement of Activities Governmental Funds …..…………………………………………………………………… 10III Combined Statement of Net Position Proprietary Funds ………...….……………….…………………………………………… 14IV Combined Statement of Revenues, Expenses, and Changes in Net Position Proprietary Funds………………… 18V Combined Statement of Cash Flows Proprietary Funds …………...…..…..……………………………………………………… 22VI Combined Statement of Fiduciary Net Position Fiduciary Funds …..…………………………………………………………… 26
NOTES TO THE FINANCIAL STATEMENTS……..…....…...………………………………………………………………………………………………………… 27
COMBINING FINANCIAL STATEMENTSExhibit:A 1 Combining Balance Sheet General and Consolidated Funds……………..………………………………………………………… 84A 2 Combining Statement of Revenues, Expenditures, and Changes in Fund Balances
General and Consolidated Funds………………..………………………………..………………………………………………………… 86B 1 Combining Balance Sheet Special Revenue Funds…………..………………………………………………………………………… 88B 2 Combining Statement of Revenues, Expenditures, and Changes in Fund Balances Special Revenue Funds… 90C 1 Combining Balance Sheet Permanent Funds……………………………………………………………………………………………… 92C 2 Combining Statement of Revenues, Expenditures, and Changes in Fund Balances Permanent Funds………… 94D 1a Combining Statement of Net Position Housing Assistance Program Proprietary Funds ……………………………… 96D 1b Combining Statement of Net Position Land Program Proprietary Funds…...……………………………………………… 98D 1c Combining Statement of Net Position Vet Homes Program Proprietary Funds…...……………………………………… 102D 2a Combining Statement of Revenues, Expenses, and Changes in Net Position
Housing Assistance Program Proprietary Funds………………………………………..……………………..……………………… 104D 2b Combining Statement of Revenues, Expenses, and Changes in Net Position
Land Program Proprietary Funds…………………....……………………………………………………………………………………… 106D 2c Combining Statement of Revenues, Expenses, and Changes in Net Position
Vet Homes Program Proprietary Funds…………..……………………………………………………………………………………… 108D 3a Statement of Cash Flows Housing Assistance Program Proprietary Funds ……..…….…………………………………… 110D 3b Statement of Cash Flows Land Program Proprietary Funds…...…..….…...………….…...…………………………………… 114D 3c Statement of Cash Flows Vet Homes Program Proprietary Funds…...…..….…...………….…...………………………… 118E 1 Combining Statement of Changes in Assets and Liabilities Agency Funds …………...….…...…………………………… 122
SUPPLEMENTARY SCHEDULESSchedule:1 A Schedule of Expenditures of Federal Awards………………………………..……………………………………………………………… 1261 B Schedule of State Pass Through Grants From/To State Agencies……..…………………………………………………………… 1312 A Miscellaneous Bond Information ……..…………………………………………..……….…………………………………………………… 1322 B Changes in Bonded Indebtedness …….……………………………...……………………..………………………………………………… 1342 C Debt Service Requirements ………………………………………..……….…...…….……………………………………………………….… 1362 D Analysis of Funds Available for Debt Service ……………………………………………………………………...……………………… 1402 E Defeased Bonds Outstanding………………….……...………………………………………………………………...………………………… 1412 F Early Extinguishment and Refunding………………….……...……………………………………………………...………………………… 1422 G Data on Bond Issues By Series ………………..……………………….………………………………………………………………………… 1433 Detail of Additions and Deductions Agency Funds……….…………………………………………………………………………… 1464 Summary of Texas General Land Office Deposits to Other Agencies By Fund and Agency………………………… 1475 Summary of Texas General Land Office Deposits to Other Agencies By Source………………………………………… 151
ADDENDUMOrganizational Chart…………………...………………………..…………...…………………..…………………………………………………………………… 154Organizational and General Comments……………………………………..………………………………………………………………………………… 155
TEXAS GENERAL LAND OFFICE
VETERANS' LAND BOARD
INTRODUCTION
UNAUDITED ANNUAL FINANCIAL REPORTAUGUST 31, 2017

(This page intentionally left blank)
UNAUDITEDTexas General Land Office and Veterans' Land Board (305)
2 | Annual Financial Report

GENERAL PURPOSE
FINANCIAL STATEMENTS
UNAUDITED ANNUAL FINANCIAL REPORTAUGUST 31, 2017
TEXAS GENERAL LAND OFFICE
VETERANS' LAND BOARD
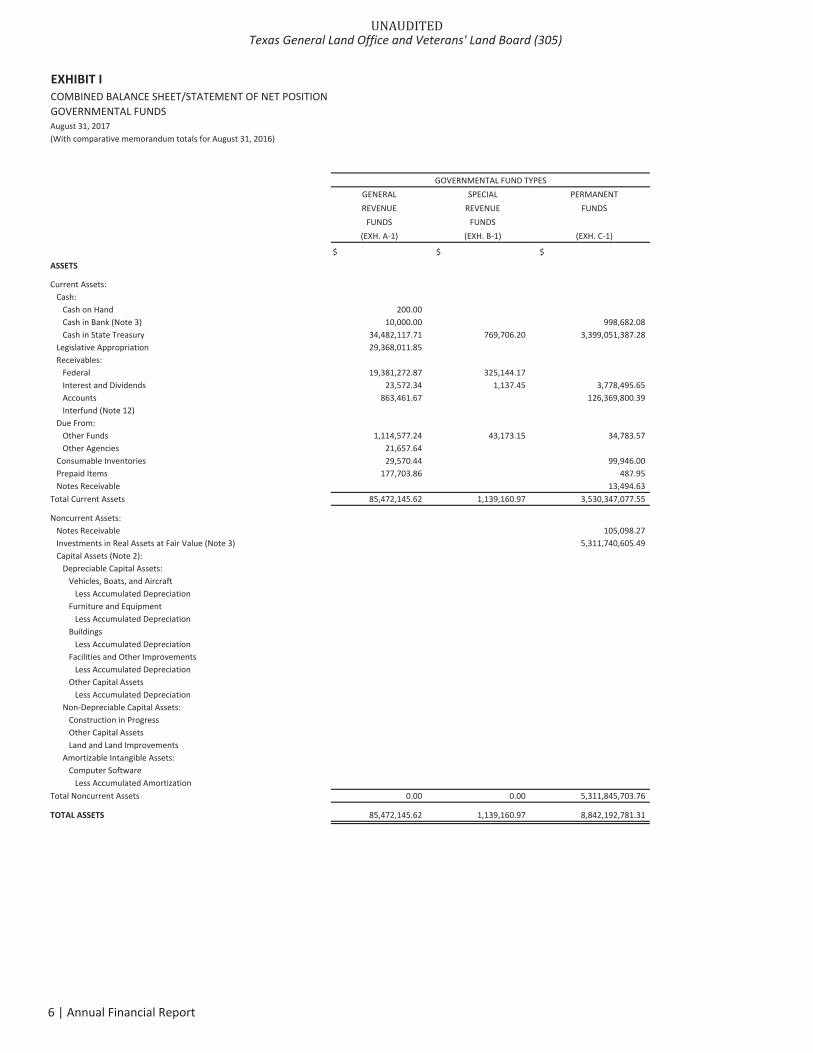
EXHIBIT ICOMBINED BALANCE SHEET/STATEMENT OF NET POSITIONGOVERNMENTAL FUNDSAugust 31, 2017(With comparative memorandum totals for August 31, 2016)
GOVERNMENTAL FUND TYPESGENERAL SPECIAL PERMANENTREVENUE REVENUE FUNDS
FUNDS FUNDS(EXH. A 1) (EXH. B 1) (EXH. C 1)
$ $ $ASSETS
Current Assets:Cash:
Cash on Hand 200.00Cash in Bank (Note 3) 10,000.00 998,682.08Cash in State Treasury 34,482,117.71 769,706.20 3,399,051,387.28
Legislative Appropriation 29,368,011.85Receivables:
Federal 19,381,272.87 325,144.17Interest and Dividends 23,572.34 1,137.45 3,778,495.65Accounts 863,461.67 126,369,800.39Interfund (Note 12)
Due From:Other Funds 1,114,577.24 43,173.15 34,783.57Other Agencies 21,657.64
Consumable Inventories 29,570.44 99,946.00Prepaid Items 177,703.86 487.95Notes Receivable 13,494.63
Total Current Assets 85,472,145.62 1,139,160.97 3,530,347,077.55
Noncurrent Assets:Notes Receivable 105,098.27Investments in Real Assets at Fair Value (Note 3) 5,311,740,605.49Capital Assets (Note 2):
Depreciable Capital Assets:Vehicles, Boats, and Aircraft
Less Accumulated DepreciationFurniture and Equipment
Less Accumulated DepreciationBuildings
Less Accumulated DepreciationFacilities and Other Improvements
Less Accumulated DepreciationOther Capital Assets
Less Accumulated DepreciationNon Depreciable Capital Assets:
Construction in ProgressOther Capital AssetsLand and Land Improvements
Amortizable Intangible Assets:Computer Software
Less Accumulated AmortizationTotal Noncurrent Assets 0.00 0.00 5,311,845,703.76
TOTAL ASSETS 85,472,145.62 1,139,160.97 8,842,192,781.31
UNAUDITEDTexas General Land Office and Veterans' Land Board (305)
6 | Annual Financial Report
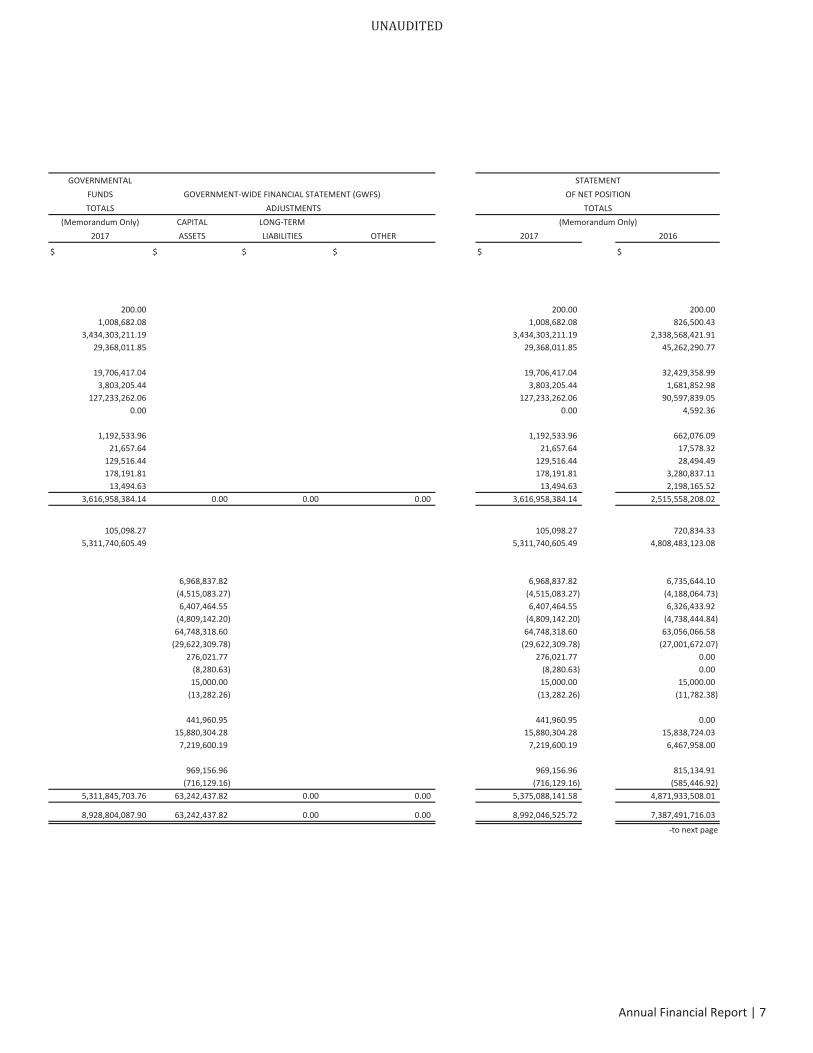
GOVERNMENTAL STATEMENTFUNDS GOVERNMENT WIDE FINANCIAL STATEMENT (GWFS) OF NET POSITIONTOTALS ADJUSTMENTS TOTALS
(Memorandum Only) CAPITAL LONG TERM (Memorandum Only)2017 ASSETS LIABILITIES OTHER 2017 2016
$ $ $ $ $ $
200.00 200.00 200.001,008,682.08 1,008,682.08 826,500.43
3,434,303,211.19 3,434,303,211.19 2,338,568,421.9129,368,011.85 29,368,011.85 45,262,290.77
19,706,417.04 19,706,417.04 32,429,358.993,803,205.44 3,803,205.44 1,681,852.98
127,233,262.06 127,233,262.06 90,597,839.050.00 0.00 4,592.36
1,192,533.96 1,192,533.96 662,076.0921,657.64 21,657.64 17,578.32
129,516.44 129,516.44 28,494.49178,191.81 178,191.81 3,280,837.11
13,494.63 13,494.63 2,198,165.523,616,958,384.14 0.00 0.00 0.00 3,616,958,384.14 2,515,558,208.02
105,098.27 105,098.27 720,834.335,311,740,605.49 5,311,740,605.49 4,808,483,123.08
6,968,837.82 6,968,837.82 6,735,644.10(4,515,083.27) (4,515,083.27) (4,188,064.73)6,407,464.55 6,407,464.55 6,326,433.92
(4,809,142.20) (4,809,142.20) (4,738,444.84)64,748,318.60 64,748,318.60 63,056,066.58
(29,622,309.78) (29,622,309.78) (27,001,672.07)276,021.77 276,021.77 0.00
(8,280.63) (8,280.63) 0.0015,000.00 15,000.00 15,000.00
(13,282.26) (13,282.26) (11,782.38)
441,960.95 441,960.95 0.0015,880,304.28 15,880,304.28 15,838,724.03
7,219,600.19 7,219,600.19 6,467,958.00
969,156.96 969,156.96 815,134.91(716,129.16) (716,129.16) (585,446.92)
5,311,845,703.76 63,242,437.82 0.00 0.00 5,375,088,141.58 4,871,933,508.01
8,928,804,087.90 63,242,437.82 0.00 0.00 8,992,046,525.72 7,387,491,716.03
to next page
UNAUDITED
Annual Financial Report | 7
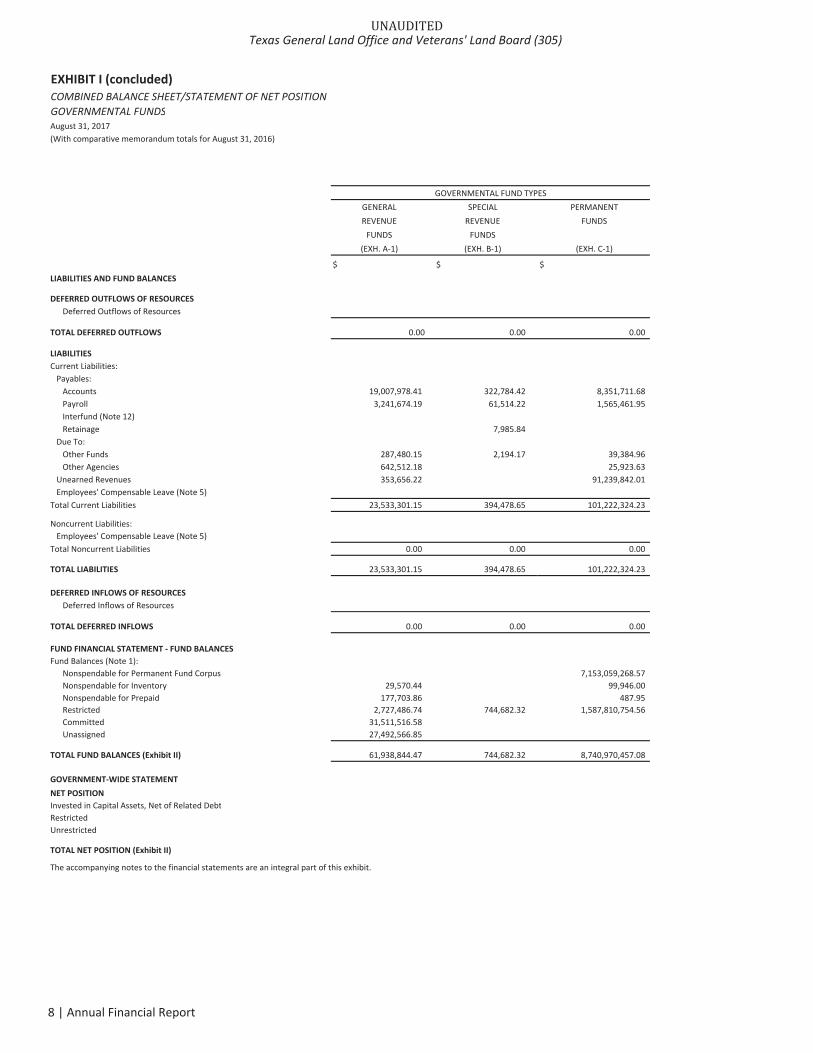
EXHIBIT I (concluded)COMBINED BALANCE SHEET/STATEMENT OF NET POSITIONGOVERNMENTAL FUNDSAugust 31, 2017(With comparative memorandum totals for August 31, 2016)
GOVERNMENTAL FUND TYPESGENERAL SPECIAL PERMANENTREVENUE REVENUE FUNDS
FUNDS FUNDS(EXH. A 1) (EXH. B 1) (EXH. C 1)
$ $ $LIABILITIES AND FUND BALANCES
DEFERRED OUTFLOWS OF RESOURCESDeferred Outflows of Resources
TOTAL DEFERRED OUTFLOWS 0.00 0.00 0.00
LIABILITIESCurrent Liabilities:
Payables:Accounts 19,007,978.41 322,784.42 8,351,711.68Payroll 3,241,674.19 61,514.22 1,565,461.95Interfund (Note 12)Retainage 7,985.84
Due To:Other Funds 287,480.15 2,194.17 39,384.96Other Agencies 642,512.18 25,923.63
Unearned Revenues 353,656.22 91,239,842.01Employees' Compensable Leave (Note 5)
Total Current Liabilities 23,533,301.15 394,478.65 101,222,324.23
Noncurrent Liabilities:Employees' Compensable Leave (Note 5)
Total Noncurrent Liabilities 0.00 0.00 0.00
TOTAL LIABILITIES 23,533,301.15 394,478.65 101,222,324.23
DEFERRED INFLOWS OF RESOURCESDeferred Inflows of Resources
TOTAL DEFERRED INFLOWS 0.00 0.00 0.00
FUND FINANCIAL STATEMENT FUND BALANCESFund Balances (Note 1):
Nonspendable for Permanent Fund Corpus 7,153,059,268.57Nonspendable for Inventory 29,570.44 99,946.00Nonspendable for Prepaid 177,703.86 487.95Restricted 2,727,486.74 744,682.32 1,587,810,754.56Committed 31,511,516.58Unassigned 27,492,566.85
TOTAL FUND BALANCES (Exhibit II) 61,938,844.47 744,682.32 8,740,970,457.08
GOVERNMENT WIDE STATEMENTNET POSITIONInvested in Capital Assets, Net of Related DebtRestrictedUnrestricted
TOTAL NET POSITION (Exhibit II)
The accompanying notes to the financial statements are an integral part of this exhibit.
UNAUDITEDTexas General Land Office and Veterans' Land Board (305)
8 | Annual Financial Report
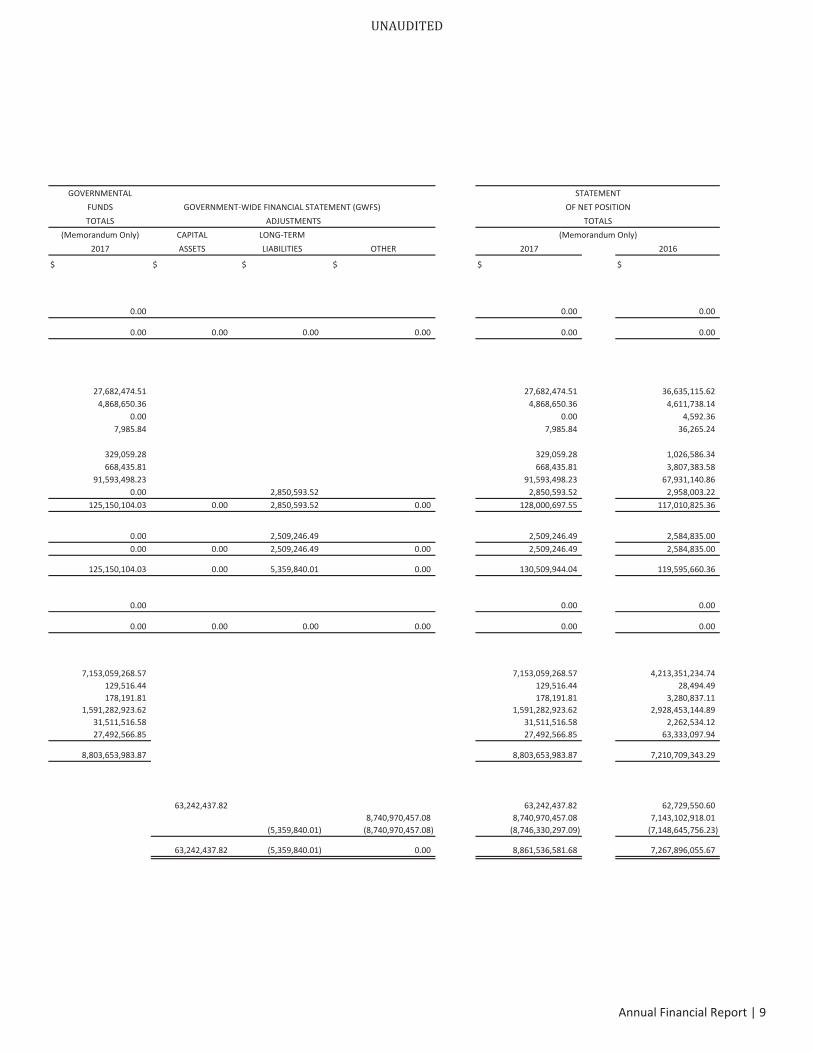
GOVERNMENTAL STATEMENTFUNDS GOVERNMENT WIDE FINANCIAL STATEMENT (GWFS) OF NET POSITIONTOTALS ADJUSTMENTS TOTALS
(Memorandum Only) CAPITAL LONG TERM (Memorandum Only)2017 ASSETS LIABILITIES OTHER 2017 2016
$ $ $ $ $ $
0.00 0.00 0.00
0.00 0.00 0.00 0.00 0.00 0.00
27,682,474.51 27,682,474.51 36,635,115.624,868,650.36 4,868,650.36 4,611,738.14
0.00 0.00 4,592.367,985.84 7,985.84 36,265.24
329,059.28 329,059.28 1,026,586.34668,435.81 668,435.81 3,807,383.58
91,593,498.23 91,593,498.23 67,931,140.860.00 2,850,593.52 2,850,593.52 2,958,003.22
125,150,104.03 0.00 2,850,593.52 0.00 128,000,697.55 117,010,825.36
0.00 2,509,246.49 2,509,246.49 2,584,835.000.00 0.00 2,509,246.49 0.00 2,509,246.49 2,584,835.00
125,150,104.03 0.00 5,359,840.01 0.00 130,509,944.04 119,595,660.36
0.00 0.00 0.00
0.00 0.00 0.00 0.00 0.00 0.00
7,153,059,268.57 7,153,059,268.57 4,213,351,234.74129,516.44 129,516.44 28,494.49178,191.81 178,191.81 3,280,837.11
1,591,282,923.62 1,591,282,923.62 2,928,453,144.8931,511,516.58 31,511,516.58 2,262,534.1227,492,566.85 27,492,566.85 63,333,097.94
8,803,653,983.87 8,803,653,983.87 7,210,709,343.29
63,242,437.82 63,242,437.82 62,729,550.608,740,970,457.08 8,740,970,457.08 7,143,102,918.01
(5,359,840.01) (8,740,970,457.08) (8,746,330,297.09) (7,148,645,756.23)
63,242,437.82 (5,359,840.01) 0.00 8,861,536,581.68 7,267,896,055.67
UNAUDITED
Annual Financial Report | 9
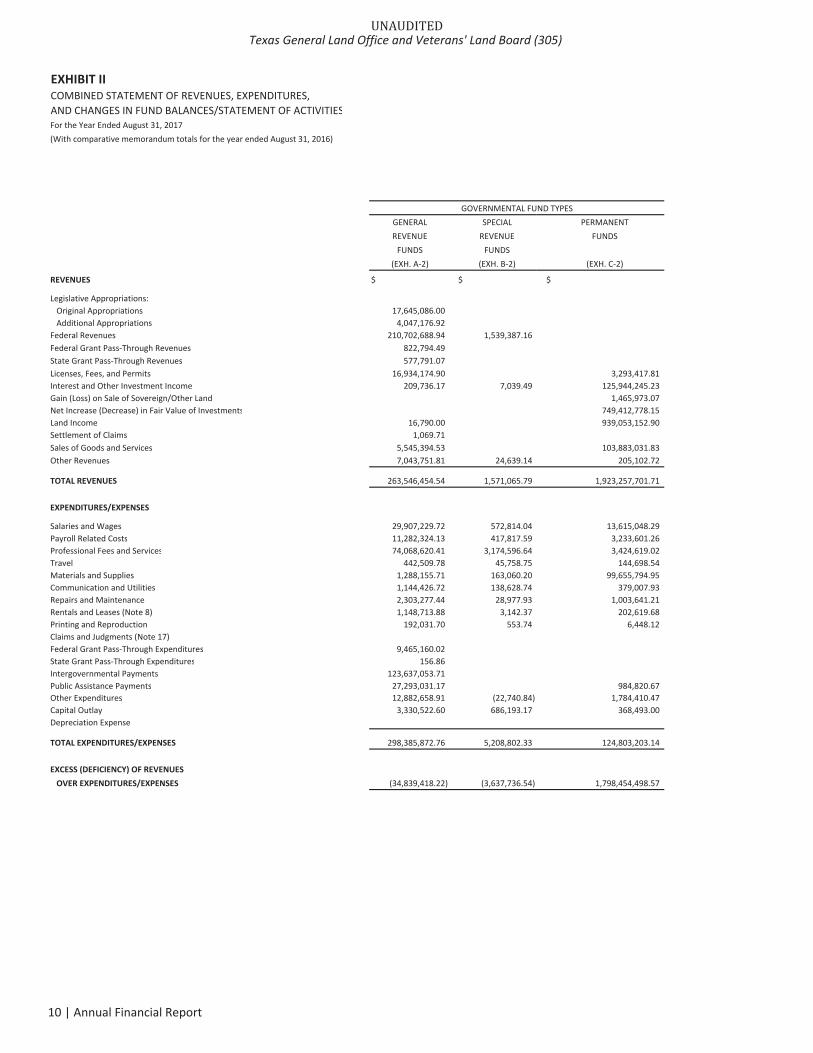
EXHIBIT IICOMBINED STATEMENT OF REVENUES, EXPENDITURES,AND CHANGES IN FUND BALANCES/STATEMENT OF ACTIVITIESFor the Year Ended August 31, 2017(With comparative memorandum totals for the year ended August 31, 2016)
GOVERNMENTAL FUND TYPESGENERAL SPECIAL PERMANENTREVENUE REVENUE FUNDS
FUNDS FUNDS(EXH. A 2) (EXH. B 2) (EXH. C 2)
REVENUES $ $ $
Legislative Appropriations:Original Appropriations 17,645,086.00Additional Appropriations 4,047,176.92
Federal Revenues 210,702,688.94 1,539,387.16Federal Grant Pass Through Revenues 822,794.49State Grant Pass Through Revenues 577,791.07Licenses, Fees, and Permits 16,934,174.90 3,293,417.81Interest and Other Investment Income 209,736.17 7,039.49 125,944,245.23Gain (Loss) on Sale of Sovereign/Other Land 1,465,973.07Net Increase (Decrease) in Fair Value of Investments 749,412,778.15Land Income 16,790.00 939,053,152.90Settlement of Claims 1,069.71Sales of Goods and Services 5,545,394.53 103,883,031.83Other Revenues 7,043,751.81 24,639.14 205,102.72
TOTAL REVENUES 263,546,454.54 1,571,065.79 1,923,257,701.71
EXPENDITURES/EXPENSES
Salaries and Wages 29,907,229.72 572,814.04 13,615,048.29Payroll Related Costs 11,282,324.13 417,817.59 3,233,601.26Professional Fees and Services 74,068,620.41 3,174,596.64 3,424,619.02Travel 442,509.78 45,758.75 144,698.54Materials and Supplies 1,288,155.71 163,060.20 99,655,794.95Communication and Utilities 1,144,426.72 138,628.74 379,007.93Repairs and Maintenance 2,303,277.44 28,977.93 1,003,641.21Rentals and Leases (Note 8) 1,148,713.88 3,142.37 202,619.68Printing and Reproduction 192,031.70 553.74 6,448.12Claims and Judgments (Note 17)Federal Grant Pass Through Expenditures 9,465,160.02State Grant Pass Through Expenditures 156.86Intergovernmental Payments 123,637,053.71Public Assistance Payments 27,293,031.17 984,820.67Other Expenditures 12,882,658.91 (22,740.84) 1,784,410.47Capital Outlay 3,330,522.60 686,193.17 368,493.00Depreciation Expense
TOTAL EXPENDITURES/EXPENSES 298,385,872.76 5,208,802.33 124,803,203.14
EXCESS (DEFICIENCY) OF REVENUESOVER EXPENDITURES/EXPENSES (34,839,418.22) (3,637,736.54) 1,798,454,498.57
UNAUDITEDTexas General Land Office and Veterans' Land Board (305)
10 | Annual Financial Report
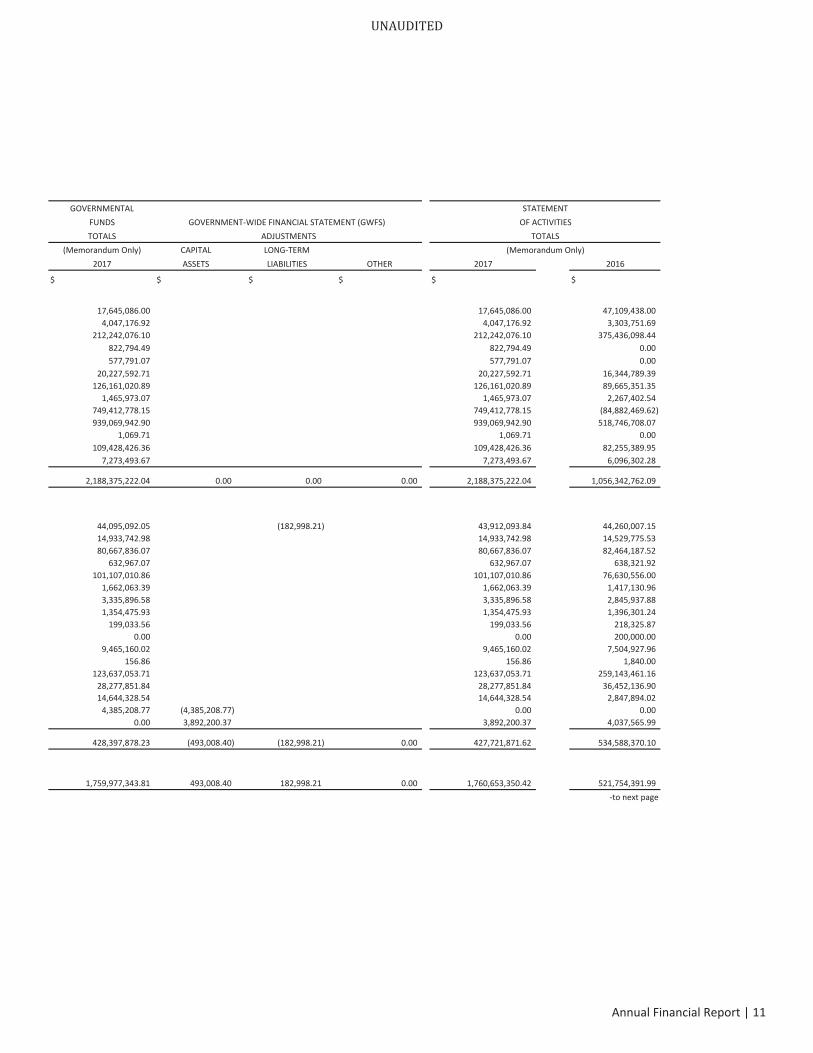
GOVERNMENTAL STATEMENTFUNDS GOVERNMENT WIDE FINANCIAL STATEMENT (GWFS) OF ACTIVITIESTOTALS ADJUSTMENTS TOTALS
(Memorandum Only) CAPITAL LONG TERM (Memorandum Only)2017 ASSETS LIABILITIES OTHER 2017 2016
$ $ $ $ $ $
17,645,086.00 17,645,086.00 47,109,438.004,047,176.92 4,047,176.92 3,303,751.69
212,242,076.10 212,242,076.10 375,436,098.44822,794.49 822,794.49 0.00577,791.07 577,791.07 0.00
20,227,592.71 20,227,592.71 16,344,789.39126,161,020.89 126,161,020.89 89,665,351.35
1,465,973.07 1,465,973.07 2,267,402.54749,412,778.15 749,412,778.15 (84,882,469.62)939,069,942.90 939,069,942.90 518,746,708.07
1,069.71 1,069.71 0.00109,428,426.36 109,428,426.36 82,255,389.95
7,273,493.67 7,273,493.67 6,096,302.28
2,188,375,222.04 0.00 0.00 0.00 2,188,375,222.04 1,056,342,762.09
44,095,092.05 (182,998.21) 43,912,093.84 44,260,007.1514,933,742.98 14,933,742.98 14,529,775.5380,667,836.07 80,667,836.07 82,464,187.52
632,967.07 632,967.07 638,321.92101,107,010.86 101,107,010.86 76,630,556.00
1,662,063.39 1,662,063.39 1,417,130.963,335,896.58 3,335,896.58 2,845,937.881,354,475.93 1,354,475.93 1,396,301.24
199,033.56 199,033.56 218,325.870.00 0.00 200,000.00
9,465,160.02 9,465,160.02 7,504,927.96156.86 156.86 1,840.00
123,637,053.71 123,637,053.71 259,143,461.1628,277,851.84 28,277,851.84 36,452,136.9014,644,328.54 14,644,328.54 2,847,894.02
4,385,208.77 (4,385,208.77) 0.00 0.000.00 3,892,200.37 3,892,200.37 4,037,565.99
428,397,878.23 (493,008.40) (182,998.21) 0.00 427,721,871.62 534,588,370.10
1,759,977,343.81 493,008.40 182,998.21 0.00 1,760,653,350.42 521,754,391.99to next page
UNAUDITED
Annual Financial Report | 11

EXHIBIT II (concluded)COMBINED STATEMENT OF REVENUES, EXPENDITURES,AND CHANGES IN FUND BALANCES/STATEMENT OF ACTIVITIESGOVERNMENTAL FUNDSFor the Year Ended August 31, 2017(With comparative memorandum totals for the year ended August 31, 2016)
GOVERNMENTAL FUND TYPESGENERAL SPECIAL PERMANENTREVENUE REVENUE FUNDS
FUNDS FUNDS(EXH. A 2) (EXH. B 2) (EXH. C 2)
OTHER FINANCING SOURCES (USES) $ $ $
Transfers In 33,973,755.94 3,248,560.85Transfers Out (3,366,259.33) 230,094.15 (200,000,000.00)Sale of Capital Assets 89,805.00 3,795.00Gain (Loss) on Sale of Capital AssetsIncrease (Decrease) in Net Assets Due to
Interagency Transfer of Capital AssetsCapital ContributionsAppropriations Lapsed (567,499.12)
TOTAL OTHER FINANCING SOURCES (USES) 30,129,802.49 3,478,655.00 (199,996,205.00)
NET CHANGE IN FUND BALANCES/NET POSITION (4,709,615.73) (159,081.54) 1,598,458,293.57
FUND FINANCIAL STATEMENTFUND BALANCES
FUND BALANCES August 31, 2016 66,732,563.43 873,861.85 7,143,102,918.01Restatements (Note 14) (84,103.23) 29,902.01 (590,754.50)FUND BALANCES August 31, 2016, as restated 66,648,460.20 903,763.86 7,142,512,163.51
FUND BALANCES August 31, 2017 (Exhibit I) 61,938,844.47 744,682.32 8,740,970,457.08
GOVERNMENT WIDE STATEMENT OF NET POSITION
NET POSITION/NET CHANGE IN NET POSITION
NET POSITION August 31, 2016Restatements (Note 14)NET POSITION August 31, 2016, as restated
NET POSITION August 31, 2017 (Exhibit I)
The accompanying notes to the financial statements are an integral part of this exhibit.
UNAUDITEDTexas General Land Office and Veterans' Land Board (305)
12 | Annual Financial Report
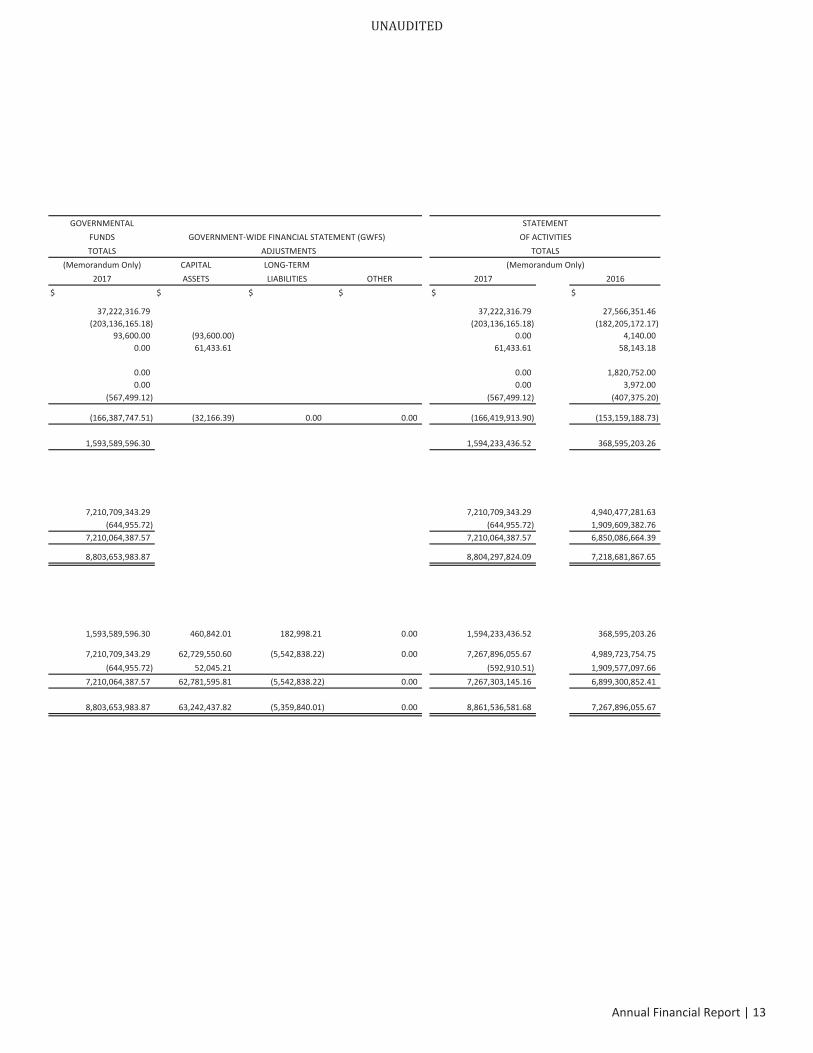
GOVERNMENTALFUNDS GOVERNMENT WIDE FINANCIAL STATEMENT (GWFS)TOTALS ADJUSTMENTS
(Memorandum Only) CAPITAL LONG TERM2017 ASSETS LIABILITIES OTHER 2017 2016
$ $ $ $ $ $
37,222,316.79 37,222,316.79 27,566,351.46(203,136,165.18) (203,136,165.18) (182,205,172.17)
93,600.00 (93,600.00) 0.00 4,140.000.00 61,433.61 61,433.61 58,143.18
0.00 0.00 1,820,752.000.00 0.00 3,972.00
(567,499.12) (567,499.12) (407,375.20)
(166,387,747.51) (32,166.39) 0.00 0.00 (166,419,913.90) (153,159,188.73)
1,593,589,596.30 1,594,233,436.52 368,595,203.26
7,210,709,343.29 7,210,709,343.29 4,940,477,281.63(644,955.72) (644,955.72) 1,909,609,382.76
7,210,064,387.57 7,210,064,387.57 6,850,086,664.39
8,803,653,983.87 8,804,297,824.09 7,218,681,867.65
1,593,589,596.30 460,842.01 182,998.21 0.00 1,594,233,436.52 368,595,203.26
7,210,709,343.29 62,729,550.60 (5,542,838.22) 0.00 7,267,896,055.67 4,989,723,754.75(644,955.72) 52,045.21 (592,910.51) 1,909,577,097.66
7,210,064,387.57 62,781,595.81 (5,542,838.22) 0.00 7,267,303,145.16 6,899,300,852.41
8,803,653,983.87 63,242,437.82 (5,359,840.01) 0.00 8,861,536,581.68 7,267,896,055.67
STATEMENTOF ACTIVITIES
TOTALS(Memorandum Only)
UNAUDITED
Annual Financial Report | 13
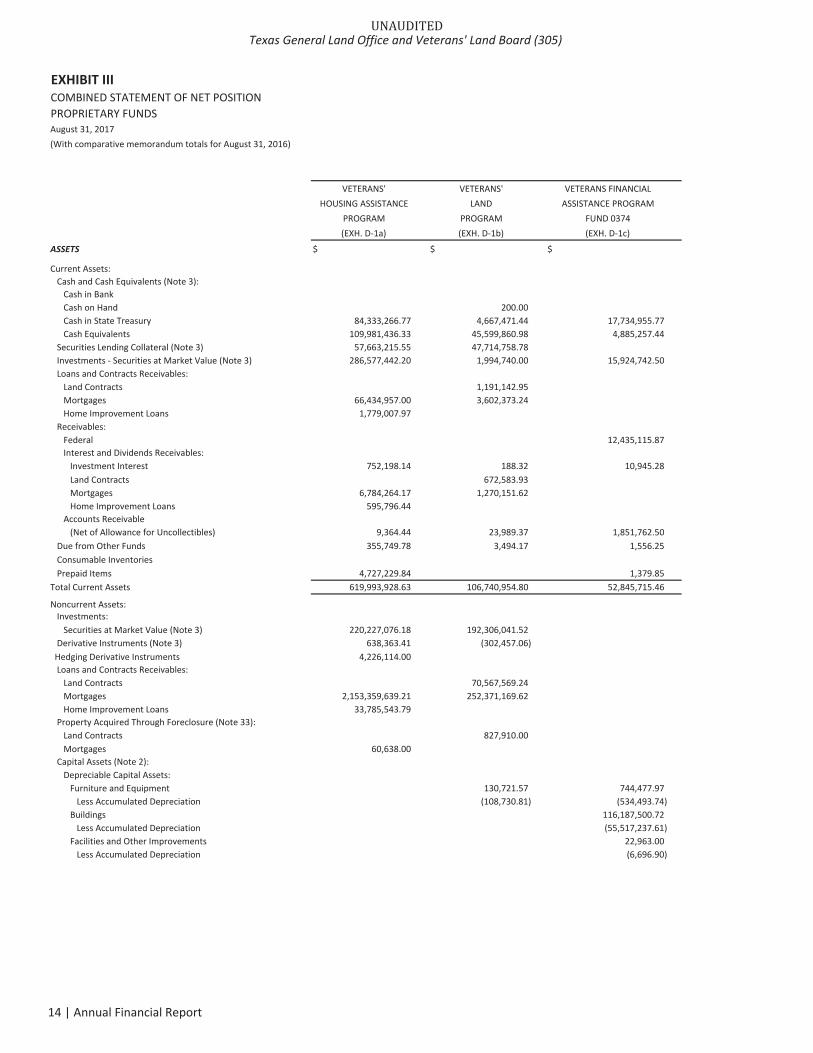
EXHIBIT IIICOMBINED STATEMENT OF NET POSITIONPROPRIETARY FUNDSAugust 31, 2017(With comparative memorandum totals for August 31, 2016)
VETERANS' VETERANS' VETERANS FINANCIALHOUSING ASSISTANCE LAND ASSISTANCE PROGRAM
PROGRAM PROGRAM FUND 0374(EXH. D 1a) (EXH. D 1b) (EXH. D 1c)
ASSETS $ $ $
Current Assets:Cash and Cash Equivalents (Note 3):
Cash in BankCash on Hand 200.00Cash in State Treasury 84,333,266.77 4,667,471.44 17,734,955.77Cash Equivalents 109,981,436.33 45,599,860.98 4,885,257.44
Securities Lending Collateral (Note 3) 57,663,215.55 47,714,758.78Investments Securities at Market Value (Note 3) 286,577,442.20 1,994,740.00 15,924,742.50Loans and Contracts Receivables:
Land Contracts 1,191,142.95Mortgages 66,434,957.00 3,602,373.24Home Improvement Loans 1,779,007.97
Receivables:Federal 12,435,115.87Interest and Dividends Receivables:
Investment Interest 752,198.14 188.32 10,945.28Land Contracts 672,583.93Mortgages 6,784,264.17 1,270,151.62Home Improvement Loans 595,796.44
Accounts Receivable(Net of Allowance for Uncollectibles) 9,364.44 23,989.37 1,851,762.50
Due from Other Funds 355,749.78 3,494.17 1,556.25Consumable InventoriesPrepaid Items 4,727,229.84 1,379.85
Total Current Assets 619,993,928.63 106,740,954.80 52,845,715.46
Noncurrent Assets:Investments:
Securities at Market Value (Note 3) 220,227,076.18 192,306,041.52Derivative Instruments (Note 3) 638,363.41 (302,457.06)Hedging Derivative Instruments 4,226,114.00Loans and Contracts Receivables:
Land Contracts 70,567,569.24Mortgages 2,153,359,639.21 252,371,169.62Home Improvement Loans 33,785,543.79
Property Acquired Through Foreclosure (Note 33):Land Contracts 827,910.00Mortgages 60,638.00
Capital Assets (Note 2):Depreciable Capital Assets:
Furniture and Equipment 130,721.57 744,477.97Less Accumulated Depreciation (108,730.81) (534,493.74)
Buildings 116,187,500.72Less Accumulated Depreciation (55,517,237.61)
Facilities and Other Improvements 22,963.00Less Accumulated Depreciation (6,696.90)
UNAUDITEDTexas General Land Office and Veterans' Land Board (305)
14 | Annual Financial Report
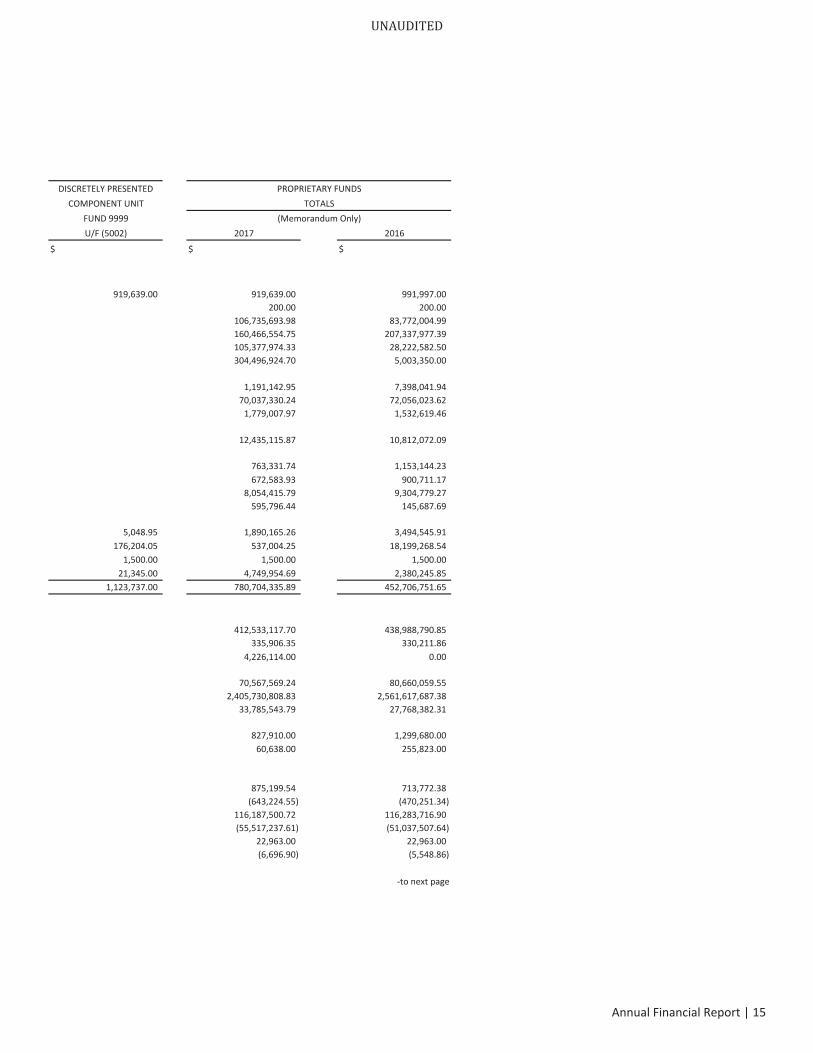
DISCRETELY PRESENTED PROPRIETARY FUNDSCOMPONENT UNIT TOTALS
FUND 9999 (Memorandum Only)U/F (5002) 2017 2016
$ $ $
919,639.00 919,639.00 991,997.00200.00 200.00
106,735,693.98 83,772,004.99160,466,554.75 207,337,977.39105,377,974.33 28,222,582.50304,496,924.70 5,003,350.00
1,191,142.95 7,398,041.9470,037,330.24 72,056,023.62
1,779,007.97 1,532,619.46
12,435,115.87 10,812,072.09
763,331.74 1,153,144.23672,583.93 900,711.17
8,054,415.79 9,304,779.27595,796.44 145,687.69
5,048.95 1,890,165.26 3,494,545.91176,204.05 537,004.25 18,199,268.54
1,500.00 1,500.00 1,500.0021,345.00 4,749,954.69 2,380,245.85
1,123,737.00 780,704,335.89 452,706,751.65
412,533,117.70 438,988,790.85335,906.35 330,211.86
4,226,114.00 0.00
70,567,569.24 80,660,059.552,405,730,808.83 2,561,617,687.38
33,785,543.79 27,768,382.31
827,910.00 1,299,680.0060,638.00 255,823.00
875,199.54 713,772.38(643,224.55) (470,251.34)
116,187,500.72 116,283,716.90(55,517,237.61) (51,037,507.64)
22,963.00 22,963.00(6,696.90) (5,548.86)
to next page
UNAUDITED
Annual Financial Report | 15
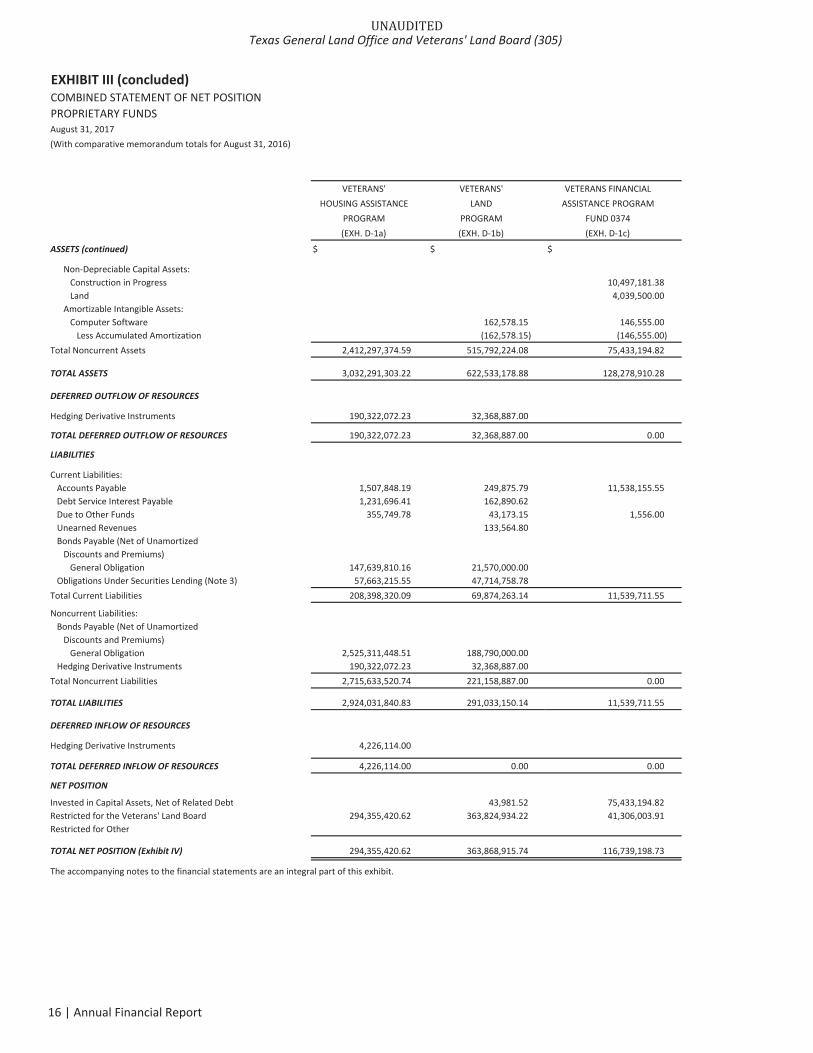
EXHIBIT III (concluded)COMBINED STATEMENT OF NET POSITIONPROPRIETARY FUNDSAugust 31, 2017(With comparative memorandum totals for August 31, 2016)
VETERANS' VETERANS' VETERANS FINANCIALHOUSING ASSISTANCE LAND ASSISTANCE PROGRAM
PROGRAM PROGRAM FUND 0374(EXH. D 1a) (EXH. D 1b) (EXH. D 1c)
ASSETS (continued) $ $ $
Non Depreciable Capital Assets:Construction in Progress 10,497,181.38Land 4,039,500.00
Amortizable Intangible Assets:Computer Software 162,578.15 146,555.00
Less Accumulated Amortization (162,578.15) (146,555.00)Total Noncurrent Assets 2,412,297,374.59 515,792,224.08 75,433,194.82
TOTAL ASSETS 3,032,291,303.22 622,533,178.88 128,278,910.28
DEFERRED OUTFLOW OF RESOURCES
Hedging Derivative Instruments 190,322,072.23 32,368,887.00
TOTAL DEFERRED OUTFLOW OF RESOURCES 190,322,072.23 32,368,887.00 0.00
LIABILITIES
Current Liabilities:Accounts Payable 1,507,848.19 249,875.79 11,538,155.55Debt Service Interest Payable 1,231,696.41 162,890.62Due to Other Funds 355,749.78 43,173.15 1,556.00Unearned Revenues 133,564.80Bonds Payable (Net of Unamortized
Discounts and Premiums)General Obligation 147,639,810.16 21,570,000.00
Obligations Under Securities Lending (Note 3) 57,663,215.55 47,714,758.78Total Current Liabilities 208,398,320.09 69,874,263.14 11,539,711.55
Noncurrent Liabilities:Bonds Payable (Net of Unamortized
Discounts and Premiums)General Obligation 2,525,311,448.51 188,790,000.00
Hedging Derivative Instruments 190,322,072.23 32,368,887.00Total Noncurrent Liabilities 2,715,633,520.74 221,158,887.00 0.00
TOTAL LIABILITIES 2,924,031,840.83 291,033,150.14 11,539,711.55
DEFERRED INFLOW OF RESOURCES
Hedging Derivative Instruments 4,226,114.00
TOTAL DEFERRED INFLOW OF RESOURCES 4,226,114.00 0.00 0.00
NET POSITION
Invested in Capital Assets, Net of Related Debt 43,981.52 75,433,194.82Restricted for the Veterans' Land Board 294,355,420.62 363,824,934.22 41,306,003.91Restricted for Other
TOTAL NET POSITION (Exhibit IV) 294,355,420.62 363,868,915.74 116,739,198.73
The accompanying notes to the financial statements are an integral part of this exhibit.
UNAUDITEDTexas General Land Office and Veterans' Land Board (305)
16 | Annual Financial Report
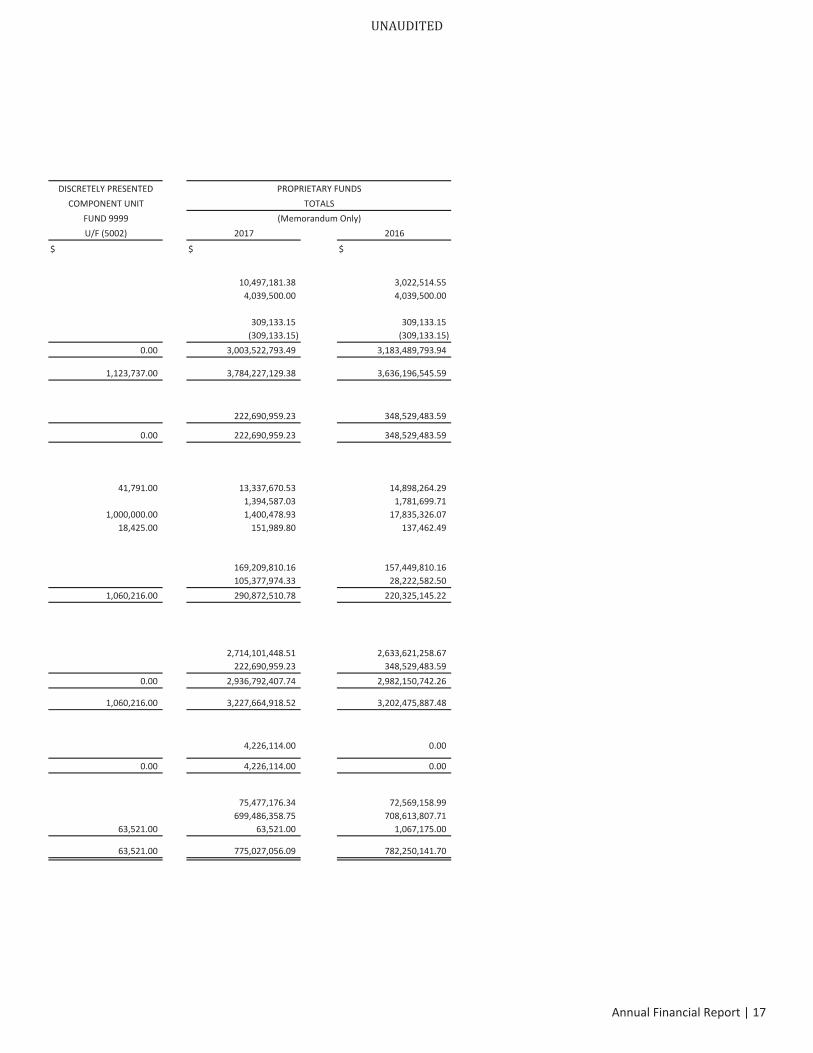
DISCRETELY PRESENTED PROPRIETARY FUNDSCOMPONENT UNIT TOTALS
FUND 9999 (Memorandum Only)U/F (5002) 2017 2016
$ $ $
10,497,181.38 3,022,514.554,039,500.00 4,039,500.00
309,133.15 309,133.15(309,133.15) (309,133.15)
0.00 3,003,522,793.49 3,183,489,793.94
1,123,737.00 3,784,227,129.38 3,636,196,545.59
222,690,959.23 348,529,483.59
0.00 222,690,959.23 348,529,483.59
41,791.00 13,337,670.53 14,898,264.291,394,587.03 1,781,699.71
1,000,000.00 1,400,478.93 17,835,326.0718,425.00 151,989.80 137,462.49
169,209,810.16 157,449,810.16105,377,974.33 28,222,582.50
1,060,216.00 290,872,510.78 220,325,145.22
2,714,101,448.51 2,633,621,258.67222,690,959.23 348,529,483.59
0.00 2,936,792,407.74 2,982,150,742.26
1,060,216.00 3,227,664,918.52 3,202,475,887.48
4,226,114.00 0.00
0.00 4,226,114.00 0.00
75,477,176.34 72,569,158.99699,486,358.75 708,613,807.71
63,521.00 63,521.00 1,067,175.00
63,521.00 775,027,056.09 782,250,141.70
UNAUDITED
Annual Financial Report | 17
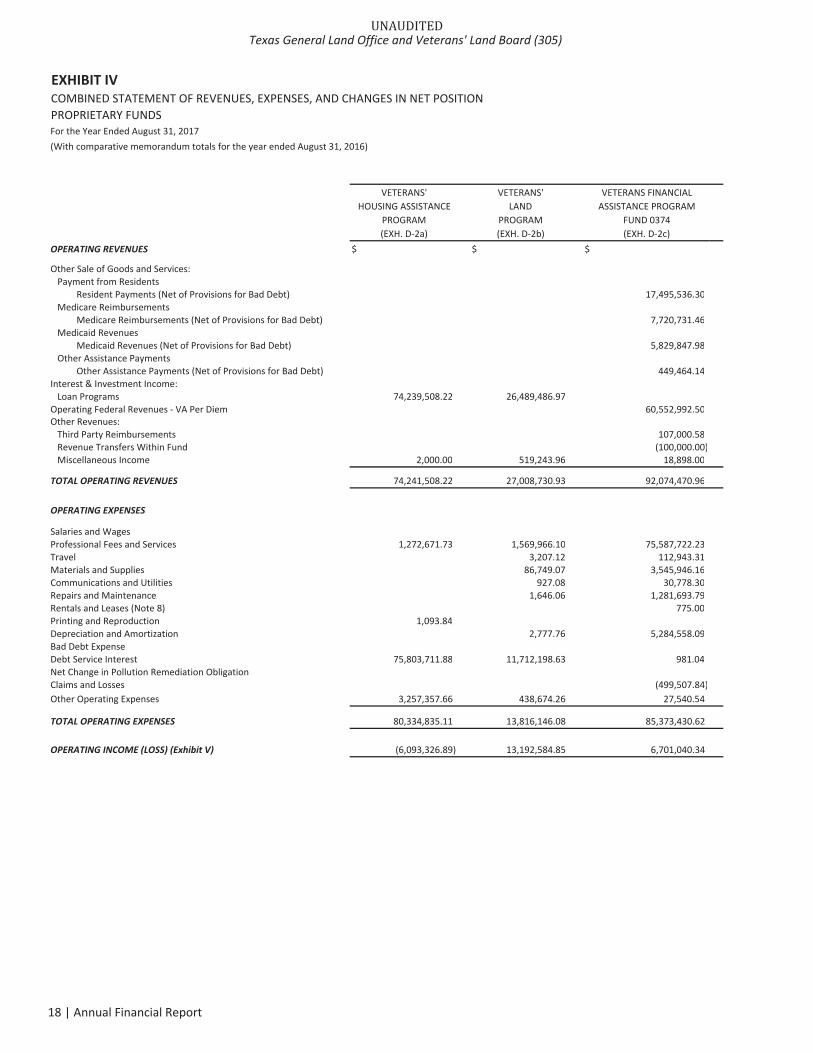
EXHIBIT IVCOMBINED STATEMENT OF REVENUES, EXPENSES, AND CHANGES IN NET POSITIONPROPRIETARY FUNDSFor the Year Ended August 31, 2017(With comparative memorandum totals for the year ended August 31, 2016)
VETERANS' VETERANS' VETERANS FINANCIALHOUSING ASSISTANCE LAND ASSISTANCE PROGRAM
PROGRAM PROGRAM FUND 0374(EXH. D 2a) (EXH. D 2b) (EXH. D 2c)
OPERATING REVENUES $ $ $
Other Sale of Goods and Services:Payment from Residents
Resident Payments (Net of Provisions for Bad Debt) 17,495,536.30Medicare Reimbursements
Medicare Reimbursements (Net of Provisions for Bad Debt) 7,720,731.46Medicaid Revenues
Medicaid Revenues (Net of Provisions for Bad Debt) 5,829,847.98Other Assistance Payments
Other Assistance Payments (Net of Provisions for Bad Debt) 449,464.14Interest & Investment Income:
Loan Programs 74,239,508.22 26,489,486.97Operating Federal Revenues VA Per Diem 60,552,992.50Other Revenues:
Third Party Reimbursements 107,000.58Revenue Transfers Within Fund (100,000.00)Miscellaneous Income 2,000.00 519,243.96 18,898.00
TOTAL OPERATING REVENUES 74,241,508.22 27,008,730.93 92,074,470.96
OPERATING EXPENSES
Salaries and WagesProfessional Fees and Services 1,272,671.73 1,569,966.10 75,587,722.23Travel 3,207.12 112,943.31Materials and Supplies 86,749.07 3,545,946.16Communications and Utilities 927.08 30,778.30Repairs and Maintenance 1,646.06 1,281,693.79Rentals and Leases (Note 8) 775.00Printing and Reproduction 1,093.84Depreciation and Amortization 2,777.76 5,284,558.09Bad Debt ExpenseDebt Service Interest 75,803,711.88 11,712,198.63 981.04Net Change in Pollution Remediation ObligationClaims and Losses (499,507.84)Other Operating Expenses 3,257,357.66 438,674.26 27,540.54
TOTAL OPERATING EXPENSES 80,334,835.11 13,816,146.08 85,373,430.62
OPERATING INCOME (LOSS) (Exhibit V) (6,093,326.89) 13,192,584.85 6,701,040.34
UNAUDITEDTexas General Land Office and Veterans' Land Board (305)
18 | Annual Financial Report
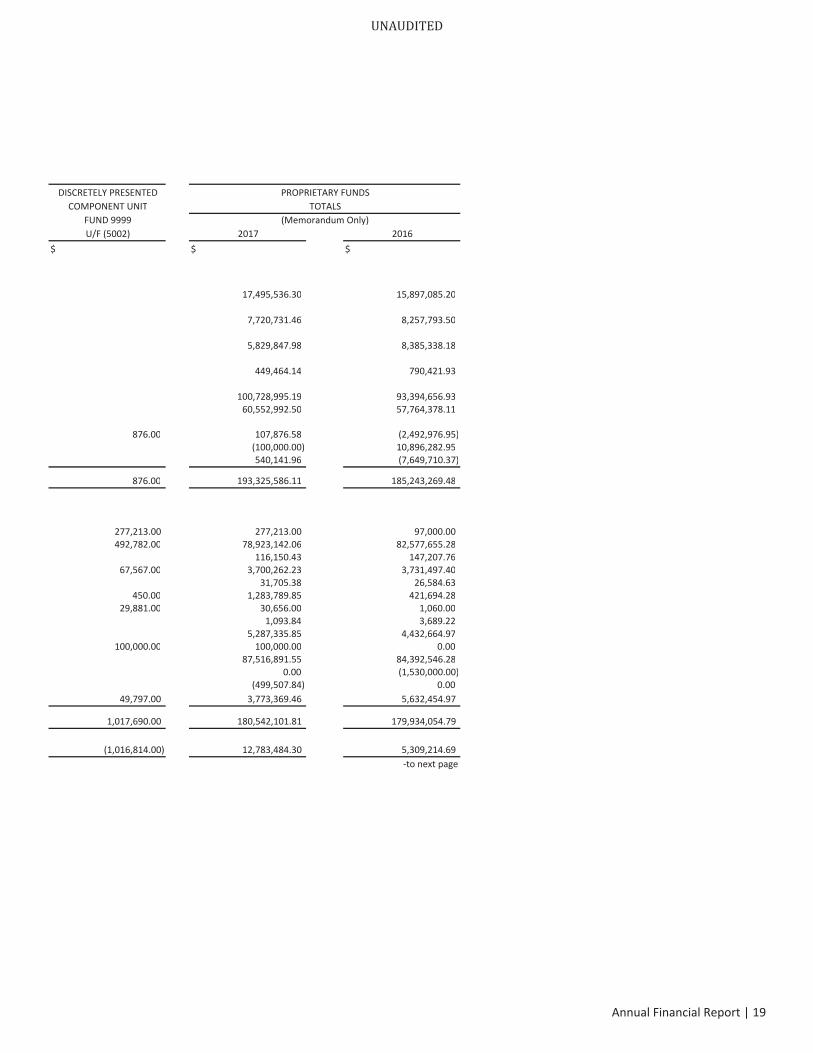
DISCRETELY PRESENTED PROPRIETARY FUNDSCOMPONENT UNIT TOTALS
FUND 9999 (Memorandum Only)U/F (5002) 2017 2016
$ $ $
17,495,536.30 15,897,085.20
7,720,731.46 8,257,793.50
5,829,847.98 8,385,338.18
449,464.14 790,421.93
100,728,995.19 93,394,656.9360,552,992.50 57,764,378.11
876.00 107,876.58 (2,492,976.95)(100,000.00) 10,896,282.95540,141.96 (7,649,710.37)
876.00 193,325,586.11 185,243,269.48
277,213.00 277,213.00 97,000.00492,782.00 78,923,142.06 82,577,655.28
116,150.43 147,207.7667,567.00 3,700,262.23 3,731,497.40
31,705.38 26,584.63450.00 1,283,789.85 421,694.28
29,881.00 30,656.00 1,060.001,093.84 3,689.22
5,287,335.85 4,432,664.97100,000.00 100,000.00 0.00
87,516,891.55 84,392,546.280.00 (1,530,000.00)
(499,507.84) 0.0049,797.00 3,773,369.46 5,632,454.97
1,017,690.00 180,542,101.81 179,934,054.79
(1,016,814.00) 12,783,484.30 5,309,214.69to next page
UNAUDITED
Annual Financial Report | 19
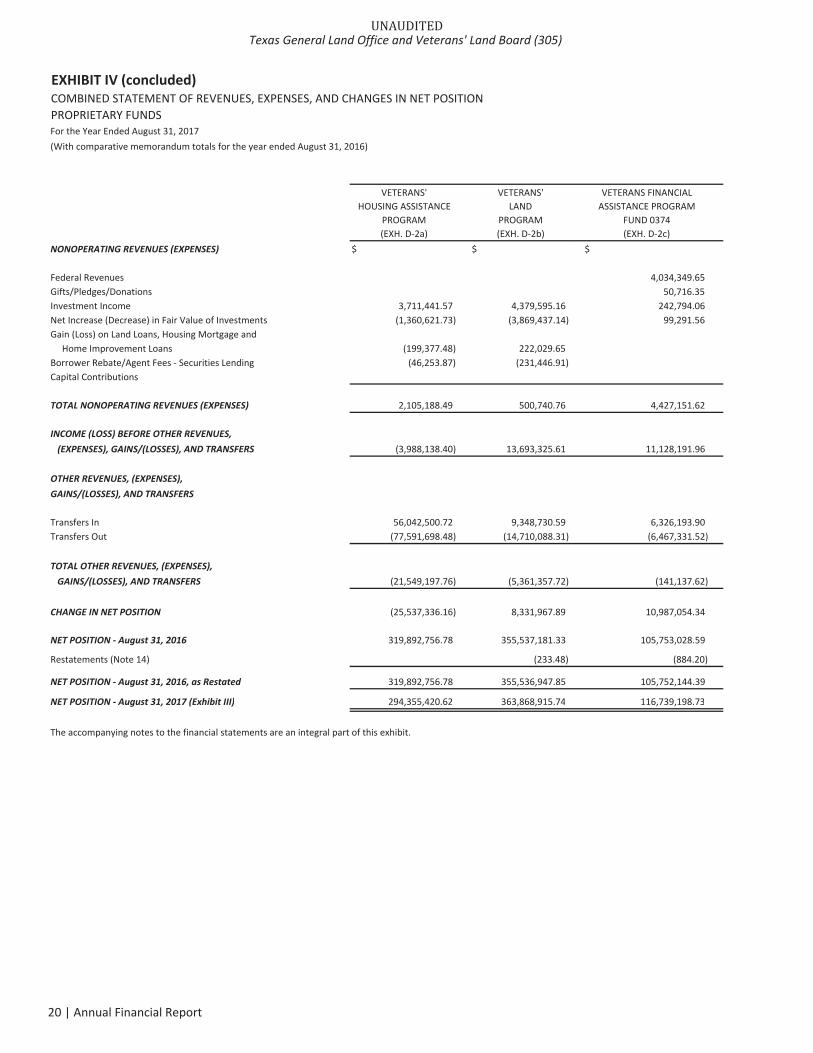
EXHIBIT IV (concluded)COMBINED STATEMENT OF REVENUES, EXPENSES, AND CHANGES IN NET POSITIONPROPRIETARY FUNDSFor the Year Ended August 31, 2017(With comparative memorandum totals for the year ended August 31, 2016)
VETERANS' VETERANS' VETERANS FINANCIALHOUSING ASSISTANCE LAND ASSISTANCE PROGRAM
PROGRAM PROGRAM FUND 0374(EXH. D 2a) (EXH. D 2b) (EXH. D 2c)
NONOPERATING REVENUES (EXPENSES) $ $ $
Federal Revenues 4,034,349.65Gifts/Pledges/Donations 50,716.35Investment Income 3,711,441.57 4,379,595.16 242,794.06Net Increase (Decrease) in Fair Value of Investments (1,360,621.73) (3,869,437.14) 99,291.56Gain (Loss) on Land Loans, Housing Mortgage and
Home Improvement Loans (199,377.48) 222,029.65Borrower Rebate/Agent Fees Securities Lending (46,253.87) (231,446.91)Capital Contributions
TOTAL NONOPERATING REVENUES (EXPENSES) 2,105,188.49 500,740.76 4,427,151.62
INCOME (LOSS) BEFORE OTHER REVENUES,(EXPENSES), GAINS/(LOSSES), AND TRANSFERS (3,988,138.40) 13,693,325.61 11,128,191.96
OTHER REVENUES, (EXPENSES),GAINS/(LOSSES), AND TRANSFERS
Transfers In 56,042,500.72 9,348,730.59 6,326,193.90Transfers Out (77,591,698.48) (14,710,088.31) (6,467,331.52)
TOTAL OTHER REVENUES, (EXPENSES),GAINS/(LOSSES), AND TRANSFERS (21,549,197.76) (5,361,357.72) (141,137.62)
CHANGE IN NET POSITION (25,537,336.16) 8,331,967.89 10,987,054.34
NET POSITION August 31, 2016 319,892,756.78 355,537,181.33 105,753,028.59
Restatements (Note 14) (233.48) (884.20)
NET POSITION August 31, 2016, as Restated 319,892,756.78 355,536,947.85 105,752,144.39
NET POSITION August 31, 2017 (Exhibit III) 294,355,420.62 363,868,915.74 116,739,198.73
The accompanying notes to the financial statements are an integral part of this exhibit.
UNAUDITEDTexas General Land Office and Veterans' Land Board (305)
20 | Annual Financial Report
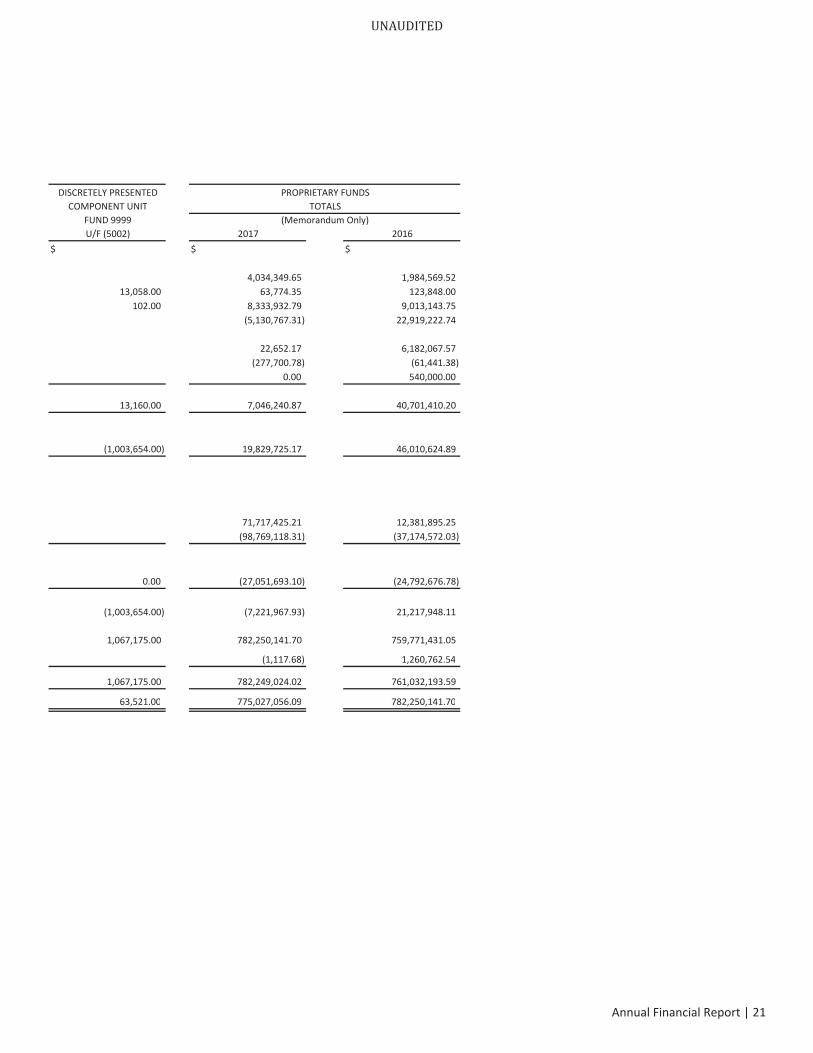
DISCRETELY PRESENTED PROPRIETARY FUNDSCOMPONENT UNIT TOTALS
FUND 9999 (Memorandum Only)U/F (5002) 2017 2016
$ $ $
4,034,349.65 1,984,569.5213,058.00 63,774.35 123,848.00
102.00 8,333,932.79 9,013,143.75(5,130,767.31) 22,919,222.74
22,652.17 6,182,067.57(277,700.78) (61,441.38)
0.00 540,000.00
13,160.00 7,046,240.87 40,701,410.20
(1,003,654.00) 19,829,725.17 46,010,624.89
71,717,425.21 12,381,895.25(98,769,118.31) (37,174,572.03)
0.00 (27,051,693.10) (24,792,676.78)
(1,003,654.00) (7,221,967.93) 21,217,948.11
1,067,175.00 782,250,141.70 759,771,431.05
(1,117.68) 1,260,762.54
1,067,175.00 782,249,024.02 761,032,193.59
63,521.00 775,027,056.09 782,250,141.70
UNAUDITED
Annual Financial Report | 21
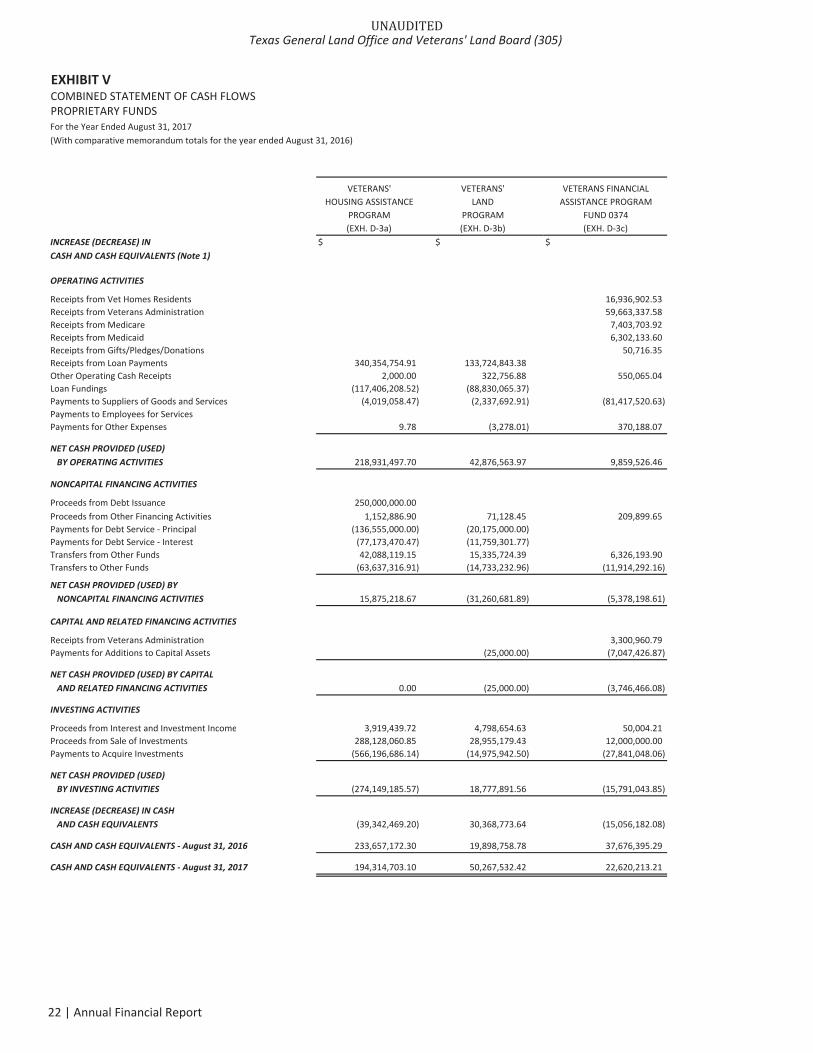
EXHIBIT VCOMBINED STATEMENT OF CASH FLOWSPROPRIETARY FUNDSFor the Year Ended August 31, 2017(With comparative memorandum totals for the year ended August 31, 2016)
VETERANS' VETERANS' VETERANS FINANCIALHOUSING ASSISTANCE LAND ASSISTANCE PROGRAM
PROGRAM PROGRAM FUND 0374(EXH. D 3a) (EXH. D 3b) (EXH. D 3c)
INCREASE (DECREASE) IN $ $ $CASH AND CASH EQUIVALENTS (Note 1)
OPERATING ACTIVITIES
Receipts from Vet Homes Residents 16,936,902.53Receipts from Veterans Administration 59,663,337.58Receipts from Medicare 7,403,703.92Receipts from Medicaid 6,302,133.60Receipts from Gifts/Pledges/Donations 50,716.35Receipts from Loan Payments 340,354,754.91 133,724,843.38Other Operating Cash Receipts 2,000.00 322,756.88 550,065.04Loan Fundings (117,406,208.52) (88,830,065.37)Payments to Suppliers of Goods and Services (4,019,058.47) (2,337,692.91) (81,417,520.63)Payments to Employees for ServicesPayments for Other Expenses 9.78 (3,278.01) 370,188.07
NET CASH PROVIDED (USED)BY OPERATING ACTIVITIES 218,931,497.70 42,876,563.97 9,859,526.46
NONCAPITAL FINANCING ACTIVITIES
Proceeds from Debt Issuance 250,000,000.00Proceeds from Other Financing Activities 1,152,886.90 71,128.45 209,899.65Payments for Debt Service Principal (136,555,000.00) (20,175,000.00)Payments for Debt Service Interest (77,173,470.47) (11,759,301.77)Transfers from Other Funds 42,088,119.15 15,335,724.39 6,326,193.90Transfers to Other Funds (63,637,316.91) (14,733,232.96) (11,914,292.16)
NET CASH PROVIDED (USED) BYNONCAPITAL FINANCING ACTIVITIES 15,875,218.67 (31,260,681.89) (5,378,198.61)
CAPITAL AND RELATED FINANCING ACTIVITIES
Receipts from Veterans Administration 3,300,960.79Payments for Additions to Capital Assets (25,000.00) (7,047,426.87)
NET CASH PROVIDED (USED) BY CAPITALAND RELATED FINANCING ACTIVITIES 0.00 (25,000.00) (3,746,466.08)
INVESTING ACTIVITIES
Proceeds from Interest and Investment Income 3,919,439.72 4,798,654.63 50,004.21Proceeds from Sale of Investments 288,128,060.85 28,955,179.43 12,000,000.00Payments to Acquire Investments (566,196,686.14) (14,975,942.50) (27,841,048.06)
NET CASH PROVIDED (USED)BY INVESTING ACTIVITIES (274,149,185.57) 18,777,891.56 (15,791,043.85)
INCREASE (DECREASE) IN CASHAND CASH EQUIVALENTS (39,342,469.20) 30,368,773.64 (15,056,182.08)
CASH AND CASH EQUIVALENTS August 31, 2016 233,657,172.30 19,898,758.78 37,676,395.29
CASH AND CASH EQUIVALENTS August 31, 2017 194,314,703.10 50,267,532.42 22,620,213.21
UNAUDITEDTexas General Land Office and Veterans' Land Board (305)
22 | Annual Financial Report
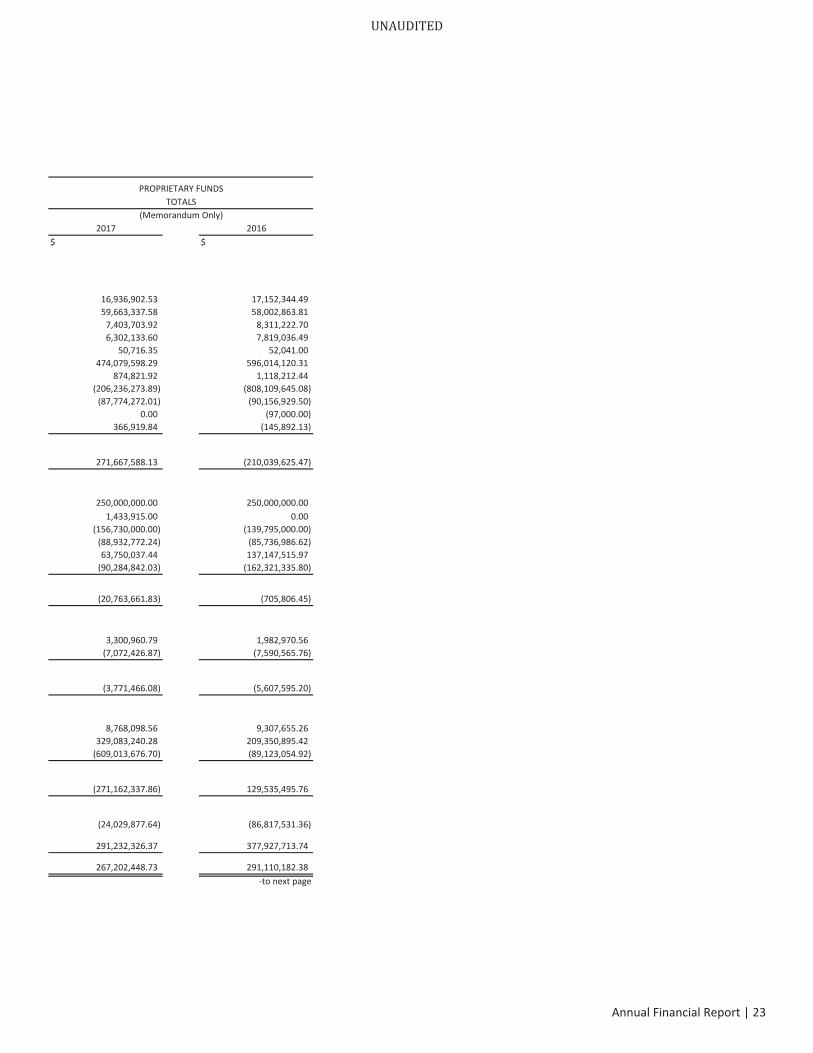
PROPRIETARY FUNDSTOTALS
(Memorandum Only)2017 2016
$ $
16,936,902.53 17,152,344.4959,663,337.58 58,002,863.81
7,403,703.92 8,311,222.706,302,133.60 7,819,036.49
50,716.35 52,041.00474,079,598.29 596,014,120.31
874,821.92 1,118,212.44(206,236,273.89) (808,109,645.08)
(87,774,272.01) (90,156,929.50)0.00 (97,000.00)
366,919.84 (145,892.13)
271,667,588.13 (210,039,625.47)
250,000,000.00 250,000,000.001,433,915.00 0.00
(156,730,000.00) (139,795,000.00)(88,932,772.24) (85,736,986.62)63,750,037.44 137,147,515.97
(90,284,842.03) (162,321,335.80)
(20,763,661.83) (705,806.45)
3,300,960.79 1,982,970.56(7,072,426.87) (7,590,565.76)
(3,771,466.08) (5,607,595.20)
8,768,098.56 9,307,655.26329,083,240.28 209,350,895.42
(609,013,676.70) (89,123,054.92)
(271,162,337.86) 129,535,495.76
(24,029,877.64) (86,817,531.36)
291,232,326.37 377,927,713.74
267,202,448.73 291,110,182.38to next page
UNAUDITED
Annual Financial Report | 23
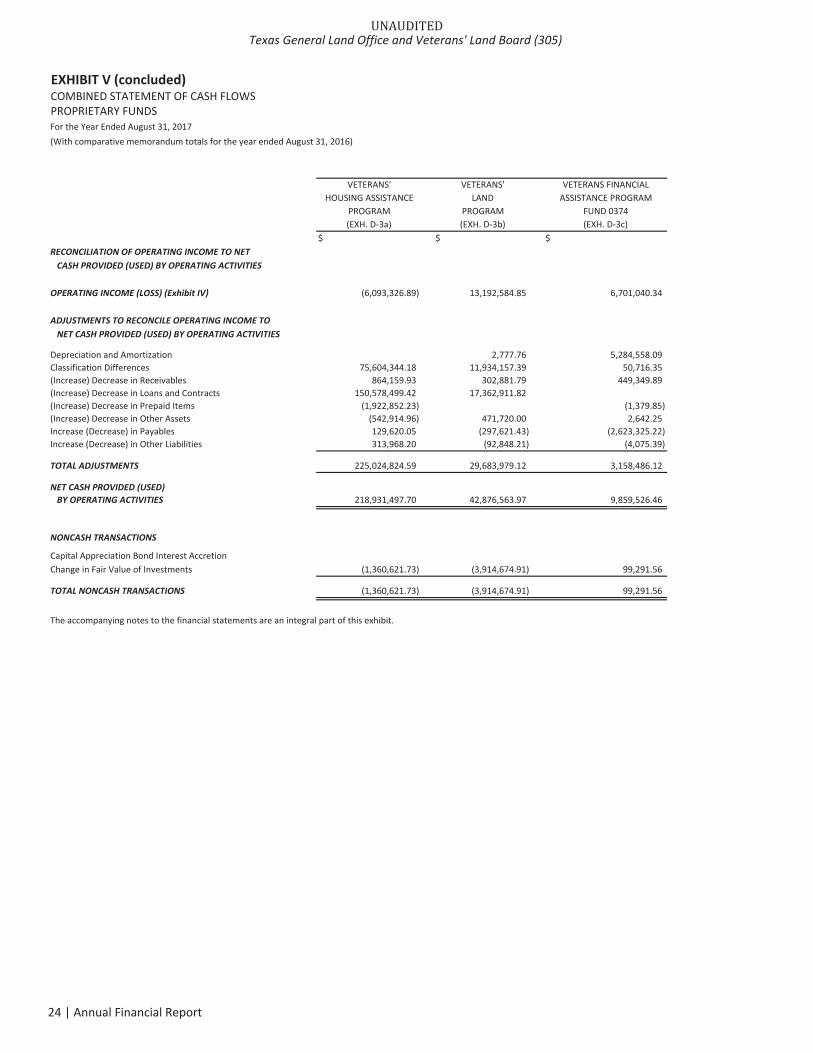
EXHIBIT V (concluded)COMBINED STATEMENT OF CASH FLOWSPROPRIETARY FUNDSFor the Year Ended August 31, 2017(With comparative memorandum totals for the year ended August 31, 2016)
VETERANS' VETERANS' VETERANS FINANCIALHOUSING ASSISTANCE LAND ASSISTANCE PROGRAM
PROGRAM PROGRAM FUND 0374(EXH. D 3a) (EXH. D 3b) (EXH. D 3c)
$ $ $RECONCILIATION OF OPERATING INCOME TO NETCASH PROVIDED (USED) BY OPERATING ACTIVITIES
OPERATING INCOME (LOSS) (Exhibit IV) (6,093,326.89) 13,192,584.85 6,701,040.34
ADJUSTMENTS TO RECONCILE OPERATING INCOME TONET CASH PROVIDED (USED) BY OPERATING ACTIVITIES
Depreciation and Amortization 2,777.76 5,284,558.09Classification Differences 75,604,344.18 11,934,157.39 50,716.35(Increase) Decrease in Receivables 864,159.93 302,881.79 449,349.89(Increase) Decrease in Loans and Contracts 150,578,499.42 17,362,911.82(Increase) Decrease in Prepaid Items (1,922,852.23) (1,379.85)(Increase) Decrease in Other Assets (542,914.96) 471,720.00 2,642.25Increase (Decrease) in Payables 129,620.05 (297,621.43) (2,623,325.22)Increase (Decrease) in Other Liabilities 313,968.20 (92,848.21) (4,075.39)
TOTAL ADJUSTMENTS 225,024,824.59 29,683,979.12 3,158,486.12
NET CASH PROVIDED (USED)BY OPERATING ACTIVITIES 218,931,497.70 42,876,563.97 9,859,526.46
NONCASH TRANSACTIONS
Capital Appreciation Bond Interest AccretionChange in Fair Value of Investments (1,360,621.73) (3,914,674.91) 99,291.56
TOTAL NONCASH TRANSACTIONS (1,360,621.73) (3,914,674.91) 99,291.56
The accompanying notes to the financial statements are an integral part of this exhibit.
UNAUDITEDTexas General Land Office and Veterans' Land Board (305)
24 | Annual Financial Report
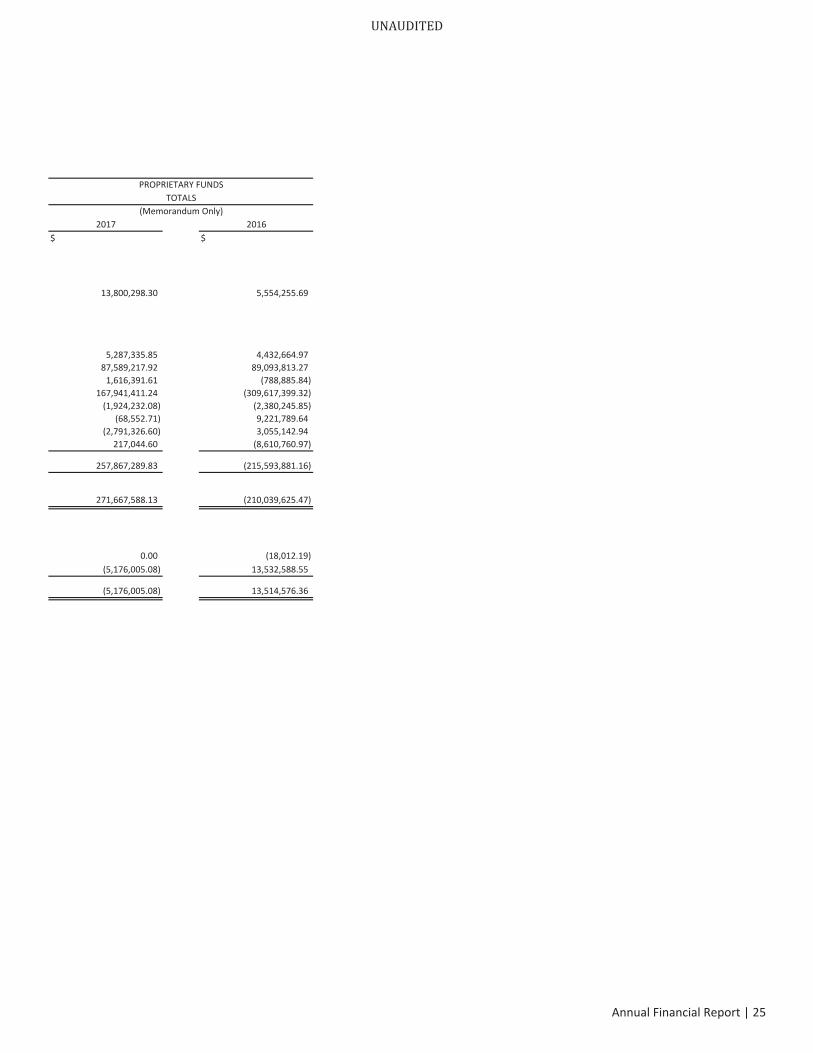
PROPRIETARY FUNDSTOTALS
(Memorandum Only)2017 2016
$ $
13,800,298.30 5,554,255.69
5,287,335.85 4,432,664.9787,589,217.92 89,093,813.27
1,616,391.61 (788,885.84)167,941,411.24 (309,617,399.32)
(1,924,232.08) (2,380,245.85)(68,552.71) 9,221,789.64
(2,791,326.60) 3,055,142.94217,044.60 (8,610,760.97)
257,867,289.83 (215,593,881.16)
271,667,588.13 (210,039,625.47)
0.00 (18,012.19)(5,176,005.08) 13,532,588.55
(5,176,005.08) 13,514,576.36
UNAUDITED
Annual Financial Report | 25
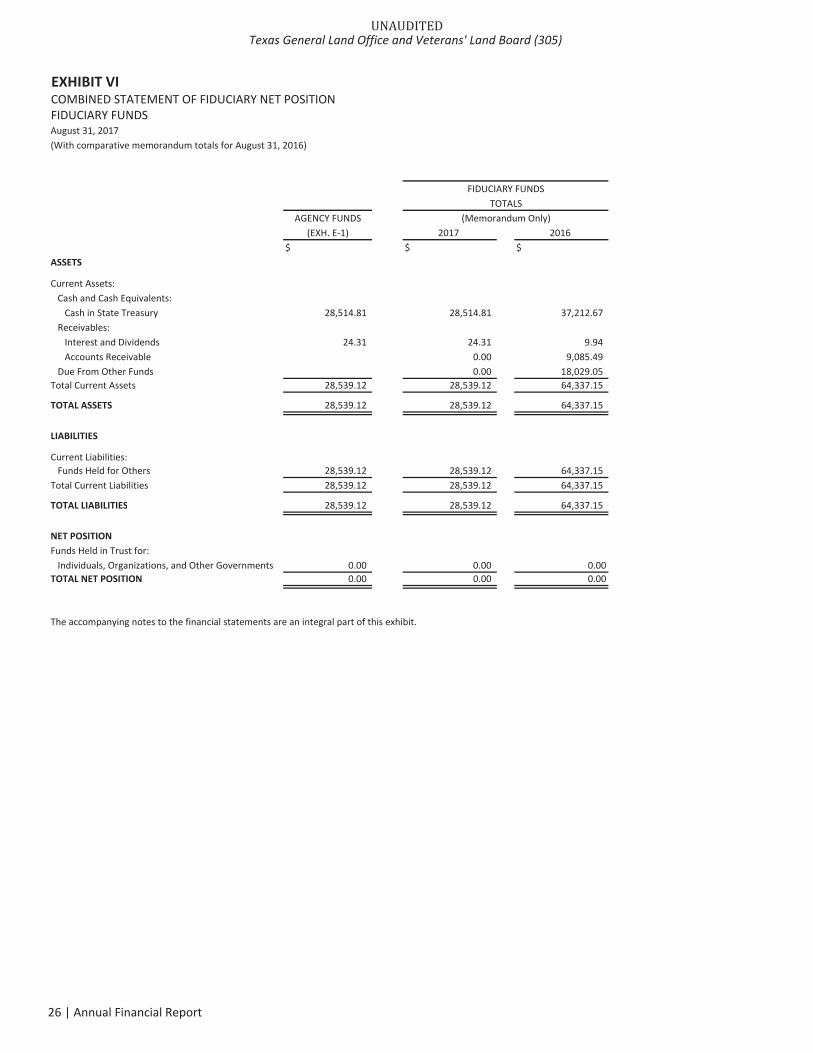
EXHIBIT VICOMBINED STATEMENT OF FIDUCIARY NET POSITIONFIDUCIARY FUNDSAugust 31, 2017(With comparative memorandum totals for August 31, 2016)
AGENCY FUNDS(EXH. E 1) 2017 2016
$ $ $ASSETS
Current Assets:Cash and Cash Equivalents:
Cash in State Treasury 28,514.81 28,514.81 37,212.67Receivables:
Interest and Dividends 24.31 24.31 9.94Accounts Receivable 0.00 9,085.49
Due From Other Funds 0.00 18,029.05Total Current Assets 28,539.12 28,539.12 64,337.15
TOTAL ASSETS 28,539.12 28,539.12 64,337.15
LIABILITIES
Current Liabilities:Funds Held for Others 28,539.12 28,539.12 64,337.15
Total Current Liabilities 28,539.12 28,539.12 64,337.15
TOTAL LIABILITIES 28,539.12 28,539.12 64,337.15
NET POSITIONFunds Held in Trust for:
Individuals, Organizations, and Other Governments 0.00 0.00 0.00TOTAL NET POSITION 0.00 0.00 0.00
The accompanying notes to the financial statements are an integral part of this exhibit.
FIDUCIARY FUNDSTOTALS
(Memorandum Only)
UNAUDITEDTexas General Land Office and Veterans' Land Board (305)
26 | Annual Financial Report

NOTES TO THE
FINANCIAL STATEMENTS
UNAUDITED ANNUAL FINANCIAL REPORTAUGUST 31, 2017
TEXAS GENERAL LAND OFFICE
VETERANS' LAND BOARD
(This page intentionally left blank)
UNAUDITEDTexas General Land Office and Veterans' Land Board (305)
28 | Annual Financial Report
Note 1 SUMMARY OF SIGNIFICANT ACCOUNTINGPOLICIES
ENTITY The Texas General Land Office (GLO) and Veterans' Land Board(VLB) are agencies of the state of Texas. Their financial recordscomply with state statutes and regulations. This includescompliance with the Texas Comptroller of Public Accounts'Reporting Requirements for Annual Financial Reports of StateAgencies and Universities.
The Tex. Const. Art. XIV, §1 created the Texas General Land Office,which is responsible for managing most state owned lands andminerals. The Veterans' Land Board was created in 1946 by Tex.Const. Art. III, §49 b to provide loans to veterans for the purchaseof land in the state of Texas. In 1983, §49 b was amended to allowVLB to provide loans to veterans buying homes in Texas. In 1997,Tex. Nat. Res. Code Ann., §164 was amended to allow VLB toconstruct and operate veterans nursing homes. In 2001, Tex. Nat.Res. Code Ann., §164 was again amended to provide for the StateVeterans Cemetery Program. Tex. Nat. Res. Code Ann., chs. 11, 31,32, 33, 40, 51, 52, 53, and 61 establish the administrativeprovisions, powers, and duties of GLO and the LandCommissioner.
BASIS OF PRESENTATION Due to statewide requirements embedded in GovernmentalAccounting Standards Board (GASB) Statement No. 34, BasicFinancial Statements – and Management's Discussion andAnalysis – for State and Local Governments, the Texas Comptrollerof Public Accounts does not require the accompanying annualfinancial report to comply with all the requirements in thisstatement. The financial report will be considered for audit by thestate auditor as part of the audit of the State of TexasComprehensive Annual Financial Report; therefore, an opinion hasnot been expressed on the financial statements and relatedinformation contained in this report.
FUND STRUCTURE The accounts of GLO and VLB are organized on the basis of funds,each of which is considered a separate accounting entity. Theoperations of each fund are accounted for with a complete set ofself balancing accounts that comprise its assets, liabilities, fundbalance or net position, revenues, and expenditures or expenses.
GOVERNMENTAL FUND TYPES & GOVERNMENT WIDEADJUSTMENT FUND TYPESGeneral and administrative operations of GLO and VLB arefinanced from general revenue, special revenue, and permanentfunds. General revenue funds serve as the general operatingfunds of the agency. Special revenue funds are used to accountfor the proceeds of specific revenue sources (other than privatepurpose trusts or for major capital projects) that are legallyrestricted to expenditures for specified purposes. Permanentfunds are used to account for resources that are legallyrestricted to the extent that only earnings, and not principal,may be used for purposes that support the state's program.
Assets, deferred outflows of resources, liabilities, deferredinflows of resources, and fund balance comprising the generalrevenue, special revenue, and permanent funds in the aggregateare presented in Exhibit I. Revenues, expenditures, and changesin fund balance and net position for the general revenue, specialrevenue, and permanent funds in the aggregate are presentedin Exhibit II.
General Fund (GAAP Fund Type 01)The General Revenue Fund (Fund 0001) is the principleoperating fund used to account for all financial resources of thestate except those required to be accounted for in another fund.
Coastal Protection Fund (GAAP Fund Type 01)The coastal protection fund (Fund 0027) provides readilyavailable monies for response cleanup and payment of damagesfrom unauthorized discharges of oil and other substances.
Coastal Public Lands Management Fund (GAAP Fund Type 01)The coastal public lands management fee fund (Fund 0450)receives monies for the grant of surface interest for themanagement of surface estate in coastal public lands.
Veterans' Land Program Administration Fund (GAAP Fund Type01)The veterans' land program administration fund (Fund 0522)pays administrative costs associated with VLB programs,including expenses of bond issue, investments, land purchasesand resale, and the veterans' homes programs.
Capital Trust Fund (GAAP Fund Type 01)The capital trust fund (Fund 0543) is used to finance theacquisition, construction, repair, improvement, or equipping ofa building by a state agency, the acquisition of real or personalproperty for a state agency or, any other purpose for whichfunds may be appropriated from general revenue.
UNAUDITED
Annual Financial Report | 29

Specialty License Plate Trust Fund (GAAP Fund Type 01)The specialty license plate general fund (Fund 0802) collectsrevenues from the sale of the specialty license plates.
For every Adopt A Beach plate sold, the Adopt A Beachprogram will receive $22.00 from the $30.00 fee to aidin the volunteer effort to clean up Texas beaches.For every San Jacinto Texas Historic District plate sold,the San Jacinto Texas Historic District will receive$22.00 from the $30.00 fee to aid in the effort torevitalize the historical significance of the region.For every Buffalo Soldiers plate sold, the BuffaloSoldiers National Museum in Houston will receive$22.00 from the $30.00 fee to benefit and support themuseum.For every Daughters of the American Revolution platesold, the Texas Society of Daughters of the AmericanRevolution will receive $22.00 from the $30.00 fee tosupport historic preservation, education andscholarships.For every Childhood Cancer Awareness plate sold, theGeneral Land Office will receive $22.00 from the $30.00fee to provide grants to benefit organizations operatingin the state that raise awareness of, conduct researchon, or provide services for persons diagnosed withchildhood cancer. GLO currently has a contract with theSnowdrop Foundation to received such grants.For every Alamo plate sold, the General Land Office willreceive $22.00 from the $30.00 fee to preserve theAlamo and provide education.
Alamo Complex Fund (GAAP Fund Type 01)The Alamo complex fund (Fund 5152) consists of transfers, fees,and other revenue from the operation of the Alamo complex,grants, donations, and other income earned from the operationof the Alamo complex. Funds are used for the preservation,repair, renovation, improvement, expansion, or equipment ofthe Alamo complex or to acquire historical items.
Veterans Financial Assistance Program Fund (GAAP Fund Type02)The veterans financial assistance program fund (Fund 0374)receives proceeds from gifts, grants, and other authorizedsources to fund the veterans' cemetery program.
Permanent School Fund (GAAP Fund Type 19)The permanent school fund (Fund 0044) consists of all land andall revenues derived from the land or other propertiesappropriated for the support of public free schools.
Capital Asset Adjustment Fund (GAAP Fund Type 11)The capital asset adjustment fund (Fund 9998) is used to convertgovernmental fund capital assets from modified accrual to fullaccrual basis of accounting.
Long Term Liability Adjustment Fund (GAAP Fund Type 12)The long term liability adjustment fund (Fund 9997) is used toconvert governmental fund liabilities from modified accrual tofull accrual basis of accounting.
Other Adjustment Fund (GAAP Fund Type 21)The other adjustment fund (Fund 9996) is used to convert allother governmental fund activity from modified accrual to fullaccrual basis of accounting.
PROPRIETARY FUND TYPESAssets, deferred outflows of resources, liabilities, deferred inflowsof resources and net position comprising the proprietary funds inaggregate are presented in Exhibit III. Revenues, expenses, andchanges in net position comprising the proprietary funds inaggregate are presented in Exhibit IV. A combined statement ofcash flows comprising the proprietary funds in aggregate ispresented in Exhibit V.
Enterprise funds are used to account for any activity when a fee ischarged to external users for goods and services. Activities mustbe reported in enterprise funds if any one of the following criteriais met:
1. The activity is financed with debt that is secured solely by apledge of the net revenues from fees and charges of theactivity.
2. Laws or regulations require that the activity's costs ofproviding services, including capital costs (such asdepreciation or debt service) be recovered with fees andcharges.
3. The pricing policies of the activity establish fees and chargesdesigned to recover its costs including capital costs.
Veterans' Land Program Fund (GAAP Fund Type 05)The veterans' land program funds (Funds 0385, 0571, and 0626)receive proceeds from the sale of general obligation bonds to fundland mortgages for Texas veterans.
Veterans' Housing Assistance Program Fund (GAAP Fund Type05)The veterans' housing assistance program funds (Funds 0383,0527, 0528, 0529, 0567, and 0590) receive proceeds from the saleof general obligation bonds to fund housing mortgages and homeimprovement loans for Texas veterans.
Veterans' Financial Assistance Program Fund (GAAP Fund Type05)The veterans' financial assistance program fund (Fund 0374)receives proceeds from the sale of bonds, gifts, grants, and otherauthorized sources to fund all veterans homes programs.
UNAUDITEDTexas General Land Office and Veterans' Land Board (305)
30 | Annual Financial Report
FIDUCIARY FUND TYPESAssets, liabilities, and net position relating to agency funds aresummarized in Exhibits VI and E 1. Schedule 3 summarizesadditions and deductions applicable to the reporting period.Amounts collected for other agencies in connection with theGLO's custodial duties of the state's land resources are shown byfund in Schedule 4 and by source in Schedule 5.
Agency funds are used to account for assets held as an agent forindividuals, other government entities, and/or other funds. Thesefunds are custodial in nature and do not involve measurement ofresults of operations.
Purchase/Lease Land Vacancy Trust Fund (GAAP Fund Type 09)The purchase/lease land vacancy trust fund (Fund 0873) holdsfees and money deposited to cover costs of proceeding under anapplication to purchase or lease vacant land. After proceedings onapplication have concluded and all authorized expenditures havebeen paid, the agency shall remit the remaining balance back tothe applicant.
Child Support Employee Deductions Offset Account Fund (GAAPFund Type 09)The child support employee deductions offset account (Fund0807) accumulates money withheld from the salaries of stateemployees for child support deductions, and is distributed to thestatewide disbursement unit through a single direct deposit.
COMPONENT UNITSComponent units are legally separate organizations for which theelected officials of the primary government are either financiallyaccountable or the nature and significance of their relationshipwith the agency is such that exclusion would cause the agency'sfinancial statements to be misleading or incomplete. TexasGeneral Land Office has one discrete component unit presentedin the Combined Statement of Net Position and the CombinedStatement of Revenues, Expenses, and Changes in Net Position.
Alamo Endowment Component Unit Fund (GAAP Fund Type15)The Alamo Endowment component unit fund (Fund 5002)presents the activities and balances of a discrete componentunit, the Alamo Endowment and its affiliates, Remember theAlamo Foundation and Alamo Complex Management. Additionalcomponent unit information is presented annually in Note 19.
MEMORANDUM TOTALS The total columns on the financial statements are captioned"Memorandum Only" to indicate that they are for informationalpurposes only. Data in these columns do not present the financialposition, results of operations, or changes in financial position inconformity with generally accepted accounting principles, nor issuch data comparable to a consolidation.
BASIS OF ACCOUNTINGThe basis of accounting determines when revenues andexpenditures or expenses are recognized in the accounts reportedin the financial statements. The accounting and financial reportingtreatment applied to a fund is determined by its measurementfocus.
Governmental fund types that build the fund financial statementsare accounted for using the modified accrual basis of accounting.Under the modified accrual basis, revenues are recognized in theperiod in which they become both measurable and available tofinance operations of the fiscal year or liquidate liabilities existingat fiscal year end. The State of Texas considers receivablescollected within sixty days after year end to be available, andrecognizes them as revenues of the current year for fund financialstatements prepared on the modified accrual basis. Expendituresand other uses of financial resources are recognized when therelated fund liability is incurred.
Governmental adjustment fund types that build the governmentwide financial statements are accounted for using the full accrualbasis of accounting. This includes capital assets, accumulateddepreciation, unpaid employee compensable leave, theunmatured debt service (principal and interest) on general longterm liabilities, long term capital leases, long term claims andjudgments, and full accrual revenues and expenses. The activity isrecognized in these fund types.
Proprietary funds are accounted for on the full accrual basis ofaccounting. Under the full accrual basis of accounting, revenuesare recognized when earned and expenses are recognized at thetime liabilities are incurred. Proprietary funds distinguishoperating from non operating items. Operating revenues andexpenses result from providing services or producing anddelivering goods in connection with the proprietary funds'principal ongoing operations. Operating expenses for theenterprise funds include the cost of sales and services,administrative expenses, and depreciation on capital assets.
The VLB, from time to time, enters into interest rate swapagreements to hedge interest rates on outstanding debt. Otherthan the net interest expenses resulting from these agreements,no amounts are recorded in the financial statements.
BUDGETS AND BUDGETARY ACCOUNTING The budget is prepared biennially and represents appropriationsauthorized by the legislature and approved by the governor (theGeneral Appropriations Act). Encumbrance accounting isemployed for budgetary control purposes. Unencumberedappropriations are subject to lapse 60 days after the end of thefiscal year for which they were appropriated.
UNAUDITED
Annual Financial Report | 31
ASSETS, LIABILITIES, AND FUND BALANCES/NET POSITIONASSETSRestricted assets include monies or other resources restricted bylegal or contractual requirements. These assets include proceedsof enterprise fund general obligation or revenue bonds andrevenues set aside for statutory or contractual requirements.
Cash and cash equivalents includes cash on hand, cash in localbanks, cash in the State Treasury, and short term highly liquidinvestments with an original maturity of three months or less.
Legislative appropriations represent the general revenue fund(Fund 0001) amount in the State Treasury at fiscal year end.
Investments are stated at fair value in accordance with GASBStatement No. 31, Accounting and Financial Reporting for CertainInvestments and for External Investment Pools and GASBStatement No. 72, Fair Value Measurement and Application.Securities lent are reported as assets on the balance sheet. Thecosts of securities lending transactions are reported asexpenditures or expenses in the operating statement. These costsare reported at gross. Current investments have a maturity dateof one year or less, while noncurrent investments have a maturitydate of greater than one year.
Investments in real assets represent real property, mineralinterests (excluding hard minerals), and shares in externalinvestment funds held for the benefit of the permanent schoolfund, and are carried at fair value.
Receivables consist mainly of intergovernmental federal, interest,and accounts receivable as of the balance sheet date.
The voluntary oil and gas royalty receivables are calculated fromproduction reports or remittance advices; the payments andreporting of these royalties are not legally due until the secondmonth after production occurs. The receivables for voluntary oiland gas royalties are established based on the informationreceived in the remittance advices in September and October2017 for the production months August 2017 and earlier.
Allowance for uncollectibles is a contra asset accountrepresenting estimated accounts receivables determined not tobe collectible. The change in allowance for uncollectibles ischarged against its respective revenue source.
Due from other funds and agencies represents nonreciprocalinterfund and interagency activities, or transfers of assets withoutequivalent flow of assets in return or a requirement forrepayment.
Notes, loans, and contracts represent the receivable balance onall active housing assistance mortgages, home improvement
loans, land loans, land mortgages, loans issued on the sale ofpermanent school fund internal real assets investments, andcapital trust fund land sale loans. Because housing and landmortgages are insured, and land contracts, permanent schoolfund notes, and capital trust fund notes are collateralized by theland, losses on loans and contracts are minimal; therefore, anestimate for allowance for uncollectibles is unnecessary. Currentloans and contracts represent the principal balances maturingwithin one year, while noncurrent loans and contracts representthe principal balances maturing after one year.
Property acquired through foreclosure represents the outstandingbalance on foreclosed housing mortgages and land loans.
Inventories and Prepaid items include inventories valued using theconsumption method; costs of inventories are expensed whenthey are consumed. Prepaid items reflect payments for costsapplicable to future accounting periods.
Capital assets are capitalized at cost, or if not purchased, atacquisition value as of the date of acquisition if the asset'sindividual cost or estimated fair value is greater than $100,000 forbuildings and $5,000 for other capital assets, and estimated usefullife is greater than one year. Depreciation is reported on all"exhaustible" assets. Capital assets are depreciated over theestimated useful life of the asset using the straight line method.Capital assets of governmental funds are reported asexpenditures. Adjustments are recorded in the capital assetadjustment fund type to convert these expenditures to capitalassets for the government wide financial statements.
Intangible assets are defined as assets that lack physicalsubstance, are nonfinancial in nature, and have an initial useful lifeextending beyond a single reporting period. Intangible assets areclassified as capital assets and reported on the statement of netposition only if they are identifiable. Purchased software iscapitalized if the aggregate purchase exceeds $100,000. Internallygenerated computer software is capitalized if it meets the $1million threshold. Other intangible capital assets include patents,trademarks and copyrights. Purchases of other intangible assetsare capitalized if the cost meets or exceeds $100,000. Intangibleassets are depreciated over the estimated useful life of the assetusing the straight line method.
The disaggregation of other receivables as reported in thefinancial statements is shown in Note 24, Disaggregation ofReceivables and Payables Balances.
LIABILITIESAccounts payable represents the liability for the value of assets orservices received at the balance sheet date for which payment ispending.
UNAUDITEDTexas General Land Office and Veterans' Land Board (305)
32 | Annual Financial Report
Debt service interest payable represents accrued interest expenseon bond indebtedness for which payment is scheduled in thesubsequent fiscal year.
The disaggregation of other payables as reported in the financialstatements is shown in Note 24, Disaggregation of Receivablesand Payables Balances.
Unearned revenues represent income for which payment hasbeen received before it is earned. The recognition of theserevenues is delayed and not available to liquidate liabilities of thecurrent period.
Due to other funds and agencies represents nonreciprocalinterfund and interagency activities, or transfers of assets withoutequivalent flow of assets in return or a requirement forrepayment.
Employees' compensable leave represents the liability thatbecomes due upon the occurrence of relevant events such asresignations, retirements, and uses of leave balances by coveredemployees. Liabilities are reported separately as either current ornoncurrent in the statement of net position. These obligations arenormally paid from the same funding source from which eachemployee's salary or wage compensation was paid.
Bonds payable includes current interest and capital appreciationbonds. The outstanding principal amount of current interestbonds is accounted for as a liability in their respective funds forenterprise funds. Bonds are reported at par, net of unamortizedpremiums, discounts, issuance costs and gains or losses on bondrefunding activities. Bonds Payable is reported net of unamortizeddiscounts and premiums and separately as either current ornoncurrent on the statement of net position. Current bondspayable represents bonds payable balances that will maturewithin one year, while noncurrent bonds payable representsbonds payable balances that will mature in greater than one year.
Deep discount bonds do not pay interest until the maturity ofrelated principal. Bonds are initially reported at the discountedvalue. Accretion (the difference between the discounted valueand the par [maturity] value of the bonds payable) is amortizedover the life of the bond issue. At final maturity, accretion is fullyamortized and the discounted bond value equals par value.Annual accretion amortized is recognized as an addition to bondspayable.Obligations under securities lending are funds held in exchange forsecurities lending collateral and their earnings are recognized asrevenues.
FUND BALANCE/NET POSITIONFund balance is the difference between assets plus deferredoutflows of resources and liabilities plus deferred inflows ofresources on the governmental fund statements. Net position isthe difference between assets plus deferred outflows of resources
and liabilities plus deferred inflows of resources on thegovernment wide, proprietary and fiduciary fund statements.
Nonspendable fund balance includes amounts not available to bespent because they are either not in spendable form or legally orcontractually required to be maintained intact.
Restricted fund balance includes those resources that haveconstraints placed on their use through external parties or by lawthrough constitutional provisions.
Committed fund balance can be used only for specific purposespursuant to constraints imposed by a formal action of the TexasLegislature, the state's highest level of decision making authority.
Assigned fund balance includes amounts constrained by thestate's intent to be used for specific purposes, but are neitherrestricted nor committed. Intent is expressed by the TexasLegislature or a body or official to which the governing body hasdelegated the authority to assign amounts to be used for specificpurposes.
Unassigned fund balance is the residual classification for thegeneral fund. The classification represents the fund balance thatwas not assigned to other funds and was not restricted,committed or assigned to specific purposes within the generalfund.
Net Position, Invested in Capital Assets, Net of Related Debtconsists of capital assets, net of accumulated depreciation andreduced by outstanding balances for bonds, notes, and other debtthat are attributed to the acquisition, construction, orimprovement of those assets.
Restricted Net Position results when constraints placed on assetsuse are either externally imposed by creditors, grantors, and thelike, or imposed by law through constitutional provisions orenabling legislation. When both restricted and unrestricted netposition are available for use, restricted resources are used first,and then unrestricted resources are used as they are needed.
Unrestricted Net Position consists of assets that do not meet thedefinition of net position, invested in capital assets, net of relateddebt or restricted net position. Unrestricted net position often hasconstraints on resources that are imposed by management, butcan be removed or modified.
INTERFUND ACTIVITY AND TRANSACTIONS Transactions between the agency's funds have been analyzed andclassified in accordance with the following criteria:
Nonreciprocal interfund activity is similar to non exchangetransactions or other events and includes transfers andreimbursements. Interfund transfers represent the flow of assetswithout the equivalent flow of assets in return or a requirement
UNAUDITED
Annual Financial Report | 33
for repayment. Interfund transfers are reported as transfers in bythe recipient fund and as transfers out by the disbursing fund,which are included as other financing sources or uses ingovernmental funds and after non operating revenues andexpenses in proprietary funds.
Reimbursements are repayments from funds responsible forexpenditures or expenses to funds that made the actual payment.Reimbursements of expenditures or expenses made by one fundfor another fund are recorded as expenditures or expenses in thereimbursing fund, and as a reduction of expenditures or expensesin the reimbursed funds. Reimbursements are not displayed in thefinancial statements.
Reciprocal interfund activity includes loans and interfund salesand purchases. Loans are reported as interfund receivables andpayables on the balance sheet. If repayment is due during thecurrent year or soon thereafter, the balance is classified ascurrent. Balances for repayment due in two or more years areclassified as noncurrent.
Note 2 CAPITAL ASSETS
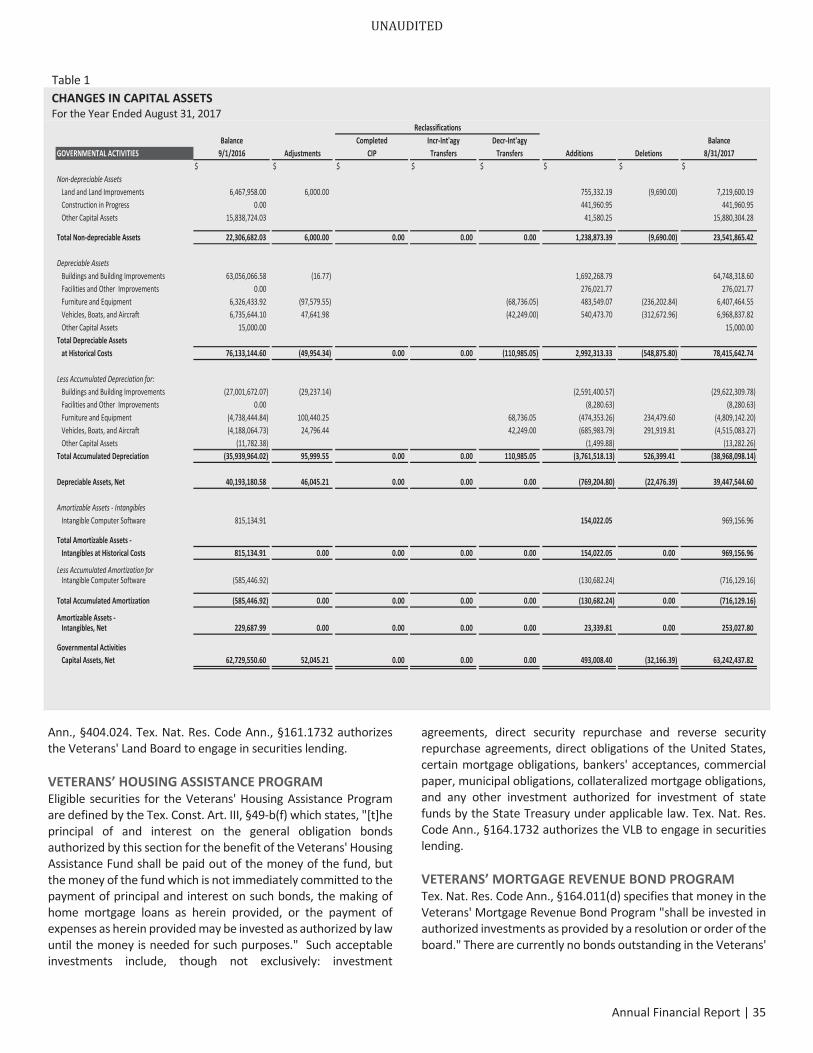
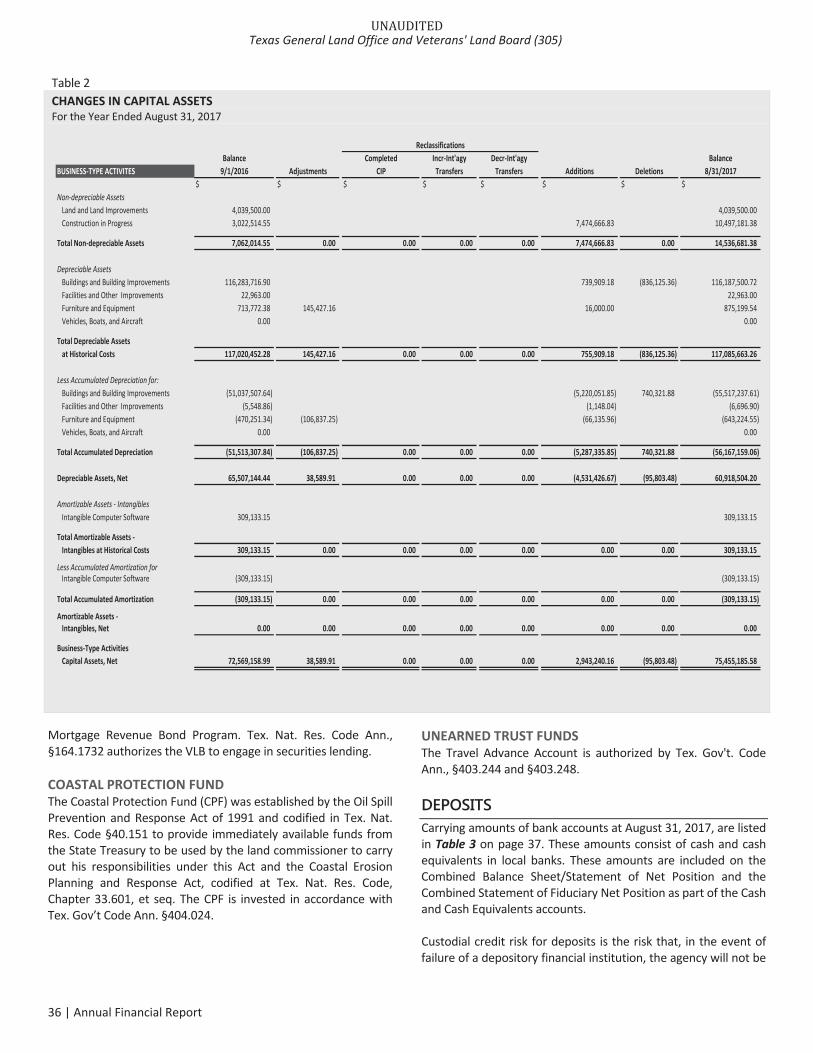
A summary of changes in capital assets for governmental activitiesfor the year ended August 31, 2017, is presented in Table 1 onpage 35. Changes in capital assets for business type activities arepresented in Table 2 on page 36. Not included in theaforementioned tables, the General Land Office maintains ahistorical archive collection held for public exhibition, education,and public service. The collection includes approximately 36million records dating back to 1561, including approximately45,000 maps, sketches and plat maps. Artifacts in the archivescollection are not sold, but preserved and kept in the historicalcollection. As such, the archives collection is not required to becapitalized and is exempt under GASB Statement No. 34requirements.
Note 3 DEPOSITS, INVESTMENTS AND REPURCHASEAGREEMENTS
AUTHORITY FOR INVESTMENTS AND SECURITIES LENDING Investments are restricted as follows:
PERMANENT SCHOOL FUNDTex. Nat. Res. Code Ann., §51.402 allows the board to use moneydesignated under §51.401 to "add to a tract of public school landto form a tract of sufficient size to be manageable; to addcontiguous land to public school land; to acquire, as public schoolland, interests in real property for biological, commercial,geological, cultural, or recreational purposes; to acquire mineraland royalty interests for the use and benefit of the permanentschool fund; to protect, maintain, or enhance the value of publicschool land; to acquire interests in real estate; to pay reasonablefees for professional services related to permanent school fundinvestments; or to acquire, sell, lease, trade, improve, maintain,protect or use land, mineral or royalty interests, or real estateinvestments, an investment or interest in public infrastructure, orother interests, at such prices, and under such terms andconditions the board determines to be in the best interest of thepermanent school fund.” Before using funds for any of the abovepurposes, the board must determine that the use of the funds forthe intended purpose is authorized, and by using the prudentinvestor standard, the board must also determine that the use ofthe funds for the intended purpose is in the best interest of thepermanent school fund. Additionally, §51.402 states that themarket value of the investments in real estate on January 1 ofeach even numbered year may not exceed an amount that isequal to 15 percent of the market value of the permanent schoolfund on that date.
VETERANS’ LAND PROGRAMEligible securities for the Veterans' Land Program are defined bythe Tex. Const. Art. III, §49 b and Tex. Nat. Res. Code Ann.,§161.173. Art. III, §49 b (k) states, monies which are "notimmediately committed to the payment of principal and intereston the bonds, the purchase of lands as herein provided, or thepayment of expenses as herein provided may be invested asauthorized by law until such monies are needed for suchpurposes." Tex. Nat. Res. Code Ann., §161.173 defines authorizedinvestments to include, though not exclusively: direct securityrepurchase and reverse security repurchase agreements, directobligations of the United States, certain mortgage obligations,bankers' acceptances, commercial paper, municipal obligations,collateralized mortgage obligations, and any other investmentauthorized for investment of state funds under Tex. Gov’t Code
UNAUDITEDTexas General Land Office and Veterans' Land Board (305)
34 | Annual Financial Report
Ann., §404.024. Tex. Nat. Res. Code Ann., §161.1732 authorizesthe Veterans' Land Board to engage in securities lending.
VETERANS’ HOUSING ASSISTANCE PROGRAMEligible securities for the Veterans' Housing Assistance Programare defined by the Tex. Const. Art. III, §49 b(f) which states, "[t]heprincipal of and interest on the general obligation bondsauthorized by this section for the benefit of the Veterans' HousingAssistance Fund shall be paid out of the money of the fund, butthe money of the fund which is not immediately committed to thepayment of principal and interest on such bonds, the making ofhome mortgage loans as herein provided, or the payment ofexpenses as herein provided may be invested as authorized by lawuntil the money is needed for such purposes." Such acceptableinvestments include, though not exclusively: investment
agreements, direct security repurchase and reverse securityrepurchase agreements, direct obligations of the United States,certain mortgage obligations, bankers' acceptances, commercialpaper, municipal obligations, collateralized mortgage obligations,and any other investment authorized for investment of statefunds by the State Treasury under applicable law. Tex. Nat. Res.Code Ann., §164.1732 authorizes the VLB to engage in securitieslending.
VETERANS’ MORTGAGE REVENUE BOND PROGRAMTex. Nat. Res. Code Ann., §164.011(d) specifies that money in theVeterans' Mortgage Revenue Bond Program "shall be invested inauthorized investments as provided by a resolution or order of theboard." There are currently no bonds outstanding in the Veterans'
Table 1CHANGES IN CAPITAL ASSETSFor the Year Ended August 31, 2017
ReclassificationsBalance Completed Incr Int'agy Decr Int'agy Balance
GOVERNMENTAL ACTIVITIES 9/1/2016 Adjustments CIP Transfers Transfers Additions Deletions 8/31/2017$ $ $ $ $ $ $ $
Non depreciable AssetsLand and Land Improvements 6,467,958.00 6,000.00 755,332.19 (9,690.00) 7,219,600.19Construction in Progress 0.00 441,960.95 441,960.95Other Capital Assets 15,838,724.03 41,580.25 15,880,304.28
Total Non depreciable Assets 22,306,682.03 6,000.00 0.00 0.00 0.00 1,238,873.39 (9,690.00) 23,541,865.42
Depreciable AssetsBuildings and Building Improvements 63,056,066.58 (16.77) 1,692,268.79 64,748,318.60Facilities and Other Improvements 0.00 276,021.77 276,021.77Furniture and Equipment 6,326,433.92 (97,579.55) (68,736.05) 483,549.07 (236,202.84) 6,407,464.55Vehicles, Boats, and Aircraft 6,735,644.10 47,641.98 (42,249.00) 540,473.70 (312,672.96) 6,968,837.82Other Capital Assets 15,000.00 15,000.00
Total Depreciable Assetsat Historical Costs 76,133,144.60 (49,954.34) 0.00 0.00 (110,985.05) 2,992,313.33 (548,875.80) 78,415,642.74
Less Accumulated Depreciation for:Buildings and Building Improvements (27,001,672.07) (29,237.14) (2,591,400.57) (29,622,309.78)Facilities and Other Improvements 0.00 (8,280.63) (8,280.63)Furniture and Equipment (4,738,444.84) 100,440.25 68,736.05 (474,353.26) 234,479.60 (4,809,142.20)Vehicles, Boats, and Aircraft (4,188,064.73) 24,796.44 42,249.00 (685,983.79) 291,919.81 (4,515,083.27)Other Capital Assets (11,782.38) (1,499.88) (13,282.26)
Total Accumulated Depreciation (35,939,964.02) 95,999.55 0.00 0.00 110,985.05 (3,761,518.13) 526,399.41 (38,968,098.14)
Depreciable Assets, Net 40,193,180.58 46,045.21 0.00 0.00 0.00 (769,204.80) (22,476.39) 39,447,544.60
Amortizable Assets IntangiblesIntangible Computer Software 815,134.91 154,022.05 969,156.96
Total Amortizable AssetsIntangibles at Historical Costs 815,134.91 0.00 0.00 0.00 0.00 154,022.05 0.00 969,156.96
Less Accumulated Amortization forIntangible Computer Software (585,446.92) (130,682.24) (716,129.16)
Total Accumulated Amortization (585,446.92) 0.00 0.00 0.00 0.00 (130,682.24) 0.00 (716,129.16)
Amortizable AssetsIntangibles, Net 229,687.99 0.00 0.00 0.00 0.00 23,339.81 0.00 253,027.80
Governmental ActivitiesCapital Assets, Net 62,729,550.60 52,045.21 0.00 0.00 0.00 493,008.40 (32,166.39) 63,242,437.82
UNAUDITED
Annual Financial Report | 35
Mortgage Revenue Bond Program. Tex. Nat. Res. Code Ann.,§164.1732 authorizes the VLB to engage in securities lending.
COASTAL PROTECTION FUNDThe Coastal Protection Fund (CPF) was established by the Oil SpillPrevention and Response Act of 1991 and codified in Tex. Nat.Res. Code §40.151 to provide immediately available funds fromthe State Treasury to be used by the land commissioner to carryout his responsibilities under this Act and the Coastal ErosionPlanning and Response Act, codified at Tex. Nat. Res. Code,Chapter 33.601, et seq. The CPF is invested in accordance withTex. Gov’t Code Ann. §404.024.
UNEARNED TRUST FUNDSThe Travel Advance Account is authorized by Tex. Gov't. CodeAnn., §403.244 and §403.248.
DEPOSITS Carrying amounts of bank accounts at August 31, 2017, are listedin Table 3 on page 37. These amounts consist of cash and cashequivalents in local banks. These amounts are included on theCombined Balance Sheet/Statement of Net Position and theCombined Statement of Fiduciary Net Position as part of the Cashand Cash Equivalents accounts.
Custodial credit risk for deposits is the risk that, in the event offailure of a depository financial institution, the agency will not be
Table 2CHANGES IN CAPITAL ASSETSFor the Year Ended August 31, 2017
ReclassificationsBalance Completed Incr Int'agy Decr Int'agy Balance
BUSINESS TYPE ACTIVITES 9/1/2016 Adjustments CIP Transfers Transfers Additions Deletions 8/31/2017$ $ $ $ $ $ $ $
Non depreciable AssetsLand and Land Improvements 4,039,500.00 4,039,500.00Construction in Progress 3,022,514.55 7,474,666.83 10,497,181.38
Total Non depreciable Assets 7,062,014.55 0.00 0.00 0.00 0.00 7,474,666.83 0.00 14,536,681.38
Depreciable AssetsBuildings and Building Improvements 116,283,716.90 739,909.18 (836,125.36) 116,187,500.72Facilities and Other Improvements 22,963.00 22,963.00Furniture and Equipment 713,772.38 145,427.16 16,000.00 875,199.54Vehicles, Boats, and Aircraft 0.00 0.00
Total Depreciable Assetsat Historical Costs 117,020,452.28 145,427.16 0.00 0.00 0.00 755,909.18 (836,125.36) 117,085,663.26
Less Accumulated Depreciation for:Buildings and Building Improvements (51,037,507.64) (5,220,051.85) 740,321.88 (55,517,237.61)Facilities and Other Improvements (5,548.86) (1,148.04) (6,696.90)Furniture and Equipment (470,251.34) (106,837.25) (66,135.96) (643,224.55)Vehicles, Boats, and Aircraft 0.00 0.00
Total Accumulated Depreciation (51,513,307.84) (106,837.25) 0.00 0.00 0.00 (5,287,335.85) 740,321.88 (56,167,159.06)
Depreciable Assets, Net 65,507,144.44 38,589.91 0.00 0.00 0.00 (4,531,426.67) (95,803.48) 60,918,504.20
Amortizable Assets IntangiblesIntangible Computer Software 309,133.15 309,133.15
Total Amortizable AssetsIntangibles at Historical Costs 309,133.15 0.00 0.00 0.00 0.00 0.00 0.00 309,133.15
Less Accumulated Amortization forIntangible Computer Software (309,133.15) (309,133.15)
Total Accumulated Amortization (309,133.15) 0.00 0.00 0.00 0.00 0.00 0.00 (309,133.15)
Amortizable AssetsIntangibles, Net 0.00 0.00 0.00 0.00 0.00 0.00 0.00 0.00
Business Type ActivitiesCapital Assets, Net 72,569,158.99 38,589.91 0.00 0.00 0.00 2,943,240.16 (95,803.48) 75,455,185.58
UNAUDITEDTexas General Land Office and Veterans' Land Board (305)
36 | Annual Financial Report
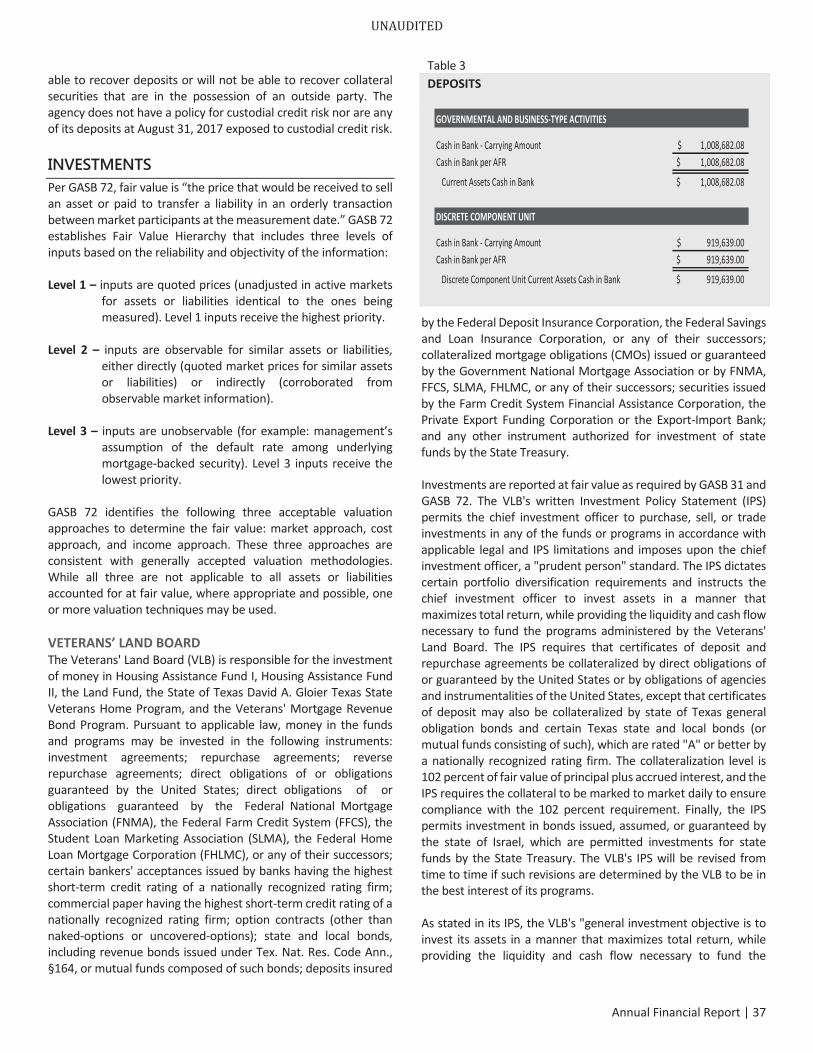
able to recover deposits or will not be able to recover collateralsecurities that are in the possession of an outside party. Theagency does not have a policy for custodial credit risk nor are anyof its deposits at August 31, 2017 exposed to custodial credit risk.
INVESTMENTS Per GASB 72, fair value is “the price that would be received to sellan asset or paid to transfer a liability in an orderly transactionbetween market participants at the measurement date.” GASB 72establishes Fair Value Hierarchy that includes three levels ofinputs based on the reliability and objectivity of the information:
Level 1 – inputs are quoted prices (unadjusted in active marketsfor assets or liabilities identical to the ones beingmeasured). Level 1 inputs receive the highest priority.
Level 2 – inputs are observable for similar assets or liabilities,either directly (quoted market prices for similar assetsor liabilities) or indirectly (corroborated fromobservable market information).
Level 3 – inputs are unobservable (for example: management’sassumption of the default rate among underlyingmortgage backed security). Level 3 inputs receive thelowest priority.
GASB 72 identifies the following three acceptable valuationapproaches to determine the fair value: market approach, costapproach, and income approach. These three approaches areconsistent with generally accepted valuation methodologies.While all three are not applicable to all assets or liabilitiesaccounted for at fair value, where appropriate and possible, oneor more valuation techniques may be used.
VETERANS’ LAND BOARDThe Veterans' Land Board (VLB) is responsible for the investmentof money in Housing Assistance Fund I, Housing Assistance FundII, the Land Fund, the State of Texas David A. Gloier Texas StateVeterans Home Program, and the Veterans' Mortgage RevenueBond Program. Pursuant to applicable law, money in the fundsand programs may be invested in the following instruments:investment agreements; repurchase agreements; reverserepurchase agreements; direct obligations of or obligationsguaranteed by the United States; direct obligations of orobligations guaranteed by the Federal National MortgageAssociation (FNMA), the Federal Farm Credit System (FFCS), theStudent Loan Marketing Association (SLMA), the Federal HomeLoan Mortgage Corporation (FHLMC), or any of their successors;certain bankers' acceptances issued by banks having the highestshort term credit rating of a nationally recognized rating firm;commercial paper having the highest short term credit rating of anationally recognized rating firm; option contracts (other thannaked options or uncovered options); state and local bonds,including revenue bonds issued under Tex. Nat. Res. Code Ann.,§164, or mutual funds composed of such bonds; deposits insured
by the Federal Deposit Insurance Corporation, the Federal Savingsand Loan Insurance Corporation, or any of their successors;collateralized mortgage obligations (CMOs) issued or guaranteedby the Government National Mortgage Association or by FNMA,FFCS, SLMA, FHLMC, or any of their successors; securities issuedby the Farm Credit System Financial Assistance Corporation, thePrivate Export Funding Corporation or the Export Import Bank;and any other instrument authorized for investment of statefunds by the State Treasury.
Investments are reported at fair value as required by GASB 31 andGASB 72. The VLB's written Investment Policy Statement (IPS)permits the chief investment officer to purchase, sell, or tradeinvestments in any of the funds or programs in accordance withapplicable legal and IPS limitations and imposes upon the chiefinvestment officer, a "prudent person" standard. The IPS dictatescertain portfolio diversification requirements and instructs thechief investment officer to invest assets in a manner thatmaximizes total return, while providing the liquidity and cash flownecessary to fund the programs administered by the Veterans'Land Board. The IPS requires that certificates of deposit andrepurchase agreements be collateralized by direct obligations ofor guaranteed by the United States or by obligations of agenciesand instrumentalities of the United States, except that certificatesof deposit may also be collateralized by state of Texas generalobligation bonds and certain Texas state and local bonds (ormutual funds consisting of such), which are rated "A" or better bya nationally recognized rating firm. The collateralization level is102 percent of fair value of principal plus accrued interest, and theIPS requires the collateral to be marked to market daily to ensurecompliance with the 102 percent requirement. Finally, the IPSpermits investment in bonds issued, assumed, or guaranteed bythe state of Israel, which are permitted investments for statefunds by the State Treasury. The VLB's IPS will be revised fromtime to time if such revisions are determined by the VLB to be inthe best interest of its programs.
As stated in its IPS, the VLB's "general investment objective is toinvest its assets in a manner that maximizes total return, whileproviding the liquidity and cash flow necessary to fund the
Table 3DEPOSITS
Cash in Bank Carrying Amount 1,008,682.08$Cash in Bank per AFR 1,008,682.08$
Current Assets Cash in Bank 1,008,682.08$
Cash in Bank Carrying Amount 919,639.00$Cash in Bank per AFR 919,639.00$
Discrete Component Unit Current Assets Cash in Bank 919,639.00$
GOVERNMENTAL AND BUSINESS TYPE ACTIVITIES
DISCRETE COMPONENT UNIT
UNAUDITED
Annual Financial Report | 37
programs it administers. "Within the context of that generalobjective, the IPS further states that the primary objective is to"ensure the liquidity and cash flow necessary to fund loanpurchases," while the "maximization of total return… is animportant, but secondary, consideration." In addition, the IPSdictates that "the time horizon of the board's compositeinvestment portfolio should be flexible enough to allow for theinherent volatility in demand in its various loan programs."Therefore, during periods of high loan demand, the time horizonof the portfolio will generally be very short (two years or less), andduring periods of normal loan demand, the time horizon will begenerally short to intermediate (three to five years).
The preservation of principal is an important component ofensuring sufficient liquidity and cash flow to fund loan purchases,as mandated by the IPS. The VLB accomplishes the preservationof principal in the investment portfolio primarily by controlling itsinterest rate risk and credit risk.
Interest Rate Risk. The investment portfolio's interest rate risk iscontrolled primarily through cash flow matching. This techniqueinvolves projecting cash flow needs and investing in securities thatmature at or near the time of the projected cash flowrequirements. As a result, the weighted average maturity andmodified duration of the portfolio are maintained in a flexiblemanner and typically range from two to five years. At August 31,2017, the weighted average maturity of the portfolio wasapproximately 4.74 years, and the modified duration wasapproximately 4.56 years.
Credit Risk. The investment portfolio's credit risk is controlled byinvesting in securities with high credit quality. These are typicallysecurities rated "A" or higher by a nationally recognized ratingagency. At August 31, 2017, the average credit rating of thesecurities in the investment portfolio was Aaa by Moody’sInvestor Services and AA+ by Standard & Poor's.
Custodial Credit Risk. There was no custodial credit risk at August31, 2017, because the securities in the investment portfolio wereregistered in the name of the VLB.
Money in Housing Assistance Fund I, Housing Assistance Fund II,and the Land Fund that is not invested by the VLB is currently heldin an external investment pool by the Texas Comptroller of PublicAccounts (CPA). The CPA invests in authorized investmentsconsistent with applicable law and the CPA Investment Policy. TheCPA pools funds for investment purposes and allocatesinvestment earnings on pooled funds proportionately among thevarious state agencies whose funds are so pooled. Theapproximate size of the pool ranges from $17 billion to $35 billion,depending upon seasonal variations in revenues andexpenditures. Typically, most pooled funds are invested in thefollowing instruments: repurchase agreements, obligations of theUnited States and its agencies and instrumentalities, corporatedebt, and fully collateralized deposits in authorized state
depositories. All investments are marked to market daily, using anexternal financial service.
State Street Bank and Trust Company (State Street) serves as theVLB's investment custodian and securities lending agent for theHousing Assistance Fund I, Housing Assistance Fund II, and theLand Fund. State Street also serves as the investment custodianfor the State of Texas David A. Gloier Texas State Veterans HomeProgram.
As of August 31, 2017, and including cash held at the Texas StateTreasury, the fair value of the total portfolio of investments in theHousing Assistance Fund I, Housing Assistance Fund II, and theLand Fund was $ ; the fair value of the totalportfolio of investments in the State of Texas David A. GloierTexas State Veterans Home Program was $38,544,955.71. TheVLB does not anticipate the need to sell any investments priorto their maturity to fulfill the liquidity needs of its programs.However, the VLB reserves the right to sell any investment,possibly realizing a gain or loss in the process, if it determines thatsuch action is in the best interest of its programs. Summarystatements showing the fair value of the board's investmentportfolio as of August 31, 2017, can be found in Table 4 on page39 and Table 5 on page 40.
Debt securities classified in Level 1 of the fair value hierarchy arevalued using prices quoted in active markets for those types ofsecurities. Debt securities classified in Level 2 of the fair valuehierarchy are valued using a matrix pricing technique. Matrixpricing is often used to value infrequently traded securities basedon the securities; relationship to benchmark quoted prices.
Investment derivative instruments classified in Level 2 of the fairvalue hierarchy are valued using an income approach based uponthe present value of future implied cash flows that considersobservable inputs related to benchmark interest rates and creditdefault swap pricing.
SCHOOL LAND BOARDThe School Land Board (SLB) is responsible for the investment ofmoney in the Real Estate Special Fund Account (RESFA) of thepermanent school fund. Pursuant to applicable law, money in theRESFA may be invested in land, interests in real estate, mineraland royalty interests, real assets investments, investments orinterests in public infrastructure, or other interests. Investmentsof the Permanent School Fund/SLB are reported at fair value andare summarized in Table 7 on page 42.
The SLB's written real assets investment policy statement(Investment Policy) authorizes the investment of money in theRESFA in externally managed commingled funds and separateaccounts, as well as in direct investments that aresourced, executed, and managed by internal Texas GeneralLand Office staff.
UNAUDITEDTexas General Land Office and Veterans' Land Board (305)
38 | Annual Financial Report
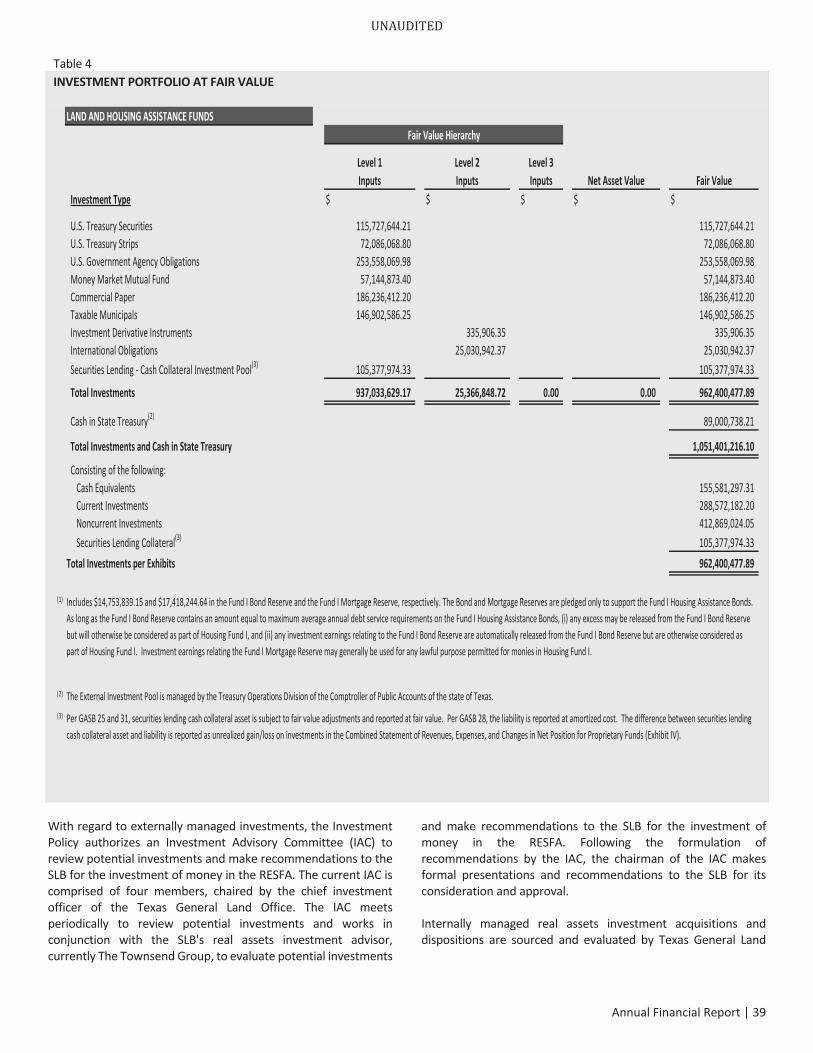
With regard to externally managed investments, the InvestmentPolicy authorizes an Investment Advisory Committee (IAC) toreview potential investments and make recommendations to theSLB for the investment of money in the RESFA. The current IAC iscomprised of four members, chaired by the chief investmentofficer of the Texas General Land Office. The IAC meetsperiodically to review potential investments and works inconjunction with the SLB's real assets investment advisor,currently The Townsend Group, to evaluate potential investments
and make recommendations to the SLB for the investment ofmoney in the RESFA. Following the formulation ofrecommendations by the IAC, the chairman of the IAC makesformal presentations and recommendations to the SLB for itsconsideration and approval.
Internally managed real assets investment acquisitions anddispositions are sourced and evaluated by Texas General Land
Table 4INVESTMENT PORTFOLIO AT FAIR VALUE
LAND AND HOUSING ASSISTANCE FUNDS
Level 1Inputs
Level 2Inputs
Level 3Inputs Net Asset Value Fair Value
Investment Type $ $ $ $ $
U.S. Treasury Securities 115,727,644.21 115,727,644.21U.S. Treasury Strips 72,086,068.80 72,086,068.80U.S. Government Agency Obligations 253,558,069.98 253,558,069.98Money Market Mutual Fund 57,144,873.40 57,144,873.40Commercial Paper 186,236,412.20 186,236,412.20Taxable Municipals 146,902,586.25 146,902,586.25Investment Derivative Instruments 335,906.35 335,906.35International Obligations 25,030,942.37 25,030,942.37Securities Lending Cash Collateral Investment Pool(3) 105,377,974.33 105,377,974.33
Total Investments 937,033,629.17 25,366,848.72 0.00 0.00 962,400,477.89
Cash in State Treasury(2) 89,000,738.21
Total Investments and Cash in State Treasury 1,051,401,216.10
Consisting of the following:Cash Equivalents 155,581,297.31Current Investments 288,572,182.20Noncurrent Investments 412,869,024.05Securities Lending Collateral(3) 105,377,974.33
Total Investments per Exhibits 962,400,477.89
(1)
(2)
(3)
Fair Value Hierarchy
Includes $14,753,839.15 and $17,418,244.64 in the Fund I Bond Reserve and the Fund I Mortgage Reserve, respectively. The Bond and Mortgage Reserves are pledged only to support the Fund I Housing Assistance Bonds.As long as the Fund I Bond Reserve contains an amount equal to maximum average annual debt service requirements on the Fund I Housing Assistance Bonds, (i) any excess may be released from the Fund I Bond Reservebut will otherwise be considered as part of Housing Fund I, and (ii) any investment earnings relating to the Fund I Bond Reserve are automatically released from the Fund I Bond Reserve but are otherwise considered aspart of Housing Fund I. Investment earnings relating the Fund I Mortgage Reserve may generally be used for any lawful purpose permitted for monies in Housing Fund I.
The External Investment Pool is managed by the Treasury Operations Division of the Comptroller of Public Accounts of the state of Texas.
Per GASB 25 and 31, securities lending cash collateral asset is subject to fair value adjustments and reported at fair value. Per GASB 28, the liability is reported at amortized cost. The difference between securities lendingcash collateral asset and liability is reported as unrealized gain/loss on investments in the Combined Statement of Revenues, Expenses, and Changes in Net Position for Proprietary Funds (Exhibit IV).
UNAUDITED
Annual Financial Report | 39
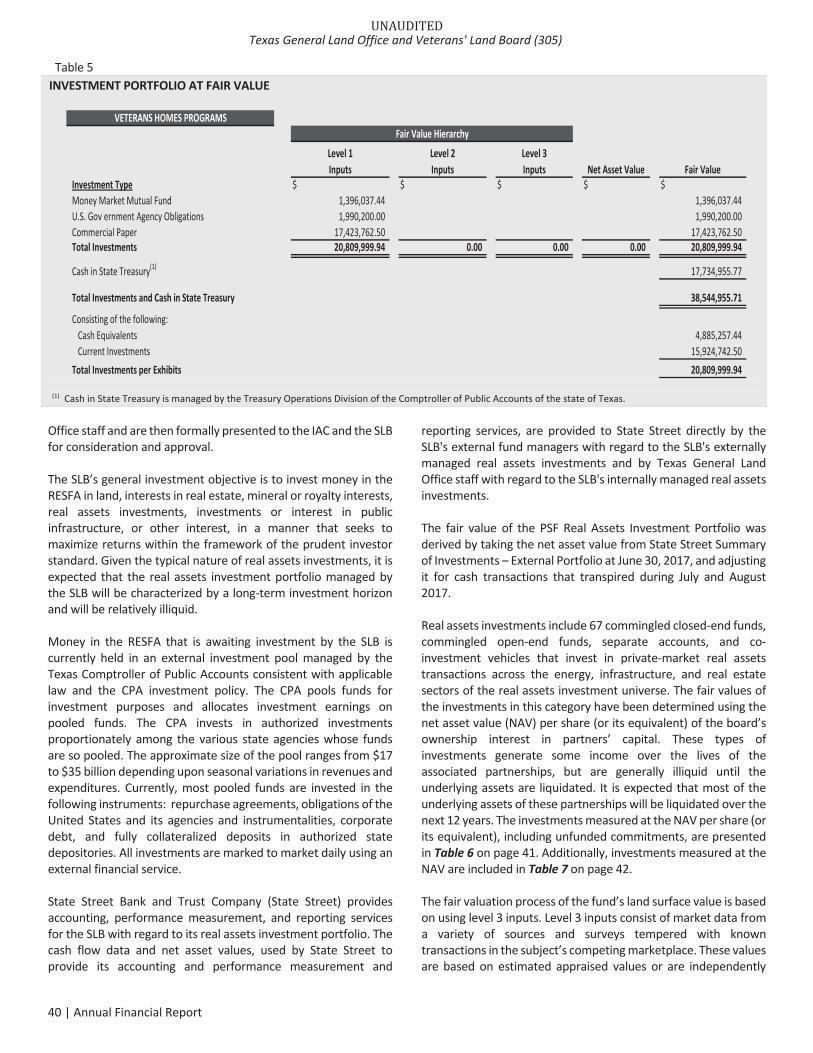
Office staff and are then formally presented to the IAC and the SLBfor consideration and approval.
The SLB’s general investment objective is to invest money in theRESFA in land, interests in real estate, mineral or royalty interests,real assets investments, investments or interest in publicinfrastructure, or other interest, in a manner that seeks tomaximize returns within the framework of the prudent investorstandard. Given the typical nature of real assets investments, it isexpected that the real assets investment portfolio managed bythe SLB will be characterized by a long term investment horizonand will be relatively illiquid.
Money in the RESFA that is awaiting investment by the SLB iscurrently held in an external investment pool managed by theTexas Comptroller of Public Accounts consistent with applicablelaw and the CPA investment policy. The CPA pools funds forinvestment purposes and allocates investment earnings onpooled funds. The CPA invests in authorized investmentsproportionately among the various state agencies whose fundsare so pooled. The approximate size of the pool ranges from $17to $35 billion depending upon seasonal variations in revenues andexpenditures. Currently, most pooled funds are invested in thefollowing instruments: repurchase agreements, obligations of theUnited States and its agencies and instrumentalities, corporatedebt, and fully collateralized deposits in authorized statedepositories. All investments are marked to market daily using anexternal financial service.
State Street Bank and Trust Company (State Street) providesaccounting, performance measurement, and reporting servicesfor the SLB with regard to its real assets investment portfolio. Thecash flow data and net asset values, used by State Street toprovide its accounting and performance measurement and
reporting services, are provided to State Street directly by theSLB's external fund managers with regard to the SLB's externallymanaged real assets investments and by Texas General LandOffice staff with regard to the SLB's internally managed real assetsinvestments.
The fair value of the PSF Real Assets Investment Portfolio wasderived by taking the net asset value from State Street Summaryof Investments – External Portfolio at June 30, 2017, and adjustingit for cash transactions that transpired during July and August2017.
Real assets investments include 67 commingled closed end funds,commingled open end funds, separate accounts, and coinvestment vehicles that invest in private market real assetstransactions across the energy, infrastructure, and real estatesectors of the real assets investment universe. The fair values ofthe investments in this category have been determined using thenet asset value (NAV) per share (or its equivalent) of the board’sownership interest in partners’ capital. These types ofinvestments generate some income over the lives of theassociated partnerships, but are generally illiquid until theunderlying assets are liquidated. It is expected that most of theunderlying assets of these partnerships will be liquidated over thenext 12 years. The investments measured at the NAV per share (orits equivalent), including unfunded commitments, are presentedin Table 6 on page 41. Additionally, investments measured at theNAV are included in Table 7 on page 42.
The fair valuation process of the fund’s land surface value is basedon using level 3 inputs. Level 3 inputs consist of market data froma variety of sources and surveys tempered with knowntransactions in the subject’s competing marketplace. These valuesare based on estimated appraised values or are independently
Table 5INVESTMENT PORTFOLIO AT FAIR VALUE
VETERANS HOMES PROGRAMS
Level 1Inputs
Level 2Inputs
Level 3Inputs Net Asset Value Fair Value
Investment Type $ $ $ $ $Money Market Mutual Fund 1,396,037.44 1,396,037.44U.S. Gov ernment Agency Obligations 1,990,200.00 1,990,200.00Commercial Paper 17,423,762.50 17,423,762.50Total Investments 20,809,999.94 0.00 0.00 0.00 20,809,999.94
Cash in State Treasury(1) 17,734,955.77
Total Investments and Cash in State Treasury 38,544,955.71
Consisting of the following:Cash Equivalents 4,885,257.44Current Investments 15,924,742.50
Total Investments per Exhibits 20,809,999.94
Fair Value Hierarchy
(1) Cash in State Treasury is managed by the Treasury Operations Division of the Comptroller of Public Accounts of the state of Texas.
UNAUDITEDTexas General Land Office and Veterans' Land Board (305)
40 | Annual Financial Report
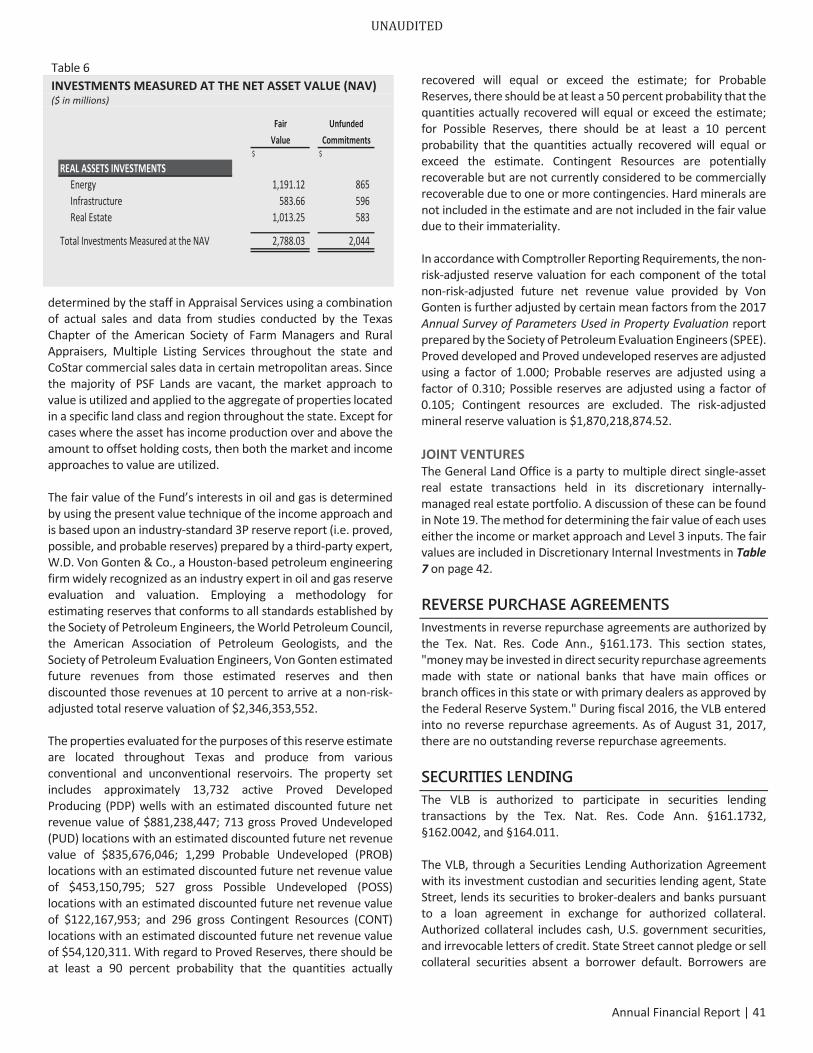
determined by the staff in Appraisal Services using a combinationof actual sales and data from studies conducted by the TexasChapter of the American Society of Farm Managers and RuralAppraisers, Multiple Listing Services throughout the state andCoStar commercial sales data in certain metropolitan areas. Sincethe majority of PSF Lands are vacant, the market approach tovalue is utilized and applied to the aggregate of properties locatedin a specific land class and region throughout the state. Except forcases where the asset has income production over and above theamount to offset holding costs, then both the market and incomeapproaches to value are utilized.
The fair value of the Fund’s interests in oil and gas is determinedby using the present value technique of the income approach andis based upon an industry standard 3P reserve report (i.e. proved,possible, and probable reserves) prepared by a third party expert,W.D. Von Gonten & Co., a Houston based petroleum engineeringfirm widely recognized as an industry expert in oil and gas reserveevaluation and valuation. Employing a methodology forestimating reserves that conforms to all standards established bythe Society of Petroleum Engineers, the World Petroleum Council,the American Association of Petroleum Geologists, and theSociety of Petroleum Evaluation Engineers, Von Gonten estimatedfuture revenues from those estimated reserves and thendiscounted those revenues at 10 percent to arrive at a non riskadjusted total reserve valuation of $2,346,353,552.
The properties evaluated for the purposes of this reserve estimateare located throughout Texas and produce from variousconventional and unconventional reservoirs. The property setincludes approximately 13,732 active Proved DevelopedProducing (PDP) wells with an estimated discounted future netrevenue value of $881,238,447; 713 gross Proved Undeveloped(PUD) locations with an estimated discounted future net revenuevalue of $835,676,046; 1,299 Probable Undeveloped (PROB)locations with an estimated discounted future net revenue valueof $453,150,795; 527 gross Possible Undeveloped (POSS)locations with an estimated discounted future net revenue valueof $122,167,953; and 296 gross Contingent Resources (CONT)locations with an estimated discounted future net revenue valueof $54,120,311. With regard to Proved Reserves, there should beat least a 90 percent probability that the quantities actually
recovered will equal or exceed the estimate; for ProbableReserves, there should be at least a 50 percent probability that thequantities actually recovered will equal or exceed the estimate;for Possible Reserves, there should be at least a 10 percentprobability that the quantities actually recovered will equal orexceed the estimate. Contingent Resources are potentiallyrecoverable but are not currently considered to be commerciallyrecoverable due to one or more contingencies. Hard minerals arenot included in the estimate and are not included in the fair valuedue to their immateriality.
In accordance with Comptroller Reporting Requirements, the nonrisk adjusted reserve valuation for each component of the totalnon risk adjusted future net revenue value provided by VonGonten is further adjusted by certain mean factors from the 2017Annual Survey of Parameters Used in Property Evaluation reportprepared by the Society of Petroleum Evaluation Engineers (SPEE).Proved developed and Proved undeveloped reserves are adjustedusing a factor of 1.000; Probable reserves are adjusted using afactor of 0.310; Possible reserves are adjusted using a factor of0.105; Contingent resources are excluded. The risk adjustedmineral reserve valuation is $1,870,218,874.52.
JOINT VENTURESThe General Land Office is a party to multiple direct single assetreal estate transactions held in its discretionary internallymanaged real estate portfolio. A discussion of these can be foundin Note 19. The method for determining the fair value of each useseither the income or market approach and Level 3 inputs. The fairvalues are included in Discretionary Internal Investments in Table7 on page 42.
REVERSE PURCHASE AGREEMENTS Investments in reverse repurchase agreements are authorized bythe Tex. Nat. Res. Code Ann., §161.173. This section states,"money may be invested in direct security repurchase agreementsmade with state or national banks that have main offices orbranch offices in this state or with primary dealers as approved bythe Federal Reserve System." During fiscal 2016, the VLB enteredinto no reverse repurchase agreements. As of August 31, 2017,there are no outstanding reverse repurchase agreements.
SECURITIES LENDING The VLB is authorized to participate in securities lendingtransactions by the Tex. Nat. Res. Code Ann. §161.1732,§162.0042, and §164.011.
The VLB, through a Securities Lending Authorization Agreementwith its investment custodian and securities lending agent, StateStreet, lends its securities to broker dealers and banks pursuantto a loan agreement in exchange for authorized collateral.Authorized collateral includes cash, U.S. government securities,and irrevocable letters of credit. State Street cannot pledge or sellcollateral securities absent a borrower default. Borrowers are
Table 6INVESTMENTS MEASURED AT THE NET ASSET VALUE (NAV)($ in millions)
Fair UnfundedValue Commitments
$ $
REAL ASSETS INVESTMENTSEnergy 1,191.12 865Infrastructure 583.66 596Real Estate 1,013.25 583
Total Investments Measured at the NAV 2,788.03 2,044
UNAUDITED
Annual Financial Report | 41
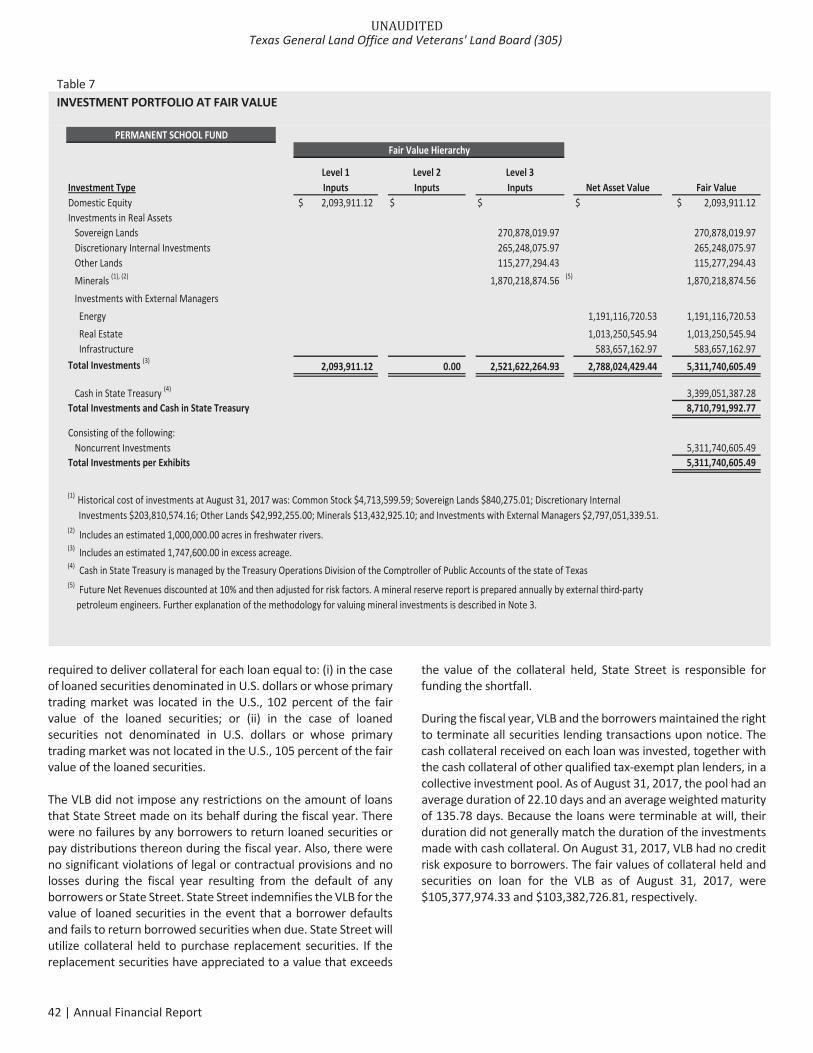
required to deliver collateral for each loan equal to: (i) in the caseof loaned securities denominated in U.S. dollars or whose primarytrading market was located in the U.S., 102 percent of the fairvalue of the loaned securities; or (ii) in the case of loanedsecurities not denominated in U.S. dollars or whose primarytrading market was not located in the U.S., 105 percent of the fairvalue of the loaned securities.
The VLB did not impose any restrictions on the amount of loansthat State Street made on its behalf during the fiscal year. Therewere no failures by any borrowers to return loaned securities orpay distributions thereon during the fiscal year. Also, there wereno significant violations of legal or contractual provisions and nolosses during the fiscal year resulting from the default of anyborrowers or State Street. State Street indemnifies the VLB for thevalue of loaned securities in the event that a borrower defaultsand fails to return borrowed securities when due. State Street willutilize collateral held to purchase replacement securities. If thereplacement securities have appreciated to a value that exceeds
the value of the collateral held, State Street is responsible forfunding the shortfall.
During the fiscal year, VLB and the borrowers maintained the rightto terminate all securities lending transactions upon notice. Thecash collateral received on each loan was invested, together withthe cash collateral of other qualified tax exempt plan lenders, in acollective investment pool. As of August 31, 2017, the pool had anaverage duration of 22.10 days and an average weighted maturityof 135.78 days. Because the loans were terminable at will, theirduration did not generally match the duration of the investmentsmade with cash collateral. On August 31, 2017, VLB had no creditrisk exposure to borrowers. The fair values of collateral held andsecurities on loan for the VLB as of August 31, 2017, were$105,377,974.33 and $103,382,726.81, respectively.
Table 7INVESTMENT PORTFOLIO AT FAIR VALUE
PERMANENT SCHOOL FUND
Investment TypeLevel 1Inputs
Level 2Inputs
Level 3Inputs Net Asset Value Fair Value
Domestic Equity 2,093,911.12$ $ $ $ 2,093,911.12$Investments in Real Assets
Sovereign Lands 270,878,019.97 270,878,019.97Discretionary Internal Investments 265,248,075.97 265,248,075.97Other Lands 115,277,294.43 115,277,294.43Minerals (1), (2) 1,870,218,874.56 (5) 1,870,218,874.56Investments with External Managers
Energy 1,191,116,720.53 1,191,116,720.53Real Estate 1,013,250,545.94 1,013,250,545.94Infrastructure 583,657,162.97 583,657,162.97
Total Investments (3) 2,093,911.12 0.00 2,521,622,264.93 2,788,024,429.44 5,311,740,605.49
Cash in State Treasury (4) 3,399,051,387.28Total Investments and Cash in State Treasury 8,710,791,992.77
Consisting of the following:Noncurrent Investments 5,311,740,605.49
Total Investments per Exhibits 5,311,740,605.49
(2) Includes an estimated 1,000,000.00 acres in freshwater rivers.(3) Includes an estimated 1,747,600.00 in excess acreage.(4) Cash in State Treasury is managed by the Treasury Operations Division of the Comptroller of Public Accounts of the state of Texas
Fair Value Hierarchy
(1) Historical cost of investments at August 31, 2017 was: Common Stock $4,713,599.59; Sovereign Lands $840,275.01; Discretionary InternalInvestments $203,810,574.16; Other Lands $42,992,255.00; Minerals $13,432,925.10; and Investments with External Managers $2,797,051,339.51.
(5) Future Net Revenues discounted at 10% and then adjusted for risk factors. A mineral reserve report is prepared annually by external third partypetroleum engineers. Further explanation of the methodology for valuing mineral investments is described in Note 3.
UNAUDITEDTexas General Land Office and Veterans' Land Board (305)
42 | Annual Financial Report
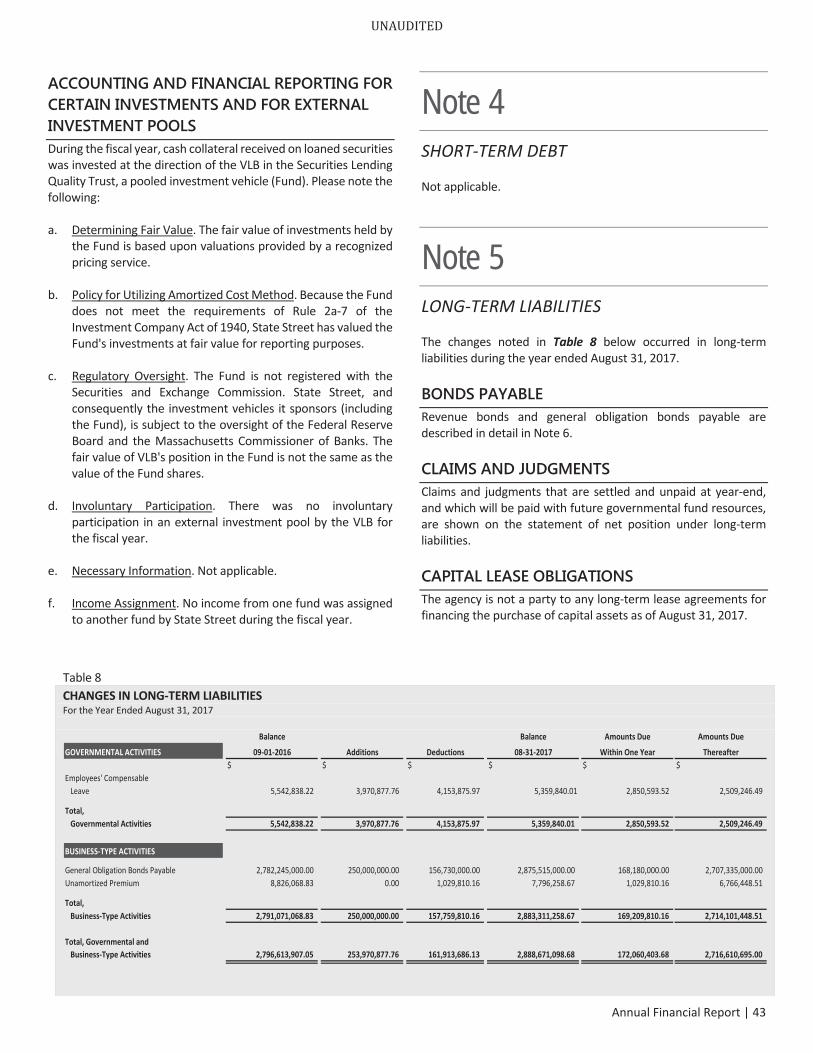
ACCOUNTING AND FINANCIAL REPORTING FOR CERTAIN INVESTMENTS AND FOR EXTERNAL INVESTMENT POOLS During the fiscal year, cash collateral received on loaned securitieswas invested at the direction of the VLB in the Securities LendingQuality Trust, a pooled investment vehicle (Fund). Please note thefollowing:
a. Determining Fair Value. The fair value of investments held bythe Fund is based upon valuations provided by a recognizedpricing service.
b. Policy for Utilizing Amortized Cost Method. Because the Funddoes not meet the requirements of Rule 2a 7 of theInvestment Company Act of 1940, State Street has valued theFund's investments at fair value for reporting purposes.
c. Regulatory Oversight. The Fund is not registered with theSecurities and Exchange Commission. State Street, andconsequently the investment vehicles it sponsors (includingthe Fund), is subject to the oversight of the Federal ReserveBoard and the Massachusetts Commissioner of Banks. Thefair value of VLB's position in the Fund is not the same as thevalue of the Fund shares.
d. Involuntary Participation. There was no involuntaryparticipation in an external investment pool by the VLB forthe fiscal year.
e. Necessary Information. Not applicable.
f. Income Assignment. No income from one fund was assignedto another fund by State Street during the fiscal year.
Note 4 SHORT TERM DEBT
Not applicable.
Note 5 LONG TERM LIABILITIES
The changes noted in Table 8 below occurred in long termliabilities during the year ended August 31, 2017.
BONDS PAYABLE Revenue bonds and general obligation bonds payable aredescribed in detail in Note 6.
CLAIMS AND JUDGMENTS Claims and judgments that are settled and unpaid at year end,and which will be paid with future governmental fund resources,are shown on the statement of net position under long termliabilities.
CAPITAL LEASE OBLIGATIONS The agency is not a party to any long term lease agreements forfinancing the purchase of capital assets as of August 31, 2017.
Table 8CHANGES IN LONG TERM LIABILITIESFor the Year Ended August 31, 2017
Balance Balance Amounts Due Amounts Due
GOVERNMENTAL ACTIVITIES 09 01 2016 Additions Deductions 08 31 2017 Within One Year Thereafter$ $ $ $ $ $
Employees' CompensableLeave 5,542,838.22 3,970,877.76 4,153,875.97 5,359,840.01 2,850,593.52 2,509,246.49
Total,Governmental Activities 5,542,838.22 3,970,877.76 4,153,875.97 5,359,840.01 2,850,593.52 2,509,246.49
BUSINESS TYPE ACTIVITIES
General Obligation Bonds Payable 2,782,245,000.00 250,000,000.00 156,730,000.00 2,875,515,000.00 168,180,000.00 2,707,335,000.00Unamortized Premium 8,826,068.83 0.00 1,029,810.16 7,796,258.67 1,029,810.16 6,766,448.51
Total,Business Type Activities 2,791,071,068.83 250,000,000.00 157,759,810.16 2,883,311,258.67 169,209,810.16 2,714,101,448.51
Total, Governmental andBusiness Type Activities 2,796,613,907.05 253,970,877.76 161,913,686.13 2,888,671,098.68 172,060,403.68 2,716,610,695.00
UNAUDITED
Annual Financial Report | 43
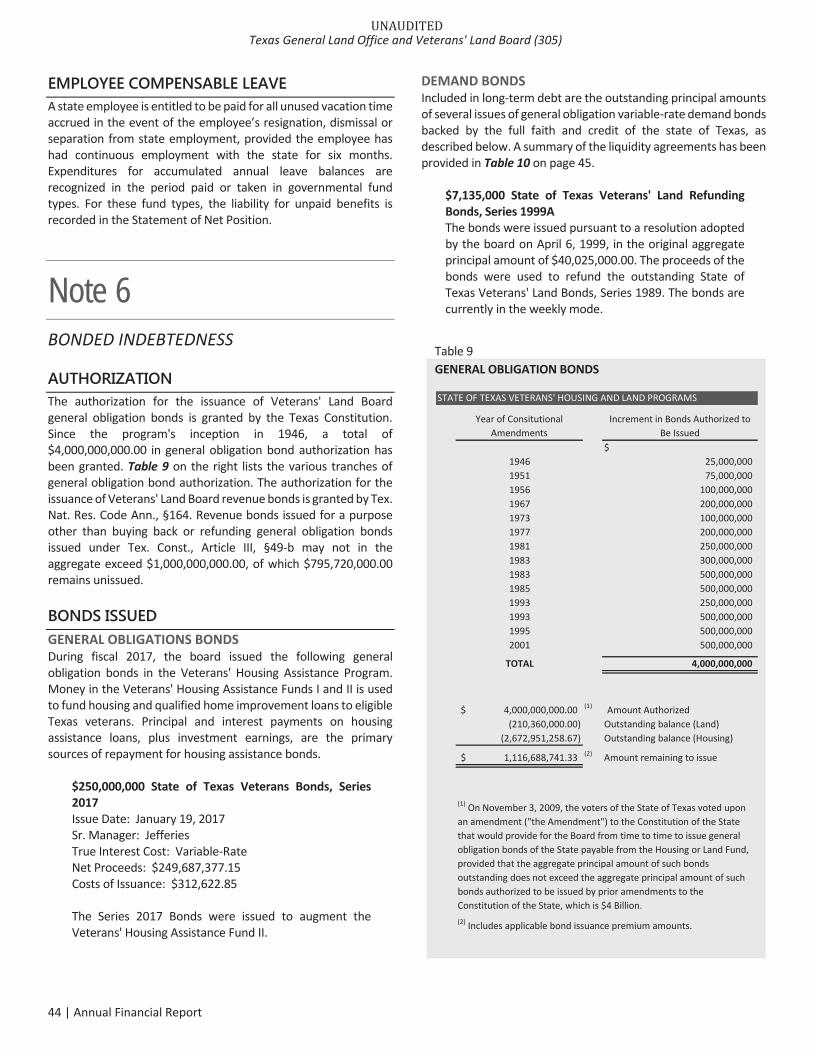
EMPLOYEE COMPENSABLE LEAVE A state employee is entitled to be paid for all unused vacation timeaccrued in the event of the employee’s resignation, dismissal orseparation from state employment, provided the employee hashad continuous employment with the state for six months.Expenditures for accumulated annual leave balances arerecognized in the period paid or taken in governmental fundtypes. For these fund types, the liability for unpaid benefits isrecorded in the Statement of Net Position.
Note 6 BONDED INDEBTEDNESS
AUTHORIZATION The authorization for the issuance of Veterans' Land Boardgeneral obligation bonds is granted by the Texas Constitution.Since the program's inception in 1946, a total of$4,000,000,000.00 in general obligation bond authorization hasbeen granted. Table 9 on the right lists the various tranches ofgeneral obligation bond authorization. The authorization for theissuance of Veterans' Land Board revenue bonds is granted by Tex.Nat. Res. Code Ann., §164. Revenue bonds issued for a purposeother than buying back or refunding general obligation bondsissued under Tex. Const., Article III, §49 b may not in theaggregate exceed $1,000,000,000.00, of which $795,720,000.00remains unissued.
BONDS ISSUED
GENERAL OBLIGATIONS BONDSDuring fiscal 2017, the board issued the following generalobligation bonds in the Veterans' Housing Assistance Program.Money in the Veterans' Housing Assistance Funds I and II is usedto fund housing and qualified home improvement loans to eligibleTexas veterans. Principal and interest payments on housingassistance loans, plus investment earnings, are the primarysources of repayment for housing assistance bonds.
$250,000,000 State of Texas Veterans Bonds, Series2017Issue Date: January 19, 2017Sr. Manager: JefferiesTrue Interest Cost: Variable RateNet Proceeds: $249,687,377.15Costs of Issuance: $312,622.85
The Series 2017 Bonds were issued to augment theVeterans' Housing Assistance Fund II.
DEMAND BONDSIncluded in long term debt are the outstanding principal amountsof several issues of general obligation variable rate demand bondsbacked by the full faith and credit of the state of Texas, asdescribed below. A summary of the liquidity agreements has beenprovided in Table 10 on page 45.
$7,135,000 State of Texas Veterans' Land RefundingBonds, Series 1999AThe bonds were issued pursuant to a resolution adoptedby the board on April 6, 1999, in the original aggregateprincipal amount of $40,025,000.00. The proceeds of thebonds were used to refund the outstanding State ofTexas Veterans' Land Bonds, Series 1989. The bonds arecurrently in the weekly mode.
Table 9GENERAL OBLIGATION BONDS
Year of ConsitutionalAmendments
Increment in Bonds Authorized toBe Issued
$1946 25,000,0001951 75,000,0001956 100,000,0001967 200,000,0001973 100,000,0001977 200,000,0001981 250,000,0001983 300,000,0001983 500,000,0001985 500,000,0001993 250,000,0001993 500,000,0001995 500,000,0002001 500,000,000
TOTAL 4,000,000,000
4,000,000,000.00$ (1) Amount Authorized(210,360,000.00) Outstanding balance (Land)
(2,672,951,258.67) Outstanding balance (Housing)
1,116,688,741.33$ (2) Amount remaining to issue
(2) Includes applicable bond issuance premium amounts.
(1) On November 3, 2009, the voters of the State of Texas voted uponan amendment ("the Amendment") to the Constitution of the Statethat would provide for the Board from time to time to issue generalobligation bonds of the State payable from the Housing or Land Fund,provided that the aggregate principal amount of such bondsoutstanding does not exceed the aggregate principal amount of suchbonds authorized to be issued by prior amendments to theConstitution of the State, which is $4 Billion.
STATE OF TEXAS VETERANS' HOUSING AND LAND PROGRAMS
UNAUDITEDTexas General Land Office and Veterans' Land Board (305)
44 | Annual Financial Report
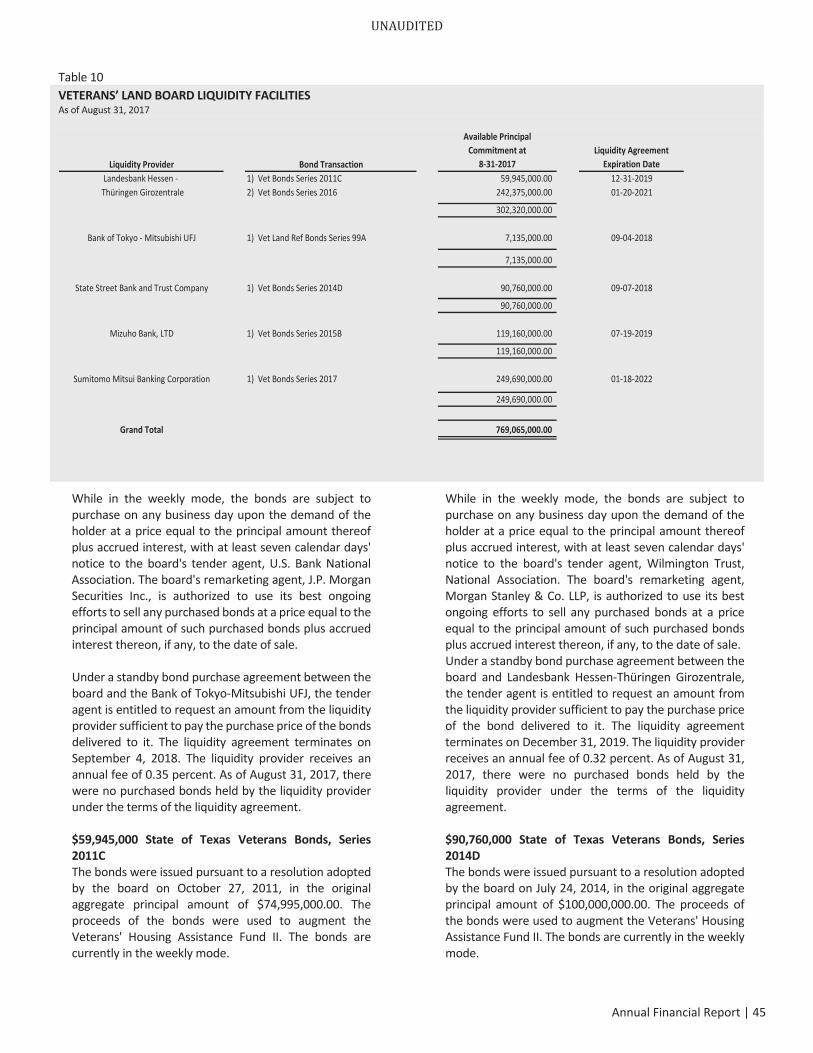
While in the weekly mode, the bonds are subject topurchase on any business day upon the demand of theholder at a price equal to the principal amount thereofplus accrued interest, with at least seven calendar days'notice to the board's tender agent, U.S. Bank NationalAssociation. The board's remarketing agent, J.P. MorganSecurities Inc., is authorized to use its best ongoingefforts to sell any purchased bonds at a price equal to theprincipal amount of such purchased bonds plus accruedinterest thereon, if any, to the date of sale.
Under a standby bond purchase agreement between theboard and the Bank of Tokyo Mitsubishi UFJ, the tenderagent is entitled to request an amount from the liquidityprovider sufficient to pay the purchase price of the bondsdelivered to it. The liquidity agreement terminates onSeptember 4, 2018. The liquidity provider receives anannual fee of 0.35 percent. As of August 31, 2017, therewere no purchased bonds held by the liquidity providerunder the terms of the liquidity agreement.
$59,945,000 State of Texas Veterans Bonds, Series2011CThe bonds were issued pursuant to a resolution adoptedby the board on October 27, 2011, in the originalaggregate principal amount of $74,995,000.00. Theproceeds of the bonds were used to augment theVeterans' Housing Assistance Fund II. The bonds arecurrently in the weekly mode.
While in the weekly mode, the bonds are subject topurchase on any business day upon the demand of theholder at a price equal to the principal amount thereofplus accrued interest, with at least seven calendar days'notice to the board's tender agent, Wilmington Trust,National Association. The board's remarketing agent,Morgan Stanley & Co. LLP, is authorized to use its bestongoing efforts to sell any purchased bonds at a priceequal to the principal amount of such purchased bondsplus accrued interest thereon, if any, to the date of sale.Under a standby bond purchase agreement between theboard and Landesbank Hessen Thüringen Girozentrale,the tender agent is entitled to request an amount fromthe liquidity provider sufficient to pay the purchase priceof the bond delivered to it. The liquidity agreementterminates on December 31, 2019. The liquidity providerreceives an annual fee of 0.32 percent. As of August 31,2017, there were no purchased bonds held by theliquidity provider under the terms of the liquidityagreement.
$90,760,000 State of Texas Veterans Bonds, Series2014DThe bonds were issued pursuant to a resolution adoptedby the board on July 24, 2014, in the original aggregateprincipal amount of $100,000,000.00. The proceeds ofthe bonds were used to augment the Veterans' HousingAssistance Fund II. The bonds are currently in the weeklymode.
Table 10VETERANS’ LAND BOARD LIQUIDITY FACILITIESAs of August 31, 2017
Liquidity Provider Bond Transaction
Available PrincipalCommitment at
8 31 2017Liquidity Agreement
Expiration DateLandesbank Hessen 1) Vet Bonds Series 2011C 59,945,000.00 12 31 2019Thüringen Girozentrale 2) Vet Bonds Series 2016 242,375,000.00 01 20 2021
302,320,000.00
Bank of Tokyo Mitsubishi UFJ 1) Vet Land Ref Bonds Series 99A 7,135,000.00 09 04 2018
7,135,000.00
State Street Bank and Trust Company 1) Vet Bonds Series 2014D 90,760,000.00 09 07 2018
90,760,000.00
Mizuho Bank, LTD 1) Vet Bonds Series 2015B 119,160,000.00 07 19 2019
119,160,000.00
Sumitomo Mitsui Banking Corporation 1) Vet Bonds Series 2017 249,690,000.00 01 18 2022
249,690,000.00
Grand Total 769,065,000.00
UNAUDITED
Annual Financial Report | 45
While in the weekly mode, the bonds are subject topurchase on any business day upon the demand of theholder at a price equal to the principal amount thereofplus accrued interest, with at least seven calendar days'notice to the board's tender agent, U.S. Bank, NationalAssociation. The board's remarketing agent, J. P. MorganSecurities LLC, is authorized to use its best ongoing effortsto sell any purchased bonds at a price equal to theprincipal amount of such purchased bonds plus accruedinterest thereon, if any, to the date of sale.
Under a standby bond purchase agreement between theboard and State Street Bank and Trust Company, thetender agent is entitled to request an amount from theliquidity provider sufficient to pay the purchase price ofthe bond delivered to it. The liquidity agreementterminates on September 7, 2018. The liquidity providerreceives an annual fee of 0.35 percent. As of August 31,2017, there were no purchased bonds held by theliquidity provider under the terms of the liquidityagreement.
$119,160,000 State of Texas Veterans Bonds, Series2015BThe bonds were issued pursuant to a resolution adoptedby the board on July 24, 2014, in the original aggregateprincipal amount of $125,000,000.00. The proceeds ofthe bonds were used to augment the Veterans' HousingAssistance Fund II. The bonds are currently in the weeklymode.
While in the weekly mode, the bonds are subject topurchase on any business day upon the demand of theholder at a price equal to the principal amount thereofplus accrued interest, with at least seven calendar days'notice to the board's tender agent, U.S. Bank, NationalAssociation. The board's remarketing agent, J. P. MorganSecurities LLC, is authorized to use its best ongoing effortsto sell any purchased bonds at a price equal to theprincipal amount of such purchased bonds plus accruedinterest thereon, if any, to the date of sale.
Under a standby bond purchase agreement between theboard and Mizuho Bank, LTD, the tender agent is entitledto request an amount from the liquidity providersufficient to pay the purchase price of the bond deliveredto it. The liquidity agreement terminates on July 19, 2019.The liquidity provider receives an annual fee of 0.34percent. As of August 31, 2017, there were no purchasedbonds held by the liquidity provider under the terms ofthe liquidity agreement.
$242,375,000 State of Texas Veterans Bonds, Series2016The bonds were issued pursuant to a resolution adoptedby the board on July 30, 2015, in the original aggregateprincipal amount of $250,000,000.00. The proceeds ofthe bonds were used to augment the Veterans’ HousingAssistance Fund II. The bonds are currently in the weeklymode.
While in the weekly mode, the bonds are subject topurchase on any business day upon the demand of theholder at a price equal to the principal amount thereofplus accrued interest, with at least seven calendar days'notice to the board's tender agent, U.S. Bank NationalAssociation. The board's remarketing agent, BNY MellonCapital Markets, LLC, is authorized to use its best ongoingefforts to sell any purchased bonds at a price equal to theprincipal amount of such purchased bonds plus accruedinterest thereon, if any, to the date of sale.
Under a standby bond purchase agreement between theboard and Landesbank Hessen Thüringen Girozentrale,the tender agent is entitled to request an amount fromthe liquidity provider sufficient to pay the purchase priceof the bond delivered to it. The liquidity agreementterminates on January 20, 2021. The liquidity providerreceives an annual fee of 0.28 percent. As of August 31,2017, there were no purchased bonds held by theliquidity provider under the terms of the liquidityagreement.
$249,690,000 State of Texas Veterans Bonds, Series2017The bonds were issued pursuant to a resolution adoptedby the board on July 28, 2016, in the original aggregateprincipal amount of $250,000,000.00. The proceeds ofthe bonds were used to augment the Veterans' HousingAssistance Fund II. The bonds are currently in the weeklymode.
While in the weekly mode, the bonds are subject topurchase on any business day upon the demand of theholder at a price equal to the principal amount thereofplus accrued interest, with at least seven calendar days'notice to the board's tender agent, U.S. Bank, NationalAssociation. The board's remarketing agent, Jefferies,LLC, is authorized to use its best ongoing efforts to sellany purchased bonds at a price equal to the principalamount of such purchased bonds plus accrued interestthereon, if any, to the date of sale.
Under a standby bond purchase agreement between theboard and Sumitomo Mitsui Banking Corporation, thetender agent is entitled to request an amount from theliquidity provider sufficient to pay the purchase price of
UNAUDITEDTexas General Land Office and Veterans' Land Board (305)
46 | Annual Financial Report
the bond delivered to it. The liquidity agreementterminates on January 18, 2022. The liquidity providerreceives an annual fee of 0.30 percent. As of August 31,2017, there were no purchased bonds held by theliquidity provider under the terms of the liquidityagreement.
VARIABLE-RATE BOND MODE CHANGES On May 29, 2015, the board approved the implementation of aseries of mode changes with respect to several existing VLBvariable rate bond issues that converted the bond issues from aweekly mode to a direct purchase mode for the next 5 7 years.The bond issues converted to a direct purchase mode were:Adjustable Convertible Extendable Securities, Veterans' HousingAssistance Bonds, Series 1994A 1, Veterans' Housing AssistanceProgram, Fund II Series 2001C 2 Bonds, Veterans' HousingAssistance Program, Fund II Series 2004A Bonds, Veterans'Housing Assistance Program, Fund II Series 2005A Bonds,Veterans' Housing Assistance Program, Fund II Series 2005BBonds, Veterans' Housing Assistance Program, Fund II Series2007A Bonds, Veterans' Housing Assistance Program, Fund IISeries 2008A Bonds, Veterans' Housing Assistance Program, FundII Series 2008B Bonds, Veterans Bonds, Series 2010C, VeteransBonds, Series 2012A, and Veterans' Land Bonds, Series 2002. Themode changes were implemented in three different tranches onJuly 24, August 7, and October 7, 2015, respectively.
The mode changes were undertaken primarily to take advantageof a unique opportunity provided by a large institutional investorto convert several of the outstanding VLB tax exempt floating ratebonds that reset weekly through a remarketing process into taxexempt indexed floaters which are reset monthly at 68% of 1month LIBOR plus various fixed spreads. (The spreads result inamounts that are less than the amounts previously paid by theboard for liquidity and remarketing expenses on the associatedbonds and are expected to generate approximately $3.6 million insavings over the life of the direct purchase mode.) In addition, thetransactions were also particularly attractive for the followingreasons: (1) eliminated the need for liquidity facilities andremarketing services with regard to the refunding bonds; (2) freedup approximately $365 million in existing liquidity facilities to usein conjunction with future new money VLB variable ratetransactions; and (3) eliminated the pricing, market access, andcounterparty risk associated with having to extend or negotiatenew liquidity facilities two or more times over the next 5 7 years.
On October 29, 2015, the board approved the implementation ofa series of mode changes with respect to several existing VLBvariable rate bond issues that converted the bond issues from aweekly mode to a direct purchase mode for the next 7 10 years.The bond issues converted to direct purchase mode were:Veterans’ Housing Assistance Program, Fund II Series 2001A 2Bonds, Veterans’ Housing Assistance Program, Fund II Series2002A 2 Bonds, Veterans’ Housing Assistance Program, Fund IISeries 2003A Bonds, Veterans’ Housing Assistance Program, Fund
II Series 2003B Bonds, Veterans’ Housing Assistance Program,Fund II Series 2004B Bonds, Veterans’ Housing AssistanceProgram, Fund II Series 2006A Bonds, Veterans’ HousingAssistance Program, Fund II 2006D Bonds, Veterans’ HousingAssistance Program, Fund II 2007B Bonds, Veterans Bonds, Series2011A, Veterans Bonds, Series 2011B, Veterans Bonds, Series2012B, Veterans Bonds, Series 2013A, Veterans Bonds, Series2013B, Veterans Bonds, Series 2014A, and Veterans Bonds, Series2015A. The mode changes were implemented on December 15,2015.
The mode changes were undertaken primarily to take advantageof a unique opportunity provided by a large institutional investorto convert several of the outstanding VLB tax exempt floating ratebonds that reset weekly through a remarketing process into taxexempt indexed floaters which are reset monthly at 68% of 1month LIBOR plus various fixed spreads. (The spreads result inamounts that are less than the amounts previously paid by theboard for liquidity and remarketing expenses on the associatedbonds and are expected to generate approximately $3.2 million insaving over the life of the direct purchase mode.) In addition, thetransactions were also particularly attractive for the followingreasons: (1) eliminated the need for liquidity facilities andremarketing services with regard to the refunding bonds; (2)freed up approximately $945 million in existing liquidity facilitiesto use in conjunction with future new money VLB variable ratetransactions; and (3) eliminated the pricing, market access, andcounterparty risk associated with having to extend or negotiatenew liquidity facilities three or more times over the next 7 10years.
DEFEASED BONDS OUTSTANDING – LAND Advance refunding bonds totaling $716,545,000.00 have beenissued to defease Veterans' Land Bonds. At August 31, 2017,$15,500,000.00 of the defeased bonds remained outstanding. Theproceeds of the refundings, together with additional securitiesand cash owned by the board, were deposited with the board'sescrow agents pursuant to the special escrow fund agreements.These agreements provide that the special escrow funds areirrevocably pledged to the payment of principal and interest onthe refunded bonds. The escrow agent will retire the remainingdefeased debt as it matures. Details of the refunding transactionsare outlined in Table 11 on page 50.
In the opinion of the board's bond counsel, as a result of thefollowing defeasances, Veterans' Land Bond Series 1949 through1985B and the 1983 Refunding Bonds in the land program areconsidered defeased. The securities and cash held by the escrowagents and the related defeased debt have been removed fromthe accompanying exhibits. The land contracts and remaininginvestments purchased with Veterans' Land Bond Series 1949through 1985B Bonds became assets of the 1985, 1986, 1989,1990, and 1991 Refunding Bonds.
UNAUDITED
Annual Financial Report | 47
With the issuance of the refunding bonds, all of the outstandingVeterans' Land Bond Series 1949 through 1985B were refunded,which released available monies from certain covenants in theresolutions that authorized the issuance of those bonds. Thefuture receipts were pledged by the resolution authorizing theSeries 1985, 1986, 1989, 1990, and 1991 Refunding Bonds. In April1998, the board completed a current refunding of the Series 1985and 1986 Refunding Bonds with its Series 1998A and 1998BTaxable Refunding Bonds. Thus, upon completion of the 1998transactions, assets formerly pledged to the Series 1985 and 1986Refunding Bonds became assets of the Series 1998A and 1998BTaxable Refunding Bonds. In October 1999, the board completeda current refunding of the current interest bond portion of theSeries 1989 Refunding Bonds with its Series 1999B TaxableRefunding Bonds. Thus, assets formerly pledged to the Series1989 Refunding Bonds became assets of the Series 1999B TaxableRefunding Bonds. In November 2000, the board completed acurrent refunding of the current interest bond portion of theSeries 1990 Refunding Bonds with its Series 2000 TaxableRefunding Bonds. Thus, assets formerly pledged to the Series1990 Refunding Bonds became assets of the Series 2000 TaxableRefunding Bonds. In November 2002, the board completed acurrent refunding of the current interest bond portion of theSeries 1991 Refunding Bonds with its Series 2002 TaxableRefunding Bonds. Thus, assets formerly pledged to the Series1991 Refunding Bonds became assets of the Series 2002 TaxableRefunding Bonds.
ADMINISTRATION OF LOAN PROGRAMS Under the Veterans' Land Program, eligible veterans may qualifyfor a loan of up to $150,000.00 at an interest rate set by theVeterans' Land Board, payable over a 30 year period to purchasenot less than one net acre of land in the state of Texas. Currentboard policy permits the transfer of contracts after three years.Higher rates of interest are charged to non veterans as permittedby law. The board may provide financing for veterans for thepurchase of foreclosed land tracts from the board. The loan ratein the program at August 31, 2017 is 7.25 percent.
In May 2007, a nationally recognized loan servicing organizationbegan servicing the loans in the Veterans' Land Program. TexasSenate Joint Resolution 14, 68th Leg., Reg. Sess. (1983), proposeda constitutional amendment for a Veterans' Housing AssistanceProgram to provide financial assistance to veterans. Thisamendment, which was approved by the voters on November 8,1983, authorized the issuance of $500,000,000.00 in bonds tofinance the Veterans' Housing Assistance Program. Tex. S.J. Res. 9,69th Leg., Reg. Sess. (1985), proposed a constitutional amendmentto increase the Veterans' Housing Assistance Program bondingauthority by $500,000,000.00. The voters approved thisamendment on November 5, 1985. Tex. S.J. Res. 34, 73rd Leg., Reg.Sess. (1993) proposed a constitutional amendment to increasethe Veterans' Housing Assistance Program bonding authority by$500,000,000.00. The voters approved this amendment onNovember 2, 1993. Tex. S.J. Res. 32, 74th Leg., Reg. Sess. (1995)
proposed a constitutional amendment to increase the Veteran'sHousing Assistance Program bonding authority by$500,000,000.00. The voters approved this amendment onNovember 7, 1995. Tex. H.J. Res. 82, 77th Leg., Reg. Sess. (2001)proposed a constitutional amendment to increase the Veterans'Housing Assistance Program bonding authority by$500,000,000.00. The voters approved this amendment onNovember 6, 2001.
In January 1984, the Veterans' Land Board began providinghousing loans. Currently under this program, eligible Texasveterans may qualify for a loan of up to $424,100.00. The interestrates for these loans are currently reset weekly after the close ofbusiness on the last business day of the week at a variable spreadbelow a constructed benchmark that approximates currentFHA/VA marketing rates. In May 1986, the Housing AssistanceProgram was expanded to include home improvement loans.Home improvements, which are originated by the Veterans' LandBoard, can be financed for a period of 2 to 20 years for a principalamount of up to $50,000.00. Interest rates for these loans arecurrently determined in the same manner and at the same spreadas described above.
CitiMortgage is currently the administrator of the Veterans’Housing Assistance Program. Housing loans are originated andserviced through qualified lending institutions participating in theprogram. The expenditures related to administering the Veterans'Housing Assistance Program are paid from the receipts ofrepayments on the loans and other receipts of the Veterans'Housing Assistance Program.
Additional financial information related to the VLB loan programsis available in Note 33 on page 77.
OUTSTANDING BONDSOutstanding land and housing assistance general obligation bondsare repaid from land, housing, and home improvement loanprincipal and interest receipts, and investment earnings.Schedules 2 A through 2 G present bond activity during fiscal2017. Annual interest accretion on capital appreciation bonds isreported in the Bonds Issued column of Schedule 2 A. As of August31, 2017, the GLO does not have any capital appreciation bonds.
A summary of bonds outstanding, excluding unamortizedpremium, at August 31, 2017, and the issue and final maturitydates are presented in Table 12 on page 51 and a summary ofbond transactions is presented in Table 13 on page 52.
DEBT SERVICE REQUIREMENTSTable 14 on page 53 and Table 15 on page 54 represent principaland interest due on bonds from the period of September 1, 2017,through final maturity on December 1, 2047. The information isdisclosed by bond issue and fiscal year, respectively.
UNAUDITEDTexas General Land Office and Veterans' Land Board (305)
48 | Annual Financial Report
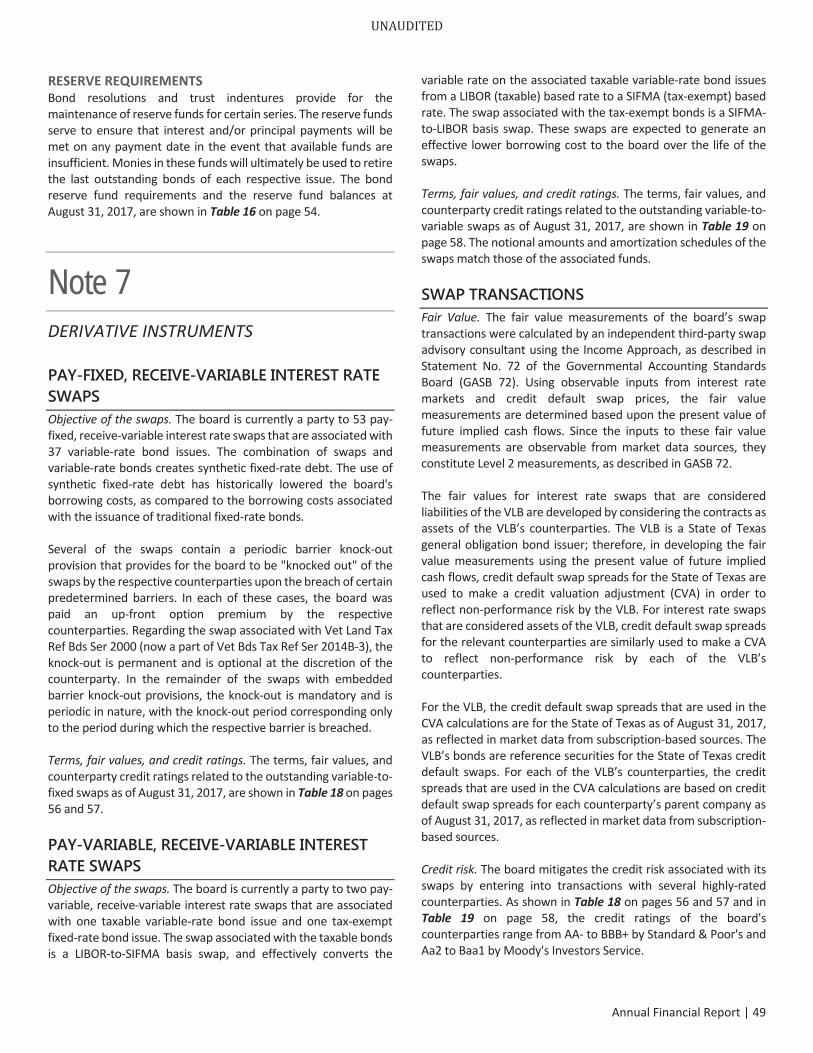
RESERVE REQUIREMENTSBond resolutions and trust indentures provide for themaintenance of reserve funds for certain series. The reserve fundsserve to ensure that interest and/or principal payments will bemet on any payment date in the event that available funds areinsufficient. Monies in these funds will ultimately be used to retirethe last outstanding bonds of each respective issue. The bondreserve fund requirements and the reserve fund balances atAugust 31, 2017, are shown in Table 16 on page 54.
Note 7 DERIVATIVE INSTRUMENTS
PAY-FIXED, RECEIVE-VARIABLE INTEREST RATE SWAPS Objective of the swaps. The board is currently a party to 53 payfixed, receive variable interest rate swaps that are associated with37 variable rate bond issues. The combination of swaps andvariable rate bonds creates synthetic fixed rate debt. The use ofsynthetic fixed rate debt has historically lowered the board'sborrowing costs, as compared to the borrowing costs associatedwith the issuance of traditional fixed rate bonds.
Several of the swaps contain a periodic barrier knock outprovision that provides for the board to be "knocked out" of theswaps by the respective counterparties upon the breach of certainpredetermined barriers. In each of these cases, the board waspaid an up front option premium by the respectivecounterparties. Regarding the swap associated with Vet Land TaxRef Bds Ser 2000 (now a part of Vet Bds Tax Ref Ser 2014B 3), theknock out is permanent and is optional at the discretion of thecounterparty. In the remainder of the swaps with embeddedbarrier knock out provisions, the knock out is mandatory and isperiodic in nature, with the knock out period corresponding onlyto the period during which the respective barrier is breached.
Terms, fair values, and credit ratings. The terms, fair values, andcounterparty credit ratings related to the outstanding variable tofixed swaps as of August 31, 2017, are shown in Table 18 on pages56 and 57.
PAY-VARIABLE, RECEIVE-VARIABLE INTEREST RATE SWAPS Objective of the swaps. The board is currently a party to two payvariable, receive variable interest rate swaps that are associatedwith one taxable variable rate bond issue and one tax exemptfixed rate bond issue. The swap associated with the taxable bondsis a LIBOR to SIFMA basis swap, and effectively converts the
variable rate on the associated taxable variable rate bond issuesfrom a LIBOR (taxable) based rate to a SIFMA (tax exempt) basedrate. The swap associated with the tax exempt bonds is a SIFMAto LIBOR basis swap. These swaps are expected to generate aneffective lower borrowing cost to the board over the life of theswaps.
Terms, fair values, and credit ratings. The terms, fair values, andcounterparty credit ratings related to the outstanding variable tovariable swaps as of August 31, 2017, are shown in Table 19 onpage 58. The notional amounts and amortization schedules of theswaps match those of the associated funds.
SWAP TRANSACTIONS Fair Value. The fair value measurements of the board’s swaptransactions were calculated by an independent third party swapadvisory consultant using the Income Approach, as described inStatement No. 72 of the Governmental Accounting StandardsBoard (GASB 72). Using observable inputs from interest ratemarkets and credit default swap prices, the fair valuemeasurements are determined based upon the present value offuture implied cash flows. Since the inputs to these fair valuemeasurements are observable from market data sources, theyconstitute Level 2 measurements, as described in GASB 72.
The fair values for interest rate swaps that are consideredliabilities of the VLB are developed by considering the contracts asassets of the VLB’s counterparties. The VLB is a State of Texasgeneral obligation bond issuer; therefore, in developing the fairvalue measurements using the present value of future impliedcash flows, credit default swap spreads for the State of Texas areused to make a credit valuation adjustment (CVA) in order toreflect non performance risk by the VLB. For interest rate swapsthat are considered assets of the VLB, credit default swap spreadsfor the relevant counterparties are similarly used to make a CVAto reflect non performance risk by each of the VLB’scounterparties.
For the VLB, the credit default swap spreads that are used in theCVA calculations are for the State of Texas as of August 31, 2017,as reflected in market data from subscription based sources. TheVLB’s bonds are reference securities for the State of Texas creditdefault swaps. For each of the VLB’s counterparties, the creditspreads that are used in the CVA calculations are based on creditdefault swap spreads for each counterparty’s parent company asof August 31, 2017, as reflected in market data from subscriptionbased sources.
Credit risk. The board mitigates the credit risk associated with itsswaps by entering into transactions with several highly ratedcounterparties. As shown in Table 18 on pages 56 and 57 and inTable 19 on page 58, the credit ratings of the board'scounterparties range from AA to BBB+ by Standard & Poor's andAa2 to Baa1 by Moody's Investors Service.
UNAUDITED
Annual Financial Report | 49
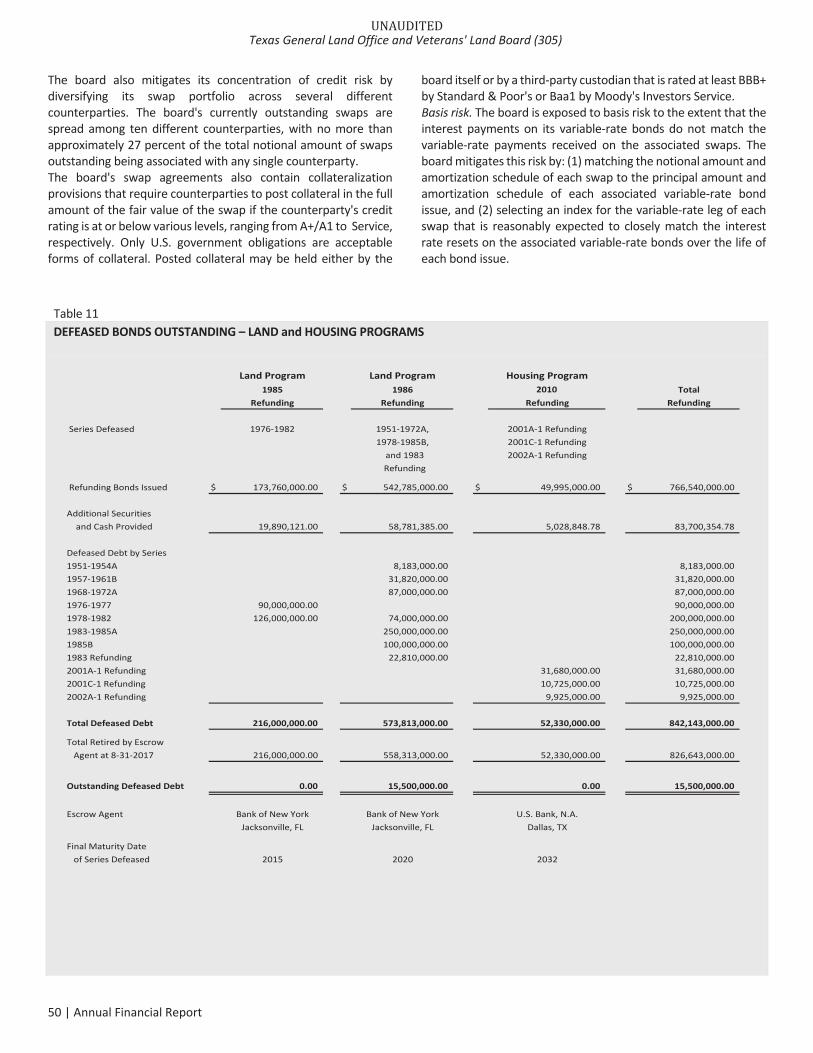
The board also mitigates its concentration of credit risk bydiversifying its swap portfolio across several differentcounterparties. The board's currently outstanding swaps arespread among ten different counterparties, with no more thanapproximately 27 percent of the total notional amount of swapsoutstanding being associated with any single counterparty.The board's swap agreements also contain collateralizationprovisions that require counterparties to post collateral in the fullamount of the fair value of the swap if the counterparty's creditrating is at or below various levels, ranging from A+/A1 to Service,respectively. Only U.S. government obligations are acceptableforms of collateral. Posted collateral may be held either by the
board itself or by a third party custodian that is rated at least BBB+by Standard & Poor's or Baa1 by Moody's Investors Service.Basis risk. The board is exposed to basis risk to the extent that theinterest payments on its variable rate bonds do not match thevariable rate payments received on the associated swaps. Theboard mitigates this risk by: (1) matching the notional amount andamortization schedule of each swap to the principal amount andamortization schedule of each associated variable rate bondissue, and (2) selecting an index for the variable rate leg of eachswap that is reasonably expected to closely match the interestrate resets on the associated variable rate bonds over the life ofeach bond issue.
Table 11DEFEASED BONDS OUTSTANDING – LAND and HOUSING PROGRAMS
Land Program Land Program Housing Program1985 1986 2010 Total
Refunding Refunding Refunding Refunding
Series Defeased 1976 1982 1951 1972A, 2001A 1 Refunding1978 1985B, 2001C 1 Refunding
and 1983 2002A 1 RefundingRefunding
Refunding Bonds Issued $ 173,760,000.00 $ 542,785,000.00 $ 49,995,000.00 $ 766,540,000.00
Additional Securitiesand Cash Provided 19,890,121.00 58,781,385.00 5,028,848.78 83,700,354.78
Defeased Debt by Series1951 1954A 8,183,000.00 8,183,000.001957 1961B 31,820,000.00 31,820,000.001968 1972A 87,000,000.00 87,000,000.001976 1977 90,000,000.00 90,000,000.001978 1982 126,000,000.00 74,000,000.00 200,000,000.001983 1985A 250,000,000.00 250,000,000.001985B 100,000,000.00 100,000,000.001983 Refunding 22,810,000.00 22,810,000.002001A 1 Refunding 31,680,000.00 31,680,000.002001C 1 Refunding 10,725,000.00 10,725,000.002002A 1 Refunding 9,925,000.00 9,925,000.00
Total Defeased Debt 216,000,000.00 573,813,000.00 52,330,000.00 842,143,000.00
Total Retired by EscrowAgent at 8 31 2017 216,000,000.00 558,313,000.00 52,330,000.00 826,643,000.00
Outstanding Defeased Debt 0.00 15,500,000.00 0.00 15,500,000.00
Escrow Agent Bank of New York Bank of New York U.S. Bank, N.A.Jacksonville, FL Jacksonville, FL Dallas, TX
Final Maturity Dateof Series Defeased 2015 2020 2032
UNAUDITEDTexas General Land Office and Veterans' Land Board (305)
50 | Annual Financial Report
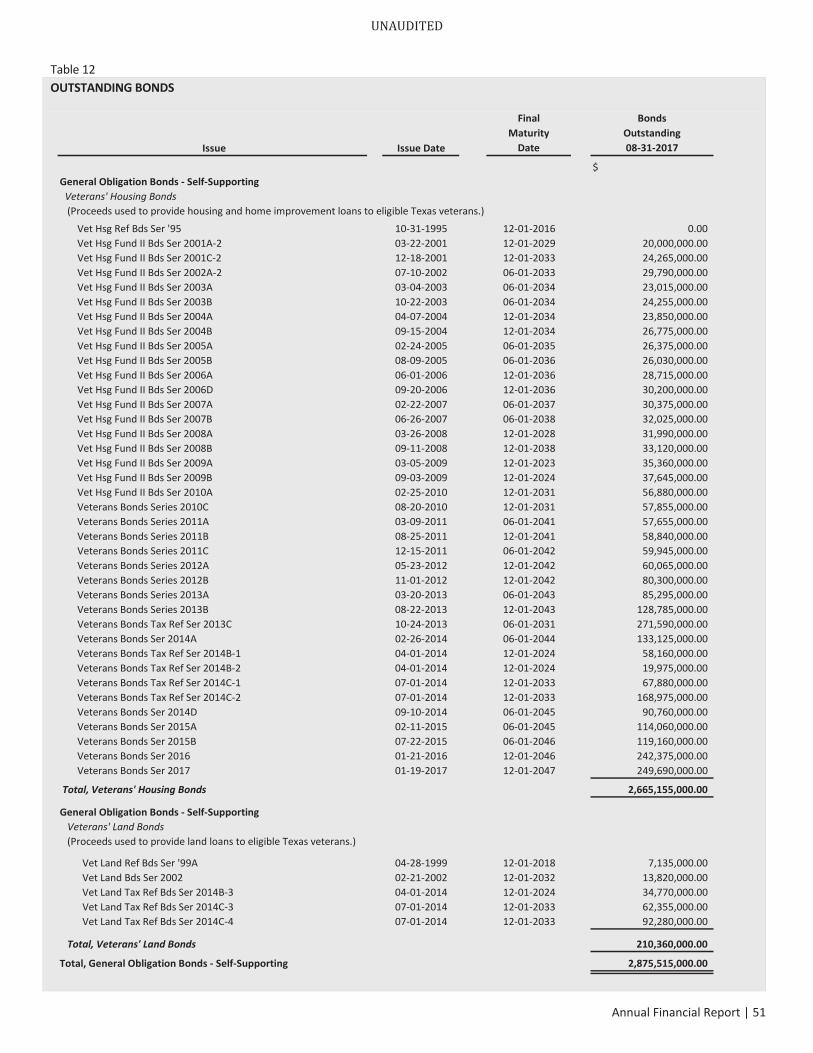
Table 12OUTSTANDING BONDS
Issue Issue Date
FinalMaturityDate
BondsOutstanding08 31 2017
$General Obligation Bonds Self SupportingVeterans' Housing Bonds(Proceeds used to provide housing and home improvement loans to eligible Texas veterans.)
Vet Hsg Ref Bds Ser '95 10 31 1995 12 01 2016 0.00Vet Hsg Fund II Bds Ser 2001A 2 03 22 2001 12 01 2029 20,000,000.00Vet Hsg Fund II Bds Ser 2001C 2 12 18 2001 12 01 2033 24,265,000.00Vet Hsg Fund II Bds Ser 2002A 2 07 10 2002 06 01 2033 29,790,000.00Vet Hsg Fund II Bds Ser 2003A 03 04 2003 06 01 2034 23,015,000.00Vet Hsg Fund II Bds Ser 2003B 10 22 2003 06 01 2034 24,255,000.00Vet Hsg Fund II Bds Ser 2004A 04 07 2004 12 01 2034 23,850,000.00Vet Hsg Fund II Bds Ser 2004B 09 15 2004 12 01 2034 26,775,000.00Vet Hsg Fund II Bds Ser 2005A 02 24 2005 06 01 2035 26,375,000.00Vet Hsg Fund II Bds Ser 2005B 08 09 2005 06 01 2036 26,030,000.00Vet Hsg Fund II Bds Ser 2006A 06 01 2006 12 01 2036 28,715,000.00Vet Hsg Fund II Bds Ser 2006D 09 20 2006 12 01 2036 30,200,000.00Vet Hsg Fund II Bds Ser 2007A 02 22 2007 06 01 2037 30,375,000.00Vet Hsg Fund II Bds Ser 2007B 06 26 2007 06 01 2038 32,025,000.00Vet Hsg Fund II Bds Ser 2008A 03 26 2008 12 01 2028 31,990,000.00Vet Hsg Fund II Bds Ser 2008B 09 11 2008 12 01 2038 33,120,000.00Vet Hsg Fund II Bds Ser 2009A 03 05 2009 12 01 2023 35,360,000.00Vet Hsg Fund II Bds Ser 2009B 09 03 2009 12 01 2024 37,645,000.00Vet Hsg Fund II Bds Ser 2010A 02 25 2010 12 01 2031 56,880,000.00Veterans Bonds Series 2010C 08 20 2010 12 01 2031 57,855,000.00Veterans Bonds Series 2011A 03 09 2011 06 01 2041 57,655,000.00Veterans Bonds Series 2011B 08 25 2011 12 01 2041 58,840,000.00Veterans Bonds Series 2011C 12 15 2011 06 01 2042 59,945,000.00Veterans Bonds Series 2012A 05 23 2012 12 01 2042 60,065,000.00Veterans Bonds Series 2012B 11 01 2012 12 01 2042 80,300,000.00Veterans Bonds Series 2013A 03 20 2013 06 01 2043 85,295,000.00Veterans Bonds Series 2013B 08 22 2013 12 01 2043 128,785,000.00Veterans Bonds Tax Ref Ser 2013C 10 24 2013 06 01 2031 271,590,000.00Veterans Bonds Ser 2014A 02 26 2014 06 01 2044 133,125,000.00Veterans Bonds Tax Ref Ser 2014B 1 04 01 2014 12 01 2024 58,160,000.00Veterans Bonds Tax Ref Ser 2014B 2 04 01 2014 12 01 2024 19,975,000.00Veterans Bonds Tax Ref Ser 2014C 1 07 01 2014 12 01 2033 67,880,000.00Veterans Bonds Tax Ref Ser 2014C 2 07 01 2014 12 01 2033 168,975,000.00Veterans Bonds Ser 2014D 09 10 2014 06 01 2045 90,760,000.00Veterans Bonds Ser 2015A 02 11 2015 06 01 2045 114,060,000.00Veterans Bonds Ser 2015B 07 22 2015 06 01 2046 119,160,000.00Veterans Bonds Ser 2016 01 21 2016 12 01 2046 242,375,000.00Veterans Bonds Ser 2017 01 19 2017 12 01 2047 249,690,000.00
Total, Veterans' Housing Bonds 2,665,155,000.00
General Obligation Bonds Self SupportingVeterans' Land Bonds(Proceeds used to provide land loans to eligible Texas veterans.)
Vet Land Ref Bds Ser '99A 04 28 1999 12 01 2018 7,135,000.00Vet Land Bds Ser 2002 02 21 2002 12 01 2032 13,820,000.00Vet Land Tax Ref Bds Ser 2014B 3 04 01 2014 12 01 2024 34,770,000.00Vet Land Tax Ref Bds Ser 2014C 3 07 01 2014 12 01 2033 62,355,000.00Vet Land Tax Ref Bds Ser 2014C 4 07 01 2014 12 01 2033 92,280,000.00
Total, Veterans' Land Bonds 210,360,000.00
Total, General Obligation Bonds Self Supporting 2,875,515,000.00
UNAUDITED
Annual Financial Report | 51
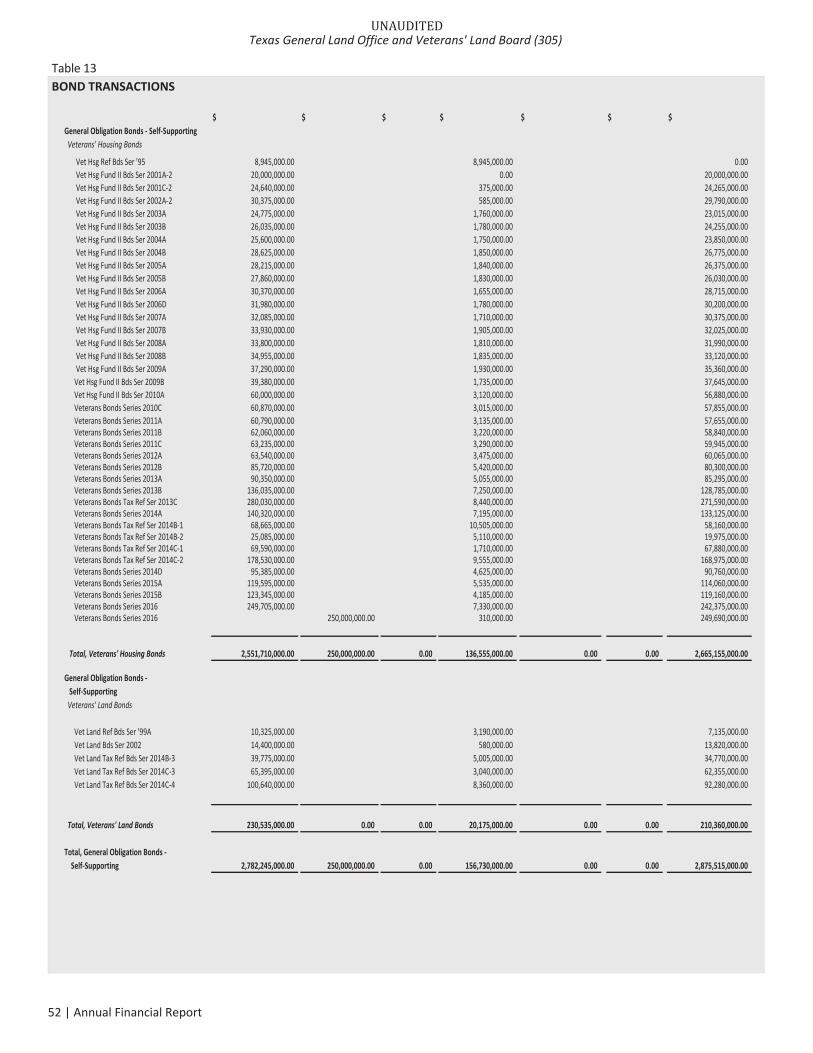
Table 13BOND TRANSACTIONS
$ $ $ $ $ $ $General Obligation Bonds Self SupportingVeterans' Housing Bonds
Vet Hsg Ref Bds Ser '95 8,945,000.00 8,945,000.00 0.00Vet Hsg Fund II Bds Ser 2001A 2 20,000,000.00 0.00 20,000,000.00Vet Hsg Fund II Bds Ser 2001C 2 24,640,000.00 375,000.00 24,265,000.00Vet Hsg Fund II Bds Ser 2002A 2 30,375,000.00 585,000.00 29,790,000.00Vet Hsg Fund II Bds Ser 2003A 24,775,000.00 1,760,000.00 23,015,000.00Vet Hsg Fund II Bds Ser 2003B 26,035,000.00 1,780,000.00 24,255,000.00Vet Hsg Fund II Bds Ser 2004A 25,600,000.00 1,750,000.00 23,850,000.00Vet Hsg Fund II Bds Ser 2004B 28,625,000.00 1,850,000.00 26,775,000.00Vet Hsg Fund II Bds Ser 2005A 28,215,000.00 1,840,000.00 26,375,000.00Vet Hsg Fund II Bds Ser 2005B 27,860,000.00 1,830,000.00 26,030,000.00Vet Hsg Fund II Bds Ser 2006A 30,370,000.00 1,655,000.00 28,715,000.00Vet Hsg Fund II Bds Ser 2006D 31,980,000.00 1,780,000.00 30,200,000.00Vet Hsg Fund II Bds Ser 2007A 32,085,000.00 1,710,000.00 30,375,000.00Vet Hsg Fund II Bds Ser 2007B 33,930,000.00 1,905,000.00 32,025,000.00Vet Hsg Fund II Bds Ser 2008A 33,800,000.00 1,810,000.00 31,990,000.00Vet Hsg Fund II Bds Ser 2008B 34,955,000.00 1,835,000.00 33,120,000.00Vet Hsg Fund II Bds Ser 2009A 37,290,000.00 1,930,000.00 35,360,000.00
Vet Hsg Fund II Bds Ser 2009B 39,380,000.00 1,735,000.00 37,645,000.00Vet Hsg Fund II Bds Ser 2010A 60,000,000.00 3,120,000.00 56,880,000.00Veterans Bonds Series 2010C 60,870,000.00 3,015,000.00 57,855,000.00Veterans Bonds Series 2011A 60,790,000.00 3,135,000.00 57,655,000.00Veterans Bonds Series 2011B 62,060,000.00 3,220,000.00 58,840,000.00Veterans Bonds Series 2011C 63,235,000.00 3,290,000.00 59,945,000.00Veterans Bonds Series 2012A 63,540,000.00 3,475,000.00 60,065,000.00Veterans Bonds Series 2012B 85,720,000.00 5,420,000.00 80,300,000.00Veterans Bonds Series 2013A 90,350,000.00 5,055,000.00 85,295,000.00Veterans Bonds Series 2013B 136,035,000.00 7,250,000.00 128,785,000.00Veterans Bonds Tax Ref Ser 2013C 280,030,000.00 8,440,000.00 271,590,000.00Veterans Bonds Series 2014A 140,320,000.00 7,195,000.00 133,125,000.00Veterans Bonds Tax Ref Ser 2014B 1 68,665,000.00 10,505,000.00 58,160,000.00Veterans Bonds Tax Ref Ser 2014B 2 25,085,000.00 5,110,000.00 19,975,000.00Veterans Bonds Tax Ref Ser 2014C 1 69,590,000.00 1,710,000.00 67,880,000.00Veterans Bonds Tax Ref Ser 2014C 2 178,530,000.00 9,555,000.00 168,975,000.00Veterans Bonds Series 2014D 95,385,000.00 4,625,000.00 90,760,000.00Veterans Bonds Series 2015A 119,595,000.00 5,535,000.00 114,060,000.00Veterans Bonds Series 2015B 123,345,000.00 4,185,000.00 119,160,000.00Veterans Bonds Series 2016 249,705,000.00 7,330,000.00 242,375,000.00Veterans Bonds Series 2016 250,000,000.00 310,000.00 249,690,000.00
Total, Veterans' Housing Bonds 2,551,710,000.00 250,000,000.00 0.00 136,555,000.00 0.00 0.00 2,665,155,000.00
General Obligation BondsSelf SupportingVeterans' Land Bonds
Vet Land Ref Bds Ser '99A 10,325,000.00 3,190,000.00 7,135,000.00Vet Land Bds Ser 2002 14,400,000.00 580,000.00 13,820,000.00Vet Land Tax Ref Bds Ser 2014B 3 39,775,000.00 5,005,000.00 34,770,000.00Vet Land Tax Ref Bds Ser 2014C 3 65,395,000.00 3,040,000.00 62,355,000.00Vet Land Tax Ref Bds Ser 2014C 4 100,640,000.00 8,360,000.00 92,280,000.00
Total, Veterans' Land Bonds 230,535,000.00 0.00 0.00 20,175,000.00 0.00 0.00 210,360,000.00
Total, General Obligation BondsSelf Supporting 2,782,245,000.00 250,000,000.00 0.00 156,730,000.00 0.00 0.00 2,875,515,000.00
UNAUDITEDTexas General Land Office and Veterans' Land Board (305)
52 | Annual Financial Report

Table 14DEBT SERVICE REQUIREMENTS BY BOND ISSUE
Total DebtBond Issue Principal Interest Service
$ $ $General Obligation Bonds Self Supporting
Veterans' Housing BondsVet Hsg Ref Bds Ser '95 0.00 0.00 0.00Vet Hsg Fund II Bds Ser 2001A 2 20,000,000.00 2,293,488.59 22,293,488.59Vet Hsg Fund II Bds Ser 2001C 2 24,265,000.00 3,609,331.38 27,874,331.38Vet Hsg Fund II Bds Ser 2002A 2 29,790,000.00 4,164,880.02 33,954,880.02Vet Hsg Fund II Bds Ser 2003A 23,015,000.00 2,875,483.53 25,890,483.53Vet Hsg Fund II Bds Ser 2003B 24,255,000.00 3,054,641.74 27,309,641.74Vet Hsg Fund II Bds Ser 2004A 23,850,000.00 2,420,433.60 26,270,433.60Vet Hsg Fund II Bds Ser 2004B 26,775,000.00 3,544,629.80 30,319,629.80Vet Hsg Fund II Bds Ser 2005A 26,375,000.00 2,815,614.28 29,190,614.28Vet Hsg Fund II Bds Ser 2005B 26,030,000.00 2,813,781.23 28,843,781.23Vet Hsg Fund II Bds Ser 2006A 28,715,000.00 3,783,133.43 32,498,133.43Vet Hsg Fund II Bds Ser 2006D 30,200,000.00 3,996,224.66 34,196,224.66Vet Hsg Fund II Bds Ser 2007A 30,375,000.00 3,872,755.12 34,247,755.12Vet Hsg Fund II Bds Ser 2007B 32,025,000.00 4,322,023.12 36,347,023.12Vet Hsg Fund II Bds Ser 2008A 31,990,000.00 3,983,070.20 35,973,070.20Vet Hsg Fund II Bds Ser 2008B 33,120,000.00 4,239,898.96 37,359,898.96Vet Hsg Fund II Bds Ser 2009A 35,360,000.00 10,958,312.50 46,318,312.50Vet Hsg Fund II Bds Ser 2009B 37,645,000.00 12,019,375.00 49,664,375.00Vet Hsg Fund II Bds Ser 2010A 56,880,000.00 18,975,975.00 75,855,975.00Veterans Bonds Series 2010C 57,855,000.00 7,670,016.11 65,525,016.11Veterans Bonds Series 2011A 57,655,000.00 8,755,267.88 66,410,267.88Veterans Bonds Series 2011B 58,840,000.00 9,087,515.38 67,927,515.38Veterans Bonds Series 2011C 59,945,000.00 5,521,280.00 65,466,280.00Veterans Bonds Series 2012A 60,065,000.00 7,895,613.33 67,960,613.33Veterans Bonds Series 2012B 80,300,000.00 11,816,605.69 92,116,605.69Veterans Bonds Series 2013A 85,295,000.00 13,935,663.07 99,230,663.07Veterans Bonds Series 2013B 128,785,000.00 19,833,767.02 148,618,767.02Veterans Bonds Series 2013C 271,590,000.00 33,100,856.38 304,690,856.38Veterans Bonds Series 2014A 133,125,000.00 20,275,076.26 153,400,076.26Veterans Bonds Series 2014B 1 58,160,000.00 3,196,513.82 61,356,513.82Veterans Bonds Series 2014B 2 19,975,000.00 524,503.97 20,499,503.97Veterans Bonds Series 2014C 1 67,880,000.00 17,364,955.52 85,244,955.52Veterans Bonds Series 2014C 2 168,975,000.00 21,656,470.20 190,631,470.20Veterans Bonds Series 2014D 90,760,000.00 8,519,952.50 99,279,952.50Veterans Bonds Series 2015A 114,060,000.00 18,729,516.28 132,789,516.28Veterans Bonds Series 2015B 119,160,000.00 11,937,440.00 131,097,440.00Veterans Bonds Series 2016 242,375,000.00 17,528,580.00 259,903,580.00Veterans Bonds Series 2017 249,690,000.00 19,313,620.00 269,003,620.00
Total, Veterans' Housing Bonds 2,665,155,000.00 350,406,265.57 3,015,561,265.57
General Obligation Bonds Self SupportingVeterans' Land Bonds
Vet Land Ref Bds Ser '99A 7,135,000.00 60,320.25 7,195,320.25Vet Land Bds Ser 2002 13,820,000.00 1,535,353.60 15,355,353.60Vet Land Tax Ref Bds Ser 2014B 3 34,770,000.00 2,070,390.03 36,840,390.03Vet Land Tax Ref Bds Ser 2014C 3 62,355,000.00 8,192,574.06 70,547,574.06Vet Land Tax Ref Bds Ser 2014C 4 92,280,000.00 7,511,540.97 99,791,540.97
Total, Veterans' Land Bonds 210,360,000.00 19,370,178.91 229,730,178.91
Total, General Obligation Bonds Self Supporting 2,875,515,000.00 369,776,444.48 3,245,291,444.48
Total, All Bonds 2,875,515,000.00 369,776,444.48 3,245,291,444.48
UNAUDITED
Annual Financial Report | 53
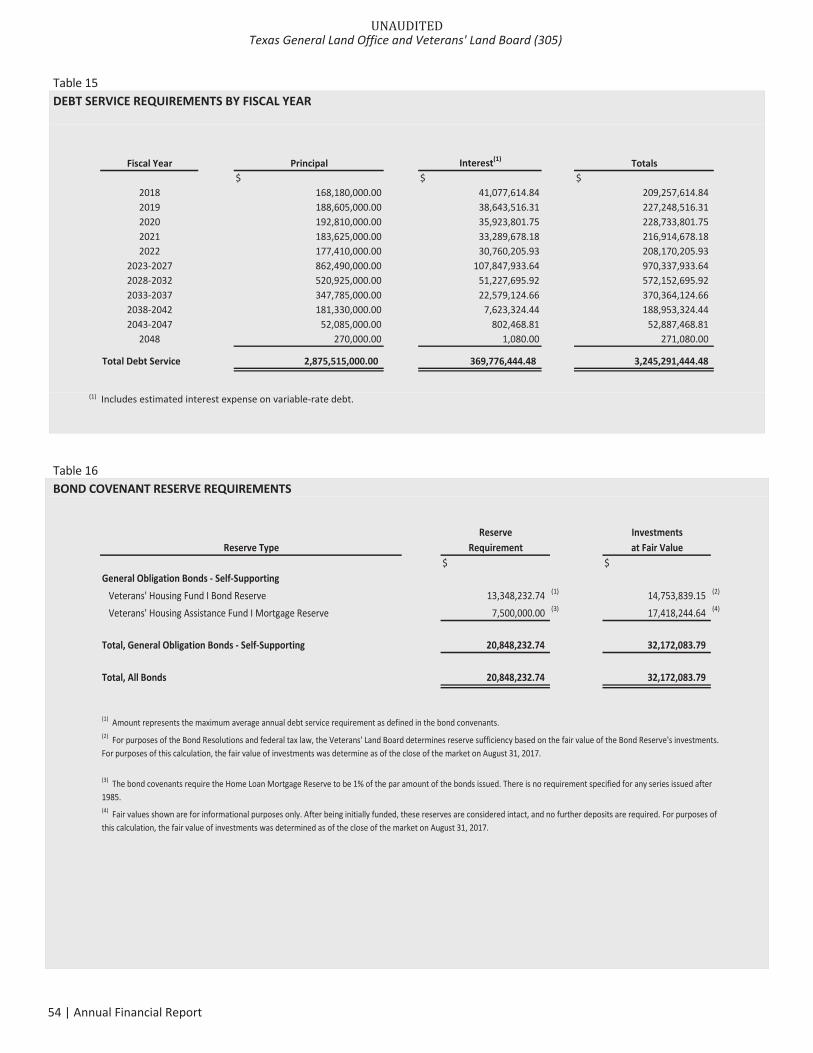
Table 15DEBT SERVICE REQUIREMENTS BY FISCAL YEAR
Fiscal Year Principal Interest(1) Totals$ $ $
2018 168,180,000.00 41,077,614.84 209,257,614.842019 188,605,000.00 38,643,516.31 227,248,516.312020 192,810,000.00 35,923,801.75 228,733,801.752021 183,625,000.00 33,289,678.18 216,914,678.182022 177,410,000.00 30,760,205.93 208,170,205.93
2023 2027 862,490,000.00 107,847,933.64 970,337,933.642028 2032 520,925,000.00 51,227,695.92 572,152,695.922033 2037 347,785,000.00 22,579,124.66 370,364,124.662038 2042 181,330,000.00 7,623,324.44 188,953,324.442043 2047 52,085,000.00 802,468.81 52,887,468.81
2048 270,000.00 1,080.00 271,080.00
Total Debt Service 2,875,515,000.00 369,776,444.48 3,245,291,444.48
(1) Includes estimated interest expense on variable rate debt.
Table 16BOND COVENANT RESERVE REQUIREMENTS
Reserve InvestmentsReserve Type Requirement at Fair Value
$ $General Obligation Bonds Self Supporting
Veterans' Housing Fund I Bond Reserve 13,348,232.74 (1) 14,753,839.15 (2)
Veterans' Housing Assistance Fund I Mortgage Reserve 7,500,000.00 (3) 17,418,244.64 (4)
Total, General Obligation Bonds Self Supporting 20,848,232.74 32,172,083.79
Total, All Bonds 20,848,232.74 32,172,083.79
(2) For purposes of the Bond Resolutions and federal tax law, the Veterans' Land Board determines reserve sufficiency based on the fair value of the Bond Reserve's investments.For purposes of this calculation, the fair value of investments was determine as of the close of the market on August 31, 2017.
(1) Amount represents the maximum average annual debt service requirement as defined in the bond convenants.
(3) The bond covenants require the Home Loan Mortgage Reserve to be 1% of the par amount of the bonds issued. There is no requirement specified for any series issued after1985.(4) Fair values shown are for informational purposes only. After being initially funded, these reserves are considered intact, and no further deposits are required. For purposes ofthis calculation, the fair value of investments was determined as of the close of the market on August 31, 2017.
UNAUDITEDTexas General Land Office and Veterans' Land Board (305)
54 | Annual Financial Report
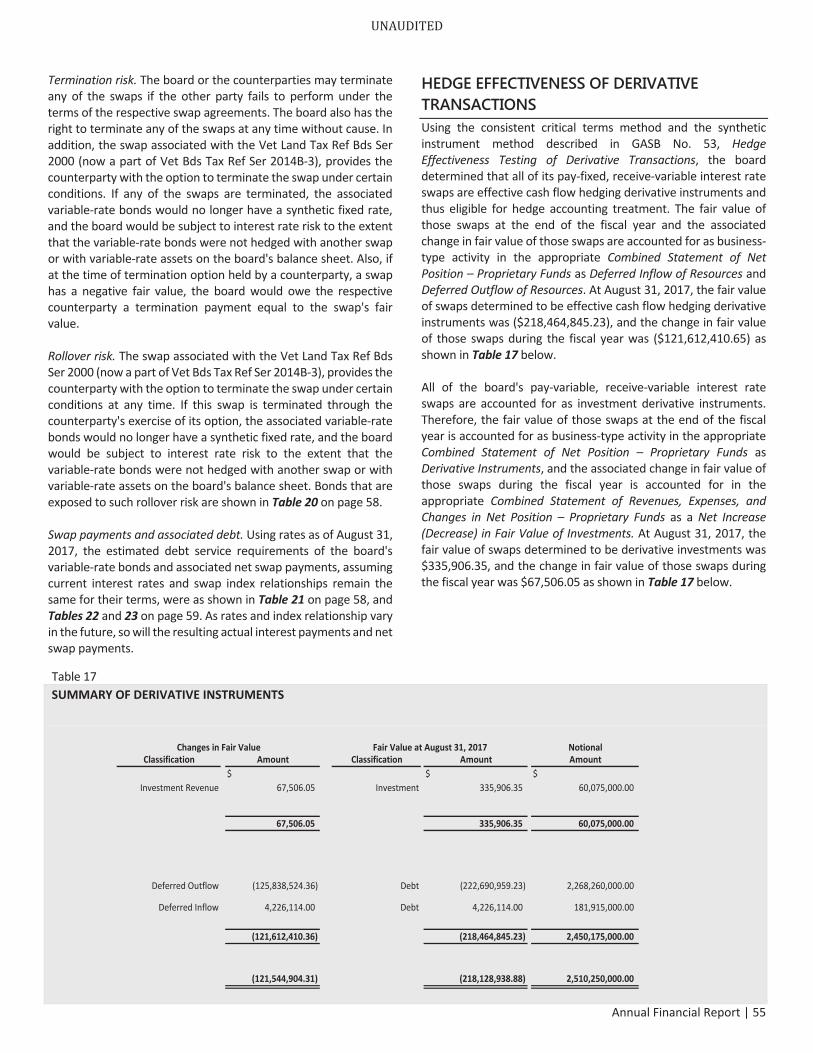
Termination risk. The board or the counterparties may terminateany of the swaps if the other party fails to perform under theterms of the respective swap agreements. The board also has theright to terminate any of the swaps at any time without cause. Inaddition, the swap associated with the Vet Land Tax Ref Bds Ser2000 (now a part of Vet Bds Tax Ref Ser 2014B 3), provides thecounterparty with the option to terminate the swap under certainconditions. If any of the swaps are terminated, the associatedvariable rate bonds would no longer have a synthetic fixed rate,and the board would be subject to interest rate risk to the extentthat the variable rate bonds were not hedged with another swapor with variable rate assets on the board's balance sheet. Also, ifat the time of termination option held by a counterparty, a swaphas a negative fair value, the board would owe the respectivecounterparty a termination payment equal to the swap's fairvalue.
Rollover risk. The swap associated with the Vet Land Tax Ref BdsSer 2000 (now a part of Vet Bds Tax Ref Ser 2014B 3), provides thecounterparty with the option to terminate the swap under certainconditions at any time. If this swap is terminated through thecounterparty's exercise of its option, the associated variable ratebonds would no longer have a synthetic fixed rate, and the boardwould be subject to interest rate risk to the extent that thevariable rate bonds were not hedged with another swap or withvariable rate assets on the board's balance sheet. Bonds that areexposed to such rollover risk are shown in Table 20 on page 58.
Swap payments and associated debt. Using rates as of August 31,2017, the estimated debt service requirements of the board'svariable rate bonds and associated net swap payments, assumingcurrent interest rates and swap index relationships remain thesame for their terms, were as shown in Table 21 on page 58, andTables 22 and 23 on page 59. As rates and index relationship varyin the future, so will the resulting actual interest payments and netswap payments.
HEDGE EFFECTIVENESS OF DERIVATIVE TRANSACTIONS Using the consistent critical terms method and the syntheticinstrument method described in GASB No. 53, HedgeEffectiveness Testing of Derivative Transactions, the boarddetermined that all of its pay fixed, receive variable interest rateswaps are effective cash flow hedging derivative instruments andthus eligible for hedge accounting treatment. The fair value ofthose swaps at the end of the fiscal year and the associatedchange in fair value of those swaps are accounted for as businesstype activity in the appropriate Combined Statement of NetPosition – Proprietary Funds as Deferred Inflow of Resources andDeferred Outflow of Resources. At August 31, 2017, the fair valueof swaps determined to be effective cash flow hedging derivativeinstruments was ($218,464,845.23), and the change in fair valueof those swaps during the fiscal year was ($121,612,410.65) asshown in Table 17 below.
All of the board's pay variable, receive variable interest rateswaps are accounted for as investment derivative instruments.Therefore, the fair value of those swaps at the end of the fiscalyear is accounted for as business type activity in the appropriateCombined Statement of Net Position – Proprietary Funds asDerivative Instruments, and the associated change in fair value ofthose swaps during the fiscal year is accounted for in theappropriate Combined Statement of Revenues, Expenses, andChanges in Net Position – Proprietary Funds as a Net Increase(Decrease) in Fair Value of Investments. At August 31, 2017, thefair value of swaps determined to be derivative investments was$335,906.35, and the change in fair value of those swaps duringthe fiscal year was $67,506.05 as shown in Table 17 below.
Table 17SUMMARY OF DERIVATIVE INSTRUMENTS
NotionalClassification Amount Classification Amount Amount
$ $ $Investment Revenue 67,506.05 Investment 335,906.35 60,075,000.00
67,506.05 335,906.35 60,075,000.00
Deferred Outflow (125,838,524.36) Debt (222,690,959.23) 2,268,260,000.00
Deferred Inflow 4,226,114.00 Debt 4,226,114.00 181,915,000.00
(121,612,410.36) (218,464,845.23) 2,450,175,000.00
(121,544,904.31) (218,128,938.88) 2,510,250,000.00
Changes in Fair Value Fair Value at August 31, 2017
UNAUDITED
Annual Financial Report | 55
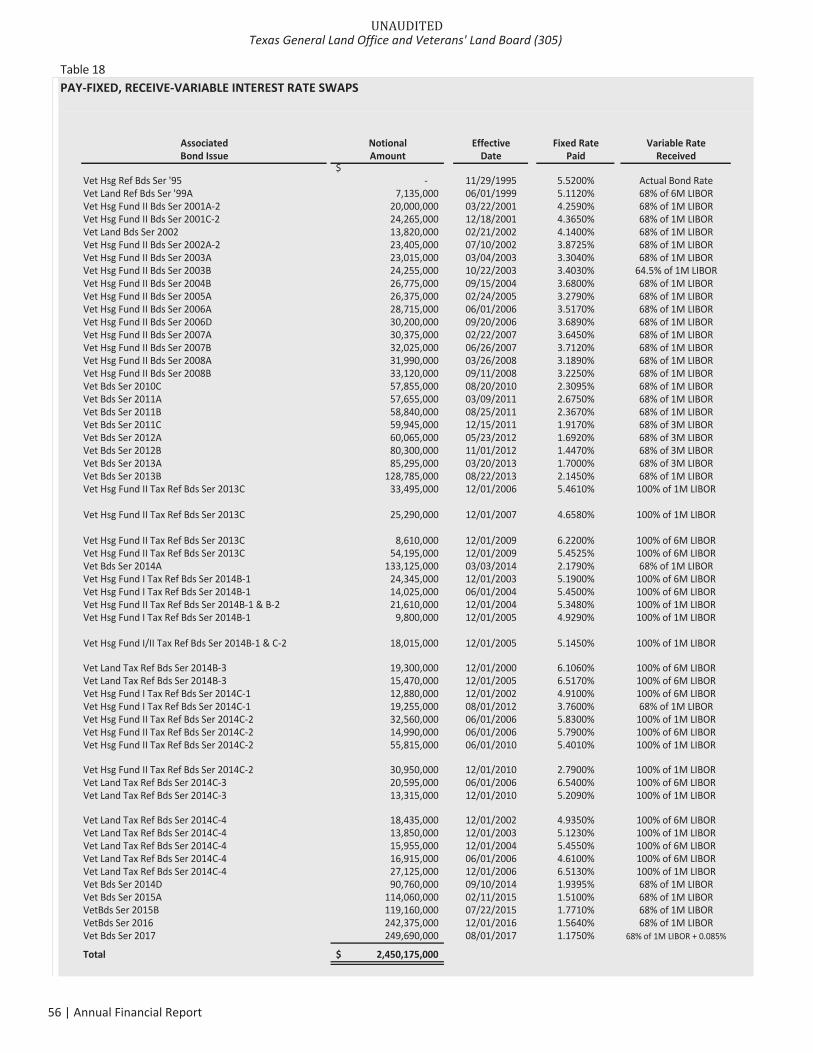
Table 18PAY FIXED, RECEIVE VARIABLE INTEREST RATE SWAPS
Associated Notional Effective Fixed Rate Variable RateBond Issue Amount Date Paid Received
$Vet Hsg Ref Bds Ser '95 11/29/1995 5.5200% Actual Bond RateVet Land Ref Bds Ser '99A 7,135,000 06/01/1999 5.1120% 68% of 6M LIBORVet Hsg Fund II Bds Ser 2001A 2 20,000,000 03/22/2001 4.2590% 68% of 1M LIBORVet Hsg Fund II Bds Ser 2001C 2 24,265,000 12/18/2001 4.3650% 68% of 1M LIBORVet Land Bds Ser 2002 13,820,000 02/21/2002 4.1400% 68% of 1M LIBORVet Hsg Fund II Bds Ser 2002A 2 23,405,000 07/10/2002 3.8725% 68% of 1M LIBORVet Hsg Fund II Bds Ser 2003A 23,015,000 03/04/2003 3.3040% 68% of 1M LIBORVet Hsg Fund II Bds Ser 2003B 24,255,000 10/22/2003 3.4030% 64.5% of 1M LIBORVet Hsg Fund II Bds Ser 2004B 26,775,000 09/15/2004 3.6800% 68% of 1M LIBORVet Hsg Fund II Bds Ser 2005A 26,375,000 02/24/2005 3.2790% 68% of 1M LIBORVet Hsg Fund II Bds Ser 2006A 28,715,000 06/01/2006 3.5170% 68% of 1M LIBORVet Hsg Fund II Bds Ser 2006D 30,200,000 09/20/2006 3.6890% 68% of 1M LIBORVet Hsg Fund II Bds Ser 2007A 30,375,000 02/22/2007 3.6450% 68% of 1M LIBORVet Hsg Fund II Bds Ser 2007B 32,025,000 06/26/2007 3.7120% 68% of 1M LIBORVet Hsg Fund II Bds Ser 2008A 31,990,000 03/26/2008 3.1890% 68% of 1M LIBORVet Hsg Fund II Bds Ser 2008B 33,120,000 09/11/2008 3.2250% 68% of 1M LIBORVet Bds Ser 2010C 57,855,000 08/20/2010 2.3095% 68% of 1M LIBORVet Bds Ser 2011A 57,655,000 03/09/2011 2.6750% 68% of 1M LIBORVet Bds Ser 2011B 58,840,000 08/25/2011 2.3670% 68% of 1M LIBORVet Bds Ser 2011C 59,945,000 12/15/2011 1.9170% 68% of 3M LIBORVet Bds Ser 2012A 60,065,000 05/23/2012 1.6920% 68% of 3M LIBORVet Bds Ser 2012B 80,300,000 11/01/2012 1.4470% 68% of 3M LIBORVet Bds Ser 2013A 85,295,000 03/20/2013 1.7000% 68% of 3M LIBORVet Bds Ser 2013B 128,785,000 08/22/2013 2.1450% 68% of 1M LIBORVet Hsg Fund II Tax Ref Bds Ser 2013C 33,495,000 12/01/2006 5.4610% 100% of 1M LIBOR
Vet Hsg Fund II Tax Ref Bds Ser 2013C 25,290,000 12/01/2007 4.6580% 100% of 1M LIBOR
Vet Hsg Fund II Tax Ref Bds Ser 2013C 8,610,000 12/01/2009 6.2200% 100% of 6M LIBORVet Hsg Fund II Tax Ref Bds Ser 2013C 54,195,000 12/01/2009 5.4525% 100% of 6M LIBORVet Bds Ser 2014A 133,125,000 03/03/2014 2.1790% 68% of 1M LIBORVet Hsg Fund I Tax Ref Bds Ser 2014B 1 24,345,000 12/01/2003 5.1900% 100% of 6M LIBORVet Hsg Fund I Tax Ref Bds Ser 2014B 1 14,025,000 06/01/2004 5.4500% 100% of 6M LIBORVet Hsg Fund II Tax Ref Bds Ser 2014B 1 & B 2 21,610,000 12/01/2004 5.3480% 100% of 1M LIBORVet Hsg Fund I Tax Ref Bds Ser 2014B 1 9,800,000 12/01/2005 4.9290% 100% of 1M LIBOR
Vet Hsg Fund I/II Tax Ref Bds Ser 2014B 1 & C 2 18,015,000 12/01/2005 5.1450% 100% of 1M LIBOR
Vet Land Tax Ref Bds Ser 2014B 3 19,300,000 12/01/2000 6.1060% 100% of 6M LIBORVet Land Tax Ref Bds Ser 2014B 3 15,470,000 12/01/2005 6.5170% 100% of 6M LIBORVet Hsg Fund I Tax Ref Bds Ser 2014C 1 12,880,000 12/01/2002 4.9100% 100% of 6M LIBORVet Hsg Fund I Tax Ref Bds Ser 2014C 1 19,255,000 08/01/2012 3.7600% 68% of 1M LIBORVet Hsg Fund II Tax Ref Bds Ser 2014C 2 32,560,000 06/01/2006 5.8300% 100% of 1M LIBORVet Hsg Fund II Tax Ref Bds Ser 2014C 2 14,990,000 06/01/2006 5.7900% 100% of 6M LIBORVet Hsg Fund II Tax Ref Bds Ser 2014C 2 55,815,000 06/01/2010 5.4010% 100% of 1M LIBOR
Vet Hsg Fund II Tax Ref Bds Ser 2014C 2 30,950,000 12/01/2010 2.7900% 100% of 1M LIBORVet Land Tax Ref Bds Ser 2014C 3 20,595,000 06/01/2006 6.5400% 100% of 6M LIBORVet Land Tax Ref Bds Ser 2014C 3 13,315,000 12/01/2010 5.2090% 100% of 1M LIBOR
Vet Land Tax Ref Bds Ser 2014C 4 18,435,000 12/01/2002 4.9350% 100% of 6M LIBORVet Land Tax Ref Bds Ser 2014C 4 13,850,000 12/01/2003 5.1230% 100% of 1M LIBORVet Land Tax Ref Bds Ser 2014C 4 15,955,000 12/01/2004 5.4550% 100% of 6M LIBORVet Land Tax Ref Bds Ser 2014C 4 16,915,000 06/01/2006 4.6100% 100% of 6M LIBORVet Land Tax Ref Bds Ser 2014C 4 27,125,000 12/01/2006 6.5130% 100% of 1M LIBORVet Bds Ser 2014D 90,760,000 09/10/2014 1.9395% 68% of 1M LIBORVet Bds Ser 2015A 114,060,000 02/11/2015 1.5100% 68% of 1M LIBORVetBds Ser 2015B 119,160,000 07/22/2015 1.7710% 68% of 1M LIBORVetBds Ser 2016 242,375,000 12/01/2016 1.5640% 68% of 1M LIBORVet Bds Ser 2017 249,690,000 08/01/2017 1.1750% 68% of 1M LIBOR + 0.085%
Total 2,450,175,000$
UNAUDITEDTexas General Land Office and Veterans' Land Board (305)
56 | Annual Financial Report
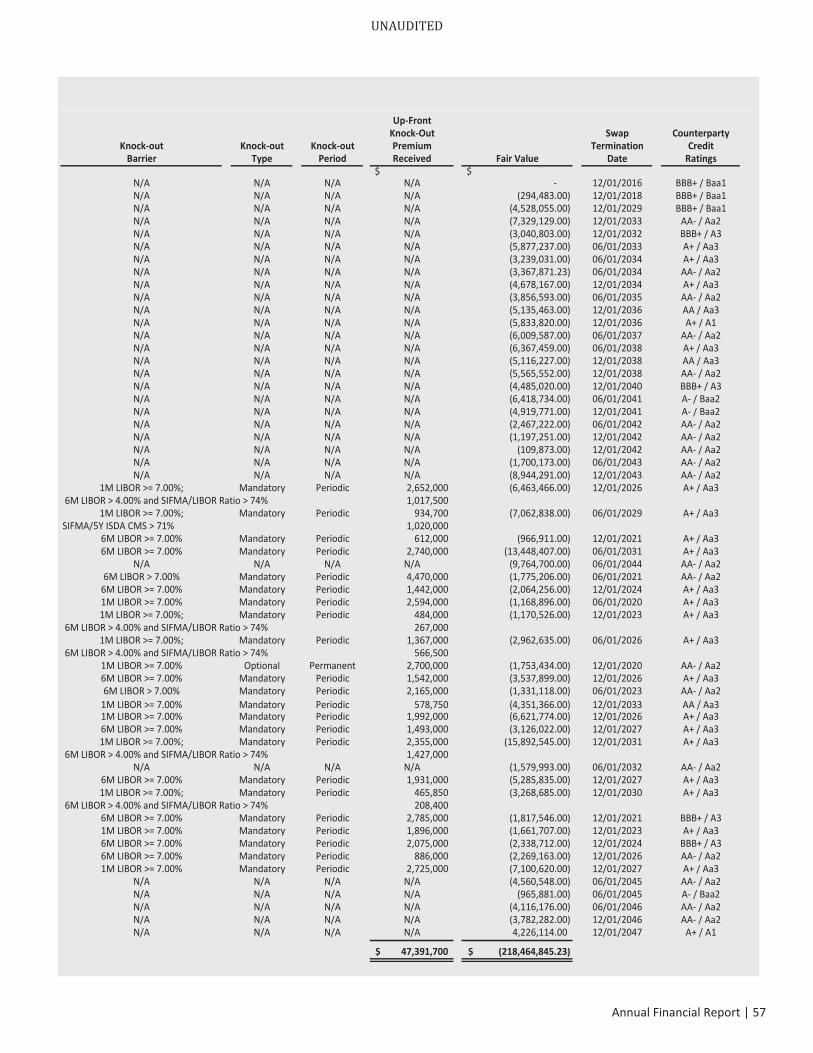
Up FrontKnock Out Swap Counterparty
Knock out Knock out Knock out Premium Termination CreditBarrier Type Period Received Fair Value Date Ratings
$ $N/A N/A N/A N/A 12/01/2016 BBB+ / Baa1N/A N/A N/A N/A (294,483.00) 12/01/2018 BBB+ / Baa1N/A N/A N/A N/A (4,528,055.00) 12/01/2029 BBB+ / Baa1N/A N/A N/A N/A (7,329,129.00) 12/01/2033 AA / Aa2N/A N/A N/A N/A (3,040,803.00) 12/01/2032 BBB+ / A3N/A N/A N/A N/A (5,877,237.00) 06/01/2033 A+ / Aa3N/A N/A N/A N/A (3,239,031.00) 06/01/2034 A+ / Aa3N/A N/A N/A N/A (3,367,871.23) 06/01/2034 AA / Aa2N/A N/A N/A N/A (4,678,167.00) 12/01/2034 A+ / Aa3N/A N/A N/A N/A (3,856,593.00) 06/01/2035 AA / Aa2N/A N/A N/A N/A (5,135,463.00) 12/01/2036 AA / Aa3N/A N/A N/A N/A (5,833,820.00) 12/01/2036 A+ / A1N/A N/A N/A N/A (6,009,587.00) 06/01/2037 AA / Aa2N/A N/A N/A N/A (6,367,459.00) 06/01/2038 A+ / Aa3N/A N/A N/A N/A (5,116,227.00) 12/01/2038 AA / Aa3N/A N/A N/A N/A (5,565,552.00) 12/01/2038 AA / Aa2N/A N/A N/A N/A (4,485,020.00) 12/01/2040 BBB+ / A3N/A N/A N/A N/A (6,418,734.00) 06/01/2041 A / Baa2N/A N/A N/A N/A (4,919,771.00) 12/01/2041 A / Baa2N/A N/A N/A N/A (2,467,222.00) 06/01/2042 AA / Aa2N/A N/A N/A N/A (1,197,251.00) 12/01/2042 AA / Aa2N/A N/A N/A N/A (109,873.00) 12/01/2042 AA / Aa2N/A N/A N/A N/A (1,700,173.00) 06/01/2043 AA / Aa2N/A N/A N/A N/A (8,944,291.00) 12/01/2043 AA / Aa2
1M LIBOR >= 7.00%; Mandatory Periodic 2,652,000 (6,463,466.00) 12/01/2026 A+ / Aa36M LIBOR > 4.00% and SIFMA/LIBOR Ratio > 74% 1,017,500
1M LIBOR >= 7.00%; Mandatory Periodic 934,700 (7,062,838.00) 06/01/2029 A+ / Aa3SIFMA/5Y ISDA CMS > 71% 1,020,000
6M LIBOR >= 7.00% Mandatory Periodic 612,000 (966,911.00) 12/01/2021 A+ / Aa36M LIBOR >= 7.00% Mandatory Periodic 2,740,000 (13,448,407.00) 06/01/2031 A+ / Aa3
N/A N/A N/A N/A (9,764,700.00) 06/01/2044 AA / Aa26M LIBOR > 7.00% Mandatory Periodic 4,470,000 (1,775,206.00) 06/01/2021 AA / Aa2
6M LIBOR >= 7.00% Mandatory Periodic 1,442,000 (2,064,256.00) 12/01/2024 A+ / Aa31M LIBOR >= 7.00% Mandatory Periodic 2,594,000 (1,168,896.00) 06/01/2020 A+ / Aa31M LIBOR >= 7.00%; Mandatory Periodic 484,000 (1,170,526.00) 12/01/2023 A+ / Aa3
6M LIBOR > 4.00% and SIFMA/LIBOR Ratio > 74% 267,0001M LIBOR >= 7.00%; Mandatory Periodic 1,367,000 (2,962,635.00) 06/01/2026 A+ / Aa3
6M LIBOR > 4.00% and SIFMA/LIBOR Ratio > 74% 566,5001M LIBOR >= 7.00% Optional Permanent 2,700,000 (1,753,434.00) 12/01/2020 AA / Aa26M LIBOR >= 7.00% Mandatory Periodic 1,542,000 (3,537,899.00) 12/01/2026 A+ / Aa36M LIBOR > 7.00% Mandatory Periodic 2,165,000 (1,331,118.00) 06/01/2023 AA / Aa2
1M LIBOR >= 7.00% Mandatory Periodic 578,750 (4,351,366.00) 12/01/2033 AA / Aa31M LIBOR >= 7.00% Mandatory Periodic 1,992,000 (6,621,774.00) 12/01/2026 A+ / Aa36M LIBOR >= 7.00% Mandatory Periodic 1,493,000 (3,126,022.00) 12/01/2027 A+ / Aa31M LIBOR >= 7.00%; Mandatory Periodic 2,355,000 (15,892,545.00) 12/01/2031 A+ / Aa3
6M LIBOR > 4.00% and SIFMA/LIBOR Ratio > 74% 1,427,000N/A N/A N/A N/A (1,579,993.00) 06/01/2032 AA / Aa2
6M LIBOR >= 7.00% Mandatory Periodic 1,931,000 (5,285,835.00) 12/01/2027 A+ / Aa31M LIBOR >= 7.00%; Mandatory Periodic 465,850 (3,268,685.00) 12/01/2030 A+ / Aa3
6M LIBOR > 4.00% and SIFMA/LIBOR Ratio > 74% 208,4006M LIBOR >= 7.00% Mandatory Periodic 2,785,000 (1,817,546.00) 12/01/2021 BBB+ / A31M LIBOR >= 7.00% Mandatory Periodic 1,896,000 (1,661,707.00) 12/01/2023 A+ / Aa36M LIBOR >= 7.00% Mandatory Periodic 2,075,000 (2,338,712.00) 12/01/2024 BBB+ / A36M LIBOR >= 7.00% Mandatory Periodic 886,000 (2,269,163.00) 12/01/2026 AA / Aa21M LIBOR >= 7.00% Mandatory Periodic 2,725,000 (7,100,620.00) 12/01/2027 A+ / Aa3
N/A N/A N/A N/A (4,560,548.00) 06/01/2045 AA / Aa2N/A N/A N/A N/A (965,881.00) 06/01/2045 A / Baa2N/A N/A N/A N/A (4,116,176.00) 06/01/2046 AA / Aa2N/A N/A N/A N/A (3,782,282.00) 12/01/2046 AA / Aa2N/A N/A N/A N/A 4,226,114.00 12/01/2047 A+ / A1
47,391,700$ (218,464,845.23)$
UNAUDITED
Annual Financial Report | 57
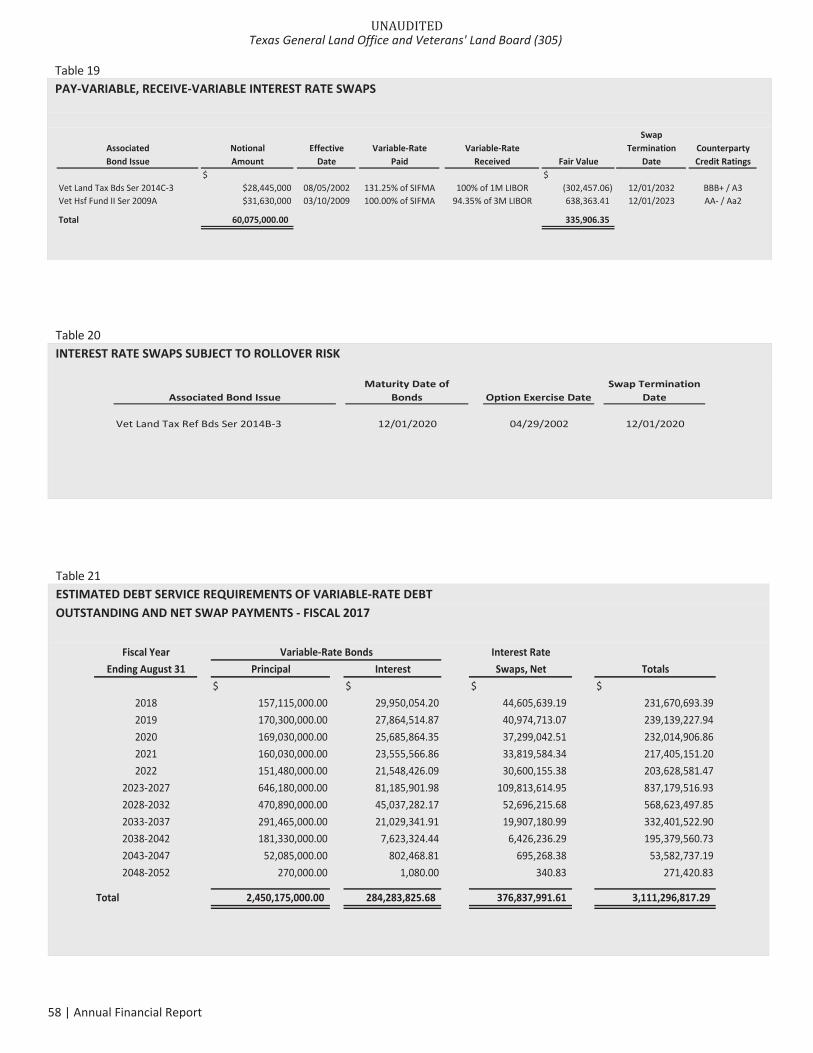
Table 19PAY VARIABLE, RECEIVE VARIABLE INTEREST RATE SWAPS
SwapAssociated Notional Effective Variable Rate Variable Rate Termination CounterpartyBond Issue Amount Date Paid Received Fair Value Date Credit Ratings
$ $Vet Land Tax Bds Ser 2014C 3 $28,445,000 08/05/2002 131.25% of SIFMA 100% of 1M LIBOR (302,457.06) 12/01/2032 BBB+ / A3Vet Hsf Fund II Ser 2009A $31,630,000 03/10/2009 100.00% of SIFMA 94.35% of 3M LIBOR 638,363.41 12/01/2023 AA / Aa2
Total 60,075,000.00 335,906.35
Table 20INTEREST RATE SWAPS SUBJECT TO ROLLOVER RISK
Associated Bond IssueMaturity Date of
Bonds Option Exercise DateSwap Termination
Date
Vet Land Tax Ref Bds Ser 2014B 3 12/01/2020 04/29/2002 12/01/2020
Table 21ESTIMATED DEBT SERVICE REQUIREMENTS OF VARIABLE RATE DEBTOUTSTANDING AND NET SWAP PAYMENTS FISCAL 2017
Fiscal Year Interest RateEnding August 31 Principal Interest Swaps, Net Totals
$ $ $ $2018 157,115,000.00 29,950,054.20 44,605,639.19 231,670,693.392019 170,300,000.00 27,864,514.87 40,974,713.07 239,139,227.942020 169,030,000.00 25,685,864.35 37,299,042.51 232,014,906.862021 160,030,000.00 23,555,566.86 33,819,584.34 217,405,151.202022 151,480,000.00 21,548,426.09 30,600,155.38 203,628,581.47
2023 2027 646,180,000.00 81,185,901.98 109,813,614.95 837,179,516.932028 2032 470,890,000.00 45,037,282.17 52,696,215.68 568,623,497.852033 2037 291,465,000.00 21,029,341.91 19,907,180.99 332,401,522.902038 2042 181,330,000.00 7,623,324.44 6,426,236.29 195,379,560.732043 2047 52,085,000.00 802,468.81 695,268.38 53,582,737.192048 2052 270,000.00 1,080.00 340.83 271,420.83
Total 2,450,175,000.00 284,283,825.68 376,837,991.61 3,111,296,817.29
Variable Rate Bonds
UNAUDITEDTexas General Land Office and Veterans' Land Board (305)
58 | Annual Financial Report
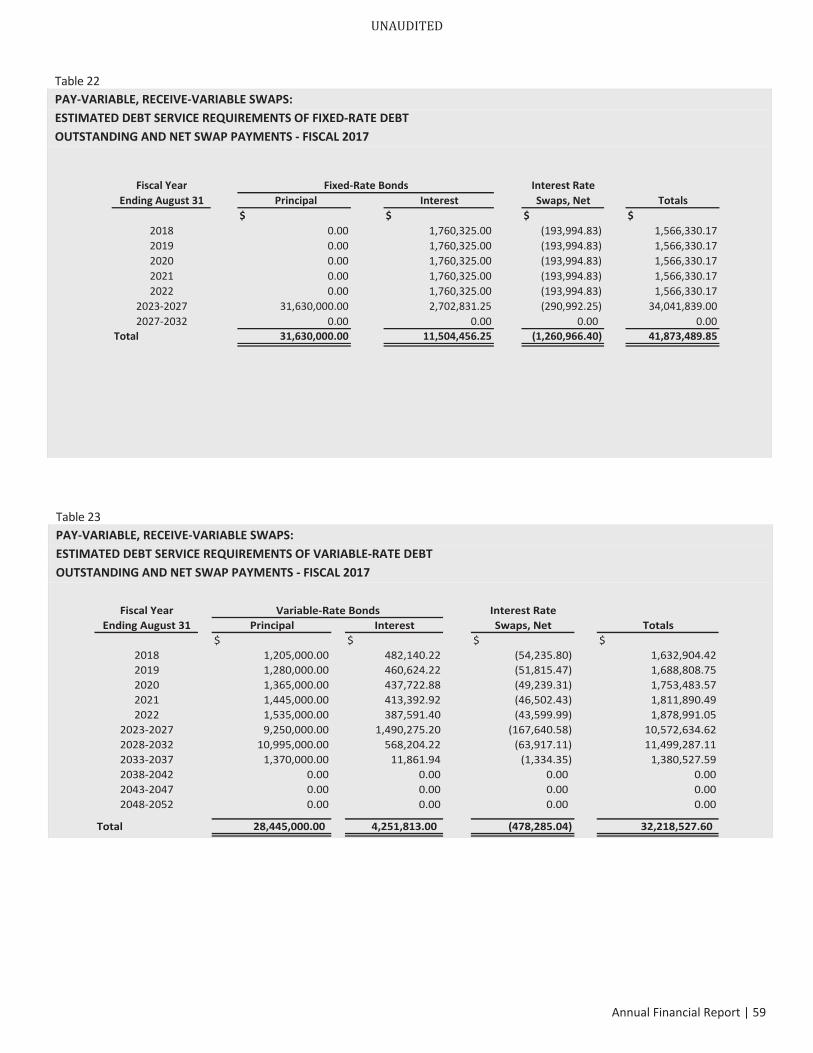
Table 23PAY VARIABLE, RECEIVE VARIABLE SWAPS:ESTIMATED DEBT SERVICE REQUIREMENTS OF VARIABLE RATE DEBTOUTSTANDING AND NET SWAP PAYMENTS FISCAL 2017
Fiscal Year Interest RateEnding August 31 Principal Interest Swaps, Net Totals
$ $ $ $2018 1,205,000.00 482,140.22 (54,235.80) 1,632,904.422019 1,280,000.00 460,624.22 (51,815.47) 1,688,808.752020 1,365,000.00 437,722.88 (49,239.31) 1,753,483.572021 1,445,000.00 413,392.92 (46,502.43) 1,811,890.492022 1,535,000.00 387,591.40 (43,599.99) 1,878,991.05
2023 2027 9,250,000.00 1,490,275.20 (167,640.58) 10,572,634.622028 2032 10,995,000.00 568,204.22 (63,917.11) 11,499,287.112033 2037 1,370,000.00 11,861.94 (1,334.35) 1,380,527.592038 2042 0.00 0.00 0.00 0.002043 2047 0.00 0.00 0.00 0.002048 2052 0.00 0.00 0.00 0.00
Total 28,445,000.00 4,251,813.00 (478,285.04) 32,218,527.60
Variable Rate Bonds
Table 22PAY VARIABLE, RECEIVE VARIABLE SWAPS:ESTIMATED DEBT SERVICE REQUIREMENTS OF FIXED RATE DEBTOUTSTANDING AND NET SWAP PAYMENTS FISCAL 2017
Fiscal Year Interest RateEnding August 31 Principal Interest Swaps, Net Totals
$ $ $ $2018 0.00 1,760,325.00 (193,994.83) 1,566,330.172019 0.00 1,760,325.00 (193,994.83) 1,566,330.172020 0.00 1,760,325.00 (193,994.83) 1,566,330.172021 0.00 1,760,325.00 (193,994.83) 1,566,330.172022 0.00 1,760,325.00 (193,994.83) 1,566,330.17
2023 2027 31,630,000.00 2,702,831.25 (290,992.25) 34,041,839.002027 2032 0.00 0.00 0.00 0.00
Total 31,630,000.00 11,504,456.25 (1,260,966.40) 41,873,489.85
Fixed Rate Bonds
UNAUDITED
Annual Financial Report | 59
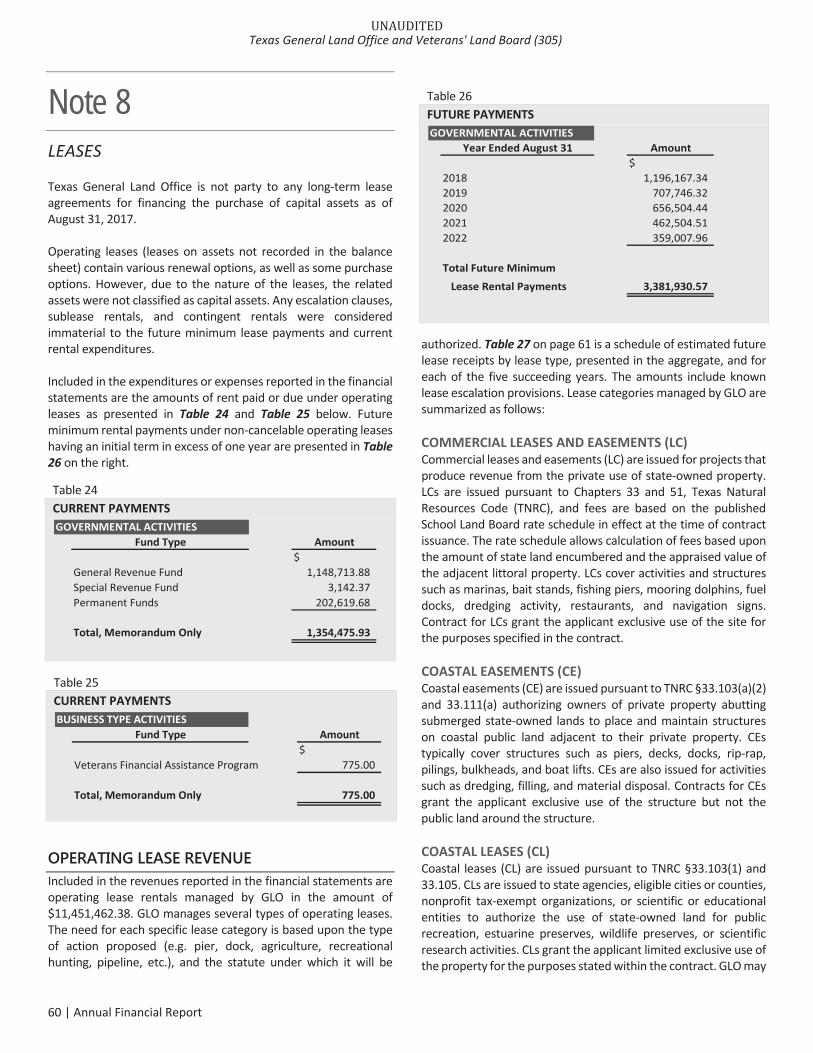
Note 8 LEASES
Texas General Land Office is not party to any long term leaseagreements for financing the purchase of capital assets as ofAugust 31, 2017.
Operating leases (leases on assets not recorded in the balancesheet) contain various renewal options, as well as some purchaseoptions. However, due to the nature of the leases, the relatedassets were not classified as capital assets. Any escalation clauses,sublease rentals, and contingent rentals were consideredimmaterial to the future minimum lease payments and currentrental expenditures.
Included in the expenditures or expenses reported in the financialstatements are the amounts of rent paid or due under operatingleases as presented in Table 24 and Table 25 below. Futureminimum rental payments under non cancelable operating leaseshaving an initial term in excess of one year are presented in Table26 on the right.
OPERATING LEASE REVENUE Included in the revenues reported in the financial statements areoperating lease rentals managed by GLO in the amount of$11,451,462.38. GLO manages several types of operating leases.The need for each specific lease category is based upon the typeof action proposed (e.g. pier, dock, agriculture, recreationalhunting, pipeline, etc.), and the statute under which it will be
authorized. Table 27 on page 61 is a schedule of estimated futurelease receipts by lease type, presented in the aggregate, and foreach of the five succeeding years. The amounts include knownlease escalation provisions. Lease categories managed by GLO aresummarized as follows:
COMMERCIAL LEASES AND EASEMENTS (LC)Commercial leases and easements (LC) are issued for projects thatproduce revenue from the private use of state owned property.LCs are issued pursuant to Chapters 33 and 51, Texas NaturalResources Code (TNRC), and fees are based on the publishedSchool Land Board rate schedule in effect at the time of contractissuance. The rate schedule allows calculation of fees based uponthe amount of state land encumbered and the appraised value ofthe adjacent littoral property. LCs cover activities and structuressuch as marinas, bait stands, fishing piers, mooring dolphins, fueldocks, dredging activity, restaurants, and navigation signs.Contract for LCs grant the applicant exclusive use of the site forthe purposes specified in the contract.
COASTAL EASEMENTS (CE)Coastal easements (CE) are issued pursuant to TNRC §33.103(a)(2)and 33.111(a) authorizing owners of private property abuttingsubmerged state owned lands to place and maintain structureson coastal public land adjacent to their private property. CEstypically cover structures such as piers, decks, docks, rip rap,pilings, bulkheads, and boat lifts. CEs are also issued for activitiessuch as dredging, filling, and material disposal. Contracts for CEsgrant the applicant exclusive use of the structure but not thepublic land around the structure.
COASTAL LEASES (CL)Coastal leases (CL) are issued pursuant to TNRC §33.103(1) and33.105. CLs are issued to state agencies, eligible cities or counties,nonprofit tax exempt organizations, or scientific or educationalentities to authorize the use of state owned land for publicrecreation, estuarine preserves, wildlife preserves, or scientificresearch activities. CLs grant the applicant limited exclusive use ofthe property for the purposes stated within the contract. GLO may
Table 26FUTURE PAYMENTSGOVERNMENTAL ACTIVITIES
Year Ended August 31 Amount$
2018 1,196,167.342019 707,746.322020 656,504.442021 462,504.512022 359,007.96
Total Future MinimumLease Rental Payments 3,381,930.57
Table 24CURRENT PAYMENTSGOVERNMENTAL ACTIVITIES
Fund Type Amount$
General Revenue Fund 1,148,713.88Special Revenue Fund 3,142.37Permanent Funds 202,619.68
Total, Memorandum Only 1,354,475.93
Table 25CURRENT PAYMENTSBUSINESS TYPE ACTIVITIES
Fund Type Amount$
Veterans Financial Assistance Program 775.00
Total, Memorandum Only 775.00
UNAUDITEDTexas General Land Office and Veterans' Land Board (305)
60 | Annual Financial Report
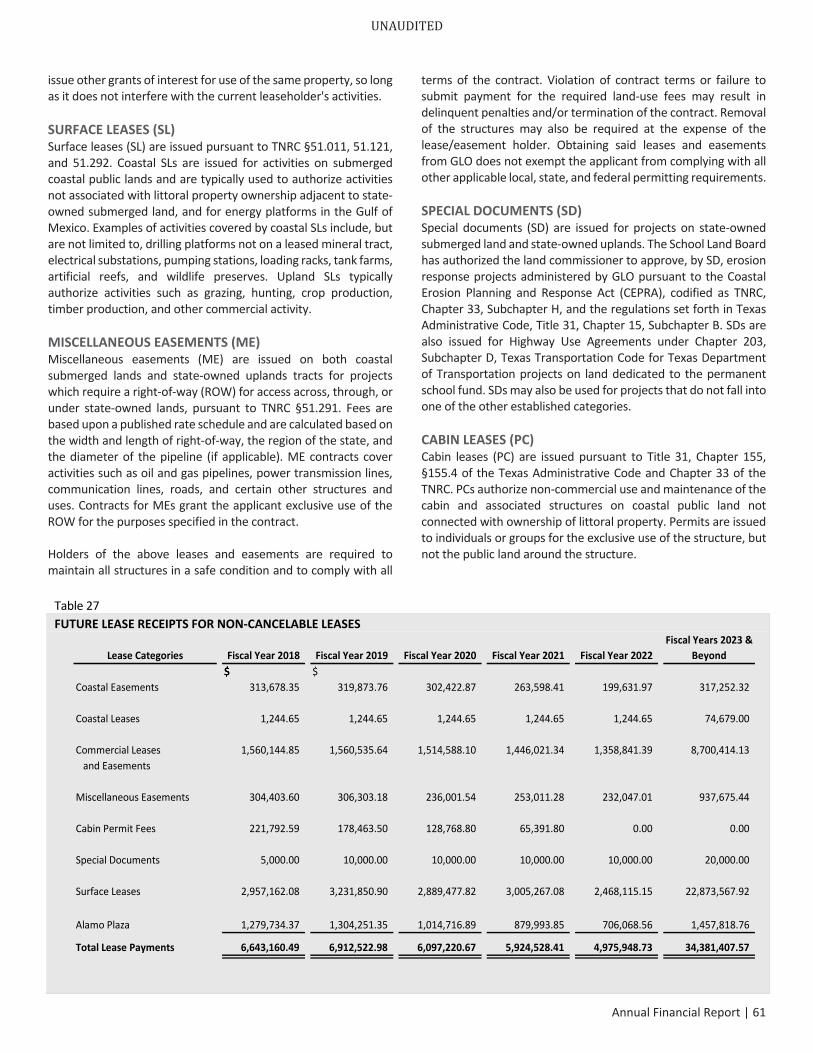
issue other grants of interest for use of the same property, so longas it does not interfere with the current leaseholder's activities.
SURFACE LEASES (SL)Surface leases (SL) are issued pursuant to TNRC §51.011, 51.121,and 51.292. Coastal SLs are issued for activities on submergedcoastal public lands and are typically used to authorize activitiesnot associated with littoral property ownership adjacent to stateowned submerged land, and for energy platforms in the Gulf ofMexico. Examples of activities covered by coastal SLs include, butare not limited to, drilling platforms not on a leased mineral tract,electrical substations, pumping stations, loading racks, tank farms,artificial reefs, and wildlife preserves. Upland SLs typicallyauthorize activities such as grazing, hunting, crop production,timber production, and other commercial activity.
MISCELLANEOUS EASEMENTS (ME)Miscellaneous easements (ME) are issued on both coastalsubmerged lands and state owned uplands tracts for projectswhich require a right of way (ROW) for access across, through, orunder state owned lands, pursuant to TNRC §51.291. Fees arebased upon a published rate schedule and are calculated based onthe width and length of right of way, the region of the state, andthe diameter of the pipeline (if applicable). ME contracts coveractivities such as oil and gas pipelines, power transmission lines,communication lines, roads, and certain other structures anduses. Contracts for MEs grant the applicant exclusive use of theROW for the purposes specified in the contract.
Holders of the above leases and easements are required tomaintain all structures in a safe condition and to comply with all
terms of the contract. Violation of contract terms or failure tosubmit payment for the required land use fees may result indelinquent penalties and/or termination of the contract. Removalof the structures may also be required at the expense of thelease/easement holder. Obtaining said leases and easementsfrom GLO does not exempt the applicant from complying with allother applicable local, state, and federal permitting requirements.
SPECIAL DOCUMENTS (SD)Special documents (SD) are issued for projects on state ownedsubmerged land and state owned uplands. The School Land Boardhas authorized the land commissioner to approve, by SD, erosionresponse projects administered by GLO pursuant to the CoastalErosion Planning and Response Act (CEPRA), codified as TNRC,Chapter 33, Subchapter H, and the regulations set forth in TexasAdministrative Code, Title 31, Chapter 15, Subchapter B. SDs arealso issued for Highway Use Agreements under Chapter 203,Subchapter D, Texas Transportation Code for Texas Departmentof Transportation projects on land dedicated to the permanentschool fund. SDs may also be used for projects that do not fall intoone of the other established categories.
CABIN LEASES (PC)Cabin leases (PC) are issued pursuant to Title 31, Chapter 155,§155.4 of the Texas Administrative Code and Chapter 33 of theTNRC. PCs authorize non commercial use and maintenance of thecabin and associated structures on coastal public land notconnected with ownership of littoral property. Permits are issuedto individuals or groups for the exclusive use of the structure, butnot the public land around the structure.
UNAUDITED
Annual Financial Report | 61
Table 27 FUTURE LEASE RECEIPTS FOR NON‐CANCELABLE LEASES
Lease Categories Fiscal Year 2018 Fiscal Year 2019 Fiscal Year 2020 Fiscal Year 2021 Fiscal Year 2022Fiscal Years 2023 &
Beyond$ $$$$$
Coastal Easements 313,678.35 319,873.76 302,422.87 263,598.41 199,631.97 317,252.32
1,244.65 1,244.65 1,244.65 1,244.65 1,244.65 74,679.00
1,560,144.85 1,560,535.64 1,514,588.10 1,446,021.34 1,358,841.39 8,700,414.13
304,403.60 306,303.18 236,001.54 253,011.28 232,047.01 937,675.44
221,792.59 178,463.50 128,768.80 65,391.80 0.00 0.00
5,000.00 10,000.00 10,000.00 10,000.00 10,000.00 20,000.00
2,957,162.08 3,231,850.90 2,889,477.82 3,005,267.08 2,468,115.15 22,873,567.92
1,279,734.37 1,304,251.35 1,014,716.89 879,993.85 706,068.56 1,457,818.76
Coastal Leases
Commercial Leases and Easements
Miscellaneous Easements
Cabin Permit Fees
Special Documents
Surface Leases
Alamo Plaza
Total Lease Payments 6,643,160.49 6,912,522.98 6,097,220.67 5,924,528.41 4,975,948.73 34,381,407.57
ALAMO PLAZAAlamo Plaza leases are commercial leases within the Crockett,Palace and Woolworth buildings located in San Antonio, Texas.Alamo Plaza leases are existing leases from prior ownership of thebuilding upon GLO’s acquisition in fiscal 2016. The lease incomeprovides revenue to support the function and mission of theAlamo. It includes office, retail and restaurant space.
LEASING ACTIVITY All PSF lands are evaluated for lease potential. The historical costof all internally managed properties is $247,643,104.17. The fairvalue of the properties is $651,403,390.37. Sovereign and nonsovereign real estate in the permanent school fund is held as aninvestment and is not depreciated. Contingent rental revenuesfrom 24 leases in the amount of $978,597.54 are reported as ofAugust 31, 2017.
Due to Hurricane Harvey’s coastal destruction, the agency hassince offered rental waivers on qualifying commercial leases forfiscal 2018. As a result, the projected revenues for fiscal 2018 inTable 27 have been reduced.
Note 9 PENSION PLANS
Not applicable.
Note 10 DEFERRED COMPENSATION
Not applicable.
Note 11 POST EMPLOYMENT HEALTH CARE AND LIFEINSURANCE BENEFITS
Not applicable.
Note 12 INTERFUND ACTIVITY AND TRANSACTIONS
As explained in Note 1 on interfund transactions and balances,there are numerous transactions between funds and agencies. Atfiscal year end, amounts to be received or paid are reported asinterfund receivables or interfund payables, due from or due toother funds, due from or due to other agencies, transfers in ortransfers out, or legislative transfers in or legislative transfers out.
Net operating transfers in Exhibit II and IV, and due to and duefrom balances in Exhibits I and III represent the transfer of fundsfrom proprietary funds and the corpus of the permanent schoolfund to governmental funds to support administrative expensesof the Texas General Land Office.
Note 13 CONTINUANCE SUBJECT TO REVIEW
Texas Constitution Article XIV, §1 established the Texas GeneralLand Office, and Texas Constitution Article IV, §1 created theoffice of commissioner of the Texas General Land Office.Therefore, the agency is not subject to abolishment.
The 82nd Legislature, Regular Session passed Senate Bill 652 withan effective date of June 17, 2011, in which section 4.04 amendssection 32.003 of the Texas Natural Resource Code to read asfollows: "Sec. 32.003. APPLICATION OF SUNSET ACT. The SchoolLand Board is subject to Chapter 325, Government Code (TexasSunset Act). Unless continued in existence as provided by thatchapter, the board is abolished September 1, 2019." Thelegislature abolished all other boards for lease with the exceptionof the Boards for Lease for University Lands, Texas Parks andWildlife Department, and Texas Department of Criminal Justice.The School Land Board handles the functions of the abolishedboards for lease. The land commissioner serves as chairman of theSchool Land Board and each of the remaining boards for lease.
Under Texas Natural Resource Code, Section 161.0111, theVeterans’ Land Board (VLB) is subject to review under Chapter325, Government Code (Texas Sunset Act), but is not abolishedunder that chapter. The VLB shall be reviewed in 2019 and every12th year thereafter.
UNAUDITEDTexas General Land Office and Veterans' Land Board (305)
62 | Annual Financial Report
Note 14 ADJUSTMENTS TO FUND BALANCES AND NETPOSITION
During fiscal 2017, adjustments and corrections were made thatrequired the restatement of beginning fund balance and netposition. These restatements and adjustments are presented inTable 28 below.
GOVERNMENTAL FUNDS AND GOVERNMENTAL ACTIVITIES
GENERAL FUNDA restatement of ($16.77) was necessary in Fund 0001 to correcta payable related to building improvements in a prior period. Arestatement of $84,120.00 was made in Fund 0027 to account forassets received and put in service in a prior year.
PERMANENT SCHOOL FUNDMultiple restatements were made in Fund 0013 during fiscal 2017with a net effect of ($590,754.50). A restatement of ($633,494.43)was required to be consistent in how the agency accounts fordistributions from partnerships in which the GLO is a limitedpartner. An additional restatement of ($1,333,339.07) was
required to account for two land conveyances that occurred in aprior year that were not previously recorded.
A distribution received on August 15, 2016 was originallyidentified and recorded as return of capital. During fiscal 2017, itwas changed to interest income based on new informationreceived from the investment manager, resulting in arestatement for $1,376,079.00.
SPECIAL REVENUE FUNDSA restatement of $29,902.01 was made for Appropriated Fund0374 to correct prior year retainage payable balances related toconstruction projects at GLO’s veterans’ cemeteries.
GOVERNMENTAL ACTIVITIESAn adjustment of $6,000.00 was made to Capital Assets for theinclusion of land that was not previously recorded. The land wassubsequently sold in fiscal 2017.
The restatement of ($16.77) in Fund 0001 also required anadjustment to Capital Assets for the same amount.
Furniture and Equipment balances and the associatedaccumulated depreciation balances were adjusted $105,721.57and ($105,721.57), respectively for the correction of capital assetsfrom a governmental fund to a proprietary fund.
Additional adjustments to Capital Assets include ($15,586.00) and$15,586.00 to correct for asset trade in values and accumulateddepreciation, respectively, that should have been disposed of in a
UNAUDITED
Annual Financial Report | 63
Table 28 RESTATEMENT TO FUND BALANCE AND NET POSITION
September 1, 2016, As Previously Reported Restatements
September 1, 2016, As Restated
GOVERNMENTAL FUNDS AND GOVERNMENTAL ACTIVITIES
Major Funds:66,732,563.43 (84,103.23) 66,648,460.20 General Fund
Permanent School Fund 7,143,102,918.01 (590,754.50) 7,142,512,163.51
Total Major Funds 7,209,835,481.44 (674,857.73) 7,209,160,623.71
Nonmajor Funds: Special Revenue Funds 873,861.85 29,902.01 903,763.86
873,861.85 29,902.01 903,763.86 Total Nonmajor Funds
Governmental Activities Adjustments:62,729,550.60 52,045.21 62,781,595.81 Capital Assets
Long‐Term Liabilities (5,542,838.22) 0.00 (5,542,838.22)
57,186,712.38 52,045.21 57,238,757.59 Total Governmental Act. Adj.
Total Governmental Activities 7,267,896,055.67 (592,910.51) 7,267,303,145.16
BUSINESS TYPE ACTIVITIES
Nonmajor Funds: Enterprise Funds 781,183,191.70 (1,117.68) 781,182,074.02
781,183,191.70 (1,117.68) 781,182,074.02 Total Nonmajor Funds
Total Business Type Activities 781,183,191.70 (1,117.68) 781,182,074.02
TOTAL REPORTING ENTITY 8,050,146,422.37 (594,028.19) 8,049,552,394.18
prior period; $67,870.00 and $4,568.42 related accumulateddepreciation for boat motors purchased in a prior period thatwere corrected to a capitalized asset; and $3,500.00 net of($32.40) related accumulated depreciation for a prior period assetnot previously recorded. Additional accumulated depreciationwas corrected for ($29,844.04).
BUSINESS TYPE ACTIVITIES Restatements were made in Appropriated Fund 0374 to movecash equivalent balances and asset balances between agencyfunds (within the same appropriated fund) for $12,274,634.66$7,884,651.19, respectively. However, these adjustments net tozero at the Appropriated Fund level.
Capital asset balances and related depreciation accounts wereadjusted in Fund 0652 for assets not previously recorded. The neteffect of these restatements totaled ($884.20).
Fund 0571’s beginning net position was adjusted $25,000.00 toaccount for an asset from fiscal 2016 not previously recorded. Thedepreciation expense of ($231.48) was also adjusted for this asset.A related adjustment was made for ($25,000.00) to correct thepayable for said asset.
Furniture and Equipment balances and the associatedaccumulated depreciation balances were adjusted $105,721.57and ($105,721.57), respectively for the correction of capital assetsfrom a governmental fund to a proprietary fund.
Additionally, a ($2.00) adjustment was necessary to adjust a cashequivalent balance due to an accounting error in a previousperiod.
Note 15 CONTINGENCIES AND COMMITMENTS
SIGNIFICANT COMMITMENTS
ARBITRAGE REBATE PAYABLEEarnings on portions of Vet Hsg Bds Reserve Fund, Vet Hsg BdsMortgage Reserve Fund, and all of Vet Land Ref Bds Ser '99A, VetHsg Fund II Bds Ser 2000C, 2001A 2, 2001C 2, 2002A 2, 2003A,2003B, 2004A, 2004B, 2005A, 2005B, 2006A, 2006D, 2007A,2007B, 2008B, 2009A, 2009B, 2010A, 2010C, 2011A, 2011B,2011C, 2012A, 2012B, 2013A, 2013B, 2014A, 2014D, 2015A,2015B, 2016, 2017, and Vet Land Bds Ser 2002, are subject toprovisions of §148(f) of the Internal Revenue Code of 1986, asamended, pertaining to the rebate of certain profits realizedthrough the investment of bond proceeds. Any rebate liability is
payable five years after the date of issuance of each bond issuesubject to the provisions and after each subsequent five yearperiod thereafter. As of August 31, 2017, there is no rebateliability.
CONTRACTUAL COMMITMENTSAt August 31, 2017, the School Land Board had approximately$2.0 billion in unfunded capital commitments outstanding toexternal investment managers.
CONTINGENCIES
FEDERAL ASSISTANCETexas General Land Office receives federal financial assistance forspecific purposes that are subject to review or audit by the federalgrantor agencies. Entitlement to this assistance is generallyconditional upon compliance with the terms and conditions ofgrant agreements and applicable federal regulations, includingthe expenditure of assistance for allowable purposes. Such auditscould lead to requests for reimbursements to grantor agencies forexpenditures disallowed under the terms of the grant. Based onprior experience, management believes such disallowance (if any)will be immaterial.
INVESTMENT INCENTIVE COMPENSATION PLANThe Performance Incentive Compensation Pay Plan (Plan) forfiscal 2017 was adopted by Texas Land Commissioner, George P.Bush, and Chief Clerk, Anne Idsal, to cover the plan year effectiveJuly 1, 2016 through June 30, 2017. The Plan enables the agencyto remain competitive in its efforts to attract, retain, and motivatehigh caliber investment staff. The purpose of the Plan is to providethe opportunity for investment division employees to earnincentive pay based on the GLO managed portion of thePermanent School Fund investment portfolio's performance andthe investment division employees' job performance. Any earnedperformance incentive compensation pay is paid over thesubsequent 2 year period. For Plan year ended June 30, 2017, theoutstanding liability is estimated not to exceed $312,082.70.Payments for the 2017 Plan will occur after the end of the Planyear, with the first payment as early as December 2017. A portionof the incentive compensation can only be earned following a yearin which the GLO managed portion of the Permanent School Fundinvestment portfolio experienced a positive return. In addition,division employees must remain employed by the land office upto and on the dates designated in the Plan in order to earn andreceive payment. The Executive Compensation Committee maycancel or modify the Plan at any time.
CLAIMSAs of August 31, 2017, certain lawsuits were pending against thestate and/or the commissioner of the Texas General Land Office.The following lawsuits are pending and may represent contingentliabilities:
UNAUDITEDTexas General Land Office and Veterans' Land Board (305)
64 | Annual Financial Report
Aderholt, et al. v. U.S. Bureau of Land Management (BLM), etal.GLO intervened in quiet title action (brought by private propertyowners against BLM) to protect its mineral interests in PSFacreage in Wilbarger County. A petition was filed November 16,2015. State of Texas (by/through the OAG) moved to intervene onNovember 18, 2015; GLO filed its Motion to Intervene/Complaintin Intervention on December 1, 2015. On December 21, 2015,Plaintiffs filed a response in support of GLO & State’s Motions toIntervene. Via extensions, BLM filed responses to both motions onDecember 22, 2015; GLO & the State filed replies January 12,2016. On January 19, 2016, the federal Defendants filed a motionto dismiss and memorandum in support. All parties collaboratedon a Rule 26 scheduling report and discovery stipulations. OnFebruary 26, 2016, Defendants filed a motion for partial dismissalof Plaintiffs’ Amended Complaint. Interventions were grantedMarch 14 (State) and March 24 (GLO); Original Complaints filedMarch 28 (State) and March 30 (GLO). On May 27 and 31respectively, Defendants filed motions to dismiss AmendedComplaints filed by the State and the GLO; responses to whichwere filed June 17 (State) and June 21 (GLO). By order issued June29, 2016, the Court denied the motion to dismiss on all but two ofPlaintiffs’ claims (Counties’ taxing interest/QTA claim and 5th
Amendment claim). On July 5, 2016, Defendants filed a Reply inSupport of their Motion to Dismiss the GLO. On July 13, 2016,Defendants filed their answer to Plaintiffs’ First AmendedComplaint. Unopposed Motion to Amend the Scheduling Orderwas granted at the July 21, 2016 hearing, extending all deadlinesout four months. By order dated July 27, 2016, the Court deferredruling on the motion to dismiss/GLO’s QTA claim until trial; onAugust 5, 2016, the Court denied Defendants’ motion to dismissthe State. Tracts inspected by BLM after court interventionaddressing objections raised by landowner Plaintiffs and denyingPlaintiffs’ Motion for Protective Order. On December 5, 2016, thecourt granted the parties’ joint motion and ordered mediation bymagistrate – held January 10, 2017. On April 4, 2017, BLM filedwith the court a Notice of Suspension of Surveys currentlyunderway of Indian trust allotment land in Oklahoma (Red Rivernorth bank), predicated on the basis of uncertainty as to whetherdoctrines of erosion, accretion and evulsion were appropriatelyconsidered; otherwise allowing for the possibility of error insurvey methodology used and in identifying the GradientBoundary. BLM summary judgment motion as to GLO’s claim filedJune 5, 2017; response filed June 26, 2017. Trial reset on thecourt’s four week docket beginning September 25, 2017; pretrialconference held September 20, 2017, trial setting cancelled; DOJsettlement acceptance status reports filed October 4 and 11,2017; settlement approval pending. Court ordered third statusreport filed October 20, 2017, proffering a settlement decision orstatus report by October 30, 2017. The probability of liability isreasonably possible. The possible final amount of loss isindeterminable at this time.
Brannan, et al. v. State of Texas, et al.Plaintiffs seek declaratory relief as to the rights of beachfrontproperty owners, and members of the general public, to beacheson the Gulf Coast of Texas at Surfside Beach as well as adetermination as to whether the imposition upon privateproperty of a rolling easement for public use constitutes adeprivation of use or a taking by the State. Trial court granted theState's summary judgment motion regarding Plaintiffs' takingsclaims based on the rolling beach easement. Multiple partiessubsequently intervened, claiming that the GLO was taking theirproperty by refusing to allow them to make repairs to theirbeachfront homes after a high tide. Trial court issued an injunctionordering the removal of all houses on the easement. First Court ofAppeals affirmed the injunction and agreed that the owners'claims for damages due to a permanent taking and a regulatorytaking had been properly denied. Court of Appeals deniedPlaintiffs' motion for rehearing, withdrew the opinion fromAugust 2009, and issued a new opinion in February 2010. In April2010, Plaintiffs filed a petition for review in the Texas SupremeCourt. The case was remanded to the First Court of Appeals forfurther consideration in light of the Severance opinion. On May 1,2014, the First Court of Appeals reversed on submission the trialcourt's summary judgment granted in favor of the State andremanded the case back to the trial court for reconsideration inlight of/accordance with Severance. On July 28, 2014, a StatusConference was held in Brazoria County District Court. On August13, 2014, Plaintiffs filed a motion for partial summary judgmentseeking a declaration that the GLO and City's imposition of a"rolling easement" following Tropical Storm Frances in 1998 andthe 2006 "bull tides" constituted taking without justcompensation. A summary judgment hearing was held on January27, 2015. On February 19, 2015, the GLO filed its reply brief insupport of its plea to the jurisdiction and a cross motion forsummary judgment on Plaintiffs’ claims. On April 20, 2015, theGLO filed a Plea to the Jurisdiction and a Motion for SummaryJudgment on the issue of attorney’s fees. On June 22, 2015, thecourt heard all motions but dismissed only Brannan’s takingsclaims as against the Village of Surfside and its mayor. In Octoberand November of 2015, Plaintiffs filed multiple supplementalmotions and memoranda and attempted to set a hearing tofacilitate the court’s decision making. By rulings issued November18, 2015 on motions properly before the court, the State’sjurisdictional pleas/summary judgment motions regarding 1) nonentitlement to attorney’s fees and 2) Plaintiffs’ takings claimswere granted; and all of Plaintiffs’ motions were denied exceptBrannan’s motion for separate trial only on her takings claim – allof which was memorialized by order dated January 4, 2016.Plaintiffs’ multiple motions for declarations filed subsequent tothe November rulings were heard on January 25, 2016. OnFebruary 1, 2016, Plaintiffs filed 3 additional motions, noticing ahearing for February 23, 2016. On February 16, 2016, the GLO filedresponses and a jurisdictional plea, the latter of which was alsoargued at the reset March 29, 2016 hearing. On July 8, 2016,Plaintiffs filed Supplemental Pleadings specific to Angela MaeBrannan. On August 18, 2016, a new claim was filed via “Motion
UNAUDITED
Annual Financial Report | 65

on a Taking” specific only to Angela Mae Brannan, simultaneouslynoticing a request that her claims be tried in October 2016 and adocket call for same on September 9, 2016. On September 8,2016, the GLO served additional discovery and filed a jurisdictionalplea on Ms. Brannan’s declaratory judgment claims, setting thelatter for a September 27, 2016 hearing, which subsequentlypushed. On September 9, 2016, the court ordered the parties tomediate within 30 days Ms. Brannan’s remaining takings claims,and set same for trial on November 14, 2016; mediationsubsequently cancelled and trial setting passed. On December 2,2016, Ms. Brannan filed her opposition to the GLO’s jurisdictionalplea on her declaratory judgment claims; hearing on which washeld February 27, 2017 (along with GLO’s motion to strikePedestrian Beach, LLC’s petition in intervention filed December13, 2016, and motion to sever Plaintiffs’ New Property Claims ifAgreed Order as to same not signed/entered, as well as Plaintiffs’Motion for Relief from Unfair Discovery Practice). On March 27,2017, the court signed an order granting the GLO’s motion tosever all new property claims (from original cases) and sua spontesevering all declaratory judgment causes of action in all cases(from takings claims) into Cause No. 91156 CV, but abateddiscovery and conveyed an intent to rule on all pending motionsregardless. On April 25, 2017, the court heard and granted GLO’smotion to dismiss Plaintiffs’ anthropogenic erosion claims, butdenied GLO’s summary judgment motion as to revetment claims(limitations). Agreements in principle reached on 10 originalproperties with takings compensation claims. On September 20,2017, the court issued rulings striking Pedestrian Beach, LLC’sPetition in Intervention; granting the GLO’s jurisdictional pleas asto new properties added by October 2015 supplemental pleadingsand as to Angela Mae Brannan’s declaratory judgment claims; anddenying four of Plaintiffs’ pending declaratory judgment motions.The probability of liability is reasonably possible. The possible finalamount of loss is indeterminable at this time.
Galan Family Trust, et al. v. State of Texas, et al.Plaintiff claims that in 1874 the State of Texas improperly revokeda land patent granted to Plaintiff’s heirs. The GLO filed its answeron August 31, 2015. On September 2, 2015, the GLO and OAGjointly filed a plea to the jurisdiction and motion to dismiss, bothof which were heard on October 6, 2015. By Order dated October14, 2015, the court granted both joint pleadings and dismissed allclaims. Motions for New Trial were filed on November 2, 2015(Intervenors) and November 12, 2015 (Plaintiffs). Plaintiffs filedtheir notice of appeal on December 28, 2015 – the day theirmotion was overruled by operation of law. On February 16, 2016,Intervenors filed a Notice of Non suit, intending to withdraw fromthe appeal. After full briefing, oral argument held November 16,2016. Third Court of Appeals affirmed the dismissal in an opinionissued February 24, 2017; on March 10, 2017, Galan filed a motionfor rehearing and motion for en banc reconsideration; both ofwhich were denied on March 21, 2017. Via extension, (corrected)Petition for Review refiled June 8, 2017; denied July 21, 2017. Viaextensions, rehearing motion filed August 22, 2017; deniedSeptember 29, 2017.
Galveston Bay Energy, LLC v. Tekoil & Gas Gulf Coast, LLC, et al.Through Tekoil’s bankruptcy proceedings, Plaintiff acquiredTekoil’s interest in specific oil, gas and/or mineral leases as wellas Tekoil’s interest in related easements in a Purchase and SaleAgreement (“PSA”) effectuated June 30, 2009. In 2010, Tekoil(Assignor) and Plaintiff (Assignee) executed an Assignment andAssumption Agreement of Multiple Miscellaneous Easementsand Surface Leases to implement the PSA, which the GLO signedas Grantor. Plaintiff now seeks to have the Assignment andAssumption reformed, as it includes 18 miscellaneouseasements related to leases that had terminated prior to the PSAeffective date. On October 15, 2014, the GLO filed a Motion toTransfer Venue and Following Original Answer. On August 27,2015, Plaintiff filed a Motion to Reopen the chapter 11 Case andEnforce Sale Order; on September 24, 2015, the bankruptcycourt denied GBE’s Motion, effectively returning the matter toChambers County District Court. On April 12, 2016, GBE filed avoluntary chapter 11 petition, staying the district courtproceedings. The probability of liability is reasonably possible.The possible final amount of loss is indeterminable at this time.
GKMMineral Partners, LP f/k/a Mitchell Mineral Partnershipv. SandRidge Energy, Inc., et al.Plaintiff/Lessor (and GLO agent) alleges that Defendant/LesseeSandRidge has failed to pay royalties in full under an oil and gaslease for property in Terrell County. On November 25, 2014, theagency filed its Plea in Intervention. Plaintiff filed a First AmendedPetition on February 2, 2015; on February 24, 2015, DefendantsSandRidge Tertiary, LLC filed an Answer and Trinity CO2 LLC filed aMotion to Dismiss. On March 9, 2015, the court grantedDefendants’ Motion to Transfer Venue to Pecos County. On May16, 2016, SandRidge Energy, Inc. and SandRidge Exploration &Production, LLC filed voluntary chapter 11 petitions, staying statecourt proceedings. On May 24, 2016, the GLO filed a FirstAmended Plea in Intervention in tandem with Plaintiff’s SecondAmended Petition to add Occidental West Texas Overthrust, Inc.as a Defendant based on lease assignments, contemporaneouslyfiling a motion to sever the bankruptcy filing SandRidge entities.On July 19, 2016, Occidental filed a plea in abatement; plea to thejurisdiction/for abstention and its original answer. SandRidgeDebtors and the GLO will stipulate to lifting the bankruptcy stay toallow the litigation to proceed to final judgment; collection of anymonetary judgment remains stayed/will be handled inaccordance with the bankruptcy plan. Discovery is currently inprogress. The probability of liability is reasonably possible. Thepossible final amount of loss is indeterminable at this time.
GLO v. USFWS, DOI, et al.Suit for declaratory judgment/injunctive relief as regardsFederal Defendants’ denial of the Petition to Delist from theEndangered Species Act the Golden Cheeked Warbler. Petitionfiled June 5, 2017. On August 1, 2017, The Travis AudubonSociety, Texas Ornithological Society, Center for BiologicalDiversity and Defenders of Wildlife collectively filed a motion tointervene, to which both GLO and Defendants filed motions in
UNAUDITEDTexas General Land Office and Veterans' Land Board (305)
66 | Annual Financial Report

opposition. Defendants’ Motion to Dismiss (12(b)(1) and (6))filed September 11, 2017; GLO filed response to same and itsFirst Amended Complaint on September 21, 2017, in responseto which Defendants filed a motion to partially dismiss same onOctober 5, 2017. GLO filed its response on October 19, 2017. OnOctober 11, 2017, Intervenors filed a proposed answer toPlaintiff’s Amended Complaint. A hearing on intervention anddismissal motions is set for November 16, 2017. The probabilityof liability is possible. The possible final amount of loss isindeterminable at this time.
GLO v. UT Board of Regents, et al.The GLO received legislative permission to file a declaratory actionin Travis County against the UT Board of Regents – the UniversityFund manager – regarding the PSF land/University Land boundaryin Pecos County. GLO filed an Amended Petition on February 5,2014. On May 12, 2014, a hearing was held on the Board ofRegents' Motion to Dismiss and special exceptions, all of whichwere denied via orders signed and entered on June 27, 2014. OnJuly 25, 2014, the Board of Regents filed a Motion to Dismiss forLack of Jurisdiction, which was denied on August 5, 2014. On July30, 2014, select Defendants/Cross Plaintiffs filed a Motion forPartial Summary Judgment. The GLO filed a Motion for SummaryJudgment on September 18, 2014. Defendants/Cross Plaintiffsfiled a Motion for Summary Judgment on October 23, 2014; towhich the GLO filed a response on November 6, 2014. All motionswere heard November 13, 2014; on November 21, 2014, the courtissued a letter ruling and subsequently signed and entered anorder on December 5, 2014, granting the GLO's motion anddenying the Board's motion. Mediation was held June 11, 2015and settlement discussions are ongoing. On September 16, 2015,the GLO filed a motion (which Cross Plaintiffs filed subsequentmotions to join) to sever its claims as against the Board in order torender the court’s prior order granting the GLO’s summaryjudgment motion final and appealable. The probability of liabilityis remotely possible. The possible final amount of loss isindeterminable at this time.
Krieter v. Unknown Claimants of Interest in LandAlthough not specifically named as a defendant, CommissionerBush in his official capacity was served and identified as a“potential claimant” in a lawsuit seeking declaratory relief as towhether an identified 8.47 acre stretch of the Medina Riverconstitutes public property, as well as injunctive relief thereto.Petition filed April 21, 2017; answered June 7, 2017, including ajurisdictional plea. The probability of liability is remote. Thepossible final amount of loss is indeterminable at this time.
Lone Oak Club, LLC v. Jerry Patterson, et al.Plaintiff filed a trespass to try title suit, asserting ownership tocertain property involving the tidally influenced boundary inChambers County, and alleging that the Commissioner, throughultra vires acts, has wrongfully asserted jurisdiction, title and rightto possession and control over watercourses or navigable streamson said properties; has been encouraging the general public to
commit trespass and hunt without consent on the properties andstreambeds and has unreasonably interfered with Plaintiff's rightsto possession, use, control and quiet enjoyment. Plaintiff seekstitle and possession of the disputed property, pre and postjudgment interest and reasonable attorney's fees. Lone Oak’sMotion to Retain was granted November 19, 2015. On April 14,2016, Plaintiff filed a motion to substitute counsel andsubsequently substituted Commissioner Bush for Patterson andnon suited all other remaining Defendants. Rule 166 Conferenceheld June 30, 2016: claims related to all but one tract severed andabated. On October 26, 2016, the court granted Lone Oak’ssummary judgment motion, denying the Commissioner’s motion.Judgment entered January 26, 2017, following hearing on same.GLO noticed appeal on February 24, 2017; assigned to 1st Courtof Appeals. GLO Brief filed July 14, 2017; by extensions, Lone OakBrief filed October 2, 2017; GLO Reply Brief due November 22,2017. The probability of liability is reasonably possible. Thepossible final amount of loss is indeterminable at this time.
Presidio Holdings, LLC, et al. v. Green River Resources, Inc., etal.Plaintiffs sued to have certain oil, gas, and mineral leases declaredterminated. The GLO’s Answer and Plea to the Jurisdiction werefiled on August 7, 2015. The probability of liability is reasonablypossible. The possible final amount of loss is indeterminable at thistime.
Signal Drilling, LLC, et al. v. New Tex Operating, LLC, et al.Plaintiff sued for injunctive relief and compensation for allegedinterest in oil, gas, and mineral leases. Answer filed October 26,2015. On December 4, 2015, New Tex Defendants filed a FirstAmended Answer and a Second Amended Counterclaim. OnDecember 24, 2015, Signal propounded discovery on the agencyand filed a Second Amended Petition and Applications forReceivership and Injunctive Relief, in which Jaten Oil Company isalso named as a Plaintiff and multiple causes of action arealleged as against the GLO and Commissioner Bush. On January15, 2016, the GLO filed its First Amended Answer/JurisdictionalPlea. On March 21, 2016, the court granted without hearing anopposed motion for continuance on the GLO’s plea hearing,previously reset for March 23, 2016. On April 19, 2016, theagency filed a First Amended Motion for Protective Order inresponse to Signal’s attempt to serve a second set of discoveryrequests; GLO’s plea hearing reset for June 8, 2016. On June 7,2016, the court signed an order as to Signal’s nonsuit withoutprejudice of all claims against the GLO and Commissioner Bush.On September 8, 2016, the GLO filed its jurisdictional plea as toJaten/Riparia claims, noticing a hearing for October 19, 2016. OnSeptember 29, 2016, Signal filed a motion for partial summaryjudgment as against the New Tex Defendants, also to be heardOctober 19, 2016. On October 13, 2016, the court signed anorder on Jaten/Riparia’s nonsuit without prejudice of all claimsagainst the State, the GLO and Commissioner Bush, removing allState Defendants from the litigation and mooting the need forthe October 19th jurisdictional plea hearing. On November 22,
UNAUDITED
Annual Financial Report | 67
2016, the New Tex Defendants filed a motion to dismiss(absence of the State as an indispensable party) and a partialsummary judgment motion for a declaration that the subjectJaten Top Lease is void as violative of the rule againstperpetuities. On December 8, 2016, Signal filed a Third AmendedPetition, naming Ponderosa Operating, LLC and PonderosaEnergy, LLC as defendants, to which New Tex allegedly assignedits (subject) leasehold interest effective as of May 1, 2016.Ponderosa Energy filed its answer on December 26, 2016,denying property ownership and arguing indispensability of theState as necessary party. On January 26, 2017, PonderosaOperating, LLC filed a plea in abatement. On February 21, 2017,Signal filed its First Supplemental Petition and Application forDeclaratory Relief, seeking in part to bring the State andCommissioner Bush back into the litigation (not seeking “to(re)assert affirmative claims for relief against the [GLO], butrather merely add them … as a necessary and indispensableparty”); and Ponderosa Operating, LLC filed an amended plea inabatement. Signal served its supplemental petition on theCommissioner and the agency on March 16, 2017; answer dueApril 10, 2017. On March 30, 2017, Signal filed a Motion forModification of Temporary Injunction Order, noticing a hearingfor April 5, 2017. The GLO filed its answer early, including ajurisdictional plea for which a motion to shorten time was alsofiled to have it heard contemporaneously; however, the courtcontinued the plea, allowing for limited jurisdictional discoveryin the interim and dissolved the prior injunction between Signaland New Tex, the former of which entered into a new agreementas to timelines by when assignee Ponderosa is to timely depositroyalties into the court registry. GLO plea heard September 12,2017; continuance granted as to Plaintiffs’ partial summaryjudgment motions previously set for late September. GLO pleadenied October 12, 2017; notice of appeal due November 1,2017. The probability of liability is reasonably possible. Thepossible final amount of loss is indeterminable at this time.
State v. RiemerState alleged unlawful fencing of the Canadian River bed belowSanford Dam; Riemer filed multiple counterclaims. Trial courtdenied the State's plea to the jurisdiction. Appellate courtreversed, ordering the trial court to dismiss all claims against theState except Riemer's claim to the surface of the two tracts aswell as select takings claims of other parties who sought classcertification. On December 30, 2009, the trial court denied classcertification, a decision affirmed on appeal in May 2011.Counter Plaintiffs filed a petition for review with the TexasSupreme Court, which held that the trial court abused itsdiscretion and reversed and remanded the matter to theSeventh Court of Appeals to address the remaining contestedclass certification requirements. Appellate oral arguments wereheld on November 4, 2013. In an opinion issued November 26,2014, the 7th Court affirmed the denial of class certification. OnJanuary 9, 2015, Riemer filed a petition for review with the TexasSupreme Court; the State filed its response on February 9, 2015;and Riemer filed a reply on February 24, 2015. In response to the
Court’s request for merits briefing (and via extensions granted),Riemer filed on July 1, 2015; the State filed its Response on August20, 2015 and Riemer filed a Reply on September 25, 2015. OnOctober 23, 2015, the Court denied Riemer’s petition. Riemer’smotion for rehearing was filed December 7, 2015, and deniedJanuary 8, 2016. On February 27, 2017, Riemer filed in districtcourt its 14th Amended Counterclaim and 12th Amended ThirdParty Petition, as well as motions for partial summary judgmenton limitations and navigability. Hearing held May 22, 2017,wherein both Riemer partial summary judgments were granted.On September 20, 2017, Plaintiffs filed a motion to sever(properties – albeit not specifically identified – west of the BorgerStinnett Highway from those east); case reassigned to JudgeBrancheau, who requested case status briefs. Motion to Sever andState’s plea hearing set for November 1, 2017. The probability ofliability is reasonably possible. The possible final amount of lossis indeterminable at this time.
Texas General Land Office v. CDM Smith Inc. and the City ofGalvestonThe GLO filed a declaratory action related to CDM Smith Inc. v. Cityof Galveston (Galveston County), seeking to establish its rights,status and obligations among the parties involved: that, under thecontracts between CDM Smith and Galveston, CDM claims not beconstrued as creating a debt or obligation on behalf of the GLO orthe State; any GLO obligation in administering the CDBG DRprogram must be limited contingent upon/subject to the actualreceipt and availability of adequate federal funds; and the totalamount of funds available for payment to CDM is limited to thefederal grant funds available under CDM's contract withGalveston, less payments already made and any other offsets orcredits, plus attorney's fees. Both CDM and Galvestoncounterclaimed against the GLO and cross claimed: CDMessentially re pled its Galveston County lawsuit, bringing in theGLO and identified staff as third party Defendants, and Galvestonseeks declarations as to the duties of the parties under thecontract and that the GLO is ultimately responsible for payment.CDM served a second request for production on November 22,2013. GLO (on behalf of the Agency as well as named third partyDefendants) and Galveston filed jurisdictional pleas, and the GLOalso filed a Motion to Dismiss. Pursuant to a Rule 11 Agreement,the parties agreed not to oppose a stay of proceedings if anyinterlocutory appeal was filed. All pending motions were heardApril 15, 2014. On May 16, 2014, the request for specialassignment was denied because Judge Scott Jenkins wascontemplating abating the entire case sua sponte and had askedall parties to brief the abatement issue. On July 25, 2014, the Courtnotified all parties of its intent to abate and/or stay the casepending the outcome of the Galveston County litigation,requesting proposed orders – which CDM provided to the courton August 1, 2014. On August 12, 2014, the Court ordered thecase temporarily abated and/or stayed pending resolution of theGalveston County lawsuit. On September 9, 2014, the State fileda petition in the Third Court of Appeals to mandamus JudgeJenkins to rule on the pending jurisdictional pleas. On November
UNAUDITEDTexas General Land Office and Veterans' Land Board (305)
68 | Annual Financial Report
5, 2014, both mandamus petitions were denied. The probabilityof liability is reasonably possible. The possible final amount of lossis indeterminable at this time.
USOR Site PRP Group v. A&M Contractors, Inc., et al.The agency is one of a multitude of defendants from which,pursuant to CERCLA and the Texas Solid Waste Disposal Act,Plaintiff seeks cost recovery and contribution for past and futurecosts incurred for response activities undertaken and to beundertaken at the U.S. Oil Recovery Superfund Site propertylocated at 200 North Richey Street and 400 North Richey Street inPasadena, Harris County as well as any area where hazardoussubstances migrating from the Superfund Site come to be located.Plaintiff further seeks declarations as to each Defendant's liabilityand an allocation of past and future response costs among allparties. Summons and Complaint served May 18, 2015, but astanding order from the court prohibited the GLO from answeringuntil November 14, 2015. On July 31, 2015, Plaintiff filed its FirstAmended Complaint. By Order entered August 25, 2015, thedeadline for the GLO to file its Answer was December 31, 2015,before which time parties were not to file dispositive or defaultjudgment motions. The State Defendants’ motion for leave to filetheir motion to dismiss was denied December 23, 2015. OnFebruary 1, 2016, Plaintiff filed a 2nd Amended Complaint – addingnew parties and amending others – and a motion to extenddeadlines. State Defendants filed their 12(b) motion August 1,2016. Response filed October 31, 2016; Reply filed November 30,2016. On March 24, 2017, the motion to dismiss was denied. StateDefendants filed a Motion to Correct Order, for which expeditedbriefing was ordered: Response filed April 24, 2017; Reply filedApril 26, 2017; State’s 12(b)(1) Motion to Dismiss denied May 5,2017; Notice of Appeal filed May 26, 2017 and formally docketedin the Fifth Circuit on June 5, 2017. Opening Brief filed August 22,2017; USOR Brief filed October 20, 2017. The probability of liabilityis remote. The possible final amount of loss is indeterminable atthis time.
WesleyWestMinerals, et al. v. SandRidge Energy and GLO, et al.Plaintiff/Lessor Wesley West Mineral alleged thatDefendant/Lessee SandRidge failed to pay royalties. The GLOclaimed sovereign immunity and cross claimed, alleging thatSandRidge entered into an agreement with Oxy USA, Inc.,depriving GLO of royalties from disposition of carbon dioxide,which SandRidge is required to pay the GLO under theRelinquishment Act. The District Court granted partial summaryjudgment for SandRidge regarding the proper interpretation ofthe Citation oil and gas lease; SandRidge's cross motion forsummary judgment against GLO and Plaintiffs' motion forclarification of the summary judgment as it relates to SandRidge'sroyalty obligations was denied. The parties agreed on a motionand order for interlocutory appeal of the summary judgmentruling; oral arguments were held at the 8th Court of Appeals onMay 15, 2014. In an opinion issued November 19, 2014, the 8th
Court affirmed the trial court's judgment as regards the Stateleases. On December 17, 2014, the GLO filed a Motion for
Rehearing/Motion for En Banc Reconsideration; on December 18,2014, Co Appellants Wesley West Minerals and Longfellow RanchPartners filed their Motion for En Banc Reconsideration. OnJanuary 9, 2015, the 8th Court requested that Appellees file aresponse to Appellants' motions due by February 2, 2015. OnFebruary 13, 2015, the 8th Court denied all pending Appellantmotions. On March 30, 2015, Petitioners (including the GLO) filedSupreme Court Petitions for Review. On April 14, 2015, SandRidgefiled a Conditional Cross Petition, to which Longfellow filed aResponse on May 21, 2015. On July 31, 2015, SandRidge filedCourt requested Responses to both Petitions; on August 24, 2015,Petitioners filed their respective Replies. On September 11, 2015,the Court requested merits briefing: via extensions, Petitionersfiled their briefs on November 2, 2015, and SandRidge filed itsResponse on December 14, 2015. Longfellow filed a Response tothe Conditional Cross Petition on November 23, 2015; to whichSandRidge filed a Reply on December 9, 2015. Via extension,Petitioners filed Replies on January 19, 2016. On May 16, 2016,SandRidge Energy, Inc. and SandRidge Exploration & Production,LLC filed voluntary chapter 11 petitions and a Notice of Suggestionon Pendency of Bankruptcy and Automatic Stay of Proceedings;the Supreme Court abated the Petition for Review. On July 7,2016, the GLO filed a motion to substitute parties (OccidentalWest Texas Overthrust, Inc. for SandRidge), sever the latter andreinstate the appeal, to which both SandRidge and Oxy noticedobjections. On September 27, 2016, Overthrust filed a Plea inAbatement, Jurisdictional Plea, Request for Abstention andOriginal Answer in the Pecos County district court proceeding. OnDecember 20, 2016, the bankruptcy court signed and entered theparties’ stipulation to modify the Plan of Reorganizationinjunction, allowing the litigation to proceed to final judgment;collection of any monetary judgment remains stayed/will behandled in accordance with the bankruptcy plan. Appealreinstated on January 6, 2017. All petitions denied on March 10,2017; motions for rehearing filed on April 11, 2017; via extension,Court requested response filed July 10, 2017; replies filed by GLO(August 24) and co petitioners (August 29); rehearing deniedSeptember 1, 2017; 8th Court mandate issued October 5, 2017.The probability of liability is reasonably possible. The possible finalamount of loss is indeterminable at this time.
There may be substantial legal obstacles to satisfaction of ajudgment with permanent school fund monies. The abovelawsuits are referenced in this note as contingent liabilities in theinterest of full disclosure. Nonetheless, the possibility thatpayment will be required from the permanent school fund isremote.
DERIVATIVESAs a function of its normal business operations, the State EnergyMarketing Program (SEMP) of the GLO enters into contracts forthe purchase and sale of natural gas, the sale of oil, and thedelivery of natural gas and electric energy to certain Public RetailCustomers (PRCs). Some of these contracts are derivatives, asdefined under GASB Statement No. 53, Accounting and Reporting
UNAUDITED
Annual Financial Report | 69
for Derivative Instruments. As of August 31, 2017, all SEMPcontracts identified as derivatives under GASB 53 also qualify forthe normal purchases and normal sales exception described inParagraph 14 of GASB 53. Therefore, all SEMP contracts identifiedas derivatives under GASB 53 are not subject to the requirementsof GASB 53. The documentation supporting the determination ofthe normal purchases and normal sales exception with regard toGASB 53 is maintained by GLO in the applicable SEMP contractfiles.
Note 16 SUBSEQUENT EVENTS
On July 27, 2017, the VLB authorized the issuance and sale of Stateof Texas Veterans Bonds, Series 2018 in one or more installmentsin an aggregate principal amount not to exceed $250,000,000.Accordingly, the VLB expects to issue its $250,000,000 State ofTexas Veterans' Bonds, Series 2018 as referenced in Table 29below. The proceeds of the bonds will be used to augment theVeterans' Housing Assistance Fund II.
Hurricane Harvey made landfall along the middle Texas coast onAugust 25, 2017 and continued to impact most of the Texascoastal regions for several days. On September 14, 2017, theGovernor tasked the General Land Office with short term housingrecovery efforts in coordination with the Federal EmergencyManagement Agency (FEMA). This is in addition to the long termrecovery work that GLO manages for the state and hasundertaken in previous disasters as part of the FederalDepartment of Housing and Urban Development’s (HUD)Community Development Block Grant – Disaster Recoveryprogram (CDBG DR). At publication, Texas has been allocatedapproximately $5.024 billion from HUD to help with the long termhousing and infrastructure recovery from Hurricane Harvey.
During October 2017, the VLB replaced CitiMortgage, Inc. as theadministrator of the Veterans’ Housing Assistance Program withGateway Mortgage Group, LLC as administrator of loanoriginations and Nationstar Mortgage as administrator of masterservicing.
On November 1, 2017, the VLB replaced State Street Bank andTrust Company and Mizuho Bank, LTD, as liquidity providers onthe State of Texas Veterans Bonds, Series 2014D and the State of
Texas Veterans Bonds, Series 2015B, respectively, with theFederal Home Loan Bank of Dallas.
On November 1, 2017, the VLB closed on the sale to NexBank SSBof approximately 2,300 loans with an unpaid principal balance ofapproximately $369 million in the Veterans’ Housing AssistanceProgram.
Note 17 RISK MANAGEMENT
INSURANCE POLICIES The Texas General Land Office assumes substantially all risksassociated with tort and liability claims due to the performance ofits duties. The agency has purchased the following three insurancepolicies: Public Employees Dishonesty & Computer Fraud Policy,Volunteer Insurance Coverage pursuant to Statewide VolunteerInsurance Program and Commercial Property Insurance.
The Public Employees Dishonesty & Computer Fraud Policy coverslosses associated with negligent and criminal conduct by anemployee through the normal course of business. The policycovers up to $1 million per loss, with a $50,000 deductible foremployee theft and up to $1 million per loss, with a $50,000deductible for computer fraud.
The Statewide Volunteer Insurance Policy covers excess personalliability for three volunteers at $8.55 per volunteer. ExcessPersonal Liability covers losses associated with volunteer liabilityup to $1 million per occurrence, subject to an annual aggregateper named organization. This policy provides protection for apersonal injury or a property damage liability claim arising fromthe performance of the registered volunteer's duties, howeveronly covers claims that occur during assignment – not on the wayto or from the volunteer's assignment. This coverage is in excessof, and non contributing with any other valid or collectibleinsurance the volunteer may have. Accident medical expenses forthree volunteers at $9.30 per volunteer are also provided forunder the Statewide Volunteer Insurance Policy with a BenefitMaximum of $100,000. The provider will not pay more than theBenefit Maximum for all losses per Accidental Death &Dismemberment Covered Accident. If, in the absence of thisprovision, the provider would pay more than Benefit Maximum
Table 29NEW BOND ISSUANCE
ANTICIPATEDBOND ISSUANCE SERIES AMOUNT DATE OF ISSUANCE PURPOSE
General Obligation Bonds 2018 250,000,000$ TBD To augment the Veterans' Housing Assistance Fund II
UNAUDITEDTexas General Land Office and Veterans' Land Board (305)
70 | Annual Financial Report
for all losses from one Accidental Death & DismembermentCovered Accident, then the benefits payable to each person witha valid claim will be reduced proportionately, so the total amountpaid by the provider is the Benefit Maximum.
The Statewide Commercial Property Insurance policy limit coversup to $1 million for any one occurrence for all perils; coverage isshared by all participants of the statewide program and is subjectto sublimits as listed in the policy. Sublimits are part of, not inaddition to, policy limit. Insured perils include all risks of directphysical loss or damage including flood and earthquake, except asexcluded in policy forms. This policy also provides coverage foracts of terrorism, up to $150 million per occurrence.
The agency is not involved in any risk pools with other governmententities. During fiscal 2017, the agency recognized a loss of$499,507.84 related to an insurance recovery of an asset with anet book value less than the insurance proceeds for thereplacement of the asset.
WORKERS' COMPENSATION CLAIMS For workers' compensation claims, the Texas General Land Officeis covered by an assessment imposed by the State Office of RiskManagement (SORM). SORM now handles all claims for workers'compensation and unemployment.
RISK FINANCING In fiscal 2017, the Texas General Land Office did not pay any claimsrelated to attorneys’ fees.
Note 18 MANAGEMENT'S DISCUSSION AND ANALYSIS
AGENCY HIGHLIGHTS During fiscal 2017, the General Land Office purchased the buildinglocated at 713 E. Houston Street in San Antonio, Texas forinclusion in implementation of the Alamo Master Plan.
FINANCIAL HIGHLIGHTS Net Position, Governmental FundsThe assets of the agency's governmental funds exceeded itsliabilities at August 31, 2017 by $8,861,536,581.68 (presented asNet Position in Exhibits I and II). Of this amount,$8,740,970,457.08 is restricted for the benefit of the permanentschool fund (PSF), much of which is dedicated for investing in realassets.
Net Position, Proprietary FundsThe assets of the agency's proprietary funds exceeded its liabilitiesat August 31, 2017 by $775,027,056.09 (as presented in ExhibitsIII and IV). Of this amount, $75,477,176.34 is invested in capitalassets, net of related debt, $63,521.00 is restricted for thediscretely presented component unit, and the remaining$699,486,358.75 is restricted for the Veterans' Land Boardprograms.
Operational activities in the housing and land programs resultedin operating income of approximately $7.1 million. Along withoperational activities, the approximate income from investmentactivities of $8.1 million, net decrease in fair value of investmentsof $5.2 million, and net Transfers Out of $26.9 million to fundadministrative costs and to construct veterans’ cemeteries andveterans’ homes, contributed to a decrease in net position ofapproximately $17.2 million.
The State of Texas David A. Gloier State Veterans Home Programoperated at a profit of about $6.7 million. With other nonoperating revenues and transfers out of approximately $4.4million and $141 thousand, respectively, the program increasednet position by approximately $11 million.
PSF INVESTMENT ACTIVITY Since its formation as an independent Republic in 1836, Texas hasused its public lands to benefit its citizens. In 1854, the state ofTexas set aside the remainder of its public lands to create thepermanent school fund (PSF), a constitutional endowmentdedicated to the support of public education. Over the years, realproperty in the fund has been sold or leased and the proceedsinvested to foster growth of the PSF and generate income forpublic education. Today, the Texas General Land Office managesapproximately 13 million acres of subsurface real propertyinterests owned by the fund, providing a consistent source ofrevenue for Texas schoolchildren.
In 1985, the School Land Board was authorized to use land saleproceeds to acquire other interests in real property. In the ensuingyears, the board's investment authority has been modified andexpanded several times. Currently, §51.401 of the NaturalResource Code states that, "The board may designate fundsreceived from any land, mineral or royalty interest, real estateinvestment, or other interest, including revenue received fromthose sources, that is set apart to the permanent school fundunder the constitution and laws of this state together with themineral estate in riverbeds, channels, and the tidelands, includingislands, for deposit in the Real Estate Special Fund Account of thepermanent school fund in the State Treasury…"
Section 51.402 of the Natural Resource Code allows the board touse money designated under §51.401 to "add to a tract of publicschool land to form a tract of sufficient size to be manageable; toadd contiguous land to public school land; to acquire, as publicschool land, interests in real property for biological, commercial,
UNAUDITED
Annual Financial Report | 71
LOANS AND CONTRACTS RECEIVABLE Loans and contracts receivables are divided between current andnoncurrent assets. Current loans and contracts receivable for landcontracts are $1,191,142.95, land mortgages are $3,602,373.24,housing mortgages are $66,434,957.00, and home improvementloans are $1,779,007.97. Noncurrent loans and contractsreceivable for land contracts are $70,567,569.24, land mortgagesare $252,371,169.62, housing mortgages are $2,153,359,639.21,and home improvement loans are $33,785,543.79.
CAPITAL ASSETS In compliance with GASB Statement No. 34, depreciable assets arereported along with accumulated depreciation. Governmentalfunds report non depreciable assets for land of $7,219,600.19,construction in progress of $441,960.95, and other assets of$15,880,304.28.
Governmental funds report depreciable assets: buildings of$64,748,318.60 less accumulated depreciation of($29,622,309.78), furniture and equipment of $6,407,464.55 lessaccumulated depreciation of ($4,809,142.20), vehicles, boats andaircraft of $6,968,837.82 less accumulated depreciation of($4,515,083.27), intangible computer software of $969,156.96less accumulated amortization of ($716,129.16), facilities andother improvements of $276,021.77 less accumulateddepreciation of ($8,280.63), and other assets of $15,000 lessaccumulated depreciation of ($13,282.26).
The Veterans' Home Revenue Bond Funds report non depreciableassets for land of $4,039,500.00, and construction in progress of$10,497,181.38. The Veterans' Home Revenue Bond Funds reportdepreciable assets: buildings of $116,187,500.72 lessaccumulated depreciation of ($55,517,237.61), furniture andequipment of $744,477.97 less accumulated depreciation of($534,493.74), facilities and other improvements of $22,963.00less accumulated depreciation of ($6,696.90), and intangiblecomputer software of $146,555.00 less accumulated depreciationof ($146,555.00).
LONG-TERM DEBT The agency's debt obligations associated with bonds increased by$93,270,000.00. Changes in bonds payable is represented by$250,000,000.00 of new issuances including premiums received,and $156,730,000.00 of retired or matured bonds, includingamortization of premiums. For additional details, see Schedules 2A and 2 B.
SIGNIFICANT COMMITMENTS Between September 1, 2016 and August 31, 2017, the SLB closedon capital commitments to seven externally managed real assetsinvestment funds, separate accounts, or co investment vehicles ina total amount of approximately $942 million. At August 31, 2017,the SLB had approved and closed on total capital commitments,
UNAUDITEDTexas General Land Office and Veterans' Land Board (305)
geological, cultural, or recreational purposes; to acquire mineral and royalty interests for the use and benefit of the permanent school fund; to protect, maintain, or enhance the value of public school land; to acquire interest in real estate; to pay reasonable fees for professional services related to the permanent school fund investments; or to acquire, sell, lease, trade, improve, maintain, protect or use land, mineral or royalty interests, or real estate investments, an investment or interest in public infrastructure, or other interests, at such prices, and under such terms and conditions that board determines to be in the best interest of the permanent school fund." Before using funds for any of the above purposes, the board must determine that the use of the funds for the intended purpose is authorized, and by using the prudent investor standard, the board must also determine that the use of the funds for the intended purpose is in the best interest of the permanent school fund. Additionally, §51.402 states that the fair value of the investments in real assets on January 1 of each even numbered year, may not exceed an amount that is equal to 15 percent of the fair value of the permanent school fund on that date.
Approximately $571.1 million of capital commitments to externally managed real assets investment funds were funded between September 1, 2016 and August 31, 2017.
The current surface real property portfolio of the fund consists of 663,849.53 surface acres with a portfolio value of $651,403,390.37. The sovereign portion of this is located primarily in west Texas. 408,347.73 acres of sovereign land represent 61.5 percent of the total portfolio acreage but are only valued at $270,878,019.97, 41.6 percent of the total portfolio value. Some of this property, though marginally suitable, has been leased for grazing and hunting purposes. The remainder of the sovereign land, most of which is land locked, has little value other than for adjacent landowners who wish to increase their holdings. Over time, these properties will likely be sold.
The mineral reserve valuation of the permanent school fund's interest in oil and gas minerals is conducted by a third party entity on an annual basis. The fair value is determined using Comptroller guidelines for adjusting the reserve report by mean risk adjustment factors provided by the Society of Petroleum Evaluation Engineers.
The August 31, 2017 ending historical cost basis for the fund's land surface portfolio was $247,643,104.17. Contributions of approximately $2.3 million were made to development projects. The permanent school fund also manages approximately 13 million acres of Relinquishment Act, submerged, free royalty, and mineral reserved lands, and mineral estates on surface lands representing a basis of $13,432,925.10.
Dispositions for the fiscal year ended August 31, 2017, equaled 9,549.639 acres, for a loss of approximately $11.9 million.
72 | Annual Financial Report
net of any capital commitments associated with any investmentsthat were subsequently sold or dissolved, of approximately $5.64billion to 59 funds and eight co investment vehicles, of whichapproximately $2.04 billion remains unfunded. There were nonew capital commitments to externally managed real assetsinvestment funds or co investment vehicles that were not yetclosed at August 31, 2017.
On August 8, 2016, the SLB adopted a resolution that releases$490 million from the Real Estate Special Fund Account (RESFA)during fiscal 2018 and fiscal 2019 to the State Board of Educationfor investment in the PSF. The funds are scheduled to be releasedin four quarterly installments of $58.75 million each on the 25th
day (or next succeeding business day if the 25th is not a businessday) of November 2017, February 2018, May 2018, and August2018, and four quarterly installments of $63.75 million each onthe 25th day (or next succeeding business day if the 25th is not abusiness day) of November 2018, February 2019, April 2019, andAugust 2019, respectively.
On April 4, 2017, the SLB adopted a resolution that releases $300million from the Real Estate Special Fund Account (RESFA) duringfiscal 2018 and fiscal 2019 to the State Board of Education forinvestment in the PSF. The funds are scheduled to be released infour quarterly installments of $75 million each on the 25th day (ornext succeeding business day if the 25th is not a business day) ofNovember 2018, February 2019, May 2019, and August 2019,respectively.
BANKRUPTCIES The agency had filed proofs of claim in these pending bankruptciesfor the following amounts:
a. Energy & Exploration Partners, LLC $46,310.41b. Linc USA GP $5,579.39c. SandRidge Energy, Inc. and SandRidge Exploration &
Production, LLC $23,995,494 in each bankruptcyproceeding
d. Penn Virginia Corp $54,845.35 (filed 11/2/2016)e. Breitburn Energy Partners LP $52,382.89 (filed
11/2/2016)f. Galveston Bay Energy, LLC $10,702.58 (filed 11/7/2016)
Any revenues received from these bankruptcy proceedings will berecognized in the year collections are received.
Prior to fiscal 2017, the agency had a claim amount of$4,702,727.33 for oil and gas sales transactions related to EnronCorporations, of which none was accrued as revenue in the yearof bankruptcy due to the unlikeliness of it collection. Revenues willbe recognized in the year collections are received. The agency hasreceived $2,765,691.55 through August 31, 2017.
Note 19 THE FINANCIAL REPORTING ENTITY
RELATED ORGANIZATIONS Related party transactions arise when an entity engages intransactions in which one of the parties has the ability tosignificantly influence the policies of the other, or in which a nontransacting party has the ability to influence the policies of the twotransacting parties.
TENANCY IN COMMON In July 2007, a one half tenancy in common interest was formedbetween the School Land Board and Cherokee Sugar Land, LP, forthe use and benefit of the Permanent School Fund (PSF). This jointtenancy in common was formed to develop the combined tractsof land over several years. The PSF will pay one half of thedevelopment cost, and will participate in one half of all income.Imperial Johnson, LLC, the development manager, submits anannual budget to the PSF for approval. During fiscal 2017, a totalof approximately $1.8 million was contributed to funddevelopment costs. Additionally, a payable of approximately $49thousand for development costs has been accrued as of August31, 2017. Audits of the 2016 and 2017 financials of the jointtenancy in common have been engaged. Once completed, thereports will be available upon request. The August 31, 2017financial statements of the joint tenancy in common have beenconsolidated into the PSF financial statements.
JOINT VENTURES In 2005, the Permanent School Fund (PSF) acquired 1,984 acreslocated in New Braunfels, Texas fee simple, associated with aDevelopment/Disposition Agreement with RS New Braunfels, LTDand RS New Braunfels, Two, LTD. The purpose of the contractualagreement was for the agent to obtain necessary entitlements toenhance the value and marketability of the assets. Audits of the2016 and 2017 financial statements have been engaged. Oncecompleted, the reports will be available upon request.
In August 2012, Galveston Preserve at West Beach, Ltd., a Texaslimited partnership, was formed between MP MarquetteGalveston LLC and Marquette Preserve, LP, LLC – both Texaslimited liability companies – and the School Land Board for the useand benefit of the Permanent School Fund. The School Land Boardis a 95 percent limited partner. The Permanent School Fundcontributed 1,031.52 acres to the partnership. The acreage will beused for a mixed use residential/commercial development. The2016 financial statements were compiled by an independentaccounting firm and are available upon request. An audit of the2017 financials has been engaged. Once completed, the reportwill be available upon request.
UNAUDITED
Annual Financial Report | 73
In April 2014, Grand Parkway 1358, LP, a Texas limitedpartnership, was formed between Johnson GP 1358, LLC andJohnson 1258 Investors LLC – both Texas limited liabilitycompanies – and the School Land Board for the use and benefit ofthe Permanent School Fund (PSF). The School Land Board is a 95percent limited partner. The development, known as HarvestGreen, will be a mixed use residential/commercial developmentlocated near Sugarland, Texas. The PSF contributed 1,343.679acres of land to the partnership. The general partner, and otherlimited partners, will secure third party financing debt in the formof development loans to fund the development and infrastructurefor the project. The infrastructure for the master planneddevelopment began in late 2014. Audits of the 2016 and 2017financial statements have been engaged. Once completed, thereports will be available upon request.
In May 2017, 290 WR Holdings LP, a Texas limited partnership wasformed between Johnson WR Investors LLC, Johnson WR GP LLC,and the School Land Board for the use and benefit of thePermanent School Fund (PSF). The partnership acquired 1,617acres located in northwest Houston. The property is planned for afuture master planned community. Construction is scheduled tobegin in approximately two years.
DISCRETELY PRESENTED COMPONENT UNITS The Texas Natural Resources Code Ch. 31.451(d) authorizes theTexas General Land Office to participate in the establishment ofand partner with a qualifying nonprofit organization for purposeswhich include raising funds for or providing services or otherbenefits for the preservation and maintenance of the Alamocomplex. The land office may contract with the organization forthe performance of any activity.
The Alamo Endowment, a Texas 501(c)(3) non profit corporation,was created to provide resources and support for the preservationand maintenance of the Alamo Complex and its contents locatedin San Antonio, Texas. The organization's goals are to promote theAlamo Complex and provide for the preservation, education,management and restoration of the Alamo Complex, includingraising of funds to achieve these purposes.
The Texas General Land Office currently includes the AlamoEndowment as a discrete component unit in its financialstatements. The Alamo Endowment is a legally separate entitywhose relationship with the GLO is such that inclusion in GLO'sfinancial statements is required under GASB Statements 14, 39,and 61. The land commissioner of the General Land Office is apermanent director, ex officio with full voting rights, who servesas the Chairman of the Board of Directors of the AlamoEndowment. The remaining board members are individualsappointed by the land commissioner and may be removed by thecommissioner at any time with or without cause.
The Alamo Endowment provides consolidated audited financialstatements for the period July 1 through June 30 of each year to
the Texas General Land Office for inclusion as a discretecomponent unit in its annual financial statements. These auditedfinancial statements can be obtained directly from The AlamoEndowment’s administrative offices at PO Box 2099, San Antonio,TX 78297.
Alamo Complex Management (ACM), an affiliate of the AlamoEndowment, was organized for the exclusive benefit of, toperform the functions of, and to carry out and support the generalcharitable purposes of the Alamo Endowment. Alamo ComplexManagement, as a supporting organization of the AlamoEndowment, has contracted with the Endowment for thepreservation, management, education, maintenance, operationand restoration of the Alamo Complex. As such, the Endowmentdelegated to ACM the day to day management of the AlamoComplex, including personnel, education, grounds, maintenance,security, events, and programming. Alamo Complex Managementis a blended component unit of the Alamo Endowment and isincluded as such in the consolidated financial statements of theEndowment.
Remember the Alamo Foundation, an affiliate of the AlamoEndowment, was organized for the sole purposes of benefitingthe Alamo Endowment with the focus on charitable andeducational purposes. Remember the Alamo Foundation is ablended component unit of the Alamo Endowment and isincluded as such in the consolidated financial statements of theEndowment.
During the fiscal year, GLO reimbursed ACM for expenses relatedto the operation and maintenance of the Alamo and all revenuesreceived by ACM are transferred to the Treasury for the benefit ofthe Alamo. The expenditures and revenues of the Alamo Complexare presented in the Combining Statement of Revenues,Expenditures, and Changes in Fund Balance.
Note 20 STEWARDSHIP, COMPLIANCE, ANDACCOUNTABILITY
ACCOUNTABILITY A deficit net position was reported in fiscal 2017 in AppropriatedFund 0383 and 0385 is the result of liabilities for bonds payableexceeding asset balances.
UNAUDITEDTexas General Land Office and Veterans' Land Board (305)
74 | Annual Financial Report
Note 21 N/A
Not applicable.
Note 22 DONOR RESTRICTED ENDOWMENTS
The net appreciation (cumulative and unexpended) on donorrestricted endowments as presented in Table 30 on the right isavailable for authorization for expenditure by the School LandBoard (SLB). The SLB is responsible for the investment of moneyin the Real Estate Special Fund Account (RESFA) of the permanentschool fund.
Texas Natural Resource Code Ann., §51.402 allows the board touse money designated under §51.401 to "add to a tract of publicschool land to form a tract of sufficient size to be manageable; toadd contiguous land to public school land; to acquire, as publicschool land, interests in real property for biological, commercial,geological, cultural, or recreational purposes; to acquire mineraland royalty interests for the use and benefit of the permanentschool fund; to protect, maintain, or enhance the value of publicschool land; to acquire interests in real estate; to pay reasonablefees for professional services related to permanent school fundinvestment; or to acquire, sell, lease, trade, improve, maintain,protect, or use land, mineral and royalty interests, or real estateinvestments, an investment or interest in public infrastructure, orother interests, at such prices and under such terms andconditions the board determines to be in the best interest of thepermanent school fund." Before using funds for any of the abovepurposes, the board must determine that the use of the funds forthe intended purpose is authorized, and by using the prudentinvestor standard, the board must also determine that the use ofthe funds for the intended purpose is in the best interest of thepermanent school fund. The Texas Education Agency (TEA),agency 701, will report the remaining balances.
Note 23 EXTRAORDINARY AND SPECIAL ITEMS
Not applicable.
Note 24 DISAGGREGATION OF RECEIVABLE ANDPAYABLE BALANCES
Details of the receivable and payable balances that may have beenobscured by aggregation on the financial statements are reportedin Table 31 on page 76.
Note 25 TERMINATION BENEFITS
The GLO offered a financial incentive to employees who werewilling and eligible to retire from the agency. The incentive was aone time payment of $15,000. Eligibility requirements includedprovisions regarding tenure with the GLO and eligibility to retireby August 31, 2017. A total of 13 employees participated in theprogram. The agency’s expenditure for this program was$195,000. One employee was eligible to retire September 30,2017 and was paid $15,000 from 2018 funds.
Note 26 SEGMENT INFORMATION
Not applicable.
Table 30DONOR RESTRICTED ENDOWMENTS
Permanent SchoolFund (PSF)
$Nonspendable Corpus of the Fund 7,153,059,268.57Nonspendable for Inventory 99,946.00Nonspendable for Prepaid Items 487.95Restricted Income of the Fund 1,587,810,754.56
Balance at Fiscal Year End 8,740,970,457.08
UNAUDITED
Annual Financial Report | 75
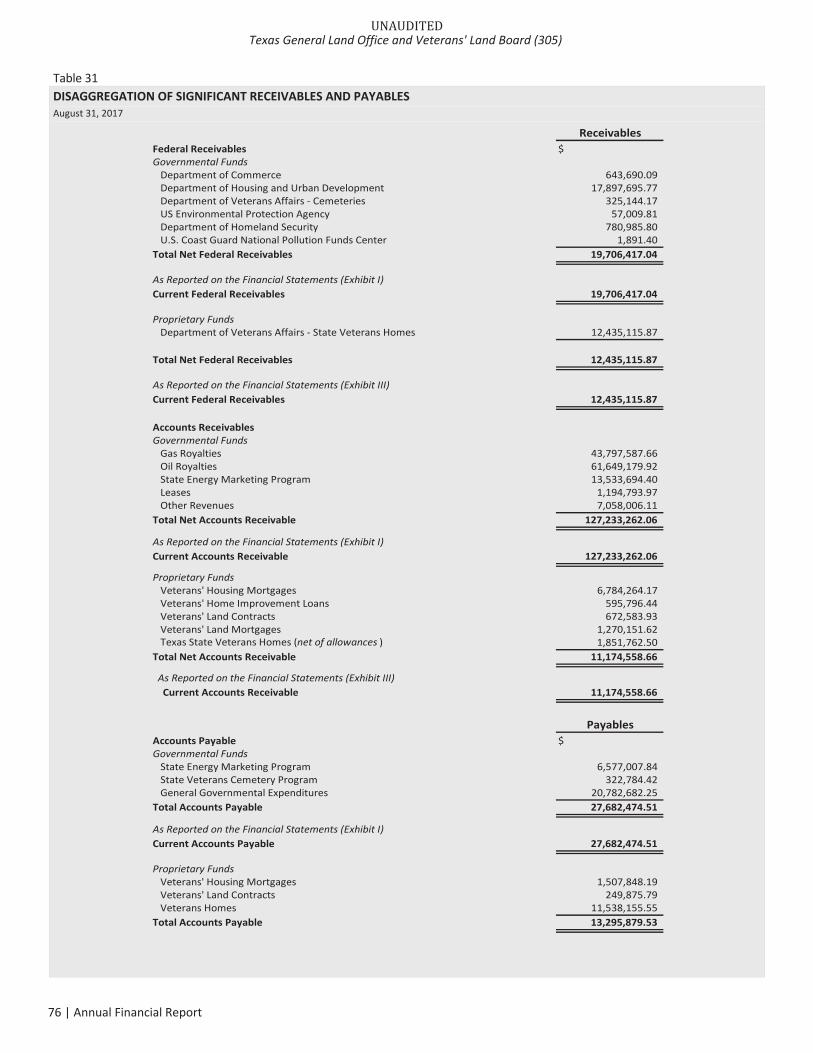
Table 31DISAGGREGATION OF SIGNIFICANT RECEIVABLES AND PAYABLESAugust 31, 2017
ReceivablesFederal Receivables $Governmental Funds
Department of Commerce 643,690.09Department of Housing and Urban Development 17,897,695.77Department of Veterans Affairs Cemeteries 325,144.17US Environmental Protection Agency 57,009.81Department of Homeland Security 780,985.80U.S. Coast Guard National Pollution Funds Center 1,891.40
Total Net Federal Receivables 19,706,417.04
As Reported on the Financial Statements (Exhibit I)Current Federal Receivables 19,706,417.04
Proprietary FundsDepartment of Veterans Affairs State Veterans Homes 12,435,115.87
Total Net Federal Receivables 12,435,115.87
As Reported on the Financial Statements (Exhibit III)Current Federal Receivables 12,435,115.87
Accounts ReceivablesGovernmental Funds
Gas Royalties 43,797,587.66Oil Royalties 61,649,179.92State Energy Marketing Program 13,533,694.40Leases 1,194,793.97Other Revenues 7,058,006.11
Total Net Accounts Receivable 127,233,262.06
As Reported on the Financial Statements (Exhibit I)Current Accounts Receivable 127,233,262.06
Proprietary FundsVeterans' Housing Mortgages 6,784,264.17Veterans' Home Improvement Loans 595,796.44Veterans' Land Contracts 672,583.93Veterans' Land Mortgages 1,270,151.62Texas State Veterans Homes (net of allowances ) 1,851,762.50
Total Net Accounts Receivable 11,174,558.66
As Reported on the Financial Statements (Exhibit III)Current Accounts Receivable 11,174,558.66
PayablesAccounts Payable $Governmental Funds
State Energy Marketing Program 6,577,007.84State Veterans Cemetery Program 322,784.42General Governmental Expenditures 20,782,682.25
Total Accounts Payable 27,682,474.51
As Reported on the Financial Statements (Exhibit I)Current Accounts Payable 27,682,474.51
Proprietary FundsVeterans' Housing Mortgages 1,507,848.19Veterans' Land Contracts 249,875.79Veterans Homes 11,538,155.55
Total Accounts Payable 13,295,879.53
UNAUDITEDTexas General Land Office and Veterans' Land Board (305)
76 | Annual Financial Report
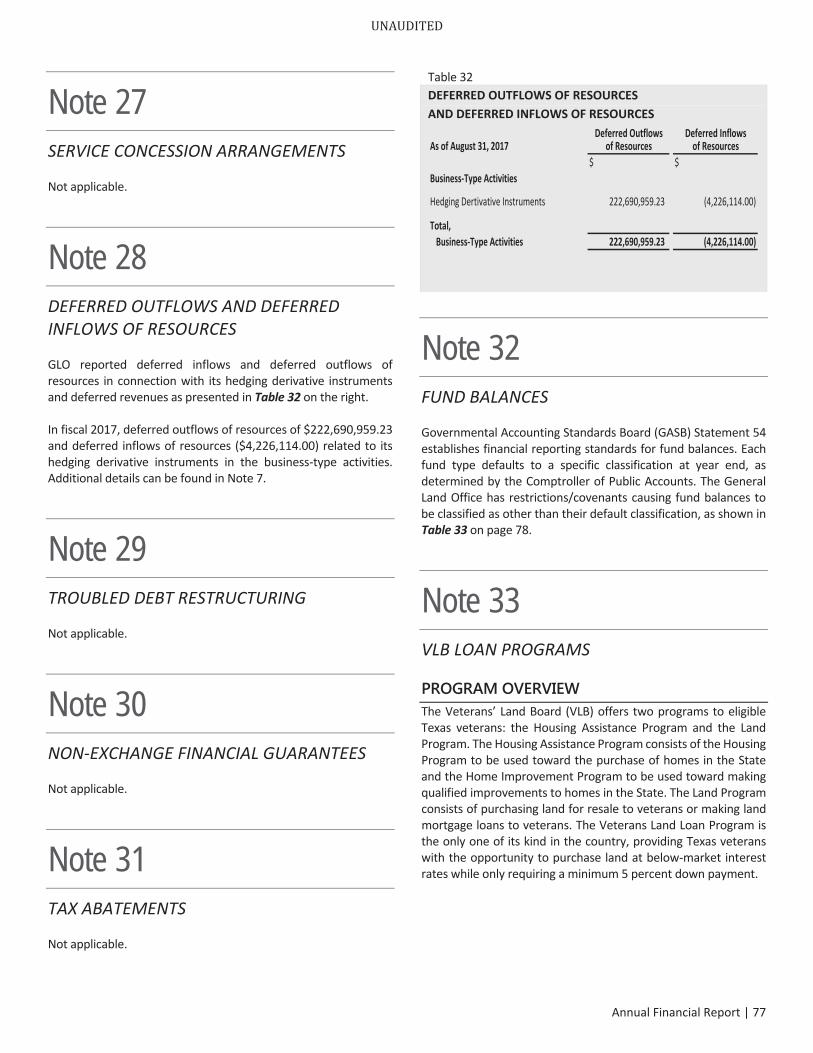
Note 27 SERVICE CONCESSION ARRANGEMENTS
Not applicable.
Note 28 DEFERRED OUTFLOWS AND DEFERREDINFLOWS OF RESOURCES
GLO reported deferred inflows and deferred outflows ofresources in connection with its hedging derivative instrumentsand deferred revenues as presented in Table 32 on the right.
In fiscal 2017, deferred outflows of resources of $222,690,959.23and deferred inflows of resources ($4,226,114.00) related to itshedging derivative instruments in the business type activities.Additional details can be found in Note 7.
Note 29 TROUBLED DEBT RESTRUCTURING
Not applicable.
Note 30 NON EXCHANGE FINANCIAL GUARANTEES
Not applicable.
Note 31 TAX ABATEMENTS
Not applicable.
Note 32 FUND BALANCES
Governmental Accounting Standards Board (GASB) Statement 54establishes financial reporting standards for fund balances. Eachfund type defaults to a specific classification at year end, asdetermined by the Comptroller of Public Accounts. The GeneralLand Office has restrictions/covenants causing fund balances tobe classified as other than their default classification, as shown inTable 33 on page 78.
Note 33 VLB LOAN PROGRAMS
PROGRAM OVERVIEW The Veterans’ Land Board (VLB) offers two programs to eligibleTexas veterans: the Housing Assistance Program and the LandProgram. The Housing Assistance Program consists of the HousingProgram to be used toward the purchase of homes in the Stateand the Home Improvement Program to be used toward makingqualified improvements to homes in the State. The Land Programconsists of purchasing land for resale to veterans or making landmortgage loans to veterans. The Veterans Land Loan Program isthe only one of its kind in the country, providing Texas veteranswith the opportunity to purchase land at below market interestrates while only requiring a minimum 5 percent down payment.
Table 32DEFERRED OUTFLOWS OF RESOURCESAND DEFERRED INFLOWS OF RESOURCES
Deferred Outflows Deferred InflowsAs of August 31, 2017 of Resources of Resources
$ $Business Type Activities
Hedging Dertivative Instruments 222,690,959.23 (4,226,114.00)
Total,Business Type Activities 222,690,959.23 (4,226,114.00)
UNAUDITED
Annual Financial Report | 77
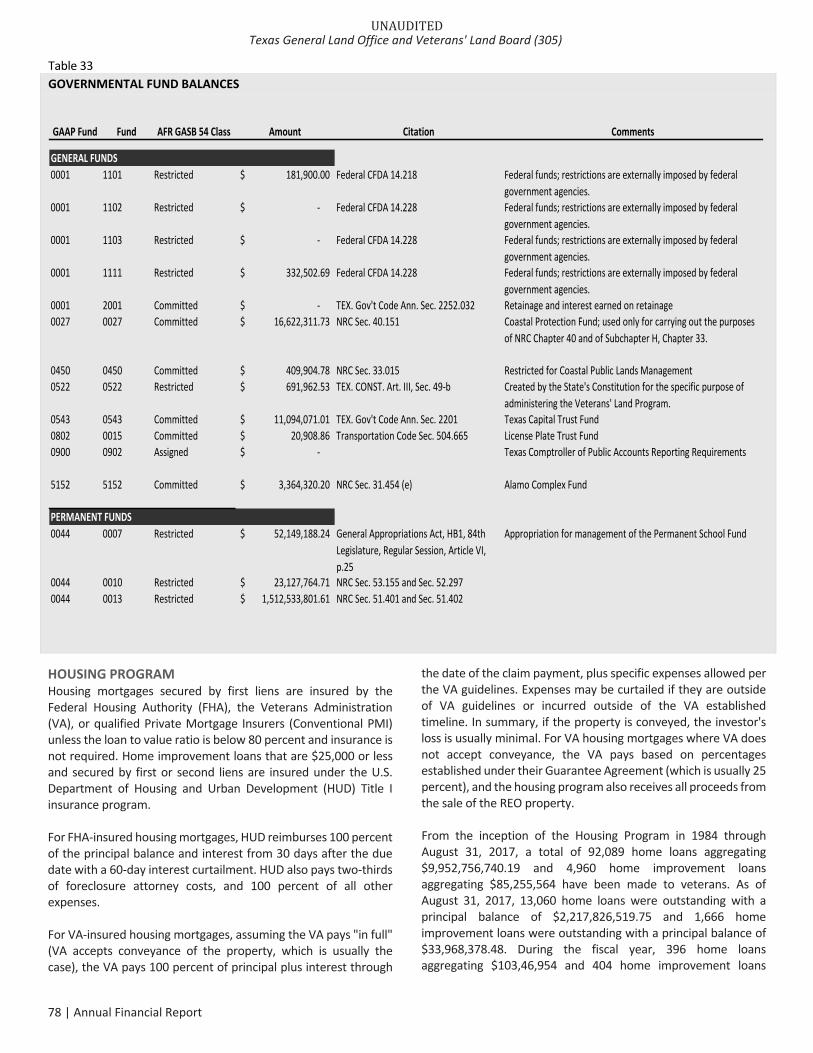
HOUSING PROGRAMHousing mortgages secured by first liens are insured by theFederal Housing Authority (FHA), the Veterans Administration(VA), or qualified Private Mortgage Insurers (Conventional PMI)unless the loan to value ratio is below 80 percent and insurance isnot required. Home improvement loans that are $25,000 or lessand secured by first or second liens are insured under the U.S.Department of Housing and Urban Development (HUD) Title Iinsurance program.
For FHA insured housing mortgages, HUD reimburses 100 percentof the principal balance and interest from 30 days after the duedate with a 60 day interest curtailment. HUD also pays two thirdsof foreclosure attorney costs, and 100 percent of all otherexpenses.
For VA insured housing mortgages, assuming the VA pays "in full"(VA accepts conveyance of the property, which is usually thecase), the VA pays 100 percent of principal plus interest through
the date of the claim payment, plus specific expenses allowed perthe VA guidelines. Expenses may be curtailed if they are outsideof VA guidelines or incurred outside of the VA establishedtimeline. In summary, if the property is conveyed, the investor'sloss is usually minimal. For VA housing mortgages where VA doesnot accept conveyance, the VA pays based on percentagesestablished under their Guarantee Agreement (which is usually 25percent), and the housing program also receives all proceeds fromthe sale of the REO property.
From the inception of the Housing Program in 1984 throughAugust 31, 2017, a total of 92,089 home loans aggregating$9,952,756,740.19 and 4,960 home improvement loansaggregating $85,255,564 have been made to veterans. As ofAugust 31, 2017, 13,060 home loans were outstanding with aprincipal balance of $2,217,826,519.75 and 1,666 homeimprovement loans were outstanding with a principal balance of$33,968,378.48. During the fiscal year, 396 home loansaggregating $103,46,954 and 404 home improvement loans
UNAUDITEDTexas General Land Office and Veterans' Land Board (305)
78 | Annual Financial Report
Table 33 GOVERNMENTAL FUND BALANCES
GAAP Fund Fund AFR GASB 54 Class Amount Citation Comments
0001 1101 Restricted $
0001 1102 Restricted $
0001 1103 Restricted $
0001 1111 Restricted $
181,900.00 Federal CFDA 14.218
‐ Federal CFDA 14.228
‐ Federal CFDA 14.228
332,502.69 Federal CFDA 14.228
0001 2001 Committed $ 0027 0027 Committed $
‐ TEX. Gov't Code Ann. Sec. 2252.032 16,622,311.73 NRC Sec. 40.151
0450 0450 Committed $ 0522 0522 Restricted $
409,904.78 NRC Sec. 33.015 691,962.53 TEX. CONST. Art. III, Sec. 49‐b
0543 0543 Committed $ 11,094,071.01 TEX. Gov't Code Ann. Sec. 22010802 0015 Committed $ 20,908.86 Transportation Code Sec. 504.6650900 0902 Assigned ‐$
5152 5152 Committed $ 3,364,320.20 NRC Sec. 31.454 (e)
PERMANENT FUNDS0044 0007 Restricted $
Federal funds; restrictions are externally imposed by federal government agencies.Federal funds; restrictions are externally imposed by federal government agencies.Federal funds; restrictions are externally imposed by federal government agencies.Federal funds; restrictions are externally imposed by federal government agencies.Retainage and interest earned on retainageCoastal Protection Fund; used only for carrying out the purposes of NRC Chapter 40 and of Subchapter H, Chapter 33.
Restricted for Coastal Public Lands ManagementC r byea te thed State's Constitution for the specific purpose of administering the Veterans' Land Program.Texas Capital Trust FundLicense Plate Trust FundTexas Comptroller of Public Accounts Reporting Requirements
Alamo Complex Fund
Appropriation for management of the Permanent School Fund
0044 0010 Restricted $
52,149,188.24 General Appropriations Act, HB1, 84th Legislature, Regular Session, Article VI, p.25
23,127,764.71 NRC Sec. 53.155 and Sec. 52.2970044 0013 Restricted $ 1,512,533,801.61 NRC Sec. 51.401 and Sec. 51.402
GENERAL FUNDS
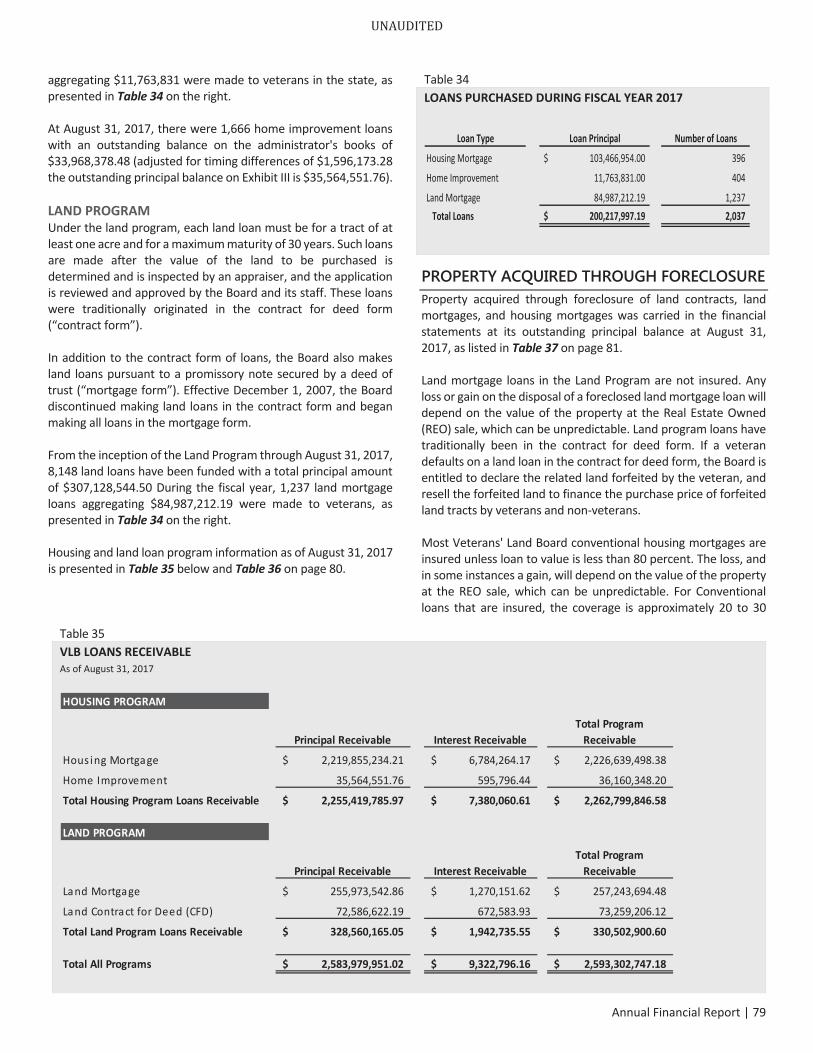
aggregating $11,763,831 were made to veterans in the state, aspresented in Table 34 on the right.
At August 31, 2017, there were 1,666 home improvement loanswith an outstanding balance on the administrator's books of$33,968,378.48 (adjusted for timing differences of $1,596,173.28the outstanding principal balance on Exhibit III is $35,564,551.76).
LAND PROGRAMUnder the land program, each land loan must be for a tract of atleast one acre and for a maximum maturity of 30 years. Such loansare made after the value of the land to be purchased isdetermined and is inspected by an appraiser, and the applicationis reviewed and approved by the Board and its staff. These loanswere traditionally originated in the contract for deed form(“contract form”).
In addition to the contract form of loans, the Board also makesland loans pursuant to a promissory note secured by a deed oftrust (“mortgage form”). Effective December 1, 2007, the Boarddiscontinued making land loans in the contract form and beganmaking all loans in the mortgage form.
From the inception of the Land Program through August 31, 2017,8,148 land loans have been funded with a total principal amountof $307,128,544.50 During the fiscal year, 1,237 land mortgageloans aggregating $84,987,212.19 were made to veterans, aspresented in Table 34 on the right.
Housing and land loan program information as of August 31, 2017is presented in Table 35 below and Table 36 on page 80.
PROPERTY ACQUIRED THROUGH FORECLOSURE Property acquired through foreclosure of land contracts, landmortgages, and housing mortgages was carried in the financialstatements at its outstanding principal balance at August 31,2017, as listed in Table 37 on page 81.
Land mortgage loans in the Land Program are not insured. Anyloss or gain on the disposal of a foreclosed land mortgage loan willdepend on the value of the property at the Real Estate Owned(REO) sale, which can be unpredictable. Land program loans havetraditionally been in the contract for deed form. If a veterandefaults on a land loan in the contract for deed form, the Board isentitled to declare the related land forfeited by the veteran, andresell the forfeited land to finance the purchase price of forfeitedland tracts by veterans and non veterans.
Most Veterans' Land Board conventional housing mortgages areinsured unless loan to value is less than 80 percent. The loss, andin some instances a gain, will depend on the value of the propertyat the REO sale, which can be unpredictable. For Conventionalloans that are insured, the coverage is approximately 20 to 30
Table 35VLB LOANS RECEIVABLEAs of August 31, 2017
HOUSING PROGRAM
Principal Receivable Interest ReceivableTotal ProgramReceivable
Hous ing Mortgage 2,219,855,234.21$ 6,784,264.17$ 2,226,639,498.38$
Home Improvement 35,564,551.76 595,796.44 36,160,348.20
Total Housing Program Loans Receivable 2,255,419,785.97$ 7,380,060.61$ 2,262,799,846.58$
LAND PROGRAM
Principal Receivable Interest ReceivableTotal ProgramReceivable
Land Mortgage 255,973,542.86$ 1,270,151.62$ 257,243,694.48$
Land Contract for Deed (CFD) 72,586,622.19 672,583.93 73,259,206.12
Total Land Program Loans Receivable 328,560,165.05$ 1,942,735.55$ 330,502,900.60$
Total All Programs 2,583,979,951.02$ 9,322,796.16$ 2,593,302,747.18$
Table 34LOANS PURCHASED DURING FISCAL YEAR 2017
Loan Type Loan Principal Number of Loans
Housing Mortgage 103,466,954.00$ 396
Home Improvement 11,763,831.00 404
Land Mortgage 84,987,212.19 1,237Total Loans 200,217,997.19$ 2,037
UNAUDITED
Annual Financial Report | 79
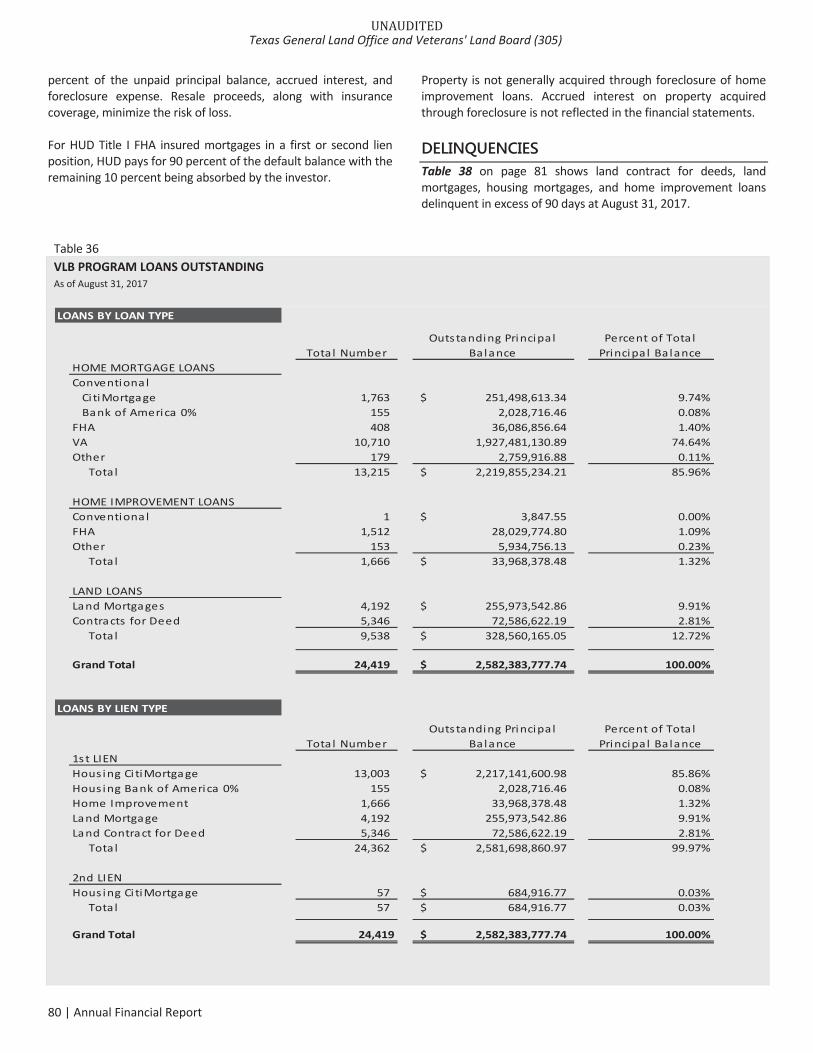
percent of the unpaid principal balance, accrued interest, andforeclosure expense. Resale proceeds, along with insurancecoverage, minimize the risk of loss.
For HUD Title I FHA insured mortgages in a first or second lienposition, HUD pays for 90 percent of the default balance with theremaining 10 percent being absorbed by the investor.
Property is not generally acquired through foreclosure of homeimprovement loans. Accrued interest on property acquiredthrough foreclosure is not reflected in the financial statements.
DELINQUENCIES Table 38 on page 81 shows land contract for deeds, landmortgages, housing mortgages, and home improvement loansdelinquent in excess of 90 days at August 31, 2017.
Table 36VLB PROGRAM LOANS OUTSTANDINGAs of August 31, 2017
Tota l NumberOutstanding Principa l
Ba lancePercent of Tota l
Principa l Ba lanceHOME MORTGAGE LOANSConventiona l
Ci tiMortgage 1,763 251,498,613.34$ 9.74%Bank of America 0% 155 2,028,716.46 0.08%
FHA 408 36,086,856.64 1.40%VA 10,710 1,927,481,130.89 74.64%Other 179 2,759,916.88 0.11%
Tota l 13,215 2,219,855,234.21$ 85.96%
HOME IMPROVEMENT LOANSConventiona l 1 3,847.55$ 0.00%FHA 1,512 28,029,774.80 1.09%Other 153 5,934,756.13 0.23%
Tota l 1,666 33,968,378.48$ 1.32%
LAND LOANSLand Mortgages 4,192 255,973,542.86$ 9.91%Contracts for Deed 5,346 72,586,622.19 2.81%
Tota l 9,538 328,560,165.05$ 12.72%
Grand Total 24,419 2,582,383,777.74$ 100.00%
Tota l NumberOutstanding Principa l
Ba lancePercent of Tota l
Principa l Ba lance1st LIENHous ing Ci tiMortgage 13,003 2,217,141,600.98$ 85.86%Hous ing Bank of America 0% 155 2,028,716.46 0.08%Home Improvement 1,666 33,968,378.48 1.32%Land Mortgage 4,192 255,973,542.86 9.91%Land Contract for Deed 5,346 72,586,622.19 2.81%
Tota l 24,362 2,581,698,860.97$ 99.97%
2nd LIENHous ing Ci tiMortgage 57 684,916.77$ 0.03%
Tota l 57 684,916.77$ 0.03%
Grand Total 24,419 2,582,383,777.74$ 100.00%
LOANS BY LOAN TYPE
LOANS BY LIEN TYPE
UNAUDITEDTexas General Land Office and Veterans' Land Board (305)
80 | Annual Financial Report
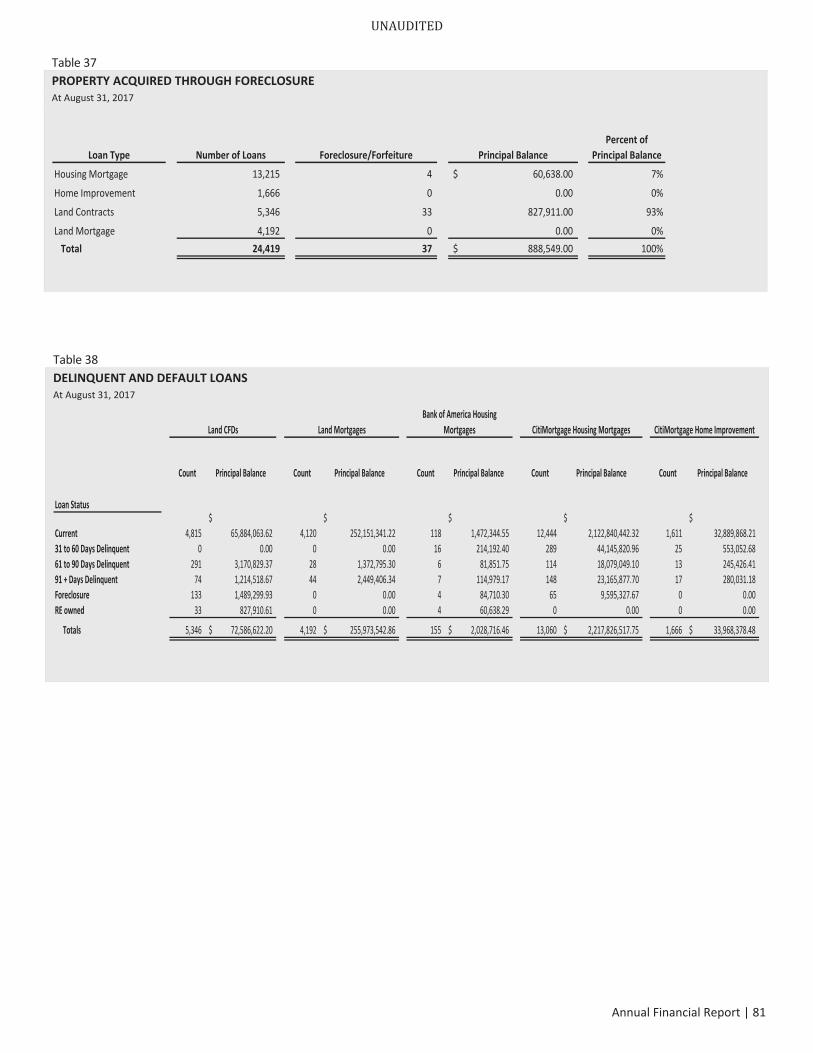
Table 37PROPERTY ACQUIRED THROUGH FORECLOSUREAt August 31, 2017
Loan Type Number of Loans Foreclosure/Forfeiture Principal BalancePercent of
Principal Balance
Housing Mortgage 13,215 4 60,638.00$ 7%
Home Improvement 1,666 0 0.00 0%
Land Contracts 5,346 33 827,911.00 93%
Land Mortgage 4,192 0 0.00 0%Total 24,419 37 888,549.00$ 100%
Table 38DELINQUENT AND DEFAULT LOANSAt August 31, 2017
Count Principal Balance Count Principal Balance Count Principal Balance Count Principal Balance Count Principal Balance
Loan Status$ $ $ $ $
Current 4,815 65,884,063.62 4,120 252,151,341.22 118 1,472,344.55 12,444 2,122,840,442.32 1,611 32,889,868.2131 to 60 Days Delinquent 0 0.00 0 0.00 16 214,192.40 289 44,145,820.96 25 553,052.6861 to 90 Days Delinquent 291 3,170,829.37 28 1,372,795.30 6 81,851.75 114 18,079,049.10 13 245,426.4191 + Days Delinquent 74 1,214,518.67 44 2,449,406.34 7 114,979.17 148 23,165,877.70 17 280,031.18Foreclosure 133 1,489,299.93 0 0.00 4 84,710.30 65 9,595,327.67 0 0.00RE owned 33 827,910.61 0 0.00 4 60,638.29 0 0.00 0 0.00
Totals 5,346 72,586,622.20$ 4,192 255,973,542.86$ 155 2,028,716.46$ 13,060 2,217,826,517.75$ 1,666 33,968,378.48$
Land CFDs Land MortgagesBank of America Housing
Mortgages CitiMortgage Housing Mortgages CitiMortgage Home Improvement
UNAUDITED
Annual Financial Report | 81
(This page intentionally left blank)
UNAUDITEDTexas General Land Office and Veterans' Land Board (305)
82 | Annual Financial Report
COMBINING
FINANCIAL STATEMENTS
UNAUDITED ANNUAL FINANCIAL REPORTAUGUST 31, 2017
TEXAS GENERAL LAND OFFICE
VETERANS' LAND BOARD
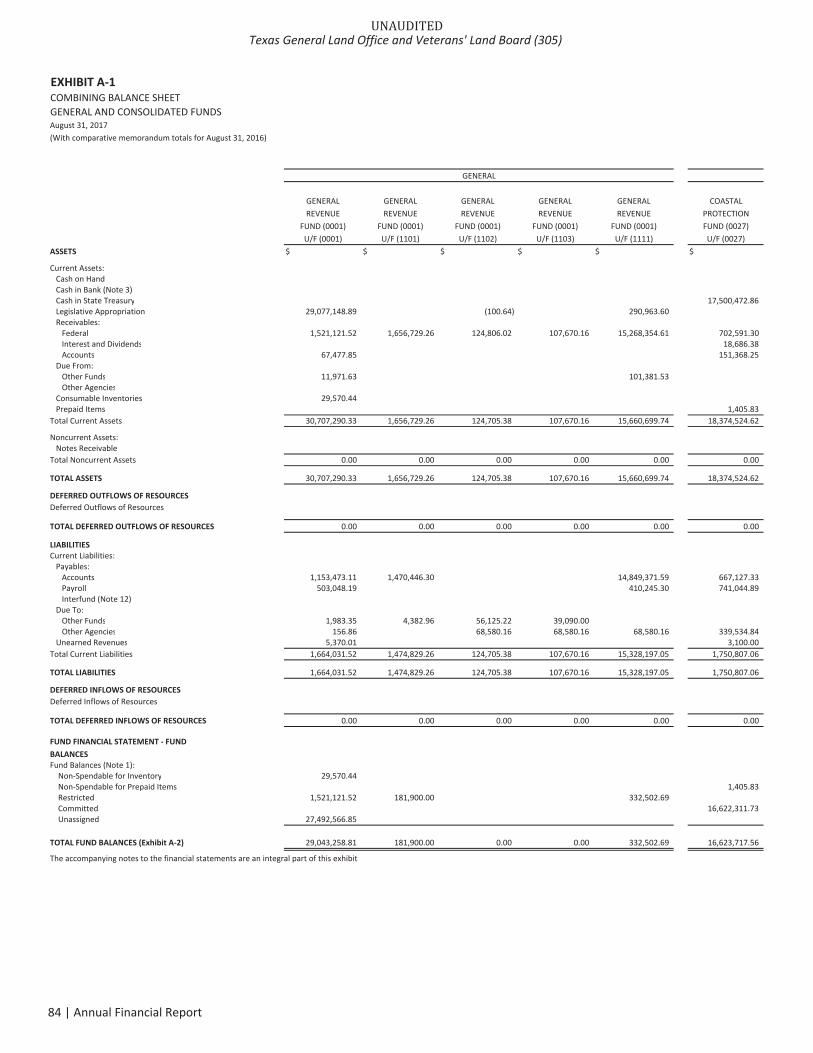
EXHIBIT A 1COMBINING BALANCE SHEETGENERAL AND CONSOLIDATED FUNDSAugust 31, 2017(With comparative memorandum totals for August 31, 2016)
GENERAL
GENERAL GENERAL GENERAL GENERAL GENERAL COASTALREVENUE REVENUE REVENUE REVENUE REVENUE PROTECTION
FUND (0001) FUND (0001) FUND (0001) FUND (0001) FUND (0001) FUND (0027)U/F (0001) U/F (1101) U/F (1102) U/F (1103) U/F (1111) U/F (0027)
ASSETS $ $ $ $ $ $
Current Assets:Cash on HandCash in Bank (Note 3)Cash in State Treasury 17,500,472.86Legislative Appropriation 29,077,148.89 (100.64) 290,963.60Receivables:
Federal 1,521,121.52 1,656,729.26 124,806.02 107,670.16 15,268,354.61 702,591.30Interest and Dividends 18,686.38Accounts 67,477.85 151,368.25
Due From:Other Funds 11,971.63 101,381.53Other Agencies
Consumable Inventories 29,570.44Prepaid Items 1,405.83
Total Current Assets 30,707,290.33 1,656,729.26 124,705.38 107,670.16 15,660,699.74 18,374,524.62
Noncurrent Assets:Notes Receivable
Total Noncurrent Assets 0.00 0.00 0.00 0.00 0.00 0.00
TOTAL ASSETS 30,707,290.33 1,656,729.26 124,705.38 107,670.16 15,660,699.74 18,374,524.62
DEFERRED OUTFLOWS OF RESOURCESDeferred Outflows of Resources
TOTAL DEFERRED OUTFLOWS OF RESOURCES 0.00 0.00 0.00 0.00 0.00 0.00
LIABILITIESCurrent Liabilities:
Payables:Accounts 1,153,473.11 1,470,446.30 14,849,371.59 667,127.33Payroll 503,048.19 410,245.30 741,044.89Interfund (Note 12)
Due To:Other Funds 1,983.35 4,382.96 56,125.22 39,090.00Other Agencies 156.86 68,580.16 68,580.16 68,580.16 339,534.84
Unearned Revenues 5,370.01 3,100.00Total Current Liabilities 1,664,031.52 1,474,829.26 124,705.38 107,670.16 15,328,197.05 1,750,807.06
TOTAL LIABILITIES 1,664,031.52 1,474,829.26 124,705.38 107,670.16 15,328,197.05 1,750,807.06
DEFERRED INFLOWS OF RESOURCESDeferred Inflows of Resources
TOTAL DEFERRED INFLOWS OF RESOURCES 0.00 0.00 0.00 0.00 0.00 0.00
FUND FINANCIAL STATEMENT FUNDBALANCESFund Balances (Note 1):
Non Spendable for Inventory 29,570.44Non Spendable for Prepaid Items 1,405.83Restricted 1,521,121.52 181,900.00 332,502.69Committed 16,622,311.73Unassigned 27,492,566.85
TOTAL FUND BALANCES (Exhibit A 2) 29,043,258.81 181,900.00 0.00 0.00 332,502.69 16,623,717.56
The accompanying notes to the financial statements are an integral part of this exhibit.
UNAUDITEDTexas General Land Office and Veterans' Land Board (305)
84 | Annual Financial Report
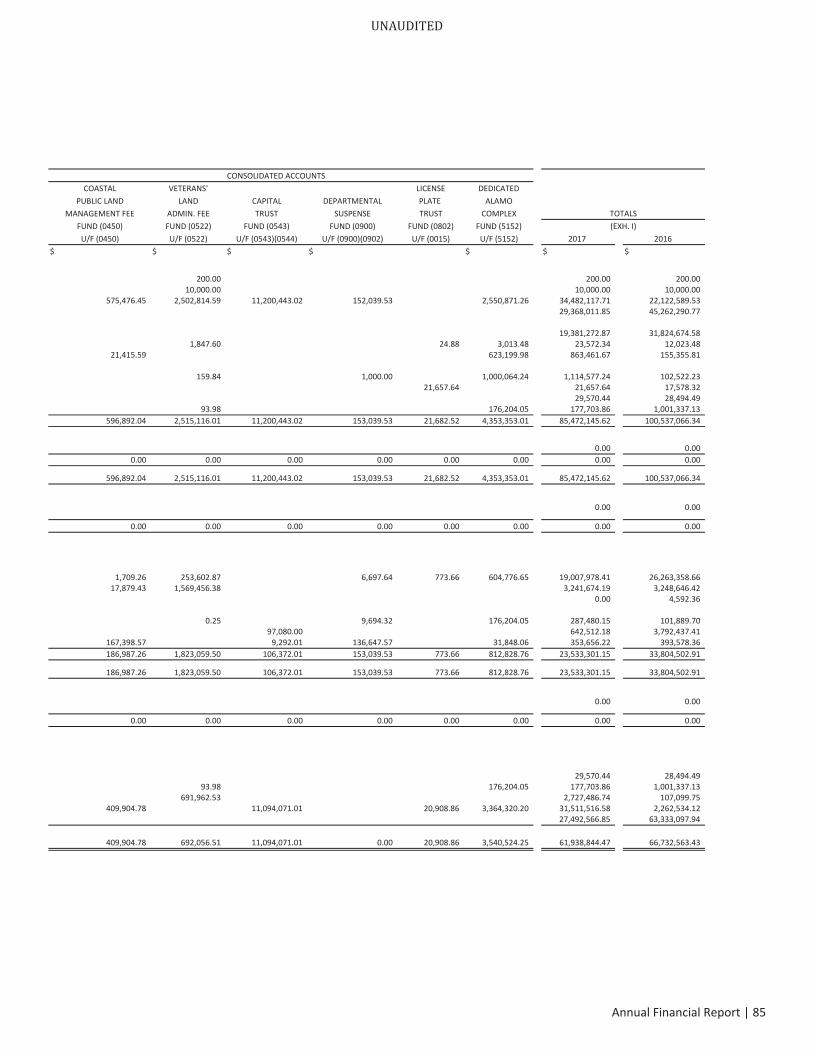
CONSOLIDATED ACCOUNTSCOASTAL VETERANS' LICENSE DEDICATED
PUBLIC LAND LAND CAPITAL DEPARTMENTAL PLATE ALAMOMANAGEMENT FEE ADMIN. FEE TRUST SUSPENSE TRUST COMPLEX
FUND (0450) FUND (0522) FUND (0543) FUND (0900) FUND (0802) FUND (5152) (EXH. I)U/F (0450) U/F (0522) U/F (0543)(0544) U/F (0900)(0902) U/F (0015) U/F (5152) 2017 2016
$ $ $ $ $ $ $
200.00 200.00 200.0010,000.00 10,000.00 10,000.00
575,476.45 2,502,814.59 11,200,443.02 152,039.53 2,550,871.26 34,482,117.71 22,122,589.5329,368,011.85 45,262,290.77
19,381,272.87 31,824,674.581,847.60 24.88 3,013.48 23,572.34 12,023.48
21,415.59 623,199.98 863,461.67 155,355.81
159.84 1,000.00 1,000,064.24 1,114,577.24 102,522.2321,657.64 21,657.64 17,578.32
29,570.44 28,494.4993.98 176,204.05 177,703.86 1,001,337.13
596,892.04 2,515,116.01 11,200,443.02 153,039.53 21,682.52 4,353,353.01 85,472,145.62 100,537,066.34
0.00 0.000.00 0.00 0.00 0.00 0.00 0.00 0.00 0.00
596,892.04 2,515,116.01 11,200,443.02 153,039.53 21,682.52 4,353,353.01 85,472,145.62 100,537,066.34
0.00 0.00
0.00 0.00 0.00 0.00 0.00 0.00 0.00 0.00
1,709.26 253,602.87 6,697.64 773.66 604,776.65 19,007,978.41 26,263,358.6617,879.43 1,569,456.38 3,241,674.19 3,248,646.42
0.00 4,592.36
0.25 9,694.32 176,204.05 287,480.15 101,889.7097,080.00 642,512.18 3,792,437.41
167,398.57 9,292.01 136,647.57 31,848.06 353,656.22 393,578.36186,987.26 1,823,059.50 106,372.01 153,039.53 773.66 812,828.76 23,533,301.15 33,804,502.91
186,987.26 1,823,059.50 106,372.01 153,039.53 773.66 812,828.76 23,533,301.15 33,804,502.91
0.00 0.00
0.00 0.00 0.00 0.00 0.00 0.00 0.00 0.00
29,570.44 28,494.4993.98 176,204.05 177,703.86 1,001,337.13
691,962.53 2,727,486.74 107,099.75409,904.78 11,094,071.01 20,908.86 3,364,320.20 31,511,516.58 2,262,534.12
27,492,566.85 63,333,097.94
409,904.78 692,056.51 11,094,071.01 0.00 20,908.86 3,540,524.25 61,938,844.47 66,732,563.43
TOTALS
UNAUDITED
Annual Financial Report | 85
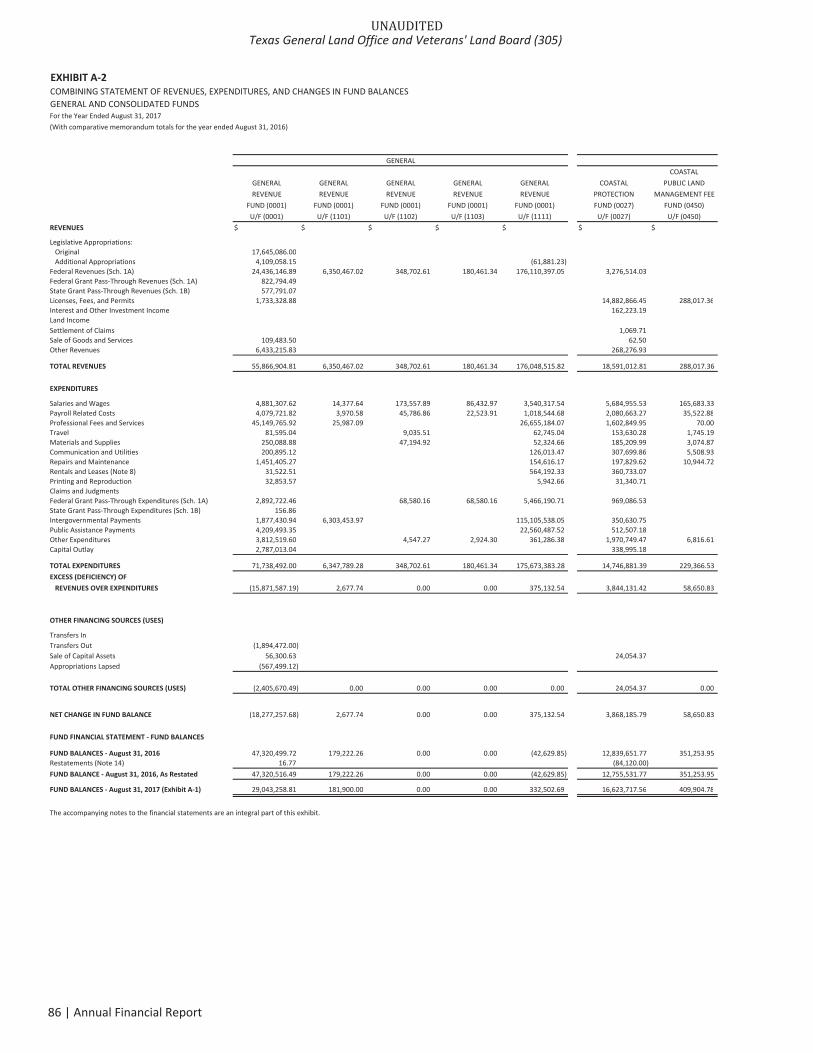
EXHIBIT A 2COMBINING STATEMENT OF REVENUES, EXPENDITURES, AND CHANGES IN FUND BALANCESGENERAL AND CONSOLIDATED FUNDSFor the Year Ended August 31, 2017(With comparative memorandum totals for the year ended August 31, 2016)
GENERALCOASTAL
GENERAL GENERAL GENERAL GENERAL GENERAL COASTAL PUBLIC LANDREVENUE REVENUE REVENUE REVENUE REVENUE PROTECTION MANAGEMENT FEE
FUND (0001) FUND (0001) FUND (0001) FUND (0001) FUND (0001) FUND (0027) FUND (0450)U/F (0001) U/F (1101) U/F (1102) U/F (1103) U/F (1111) U/F (0027) U/F (0450)
REVENUES $ $ $ $ $ $ $
Legislative Appropriations:Original 17,645,086.00Additional Appropriations 4,109,058.15 (61,881.23)
Federal Revenues (Sch. 1A) 24,436,146.89 6,350,467.02 348,702.61 180,461.34 176,110,397.05 3,276,514.03Federal Grant Pass Through Revenues (Sch. 1A) 822,794.49State Grant Pass Through Revenues (Sch. 1B) 577,791.07Licenses, Fees, and Permits 1,733,328.88 14,882,866.45 288,017.36Interest and Other Investment Income 162,223.19Land IncomeSettlement of Claims 1,069.71Sale of Goods and Services 109,483.50 62.50Other Revenues 6,433,215.83 268,276.93
TOTAL REVENUES 55,866,904.81 6,350,467.02 348,702.61 180,461.34 176,048,515.82 18,591,012.81 288,017.36
EXPENDITURES
Salaries and Wages 4,881,307.62 14,377.64 173,557.89 86,432.97 3,540,317.54 5,684,955.53 165,683.33Payroll Related Costs 4,079,721.82 3,970.58 45,786.86 22,523.91 1,018,544.68 2,080,663.27 35,522.88Professional Fees and Services 45,149,765.92 25,987.09 26,655,184.07 1,602,849.95 70.00Travel 81,595.04 9,035.51 62,745.04 153,630.28 1,745.19Materials and Supplies 250,088.88 47,194.92 52,324.66 185,209.99 3,074.87Communication and Utilities 200,895.12 126,013.47 307,699.86 5,508.93Repairs and Maintenance 1,451,405.27 154,616.17 197,829.62 10,944.72Rentals and Leases (Note 8) 31,522.51 564,192.33 360,733.07Printing and Reproduction 32,853.57 5,942.66 31,340.71Claims and JudgmentsFederal Grant Pass Through Expenditures (Sch. 1A) 2,892,722.46 68,580.16 68,580.16 5,466,190.71 969,086.53State Grant Pass Through Expenditures (Sch. 1B) 156.86Intergovernmental Payments 1,877,430.94 6,303,453.97 115,105,538.05 350,630.75Public Assistance Payments 4,209,493.35 22,560,487.52 512,507.18Other Expenditures 3,812,519.60 4,547.27 2,924.30 361,286.38 1,970,749.47 6,816.61Capital Outlay 2,787,013.04 338,995.18
TOTAL EXPENDITURES 71,738,492.00 6,347,789.28 348,702.61 180,461.34 175,673,383.28 14,746,881.39 229,366.53EXCESS (DEFICIENCY) OFREVENUES OVER EXPENDITURES (15,871,587.19) 2,677.74 0.00 0.00 375,132.54 3,844,131.42 58,650.83
OTHER FINANCING SOURCES (USES)
Transfers InTransfers Out (1,894,472.00)Sale of Capital Assets 56,300.63 24,054.37Appropriations Lapsed (567,499.12)
TOTAL OTHER FINANCING SOURCES (USES) (2,405,670.49) 0.00 0.00 0.00 0.00 24,054.37 0.00
NET CHANGE IN FUND BALANCE (18,277,257.68) 2,677.74 0.00 0.00 375,132.54 3,868,185.79 58,650.83
FUND FINANCIAL STATEMENT FUND BALANCES
FUND BALANCES August 31, 2016 47,320,499.72 179,222.26 0.00 0.00 (42,629.85) 12,839,651.77 351,253.95Restatements (Note 14) 16.77 (84,120.00)FUND BALANCE August 31, 2016, As Restated 47,320,516.49 179,222.26 0.00 0.00 (42,629.85) 12,755,531.77 351,253.95
FUND BALANCES August 31, 2017 (Exhibit A 1) 29,043,258.81 181,900.00 0.00 0.00 332,502.69 16,623,717.56 409,904.78
The accompanying notes to the financial statements are an integral part of this exhibit.
UNAUDITEDTexas General Land Office and Veterans' Land Board (305)
86 | Annual Financial Report
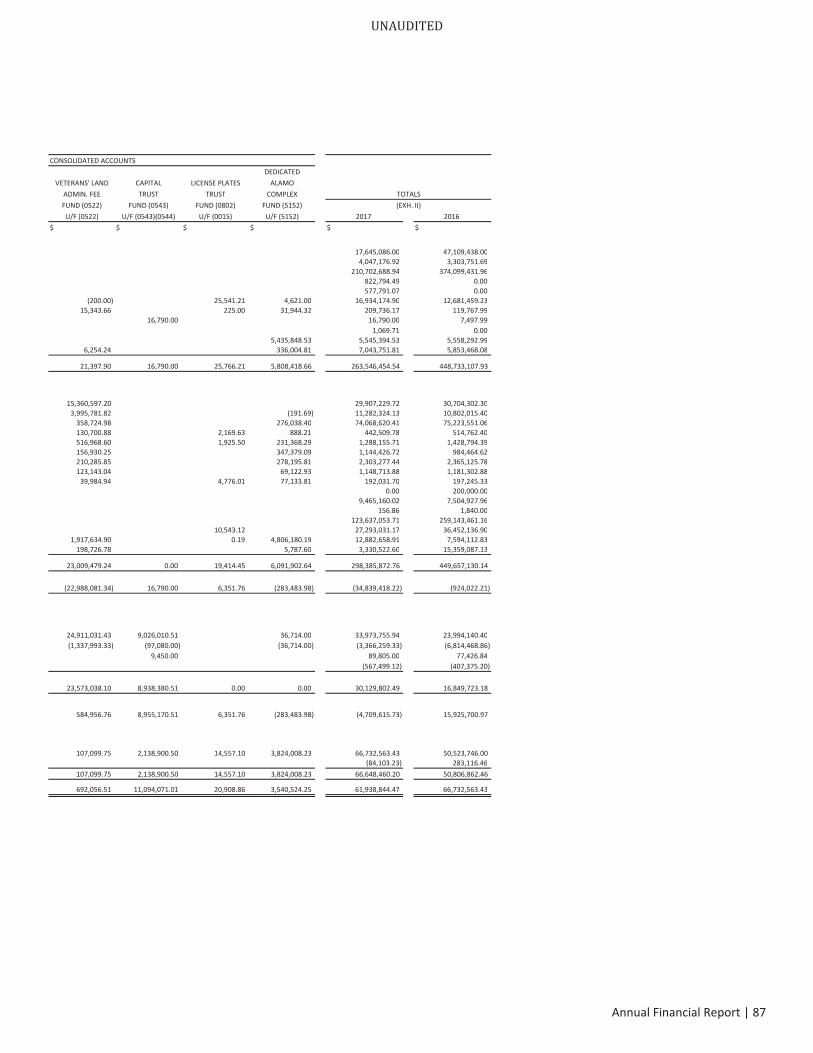
CONSOLIDATED ACCOUNTSDEDICATED
VETERANS' LAND CAPITAL LICENSE PLATES ALAMOADMIN. FEE TRUST TRUST COMPLEX TOTALSFUND (0522) FUND (0543) FUND (0802) FUND (5152) (EXH. II)U/F (0522) U/F (0543)(0544) U/F (0015) U/F (5152) 2017 2016
$ $ $ $ $ $
17,645,086.00 47,109,438.004,047,176.92 3,303,751.69
210,702,688.94 374,099,431.96822,794.49 0.00577,791.07 0.00
(200.00) 25,541.21 4,621.00 16,934,174.90 12,681,459.2315,343.66 225.00 31,944.32 209,736.17 119,767.99
16,790.00 16,790.00 7,497.991,069.71 0.00
5,435,848.53 5,545,394.53 5,558,292.996,254.24 336,004.81 7,043,751.81 5,853,468.08
21,397.90 16,790.00 25,766.21 5,808,418.66 263,546,454.54 448,733,107.93
15,360,597.20 29,907,229.72 30,704,302.303,995,781.82 (191.69) 11,282,324.13 10,802,015.40
358,724.98 276,038.40 74,068,620.41 75,223,551.06130,700.88 2,169.63 888.21 442,509.78 514,762.40516,968.60 1,925.50 231,368.29 1,288,155.71 1,428,794.39156,930.25 347,379.09 1,144,426.72 984,464.62210,285.85 278,195.81 2,303,277.44 2,365,125.78123,143.04 69,122.93 1,148,713.88 1,181,302.88
39,984.94 4,776.01 77,133.81 192,031.70 197,245.330.00 200,000.00
9,465,160.02 7,504,927.96156.86 1,840.00
123,637,053.71 259,143,461.1610,543.12 27,293,031.17 36,452,136.90
1,917,634.90 0.19 4,806,180.19 12,882,658.91 7,594,112.83198,726.78 5,787.60 3,330,522.60 15,359,087.13
23,009,479.24 0.00 19,414.45 6,091,902.64 298,385,872.76 449,657,130.14
(22,988,081.34) 16,790.00 6,351.76 (283,483.98) (34,839,418.22) (924,022.21)
24,911,031.43 9,026,010.51 36,714.00 33,973,755.94 23,994,140.40(1,337,993.33) (97,080.00) (36,714.00) (3,366,259.33) (6,814,468.86)
9,450.00 89,805.00 77,426.84(567,499.12) (407,375.20)
23,573,038.10 8,938,380.51 0.00 0.00 30,129,802.49 16,849,723.18
584,956.76 8,955,170.51 6,351.76 (283,483.98) (4,709,615.73) 15,925,700.97
107,099.75 2,138,900.50 14,557.10 3,824,008.23 66,732,563.43 50,523,746.00(84,103.23) 283,116.46
107,099.75 2,138,900.50 14,557.10 3,824,008.23 66,648,460.20 50,806,862.46
692,056.51 11,094,071.01 20,908.86 3,540,524.25 61,938,844.47 66,732,563.43
UNAUDITED
Annual Financial Report | 87
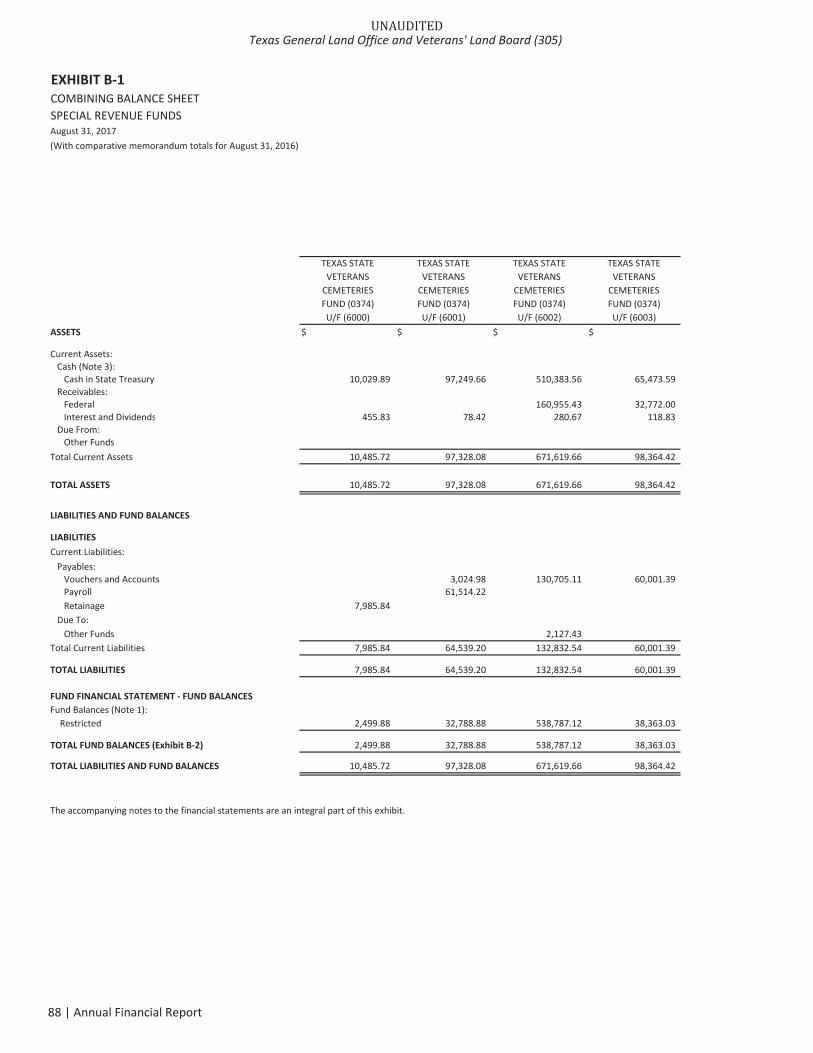
EXHIBIT B 1COMBINING BALANCE SHEETSPECIAL REVENUE FUNDSAugust 31, 2017(With comparative memorandum totals for August 31, 2016)
TEXAS STATE TEXAS STATE TEXAS STATE TEXAS STATEVETERANS VETERANS VETERANS VETERANS
CEMETERIES CEMETERIES CEMETERIES CEMETERIESFUND (0374) FUND (0374) FUND (0374) FUND (0374)U/F (6000) U/F (6001) U/F (6002) U/F (6003)
ASSETS $ $ $ $
Current Assets:Cash (Note 3):
Cash in State Treasury 10,029.89 97,249.66 510,383.56 65,473.59Receivables:
Federal 160,955.43 32,772.00Interest and Dividends 455.83 78.42 280.67 118.83
Due From:Other Funds
Total Current Assets 10,485.72 97,328.08 671,619.66 98,364.42
TOTAL ASSETS 10,485.72 97,328.08 671,619.66 98,364.42
LIABILITIES AND FUND BALANCES
LIABILITIESCurrent Liabilities:
Payables:Vouchers and Accounts 3,024.98 130,705.11 60,001.39Payroll 61,514.22Retainage 7,985.84
Due To:Other Funds 2,127.43
Total Current Liabilities 7,985.84 64,539.20 132,832.54 60,001.39
TOTAL LIABILITIES 7,985.84 64,539.20 132,832.54 60,001.39
FUND FINANCIAL STATEMENT FUND BALANCESFund Balances (Note 1):
Restricted 2,499.88 32,788.88 538,787.12 38,363.03
TOTAL FUND BALANCES (Exhibit B 2) 2,499.88 32,788.88 538,787.12 38,363.03
TOTAL LIABILITIES AND FUND BALANCES 10,485.72 97,328.08 671,619.66 98,364.42
The accompanying notes to the financial statements are an integral part of this exhibit.
UNAUDITEDTexas General Land Office and Veterans' Land Board (305)
88 | Annual Financial Report
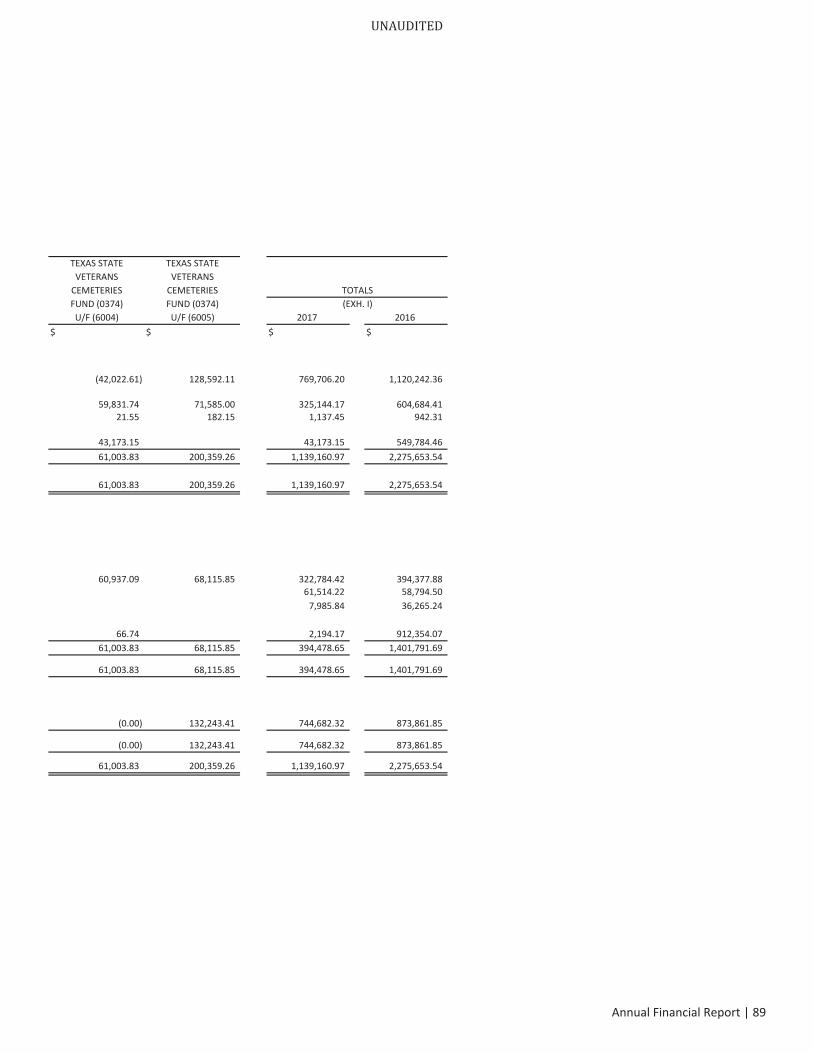
TEXAS STATE TEXAS STATEVETERANS VETERANS
CEMETERIES CEMETERIES TOTALSFUND (0374) FUND (0374) (EXH. I)U/F (6004) U/F (6005) 2017 2016
$ $ $ $
(42,022.61) 128,592.11 769,706.20 1,120,242.36
59,831.74 71,585.00 325,144.17 604,684.4121.55 182.15 1,137.45 942.31
43,173.15 43,173.15 549,784.4661,003.83 200,359.26 1,139,160.97 2,275,653.54
61,003.83 200,359.26 1,139,160.97 2,275,653.54
60,937.09 68,115.85 322,784.42 394,377.8861,514.22 58,794.50
7,985.84 36,265.24
66.74 2,194.17 912,354.0761,003.83 68,115.85 394,478.65 1,401,791.69
61,003.83 68,115.85 394,478.65 1,401,791.69
(0.00) 132,243.41 744,682.32 873,861.85
(0.00) 132,243.41 744,682.32 873,861.85
61,003.83 200,359.26 1,139,160.97 2,275,653.54
UNAUDITED
Annual Financial Report | 89
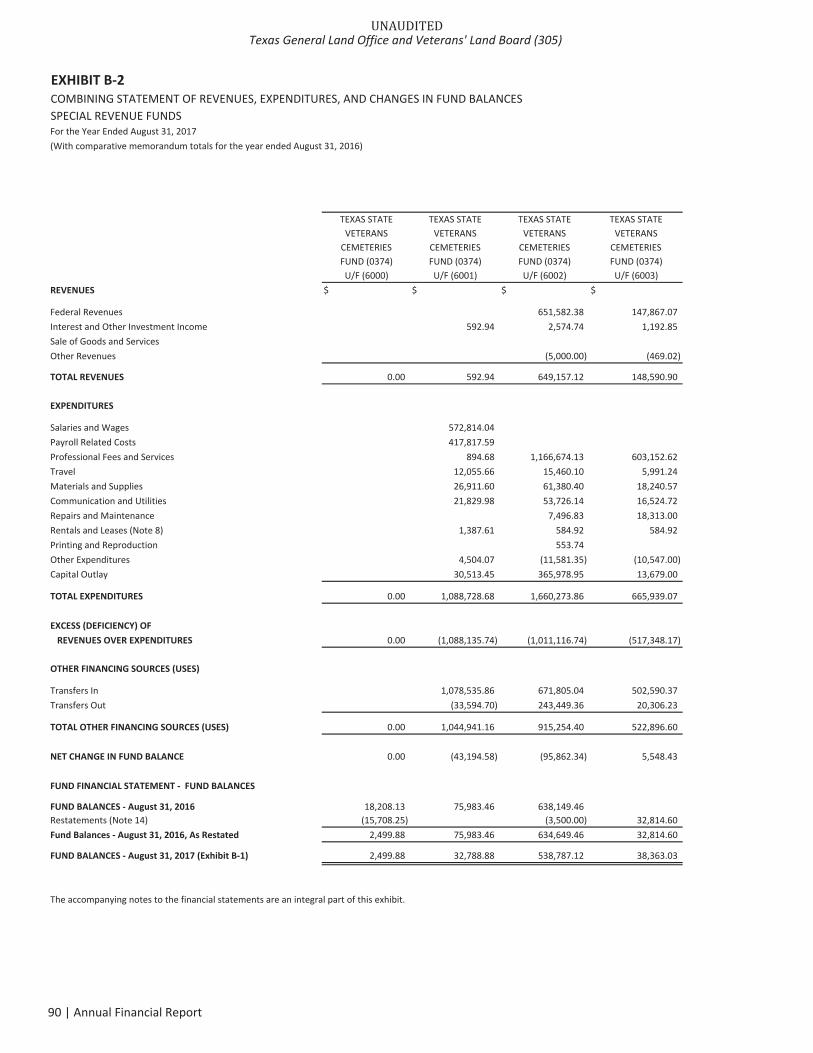
EXHIBIT B 2COMBINING STATEMENT OF REVENUES, EXPENDITURES, AND CHANGES IN FUND BALANCESSPECIAL REVENUE FUNDSFor the Year Ended August 31, 2017(With comparative memorandum totals for the year ended August 31, 2016)
TEXAS STATE TEXAS STATE TEXAS STATE TEXAS STATEVETERANS VETERANS VETERANS VETERANS
CEMETERIES CEMETERIES CEMETERIES CEMETERIESFUND (0374) FUND (0374) FUND (0374) FUND (0374)U/F (6000) U/F (6001) U/F (6002) U/F (6003)
REVENUES $ $ $ $
Federal Revenues 651,582.38 147,867.07Interest and Other Investment Income 592.94 2,574.74 1,192.85Sale of Goods and ServicesOther Revenues (5,000.00) (469.02)
TOTAL REVENUES 0.00 592.94 649,157.12 148,590.90
EXPENDITURES
Salaries and Wages 572,814.04Payroll Related Costs 417,817.59Professional Fees and Services 894.68 1,166,674.13 603,152.62Travel 12,055.66 15,460.10 5,991.24Materials and Supplies 26,911.60 61,380.40 18,240.57Communication and Utilities 21,829.98 53,726.14 16,524.72Repairs and Maintenance 7,496.83 18,313.00Rentals and Leases (Note 8) 1,387.61 584.92 584.92Printing and Reproduction 553.74Other Expenditures 4,504.07 (11,581.35) (10,547.00)Capital Outlay 30,513.45 365,978.95 13,679.00
TOTAL EXPENDITURES 0.00 1,088,728.68 1,660,273.86 665,939.07
EXCESS (DEFICIENCY) OFREVENUES OVER EXPENDITURES 0.00 (1,088,135.74) (1,011,116.74) (517,348.17)
OTHER FINANCING SOURCES (USES)
Transfers In 1,078,535.86 671,805.04 502,590.37Transfers Out (33,594.70) 243,449.36 20,306.23
TOTAL OTHER FINANCING SOURCES (USES) 0.00 1,044,941.16 915,254.40 522,896.60
NET CHANGE IN FUND BALANCE 0.00 (43,194.58) (95,862.34) 5,548.43
FUND FINANCIAL STATEMENT FUND BALANCES
FUND BALANCES August 31, 2016 18,208.13 75,983.46 638,149.46Restatements (Note 14) (15,708.25) (3,500.00) 32,814.60Fund Balances August 31, 2016, As Restated 2,499.88 75,983.46 634,649.46 32,814.60
FUND BALANCES August 31, 2017 (Exhibit B 1) 2,499.88 32,788.88 538,787.12 38,363.03
The accompanying notes to the financial statements are an integral part of this exhibit.
UNAUDITEDTexas General Land Office and Veterans' Land Board (305)
90 | Annual Financial Report

TEXAS STATE TEXAS STATEVETERANS VETERANS
CEMETERIES CEMETERIES TOTALSFUND (0374) FUND (0374) (EXH. II)U/F (6004) U/F (6005) 2017 2016
$ $ $ $
447,143.71 292,794.00 1,539,387.16 1,336,666.48749.36 1,929.60 7,039.49 6,935.35
0.00 50,098.067,237.77 22,870.39 24,639.14 27,124.00
455,130.84 317,593.99 1,571,065.79 1,420,823.89
572,814.04 568,901.96417,817.59 478,783.14
653,760.21 750,115.00 3,174,596.64 3,199,083.945,868.10 6,383.65 45,758.75 15,910.84
28,943.15 27,584.48 163,060.20 106,798.3024,182.80 22,365.10 138,628.74 125,890.12
1,744.15 1,423.95 28,977.93 56,074.49584.92 3,142.37 7,911.73
553.74 654.57(1,237.46) (3,879.10) (22,740.84) 54,232.59
276,021.77 686,193.17 51,853.31
989,867.64 803,993.08 5,208,802.33 4,666,094.99
(534,736.80) (486,399.09) (3,637,736.54) (3,245,271.10)
495,043.30 500,586.28 3,248,560.85 3,562,879.89(66.74) 230,094.15 (381,372.14)
494,976.56 500,586.28 3,478,655.00 3,181,507.75
(39,760.24) 14,187.19 (159,081.54) (63,763.35)
39,760.24 101,760.56 873,861.85 2,177,912.2016,295.66 29,902.01 (1,240,287.00)
39,760.24 118,056.22 903,763.86 937,625.20
(0.00) 132,243.41 744,682.32 873,861.85
UNAUDITED
Annual Financial Report | 91
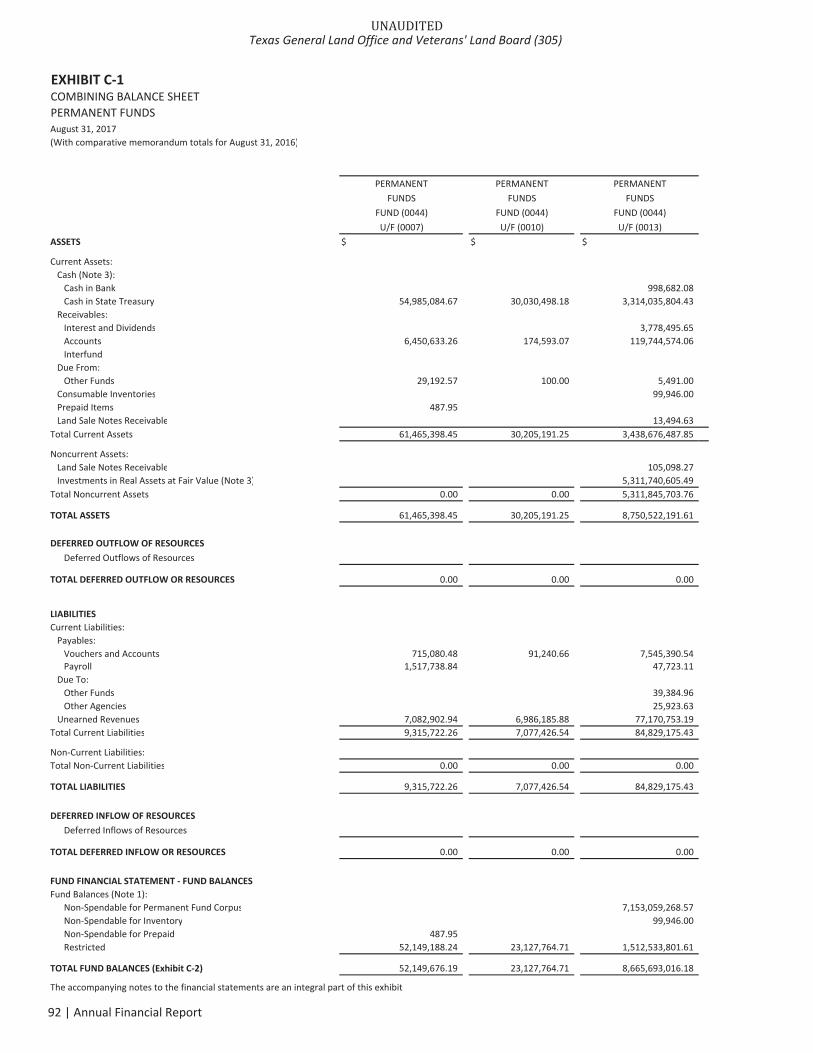
EXHIBIT C 1COMBINING BALANCE SHEETPERMANENT FUNDSAugust 31, 2017(With comparative memorandum totals for August 31, 2016)
PERMANENT PERMANENT PERMANENTFUNDS FUNDS FUNDS
FUND (0044) FUND (0044) FUND (0044)U/F (0007) U/F (0010) U/F (0013)
ASSETS $ $ $
Current Assets:Cash (Note 3):
Cash in Bank 998,682.08Cash in State Treasury 54,985,084.67 30,030,498.18 3,314,035,804.43
Receivables:Interest and Dividends 3,778,495.65Accounts 6,450,633.26 174,593.07 119,744,574.06Interfund
Due From:Other Funds 29,192.57 100.00 5,491.00
Consumable Inventories 99,946.00Prepaid Items 487.95Land Sale Notes Receivable 13,494.63
Total Current Assets 61,465,398.45 30,205,191.25 3,438,676,487.85
Noncurrent Assets:Land Sale Notes Receivable 105,098.27Investments in Real Assets at Fair Value (Note 3) 5,311,740,605.49
Total Noncurrent Assets 0.00 0.00 5,311,845,703.76
TOTAL ASSETS 61,465,398.45 30,205,191.25 8,750,522,191.61
DEFERRED OUTFLOW OF RESOURCESDeferred Outflows of Resources
TOTAL DEFERRED OUTFLOW OR RESOURCES 0.00 0.00 0.00
LIABILITIESCurrent Liabilities:
Payables:Vouchers and Accounts 715,080.48 91,240.66 7,545,390.54Payroll 1,517,738.84 47,723.11
Due To:Other Funds 39,384.96Other Agencies 25,923.63
Unearned Revenues 7,082,902.94 6,986,185.88 77,170,753.19Total Current Liabilities 9,315,722.26 7,077,426.54 84,829,175.43
Non Current Liabilities:Total Non Current Liabilities 0.00 0.00 0.00
TOTAL LIABILITIES 9,315,722.26 7,077,426.54 84,829,175.43
DEFERRED INFLOW OF RESOURCESDeferred Inflows of Resources
TOTAL DEFERRED INFLOW OR RESOURCES 0.00 0.00 0.00
FUND FINANCIAL STATEMENT FUND BALANCESFund Balances (Note 1):
Non Spendable for Permanent Fund Corpus 7,153,059,268.57Non Spendable for Inventory 99,946.00Non Spendable for Prepaid 487.95Restricted 52,149,188.24 23,127,764.71 1,512,533,801.61
TOTAL FUND BALANCES (Exhibit C 2) 52,149,676.19 23,127,764.71 8,665,693,016.18
The accompanying notes to the financial statements are an integral part of this exhibit
UNAUDITEDTexas General Land Office and Veterans' Land Board (305)
92 | Annual Financial Report
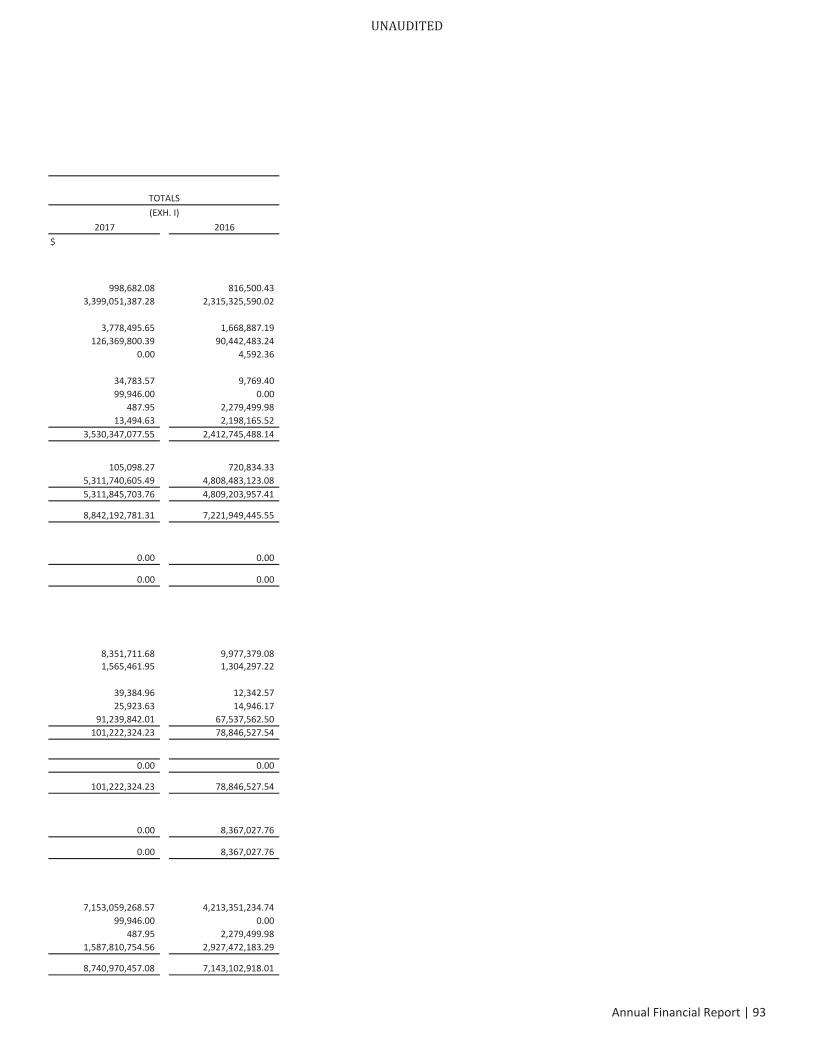
2017 2016$
998,682.08 816,500.433,399,051,387.28 2,315,325,590.02
3,778,495.65 1,668,887.19126,369,800.39 90,442,483.24
0.00 4,592.36
34,783.57 9,769.4099,946.00 0.00
487.95 2,279,499.9813,494.63 2,198,165.52
3,530,347,077.55 2,412,745,488.14
105,098.27 720,834.335,311,740,605.49 4,808,483,123.085,311,845,703.76 4,809,203,957.41
8,842,192,781.31 7,221,949,445.55
0.00 0.00
0.00 0.00
8,351,711.68 9,977,379.081,565,461.95 1,304,297.22
39,384.96 12,342.5725,923.63 14,946.17
91,239,842.01 67,537,562.50101,222,324.23 78,846,527.54
0.00 0.00
101,222,324.23 78,846,527.54
0.00 8,367,027.76
0.00 8,367,027.76
7,153,059,268.57 4,213,351,234.7499,946.00 0.00
487.95 2,279,499.981,587,810,754.56 2,927,472,183.29
8,740,970,457.08 7,143,102,918.01
TOTALS(EXH. I)
UNAUDITED
Annual Financial Report | 93
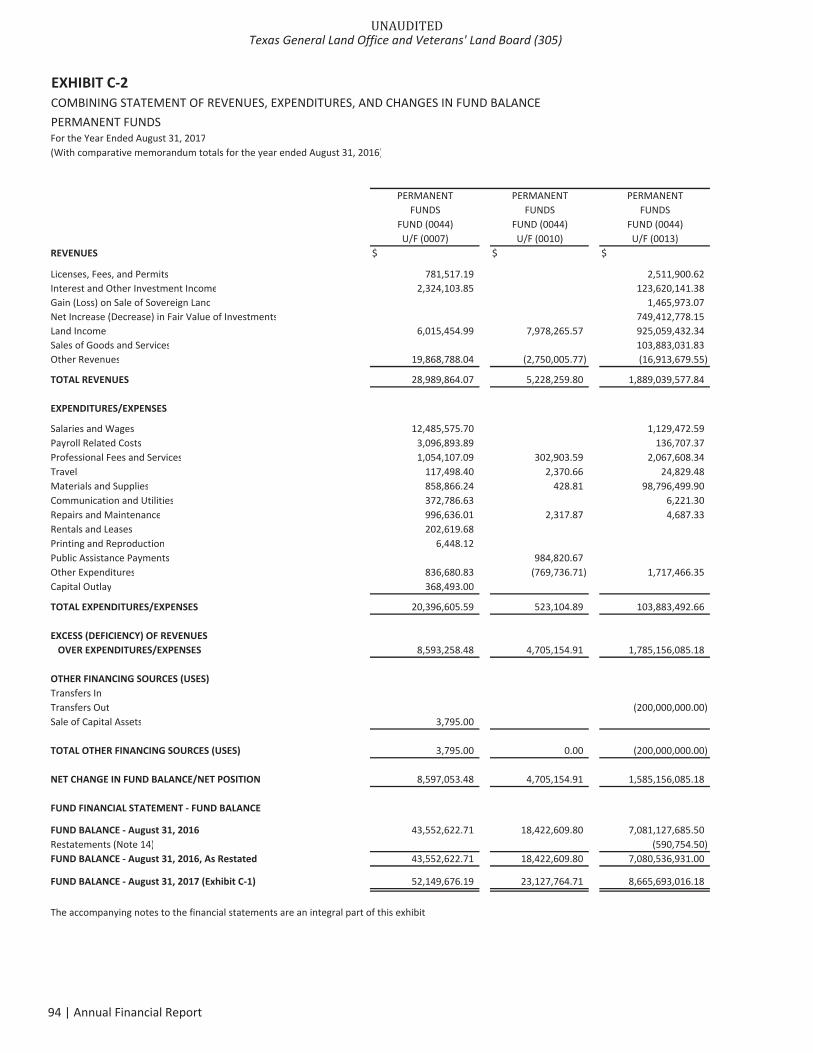
EXHIBIT C 2COMBINING STATEMENT OF REVENUES, EXPENDITURES, AND CHANGES IN FUND BALANCEPERMANENT FUNDSFor the Year Ended August 31, 2017(With comparative memorandum totals for the year ended August 31, 2016)
PERMANENT PERMANENT PERMANENTFUNDS FUNDS FUNDS
FUND (0044) FUND (0044) FUND (0044)U/F (0007) U/F (0010) U/F (0013)
REVENUES $ $ $
Licenses, Fees, and Permits 781,517.19 2,511,900.62Interest and Other Investment Income 2,324,103.85 123,620,141.38Gain (Loss) on Sale of Sovereign Land 1,465,973.07Net Increase (Decrease) in Fair Value of Investments 749,412,778.15Land Income 6,015,454.99 7,978,265.57 925,059,432.34Sales of Goods and Services 103,883,031.83Other Revenues 19,868,788.04 (2,750,005.77) (16,913,679.55)
TOTAL REVENUES 28,989,864.07 5,228,259.80 1,889,039,577.84
EXPENDITURES/EXPENSES
Salaries and Wages 12,485,575.70 1,129,472.59Payroll Related Costs 3,096,893.89 136,707.37Professional Fees and Services 1,054,107.09 302,903.59 2,067,608.34Travel 117,498.40 2,370.66 24,829.48Materials and Supplies 858,866.24 428.81 98,796,499.90Communication and Utilities 372,786.63 6,221.30Repairs and Maintenance 996,636.01 2,317.87 4,687.33Rentals and Leases 202,619.68Printing and Reproduction 6,448.12Public Assistance Payments 984,820.67Other Expenditures 836,680.83 (769,736.71) 1,717,466.35Capital Outlay 368,493.00
TOTAL EXPENDITURES/EXPENSES 20,396,605.59 523,104.89 103,883,492.66
EXCESS (DEFICIENCY) OF REVENUESOVER EXPENDITURES/EXPENSES 8,593,258.48 4,705,154.91 1,785,156,085.18
OTHER FINANCING SOURCES (USES)Transfers InTransfers Out (200,000,000.00)Sale of Capital Assets 3,795.00
TOTAL OTHER FINANCING SOURCES (USES) 3,795.00 0.00 (200,000,000.00)
NET CHANGE IN FUND BALANCE/NET POSITION 8,597,053.48 4,705,154.91 1,585,156,085.18
FUND FINANCIAL STATEMENT FUND BALANCE
FUND BALANCE August 31, 2016 43,552,622.71 18,422,609.80 7,081,127,685.50Restatements (Note 14) (590,754.50)FUND BALANCE August 31, 2016, As Restated 43,552,622.71 18,422,609.80 7,080,536,931.00
FUND BALANCE August 31, 2017 (Exhibit C 1) 52,149,676.19 23,127,764.71 8,665,693,016.18
The accompanying notes to the financial statements are an integral part of this exhibit
UNAUDITEDTexas General Land Office and Veterans' Land Board (305)
94 | Annual Financial Report
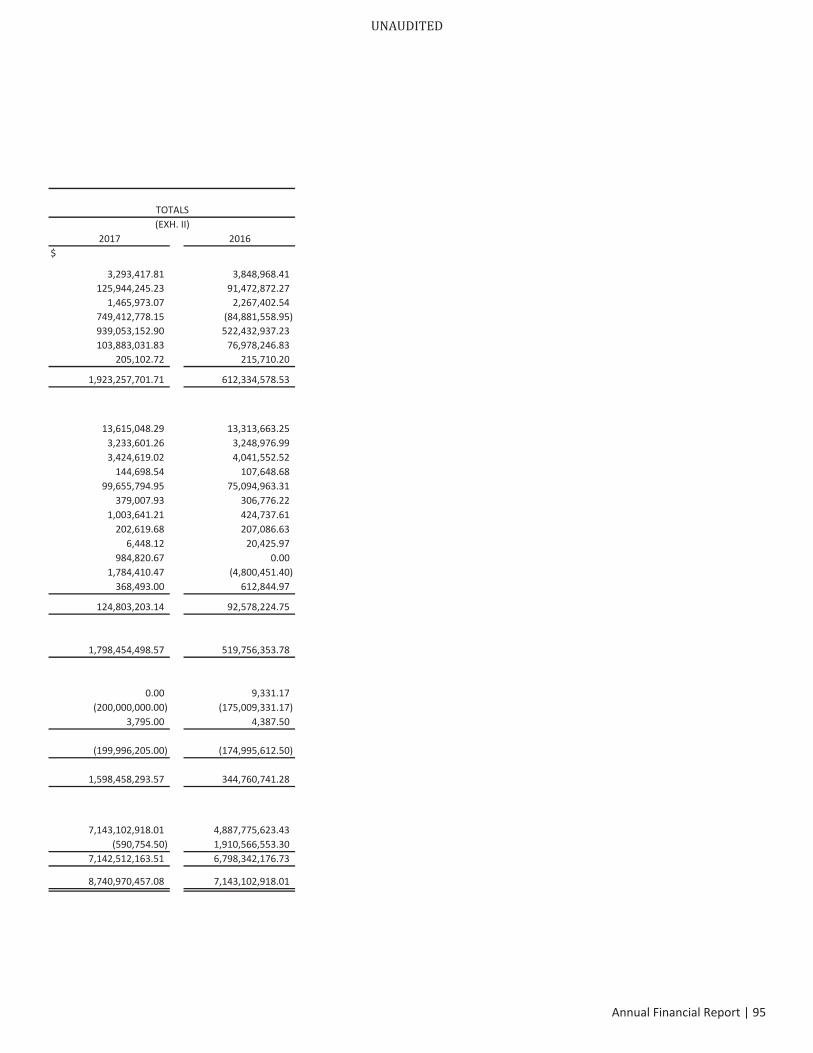
2017 2016$
3,293,417.81 3,848,968.41125,944,245.23 91,472,872.27
1,465,973.07 2,267,402.54749,412,778.15 (84,881,558.95)939,053,152.90 522,432,937.23103,883,031.83 76,978,246.83
205,102.72 215,710.20
1,923,257,701.71 612,334,578.53
13,615,048.29 13,313,663.253,233,601.26 3,248,976.993,424,619.02 4,041,552.52
144,698.54 107,648.6899,655,794.95 75,094,963.31
379,007.93 306,776.221,003,641.21 424,737.61
202,619.68 207,086.636,448.12 20,425.97
984,820.67 0.001,784,410.47 (4,800,451.40)
368,493.00 612,844.97
124,803,203.14 92,578,224.75
1,798,454,498.57 519,756,353.78
0.00 9,331.17(200,000,000.00) (175,009,331.17)
3,795.00 4,387.50
(199,996,205.00) (174,995,612.50)
1,598,458,293.57 344,760,741.28
7,143,102,918.01 4,887,775,623.43(590,754.50) 1,910,566,553.30
7,142,512,163.51 6,798,342,176.73
8,740,970,457.08 7,143,102,918.01
TOTALS(EXH. II)
UNAUDITED
Annual Financial Report | 95
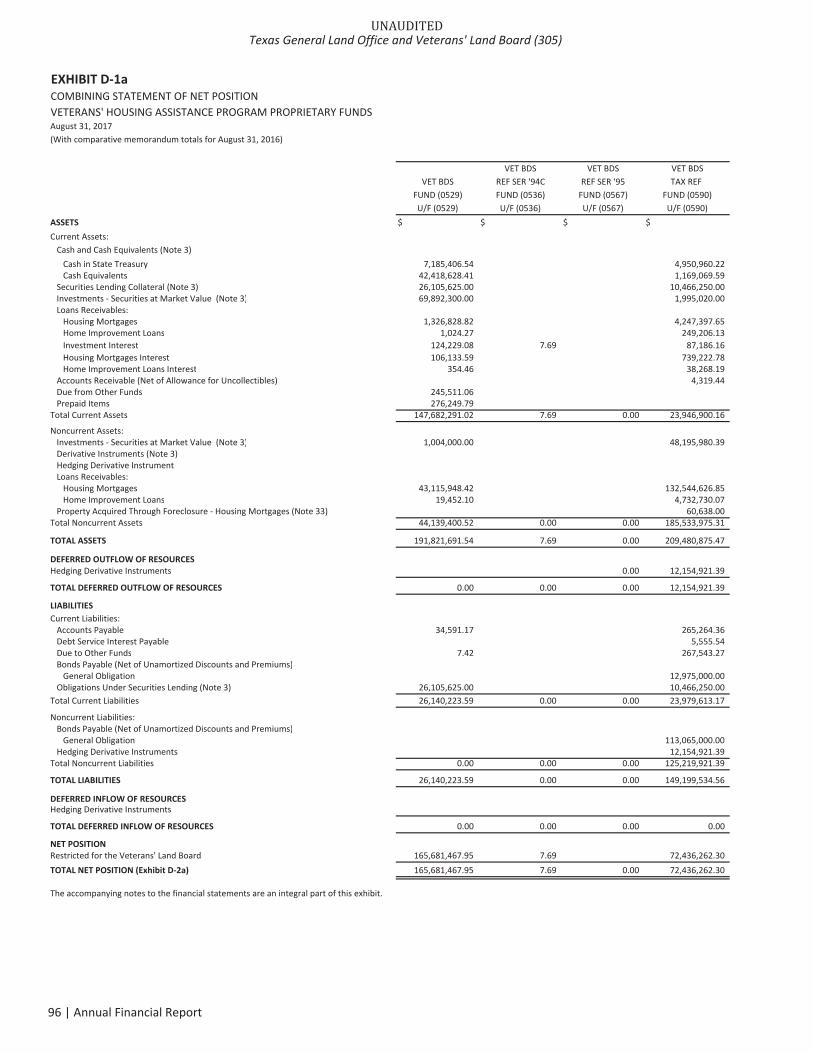
EXHIBIT D 1aCOMBINING STATEMENT OF NET POSITIONVETERANS' HOUSING ASSISTANCE PROGRAM PROPRIETARY FUNDSAugust 31, 2017(With comparative memorandum totals for August 31, 2016)
VET BDS VET BDS VET BDSVET BDS REF SER '94C REF SER '95 TAX REF
FUND (0529) FUND (0536) FUND (0567) FUND (0590)U/F (0529) U/F (0536) U/F (0567) U/F (0590)
ASSETS $ $ $ $Current Assets:
Cash and Cash Equivalents (Note 3)Cash in State Treasury 7,185,406.54 4,950,960.22Cash Equivalents 42,418,628.41 1,169,069.59
Securities Lending Collateral (Note 3) 26,105,625.00 10,466,250.00Investments Securities at Market Value (Note 3) 69,892,300.00 1,995,020.00Loans Receivables:
Housing Mortgages 1,326,828.82 4,247,397.65Home Improvement Loans 1,024.27 249,206.13Investment Interest 124,229.08 7.69 87,186.16Housing Mortgages Interest 106,133.59 739,222.78Home Improvement Loans Interest 354.46 38,268.19
Accounts Receivable (Net of Allowance for Uncollectibles) 4,319.44Due from Other Funds 245,511.06Prepaid Items 276,249.79
Total Current Assets 147,682,291.02 7.69 0.00 23,946,900.16
Noncurrent Assets:Investments Securities at Market Value (Note 3) 1,004,000.00 48,195,980.39Derivative Instruments (Note 3)Hedging Derivative InstrumentLoans Receivables:
Housing Mortgages 43,115,948.42 132,544,626.85Home Improvement Loans 19,452.10 4,732,730.07
Property Acquired Through Foreclosure Housing Mortgages (Note 33) 60,638.00Total Noncurrent Assets 44,139,400.52 0.00 0.00 185,533,975.31
TOTAL ASSETS 191,821,691.54 7.69 0.00 209,480,875.47
DEFERRED OUTFLOW OF RESOURCESHedging Derivative Instruments 0.00 12,154,921.39
TOTAL DEFERRED OUTFLOW OF RESOURCES 0.00 0.00 0.00 12,154,921.39
LIABILITIESCurrent Liabilities:
Accounts Payable 34,591.17 265,264.36Debt Service Interest Payable 5,555.54Due to Other Funds 7.42 267,543.27Bonds Payable (Net of Unamortized Discounts and Premiums)
General Obligation 12,975,000.00Obligations Under Securities Lending (Note 3) 26,105,625.00 10,466,250.00
Total Current Liabilities 26,140,223.59 0.00 0.00 23,979,613.17
Noncurrent Liabilities:Bonds Payable (Net of Unamortized Discounts and Premiums)
General Obligation 113,065,000.00Hedging Derivative Instruments 12,154,921.39
Total Noncurrent Liabilities 0.00 0.00 0.00 125,219,921.39
TOTAL LIABILITIES 26,140,223.59 0.00 0.00 149,199,534.56
DEFERRED INFLOW OF RESOURCESHedging Derivative Instruments
TOTAL DEFERRED INFLOW OF RESOURCES 0.00 0.00 0.00 0.00
NET POSITIONRestricted for the Veterans' Land Board 165,681,467.95 7.69 72,436,262.30TOTAL NET POSITION (Exhibit D 2a) 165,681,467.95 7.69 0.00 72,436,262.30
The accompanying notes to the financial statements are an integral part of this exhibit.
UNAUDITEDTexas General Land Office and Veterans' Land Board (305)
96 | Annual Financial Report
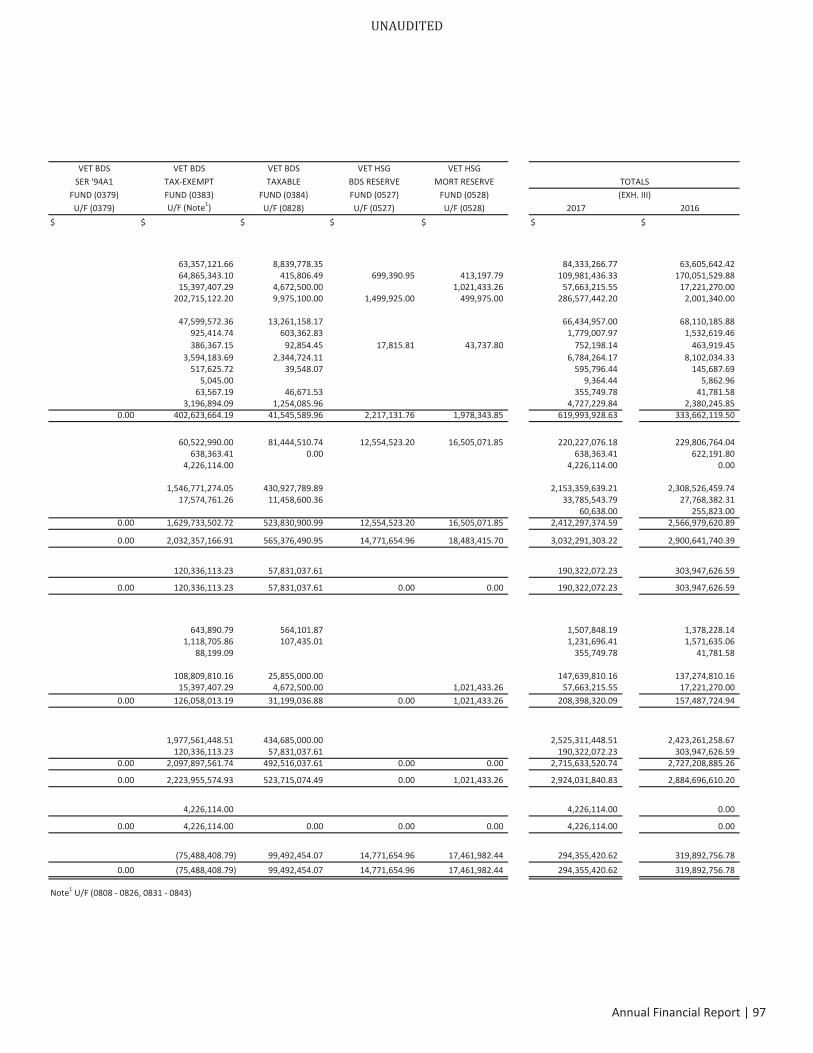
VET BDS VET BDS VET BDS VET HSG VET HSGSER '94A1 TAX EXEMPT TAXABLE BDS RESERVE MORT RESERVE
FUND (0379) FUND (0383) FUND (0384) FUND (0527) FUND (0528)U/F (0379) U/F (Note1) U/F (0828) U/F (0527) U/F (0528) 2017 2016
$ $ $ $ $ $ $
63,357,121.66 8,839,778.35 84,333,266.77 63,605,642.4264,865,343.10 415,806.49 699,390.95 413,197.79 109,981,436.33 170,051,529.8815,397,407.29 4,672,500.00 1,021,433.26 57,663,215.55 17,221,270.00
202,715,122.20 9,975,100.00 1,499,925.00 499,975.00 286,577,442.20 2,001,340.00
47,599,572.36 13,261,158.17 66,434,957.00 68,110,185.88925,414.74 603,362.83 1,779,007.97 1,532,619.46386,367.15 92,854.45 17,815.81 43,737.80 752,198.14 463,919.45
3,594,183.69 2,344,724.11 6,784,264.17 8,102,034.33517,625.72 39,548.07 595,796.44 145,687.69
5,045.00 9,364.44 5,862.9663,567.19 46,671.53 355,749.78 41,781.58
3,196,894.09 1,254,085.96 4,727,229.84 2,380,245.850.00 402,623,664.19 41,545,589.96 2,217,131.76 1,978,343.85 619,993,928.63 333,662,119.50
60,522,990.00 81,444,510.74 12,554,523.20 16,505,071.85 220,227,076.18 229,806,764.04638,363.41 0.00 638,363.41 622,191.80
4,226,114.00 4,226,114.00 0.00
1,546,771,274.05 430,927,789.89 2,153,359,639.21 2,308,526,459.7417,574,761.26 11,458,600.36 33,785,543.79 27,768,382.31
0.00 0.00 60,638.00 255,823.000.00 1,629,733,502.72 523,830,900.99 12,554,523.20 16,505,071.85 2,412,297,374.59 2,566,979,620.89
0.00 2,032,357,166.91 565,376,490.95 14,771,654.96 18,483,415.70 3,032,291,303.22 2,900,641,740.39
120,336,113.23 57,831,037.61 190,322,072.23 303,947,626.59
0.00 120,336,113.23 57,831,037.61 0.00 0.00 190,322,072.23 303,947,626.59
643,890.79 564,101.87 1,507,848.19 1,378,228.141,118,705.86 107,435.01 1,231,696.41 1,571,635.06
88,199.09 355,749.78 41,781.58
108,809,810.16 25,855,000.00 147,639,810.16 137,274,810.1615,397,407.29 4,672,500.00 1,021,433.26 57,663,215.55 17,221,270.00
0.00 126,058,013.19 31,199,036.88 0.00 1,021,433.26 208,398,320.09 157,487,724.94
1,977,561,448.51 434,685,000.00 2,525,311,448.51 2,423,261,258.67120,336,113.23 57,831,037.61 190,322,072.23 303,947,626.59
0.00 2,097,897,561.74 492,516,037.61 0.00 0.00 2,715,633,520.74 2,727,208,885.26
0.00 2,223,955,574.93 523,715,074.49 0.00 1,021,433.26 2,924,031,840.83 2,884,696,610.20
4,226,114.00 4,226,114.00 0.00
0.00 4,226,114.00 0.00 0.00 0.00 4,226,114.00 0.00
(75,488,408.79) 99,492,454.07 14,771,654.96 17,461,982.44 294,355,420.62 319,892,756.780.00 (75,488,408.79) 99,492,454.07 14,771,654.96 17,461,982.44 294,355,420.62 319,892,756.78
Note1 U/F (0808 0826, 0831 0843)
TOTALS(EXH. III)
UNAUDITED
Annual Financial Report | 97
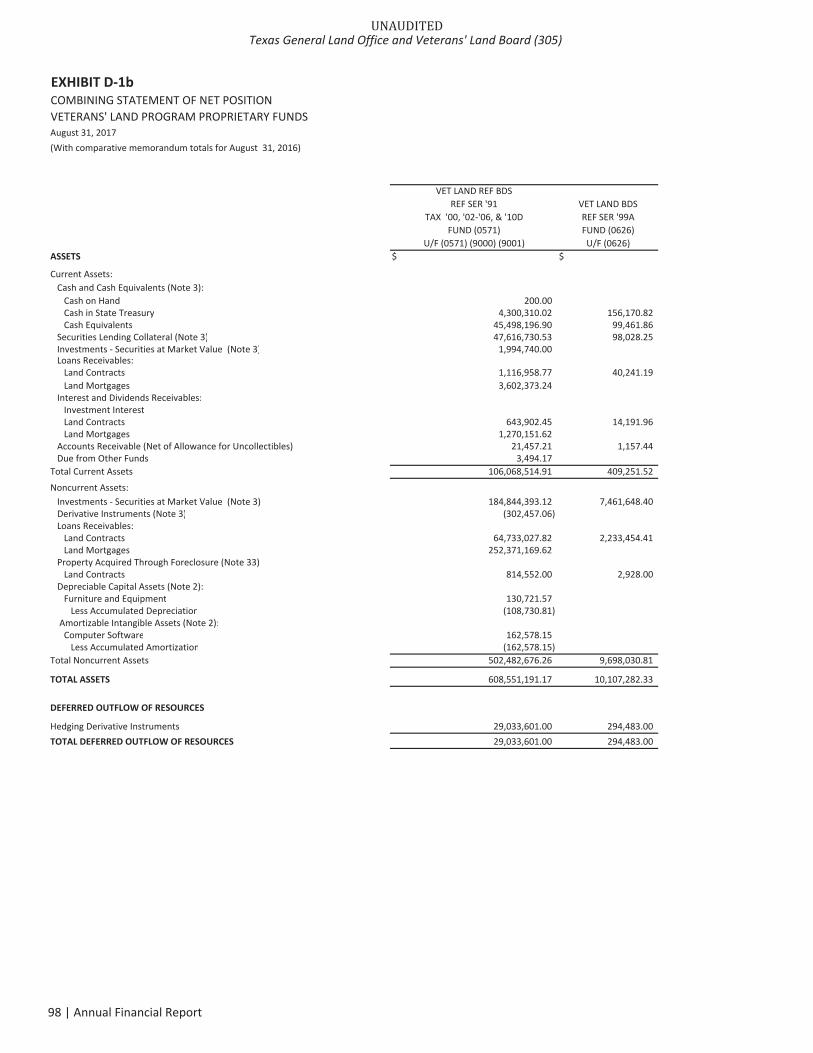
EXHIBIT D 1bCOMBINING STATEMENT OF NET POSITIONVETERANS' LAND PROGRAM PROPRIETARY FUNDSAugust 31, 2017(With comparative memorandum totals for August 31, 2016)
VET LAND REF BDSREF SER '91 VET LAND BDS
TAX '00, '02 '06, & '10D REF SER '99AFUND (0571) FUND (0626)
U/F (0571) (9000) (9001) U/F (0626)ASSETS $ $
Current Assets:Cash and Cash Equivalents (Note 3):
Cash on Hand 200.00Cash in State Treasury 4,300,310.02 156,170.82Cash Equivalents 45,498,196.90 99,461.86
Securities Lending Collateral (Note 3) 47,616,730.53 98,028.25Investments Securities at Market Value (Note 3) 1,994,740.00Loans Receivables:
Land Contracts 1,116,958.77 40,241.19Land Mortgages 3,602,373.24
Interest and Dividends Receivables:Investment InterestLand Contracts 643,902.45 14,191.96Land Mortgages 1,270,151.62
Accounts Receivable (Net of Allowance for Uncollectibles) 21,457.21 1,157.44Due from Other Funds 3,494.17
Total Current Assets 106,068,514.91 409,251.52
Noncurrent Assets:Investments Securities at Market Value (Note 3) 184,844,393.12 7,461,648.40Derivative Instruments (Note 3) (302,457.06)Loans Receivables:
Land Contracts 64,733,027.82 2,233,454.41Land Mortgages 252,371,169.62
Property Acquired Through Foreclosure (Note 33)Land Contracts 814,552.00 2,928.00
Depreciable Capital Assets (Note 2):Furniture and Equipment 130,721.57
Less Accumulated Depreciation (108,730.81)Amortizable Intangible Assets (Note 2):
Computer Software 162,578.15Less Accumulated Amortization (162,578.15)
Total Noncurrent Assets 502,482,676.26 9,698,030.81
TOTAL ASSETS 608,551,191.17 10,107,282.33
DEFERRED OUTFLOW OF RESOURCES
Hedging Derivative Instruments 29,033,601.00 294,483.00TOTAL DEFERRED OUTFLOW OF RESOURCES 29,033,601.00 294,483.00
UNAUDITEDTexas General Land Office and Veterans' Land Board (305)
98 | Annual Financial Report
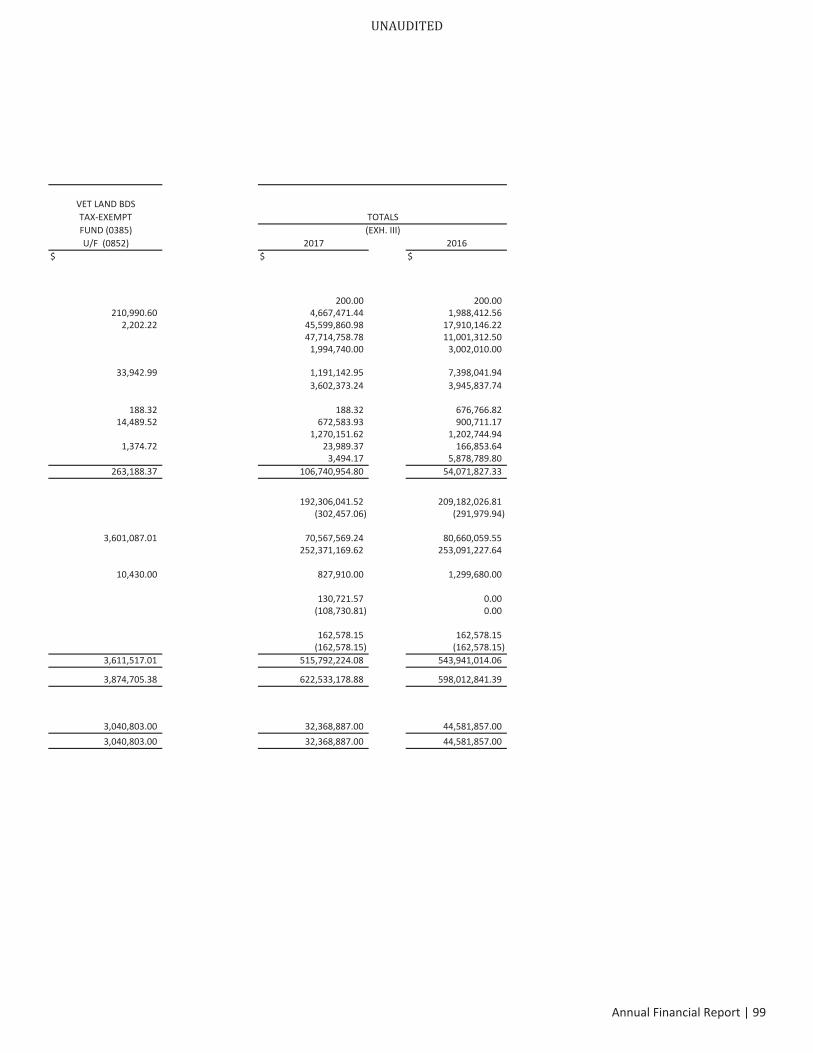
VET LAND BDSTAX EXEMPT TOTALSFUND (0385)U/F (0852) 2017 2016
$ $ $
200.00 200.00210,990.60 4,667,471.44 1,988,412.56
2,202.22 45,599,860.98 17,910,146.2247,714,758.78 11,001,312.50
1,994,740.00 3,002,010.00
33,942.99 1,191,142.95 7,398,041.943,602,373.24 3,945,837.74
188.32 188.32 676,766.8214,489.52 672,583.93 900,711.17
1,270,151.62 1,202,744.941,374.72 23,989.37 166,853.64
3,494.17 5,878,789.80263,188.37 106,740,954.80 54,071,827.33
192,306,041.52 209,182,026.81(302,457.06) (291,979.94)
3,601,087.01 70,567,569.24 80,660,059.55252,371,169.62 253,091,227.64
10,430.00 827,910.00 1,299,680.00
130,721.57 0.00(108,730.81) 0.00
162,578.15 162,578.15(162,578.15) (162,578.15)
3,611,517.01 515,792,224.08 543,941,014.06
3,874,705.38 622,533,178.88 598,012,841.39
3,040,803.00 32,368,887.00 44,581,857.003,040,803.00 32,368,887.00 44,581,857.00
(EXH. III)
UNAUDITED
Annual Financial Report | 99
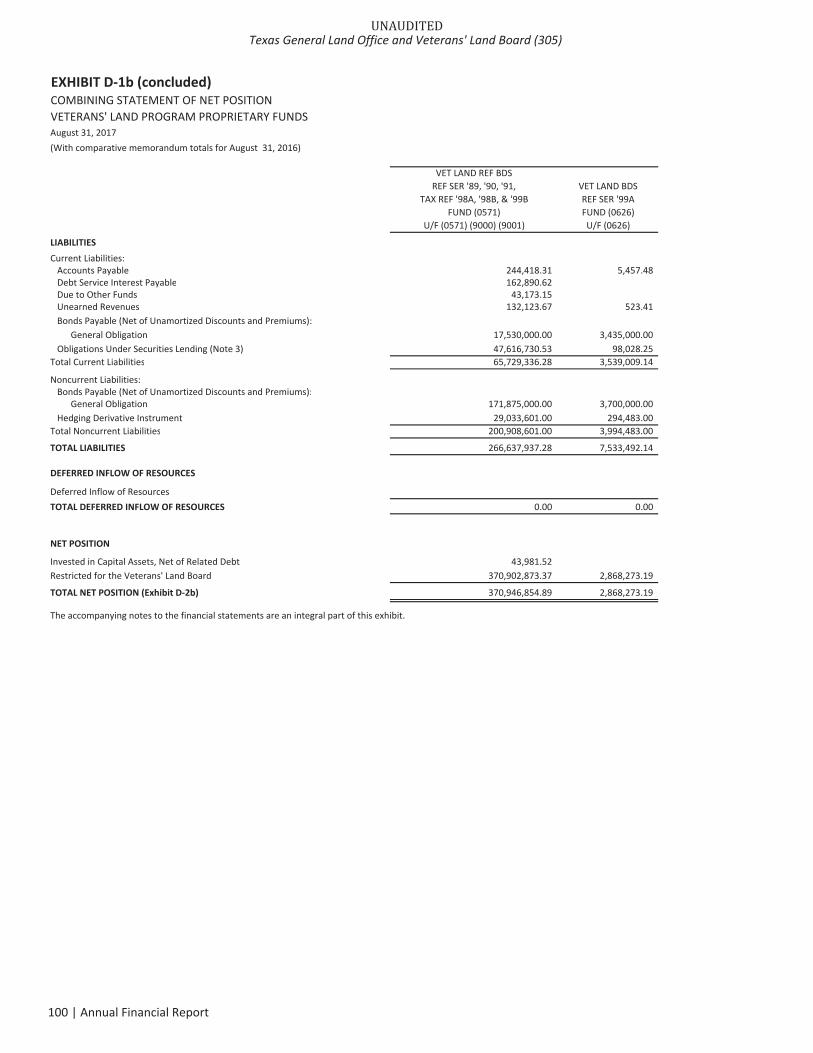
EXHIBIT D 1b (concluded)COMBINING STATEMENT OF NET POSITIONVETERANS' LAND PROGRAM PROPRIETARY FUNDSAugust 31, 2017(With comparative memorandum totals for August 31, 2016)
VET LAND REF BDSREF SER '89, '90, '91, VET LAND BDS
TAX REF '98A, '98B, & '99B REF SER '99AFUND (0571) FUND (0626)
U/F (0571) (9000) (9001) U/F (0626)
LIABILITIESCurrent Liabilities:
Accounts Payable 244,418.31 5,457.48Debt Service Interest Payable 162,890.62Due to Other Funds 43,173.15Unearned Revenues 132,123.67 523.41Bonds Payable (Net of Unamortized Discounts and Premiums):
General Obligation 17,530,000.00 3,435,000.00Obligations Under Securities Lending (Note 3) 47,616,730.53 98,028.25
Total Current Liabilities 65,729,336.28 3,539,009.14
Noncurrent Liabilities:Bonds Payable (Net of Unamortized Discounts and Premiums):
General Obligation 171,875,000.00 3,700,000.00Hedging Derivative Instrument 29,033,601.00 294,483.00
Total Noncurrent Liabilities 200,908,601.00 3,994,483.00
TOTAL LIABILITIES 266,637,937.28 7,533,492.14
DEFERRED INFLOW OF RESOURCES
Deferred Inflow of ResourcesTOTAL DEFERRED INFLOW OF RESOURCES 0.00 0.00
NET POSITION
Invested in Capital Assets, Net of Related Debt 43,981.52Restricted for the Veterans' Land Board 370,902,873.37 2,868,273.19
TOTAL NET POSITION (Exhibit D 2b) 370,946,854.89 2,868,273.19
The accompanying notes to the financial statements are an integral part of this exhibit.
UNAUDITEDTexas General Land Office and Veterans' Land Board (305)
100 | Annual Financial Report
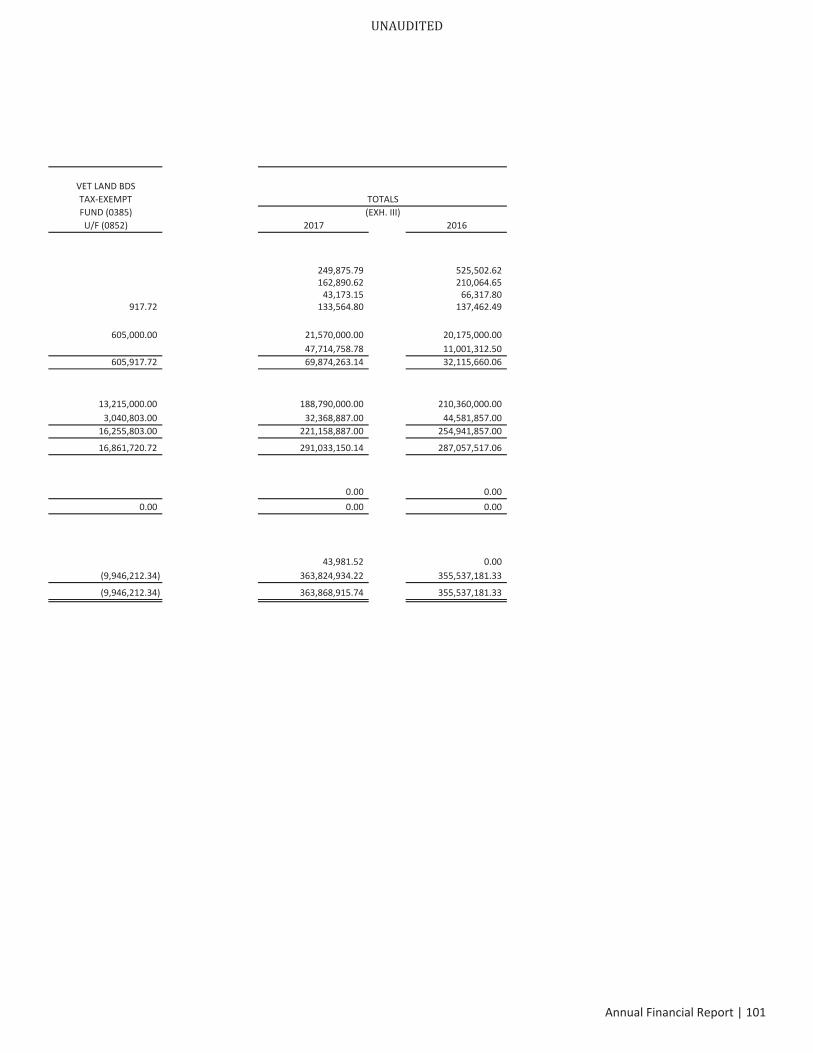
VET LAND BDSTAX EXEMPT TOTALSFUND (0385)U/F (0852) 2017 2016
249,875.79 525,502.62162,890.62 210,064.65
43,173.15 66,317.80917.72 133,564.80 137,462.49
605,000.00 21,570,000.00 20,175,000.0047,714,758.78 11,001,312.50
605,917.72 69,874,263.14 32,115,660.06
13,215,000.00 188,790,000.00 210,360,000.003,040,803.00 32,368,887.00 44,581,857.00
16,255,803.00 221,158,887.00 254,941,857.00
16,861,720.72 291,033,150.14 287,057,517.06
0.00 0.000.00 0.00 0.00
43,981.52 0.00(9,946,212.34) 363,824,934.22 355,537,181.33
(9,946,212.34) 363,868,915.74 355,537,181.33
(EXH. III)
UNAUDITED
Annual Financial Report | 101
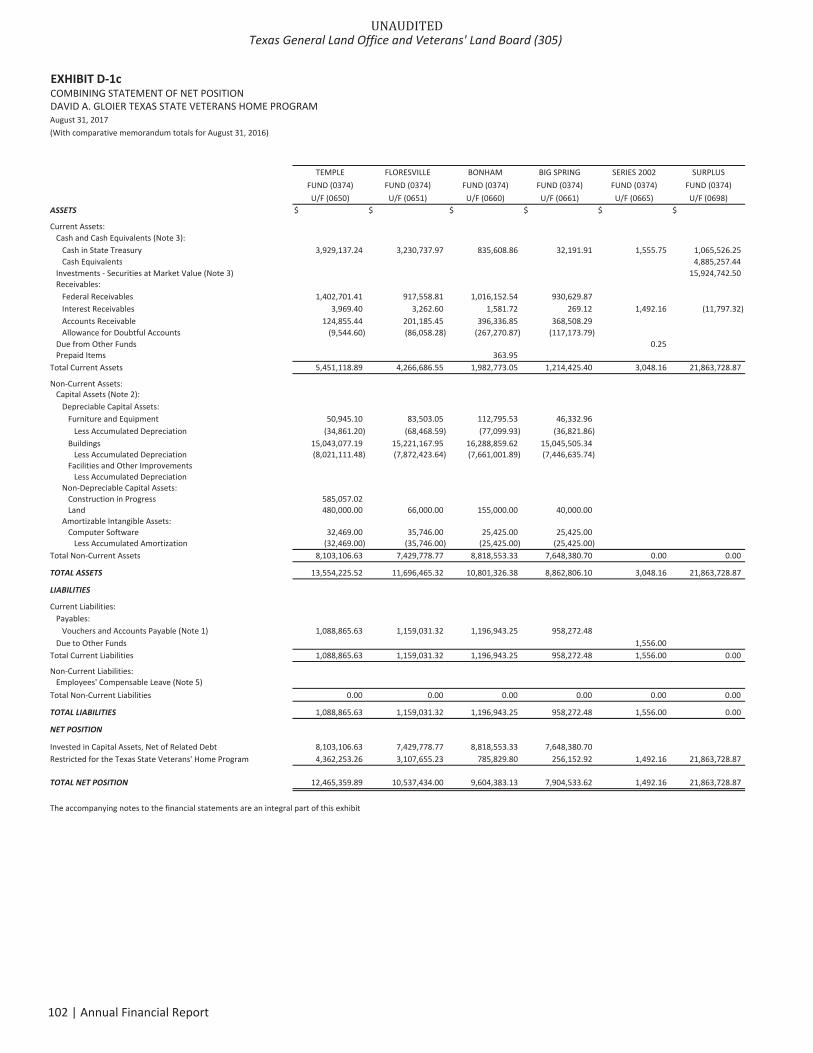
EXHIBIT D 1cCOMBINING STATEMENT OF NET POSITIONDAVID A. GLOIER TEXAS STATE VETERANS HOME PROGRAMAugust 31, 2017(With comparative memorandum totals for August 31, 2016)
TEMPLE FLORESVILLE BONHAM BIG SPRING SERIES 2002 SURPLUSFUND (0374) FUND (0374) FUND (0374) FUND (0374) FUND (0374) FUND (0374)U/F (0650) U/F (0651) U/F (0660) U/F (0661) U/F (0665) U/F (0698)
ASSETS $ $ $ $ $ $
Current Assets:Cash and Cash Equivalents (Note 3):
Cash in State Treasury 3,929,137.24 3,230,737.97 835,608.86 32,191.91 1,555.75 1,065,526.25Cash Equivalents 4,885,257.44
Investments Securities at Market Value (Note 3) 15,924,742.50Receivables:
Federal Receivables 1,402,701.41 917,558.81 1,016,152.54 930,629.87Interest Receivables 3,969.40 3,262.60 1,581.72 269.12 1,492.16 (11,797.32)Accounts Receivable 124,855.44 201,185.45 396,336.85 368,508.29Allowance for Doubtful Accounts (9,544.60) (86,058.28) (267,270.87) (117,173.79)
Due from Other Funds 0.25Prepaid Items 363.95
Total Current Assets 5,451,118.89 4,266,686.55 1,982,773.05 1,214,425.40 3,048.16 21,863,728.87
Non Current Assets:Capital Assets (Note 2):
Depreciable Capital Assets:Furniture and Equipment 50,945.10 83,503.05 112,795.53 46,332.96
Less Accumulated Depreciation (34,861.20) (68,468.59) (77,099.93) (36,821.86)Buildings 15,043,077.19 15,221,167.95 16,288,859.62 15,045,505.34
Less Accumulated Depreciation (8,021,111.48) (7,872,423.64) (7,661,001.89) (7,446,635.74)Facilities and Other Improvements
Less Accumulated DepreciationNon Depreciable Capital Assets:
Construction in Progress 585,057.02Land 480,000.00 66,000.00 155,000.00 40,000.00
Amortizable Intangible Assets:Computer Software 32,469.00 35,746.00 25,425.00 25,425.00
Less Accumulated Amortization (32,469.00) (35,746.00) (25,425.00) (25,425.00)Total Non Current Assets 8,103,106.63 7,429,778.77 8,818,553.33 7,648,380.70 0.00 0.00
TOTAL ASSETS 13,554,225.52 11,696,465.32 10,801,326.38 8,862,806.10 3,048.16 21,863,728.87
LIABILITIES
Current Liabilities:Payables:
Vouchers and Accounts Payable (Note 1) 1,088,865.63 1,159,031.32 1,196,943.25 958,272.48Due to Other Funds 1,556.00
Total Current Liabilities 1,088,865.63 1,159,031.32 1,196,943.25 958,272.48 1,556.00 0.00
Non Current Liabilities:Employees' Compensable Leave (Note 5)
Total Non Current Liabilities 0.00 0.00 0.00 0.00 0.00 0.00
TOTAL LIABILITIES 1,088,865.63 1,159,031.32 1,196,943.25 958,272.48 1,556.00 0.00
NET POSITION
Invested in Capital Assets, Net of Related Debt 8,103,106.63 7,429,778.77 8,818,553.33 7,648,380.70Restricted for the Texas State Veterans' Home Program 4,362,253.26 3,107,655.23 785,829.80 256,152.92 1,492.16 21,863,728.87
TOTAL NET POSITION 12,465,359.89 10,537,434.00 9,604,383.13 7,904,533.62 1,492.16 21,863,728.87
The accompanying notes to the financial statements are an integral part of this exhibit.
UNAUDITEDTexas General Land Office and Veterans' Land Board (305)
102 | Annual Financial Report

TYLER 35% FED ARRA 65% MCALLEN EL PASO AMARILLO HOUSTONFUND (0374) FUND (0374) FUND (0374) FUND (0374) FUND (0374) FUND (0374)U/F (0656) U/F (6656) U/F (0652) U/F (0653) U/F (0654) U/F (0657) 2017 2016
$ $ $ $ $ $ $ $
4,411,066.34 1,865,363.30 2,689,575.10 (424,854.98) 99,048.03 17,734,955.77 18,300,094.004,885,257.44 19,376,301.29
15,924,742.50 0.00
598,616.60 2,259,078.98 2,428,247.92 1,485,340.95 1,396,788.79 12,435,115.87 10,812,072.096,348.98 2,352.67 3,197.21 156.00 112.74 10,945.28 12,457.96
831,526.07 455,303.91 274,692.61 261,496.45 2,913,905.07 4,753,339.67(288,258.23) (124,710.72) (63,084.95) (106,041.13) (1,062,142.57) (1,562,572.36)
1,556.00 1,556.25 12,278,833.16155.98 50.00 544.96 264.96 1,379.85 0.00
5,561,011.74 0.00 4,457,438.14 5,333,172.85 1,216,097.29 1,496,214.52 52,845,715.46 63,970,525.81
262,343.13 69,699.79 69,070.26 49,788.15 744,477.97 713,772.38(207,502.05) (46,579.56) (36,960.00) (26,200.55) (534,493.74) (470,251.34)
16,368,166.11 12,964,104.49 12,175,434.11 13,081,185.91 116,187,500.72 116,283,716.90(4,891,318.60) (7,139,322.72) (6,261,637.73) (6,223,785.81) (55,517,237.61) (51,037,507.64)
22,963.00 22,963.00 22,963.00(6,696.90) (6,696.90) (5,548.86)
228,479.47 2,493,372.31 2,327,699.38 1,451,570.81 3,411,002.39 10,497,181.38 3,022,514.551,300,000.00 650,000.00 808,500.00 540,000.00 4,039,500.00 4,039,500.00
8,525.00 8,525.00 10,440.00 146,555.00 146,555.00(8,525.00) (8,525.00) (10,440.00) (146,555.00) (146,555.00)
11,760,168.06 0.00 9,641,274.31 8,923,606.02 9,157,324.61 3,951,002.39 75,433,194.82 72,569,158.99
17,321,179.80 0.00 14,098,712.45 14,256,778.87 10,373,421.90 5,447,216.91 128,278,910.28 136,539,684.80
2,173,034.56 1,341,753.79 1,396,378.01 828,782.98 1,395,093.53 11,538,155.55 13,059,429.521,556.00 17,727,226.69
2,173,034.56 0.00 1,341,753.79 1,396,378.01 828,782.98 1,395,093.53 11,539,711.55 30,786,656.21
0.00 0.000.00 0.00 0.00 0.00 0.00 0.00 0.00 0.00
2,173,034.56 0.00 1,341,753.79 1,396,378.01 828,782.98 1,395,093.53 11,539,711.55 30,786,656.21
11,760,168.06 9,641,274.31 8,923,606.02 9,157,324.61 3,951,002.39 75,433,194.82 72,569,158.993,387,977.18 3,115,684.35 3,936,794.84 387,314.31 101,120.99 41,306,003.91 33,183,869.60
15,148,145.24 0.00 12,756,958.66 12,860,400.86 9,544,638.92 4,052,123.38 116,739,198.73 105,753,028.59
TOTALS(EXH III)
UNAUDITED
Annual Financial Report | 103
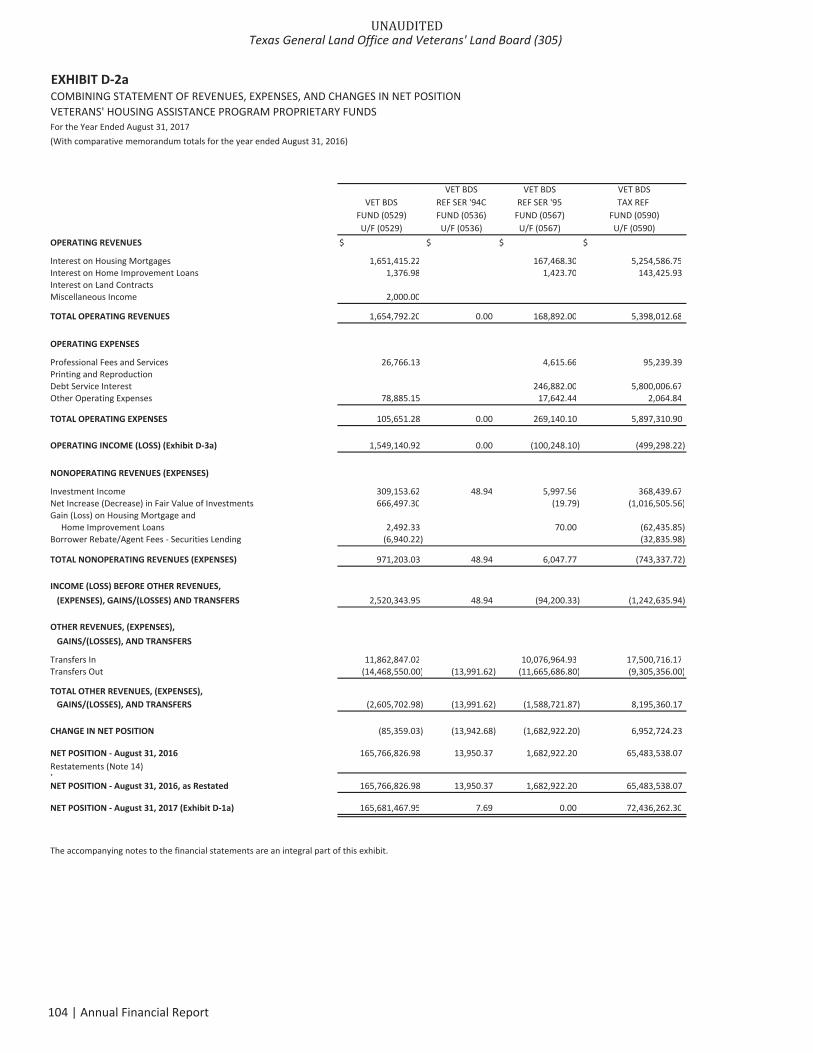
EXHIBIT D 2aCOMBINING STATEMENT OF REVENUES, EXPENSES, AND CHANGES IN NET POSITIONVETERANS' HOUSING ASSISTANCE PROGRAM PROPRIETARY FUNDSFor the Year Ended August 31, 2017(With comparative memorandum totals for the year ended August 31, 2016)
VET BDS VET BDS VET BDSVET BDS REF SER '94C REF SER '95 TAX REF
FUND (0529) FUND (0536) FUND (0567) FUND (0590)U/F (0529) U/F (0536) U/F (0567) U/F (0590)
OPERATING REVENUES $ $ $ $
Interest on Housing Mortgages 1,651,415.22 167,468.30 5,254,586.75Interest on Home Improvement Loans 1,376.98 1,423.70 143,425.93Interest on Land ContractsMiscellaneous Income 2,000.00
TOTAL OPERATING REVENUES 1,654,792.20 0.00 168,892.00 5,398,012.68
OPERATING EXPENSES
Professional Fees and Services 26,766.13 4,615.66 95,239.39Printing and ReproductionDebt Service Interest 246,882.00 5,800,006.67Other Operating Expenses 78,885.15 17,642.44 2,064.84
TOTAL OPERATING EXPENSES 105,651.28 0.00 269,140.10 5,897,310.90
OPERATING INCOME (LOSS) (Exhibit D 3a) 1,549,140.92 0.00 (100,248.10) (499,298.22)
NONOPERATING REVENUES (EXPENSES)
Investment Income 309,153.62 48.94 5,997.56 368,439.67Net Increase (Decrease) in Fair Value of Investments 666,497.30 (19.79) (1,016,505.56)Gain (Loss) on Housing Mortgage and
Home Improvement Loans 2,492.33 70.00 (62,435.85)Borrower Rebate/Agent Fees Securities Lending (6,940.22) (32,835.98)
TOTAL NONOPERATING REVENUES (EXPENSES) 971,203.03 48.94 6,047.77 (743,337.72)
INCOME (LOSS) BEFORE OTHER REVENUES,(EXPENSES), GAINS/(LOSSES) AND TRANSFERS 2,520,343.95 48.94 (94,200.33) (1,242,635.94)
OTHER REVENUES, (EXPENSES),GAINS/(LOSSES), AND TRANSFERS
Transfers In 11,862,847.02 10,076,964.93 17,500,716.17Transfers Out (14,468,550.00) (13,991.62) (11,665,686.80) (9,305,356.00)
TOTAL OTHER REVENUES, (EXPENSES),GAINS/(LOSSES), AND TRANSFERS (2,605,702.98) (13,991.62) (1,588,721.87) 8,195,360.17
CHANGE IN NET POSITION (85,359.03) (13,942.68) (1,682,922.20) 6,952,724.23
NET POSITION August 31, 2016 165,766,826.98 13,950.37 1,682,922.20 65,483,538.07Restatements (Note 14).NET POSITION August 31, 2016, as Restated 165,766,826.98 13,950.37 1,682,922.20 65,483,538.07
NET POSITION August 31, 2017 (Exhibit D 1a) 165,681,467.95 7.69 0.00 72,436,262.30
The accompanying notes to the financial statements are an integral part of this exhibit.
UNAUDITEDTexas General Land Office and Veterans' Land Board (305)
104 | Annual Financial Report
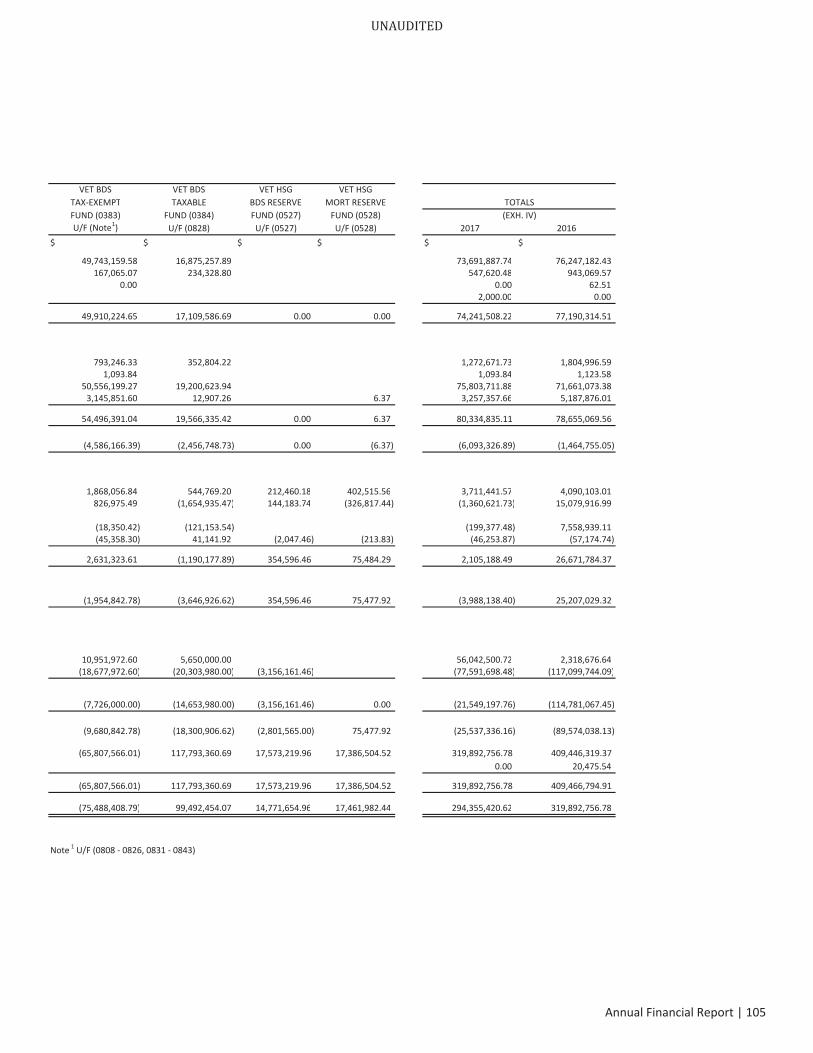
VET BDS VET BDS VET HSG VET HSGTAX EXEMPT TAXABLE BDS RESERVE MORT RESERVE TOTALSFUND (0383) FUND (0384) FUND (0527) FUND (0528) (EXH. IV)U/F (Note1) U/F (0828) U/F (0527) U/F (0528) 2017 2016
$ $ $ $ $ $
49,743,159.58 16,875,257.89 73,691,887.74 76,247,182.43167,065.07 234,328.80 547,620.48 943,069.57
0.00 0.00 62.512,000.00 0.00
49,910,224.65 17,109,586.69 0.00 0.00 74,241,508.22 77,190,314.51
793,246.33 352,804.22 1,272,671.73 1,804,996.591,093.84 1,093.84 1,123.58
50,556,199.27 19,200,623.94 75,803,711.88 71,661,073.383,145,851.60 12,907.26 6.37 3,257,357.66 5,187,876.01
54,496,391.04 19,566,335.42 0.00 6.37 80,334,835.11 78,655,069.56
(4,586,166.39) (2,456,748.73) 0.00 (6.37) (6,093,326.89) (1,464,755.05)
1,868,056.84 544,769.20 212,460.18 402,515.56 3,711,441.57 4,090,103.01826,975.49 (1,654,935.47) 144,183.74 (326,817.44) (1,360,621.73) 15,079,916.99
(18,350.42) (121,153.54) (199,377.48) 7,558,939.11(45,358.30) 41,141.92 (2,047.46) (213.83) (46,253.87) (57,174.74)
2,631,323.61 (1,190,177.89) 354,596.46 75,484.29 2,105,188.49 26,671,784.37
(1,954,842.78) (3,646,926.62) 354,596.46 75,477.92 (3,988,138.40) 25,207,029.32
10,951,972.60 5,650,000.00 56,042,500.72 2,318,676.64(18,677,972.60) (20,303,980.00) (3,156,161.46) (77,591,698.48) (117,099,744.09)
(7,726,000.00) (14,653,980.00) (3,156,161.46) 0.00 (21,549,197.76) (114,781,067.45)
(9,680,842.78) (18,300,906.62) (2,801,565.00) 75,477.92 (25,537,336.16) (89,574,038.13)
(65,807,566.01) 117,793,360.69 17,573,219.96 17,386,504.52 319,892,756.78 409,446,319.370.00 20,475.54
(65,807,566.01) 117,793,360.69 17,573,219.96 17,386,504.52 319,892,756.78 409,466,794.91
(75,488,408.79) 99,492,454.07 14,771,654.96 17,461,982.44 294,355,420.62 319,892,756.78
Note 1 U/F (0808 0826, 0831 0843)
UNAUDITED
Annual Financial Report | 105
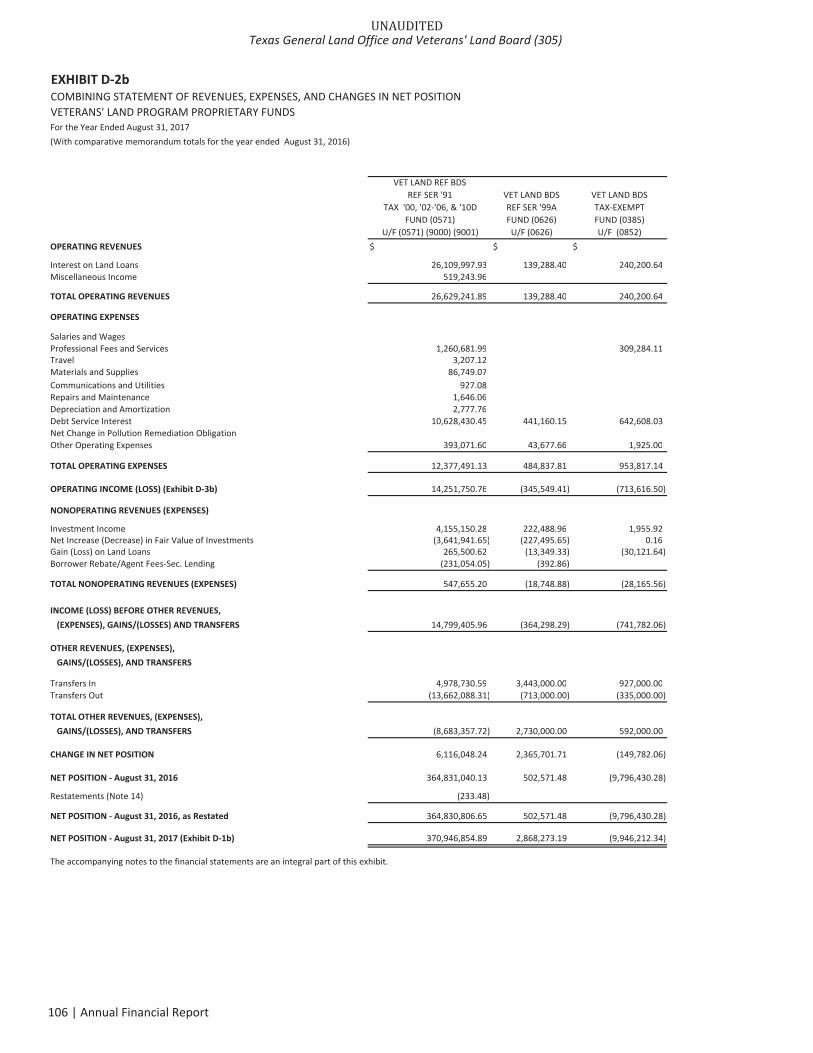
EXHIBIT D 2bCOMBINING STATEMENT OF REVENUES, EXPENSES, AND CHANGES IN NET POSITIONVETERANS' LAND PROGRAM PROPRIETARY FUNDSFor the Year Ended August 31, 2017(With comparative memorandum totals for the year ended August 31, 2016)
VET LAND REF BDSREF SER '91 VET LAND BDS VET LAND BDS
TAX '00, '02 '06, & '10D REF SER '99A TAX EXEMPTFUND (0571) FUND (0626) FUND (0385)
U/F (0571) (9000) (9001) U/F (0626) U/F (0852)OPERATING REVENUES $ $ $
Interest on Land Loans 26,109,997.93 139,288.40 240,200.64Miscellaneous Income 519,243.96
TOTAL OPERATING REVENUES 26,629,241.89 139,288.40 240,200.64
OPERATING EXPENSES
Salaries and WagesProfessional Fees and Services 1,260,681.99 309,284.11Travel 3,207.12Materials and Supplies 86,749.07Communications and Utilities 927.08Repairs and Maintenance 1,646.06Depreciation and Amortization 2,777.76Debt Service Interest 10,628,430.45 441,160.15 642,608.03Net Change in Pollution Remediation ObligationOther Operating Expenses 393,071.60 43,677.66 1,925.00
TOTAL OPERATING EXPENSES 12,377,491.13 484,837.81 953,817.14
OPERATING INCOME (LOSS) (Exhibit D 3b) 14,251,750.76 (345,549.41) (713,616.50)
NONOPERATING REVENUES (EXPENSES)
Investment Income 4,155,150.28 222,488.96 1,955.92Net Increase (Decrease) in Fair Value of Investments (3,641,941.65) (227,495.65) 0.16Gain (Loss) on Land Loans 265,500.62 (13,349.33) (30,121.64)Borrower Rebate/Agent Fees Sec. Lending (231,054.05) (392.86)
TOTAL NONOPERATING REVENUES (EXPENSES) 547,655.20 (18,748.88) (28,165.56)
INCOME (LOSS) BEFORE OTHER REVENUES,(EXPENSES), GAINS/(LOSSES) AND TRANSFERS 14,799,405.96 (364,298.29) (741,782.06)
OTHER REVENUES, (EXPENSES),GAINS/(LOSSES), AND TRANSFERS
Transfers In 4,978,730.59 3,443,000.00 927,000.00Transfers Out (13,662,088.31) (713,000.00) (335,000.00)
TOTAL OTHER REVENUES, (EXPENSES),GAINS/(LOSSES), AND TRANSFERS (8,683,357.72) 2,730,000.00 592,000.00
CHANGE IN NET POSITION 6,116,048.24 2,365,701.71 (149,782.06)
NET POSITION August 31, 2016 364,831,040.13 502,571.48 (9,796,430.28)
Restatements (Note 14) (233.48)
NET POSITION August 31, 2016, as Restated 364,830,806.65 502,571.48 (9,796,430.28)
NET POSITION August 31, 2017 (Exhibit D 1b) 370,946,854.89 2,868,273.19 (9,946,212.34)
The accompanying notes to the financial statements are an integral part of this exhibit.
UNAUDITEDTexas General Land Office and Veterans' Land Board (305)
106 | Annual Financial Report
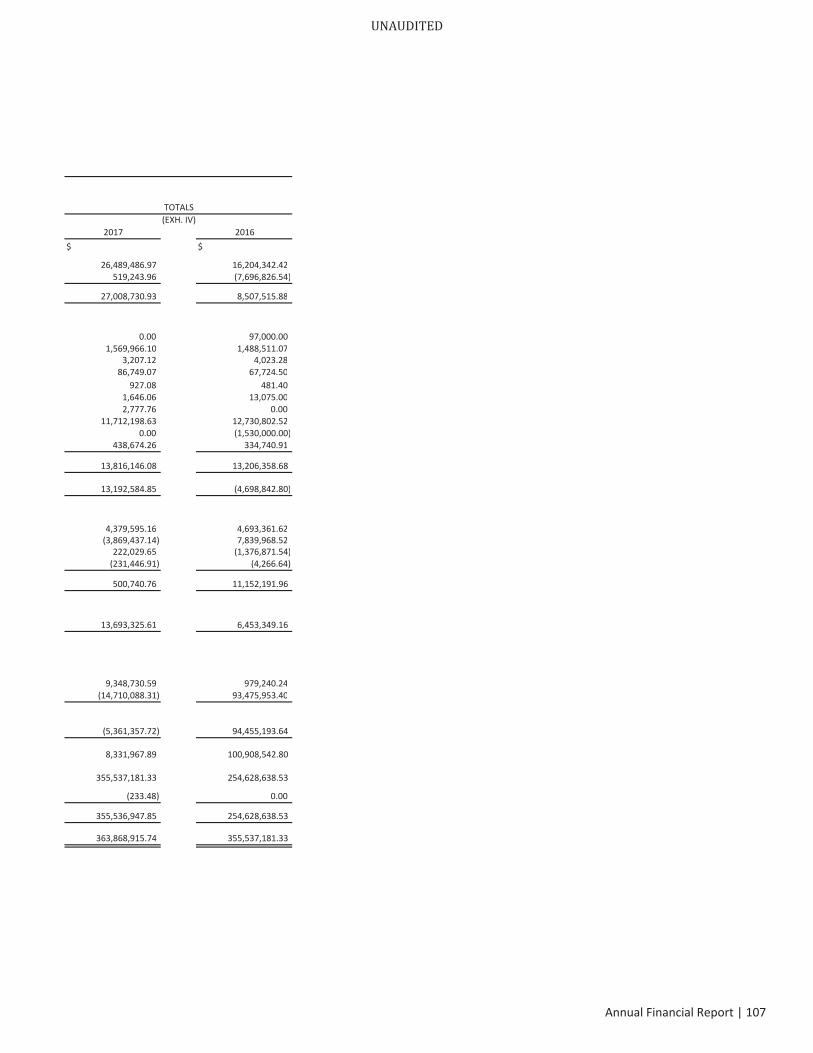
TOTALS
2017 2016$ $
26,489,486.97 16,204,342.42519,243.96 (7,696,826.54)
27,008,730.93 8,507,515.88
0.00 97,000.001,569,966.10 1,488,511.07
3,207.12 4,023.2886,749.07 67,724.50
927.08 481.401,646.06 13,075.002,777.76 0.00
11,712,198.63 12,730,802.520.00 (1,530,000.00)
438,674.26 334,740.91
13,816,146.08 13,206,358.68
13,192,584.85 (4,698,842.80)
4,379,595.16 4,693,361.62(3,869,437.14) 7,839,968.52
222,029.65 (1,376,871.54)(231,446.91) (4,266.64)
500,740.76 11,152,191.96
13,693,325.61 6,453,349.16
9,348,730.59 979,240.24(14,710,088.31) 93,475,953.40
(5,361,357.72) 94,455,193.64
8,331,967.89 100,908,542.80
355,537,181.33 254,628,638.53
(233.48) 0.00
355,536,947.85 254,628,638.53
363,868,915.74 355,537,181.33
(EXH. IV)
UNAUDITED
Annual Financial Report | 107

EXHIBIT D 2cCOMBINING STATEMENT OF REVENUES, EXPENSES, AND CHANGES IN NET POSITIONDAVID A. GLOIER TEXAS STATE VETERANS HOME PROGRAMFor the Year Ended August 31, 2017(With comparative memorandum totals for the year ended August 31, 2016)
TEMPLE FLORESVILLE BONHAM BIG SPRING SERIES 2002 SURPLUSFUND (0374) FUND (0374) FUND (0374) FUND (0374) FUND (0374) FUND (0374)U/F (0650) U/F (0651) U/F (0660) U/F (0661) U/F (0665) U/F (0698)
OPERATING REVENUES $ $ $ $ $ $
Charges for Services:Veterans Administration Per Diem 9,436,331.48 8,591,998.57 7,011,775.28 5,348,794.07Resident Payments (Net of Provisions for Bad Debt) 2,197,224.00 2,376,894.72 2,366,657.55 1,657,689.24Medicare Reimbursements (Net of Provisions for Bad Debt) 516,082.45 1,146,292.53 907,765.96 879,015.45Medicaid Revenues (Net of Provisions for Bad Debt) 374,869.25 406,431.97 382,547.71 337,737.26Other Assistance Payments (Net of Provisions for Bad Debt) (3,984.13) 3,064.63 2,813.97 40,179.68Third Party Reimbursements 121.00 1,877.75Revenue Transfers Within Fund (1,021,037.99) (1,000,000.00) 866,661.48 2,458,338.52Miscellaneous Income 23.80 484.77 4,507.60 6,157.36
TOTAL OPERATING REVENUES 11,499,629.86 11,527,044.94 10,676,068.07 9,136,234.54 0.00 2,458,338.52
OPERATING EXPENSES
Professional Fees and Services 9,430,049.62 10,308,547.72 10,074,577.71 8,296,438.64Travel 3,216.85 3,501.07 14,060.49 14,480.10Materials and Supplies 403,537.66 574,729.22 351,584.75 274,921.54Communications and Utilities 4,540.63 4,046.06 3,664.02 4,479.24Repairs and Maintenance 247,643.77 169,832.11 30,237.00 86,219.78 22,500.00Rentals and Leases (Note 8)Printing and ReproductionDepreciation and Amortization 654,896.16 665,047.38 714,506.72 655,562.88Interest Expense 150.66 47.60 211.51 28.07Claims and LossesOther Operating Expenses 304.98 484.53 300.00 361.65
TOTAL OPERATING EXPENSES 10,744,340.33 11,726,235.69 11,189,142.20 9,332,491.90 0.00 22,500.00
OPERATING INCOME (LOSS) (Exhibit D 3c) 755,289.53 (199,190.75) (513,074.13) (196,257.36) 0.00 2,435,838.52
NONOPERATING REVENUES/(EXPENSES)
Federal Revenues (25,869.62) (89,201.44) (57,352.50) (39,533.42)Gifts/Pledges/Donations 8,880.00 11,000.00 2,062.00 7,985.00Investment Income 39,974.33 32,839.48 17,448.99 5,246.35 (19,393.83) 51,123.39Net Increase (Decrease) in Fair Value of Investments 99,291.56Capital Contributions
TOTAL NONOPERATING REVENUES/(EXPENSES) 22,984.71 (45,361.96) (37,841.51) (26,302.07) (19,393.83) 150,414.95
INCOME/(LOSS) BEFORE OTHER REVENUES,(EXPENSES), GAINS/(LOSSES) AND TRANSFERS 778,274.24 (244,552.71) (550,915.64) (222,559.43) (19,393.83) 2,586,253.47
OTHER REVENUES, (EXPENSES),GAINS/(LOSSES), AND TRANSFERS
Transfers In 751,211.97 806,949.64 11,976.43 953,521.81 22,500.00Transfers Out (175,180.35) (668,893.76) (419,311.15) (817,805.55) (136,265.51)
TOTAL OTHER REVENUES, (EXPENSES),GAINS/(LOSSES), AND TRANSFERS 576,031.62 138,055.88 (407,334.72) 135,716.26 0.00 (113,765.51)
CHANGE IN NET POSITION 1,354,305.86 (106,496.83) (958,250.36) (86,843.17) (19,393.83) 2,472,487.96
NET POSITION, August 31, 2016 11,111,054.03 10,643,930.83 10,562,633.49 7,991,376.79 12,295,520.65 7,116,606.25
Restatements (Note 14) (12,274,634.66) 12,274,634.66
NET POSITION AUGUST 31, 2016, as RESTATED 11,111,054.03 10,643,930.83 10,562,633.49 7,991,376.79 20,885.99 19,391,240.91
NET POSITION August 31, 2017 (Exhibit D 1c) 12,465,359.89 10,537,434.00 9,604,383.13 7,904,533.62 1,492.16 21,863,728.87
The accompanying notes to the financial statements are an integral part of this exhibit.
UNAUDITEDTexas General Land Office and Veterans' Land Board (305)
108 | Annual Financial Report
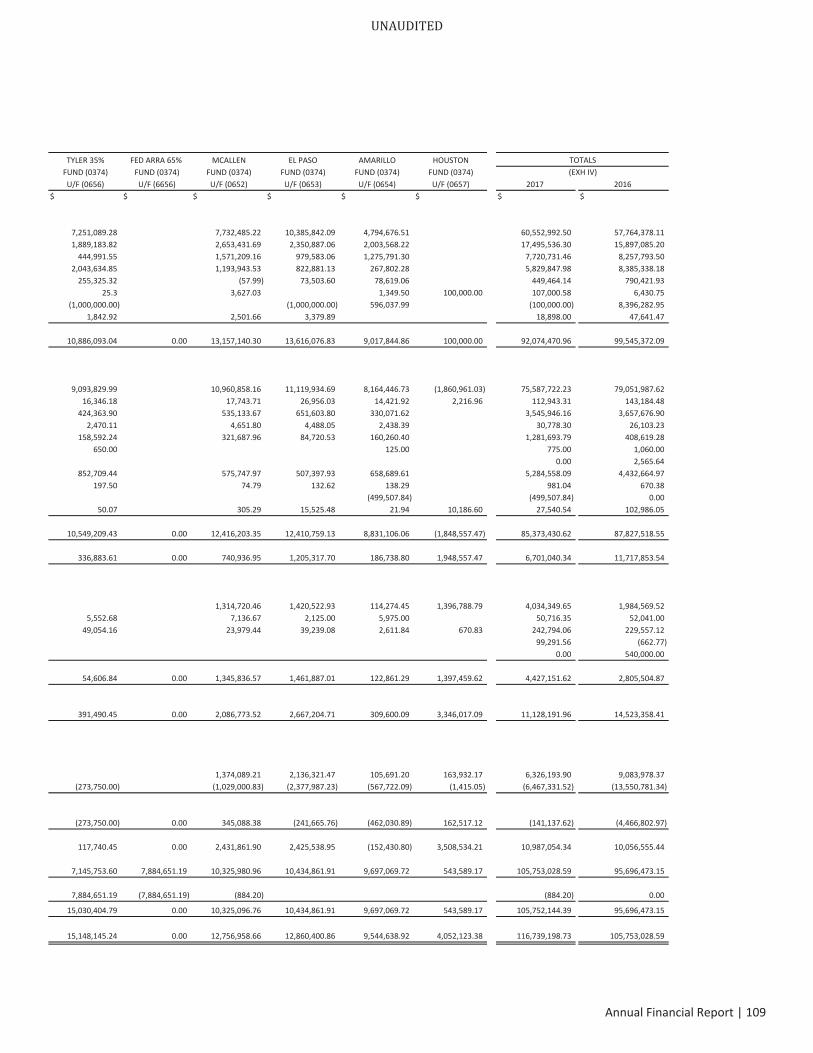
TYLER 35% FED ARRA 65% MCALLEN EL PASO AMARILLO HOUSTONFUND (0374) FUND (0374) FUND (0374) FUND (0374) FUND (0374) FUND (0374)U/F (0656) U/F (6656) U/F (0652) U/F (0653) U/F (0654) U/F (0657) 2017 2016
$ $ $ $ $ $ $ $
7,251,089.28 7,732,485.22 10,385,842.09 4,794,676.51 60,552,992.50 57,764,378.111,889,183.82 2,653,431.69 2,350,887.06 2,003,568.22 17,495,536.30 15,897,085.20
444,991.55 1,571,209.16 979,583.06 1,275,791.30 7,720,731.46 8,257,793.502,043,634.85 1,193,943.53 822,881.13 267,802.28 5,829,847.98 8,385,338.18
255,325.32 (57.99) 73,503.60 78,619.06 449,464.14 790,421.9325.3 3,627.03 1,349.50 100,000.00 107,000.58 6,430.75
(1,000,000.00) (1,000,000.00) 596,037.99 (100,000.00) 8,396,282.951,842.92 2,501.66 3,379.89 18,898.00 47,641.47
10,886,093.04 0.00 13,157,140.30 13,616,076.83 9,017,844.86 100,000.00 92,074,470.96 99,545,372.09
9,093,829.99 10,960,858.16 11,119,934.69 8,164,446.73 (1,860,961.03) 75,587,722.23 79,051,987.6216,346.18 17,743.71 26,956.03 14,421.92 2,216.96 112,943.31 143,184.48
424,363.90 535,133.67 651,603.80 330,071.62 3,545,946.16 3,657,676.902,470.11 4,651.80 4,488.05 2,438.39 30,778.30 26,103.23
158,592.24 321,687.96 84,720.53 160,260.40 1,281,693.79 408,619.28650.00 125.00 775.00 1,060.00
0.00 2,565.64852,709.44 575,747.97 507,397.93 658,689.61 5,284,558.09 4,432,664.97
197.50 74.79 132.62 138.29 981.04 670.38(499,507.84) (499,507.84) 0.00
50.07 305.29 15,525.48 21.94 10,186.60 27,540.54 102,986.05
10,549,209.43 0.00 12,416,203.35 12,410,759.13 8,831,106.06 (1,848,557.47) 85,373,430.62 87,827,518.55
336,883.61 0.00 740,936.95 1,205,317.70 186,738.80 1,948,557.47 6,701,040.34 11,717,853.54
1,314,720.46 1,420,522.93 114,274.45 1,396,788.79 4,034,349.65 1,984,569.525,552.68 7,136.67 2,125.00 5,975.00 50,716.35 52,041.00
49,054.16 23,979.44 39,239.08 2,611.84 670.83 242,794.06 229,557.1299,291.56 (662.77)
0.00 540,000.00
54,606.84 0.00 1,345,836.57 1,461,887.01 122,861.29 1,397,459.62 4,427,151.62 2,805,504.87
391,490.45 0.00 2,086,773.52 2,667,204.71 309,600.09 3,346,017.09 11,128,191.96 14,523,358.41
1,374,089.21 2,136,321.47 105,691.20 163,932.17 6,326,193.90 9,083,978.37(273,750.00) (1,029,000.83) (2,377,987.23) (567,722.09) (1,415.05) (6,467,331.52) (13,550,781.34)
(273,750.00) 0.00 345,088.38 (241,665.76) (462,030.89) 162,517.12 (141,137.62) (4,466,802.97)
117,740.45 0.00 2,431,861.90 2,425,538.95 (152,430.80) 3,508,534.21 10,987,054.34 10,056,555.44
7,145,753.60 7,884,651.19 10,325,980.96 10,434,861.91 9,697,069.72 543,589.17 105,753,028.59 95,696,473.15
7,884,651.19 (7,884,651.19) (884.20) (884.20) 0.00
15,030,404.79 0.00 10,325,096.76 10,434,861.91 9,697,069.72 543,589.17 105,752,144.39 95,696,473.15
15,148,145.24 0.00 12,756,958.66 12,860,400.86 9,544,638.92 4,052,123.38 116,739,198.73 105,753,028.59
TOTALS(EXH IV)
UNAUDITED
Annual Financial Report | 109
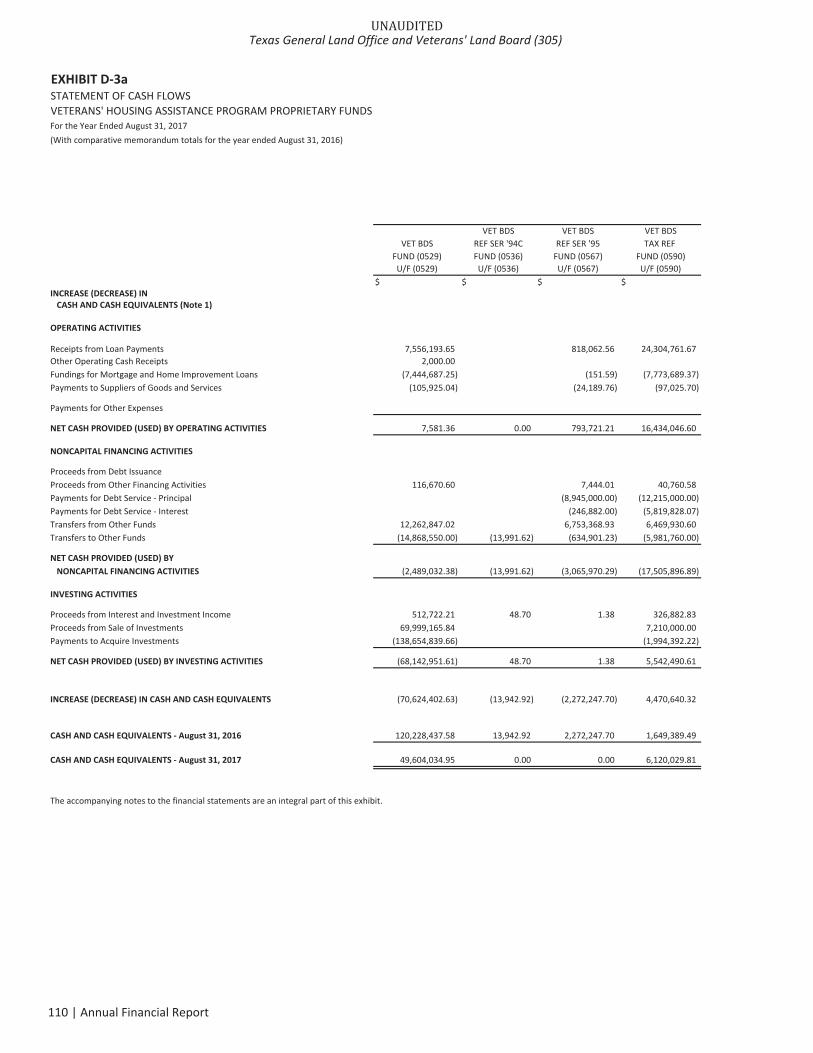
EXHIBIT D 3aSTATEMENT OF CASH FLOWSVETERANS' HOUSING ASSISTANCE PROGRAM PROPRIETARY FUNDSFor the Year Ended August 31, 2017(With comparative memorandum totals for the year ended August 31, 2016)
VET BDS VET BDS VET BDSVET BDS REF SER '94C REF SER '95 TAX REF
FUND (0529) FUND (0536) FUND (0567) FUND (0590)U/F (0529) U/F (0536) U/F (0567) U/F (0590)
$ $ $ $INCREASE (DECREASE) INCASH AND CASH EQUIVALENTS (Note 1)
OPERATING ACTIVITIES
Receipts from Loan Payments 7,556,193.65 818,062.56 24,304,761.67Other Operating Cash Receipts 2,000.00Fundings for Mortgage and Home Improvement Loans (7,444,687.25) (151.59) (7,773,689.37)Payments to Suppliers of Goods and Services (105,925.04) (24,189.76) (97,025.70)
Payments for Other Expenses
NET CASH PROVIDED (USED) BY OPERATING ACTIVITIES 7,581.36 0.00 793,721.21 16,434,046.60
NONCAPITAL FINANCING ACTIVITIES
Proceeds from Debt IssuanceProceeds from Other Financing Activities 116,670.60 7,444.01 40,760.58Payments for Debt Service Principal (8,945,000.00) (12,215,000.00)Payments for Debt Service Interest (246,882.00) (5,819,828.07)Transfers from Other Funds 12,262,847.02 6,753,368.93 6,469,930.60Transfers to Other Funds (14,868,550.00) (13,991.62) (634,901.23) (5,981,760.00)
NET CASH PROVIDED (USED) BYNONCAPITAL FINANCING ACTIVITIES (2,489,032.38) (13,991.62) (3,065,970.29) (17,505,896.89)
INVESTING ACTIVITIES
Proceeds from Interest and Investment Income 512,722.21 48.70 1.38 326,882.83Proceeds from Sale of Investments 69,999,165.84 7,210,000.00Payments to Acquire Investments (138,654,839.66) (1,994,392.22)
NET CASH PROVIDED (USED) BY INVESTING ACTIVITIES (68,142,951.61) 48.70 1.38 5,542,490.61
INCREASE (DECREASE) IN CASH AND CASH EQUIVALENTS (70,624,402.63) (13,942.92) (2,272,247.70) 4,470,640.32
CASH AND CASH EQUIVALENTS August 31, 2016 120,228,437.58 13,942.92 2,272,247.70 1,649,389.49
CASH AND CASH EQUIVALENTS August 31, 2017 49,604,034.95 0.00 0.00 6,120,029.81
The accompanying notes to the financial statements are an integral part of this exhibit.
UNAUDITEDTexas General Land Office and Veterans' Land Board (305)
110 | Annual Financial Report
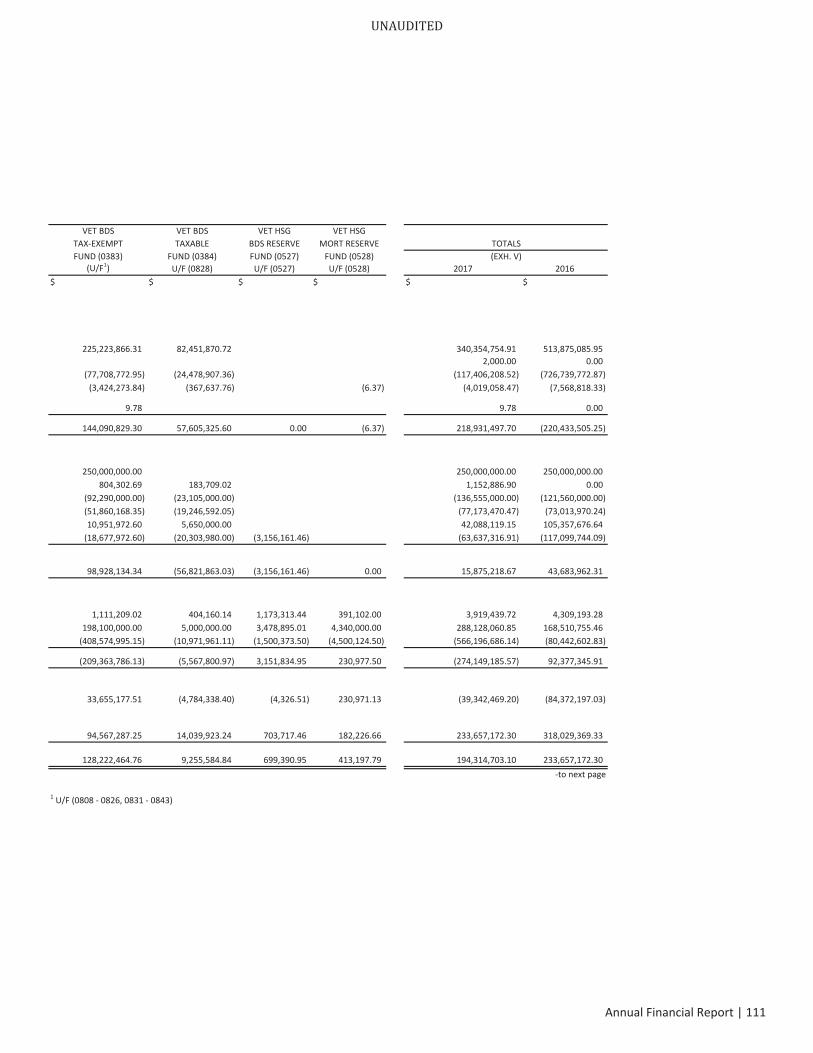
VET BDS VET BDS VET HSG VET HSGTAX EXEMPT TAXABLE BDS RESERVE MORT RESERVEFUND (0383) FUND (0384) FUND (0527) FUND (0528) (EXH. V)
(U/F1) U/F (0828) U/F (0527) U/F (0528) 2017 2016$ $ $ $ $ $
225,223,866.31 82,451,870.72 340,354,754.91 513,875,085.952,000.00 0.00
(77,708,772.95) (24,478,907.36) (117,406,208.52) (726,739,772.87)(3,424,273.84) (367,637.76) (6.37) (4,019,058.47) (7,568,818.33)
9.78 9.78 0.00
144,090,829.30 57,605,325.60 0.00 (6.37) 218,931,497.70 (220,433,505.25)
250,000,000.00 250,000,000.00 250,000,000.00804,302.69 183,709.02 1,152,886.90 0.00
(92,290,000.00) (23,105,000.00) (136,555,000.00) (121,560,000.00)(51,860,168.35) (19,246,592.05) (77,173,470.47) (73,013,970.24)10,951,972.60 5,650,000.00 42,088,119.15 105,357,676.64
(18,677,972.60) (20,303,980.00) (3,156,161.46) (63,637,316.91) (117,099,744.09)
98,928,134.34 (56,821,863.03) (3,156,161.46) 0.00 15,875,218.67 43,683,962.31
1,111,209.02 404,160.14 1,173,313.44 391,102.00 3,919,439.72 4,309,193.28198,100,000.00 5,000,000.00 3,478,895.01 4,340,000.00 288,128,060.85 168,510,755.46
(408,574,995.15) (10,971,961.11) (1,500,373.50) (4,500,124.50) (566,196,686.14) (80,442,602.83)
(209,363,786.13) (5,567,800.97) 3,151,834.95 230,977.50 (274,149,185.57) 92,377,345.91
33,655,177.51 (4,784,338.40) (4,326.51) 230,971.13 (39,342,469.20) (84,372,197.03)
94,567,287.25 14,039,923.24 703,717.46 182,226.66 233,657,172.30 318,029,369.33
128,222,464.76 9,255,584.84 699,390.95 413,197.79 194,314,703.10 233,657,172.30to next page
1 U/F (0808 0826, 0831 0843)
TOTALS
UNAUDITED
Annual Financial Report | 111
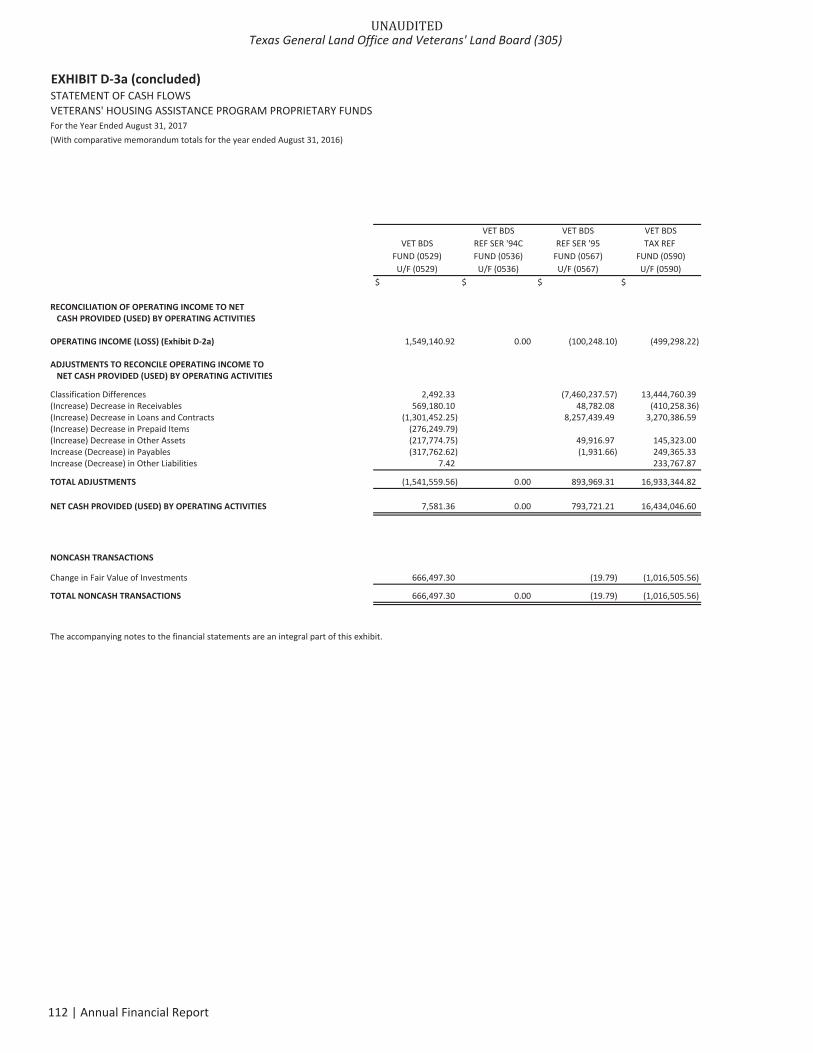
EXHIBIT D 3a (concluded)STATEMENT OF CASH FLOWSVETERANS' HOUSING ASSISTANCE PROGRAM PROPRIETARY FUNDSFor the Year Ended August 31, 2017(With comparative memorandum totals for the year ended August 31, 2016)
VET BDS VET BDS VET BDSVET BDS REF SER '94C REF SER '95 TAX REF
FUND (0529) FUND (0536) FUND (0567) FUND (0590)U/F (0529) U/F (0536) U/F (0567) U/F (0590)
$ $ $ $
RECONCILIATION OF OPERATING INCOME TO NETCASH PROVIDED (USED) BY OPERATING ACTIVITIES
OPERATING INCOME (LOSS) (Exhibit D 2a) 1,549,140.92 0.00 (100,248.10) (499,298.22)
ADJUSTMENTS TO RECONCILE OPERATING INCOME TONET CASH PROVIDED (USED) BY OPERATING ACTIVITIES
Classification Differences 2,492.33 (7,460,237.57) 13,444,760.39(Increase) Decrease in Receivables 569,180.10 48,782.08 (410,258.36)(Increase) Decrease in Loans and Contracts (1,301,452.25) 8,257,439.49 3,270,386.59(Increase) Decrease in Prepaid Items (276,249.79)(Increase) Decrease in Other Assets (217,774.75) 49,916.97 145,323.00Increase (Decrease) in Payables (317,762.62) (1,931.66) 249,365.33Increase (Decrease) in Other Liabilities 7.42 233,767.87
TOTAL ADJUSTMENTS (1,541,559.56) 0.00 893,969.31 16,933,344.82
NET CASH PROVIDED (USED) BY OPERATING ACTIVITIES 7,581.36 0.00 793,721.21 16,434,046.60
NONCASH TRANSACTIONS
Change in Fair Value of Investments 666,497.30 (19.79) (1,016,505.56)
TOTAL NONCASH TRANSACTIONS 666,497.30 0.00 (19.79) (1,016,505.56)
The accompanying notes to the financial statements are an integral part of this exhibit.
UNAUDITEDTexas General Land Office and Veterans' Land Board (305)
112 | Annual Financial Report
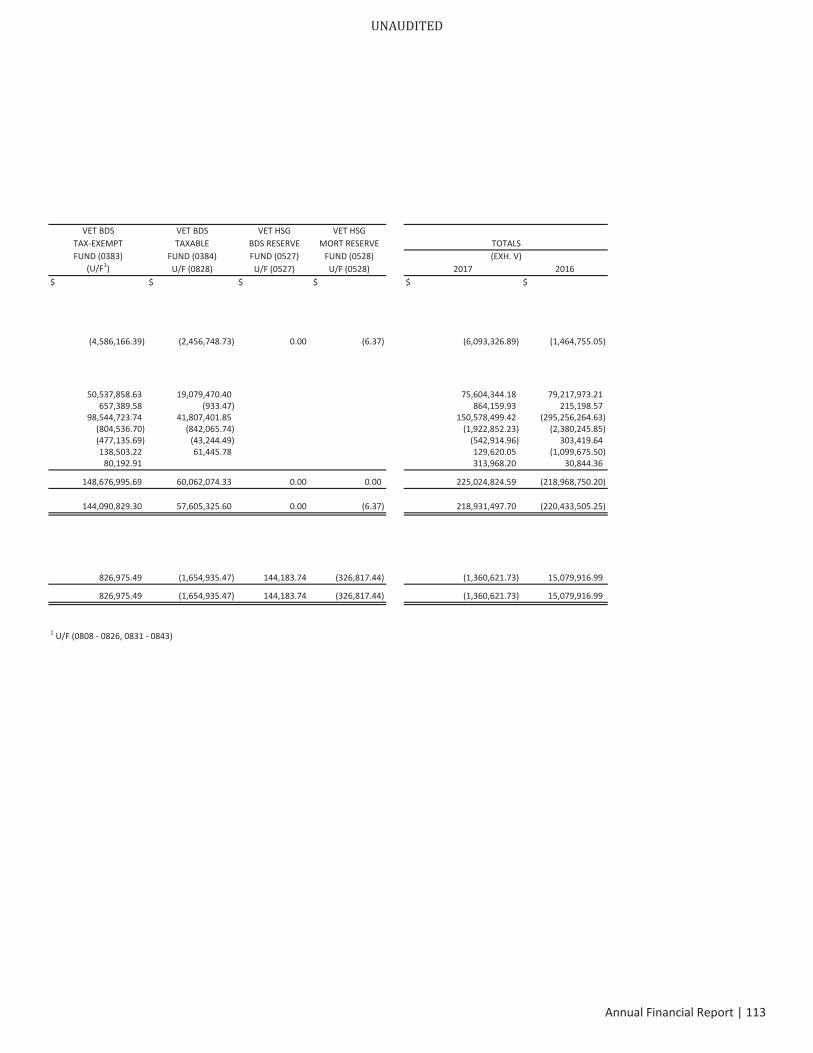
VET BDS VET BDS VET HSG VET HSGTAX EXEMPT TAXABLE BDS RESERVE MORT RESERVE TOTALSFUND (0383) FUND (0384) FUND (0527) FUND (0528) (EXH. V)
(U/F1) U/F (0828) U/F (0527) U/F (0528) 2017 2016$ $ $ $ $ $
(4,586,166.39) (2,456,748.73) 0.00 (6.37) (6,093,326.89) (1,464,755.05)
50,537,858.63 19,079,470.40 75,604,344.18 79,217,973.21657,389.58 (933.47) 864,159.93 215,198.57
98,544,723.74 41,807,401.85 150,578,499.42 (295,256,264.63)(804,536.70) (842,065.74) (1,922,852.23) (2,380,245.85)(477,135.69) (43,244.49) (542,914.96) 303,419.64138,503.22 61,445.78 129,620.05 (1,099,675.50)
80,192.91 313,968.20 30,844.36
148,676,995.69 60,062,074.33 0.00 0.00 225,024,824.59 (218,968,750.20)
144,090,829.30 57,605,325.60 0.00 (6.37) 218,931,497.70 (220,433,505.25)
826,975.49 (1,654,935.47) 144,183.74 (326,817.44) (1,360,621.73) 15,079,916.99
826,975.49 (1,654,935.47) 144,183.74 (326,817.44) (1,360,621.73) 15,079,916.99
1 U/F (0808 0826, 0831 0843)
UNAUDITED
Annual Financial Report | 113

EXHIBIT D 3bSTATEMENT OF CASH FLOWSVETERANS' LAND PROGRAM PROPRIETARY FUNDSFor the Year Ended August 31, 2017(With comparative memorandum totals for the year ended August 31, 2016)
VET LAND REF BDSREF SER '91 VET LAND BDS
TAX '00, '02 '06, & '10D REF SER '99AFUND (0571) FUND (0626)
U/F (0571) (9000) (9001) U/F (0626)$ $
INCREASE (DECREASE) INCASH AND CASH EQUIVALENTS (Note 1)
OPERATING ACTIVITIES
Receipts from Loan Payments 131,946,116.58 757,507.86Other Operating Cash Receipts 322,756.88Fundings for Land Loans (88,830,065.37)Payments to Suppliers of Goods and Services (1,921,638.49) (38,252.47)Payments to Employees for Services 0.00Payments for Other Expenses (3,278.01)
NET CASH PROVIDED (USED)BY OPERATING ACTIVITIES 41,513,891.59 719,255.39
NONCAPITAL FINANCING ACTIVITIES
Proceeds from Other Financing Activities 68,133.76 1,131.49Payments for Debt Service Principal (16,405,000.00) (3,190,000.00)Payments for Debt Service Interest (10,675,533.59) (441,160.15)Transfers from Other Funds 10,965,724.39 3,443,000.00Transfers to Other Funds (13,685,232.96) (713,000.00)
NET CASH PROVIDED (USED) BYNONCAPITAL FINANCING ACTIVITIES (29,731,908.40) (900,028.66)
CAPITAL AND RELATED FINANCING ACTIVITIES
Payments for Additional Capital Assets (25,000.00)
NET CASH PROVIDED (USED) BY CAPITALAND RELATED FINANCING ACTIVITIES (25,000.00) 0.00
INVESTING ACTIVITIES
Proceeds from Interest and Investment Income 4,552,469.52 246,159.61Proceeds from Sale of Investments 28,955,179.43Payments to Acquire Investments (14,975,942.50)
NET CASH PROVIDED (USED)BY INVESTING ACTIVITIES 18,531,706.45 246,159.61
INCREASE (DECREASE) IN CASH AND CASH EQUIVALENTS 30,288,689.64 65,386.34
CASH AND CASH EQUIVALENTS August 31, 2016 19,510,017.28 190,246.34
CASH AND CASH EQUIVALENTS August 31, 2017 49,798,706.92 255,632.68
UNAUDITEDTexas General Land Office and Veterans' Land Board (305)
114 | Annual Financial Report
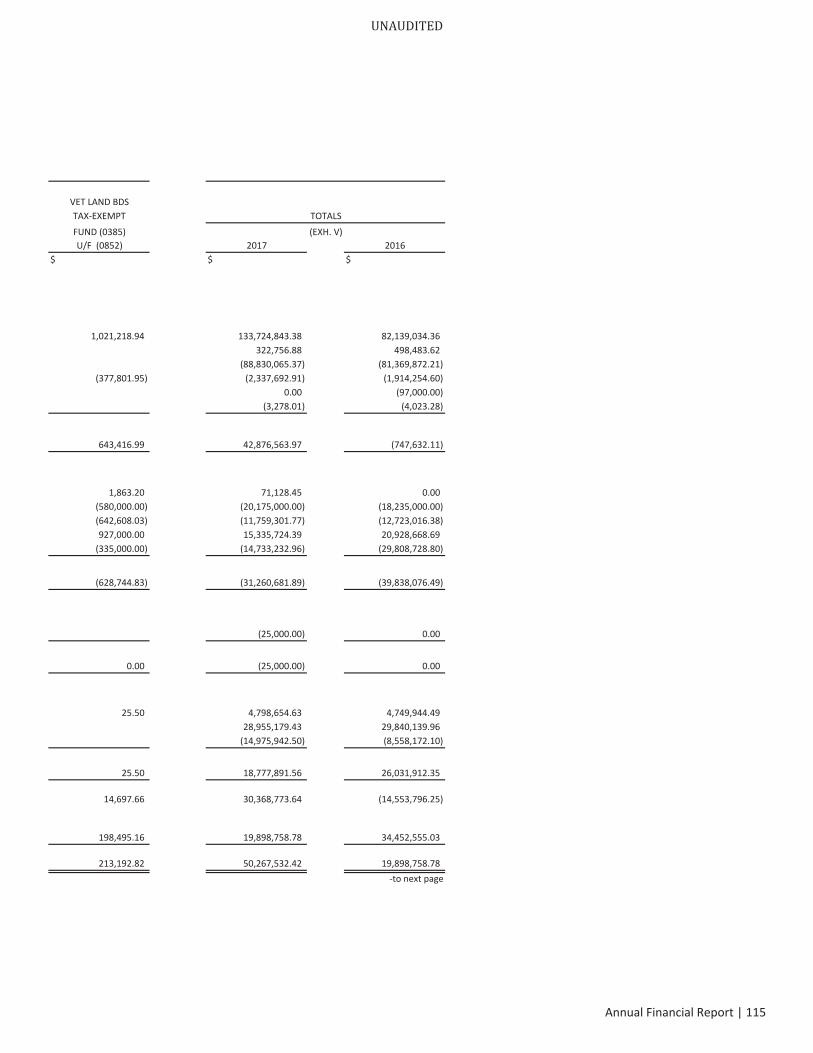
VET LAND BDSTAX EXEMPT TOTALSFUND (0385)U/F (0852) 2017 2016
$ $ $
1,021,218.94 133,724,843.38 82,139,034.36322,756.88 498,483.62
(88,830,065.37) (81,369,872.21)(377,801.95) (2,337,692.91) (1,914,254.60)
0.00 (97,000.00)(3,278.01) (4,023.28)
643,416.99 42,876,563.97 (747,632.11)
1,863.20 71,128.45 0.00(580,000.00) (20,175,000.00) (18,235,000.00)(642,608.03) (11,759,301.77) (12,723,016.38)927,000.00 15,335,724.39 20,928,668.69
(335,000.00) (14,733,232.96) (29,808,728.80)
(628,744.83) (31,260,681.89) (39,838,076.49)
(25,000.00) 0.00
0.00 (25,000.00) 0.00
25.50 4,798,654.63 4,749,944.4928,955,179.43 29,840,139.96
(14,975,942.50) (8,558,172.10)
25.50 18,777,891.56 26,031,912.35
14,697.66 30,368,773.64 (14,553,796.25)
198,495.16 19,898,758.78 34,452,555.03
213,192.82 50,267,532.42 19,898,758.78to next page
(EXH. V)
UNAUDITED
Annual Financial Report | 115

EXHIBIT D 3b (concluded)STATEMENT OF CASH FLOWSVETERANS' LAND PROGRAM PROPRIETARY FUNDSFor the Year Ended August 31, 2017(With comparative memorandum totals for the year ended August 31, 2016)
VET LAND REF BDSREF SER '89, '90, '91, VET LAND BDS
TAX REF '98A, '98B, & '99B REF SER '99AFUND (0571) FUND (0626)
U/F (0571) (9000) (9001) U/F (0626)$ $
RECONCILIATION OF OPERATING INCOME TO NETCASH PROVIDED (USED) BY OPERATING ACTIVITIES
OPERATING INCOME (LOSS) (Exhibit D 2b) 14,251,750.76 (345,549.41)
ADJUSTMENTS TO RECONCILE OPERATING INCOMETO NET CASH PROVIDED (USED) BY OPERATING ACTIVITIES
Depreciation and Amortization 2,777.76Classification Differences 10,893,860.18 427,810.82(Increase) Decrease in Receivables 293,531.55 4,653.71(Increase) Decrease in Loans and Contracts 15,966,921.34 613,208.89(Increase) Decrease in Other Assets 435,029.00 13,350.00Increase (Decrease) in Payables (236,486.07) 5,457.48Increase (Decrease) in Other Liabilities (93,492.93) 323.90
TOTAL ADJUSTMENTS 27,262,140.83 1,064,804.80
NET CASH PROVIDED (USED)BY OPERATING ACTIVITIES 41,513,891.59 719,255.39
NONCASH TRANSACTIONS
Change in Pollution Remediation ObligationCapital Appreciation Bond Interest AccretionChange in Fair Value of Investments (3,641,941.65) (227,495.65)
TOTAL NONCASH TRANSACTIONS (3,641,941.65) (227,495.65)
The accompanying notes to the financial statements are an integral part of this exhibit.
UNAUDITEDTexas General Land Office and Veterans' Land Board (305)
116 | Annual Financial Report
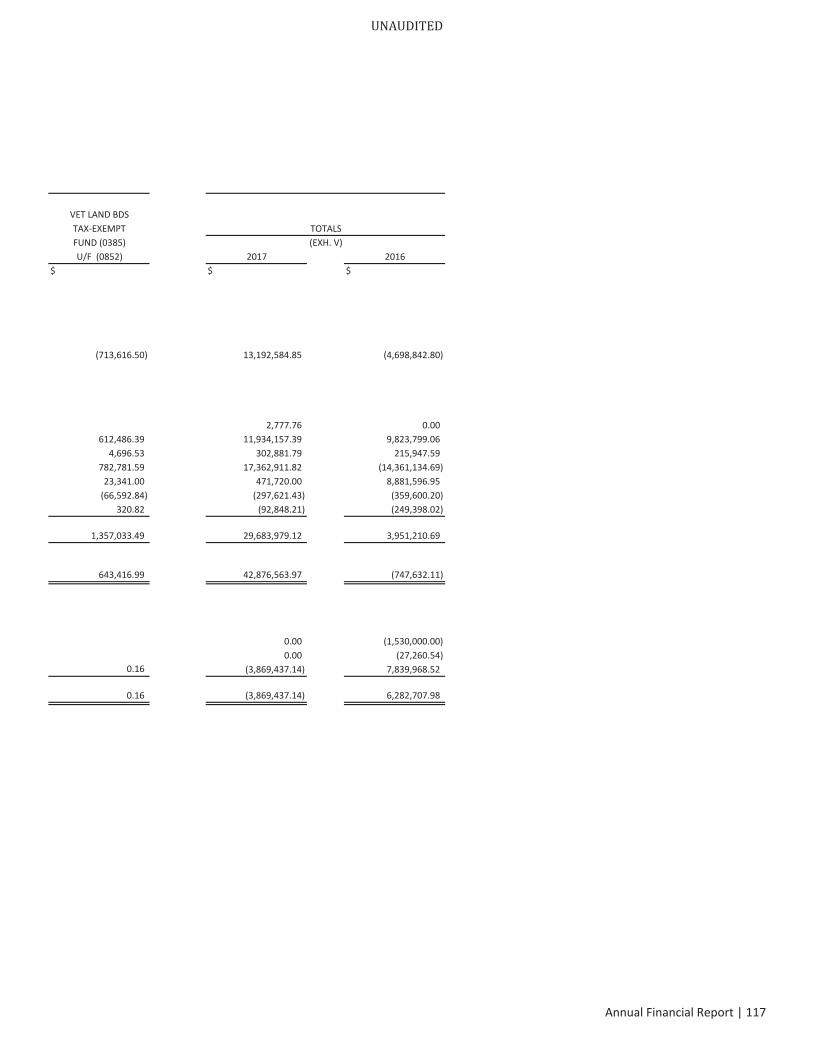
VET LAND BDSTAX EXEMPT TOTALSFUND (0385) (EXH. V)U/F (0852) 2017 2016
$ $ $
(713,616.50) 13,192,584.85 (4,698,842.80)
2,777.76 0.00612,486.39 11,934,157.39 9,823,799.06
4,696.53 302,881.79 215,947.59782,781.59 17,362,911.82 (14,361,134.69)
23,341.00 471,720.00 8,881,596.95(66,592.84) (297,621.43) (359,600.20)
320.82 (92,848.21) (249,398.02)
1,357,033.49 29,683,979.12 3,951,210.69
643,416.99 42,876,563.97 (747,632.11)
0.00 (1,530,000.00)0.00 (27,260.54)
(3,869,437.14) 7,839,968.52
0.16 (3,869,437.14) 6,282,707.98
UNAUDITED
Annual Financial Report | 117
0.16
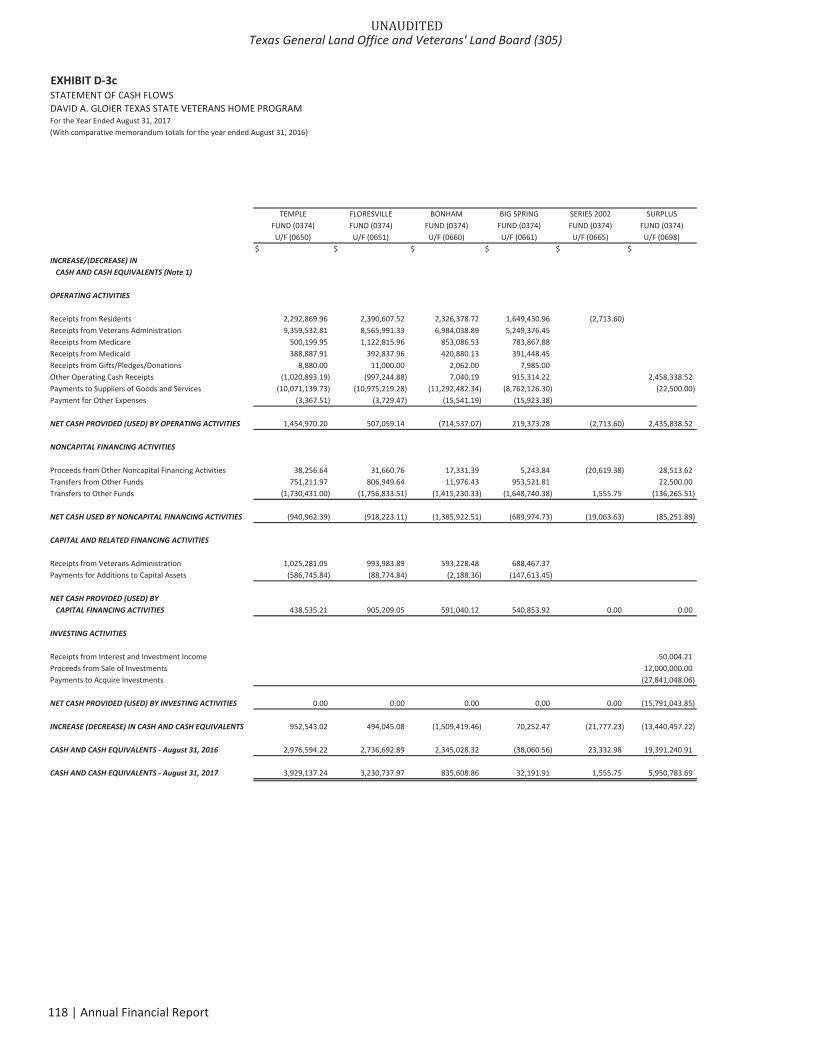
EXHIBIT D 3cSTATEMENT OF CASH FLOWSDAVID A. GLOIER TEXAS STATE VETERANS HOME PROGRAMFor the Year Ended August 31, 2017(With comparative memorandum totals for the year ended August 31, 2016)
TEMPLE FLORESVILLE BONHAM BIG SPRING SERIES 2002 SURPLUSFUND (0374) FUND (0374) FUND (0374) FUND (0374) FUND (0374) FUND (0374)U/F (0650) U/F (0651) U/F (0660) U/F (0661) U/F (0665) U/F (0698)
$ $ $ $ $ $INCREASE/(DECREASE) INCASH AND CASH EQUIVALENTS (Note 1)
OPERATING ACTIVITIES
Receipts from Residents 2,292,869.96 2,390,607.52 2,326,378.72 1,649,430.96 (2,713.60)Receipts from Veterans Administration 9,359,532.81 8,565,991.33 6,984,038.89 5,249,376.45Receipts from Medicare 500,199.95 1,122,815.96 853,086.53 783,867.88Receipts from Medicaid 388,887.91 392,837.96 420,880.13 391,448.45Receipts from Gifts/Pledges/Donations 8,880.00 11,000.00 2,062.00 7,985.00Other Operating Cash Receipts (1,020,893.19) (997,244.88) 7,040.19 915,314.22 2,458,338.52Payments to Suppliers of Goods and Services (10,071,139.73) (10,975,219.28) (11,292,482.34) (8,762,126.30) (22,500.00)Payment for Other Expenses (3,367.51) (3,729.47) (15,541.19) (15,923.38)
NET CASH PROVIDED (USED) BY OPERATING ACTIVITIES 1,454,970.20 507,059.14 (714,537.07) 219,373.28 (2,713.60) 2,435,838.52
NONCAPITAL FINANCING ACTIVITIES
Proceeds from Other Noncapital Financing Activities 38,256.64 31,660.76 17,331.39 5,243.84 (20,619.38) 28,513.62Transfers from Other Funds 751,211.97 806,949.64 11,976.43 953,521.81 22,500.00Transfers to Other Funds (1,730,431.00) (1,756,833.51) (1,415,230.33) (1,648,740.38) 1,555.75 (136,265.51)
NET CASH USED BY NONCAPITAL FINANCING ACTIVITIES (940,962.39) (918,223.11) (1,385,922.51) (689,974.73) (19,063.63) (85,251.89)
CAPITAL AND RELATED FINANCING ACTIVITIES
Receipts from Veterans Administration 1,025,281.05 993,983.89 593,228.48 688,467.37Payments for Additions to Capital Assets (586,745.84) (88,774.84) (2,188.36) (147,613.45)
NET CASH PROVIDED (USED) BYCAPITAL FINANCING ACTIVITIES 438,535.21 905,209.05 591,040.12 540,853.92 0.00 0.00
INVESTING ACTIVITIES
Receipts from Interest and Investment Income 50,004.21Proceeds from Sale of Investments 12,000,000.00Payments to Acquire Investments (27,841,048.06)
NET CASH PROVIDED (USED) BY INVESTING ACTIVITIES 0.00 0.00 0.00 0.00 0.00 (15,791,043.85)
INCREASE (DECREASE) IN CASH AND CASH EQUIVALENTS 952,543.02 494,045.08 (1,509,419.46) 70,252.47 (21,777.23) (13,440,457.22)
CASH AND CASH EQUIVALENTS August 31, 2016 2,976,594.22 2,736,692.89 2,345,028.32 (38,060.56) 23,332.98 19,391,240.91
CASH AND CASH EQUIVALENTS August 31, 2017 3,929,137.24 3,230,737.97 835,608.86 32,191.91 1,555.75 5,950,783.69
UNAUDITEDTexas General Land Office and Veterans' Land Board (305)
118 | Annual Financial Report
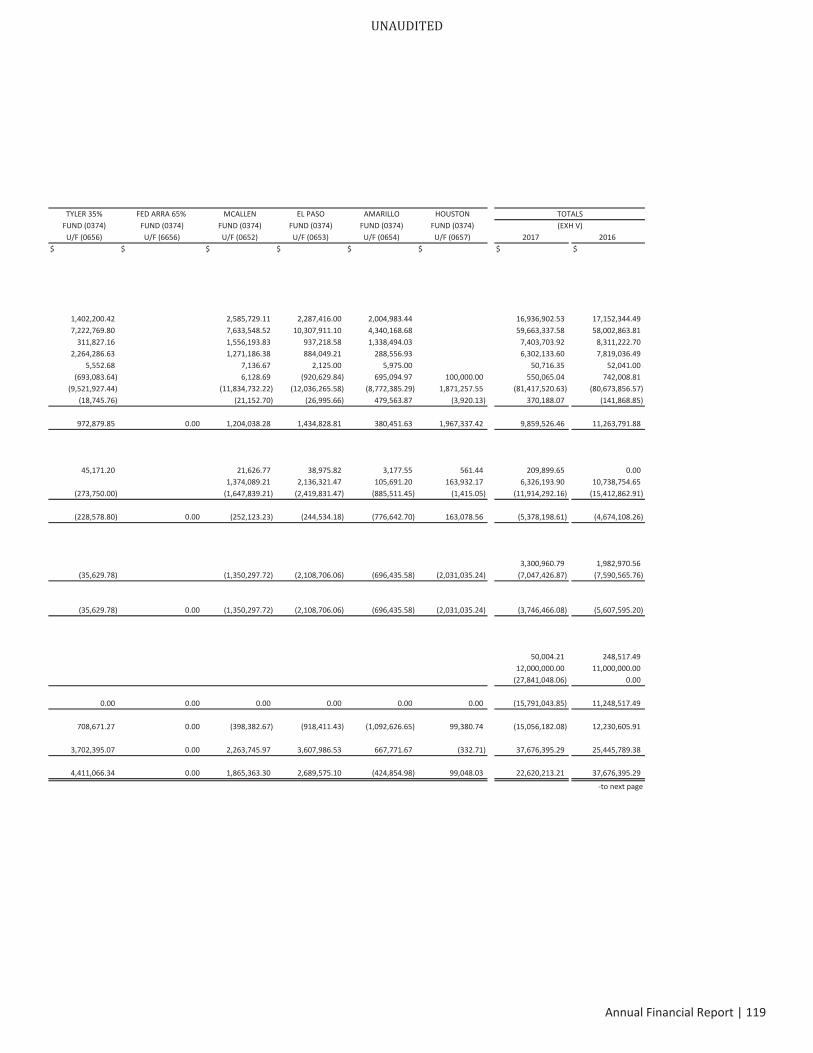
TYLER 35% FED ARRA 65% MCALLEN EL PASO AMARILLO HOUSTONFUND (0374) FUND (0374) FUND (0374) FUND (0374) FUND (0374) FUND (0374)U/F (0656) U/F (6656) U/F (0652) U/F (0653) U/F (0654) U/F (0657) 2017 2016
$ $ $ $ $ $ $ $
1,402,200.42 2,585,729.11 2,287,416.00 2,004,983.44 16,936,902.53 17,152,344.497,222,769.80 7,633,548.52 10,307,911.10 4,340,168.68 59,663,337.58 58,002,863.81
311,827.16 1,556,193.83 937,218.58 1,338,494.03 7,403,703.92 8,311,222.702,264,286.63 1,271,186.38 884,049.21 288,556.93 6,302,133.60 7,819,036.49
5,552.68 7,136.67 2,125.00 5,975.00 50,716.35 52,041.00(693,083.64) 6,128.69 (920,629.84) 695,094.97 100,000.00 550,065.04 742,008.81
(9,521,927.44) (11,834,732.22) (12,036,265.58) (8,772,385.29) 1,871,257.55 (81,417,520.63) (80,673,856.57)(18,745.76) (21,152.70) (26,995.66) 479,563.87 (3,920.13) 370,188.07 (141,868.85)
972,879.85 0.00 1,204,038.28 1,434,828.81 380,451.63 1,967,337.42 9,859,526.46 11,263,791.88
45,171.20 21,626.77 38,975.82 3,177.55 561.44 209,899.65 0.001,374,089.21 2,136,321.47 105,691.20 163,932.17 6,326,193.90 10,738,754.65
(273,750.00) (1,647,839.21) (2,419,831.47) (885,511.45) (1,415.05) (11,914,292.16) (15,412,862.91)
(228,578.80) 0.00 (252,123.23) (244,534.18) (776,642.70) 163,078.56 (5,378,198.61) (4,674,108.26)
3,300,960.79 1,982,970.56(35,629.78) (1,350,297.72) (2,108,706.06) (696,435.58) (2,031,035.24) (7,047,426.87) (7,590,565.76)
(35,629.78) 0.00 (1,350,297.72) (2,108,706.06) (696,435.58) (2,031,035.24) (3,746,466.08) (5,607,595.20)
50,004.21 248,517.4912,000,000.00 11,000,000.00
(27,841,048.06) 0.00
0.00 0.00 0.00 0.00 0.00 0.00 (15,791,043.85) 11,248,517.49
708,671.27 0.00 (398,382.67) (918,411.43) (1,092,626.65) 99,380.74 (15,056,182.08) 12,230,605.91
3,702,395.07 0.00 2,263,745.97 3,607,986.53 667,771.67 (332.71) 37,676,395.29 25,445,789.38
4,411,066.34 0.00 1,865,363.30 2,689,575.10 (424,854.98) 99,048.03 22,620,213.21 37,676,395.29
to next page
TOTALS(EXH V)
UNAUDITED
Annual Financial Report | 119
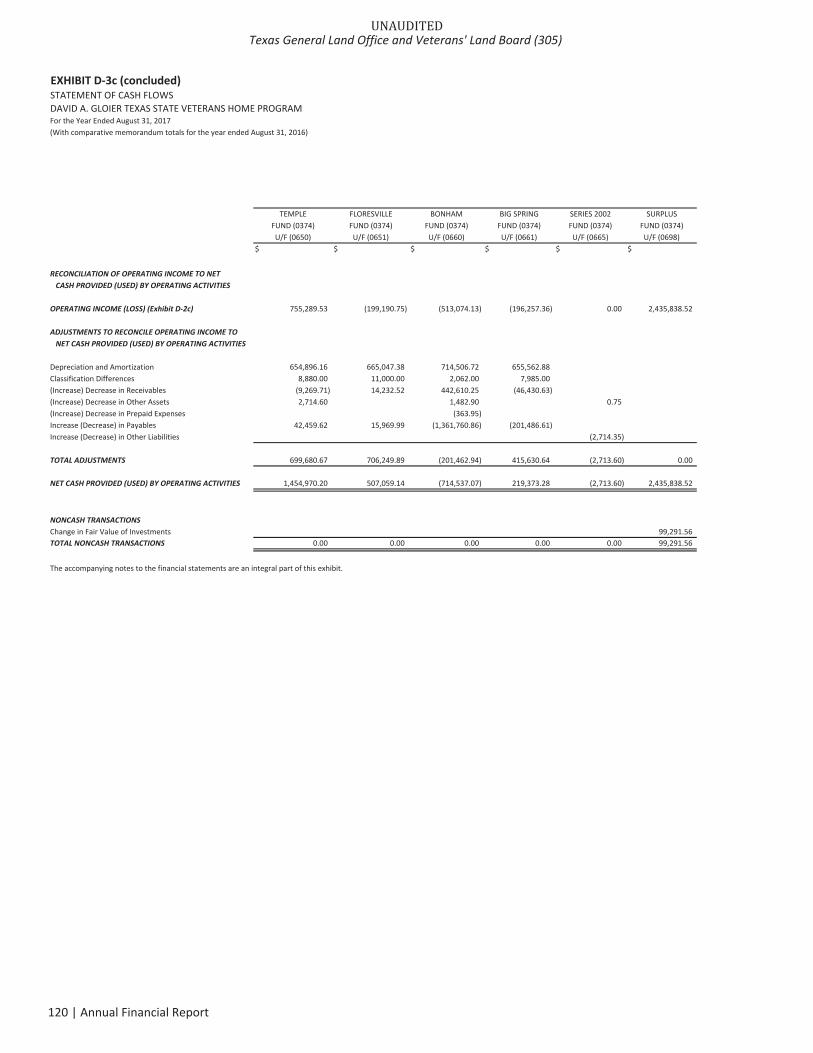
EXHIBIT D 3c (concluded)STATEMENT OF CASH FLOWSDAVID A. GLOIER TEXAS STATE VETERANS HOME PROGRAMFor the Year Ended August 31, 2017(With comparative memorandum totals for the year ended August 31, 2016)
TEMPLE FLORESVILLE BONHAM BIG SPRING SERIES 2002 SURPLUSFUND (0374) FUND (0374) FUND (0374) FUND (0374) FUND (0374) FUND (0374)U/F (0650) U/F (0651) U/F (0660) U/F (0661) U/F (0665) U/F (0698)
$ $ $ $ $ $
RECONCILIATION OF OPERATING INCOME TO NETCASH PROVIDED (USED) BY OPERATING ACTIVITIES
OPERATING INCOME (LOSS) (Exhibit D 2c) 755,289.53 (199,190.75) (513,074.13) (196,257.36) 0.00 2,435,838.52
ADJUSTMENTS TO RECONCILE OPERATING INCOME TONET CASH PROVIDED (USED) BY OPERATING ACTIVITIES
Depreciation and Amortization 654,896.16 665,047.38 714,506.72 655,562.88Classification Differences 8,880.00 11,000.00 2,062.00 7,985.00 0.00(Increase) Decrease in Receivables (9,269.71) 14,232.52 442,610.25 (46,430.63)(Increase) Decrease in Other Assets 2,714.60 1,482.90 0.75(Increase) Decrease in Prepaid Expenses (363.95)Increase (Decrease) in Payables 42,459.62 15,969.99 (1,361,760.86) (201,486.61)Increase (Decrease) in Other Liabilities (2,714.35)
TOTAL ADJUSTMENTS 699,680.67 706,249.89 (201,462.94) 415,630.64 (2,713.60) 0.00
NET CASH PROVIDED (USED) BY OPERATING ACTIVITIES 1,454,970.20 507,059.14 (714,537.07) 219,373.28 (2,713.60) 2,435,838.52
NONCASH TRANSACTIONSChange in Fair Value of Investments 99,291.56TOTAL NONCASH TRANSACTIONS 0.00 0.00 0.00 0.00 0.00 99,291.56
The accompanying notes to the financial statements are an integral part of this exhibit.
UNAUDITEDTexas General Land Office and Veterans' Land Board (305)
120 | Annual Financial Report
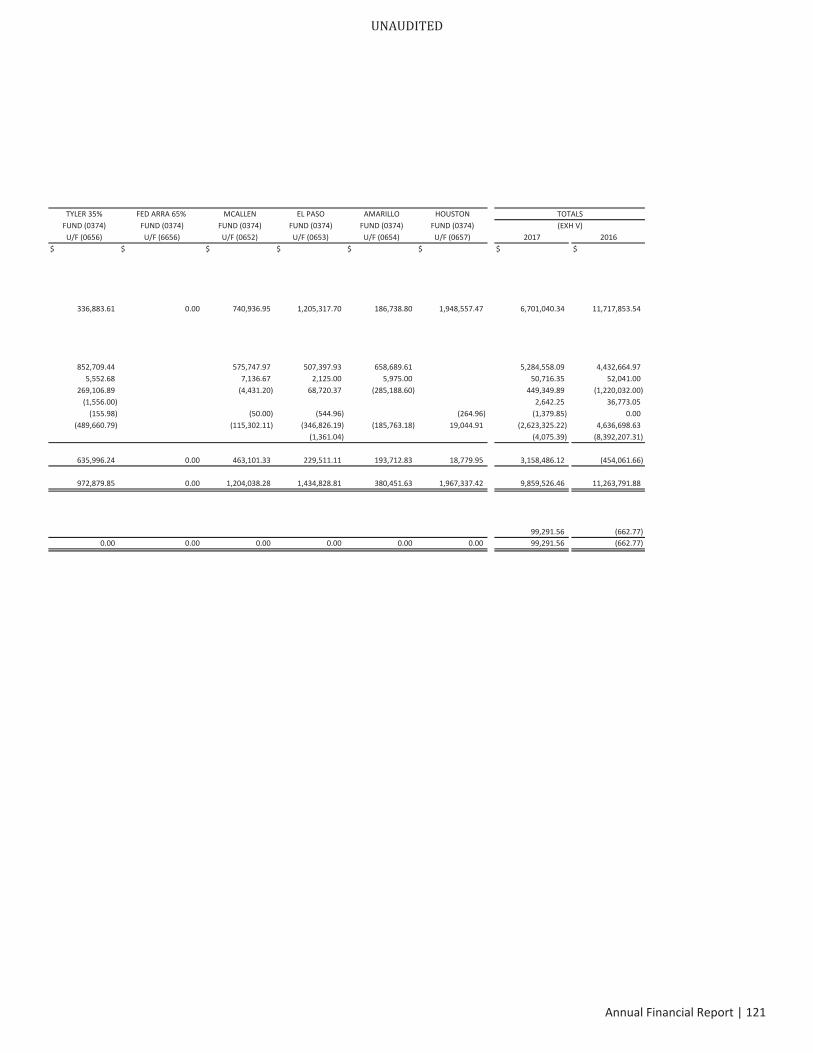
TYLER 35% FED ARRA 65% MCALLEN EL PASO AMARILLO HOUSTONFUND (0374) FUND (0374) FUND (0374) FUND (0374) FUND (0374) FUND (0374) (EXH V)U/F (0656) U/F (6656) U/F (0652) U/F (0653) U/F (0654) U/F (0657) 2017 2016
$ $ $ $ $ $ $ $
336,883.61 0.00 740,936.95 1,205,317.70 186,738.80 1,948,557.47 6,701,040.34 11,717,853.54
852,709.44 575,747.97 507,397.93 658,689.61 5,284,558.09 4,432,664.975,552.68 7,136.67 2,125.00 5,975.00 50,716.35 52,041.00
269,106.89 (4,431.20) 68,720.37 (285,188.60) 449,349.89 (1,220,032.00)(1,556.00) 2,642.25 36,773.05
(155.98) (50.00) (544.96) (264.96) (1,379.85) 0.00(489,660.79) (115,302.11) (346,826.19) (185,763.18) 19,044.91 (2,623,325.22) 4,636,698.63
(1,361.04) (4,075.39) (8,392,207.31)
635,996.24 0.00 463,101.33 229,511.11 193,712.83 18,779.95 3,158,486.12 (454,061.66)
972,879.85 0.00 1,204,038.28 1,434,828.81 380,451.63 1,967,337.42 9,859,526.46 11,263,791.88
99,291.56 (662.77)0.00 0.00 0.00 0.00 0.00 0.00 99,291.56 (662.77)
TOTALS
UNAUDITED
Annual Financial Report | 121

EXHIBIT E 1COMBINING STATEMENT OF CHANGES IN ASSETS AND LIABILITIESAGENCY FUNDSFor the Year Ended August 31, 2017
(EXH. VI)BALANCE BALANCE
09 01 2016 ADDITIONS DEDUCTIONS 08 31 2017UNAPPROPRIATED RECEIPTS $ $ $ $
GENERAL REVENUE FUND (0001)U/F (0111)
ASSETSCurrent Assets:
Cash in State Treasury 0.00 6,623,049.10 6,623,049.10 0.00Accounts Receivable 50,597.11 0.00 50,597.11 0.00Due from Other Funds 567.78 0.00 567.78 0.00
Total Current Assets 51,164.89 6,623,049.10 6,674,213.99 0.00
TOTAL ASSETS 51,164.89 6,623,049.10 6,674,213.99 0.00
LIABILITIESCurrent Liabilities:
Funds Held for Others 50,806.14 6,623,049.10 6,673,855.24 0.00Unearned Revenue 358.75 0.00 358.75 0.00
Total Current Liabilities 51,164.89 6,623,049.10 6,674,213.99 0.00
TOTAL LIABILITIES 51,164.89 6,623,049.10 6,674,213.99 0.00
OTHER AGENCY FUNDS
CHILD SUPPORT ADDENDA DEDUCTS SUSPENSE (0807)U/F (8070)
ASSETSCurrent Assets:
Cash in State Treasury 6,973.00 91,416.58 91,938.21 6,451.37Total Current Assets 6,973.00 91,416.58 91,938.21 6,451.37
TOTAL ASSETS 6,973.00 91,416.58 91,938.21 6,451.37
LIABILITIESCurrent Liabilities:
Funds Held for Others 6,973.00 91,416.58 91,938.21 6,451.37Total Current Liabilities 6,973.00 91,416.58 91,938.21 6,451.37
TOTAL LIABILITIES 6,973.00 91,416.58 91,938.21 6,451.37
to next page
UNAUDITEDTexas General Land Office and Veterans' Land Board (305)
122 | Annual Financial Report
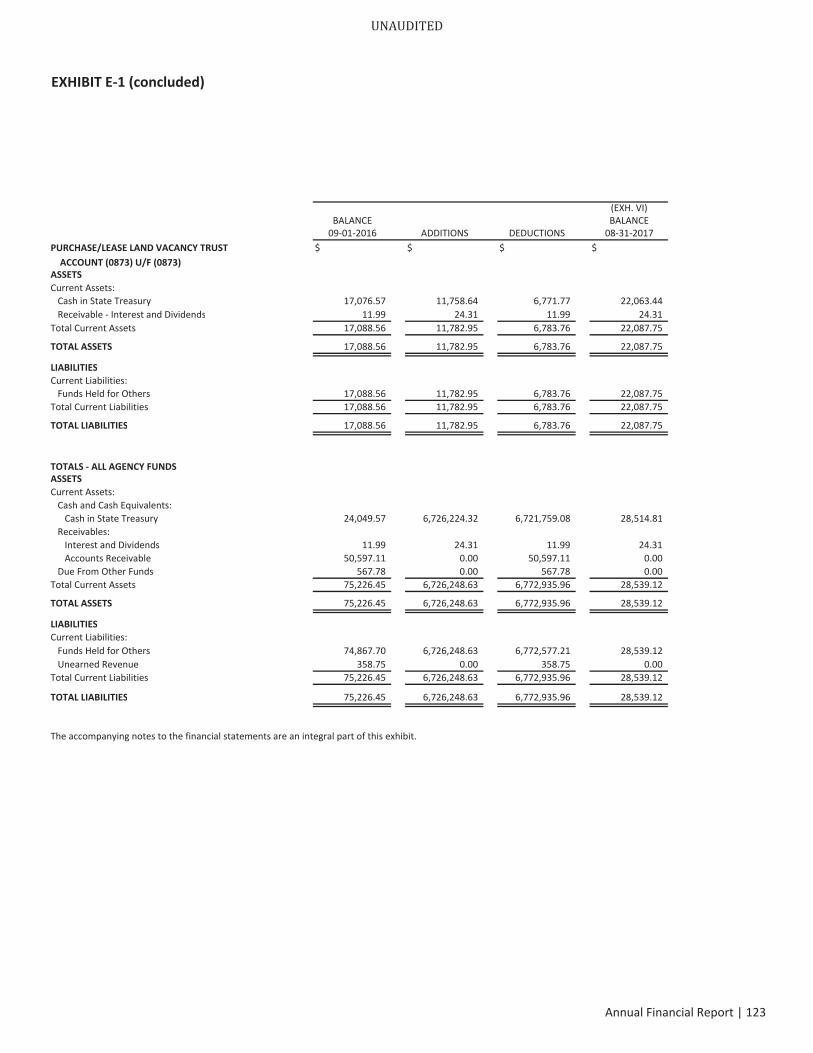
EXHIBIT E 1 (concluded)
(EXH. VI)BALANCE BALANCE
09 01 2016 ADDITIONS DEDUCTIONS 08 31 2017PURCHASE/LEASE LAND VACANCY TRUST $ $ $ $ACCOUNT (0873) U/F (0873)
ASSETSCurrent Assets:
Cash in State Treasury 17,076.57 11,758.64 6,771.77 22,063.44Receivable Interest and Dividends 11.99 24.31 11.99 24.31
Total Current Assets 17,088.56 11,782.95 6,783.76 22,087.75
TOTAL ASSETS 17,088.56 11,782.95 6,783.76 22,087.75
LIABILITIESCurrent Liabilities:
Funds Held for Others 17,088.56 11,782.95 6,783.76 22,087.75Total Current Liabilities 17,088.56 11,782.95 6,783.76 22,087.75
TOTAL LIABILITIES 17,088.56 11,782.95 6,783.76 22,087.75
TOTALS ALL AGENCY FUNDSASSETSCurrent Assets:
Cash and Cash Equivalents:Cash in State Treasury 24,049.57 6,726,224.32 6,721,759.08 28,514.81
Receivables:Interest and Dividends 11.99 24.31 11.99 24.31Accounts Receivable 50,597.11 0.00 50,597.11 0.00
Due From Other Funds 567.78 0.00 567.78 0.00Total Current Assets 75,226.45 6,726,248.63 6,772,935.96 28,539.12
TOTAL ASSETS 75,226.45 6,726,248.63 6,772,935.96 28,539.12
LIABILITIESCurrent Liabilities:
Funds Held for Others 74,867.70 6,726,248.63 6,772,577.21 28,539.12Unearned Revenue 358.75 0.00 358.75 0.00
Total Current Liabilities 75,226.45 6,726,248.63 6,772,935.96 28,539.12
TOTAL LIABILITIES 75,226.45 6,726,248.63 6,772,935.96 28,539.12
The accompanying notes to the financial statements are an integral part of this exhibit.
UNAUDITED
Annual Financial Report | 123

(This page intentionally left blank)
UNAUDITEDTexas General Land Office and Veterans' Land Board (305)
124 | Annual Financial Report
SUPPLEMENTARY
SCHEDULES
UNAUDITED ANNUAL FINANCIAL REPORTAUGUST 31, 2017
TEXAS GENERAL LAND OFFICE
VETERANS' LAND BOARD
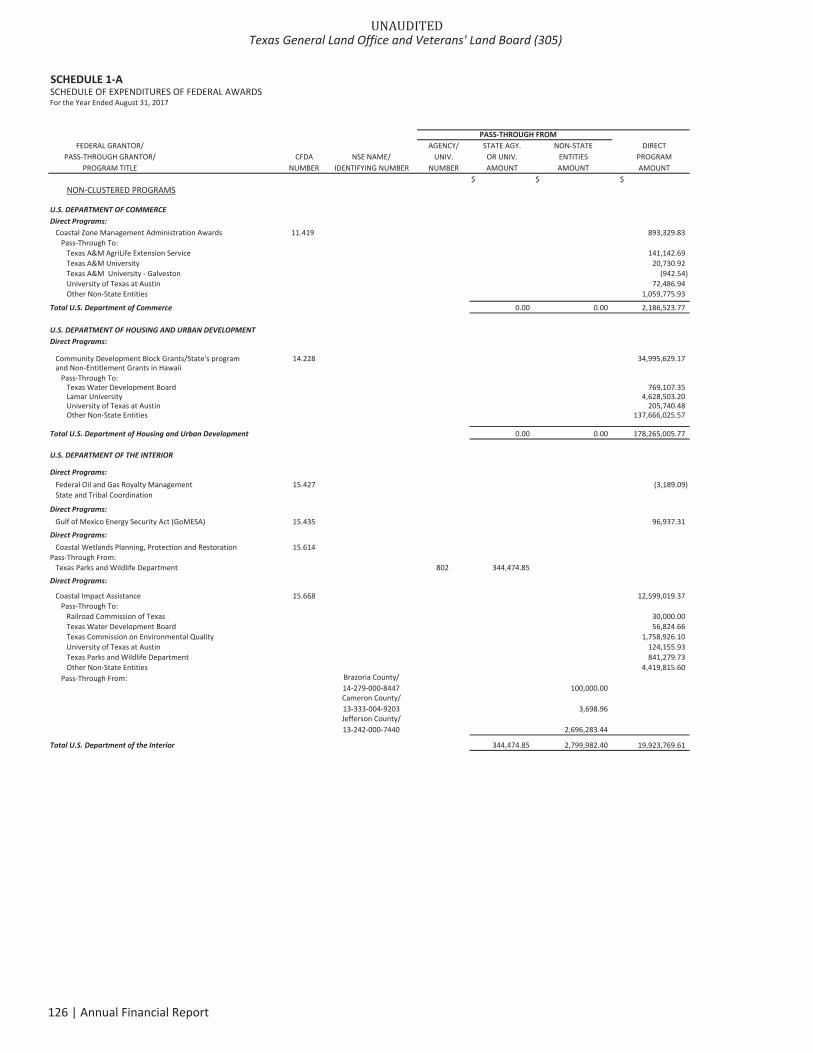
SCHEDULE 1 ASCHEDULE OF EXPENDITURES OF FEDERAL AWARDSFor the Year Ended August 31, 2017
PASS THROUGH FROMFEDERAL GRANTOR/ AGENCY/ STATE AGY. NON STATE DIRECT
PASS THROUGH GRANTOR/ CFDA NSE NAME/ UNIV. OR UNIV. ENTITIES PROGRAMPROGRAM TITLE NUMBER IDENTIFYING NUMBER NUMBER AMOUNT AMOUNT AMOUNT
$ $ $NON CLUSTERED PROGRAMS
U.S. DEPARTMENT OF COMMERCEDirect Programs:
Coastal Zone Management Administration Awards 11.419 893,329.83Pass Through To:
Texas A&M AgriLife Extension Service 141,142.69Texas A&M University 20,730.92Texas A&M University Galveston (942.54)University of Texas at Austin 72,486.94Other Non State Entities 1,059,775.93
Total U.S. Department of Commerce 0.00 0.00 2,186,523.77
U.S. DEPARTMENT OF HOUSING AND URBAN DEVELOPMENTDirect Programs:
Community Development Block Grants/State's program 14.228 34,995,629.17and Non Entitlement Grants in Hawaii
Pass Through To:Texas Water Development Board 769,107.35Lamar University 4,628,503.20University of Texas at Austin 205,740.48Other Non State Entities 137,666,025.57
Total U.S. Department of Housing and Urban Development 0.00 0.00 178,265,005.77
U.S. DEPARTMENT OF THE INTERIOR
Direct Programs:Federal Oil and Gas Royalty Management 15.427 (3,189.09)State and Tribal Coordination
Direct Programs:Gulf of Mexico Energy Security Act (GoMESA) 15.435 96,937.31
Direct Programs:Coastal Wetlands Planning, Protection and Restoration 15.614 0.00
Pass Through From:Texas Parks and Wildlife Department 802 344,474.85
Direct Programs:
Coastal Impact Assistance 15.668 12,599,019.37Pass Through To:
Railroad Commission of Texas 30,000.00Texas Water Development Board 56,824.66Texas Commission on Environmental Quality 1,758,926.10University of Texas at Austin 124,155.93Texas Parks and Wildlife Department 841,279.73Other Non State Entities 4,419,815.60
Pass Through From: Brazoria County/14 279 000 8447 100,000.00Cameron County/13 333 004 9203 3,698.96Jefferson County/13 242 000 7440 2,696,283.44
Total U.S. Department of the Interior 344,474.85 2,799,982.40 19,923,769.61
UNAUDITEDTexas General Land Office and Veterans' Land Board (305)
126 | Annual Financial Report
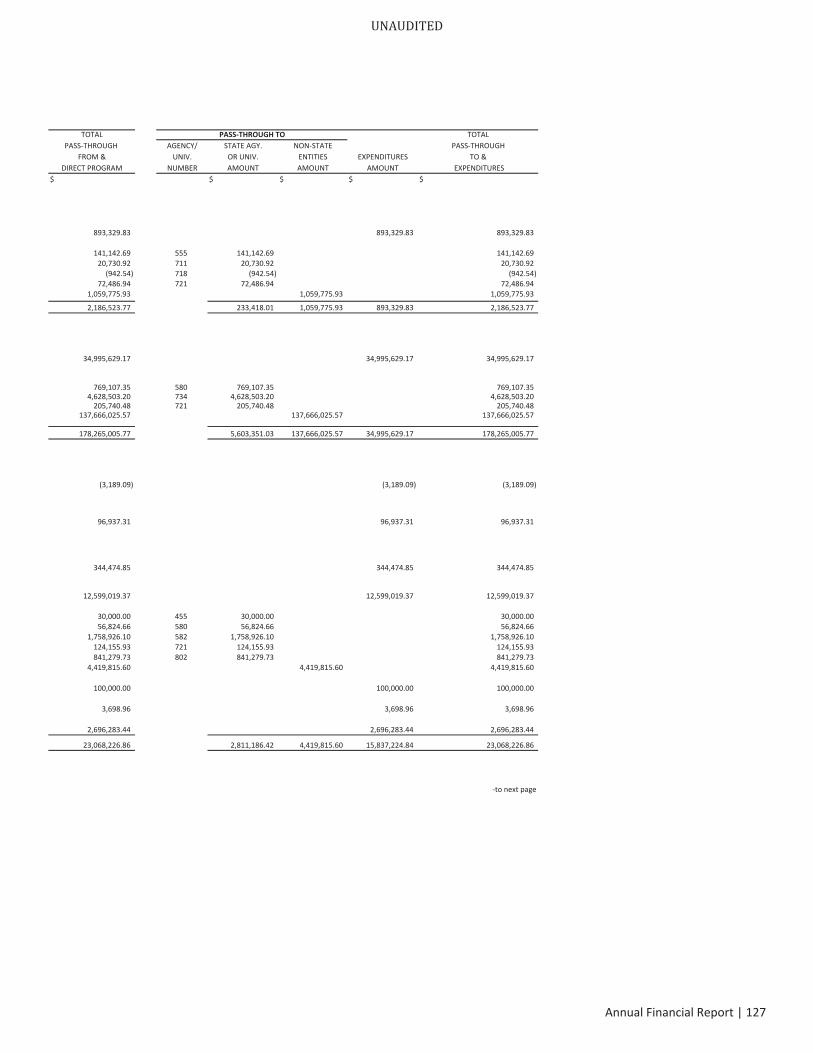
TOTAL PASS THROUGH TO TOTALPASS THROUGH AGENCY/ STATE AGY. NON STATE PASS THROUGH
FROM & UNIV. OR UNIV. ENTITIES EXPENDITURES TO &DIRECT PROGRAM NUMBER AMOUNT AMOUNT AMOUNT EXPENDITURES
$ $ $ $ $
893,329.83 893,329.83 893,329.83
141,142.69 555 141,142.69 141,142.6920,730.92 711 20,730.92 20,730.92
(942.54) 718 (942.54) (942.54)72,486.94 721 72,486.94 72,486.94
1,059,775.93 1,059,775.93 1,059,775.93
2,186,523.77 233,418.01 1,059,775.93 893,329.83 2,186,523.77
34,995,629.17 34,995,629.17 34,995,629.17
769,107.35 580 769,107.35 769,107.354,628,503.20 734 4,628,503.20 4,628,503.20
205,740.48 721 205,740.48 205,740.48137,666,025.57 137,666,025.57 137,666,025.57
178,265,005.77 5,603,351.03 137,666,025.57 34,995,629.17 178,265,005.77
(3,189.09) (3,189.09) (3,189.09)
96,937.31 96,937.31 96,937.31
0.00 0.00 0.00
344,474.85 344,474.85 344,474.85
12,599,019.37 12,599,019.37 12,599,019.37
30,000.00 455 30,000.00 30,000.0056,824.66 580 56,824.66 56,824.66
1,758,926.10 582 1,758,926.10 1,758,926.10124,155.93 721 124,155.93 124,155.93841,279.73 802 841,279.73 841,279.73
4,419,815.60 4,419,815.60 4,419,815.60
100,000.00 100,000.00 100,000.00
3,698.96 3,698.96 3,698.96
2,696,283.44 2,696,283.44 2,696,283.44
23,068,226.86 2,811,186.42 4,419,815.60 15,837,224.84 23,068,226.86
to next page
UNAUDITED
Annual Financial Report | 127

SCHEDULE 1 A (continued)SCHEDULE OF EXPENDITURES OF FEDERAL AWARDSFor the Year Ended August 31, 2017
PASS THROUGH FROMFEDERAL GRANTOR/ AGENCY/ STATE AGY. NON STATE DIRECT
PASS THROUGH GRANTOR/ CFDA NSE NAME/ UNIV. OR UNIV. ENTITIES PROGRAMPROGRAM TITLE NUMBER IDENTIFYING NUMBER NUMBER AMOUNT AMOUNT AMOUNT
$ $ $
GENERAL SERVICES ADMINISTRATIONPass Through From:
Donation of Federal Surplus Personal Property 39.003(Non monetary)
Pass Through From:Texas Facilities Commission 303 579.50
Total General Services Administration 579.50 0.00 0.00
U.S. DEPARTMENT OF VETERANS AFFAIRSDirect Programs:
Grants to States for Construction of State Home Facilities 64.005 4,034,349.65Direct Programs:
Veterans State Nursing Home Care 64.015 60,552,992.50
Direct Programs:Burial Expenses Allowance for Veterans 64.101 1,032,453.00
Direct Programs:State Cemetery Grants 64.203 506,934.16
Total U.S. Department of Veterans Affairs 0.00 0.00 66,126,729.31
U.S. ENVIRONMENTAL PROTECTION AGENCYDirect Programs:
Beach Monitoring and Notification Program 66.472Implementation Grants 376,358.10
Pass Through To:Other Non State Entities (49,668.00)
Total U.S. Environmental Protection Agency 0.00 0.00 326,690.10
U.S. DEPARTMENT OF HOMELAND SECURITYDirect Programs:
Disaster Grants Public Assistance 97.036 0.00Pass Through From:
Disaster Grants Public Assistance(Presidentially Declared Disasters)
Texas Department of Public Safety 405 478,319.64
Total U.S. Department of Homeland Security 478,319.64 0.00 0.00
RESEARCH & DEVELOPMENT CLUSTER
U.S. DEPARTMENT OF COMMERCEDirect Programs:
Coastal Zone Management Administration Awards 11.419Pass Through To:
Texas A&M Engineering Experiment Station 39,557.78Texas A&M University Kingsville 46,595.82University of Texas Rio Grand Valley 827.48Texas State University 15,290.58Texas A&M University Corpus Christi 633,396.86
Total U.S. Department of Commerce 0.00 0.00 735,668.52
U.S. DEPARTMENT OF THE INTERIORDirect Programs:
Coastal Impact Assistance 15.668Pass Through To:
Texas A&M Agrilife Research 81,536.04
Total U.S. Department of the Interior 0.00 0.00 81,536.04
CDBG ENTITLEMENT GRANTS CLUSTER
U.S. DEPARTMENT OF HOUSING AND URBAN DEVELOPMENTDirect Programs:
Community Development Block Grants/Entitlement Grants 14.218 52,427.12Pass Through To:
Other Non State Entities 6,303,453.97
Total U.S. Department of Housing and Urban Development 0.00 0.00 6,355,881.09
TOTAL EXPENDITURES OF FEDERAL AWARDS 823,373.99 2,799,982.40 274,001,804.21
UNAUDITEDTexas General Land Office and Veterans' Land Board (305)
128 | Annual Financial Report
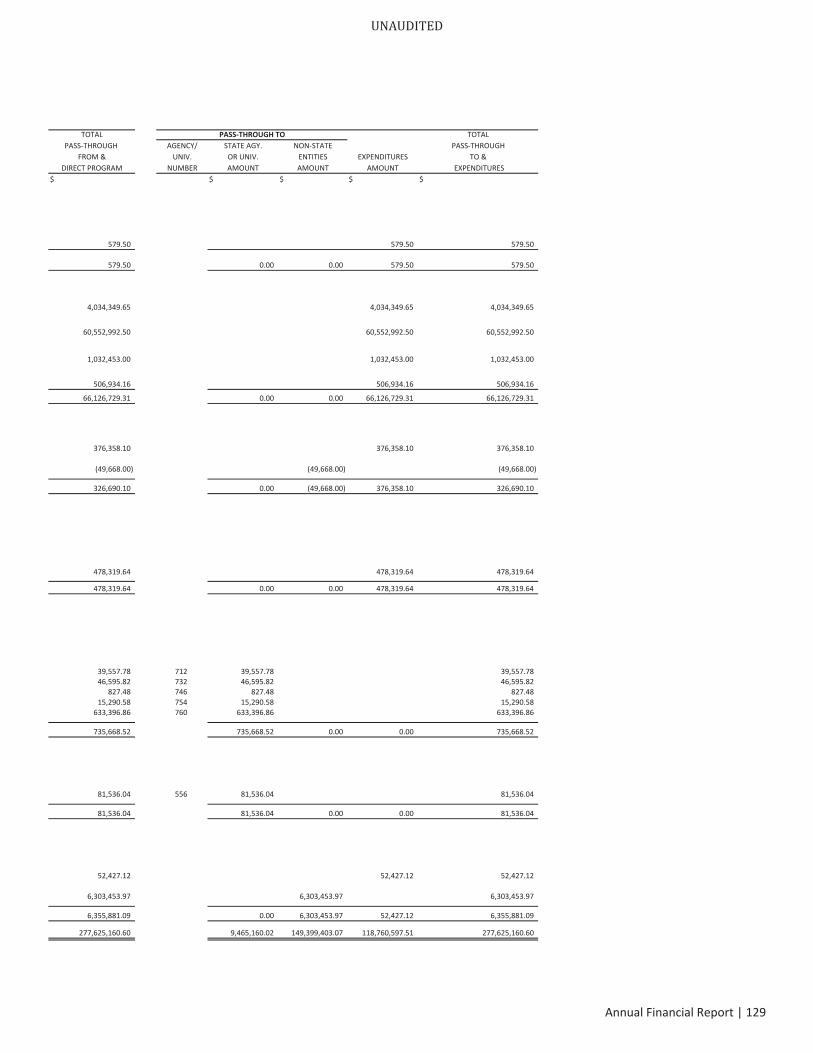
TOTAL PASS THROUGH TO TOTALPASS THROUGH AGENCY/ STATE AGY. NON STATE PASS THROUGH
FROM & UNIV. OR UNIV. ENTITIES EXPENDITURES TO &DIRECT PROGRAM NUMBER AMOUNT AMOUNT AMOUNT EXPENDITURES
$ $ $ $ $
579.50 579.50 579.50
579.50 0.00 0.00 579.50 579.50
4,034,349.65 4,034,349.65 4,034,349.65
60,552,992.50 60,552,992.50 60,552,992.50
1,032,453.00 1,032,453.00 1,032,453.00
506,934.16 506,934.16 506,934.16
66,126,729.31 0.00 0.00 66,126,729.31 66,126,729.31
376,358.10 376,358.10 376,358.10
(49,668.00) (49,668.00) (49,668.00)
326,690.10 0.00 (49,668.00) 376,358.10 326,690.10
0.00 0.00 0.00
478,319.64 478,319.64 478,319.64
478,319.64 0.00 0.00 478,319.64 478,319.64
39,557.78 712 39,557.78 39,557.7846,595.82 732 46,595.82 46,595.82
827.48 746 827.48 827.4815,290.58 754 15,290.58 15,290.58
633,396.86 760 633,396.86 633,396.86
735,668.52 735,668.52 0.00 0.00 735,668.52
81,536.04 556 81,536.04 81,536.04
81,536.04 81,536.04 0.00 0.00 81,536.04
52,427.12 52,427.12 52,427.12
6,303,453.97 6,303,453.97 6,303,453.97
6,355,881.09 0.00 6,303,453.97 52,427.12 6,355,881.09
277,625,160.60 9,465,160.02 149,399,403.07 118,760,597.51 277,625,160.60
UNAUDITED
Annual Financial Report | 129
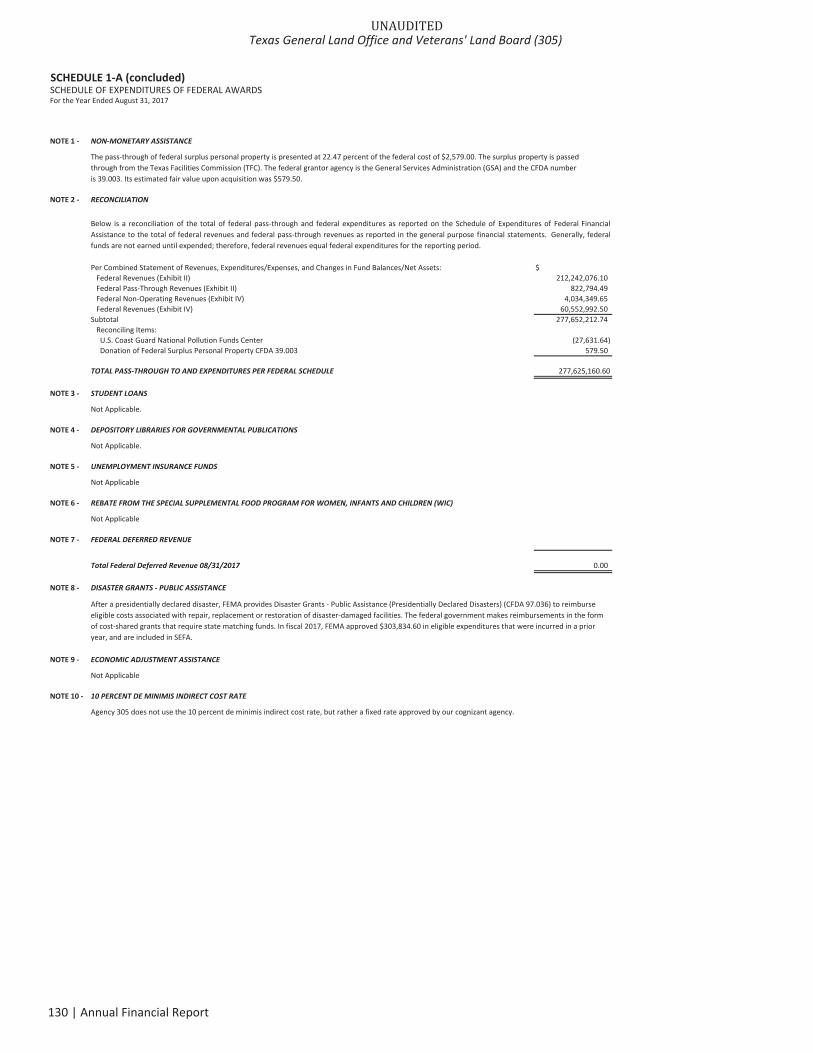
SCHEDULE 1 A (concluded)SCHEDULE OF EXPENDITURES OF FEDERAL AWARDSFor the Year Ended August 31, 2017
NOTE 1 NON MONETARY ASSISTANCE
The pass through of federal surplus personal property is presented at 22.47 percent of the federal cost of $2,579.00. The surplus property is passedthrough from the Texas Facilities Commission (TFC). The federal grantor agency is the General Services Administration (GSA) and the CFDA numberis 39.003. Its estimated fair value upon acquisition was $579.50.
NOTE 2 RECONCILIATION
Per Combined Statement of Revenues, Expenditures/Expenses, and Changes in Fund Balances/Net Assets: $Federal Revenues (Exhibit II) 212,242,076.10Federal Pass Through Revenues (Exhibit II) 822,794.49Federal Non Operating Revenues (Exhibit IV) 4,034,349.65Federal Revenues (Exhibit IV) 60,552,992.50
Subtotal 277,652,212.74Reconciling Items:U.S. Coast Guard National Pollution Funds Center (27,631.64)Donation of Federal Surplus Personal Property CFDA 39.003 579.50
TOTAL PASS THROUGH TO AND EXPENDITURES PER FEDERAL SCHEDULE 277,625,160.60
NOTE 3 STUDENT LOANS
Not Applicable.
NOTE 4 DEPOSITORY LIBRARIES FOR GOVERNMENTAL PUBLICATIONS
Not Applicable.
NOTE 5 UNEMPLOYMENT INSURANCE FUNDS
Not Applicable
NOTE 6 REBATE FROM THE SPECIAL SUPPLEMENTAL FOOD PROGRAM FOR WOMEN, INFANTS AND CHILDREN (WIC)
Not Applicable
NOTE 7 FEDERAL DEFERRED REVENUE
Total Federal Deferred Revenue 08/31/2017 0.00
NOTE 8 DISASTER GRANTS PUBLIC ASSISTANCE
NOTE 9 ECONOMIC ADJUSTMENT ASSISTANCE
Not Applicable
NOTE 10 10 PERCENT DE MINIMIS INDIRECT COST RATE
Agency 305 does not use the 10 percent de minimis indirect cost rate, but rather a fixed rate approved by our cognizant agency.
Below is a reconciliation of the total of federal pass through and federal expenditures as reported on the Schedule of Expenditures of Federal FinancialAssistance to the total of federal revenues and federal pass through revenues as reported in the general purpose financial statements. Generally, federalfunds are not earned until expended; therefore, federal revenues equal federal expenditures for the reporting period.
After a presidentially declared disaster, FEMA provides Disaster Grants Public Assistance (Presidentially Declared Disasters) (CFDA 97.036) to reimburseeligible costs associated with repair, replacement or restoration of disaster damaged facilities. The federal government makes reimbursements in the formof cost shared grants that require state matching funds. In fiscal 2017, FEMA approved $303,834.60 in eligible expenditures that were incurred in a prioryear, and are included in SEFA.
UNAUDITEDTexas General Land Office and Veterans' Land Board (305)
130 | Annual Financial Report
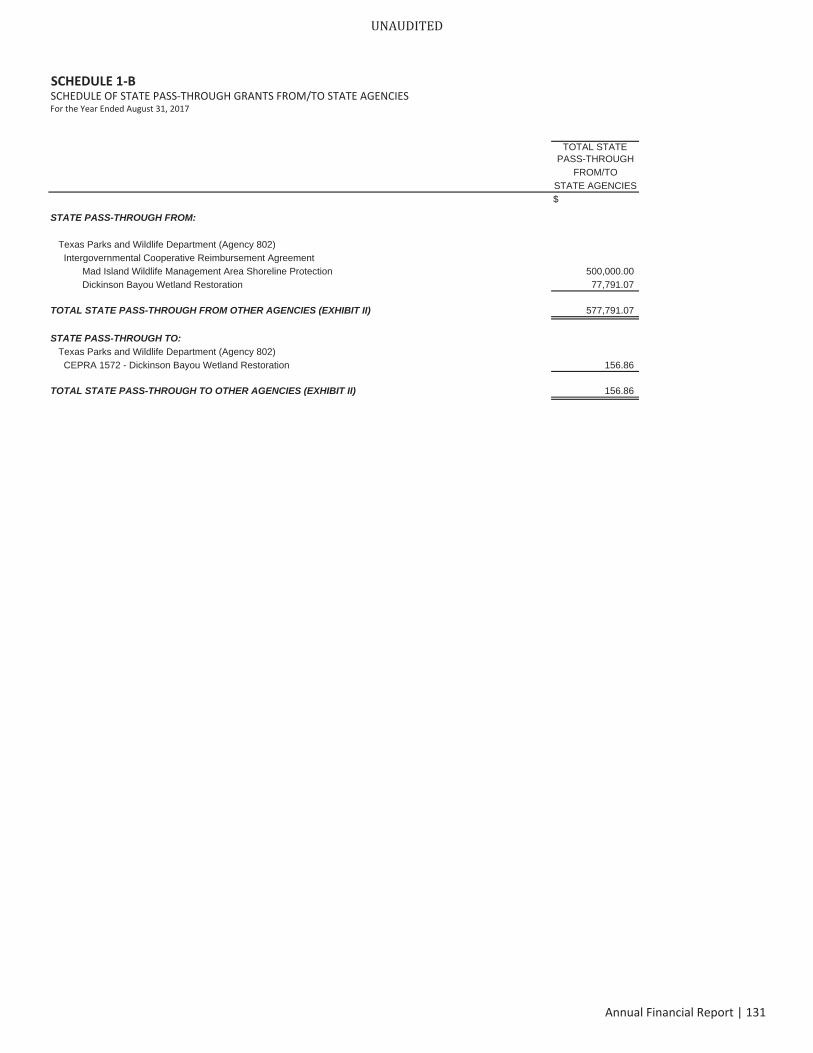
SCHEDULE 1 BSCHEDULE OF STATE PASS THROUGH GRANTS FROM/TO STATE AGENCIESFor the Year Ended August 31, 2017
TOTAL STATEPASS-THROUGH
FROM/TOSTATE AGENCIES$
STATE PASS-THROUGH FROM:
Texas Parks and Wildlife Department (Agency 802) Intergovernmental Cooperative Reimbursement Agreement Mad Island Wildlife Management Area Shoreline Protection 500,000.00 Dickinson Bayou Wetland Restoration 77,791.07
TOTAL STATE PASS-THROUGH FROM OTHER AGENCIES (EXHIBIT II) 577,791.07
STATE PASS-THROUGH TO: Texas Parks and Wildlife Department (Agency 802) CEPRA 1572 - Dickinson Bayou Wetland Restoration 156.86
TOTAL STATE PASS-THROUGH TO OTHER AGENCIES (EXHIBIT II) 156.86
UNAUDITED
Annual Financial Report | 131
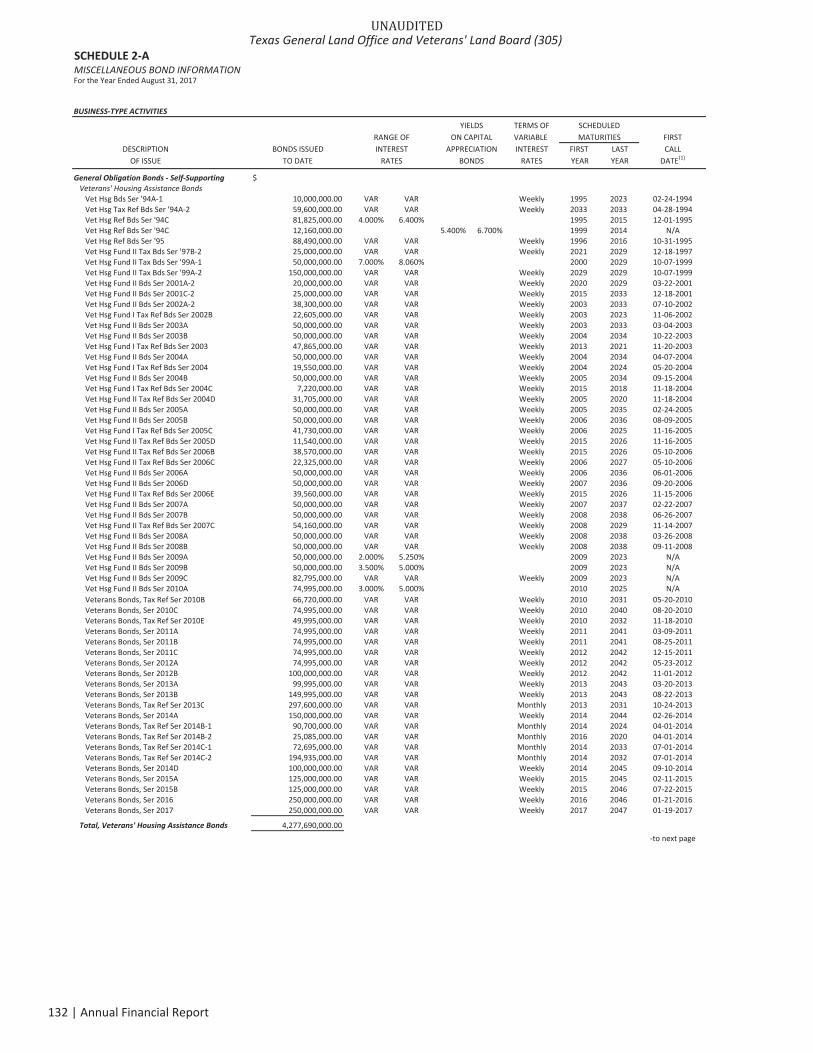
SCHEDULE 2 AMISCELLANEOUS BOND INFORMATIONFor the Year Ended August 31, 2017
BUSINESS TYPE ACTIVITIES
YIELDS TERMS OF SCHEDULEDON CAPITAL VARIABLE MATURITIES FIRST
DESCRIPTION BONDS ISSUED APPRECIATION INTEREST FIRST LAST CALLOF ISSUE TO DATE BONDS RATES YEAR YEAR DATE(1)
General Obligation Bonds Self Supporting $Veterans' Housing Assistance Bonds
Vet Hsg Bds Ser '94A 1 10,000,000.00 VAR VAR Weekly 1995 2023 02 24 1994Vet Hsg Tax Ref Bds Ser '94A 2 59,600,000.00 VAR VAR Weekly 2033 2033 04 28 1994Vet Hsg Ref Bds Ser '94C 81,825,000.00 4.000% 6.400% 1995 2015 12 01 1995Vet Hsg Ref Bds Ser '94C 12,160,000.00 5.400% 6.700% 1999 2014 N/AVet Hsg Ref Bds Ser '95 88,490,000.00 VAR VAR Weekly 1996 2016 10 31 1995Vet Hsg Fund II Tax Bds Ser '97B 2 25,000,000.00 VAR VAR Weekly 2021 2029 12 18 1997Vet Hsg Fund II Tax Bds Ser '99A 1 50,000,000.00 7.000% 8.060% 2000 2029 10 07 1999Vet Hsg Fund II Tax Bds Ser '99A 2 150,000,000.00 VAR VAR Weekly 2029 2029 10 07 1999Vet Hsg Fund II Bds Ser 2001A 2 20,000,000.00 VAR VAR Weekly 2020 2029 03 22 2001Vet Hsg Fund II Bds Ser 2001C 2 25,000,000.00 VAR VAR Weekly 2015 2033 12 18 2001Vet Hsg Fund II Bds Ser 2002A 2 38,300,000.00 VAR VAR Weekly 2003 2033 07 10 2002Vet Hsg Fund I Tax Ref Bds Ser 2002B 22,605,000.00 VAR VAR Weekly 2003 2023 11 06 2002Vet Hsg Fund II Bds Ser 2003A 50,000,000.00 VAR VAR Weekly 2003 2033 03 04 2003Vet Hsg Fund II Bds Ser 2003B 50,000,000.00 VAR VAR Weekly 2004 2034 10 22 2003Vet Hsg Fund I Tax Ref Bds Ser 2003 47,865,000.00 VAR VAR Weekly 2013 2021 11 20 2003Vet Hsg Fund II Bds Ser 2004A 50,000,000.00 VAR VAR Weekly 2004 2034 04 07 2004Vet Hsg Fund I Tax Ref Bds Ser 2004 19,550,000.00 VAR VAR Weekly 2004 2024 05 20 2004Vet Hsg Fund II Bds Ser 2004B 50,000,000.00 VAR VAR Weekly 2005 2034 09 15 2004Vet Hsg Fund I Tax Ref Bds Ser 2004C 7,220,000.00 VAR VAR Weekly 2015 2018 11 18 2004Vet Hsg Fund II Tax Ref Bds Ser 2004D 31,705,000.00 VAR VAR Weekly 2005 2020 11 18 2004Vet Hsg Fund II Bds Ser 2005A 50,000,000.00 VAR VAR Weekly 2005 2035 02 24 2005Vet Hsg Fund II Bds Ser 2005B 50,000,000.00 VAR VAR Weekly 2006 2036 08 09 2005Vet Hsg Fund I Tax Ref Bds Ser 2005C 41,730,000.00 VAR VAR Weekly 2006 2025 11 16 2005Vet Hsg Fund II Tax Ref Bds Ser 2005D 11,540,000.00 VAR VAR Weekly 2015 2026 11 16 2005Vet Hsg Fund II Tax Ref Bds Ser 2006B 38,570,000.00 VAR VAR Weekly 2015 2026 05 10 2006Vet Hsg Fund II Tax Ref Bds Ser 2006C 22,325,000.00 VAR VAR Weekly 2006 2027 05 10 2006Vet Hsg Fund II Bds Ser 2006A 50,000,000.00 VAR VAR Weekly 2006 2036 06 01 2006Vet Hsg Fund II Bds Ser 2006D 50,000,000.00 VAR VAR Weekly 2007 2036 09 20 2006Vet Hsg Fund II Tax Ref Bds Ser 2006E 39,560,000.00 VAR VAR Weekly 2015 2026 11 15 2006Vet Hsg Fund II Bds Ser 2007A 50,000,000.00 VAR VAR Weekly 2007 2037 02 22 2007Vet Hsg Fund II Bds Ser 2007B 50,000,000.00 VAR VAR Weekly 2008 2038 06 26 2007Vet Hsg Fund II Tax Ref Bds Ser 2007C 54,160,000.00 VAR VAR Weekly 2008 2029 11 14 2007Vet Hsg Fund II Bds Ser 2008A 50,000,000.00 VAR VAR Weekly 2008 2038 03 26 2008Vet Hsg Fund II Bds Ser 2008B 50,000,000.00 VAR VAR Weekly 2008 2038 09 11 2008Vet Hsg Fund II Bds Ser 2009A 50,000,000.00 2.000% 5.250% 2009 2023 N/AVet Hsg Fund II Bds Ser 2009B 50,000,000.00 3.500% 5.000% 2009 2023 N/AVet Hsg Fund II Bds Ser 2009C 82,795,000.00 VAR VAR Weekly 2009 2023 N/AVet Hsg Fund II Bds Ser 2010A 74,995,000.00 3.000% 5.000% 2010 2025 N/AVeterans Bonds, Tax Ref Ser 2010B 66,720,000.00 VAR VAR Weekly 2010 2031 05 20 2010Veterans Bonds, Ser 2010C 74,995,000.00 VAR VAR Weekly 2010 2040 08 20 2010Veterans Bonds, Tax Ref Ser 2010E 49,995,000.00 VAR VAR Weekly 2010 2032 11 18 2010Veterans Bonds, Ser 2011A 74,995,000.00 VAR VAR Weekly 2011 2041 03 09 2011Veterans Bonds, Ser 2011B 74,995,000.00 VAR VAR Weekly 2011 2041 08 25 2011Veterans Bonds, Ser 2011C 74,995,000.00 VAR VAR Weekly 2012 2042 12 15 2011Veterans Bonds, Ser 2012A 74,995,000.00 VAR VAR Weekly 2012 2042 05 23 2012Veterans Bonds, Ser 2012B 100,000,000.00 VAR VAR Weekly 2012 2042 11 01 2012Veterans Bonds, Ser 2013A 99,995,000.00 VAR VAR Weekly 2013 2043 03 20 2013Veterans Bonds, Ser 2013B 149,995,000.00 VAR VAR Weekly 2013 2043 08 22 2013Veterans Bonds, Tax Ref Ser 2013C 297,600,000.00 VAR VAR Monthly 2013 2031 10 24 2013Veterans Bonds, Ser 2014A 150,000,000.00 VAR VAR Weekly 2014 2044 02 26 2014Veterans Bonds, Tax Ref Ser 2014B 1 90,700,000.00 VAR VAR Monthly 2014 2024 04 01 2014Veterans Bonds, Tax Ref Ser 2014B 2 25,085,000.00 VAR VAR Monthly 2016 2020 04 01 2014Veterans Bonds, Tax Ref Ser 2014C 1 72,695,000.00 VAR VAR Monthly 2014 2033 07 01 2014Veterans Bonds, Tax Ref Ser 2014C 2 194,935,000.00 VAR VAR Monthly 2014 2032 07 01 2014Veterans Bonds, Ser 2014D 100,000,000.00 VAR VAR Weekly 2014 2045 09 10 2014Veterans Bonds, Ser 2015A 125,000,000.00 VAR VAR Weekly 2015 2045 02 11 2015Veterans Bonds, Ser 2015B 125,000,000.00 VAR VAR Weekly 2015 2046 07 22 2015Veterans Bonds, Ser 2016 250,000,000.00 VAR VAR Weekly 2016 2046 01 21 2016Veterans Bonds, Ser 2017 250,000,000.00 VAR VAR Weekly 2017 2047 01 19 2017
Total, Veterans' Housing Assistance Bonds 4,277,690,000.00to next page
RANGE OFINTEREST
RATES
UNAUDITEDTexas General Land Office and Veterans' Land Board (305)
132 | Annual Financial Report
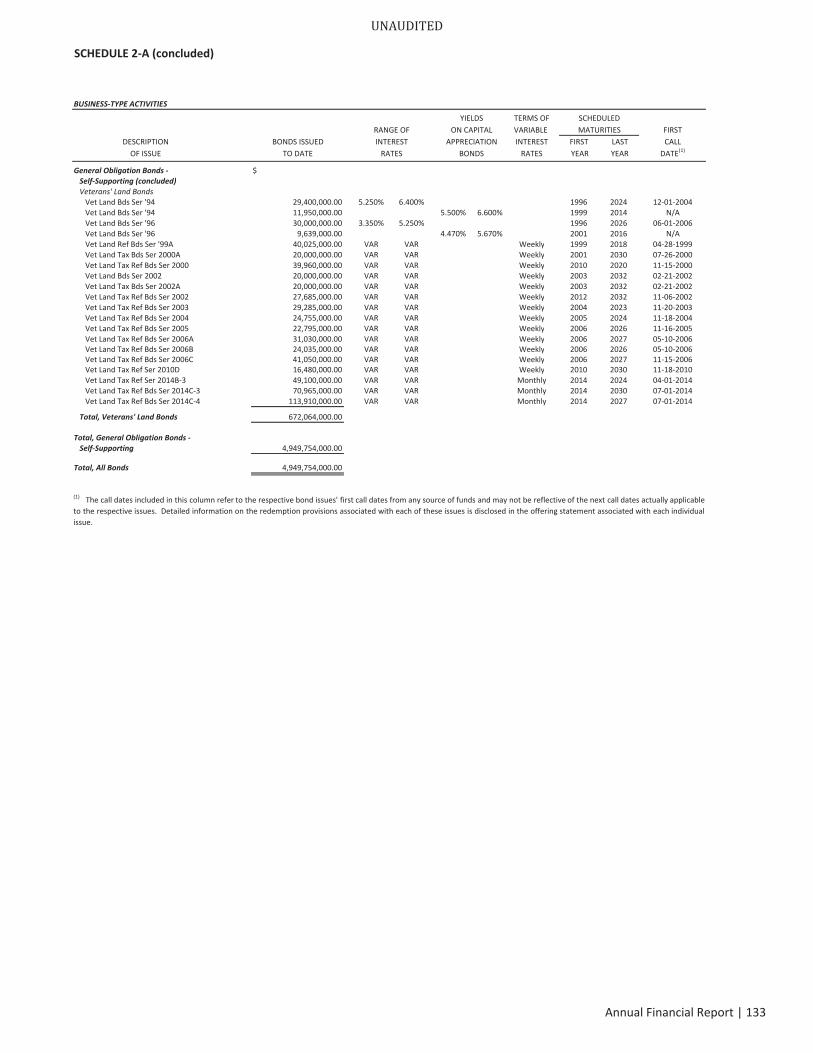
SCHEDULE 2 A (concluded)
BUSINESS TYPE ACTIVITIES
YIELDS TERMS OF SCHEDULEDON CAPITAL VARIABLE MATURITIES FIRST
DESCRIPTION BONDS ISSUED APPRECIATION INTEREST FIRST LAST CALLOF ISSUE TO DATE BONDS RATES YEAR YEAR DATE(1)
General Obligation Bonds $Self Supporting (concluded)Veterans' Land Bonds
Vet Land Bds Ser '94 29,400,000.00 5.250% 6.400% 1996 2024 12 01 2004Vet Land Bds Ser '94 11,950,000.00 5.500% 6.600% 1999 2014 N/AVet Land Bds Ser '96 30,000,000.00 3.350% 5.250% 1996 2026 06 01 2006Vet Land Bds Ser '96 9,639,000.00 4.470% 5.670% 2001 2016 N/AVet Land Ref Bds Ser '99A 40,025,000.00 VAR VAR Weekly 1999 2018 04 28 1999Vet Land Tax Bds Ser 2000A 20,000,000.00 VAR VAR Weekly 2001 2030 07 26 2000Vet Land Tax Ref Bds Ser 2000 39,960,000.00 VAR VAR Weekly 2010 2020 11 15 2000Vet Land Bds Ser 2002 20,000,000.00 VAR VAR Weekly 2003 2032 02 21 2002Vet Land Tax Bds Ser 2002A 20,000,000.00 VAR VAR Weekly 2003 2032 02 21 2002Vet Land Tax Ref Bds Ser 2002 27,685,000.00 VAR VAR Weekly 2012 2032 11 06 2002Vet Land Tax Ref Bds Ser 2003 29,285,000.00 VAR VAR Weekly 2004 2023 11 20 2003Vet Land Tax Ref Bds Ser 2004 24,755,000.00 VAR VAR Weekly 2005 2024 11 18 2004Vet Land Tax Ref Bds Ser 2005 22,795,000.00 VAR VAR Weekly 2006 2026 11 16 2005Vet Land Tax Ref Bds Ser 2006A 31,030,000.00 VAR VAR Weekly 2006 2027 05 10 2006Vet Land Tax Ref Bds Ser 2006B 24,035,000.00 VAR VAR Weekly 2006 2026 05 10 2006Vet Land Tax Ref Bds Ser 2006C 41,050,000.00 VAR VAR Weekly 2006 2027 11 15 2006Vet Land Tax Ref Ser 2010D 16,480,000.00 VAR VAR Weekly 2010 2030 11 18 2010Vet Land Tax Ref Ser 2014B 3 49,100,000.00 VAR VAR Monthly 2014 2024 04 01 2014Vet Land Tax Ref Bds Ser 2014C 3 70,965,000.00 VAR VAR Monthly 2014 2030 07 01 2014Vet Land Tax Ref Bds Ser 2014C 4 113,910,000.00 VAR VAR Monthly 2014 2027 07 01 2014
Total, Veterans' Land Bonds 672,064,000.00
Total, General Obligation BondsSelf Supporting 4,949,754,000.00
Total, All Bonds 4,949,754,000.00
(1) The call dates included in this column refer to the respective bond issues' first call dates from any source of funds and may not be reflective of the next call dates actually applicableto the respective issues. Detailed information on the redemption provisions associated with each of these issues is disclosed in the offering statement associated with each individualissue.
RANGE OFINTEREST
RATES
UNAUDITED
Annual Financial Report | 133
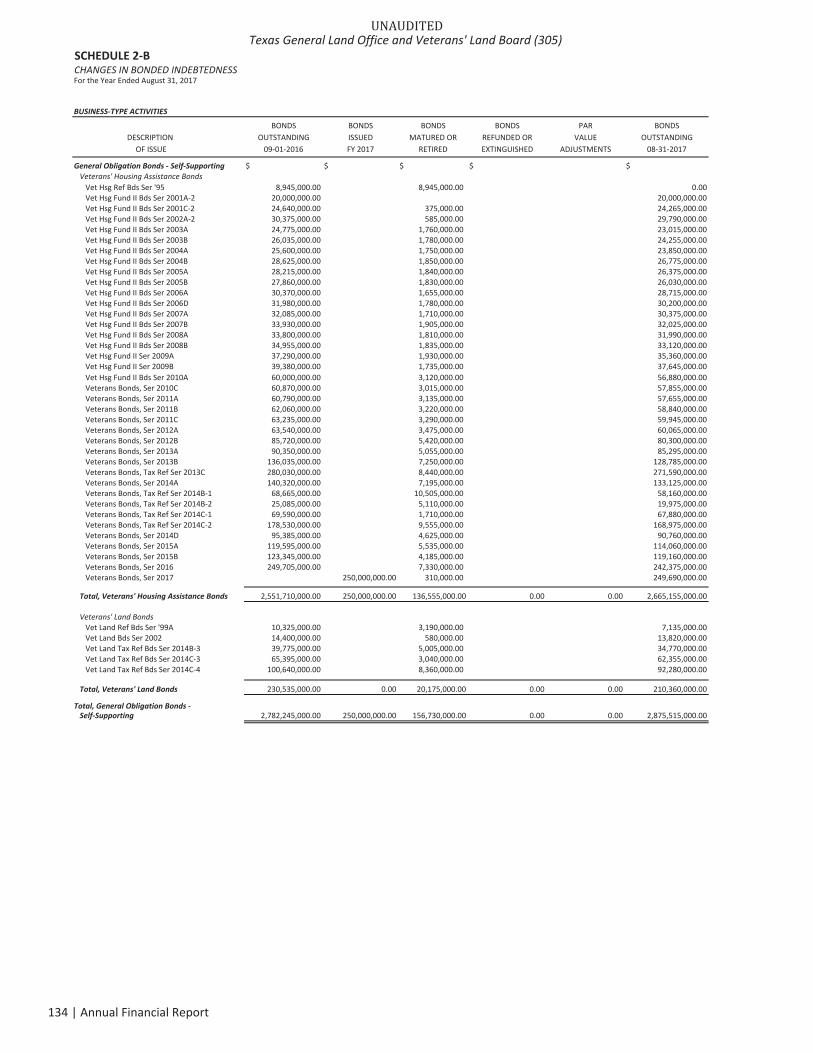
SCHEDULE 2 BCHANGES IN BONDED INDEBTEDNESSFor the Year Ended August 31, 2017
BUSINESS TYPE ACTIVITIES
BONDS BONDS BONDS BONDS PAR BONDSDESCRIPTION OUTSTANDING ISSUED MATURED OR REFUNDED OR VALUE OUTSTANDING
OF ISSUE 09 01 2016 FY 2017 RETIRED EXTINGUISHED ADJUSTMENTS 08 31 2017
General Obligation Bonds Self Supporting $ $ $ $ $Veterans' Housing Assistance Bonds
Vet Hsg Ref Bds Ser '95 8,945,000.00 8,945,000.00 0.00Vet Hsg Fund II Bds Ser 2001A 2 20,000,000.00 20,000,000.00Vet Hsg Fund II Bds Ser 2001C 2 24,640,000.00 375,000.00 24,265,000.00Vet Hsg Fund II Bds Ser 2002A 2 30,375,000.00 585,000.00 29,790,000.00Vet Hsg Fund II Bds Ser 2003A 24,775,000.00 1,760,000.00 23,015,000.00Vet Hsg Fund II Bds Ser 2003B 26,035,000.00 1,780,000.00 24,255,000.00Vet Hsg Fund II Bds Ser 2004A 25,600,000.00 1,750,000.00 23,850,000.00Vet Hsg Fund II Bds Ser 2004B 28,625,000.00 1,850,000.00 26,775,000.00Vet Hsg Fund II Bds Ser 2005A 28,215,000.00 1,840,000.00 26,375,000.00Vet Hsg Fund II Bds Ser 2005B 27,860,000.00 1,830,000.00 26,030,000.00Vet Hsg Fund II Bds Ser 2006A 30,370,000.00 1,655,000.00 28,715,000.00Vet Hsg Fund II Bds Ser 2006D 31,980,000.00 1,780,000.00 30,200,000.00Vet Hsg Fund II Bds Ser 2007A 32,085,000.00 1,710,000.00 30,375,000.00Vet Hsg Fund II Bds Ser 2007B 33,930,000.00 1,905,000.00 32,025,000.00Vet Hsg Fund II Bds Ser 2008A 33,800,000.00 1,810,000.00 31,990,000.00Vet Hsg Fund II Bds Ser 2008B 34,955,000.00 1,835,000.00 33,120,000.00Vet Hsg Fund II Ser 2009A 37,290,000.00 1,930,000.00 35,360,000.00Vet Hsg Fund II Ser 2009B 39,380,000.00 1,735,000.00 37,645,000.00Vet Hsg Fund II Bds Ser 2010A 60,000,000.00 3,120,000.00 56,880,000.00Veterans Bonds, Ser 2010C 60,870,000.00 3,015,000.00 57,855,000.00Veterans Bonds, Ser 2011A 60,790,000.00 3,135,000.00 57,655,000.00Veterans Bonds, Ser 2011B 62,060,000.00 3,220,000.00 58,840,000.00Veterans Bonds, Ser 2011C 63,235,000.00 3,290,000.00 59,945,000.00Veterans Bonds, Ser 2012A 63,540,000.00 3,475,000.00 60,065,000.00Veterans Bonds, Ser 2012B 85,720,000.00 5,420,000.00 80,300,000.00Veterans Bonds, Ser 2013A 90,350,000.00 5,055,000.00 85,295,000.00Veterans Bonds, Ser 2013B 136,035,000.00 7,250,000.00 128,785,000.00Veterans Bonds, Tax Ref Ser 2013C 280,030,000.00 8,440,000.00 271,590,000.00Veterans Bonds, Ser 2014A 140,320,000.00 7,195,000.00 133,125,000.00Veterans Bonds, Tax Ref Ser 2014B 1 68,665,000.00 10,505,000.00 58,160,000.00Veterans Bonds, Tax Ref Ser 2014B 2 25,085,000.00 5,110,000.00 19,975,000.00Veterans Bonds, Tax Ref Ser 2014C 1 69,590,000.00 1,710,000.00 67,880,000.00Veterans Bonds, Tax Ref Ser 2014C 2 178,530,000.00 9,555,000.00 168,975,000.00Veterans Bonds, Ser 2014D 95,385,000.00 4,625,000.00 90,760,000.00Veterans Bonds, Ser 2015A 119,595,000.00 5,535,000.00 114,060,000.00Veterans Bonds, Ser 2015B 123,345,000.00 4,185,000.00 119,160,000.00Veterans Bonds, Ser 2016 249,705,000.00 7,330,000.00 242,375,000.00Veterans Bonds, Ser 2017 250,000,000.00 310,000.00 249,690,000.00
Total, Veterans' Housing Assistance Bonds 2,551,710,000.00 250,000,000.00 136,555,000.00 0.00 0.00 2,665,155,000.00
Veterans' Land BondsVet Land Ref Bds Ser '99A 10,325,000.00 3,190,000.00 7,135,000.00Vet Land Bds Ser 2002 14,400,000.00 580,000.00 13,820,000.00Vet Land Tax Ref Bds Ser 2014B 3 39,775,000.00 5,005,000.00 34,770,000.00Vet Land Tax Ref Bds Ser 2014C 3 65,395,000.00 3,040,000.00 62,355,000.00Vet Land Tax Ref Bds Ser 2014C 4 100,640,000.00 8,360,000.00 92,280,000.00
Total, Veterans' Land Bonds 230,535,000.00 0.00 20,175,000.00 0.00 0.00 210,360,000.00
Total, General Obligation BondsSelf Supporting 2,782,245,000.00 250,000,000.00 156,730,000.00 0.00 0.00 2,875,515,000.00
UNAUDITEDTexas General Land Office and Veterans' Land Board (305)
134 | Annual Financial Report
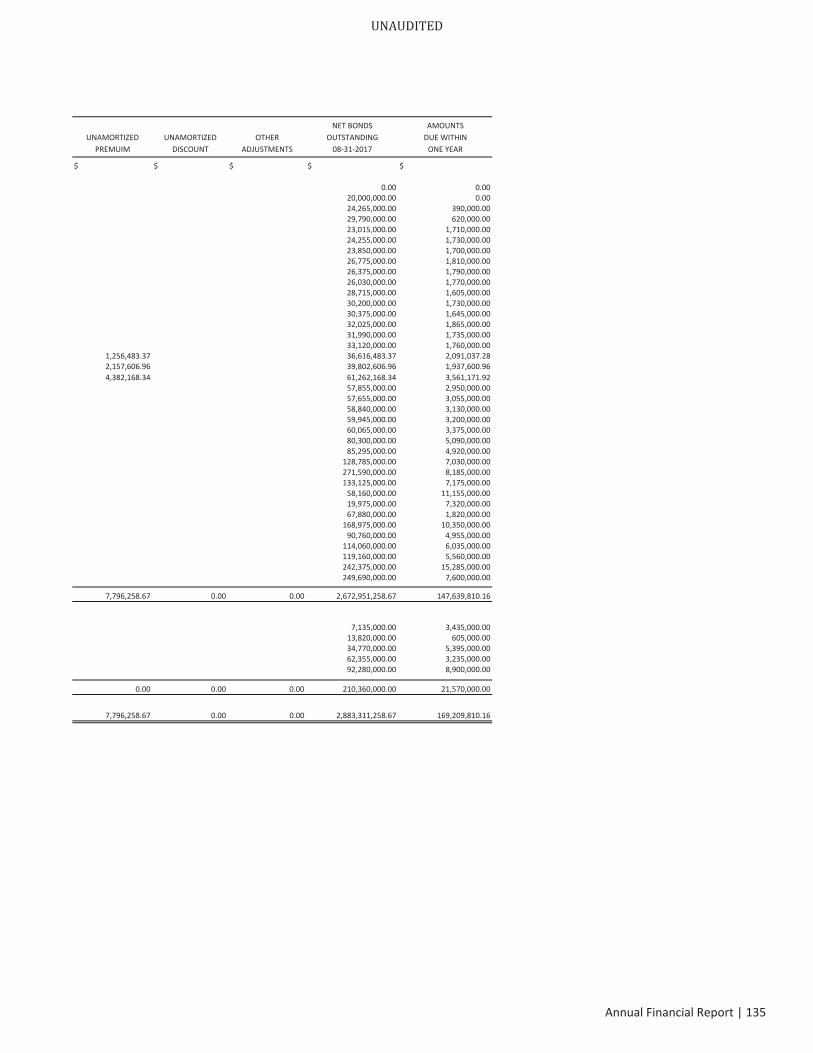
NET BONDS AMOUNTSUNAMORTIZED UNAMORTIZED OTHER OUTSTANDING DUE WITHIN
PREMUIM DISCOUNT ADJUSTMENTS 08 31 2017 ONE YEAR
$ $ $ $ $
0.00 0.0020,000,000.00 0.0024,265,000.00 390,000.0029,790,000.00 620,000.0023,015,000.00 1,710,000.0024,255,000.00 1,730,000.0023,850,000.00 1,700,000.0026,775,000.00 1,810,000.0026,375,000.00 1,790,000.0026,030,000.00 1,770,000.0028,715,000.00 1,605,000.0030,200,000.00 1,730,000.0030,375,000.00 1,645,000.0032,025,000.00 1,865,000.0031,990,000.00 1,735,000.0033,120,000.00 1,760,000.00
1,256,483.37 36,616,483.37 2,091,037.282,157,606.96 39,802,606.96 1,937,600.964,382,168.34 61,262,168.34 3,561,171.92
57,855,000.00 2,950,000.0057,655,000.00 3,055,000.0058,840,000.00 3,130,000.0059,945,000.00 3,200,000.0060,065,000.00 3,375,000.0080,300,000.00 5,090,000.0085,295,000.00 4,920,000.00
128,785,000.00 7,030,000.00271,590,000.00 8,185,000.00133,125,000.00 7,175,000.00
58,160,000.00 11,155,000.0019,975,000.00 7,320,000.0067,880,000.00 1,820,000.00
168,975,000.00 10,350,000.0090,760,000.00 4,955,000.00
114,060,000.00 6,035,000.00119,160,000.00 5,560,000.00242,375,000.00 15,285,000.00249,690,000.00 7,600,000.00
7,796,258.67 0.00 0.00 2,672,951,258.67 147,639,810.16
7,135,000.00 3,435,000.0013,820,000.00 605,000.0034,770,000.00 5,395,000.0062,355,000.00 3,235,000.0092,280,000.00 8,900,000.00
0.00 0.00 0.00 210,360,000.00 21,570,000.00
7,796,258.67 0.00 0.00 2,883,311,258.67 169,209,810.16
UNAUDITED
Annual Financial Report | 135
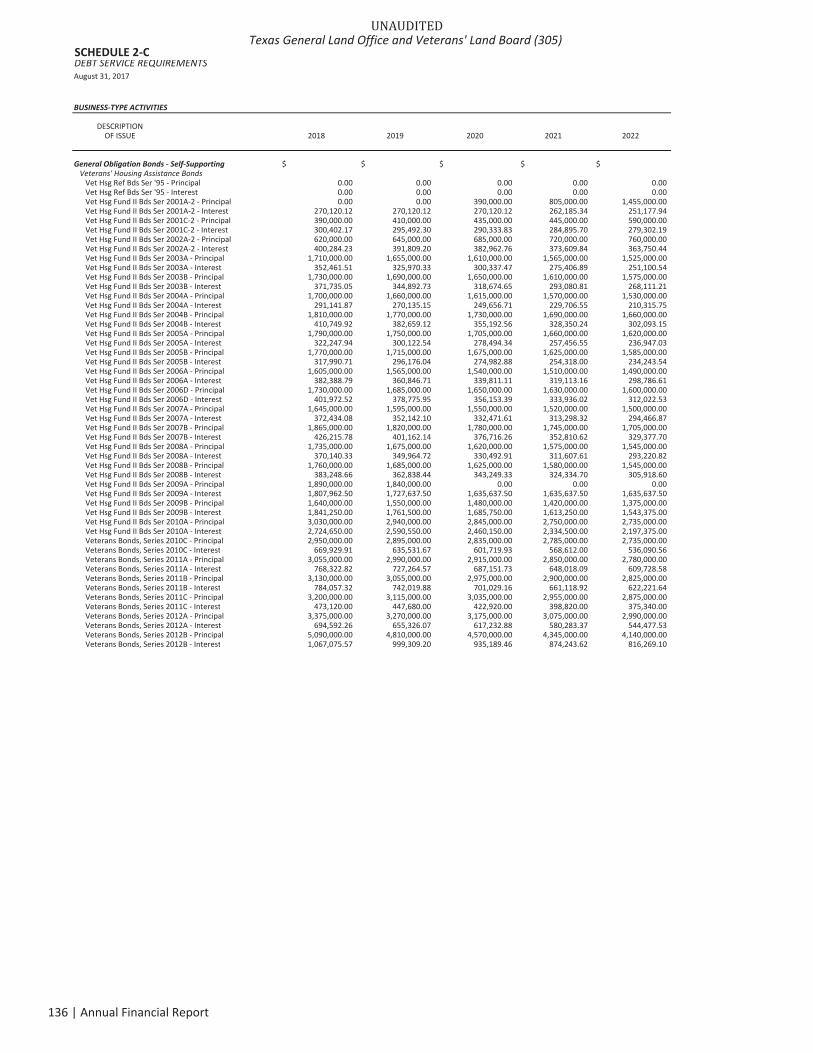
SCHEDULE 2 CDEBT SERVICE REQUIREMENTSAugust 31, 2017
BUSINESS TYPE ACTIVITIES
DESCRIPTIONOF ISSUE 2018 2019 2020 2021 2022
General Obligation Bonds Self Supporting $ $ $ $ $Veterans' Housing Assistance Bonds
Vet Hsg Ref Bds Ser '95 Principal 0.00 0.00 0.00 0.00 0.00Vet Hsg Ref Bds Ser '95 Interest 0.00 0.00 0.00 0.00 0.00Vet Hsg Fund II Bds Ser 2001A 2 Principal 0.00 0.00 390,000.00 805,000.00 1,455,000.00Vet Hsg Fund II Bds Ser 2001A 2 Interest 270,120.12 270,120.12 270,120.12 262,185.34 251,177.94Vet Hsg Fund II Bds Ser 2001C 2 Principal 390,000.00 410,000.00 435,000.00 445,000.00 590,000.00Vet Hsg Fund II Bds Ser 2001C 2 Interest 300,402.17 295,492.30 290,333.83 284,895.70 279,302.19Vet Hsg Fund II Bds Ser 2002A 2 Principal 620,000.00 645,000.00 685,000.00 720,000.00 760,000.00Vet Hsg Fund II Bds Ser 2002A 2 Interest 400,284.23 391,809.20 382,962.76 373,609.84 363,750.44Vet Hsg Fund II Bds Ser 2003A Principal 1,710,000.00 1,655,000.00 1,610,000.00 1,565,000.00 1,525,000.00Vet Hsg Fund II Bds Ser 2003A Interest 352,461.51 325,970.33 300,337.47 275,406.89 251,100.54Vet Hsg Fund II Bds Ser 2003B Principal 1,730,000.00 1,690,000.00 1,650,000.00 1,610,000.00 1,575,000.00Vet Hsg Fund II Bds Ser 2003B Interest 371,735.05 344,892.73 318,674.65 293,080.81 268,111.21Vet Hsg Fund II Bds Ser 2004A Principal 1,700,000.00 1,660,000.00 1,615,000.00 1,570,000.00 1,530,000.00Vet Hsg Fund II Bds Ser 2004A Interest 291,141.87 270,135.15 249,656.71 229,706.55 210,315.75Vet Hsg Fund II Bds Ser 2004B Principal 1,810,000.00 1,770,000.00 1,730,000.00 1,690,000.00 1,660,000.00Vet Hsg Fund II Bds Ser 2004B Interest 410,749.92 382,659.12 355,192.56 328,350.24 302,093.15Vet Hsg Fund II Bds Ser 2005A Principal 1,790,000.00 1,750,000.00 1,705,000.00 1,660,000.00 1,620,000.00Vet Hsg Fund II Bds Ser 2005A Interest 322,247.94 300,122.54 278,494.34 257,456.55 236,947.03Vet Hsg Fund II Bds Ser 2005B Principal 1,770,000.00 1,715,000.00 1,675,000.00 1,625,000.00 1,585,000.00Vet Hsg Fund II Bds Ser 2005B Interest 317,990.71 296,176.04 274,982.88 254,318.00 234,243.54Vet Hsg Fund II Bds Ser 2006A Principal 1,605,000.00 1,565,000.00 1,540,000.00 1,510,000.00 1,490,000.00Vet Hsg Fund II Bds Ser 2006A Interest 382,388.79 360,846.71 339,811.11 319,113.16 298,786.61Vet Hsg Fund II Bds Ser 2006D Principal 1,730,000.00 1,685,000.00 1,650,000.00 1,630,000.00 1,600,000.00Vet Hsg Fund II Bds Ser 2006D Interest 401,972.52 378,775.95 356,153.39 333,936.02 312,022.53Vet Hsg Fund II Bds Ser 2007A Principal 1,645,000.00 1,595,000.00 1,550,000.00 1,520,000.00 1,500,000.00Vet Hsg Fund II Bds Ser 2007A Interest 372,434.08 352,142.10 332,471.61 313,298.32 294,466.87Vet Hsg Fund II Bds Ser 2007B Principal 1,865,000.00 1,820,000.00 1,780,000.00 1,745,000.00 1,705,000.00Vet Hsg Fund II Bds Ser 2007B Interest 426,215.78 401,162.14 376,716.26 352,810.62 329,377.70Vet Hsg Fund II Bds Ser 2008A Principal 1,735,000.00 1,675,000.00 1,620,000.00 1,575,000.00 1,545,000.00Vet Hsg Fund II Bds Ser 2008A Interest 370,140.33 349,964.72 330,492.91 311,607.61 293,220.82Vet Hsg Fund II Bds Ser 2008B Principal 1,760,000.00 1,685,000.00 1,625,000.00 1,580,000.00 1,545,000.00Vet Hsg Fund II Bds Ser 2008B Interest 383,248.66 362,838.44 343,249.33 324,334.70 305,918.60Vet Hsg Fund II Bds Ser 2009A Principal 1,890,000.00 1,840,000.00 0.00 0.00 0.00Vet Hsg Fund II Bds Ser 2009A Interest 1,807,962.50 1,727,637.50 1,635,637.50 1,635,637.50 1,635,637.50Vet Hsg Fund II Bds Ser 2009B Principal 1,640,000.00 1,550,000.00 1,480,000.00 1,420,000.00 1,375,000.00Vet Hsg Fund II Bds Ser 2009B Interest 1,841,250.00 1,761,500.00 1,685,750.00 1,613,250.00 1,543,375.00Vet Hsg Fund II Bds Ser 2010A Principal 3,030,000.00 2,940,000.00 2,845,000.00 2,750,000.00 2,735,000.00Vet Hsg Fund II Bds Ser 2010A Interest 2,724,650.00 2,590,550.00 2,460,150.00 2,334,500.00 2,197,375.00Veterans Bonds, Series 2010C Principal 2,950,000.00 2,895,000.00 2,835,000.00 2,785,000.00 2,735,000.00Veterans Bonds, Series 2010C Interest 669,929.91 635,531.67 601,719.93 568,612.00 536,090.56Veterans Bonds, Series 2011A Principal 3,055,000.00 2,990,000.00 2,915,000.00 2,850,000.00 2,780,000.00Veterans Bonds, Series 2011A Interest 768,322.82 727,264.57 687,151.73 648,018.09 609,728.58Veterans Bonds, Series 2011B Principal 3,130,000.00 3,055,000.00 2,975,000.00 2,900,000.00 2,825,000.00Veterans Bonds, Series 2011B Interest 784,057.32 742,019.88 701,029.16 661,118.92 622,221.64Veterans Bonds, Series 2011C Principal 3,200,000.00 3,115,000.00 3,035,000.00 2,955,000.00 2,875,000.00Veterans Bonds, Series 2011C Interest 473,120.00 447,680.00 422,920.00 398,820.00 375,340.00Veterans Bonds, Series 2012A Principal 3,375,000.00 3,270,000.00 3,175,000.00 3,075,000.00 2,990,000.00Veterans Bonds, Series 2012A Interest 694,592.26 655,326.07 617,232.88 580,283.37 544,477.53Veterans Bonds, Series 2012B Principal 5,090,000.00 4,810,000.00 4,570,000.00 4,345,000.00 4,140,000.00Veterans Bonds, Series 2012B Interest 1,067,075.57 999,309.20 935,189.46 874,243.62 816,269.10
UNAUDITEDTexas General Land Office and Veterans' Land Board (305)
136 | Annual Financial Report
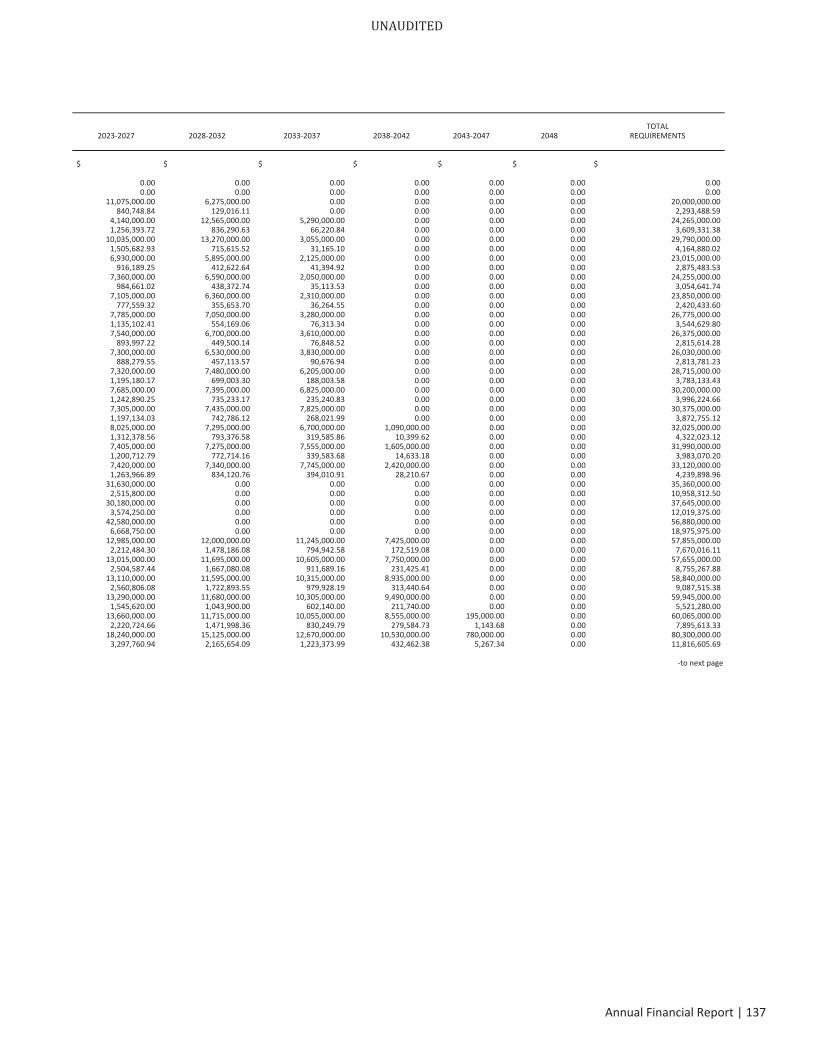
TOTAL2023 2027 2028 2032 2033 2037 2038 2042 2043 2047 2048 REQUIREMENTS
$ $ $ $ $ $ $
0.00 0.00 0.00 0.00 0.00 0.00 0.000.00 0.00 0.00 0.00 0.00 0.00 0.00
11,075,000.00 6,275,000.00 0.00 0.00 0.00 0.00 20,000,000.00840,748.84 129,016.11 0.00 0.00 0.00 0.00 2,293,488.59
4,140,000.00 12,565,000.00 5,290,000.00 0.00 0.00 0.00 24,265,000.001,256,393.72 836,290.63 66,220.84 0.00 0.00 0.00 3,609,331.38
10,035,000.00 13,270,000.00 3,055,000.00 0.00 0.00 0.00 29,790,000.001,505,682.93 715,615.52 31,165.10 0.00 0.00 0.00 4,164,880.026,930,000.00 5,895,000.00 2,125,000.00 0.00 0.00 0.00 23,015,000.00
916,189.25 412,622.64 41,394.92 0.00 0.00 0.00 2,875,483.537,360,000.00 6,590,000.00 2,050,000.00 0.00 0.00 0.00 24,255,000.00
984,661.02 438,372.74 35,113.53 0.00 0.00 0.00 3,054,641.747,105,000.00 6,360,000.00 2,310,000.00 0.00 0.00 0.00 23,850,000.00
777,559.32 355,653.70 36,264.55 0.00 0.00 0.00 2,420,433.607,785,000.00 7,050,000.00 3,280,000.00 0.00 0.00 0.00 26,775,000.001,135,102.41 554,169.06 76,313.34 0.00 0.00 0.00 3,544,629.807,540,000.00 6,700,000.00 3,610,000.00 0.00 0.00 0.00 26,375,000.00
893,997.22 449,500.14 76,848.52 0.00 0.00 0.00 2,815,614.287,300,000.00 6,530,000.00 3,830,000.00 0.00 0.00 0.00 26,030,000.00
888,279.55 457,113.57 90,676.94 0.00 0.00 0.00 2,813,781.237,320,000.00 7,480,000.00 6,205,000.00 0.00 0.00 0.00 28,715,000.001,195,180.17 699,003.30 188,003.58 0.00 0.00 0.00 3,783,133.437,685,000.00 7,395,000.00 6,825,000.00 0.00 0.00 0.00 30,200,000.001,242,890.25 735,233.17 235,240.83 0.00 0.00 0.00 3,996,224.667,305,000.00 7,435,000.00 7,825,000.00 0.00 0.00 0.00 30,375,000.001,197,134.03 742,786.12 268,021.99 0.00 0.00 0.00 3,872,755.128,025,000.00 7,295,000.00 6,700,000.00 1,090,000.00 0.00 0.00 32,025,000.001,312,378.56 793,376.58 319,585.86 10,399.62 0.00 0.00 4,322,023.127,405,000.00 7,275,000.00 7,555,000.00 1,605,000.00 0.00 0.00 31,990,000.001,200,712.79 772,714.16 339,583.68 14,633.18 0.00 0.00 3,983,070.207,420,000.00 7,340,000.00 7,745,000.00 2,420,000.00 0.00 0.00 33,120,000.001,263,966.89 834,120.76 394,010.91 28,210.67 0.00 0.00 4,239,898.96
31,630,000.00 0.00 0.00 0.00 0.00 0.00 35,360,000.002,515,800.00 0.00 0.00 0.00 0.00 0.00 10,958,312.50
30,180,000.00 0.00 0.00 0.00 0.00 0.00 37,645,000.003,574,250.00 0.00 0.00 0.00 0.00 0.00 12,019,375.00
42,580,000.00 0.00 0.00 0.00 0.00 0.00 56,880,000.006,668,750.00 0.00 0.00 0.00 0.00 0.00 18,975,975.00
12,985,000.00 12,000,000.00 11,245,000.00 7,425,000.00 0.00 0.00 57,855,000.002,212,484.30 1,478,186.08 794,942.58 172,519.08 0.00 0.00 7,670,016.11
13,015,000.00 11,695,000.00 10,605,000.00 7,750,000.00 0.00 0.00 57,655,000.002,504,587.44 1,667,080.08 911,689.16 231,425.41 0.00 0.00 8,755,267.88
13,110,000.00 11,595,000.00 10,315,000.00 8,935,000.00 0.00 0.00 58,840,000.002,560,806.08 1,722,893.55 979,928.19 313,440.64 0.00 0.00 9,087,515.38
13,290,000.00 11,680,000.00 10,305,000.00 9,490,000.00 0.00 0.00 59,945,000.001,545,620.00 1,043,900.00 602,140.00 211,740.00 0.00 0.00 5,521,280.00
13,660,000.00 11,715,000.00 10,055,000.00 8,555,000.00 195,000.00 0.00 60,065,000.002,220,724.66 1,471,998.36 830,249.79 279,584.73 1,143.68 0.00 7,895,613.33
18,240,000.00 15,125,000.00 12,670,000.00 10,530,000.00 780,000.00 0.00 80,300,000.003,297,760.94 2,165,654.09 1,223,373.99 432,462.38 5,267.34 0.00 11,816,605.69
to next page
UNAUDITED
Annual Financial Report | 137
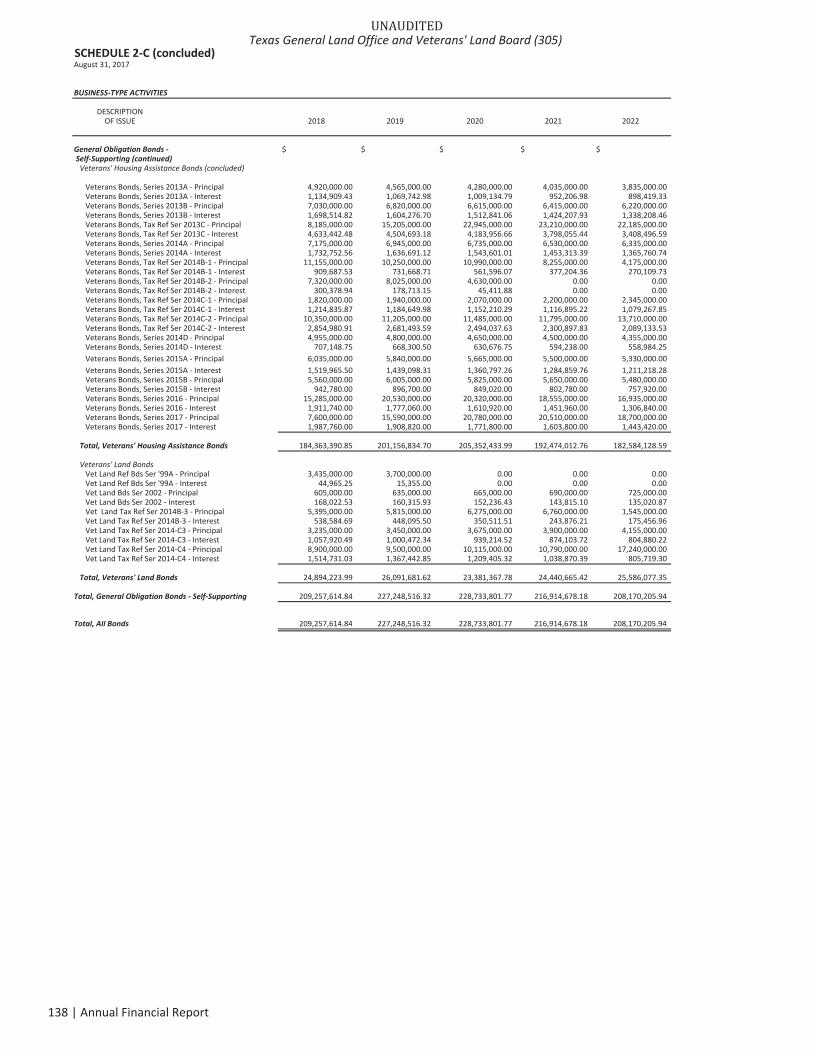
SCHEDULE 2 C (concluded)August 31, 2017
BUSINESS TYPE ACTIVITIES
DESCRIPTIONOF ISSUE 2018 2019 2020 2021 2022
General Obligation Bonds $ $ $ $ $Self Supporting (continued)Veterans' Housing Assistance Bonds (concluded)
Veterans Bonds, Series 2013A Principal 4,920,000.00 4,565,000.00 4,280,000.00 4,035,000.00 3,835,000.00Veterans Bonds, Series 2013A Interest 1,134,909.43 1,069,742.98 1,009,134.79 952,206.98 898,419.33Veterans Bonds, Series 2013B Principal 7,030,000.00 6,820,000.00 6,615,000.00 6,415,000.00 6,220,000.00Veterans Bonds, Series 2013B Interest 1,698,514.82 1,604,276.70 1,512,841.06 1,424,207.93 1,338,208.46Veterans Bonds, Tax Ref Ser 2013C Principal 8,185,000.00 15,205,000.00 22,945,000.00 23,210,000.00 22,185,000.00Veterans Bonds, Tax Ref Ser 2013C Interest 4,633,442.48 4,504,693.18 4,183,956.66 3,798,055.44 3,408,496.59Veterans Bonds, Series 2014A Principal 7,175,000.00 6,945,000.00 6,735,000.00 6,530,000.00 6,335,000.00Veterans Bonds, Series 2014A Interest 1,732,752.56 1,636,691.12 1,543,601.01 1,453,313.39 1,365,760.74Veterans Bonds, Tax Ref Ser 2014B 1 Principal 11,155,000.00 10,250,000.00 10,990,000.00 8,255,000.00 4,175,000.00Veterans Bonds, Tax Ref Ser 2014B 1 Interest 909,687.53 731,668.71 561,596.07 377,204.36 270,109.73Veterans Bonds, Tax Ref Ser 2014B 2 Principal 7,320,000.00 8,025,000.00 4,630,000.00 0.00 0.00Veterans Bonds, Tax Ref Ser 2014B 2 Interest 300,378.94 178,713.15 45,411.88 0.00 0.00Veterans Bonds, Tax Ref Ser 2014C 1 Principal 1,820,000.00 1,940,000.00 2,070,000.00 2,200,000.00 2,345,000.00Veterans Bonds, Tax Ref Ser 2014C 1 Interest 1,214,835.87 1,184,649.98 1,152,210.29 1,116,895.22 1,079,267.85Veterans Bonds, Tax Ref Ser 2014C 2 Principal 10,350,000.00 11,205,000.00 11,485,000.00 11,795,000.00 13,710,000.00Veterans Bonds, Tax Ref Ser 2014C 2 Interest 2,854,980.91 2,681,493.59 2,494,037.63 2,300,897.83 2,089,133.53Veterans Bonds, Series 2014D Principal 4,955,000.00 4,800,000.00 4,650,000.00 4,500,000.00 4,355,000.00Veterans Bonds, Series 2014D Interest 707,148.75 668,300.50 630,676.75 594,238.00 558,984.25Veterans Bonds, Series 2015A Principal 6,035,000.00 5,840,000.00 5,665,000.00 5,500,000.00 5,330,000.00Veterans Bonds, Series 2015A Interest 1,519,965.50 1,439,098.31 1,360,797.26 1,284,859.76 1,211,218.28Veterans Bonds, Series 2015B Principal 5,560,000.00 6,005,000.00 5,825,000.00 5,650,000.00 5,480,000.00Veterans Bonds, Series 2015B Interest 942,780.00 896,700.00 849,020.00 802,780.00 757,920.00Veterans Bonds, Series 2016 Principal 15,285,000.00 20,530,000.00 20,320,000.00 18,555,000.00 16,935,000.00Veterans Bonds, Series 2016 Interest 1,911,740.00 1,777,060.00 1,610,920.00 1,451,960.00 1,306,840.00Veterans Bonds, Series 2017 Principal 7,600,000.00 15,590,000.00 20,780,000.00 20,510,000.00 18,700,000.00Veterans Bonds, Series 2017 Interest 1,987,760.00 1,908,820.00 1,771,800.00 1,603,800.00 1,443,420.00
Total, Veterans' Housing Assistance Bonds 184,363,390.85 201,156,834.70 205,352,433.99 192,474,012.76 182,584,128.59
Veterans' Land BondsVet Land Ref Bds Ser '99A Principal 3,435,000.00 3,700,000.00 0.00 0.00 0.00Vet Land Ref Bds Ser '99A Interest 44,965.25 15,355.00 0.00 0.00 0.00Vet Land Bds Ser 2002 Principal 605,000.00 635,000.00 665,000.00 690,000.00 725,000.00Vet Land Bds Ser 2002 Interest 168,022.53 160,315.93 152,236.43 143,815.10 135,020.87Vet Land Tax Ref Ser 2014B 3 Principal 5,395,000.00 5,815,000.00 6,275,000.00 6,760,000.00 1,545,000.00Vet Land Tax Ref Ser 2014B 3 Interest 538,584.69 448,095.50 350,511.51 243,876.21 175,456.96Vet Land Tax Ref Ser 2014 C3 Principal 3,235,000.00 3,450,000.00 3,675,000.00 3,900,000.00 4,155,000.00Vet Land Tax Ref Ser 2014 C3 Interest 1,057,920.49 1,000,472.34 939,214.52 874,103.72 804,880.22Vet Land Tax Ref Ser 2014 C4 Principal 8,900,000.00 9,500,000.00 10,115,000.00 10,790,000.00 17,240,000.00Vet Land Tax Ref Ser 2014 C4 Interest 1,514,731.03 1,367,442.85 1,209,405.32 1,038,870.39 805,719.30
Total, Veterans' Land Bonds 24,894,223.99 26,091,681.62 23,381,367.78 24,440,665.42 25,586,077.35
Total, General Obligation Bonds Self Supporting 209,257,614.84 227,248,516.32 228,733,801.77 216,914,678.18 208,170,205.94
Total, All Bonds 209,257,614.84 227,248,516.32 228,733,801.77 216,914,678.18 208,170,205.94
UNAUDITEDTexas General Land Office and Veterans' Land Board (305)
138 | Annual Financial Report
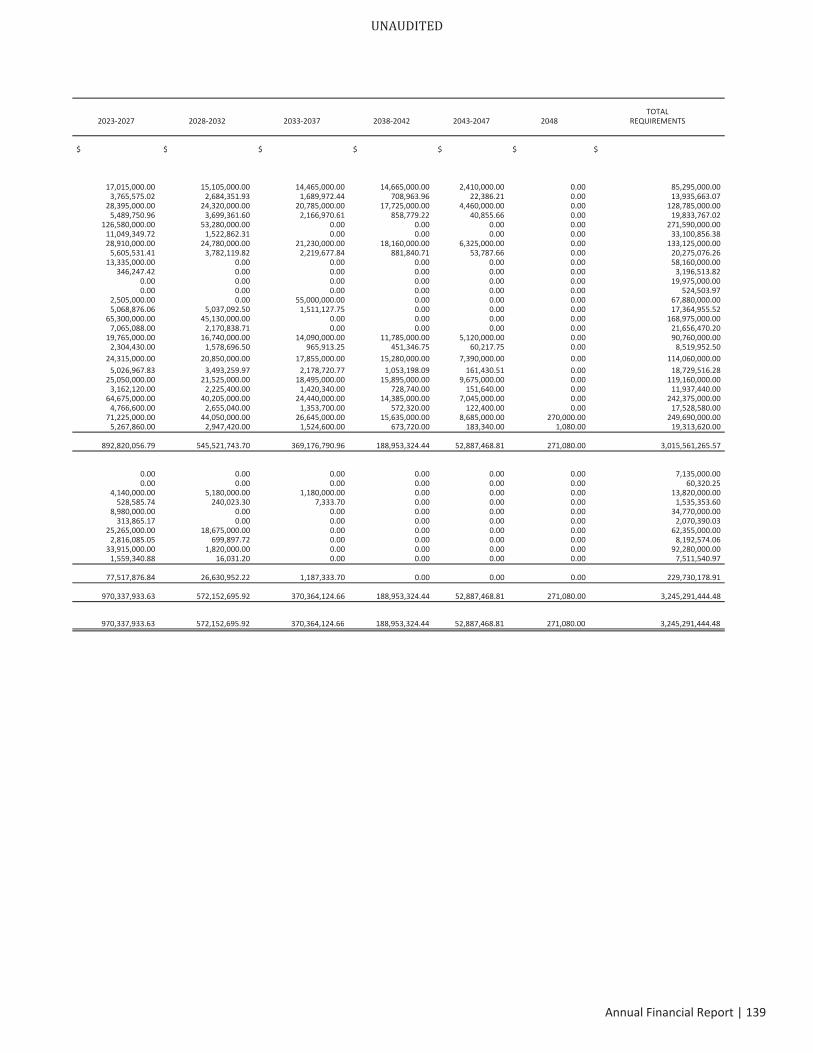
TOTAL2023 2027 2028 2032 2033 2037 2038 2042 2043 2047 2048 REQUIREMENTS
$ $ $ $ $ $ $
17,015,000.00 15,105,000.00 14,465,000.00 14,665,000.00 2,410,000.00 0.00 85,295,000.003,765,575.02 2,684,351.93 1,689,972.44 708,963.96 22,386.21 0.00 13,935,663.07
28,395,000.00 24,320,000.00 20,785,000.00 17,725,000.00 4,460,000.00 0.00 128,785,000.005,489,750.96 3,699,361.60 2,166,970.61 858,779.22 40,855.66 0.00 19,833,767.02
126,580,000.00 53,280,000.00 0.00 0.00 0.00 0.00 271,590,000.0011,049,349.72 1,522,862.31 0.00 0.00 0.00 0.00 33,100,856.3828,910,000.00 24,780,000.00 21,230,000.00 18,160,000.00 6,325,000.00 0.00 133,125,000.00
5,605,531.41 3,782,119.82 2,219,677.84 881,840.71 53,787.66 0.00 20,275,076.2613,335,000.00 0.00 0.00 0.00 0.00 0.00 58,160,000.00
346,247.42 0.00 0.00 0.00 0.00 0.00 3,196,513.820.00 0.00 0.00 0.00 0.00 0.00 19,975,000.000.00 0.00 0.00 0.00 0.00 0.00 524,503.97
2,505,000.00 0.00 55,000,000.00 0.00 0.00 0.00 67,880,000.005,068,876.06 5,037,092.50 1,511,127.75 0.00 0.00 0.00 17,364,955.52
65,300,000.00 45,130,000.00 0.00 0.00 0.00 0.00 168,975,000.007,065,088.00 2,170,838.71 0.00 0.00 0.00 0.00 21,656,470.20
19,765,000.00 16,740,000.00 14,090,000.00 11,785,000.00 5,120,000.00 0.00 90,760,000.002,304,430.00 1,578,696.50 965,913.25 451,346.75 60,217.75 0.00 8,519,952.50
24,315,000.00 20,850,000.00 17,855,000.00 15,280,000.00 7,390,000.00 0.00 114,060,000.005,026,967.83 3,493,259.97 2,178,720.77 1,053,198.09 161,430.51 0.00 18,729,516.28
25,050,000.00 21,525,000.00 18,495,000.00 15,895,000.00 9,675,000.00 0.00 119,160,000.003,162,120.00 2,225,400.00 1,420,340.00 728,740.00 151,640.00 0.00 11,937,440.00
64,675,000.00 40,205,000.00 24,440,000.00 14,385,000.00 7,045,000.00 0.00 242,375,000.004,766,600.00 2,655,040.00 1,353,700.00 572,320.00 122,400.00 0.00 17,528,580.00
71,225,000.00 44,050,000.00 26,645,000.00 15,635,000.00 8,685,000.00 270,000.00 249,690,000.005,267,860.00 2,947,420.00 1,524,600.00 673,720.00 183,340.00 1,080.00 19,313,620.00
892,820,056.79 545,521,743.70 369,176,790.96 188,953,324.44 52,887,468.81 271,080.00 3,015,561,265.57
0.00 0.00 0.00 0.00 0.00 0.00 7,135,000.000.00 0.00 0.00 0.00 0.00 0.00 60,320.25
4,140,000.00 5,180,000.00 1,180,000.00 0.00 0.00 0.00 13,820,000.00528,585.74 240,023.30 7,333.70 0.00 0.00 0.00 1,535,353.60
8,980,000.00 0.00 0.00 0.00 0.00 0.00 34,770,000.00313,865.17 0.00 0.00 0.00 0.00 0.00 2,070,390.03
25,265,000.00 18,675,000.00 0.00 0.00 0.00 0.00 62,355,000.002,816,085.05 699,897.72 0.00 0.00 0.00 0.00 8,192,574.06
33,915,000.00 1,820,000.00 0.00 0.00 0.00 0.00 92,280,000.001,559,340.88 16,031.20 0.00 0.00 0.00 0.00 7,511,540.97
77,517,876.84 26,630,952.22 1,187,333.70 0.00 0.00 0.00 229,730,178.91
970,337,933.63 572,152,695.92 370,364,124.66 188,953,324.44 52,887,468.81 271,080.00 3,245,291,444.48
970,337,933.63 572,152,695.92 370,364,124.66 188,953,324.44 52,887,468.81 271,080.00 3,245,291,444.48
UNAUDITED
Annual Financial Report | 139
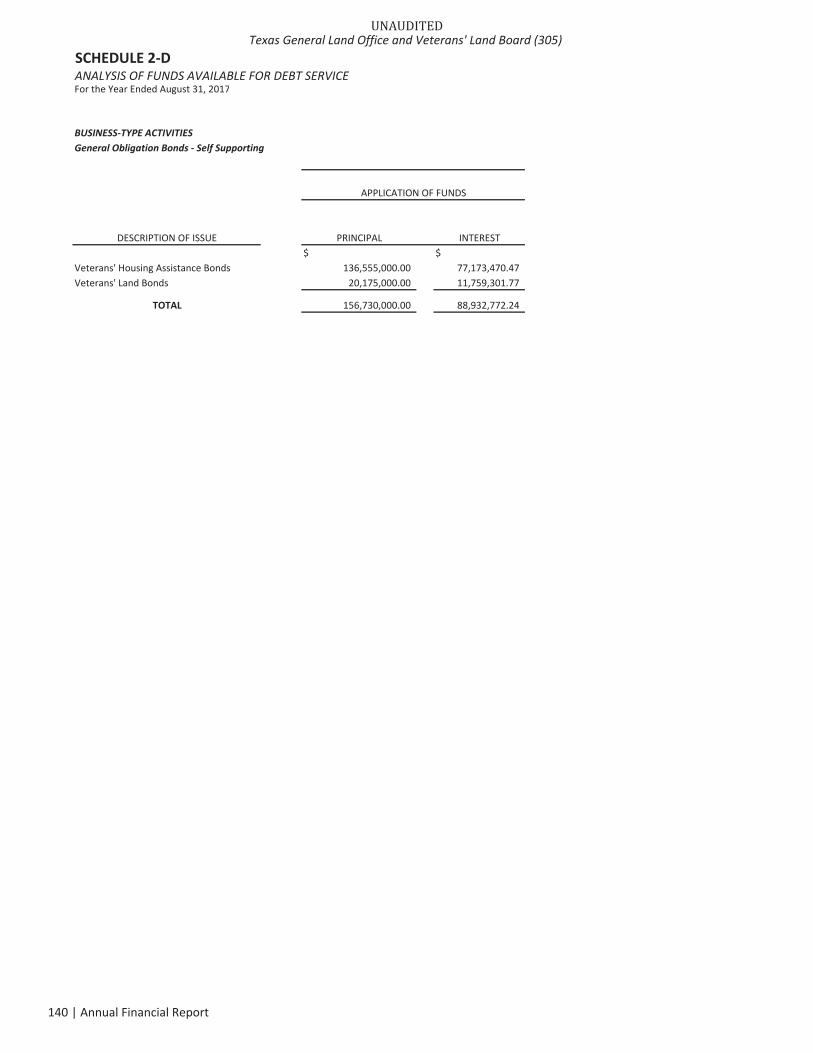
SCHEDULE 2 DANALYSIS OF FUNDS AVAILABLE FOR DEBT SERVICEFor the Year Ended August 31, 2017
BUSINESS TYPE ACTIVITIESGeneral Obligation Bonds Self Supporting
APPLICATION OF FUNDS
DESCRIPTION OF ISSUE PRINCIPAL INTEREST$ $
Veterans' Housing Assistance Bonds 136,555,000.00 77,173,470.47Veterans' Land Bonds 20,175,000.00 11,759,301.77
TOTAL 156,730,000.00 88,932,772.24
UNAUDITEDTexas General Land Office and Veterans' Land Board (305)
140 | Annual Financial Report
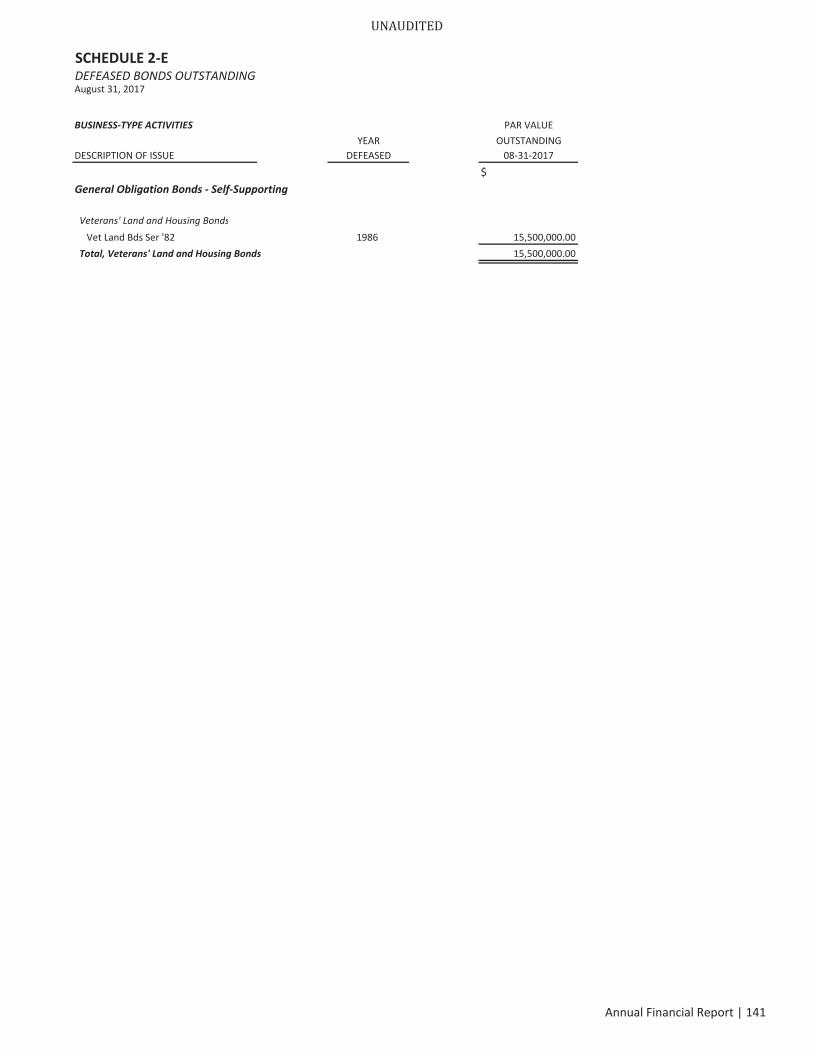
SCHEDULE 2 EDEFEASED BONDS OUTSTANDINGAugust 31, 2017
BUSINESS TYPE ACTIVITIES PAR VALUEYEAR OUTSTANDING
DESCRIPTION OF ISSUE DEFEASED 08 31 2017
$General Obligation Bonds Self Supporting
Veterans' Land and Housing BondsVet Land Bds Ser '82 1986 15,500,000.00
Total, Veterans' Land and Housing Bonds 15,500,000.00
UNAUDITED
Annual Financial Report | 141
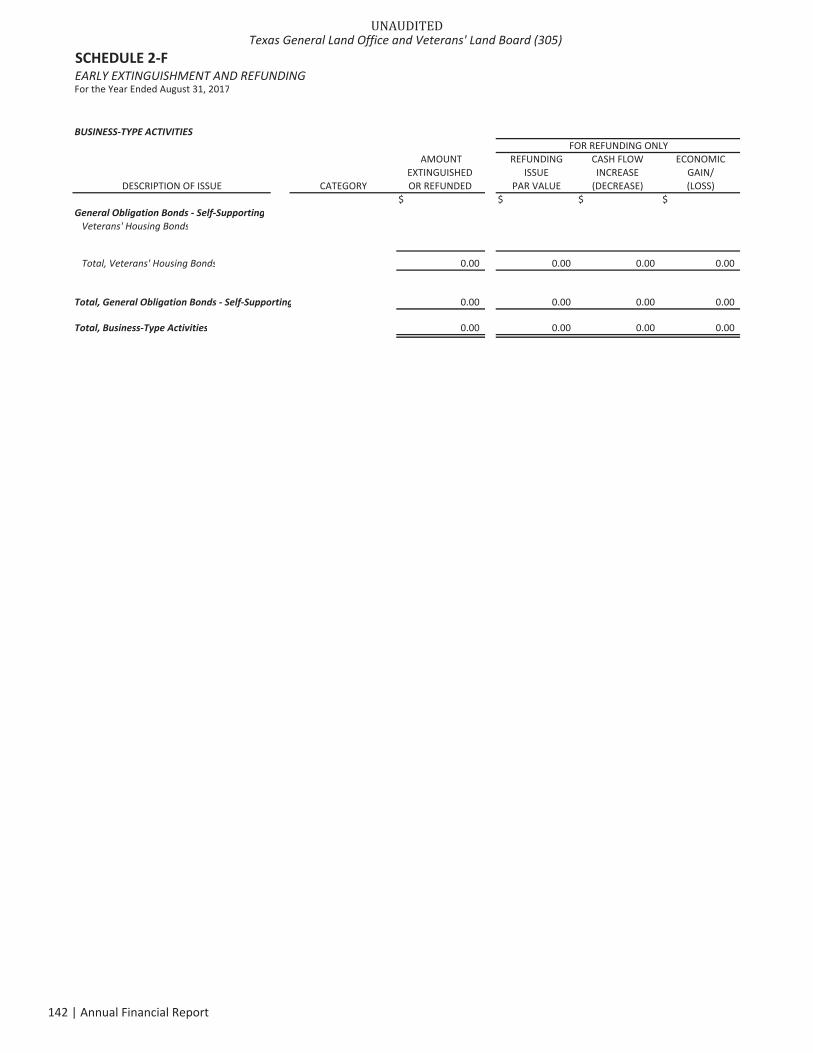
SCHEDULE 2 FEARLY EXTINGUISHMENT AND REFUNDINGFor the Year Ended August 31, 2017
BUSINESS TYPE ACTIVITIES
AMOUNT REFUNDING CASH FLOW ECONOMICEXTINGUISHED ISSUE INCREASE GAIN/
DESCRIPTION OF ISSUE CATEGORY OR REFUNDED PAR VALUE (DECREASE) (LOSS)$ $ $ $
General Obligation Bonds Self SupportingVeterans' Housing Bonds
Total, Veterans' Housing Bonds 0.00 0.00 0.00 0.00
Total, General Obligation Bonds Self Supporting 0.00 0.00 0.00 0.00
Total, Business Type Activities 0.00 0.00 0.00 0.00
FOR REFUNDING ONLY
UNAUDITEDTexas General Land Office and Veterans' Land Board (305)
142 | Annual Financial Report
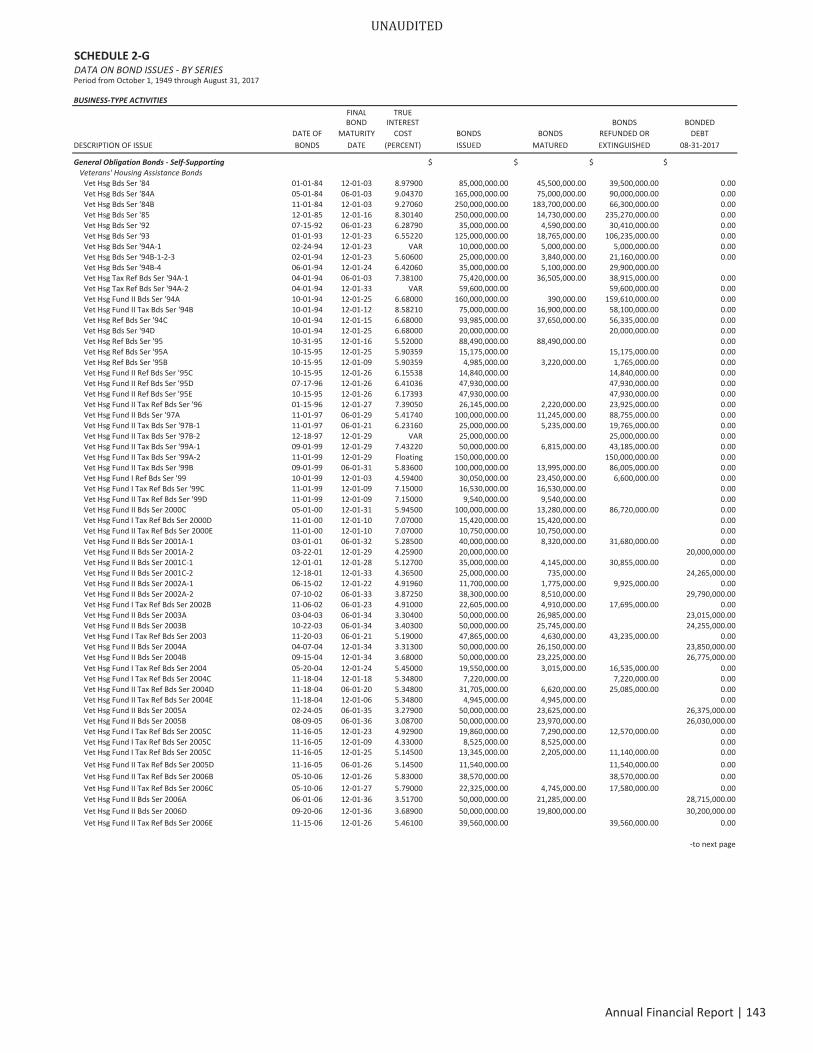
SCHEDULE 2 GDATA ON BOND ISSUES BY SERIESPeriod from October 1, 1949 through August 31, 2017
BUSINESS TYPE ACTIVITIESFINAL TRUEBOND INTEREST BONDS BONDED
DATE OF MATURITY COST BONDS BONDS REFUNDED OR DEBTDESCRIPTION OF ISSUE BONDS DATE (PERCENT) ISSUED MATURED EXTINGUISHED 08 31 2017
General Obligation Bonds Self Supporting $ $ $ $Veterans' Housing Assistance Bonds
Vet Hsg Bds Ser '84 01 01 84 12 01 03 8.97900 85,000,000.00 45,500,000.00 39,500,000.00 0.00Vet Hsg Bds Ser '84A 05 01 84 06 01 03 9.04370 165,000,000.00 75,000,000.00 90,000,000.00 0.00Vet Hsg Bds Ser '84B 11 01 84 12 01 03 9.27060 250,000,000.00 183,700,000.00 66,300,000.00 0.00Vet Hsg Bds Ser '85 12 01 85 12 01 16 8.30140 250,000,000.00 14,730,000.00 235,270,000.00 0.00Vet Hsg Bds Ser '92 07 15 92 06 01 23 6.28790 35,000,000.00 4,590,000.00 30,410,000.00 0.00Vet Hsg Bds Ser '93 01 01 93 12 01 23 6.55220 125,000,000.00 18,765,000.00 106,235,000.00 0.00Vet Hsg Bds Ser '94A 1 02 24 94 12 01 23 VAR 10,000,000.00 5,000,000.00 5,000,000.00 0.00Vet Hsg Bds Ser '94B 1 2 3 02 01 94 12 01 23 5.60600 25,000,000.00 3,840,000.00 21,160,000.00 0.00Vet Hsg Bds Ser '94B 4 06 01 94 12 01 24 6.42060 35,000,000.00 5,100,000.00 29,900,000.00Vet Hsg Tax Ref Bds Ser '94A 1 04 01 94 06 01 03 7.38100 75,420,000.00 36,505,000.00 38,915,000.00 0.00Vet Hsg Tax Ref Bds Ser '94A 2 04 01 94 12 01 33 VAR 59,600,000.00 59,600,000.00 0.00Vet Hsg Fund II Bds Ser '94A 10 01 94 12 01 25 6.68000 160,000,000.00 390,000.00 159,610,000.00 0.00Vet Hsg Fund II Tax Bds Ser '94B 10 01 94 12 01 12 8.58210 75,000,000.00 16,900,000.00 58,100,000.00 0.00Vet Hsg Ref Bds Ser '94C 10 01 94 12 01 15 6.68000 93,985,000.00 37,650,000.00 56,335,000.00 0.00Vet Hsg Bds Ser '94D 10 01 94 12 01 25 6.68000 20,000,000.00 20,000,000.00 0.00Vet Hsg Ref Bds Ser '95 10 31 95 12 01 16 5.52000 88,490,000.00 88,490,000.00 0.00Vet Hsg Ref Bds Ser '95A 10 15 95 12 01 25 5.90359 15,175,000.00 15,175,000.00 0.00Vet Hsg Ref Bds Ser '95B 10 15 95 12 01 09 5.90359 4,985,000.00 3,220,000.00 1,765,000.00 0.00Vet Hsg Fund II Ref Bds Ser '95C 10 15 95 12 01 26 6.15538 14,840,000.00 14,840,000.00 0.00Vet Hsg Fund II Ref Bds Ser '95D 07 17 96 12 01 26 6.41036 47,930,000.00 47,930,000.00 0.00Vet Hsg Fund II Ref Bds Ser '95E 10 15 95 12 01 26 6.17393 47,930,000.00 47,930,000.00 0.00Vet Hsg Fund II Tax Ref Bds Ser '96 01 15 96 12 01 27 7.39050 26,145,000.00 2,220,000.00 23,925,000.00 0.00Vet Hsg Fund II Bds Ser '97A 11 01 97 06 01 29 5.41740 100,000,000.00 11,245,000.00 88,755,000.00 0.00Vet Hsg Fund II Tax Bds Ser '97B 1 11 01 97 06 01 21 6.23160 25,000,000.00 5,235,000.00 19,765,000.00 0.00Vet Hsg Fund II Tax Bds Ser '97B 2 12 18 97 12 01 29 VAR 25,000,000.00 25,000,000.00 0.00Vet Hsg Fund II Tax Bds Ser '99A 1 09 01 99 12 01 29 7.43220 50,000,000.00 6,815,000.00 43,185,000.00 0.00Vet Hsg Fund II Tax Bds Ser '99A 2 11 01 99 12 01 29 Floating 150,000,000.00 150,000,000.00 0.00Vet Hsg Fund II Tax Bds Ser '99B 09 01 99 06 01 31 5.83600 100,000,000.00 13,995,000.00 86,005,000.00 0.00Vet Hsg Fund I Ref Bds Ser '99 10 01 99 12 01 03 4.59400 30,050,000.00 23,450,000.00 6,600,000.00 0.00Vet Hsg Fund I Tax Ref Bds Ser '99C 11 01 99 12 01 09 7.15000 16,530,000.00 16,530,000.00 0.00Vet Hsg Fund II Tax Ref Bds Ser '99D 11 01 99 12 01 09 7.15000 9,540,000.00 9,540,000.00 0.00Vet Hsg Fund II Bds Ser 2000C 05 01 00 12 01 31 5.94500 100,000,000.00 13,280,000.00 86,720,000.00 0.00Vet Hsg Fund I Tax Ref Bds Ser 2000D 11 01 00 12 01 10 7.07000 15,420,000.00 15,420,000.00 0.00Vet Hsg Fund II Tax Ref Bds Ser 2000E 11 01 00 12 01 10 7.07000 10,750,000.00 10,750,000.00 0.00Vet Hsg Fund II Bds Ser 2001A 1 03 01 01 06 01 32 5.28500 40,000,000.00 8,320,000.00 31,680,000.00 0.00Vet Hsg Fund II Bds Ser 2001A 2 03 22 01 12 01 29 4.25900 20,000,000.00 20,000,000.00Vet Hsg Fund II Bds Ser 2001C 1 12 01 01 12 01 28 5.12700 35,000,000.00 4,145,000.00 30,855,000.00 0.00Vet Hsg Fund II Bds Ser 2001C 2 12 18 01 12 01 33 4.36500 25,000,000.00 735,000.00 24,265,000.00Vet Hsg Fund II Bds Ser 2002A 1 06 15 02 12 01 22 4.91960 11,700,000.00 1,775,000.00 9,925,000.00 0.00Vet Hsg Fund II Bds Ser 2002A 2 07 10 02 06 01 33 3.87250 38,300,000.00 8,510,000.00 29,790,000.00Vet Hsg Fund I Tax Ref Bds Ser 2002B 11 06 02 06 01 23 4.91000 22,605,000.00 4,910,000.00 17,695,000.00 0.00Vet Hsg Fund II Bds Ser 2003A 03 04 03 06 01 34 3.30400 50,000,000.00 26,985,000.00 23,015,000.00Vet Hsg Fund II Bds Ser 2003B 10 22 03 06 01 34 3.40300 50,000,000.00 25,745,000.00 24,255,000.00Vet Hsg Fund I Tax Ref Bds Ser 2003 11 20 03 06 01 21 5.19000 47,865,000.00 4,630,000.00 43,235,000.00 0.00Vet Hsg Fund II Bds Ser 2004A 04 07 04 12 01 34 3.31300 50,000,000.00 26,150,000.00 23,850,000.00Vet Hsg Fund II Bds Ser 2004B 09 15 04 12 01 34 3.68000 50,000,000.00 23,225,000.00 26,775,000.00Vet Hsg Fund I Tax Ref Bds Ser 2004 05 20 04 12 01 24 5.45000 19,550,000.00 3,015,000.00 16,535,000.00 0.00Vet Hsg Fund I Tax Ref Bds Ser 2004C 11 18 04 12 01 18 5.34800 7,220,000.00 7,220,000.00 0.00Vet Hsg Fund II Tax Ref Bds Ser 2004D 11 18 04 06 01 20 5.34800 31,705,000.00 6,620,000.00 25,085,000.00 0.00Vet Hsg Fund II Tax Ref Bds Ser 2004E 11 18 04 12 01 06 5.34800 4,945,000.00 4,945,000.00 0.00Vet Hsg Fund II Bds Ser 2005A 02 24 05 06 01 35 3.27900 50,000,000.00 23,625,000.00 26,375,000.00Vet Hsg Fund II Bds Ser 2005B 08 09 05 06 01 36 3.08700 50,000,000.00 23,970,000.00 26,030,000.00Vet Hsg Fund I Tax Ref Bds Ser 2005C 11 16 05 12 01 23 4.92900 19,860,000.00 7,290,000.00 12,570,000.00 0.00Vet Hsg Fund I Tax Ref Bds Ser 2005C 11 16 05 12 01 09 4.33000 8,525,000.00 8,525,000.00 0.00Vet Hsg Fund I Tax Ref Bds Ser 2005C 11 16 05 12 01 25 5.14500 13,345,000.00 2,205,000.00 11,140,000.00 0.00Vet Hsg Fund II Tax Ref Bds Ser 2005D 11 16 05 06 01 26 5.14500 11,540,000.00 11,540,000.00 0.00Vet Hsg Fund II Tax Ref Bds Ser 2006B 05 10 06 12 01 26 5.83000 38,570,000.00 38,570,000.00 0.00Vet Hsg Fund II Tax Ref Bds Ser 2006C 05 10 06 12 01 27 5.79000 22,325,000.00 4,745,000.00 17,580,000.00 0.00Vet Hsg Fund II Bds Ser 2006A 06 01 06 12 01 36 3.51700 50,000,000.00 21,285,000.00 28,715,000.00Vet Hsg Fund II Bds Ser 2006D 09 20 06 12 01 36 3.68900 50,000,000.00 19,800,000.00 30,200,000.00Vet Hsg Fund II Tax Ref Bds Ser 2006E 11 15 06 12 01 26 5.46100 39,560,000.00 39,560,000.00 0.00
to next page
UNAUDITED
Annual Financial Report | 143
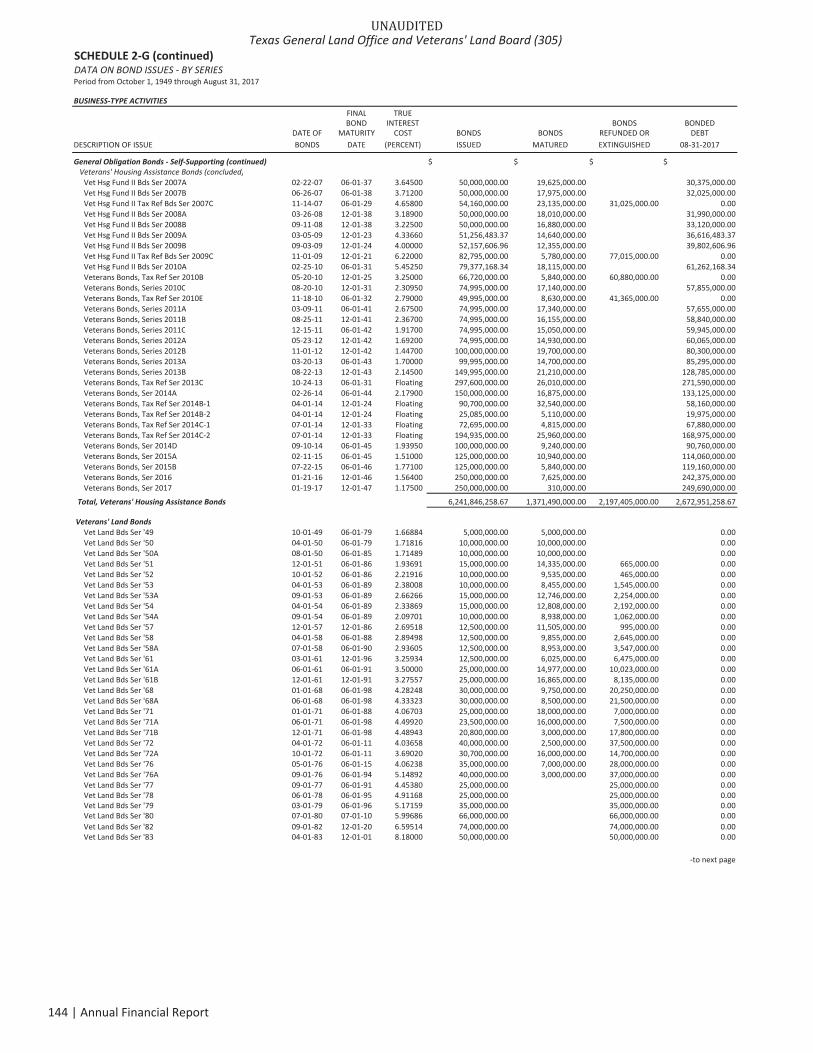
SCHEDULE 2 G (continued)DATA ON BOND ISSUES BY SERIESPeriod from October 1, 1949 through August 31, 2017
BUSINESS TYPE ACTIVITIESFINAL TRUEBOND INTEREST BONDS BONDED
DATE OF MATURITY COST BONDS BONDS REFUNDED OR DEBTDESCRIPTION OF ISSUE BONDS DATE (PERCENT) ISSUED MATURED EXTINGUISHED 08 31 2017
General Obligation Bonds Self Supporting (continued) $ $ $ $Veterans' Housing Assistance Bonds (concluded)
Vet Hsg Fund II Bds Ser 2007A 02 22 07 06 01 37 3.64500 50,000,000.00 19,625,000.00 30,375,000.00Vet Hsg Fund II Bds Ser 2007B 06 26 07 06 01 38 3.71200 50,000,000.00 17,975,000.00 32,025,000.00Vet Hsg Fund II Tax Ref Bds Ser 2007C 11 14 07 06 01 29 4.65800 54,160,000.00 23,135,000.00 31,025,000.00 0.00Vet Hsg Fund II Bds Ser 2008A 03 26 08 12 01 38 3.18900 50,000,000.00 18,010,000.00 31,990,000.00Vet Hsg Fund II Bds Ser 2008B 09 11 08 12 01 38 3.22500 50,000,000.00 16,880,000.00 33,120,000.00Vet Hsg Fund II Bds Ser 2009A 03 05 09 12 01 23 4.33660 51,256,483.37 14,640,000.00 36,616,483.37Vet Hsg Fund II Bds Ser 2009B 09 03 09 12 01 24 4.00000 52,157,606.96 12,355,000.00 39,802,606.96Vet Hsg Fund II Tax Ref Bds Ser 2009C 11 01 09 12 01 21 6.22000 82,795,000.00 5,780,000.00 77,015,000.00 0.00Vet Hsg Fund II Bds Ser 2010A 02 25 10 06 01 31 5.45250 79,377,168.34 18,115,000.00 61,262,168.34Veterans Bonds, Tax Ref Ser 2010B 05 20 10 12 01 25 3.25000 66,720,000.00 5,840,000.00 60,880,000.00 0.00Veterans Bonds, Series 2010C 08 20 10 12 01 31 2.30950 74,995,000.00 17,140,000.00 57,855,000.00Veterans Bonds, Tax Ref Ser 2010E 11 18 10 06 01 32 2.79000 49,995,000.00 8,630,000.00 41,365,000.00 0.00Veterans Bonds, Series 2011A 03 09 11 06 01 41 2.67500 74,995,000.00 17,340,000.00 57,655,000.00Veterans Bonds, Series 2011B 08 25 11 12 01 41 2.36700 74,995,000.00 16,155,000.00 58,840,000.00Veterans Bonds, Series 2011C 12 15 11 06 01 42 1.91700 74,995,000.00 15,050,000.00 59,945,000.00Veterans Bonds, Series 2012A 05 23 12 12 01 42 1.69200 74,995,000.00 14,930,000.00 60,065,000.00Veterans Bonds, Series 2012B 11 01 12 12 01 42 1.44700 100,000,000.00 19,700,000.00 80,300,000.00Veterans Bonds, Series 2013A 03 20 13 06 01 43 1.70000 99,995,000.00 14,700,000.00 85,295,000.00Veterans Bonds, Series 2013B 08 22 13 12 01 43 2.14500 149,995,000.00 21,210,000.00 128,785,000.00Veterans Bonds, Tax Ref Ser 2013C 10 24 13 06 01 31 Floating 297,600,000.00 26,010,000.00 271,590,000.00Veterans Bonds, Ser 2014A 02 26 14 06 01 44 2.17900 150,000,000.00 16,875,000.00 133,125,000.00Veterans Bonds, Tax Ref Ser 2014B 1 04 01 14 12 01 24 Floating 90,700,000.00 32,540,000.00 58,160,000.00Veterans Bonds, Tax Ref Ser 2014B 2 04 01 14 12 01 24 Floating 25,085,000.00 5,110,000.00 19,975,000.00Veterans Bonds, Tax Ref Ser 2014C 1 07 01 14 12 01 33 Floating 72,695,000.00 4,815,000.00 67,880,000.00Veterans Bonds, Tax Ref Ser 2014C 2 07 01 14 12 01 33 Floating 194,935,000.00 25,960,000.00 168,975,000.00Veterans Bonds, Ser 2014D 09 10 14 06 01 45 1.93950 100,000,000.00 9,240,000.00 90,760,000.00Veterans Bonds, Ser 2015A 02 11 15 06 01 45 1.51000 125,000,000.00 10,940,000.00 114,060,000.00Veterans Bonds, Ser 2015B 07 22 15 06 01 46 1.77100 125,000,000.00 5,840,000.00 119,160,000.00Veterans Bonds, Ser 2016 01 21 16 12 01 46 1.56400 250,000,000.00 7,625,000.00 242,375,000.00Veterans Bonds, Ser 2017 01 19 17 12 01 47 1.17500 250,000,000.00 310,000.00 249,690,000.00
Total, Veterans' Housing Assistance Bonds 6,241,846,258.67 1,371,490,000.00 2,197,405,000.00 2,672,951,258.67
Veterans' Land BondsVet Land Bds Ser '49 10 01 49 06 01 79 1.66884 5,000,000.00 5,000,000.00 0.00Vet Land Bds Ser '50 04 01 50 06 01 79 1.71816 10,000,000.00 10,000,000.00 0.00Vet Land Bds Ser '50A 08 01 50 06 01 85 1.71489 10,000,000.00 10,000,000.00 0.00Vet Land Bds Ser '51 12 01 51 06 01 86 1.93691 15,000,000.00 14,335,000.00 665,000.00 0.00Vet Land Bds Ser '52 10 01 52 06 01 86 2.21916 10,000,000.00 9,535,000.00 465,000.00 0.00Vet Land Bds Ser '53 04 01 53 06 01 89 2.38008 10,000,000.00 8,455,000.00 1,545,000.00 0.00Vet Land Bds Ser '53A 09 01 53 06 01 89 2.66266 15,000,000.00 12,746,000.00 2,254,000.00 0.00Vet Land Bds Ser '54 04 01 54 06 01 89 2.33869 15,000,000.00 12,808,000.00 2,192,000.00 0.00Vet Land Bds Ser '54A 09 01 54 06 01 89 2.09701 10,000,000.00 8,938,000.00 1,062,000.00 0.00Vet Land Bds Ser '57 12 01 57 12 01 86 2.69518 12,500,000.00 11,505,000.00 995,000.00 0.00Vet Land Bds Ser '58 04 01 58 06 01 88 2.89498 12,500,000.00 9,855,000.00 2,645,000.00 0.00Vet Land Bds Ser '58A 07 01 58 06 01 90 2.93605 12,500,000.00 8,953,000.00 3,547,000.00 0.00Vet Land Bds Ser '61 03 01 61 12 01 96 3.25934 12,500,000.00 6,025,000.00 6,475,000.00 0.00Vet Land Bds Ser '61A 06 01 61 06 01 91 3.50000 25,000,000.00 14,977,000.00 10,023,000.00 0.00Vet Land Bds Ser '61B 12 01 61 12 01 91 3.27557 25,000,000.00 16,865,000.00 8,135,000.00 0.00Vet Land Bds Ser '68 01 01 68 06 01 98 4.28248 30,000,000.00 9,750,000.00 20,250,000.00 0.00Vet Land Bds Ser '68A 06 01 68 06 01 98 4.33323 30,000,000.00 8,500,000.00 21,500,000.00 0.00Vet Land Bds Ser '71 01 01 71 06 01 88 4.06703 25,000,000.00 18,000,000.00 7,000,000.00 0.00Vet Land Bds Ser '71A 06 01 71 06 01 98 4.49920 23,500,000.00 16,000,000.00 7,500,000.00 0.00Vet Land Bds Ser '71B 12 01 71 06 01 98 4.48943 20,800,000.00 3,000,000.00 17,800,000.00 0.00Vet Land Bds Ser '72 04 01 72 06 01 11 4.03658 40,000,000.00 2,500,000.00 37,500,000.00 0.00Vet Land Bds Ser '72A 10 01 72 06 01 11 3.69020 30,700,000.00 16,000,000.00 14,700,000.00 0.00Vet Land Bds Ser '76 05 01 76 06 01 15 4.06238 35,000,000.00 7,000,000.00 28,000,000.00 0.00Vet Land Bds Ser '76A 09 01 76 06 01 94 5.14892 40,000,000.00 3,000,000.00 37,000,000.00 0.00Vet Land Bds Ser '77 09 01 77 06 01 91 4.45380 25,000,000.00 25,000,000.00 0.00Vet Land Bds Ser '78 06 01 78 06 01 95 4.91168 25,000,000.00 25,000,000.00 0.00Vet Land Bds Ser '79 03 01 79 06 01 96 5.17159 35,000,000.00 35,000,000.00 0.00Vet Land Bds Ser '80 07 01 80 07 01 10 5.99686 66,000,000.00 66,000,000.00 0.00Vet Land Bds Ser '82 09 01 82 12 01 20 6.59514 74,000,000.00 74,000,000.00 0.00Vet Land Bds Ser '83 04 01 83 12 01 01 8.18000 50,000,000.00 50,000,000.00 0.00
to next page
UNAUDITEDTexas General Land Office and Veterans' Land Board (305)
144 | Annual Financial Report
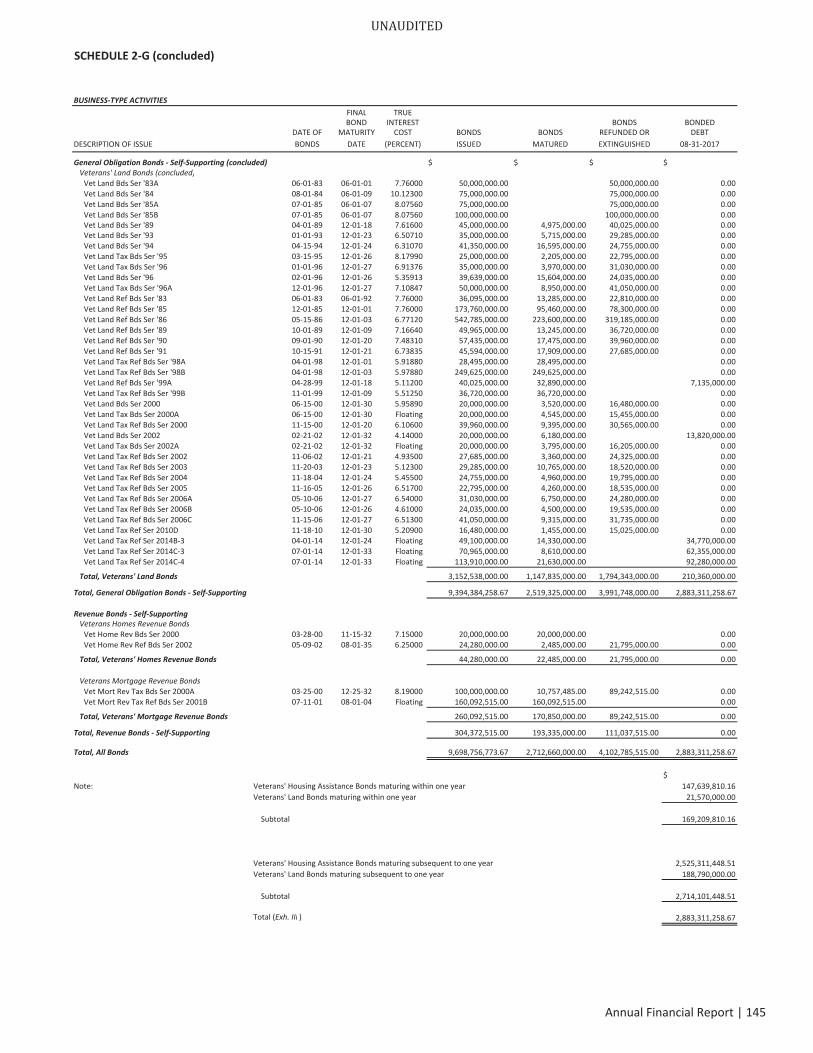
SCHEDULE 2 G (concluded)
BUSINESS TYPE ACTIVITIESFINAL TRUEBOND INTEREST BONDS BONDED
DATE OF MATURITY COST BONDS BONDS REFUNDED OR DEBTDESCRIPTION OF ISSUE BONDS DATE (PERCENT) ISSUED MATURED EXTINGUISHED 08 31 2017
$ $ $ $
Vet Land Bds Ser '83A 06 01 83 06 01 01 7.76000 50,000,000.00 50,000,000.00 0.00Vet Land Bds Ser '84 08 01 84 06 01 09 10.12300 75,000,000.00 75,000,000.00 0.00Vet Land Bds Ser '85A 07 01 85 06 01 07 8.07560 75,000,000.00 75,000,000.00 0.00Vet Land Bds Ser '85B 07 01 85 06 01 07 8.07560 100,000,000.00 100,000,000.00 0.00Vet Land Bds Ser '89 04 01 89 12 01 18 7.61600 45,000,000.00 4,975,000.00 40,025,000.00 0.00Vet Land Bds Ser '93 01 01 93 12 01 23 6.50710 35,000,000.00 5,715,000.00 29,285,000.00 0.00Vet Land Bds Ser '94 04 15 94 12 01 24 6.31070 41,350,000.00 16,595,000.00 24,755,000.00 0.00Vet Land Tax Bds Ser '95 03 15 95 12 01 26 8.17990 25,000,000.00 2,205,000.00 22,795,000.00 0.00Vet Land Tax Bds Ser '96 01 01 96 12 01 27 6.91376 35,000,000.00 3,970,000.00 31,030,000.00 0.00Vet Land Bds Ser '96 02 01 96 12 01 26 5.35913 39,639,000.00 15,604,000.00 24,035,000.00 0.00Vet Land Tax Bds Ser '96A 12 01 96 12 01 27 7.10847 50,000,000.00 8,950,000.00 41,050,000.00 0.00Vet Land Ref Bds Ser '83 06 01 83 06 01 92 7.76000 36,095,000.00 13,285,000.00 22,810,000.00 0.00Vet Land Ref Bds Ser '85 12 01 85 12 01 01 7.76000 173,760,000.00 95,460,000.00 78,300,000.00 0.00Vet Land Ref Bds Ser '86 05 15 86 12 01 03 6.77120 542,785,000.00 223,600,000.00 319,185,000.00 0.00Vet Land Ref Bds Ser '89 10 01 89 12 01 09 7.16640 49,965,000.00 13,245,000.00 36,720,000.00 0.00Vet Land Ref Bds Ser '90 09 01 90 12 01 20 7.48310 57,435,000.00 17,475,000.00 39,960,000.00 0.00Vet Land Ref Bds Ser '91 10 15 91 12 01 21 6.73835 45,594,000.00 17,909,000.00 27,685,000.00 0.00Vet Land Tax Ref Bds Ser '98A 04 01 98 12 01 01 5.91880 28,495,000.00 28,495,000.00 0.00Vet Land Tax Ref Bds Ser '98B 04 01 98 12 01 03 5.97880 249,625,000.00 249,625,000.00 0.00Vet Land Ref Bds Ser '99A 04 28 99 12 01 18 5.11200 40,025,000.00 32,890,000.00 7,135,000.00Vet Land Tax Ref Bds Ser '99B 11 01 99 12 01 09 5.51250 36,720,000.00 36,720,000.00 0.00Vet Land Bds Ser 2000 06 15 00 12 01 30 5.95890 20,000,000.00 3,520,000.00 16,480,000.00 0.00Vet Land Tax Bds Ser 2000A 06 15 00 12 01 30 Floating 20,000,000.00 4,545,000.00 15,455,000.00 0.00Vet Land Tax Ref Bds Ser 2000 11 15 00 12 01 20 6.10600 39,960,000.00 9,395,000.00 30,565,000.00 0.00Vet Land Bds Ser 2002 02 21 02 12 01 32 4.14000 20,000,000.00 6,180,000.00 13,820,000.00Vet Land Tax Bds Ser 2002A 02 21 02 12 01 32 Floating 20,000,000.00 3,795,000.00 16,205,000.00 0.00Vet Land Tax Ref Bds Ser 2002 11 06 02 12 01 21 4.93500 27,685,000.00 3,360,000.00 24,325,000.00 0.00Vet Land Tax Ref Bds Ser 2003 11 20 03 12 01 23 5.12300 29,285,000.00 10,765,000.00 18,520,000.00 0.00Vet Land Tax Ref Bds Ser 2004 11 18 04 12 01 24 5.45500 24,755,000.00 4,960,000.00 19,795,000.00 0.00Vet Land Tax Ref Bds Ser 2005 11 16 05 12 01 26 6.51700 22,795,000.00 4,260,000.00 18,535,000.00 0.00Vet Land Tax Ref Bds Ser 2006A 05 10 06 12 01 27 6.54000 31,030,000.00 6,750,000.00 24,280,000.00 0.00Vet Land Tax Ref Bds Ser 2006B 05 10 06 12 01 26 4.61000 24,035,000.00 4,500,000.00 19,535,000.00 0.00Vet Land Tax Ref Bds Ser 2006C 11 15 06 12 01 27 6.51300 41,050,000.00 9,315,000.00 31,735,000.00 0.00Vet Land Tax Ref Ser 2010D 11 18 10 12 01 30 5.20900 16,480,000.00 1,455,000.00 15,025,000.00 0.00Vet Land Tax Ref Ser 2014B 3 04 01 14 12 01 24 Floating 49,100,000.00 14,330,000.00 34,770,000.00Vet Land Tax Ref Ser 2014C 3 07 01 14 12 01 33 Floating 70,965,000.00 8,610,000.00 62,355,000.00Vet Land Tax Ref Ser 2014C 4 07 01 14 12 01 33 Floating 113,910,000.00 21,630,000.00 92,280,000.00
Total, Veterans' Land Bonds 3,152,538,000.00 1,147,835,000.00 1,794,343,000.00 210,360,000.00
Total, General Obligation Bonds Self Supporting 9,394,384,258.67 2,519,325,000.00 3,991,748,000.00 2,883,311,258.67
Revenue Bonds Self SupportingVeterans Homes Revenue Bonds
Vet Home Rev Bds Ser 2000 03 28 00 11 15 32 7.15000 20,000,000.00 20,000,000.00 0.00Vet Home Rev Ref Bds Ser 2002 05 09 02 08 01 35 6.25000 24,280,000.00 2,485,000.00 21,795,000.00 0.00
Total, Veterans' Homes Revenue Bonds 44,280,000.00 22,485,000.00 21,795,000.00 0.00
Veterans Mortgage Revenue BondsVet Mort Rev Tax Bds Ser 2000A 03 25 00 12 25 32 8.19000 100,000,000.00 10,757,485.00 89,242,515.00 0.00Vet Mort Rev Tax Ref Bds Ser 2001B 07 11 01 08 01 04 Floating 160,092,515.00 160,092,515.00 0.00
Total, Veterans' Mortgage Revenue Bonds 260,092,515.00 170,850,000.00 89,242,515.00 0.00
Total, Revenue Bonds Self Supporting 304,372,515.00 193,335,000.00 111,037,515.00 0.00
Total, All Bonds 9,698,756,773.67 2,712,660,000.00 4,102,785,515.00 2,883,311,258.67
$Note: Veterans' Housing Assistance Bonds maturing within one year 147,639,810.16
Veterans' Land Bonds maturing within one year 21,570,000.00
Subtotal 169,209,810.16
Veterans' Housing Assistance Bonds maturing subsequent to one year 2,525,311,448.51Veterans' Land Bonds maturing subsequent to one year 188,790,000.00
Subtotal 2,714,101,448.51
Total (Exh. III ) 2,883,311,258.67
Veterans' Land Bonds (concluded)General Obligation Bonds Self Supporting (concluded)
UNAUDITED
Annual Financial Report | 145
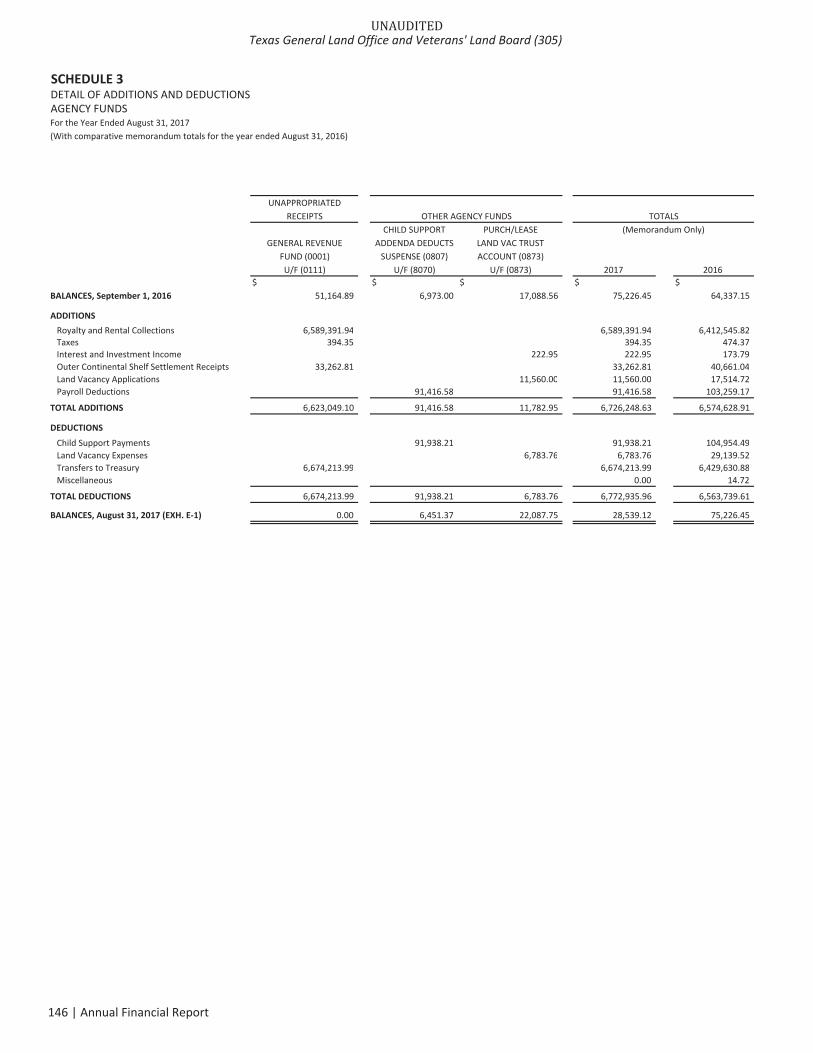
SCHEDULE 3DETAIL OF ADDITIONS AND DEDUCTIONSAGENCY FUNDSFor the Year Ended August 31, 2017(With comparative memorandum totals for the year ended August 31, 2016)
UNAPPROPRIATEDRECEIPTS OTHER AGENCY FUNDS
CHILD SUPPORT PURCH/LEASEGENERAL REVENUE ADDENDA DEDUCTS LAND VAC TRUST
FUND (0001) SUSPENSE (0807) ACCOUNT (0873)U/F (0111) U/F (8070) U/F (0873) 2017 2016
$ $ $ $ $BALANCES, September 1, 2016 51,164.89 6,973.00 17,088.56 75,226.45 64,337.15
ADDITIONSRoyalty and Rental Collections 6,589,391.94 6,589,391.94 6,412,545.82Taxes 394.35 394.35 474.37Interest and Investment Income 0.00 222.95 222.95 173.79Outer Continental Shelf Settlement Receipts 33,262.81 33,262.81 40,661.04Land Vacancy Applications 11,560.00 11,560.00 17,514.72Payroll Deductions 91,416.58 91,416.58 103,259.17
TOTAL ADDITIONS 6,623,049.10 91,416.58 11,782.95 6,726,248.63 6,574,628.91
DEDUCTIONSChild Support Payments 91,938.21 91,938.21 104,954.49Land Vacancy Expenses 6,783.76 6,783.76 29,139.52Transfers to Treasury 6,674,213.99 6,674,213.99 6,429,630.88Miscellaneous 0.00 14.72
TOTAL DEDUCTIONS 6,674,213.99 91,938.21 6,783.76 6,772,935.96 6,563,739.61
BALANCES, August 31, 2017 (EXH. E 1) 0.00 6,451.37 22,087.75 28,539.12 75,226.45
TOTALS(Memorandum Only)
UNAUDITEDTexas General Land Office and Veterans' Land Board (305)
146 | Annual Financial Report
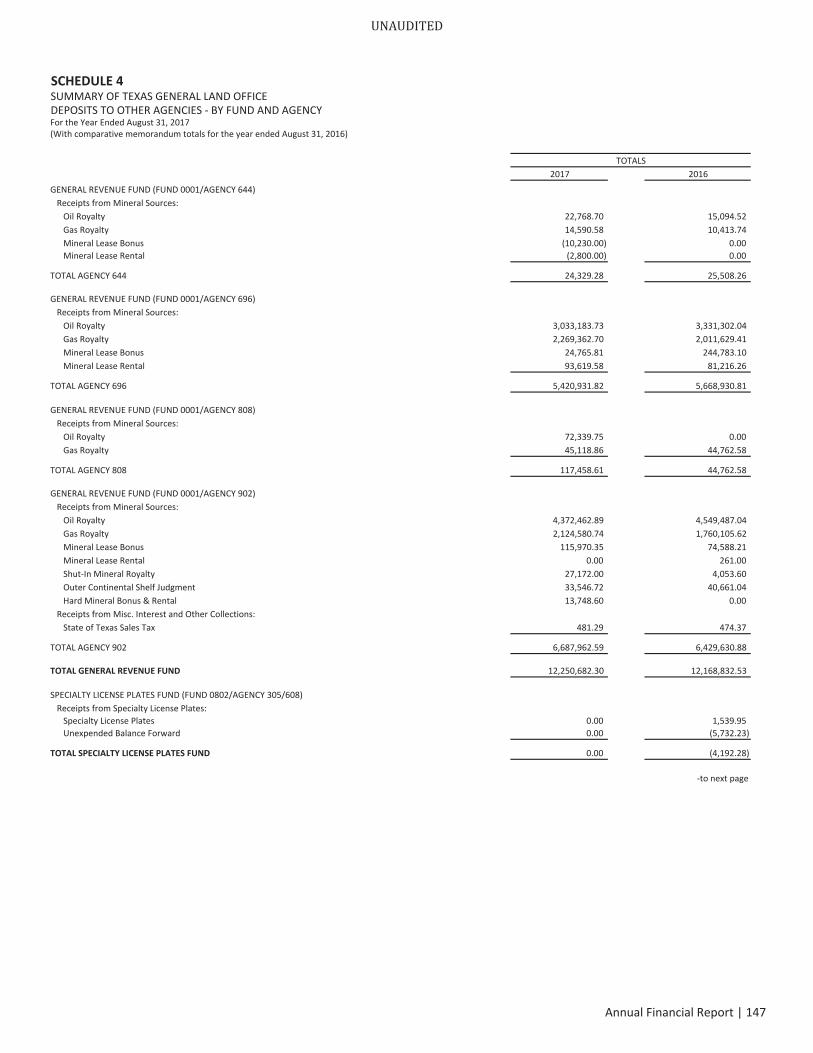
SCHEDULE 4SUMMARY OF TEXAS GENERAL LAND OFFICEDEPOSITS TO OTHER AGENCIES BY FUND AND AGENCYFor the Year Ended August 31, 2017(With comparative memorandum totals for the year ended August 31, 2016)
TOTALS2017 2016
GENERAL REVENUE FUND (FUND 0001/AGENCY 644)Receipts from Mineral Sources:
Oil Royalty 22,768.70 15,094.52Gas Royalty 14,590.58 10,413.74Mineral Lease Bonus (10,230.00) 0.00Mineral Lease Rental (2,800.00) 0.00
TOTAL AGENCY 644 24,329.28 25,508.26
GENERAL REVENUE FUND (FUND 0001/AGENCY 696)Receipts from Mineral Sources:
Oil Royalty 3,033,183.73 3,331,302.04Gas Royalty 2,269,362.70 2,011,629.41Mineral Lease Bonus 24,765.81 244,783.10Mineral Lease Rental 93,619.58 81,216.26
TOTAL AGENCY 696 5,420,931.82 5,668,930.81
GENERAL REVENUE FUND (FUND 0001/AGENCY 808)Receipts from Mineral Sources:
Oil Royalty 72,339.75 0.00Gas Royalty 45,118.86 44,762.58
TOTAL AGENCY 808 117,458.61 44,762.58
GENERAL REVENUE FUND (FUND 0001/AGENCY 902)Receipts from Mineral Sources:
Oil Royalty 4,372,462.89 4,549,487.04Gas Royalty 2,124,580.74 1,760,105.62Mineral Lease Bonus 115,970.35 74,588.21Mineral Lease Rental 0.00 261.00Shut In Mineral Royalty 27,172.00 4,053.60Outer Continental Shelf Judgment 33,546.72 40,661.04Hard Mineral Bonus & Rental 13,748.60 0.00
Receipts from Misc. Interest and Other Collections:State of Texas Sales Tax 481.29 474.37
TOTAL AGENCY 902 6,687,962.59 6,429,630.88
TOTAL GENERAL REVENUE FUND 12,250,682.30 12,168,832.53
SPECIALTY LICENSE PLATES FUND (FUND 0802/AGENCY 305/608)Receipts from Specialty License Plates:
Specialty License Plates 0.00 1,539.95Unexpended Balance Forward 0.00 (5,732.23)
TOTAL SPECIALTY LICENSE PLATES FUND 0.00 (4,192.28)
to next page
UNAUDITED
Annual Financial Report | 147
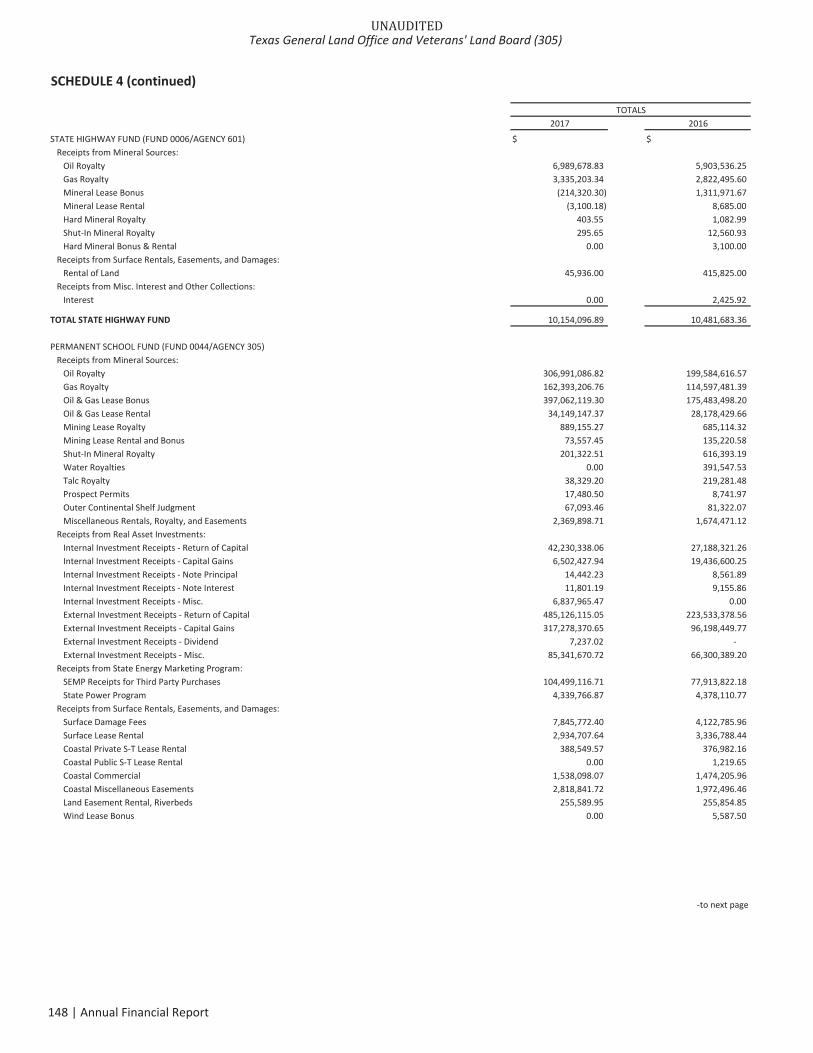
SCHEDULE 4 (continued)
TOTALS2017 2016
STATE HIGHWAY FUND (FUND 0006/AGENCY 601) $ $Receipts from Mineral Sources:
Oil Royalty 6,989,678.83 5,903,536.25Gas Royalty 3,335,203.34 2,822,495.60Mineral Lease Bonus (214,320.30) 1,311,971.67Mineral Lease Rental (3,100.18) 8,685.00Hard Mineral Royalty 403.55 1,082.99Shut In Mineral Royalty 295.65 12,560.93Hard Mineral Bonus & Rental 0.00 3,100.00
Receipts from Surface Rentals, Easements, and Damages:Rental of Land 45,936.00 415,825.00
Receipts from Misc. Interest and Other Collections:Interest 0.00 2,425.92
TOTAL STATE HIGHWAY FUND 10,154,096.89 10,481,683.36
PERMANENT SCHOOL FUND (FUND 0044/AGENCY 305)Receipts from Mineral Sources:
Oil Royalty 306,991,086.82 199,584,616.57Gas Royalty 162,393,206.76 114,597,481.39Oil & Gas Lease Bonus 397,062,119.30 175,483,498.20Oil & Gas Lease Rental 34,149,147.37 28,178,429.66Mining Lease Royalty 889,155.27 685,114.32Mining Lease Rental and Bonus 73,557.45 135,220.58Shut In Mineral Royalty 201,322.51 616,393.19Water Royalties 0.00 391,547.53Talc Royalty 38,329.20 219,281.48Prospect Permits 17,480.50 8,741.97Outer Continental Shelf Judgment 67,093.46 81,322.07Miscellaneous Rentals, Royalty, and Easements 2,369,898.71 1,674,471.12
Receipts from Real Asset Investments:Internal Investment Receipts Return of Capital 42,230,338.06 27,188,321.26Internal Investment Receipts Capital Gains 6,502,427.94 19,436,600.25Internal Investment Receipts Note Principal 14,442.23 8,561.89Internal Investment Receipts Note Interest 11,801.19 9,155.86Internal Investment Receipts Misc. 6,837,965.47 0.00External Investment Receipts Return of Capital 485,126,115.05 223,533,378.56External Investment Receipts Capital Gains 317,278,370.65 96,198,449.77External Investment Receipts Dividend 7,237.02External Investment Receipts Misc. 85,341,670.72 66,300,389.20
Receipts from State Energy Marketing Program:SEMP Receipts for Third Party Purchases 104,499,116.71 77,913,822.18State Power Program 4,339,766.87 4,378,110.77
Receipts from Surface Rentals, Easements, and Damages:Surface Damage Fees 7,845,772.40 4,122,785.96Surface Lease Rental 2,934,707.64 3,336,788.44Coastal Private S T Lease Rental 388,549.57 376,982.16Coastal Public S T Lease Rental 0.00 1,219.65Coastal Commercial 1,538,098.07 1,474,205.96Coastal Miscellaneous Easements 2,818,841.72 1,972,496.46Land Easement Rental, Riverbeds 255,589.95 255,854.85Wind Lease Bonus 0.00 5,587.50
to next page
UNAUDITEDTexas General Land Office and Veterans' Land Board (305)
148 | Annual Financial Report
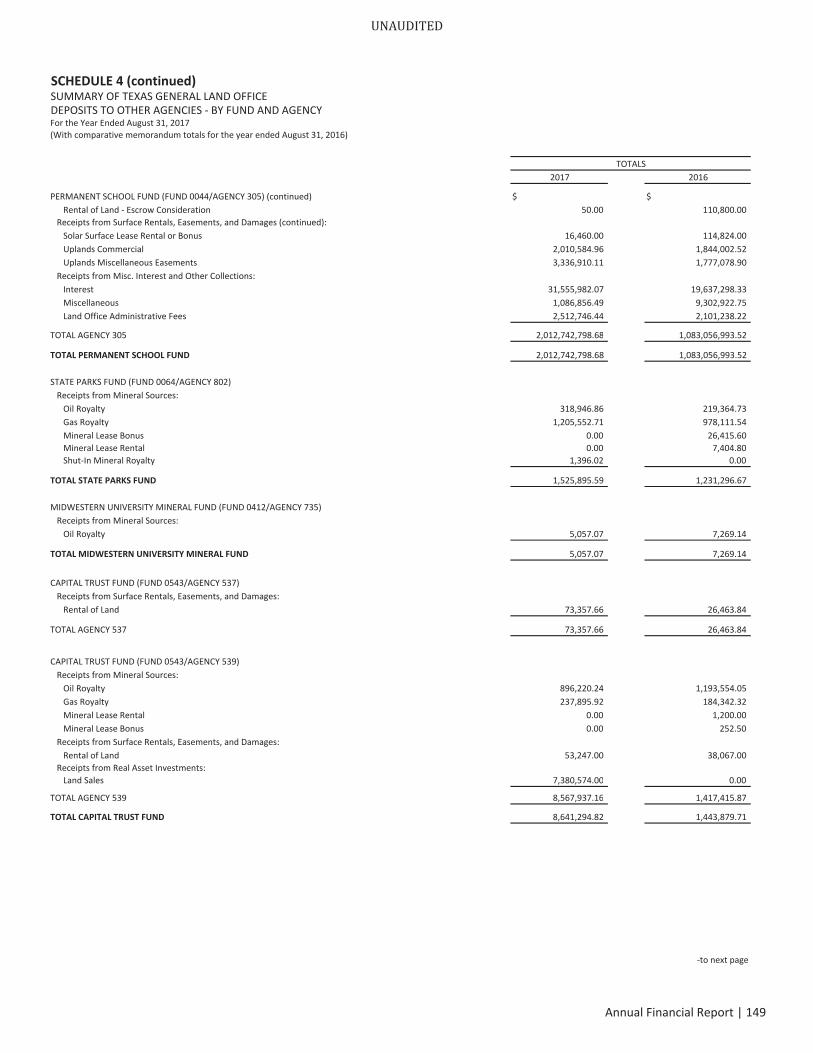
SCHEDULE 4 (continued)SUMMARY OF TEXAS GENERAL LAND OFFICEDEPOSITS TO OTHER AGENCIES BY FUND AND AGENCYFor the Year Ended August 31, 2017(With comparative memorandum totals for the year ended August 31, 2016)
TOTALS2017 2016
PERMANENT SCHOOL FUND (FUND 0044/AGENCY 305) (continued) $ $Rental of Land Escrow Consideration 50.00 110,800.00
Receipts from Surface Rentals, Easements, and Damages (continued):Solar Surface Lease Rental or Bonus 16,460.00 114,824.00Uplands Commercial 2,010,584.96 1,844,002.52Uplands Miscellaneous Easements 3,336,910.11 1,777,078.90
Receipts from Misc. Interest and Other Collections:Interest 31,555,982.07 19,637,298.33Miscellaneous 1,086,856.49 9,302,922.75Land Office Administrative Fees 2,512,746.44 2,101,238.22
TOTAL AGENCY 305 2,012,742,798.68 1,083,056,993.52
TOTAL PERMANENT SCHOOL FUND 2,012,742,798.68 1,083,056,993.52
STATE PARKS FUND (FUND 0064/AGENCY 802)Receipts from Mineral Sources:
Oil Royalty 318,946.86 219,364.73Gas Royalty 1,205,552.71 978,111.54Mineral Lease Bonus 0.00 26,415.60Mineral Lease Rental 0.00 7,404.80Shut In Mineral Royalty 1,396.02 0.00
TOTAL STATE PARKS FUND 1,525,895.59 1,231,296.67
MIDWESTERN UNIVERSITY MINERAL FUND (FUND 0412/AGENCY 735)Receipts from Mineral Sources:
Oil Royalty 5,057.07 7,269.14
TOTAL MIDWESTERN UNIVERSITY MINERAL FUND 5,057.07 7,269.14
CAPITAL TRUST FUND (FUND 0543/AGENCY 537)Receipts from Surface Rentals, Easements, and Damages:
Rental of Land 73,357.66 26,463.84
TOTAL AGENCY 537 73,357.66 26,463.84
CAPITAL TRUST FUND (FUND 0543/AGENCY 539)Receipts from Mineral Sources:
Oil Royalty 896,220.24 1,193,554.05Gas Royalty 237,895.92 184,342.32Mineral Lease Rental 0.00 1,200.00Mineral Lease Bonus 0.00 252.50
Receipts from Surface Rentals, Easements, and Damages:Rental of Land 53,247.00 38,067.00
Receipts from Real Asset Investments:Land Sales 7,380,574.00 0.00
TOTAL AGENCY 539 8,567,937.16 1,417,415.87
TOTAL CAPITAL TRUST FUND 8,641,294.82 1,443,879.71
to next page
UNAUDITED
Annual Financial Report | 149
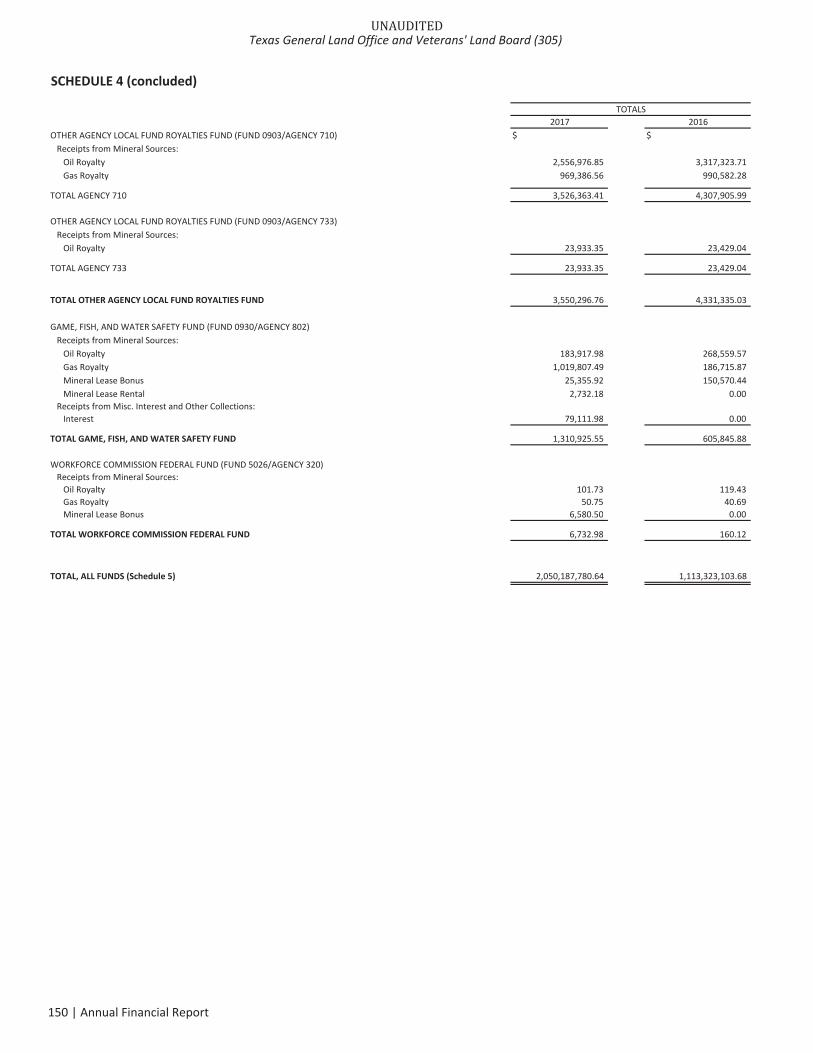
SCHEDULE 4 (concluded)
TOTALS2017 2016
OTHER AGENCY LOCAL FUND ROYALTIES FUND (FUND 0903/AGENCY 710) $ $Receipts from Mineral Sources:
Oil Royalty 2,556,976.85 3,317,323.71Gas Royalty 969,386.56 990,582.28
TOTAL AGENCY 710 3,526,363.41 4,307,905.99
OTHER AGENCY LOCAL FUND ROYALTIES FUND (FUND 0903/AGENCY 733)Receipts from Mineral Sources:
Oil Royalty 23,933.35 23,429.04
TOTAL AGENCY 733 23,933.35 23,429.04
TOTAL OTHER AGENCY LOCAL FUND ROYALTIES FUND 3,550,296.76 4,331,335.03
GAME, FISH, AND WATER SAFETY FUND (FUND 0930/AGENCY 802)Receipts from Mineral Sources:
Oil Royalty 183,917.98 268,559.57Gas Royalty 1,019,807.49 186,715.87Mineral Lease Bonus 25,355.92 150,570.44Mineral Lease Rental 2,732.18 0.00
Receipts from Misc. Interest and Other Collections:Interest 79,111.98 0.00
TOTAL GAME, FISH, ANDWATER SAFETY FUND 1,310,925.55 605,845.88
WORKFORCE COMMISSION FEDERAL FUND (FUND 5026/AGENCY 320)Receipts from Mineral Sources:
Oil Royalty 101.73 119.43Gas Royalty 50.75 40.69Mineral Lease Bonus 6,580.50 0.00
TOTAL WORKFORCE COMMISSION FEDERAL FUND 6,732.98 160.12
TOTAL, ALL FUNDS (Schedule 5) 2,050,187,780.64 1,113,323,103.68
UNAUDITEDTexas General Land Office and Veterans' Land Board (305)
150 | Annual Financial Report
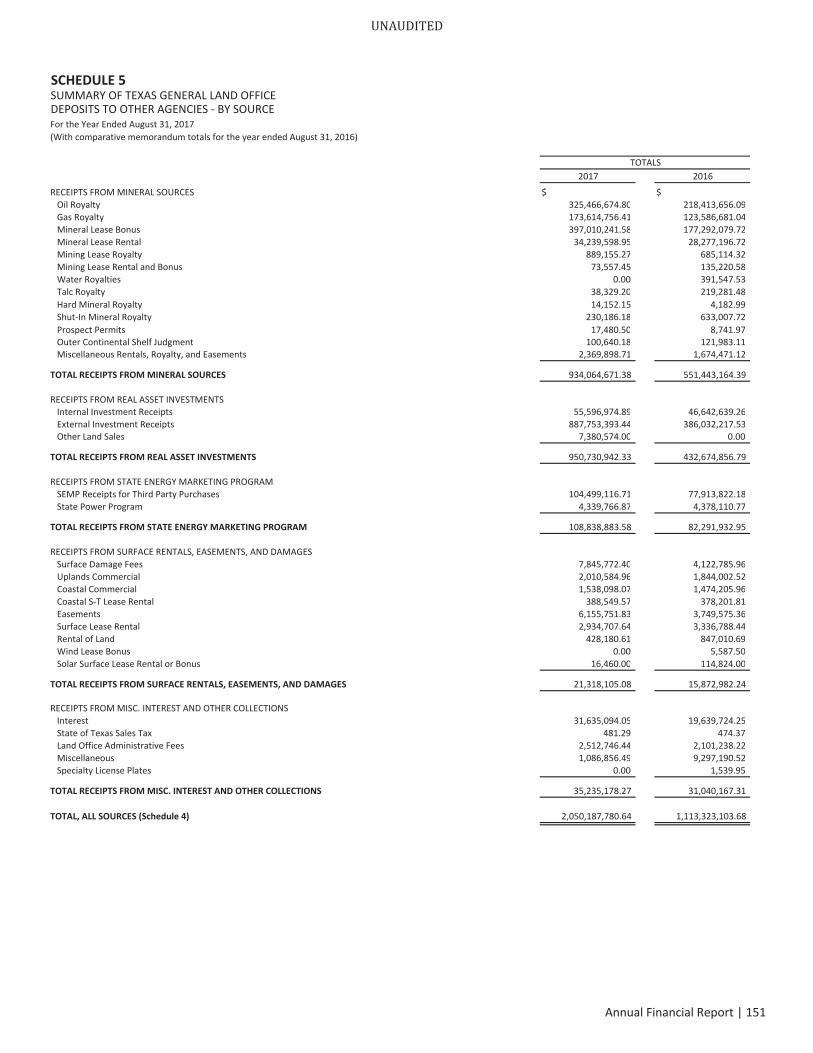
SCHEDULE 5SUMMARY OF TEXAS GENERAL LAND OFFICEDEPOSITS TO OTHER AGENCIES BY SOURCEFor the Year Ended August 31, 2017(With comparative memorandum totals for the year ended August 31, 2016)
TOTALS2017 2016
RECEIPTS FROM MINERAL SOURCES $ $Oil Royalty 325,466,674.80 218,413,656.09Gas Royalty 173,614,756.41 123,586,681.04Mineral Lease Bonus 397,010,241.58 177,292,079.72Mineral Lease Rental 34,239,598.95 28,277,196.72Mining Lease Royalty 889,155.27 685,114.32Mining Lease Rental and Bonus 73,557.45 135,220.58Water Royalties 0.00 391,547.53Talc Royalty 38,329.20 219,281.48Hard Mineral Royalty 14,152.15 4,182.99Shut In Mineral Royalty 230,186.18 633,007.72Prospect Permits 17,480.50 8,741.97Outer Continental Shelf Judgment 100,640.18 121,983.11Miscellaneous Rentals, Royalty, and Easements 2,369,898.71 1,674,471.12
TOTAL RECEIPTS FROMMINERAL SOURCES 934,064,671.38 551,443,164.39
RECEIPTS FROM REAL ASSET INVESTMENTSInternal Investment Receipts 55,596,974.89 46,642,639.26External Investment Receipts 887,753,393.44 386,032,217.53Other Land Sales 7,380,574.00 0.00
TOTAL RECEIPTS FROM REAL ASSET INVESTMENTS 950,730,942.33 432,674,856.79
RECEIPTS FROM STATE ENERGY MARKETING PROGRAMSEMP Receipts for Third Party Purchases 104,499,116.71 77,913,822.18State Power Program 4,339,766.87 4,378,110.77
TOTAL RECEIPTS FROM STATE ENERGY MARKETING PROGRAM 108,838,883.58 82,291,932.95
RECEIPTS FROM SURFACE RENTALS, EASEMENTS, AND DAMAGESSurface Damage Fees 7,845,772.40 4,122,785.96Uplands Commercial 2,010,584.96 1,844,002.52Coastal Commercial 1,538,098.07 1,474,205.96Coastal S T Lease Rental 388,549.57 378,201.81Easements 6,155,751.83 3,749,575.36Surface Lease Rental 2,934,707.64 3,336,788.44Rental of Land 428,180.61 847,010.69Wind Lease Bonus 0.00 5,587.50Solar Surface Lease Rental or Bonus 16,460.00 114,824.00
TOTAL RECEIPTS FROM SURFACE RENTALS, EASEMENTS, AND DAMAGES 21,318,105.08 15,872,982.24
RECEIPTS FROM MISC. INTEREST AND OTHER COLLECTIONSInterest 31,635,094.05 19,639,724.25State of Texas Sales Tax 481.29 474.37Land Office Administrative Fees 2,512,746.44 2,101,238.22Miscellaneous 1,086,856.49 9,297,190.52Specialty License Plates 0.00 1,539.95
TOTAL RECEIPTS FROMMISC. INTEREST AND OTHER COLLECTIONS 35,235,178.27 31,040,167.31
TOTAL, ALL SOURCES (Schedule 4) 2,050,187,780.64 1,113,323,103.68
UNAUDITED
Annual Financial Report | 151

(This page intentionally left blank)
UNAUDITEDTexas General Land Office and Veterans' Land Board (305)
152 | Annual Financial Report
ADDENDUM
UNAUDITED ANNUAL FINANCIAL REPORTAUGUST 31, 2017
TEXAS GENERAL LAND OFFICE
VETERANS' LAND BOARD
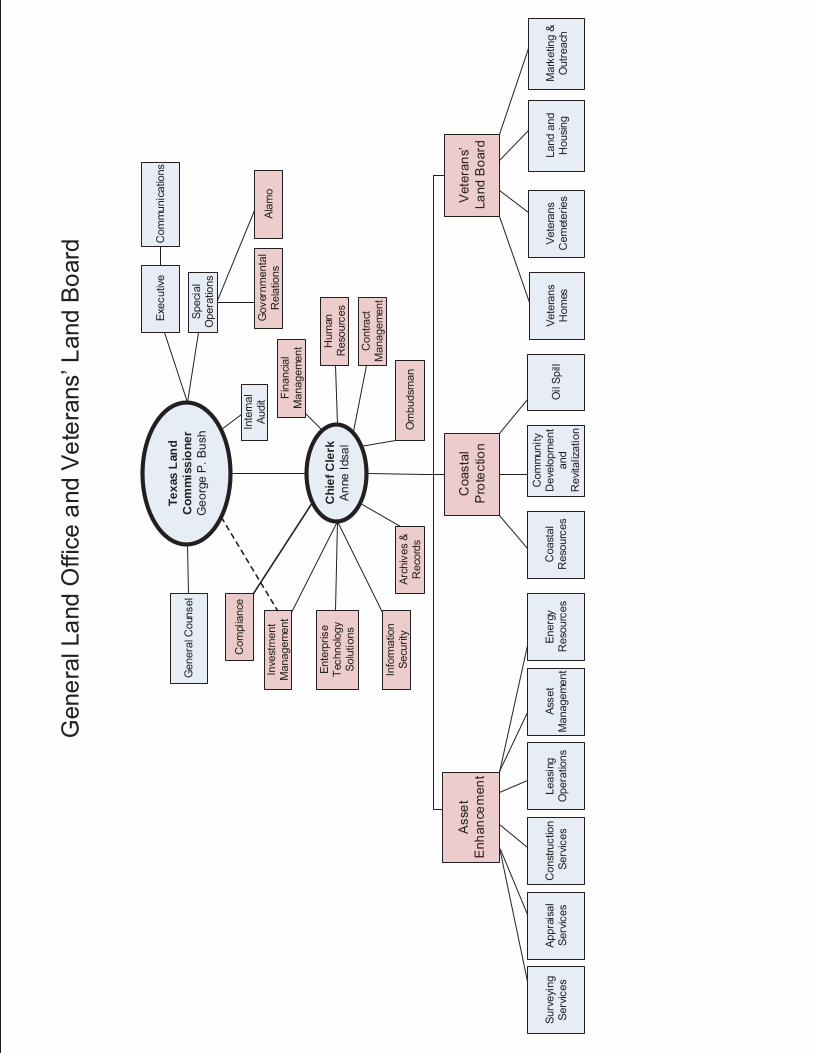
Texa
s La
ndC
omm
issi
oner
Chi
ef C
lerk
ADDENDUM
AGENCY AND GENERAL COMMENTS The Texas General Land Office (GLO) serves as the managerand/or trustee in varying duties and responsibilities of over 18.4million acres of state owned land consisting of the following:
Description of Acreage Number of Acres
Freshwater Rivers (estimated) 1,000,000.000Rivers, Creeks, Bayous (tidal) 9,274.960Bays, Inlets, Coves 1,462,168.720Gulf of Mexico 2,441,568.950Surveyed School Lands 408,347.730Lakes 67,934.330Islands 18,051.840Relinquishment Act Land(mineral interest) 6,322,123.030
Free Royalty Land 818,719.530Surface Sold and All or PartMinerals Reserved 399,014.660
Surface Only Acquired 109,201.390
Surface Acquired and All or PartMinerals Acquired 145,997.710
Small Tracts 0.320Escheated Lands 75.770Court Judgments 54,083.900Gifts 19.730Undivided Interest 207.200State Real Property Inventory 1,218,977.664Permanent University Fund 2,108,104.170Excess (estimated) 1,747,600.000Veterans' Land Board(land contracts) 157,754.490
Total (estimated) 18,489,226.094
Trust duties include administering state land sales and leases,issuing land patents and settling vacancy questions, protectingstate land from uncompensated or unlawful use, ensuring thatthe conditions of mining claims, gas and oil leases, commercialand grazing surface leases, pipeline easements, and variousother permits are fulfilled, and providing the public withinformation on the state's land resources.
The commissioner of the Texas General Land Office is a stateofficial elected by the voters of Texas to a four year term. TheHonorable George P. Bush was elected in the November 2014General Election for a term beginning January 1, 2015 throughDecember 31, 2018.
BOARDS & COMMISSIONS The Land Commissioner is tasked with serving as a member andChairman of numerous boards and commissions that areresponsible for state lands, coastal resources, veterans benefits,and alternative fuels. A primary responsibility of the landcommissioner is to assist in the supervision and management ofthe public lands of Texas as chairman of the various boards thatare responsible for leasing state owned lands. Two of the moreimportant of these boards, in terms of land area managed andlease revenues collected, are the School Land Board and theBoard for Lease of University Lands.
SCHOOL LAND BOARDThe School Land Board includes the land commissioner, whoserves as chairman, and two citizen members who are appointedfor a two year term. One member is appointed by the attorneygeneral and the other by the governor. Citizen membersreceived a $30 per diem allowance and actual travel expenses(not exceeding the maximum meals and lodging rates based onthe federal travel regulations issued by the Texas Comptroller ofPublic Accounts) while in the performance of their official dutiesduring fiscal 2017. Expenses related to citizen members are paidfrom legislative appropriations granted to the Texas GeneralLand Office. The citizen members serving at August 31, 2017were:
Member City Term ExpiresGilbert Burciaga Austin 08/29/2017
Michael Scott Rohrman Dallas 08/31/2019
Lands owned by state agencies and institutions, other than thosepreviously maintained, are leased for mineral developmentthrough the School Land Board. Mineral lease sales conductedduring the fiscal 2017 by the Texas General Land Office forvarious state land boards and/or commissions are presented onpage 150.
BOARD FOR LEASE OF UNIVERSITY LANDSThe Board for Lease of University Lands includes the landcommissioner, who serves as chairman, two members of theBoard of Regents of the University of Texas System, and onemember of the Board of Regents of Texas A&M University.Regent members may not be employed by an oil or gas companyeither directly or indirectly.
Regent members are appointed by the chairman of the Board ofRegents, with the consent of the entire board, to serve two yearterms on the Board for Lease. Regent members serving at August31, 2017 were:
Member City Term ExpiresCharles Schwartz Houston 02/01/2019
Ernest Aliseda Austin 02/01/2019Kevin Eltife Austin 02/01/2019
UNAUDITED
Annual Financial Report | 155
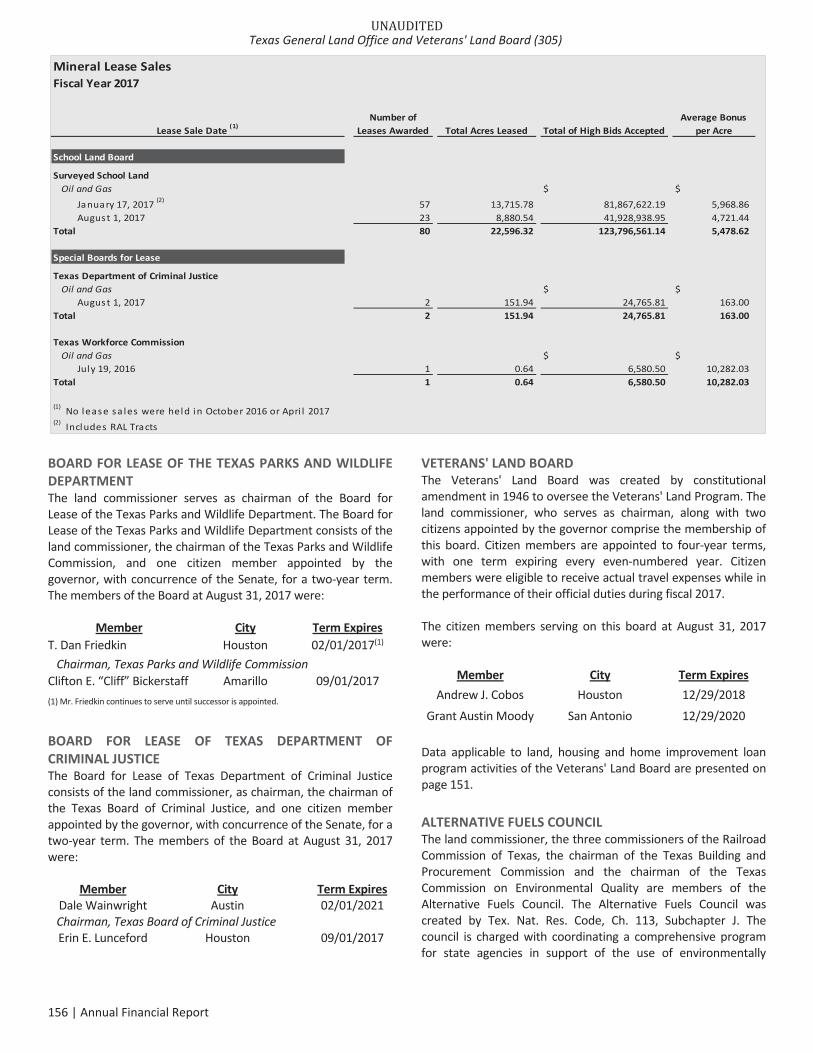
BOARD FOR LEASE OF THE TEXAS PARKS AND WILDLIFEDEPARTMENTThe land commissioner serves as chairman of the Board forLease of the Texas Parks and Wildlife Department. The Board forLease of the Texas Parks and Wildlife Department consists of theland commissioner, the chairman of the Texas Parks and WildlifeCommission, and one citizen member appointed by thegovernor, with concurrence of the Senate, for a two year term.The members of the Board at August 31, 2017 were:
Member City Term ExpiresT. Dan Friedkin Houston 02/01/2017(1)
Chairman, Texas Parks and Wildlife CommissionClifton E. “Cliff” Bickerstaff Amarillo 09/01/2017(1) Mr. Friedkin continues to serve until successor is appointed.
BOARD FOR LEASE OF TEXAS DEPARTMENT OFCRIMINAL JUSTICEThe Board for Lease of Texas Department of Criminal Justiceconsists of the land commissioner, as chairman, the chairman ofthe Texas Board of Criminal Justice, and one citizen memberappointed by the governor, with concurrence of the Senate, for atwo year term. The members of the Board at August 31, 2017were:
Member City Term ExpiresDale Wainwright Austin 02/01/2021Chairman, Texas Board of Criminal JusticeErin E. Lunceford Houston 09/01/2017
VETERANS' LAND BOARDThe Veterans' Land Board was created by constitutionalamendment in 1946 to oversee the Veterans' Land Program. Theland commissioner, who serves as chairman, along with twocitizens appointed by the governor comprise the membership ofthis board. Citizen members are appointed to four year terms,with one term expiring every even numbered year. Citizenmembers were eligible to receive actual travel expenses while inthe performance of their official duties during fiscal 2017.
The citizen members serving on this board at August 31, 2017were:
Member City Term ExpiresAndrew J. Cobos Houston 12/29/2018
Grant Austin Moody San Antonio 12/29/2020
Data applicable to land, housing and home improvement loanprogram activities of the Veterans' Land Board are presented onpage 151.
ALTERNATIVE FUELS COUNCILThe land commissioner, the three commissioners of the RailroadCommission of Texas, the chairman of the Texas Building andProcurement Commission and the chairman of the TexasCommission on Environmental Quality are members of theAlternative Fuels Council. The Alternative Fuels Council wascreated by Tex. Nat. Res. Code, Ch. 113, Subchapter J. Thecouncil is charged with coordinating a comprehensive programfor state agencies in support of the use of environmentally
Mineral Lease SalesFiscal Year 2017
Lease Sale Date (1)Number of
Leases Awarded Total Acres Leased Total of High Bids AcceptedAverage Bonus
per Acre
School Land Board
Surveyed School LandOil and Gas $ $
January 17, 2017 (2) 57 13,715.78 81,867,622.19 5,968.86August 1, 2017 23 8,880.54 41,928,938.95 4,721.44
Total 80 22,596.32 123,796,561.14 5,478.62
Special Boards for Lease
Texas Department of Criminal JusticeOil and Gas $ $
August 1, 2017 2 151.94 24,765.81 163.00Total 2 151.94 24,765.81 163.00
Texas Workforce CommissionOil and Gas $ $
July 19, 2016 1 0.64 6,580.50 10,282.03Total 1 0.64 6,580.50 10,282.03
(1) No lease sa les were held in October 2016 or Apri l 2017(2) Includes RAL Tracts
UNAUDITEDTexas General Land Office and Veterans' Land Board (305)
156 | Annual Financial Report
beneficial alternative fuels. The council administers thealternative fuels programs to support and encourage the use ofalternative fuels. Legal issues primarily relate to whether andhow state or federal laws or regulations apply to councilactivities or grants.
TEXAS BOARD OF PROFESSIONAL LAND SURVEYINGAs authorized by Tex. Occ. Code §1071.051, the landcommissioner is an ex officio member of the Texas Board ofProfessional Land Surveying. Other board members areappointed by the governor with the advice and consent of theSenate and include three members from the general public, twolicensed state land surveyors, and three registered professionalland surveyors. This board examines surveyors in training,registers professional land surveyors, and licenses state landsurveyors. Additionally, the board establishes and enforcesstandards of conduct for those it licenses and registers. Theboard employs staff to carry out these duties.
LEGISLATIVE REDISTRICTING BOARD OF TEXASThe land commissioner, the lieutenant governor, the speaker ofthe House of Representatives, the attorney general, and thecomptroller of public accounts are members of the LegislativeRedistricting Board of Texas. This board, under the authoritygranted in the Texas Constitution, Art. III, §28, is responsible forapportioning the state's senatorial and representative districts inthe event that the Texas Legislature fails to do so at the firstregular legislative session following the publication of a UnitedStates decennial census. Pursuant to Tex. Const. Art. V, §7a (e),the board is responsible for reapportioning the state's judicialdistricts if the Texas Legislature or the Judicial Districts Board failsto do so.
COASTAL LAND ADVISORY BOARDEstablished in 2006 by Governor Rick Perry, the Coastal LandAdvisory Board provides recommendations to the Governor onthe best use of state funds in the Texas Coastal Impact AssistanceProgram (CIAP). The Board is also responsible for preparing theTexas CIAP Plan and any amendments to the plan, which theGovernor submits to the U.S. Fish and Wildlife Service. TheGovernor designated the Texas General Land Office as theadministrative agency for CIAP. The Land Commissioner serves asChairman of the Board and includes two members of the CoastalAdvisory Committee. The board members at August 31, 2017were:
MemberToby Baker
Texas Commission on Environmental QualityBarry T. Smitherman
COASTAL COORDINATION ADVISORY COMMITTEEThe 82nd legislature passed and the Governor signed into law abill implementing the transfer of duties from the CoastalCoordination Council to the Land Commissioner. The bill alsorequired the Land Commissioner to establish a CoastalCoordination Advisory Committee (CCAC) by January 1, 2012.The Advisory Committee is comprised of representativesappointed by the eight state natural resource agencies and frompublic members appointed by the Land Commissioner. The termsof office for the CCAC members will align with the Coastal ZoneManagement Act (CZMA) Section 309 five year assessment ofthe Coastal Management Program (CMP). The members of theCCAC at August 31, 2017 were:
Member Term ExpiresCommissioner Dude Payne
Local Elected Official Appointee2015(1)
Jerry MohnLocal Business Appointee
2015(1)
George DeshotelsLocal Resident Appointee
2015(1)
VacantLocal Agricultural Grantee
Brian Koch 2015(1)
Texas State Soil and Water Conservation BoardLeslie Savage 2020Railroad Commission of Texas
Carla Guthrie 2020Texas Water Development Board
Pamela Plotkin 2020Texas Sea Grant College Program
Ross Melinchuk 2020Texas Parks and Wildlife Commission
Jodi Bechtel 2020Texas Transportation Commission
Stephen Tatum 2020Texas Commission on Environmental Quality
(1) Member will serve until a replacement is appointed.
TEXAS STATE VETERANS CEMETERY COMMITTEEEstablished in 1991 by the 72nd Texas Legislature, the Texas StateVeterans Cemetery Committee is responsible for the creation ofguidelines to determine the location and size of veterans’cemeteries, and the eligibility for burial in a veterans’ cemetery.The committee is composed of six members. The three memberboard of the VLB is joined by the Chairman of the Texas VeteransCommission (TVC) and two representatives of the veterans’community, with the Land Commissioner serving as Chairman.The committee members at August 31, 2017 were:
Member City Term ExpiresEliseo (Al) Cantu Corpus Christi December 2019Andrew J. Cobos Houston December 2018
Grant Austin Moody San Antonio December 2020
UNAUDITED
Annual Financial Report | 157
NATURAL RESOURCE DAMAGE RESTORATION TRUSTFUNDThe Texas General Land Office is a trustee for natural resourcesunder the Comprehensive Environmental Response,Compensation, and Liability Act, 42 USC §9607(f) and the OilPollution Act of 1990, 33 USC §2706(f). This designationauthorizes the Texas General Land Office to assess damages forinjuries to natural resources resulting from any spilling, leaking,dumping, leaching, or other disposal of oil and hazardoussubstances. Natural resource trustees are statutorily required tokeep money collected as damages in separate accounts to beused only for the restoration of the injured natural resources. Insome instances, administrative funding agreements are executedat the initiation of a natural resource damage assessment, andaccounts are established that also allow the remuneration ofadministrative costs. The majority of the accounts have been setup for this purpose. The Texas General Land Office, together withtwo other state natural resource trustees – the Texas Parks andWildlife Department and the Texas Commission onEnvironmental Quality – created a Natural Resource DamageRestoration Trust Fund in the State Treasury Safekeeping TrustCompany to ensure that the funds are used only for designatedpurposes as required by federal law. Each account bears interestand is subject to minimal management fees. All three statetrustee agencies must authorize the establishment of anindividual account and approve any expenditure.
ORGANIZATIONAL HIGHLIGHTS AND PROGRAM AREA DESCRIPTIONS The land commissioner, together with the deputy landcommissioner and chief clerk, the general counsel, theombudsman, the agency directors, and other key administrativepersonnel, supervises the activities of the Texas General LandOffice and Veterans' Land Board. The following paragraphs,which are complemented by the organizational chart, highlightthese areas and the overall organization of the agency.
AlamoThe General Land Office is responsible for the preservation,maintenance, and restoration of the Alamo Complex and itscontents. GLO is responsible for the protection of the historicaland architectural integrity of the exterior, interior, and groundsof the Alamo Complex. GLO is committed to turning the Shrine ofTexas History into a world class destination worthy of thememory of the brave Texans who paid the ultimate price for thefreedom of Texas. GLO has entered into a historic agreementwith the Alamo Endowment and the City of San Antonio tocreate a Master Plan to develop the future of the Alamo. GLOprovided a report on the Alamo Master Plan and comprehensiveneeds assessment to the legislature during the 85th RegularSession in 2017. GLO contracted with Alamo ComplexManagement to provide the daily oversight, operation andmanagement of the Alamo.
Archives and RecordsThe Archives and Records program area is responsible for thepermanent records (archives) of the Texas General Land Office,including the agency's map collection, the agency recordsmanagement program, the Office of Veterans Records, andproviding document scanning services for the agency. Theprogram also preserves and provides access to the original landgrants and land patent records issued by the variousgovernments of Texas: the Crown of Spain, the Republic ofMexico, the Republic of Texas, and the State of Texas. Theprogram also manages records of mineral lease files and filespertaining to the management of state owned lands, with theOffice of Veterans Records providing file storage and tracking ofveterans' loan records.
In compliance with legislative and Texas State Library andArchives Commission requirements, Archives and Recordsadminister the agency's records retention schedule to ensureaccess to the records of the various departments within GLO andpublications produced by the GLO. Other duties includeprocessing permanent correspondence for filming and indexing;preserving records and other materials documenting the historyof the Texas General Land Office and Texas public lands; andassisting customers doing genealogical, historical, mineral andland title, and other types of research.
The program also provides high quality copies and reproductionsof documents and maps to customers, both internal andexternal. Document reproduction charges are used to conservethe 36 million documents and 45,000 maps, sketches anddrawings housed at the GLO. The program's outreach effortsinclude an annual history symposium, several publications, anonline blog, tours, exhibits, presentations to the public, apresence at various historical and genealogical conferences and awebsite to increase public awareness of the history of the TexasGeneral Land Office and Texas public lands.
The Archives and Records program area operates a programentitled Save Texas History! that leverages private funding in theform of corporate, non profit and individual donations, and mapand document sales to help defray the expense of conservingand preserving these treasures for future generations of Texans.The Save Texas History! program has also developed aneducational program for fourth and seventh grade students andteachers in Texas. Teachers now have access to speciallydesigned lesson plans that focus on STAAR elements and utilizemany archival documents and maps available at the GLO, as wellas increased online access to these resources.
During the past year, Archives and Records, in collaboration withthe Houston Museum of Natural Science (HSMN) in Houston andthe Bob Bullock Texas State History Museum in Austin, createdtwo temporary map exhibits. Mapping Texas: From Frontier toLone Star State, held at the HSMN, highlighted 40 maps anddocuments from the Archives of the Texas General Land Office,
UNAUDITEDTexas General Land Office and Veterans' Land Board (305)
158 | Annual Financial Report
the Witte Museum and from private collectors Frank and CarolHolcomb; Mapping Texas: Collections from the General LandOffice, at the Bullock Museum, featured Texas County Maps byEltea Armstrong, the most prolific draftsman of the 20th centuryat the General Land Office. These exhibits utilized documentsand maps from the GLO Archives, augmented with items fromthe Witte Museum and other loaning institutions and collectors.
During the past year, the Archives and Records program areaalso continued its map and document digitization program. Thisproject provides the agency with a comprehensive means ofdigitally preserving the historic maps and documents housed inthe Texas General Land Office vaults. Up to this point, thedigitization program has scanned more than 281,771 maps andfiles, representing more than 3 million digital images, which areavailable in an online searchable database. These documentsinclude historically significant maps of Texas dating back to the16th century, as well as original land grant records of individualsin Texas dating back to 1720. These maps and documents, oncedigitized, are placed on the agency's website for the public toview and research. Digitization of the records provides muchwider access to these historically significant collections in ourcare, including to persons who do not have the time or money totravel to Austin to view these records in person, as well as betterpreserving the originals in our care through less use. In addition,the Archives and Records program provides this digitalpreservation service at reasonable cost to other state entities, aswell as participating in national and state level grants involvingthe digitization of cultural heritage objects.
Asset EnhancementThe Asset Enhancement program area consists of the followingdivisions: Asset Management, Appraisal Services, ConstructionServices, Energy Resources, Leasing Operations, and SurveyingServices.
ASSET MANAGEMENTThe Asset Management program area is comprised of threedivisions: Portfolio Management, Inventory and SovereignDisposition Management, and Commercial Leasing.
Portfolio Management, under the direction and oversight of theSchool Land Board, acquires real property for the purposes ofvalue appreciation and ongoing revenue production throughlease revenues for the Permanent School Fund (PSF). This areaidentifies potential targets for both acquisition and disposition ofinvestment properties, performs due diligence on the properties,develops and executes asset management and disposition plans,and negotiates the terms of the transaction.
Inventory and Sovereign Disposition Management is responsiblefor a number of real estate and related activities associated withstatutory requirements and responsibilities. Under §31.153§31.159, Texas Natural Resources Code (TNRC), this area isresponsible for reviewing and recommending retention or
disposition of lands currently in the possession of other stateagencies, particularly in reference to under utilization. Relatingto this activity, the area maintains an inventory of other agencyland holdings. Also within this activity, the agency conducts acontinuous effort to dispose of unsold rural lands dedicated tothe Permanent School Fund by sealed bid and direct sale.
Archeological evaluations of proposed land for sale inaccordance with the Texas Antiquities Code are either performedby contract personnel or are routed to the Texas HistoricalCommission for comprehensive review prior to the sale.
Commercial Leasing is responsible for the negotiation andissuance of instruments of authorization for the use of stateowned submerged land along the Texas coast. They analyze therevenue prospects of proposed uses and coordinate theassessment of environmental impacts with technical staff.Commercial Leasing also issues permits, easements, and leaseson all state owned coastal lands, including submerged lands inbays and within tidewater limits of coastal lakes, bayous, inlets,streams, estuaries, rivers, and creeks.
APPRAISAL SERVICESThe Appraisal Division's primary function is to provide propertyvalues, market studies and feasibility analysis to the AssetEnhancement program area, as well as to the School Land Board,so that informed decisions may be made on behalf of thePermanent School Fund's portfolio. The Appraisal Division is alsocharged with the responsibility of appraising state ownedproperty to ensure it is being utilized to its maximum potential.This service incorporates a highest and best use analysis thataddresses property utilization in the most economical way.
Under the Veterans' Land Board programs, appraisers assistedthousands of Texas veterans applying for loans by evaluating theproperty involved in their land, housing, or home improvementloans.
Meeting the challenge through teamwork and coordination,Appraisal had another busy year, producing 4,909 reports onproperties having a total market value of over $832 million.
CONSTRUCTION SERVICESThe Construction Services Division is responsible for managing allconstruction projects for the agency, planning and maintenancefor nine (9) Texas State Veterans Homes, and four (4) Texas StateVeterans Cemeteries, coastal construction projects,unauthorized structure removal along the Texas Gulf Coast, and,all maintenance and construction projects for the Texas Alamo.
ENERGY RESOURCESEnergy Resources is responsible for five broad functions relatedto state owned minerals: leasing mineral lands; monitoring andprocessing royalties and lease payments; reviewing informationfrom companies that produce the minerals from state owned
UNAUDITED
Annual Financial Report | 159
lands to ensure proper prices and volumes have been reported;marketing natural gas for the state's take in kind program; andconverting those volumes of take in kind royalties and "thirdparty" oil and gas produced from state leases necessary tooperate the State Power Program which sells electricity to retailpublic customers. The program area consists of seven sections:Minerals & Royalty State Energy Marketing, Minerals Audit,Minerals Review, Energy Inspections, Energy Geoscience andWater Resources.
The Minerals & Royalty section issues geophysical permits formineral exploration of state acreage; evaluates state lands formineral potential and value; recommends terms and conditionsfor the leasing of state owned minerals; ensures leasecompliance with state laws and agency policy; conducts oil, gas,and other mineral lease sales for the Permanent School Fund(PSF) and other state agencies; reviews the relationshipsbetween lessees and surface owners of Relinquishment Actleases; evaluates Relinquishment Act and highway right of waytracts for lease; reviews applications for pooling and makesrecommendations to the School Land Board and other boards forlease for final consideration; processes lease terminations;provides research and mapping expertise to the general publicand agency program areas; and processes non royalty leasepayments such as rental and shut in payments.
During fiscal 2017, the General Land Office received over $386million in oil and gas lease bonus revenue for the PSF, more thantwice the previous fiscal year. Over $34 million in delay rentalswere also deposited in fiscal 2017. Bonus is the cashconsideration paid by the lessee for execution of an oil and gaslease by the state. Delay rentals are due annually during theprimary term of a lease if no well is producing in payingquantities. Like in recent years, much of this revenue was derivedfrom leasing acreage in the developing Wolfcamp/Bone Spring(Wolfbone) play area in West Texas. A new play, which includes asignificant amount of PSF land, in West Texas but targeting theWoodford and Barnett Shale formations, is currently beingdeveloped in Southern Reeves County.
The State Energy Marketing Program (SEMP) markets and sellselectricity and natural gas to its public customers as defined bythe Legislature. Oil and gas royalty revenue for the PermanentSchool Fund is enhanced as a result of the marketing program inaddition to providing utility savings for public customers thatpurchase electricity and natural gas from the Texas General LandOffice.
SEMP can purchase, transport, nominate, schedule, balance andtake in kind oil and gas production for delivery into the StatePower Program or to customers. Much of the state landsmanaged and administered by the Texas General Land Office incertain areas are rich in oil and gas.
The State Power Program was authorized with the passage ofSenate Bill 7, and was effective September 1, 1999 when theelectric utility market in Texas was restructured
The Minerals Audit Section conducts field audits to determine ifoil and natural gas royalties have been properly paid. TheMinerals Review Section performs account volumereconciliations to assess the accuracy of the royaltycomputations and payments being reported to the agency.
The Energy Inspection Section physically inspects oil and gasactivity on PSF land to monitor production facilities and ensureproper metering of oil and natural gas production on stateowned minerals. The Energy Geoscience Section reviews oil andnatural gas commingling issues and offset obligations; performsengineering and geological reviews and issues hard mineralleases and prospect permits.
The Water Resources Section leases PSF lands to generaterevenue to the state. If the project is developed, the statecollects royalty payments based on the amount of water soldfrom the facility. In fiscal 2017, Solaris Midstream leased PSFproperty in West Texas and drilled two supply wells for hydraulicfracturing.
LEASING OPERATIONSUplands Leasing has responsibility for 663,946.28 acres ofPermanent School Fund land located throughout 140 counties inTexas. The division has four areas of emphasis consisting ofsurface leasing, right of way easements, technical support and afield office located in Alpine, Texas.
Staff members are in Austin and the Alpine Field Office. LeasingOperations staff issues surface leases for grazing, hunting, cropproduction, recreation, timber management, and somecommercial purposes. Currently there are 221 active uplandsurface leases and 97 Special Documents authorizing a variety ofuses on 606,568.38 acres of Permanent School Fund land. TheUplands range specialists completed 235 inspections in fiscal2017.
Leasing Operations is responsible for the overall management ofactivities involving the use of state owned upland property. Thedivision provides field assessments on proposed and existingprojects, monitors the use of state owned land, provides directcustomer service to the public on the use of upland property,and negotiates and issues instruments of authorization for theuse of state owned land. Leasing Operations is dedicated tomaintaining a land leasing and inspection process which protectsthe state's interest in its lands, maximizes revenue from uses ofstate property, preserves natural resources for futuregenerations, and serves the public in a professional, timely, andefficient manner.
UNAUDITEDTexas General Land Office and Veterans' Land Board (305)
160 | Annual Financial Report
The Right of Way team issues easements on both coastalsubmerged lands and state owned uplands for projects whichrequire a right of way on, across, under, or over state ownedlands, pursuant to Texas Natural Resource Code (TNRC) §51.291.These easement contracts cover activities, such as oil and gaspipelines, subsurface easements, water lines, power lines,communication lines, roads, and certain other structures anduses, for the purposes specified in the contract. Currently thereare 3,797 active easements on submerged and upland stateowned lands.
This division also leases PSF lands to generate revenue to thestate through annual per acre rental payments. If the project isdeveloped, the state collects royalty payments based on theamount of power generated from the facility.
SURVEYING SERVICESThe Surveying Division supports all facets of Texas General LandOffice activity related to the boundaries of real property. Theseactivities include identifying the location of state owned land,minerals, and encumbrances. This is accomplished by providingprofessional surveying services in the field as necessary andexpertise in surveying and survey related matters in house daily.
The primary focus of Surveying is to define the boundaries ofPermanent School Fund lands, county boundaries, andoccasionally, the boundaries of the state. These boundariesinclude, but are not limited to, the boundaries of approximately687,000 acres of Permanent School Fund uplands; an estimated200,000 miles of boundary between private and state ownershipalong navigable streams; and between private uplands and stateowned submerged lands along the Texas Gulf Coast.
The licensed professional staff routinely provides consultationsand advice for a wide range of surveying related issues facing theGeneral Land Office. The lands of the Permanent School Fund,managed by the GLO face many contests and challenges.Surveying staff provides knowledge of the historic and currentlaws and practices affecting the boundaries of Permanent SchoolFund lands and assists in the decision making processes at alladministration levels of the agency.
The Surveying staff is instrumental in addressing boundaryquestions regarding original land survey critical to the issuance ofpatents and deeds of acquittance and processing vacancyapplications; for boundaries of Veterans' Land Board tracts; andfor boundary determinations essential to all other revenueproducing Texas General Land Office programs. These programsinclude mineral and surface leasing, easements, otherpermitting, and acquisition/disposition of Permanent SchoolFund land. Surveying staff also interprets archival surveydocuments and maps for in house and outside customers.
Additionally, the Surveying staff continually updates the TexasGeneral Land Office county maps and archives files, by adding
documents and endorsements as transactions warrant, preparesworking sketches upon request for internal and externalcustomers, and files survey plats and other related documents inthe map room collections of the archives.
Coastal ProtectionThe Coastal Protection program area consists of the CoastalResources division, the Disaster Recovery division, and the OilSpill division.
COASTAL RESOURCESCoastal Resources, a division of Coastal Protection, is responsiblefor a number of initiatives designed to foster sound stewardshipof natural resources and to promote economic growth along theTexas coast. Coastal Resources is comprised of Grant Programs,the Coastal Erosion Planning and Response Act Program, NaturalResource Damage Assessment (NRDA), Texas Beach Watch,Texas Coastal Ocean Observation Network, Adopt A Beach, theUpper and Lower Coast Field Offices, and the Beach Access andDune Protection Program.
Grant Programs administers the Coastal Impact AssistanceProgram (CIAP). The Energy Policy Act of 2005 authorized $250million in CIAP funding to be divided annually among the coastalstates of Alabama, Alaska, California, Louisiana, Mississippi, andTexas for fiscal years 2007 through 2010. On April 16, 2007, theMinerals Management Service (now known as the Bureau ofOcean Energy Management (BOEM) and the Bureau of Safetyand Environmental Enforcement (BSEE)) released individual CIAPallocation amounts for fiscal years 2007 and 2008. The State ofTexas received $48,591,202.09 for each fiscal year 2007 and2008. As administer of the State funding, the Texas General LandOffice (GLO) was awarded $31,584,281.36 of this amount, andthe 18 coastal counties were awarded a collective total of$17,006,920.73. For fiscal years 2009 and 2010, the State ofTexas received $70,924,780.81. Of that amount, the GLO wasawarded $46,101,107.53 and the 18 coastal counties wereawarded a collective total of $24,823,673.
Grant Programs also oversees the Coastal Preserve program, theconservation of designated state owned, environmentallysensitive estuarine areas on the Texas coast. This program alsomanages a database on resource management codes available topotential users of coastal public land as guidance fordevelopment.
Grant Programs administers the Coastal Erosion Planning andResponse Act (CEPRA) Program was created in the 76th TexasLegislature. This program represents the first coastal erosionprogram in Texas and entails a coordinated effort of state,federal, and local entities to conduct erosion response projectsand related studies for the 367 miles of Texas Gulf beaches andthe more than 3,300 miles of bay shoreline. Texas beaches sufferfrom the highest erosion rates in the country. The TexasLegislature has appropriated approximately $187.7 million for
UNAUDITED
Annual Financial Report | 161

the CEPRA program through fiscal 2017. The selected projectsand studies, when leveraged with other federal, state, local, andprivate funds, have made the total budget for the program inexcess of $414.8 million. Erosion response projects include beachnourishment, dune restoration, shoreline protection, marshrestoration, structure and debris removal, demonstrationprojects and supporting studies on shoreline change, sand sourcepermitting, and economic/natural resource benefits.
Grant Programs administers the Texas Coastal ManagementProgram (CMP), which was approved by the National Oceanicand Atmospheric Administration (NOAA) in January 1997. Theprogram is designed to coordinate the stewardship of Texas'abundant coastal resources. Through the CMP and its CoastalCoordination Advisory Committee, the program has establisheda set of goals and policies for the management of coastal naturalresources. The CMP goals and policies are implemented throughthe consistency review of federal agency permitting, the reviewof federal agency activities and funding decisions, and the reviewof certain listed state agency actions. The program alsoimplements the CMP goals and policies through the coordinationof state agency activities, and through funding under the CMPgrant program, of local projects to preserve, protect, enhance, orrestore coastal natural resources.
In the 22nd cycle of the Coastal Management Program (CMP)grants program, the Texas General Land Office (GLO) wasawarded approximately $2.52 million to administer the CMPprogram and provide grant funding to eligible sub recipients forauthorized CMP projects along the coast. As programadministrator for the State of Texas, the GLO is updatingChapters 501, 504, and 505 in Title 31 of the TexasAdministrative Code to comply with changes to the CoastalCoordination Act, enacted through Senate Bill 656 under the 82nd
Texas Legislature. The proposed rules reflect the abolishment ofthe Coastal Coordination Council, the transfer of the Council’sfunctions to the GLO and the Land Commissioner, and thecreation of the Coastal Coordination Advisory Committee by rule.
Coastal Resources also houses the hazard mitigation programthat works with the Texas Division of Emergency Management’sState Hazard Mitigation Team to implement state and federalcoastal hazard mitigation efforts, including Federal EmergencyManagement Agency (FEMA) grants.
The Tide Gauge Program began in 1989 at Texas A&M UniversityCorpus Christi. The first measurement systems installed wereintended to provide real time water level and meteorologicalinformation to the City of Corpus Christi to assist local officialswith preparations for incoming hurricanes and tropical storms.From this initial work, other state agencies, including the TexasGeneral Land Office and the Texas Water Development Board,began contracting with Texas A&M University Corpus Christi toprovide similar information for other areas along the Texas coast.Following a Texas Legislative mandate in 1991, this network of
water level gauges became the Texas Coastal Ocean ObservationNetwork (TCOON). As a result, TCOON expanded from initiallythree stations in Corpus Christi in 1989 to over 40 stations by1992,currently there are 34 operating stations along the coast.
Coastal Resources administers the Texas Beach Watch program.The Beaches Environmental Assessment and Coastal Health(BEACH) Act was passed by Congress in 2000 to protect publichealth in coastal recreational waters. The Beach Act requires thatstates, in cooperation with EPA, develop and implement aprogram to monitor coastal recreation waters adjacent tobeaches used by the public and to notify the public if waterquality standards for pathogens and pathogen indicators areexceeded. In July 2001, the Office of the Governor appointed theTexas General Land Office as the lead state agency responsiblefor implementing the provisions of the BEACH Act because of itsexisting Beach Watch Program, which started in the late 1990s asa water quality monitoring program funded by the CoastalManagement Program. To date, the Texas Beach Watch Programhas been awarded $6.8 million in federal EPA funding toimplement the program and meet the requirements of theBEACH Act.
The Texas Beach Watch Program works with local governmentsto issue advisories, warning the public not to swim in affectedwaters. Water samples are collected from 164 stations at 62recreational beaches along the Texas coast in Aransas, Brazoria,Cameron, Galveston, Harris, Jefferson, Matagorda, Nueces, andSan Patricio counties. Water samples are collected weekly duringthe peak beach season, which runs from May throughSeptember, and every two weeks during the rest of the year. Theone exception occurs in March when weekly sampling isconducted to coincide with spring break at Texas Beach Watchmonitored gulf beaches.
The Beach Access and Dune Protection Program, fosters soundstewardship of coastal natural resources. The program assistslocal governments and coastal property owners in managing theTexas coast so that both the private landowners' interests andthe public's right of access, and use of, the public beaches areprotected.
The Beach Maintenance Reimbursement Fund provides partialreimbursements to eligible coastal communities for expensesincurred in maintaining clean, safe and healthy beaches. TheBeach User Fee program allows for local governments to collectfees in exchange for providing services to beach users in general.
The Texas Adopt A Beach Program is an all volunteer effortstarted by the Texas General Land Office (GLO) in 1986 to rid thestate's publicly owned beaches of trash and raise publicawareness of the problems associated with marine debris. Twiceeach year in the fall and spring, volunteers check in at sitesalong the coast to pick up trash. Two annual regional winter
UNAUDITEDTexas General Land Office and Veterans' Land Board (305)
162 | Annual Financial Report
cleanups also take place in mid February at South Padre Islandand the Coastal Bend.
The Adopt A Beach Program also administers the Beach AdopterProgram, which invites interested individuals and volunteergroups to adopt a section of beach in their local community.Each adopter agrees to clean their stretch of beach at least threetimes a year for a two year commitment.
The success of the program, both as a beach cleanup effort andas an educational and public awareness campaign, has won itnational recognition and has prompted the development ofsimilar programs in all 55 U.S. states and territories and morethan 100 foreign countries. Since the program began, more than517,000 volunteers have removed 9,500 tons of trash from Texasbeaches.
The Coastal Resources division directs the preparation ofrequired program reports, studies, performance measures andplans, such as Legislative Budget Board reports, legislativereports, NOAA reports and other reports to educate the publicabout the success of Coastal Resources programs. The division isalso responsible for the management of records for the CoastalResources division. This involves ensuring all files are scannedand complete for proper storage, retention and for future use.
The Upper and Lower Coast Field Offices work directly withCommercial Leasing, and together, during fiscal 2017, managedover 8,900 coastal instruments. The Upper Coast Field Office islocated in La Porte, Texas, and is geographically responsible forall activities north of the Colorado River. The Lower Coast FieldOffice is located in Corpus Christi, Texas, and is geographicallyresponsible for all activities from the Colorado River south. Theseoffices are responsible for providing field assessments ofproposed and existing coastal projects along the Texas coast. Theoffices work directly with the public on the planning and designof proposed structures that require authorization from the TexasGeneral Land Office and the School Land Board. Field biologistswork diligently to ensure compliance with state guidelinesthrough aggressive field activities involving monitoring coastalareas, educational initiatives, documenting findings, andcoordinating with various resource agencies. Field officebiologists completed 1,631 inspections in fiscal 2017 coveringlands in bay areas, tidally influenced rivers, and submerged tractsalong the Gulf of Mexico. Both field offices provide services toCoastal Leasing, as well as to other program areas within theagency, including Coastal Resources, Asset Management, LegalServices, and Energy Resources.
The GLO is one of the three Texas state agencies designated bythe governor as natural resources trustees under The OilPollution Act of 1990, 33 U.S.C. 2701 2720 (OPA),Comprehensive Environmental Response Compensation, andLiability Act, 42 U.S.C. 9622 (CERCLA), and Texas Oil SpillPrevention and Response Act of 1991, Tex. Nat. Res. Code, Chap.
40 (OSPRA), to perform Natural Resource Damage Assessment(NRDA). The other Texas trustee agencies are Texas Parks andWildlife Department (TPWD) and Texas Commission onEnvironmental Quality (TCEQ). The federal trustees for Texas areusually U.S. Fish & Wildlife Service, a division of the Departmentof the Interior, and the National Oceanic and AtmosphericAdministration, a division of the Department of Commerce.
NRDA implementation involves the legal and technical processesnecessary to pursue compensation for and restoration of injuriesto natural resources caused by the responsible party’s release ofoil or hazardous substances into the environment. Before andduring an active spill or release, the trustees identify andprioritize natural resources at risk to help ensure their protectionduring the emergency response. Trustees provide technicalassistance to responders, including information on appropriateresponse techniques in environmentally sensitive areas andtechniques of wildlife recovery and rehabilitation.
Following a spill or release, there are three main components tothe NRDA process:
Pre assessment: Trustees determine whether injury tonatural resources has occurred. This work includescollecting time sensitive data, reviewing scientificliterature about the type of oil spilled or the hazardoussubstances released, and determining the types of injuriesthat may have occurred.
Injury Assessment and Planning: Trustees performscientific and economic studies to assess and quantify theinjuries and the loss of natural resource services. Trusteesdevelop a restoration plan to identify restoration projectsthat will offset the injury.
Restoration: Trustees work with the Responsible Party(RP) and the public to select and implement restorationprojects. Examples of restoration include acquiring landand protecting its natural state, improving fishing accesssites, and restoring lost habitat. The RP pays the full costof the response, assessment, and restoration.
Trustees encourage the responsible parties to workcooperatively and jointly with them throughout the preassessment, assessment and planning, and restoration phases ofthe NRDA process. This reduces assessment costs and increasesrestoration value.
Since the NRDA program's inception, natural resourcerestoration projects valued at more than $75 million have beenimplemented or are planned on behalf of the public as a result ofNRDA settlements for the restoration of injured naturalresources.
Deepwater Horizon Spill Civil Penalties. In addition to otheractive cases, the GLO’s NRDA staff has been working with stateand federal trustees since 2010 on the biggest NRDA case in
UNAUDITED
Annual Financial Report | 163
history – the Deepwater Horizon oil spill (DWH). On April 4, 2015,the federal court approved the settlement with BP and entered aconsent decree resolving the civil claims associated with the spillfor more than $20 billion. The settlement includes claims underthe Clean Water Act, Natural Resource Damages under OilPollution Act, and economic damages sought by the impactedstates, including Texas.
The trustees are currently implementing seven projects in Texasto compensate for lost recreational use of natural resources,injury to sea turtles, and injury to birds. The recreational projectsinclude three offshore artificial reefs and two redevelopmentprojects for coastal State Parks at a cost of about $18 million. Thecompensation of injury to birds includes the construction andrestoration of four rookery islands at a cost of about $20 million.In addition, to compensate for the injury to sea turtles, thetrustees will implement projects that will enhance sea turtlenesting patrols, the rescue and salvage network, andenforcement of Turtle Exclusion Device requirements to reduceby catch of sea turtles in Texas. The sea turtle restorationprojects will cost over $15 million to implement in Texas. TheDWH NRDA process will continue until the damages are decidedby a federal court, or until BP reaches a settlement agreementwith the trustees.
Legislators from affected Gulf Coast States worked to enactlegislation to allocate a substantial portion of the civil penaltiesfrom DWH to Gulf Coast restoration. As a result, the Resourcesand Ecosystems Sustainability, Tourist Opportunities, andRevived Economies of the Gulf Coast States Act of 2012, or theRESTORE Act, was signed into law in July 2012. The RESTORE Actdedicates 80 percent of any civil and administrative penaltiespaid by DWH RPs under the CWA to the Gulf Coast EcosystemRestoration Trust Fund (Trust Fund), administered by theTreasury Department, for ecosystem restoration, economicrecovery, and tourism promotion in the Gulf Coast region. TheAct created a new federal agency, the Gulf Coast EcosystemRestoration Council, which is charged with developing andoverseeing implementation of a Comprehensive Plan to restorethe ecosystems and economy of the Gulf Coast. The Council ischaired by the Secretary of the U.S. Department of Commerceand includes the Governors of the states of Alabama, Florida,Louisiana, Mississippi and Texas and the Secretaries of the U.S.Departments of Agriculture, Army, Homeland Security and theInterior, and the Administrator of the U.S. EnvironmentalProtection Agency. Texas Governor Greg Abbott has designatedToby Baker, Commissioner of Texas Commission onEnvironmental Quality, as the Texas representative on theCouncil.
Thirty percent of the Trust Fund will be administered by the GulfCoast Ecosystem Restoration Council, awarded as grants underthe Comprehensive Plan for projects that protect and restore theGulf Coast ecosystem (Bucket 2). Thirty percent of the Trust Fundwill be allocated to the Gulf Coast States under a formula
described in the RESTORE Act and spent according to Councilapproved individual State Expenditure Plans (Bucket 3). Thirtyfive percent of the RESTORE Act funds will be allocated in equalshares to each Gulf Coast state to be spent for any eligiblepurpose under the RESTORE Act and the state’s multi yearImplementation Plan (Bucket 1). The remaining five percent willbe split equally between two programs created by the Act: TheGulf Coast Ecosystem Restoration Science Program and theCenters for Excellence Research Grants Program. The Trust Fundreceived $800 million from the Transocean, $128 million fromAndarko, and $4.4 billion from BP settlements. Plans arecurrently underway to distribute the funding over 15 years. Thecouncil recently released a draft of initial Funding Priorities forBucket 2 which includes several projects in Texas. The GLO wasawarded $968,000 and will implement the Texas BeneficialUse/Marsh Restoration Project that will fund engineering anddesign to facilitate the beneficial use of dredge material formarsh restoration on the Upper Coast of Texas. GLO staff willcontinue to work with Commissioner Baker to select projects andimplement the RESTORE Act in Texas.
Deepwater Horizon Spill Criminal Penalties. The U.S. Departmentof Justice entered into criminal plea bargain agreements withtwo of the DWH RPs, BP and Transocean. A third RP, Halliburton,has negotiated a criminal plea agreement with the JusticeDepartment, which is still being reviewed by the federal court.BP agreed to pay $2.35 billion and Transocean agreed to pay$150 million in criminal penalties. The National Fish and WildlifeFoundation (NFWF), a non governmental grant makingorganization, was charged with the distribution and spending ofthe criminal fines through grants within each of the five affectedGulf states. NFWF has set up the Gulf Environmental BenefitFund (GEBF) to receive the criminal penalties and provide grantfunding for the states.
Under the terms of the BP and Transocean plea agreements,Texas will receive around $203 million over five years. NFWF isconsulting extensively with NRDA staff at GLO, TPWD, and TCEQto develop projects for possible funding. To date, NFWF hasawarded over $70.4 million to fund 22 projects in Texas. Fromthe $70.4 million the GLO was awarded, over $6.6 million is forthree projects which include marsh restoration and breakwatersin Galveston Island State Park and an erosion protection projectfor Virginia Point Prairie Preserve. NFWF is currently workingwith the NRDA staff from GLO, TPWD and TCEQ on requests tofund an additional $15 million in coastal restoration projects inTexas.
COMMUNITY DEVELOPMENT AND REVITALIZATIONThe Community Development and Revitalization (CDR) programmanages all aspects of Community Development Block Grantsfor Disaster Recovery (CDBG DR) received from the United StatesDepartment of Housing and Urban Development (HUD) as aresult of hurricanes, wildfires, floods and other national disasterdeclarations. Their area of responsibility includes, but is not
UNAUDITEDTexas General Land Office and Veterans' Land Board (305)
164 | Annual Financial Report
limited to, ensuring compliance with all federal regulations intheir efforts to assist with housing, infrastructure, and economicdevelopment for affected Texas areas and communities. Theprogram consists of four divisions: Program Development &Contract Services, Program Oversight, Finance, and QualityAssurance & Process improvement. The program also has aseparate team dedicated to environmental review and programintegration, as well as legal support that reviews Federal andState guidelines to ensure compliance. These functions reportdirectly to the program Staff Director.
The Program Development and Contract Services division iscomprised of two departments. Program Development managesthe business operations of the program and serves as the liaisonfor public, governmental, and internal customers. This includesthe creation of all program reports for the GLO Commissioner,GLO executives, the Governor's office, Legislators and otherexternal parties. They also do long term planning and overseethe development and maintenance of the policies andprocedures of the program while also conducting work on specialprojects and operations. Contracts Services manages andmonitors all contract processes and procedures while alsoensuring that contracts comply with Federal and State laws.
The Program Oversight division is composed of threedepartments: Residential Activities, Infrastructure, and ProgramServices. The primary focus of both the Residential Activities andInfrastructure teams is managing the CDBG DR grants whileserving the customer and citizens of Texas. Their work includesproject management support, programmatic technicalassistance, oversight, and monitoring of all aspects of grantmanagement from grantee application, to implementation, andall the way to closeout. Program Services responsibilities includemanagement of construction and inspections, Section 3compliance, and Fair Housing Activity Statement programcompliance.
The Finance division oversees Accounting and ContractsAdministration. It’s the main function of the Finance division tocarry out the accounts payable, operational budget planning, andfinancial reporting tasks of the program.
The Quality Assurance & Process Improvement division isresponsible for conducting audits of CDBG DR grantees whilealso ensuring that all parties comply with CDBG DR guidelines.They are also responsible for identifying programmatic areaswhere process improvements can enhance the business processof the CDR program. The process, reports, and improvementsgroup facilitates and supports CDR’s information technologyprojects and handles HUD DRGR reporting.
OIL SPILL PREVENTION AND RESPONSEThe Oil Spill Prevention and Response Act of 1991 (OSPRA)designated the Texas General Land Office as the lead stateagency for the prevention of and response to oil spills in coastal
waters. The program is funded by a one – one/third cent perbarrel fee on crude oil loaded or off loaded in Texas ports byvessel. Revenue is deposited in the Coastal Protection Fund,which is capped at $20 million.
Mounting an efficient and effective response is a primaryobjective of the Oil Spill Prevention and Response program area.Five regional offices respond to over 600 spill notificationsreported to the Texas General Land Office annually. Located inNederland, LaPorte, Port Lavaca, Corpus Christi, and Brownsville,personnel at these offices respond to spills 24 hours a day, 7days a week, 365 days a year. Notification requirements are metby calling a toll free number. In addition to their "firehouse"response capability, regional staff conducts audits, inspections,and harbor patrols by boat and vehicle; maintain responseequipment; participate in oil spill response exercises with marineand shore based industries; and provide public educationservices about oil spill prevention and response.
OSPRA also authorizes the Texas General Land Office to procurespill response equipment—boom, skimmers, boats, trucks,pumps, wildlife rehabilitation equipment, communications,mobile command posts, and associated support equipment. Allequipment is maintained by field personnel in a ready conditionand is available to supplement spill contractor and industryowned equipment, as well as for emergency response in theevent of a natural disaster.
OSPRA requires all facilities that handle oil and pose a threat tocoastal waters to submit contingency plan information to theTexas General Land Office for review and certification.Approximately 575 facilities currently require this certification.Their plans, which are routinely audited by field personnel, detailspill response strategies, identify sensitive natural resources, andlist trained personnel and inventories of spill responseequipment. The law also requires that certain classes of vesselsthat sail in state waters submit contingency plans. The programmaintains a database containing over 3,500 company accountsrepresenting over 26,000 vessels.
The prevention of spills is also a primary objective of the Oil SpillPrevention and Response program staff. Regional personnel areon the water or in vehicles daily patrolling for discharges, andmonitoring the loading and offloading of petroleum products atrefineries. Oil Spill’s Small Spill Education Program providesinformation to vessel owners and operators about theenvironmental damage caused by small chronic spills, and toprovide practical prevention measures. The Small Spill EducationProgram supports Operation Scupper Plug to furnish fuel docksand fishermen with sorbent materials to prevent the accidentaldischarge of diesel and gasoline during fueling operations.
The Oil Spill program supports fixed and portable bilgereclamation facilities for public use. Located in Aransas Pass,Brownsville, Corpus Christi, Fulton, Palacios, Port Aransas, Port
UNAUDITED
Annual Financial Report | 165
Isabel, Port Mansfield, Rockport and Seadrift, the bilge facilitiesprovide a no cost option for vessel owners to offload oily bilgewater. The contaminated water and oil is separated, the water isprocessed and oil is then recycled. More than 85,600 gallons ofcontaminated water were cleaned in fiscal 2017.
To promote a safer, cleaner marine environment, the Oil SpillProgram supports two vessel removal initiatives to rid the coastof pollution, fuel and navigational hazards. The Derelict VesselRemoval Program (DVR) documents, determines ownership andremoves derelict vessels for salvage and destruction as fundingresources are available. Since 2005, the DVR program hasdocumented 1,157 derelict vessels coast wide, and assisted withremoval of 960 vessels. Although the number fluctuates asvessels are added and removed, currently, 194 vessels remain.
The Oil Spill Vessel Turn In Program (VTIP) eliminates potentialpollution sources from Texas coastal areas by providing publicopportunities to relinquish derelict vessels at no cost. The VTIPinitiative creates partnerships with other public entities for fuelremoval, salvage and destruction of derelict vessels and, to date,has facilitated the removal of 343 boats totaling 5,861 linearfeet. Based on an estimated removal cost of $250 per linear foot,eight GLO sponsored VTIP events have saved taxpayers morethan 1.46 million dollars.
Office of CommunicationsThe Office of Communications primarily handles informationrequests from the news media and serves as the agency's mainvoice to the world. Led by the director of communications, whoreports directly to the land commissioner, the division iscomprised of a press team, publications team, media servicesteam and public outreach staff. To accomplish theseresponsibilities, the Office of Communications provides accurateinformation about the Texas General Land Office and Veterans'Land Board in a timely and helpful manner, and provides a single,consistent voice for the Texas General Land Office.
The Office of Communications writes and disseminates newsreleases, advisories, articles and other informational piecesabout the Texas General Land Office. The division also arrangespublic events to publicize agency activities and programs,provides briefing materials for the land commissioner, educatesTexans on the benefits and programs offered by the TexasGeneral Land Office, and keeps Texans informed of responseefforts in the event of major oil spills.
Additional duties include designing the agency's publications andweb site, creating high quality video products to highlight agencyprograms and events, and videotaping agency events andmaking copies available to the news media as another means ofspreading the agency's message. The division also takesphotographs at agency events and provides publicationsregarding agency programs, initiatives and benefits.
Office of ComplianceThe Office of Compliance is responsible for working with agencystaff to ensure the GLO has policies and procedures in place thatcomply with state and federal statutes, rules, regulations andpolicies. Following is overview of the divisions responsibilities:
Conflict checks. Conduct conflict checks on donated gifts,donated travel, potential donors for special campaigns,vendors, potential vendors, outside employment, andother potential conflicts.
Contract reporting requirements. Work with Procurementand Contracts Management to develop and implementprocedures that ensure the GLO is meeting the contractreporting requirements per state statutes.
Ethics policy development and training. Develop anddisseminate ethics statements, policies, training, and anynecessary forms related to GLO, SLB or VLB ethics policies.Provide guidance to staff related to agency ethics policies.
Procurements and Grants Review Committee. Coordinateand facilitate the Procurements and Grants ReviewCommittee Meetings. The purpose of this committee is toexamine proposed procurements, projects, contracts, andgrants to determine whether they are in the best interestof the GLO.
Compliance with contract rules. Work with GLO’s ContractManagement Division to develop and inventory of allcontracting rules applicable to the GLO, including anyrelevant procurement rules. Assist with the developmentof policies, procedures, and guides related to contractmanagement. Work with agency staff to ensure thoseresponsible for project management, contractmanagement, and procurement understand theirresponsibilities and are accurately and timely meetingthose responsibilities.
Compliance with audit responses. Follow up with InternalAudit and the audited division to ensure the divisions areadequately implementing corrective actions. Provideassistance as needed to divisions regarding correctiveaction implementation.
Compliance with new legislation. Work withGovernmental Relations to ensure any necessary changesto agency policies and procedures are implemented incompliance with any new legislative requirements.
Compliance with agency reporting requirements. Maintainthe GLO’s list of reports that are required by state orfederal statute, rule, or policy. Track the submission statusof the reports and send reminders to applicable GLO staffof upcoming due dates.
Special projects. Work with programs and divisions toimplement solutions to policies, procedures, or processesthat incorporate best practices and ensure compliance
UNAUDITEDTexas General Land Office and Veterans' Land Board (305)
166 | Annual Financial Report
with state and federal statutes, rules, regulations, andpolicies.
Contract Management DivisionTo streamline efficiencies and to ensure consistency, the GLOconsolidated contract management responsibilities forcommodities and services into a single division – the ContractManagement Division (CMD) – in the spring of 2016. The goalwas and continues to be, compliance with the State of TexasContract Management Guide and to ensure compliance with allstatutes, rules, and policies related to contract development andmanagement. In the fall of 2017, contract managers from theCommunity Development and Revitalization division of the GLOjoined CMD, to ensure a consistent methodology of contractmanagement.
Today, the division consists of six contract managers, twocontract specialists (drafters), a manager, and a Director.Together the team manages over 3,000 active contracts orwork orders.
Enterprise Technology SolutionsEnterprise Technology Solutions (ETS) is responsible for allaspects of information technology strategic planning andoperations for the GLO. The program supports the GLO byproviding tools and services that enhance and harmonize thepeople, processes, and technologies that drive agency business.ETS serves the agency in three primary roles:
Technology Consultant ETS understands the mission,goals, and priorities of each agency program so that wecan offer options and advice regarding technology andprocess changes that support and improve missionperformance.
Guardian ETS establishes policies and proceduresregarding the purchase, implementation, and use oftechnology resources in accordance with Legislation,Administrative Code, and Agency Rules.
Service Provider ETS provides computing devices, datacenter services, and other key technology hardware andsoftware services when and where they are needed.
ETS Divisions and Teams include:
Strategic Technology Services consists of the Technology ProjectPortfolio Management Office (PPMO), Technology Training, andBusiness Services. Business Services handles all technologyrelated purchases for the agency, oversight of the ETS budget,legislative reporting, software inventory and licensingagreements, operational activities that serve as audit pointsthroughout several agency processes, and ETS administrativesupport.
Technology Integration Services (TIS) is responsible for planning,designing, managing and securing the agency datacommunications network, servers, personal computers, andperipherals. Major activities of TIS include providing tier 1 3technical support, design and administration of the network,servers, and databases, maintaining internet, intranet andregional connectivity, administering the electroniccommunication system, and ensuring system fault tolerance andbusiness continuity.
Applications Development builds software solutions that enablethe agency’s customers and staff members to be efficient andeffective by automating manual processes, providing moderntools that deliver new capabilities, and enabling automatedsystems to communicate behind the scenes.
Technology Analysis Services (TAS) houses the agency’s softwarequality assurance and business analysis capabilities. BusinessAnalysts (BAs) in TAS serve as technology consultants for theagency’s business units. The BAs drive innovation andautomation efforts by understanding agency business goals andprocesses and recommending strategic and tactical technologysolutions that deliver improved performance for the agency’smissions.
Geographic Information Systems (GIS) provides geospatial tools,data and analyses to GLO staff, other government entities, andthe public. The GIS team researches and develops geospatialdata, maintains and administers all GIS data layers for theagency, creates custom hardcopy and digital map products, anddevelops, manages, and administers GIS databases, applicationsand servers.
Office of Information SecurityOffice of Information Security (OIS) is focused on theidentification, management, and mitigation of informationsecurity risks and vulnerabilities within the GLO enterprise. TheOffice covers but is not limited to: privacy, compliance,information assurance, policy and standards security awareness,threat management, risk management, and incidentmanagement.
Financial ManagementFinancial Management serves to enhance and strengthenaccounting controls over all financial transactions of the agency.The responsibility of identifying, tracking, and reporting on thefinancial condition and results of agency operations is acooperative effort between the following divisions: Operations,Budget & Planning, Cash Management, Financial Reporting &Accounting, Revenue Administration, Support Services, andProcurement and Historically Underutilized Business programcoordination.
UNAUDITED
Annual Financial Report | 167
The Operations division oversees and supports theadministrative and daily needs of Financial Management. Theirmain objective is to ensure the program is operating in the mostefficient and productive manner possible. The division alsocoordinates security access for the agency's accounting systemand the Uniform Statewide Accounting System (USAS) for all GLOemployees. Additionally, they assist in integrating and improvingagency financial processes and systems.
The Budget & Planning division prepares and maintains theagency's operating budget and FTEs, employee leave and payroll,strategic plan, performance measures, fiscal notes, andlegislative appropriation requests. The division also responds toinquiries from the Legislative Budget Board (LBB), Office of theGovernor, Comptroller of Public Accounts and other entities.
The Cash Management division manages the receipt anddisbursement of cash by accurately and timely recording cashrelated transactions to the agency's accounting and procurementsystems. The division follows agency policy, accountingstandards, and federal and state laws and regulations including,but not limited to, the Prompt Payment Act, the three daydeposit rule, and the $50,000 deposit rule. The CashManagement division is also responsible for maintaining theagency’s capital, controlled, and inventoried asset records.
The Financial Reporting & Accounting division maintains theagency's general ledger in accordance with state and federalaccounting rules and regulations, ensures agency compliance toall Comptroller of Public Accounts (CPA) financial reportingrequirements, performs reconciliations to internal and externalsystems, manages the Uniform Statewide Accounting System(USAS) appropriations to ensure available funding for dailyoperations; assists all agency program areas with updates andinterpretations of Governmental Accounting Standards Board(GASB) rules and guidelines as needed, provides financialinformation to internal and external users, administers theagency's federal grant financial reports, and produces the AnnualReport of Non Financial Data and Unaudited Annual FinancialReport (AFR).
The Revenue Administration division performs the complianceand control functions necessary to ensure subsidiary andrevenue transactions are appropriately recorded in thesubsidiary and general ledger for accurate and completereporting. These areas of responsibility include monitoring TheAlamo financials, the internally managed real assets investmentportfolio, accounting for surface leasing receivables and mineralleasing royalty receivables. The division also assesses penalty andinterest for late production reports and late royalty payments.
The Support Services division provides a variety of services to theagency, including processing incoming and out bound mail,shipping and receiving, pickup and delivery services, officedesign, and modular furniture reconfiguration. The support
services staff also serves as the agency liaison fortelecommunications, facilities management, and fleetmanagement; manages the agency's warehouse space. TheStephen F. Austin building receptionist is also part of thisdivision.
The Procurement division is responsible for the agency'spurchasing and travel. The procurement department purchasesgoods and services for the agency. The procurement team makesbest value purchasing decisions based upon reasonableassessment of quality, service, competitive pricing, and technicalqualifications in accordance with federal and state laws, rules,and regulations. The travel office assists employees with travelarrangements and ensures compliance with state travelregulations.
The HUB Coordinator is responsible for the agency’s HistoricallyUnderutilized Business program.
Office of General CounselThe Office of General Counsel provides legal advice and counselto the Land Commissioner, School Land Board, Veterans' LandBoard, Coastal Land Advisory Board, Boards for Lease, and allagency divisions. The program consists of six practice groups:Coastal and Public Lands; Oil, Gas & Energy; Open Government;Litigation; General Law and Support Services.
The Coastal and Public Lands group provides advice regardingthe purchase and sale of land, land trades, commercial leases,surface leases, and general legal matters and issues relating tocoastal public lands. This group also advises agency clients onlegal issues regarding easements, boundary disputes, andenvironmental law matters involving hazardous substanceswhich may impact state lands, title disputes, VLB matters, andother legal issues concerning real property and coastal publiclands. The group also supports efforts related to protection ofthe public beach easement administration of the Open BeachesAct and the Dune Protection Act, coastal erosion response,natural resource damage assessment, the Texas CoastalManagement Program, oil spill prevention and response,alternative fuels, and wetlands mitigation banking.
The Oil, Gas & Energy group advises agency clients on issuesconcerning state ownership and leasing of oil, gas, and otherminerals, including lease maintenance, pooling, unitization, theRelinquishment Act, royalty payments, energy related surfaceuse easements and agreements, Railroad Commission matters,geochemical/geophysical permitting, mining, retail electricservice under the State Power Program, and natural gasmarketing.
The General Law group provides legal services for contracting,purchasing, open records, open meetings, rulemaking, ethics, theCommunity Development Block Grant Disaster RecoveryProgram, the Veterans Land Board, and general advice relating to
UNAUDITEDTexas General Land Office and Veterans' Land Board (305)
168 | Annual Financial Report

state and federal laws relevant to all program areas of the TexasGeneral Land Office.
The Support Services team provides administrative support forthe other teams. Clerical help, filing, travel assistance, andgeneral office management tasks are performed by the membersof the Support Services team.
Governmental RelationsThe Governmental Relations and Policy division facilitatescommunication between the General Land Office andgovernmental entities at the local, state and federal level. Thedivision monitors legislative issues before the Texas Legislatureand the United States Congress, as well as serving as the primaryagency interface with other elected and appointed officials,boards and commissions. The division provides information andanalysis to key decision makers on policy measures which mayaffect the GLO’s missions and performance.
The division also analyzes legislative proposals andcommunicates possible impacts to agency program areas andbudgets to legislative and executive offices at all levels ofgovernment. The division also provides information and trainingwith respect to fulfilling requests for information from officialsand staff and testifying before legislative bodies. The divisionworks closely with the executive team and the FinancialManagement division in the preparation of the biennialLegislative Appropriations Request (LAR) as well as otherbudgetary and performance measure reports.
Human ResourcesHuman Resources (HR) is responsible for providing humanresource management, leadership, expertise, and assistance forall GLO employees. Among its duties, HR:
posts agency job vacancies, attends job fairs to recruitdiverse and qualified applicants, reviews hiringrecommendations, and administers the agency’s internprograms;
conducts new hire orientation to familiarize newemployees with agency policies and procedures andverifies employment eligibility of new hires through theproper completion of the Form I 9 and examination ofemployees' identity documents, as required by federallaw;
supports the professional development of agencyemployees by providing training to enhance employees'skills, abilities, and leadership capacity;
administers all insurance and other employee relatedbenefits for the agency (including medical, dental, life, anddisability insurance and deferred compensation), conductsannual enrollment, and assists employees with benefitand coverage questions;
analyzes personnel action forms (PAFs) to ensure thatcompensation, classification, and FLSA issues areaddressed according to the law;
provides performance management assistance, includingreporting upcoming performance evaluation deadlines tohelp agency managers provide timely feedback;
reviews, updates, and maintains the agency policies andprocedures in the GLO Employee Handbook to make surethe Handbook is useful and in compliance with relevantlaws and regulations;
answers employee's questions about HR related policies,laws, and procedures and helps to resolve employeeissues;
coordinates leave administration, such as processingrequests under the Family and Medical Leave Act (FMLA)and applications for sick leave pool;
responds to inquiries from the Texas WorkforceCommission Human Rights division, Equal EmploymentOpportunity Commission, Department of Labor, andsimilar entities and represents the agency in hearingsregarding unemployment compensation benefits;
investigates complaints made under agency policy orapplicable law and reports findings to agencymanagement;
responds to reasonable accommodation requests underthe Americans with Disabilities Act;
maintains employee personnel files, confidential medicalinformation, and benefits records and responds tosubpoenas, requests for records, and employmentverifications;
prepares various reports regarding agency personnelinformation and statistics for internal, as well as forexternal, reporting needs;
coordinates employee safety program and training for theagency to ensure compliance with OSHA and otherregulations and limit agency liability; and
coordinates special projects for the agency, includingemployee recognition events such as the annual GLOservice awards recognition ceremony.
Because the law as it relates to the employer/employeerelationship is constantly changing, HR staff work to remaincurrent in their knowledge of all facets of human resourcesmanagement and responds appropriately.
Internal AuditInternal Audit improves agency operations through systematic,independent and objective evaluation of all Texas General LandOffice programs. Internal audit reports are provided to the landcommissioner, agency management, the Office of the Governor,
UNAUDITED
Annual Financial Report | 169
the Legislative Budget Board, the Sunset Advisory Commissionand the State Auditor's Office.
Investment ManagementThe Investment Management program area is responsible for allstrategic and tactical financial operations related to the financingmechanisms associated with the programs administered by theVeterans' Land Board of the State of Texas (VLB). Within thatconstruct, Investment Management plans and manages theissuance of all tax exempt and taxable bonds for the VLB andhedges associated interest rate risk by entering into interest rateswaps and other bond enhancement agreements. In addition, itoversees the financial operations of the VLB loan programs,including the certification and sale of GNMA pass throughmortgage backed securities in the secondary market. Investment
Management also manages the Veterans' Land Board investmentportfolio to maximize return and minimize risk, while ensuringthat programmatic liquidity and cash flow needs are satisfied.The program also ensures that the Veterans' Land Boardinvestment portfolio maintains compliance with federal arbitrageregulations. Also, the program negotiates contract terms ofmanagement and operations agreements with operators of theveterans homes in the David A. Gloier Texas State VeteransHome Program, and manages all aspects of the revenue bondsassociated with the financing of veterans homes, including cashflow projections, debt service coverage analyses, andrecommendations to the VLB concerning the structure ofresident room rates.
In addition, the program manages the portion of the PermanentSchool Fund (PSF) real assets investment portfolio that isallocated to externally managed real assets investment fundsand separate account managers. In this role, the program isresponsible for screening potential investments, performing duediligence in conjunction with the PSF's investment advisoryconsultant, scheduling and managing PSF Investment AdvisoryCommittee (IAC) meetings, presenting recommendations to theSchool Land Board (SLB), maintaining the PSF Real AssetsInvestment Policy Statement, managing the PSF's externalaccounting/custody/performance measurement entity,managing relationships with external investment fund managers,and preparing and presenting Quarterly Investment Reports tothe IAC and SLB.
The program also assists other General Land Office divisions andprogram areas with complex financial planning and analysis.
OmbudsmanThe Ombudsman Office provides a safe way for currentemployees, staff or management, of the Texas General LandOffice to raise questions, concerns, suggestions or ideasconfidentially, and without fear of retaliation. A principal interestof the office is to assist the agency and employees in the
facilitation of fair and equitable resolutions involving workplacedisputes and other matters. At least quarterly, the officeprovides executive management with general statisticalinformation about concerns or trends observed during theperiod. The office provides its services in a confidential,independent, impartial and informal manner.
Veterans' Land Board (VLB)The Veterans' Land Board is comprised of four divisions: theVeteran Land and Housing Program, the Veteran HomesProgram, the Veteran Cemeteries Program, and the Marketingand Outreach division.
VETERANS LAND AND HOUSING PROGRAMThe Veterans Land Board (VLB) fiscal 2017 reassessment of theexisting strategic plan in the context of current statewide marketconditions; loan operational capacity; and the fiscal 2017approved budget. Although, there are no dollar caps within VLBfund management authority for land loans there are capsimposed on the federal Qualified Veterans Mortgage Bondauthority ($250 million cap). As such, the leadership teamcontinued to promote a short term (less than five year)marketing strategy that would create demand for land loanswhile meeting demand for housing and home improvementloans. Subsequently, the team recommended to continue andthe Deputy Commissioner approved seven key teamperformance goals that continued to promote that approach.
The Loan Operations team receives, processes, originates, andcloses land and home improvement loan applications. Thedivision provides oversight as VLB liaison with CitiMortgage andits participating lenders. CitiMortgage is the Administrator andMaster Loan Servicer of the Home Loan program. CitiMortgagerecommends participating lenders; however, they are subject toVLB approval. The division acts as operational liaison betweenboth our land loan servicer, Dovenmuehle Mortgage Inc., andour Home Loan master servicer. They initially handle customercomplaints and inquiries, resolving issues on behalf of ourcustomers that involve our servicers. The Loan Operations teamreceives and tracts documents, performs minimal quality controlon documents and ensures documents are properly executed,notarized and returned to the servicers.
In addition, the team is also responsible for processing housingand home improvement loan releases of lien as well asdocuments related to land, housing and home improvementforeclosures. Loan Operations oversees Loss Mitigation servicesfor the land Contract for Deed program. This includes facilitatingpayment of back taxes payable on the sale of foreclosed landtracts, monitoring and handling accounts that are more than 120days delinquent, forfeited or ordered for sale (foreclosed). LoanOperations prepares and conducts quarterly online forfeited landsales and maintains the Type II Program which offers the publicthe opportunity to purchase foreclosed tracts not sold toveterans during forfeited land sales four times per year.
UNAUDITEDTexas General Land Office and Veterans' Land Board (305)
170 | Annual Financial Report
MARKETING PROGRAMThe team continued to apply more non traditional outreach andawareness tactics to reach more of today’s 1.7 million Texasveterans as a result of changing demographics and theavailability of new technology. As such, the VLB expanded theemployment of social media in combination with traditionalmedia to inform not just the honorably discharged Veteran asour market customer but now included in our market focus andcalculations those active, reserve and national guard militarymembers as equally important constituencies.
The Texas Veterans Land Board (VLB) debuted its new VLBMobile Benefits Center in fiscal 2017. This new state of the artRV travels across Texas helping the VLB staff spread the word toTexas veterans about the benefits and services they have earnedby serving their country. Among the services the Mobile BenefitsCenter provides is information assistance applying for lowinterest land, home and home improvement loans.
Although paid advertising was crucial for the VLB to reach abroader market audience, other key supporting and lessexpensive marketing initiatives were important inclusions in thedevelopment of a broad, deep and comprehensive market plan.The supporting initiatives included: Enhancement and promotionof the VLB website; testing the effectiveness of using tailoredland loan promotions; conducting joint Veterans Benefit Fairswith the U.S. Department of Veterans Affairs (VA) and TexasVeterans Commission (TVC); encouraging and recognizingintergovernmental outreach and awareness partnerships withthe VA, TVC, and County Veterans Service Offices; and arecognition initiative to encourage outreach and awarenesssupport for VLB programs from the real estate industry.
The Marketing/Customer Service division develops andimplements the VLB marketing communications strategy to meetVLB goals. Responsible for managing non traditional and paidmedia efforts, media relations, outreach activities and businessdevelopment initiatives, the division also responds to inquiriesabout the VLB, TVC and VA programs, benefits and services. Bylegislative decree, the VLB and the TVC established a joint callservice center to support Texas veterans and military members.The statewide, toll free call service center is actively staffed from7:30 a.m. to 5:30 p.m. on weekdays, with an ongoing response tocallers who leave inquiries after hours on weekends/holidays.
The division maintains and updates the VLB Web site and theVLB blog; oversees VLB's social media activities; manages textmessaging; and email marketing initiatives. Additionally, thedivision maintains veteran, lender, and real estate agentdatabases to provide support for marketing activities.
The Administration division provides executive leadership,resources and support for the operation of the Veteran's Landand Housing Program. This division acts as a liaison between theVeterans Land Board and Veterans or Military organizations, and
develops new initiatives dealing with veterans' issues concerns,and benefits. Additionally, the division acts as liaison betweenthe board, CitiMortgage Inc. (administrator of the HousingAssistance and Home Improvement Loan Programs),Dovenmuehle Mortgage, Inc. (servicer of the Land Program), andthe lending industries. The division also monitors, mediates, andresolves customer questions/complaints regarding lenders,realtors, origination issues or inquiries about the VLB, TVC, andU. S. Department of Veterans Affairs programs, benefits, andservices.
VETERANS HOMES PROGRAMThe Deputy Director of the Texas State Veterans Homes Program(TSVH), along with the Program Administrator and staff overseesthe operation of long term skilled care nursing homes inAmarillo, Floresville, Temple, Big Spring, Bonham, El Paso,McAllen, and Tyler. Also, a new veterans nursing home located inHouston is currently under construction. The total licensedcapacity of the eight homes is 1,152 residents comprised ofVeterans, their spouses, and Gold Star Parents. The DeputyDirector also oversees the planning process for additionalhomes. TSVH provides public information about the Texas StateVeterans Home Program to communities, hospitals, veterans'organizations, and other interested persons and groupsthroughout the state of Texas.
A professional long term health care company under contractwith the board operates each home. Each home also relies onvery close cooperation with a nearby Veterans AdministrationMedical Center to meet specific health care needs of the Veteranresidents admitted to each home. The division also acts as aliaison between the contracted operators and the residents tomaintain the necessary close cooperative relationship betweenthe Veterans' Land Board and the United States Department ofVeterans Affairs.
VETERANS CEMETERY PROGRAMThe Deputy Director for TSVC oversees the operation of thecemetery program created to meet the burial needs of Texasveterans. The program currently operates a state veterans'cemetery in Killeen, Mission, Abilene and Corpus Christi. The fourcemeteries have a combined capacity for 137,000 internments.
UNAUDITED
Annual Financial Report | 171
ALAMO ENDOWMENT The Alamo Endowment is a private, nonprofit Texas corporationorganized for charitable and educational purposes. It assists theGeneral Land Office in the preservation, management,education, maintenance, operation and restoration of the AlamoComplex. The Board of Directors is comprised of citizen membersappointed by the land commissioner, who serves as Chairman.The members of the board at August 31, 2017 were:
MemberEsperanza "Hope" Andrade
Ramona BassFrancisco G. Cigarroa, M.D.
James D. (Jim) DannenbaumRed McCombsLew Moorman
Nancy PerotAmbassador Jeanne Phillips
William Eugene (Gene) PowellWelcome W. Wilson, Jr.
UNAUDITEDTexas General Land Office and Veterans' Land Board (305)
172 | Annual Financial Report

The Texas General Land Office does not discriminate on the basis of race, color, national origin, sex, sexual orientation, religion, age, or disability in employment or the provision of services. To request an accessible format, contact us through RELAY Texas at 1-800-735-2989 (TDD), or mail your request to 1700 North Congress Avenue, Austin, Texas, 78701-1495. Additional information about the Texas General Land Office can be found at our Internet address, www.glo.texas.gov.