30 September 2020 Semi-Annual Report, including Unaudited ...
67
Société d’investissement à Capital Variable Luxembourg RCS Luxembourg B 151 275 ASIA FIXED INCOME STRATEGIES Asia Total Return Bond Fund Asia Credit Opportunities Fund ASIA GROWTH AND INCOME STRATEGIES Asia Dividend Fund Asia ex Japan Dividend Fund China Dividend Fund ASIA GROWTH STRATEGIES Pacific Tiger Fund China Fund India Fund Japan Fund ASIA SMALL COMPANY STRATEGIES Asia Small Companies Fund China Small Companies Fund '20 Matthews Asia Funds | 30 September 2020 Semi-Annual Report, including Unaudited Financial Statements
-
Upload
khangminh22 -
Category
Documents
-
view
0 -
download
0
Transcript of 30 September 2020 Semi-Annual Report, including Unaudited ...

Société d’investissement à Capital VariableLuxembourgRCS Luxembourg B 151 275
ASIA FIXED INCOME STRATEGIES
Asia Total Return Bond Fund
Asia Credit Opportunities Fund
ASIA GROWTH AND INCOME STRATEGIES
Asia Dividend Fund
Asia ex Japan Dividend Fund
China Dividend Fund
ASIA GROWTH STRATEGIES
Pacific Tiger Fund
China Fund
India Fund
Japan Fund
ASIA SMALL COMPANY STRATEGIES
Asia Small Companies Fund
China Small Companies Fund'20
Matthews Asia Funds | 30 September 2020
Semi-Annual Report, including Unaudited Financial Statements

Special Notice to Hong Kong InvestorsPlease note that the Annual Report, including audited financial statements and unaudited Semi Annual Report are global documents and therefore also contain information concerning the Asia Total Return Bond Fund * and the Asia Credit Opportunities Fund, which are not authorized in Hong Kong and are not available to the public in Hong Kong, as well as information concerning certain share classes which are also not available to the public in Hong Kong.
The Hong Kong Offering Document of the Matthews Asia Funds (which comprises the Prospectus, Supplement for Hong Kong Investors, and Product Key Facts Statements), the latest annual reports, including audited financial statements, and unaudited semi-annual reports are available free of charge from the Hong Kong Representative (contact details are provided below).
Brown Brothers Harriman (Hong Kong) Limited13/F Man Yee Building68 Des Voeux Road CentralHong KongPhone: +852 3756 1755
Please note that the website mentioned in the Annual Report, including audited financial statements, and unaudited Semi Annual Report has not been reviewed by the Securities and Futures Commission and may contain information in respect of funds which are not authorized in Hong Kong and may not be offered to the public in Hong Kong.
* The Fund’s name changed from Matthews Asia Strategic Income Fund to Matthews Asia Total Return Bond Fund on 25 May 2020.

General InformationMatthews International Capital Management, LLC (“Matthews”), formed under the laws of Delaware and regulated by the U.S. Securities and Exchange Com-mission, acts as Investment Manager to the Matthews Asia Funds (the “Fund”). Matthews believes in the long-term growth of Asia. Since Matthews was founded in 1991 by Paul Matthews, the firm has focused its efforts and exper-tise within the Asian region, investing through a variety of market environ-ments. As an independent, privately owned firm, Matthews is the largest dedicated Asia investment specialist in the United States.
The Fund has an “umbrella” structure comprising a number of separate sub-funds. As at the closing date, 11 Sub-Funds were available for investment: Asia Total Return Bond Fund *, Asia Credit Opportunities Fund, Asia Dividend Fund, Asia ex Japan Dividend Fund, China Dividend Fund, Pacific Tiger Fund, China Fund, India Fund, Japan Fund, Asia Small Companies Fund and China Small Companies Fund (each a “Sub-Fund,” and together the “Sub-Funds”). This report covers the period from 1 April 2020 to 30 September 2020. The last day on which official prices were calculated was 30 September 2020. The figures presented in the financial statements are as at that date.
The annual general meeting of Shareholders will be held in accordance with the Articles of Incorporation, the law of 17 December 2010 relating to under-takings for collective investment, and the law of 10 August 1915 on commercial companies (together referred to as the “Luxembourg Laws”). Notices of all general meetings will be published to the extent required by Luxembourg Laws in RESA (Recueil Electronique des Sociétés et Associations), and in such other newspaper as the Board of Directors of the Fund shall determine and will be sent to the Shareholders of registered Shares in accordance with Luxembourg Laws to their addresses shown on the register of Shareholders. Such notices should include the agenda and will specify the time and place of the meeting and the conditions of admission. They will also refer to the rules of quorum and majorities required by Luxembourg Laws.
Each Share confers the right to one vote. The vote on the payment of a divi-dend on a particular Class requires a separate majority vote from the meeting of Shareholders of the Class concerned. Any change in the Articles of Incorpora-tion affecting the rights of a Sub-Fund must be approved by a resolution of both the Shareholders at the general meeting of the Fund and the Shareholders of the Sub-Fund concerned.
Annual reports, including audited financial statements shall be published within four months following the end of the accounting year and unaudited semi-annual reports shall be published within two months following the period to which they refer. The annual reports, including audited financial statements and the unaudited semi-annual reports shall be made available at the registered office of the Fund during ordinary office hours.
The Fund’s accounting year ends on 31 March each year.
The Base Currency of the Fund is U.S. dollars (USD). The aforesaid reports will comprise combined financial statements of the Fund expressed in USD as well as individual information on each Sub-Fund expressed in the Base Currency of each Sub-Fund.
Shares have not been registered under the United States Securities Act of 1933, as amended, nor the Investment Companies Act of 1940, as amended, and may not be offered directly or indirectly in the United States of America (including its territories and possessions) to nationals or residents thereof or to persons normally resident therein, or to any partnership or persons connected thereto unless pursuant to any applicable statute, rule or interpretation available under United States Law.
The Board of Directors of the Fund confirms adherence to the ALFI Code of Conduct for Luxembourg investment funds.
* The Fund’s name changed from Matthews Asia Strategic Income Fund to Matthews Asia Total Return Bond Fund on 25 May 2020.

This page intentionally left blank.

global.matthewsasia.com 1
Contents
Management and Administration 2
Other Information 3
Investment Manager’s Report 4
Schedules of Investments:
ASIA FIXED INCOME STRATEGIESAsia Total Return Bond Fund * 6Asia Credit Opportunities Fund 9
ASIA GROWTH AND INCOME STRATEGIESAsia Dividend Fund 11Asia ex Japan Dividend Fund 13China Dividend Fund 15
ASIA GROWTH STRATEGIESPacific Tiger Fund 18China Fund 20India Fund 23Japan Fund 26
ASIA SMALL COMPANY STRATEGIESAsia Small Companies Fund 29China Small Companies Fund 31
Statement of Assets and Liabilities 34
Statement of Operations and Changes in Net Assets 37
Statement of Changes in Number of Shares 40
Statement of Net Asset Value (NAV) Per Share and Net Asset Statistics 45
Notes to Financial Statements 49
Performance and Expenses 58
Securities Financing Transactions Regulation 61
Disclosures and Index Definitions 62
* The Fund’s name changed from Matthews Asia Strategic Income Fund to Matthews Asia Total Return Bond Fund on 25 May 2020.
Cover photo: Asian Palace.
This report does not constitute or form part of any offer of shares or an invitation to subscribe for shares of the Funds. Subscriptions are to be made on the basis of the Key Investor Information Documents (KIIDs) accompanied by the current full prospectus, and supplemented by the latest Annual Report, including Audited Financial Statements, or the most recent unaudited Semi-Annual Report.
The views and opinions in this report were current as at 30 September 2020. They are not guarantees of performance or investment results and should not be taken as investment advice. Investment decisions reflect a variety of factors, and the managers reserve the right to change their views about individual stocks, sectors and the markets at any time. As a result, the views expressed should not be relied upon as a forecast of a Fund’s future investment intent.
The subject matter contained herein has been derived from several sources believed to be reliable and accurate at the time of compilation. Matthews does not accept any liability for losses either direct or consequential caused by the use of this information.
The most current Key Investor Information Documents, full prospectus, and most recent unaudited Semi-Annual Report and Annual Report, including Audited Financial Statements for the Fund, can be found at global.matthewsasia.com. Please read the Key Investor Information Documents and current full prospectus carefully before investing.
In Singapore, this document is available to, and intended for Institutional Investors under Section 304 of the SFA (Securities and Futures Act), and to Relevant Persons pursuant to section 305 of the SFA, as those terms are used under the SFA.

2 MATTHEWS ASIA FUNDS
Matthews Asia Funds
Management and Administration
BOARD OF DIRECTORS OF THE FUNDChairmanWilliam J. Hackett, Chief Executive OfficerMatthews International Capital Management, LLCFour Embarcadero Center, Suite 550San Francisco, CA 94111, United States of America
DirectorsHanna Esmee Duer, Independent Director31, Rue Henri VII, L-1725 Luxembourg (from 1 October 2020)Grand Duchy of Luxembourg
Richard Goddard, Independent DirectorThe Directors’ Office, S.A.19, rue de Bitbourg, L-1273 LuxembourgGrand Duchy of Luxembourg
John P. McGowan, Head of Fund AdministrationMatthews International Capital Management, LLCFour Embarcadero Center, Suite 550 San Francisco, CA 94111, United States of America
Jonathan Schuman, Head of Global Business DevelopmentMatthews International Capital Management, LLCFour Embarcadero Center, Suite 550San Francisco, CA 94111, United States of America
MANAGEMENT COMPANY (from 4 November 2019) 1
Carne Global Fund Managers (Luxembourg) S.A.6B, route de TrèvesL-2633 SenningerbergGrand Duchy of Luxembourg
BOARD OF DIRECTORS OF THE MANAGEMENT COMPANYWilliam BlackwellJohn AlldisJohn DonohoeDavid McGowan (appointed on 29 April 2020)Veronica Buffoni (appointed on 13 October 2020)Martin Dobbins (appointed on 13 October 2020)
INVESTMENT MANAGER AND GLOBAL DISTRIBUTORMatthews International Capital Management, LLCFour Embarcadero Center, Suite 550San Francisco, CA 94111, United States of America
SUB-INVESTMENT ADVISORMatthews Global Investors (Singapore) Pte. Ltd. 10 Collyer Quay #23-06Ocean Financial CentreSingapore
SUB-INVESTMENT MANAGER (since 25 May 2020)Matthews Global Investors (Hong Kong) Ltd.Suite 3602Two Pacific Place88 QueenswayAdmiralty, Hong Kong
DEPOSITARY, ADMINISTRATIVE AGENT, DOMICILIARY AGENT, REGISTRAR AND TRANSFER AGENT AND PAYING AGENTBrown Brothers Harriman (Luxembourg) S.C.A. 80, route d’Esch L-1470 Luxembourg Grand Duchy of Luxembourg
CABINET DE REVISION AGREEDeloitte Audit Société à responsabilité limitée20, Boulevard de Kockelscheuer L-1821 LuxembourgGrand Duchy of Luxembourg
LEGAL ADVISORArendt & Medernach S.A. 41A, avenue J.F. KennedyL-2082 LuxembourgGrand Duchy of Luxembourg
REGISTERED OFFICEBrown Brothers Harriman (Luxembourg) S.C.A. 80, route d’Esch L-1470 Luxembourg Grand Duchy of Luxembourg
1 Effective 1 July 2020 the entities address changed to 3, rue Jean Piret, L-2350 Luxembourg, Grand Duchy of Luxembourg.

global.matthewsasia.com 3
Matthews Asia Funds
Other Information
THE PAYING AND INFORMATION AGENT IN AUSTRIAErste Bank AM Belvedere 11100 ViennaAustria
CENTRALIZING CORRESPONDENT AND PAYING AGENT IN FRANCECACEIS Bank France1-3 Place ValhubertF-75013 ParisFrance
PAYING AND INFORMATION AGENT IN GERMANYBNP Paribas Securities Services S.C.A.ZweigniederlassungEuropa-Allee 12D-60327 Frankfurt am MainGermany
THE FACILITIES AGENT IN IRELANDMaples Fund Services (Ireland) Limited32 Molesworth Street Dublin 2Ireland
REPRESENTATIVE IN SPAINAllfunds Bank S.A.C/ Estafeta 6, La Moraleja28109 AlcobendasMadridSpain
PAYING AND INFORMATION AGENT IN SWEDEN MFEX Mutual Funds Exchange ABGrev Turegatan 19, Box 5378SE-102 49 StockholmSweden
FACILITIES AND INFORMATION AGENT IN UNITED KINGDOMBNP Paribas Securities Services10 Harewood AvenueLondon, NW1 6AAUnited Kingdom
REPRESENTATIVE IN SWITZERLAND1741 Fund Solutions AGBurggraben 16 CH-9000 St. Gallen Switzerland
PAYING AGENT IN SWITZERLAND Tellco AG Bahnhofstrasse 4 6430 Schwyz Switzerland

4 MATTHEWS ASIA FUNDS
If you had told me everything that would happen in politics and the global economy over the last nine months, I would have bet heavily on a bear mar-ket. At the beginning of the year, I was using my experience with Swine Flu and SARS as a guide; I was not overly concerned about COVID-19. That turned out to be wrong, as far as the properties of the virus were concerned and in terms of the success or failure of government policy to combat it. However, the markets have not punished my misplaced optimism. Indeed, being wrong on the facts has led me to being more right than wrong on the markets, but for totally the wrong reasons—so how and why have markets performed so well, given that the real world is doing so badly?
In the U.S., it’s partly because long bond yields collapsed, which helps sup-port valuations; indeed it propels valuations to startling levels in some stocks. It’s also partly because people, living more virtual lives, ascribed more value to more virtual companies. And, I suspect, partly because bored at home, they resorted to day trading and momentum trading so that some part of the rise in the market was superficial to say the least. The truth of this latter conjecture appears to be borne out by the fact that once stimulus was withdrawn, savings fell, yields rose and the momentum came out of the equity market.
In China, the markets have also celebrated a strong year so far. However, this success is perhaps more due to the success in controlling the virus’ spread. There may be controversy around China’s numbers but, in our view, China has more experience with virus outbreaks and reacted to COVID-19 in a more disciplined manner. Using the experience of SARS and Swine Flu as a guide to action has actually been quite useful and China’s economy has revived to something closely resembling normality. I am tempted to there-fore start my expectations of the next 12 months in China with my expecta-tions as they were in late 2019—a moderate reflationary environment is likely to support faster earnings per share growth. China looks well placed.
In other parts of Asia, though, we have seen countries such as Japan, who have had great success against the virus but whose equity markets have not done quite as well as China. Perhaps this is due to the fact that Japan has had several years of stronger earnings growth relative to GDP and the cycle may be getting a bit old. Nevertheless, we were still able to find strong per-formance among the smaller companies. And there are countries such as India, who have struggled with the virus and whose markets have been less buoyant than the rest of the world, but nevertheless appear to have done far better than could reasonably have been expected. All of this leads me to sus-pect that many investors have been quick to write off 2020, to see through it to a more normal life in 2021. They have been patient, given the low yields on offer to fearful money.
Across our strategies, the weightings in China have risen markedly. This may in part be due to outperformance but is also because we generally see better fundamental backing for current valuations in China than we do in the rest of the region and the rest of the world. Because of this fundamental backing, Chinese equities seem less prone to possible disappointment surrounding any return to normality than markets in the U.S., Europe, or other parts of Asia.
Not yet fully convinced of China’s underlying strength perhaps, interna-tional investors have only recently moved back into Chinese equities. I sus-pect that the overall environment was not conducive to looking outside the home country—both in terms of fear over the world’s problems and excite-ment over the momentum in popular tech stocks. It may also have been because of concerns about U.S. – China relations and the potential for increased tension during the U.S. election in November. Now, however,
Investment Manager’s Report

global.matthewsasia.com 5
investors appear to be accepting that whatever the outcome of the election, tensions are likely to lessen due to either a decrease in rhetoric or a contain-ment policy more focused on issues of democracy and human rights. The direct impact on businesses, both U.S. and Chinese, may therefore be less extreme. Economics seems to be exerting its natural dominance over politics once again.
Which leaves us with the question of how the health care and tech sectors might behave given their strong run-up and the degree of speculation in these stocks. Well, first I note that the degree of speculation is likely greater in the U.S., given the lower yields and the fiscal and monetary stimulus. Sec-ond, is the fact that one person’s speculation is another’s risk-taking. It seems that many of the new companies in Asia are beneficiaries of structural changes that may be enduring. For example, China enjoys a more virtual everyday life more easily and naturally compared to the U.S. as China leap-frogs technologies and accepts mobile platforms, for example, more quickly. Or in health care, where new companies in China offer real innovation com-pared to the cheap generic manufacturing of the past. So, whereas there may be speculation, there will be long-term winners, too. It’s a hard balance to strike but we devote much of our resources to endeavor the right balance and to identify secular growth companies rather than will-o’-the-wisps.
That is where our focus remains: on the companies. It’s been a year domi-nated by macro. However, at least in the case of this investor, macro would have been a poor guide to correct decisions and good outcomes. Our team of investors continues to concentrate on the businesses and the people who run them. We may have had to stretch our imagination about the possible futures of many of these businesses, but we always try to relate that imagina-tion to the concrete facts about successful business models that we see all around us. We are excited for the further evolution of Asia’s markets and ready for the challenge of navigating them.
Robert J. Horrocks, PhD Chief Investment Officer Matthews International Capital Management, LLC
The figures stated in the report are historical and not necessarily indicative of future performance.
Investment Manager’s Report (continued)

6 MATTHEWS ASIA FUNDS
Asia Total Return Bond Fund* 30 September 2020
Schedule of Investments
Transferable securities and money market instruments admitted to an official exchange listing
BONDS
Investments Currency Quantity/ Nominal Value
Market Value USD
% of Net Assets
CHINA/HONG KONG
Wanda Properties International Co., Ltd., 7.250%, 01/29/2024 USD 2,666,000 2,649,338 4.55
CIFI Holdings Group Co., Ltd., 6.700%, 04/23/2022 CNH 15,000,000 2,249,972 3.87
KWG Group Holdings, Ltd., 5.875%, 11/10/2024 USD 2,200,000 2,142,250 3.68
Franshion Brilliant, Ltd., 5.750%, 12/29/2049 USD 1,900,000 1,788,375 3.07
Logan Property Holdings, Ltd., 5.250%, 02/23/2023 USD 1,700,000 1,685,125 2.89
Times China Holdings, Ltd., 6.200%, 03/22/2026 USD 1,500,000 1,470,000 2.53
China Cinda Asset Management Co., Ltd., 3.9%, 03/05/2030 CNY 10,000,000 1,446,050 2.49
CITIC Telecom International Finance, Ltd., 6.100%, 03/05/2025 USD 807,000 851,385 1.46
CIFI Holdings Group Co., Ltd., 6.550%, 03/28/2024 USD 800,000 822,000 1.41
KWG Group Holdings, Ltd., 7.875%, 09/01/2023 USD 800,000 818,000 1.41
Sino-Ocean Land Treasure III, Ltd., 4.900%, 12/29/2049 USD 800,000 666,000 1.15
Honghua Group, Ltd., 6.375%, 08/01/2022 USD 650,000 645,938 1.11
17,234,433 29.62
SINGAPORE
ABJA Investment Co. Pte, Ltd., 5.450%, 01/24/2028 USD 1,891,000 1,829,542 3.15
Indika Energy Capital III Pte, Ltd., 5.875%, 11/09/2024 USD 1,700,000 1,519,375 2.61
Jollibee Worldwide Pte, Ltd., 3.900%, 12/29/2049 USD 951,000 839,258 1.44
4,188,175 7.20
Investments Currency Quantity/ Nominal Value
Market Value USD
% of Net Assets
INDONESIA
Indonesia Treasury Bond, 7.000%, 05/15/2027 IDR 30,000,000,000 2,077,823 3.57
Indonesia Treasury Bond, 9.000%, 03/15/2029 IDR 13,000,000,000 985,746 1.69
Indonesia Treasury Bond, 8.375%, 04/15/2039 IDR 9,000,000,000 643,427 1.11
3,706,996 6.37
MAURITIUS
Network i2i, Ltd., 5.650%, 12/29/2049 USD 3,400,000 3,383,000 5.81
3,383,000 5.81
PHILIPPINES
Philippine Government International Bond, 3.900%, 11/26/2022 PHP 77,000,000 1,617,446 2.78
Philippine Government International Bond, 4.950%, 01/15/2021 PHP 70,000,000 1,444,530 2.48
Philippine Government International Bond, 6.250%, 01/14/2036 PHP 10,000,000 263,917 0.46
3,325,893 5.72
NETHERLANDS
PB International BV, 7.625%, 01/26/2022 USD 3,000,000 2,572,500 4.42
Royal Capital BV, 4.875%, 12/29/2049 USD 337,000 335,736 0.58
2,908,236 5.00
THAILAND
Thailand Government Bond, 2.875%, 12/17/2028 THB 45,000,000 1,602,340 2.75
Thailand Government Bond, 1.600%, 12/17/2029 THB 40,000,000 1,292,153 2.22
2,894,493 4.97
VIETNAM
Debt & Asset Trading Corp., 1.000%, 10/10/2025 USD 3,550,000 2,840,000 4.88
2,840,000 4.88
The accompanying notes form an integral part of these financial statements.
* The Fund’s name changed from Matthews Asia Strategic Income Fund to Matthews Asia Total Return Bond Fund on 25 May 2020.

global.matthewsasia.com 7
BONDS (CONTINUED)
Investments Currency Quantity/ Nominal Value
Market Value USD
% of Net Assets
INDIA
Tata Motors, Ltd., 5.875%, 05/20/2025 USD 1,100,000 1,111,000 1.91
1,111,000 1.91
UNITED KINGDOM
ICICI Bank UK PLC, 5.375%, 09/26/2028 SGD 1,000,000 739,941 1.27
739,941 1.27
GERMANY
Deutsche Bank AG, 3.671%, 04/10/2025 CNH 1,000,000 129,229 0.22
129,229 0.22
TOTAL BONDS 42,461,396 72.97
CONVERTIBLE BONDS
CHINA/HONG KONG
Luye Pharma Group, Ltd., Cnv., 1.500%, 07/09/2024 USD 2,600,000 2,542,488 4.37
Bosideng International Holdings, Ltd., Cnv., 1.000%, 12/17/2024 USD 2,800,000 2,446,500 4.20
Poseidon Finance 1, Ltd., Cnv., 0.00%, 02/01/2025 USD 2,000,000 1,904,240 3.27
6,893,228 11.84
TOTAL CONVERTIBLE BONDS 6,893,228 11.84
TOTAL TRANSFERABLE SECURITIES AND MONEY MARKET INSTRUMENTS ADMITTED TO AN OFFICIAL EXCHANGE LISTING 49,354,624 84.81
Transferable securities and money market instruments dealt in on another regulated market
BONDS
Investments Currency Quantity/ Nominal Value
Market Value USD
% of Net Assets
MALAYSIA
Malaysia Government Bond, 4.642%, 11/07/2033 MYR 7,400,000 2,065,945 3.55
Malaysia Government Bond, 3.478%, 06/14/2024 MYR 2,700,000 679,649 1.17
Malaysia Government Investment Issue, 4.119%, 11/30/2034 MYR 2,500,000 663,211 1.14
Malaysia Government Investment Issue, 3.422%, 09/30/2027 MYR 2,000,000 513,426 0.88
3,922,231 6.74
CHINA/HONG KONG
King Talent Management, Ltd., 5.600%, 12/29/2049 USD 2,600,000 2,281,500 3.92
2,281,500 3.92
NETHERLANDS
Syngenta Finance NV, 5.182%, 04/24/2028 USD 1,550,000 1,696,134 2.91
Syngenta Finance NV, 5.676%, 04/24/2048 USD 200,000 215,000 0.37
1,911,134 3.28
TOTAL BONDS 8,114,865 13.94
TOTAL TRANSFERABLE SECURITIES AND MONEY MARKET INSTRUMENTS DEALT IN ON ANOTHER REGULATED MARKET 8,114,865 13.94
TOTAL INVESTMENTS 57,469,489 98.75
CASH AND OTHER ASSETS, LESS LIABILITIES 727,457 1.25
TOTAL NET ASSETS 58,196,946 100.00
Asia Total Return Bond Fund 30 September 2020
Schedule of Investments (continued)
The accompanying notes form an integral part of these financial statements.

8 MATTHEWS ASIA FUNDS
Country Allocation % of Net Assets
China/Hong Kong 45.38Netherlands 8.28Singapore 7.20Malaysia 6.74Indonesia 6.37Mauritius 5.81Philippines 5.72Thailand 4.97Vietnam 4.88India 1.91United Kingdom 1.27Germany 0.22
Total Investments 98.75
Cash and Other Assets, Less Liabilities 1.25
Total 100.00
The following table represents movements in the portfolio holdings:
Country Allocation
% of Net Assets as at
30 September 2020
% of Net Assets as at
31 March 2020
TRANSFERABLE SECURITIES AND MONEY MARKET INSTRUMENTS ADMITTED TO AN OFFICIAL EXCHANGE LISTING 84.81 82.56
BONDS 72.97 74.80
China/Hong Kong 29.62 33.21Singapure 7.20 6.26Indonesia 6.37 8.00Mauritius 5.81 4.74Philippines 5.72 4.13Netherlands 5.00 4.78Thailand 4.97 4.92Vietnam 4.88 4.92India 1.91 -United Kingdom 1.27 1.21Germany 0.22 0.23Sir Lanka - 2.40
CONVERTIBLE BONDS 11.84 7.76
China/Hong Kong 11.84 7.76
TRANSFERABLE SECURITIES AND MONEY MARKET INSTRUMENTS DEALT IN ON ANOTHER REGULATED MARKET 13.94 11.59
BONDS 13.94 7.86
Malaysia 6.74 5.53China/Hong Kong 3.92 2.33Netherlands 3.28 -
CONVERTIBLE BONDS - 3.73
China/Hong Kong - 3.73
Total Investments 98.75 94.15
Cash and Other Assets, Less Liabilities 1.25 5.85
Total 100.00 100.00
Asia Total Return Bond Fund 30 September 2020
Schedule of Investments (continued)
The accompanying notes form an integral part of these financial statements.

global.matthewsasia.com 9
Asia Credit Opportunities Fund 30 September 2020
Schedule of Investments
Transferable securities and money market instruments admitted to an official exchange listing
BONDS
Investments Currency Quantity/ Nominal Value
Market Value USD
% of Net Assets
CHINA/HONG KONG
Wanda Properties International Co., Ltd., 7.250%, 01/29/2024 USD 1,150,000 1,142,812 5.34
Logan Property Holdings, Ltd., 5.250%, 02/23/2023 USD 1,050,000 1,040,813 4.87
Honghua Group, Ltd., 6.375%, 08/01/2022 USD 1,000,000 993,750 4.65
Franshion Brilliant, Ltd., 5.750%, 12/29/2049 USD 950,000 894,188 4.18
KWG Group Holdings, Ltd., 5.875%, 11/10/2024 USD 800,000 779,000 3.64
Sino-Ocean Land Treasure III, Ltd., 4.900%, 12/29/2049 USD 900,000 749,250 3.50
CIFI Holdings Group Co., Ltd., 6.550%, 03/28/2024 USD 623,000 640,132 2.99
Times China Holdings, Ltd., 6.750%, 07/08/2025 USD 200,000 202,500 0.95
6,442,445 30.12
SINGAPORE
ABJA Investment Co. Pte, Ltd., 5.450%, 01/24/2028 USD 1,100,000 1,064,250 4.97
Indika Energy Capital III Pte, Ltd., 5.875%, 11/09/2024 USD 1,150,000 1,027,813 4.80
Theta Capital Pte, Ltd., 6.750%, 10/31/2026 USD 700,000 553,000 2.59
Jollibee Worldwide Pte, Ltd., 3.900%, 12/29/2049 USD 264,000 232,980 1.09
2,878,043 13.45
VIETNAM
Debt & Asset Trading Corp., 1.000%, 10/10/2025 USD 1,270,000 1,016,000 4.75
Socialist Republic of Vietnam, 5.500%, 03/12/2028 USD 550,000 543,543 2.54
1,559,543 7.29
NETHERLANDS
PB International BV, 7.625%, 01/26/2022 USD 1,100,000 943,250 4.41
Royal Capital BV, 4.875%, 12/29/2049 USD 537,000 534,986 2.50
1,478,236 6.91
Investments Currency Quantity/ Nominal Value
Market Value USD
% of Net Assets
MAURITIUS
Network i2i, Ltd., 5.650%, 12/29/2049 USD 1,200,000 1,194,000 5.58
1,194,000 5.58
INDIA
Tata Motors, Ltd., 5.875%, 05/20/2025 USD 1,000,000 1,010,000 4.72
1,010,000 4.72
INDONESIA
Adaro Indonesia PT, 4.250%, 10/31/2024 USD 500,000 486,875 2.28
PT Sri Rejeki Isman , 7.250%, 01/16/2025 USD 400,000 391,500 1.83
878,375 4.11
TOTAL BONDS 15,440,642 72.18
CONVERTIBLE BONDS
CHINA/HONG KONG
Bosideng International Holdings, Ltd., Cnv., 1.000%, 12/17/2024 USD 1,100,000 961,125 4.49
Luye Pharma Group, Ltd., Cnv., 1.500%, 07/09/2024 USD 950,000 928,986 4.34
Poseidon Finance 1, Ltd., Cnv., 0.000%, 02/01/2025 USD 900,000 856,908 4.01
2,747,019 12.84
TOTAL CONVERTIBLE BONDS 2,747,019 12.84
TOTAL TRANSFERABLE SECURITIES AND MONEY MARKET INSTRUMENTS ADMITTED TO AN OFFICIAL EXCHANGE LISTING 18,187,661 85.02
The accompanying notes form an integral part of these financial statements.

10 MATTHEWS ASIA FUNDS
Asia Credit Opportunities Fund 30 September 2020
Schedule of Investments (continued)
Transferable securities and money market instruments dealt in on another regulated market
BONDS
Investments Currency Quantity/ Nominal Value
Market Value USD
% of Net Assets
NETHERLANDS
Syngenta Finance NV, 5.676%, 04/24/2048 USD 700,000 752,500 3.51
Syngenta Finance NV, 5.182%, 04/24/2028 USD 250,000 273,570 1.28
1,026,070 4.79
CHINA/HONG KONG
King Talent Management, Ltd., 5.600%, 12/29/2049 USD 850,000 745,875 3.49
745,875 3.49
TOTAL BONDS 1,771,945 8.28
CONVERTIBLE BONDS
CHINA/HONG KONG
Baozun, Inc., Cnv., 1.625%, 05/01/2024 USD 500,000 453,970 2.12
453,970 2.12
TOTAL CONVERTIBLE BONDS 453,970 2.12
TOTAL TRANSFERABLE SECURITIES AND MONEY MARKET INSTRUMENTS DEALT IN ON ANOTHER REGULATED MARKET 2,225,915 10.40
TOTAL INVESTMENTS 20,413,576 95.42
CASH AND OTHER ASSETS, LESS LIABILITIES 979,755 4.58
TOTAL NET ASSETS 21,393,331 100.00
Country Allocation % of Net Assets
China/Hong Kong 48.57Singapore 13.45Netherlands 11.70Vietnam 7.29Mauritius 5.58India 4.72Indonesia 4.11
Total Investments 95.42
Cash and Other Assets, Less Liabilities 4.58
Total 100.00
The following table represents movements in the portfolio holdings:
Country Allocation
% of Net Assets as at
30 September 2020
% of Net Assets as at
31 March 2020
TRANSFERABLE SECURITIES AND MONEY MARKET INSTRUMENTS ADMITTED TO AN OFFICIAL EXCHANGE LISTING 85.02 90.11
BONDS 72.18 81.67
China/Hong Kong 30.12 38.31Singapore 13.45 15.09Vietnam 7.29 7.89Netherlands 6.91 8.36Mauritius 5.58 4.81India 4.72 -Indonesia 4.11 -Pakistan - 3.81Sir Lanka - 3.40
CONVERTIBLE BONDS 12.84 8.44
China/Hong Kong 12.84 8.44
TRANSFERABLE SECURITIES AND MONEY MARKET INSTRUMENTS DEALT IN ON ANOTHER REGULATED MARKET 10.40 7.48
BONDS 8.28 4.06
Netherlands 4.79 -China/Hong Kong 3.49 4.06
CONVERTIBLE BONDS 2.12 3.42
China/Hong Kong 2.12 3.42
Total Investments 95.42 97.59
Cash and Other Assets, Less Liabilities 4.58 2.41
Total 100.00 100.00
The accompanying notes form an integral part of these financial statements.

global.matthewsasia.com 11
Asia Dividend Fund 30 September 2020
Schedule of Investments
The accompanying notes form an integral part of these financial statements.
Transferable securities and money market instruments admitted to an official exchange listing
EQUITIES
Investments Quantity/ Nominal Value
Market Value USD
% of Net Assets
JAPAN
Anritsu Corp. 251,800 5,715,526 2.99Katitas Co., Ltd. 188,600 5,308,573 2.77Hoya Corp. 45,000 5,054,563 2.64MISUMI Group, Inc. 172,000 4,786,834 2.50Bandai Namco Holdings, Inc. 61,300 4,464,494 2.33LIXIL Group Corp. 213,400 4,270,769 2.23Nintendo Co., Ltd. 7,300 4,128,463 2.16Bell System24 Holdings, Inc. 228,800 3,827,685 2.00Pigeon Corp. 82,900 3,690,091 1.93Daifuku Co., Ltd. 32,700 3,280,598 1.71Disco Corp. 12,900 3,113,020 1.63Dai-ichi Life Holdings, Inc. 215,900 3,034,862 1.59TDK Corp. 27,600 2,989,002 1.56Oriental Land Co., Ltd. 20,000 2,792,305 1.46Shiseido Co., Ltd. 48,200 2,757,705 1.44MANI, Inc. 96,300 2,614,490 1.37Mitsubishi Pencil Co., Ltd. 109,200 1,418,976 0.74
63,247,956 33.05
CHINA/HONG KONG
Minth Group, Ltd. 2,750,000 11,940,091 6.24Chongqing Brewery Co., Ltd.
A Shares 407,313 6,171,355 3.23Zhongsheng Group Holdings,
Ltd. 731,500 4,574,435 2.39China International Travel Service
Corp., Ltd. A Shares 125,600 4,113,262 2.15HKBN, Ltd. 2,121,635 4,035,135 2.11Tencent Holdings, Ltd. 59,000 3,900,026 2.04Shenzhou International Group
Holdings, Ltd. 215,300 3,625,304 1.89China Education Group Holdings,
Ltd. 1,955,000 3,584,431 1.87China Resources Land, Ltd. 716,000 3,229,990 1.69Pharmaron Beijing Co., Ltd.
A Shares 195,000 2,976,946 1.56Wuliangye Yibin Co., Ltd.
A Shares 90,670 2,943,298 1.54Gree Electric Appliances, Inc. of
Zhuhai A Shares 372,046 2,911,963 1.52Yuexiu Transport Infrastructure,
Ltd. 4,722,000 2,744,295 1.43China East Education Holdings,
Ltd. 1,260,000 2,729,772 1.43Pharmaron Beijing Co., Ltd.
H Shares 82,000 1,019,954 0.5360,500,257 31.62
Investments Quantity/ Nominal Value
Market Value USD
% of Net Assets
SOUTH KOREA
LG Chem, Ltd., Pfd. 24,082 6,517,681 3.41Hyundai Mobis Co., Ltd. 19,622 3,832,312 2.00Samsung Electronics Co., Ltd.,
Pfd. 75,832 3,249,679 1.70Samsung Electronics Co., Ltd. 40,044 1,977,517 1.03
15,577,189 8.14
AUSTRALIA
Breville Group, Ltd. 335,107 6,037,996 3.16Sydney Airport 765,642 3,200,714 1.67Macquarie Group, Ltd. 35,458 3,030,172 1.58QBE Insurance Group, Ltd. 436,791 2,691,359 1.41
14,960,241 7.82
SINGAPORE
Keppel DC, REIT 1,791,001 3,801,611 1.99NetLink NBN Trust 4,245,700 3,020,143 1.58BOC Aviation, Ltd. 439,900 2,993,871 1.56Ascendas India Trust 2,650,500 2,651,177 1.38
12,466,802 6.51
TAIWAN
Taiwan Semiconductor Manufacturing Co., Ltd. ADR 53,139 4,256,440 2.22
Taiwan Semiconductor Manufacturing Co., Ltd. 213,000 3,192,400 1.67
Cathay Financial Holding Co., Ltd. 2,096,000 2,795,797 1.46
10,244,637 5.35
INDIA
Minda Industries, Ltd. 636,352 2,853,148 1.49Reliance Industries, Ltd. 76,718 2,323,324 1.22
5,176,472 2.71
PHILIPPINES
Globe Telecom, Inc. 82,910 3,559,859 1.863,559,859 1.86
BANGLADESH
GrameenPhone, Ltd. 602,309 2,343,347 1.222,343,347 1.22

12 MATTHEWS ASIA FUNDS
Asia Dividend Fund 30 September 2020
Schedule of Investments (continued)
EQUITIES (CONTINUED)
Investments Quantity/ Nominal Value
Market Value USD
% of Net Assets
THAILAND
Thai Beverage Public Co., Ltd. 2,629,400 1,159,898 0.611,159,898 0.61
TOTAL EQUITIES 189,236,658 98.89
TOTAL TRANSFERABLE SECURITIES AND MONEY MARKET INSTRUMENTS ADMITTED TO AN OFFICIAL EXCHANGE LISTING 189,236,658 98.89
TOTAL INVESTMENTS 189,236,658 98.89
CASH AND OTHER ASSETS, LESS LIABILITIES 2,122,676 1.11
TOTAL NET ASSETS 191,359,334 100.00
A Shares: Shares traded through the Shanghai-Hong Kong and/or Shenzhen- Hong Kong Stock Connect programs
ADR: American Depositary Receipt
H Shares: Mainland China companies listed on the Stock Exchange of Hong Kong but incorporated in mainland China
Pfd: Preferred shares
REIT: Real Estate Investment Trust
Country Allocation % of Net Assets
Japan 33.05China/Hong Kong 31.62South Korea 8.14Australia 7.82Singapore 6.51Taiwan 5.35India 2.71Philippines 1.86Bangladesh 1.22Thailand 0.61
Total Investments 98.89
Cash and Other Assets, Less Liabilities 1.11
Total 100.00
The following table represents movements in the portfolio holdings:
% of Net Assets as at
30 September 2020
% of Net Assets as at
31 March 2020
TRANSFERABLE SECURITIES AND MONEY MARKET INSTRUMENTS ADMITTED TO AN OFFICIAL EXCHANGE LISTING 98.89 97.68
EQUITIES 98.89 97.68
Japan 33.05 32.34China/Hong Kong 31.62 34.89South Korea 8.14 8.73Austalia 7.82 1.91Singapore 6.51 5.76Taiwan 5.35 5.27India 2.71 1.98Philippines 1.86 2.02Bangladesh 1.22 1.26Thailand 0.61 1.62Indonesia - 1.28Vietnam - 0.62
Total Investments 98.89 97.68
Cash and Other Assets, Less Liabilities 1.11 2.32
Total 100.00 100.00
The accompanying notes form an integral part of these financial statements.

global.matthewsasia.com 13
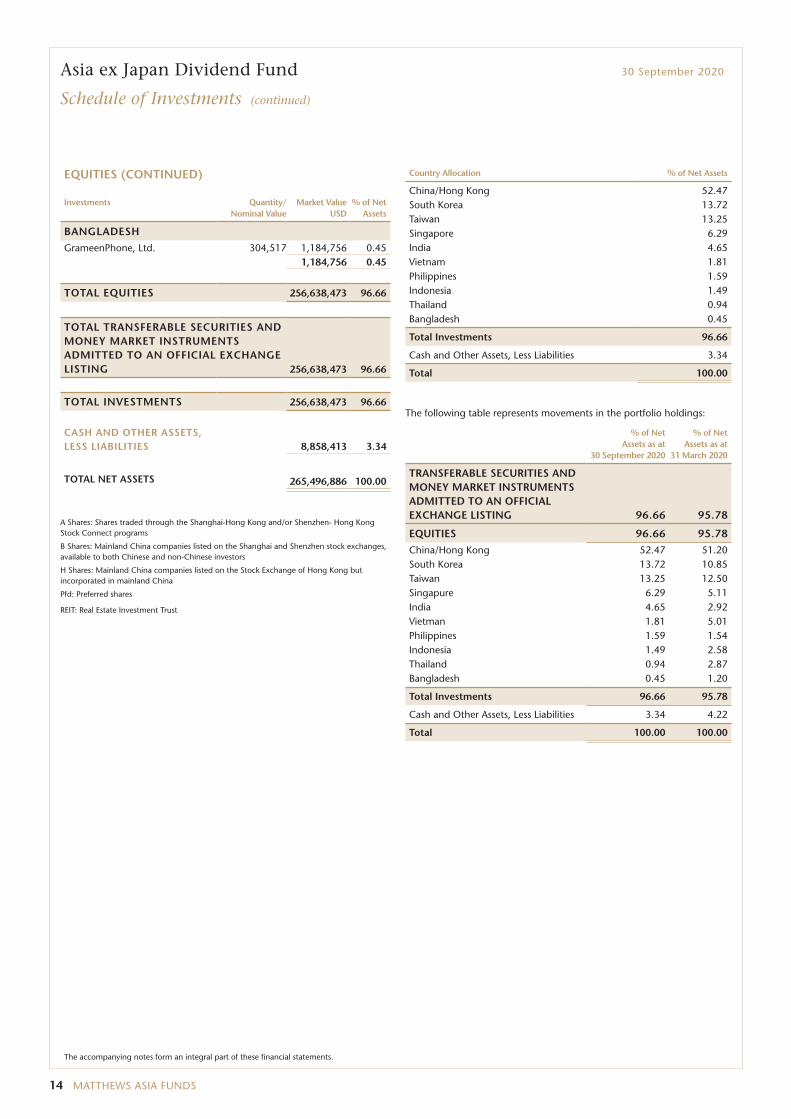
Asia ex Japan Dividend Fund 30 September 2020
Schedule of Investments
Transferable securities and money market instruments admitted to an official exchange listing
EQUITIES
Investments Quantity/ Nominal Value
Market Value USD
% of Net Assets
CHINA/HONG KONG
Tencent Holdings, Ltd. 216,500 14,311,114 5.39China International Travel Service
Corp., Ltd. A Shares 243,151 7,962,927 3.00Pharmaron Beijing Co., Ltd.
H Shares 505,000 6,281,427 2.37Hong Kong Exchanges &
Clearing, Ltd. 125,200 5,850,248 2.20Minth Group, Ltd. 1,230,000 5,340,477 2.01Li Ning Co., Ltd. 1,135,500 5,286,805 1.99AIA Group, Ltd. 529,200 5,185,657 1.95Bafang Electric Suzhou Co., Ltd.
A Shares 217,523 5,074,602 1.91SITC International Holdings Co.,
Ltd. 3,648,000 5,036,496 1.90Shanghai Baosight Software Co.,
Ltd. B Shares 1,417,786 4,983,518 1.88Chongqing Brewery Co., Ltd.
A Shares 316,706 4,797,301 1.81Powerlong Commercial
Management Holdings, Ltd. 1,426,000 4,779,435 1.80Leader Harmonious Drive
Systems Co., Ltd. A Shares 436,284 4,762,828 1.79Kingdee International Software
Group Co., Ltd. 1,836,000 4,737,973 1.79Ginlong Technologies Co., Ltd.
A Shares 256,630 4,447,485 1.68NetEase, Inc. 245,200 4,362,894 1.64Zhongsheng Group Holdings,
Ltd. 688,000 4,302,407 1.62Hainan Meilan International
Airport Co., Ltd. H Shares 758,000 4,254,498 1.60Zhejiang HangKe Technology,
Inc. Co. A Shares 552,600 4,206,206 1.58Yuexiu Transport Infrastructure,
Ltd. 7,208,000 4,189,090 1.58Hope Education Group Co., Ltd. 13,682,000 4,187,539 1.58HKBN, Ltd. 2,178,000 4,142,335 1.56AK Medical Holdings, Ltd. 1,618,000 4,132,599 1.56Shanghai Kindly Medical
Instruments Co., Ltd. H Shares 676,000 4,099,533 1.54China Resources Land, Ltd. 896,000 4,041,998 1.52Wuliangye Yibin Co., Ltd.
A Shares 123,500 4,009,014 1.51Gree Electric Appliances, Inc. of
Zhuhai A Shares 496,700 3,887,616 1.46Neusoft Education Technology
Co., Ltd. 843,200 660,403 0.25139,314,425 52.47
Investments Quantity/ Nominal Value
Market Value USD
% of Net Assets
SOUTH KOREA
LG Chem, Ltd. 14,960 8,286,231 3.12Hugel, Inc. 38,098 5,935,938 2.24KINX, Inc. 71,354 5,356,888 2.02LEENO Industrial, Inc. 42,187 4,419,041 1.66Samsung Electronics Co., Ltd. 86,371 4,265,312 1.61Samsung Electronics Co., Ltd.,
Pfd. 97,214 4,165,976 1.57Koh Young Technology, Inc. 52,276 3,989,583 1.50
36,418,969 13.72
TAIWAN
Taiwan Semiconductor Manufacturing Co., Ltd. 829,000 12,424,880 4.68
MediaTek, Inc. 282,000 5,919,280 2.23Cathay Financial Holding Co.,
Ltd. 3,987,000 5,318,149 2.00Poya International Co., Ltd. 228,000 4,348,479 1.64Chief Telecom, Inc. 330,000 3,925,316 1.48Accton Technology Corp. 423,000 3,255,399 1.22
35,191,503 13.25
SINGAPORE
BOC Aviation, Ltd. 685,600 4,666,055 1.76NetLink NBN Trust 5,694,600 4,050,806 1.52SATS, Ltd. 1,956,200 4,042,653 1.52Keppel DC, REIT 1,862,112 3,952,553 1.49
16,712,067 6.29
INDIA
Reliance Industries, Ltd. 136,426 4,131,518 1.56HDFC Bank, Ltd. 281,372 4,113,416 1.55Maruti Suzuki India, Ltd. 44,713 4,086,743 1.54
12,331,677 4.65
VIETNAM
Nam Long Investment Corp. 2,688,308 2,986,809 1.12FPT Corp. 720,176 1,555,199 0.59Mobile World Investment Corp. 59,253 266,761 0.10
4,808,769 1.81
PHILIPPINES
Globe Telecom, Inc. 98,280 4,219,792 1.594,219,792 1.59
INDONESIA
PT Bank Rakyat Indonesia Persero 19,295,100 3,948,313 1.493,948,313 1.49
THAILAND
Thai Beverage Public Co., Ltd. 5,685,900 2,508,202 0.942,508,202 0.94
The accompanying notes form an integral part of these financial statements.
14 MATTHEWS ASIA FUNDS
Asia ex Japan Dividend Fund 30 September 2020
Schedule of Investments (continued)
EQUITIES (CONTINUED)
Investments Quantity/ Nominal Value
Market Value USD
% of Net Assets
BANGLADESH
GrameenPhone, Ltd. 304,517 1,184,756 0.451,184,756 0.45
TOTAL EQUITIES 256,638,473 96.66
TOTAL TRANSFERABLE SECURITIES AND MONEY MARKET INSTRUMENTS ADMITTED TO AN OFFICIAL EXCHANGE LISTING 256,638,473 96.66
TOTAL INVESTMENTS 256,638,473 96.66
CASH AND OTHER ASSETS, LESS LIABILITIES 8,858,413 3.34
TOTAL NET ASSETS 265,496,886 100.00
A Shares: Shares traded through the Shanghai-Hong Kong and/or Shenzhen- Hong Kong Stock Connect programs
B Shares: Mainland China companies listed on the Shanghai and Shenzhen stock exchanges, available to both Chinese and non-Chinese investors
H Shares: Mainland China companies listed on the Stock Exchange of Hong Kong but incorporated in mainland China
Pfd: Preferred shares
REIT: Real Estate Investment Trust
Country Allocation % of Net Assets
China/Hong Kong 52.47South Korea 13.72Taiwan 13.25Singapore 6.29India 4.65Vietnam 1.81Philippines 1.59Indonesia 1.49Thailand 0.94Bangladesh 0.45
Total Investments 96.66
Cash and Other Assets, Less Liabilities 3.34
Total 100.00
The following table represents movements in the portfolio holdings:
% of Net Assets as at
30 September 2020
% of Net Assets as at
31 March 2020
TRANSFERABLE SECURITIES AND MONEY MARKET INSTRUMENTS ADMITTED TO AN OFFICIAL EXCHANGE LISTING 96.66 95.78
EQUITIES 96.66 95.78
China/Hong Kong 52.47 51.20South Korea 13.72 10.85Taiwan 13.25 12.50Singapure 6.29 5.11India 4.65 2.92Vietman 1.81 5.01Philippines 1.59 1.54Indonesia 1.49 2.58Thailand 0.94 2.87Bangladesh 0.45 1.20
Total Investments 96.66 95.78
Cash and Other Assets, Less Liabilities 3.34 4.22
Total 100.00 100.00
The accompanying notes form an integral part of these financial statements.

global.matthewsasia.com 15
China Dividend Fund 30 September 2020
Schedule of Investments
Transferable securities and money market instruments admitted to an official exchange listing
EQUITIES
Investments Quantity/ Nominal Value
Market Value USD
% of Net Assets
COMMUNICATION SERVICES
Diversified Telecommunication ServicesHKBN, Ltd. 260,758 495,935 2.90CITIC Telecom International
Holdings, Ltd. 1,442,000 459,736 2.69China Tower Corp., Ltd. H Shares 2,210,000 382,800 2.24
1,338,471 7.83
Interactive Media & ServicesTencent Holdings, Ltd. 19,900 1,315,433 7.69
1,315,433 7.69
EntertainmentNetEase, Inc. ADR 1,100 494,065 2.89BAIOO Family Interactive, Ltd. 1,198,000 166,944 0.97Cathay Media And Education
Group, Inc. 184,697 110,577 0.65771,586 4.51
Total Communication Services 3,425,490 20.03
CONSUMER DISCRETIONARY
Diversified Consumer ServicesChina Education Group Holdings,
Ltd. 260,000 476,702 2.79Hope Education Group Co., Ltd. 1,114,000 340,953 1.99
817,655 4.78
Specialty RetailZhongsheng Group Holdings, Ltd. 74,500 465,886 2.72Topsports International Holdings,
Ltd. 237,000 327,905 1.92793,791 4.64
Auto ComponentsMinth Group, Ltd. 118,000 512,338 2.99
512,338 2.99
Household DurablesGree Electric Appliances, Inc. of
Zhuhai A Shares 58,700 459,438 2.69459,438 2.69
Leisure ProductsBafang Electric Suzhou Co., Ltd.
A Shares 7,600 177,301 1.04177,301 1.04
Textiles, Apparel & Luxury GoodsNan Liu Enterprise Co., Ltd. 20,000 161,936 0.95
161,936 0.95
Consumer Discretionary ServicesNeusoft Education Technology
Co., Ltd. 164,000 128,447 0.75128,447 0.75
Hotels, Restaurants & LeisureShanghai Jin Jiang International
Hotels Group Co., Ltd. H Shares 66,000 10,313 0.0610,313 0.06
Total Consumer Discretionary 3,061,219 17.90
Investments Quantity/ Nominal Value
Market Value USD
% of Net Assets
INDUSTRIALS
MachineryShanghai Mechanical & Electrical
Industry Co., Ltd. B Shares 246,334 302,142 1.76Leader Harmonious Drive
Systems Co., Ltd. A Shares 15,800 172,485 1.01Guangzhou Guangri Stock Co.,
Ltd. A Shares 113,300 128,160 0.75602,787 3.52
MarineSITC International Holdings Co.,
Ltd. 360,000 497,023 2.91497,023 2.91
Transportation InfrastructureHainan Meilan International
Airport Co., Ltd. H Shares 43,000 241,350 1.41Guangdong Provincial
Expressway Development Co., Ltd. B Shares 314,871 166,574 0.97
407,924 2.38
Trading Companies & DistributorsBOC Aviation, Ltd. 50,900 346,415 2.03
346,415 2.03
Total Industrials 1,854,149 10.84
INFORMATION TECHNOLOGY
SoftwareShanghai Baosight Software Co.,
Ltd. B Shares 208,555 733,071 4.28Kingdee International Software
Group Co., Ltd. 86,000 221,931 1.30955,002 5.58
Semiconductors & Semiconductor EquipmentMediaTek, Inc. 20,000 419,807 2.46
419,807 2.46
Communications EquipmentAccton Technology Corp. 39,000 300,143 1.76
300,143 1.76
Total Information Technology 1,674,952 9.80
FINANCIALS
Capital MarketsChina International Capital Corp.,
Ltd. H Shares 251,200 579,630 3.39China Everbright, Ltd. 238,000 317,906 1.86
897,536 5.25
InsurancePing An Insurance Group Co. of
China, Ltd. H Shares 30,500 313,084 1.83313,084 1.83
Total Financials 1,210,620 7.08
The accompanying notes form an integral part of these financial statements.

16 MATTHEWS ASIA FUNDS
China Dividend Fund 30 September 2020
Schedule of Investments (continued)
EQUITIES (CONTINUED)
Investments Quantity/ Nominal Value
Market Value USD
% of Net Assets
HEALTH CARE
PharmaceuticalsLivzon Pharmaceutical Group,
Inc. H Shares 113,100 517,101 3.02517,101 3.02
Life Sciences Tools & ServicesPharmaron Beijing Co., Ltd.
H Shares 39,600 492,564 2.88492,564 2.88
Total Health Care 1,009,665 5.90
REAL ESTATE
Real Estate Management & DevelopmentPowerlong Commercial
Management Holdings, Ltd. 151,000 506,097 2.96KWG Property Holding, Ltd. 293,000 500,924 2.93
1,007,021 5.89
Total Real Estate 1,007,021 5.89
CONSUMER STAPLES
BeveragesTsingtao Brewery Co., Ltd.
H Shares 64,000 521,451 3.05521,451 3.05
Food ProductsWH Group, Ltd. 567,000 459,934 2.69
459,934 2.69
Total Consumer Staples 981,385 5.74
MATERIALS
Construction MaterialsHuaxin Cement Co., Ltd.
B Shares 231,836 525,711 3.07525,711 3.07
Containers & PackagingGreatview Aseptic Packaging Co.,
Ltd. 711,000 273,386 1.60273,386 1.60
Total Materials 799,097 4.67
ENERGY
Oil, Gas & Consumable FuelsChina Suntien Green Energy
Corp., Ltd. H Shares 1,683,000 434,489 2.54China Petroleum & Chemical
Corp. H Shares 740,000 297,234 1.74731,723 4.28
Total Energy 731,723 4.28
Investments Quantity/ Nominal Value
Market Value USD
% of Net Assets
UTILITIES
Gas UtilitiesKunlun Energy Co., Ltd. 470,000 308,302 1.80
308,302 1.80
Total Utilities 308,302 1.80
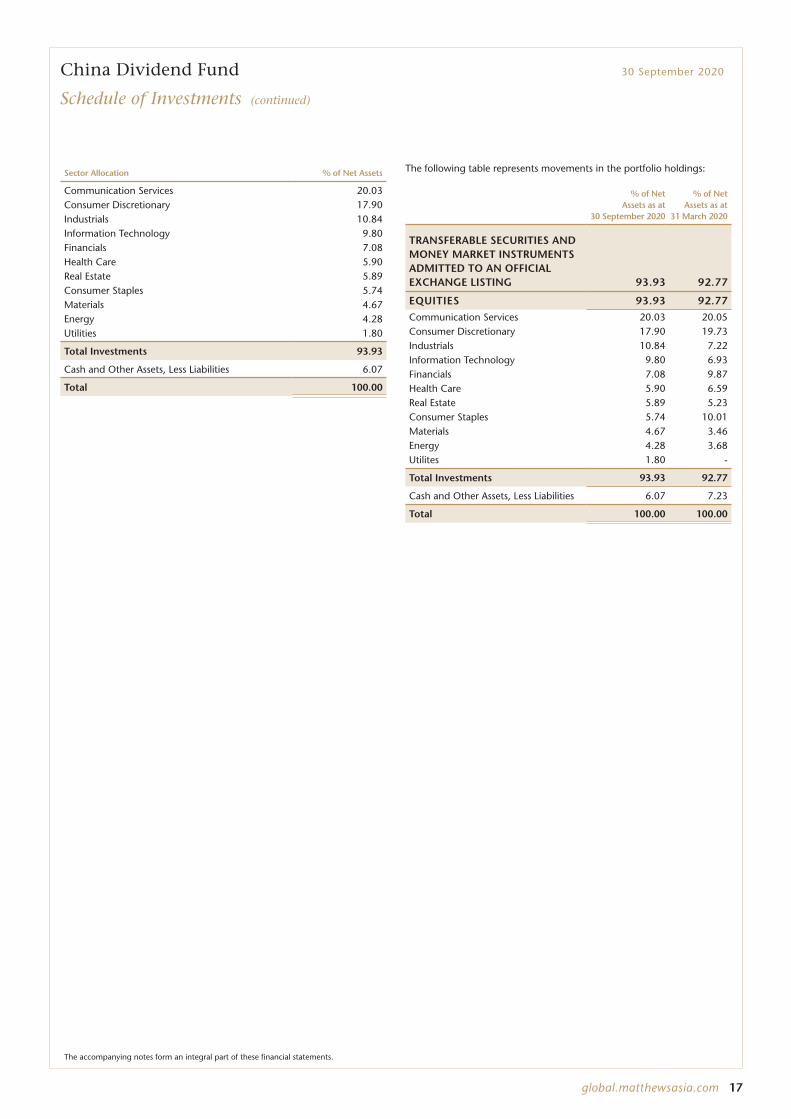
TOTAL EQUITIES 16,063,623 93.93
TOTAL TRANSFERABLE SECURITIES AND MONEY MARKET INSTRUMENTS ADMITTED TO AN OFFICIAL EXCHANGE LISTING 16,063,623 93.93
TOTAL INVESTMENTS 16,063,623 93.93
CASH AND OTHER ASSETS, LESS LIABILITIES 1,037,571 6.07
TOTAL NET ASSETS 17,101,194 100.00
A Shares: Shares traded through the Shanghai-Hong Kong and/or Shenzhen- Hong Kong Stock Connect programs
ADR: American Depositary Receipt
B Shares: Mainland China companies listed on the Shanghai and Shenzhen stock exchanges, available to both Chinese and non-Chinese investors
H Shares: Mainland China companies listed on the Stock Exchange of Hong Kong but incorporated in mainland China
The accompanying notes form an integral part of these financial statements.
global.matthewsasia.com 17
China Dividend Fund 30 September 2020
Schedule of Investments (continued)
Sector Allocation % of Net Assets
Communication Services 20.03Consumer Discretionary 17.90Industrials 10.84Information Technology 9.80Financials 7.08Health Care 5.90Real Estate 5.89Consumer Staples 5.74Materials 4.67Energy 4.28Utilities 1.80
Total Investments 93.93
Cash and Other Assets, Less Liabilities 6.07
Total 100.00
The following table represents movements in the portfolio holdings:
% of Net Assets as at
30 September 2020
% of Net Assets as at
31 March 2020
TRANSFERABLE SECURITIES AND MONEY MARKET INSTRUMENTS ADMITTED TO AN OFFICIAL EXCHANGE LISTING 93.93 92.77
EQUITIES 93.93 92.77
Communication Services 20.03 20.05Consumer Discretionary 17.90 19.73Industrials 10.84 7.22Information Technology 9.80 6.93Financials 7.08 9.87Health Care 5.90 6.59Real Estate 5.89 5.23Consumer Staples 5.74 10.01Materials 4.67 3.46Energy 4.28 3.68Utilites 1.80 -
Total Investments 93.93 92.77
Cash and Other Assets, Less Liabilities 6.07 7.23
Total 100.00 100.00
The accompanying notes form an integral part of these financial statements.

18 MATTHEWS ASIA FUNDS
Pacific Tiger Fund 30 September 2020
Schedule of Investments
Transferable securities and money market instruments admitted to an official exchange listing
EQUITIES
Investments Quantity/ Nominal Value
Market Value USD
% of Net Assets
CHINA/HONG KONG
Alibaba Group Holding, Ltd. 915,572 32,644,994 7.09Tencent Holdings, Ltd. 438,900 29,012,230 6.30AIA Group, Ltd. 1,580,800 15,490,336 3.36Hong Kong Exchanges &
Clearing, Ltd. 314,200 14,681,694 3.19Wuxi Biologics Cayman, Inc. 541,500 13,177,409 2.86China Resources Beer Holdings
Co., Ltd. 2,141,086 13,114,285 2.85China Resources Land, Ltd. 2,861,111 12,906,926 2.80Inner Mongolia Yili Industrial
Group Co., Ltd. A Shares 1,993,175 11,265,849 2.45Midea Group Co., Ltd. A Shares 933,300 9,948,623 2.16Kweichow Moutai Co., Ltd.
A Shares 39,420 9,657,252 2.10Alibaba Group Holding, Ltd. ADR 32,969 9,097,922 1.97ENN Energy Holdings, Ltd. 763,100 8,310,244 1.80Weichai Power Co., Ltd. A Shares 3,429,200 7,606,395 1.65China International Travel Service
Corp., Ltd. A Shares 227,599 7,453,616 1.62Jiangsu Hengrui Medicine Co.,
Ltd. A Shares 550,728 7,266,546 1.58Topsports International Holdings,
Ltd. 5,168,000 7,150,270 1.55Ping An Insurance Group Co. of
China, Ltd. H Shares 674,000 6,918,655 1.50Kingdee International Software
Group Co., Ltd. 2,338,000 6,033,432 1.31Tencent Music Entertainment
Group ADR 388,400 5,767,793 1.25China East Education Holdings,
Ltd. 2,499,000 5,414,047 1.17CITIC Securities Co., Ltd.
H Shares 1,631,500 3,633,634 0.79Shenzhen New Industries
Biomedical Engineering Co., Ltd. A Shares 80,000 1,958,712 0.43
Ming Yuan Cloud Group Holdings, Ltd. 269,000 1,006,561 0.22
TravelSky Technology, Ltd. H Shares 421,000 898,980 0.19
240,416,405 52.19
SOUTH KOREA
Samsung Electronics Co., Ltd. 481,095 23,758,207 5.16Naver Corp. 56,438 14,241,845 3.09LG Chem, Ltd. 16,910 9,366,321 2.03LEENO Industrial, Inc. 46,508 4,871,661 1.06Koh Young Technology, Inc. 45,000 3,434,295 0.75NCSoft Corp. 3,707 2,546,594 0.55
58,218,923 12.64
Investments Quantity/ Nominal Value
Market Value USD
% of Net Assets
TAIWAN
Taiwan Semiconductor Manufacturing Co., Ltd. 1,490,000 22,331,811 4.85
MediaTek, Inc. 455,000 9,550,611 2.07Realtek Semiconductor Corp. 678,000 8,636,000 1.87President Chain Store Corp. 781,000 7,096,964 1.54Delta Electronics, Inc. 541,032 3,534,066 0.77ASMedia Technology, Inc. 70,000 3,525,820 0.77
54,675,272 11.87
INDIA
Housing Development Finance Corp., Ltd. 305,252 7,199,156 1.56
Dabur India, Ltd. 976,162 6,754,941 1.47Titan Co., Ltd. 401,899 6,544,068 1.42The Tata Power Co., Ltd. 8,476,908 6,123,871 1.33Kotak Mahindra Bank, Ltd. 322,016 5,535,114 1.20Tata Consultancy Services, Ltd. 142,473 4,812,760 1.05Crompton Greaves Consumer
Electricals, Ltd. 1,173,643 4,650,509 1.01PI Industries, Ltd. 120,645 3,223,795 0.70Container Corp. of India, Ltd. 441,293 2,182,839 0.47Info Edge India, Ltd. 40,640 2,002,090 0.43PVR, Ltd. 110,000 1,808,783 0.39
50,837,926 11.03
INDONESIA
PT Bank Central Asia 3,986,600 7,266,386 1.58PT Indofood CBP Sukses Makmur 5,654,100 3,830,422 0.83PT Mitra Keluarga Karyasehat 19,177,200 3,158,316 0.68
14,255,124 3.09
THAILAND
Central Pattana Public Co., Ltd. F Shares 5,432,100 7,285,657 1.58
7,285,657 1.58
PHILIPPINES
SM Prime Holdings, Inc. 10,492,875 6,368,764 1.386,368,764 1.38
VIETNAM
Vietnam Dairy Products JSC 1,235,078 5,808,756 1.265,808,756 1.26
UNITED STATES
Yum China Holdings, Inc. 110,100 5,646,493 1.235,646,493 1.23
SINGAPORE
Venture Corp., Ltd. 264,300 3,714,699 0.80SATS, Ltd. 730,500 1,509,640 0.33
5,224,339 1.13
The accompanying notes form an integral part of these financial statements.

global.matthewsasia.com 19
Pacific Tiger Fund 30 September 2020
Schedule of Investments (continued)
EQUITIES (CONTINUED)
Investments Quantity/ Nominal Value
Market Value USD
% of Net Assets
MALAYSIA
IHH Healthcare BHD 3,910,900 4,893,919 1.064,893,919 1.06
SWITZERLAND
DKSH Holding AG 39,658 2,774,233 0.602,774,233 0.60
TOTAL EQUITIES 456,405,811 99.06
TOTAL TRANSFERABLE SECURITIES AND MONEY MARKET INSTRUMENTS ADMITTED TO AN OFFICIAL EXCHANGE LISTING 456,405,811 99.06
TOTAL INVESTMENTS 456,405,811 99.06
CASH AND OTHER ASSETS, LESS LIABILITIES 4,335,048 0.94
TOTAL NET ASSETS 460,740,859 100.00
A Shares: Shares traded through the Shanghai-Hong Kong and/or Shenzhen- Hong Kong Stock Connect programs
ADR: American Depositary Receipt
BHD: Berhad
F Shares: Foreign Shares
H Shares: Mainland China companies listed on the Stock Exchange of Hong Kong but incorporated in mainland China
Country Allocation % of Net Assets
China/Hong Kong 52.19South Korea 12.64Taiwan 11.87India 11.03Indonesia 3.09Thailand 1.58Philippines 1.38Vietnam 1.26United States 1.23Singapore 1.13Malaysia 1.06Switzerland 0.60
Total Investments 99.06
Cash and Other Assets, Less Liabilities 0.94
Total 100.00
The following table represents movements in the portfolio holdings:
% of Net Assets as at
30 September 2020
% of Net Assets as at
31 March 2020
TRANSFERABLE SECURITIES AND MONEY MARKET INSTRUMENTS ADMITTED TO AN OFFICIAL EXCHANGE LISTING 99.06 97.45
EQUITIES 99.06 97.45
China/Hong Kong 52.19 50.59South Korea 12.64 12.26Taiwan 11.87 5.15India 11.03 11.87Indonesia 3.09 6.67Thailand 1.58 1.71Philippines 1.38 3.23Vietnam 1.26 1.41United States 1.23 1.04Singapore 1.13 0.00Malaysia 1.06 1.61Switzerland 0.60 1.91
Total Investments 99.06 97.45
Cash and Other Assets, Less Liabilities 0.94 2.55
Total 100.00 100.00
The accompanying notes form an integral part of these financial statements.

20 MATTHEWS ASIA FUNDS
China Fund 30 September 2020
Schedule of Investments
Transferable securities and money market instruments admitted to an official exchange listing
EQUITIES
Investments Quantity/ Nominal Value
Market Value USD
% of Net Assets
CONSUMER DISCRETIONARY
Internet & Direct Marketing RetailAlibaba Group Holding, Ltd. 321,400 11,459,613 9.91JD.com, Inc. A Shares 104,900 3,976,648 3.44JD.com, Inc. ADR 52,000 3,890,604 3.36Meituan Dianping B Shares 62,900 1,965,413 1.70
21,292,278 18.41
Diversified Consumer ServicesNew Oriental Education &
Technology Group, Inc. ADR 19,800 2,904,237 2.512,904,237 2.51
Household DurablesMidea Group Co., Ltd. A Shares 244,515 2,606,437 2.25
2,606,437 2.25
Auto ComponentsXinyi Glass Holdings, Ltd. 1,218,000 2,450,425 2.12
2,450,425 2.12
Specialty RetailZhongsheng Group Holdings, Ltd. 340,000 2,126,190 1.84
2,126,190 1.84
Hotels, Restaurants & LeisureGalaxy Entertainment Group, Ltd. 86,000 577,603 0.50
577,603 0.50
Total Consumer Discretionary 31,957,170 27.63
FINANCIALS
Capital MarketsCITIC Securities Co., Ltd.
H Shares 1,612,500 3,591,318 3.10Hong Kong Exchanges &
Clearing, Ltd. 71,200 3,326,978 2.88China International Capital Corp.,
Ltd. H Shares 1,437,200 3,316,259 2.8710,234,555 8.85
InsuranceAIA Group, Ltd. 532,400 5,217,013 4.51Ping An Insurance Group Co. of
China, Ltd. A Shares 211,400 2,367,783 2.057,584,796 6.56
BanksChina Merchants Bank Co., Ltd.
A Shares 1,001,419 5,294,025 4.57China Construction Bank Corp.
H Shares 3,424,340 2,219,090 1.927,513,115 6.49
Total Financials 25,332,466 21.90
Investments Quantity/ Nominal Value
Market Value USD
% of Net Assets
COMMUNICATION SERVICES
Interactive Media & ServicesTencent Holdings, Ltd. 169,100 11,177,872 9.66JOYY, Inc. ADR 18,119 1,405,805 1.22
12,583,677 10.88
EntertainmentTencent Music Entertainment
Group ADR 96,600 1,434,523 1.24Bilibili, Inc. ADR 24,400 987,290 0.85
2,421,813 2.09
Total Communication Services 15,005,490 12.97
HEALTH CARE
Health Care Equipment & SuppliesLepu Medical Technology Co.,
Ltd. A Shares 347,200 1,718,167 1.49Shenzhen Mindray Bio-Medical
Electronics Co., Ltd. A Shares 23,400 1,196,151 1.03China Isotope & Radiation Corp. 226,200 815,352 0.71
3,729,670 3.23
Life Sciences Tools & ServicesWuxi Biologics Cayman, Inc. 56,500 1,374,928 1.19Pharmaron Beijing Co., Ltd.
A Shares 82,600 1,261,004 1.09Hangzhou Tigermed Consulting
Co., Ltd. A Shares 81,200 1,227,890 1.063,863,822 3.34
PharmaceuticalsSino Biopharmaceutical, Ltd. 1,434,750 1,564,809 1.35
1,564,809 1.35
BiotechnologyInnovent Biologics, Inc. 147,000 1,088,727 0.94
1,088,727 0.94
Health Care Providers & ServicesSinopharm Group Co., Ltd.
H Shares 481,200 1,011,506 0.871,011,506 0.87
Total Health Care 11,258,534 9.73
The accompanying notes form an integral part of these financial statements.

global.matthewsasia.com 21
China Fund 30 September 2020
Schedule of Investments (continued)
EQUITIES (CONTINUED)
Investments Quantity/ Nominal Value
Market Value USD
% of Net Assets
INFORMATION TECHNOLOGY
Electronic Equipment, Instruments & ComponentsAVIC Jonhon OptronicTechnology
Co., Ltd. A Shares 277,654 1,888,785 1.63Wingtech Technology Co., Ltd.
A Shares 65,333 1,120,732 0.97Luxshare Precision Industry Co.,
Ltd. A Shares 102,236 858,803 0.743,868,320 3.34
SoftwareWeimob, Inc. 1,120,000 1,498,906 1.30Kingdee International Software
Group Co., Ltd. 217,000 559,989 0.482,058,895 1.78
IT ServicesChinasoft International, Ltd. 2,844,000 2,055,843 1.78
2,055,843 1.78
Semiconductors & Semiconductor EquipmentNAURA Technology Group Co.,
Ltd. A Shares 60,703 1,417,340 1.231,417,340 1.23
Total Information Technology 9,400,398 8.13
REAL ESTATE
Real Estate Management & DevelopmentChina Resources Land, Ltd. 520,000 2,345,803 2.03CIFI Holdings Group Co., Ltd. 2,300,000 1,694,082 1.46China Overseas Property
Holdings, Ltd. 2,020,000 1,648,717 1.43Times China Holdings, Ltd. 1,146,000 1,588,931 1.37
7,277,533 6.29
Total Real Estate 7,277,533 6.29
CONSUMER STAPLES
BeveragesKweichow Moutai Co., Ltd.
A Shares 9,207 2,255,564 1.95Wuliangye Yibin Co., Ltd. A Shares 52,294 1,697,549 1.47
3,953,113 3.42
Total Consumer Staples 3,953,113 3.42
INDUSTRIALS
MachineryEstun Automation Co., Ltd.
A Shares 804,532 2,314,656 2.00Weichai Power Co., Ltd. A Shares 732,407 1,624,570 1.41
3,939,226 3.41
Total Industrials 3,939,226 3.41
Investments Quantity/ Nominal Value
Market Value USD
% of Net Assets
MATERIALS
Construction MaterialsAnhui Conch Cement Co., Ltd.
A Shares 283,501 2,301,742 1.992,301,742 1.99
ChemicalsWanhua Chemical Group Co., Ltd.
A Shares 147,614 1,502,354 1.301,502,354 1.30
Total Materials 3,804,096 3.29
UTILITIES
Gas UtilitiesENN Energy Holdings, Ltd. 126,100 1,373,243 1.19
1,373,243 1.19Total Utilities 1,373,243 1.19
TOTAL EQUITIES 113,301,269 97.96
TOTAL TRANSFERABLE SECURITIES AND MONEY MARKET INSTRUMENTS ADMITTED TO AN OFFICIAL EXCHANGE LISTING 113,301,269 97.96
TOTAL INVESTMENTS 113,301,269 97.96
CASH AND OTHER ASSETS, LESS LIABILITIES 2,363,087 2.04
TOTAL NET ASSETS 115,664,356 100.00
A Shares: Shares traded through the Shanghai-Hong Kong and/or Shenzhen- Hong Kong Stock Connect programs
ADR: American Depositary Receipt
B Shares: Mainland China companies listed on the Shanghai and Shenzhen stock exchanges, available to both Chinese and non-Chinese investors
H Shares: Mainland China companies listed on the Stock Exchange of Hong Kong but incorporated in mainland China
The accompanying notes form an integral part of these financial statements.

22 MATTHEWS ASIA FUNDS
Sector Allocation % of Net Assets
Consumer Discretionary 27.63Financials 21.90Communication Services 12.97Health Care 9.73Information Technology 8.13Real Estate 6.29Consumer Staples 3.42Industrials 3.41Materials 3.29Utilities 1.19
Total Investments 97.96
Cash and Other Assets, Less Liabilities 2.04
Total 100.00
The following table represents movements in the portfolio holdings:
% of Net Assets as at
30 September 2020
% of Net Assets as at
31 March 2020
TRANSFERABLE SECURITIES AND MONEY MARKET INSTRUMENTS ADMITTED TO AN OFFICIAL EXCHANGE LISTING 97.96 93.87
EQUITIES 97.96 93.87
Consumer Discretionary 27.63 25.50Financials 21.90 24.58Communication Services 12.97 10.59Health Care 9.73 8.88Information Technology 8.13 5.89Real Estate 6.29 8.17Consumer Staples 3.42 6.11Industrials 3.41 1.79Materials 3.29 2.36Utilities 1.19 -
Total Investments 97.96 93.87
Cash and Other Assets, Less Liabilities 2.04 6.13
Total 100.00 100.00
China Fund 30 September 2020
Schedule of Investments (continued)

global.matthewsasia.com 23
India Fund 30 September 2020
Schedule of Investments
Transferable securities and money market instruments admitted to an official exchange listing
EQUITIES
Investments Quantity/ Nominal Value
Market Value USD
% of Net Assets
FINANCIALS
BanksHDFC Bank, Ltd. 103,208 1,508,812 7.28Kotak Mahindra Bank, Ltd. 45,204 777,009 3.75ICICI Bank, Ltd. 155,690 748,591 3.61Bandhan Bank, Ltd. 129,161 477,920 2.30DCB Bank, Ltd. 220,948 234,484 1.13Axis Bank, Ltd. 34,960 201,216 0.97
3,948,032 19.04
Consumer FinanceBajaj Finance, Ltd. 9,989 443,886 2.14Shriram City Union Finance, Ltd. 26,574 341,720 1.65
785,606 3.79
Thrifts & Mortgage FinanceHousing Development Finance
Corp., Ltd. 28,360 668,851 3.23Aavas Financiers, Ltd. 5,598 108,845 0.52
777,696 3.75
Capital MarketsMulti Commodity Exchange of
India, Ltd. 7,591 177,254 0.85177,254 0.85
InsuranceHDFC Life Insurance Co., Ltd. 21,426 162,452 0.78
162,452 0.78
Total Financials 5,851,040 28.21
INFORMATION TECHNOLOGY
IT ServicesInfosys, Ltd. 94,572 1,292,386 6.23Tata Consultancy Services, Ltd. 26,393 891,560 4.30Wipro, Ltd. 129,423 550,021 2.65Larsen & Toubro Infotech, Ltd. 12,333 425,178 2.05Mindtree, Ltd. 21,616 392,153 1.89Mphasis, Ltd. 15,035 281,921 1.36
3,833,219 18.48
Total Information Technology 3,833,219 18.48
Investments Quantity/ Nominal Value
Market Value USD
% of Net Assets
CONSUMER STAPLES
Food ProductsZydus Wellness, Ltd. 27,807 693,272 3.34Britannia Industries, Ltd. 2,051 105,584 0.51
798,856 3.85
TobaccoVST Industries, Ltd. 13,718 607,558 2.93
607,558 2.93
Personal ProductsDabur India, Ltd. 41,897 289,923 1.40Marico, Ltd. 58,890 289,741 1.40
579,664 2.80
Food & Staples RetailingAvenue Supermarts, Ltd. 6,296 188,005 0.91Spencer’s Retail, Ltd. 162,864 166,771 0.80
354,776 1.71
Household ProductsHindustan Unilever, Ltd. 7,078 198,415 0.96
198,415 0.96
Total Consumer Staples 2,539,269 12.25
ENERGY
Oil, Gas & Consumable FuelsReliance Industries, Ltd. 62,127 1,881,451 9.07Reliance Industries, Ltd.
(Partly Paid Shares) 5,694 103,685 0.501,985,136 9.57
Total Energy 1,985,136 9.57
CONSUMER DISCRETIONARY
AutomobilesHero MotoCorp, Ltd. 6,174 263,370 1.27Eicher Motors, Ltd. 8,520 254,376 1.23Suzuki Motor Corp. 5,300 225,905 1.09
743,651 3.59
Household DurablesCrompton Greaves Consumer
Electricals, Ltd. 69,520 275,470 1.33Amber Enterprises India, Ltd. 6,529 180,384 0.87Whirlpool of India, Ltd. 5,753 171,292 0.82Symphony, Ltd. 9,015 116,035 0.56
743,181 3.58
Specialty RetailShankara Building Products, Ltd. 41,275 192,165 0.93Thanga Mayil Jewellery, Ltd. 30,781 170,322 0.82
362,487 1.75
Total Consumer Discretionary 1,849,319 8.92
The accompanying notes form an integral part of these financial statements.

24 MATTHEWS ASIA FUNDS
India Fund 30 September 2020
Schedule of Investments (continued)
EQUITIES (CONTINUED)
Investments Quantity/ Nominal Value
Market Value USD
% of Net Assets
HEALTH CARE
PharmaceuticalsNeuland Laboratories, Ltd. 27,727 431,313 2.08Caplin Point Laboratories, Ltd. 29,052 218,008 1.05Amrutanjan Health Care, Ltd. 37,526 215,147 1.04
864,468 4.17
Life Sciences Tools & ServicesDivi’s Laboratories, Ltd. 4,675 193,130 0.93Syngene International, Ltd. 22,944 171,956 0.83
365,086 1.76
Health Care Equipment & SuppliesPoly Medicure, Ltd. 50,082 311,265 1.50
311,265 1.50
Health Care Providers & ServicesMetropolis Healthcare, Ltd. 8,461 205,739 0.99
205,739 0.99
Total Health Care 1,746,558 8.42
COMMUNICATION SERVICES
Interactive Media & ServicesInfo Edge India, Ltd. 18,464 909,611 4.39
909,611 4.39
Wireless Telecommunication ServicesBharti Airtel, Ltd. 54,314 309,887 1.49
309,887 1.49
MediaAffle India, Ltd. 6,090 237,314 1.15
237,314 1.15
EntertainmentPVR, Ltd. 9,731 160,012 0.77
160,012 0.77
Total Communication Services 1,616,824 7.80
INDUSTRIALS
MachineryAIA Engineering, Ltd. 9,181 230,029 1.11Ashok Leyland, Ltd. 168,598 170,015 0.82
400,044 1.93
Professional ServicesQuess Corp., Ltd. 34,438 192,588 0.93
192,588 0.93
Electrical EquipmentFinolex Cables, Ltd. 34,929 130,522 0.63
130,522 0.63
Total Industrials 723,154 3.49
Investments Quantity/ Nominal Value
Market Value USD
% of Net Assets
MATERIALS
ChemicalsPidilite Industries, Ltd. 10,587 205,806 0.99
205,806 0.99
Construction MaterialsAmbuja Cements, Ltd. 68,460 201,353 0.97
201,353 0.97Total Materials 407,159 1.96
TOTAL EQUITIES 20,551,678 99.10
TOTAL TRANSFERABLE SECURITIES AND MONEY MARKET INSTRUMENTS ADMITTED TO AN OFFICIAL EXCHANGE LISTING 20,551,678 99.10
TOTAL INVESTMENTS 20,551,678 99.10
CASH AND OTHER ASSETS, LESS LIABILITIES 187,072 0.90
TOTAL NET ASSETS 20,738,750 100.00
The accompanying notes form an integral part of these financial statements.

global.matthewsasia.com 25
Sector Allocation % of Net Assets
Financials 28.21Information Technology 18.48Consumer Staples 12.25Energy 9.57Consumer Discretionary 8.92Health Care 8.42Communication Services 7.80Industrials 3.49Materials 1.96
Total Investments 99.10
Cash and Other Assets, Less Liabilities 0.90
Total 100.00
The following table represents movements in the portfolio holdings:
% of Net Assets as at
30 September 2020
% of Net Assets as at
31 March 2020
TRANSFERABLE SECURITIES AND MONEY MARKET INSTRUMENTS ADMITTED TO AN OFFICIAL EXCHANGE LISTING 99.10 99.28
EQUITIES 99.10 99.28
Financials 28.21 35.55Information Technology 18.48 11.68Consumer Staples 12.25 16.26Energy 9.57 4.08Consumer Discretionary 8.92 7.52Health Care 8.42 9.39Communication Services 7.80 5.67Industrials 3.49 7.71Materials 1.96 1.42
Total Investments 99.10 99.28
Cash and Other Assets, Less Liabilities 0.90 0.72
Total 100.00 100.00
India Fund 30 September 2020
Schedule of Investments (continued)

26 MATTHEWS ASIA FUNDS
Japan Fund 30 September 2020
Schedule of Investments
Transferable securities and money market instruments admitted to an official exchange listing
EQUITIES
Investments Quantity/ Nominal Value
Market Value USD
% of Net Assets
INFORMATION TECHNOLOGY
Electronic Equipment, Instruments & ComponentsTDK Corp. 44,600 4,830,053 3.33Ibiden Co., Ltd. 118,000 3,981,010 2.74Keyence Corp. 6,300 2,923,804 2.01
11,734,867 8.08
SoftwareSansan, Inc.. 68,900 4,431,350 3.05Freee KK 47,600 3,583,186 2.47Kaonavi, Inc. 21,000 1,274,970 0.88Oracle Corp. Japan 8,900 953,589 0.66AI inside, Inc. 2,100 880,754 0.60
11,123,849 7.66
IT ServicesObic Co., Ltd. 18,500 3,232,696 2.22Itochu Techno-Solutions Corp. 84,200 3,181,861 2.19Hennge KK 48,200 3,088,220 2.13
9,502,777 6.54
Semiconductors & Semiconductor EquipmentDisco Corp. 9,100 2,196,007 1.51
2,196,007 1.51
Technology Hardware, Storage & PeripheralsFUJIFILM Holdings Corp. 29,800 1,461,559 1.01
1,461,559 1.01
Total Information Technology 36,019,059 24.80
INDUSTRIALS
Professional ServicesNihon M&A Center, Inc. 96,500 5,466,774 3.76SMS Co., Ltd. 146,400 4,223,269 2.91Recruit Holdings Co., Ltd. 105,700 4,165,337 2.87
13,855,380 9.54
MachinerySMC Corp. 7,800 4,330,003 2.98Makita Corp. 52,900 2,520,539 1.74
6,850,542 4.72
Electrical EquipmentNidec Corp. 63,600 5,906,098 4.07
5,906,098 4.07
Building ProductsDaikin Industries, Ltd. 15,500 2,839,903 1.95
2,839,903 1.95
Total Industrials 29,451,923 20.28
Investments Quantity/ Nominal Value
Market Value USD
% of Net Assets
HEALTH CARE
PharmaceuticalsTakeda Pharmaceutical Co., Ltd. 98,900 3,511,768 2.42Santen Pharmaceutical Co., Ltd. 145,700 2,965,557 2.04Eisai Co., Ltd. 27,700 2,517,598 1.73Chugai Pharmaceutical Co., Ltd. 25,400 1,133,218 0.78
10,128,141 6.97
Health Care Equipment & SuppliesHoya Corp. 38,100 4,279,530 2.95Terumo Corp. 96,500 3,828,144 2.64Sysmex Corp. 19,200 1,822,731 1.25
9,930,405 6.84
Health Care TechnologyM3, Inc. 70,200 4,327,963 2.98
4,327,963 2.98
BiotechnologyPeptiDream, Inc. 79,000 3,683,903 2.54
3,683,903 2.54
Total Health Care 28,070,412 19.33
CONSUMER DISCRETIONARY
Specialty RetailNitori Holdings Co., Ltd. 21,500 4,450,151 3.07Hikari Tsushin, Inc. 11,900 2,818,954 1.94Fast Retailing Co., Ltd. 4,400 2,749,586 1.89
10,018,691 6.90
Household DurablesSony Corp. 73,500 5,604,131 3.86
5,604,131 3.86
Multiline RetailPan Pacific International Holdings
Corp. 151,900 3,524,681 2.43Marui Group Co., Ltd. 76,300 1,456,668 1.00
4,981,349 3.43
Leisure ProductsBandai Namco Holdings, Inc. 46,100 3,357,474 2.31
3,357,474 2.31
Total Consumer Discretionary 23,961,645 16.50
The accompanying notes form an integral part of these financial statements.

global.matthewsasia.com 27
Japan Fund 30 September 2020
Schedule of Investments (continued)
EQUITIES (CONTINUED)
Investments Quantity/ Nominal Value
Market Value USD
% of Net Assets
COMMUNICATION SERVICES
EntertainmentNintendo Co., Ltd. 11,000 6,220,971 4.28Capcom Co., Ltd. 25,800 1,432,159 0.99
7,653,130 5.27
Wireless Telecommunication ServicesSoftBank Group Corp. 58,700 3,611,614 2.49
3,611,614 2.49
MediaDirect Marketing MiX, Inc. 31,800 812,184 0.56
812,184 0.56
Total Communication Services 12,076,928 8.32
FINANCIALS
InsuranceDai-ichi Life Holdings, Inc. 319,200 4,486,929 3.09
4,486,929 3.09
Diversified Financial ServiceseGuarantee, Inc. 156,900 3,560,289 2.45
3,560,289 2.45
Total Financials 8,047,218 5.54
Investments Quantity/ Nominal Value
Market Value USD
% of Net Assets
MATERIALS
ChemicalsShin-Etsu Chemical Co., Ltd. 42,500 5,517,548 3.80Sumitomo Bakelite Co., Ltd. 64,400 1,763,614 1.21
7,281,162 5.01Total Materials 7,281,162 5.01
TOTAL EQUITIES 144,908,347 99.78
TOTAL TRANSFERABLE SECURITIES AND MONEY MARKET INSTRUMENTS ADMITTED TO AN OFFICIAL EXCHANGE LISTING 144,908,347 99.78
TOTAL INVESTMENTS 144,908,347 99.78
CASH AND OTHER ASSETS, LESS LIABILITIES 315,321 0.22
TOTAL NET ASSETS 145,223,668 100.00
The accompanying notes form an integral part of these financial statements.

28 MATTHEWS ASIA FUNDS
Sector Allocation % of Net Assets
Information Technology 24.80Industrials 20.28Health Care 19.33Consumer Discretionary 16.50Communication Services 8.32Financials 5.54Materials 5.01
Total Investments 99.78
Cash and Other Assets, Less Liabilities 0.22
Total 100.00
The following table represents movements in the portfolio holdings:
% of Net Assets as at
30 September 2020
% of Net Assets as at
31 March 2020
TRANSFERABLE SECURITIES AND MONEY MARKET INSTRUMENTS ADMITTED TO AN OFFICIAL EXCHANGE LISTING 99.78 99.12
EQUITIES 99.78 99.12
Information Technology 24.80 25.09Industrials 20.28 16.28Health Care 19.33 18.87Consumer Discretionary 16.50 13.97Communucation Services 8.32 9.59Financials 5.54 5.23Materials 5.01 1.28Condumer Staples - 5.97Real Estate - 2.84
Total Investments 99.78 99.12
Cash and Other Assets, Less Liabilities 0.22 0.88
Total 100.00 100.00
Japan Fund 30 September 2020
Schedule of Investments (continued)

global.matthewsasia.com 29
Transferable securities and money market instruments admitted to an official exchange listing
EQUITIES
Investments Quantity/ Nominal Value
Market Value USD
% of Net Assets
CHINA/HONG KONG
Silergy Corp. 13,000 766,845 4.52Kingdee International Software
Group Co., Ltd. 191,000 492,894 2.90Flat Glass Group Co., Ltd.
H Shares 178,000 472,834 2.78Innovent Biologics, Inc. 54,500 403,644 2.38Peijia Medical, Ltd. 111,000 386,702 2.28Joyoung Co., Ltd. A Shares 59,200 352,437 2.08Sichuan Teway Food Group Co.,
Ltd. A Shares 32,700 315,065 1.86Pharmaron Beijing Co., Ltd.
H Shares 25,100 312,206 1.84Zai Lab, Ltd. ADR 3,700 304,173 1.79Centre Testing International
Group Co., Ltd. A Shares 80,100 287,370 1.69SITC International Holdings Co.,
Ltd. 207,000 285,788 1.68Alphamab Oncology 136,000 266,028 1.57Yihai International Holding, Ltd. 17,000 265,949 1.57Asymchem Laboratories Tianjin
Co., Ltd. A Shares 6,862 265,536 1.56Yantai China Pet Foods Co., Ltd.
A Shares 39,510 256,148 1.51Jiajiayue Group Co., Ltd. A Shares 47,303 250,460 1.47Times China Holdings, Ltd. 180,000 249,570 1.47Ginlong Technologies Co., Ltd.
A Shares 13,800 239,159 1.41Hongfa Technology Co., Ltd.
A Shares 35,600 238,883 1.41InnoCare Pharma, Ltd. 168,000 219,366 1.29Hua Hong Semiconductor, Ltd. 57,000 217,762 1.28AK Medical Holdings, Ltd. 82,000 209,439 1.23Winning Health Technology
Group Co., Ltd. A Shares 72,020 205,855 1.21Jiumaojiu International Holdings,
Ltd. 87,000 204,755 1.21Venus MedTech Hangzhou, Inc.
H Shares 17,000 180,797 1.06Shanghai AtHub Co., Ltd.
A Shares 13,200 147,057 0.87Kangji Medical Holdings, Ltd. 39,500 98,672 0.58XPeng, Inc. ADR 2,600 48,828 0.29Ming Yuan Cloud Group
Holdings, Ltd. 10,000 37,419 0.227,981,641 47.01
Investments Quantity/ Nominal Value
Market Value USD
% of Net Assets
TAIWAN
ASMedia Technology, Inc. 7,000 352,582 2.08Airtac International Group 15,000 338,227 1.99Voltronic Power Technology
Corp. 8,400 285,117 1.68Accton Technology Corp. 36,000 277,055 1.63M31 Technology Corp. 25,000 264,291 1.56Sunonwealth Electric Machine
Industry Co., Ltd. 118,000 253,462 1.49Win Semiconductors Corp. 24,000 237,669 1.40Chief Telecom, Inc. 19,000 226,003 1.33Andes Technology Corp. 33,000 170,648 1.01Sunny Friend Environmental
Technology Co., Ltd. 18,000 142,791 0.84Realtek Semiconductor Corp. 10,000 127,375 0.75Foxsemicon Integrated
Technology, Inc. 19,000 118,080 0.702,793,300 16.46
INDIA
Crompton Greaves Consumer Electricals, Ltd. 106,107 420,444 2.48
Dr Lal PathLabs, Ltd. 16,334 416,154 2.45The Phoenix Mills, Ltd. 49,822 393,484 2.32Galaxy Surfactants, Ltd. 11,763 302,270 1.78Marico, Ltd. 49,679 244,422 1.44Gabriel India, Ltd. 146,470 208,747 1.23GMR Infrastructure, Ltd. 663,974 207,436 1.22IFB Industries, Ltd. 24,933 203,151 1.20Shankara Building Products, Ltd. 32,954 153,425 0.90Shriram City Union Finance, Ltd. 9,572 123,088 0.72Amrutanjan Health Care, Ltd. 13,586 77,892 0.46
2,750,513 16.20
SOUTH KOREA
Hugel, Inc. 2,096 326,572 1.92Koh Young Technology, Inc. 3,915 298,784 1.76KINX, Inc. 3,114 233,783 1.38LEENO Industrial, Inc. 1,994 208,869 1.23Douzone Bizon Co., Ltd. 2,215 196,213 1.16Vitzrocell Co., Ltd. 11,807 171,934 1.01Big Hit Entertainment Co., Ltd. 174 20,085 0.12
1,456,240 8.58
VIETNAM
Nam Long Investment Corp. 202,642 225,143 1.33Sai Gon Cargo Service Corp. 36,060 187,751 1.10FPT Corp. 46,230 99,832 0.59
512,726 3.02
PHILIPPINES
Wilcon Depot, Inc. 856,600 282,706 1.67282,706 1.67
Asia Small Companies Fund 30 September 2020
Schedule of Investments
The accompanying notes form an integral part of these financial statements.

30 MATTHEWS ASIA FUNDS
Asia Small Companies Fund 30 September 2020
Schedule of Investments (continued)
The accompanying notes form an integral part of these financial statements.
EQUITIES (CONTINUED)
Investments Quantity/ Nominal Value
Market Value USD
% of Net Assets
UNITED STATES
Legend Biotech Corp. ADR 6,070 187,006 1.10187,006 1.10
SINGAPORE
Keppel DC, , REIT 77,700 164,927 0.97164,927 0.97
THAILAND
Humanica Public Co., Ltd. F Shares 280,000 72,458 0.43
72,458 0.43
TOTAL EQUITIES 16,201,517 95.44
TOTAL TRANSFERABLE SECURITIES AND MONEY MARKET INSTRUMENTS ADMITTED TO AN OFFICIAL EXCHANGE LISTING 16,201,517 95.44
TOTAL INVESTMENTS 16,201,517 95.44
CASH AND OTHER ASSETS, LESS LIABILITIES 774,280 4.56
TOTAL NET ASSETS 16,975,797 100.00
A Shares: Shares traded through the Shanghai-Hong Kong and/or Shenzhen- Hong Kong Stock Connect programs
ADR: American Depositary Receipt
F Shares: Foreign Shares
H Shares: Mainland China companies listed on the Stock Exchange of Hong Kong but incorporated in mainland China
REIT: Real Estate Investment Trust
Country Allocation % of Net Assets
China/Hong Kong 47.01Taiwan 16.46India 16.20South Korea 8.58Vietnam 3.02Philippines 1.67United States 1.10Singapore 0.97Thailand 0.43
Total Investments 95.44
Cash and Other Assets, Less Liabilities 4.56
Total 100.00
The following table represents movements in the portfolio holdings:
% of Net Assets as at
30 September 2020
% of Net Assets as at
31 March 2020
TRANSFERABLE SECURITIES AND MONEY MARKET INSTRUMENTS ADMITTED TO AN OFFICIAL EXCHANGE LISTING 95.44 92.82
EQUITIES 95.44 92.82
China/Hong Kong 47.01 39.64Taiwan 16.46 16.32India 16.20 12.17Sounth Korea 8.58 12.55Vietnam 3.02 3.38Philippines 1.67 1.58United States 1.10 0.87Singapure 0.97 0.33Thailand 0.43 3.57Malaysia - 1.49Indonesia - 0.92
Total Investments 95.44 92.82
Cash and Other Assets, Less Liabilities 4.56 7.18
Total 100.00 100.00

global.matthewsasia.com 31
China Small Companies Fund 30 September 2020
Schedule of Investments
Transferable securities and money market instruments admitted to an official exchange listing
EQUITIES
Investments Quantity/ Nominal Value
Market Value USD
% of Net Assets
INFORMATION TECHNOLOGY
Semiconductors & Semiconductor EquipmentFlat Glass Group Co., Ltd. H Shares 2,926,000 7,772,543 2.78StarPower Semiconductor, Ltd.
A Shares 240,378 6,865,523 2.46Win Semiconductors Corp. 686,000 6,793,387 2.43Silergy Corp. 114,000 6,724,637 2.41ASMedia Technology, Inc. 98,000 4,936,149 1.77
33,092,239 11.85
SoftwareKingdee International Software
Group Co., Ltd. 2,350,000 6,064,399 2.17Weimob, Inc. 3,250,000 4,349,504 1.56China Youzan, Ltd. 13,644,000 2,856,655 1.03Ming Yuan Cloud Group
Holdings, Ltd. 62,000 231,995 0.0813,502,553 4.84
Communications EquipmentAccton Technology Corp. 763,000 5,872,032 2.10
5,872,032 2.10
IT ServicesShanghai AtHub Co., Ltd. A Shares 347,500 3,871,398 1.39
3,871,398 1.39
Total Information Technology 56,338,222 20.18
INDUSTRIALS
Electrical EquipmentHongfa Technology Co., Ltd.
A Shares 918,782 6,165,214 2.21Ginlong Technologies Co., Ltd.
A Shares 272,131 4,716,122 1.6910,881,336 3.90
MachineryAirtac International Group 232,000 5,231,244 1.87Leader Harmonious Drive
Systems Co., Ltd. A Shares 295,924 3,230,545 1.168,461,789 3.03
MarineSITC International Holdings Co., Ltd. 6,101,000 8,423,153 3.02
8,423,153 3.02
Transportation InfrastructureHainan Meilan International
Airport Co., Ltd. H Shares 1,041,000 5,842,919 2.095,842,919 2.09
Commercial Services & SuppliesEver Sunshine Lifestyle Services
Group, Ltd. 2,620,000 5,162,031 1.855,162,031 1.85
Professional ServicesCentre Testing International
Group Co., Ltd. A Shares 1,374,389 4,930,808 1.764,930,808 1.76
Total Industrials 43,702,036 15.65
Investments Quantity/ Nominal Value
Market Value USD
% of Net Assets
HEALTH CARE
Health Care Equipment & SuppliesPeijia Medical, Ltd. 1,845,000 6,427,618 2.30China Isotope & Radiation Corp. 1,314,600 4,738,559 1.69AK Medical Holdings, Ltd. 1,080,000 2,758,472 0.99Kangji Medical Holdings, Ltd. 645,500 1,612,469 0.58
15,537,118 5.56
BiotechnologyInnovent Biologics, Inc. 555,000 4,110,501 1.47Amoy Diagnostics Co., Ltd.
A Shares 349,830 3,932,746 1.41Legend Biotech Corp. ADR 92,895 2,861,931 1.03InnoCare Pharma, Ltd. 626,000 817,399 0.29
11,722,577 4.20
Health Care Providers & ServicesDian Diagnostics Group Co., Ltd.
A Shares 757,200 4,409,363 1.584,409,363 1.58
Life Sciences Tools & ServicesPharmaron Beijing Co., Ltd.
H Shares 351,000 4,365,903 1.564,365,903 1.56
PharmaceuticalsAsymchem Laboratories Tianjin
Co., Ltd. A Shares 75,418 2,918,415 1.052,918,415 1.05
Health Care TechnologyWinning Health Technology
Group Co., Ltd. A Shares 945,958 2,703,835 0.972,703,835 0.97
Total Health Care 41,657,211 14.92
REAL ESTATE
Real Estate Management & DevelopmentChina Overseas Property
Holdings, Ltd. 9,250,000 7,549,816 2.70KWG Property Holding, Ltd. 4,003,000 6,843,684 2.45Times China Holdings, Ltd. 4,508,000 6,250,351 2.24Powerlong Commercial
Management Holdings, Ltd. 1,632,500 5,471,548 1.96Powerlong Real Estate Holdings,
Ltd. 4,891,000 3,671,797 1.3229,787,196 10.67
Total Real Estate 29,787,196 10.67
The accompanying notes form an integral part of these financial statements.

32 MATTHEWS ASIA FUNDS
China Small Companies Fund 30 September 2020
Schedule of Investments (continued)
EQUITIES (CONTINUED)
Investments Quantity/ Nominal Value
Market Value USD
% of Net Assets
CONSUMER DISCRETIONARY
Household DurablesJoyoung Co., Ltd. A Shares 1,384,992 8,245,301 2.95
8,245,301 2.95
Specialty RetailChina Meidong Auto Holdings,
Ltd. 2,060,000 7,902,114 2.837,902,114 2.83
Hotels, Restaurants & LeisureJiumaojiu International Holdings,
Ltd. 2,488,000 5,855,534 2.105,855,534 2.10
Diversified Consumer ServicesChina Yuhua Education Corp.,
Ltd. 4,198,000 3,590,178 1.293,590,178 1.29
AutomobilesXPeng, Inc. ADR 164,000 3,079,920 1.10
3,079,920 1.10
Total Consumer Discretionary 28,673,047 10.27
CONSUMER STAPLES
Food ProductsYantai China Pet Foods Co., Ltd.
A Shares 1,078,470 6,991,855 2.50Yihai International Holding, Ltd. 193,000 3,019,301 1.08Sichuan Teway Food Group Co.,
Ltd. A Shares 311,078 2,997,246 1.07Kemen Noodle Manufacturing
Co., Ltd. A Shares 848,400 2,557,047 0.9215,565,449 5.57
Food & Staples RetailingJiajiayue Group Co., Ltd. A Shares 1,142,884 6,051,337 2.17
6,051,337 2.17
Household ProductsVinda International Holdings, Ltd. 1,328,000 4,357,856 1.56
4,357,856 1.56
Total Consumer Staples 25,974,642 9.30
MATERIALS
Construction MaterialsAsia Cement China Holdings
Corp. 5,904,500 5,199,328 1.875,199,328 1.87
ChemicalsENN Ecological Holdings Co., Ltd.
A Shares 3,090,300 5,086,975 1.825,086,975 1.82
Total Materials 10,286,303 3.69
Investments Quantity/ Nominal Value
Market Value USD
% of Net Assets
COMMUNICATION SERVICES
EntertainmentBilibili, Inc. ADR 100,600 4,070,549 1.46
4,070,549 1.46
Diversified Telecommunication ServicesChief Telecom, Inc. 332,000 3,949,106 1.41
3,949,106 1.41
Total Communication Services 8,019,655 2.87
FINANCIALS
Capital MarketsChina Renaissance Holdings, Ltd. 661,700 1,511,350 0.54Haitong International Securities
Group, Ltd. 636,000 152,005 0.061,663,355 0.60
Total Financials 1,663,355 0.60
TOTAL EQUITIES 246,101,667 88.15
TOTAL TRANSFERABLE SECURITIES AND MONEY MARKET INSTRUMENTS ADMITTED TO AN OFFICIAL EXCHANGE LISTING 246,101,667 88.15
TOTAL INVESTMENTS 246,101,667 88.15
CASH AND OTHER ASSETS, LESS LIABILITIES 33,081,555 11.85
TOTAL NET ASSETS 279,183,222 100.00
A Shares: Shares traded through the Shanghai-Hong Kong and/or Shenzhen- Hong Kong Stock Connect programs
ADR: American Depositary Receipt
H Shares: Mainland China companies listed on the Stock Exchange of Hong Kong but incorporated in mainland China
The accompanying notes form an integral part of these financial statements.

global.matthewsasia.com 33
China Small Companies Fund 30 September 2020
Schedule of Investments (continued)
Country Allocation % of Net Assets
Information Technology 20.18Industrials 15.65Health Care 14.92Real Estate 10.67Consumer Discretionary 10.27Consumer Staples 9.30Materials 3.69Communication Services 2.87Financials 0.60
Total Investments 88.15
Cash and Other Assets, Less Liabilities 11.85
Total 100.00
The following table represents movements in the portfolio holdings:
% of Net Assets as at
30 September 2020
% of Net Assets as at
31 March 2020
TRANSFERABLE SECURITIES AND MONEY MARKET INSTRUMENTS ADMITTED TO AN OFFICIAL EXCHANGE LISTING 88.15 95.63
EQUITIES 88.15 95.63
Information Technology 20.18 18.61Industrials 15.65 15.82Health Care 14.92 21.38Real Estate 10.67 11.69Consumer Discreationary 10.27 9.95Consumer Staples 9.30 10.96Materials 3.69 2.53Commuciation Services 2.87 4.69Financials 0.60 -
Total Investments 88.15 95.63
Cash and Other Assets, Less Liabilities 11.85 4.37
Total 100.00 100.00
The accompanying notes form an integral part of these financial statements.

34 MATTHEWS ASIA FUNDS
Statement of Assets and LiabilitiesAs at 30 September 2020
Asia Total Return Bond Fund* (USD)
Asia Credit Opportunities
Fund (USD)Asia Dividend
Fund (USD)
Asia ex Japan Dividend Fund
(USD)
ASSETS
Investment in securities at market value (note 2C) 57,469,489 20,413,576 189,236,658 256,638,473
Investment in securities at cost (note 2H) 56,872,151 20,646,583 145,052,120 210,628,625
Cash and cash equivalent at bank 1,717,475 1,026,595 552,867 13,175,939
Amount receivable on sales of investments – – 208,582 –
Interest and dividends receivable 1,026,535 367,630 469,545 242,243
Subscriptions receivable 41,750 2,950 1,965,271 1,931,974
Unrealized gain on forward currency exchange contracts (note 2E and note 15) 203,405 – – –
Unrealized gain on interest rate swap agreements (note 2G and note 16) 194,252 – – –
Prepaid expenses and other receivables – – – –
TOTAL ASSETS 60,652,906 21,810,751 192,432,923 271,988,629
LIABILITIES
Amounts payable on purchases of investments 1,472,325 – – 3,408,120
Redemptions payable 38,481 – 101,880 1,810,244
Management fees and administration fees payable (note 2J and note 4) 19,670 6,669 174,702 135,857
Payable for foreign taxes (note 9B) – – – 40,182
Unrealized loss on forward currency exchange contracts (note 2E and note 15) 46,465 – – –
Accrued expenses and other payables (note 7 and note 8) 879,019 410,751 797,007 1,097,340
TOTAL LIABILITIES 2,455,960 417,420 1,073,589 6,491,743
TOTAL NET ASSETS 58,196,946 21,393,331 191,359,334 265,496,886
* The Fund’s name changed from Matthews Asia Strategic Income Fund to Matthews Asia Total Return Bond Fund on 25 May 2020.
The accompanying notes form an integral part of these financial statements.

global.matthewsasia.com 35
Statement of Assets and Liabilities (continued)
As at 30 September 2020
China Dividend Fund (USD)
Pacific Tiger Fund (USD)
China Fund (USD)
India Fund (USD)
ASSETS
Investment in securities at market value (note 2C) 16,063,623 456,405,811 113,301,269 20,551,678
Investment in securities at cost (note 2H) 13,772,979 356,442,672 96,115,091 18,152,246
Cash and cash equivalent at bank 976,937 4,189,345 3,598,549 333,398
Amount receivable on sales of investments 213,661 1,992,782 667,896 17,410
Interest and dividends receivable 48,419 721,756 53,353 3,554
Subscriptions receivable 4,596 177,785 117,717 45,307
Unrealized gain on forward currency exchange contracts (note 2E and note 15) – – – –
Unrealized gain on interest rate swap agreements (note 2G and note 16) – – – –
Prepaid expenses and other receivables 1 – – 169
TOTAL ASSETS 17,307,237 463,487,479 117,738,784 20,951,516
LIABILITIES
Amounts payable on purchases of investments 86,995 926,526 1,689,090 20,591
Redemptions payable 64,220 810,390 265,186 90,870
Management fees and administration fees payable (note 2J and note 4) 3,430 358,786 64,739 (3,233)
Payable for foreign taxes (note 9B) – – – –
Unrealized loss on forward currency exchange contracts (note 2E and note 15) – – – –
Accrued expenses and other payables (note 7 and note 8) 51,398 650,918 55,413 104,538
TOTAL LIABILITIES 206,043 2,746,620 2,074,428 212,766
TOTAL NET ASSETS 17,101,194 460,740,859 115,664,356 20,738,750
The accompanying notes form an integral part of these financial statements.

36 MATTHEWS ASIA FUNDS
Statement of Assets and Liabilities (continued)
As at 30 September 2020
Japan Fund (USD)
Asia Small Companies Fund
(USD)
China Small Companies Fund
(USD)Combined
(USD)
ASSETS
Investment in securities at market value (note 2C) 144,908,347 16,201,517 246,101,667 1,537,292,108
Investment in securities at cost (note 2H) 119,725,493 12,882,201 227,870,305 1,278,160,466
Cash and cash equivalent at bank 2,443,894 822,246 39,485,027 68,322,272
Amount receivable on sales of investments 1,416,315 – 221,353 4,737,999
Interest and dividends receivable 523,276 11,301 243,764 3,711,376
Subscriptions receivable 473,699 95,671 2,086,541 6,943,261
Unrealized gain on forward currency exchange contracts (note 2E and note 15) 100 5 – 203,510
Unrealized gain on interest rate swap agreements (note 2G and note 16) – – – 194,252
Prepaid expenses and other receivables – – 83,052 83,222
TOTAL ASSETS 149,765,631 17,130,740 288,221,404 1,621,488,000
LIABILITIES
Amounts payable on purchases of investments 3,670,161 20,286 6,055,997 17,350,091
Redemptions payable 263,039 84,839 2,709,574 6,238,723
Management fees and administration fees payable (note 2J and note 4) 109,250 5,280 272,611 1,147,761
Payable for foreign taxes (note 9B) – – – 40,182
Unrealized loss on forward currency exchange contracts (note 2E and note 15) 109,827 – – 156,292
Accrued expenses and other payables (note 7 and note 8) 389,686 44,538 – 4,480,608
TOTAL LIABILITIES 4,541,963 154,943 9,038,182 29,413,657
TOTAL NET ASSETS 145,223,668 16,975,797 279,183,222 1,592,074,343
The accompanying notes form an integral part of these financial statements.

global.matthewsasia.com 37
Statement of Operations and Changes in Net AssetsFor the period ended 30 September 2020
Asia Total Return Bond Fund* (USD)
Asia Credit Opportunities
Fund (USD)Asia Dividend
Fund (USD)
Asia ex Japan Dividend Fund
(USD)
NET ASSETS AT THE BEGINNING OF THE PERIOD 56,161,456 19,512,223 189,438,553 71,090,831
INCOME
Dividend income, net of foreign withholding tax (note 2I) – – 2,452,081 2,080,502
Interest income, net of foreign withholding tax (note 2I) 1,642,175 668,423 2,808 948
Other income – – 3,441 –
TOTAL INCOME 1,642,175 668,423 2,458,330 2,081,450
EXPENSES
Overdraft interest on bank accounts 1,296 – 440 1,297
Management fees and administration fees (note 4) 247,927 93,664 1,042,841 817,229
Domiciliation, Administrative Agent and Transfer agency fees (note 5 and note 6) 42,860 41,697 88,325 55,934
Professional fees (note 7) 19,640 12,781 34,565 25,823
Directors fee (note 8) 3,889 3,127 2,051 3,471
Depositary fees (note 5) 12,876 13,939 17,830 26,815
Taxe d'abonnement (note 9A) 4,191 5,307 46,673 15,142
Transaction costs (note 10) 3,358 3,609 286,022 494,002
Other expenses (note 7 and note 8) 41,990 30,211 170,290 58,919
TOTAL EXPENSES 378,027 204,335 1,689,037 1,498,632
Advisory Fees Waived and Expenses Reimbursed (note 2J) 122,845 58,767 64,320 307,163
NET INVESTMENT INCOME/(LOSS) 1,386,993 522,855 833,613 889,981
Net realized gain/(loss) on sales of investments (note 2D) (496,440) (1,044,951) 4,562,273 5,099,927
Net realized gain/(loss) on forward currency exchange contracts (note 2E) (219,062) – 5 (46)
Net realized gain/(loss) on interest rate swap agreements (note 2F) 16,577 – – –
Net realized gain/(loss) on foreign exchanges (note 2G) 2,894 (246) (69,645) 264,709
Net realized gain/(loss) for the period (696,031) (1,045,197) 4,492,633 5,364,590
Net change in unrealized gain/(loss) on sales of investments (note 2D) 6,928,761 2,864,628 58,740,993 50,003,142
Net change in unrealized gain/(loss) on foreign tax provision (note 9B) – – – (40,182)
Net change in unrealized gain/(loss) on forward currency exchange contracts (note 2E) 532,002 – – –
Net change in unrealized gain/(loss) on interest rate swap agreements (note 2F) 72,275 – – –
Net change in unrealized gain/(loss) on foreign exchanges (note 2G) 17,429 723 36,288 16,965
Net change in unrealized gain/(loss) for the period 7,550,467 2,865,351 58,777,281 49,979,925
Increase/(decrease) in net assets as a result of operations 8,241,429 2,343,009 64,103,527 56,234,496
Subscriptions 477,813 305,813 10,486,777 155,516,731
Redemptions (5,112,870) (96,530) (71,681,862) (15,441,010)
Dividend distributions (note 13) (1,570,882) (671,184) (987,661) (1,904,162)
NET ASSETS AT THE END OF THE PERIOD 58,196,946 21,393,331 191,359,334 265,496,886
The accompanying notes form an integral part of these financial statements.
* The Fund’s name changed from Matthews Asia Strategic Income Fund to Matthews Asia Total Return Bond Fund on 25 May 2020.

38 MATTHEWS ASIA FUNDS
Statement of Operations and Changes in Net Assets (continued)
For the period ended 30 September 2020
China Dividend Fund (USD)
Pacific Tiger Fund (USD)
China Fund (USD)
India Fund (USD)
NET ASSETS AT THE BEGINNING OF THE PERIOD 14,012,212 516,327,342 62,754,804 36,306,562
INCOME
Dividend income, net of foreign withholding tax (note 2I) 399,987 5,311,552 1,166,982 130,613
Interest income, net of foreign withholding tax (note 2I) 623 2,287 2,079 390
Other income – – – –
TOTAL INCOME 400,610 5,313,839 1,169,061 131,003
EXPENSES
Overdraft interest on bank accounts 6 1,301 – 129
Management fees and administration fees (note 4) 93,738 2,233,936 429,183 168,083
Domiciliation, Administrative Agent and Transfer agency fees (note 5 and note 6) 31,117 144,975 33,784 42,518
Professional fees (note 7) 12,342 117,529 18,340 21,936
Directors fee (note 8) 3,014 18,416 3,032 4,046
Depositary fees (note 5) 8,330 86,712 15,690 28,453
Taxe d'abonnement (note 9A) 4,192 115,048 12,513 6,489
Transaction costs (note 10) 51,167 899,604 155,603 113,772
Other expenses (note 7 and note 8) 31,227 225,456 45,335 47,105
TOTAL EXPENSES 235,133 3,842,977 713,480 432,531
Advisory Fees Waived and Expenses Reimbursed (note 2J) 78,503 49,671 131,340 113,597
NET INVESTMENT INCOME/(LOSS) 243,980 1,520,533 586,921 (187,931)
Net realized gain/(loss) on sales of investments (note 2D) 69,265 3,237,472 3,971,240 (3,571,240)
Net realized gain/(loss) on forward currency exchange contracts (note 2E) – – – –
Net realized gain/(loss) on interest rate swap agreements (note 2F) – – – –
Net realized gain/(loss) on foreign exchanges (note 2G) 1,907 (326,002) 4,594 (26,674)
Net realized gain/(loss) for the period 71,172 2,911,470 3,975,834 (3,597,914)
Net change in unrealized gain/(loss) on sales of investments (note 2D) 3,444,607 141,744,890 21,391,482 16,374,402
Net change in unrealized gain/(loss) on foreign tax provision (note 9B) – – – 15
Net change in unrealized gain/(loss) on forward currency exchange contracts (note 2E) – – – –
Net change in unrealized gain/(loss) on interest rate swap agreements (note 2F) – – – –
Net change in unrealized gain/(loss) on foreign exchanges (note 2G) 7,172 31,559 (3,577) (99)
Net change in unrealized gain/(loss) for the period 3,451,779 141,776,449 21,387,905 16,374,318
Increase/(decrease) in net assets as a result of operations 3,766,931 146,208,452 25,950,660 12,588,473
Subscriptions 1,774,343 94,083,029 35,706,408 1,855,764
Redemptions (2,407,997) (295,877,964) (8,747,516) (30,012,049)
Dividend distributions (note 13) (44,295) – – –
NET ASSETS AT THE END OF THE PERIOD 17,101,194 460,740,859 115,664,356 20,738,750
The accompanying notes form an integral part of these financial statements.

global.matthewsasia.com 39
Statement of Operations and Changes in Net Assets (continued)
For the period ended 30 September 2020
Japan Fund (USD)
Asia Small Companies Fund
(USD)
China Small Companies Fund
(USD)Combined
(USD)
NET ASSETS AT THE BEGINNING OF THE PERIOD 326,903,160 13,611,322 72,972,206 1,379,090,671
INCOME
Dividend income, net of foreign withholding tax (note 2I) 713,633 128,008 1,999,245 14,382,603
Interest income, net of foreign withholding tax (note 2I) 2,536 567 6,680 2,329,516
Other income – – – 3,441
TOTAL INCOME 716,169 128,575 2,005,925 16,715,560
EXPENSES
Overdraft interest on bank accounts 2,511 – 220 7,200
Management fees and administration fees (note 4) 1,134,371 126,101 1,360,897 7,747,970
Domiciliation, Administrative Agent and Transfer agency fees (note 5 and note 6) 104,670 32,188 38,443 656,511
Professional fees (note 7) 59,237 16,759 18,567 357,519
Directors fee (note 8) 11,492 2,946 3,773 59,257
Depositary fees (note 5) 35,114 16,540 21,501 283,800
Taxe d'abonnement (note 9A) 49,308 3,879 48,347 311,089
Transaction costs (note 10) 286,737 78,995 830,176 3,203,045
Other expenses (note 7 and note 8) 94,580 33,658 65,025 843,796
TOTAL EXPENSES 1,778,020 311,066 2,386,949 13,470,187
Advisory Fees Waived and Expenses Reimbursed (note 2J) 3,197 94,177 192,428 1,216,008
NET INVESTMENT INCOME/(LOSS) (1,058,654) (88,314) (188,596) 4,461,381
Net realized gain/(loss) on sales of investments (note 2D) 36,495,220 1,014,553 38,061,667 87,398,986
Net realized gain/(loss) on forward currency exchange contracts (note 2E) 248,571 – 28 29,496
Net realized gain/(loss) on interest rate swap agreements (note 2F) – – – 16,577
Net realized gain/(loss) on foreign exchanges (note 2G) (10,819) (17,414) 64,192 (112,504)
Net realized gain/(loss) for the period 36,732,972 997,139 38,125,887 87,332,555
Net change in unrealized gain/(loss) on sales of investments (note 2D) 47,990,762 4,839,837 7,795,997 362,119,501
Net change in unrealized gain/(loss) on foreign tax provision (note 9B) – (1,994) – (42,161)
Net change in unrealized gain/(loss) on forward currency exchange contracts (note 2E) (15,906) 5 – 516,101
Net change in unrealized gain/(loss) on interest rate swap agreements (note 2F) – – – 72,275
Net change in unrealized gain/(loss) on foreign exchanges (note 2G) (2,767) (44) (21,242) 82,407
Net change in unrealized gain/(loss) for the period 47,972,089 4,837,804 7,774,755 362,748,123
Increase/(decrease) in net assets as a result of operations 83,646,407 5,746,629 45,712,046 454,542,059
Subscriptions 43,293,624 4,069,965 291,444,276 639,014,543
Redemptions (308,619,523) (6,452,119) (130,945,306) (875,394,746)
Dividend distributions (note 13) – – – (5,178,184)
NET ASSETS AT THE END OF THE PERIOD 145,223,668 16,975,797 279,183,222 1,592,074,343
The accompanying notes form an integral part of these financial statements.

40 MATTHEWS ASIA FUNDS
Statement of Changes in Number of SharesFor the period ended 30 September 2020
ASIA TOTAL RETURN BOND FUND*
Class I Acc (USD) Class I Dist (USD)
Shares outstanding at the beginning of the period 263,458 Shares outstanding at the beginning of the period 302,610
Shares subscribed 9,238 Shares subscribed 39,853
Shares redeemed 109,219 Shares redeemed 152,269
Shares outstanding at the end of the period 163,477 Shares outstanding at the end of the period 190,194
Class A Acc (USD) Class A Dist (USD)
Shares outstanding at the beginning of the period 280,452 Shares outstanding at the beginning of the period 283,572
Shares subscribed 993 Shares subscribed 70
Shares redeemed 107,703 Shares redeemed 150,241
Shares outstanding at the end of the period 173,742 Shares outstanding at the end of the period 133,401
Class S Dist (USD)
Shares outstanding at the beginning of the period 4,970,679
Shares subscribed –
Shares redeemed –
Shares outstanding at the end of the period 4,970,679
ASIA CREDIT OPPORTUNITIES FUND
Class I Dist (USD) Class A Dist (USD)
Shares outstanding at the beginning of the period 1,458,673 Shares outstanding at the beginning of the period 374,362
Shares subscribed – Shares subscribed 1,073
Shares redeemed – Shares redeemed 1,073
Shares outstanding at the end of the period 1,458,673 Shares outstanding at the end of the period 374,362
Class I Dist (GBP)
Shares outstanding at the beginning of the period 250,763
Shares subscribed 20,638
Shares redeemed 6,012
Shares outstanding at the end of the period 265,389
ASIA DIVIDEND FUND
Class I Acc (USD) Class I Dist (USD)
Shares outstanding at the beginning of the period 4,086,286 Shares outstanding at the beginning of the period 1,436,939
Shares subscribed 184,571 Shares subscribed 13,509
Shares redeemed 1,705,241 Shares redeemed 531,811
Shares outstanding at the end of the period 2,565,616 Shares outstanding at the end of the period 918,637
Class A Acc (USD) Class A Dist (USD)
Shares outstanding at the beginning of the period 3,328,709 Shares outstanding at the beginning of the period 863,909
Shares subscribed 157,790 Shares subscribed 19,566
Shares redeemed 1,256,381 Shares redeemed 164,391
Shares outstanding at the end of the period 2,230,118 Shares outstanding at the end of the period 719,084
Class I Acc (GBP) Class I Dist (GBP)
Shares outstanding at the beginning of the period 185,065 Shares outstanding at the beginning of the period 2,257,372
Shares subscribed 23,026 Shares subscribed 61,167
Shares redeemed 12,871 Shares redeemed 358,327
Shares outstanding at the end of the period 195,220 Shares outstanding at the end of the period 1,960,212
The accompanying notes form an integral part of these financial statements.
* The Fund’s name changed from Matthews Asia Strategic Income Fund to Matthews Asia Total Return Bond Fund on 25 May 2020.

global.matthewsasia.com 41
Statement of Changes in Number of Shares (continued)
For the period ended 30 September 2020
ASIA DIVIDEND FUND (CONTINUED)
Class A Acc (GBP) Class A Dist (GBP)
Shares outstanding at the beginning of the period 244,205 Shares outstanding at the beginning of the period 74,194
Shares subscribed 74,578 Shares subscribed 2,201
Shares redeemed 47,235 Shares redeemed 18,530
Shares outstanding at the end of the period 271,548 Shares outstanding at the end of the period 57,865
Class I Acc (EUR)
Shares outstanding at the beginning of the period 66,317
Shares subscribed 1,278
Shares redeemed 47,158
Shares outstanding at the end of the period 20,437
ASIA EX JAPAN DIVIDEND FUND
Class I Acc (USD) Class I Dist (USD)
Shares outstanding at the beginning of the period 431,793 Shares outstanding at the beginning of the period 17,230
Shares subscribed 165,148 Shares subscribed 8,755
Shares redeemed 88,525 Shares redeemed –
Shares outstanding at the end of the period 508,416 Shares outstanding at the end of the period 25,985
Class A Acc (USD) Class A Dist (USD)
Shares outstanding at the beginning of the period 108,893 Shares outstanding at the beginning of the period 24,495
Shares subscribed 46,321 Shares subscribed 8,638
Shares redeemed 15,380 Shares redeemed 846
Shares outstanding at the end of the period 139,834 Shares outstanding at the end of the period 32,287
Class S Acc (USD) Class S Dist (USD)
Shares outstanding at the beginning of the period 101,600 Shares outstanding at the beginning of the period 685,845
Shares subscribed 11,589 Shares subscribed 110,443
Shares redeemed 432 Shares redeemed 41,745
Shares outstanding at the end of the period 112,757 Shares outstanding at the end of the period 754,543
Class I Acc (GBP) Class I Dist (GBP)
Shares outstanding at the beginning of the period 68,916 Shares outstanding at the beginning of the period 30,585
Shares subscribed 175,504 Shares subscribed 57,718
Shares redeemed 48,007 Shares redeemed 7,398
Shares outstanding at the end of the period 196,413 Shares outstanding at the end of the period 80,905
Class A Acc (GBP)1 Class A Dist (GBP)1
Shares outstanding at the beginning of the period – Shares outstanding at the beginning of the period –
Shares subscribed 500 Shares subscribed 500
Shares redeemed – Shares redeemed –
Shares outstanding at the end of the period 500 Shares outstanding at the end of the period 500
Class S Acc (GBP) Class S Dist (GBP)
Shares outstanding at the beginning of the period 626,760 Shares outstanding at the beginning of the period 4,213,869
Shares subscribed 850,700 Shares subscribed 9,265,539
Shares redeemed 111,137 Shares redeemed 656,224
Shares outstanding at the end of the period 1,366,323 Shares outstanding at the end of the period 12,823,184
1 Commenced operations on 31 July 2020.
The accompanying notes form an integral part of these financial statements.

42 MATTHEWS ASIA FUNDS
1 Commenced operations on 31 July 2020.
ASIA EX JAPAN DIVIDEND FUND (CONTINUED)
Class I Acc (EUR)1 Class S Acc (EUR)1
Shares outstanding at the beginning of the period – Shares outstanding at the beginning of the period –
Shares subscribed 556 Shares subscribed 556
Shares redeemed – Shares redeemed –
Shares outstanding at the end of the period 556 Shares outstanding at the end of the period 556
CHINA DIVIDEND FUND
Class I Acc (USD) Class I Dist (USD)
Shares outstanding at the beginning of the period 479,631 Shares outstanding at the beginning of the period 69,541
Shares subscribed 44,006 Shares subscribed 12,271
Shares redeemed 38,630 Shares redeemed 5,455
Shares outstanding at the end of the period 485,007 Shares outstanding at the end of the period 76,357
Class A Acc (USD) Class A Dist (USD)
Shares outstanding at the beginning of the period 284,705 Shares outstanding at the beginning of the period 111,014
Shares subscribed 32,103 Shares subscribed 21,253
Shares redeemed 46,980 Shares redeemed 55,385
Shares outstanding at the end of the period 269,828 Shares outstanding at the end of the period 76,882
PACIFIC TIGER FUND
Class I Acc (USD) Class I Dist (USD)
Shares outstanding at the beginning of the period 23,215,235 Shares outstanding at the beginning of the period 592,011
Shares subscribed 4,180,310 Shares subscribed 16,045
Shares redeemed 13,532,050 Shares redeemed 137,055
Shares outstanding at the end of the period 13,863,495 Shares outstanding at the end of the period 471,001
Class A Acc (USD) Class I Acc (GBP)
Shares outstanding at the beginning of the period 1,146,866 Shares outstanding at the beginning of the period 2,834,215
Shares subscribed 453,767 Shares subscribed 243,442
Shares redeemed 314,824 Shares redeemed 1,027,015
Shares outstanding at the end of the period 1,285,809 Shares outstanding at the end of the period 2,050,642
Class I Dist (GBP) Class A Acc (GBP)
Shares outstanding at the beginning of the period 1,562,463 Shares outstanding at the beginning of the period 47,701
Shares subscribed 219,760 Shares subscribed 45,690
Shares redeemed 130,400 Shares redeemed 7,747
Shares outstanding at the end of the period 1,651,823 Shares outstanding at the end of the period 85,644
Class I Acc (EUR) Class I Acc (JPY)
Shares outstanding at the beginning of the period 500 Shares outstanding at the beginning of the period 6,180,321
Shares subscribed – Shares subscribed 64,923
Shares redeemed – Shares redeemed 2,432,711
Shares outstanding at the end of the period 500 Shares outstanding at the end of the period 3,812,533
Statement of Changes in Number of Shares (continued)
For the period ended 30 September 2020
The accompanying notes form an integral part of these financial statements.

global.matthewsasia.com 43
CHINA FUND
Class I Acc (USD) Class A Acc (USD)
Shares outstanding at the beginning of the period 856,459 Shares outstanding at the beginning of the period 109,237
Shares subscribed 340,551 Shares subscribed 124,782
Shares redeemed 92,837 Shares redeemed 81,139
Shares outstanding at the end of the period 1,104,173 Shares outstanding at the end of the period 152,880
Class S Acc (USD)2 Class I Acc (GBP)
Shares outstanding at the beginning of the period – Shares outstanding at the beginning of the period 239,854
Shares subscribed 1,323,251 Shares subscribed 376,294
Shares redeemed – Shares redeemed 172,598
Shares outstanding at the end of the period 1,323,251 Shares outstanding at the end of the period 443,550
Class A Acc (GBP) Class S Acc (JPY)
Shares outstanding at the beginning of the period 12,858 Shares outstanding at the beginning of the period 5,000,000
Shares subscribed 5,086 Shares subscribed –
Shares redeemed 2,779 Shares redeemed –
Shares outstanding at the end of the period 15,165 Shares outstanding at the end of the period 5,000,000
INDIA FUND
Class I Acc (USD) Class A Acc (USD)
Shares outstanding at the beginning of the period 2,488,861 Shares outstanding at the beginning of the period 209,593
Shares subscribed 1,060 Shares subscribed 66,902
Shares redeemed 1,960,692 Shares redeemed 82,768
Shares outstanding at the end of the period 529,229 Shares outstanding at the end of the period 193,727
Class S Acc (USD) Class I Acc (GBP)
Shares outstanding at the beginning of the period 358 Shares outstanding at the beginning of the period 336,285
Shares subscribed – Shares subscribed 53,929
Shares redeemed – Shares redeemed 117,626
Shares outstanding at the end of the period 358 Shares outstanding at the end of the period 272,588
Class A Acc (GBP)
Shares outstanding at the beginning of the period 202,274
Shares subscribed 3,835
Shares redeemed 37,967
Shares outstanding at the end of the period 168,142
JAPAN FUND
Class I Acc (USD) Class A Acc (USD)
Shares outstanding at the beginning of the period 26,121,338 Shares outstanding at the beginning of the period 612,111
Shares subscribed 3,233,537 Shares subscribed 119,351
Shares redeemed 21,427,377 Shares redeemed 116,147
Shares outstanding at the end of the period 7,927,498 Shares outstanding at the end of the period 615,315
Class S Acc (USD) Class I Acc (USD) Hedged
Shares outstanding at the beginning of the period 1,003,532 Shares outstanding at the beginning of the period 150,224
Shares subscribed – Shares subscribed 1,109
Shares redeemed 1,003,100 Shares redeemed 41,131
Shares outstanding at the end of the period 432 Shares outstanding at the end of the period 110,202
Statement of Changes in Number of Shares (continued)
For the period ended 30 September 2020
The accompanying notes form an integral part of these financial statements.
2 Commenced operations on 30 April 2020.

44 MATTHEWS ASIA FUNDS
Statement of Changes in Number of Shares (continued)
For the period ended 30 September 2020
JAPAN FUND (CONTINUED)
Class I Acc (GBP) Class I Acc (EUR) Hedged
Shares outstanding at the beginning of the period 31,123 Shares outstanding at the beginning of the period 559,452
Shares subscribed 4,328 Shares subscribed –
Shares redeemed 736 Shares redeemed 4,000
Shares outstanding at the end of the period 34,715 Shares outstanding at the end of the period 555,452
ASIA SMALL COMPANIES FUND
Class I Acc (USD) Class A Acc (USD)
Shares outstanding at the beginning of the period 183,644 Shares outstanding at the beginning of the period 1,040,849
Shares subscribed 68,359 Shares subscribed 26,974
Shares redeemed 3,413 Shares redeemed 376,394
Shares outstanding at the end of the period 248,590 Shares outstanding at the end of the period 691,429
Class I Acc (GBP)
Shares outstanding at the beginning of the period 53,643
Shares subscribed 122,152
Shares redeemed 57,246
Shares outstanding at the end of the period 118,549
CHINA SMALL COMPANIES FUND
Class I Acc (USD) Class A Acc (USD)
Shares outstanding at the beginning of the period 658,614 Shares outstanding at the beginning of the period 609,400
Shares subscribed 5,694,645 Shares subscribed 2,544,923
Shares redeemed 2,091,776 Shares redeemed 715,648
Shares outstanding at the end of the period 4,261,483 Shares outstanding at the end of the period 2,438,675
Class S Acc (USD) Class I Acc (GBP)
Shares outstanding at the beginning of the period 2,168,248 Shares outstanding at the beginning of the period 4,341
Shares subscribed 1,733,942 Shares subscribed 695,722
Shares redeemed 2,050,120 Shares redeemed 176,786
Shares outstanding at the end of the period 1,852,070 Shares outstanding at the end of the period 523,277
Class S Acc (GBP)
Shares outstanding at the beginning of the period 1,367,619
Shares subscribed 261,680
Shares redeemed 289,170
Shares outstanding at the end of the period 1,340,129
The accompanying notes form an integral part of these financial statements.

global.matthewsasia.com 45
Statement of Net Asset Value (NAV) Per Share and Net Asset Statistics
Values per share in Share Class currency
As at 30 September 2020 As at 31 March 2020 As at 31 March 2019
ASIA TOTAL RETURN BOND FUND^Net Assets 58,196,946 56,161,456 63,369,995
NAV Per Share
I Acc (USD) 12.42 10.81 11.59
I Dist (USD) 8.81 7.87 8.98
A Acc (USD) 12.05 10.52 11.32
A Dist (USD) 8.52 7.64 8.77
S Dist (USD) 10.31 9.22 10.47
Shares Outstanding
I Acc (USD) 163,477 263,458 263,001
I Dist (USD) 190,194 302,610 293,513
A Acc (USD) 173,742 280,452 280,525
A Dist (USD) 133,401 283,572 283,723
S Dist (USD) 4,970,679 4,970,679 4,970,679
ASIA CREDIT OPPORTUNITIES FUNDNet Assets 21,393,331 19,512,223 22,423,730
NAV Per Share
I Dist (USD) 9.63* 8.87 10.21
A Dist (USD) 9.33* 8.61 9.97
I Dist (GBP) 11.33* 10.83 11.77
Shares Outstanding
I Dist (USD) 1,458,673 1,458,673 1,458,673
A Dist (USD) 374,362 374,362 365,574
I Dist (GBP) 265,389 250,763 252,189
ASIA DIVIDEND FUNDNet Assets 191,359,334 189,438,553 439,027,833
NAV Per Share
I Acc (USD) 21.28 15.18 18.06
I Dist (USD) 16.56 12.00 14.76
A Acc (USD) 20.10 14.38 17.22
A Dist (USD) 16.01 11.61 14.33
C Acc (USD)1 – – 17.76
I Acc (GBP) 24.95 18.47 20.74
I Dist (GBP) 19.49 14.62 16.93
A Acc (GBP) 23.70 17.61 19.88
A Dist (GBP) 18.79 14.14 16.48
I Acc (EUR) 11.95 9.11 10.57
Shares Outstanding
I Acc (USD) 2,565,616 4,086,286 5,434,617
I Dist (USD) 918,637 1,436,939 2,650,129
A Acc (USD) 2,230,118 3,328,709 3,908,560
A Dist (USD) 719,084 863,909 920,061
C Acc (USD)1 – – 8,000,000
I Acc (GBP) 195,220 185,065 250,814
I Dist (GBP) 1,960,212 2,257,372 2,517,427
A Acc (GBP) 271,548 244,205 315,896
A Dist (GBP) 57,865 74,194 71,304
I Acc (EUR) 20,437 66,317 572,591
^ The Fund’s name changed from Matthews Asia Strategic Income Fund to Matthews Asia Total Return Bond Fund on 25 May 2020.
* NAV per share includes swing pricing adjustment.
1 Closed on 18 December 2019.
The accompanying notes form an integral part of these financial statements.

46 MATTHEWS ASIA FUNDS
Statement of Net Asset Value (NAV) Per Share and Net Asset Statistics (continued)
Values per share in Share Class currency
As at 30 September 2020 As at 31 March 2020 As at 31 March 2019
ASIA EX JAPAN DIVIDEND FUNDNet Assets 265,496,886 71,090,831 44,622,585
NAV Per Share
I Acc (USD) 20.21* 13.78 15.31
I Dist (USD) 17.46* 12.05 13.86
A Acc (USD) 19.63* 13.42 15.02
A Dist (USD) 16.27* 11.26 13.06
S Acc (USD) 13.15* 8.95 9.90
S Dist (USD) 12.08* 8.32 9.53
I Acc (GBP) 23.65* 16.74 17.55
I Dist (GBP) 20.53* 14.69 15.91
A Acc (GBP)2 10.85* n.a. n.a.
A Dist (GBP)2 10.83* n.a. n.a.
S Acc (GBP) 13.70* 9.67 10.09
S Dist (GBP) 12.69* 9.05 9.75
I Acc (EUR)2 10.72* n.a. n.a.
S Acc (EUR)2 10.73* n.a. n.a.
Shares Outstanding
I Acc (USD) 508,416 431,793 151,625
I Dist (USD) 25,984 17,230 17,230
A Acc (USD) 139,834 108,893 141,937
A Dist (USD) 32,287 24,495 17,230
S Acc (USD) 112,757 101,600 101,450
S Dist (USD) 754,543 685,845 133,079
I Acc (GBP) 196,413 68,916 43,913
I Dist (GBP) 80,905 30,585 16,009
A Acc (GBP)2 500 n.a. n.a.
A Dist (GBP)2 500 n.a. n.a.
S Acc (GBP) 1,366,323 626,760 827,493
S Dist (GBP) 12,823,184 4,213,869 1,970,736
I Acc (EUR)2 556 n.a. n.a.
S Acc (EUR)2 556 n.a. n.a.
CHINA DIVIDEND FUNDNet Assets 17,101,194 14,012,212 17,488,625
NAV Per Share
I Acc (USD) 19.75 15.58 18.02
I Dist (USD) 16.35 13.11 15.66
A Acc (USD) 18.90 14.97 17.44
A Dist (USD) 15.29 12.32 14.90
Shares Outstanding
I Acc (USD) 485,007 479,631 548,901
I Dist (USD) 76,357 69,541 72,326
A Acc (USD) 269,828 284,705 236,388
A Dist (USD) 76,882 111,014 157,271
ASIA FOCUS FUND#
Net Assets – – 1,154,097
NAV Per Share
I Acc (USD) – – 11.68
A Acc (USD) – – 11.38
Shares Outstanding
I Acc (USD) – – 50,086
A Acc (USD) – – 50,000
* NAV per share includes swing pricing adjustment.
# Asia Focus Fund liquidated on 31 May 2019.
2 Commenced operations on 31 July 2020.
The accompanying notes form an integral part of these financial statements.

global.matthewsasia.com 47
Statement of Net Asset Value (NAV) Per Share and Net Asset Statistics (continued)
Values per share in Share Class currency
As at 30 September 2020 As at 31 March 2020 As at 31 March 2019
PACIFIC TIGER FUNDNet Assets 460,740,859 516,327,342 1,270,983,619
NAV Per Share
I Acc (USD) 20.52 15.11 18.58
I Dist (USD) 12.38 9.11 11.42
A Acc (USD) 18.64 13.77 17.04
I Acc (GBP) 24.11 18.43 21.38
I Dist (GBP) 16.32 12.47 14.68
A Acc (GBP) 22.84 17.51 20.45
I Acc (EUR)3 10.53 8.28 n.a.
I Acc (JPY) 1,273.11 962.43 1,207.93
Shares Outstanding
I Acc (USD) 13,863,495 23,215,235 44,747,220
I Dist (USD) 471,001 592,011 989,686
A Acc (USD) 1,285,809 1,146,866 1,349,882
I Acc (GBP) 2,050,642 2,834,215 6,226,073
I Dist (GBP) 1,651,823 1,562,463 2,290,220
A Acc (GBP) 85,644 47,701 49,499
I Acc (EUR)3 500 500 n.a.
I Acc (JPY) 3,812,533 6,180,321 17,035,402
CHINA FUNDNet Assets 115,664,356 62,754,804 17,663,847
NAV Per Share
I Acc (USD) 22.26 16.25 16.63
A Acc (USD) 19.78 14.48 14.93
S Acc (USD)4 12.56 n.a. n.a.
I Acc (GBP) 24.88 18.86 18.22
A Acc (GBP) 23.54 17.90 17.42
S Acc (JPY)5 1,201.41 898.53 n.a.
Shares Outstanding
I Acc (USD) 1,104,173 856,459 626,809
A Acc (USD) 152,880 109,237 108,190
S Acc (USD)4 1,323,251 n.a. n.a.
I Acc (GBP) 443,550 239,854 221,078
A Acc (GBP) 15,165 12,858 15,415
S Acc (JPY)5 5,000,000 5,000,000 n.a.
INDIA FUNDNet Assets 20,738,750 36,306,562 90,197,687
NAV Per Share
I Acc (USD) 14.75 10.27 15.96
A Acc (USD) 14.00 9.78 15.32
S Acc (USD) 12.89 8.95 13.88
I Acc (GBP) 18.43 13.32 19.54
A Acc (GBP) 17.48 12.68 18.74
Shares Outstanding
I Acc (USD) 529,229 2,488,861 4,180,874
A Acc (USD) 193,727 209,593 187,907
S Acc (USD) 358 358 358
I Acc (GBP) 272,588 336,285 620,308
A Acc (GBP) 168,142 202,274 191,649
3 Commenced operations on 30 April 2019.
4 Commenced operations on 30 April 2020.
5 Commenced operations on 18 December 2019.
The accompanying notes form an integral part of these financial statements.

48 MATTHEWS ASIA FUNDS
Statement of Net Asset Value (NAV) Per Share and Net Asset Statistics (continued)
Values per share in Share Class currency
As at 30 September 2020 As at 31 March 2020 As at 31 March 2019
JAPAN FUNDNet Assets 145,223,668 326,903,160 563,024,595
NAV Per Share
I Acc (USD) 15.77 11.49 12.34
A Acc (USD) 15.26 11.16 12.07
S Acc (USD) 16.18 11.76 12.62
I Acc (USD) Hedged 14.04 10.49 11.39
I Acc (GBP) 18.91 14.31 14.50
I Acc (EUR) Hedged 12.97 9.76 10.80
S Acc (EUR) Hedged6 – – 10.30
Shares Outstanding
I Acc (USD) 7,927,498 26,121,338 39,903,215
A Acc (USD) 615,315 612,111 621,826
S Acc (USD) 432 1,003,532 1,310,332
I Acc (USD) Hedged 110,202 150,224 155,008
I Acc (GBP) 34,715 31,123 29,635
I Acc (EUR) Hedged 555,452 559,452 1,401,819
S Acc (EUR) Hedged6 – – 2,340,052
ASIA SMALL COMPANIES FUNDNet Assets 16,975,797 13,611,322 14,223,473
NAV Per Share
I Acc (USD) 15.45* 10.73 12.23
A Acc (USD) 14.8* 10.31 11.84
I Acc (GBP) 19.09* 13.76 14.8
Shares Outstanding
I Acc (USD) 248,590 183,644 164,462
A Acc (USD) 691,429 1,040,849 961,843
I Acc (GBP) 118,549 53,643 42,358
CHINA SMALL COMPANIES FUND
Net Assets 279,183,222 72,972,206 58,494,309
NAV Per Share
I Acc (USD) 32.24* 23.06 18.32
A Acc (USD) 30.72* 22.04 17.64
S Acc (USD) 15.42* 10.99 8.69
I Acc (GBP)7 15.19* 11.28 n.a.
S Acc (GBP) 16.36* 12.11 9.03
Shares Outstanding
I Acc (USD) 4,261,483 658,614 1,461,435
A Acc (USD) 2,438,675 609,400 477,998
S Acc (USD) 1,852,070 2,168,248 151,550
I Acc (GBP)7 523,277 4,341 n.a.
S Acc (GBP) 1,340,129 1,367,619 1,857,899
* NAV per share includes swing pricing adjustment.
6 Dormant since 24 July 2019.
7 Commenced operations on 30 January 2020.
The accompanying notes form an integral part of these financial statements.

global.matthewsasia.com 49
Notes to Financial Statements As at 30 September 2020
1. GENERAL
MATTHEWS ASIA FUNDS (the “Fund”) is an investment company organized under the laws of the Grand Duchy of Luxembourg as a “société d’investissement à capital variable” (SICAV) and is authorized under Part I of the amended Luxembourg Law of 17 December 2010, implementing the Directive 2014/91/EU of the European Parliament (“UCITS V Directive”) and of the Council of 23 July 2014 amending Directive 2009/65/EC on the coordination of laws, regulations and administrative provisions relating to Undertakings for Collective Investment in Transferable Securities (“UCITS”). The Fund was incorporated on 5 February 2010.
The Fund’s articles of incorporation have been deposited with the Luxembourg Registre du Commerce et des Sociétés and were published in the Mémorial C, Recueil des Sociétés et Associations (the “Mémorial”) on 25 February 2010 and the last update was published on 31 March 2016.
The Fund has been registered under number B-151275 with the Luxembourg Trade and Company Register.
The Fund appointed Carne Global Fund Managers as Management Company on 4 November 2019.
The objective of the Fund is to provide investors with access to the markets of the Asia Pacific region, through diversification of investments. Each Sub-Fund will have a specific investment objective.
Each Sub-Fund offers the following Classes of Shares:
Share Class
Asia Total Return
Bond Fund*
Asia Credit Opportunities
Fund
Asia Dividend
Fund
Asia ex Japan
Dividend Fund
China Dividend
FundPacific
Tiger Fund China FundIndia Fund Japan Fund
Asia Small Companies
Fund
China Small Companies
Fund
I Acc (USD) X X X X X X X X X X
I Dist (USD) X X X X X X
A Acc (USD) X X X X X X X X X X
A Dist (USD) X X X X X
S Acc (USD) X X1 X X X
S Dist (USD) X X
I Acc (USD) Hedged
X X
I Acc (GBP) X X X X X X X X
I Dist (GBP) X X X X
A Acc (GBP) X X2 X X X
A Dist (GBP) X X2
S Acc (GBP) X X
S Dist (GBP) X
I Acc (EUR) X X2 X
S Acc (EUR) X2
I Acc (EUR) Hedged
X
I Acc (JPY) X
S Acc (JPY) X
* The Fund’s name changed from Matthews Asia Strategic Income Fund to Matthews Asia Total Return Bond Fund on 25 May 2020.
1 Commenced operations on 30 April 2020. 2 Commenced operations on 31 July 2020.
Each Sub-Fund may offer both accumulation (“Acc”) and distribution Shares (“Dist”). Unless otherwise provided for in the Fund’s Prospectus, in relation to Shares referenced as “Acc” Shares, no distributions will be made and all interests and other income earned by the Sub-Fund will be reflected in the Net Asset Value (“NAV”) of such Shares. In relation to Shares referenced as “Dist” Shares, it is the intention of the Board of Directors of the Fund to distribute substantially all the income earned on investments at least annually. All classes belonging to the same Sub-Fund will be commonly invested in adherence with the specific investment objective of the relevant Sub-Fund but may differ with regard to fee structure, minimum subscription amount, dividend policy or other particular features described in the Fund’s prospectus. All Classes of Shares except I Acc (JPY), S Acc (USD), S Dist (USD), S Acc (GBP), S Dist (GBP), S Acc (JPY), I Acc (GBP), I Dist (GBP), A Acc (GBP) and A Dist (GBP) are listed on Euro MTF.

50 MATTHEWS ASIA FUNDS
2. SUMMARY OF SIGNIFICANT ACCOUNTING POLICIES
A) PRESENTATION OF FINANCIAL STATEMENTS
The financial statements are prepared in accordance with Luxembourg law and regulations relating to UCITS and generally accepted accounting principles in Luxembourg.
B) COMBINED FINANCIAL STATEMENTS
The Combined Financial Statements equal the sum of the financial statements of all Sub-Funds.
The Combined Statement of Assets and Liabilities and Combined Statement of Operations and Changes in Net Assets are expressed in USD. The currency of all Sub-Funds is USD and therefore there is no currency translation adjustment.
C) VALUATION OF THE INVESTMENTS IN SECURITIES AND MONEY MARKET INSTRUMENTS
The Fund’s equity securities are valued based on market quotations or at fair value as determined in good faith by or under the direction of the Board of Directors of the Fund when no market quotations are available or when market quotations have become unreliable.
Market values for equity securities are determined based on the last sale price on the principal (or most advantageous) market on which the security is traded. If a reliable last sale price is not available, market values for equity securities are determined using the mean between the last available bid and ask price. Securities are valued through valuations obtained from a commercial pricing service or at the most recent mean of the bid and ask prices provided by investment dealers in accordance with the Fund’s Pricing Policies.
Securities that trade in over-the-counter markets, including most debt securities (bonds), may be valued by other third-party vendors or by using indicative bid quotations from dealers or market makers, or other available market information.
Events affecting the value of foreign investments may occur between the time at which they are determined and the Fund’s valuation point of 2:00 p.m. Luxembourg time. When such events occur, each Sub-Fund may apply a model-derived factor, as provided by an independent pricing service, to the closing price of equity securities traded on foreign securities exchanges. Notwithstanding the foregoing, the Fund may determine not to fair value securities where it believes that the impact of doing so would not have a material impact on the calculation of a Sub-Fund’s NAV on that day.
The Board of Directors of the Fund has delegated the fair value analysis and assessment to the Investment Manager’s Valuation Committee (the “Valuation Committee”), subject to the Fund’s Pricing and Valuation Policy and Procedures (the “Pricing Policies”). The Fund has retained third-party pricing services that may be utilized by the Valuation Committee under circumstances described in the Pricing Policies to provide fair value prices for certain securities held by the Fund. To propose the fair value price of the suspended securities, the Valuation Committee may use techniques such as analysis of the price movements of selected proxies / indices whose performance might indicate valuation changes of the suspended securities.
When fair value pricing is used, the prices of securities used by a Sub-Fund to calculate its Net Asset Value differ from quoted or published prices for the same securities for that day. All fair value determinations are made subject to the Board of Directors of the Fund’s oversight.
D) NET REALIZED GAIN/(LOSS) ON SALES OF INVESTMENTS AND CHANGE IN UNREALIZED GAIN/(LOSS) ON INVESTMENTS
Net realized gain or loss on sales of investments are calculated on the basis of first in first out cost method of the investments sold. At period end, holdings in securities have been valued at their last available prices on the main market for the relevant security. The net realized gain or loss and net change in unrealized gain or loss are included within the Statement of Operations and Changes in Net Assets.
E) FORWARD CURRENCY EXCHANGE CONTRACTS
A forward currency exchange contract is an agreement to buy or sell a specific amount of foreign currency at a certain rate, on or before a certain date. Outstanding forward currency exchange contracts are valued by reference to the forward rate of exchange applicable to the maturity of the contracts.
The unrealized gain and loss are shown in the Statement of Assets and Liabilities under “Unrealized gain on forward currency exchange contracts” and “Unrealized loss on forward currency exchange contracts.”
Net realized gain/(loss) and net change in unrealized gain/(loss) as a result thereof are included in the Statement of Operations and Changes in Net Assets under “Net realized gain/(loss) on forward currency exchange contracts” and “Net change in unrealized gain/(loss) on forward currency exchange contracts,” respectively.
Notes to Financial Statements (continued)
As at 30 September 2020

global.matthewsasia.com 51
2. SUMMARY OF SIGNIFICANT ACCOUNTING POLICIES (continued)
F) INTEREST RATE SWAP AGREEMENTS
An interest rate swap agreement is a bilateral agreement in which each party agrees to exchange a series of interest payments for another series for interest payments (usually fixed/floating) based on a notional amount that serves as a computation basis and that is usually not exchanged. Dirty pricing is utilized for all interest rate swap agreements where the floating rate index resets daily.
The unrealized gain and loss as shown in the Statement of Assets and Liabilities under “Unrealized gain on interest rate swap agreements” and “Unrealized loss on interest rate swap agreements.”
Net change in unrealized gain/(loss) as result thereof is included in the Statement of Operations and Changes in Net Assets under “Net change in unrealized gain/(loss) on interest rate swap agreements.”
In case of settlements of the interest rate swap agreements, the net realized gain/(loss) as a result thereof is included in the Statement of Operations and Changes in Net Assets under “Net realized gain/(loss) on interest rate swap agreement.”
G) CONVERSION OF FOREIGN CURRENCIES
The books and records of the Fund are maintained in USD.
Transactions denominated in foreign currencies are recorded at the current prevailing exchange rates on the transaction date. All assets and liabilities denominated in foreign currencies are translated into USD at the exchange rate as at 30 September 2020.
Conversion gains or losses resulting from changes in the exchange rate during the period and realized gains and losses on the settlement of foreign currency transactions are reported in the Statement of Operations and Changes in Net Assets for the current period.
The Fund does not isolate that portion of gains and losses on investments in equity securities that are due to changes in the foreign exchange rate from those that are due to changes in market prices of equity securities.
The accounting records and the financial statements of each Sub-Fund are expressed in USD.
Bank accounts, other net assets and market value of the investments in securities expressed in currencies other than the currency of a Sub-Fund are converted at the exchange rates prevailing on the date of the Statement of Assets and Liabilities. Income and expenses in currencies other than the currency of a Sub-Fund are converted at the rate of exchange prevailing at the transaction date.
Net realized gain and loss on foreign exchanges and net change in unrealized gain and loss on foreign exchanges represent: (i) foreign exchange gains and losses from the sale and holding of foreign currencies; (ii) gains and losses between trade date and settlement date on securities transactions and (iii) gains and losses arising from the difference between amounts of dividends and interest recorded and the amounts actually received.
H) COST OF INVESTMENTS IN SECURITIES
Cost of investments in securities in currencies other than the currency of a Sub-Fund is converted into the Sub-Fund’s currency at the exchange rate applicable at purchase date.
I) INCOME
Interest income is accrued on a daily basis and may include the amortization of premiums and accretions of discounts. Bank and time deposits interest income are recognized on an accrual basis. Interest income is recorded net of withholding tax.
Dividends are credited to income on the date upon which the relevant securities are first listed as ‘ex dividend’ provided that the amount of a dividend is known with reasonable certainty. This income is shown net of any withholding taxes, except where the withholding tax has been received or is receivable.
J) FEE WAIVER
The Investment Manager may, for such time as it considers appropriate, choose to waive all or part of the fees that it is entitled to receive, or to reimburse a Sub-Fund for other expenses, in order to reduce the impact such fees and expenses may have on the performance of the Share Class. The Investment Manager will reimburse on a monthly basis the amount of the fee waiver or expense reimbursement to the respective Sub-Fund. Fees that have been previously waived and expenses that have been previously reimbursed may be recovered by the Investment Manager.
The waived fees are settled monthly on a net basis with management and administration fees and therefore they are presented as one line item in the Statement of Assets and Liabilities under “Management fees and administration fees payable.”
The amounts of the fees waived for the current period is separately disclosed as “Fees Waived and Expenses Reimbursed” in the Statement of Operations and Changes in Net Assets.
K) USE OF ESTIMATES
The preparation of financial statements in conformity with generally accepted accounting principles requires management to make estimates and assumptions that affect the amounts reported in the financial statements and accompanying notes. Actual results may differ from those estimates.
Notes to Financial Statements (continued)
As at 30 September 2020

52 MATTHEWS ASIA FUNDS
3. EXCHANGE RATES
The exchange rates to 1 USD used in the financial statements as at 30 September 2020 are:
Australian Dollar (AUD) 1.4050 British Pound (GBP) 0.7797 Malaysian Ringgit (MYR) 4.1555
Bangladesh Taka (BDT) 84.795 Hong Kong Dollar (HKD) 7.7502 Philippines Peso (PHP) 48.480
Swiss Franc (CHF) 0.9228 Indonesian Rupiah (IDR) 14,880 Singapore Dollar (SGD) 1.3697
Chinese Yuan Renminbi (CNH) 6.8124 Indian Rupee (INR) 73.780 Thai Bhat (THB) 31.688
Chinese Yuan (CNY) 6.8106 Japanese Yen (JPY) 105.72 Taiwan New Dollar (TWD) 28.962
Euro (EUR) 0.8542 South Korean Won (KRW) 1,169.5 Vietnamese Dong (VND) 23,182
4. MANAGEMENT FEES AND ADMINISTRATION FEES
The Management Company receives an amount corresponding to the Management Company Fee, which may be up to 0.02% per annum of the NAV of the relevant Sub-Fund calculated on each Valuation Day. The fee is accrued daily and is payable monthly in arrears.
The Investment Manager receives an amount corresponding to the Management Fee, which may be up to 1.50% per annum of the NAV of the Sub-Fund calculated on each Valuation Day. The Management fees in the table represent the maximum effective fees paid to the Investment Manager.
Share Class
Asia Total Return
Bond Fund*
Asia Credit Opportunities
Fund
Asia Dividend
Fund
Asia ex Japan
Dividend Fund
China Dividend
FundPacific
Tiger Fund China Fund India Fund Japan Fund
Asia Small Companies
Fund
China Small Companies
Fund
I Acc (USD) 0.65% - 0.75% 0.75% 0.75% 0.75% 0.75% 0.75% 0.75% 1.00% 1.00%
I Dist (USD) 0.65% 0.65% 0.75% 0.75% 0.75% 0.75% - - - - -
A Acc (USD) 1.20% - 1.25% 1.25% 1.25% 1.25% 1.25% 1.25% 1.25% 1.50% 1.50%
A Dist (USD) 1.20% 1.20% 1.25% 1.25% 1.25% - - - - - -
S Acc (USD) - - - 0.75% - - 0.75%** 0.75% 0.75% - 1.00%
S Dist (USD) 0.65% - - 0.75% - - - - - - -
I Acc (USD) Hedged
- - - - - - - - 0.75% - -
I Acc (GBP) - - 0.75% 0.75% - 0.75% 0.75% 0.75% 0.75% 1.00% 1.00%
I Dist (GBP) - 0.65% 0.75% 0.75% - 0.75% - - - - -
A Acc (GBP) - - 1.25% 1.25%** - 1.25% 1.25% 1.25% - - -
A Dist (GBP) - - 1.25% 1.25%** - - - - - - -
S Acc (GBP) - - - 0.75% - - - - - - 1.00%
S Dist (GBP) - - - 0.75% - - - - - - -
I Acc (EUR) - - 0.75% 0.75%** - 0.75% - - - - -
S Acc (EUR) 0.75%**
I Acc (EUR) Hedged
- - - - - - - - 0.75% - -
I Acc (JPY) - - - - - 0.75% - - - - -
S Acc (JPY) - - - - - - 0.75% - - - -
* The Fund’s name changed from Matthews Asia Strategic Income Fund to Matthews Asia Total Return Bond Fund on 25 May 2020.** The details of the dates on which the share classes were launched during the reporting period are included in Note 1.
In addition, the Investment Manager receives an Administration Fee payable monthly in arrears, which may be up to 0.25% per annum of the NAV of the Sub-Fund calculated on each Valuation Day. The Administration Fee is 0.15% for the I and S Share Classes and 0.25% for the A Share Class of each Sub-Fund. The Administration Fee is for administrative services provided to each Sub-Fund.
5. DEPOSITARY AND ADMINISTRATIVE AGENT FEES
The Depositary and the Administrative Agent receive from the Fund aggregate fees that amount to a maximum of 2% per annum of the total net assets of each Sub-Fund. The fees effectively charged to each Sub-Fund are disclosed in the Statement of Operations and Changes in Net Assets of the Sub-Fund. The Depositary and Administrative Agent fees are payable monthly in arrears. Transaction costs are charged separately.
6. TRANSFER AGENCY FEES
The Transfer Agent receives a minimum annual fee of USD 3,000 per Sub-Fund. The fees effectively charged to each Sub-Fund are disclosed in the Statement of Operations and Changes in Net Assets of the Sub-Fund. The Transfer agency fees are payable monthly.
Notes to Financial Statements (continued)
As at 30 September 2020

global.matthewsasia.com 53
Notes to Financial Statements (continued)
As at 30 September 2020
7. OTHER EXPENSES
The Fund bears its operational costs including but not limited to governmental fees, taxes, professional fees (legal and auditing), infrastructure fees, publishing and printing expenses, the cost of preparing the explanatory memoranda, financial reports and other documents for the Shareholders.
Professional fees are disclosed in the Statement of Operations and Changes in Net Assets of the Sub-Fund.
In addition to the fees paid to the Fund’s transfer agent, the relevant Sub-Funds bear the cost of fees paid to certain service providers, such as distributors or financial intermediaries, which provide transfer agency, record-keeping and shareholder servicing to certain shareholders. Such fees accrued to pay these service providers are a component of “accrued expenses and other payables” on the Statement of Assets and Liabilities as well as included in “other expenses” in the Statement of Operations and Changes in Net Assets.
8. COMPENSATION OF THE FUND’S IDENTIFIED STAFF
The Fund has no employees and has identified members whose professional activities have a material impact on its risk profile (the “Identified Staff”). The Fund’s Identified Staff is composed of the five members of its Board of Directors. Two members of the Board of Directors each receives fixed remuneration for their responsibilities. The three other directors are employees of the Investment Manager and do not receive additional compensation in respect of their roles as directors of the Fund.
None of the Identified Staff of the Fund receives any variable remuneration in exchange for professional services rendered to the Fund.
The aggregate compensation of the Fund’s Identified Staff, all of which is composed of fixed remuneration, for the period from 1 April 2020 to 30 September 2020 was EUR 30,000.
The Fund appointed the Management Company with effect as of November 4, 2019.
9. TAXATION
A) TAXE D’ABONNEMENT
The subscription tax is payable quarterly and calculated on the total net assets of each Sub-Fund at the end of the relevant quarter at a rate of 0.05% per annum.
This rate is reduced to 0.01% (i) for Sub-Funds or individual classes of shares reserved to one or more institutional investors or (ii) funds or Sub-Funds having the exclusive objective to invest in money market instruments as defined by the amended law of 17 December 2010 relating to undertakings of collective investment.
The portion of a Sub-Fund’s assets invested in other Luxembourg funds, which have already been subject to subscription tax, is excluded for the purposes of computing the tax.
B) PROVISION FOR FOREIGN TAXES
The Sub-Funds may be subject to foreign taxation related to income received, capital gains on the sale of securities and certain foreign currency transactions in the foreign jurisdictions in which they invest. Foreign taxes, if any, are recorded based on the tax regulations and rates that exist in the foreign markets in which the Sub-Funds invest. When a capital gain tax is determined to apply, the Sub-Funds may record estimated deferred tax liability in an amount that may be payable if the securities were disposed of on the valuation date.
10. TRANSACTION COSTS
For the period ended 30 September 2020, the Fund incurred transaction costs which have been defined as brokerage fees and commissions and depositary transaction fees relating to purchase or sale of transferable securities or other eligible instruments as follows:
Sub-Fund (USD)Brokerage Fees and
CommissionsDepositary Transaction
Fees Total Transaction Costs
Asia Total Return Bond Fund* – 3,358 3,358
Asia Credit Opportunities Fund – 3,609 3,609
Asia Dividend Fund 249,386 36,636 286,022
Asia ex Japan Dividend Fund 462,167 31,835 494,002
China Dividend Fund 29,103 22,064 51,167
Pacific Tiger Fund 849,944 49,660 899,604
China Fund 131,822 23,781 155,603
India Fund 87,942 25,830 113,772
Japan Fund 267,322 19,415 286,737
Asia Small Companies Fund 53,578 25,417 78,995
China Small Companies Fund 811,988 18,188 830,176
* The Fund’s name changed from Matthews Asia Strategic Income Fund to Matthews Asia Total Return Bond Fund on 25 May 2020.

54 MATTHEWS ASIA FUNDS
11. TRANSACTIONS WITH CONNECTED PERSONS
All transactions entered into between the Fund and the Investment Manager, the Directors of the Fund or any entity in which those parties or their connected persons have a material interest have been entered into in the ordinary course of business and on normal commercial terms. The Fund has not entered into any transactions through a broker who is a connected person, nor has the Fund entered into any transactions which are outside the ordinary course of business or not on normal commercial terms.
12. SOFT COMMISSION ARRANGEMENTS
The Investment Manager may effect transactions with or through the agency of another person with whom the Investment Manager or an entity affiliated to the Investment Manager has arrangements under which that person will, from time to time, provide to or procure for the Investment Manager and/or an affiliated party goods, services or other benefits such as research and advisory services, specialized computer hardware or software. No direct payment may be made for such goods or services but the Investment Manager may undertake to place business with that person provided that person has agreed to provide best execution with respect to such business and the services provided must be of a type which assist in the provision of investment services to the Fund. The total monetary value of these arrangements for the period ended 30 September 2020 is USD 124,925.
13. DIVIDENDS
The Fund intends to declare and distribute dividends representing substantially all of the investment income attributable to distribution Shares. Dividends in respect of these Shares will normally be payable at least annually, will be declared in the currency of denomination of the relevant share class and will be recorded on ex-date. Interim dividends in respect of the distribution Shares of any particular Fund may be paid from the attributable net investment income and realized capital gains with a frequency and at such intervals as the Board of Directors of the Fund may decide.
The Securities and Futures Commission of Hong Kong (“SFC”) requires disclosure of the composition of dividends distributed by SFC authorized funds. This disclosure includes the amount of the distribution per share as well as the portion of the dividend paid out of capital or effectively out of capital on a rolling twelve-month period.
The following dividend payments were made during the twelve months ended 30 September 2020:
Ex-DateDate of Dividend
PaymentDividend per
Share
Dividend Paid out of Net Distributable Income for
the Period (%)
Dividend Paid out of Capital or Effectively Out
of Capital (%)
ASIA TOTAL RETURN BOND FUND*
I Dist (USD) 12/17/19 12/30/19 0.140204 n.a. 1 n.a. 1
I Dist (USD) 03/26/20 04/02/20 0.136470 n.a. 1 n.a. 1
I Dist (USD) 06/25/20 07/02/20 0.122010 n.a. 1 n.a. 1
I Dist (USD) 09/29/20 10/06/20 0.105629 n.a. 1 n.a. 1
A Dist (USD) 12/17/19 12/30/19 0.137687 n.a. 1 n.a. 1
A Dist (USD) 03/26/20 04/02/20 0.128870 n.a. 1 n.a. 1
A Dist (USD) 06/25/20 07/02/20 0.118740 n.a. 1 n.a. 1
A Dist (USD) 09/29/20 10/06/20 0.117652 n.a. 1 n.a. 1
S Dist (USD) 12/17/19 12/30/19 0.165411 n.a. 1 n.a. 1
S Dist (USD) 03/26/20 04/02/20 0.155327 n.a. 1 n.a. 1
S Dist (USD) 06/25/20 07/02/20 0.143372 n.a. 1 n.a. 1
S Dist (USD) 09/29/20 10/06/20 0.151151 n.a. 1 n.a. 1
ASIA CREDIT OPPORTUNITIES FUND
I Dist (USD) 12/17/19 12/30/19 0.164296 n.a. 1 n.a. 1
I Dist (USD) 03/26/20 04/02/20 0.161264 n.a. 1 n.a. 1
I Dist (USD) 06/25/20 07/02/20 0.153791 n.a. 1 n.a. 1
I Dist (USD) 09/29/20 10/06/20 0.149573 n.a. 1 n.a. 1
A Dist (USD) 12/17/19 12/30/19 0.159889 n.a. 1 n.a. 1
A Dist (USD) 03/26/20 04/02/20 0.159140 n.a. 1 n.a. 1
A Dist (USD) 06/25/20 07/02/20 0.148934 n.a. 1 n.a. 1
A Dist (USD) 09/29/20 10/06/20 0.145115 n.a. 1 n.a. 1
I Dist (GBP) 12/17/19 12/30/19 0.186996 n.a. 1 n.a. 1
I Dist (GBP) 03/26/20 04/02/20 0.212289 n.a. 1 n.a. 1
I Dist (GBP) 06/25/20 07/02/20 0.179179 n.a. 1 n.a. 1
I DIST (GBP) 09/29/20 10/06/20 0.177483 n.a. 1 n.a. 1
Notes to Financial Statements (continued)
As at 30 September 2020
* The Fund’s name changed from Matthews Asia Strategic Income Fund to Matthews Asia Total Return Bond Fund on 25 May 2020.1 This Sub-Fund is not authorized in Hong Kong, therefore disclosure of the portion paid out of distributable income and out of capital is not required.

global.matthewsasia.com 55
Notes to Financial Statements (continued)
As at 30 September 2020
1 This Share Class is not authorized in Hong Kong, therefore disclosure of the portion paid out of distributable income and out of capital is not required.2 Commenced operations on 31 July 2020.
Ex-DateDate of Dividend
PaymentDividend per
Share
Dividend Paid out of Net Distributable Income for
the Period (%)
Dividend Paid out of Capital or Effectively Out
of Capital (%)
ASIA DIVIDEND FUND
I Dist (USD) 12/17/19 12/30/19 0.072401 37.40% 62.60%
I Dist (USD) 03/26/20 04/02/20 0.063247 25.90% 74.10%
I Dist (USD) 06/25/20 07/02/20 0.160608 67.16% 32.84%
I Dist (USD) 09/29/20 10/06/20 0.069353 70.19% 29.81%
A Dist (USD) 12/17/19 12/30/19 0.070892 4.02% 95.98%
A Dist (USD) 03/26/20 04/02/20 0.062909 0.00% 100.00%
A Dist (USD) 06/25/20 07/02/20 0.122489 46.66% 53.34%
A Dist (USD) 09/29/20 10/06/20 0.067758 73.68% 26.32%
I Dist (GBP) 12/17/19 12/30/19 0.081212 38.08% 61.92%
I Dist (GBP) 03/26/20 04/02/20 0.081135 26.36% 73.64%
I Dist (GBP) 06/25/20 07/02/20 0.151418 66.45% 33.55%
I Dist (GBP) 09/29/20 10/06/20 0.086003 73.08% 26.92%
A Dist (GBP) 12/17/19 12/30/19 0.078753 1.09% 98.91%
A Dist (GBP) 03/26/20 04/02/20 0.078096 0.00% 100.00%
A Dist (GBP) 06/25/20 07/02/20 0.148515 43.25% 56.75%
A Dist (GBP) 09/29/20 10/06/20 0.081382 72.54% 27.46%
ASIA EX JAPAN DIVIDEND FUND
I Dist (USD) 12/17/19 12/30/19 0.088454 50.63% 49.37%
I Dist (USD) 03/26/20 04/02/20 0.051463 16.49% 83.51%
I Dist (USD) 06/25/20 07/02/20 0.118083 68.13% 31.87%
I Dist (USD) 09/29/20 10/06/20 0.085335 77.98% 22.02%
A Dist (USD) 12/17/19 12/30/19 0.082079 20.40% 79.60%
A Dist (USD) 03/26/20 04/02/20 0.048944 0.00% 100.00%
A Dist (USD) 06/25/20 07/02/20 0.116816 45.20% 54.80%
A Dist (USD) 09/29/20 10/06/20 0.066376 74.83% 25.17%
S Dist (USD) 12/17/19 12/30/19 0.061340 n.a. 1 n.a. 1
S Dist (USD) 03/26/20 04/02/20 0.038935 n.a. 1 n.a. 1
S Dist (USD) 06/25/20 07/02/20 0.083587 n.a. 1 n.a. 1
S Dist (USD) 09/29/20 10/06/20 0.055225 n.a. 1 n.a. 1
I Dist (GBP) 12/17/19 12/30/19 0.097761 51.64% 48.36%
I Dist (GBP) 03/26/20 04/02/20 0.063439 19.79% 80.21%
I Dist (GBP) 06/25/20 07/02/20 0.126387 66.93% 33.07%
I Dist (GBP) 09/29/20 10/06/20 0.077114 77.07% 22.93%
A Dist (GBP)2 09/29/20 10/06/20 0.027414 73.83% 26.17%
S Dist (GBP) 12/17/19 12/30/19 0.059768 n.a. 1 n.a. 1
S Dist (GBP) 03/26/20 04/02/20 0.040487 n.a. 1 n.a. 1
S Dist (GBP) 06/25/20 07/02/20 0.058243 n.a. 1 n.a. 1
S Dist (GBP) 09/29/20 10/06/20 0.060300 n.a. 1 n.a. 1
CHINA DIVIDEND FUND
I Dist (USD) 12/17/19 12/30/19 0.195781 76.38% 23.62%
I Dist (USD) 06/25/20 07/02/20 0.248219 81.90% 18.10%
A Dist (USD) 12/17/19 12/30/19 0.343595 68.98% 31.02%
A Dist (USD) 06/25/20 07/02/20 0.242792 69.77% 30.23%
PACIFIC TIGER FUND
I Dist (USD) 12/17/19 12/30/19 0.216116 83.63% 16.37%
I Dist (GBP) 12/17/19 12/30/19 0.208480 80.37% 19.63%
13. DIVIDENDS (continued)
The following dividend payments were made during the twelve months ended 30 September 2020:

56 MATTHEWS ASIA FUNDS
14. SWING PRICING
The Board of Directors of the Fund implemented a price adjustment policy in order to protect the interests of the Fund’s Shareholders. The purpose of the price adjustment policy is to allocate the costs associated with large inflows and outflows to investors transacting that day, thereby protecting the long-term Shareholders from the worst effects of dilution. It achieves this purpose by adjusting the price at which deals in a Sub-Fund are transacted. In other words, Sub-Funds’ prices may be adjusted up (when there are large net capital inflows) or down (when there are large net capital outflows) depending on the level and type of investor transactions on a particular day. In this way the existing and remaining Shareholders do not suffer an inappropriate level of dilution. The Fund will only trigger an adjustment in the price when there are net capital flows.
The Board of Directors of the Fund have applied partial swing pricing method for the period. Accordingly, rather than setting a single swing threshold with a single swing factor for each Sub-Fund, the Board of Directors of the Fund has chosen to deploy a more refined approach, with multiple thresholds and multiple factors. The application of swing pricing, the thresholds and factors may vary Sub-Fund to Sub-Fund. If on any Valuation Day the aggregate transactions in Shares of a Sub-Fund result in a net increase or decrease of Shares which exceeds such threshold preset by the Board of Directors from time to time for that Sub-Fund (relating to the cost of market dealing for that Sub-Fund), the Net Asset Value of the Sub-Fund will be adjusted by an amount not exceeding 2% of that Net Asset Value, which reflects both the estimated fiscal charges and dealing costs that may be incurred by the Sub-Fund and the estimated bid/offer spread of the assets in which the Sub-Fund invests. Once an adjustment is made to the price, that price is the official price for that Sub-Fund for all deals that day.
During the period ended 30 September 2020, China Small Companies Fund, Asia Credit Opportunities Fund, Asia ex Japan Dividend Fund and Asia Small Companies Fund have applied swing pricing.
Upon request, the Fund will also provide investors the impact of swing pricing on a day in which that investor has transacted, with an appropriate lag before such information is provided. Investors should be aware that the Board of Directors of the Fund may change the swing thresholds and swing factors at any time without notice to investors, so the information provided may not be indicative of the impact that swing pricing may have on future transactions in the shares of the Sub-Fund.
A periodic review is undertaken in order to verify the appropriateness of swing factor being applied.
15. FORWARD CURRENCY EXCHANGE CONTRACTS
As at 30 September 2020, Asia Total Return Bond Fund* has outstanding forward currency exchange contracts as follows:
Currency Purchased
Amount Purchased Currency Sold Amount Sold Maturity Date Counterparty
Unrealized Gain/(Loss) USD % of Net Assets
Unrealized Gain on Forward Currency Exchange Contracts
KRW 5,148,605,000 USD 4,300,000 01/15/21 Merrill Lynch 104,281 0.18
SGD 4,991,040 USD 3,600,000 01/15/21 Merrill Lynch 44,686 0.08
CNH 10,584,000 USD 1,500,000 02/04/21 Merrill Lynch 40,215 0.07
KRW 864,758,000 USD 730,000 01/15/21 Merrill Lynch 9,742 0.01
USD 1,317,000 IDR 19,564,035,000 10/06/20 Brown Brothers Harriman & Co. New York
4,481 0.01
Total Unrealized Gain on Forward Currency Exchange Contracts 203,405 0.35
Unrealized Loss on Forward Currency Exchange Contracts
CNY 14,069,800 USD 2,060,000 02/04/21 Merrill Lynch (11,905) (0.02)
USD 1,505,655 CNH 10,584,000 02/04/21 Merrill Lynch (34,560) (0.06)
Total Unrealized Loss on Forward Currency Contracts (46,465) (0.08)
Net Unrealized Gain on Forward Currency Exchange Contracts 156,940 0.27
* The Fund’s name changed from Matthews Asia Strategic Income Fund to Matthews Asia Total Return Bond Fund on 25 May 2020.
As at 30 September 2020, Asia Small Companies Fund has outstanding forward currency exchange contracts as follows:
Currency Purchased
Amount Purchased Currency Sold Amount Sold Maturity Date Counterparty
Unrealized Gain/(Loss) USD % of Net Assets
Unrealized Gain on Forward Currency Exchange Contracts
KRW 23,724,900 USD 20,285 10/08/20 Brown Brothers Harriman & Co. New York
5 0.00
Total Unrealized Gain on Forward Currency Exchange Contracts 5 0.00
Net Unrealized Gain on Forward Currency Exchange Contracts 5 0.00
Notes to Financial Statements (continued)
As at 30 September 2020

global.matthewsasia.com 57
15. FORWARD CURRENCY EXCHANGE CONTRACTS (continued)
As at 30 September 2020, Japan Fund has outstanding hedge share class forward currency exchange contracts as follows:
Currency Purchased
Amount Purchased
Currency Sold Amount Sold Maturity Date Counterparty Share Class
Unrealized Gain/(Loss) USD
% of Net Assets
Unrealized Gain on Forward Currency Exchange Contracts
USD 85,800 JPY 9,058,602 10/13/20 Brown Brothers Harriman & Co. New York
I Acc (USD) Hedged
100 0.00
Total Unrealized Gain on Forward Currency Exchange Contracts 100 0.00
Unrealized Loss on Forward Currency Exchange Contracts
EUR 417,357 JPY 51,704,952 10/12/20 Brown Brothers Harriman & Co. New York
I Acc (EUR) Hedged
(429) (0.00)
USD 1,459,595 JPY 155,019,891 10/13/20 Brown Brothers Harriman & Co. New York
I Acc (USD) Hedged
(6,977) (0.01)
EUR 6,861,686 JPY 860,151,434 10/12/20 Brown Brothers Harriman & Co. New York
I Acc (EUR) Hedged
(102,421) (0.07)
Total Unrealized Loss on Forward Currency Contracts (109,827) (0.08)
Net Unrealized Loss on Forward Currency Exchange Contracts (109,727) (0.08)
16. INTEREST RATE SWAP AGREEMENTS
As at 30 September 2020, Asia Total Return Bond Fund* has outstanding interest rate swap contracts as follows:
Nominal Amount Currency Fixed Rate %
Settlement Date Counterparty
Floating Rate Index
Unrealized Gain/(Loss)
% of Net Assets
115,000,000 THB 1.27 09/04/24 Bank of America 6M THBFIX 86,727 0.15
7,000,000 MYR 3.30 06/19/24 Bank of America 3M KLIBOR 80,388 0.14
24,000,000 THB 1.61 06/21/24 Bank of America 6M THBFIX 27,137 0.05
Total Unrealized Loss on Interest Rate Swap Contracts 194,252 0.34
* The Fund’s name changed from Matthews Asia Strategic Income Fund to Matthews Asia Total Return Bond Fund on 25 May 2020.
17. STATEMENT OF CHANGES IN SECURITIES PORTFOLIO
A copy of the changes in the securities portfolio for the period is available free of charge at the registered office of the Fund.
18. ADDITIONAL RISK FACTORS
Pandemics and other local, national, and international public health emergencies, such as the current outbreak of the novel coronavirus (“COVID-19”), can result in market volatility and disruption, and negatively impact the national, regional or global economy and business activity in the countries in which the Fund invests and thereby adversely affect the performance of the Fund’s investments. While the full economic impact of the ongoing global outbreak of COVID-19 is presently uncertain, such future emergencies may materially adversely impact economic production, activity and securities markets in ways that cannot be predicted, all of which could result in substantial investment losses for the Fund.
Notes to Financial Statements (continued)
As at 30 September 2020

58 MATTHEWS ASIA FUNDS
Performance and Expenses As at 30 September 2020
Average Annual Total Return 1
3 months 1 year 3 years 5 years 10 yearsSince
Inception Inception Date
Portfolio Turnover
Ratio 2
Total Expense
Ratio 3
ASIA TOTAL RETURN BOND FUND *
I Acc (USD) 3.85% 3.76% 3.29% 5.66% n.a. 3.62% 29 Aug 2014 32.26% 1.24%
I Dist (USD) 3.91% 3.80% 3.33% 5.69% n.a. 3.63% 29 Aug 2014 32.26% 1.25%
A Acc (USD) 3.79% 3.26% 2.78% 5.16% n.a. 3.11% 29 Aug 2014 32.26% 1.75%
A Dist (USD) 3.82% 3.29% 2.79% 5.16% n.a. 3.12% 29 Aug 2014 32.26% 1.75%
S Dist (USD) 3.99% 4.26% n.a. n.a. n.a. 8.21% 10 Dec 2018 32.26% 0.75%
Markit iBoxx Asian Local Bond Index (USD) 4, 5 2.26% 6.63% 5.04% 5.46% n.a. 3.14% 6
50% Markit iBoxx Asian Local Bond Index, 50% J.P. Morgan Asia Credit Index 4, 5 2.19% 6.15% 5.06% 5.51% n.a. 4.02% 6
ASIA CREDIT OPPORTUNITIES FUND
I Dist (USD) 2.83% -0.98% 2.25% 5.28% n.a. 5.28% 30 Sept 2015 37.14% 1.25%
A Dist (USD) 2.66% -1.37% 1.73% 4.76% n.a. 4.76% 30 Sept 2015 37.14% 1.75%
I Dist (GBP) -1.73% -4.98% 3.70% 8.87% n.a. 8.87% 30 Sept 2015 37.14% 1.25%
J.P. Morgan Asia Credit Index (USD) 5 2.12% 5.63% 5.03% 5.53% n.a. 5.53% 7
ASIA DIVIDEND FUND
I Acc (USD) 17.63% 21.60% 6.03% 10.11% 7.26% 7.52% 30 Apr 2010 33.41% 1.24%
I Dist (USD) 17.60% 21.54% 6.04% 10.10% 7.26% 7.75% 26 Aug 2010 33.41% 1.25%
A Acc (USD) 17.48% 20.87% 5.35% 9.45% 6.68% 7.16% 26 Aug 2010 33.41% 1.86%
A Dist (USD) 17.44% 20.89% 5.35% 9.44% 6.68% 7.16% 26 Aug 2010 33.41% 1.85%
I Acc (GBP) 12.59% 16.75% 7.56% 13.87% n.a. 10.01% 28 Feb 2011 33.41% 1.25%
I Dist (GBP) 12.57% 16.68% 7.58% 13.88% n.a. 10.01% 28 Feb 2011 33.41% 1.24%
A Acc (GBP) 12.43% 16.01% 6.92% 13.24% n.a. 9.42% 28 Feb 2011 33.41% 1.84%
A Dist (GBP) 12.40% 15.96% 6.88% 13.21% n.a. 9.41% 28 Feb 2011 33.41% 1.87%
I Acc (EUR) 12.52% 13.27% 6.37% n.a. n.a. 5.42% 15 May 2017 33.41% 1.25%
MSCI All Country Asia Pacific Index (USD) 5 8.69% 11.55% 4.61% 9.48% 5.88% 5.82% 6
ASIA EX JAPAN DIVIDEND FUND
I Acc (USD) 13.60% 31.32% 14.06% n.a. n.a. 15.67% 30 Nov 2015 40.06% 1.21%
I Dist (USD) 13.64% 31.39% 14.07% n.a. n.a. 15.67% 30 Nov 2015 40.06% 1.21%
A Acc (USD) 13.47% 30.52% 13.32% n.a. n.a. 14.98% 30 Nov 2015 40.06% 1.81%
A Dist (USD) 13.45% 30.45% 13.28% n.a. n.a. 14.95% 30 Nov 2015 40.06% 1.82%
S Acc (USD) 13.66% 31.90% n.a. n.a. n.a. 10.28% 13 Dec 2017 40.06% 0.75%
S Dist (USD) 13.73% 31.98% n.a. n.a. n.a. 10.30% 13 Dec 2017 40.06% 0.75%
I Acc (GBP) 8.69% 26.07% 15.70% n.a. n.a. 19.49% 30 Nov 2015 40.06% 1.19%
I Dist (GBP) 8.69% 26.05% 15.68% n.a. n.a. 19.48% 30 Nov 2015 40.06% 1.22%
A Acc (GBP) n.a. n.a. n.a. n.a. n.a. 8.50% 31 Jul 2020 40.06% 1.66%
A Dist (GBP) n.a. n.a. n.a. n.a. n.a. 8.58% 31 Jul 2020 40.06% 1.66%
S Acc (GBP) 8.90% 26.62% n.a. n.a. n.a. 11.91% 13 Dec 2017 40.06% 0.75%
S Dist (GBP) 8.79% 26.58% n.a. n.a. n.a. 11.88% 13 Dec 2017 40.06% 0.75%
I ACC EUR n.a. n.a. n.a. n.a. n.a. 7.20% 31 Jul 2020 40.06% 1.05%
S ACC EUR n.a. n.a. n.a. n.a. n.a. 7.30% 31 Jul 2020 40.06% 0.75%
MSCI All Country Asia ex Japan Index (USD) 5 10.79% 18.16% 5.20% n.a. n.a. 10.34% 6
* The Fund’s name changed from Matthews Asia Strategic Income Fund to Matthews Asia Total Return Bond Fund on 25 May 2020.1 Annualised performance for periods of at least one year, otherwise cumulative.2 The Portfolio Turnover Ratio is calculated in accordance with the CSSF Circular 03/122 i.e. the aggregated sales and purchases less aggregated subscriptions and redemptions, divided by
average net assets of the period. The portfolio turnover ratio may be negative as a result of shareholder transactions exceeding the investment transactions for the accounting period.3 The Total Expense Ratio includes such fees as the Management and Administration fee, Domiciliation, Administration and Transfer agency fees, Professional fees, Depositary fees and Taxe
d’abonnement. The Total Expense Ratio reported is for the 12 month period ended 30 September 2020 and is annualised for periods of less than 12 months.4 Effective 25 May 2020, the Sub-Fund changed its benchmark to a blended benchmark comprised of 50% Markit iBoxx Asian Local Bond Index and 50% J.P. Morgan Asia Credit Index. Prior
to 25 May 2020, the Sub-Fund’s benchmark was the Markit iBoxx Asian Local Bond Index. Matthews believes that the blended benchmark is more appropriate in light of the Sub-Fund’s current investment strategy.
5 Benchmarks are indicated for performance comparison only. Each Sub-Fund is actively managed and does not aim to replicate or track its benchmark. Consequently, the Investment Man-ager may freely select the securities in which it invests, and each Sub-Fund’s portfolio composition and performance may deviate materially from its benchmark.
6 Based on the Inception Date of the I Acc (USD) Share Class.7 Based on the Inception Date of the I Dist (USD) Share Class.

global.matthewsasia.com 59
Average Annual Total Return 1
3 months 1 year 3 years 5 years 10 yearsSince
Inception Inception Date
Portfolio Turnover
Ratio 2
Total Expense
Ratio 3
CHINA DIVIDEND FUND
I Acc (USD) 7.28% 17.49% 7.59% 12.58% n.a. 9.29% 31 Jan 2013 62.08% 1.25%
I Dist (USD) 7.28% 17.51% 7.59% 12.59% n.a. 9.29% 31 Jan 2013 62.08% 1.25%
A Acc (USD) 7.08% 16.59% 6.81% 11.88% n.a. 8.66% 31 Jan 2013 62.08% 2.00%
A Dist (USD) 7.07% 16.59% 6.82% 11.89% n.a. 8.67% 31 Jan 2013 62.08% 2.00%
MSCI China Index (USD) 4 12.57% 33.76% 8.03% 13.72% n.a. 8.17% 5
PACIFIC TIGER FUND
I Acc (USD) 13.00% 15.22% 6.18% 10.14% 5.96% 7.14% 30 Apr 2010 -8.01% 1.18%
I Dist (USD) 12.96% 15.19% 6.19% 10.14% n.a. 6.22% 31 Oct 2014 -8.01% 1.19%
A Acc (USD) 12.83% 14.50% 5.51% 9.46% 5.36% 6.36% 26 Aug 2010 -8.01% 1.84%
I Acc (GBP) 8.12% 10.60% 7.72% 13.93% n.a. 9.62% 28 Feb 2011 -8.01% 1.21%
I Dist (GBP) 8.15% 10.57% 7.72% 13.91% n.a. 10.22% 31 Oct 2014 -8.01% 1.19%
A Acc (GBP) 7.99% 9.97% 7.05% 13.25% n.a. 9.00% 28 Feb 2011 -8.01% 1.80%
I Acc (JPY) 10.88% 12.84% 4.02% n.a. n.a. 7.12% 27 Mar 2017 -8.01% 1.19%
I Acc (EUR) 8.11% 7.23% n.a. n.a. n.a. 3.71% 30 Apr 2019 -8.01% 1.25%
MSCI All Country Asia ex Japan Index (USD) 4 10.79% 18.16% 5.20% 10.91% 5.67% 6.28% 5
CHINA FUND
I Acc (USD) 10.86% 41.87% 13.71% 17.26% 6.59% 7.85% 26 Feb 2010 39.35% 1.24%
A Acc (USD) 10.75% 40.98% 12.94% 16.54% 6.00% 6.99% 26 Aug 2010 39.35% 1.84%
S Acc (USD) 10.95% n.a. n.a. n.a. n.a. 25.60% 30 Apr 2020 39.35% 0.75%
I Acc (GBP) 6.05% 36.18% 15.35% 21.26% n.a. 9.98% 28 Feb 2011 39.35% 1.25%
A Acc (GBP) 5.94% 35.21% 14.55% 20.49% n.a. 9.34% 28 Feb 2011 39.35% 1.93%
S Acc (JPY) 8.92% n.a. n.a. n.a. n.a. 20.14% 18 Dec 2019 39.35% 0.75%
MSCI China Index (USD) 4 12.57% 33.76% 8.03% 13.72% 6.78% 7.48% 5
INDIA FUND
I Acc (USD) 19.05% -2.58% -0.78% 3.22% n.a. 4.29% 30 June 2011 38.02% 1.25%
A Acc (USD) 18.85% -3.25% -1.46% 2.59% n.a. 3.70% 30 June 2011 38.02% 2.00%
S Acc (USD) 19.24% -2.13% -0.44% n.a. n.a. 5.61% 5 Feb 2016 38.02% 0.75%
I Acc (GBP) 13.91% -6.45% 0.68% 6.77% n.a. 6.83% 30 June 2011 38.02% 1.25%
A Acc (GBP) 13.73% -7.17% -0.04% 6.10% n.a. 6.22% 30 June 2011 38.02% 2.00%
S&P Bombay Stock Exchange 100 Index (USD) 4 12.93% -4.34% 1.10% 6.05% n.a. 3.57% 5
Performance and Expenses (continued) As at 30 September 2020
1 Annualised performance for periods of at least one year, otherwise cumulative.2 The Portfolio Turnover Ratio is calculated in accordance with the CSSF Circular 03/122 i.e. the aggregated sales and purchases less aggregated subscriptions and redemptions, divided by
average net assets of the period. The portfolio turnover ratio may be negative as a result of shareholder transactions exceeding the investment transactions for the accounting period.3 The Total Expense Ratio includes such fees as the Management and Administration fee, Domiciliation, Administration and Transfer agency fees, Professional fees, Depositary fees and Taxe
d’abonnement. The Total Expense Ratio reported is for the 12 month period ended 30 September 2020 and is annualised for periods of less than 12 months.4 Benchmarks are indicated for performance comparison only. Each Sub-Fund is actively managed and does not aim to replicate or track its benchmark. Consequently, the Investment Man-
ager may freely select the securities in which it invests, and each Sub-Fund’s portfolio composition and performance may deviate materially from its benchmark.5 Based on the Inception Date of the I Acc (USD) Share Class.

60 MATTHEWS ASIA FUNDS
Performance and Expenses (continued) As at 30 September 2020
Average Annual Total Return 1
3 months 1 year 3 years 5 years 10 yearsSince
Inception Inception Date
Portfolio Turnover
Ratio 2
Total Expense
Ratio 3
JAPAN FUND
I Acc (USD) 14.77% 24.96% 7.23% 11.16% n.a. 8.77% 30 Apr 2015 19.77% 1.20%
A Acc (USD) 14.56% 24.17% 6.54% 10.48% n.a. 8.11% 30 Apr 2015 19.77% 1.82%
S Acc (USD) 14.91% 25.33% 7.48% n.a. n.a. 10.72% 8 Jan 2016 19.77% 0.75%
I Acc (USD) Hedged 12.68% 22.09% 6.42% n.a. n.a. 10.21% 3 Apr 2017 19.77% 1.25%
I Acc (GBP) 9.88% 19.99% 8.71% 14.91% n.a. 12.48% 30 Apr 2015 19.77% 1.24%
I Acc (EUR) Hedged 12.49% 20.76% 3.97% n.a. n.a. 7.73% 3 Apr 2017 19.77% 1.25%
MSCI Japan Index (USD) 4 7.08% 7.31% 4.32% 7.90% n.a. 4.75% 5
ASIA SMALL COMPANIES FUND
I Acc (USD) 7.59% 22.81% 8.52% 9.80% n.a. 6.04% 30 Apr 2013 81.28% 1.50%
A Acc (USD) 7.40% 21.91% 7.75% 9.11% n.a. 5.43% 30 Apr 2013 81.28% 2.25%
I Acc (GBP) 2.97% 17.84% 10.08% 13.56% n.a. 10.60% 30 Apr 2014 81.28% 1.50%
MSCI All Country Asia ex Japan Small Cap Index (USD) 4 13.05% 13.83% 0.61% 4.93% n.a. 2.33% 5
CHINA SMALL COMPANIES FUND
I Acc (USD) 1.32% 69.95% 21.99% 22.81% n.a. 14.61% 29 Feb 2012 26.76% 1.33%
A Acc (USD) 1.15% 68.79% 21.14% 22.06% n.a. 13.97% 29 Feb 2012 26.76% 1.95%
S Acc (USD) 1.45% 70.95% n.a. n.a. n.a. 21.18% 2 July 2018 26.76% 0.75%
I Acc (GBP) -3.00% n.a. n.a. n.a. n.a. 51.90% 30 Jun 2020 26.76% 1.32%
S Acc (GBP) -2.91% 64.09% n.a. n.a. n.a. 22.89% 14 May 2018 26.76% 0.75%
MSCI China Small Cap Index (USD) 4 10.79% 16.67% -1.79% 3.85% n.a. 3.71% 5
1 Annualised performance for periods of at least one year, otherwise cumulative.2 The Portfolio Turnover Ratio is calculated in accordance with the CSSF Circular 03/122 i.e. the aggregated sales and purchases less aggregated subscriptions and redemptions, divided by
average net assets of the period. The portfolio turnover ratio may be negative as a result of shareholder transactions exceeding the investment transactions for the accounting period.3 The Total Expense Ratio includes such fees as the Management and Administration fee, Domiciliation, Administration and Transfer agency fees, Professional fees, Depositary fees and Taxe
d’abonnement. The Total Expense Ratio reported is for the 12 month period ended 30 September 2020 and is annualised for periods of less than 12 months.4 Benchmarks are indicated for performance comparison only. Each Sub-Fund is actively managed and does not aim to replicate or track its benchmark. Consequently, the Investment Man-
ager may freely select the securities in which it invests, and each Sub-Fund’s portfolio composition and performance may deviate materially from its benchmark.5 Based on the Inception Date of the I Acc (USD) Share Class.

global.matthewsasia.com 61
Securities Financing Transactions Regulation
As at 30 September 2020, the Sub-Funds do not hold any instruments falling into the scope of the Luxembourg Law of 6 June 2018 implementing the Securities Financing Transactions Regulation (EU) 2015/2365 (“SFT Regulation“).

62 MATTHEWS ASIA FUNDS
Investor Disclosure All performance quoted represents past performance and is no guarantee of future results. The performance data do not
take into account the commissions and costs incurred on the issue and redemption of shares. Investment returns and principal value will fluctuate with market conditions so that when redeemed, shares may be worth more or less than the original cost. Current performance may be lower or higher than the return figures quoted. Investors investing in Sub-Funds denominated in non-local currency should be aware of the risk of currency exchange fluctuations that may cause a loss of principal.
Performance details provided for the Sub-Funds are based on a NAV to NAV basis, assuming reinvestment of dividends and capital gains, and are net of management fees and other expenses.
Calculation Method of the Risk Exposure The methodology used in order to calculate the global exposure is the commitment approach in accordance with the
CSSF Circular 11/512.
Index Definitions The Markit iBoxx Asian Local Bond Index (ALBI) tracks the total return performance of a bond portfolio consisting
of local-currency denominated, high quality and liquid bonds in Asia ex-Japan. The Markit iBoxx Asian Local Bond Index includes bonds from the following countries: China, Hong Kong, India, Indonesia, Malaysia, Philippines, Singapore, South Korea, Taiwan and Thailand.
The J.P. Morgan Asia Credit Index (JACI) tracks the total return performance of the Asia fixed-rate dollar bond market. JACI is a market cap-weighted index comprising sovereign, quasi-sovereign and corporate bonds and is partitioned by country, sector and credit rating. JACI includes bonds from the following countries: China, Hong Kong, India, Indonesia, Malaysia, Philippines, Singapore, South Korea, and Thailand.
The MSCI All Country Asia ex Japan Index is a free float-adjusted market capitalisation-weighted index of the stock markets of China, Hong Kong, India, Indonesia, Malaysia, Pakistan, Philippines, Singapore, South Korea, Taiwan and Thailand.
The MSCI All Country Asia ex Japan Small Cap Index is a free float–adjusted market capitalization–weighted small cap index of the stock markets of China, Hong Kong, India, Indonesia, Malaysia, Pakistan, Philippines, Singapore, South Korea, Taiwan and Thailand.
The MSCI All Country Asia Pacific Index is a free float-adjusted market capitalisation-weighted index of the stock markets of Australia, China, Hong Kong, India, Indonesia, Japan, Malaysia, New Zealand, Pakistan, Philippines, Singapore, South Korea, Taiwan and Thailand.
The MSCI China Index is a free float-adjusted market capitalisation-weighted index of Chinese equities that includes H shares listed on the Hong Kong exchange, and B shares listed on the Shanghai and Shenzhen exchanges, Hong Kong-listed securities known as Red Chips (issued by entities owned by national or local governments in China) and P Chips (issued by companies controlled by individuals in China and deriving substantial revenues in China), and foreign listings (e.g., ADRs).
The MSCI China Small Cap Index is a free float–adjusted market capitalization–weighted small cap index of the Chinese equity securities markets, including H shares listed on the Hong Kong exchange, and B shares listed on the Shanghai and Shenzhen exchanges, Hong Kong-listed securities known as Red Chips (issued by entities owned by national or local governments in China) and P Chips (issued by companies controlled by individuals in China and deriving substantial revenues in China), and foreign listings (e.g., ADRs).
The MSCI Japan Index is a free float–adjusted market capitalization–weighted index of Japanese equities listed in Japan.
The S&P Bombay Stock Exchange 100 (S&P BSE 100) Index is a free float-adjusted market capitalisation-weighted index of the 100 stocks listed on the Bombay Stock Exchange.
Disclosures and Index Definitions

global.matthewsasia.com G-AR001-0920
©2020 Matthews Asia Funds (SICAV)