Janus Capital Funds Plc Annual Report and Statutory Financial ... - AIA
Upload
khangminh22Category
view
0download
0
����������� �����������������������������������������������������������������������������������������������������������
!����������������������������������������������������������������"���������������#"�������������������������������������� �
�� ��������������������������������������#���������������������� �$����������������������������������%���������������������&'()"�����������������������������������������������#����*���������
+��������������������������"�,�����"����������������#���������"�������������������������������������������������������
��������-����������#�./&�/&��01�2������3���������/4((/52���������������*�����6�7489�4(35�''))%:6�7489�4(35�5-(/������6���� �� ��� ��2����#�;�� �,� 6�&'4'//-''<
�=>?
3/&8
?;��
���?
�8?
�& &
?���
3/&4
�������=>���������
��������#��������)/�@����3/&4
�������������������� ���������#���������)/�@����3/&4

contents
List of Funds 1Message by Chief Executive Officer 6Market review & investment outlook 7Notes to the fund disclosures 9
Aberdeen Asset Management Asia LimitedAberdeen Global - Asia Pacific Equity Fund 11Aberdeen Global - Asian Local Currency Short Duration Bond Fund 13Aberdeen Global - Australasian Equity Fund 15Aberdeen Global - Chinese Equity Fund 17Aberdeen Global - Indian Equity Fund 19Aberdeen Global - Select Emerging Markets Bond Fund 21Aberdeen Select Portfolio - Aberdeen India Opportunities Fund 23Aberdeen Select Portfolio - Aberdeen Pacific Equity Fund 25Aberdeen Select Portfolio - Aberdeen Singapore Equity Fund 27Aberdeen Select Portfolio - Aberdeen Thailand Equity Fund 29
AllianceBernstein (Singapore) LtdAB FCP I - Developed Markets Multi-Asset Income Portfolio 31AB FCP I - Dynamic Diversified Portfolio 33AB FCP I - Global Equity Blend Portfolio 35AB FCP I - Global Value Portfolio 37AB FCP I - US Thematic Research Portfolio 39
Allianz Global Investors Singapore LimitedAllianz Global Investors Fund - Allianz China Equity Fund (SGD) 41Allianz Global Investors Fund - Allianz Global Sustainability Fund 43Allianz Global Investors Fund - Allianz Oriental Income Fund (SGD) 45
Amundi Singapore LimitedAmundi Funds - Absolute Volatility Arbitrage 47Amundi Funds - Absolute Volatility World Equities 49Amundi Funds - Bond Global 51Amundi Islamic - Amundi Islamic BRIC Quant 53
Aviva Investors Asia Pte LtdAviva Investors - Asian Equity Income Fund 55Aviva Investors - Emerging Europe Equity Fund 57Aviva Investors - Emerging Markets Equity Income Fund 59
i
ii iii
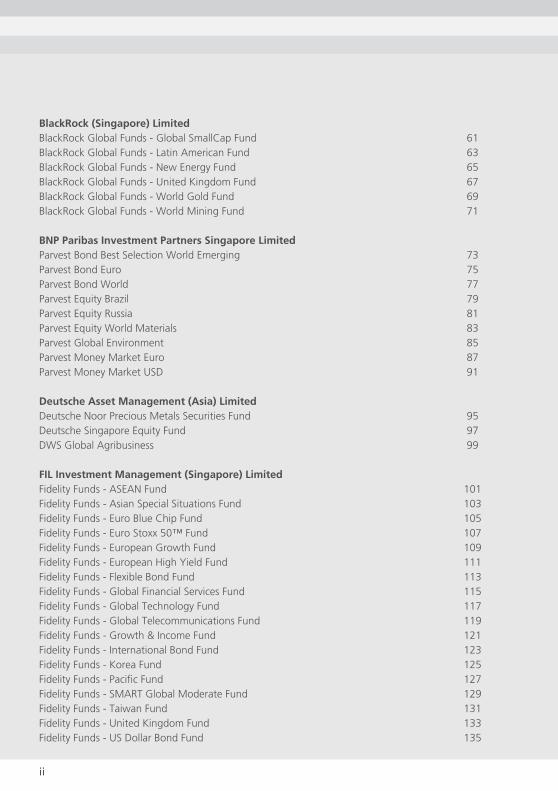
BlackRock (Singapore) Limited BlackRock Global Funds - Global SmallCap Fund 61 BlackRock Global Funds - Latin American Fund 63BlackRock Global Funds - New Energy Fund 65BlackRock Global Funds - United Kingdom Fund 67BlackRock Global Funds - World Gold Fund 69BlackRock Global Funds - World Mining Fund 71
BNP Paribas Investment Partners Singapore LimitedParvest Bond Best Selection World Emerging 73Parvest Bond Euro 75Parvest Bond World 77Parvest Equity Brazil 79Parvest Equity Russia 81Parvest Equity World Materials 83Parvest Global Environment 85Parvest Money Market Euro 87Parvest Money Market USD 91
Deutsche Asset Management (Asia) LimitedDeutsche Noor Precious Metals Securities Fund 95Deutsche Singapore Equity Fund 97DWS Global Agribusiness 99
FIL Investment Management (Singapore) LimitedFidelity Funds - ASEAN Fund 101Fidelity Funds - Asian Special Situations Fund 103Fidelity Funds - Euro Blue Chip Fund 105Fidelity Funds - Euro Stoxx 50™ Fund 107Fidelity Funds - European Growth Fund 109Fidelity Funds - European High Yield Fund 111Fidelity Funds - Flexible Bond Fund 113Fidelity Funds - Global Financial Services Fund 115Fidelity Funds - Global Technology Fund 117Fidelity Funds - Global Telecommunications Fund 119Fidelity Funds - Growth & Income Fund 121Fidelity Funds - International Bond Fund 123Fidelity Funds - Korea Fund 125Fidelity Funds - Pacific Fund 127Fidelity Funds - SMART Global Moderate Fund 129Fidelity Funds - Taiwan Fund 131Fidelity Funds - United Kingdom Fund 133Fidelity Funds - US Dollar Bond Fund 135

ii iii
First State Investments (Singapore)First State Regional China Fund 137First State Singapore Growth Fund 139
Henderson Global InvestorsHenderson Horizon Fund (HHF) - Euroland Fund 141Henderson Horizon Fund (HHF) - Global Property Equities Fund 143Henderson Horizon Fund (HHF) - Global Technology Fund 145Henderson Horizon Fund (HHF) - Japan Opportunities Fund 147Henderson Horizon Fund (HHF) - Pan European Equity Fund 149Henderson Horizon Fund (HHF) - Pan European Property Equities Fund 151
JPMorgan Asset Management (Singapore) Ltd JPMorgan Funds - Emerging Europe, Middle East and Africa Equity Fund 153JPMorgan Funds - Emerging Middle East Equity Fund 155JPMorgan Funds - Global Dynamic Fund 157JPMorgan Funds - Global Natural Resources Fund 159JPMorgan Funds - JF India Fund 161JPMorgan Funds - JF Taiwan Fund 163
Jupiter Asset ManagementJupiter Global Fund - Jupiter European Growth 165Jupiter Global Fund - Jupiter Global Ecology Growth 167Jupiter Global Fund - Jupiter Global Financials 169Jupiter Global Fund - Jupiter India Select 171
Legg Mason Asset Management Singapore Pte LimitedLegg Mason QS MV European Equity Growth and Income Fund 173Legg Mason Western Asset Asian Opportunities Fund 175
MFS Investment ManagementMassachusetts Financial Services (MFS) Meridian Funds - Global Equity Fund 177
NN Investment Partners (Singapore) LtdNN (L) Euro Equity 179NN (L) Euromix Bond 181
PIMCO Asia Pte LtdPIMCO Funds: Global Investors Series PLC (GIS plc) - Emerging Markets Bond Fund 183PIMCO Funds: Global Investors Series PLC (GIS plc) - Global Bond Fund 185PIMCO Funds: Global Investors Series PLC (GIS plc) - Global Real Return Fund 187PIMCO Funds: Global Investors Series PLC (GIS plc) - Total Return Bond Fund 189PIMCO Funds: Global Investors Series PLC (GIS plc) - US High Yield Bond Fund 191
iv v
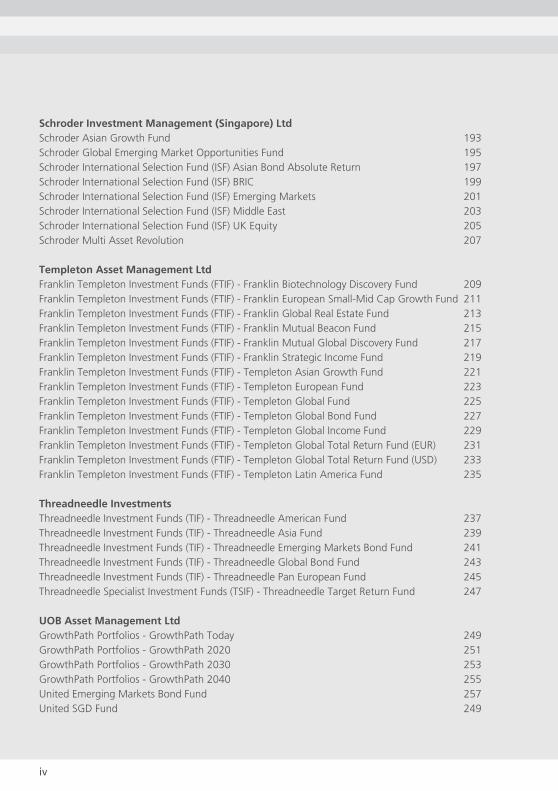
Schroder Investment Management (Singapore) LtdSchroder Asian Growth Fund 193Schroder Global Emerging Market Opportunities Fund 195Schroder International Selection Fund (ISF) Asian Bond Absolute Return 197Schroder International Selection Fund (ISF) BRIC 199Schroder International Selection Fund (ISF) Emerging Markets 201Schroder International Selection Fund (ISF) Middle East 203Schroder International Selection Fund (ISF) UK Equity 205Schroder Multi Asset Revolution 207
Templeton Asset Management LtdFranklin Templeton Investment Funds (FTIF) - Franklin Biotechnology Discovery Fund 209Franklin Templeton Investment Funds (FTIF) - Franklin European Small-Mid Cap Growth Fund 211Franklin Templeton Investment Funds (FTIF) - Franklin Global Real Estate Fund 213Franklin Templeton Investment Funds (FTIF) - Franklin Mutual Beacon Fund 215Franklin Templeton Investment Funds (FTIF) - Franklin Mutual Global Discovery Fund 217Franklin Templeton Investment Funds (FTIF) - Franklin Strategic Income Fund 219Franklin Templeton Investment Funds (FTIF) - Templeton Asian Growth Fund 221Franklin Templeton Investment Funds (FTIF) - Templeton European Fund 223Franklin Templeton Investment Funds (FTIF) - Templeton Global Fund 225Franklin Templeton Investment Funds (FTIF) - Templeton Global Bond Fund 227Franklin Templeton Investment Funds (FTIF) - Templeton Global Income Fund 229Franklin Templeton Investment Funds (FTIF) - Templeton Global Total Return Fund (EUR) 231Franklin Templeton Investment Funds (FTIF) - Templeton Global Total Return Fund (USD) 233Franklin Templeton Investment Funds (FTIF) - Templeton Latin America Fund 235
Threadneedle InvestmentsThreadneedle Investment Funds (TIF) - Threadneedle American Fund 237Threadneedle Investment Funds (TIF) - Threadneedle Asia Fund 239Threadneedle Investment Funds (TIF) - Threadneedle Emerging Markets Bond Fund 241Threadneedle Investment Funds (TIF) - Threadneedle Global Bond Fund 243Threadneedle Investment Funds (TIF) - Threadneedle Pan European Fund 245Threadneedle Specialist Investment Funds (TSIF) - Threadneedle Target Return Fund 247
UOB Asset Management LtdGrowthPath Portfolios - GrowthPath Today 249GrowthPath Portfolios - GrowthPath 2020 251GrowthPath Portfolios - GrowthPath 2030 253GrowthPath Portfolios - GrowthPath 2040 255United Emerging Markets Bond Fund 257United SGD Fund 249
iv v
Financial StatementsCapital Account for the year ended 30 June 2016 261Statement of Assets & Liabilities as at 30 June 2016 293Notes to the Financial Statements 309Independent Auditor’s Report 313
Note: Past performance is not necessarily indicative of future performance. The value of the units in the sub-fund and income accruing to the units, if any, may fall as well as rise.
Funds available under Global Investment Account and Global Savings Account
Aberdeen Asset Management Asia LimitedAberdeen Global - Asia Pacific Equity FundAberdeen Global - Asian Local Currency Short Duration Bond FundAberdeen Global - Australasian Equity FundAberdeen Global - Chinese Equity FundAberdeen Global - Indian Equity FundAberdeen Global - Select Emerging Markets Bond FundAberdeen Select Portfolio - Aberdeen Thailand Equity Fund
AllianceBernstein (Singapore) LtdAB FCP I - Developed Markets Multi-Asset Income PortfolioAB FCP I - Dynamic Diversified Portfolio AB FCP I - Global Equity Blend Portfolio AB FCP I - Global Value PortfolioAB FCP I - US Thematic Research Portfolio
Allianz Global Investors Singapore LimitedAllianz Global Investors Fund - Allianz Global Sustainability Fund
Amundi Singapore LimitedAmundi Funds - Absolute Volatility ArbitrageAmundi Funds - Absolute Volatility World EquitiesAmundi Funds - Bond GlobalAmundi Islamic - Amundi Islamic BRIC Quant
Aviva Investors Asia Pte LtdAviva Investors - Asian Equity Income FundAviva Investors - Emerging Europe Equity FundAviva Investors - Emerging Markets Equity Income Fund
BlackRock (Singapore) Limited BlackRock Global Funds - Global SmallCap FundBlackRock Global Funds - Latin American FundBlackRock Global Funds - New Energy FundBlackRock Global Funds - United Kingdom FundBlackRock Global Funds - World Gold FundBlackRock Global Funds - World Mining Fund
list of funds
1 2
BNP Paribas Investment Partners Singapore LimitedParvest Bond Best Selection World EmergingParvest Bond EuroParvest Bond WorldParvest Equity BrazilParvest Equity RussiaParvest Equity World MaterialsParvest Global EnvironmentParvest Money Market EuroParvest Money Market USD
Deutsche Asset Management (Asia) LimitedDeutsche Noor Precious Metals Securities FundDeutsche Singapore Equity Fund DWS Global Agribusiness
FIL Investment Management (Singapore) LimitedFidelity Funds - Asian Special Situations FundFidelity Funds - Euro Blue Chip FundFidelity Funds - Euro Stoxx 50™ FundFidelity Funds - European Growth FundFidelity Funds - European High Yield FundFidelity Funds - Flexible Bond FundFidelity Funds - Global Financial Services FundFidelity Funds - Global Technology FundFidelity Funds - Global Telecommunications FundFidelity Funds - Growth & Income FundFidelity Funds - International Bond FundFidelity Funds - Korea FundFidelity Funds - Pacific FundFidelity Funds - SMART Global Moderate FundFidelity Funds - Taiwan FundFidelity Funds - United Kingdom FundFidelity Funds - US Dollar Bond Fund
First State Investments (Singapore)First State Regional China FundFirst State Singapore Growth Fund
1 2
Henderson Global InvestorsHenderson Horizon Fund (HHF) - Euroland FundHenderson Horizon Fund (HHF) - Global Property Equities FundHenderson Horizon Fund (HHF) - Global Technology FundHenderson Horizon Fund (HHF) - Japan Opportunities FundHenderson Horizon Fund (HHF) - Pan European Property Equities Fund
JPMorgan Asset Management (Singapore) Ltd JPMorgan Funds - Emerging Europe, Middle East and Africa Equity FundJPMorgan Funds - Emerging Middle East Equity FundJPMorgan Funds - Global Dynamic FundJPMorgan Funds - Global Natural Resources FundJPMorgan Funds - JF India FundJPMorgan Funds - JF Taiwan Fund
Jupiter Asset ManagementJupiter Global Fund - Jupiter European GrowthJupiter Global Fund - Jupiter Global Ecology GrowthJupiter Global Fund - Jupiter Global FinancialsJupiter Global Fund - Jupiter India Select
Legg Mason Asset Management Singapore Pte LimitedLegg Mason QS MV European Equity Growth and Income Fund
MFS Investment ManagementMassachusetts Financial Services (MFS) Meridian Funds - Global Equity Fund
NN Investment Partners (Singapore) LtdNN (L) Euro Equity NN (L) Euromix Bond
PIMCO Asia Pte LtdPIMCO Funds: Global Investors Series PLC (GIS plc) - Emerging Markets Bond FundPIMCO Funds: Global Investors Series PLC (GIS plc) - Global Bond FundPIMCO Funds: Global Investors Series PLC (GIS plc) - Global Real Return FundPIMCO Funds: Global Investors Series PLC (GIS plc) - Total Return Bond FundPIMCO Funds: Global Investors Series PLC (GIS plc) - US High Yield Bond Fund
3 4
Schroder Investment Management (Singapore) LtdSchroder Asian Growth FundSchroder International Selection Fund (ISF) Asian Bond Absolute ReturnSchroder International Selection Fund (ISF) BRICSchroder International Selection Fund (ISF) Emerging MarketsSchroder International Selection Fund (ISF) Middle EastSchroder International Selection Fund (ISF) UK Equity
Templeton Asset Management LtdFranklin Templeton Investment Funds (FTIF) - Franklin Biotechnology Discovery FundFranklin Templeton Investment Funds (FTIF) - Franklin European Small-Mid Cap Growth FundFranklin Templeton Investment Funds (FTIF) - Franklin Global Real Estate FundFranklin Templeton Investment Funds (FTIF) - Franklin Mutual Beacon FundFranklin Templeton Investment Funds (FTIF) - Franklin Strategic Income FundFranklin Templeton Investment Funds (FTIF) - Templeton Asian Growth FundFranklin Templeton Investment Funds (FTIF) - Templeton European FundFranklin Templeton Investment Funds (FTIF) - Templeton Global FundFranklin Templeton Investment Funds (FTIF) - Templeton Global Income FundFranklin Templeton Investment Funds (FTIF) - Templeton Global Total Return Fund (EUR)Franklin Templeton Investment Funds (FTIF) - Templeton Global Total Return Fund (USD)Franklin Templeton Investment Funds (FTIF) - Templeton Latin America Fund
Threadneedle InvestmentsThreadneedle Investment Funds (TIF) - Threadneedle American FundThreadneedle Investment Funds (TIF) - Threadneedle Asia FundThreadneedle Investment Funds (TIF) - Threadneedle Emerging Markets Bond FundThreadneedle Investment Funds (TIF) - Threadneedle Global Bond FundThreadneedle Investment Funds (TIF) - Threadneedle Pan European FundThreadneedle Specialist Investment Funds (TSIF) - Threadneedle Target Return Fund
UOB Asset Management LtdGrowthPath Portfolios - GrowthPath TodayGrowthPath Portfolios - GrowthPath 2020GrowthPath Portfolios - GrowthPath 2030GrowthPath Portfolios - GrowthPath 2040United SGD Fund
3 4
5 6
Funds available under LifetimeFlexi
Aberdeen Asset Management Asia LimitedAberdeen Select Portfolio - Aberdeen India Opportunities FundAberdeen Select Portfolio - Aberdeen Pacific Equity FundAberdeen Select Portfolio - Aberdeen Singapore Equity Fund
Allianz Global Investors Singapore LimitedAllianz Global Investors Fund - Allianz China Equity Fund (SGD)Allianz Global Investors Fund - Allianz Oriental Income Fund (SGD)
BlackRock (Singapore) Limited BlackRock Global Funds - Latin American FundBlackRock Global Funds - World Gold FundBlackRock Global Funds - World Mining Fund
FIL Investment Management (Singapore) LimitedFidelity Funds - ASEAN Fund
First State Investments (Singapore)First State Regional China FundFirst State Singapore Growth Fund
Henderson Global InvestorsHenderson Horizon Fund (HHF) - Global Property Equities FundHenderson Horizon Fund (HHF) - Global Technology Fund Henderson Horizon Fund (HHF) - Pan European Equity Fund
Legg Mason Asset Management Singapore Pte LimitedLegg Mason Western Asset Asian Opportunities Fund
PIMCO Asia Pte LtdPIMCO Funds: Global Investors Series PLC (GIS plc) - Global Bond Fund PIMCO Funds: Global Investors Series PLC (GIS plc) - Total Return Bond Fund
Schroder Investment Management (Singapore) LtdSchroder Global Emerging Market Opportunities FundSchroder Multi Asset Revolution
Templeton Asset Management LtdFranklin Templeton Investment Funds (FTIF) - Franklin Mutual Global Discovery FundFranklin Templeton Investment Funds (FTIF) - Templeton Global Bond FundFranklin Templeton Investment Funds (FTIF) - Templeton Global Total Return Fund (USD)
UOB Asset Management LtdUnited Emerging Markets Bond FundUnited SGD Fund

ceo messageby Nishit Majmudar
5 6
Dear customer,
Thank you for your trust in Aviva.
We are pleased to present you with our semi-annual ILP funds report. We trust you will find this report beneficial.
We will continue to review our fund offerings regularly to ensure you have a good mix of funds to choose from, and to help you grow your wealth over the long term.
To ensure you are on track towards your financial goals, we encourage you to evaluate your portfolio regularly with your preferred financial adviser.
Thank you for choosing Aviva and we wish you a great year ahead.
Mr. Nishit MajmudarChief Executive OfficerAviva Singapore
market review andinvestment outlookby Aviva Investors Asia Pte Ltd
7 8
Markets rebounded in the second quarter after quarter one jitters and macro-economic data releases generally pointing to ongoing, if slow, recovery and a base for headline inflation. Although that remains largely true still, the Brexit decision has muddied the waters considerably. The direct macro-economic consequences of the UK vote to leave the European Union (“EU”) should be relatively contained – except for the UK itself where they are expected to be adverse and significant. But the consequences will be considerably worse if there is political contagion to other parts of Europe.
The scaling back of anticipated hikes in the US, alongside some signs of relative stability in China has helped investor sentiment. Looser monetary policy across the world will support growth and even those countries that have suffered most in recent times – Brazil, Russia – have some reason to think that the worst may be over. Overall, global growth expectations have been scaled back modestly again, but we hope that this may be the end of a long sequence of downgrades.
Global inflation remains low, but is expected to rise slowly and steadily from here, helped by the rebound in the oil price and significant base effects. In the US, core inflation measures are more or less at pre-crisis averages already and there are some clear indications of gently rising inflation pressures. Elsewhere, inflation is generally below target and set to remain there. Worryingly, Japan is seeing falling prices again which should lead to additional policy action. Overall, Central Banks are likely to delay hiking (US) or provide additional/extended stimulus (Japan, UK, Eurozone).
Market implications
Equity markets across the globe suffered in the immediate aftermath of the British referendum result, with the MSCI World benchmark index dropping some 7% in the two days after the announcement, with many investors who had been positioned for a “Remain” result being caught out. They did stage a recovery in the period after, with Central Banks such as the Bank of England in particular keen to emphasize that they will provide further liquidity if required. We expect volatility to remain as investors come to grips with the implications of the UK withdrawing from the European Union, although there will inevitably be opportunities for those with a longer-term investment horizon. Elsewhere, the second quarter has proved superficially less volatile with Emerging Markets gradually drifting lower. We believe they remain cheap despite a resumption of the downward trend in expectations for corporate earnings.
7 8
The economic backdrop has continued to be supportive for fixed income markets, with a moderation in US growth combined with the European Central Bank (“ECB”) asset purchases driving yields down over the course of the second quarter. The vote for the UK to leave the EU has increased uncertainty in the outlook. Given the likely long and difficult negotiations that will follow, we expect that uncertainty to persist. Despite expensive valuations, we expect the demand for a limited universe of safe haven assets to remain the dominant factor.
Another key influence on rates markets will be how policy in both the UK and elsewhere respond to Brexit. There seems little doubt that the risks to economic activity are now more skewed to the downside globally, but the largest impact will undoubtedly be felt in UK markets. Yields have hit multi-decade lows and as such offer little value from a historical perspective. In our central case, we do not expect the hit to global growth from Brexit to be substantial. However, we think the global downside risks have intensified from the potential political contagion to the Eurozone and beyond. As such, we expect that the Federal Open Market Committee (“FOMC”) will further delay raising rates, in turn implying a global policy back drop that is unlikely to see a significant back up in yields.
9 10
notes to thefund disclosures
1 Fund performance
Fund performance figures are presented as at 30 June 2016; on bid-to-bid basis with dividends
reinvested at the bid price and in the ILP fund currency terms.
Source of fund performance and benchmark performance - Fund Manager of Underlying Fund
2 Top 10 holdings
Top 10 Holdings are presented as at 30 June 2016 and 30 June 2015. In the event that these
holdings are not available as at the date of this report, they will be represented by the latest
available information.
3 Expense ratio
Expense ratios are presented for the 12 months ended 30 June 2016 and for the 12 months
ended 30 June 2015. In the event that these ratios are not available as at the date of this report,
they will be represented by the latest available period of information.
The expense ratio does not include (where applicable) charges for insurance coverage,
brokerage and other transaction costs, performance fee, foreign exchange gains or losses,
front or back end loads arising from the purchase or sale of collective investment schemes and
tax deducted at source or arising out of income received.
4 Turnover ratio
Turnover ratios are presented for the 12 months ended 30 June 2016 and for the 12 months
ended 30 June 2015. In the event that these ratios are not available as at the date of this report,
they will be represented by the latest available period of information.
9 10
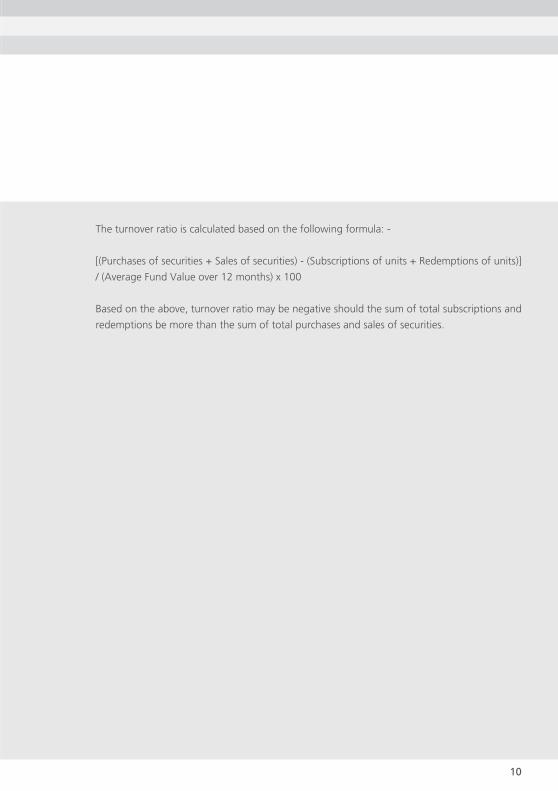
The turnover ratio is calculated based on the following formula: -
[(Purchases of securities + Sales of securities) - (Subscriptions of units + Redemptions of units)]
/ (Average Fund Value over 12 months) x 100
Based on the above, turnover ratio may be negative should the sum of total subscriptions and
redemptions be more than the sum of total purchases and sales of securities.
11 12
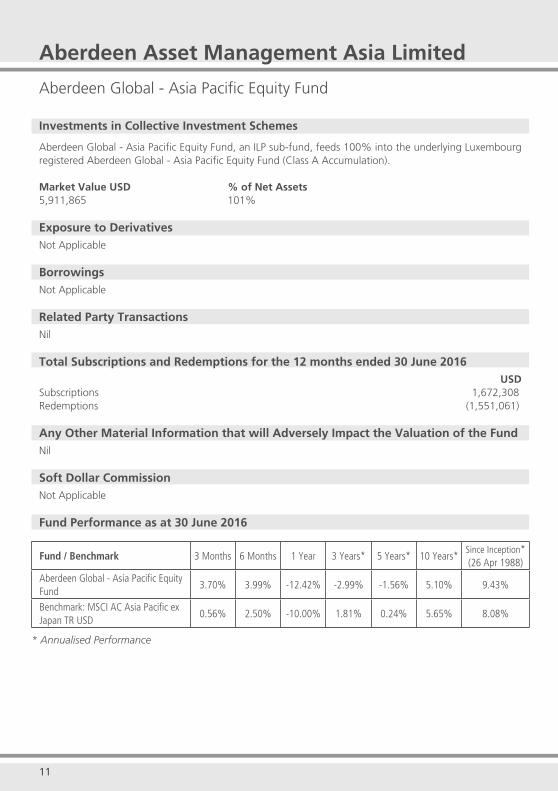
Aberdeen Asset Management Asia Limited
Aberdeen Global - Asia Pacific Equity Fund
Investments in Collective Investment Schemes
Aberdeen Global - Asia Pacific Equity Fund, an ILP sub-fund, feeds 100% into the underlying Luxembourg registered Aberdeen Global - Asia Pacific Equity Fund (Class A Accumulation).
Market Value USD % of Net Assets5,911,865 101%
Exposure to DerivativesNot Applicable
BorrowingsNot Applicable
Related Party TransactionsNil
Total Subscriptions and Redemptions for the 12 months ended 30 June 2016USD
Subscriptions 1,672,308Redemptions (1,551,061)
Any Other Material Information that will Adversely Impact the Valuation of the FundNil
Soft Dollar CommissionNot Applicable
Fund Performance as at 30 June 2016
Fund / Benchmark 3 Months 6 Months 1 Year 3 Years* 5 Years* 10 Years*Since Inception*(26 Apr 1988)
Aberdeen Global - Asia Pacific Equity Fund
3.70% 3.99% -12.42% -2.99% -1.56% 5.10% 9.43%
Benchmark: MSCI AC Asia Pacific ex Japan TR USD
0.56% 2.50% -10.00% 1.81% 0.24% 5.65% 8.08%
* Annualised Performance
11 12
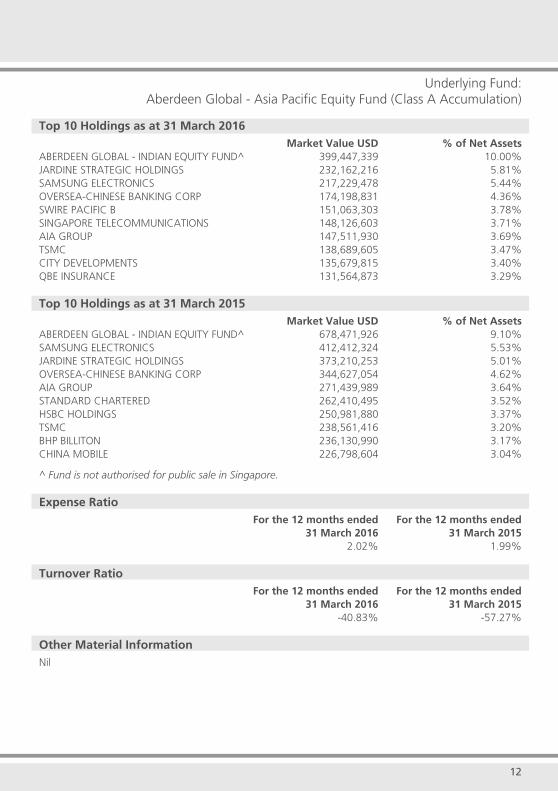
Underlying Fund:Aberdeen Global - Asia Pacific Equity Fund (Class A Accumulation)
Top 10 Holdings as at 31 March 2016 Market Value USD % of Net AssetsABERDEEN GLOBAL - INDIAN EQUITY FUND^ 399,447,339 10.00%JARDINE STRATEGIC HOLDINGS 232,162,216 5.81%SAMSUNG ELECTRONICS 217,229,478 5.44%OVERSEA-CHINESE BANKING CORP 174,198,831 4.36%SWIRE PACIFIC B 151,063,303 3.78%SINGAPORE TELECOMMUNICATIONS 148,126,603 3.71%AIA GROUP 147,511,930 3.69%TSMC 138,689,605 3.47%CITY DEVELOPMENTS 135,679,815 3.40%QBE INSURANCE 131,564,873 3.29%
Top 10 Holdings as at 31 March 2015 Market Value USD % of Net AssetsABERDEEN GLOBAL - INDIAN EQUITY FUND^ 678,471,926 9.10%SAMSUNG ELECTRONICS 412,412,324 5.53%JARDINE STRATEGIC HOLDINGS 373,210,253 5.01%OVERSEA-CHINESE BANKING CORP 344,627,054 4.62%AIA GROUP 271,439,989 3.64%STANDARD CHARTERED 262,410,495 3.52%HSBC HOLDINGS 250,981,880 3.37%TSMC 238,561,416 3.20%BHP BILLITON 236,130,990 3.17%CHINA MOBILE 226,798,604 3.04%
^ Fund is not authorised for public sale in Singapore.
Expense Ratio For the 12 months ended For the 12 months ended 31 March 2016 31 March 2015 2.02% 1.99%
Turnover Ratio For the 12 months ended For the 12 months ended 31 March 2016 31 March 2015 -40.83% -57.27%
Other Material InformationNil
13 14
Aberdeen Asset Management Asia Limited
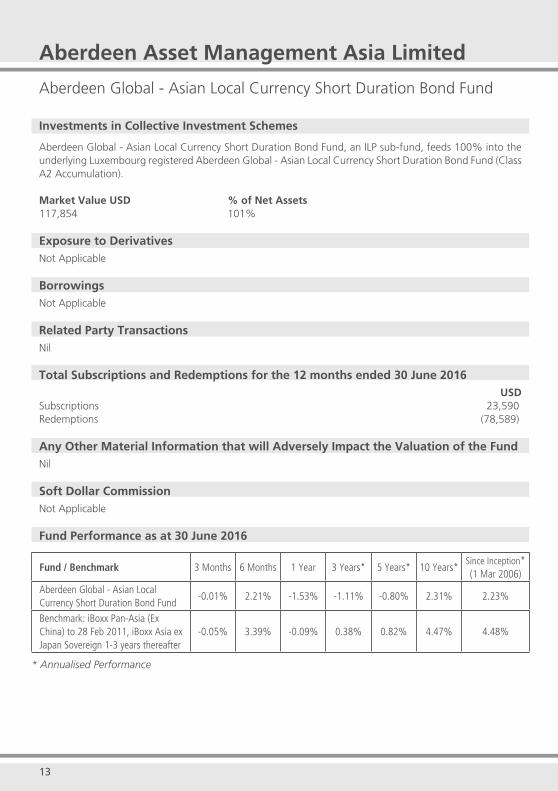
Aberdeen Global - Asian Local Currency Short Duration Bond Fund
Investments in Collective Investment Schemes
Aberdeen Global - Asian Local Currency Short Duration Bond Fund, an ILP sub-fund, feeds 100% into the underlying Luxembourg registered Aberdeen Global - Asian Local Currency Short Duration Bond Fund (Class A2 Accumulation).
Market Value USD % of Net Assets117,854 101%
Exposure to DerivativesNot Applicable
BorrowingsNot Applicable
Related Party TransactionsNil
Total Subscriptions and Redemptions for the 12 months ended 30 June 2016USD
Subscriptions 23,590Redemptions (78,589)
Any Other Material Information that will Adversely Impact the Valuation of the FundNil
Soft Dollar CommissionNot Applicable
Fund Performance as at 30 June 2016
Fund / Benchmark 3 Months 6 Months 1 Year 3 Years* 5 Years* 10 Years*Since Inception*(1 Mar 2006)
Aberdeen Global - Asian Local Currency Short Duration Bond Fund
-0.01% 2.21% -1.53% -1.11% -0.80% 2.31% 2.23%
Benchmark: iBoxx Pan-Asia (Ex China) to 28 Feb 2011, iBoxx Asia ex Japan Sovereign 1-3 years thereafter
-0.05% 3.39% -0.09% 0.38% 0.82% 4.47% 4.48%
* Annualised Performance
13 14
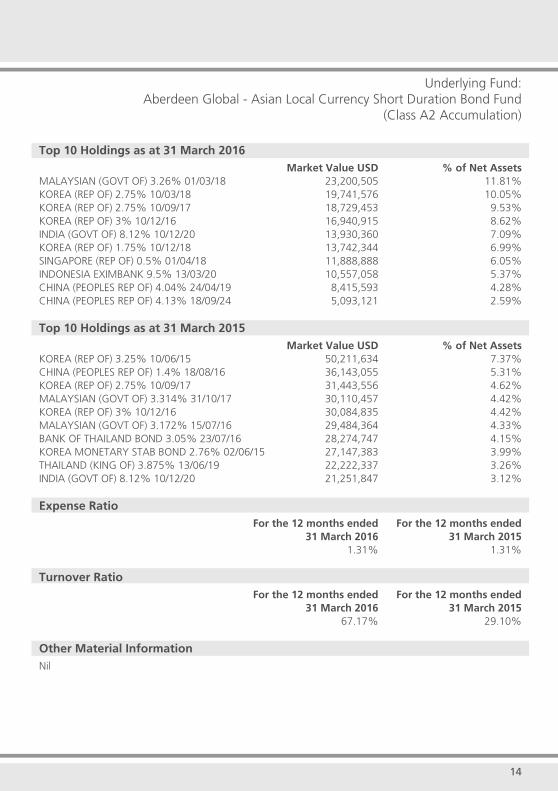
Underlying Fund:Aberdeen Global - Asian Local Currency Short Duration Bond Fund
(Class A2 Accumulation)
Top 10 Holdings as at 31 March 2016 Market Value USD % of Net AssetsMALAYSIAN (GOVT OF) 3.26% 01/03/18 23,200,505 11.81%KOREA (REP OF) 2.75% 10/03/18 19,741,576 10.05%KOREA (REP OF) 2.75% 10/09/17 18,729,453 9.53%KOREA (REP OF) 3% 10/12/16 16,940,915 8.62%INDIA (GOVT OF) 8.12% 10/12/20 13,930,360 7.09%KOREA (REP OF) 1.75% 10/12/18 13,742,344 6.99%SINGAPORE (REP OF) 0.5% 01/04/18 11,888,888 6.05%INDONESIA EXIMBANK 9.5% 13/03/20 10,557,058 5.37%CHINA (PEOPLES REP OF) 4.04% 24/04/19 8,415,593 4.28%CHINA (PEOPLES REP OF) 4.13% 18/09/24 5,093,121 2.59%
Top 10 Holdings as at 31 March 2015 Market Value USD % of Net AssetsKOREA (REP OF) 3.25% 10/06/15 50,211,634 7.37%CHINA (PEOPLES REP OF) 1.4% 18/08/16 36,143,055 5.31%KOREA (REP OF) 2.75% 10/09/17 31,443,556 4.62%MALAYSIAN (GOVT OF) 3.314% 31/10/17 30,110,457 4.42%KOREA (REP OF) 3% 10/12/16 30,084,835 4.42%MALAYSIAN (GOVT OF) 3.172% 15/07/16 29,484,364 4.33%BANK OF THAILAND BOND 3.05% 23/07/16 28,274,747 4.15%KOREA MONETARY STAB BOND 2.76% 02/06/15 27,147,383 3.99%THAILAND (KING OF) 3.875% 13/06/19 22,222,337 3.26%INDIA (GOVT OF) 8.12% 10/12/20 21,251,847 3.12%
Expense Ratio For the 12 months ended For the 12 months ended 31 March 2016 31 March 2015 1.31% 1.31%
Turnover Ratio For the 12 months ended For the 12 months ended 31 March 2016 31 March 2015 67.17% 29.10%
Other Material InformationNil
15 16
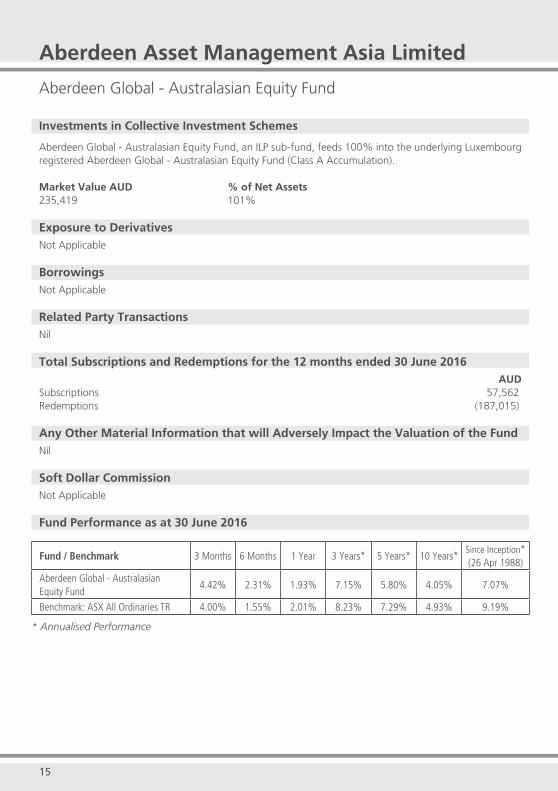
Aberdeen Asset Management Asia Limited
Aberdeen Global - Australasian Equity Fund
Investments in Collective Investment Schemes
Aberdeen Global - Australasian Equity Fund, an ILP sub-fund, feeds 100% into the underlying Luxembourg registered Aberdeen Global - Australasian Equity Fund (Class A Accumulation).
Market Value AUD % of Net Assets235,419 101%
Exposure to DerivativesNot Applicable
BorrowingsNot Applicable
Related Party TransactionsNil
Total Subscriptions and Redemptions for the 12 months ended 30 June 2016AUD
Subscriptions 57,562Redemptions (187,015)
Any Other Material Information that will Adversely Impact the Valuation of the FundNil
Soft Dollar CommissionNot Applicable
Fund Performance as at 30 June 2016
Fund / Benchmark 3 Months 6 Months 1 Year 3 Years* 5 Years* 10 Years*Since Inception*(26 Apr 1988)
Aberdeen Global - Australasian Equity Fund
4.42% 2.31% 1.93% 7.15% 5.80% 4.05% 7.07%
Benchmark: ASX All Ordinaries TR 4.00% 1.55% 2.01% 8.23% 7.29% 4.93% 9.19%
* Annualised Performance

15 16
Underlying Fund:Aberdeen Global - Australasian Equity Fund (Class A Accumulation)
Top 10 Holdings as at 31 March 2016 Market Value AUD % of Net AssetsCSL 4,377,240 6.50%COMMONWEALTH BANK OF AUSTRALIA 4,011,692 5.96%AUSTRALIAN STOCK EXCHANGE 3,847,410 5.71%WESTPAC BANK 3,842,943 5.71%TELSTRA 3,575,205 5.31%RIO TINTO 3,434,529 5.10%AGL ENERGY 3,151,151 4.68%AMP 3,070,336 4.56%WESTFIELD CORP 3,059,868 4.55%BHP BILLITON 2,765,819 4.11%
Top 10 Holdings as at 31 March 2015 Market Value AUD % of Net AssetsBHP BILLITON 6,164,537 7.23%AUSTRALIA & NEW ZEALAND BANK 5,234,950 6.14%COMMONWEALTH BANK OF AUSTRALIA 5,196,654 6.10%SINGAPORE TELECOMMUNICATIONS 4,669,343 5.48%CSL 4,477,968 5.25%WESTPAC BANK 4,303,688 5.05%RIO TINTO 4,055,968 4.76%AUSTRALIAN STOCK EXCHANGE 3,991,924 4.68%AMP 3,914,876 4.59%WESTFIELD CORP 3,687,333 4.33%
Expense Ratio For the 12 months ended For the 12 months ended 31 March 2016 31 March 2015 1.76% 1.76%
Turnover Ratio For the 12 months ended For the 12 months ended 31 March 2016 31 March 2015 -25.07% -33.34%
Other Material InformationNil

17 18
Aberdeen Asset Management Asia Limited
Aberdeen Global - Chinese Equity Fund
Investments in Collective Investment Schemes
Aberdeen Global - Chinese Equity Fund, an ILP sub-fund, feeds 100% into the underlying Luxembourg registered Aberdeen Global - Chinese Equity Fund (Class A Accumulation).
Market Value USD % of Net Assets1,750,016 101%
Exposure to DerivativesNot Applicable
BorrowingsNot Applicable
Related Party TransactionsNil
Total Subscriptions and Redemptions for the 12 months ended 30 June 2016USD
Subscriptions 305,598Redemptions (401,428)
Any Other Material Information that will Adversely Impact the Valuation of the FundNil
Soft Dollar CommissionNot Applicable
Fund Performance as at 30 June 2016
Fund / Benchmark 3 Months 6 Months 1 Year 3 Years* 5 Years* 10 Years*Since Inception*^
(27 Apr 1992)
Aberdeen Global - Chinese Equity Fund
-1.60% -5.36% -18.43% -4.30% -3.32% 4.51% 10.79%
Benchmark: MSCI Zhong Hua Index 0.50% -3.09% -19.64% 4.15% 1.35% 9.14% NA^
* Annualised Performance
Aberdeen Global – Chinese Equity Fund was created as a sub fund of Aberdeen Global on 24 March 2006 by the conversion of Aberdeen International China Opportunities Fund. The historical track record reflects that of Aberdeen International China Opportunities Fund launched on 27 April 1992.
^ MSCI Zhong Hua Index was the benchmark since October 2007, previous benchmark was MSCI China Index. Performance of the Composite Index is unavailable from 27 April 1992.
17 18
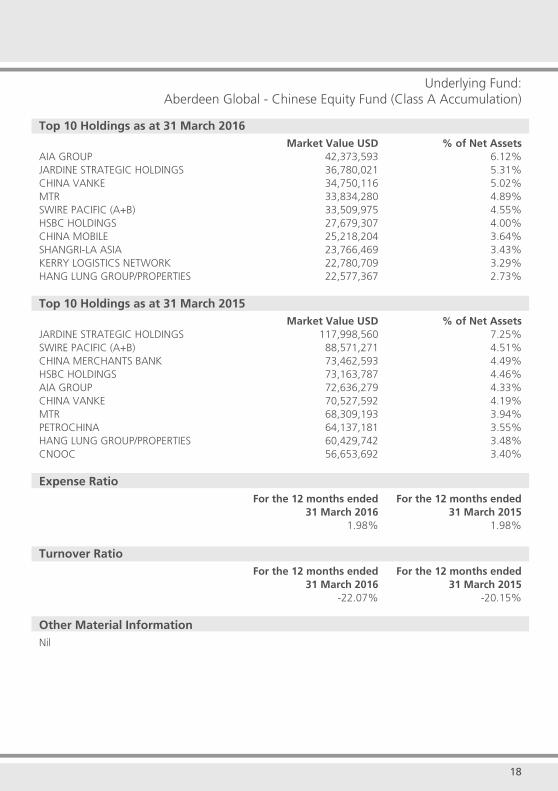
Underlying Fund:Aberdeen Global - Chinese Equity Fund (Class A Accumulation)
Top 10 Holdings as at 31 March 2016 Market Value USD % of Net AssetsAIA GROUP 42,373,593 6.12%JARDINE STRATEGIC HOLDINGS 36,780,021 5.31%CHINA VANKE 34,750,116 5.02%MTR 33,834,280 4.89%SWIRE PACIFIC (A+B) 33,509,975 4.55%HSBC HOLDINGS 27,679,307 4.00%CHINA MOBILE 25,218,204 3.64%SHANGRI-LA ASIA 23,766,469 3.43%KERRY LOGISTICS NETWORK 22,780,709 3.29%HANG LUNG GROUP/PROPERTIES 22,577,367 2.73%
Top 10 Holdings as at 31 March 2015 Market Value USD % of Net AssetsJARDINE STRATEGIC HOLDINGS 117,998,560 7.25%SWIRE PACIFIC (A+B) 88,571,271 4.51%CHINA MERCHANTS BANK 73,462,593 4.49%HSBC HOLDINGS 73,163,787 4.46%AIA GROUP 72,636,279 4.33%CHINA VANKE 70,527,592 4.19%MTR 68,309,193 3.94%PETROCHINA 64,137,181 3.55%HANG LUNG GROUP/PROPERTIES 60,429,742 3.48%CNOOC 56,653,692 3.40%
Expense Ratio For the 12 months ended For the 12 months ended 31 March 2016 31 March 2015 1.98% 1.98%
Turnover Ratio For the 12 months ended For the 12 months ended 31 March 2016 31 March 2015 -22.07% -20.15%
Other Material InformationNil
19 20
Aberdeen Asset Management Asia Limited
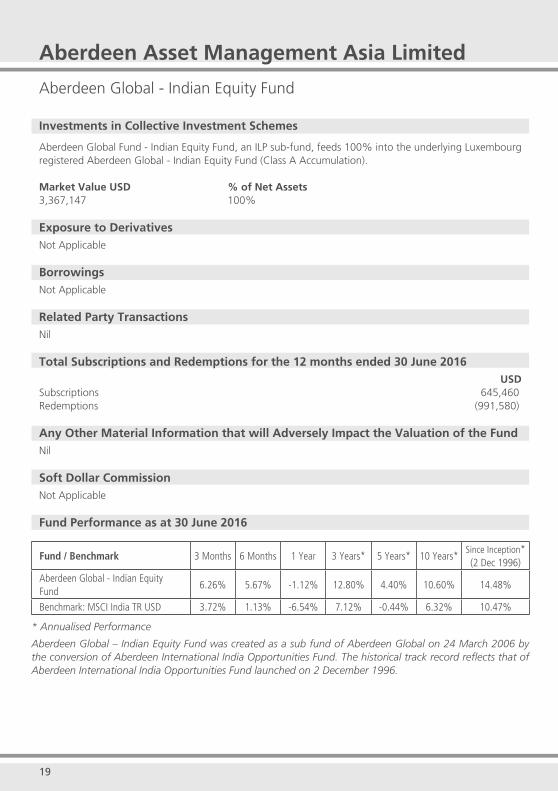
Aberdeen Global - Indian Equity Fund
Investments in Collective Investment Schemes
Aberdeen Global Fund - Indian Equity Fund, an ILP sub-fund, feeds 100% into the underlying Luxembourg registered Aberdeen Global - Indian Equity Fund (Class A Accumulation).
Market Value USD % of Net Assets3,367,147 100%
Exposure to DerivativesNot Applicable
BorrowingsNot Applicable
Related Party TransactionsNil
Total Subscriptions and Redemptions for the 12 months ended 30 June 2016USD
Subscriptions 645,460Redemptions (991,580)
Any Other Material Information that will Adversely Impact the Valuation of the FundNil
Soft Dollar CommissionNot Applicable
Fund Performance as at 30 June 2016
Fund / Benchmark 3 Months 6 Months 1 Year 3 Years* 5 Years* 10 Years*Since Inception*(2 Dec 1996)
Aberdeen Global - Indian Equity Fund
6.26% 5.67% -1.12% 12.80% 4.40% 10.60% 14.48%
Benchmark: MSCI India TR USD 3.72% 1.13% -6.54% 7.12% -0.44% 6.32% 10.47%
* Annualised Performance
Aberdeen Global – Indian Equity Fund was created as a sub fund of Aberdeen Global on 24 March 2006 by the conversion of Aberdeen International India Opportunities Fund. The historical track record reflects that of Aberdeen International India Opportunities Fund launched on 2 December 1996.
19 20
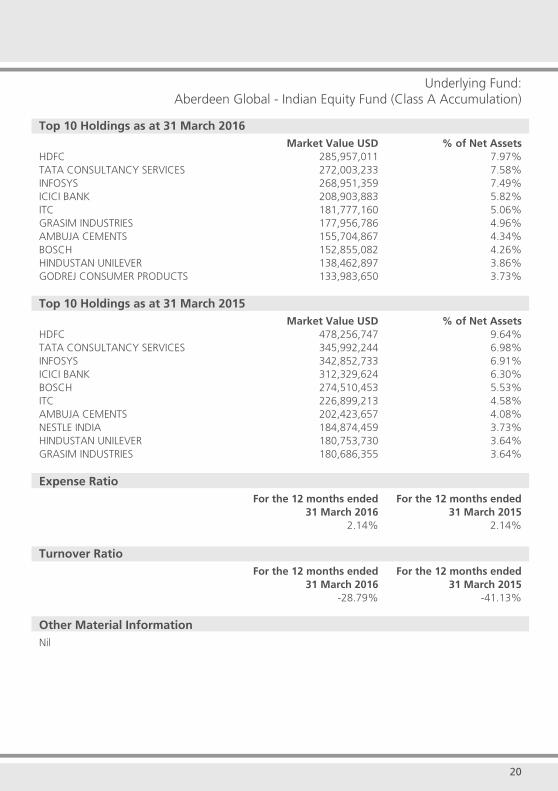
Underlying Fund:Aberdeen Global - Indian Equity Fund (Class A Accumulation)
Top 10 Holdings as at 31 March 2016 Market Value USD % of Net AssetsHDFC 285,957,011 7.97%TATA CONSULTANCY SERVICES 272,003,233 7.58%INFOSYS 268,951,359 7.49%ICICI BANK 208,903,883 5.82%ITC 181,777,160 5.06%GRASIM INDUSTRIES 177,956,786 4.96%AMBUJA CEMENTS 155,704,867 4.34%BOSCH 152,855,082 4.26%HINDUSTAN UNILEVER 138,462,897 3.86%GODREJ CONSUMER PRODUCTS 133,983,650 3.73%
Top 10 Holdings as at 31 March 2015 Market Value USD % of Net AssetsHDFC 478,256,747 9.64%TATA CONSULTANCY SERVICES 345,992,244 6.98%INFOSYS 342,852,733 6.91%ICICI BANK 312,329,624 6.30%BOSCH 274,510,453 5.53%ITC 226,899,213 4.58%AMBUJA CEMENTS 202,423,657 4.08%NESTLE INDIA 184,874,459 3.73%HINDUSTAN UNILEVER 180,753,730 3.64%GRASIM INDUSTRIES 180,686,355 3.64%
Expense Ratio For the 12 months ended For the 12 months ended 31 March 2016 31 March 2015 2.14% 2.14%
Turnover Ratio For the 12 months ended For the 12 months ended 31 March 2016 31 March 2015 -28.79% -41.13%
Other Material InformationNil
21 22
Aberdeen Asset Management Asia Limited
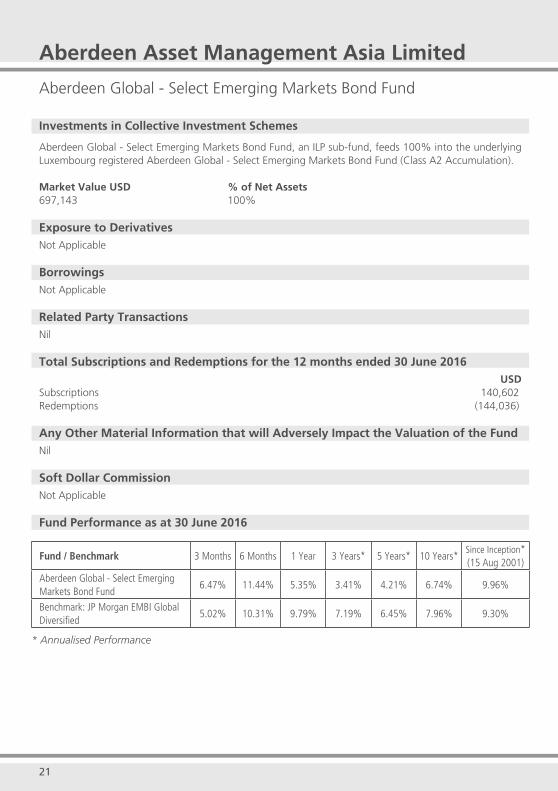
Aberdeen Global - Select Emerging Markets Bond Fund
Investments in Collective Investment Schemes
Aberdeen Global - Select Emerging Markets Bond Fund, an ILP sub-fund, feeds 100% into the underlying Luxembourg registered Aberdeen Global - Select Emerging Markets Bond Fund (Class A2 Accumulation).
Market Value USD % of Net Assets697,143 100%
Exposure to DerivativesNot Applicable
BorrowingsNot Applicable
Related Party TransactionsNil
Total Subscriptions and Redemptions for the 12 months ended 30 June 2016USD
Subscriptions 140,602Redemptions (144,036)
Any Other Material Information that will Adversely Impact the Valuation of the FundNil
Soft Dollar CommissionNot Applicable
Fund Performance as at 30 June 2016
Fund / Benchmark 3 Months 6 Months 1 Year 3 Years* 5 Years* 10 Years*Since Inception*(15 Aug 2001)
Aberdeen Global - Select Emerging Markets Bond Fund
6.47% 11.44% 5.35% 3.41% 4.21% 6.74% 9.96%
Benchmark: JP Morgan EMBI Global Diversified
5.02% 10.31% 9.79% 7.19% 6.45% 7.96% 9.30%
* Annualised Performance

21 22
Underlying Fund:Aberdeen Global - Select Emerging Markets Bond Fund (Class A2 Accumulation)
Top 10 Holdings as at 31 March 2016 Market Value USD % of Net AssetsARGENTINA (REP OF) 8.28% 31/12/33 42,452,744 3.09%PETROLEOS MEXICANOS 6.5% 02/06/41 31,808,992 2.31%ETHIOPIA (GOVT OF) 6.625% 11/12/24 31,072,095 2.26%TURKEY (REP OF) 6.25% 26/09/22 30,903,411 2.25%MEXICO (UNITED MEXICAN STATES) 6.05% 11/01/40 28,238,587 2.05%GHANA (REP OF) 8.125% 18/01/26 27,660,582 2.01%SERBIA (REP OF) 7.25% 28/09/21 26,729,297 1.94%KAZAKHSTAN TEMIR ZHOLY 6.95% 10/07/42 25,900,058 1.88%INDONESIA (REP OF) 8.375% 15/03/34 24,314,422 1.77%URUGUAY (REP OF) 5.1% 18/06/50 24,155,176 1.76%
Top 10 Holdings as at 31 March 2015 Market Value USD % of Net AssetsROMANIA (REP OF) 6.75% 07/02/22 67,126,770 2.73%INDONESIA (REP OF) 5.875% 15/01/24 64,419,265 2.62%BRAZIL (FED REP OF) 6% INDEX LINKED 15/08/20 60,239,141 2.45%RUSSIAN FEDERATION 4.875% 16/09/23 59,917,031 2.43%MEXICO (UNITED MEXICAN STATES) 6.05% 11/01/40 58,665,310 2.38%GHANA (REP OF) 8.125% 18/01/26 54,548,360 2.22%INDONESIA (REP OF) 8.375% 15/03/34 46,268,577 1.88%RUSSIAN FEDERATION 7.05%% 19/01/28 43,029,331 1.75%PETROLEOS MEXICANOS 6.5% 02/06/41 42,986,795 1.75%EUROPEAN BANK RECON & DEV 6% 03/03/16 42,430,636 1.72%
Expense Ratio For the 12 months ended For the 12 months ended 31 March 2016 31 March 2015 1.71% 1.69%
Turnover Ratio For the 12 months ended For the 12 months ended 31 March 2016 31 March 2015 64.44% -1.11%
Other Material InformationNil

23 24
Aberdeen Asset Management Asia Limited
Aberdeen Select Portfolio - Aberdeen India Opportunities Fund
Investments in Collective Investment Schemes
Aberdeen Select Portfolio - Aberdeen India Opportunities Fund, an ILP sub-fund, feeds 100% into the underlying Singapore registered Aberdeen Select Portfolio - Aberdeen India Opportunities Fund (SGD Class).
Market Value SGD % of Net Assets81,532 100%
Exposure to DerivativesNot Applicable
BorrowingsNot Applicable
Related Party TransactionsNil
Total Subscriptions and Redemptions for the 12 months ended 30 June 2016SGD
Subscriptions 28,139Redemptions (10,724)
Any Other Material Information that will Adversely Impact the Valuation of the FundNil
Soft Dollar CommissionNot Applicable
Fund Performance as at 30 June 2016
Fund / Benchmark 3 Months 6 Months 1 Year 3 Years* 5 Years* 10 Years*Since Inception*(8 Mar 2004)
Aberdeen Select Portfolio - Aberdeen India Opportunities Fund
6.30% 0.49% -0.88% 15.33% 6.58% 9.02% 10.05%
BBenchmark: MSCI India Index 3.67% -4.05% -6.59% 9.26% 1.41% 4.62% 8.11%
* Annualised Performance
23 24
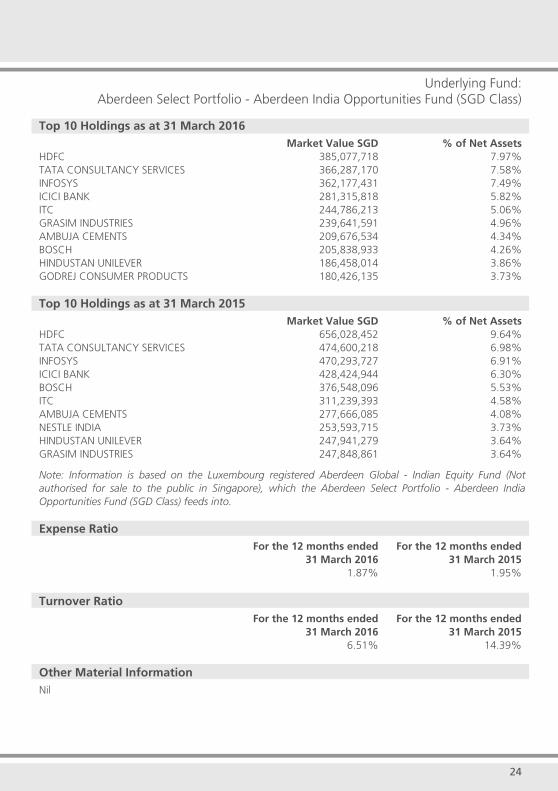
Underlying Fund:Aberdeen Select Portfolio - Aberdeen India Opportunities Fund (SGD Class)
Top 10 Holdings as at 31 March 2016 Market Value SGD % of Net AssetsHDFC 385,077,718 7.97%TATA CONSULTANCY SERVICES 366,287,170 7.58%INFOSYS 362,177,431 7.49%ICICI BANK 281,315,818 5.82%ITC 244,786,213 5.06%GRASIM INDUSTRIES 239,641,591 4.96%AMBUJA CEMENTS 209,676,534 4.34%BOSCH 205,838,933 4.26%HINDUSTAN UNILEVER 186,458,014 3.86%GODREJ CONSUMER PRODUCTS 180,426,135 3.73%
Top 10 Holdings as at 31 March 2015 Market Value SGD % of Net AssetsHDFC 656,028,452 9.64%TATA CONSULTANCY SERVICES 474,600,218 6.98%INFOSYS 470,293,727 6.91%ICICI BANK 428,424,944 6.30%BOSCH 376,548,096 5.53%ITC 311,239,393 4.58%AMBUJA CEMENTS 277,666,085 4.08%NESTLE INDIA 253,593,715 3.73%HINDUSTAN UNILEVER 247,941,279 3.64%GRASIM INDUSTRIES 247,848,861 3.64%
Note: Information is based on the Luxembourg registered Aberdeen Global - Indian Equity Fund (Not authorised for sale to the public in Singapore), which the Aberdeen Select Portfolio - Aberdeen India Opportunities Fund (SGD Class) feeds into.
Expense Ratio For the 12 months ended For the 12 months ended 31 March 2016 31 March 2015 1.87% 1.95%
Turnover Ratio For the 12 months ended For the 12 months ended 31 March 2016 31 March 2015 6.51% 14.39%
Other Material InformationNil
25 26
Aberdeen Asset Management Asia Limited
Aberdeen Select Portfolio - Aberdeen Pacific Equity Fund
Investments in Collective Investment Schemes
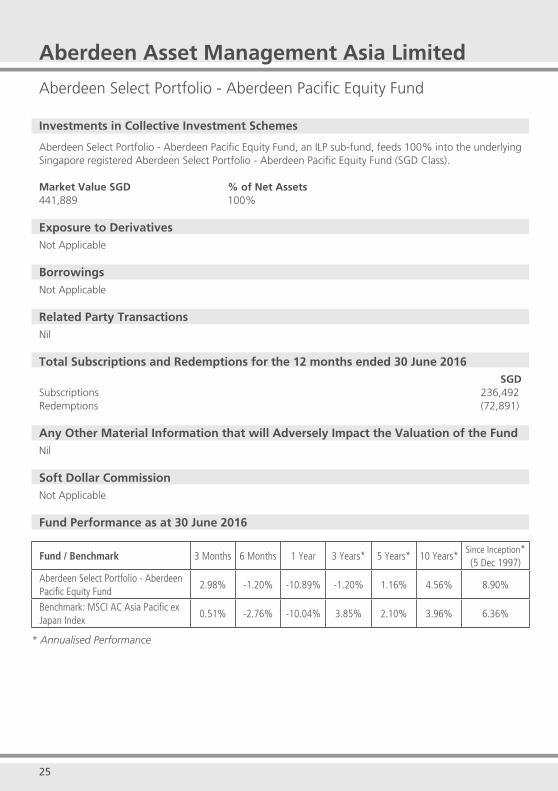
Aberdeen Select Portfolio - Aberdeen Pacific Equity Fund, an ILP sub-fund, feeds 100% into the underlying Singapore registered Aberdeen Select Portfolio - Aberdeen Pacific Equity Fund (SGD Class).
Market Value SGD % of Net Assets441,889 100%
Exposure to DerivativesNot Applicable
BorrowingsNot Applicable
Related Party TransactionsNil
Total Subscriptions and Redemptions for the 12 months ended 30 June 2016SGD
Subscriptions 236,492Redemptions (72,891)
Any Other Material Information that will Adversely Impact the Valuation of the FundNil
Soft Dollar CommissionNot Applicable
Fund Performance as at 30 June 2016
Fund / Benchmark 3 Months 6 Months 1 Year 3 Years* 5 Years* 10 Years*Since Inception*(5 Dec 1997)
Aberdeen Select Portfolio - Aberdeen Pacific Equity Fund
2.98% -1.20% -10.89% -1.20% 1.16% 4.56% 8.90%
Benchmark: MSCI AC Asia Pacific ex Japan Index
0.51% -2.76% -10.04% 3.85% 2.10% 3.96% 6.36%
* Annualised Performance

25 26
Underlying Fund:Aberdeen Select Portfolio - Aberdeen Pacific Equity Fund (SGD Class)
Top 10 Holdings as at 31 March 2016 Market Value SGD % of Net Assets ABERDEEN SINGAPORE EQUITY FUND 129,307,338 9.73% ABERDEEN GLOBAL -INDIAN EQUITY FUND^ 128,119,423 9.64% ABERDEEN CHINA OPPORTUNITIES FUND 115,864,886 8.72% SAMSUNG ELECTRONICS (PREFERENCE SHARES) 76,187,633 5.73% ABERDEEN THAILAND EQUITY FUND 57,273,440 4.31% TAIWAN SEMICONDUCTOR MANUFACTURING COMPANY 55,303,695 4.16% ABERDEEN INDONESIA EQUITY FUND 54,803,435 4.12% ABERDEEN MALAYSIAN EQUITY FUND 52,478,934 3.95% JARDINE STRATEGIC HOLDINGS 47,183,798 3.55% AIA GROUP 40,937,595 3.08%
Top 10 Holdings as at 31 March 2015 Market Value SGD % of Net Assets ABERDEEN CHINA OPPORTUNITIES FUND 165,657,842 9.80% ABERDEEN SINGAPORE EQUITY FUND 158,079,762 9.35% ABERDEEN GLOBAL -INDIAN EQUITY FUND^ 156,257,049 9.24% SAMSUNG ELECTRONICS (PREFERENCE SHARES) 86,408,490 5.11% ABERDEEN THAILAND EQUITY FUND 67,565,895 4.00% ABERDEEN INDONESIA EQUITY FUND 66,341,250 3.92% AIA GROUP 59,231,952 3.50% ABERDEEN MALAYSIAN EQUITY FUND 57,802,940 3.42% JARDINE STRATEGIC HOLDINGS 56,411,477 3.34% TAIWAN SEMICONDUCTOR MANUFACTURING COMPANY 52,184,839 3.09%
^Fund is not authorised for public sale in Singapore.
Expense Ratio For the 12 months ended For the 12 months ended 31 March 2016 31 March 2015 1.78% 1.76%
Turnover Ratio For the 12 months ended For the 12 months ended 31 March 2016 31 March 2015 1.66% 1.22%
Other Material InformationNil

27 28
Aberdeen Asset Management Asia Limited
Aberdeen Select Portfolio - Aberdeen Singapore Equity Fund
Investments in Collective Investment Schemes
Aberdeen Select Portfolio - Aberdeen Singapore Equity Fund, an ILP sub-fund, feeds 100% into the underlying Singapore registered Aberdeen Select Portfolio - Aberdeen Singapore Equity Fund (SGD Class).
Market Value SGD % of Net Assets60,725 100%
Exposure to DerivativesNot Applicable
BorrowingsNot Applicable
Related Party TransactionsNil
Total Subscriptions and Redemptions for the 12 months ended 30 June 2016SGD
Subscriptions 38,354Redemptions (9,044)
Any Other Material Information that will Adversely Impact the Valuation of the FundNil
Soft Dollar CommissionNot Applicable
Fund Performance as at 30 June 2016
Fund / Benchmark 3 Months 6 Months 1 Year 3 Years* 5 Years* 10 Years*Since Inception*(5 Dec 1997)
Aberdeen Select Portfolio - Aberdeen Singapore Equity Fund
0.63% 1.05% -10.53% -2.23% 1.25% 5.24% 8.68%
Benchmark: Straits Times Index 1.53% 0.28% -11.11% -0.10% 1.34% 5.10% NA^
* Annualised Performance
^ Benchmark data is only available from 31 August 1999 following the takeover of index calculation by FTSE on 10 January 2008.

27 28
Underlying Fund:Aberdeen Select Portfolio - Aberdeen Singapore Equity Fund (SGD Class)
Top 10 Holdings as at 31 March 2016 Market Value SGD % of Net AssetsOVERSEA-CHINESE BANKING CORPORATION 81,301,683 10.88%DBS GROUP HOLDINGS 66,993,127 8.96%JARDINE STRATEGIC HOLDINGS 63,492,286 8.50%UNITED OVERSEAS BANK 52,341,064 7.00%CITY DEVELOPMENTS 48,309,210 6.46%SINGAPORE TELECOMMUNICATIONS 41,721,634 5.58%KEPPEL CORPORATION 39,566,461 5.29%SINGAPORE TECHNOLOGIES ENGINEERING 36,423,030 4.87%RAFFLES MEDICAL GROUP 26,600,616 3.56%JARDINE CYCLE & CARRIAGE 24,698,264 3.30%
Top 10 Holdings as at 31 March 2015 Market Value SGD % of Net AssetsOVERSEA-CHINESE BANKING CORPORATION 86,503,497 10.41%DBS GROUP HOLDINGS 76,133,370 9.17%JARDINE STRATEGIC HOLDINGS 75,908,700 9.14%UNITED OVERSEAS BANK 65,766,160 7.90%KEPPEL CORPORATION 63,228,032 7.61%CITY DEVELOPMENTS 47,966,080 5.77%SINGAPORE TELECOMMUNICATIONS 40,359,397 4.86%SINGAPORE TECHNOLOGIES ENGINEERING 35,848,570 4.32%VENTURE CORPORATION 22,782,479 2.74%SEMBCORP MARINE 21,854,100 2.63%
Expense Ratio For the 12 months ended For the 12 months ended 31 March 2016 31 March 2015 1.67% 1.66%
Turnover Ratio For the 12 months ended For the 12 months ended 31 March 2016 31 March 2015 3.67% 4.48%
Other Material InformationNil

29 30
Aberdeen Asset Management Asia Limited
Aberdeen Select Portfolio - Aberdeen Thailand Equity Fund
Investments in Collective Investment Schemes
Aberdeen Select Portfolio - Aberdeen Thailand Equity Fund, an ILP sub-fund, feeds 100% into the underlying Singapore registered Aberdeen Select Portfolio - Aberdeen Thailand Equity Fund (USD Class).
Market Value USD % of Net Assets1,009,719 100%
Exposure to DerivativesNot Applicable
BorrowingsNot Applicable
Related Party TransactionsNil
Total Subscriptions and Redemptions for the 12 months ended 30 June 2016USD
Subscriptions 236,946Redemptions (267,454)
Any Other Material Information that will Adversely Impact the Valuation of the FundNil
Soft Dollar CommissionNot Applicable
Fund Performance as at 30 June 2016
Fund / Benchmark 3 Months 6 Months 1 Year 3 Years* 5 Years* 10 Years*Since Inception*
(1 Jun 2004)
Aberdeen Select Portfolio - Aberdeen Thailand Equity Fund
0.32% 10.54% -7.75% -3.82% 7.84% 11.77% 12.66%
Benchmark: Thailand SET TR 3.93% 17.34% -4.47% -1.01% 7.55% 13.14% 12.71%
* Annualised Performance

29 30
Underlying Fund:Aberdeen Select Portfolio - Aberdeen Thailand Equity Fund (USD Class)
Top 10 Holdings as at 31 March 2016 Market Value SGD % of Net AssetsBIG C SUPERCENTER 8,638,409 6.30%SIAM CEMENT 8,210,959 5.99%BANGKOK INSURANCE 6,918,614 5.04%KASIKORNBANK 6,713,698 4.90%SIAM COMMERCIAL BANK 6,272,120 4.57%ADVANCED INFORMATION SERVICES 5,204,008 3.80%BEC WORLD 4,783,608 3.49%HOME PRODUCT CENTER 4,764,252 3.47%HANA MICROELECTRONICS 4,724,564 3.45%AEON THANA SINSAP THAILAND 4,566,633 3.33%
Top 10 Holdings as at 31 March 2015 Market Value SGD % of Net AssetsBANGKOK INSURANCE 10,717,851 5.79%SIAM CEMENT 10,456,691 5.65%SIAM COMMERCIAL BANK 9,971,391 5.39%BIG C SUPERCENTER 9,677,415 5.23%KASIKORNBANK 9,074,175 4.90%PTT EXPLORATION & PRODUCTION 8,967,318 4.85%BEC WORLD 7,783,380 4.21%ADVANCED INFORMATION SERVICES 6,592,524 3.56%TISCO FINANCIAL GROUP 6,439,720 3.47%HANA MICROELECTRONICS 6,343,572 3.43%
Note: Market Values are based in SGD according to data source provided by Aberdeen Asset Management Asia Limited.
Expense Ratio For the 12 months ended For the 12 months ended 31 March 2016 31 March 2015 1.74% 1.54%
Turnover Ratio For the 12 months ended For the 12 months ended 31 March 2016 31 March 2015 2.71% 2.01%
Other Material InformationNil
31 32
AllianceBernstein (Singapore) Ltd
AB FCP I - Developed Markets Multi-Asset Income Portfolio^
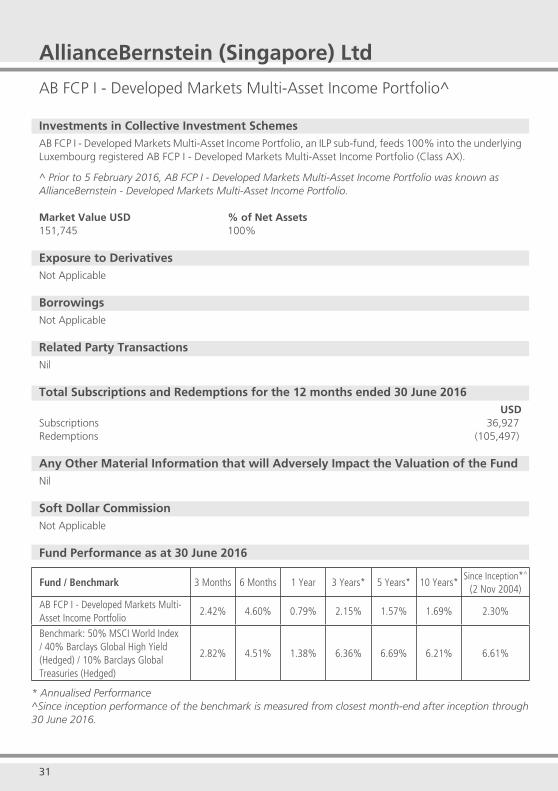
Investments in Collective Investment SchemesAB FCP I - Developed Markets Multi-Asset Income Portfolio, an ILP sub-fund, feeds 100% into the underlying Luxembourg registered AB FCP I - Developed Markets Multi-Asset Income Portfolio (Class AX).
^ Prior to 5 February 2016, AB FCP I - Developed Markets Multi-Asset Income Portfolio was known as AllianceBernstein - Developed Markets Multi-Asset Income Portfolio.
Market Value USD % of Net Assets151,745 100%
Exposure to DerivativesNot Applicable
BorrowingsNot Applicable
Related Party TransactionsNil
Total Subscriptions and Redemptions for the 12 months ended 30 June 2016USD
Subscriptions 36,927Redemptions (105,497)
Any Other Material Information that will Adversely Impact the Valuation of the FundNil
Soft Dollar CommissionNot Applicable
Fund Performance as at 30 June 2016
Fund / Benchmark 3 Months 6 Months 1 Year 3 Years* 5 Years* 10 Years*Since Inception*^
(2 Nov 2004)
AB FCP I - Developed Markets Multi-Asset Income Portfolio
2.42% 4.60% 0.79% 2.15% 1.57% 1.69% 2.30%
Benchmark: 50% MSCI World Index / 40% Barclays Global High Yield (Hedged) / 10% Barclays Global Treasuries (Hedged)
2.82% 4.51% 1.38% 6.36% 6.69% 6.21% 6.61%
* Annualised Performance^Since inception performance of the benchmark is measured from closest month-end after inception through 30 June 2016.

31 32
Underlying Fund:AB FCP I - Developed Markets Multi-Asset Income Portfolio (Class AX)
Top 10 Holdings as at 30 June 2016 Market Value USD % of Net AssetsU.S. TREASURY NOTES 1.38%, 04/30/20 4,299,454 4.58%ALTRIA GROUP, INC. 1,179,009 1.26%PHILIP MORRIS INTERNATIONAL, INC. 1,014,860 1.08%MICROSOFT CORP. 1,014,496 1.08%JOHNSON & JOHNSON 931,341 0.99%VERIZON COMMUNICATIONS, INC. 907,232 0.97%EXXON MOBIL CORP. 785,822 0.84%ROCHE HOLDING AG 770,529 0.82%RAYTHEON CO. 754,523 0.80%IMPERIAL BRANDS PLC 733,670 0.78%
Top 10 Holdings as at 30 June 2015 Market Value USD % of Net AssetsU.S. TREASURY NOTES 1.38%, 04/30/20 5,040,260 5.98%ALTRIA GROUP, INC. 1,388,213 1.65%VERIZON COMMUNICATIONS, INC. 1,312,025 1.56%SWISS RE AG 1,303,626 1.55%VODAFONE GROUP PLC 1,262,933 1.50%PFIZER, INC. 1,121,310 1.33%GENERAL MOTORS CO. 1,080,325 1.28%GENERAL ELECTRIC CO. 972,621 1.15%CHEVRON CORP. 972,032 1.15%PAYCHEX, INC. 968,822 1.15%
Expense Ratio For the 12 months ended For the 12 months ended 30 June 2016 30 June 2015 1.65% 1.65%
Turnover Ratio For the 12 months ended For the 12 months ended 30 June 2016 30 June 2015 133.48% 269.90%
Other Material InformationNil
33 34
AllianceBernstein (Singapore) Ltd
AB FCP I - Dynamic Diversified Portfolio^
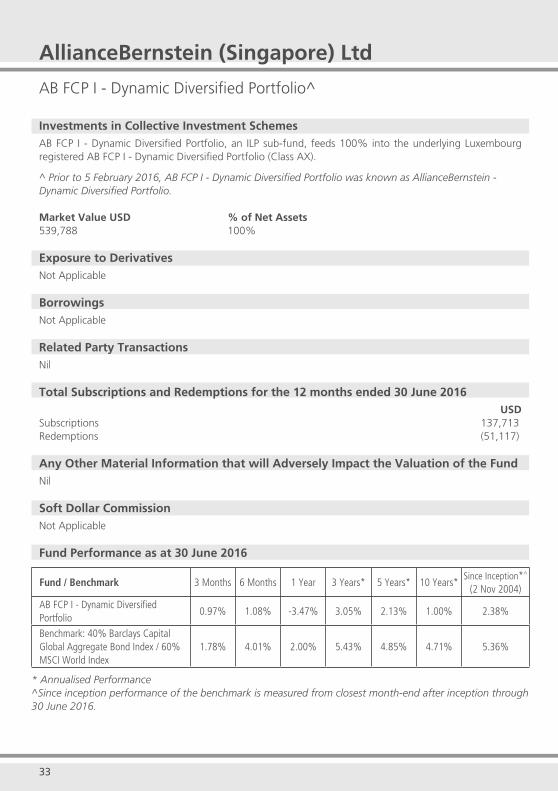
Investments in Collective Investment SchemesAB FCP I - Dynamic Diversified Portfolio, an ILP sub-fund, feeds 100% into the underlying Luxembourg registered AB FCP I - Dynamic Diversified Portfolio (Class AX).
^ Prior to 5 February 2016, AB FCP I - Dynamic Diversified Portfolio was known as AllianceBernstein - Dynamic Diversified Portfolio.
Market Value USD % of Net Assets539,788 100%
Exposure to DerivativesNot Applicable
BorrowingsNot Applicable
Related Party TransactionsNil
Total Subscriptions and Redemptions for the 12 months ended 30 June 2016USD
Subscriptions 137,713 Redemptions (51,117)
Any Other Material Information that will Adversely Impact the Valuation of the FundNil
Soft Dollar CommissionNot Applicable
Fund Performance as at 30 June 2016
Fund / Benchmark 3 Months 6 Months 1 Year 3 Years* 5 Years* 10 Years*Since Inception*^
(2 Nov 2004)
AB FCP I - Dynamic Diversified Portfolio
0.97% 1.08% -3.47% 3.05% 2.13% 1.00% 2.38%
Benchmark: 40% Barclays Capital Global Aggregate Bond Index / 60% MSCI World Index
1.78% 4.01% 2.00% 5.43% 4.85% 4.71% 5.36%
* Annualised Performance^Since inception performance of the benchmark is measured from closest month-end after inception through 30 June 2016.
33 34
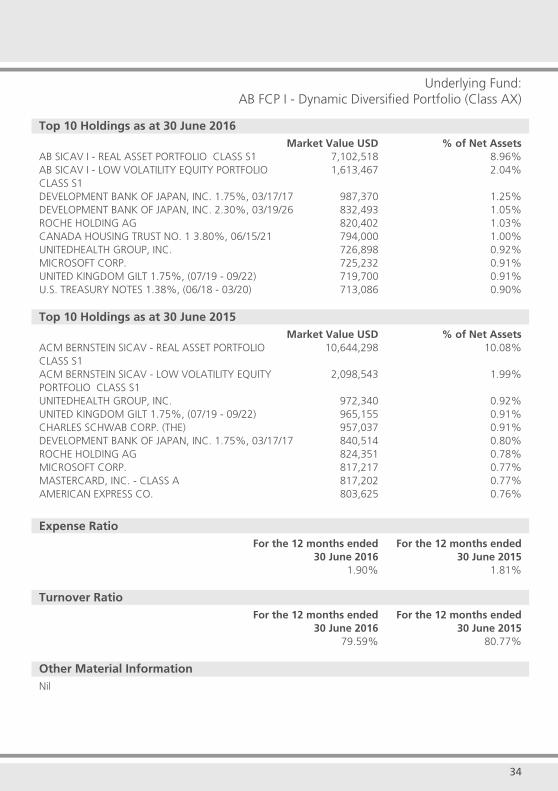
Underlying Fund:AB FCP I - Dynamic Diversified Portfolio (Class AX)
Top 10 Holdings as at 30 June 2016 Market Value USD % of Net AssetsAB SICAV I - REAL ASSET PORTFOLIO CLASS S1 7,102,518 8.96%AB SICAV I - LOW VOLATILITY EQUITY PORTFOLIO 1,613,467 2.04%CLASS S1DEVELOPMENT BANK OF JAPAN, INC. 1.75%, 03/17/17 987,370 1.25%DEVELOPMENT BANK OF JAPAN, INC. 2.30%, 03/19/26 832,493 1.05%ROCHE HOLDING AG 820,402 1.03%CANADA HOUSING TRUST NO. 1 3.80%, 06/15/21 794,000 1.00%UNITEDHEALTH GROUP, INC. 726,898 0.92%MICROSOFT CORP. 725,232 0.91%UNITED KINGDOM GILT 1.75%, (07/19 - 09/22) 719,700 0.91%U.S. TREASURY NOTES 1.38%, (06/18 - 03/20) 713,086 0.90%
Top 10 Holdings as at 30 June 2015 Market Value USD % of Net AssetsACM BERNSTEIN SICAV - REAL ASSET PORTFOLIO 10,644,298 10.08%CLASS S1ACM BERNSTEIN SICAV - LOW VOLATILITY EQUITY 2,098,543 1.99%PORTFOLIO CLASS S1UNITEDHEALTH GROUP, INC. 972,340 0.92%UNITED KINGDOM GILT 1.75%, (07/19 - 09/22) 965,155 0.91%CHARLES SCHWAB CORP. (THE) 957,037 0.91%DEVELOPMENT BANK OF JAPAN, INC. 1.75%, 03/17/17 840,514 0.80%ROCHE HOLDING AG 824,351 0.78%MICROSOFT CORP. 817,217 0.77%MASTERCARD, INC. - CLASS A 817,202 0.77%AMERICAN EXPRESS CO. 803,625 0.76%
Expense Ratio For the 12 months ended For the 12 months ended 30 June 2016 30 June 2015 1.90% 1.81%
Turnover Ratio For the 12 months ended For the 12 months ended 30 June 2016 30 June 2015 79.59% 80.77%
Other Material InformationNil
35 36
AllianceBernstein (Singapore) Ltd
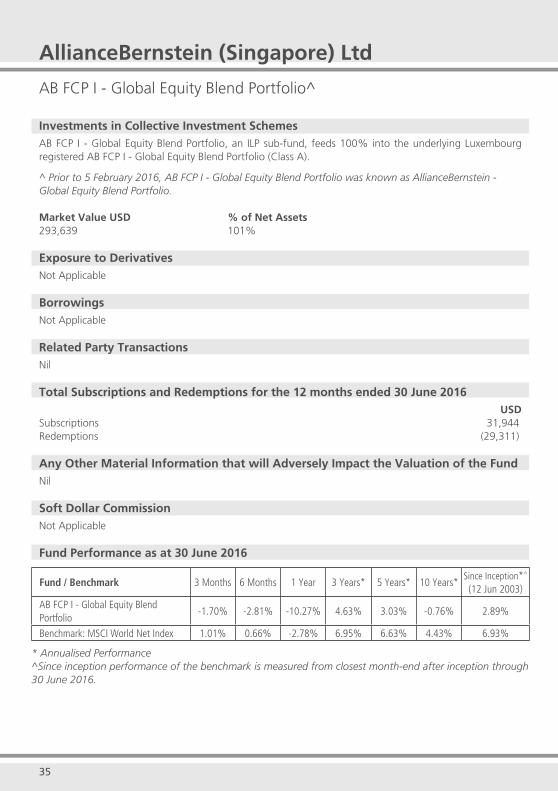
AB FCP I - Global Equity Blend Portfolio^
Investments in Collective Investment SchemesAB FCP I - Global Equity Blend Portfolio, an ILP sub-fund, feeds 100% into the underlying Luxembourg registered AB FCP I - Global Equity Blend Portfolio (Class A).
^ Prior to 5 February 2016, AB FCP I - Global Equity Blend Portfolio was known as AllianceBernstein - Global Equity Blend Portfolio.
Market Value USD % of Net Assets293,639 101%
Exposure to DerivativesNot Applicable
BorrowingsNot Applicable
Related Party TransactionsNil
Total Subscriptions and Redemptions for the 12 months ended 30 June 2016USD
Subscriptions 31,944 Redemptions (29,311)
Any Other Material Information that will Adversely Impact the Valuation of the FundNil
Soft Dollar CommissionNot Applicable
Fund Performance as at 30 June 2016
Fund / Benchmark 3 Months 6 Months 1 Year 3 Years* 5 Years* 10 Years*Since Inception*^
(12 Jun 2003)
AB FCP I - Global Equity Blend Portfolio
-1.70% -2.81% -10.27% 4.63% 3.03% -0.76% 2.89%
Benchmark: MSCI World Net Index 1.01% 0.66% -2.78% 6.95% 6.63% 4.43% 6.93%
* Annualised Performance^Since inception performance of the benchmark is measured from closest month-end after inception through 30 June 2016.
35 36
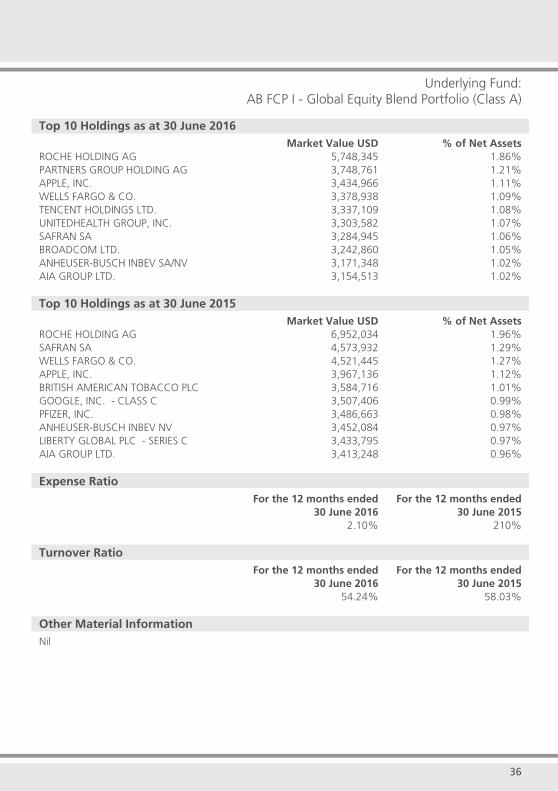
Underlying Fund:AB FCP I - Global Equity Blend Portfolio (Class A)
Top 10 Holdings as at 30 June 2016 Market Value USD % of Net AssetsROCHE HOLDING AG 5,748,345 1.86%PARTNERS GROUP HOLDING AG 3,748,761 1.21%APPLE, INC. 3,434,966 1.11%WELLS FARGO & CO. 3,378,938 1.09%TENCENT HOLDINGS LTD. 3,337,109 1.08%UNITEDHEALTH GROUP, INC. 3,303,582 1.07%SAFRAN SA 3,284,945 1.06%BROADCOM LTD. 3,242,860 1.05%ANHEUSER-BUSCH INBEV SA/NV 3,171,348 1.02%AIA GROUP LTD. 3,154,513 1.02%
Top 10 Holdings as at 30 June 2015 Market Value USD % of Net AssetsROCHE HOLDING AG 6,952,034 1.96%SAFRAN SA 4,573,932 1.29%WELLS FARGO & CO. 4,521,445 1.27%APPLE, INC. 3,967,136 1.12%BRITISH AMERICAN TOBACCO PLC 3,584,716 1.01%GOOGLE, INC. - CLASS C 3,507,406 0.99%PFIZER, INC. 3,486,663 0.98%ANHEUSER-BUSCH INBEV NV 3,452,084 0.97%LIBERTY GLOBAL PLC - SERIES C 3,433,795 0.97%AIA GROUP LTD. 3,413,248 0.96%
Expense Ratio For the 12 months ended For the 12 months ended 30 June 2016 30 June 2015 2.10% 210%
Turnover Ratio For the 12 months ended For the 12 months ended 30 June 2016 30 June 2015 54.24% 58.03%
Other Material InformationNil
37 38
AllianceBernstein (Singapore) Ltd
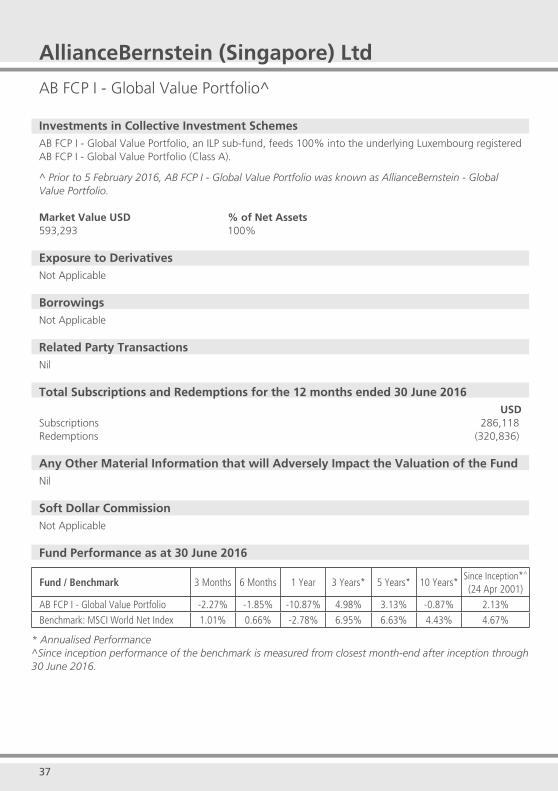
AB FCP I - Global Value Portfolio^
Investments in Collective Investment SchemesAB FCP I - Global Value Portfolio, an ILP sub-fund, feeds 100% into the underlying Luxembourg registered AB FCP I - Global Value Portfolio (Class A).
^ Prior to 5 February 2016, AB FCP I - Global Value Portfolio was known as AllianceBernstein - Global Value Portfolio.
Market Value USD % of Net Assets593,293 100%
Exposure to DerivativesNot Applicable
BorrowingsNot Applicable
Related Party TransactionsNil
Total Subscriptions and Redemptions for the 12 months ended 30 June 2016USD
Subscriptions 286,118 Redemptions (320,836)
Any Other Material Information that will Adversely Impact the Valuation of the FundNil
Soft Dollar CommissionNot Applicable
Fund Performance as at 30 June 2016
Fund / Benchmark 3 Months 6 Months 1 Year 3 Years* 5 Years* 10 Years*Since Inception*^
(24 Apr 2001)
AB FCP I - Global Value Portfolio -2.27% -1.85% -10.87% 4.98% 3.13% -0.87% 2.13%
Benchmark: MSCI World Net Index 1.01% 0.66% -2.78% 6.95% 6.63% 4.43% 4.67%
* Annualised Performance^Since inception performance of the benchmark is measured from closest month-end after inception through 30 June 2016.
37 38
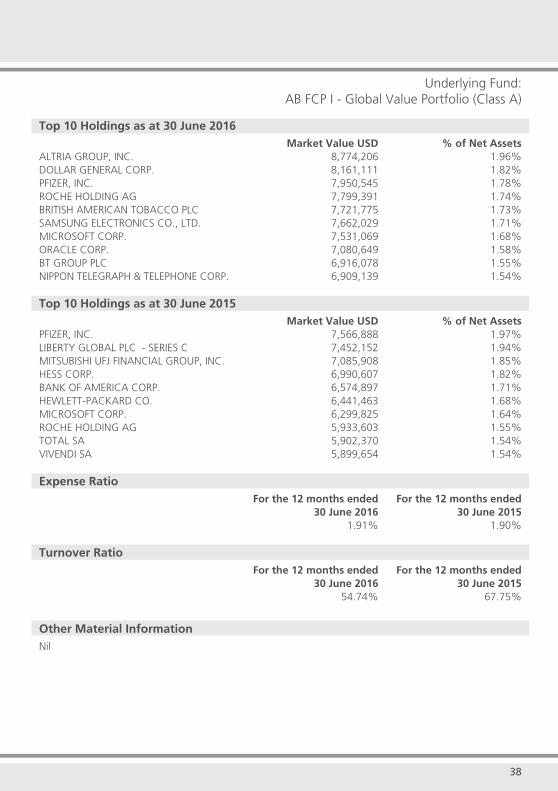
Underlying Fund:AB FCP I - Global Value Portfolio (Class A)
Top 10 Holdings as at 30 June 2016 Market Value USD % of Net AssetsALTRIA GROUP, INC. 8,774,206 1.96%DOLLAR GENERAL CORP. 8,161,111 1.82%PFIZER, INC. 7,950,545 1.78%ROCHE HOLDING AG 7,799,391 1.74%BRITISH AMERICAN TOBACCO PLC 7,721,775 1.73%SAMSUNG ELECTRONICS CO., LTD. 7,662,029 1.71%MICROSOFT CORP. 7,531,069 1.68%ORACLE CORP. 7,080,649 1.58%BT GROUP PLC 6,916,078 1.55%NIPPON TELEGRAPH & TELEPHONE CORP. 6,909,139 1.54%
Top 10 Holdings as at 30 June 2015 Market Value USD % of Net AssetsPFIZER, INC. 7,566,888 1.97%LIBERTY GLOBAL PLC - SERIES C 7,452,152 1.94%MITSUBISHI UFJ FINANCIAL GROUP, INC. 7,085,908 1.85%HESS CORP. 6,990,607 1.82%BANK OF AMERICA CORP. 6,574,897 1.71%HEWLETT-PACKARD CO. 6,441,463 1.68%MICROSOFT CORP. 6,299,825 1.64%ROCHE HOLDING AG 5,933,603 1.55%TOTAL SA 5,902,370 1.54%VIVENDI SA 5,899,654 1.54%
Expense Ratio For the 12 months ended For the 12 months ended 30 June 2016 30 June 2015 1.91% 1.90%
Turnover Ratio For the 12 months ended For the 12 months ended 30 June 2016 30 June 2015 54.74% 67.75%
Other Material InformationNil
39 40
AllianceBernstein (Singapore) Ltd
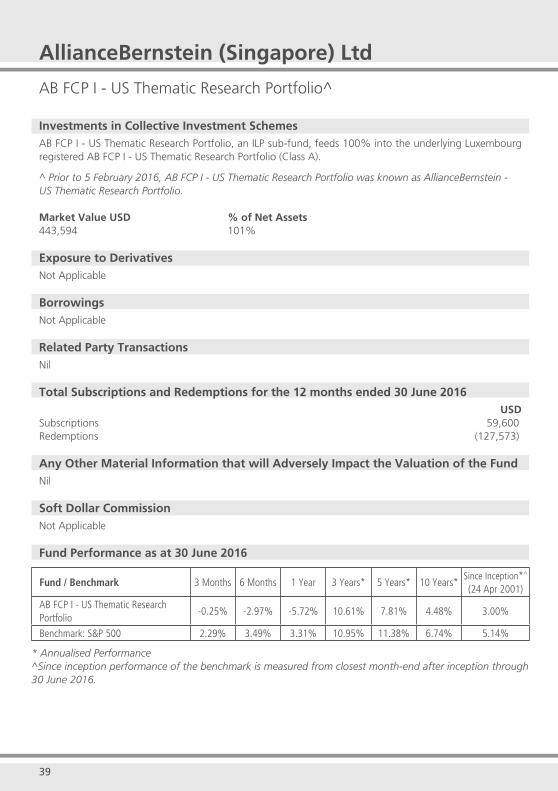
AB FCP I - US Thematic Research Portfolio^
Investments in Collective Investment SchemesAB FCP I - US Thematic Research Portfolio, an ILP sub-fund, feeds 100% into the underlying Luxembourg registered AB FCP I - US Thematic Research Portfolio (Class A).
^ Prior to 5 February 2016, AB FCP I - US Thematic Research Portfolio was known as AllianceBernstein - US Thematic Research Portfolio.
Market Value USD % of Net Assets443,594 101%
Exposure to DerivativesNot Applicable
BorrowingsNot Applicable
Related Party TransactionsNil
Total Subscriptions and Redemptions for the 12 months ended 30 June 2016USD
Subscriptions 59,600 Redemptions (127,573)
Any Other Material Information that will Adversely Impact the Valuation of the FundNil
Soft Dollar CommissionNot Applicable
Fund Performance as at 30 June 2016
Fund / Benchmark 3 Months 6 Months 1 Year 3 Years* 5 Years* 10 Years*Since Inception*^
(24 Apr 2001)
AB FCP I - US Thematic Research Portfolio
-0.25% -2.97% -5.72% 10.61% 7.81% 4.48% 3.00%
Benchmark: S&P 500 2.29% 3.49% 3.31% 10.95% 11.38% 6.74% 5.14%
* Annualised Performance^Since inception performance of the benchmark is measured from closest month-end after inception through 30 June 2016.
39 40
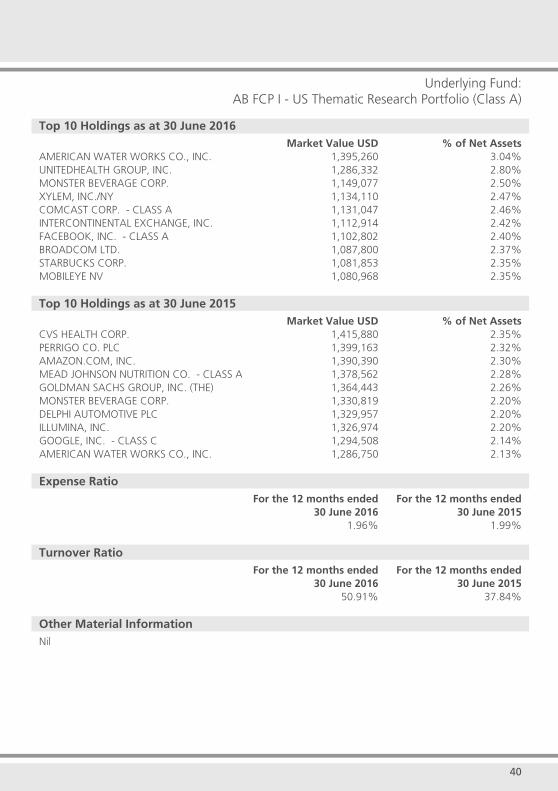
Underlying Fund:AB FCP I - US Thematic Research Portfolio (Class A)
Top 10 Holdings as at 30 June 2016 Market Value USD % of Net AssetsAMERICAN WATER WORKS CO., INC. 1,395,260 3.04%UNITEDHEALTH GROUP, INC. 1,286,332 2.80%MONSTER BEVERAGE CORP. 1,149,077 2.50%XYLEM, INC./NY 1,134,110 2.47%COMCAST CORP. - CLASS A 1,131,047 2.46%INTERCONTINENTAL EXCHANGE, INC. 1,112,914 2.42%FACEBOOK, INC. - CLASS A 1,102,802 2.40%BROADCOM LTD. 1,087,800 2.37%STARBUCKS CORP. 1,081,853 2.35%MOBILEYE NV 1,080,968 2.35%
Top 10 Holdings as at 30 June 2015 Market Value USD % of Net AssetsCVS HEALTH CORP. 1,415,880 2.35%PERRIGO CO. PLC 1,399,163 2.32%AMAZON.COM, INC. 1,390,390 2.30%MEAD JOHNSON NUTRITION CO. - CLASS A 1,378,562 2.28%GOLDMAN SACHS GROUP, INC. (THE) 1,364,443 2.26%MONSTER BEVERAGE CORP. 1,330,819 2.20%DELPHI AUTOMOTIVE PLC 1,329,957 2.20%ILLUMINA, INC. 1,326,974 2.20%GOOGLE, INC. - CLASS C 1,294,508 2.14%AMERICAN WATER WORKS CO., INC. 1,286,750 2.13%
Expense Ratio For the 12 months ended For the 12 months ended 30 June 2016 30 June 2015 1.96% 1.99%
Turnover Ratio For the 12 months ended For the 12 months ended 30 June 2016 30 June 2015 50.91% 37.84%
Other Material InformationNil

41
Allianz Global Investors Singapore Limited
Allianz Global Investors Fund - Allianz China Equity Fund
Investments in Collective Investment SchemesAllianz Global Investors Fund - Allianz China Equity Fund, an ILP sub-fund, feeds 100% into the underlying Luxembourg registered Allianz Global Investors Fund - Allianz China Equity Fund (Class AT SGD).
Market Value SGD % of Net Assets25,716 100%
Exposure to DerivativesNot Applicable
BorrowingsNot Applicable
Related Party TransactionsNil
Total Subscriptions and Redemptions for the 12 months ended 30 June 2016SGD
Subscriptions 11,264 Redemptions (2,536)
Any Other Material Information That Will Adversely Impact The Valuation Of The FundNil
Soft Dollar CommissionNot Applicable
Fund Performance as at 30 June 2016
Fund / Benchmark 3 Months 6 Months 1 Year 3 Years* 5 Years* 10 Years*Since Inception*(11 Aug 2009)
Allianz Global Investors Fund - Allianz China Equity Fund
-1.83% -10.52% -22.26% 8.04% 1.65% NA 1.01%
Benchmark: MSCI China Total Return (Net)
0.06% -9.58% -23.41% 5.43% 1.35% NA 0.36%
*Annualised Performance
42
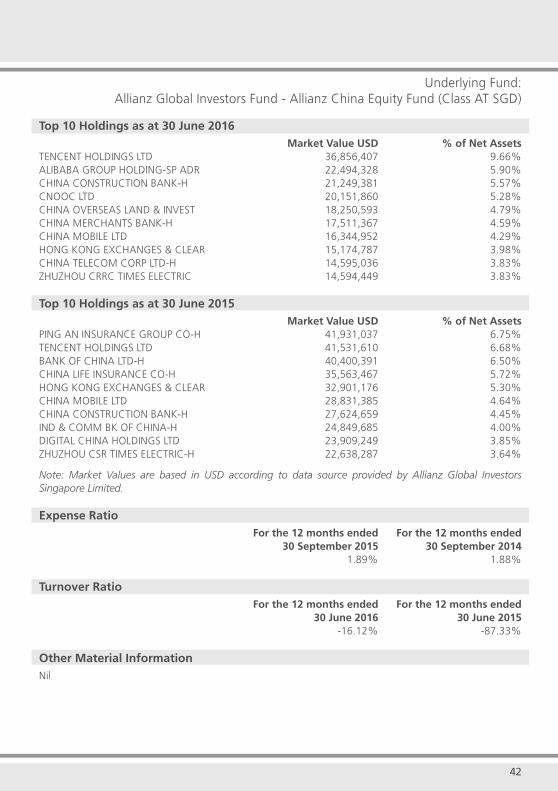
Underlying Fund:Allianz Global Investors Fund - Allianz China Equity Fund (Class AT SGD)
Top 10 Holdings as at 30 June 2016 Market Value USD % of Net AssetsTENCENT HOLDINGS LTD 36,856,407 9.66%ALIBABA GROUP HOLDING-SP ADR 22,494,328 5.90%CHINA CONSTRUCTION BANK-H 21,249,381 5.57%CNOOC LTD 20,151,860 5.28%CHINA OVERSEAS LAND & INVEST 18,250,593 4.79%CHINA MERCHANTS BANK-H 17,511,367 4.59%CHINA MOBILE LTD 16,344,952 4.29%HONG KONG EXCHANGES & CLEAR 15,174,787 3.98%CHINA TELECOM CORP LTD-H 14,595,036 3.83%ZHUZHOU CRRC TIMES ELECTRIC 14,594,449 3.83%
Top 10 Holdings as at 30 June 2015 Market Value USD % of Net AssetsPING AN INSURANCE GROUP CO-H 41,931,037 6.75%TENCENT HOLDINGS LTD 41,531,610 6.68%BANK OF CHINA LTD-H 40,400,391 6.50%CHINA LIFE INSURANCE CO-H 35,563,467 5.72%HONG KONG EXCHANGES & CLEAR 32,901,176 5.30%CHINA MOBILE LTD 28,831,385 4.64%CHINA CONSTRUCTION BANK-H 27,624,659 4.45%IND & COMM BK OF CHINA-H 24,849,685 4.00%DIGITAL CHINA HOLDINGS LTD 23,909,249 3.85%ZHUZHOU CSR TIMES ELECTRIC-H 22,638,287 3.64%
Note: Market Values are based in USD according to data source provided by Allianz Global Investors Singapore Limited.
Expense Ratio For the 12 months ended For the 12 months ended 30 September 2015 30 September 2014 1.89% 1.88%
Turnover Ratio For the 12 months ended For the 12 months ended 30 June 2016 30 June 2015 -16.12% -87.33%
Other Material InformationNil
43
Allianz Global Investors Singapore Limited
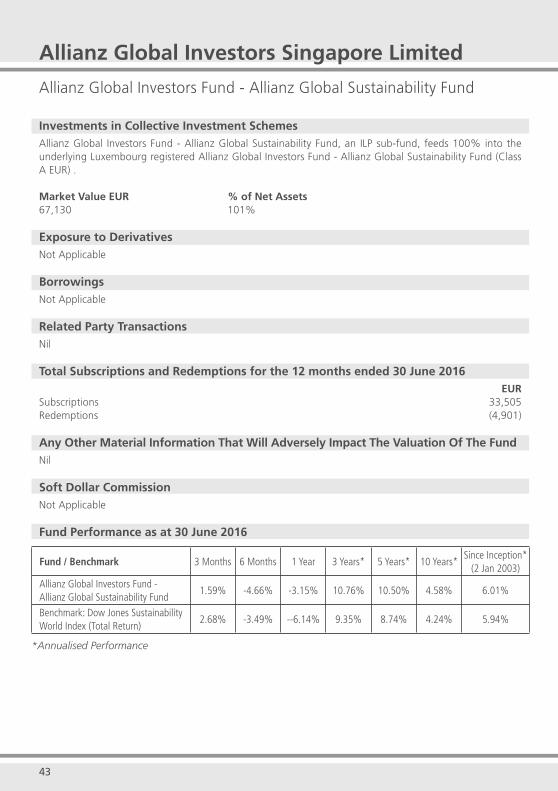
Allianz Global Investors Fund - Allianz Global Sustainability Fund
Investments in Collective Investment SchemesAllianz Global Investors Fund - Allianz Global Sustainability Fund, an ILP sub-fund, feeds 100% into the underlying Luxembourg registered Allianz Global Investors Fund - Allianz Global Sustainability Fund (Class A EUR) .
Market Value EUR % of Net Assets67,130 101%
Exposure to DerivativesNot Applicable
BorrowingsNot Applicable
Related Party TransactionsNil
Total Subscriptions and Redemptions for the 12 months ended 30 June 2016EUR
Subscriptions 33,505Redemptions (4,901)
Any Other Material Information That Will Adversely Impact The Valuation Of The FundNil
Soft Dollar CommissionNot Applicable
Fund Performance as at 30 June 2016
Fund / Benchmark 3 Months 6 Months 1 Year 3 Years* 5 Years* 10 Years*Since Inception*
(2 Jan 2003)
Allianz Global Investors Fund - Allianz Global Sustainability Fund
1.59% -4.66% -3.15% 10.76% 10.50% 4.58% 6.01%
Benchmark: Dow Jones Sustainability World Index (Total Return)
2.68% -3.49% --6.14% 9.35% 8.74% 4.24% 5.94%
*Annualised Performance
44
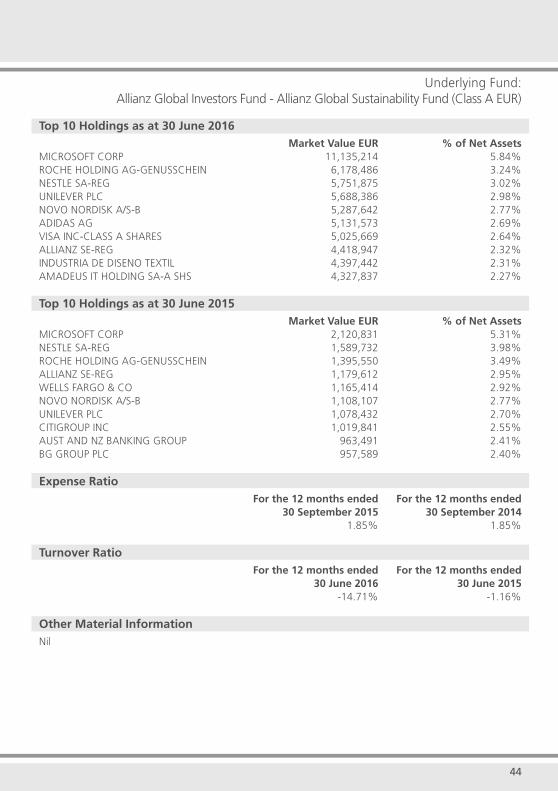
Underlying Fund:Allianz Global Investors Fund - Allianz Global Sustainability Fund (Class A EUR)
Top 10 Holdings as at 30 June 2016 Market Value EUR % of Net AssetsMICROSOFT CORP 11,135,214 5.84%ROCHE HOLDING AG-GENUSSCHEIN 6,178,486 3.24%NESTLE SA-REG 5,751,875 3.02%UNILEVER PLC 5,688,386 2.98%NOVO NORDISK A/S-B 5,287,642 2.77%ADIDAS AG 5,131,573 2.69%VISA INC-CLASS A SHARES 5,025,669 2.64%ALLIANZ SE-REG 4,418,947 2.32%INDUSTRIA DE DISENO TEXTIL 4,397,442 2.31%AMADEUS IT HOLDING SA-A SHS 4,327,837 2.27%
Top 10 Holdings as at 30 June 2015 Market Value EUR % of Net AssetsMICROSOFT CORP 2,120,831 5.31%NESTLE SA-REG 1,589,732 3.98%ROCHE HOLDING AG-GENUSSCHEIN 1,395,550 3.49%ALLIANZ SE-REG 1,179,612 2.95%WELLS FARGO & CO 1,165,414 2.92%NOVO NORDISK A/S-B 1,108,107 2.77%UNILEVER PLC 1,078,432 2.70%CITIGROUP INC 1,019,841 2.55%AUST AND NZ BANKING GROUP 963,491 2.41%BG GROUP PLC 957,589 2.40%
Expense Ratio For the 12 months ended For the 12 months ended 30 September 2015 30 September 2014 1.85% 1.85%
Turnover Ratio For the 12 months ended For the 12 months ended 30 June 2016 30 June 2015 -14.71% -1.16%
Other Material InformationNil
45
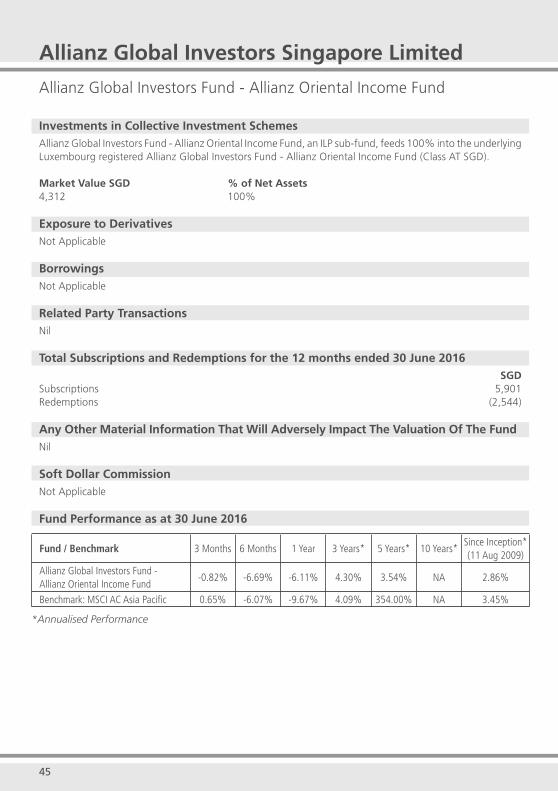
Allianz Global Investors Singapore Limited
Allianz Global Investors Fund - Allianz Oriental Income Fund
Investments in Collective Investment SchemesAllianz Global Investors Fund - Allianz Oriental Income Fund, an ILP sub-fund, feeds 100% into the underlying Luxembourg registered Allianz Global Investors Fund - Allianz Oriental Income Fund (Class AT SGD).
Market Value SGD % of Net Assets4,312 100%
Exposure to DerivativesNot Applicable
BorrowingsNot Applicable
Related Party TransactionsNil
Total Subscriptions and Redemptions for the 12 months ended 30 June 2016 SGD
Subscriptions 5,901Redemptions (2,544)
Any Other Material Information That Will Adversely Impact The Valuation Of The FundNil
Soft Dollar CommissionNot Applicable
Fund Performance as at 30 June 2016
Fund / Benchmark 3 Months 6 Months 1 Year 3 Years* 5 Years* 10 Years*Since Inception*(11 Aug 2009)
Allianz Global Investors Fund - Allianz Oriental Income Fund
-0.82% -6.69% -6.11% 4.30% 3.54% NA 2.86%
Benchmark: MSCI AC Asia Pacifi c 0.65% -6.07% -9.67% 4.09% 354.00% NA 3.45%
*Annualised Performance
46
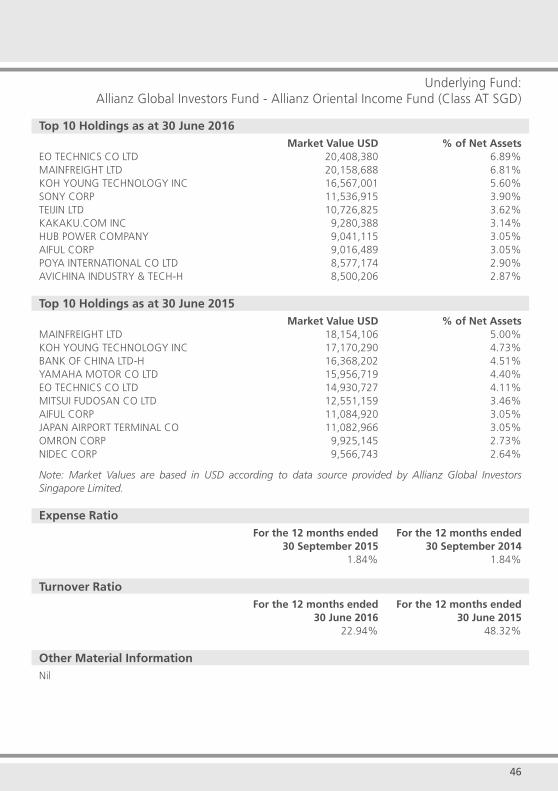
Underlying Fund:Allianz Global Investors Fund - Allianz Oriental Income Fund (Class AT SGD)
Top 10 Holdings as at 30 June 2016 Market Value USD % of Net AssetsEO TECHNICS CO LTD 20,408,380 6.89%MAINFREIGHT LTD 20,158,688 6.81%KOH YOUNG TECHNOLOGY INC 16,567,001 5.60%SONY CORP 11,536,915 3.90%TEIJIN LTD 10,726,825 3.62%KAKAKU.COM INC 9,280,388 3.14%HUB POWER COMPANY 9,041,115 3.05%AIFUL CORP 9,016,489 3.05%POYA INTERNATIONAL CO LTD 8,577,174 2.90%AVICHINA INDUSTRY & TECH-H 8,500,206 2.87%
Top 10 Holdings as at 30 June 2015 Market Value USD % of Net AssetsMAINFREIGHT LTD 18,154,106 5.00%KOH YOUNG TECHNOLOGY INC 17,170,290 4.73%BANK OF CHINA LTD-H 16,368,202 4.51%YAMAHA MOTOR CO LTD 15,956,719 4.40% EO TECHNICS CO LTD 14,930,727 4.11% MITSUI FUDOSAN CO LTD 12,551,159 3.46%AIFUL CORP 11,084,920 3.05%JAPAN AIRPORT TERMINAL CO 11,082,966 3.05%OMRON CORP 9,925,145 2.73%NIDEC CORP 9,566,743 2.64%
Note: Market Values are based in USD according to data source provided by Allianz Global Investors Singapore Limited.
Expense Ratio For the 12 months ended For the 12 months ended 30 September 2015 30 September 2014 1.84% 1.84%
Turnover Ratio For the 12 months ended For the 12 months ended 30 June 2016 30 June 2015 22.94% 48.32%
Other Material InformationNil
47 48
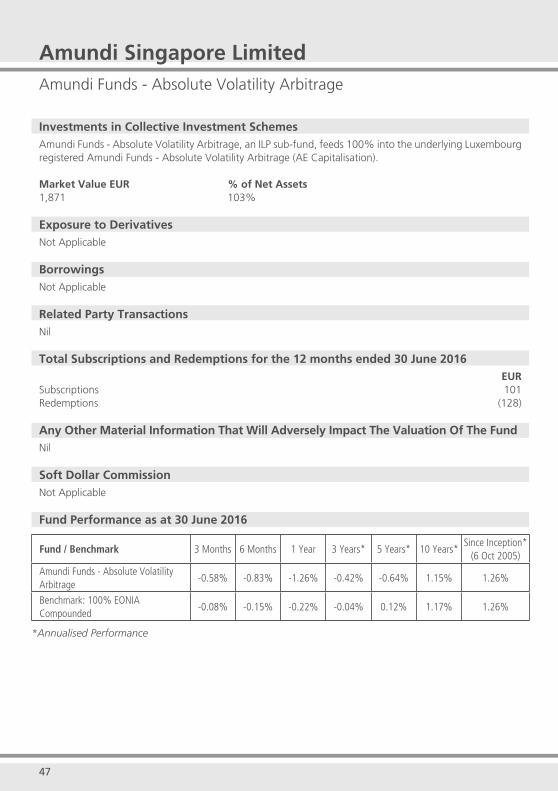
Amundi Singapore LimitedAmundi Funds - Absolute Volatility Arbitrage
Investments in Collective Investment SchemesAmundi Funds - Absolute Volatility Arbitrage, an ILP sub-fund, feeds 100% into the underlying Luxembourg registered Amundi Funds - Absolute Volatility Arbitrage (AE Capitalisation). Market Value EUR % of Net Assets1,871 103%
Exposure to DerivativesNot Applicable
BorrowingsNot Applicable
Related Party TransactionsNil
Total Subscriptions and Redemptions for the 12 months ended 30 June 2016EUR
Subscriptions 101 Redemptions (128)
Any Other Material Information That Will Adversely Impact The Valuation Of The FundNil
Soft Dollar CommissionNot Applicable
Fund Performance as at 30 June 2016
Fund / Benchmark 3 Months 6 Months 1 Year 3 Years* 5 Years* 10 Years*Since Inception*
(6 Oct 2005)
Amundi Funds - Absolute Volatility Arbitrage
-0.58% -0.83% -1.26% -0.42% -0.64% 1.15% 1.26%
Benchmark: 100% EONIA Compounded
-0.08% -0.15% -0.22% -0.04% 0.12% 1.17% 1.26%
*Annualised Performance
47 48
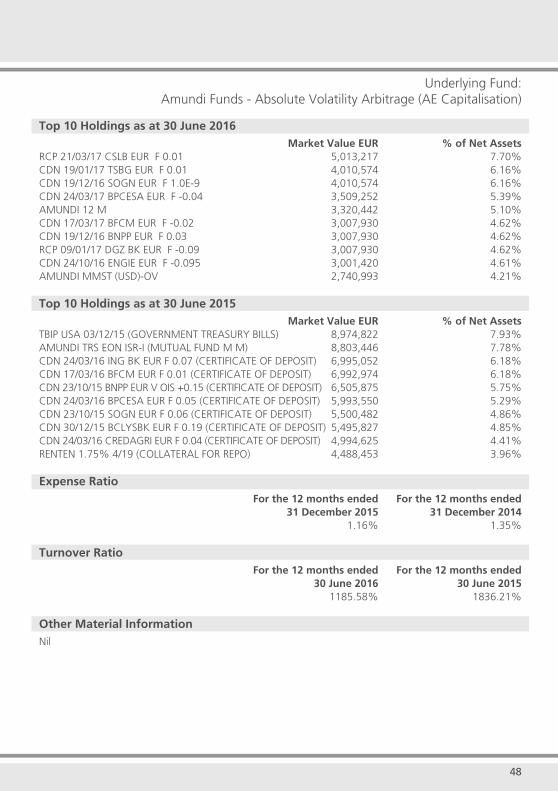
Underlying Fund:Amundi Funds - Absolute Volatility Arbitrage (AE Capitalisation)
Top 10 Holdings as at 30 June 2016 Market Value EUR % of Net AssetsRCP 21/03/17 CSLB EUR F 0.01 5,013,217 7.70%CDN 19/01/17 TSBG EUR F 0.01 4,010,574 6.16% CDN 19/12/16 SOGN EUR F 1.0E-9 4,010,574 6.16% CDN 24/03/17 BPCESA EUR F -0.04 3,509,252 5.39% AMUNDI 12 M 3,320,442 5.10% CDN 17/03/17 BFCM EUR F -0.02 3,007,930 4.62% CDN 19/12/16 BNPP EUR F 0.03 3,007,930 4.62% RCP 09/01/17 DGZ BK EUR F -0.09 3,007,930 4.62% CDN 24/10/16 ENGIE EUR F -0.095 3,001,420 4.61% AMUNDI MMST (USD)-OV 2,740,993 4.21%
Top 10 Holdings as at 30 June 2015 Market Value EUR % of Net AssetsTBIP USA 03/12/15 (GOVERNMENT TREASURY BILLS) 8,974,822 7.93% AMUNDI TRS EON ISR-I (MUTUAL FUND M M) 8,803,446 7.78% CDN 24/03/16 ING BK EUR F 0.07 (CERTIFICATE OF DEPOSIT) 6,995,052 6.18% CDN 17/03/16 BFCM EUR F 0.01 (CERTIFICATE OF DEPOSIT) 6,992,974 6.18% CDN 23/10/15 BNPP EUR V OIS +0.15 (CERTIFICATE OF DEPOSIT) 6,505,875 5.75% CDN 24/03/16 BPCESA EUR F 0.05 (CERTIFICATE OF DEPOSIT) 5,993,550 5.29% CDN 23/10/15 SOGN EUR F 0.06 (CERTIFICATE OF DEPOSIT) 5,500,482 4.86% CDN 30/12/15 BCLYSBK EUR F 0.19 (CERTIFICATE OF DEPOSIT) 5,495,827 4.85% CDN 24/03/16 CREDAGRI EUR F 0.04 (CERTIFICATE OF DEPOSIT) 4,994,625 4.41% RENTEN 1.75% 4/19 (COLLATERAL FOR REPO) 4,488,453 3.96% Expense Ratio For the 12 months ended For the 12 months ended 31 December 2015 31 December 2014 1.16% 1.35%
Turnover Ratio For the 12 months ended For the 12 months ended 30 June 2016 30 June 2015 1185.58% 1836.21%
Other Material InformationNil
49 50
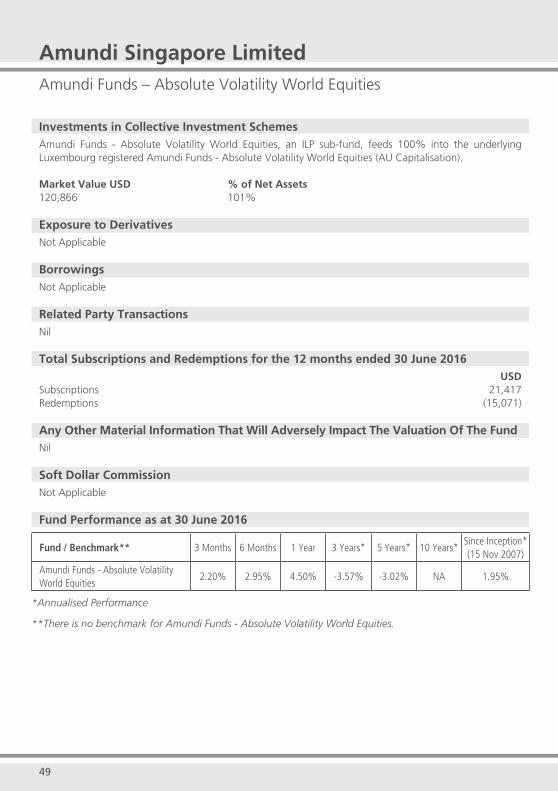
Fund / Benchmark** 3 Months 6 Months 1 Year 3 Years* 5 Years* 10 Years*Since Inception*(15 Nov 2007)
Amundi Funds - Absolute Volatility World Equities
2.20% 2.95% 4.50% -3.57% -3.02% NA 1.95%
*Annualised Performance
**There is no benchmark for Amundi Funds - Absolute Volatility World Equities.
Amundi Singapore LimitedAmundi Funds – Absolute Volatility World Equities
Investments in Collective Investment SchemesAmundi Funds - Absolute Volatility World Equities, an ILP sub-fund, feeds 100% into the underlying Luxembourg registered Amundi Funds - Absolute Volatility World Equities (AU Capitalisation). Market Value USD % of Net Assets120,866 101%
Exposure to DerivativesNot Applicable
BorrowingsNot Applicable
Related Party TransactionsNil
Total Subscriptions and Redemptions for the 12 months ended 30 June 2016 USD
Subscriptions 21,417 Redemptions (15,071)
Any Other Material Information That Will Adversely Impact The Valuation Of The FundNil
Soft Dollar CommissionNot Applicable
Fund Performance as at 30 June 2016
49 50
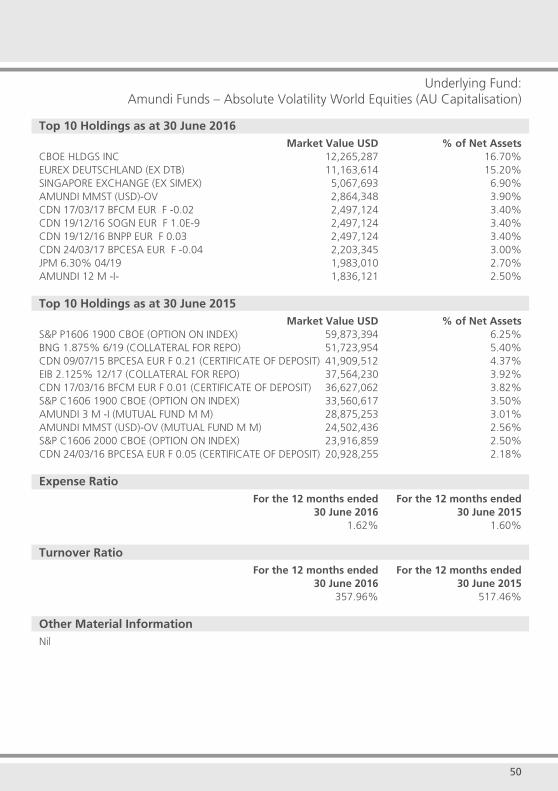
Underlying Fund:Amundi Funds – Absolute Volatility World Equities (AU Capitalisation)
Top 10 Holdings as at 30 June 2016 Market Value USD % of Net AssetsCBOE HLDGS INC 12,265,287 16.70%EUREX DEUTSCHLAND (EX DTB) 11,163,614 15.20%SINGAPORE EXCHANGE (EX SIMEX) 5,067,693 6.90%AMUNDI MMST (USD)-OV 2,864,348 3.90%CDN 17/03/17 BFCM EUR F -0.02 2,497,124 3.40%CDN 19/12/16 SOGN EUR F 1.0E-9 2,497,124 3.40%CDN 19/12/16 BNPP EUR F 0.03 2,497,124 3.40%CDN 24/03/17 BPCESA EUR F -0.04 2,203,345 3.00%JPM 6.30% 04/19 1,983,010 2.70%AMUNDI 12 M -I- 1,836,121 2.50%
Top 10 Holdings as at 30 June 2015 Market Value USD % of Net AssetsS&P P1606 1900 CBOE (OPTION ON INDEX) 59,873,394 6.25%BNG 1.875% 6/19 (COLLATERAL FOR REPO) 51,723,954 5.40%CDN 09/07/15 BPCESA EUR F 0.21 (CERTIFICATE OF DEPOSIT) 41,909,512 4.37%EIB 2.125% 12/17 (COLLATERAL FOR REPO) 37,564,230 3.92%CDN 17/03/16 BFCM EUR F 0.01 (CERTIFICATE OF DEPOSIT) 36,627,062 3.82%S&P C1606 1900 CBOE (OPTION ON INDEX) 33,560,617 3.50%AMUNDI 3 M -I (MUTUAL FUND M M) 28,875,253 3.01%AMUNDI MMST (USD)-OV (MUTUAL FUND M M) 24,502,436 2.56%S&P C1606 2000 CBOE (OPTION ON INDEX) 23,916,859 2.50%CDN 24/03/16 BPCESA EUR F 0.05 (CERTIFICATE OF DEPOSIT) 20,928,255 2.18%
Expense Ratio For the 12 months ended For the 12 months ended 30 June 2016 30 June 2015 1.62% 1.60%
Turnover Ratio For the 12 months ended For the 12 months ended 30 June 2016 30 June 2015 357.96% 517.46%
Other Material InformationNil
51 52
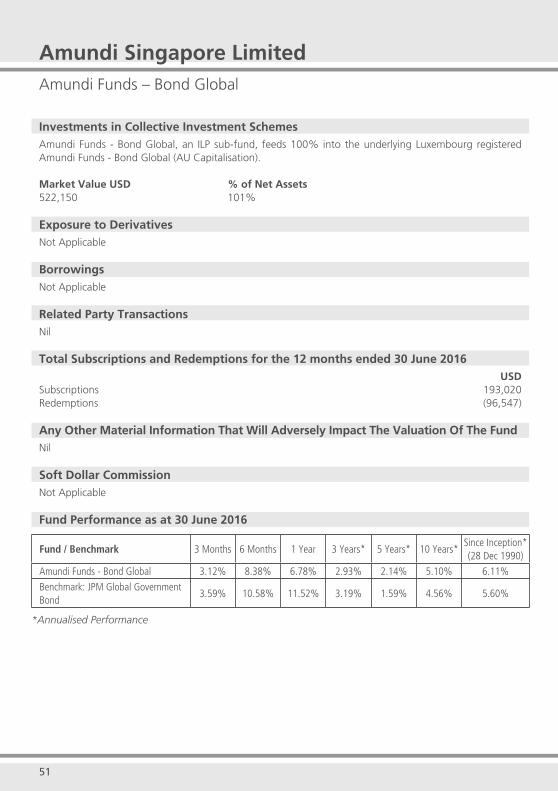
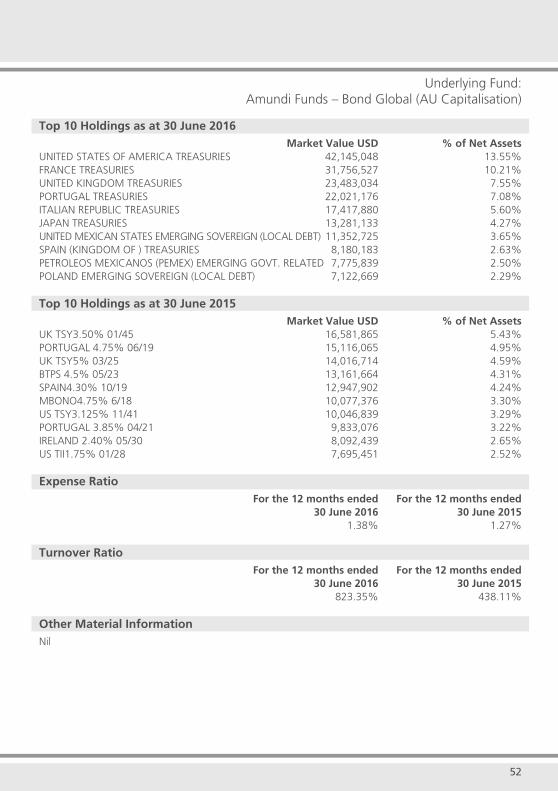
Amundi Singapore LimitedAmundi Funds – Bond Global
Investments in Collective Investment SchemesAmundi Funds - Bond Global, an ILP sub-fund, feeds 100% into the underlying Luxembourg registered Amundi Funds - Bond Global (AU Capitalisation). Market Value USD % of Net Assets522,150 101%
Exposure to DerivativesNot Applicable
BorrowingsNot Applicable
Related Party TransactionsNil
Total Subscriptions and Redemptions for the 12 months ended 30 June 2016USD
Subscriptions 193,020 Redemptions (96,547)
Any Other Material Information That Will Adversely Impact The Valuation Of The FundNil
Soft Dollar CommissionNot Applicable
Fund Performance as at 30 June 2016
Fund / Benchmark 3 Months 6 Months 1 Year 3 Years* 5 Years* 10 Years*Since Inception*(28 Dec 1990)
Amundi Funds - Bond Global 3.12% 8.38% 6.78% 2.93% 2.14% 5.10% 6.11%
Benchmark: JPM Global Government Bond
3.59% 10.58% 11.52% 3.19% 1.59% 4.56% 5.60%
*Annualised Performance
51 52
Underlying Fund:Amundi Funds – Bond Global (AU Capitalisation)
Top 10 Holdings as at 30 June 2016 Market Value USD % of Net AssetsUNITED STATES OF AMERICA TREASURIES 42,145,048 13.55%FRANCE TREASURIES 31,756,527 10.21%UNITED KINGDOM TREASURIES 23,483,034 7.55%PORTUGAL TREASURIES 22,021,176 7.08%ITALIAN REPUBLIC TREASURIES 17,417,880 5.60%JAPAN TREASURIES 13,281,133 4.27%UNITED MEXICAN STATES EMERGING SOVEREIGN (LOCAL DEBT) 11,352,725 3.65%SPAIN (KINGDOM OF ) TREASURIES 8,180,183 2.63%PETROLEOS MEXICANOS (PEMEX) EMERGING GOVT. RELATED 7,775,839 2.50%POLAND EMERGING SOVEREIGN (LOCAL DEBT) 7,122,669 2.29%
Top 10 Holdings as at 30 June 2015 Market Value USD % of Net AssetsUK TSY3.50% 01/45 16,581,865 5.43%PORTUGAL 4.75% 06/19 15,116,065 4.95%UK TSY5% 03/25 14,016,714 4.59%BTPS 4.5% 05/23 13,161,664 4.31%SPAIN4.30% 10/19 12,947,902 4.24%MBONO4.75% 6/18 10,077,376 3.30%US TSY3.125% 11/41 10,046,839 3.29%PORTUGAL 3.85% 04/21 9,833,076 3.22%IRELAND 2.40% 05/30 8,092,439 2.65%US TII1.75% 01/28 7,695,451 2.52%
Expense Ratio For the 12 months ended For the 12 months ended 30 June 2016 30 June 2015 1.38% 1.27%
Turnover Ratio For the 12 months ended For the 12 months ended 30 June 2016 30 June 2015 823.35% 438.11%
Other Material InformationNil
53 54
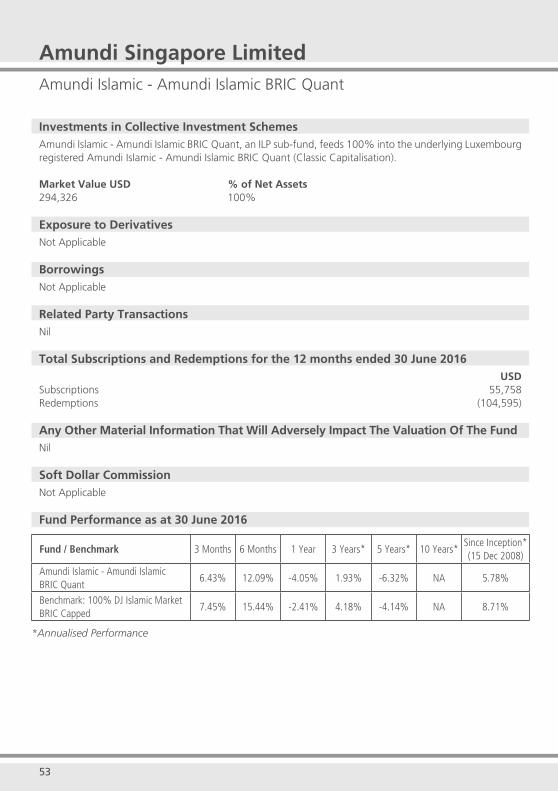
Amundi Singapore LimitedAmundi Islamic - Amundi Islamic BRIC Quant
Investments in Collective Investment SchemesAmundi Islamic - Amundi Islamic BRIC Quant, an ILP sub-fund, feeds 100% into the underlying Luxembourg registered Amundi Islamic - Amundi Islamic BRIC Quant (Classic Capitalisation). Market Value USD % of Net Assets294,326 100%
Exposure to DerivativesNot Applicable
BorrowingsNot Applicable
Related Party TransactionsNil
Total Subscriptions and Redemptions for the 12 months ended 30 June 2016USD
Subscriptions 55,758 Redemptions (104,595)
Any Other Material Information That Will Adversely Impact The Valuation Of The FundNil
Soft Dollar CommissionNot Applicable
Fund Performance as at 30 June 2016
Fund / Benchmark 3 Months 6 Months 1 Year 3 Years* 5 Years* 10 Years*Since Inception*(15 Dec 2008)
Amundi Islamic - Amundi Islamic BRIC Quant
6.43% 12.09% -4.05% 1.93% -6.32% NA 5.78%
Benchmark: 100% DJ Islamic Market BRIC Capped
7.45% 15.44% -2.41% 4.18% -4.14% NA 8.71%
*Annualised Performance
53 54
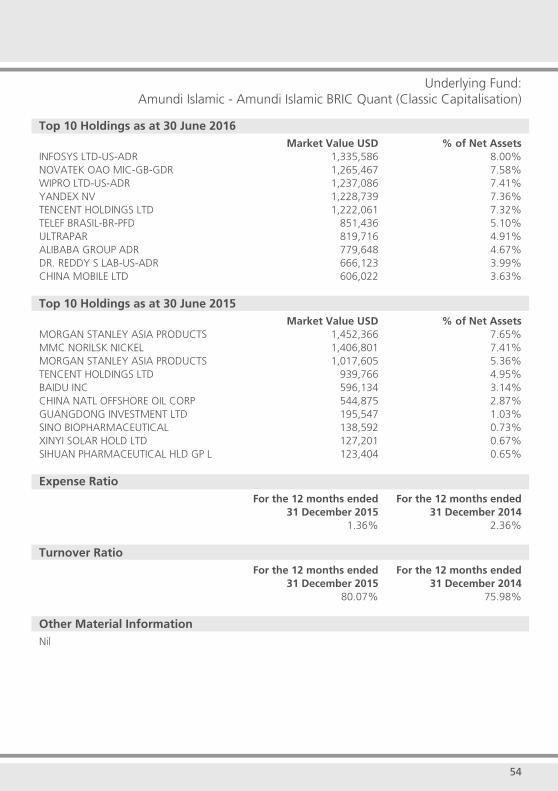
Underlying Fund:Amundi Islamic - Amundi Islamic BRIC Quant (Classic Capitalisation)
Top 10 Holdings as at 30 June 2016 Market Value USD % of Net AssetsINFOSYS LTD-US-ADR 1,335,586 8.00%NOVATEK OAO MIC-GB-GDR 1,265,467 7.58%WIPRO LTD-US-ADR 1,237,086 7.41%YANDEX NV 1,228,739 7.36% TENCENT HOLDINGS LTD 1,222,061 7.32%TELEF BRASIL-BR-PFD 851,436 5.10%ULTRAPAR 819,716 4.91%ALIBABA GROUP ADR 779,648 4.67%DR. REDDY S LAB-US-ADR 666,123 3.99%CHINA MOBILE LTD 606,022 3.63%
Top 10 Holdings as at 30 June 2015 Market Value USD % of Net AssetsMORGAN STANLEY ASIA PRODUCTS 1,452,366 7.65%MMC NORILSK NICKEL 1,406,801 7.41%MORGAN STANLEY ASIA PRODUCTS 1,017,605 5.36%TENCENT HOLDINGS LTD 939,766 4.95%BAIDU INC 596,134 3.14%CHINA NATL OFFSHORE OIL CORP 544,875 2.87%GUANGDONG INVESTMENT LTD 195,547 1.03%SINO BIOPHARMACEUTICAL 138,592 0.73%XINYI SOLAR HOLD LTD 127,201 0.67%SIHUAN PHARMACEUTICAL HLD GP L 123,404 0.65%
Expense Ratio For the 12 months ended For the 12 months ended 31 December 2015 31 December 2014 1.36% 2.36%
Turnover Ratio For the 12 months ended For the 12 months ended 31 December 2015 31 December 2014 80.07% 75.98%
Other Material InformationNil
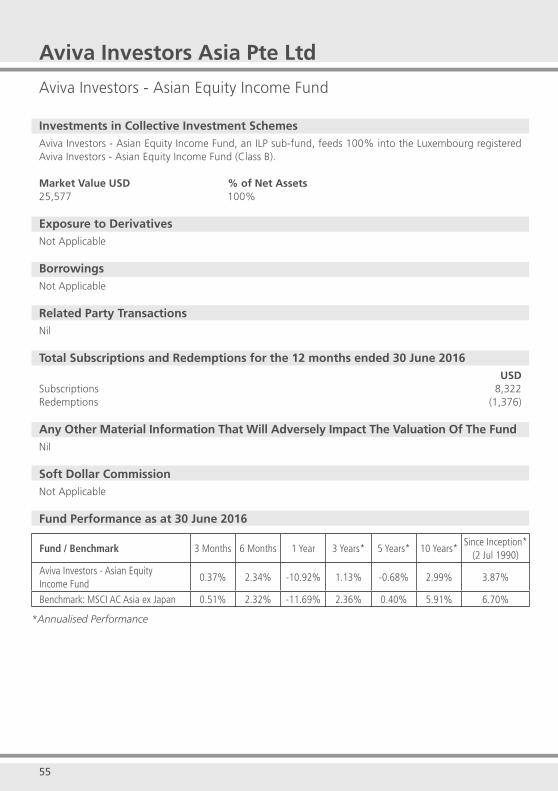
55
Aviva Investors Asia Pte Ltd
Aviva Investors - Asian Equity Income Fund
Investments in Collective Investment SchemesAviva Investors - Asian Equity Income Fund, an ILP sub-fund, feeds 100% into the Luxembourg registered Aviva Investors - Asian Equity Income Fund (Class B).
Market Value USD % of Net Assets25,577 100%
Exposure to DerivativesNot Applicable
BorrowingsNot Applicable
Related Party TransactionsNil
Total Subscriptions and Redemptions for the 12 months ended 30 June 2016USD
Subscriptions 8,322Redemptions (1,376)
Any Other Material Information That Will Adversely Impact The Valuation Of The FundNil
Soft Dollar CommissionNot Applicable
Fund Performance as at 30 June 2016
Fund / Benchmark 3 Months 6 Months 1 Year 3 Years* 5 Years* 10 Years*Since Inception*
(2 Jul 1990)
Aviva Investors - Asian Equity Income Fund
0.37% 2.34% -10.92% 1.13% -0.68% 2.99% 3.87%
Benchmark: MSCI AC Asia ex Japan 0.51% 2.32% -11.69% 2.36% 0.40% 5.91% 6.70%
*Annualised Performance
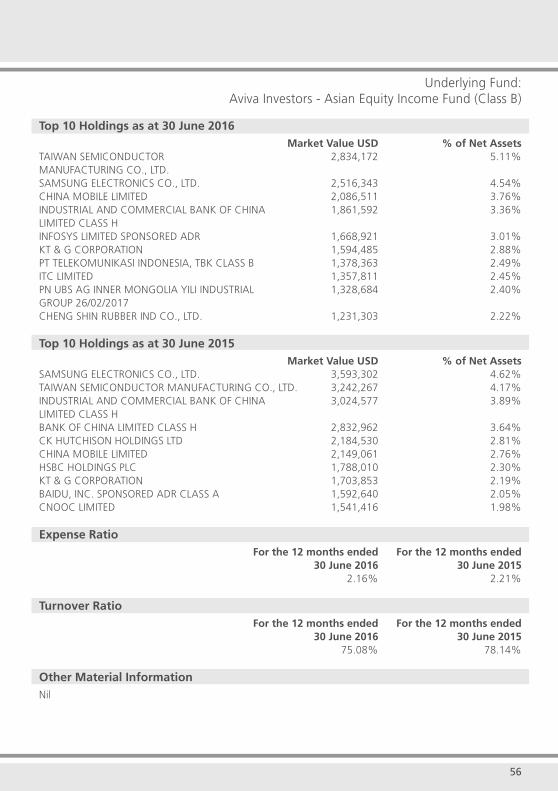
56
Underlying Fund:Aviva Investors - Asian Equity Income Fund (Class B)
Top 10 Holdings as at 30 June 2016 Market Value USD % of Net AssetsTAIWAN SEMICONDUCTOR 2,834,172 5.11% MANUFACTURING CO., LTD.SAMSUNG ELECTRONICS CO., LTD. 2,516,343 4.54%CHINA MOBILE LIMITED 2,086,511 3.76%INDUSTRIAL AND COMMERCIAL BANK OF CHINA 1,861,592 3.36%LIMITED CLASS H INFOSYS LIMITED SPONSORED ADR 1,668,921 3.01%KT & G CORPORATION 1,594,485 2.88%PT TELEKOMUNIKASI INDONESIA, TBK CLASS B 1,378,363 2.49%ITC LIMITED 1,357,811 2.45%PN UBS AG INNER MONGOLIA YILI INDUSTRIAL 1,328,684 2.40%GROUP 26/02/2017 CHENG SHIN RUBBER IND CO., LTD. 1,231,303 2.22%
Top 10 Holdings as at 30 June 2015 Market Value USD % of Net AssetsSAMSUNG ELECTRONICS CO., LTD. 3,593,302 4.62%TAIWAN SEMICONDUCTOR MANUFACTURING CO., LTD. 3,242,267 4.17%INDUSTRIAL AND COMMERCIAL BANK OF CHINA 3,024,577 3.89%LIMITED CLASS H BANK OF CHINA LIMITED CLASS H 2,832,962 3.64%CK HUTCHISON HOLDINGS LTD 2,184,530 2.81%CHINA MOBILE LIMITED 2,149,061 2.76%HSBC HOLDINGS PLC 1,788,010 2.30%KT & G CORPORATION 1,703,853 2.19%BAIDU, INC. SPONSORED ADR CLASS A 1,592,640 2.05%CNOOC LIMITED 1,541,416 1.98%
Expense Ratio For the 12 months ended For the 12 months ended 30 June 2016 30 June 2015 2.16% 2.21%
Turnover Ratio For the 12 months ended For the 12 months ended 30 June 2016 30 June 2015 75.08% 78.14%
Other Material InformationNil
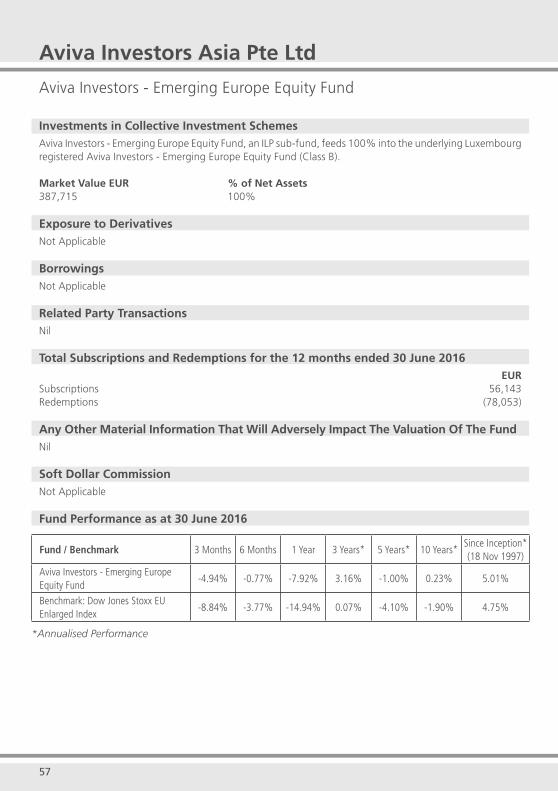
57
Aviva Investors Asia Pte Ltd
Aviva Investors - Emerging Europe Equity Fund
Investments in Collective Investment SchemesAviva Investors - Emerging Europe Equity Fund, an ILP sub-fund, feeds 100% into the underlying Luxembourg registered Aviva Investors - Emerging Europe Equity Fund (Class B).
Market Value EUR % of Net Assets387,715 100%
Exposure to DerivativesNot Applicable
BorrowingsNot Applicable
Related Party TransactionsNil
Total Subscriptions and Redemptions for the 12 months ended 30 June 2016EUR
Subscriptions 56,143 Redemptions (78,053)
Any Other Material Information That Will Adversely Impact The Valuation Of The FundNil
Soft Dollar CommissionNot Applicable
Fund Performance as at 30 June 2016
Fund / Benchmark 3 Months 6 Months 1 Year 3 Years* 5 Years* 10 Years*Since Inception*(18 Nov 1997)
Aviva Investors - Emerging Europe Equity Fund
-4.94% -0.77% -7.92% 3.16% -1.00% 0.23% 5.01%
Benchmark: Dow Jones Stoxx EU Enlarged Index
-8.84% -3.77% -14.94% 0.07% -4.10% -1.90% 4.75%
*Annualised Performance

58
Underlying Fund:Aviva Investors - Emerging Europe Equity Fund (Class B)
Top 10 Holdings as at 30 June 2016 Market Value EUR % of Net AssetsBANCA TRANSILVANIA SA 1,506,350 6.97%KRKA DD 1,432,539 6.63%OTP BANK NYRT 1,065,122 4.93%CCC SA 969,051 4.48%BUDIMEX SA 964,728 4.46%TALLINK GRUPP AS 921,643 4.26%KRUK S.A. 891,287 4.12%ASSECO POLAND S.A. 843,051 3.90%CHEMICAL WORKS OF GEDEON RICHTER PLC 817,664 3.78%TURK TRAKTOER VE ZIRAAT MAKINELERI A.S. 775,430 3.59%
Top 10 Holdings as at 30 June 2015 Market Value EUR % of Net AssetsBANCA TRANSILVANIA SA 2,988,489 6.01%KRKA DD 2,735,222 5.50%OTP BANK NYRT 2,385,140 4.80%KOMERCNI BANKA AS 2,284,700 4.60%TVN S.A. 2,222,930 4.47%POLSKI KONCERN NAFTOWY ORLEN S.A. 2,145,824 4.32%LPP S.A. 1,952,561 3.93%POLISH OIL & GAS CO. 1,899,333 3.82%ASSECO POLAND S.A. 1,861,554 3.75%STOMIL SANOK SA 1,714,730 3.45%
Expenses Ratio For the 12 months ended For the 12 months ended 30 June 2016 30 June 2015 2.30% 2.53%
Turnover Ratio For the 12 months ended For the 12 months ended 30 June 2016 30 June 2015 37.69% 27.54%
Other Material InformationNil

59
Aviva Investors Asia Pte Ltd
Aviva Investors - Emerging Markets Equity Income Fund
Investments in Collective Investment SchemesAviva Investors - Emerging Markets Equity Income Fund, an ILP sub-fund, feeds 100% into the underlying Luxembourg registered Aviva Investors - Emerging Markets Equity Income Fund (Class B).
Market Value USD % of Net Assets294,047 101%
Exposure to DerivativesNot Applicable
BorrowingsNot Applicable
Related Party TransactionsNil
Total Subscriptions and Redemptions for the 12 months ended 30 June 2016USD
Subscriptions 62,878 Redemptions (98,053)
Any Other Material Information That Will Adversely Impact The Valuation Of The FundNil
Soft Dollar CommissionNot Applicable
Fund Performance as at 30 June 2016
Fund / Benchmark 3 Months 6 Months 1 Year 3 Years* 5 Years* 10 Years*Since Inception*
(4 Nov 1993)
Aviva Investors - Emerging Markets Equity Income Fund
0.03% 6.46% -11.72% -3.90% -6.07% 0.25% 2.06%
Benchmark: MSCI Emerging Markets TR
0.80% 6.60% -11.71% -1.21% -3.44% 3.87% 5.40%
*Annualised Performance
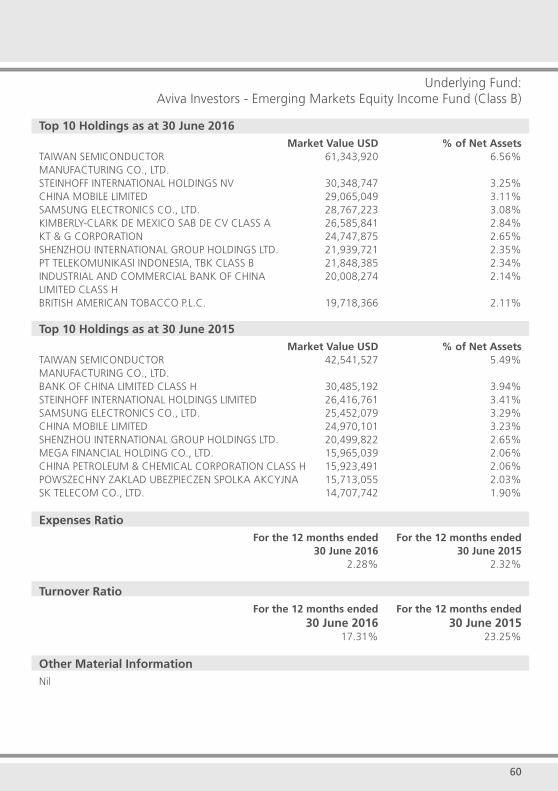
60
Underlying Fund:Aviva Investors - Emerging Markets Equity Income Fund (Class B)
Top 10 Holdings as at 30 June 2016 Market Value USD % of Net AssetsTAIWAN SEMICONDUCTOR 61,343,920 6.56%MANUFACTURING CO., LTD. STEINHOFF INTERNATIONAL HOLDINGS NV 30,348,747 3.25%CHINA MOBILE LIMITED 29,065,049 3.11%SAMSUNG ELECTRONICS CO., LTD. 28,767,223 3.08%KIMBERLY-CLARK DE MEXICO SAB DE CV CLASS A 26,585,841 2.84%KT & G CORPORATION 24,747,875 2.65%SHENZHOU INTERNATIONAL GROUP HOLDINGS LTD. 21,939,721 2.35%PT TELEKOMUNIKASI INDONESIA, TBK CLASS B 21,848,385 2.34%INDUSTRIAL AND COMMERCIAL BANK OF CHINA 20,008,274 2.14%LIMITED CLASS H BRITISH AMERICAN TOBACCO P.L.C. 19,718,366 2.11%
Top 10 Holdings as at 30 June 2015 Market Value USD % of Net AssetsTAIWAN SEMICONDUCTOR 42,541,527 5.49%MANUFACTURING CO., LTD. BANK OF CHINA LIMITED CLASS H 30,485,192 3.94%STEINHOFF INTERNATIONAL HOLDINGS LIMITED 26,416,761 3.41%SAMSUNG ELECTRONICS CO., LTD. 25,452,079 3.29%CHINA MOBILE LIMITED 24,970,101 3.23%SHENZHOU INTERNATIONAL GROUP HOLDINGS LTD. 20,499,822 2.65%MEGA FINANCIAL HOLDING CO., LTD. 15,965,039 2.06%CHINA PETROLEUM & CHEMICAL CORPORATION CLASS H 15,923,491 2.06%POWSZECHNY ZAKLAD UBEZPIECZEN SPOLKA AKCYJNA 15,713,055 2.03%SK TELECOM CO., LTD. 14,707,742 1.90%
Expenses Ratio For the 12 months ended For the 12 months ended 30 June 2016 30 June 2015 2.28% 2.32%
Turnover Ratio For the 12 months ended For the 12 months ended 30 June 2016 30 June 2015 17.31% 23.25%
Other Material InformationNil
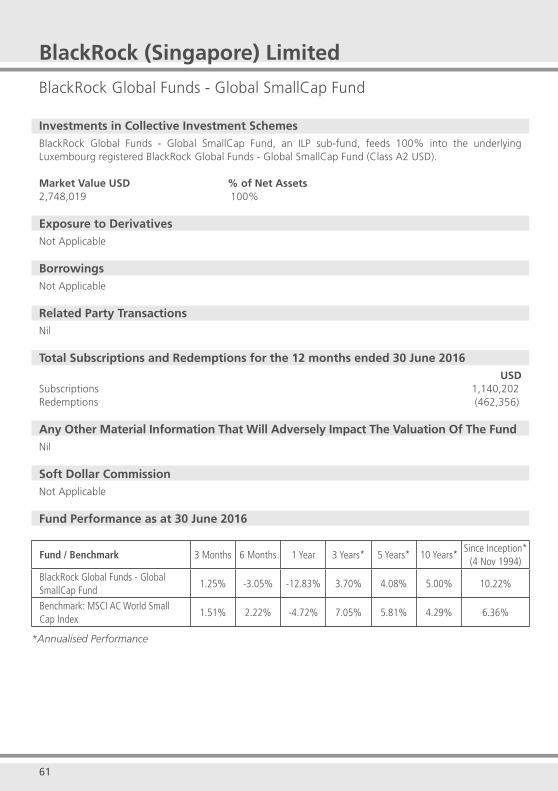
61
BlackRock (Singapore) Limited
BlackRock Global Funds - Global SmallCap Fund
Investments in Collective Investment SchemesBlackRock Global Funds - Global SmallCap Fund, an ILP sub-fund, feeds 100% into the underlying Luxembourg registered BlackRock Global Funds - Global SmallCap Fund (Class A2 USD).
Market Value USD % of Net Assets2,748,019 100%
Exposure to DerivativesNot Applicable
BorrowingsNot Applicable
Related Party TransactionsNil
Total Subscriptions and Redemptions for the 12 months ended 30 June 2016USD
Subscriptions 1,140,202 Redemptions (462,356)
Any Other Material Information That Will Adversely Impact The Valuation Of The FundNil
Soft Dollar CommissionNot Applicable
Fund Performance as at 30 June 2016
Fund / Benchmark 3 Months 6 Months 1 Year 3 Years* 5 Years* 10 Years*Since Inception*
(4 Nov 1994)
BlackRock Global Funds - Global SmallCap Fund
1.25% -3.05% -12.83% 3.70% 4.08% 5.00% 10.22%
Benchmark: MSCI AC World Small Cap Index
1.51% 2.22% -4.72% 7.05% 5.81% 4.29% 6.36%
*Annualised Performance
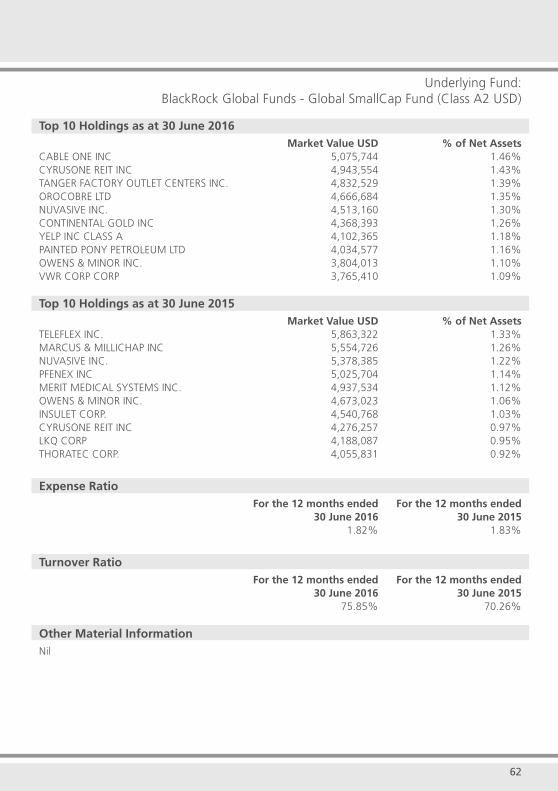
62
Underlying Fund:BlackRock Global Funds - Global SmallCap Fund (Class A2 USD)
Top 10 Holdings as at 30 June 2016 Market Value USD % of Net AssetsCABLE ONE INC 5,075,744 1.46%CYRUSONE REIT INC 4,943,554 1.43%TANGER FACTORY OUTLET CENTERS INC. 4,832,529 1.39%OROCOBRE LTD 4,666,684 1.35%NUVASIVE INC. 4,513,160 1.30%CONTINENTAL GOLD INC 4,368,393 1.26%YELP INC CLASS A 4,102,365 1.18%PAINTED PONY PETROLEUM LTD 4,034,577 1.16%OWENS & MINOR INC. 3,804,013 1.10%VWR CORP CORP 3,765,410 1.09%
Top 10 Holdings as at 30 June 2015 Market Value USD % of Net AssetsTELEFLEX INC. 5,863,322 1.33%MARCUS & MILLICHAP INC 5,554,726 1.26%NUVASIVE INC. 5,378,385 1.22%PFENEX INC 5,025,704 1.14%MERIT MEDICAL SYSTEMS INC. 4,937,534 1.12%OWENS & MINOR INC. 4,673,023 1.06%INSULET CORP. 4,540,768 1.03%CYRUSONE REIT INC 4,276,257 0.97%LKQ CORP 4,188,087 0.95%THORATEC CORP. 4,055,831 0.92%
Expense Ratio For the 12 months ended For the 12 months ended 30 June 2016 30 June 2015 1.82% 1.83%
Turnover Ratio For the 12 months ended For the 12 months ended 30 June 2016 30 June 2015 75.85% 70.26%
Other Material InformationNil
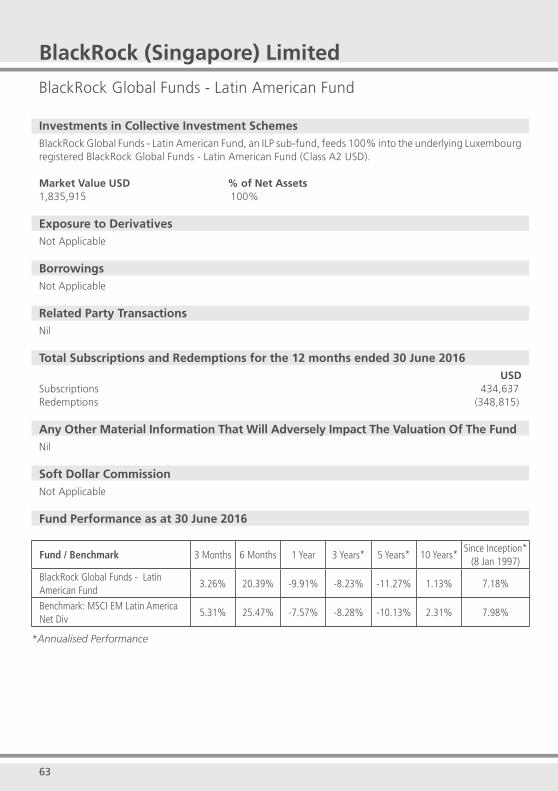
63
BlackRock (Singapore) Limited
BlackRock Global Funds - Latin American Fund
Investments in Collective Investment SchemesBlackRock Global Funds - Latin American Fund, an ILP sub-fund, feeds 100% into the underlying Luxembourg registered BlackRock Global Funds - Latin American Fund (Class A2 USD).
Market Value USD % of Net Assets1,835,915 100%
Exposure to DerivativesNot Applicable
BorrowingsNot Applicable
Related Party TransactionsNil
Total Subscriptions and Redemptions for the 12 months ended 30 June 2016USD
Subscriptions 434,637 Redemptions (348,815)
Any Other Material Information That Will Adversely Impact The Valuation Of The FundNil
Soft Dollar CommissionNot Applicable
Fund Performance as at 30 June 2016
Fund / Benchmark 3 Months 6 Months 1 Year 3 Years* 5 Years* 10 Years*Since Inception*
(8 Jan 1997)
BlackRock Global Funds - Latin American Fund
3.26% 20.39% -9.91% -8.23% -11.27% 1.13% 7.18%
Benchmark: MSCI EM Latin America Net Div
5.31% 25.47% -7.57% -8.28% -10.13% 2.31% 7.98%
*Annualised Performance

64
Underlying Fund:BlackRock Global Funds - Latin American Fund (Class A2 USD)
Top 10 Holdings as at 30 June 2016 Market Value USD % of Net AssetsITAU UNIBANCO HOLDING S/A ADS 110,920,000 8.60%AMBEV ADR REPRESENTING ONE SA 95,151,000 7.38%BANCO BRADESCO ADR REPTG PREF 87,799,646 6.81%FOMENTO ECONOMICO MEXICANO S.A.B. 69,367,500 5.38%GPO FINANCE BANORTE 54,457,281 4.22%CIELO S/A 54,218,275 4.20%PETROBRAS PETROLEO BRASILEIRO PREF 47,061,000 3.65%CREDICORP LTD 40,897,450 3.17%GRUPO MEXICO B 38,887,678 3.02%WALMART DE MEXICO V 37,790,316 2.93%
Top 10 Holdings as at 30 June 2015 Market Value USD % of Net AssetsITAU UNIBANCO HOLDING SA 111,977,795 7.05%BANCO BRADESCO S/A 94,188,414 5.93%AMBEV SA 90,852,906 5.72%CEMEX SAB DE CV 80,687,546 5.08%GRUPO TELEVISA SAB 78,622,707 4.95%FOMENTO ECONOMICO MEXICANO SAB DE CV 75,763,699 4.77%BB SEGURIDADE PARTICIPACOES SA 74,175,362 4.67%CREDICORP LTD 65,280,672 4.11%WAL MART DE MEXICO SAB DE CV 64,168,835 4.04%AMERICA MOVIL SAB DE CV 61,786,329 3.89%
Expense Ratio For the 12 months ended For the 12 months ended 30 June 2016 30 June 2015 2.09% 2.09%
Turnover Ratio For the 12 months ended For the 12 months ended 30 June 2016 30 June 2015 38.40% 39.73%
Other Material InformationNil
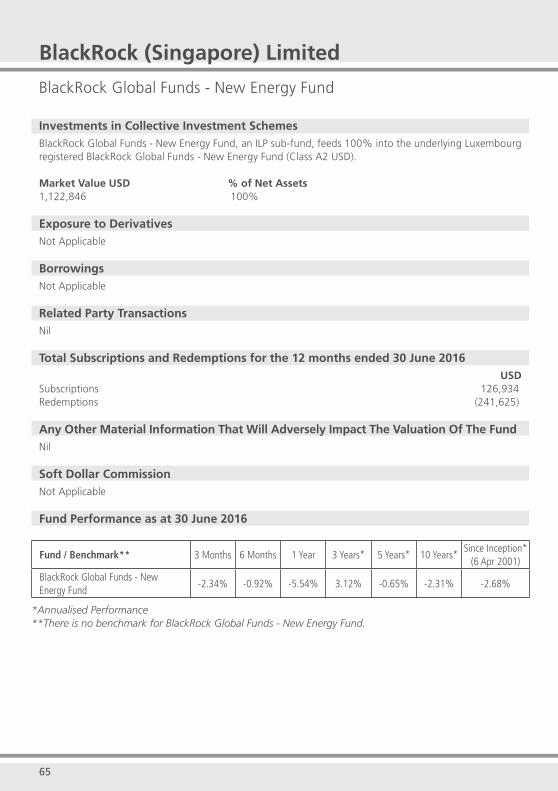
65
BlackRock (Singapore) Limited
BlackRock Global Funds - New Energy Fund
Investments in Collective Investment SchemesBlackRock Global Funds - New Energy Fund, an ILP sub-fund, feeds 100% into the underlying Luxembourg registered BlackRock Global Funds - New Energy Fund (Class A2 USD).
Market Value USD % of Net Assets1,122,846 100%
Exposure to DerivativesNot Applicable
BorrowingsNot Applicable
Related Party TransactionsNil
Total Subscriptions and Redemptions for the 12 months ended 30 June 2016USD
Subscriptions 126,934 Redemptions (241,625)
Any Other Material Information That Will Adversely Impact The Valuation Of The FundNil
Soft Dollar CommissionNot Applicable
Fund Performance as at 30 June 2016
Fund / Benchmark** 3 Months 6 Months 1 Year 3 Years* 5 Years* 10 Years*Since Inception*
(6 Apr 2001)
BlackRock Global Funds - New Energy Fund
-2.34% -0.92% -5.54% 3.12% -0.65% -2.31% -2.68%
*Annualised Performance**There is no benchmark for BlackRock Global Funds - New Energy Fund.
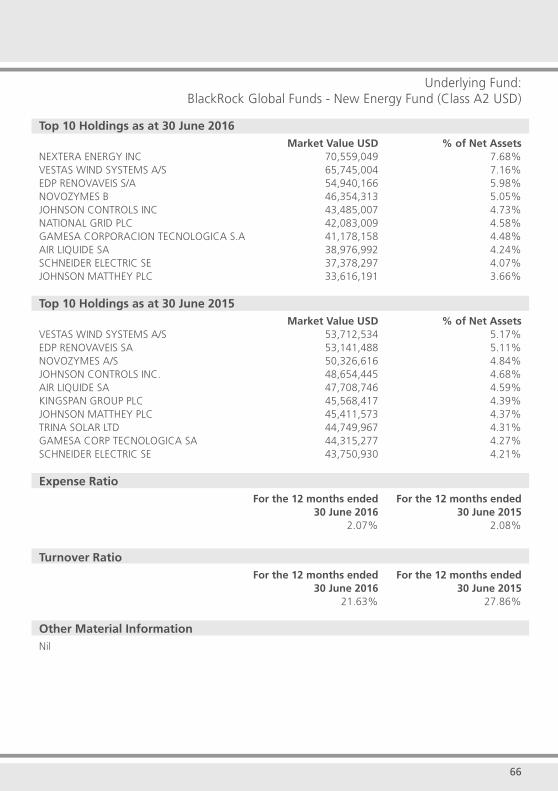
66
Underlying Fund:BlackRock Global Funds - New Energy Fund (Class A2 USD)
Top 10 Holdings as at 30 June 2016 Market Value USD % of Net AssetsNEXTERA ENERGY INC 70,559,049 7.68%VESTAS WIND SYSTEMS A/S 65,745,004 7.16%EDP RENOVAVEIS S/A 54,940,166 5.98%NOVOZYMES B 46,354,313 5.05%JOHNSON CONTROLS INC 43,485,007 4.73%NATIONAL GRID PLC 42,083,009 4.58%GAMESA CORPORACION TECNOLOGICA S.A 41,178,158 4.48%AIR LIQUIDE SA 38,976,992 4.24%SCHNEIDER ELECTRIC SE 37,378,297 4.07%JOHNSON MATTHEY PLC 33,616,191 3.66%
Top 10 Holdings as at 30 June 2015 Market Value USD % of Net AssetsVESTAS WIND SYSTEMS A/S 53,712,534 5.17%EDP RENOVAVEIS SA 53,141,488 5.11%NOVOZYMES A/S 50,326,616 4.84%JOHNSON CONTROLS INC. 48,654,445 4.68%AIR LIQUIDE SA 47,708,746 4.59%KINGSPAN GROUP PLC 45,568,417 4.39%JOHNSON MATTHEY PLC 45,411,573 4.37%TRINA SOLAR LTD 44,749,967 4.31%GAMESA CORP TECNOLOGICA SA 44,315,277 4.27%SCHNEIDER ELECTRIC SE 43,750,930 4.21%
Expense Ratio For the 12 months ended For the 12 months ended 30 June 2016 30 June 2015 2.07% 2.08%
Turnover Ratio For the 12 months ended For the 12 months ended 30 June 2016 30 June 2015 21.63% 27.86%
Other Material InformationNil

67
BlackRock (Singapore) Limited
BlackRock Global Funds - United Kingdom Fund
Investments in Collective Investment SchemesBlackRock Global Funds - United Kingdom Fund, an ILP sub-fund, feeds 100% into the underlying Luxembourg registered BlackRock Global Funds - United Kingdom Fund (Class A2 GBP).
Market Value GBP % of Net Assets166,767 100%
Exposure to DerivativesNot Applicable
BorrowingsNot Applicable
Related Party TransactionsNil
Total Subscriptions and Redemptions for the 12 months ended 30 June 2016GBP
Subscriptions 36,651 Redemptions (52,165)
Any Other Material Information That Will Adversely Impact The Valuation Of The Fund Nil
Soft Dollar CommissionNot Applicable
Fund Performance as at 30 June 2016
Fund / Benchmark 3 Months 6 Months 1 Year 3 Years* 5 Years* 10 Years*Since Inception*(31 Dec 1985)
BlackRock Global Funds - United Kingdom Fund
-0.07% -5.73% -0.28% 5.10% 4.85% 4.40% 8.51%
Benchmark: FTSE All-Share TR Index 4.70% 4.27% 2.21% 5.86% 6.27% 5.38% 9.47%
*Annualised Performance
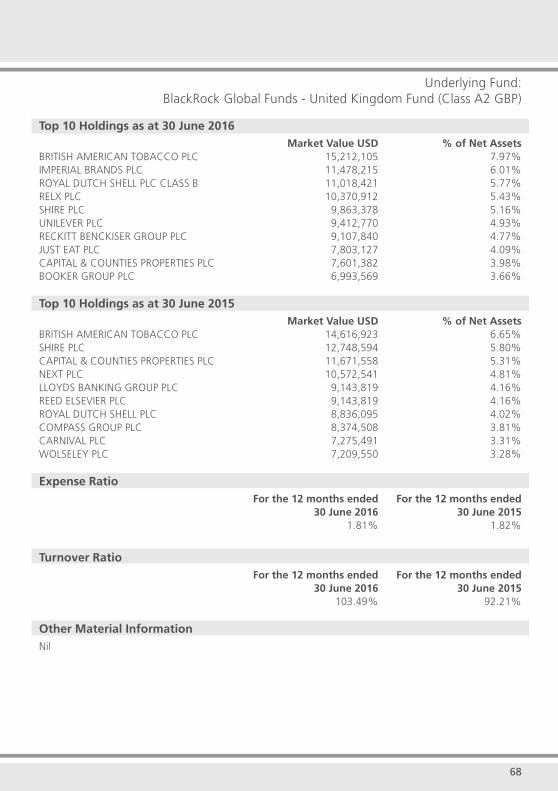
68
Underlying Fund:BlackRock Global Funds - United Kingdom Fund (Class A2 GBP)
Top 10 Holdings as at 30 June 2016 Market Value USD % of Net AssetsBRITISH AMERICAN TOBACCO PLC 15,212,105 7.97%IMPERIAL BRANDS PLC 11,478,215 6.01%ROYAL DUTCH SHELL PLC CLASS B 11,018,421 5.77%RELX PLC 10,370,912 5.43%SHIRE PLC 9,863,378 5.16%UNILEVER PLC 9,412,770 4.93%RECKITT BENCKISER GROUP PLC 9,107,840 4.77%JUST EAT PLC 7,803,127 4.09%CAPITAL & COUNTIES PROPERTIES PLC 7,601,382 3.98%BOOKER GROUP PLC 6,993,569 3.66%
Top 10 Holdings as at 30 June 2015 Market Value USD % of Net AssetsBRITISH AMERICAN TOBACCO PLC 14,616,923 6.65%SHIRE PLC 12,748,594 5.80%CAPITAL & COUNTIES PROPERTIES PLC 11,671,558 5.31%NEXT PLC 10,572,541 4.81%LLOYDS BANKING GROUP PLC 9,143,819 4.16%REED ELSEVIER PLC 9,143,819 4.16%ROYAL DUTCH SHELL PLC 8,836,095 4.02%COMPASS GROUP PLC 8,374,508 3.81%CARNIVAL PLC 7,275,491 3.31%WOLSELEY PLC 7,209,550 3.28%
Expense Ratio For the 12 months ended For the 12 months ended 30 June 2016 30 June 2015 1.81% 1.82%
Turnover Ratio For the 12 months ended For the 12 months ended 30 June 2016 30 June 2015 103.49% 92.21%
Other Material InformationNil
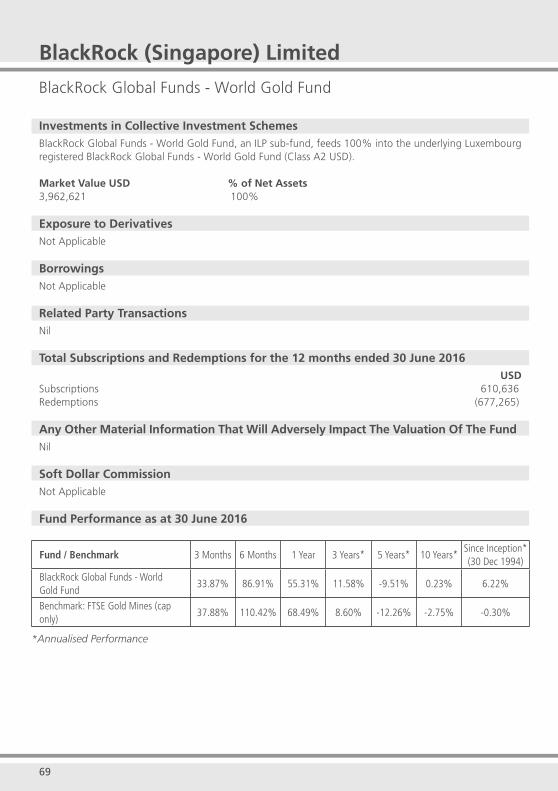
69
BlackRock (Singapore) Limited
BlackRock Global Funds - World Gold Fund
Investments in Collective Investment SchemesBlackRock Global Funds - World Gold Fund, an ILP sub-fund, feeds 100% into the underlying Luxembourg registered BlackRock Global Funds - World Gold Fund (Class A2 USD).
Market Value USD % of Net Assets3,962,621 100%
Exposure to DerivativesNot Applicable
BorrowingsNot Applicable
Related Party TransactionsNil
Total Subscriptions and Redemptions for the 12 months ended 30 June 2016USD
Subscriptions 610,636 Redemptions (677,265)
Any Other Material Information That Will Adversely Impact The Valuation Of The FundNil
Soft Dollar CommissionNot Applicable
Fund Performance as at 30 June 2016
Fund / Benchmark 3 Months 6 Months 1 Year 3 Years* 5 Years* 10 Years*Since Inception*(30 Dec 1994)
BlackRock Global Funds - World Gold Fund
33.87% 86.91% 55.31% 11.58% -9.51% 0.23% 6.22%
Benchmark: FTSE Gold Mines (cap only)
37.88% 110.42% 68.49% 8.60% -12.26% -2.75% -0.30%
*Annualised Performance
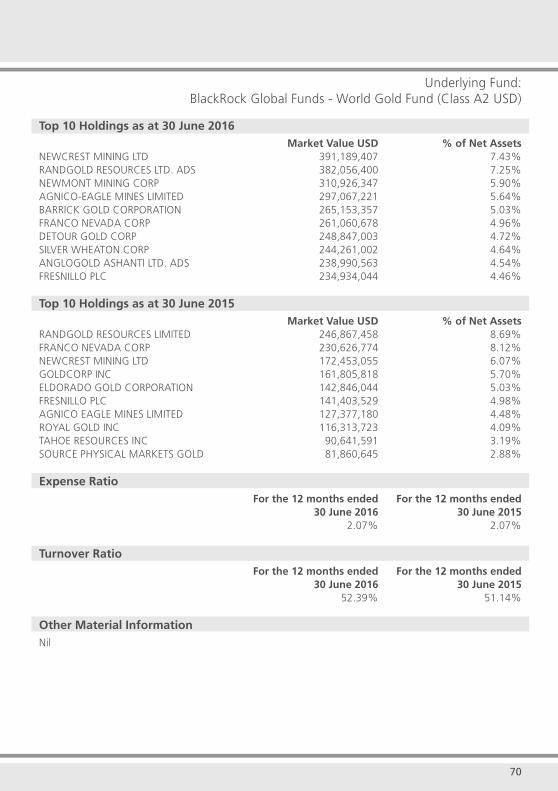
70
Underlying Fund:BlackRock Global Funds - World Gold Fund (Class A2 USD)
Top 10 Holdings as at 30 June 2016 Market Value USD % of Net AssetsNEWCREST MINING LTD 391,189,407 7.43%RANDGOLD RESOURCES LTD. ADS 382,056,400 7.25%NEWMONT MINING CORP 310,926,347 5.90%AGNICO-EAGLE MINES LIMITED 297,067,221 5.64%BARRICK GOLD CORPORATION 265,153,357 5.03%FRANCO NEVADA CORP 261,060,678 4.96%DETOUR GOLD CORP 248,847,003 4.72%SILVER WHEATON CORP 244,261,002 4.64%ANGLOGOLD ASHANTI LTD. ADS 238,990,563 4.54%FRESNILLO PLC 234,934,044 4.46%
Top 10 Holdings as at 30 June 2015 Market Value USD % of Net AssetsRANDGOLD RESOURCES LIMITED 246,867,458 8.69%FRANCO NEVADA CORP 230,626,774 8.12%NEWCREST MINING LTD 172,453,055 6.07%GOLDCORP INC 161,805,818 5.70%ELDORADO GOLD CORPORATION 142,846,044 5.03%FRESNILLO PLC 141,403,529 4.98%AGNICO EAGLE MINES LIMITED 127,377,180 4.48%ROYAL GOLD INC 116,313,723 4.09%TAHOE RESOURCES INC 90,641,591 3.19%SOURCE PHYSICAL MARKETS GOLD 81,860,645 2.88%
Expense Ratio For the 12 months ended For the 12 months ended 30 June 2016 30 June 2015 2.07% 2.07%
Turnover Ratio For the 12 months ended For the 12 months ended 30 June 2016 30 June 2015 52.39% 51.14%
Other Material InformationNil

71
BlackRock (Singapore) Limited
BlackRock Global Funds - World Mining Fund
Investments in Collective Investment SchemesBlackRock Global Funds - World Mining Fund, an ILP sub-fund, feeds 100% into the underlying Luxembourg registered BlackRock Global Funds - World Mining Fund (Class A2 USD).
Market Value USD % of Net Assets2,543,358 100%
Exposure to DerivativesNot Applicable
BorrowingsNot Applicable
Related Party TransactionsNil
Total Subscriptions and Redemptions for the 12 months ended 30 June 2016USD
Subscriptions 565,015 Redemptions (529,335)
Any Other Material Information That Will Adversely Impact The Valuation Of The FundNil
Soft Dollar CommissionNot Applicable
Fund Performance as at 30 June 2016
Fund / Benchmark 3 Months 6 Months 1 Year 3 Years* 5 Years* 10 Years*Since Inception*(24 Mar 1997)
BlackRock Global Funds - World Mining Fund
15.49% 40.51% -8.96% -9.54% -18.86% -5.41% 5.67%
Benchmark: Euromoney Global Mining Constrained Weights Net Total Return Index
19.37% 51.73% -1.65% -5.49% -15.69% -2.19% 5.71%
*Annualised Performance
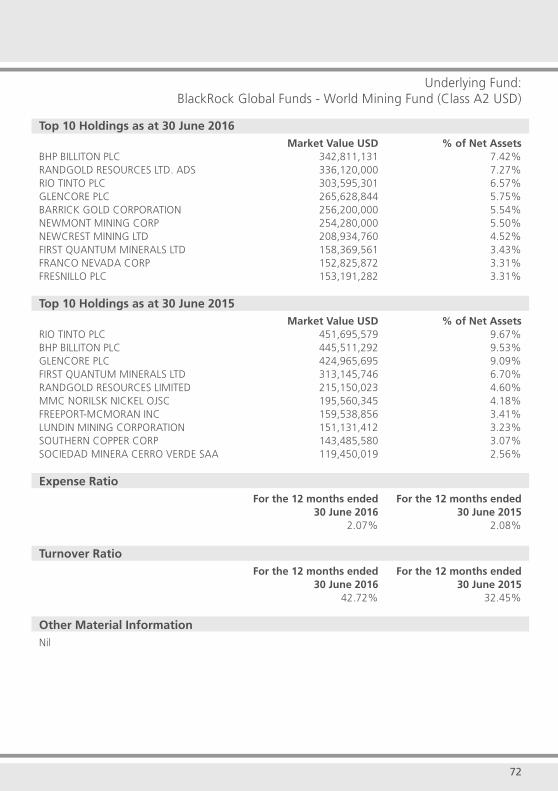
72
Underlying Fund:BlackRock Global Funds - World Mining Fund (Class A2 USD)
Top 10 Holdings as at 30 June 2016 Market Value USD % of Net AssetsBHP BILLITON PLC 342,811,131 7.42%RANDGOLD RESOURCES LTD. ADS 336,120,000 7.27%RIO TINTO PLC 303,595,301 6.57%GLENCORE PLC 265,628,844 5.75%BARRICK GOLD CORPORATION 256,200,000 5.54%NEWMONT MINING CORP 254,280,000 5.50%NEWCREST MINING LTD 208,934,760 4.52%FIRST QUANTUM MINERALS LTD 158,369,561 3.43%FRANCO NEVADA CORP 152,825,872 3.31%FRESNILLO PLC 153,191,282 3.31%
Top 10 Holdings as at 30 June 2015 Market Value USD % of Net AssetsRIO TINTO PLC 451,695,579 9.67%BHP BILLITON PLC 445,511,292 9.53%GLENCORE PLC 424,965,695 9.09%FIRST QUANTUM MINERALS LTD 313,145,746 6.70%RANDGOLD RESOURCES LIMITED 215,150,023 4.60%MMC NORILSK NICKEL OJSC 195,560,345 4.18%FREEPORT-MCMORAN INC 159,538,856 3.41%LUNDIN MINING CORPORATION 151,131,412 3.23%SOUTHERN COPPER CORP 143,485,580 3.07%SOCIEDAD MINERA CERRO VERDE SAA 119,450,019 2.56%
Expense Ratio For the 12 months ended For the 12 months ended 30 June 2016 30 June 2015 2.07% 2.08%
Turnover Ratio For the 12 months ended For the 12 months ended 30 June 2016 30 June 2015 42.72% 32.45%
Other Material InformationNil

73
BNP Paribas Investment Partners Singapore LimitedParvest Bond Best Selection World Emerging
Investments in Collective Investment SchemesParvest Bond Best Selection World Emerging, an ILP sub-fund, feeds 100% into the Luxembourg registered Parvest Bond Best Selection World Emerging (Classic Capitalisation). Market Value USD % of Net Assets153,293 100%
Exposure to DerivativesNot Applicable
BorrowingsNot Applicable
Related Party TransactionsNil
Total Subscriptions and Redemptions for the 12 months ended 30 June 2016USD
Subscriptions 20,669 Redemptions (24,348)
Any Other Material Information That Will Adversely Impact The Valuation Of The FundNil
Soft Dollar CommissionNot Applicable
Fund Performance as at 30 June 2016
Fund / Benchmark 3 Months 6 Months 1 Year 3 Years* 5 Years* 10 Years*Since Inception*(27 May 1998)
Parvest Bond Best Selection World Emerging
5.47% 9.92% 0.58% -1.50% -0.63% 1.41% 9.68%
Benchmark: JPM EMBI Global Composite Gross Return Index
3.90% 12.24% 5.96% 4.82% 5.28% 7.41% 9.05%
*Annualised Performance
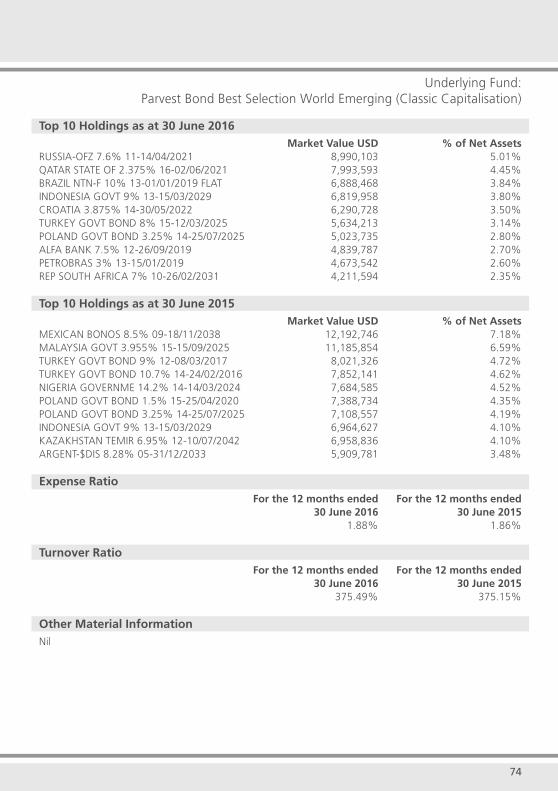
74
Underlying Fund:Parvest Bond Best Selection World Emerging (Classic Capitalisation)
Top 10 Holdings as at 30 June 2016 Market Value USD % of Net AssetsRUSSIA-OFZ 7.6% 11-14/04/2021 8,990,103 5.01%QATAR STATE OF 2.375% 16-02/06/2021 7,993,593 4.45%BRAZIL NTN-F 10% 13-01/01/2019 FLAT 6,888,468 3.84%INDONESIA GOVT 9% 13-15/03/2029 6,819,958 3.80%CROATIA 3.875% 14-30/05/2022 6,290,728 3.50%TURKEY GOVT BOND 8% 15-12/03/2025 5,634,213 3.14%POLAND GOVT BOND 3.25% 14-25/07/2025 5,023,735 2.80%ALFA BANK 7.5% 12-26/09/2019 4,839,787 2.70%PETROBRAS 3% 13-15/01/2019 4,673,542 2.60%REP SOUTH AFRICA 7% 10-26/02/2031 4,211,594 2.35%
Top 10 Holdings as at 30 June 2015 Market Value USD % of Net AssetsMEXICAN BONOS 8.5% 09-18/11/2038 12,192,746 7.18%MALAYSIA GOVT 3.955% 15-15/09/2025 11,185,854 6.59%TURKEY GOVT BOND 9% 12-08/03/2017 8,021,326 4.72%TURKEY GOVT BOND 10.7% 14-24/02/2016 7,852,141 4.62%NIGERIA GOVERNME 14.2% 14-14/03/2024 7,684,585 4.52%POLAND GOVT BOND 1.5% 15-25/04/2020 7,388,734 4.35%POLAND GOVT BOND 3.25% 14-25/07/2025 7,108,557 4.19%INDONESIA GOVT 9% 13-15/03/2029 6,964,627 4.10%KAZAKHSTAN TEMIR 6.95% 12-10/07/2042 6,958,836 4.10%ARGENT-$DIS 8.28% 05-31/12/2033 5,909,781 3.48%
Expense Ratio For the 12 months ended For the 12 months ended 30 June 2016 30 June 2015 1.88% 1.86%
Turnover Ratio For the 12 months ended For the 12 months ended 30 June 2016 30 June 2015 375.49% 375.15%
Other Material InformationNil
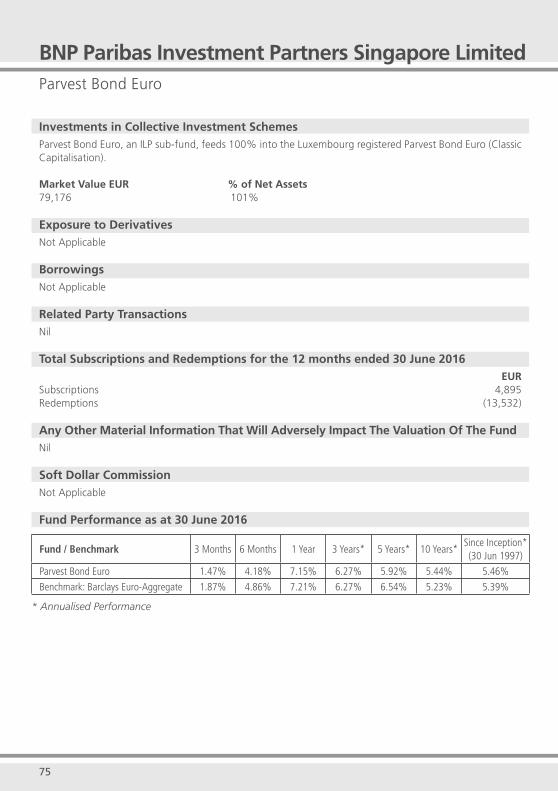
75
BNP Paribas Investment Partners Singapore LimitedParvest Bond Euro
Investments in Collective Investment SchemesParvest Bond Euro, an ILP sub-fund, feeds 100% into the Luxembourg registered Parvest Bond Euro (Classic Capitalisation). Market Value EUR % of Net Assets79,176 101%
Exposure to DerivativesNot Applicable
BorrowingsNot Applicable
Related Party TransactionsNil
Total Subscriptions and Redemptions for the 12 months ended 30 June 2016 EUR
Subscriptions 4,895Redemptions (13,532)
Any Other Material Information That Will Adversely Impact The Valuation Of The FundNil
Soft Dollar Commission Not Applicable
Fund Performance as at 30 June 2016
Fund / Benchmark 3 Months 6 Months 1 Year 3 Years* 5 Years* 10 Years*Since Inception*(30 Jun 1997)
Parvest Bond Euro 1.47% 4.18% 7.15% 6.27% 5.92% 5.44% 5.46%
Benchmark: Barclays Euro-Aggregate 1.87% 4.86% 7.21% 6.27% 6.54% 5.23% 5.39%
* Annualised Performance
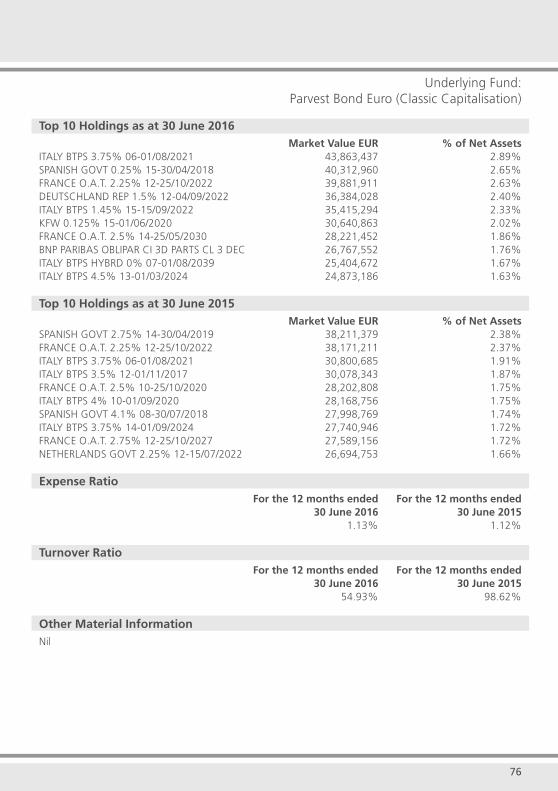
76
Underlying Fund:Parvest Bond Euro (Classic Capitalisation)
Top 10 Holdings as at 30 June 2016 Market Value EUR % of Net AssetsITALY BTPS 3.75% 06-01/08/2021 43,863,437 2.89%SPANISH GOVT 0.25% 15-30/04/2018 40,312,960 2.65%FRANCE O.A.T. 2.25% 12-25/10/2022 39,881,911 2.63%DEUTSCHLAND REP 1.5% 12-04/09/2022 36,384,028 2.40%ITALY BTPS 1.45% 15-15/09/2022 35,415,294 2.33%KFW 0.125% 15-01/06/2020 30,640,863 2.02%FRANCE O.A.T. 2.5% 14-25/05/2030 28,221,452 1.86%BNP PARIBAS OBLIPAR CI 3D PARTS CL 3 DEC 26,767,552 1.76%ITALY BTPS HYBRD 0% 07-01/08/2039 25,404,672 1.67%ITALY BTPS 4.5% 13-01/03/2024 24,873,186 1.63%
Top 10 Holdings as at 30 June 2015 Market Value EUR % of Net AssetsSPANISH GOVT 2.75% 14-30/04/2019 38,211,379 2.38%FRANCE O.A.T. 2.25% 12-25/10/2022 38,171,211 2.37%ITALY BTPS 3.75% 06-01/08/2021 30,800,685 1.91%ITALY BTPS 3.5% 12-01/11/2017 30,078,343 1.87%FRANCE O.A.T. 2.5% 10-25/10/2020 28,202,808 1.75%ITALY BTPS 4% 10-01/09/2020 28,168,756 1.75%SPANISH GOVT 4.1% 08-30/07/2018 27,998,769 1.74%ITALY BTPS 3.75% 14-01/09/2024 27,740,946 1.72%FRANCE O.A.T. 2.75% 12-25/10/2027 27,589,156 1.72%NETHERLANDS GOVT 2.25% 12-15/07/2022 26,694,753 1.66%
Expense Ratio For the 12 months ended For the 12 months ended 30 June 2016 30 June 2015 1.13% 1.12%
Turnover Ratio For the 12 months ended For the 12 months ended 30 June 2016 30 June 2015 54.93% 98.62%
Other Material InformationNil
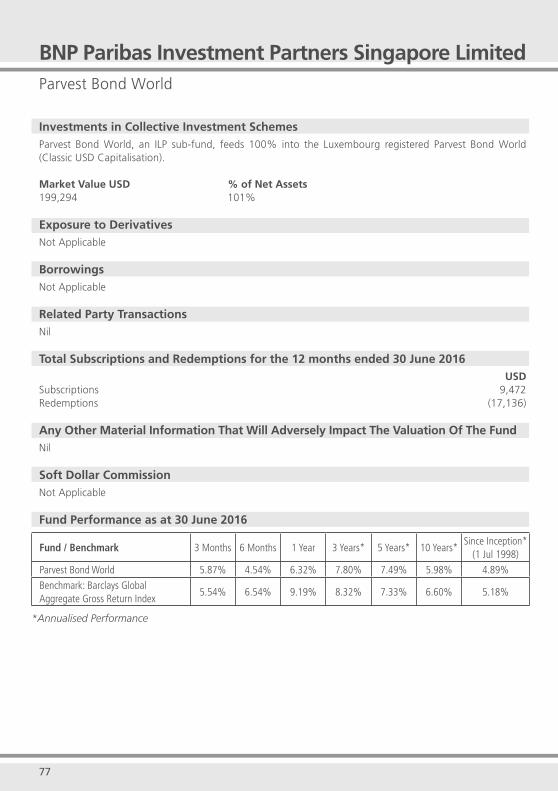
77
Parvest Bond World
Investments in Collective Investment SchemesParvest Bond World, an ILP sub-fund, feeds 100% into the Luxembourg registered Parvest Bond World (Classic USD Capitalisation). Market Value USD % of Net Assets199,294 101%
Exposure to DerivativesNot Applicable
BorrowingsNot Applicable
Related Party TransactionsNil
Total Subscriptions and Redemptions for the 12 months ended 30 June 2016USD
Subscriptions 9,472 Redemptions (17,136)
Any Other Material Information That Will Adversely Impact The Valuation Of The FundNil
Soft Dollar CommissionNot Applicable
Fund Performance as at 30 June 2016
Fund / Benchmark 3 Months 6 Months 1 Year 3 Years* 5 Years* 10 Years*Since Inception*
(1 Jul 1998)
Parvest Bond World 5.87% 4.54% 6.32% 7.80% 7.49% 5.98% 4.89%
Benchmark: Barclays Global Aggregate Gross Return Index
5.54% 6.54% 9.19% 8.32% 7.33% 6.60% 5.18%
*Annualised Performance
BNP Paribas Investment Partners Singapore Limited
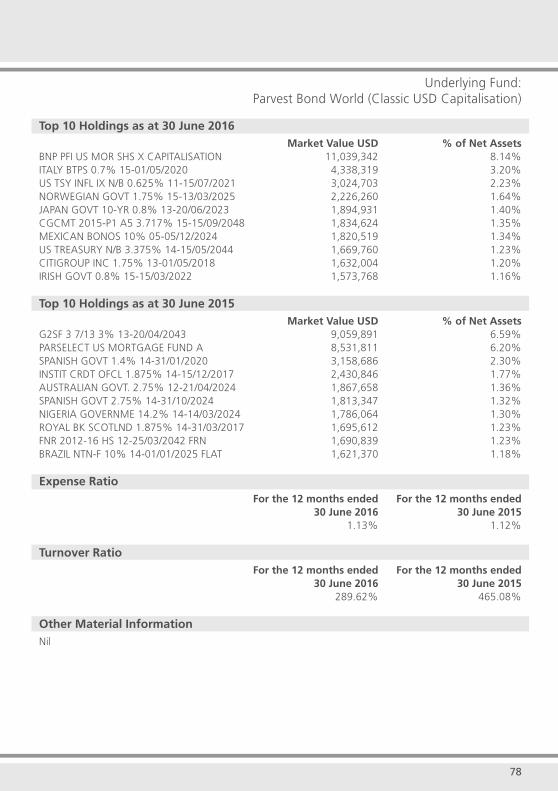
78
Underlying Fund:Parvest Bond World (Classic USD Capitalisation)
Top 10 Holdings as at 30 June 2016 Market Value USD % of Net AssetsBNP PFI US MOR SHS X CAPITALISATION 11,039,342 8.14%ITALY BTPS 0.7% 15-01/05/2020 4,338,319 3.20%US TSY INFL IX N/B 0.625% 11-15/07/2021 3,024,703 2.23%NORWEGIAN GOVT 1.75% 15-13/03/2025 2,226,260 1.64%JAPAN GOVT 10-YR 0.8% 13-20/06/2023 1,894,931 1.40%CGCMT 2015-P1 A5 3.717% 15-15/09/2048 1,834,624 1.35%MEXICAN BONOS 10% 05-05/12/2024 1,820,519 1.34%US TREASURY N/B 3.375% 14-15/05/2044 1,669,760 1.23%CITIGROUP INC 1.75% 13-01/05/2018 1,632,004 1.20%IRISH GOVT 0.8% 15-15/03/2022 1,573,768 1.16%
Top 10 Holdings as at 30 June 2015 Market Value USD % of Net AssetsG2SF 3 7/13 3% 13-20/04/2043 9,059,891 6.59%PARSELECT US MORTGAGE FUND A 8,531,811 6.20%SPANISH GOVT 1.4% 14-31/01/2020 3,158,686 2.30%INSTIT CRDT OFCL 1.875% 14-15/12/2017 2,430,846 1.77%AUSTRALIAN GOVT. 2.75% 12-21/04/2024 1,867,658 1.36%SPANISH GOVT 2.75% 14-31/10/2024 1,813,347 1.32%NIGERIA GOVERNME 14.2% 14-14/03/2024 1,786,064 1.30%ROYAL BK SCOTLND 1.875% 14-31/03/2017 1,695,612 1.23%FNR 2012-16 HS 12-25/03/2042 FRN 1,690,839 1.23%BRAZIL NTN-F 10% 14-01/01/2025 FLAT 1,621,370 1.18%
Expense Ratio For the 12 months ended For the 12 months ended 30 June 2016 30 June 2015 1.13% 1.12%
Turnover Ratio For the 12 months ended For the 12 months ended 30 June 2016 30 June 2015 289.62% 465.08%
Other Material InformationNil
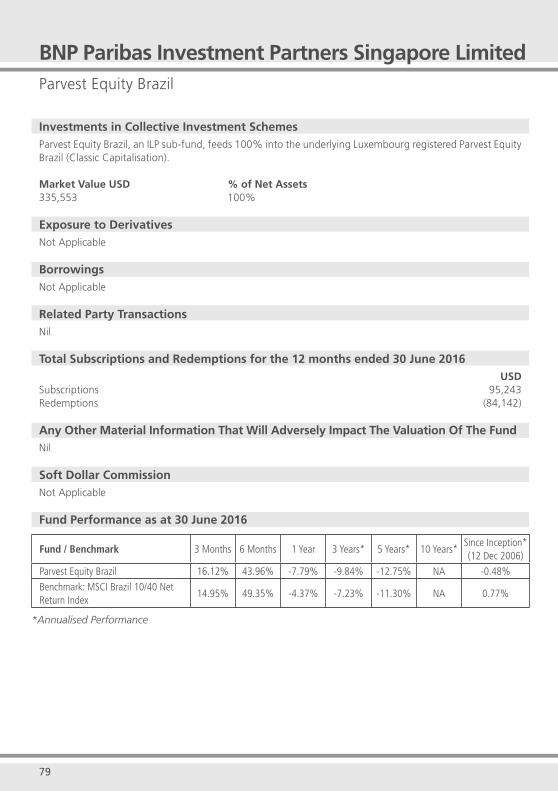
79
Parvest Equity Brazil
Investments in Collective Investment SchemesParvest Equity Brazil, an ILP sub-fund, feeds 100% into the underlying Luxembourg registered Parvest Equity Brazil (Classic Capitalisation). Market Value USD % of Net Assets335,553 100%
Exposure to DerivativesNot Applicable
BorrowingsNot Applicable
Related Party TransactionsNil
Total Subscriptions and Redemptions for the 12 months ended 30 June 2016USD
Subscriptions 95,243 Redemptions (84,142)
Any Other Material Information That Will Adversely Impact The Valuation Of The FundNil
Soft Dollar CommissionNot Applicable
Fund Performance as at 30 June 2016
Fund / Benchmark 3 Months 6 Months 1 Year 3 Years* 5 Years* 10 Years*Since Inception*(12 Dec 2006)
Parvest Equity Brazil 16.12% 43.96% -7.79% -9.84% -12.75% NA -0.48%
Benchmark: MSCI Brazil 10/40 Net Return Index
14.95% 49.35% -4.37% -7.23% -11.30% NA 0.77%
*Annualised Performance
BNP Paribas Investment Partners Singapore Limited
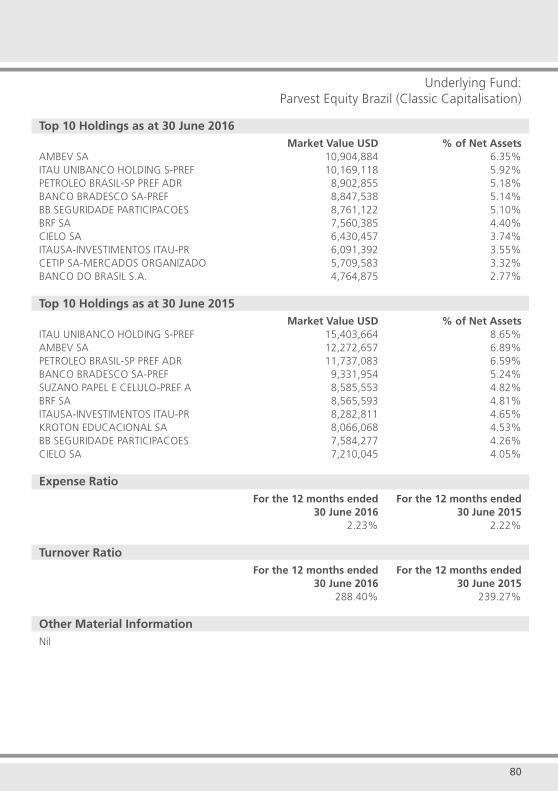
80
Underlying Fund:Parvest Equity Brazil (Classic Capitalisation)
Top 10 Holdings as at 30 June 2016 Market Value USD % of Net AssetsAMBEV SA 10,904,884 6.35%ITAU UNIBANCO HOLDING S-PREF 10,169,118 5.92%PETROLEO BRASIL-SP PREF ADR 8,902,855 5.18%BANCO BRADESCO SA-PREF 8,847,538 5.14%BB SEGURIDADE PARTICIPACOES 8,761,122 5.10%BRF SA 7,560,385 4.40%CIELO SA 6,430,457 3.74%ITAUSA-INVESTIMENTOS ITAU-PR 6,091,392 3.55%CETIP SA-MERCADOS ORGANIZADO 5,709,583 3.32%BANCO DO BRASIL S.A. 4,764,875 2.77%
Top 10 Holdings as at 30 June 2015 Market Value USD % of Net AssetsITAU UNIBANCO HOLDING S-PREF 15,403,664 8.65%AMBEV SA 12,272,657 6.89%PETROLEO BRASIL-SP PREF ADR 11,737,083 6.59%BANCO BRADESCO SA-PREF 9,331,954 5.24%SUZANO PAPEL E CELULO-PREF A 8,585,553 4.82%BRF SA 8,565,593 4.81%ITAUSA-INVESTIMENTOS ITAU-PR 8,282,811 4.65%KROTON EDUCACIONAL SA 8,066,068 4.53%BB SEGURIDADE PARTICIPACOES 7,584,277 4.26%CIELO SA 7,210,045 4.05%
Expense Ratio For the 12 months ended For the 12 months ended 30 June 2016 30 June 2015 2.23% 2.22%
Turnover Ratio For the 12 months ended For the 12 months ended 30 June 2016 30 June 2015 288.40% 239.27%
Other Material InformationNil
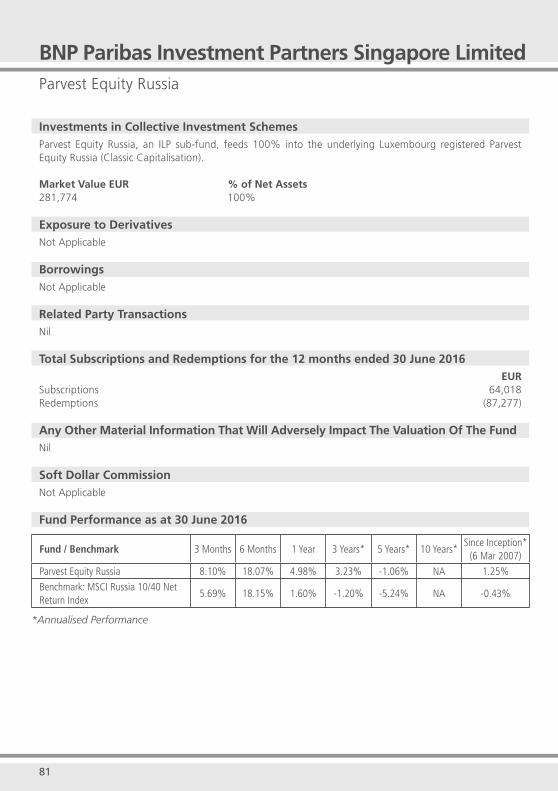
81
Parvest Equity Russia
Investments in Collective Investment SchemesParvest Equity Russia, an ILP sub-fund, feeds 100% into the underlying Luxembourg registered Parvest Equity Russia (Classic Capitalisation). Market Value EUR % of Net Assets281,774 100%
Exposure to DerivativesNot Applicable
BorrowingsNot Applicable
Related Party TransactionsNil
Total Subscriptions and Redemptions for the 12 months ended 30 June 2016EUR
Subscriptions 64,018 Redemptions (87,277)
Any Other Material Information That Will Adversely Impact The Valuation Of The FundNil
Soft Dollar CommissionNot Applicable
Fund Performance as at 30 June 2016
Fund / Benchmark 3 Months 6 Months 1 Year 3 Years* 5 Years* 10 Years*Since Inception*
(6 Mar 2007)
Parvest Equity Russia 8.10% 18.07% 4.98% 3.23% -1.06% NA 1.25%
Benchmark: MSCI Russia 10/40 Net Return Index
5.69% 18.15% 1.60% -1.20% -5.24% NA -0.43%
*Annualised Performance
BNP Paribas Investment Partners Singapore Limited
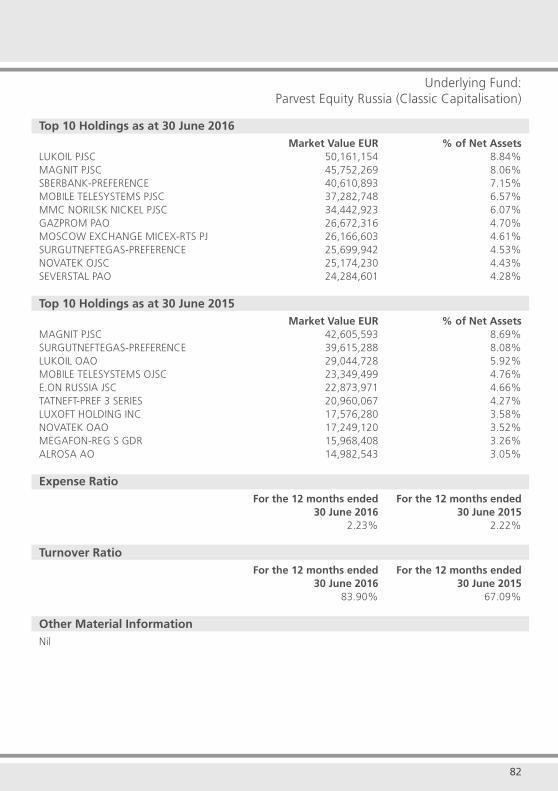
82
Underlying Fund:Parvest Equity Russia (Classic Capitalisation)
Top 10 Holdings as at 30 June 2016 Market Value EUR % of Net AssetsLUKOIL PJSC 50,161,154 8.84%MAGNIT PJSC 45,752,269 8.06%SBERBANK-PREFERENCE 40,610,893 7.15%MOBILE TELESYSTEMS PJSC 37,282,748 6.57%MMC NORILSK NICKEL PJSC 34,442,923 6.07%GAZPROM PAO 26,672,316 4.70%MOSCOW EXCHANGE MICEX-RTS PJ 26,166,603 4.61%SURGUTNEFTEGAS-PREFERENCE 25,699,942 4.53%NOVATEK OJSC 25,174,230 4.43%SEVERSTAL PAO 24,284,601 4.28%
Top 10 Holdings as at 30 June 2015 Market Value EUR % of Net AssetsMAGNIT PJSC 42,605,593 8.69%SURGUTNEFTEGAS-PREFERENCE 39,615,288 8.08%LUKOIL OAO 29,044,728 5.92%MOBILE TELESYSTEMS OJSC 23,349,499 4.76%E.ON RUSSIA JSC 22,873,971 4.66%TATNEFT-PREF 3 SERIES 20,960,067 4.27%LUXOFT HOLDING INC 17,576,280 3.58%NOVATEK OAO 17,249,120 3.52%MEGAFON-REG S GDR 15,968,408 3.26%ALROSA AO 14,982,543 3.05%
Expense Ratio For the 12 months ended For the 12 months ended 30 June 2016 30 June 2015 2.23% 2.22%
Turnover Ratio For the 12 months ended For the 12 months ended 30 June 2016 30 June 2015 83.90% 67.09%
Other Material InformationNil

83
Parvest Equity World Materials
Investments in Collective Investment SchemesParvest Equity World Materials, an ILP sub-fund, feeds 100% into the Luxembourg registered Parvest Equity World Materials (Classic Capitalisation). Market Value EUR % of Net Assets52,842 101%
Exposure to DerivativesNot Applicable
BorrowingsNot Applicable
Related Party TransactionsNil
Total Subscriptions and Redemptions for the 12 months ended 30 June 2016 EUR
Subscriptions 10,493 Redemptions (13,272)
Any Other Material Information That Will Adversely Impact The Valuation Of The Fund Nil
Soft Dollar CommissionNot Applicable
Fund Performance as at 30 June 2016
Fund / Benchmark 3 Months 6 Months 1 Year 3 Years* 5 Years* 10 Years*Since Inception*
(22 Jul 2004)
Parvest Equity World Materials 7.38% 3.38% -6.67% 7.47% 2.01% 3.27% 6.80%
Benchmark: MSCI World Materials Net Return Index
6.61% 6.15% -8.69% 6.19% 0.73% 3.23% 6.63%
*Annualised Performance
BNP Paribas Investment Partners Singapore Limited
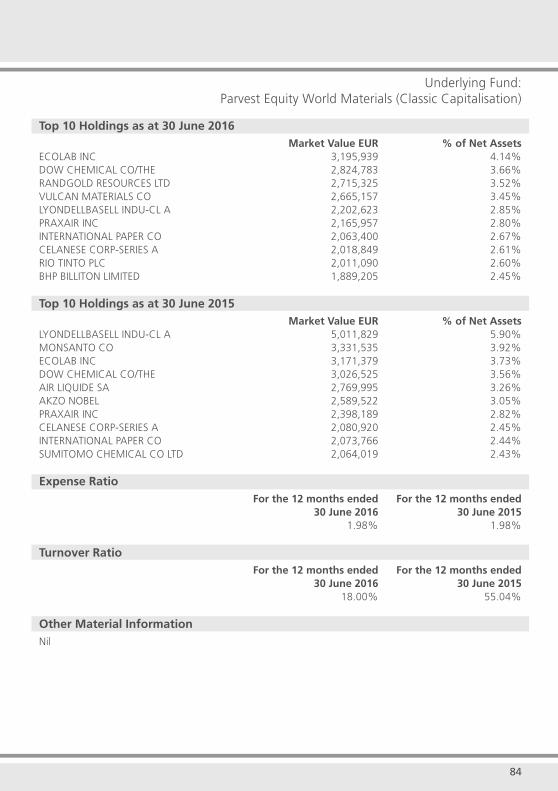
84
Underlying Fund:Parvest Equity World Materials (Classic Capitalisation)
Top 10 Holdings as at 30 June 2016 Market Value EUR % of Net AssetsECOLAB INC 3,195,939 4.14%DOW CHEMICAL CO/THE 2,824,783 3.66%RANDGOLD RESOURCES LTD 2,715,325 3.52%VULCAN MATERIALS CO 2,665,157 3.45%LYONDELLBASELL INDU-CL A 2,202,623 2.85%PRAXAIR INC 2,165,957 2.80%INTERNATIONAL PAPER CO 2,063,400 2.67%CELANESE CORP-SERIES A 2,018,849 2.61%RIO TINTO PLC 2,011,090 2.60%BHP BILLITON LIMITED 1,889,205 2.45%
Top 10 Holdings as at 30 June 2015 Market Value EUR % of Net AssetsLYONDELLBASELL INDU-CL A 5,011,829 5.90%MONSANTO CO 3,331,535 3.92%ECOLAB INC 3,171,379 3.73%DOW CHEMICAL CO/THE 3,026,525 3.56%AIR LIQUIDE SA 2,769,995 3.26%AKZO NOBEL 2,589,522 3.05%PRAXAIR INC 2,398,189 2.82%CELANESE CORP-SERIES A 2,080,920 2.45%INTERNATIONAL PAPER CO 2,073,766 2.44%SUMITOMO CHEMICAL CO LTD 2,064,019 2.43%
Expense Ratio For the 12 months ended For the 12 months ended 30 June 2016 30 June 2015 1.98% 1.98%
Turnover Ratio For the 12 months ended For the 12 months ended 30 June 2016 30 June 2015 18.00% 55.04%
Other Material InformationNil
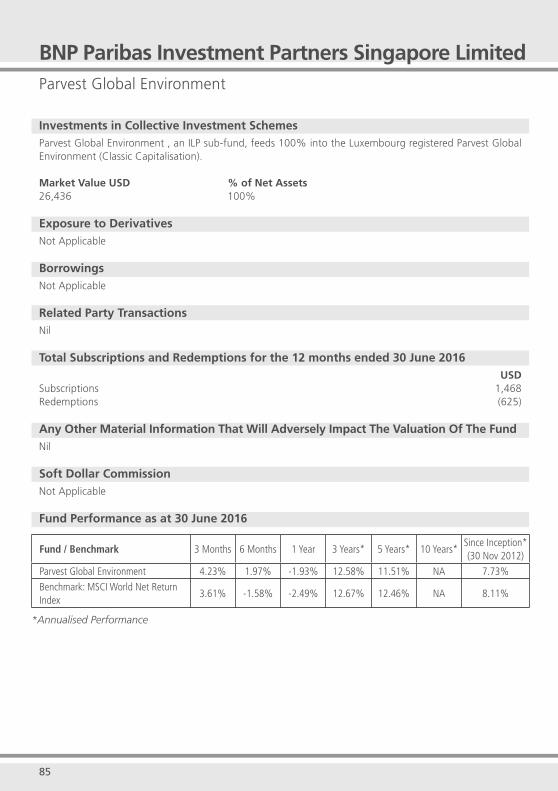
85
Parvest Global Environment
Investments in Collective Investment SchemesParvest Global Environment , an ILP sub-fund, feeds 100% into the Luxembourg registered Parvest Global Environment (Classic Capitalisation). Market Value USD % of Net Assets26,436 100%
Exposure to DerivativesNot Applicable
BorrowingsNot Applicable
Related Party TransactionsNil
Total Subscriptions and Redemptions for the 12 months ended 30 June 2016 USD
Subscriptions 1,468 Redemptions (625)
Any Other Material Information That Will Adversely Impact The Valuation Of The FundNil
Soft Dollar CommissionNot Applicable
Fund Performance as at 30 June 2016
Fund / Benchmark 3 Months 6 Months 1 Year 3 Years* 5 Years* 10 Years*Since Inception*(30 Nov 2012)
Parvest Global Environment 4.23% 1.97% -1.93% 12.58% 11.51% NA 7.73%
Benchmark: MSCI World Net Return Index
3.61% -1.58% -2.49% 12.67% 12.46% NA 8.11%
*Annualised Performance
BNP Paribas Investment Partners Singapore Limited
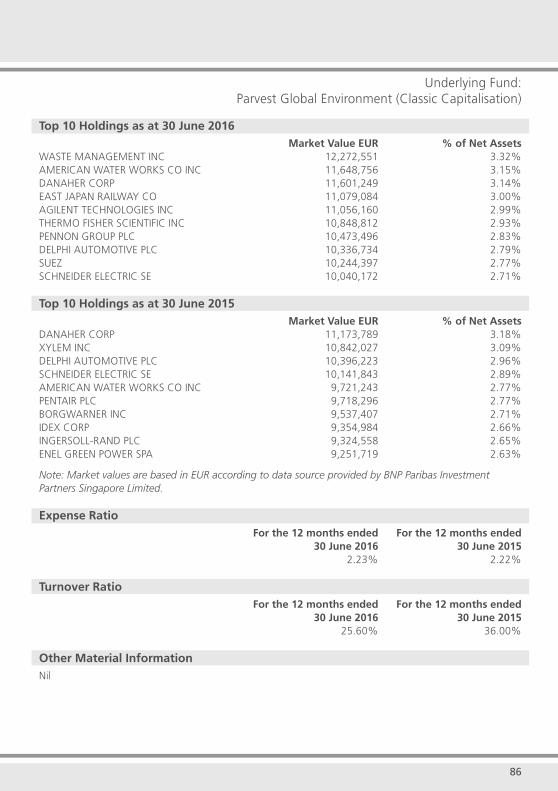
86
Underlying Fund:Parvest Global Environment (Classic Capitalisation)
Top 10 Holdings as at 30 June 2016 Market Value EUR % of Net AssetsWASTE MANAGEMENT INC 12,272,551 3.32%AMERICAN WATER WORKS CO INC 11,648,756 3.15%DANAHER CORP 11,601,249 3.14%EAST JAPAN RAILWAY CO 11,079,084 3.00%AGILENT TECHNOLOGIES INC 11,056,160 2.99%THERMO FISHER SCIENTIFIC INC 10,848,812 2.93%PENNON GROUP PLC 10,473,496 2.83%DELPHI AUTOMOTIVE PLC 10,336,734 2.79%SUEZ 10,244,397 2.77%SCHNEIDER ELECTRIC SE 10,040,172 2.71%
Top 10 Holdings as at 30 June 2015 Market Value EUR % of Net AssetsDANAHER CORP 11,173,789 3.18%XYLEM INC 10,842,027 3.09%DELPHI AUTOMOTIVE PLC 10,396,223 2.96%SCHNEIDER ELECTRIC SE 10,141,843 2.89%AMERICAN WATER WORKS CO INC 9,721,243 2.77%PENTAIR PLC 9,718,296 2.77%BORGWARNER INC 9,537,407 2.71%IDEX CORP 9,354,984 2.66%INGERSOLL-RAND PLC 9,324,558 2.65%ENEL GREEN POWER SPA 9,251,719 2.63%
Note: Market values are based in EUR according to data source provided by BNP Paribas Investment Partners Singapore Limited.
Expense Ratio For the 12 months ended For the 12 months ended 30 June 2016 30 June 2015 2.23% 2.22%
Turnover Ratio For the 12 months ended For the 12 months ended 30 June 2016 30 June 2015 25.60% 36.00%
Other Material InformationNil

87
Parvest Money Market Euro
Investments in Collective Investment SchemesParvest Money Market Euro, an ILP sub-fund, feeds 100% into the Luxembourg registered Parvest Money Market Euro (Classic Capitalisation). Market Value EUR % of Net Assets233,034 101%
Exposure to DerivativesNot Applicable
BorrowingsNot Applicable
Related Party TransactionsNil
Total Subscriptions and Redemptions for the 12 months ended 30 June 2016EUR
Subscriptions 76,554 Redemptions (8,402)
Any Other Material Information That Will Adversely Impact The Valuation Of The FundNil
Soft Dollar CommissionNot Applicable
Fund Performance as at 30 June 2016
Fund / Benchmark 3 Months 6 Months 1 Year 3 Years* 5 Years* 10 Years*Since Inception*
(7 Feb 1991)
Parvest Money Market Euro 0.06% 0.07% 0.10% 0.31% 0.54% 1.57% 3.67%
Benchmark: EONIA Euro Overnight Index Average
-0.34% -0.30% -0.22% -0.03% 0.12% 1.17% 3.64%
*Annualised Performance
BNP Paribas Investment Partners Singapore Limited
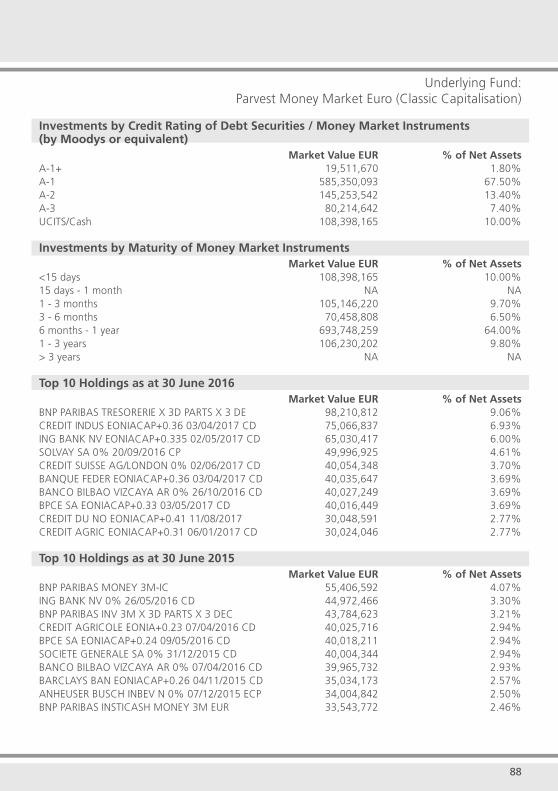
88
Underlying Fund:Parvest Money Market Euro (Classic Capitalisation)
Investments by Credit Rating of Debt Securities / Money Market Instruments (by Moodys or equivalent) Market Value EUR % of Net AssetsA-1+ 19,511,670 1.80%A-1 585,350,093 67.50%A-2 145,253,542 13.40%A-3 80,214,642 7.40%UCITS/Cash 108,398,165 10.00%
Investments by Maturity of Money Market Instruments Market Value EUR % of Net Assets<15 days 108,398,165 10.00%15 days - 1 month NA NA1 - 3 months 105,146,220 9.70%3 - 6 months 70,458,808 6.50%6 months - 1 year 693,748,259 64.00%1 - 3 years 106,230,202 9.80%> 3 years NA NA
Top 10 Holdings as at 30 June 2016 Market Value EUR % of Net AssetsBNP PARIBAS TRESORERIE X 3D PARTS X 3 DE 98,210,812 9.06%CREDIT INDUS EONIACAP+0.36 03/04/2017 CD 75,066,837 6.93%ING BANK NV EONIACAP+0.335 02/05/2017 CD 65,030,417 6.00%SOLVAY SA 0% 20/09/2016 CP 49,996,925 4.61%CREDIT SUISSE AG/LONDON 0% 02/06/2017 CD 40,054,348 3.70%BANQUE FEDER EONIACAP+0.36 03/04/2017 CD 40,035,647 3.69%BANCO BILBAO VIZCAYA AR 0% 26/10/2016 CD 40,027,249 3.69%BPCE SA EONIACAP+0.33 03/05/2017 CD 40,016,449 3.69%CREDIT DU NO EONIACAP+0.41 11/08/2017 30,048,591 2.77%CREDIT AGRIC EONIACAP+0.31 06/01/2017 CD 30,024,046 2.77%
Top 10 Holdings as at 30 June 2015 Market Value EUR % of Net AssetsBNP PARIBAS MONEY 3M-IC 55,406,592 4.07%ING BANK NV 0% 26/05/2016 CD 44,972,466 3.30%BNP PARIBAS INV 3M X 3D PARTS X 3 DEC 43,784,623 3.21%CREDIT AGRICOLE EONIA+0.23 07/04/2016 CD 40,025,716 2.94%BPCE SA EONIACAP+0.24 09/05/2016 CD 40,018,211 2.94%SOCIETE GENERALE SA 0% 31/12/2015 CD 40,004,344 2.94%BANCO BILBAO VIZCAYA AR 0% 07/04/2016 CD 39,965,732 2.93%BARCLAYS BAN EONIACAP+0.26 04/11/2015 CD 35,034,173 2.57%ANHEUSER BUSCH INBEV N 0% 07/12/2015 ECP 34,004,842 2.50%BNP PARIBAS INSTICASH MONEY 3M EUR 33,543,772 2.46%
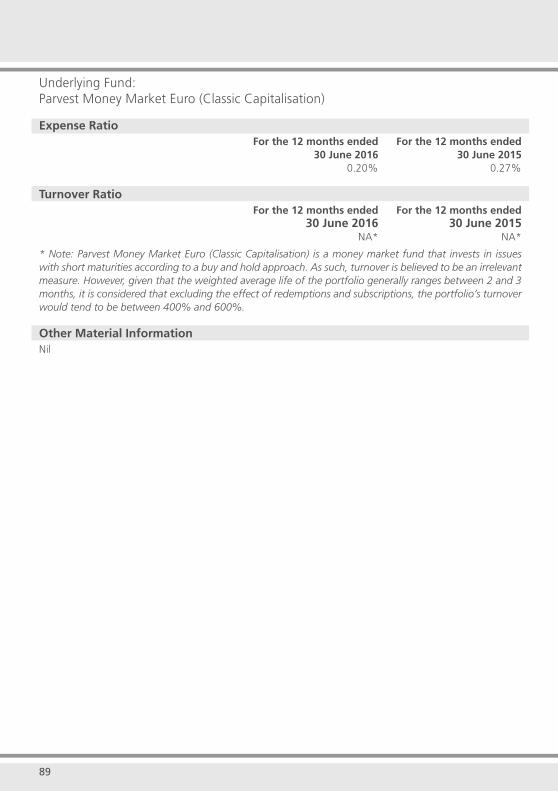
89
Expense Ratio For the 12 months ended For the 12 months ended 30 June 2016 30 June 2015 0.20% 0.27%
Turnover Ratio For the 12 months ended For the 12 months ended 30 June 2016 30 June 2015 NA* NA*
* Note: Parvest Money Market Euro (Classic Capitalisation) is a money market fund that invests in issues with short maturities according to a buy and hold approach. As such, turnover is believed to be an irrelevant measure. However, given that the weighted average life of the portfolio generally ranges between 2 and 3 months, it is considered that excluding the effect of redemptions and subscriptions, the portfolio’s turnover would tend to be between 400% and 600%. Other Material InformationNil
Underlying Fund:Parvest Money Market Euro (Classic Capitalisation)

90
This page has been intentionally left blank.

91
Parvest Money Market USD
Investments in Collective Investment SchemesParvest Money Market USD, an ILP sub-fund, feeds 100% into the Luxembourg registered Parvest Money Market USD (Classic Capitalisation). Market Value USD % of Net Assets1,568,113 101%
Exposure to DerivativesNot Applicable
BorrowingsNot Applicable
Related Party TransactionsNil
Total Subscriptions and Redemptions for the 12 months ended 30 June 2016USD
Subscriptions 889,727 Redemptions (913,547)
Any Other Material Information That Will Adversely Impact The Valuation Of The FundNil
Soft Dollar CommissionNot Applicable
Fund Performance as at 30 June 2016
Fund / Benchmark 3 Months 6 Months 1 Year 3 Years* 5 Years* 10 Years*Since Inception*
(26 Jul 1990)
Parvest Money Market USD 0.88% 0.82% 0.59% 0.39% 0.37% 1.41% 3.47%
Benchmark: BBA LIBOR USD 3 Month
0.51% 0.51% 0.37% 0.21% 0.23% 1.27% 3.19%
*Annualised Performance
BNP Paribas Investment Partners Singapore Limited
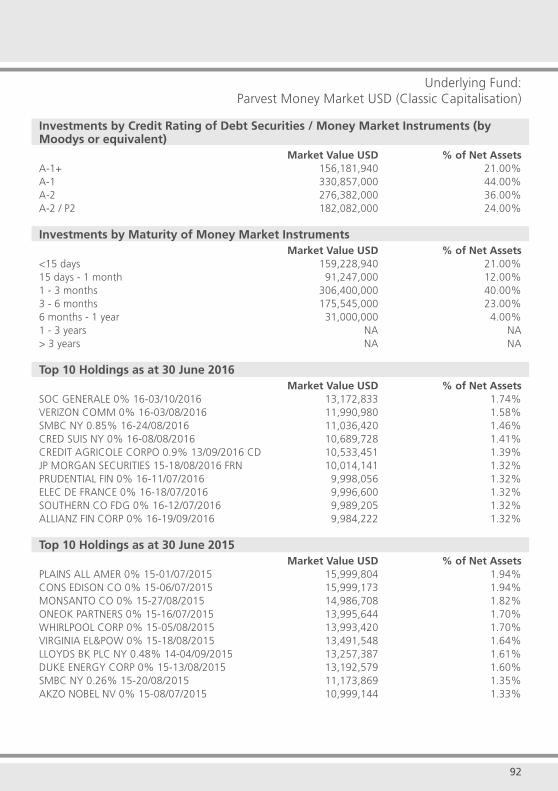
92
Underlying Fund:Parvest Money Market USD (Classic Capitalisation)
Investments by Credit Rating of Debt Securities / Money Market Instruments (by Moodys or equivalent) Market Value USD % of Net AssetsA-1+ 156,181,940 21.00%A-1 330,857,000 44.00%A-2 276,382,000 36.00%A-2 / P2 182,082,000 24.00%
Investments by Maturity of Money Market Instruments Market Value USD % of Net Assets<15 days 159,228,940 21.00%15 days - 1 month 91,247,000 12.00%1 - 3 months 306,400,000 40.00%3 - 6 months 175,545,000 23.00%6 months - 1 year 31,000,000 4.00%1 - 3 years NA NA> 3 years NA NA
Top 10 Holdings as at 30 June 2016 Market Value USD % of Net AssetsSOC GENERALE 0% 16-03/10/2016 13,172,833 1.74%VERIZON COMM 0% 16-03/08/2016 11,990,980 1.58%SMBC NY 0.85% 16-24/08/2016 11,036,420 1.46%CRED SUIS NY 0% 16-08/08/2016 10,689,728 1.41%CREDIT AGRICOLE CORPO 0.9% 13/09/2016 CD 10,533,451 1.39%JP MORGAN SECURITIES 15-18/08/2016 FRN 10,014,141 1.32%PRUDENTIAL FIN 0% 16-11/07/2016 9,998,056 1.32%ELEC DE FRANCE 0% 16-18/07/2016 9,996,600 1.32%SOUTHERN CO FDG 0% 16-12/07/2016 9,989,205 1.32%ALLIANZ FIN CORP 0% 16-19/09/2016 9,984,222 1.32%
Top 10 Holdings as at 30 June 2015 Market Value USD % of Net AssetsPLAINS ALL AMER 0% 15-01/07/2015 15,999,804 1.94%CONS EDISON CO 0% 15-06/07/2015 15,999,173 1.94%MONSANTO CO 0% 15-27/08/2015 14,986,708 1.82%ONEOK PARTNERS 0% 15-16/07/2015 13,995,644 1.70%WHIRLPOOL CORP 0% 15-05/08/2015 13,993,420 1.70%VIRGINIA EL&POW 0% 15-18/08/2015 13,491,548 1.64%LLOYDS BK PLC NY 0.48% 14-04/09/2015 13,257,387 1.61%DUKE ENERGY CORP 0% 15-13/08/2015 13,192,579 1.60%SMBC NY 0.26% 15-20/08/2015 11,173,869 1.35%AKZO NOBEL NV 0% 15-08/07/2015 10,999,144 1.33%

93
Expense Ratio For the 12 months ended For the 12 months ended 30 June 2016 30 June 2015 0.31% 0.19%
Turnover Ratio For the 12 months ended For the 12 months ended 30 June 2016 30 June 2015 NA* NA*
* Note: Parvest Money Market USD (Classic Capitalisation) is a money market fund that invests in issues with short maturities according to a buy and hold approach. As such, turnover is believed to be an irrelevant measure. However, given that the weighted average life of the portfolio generally ranges between 2 and 3 months, it is considered that excluding the effect of redemptions and subscriptions, the portfolio’s turnover would tend to be between 400% and 600%. Other Material InformationNil
Underlying Fund:Parvest Money Market USD (Classic Capitalisation)
94
This page has been intentionally left blank.
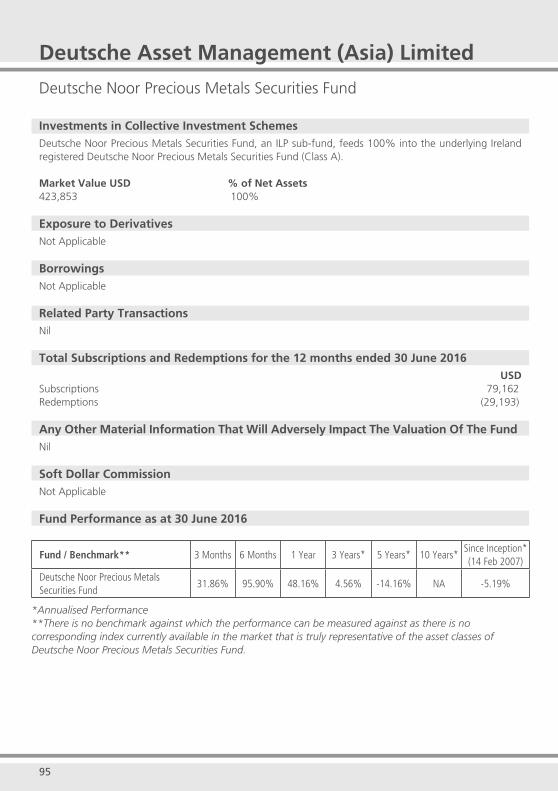
95 96
Deutsche Asset Management (Asia) Limited
Deutsche Noor Precious Metals Securities Fund
Investments in Collective Investment SchemesDeutsche Noor Precious Metals Securities Fund, an ILP sub-fund, feeds 100% into the underlying Ireland registered Deutsche Noor Precious Metals Securities Fund (Class A).
Market Value USD % of Net Assets423,853 100%
Exposure to DerivativesNot Applicable
BorrowingsNot Applicable
Related Party TransactionsNil
Total Subscriptions and Redemptions for the 12 months ended 30 June 2016USD
Subscriptions 79,162 Redemptions (29,193)
Any Other Material Information That Will Adversely Impact The Valuation Of The FundNil
Soft Dollar CommissionNot Applicable
Fund Performance as at 30 June 2016
Fund / Benchmark** 3 Months 6 Months 1 Year 3 Years* 5 Years* 10 Years*Since Inception*(14 Feb 2007)
Deutsche Noor Precious Metals Securities Fund
31.86% 95.90% 48.16% 4.56% -14.16% NA -5.19%
*Annualised Performance **There is no benchmark against which the performance can be measured against as there is no corresponding index currently available in the market that is truly representative of the asset classes of Deutsche Noor Precious Metals Securities Fund.
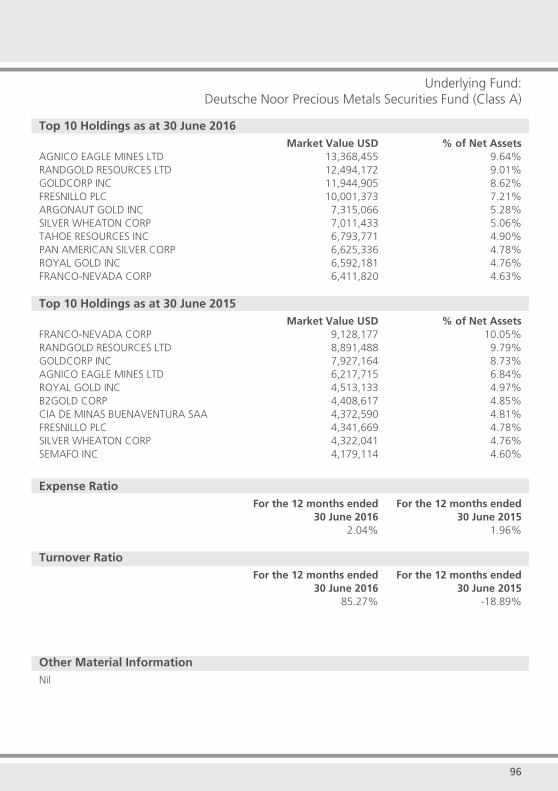
95 96
Underlying Fund:Deutsche Noor Precious Metals Securities Fund (Class A)
Top 10 Holdings as at 30 June 2016 Market Value USD % of Net AssetsAGNICO EAGLE MINES LTD 13,368,455 9.64%RANDGOLD RESOURCES LTD 12,494,172 9.01%GOLDCORP INC 11,944,905 8.62%FRESNILLO PLC 10,001,373 7.21%ARGONAUT GOLD INC 7,315,066 5.28%SILVER WHEATON CORP 7,011,433 5.06%TAHOE RESOURCES INC 6,793,771 4.90%PAN AMERICAN SILVER CORP 6,625,336 4.78%ROYAL GOLD INC 6,592,181 4.76%FRANCO-NEVADA CORP 6,411,820 4.63%
Top 10 Holdings as at 30 June 2015 Market Value USD % of Net AssetsFRANCO-NEVADA CORP 9,128,177 10.05%RANDGOLD RESOURCES LTD 8,891,488 9.79%GOLDCORP INC 7,927,164 8.73%AGNICO EAGLE MINES LTD 6,217,715 6.84%ROYAL GOLD INC 4,513,133 4.97%B2GOLD CORP 4,408,617 4.85%CIA DE MINAS BUENAVENTURA SAA 4,372,590 4.81%FRESNILLO PLC 4,341,669 4.78%SILVER WHEATON CORP 4,322,041 4.76%SEMAFO INC 4,179,114 4.60%
Expense Ratio For the 12 months ended For the 12 months ended 30 June 2016 30 June 2015 2.04% 1.96%
Turnover Ratio For the 12 months ended For the 12 months ended 30 June 2016 30 June 2015 85.27% -18.89%
Other Material InformationNil

97 98
Deutsche Asset Management (Asia) Limited
Deutsche Singapore Equity Fund
Investments in Collective Investment SchemesDeutsche Singapore Equity Fund, an ILP sub-fund, feeds 100% into the underlying Singapore registered Deutsche Singapore Equity Fund (Class A).
Market Value SGD % of Net Assets786,182 101%
Exposure to DerivativesNot Applicable
BorrowingsNot Applicable
Related Party TransactionsNil
Total Subscriptions and Redemptions for the 12 months ended 30 June 2016SGD
Subscriptions 414,700 Redemptions (316,329)
Any Other Material Information That Will Adversely Impact The Valuation Of The FundNil
Soft Dollar CommissionNot Applicable
Fund Performance as at 30 June 2016
Fund / Benchmark 3 Months 6 Months 1 Year 3 Years* 5 Years* 10 Years*Since Inception*(12 Dec 2003)
Deutsche Singapore Equity Fund 0.64% -0.11% -10.47% -1.29% 0.60% 4.37% 7.35%
Benchmark: MSCI Singapore Total 0.30% 0.02% -11.52% 0.02% 1.13% 4.66% 7.01%
*Annualised Performance

97 98
Underlying Fund:Deutsche Singapore Equity Fund (Class A)
Top 10 Holdings as at 30 June 2016 Market Value SGD % of Net AssetsDBS GROUP HOLDINGS LIMITED 8,243,898 13.26%SINGAPORE TELECOMMUNICATIONS LIMITED 7,841,225 12.61%OVERSEA-CHINESE BANKING CORPORATION LIMITED 5,588,557 8.99%UNITED OVERSEAS BANK LIMITED 3,997,547 6.43%KEPPEL CORPORATION LIMITED 3,003,030 4.83%COMFORTDELGRO CORPORATION LIMITED 2,956,460 4.76%JARDINE CYCLE & CARRIAGE LIMITED 2,591,500 4.17%UOL GROUP LIMITED 2,485,200 4.00%SINGAPORE EXCHANGE LIMITED 2,484,120 4.00%CAPITALAND LIMITED 2,373,110 3.82%
Top 10 Holdings as at 30 June 2015 Market Value SGD % of Net AssetsSINGAPORE TELECOMMUNICATIONS LIMITED 9,221,562 13.39%DBS GROUP HOLDINGS LIMITED 8,832,221 12.82%UNITED OVERSEAS BANK LIMITED 6,878,090 9.98%OVERSEA-CHINESE BANKING CORPORATION LIMITED 6,596,324 9.57%CAPITALAND LIMITED 3,657,500 5.31%KEPPEL CORPORATION LIMITED 3,361,980 4.88%COMFORTDELGRO CORPORATION LIMITED 2,926,510 4.25%GLOBAL LOGISTIC PROPERTIES LIMITED 2,670,668 3.88%SINGAPORE EXCHANGE LIMITED 2,200,230 3.19%UOL GROUP LIMITED 2,028,600 2.94%
Expense Ratio For the 12 months ended For the 12 months ended 30 June 2016 30 June 2015 1.73% 1.71%
Turnover Ratio For the 12 months ended For the 12 months ended 30 June 2016 30 June 2015 50.29% 47.30%
Other Material InformationNil

99 100
Deutsche Asset Management (Asia) Limited
DWS Global Agribusiness
Investments in Collective Investment SchemesDWS Global Agribusiness , an ILP sub-fund, feeds 100% into the underlying Luxembourg registered DWS Global Agribusiness (LC Share Class).
Market Value EUR % of Net Assets270,016 101%
Exposure to DerivativesNot Applicable
BorrowingsNot Applicable
Related Party TransactionsNil
Total Subscriptions and Redemptions for the 12 months ended 30 June 2016EUR
Subscriptions 54,814 Redemptions (81,956)
Any Other Material Information That Will Adversely Impact The Valuation Of The FundNil
Soft Dollar CommissionNot Applicable
Fund Performance as at 30 June 2016
Fund / Benchmark 3 Months 6 Months 1 Year 3 Years* 5 Years* 10 Years*Since Inception*(15 Sep 2006)
DWS Global Agribusiness 0.93% -5.63% -21.92% -1.11% 0.12% N.A. 2.78%
Reference: MSCI World Free Total 3.82% -1.57% -1.91% 13.32% 13.10% N.A. 6.20%
*Annualised Performance
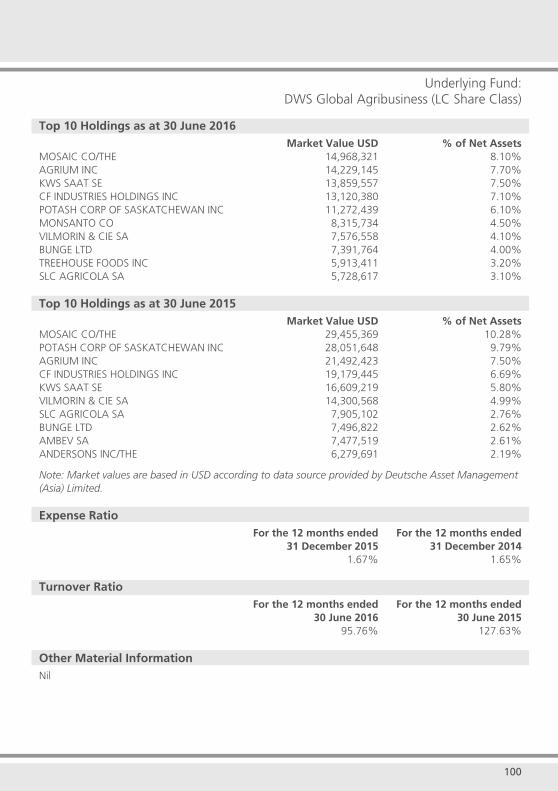
99 100
Underlying Fund:DWS Global Agribusiness (LC Share Class)
Top 10 Holdings as at 30 June 2016 Market Value USD % of Net AssetsMOSAIC CO/THE 14,968,321 8.10%AGRIUM INC 14,229,145 7.70%KWS SAAT SE 13,859,557 7.50%CF INDUSTRIES HOLDINGS INC 13,120,380 7.10%POTASH CORP OF SASKATCHEWAN INC 11,272,439 6.10%MONSANTO CO 8,315,734 4.50%VILMORIN & CIE SA 7,576,558 4.10%BUNGE LTD 7,391,764 4.00%TREEHOUSE FOODS INC 5,913,411 3.20%SLC AGRICOLA SA 5,728,617 3.10%
Top 10 Holdings as at 30 June 2015 Market Value USD % of Net AssetsMOSAIC CO/THE 29,455,369 10.28%POTASH CORP OF SASKATCHEWAN INC 28,051,648 9.79%AGRIUM INC 21,492,423 7.50%CF INDUSTRIES HOLDINGS INC 19,179,445 6.69%KWS SAAT SE 16,609,219 5.80%VILMORIN & CIE SA 14,300,568 4.99%SLC AGRICOLA SA 7,905,102 2.76%BUNGE LTD 7,496,822 2.62%AMBEV SA 7,477,519 2.61%ANDERSONS INC/THE 6,279,691 2.19%
Note: Market values are based in USD according to data source provided by Deutsche Asset Management (Asia) Limited.
Expense Ratio For the 12 months ended For the 12 months ended 31 December 2015 31 December 2014 1.67% 1.65%
Turnover Ratio For the 12 months ended For the 12 months ended 30 June 2016 30 June 2015 95.76% 127.63%
Other Material InformationNil

101
FIL Investment Management (Singapore) LimitedFidelity Funds - ASEAN Fund
Investments in Collective Investment SchemesFidelity Funds - ASEAN Fund, an ILP sub-fund, feeds 100% into the underlying Luxembourg registered Fidelity Funds - ASEAN Fund (Class A). Market Value SGD % of Net Assets8,123 99%
Exposure to DerivativesNot Applicable
BorrowingsNot Applicable
Related Party TransactionsNil
Total Subscriptions and Redemptions for the 12 months ended 30 June 2016SGD
Subscriptions 4,422 Redemptions (1,233)
Any Other Material Information That Will Adversely Impact The Valuation Of The FundNil
Soft Dollar CommissionNot Applicable
Fund Performance as at 30 June 2016
Fund / Benchmark 3 Months 6 Months 1 Year 3 Years* 5 Years* 10 Years*Since Inception*(15 May 2006)
Fidelity Funds - ASEAN Fund 0.76% 4.62% -4.72% -1.38% 1.77% 6.45% 5.58%
Benchmark: MSCI ASEAN SE Asia Blend
0.41% 4.91% -5.29% -1.62% 1.78% 6.84% 6.04%
*Annualised Performance
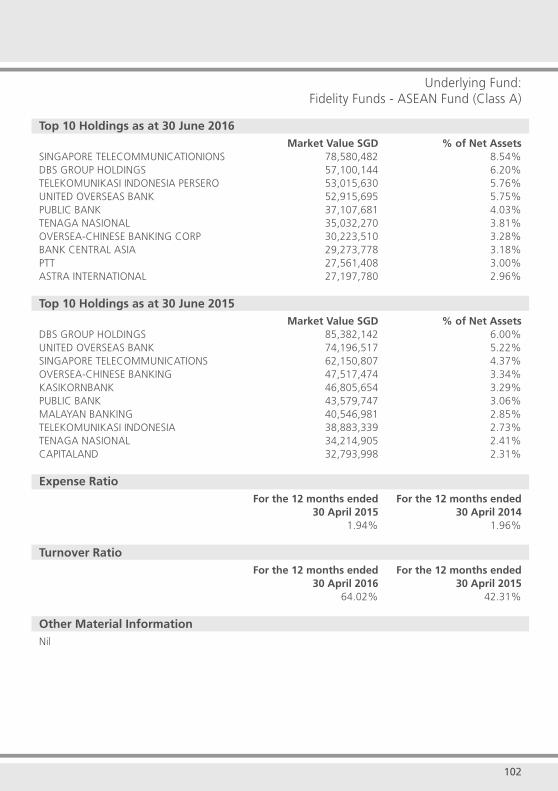
102
Underlying Fund:Fidelity Funds - ASEAN Fund (Class A)
Top 10 Holdings as at 30 June 2016 Market Value SGD % of Net AssetsSINGAPORE TELECOMMUNICATIONIONS 78,580,482 8.54%DBS GROUP HOLDINGS 57,100,144 6.20%TELEKOMUNIKASI INDONESIA PERSERO 53,015,630 5.76%UNITED OVERSEAS BANK 52,915,695 5.75%PUBLIC BANK 37,107,681 4.03%TENAGA NASIONAL 35,032,270 3.81%OVERSEA-CHINESE BANKING CORP 30,223,510 3.28%BANK CENTRAL ASIA 29,273,778 3.18%PTT 27,561,408 3.00%ASTRA INTERNATIONAL 27,197,780 2.96%
Top 10 Holdings as at 30 June 2015 Market Value SGD % of Net AssetsDBS GROUP HOLDINGS 85,382,142 6.00%UNITED OVERSEAS BANK 74,196,517 5.22%SINGAPORE TELECOMMUNICATIONS 62,150,807 4.37%OVERSEA-CHINESE BANKING 47,517,474 3.34%KASIKORNBANK 46,805,654 3.29%PUBLIC BANK 43,579,747 3.06%MALAYAN BANKING 40,546,981 2.85%TELEKOMUNIKASI INDONESIA 38,883,339 2.73%TENAGA NASIONAL 34,214,905 2.41%CAPITALAND 32,793,998 2.31%
Expense Ratio For the 12 months ended For the 12 months ended 30 April 2015 30 April 2014 1.94% 1.96%
Turnover Ratio For the 12 months ended For the 12 months ended 30 April 2016 30 April 2015 64.02% 42.31%
Other Material InformationNil
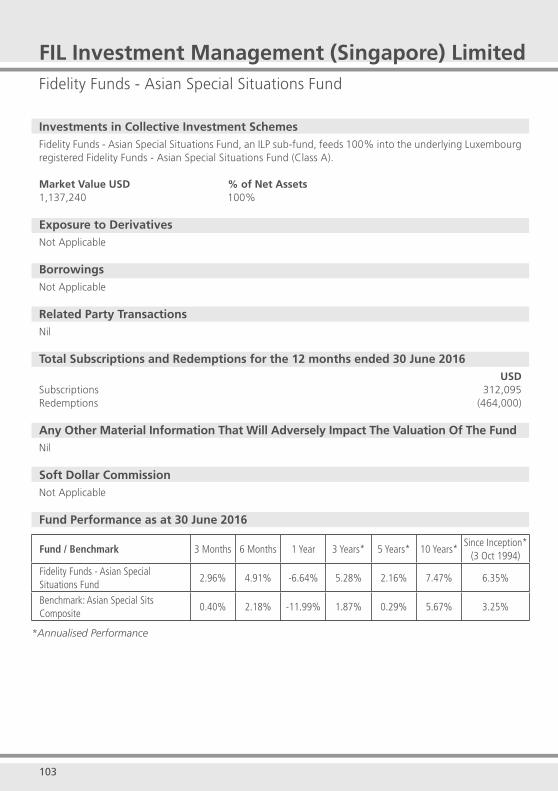
103
Fidelity Funds - Asian Special Situations Fund
Investments in Collective Investment SchemesFidelity Funds - Asian Special Situations Fund, an ILP sub-fund, feeds 100% into the underlying Luxembourg registered Fidelity Funds - Asian Special Situations Fund (Class A). Market Value USD % of Net Assets1,137,240 100%
Exposure to DerivativesNot Applicable
BorrowingsNot Applicable
Related Party TransactionsNil
Total Subscriptions and Redemptions for the 12 months ended 30 June 2016USD
Subscriptions 312,095 Redemptions (464,000)
Any Other Material Information That Will Adversely Impact The Valuation Of The FundNil
Soft Dollar Commission Not Applicable
Fund Performance as at 30 June 2016
Fund / Benchmark 3 Months 6 Months 1 Year 3 Years* 5 Years* 10 Years*Since Inception*
(3 Oct 1994)
Fidelity Funds - Asian Special Situations Fund
2.96% 4.91% -6.64% 5.28% 2.16% 7.47% 6.35%
Benchmark: Asian Special Sits Composite
0.40% 2.18% -11.99% 1.87% 0.29% 5.67% 3.25%
*Annualised Performance
FIL Investment Management (Singapore) Limited
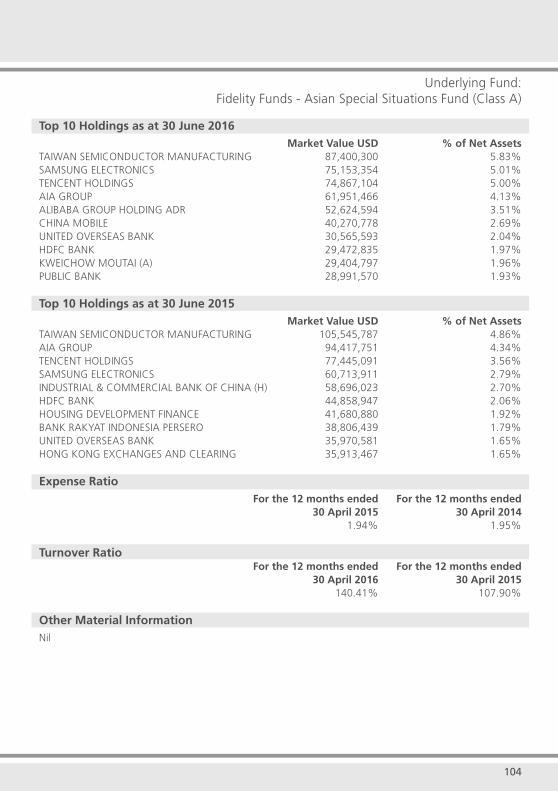
104
Underlying Fund:Fidelity Funds - Asian Special Situations Fund (Class A)
Top 10 Holdings as at 30 June 2016 Market Value USD % of Net AssetsTAIWAN SEMICONDUCTOR MANUFACTURING 87,400,300 5.83%SAMSUNG ELECTRONICS 75,153,354 5.01%TENCENT HOLDINGS 74,867,104 5.00%AIA GROUP 61,951,466 4.13%ALIBABA GROUP HOLDING ADR 52,624,594 3.51%CHINA MOBILE 40,270,778 2.69%UNITED OVERSEAS BANK 30,565,593 2.04%HDFC BANK 29,472,835 1.97%KWEICHOW MOUTAI (A) 29,404,797 1.96%PUBLIC BANK 28,991,570 1.93%
Top 10 Holdings as at 30 June 2015 Market Value USD % of Net AssetsTAIWAN SEMICONDUCTOR MANUFACTURING 105,545,787 4.86%AIA GROUP 94,417,751 4.34%TENCENT HOLDINGS 77,445,091 3.56%SAMSUNG ELECTRONICS 60,713,911 2.79%INDUSTRIAL & COMMERCIAL BANK OF CHINA (H) 58,696,023 2.70%HDFC BANK 44,858,947 2.06%HOUSING DEVELOPMENT FINANCE 41,680,880 1.92%BANK RAKYAT INDONESIA PERSERO 38,806,439 1.79%UNITED OVERSEAS BANK 35,970,581 1.65%HONG KONG EXCHANGES AND CLEARING 35,913,467 1.65%
Expense Ratio For the 12 months ended For the 12 months ended 30 April 2015 30 April 2014 1.94% 1.95%
Turnover Ratio For the 12 months ended For the 12 months ended 30 April 2016 30 April 2015 140.41% 107.90%
Other Material InformationNil
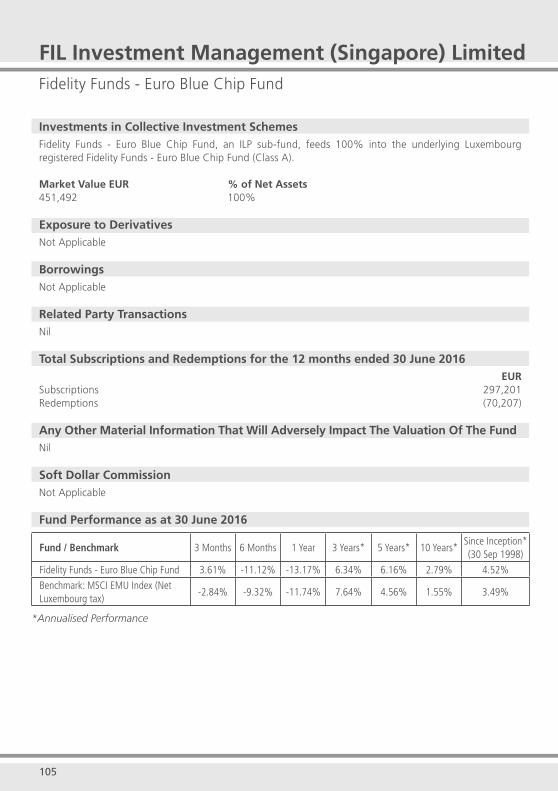
105
Fidelity Funds - Euro Blue Chip Fund
Investments in Collective Investment SchemesFidelity Funds - Euro Blue Chip Fund, an ILP sub-fund, feeds 100% into the underlying Luxembourg registered Fidelity Funds - Euro Blue Chip Fund (Class A). Market Value EUR % of Net Assets451,492 100%
Exposure to DerivativesNot Applicable
BorrowingsNot Applicable
Related Party TransactionsNil
Total Subscriptions and Redemptions for the 12 months ended 30 June 2016EUR
Subscriptions 297,201 Redemptions (70,207)
Any Other Material Information That Will Adversely Impact The Valuation Of The FundNil
Soft Dollar CommissionNot Applicable
Fund Performance as at 30 June 2016
Fund / Benchmark 3 Months 6 Months 1 Year 3 Years* 5 Years* 10 Years*Since Inception*(30 Sep 1998)
Fidelity Funds - Euro Blue Chip Fund 3.61% -11.12% -13.17% 6.34% 6.16% 2.79% 4.52%
Benchmark: MSCI EMU Index (Net Luxembourg tax)
-2.84% -9.32% -11.74% 7.64% 4.56% 1.55% 3.49%
*Annualised Performance
FIL Investment Management (Singapore) Limited
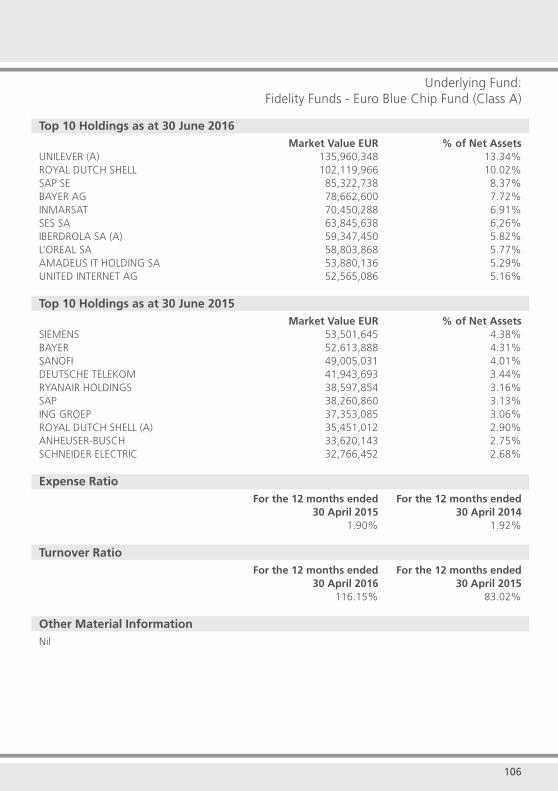
106
Underlying Fund:Fidelity Funds - Euro Blue Chip Fund (Class A)
Top 10 Holdings as at 30 June 2016 Market Value EUR % of Net AssetsUNILEVER (A) 135,960,348 13.34%ROYAL DUTCH SHELL 102,119,966 10.02%SAP SE 85,322,738 8.37%BAYER AG 78,662,600 7.72%INMARSAT 70,450,288 6.91%SES SA 63,845,638 6.26%IBERDROLA SA (A) 59,347,450 5.82%L’OREAL SA 58,803,868 5.77%AMADEUS IT HOLDING SA 53,880,136 5.29%UNITED INTERNET AG 52,565,086 5.16%
Top 10 Holdings as at 30 June 2015 Market Value EUR % of Net AssetsSIEMENS 53,501,645 4.38%BAYER 52,613,888 4.31%SANOFI 49,005,031 4.01%DEUTSCHE TELEKOM 41,943,693 3.44%RYANAIR HOLDINGS 38,597,854 3.16%SAP 38,260,860 3.13%ING GROEP 37,353,085 3.06%ROYAL DUTCH SHELL (A) 35,451,012 2.90%ANHEUSER-BUSCH 33,620,143 2.75%SCHNEIDER ELECTRIC 32,766,452 2.68%
Expense Ratio For the 12 months ended For the 12 months ended 30 April 2015 30 April 2014 1.90% 1.92%
Turnover Ratio For the 12 months ended For the 12 months ended 30 April 2016 30 April 2015 116.15% 83.02%
Other Material InformationNil
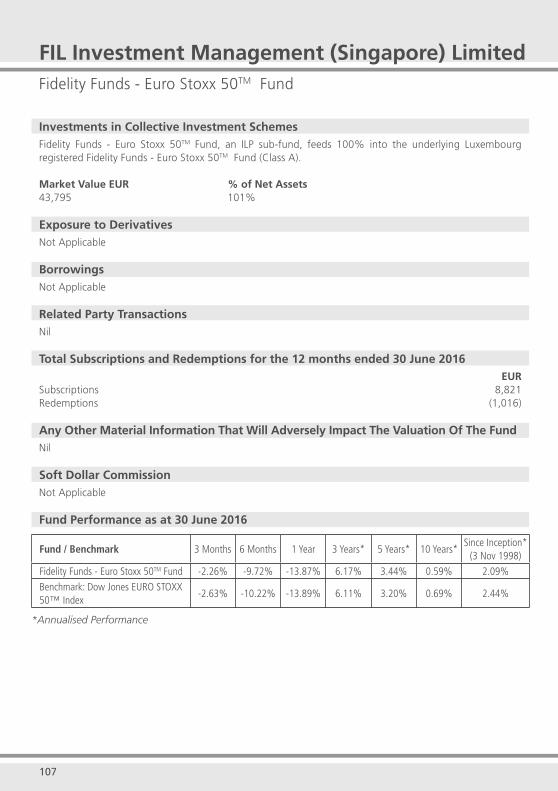
107
Fidelity Funds - Euro Stoxx 50TM Fund
Investments in Collective Investment SchemesFidelity Funds - Euro Stoxx 50TM Fund, an ILP sub-fund, feeds 100% into the underlying Luxembourg registered Fidelity Funds - Euro Stoxx 50TM Fund (Class A). Market Value EUR % of Net Assets43,795 101%
Exposure to DerivativesNot Applicable
BorrowingsNot Applicable
Related Party TransactionsNil
Total Subscriptions and Redemptions for the 12 months ended 30 June 2016 EUR
Subscriptions 8,821 Redemptions (1,016)
Any Other Material Information That Will Adversely Impact The Valuation Of The FundNil
Soft Dollar CommissionNot Applicable
Fund Performance as at 30 June 2016
Fund / Benchmark 3 Months 6 Months 1 Year 3 Years* 5 Years* 10 Years*Since Inception*
(3 Nov 1998)
Fidelity Funds - Euro Stoxx 50TM Fund -2.26% -9.72% -13.87% 6.17% 3.44% 0.59% 2.09%
Benchmark: Dow Jones EURO STOXX 50™ Index
-2.63% -10.22% -13.89% 6.11% 3.20% 0.69% 2.44%
*Annualised Performance
FIL Investment Management (Singapore) Limited
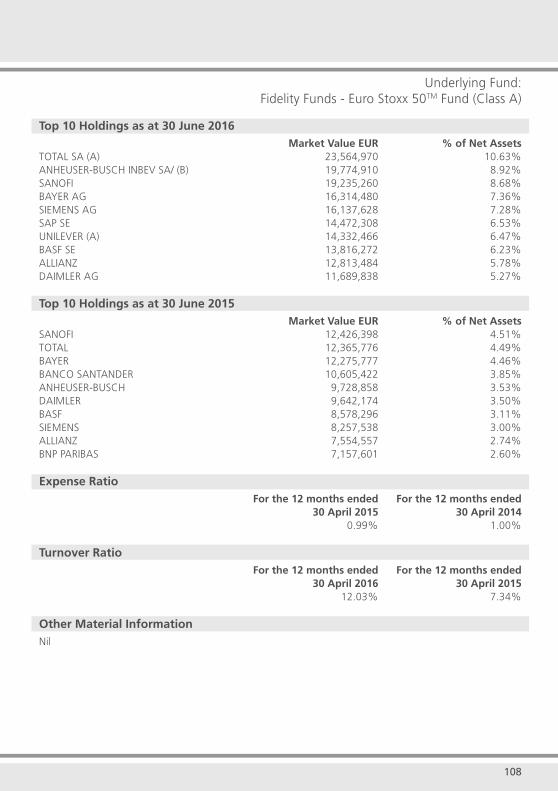
108
Underlying Fund:Fidelity Funds - Euro Stoxx 50TM Fund (Class A)
Top 10 Holdings as at 30 June 2016 Market Value EUR % of Net AssetsTOTAL SA (A) 23,564,970 10.63%ANHEUSER-BUSCH INBEV SA/ (B) 19,774,910 8.92%SANOFI 19,235,260 8.68%BAYER AG 16,314,480 7.36%SIEMENS AG 16,137,628 7.28%SAP SE 14,472,308 6.53%UNILEVER (A) 14,332,466 6.47%BASF SE 13,816,272 6.23%ALLIANZ 12,813,484 5.78%DAIMLER AG 11,689,838 5.27%
Top 10 Holdings as at 30 June 2015 Market Value EUR % of Net AssetsSANOFI 12,426,398 4.51%TOTAL 12,365,776 4.49%BAYER 12,275,777 4.46%BANCO SANTANDER 10,605,422 3.85%ANHEUSER-BUSCH 9,728,858 3.53%DAIMLER 9,642,174 3.50%BASF 8,578,296 3.11%SIEMENS 8,257,538 3.00%ALLIANZ 7,554,557 2.74%BNP PARIBAS 7,157,601 2.60%
Expense Ratio For the 12 months ended For the 12 months ended 30 April 2015 30 April 2014 0.99% 1.00%
Turnover Ratio For the 12 months ended For the 12 months ended 30 April 2016 30 April 2015 12.03% 7.34%
Other Material InformationNil
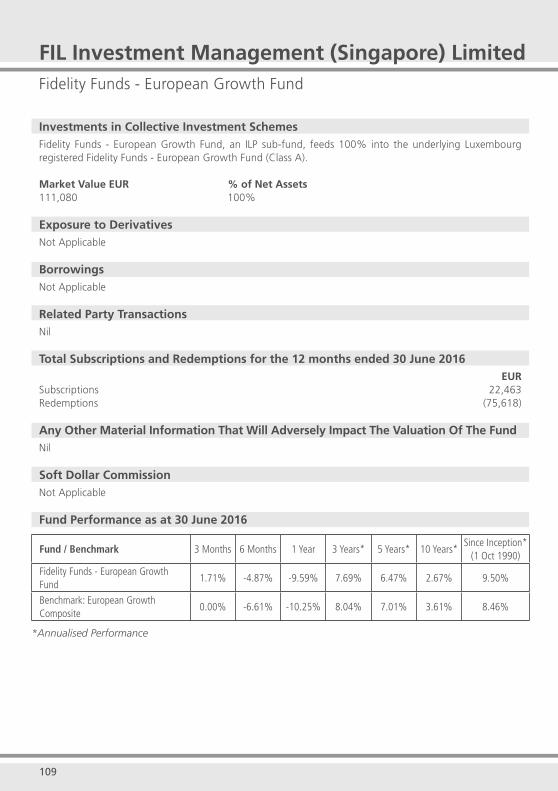
109
Fidelity Funds - European Growth Fund
Investments in Collective Investment SchemesFidelity Funds - European Growth Fund, an ILP sub-fund, feeds 100% into the underlying Luxembourg registered Fidelity Funds - European Growth Fund (Class A). Market Value EUR % of Net Assets111,080 100%
Exposure to DerivativesNot Applicable
BorrowingsNot Applicable
Related Party TransactionsNil
Total Subscriptions and Redemptions for the 12 months ended 30 June 2016 EUR
Subscriptions 22,463 Redemptions (75,618)
Any Other Material Information That Will Adversely Impact The Valuation Of The FundNil
Soft Dollar CommissionNot Applicable
Fund Performance as at 30 June 2016
Fund / Benchmark 3 Months 6 Months 1 Year 3 Years* 5 Years* 10 Years*Since Inception*
(1 Oct 1990)
Fidelity Funds - European Growth Fund
1.71% -4.87% -9.59% 7.69% 6.47% 2.67% 9.50%
Benchmark: European Growth Composite
0.00% -6.61% -10.25% 8.04% 7.01% 3.61% 8.46%
*Annualised Performance
FIL Investment Management (Singapore) Limited
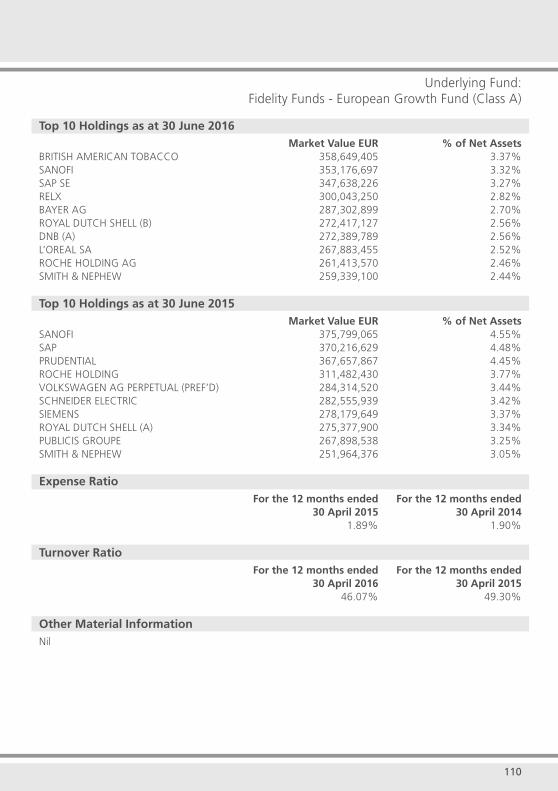
110
Underlying Fund:Fidelity Funds - European Growth Fund (Class A)
Top 10 Holdings as at 30 June 2016 Market Value EUR % of Net AssetsBRITISH AMERICAN TOBACCO 358,649,405 3.37%SANOFI 353,176,697 3.32%SAP SE 347,638,226 3.27%RELX 300,043,250 2.82%BAYER AG 287,302,899 2.70%ROYAL DUTCH SHELL (B) 272,417,127 2.56%DNB (A) 272,389,789 2.56%L’OREAL SA 267,883,455 2.52%ROCHE HOLDING AG 261,413,570 2.46%SMITH & NEPHEW 259,339,100 2.44%
Top 10 Holdings as at 30 June 2015 Market Value EUR % of Net AssetsSANOFI 375,799,065 4.55%SAP 370,216,629 4.48%PRUDENTIAL 367,657,867 4.45%ROCHE HOLDING 311,482,430 3.77%VOLKSWAGEN AG PERPETUAL (PREF’D) 284,314,520 3.44%SCHNEIDER ELECTRIC 282,555,939 3.42%SIEMENS 278,179,649 3.37%ROYAL DUTCH SHELL (A) 275,377,900 3.34%PUBLICIS GROUPE 267,898,538 3.25%SMITH & NEPHEW 251,964,376 3.05%
Expense Ratio For the 12 months ended For the 12 months ended 30 April 2015 30 April 2014 1.89% 1.90%
Turnover Ratio For the 12 months ended For the 12 months ended 30 April 2016 30 April 2015 46.07% 49.30%
Other Material InformationNil
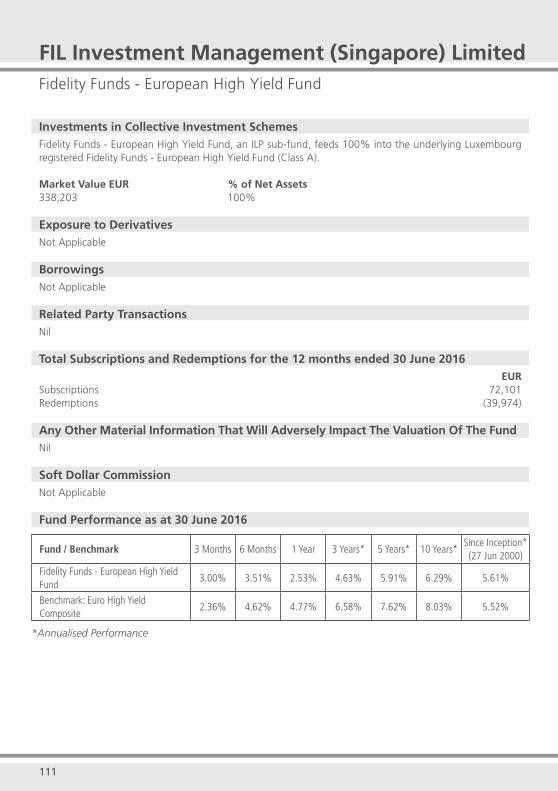
111
Fidelity Funds - European High Yield Fund
Investments in Collective Investment SchemesFidelity Funds - European High Yield Fund, an ILP sub-fund, feeds 100% into the underlying Luxembourg registered Fidelity Funds - European High Yield Fund (Class A). Market Value EUR % of Net Assets338,203 100%
Exposure to DerivativesNot Applicable
BorrowingsNot Applicable
Related Party TransactionsNil
Total Subscriptions and Redemptions for the 12 months ended 30 June 2016EUR
Subscriptions 72,101Redemptions (39,974)
Any Other Material Information That Will Adversely Impact The Valuation Of The FundNil
Soft Dollar CommissionNot Applicable
Fund Performance as at 30 June 2016
Fund / Benchmark 3 Months 6 Months 1 Year 3 Years* 5 Years* 10 Years*Since Inception*(27 Jun 2000)
Fidelity Funds - European High Yield Fund
3.00% 3.51% 2.53% 4.63% 5.91% 6.29% 5.61%
Benchmark: Euro High Yield Composite
2.36% 4.62% 4.77% 6.58% 7.62% 8.03% 5.52%
*Annualised Performance
FIL Investment Management (Singapore) Limited

112
Underlying Fund:Fidelity Funds - European High Yield Fund (Class A)
Top 10 Holdings as at 30 June 2016 Market Value EUR % of Net AssetsIFIDELITY INSTITUTIONAL LIQUIDITY FUND -A-ACC-EUR 331,737,465 7.98%LINCOLN FINANCE 6.875% 15/04/2021 REGS 63,085,603 1.52%TELECOM ITALIA/MILANO 3.625% 25/05/2026 EMTN 49,828,005 1.20%WIND ACQUISITION FINANCE 7.375% 23/04/2021 144A 48,353,611 1.16%ALTICE LUXEMBOURG SA 7.25% 15/05/2022 REGS 44,602,299 1.07%ALTICE LUXEMBOURG SA 6.25% 15/02/2025 REGS 43,249,681 1.04%VIRGIN MEDIA SECURED FINANCEANCE 6.25% 43,192,752 1.04%28/03/2029 REGSINTERNATIONAL BANK FOR RECONSTRUCTION & 41,926,736 1.01%DEVELOPMENT 1.375% 30/03/2020 WIND ACQUISITION FINANCEANCE SA 7.00% 41,923,177 1.01%23/04/2021 REGSMARFRIG OVERSEAS 9.50% 04/05/2020 REGS 38,456,854 0.92%
Top 10 Holdings as at 30 June 2015 Market Value EUR % of Net AssetsFIDELITY INSTITUTIONAL LIQUIDITY FUND - A-ACC-EUR 393,527,578 7.95%PLAY TOPCO 7.75% 28/02/2020 REGS 63,332,106 1.28%VIRGIN MEDIA SECURED FIN. 6.25% 28/03/2029 REGS 54,588,188 1.10%WIND ACQUISITION FINANCE 7.375% 23/04/2021 144A 51,464,801 1.04%ALTICE 7.25% 15/05/2022 REGS 49,125,287 0.99%EVRAZ N. AMERICA 7.50% 15/11/2019 144A 46,341,788 0.94%WIND ACQUISITION FINANCE 7.00% 23/04/2021 REGS 45,742,298 0.92%LAUREATE EDUCATION 10.00% 01/09/2019 144A 39,484,881 0.80%AA BOND 5.50% 31/07/2022 REGS 38,364,138 0.77%VEB (VNESHECONOMBANK) 3.75% 17/02/2016 EMTN 36,707,162 0.74%
Expense Ratio For the 12 months ended For the 12 months ended 30 April 2015 30 April 2014 1.39% 1.40%
Turnover Ratio For the 12 months ended For the 12 months ended 30 April 2016 30 April 2015 77.95% 97.54%
Other Material InformationNil
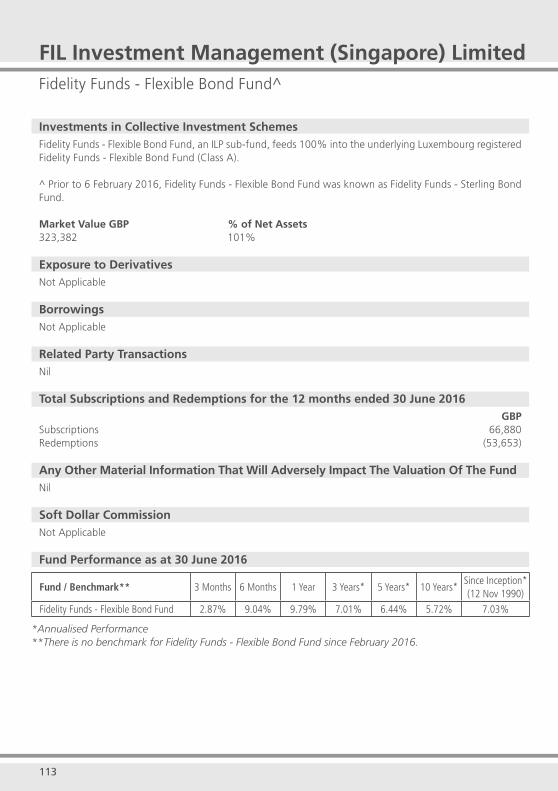
113
Fidelity Funds - Flexible Bond Fund^
Investments in Collective Investment SchemesFidelity Funds - Flexible Bond Fund, an ILP sub-fund, feeds 100% into the underlying Luxembourg registered Fidelity Funds - Flexible Bond Fund (Class A). ^ Prior to 6 February 2016, Fidelity Funds - Flexible Bond Fund was known as Fidelity Funds - Sterling Bond Fund. Market Value GBP % of Net Assets323,382 101%
Exposure to DerivativesNot Applicable
BorrowingsNot Applicable
Related Party TransactionsNil
Total Subscriptions and Redemptions for the 12 months ended 30 June 2016GBP
Subscriptions 66,880 Redemptions (53,653)
Any Other Material Information That Will Adversely Impact The Valuation Of The FundNil
Soft Dollar CommissionNot Applicable
Fund Performance as at 30 June 2016
FIL Investment Management (Singapore) Limited
Fund / Benchmark** 3 Months 6 Months 1 Year 3 Years* 5 Years* 10 Years*Since Inception*(12 Nov 1990)
Fidelity Funds - Flexible Bond Fund 2.87% 9.04% 9.79% 7.01% 6.44% 5.72% 7.03%
*Annualised Performance**There is no benchmark for Fidelity Funds - Flexible Bond Fund since February 2016.
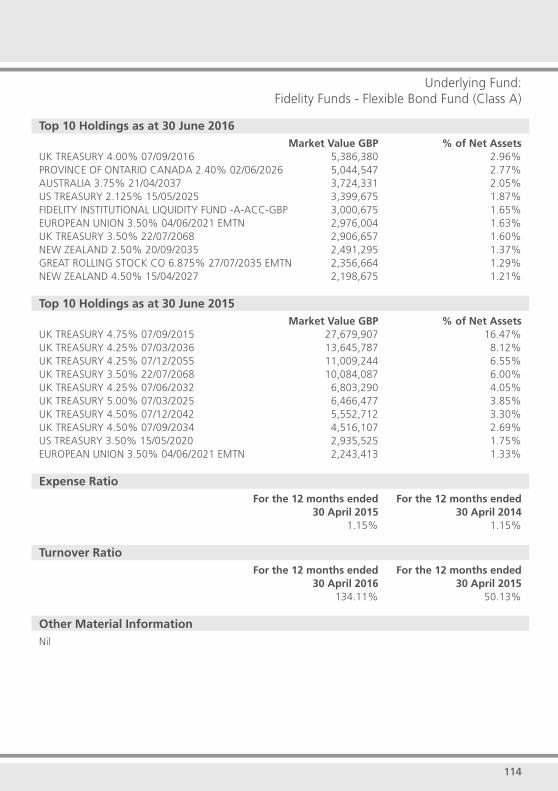
114
Underlying Fund:Fidelity Funds - Flexible Bond Fund (Class A)
Top 10 Holdings as at 30 June 2016 Market Value GBP % of Net AssetsUK TREASURY 4.00% 07/09/2016 5,386,380 2.96%PROVINCE OF ONTARIO CANADA 2.40% 02/06/2026 5,044,547 2.77%AUSTRALIA 3.75% 21/04/2037 3,724,331 2.05%US TREASURY 2.125% 15/05/2025 3,399,675 1.87%FIDELITY INSTITUTIONAL LIQUIDITY FUND -A-ACC-GBP 3,000,675 1.65%EUROPEAN UNION 3.50% 04/06/2021 EMTN 2,976,004 1.63%UK TREASURY 3.50% 22/07/2068 2,906,657 1.60%NEW ZEALAND 2.50% 20/09/2035 2,491,295 1.37%GREAT ROLLING STOCK CO 6.875% 27/07/2035 EMTN 2,356,664 1.29%NEW ZEALAND 4.50% 15/04/2027 2,198,675 1.21%
Top 10 Holdings as at 30 June 2015 Market Value GBP % of Net AssetsUK TREASURY 4.75% 07/09/2015 27,679,907 16.47%UK TREASURY 4.25% 07/03/2036 13,645,787 8.12%UK TREASURY 4.25% 07/12/2055 11,009,244 6.55%UK TREASURY 3.50% 22/07/2068 10,084,087 6.00%UK TREASURY 4.25% 07/06/2032 6,803,290 4.05%UK TREASURY 5.00% 07/03/2025 6,466,477 3.85%UK TREASURY 4.50% 07/12/2042 5,552,712 3.30%UK TREASURY 4.50% 07/09/2034 4,516,107 2.69%US TREASURY 3.50% 15/05/2020 2,935,525 1.75%EUROPEAN UNION 3.50% 04/06/2021 EMTN 2,243,413 1.33%
Expense Ratio For the 12 months ended For the 12 months ended 30 April 2015 30 April 2014 1.15% 1.15%
Turnover Ratio For the 12 months ended For the 12 months ended 30 April 2016 30 April 2015 134.11% 50.13%
Other Material InformationNil

115
Fidelity Funds - Global Financial Services Fund
Investments in Collective Investment SchemesFidelity Funds - Global Financial Services Fund, an ILP sub-fund, feeds 100% into the underlying Luxembourg registered Fidelity Funds - Global Financial Services Fund (Class A). Market Value EUR % of Net Assets130,855 99%
Exposure to DerivativesNot Applicable
BorrowingsNot Applicable
Related Party TransactionsNil
Total Subscriptions and Redemptions for the 12 months ended 30 June 2016 EUR
Subscriptions 63,891 Redemptions (57,289)
Any Other Material Information That Will Adversely Impact The Valuation Of The Fund Nil
Soft Dollar CommissionNot Applicable
Fund Performance as at 30 June 2016
Fund / Benchmark 3 Months 6 Months 1 Year 3 Years* 5 Years* 10 Years*Since Inception*
(1 Sep 2000)
Fidelity Funds - Global Financial Services Fund
-0.51% -10.32% -11.10% 8.43% 9.96% 2.26% 2.13%
Benchmark: Financial Services Blend 0.85% -8.75% -13.72% 6.97% 8.28% -0.22% 0.24%
*Annualised Performance
FIL Investment Management (Singapore) Limited

116
Underlying Fund:Fidelity Funds - Global Financial Services Fund (Class A)
Top 10 Holdings as at 30 June 2016 Market Value EUR % of Net AssetsJPMORGAN CHASE & CO 34,948,607 5.19%BERKSHIRE HATHAWAY (B) 23,869,422 3.54%AIA GROUP 18,980,997 2.82%CITIGROUP 18,809,081 2.79%AMERICAN TOWER 18,316,212 2.72%HARTFORD FINANCIAL SERVICES GROUP 16,796,608 2.49%WELLS FARGO & CO 14,628,823 2.17%GRAND CITY PROPERTIES SA 14,147,220 2.10%BROADRIDGE FINANCIAL SOLUTIONS 13,878,737 2.06%ALLSTATE 13,650,931 2.03%
Top 10 Holdings as at 30 June 2015 Market Value EUR % of Net AssetsJPMORGAN CHASE & CO 30,862,134 4.23%CITIGROUP 20,187,117 2.77%WELLS FARGO & CO 17,387,322 2.38%INTESA SANPAOLO 15,796,374 2.17%LLOYDS BANKING GROUP 14,715,623 2.02%AMERICAN TOWER 14,703,896 2.02%UBS GROUP 14,149,000 1.94%INDUSTRIAL & COMMERCIAL BANK OF CHINA (H) 13,168,050 1.81%DEUTSCHE ANNINGTON IMMOBILIEN 13,147,396 1.80%GRAND CITY PROPERTIES 12,914,287 1.77%
Expense Ratio For the 12 months ended For the 12 months ended 30 April 2015 30 April 2014 1.91% 1.93%
Turnover Ratio For the 12 months ended For the 12 months ended 30 April 2016 30 April 2015 28.21% 57.13%
Other Material InformationNil

117
Fidelity Funds - Global Technology Fund
Investments in Collective Investment SchemesFidelity Funds - Global Technology Fund, an ILP sub-fund, feeds 100% into the underlying Luxembourg registered Fidelity Funds - Global Technology Fund (Class A). Market Value EUR % of Net Assets185,239 100%
Exposure to DerivativesNot Applicable
BorrowingsNot Applicable
Related Party TransactionsNil
Total Subscriptions and Redemptions for the 12 months ended 30 June 2016 EURSubscriptions 76,658 Redemptions (55,368)
Any Other Material Information That Will Adversely Impact The Valuation Of The FundNil
Soft Dollar CommissionNot Applicable
Fund Performance as at 30 June 2016
Fund / Benchmark 3 Months 6 Months 1 Year 3 Years* 5 Years* 10 Years*Since Inception*(30 Sep 1999)
Fidelity Funds - Global Technology Fund
2.87% -1.48% 4.64% 20.94% 17.63% 9.65% 2.02%
Benchmark: Technology Blend 0.79% -2.49% 1.37% 18.79% 16.62% 9.11% 1.99%
*Annualised Performance
FIL Investment Management (Singapore) Limited
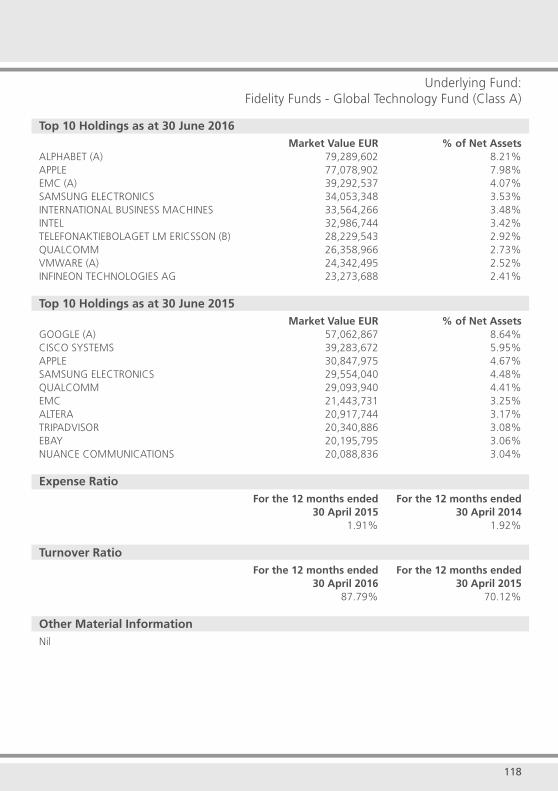
118
Underlying Fund:Fidelity Funds - Global Technology Fund (Class A)
Top 10 Holdings as at 30 June 2016 Market Value EUR % of Net AssetsALPHABET (A) 79,289,602 8.21%APPLE 77,078,902 7.98%EMC (A) 39,292,537 4.07%SAMSUNG ELECTRONICS 34,053,348 3.53%INTERNATIONAL BUSINESS MACHINES 33,564,266 3.48%INTEL 32,986,744 3.42%TELEFONAKTIEBOLAGET LM ERICSSON (B) 28,229,543 2.92%QUALCOMM 26,358,966 2.73%VMWARE (A) 24,342,495 2.52%INFINEON TECHNOLOGIES AG 23,273,688 2.41%
Top 10 Holdings as at 30 June 2015 Market Value EUR % of Net AssetsGOOGLE (A) 57,062,867 8.64%CISCO SYSTEMS 39,283,672 5.95%APPLE 30,847,975 4.67%SAMSUNG ELECTRONICS 29,554,040 4.48%QUALCOMM 29,093,940 4.41%EMC 21,443,731 3.25%ALTERA 20,917,744 3.17%TRIPADVISOR 20,340,886 3.08%EBAY 20,195,795 3.06%NUANCE COMMUNICATIONS 20,088,836 3.04%
Expense Ratio For the 12 months ended For the 12 months ended 30 April 2015 30 April 2014 1.91% 1.92%
Turnover Ratio For the 12 months ended For the 12 months ended 30 April 2016 30 April 2015 87.79% 70.12%
Other Material InformationNil
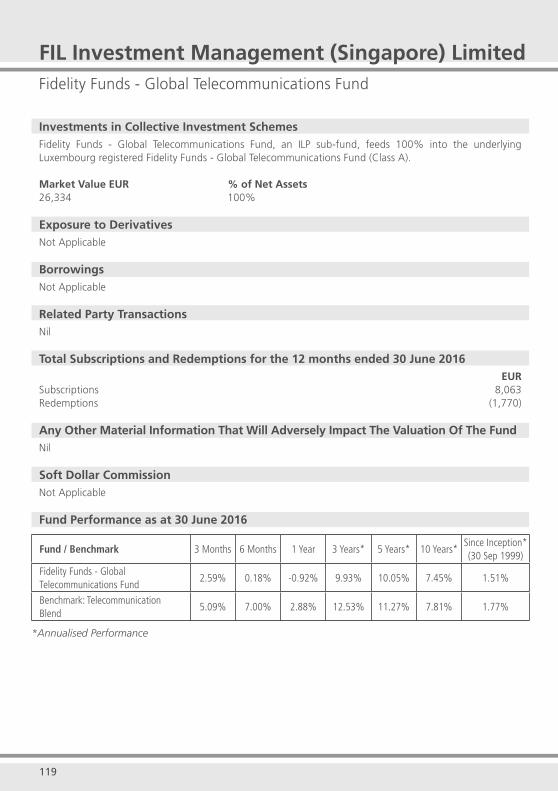
119
Fidelity Funds - Global Telecommunications Fund
Investments in Collective Investment SchemesFidelity Funds - Global Telecommunications Fund, an ILP sub-fund, feeds 100% into the underlying Luxembourg registered Fidelity Funds - Global Telecommunications Fund (Class A). Market Value EUR % of Net Assets26,334 100%
Exposure to DerivativesNot Applicable
BorrowingsNot Applicable
Related Party TransactionsNil
Total Subscriptions and Redemptions for the 12 months ended 30 June 2016 EURSubscriptions 8,063Redemptions (1,770)
Any Other Material Information That Will Adversely Impact The Valuation Of The Fund Nil
Soft Dollar CommissionNot Applicable
Fund Performance as at 30 June 2016
Fund / Benchmark 3 Months 6 Months 1 Year 3 Years* 5 Years* 10 Years*Since Inception*(30 Sep 1999)
Fidelity Funds - Global Telecommunications Fund
2.59% 0.18% -0.92% 9.93% 10.05% 7.45% 1.51%
Benchmark: Telecommunication Blend
5.09% 7.00% 2.88% 12.53% 11.27% 7.81% 1.77%
*Annualised Performance
FIL Investment Management (Singapore) Limited
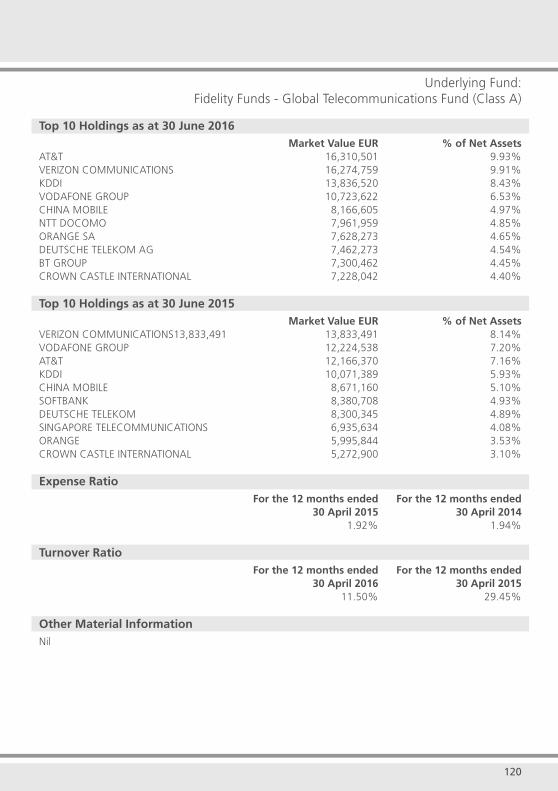
120
Underlying Fund:Fidelity Funds - Global Telecommunications Fund (Class A)
Top 10 Holdings as at 30 June 2016 Market Value EUR % of Net AssetsAT&T 16,310,501 9.93%VERIZON COMMUNICATIONS 16,274,759 9.91%KDDI 13,836,520 8.43%VODAFONE GROUP 10,723,622 6.53%CHINA MOBILE 8,166,605 4.97%NTT DOCOMO 7,961,959 4.85%ORANGE SA 7,628,273 4.65%DEUTSCHE TELEKOM AG 7,462,273 4.54%BT GROUP 7,300,462 4.45%CROWN CASTLE INTERNATIONAL 7,228,042 4.40%
Top 10 Holdings as at 30 June 2015 Market Value EUR % of Net AssetsVERIZON COMMUNICATIONS13,833,491 13,833,491 8.14%VODAFONE GROUP 12,224,538 7.20%AT&T 12,166,370 7.16%KDDI 10,071,389 5.93%CHINA MOBILE 8,671,160 5.10%SOFTBANK 8,380,708 4.93%DEUTSCHE TELEKOM 8,300,345 4.89%SINGAPORE TELECOMMUNICATIONS 6,935,634 4.08%ORANGE 5,995,844 3.53%CROWN CASTLE INTERNATIONAL 5,272,900 3.10%
Expense Ratio For the 12 months ended For the 12 months ended 30 April 2015 30 April 2014 1.92% 1.94%
Turnover Ratio For the 12 months ended For the 12 months ended 30 April 2016 30 April 2015 11.50% 29.45%
Other Material InformationNil

121
Fidelity Funds - Growth & Income Fund
Investments in Collective Investment SchemesFidelity Funds - Growth & Income Fund, an ILP sub-fund, feeds 100% into the underlying Luxembourg registered Fidelity Funds - Growth & Income Fund (Class A). Market Value USD % of Net Assets504,764 101%
Exposure to DerivativesNot Applicable
BorrowingsNot Applicable
Related Party TransactionsNil
Total Subscriptions and Redemptions for the 12 months ended 30 June 2016 USDSubscriptions 96,551 Redemptions (124,148)
Any Other Material Information That Will Adversely Impact The Valuation Of The FundNil
Soft Dollar CommissionNot Applicable
Fund Performance as at 30 June 2016
Fund / Benchmark 3 Months 6 Months 1 Year 3 Years* 5 Years* 10 Years*Since Inception*(20 Nov 2001)
Fidelity Funds - Growth & Income Fund
1.10% 1.45% -1.28% 3.21% 1.94% 3.07% 4.84%
Benchmark: Growth & Income Composite
2.20% 5.66% 3.26% 4.59% 3.74% 4.62% 5.45%
*Annualised Performance
FIL Investment Management (Singapore) Limited
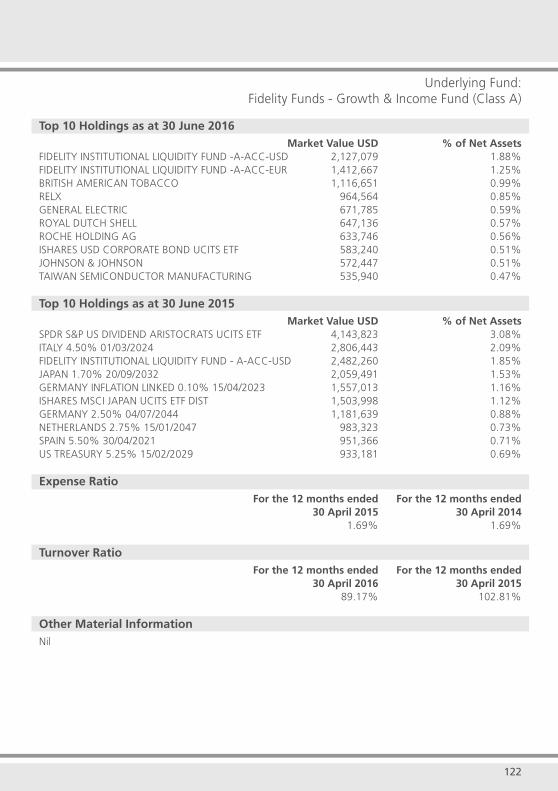
122
Underlying Fund:Fidelity Funds - Growth & Income Fund (Class A)
Top 10 Holdings as at 30 June 2016 Market Value USD % of Net AssetsFIDELITY INSTITUTIONAL LIQUIDITY FUND -A-ACC-USD 2,127,079 1.88%FIDELITY INSTITUTIONAL LIQUIDITY FUND -A-ACC-EUR 1,412,667 1.25%BRITISH AMERICAN TOBACCO 1,116,651 0.99%RELX 964,564 0.85%GENERAL ELECTRIC 671,785 0.59%ROYAL DUTCH SHELL 647,136 0.57%ROCHE HOLDING AG 633,746 0.56%ISHARES USD CORPORATE BOND UCITS ETF 583,240 0.51%JOHNSON & JOHNSON 572,447 0.51%TAIWAN SEMICONDUCTOR MANUFACTURING 535,940 0.47%
Top 10 Holdings as at 30 June 2015 Market Value USD % of Net AssetsSPDR S&P US DIVIDEND ARISTOCRATS UCITS ETF 4,143,823 3.08%ITALY 4.50% 01/03/2024 2,806,443 2.09%FIDELITY INSTITUTIONAL LIQUIDITY FUND - A-ACC-USD 2,482,260 1.85%JAPAN 1.70% 20/09/2032 2,059,491 1.53%GERMANY INFLATION LINKED 0.10% 15/04/2023 1,557,013 1.16%ISHARES MSCI JAPAN UCITS ETF DIST 1,503,998 1.12%GERMANY 2.50% 04/07/2044 1,181,639 0.88%NETHERLANDS 2.75% 15/01/2047 983,323 0.73%SPAIN 5.50% 30/04/2021 951,366 0.71%US TREASURY 5.25% 15/02/2029 933,181 0.69%
Expense Ratio For the 12 months ended For the 12 months ended 30 April 2015 30 April 2014 1.69% 1.69%
Turnover Ratio For the 12 months ended For the 12 months ended 30 April 2016 30 April 2015 89.17% 102.81%
Other Material InformationNil

123
Fidelity Funds - International Bond Fund
Investments in Collective Investment SchemesFidelity Funds - International Bond Fund, an ILP sub-fund, feeds 100% into the underlying Luxembourg registered Fidelity Funds - International Bond Fund (Class A). Market Value USD % of Net Assets121,126 100%
Exposure to DerivativesNot Applicable
BorrowingsNot Applicable
Related Party TransactionsNil
Total Subscriptions and Redemptions for the 12 months ended 30 June 2016 USDSubscriptions 22,154 Redemptions (8,081)
Any Other Material Information That Will Adversely Impact The Valuation Of The FundNil
Soft Dollar CommissionNot Applicable
Fund Performance as at 30 June 2016
Fund / Benchmark 3 Months 6 Months 1 Year 3 Years* 5 Years* 10 Years*Since Inception*
(1 Oct 1990)
Fidelity Funds - International Bond Fund
2.00% 7.41% 5.67% 0.94% 0.24% 3.14% 4.76%
Benchmark: International Bond Fund Composite
3.39% 10.02% 10.12% 2.85% 1.70% 4.33% 6.48%
*Annualised Performance
FIL Investment Management (Singapore) Limited
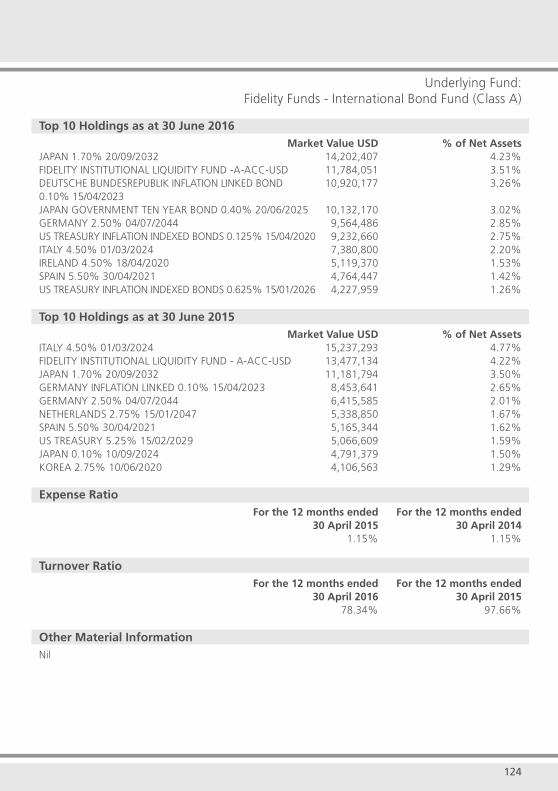
124
Underlying Fund:Fidelity Funds - International Bond Fund (Class A)
Top 10 Holdings as at 30 June 2016 Market Value USD % of Net AssetsJAPAN 1.70% 20/09/2032 14,202,407 4.23%FIDELITY INSTITUTIONAL LIQUIDITY FUND -A-ACC-USD 11,784,051 3.51%DEUTSCHE BUNDESREPUBLIK INFLATION LINKED BOND 10,920,177 3.26%0.10% 15/04/2023JAPAN GOVERNMENT TEN YEAR BOND 0.40% 20/06/2025 10,132,170 3.02%GERMANY 2.50% 04/07/2044 9,564,486 2.85%US TREASURY INFLATION INDEXED BONDS 0.125% 15/04/2020 9,232,660 2.75%ITALY 4.50% 01/03/2024 7,380,800 2.20%IRELAND 4.50% 18/04/2020 5,119,370 1.53%SPAIN 5.50% 30/04/2021 4,764,447 1.42%US TREASURY INFLATION INDEXED BONDS 0.625% 15/01/2026 4,227,959 1.26%
Top 10 Holdings as at 30 June 2015 Market Value USD % of Net AssetsITALY 4.50% 01/03/2024 15,237,293 4.77%FIDELITY INSTITUTIONAL LIQUIDITY FUND - A-ACC-USD 13,477,134 4.22%JAPAN 1.70% 20/09/2032 11,181,794 3.50%GERMANY INFLATION LINKED 0.10% 15/04/2023 8,453,641 2.65%GERMANY 2.50% 04/07/2044 6,415,585 2.01%NETHERLANDS 2.75% 15/01/2047 5,338,850 1.67%SPAIN 5.50% 30/04/2021 5,165,344 1.62%US TREASURY 5.25% 15/02/2029 5,066,609 1.59%JAPAN 0.10% 10/09/2024 4,791,379 1.50%KOREA 2.75% 10/06/2020 4,106,563 1.29%
Expense Ratio For the 12 months ended For the 12 months ended 30 April 2015 30 April 2014 1.15% 1.15%
Turnover Ratio For the 12 months ended For the 12 months ended 30 April 2016 30 April 2015 78.34% 97.66%
Other Material InformationNil

125
Fidelity Funds - Korea Fund
Investments in Collective Investment SchemesFidelity Funds - Korea Fund, an ILP sub-fund, feeds 100% into the underlying Luxembourg registered Fidelity Funds - Korea Fund (Class A). Market Value USD % of Net Assets202,326 100%
Exposure to DerivativesNot Applicable
BorrowingsNot Applicable
Related Party TransactionsNil
Total Subscriptions and Redemptions for the 12 months ended 30 June 2016 USDSubscriptions 45,461Redemptions (31,214)
Any Other Material Information That Will Adversely Impact The Valuation Of The Fund Nil
Soft Dollar CommissionNot Applicable
Fund Performance as at 30 June 2016
Fund / Benchmark 3 Months 6 Months 1 Year 3 Years* 5 Years* 10 Years*Since Inception*
(6 Nov 1995)
Fidelity Funds - Korea Fund -3.15% -0.12% -12.77% 1.11% -6.38% 1.08% 2.68%
Benchmark: KOSPI Blend -2.80% 1.34% -9.52% 1.05% -3.07% 2.17% 1.30%
*Annualised Performance
FIL Investment Management (Singapore) Limited
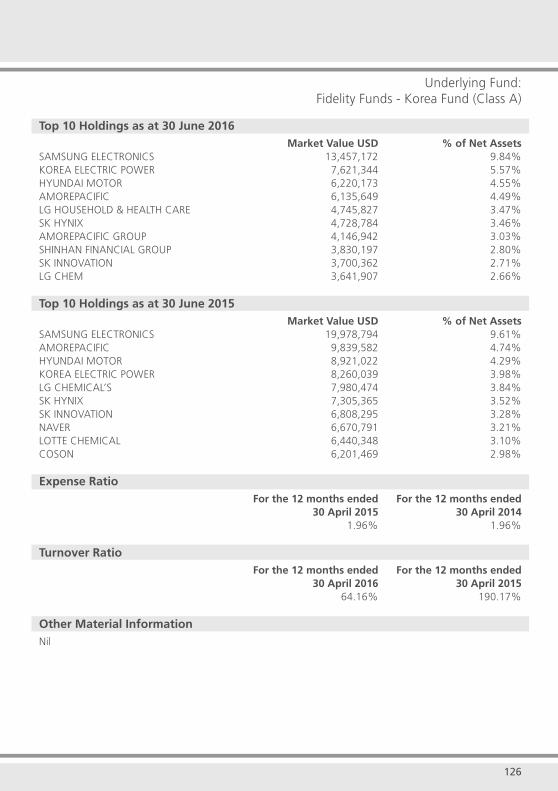
126
Underlying Fund:Fidelity Funds - Korea Fund (Class A)
Top 10 Holdings as at 30 June 2016 Market Value USD % of Net AssetsSAMSUNG ELECTRONICS 13,457,172 9.84%KOREA ELECTRIC POWER 7,621,344 5.57%HYUNDAI MOTOR 6,220,173 4.55%AMOREPACIFIC 6,135,649 4.49%LG HOUSEHOLD & HEALTH CARE 4,745,827 3.47%SK HYNIX 4,728,784 3.46%AMOREPACIFIC GROUP 4,146,942 3.03%SHINHAN FINANCIAL GROUP 3,830,197 2.80%SK INNOVATION 3,700,362 2.71%LG CHEM 3,641,907 2.66%
Top 10 Holdings as at 30 June 2015 Market Value USD % of Net AssetsSAMSUNG ELECTRONICS 19,978,794 9.61%AMOREPACIFIC 9,839,582 4.74%HYUNDAI MOTOR 8,921,022 4.29%KOREA ELECTRIC POWER 8,260,039 3.98%LG CHEMICAL’S 7,980,474 3.84%SK HYNIX 7,305,365 3.52%SK INNOVATION 6,808,295 3.28%NAVER 6,670,791 3.21%LOTTE CHEMICAL 6,440,348 3.10%COSON 6,201,469 2.98%
Expense Ratio For the 12 months ended For the 12 months ended 30 April 2015 30 April 2014 1.96% 1.96%
Turnover Ratio For the 12 months ended For the 12 months ended 30 April 2016 30 April 2015 64.16% 190.17%
Other Material InformationNil

127
Fidelity Funds - Pacific Fund
Investments in Collective Investment SchemesFidelity Funds - Pacific Fund, an ILP sub-fund, feeds 100% into the underlying Luxembourg registered Fidelity Funds - Pacific Fund (Class A). Market Value USD % of Net Assets278,566 100%
Exposure to DerivativesNot Applicable
BorrowingsNot Applicable
Related Party TransactionsNil
Total Subscriptions and Redemptions for the 12 months ended 30 June 2016 USDSubscriptions 99,920Redemptions (92,631)
Any Other Material Information That Will Adversely Impact The Valuation Of The Fund Nil
Soft Dollar CommissionNot Applicable
Fund Performance as at 30 June 2016
Fund / Benchmark 3 Months 6 Months 1 Year 3 Years* 5 Years* 10 Years*Since Inception*(10 Jan 1994)
Fidelity Funds - Pacifi c Fund 0.60% 1.67% -8.23% 7.46% 5.26% 4.99% 4.82%
Benchmark: Pacifi c Fund Composite 0.56% -1.10% -9.77% 1.84% 1.75% 2.46% 2.53%
*Annualised Performance
FIL Investment Management (Singapore) Limited

128
Underlying Fund:Fidelity Funds - Pacific Fund (Class A)
Top 10 Holdings as at 30 June 2016 Market Value USD % of Net AssetsORIX 54,596,831 2.73%SOFTBANK GROUP 37,248,077 1.86%CITIC TELECOM INTERNATIONAL HOLDINGS 26,669,572 1.33%WOORI BANK 26,578,533 1.33%MITSUBISHI UFJ FINANCIAL GROUP 25,848,042 1.29%CHINA PACIFIC INSURANCE GROUP (H) 23,016,574 1.15%LEOPALACE21 22,076,863 1.10%KOREA ELECTRIC POWER 21,476,472 1.07%FUJIBO HOLDINGS 20,282,980 1.01%AEON FINANCIAL SERVICE 19,455,076 0.97%
Top 10 Holdings as at 30 June 2015 Market Value USD % of Net AssetsORIX 62,804,905 2.79%DAOU TECHNOLOGY 41,894,530 1.86%TENCENT HOLDINGS 33,137,800 1.47%BNP (PING AN INSURANCE CHINA (A)) ELN 11/11/2016 30,404,409 1.35%SOFTBANK 29,855,685 1.33%MITSUBISHI UFJ FINANCIAL GROUP 28,609,447 1.27%WOORI BANK 28,466,400 1.27%AIA GROUP 27,370,737 1.22%CITIC TELECOM INTERNATIONAL HOLDINGS 27,248,729 1.21%AEON FINANCIAL SERVICE 26,718,389 1.19%
Expense Ratio For the 12 months ended For the 12 months ended 30 April 2015 30 April 2014 1.92% 1.92%
Turnover Ratio For the 12 months ended For the 12 months ended 30 April 2016 30 April 2015 67.35% 69.97%
Other Material InformationNil

129
Fidelity Funds - SMART Global Moderate Fund^
Investments in Collective Investment SchemesFidelity Funds - SMART Global Moderate Fund, an ILP sub-fund, feeds 100% into the underlying Luxembourg registered Fidelity Funds - SMART Global Moderate Fund (Class A)
^ Prior to 30 June 2016, Fidelity Funds - SMART Global Moderate Fund was known as Fidelity Funds - Fidelity Portfolio Selector (FPS) Global Growth Fund. Market Value USD % of Net Assets96,891 101%
Exposure to DerivativesNot Applicable
BorrowingsNot Applicable
Related Party TransactionsNil
Total Subscriptions and Redemptions for the 12 months ended 30 June 2016 USDSubscriptions 64,719 Redemptions (86,123)
Any Other Material Information That Will Adversely Impact The Valuation Of The Fund Nil
Soft Dollar CommissionNot Applicable
Fund Performance as at 30 June 2016
FIL Investment Management (Singapore) Limited
Fund / Benchmark** 3 Months 6 Months 1 Year 3 Years* 5 Years* 10 Years*Since Inception*
(6 Jan 1998)
Fidelity Funds - SMART Global Moderate Fund
-0.21% -1.21% -5.08% 6.19% 5.48% 3.16% 4.78%
*Annualised Performance**There is no benchmark for Fidelity Funds - SMART Global Moderate Fund since June 2016.
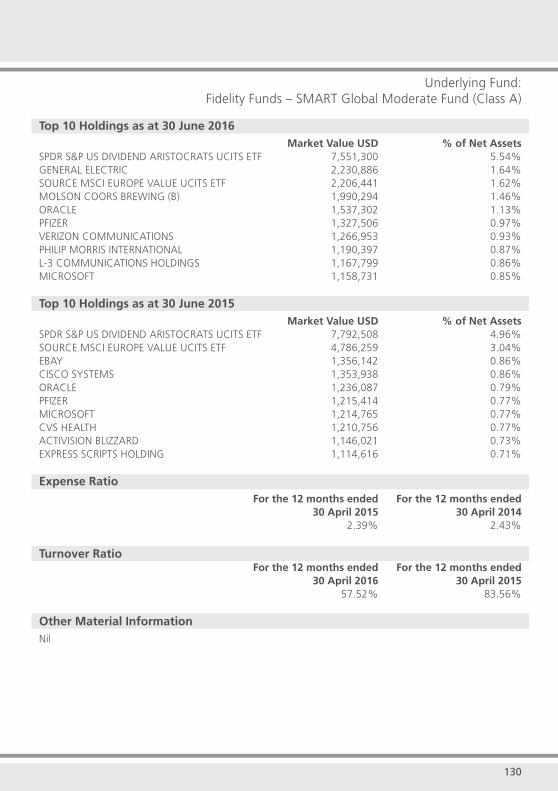
130
Underlying Fund:Fidelity Funds – SMART Global Moderate Fund (Class A)
Top 10 Holdings as at 30 June 2016 Market Value USD % of Net AssetsSPDR S&P US DIVIDEND ARISTOCRATS UCITS ETF 7,551,300 5.54%GENERAL ELECTRIC 2,230,886 1.64%SOURCE MSCI EUROPE VALUE UCITS ETF 2,206,441 1.62%MOLSON COORS BREWING (B) 1,990,294 1.46%ORACLE 1,537,302 1.13%PFIZER 1,327,506 0.97%VERIZON COMMUNICATIONS 1,266,953 0.93%PHILIP MORRIS INTERNATIONAL 1,190,397 0.87%L-3 COMMUNICATIONS HOLDINGS 1,167,799 0.86%MICROSOFT 1,158,731 0.85%
Top 10 Holdings as at 30 June 2015 Market Value USD % of Net AssetsSPDR S&P US DIVIDEND ARISTOCRATS UCITS ETF 7,792,508 4.96%SOURCE MSCI EUROPE VALUE UCITS ETF 4,786,259 3.04%EBAY 1,356,142 0.86%CISCO SYSTEMS 1,353,938 0.86%ORACLE 1,236,087 0.79%PFIZER 1,215,414 0.77%MICROSOFT 1,214,765 0.77%CVS HEALTH 1,210,756 0.77%ACTIVISION BLIZZARD 1,146,021 0.73%EXPRESS SCRIPTS HOLDING 1,114,616 0.71%
Expense Ratio For the 12 months ended For the 12 months ended 30 April 2015 30 April 2014 2.39% 2.43%
Turnover Ratio For the 12 months ended For the 12 months ended 30 April 2016 30 April 2015 57.52% 83.56%
Other Material InformationNil

131
Fidelity Funds - Taiwan Fund
Investments in Collective Investment SchemesFidelity Funds - Taiwan Fund, an ILP sub-fund, feeds 100% into the underlying Luxembourg registered Fidelity Funds - Taiwan Fund (Class A). Market Value USD % of Net Assets118,650 101%
Exposure to DerivativesNot Applicable
BorrowingsNot Applicable
Related Party TransactionsNil
Total Subscriptions and Redemptions for the 12 months ended 30 June 2016 USDSubscriptions 16,074 Redemptions (26,603)
Any Other Material Information That Will Adversely Impact The Valuation Of The FundNil
Soft Dollar CommissionNot Applicable
Fund Performance as at 30 June 2016
Fund / Benchmark 3 Months 6 Months 1 Year 3 Years* 5 Years* 10 Years*Since Inception*
(7 Apr 1997)
Fidelity Funds - Taiwan Fund 0.20% 7.07% -10.15% 5.34% 1.91% 3.26% 0.44%
Benchmark: FF Taiwan Blend 0.20% 6.00% -13.29% 2.03% -0.57% 3.58% -0.26%
*Annualised Performance
FIL Investment Management (Singapore) Limited
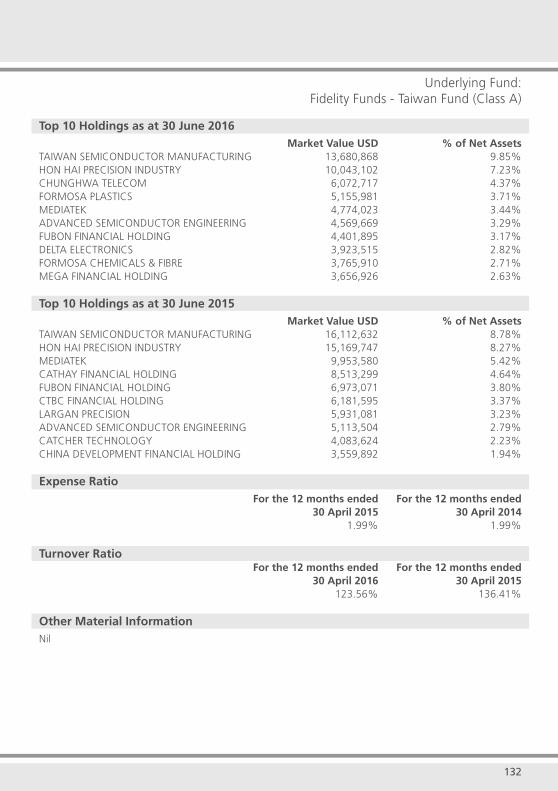
132
Underlying Fund:Fidelity Funds - Taiwan Fund (Class A)
Top 10 Holdings as at 30 June 2016 Market Value USD % of Net AssetsTAIWAN SEMICONDUCTOR MANUFACTURING 13,680,868 9.85%HON HAI PRECISION INDUSTRY 10,043,102 7.23%CHUNGHWA TELECOM 6,072,717 4.37%FORMOSA PLASTICS 5,155,981 3.71%MEDIATEK 4,774,023 3.44%ADVANCED SEMICONDUCTOR ENGINEERING 4,569,669 3.29%FUBON FINANCIAL HOLDING 4,401,895 3.17%DELTA ELECTRONICS 3,923,515 2.82%FORMOSA CHEMICALS & FIBRE 3,765,910 2.71%MEGA FINANCIAL HOLDING 3,656,926 2.63%
Top 10 Holdings as at 30 June 2015 Market Value USD % of Net AssetsTAIWAN SEMICONDUCTOR MANUFACTURING 16,112,632 8.78%HON HAI PRECISION INDUSTRY 15,169,747 8.27%MEDIATEK 9,953,580 5.42%CATHAY FINANCIAL HOLDING 8,513,299 4.64%FUBON FINANCIAL HOLDING 6,973,071 3.80%CTBC FINANCIAL HOLDING 6,181,595 3.37%LARGAN PRECISION 5,931,081 3.23%ADVANCED SEMICONDUCTOR ENGINEERING 5,113,504 2.79%CATCHER TECHNOLOGY 4,083,624 2.23%CHINA DEVELOPMENT FINANCIAL HOLDING 3,559,892 1.94%
Expense Ratio For the 12 months ended For the 12 months ended 30 April 2015 30 April 2014 1.99% 1.99% Turnover Ratio For the 12 months ended For the 12 months ended 30 April 2016 30 April 2015 123.56% 136.41%
Other Material InformationNil

133
Fidelity Funds - United Kingdom Fund
Investments in Collective Investment SchemesFidelity Funds - United Kingdom Fund, an ILP sub-fund, feeds 100% into the underlying Luxembourg registered Fidelity Funds - United Kingdom Fund (Class A). Market Value GBP % of Net Assets129,509 101%
Exposure to DerivativesNot Applicable
BorrowingsNot Applicable
Related Party TransactionsNil
Total Subscriptions and Redemptions for the 12 months ended 30 June 2016 GBPSubscriptions 32,782Redemptions (35,802)
Any Other Material Information That Will Adversely Impact The Valuation Of The Fund Nil
Soft Dollar CommissionNot Applicable
Fund Performance as at 30 June 2016
Fund / Benchmark 3 Months 6 Months 1 Year 3 Years* 5 Years* 10 Years*Since Inception*
(1 Oct 1990)
Fidelity Funds - United Kingdom Fund
0.63% -4.68% -2.96% 5.74% 6.94% 5.17% 7.10%
Benchmark: FTSE All Share Index 4.70% 4.27% 2.21% 5.86% 6.27% 5.38% 8.58%
*Annualised Performance
FIL Investment Management (Singapore) Limited

134
Underlying Fund:Fidelity Funds - United Kingdom Fund (Class A)
Top 10 Holdings as at 30 June 2016 Market Value GBP % of Net AssetsGLAXOSMITHKLINE 7,142,929 8.39%ROYAL DUTCH SHELL (B) 6,098,736 7.16%SHIRE 5,815,451 6.83%BT GROUP 4,774,085 5.61%CRH 4,668,493 5.48%ASTRAZENECA 4,435,329 5.21%WOLSELEY 4,006,031 4.71%VODAFONE GROUP 3,650,290 4.29%LLOYDS BANKING GROUP 3,647,501 4.28%INMARSAT 3,460,259 4.06%
Top 10 Holdings as at 30 June 2015 Market Value GBP % of Net AssetsHSBC HOLDINGS (UK) 7,648,906 6.57%LLOYDS BANKING GROUP 6,986,833 6.00%VODAFONE GROUP 6,178,233 5.30%GLAXOSMITHKLINE 5,843,888 5.02%BARCLAYS 5,386,961 4.62%ASTRAZENECA 5,050,843 4.34%WOLSELEY 4,752,213 4.08%SHIRE 4,386,307 3.76%INTERNATIONAL CONSOLIDATED AIRLINES GROUP 4,208,762 3.61%SKY 4,045,139 3.47%
Expense Ratio For the 12 months ended For the 12 months ended 30 April 2015 30 April 2014 1.92% 1.93% Turnover Ratio For the 12 months ended For the 12 months ended 30 April 2016 30 April 2015 47.14% 51.10%
Other Material InformationNil

135
Fidelity Funds - US Dollar Bond Fund
Investments in Collective Investment SchemesFidelity Funds- US Dollar Bond Fund, an ILP sub-fund, feeds 100% into the underlying Luxembourg registered Fidelity Funds - US Dollar Bond Fund (Class A).
Market Value USD % of Net Assets991,465 99%
Exposure to DerivativesNot Applicable
BorrowingsNot Applicable
Related Party TransactionsNil
Total Subscriptions and Redemptions for the 12 months ended 30 June 2016 USDSubscriptions 536,722Redemptions (281,294)
Any Other Material Information That Will Adversely Impact The Valuation Of The FundNil
Soft Dollar CommissionNot Applicable
Fund Performance as at 30 June 2016
Fund / Benchmark 3 Months 6 Months 1 Year 3 Years* 5 Years* 10 Years*Since Inception*(12 Nov 1990)
Fidelity Funds - US Dollar Bond Fund 2.50% 5.88% 5.90% 4.32% 4.47% 4.96% 5.58%
Benchmark: US Dollar Bond Composite
2.58% 6.18% 6.73% 4.28% 4.09% 5.19% 6.52%
*Annualised Performance
FIL Investment Management (Singapore) Limited
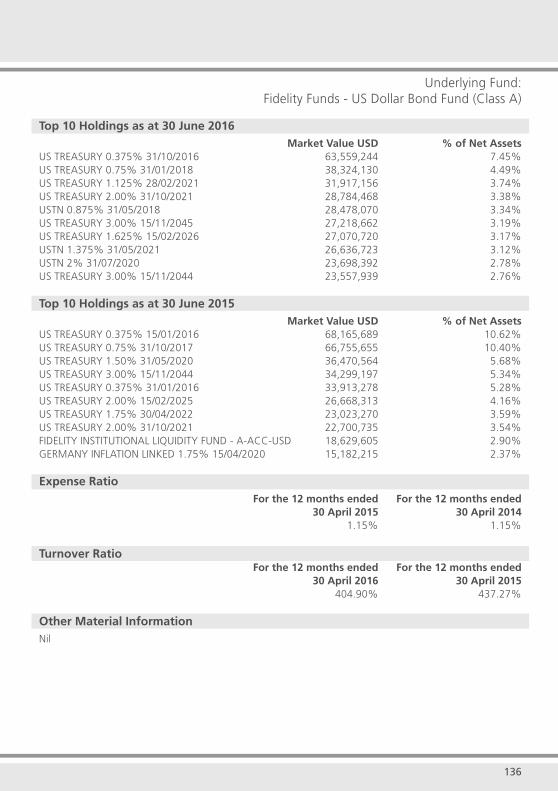
136
Underlying Fund:Fidelity Funds - US Dollar Bond Fund (Class A)
Top 10 Holdings as at 30 June 2016 Market Value USD % of Net AssetsUS TREASURY 0.375% 31/10/2016 63,559,244 7.45%US TREASURY 0.75% 31/01/2018 38,324,130 4.49%US TREASURY 1.125% 28/02/2021 31,917,156 3.74%US TREASURY 2.00% 31/10/2021 28,784,468 3.38%USTN 0.875% 31/05/2018 28,478,070 3.34%US TREASURY 3.00% 15/11/2045 27,218,662 3.19%US TREASURY 1.625% 15/02/2026 27,070,720 3.17%USTN 1.375% 31/05/2021 26,636,723 3.12%USTN 2% 31/07/2020 23,698,392 2.78%US TREASURY 3.00% 15/11/2044 23,557,939 2.76%
Top 10 Holdings as at 30 June 2015 Market Value USD % of Net AssetsUS TREASURY 0.375% 15/01/2016 68,165,689 10.62%US TREASURY 0.75% 31/10/2017 66,755,655 10.40%US TREASURY 1.50% 31/05/2020 36,470,564 5.68%US TREASURY 3.00% 15/11/2044 34,299,197 5.34%US TREASURY 0.375% 31/01/2016 33,913,278 5.28%US TREASURY 2.00% 15/02/2025 26,668,313 4.16%US TREASURY 1.75% 30/04/2022 23,023,270 3.59%US TREASURY 2.00% 31/10/2021 22,700,735 3.54%FIDELITY INSTITUTIONAL LIQUIDITY FUND - A-ACC-USD 18,629,605 2.90%GERMANY INFLATION LINKED 1.75% 15/04/2020 15,182,215 2.37%
Expense Ratio For the 12 months ended For the 12 months ended 30 April 2015 30 April 2014 1.15% 1.15% Turnover Ratio For the 12 months ended For the 12 months ended 30 April 2016 30 April 2015 404.90% 437.27%
Other Material InformationNil

137
First State Investments (Singapore)
First State Regional China Fund
Investments in Collective Investment SchemesFirst State Regional China Fund, an ILP sub-fund, feeds 100% into the underlying Singapore registered First State Regional China Fund.
Market Value SGD % of Net Assets2,241,979 101%
Exposure to DerivativesNot Applicable
BorrowingsNot Applicable
Related Party TransactionsNil
Total Subscriptions and Redemptions for the 12 months ended 30 June 2016SGD
Subscriptions 562,066Redemptions (528,394)
Any Other Material Information That Will Adversely Impact The Valuation Of The FundNil
Soft Dollar CommissionNot Applicable
Fund Performance as at 30 June 2016
Fund / Benchmark 3 Months 6 Months 1 Year 3 Years* 5 Years* 10 Years*Since Inception*
(1 Nov 1993)
First State Regional China Fund -0.77% -8.97% -13.73% 4.87% 4.41% 7.85% 7.58%
Benchmark: MSCI Golden Dragon TR USD
0.53% -5.35% -16.87% 6.31% 3.47% 4.45% NA**
*Annualised Performance**There is no Since Inception fi gure as the benchmark was launched in 1996, after the inception of First State Regional China Fund in 1993.
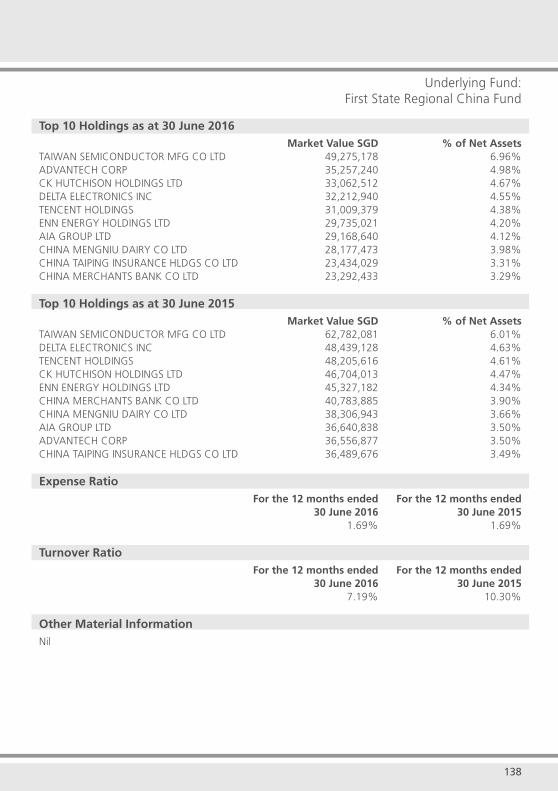
138
Underlying Fund:First State Regional China Fund
Top 10 Holdings as at 30 June 2016 Market Value SGD % of Net AssetsTAIWAN SEMICONDUCTOR MFG CO LTD 49,275,178 6.96%ADVANTECH CORP 35,257,240 4.98%CK HUTCHISON HOLDINGS LTD 33,062,512 4.67%DELTA ELECTRONICS INC 32,212,940 4.55%TENCENT HOLDINGS 31,009,379 4.38%ENN ENERGY HOLDINGS LTD 29,735,021 4.20%AIA GROUP LTD 29,168,640 4.12%CHINA MENGNIU DAIRY CO LTD 28,177,473 3.98%CHINA TAIPING INSURANCE HLDGS CO LTD 23,434,029 3.31%CHINA MERCHANTS BANK CO LTD 23,292,433 3.29%
Top 10 Holdings as at 30 June 2015 Market Value SGD % of Net AssetsTAIWAN SEMICONDUCTOR MFG CO LTD 62,782,081 6.01%DELTA ELECTRONICS INC 48,439,128 4.63%TENCENT HOLDINGS 48,205,616 4.61%CK HUTCHISON HOLDINGS LTD 46,704,013 4.47%ENN ENERGY HOLDINGS LTD 45,327,182 4.34%CHINA MERCHANTS BANK CO LTD 40,783,885 3.90%CHINA MENGNIU DAIRY CO LTD 38,306,943 3.66%AIA GROUP LTD 36,640,838 3.50%ADVANTECH CORP 36,556,877 3.50%CHINA TAIPING INSURANCE HLDGS CO LTD 36,489,676 3.49%
Expense Ratio For the 12 months ended For the 12 months ended 30 June 2016 30 June 2015 1.69% 1.69%
Turnover Ratio For the 12 months ended For the 12 months ended 30 June 2016 30 June 2015 7.19% 10.30%
Other Material InformationNil

139
First State Investments (Singapore)
First State Singapore Growth Fund
Investments in Collective Investment SchemesFirst State Singapore Growth Fund, an ILP sub-fund, feeds 100% into the underlying Singapore registered First State Singapore Growth Fund.
Market Value SGD % of Net Assets2,027,896 101%
Exposure to DerivativesNot Applicable
BorrowingsNot Applicable
Related Party TransactionsNil
Total Subscriptions and Redemptions for the 12 months ended 30 June 2016SGD
Subscriptions 690,828Redemptions (401,622)
Any Other Material Information That Will Adversely Impact The Valuation Of The FundNil
Soft Dollar CommissionNot Applicable
Fund Performance as at 30 June 2016
Fund / Benchmark 3 Months 6 Months 1 Year 3 Years* 5 Years* 10 Years*Since Inception*
(28 Jul 1969)
First State Singapore Growth Fund 0.14% 3.65% -7.08% -0.01% 6.09% 8.23% 8.44%
Benchmark: Market Capitalisation of MSCI Singapore Free Index and MSCI Malaysia Index
-2.46% -6.59% -15.69% -5.02% -1.23% 4.43% NA**
*Annualised Performance**There is no Since Inception fi gure as the current benchmark was not available at the time of the fund’s launch.
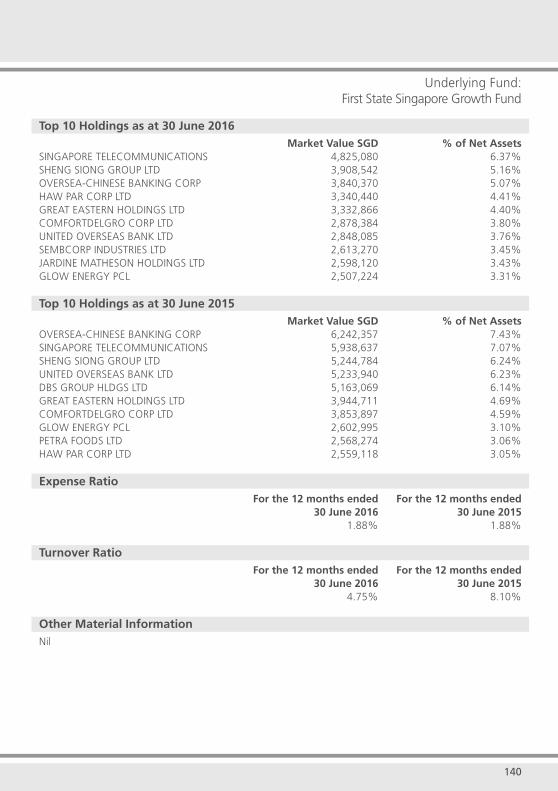
140
Underlying Fund:First State Singapore Growth Fund
Top 10 Holdings as at 30 June 2016 Market Value SGD % of Net AssetsSINGAPORE TELECOMMUNICATIONS 4,825,080 6.37%SHENG SIONG GROUP LTD 3,908,542 5.16%OVERSEA-CHINESE BANKING CORP 3,840,370 5.07%HAW PAR CORP LTD 3,340,440 4.41%GREAT EASTERN HOLDINGS LTD 3,332,866 4.40%COMFORTDELGRO CORP LTD 2,878,384 3.80%UNITED OVERSEAS BANK LTD 2,848,085 3.76%SEMBCORP INDUSTRIES LTD 2,613,270 3.45%JARDINE MATHESON HOLDINGS LTD 2,598,120 3.43%GLOW ENERGY PCL 2,507,224 3.31%
Top 10 Holdings as at 30 June 2015 Market Value SGD % of Net AssetsOVERSEA-CHINESE BANKING CORP 6,242,357 7.43%SINGAPORE TELECOMMUNICATIONS 5,938,637 7.07%SHENG SIONG GROUP LTD 5,244,784 6.24%UNITED OVERSEAS BANK LTD 5,233,940 6.23%DBS GROUP HLDGS LTD 5,163,069 6.14%GREAT EASTERN HOLDINGS LTD 3,944,711 4.69%COMFORTDELGRO CORP LTD 3,853,897 4.59%GLOW ENERGY PCL 2,602,995 3.10%PETRA FOODS LTD 2,568,274 3.06%HAW PAR CORP LTD 2,559,118 3.05%
Expense Ratio For the 12 months ended For the 12 months ended 30 June 2016 30 June 2015 1.88% 1.88%
Turnover Ratio For the 12 months ended For the 12 months ended 30 June 2016 30 June 2015 4.75% 8.10%
Other Material InformationNil
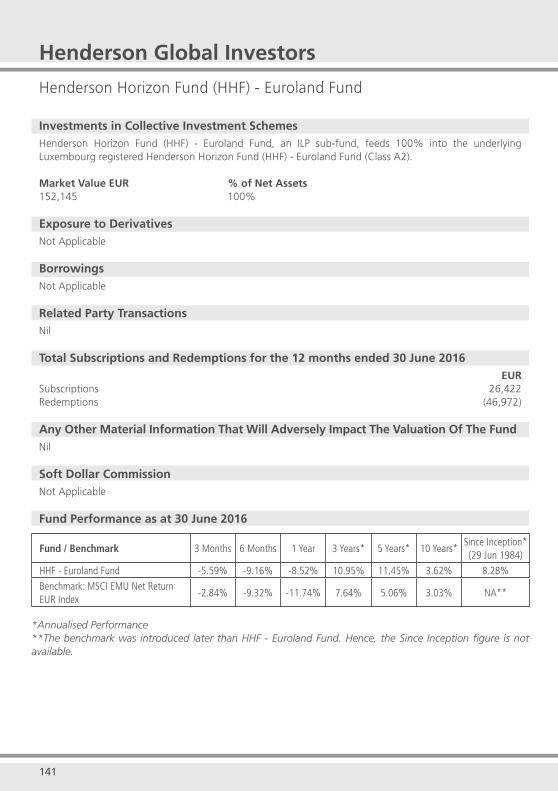
141
Henderson Global Investors
Henderson Horizon Fund (HHF) - Euroland Fund
Investments in Collective Investment SchemesHenderson Horizon Fund (HHF) - Euroland Fund, an ILP sub-fund, feeds 100% into the underlying Luxembourg registered Henderson Horizon Fund (HHF) - Euroland Fund (Class A2).
Market Value EUR % of Net Assets152,145 100%
Exposure to DerivativesNot Applicable
BorrowingsNot Applicable
Related Party TransactionsNil
Total Subscriptions and Redemptions for the 12 months ended 30 June 2016EUR
Subscriptions 26,422 Redemptions (46,972)
Any Other Material Information That Will Adversely Impact The Valuation Of The FundNil
Soft Dollar CommissionNot Applicable
Fund Performance as at 30 June 2016
Fund / Benchmark 3 Months 6 Months 1 Year 3 Years* 5 Years* 10 Years*Since Inception*(29 Jun 1984)
HHF - Euroland Fund -5.59% -9.16% -8.52% 10.95% 11.45% 3.62% 8.28%
Benchmark: MSCI EMU Net Return EUR Index
-2.84% -9.32% -11.74% 7.64% 5.06% 3.03% NA**
*Annualised Performance **The benchmark was introduced later than HHF - Euroland Fund. Hence, the Since Inception fi gure is not available.
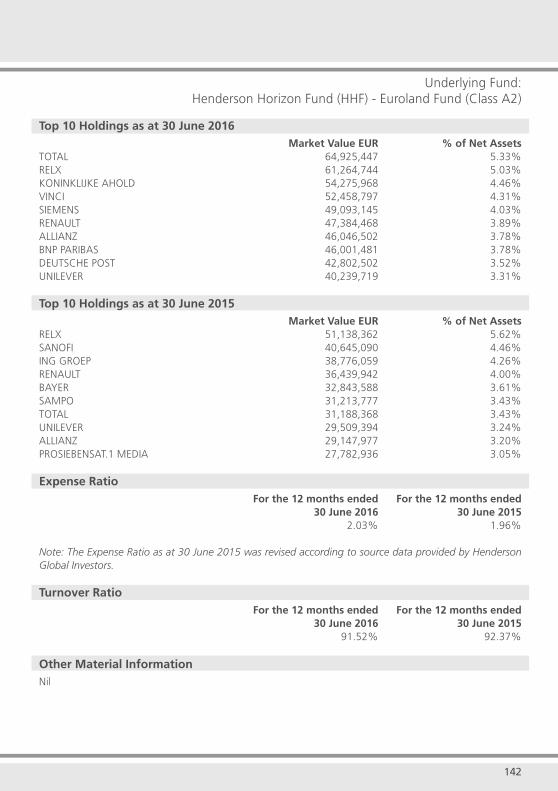
142
Underlying Fund:Henderson Horizon Fund (HHF) - Euroland Fund (Class A2)
Top 10 Holdings as at 30 June 2016 Market Value EUR % of Net AssetsTOTAL 64,925,447 5.33%RELX 61,264,744 5.03%KONINKLIJKE AHOLD 54,275,968 4.46%VINCI 52,458,797 4.31%SIEMENS 49,093,145 4.03%RENAULT 47,384,468 3.89%ALLIANZ 46,046,502 3.78%BNP PARIBAS 46,001,481 3.78%DEUTSCHE POST 42,802,502 3.52%UNILEVER 40,239,719 3.31%
Top 10 Holdings as at 30 June 2015 Market Value EUR % of Net AssetsRELX 51,138,362 5.62%SANOFI 40,645,090 4.46%ING GROEP 38,776,059 4.26%RENAULT 36,439,942 4.00%BAYER 32,843,588 3.61%SAMPO 31,213,777 3.43%TOTAL 31,188,368 3.43%UNILEVER 29,509,394 3.24%ALLIANZ 29,147,977 3.20%PROSIEBENSAT.1 MEDIA 27,782,936 3.05%
Expense Ratio For the 12 months ended For the 12 months ended 30 June 2016 30 June 2015 2.03% 1.96%
Note: The Expense Ratio as at 30 June 2015 was revised according to source data provided by Henderson Global Investors.
Turnover Ratio For the 12 months ended For the 12 months ended 30 June 2016 30 June 2015 91.52% 92.37%
Other Material InformationNil
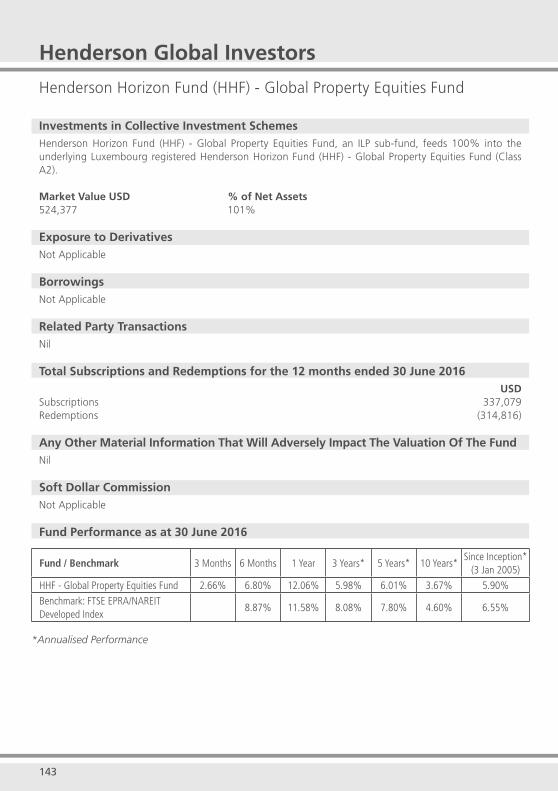
143
Henderson Global Investors
Henderson Horizon Fund (HHF) - Global Property Equities Fund
Investments in Collective Investment SchemesHenderson Horizon Fund (HHF) - Global Property Equities Fund, an ILP sub-fund, feeds 100% into the underlying Luxembourg registered Henderson Horizon Fund (HHF) - Global Property Equities Fund (Class A2).
Market Value USD % of Net Assets524,377 101%
Exposure to DerivativesNot Applicable
BorrowingsNot Applicable
Related Party TransactionsNil
Total Subscriptions and Redemptions for the 12 months ended 30 June 2016USD
Subscriptions 337,079Redemptions (314,816)
Any Other Material Information That Will Adversely Impact The Valuation Of The Fund Nil
Soft Dollar CommissionNot Applicable
Fund Performance as at 30 June 2016
Fund / Benchmark 3 Months 6 Months 1 Year 3 Years* 5 Years* 10 Years*Since Inception*
(3 Jan 2005)
HHF - Global Property Equities Fund 2.66% 6.80% 12.06% 5.98% 6.01% 3.67% 5.90%
Benchmark: FTSE EPRA/NAREIT Developed Index
8.87% 11.58% 8.08% 7.80% 4.60% 6.55%
*Annualised Performance
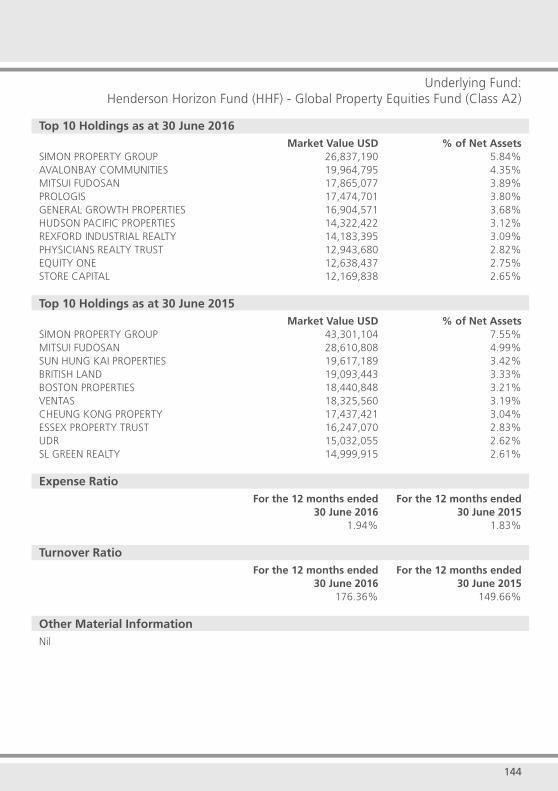
144
Underlying Fund:Henderson Horizon Fund (HHF) - Global Property Equities Fund (Class A2)
Top 10 Holdings as at 30 June 2016 Market Value USD % of Net AssetsSIMON PROPERTY GROUP 26,837,190 5.84%AVALONBAY COMMUNITIES 19,964,795 4.35%MITSUI FUDOSAN 17,865,077 3.89%PROLOGIS 17,474,701 3.80%GENERAL GROWTH PROPERTIES 16,904,571 3.68%HUDSON PACIFIC PROPERTIES 14,322,422 3.12%REXFORD INDUSTRIAL REALTY 14,183,395 3.09%PHYSICIANS REALTY TRUST 12,943,680 2.82%EQUITY ONE 12,638,437 2.75%STORE CAPITAL 12,169,838 2.65%
Top 10 Holdings as at 30 June 2015 Market Value USD % of Net AssetsSIMON PROPERTY GROUP 43,301,104 7.55%MITSUI FUDOSAN 28,610,808 4.99%SUN HUNG KAI PROPERTIES 19,617,189 3.42%BRITISH LAND 19,093,443 3.33%BOSTON PROPERTIES 18,440,848 3.21%VENTAS 18,325,560 3.19%CHEUNG KONG PROPERTY 17,437,421 3.04%ESSEX PROPERTY TRUST 16,247,070 2.83%UDR 15,032,055 2.62%SL GREEN REALTY 14,999,915 2.61%
Expense Ratio For the 12 months ended For the 12 months ended 30 June 2016 30 June 2015 1.94% 1.83%
Turnover Ratio For the 12 months ended For the 12 months ended 30 June 2016 30 June 2015 176.36% 149.66%
Other Material InformationNil
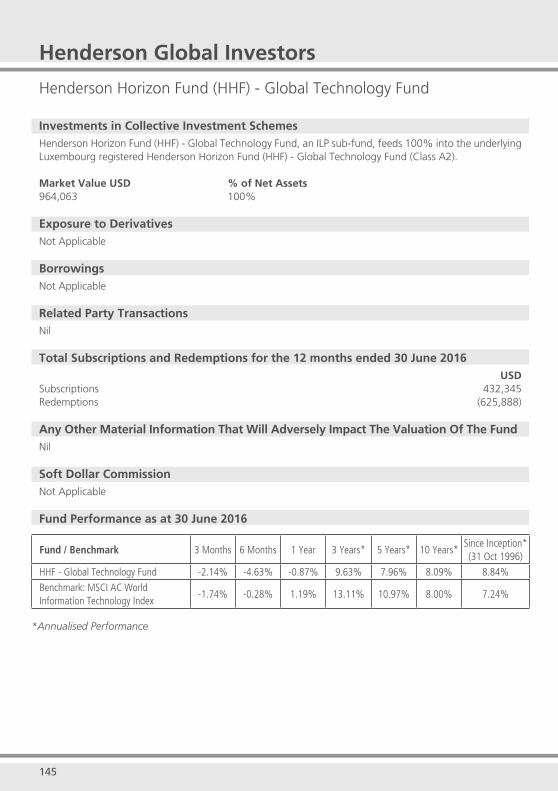
145 146
Henderson Global Investors
Henderson Horizon Fund (HHF) - Global Technology Fund
Investments in Collective Investment SchemesHenderson Horizon Fund (HHF) - Global Technology Fund, an ILP sub-fund, feeds 100% into the underlying Luxembourg registered Henderson Horizon Fund (HHF) - Global Technology Fund (Class A2).
Market Value USD % of Net Assets964,063 100%
Exposure to DerivativesNot Applicable
BorrowingsNot Applicable
Related Party TransactionsNil
Total Subscriptions and Redemptions for the 12 months ended 30 June 2016USD
Subscriptions 432,345Redemptions (625,888)
Any Other Material Information That Will Adversely Impact The Valuation Of The FundNil
Soft Dollar CommissionNot Applicable
Fund Performance as at 30 June 2016
Fund / Benchmark 3 Months 6 Months 1 Year 3 Years* 5 Years* 10 Years*Since Inception*(31 Oct 1996)
HHF - Global Technology Fund -2.14% -4.63% -0.87% 9.63% 7.96% 8.09% 8.84%
Benchmark: MSCI AC World Information Technology Index
-1.74% -0.28% 1.19% 13.11% 10.97% 8.00% 7.24%
*Annualised Performance
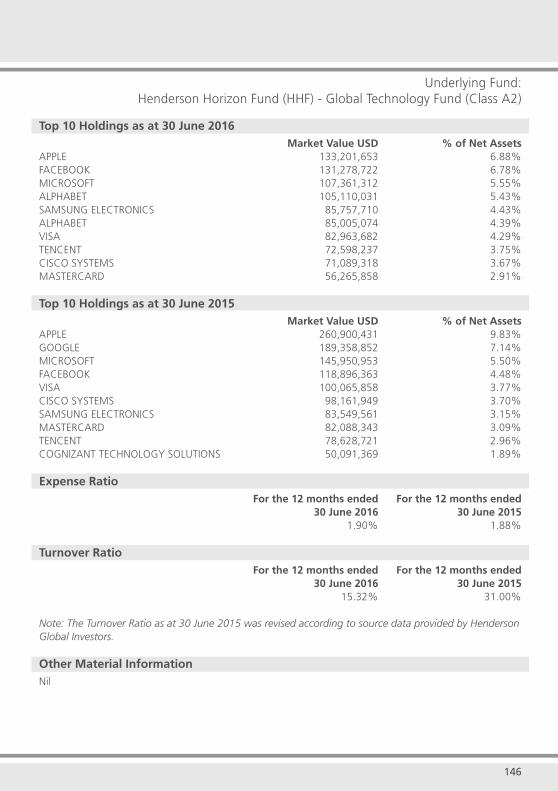
146
Underlying Fund:Henderson Horizon Fund (HHF) - Global Technology Fund (Class A2)
Top 10 Holdings as at 30 June 2016 Market Value USD % of Net AssetsAPPLE 133,201,653 6.88%FACEBOOK 131,278,722 6.78%MICROSOFT 107,361,312 5.55%ALPHABET 105,110,031 5.43%SAMSUNG ELECTRONICS 85,757,710 4.43%ALPHABET 85,005,074 4.39%VISA 82,963,682 4.29%TENCENT 72,598,237 3.75%CISCO SYSTEMS 71,089,318 3.67%MASTERCARD 56,265,858 2.91%
Top 10 Holdings as at 30 June 2015 Market Value USD % of Net AssetsAPPLE 260,900,431 9.83%GOOGLE 189,358,852 7.14%MICROSOFT 145,950,953 5.50%FACEBOOK 118,896,363 4.48%VISA 100,065,858 3.77%CISCO SYSTEMS 98,161,949 3.70%SAMSUNG ELECTRONICS 83,549,561 3.15%MASTERCARD 82,088,343 3.09%TENCENT 78,628,721 2.96%COGNIZANT TECHNOLOGY SOLUTIONS 50,091,369 1.89%
Expense Ratio For the 12 months ended For the 12 months ended 30 June 2016 30 June 2015 1.90% 1.88%
Turnover Ratio For the 12 months ended For the 12 months ended 30 June 2016 30 June 2015 15.32% 31.00%
Note: The Turnover Ratio as at 30 June 2015 was revised according to source data provided by Henderson Global Investors.
Other Material InformationNil
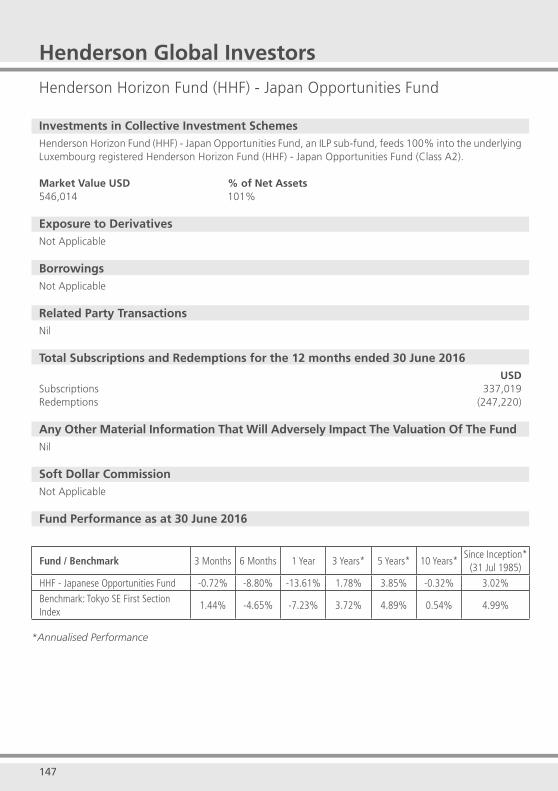
147
Henderson Global Investors
Henderson Horizon Fund (HHF) - Japan Opportunities Fund
Investments in Collective Investment SchemesHenderson Horizon Fund (HHF) - Japan Opportunities Fund, an ILP sub-fund, feeds 100% into the underlying Luxembourg registered Henderson Horizon Fund (HHF) - Japan Opportunities Fund (Class A2).
Market Value USD % of Net Assets546,014 101%
Exposure to DerivativesNot Applicable
BorrowingsNot Applicable
Related Party TransactionsNil
Total Subscriptions and Redemptions for the 12 months ended 30 June 2016USD
Subscriptions 337,019Redemptions (247,220)
Any Other Material Information That Will Adversely Impact The Valuation Of The FundNil
Soft Dollar CommissionNot Applicable
Fund Performance as at 30 June 2016
Fund / Benchmark 3 Months 6 Months 1 Year 3 Years* 5 Years* 10 Years*Since Inception*
(31 Jul 1985)
HHF - Japanese Opportunities Fund -0.72% -8.80% -13.61% 1.78% 3.85% -0.32% 3.02%
Benchmark: Tokyo SE First Section Index
1.44% -4.65% -7.23% 3.72% 4.89% 0.54% 4.99%
*Annualised Performance
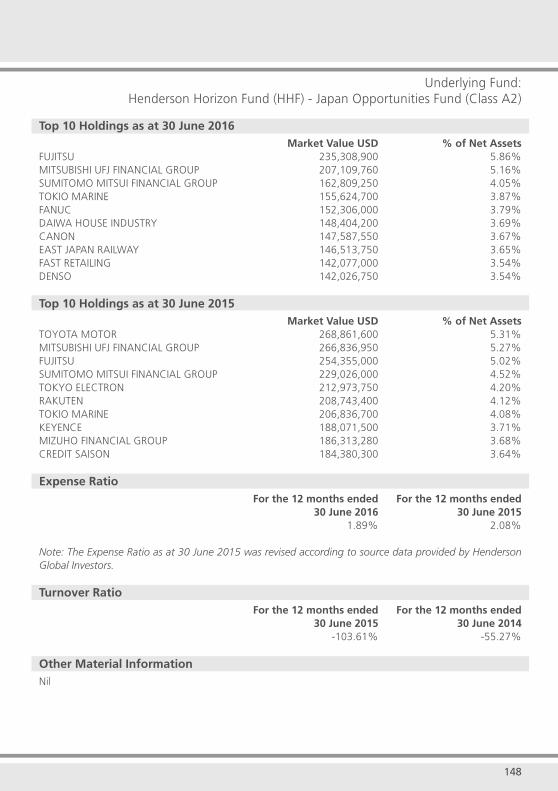
148
Underlying Fund:Henderson Horizon Fund (HHF) - Japan Opportunities Fund (Class A2)
Top 10 Holdings as at 30 June 2016 Market Value USD % of Net AssetsFUJITSU 235,308,900 5.86%MITSUBISHI UFJ FINANCIAL GROUP 207,109,760 5.16%SUMITOMO MITSUI FINANCIAL GROUP 162,809,250 4.05%TOKIO MARINE 155,624,700 3.87%FANUC 152,306,000 3.79%DAIWA HOUSE INDUSTRY 148,404,200 3.69%CANON 147,587,550 3.67%EAST JAPAN RAILWAY 146,513,750 3.65%FAST RETAILING 142,077,000 3.54%DENSO 142,026,750 3.54%
Top 10 Holdings as at 30 June 2015 Market Value USD % of Net AssetsTOYOTA MOTOR 268,861,600 5.31%MITSUBISHI UFJ FINANCIAL GROUP 266,836,950 5.27%FUJITSU 254,355,000 5.02%SUMITOMO MITSUI FINANCIAL GROUP 229,026,000 4.52%TOKYO ELECTRON 212,973,750 4.20%RAKUTEN 208,743,400 4.12%TOKIO MARINE 206,836,700 4.08%KEYENCE 188,071,500 3.71%MIZUHO FINANCIAL GROUP 186,313,280 3.68%CREDIT SAISON 184,380,300 3.64%
Expense Ratio For the 12 months ended For the 12 months ended 30 June 2016 30 June 2015 1.89% 2.08%
Note: The Expense Ratio as at 30 June 2015 was revised according to source data provided by Henderson Global Investors.
Turnover Ratio For the 12 months ended For the 12 months ended 30 June 2015 30 June 2014 -103.61% -55.27%
Other Material InformationNil

149
Henderson Global Investors
Henderson Horizon Fund (HHF) - Pan European Equity Fund
Investments in Collective Investment SchemesHenderson Horizon Fund (HHF) - Pan European Equity Fund, an ILP sub-fund, feeds 100% into the underlying Luxembourg registered Henderson Horizon Fund (HHF) - Pan European Equity Fund (Class A2 Accumulation).
Market Value EUR % of Net Assets5,374 100%
Exposure to DerivativesNot Applicable
BorrowingsNot Applicable
Related Party TransactionsNil
Total Subscriptions and Redemptions for the 12 months ended 30 June 2016EUR
Subscriptions 2,567Redemptions (546)
Any Other Material Information That Will Adversely Impact The Valuation Of The FundNil
Soft Dollar CommissionNot Applicable
Fund Performance as at 30 June 2016
Fund / Benchmark 3 Months 6 Months 1 Year 3 Years* 5 Years* 10 Years*Since Inception*(30 Nov 2001)
HHF - Pan European Equity Fund -2.36% -10.83% -12.22% 8.30% 8.57% 5.33% 6.44%
Benchmark: FTSE World Europe Index
0.00% -6.61% -10.25% 8.04% 7.01% 3.61% 4.14%
*Annualised Performance
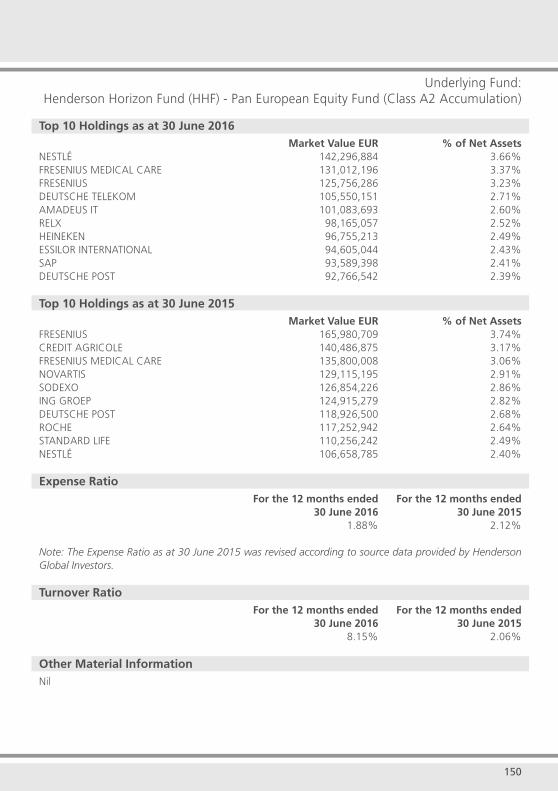
150
Underlying Fund:Henderson Horizon Fund (HHF) - Pan European Equity Fund (Class A2 Accumulation)
Top 10 Holdings as at 30 June 2016 Market Value EUR % of Net AssetsNESTLÉ 142,296,884 3.66%FRESENIUS MEDICAL CARE 131,012,196 3.37%FRESENIUS 125,756,286 3.23%DEUTSCHE TELEKOM 105,550,151 2.71%AMADEUS IT 101,083,693 2.60%RELX 98,165,057 2.52%HEINEKEN 96,755,213 2.49%ESSILOR INTERNATIONAL 94,605,044 2.43%SAP 93,589,398 2.41%DEUTSCHE POST 92,766,542 2.39%
Top 10 Holdings as at 30 June 2015 Market Value EUR % of Net AssetsFRESENIUS 165,980,709 3.74%CREDIT AGRICOLE 140,486,875 3.17%FRESENIUS MEDICAL CARE 135,800,008 3.06%NOVARTIS 129,115,195 2.91%SODEXO 126,854,226 2.86%ING GROEP 124,915,279 2.82%DEUTSCHE POST 118,926,500 2.68%ROCHE 117,252,942 2.64%STANDARD LIFE 110,256,242 2.49%NESTLÉ 106,658,785 2.40%
Expense Ratio For the 12 months ended For the 12 months ended 30 June 2016 30 June 2015 1.88% 2.12%
Note: The Expense Ratio as at 30 June 2015 was revised according to source data provided by Henderson Global Investors.
Turnover Ratio For the 12 months ended For the 12 months ended 30 June 2016 30 June 2015 8.15% 2.06%
Other Material InformationNil

151
Henderson Global Investors
Henderson Horizon Fund (HHF) - Pan European Property Equities Fund
Investments in Collective Investment SchemesHenderson Horizon Fund (HHF) - Pan European Property Equities Fund, an ILP sub-fund, feeds 100% into the underlying Luxembourg registered Henderson Horizon Fund (HHF) - Pan European Property Equities Fund (Class A2).
Market Value EUR % of Net Assets153,279 101%
Exposure to DerivativesNot Applicable
BorrowingsNot Applicable
Related Party TransactionsNil
Total Subscriptions and Redemptions for the 12 months ended 30 June 2016EUR
Subscriptions 30,670 Redemptions (41,918)
Any Other Material Information That Will Adversely Impact The Valuation Of The FundNil
Soft Dollar CommissionNot Applicable
Fund Performance as at 30 June 2016
Fund / Benchmark 3 Months 6 Months 1 Year 3 Years* 5 Years* 10 Years*Since Inception*
(31 Jul 1998)
HHF - Pan European Property Equities Fund
-4.41% -7.99% 0.69% 18.80% 12.69% 1.93% 7.64%
Benchmark: FTSE EPRA/NAREIT Developed Europe Capped Index Net TRI
-3.01% -5.75% 0.30% 15.52% 10.35% 3.30% 8.91%
*Annualised Performance
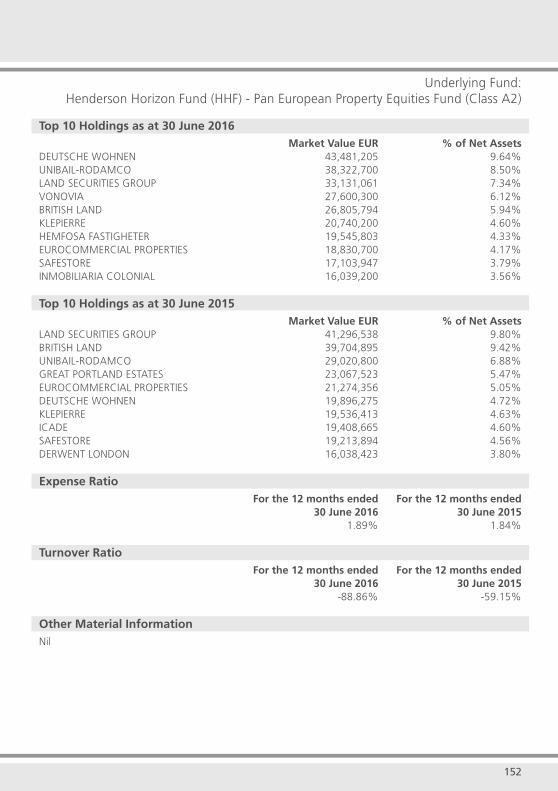
152
Underlying Fund:Henderson Horizon Fund (HHF) - Pan European Property Equities Fund (Class A2)
Top 10 Holdings as at 30 June 2016 Market Value EUR % of Net AssetsDEUTSCHE WOHNEN 43,481,205 9.64%UNIBAIL-RODAMCO 38,322,700 8.50%LAND SECURITIES GROUP 33,131,061 7.34%VONOVIA 27,600,300 6.12%BRITISH LAND 26,805,794 5.94%KLEPIERRE 20,740,200 4.60%HEMFOSA FASTIGHETER 19,545,803 4.33%EUROCOMMERCIAL PROPERTIES 18,830,700 4.17%SAFESTORE 17,103,947 3.79%INMOBILIARIA COLONIAL 16,039,200 3.56%
Top 10 Holdings as at 30 June 2015 Market Value EUR % of Net AssetsLAND SECURITIES GROUP 41,296,538 9.80%BRITISH LAND 39,704,895 9.42%UNIBAIL-RODAMCO 29,020,800 6.88%GREAT PORTLAND ESTATES 23,067,523 5.47%EUROCOMMERCIAL PROPERTIES 21,274,356 5.05%DEUTSCHE WOHNEN 19,896,275 4.72%KLEPIERRE 19,536,413 4.63%ICADE 19,408,665 4.60%SAFESTORE 19,213,894 4.56%DERWENT LONDON 16,038,423 3.80%
Expense Ratio For the 12 months ended For the 12 months ended 30 June 2016 30 June 2015 1.89% 1.84%
Turnover Ratio For the 12 months ended For the 12 months ended 30 June 2016 30 June 2015 -88.86% -59.15%
Other Material InformationNil
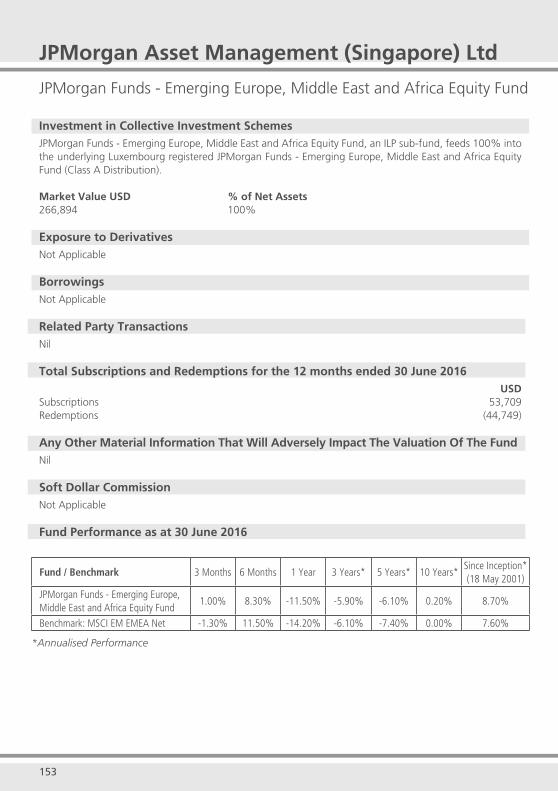
153 154
JPMorgan Asset Management (Singapore) Ltd
JPMorgan Funds - Emerging Europe, Middle East and Africa Equity Fund
Investment in Collective Investment SchemesJPMorgan Funds - Emerging Europe, Middle East and Africa Equity Fund, an ILP sub-fund, feeds 100% into the underlying Luxembourg registered JPMorgan Funds - Emerging Europe, Middle East and Africa Equity Fund (Class A Distribution).
Market Value USD % of Net Assets266,894 100%
Exposure to DerivativesNot Applicable
BorrowingsNot Applicable
Related Party TransactionsNil
Total Subscriptions and Redemptions for the 12 months ended 30 June 2016USD
Subscriptions 53,709Redemptions (44,749)
Any Other Material Information That Will Adversely Impact The Valuation Of The FundNil
Soft Dollar CommissionNot Applicable
Fund Performance as at 30 June 2016
Underlying Fund:JPMorgan Funds - Emerging Europe, Middle East and Africa Equity Fund
(Class A Distribution)
Fund / Benchmark 3 Months 6 Months 1 Year 3 Years* 5 Years* 10 Years*Since Inception*(18 May 2001)
JPMorgan Funds - Emerging Europe, Middle East and Africa Equity Fund
1.00% 8.30% -11.50% -5.90% -6.10% 0.20% 8.70%
Benchmark: MSCI EM EMEA Net -1.30% 11.50% -14.20% -6.10% -7.40% 0.00% 7.60%
*Annualised Performance

153 154
Underlying Fund:JPMorgan Funds - Emerging Europe, Middle East and Africa Equity Fund
(Class A Distribution)
Top 10 Holdings as at 30 June 2016 Market Value USD % of Net AssetsNASPERS 29,926,692 9.98%SBERBANK OF RUSSIA 16,765,341 5.59%GAZPROM 13,253,077 4.42%FIRSTRAND 9,296,683 3.10%ASPEN PHARMACARE 8,433,245 2.81%MAGNIT 7,875,368 2.63%NOVATEK 7,741,800 2.58%QATAR NATIONAL BANK 7,351,990 2.45%SURGUTNEFTEGAZ 7,074,946 2.36%ROSNEFT OIL 6,738,176 2.25%
Top 10 Holdings as at 30 June 2015 Market Value USD % of Net AssetsNASPERS 35,105,065 9.78%MTN 16,312,515 4.54%LUKOIL 14,757,269 4.11%FIRSTRAND 13,903,434 3.87%SBERBANK OF RUSSIA 12,840,642 3.58%MAGNIT 12,197,372 3.40%SURGUTNEFTEGAZ 11,406,587 3.18%ASPEN PHARMACARE 11,153,126 3.11%MMC NORILSK NICKEL 10,085,495 2.81%SANLAM 9,932,763 2.77%
Expense Ratio For the 12 months ended For the 12 months ended 30 June 2016 30 June 2015 1.80% 1.95%
Turnover Ratio For the 12 months ended For the 12 months ended 30 June 2016 30 June 2015 37.17% 75.03%
Other Material InformationNil
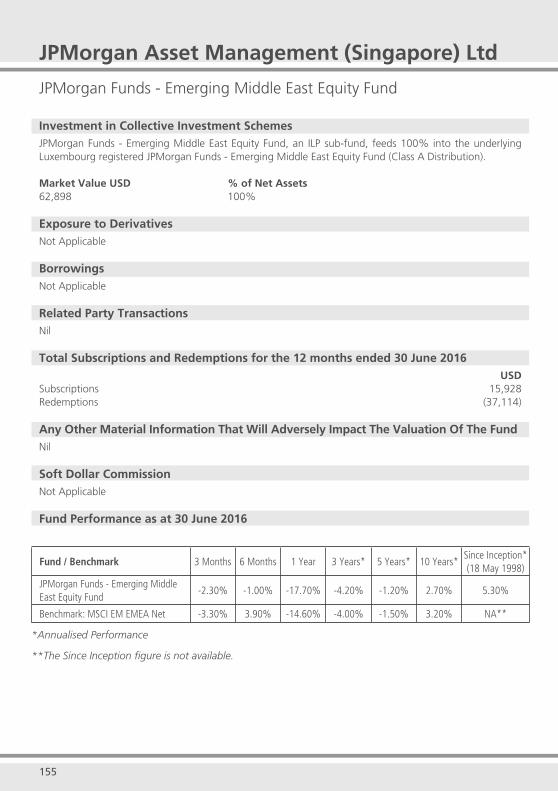
155 156
JPMorgan Funds - Emerging Middle East Equity Fund
Investment in Collective Investment SchemesJPMorgan Funds - Emerging Middle East Equity Fund, an ILP sub-fund, feeds 100% into the underlying Luxembourg registered JPMorgan Funds - Emerging Middle East Equity Fund (Class A Distribution). Market Value USD % of Net Assets62,898 100%
Exposure to DerivativesNot Applicable
BorrowingsNot Applicable
Related Party TransactionsNil
Total Subscriptions and Redemptions for the 12 months ended 30 June 2016USD
Subscriptions 15,928Redemptions (37,114)
Any Other Material Information That Will Adversely Impact The Valuation Of The FundNil
Soft Dollar CommissionNot Applicable
Fund Performance as at 30 June 2016
Fund / Benchmark 3 Months 6 Months 1 Year 3 Years* 5 Years* 10 Years*Since Inception*(18 May 1998)
JPMorgan Funds - Emerging Middle East Equity Fund
-2.30% -1.00% -17.70% -4.20% -1.20% 2.70% 5.30%
Benchmark: MSCI EM EMEA Net -3.30% 3.90% -14.60% -4.00% -1.50% 3.20% NA**
*Annualised Performance
**The Since Inception figure is not available.
JPMorgan Asset Management (Singapore) Ltd
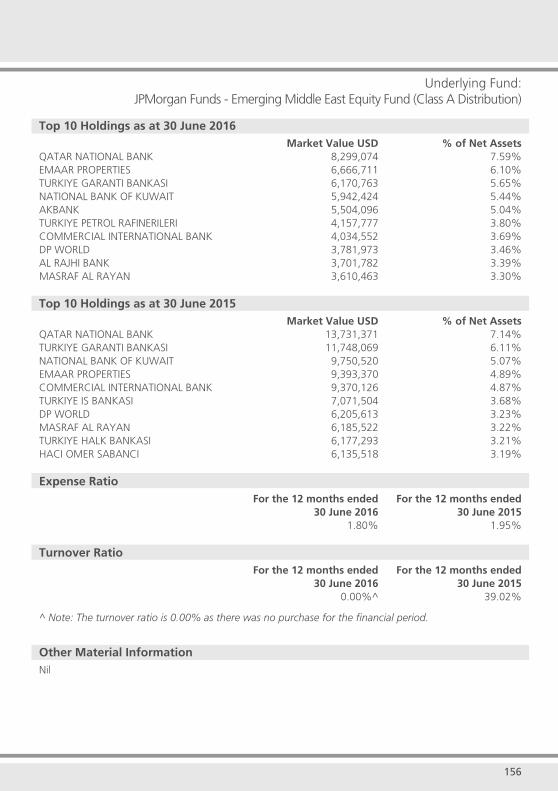
155 156
Underlying Fund:JPMorgan Funds - Emerging Middle East Equity Fund (Class A Distribution)
Top 10 Holdings as at 30 June 2016 Market Value USD % of Net AssetsQATAR NATIONAL BANK 8,299,074 7.59%EMAAR PROPERTIES 6,666,711 6.10%TURKIYE GARANTI BANKASI 6,170,763 5.65%NATIONAL BANK OF KUWAIT 5,942,424 5.44%AKBANK 5,504,096 5.04%TURKIYE PETROL RAFINERILERI 4,157,777 3.80%COMMERCIAL INTERNATIONAL BANK 4,034,552 3.69%DP WORLD 3,781,973 3.46%AL RAJHI BANK 3,701,782 3.39%MASRAF AL RAYAN 3,610,463 3.30%
Top 10 Holdings as at 30 June 2015 Market Value USD % of Net AssetsQATAR NATIONAL BANK 13,731,371 7.14%TURKIYE GARANTI BANKASI 11,748,069 6.11%NATIONAL BANK OF KUWAIT 9,750,520 5.07%EMAAR PROPERTIES 9,393,370 4.89%COMMERCIAL INTERNATIONAL BANK 9,370,126 4.87%TURKIYE IS BANKASI 7,071,504 3.68%DP WORLD 6,205,613 3.23%MASRAF AL RAYAN 6,185,522 3.22%TURKIYE HALK BANKASI 6,177,293 3.21%HACI OMER SABANCI 6,135,518 3.19%
Expense Ratio For the 12 months ended For the 12 months ended 30 June 2016 30 June 2015 1.80% 1.95%
Turnover Ratio For the 12 months ended For the 12 months ended 30 June 2016 30 June 2015 0.00%^ 39.02%
^ Note: The turnover ratio is 0.00% as there was no purchase for the financial period.
Other Material InformationNil
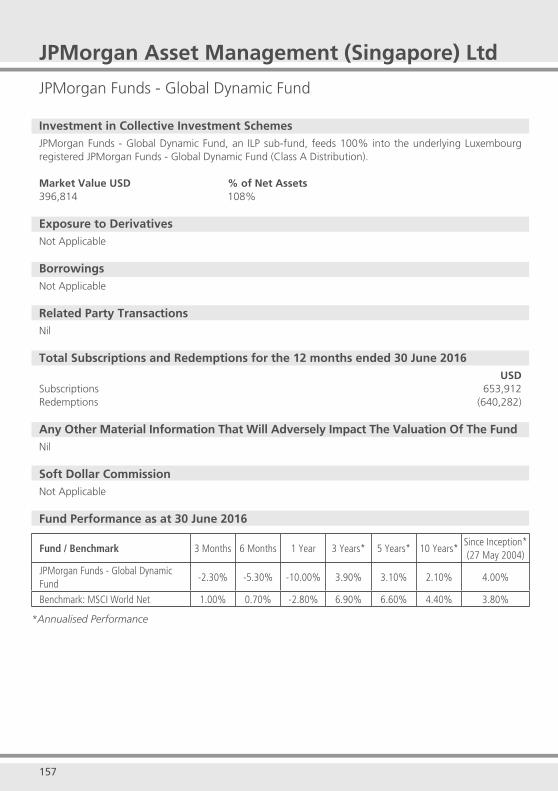
157 158
JPMorgan Asset Management (Singapore) Ltd
JPMorgan Funds - Global Dynamic Fund
Investment in Collective Investment SchemesJPMorgan Funds - Global Dynamic Fund, an ILP sub-fund, feeds 100% into the underlying Luxembourg registered JPMorgan Funds - Global Dynamic Fund (Class A Distribution).
Market Value USD % of Net Assets396,814 108%
Exposure to DerivativesNot Applicable
BorrowingsNot Applicable
Related Party TransactionsNil
Total Subscriptions and Redemptions for the 12 months ended 30 June 2016USD
Subscriptions 653,912 Redemptions (640,282)
Any Other Material Information That Will Adversely Impact The Valuation Of The FundNil
Soft Dollar CommissionNot Applicable
Fund Performance as at 30 June 2016 Fund / Benchmark 3 Months 6 Months 1 Year 3 Years* 5 Years* 10 Years*
Since Inception*(27 May 2004)
JPMorgan Funds - Global Dynamic Fund
-2.30% -5.30% -10.00% 3.90% 3.10% 2.10% 4.00%
Benchmark: MSCI World Net 1.00% 0.70% -2.80% 6.90% 6.60% 4.40% 3.80%
*Annualised Performance
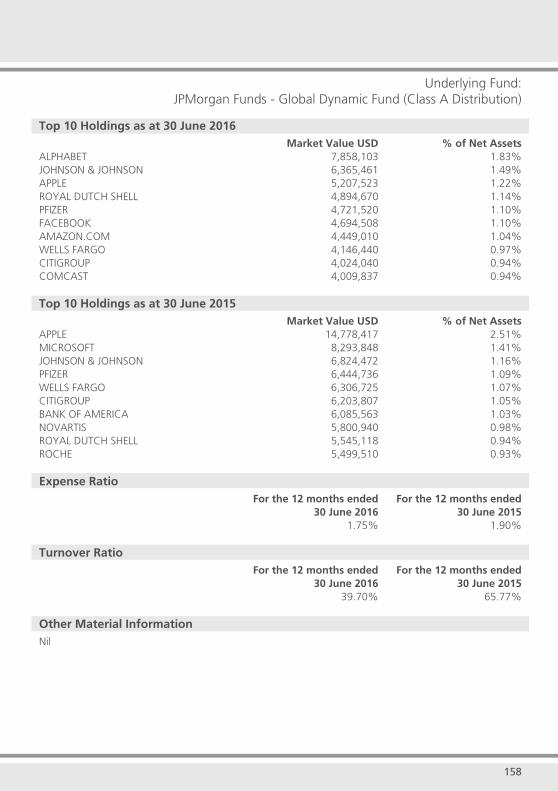
157 158
Underlying Fund:JPMorgan Funds - Global Dynamic Fund (Class A Distribution)
Top 10 Holdings as at 30 June 2016 Market Value USD % of Net AssetsALPHABET 7,858,103 1.83%JOHNSON & JOHNSON 6,365,461 1.49%APPLE 5,207,523 1.22%ROYAL DUTCH SHELL 4,894,670 1.14%PFIZER 4,721,520 1.10%FACEBOOK 4,694,508 1.10%AMAZON.COM 4,449,010 1.04%WELLS FARGO 4,146,440 0.97%CITIGROUP 4,024,040 0.94%COMCAST 4,009,837 0.94%
Top 10 Holdings as at 30 June 2015 Market Value USD % of Net AssetsAPPLE 14,778,417 2.51%MICROSOFT 8,293,848 1.41%JOHNSON & JOHNSON 6,824,472 1.16%PFIZER 6,444,736 1.09%WELLS FARGO 6,306,725 1.07%CITIGROUP 6,203,807 1.05%BANK OF AMERICA 6,085,563 1.03%NOVARTIS 5,800,940 0.98%ROYAL DUTCH SHELL 5,545,118 0.94%ROCHE 5,499,510 0.93%
Expense Ratio For the 12 months ended For the 12 months ended 30 June 2016 30 June 2015 1.75% 1.90%
Turnover Ratio For the 12 months ended For the 12 months ended 30 June 2016 30 June 2015 39.70% 65.77%
Other Material InformationNil
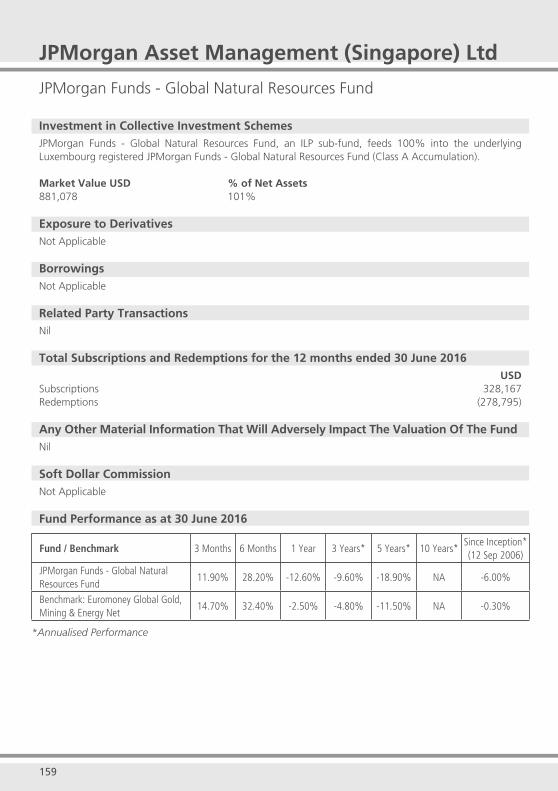
159 160
JPMorgan Asset Management (Singapore) Ltd
JPMorgan Funds - Global Natural Resources Fund
Investment in Collective Investment SchemesJPMorgan Funds - Global Natural Resources Fund, an ILP sub-fund, feeds 100% into the underlying Luxembourg registered JPMorgan Funds - Global Natural Resources Fund (Class A Accumulation). Market Value USD % of Net Assets881,078 101%
Exposure to DerivativesNot Applicable
BorrowingsNot Applicable
Related Party TransactionsNil
Total Subscriptions and Redemptions for the 12 months ended 30 June 2016USD
Subscriptions 328,167 Redemptions (278,795)
Any Other Material Information That Will Adversely Impact The Valuation Of The FundNil
Soft Dollar CommissionNot Applicable
Fund Performance as at 30 June 2016
Fund / Benchmark 3 Months 6 Months 1 Year 3 Years* 5 Years* 10 Years*Since Inception*(12 Sep 2006)
JPMorgan Funds - Global Natural Resources Fund
11.90% 28.20% -12.60% -9.60% -18.90% NA -6.00%
Benchmark: Euromoney Global Gold, Mining & Energy Net
14.70% 32.40% -2.50% -4.80% -11.50% NA -0.30%
*Annualised Performance
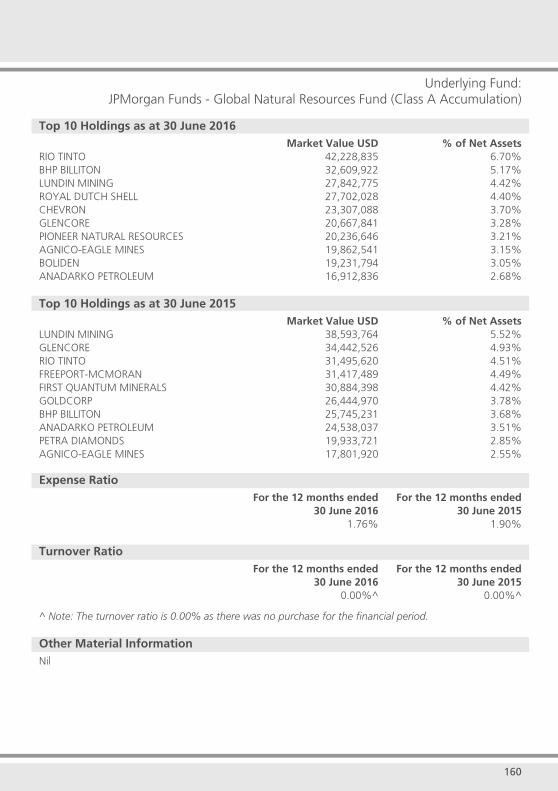
159 160
Underlying Fund:JPMorgan Funds - Global Natural Resources Fund (Class A Accumulation)
Top 10 Holdings as at 30 June 2016 Market Value USD % of Net AssetsRIO TINTO 42,228,835 6.70%BHP BILLITON 32,609,922 5.17%LUNDIN MINING 27,842,775 4.42%ROYAL DUTCH SHELL 27,702,028 4.40%CHEVRON 23,307,088 3.70%GLENCORE 20,667,841 3.28%PIONEER NATURAL RESOURCES 20,236,646 3.21%AGNICO-EAGLE MINES 19,862,541 3.15%BOLIDEN 19,231,794 3.05%ANADARKO PETROLEUM 16,912,836 2.68%
Top 10 Holdings as at 30 June 2015 Market Value USD % of Net AssetsLUNDIN MINING 38,593,764 5.52%GLENCORE 34,442,526 4.93%RIO TINTO 31,495,620 4.51%FREEPORT-MCMORAN 31,417,489 4.49%FIRST QUANTUM MINERALS 30,884,398 4.42%GOLDCORP 26,444,970 3.78%BHP BILLITON 25,745,231 3.68%ANADARKO PETROLEUM 24,538,037 3.51%PETRA DIAMONDS 19,933,721 2.85%AGNICO-EAGLE MINES 17,801,920 2.55%
Expense Ratio For the 12 months ended For the 12 months ended 30 June 2016 30 June 2015 1.76% 1.90%
Turnover Ratio For the 12 months ended For the 12 months ended 30 June 2016 30 June 2015 0.00%^ 0.00%^
^ Note: The turnover ratio is 0.00% as there was no purchase for the financial period. Other Material InformationNil
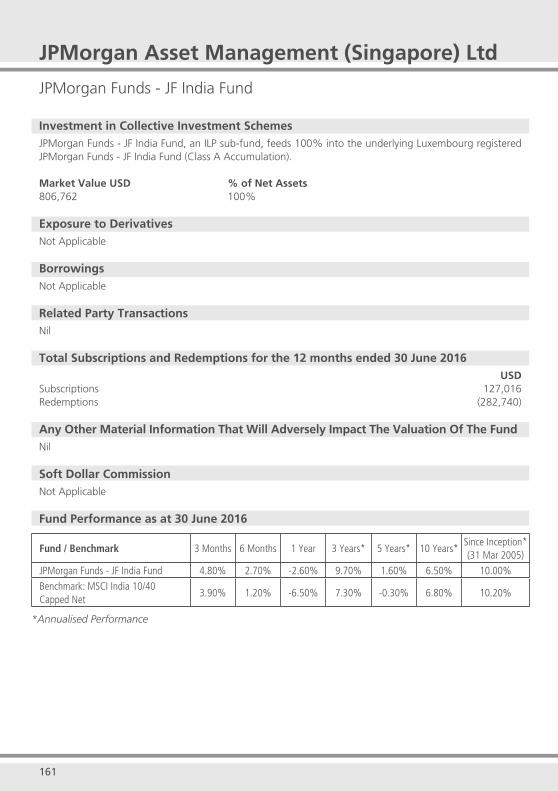
161 162
JPMorgan Asset Management (Singapore) Ltd
JPMorgan Funds - JF India Fund
Investment in Collective Investment SchemesJPMorgan Funds - JF India Fund, an ILP sub-fund, feeds 100% into the underlying Luxembourg registered JPMorgan Funds - JF India Fund (Class A Accumulation). Market Value USD % of Net Assets806,762 100%
Exposure to DerivativesNot Applicable
BorrowingsNot Applicable
Related Party TransactionsNil
Total Subscriptions and Redemptions for the 12 months ended 30 June 2016USD
Subscriptions 127,016 Redemptions (282,740)
Any Other Material Information That Will Adversely Impact The Valuation Of The FundNil
Soft Dollar CommissionNot Applicable
Fund Performance as at 30 June 2016
Fund / Benchmark 3 Months 6 Months 1 Year 3 Years* 5 Years* 10 Years*Since Inception*(31 Mar 2005)
JPMorgan Funds - JF India Fund 4.80% 2.70% -2.60% 9.70% 1.60% 6.50% 10.00%
Benchmark: MSCI India 10/40 Capped Net
3.90% 1.20% -6.50% 7.30% -0.30% 6.80% 10.20%
*Annualised Performance
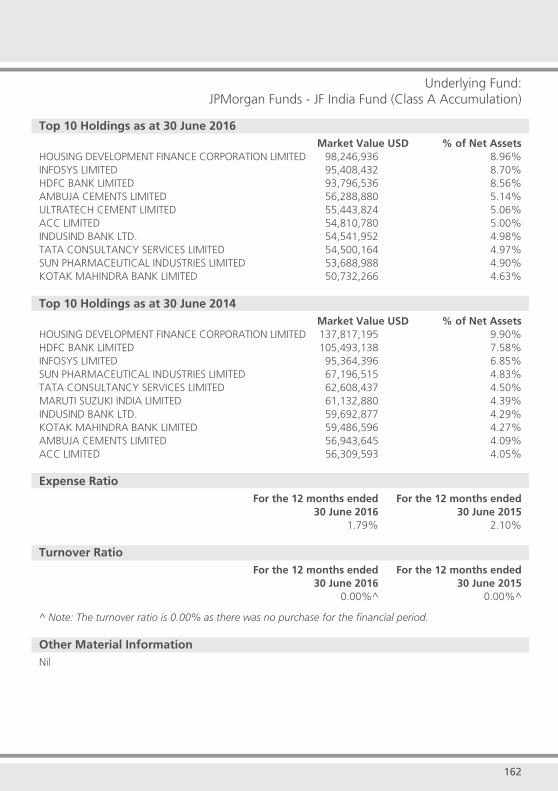
161 162
Underlying Fund:JPMorgan Funds - JF India Fund (Class A Accumulation)
Top 10 Holdings as at 30 June 2016 Market Value USD % of Net AssetsHOUSING DEVELOPMENT FINANCE CORPORATION LIMITED 98,246,936 8.96%INFOSYS LIMITED 95,408,432 8.70%HDFC BANK LIMITED 93,796,536 8.56%AMBUJA CEMENTS LIMITED 56,288,880 5.14%ULTRATECH CEMENT LIMITED 55,443,824 5.06%ACC LIMITED 54,810,780 5.00%INDUSIND BANK LTD. 54,541,952 4.98%TATA CONSULTANCY SERVICES LIMITED 54,500,164 4.97%SUN PHARMACEUTICAL INDUSTRIES LIMITED 53,688,988 4.90%KOTAK MAHINDRA BANK LIMITED 50,732,266 4.63%
Top 10 Holdings as at 30 June 2014 Market Value USD % of Net AssetsHOUSING DEVELOPMENT FINANCE CORPORATION LIMITED 137,817,195 9.90%HDFC BANK LIMITED 105,493,138 7.58%INFOSYS LIMITED 95,364,396 6.85%SUN PHARMACEUTICAL INDUSTRIES LIMITED 67,196,515 4.83%TATA CONSULTANCY SERVICES LIMITED 62,608,437 4.50%MARUTI SUZUKI INDIA LIMITED 61,132,880 4.39%INDUSIND BANK LTD. 59,692,877 4.29%KOTAK MAHINDRA BANK LIMITED 59,486,596 4.27%AMBUJA CEMENTS LIMITED 56,943,645 4.09%ACC LIMITED 56,309,593 4.05%
Expense Ratio For the 12 months ended For the 12 months ended 30 June 2016 30 June 2015 1.79% 2.10%
Turnover Ratio For the 12 months ended For the 12 months ended 30 June 2016 30 June 2015 0.00%^ 0.00%^
^ Note: The turnover ratio is 0.00% as there was no purchase for the financial period. Other Material InformationNil
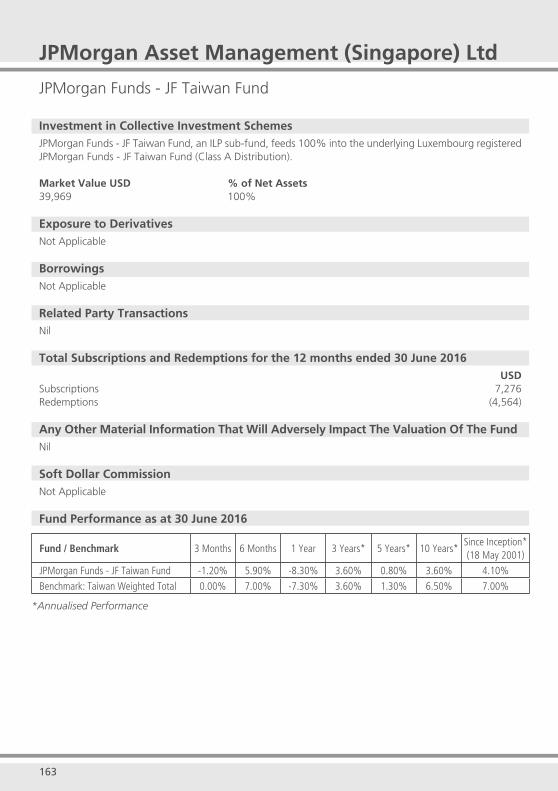
163 164
JPMorgan Asset Management (Singapore) Ltd
JPMorgan Funds - JF Taiwan Fund
Investment in Collective Investment SchemesJPMorgan Funds - JF Taiwan Fund, an ILP sub-fund, feeds 100% into the underlying Luxembourg registered JPMorgan Funds - JF Taiwan Fund (Class A Distribution). Market Value USD % of Net Assets39,969 100%
Exposure to DerivativesNot Applicable
BorrowingsNot Applicable
Related Party TransactionsNil
Total Subscriptions and Redemptions for the 12 months ended 30 June 2016USD
Subscriptions 7,276 Redemptions (4,564)
Any Other Material Information That Will Adversely Impact The Valuation Of The FundNil
Soft Dollar CommissionNot Applicable
Fund Performance as at 30 June 2016
Fund / Benchmark 3 Months 6 Months 1 Year 3 Years* 5 Years* 10 Years*Since Inception*(18 May 2001)
JPMorgan Funds - JF Taiwan Fund -1.20% 5.90% -8.30% 3.60% 0.80% 3.60% 4.10%
Benchmark: Taiwan Weighted Total 0.00% 7.00% -7.30% 3.60% 1.30% 6.50% 7.00%
*Annualised Performance

163 164
Underlying Fund:JPMorgan Funds - JF Taiwan Fund (Class A Distribution)
Top 10 Holdings as at 30 June 2016 Market Value USD % of Net AssetsTAIWAN SEMICONDUCTOR MANUFACTURING CO., LTD. 16,668,604 9.83%LARGAN PRECISION CO., LTD. 10,042,159 5.92%TUNG THIH ELECTRONIC CO., LTD. 6,628,352 3.91%ENNOCONN CORP. 5,935,336 3.50%HON HAI PRECISION INDUSTRY CO., LTD. 5,599,668 3.30%ECLAT TEXTILE CO., LTD. 5,288,116 3.12%YEONG GUAN ENERGY TECHNOLOGY GROUP CO., LTD. 5,273,810 3.11%ADVANCED SEMICONDUCTOR ENGINEERING, INC. 5,170,469 3.05%FORMOSA PETROCHEMICAL CORP 5,042,391 2.97%UNI-PRESIDENT ENTERPRISES CORP. 4,773,134 2.81%
Top 10 Holdings as at 30 June 2014 Market Value USD % of Net AssetsTAIWAN SEMICONDUCTOR MANUFACTURING CO., LTD. 19,547,639 8.50%HON HAI PRECISION INDUSTRY CO., LTD. 14,192,174 6.17%CATHAY FINANCIAL HOLDING CO., LTD. 9,340,968 4.06%LARGAN PRECISION CO., LTD. 8,911,180 3.88%FUBON FINANCIAL HOLDING CO., LTD. 8,340,854 3.63%ADVANCED SEMICONDUCTOR ENGINEERING, INC. 7,208,602 3.14%CATCHER TECHNOLOGY CO., LTD. 7,155,909 3.11%CTBC FINANCIAL HOLDING COMPANY LTD. 6,515,419 2.83%ECLAT TEXTILE CO., LTD. 5,887,439 2.56%PEGATRON CORPORATION 5,850,352 2.54%
Expense Ratio For the 12 months ended For the 12 months ended 30 June 2016 30 June 2015 1.80% 1.90%
Turnover Ratio For the 12 months ended For the 12 months ended 30 June 2016 30 June 2015 94.47% 133.35%
Other Material InformationNil
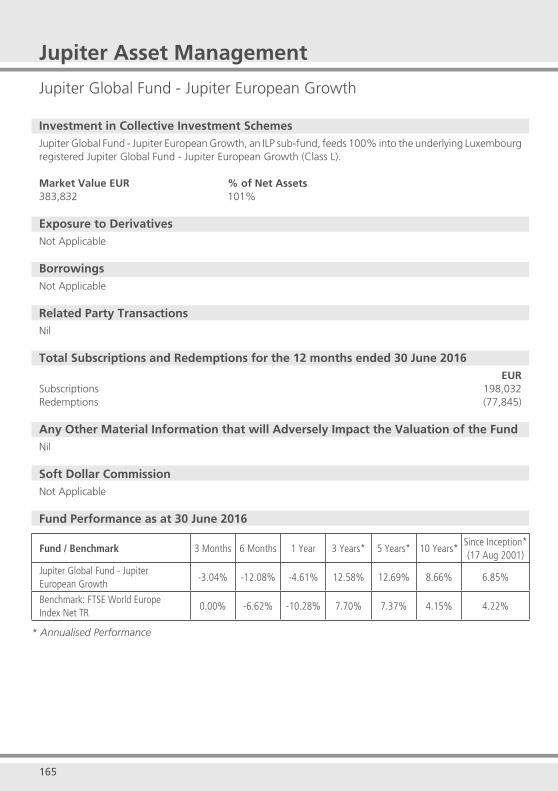
165 166
Jupiter Asset Management
Jupiter Global Fund - Jupiter European Growth
Investment in Collective Investment SchemesJupiter Global Fund - Jupiter European Growth, an ILP sub-fund, feeds 100% into the underlying Luxembourg registered Jupiter Global Fund - Jupiter European Growth (Class L). Market Value EUR % of Net Assets383,832 101%
Exposure to DerivativesNot Applicable
BorrowingsNot Applicable
Related Party TransactionsNil
Total Subscriptions and Redemptions for the 12 months ended 30 June 2016EUR
Subscriptions 198,032 Redemptions (77,845)
Any Other Material Information that will Adversely Impact the Valuation of the FundNil
Soft Dollar CommissionNot Applicable
Fund Performance as at 30 June 2016
Fund / Benchmark 3 Months 6 Months 1 Year 3 Years* 5 Years* 10 Years*Since Inception*(17 Aug 2001)
Jupiter Global Fund - Jupiter European Growth
-3.04% -12.08% -4.61% 12.58% 12.69% 8.66% 6.85%
Benchmark: FTSE World Europe Index Net TR
0.00% -6.62% -10.28% 7.70% 7.37% 4.15% 4.22%
* Annualised Performance
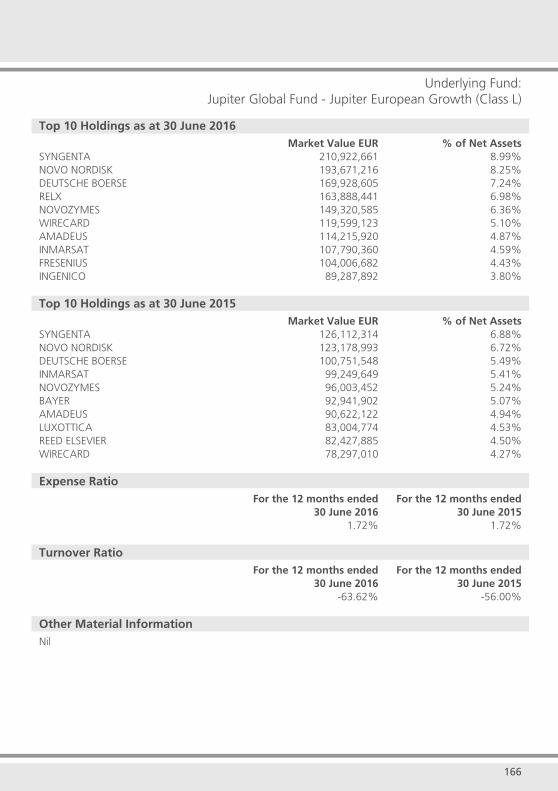
165 166
Underlying Fund:Jupiter Global Fund - Jupiter European Growth (Class L)
Top 10 Holdings as at 30 June 2016 Market Value EUR % of Net AssetsSYNGENTA 210,922,661 8.99%NOVO NORDISK 193,671,216 8.25%DEUTSCHE BOERSE 169,928,605 7.24%RELX 163,888,441 6.98%NOVOZYMES 149,320,585 6.36%WIRECARD 119,599,123 5.10%AMADEUS 114,215,920 4.87%INMARSAT 107,790,360 4.59%FRESENIUS 104,006,682 4.43%INGENICO 89,287,892 3.80%
Top 10 Holdings as at 30 June 2015 Market Value EUR % of Net AssetsSYNGENTA 126,112,314 6.88%NOVO NORDISK 123,178,993 6.72%DEUTSCHE BOERSE 100,751,548 5.49%INMARSAT 99,249,649 5.41%NOVOZYMES 96,003,452 5.24%BAYER 92,941,902 5.07%AMADEUS 90,622,122 4.94%LUXOTTICA 83,004,774 4.53%REED ELSEVIER 82,427,885 4.50%WIRECARD 78,297,010 4.27%
Expense Ratio For the 12 months ended For the 12 months ended 30 June 2016 30 June 2015 1.72% 1.72%
Turnover Ratio For the 12 months ended For the 12 months ended 30 June 2016 30 June 2015 -63.62% -56.00%
Other Material InformationNil

167 168
Jupiter Asset Management
Jupiter Global Fund - Jupiter Global Ecology Growth
Investment in Collective Investment SchemesJupiter Global Fund - Jupiter Global Ecology Growth, an ILP sub-fund, feeds 100% into the underlying Luxembourg registered Jupiter Global Fund - Jupiter Global Ecology Growth (Class L).
Market Value USD % of Net Assets33,755 101%
Exposure to DerivativesNot Applicable
BorrowingsNot Applicable
Related Party TransactionsNil
Total Subscriptions and Redemptions for the 12 months ended 30 June 2016USD
Subscriptions 13,827 Redemptions (4,247)
Any Other Material Information that will Adversely Impact the Valuation of the FundNil
Soft Dollar CommissionNot Applicable
Fund Performance as at 30 June 2016
Fund / Benchmark 3 Months 6 Months 1 Year 3 Years* 5 Years* 10 Years*Since Inception*(15 May 2008)
Jupiter Global Fund - Jupiter Global Ecology Growth
-3.60% -3.63% -10.00% 2.94% 1.83% NA -1.38%
Benchmark: FTSE World Index Net TR
1.10% 1.55% 2.57% 6.88% 6.34% NA 3.25%
* Annualised Performance

167 168
Underlying Fund:Jupiter Global Fund - Jupiter Global Ecology Growth (Class L)
Top 10 Holdings as at 30 June 2016 Market Value USD % of Net AssetsCRANSWICK 17,974,876 3.40%LKQ 16,941,466 3.20%VESTAS WIND SYSTEMS 15,619,623 2.95%A.O. SMITH 14,821,277 2.80%UNITED NATURAL FOODS 14,721,102 2.78%REPUBLIC SERVICES 12,397,577 2.34%JOHNSON MATTHEY 12,386,527 2.34%NOVOZYMES 11,670,114 2.21%JOHNSON CONTROLS 11,498,964 2.17%XYLEM 11,479,233 2.17%
Top 10 Holdings as at 30 June 2015 Market Value USD % of Net AssetsPALL 467,399 4.08%LKQ 389,093 3.40%UNITED NATURAL FOODS 388,984 3.40%CRANSWICK 309,357 2.70%JOHNSON MATTHEY 294,230 2.57%STANTEC 287,015 2.51%REPUBLIC SERVICES 259,856 2.27%REGAL-BELOIT 254,293 2.22%STERICYCLE 252,728 2.21%VESTAS WIND SYSTEMS 242,427 2.12%
Expense Ratio For the 12 months ended For the 12 months ended 30 June 2016 30 June 2015 1.72% 1.72%
Turnover Ratio For the 12 months ended For the 12 months ended 30 June 2016 30 June 2015 -37.48% -23.57%
Other Material InformationNil
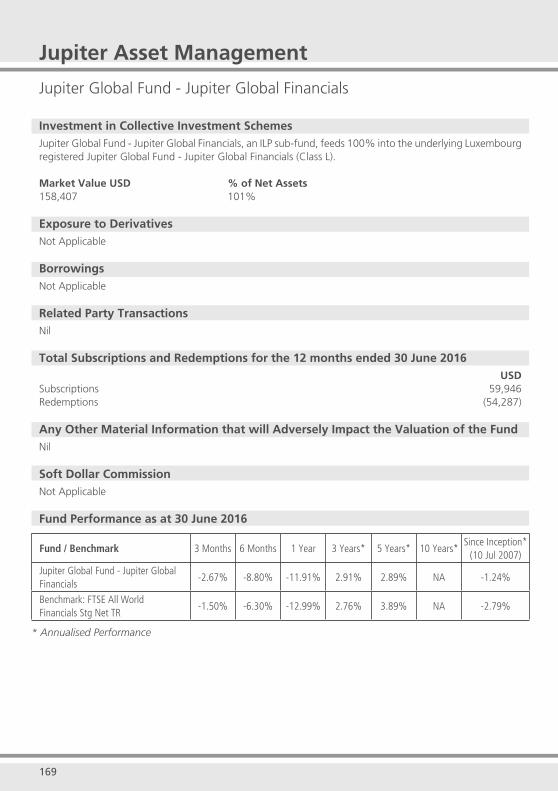
169 170
Jupiter Asset Management
Jupiter Global Fund - Jupiter Global Financials
Investment in Collective Investment SchemesJupiter Global Fund - Jupiter Global Financials, an ILP sub-fund, feeds 100% into the underlying Luxembourg registered Jupiter Global Fund - Jupiter Global Financials (Class L). Market Value USD % of Net Assets158,407 101%
Exposure to DerivativesNot Applicable
BorrowingsNot Applicable
Related Party TransactionsNil
Total Subscriptions and Redemptions for the 12 months ended 30 June 2016USD
Subscriptions 59,946 Redemptions (54,287)
Any Other Material Information that will Adversely Impact the Valuation of the FundNil
Soft Dollar CommissionNot Applicable
Fund Performance as at 30 June 2016
Fund / Benchmark 3 Months 6 Months 1 Year 3 Years* 5 Years* 10 Years*Since Inception*
(10 Jul 2007)
Jupiter Global Fund - Jupiter Global Financials
-2.67% -8.80% -11.91% 2.91% 2.89% NA -1.24%
Benchmark: FTSE All World Financials Stg Net TR
-1.50% -6.30% -12.99% 2.76% 3.89% NA -2.79%
* Annualised Performance
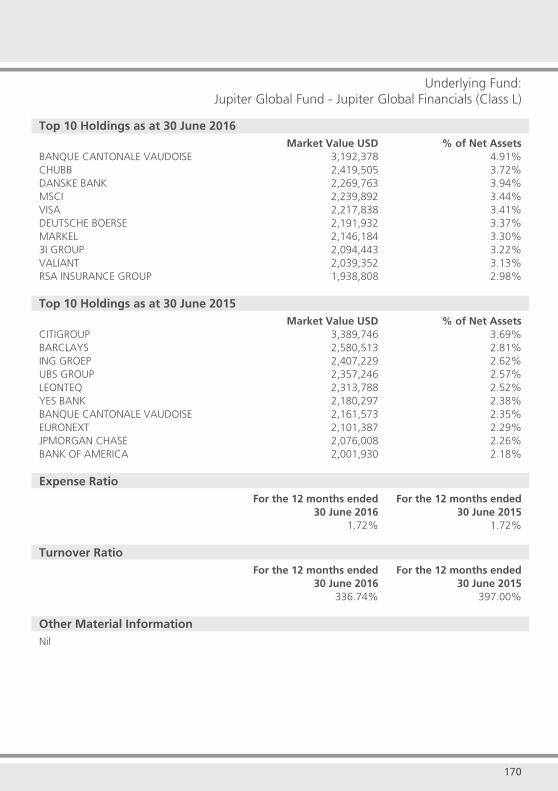
169 170
Underlying Fund:Jupiter Global Fund - Jupiter Global Financials (Class L)
Top 10 Holdings as at 30 June 2016 Market Value USD % of Net AssetsBANQUE CANTONALE VAUDOISE 3,192,378 4.91%CHUBB 2,419,505 3.72%DANSKE BANK 2,269,763 3.94%MSCI 2,239,892 3.44%VISA 2,217,838 3.41%DEUTSCHE BOERSE 2,191,932 3.37%MARKEL 2,146,184 3.30%3I GROUP 2,094,443 3.22%VALIANT 2,039,352 3.13%RSA INSURANCE GROUP 1,938,808 2.98%
Top 10 Holdings as at 30 June 2015 Market Value USD % of Net AssetsCITIGROUP 3,389,746 3.69%BARCLAYS 2,580,513 2.81%ING GROEP 2,407,229 2.62%UBS GROUP 2,357,246 2.57%LEONTEQ 2,313,788 2.52%YES BANK 2,180,297 2.38%BANQUE CANTONALE VAUDOISE 2,161,573 2.35%EURONEXT 2,101,387 2.29%JPMORGAN CHASE 2,076,008 2.26%BANK OF AMERICA 2,001,930 2.18%
Expense Ratio For the 12 months ended For the 12 months ended 30 June 2016 30 June 2015 1.72% 1.72%
Turnover Ratio For the 12 months ended For the 12 months ended 30 June 2016 30 June 2015 336.74% 397.00%
Other Material InformationNil
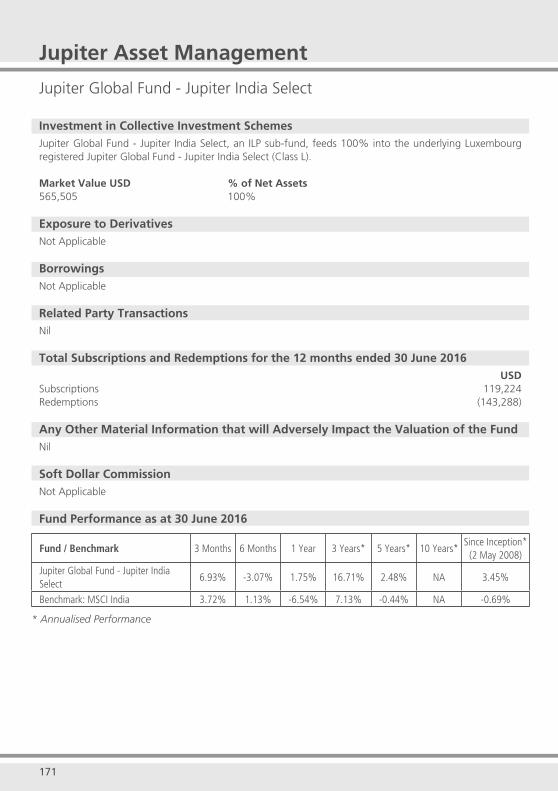
171 172
Jupiter Asset Management
Jupiter Global Fund - Jupiter India Select
Investment in Collective Investment SchemesJupiter Global Fund - Jupiter India Select, an ILP sub-fund, feeds 100% into the underlying Luxembourg registered Jupiter Global Fund - Jupiter India Select (Class L). Market Value USD % of Net Assets565,505 100%
Exposure to DerivativesNot Applicable
BorrowingsNot Applicable
Related Party TransactionsNil
Total Subscriptions and Redemptions for the 12 months ended 30 June 2016USD
Subscriptions 119,224 Redemptions (143,288)
Any Other Material Information that will Adversely Impact the Valuation of the FundNil
Soft Dollar CommissionNot Applicable
Fund Performance as at 30 June 2016
Fund / Benchmark 3 Months 6 Months 1 Year 3 Years* 5 Years* 10 Years*Since Inception*
(2 May 2008)
Jupiter Global Fund - Jupiter India Select
6.93% -3.07% 1.75% 16.71% 2.48% NA 3.45%
Benchmark: MSCI India 3.72% 1.13% -6.54% 7.13% -0.44% NA -0.69%
* Annualised Performance

171 172
Underlying Fund:Jupiter Global Fund - Jupiter India Select (Class L)
Top 10 Holdings as at 30 June 2016 Market Value USD % of Net AssetsHINDUSTAN PETROLEUM 25,179,302 9.58%GODFREY PHILLIPS INDIA 14,196,755 5.40%INFOSYS TECHNOLOGIES 13,898,808 5.29%INTERGLOBE AVIATION 8,038,181 3.06%EROS INTERNATIONAL 7,033,500 2.67%EIH ASSOCIATED HOTELS 6,688,792 2.54%FORCE MOTORS 6,267,236 2.38%STATE BANK OF INDIA 5,418,721 2.06%NESTLE INDIA 5,290,455 2.01%KOTAK MAHINDRA BANK 5,163,682 1.96%
Top 10 Holdings as at 30 June 2015 Market Value USD % of Net AssetsHINDUSTAN PETROLEUM 22,902,238 8.84%INFOSYS TECHNOLOGIES 14,165,153 5.47%GODFREY PHILLIPS INDIA 7,986,635 3.08%NESTLE INDIA 5,486,784 2.12%SUN PHARMACEUTICAL INDUSTRIES 5,340,314 2.06%FORCE MOTORS 5,303,858 2.05%KOTAK MAHINDRA BANK 5,227,467 2.02%STATE BANK OF INDIA 5,212,408 2.01%PRISM CEMENT 5,173,145 2.00%BHARTI AIRTEL 4,947,585 1.91%
Expense Ratio For the 12 months ended For the 12 months ended 30 June 2016 30 June 2015 1.97% 1.97%
Turnover Ratio For the 12 months ended For the 12 months ended 30 June 2016 30 June 2015 -6.68% 4.01%
Other Material InformationNil
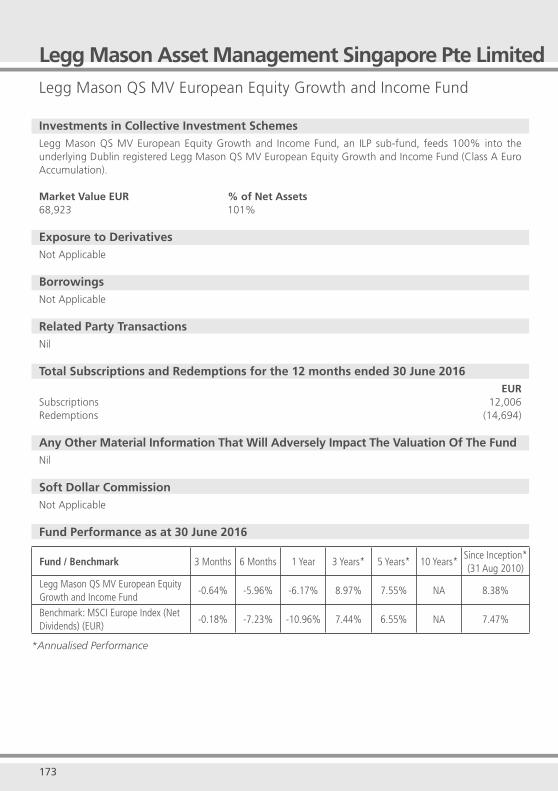
173
Legg Mason QS MV European Equity Growth and Income Fund
Investments in Collective Investment SchemesLegg Mason QS MV European Equity Growth and Income Fund, an ILP sub-fund, feeds 100% into the underlying Dublin registered Legg Mason QS MV European Equity Growth and Income Fund (Class A Euro Accumulation).
Market Value EUR % of Net Assets68,923 101%
Exposure to DerivativesNot Applicable
BorrowingsNot Applicable
Related Party TransactionsNil
Total Subscriptions and Redemptions for the 12 months ended 30 June 2016EUR
Subscriptions 12,006 Redemptions (14,694)
Any Other Material Information That Will Adversely Impact The Valuation Of The FundNil
Soft Dollar CommissionNot Applicable
Fund Performance as at 30 June 2016
Fund / Benchmark 3 Months 6 Months 1 Year 3 Years* 5 Years* 10 Years*Since Inception*(31 Aug 2010)
Legg Mason QS MV European Equity Growth and Income Fund
-0.64% -5.96% -6.17% 8.97% 7.55% NA 8.38%
Benchmark: MSCI Europe Index (Net Dividends) (EUR)
-0.18% -7.23% -10.96% 7.44% 6.55% NA 7.47%
*Annualised Performance
Legg Mason Asset Management Singapore Pte Limited
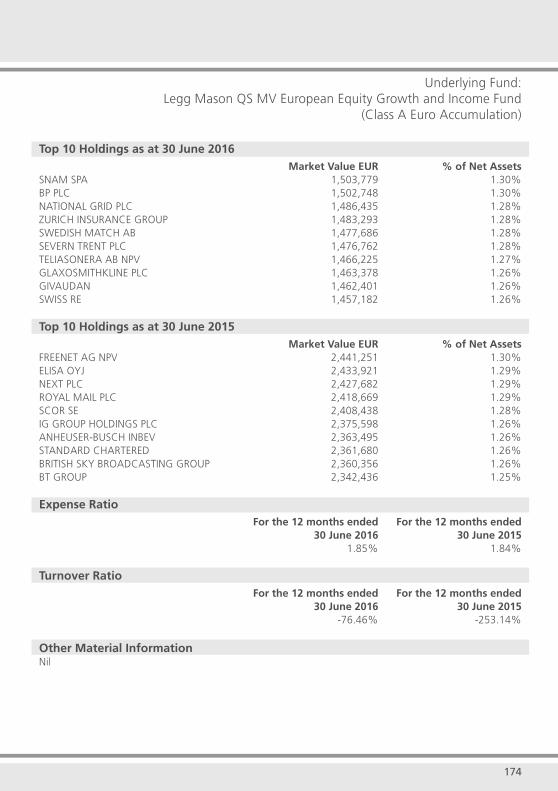
174
Top 10 Holdings as at 30 June 2016 Market Value EUR % of Net AssetsSNAM SPA 1,503,779 1.30%BP PLC 1,502,748 1.30%NATIONAL GRID PLC 1,486,435 1.28%ZURICH INSURANCE GROUP 1,483,293 1.28%SWEDISH MATCH AB 1,477,686 1.28%SEVERN TRENT PLC 1,476,762 1.28%TELIASONERA AB NPV 1,466,225 1.27%GLAXOSMITHKLINE PLC 1,463,378 1.26%GIVAUDAN 1,462,401 1.26%SWISS RE 1,457,182 1.26%
Top 10 Holdings as at 30 June 2015 Market Value EUR % of Net AssetsFREENET AG NPV 2,441,251 1.30%ELISA OYJ 2,433,921 1.29%NEXT PLC 2,427,682 1.29%ROYAL MAIL PLC 2,418,669 1.29%SCOR SE 2,408,438 1.28%IG GROUP HOLDINGS PLC 2,375,598 1.26%ANHEUSER-BUSCH INBEV 2,363,495 1.26%STANDARD CHARTERED 2,361,680 1.26%BRITISH SKY BROADCASTING GROUP 2,360,356 1.26%BT GROUP 2,342,436 1.25%
Expense Ratio For the 12 months ended For the 12 months ended 30 June 2016 30 June 2015 1.85% 1.84%
Turnover Ratio For the 12 months ended For the 12 months ended 30 June 2016 30 June 2015 -76.46% -253.14%
Other Material InformationNil
Underlying Fund:Legg Mason QS MV European Equity Growth and Income Fund
(Class A Euro Accumulation)
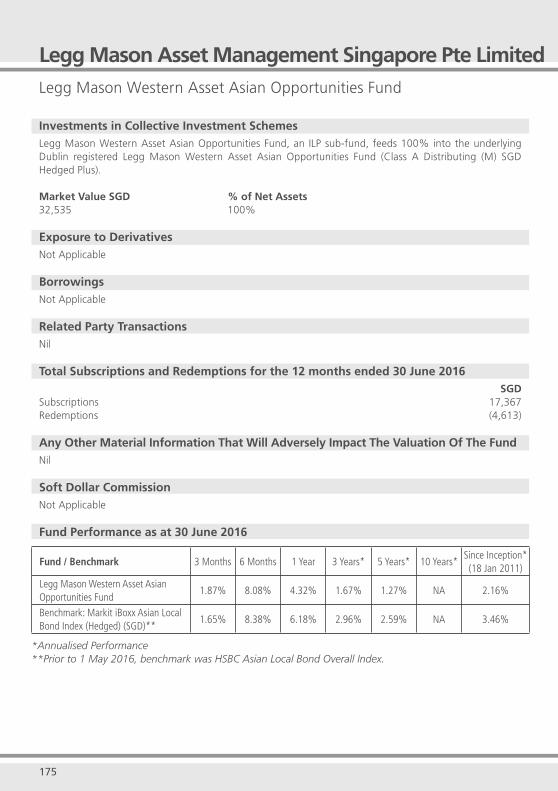
175
Legg Mason Western Asset Asian Opportunities Fund
Investments in Collective Investment SchemesLegg Mason Western Asset Asian Opportunities Fund, an ILP sub-fund, feeds 100% into the underlying Dublin registered Legg Mason Western Asset Asian Opportunities Fund (Class A Distributing (M) SGD Hedged Plus).
Market Value SGD % of Net Assets32,535 100%
Exposure to DerivativesNot Applicable
BorrowingsNot Applicable
Related Party TransactionsNil
Total Subscriptions and Redemptions for the 12 months ended 30 June 2016SGD
Subscriptions 17,367Redemptions (4,613)
Any Other Material Information That Will Adversely Impact The Valuation Of The FundNil
Soft Dollar CommissionNot Applicable
Fund Performance as at 30 June 2016
Fund / Benchmark 3 Months 6 Months 1 Year 3 Years* 5 Years* 10 Years*Since Inception*(18 Jan 2011)
Legg Mason Western Asset Asian Opportunities Fund
1.87% 8.08% 4.32% 1.67% 1.27% NA 2.16%
Benchmark: Markit iBoxx Asian Local Bond Index (Hedged) (SGD)**
1.65% 8.38% 6.18% 2.96% 2.59% NA 3.46%
*Annualised Performance **Prior to 1 May 2016, benchmark was HSBC Asian Local Bond Overall Index.
Legg Mason Asset Management Singapore Pte Limited
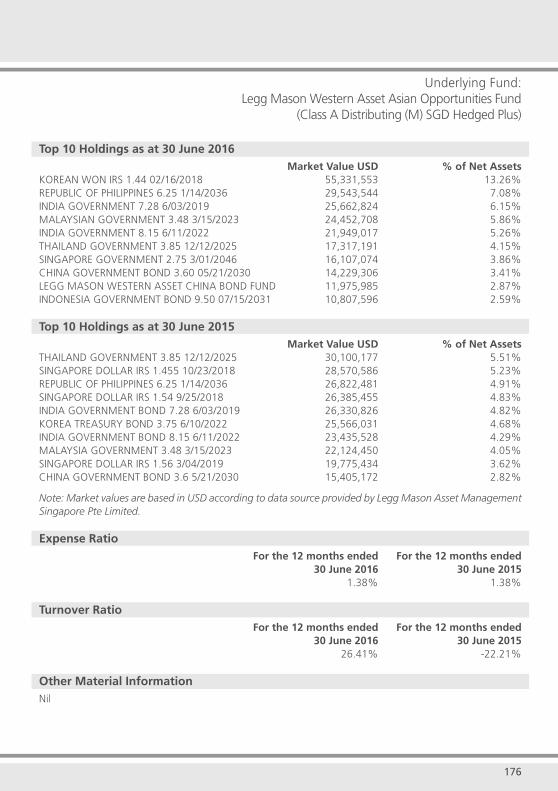
176
Underlying Fund:Legg Mason Western Asset Asian Opportunities Fund
(Class A Distributing (M) SGD Hedged Plus)
Top 10 Holdings as at 30 June 2016 Market Value USD % of Net AssetsKOREAN WON IRS 1.44 02/16/2018 55,331,553 13.26%REPUBLIC OF PHILIPPINES 6.25 1/14/2036 29,543,544 7.08%INDIA GOVERNMENT 7.28 6/03/2019 25,662,824 6.15%MALAYSIAN GOVERNMENT 3.48 3/15/2023 24,452,708 5.86%INDIA GOVERNMENT 8.15 6/11/2022 21,949,017 5.26%THAILAND GOVERNMENT 3.85 12/12/2025 17,317,191 4.15%SINGAPORE GOVERNMENT 2.75 3/01/2046 16,107,074 3.86%CHINA GOVERNMENT BOND 3.60 05/21/2030 14,229,306 3.41%LEGG MASON WESTERN ASSET CHINA BOND FUND 11,975,985 2.87%INDONESIA GOVERNMENT BOND 9.50 07/15/2031 10,807,596 2.59%
Top 10 Holdings as at 30 June 2015 Market Value USD % of Net AssetsTHAILAND GOVERNMENT 3.85 12/12/2025 30,100,177 5.51%SINGAPORE DOLLAR IRS 1.455 10/23/2018 28,570,586 5.23%REPUBLIC OF PHILIPPINES 6.25 1/14/2036 26,822,481 4.91%SINGAPORE DOLLAR IRS 1.54 9/25/2018 26,385,455 4.83%INDIA GOVERNMENT BOND 7.28 6/03/2019 26,330,826 4.82%KOREA TREASURY BOND 3.75 6/10/2022 25,566,031 4.68%INDIA GOVERNMENT BOND 8.15 6/11/2022 23,435,528 4.29%MALAYSIA GOVERNMENT 3.48 3/15/2023 22,124,450 4.05%SINGAPORE DOLLAR IRS 1.56 3/04/2019 19,775,434 3.62%CHINA GOVERNMENT BOND 3.6 5/21/2030 15,405,172 2.82%
Note: Market values are based in USD according to data source provided by Legg Mason Asset Management Singapore Pte Limited.
Expense Ratio For the 12 months ended For the 12 months ended 30 June 2016 30 June 2015 1.38% 1.38%
Turnover Ratio For the 12 months ended For the 12 months ended 30 June 2016 30 June 2015 26.41% -22.21%
Other Material InformationNil
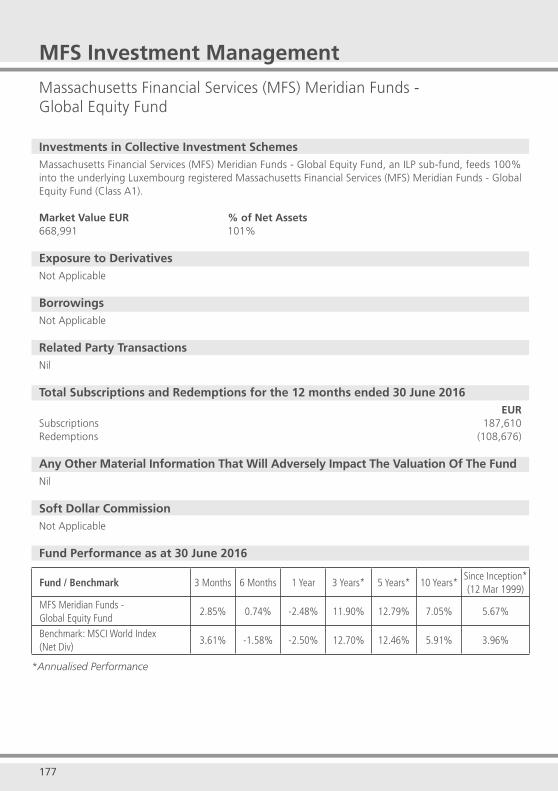
177
MFS Investment Management
Massachusetts Financial Services (MFS) Meridian Funds - Global Equity Fund
Investments in Collective Investment SchemesMassachusetts Financial Services (MFS) Meridian Funds - Global Equity Fund, an ILP sub-fund, feeds 100% into the underlying Luxembourg registered Massachusetts Financial Services (MFS) Meridian Funds - Global Equity Fund (Class A1).
Market Value EUR % of Net Assets668,991 101%
Exposure to DerivativesNot Applicable
BorrowingsNot Applicable
Related Party TransactionsNil
Total Subscriptions and Redemptions for the 12 months ended 30 June 2016EUR
Subscriptions 187,610Redemptions (108,676)
Any Other Material Information That Will Adversely Impact The Valuation Of The Fund Nil
Soft Dollar CommissionNot Applicable
Fund Performance as at 30 June 2016
Fund / Benchmark 3 Months 6 Months 1 Year 3 Years* 5 Years* 10 Years*Since Inception*(12 Mar 1999)
MFS Meridian Funds - Global Equity Fund
2.85% 0.74% -2.48% 11.90% 12.79% 7.05% 5.67%
Benchmark: MSCI World Index(Net Div)
3.61% -1.58% -2.50% 12.70% 12.46% 5.91% 3.96%
*Annualised Performance
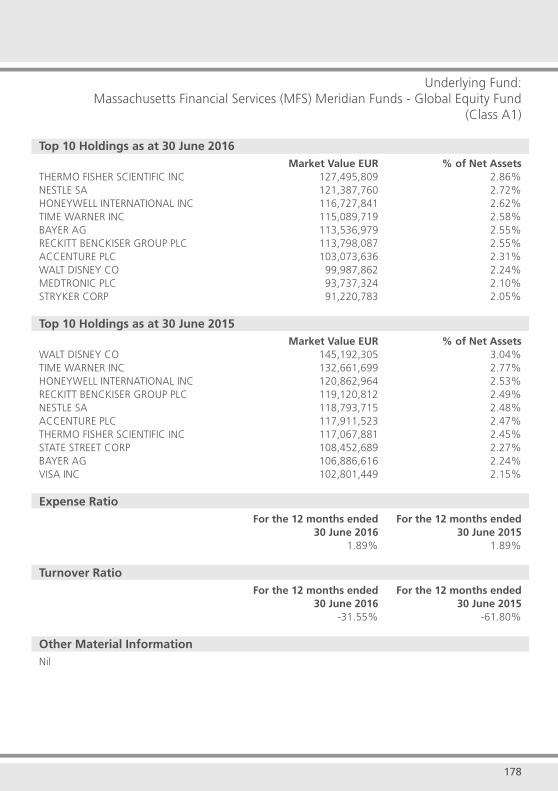
178
Underlying Fund:Massachusetts Financial Services (MFS) Meridian Funds - Global Equity Fund
(Class A1)
Top 10 Holdings as at 30 June 2016 Market Value EUR % of Net AssetsTHERMO FISHER SCIENTIFIC INC 127,495,809 2.86%NESTLE SA 121,387,760 2.72%HONEYWELL INTERNATIONAL INC 116,727,841 2.62%TIME WARNER INC 115,089,719 2.58%BAYER AG 113,536,979 2.55%RECKITT BENCKISER GROUP PLC 113,798,087 2.55%ACCENTURE PLC 103,073,636 2.31%WALT DISNEY CO 99,987,862 2.24%MEDTRONIC PLC 93,737,324 2.10%STRYKER CORP 91,220,783 2.05%
Top 10 Holdings as at 30 June 2015 Market Value EUR % of Net AssetsWALT DISNEY CO 145,192,305 3.04%TIME WARNER INC 132,661,699 2.77%HONEYWELL INTERNATIONAL INC 120,862,964 2.53%RECKITT BENCKISER GROUP PLC 119,120,812 2.49%NESTLE SA 118,793,715 2.48%ACCENTURE PLC 117,911,523 2.47%THERMO FISHER SCIENTIFIC INC 117,067,881 2.45%STATE STREET CORP 108,452,689 2.27%BAYER AG 106,886,616 2.24%VISA INC 102,801,449 2.15%
Expense Ratio For the 12 months ended For the 12 months ended 30 June 2016 30 June 2015 1.89% 1.89%
Turnover Ratio For the 12 months ended For the 12 months ended 30 June 2016 30 June 2015 -31.55% -61.80%
Other Material InformationNil
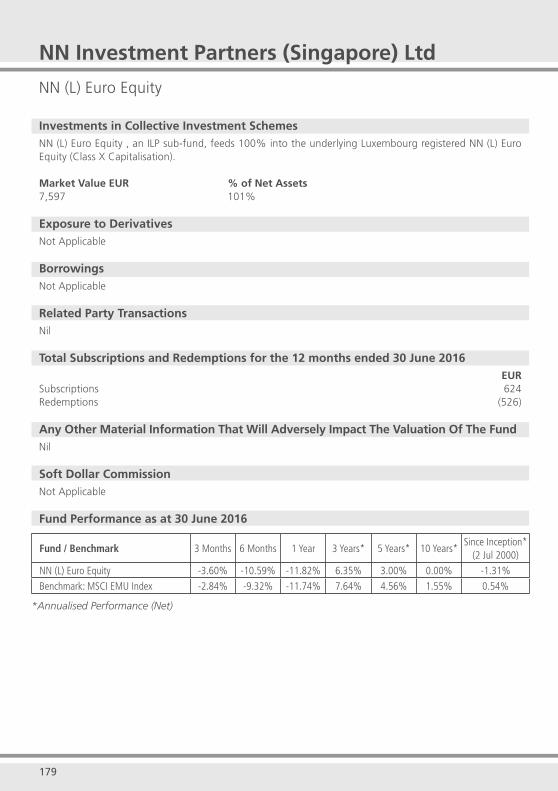
179
NN Investment Partners (Singapore) Ltd
NN (L) Euro Equity
Investments in Collective Investment SchemesNN (L) Euro Equity , an ILP sub-fund, feeds 100% into the underlying Luxembourg registered NN (L) Euro Equity (Class X Capitalisation).
Market Value EUR % of Net Assets7,597 101%
Exposure to DerivativesNot Applicable
BorrowingsNot Applicable
Related Party TransactionsNil
Total Subscriptions and Redemptions for the 12 months ended 30 June 2016EUR
Subscriptions 624Redemptions (526)
Any Other Material Information That Will Adversely Impact The Valuation Of The FundNil
Soft Dollar CommissionNot Applicable
Fund Performance as at 30 June 2016
Fund / Benchmark 3 Months 6 Months 1 Year 3 Years* 5 Years* 10 Years*Since Inception*
(2 Jul 2000)
NN (L) Euro Equity -3.60% -10.59% -11.82% 6.35% 3.00% 0.00% -1.31%
Benchmark: MSCI EMU Index -2.84% -9.32% -11.74% 7.64% 4.56% 1.55% 0.54%
*Annualised Performance (Net)
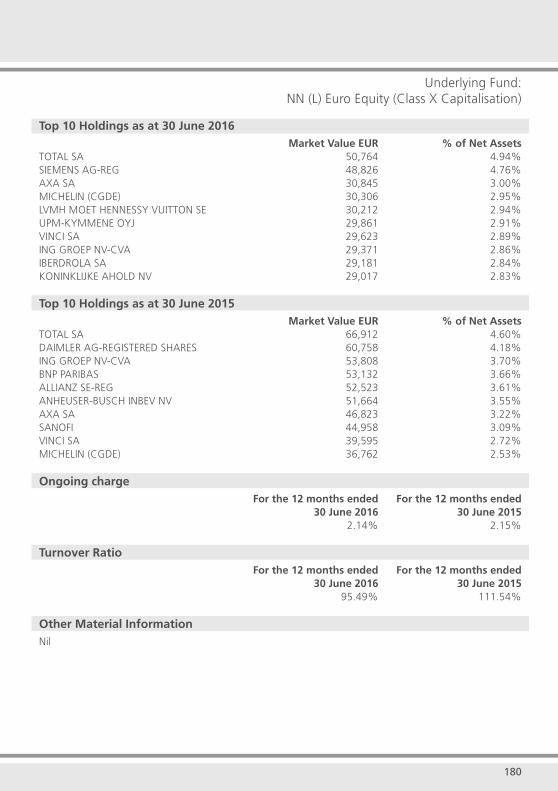
180
Underlying Fund:NN (L) Euro Equity (Class X Capitalisation)
Top 10 Holdings as at 30 June 2016 Market Value EUR % of Net AssetsTOTAL SA 50,764 4.94%SIEMENS AG-REG 48,826 4.76%AXA SA 30,845 3.00%MICHELIN (CGDE) 30,306 2.95%LVMH MOET HENNESSY VUITTON SE 30,212 2.94%UPM-KYMMENE OYJ 29,861 2.91%VINCI SA 29,623 2.89%ING GROEP NV-CVA 29,371 2.86%IBERDROLA SA 29,181 2.84%KONINKLIJKE AHOLD NV 29,017 2.83%
Top 10 Holdings as at 30 June 2015 Market Value EUR % of Net AssetsTOTAL SA 66,912 4.60%DAIMLER AG-REGISTERED SHARES 60,758 4.18%ING GROEP NV-CVA 53,808 3.70%BNP PARIBAS 53,132 3.66%ALLIANZ SE-REG 52,523 3.61%ANHEUSER-BUSCH INBEV NV 51,664 3.55%AXA SA 46,823 3.22%SANOFI 44,958 3.09%VINCI SA 39,595 2.72%MICHELIN (CGDE) 36,762 2.53%
Ongoing charge For the 12 months ended For the 12 months ended 30 June 2016 30 June 2015 2.14% 2.15%
Turnover Ratio For the 12 months ended For the 12 months ended 30 June 2016 30 June 2015 95.49% 111.54%
Other Material InformationNil
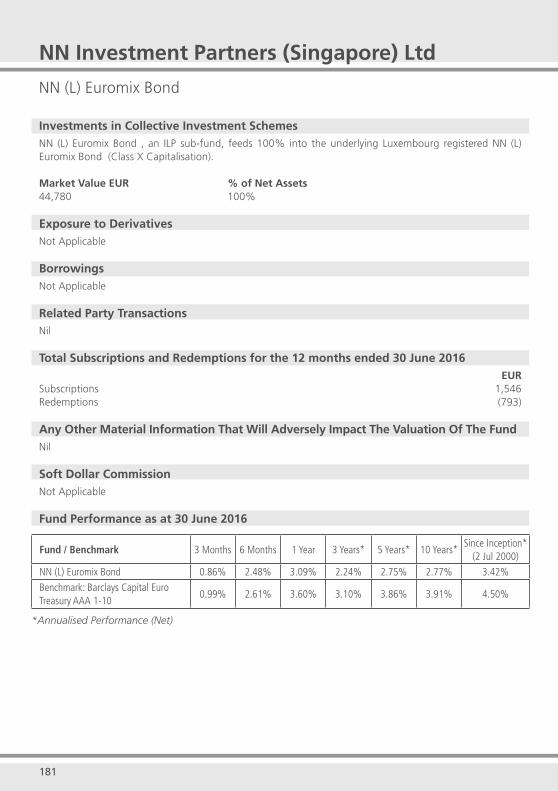
181
NN Investment Partners (Singapore) Ltd
NN (L) Euromix Bond
Investments in Collective Investment SchemesNN (L) Euromix Bond , an ILP sub-fund, feeds 100% into the underlying Luxembourg registered NN (L) Euromix Bond (Class X Capitalisation).
Market Value EUR % of Net Assets44,780 100%
Exposure to DerivativesNot Applicable
BorrowingsNot Applicable
Related Party TransactionsNil
Total Subscriptions and Redemptions for the 12 months ended 30 June 2016EUR
Subscriptions 1,546Redemptions (793)
Any Other Material Information That Will Adversely Impact The Valuation Of The FundNil
Soft Dollar CommissionNot Applicable
Fund Performance as at 30 June 2016
Fund / Benchmark 3 Months 6 Months 1 Year 3 Years* 5 Years* 10 Years*Since Inception*
(2 Jul 2000)
NN (L) Euromix Bond 0.86% 2.48% 3.09% 2.24% 2.75% 2.77% 3.42%
Benchmark: Barclays Capital Euro Treasury AAA 1-10
0.99% 2.61% 3.60% 3.10% 3.86% 3.91% 4.50%
*Annualised Performance (Net)
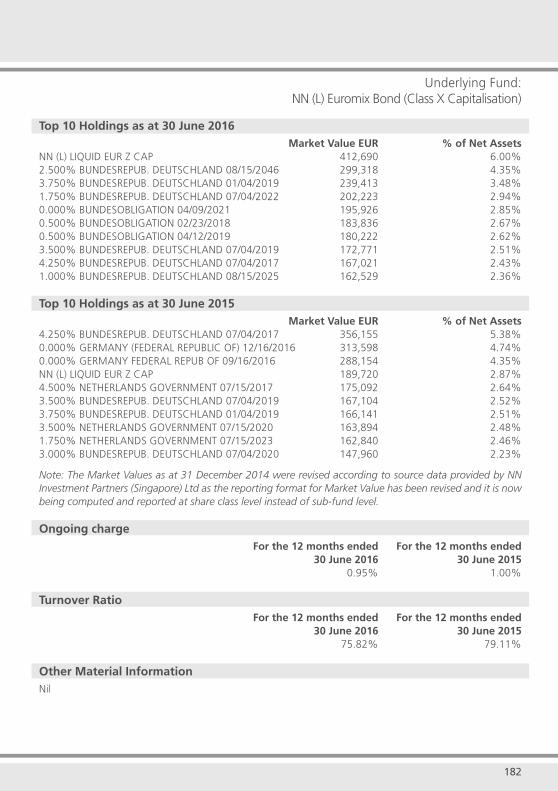
182
Underlying Fund:NN (L) Euromix Bond (Class X Capitalisation)
Top 10 Holdings as at 30 June 2016 Market Value EUR % of Net AssetsNN (L) LIQUID EUR Z CAP 412,690 6.00%2.500% BUNDESREPUB. DEUTSCHLAND 08/15/2046 299,318 4.35%3.750% BUNDESREPUB. DEUTSCHLAND 01/04/2019 239,413 3.48%1.750% BUNDESREPUB. DEUTSCHLAND 07/04/2022 202,223 2.94%0.000% BUNDESOBLIGATION 04/09/2021 195,926 2.85%0.500% BUNDESOBLIGATION 02/23/2018 183,836 2.67%0.500% BUNDESOBLIGATION 04/12/2019 180,222 2.62%3.500% BUNDESREPUB. DEUTSCHLAND 07/04/2019 172,771 2.51%4.250% BUNDESREPUB. DEUTSCHLAND 07/04/2017 167,021 2.43%1.000% BUNDESREPUB. DEUTSCHLAND 08/15/2025 162,529 2.36%
Top 10 Holdings as at 30 June 2015 Market Value EUR % of Net Assets4.250% BUNDESREPUB. DEUTSCHLAND 07/04/2017 356,155 5.38%0.000% GERMANY (FEDERAL REPUBLIC OF) 12/16/2016 313,598 4.74%0.000% GERMANY FEDERAL REPUB OF 09/16/2016 288,154 4.35%NN (L) LIQUID EUR Z CAP 189,720 2.87%4.500% NETHERLANDS GOVERNMENT 07/15/2017 175,092 2.64%3.500% BUNDESREPUB. DEUTSCHLAND 07/04/2019 167,104 2.52%3.750% BUNDESREPUB. DEUTSCHLAND 01/04/2019 166,141 2.51%3.500% NETHERLANDS GOVERNMENT 07/15/2020 163,894 2.48%1.750% NETHERLANDS GOVERNMENT 07/15/2023 162,840 2.46%3.000% BUNDESREPUB. DEUTSCHLAND 07/04/2020 147,960 2.23%
Note: The Market Values as at 31 December 2014 were revised according to source data provided by NN Investment Partners (Singapore) Ltd as the reporting format for Market Value has been revised and it is now being computed and reported at share class level instead of sub-fund level.
Ongoing charge For the 12 months ended For the 12 months ended 30 June 2016 30 June 2015 0.95% 1.00%
Turnover Ratio For the 12 months ended For the 12 months ended 30 June 2016 30 June 2015 75.82% 79.11%
Other Material InformationNil
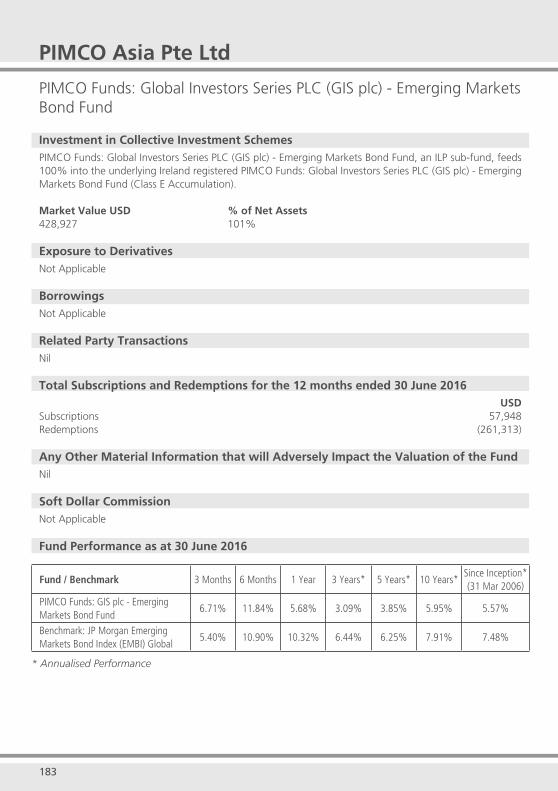
183 184
PIMCO Asia Pte Ltd
PIMCO Funds: Global Investors Series PLC (GIS plc) - Emerging Markets Bond Fund
Investment in Collective Investment SchemesPIMCO Funds: Global Investors Series PLC (GIS plc) - Emerging Markets Bond Fund, an ILP sub-fund, feeds 100% into the underlying Ireland registered PIMCO Funds: Global Investors Series PLC (GIS plc) - Emerging Markets Bond Fund (Class E Accumulation).
Market Value USD % of Net Assets428,927 101%
Exposure to DerivativesNot Applicable
BorrowingsNot Applicable
Related Party TransactionsNil
Total Subscriptions and Redemptions for the 12 months ended 30 June 2016USD
Subscriptions 57,948 Redemptions (261,313)
Any Other Material Information that will Adversely Impact the Valuation of the FundNil
Soft Dollar CommissionNot Applicable
Fund Performance as at 30 June 2016
Fund / Benchmark 3 Months 6 Months 1 Year 3 Years* 5 Years* 10 Years*Since Inception*(31 Mar 2006)
PIMCO Funds: GIS plc - Emerging Markets Bond Fund
6.71% 11.84% 5.68% 3.09% 3.85% 5.95% 5.57%
Benchmark: JP Morgan Emerging Markets Bond Index (EMBI) Global
5.40% 10.90% 10.32% 6.44% 6.25% 7.91% 7.48%
* Annualised Performance
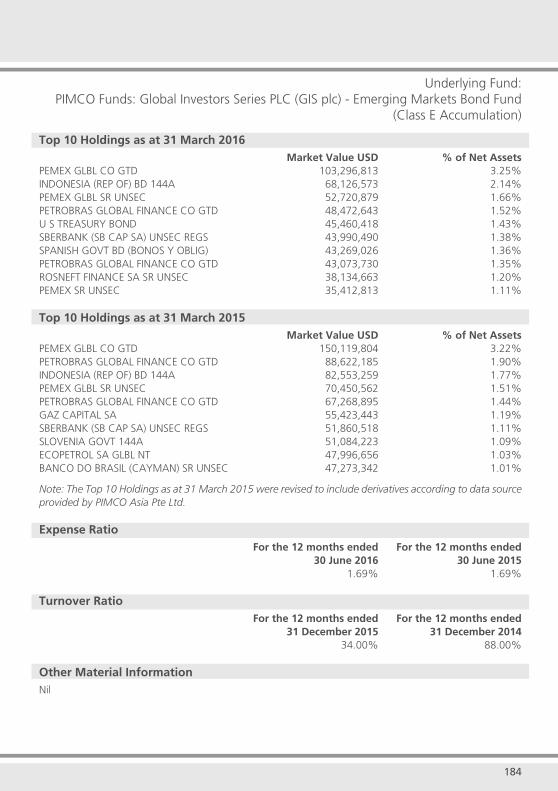
183 184
Underlying Fund:PIMCO Funds: Global Investors Series PLC (GIS plc) - Emerging Markets Bond Fund
(Class E Accumulation)
Top 10 Holdings as at 31 March 2016 Market Value USD % of Net AssetsPEMEX GLBL CO GTD 103,296,813 3.25%INDONESIA (REP OF) BD 144A 68,126,573 2.14%PEMEX GLBL SR UNSEC 52,720,879 1.66%PETROBRAS GLOBAL FINANCE CO GTD 48,472,643 1.52%U S TREASURY BOND 45,460,418 1.43%SBERBANK (SB CAP SA) UNSEC REGS 43,990,490 1.38%SPANISH GOVT BD (BONOS Y OBLIG) 43,269,026 1.36%PETROBRAS GLOBAL FINANCE CO GTD 43,073,730 1.35%ROSNEFT FINANCE SA SR UNSEC 38,134,663 1.20%PEMEX SR UNSEC 35,412,813 1.11%
Top 10 Holdings as at 31 March 2015 Market Value USD % of Net AssetsPEMEX GLBL CO GTD 150,119,804 3.22%PETROBRAS GLOBAL FINANCE CO GTD 88,622,185 1.90%INDONESIA (REP OF) BD 144A 82,553,259 1.77%PEMEX GLBL SR UNSEC 70,450,562 1.51%PETROBRAS GLOBAL FINANCE CO GTD 67,268,895 1.44%GAZ CAPITAL SA 55,423,443 1.19%SBERBANK (SB CAP SA) UNSEC REGS 51,860,518 1.11%SLOVENIA GOVT 144A 51,084,223 1.09%ECOPETROL SA GLBL NT 47,996,656 1.03%BANCO DO BRASIL (CAYMAN) SR UNSEC 47,273,342 1.01%
Note: The Top 10 Holdings as at 31 March 2015 were revised to include derivatives according to data source provided by PIMCO Asia Pte Ltd.
Expense Ratio For the 12 months ended For the 12 months ended 30 June 2016 30 June 2015 1.69% 1.69%
Turnover Ratio For the 12 months ended For the 12 months ended 31 December 2015 31 December 2014 34.00% 88.00%
Other Material InformationNil
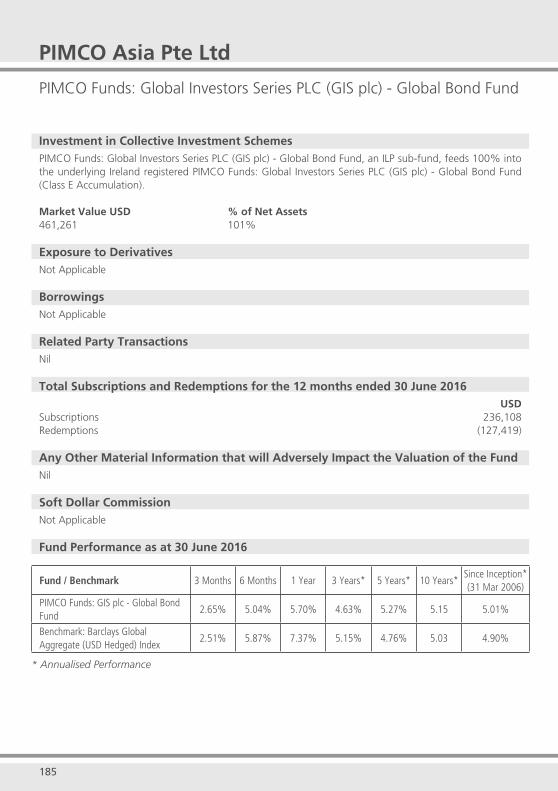
185 186
PIMCO Asia Pte Ltd
PIMCO Funds: Global Investors Series PLC (GIS plc) - Global Bond Fund
Investment in Collective Investment SchemesPIMCO Funds: Global Investors Series PLC (GIS plc) - Global Bond Fund, an ILP sub-fund, feeds 100% into the underlying Ireland registered PIMCO Funds: Global Investors Series PLC (GIS plc) - Global Bond Fund (Class E Accumulation).
Market Value USD % of Net Assets461,261 101%
Exposure to DerivativesNot Applicable
BorrowingsNot Applicable
Related Party TransactionsNil
Total Subscriptions and Redemptions for the 12 months ended 30 June 2016USD
Subscriptions 236,108 Redemptions (127,419)
Any Other Material Information that will Adversely Impact the Valuation of the FundNil
Soft Dollar CommissionNot Applicable
Fund Performance as at 30 June 2016
Fund / Benchmark 3 Months 6 Months 1 Year 3 Years* 5 Years* 10 Years*Since Inception*(31 Mar 2006)
PIMCO Funds: GIS plc - Global Bond Fund
2.65% 5.04% 5.70% 4.63% 5.27% 5.15 5.01%
Benchmark: Barclays Global Aggregate (USD Hedged) Index
2.51% 5.87% 7.37% 5.15% 4.76% 5.03 4.90%
* Annualised Performance
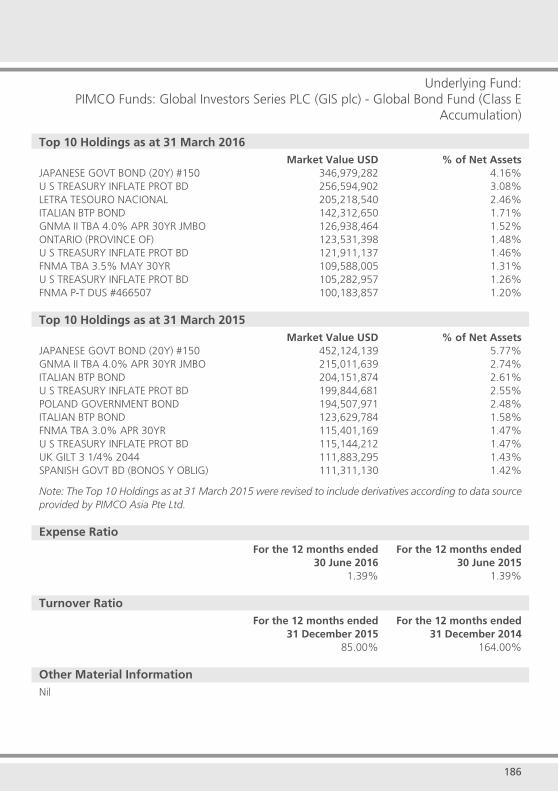
185 186
Underlying Fund:PIMCO Funds: Global Investors Series PLC (GIS plc) - Global Bond Fund (Class E
Accumulation)
Top 10 Holdings as at 31 March 2016 Market Value USD % of Net AssetsJAPANESE GOVT BOND (20Y) #150 346,979,282 4.16%U S TREASURY INFLATE PROT BD 256,594,902 3.08%LETRA TESOURO NACIONAL 205,218,540 2.46%ITALIAN BTP BOND 142,312,650 1.71%GNMA II TBA 4.0% APR 30YR JMBO 126,938,464 1.52%ONTARIO (PROVINCE OF) 123,531,398 1.48%U S TREASURY INFLATE PROT BD 121,911,137 1.46%FNMA TBA 3.5% MAY 30YR 109,588,005 1.31%U S TREASURY INFLATE PROT BD 105,282,957 1.26%FNMA P-T DUS #466507 100,183,857 1.20%
Top 10 Holdings as at 31 March 2015 Market Value USD % of Net AssetsJAPANESE GOVT BOND (20Y) #150 452,124,139 5.77%GNMA II TBA 4.0% APR 30YR JMBO 215,011,639 2.74%ITALIAN BTP BOND 204,151,874 2.61%U S TREASURY INFLATE PROT BD 199,844,681 2.55%POLAND GOVERNMENT BOND 194,507,971 2.48%ITALIAN BTP BOND 123,629,784 1.58%FNMA TBA 3.0% APR 30YR 115,401,169 1.47%U S TREASURY INFLATE PROT BD 115,144,212 1.47%UK GILT 3 1/4% 2044 111,883,295 1.43%SPANISH GOVT BD (BONOS Y OBLIG) 111,311,130 1.42%
Note: The Top 10 Holdings as at 31 March 2015 were revised to include derivatives according to data source provided by PIMCO Asia Pte Ltd.
Expense Ratio For the 12 months ended For the 12 months ended 30 June 2016 30 June 2015 1.39% 1.39%
Turnover Ratio For the 12 months ended For the 12 months ended 31 December 2015 31 December 2014 85.00% 164.00%
Other Material InformationNil
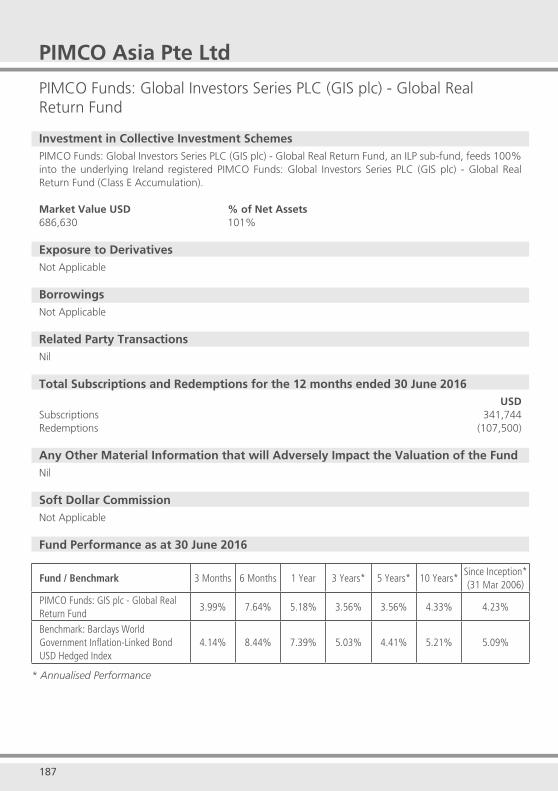
187 188
PIMCO Asia Pte Ltd
PIMCO Funds: Global Investors Series PLC (GIS plc) - Global Real Return Fund
Investment in Collective Investment SchemesPIMCO Funds: Global Investors Series PLC (GIS plc) - Global Real Return Fund, an ILP sub-fund, feeds 100% into the underlying Ireland registered PIMCO Funds: Global Investors Series PLC (GIS plc) - Global Real Return Fund (Class E Accumulation).
Market Value USD % of Net Assets686,630 101%
Exposure to DerivativesNot Applicable
BorrowingsNot Applicable
Related Party TransactionsNil
Total Subscriptions and Redemptions for the 12 months ended 30 June 2016USD
Subscriptions 341,744 Redemptions (107,500)
Any Other Material Information that will Adversely Impact the Valuation of the FundNil
Soft Dollar CommissionNot Applicable
Fund Performance as at 30 June 2016
Fund / Benchmark 3 Months 6 Months 1 Year 3 Years* 5 Years* 10 Years*Since Inception*(31 Mar 2006)
PIMCO Funds: GIS plc - Global Real Return Fund
3.99% 7.64% 5.18% 3.56% 3.56% 4.33% 4.23%
Benchmark: Barclays World Government Inflation-Linked Bond USD Hedged Index
4.14% 8.44% 7.39% 5.03% 4.41% 5.21% 5.09%
* Annualised Performance

187 188
Underlying Fund:PIMCO Funds: Global Investors Series PLC (GIS plc) - Global Real Return Fund (Class E
Accumulation)
Top 10 Holdings as at 31 March 2016 Market Value USD % of Net AssetsU S TREASURY INFLATE PROT BD 268,538,041 10.60%UK TSY 0.125% 2024 I/L GILT 133,249,469 5.26%U S TREASURY INFLATE PROT BD 122,458,389 4.83%U S TREASURY INFLATE PROT BD 111,414,569 4.40%U S TREASURY INFLATE PROT BD 102,540,187 4.05%U S TREASURY INFLATE PROT BD 91,813,248 3.62%U S TREASURY INFLATE PROT BD 85,875,430 3.39%UK TSY 1.125% 2037 I/L GILT 85,363,703 3.37%U S TREASURY INFLATE PROT BD 82,502,218 3.26%LETRA TESOURO NACIONAL 80,165,781 3.16%
Top 10 Holdings as at 31 March 2015 Market Value USD % of Net AssetsFRANCE (GOVT OF) OATE I/L 228,954,968 8.42%UK TSY 0.125% 2024 I/L GILT 203,748,809 7.49%BUNDESOBLIGATION I/L BD 176,999,837 6.51%U S TREASURY INFLATE PROT BD 174,956,151 6.44%U S TREASURY INFLATE PROT BD 158,936,916 5.85%ITALIAN BTP BOND I/L 141,219,753 5.19%UK TSY 0.125% 2044 I/L GILT 112,554,684 4.14%U S TREASURY INFLATE PROT BD 109,479,674 4.03%U S TREASURY INFLATE PROT BD 107,164,264 3.94%U S TREASURY INFLATE PROT BD 98,823,673 3.64%
Expense Ratio For the 12 months ended For the 12 months ended 30 June 2016 30 June 2015 1.39% 1.39%
Turnover Ratio For the 12 months ended For the 12 months ended 31 December 2015 31 December 2014 111.00% 183.00%
Other Material InformationNil
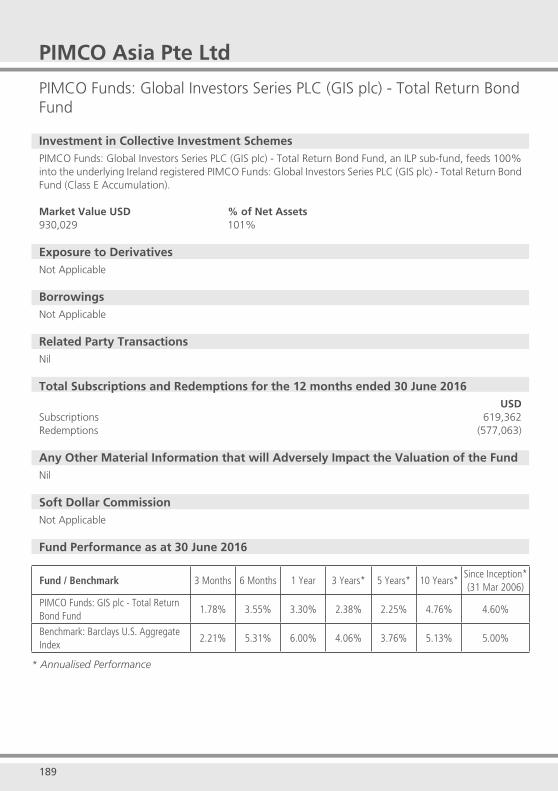
189 190
PIMCO Asia Pte Ltd
PIMCO Funds: Global Investors Series PLC (GIS plc) - Total Return Bond Fund
Investment in Collective Investment SchemesPIMCO Funds: Global Investors Series PLC (GIS plc) - Total Return Bond Fund, an ILP sub-fund, feeds 100% into the underlying Ireland registered PIMCO Funds: Global Investors Series PLC (GIS plc) - Total Return Bond Fund (Class E Accumulation).
Market Value USD % of Net Assets930,029 101%
Exposure to DerivativesNot Applicable
BorrowingsNot Applicable
Related Party TransactionsNil
Total Subscriptions and Redemptions for the 12 months ended 30 June 2016USD
Subscriptions 619,362 Redemptions (577,063)
Any Other Material Information that will Adversely Impact the Valuation of the FundNil
Soft Dollar CommissionNot Applicable
Fund Performance as at 30 June 2016
Fund / Benchmark 3 Months 6 Months 1 Year 3 Years* 5 Years* 10 Years*Since Inception*(31 Mar 2006)
PIMCO Funds: GIS plc - Total Return Bond Fund
1.78% 3.55% 3.30% 2.38% 2.25% 4.76% 4.60%
Benchmark: Barclays U.S. Aggregate Index
2.21% 5.31% 6.00% 4.06% 3.76% 5.13% 5.00%
* Annualised Performance

189 190
Underlying Fund:PIMCO Funds: Global Investors Series PLC (GIS plc) - Total Return Bond Fund (Class E
Accumulation)
Top 10 Holdings as at 31 March 2016 Market Value USD % of Net AssetsU S TREASURY BOND 393,146,936 5.46%FNMA TBA 4.0% MAY 30YR 366,754,451 5.09%FNMA TBA 4.0% APR 30YR 301,200,735 4.18%FNMA TBA 3.5% MAY 30YR 271,726,975 3.77%FNMA TBA 3.5% APR 30YR 231,621,578 3.22%U S TREASURY NOTE 188,851,813 2.62%U S TREASURY BOND 178,617,029 2.48%U S TREASURY INFLATE PROT BD 176,792,218 2.45%U S TREASURY INFLATE PROT BD 166,468,200 2.31%U S TREASURY INFLATE PROT BD 164,151,310 2.28%
Top 10 Holdings as at 31 March 2015 Market Value USD % of Net AssetsU S TREASURY INFLATE PROT BD 428,688,657 4.57%U S TREASURY BOND 414,368,990 4.41%FNMA TBA 5.5% MAY 30YR 340,218,017 3.62%FED HOME LN MTGE GLBL NT (7MMM) 304,290,002 3.24%U S TREASURY BOND 281,694,306 3.00%FNMA TBA 4.5% MAY 30YR 277,893,477 2.96%U S TREASURY INFLATE PROT BD 223,113,767 2.38%FNMA TBA 4.0% MAY 30YR 222,456,246 2.37%U S TREASURY NOTE 199,449,983 2.12%FNMA TBA 3.0% APR 30YR 180,039,595 1.92%
Note: The Top 10 Holdings as at 31 March 2015 were revised to include derivatives according to data source provided by PIMCO Asia Pte Ltd.
Expense Ratio For the 12 months ended For the 12 months ended 30 June 2016 30 June 2015 1.40% 1.40%
Turnover Ratio For the 12 months ended For the 12 months ended 31 December 2015 31 December 2014 56.00% 90.00%
Other Material InformationNil
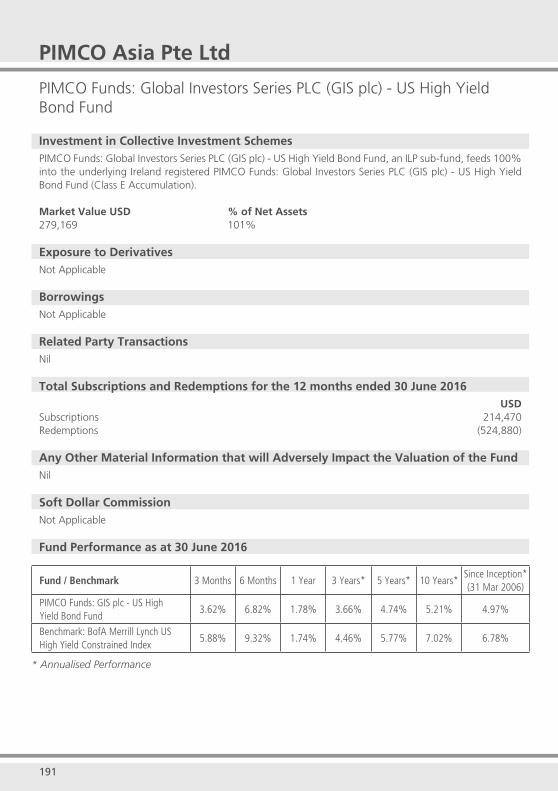
191 192
PIMCO Asia Pte Ltd
PIMCO Funds: Global Investors Series PLC (GIS plc) - US High Yield Bond Fund
Investment in Collective Investment SchemesPIMCO Funds: Global Investors Series PLC (GIS plc) - US High Yield Bond Fund, an ILP sub-fund, feeds 100% into the underlying Ireland registered PIMCO Funds: Global Investors Series PLC (GIS plc) - US High Yield Bond Fund (Class E Accumulation).
Market Value USD % of Net Assets279,169 101%
Exposure to DerivativesNot Applicable
BorrowingsNot Applicable
Related Party TransactionsNil
Total Subscriptions and Redemptions for the 12 months ended 30 June 2016USD
Subscriptions 214,470 Redemptions (524,880)
Any Other Material Information that will Adversely Impact the Valuation of the FundNil
Soft Dollar CommissionNot Applicable
Fund Performance as at 30 June 2016
Fund / Benchmark 3 Months 6 Months 1 Year 3 Years* 5 Years* 10 Years*Since Inception*(31 Mar 2006)
PIMCO Funds: GIS plc - US High Yield Bond Fund
3.62% 6.82% 1.78% 3.66% 4.74% 5.21% 4.97%
Benchmark: BofA Merrill Lynch US High Yield Constrained Index
5.88% 9.32% 1.74% 4.46% 5.77% 7.02% 6.78%
* Annualised Performance
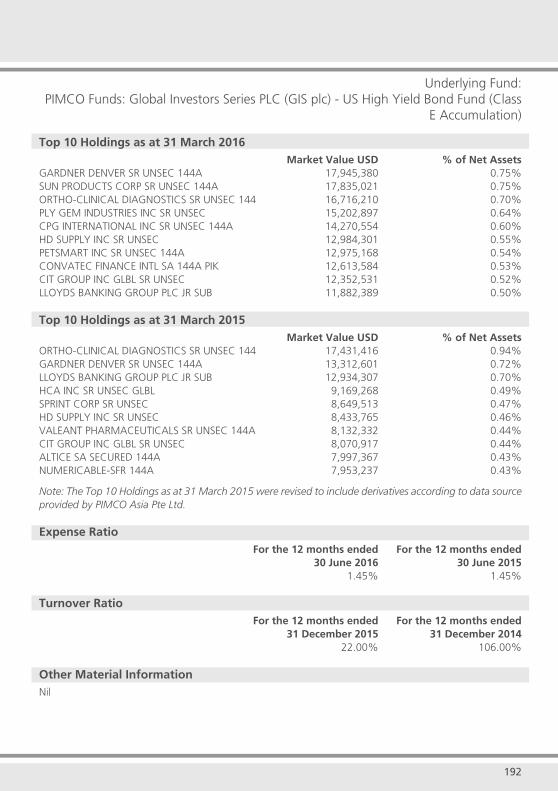
191 192
Underlying Fund:PIMCO Funds: Global Investors Series PLC (GIS plc) - US High Yield Bond Fund (Class
E Accumulation)
Top 10 Holdings as at 31 March 2016 Market Value USD % of Net AssetsGARDNER DENVER SR UNSEC 144A 17,945,380 0.75%SUN PRODUCTS CORP SR UNSEC 144A 17,835,021 0.75%ORTHO-CLINICAL DIAGNOSTICS SR UNSEC 144 16,716,210 0.70%PLY GEM INDUSTRIES INC SR UNSEC 15,202,897 0.64%CPG INTERNATIONAL INC SR UNSEC 144A 14,270,554 0.60%HD SUPPLY INC SR UNSEC 12,984,301 0.55%PETSMART INC SR UNSEC 144A 12,975,168 0.54%CONVATEC FINANCE INTL SA 144A PIK 12,613,584 0.53%CIT GROUP INC GLBL SR UNSEC 12,352,531 0.52%LLOYDS BANKING GROUP PLC JR SUB 11,882,389 0.50%
Top 10 Holdings as at 31 March 2015 Market Value USD % of Net AssetsORTHO-CLINICAL DIAGNOSTICS SR UNSEC 144 17,431,416 0.94%GARDNER DENVER SR UNSEC 144A 13,312,601 0.72%LLOYDS BANKING GROUP PLC JR SUB 12,934,307 0.70%HCA INC SR UNSEC GLBL 9,169,268 0.49%SPRINT CORP SR UNSEC 8,649,513 0.47%HD SUPPLY INC SR UNSEC 8,433,765 0.46%VALEANT PHARMACEUTICALS SR UNSEC 144A 8,132,332 0.44%CIT GROUP INC GLBL SR UNSEC 8,070,917 0.44%ALTICE SA SECURED 144A 7,997,367 0.43%NUMERICABLE-SFR 144A 7,953,237 0.43%
Note: The Top 10 Holdings as at 31 March 2015 were revised to include derivatives according to data source provided by PIMCO Asia Pte Ltd.
Expense Ratio For the 12 months ended For the 12 months ended 30 June 2016 30 June 2015 1.45% 1.45%
Turnover Ratio For the 12 months ended For the 12 months ended 31 December 2015 31 December 2014 22.00% 106.00%
Other Material InformationNil
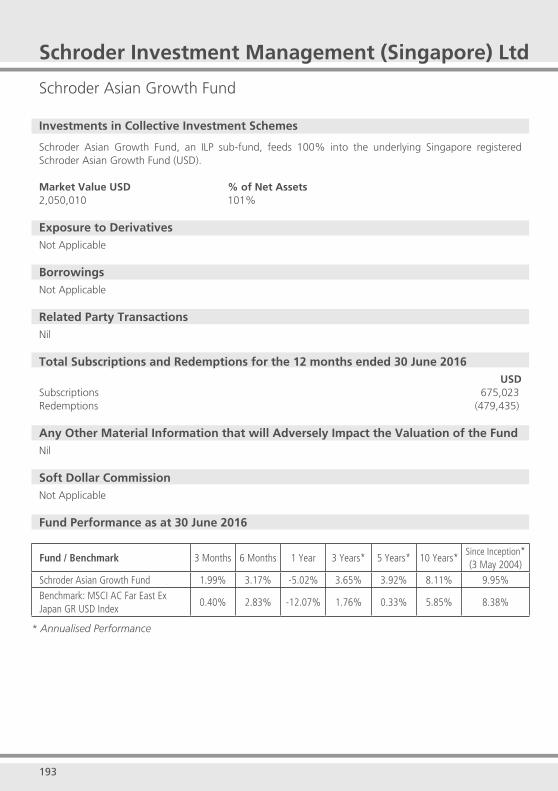
193 194
Schroder Investment Management (Singapore) Ltd
Schroder Asian Growth Fund
Investments in Collective Investment Schemes
Schroder Asian Growth Fund, an ILP sub-fund, feeds 100% into the underlying Singapore registered Schroder Asian Growth Fund (USD).
Market Value USD % of Net Assets2,050,010 101%
Exposure to DerivativesNot Applicable
BorrowingsNot Applicable
Related Party TransactionsNil
Total Subscriptions and Redemptions for the 12 months ended 30 June 2016USD
Subscriptions 675,023Redemptions (479,435)
Any Other Material Information that will Adversely Impact the Valuation of the FundNil
Soft Dollar CommissionNot Applicable
Fund Performance as at 30 June 2016
Fund / Benchmark 3 Months 6 Months 1 Year 3 Years* 5 Years* 10 Years*Since Inception*(3 May 2004)
Schroder Asian Growth Fund 1.99% 3.17% -5.02% 3.65% 3.92% 8.11% 9.95%
Benchmark: MSCI AC Far East Ex Japan GR USD Index
0.40% 2.83% -12.07% 1.76% 0.33% 5.85% 8.38%
* Annualised Performance
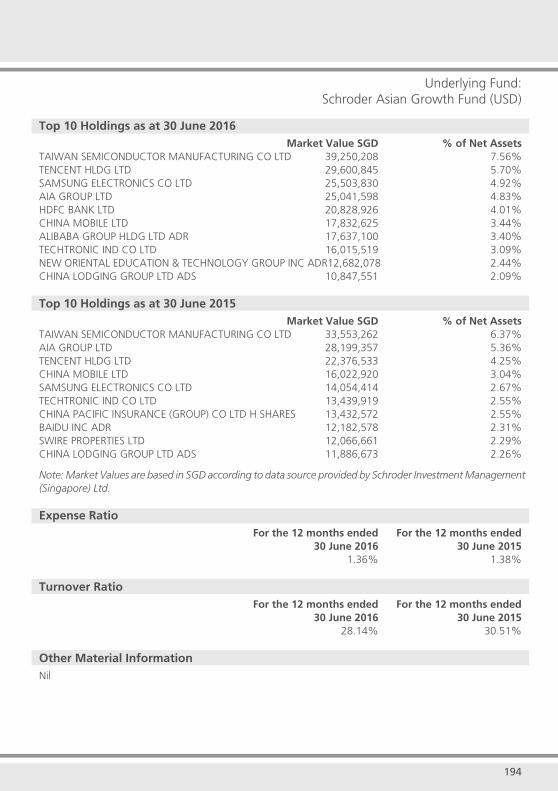
193 194
Schroder Investment Management (Singapore) LtdUnderlying Fund:
Schroder Asian Growth Fund (USD)
Top 10 Holdings as at 30 June 2016 Market Value SGD % of Net AssetsTAIWAN SEMICONDUCTOR MANUFACTURING CO LTD 39,250,208 7.56%TENCENT HLDG LTD 29,600,845 5.70%SAMSUNG ELECTRONICS CO LTD 25,503,830 4.92%AIA GROUP LTD 25,041,598 4.83%HDFC BANK LTD 20,828,926 4.01%CHINA MOBILE LTD 17,832,625 3.44%ALIBABA GROUP HLDG LTD ADR 17,637,100 3.40%TECHTRONIC IND CO LTD 16,015,519 3.09%NEW ORIENTAL EDUCATION & TECHNOLOGY GROUP INC ADR 12,682,078 2.44%CHINA LODGING GROUP LTD ADS 10,847,551 2.09%
Top 10 Holdings as at 30 June 2015 Market Value SGD % of Net AssetsTAIWAN SEMICONDUCTOR MANUFACTURING CO LTD 33,553,262 6.37%AIA GROUP LTD 28,199,357 5.36%TENCENT HLDG LTD 22,376,533 4.25%CHINA MOBILE LTD 16,022,920 3.04%SAMSUNG ELECTRONICS CO LTD 14,054,414 2.67%TECHTRONIC IND CO LTD 13,439,919 2.55%CHINA PACIFIC INSURANCE (GROUP) CO LTD H SHARES 13,432,572 2.55%BAIDU INC ADR 12,182,578 2.31%SWIRE PROPERTIES LTD 12,066,661 2.29%CHINA LODGING GROUP LTD ADS 11,886,673 2.26%
Note: Market Values are based in SGD according to data source provided by Schroder Investment Management (Singapore) Ltd.
Expense Ratio For the 12 months ended For the 12 months ended 30 June 2016 30 June 2015 1.36% 1.38%
Turnover Ratio For the 12 months ended For the 12 months ended 30 June 2016 30 June 2015 28.14% 30.51%
Other Material InformationNil
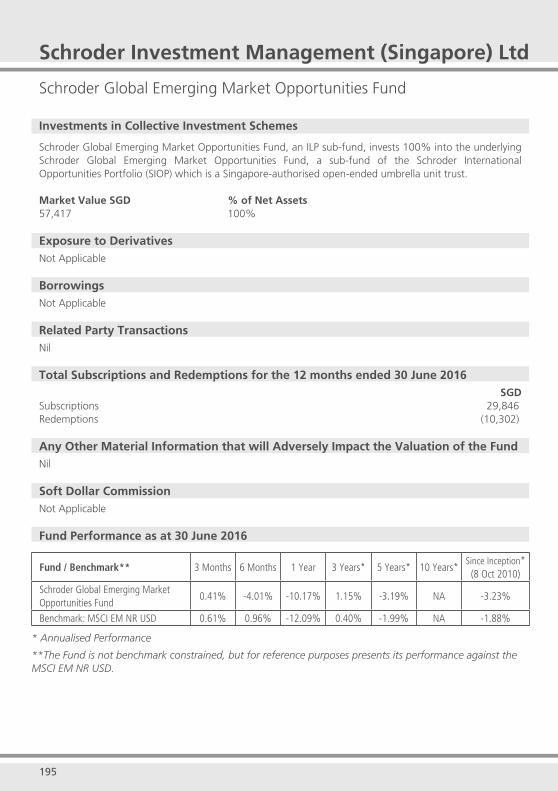
195 196
Schroder Investment Management (Singapore) Ltd
Schroder Global Emerging Market Opportunities Fund
Investments in Collective Investment Schemes
Schroder Global Emerging Market Opportunities Fund, an ILP sub-fund, invests 100% into the underlying Schroder Global Emerging Market Opportunities Fund, a sub-fund of the Schroder International Opportunities Portfolio (SIOP) which is a Singapore-authorised open-ended umbrella unit trust.
Market Value SGD % of Net Assets57,417 100%
Exposure to DerivativesNot Applicable
BorrowingsNot Applicable
Related Party TransactionsNil
Total Subscriptions and Redemptions for the 12 months ended 30 June 2016SGD
Subscriptions 29,846Redemptions (10,302)
Any Other Material Information that will Adversely Impact the Valuation of the FundNil
Soft Dollar CommissionNot Applicable
Fund Performance as at 30 June 2016
Fund / Benchmark** 3 Months 6 Months 1 Year 3 Years* 5 Years* 10 Years*Since Inception*
(8 Oct 2010)
Schroder Global Emerging Market Opportunities Fund
0.41% -4.01% -10.17% 1.15% -3.19% NA -3.23%
Benchmark: MSCI EM NR USD 0.61% 0.96% -12.09% 0.40% -1.99% NA -1.88%
* Annualised Performance
**The Fund is not benchmark constrained, but for reference purposes presents its performance against the MSCI EM NR USD.
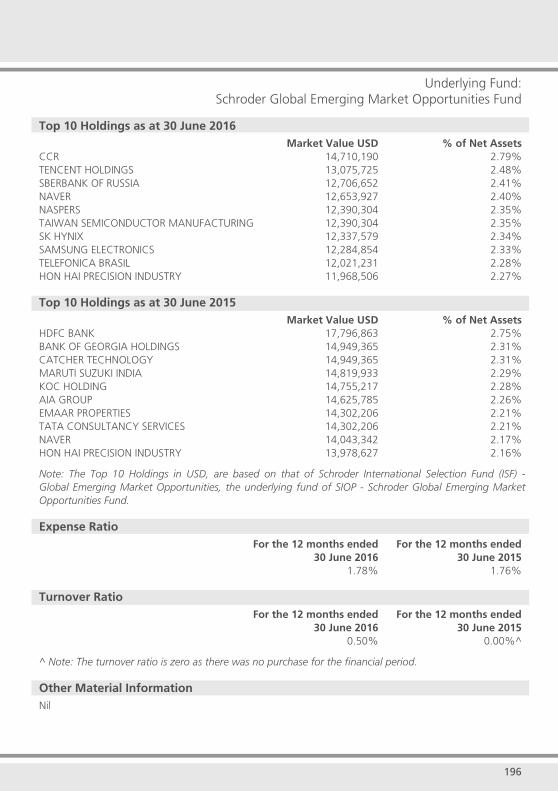
195 196
Schroder Investment Management (Singapore) LtdUnderlying Fund:
Schroder Global Emerging Market Opportunities Fund
Top 10 Holdings as at 30 June 2016 Market Value USD % of Net AssetsCCR 14,710,190 2.79%TENCENT HOLDINGS 13,075,725 2.48%SBERBANK OF RUSSIA 12,706,652 2.41%NAVER 12,653,927 2.40%NASPERS 12,390,304 2.35%TAIWAN SEMICONDUCTOR MANUFACTURING 12,390,304 2.35%SK HYNIX 12,337,579 2.34%SAMSUNG ELECTRONICS 12,284,854 2.33%TELEFONICA BRASIL 12,021,231 2.28%HON HAI PRECISION INDUSTRY 11,968,506 2.27%
Top 10 Holdings as at 30 June 2015 Market Value USD % of Net AssetsHDFC BANK 17,796,863 2.75%BANK OF GEORGIA HOLDINGS 14,949,365 2.31%CATCHER TECHNOLOGY 14,949,365 2.31%MARUTI SUZUKI INDIA 14,819,933 2.29%KOC HOLDING 14,755,217 2.28%AIA GROUP 14,625,785 2.26%EMAAR PROPERTIES 14,302,206 2.21%TATA CONSULTANCY SERVICES 14,302,206 2.21%NAVER 14,043,342 2.17%HON HAI PRECISION INDUSTRY 13,978,627 2.16%
Note: The Top 10 Holdings in USD, are based on that of Schroder International Selection Fund (ISF) - Global Emerging Market Opportunities, the underlying fund of SIOP - Schroder Global Emerging Market Opportunities Fund.
Expense Ratio For the 12 months ended For the 12 months ended 30 June 2016 30 June 2015 1.78% 1.76%
Turnover Ratio For the 12 months ended For the 12 months ended 30 June 2016 30 June 2015 0.50% 0.00%^
^ Note: The turnover ratio is zero as there was no purchase for the financial period.
Other Material InformationNil
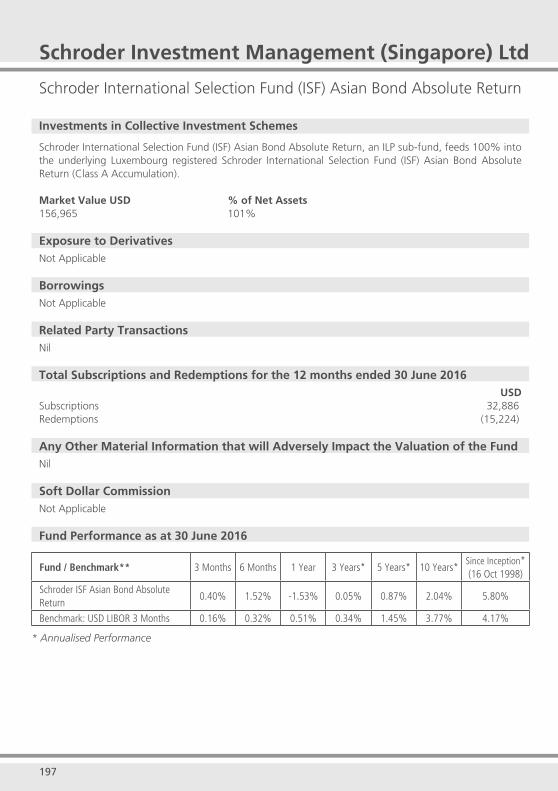
197 198
Schroder Investment Management (Singapore) Ltd
Schroder International Selection Fund (ISF) Asian Bond Absolute Return
Investments in Collective Investment Schemes
Schroder International Selection Fund (ISF) Asian Bond Absolute Return, an ILP sub-fund, feeds 100% into the underlying Luxembourg registered Schroder International Selection Fund (ISF) Asian Bond Absolute Return (Class A Accumulation).
Market Value USD % of Net Assets156,965 101%
Exposure to DerivativesNot Applicable
BorrowingsNot Applicable
Related Party TransactionsNil
Total Subscriptions and Redemptions for the 12 months ended 30 June 2016USD
Subscriptions 32,886Redemptions (15,224)
Any Other Material Information that will Adversely Impact the Valuation of the FundNil
Soft Dollar CommissionNot Applicable
Fund Performance as at 30 June 2016
Fund / Benchmark** 3 Months 6 Months 1 Year 3 Years* 5 Years* 10 Years*Since Inception*(16 Oct 1998)
Schroder ISF Asian Bond Absolute Return
0.40% 1.52% -1.53% 0.05% 0.87% 2.04% 5.80%
Benchmark: USD LIBOR 3 Months 0.16% 0.32% 0.51% 0.34% 1.45% 3.77% 4.17%
* Annualised Performance
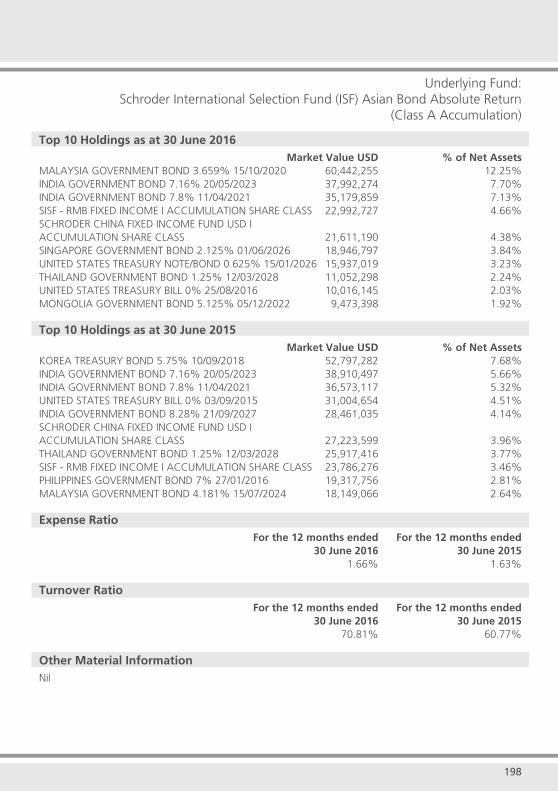
197 198
Schroder Investment Management (Singapore) LtdUnderlying Fund:
Schroder International Selection Fund (ISF) Asian Bond Absolute Return (Class A Accumulation)
Top 10 Holdings as at 30 June 2016 Market Value USD % of Net AssetsMALAYSIA GOVERNMENT BOND 3.659% 15/10/2020 60,442,255 12.25%INDIA GOVERNMENT BOND 7.16% 20/05/2023 37,992,274 7.70%INDIA GOVERNMENT BOND 7.8% 11/04/2021 35,179,859 7.13%SISF - RMB FIXED INCOME I ACCUMULATION SHARE CLASS 22,992,727 4.66%SCHRODER CHINA FIXED INCOME FUND USD I ACCUMULATION SHARE CLASS 21,611,190 4.38%SINGAPORE GOVERNMENT BOND 2.125% 01/06/2026 18,946,797 3.84%UNITED STATES TREASURY NOTE/BOND 0.625% 15/01/2026 15,937,019 3.23%THAILAND GOVERNMENT BOND 1.25% 12/03/2028 11,052,298 2.24%UNITED STATES TREASURY BILL 0% 25/08/2016 10,016,145 2.03%MONGOLIA GOVERNMENT BOND 5.125% 05/12/2022 9,473,398 1.92%
Top 10 Holdings as at 30 June 2015 Market Value USD % of Net AssetsKOREA TREASURY BOND 5.75% 10/09/2018 52,797,282 7.68%INDIA GOVERNMENT BOND 7.16% 20/05/2023 38,910,497 5.66%INDIA GOVERNMENT BOND 7.8% 11/04/2021 36,573,117 5.32%UNITED STATES TREASURY BILL 0% 03/09/2015 31,004,654 4.51%INDIA GOVERNMENT BOND 8.28% 21/09/2027 28,461,035 4.14%SCHRODER CHINA FIXED INCOME FUND USD I ACCUMULATION SHARE CLASS 27,223,599 3.96%THAILAND GOVERNMENT BOND 1.25% 12/03/2028 25,917,416 3.77%SISF - RMB FIXED INCOME I ACCUMULATION SHARE CLASS 23,786,276 3.46%PHILIPPINES GOVERNMENT BOND 7% 27/01/2016 19,317,756 2.81%MALAYSIA GOVERNMENT BOND 4.181% 15/07/2024 18,149,066 2.64%
Expense Ratio For the 12 months ended For the 12 months ended 30 June 2016 30 June 2015 1.66% 1.63%
Turnover Ratio For the 12 months ended For the 12 months ended 30 June 2016 30 June 2015 70.81% 60.77%
Other Material InformationNil
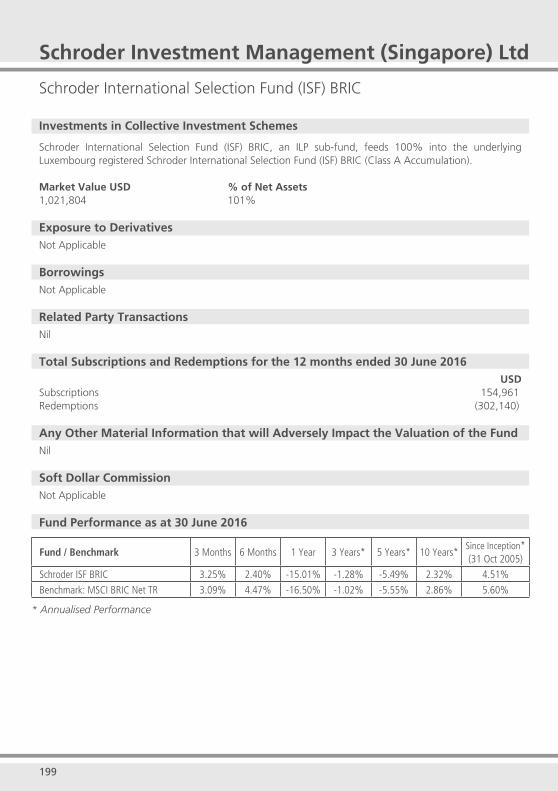
199 200
Schroder Investment Management (Singapore) Ltd
Schroder International Selection Fund (ISF) BRIC
Investments in Collective Investment Schemes
Schroder International Selection Fund (ISF) BRIC, an ILP sub-fund, feeds 100% into the underlying Luxembourg registered Schroder International Selection Fund (ISF) BRIC (Class A Accumulation).
Market Value USD % of Net Assets1,021,804 101%
Exposure to DerivativesNot Applicable
BorrowingsNot Applicable
Related Party TransactionsNil
Total Subscriptions and Redemptions for the 12 months ended 30 June 2016USD
Subscriptions 154,961Redemptions (302,140)
Any Other Material Information that will Adversely Impact the Valuation of the FundNil
Soft Dollar CommissionNot Applicable
Fund Performance as at 30 June 2016
Fund / Benchmark 3 Months 6 Months 1 Year 3 Years* 5 Years* 10 Years*Since Inception*(31 Oct 2005)
Schroder ISF BRIC 3.25% 2.40% -15.01% -1.28% -5.49% 2.32% 4.51%
Benchmark: MSCI BRIC Net TR 3.09% 4.47% -16.50% -1.02% -5.55% 2.86% 5.60%
* Annualised Performance
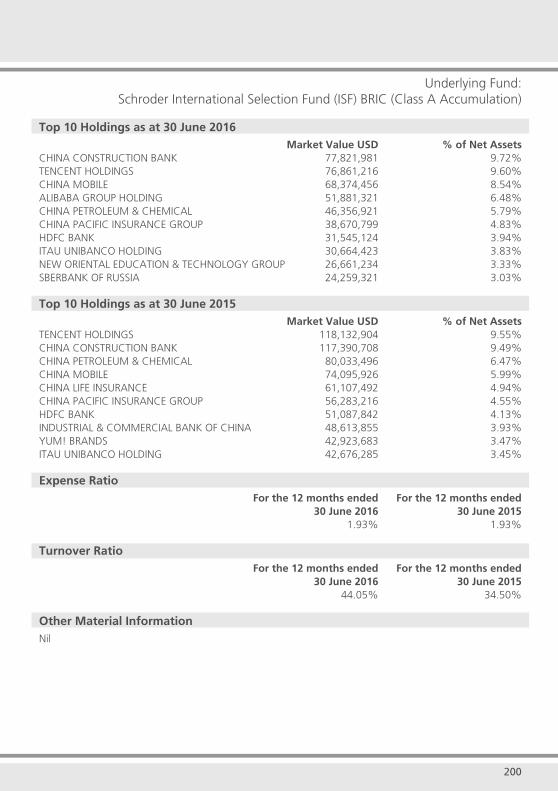
199 200
Schroder Investment Management (Singapore) LtdUnderlying Fund:
Schroder International Selection Fund (ISF) BRIC (Class A Accumulation)
Top 10 Holdings as at 30 June 2016 Market Value USD % of Net AssetsCHINA CONSTRUCTION BANK 77,821,981 9.72%TENCENT HOLDINGS 76,861,216 9.60%CHINA MOBILE 68,374,456 8.54%ALIBABA GROUP HOLDING 51,881,321 6.48%CHINA PETROLEUM & CHEMICAL 46,356,921 5.79%CHINA PACIFIC INSURANCE GROUP 38,670,799 4.83%HDFC BANK 31,545,124 3.94%ITAU UNIBANCO HOLDING 30,664,423 3.83%NEW ORIENTAL EDUCATION & TECHNOLOGY GROUP 26,661,234 3.33%SBERBANK OF RUSSIA 24,259,321 3.03%
Top 10 Holdings as at 30 June 2015 Market Value USD % of Net AssetsTENCENT HOLDINGS 118,132,904 9.55%CHINA CONSTRUCTION BANK 117,390,708 9.49%CHINA PETROLEUM & CHEMICAL 80,033,496 6.47%CHINA MOBILE 74,095,926 5.99%CHINA LIFE INSURANCE 61,107,492 4.94%CHINA PACIFIC INSURANCE GROUP 56,283,216 4.55%HDFC BANK 51,087,842 4.13%INDUSTRIAL & COMMERCIAL BANK OF CHINA 48,613,855 3.93%YUM! BRANDS 42,923,683 3.47%ITAU UNIBANCO HOLDING 42,676,285 3.45%
Expense Ratio For the 12 months ended For the 12 months ended 30 June 2016 30 June 2015 1.93% 1.93%
Turnover Ratio For the 12 months ended For the 12 months ended 30 June 2016 30 June 2015 44.05% 34.50%
Other Material InformationNil
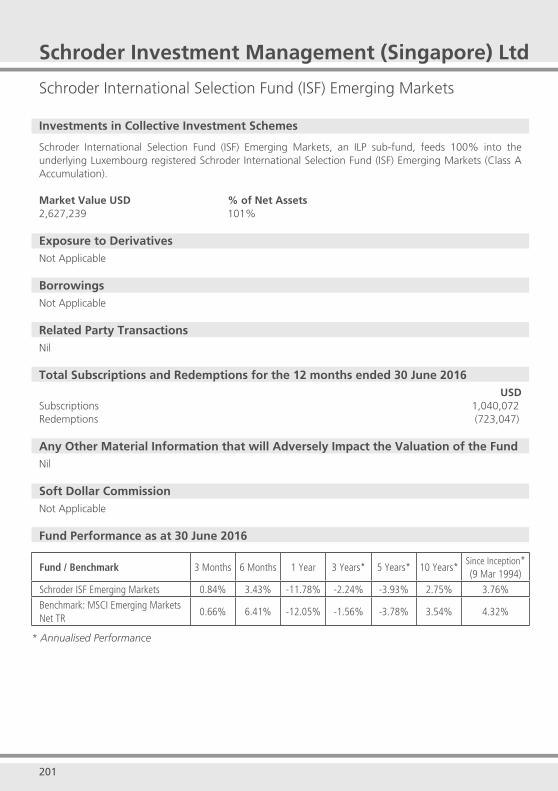
201 202
Schroder Investment Management (Singapore) Ltd
Schroder International Selection Fund (ISF) Emerging Markets
Investments in Collective Investment Schemes
Schroder International Selection Fund (ISF) Emerging Markets, an ILP sub-fund, feeds 100% into the underlying Luxembourg registered Schroder International Selection Fund (ISF) Emerging Markets (Class A Accumulation).
Market Value USD % of Net Assets2,627,239 101%
Exposure to DerivativesNot Applicable
BorrowingsNot Applicable
Related Party TransactionsNil
Total Subscriptions and Redemptions for the 12 months ended 30 June 2016USD
Subscriptions 1,040,072Redemptions (723,047)
Any Other Material Information that will Adversely Impact the Valuation of the FundNil
Soft Dollar CommissionNot Applicable
Fund Performance as at 30 June 2016
Fund / Benchmark 3 Months 6 Months 1 Year 3 Years* 5 Years* 10 Years*Since Inception*(9 Mar 1994)
Schroder ISF Emerging Markets 0.84% 3.43% -11.78% -2.24% -3.93% 2.75% 3.76%
Benchmark: MSCI Emerging Markets Net TR
0.66% 6.41% -12.05% -1.56% -3.78% 3.54% 4.32%
* Annualised Performance
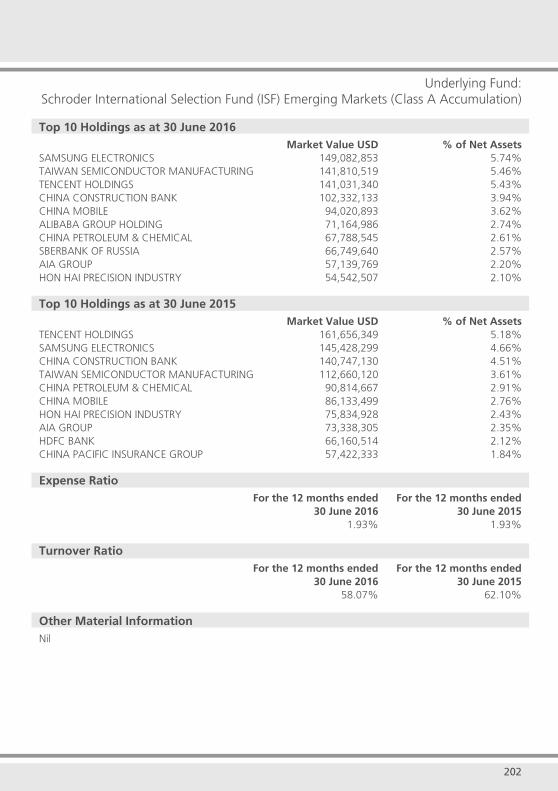
201 202
Schroder Investment Management (Singapore) LtdUnderlying Fund:
Schroder International Selection Fund (ISF) Emerging Markets (Class A Accumulation)
Top 10 Holdings as at 30 June 2016 Market Value USD % of Net AssetsSAMSUNG ELECTRONICS 149,082,853 5.74%TAIWAN SEMICONDUCTOR MANUFACTURING 141,810,519 5.46%TENCENT HOLDINGS 141,031,340 5.43%CHINA CONSTRUCTION BANK 102,332,133 3.94%CHINA MOBILE 94,020,893 3.62%ALIBABA GROUP HOLDING 71,164,986 2.74%CHINA PETROLEUM & CHEMICAL 67,788,545 2.61%SBERBANK OF RUSSIA 66,749,640 2.57%AIA GROUP 57,139,769 2.20%HON HAI PRECISION INDUSTRY 54,542,507 2.10%
Top 10 Holdings as at 30 June 2015 Market Value USD % of Net AssetsTENCENT HOLDINGS 161,656,349 5.18%SAMSUNG ELECTRONICS 145,428,299 4.66%CHINA CONSTRUCTION BANK 140,747,130 4.51%TAIWAN SEMICONDUCTOR MANUFACTURING 112,660,120 3.61%CHINA PETROLEUM & CHEMICAL 90,814,667 2.91%CHINA MOBILE 86,133,499 2.76%HON HAI PRECISION INDUSTRY 75,834,928 2.43%AIA GROUP 73,338,305 2.35%HDFC BANK 66,160,514 2.12%CHINA PACIFIC INSURANCE GROUP 57,422,333 1.84%
Expense Ratio For the 12 months ended For the 12 months ended 30 June 2016 30 June 2015 1.93% 1.93%
Turnover Ratio For the 12 months ended For the 12 months ended 30 June 2016 30 June 2015 58.07% 62.10%
Other Material InformationNil

203 204
Schroder Investment Management (Singapore) Ltd
Schroder International Selection Fund (ISF) Middle East
Investments in Collective Investment Schemes
Schroder International Selection Fund (ISF) Middle East, an ILP sub-fund, feeds 100% into the underlying Luxembourg registered Schroder International Selection Fund (ISF) Middle East (Class A Accumulation).
Market Value EUR % of Net Assets138,809 101%
Exposure to DerivativesNot Applicable
BorrowingsNot Applicable
Related Party TransactionsNil
Total Subscriptions and Redemptions for the 12 months ended 30 June 2016EUR
Subscriptions 27,757Redemptions (36,516)
Any Other Material Information that will Adversely Impact the Valuation of the FundNil
Soft Dollar CommissionNot Applicable
Fund Performance as at 30 June 2016
Fund / Benchmark 3 Months 6 Months 1 Year 3 Years* 5 Years* 10 Years*Since Inception*(3 Sep 2007)
Schroder ISF Middle East 0.42% -0.12% -14.30% 6.22% 9.76% NA 2.95%
Benchmark: MSCI Arab Markets and Turkey with Saudi Arabia capped at 20%
0.34% 0.73% -15.29% 2.25% 5.13% NA 1.13%
* Annualised Performance
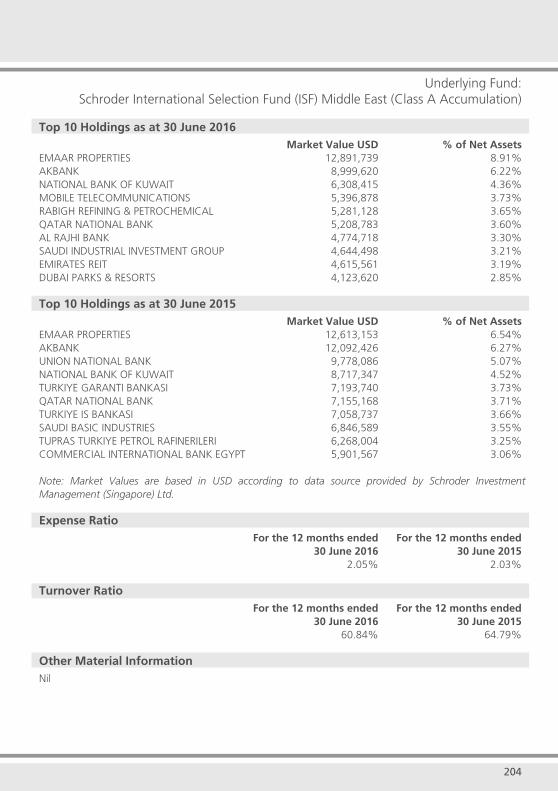
203 204
Schroder Investment Management (Singapore) LtdUnderlying Fund:
Schroder International Selection Fund (ISF) Middle East (Class A Accumulation)
Top 10 Holdings as at 30 June 2016 Market Value USD % of Net AssetsEMAAR PROPERTIES 12,891,739 8.91%AKBANK 8,999,620 6.22%NATIONAL BANK OF KUWAIT 6,308,415 4.36%MOBILE TELECOMMUNICATIONS 5,396,878 3.73%RABIGH REFINING & PETROCHEMICAL 5,281,128 3.65%QATAR NATIONAL BANK 5,208,783 3.60%AL RAJHI BANK 4,774,718 3.30%SAUDI INDUSTRIAL INVESTMENT GROUP 4,644,498 3.21%EMIRATES REIT 4,615,561 3.19%DUBAI PARKS & RESORTS 4,123,620 2.85%
Top 10 Holdings as at 30 June 2015 Market Value USD % of Net AssetsEMAAR PROPERTIES 12,613,153 6.54%AKBANK 12,092,426 6.27%UNION NATIONAL BANK 9,778,086 5.07%NATIONAL BANK OF KUWAIT 8,717,347 4.52%TURKIYE GARANTI BANKASI 7,193,740 3.73%QATAR NATIONAL BANK 7,155,168 3.71%TURKIYE IS BANKASI 7,058,737 3.66%SAUDI BASIC INDUSTRIES 6,846,589 3.55%TUPRAS TURKIYE PETROL RAFINERILERI 6,268,004 3.25%COMMERCIAL INTERNATIONAL BANK EGYPT 5,901,567 3.06%
Note: Market Values are based in USD according to data source provided by Schroder Investment Management (Singapore) Ltd.
Expense Ratio For the 12 months ended For the 12 months ended 30 June 2016 30 June 2015 2.05% 2.03%
Turnover Ratio For the 12 months ended For the 12 months ended 30 June 2016 30 June 2015 60.84% 64.79%
Other Material InformationNil
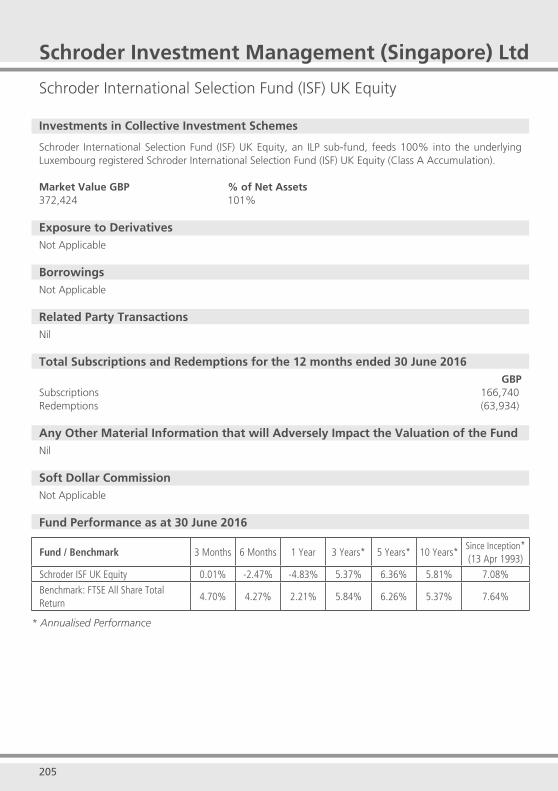
205 206
Schroder Investment Management (Singapore) Ltd
Schroder International Selection Fund (ISF) UK Equity
Investments in Collective Investment Schemes
Schroder International Selection Fund (ISF) UK Equity, an ILP sub-fund, feeds 100% into the underlying Luxembourg registered Schroder International Selection Fund (ISF) UK Equity (Class A Accumulation).
Market Value GBP % of Net Assets372,424 101%
Exposure to DerivativesNot Applicable
BorrowingsNot Applicable
Related Party TransactionsNil
Total Subscriptions and Redemptions for the 12 months ended 30 June 2016GBP
Subscriptions 166,740Redemptions (63,934)
Any Other Material Information that will Adversely Impact the Valuation of the FundNil
Soft Dollar CommissionNot Applicable
Fund Performance as at 30 June 2016
Fund / Benchmark 3 Months 6 Months 1 Year 3 Years* 5 Years* 10 Years*Since Inception*(13 Apr 1993)
Schroder ISF UK Equity 0.01% -2.47% -4.83% 5.37% 6.36% 5.81% 7.08%
Benchmark: FTSE All Share Total Return
4.70% 4.27% 2.21% 5.84% 6.26% 5.37% 7.64%
* Annualised Performance

205 206
Schroder Investment Management (Singapore) LtdUnderlying Fund:
Schroder International Selection Fund (ISF) UK Equity (Class A Accumulation)
Top 10 Holdings as at 30 June 2016 Market Value GBP % of Net AssetsBP 12,026,152 6.67%GLAXOSMITHKLINE 10,691,916 5.93%ROYAL DUTCH SHELL 8,149,656 4.52%ASTRAZENECA 7,789,052 4.32%VODAFONE GROUP 6,292,544 3.49%SAGE GROUP 5,877,849 3.26%BAE SYSTEMS 5,679,517 3.15%RELX 5,661,487 3.14%AVIVA 5,571,336 3.09%IMPERIAL BRANDS 5,391,034 2.99%
Top 10 Holdings as at 30 June 2015 Market Value GBP % of Net AssetsBP 13,089,461 5.11%ASTRAZENECA 11,450,077 4.47%HSBC HOLDINGS 11,270,769 4.40%GLAXOSMITHKLINE 10,399,846 4.06%AVIVA 9,605,769 3.75%IMPERIAL TOBACCO GROUP 8,350,615 3.26%CARNIVAL 8,094,461 3.16%VODAFONE GROUP 7,915,154 3.09%SAGE GROUP 7,863,923 3.07%BARCLAYS 7,556,538 2.95%
Expense Ratio For the 12 months ended For the 12 months ended 30 June 2016 30 June 2015 1.66% 1.66%
Turnover Ratio For the 12 months ended For the 12 months ended 30 June 2016 30 June 2015 22.69% 38.28%
Other Material InformationNil
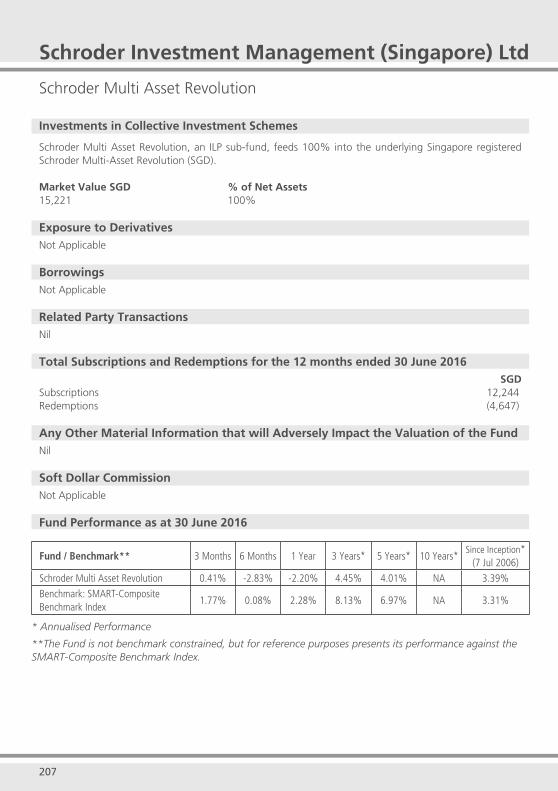
207 208
Schroder Investment Management (Singapore) Ltd
Schroder Multi Asset Revolution
Investments in Collective Investment Schemes
Schroder Multi Asset Revolution, an ILP sub-fund, feeds 100% into the underlying Singapore registered Schroder Multi-Asset Revolution (SGD).
Market Value SGD % of Net Assets15,221 100%
Exposure to DerivativesNot Applicable
BorrowingsNot Applicable
Related Party TransactionsNil
Total Subscriptions and Redemptions for the 12 months ended 30 June 2016SGD
Subscriptions 12,244Redemptions (4,647)
Any Other Material Information that will Adversely Impact the Valuation of the FundNil
Soft Dollar CommissionNot Applicable
Fund Performance as at 30 June 2016
Fund / Benchmark** 3 Months 6 Months 1 Year 3 Years* 5 Years* 10 Years*Since Inception*
(7 Jul 2006)
Schroder Multi Asset Revolution 0.41% -2.83% -2.20% 4.45% 4.01% NA 3.39%
Benchmark: SMART-Composite Benchmark Index
1.77% 0.08% 2.28% 8.13% 6.97% NA 3.31%
* Annualised Performance
**The Fund is not benchmark constrained, but for reference purposes presents its performance against the SMART-Composite Benchmark Index.
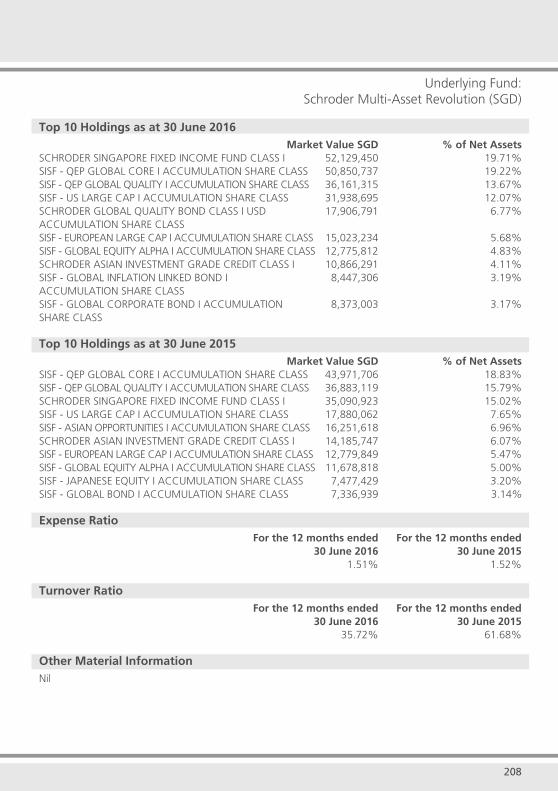
207 208
Schroder Investment Management (Singapore) LtdUnderlying Fund:
Schroder Multi-Asset Revolution (SGD)
Top 10 Holdings as at 30 June 2016 Market Value SGD % of Net AssetsSCHRODER SINGAPORE FIXED INCOME FUND CLASS I 52,129,450 19.71%SISF - QEP GLOBAL CORE I ACCUMULATION SHARE CLASS 50,850,737 19.22%SISF - QEP GLOBAL QUALITY I ACCUMULATION SHARE CLASS 36,161,315 13.67%SISF - US LARGE CAP I ACCUMULATION SHARE CLASS 31,938,695 12.07%SCHRODER GLOBAL QUALITY BOND CLASS I USD 17,906,791 6.77%ACCUMULATION SHARE CLASSSISF - EUROPEAN LARGE CAP I ACCUMULATION SHARE CLASS 15,023,234 5.68%SISF - GLOBAL EQUITY ALPHA I ACCUMULATION SHARE CLASS 12,775,812 4.83%SCHRODER ASIAN INVESTMENT GRADE CREDIT CLASS I 10,866,291 4.11%SISF - GLOBAL INFLATION LINKED BOND I 8,447,306 3.19%ACCUMULATION SHARE CLASSSISF - GLOBAL CORPORATE BOND I ACCUMULATION 8,373,003 3.17%SHARE CLASS
Top 10 Holdings as at 30 June 2015 Market Value SGD % of Net AssetsSISF - QEP GLOBAL CORE I ACCUMULATION SHARE CLASS 43,971,706 18.83%SISF - QEP GLOBAL QUALITY I ACCUMULATION SHARE CLASS 36,883,119 15.79%SCHRODER SINGAPORE FIXED INCOME FUND CLASS I 35,090,923 15.02%SISF - US LARGE CAP I ACCUMULATION SHARE CLASS 17,880,062 7.65%SISF - ASIAN OPPORTUNITIES I ACCUMULATION SHARE CLASS 16,251,618 6.96%SCHRODER ASIAN INVESTMENT GRADE CREDIT CLASS I 14,185,747 6.07%SISF - EUROPEAN LARGE CAP I ACCUMULATION SHARE CLASS 12,779,849 5.47%SISF - GLOBAL EQUITY ALPHA I ACCUMULATION SHARE CLASS 11,678,818 5.00%SISF - JAPANESE EQUITY I ACCUMULATION SHARE CLASS 7,477,429 3.20%SISF - GLOBAL BOND I ACCUMULATION SHARE CLASS 7,336,939 3.14%
Expense Ratio For the 12 months ended For the 12 months ended 30 June 2016 30 June 2015 1.51% 1.52%
Turnover Ratio For the 12 months ended For the 12 months ended 30 June 2016 30 June 2015 35.72% 61.68%
Other Material InformationNil
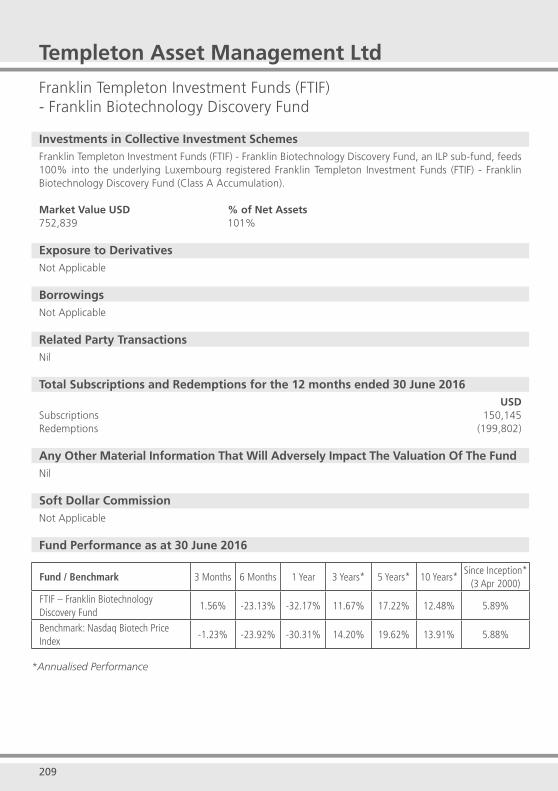
209
Templeton Asset Management Ltd
Franklin Templeton Investment Funds (FTIF)- Franklin Biotechnology Discovery Fund
Investments in Collective Investment SchemesFranklin Templeton Investment Funds (FTIF) - Franklin Biotechnology Discovery Fund, an ILP sub-fund, feeds 100% into the underlying Luxembourg registered Franklin Templeton Investment Funds (FTIF) - Franklin Biotechnology Discovery Fund (Class A Accumulation).
Market Value USD % of Net Assets752,839 101%
Exposure to DerivativesNot Applicable
BorrowingsNot Applicable
Related Party TransactionsNil
Total Subscriptions and Redemptions for the 12 months ended 30 June 2016USD
Subscriptions 150,145Redemptions (199,802)
Any Other Material Information That Will Adversely Impact The Valuation Of The Fund Nil
Soft Dollar CommissionNot Applicable
Fund Performance as at 30 June 2016
Fund / Benchmark 3 Months 6 Months 1 Year 3 Years* 5 Years* 10 Years*Since Inception*
(3 Apr 2000)
FTIF – Franklin Biotechnology Discovery Fund
1.56% -23.13% -32.17% 11.67% 17.22% 12.48% 5.89%
Benchmark: Nasdaq Biotech Price Index
-1.23% -23.92% -30.31% 14.20% 19.62% 13.91% 5.88%
*Annualised Performance
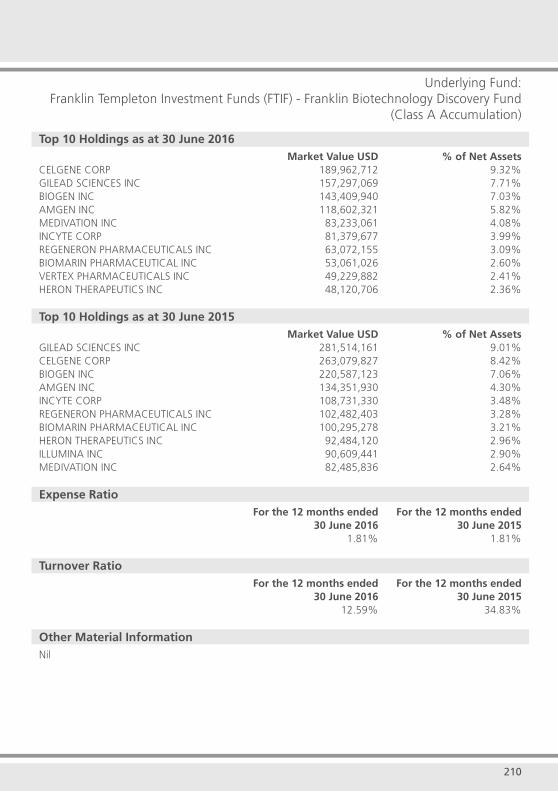
210
Underlying Fund:Franklin Templeton Investment Funds (FTIF) - Franklin Biotechnology Discovery Fund
(Class A Accumulation)
Top 10 Holdings as at 30 June 2016 Market Value USD % of Net AssetsCELGENE CORP 189,962,712 9.32%GILEAD SCIENCES INC 157,297,069 7.71%BIOGEN INC 143,409,940 7.03%AMGEN INC 118,602,321 5.82%MEDIVATION INC 83,233,061 4.08%INCYTE CORP 81,379,677 3.99%REGENERON PHARMACEUTICALS INC 63,072,155 3.09%BIOMARIN PHARMACEUTICAL INC 53,061,026 2.60%VERTEX PHARMACEUTICALS INC 49,229,882 2.41%HERON THERAPEUTICS INC 48,120,706 2.36%
Top 10 Holdings as at 30 June 2015 Market Value USD % of Net AssetsGILEAD SCIENCES INC 281,514,161 9.01%CELGENE CORP 263,079,827 8.42%BIOGEN INC 220,587,123 7.06%AMGEN INC 134,351,930 4.30%INCYTE CORP 108,731,330 3.48%REGENERON PHARMACEUTICALS INC 102,482,403 3.28%BIOMARIN PHARMACEUTICAL INC 100,295,278 3.21%HERON THERAPEUTICS INC 92,484,120 2.96%ILLUMINA INC 90,609,441 2.90%MEDIVATION INC 82,485,836 2.64%
Expense Ratio For the 12 months ended For the 12 months ended 30 June 2016 30 June 2015 1.81% 1.81%
Turnover Ratio For the 12 months ended For the 12 months ended 30 June 2016 30 June 2015 12.59% 34.83%
Other Material InformationNil
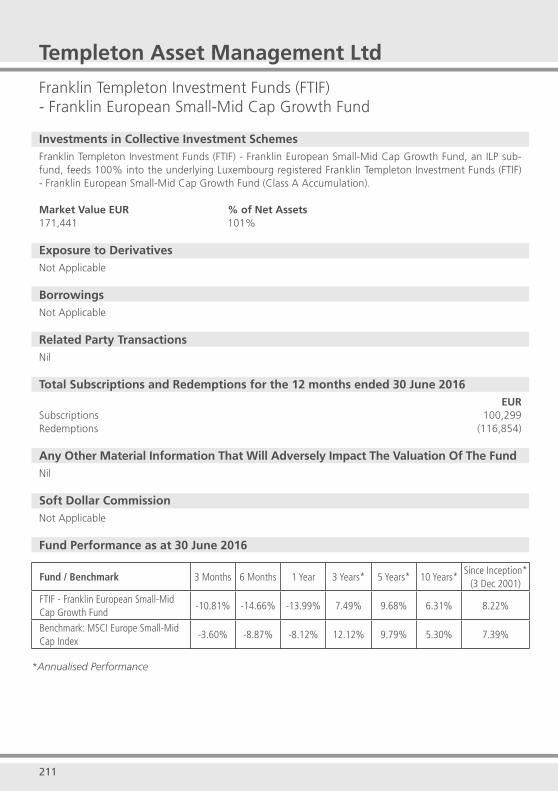
211
Templeton Asset Management Ltd
Franklin Templeton Investment Funds (FTIF)- Franklin European Small-Mid Cap Growth Fund
Investments in Collective Investment SchemesFranklin Templeton Investment Funds (FTIF) - Franklin European Small-Mid Cap Growth Fund, an ILP sub-fund, feeds 100% into the underlying Luxembourg registered Franklin Templeton Investment Funds (FTIF) - Franklin European Small-Mid Cap Growth Fund (Class A Accumulation).
Market Value EUR % of Net Assets171,441 101%
Exposure to DerivativesNot Applicable
BorrowingsNot Applicable
Related Party TransactionsNil
Total Subscriptions and Redemptions for the 12 months ended 30 June 2016EUR
Subscriptions 100,299Redemptions (116,854)
Any Other Material Information That Will Adversely Impact The Valuation Of The FundNil
Soft Dollar CommissionNot Applicable
Fund Performance as at 30 June 2016
Fund / Benchmark 3 Months 6 Months 1 Year 3 Years* 5 Years* 10 Years*Since Inception*
(3 Dec 2001)
FTIF - Franklin European Small-Mid Cap Growth Fund
-10.81% -14.66% -13.99% 7.49% 9.68% 6.31% 8.22%
Benchmark: MSCI Europe Small-Mid Cap Index
-3.60% -8.87% -8.12% 12.12% 9.79% 5.30% 7.39%
*Annualised Performance
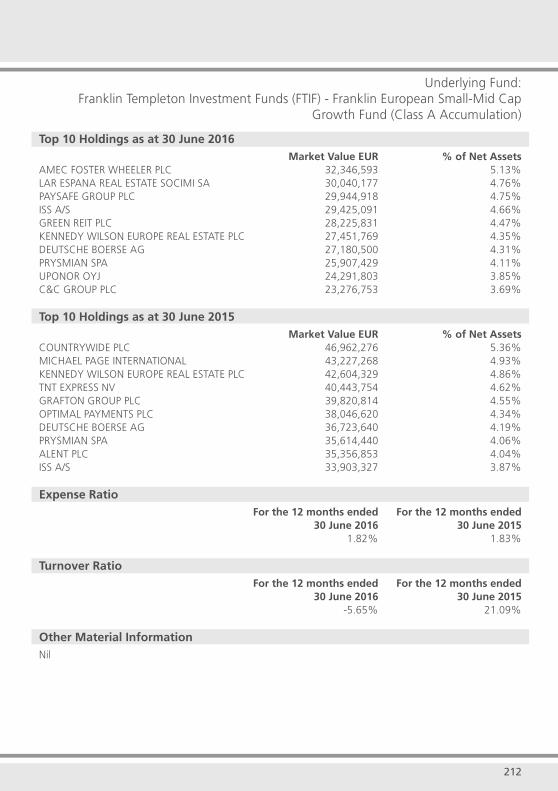
212
Underlying Fund:Franklin Templeton Investment Funds (FTIF) - Franklin European Small-Mid Cap
Growth Fund (Class A Accumulation)
Top 10 Holdings as at 30 June 2016 Market Value EUR % of Net AssetsAMEC FOSTER WHEELER PLC 32,346,593 5.13%LAR ESPANA REAL ESTATE SOCIMI SA 30,040,177 4.76%PAYSAFE GROUP PLC 29,944,918 4.75%ISS A/S 29,425,091 4.66%GREEN REIT PLC 28,225,831 4.47%KENNEDY WILSON EUROPE REAL ESTATE PLC 27,451,769 4.35%DEUTSCHE BOERSE AG 27,180,500 4.31%PRYSMIAN SPA 25,907,429 4.11%UPONOR OYJ 24,291,803 3.85%C&C GROUP PLC 23,276,753 3.69%
Top 10 Holdings as at 30 June 2015 Market Value EUR % of Net AssetsCOUNTRYWIDE PLC 46,962,276 5.36%MICHAEL PAGE INTERNATIONAL 43,227,268 4.93%KENNEDY WILSON EUROPE REAL ESTATE PLC 42,604,329 4.86%TNT EXPRESS NV 40,443,754 4.62%GRAFTON GROUP PLC 39,820,814 4.55%OPTIMAL PAYMENTS PLC 38,046,620 4.34%DEUTSCHE BOERSE AG 36,723,640 4.19%PRYSMIAN SPA 35,614,440 4.06%ALENT PLC 35,356,853 4.04%ISS A/S 33,903,327 3.87%
Expense Ratio For the 12 months ended For the 12 months ended 30 June 2016 30 June 2015 1.82% 1.83%
Turnover Ratio For the 12 months ended For the 12 months ended 30 June 2016 30 June 2015 -5.65% 21.09%
Other Material InformationNil
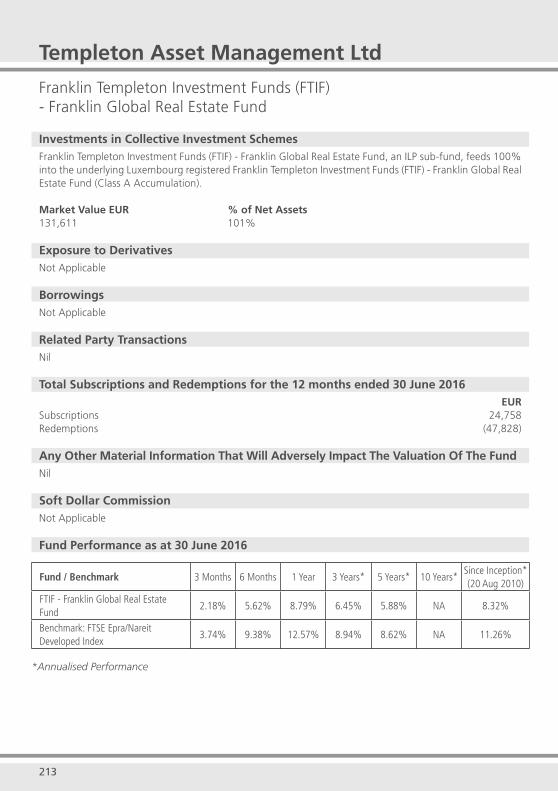
213
Templeton Asset Management Ltd
Franklin Templeton Investment Funds (FTIF) - Franklin Global Real Estate Fund
Investments in Collective Investment SchemesFranklin Templeton Investment Funds (FTIF) - Franklin Global Real Estate Fund, an ILP sub-fund, feeds 100% into the underlying Luxembourg registered Franklin Templeton Investment Funds (FTIF) - Franklin Global Real Estate Fund (Class A Accumulation).
Market Value EUR % of Net Assets131,611 101%
Exposure to DerivativesNot Applicable
BorrowingsNot Applicable
Related Party TransactionsNil
Total Subscriptions and Redemptions for the 12 months ended 30 June 2016EUR
Subscriptions 24,758Redemptions (47,828)
Any Other Material Information That Will Adversely Impact The Valuation Of The FundNil
Soft Dollar CommissionNot Applicable
Fund Performance as at 30 June 2016
Fund / Benchmark 3 Months 6 Months 1 Year 3 Years* 5 Years* 10 Years*Since Inception*(20 Aug 2010)
FTIF - Franklin Global Real Estate Fund
2.18% 5.62% 8.79% 6.45% 5.88% NA 8.32%
Benchmark: FTSE Epra/Nareit Developed Index
3.74% 9.38% 12.57% 8.94% 8.62% NA 11.26%
*Annualised Performance
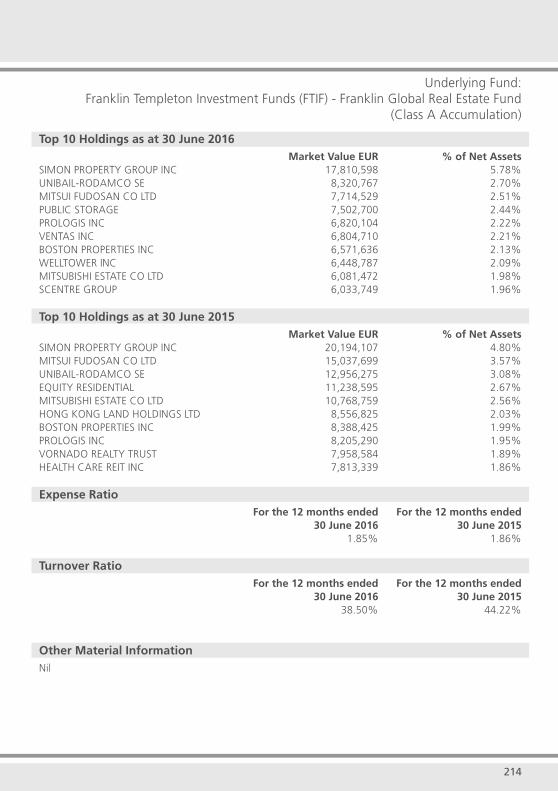
214
Underlying Fund:Franklin Templeton Investment Funds (FTIF) - Franklin Global Real Estate Fund
(Class A Accumulation)
Top 10 Holdings as at 30 June 2016 Market Value EUR % of Net AssetsSIMON PROPERTY GROUP INC 17,810,598 5.78%UNIBAIL-RODAMCO SE 8,320,767 2.70%MITSUI FUDOSAN CO LTD 7,714,529 2.51%PUBLIC STORAGE 7,502,700 2.44%PROLOGIS INC 6,820,104 2.22%VENTAS INC 6,804,710 2.21%BOSTON PROPERTIES INC 6,571,636 2.13%WELLTOWER INC 6,448,787 2.09%MITSUBISHI ESTATE CO LTD 6,081,472 1.98%SCENTRE GROUP 6,033,749 1.96%
Top 10 Holdings as at 30 June 2015 Market Value EUR % of Net AssetsSIMON PROPERTY GROUP INC 20,194,107 4.80%MITSUI FUDOSAN CO LTD 15,037,699 3.57%UNIBAIL-RODAMCO SE 12,956,275 3.08%EQUITY RESIDENTIAL 11,238,595 2.67%MITSUBISHI ESTATE CO LTD 10,768,759 2.56%HONG KONG LAND HOLDINGS LTD 8,556,825 2.03%BOSTON PROPERTIES INC 8,388,425 1.99%PROLOGIS INC 8,205,290 1.95%VORNADO REALTY TRUST 7,958,584 1.89%HEALTH CARE REIT INC 7,813,339 1.86%
Expense Ratio For the 12 months ended For the 12 months ended 30 June 2016 30 June 2015 1.85% 1.86%
Turnover Ratio For the 12 months ended For the 12 months ended 30 June 2016 30 June 2015 38.50% 44.22%
Other Material InformationNil
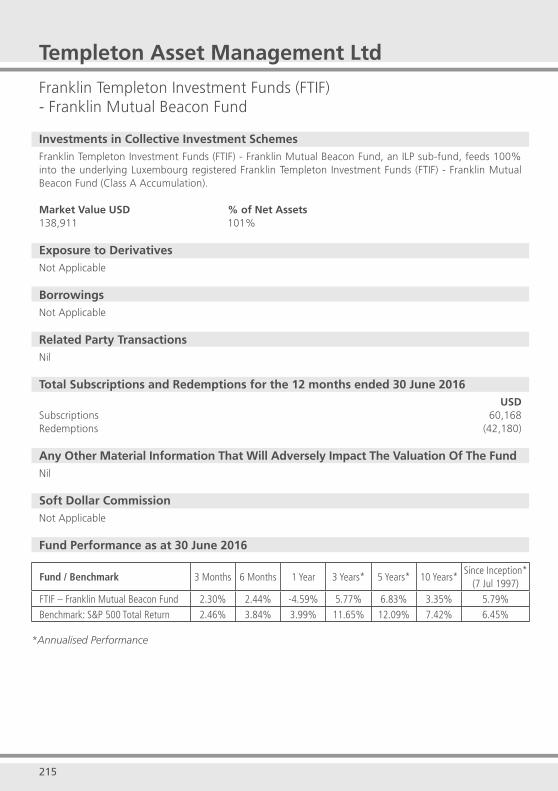
215
Templeton Asset Management Ltd
Franklin Templeton Investment Funds (FTIF)- Franklin Mutual Beacon Fund
Investments in Collective Investment SchemesFranklin Templeton Investment Funds (FTIF) - Franklin Mutual Beacon Fund, an ILP sub-fund, feeds 100% into the underlying Luxembourg registered Franklin Templeton Investment Funds (FTIF) - Franklin Mutual Beacon Fund (Class A Accumulation).
Market Value USD % of Net Assets138,911 101%
Exposure to DerivativesNot Applicable
BorrowingsNot Applicable
Related Party TransactionsNil
Total Subscriptions and Redemptions for the 12 months ended 30 June 2016USD
Subscriptions 60,168Redemptions (42,180)
Any Other Material Information That Will Adversely Impact The Valuation Of The FundNil
Soft Dollar CommissionNot Applicable
Fund Performance as at 30 June 2016
Fund / Benchmark 3 Months 6 Months 1 Year 3 Years* 5 Years* 10 Years*Since Inception*
(7 Jul 1997)
FTIF – Franklin Mutual Beacon Fund 2.30% 2.44% -4.59% 5.77% 6.83% 3.35% 5.79%
Benchmark: S&P 500 Total Return 2.46% 3.84% 3.99% 11.65% 12.09% 7.42% 6.45%
*Annualised Performance

216
Underlying Fund:Franklin Templeton Investment Funds (FTIF) - Franklin Mutual Beacon Fund
(Class A Accumulation)
Top 10 Holdings as at 30 June 2016 Market Value USD % of Net AssetsMEDTRONIC PLC 29,159,551 4.55%MICROSOFT CORP 29,017,125 4.52%MERCK & CO INC 28,235,704 4.40%WHITE MOUNTAINS INSURANCE GROUP LTD 18,435,231 2.87%ELI LILLY & CO 18,166,418 2.83%PNC FINANCIAL SERVICES GROUP INC 16,543,270 2.58%AMERICAN INTERNATIONAL GROUP INC 15,868,349 2.47%SYMANTEC CORP 14,906,009 2.32%CISCO SYSTEMS INC 13,778,788 2.15%CHUBB LTD 13,411,815 2.09%
Top 10 Holdings as at 30 June 2015 Market Value USD % of Net AssetsMERCK & CO INC 26,476,992 2.77%MICROSOFT CORP 26,418,654 2.76%WHITE MOUNTAINS INSURANCE GROUP LTD 25,988,289 2.72%MEDTRONIC PLC 25,169,640 2.63%ELI LILLY & CO 21,842,443 2.28%PNC FINANCIAL SERVICES GROUP INC 20,163,064 2.11%TIME WARNER CABLE INC 19,364,499 2.02%AMERICAN INTERNATIONAL GROUP INC 19,279,382 2.02%APPLE INC 18,318,234 1.92%TEVA PHARMACEUTICAL INDUSTRIES LTD 17,402,992 1.82%
Expense Ratio For the 12 months ended For the 12 months ended 30 June 2016 30 June 2015 1.83% 1.82%
Turnover Ratio For the 12 months ended For the 12 months ended 30 June 2016 30 June 2015 48.22% 22.57%
Other Material InformationNil

217
Templeton Asset Management Ltd
Franklin Templeton Investment Funds (FTIF) - Franklin Mutual Global Discovery Fund
Investments in Collective Investment SchemesFranklin Templeton Investment Funds (FTIF) - Franklin Mutual Global Discovery Fund , an ILP sub-fund, feeds 100% into the underlying Luxembourg registered Franklin Templeton Investment Funds (FTIF) - Franklin Mutual Global Discovery Fund (Class A Accumulation).
Market Value USD % of Net Assets4,693 100%
Exposure to DerivativesNot Applicable
BorrowingsNot Applicable
Related Party TransactionsNil
Total Subscriptions and Redemptions for the 12 months ended 30 June 2016USD
Subscriptions 3,283Redemptions (962)
Any Other Material Information That Will Adversely Impact The Valuation Of The FundNil
Soft Dollar CommissionNot Applicable
Fund Performance as at 30 June 2016
Fund / Benchmark 3 Months 6 Months 1 Year 3 Years* 5 Years* 10 Years*Since Inception*(25 Oct 2005)
FTIF - Franklin Mutual Global Discovery Fund
0.00% -1.40% -10.02% 1.42% 2.36% 3.80% 4.60%
Benchmark: MSCI World Index 1.21% 1.02% -2.19% 7.54% 7.23% 5.02% 5.92%
*Annualised Performance
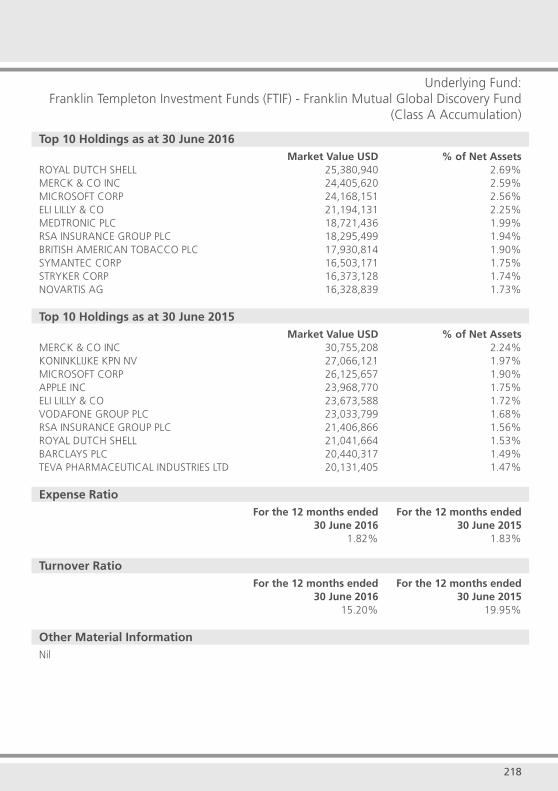
218
Underlying Fund:Franklin Templeton Investment Funds (FTIF) - Franklin Mutual Global Discovery Fund
(Class A Accumulation)
Top 10 Holdings as at 30 June 2016 Market Value USD % of Net AssetsROYAL DUTCH SHELL 25,380,940 2.69%MERCK & CO INC 24,405,620 2.59%MICROSOFT CORP 24,168,151 2.56%ELI LILLY & CO 21,194,131 2.25%MEDTRONIC PLC 18,721,436 1.99%RSA INSURANCE GROUP PLC 18,295,499 1.94%BRITISH AMERICAN TOBACCO PLC 17,930,814 1.90%SYMANTEC CORP 16,503,171 1.75%STRYKER CORP 16,373,128 1.74%NOVARTIS AG 16,328,839 1.73%
Top 10 Holdings as at 30 June 2015 Market Value USD % of Net AssetsMERCK & CO INC 30,755,208 2.24%KONINKLIJKE KPN NV 27,066,121 1.97%MICROSOFT CORP 26,125,657 1.90%APPLE INC 23,968,770 1.75%ELI LILLY & CO 23,673,588 1.72%VODAFONE GROUP PLC 23,033,799 1.68%RSA INSURANCE GROUP PLC 21,406,866 1.56%ROYAL DUTCH SHELL 21,041,664 1.53%BARCLAYS PLC 20,440,317 1.49%TEVA PHARMACEUTICAL INDUSTRIES LTD 20,131,405 1.47%
Expense Ratio For the 12 months ended For the 12 months ended 30 June 2016 30 June 2015 1.82% 1.83%
Turnover Ratio For the 12 months ended For the 12 months ended 30 June 2016 30 June 2015 15.20% 19.95%
Other Material InformationNil
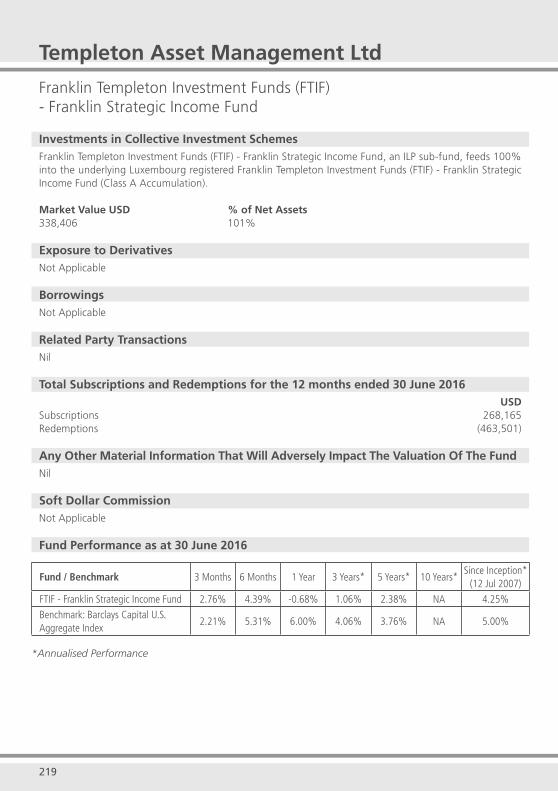
219
Templeton Asset Management Ltd
Franklin Templeton Investment Funds (FTIF) - Franklin Strategic Income Fund
Investments in Collective Investment SchemesFranklin Templeton Investment Funds (FTIF) - Franklin Strategic Income Fund, an ILP sub-fund, feeds 100% into the underlying Luxembourg registered Franklin Templeton Investment Funds (FTIF) - Franklin Strategic Income Fund (Class A Accumulation).
Market Value USD % of Net Assets338,406 101%
Exposure to DerivativesNot Applicable
BorrowingsNot Applicable
Related Party TransactionsNil
Total Subscriptions and Redemptions for the 12 months ended 30 June 2016USD
Subscriptions 268,165Redemptions (463,501)
Any Other Material Information That Will Adversely Impact The Valuation Of The Fund Nil
Soft Dollar CommissionNot Applicable
Fund Performance as at 30 June 2016
Fund / Benchmark 3 Months 6 Months 1 Year 3 Years* 5 Years* 10 Years*Since Inception*
(12 Jul 2007)
FTIF - Franklin Strategic Income Fund 2.76% 4.39% -0.68% 1.06% 2.38% NA 4.25%
Benchmark: Barclays Capital U.S. Aggregate Index
2.21% 5.31% 6.00% 4.06% 3.76% NA 5.00%
*Annualised Performance
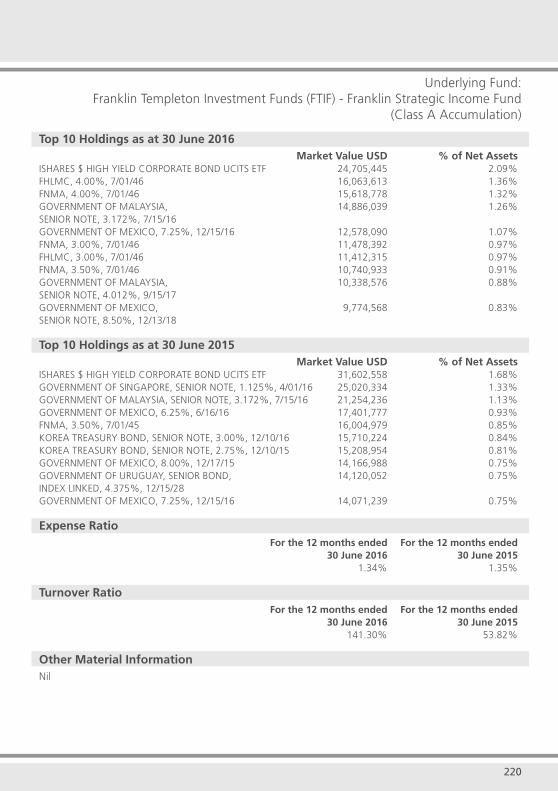
220
Underlying Fund:Franklin Templeton Investment Funds (FTIF) - Franklin Strategic Income Fund
(Class A Accumulation)
Top 10 Holdings as at 30 June 2016 Market Value USD % of Net AssetsISHARES $ HIGH YIELD CORPORATE BOND UCITS ETF 24,705,445 2.09%FHLMC, 4.00%, 7/01/46 16,063,613 1.36%FNMA, 4.00%, 7/01/46 15,618,778 1.32%GOVERNMENT OF MALAYSIA, 14,886,039 1.26%SENIOR NOTE, 3.172%, 7/15/16 GOVERNMENT OF MEXICO, 7.25%, 12/15/16 12,578,090 1.07%FNMA, 3.00%, 7/01/46 11,478,392 0.97%FHLMC, 3.00%, 7/01/46 11,412,315 0.97%FNMA, 3.50%, 7/01/46 10,740,933 0.91%GOVERNMENT OF MALAYSIA, 10,338,576 0.88%SENIOR NOTE, 4.012%, 9/15/17 GOVERNMENT OF MEXICO, 9,774,568 0.83%SENIOR NOTE, 8.50%, 12/13/18
Top 10 Holdings as at 30 June 2015 Market Value USD % of Net AssetsISHARES $ HIGH YIELD CORPORATE BOND UCITS ETF 31,602,558 1.68%GOVERNMENT OF SINGAPORE, SENIOR NOTE, 1.125%, 4/01/16 25,020,334 1.33%GOVERNMENT OF MALAYSIA, SENIOR NOTE, 3.172%, 7/15/16 21,254,236 1.13%GOVERNMENT OF MEXICO, 6.25%, 6/16/16 17,401,777 0.93%FNMA, 3.50%, 7/01/45 16,004,979 0.85%KOREA TREASURY BOND, SENIOR NOTE, 3.00%, 12/10/16 15,710,224 0.84%KOREA TREASURY BOND, SENIOR NOTE, 2.75%, 12/10/15 15,208,954 0.81%GOVERNMENT OF MEXICO, 8.00%, 12/17/15 14,166,988 0.75%GOVERNMENT OF URUGUAY, SENIOR BOND, 14,120,052 0.75%INDEX LINKED, 4.375%, 12/15/28 GOVERNMENT OF MEXICO, 7.25%, 12/15/16 14,071,239 0.75%
Expense Ratio For the 12 months ended For the 12 months ended 30 June 2016 30 June 2015 1.34% 1.35%
Turnover Ratio For the 12 months ended For the 12 months ended 30 June 2016 30 June 2015 141.30% 53.82%
Other Material InformationNil
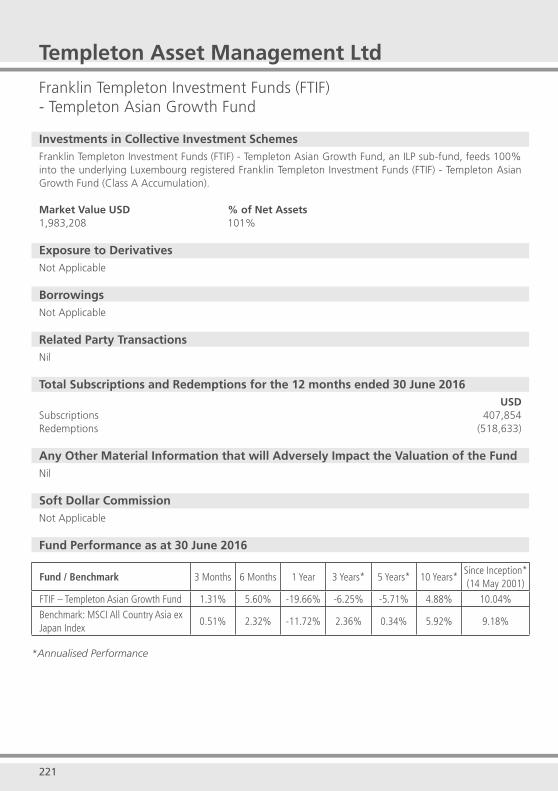
221
Templeton Asset Management Ltd
Franklin Templeton Investment Funds (FTIF)- Templeton Asian Growth Fund
Investments in Collective Investment SchemesFranklin Templeton Investment Funds (FTIF) - Templeton Asian Growth Fund, an ILP sub-fund, feeds 100% into the underlying Luxembourg registered Franklin Templeton Investment Funds (FTIF) - Templeton Asian Growth Fund (Class A Accumulation).
Market Value USD % of Net Assets1,983,208 101%
Exposure to DerivativesNot Applicable
BorrowingsNot Applicable
Related Party TransactionsNil
Total Subscriptions and Redemptions for the 12 months ended 30 June 2016USD
Subscriptions 407,854Redemptions (518,633)
Any Other Material Information that will Adversely Impact the Valuation of the FundNil
Soft Dollar CommissionNot Applicable
Fund Performance as at 30 June 2016
Fund / Benchmark 3 Months 6 Months 1 Year 3 Years* 5 Years* 10 Years*Since Inception*(14 May 2001)
FTIF – Templeton Asian Growth Fund 1.31% 5.60% -19.66% -6.25% -5.71% 4.88% 10.04%
Benchmark: MSCI All Country Asia ex Japan Index
0.51% 2.32% -11.72% 2.36% 0.34% 5.92% 9.18%
*Annualised Performance
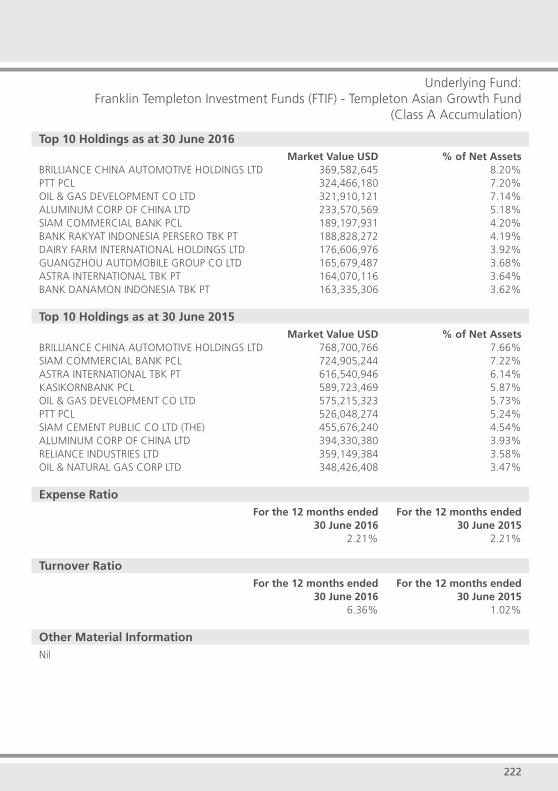
222
Underlying Fund:Franklin Templeton Investment Funds (FTIF) - Templeton Asian Growth Fund
(Class A Accumulation)
Top 10 Holdings as at 30 June 2016 Market Value USD % of Net AssetsBRILLIANCE CHINA AUTOMOTIVE HOLDINGS LTD 369,582,645 8.20%PTT PCL 324,466,180 7.20%OIL & GAS DEVELOPMENT CO LTD 321,910,121 7.14%ALUMINUM CORP OF CHINA LTD 233,570,569 5.18%SIAM COMMERCIAL BANK PCL 189,197,931 4.20%BANK RAKYAT INDONESIA PERSERO TBK PT 188,828,272 4.19%DAIRY FARM INTERNATIONAL HOLDINGS LTD 176,606,976 3.92%GUANGZHOU AUTOMOBILE GROUP CO LTD 165,679,487 3.68%ASTRA INTERNATIONAL TBK PT 164,070,116 3.64%BANK DANAMON INDONESIA TBK PT 163,335,306 3.62%
Top 10 Holdings as at 30 June 2015 Market Value USD % of Net AssetsBRILLIANCE CHINA AUTOMOTIVE HOLDINGS LTD 768,700,766 7.66%SIAM COMMERCIAL BANK PCL 724,905,244 7.22%ASTRA INTERNATIONAL TBK PT 616,540,946 6.14%KASIKORNBANK PCL 589,723,469 5.87%OIL & GAS DEVELOPMENT CO LTD 575,215,323 5.73%PTT PCL 526,048,274 5.24%SIAM CEMENT PUBLIC CO LTD (THE) 455,676,240 4.54%ALUMINUM CORP OF CHINA LTD 394,330,380 3.93%RELIANCE INDUSTRIES LTD 359,149,384 3.58%OIL & NATURAL GAS CORP LTD 348,426,408 3.47%
Expense Ratio For the 12 months ended For the 12 months ended 30 June 2016 30 June 2015 2.21% 2.21%
Turnover Ratio For the 12 months ended For the 12 months ended 30 June 2016 30 June 2015 6.36% 1.02%
Other Material InformationNil
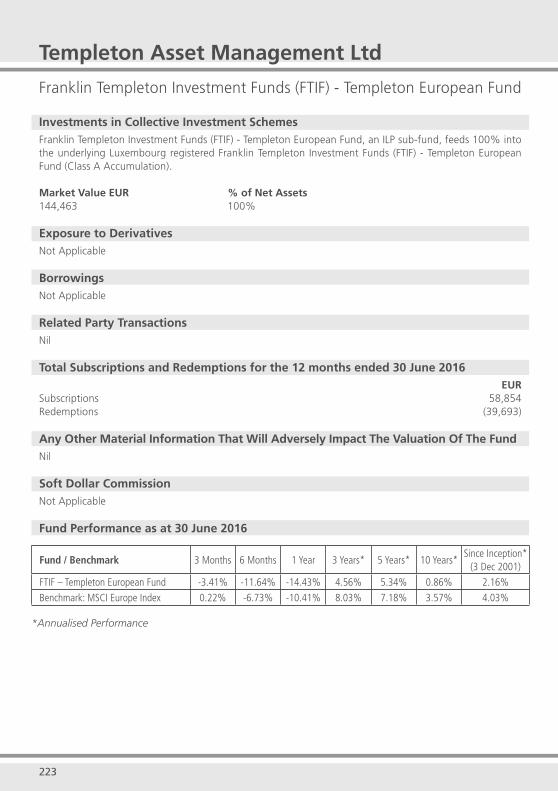
223
Templeton Asset Management Ltd
Franklin Templeton Investment Funds (FTIF) - Templeton European Fund
Investments in Collective Investment SchemesFranklin Templeton Investment Funds (FTIF) - Templeton European Fund, an ILP sub-fund, feeds 100% into the underlying Luxembourg registered Franklin Templeton Investment Funds (FTIF) - Templeton European Fund (Class A Accumulation).
Market Value EUR % of Net Assets144,463 100%
Exposure to DerivativesNot Applicable
BorrowingsNot Applicable
Related Party TransactionsNil
Total Subscriptions and Redemptions for the 12 months ended 30 June 2016EUR
Subscriptions 58,854Redemptions (39,693)
Any Other Material Information That Will Adversely Impact The Valuation Of The FundNil
Soft Dollar CommissionNot Applicable
Fund Performance as at 30 June 2016
Fund / Benchmark 3 Months 6 Months 1 Year 3 Years* 5 Years* 10 Years*Since Inception*
(3 Dec 2001)
FTIF – Templeton European Fund -3.41% -11.64% -14.43% 4.56% 5.34% 0.86% 2.16%
Benchmark: MSCI Europe Index 0.22% -6.73% -10.41% 8.03% 7.18% 3.57% 4.03%
*Annualised Performance
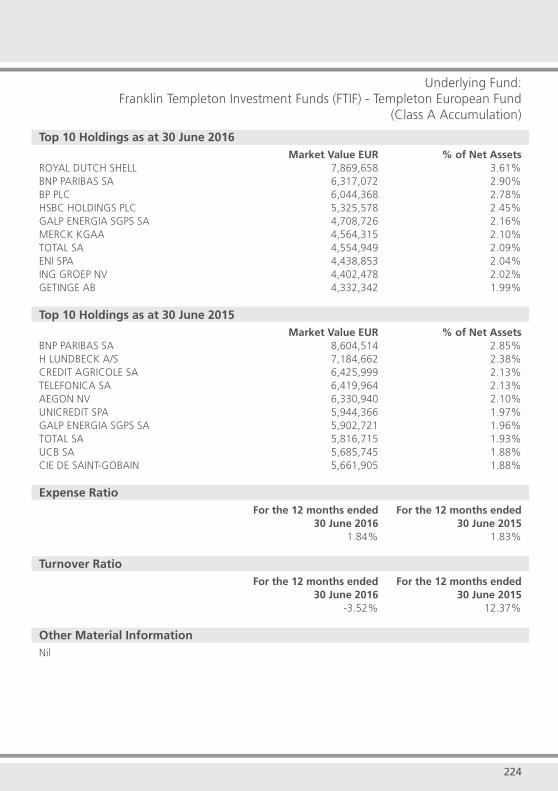
224
Underlying Fund:Franklin Templeton Investment Funds (FTIF) - Templeton European Fund
(Class A Accumulation)
Top 10 Holdings as at 30 June 2016 Market Value EUR % of Net AssetsROYAL DUTCH SHELL 7,869,658 3.61%BNP PARIBAS SA 6,317,072 2.90%BP PLC 6,044,368 2.78%HSBC HOLDINGS PLC 5,325,578 2.45%GALP ENERGIA SGPS SA 4,708,726 2.16%MERCK KGAA 4,564,315 2.10%TOTAL SA 4,554,949 2.09%ENI SPA 4,438,853 2.04%ING GROEP NV 4,402,478 2.02%GETINGE AB 4,332,342 1.99%
Top 10 Holdings as at 30 June 2015 Market Value EUR % of Net AssetsBNP PARIBAS SA 8,604,514 2.85%H LUNDBECK A/S 7,184,662 2.38%CREDIT AGRICOLE SA 6,425,999 2.13%TELEFONICA SA 6,419,964 2.13%AEGON NV 6,330,940 2.10%UNICREDIT SPA 5,944,366 1.97%GALP ENERGIA SGPS SA 5,902,721 1.96%TOTAL SA 5,816,715 1.93%UCB SA 5,685,745 1.88%CIE DE SAINT-GOBAIN 5,661,905 1.88%
Expense Ratio For the 12 months ended For the 12 months ended 30 June 2016 30 June 2015 1.84% 1.83%
Turnover Ratio For the 12 months ended For the 12 months ended 30 June 2016 30 June 2015 -3.52% 12.37%
Other Material InformationNil
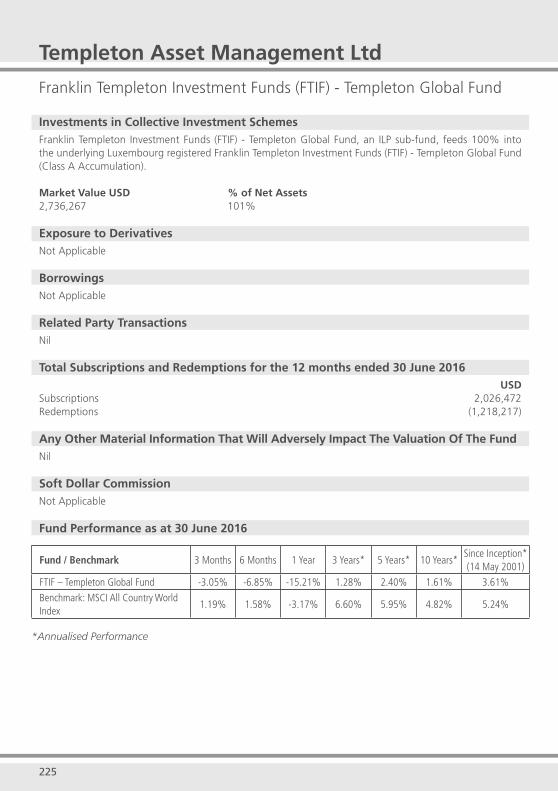
225
Templeton Asset Management Ltd
Franklin Templeton Investment Funds (FTIF) - Templeton Global Fund
Investments in Collective Investment SchemesFranklin Templeton Investment Funds (FTIF) - Templeton Global Fund, an ILP sub-fund, feeds 100% into the underlying Luxembourg registered Franklin Templeton Investment Funds (FTIF) - Templeton Global Fund (Class A Accumulation).
Market Value USD % of Net Assets2,736,267 101%
Exposure to DerivativesNot Applicable
BorrowingsNot Applicable
Related Party TransactionsNil
Total Subscriptions and Redemptions for the 12 months ended 30 June 2016USD
Subscriptions 2,026,472Redemptions (1,218,217)
Any Other Material Information That Will Adversely Impact The Valuation Of The Fund Nil
Soft Dollar CommissionNot Applicable
Fund Performance as at 30 June 2016
Fund / Benchmark 3 Months 6 Months 1 Year 3 Years* 5 Years* 10 Years*Since Inception*(14 May 2001)
FTIF – Templeton Global Fund -3.05% -6.85% -15.21% 1.28% 2.40% 1.61% 3.61%
Benchmark: MSCI All Country World Index
1.19% 1.58% -3.17% 6.60% 5.95% 4.82% 5.24%
*Annualised Performance
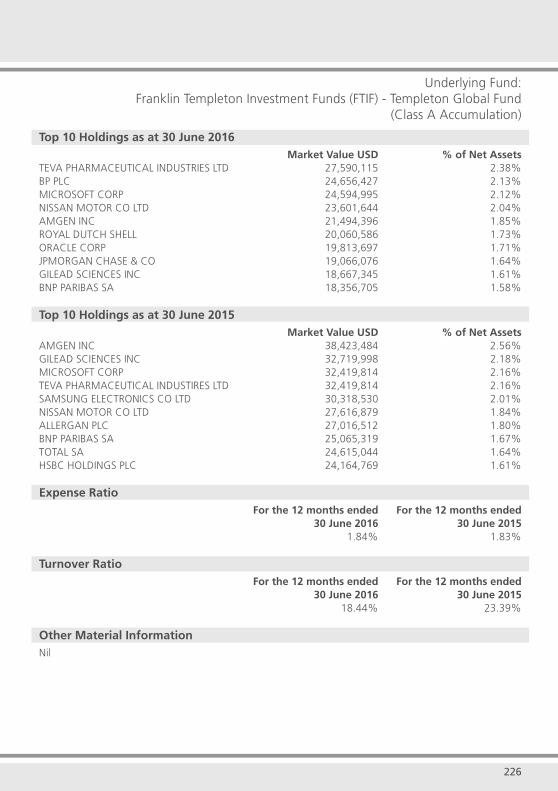
226
Underlying Fund:Franklin Templeton Investment Funds (FTIF) - Templeton Global Fund
(Class A Accumulation)
Top 10 Holdings as at 30 June 2016 Market Value USD % of Net AssetsTEVA PHARMACEUTICAL INDUSTRIES LTD 27,590,115 2.38%BP PLC 24,656,427 2.13%MICROSOFT CORP 24,594,995 2.12%NISSAN MOTOR CO LTD 23,601,644 2.04%AMGEN INC 21,494,396 1.85%ROYAL DUTCH SHELL 20,060,586 1.73%ORACLE CORP 19,813,697 1.71%JPMORGAN CHASE & CO 19,066,076 1.64%GILEAD SCIENCES INC 18,667,345 1.61%BNP PARIBAS SA 18,356,705 1.58%
Top 10 Holdings as at 30 June 2015 Market Value USD % of Net AssetsAMGEN INC 38,423,484 2.56%GILEAD SCIENCES INC 32,719,998 2.18%MICROSOFT CORP 32,419,814 2.16%TEVA PHARMACEUTICAL INDUSTIRES LTD 32,419,814 2.16%SAMSUNG ELECTRONICS CO LTD 30,318,530 2.01%NISSAN MOTOR CO LTD 27,616,879 1.84%ALLERGAN PLC 27,016,512 1.80%BNP PARIBAS SA 25,065,319 1.67%TOTAL SA 24,615,044 1.64%HSBC HOLDINGS PLC 24,164,769 1.61%
Expense Ratio For the 12 months ended For the 12 months ended 30 June 2016 30 June 2015 1.84% 1.83%
Turnover Ratio For the 12 months ended For the 12 months ended 30 June 2016 30 June 2015 18.44% 23.39%
Other Material InformationNil

227
Templeton Asset Management Ltd
Franklin Templeton Investment Funds (FTIF) - Templeton Global Bond Fund
Investments in Collective Investment SchemesFranklin Templeton Investment Funds (FTIF) - Templeton Global Bond Fund, an ILP sub-fund, feeds 100% into the underlying Luxembourg registered Franklin Templeton Investment Funds (FTIF) - Templeton Global Bond Fund (Class A Mdis).
Market Value SGD % of Net Assets20,698 100%
Exposure to DerivativesNot Applicable
BorrowingsNot Applicable
Related Party TransactionsNil
Total Subscriptions and Redemptions for the 12 months ended 30 June 2016SGD
Subscriptions 11,619Redemptions (2,784)
Any Other Material Information That Will Adversely Impact The Valuation Of The FundNil
Soft Dollar CommissionNot Applicable
Fund Performance as at 30 June 2016
Fund / Benchmark 3 Months 6 Months 1 Year 3 Years* 5 Years* 10 Years*Since Inception*(25 Oct 2007)
FTIF - Templeton Global Bond Fund -1.20% -2.22% -6.78% -1.02% 0.40% NA 4.77%
Benchmark: JP Morgan Global Government Bond Index
3.60% 10.58% 11.52% 3.20% 1.60% NA 3.68%
*Annualised Performance
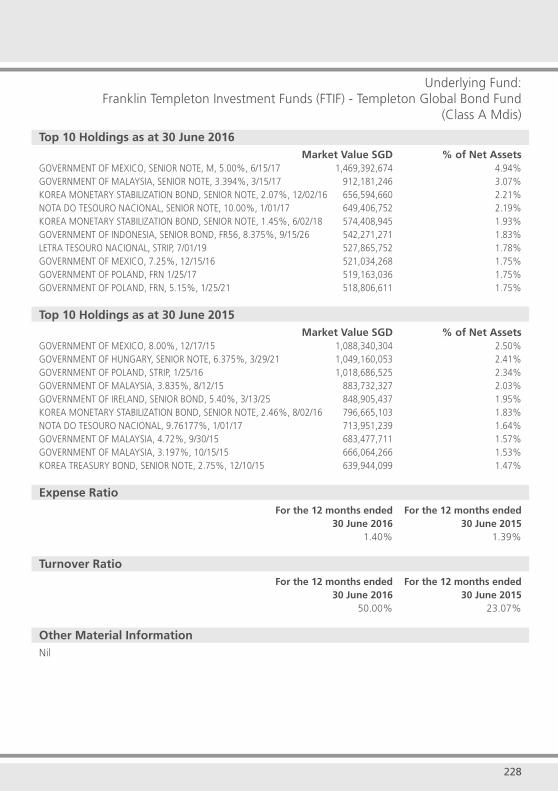
228
Underlying Fund:Franklin Templeton Investment Funds (FTIF) - Templeton Global Bond Fund
(Class A Mdis)
Top 10 Holdings as at 30 June 2016 Market Value SGD % of Net AssetsGOVERNMENT OF MEXICO, SENIOR NOTE, M, 5.00%, 6/15/17 1,469,392,674 4.94%GOVERNMENT OF MALAYSIA, SENIOR NOTE, 3.394%, 3/15/17 912,181,246 3.07%KOREA MONETARY STABILIZATION BOND, SENIOR NOTE, 2.07%, 12/02/16 656,594,660 2.21%NOTA DO TESOURO NACIONAL, SENIOR NOTE, 10.00%, 1/01/17 649,406,752 2.19%KOREA MONETARY STABILIZATION BOND, SENIOR NOTE, 1.45%, 6/02/18 574,408,945 1.93%GOVERNMENT OF INDONESIA, SENIOR BOND, FR56, 8.375%, 9/15/26 542,271,271 1.83%LETRA TESOURO NACIONAL, STRIP, 7/01/19 527,865,752 1.78%GOVERNMENT OF MEXICO, 7.25%, 12/15/16 521,034,268 1.75%GOVERNMENT OF POLAND, FRN 1/25/17 519,163,036 1.75%GOVERNMENT OF POLAND, FRN, 5.15%, 1/25/21 518,806,611 1.75%
Top 10 Holdings as at 30 June 2015 Market Value SGD % of Net AssetsGOVERNMENT OF MEXICO, 8.00%, 12/17/15 1,088,340,304 2.50%GOVERNMENT OF HUNGARY, SENIOR NOTE, 6.375%, 3/29/21 1,049,160,053 2.41%GOVERNMENT OF POLAND, STRIP, 1/25/16 1,018,686,525 2.34%GOVERNMENT OF MALAYSIA, 3.835%, 8/12/15 883,732,327 2.03%GOVERNMENT OF IRELAND, SENIOR BOND, 5.40%, 3/13/25 848,905,437 1.95%KOREA MONETARY STABILIZATION BOND, SENIOR NOTE, 2.46%, 8/02/16 796,665,103 1.83%NOTA DO TESOURO NACIONAL, 9.76177%, 1/01/17 713,951,239 1.64%GOVERNMENT OF MALAYSIA, 4.72%, 9/30/15 683,477,711 1.57%GOVERNMENT OF MALAYSIA, 3.197%, 10/15/15 666,064,266 1.53%KOREA TREASURY BOND, SENIOR NOTE, 2.75%, 12/10/15 639,944,099 1.47%
Expense Ratio For the 12 months ended For the 12 months ended 30 June 2016 30 June 2015 1.40% 1.39%
Turnover Ratio For the 12 months ended For the 12 months ended 30 June 2016 30 June 2015 50.00% 23.07%
Other Material InformationNil
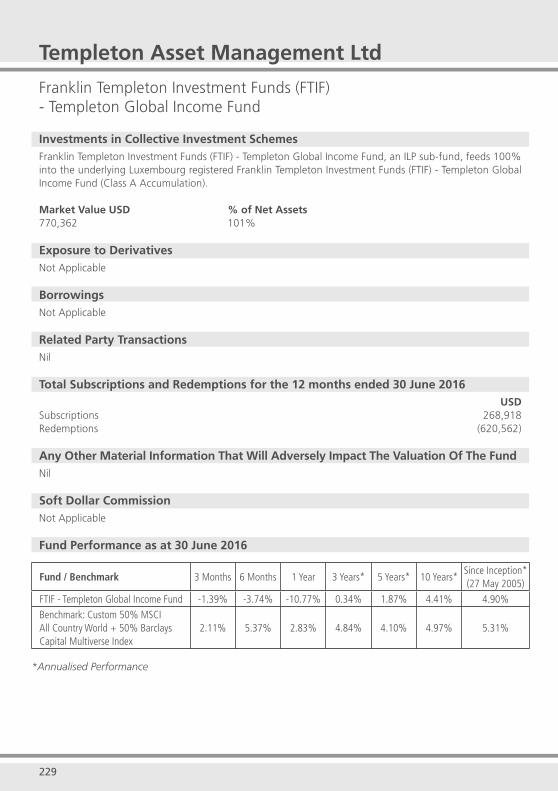
229
Templeton Asset Management Ltd
Franklin Templeton Investment Funds (FTIF) - Templeton Global Income Fund
Investments in Collective Investment SchemesFranklin Templeton Investment Funds (FTIF) - Templeton Global Income Fund, an ILP sub-fund, feeds 100% into the underlying Luxembourg registered Franklin Templeton Investment Funds (FTIF) - Templeton Global Income Fund (Class A Accumulation).
Market Value USD % of Net Assets770,362 101%
Exposure to DerivativesNot Applicable
BorrowingsNot Applicable
Related Party TransactionsNil
Total Subscriptions and Redemptions for the 12 months ended 30 June 2016USD
Subscriptions 268,918Redemptions (620,562)
Any Other Material Information That Will Adversely Impact The Valuation Of The FundNil
Soft Dollar CommissionNot Applicable
Fund Performance as at 30 June 2016
Fund / Benchmark 3 Months 6 Months 1 Year 3 Years* 5 Years* 10 Years*Since Inception*(27 May 2005)
FTIF - Templeton Global Income Fund -1.39% -3.74% -10.77% 0.34% 1.87% 4.41% 4.90%
Benchmark: Custom 50% MSCI All Country World + 50% Barclays Capital Multiverse Index
2.11% 5.37% 2.83% 4.84% 4.10% 4.97% 5.31%
*Annualised Performance
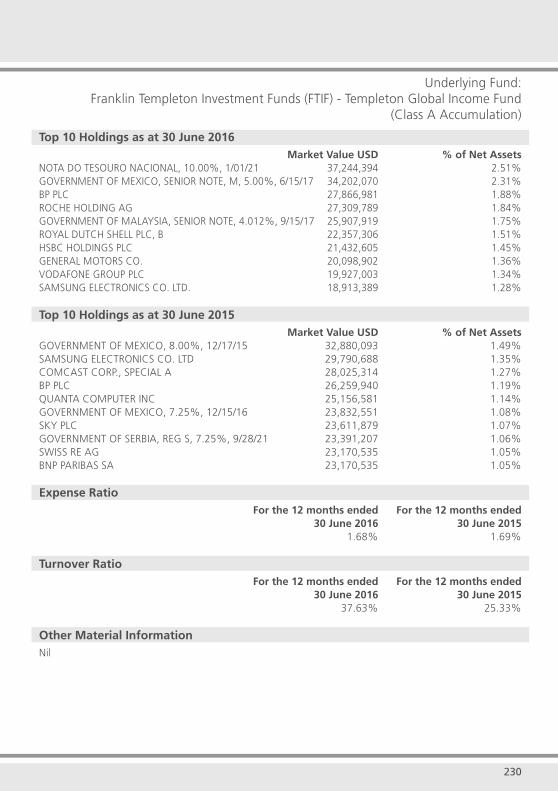
230
Underlying Fund:Franklin Templeton Investment Funds (FTIF) - Templeton Global Income Fund
(Class A Accumulation)
Top 10 Holdings as at 30 June 2016 Market Value USD % of Net AssetsNOTA DO TESOURO NACIONAL, 10.00%, 1/01/21 37,244,394 2.51%GOVERNMENT OF MEXICO, SENIOR NOTE, M, 5.00%, 6/15/17 34,202,070 2.31%BP PLC 27,866,981 1.88%ROCHE HOLDING AG 27,309,789 1.84%GOVERNMENT OF MALAYSIA, SENIOR NOTE, 4.012%, 9/15/17 25,907,919 1.75%ROYAL DUTCH SHELL PLC, B 22,357,306 1.51%HSBC HOLDINGS PLC 21,432,605 1.45%GENERAL MOTORS CO. 20,098,902 1.36%VODAFONE GROUP PLC 19,927,003 1.34%SAMSUNG ELECTRONICS CO. LTD. 18,913,389 1.28%
Top 10 Holdings as at 30 June 2015 Market Value USD % of Net AssetsGOVERNMENT OF MEXICO, 8.00%, 12/17/15 32,880,093 1.49%SAMSUNG ELECTRONICS CO. LTD 29,790,688 1.35%COMCAST CORP., SPECIAL A 28,025,314 1.27%BP PLC 26,259,940 1.19%QUANTA COMPUTER INC 25,156,581 1.14%GOVERNMENT OF MEXICO, 7.25%, 12/15/16 23,832,551 1.08%SKY PLC 23,611,879 1.07%GOVERNMENT OF SERBIA, REG S, 7.25%, 9/28/21 23,391,207 1.06%SWISS RE AG 23,170,535 1.05%BNP PARIBAS SA 23,170,535 1.05%
Expense Ratio For the 12 months ended For the 12 months ended 30 June 2016 30 June 2015 1.68% 1.69%
Turnover Ratio For the 12 months ended For the 12 months ended 30 June 2016 30 June 2015 37.63% 25.33%
Other Material InformationNil
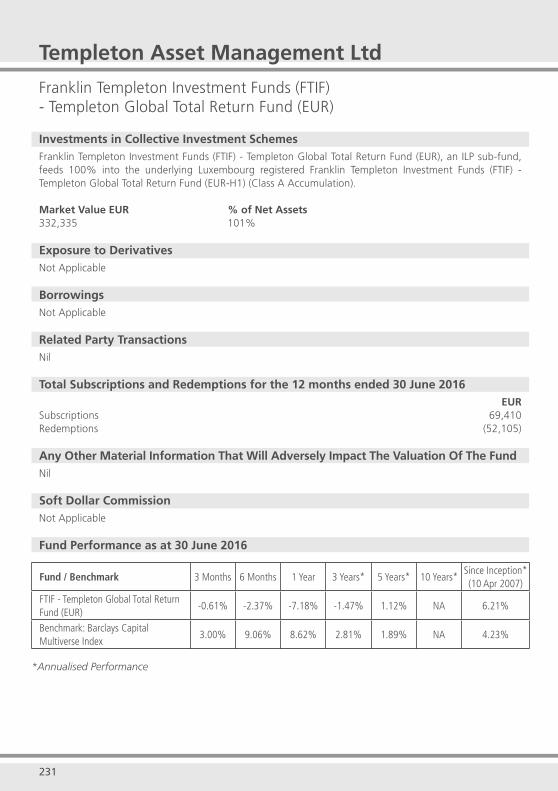
231
Templeton Asset Management Ltd
Franklin Templeton Investment Funds (FTIF) - Templeton Global Total Return Fund (EUR)
Investments in Collective Investment SchemesFranklin Templeton Investment Funds (FTIF) - Templeton Global Total Return Fund (EUR), an ILP sub-fund, feeds 100% into the underlying Luxembourg registered Franklin Templeton Investment Funds (FTIF) - Templeton Global Total Return Fund (EUR-H1) (Class A Accumulation).
Market Value EUR % of Net Assets332,335 101%
Exposure to DerivativesNot Applicable
BorrowingsNot Applicable
Related Party TransactionsNil
Total Subscriptions and Redemptions for the 12 months ended 30 June 2016EUR
Subscriptions 69,410Redemptions (52,105)
Any Other Material Information That Will Adversely Impact The Valuation Of The FundNil
Soft Dollar CommissionNot Applicable
Fund Performance as at 30 June 2016
Fund / Benchmark 3 Months 6 Months 1 Year 3 Years* 5 Years* 10 Years*Since Inception*(10 Apr 2007)
FTIF - Templeton Global Total Return Fund (EUR)
-0.61% -2.37% -7.18% -1.47% 1.12% NA 6.21%
Benchmark: Barclays Capital Multiverse Index
3.00% 9.06% 8.62% 2.81% 1.89% NA 4.23%
*Annualised Performance
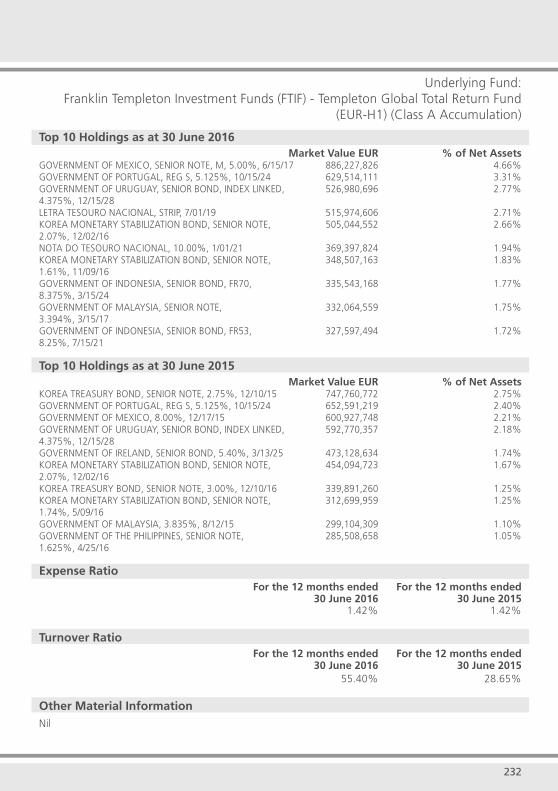
232
Underlying Fund:Franklin Templeton Investment Funds (FTIF) - Templeton Global Total Return Fund
(EUR-H1) (Class A Accumulation)
Top 10 Holdings as at 30 June 2016 Market Value EUR % of Net AssetsGOVERNMENT OF MEXICO, SENIOR NOTE, M, 5.00%, 6/15/17 886,227,826 4.66%GOVERNMENT OF PORTUGAL, REG S, 5.125%, 10/15/24 629,514,111 3.31%GOVERNMENT OF URUGUAY, SENIOR BOND, INDEX LINKED, 526,980,696 2.77%4.375%, 12/15/28 LETRA TESOURO NACIONAL, STRIP, 7/01/19 515,974,606 2.71%KOREA MONETARY STABILIZATION BOND, SENIOR NOTE, 505,044,552 2.66%2.07%, 12/02/16 NOTA DO TESOURO NACIONAL, 10.00%, 1/01/21 369,397,824 1.94%KOREA MONETARY STABILIZATION BOND, SENIOR NOTE, 348,507,163 1.83%1.61%, 11/09/16 GOVERNMENT OF INDONESIA, SENIOR BOND, FR70, 335,543,168 1.77%8.375%, 3/15/24 GOVERNMENT OF MALAYSIA, SENIOR NOTE, 332,064,559 1.75%3.394%, 3/15/17 GOVERNMENT OF INDONESIA, SENIOR BOND, FR53, 327,597,494 1.72%8.25%, 7/15/21
Top 10 Holdings as at 30 June 2015 Market Value EUR % of Net AssetsKOREA TREASURY BOND, SENIOR NOTE, 2.75%, 12/10/15 747,760,772 2.75%GOVERNMENT OF PORTUGAL, REG S, 5.125%, 10/15/24 652,591,219 2.40%GOVERNMENT OF MEXICO, 8.00%, 12/17/15 600,927,748 2.21%GOVERNMENT OF URUGUAY, SENIOR BOND, INDEX LINKED, 592,770,357 2.18%4.375%, 12/15/28 GOVERNMENT OF IRELAND, SENIOR BOND, 5.40%, 3/13/25 473,128,634 1.74%KOREA MONETARY STABILIZATION BOND, SENIOR NOTE, 454,094,723 1.67%2.07%, 12/02/16 KOREA TREASURY BOND, SENIOR NOTE, 3.00%, 12/10/16 339,891,260 1.25%KOREA MONETARY STABILIZATION BOND, SENIOR NOTE, 312,699,959 1.25%1.74%, 5/09/16 GOVERNMENT OF MALAYSIA, 3.835%, 8/12/15 299,104,309 1.10%GOVERNMENT OF THE PHILIPPINES, SENIOR NOTE, 285,508,658 1.05%1.625%, 4/25/16
Expense Ratio For the 12 months ended For the 12 months ended 30 June 2016 30 June 2015 1.42% 1.42%
Turnover Ratio For the 12 months ended For the 12 months ended 30 June 2016 30 June 2015 55.40% 28.65%
Other Material InformationNil
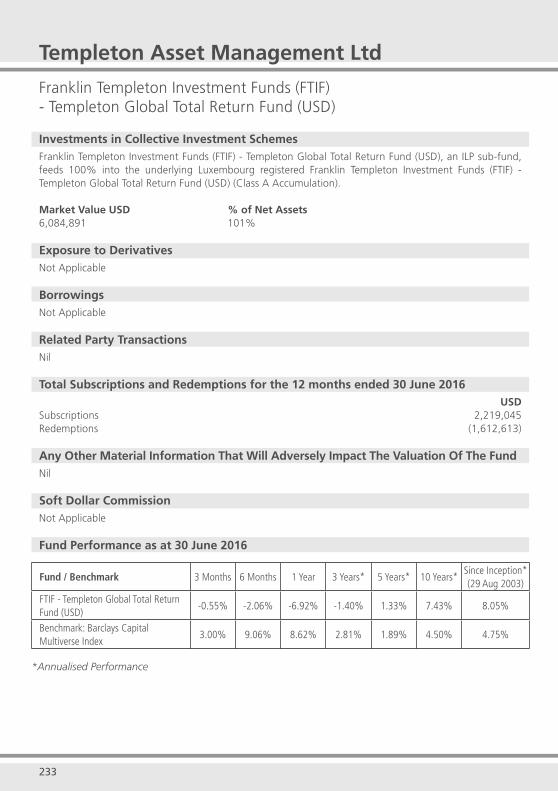
233
Templeton Asset Management Ltd
Franklin Templeton Investment Funds (FTIF) - Templeton Global Total Return Fund (USD)
Investments in Collective Investment SchemesFranklin Templeton Investment Funds (FTIF) - Templeton Global Total Return Fund (USD), an ILP sub-fund, feeds 100% into the underlying Luxembourg registered Franklin Templeton Investment Funds (FTIF) - Templeton Global Total Return Fund (USD) (Class A Accumulation).
Market Value USD % of Net Assets6,084,891 101%
Exposure to DerivativesNot Applicable
BorrowingsNot Applicable
Related Party TransactionsNil
Total Subscriptions and Redemptions for the 12 months ended 30 June 2016USD
Subscriptions 2,219,045Redemptions (1,612,613)
Any Other Material Information That Will Adversely Impact The Valuation Of The Fund Nil
Soft Dollar CommissionNot Applicable
Fund Performance as at 30 June 2016
Fund / Benchmark 3 Months 6 Months 1 Year 3 Years* 5 Years* 10 Years*Since Inception*(29 Aug 2003)
FTIF - Templeton Global Total Return Fund (USD)
-0.55% -2.06% -6.92% -1.40% 1.33% 7.43% 8.05%
Benchmark: Barclays Capital Multiverse Index
3.00% 9.06% 8.62% 2.81% 1.89% 4.50% 4.75%
*Annualised Performance
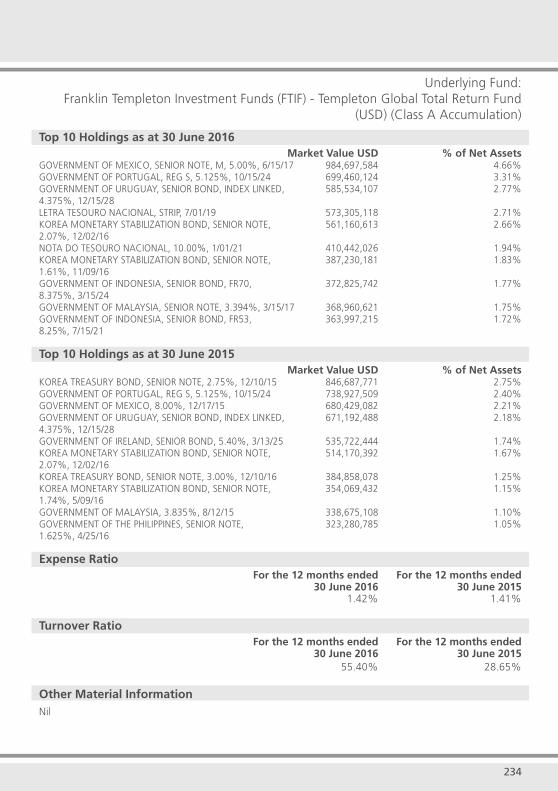
234
Underlying Fund:Franklin Templeton Investment Funds (FTIF) - Templeton Global Total Return Fund
(USD) (Class A Accumulation)
Top 10 Holdings as at 30 June 2016 Market Value USD % of Net AssetsGOVERNMENT OF MEXICO, SENIOR NOTE, M, 5.00%, 6/15/17 984,697,584 4.66%GOVERNMENT OF PORTUGAL, REG S, 5.125%, 10/15/24 699,460,124 3.31%GOVERNMENT OF URUGUAY, SENIOR BOND, INDEX LINKED, 585,534,107 2.77%4.375%, 12/15/28 LETRA TESOURO NACIONAL, STRIP, 7/01/19 573,305,118 2.71%KOREA MONETARY STABILIZATION BOND, SENIOR NOTE, 561,160,613 2.66%2.07%, 12/02/16 NOTA DO TESOURO NACIONAL, 10.00%, 1/01/21 410,442,026 1.94%KOREA MONETARY STABILIZATION BOND, SENIOR NOTE, 387,230,181 1.83%1.61%, 11/09/16 GOVERNMENT OF INDONESIA, SENIOR BOND, FR70, 372,825,742 1.77%8.375%, 3/15/24 GOVERNMENT OF MALAYSIA, SENIOR NOTE, 3.394%, 3/15/17 368,960,621 1.75%GOVERNMENT OF INDONESIA, SENIOR BOND, FR53, 363,997,215 1.72%8.25%, 7/15/21
Top 10 Holdings as at 30 June 2015 Market Value USD % of Net AssetsKOREA TREASURY BOND, SENIOR NOTE, 2.75%, 12/10/15 846,687,771 2.75%GOVERNMENT OF PORTUGAL, REG S, 5.125%, 10/15/24 738,927,509 2.40%GOVERNMENT OF MEXICO, 8.00%, 12/17/15 680,429,082 2.21%GOVERNMENT OF URUGUAY, SENIOR BOND, INDEX LINKED, 671,192,488 2.18%4.375%, 12/15/28 GOVERNMENT OF IRELAND, SENIOR BOND, 5.40%, 3/13/25 535,722,444 1.74%KOREA MONETARY STABILIZATION BOND, SENIOR NOTE, 514,170,392 1.67%2.07%, 12/02/16 KOREA TREASURY BOND, SENIOR NOTE, 3.00%, 12/10/16 384,858,078 1.25%KOREA MONETARY STABILIZATION BOND, SENIOR NOTE, 354,069,432 1.15%1.74%, 5/09/16 GOVERNMENT OF MALAYSIA, 3.835%, 8/12/15 338,675,108 1.10%GOVERNMENT OF THE PHILIPPINES, SENIOR NOTE, 323,280,785 1.05%1.625%, 4/25/16
Expense Ratio For the 12 months ended For the 12 months ended 30 June 2016 30 June 2015 1.42% 1.41%
Turnover Ratio For the 12 months ended For the 12 months ended 30 June 2016 30 June 2015 55.40% 28.65%
Other Material InformationNil

235
Templeton Asset Management Ltd
Franklin Templeton Investment Funds (FTIF) - Templeton Latin America Fund
Investments in Collective Investment SchemesFranklin Templeton Investment Funds (FTIF) - Templeton Latin America Fund, an ILP sub-fund, feeds 100% into the underlying Luxembourg registered Franklin Templeton Investment Funds (FTIF) - Templeton Latin America Fund (Class A Accumulation).
Market Value USD % of Net Assets591,153 101%
Exposure to DerivativesNot Applicable
BorrowingsNot Applicable
Related Party TransactionsNil
Total Subscriptions and Redemptions for the 12 months ended 30 June 2016USD
Subscriptions 117,109Redemptions (151,254)
Any Other Material Information That Will Adversely Impact The Valuation Of The Fund Nil
Soft Dollar CommissionNot Applicable
Fund Performance as at 30 June 2016
Fund / Benchmark 3 Months 6 Months 1 Year 3 Years* 5 Years* 10 Years*Since Inception*(14 May 2001)
FTIF - Templeton Latin America Fund 8.00% 24.41% -2.62% -9.51% -11.40% 1.33% 8.91%
Benchmark: MSCI Latin America Index
5.42% 25.68% -7.28% -8.00% -9.88% 2.57% 9.57%
*Annualised Performance
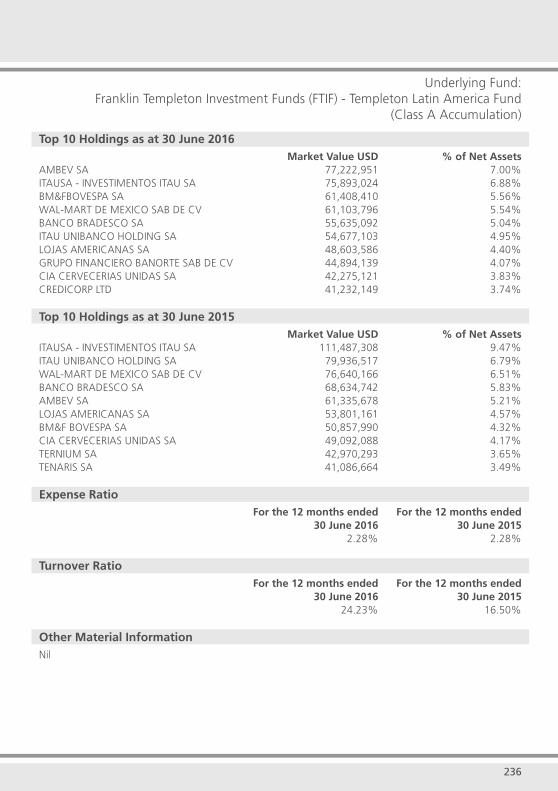
236
Underlying Fund:Franklin Templeton Investment Funds (FTIF) - Templeton Latin America Fund
(Class A Accumulation)
Top 10 Holdings as at 30 June 2016 Market Value USD % of Net AssetsAMBEV SA 77,222,951 7.00%ITAUSA - INVESTIMENTOS ITAU SA 75,893,024 6.88%BM&FBOVESPA SA 61,408,410 5.56%WAL-MART DE MEXICO SAB DE CV 61,103,796 5.54%BANCO BRADESCO SA 55,635,092 5.04%ITAU UNIBANCO HOLDING SA 54,677,103 4.95%LOJAS AMERICANAS SA 48,603,586 4.40%GRUPO FINANCIERO BANORTE SAB DE CV 44,894,139 4.07%CIA CERVECERIAS UNIDAS SA 42,275,121 3.83%CREDICORP LTD 41,232,149 3.74%
Top 10 Holdings as at 30 June 2015 Market Value USD % of Net AssetsITAUSA - INVESTIMENTOS ITAU SA 111,487,308 9.47%ITAU UNIBANCO HOLDING SA 79,936,517 6.79%WAL-MART DE MEXICO SAB DE CV 76,640,166 6.51%BANCO BRADESCO SA 68,634,742 5.83%AMBEV SA 61,335,678 5.21%LOJAS AMERICANAS SA 53,801,161 4.57%BM&F BOVESPA SA 50,857,990 4.32%CIA CERVECERIAS UNIDAS SA 49,092,088 4.17%TERNIUM SA 42,970,293 3.65%TENARIS SA 41,086,664 3.49%
Expense Ratio For the 12 months ended For the 12 months ended 30 June 2016 30 June 2015 2.28% 2.28%
Turnover Ratio For the 12 months ended For the 12 months ended 30 June 2016 30 June 2015 24.23% 16.50%
Other Material InformationNil
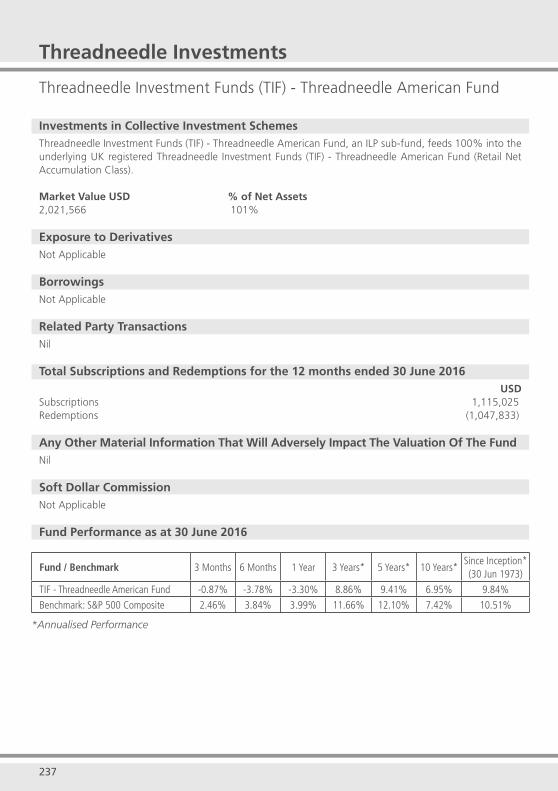
237
Threadneedle Investments
Threadneedle Investment Funds (TIF) - Threadneedle American Fund
Investments in Collective Investment SchemesThreadneedle Investment Funds (TIF) - Threadneedle American Fund, an ILP sub-fund, feeds 100% into the underlying UK registered Threadneedle Investment Funds (TIF) - Threadneedle American Fund (Retail Net Accumulation Class).
Market Value USD % of Net Assets2,021,566 101%
Exposure to DerivativesNot Applicable
BorrowingsNot Applicable
Related Party TransactionsNil
Total Subscriptions and Redemptions for the 12 months ended 30 June 2016USD
Subscriptions 1,115,025Redemptions (1,047,833)
Any Other Material Information That Will Adversely Impact The Valuation Of The Fund Nil
Soft Dollar CommissionNot Applicable
Fund Performance as at 30 June 2016
Fund / Benchmark 3 Months 6 Months 1 Year 3 Years* 5 Years* 10 Years*Since Inception*(30 Jun 1973)
TIF - Threadneedle American Fund -0.87% -3.78% -3.30% 8.86% 9.41% 6.95% 9.84%
Benchmark: S&P 500 Composite 2.46% 3.84% 3.99% 11.66% 12.10% 7.42% 10.51%
*Annualised Performance
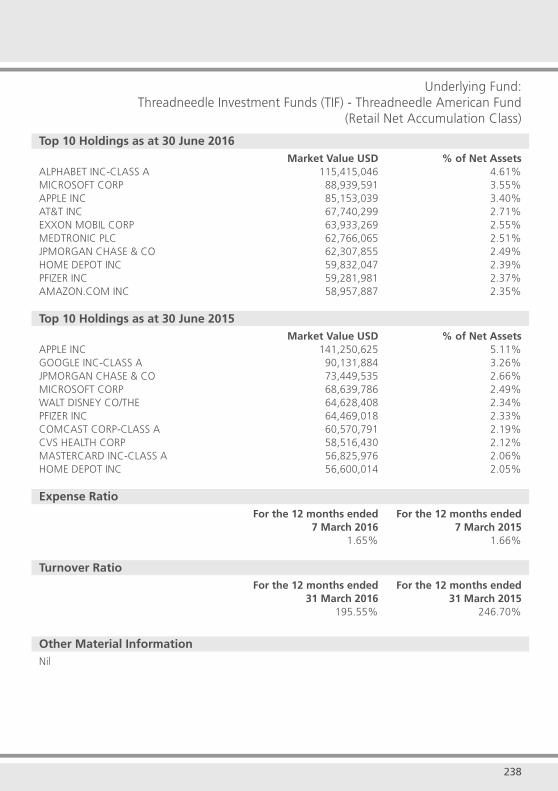
238
Underlying Fund:Threadneedle Investment Funds (TIF) - Threadneedle American Fund
(Retail Net Accumulation Class)
Top 10 Holdings as at 30 June 2016 Market Value USD % of Net AssetsALPHABET INC-CLASS A 115,415,046 4.61%MICROSOFT CORP 88,939,591 3.55%APPLE INC 85,153,039 3.40%AT&T INC 67,740,299 2.71%EXXON MOBIL CORP 63,933,269 2.55%MEDTRONIC PLC 62,766,065 2.51%JPMORGAN CHASE & CO 62,307,855 2.49%HOME DEPOT INC 59,832,047 2.39%PFIZER INC 59,281,981 2.37%AMAZON.COM INC 58,957,887 2.35%
Top 10 Holdings as at 30 June 2015 Market Value USD % of Net AssetsAPPLE INC 141,250,625 5.11%GOOGLE INC-CLASS A 90,131,884 3.26%JPMORGAN CHASE & CO 73,449,535 2.66%MICROSOFT CORP 68,639,786 2.49%WALT DISNEY CO/THE 64,628,408 2.34%PFIZER INC 64,469,018 2.33%COMCAST CORP-CLASS A 60,570,791 2.19%CVS HEALTH CORP 58,516,430 2.12%MASTERCARD INC-CLASS A 56,825,976 2.06%HOME DEPOT INC 56,600,014 2.05%
Expense Ratio For the 12 months ended For the 12 months ended 7 March 2016 7 March 2015 1.65% 1.66%
Turnover Ratio For the 12 months ended For the 12 months ended 31 March 2016 31 March 2015 195.55% 246.70%
Other Material InformationNil

239
Threadneedle Investment Funds (TIF) - Threadneedle Asia Fund
Investments in Collective Investment SchemesThreadneedle Investment Funds (TIF) - Threadneedle Asia Fund, an ILP sub-fund, feeds 100% into the underlying UK registered Threadneedle Investment Funds (TIF) - Threadneedle Asia Fund (Retail Net Accumulation Class).
Market Value USD % of Net Assets977,994 101%
Exposure to DerivativesNot Applicable
BorrowingsNot Applicable
Related Party TransactionsNil
Total Subscriptions and Redemptions for the 12 months ended 30 June 2016USD
Subscriptions 299,474Redemptions (122,661)
Any Other Material Information That Will Adversely Impact The Valuation Of The FundNil
Soft Dollar CommissionNot Applicable
Fund Performance as at 30 June 2016
Fund / Benchmark 3 Months 6 Months 1 Year 3 Years* 5 Years* 10 Years*Since Inception*(31 Oct 1990)
TIF - Threadneedle Asia Fund 0.53% 1.88% -11.93% 2.12% -0.12% 5.45% 7.30%
Benchmark: MSCI AC AP ex Jap 0.56% 2.50% -10.00% 1.81% 0.24% 5.65% 7.91%
*Annualised Performance
Threadneedle Investments
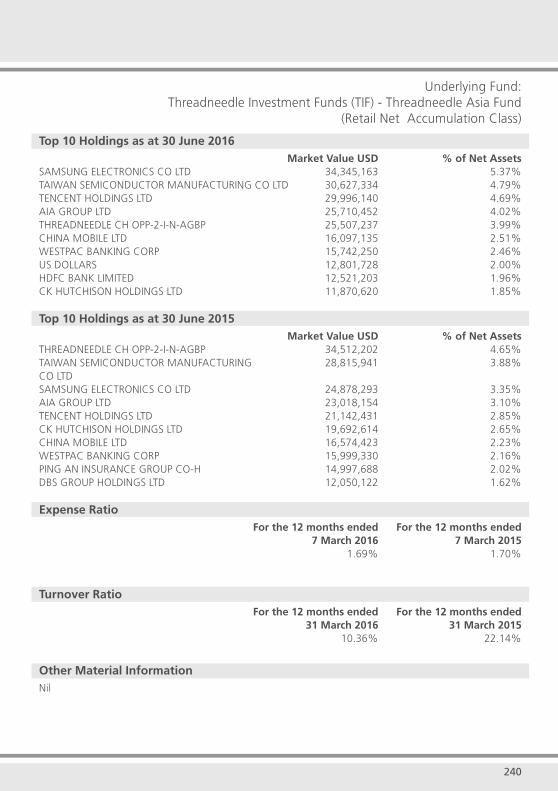
240
Underlying Fund:Threadneedle Investment Funds (TIF) - Threadneedle Asia Fund
(Retail Net Accumulation Class)
Top 10 Holdings as at 30 June 2016 Market Value USD % of Net AssetsSAMSUNG ELECTRONICS CO LTD 34,345,163 5.37%TAIWAN SEMICONDUCTOR MANUFACTURING CO LTD 30,627,334 4.79%TENCENT HOLDINGS LTD 29,996,140 4.69%AIA GROUP LTD 25,710,452 4.02%THREADNEEDLE CH OPP-2-I-N-AGBP 25,507,237 3.99%CHINA MOBILE LTD 16,097,135 2.51%WESTPAC BANKING CORP 15,742,250 2.46%US DOLLARS 12,801,728 2.00%HDFC BANK LIMITED 12,521,203 1.96%CK HUTCHISON HOLDINGS LTD 11,870,620 1.85%
Top 10 Holdings as at 30 June 2015 Market Value USD % of Net AssetsTHREADNEEDLE CH OPP-2-I-N-AGBP 34,512,202 4.65%TAIWAN SEMICONDUCTOR MANUFACTURING 28,815,941 3.88%CO LTD SAMSUNG ELECTRONICS CO LTD 24,878,293 3.35%AIA GROUP LTD 23,018,154 3.10%TENCENT HOLDINGS LTD 21,142,431 2.85%CK HUTCHISON HOLDINGS LTD 19,692,614 2.65%CHINA MOBILE LTD 16,574,423 2.23%WESTPAC BANKING CORP 15,999,330 2.16%PING AN INSURANCE GROUP CO-H 14,997,688 2.02%DBS GROUP HOLDINGS LTD 12,050,122 1.62%
Expense Ratio For the 12 months ended For the 12 months ended 7 March 2016 7 March 2015 1.69% 1.70%
Turnover Ratio For the 12 months ended For the 12 months ended 31 March 2016 31 March 2015 10.36% 22.14%
Other Material InformationNil

241
Threadneedle Investments
Threadneedle Investment Funds (TIF) - Threadneedle Emerging Markets Bond Fund
Investments in Collective Investment SchemesThreadneedle Investment Funds (TIF) - Threadneedle Emerging Markets Bond Fund, an ILP sub-fund, feeds 100% into the underlying UK registered Threadneedle Investment Funds (TIF) - Threadneedle Emerging Markets Bond Fund (Retail Gross Accumulation Class).
Market Value USD % of Net Assets497,164 101%
Exposure to DerivativesNot Applicable
BorrowingsNot Applicable
Related Party TransactionsNil
Total Subscriptions and Redemptions for the 12 months ended 30 June 2016USD
Subscriptions 82,324Redemptions (73,315)
Any Other Material Information That Will Adversely Impact The Valuation Of The FundNil
Soft Dollar CommissionNot Applicable
Fund Performance as at 30 June 2016
Fund / Benchmark 3 Months 6 Months 1 Year 3 Years* 5 Years* 10 Years*Since Inception*(26 Dec 1997)
TIF - Threadneedle Emerging Markets Bond Fund
5.47% 10.00% 6.75% 3.24% 3.56% 6.34% 10.38%
Benchmark: JPM EMBI Global (Constrained (1/1/99-1/1/02))
5.40% 10.90% 10.32% 6.44% 6.25% 7.91% 8.74%
*Annualised Performance

242
Underlying Fund:Threadneedle Investment Funds (TIF) - Threadneedle Emerging Markets Bond Fund
(Retail Gross Accumulation Class)
Top 10 Holdings as at 30 June 2016 Market Value USD % of Net AssetsMEX BONOS DESARR FIX RT 7.75 23/11/2034 6,808,058 2.24%DOMINICAN REPUBLIC 7.50 06/05/2021 6,167,611 2.03%PETROBRAS GLOBAL FINANCE 5.375 27/01/2021 5,000,146 1.64%RUSSIAN FEDERATION 5.625 04/04/2042 4,831,649 1.59%PETROLEOS MEXICANOS 3.50 30/01/2023 4,191,374 1.38%KAZAKHSTAN TEMIR ZHOLY 6.95 10/07/2042 3,968,454 1.30%UNITED MEXICAN STATES 4.60 23/01/2046 3,874,104 1.27%UNITED MEXICAN STATES 6.75 27/09/2034 3,719,526 1.22%REPUBLIC OF GHANA 8.125 18/01/2026 3,669,224 1.21%CROATIA 6.00 26/01/2024 3,427,236 1.13%
Top 10 Holdings as at 30 June 2015 Market Value USD % of Net AssetsDOMINICAN REPUBLIC 7.50 06/05/2021 6,853,478 2.12%PETRO CO TRIN/TOBAGO LTD 9.75 14/08/2019 6,706,741 2.08%PETROLEOS MEXICANOS 3.50 30/01/2023 5,804,591 1.80%REPUBLIC OF NAMIBIA 5.50 03/11/2021 4,675,596 1.45%PERTAMINA PERSERO PT 5.25 23/05/2021 4,597,249 1.42%VNESHECONOMBANK(VEB) 6.902 09/07/2020 4,062,976 1.26%PETROLEOS DE VENEZUELA S 8.50 02/11/2017 3,938,662 1.22%REPUBLIC OF COLOMBIA 7.375 18/03/2019 3,933,794 1.22%REPUBLIC OF GHANA 8.125 18/01/2026 3,856,162 1.19%ARAB REPUBLIC OF EGYPT 5.875 11/06/2025 3,675,096 1.14%
Expense Ratio For the 12 months ended For the 12 months ended 7 March 2016 7 March 2015 1.69% 1.68%
Turnover Ratio For the 12 months ended For the 12 months ended 31 March 2016 31 March 2015 0.00%^ 12.95%
^ Note: The turnover ratio is zero as there was no purchase for the fi nancial period.
Other Material InformationNil
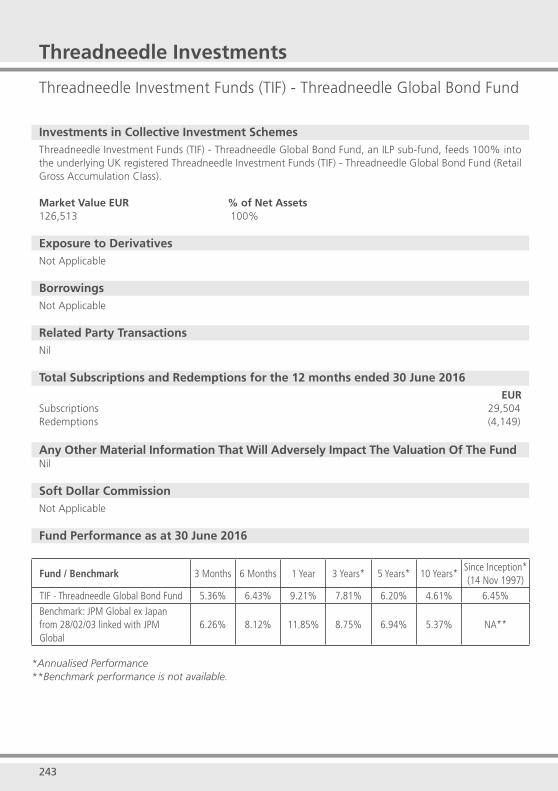
243
Threadneedle Investments
Threadneedle Investment Funds (TIF) - Threadneedle Global Bond Fund
Investments in Collective Investment SchemesThreadneedle Investment Funds (TIF) - Threadneedle Global Bond Fund, an ILP sub-fund, feeds 100% into the underlying UK registered Threadneedle Investment Funds (TIF) - Threadneedle Global Bond Fund (Retail Gross Accumulation Class).
Market Value EUR % of Net Assets126,513 100%
Exposure to DerivativesNot Applicable
BorrowingsNot Applicable
Related Party TransactionsNil
Total Subscriptions and Redemptions for the 12 months ended 30 June 2016EUR
Subscriptions 29,504Redemptions (4,149)
Any Other Material Information That Will Adversely Impact The Valuation Of The FundNil
Soft Dollar CommissionNot Applicable
Fund Performance as at 30 June 2016
Fund / Benchmark 3 Months 6 Months 1 Year 3 Years* 5 Years* 10 Years*Since Inception*(14 Nov 1997)
TIF - Threadneedle Global Bond Fund 5.36% 6.43% 9.21% 7.81% 6.20% 4.61% 6.45%
Benchmark: JPM Global ex Japan from 28/02/03 linked with JPM Global
6.26% 8.12% 11.85% 8.75% 6.94% 5.37% NA**
*Annualised Performance **Benchmark performance is not available.
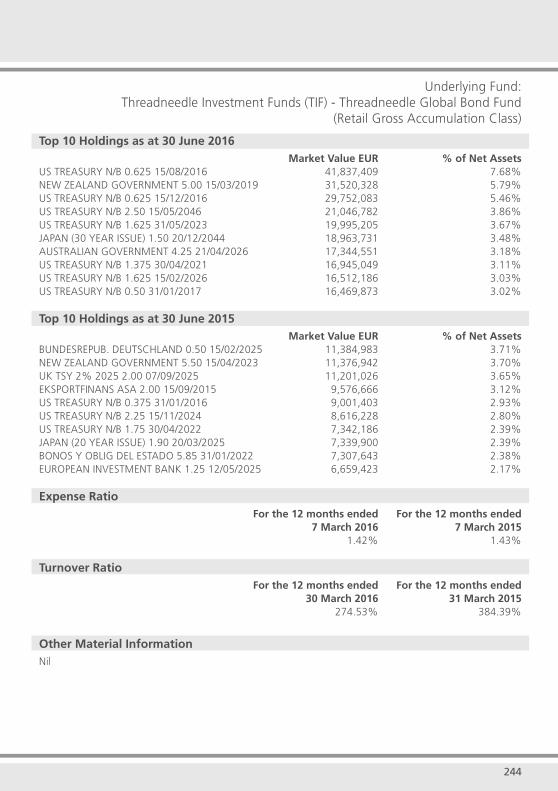
244
Underlying Fund:Threadneedle Investment Funds (TIF) - Threadneedle Global Bond Fund
(Retail Gross Accumulation Class)
Top 10 Holdings as at 30 June 2016 Market Value EUR % of Net AssetsUS TREASURY N/B 0.625 15/08/2016 41,837,409 7.68%NEW ZEALAND GOVERNMENT 5.00 15/03/2019 31,520,328 5.79%US TREASURY N/B 0.625 15/12/2016 29,752,083 5.46%US TREASURY N/B 2.50 15/05/2046 21,046,782 3.86%US TREASURY N/B 1.625 31/05/2023 19,995,205 3.67%JAPAN (30 YEAR ISSUE) 1.50 20/12/2044 18,963,731 3.48%AUSTRALIAN GOVERNMENT 4.25 21/04/2026 17,344,551 3.18%US TREASURY N/B 1.375 30/04/2021 16,945,049 3.11%US TREASURY N/B 1.625 15/02/2026 16,512,186 3.03%US TREASURY N/B 0.50 31/01/2017 16,469,873 3.02%
Top 10 Holdings as at 30 June 2015 Market Value EUR % of Net AssetsBUNDESREPUB. DEUTSCHLAND 0.50 15/02/2025 11,384,983 3.71%NEW ZEALAND GOVERNMENT 5.50 15/04/2023 11,376,942 3.70%UK TSY 2% 2025 2.00 07/09/2025 11,201,026 3.65%EKSPORTFINANS ASA 2.00 15/09/2015 9,576,666 3.12%US TREASURY N/B 0.375 31/01/2016 9,001,403 2.93%US TREASURY N/B 2.25 15/11/2024 8,616,228 2.80%US TREASURY N/B 1.75 30/04/2022 7,342,186 2.39%JAPAN (20 YEAR ISSUE) 1.90 20/03/2025 7,339,900 2.39%BONOS Y OBLIG DEL ESTADO 5.85 31/01/2022 7,307,643 2.38%EUROPEAN INVESTMENT BANK 1.25 12/05/2025 6,659,423 2.17%
Expense Ratio For the 12 months ended For the 12 months ended 7 March 2016 7 March 2015 1.42% 1.43%
Turnover Ratio For the 12 months ended For the 12 months ended 30 March 2016 31 March 2015 274.53% 384.39%
Other Material InformationNil
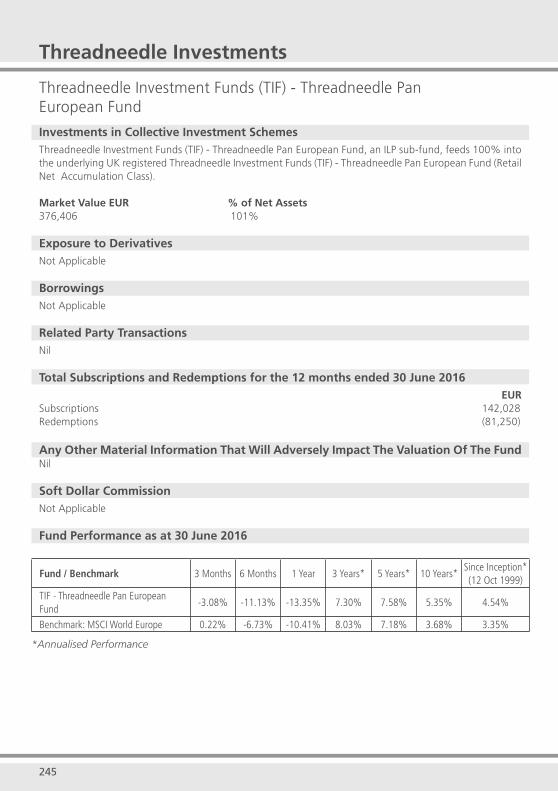
245
Threadneedle Investments
Threadneedle Investment Funds (TIF) - Threadneedle Pan European Fund
Investments in Collective Investment SchemesThreadneedle Investment Funds (TIF) - Threadneedle Pan European Fund, an ILP sub-fund, feeds 100% into the underlying UK registered Threadneedle Investment Funds (TIF) - Threadneedle Pan European Fund (Retail Net Accumulation Class).
Market Value EUR % of Net Assets376,406 101%
Exposure to DerivativesNot Applicable
BorrowingsNot Applicable
Related Party TransactionsNil
Total Subscriptions and Redemptions for the 12 months ended 30 June 2016EUR
Subscriptions 142,028Redemptions (81,250)
Any Other Material Information That Will Adversely Impact The Valuation Of The FundNil
Soft Dollar CommissionNot Applicable
Fund Performance as at 30 June 2016
Fund / Benchmark 3 Months 6 Months 1 Year 3 Years* 5 Years* 10 Years*Since Inception*(12 Oct 1999)
TIF - Threadneedle Pan European Fund
-3.08% -11.13% -13.35% 7.30% 7.58% 5.35% 4.54%
Benchmark: MSCI World Europe 0.22% -6.73% -10.41% 8.03% 7.18% 3.68% 3.35%
*Annualised Performance
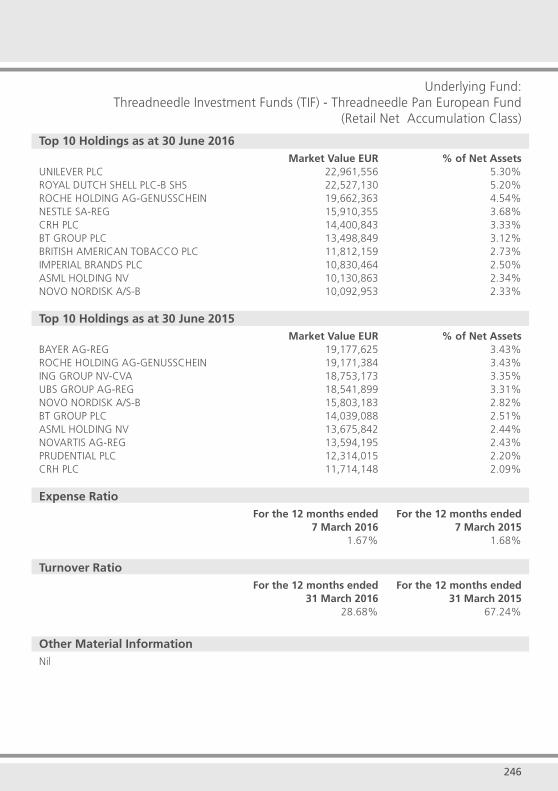
246
Underlying Fund:Threadneedle Investment Funds (TIF) - Threadneedle Pan European Fund
(Retail Net Accumulation Class)
Top 10 Holdings as at 30 June 2016 Market Value EUR % of Net AssetsUNILEVER PLC 22,961,556 5.30%ROYAL DUTCH SHELL PLC-B SHS 22,527,130 5.20%ROCHE HOLDING AG-GENUSSCHEIN 19,662,363 4.54%NESTLE SA-REG 15,910,355 3.68%CRH PLC 14,400,843 3.33%BT GROUP PLC 13,498,849 3.12%BRITISH AMERICAN TOBACCO PLC 11,812,159 2.73%IMPERIAL BRANDS PLC 10,830,464 2.50%ASML HOLDING NV 10,130,863 2.34%NOVO NORDISK A/S-B 10,092,953 2.33%
Top 10 Holdings as at 30 June 2015 Market Value EUR % of Net AssetsBAYER AG-REG 19,177,625 3.43%ROCHE HOLDING AG-GENUSSCHEIN 19,171,384 3.43%ING GROUP NV-CVA 18,753,173 3.35%UBS GROUP AG-REG 18,541,899 3.31%NOVO NORDISK A/S-B 15,803,183 2.82%BT GROUP PLC 14,039,088 2.51%ASML HOLDING NV 13,675,842 2.44%NOVARTIS AG-REG 13,594,195 2.43%PRUDENTIAL PLC 12,314,015 2.20%CRH PLC 11,714,148 2.09%
Expense Ratio For the 12 months ended For the 12 months ended 7 March 2016 7 March 2015 1.67% 1.68%
Turnover Ratio For the 12 months ended For the 12 months ended 31 March 2016 31 March 2015 28.68% 67.24%
Other Material InformationNil
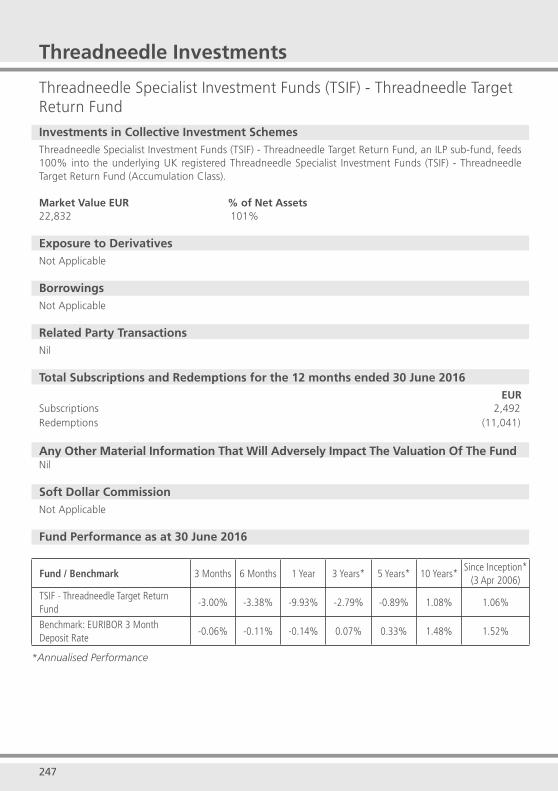
247
Threadneedle Investments
Threadneedle Specialist Investment Funds (TSIF) - Threadneedle Target Return Fund
Investments in Collective Investment SchemesThreadneedle Specialist Investment Funds (TSIF) - Threadneedle Target Return Fund, an ILP sub-fund, feeds 100% into the underlying UK registered Threadneedle Specialist Investment Funds (TSIF) - Threadneedle Target Return Fund (Accumulation Class).
Market Value EUR % of Net Assets22,832 101%
Exposure to DerivativesNot Applicable
BorrowingsNot Applicable
Related Party TransactionsNil
Total Subscriptions and Redemptions for the 12 months ended 30 June 2016EUR
Subscriptions 2,492Redemptions (11,041)
Any Other Material Information That Will Adversely Impact The Valuation Of The FundNil
Soft Dollar CommissionNot Applicable
Fund Performance as at 30 June 2016
Fund / Benchmark 3 Months 6 Months 1 Year 3 Years* 5 Years* 10 Years*Since Inception*
(3 Apr 2006)
TSIF - Threadneedle Target Return Fund
-3.00% -3.38% -9.93% -2.79% -0.89% 1.08% 1.06%
Benchmark: EURIBOR 3 Month Deposit Rate
-0.06% -0.11% -0.14% 0.07% 0.33% 1.48% 1.52%
*Annualised Performance
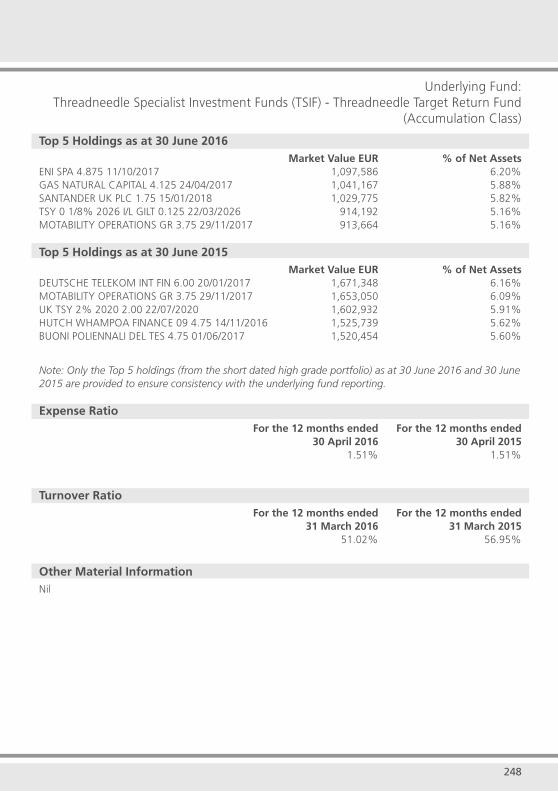
248
Underlying Fund:Threadneedle Specialist Investment Funds (TSIF) - Threadneedle Target Return Fund
(Accumulation Class)
Top 5 Holdings as at 30 June 2016 Market Value EUR % of Net AssetsENI SPA 4.875 11/10/2017 1,097,586 6.20%GAS NATURAL CAPITAL 4.125 24/04/2017 1,041,167 5.88%SANTANDER UK PLC 1.75 15/01/2018 1,029,775 5.82%TSY 0 1/8% 2026 I/L GILT 0.125 22/03/2026 914,192 5.16%MOTABILITY OPERATIONS GR 3.75 29/11/2017 913,664 5.16%
Top 5 Holdings as at 30 June 2015 Market Value EUR % of Net AssetsDEUTSCHE TELEKOM INT FIN 6.00 20/01/2017 1,671,348 6.16%MOTABILITY OPERATIONS GR 3.75 29/11/2017 1,653,050 6.09%UK TSY 2% 2020 2.00 22/07/2020 1,602,932 5.91%HUTCH WHAMPOA FINANCE 09 4.75 14/11/2016 1,525,739 5.62%BUONI POLIENNALI DEL TES 4.75 01/06/2017 1,520,454 5.60%
Note: Only the Top 5 holdings (from the short dated high grade portfolio) as at 30 June 2016 and 30 June 2015 are provided to ensure consistency with the underlying fund reporting.
Expense Ratio For the 12 months ended For the 12 months ended 30 April 2016 30 April 2015 1.51% 1.51%
Turnover Ratio For the 12 months ended For the 12 months ended 31 March 2016 31 March 2015 51.02% 56.95%
Other Material InformationNil
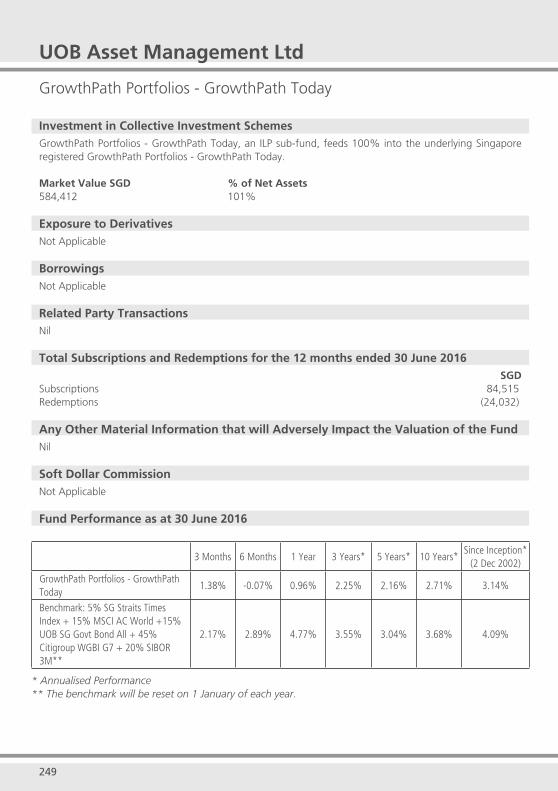
249 250
UOB Asset Management Ltd
GrowthPath Portfolios - GrowthPath Today
Investment in Collective Investment SchemesGrowthPath Portfolios - GrowthPath Today, an ILP sub-fund, feeds 100% into the underlying Singapore registered GrowthPath Portfolios - GrowthPath Today.
Market Value SGD % of Net Assets584,412 101%
Exposure to DerivativesNot Applicable
BorrowingsNot Applicable
Related Party TransactionsNil
Total Subscriptions and Redemptions for the 12 months ended 30 June 2016SGD
Subscriptions 84,515 Redemptions (24,032)
Any Other Material Information that will Adversely Impact the Valuation of the FundNil
Soft Dollar CommissionNot Applicable
Fund Performance as at 30 June 2016
3 Months 6 Months 1 Year 3 Years* 5 Years* 10 Years*Since Inception*
(2 Dec 2002)
GrowthPath Portfolios - GrowthPath Today
1.38% -0.07% 0.96% 2.25% 2.16% 2.71% 3.14%
Benchmark: 5% SG Straits Times Index + 15% MSCI AC World +15% UOB SG Govt Bond All + 45% Citigroup WGBI G7 + 20% SIBOR 3M**
2.17% 2.89% 4.77% 3.55% 3.04% 3.68% 4.09%
* Annualised Performance ** The benchmark will be reset on 1 January of each year.
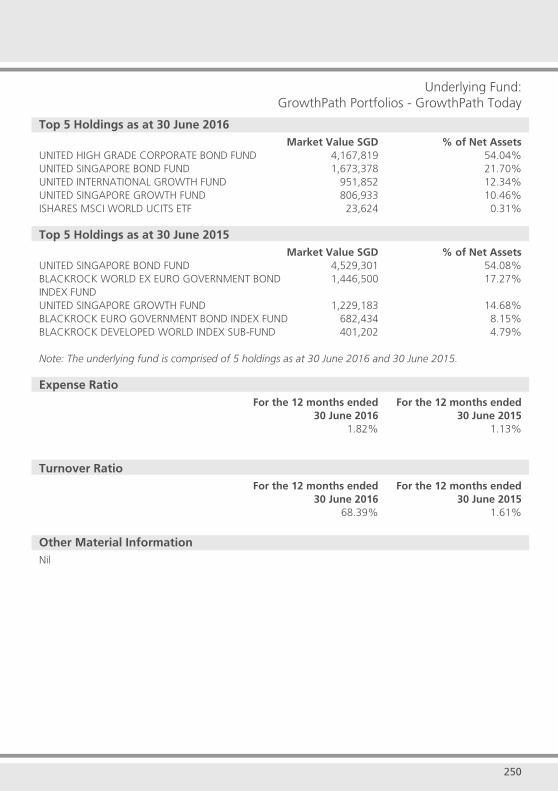
249 250
UOB Asset Management Ltd
Top 5 Holdings as at 30 June 2016 Market Value SGD % of Net AssetsUNITED HIGH GRADE CORPORATE BOND FUND 4,167,819 54.04%UNITED SINGAPORE BOND FUND 1,673,378 21.70%UNITED INTERNATIONAL GROWTH FUND 951,852 12.34%UNITED SINGAPORE GROWTH FUND 806,933 10.46%ISHARES MSCI WORLD UCITS ETF 23,624 0.31%
Top 5 Holdings as at 30 June 2015 Market Value SGD % of Net AssetsUNITED SINGAPORE BOND FUND 4,529,301 54.08%BLACKROCK WORLD EX EURO GOVERNMENT BOND 1,446,500 17.27%INDEX FUNDUNITED SINGAPORE GROWTH FUND 1,229,183 14.68%BLACKROCK EURO GOVERNMENT BOND INDEX FUND 682,434 8.15%BLACKROCK DEVELOPED WORLD INDEX SUB-FUND 401,202 4.79%
Note: The underlying fund is comprised of 5 holdings as at 30 June 2016 and 30 June 2015.
Expense Ratio For the 12 months ended For the 12 months ended 30 June 2016 30 June 2015 1.82% 1.13%
Turnover Ratio For the 12 months ended For the 12 months ended 30 June 2016 30 June 2015 68.39% 1.61%
Other Material InformationNil
Underlying Fund:GrowthPath Portfolios - GrowthPath Today
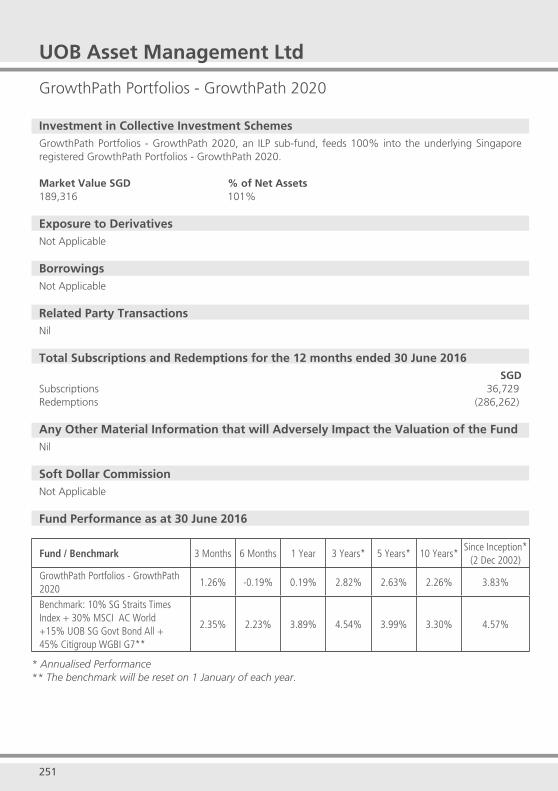
251 252
UOB Asset Management Ltd
GrowthPath Portfolios - GrowthPath 2020
Investment in Collective Investment SchemesGrowthPath Portfolios - GrowthPath 2020, an ILP sub-fund, feeds 100% into the underlying Singapore registered GrowthPath Portfolios - GrowthPath 2020.
Market Value SGD % of Net Assets189,316 101%
Exposure to DerivativesNot Applicable
BorrowingsNot Applicable
Related Party TransactionsNil
Total Subscriptions and Redemptions for the 12 months ended 30 June 2016SGD
Subscriptions 36,729 Redemptions (286,262)
Any Other Material Information that will Adversely Impact the Valuation of the FundNil
Soft Dollar CommissionNot Applicable
Fund Performance as at 30 June 2016
Fund / Benchmark 3 Months 6 Months 1 Year 3 Years* 5 Years* 10 Years*Since Inception*
(2 Dec 2002)
GrowthPath Portfolios - GrowthPath 2020
1.26% -0.19% 0.19% 2.82% 2.63% 2.26% 3.83%
Benchmark: 10% SG Straits Times Index + 30% MSCI AC World +15% UOB SG Govt Bond All + 45% Citigroup WGBI G7**
2.35% 2.23% 3.89% 4.54% 3.99% 3.30% 4.57%
* Annualised Performance ** The benchmark will be reset on 1 January of each year.

251 252
UOB Asset Management Ltd
Underlying Fund:GrowthPath Portfolios - GrowthPath 2020
Top 5 Holdings as at 30 June 2016 Market Value SGD % of Net AssetsUNITED HIGH GRADE CORPORATE BOND FUND 5,708,889 49.67%UNITED SINGAPORE BOND FUND 2,193,272 19.08%UNITED SINGAPORE GROWTH FUND 1,760,135 15.32%UNITED INTERNATIONAL GROWTH FUND 1,614,572 14.05%UNITED ASIA FUND 123,848 1.08%
Note: The underlying fund is comprised of 5 holdings as at 30 June 2016.
Top 6 Holdings as at 30 June 2015 Market Value SGD % of Net AssetsUNITED SINGAPORE BOND FUND 5,509,795 41.89%BLACKROCK WORLD EX EURO GOVERNMENT BOND 2,292,674 17.43%INDEX FUNDBLACKROCK DEVELOPED WORLD INDEX SUB-FUND 2,113,035 16.06%UNITED SINGAPORE GROWTH FUND 1,986,576 15.10%BLACKROCK EURO GOVERNMENT BOND INDEX FUND 1,054,440 8.02%UNITED ASIA FUND 144,995 1.10%
Note: The underlying fund is comprised of 6 holdings as at 30 June 2015.
Expense Ratio For the 12 months ended For the 12 months ended 30 June 2016 30 June 2015 2.15% 1.13%
Turnover Ratio For the 12 months ended For the 12 months ended 30 June 2016 30 June 2015 66.64% 0.66%
Other Material InformationNil

253 254
UOB Asset Management Ltd
GrowthPath Portfolios - GrowthPath 2030
Investment in Collective Investment SchemesGrowthPath Portfolios - GrowthPath 2030, an ILP sub-fund, feeds 100% into the underlying Singapore registered GrowthPath Portfolios - GrowthPath 2030.
Market Value SGD % of Net Assets244,087 101%
Exposure to DerivativesNot Applicable
BorrowingsNot Applicable
Related Party TransactionsNil
Total Subscriptions and Redemptions for the 12 months ended 30 June 2016SGD
Subscriptions 25,722 Redemptions (51,853)
Any Other Material Information that will Adversely Impact the Valuation of the FundNil
Soft Dollar CommissionNot Applicable
Fund Performance as at 30 June 2016
Fund / Benchmark 3 Months 6 Months 1 Year 3 Years* 5 Years* 10 Years*Since Inception*
(2 Dec 2002)
GrowthPath Portfolios - GrowthPath 2030
0.66% -3.59% -4.73% 1.59% 1.85% 1.67% 3.46%
Benchmark: 22.50% SG Straits Times Index + 67.50% MSCI AC World + 2.50% UOB SG Govt Bond All + 7.50% Citigroup WGBI G7**
1.32% -1.99% -0.23% 4.30% 4.17% 2.95% 4.58%
* Annualised Performance ** The benchmark will be reset on 1 January of each year.

253 254
UOB Asset Management Ltd
Underlying Fund:GrowthPath Portfolios - GrowthPath 2030
Top 5 Holdings as at 30 June 2016 Market Value SGD % of Net AssetsUNITED INTERNATIONAL GROWTH FUND 3,391,877 56.91%UNITED SINGAPORE GROWTH FUND 1,390,422 23.33%UNITED SINGAPORE BOND FUND 645,297 10.83%UNITED ASIA FUND 295,626 4.96%ISHARES MSCI WORLD UCITS ETF 144,103 2.41%
Note: The underlying fund is comprised of 5 holdings as at 30 June 2016.
Top 6 Holdings as at 30 June 2015 Market Value SGD % of Net AssetsBLACKROCK DEVELOPED WORLD INDEX SUB-FUND 1,743,742 25.32%UNITED SINGAPORE BOND FUND 1,715,547 24.91%BLACKROCK WORLD EX EURO GOVERNMENT BOND 1,334,045 19.37%INDEX FUND UNITED SINGAPORE GROWTH FUND 1,022,600 14.85%BLACKROCK EURO GOVERNMENT BOND INDEX FUND 642,977 9.34%UNITED ASIA FUND 394,644 5.73%
Note: The underlying fund is comprised of 6 holdings as at 30 June 2015.
Expense Ratio For the 12 months ended For the 12 months ended 30 June 2016 30 June 2015 2.36% 1.61%
Turnover Ratio For the 12 months ended For the 12 months ended 30 June 2016 30 June 2015 72.18% 1.60%
Other Material InformationNil
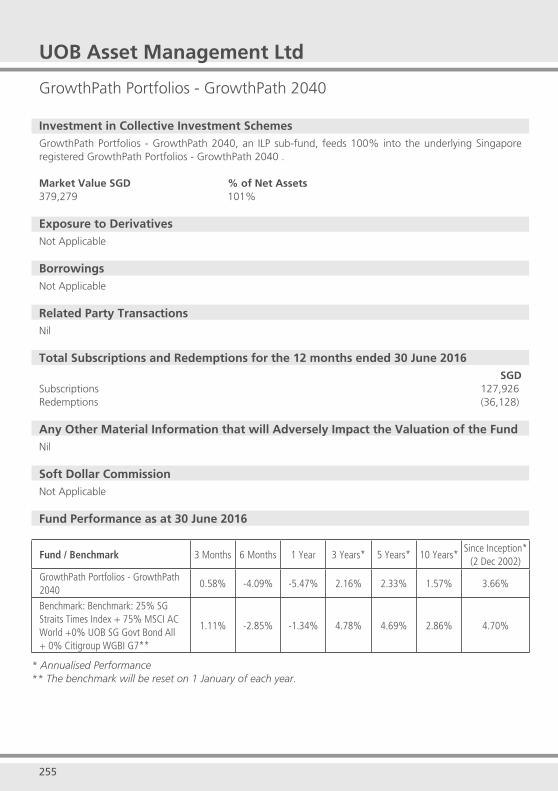
255 256
UOB Asset Management Ltd
GrowthPath Portfolios - GrowthPath 2040
Investment in Collective Investment SchemesGrowthPath Portfolios - GrowthPath 2040, an ILP sub-fund, feeds 100% into the underlying Singapore registered GrowthPath Portfolios - GrowthPath 2040 .
Market Value SGD % of Net Assets379,279 101%
Exposure to DerivativesNot Applicable
BorrowingsNot Applicable
Related Party TransactionsNil
Total Subscriptions and Redemptions for the 12 months ended 30 June 2016SGD
Subscriptions 127,926 Redemptions (36,128)
Any Other Material Information that will Adversely Impact the Valuation of the FundNil
Soft Dollar CommissionNot Applicable
Fund Performance as at 30 June 2016
Fund / Benchmark 3 Months 6 Months 1 Year 3 Years* 5 Years* 10 Years*Since Inception*
(2 Dec 2002)
GrowthPath Portfolios - GrowthPath 2040
0.58% -4.09% -5.47% 2.16% 2.33% 1.57% 3.66%
Benchmark: Benchmark: 25% SG Straits Times Index + 75% MSCI AC World +0% UOB SG Govt Bond All + 0% Citigroup WGBI G7**
1.11% -2.85% -1.34% 4.78% 4.69% 2.86% 4.70%
* Annualised Performance ** The benchmark will be reset on 1 January of each year.
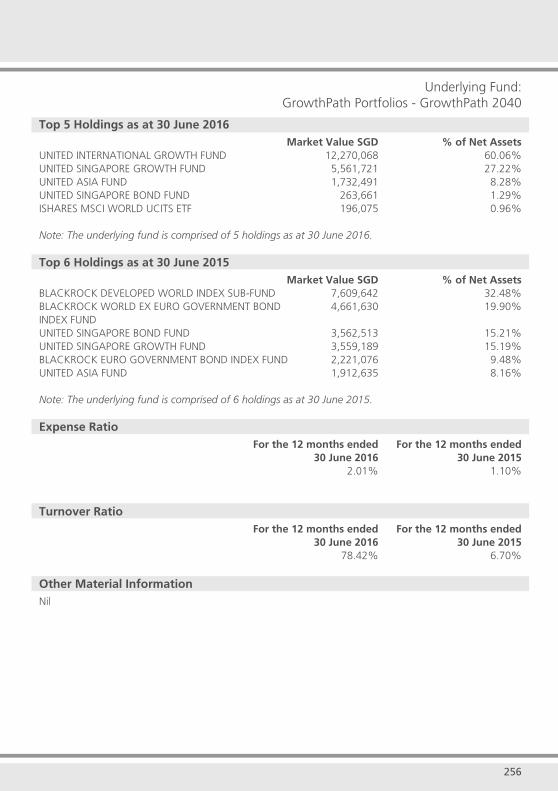
255 256
UOB Asset Management Ltd
Underlying Fund:GrowthPath Portfolios - GrowthPath 2040
Top 5 Holdings as at 30 June 2016 Market Value SGD % of Net AssetsUNITED INTERNATIONAL GROWTH FUND 12,270,068 60.06%UNITED SINGAPORE GROWTH FUND 5,561,721 27.22%UNITED ASIA FUND 1,732,491 8.28%UNITED SINGAPORE BOND FUND 263,661 1.29%ISHARES MSCI WORLD UCITS ETF 196,075 0.96%
Note: The underlying fund is comprised of 5 holdings as at 30 June 2016.
Top 6 Holdings as at 30 June 2015 Market Value SGD % of Net AssetsBLACKROCK DEVELOPED WORLD INDEX SUB-FUND 7,609,642 32.48%BLACKROCK WORLD EX EURO GOVERNMENT BOND 4,661,630 19.90%INDEX FUNDUNITED SINGAPORE BOND FUND 3,562,513 15.21%UNITED SINGAPORE GROWTH FUND 3,559,189 15.19%BLACKROCK EURO GOVERNMENT BOND INDEX FUND 2,221,076 9.48%UNITED ASIA FUND 1,912,635 8.16%
Note: The underlying fund is comprised of 6 holdings as at 30 June 2015.
Expense Ratio For the 12 months ended For the 12 months ended 30 June 2016 30 June 2015 2.01% 1.10%
Turnover Ratio For the 12 months ended For the 12 months ended 30 June 2016 30 June 2015 78.42% 6.70%
Other Material InformationNil
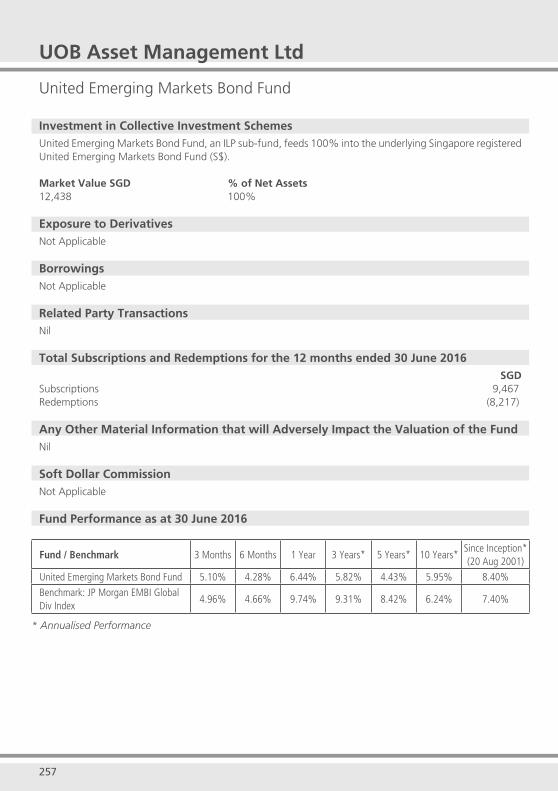
257 258
UOB Asset Management Ltd
United Emerging Markets Bond Fund
Investment in Collective Investment SchemesUnited Emerging Markets Bond Fund, an ILP sub-fund, feeds 100% into the underlying Singapore registered United Emerging Markets Bond Fund (S$).
Market Value SGD % of Net Assets12,438 100%
Exposure to DerivativesNot Applicable
BorrowingsNot Applicable
Related Party TransactionsNil
Total Subscriptions and Redemptions for the 12 months ended 30 June 2016SGD
Subscriptions 9,467 Redemptions (8,217)
Any Other Material Information that will Adversely Impact the Valuation of the FundNil
Soft Dollar CommissionNot Applicable
Fund Performance as at 30 June 2016
Fund / Benchmark 3 Months 6 Months 1 Year 3 Years* 5 Years* 10 Years*Since Inception*(20 Aug 2001)
United Emerging Markets Bond Fund 5.10% 4.28% 6.44% 5.82% 4.43% 5.95% 8.40%
Benchmark: JP Morgan EMBI Global Div Index
4.96% 4.66% 9.74% 9.31% 8.42% 6.24% 7.40%
* Annualised Performance
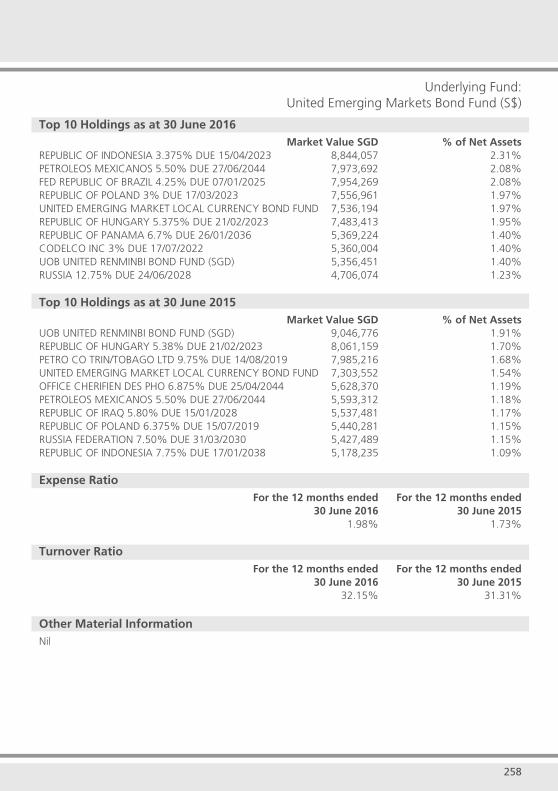
257 258
UOB Asset Management Ltd
Underlying Fund:United Emerging Markets Bond Fund (S$)
Top 10 Holdings as at 30 June 2016 Market Value SGD % of Net AssetsREPUBLIC OF INDONESIA 3.375% DUE 15/04/2023 8,844,057 2.31%PETROLEOS MEXICANOS 5.50% DUE 27/06/2044 7,973,692 2.08%FED REPUBLIC OF BRAZIL 4.25% DUE 07/01/2025 7,954,269 2.08%REPUBLIC OF POLAND 3% DUE 17/03/2023 7,556,961 1.97%UNITED EMERGING MARKET LOCAL CURRENCY BOND FUND 7,536,194 1.97%REPUBLIC OF HUNGARY 5.375% DUE 21/02/2023 7,483,413 1.95%REPUBLIC OF PANAMA 6.7% DUE 26/01/2036 5,369,224 1.40%CODELCO INC 3% DUE 17/07/2022 5,360,004 1.40%UOB UNITED RENMINBI BOND FUND (SGD) 5,356,451 1.40%RUSSIA 12.75% DUE 24/06/2028 4,706,074 1.23%
Top 10 Holdings as at 30 June 2015 Market Value SGD % of Net AssetsUOB UNITED RENMINBI BOND FUND (SGD) 9,046,776 1.91%REPUBLIC OF HUNGARY 5.38% DUE 21/02/2023 8,061,159 1.70%PETRO CO TRIN/TOBAGO LTD 9.75% DUE 14/08/2019 7,985,216 1.68%UNITED EMERGING MARKET LOCAL CURRENCY BOND FUND 7,303,552 1.54%OFFICE CHERIFIEN DES PHO 6.875% DUE 25/04/2044 5,628,370 1.19%PETROLEOS MEXICANOS 5.50% DUE 27/06/2044 5,593,312 1.18%REPUBLIC OF IRAQ 5.80% DUE 15/01/2028 5,537,481 1.17%REPUBLIC OF POLAND 6.375% DUE 15/07/2019 5,440,281 1.15%RUSSIA FEDERATION 7.50% DUE 31/03/2030 5,427,489 1.15%REPUBLIC OF INDONESIA 7.75% DUE 17/01/2038 5,178,235 1.09%
Expense Ratio For the 12 months ended For the 12 months ended 30 June 2016 30 June 2015 1.98% 1.73%
Turnover Ratio For the 12 months ended For the 12 months ended 30 June 2016 30 June 2015 32.15% 31.31%
Other Material InformationNil
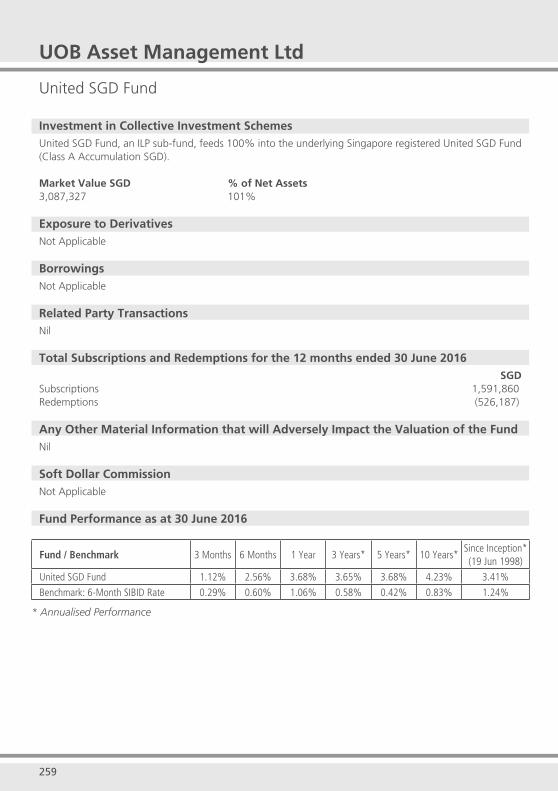
259 260
UOB Asset Management Ltd
United SGD Fund
Investment in Collective Investment SchemesUnited SGD Fund, an ILP sub-fund, feeds 100% into the underlying Singapore registered United SGD Fund (Class A Accumulation SGD).
Market Value SGD % of Net Assets3,087,327 101%
Exposure to DerivativesNot Applicable
BorrowingsNot Applicable
Related Party TransactionsNil
Total Subscriptions and Redemptions for the 12 months ended 30 June 2016SGD
Subscriptions 1,591,860 Redemptions (526,187)
Any Other Material Information that will Adversely Impact the Valuation of the FundNil
Soft Dollar CommissionNot Applicable
Fund Performance as at 30 June 2016
Fund / Benchmark 3 Months 6 Months 1 Year 3 Years* 5 Years* 10 Years*Since Inception*(19 Jun 1998)
United SGD Fund 1.12% 2.56% 3.68% 3.65% 3.68% 4.23% 3.41%
Benchmark: 6-Month SIBID Rate 0.29% 0.60% 1.06% 0.58% 0.42% 0.83% 1.24%
* Annualised Performance
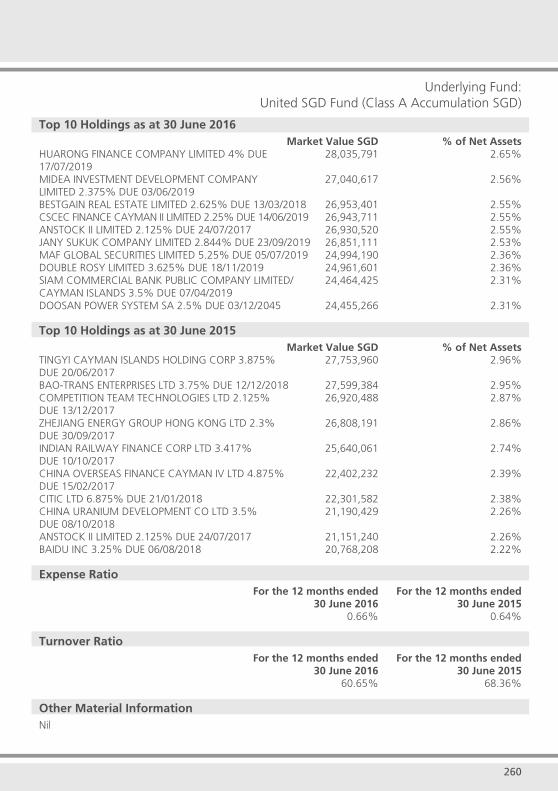
259 260
UOB Asset Management Ltd
Underlying Fund:United SGD Fund (Class A Accumulation SGD)
Top 10 Holdings as at 30 June 2016 Market Value SGD % of Net AssetsHUARONG FINANCE COMPANY LIMITED 4% DUE 28,035,791 2.65%17/07/2019MIDEA INVESTMENT DEVELOPMENT COMPANY 27,040,617 2.56%LIMITED 2.375% DUE 03/06/2019BESTGAIN REAL ESTATE LIMITED 2.625% DUE 13/03/2018 26,953,401 2.55%CSCEC FINANCE CAYMAN II LIMITED 2.25% DUE 14/06/2019 26,943,711 2.55%ANSTOCK II LIMITED 2.125% DUE 24/07/2017 26,930,520 2.55%JANY SUKUK COMPANY LIMITED 2.844% DUE 23/09/2019 26,851,111 2.53%MAF GLOBAL SECURITIES LIMITED 5.25% DUE 05/07/2019 24,994,190 2.36%DOUBLE ROSY LIMITED 3.625% DUE 18/11/2019 24,961,601 2.36%SIAM COMMERCIAL BANK PUBLIC COMPANY LIMITED/ 24,464,425 2.31%CAYMAN ISLANDS 3.5% DUE 07/04/2019DOOSAN POWER SYSTEM SA 2.5% DUE 03/12/2045 24,455,266 2.31% Top 10 Holdings as at 30 June 2015 Market Value SGD % of Net AssetsTINGYI CAYMAN ISLANDS HOLDING CORP 3.875% 27,753,960 2.96%DUE 20/06/2017BAO-TRANS ENTERPRISES LTD 3.75% DUE 12/12/2018 27,599,384 2.95%COMPETITION TEAM TECHNOLOGIES LTD 2.125% 26,920,488 2.87%DUE 13/12/2017ZHEJIANG ENERGY GROUP HONG KONG LTD 2.3% 26,808,191 2.86%DUE 30/09/2017INDIAN RAILWAY FINANCE CORP LTD 3.417% 25,640,061 2.74%DUE 10/10/2017CHINA OVERSEAS FINANCE CAYMAN IV LTD 4.875% 22,402,232 2.39%DUE 15/02/2017CITIC LTD 6.875% DUE 21/01/2018 22,301,582 2.38%CHINA URANIUM DEVELOPMENT CO LTD 3.5% 21,190,429 2.26%DUE 08/10/2018ANSTOCK II LIMITED 2.125% DUE 24/07/2017 21,151,240 2.26%BAIDU INC 3.25% DUE 06/08/2018 20,768,208 2.22%
Expense Ratio For the 12 months ended For the 12 months ended 30 June 2016 30 June 2015 0.66% 0.64%
Turnover Ratio For the 12 months ended For the 12 months ended 30 June 2016 30 June 2015 60.65% 68.36%
Other Material InformationNil
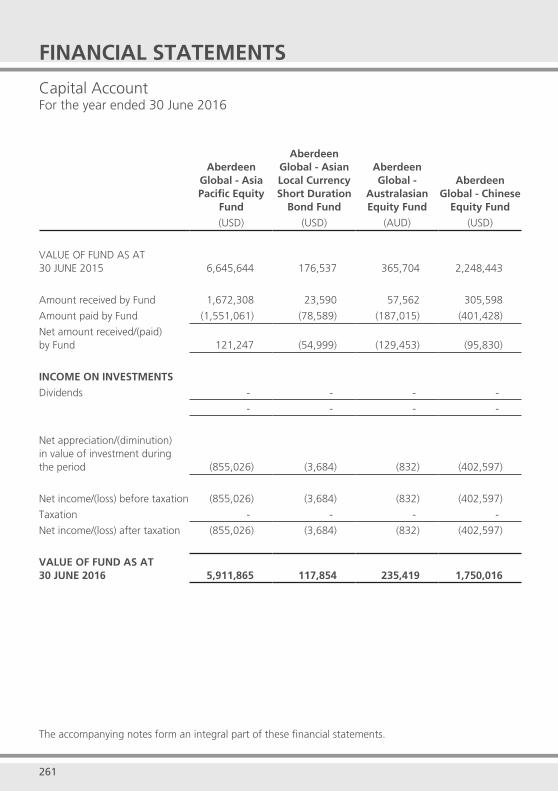
261 262
Capital AccountFor the year ended 30 June 2016
The accompanying notes form an integral part of these financial statements.
Aberdeen Global - Asia Pacific Equity
Fund
Aberdeen Global - Asian Local Currency Short Duration
Bond Fund
Aberdeen Global -
Australasian Equity Fund
Aberdeen Global - Chinese
Equity Fund
(USD) (USD) (AUD) (USD)
VALUE OF FUND AS AT 30 JUNE 2015 6,645,644 176,537 365,704 2,248,443
Amount received by Fund 1,672,308 23,590 57,562 305,598
Amount paid by Fund (1,551,061) (78,589) (187,015) (401,428)
Net amount received/(paid) by Fund 121,247 (54,999) (129,453) (95,830)
INCOME ON INVESTMENTS
Dividends - - - -
- - - -
Net appreciation/(diminution) in value of investment during the period (855,026) (3,684) (832) (402,597)
Net income/(loss) before taxation (855,026) (3,684) (832) (402,597)
Taxation - - - -
Net income/(loss) after taxation (855,026) (3,684) (832) (402,597)
VALUE OF FUND AS AT 30 JUNE 2016 5,911,865 117,854 235,419 1,750,016
FINANCIAL STATEMENTS
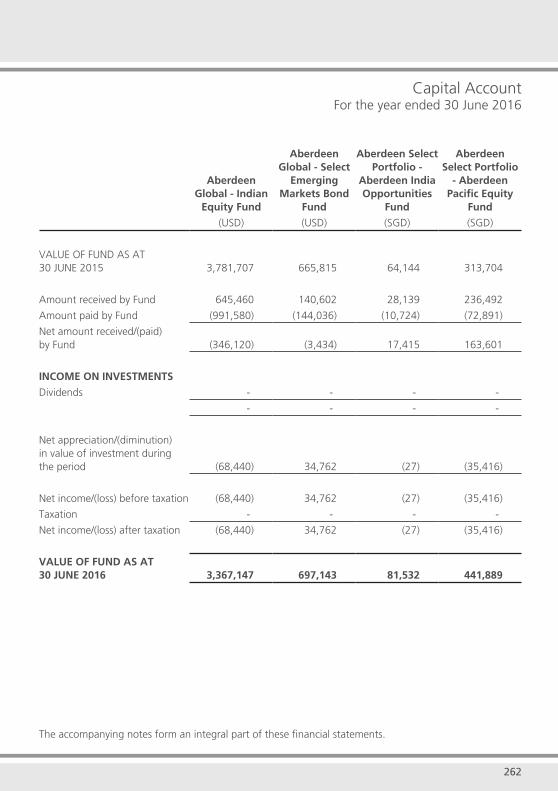
261 262
Capital AccountFor the year ended 30 June 2016
The accompanying notes form an integral part of these financial statements.
Aberdeen Global - Indian
Equity Fund
Aberdeen Global - Select
Emerging Markets Bond
Fund
Aberdeen Select Portfolio -
Aberdeen India Opportunities
Fund
Aberdeen Select Portfolio
- Aberdeen Pacific Equity
Fund
(USD) (USD) (SGD) (SGD)
VALUE OF FUND AS AT 30 JUNE 2015 3,781,707 665,815 64,144 313,704
Amount received by Fund 645,460 140,602 28,139 236,492
Amount paid by Fund (991,580) (144,036) (10,724) (72,891)
Net amount received/(paid) by Fund (346,120) (3,434) 17,415 163,601
INCOME ON INVESTMENTS
Dividends - - - -
- - - -
Net appreciation/(diminution) in value of investment during the period (68,440) 34,762 (27) (35,416)
Net income/(loss) before taxation (68,440) 34,762 (27) (35,416)
Taxation - - - -
Net income/(loss) after taxation (68,440) 34,762 (27) (35,416)
VALUE OF FUND AS AT 30 JUNE 2016 3,367,147 697,143 81,532 441,889
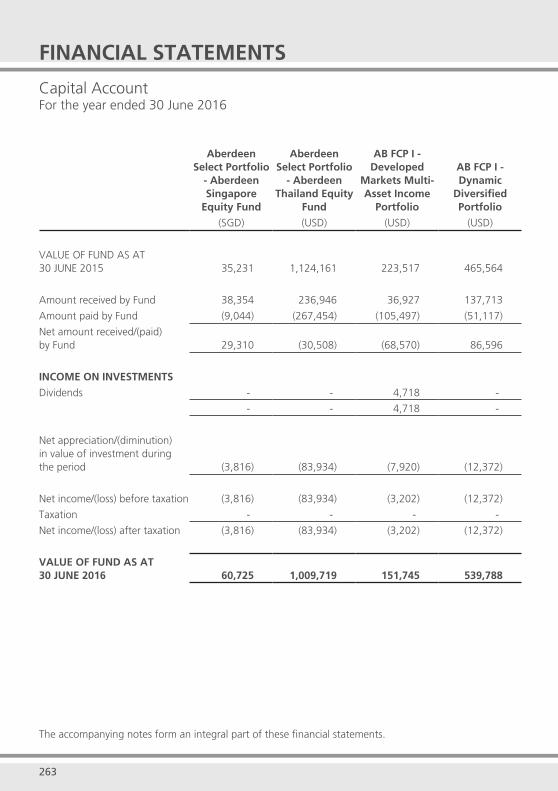
263 264
Capital AccountFor the year ended 30 June 2016
The accompanying notes form an integral part of these financial statements.
FINANCIAL STATEMENTS
Aberdeen Select Portfolio
- Aberdeen Singapore
Equity Fund
Aberdeen Select Portfolio
- Aberdeen Thailand Equity
Fund
AB FCP I - Developed
Markets Multi-Asset Income
Portfolio
AB FCP I - Dynamic
Diversified Portfolio
(SGD) (USD) (USD) (USD)
VALUE OF FUND AS AT 30 JUNE 2015 35,231 1,124,161 223,517 465,564
Amount received by Fund 38,354 236,946 36,927 137,713
Amount paid by Fund (9,044) (267,454) (105,497) (51,117)
Net amount received/(paid) by Fund 29,310 (30,508) (68,570) 86,596
INCOME ON INVESTMENTS
Dividends - - 4,718 -
- - 4,718 -
Net appreciation/(diminution) in value of investment during the period (3,816) (83,934) (7,920) (12,372)
Net income/(loss) before taxation (3,816) (83,934) (3,202) (12,372)
Taxation - - - -
Net income/(loss) after taxation (3,816) (83,934) (3,202) (12,372)
VALUE OF FUND AS AT 30 JUNE 2016 60,725 1,009,719 151,745 539,788
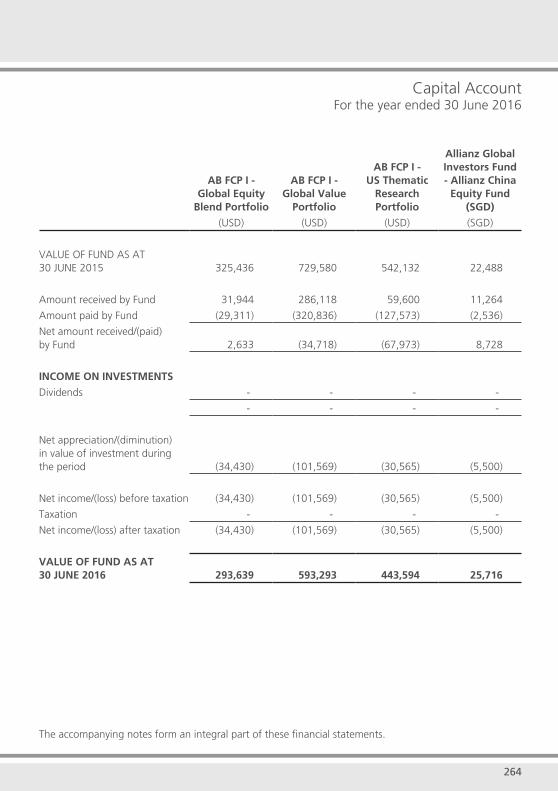
263 264
Capital AccountFor the year ended 30 June 2016
The accompanying notes form an integral part of these financial statements.
AB FCP I - Global Equity
Blend Portfolio
AB FCP I - Global Value
Portfolio
AB FCP I - US Thematic
Research Portfolio
Allianz Global Investors Fund - Allianz China
Equity Fund (SGD)
(USD) (USD) (USD) (SGD)
VALUE OF FUND AS AT 30 JUNE 2015 325,436 729,580 542,132 22,488
Amount received by Fund 31,944 286,118 59,600 11,264
Amount paid by Fund (29,311) (320,836) (127,573) (2,536)
Net amount received/(paid) by Fund 2,633 (34,718) (67,973) 8,728
INCOME ON INVESTMENTS
Dividends - - - -
- - - -
Net appreciation/(diminution) in value of investment during the period (34,430) (101,569) (30,565) (5,500)
Net income/(loss) before taxation (34,430) (101,569) (30,565) (5,500)
Taxation - - - -
Net income/(loss) after taxation (34,430) (101,569) (30,565) (5,500)
VALUE OF FUND AS AT 30 JUNE 2016 293,639 593,293 443,594 25,716

265 266
Capital AccountFor the year ended 30 June 2016
The accompanying notes form an integral part of these financial statements.
Allianz Global Investors Fund - Allianz Global Sustainability
Fund
Allianz Global Investors Fund - Allianz Oriental
Income Fund (SGD)
Amundi Funds - Absolute Volatility Arbitrage
Amundi Funds - Absolute
Volatility World Equities
(EUR) (SGD) (EUR) (USD)
VALUE OF FUND AS AT 30 JUNE 2015 40,366 1,099 1,922 109,485
Amount received by Fund 33,505 5,901 101 21,417
Amount paid by Fund (4,901) (2,544) (128) (15,071)
Net amount received/(paid) by Fund 28,604 3,357 (27) 6,346
INCOME ON INVESTMENTS
Dividends 513 - - -
513 - - -
Net appreciation/(diminution) in value of investment during the period (2,353) (144) (24) 5,035
Net income/(loss) before taxation (1,840) (144) (24) 5,035
Taxation - - - -
Net income/(loss) after taxation (1,840) (144) (24) 5,035
VALUE OF FUND AS AT 30 JUNE 2016 67,130 4,312 1,871 120,866
FINANCIAL STATEMENTS
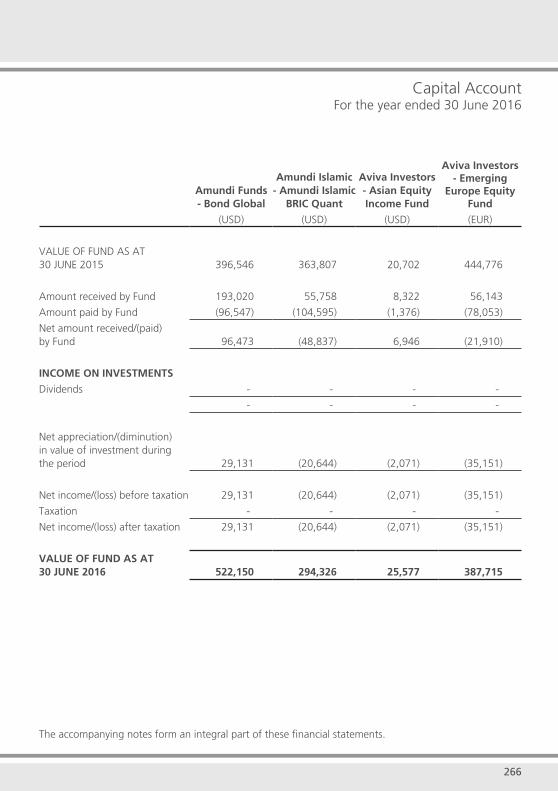
265 266
Capital AccountFor the year ended 30 June 2016
The accompanying notes form an integral part of these financial statements.
Amundi Funds - Bond Global
Amundi Islamic - Amundi Islamic
BRIC Quant
Aviva Investors - Asian Equity Income Fund
Aviva Investors - Emerging
Europe Equity Fund
(USD) (USD) (USD) (EUR)
VALUE OF FUND AS AT 30 JUNE 2015 396,546 363,807 20,702 444,776
Amount received by Fund 193,020 55,758 8,322 56,143
Amount paid by Fund (96,547) (104,595) (1,376) (78,053)
Net amount received/(paid) by Fund 96,473 (48,837) 6,946 (21,910)
INCOME ON INVESTMENTS
Dividends - - - -
- - - -
Net appreciation/(diminution) in value of investment during the period 29,131 (20,644) (2,071) (35,151)
Net income/(loss) before taxation 29,131 (20,644) (2,071) (35,151)
Taxation - - - -
Net income/(loss) after taxation 29,131 (20,644) (2,071) (35,151)
VALUE OF FUND AS AT 30 JUNE 2016 522,150 294,326 25,577 387,715
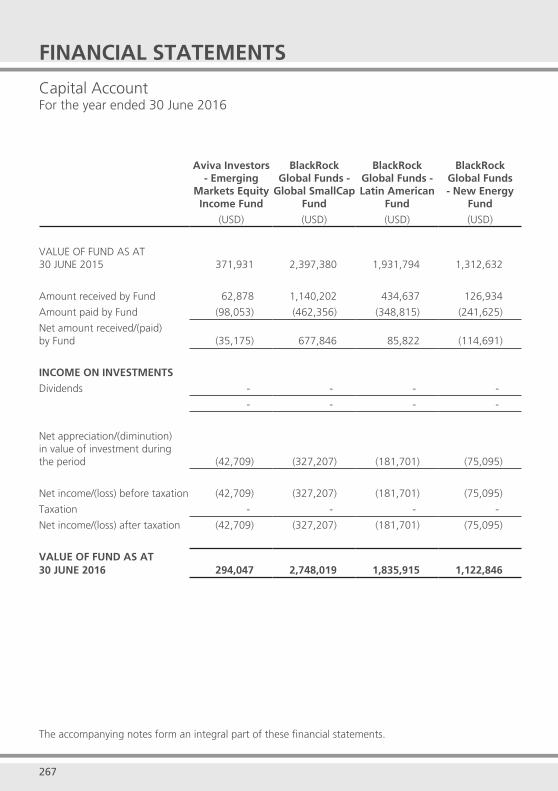
267 268
Capital AccountFor the year ended 30 June 2016
The accompanying notes form an integral part of these financial statements.
FINANCIAL STATEMENTS
Aviva Investors - Emerging
Markets Equity Income Fund
BlackRock Global Funds -
Global SmallCap Fund
BlackRock Global Funds - Latin American
Fund
BlackRock Global Funds - New Energy
Fund
(USD) (USD) (USD) (USD)
VALUE OF FUND AS AT 30 JUNE 2015 371,931 2,397,380 1,931,794 1,312,632
Amount received by Fund 62,878 1,140,202 434,637 126,934
Amount paid by Fund (98,053) (462,356) (348,815) (241,625)
Net amount received/(paid) by Fund (35,175) 677,846 85,822 (114,691)
INCOME ON INVESTMENTS
Dividends - - - -
- - - -
Net appreciation/(diminution) in value of investment during the period (42,709) (327,207) (181,701) (75,095)
Net income/(loss) before taxation (42,709) (327,207) (181,701) (75,095)
Taxation - - - -
Net income/(loss) after taxation (42,709) (327,207) (181,701) (75,095)
VALUE OF FUND AS AT 30 JUNE 2016 294,047 2,748,019 1,835,915 1,122,846

267 268
Capital AccountFor the year ended 30 June 2016
The accompanying notes form an integral part of these financial statements.
BlackRock Global Funds -
United Kingdom Fund
BlackRock Global Funds - World Gold
Fund
BlackRock Global Funds - World Mining
Fund
Parvest Bond Best Selection
World Emerging
(GBP) (USD) (USD) (USD)
VALUE OF FUND AS AT 30 JUNE 2015 182,438 2,602,141 2,740,710 159,238
Amount received by Fund 36,651 610,636 565,015 20,669
Amount paid by Fund (52,165) (677,265) (529,335) (24,348)
Net amount received/(paid) by Fund (15,514) (66,629) 35,680 (3,679)
INCOME ON INVESTMENTS
Dividends - - - -
- - - -
Net appreciation/(diminution) in value of investment during the period (157) 1,427,109 (233,032) (2,266)
Net income/(loss) before taxation (157) 1,427,109 (233,032) (2,266)
Taxation - - - -
Net income/(loss) after taxation (157) 1,427,109 (233,032) (2,266)
VALUE OF FUND AS AT 30 JUNE 2016 166,767 3,962,621 2,543,358 153,293
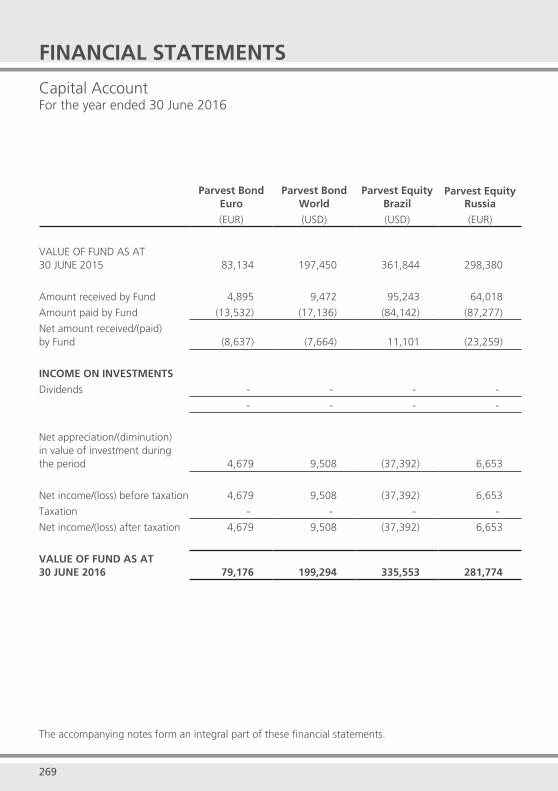
269 270
Capital AccountFor the year ended 30 June 2016
The accompanying notes form an integral part of these financial statements.
Parvest Bond Euro
Parvest Bond World
Parvest Equity Brazil
Parvest Equity Russia
(EUR) (USD) (USD) (EUR)
VALUE OF FUND AS AT 30 JUNE 2015 83,134 197,450 361,844 298,380
Amount received by Fund 4,895 9,472 95,243 64,018
Amount paid by Fund (13,532) (17,136) (84,142) (87,277)
Net amount received/(paid) by Fund (8,637) (7,664) 11,101 (23,259)
INCOME ON INVESTMENTS
Dividends - - - -
- - - -
Net appreciation/(diminution) in value of investment during the period 4,679 9,508 (37,392) 6,653
Net income/(loss) before taxation 4,679 9,508 (37,392) 6,653
Taxation - - - -
Net income/(loss) after taxation 4,679 9,508 (37,392) 6,653
VALUE OF FUND AS AT 30 JUNE 2016 79,176 199,294 335,553 281,774
FINANCIAL STATEMENTS

269 270
Capital AccountFor the year ended 30 June 2016
The accompanying notes form an integral part of these financial statements.
Parvest Equity World Materials
Parvest Global Environment
Parvest Money Market Euro
Parvest Money Market USD
(EUR) (USD) (EUR) (USD)
VALUE OF FUND AS AT 30 JUNE 2015 60,811 26,741 165,068 1,587,492
Amount received by Fund 10,493 1,468 76,554 889,727
Amount paid by Fund (13,272) (625) (8,402) (913,547)
Net amount received/(paid) by Fund (2,779) 843 68,152 (23,820)
INCOME ON INVESTMENTS
Dividends - - - -
- - - -
Net appreciation/(diminution) in value of investment during the period (5,190) (1,148) (186) 4,441
Net income/(loss) before taxation (5,190) (1,148) (186) 4,441
Taxation - - - -
Net income/(loss) after taxation (5,190) (1,148) (186) 4,441
VALUE OF FUND AS AT 30 JUNE 2016 52,842 26,436 233,034 1,568,113
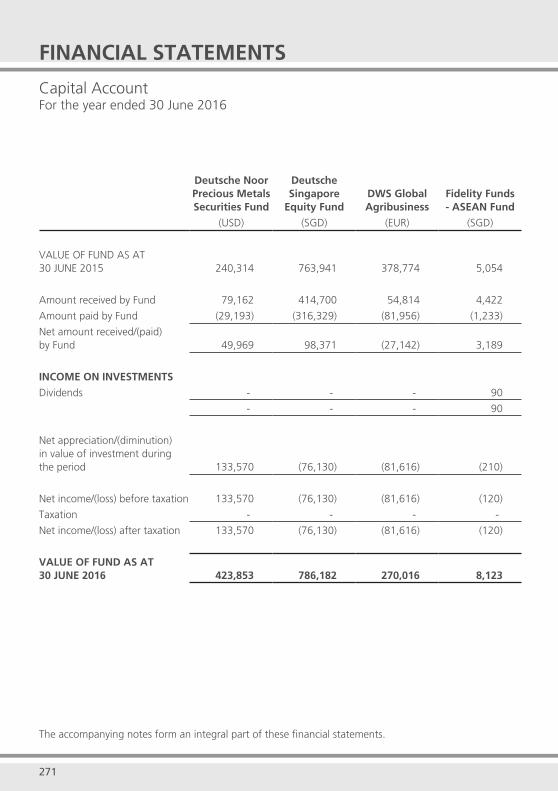
271 272
Capital AccountFor the year ended 30 June 2016
The accompanying notes form an integral part of these financial statements.
Deutsche Noor Precious Metals Securities Fund
Deutsche Singapore
Equity FundDWS Global Agribusiness
Fidelity Funds - ASEAN Fund
(USD) (SGD) (EUR) (SGD)
VALUE OF FUND AS AT 30 JUNE 2015 240,314 763,941 378,774 5,054
Amount received by Fund 79,162 414,700 54,814 4,422
Amount paid by Fund (29,193) (316,329) (81,956) (1,233)
Net amount received/(paid) by Fund 49,969 98,371 (27,142) 3,189
INCOME ON INVESTMENTS
Dividends - - - 90
- - - 90
Net appreciation/(diminution) in value of investment during the period 133,570 (76,130) (81,616) (210)
Net income/(loss) before taxation 133,570 (76,130) (81,616) (120)
Taxation - - - -
Net income/(loss) after taxation 133,570 (76,130) (81,616) (120)
VALUE OF FUND AS AT 30 JUNE 2016 423,853 786,182 270,016 8,123
FINANCIAL STATEMENTS
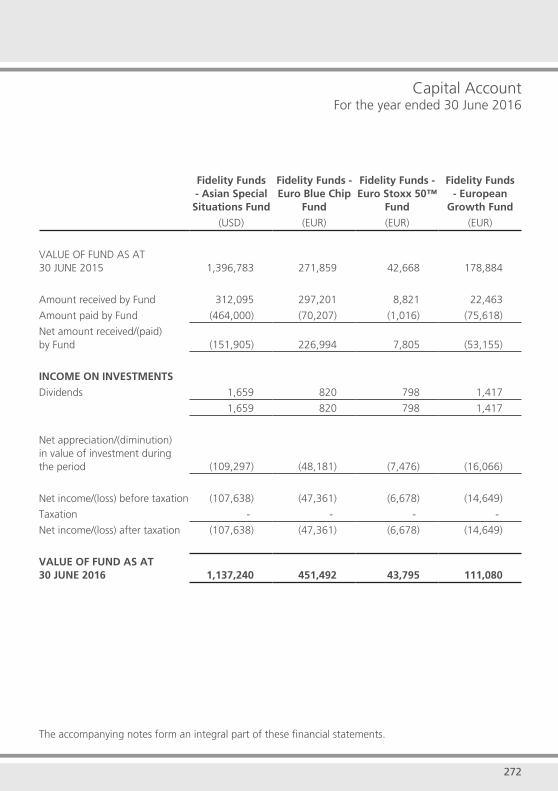
271 272
Capital AccountFor the year ended 30 June 2016
The accompanying notes form an integral part of these financial statements.
Fidelity Funds - Asian Special Situations Fund
Fidelity Funds - Euro Blue Chip
Fund
Fidelity Funds - Euro Stoxx 50™
Fund
Fidelity Funds - European
Growth Fund
(USD) (EUR) (EUR) (EUR)
VALUE OF FUND AS AT 30 JUNE 2015 1,396,783 271,859 42,668 178,884
Amount received by Fund 312,095 297,201 8,821 22,463
Amount paid by Fund (464,000) (70,207) (1,016) (75,618)
Net amount received/(paid) by Fund (151,905) 226,994 7,805 (53,155)
INCOME ON INVESTMENTS
Dividends 1,659 820 798 1,417
1,659 820 798 1,417
Net appreciation/(diminution) in value of investment during the period (109,297) (48,181) (7,476) (16,066)
Net income/(loss) before taxation (107,638) (47,361) (6,678) (14,649)
Taxation - - - -
Net income/(loss) after taxation (107,638) (47,361) (6,678) (14,649)
VALUE OF FUND AS AT 30 JUNE 2016 1,137,240 451,492 43,795 111,080
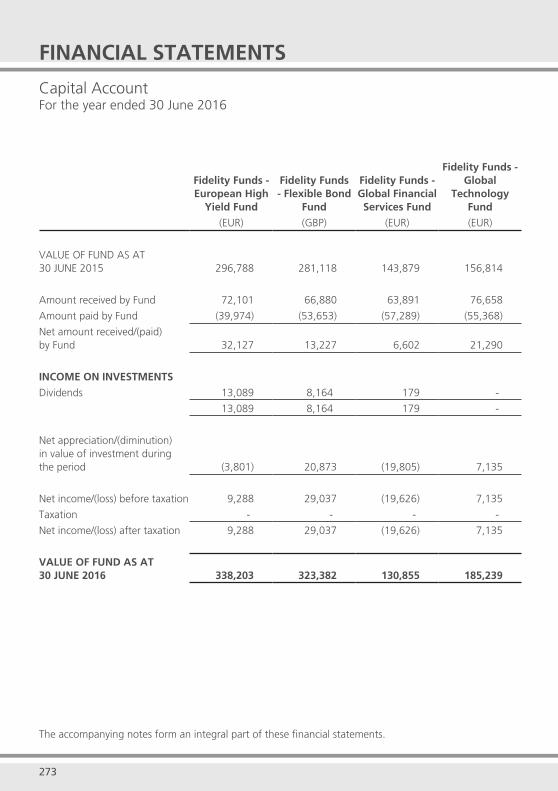
273 274
Capital AccountFor the year ended 30 June 2016
The accompanying notes form an integral part of these financial statements.
Fidelity Funds - European High
Yield Fund
Fidelity Funds - Flexible Bond
Fund
Fidelity Funds - Global Financial Services Fund
Fidelity Funds - Global
Technology Fund
(EUR) (GBP) (EUR) (EUR)
VALUE OF FUND AS AT 30 JUNE 2015 296,788 281,118 143,879 156,814
Amount received by Fund 72,101 66,880 63,891 76,658
Amount paid by Fund (39,974) (53,653) (57,289) (55,368)
Net amount received/(paid) by Fund 32,127 13,227 6,602 21,290
INCOME ON INVESTMENTS
Dividends 13,089 8,164 179 -
13,089 8,164 179 -
Net appreciation/(diminution) in value of investment during the period (3,801) 20,873 (19,805) 7,135
Net income/(loss) before taxation 9,288 29,037 (19,626) 7,135
Taxation - - - -
Net income/(loss) after taxation 9,288 29,037 (19,626) 7,135
VALUE OF FUND AS AT 30 JUNE 2016 338,203 323,382 130,855 185,239
FINANCIAL STATEMENTS
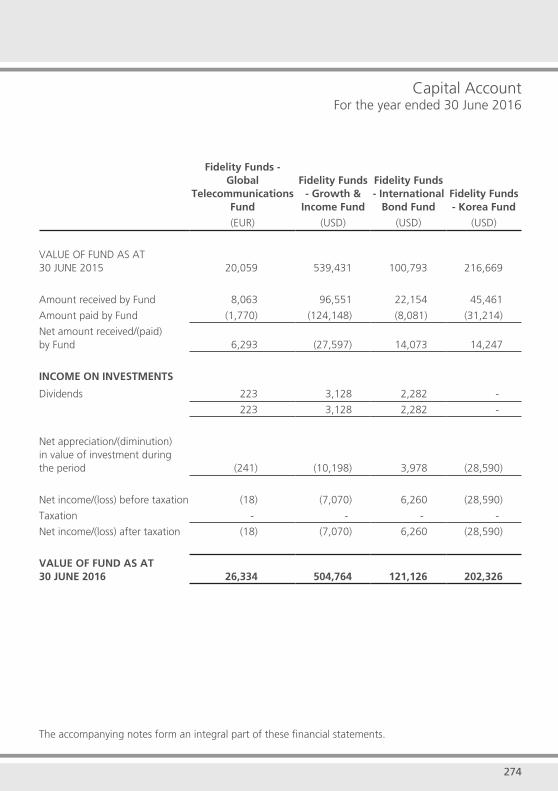
273 274
Capital AccountFor the year ended 30 June 2016
The accompanying notes form an integral part of these financial statements.
Fidelity Funds - Global
Telecommunications Fund
Fidelity Funds - Growth &
Income Fund
Fidelity Funds - International
Bond FundFidelity Funds - Korea Fund
(EUR) (USD) (USD) (USD)
VALUE OF FUND AS AT 30 JUNE 2015 20,059 539,431 100,793 216,669
Amount received by Fund 8,063 96,551 22,154 45,461
Amount paid by Fund (1,770) (124,148) (8,081) (31,214)
Net amount received/(paid) by Fund 6,293 (27,597) 14,073 14,247
INCOME ON INVESTMENTS
Dividends 223 3,128 2,282 -
223 3,128 2,282 -
Net appreciation/(diminution) in value of investment during the period (241) (10,198) 3,978 (28,590)
Net income/(loss) before taxation (18) (7,070) 6,260 (28,590)
Taxation - - - -
Net income/(loss) after taxation (18) (7,070) 6,260 (28,590)
VALUE OF FUND AS AT 30 JUNE 2016 26,334 504,764 121,126 202,326
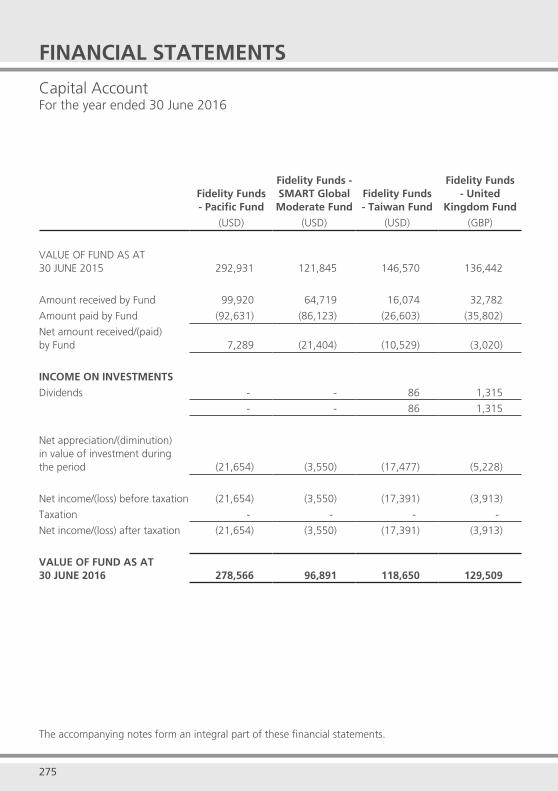
275 276
Capital AccountFor the year ended 30 June 2016
The accompanying notes form an integral part of these financial statements.
Fidelity Funds - Pacific Fund
Fidelity Funds - SMART Global Moderate Fund
Fidelity Funds - Taiwan Fund
Fidelity Funds - United
Kingdom Fund
(USD) (USD) (USD) (GBP)
VALUE OF FUND AS AT 30 JUNE 2015 292,931 121,845 146,570 136,442
Amount received by Fund 99,920 64,719 16,074 32,782
Amount paid by Fund (92,631) (86,123) (26,603) (35,802)
Net amount received/(paid) by Fund 7,289 (21,404) (10,529) (3,020)
INCOME ON INVESTMENTS
Dividends - - 86 1,315
- - 86 1,315
Net appreciation/(diminution) in value of investment during the period (21,654) (3,550) (17,477) (5,228)
Net income/(loss) before taxation (21,654) (3,550) (17,391) (3,913)
Taxation - - - -
Net income/(loss) after taxation (21,654) (3,550) (17,391) (3,913)
VALUE OF FUND AS AT 30 JUNE 2016 278,566 96,891 118,650 129,509
FINANCIAL STATEMENTS
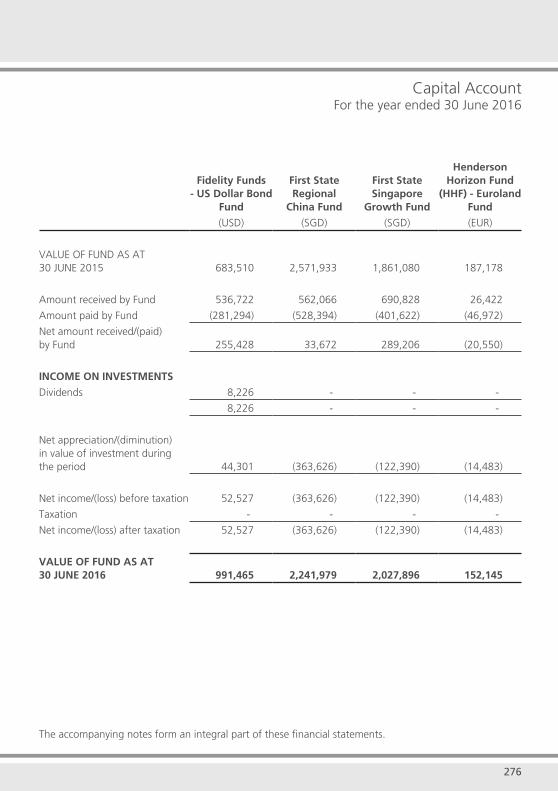
275 276
Capital AccountFor the year ended 30 June 2016
The accompanying notes form an integral part of these financial statements.
Fidelity Funds - US Dollar Bond
Fund
First State Regional
China Fund
First State Singapore
Growth Fund
Henderson Horizon Fund
(HHF) - Euroland Fund
(USD) (SGD) (SGD) (EUR)
VALUE OF FUND AS AT 30 JUNE 2015 683,510 2,571,933 1,861,080 187,178
Amount received by Fund 536,722 562,066 690,828 26,422
Amount paid by Fund (281,294) (528,394) (401,622) (46,972)
Net amount received/(paid) by Fund 255,428 33,672 289,206 (20,550)
INCOME ON INVESTMENTS
Dividends 8,226 - - -
8,226 - - -
Net appreciation/(diminution) in value of investment during the period 44,301 (363,626) (122,390) (14,483)
Net income/(loss) before taxation 52,527 (363,626) (122,390) (14,483)
Taxation - - - -
Net income/(loss) after taxation 52,527 (363,626) (122,390) (14,483)
VALUE OF FUND AS AT 30 JUNE 2016 991,465 2,241,979 2,027,896 152,145
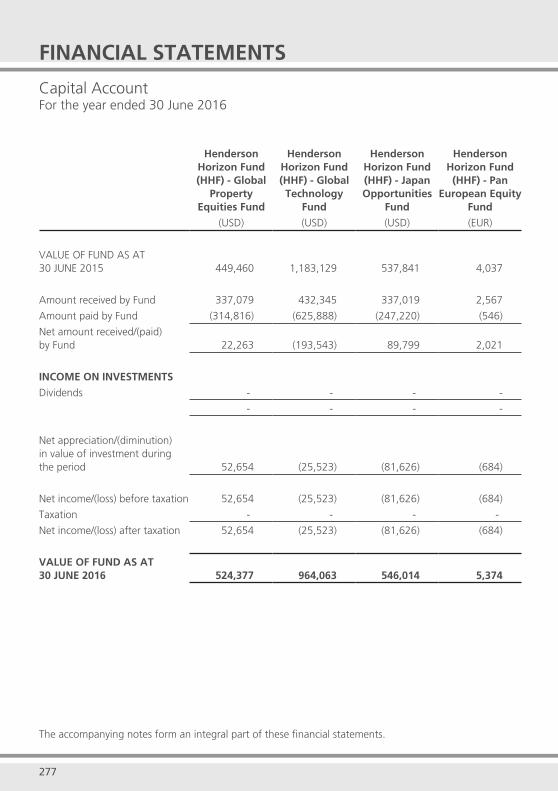
277 278
Capital AccountFor the year ended 30 June 2016
The accompanying notes form an integral part of these financial statements.
Henderson Horizon Fund (HHF) - Global
Property Equities Fund
Henderson Horizon Fund (HHF) - Global Technology
Fund
Henderson Horizon Fund (HHF) - Japan Opportunities
Fund
Henderson Horizon Fund (HHF) - Pan
European Equity Fund
(USD) (USD) (USD) (EUR)
VALUE OF FUND AS AT 30 JUNE 2015 449,460 1,183,129 537,841 4,037
Amount received by Fund 337,079 432,345 337,019 2,567
Amount paid by Fund (314,816) (625,888) (247,220) (546)
Net amount received/(paid) by Fund 22,263 (193,543) 89,799 2,021
INCOME ON INVESTMENTS
Dividends - - - -
- - - -
Net appreciation/(diminution) in value of investment during the period 52,654 (25,523) (81,626) (684)
Net income/(loss) before taxation 52,654 (25,523) (81,626) (684)
Taxation - - - -
Net income/(loss) after taxation 52,654 (25,523) (81,626) (684)
VALUE OF FUND AS AT 30 JUNE 2016 524,377 964,063 546,014 5,374
FINANCIAL STATEMENTS
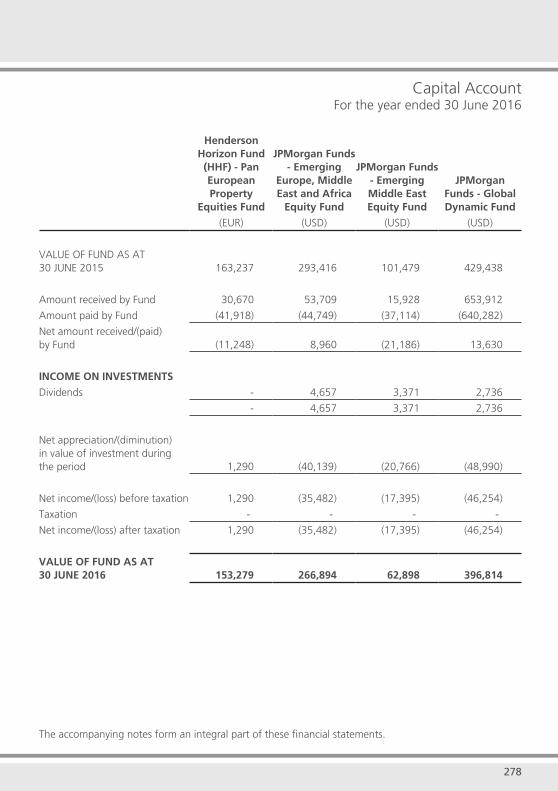
277 278
Capital AccountFor the year ended 30 June 2016
The accompanying notes form an integral part of these financial statements.
Henderson Horizon Fund (HHF) - Pan European Property
Equities Fund
JPMorgan Funds - Emerging
Europe, Middle East and Africa
Equity Fund
JPMorgan Funds - Emerging Middle East Equity Fund
JPMorgan Funds - Global Dynamic Fund
(EUR) (USD) (USD) (USD)
VALUE OF FUND AS AT 30 JUNE 2015 163,237 293,416 101,479 429,438
Amount received by Fund 30,670 53,709 15,928 653,912
Amount paid by Fund (41,918) (44,749) (37,114) (640,282)
Net amount received/(paid) by Fund (11,248) 8,960 (21,186) 13,630
INCOME ON INVESTMENTS
Dividends - 4,657 3,371 2,736
- 4,657 3,371 2,736
Net appreciation/(diminution) in value of investment during the period 1,290 (40,139) (20,766) (48,990)
Net income/(loss) before taxation 1,290 (35,482) (17,395) (46,254)
Taxation - - - -
Net income/(loss) after taxation 1,290 (35,482) (17,395) (46,254)
VALUE OF FUND AS AT 30 JUNE 2016 153,279 266,894 62,898 396,814

279 280
Capital AccountFor the year ended 30 June 2016
The accompanying notes form an integral part of these financial statements.
JPMorgan Funds - Global Natural Resources Fund
JPMorgan Funds - JF India Fund
JPMorgan Funds - JF Taiwan
Fund
Jupiter Global Fund - Jupiter
European Growth
(USD) (USD) (USD) (EUR)
VALUE OF FUND AS AT 30 JUNE 2015 961,481 987,499 40,881 281,306
Amount received by Fund 328,167 127,016 7,276 198,032
Amount paid by Fund (278,795) (282,740) (4,564) (77,845)
Net amount received/(paid) by Fund 49,372 (155,724) 2,712 120,187
INCOME ON INVESTMENTS
Dividends - - 1,082 -
- - 1,082 -
Net appreciation/(diminution) in value of investment during the period (129,775) (25,013) (4,706) (17,661)
Net income/(loss) before taxation (129,775) (25,013) (3,624) (17,661)
Taxation - - - -
Net income/(loss) after taxation (129,775) (25,013) (3,624) (17,661)
VALUE OF FUND AS AT 30 JUNE 2016 881,078 806,762 39,969 383,832
FINANCIAL STATEMENTS
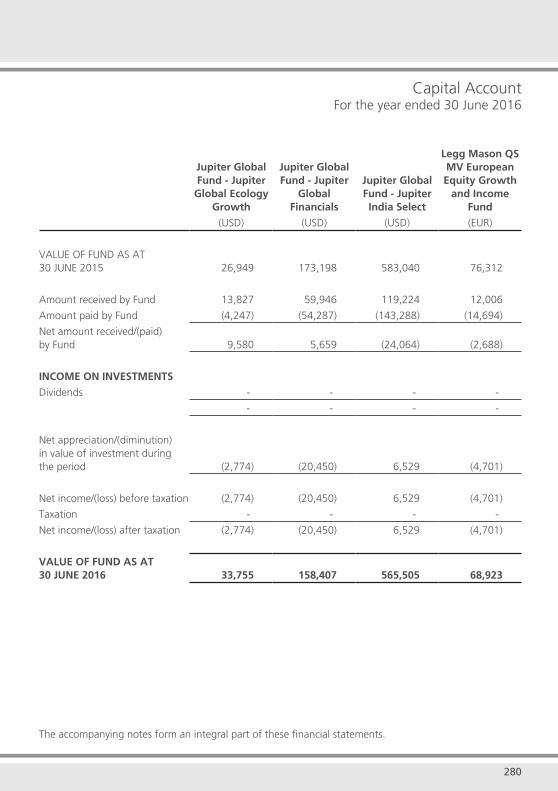
279 280
Capital AccountFor the year ended 30 June 2016
The accompanying notes form an integral part of these financial statements.
Jupiter Global Fund - Jupiter Global Ecology
Growth
Jupiter Global Fund - Jupiter
Global Financials
Jupiter Global Fund - Jupiter India Select
Legg Mason QS MV European Equity Growth
and Income Fund
(USD) (USD) (USD) (EUR)
VALUE OF FUND AS AT 30 JUNE 2015 26,949 173,198 583,040 76,312
Amount received by Fund 13,827 59,946 119,224 12,006
Amount paid by Fund (4,247) (54,287) (143,288) (14,694)
Net amount received/(paid) by Fund 9,580 5,659 (24,064) (2,688)
INCOME ON INVESTMENTS
Dividends - - - -
- - - -
Net appreciation/(diminution) in value of investment during the period (2,774) (20,450) 6,529 (4,701)
Net income/(loss) before taxation (2,774) (20,450) 6,529 (4,701)
Taxation - - - -
Net income/(loss) after taxation (2,774) (20,450) 6,529 (4,701)
VALUE OF FUND AS AT 30 JUNE 2016 33,755 158,407 565,505 68,923
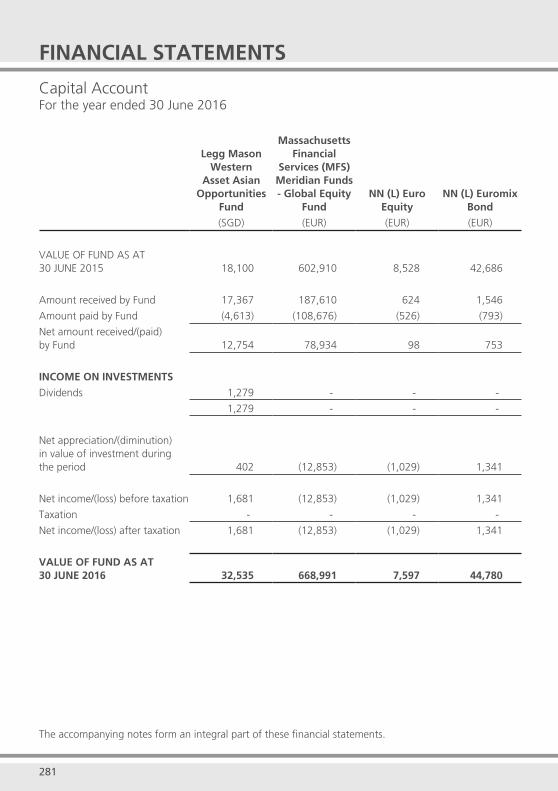
281 282
Capital AccountFor the year ended 30 June 2016
The accompanying notes form an integral part of these financial statements.
Legg Mason Western
Asset Asian Opportunities
Fund
Massachusetts Financial
Services (MFS) Meridian Funds - Global Equity
FundNN (L) Euro
EquityNN (L) Euromix
Bond
(SGD) (EUR) (EUR) (EUR)
VALUE OF FUND AS AT 30 JUNE 2015 18,100 602,910 8,528 42,686
Amount received by Fund 17,367 187,610 624 1,546
Amount paid by Fund (4,613) (108,676) (526) (793)
Net amount received/(paid) by Fund 12,754 78,934 98 753
INCOME ON INVESTMENTS
Dividends 1,279 - - -
1,279 - - -
Net appreciation/(diminution) in value of investment during the period 402 (12,853) (1,029) 1,341
Net income/(loss) before taxation 1,681 (12,853) (1,029) 1,341
Taxation - - - -
Net income/(loss) after taxation 1,681 (12,853) (1,029) 1,341
VALUE OF FUND AS AT 30 JUNE 2016 32,535 668,991 7,597 44,780
FINANCIAL STATEMENTS
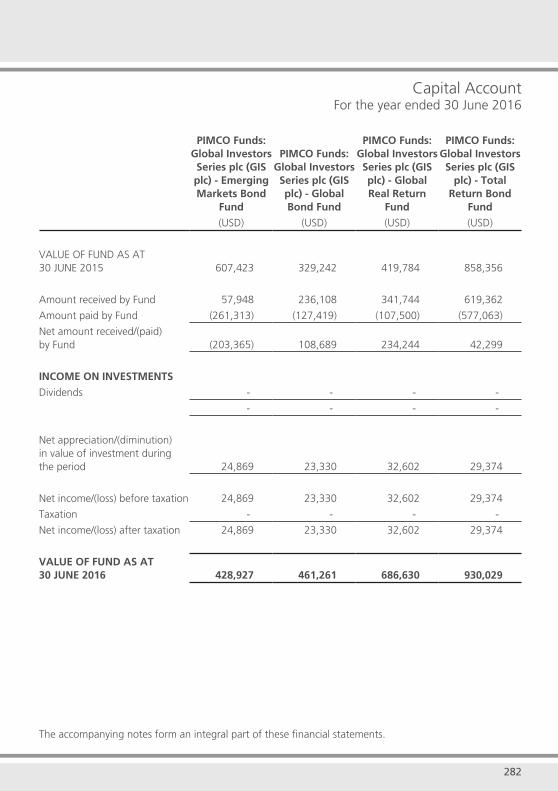
281 282
Capital AccountFor the year ended 30 June 2016
The accompanying notes form an integral part of these financial statements.
PIMCO Funds: Global Investors Series plc (GIS plc) - Emerging Markets Bond
Fund
PIMCO Funds: Global Investors Series plc (GIS plc) - Global Bond Fund
PIMCO Funds: Global Investors Series plc (GIS plc) - Global Real Return
Fund
PIMCO Funds: Global Investors Series plc (GIS
plc) - Total Return Bond
Fund
(USD) (USD) (USD) (USD)
VALUE OF FUND AS AT 30 JUNE 2015 607,423 329,242 419,784 858,356
Amount received by Fund 57,948 236,108 341,744 619,362
Amount paid by Fund (261,313) (127,419) (107,500) (577,063)
Net amount received/(paid) by Fund (203,365) 108,689 234,244 42,299
INCOME ON INVESTMENTS
Dividends - - - -
- - - -
Net appreciation/(diminution) in value of investment during the period 24,869 23,330 32,602 29,374
Net income/(loss) before taxation 24,869 23,330 32,602 29,374
Taxation - - - -
Net income/(loss) after taxation 24,869 23,330 32,602 29,374
VALUE OF FUND AS AT 30 JUNE 2016 428,927 461,261 686,630 930,029

283 284
Capital AccountFor the year ended 30 June 2016
The accompanying notes form an integral part of these financial statements.
PIMCO Funds: Global Investors Series plc (GIS plc) - US High
Yield Bond FundSchroder Asian Growth Fund
Schroder Global Emerging Market
Opportunities Fund
Schroder International
Selection Fund (ISF) Asian Bond Absolute Return
(USD) (USD) (SGD) (USD)
VALUE OF FUND AS AT 30 JUNE 2015 596,960 1,935,826 42,638 141,283
Amount received by Fund 214,470 675,023 29,846 32,886
Amount paid by Fund (524,880) (479,435) (10,302) (15,224)
Net amount received/(paid) by Fund (310,410) 195,588 19,544 17,662
INCOME ON INVESTMENTS
Dividends - 74,801 - -
- 74,801 - -
Net appreciation/(diminution) in value of investment during the period (7,381) (156,205) (4,765) (1,980)
Net income/(loss) before taxation (7,381) (81,404) (4,765) (1,980)
Taxation - - - -
Net income/(loss) after taxation (7,381) (81,404) (4,765) (1,980)
VALUE OF FUND AS AT 30 JUNE 2016 279,169 2,050,010 57,417 156,965
FINANCIAL STATEMENTS
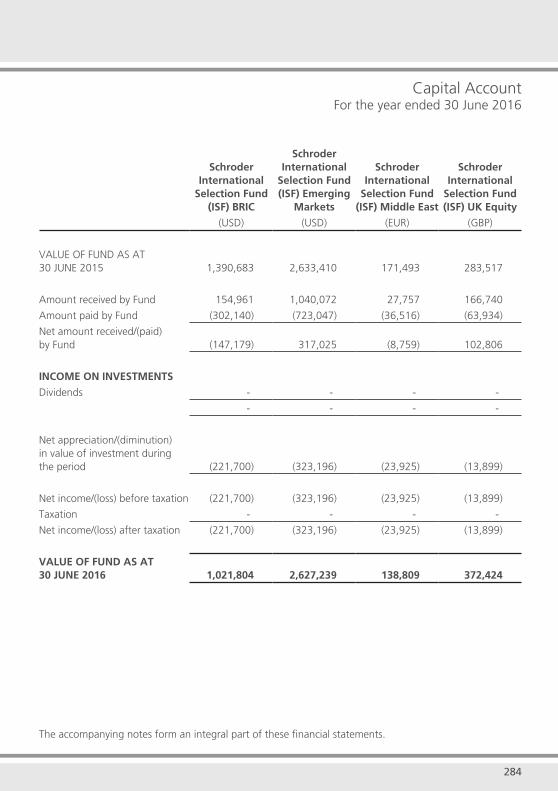
283 284
Capital AccountFor the year ended 30 June 2016
The accompanying notes form an integral part of these financial statements.
Schroder International
Selection Fund (ISF) BRIC
Schroder International
Selection Fund (ISF) Emerging
Markets
Schroder International
Selection Fund (ISF) Middle East
Schroder International
Selection Fund (ISF) UK Equity
(USD) (USD) (EUR) (GBP)
VALUE OF FUND AS AT 30 JUNE 2015 1,390,683 2,633,410 171,493 283,517
Amount received by Fund 154,961 1,040,072 27,757 166,740
Amount paid by Fund (302,140) (723,047) (36,516) (63,934)
Net amount received/(paid) by Fund (147,179) 317,025 (8,759) 102,806
INCOME ON INVESTMENTS
Dividends - - - -
- - - -
Net appreciation/(diminution) in value of investment during the period (221,700) (323,196) (23,925) (13,899)
Net income/(loss) before taxation (221,700) (323,196) (23,925) (13,899)
Taxation - - - -
Net income/(loss) after taxation (221,700) (323,196) (23,925) (13,899)
VALUE OF FUND AS AT 30 JUNE 2016 1,021,804 2,627,239 138,809 372,424
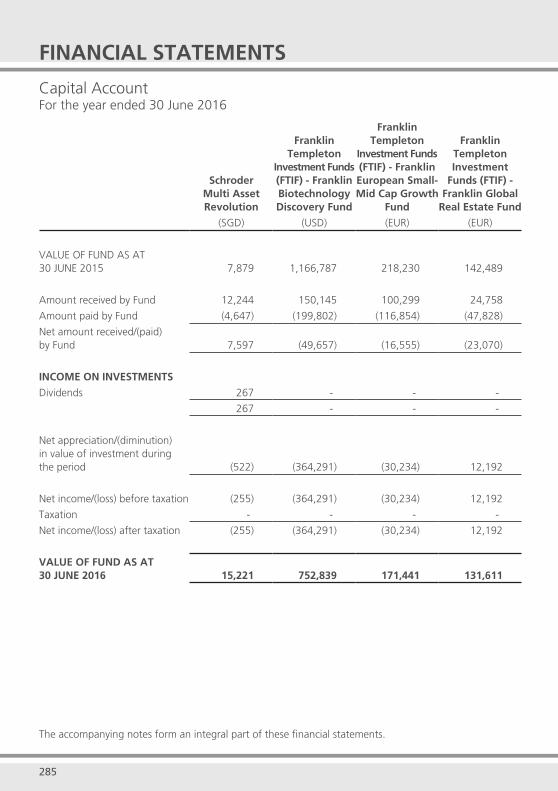
285 286
Capital AccountFor the year ended 30 June 2016
The accompanying notes form an integral part of these financial statements.
Schroder Multi Asset Revolution
Franklin Templeton
Investment Funds (FTIF) - Franklin Biotechnology Discovery Fund
Franklin Templeton
Investment Funds (FTIF) - Franklin European Small-Mid Cap Growth
Fund
Franklin Templeton Investment
Funds (FTIF) - Franklin Global
Real Estate Fund
(SGD) (USD) (EUR) (EUR)
VALUE OF FUND AS AT 30 JUNE 2015 7,879 1,166,787 218,230 142,489
Amount received by Fund 12,244 150,145 100,299 24,758
Amount paid by Fund (4,647) (199,802) (116,854) (47,828)
Net amount received/(paid) by Fund 7,597 (49,657) (16,555) (23,070)
INCOME ON INVESTMENTS
Dividends 267 - - -
267 - - -
Net appreciation/(diminution) in value of investment during the period (522) (364,291) (30,234) 12,192
Net income/(loss) before taxation (255) (364,291) (30,234) 12,192
Taxation - - - -
Net income/(loss) after taxation (255) (364,291) (30,234) 12,192
VALUE OF FUND AS AT 30 JUNE 2016 15,221 752,839 171,441 131,611
FINANCIAL STATEMENTS
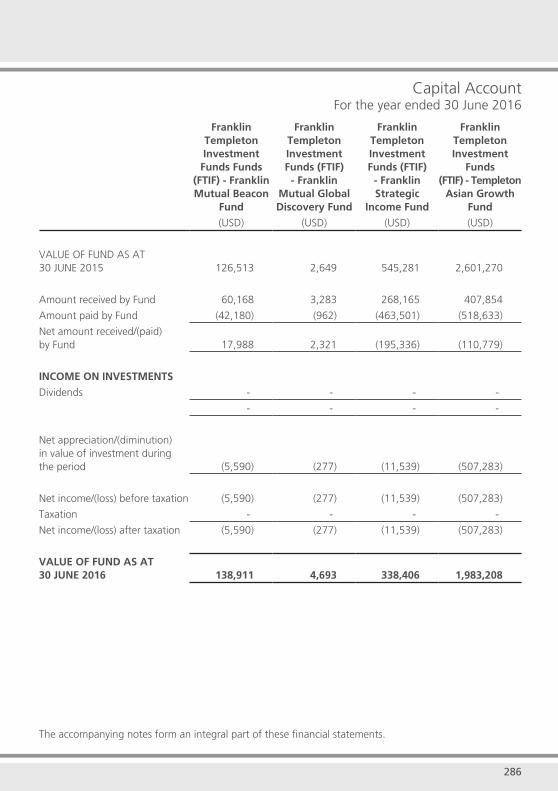
285 286
Capital AccountFor the year ended 30 June 2016
The accompanying notes form an integral part of these financial statements.
Franklin TempletonInvestment Funds Funds
(FTIF) - Franklin Mutual Beacon
Fund
Franklin Templeton Investment Funds (FTIF)
- Franklin Mutual Global Discovery Fund
Franklin Templeton Investment Funds (FTIF)
- Franklin Strategic
Income Fund
Franklin Templeton Investment
Funds(FTIF) - Templeton
Asian Growth Fund
(USD) (USD) (USD) (USD)
VALUE OF FUND AS AT 30 JUNE 2015 126,513 2,649 545,281 2,601,270
Amount received by Fund 60,168 3,283 268,165 407,854
Amount paid by Fund (42,180) (962) (463,501) (518,633)
Net amount received/(paid) by Fund 17,988 2,321 (195,336) (110,779)
INCOME ON INVESTMENTS
Dividends - - - -
- - - -
Net appreciation/(diminution) in value of investment during the period (5,590) (277) (11,539) (507,283)
Net income/(loss) before taxation (5,590) (277) (11,539) (507,283)
Taxation - - - -
Net income/(loss) after taxation (5,590) (277) (11,539) (507,283)
VALUE OF FUND AS AT 30 JUNE 2016 138,911 4,693 338,406 1,983,208
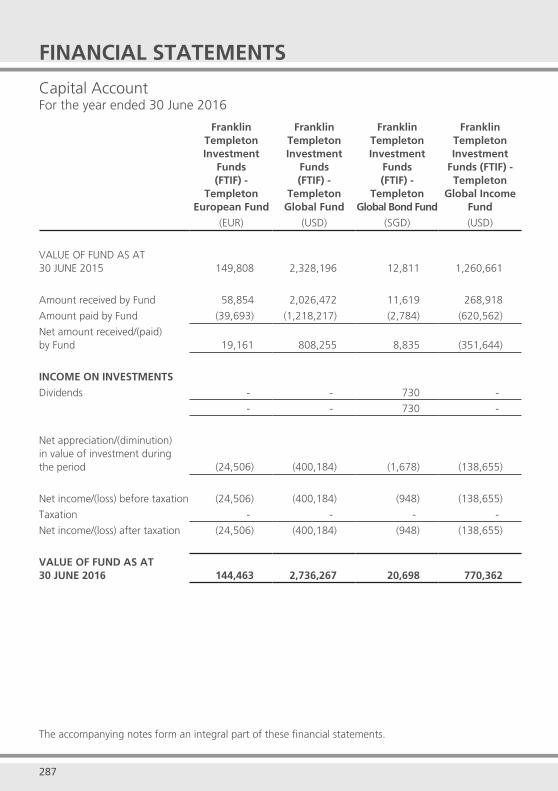
287 288
Capital AccountFor the year ended 30 June 2016
The accompanying notes form an integral part of these financial statements.
Franklin Templeton Investment
Funds(FTIF) -
Templeton European Fund
Franklin Templeton Investment
Funds(FTIF) -
Templeton Global Fund
Franklin TempletonInvestment
Funds (FTIF) -
TempletonGlobal Bond Fund
Franklin Templeton Investment
Funds (FTIF) - Templeton
Global Income Fund
(EUR) (USD) (SGD) (USD)
VALUE OF FUND AS AT 30 JUNE 2015 149,808 2,328,196 12,811 1,260,661
Amount received by Fund 58,854 2,026,472 11,619 268,918
Amount paid by Fund (39,693) (1,218,217) (2,784) (620,562)
Net amount received/(paid) by Fund 19,161 808,255 8,835 (351,644)
INCOME ON INVESTMENTS
Dividends - - 730 -
- - 730 -
Net appreciation/(diminution) in value of investment during the period (24,506) (400,184) (1,678) (138,655)
Net income/(loss) before taxation (24,506) (400,184) (948) (138,655)
Taxation - - - -
Net income/(loss) after taxation (24,506) (400,184) (948) (138,655)
VALUE OF FUND AS AT 30 JUNE 2016 144,463 2,736,267 20,698 770,362
FINANCIAL STATEMENTS
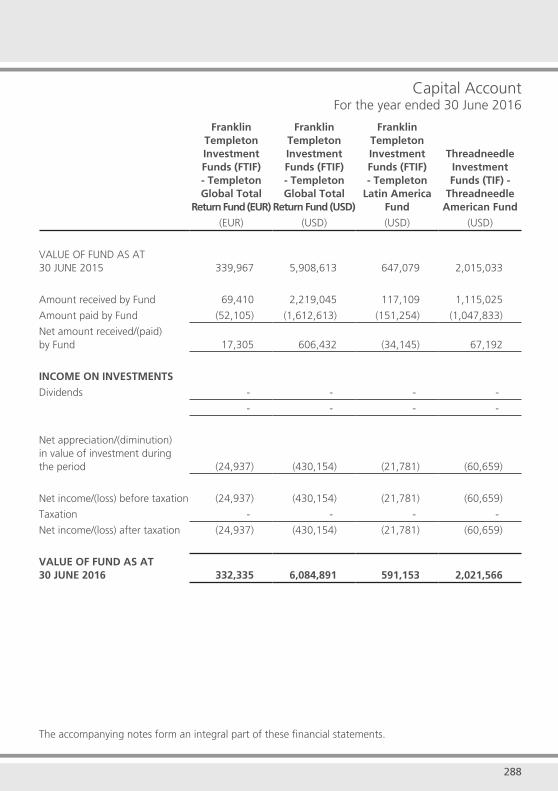
287 288
Capital AccountFor the year ended 30 June 2016
The accompanying notes form an integral part of these financial statements.
Franklin Templeton Investment Funds (FTIF) - Templeton Global Total
Return Fund (EUR)
Franklin Templeton Investment Funds (FTIF) - Templeton Global Total
Return Fund (USD)
Franklin Templeton Investment Funds (FTIF) - Templeton
Latin America Fund
Threadneedle Investment Funds (TIF) -
Threadneedle American Fund
(EUR) (USD) (USD) (USD)
VALUE OF FUND AS AT 30 JUNE 2015 339,967 5,908,613 647,079 2,015,033
Amount received by Fund 69,410 2,219,045 117,109 1,115,025
Amount paid by Fund (52,105) (1,612,613) (151,254) (1,047,833)
Net amount received/(paid) by Fund 17,305 606,432 (34,145) 67,192
INCOME ON INVESTMENTS
Dividends - - - -
- - - -
Net appreciation/(diminution) in value of investment during the period (24,937) (430,154) (21,781) (60,659)
Net income/(loss) before taxation (24,937) (430,154) (21,781) (60,659)
Taxation - - - -
Net income/(loss) after taxation (24,937) (430,154) (21,781) (60,659)
VALUE OF FUND AS AT 30 JUNE 2016 332,335 6,084,891 591,153 2,021,566
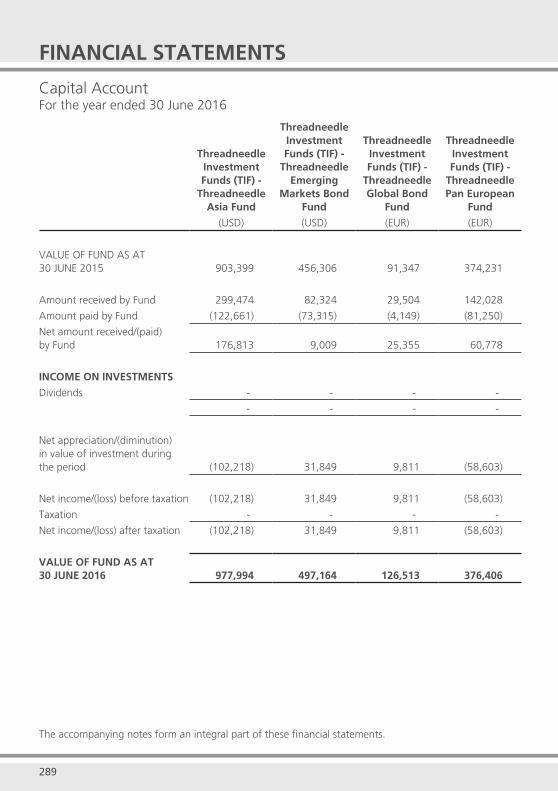
289 290
Capital AccountFor the year ended 30 June 2016
The accompanying notes form an integral part of these financial statements.
Threadneedle Investment Funds (TIF) -
Threadneedle Asia Fund
Threadneedle Investment Funds (TIF) -
Threadneedle Emerging
Markets Bond Fund
Threadneedle Investment Funds (TIF) -
Threadneedle Global Bond
Fund
Threadneedle Investment Funds (TIF) -
Threadneedle Pan European
Fund
(USD) (USD) (EUR) (EUR)
VALUE OF FUND AS AT 30 JUNE 2015 903,399 456,306 91,347 374,231
Amount received by Fund 299,474 82,324 29,504 142,028
Amount paid by Fund (122,661) (73,315) (4,149) (81,250)
Net amount received/(paid) by Fund 176,813 9,009 25,355 60,778
INCOME ON INVESTMENTS
Dividends - - - -
- - - -
Net appreciation/(diminution) in value of investment during the period (102,218) 31,849 9,811 (58,603)
Net income/(loss) before taxation (102,218) 31,849 9,811 (58,603)
Taxation - - - -
Net income/(loss) after taxation (102,218) 31,849 9,811 (58,603)
VALUE OF FUND AS AT 30 JUNE 2016 977,994 497,164 126,513 376,406
FINANCIAL STATEMENTS

289 290
Capital AccountFor the year ended 30 June 2016
The accompanying notes form an integral part of these financial statements.
Threadneedle Specialist
Investment Funds (TSIF) - Threadneedle Target Return
Fund
GrowthPath Portfolios - GrowthPath
Today
GrowthPath Portfolios - GrowthPath
2020
GrowthPath Portfolios - GrowthPath
2030
(EUR) (SGD) (SGD) (SGD)
VALUE OF FUND AS AT 30 JUNE 2015 34,812 518,692 438,224 282,046
Amount received by Fund 2,492 84,515 36,729 25,722
Amount paid by Fund (11,041) (24,032) (286,262) (51,853)
Net amount received/(paid) by Fund (8,549) 60,483 (249,533) (26,131)
INCOME ON INVESTMENTS
Dividends - - - -
- - - -
Net appreciation/(diminution) in value of investment during the period (3,431) 5,237 625 (11,828)
Net income/(loss) before taxation (3,431) 5,237 625 (11,828)
Taxation - - - -
Net income/(loss) after taxation (3,431) 5,237 625 (11,828)
VALUE OF FUND AS AT 30 JUNE 2016 22,832 584,412 189,316 244,087
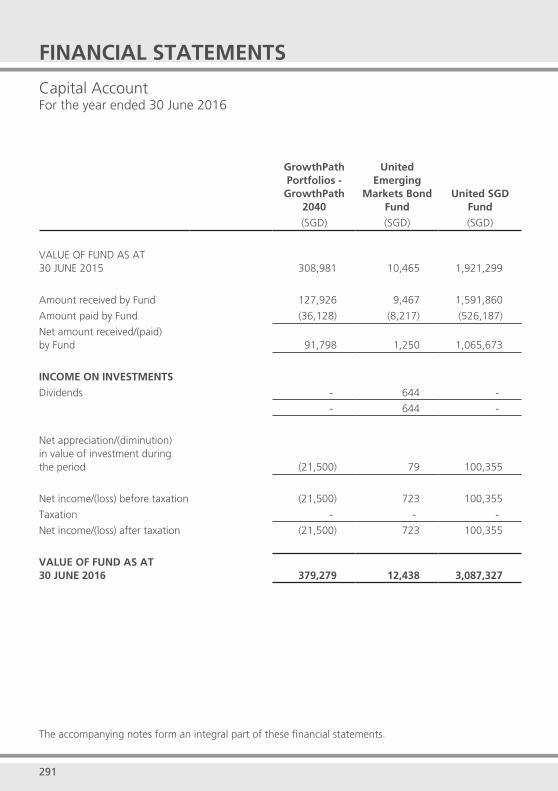
291
Capital AccountFor the year ended 30 June 2016
The accompanying notes form an integral part of these financial statements.
GrowthPath Portfolios - GrowthPath
2040
United Emerging
Markets Bond Fund
United SGD Fund
(SGD) (SGD) (SGD)
VALUE OF FUND AS AT 30 JUNE 2015 308,981 10,465 1,921,299
Amount received by Fund 127,926 9,467 1,591,860
Amount paid by Fund (36,128) (8,217) (526,187)
Net amount received/(paid) by Fund 91,798 1,250 1,065,673
INCOME ON INVESTMENTS
Dividends - 644 -
- 644 -
Net appreciation/(diminution) in value of investment during the period (21,500) 79 100,355
Net income/(loss) before taxation (21,500) 723 100,355
Taxation - - -
Net income/(loss) after taxation (21,500) 723 100,355
VALUE OF FUND AS AT 30 JUNE 2016 379,279 12,438 3,087,327
FINANCIAL STATEMENTS
292
291
This page has been intentionally left blank.
292
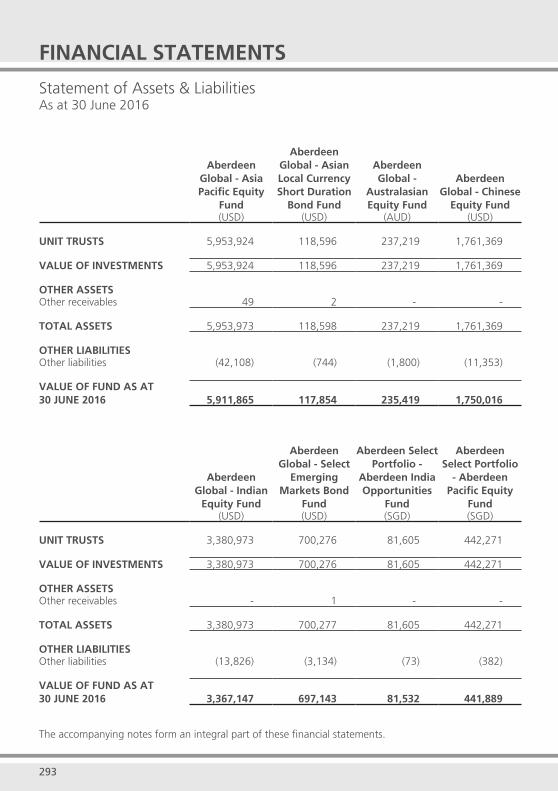
293 294
Statement of Assets & LiabilitiesAs at 30 June 2016
The accompanying notes form an integral part of these financial statements.
FINANCIAL STATEMENTS
Aberdeen Global - Asia Pacific Equity
Fund
Aberdeen Global - Asian Local Currency Short Duration
Bond Fund
Aberdeen Global -
Australasian Equity Fund
Aberdeen Global - Chinese
Equity Fund(USD) (USD) (AUD) (USD)
UNIT TRUSTS 5,953,924 118,596 237,219 1,761,369
VALUE OF INVESTMENTS 5,953,924 118,596 237,219 1,761,369
OTHER ASSETSOther receivables 49 2 - -
TOTAL ASSETS 5,953,973 118,598 237,219 1,761,369
OTHER LIABILITIESOther liabilities (42,108) (744) (1,800) (11,353)
VALUE OF FUND AS AT 30 JUNE 2016 5,911,865 117,854 235,419 1,750,016
Aberdeen Global - Indian
Equity Fund
Aberdeen Global - Select
Emerging Markets Bond
Fund
Aberdeen Select Portfolio -
Aberdeen India Opportunities
Fund
Aberdeen Select Portfolio
- Aberdeen Pacific Equity
Fund(USD) (USD) (SGD) (SGD)
UNIT TRUSTS 3,380,973 700,276 81,605 442,271
VALUE OF INVESTMENTS 3,380,973 700,276 81,605 442,271
OTHER ASSETSOther receivables - 1 - -
TOTAL ASSETS 3,380,973 700,277 81,605 442,271
OTHER LIABILITIESOther liabilities (13,826) (3,134) (73) (382)
VALUE OF FUND AS AT 30 JUNE 2016 3,367,147 697,143 81,532 441,889
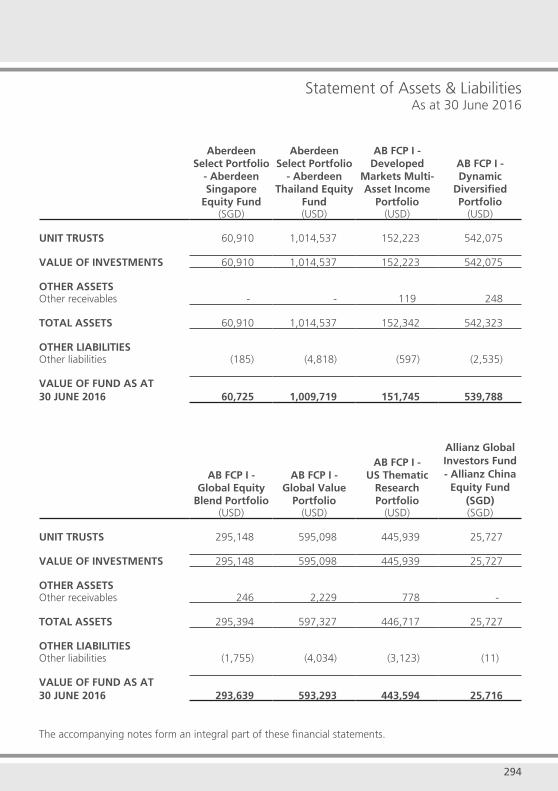
293 294
Statement of Assets & LiabilitiesAs at 30 June 2016
The accompanying notes form an integral part of these financial statements.
Aberdeen Select Portfolio
- Aberdeen Singapore
Equity Fund
Aberdeen Select Portfolio
- Aberdeen Thailand Equity
Fund
AB FCP I - Developed
Markets Multi-Asset Income
Portfolio
AB FCP I - Dynamic
Diversified Portfolio
(SGD) (USD) (USD) (USD)
UNIT TRUSTS 60,910 1,014,537 152,223 542,075
VALUE OF INVESTMENTS 60,910 1,014,537 152,223 542,075
OTHER ASSETSOther receivables - - 119 248
TOTAL ASSETS 60,910 1,014,537 152,342 542,323
OTHER LIABILITIESOther liabilities (185) (4,818) (597) (2,535)
VALUE OF FUND AS AT 30 JUNE 2016 60,725 1,009,719 151,745 539,788
AB FCP I - Global Equity
Blend Portfolio
AB FCP I - Global Value
Portfolio
AB FCP I - US Thematic
Research Portfolio
Allianz Global Investors Fund - Allianz China
Equity Fund (SGD)
(USD) (USD) (USD) (SGD)
UNIT TRUSTS 295,148 595,098 445,939 25,727
VALUE OF INVESTMENTS 295,148 595,098 445,939 25,727
OTHER ASSETSOther receivables 246 2,229 778 -
TOTAL ASSETS 295,394 597,327 446,717 25,727
OTHER LIABILITIESOther liabilities (1,755) (4,034) (3,123) (11)
VALUE OF FUND AS AT 30 JUNE 2016 293,639 593,293 443,594 25,716
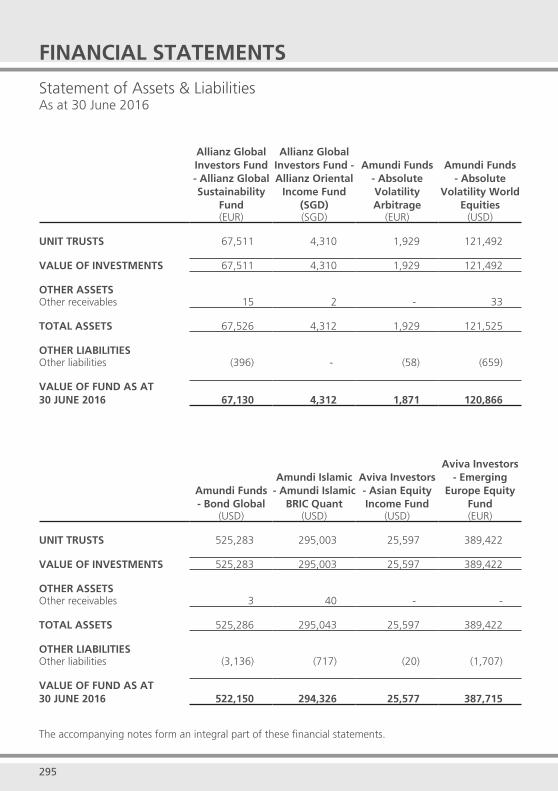
295 296
Statement of Assets & LiabilitiesAs at 30 June 2016
The accompanying notes form an integral part of these financial statements.
FINANCIAL STATEMENTS
Allianz Global Investors Fund - Allianz Global Sustainability
Fund
Allianz Global Investors Fund - Allianz Oriental
Income Fund (SGD)
Amundi Funds - Absolute Volatility Arbitrage
Amundi Funds - Absolute
Volatility World Equities
(EUR) (SGD) (EUR) (USD)
UNIT TRUSTS 67,511 4,310 1,929 121,492
VALUE OF INVESTMENTS 67,511 4,310 1,929 121,492
OTHER ASSETSOther receivables 15 2 - 33
TOTAL ASSETS 67,526 4,312 1,929 121,525
OTHER LIABILITIESOther liabilities (396) - (58) (659)
VALUE OF FUND AS AT 30 JUNE 2016 67,130 4,312 1,871 120,866
Amundi Funds - Bond Global
Amundi Islamic - Amundi Islamic
BRIC Quant
Aviva Investors - Asian Equity Income Fund
Aviva Investors - Emerging
Europe Equity Fund
(USD) (USD) (USD) (EUR)
UNIT TRUSTS 525,283 295,003 25,597 389,422
VALUE OF INVESTMENTS 525,283 295,003 25,597 389,422
OTHER ASSETSOther receivables 3 40 - -
TOTAL ASSETS 525,286 295,043 25,597 389,422
OTHER LIABILITIESOther liabilities (3,136) (717) (20) (1,707)
VALUE OF FUND AS AT 30 JUNE 2016 522,150 294,326 25,577 387,715
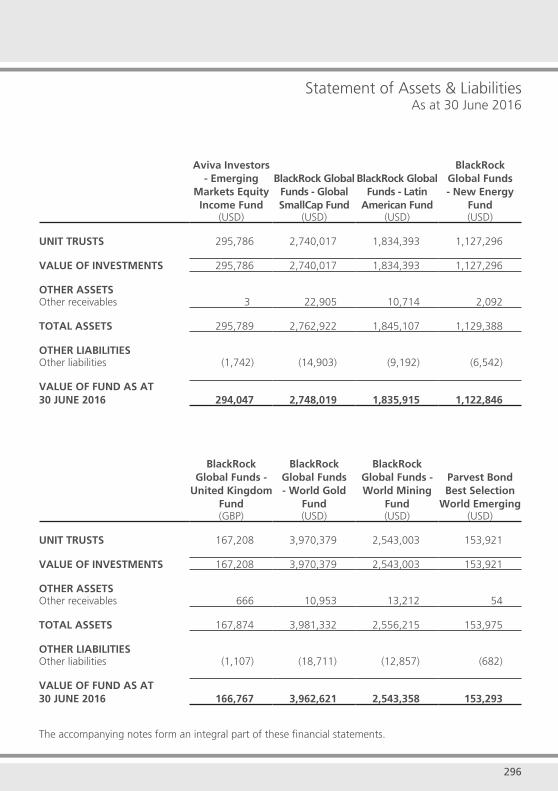
295 296
Statement of Assets & LiabilitiesAs at 30 June 2016
The accompanying notes form an integral part of these financial statements.
Aviva Investors - Emerging
Markets Equity Income Fund
BlackRock Global Funds - Global SmallCap Fund
BlackRock Global Funds - Latin
American Fund
BlackRock Global Funds - New Energy
Fund(USD) (USD) (USD) (USD)
UNIT TRUSTS 295,786 2,740,017 1,834,393 1,127,296
VALUE OF INVESTMENTS 295,786 2,740,017 1,834,393 1,127,296
OTHER ASSETSOther receivables 3 22,905 10,714 2,092
TOTAL ASSETS 295,789 2,762,922 1,845,107 1,129,388
OTHER LIABILITIESOther liabilities (1,742) (14,903) (9,192) (6,542)
VALUE OF FUND AS AT 30 JUNE 2016 294,047 2,748,019 1,835,915 1,122,846
BlackRock Global Funds -
United Kingdom Fund
BlackRock Global Funds - World Gold
Fund
BlackRock Global Funds - World Mining
Fund
Parvest Bond Best Selection
World Emerging(GBP) (USD) (USD) (USD)
UNIT TRUSTS 167,208 3,970,379 2,543,003 153,921
VALUE OF INVESTMENTS 167,208 3,970,379 2,543,003 153,921
OTHER ASSETSOther receivables 666 10,953 13,212 54
TOTAL ASSETS 167,874 3,981,332 2,556,215 153,975
OTHER LIABILITIESOther liabilities (1,107) (18,711) (12,857) (682)
VALUE OF FUND AS AT 30 JUNE 2016 166,767 3,962,621 2,543,358 153,293
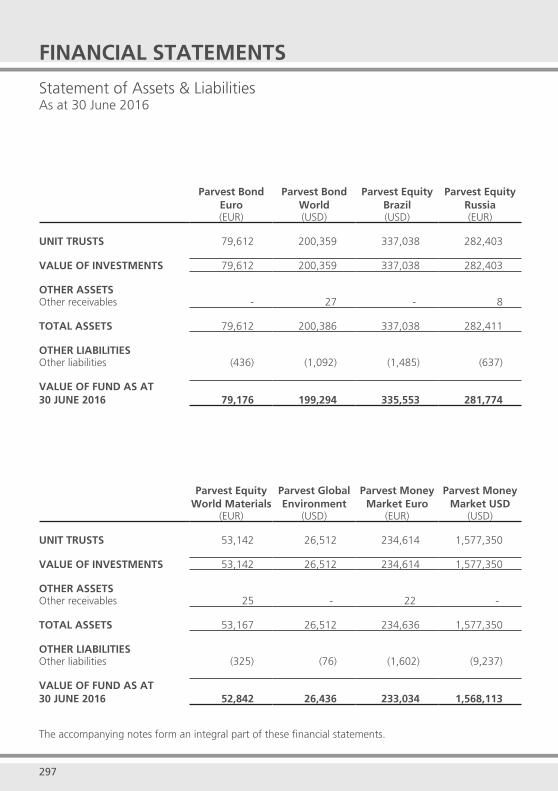
297 298
Statement of Assets & LiabilitiesAs at 30 June 2016
The accompanying notes form an integral part of these financial statements.
FINANCIAL STATEMENTS
Parvest Bond Euro
Parvest Bond World
Parvest Equity Brazil
Parvest Equity Russia
(EUR) (USD) (USD) (EUR)
UNIT TRUSTS 79,612 200,359 337,038 282,403
VALUE OF INVESTMENTS 79,612 200,359 337,038 282,403
OTHER ASSETSOther receivables - 27 - 8
TOTAL ASSETS 79,612 200,386 337,038 282,411
OTHER LIABILITIESOther liabilities (436) (1,092) (1,485) (637)
VALUE OF FUND AS AT 30 JUNE 2016 79,176 199,294 335,553 281,774
Parvest Equity World Materials
Parvest Global Environment
Parvest Money Market Euro
Parvest Money Market USD
(EUR) (USD) (EUR) (USD)
UNIT TRUSTS 53,142 26,512 234,614 1,577,350
VALUE OF INVESTMENTS 53,142 26,512 234,614 1,577,350
OTHER ASSETSOther receivables 25 - 22 -
TOTAL ASSETS 53,167 26,512 234,636 1,577,350
OTHER LIABILITIESOther liabilities (325) (76) (1,602) (9,237)
VALUE OF FUND AS AT 30 JUNE 2016 52,842 26,436 233,034 1,568,113
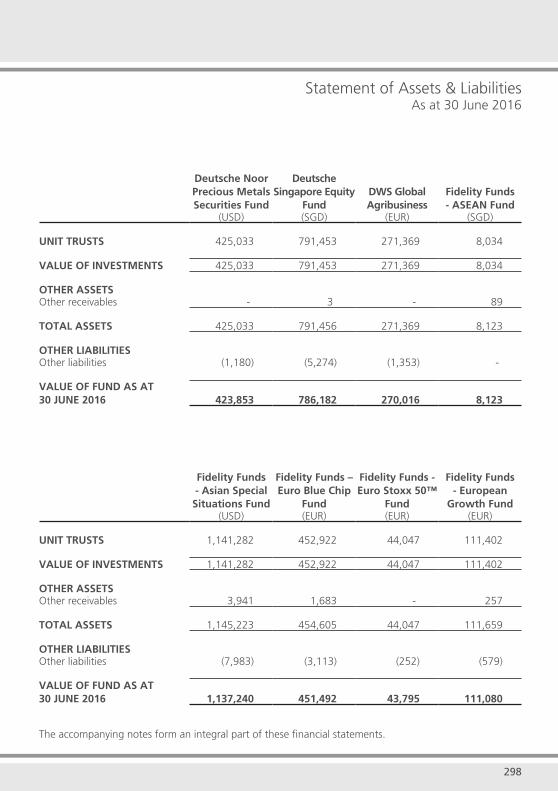
297 298
Statement of Assets & LiabilitiesAs at 30 June 2016
The accompanying notes form an integral part of these financial statements.
Deutsche Noor Precious Metals Securities Fund
Deutsche Singapore Equity
FundDWS Global Agribusiness
Fidelity Funds - ASEAN Fund
(USD) (SGD) (EUR) (SGD)
UNIT TRUSTS 425,033 791,453 271,369 8,034
VALUE OF INVESTMENTS 425,033 791,453 271,369 8,034
OTHER ASSETSOther receivables - 3 - 89
TOTAL ASSETS 425,033 791,456 271,369 8,123
OTHER LIABILITIESOther liabilities (1,180) (5,274) (1,353) -
VALUE OF FUND AS AT 30 JUNE 2016 423,853 786,182 270,016 8,123
Fidelity Funds - Asian Special Situations Fund
Fidelity Funds – Euro Blue Chip
Fund
Fidelity Funds - Euro Stoxx 50™
Fund
Fidelity Funds - European
Growth Fund(USD) (EUR) (EUR) (EUR)
UNIT TRUSTS 1,141,282 452,922 44,047 111,402
VALUE OF INVESTMENTS 1,141,282 452,922 44,047 111,402
OTHER ASSETSOther receivables 3,941 1,683 - 257
TOTAL ASSETS 1,145,223 454,605 44,047 111,659
OTHER LIABILITIESOther liabilities (7,983) (3,113) (252) (579)
VALUE OF FUND AS AT 30 JUNE 2016 1,137,240 451,492 43,795 111,080
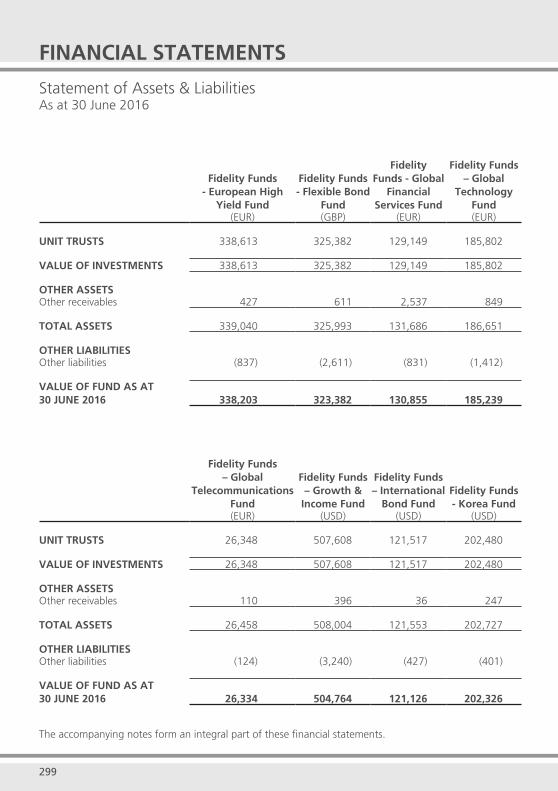
299 300
Statement of Assets & LiabilitiesAs at 30 June 2016
The accompanying notes form an integral part of these financial statements.
FINANCIAL STATEMENTS
Fidelity Funds - European High
Yield Fund
Fidelity Funds - Flexible Bond
Fund
Fidelity Funds - Global
Financial Services Fund
Fidelity Funds – Global
Technology Fund
(EUR) (GBP) (EUR) (EUR)
UNIT TRUSTS 338,613 325,382 129,149 185,802
VALUE OF INVESTMENTS 338,613 325,382 129,149 185,802
OTHER ASSETSOther receivables 427 611 2,537 849
TOTAL ASSETS 339,040 325,993 131,686 186,651
OTHER LIABILITIESOther liabilities (837) (2,611) (831) (1,412)
VALUE OF FUND AS AT 30 JUNE 2016 338,203 323,382 130,855 185,239
Fidelity Funds – Global
Telecommunications Fund
Fidelity Funds – Growth &
Income Fund
Fidelity Funds – International
Bond FundFidelity Funds - Korea Fund
(EUR) (USD) (USD) (USD)
UNIT TRUSTS 26,348 507,608 121,517 202,480
VALUE OF INVESTMENTS 26,348 507,608 121,517 202,480
OTHER ASSETSOther receivables 110 396 36 247
TOTAL ASSETS 26,458 508,004 121,553 202,727
OTHER LIABILITIESOther liabilities (124) (3,240) (427) (401)
VALUE OF FUND AS AT 30 JUNE 2016 26,334 504,764 121,126 202,326
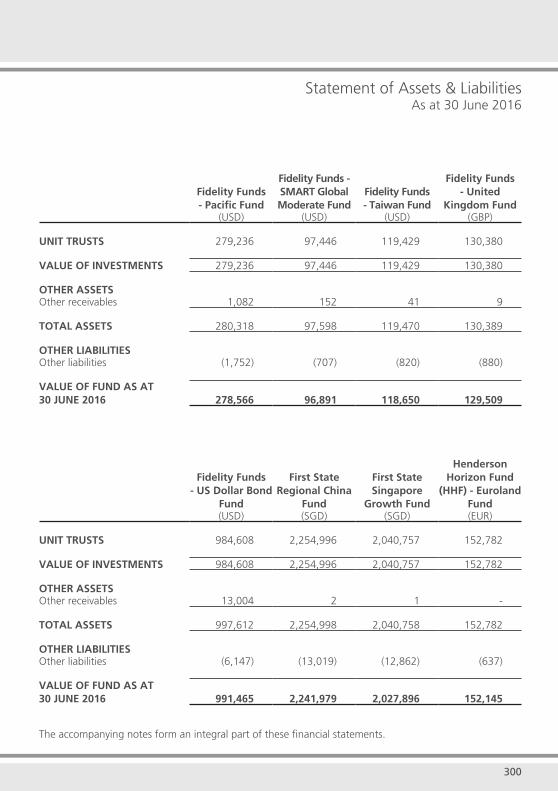
299 300
Statement of Assets & LiabilitiesAs at 30 June 2016
The accompanying notes form an integral part of these financial statements.
Fidelity Funds - Pacific Fund
Fidelity Funds - SMART Global Moderate Fund
Fidelity Funds - Taiwan Fund
Fidelity Funds - United
Kingdom Fund(USD) (USD) (USD) (GBP)
UNIT TRUSTS 279,236 97,446 119,429 130,380
VALUE OF INVESTMENTS 279,236 97,446 119,429 130,380
OTHER ASSETSOther receivables 1,082 152 41 9
TOTAL ASSETS 280,318 97,598 119,470 130,389
OTHER LIABILITIESOther liabilities (1,752) (707) (820) (880)
VALUE OF FUND AS AT 30 JUNE 2016 278,566 96,891 118,650 129,509
Fidelity Funds- US Dollar Bond
Fund
First State Regional China
Fund
First State Singapore
Growth Fund
Henderson Horizon Fund
(HHF) - Euroland Fund
(USD) (SGD) (SGD) (EUR)
UNIT TRUSTS 984,608 2,254,996 2,040,757 152,782
VALUE OF INVESTMENTS 984,608 2,254,996 2,040,757 152,782
OTHER ASSETSOther receivables 13,004 2 1 -
TOTAL ASSETS 997,612 2,254,998 2,040,758 152,782
OTHER LIABILITIESOther liabilities (6,147) (13,019) (12,862) (637)
VALUE OF FUND AS AT 30 JUNE 2016 991,465 2,241,979 2,027,896 152,145
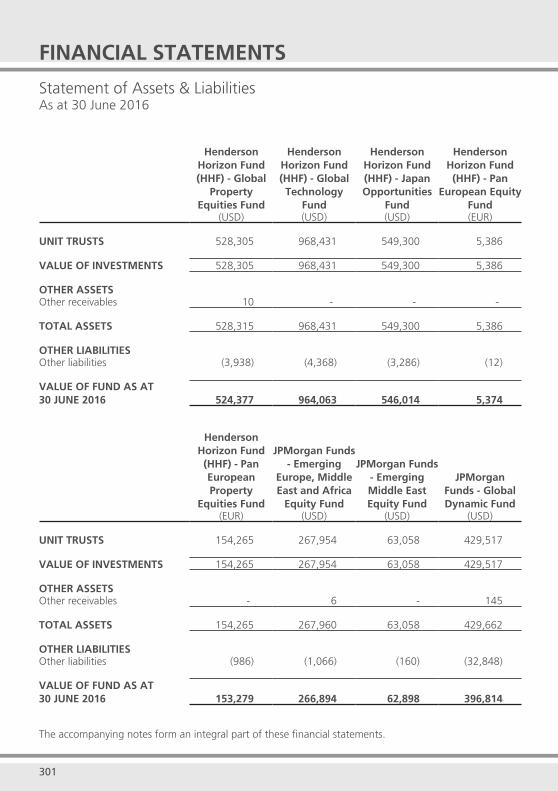
301 302
Statement of Assets & LiabilitiesAs at 30 June 2016
The accompanying notes form an integral part of these financial statements.
FINANCIAL STATEMENTS
Henderson Horizon Fund (HHF) - Global
Property Equities Fund
Henderson Horizon Fund (HHF) - Global Technology
Fund
Henderson Horizon Fund (HHF) - Japan Opportunities
Fund
Henderson Horizon Fund (HHF) - Pan
European Equity Fund
(USD) (USD) (USD) (EUR)
UNIT TRUSTS 528,305 968,431 549,300 5,386
VALUE OF INVESTMENTS 528,305 968,431 549,300 5,386
OTHER ASSETSOther receivables 10 - - -
TOTAL ASSETS 528,315 968,431 549,300 5,386
OTHER LIABILITIESOther liabilities (3,938) (4,368) (3,286) (12)
VALUE OF FUND AS AT 30 JUNE 2016 524,377 964,063 546,014 5,374
Henderson Horizon Fund (HHF) - Pan European Property
Equities Fund
JPMorgan Funds - Emerging
Europe, Middle East and Africa
Equity Fund
JPMorgan Funds - Emerging Middle East Equity Fund
JPMorgan Funds - Global Dynamic Fund
(EUR) (USD) (USD) (USD)
UNIT TRUSTS 154,265 267,954 63,058 429,517
VALUE OF INVESTMENTS 154,265 267,954 63,058 429,517
OTHER ASSETSOther receivables - 6 - 145
TOTAL ASSETS 154,265 267,960 63,058 429,662
OTHER LIABILITIESOther liabilities (986) (1,066) (160) (32,848)
VALUE OF FUND AS AT 30 JUNE 2016 153,279 266,894 62,898 396,814
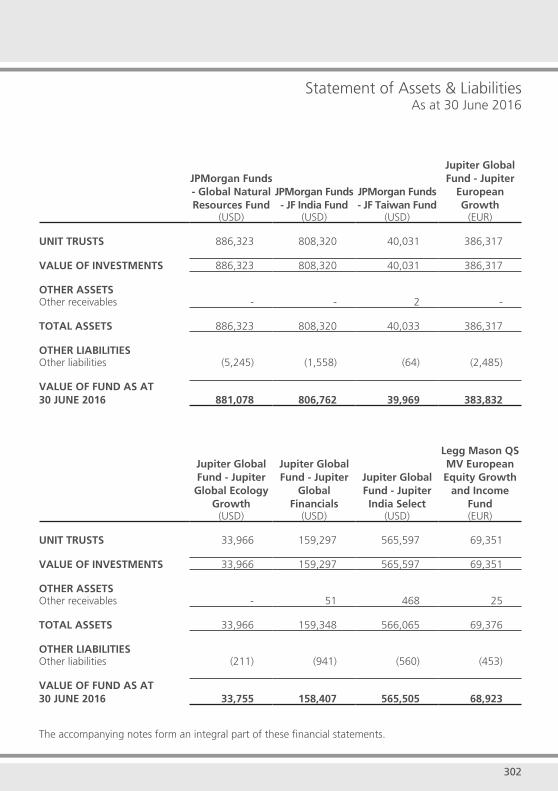
301 302
Statement of Assets & LiabilitiesAs at 30 June 2016
The accompanying notes form an integral part of these financial statements.
JPMorgan Funds - Global Natural Resources Fund
JPMorgan Funds - JF India Fund
JPMorgan Funds - JF Taiwan Fund
Jupiter Global Fund - Jupiter
European Growth
(USD) (USD) (USD) (EUR)
UNIT TRUSTS 886,323 808,320 40,031 386,317
VALUE OF INVESTMENTS 886,323 808,320 40,031 386,317
OTHER ASSETSOther receivables - - 2 -
TOTAL ASSETS 886,323 808,320 40,033 386,317
OTHER LIABILITIESOther liabilities (5,245) (1,558) (64) (2,485)
VALUE OF FUND AS AT 30 JUNE 2016 881,078 806,762 39,969 383,832
Jupiter Global Fund - Jupiter Global Ecology
Growth
Jupiter Global Fund - Jupiter
Global Financials
Jupiter Global Fund - Jupiter India Select
Legg Mason QS MV European Equity Growth
and Income Fund
(USD) (USD) (USD) (EUR)
UNIT TRUSTS 33,966 159,297 565,597 69,351
VALUE OF INVESTMENTS 33,966 159,297 565,597 69,351
OTHER ASSETSOther receivables - 51 468 25
TOTAL ASSETS 33,966 159,348 566,065 69,376
OTHER LIABILITIESOther liabilities (211) (941) (560) (453)
VALUE OF FUND AS AT 30 JUNE 2016 33,755 158,407 565,505 68,923
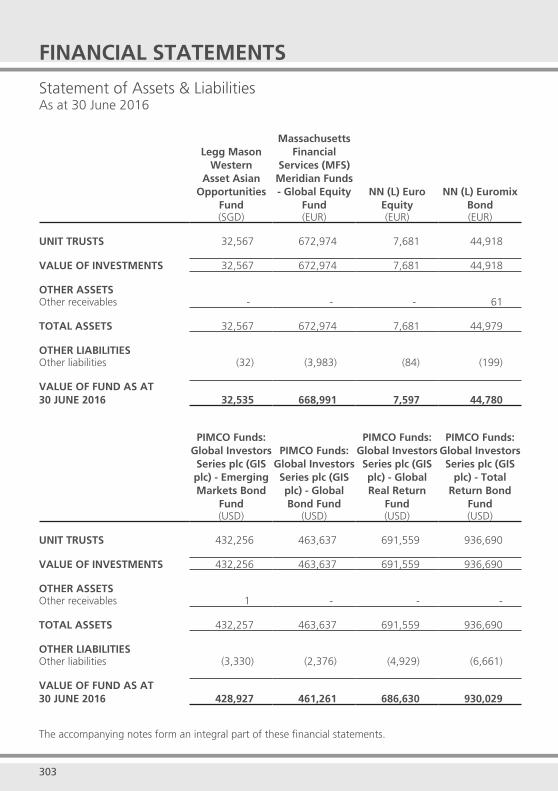
303 304
Statement of Assets & LiabilitiesAs at 30 June 2016
The accompanying notes form an integral part of these financial statements.
FINANCIAL STATEMENTS
Legg Mason Western
Asset Asian Opportunities
Fund
Massachusetts Financial
Services (MFS) Meridian Funds - Global Equity
FundNN (L) Euro
EquityNN (L) Euromix
Bond(SGD) (EUR) (EUR) (EUR)
UNIT TRUSTS 32,567 672,974 7,681 44,918
VALUE OF INVESTMENTS 32,567 672,974 7,681 44,918
OTHER ASSETSOther receivables - - - 61
TOTAL ASSETS 32,567 672,974 7,681 44,979
OTHER LIABILITIESOther liabilities (32) (3,983) (84) (199)
VALUE OF FUND AS AT 30 JUNE 2016 32,535 668,991 7,597 44,780
PIMCO Funds: Global Investors Series plc (GIS plc) - Emerging Markets Bond
Fund
PIMCO Funds: Global Investors Series plc (GIS plc) - Global Bond Fund
PIMCO Funds: Global Investors Series plc (GIS plc) - Global Real Return
Fund
PIMCO Funds: Global Investors Series plc (GIS
plc) - Total Return Bond
Fund(USD) (USD) (USD) (USD)
UNIT TRUSTS 432,256 463,637 691,559 936,690
VALUE OF INVESTMENTS 432,256 463,637 691,559 936,690
OTHER ASSETSOther receivables 1 - - -
TOTAL ASSETS 432,257 463,637 691,559 936,690
OTHER LIABILITIESOther liabilities (3,330) (2,376) (4,929) (6,661)
VALUE OF FUND AS AT 30 JUNE 2016 428,927 461,261 686,630 930,029
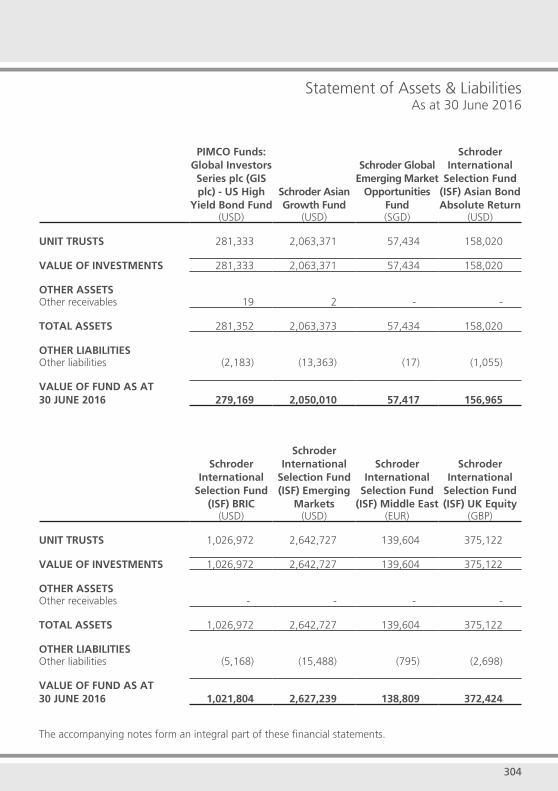
303 304
Statement of Assets & LiabilitiesAs at 30 June 2016
The accompanying notes form an integral part of these financial statements.
PIMCO Funds: Global Investors Series plc (GIS plc) - US High
Yield Bond FundSchroder Asian Growth Fund
Schroder Global Emerging Market
Opportunities Fund
Schroder International
Selection Fund (ISF) Asian Bond Absolute Return
(USD) (USD) (SGD) (USD)
UNIT TRUSTS 281,333 2,063,371 57,434 158,020
VALUE OF INVESTMENTS 281,333 2,063,371 57,434 158,020
OTHER ASSETSOther receivables 19 2 - -
TOTAL ASSETS 281,352 2,063,373 57,434 158,020
OTHER LIABILITIESOther liabilities (2,183) (13,363) (17) (1,055)
VALUE OF FUND AS AT 30 JUNE 2016 279,169 2,050,010 57,417 156,965
Schroder International
Selection Fund (ISF) BRIC
Schroder International
Selection Fund (ISF) Emerging
Markets
Schroder International
Selection Fund (ISF) Middle East
Schroder International
Selection Fund (ISF) UK Equity
(USD) (USD) (EUR) (GBP)
UNIT TRUSTS 1,026,972 2,642,727 139,604 375,122
VALUE OF INVESTMENTS 1,026,972 2,642,727 139,604 375,122
OTHER ASSETSOther receivables - - - -
TOTAL ASSETS 1,026,972 2,642,727 139,604 375,122
OTHER LIABILITIESOther liabilities (5,168) (15,488) (795) (2,698)
VALUE OF FUND AS AT 30 JUNE 2016 1,021,804 2,627,239 138,809 372,424
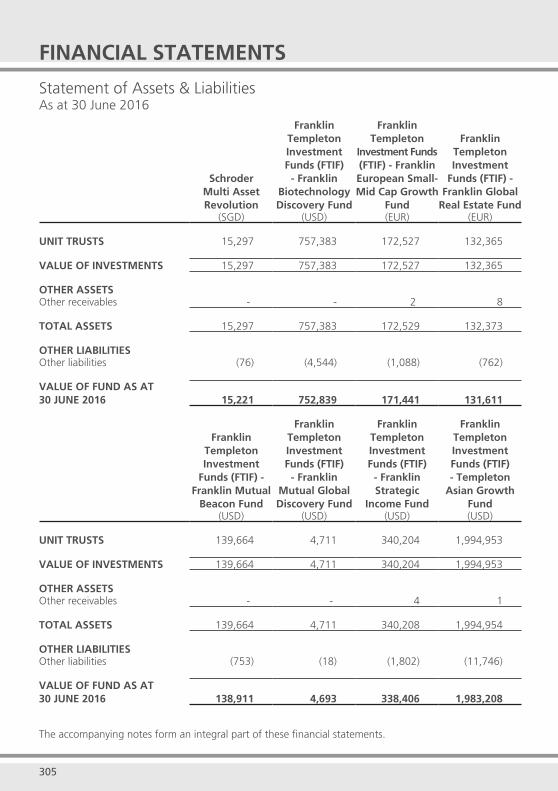
305 306
Statement of Assets & LiabilitiesAs at 30 June 2016
The accompanying notes form an integral part of these financial statements.
FINANCIAL STATEMENTS
Schroder Multi Asset Revolution
Franklin Templeton Investment Funds (FTIF)
- Franklin Biotechnology Discovery Fund
Franklin Templeton
Investment Funds (FTIF) - Franklin European Small-Mid Cap Growth
Fund
Franklin Templeton Investment
Funds (FTIF) - Franklin Global
Real Estate Fund(SGD) (USD) (EUR) (EUR)
UNIT TRUSTS 15,297 757,383 172,527 132,365
VALUE OF INVESTMENTS 15,297 757,383 172,527 132,365
OTHER ASSETSOther receivables - - 2 8
TOTAL ASSETS 15,297 757,383 172,529 132,373
OTHER LIABILITIESOther liabilities (76) (4,544) (1,088) (762)
VALUE OF FUND AS AT 30 JUNE 2016 15,221 752,839 171,441 131,611
Franklin Templeton Investment
Funds (FTIF) - Franklin Mutual
Beacon Fund
Franklin Templeton Investment Funds (FTIF)
- Franklin Mutual Global Discovery Fund
Franklin Templeton Investment Funds (FTIF)
- Franklin Strategic
Income Fund
Franklin Templeton Investment Funds (FTIF) - Templeton
Asian Growth Fund
(USD) (USD) (USD) (USD)
UNIT TRUSTS 139,664 4,711 340,204 1,994,953
VALUE OF INVESTMENTS 139,664 4,711 340,204 1,994,953
OTHER ASSETSOther receivables - - 4 1
TOTAL ASSETS 139,664 4,711 340,208 1,994,954
OTHER LIABILITIESOther liabilities (753) (18) (1,802) (11,746)
VALUE OF FUND AS AT 30 JUNE 2016 138,911 4,693 338,406 1,983,208
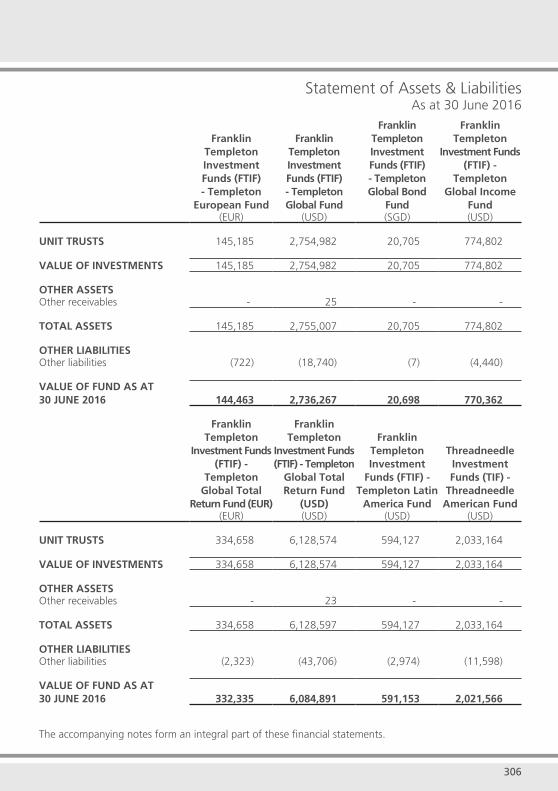
305 306
Statement of Assets & LiabilitiesAs at 30 June 2016
The accompanying notes form an integral part of these financial statements.
Franklin Templeton Investment Funds (FTIF) - Templeton
European Fund
Franklin Templeton Investment Funds (FTIF) - Templeton Global Fund
Franklin Templeton Investment Funds (FTIF) - Templeton Global Bond
Fund
Franklin Templeton
Investment Funds (FTIF) -
Templeton Global Income
Fund(EUR) (USD) (SGD) (USD)
UNIT TRUSTS 145,185 2,754,982 20,705 774,802
VALUE OF INVESTMENTS 145,185 2,754,982 20,705 774,802
OTHER ASSETSOther receivables - 25 - -
TOTAL ASSETS 145,185 2,755,007 20,705 774,802
OTHER LIABILITIESOther liabilities (722) (18,740) (7) (4,440)
VALUE OF FUND AS AT 30 JUNE 2016 144,463 2,736,267 20,698 770,362
Franklin Templeton
Investment Funds (FTIF) -
Templeton Global Total
Return Fund (EUR)
Franklin Templeton
Investment Funds (FTIF) - Templeton
Global Total Return Fund
(USD)
Franklin Templeton Investment
Funds (FTIF) - Templeton Latin
America Fund
Threadneedle Investment Funds (TIF) -
Threadneedle American Fund
(EUR) (USD) (USD) (USD)
UNIT TRUSTS 334,658 6,128,574 594,127 2,033,164
VALUE OF INVESTMENTS 334,658 6,128,574 594,127 2,033,164
OTHER ASSETSOther receivables - 23 - -
TOTAL ASSETS 334,658 6,128,597 594,127 2,033,164
OTHER LIABILITIESOther liabilities (2,323) (43,706) (2,974) (11,598)
VALUE OF FUND AS AT 30 JUNE 2016 332,335 6,084,891 591,153 2,021,566
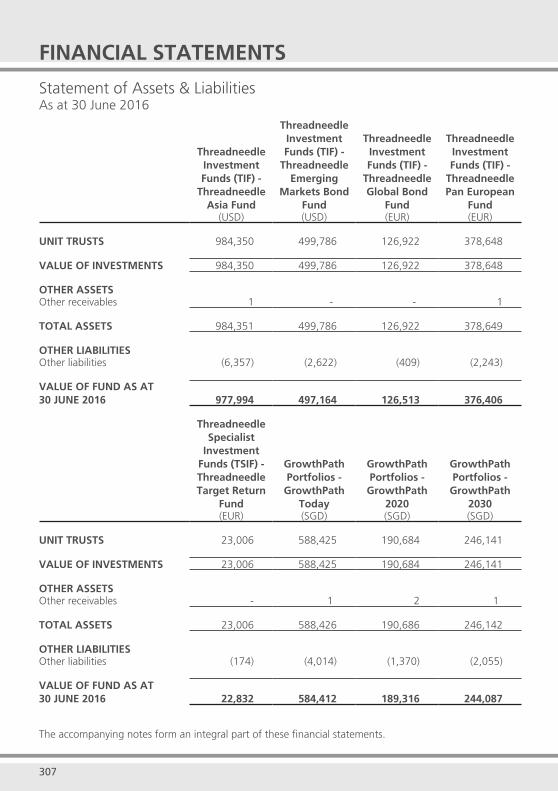
307 308
Statement of Assets & LiabilitiesAs at 30 June 2016
The accompanying notes form an integral part of these financial statements.
FINANCIAL STATEMENTS
Threadneedle Investment Funds (TIF) -
Threadneedle Asia Fund
Threadneedle Investment Funds (TIF) -
Threadneedle Emerging
Markets Bond Fund
Threadneedle Investment Funds (TIF) -
Threadneedle Global Bond
Fund
Threadneedle Investment Funds (TIF) -
Threadneedle Pan European
Fund(USD) (USD) (EUR) (EUR)
UNIT TRUSTS 984,350 499,786 126,922 378,648
VALUE OF INVESTMENTS 984,350 499,786 126,922 378,648
OTHER ASSETSOther receivables 1 - - 1
TOTAL ASSETS 984,351 499,786 126,922 378,649
OTHER LIABILITIESOther liabilities (6,357) (2,622) (409) (2,243)
VALUE OF FUND AS AT 30 JUNE 2016 977,994 497,164 126,513 376,406
Threadneedle Specialist
Investment Funds (TSIF) - Threadneedle Target Return
Fund
GrowthPath Portfolios - GrowthPath
Today
GrowthPath Portfolios - GrowthPath
2020
GrowthPath Portfolios - GrowthPath
2030(EUR) (SGD) (SGD) (SGD)
UNIT TRUSTS 23,006 588,425 190,684 246,141
VALUE OF INVESTMENTS 23,006 588,425 190,684 246,141
OTHER ASSETSOther receivables - 1 2 1
TOTAL ASSETS 23,006 588,426 190,686 246,142
OTHER LIABILITIESOther liabilities (174) (4,014) (1,370) (2,055)
VALUE OF FUND AS AT 30 JUNE 2016 22,832 584,412 189,316 244,087
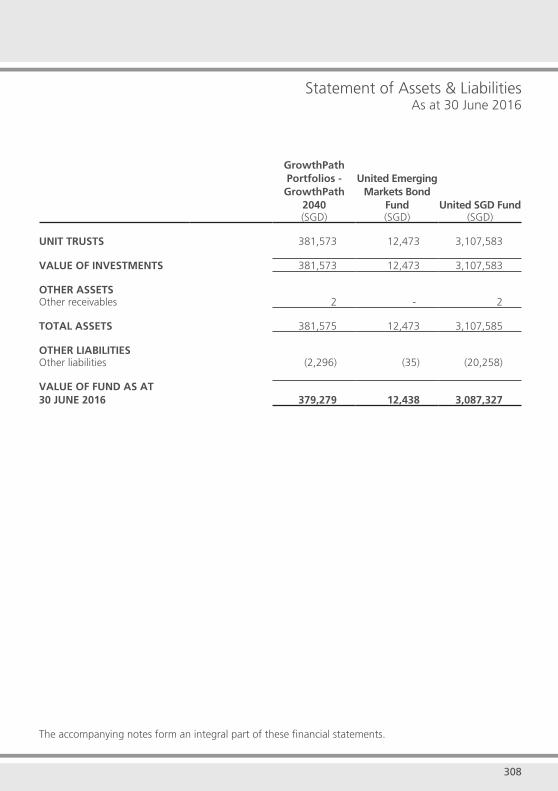
307 308
Statement of Assets & LiabilitiesAs at 30 June 2016
The accompanying notes form an integral part of these financial statements.
GrowthPath Portfolios - GrowthPath
2040
United Emerging Markets Bond
Fund United SGD Fund(SGD) (SGD) (SGD)
UNIT TRUSTS 381,573 12,473 3,107,583
VALUE OF INVESTMENTS 381,573 12,473 3,107,583
OTHER ASSETSOther receivables 2 - 2
TOTAL ASSETS 381,575 12,473 3,107,585
OTHER LIABILITIESOther liabilities (2,296) (35) (20,258)
VALUE OF FUND AS AT 30 JUNE 2016 379,279 12,438 3,087,327

FINANCIAL STATEMENTS
These notes form an integral part of and should be read in conjunction with the financial statements:
1. Summary of significant accounting policies
1.1 The financial statements are prepared under the historical cost convention except for investments, which are stated at the market value.
1.2 Interest income from investments is recognised on an accrual basis. Dividends are credited to income when the right to receive payment is established.
1.3 The management charges due to the underlying fund houses are taken to Capital Account under net appreciation/(diminution) in value of investments.
1.4 Unit trust investments are valued at the closing market prices as at 30 June 2016.
1.5 At 30 June 2016, there were no contingent liabilities or commitments.
1.6 The financial statements are stated in the foreign currencies of the respective underlying funds.
1.7 Monetary assets and liabilities in foreign currencies are translated into the presentation currency at exchange rates approximating to those ruling at the balance sheet date. Transactions in foreign currencies are translated at rates ruling on transaction dates. Exchange differences are taken to the Capital Account under net appreciation/(diminution) in value of investments during the period.
1.8 The cost of disposal of investment is determined on the average cost basis. All gains and losses are taken to the Capital Account and recognised in net appreciation/(diminution) in value of investments during the period.
1.9 Tax deducted at source is charged to the Capital Account. Any recoveries of tax deducted at source are credited to the Capital Account when received.
2. Number of issued units available for redemption at 30 June 2016:
Fund Name Number of units Aberdeen Global - Asia Pacific Equity Fund 93,259
Aberdeen Global - Asian Local Currency Short Duration Bond Fund 17,935
Aberdeen Global - Australasian Equity Fund 6,862
Aberdeen Global - Chinese Equity Fund 85,618
Aberdeen Global - Indian Equity Fund 25,739
Aberdeen Global - Select Emerging Markets Bond Fund 16,962
Aberdeen Select Portfolio - Aberdeen India Opportunities Fund 26,376
Aberdeen Select Portfolio - Aberdeen Pacific Equity Fund 95,366
Aberdeen Select Portfolio - Aberdeen Singapore Equity Fund 13,608
Aberdeen Select Portfolio - Aberdeen Thailand Equity Fund 251,631
NOTES TO THE FINANCIAL STATEMENTS
309 310
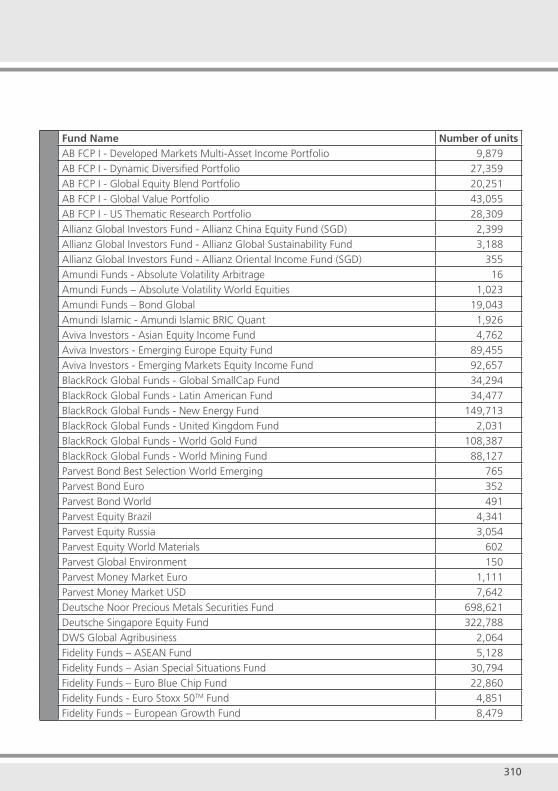
Fund Name Number of units AB FCP I - Developed Markets Multi-Asset Income Portfolio 9,879
AB FCP I - Dynamic Diversified Portfolio 27,359
AB FCP I - Global Equity Blend Portfolio 20,251
AB FCP I - Global Value Portfolio 43,055
AB FCP I - US Thematic Research Portfolio 28,309
Allianz Global Investors Fund - Allianz China Equity Fund (SGD) 2,399
Allianz Global Investors Fund - Allianz Global Sustainability Fund 3,188
Allianz Global Investors Fund - Allianz Oriental Income Fund (SGD) 355
Amundi Funds - Absolute Volatility Arbitrage 16
Amundi Funds – Absolute Volatility World Equities 1,023
Amundi Funds – Bond Global 19,043
Amundi Islamic - Amundi Islamic BRIC Quant 1,926
Aviva Investors - Asian Equity Income Fund 4,762
Aviva Investors - Emerging Europe Equity Fund 89,455
Aviva Investors - Emerging Markets Equity Income Fund 92,657
BlackRock Global Funds - Global SmallCap Fund 34,294
BlackRock Global Funds - Latin American Fund 34,477
BlackRock Global Funds - New Energy Fund 149,713
BlackRock Global Funds - United Kingdom Fund 2,031
BlackRock Global Funds - World Gold Fund 108,387
BlackRock Global Funds - World Mining Fund 88,127
Parvest Bond Best Selection World Emerging 765
Parvest Bond Euro 352
Parvest Bond World 491
Parvest Equity Brazil 4,341
Parvest Equity Russia 3,054
Parvest Equity World Materials 602
Parvest Global Environment 150
Parvest Money Market Euro 1,111
Parvest Money Market USD 7,642
Deutsche Noor Precious Metals Securities Fund 698,621
Deutsche Singapore Equity Fund 322,788
DWS Global Agribusiness 2,064
Fidelity Funds – ASEAN Fund 5,128
Fidelity Funds – Asian Special Situations Fund 30,794
Fidelity Funds – Euro Blue Chip Fund 22,860
Fidelity Funds - Euro Stoxx 50TM Fund 4,851
Fidelity Funds – European Growth Fund 8,479
309 310
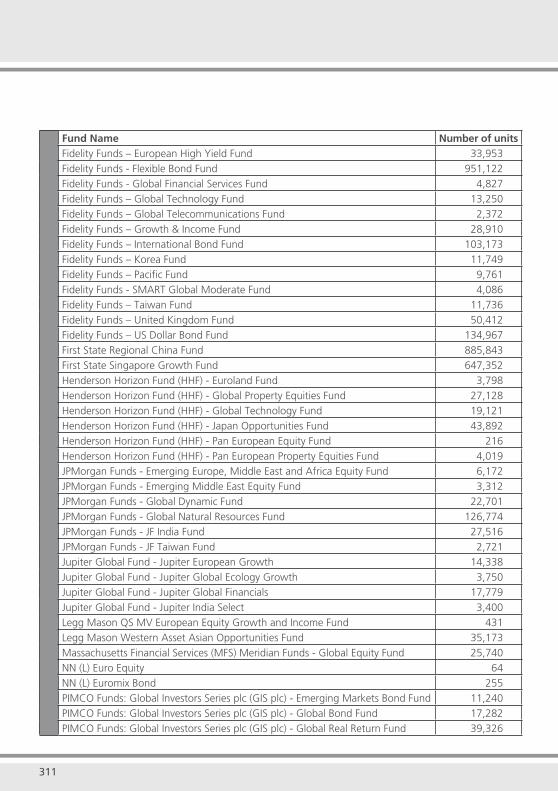
Fund Name Number of unitsFidelity Funds – European High Yield Fund 33,953
Fidelity Funds - Flexible Bond Fund 951,122
Fidelity Funds - Global Financial Services Fund 4,827
Fidelity Funds – Global Technology Fund 13,250
Fidelity Funds – Global Telecommunications Fund 2,372
Fidelity Funds – Growth & Income Fund 28,910
Fidelity Funds – International Bond Fund 103,173
Fidelity Funds – Korea Fund 11,749
Fidelity Funds – Pacific Fund 9,761
Fidelity Funds - SMART Global Moderate Fund 4,086
Fidelity Funds – Taiwan Fund 11,736
Fidelity Funds – United Kingdom Fund 50,412
Fidelity Funds – US Dollar Bond Fund 134,967
First State Regional China Fund 885,843
First State Singapore Growth Fund 647,352
Henderson Horizon Fund (HHF) - Euroland Fund 3,798
Henderson Horizon Fund (HHF) - Global Property Equities Fund 27,128
Henderson Horizon Fund (HHF) - Global Technology Fund 19,121
Henderson Horizon Fund (HHF) - Japan Opportunities Fund 43,892
Henderson Horizon Fund (HHF) - Pan European Equity Fund 216
Henderson Horizon Fund (HHF) - Pan European Property Equities Fund 4,019
JPMorgan Funds - Emerging Europe, Middle East and Africa Equity Fund 6,172
JPMorgan Funds - Emerging Middle East Equity Fund 3,312
JPMorgan Funds - Global Dynamic Fund 22,701
JPMorgan Funds - Global Natural Resources Fund 126,774
JPMorgan Funds - JF India Fund 27,516
JPMorgan Funds - JF Taiwan Fund 2,721
Jupiter Global Fund - Jupiter European Growth 14,338
Jupiter Global Fund - Jupiter Global Ecology Growth 3,750
Jupiter Global Fund - Jupiter Global Financials 17,779
Jupiter Global Fund - Jupiter India Select 3,400
Legg Mason QS MV European Equity Growth and Income Fund 431
Legg Mason Western Asset Asian Opportunities Fund 35,173
Massachusetts Financial Services (MFS) Meridian Funds - Global Equity Fund 25,740
NN (L) Euro Equity 64
NN (L) Euromix Bond 255
PIMCO Funds: Global Investors Series plc (GIS plc) - Emerging Markets Bond Fund 11,240
PIMCO Funds: Global Investors Series plc (GIS plc) - Global Bond Fund 17,282
PIMCO Funds: Global Investors Series plc (GIS plc) - Global Real Return Fund 39,326
311 312

Fund Name Number of unitsPIMCO Funds: Global Investors Series plc (GIS plc) - Total Return Bond Fund 36,202
PIMCO Funds: Global Investors Series plc (GIS plc) - US High Yield Bond Fund 10,611
Schroder Asian Growth Fund 772,423
Schroder Global Emerging Market Opportunities Fund 77,381
Schroder International Selection Fund (ISF) Asian Bond Absolute Return 12,291
Schroder International Selection Fund (ISF) BRIC 6,384
Schroder International Selection Fund (ISF) Emerging Markets 233,031
Schroder International Selection Fund (ISF) Middle East 10,740
Schroder International Selection Fund (ISF) UK Equity 86,004
Schroder Multi Asset Revolution 12,157
Franklin Templeton Investment Funds (FTIF) - Franklin Biotechnology Discovery Fund 29,721
Franklin Templeton Investment Funds (FTIF) - Franklin European Small-Mid Cap Growth Fund
5,424
Franklin Templeton Investment Funds (FTIF) - Franklin Global Real Estate Fund 8,241
Franklin Templeton Investment Funds (FTIF) - Franklin Mutual Beacon Fund 2,018
Franklin Templeton Investment Funds (FTIF) - Franklin Mutual Global Discovery Fund 290
Franklin Templeton Investment Funds (FTIF) - Franklin Strategic Income Fund 23,306
Franklin Templeton Investment Funds (FTIF) - Templeton Asian Growth Fund 73,534
Franklin Templeton Investment Funds (FTIF) - Templeton European Fund 7,611
Franklin Templeton Investment Funds (FTIF) - Templeton Global Fund 82,047
Franklin Templeton Investment Funds (FTIF) - Templeton Global Bond Fund 1,835
Franklin Templeton Investment Funds (FTIF) - Templeton Global Income Fund 45,342
Franklin Templeton Investment Funds (FTIF) - Templeton Global Total Return Fund (EUR)
17,148
Franklin Templeton Investment Funds (FTIF) - Templeton Global Total Return Fund (USD)
225,116
Franklin Templeton Investment Funds (FTIF) - Templeton Latin America Fund 11,530
Threadneedle Investment Funds (TIF) - Threadneedle American Fund 714,561
Threadneedle Investment Funds (TIF) - Threadneedle Asia Fund 463,856
Threadneedle Investment Funds (TIF) - Threadneedle Emerging Markets Bond Fund 153,186
Threadneedle Investment Funds (TIF) - Threadneedle Global Bond Fund 79,150
Threadneedle Investment Funds (TIF) - Threadneedle Pan European Fund 228,194
Threadneedle Specialist Investment Funds (TSIF) - Threadneedle Target Return Fund 20,498
GrowthPath Portfolios - GrowthPath Today 398,101
GrowthPath Portfolios - GrowthPath 2020 117,660
GrowthPath Portfolios - GrowthPath 2030 159,326
GrowthPath Portfolios - GrowthPath 2040 241,271
United Emerging Markets Bond Fund 9,092
United SGD Fund 1,714,229
311 312
INDEPENDENT AUDITOR’S REPORT
We have audited the accompanying financial statements of the investment-linked sub-funds (the “ILP Sub-Funds”) of Aviva Ltd (“the Company”) which comprise the Statement of Assets and Liabilities as at 30 June 2016, the Capital Account for the period from 1 July 2015 to 30 June 2016, and Notes to the Financial Statements presented within pages 261 to 312 (“the Statements”). The Statements have been prepared by management based on the summary of significant accounting policies set out in Note 1. The Statements do not include the Market review and investment outlook and Fund information (“other disclosures”) in respect of each fund that are also incorporated within pages 1 to 260. The other disclosures have not been subjected to our audit.
MANAGEMENT’S RESPONSIBILITY FOR THE STATEMENTSManagement is responsible for the preparation of the Statements in accordance with the accounting policies set out in Note 1. This includes determining that these accounting policies form an acceptable basis for the preparation of the Statements in the circumstances, and for such internal control as management determines is necessary to enable the preparation of Statements that are free from material misstatement, whether due to fraud or error.
AUDITOR’S RESPONSIBILITYOur responsibility is to express an opinion on the Statements based on our audit. We conducted our audit in accordance with Singapore Standards on Auditing. Those standards require that we comply with ethical requirements and plan and perform the audit to obtain reasonable assurance whether the Statements are free from material misstatement.
An audit involves performing procedures to obtain audit evidence about the amounts and disclosures in the Statements. The procedures selected depend on the auditor’s judgment, including the assessment of the risks of material misstatement of the Statements, whether due to fraud or error. In making those risk assessments, the auditor considers internal control relevant to the entity’s preparation of the Statements in order to design audit procedures that are appropriate in the circumstances, but not for the purpose of expressing an opinion on the effectiveness of the entity’s internal control. An audit also includes evaluating the appropriateness of accounting policies used and the reasonableness of accounting estimates made by management, as well as evaluating the overall presentation of the Statements.
We believe that the audit evidence we have obtained is sufficient and appropriate to provide a basis for our audit opinion.
OPINIONIn our opinion, the Statements of the ILP Sub-Funds are prepared, in all material respects, in accordance with the stated accounting policies as set out in Note 1.
BASIS OF ACCOUNTING AND RESTRICTION ON DISTRIBUTION AND USEWithout modifying our opinion, we draw attention to Note 1 to the Statements, which describes the basis of accounting. The Statements are prepared to assist the Company to comply with MAS Notice 307 Investment-Linked Life Insurance Policies. As a result, the Statements may not be suitable for another purpose.
Our report is intended solely for the use of the Company and our duties are owed solely to the Company. We do not accept responsibility and we expressly disclaim liability for loss occasioned to any third party acting or refraining from acting as a result of our report.
OTHER MATTERSThis report relates solely to the Statements of the ILP Sub-Funds of the Company, and does not extend to the Statements of the Company taken as a whole.
PricewaterhouseCoopers LLPPublic Accountants and Chartered AccountantsSingapore, 19 September 2016
INDEPENDENT AUDITOR’S REPORT TO AVIVA LTD
313

����������� �����������������������������������������������������������������������������������������������������������
!����������������������������������������������������������������"���������������#"�������������������������������������� �
�� ��������������������������������������#���������������������� �$����������������������������������%���������������������&'()"�����������������������������������������������#����*���������
+��������������������������"�,�����"����������������#���������"�������������������������������������������������������
��������-����������#�./&�/&��01�2������3���������/4((/52���������������*�����6�7489�4(35�''))%:6�7489�4(35�5-(/������6���� �� ��� ��2����#�;�� �,� 6�&'4'//-''<
�=>?
3/&8
?;��
���?
�8?
�& &
?���
3/&4
�������=>���������
��������#��������)/�@����3/&4
�������������������� ���������#���������)/�@����3/&4
Copyright © 2022 FDOKUMEN