ANNUAL REPORT
259
2018 ANNUAL REPORT Stock Code: 1606 (A joint stock limited company incorporated in the People’s Republic of China)
-
Upload
khangminh22 -
Category
Documents
-
view
0 -
download
0
Transcript of ANNUAL REPORT
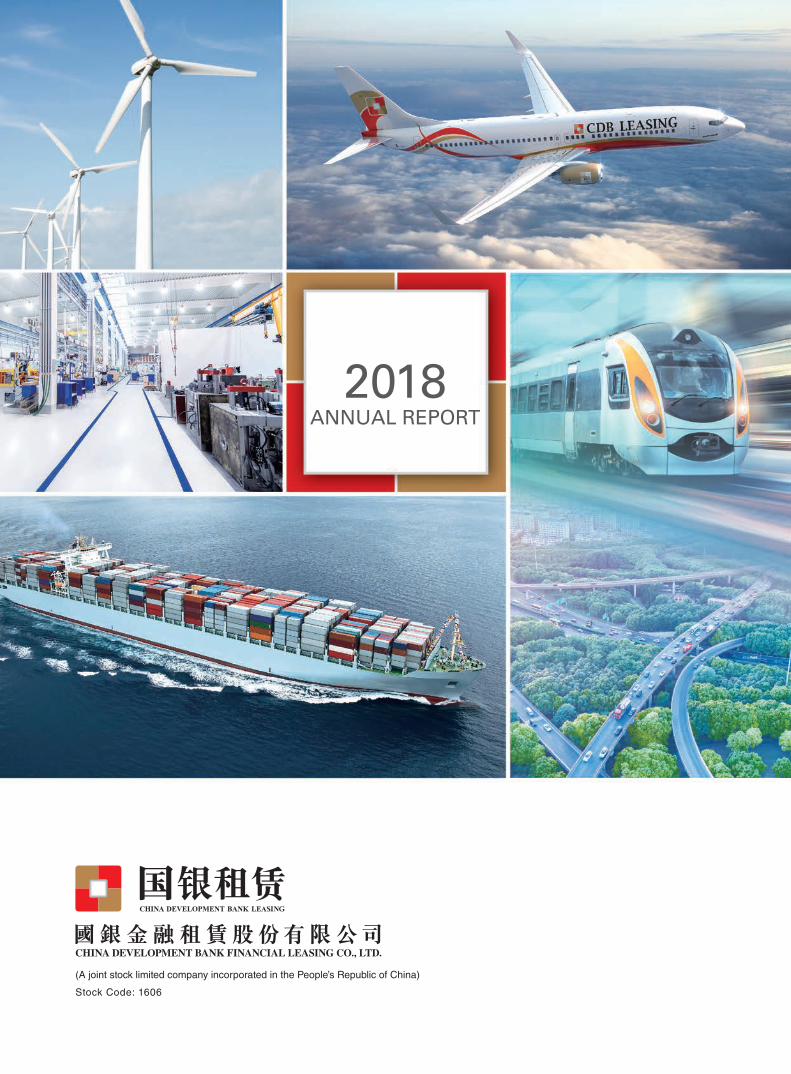
2018ANNUAL REPORT
2018 A
nnual Report Stock Code: 1606
(A joint stock limited company incorporated in the People’s Republic of China)

Contents
Company Overview 2
Corporate Information 3
Definitions 5
Glossary of Technical Terms 7
Financial Highlights 8
Ranking and Awards 15
Chairman’s Statement 16
President’s Statement 19
Management Discussion and Analysis 22
Directors, Supervisors and Senior Management 70
Corporate Governance Report 81
Report of the Board of Directors 105
Report of the Board of Supervisors 129
Independent Auditor's Report 133
Consolidated Financial Statements and Notes 138
2 Ch ina Deve lopment Bank F inanc ia l Leas ing Co . , L td .
Company Overview
China Development Bank Financial Leasing Co., Ltd., a national non-banking financial institution regulated by CBIRC, is the first listed financial leasing company in mainland China and the sole leasing business platform and listing platform of China Development Bank. Its leasing assets and business partners reach throughout nearly 30 countries and regions around the globe. The Company enjoys relatively high international credit ratings, namely “A1” by Moody’s, “A” by Standard & Poor’s and “A+” by Fitch. Founded in 1984, CDB Leasing is a pioneer and a leader in the leasing industry in the PRC, and is among the first batch of leasing companies established in the PRC. Adhering to the mission of “Leading China’s leasing industry, serving the real economy”, CDB Leasing is dedicated to providing comprehensive leasing services to high-quality customers in industries including aviation, infrastructure, shipping, vehicle and construction machinery, new energy and high-end equipment manufacturing.
As one of the leasing companies with the longest history in the PRC, CDB Leasing has witnessed and participated in the development of the PRC leasing industry, experienced various economic cycles in the industry and regulatory reforms, and gained abundant experience through our exploration in business sectors, product innovation, risk management and control, operating management and other aspects. We have been continuously adhering to the balanced development of scale, quality and efficiency. Through exploration of different business sectors in a planned manner, continuous product innovation and business improvement as well as optimization of corporate governance, CDB Leasing outpaced peers in terms of asset scale, profitability and risk control, and formed a business development model with obvious advantages of core competitiveness and prominent sustainable development capabilities.
The continued improvement in marketization and internationalization of the PRC financial industry, the increasing customer demand for customized leasing products and services, and current policies of financial supply-side reform launched by the state for enhancing the financial service’s capability to serve the real economy have brought important opportunities to the leasing industry. We believe that our long operating history, market leading position, well-developed business model and premier brand will enable us to seize such opportunities, achieve sustained growth, and continue to maintain our leading position in the fast developing PRC leasing industry, constantly upgrade our business model, improve our professional service capabilities and strive to move forward for achieving the vision of building a world-class leasing company.
32018 Annua l Report
Corporate Information
BOARD OF DIRECTORS
Executive Directors
Mr. Wang Xuedong (Chairman)Mr. Huang Min
Non-executive Director
Mr. Li Yingbao
Independent Non-executive Directors
Mr. Zheng XuedingMr. Xu JinMr. Zhang Xianchu
STRATEGY DECISION COMMITTEE OF THE BOARD
Mr. Wang Xuedong (Chairman)Mr. Li YingbaoMr. Zheng XuedingMr. Xu Jin
RISK MANAGEMENT AND INTERNAL CONTROL COMMITTEE OF THE BOARD
Mr. Wang Xuedong (Chairman)Mr. Huang MinMr. Li YingbaoMr. Zheng Xueding
RELATED PARTY TRANSACTION CONTROL COMMITTEE OF THE BOARD
Mr. Xu Jin (Chairman)Mr. Huang MinMr. Zheng XuedingMr. Zhang Xianchu
AUDIT COMMITTEE OF THE BOARD
Mr. Zheng Xueding (Chairman)Mr. Li YingbaoMr. Xu JinMr. Zhang Xianchu
REMUNERATION COMMITTEE OF THE BOARD
Mr. Zhang Xianchu (Chairman)Mr. Li YingbaoMr. Zheng XuedingMr. Xu Jin
NOMINATION COMMITTEE OF THE BOARD
Mr. Xu Jin (Chairman)Mr. Wang XuedongMr. Zheng XuedingMr. Zhang Xianchu
BOARD OF SUPERVISORS
Mr. Jiang Daozhen (Chairman)Mr. Lei YanzhengMr. Ma YongyiMs. Huang XuemeiMr. Wang Yiyun
JOINT COMPANY SECRETARIES
Mr. Huang MinMs. Wong Sau Ping (ACIS, ACS)
AUTHORIZED REPRESENTATIVES
Mr. Huang MinMs. Wong Sau Ping (ACIS, ACS)
4 Ch ina Deve lopment Bank F inanc ia l Leas ing Co . , L td .
Corporate Information
AUDITOR
PricewaterhouseCoopersCertified Public Accountants22/F, Prince’s Building, CentralHong Kong
COMPLIANCE ADVISOR(1)
Zhongtai International Capital Limited19/F, Li Po Chun Chambers189, Des Voeux Road CentralHong Kong
H SHARE REGISTRAR
Computershare Hong Kong Investor Services LimitedShops 1712–1716, 17th FloorHopewell Centre183 Queen’s Road EastWan ChaiHong Kong
REGISTERED OFFICE
CDB Financial CenterNo. 2003 Fuzhong Third RoadFutian DistrictShenzhenGuangdong ProvincePRC
HEADQUARTER
CDB Financial CenterNo. 2003 Fuzhong Third RoadFutian DistrictShenzhenGuangdong ProvincePRC
LEGAL ADVISORS
As to Hong Kong lawClifford Chance27/F, Jardine HouseOne Connaught PlaceCentralHong Kong
As to PRC lawBeijing Zhong Lun Law Firm (Shenzhen Office)8–10/F, Tower A, Rongchao Tower6003 Yitian Road, Futian DistrictShenzhen
PRINCIPAL PLACE OF BUSINESS IN HONG KONG
31/F, Tower Two, Times Square1 Matheson StreetCauseway BayHong Kong
WEBSITE OF THE COMPANY
http://www.cdb-leasing.com
STOCK CODE
1606
LISTING DATE
July 11, 2016
(1) Pursuant to Rule 3A.19 of the Hong Kong Listing Rules, Zhongtai International Capital Limited served as the compliance advisor of the Company from the listing date (i.e. July 11, 2016) to April 24, 2018; On April 24, 2018, the service period of compliance advisor had expired such that the Company no longer engaged any compliance advisor.
52018 Annua l Report
Definitions
“Articles of Association” Articles of Association of China Development Bank Financial Leasing Co., Ltd.
“Board” or “Board of Directors” the board of directors of our Company
“Board of Supervisors the board of supervisors of our Company
“Capital Administrative Measures” Administrative Measures for Capital of Commercial Banks (Provisional) (《商業銀行資本管理辦法》(試行)), issued by the CBIRC on June 7, 2012 and being effective from January 1, 2013
“CBIRC” China Banking and Insurance Regulatory Commission (中國銀行保險監督管理委員會) and its predecessor, China Banking Regulatory Commission (中國銀行業監督管理委員會)
”CDB Capital” CDB Capital Co., Ltd. (國開金融有限責任公司), a wholly-owned subsidiary of China Development Bank, the Controlling Shareholder of the Company
“CDB Development Fund” CDB Deve lopment Fund Co rpo ra t i on (國開發展基金有限公司 ) , a wholly-owned subsidiary of China Development Bank, the Controlling Shareholder of the Company
“CDB New Energy” CDB New Energy Science and Technology Company Limited (國開新能源科技有限公司), which is held as to 30.46% equity interests by CDB Capital
”CDB Securities” China Development Bank Securities Company Limited (國開證券股份有限公司), which is held as to 80.00% equity interest by China Development Bank
“China” or “the PRC” the People’s Republic of China, excluding, for the purpose of this announcement, Hong Kong, Macau and Taiwan
“China Development Bank” or “CDB” China Development Bank Corporation, the Controlling Shareholder and a connected person
“Company”, “our Company” or “CDB Leasing”
China Development Bank Financial Leasing Co., Ltd. (國銀金融租賃股份有限公司), a company established in the PRC in 1984 and converted into a joint stock limited company on September 28, 2015, the H Shares of which are listed on the Hong Kong Stock Exchange with stock code of 1606
“Companies Ordinance” the Companies Ordinance (Chapter 622 of the Laws of Hong Kong), as amended, supplemented or otherwise modified from time to time
“Connected Person(s)” has the meaning ascribed to it under the Hong Kong Listing Rules
“Controlling Shareholder(s)” has the meaning ascribed to it under the Hong Kong Listing Rules
“Corporate Governance Code” the Corporate Governance Code and Corporate Governance Report as set out in Appendix 14 to the Hong Kong Listing Rules
“Director(s)” director(s) of our Company
“Global Offering” the Hong Kong Publ ic Offer ing and the International Offer ing as mentioned in the prospectus

6 Ch ina Deve lopment Bank F inanc ia l Leas ing Co . , L td .
Definitions
“Group”, “we” or “us” our Company and its subsidiaries or SPCs, or our Company and any one or more of its subsidiaries or SPCs, as the context may require
“HK$” Hong Kong dollars, the lawful currency of Hong Kong
“Hong Kong” the Hong Kong Special Administrative Region of the PRC
“Hong Kong Listing Rules” the Rules Governing the Listing of Securities on The Stock Exchange of Hong Kong Limited (as amended from time to time)
“Hong Kong Stock Exchange” The Stock Exchange of Hong Kong Limited, a wholly-owned subsidiary of Hong Kong Exchanges and Clearing Limited
“Latest Practicable Date” April 25, 2019, being the latest practicable date for the purpose of ascertaining certain information in this annual report prior to its printing
“Model Code” the Model Code for Securities Transactions by Directors of Listed Issuers set out in Appendix 10 to the Hong Kong Listing Rules
“PBOC” People’s Bank of China (中國人民銀行), the central bank of the PRC
“Prospectus” the prospectus of the Company dated June 24, 2016
“RMB” or “Renminbi” Renminbi, the lawful currency of the PRC
“Reporting Period” from January 1, 2018 to December 31, 2018
“Securities and Futures Ordinance” or “SFO”
the Securities and Futures Ordinance (Chapter 571 of the Laws of Hong Kong) as amended, supplemented or otherwise modified from time to time
“Share(s)” share(s) in the share capital of the Company with a nominal value of RMB1.00 each
“Shareholder(s)” holder(s) of the Share(s)
“CBIRC Shenzhen Office” Shenzhen Off ice of the China Banking and Insurance Regulatory Commission and its predecessor Shenzhen office of the China Banking Regulatory Commission
“State Council” State Council of the PRC
“subsidiary(ies)” has the meaning ascribed to it in section 15 of the Companies Ordinance
“Supervisor(s)” supervisor(s) of the Company
“US$” or “US dollar(s)” United States dollar(s), the lawful currency of the United States
72018 Annua l Report
Glossary of Technical Terms
“finance lease” a lease arrangement classified under the International Financial Reporting Standards (“IFRS”), pursuant to which substantially all of the risks and returns of ownership of the leased assets are transferred from the lessors to the lessees
“finance lease related asset” leased asset under finance leases, consisting of finance leases receivable and accounts receivable (advances for finance lease projects)
“narrow-body aircraft” single-aisle aircraft, such as Airbus A320 family and Boeing 737 family
“operating lease” a lease arrangement classified under the International Financial Reporting Standards, pursuant to which substantially all of the risks and returns of the leased assets remain with the lessors
“SPC(s)” special purpose company(ies)
“wide-body aircraft” twin-aisle aircraft, such as Airbus A330 family and Boeing 777 family
8 Ch ina Deve lopment Bank F inanc ia l Leas ing Co . , L td .
Financial Highlights
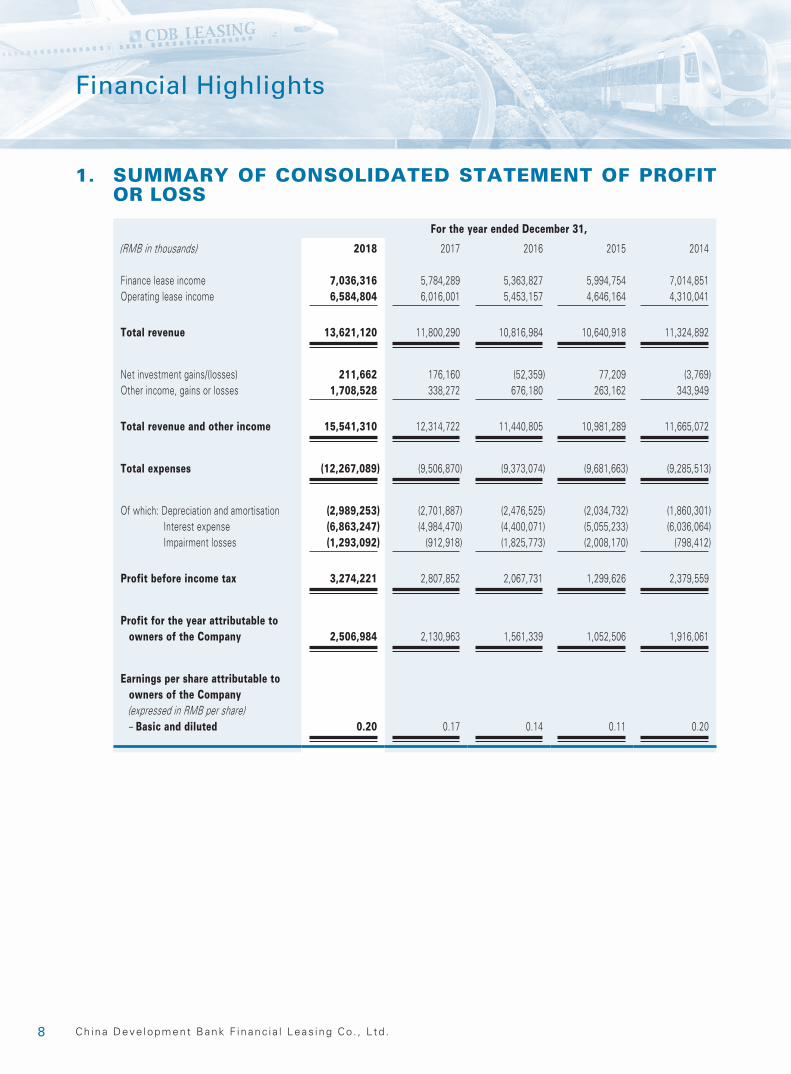
1. SUMMARY OF CONSOLIDATED STATEMENT OF PROFIT OR LOSS
For the year ended December 31,
(RMB in thousands) 2018 2017 2016 2015 2014
Finance lease income 7,036,316 5,784,289 5,363,827 5,994,754 7,014,851Operating lease income 6,584,804 6,016,001 5,453,157 4,646,164 4,310,041
Total revenue 13,621,120 11,800,290 10,816,984 10,640,918 11,324,892
Net investment gains/(losses) 211,662 176,160 (52,359) 77,209 (3,769)Other income, gains or losses 1,708,528 338,272 676,180 263,162 343,949
Total revenue and other income 15,541,310 12,314,722 11,440,805 10,981,289 11,665,072
Total expenses (12,267,089) (9,506,870) (9,373,074) (9,681,663) (9,285,513)
Of which: D epreciation and amortisation (2,989,253) (2,701,887) (2,476,525) (2,034,732) (1,860,301)Interest expense (6,863,247) (4,984,470) (4,400,071) (5,055,233) (6,036,064)Impairment losses (1,293,092) (912,918) (1,825,773) (2,008,170) (798,412)
Profit before income tax 3,274,221 2,807,852 2,067,731 1,299,626 2,379,559
Profit for the year attributable to owners of the Company 2,506,984 2,130,963 1,561,339 1,052,506 1,916,061
Earnings per share attributable to owners of the Company (expressed in RMB per share) – Basic and diluted 0.20 0.17 0.14 0.11 0.20
92018 Annua l Report
Financial Highlights
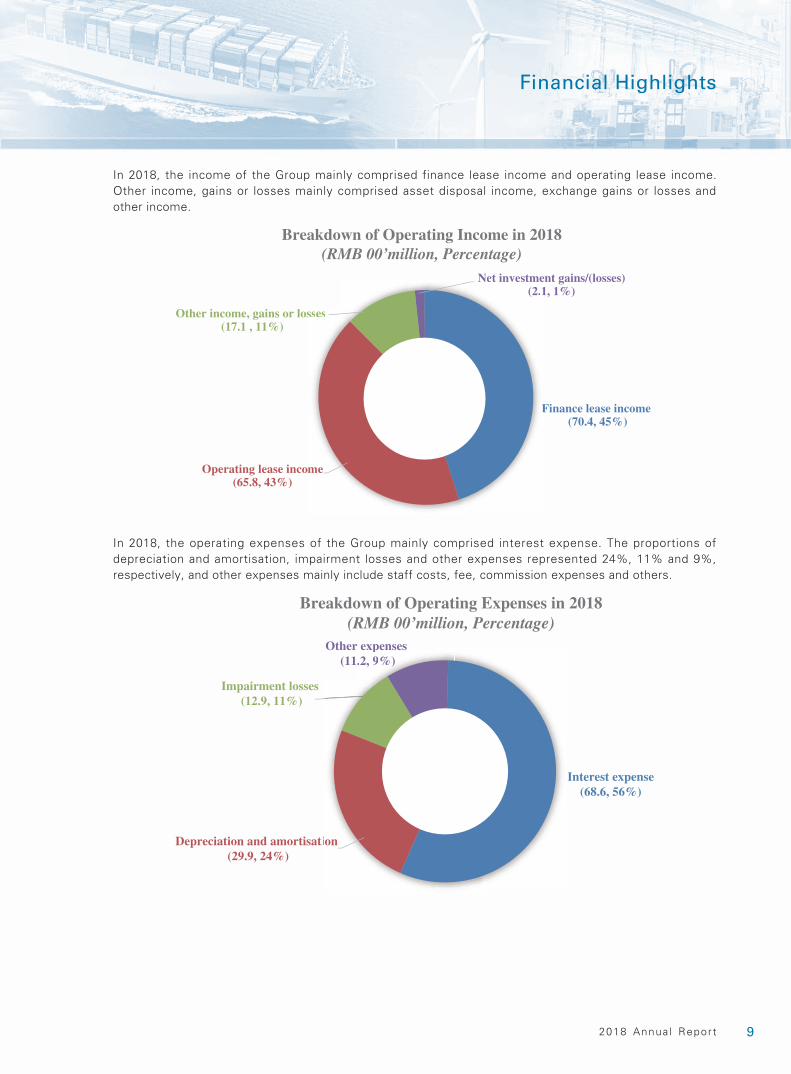
In 2018, the income of the Group mainly comprised finance lease income and operating lease income. Other income, gains or losses mainly comprised asset disposal income, exchange gains or losses and other income.
Breakdown of Operating Income in 2018(RMB 00’million, Percentage)
Net investment gains/(losses)(2.1, 1%)
Finance lease income (70.4, 45%)
Operating lease income(65.8, 43%)
Other income, gains or losses (17.1 , 11%)
Net investme(2.1
F
me
sses
In 2018, the operating expenses of the Group mainly comprised interest expense. The proportions of depreciation and amortisation, impairment losses and other expenses represented 24%, 11% and 9%, respectively, and other expenses mainly include staff costs, fee, commission expenses and others.
Impairment losses (12.9, 11%)
Other expenses (11.2, 9%)
Interest expense(68.6, 56%)
Breakdown of Operating Expenses in 2018(RMB 00’million, Percentage)
Depreciation and amortisation (29.9, 24%)
ion
e pe ses.2, 9%))
10 Ch ina Deve lopment Bank F inanc ia l Leas ing Co . , L td .
Financial Highlights
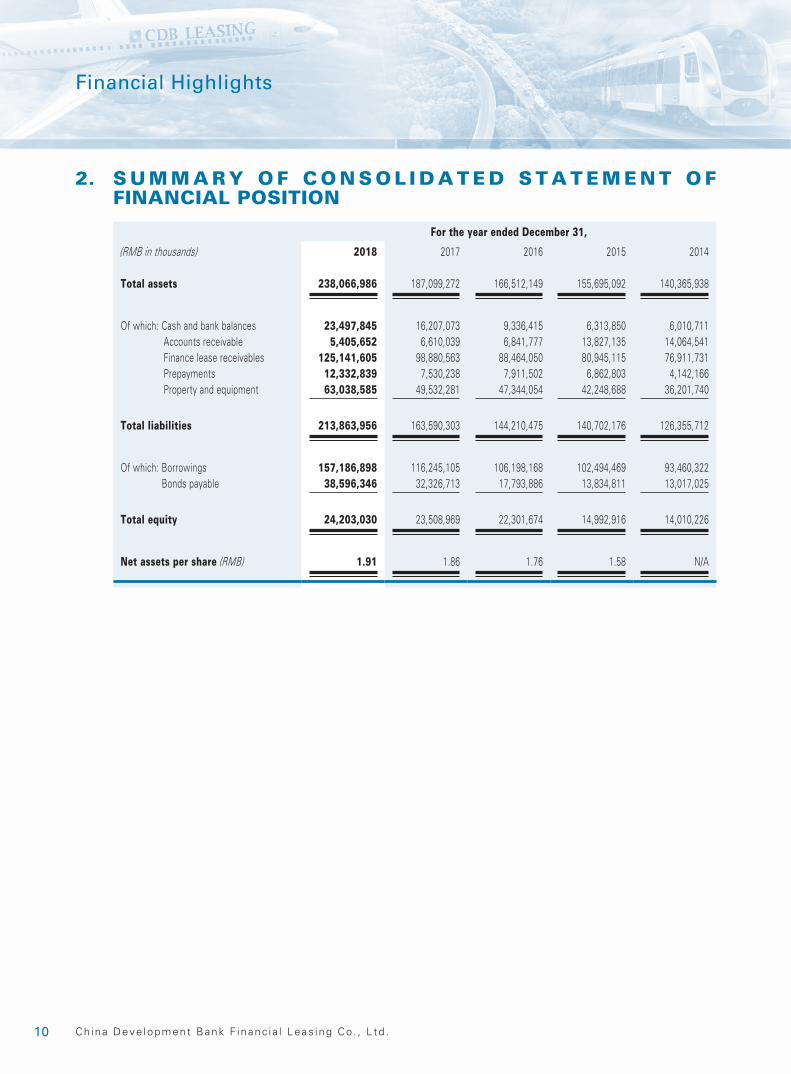
2. S U M M A R Y O F C O N S O L I D A T E D S T A T E M E N T O F FINANCIAL POSITION
For the year ended December 31,
(RMB in thousands) 2018 2017 2016 2015 2014
Total assets 238,066,986 187,099,272 166,512,149 155,695,092 140,365,938
Of which: Cash and bank balances 23,497,845 16,207,073 9,336,415 6,313,850 6,010,711Accounts receivable 5,405,652 6,610,039 6,841,777 13,827,135 14,064,541Finance lease receivables 125,141,605 98,880,563 88,464,050 80,945,115 76,911,731Prepayments 12,332,839 7,530,238 7,911,502 6,862,803 4,142,166Property and equipment 63,038,585 49,532,281 47,344,054 42,248,688 36,201,740
Total liabilities 213,863,956 163,590,303 144,210,475 140,702,176 126,355,712
Of which: Borrowings 157,186,898 116,245,105 106,198,168 102,494,469 93,460,322Bonds payable 38,596,346 32,326,713 17,793,886 13,834,811 13,017,025
Total equity 24,203,030 23,508,969 22,301,674 14,992,916 14,010,226
Net assets per share (RMB) 1.91 1.86 1.76 1.58 N/A
112018 Annua l Report
Financial Highlights
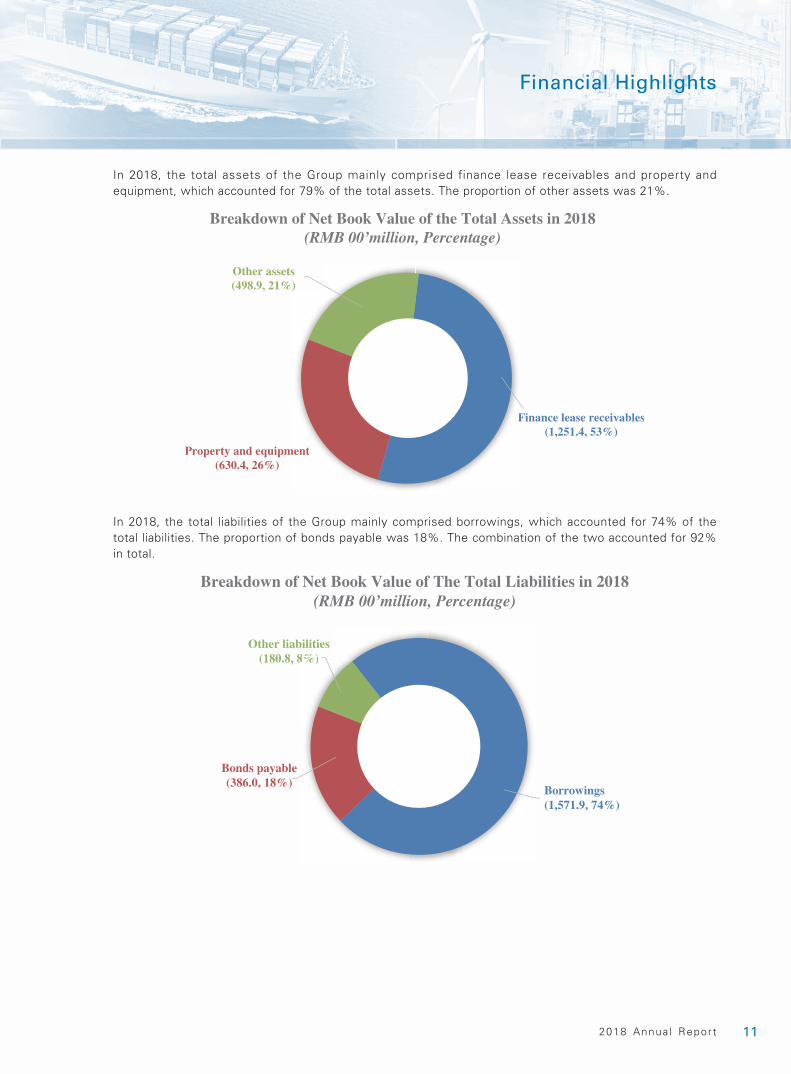
In 2018, the total assets of the Group mainly comprised finance lease receivables and property and equipment, which accounted for 79% of the total assets. The proportion of other assets was 21%.
Breakdown of Net Book Value of the Total Assets in 2018(RMB 00’million, Percentage)
Finance lease receivables(1,251.4, 53%)
Property and equipment(630.4, 26%)
Other assets(498.9, 21%)
In 2018, the total liabilities of the Group mainly comprised borrowings, which accounted for 74% of the total liabilities. The proportion of bonds payable was 18%. The combination of the two accounted for 92% in total.
Breakdown of Net Book Value of The Total Liabilities in 2018(RMB 00’million, Percentage)
Other liabilities(180.8, 8%)
Bonds payable(386.0, 18%)
Borrowings(1,571.9, 74%)
8%)

12 Ch ina Deve lopment Bank F inanc ia l Leas ing Co . , L td .
Financial Highlights
3. SELECTED FINANCIAL RATIOS
For the year ended December 31, /As at December 31,
2018 2017 2016 2015 2014
Return on average total assets(1) 1.18% 1.21% 0.97% 0.71% 1.36%Return on average equity(2) 10.73% 9.30% 8.44% 7.26% 14.66%Net interest spread of finance
lease business(3) 1.58% 1.85% 2.10% 2.21% 2.49%Net interest margin of finance
lease business(4) 1.80% 2.33% 2.70% 2.61% 2.77%Net lease yield of operating
lease business(5) 8.51% 9.13% 8.74% 8.56% 7.63%Profit margin before income tax of operating
lease business(6) 24.72% 23.97% 21.77% 20.64% 16.55%Cost-to-income ratio(7) 6.99% 7.08% 5.76% 5.05% 4.63%Net profit margin before tax and impairment
losses(8) 33.53% 31.53% 35.99% 31.09% 28.06%Net profit margin(9) 18.41% 18.06% 14.43% 9.89% 16.92%Non-performing asset ratio(10) 0.89% 0.78% 0.98% 1.39% 1.09%Non-performing asset ratio of
finance lease business(11) 1.56% 1.31% 1.63% 2.21% 1.67%Gearing ratio(12) 7.15x 5.72x 5.46x 8.03x 7.85xCredit ratingsStandard & Poor’s A A A+ A+ A+Moody’s A1 A1 Aa3 A1 A1Fitch A+ A+ A+ A+ A+
(1) Calculated by dividing net profit for the year by average balance of total assets at the beginning and the end of the year.
(2) Calculated by dividing net profit for the year by weighted average balance of total Shareholders’ equity during the year.
(3) Calculated as the difference between the average yield on the finance lease related assets and the average cost of the interest-bearing liabilities of finance lease business.
(4) Calculated by dividing net interest income of finance lease business by the average monthly balance of the finance lease related assets.
(5) Calculated by dividing net lease income of operating lease business by the average monthly balance of total operating lease assets. Net lease income of operating lease business is calculated as the difference between operating lease income and interest expense of operating lease business.
(6) Calculated by dividing profit before income tax of operating lease business by operating lease income.
(7) Calculated by dividing the sum of the depreciation and amortisation expenses of property and equipment held for administrative purposes, staff costs and other operating expenses by total revenue and other income.
132018 Annua l Report
Financial Highlights
(8) Calculated by dividing profit before tax and impairment losses for the year by the total revenue for the year.
(9) Calculated by dividing net profit for the year by the total revenue for the year.
(10) Calculated based on the percentage of non-performing assets over total assets before allowance for impairment losses as of the dates indicated.
(11) Calculated based on the percentage of non-performing finance lease related assets over finance lease related assets before allowance for impairment losses as of the dates indicated.
(12) Calculated by dividing net debt by total equity. Net debt is defined as total debt less cash and cash equivalents. Total debt comprises borrowings, due to banks and other financial institutions, financial assets sold under repurchase agreements and bonds payable.
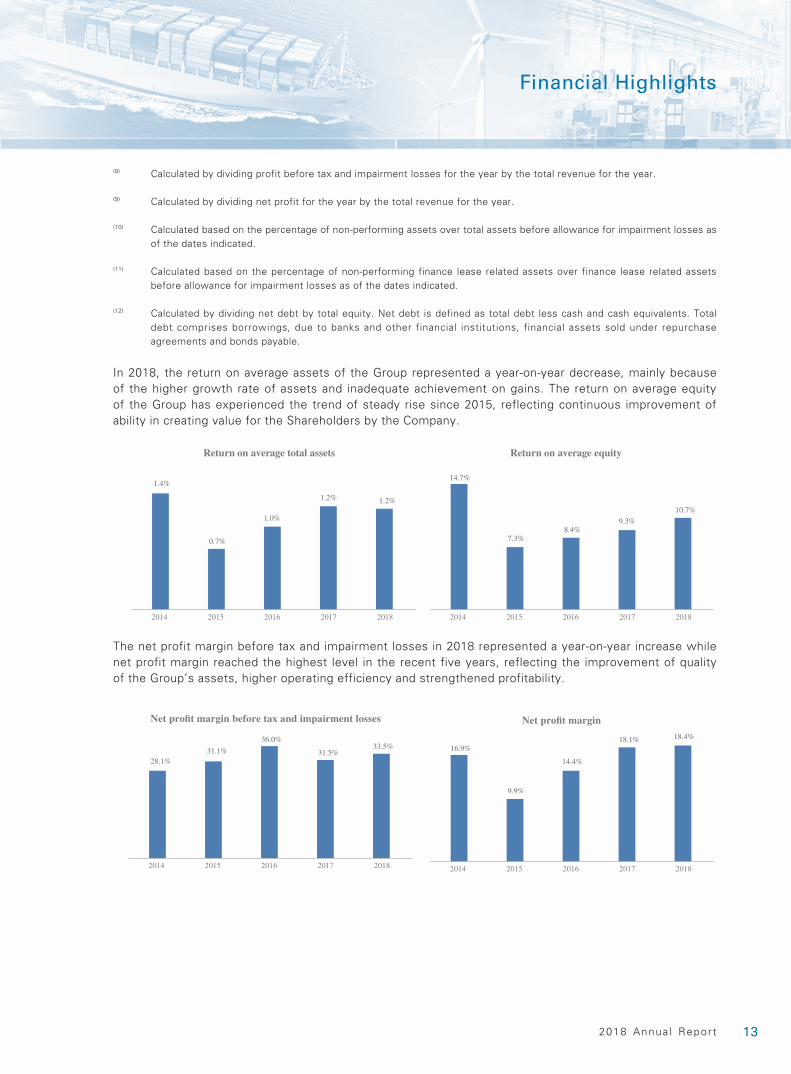
In 2018, the return on average assets of the Group represented a year-on-year decrease, mainly because of the higher growth rate of assets and inadequate achievement on gains. The return on average equity of the Group has experienced the trend of steady rise since 2015, reflecting continuous improvement of ability in creating value for the Shareholders by the Company.
1.4%
0.7%
1.0%
1.2% 1.2%
2014 2015 2016 2017 2018
Return on average total assets
14.7%
7.3%8.4%
9.3%
10.7%
2014 2015 2016 2017 2018
Return on average equity
The net profit margin before tax and impairment losses in 2018 represented a year-on-year increase while net profit margin reached the highest level in the recent five years, reflecting the improvement of quality of the Group’s assets, higher operating efficiency and strengthened profitability.
28.1%31.1%
36.0%
31.5%33.5%
2014 2015 2016 2017 2018
Net pro�t margin before tax and impairment losses
16.9%
9.9%
14.4%
18.1% 18.4%
2014 2015 2016 2017 2018
Net pro�t margin
14 Ch ina Deve lopment Bank F inanc ia l Leas ing Co . , L td .
Financial Highlights
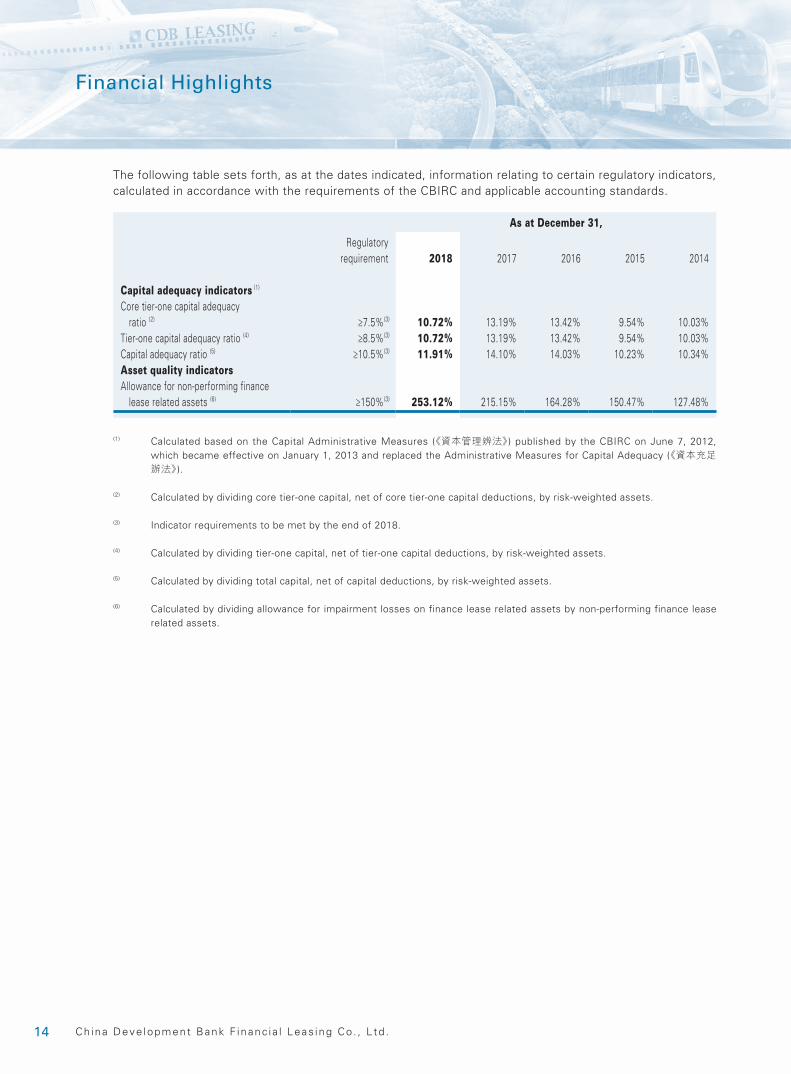
The following table sets forth, as at the dates indicated, information relating to certain regulatory indicators, calculated in accordance with the requirements of the CBIRC and applicable accounting standards.
As at December 31,
Regulatory requirement 2018 2017 2016 2015 2014
Capital adequacy indicators (1)
Core tier-one capital adequacy ratio (2) ≥7.5%(3) 10.72% 13.19% 13.42% 9.54% 10.03%
Tier-one capital adequacy ratio (4) ≥8.5%(3) 10.72% 13.19% 13.42% 9.54% 10.03%Capital adequacy ratio (5) ≥10.5%(3) 11.91% 14.10% 14.03% 10.23% 10.34%Asset quality indicatorsAllowance for non-performing finance
lease related assets (6) ≥150%(3) 253.12% 215.15% 164.28% 150.47% 127.48%
(1) Calculated based on the Capital Administrative Measures (《資本管理辨法》) published by the CBIRC on June 7, 2012, which became effective on January 1, 2013 and replaced the Administrative Measures for Capital Adequacy (《資本充足辦法》).
(2) Calculated by dividing core tier-one capital, net of core tier-one capital deductions, by risk-weighted assets.
(3) Indicator requirements to be met by the end of 2018.
(4) Calculated by dividing tier-one capital, net of tier-one capital deductions, by risk-weighted assets.
(5) Calculated by dividing total capital, net of capital deductions, by risk-weighted assets.
(6) Calculated by dividing allowance for impairment losses on finance lease related assets by non-performing finance lease related assets.
152018 Annua l Report
Ranking and Awards
In April 2018, CDB Leasing was awarded the “Industry Contribution Award” (行業貢獻獎) in service and trade in Shenzhen by Shenzhen Association of Trade in Services.
In June 2018, CDB Aviation Lease Finance Designated Activity Company was awarded the “Leasing Company of the Year in China” (中國年度租賃公司) in the first “China Aviation Finance and Leasing Award Ceremony” in the annual meeting of China Air Finance Conference, Shanghai.
In November 2018, CDB Leasing was awarded the 2017 “Best Green Finance Award in Banking Industry of Shenzhen” (最佳綠色金融獎) and the “Most Visible Brand Award” (最受關注品牌獎) by the 12th China (Shenzhen) International Finance Expo.
In December 2018, CDB Leasing was awarded the “Best Leasing Listed Company” (最佳上市租賃公司) in the first “Teng Fei Prize (騰飛獎) of China Finance Leasing at 2018 (5th) Global Leasing Industry Competitiveness Forum.”
In December 2018, CDB Leasing ranked★★★ (the highest) in Corporate Social Responsibility Evaluation awarded by Shenzhen Association of Enterprises for Promotion of Social Responsibility.
In January 2019, CDB Leasing was awarded the “Listing Company with Most Influence Brand” (最具品牌影響力上市公司) in the first “Jin Wu prize (金吾獎) of financial institutions value ranking for 2018 by Hong Kong Stocks channel of ifeng.com”.
In January 2019, CDB Leasing was awarded the “Most Socially Responsible Listed Enterprise” (最具社會責任上市公司) in the selection of “Listing Companies of 2018 Golden Hong Kong Stocks”.
16 Ch ina Deve lopment Bank F inanc ia l Leas ing Co . , L td .
Chairman’s Statement
WANG XUEDONG Chairman
Dear Shareholders,
On behalf of the Board of China Development Bank Financial Leasing Co., Ltd., I am delighted to report to all Shareholders on the annual results for the year ended December 31, 2018.
172018 Annua l Report
Chairman’s Statement
2018 is an extraordinary year for CDB Leasing. This year, the Group overcame the pressure of downward macroeconomy, increase in capital cost and increasingly strict external regulation, and the assets scale, total financing amount and operating performance hit a record high. We achieved fruitful results in areas such as strategic layout, corporate governance, business development, risk prevention and control, and internal management, realizing an overall improvement in terms of scale, quality and efficiency.
In 2018, the principal operating indicators of the Group hit a new high, and the total assets of the Group amounted to RMB238.1 billion, representing a year-on-year increase of 27.2%. Net profit amounted to RMB2.51 billion, representing a year-on-year increase of 17.6%, which shows a trend of steady growth. Return on Shareholders’ equity was 10.73%, representing a year-on-year increase of 1.43 percentage points. The non-performing asset ratio was 0.89%. Provision coverage ratio was 253%, representing an increase of 38 percentage points as compared with the beginning of the year. Capital adequacy ratio was 11.91%, showing an increasingly robust risk resistance capacity. In 2018, the major business layout of the Group was further optimized, and the lease financing to new lessees of the Group amounted to RMB82.7 billion, hitting a new historic high and representing a year-on-year increase of 57%. The professional operation level and profitability of specialized segments, such as aircraft, ship, new energy, commercial vehicles and construction machinery, continued to improve, and the Group continued its remarkable achievements in business mode and product service. The infrastructure business focused on key industries and key customers. The lease financing to new lessees accumulated for the year amounted to RMB33.7 billion, which further optimized the structure. The Group strengthened cooperation with peers in the industry, established the cooperative relationship with over 60 peers in the financial leasing and business leasing industry and created transaction platforms for leased assets in the industry. As a result, the Group enhanced the efficiency of capital utilization and ability of activating the existing assets. In 2018, the Group achieved remarkable results in risk prevention and control. As of the end of the year, the non-performing assets amounted to RMB2.172 billion, and the non-performing asset ratio was controlled within 1% for three consecutive years since our listing. The asset quality weathered the challenges of the changes arising from external environment. In 2018, the internal management mechanism was gradually perfected. The corporate governance and system development were gradually improved. The refined and scientific operation management gradually enhanced, the capital management capability significantly improved, and the development of information technology and the reform of the human resources management were firmly carried out, which provided solid support to the development of the Company.
The above achievements cannot be made without great trust and strong support from all Shareholders and sections of society for a long time as well as joint efforts and hard work of both the management and all staff. I would like to extend my sincere gratitude on behalf of the Board in this regard.
18 Ch ina Deve lopment Bank F inanc ia l Leas ing Co . , L td .
Chairman’s Statement
The Board of the Group has been proactively enhancing the corporate governance level, and continuously improving the corporate governance structure with the goal of safeguarding all Shareholders’ interests and maximizing Shareholders’ values. In 2018, the Board convened a total of three general meetings and 11 Board meetings, considering 69 resolutions on the development strategies of the Company, the annual report, financial budgets and accounts, performance evaluation of Directors and senior management members, internal control of risks, remuneration plan, related party transactions and appointment and dismissal of senior management members. All Directors performed their duties loyally, diligently, compliantly and efficiently, which effectively supported the smooth progress of all works of the Group.
Looking forward to 2019, the growth of the world economy will slow down with deeper impact of the trade protectionism, the intensified debt risks, and the weakened drive of the development of main economies. China’s economy is in the transition stage of transforming the development mode, and optimizing the economic structure with the downward economic pressure. The central government paid close attention to the above situation and launched a series of financial, monetary and industrial policies with a focus on maintaining stable growth and remedying shortcomings, providing opportunities for the Group to explore the finance lease and serve the maintenance of growth and remedying areas of weaknesses. In the future, regarding “Leading China’s leasing industry, serving the real economy” as the mission, the Group will continue to improve the quality of its development and strive for developing as the international first-class leasing company based on the market-oriented, professional, diversified and international strategic position, and adhering to core value of stability, profession, integrity and win-win development, creating greater values for all Shareholders, staff and sections of society.
Chairman, Executive Director
March 27, 2019

192018 Annua l Report
President’s Statement
Peng Zhong President
In 2018, amid the complex and ever-changing situation, CDB Leasing insisted on the overall pace of striving while maintaining stability, endeavored to expand business, increase gains, adjust structure, control costs, prevent risks and secure compliance with concerted efforts. As a result, the Company fully accomplished the goal of annual operation plan and the major indicators created the historic best level, which enabled the Company to further maintain the stable leading position in the industry.
20 Ch ina Deve lopment Bank F inanc ia l Leas ing Co . , L td .
President’s Statement
REVIEW FOR 2018
Business development hit a new high by seizing opportunities and initiating efforts. Faced with the complex domestic and international economic situation, the Company strengthened the study and judgement on the current and future situation, initiated efforts, proactively seized the favorable market opportunities for expanding the leasing business and developed the business with great efforts, achieving substantive results. The total lease financing to new lessees for the year amounted to RMB82.7 billion, representing a year-on-year increase of 57%. The aviation subsidiaries sped up its pace in international expansion, comprehensively promoted the placement of orders, lease extensions and lease transitions for the aircraft with leases expiring, sale-and-leaseback, portfolio acquisitions and other business, and continued to optimize the fleet scale via multiple channels. We seized the market opportunities in vessel operation and took advantage of recovery window of shipping market to optimize the structure of ship types. We proactively carried out operating lease business of bulk carriers, and strengthened the cooperation with high-quality customers, such as Oldendorff (德國奧登道夫), Changhang Shipping (長航國際), BG Shipping (北港航運) and Wah Kwong Maritime Transport (華光海運). As for vehicle and construction machinery business, we established the customers cooperative relationship system with the three billion-strategy customers including Sany (三一), XCMG (徐工) and BAIC (北汽) as core customers, and built long-term cooperative relationship with car rental platforms, such as Yixin (易鑫), eHi (一嗨) and Shouqi (首汽) to effectively deploy consumer finance business of passenger vehicles. As for infrastructure business, we placed emphasis on water treatment, rail transit, port and port affairs and other key sectors for business expansion. As for new energy and equipment manufacturing business, we proactively expanded the customers in industry chain sector, and pushed forward the cooperation with BYD (比亞迪), BOE Technology (京東方) Goldwind Science Technology (金風科技), Beijing Enterprises Clean Energy (北控清潔能源).
Innovation, cost reduction and increase revenue with various measures implemented at the same time. In terms of liability management, we actively expanded financing channels, innovated financing methods, and reduced financing costs. Leveraging on debt capital market instruments, we successfully issued senior bonds in US$500 million, the price of which was lower than that of the similar bonds in the similar term. In terms of asset management, we strengthened the cooperative network of asset trading, and developed strategic cooperation relationship with leasing peers, laying a solid foundation for systematic promotion of lease transitions and acceptance of transfer of assets and other business. We explored the off-sheet model for standardized products, successfully getting the qualification approval of ABN products. The asset trading of aviation and ship proceeded successfully, with the profit substantially attributable to asset transfer.
Strict control of risks, maintenance of the bottom line, and the huge influence of the compliance and internal control. We strengthened risk management system building, formulated and amended basic provisions on comprehensive risk management and several regulations on operational risk, market risk and other aspects. We set up the system of risk management and control formed through the management of dual list, risk situation topic research, project risk indicators and multi-dimension risk investigation. We stringently protected the bottom line of risks, and pushed forward the work of elimination of risk. We used compliant and effective methods to eliminate non-performing assets. We regulated internal control and compliance management, revised the connected transactions, handling of cases, anti-money laundering and other system to further improve the internal control system. We consolidated the safeguard foundation of laws, enhanced the litigation cases management, and pushed forward the Company’s standardization of contract text. We built up the overall contract system covering the agreements in relation to lease, guarantee and regulation to enhance the management efficiency.
Enhancement of management and consolidation of foundation to safeguard the sound operation of the Company. Regarding the management of institutional organization, we revised the mid-term plan, and optimized the organizational structure. With regards to the remuneration management, we optimized the system through which to obtain the total amount of remuneration of the Company and improved the performance-based remuneration system. In the aspects of the construction of information system, we launched a series of new system to gradually achieve the “integration of business and finance”.
212018 Annua l Report
President’s Statement
PROSPECT FOR 2019
In 2019, CDB Leasing will continue to adhere to the principle of a steady development pace with progress. We will adhere to new development concepts, in strict compliance with the requirements of high-quality development, grasp the key points on risk prevention and control, thus pushing forward all works to a new level by sticking to strict management, strengthening innovation and promoting transformation.
Exploration of innovation and comprehensive promotion to achieve an orderly business development. Taking the “13th Five-Year” plan as the guideline, and focusing on Guangdong-Hong Kong-Macao Greater Bay Area, Beijing-Tianjin-Hebei Region, Yangtze River Economic Belt and other key areas, we will implement the policies for remedying shortcomings in energy, transportation infrastructure areas, seize historical opportunities in the second half of the urbanization process in China, and carry out the requirements of “three major battles”. We will study and make judgements on the situation, place the emphasis on major fields, strengthen the existing advantageous business, and enhance business model and business variety innovation to create new business and profit growth driver.
Safeguard of bottom line of risks to ensure the stability of asset quality. We will put more efforts on the resolve and disposal of risky and non-performing projects, strengthen multi-dimension risk supervision of projects and establish the mechanism for the notification, review and coordination of major risky projects. We will strengthen post-lease management and risk control for the Group's customers, take a firm grasp on the impairment risk management of the operating lease assets. We will push forward the risk and compliance investigation on infrastructure business, and prudently avoid the credit risk and compliance risk.
Improvement on management of assets and liabilities and continuous enhancement on the quality and efficiency of operation. We will continue to promote cooperative network of asset trading, leverage the guidance effect of asset trading to business investment, push forward the optimization of the asset structure, and expand financing channels. We will put more efforts on the development of financing varieties such as factoring, insurance funds, etc.
Improvement of the establishment of system and consolidation of foundation for innovation and development. We will rigorously promote the construction of information system, promote the implementation of the accounting standards for new leases to support business development, and continue to develop the implementation of process management and client management. We will improve the performance appraisal system, and adapt to the needs of reform and development of the Company.
In 2019, the reform and development of CDB Leasing will reach a new level. We will seize the opportunities to promote development, take practical actions to make breakthroughs and strengthen our core competitiveness so as to strive to create a more excellent operating result, lay a solid foundation for the achievement of the objectives under the “13th Five-Year” plan and further consolidate the leading position of the Company in the PRC finance leasing industry.
PresidentMarch 27, 2019

22 Ch ina Deve lopment Bank F inanc ia l Leas ing Co . , L td .
Management Discussion and Analysis
1. BUSINESS SITUATION AND COMPANY’S RESPONSES
1.1 Business Environment
1.1.1 Macro-Economy
Since 2018, the global economy continued to recover, but the external environment showed significant changes. Exchange rates in the capital markets in emerging economies fluctuated. The economy of the US showed a sign of remaining stable at a high level, debt risks intensified, the trade protectionism emerged, and uncertain factors have increased. The economy of China maintained a high resilience, however, along with profound changes in the external environment and the impact of removal of overcapacity and deleveraging, the growth rate of the Gross Domestic Product of China in 2018 was 6.6% year on year, representing a decrease of 0.3 percentage point as compared with that of 2017. At the stage of new and old kinetic energy conversion, the long-term accumulated risk exposures had increased, difficulties in financing faced by small and micro enterprises and private economy were still prominent, and the economy growth was subject to downward pressure. The economy operated steadily with changes and concerns.
In the short term, benefitting from a series of financial, monetary and industrial policies surrounding the maintenance of growth and remedying areas of weaknesses, the investment and financing needs in ships, infrastructure, energy equipment and other areas recovered gradually, and the capital advantage and professional capability of the Group will enable us to seize new opportunities in relevant business areas more effectively. In the medium- and long-term, China’s development is in and will still remain in an important period of strategic opportunities for a long time. Since the “supply-side structural reform” was initially mentioned by the Country in November 2015, China’s economy has experienced a complex process of bottoming and restructuring. Today, China has obtained initial success in cutting overcapacity, deleveraging, strict regulation and other aspects. Various industries realized capacity clearance, non-performing assets disposal and industry order rearrangement to different extents with structural opportunities in the market emerging gradually, which leads to a bright outlook in the development of the China’s economy and the leasing industry in the future.
1.1.2 Industry Environment
As of the end of 2018, the number of finance leasing companies across China reached 11,777 (excluding single project companies, branches, subsidiaries and acquired overseas companies), representing an increase of 2,101 companies, or 21.7%, as compared with 9,676 companies as at the end of 2017. The balance of finance leasing contracts was approximately RMB6,650 billion, representing an increase of RMB570 billion, or 9.4%, as compared with RMB6,080 billion as at the end of 20171.
1 Source: The “2018 China Finance Leasing Industry Development Report” (《2018年中國融資租賃業發展報告》) by China Leasing Union and Tianjin Binhai Financial Leasing Research Institute.
232018 Annua l Report
Management Discussion and Analysis
Although there has been severe competition in the industry arising from rapid growth of leasing companies, resources were further allocated to the preeminent players in the industry under the policy of financial deleveraging and strict regulation, while the leasing industry was showing an objective development trend of increase in market concentration. In the future, integration in the leasing industry will continue, the regulatory standards will also be gradually unified. A group of substandard and non-compliant finance leasing companies will be weeded out, providing large, standardized and professional leading leasing companies, like CDB Leasing, with a favorable development atmosphere and opportunities. In general, the development opportunities in the leasing industry still outweigh challenges.
1.2 Company’s Response
In 2018, faced with complex and ever-changing macro and industrial situation, the Group improved its market response capability through enhancing business structure, improving management efficiency, and strengthening risk management. The assets scale, newly added lease financing to lessees and the net profit of the Group hit a new historical high.
The Group strengthened the study and judgment of the macro environment and industrial situation, actively grasped the market opportunities to expand the leasing business, and paid closer attention to business development. The newly added lease financing to lessees hit a historical new high. The aviation sector successfully solved the re-financing problems of regional and old wide-body aircraft. The shipping business made use of the shipping recovery window period to actively carry out bulk carrier operating leases. The business with small and medium enterprises built a customer cooperation system focusing on strategic customers, actively deploying the passenger vehicle market. The new energy and equipment business actively expanded client base in the industry chain area. The infrastructure business adhered to the principles of compliance operation, focused on key areas and customers, and strengthened business cooperation of infrastructure in key regions.
The Group gave full play to the overall coordination role of the Lease Business Development and Examination Committee and Lease Business Review Committee, introduced the “jury system” into the Lease Business Review Committee to improve the efficiency of decision-making. The average development cycle of the projects was shortened by 15 days as compared with that in 2017. The Group reduced financing costs through various debt capital market instruments such as US$-denominated senior bonds and HK$-denominated private bonds and RMB financing by way of US dollar pledging. The Group established cooperation network for asset trading, promoted a breakthrough in the business model of “leasing+factoring”. The Group improved financial management and tax planning, optimized capital management, promoted the effective implementation of national policies on tax reduction. The Group deepened comprehensive risk management, innovated and improved the comprehensive risk management system, increased risk prevention and control awareness, and took several measures to maintain risk bottom line. The Group strengthened the internal compliance management, conducted process management, improved internal control and compliance management system, actively promoted the self-inspection and implementation of rectification based on regulatory inspection opinions, organized and carried out compliance training, strengthened the concept of creating value based on compliance and fully consolidated the defensive line of compliance.
24 Ch ina Deve lopment Bank F inanc ia l Leas ing Co . , L td .
Management Discussion and Analysis
2. FINANCIAL REVIEW
2.1 Analysis on Consolidated Statement of Profit and Loss
2.1.1 Overview of Consolidated Statement of Profit and Loss
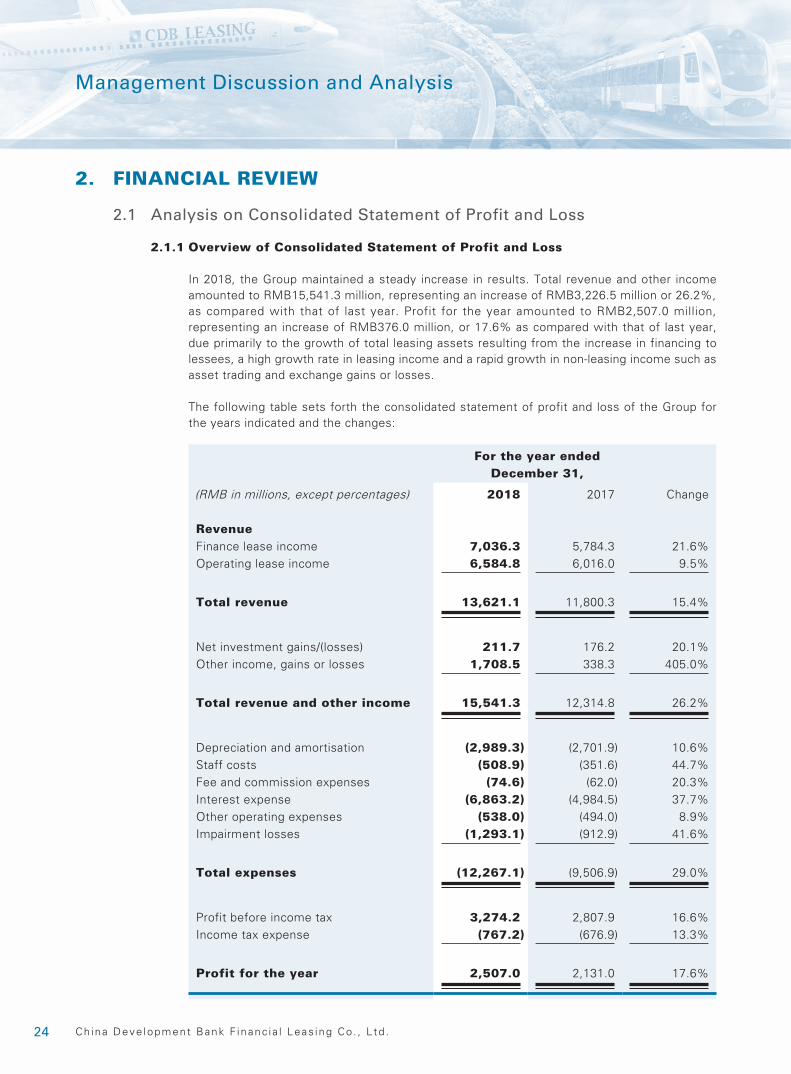
In 2018, the Group maintained a steady increase in results. Total revenue and other income amounted to RMB15,541.3 million, representing an increase of RMB3,226.5 million or 26.2%, as compared with that of last year. Profit for the year amounted to RMB2,507.0 million, representing an increase of RMB376.0 million, or 17.6% as compared with that of last year, due primarily to the growth of total leasing assets resulting from the increase in financing to lessees, a high growth rate in leasing income and a rapid growth in non-leasing income such as asset trading and exchange gains or losses.
The following table sets forth the consolidated statement of profit and loss of the Group for the years indicated and the changes:
For the year ended December 31,
(RMB in millions, except percentages) 2018 2017 Change
RevenueFinance lease income 7,036.3 5,784.3 21.6%Operating lease income 6,584.8 6,016.0 9.5%
Total revenue 13,621.1 11,800.3 15.4%
Net investment gains/(losses) 211.7 176.2 20.1%Other income, gains or losses 1,708.5 338.3 405.0%
Total revenue and other income 15,541.3 12,314.8 26.2%
Depreciation and amortisation (2,989.3) (2,701.9) 10.6%Staff costs (508.9) (351.6) 44.7%Fee and commission expenses (74.6) (62.0) 20.3%Interest expense (6,863.2) (4,984.5) 37.7%Other operating expenses (538.0) (494.0) 8.9%Impairment losses (1,293.1) (912.9) 41.6%
Total expenses (12,267.1) (9,506.9) 29.0%
Profit before income tax 3,274.2 2,807.9 16.6%Income tax expense (767.2) (676.9) 13.3%
Profit for the year 2,507.0 2,131.0 17.6%
252018 Annua l Report
Management Discussion and Analysis
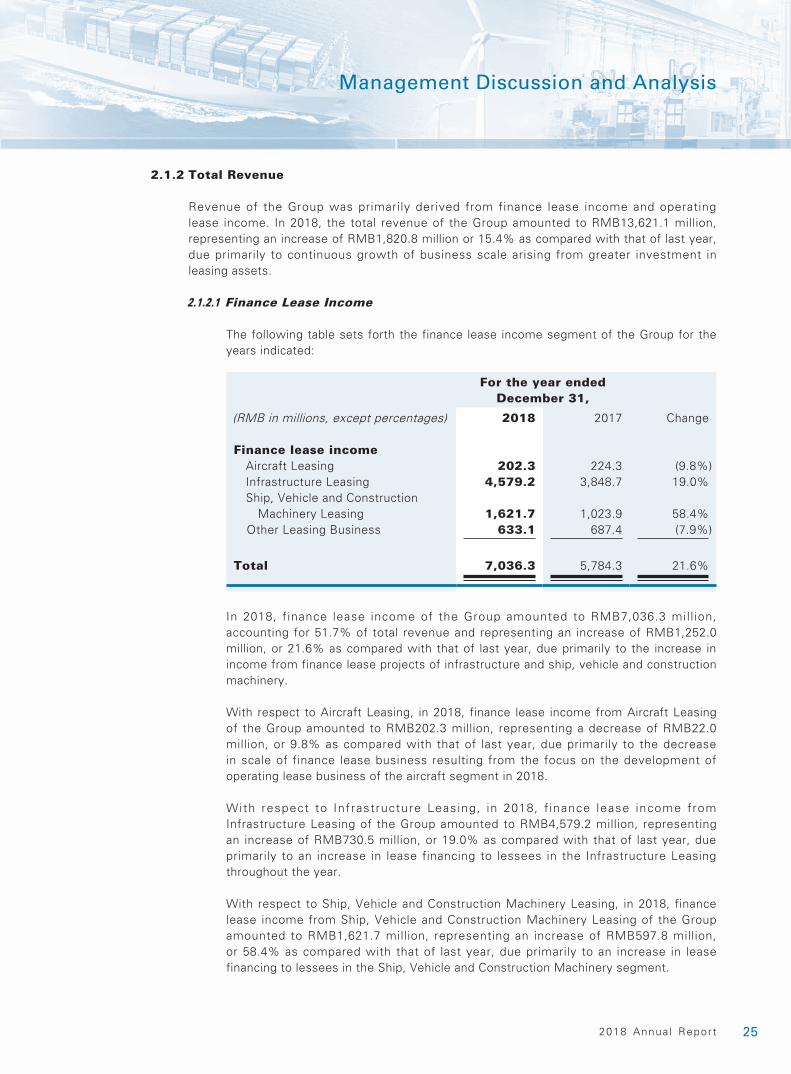
2.1.2 Total Revenue
Revenue of the Group was primarily derived from finance lease income and operating lease income. In 2018, the total revenue of the Group amounted to RMB13,621.1 million, representing an increase of RMB1,820.8 million or 15.4% as compared with that of last year, due primarily to continuous growth of business scale arising from greater investment in leasing assets.
2.1.2.1 Finance Lease Income
The following table sets forth the finance lease income segment of the Group for the years indicated:
For the year ended December 31,
(RMB in millions, except percentages) 2018 2017 Change
Finance lease incomeAircraft Leasing 202.3 224.3 (9.8%)Infrastructure Leasing 4,579.2 3,848.7 19.0%Ship, Vehicle and Construction
Machinery Leasing 1,621.7 1,023.9 58.4%Other Leasing Business 633.1 687.4 (7.9%)
Total 7,036.3 5,784.3 21.6%
In 2018, finance lease income of the Group amounted to RMB7,036.3 mill ion, accounting for 51.7% of total revenue and representing an increase of RMB1,252.0 million, or 21.6% as compared with that of last year, due primarily to the increase in income from finance lease projects of infrastructure and ship, vehicle and construction machinery.
With respect to Aircraft Leasing, in 2018, finance lease income from Aircraft Leasing of the Group amounted to RMB202.3 million, representing a decrease of RMB22.0 million, or 9.8% as compared with that of last year, due primarily to the decrease in scale of finance lease business resulting from the focus on the development of operating lease business of the aircraft segment in 2018.
With respect to Infrastructure Leasing, in 2018, f inance lease income from Infrastructure Leasing of the Group amounted to RMB4,579.2 million, representing an increase of RMB730.5 million, or 19.0% as compared with that of last year, due primarily to an increase in lease financing to lessees in the Infrastructure Leasing throughout the year.
With respect to Ship, Vehicle and Construction Machinery Leasing, in 2018, finance lease income from Ship, Vehicle and Construction Machinery Leasing of the Group amounted to RMB1,621.7 million, representing an increase of RMB597.8 million, or 58.4% as compared with that of last year, due primarily to an increase in lease financing to lessees in the Ship, Vehicle and Construction Machinery segment.
26 Ch ina Deve lopment Bank F inanc ia l Leas ing Co . , L td .
Management Discussion and Analysis
With respect to Other Leasing Business, in 2018, finance lease income from Other Leasing Business of the Group amounted to RMB633.1 mill ion, representing a decrease of RMB54.3 million, or 7.9% as compared with that of last year, due primarily to a further reduction of the assets scale of this segment resulting from the Group’s proactive control over the finance lease business scale of this segment.
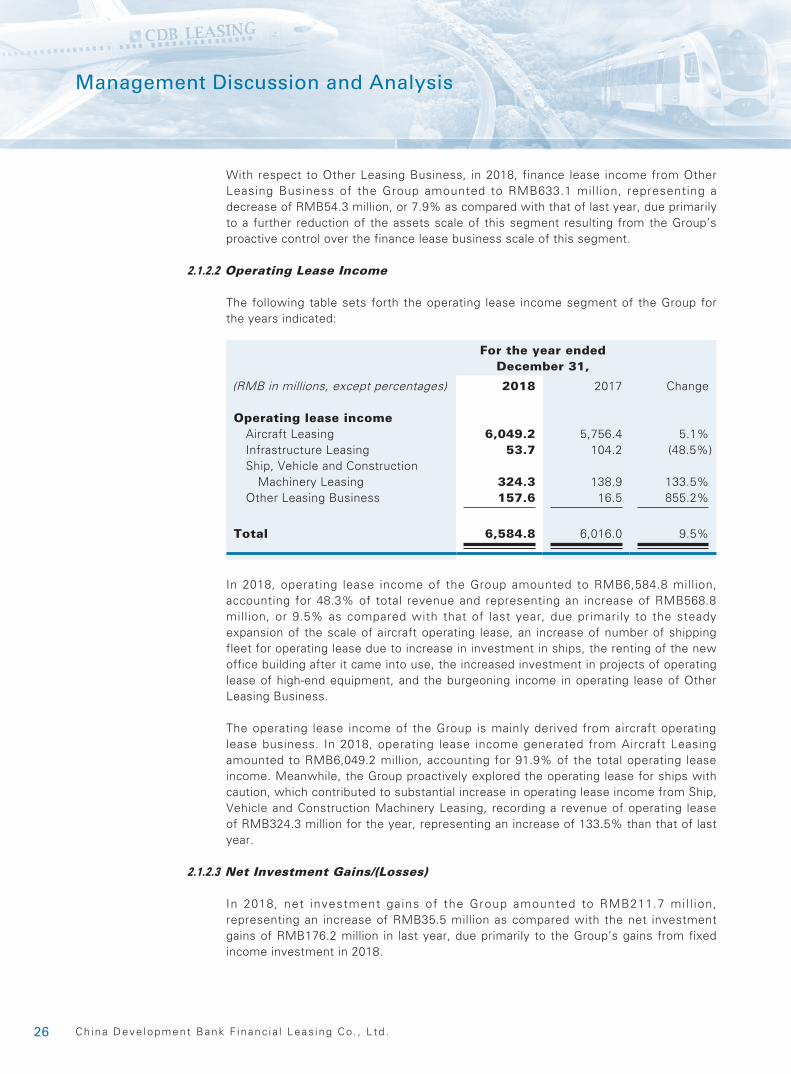
2.1.2.2 Operating Lease Income
The following table sets forth the operating lease income segment of the Group for the years indicated:
For the year ended December 31,
(RMB in millions, except percentages) 2018 2017 Change
Operating lease incomeAircraft Leasing 6,049.2 5,756.4 5.1%Infrastructure Leasing 53.7 104.2 (48.5%)Ship, Vehicle and Construction
Machinery Leasing 324.3 138.9 133.5%Other Leasing Business 157.6 16.5 855.2%
Total 6,584.8 6,016.0 9.5%
In 2018, operating lease income of the Group amounted to RMB6,584.8 million, accounting for 48.3% of total revenue and representing an increase of RMB568.8 million, or 9.5% as compared with that of last year, due primarily to the steady expansion of the scale of aircraft operating lease, an increase of number of shipping fleet for operating lease due to increase in investment in ships, the renting of the new office building after it came into use, the increased investment in projects of operating lease of high-end equipment, and the burgeoning income in operating lease of Other Leasing Business.
The operating lease income of the Group is mainly derived from aircraft operating lease business. In 2018, operating lease income generated from Aircraft Leasing amounted to RMB6,049.2 million, accounting for 91.9% of the total operating lease income. Meanwhile, the Group proactively explored the operating lease for ships with caution, which contributed to substantial increase in operating lease income from Ship, Vehicle and Construction Machinery Leasing, recording a revenue of operating lease of RMB324.3 million for the year, representing an increase of 133.5% than that of last year.
2.1.2.3 Net Investment Gains/(Losses)
In 2018, net investment gains of the Group amounted to RMB211.7 mil l ion, representing an increase of RMB35.5 million as compared with the net investment gains of RMB176.2 million in last year, due primarily to the Group’s gains from fixed income investment in 2018.
272018 Annua l Report
Management Discussion and Analysis
2.1.2.4 Other Income, Gains or Losses
In 2018, other income and gains of the Group amounted to RMB1,708.5 million, representing an increase of RMB1,370.2 million, or 405.0% as compared with that of last year, due primarily to an increase of income from disposal of aircraft assets, an increase in financial subsidies of Aircraft Leasing business, exchange gains generated from net US dollar assets exposure arising from the increase in the exchange rate of US dollar to RMB.
2.1.3 Cost Expenses
In 2018, total expenses of the Group amounted to RMB12,267.1 million, representing an increase of RMB2,760.2 million, or 29.0% as compared with that of last year, due primarily to an increase in interest expense, impairment losses, depreciation and amortisation, and other operating expenses.
2.1.3.1 Depreciation and Amortisation
In 2018, depreciat ion and amort isat ion expenses of the Group amounted to RMB2,989.3 million, representing an increase of RMB287.4 million, or 10.6% as compared with that of last year, due primarily to an increase in operating lease assets, in particular those for Aircraft Leasing. The scale of fleet of owned aircraft held for operating lease increased from 184 as of the end of 2017 to 203 as of the end of 2018.
2.1.3.2 Staff Costs
In 2018, staff costs of the Group amounted to RMB508.9 million, representing an increase of RMB157.3 million, or 44.7% as compared with that of last year. The increase was mainly because the Group strengthened the high-level talents reserve and construction of professional team, and intensified the role of incentive and restriction mechanism in order to better implement the development strategies and enhance the market competitiveness. As a result, the Group accordingly expanded the size of professional team, strengthened the strategic layout of aviation, further introduced and expanded the international and professional aeronautical team and established a more market-oriented remuneration and incentive system.
2.1.3.3 Fee and Commission Expenses
In 2018, fee and commission expenses of the Group amounted to RMB74.6 million, representing an increase of RMB12.6 million, or 20.3% as compared with that of last year, due primarily to the increase in handling fees in the finance guarantee.
28 Ch ina Deve lopment Bank F inanc ia l Leas ing Co . , L td .
Management Discussion and Analysis
2.1.3.4 Interest Expense
In 2018, interest expense of the Group amounted to RMB6,863.2 million, representing an increase of RMB1,878.7 million, or 37.7% as compared with that of last year, due primarily to the increase of comprehensive financing costs in 2018 resulting from the increase in the market interest rates, as well as the corresponding increase in the interest expense as a result of the growth of the overall financing scale along with the expansion of business scale.
2.1.3.5 Other Operating Expenses
In 2018, other operating expenses of the Group amounted to RMB538.0 million, representing an increase of RMB44.0 million, or 8.9% as compared with that of last year, due primarily to the increase in related business and management expenses resulting from the expansion of business scale.
2.1.3.6 Impairment Losses
In 2018, impairment losses of the Group amounted to RMB1,293.1 mi l l ion, representing an increase of RMB380.2 million, or 41.6% as compared with that of last year, due primarily to the increase of the impairment losses arising from the Group’s increased lease financed to lessees and leasing assets.
2.1.4 Profit before Income Tax
In 2018, profit before income tax of the Group amounted to RMB3,274.2 million, representing an increase of RMB466.3 million, or 16.6% as compared with that of last year, due primarily to an increase in lease income, asset transaction income and exchange gains.
2.1.5 Income Tax Expense
In 2018, income tax expense of the Group amounted to RMB767.2 million, representing an increase of RMB90.3 million, or 13.3% as compared with that of last year, due primarily to an increase in profit before income tax.
2.1.6 Profit for the Year
In 2018, profit for the year of the Group amounted to RMB2,507.0 million, representing an increase of RMB376.0 million, or 17.6% as compared with that of last year.
292018 Annua l Report
Management Discussion and Analysis
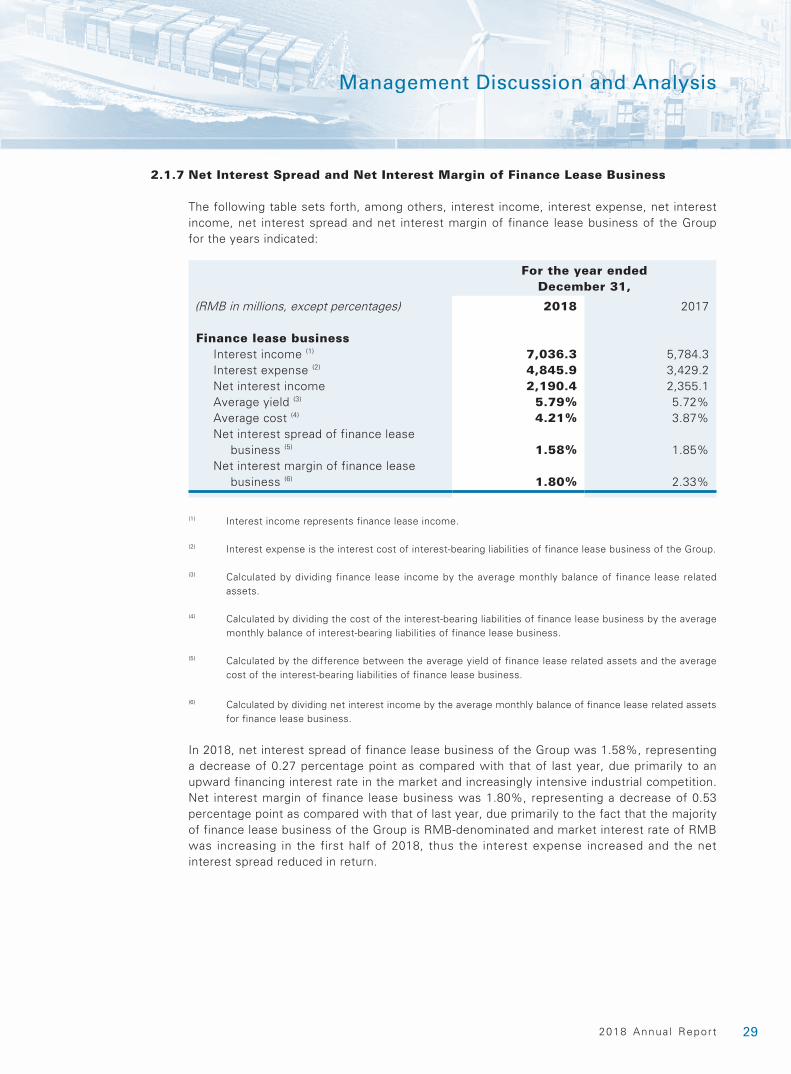
2.1.7 Net Interest Spread and Net Interest Margin of Finance Lease Business
The following table sets forth, among others, interest income, interest expense, net interest income, net interest spread and net interest margin of finance lease business of the Group for the years indicated:
For the year ended December 31,
(RMB in millions, except percentages) 2018 2017
Finance lease businessInterest income (1) 7,036.3 5,784.3Interest expense (2) 4,845.9 3,429.2Net interest income 2,190.4 2,355.1Average yield (3) 5.79% 5.72%Average cost (4) 4.21% 3.87%Net interest spread of finance lease
business (5) 1.58% 1.85%Net interest margin of finance lease
business (6) 1.80% 2.33%
(1) Interest income represents finance lease income.
(2) Interest expense is the interest cost of interest-bearing liabilities of finance lease business of the Group.
(3) Calculated by dividing finance lease income by the average monthly balance of finance lease related assets.
(4) Calculated by dividing the cost of the interest-bearing liabilities of finance lease business by the average monthly balance of interest-bearing liabilities of finance lease business.
(5) Calculated by the difference between the average yield of finance lease related assets and the average cost of the interest-bearing liabilities of finance lease business.
(6) Calculated by dividing net interest income by the average monthly balance of finance lease related assets for finance lease business.
In 2018, net interest spread of finance lease business of the Group was 1.58%, representing a decrease of 0.27 percentage point as compared with that of last year, due primarily to an upward financing interest rate in the market and increasingly intensive industrial competition. Net interest margin of finance lease business was 1.80%, representing a decrease of 0.53 percentage point as compared with that of last year, due primarily to the fact that the majority of finance lease business of the Group is RMB-denominated and market interest rate of RMB was increasing in the first half of 2018, thus the interest expense increased and the net interest spread reduced in return.
30 Ch ina Deve lopment Bank F inanc ia l Leas ing Co . , L td .
Management Discussion and Analysis
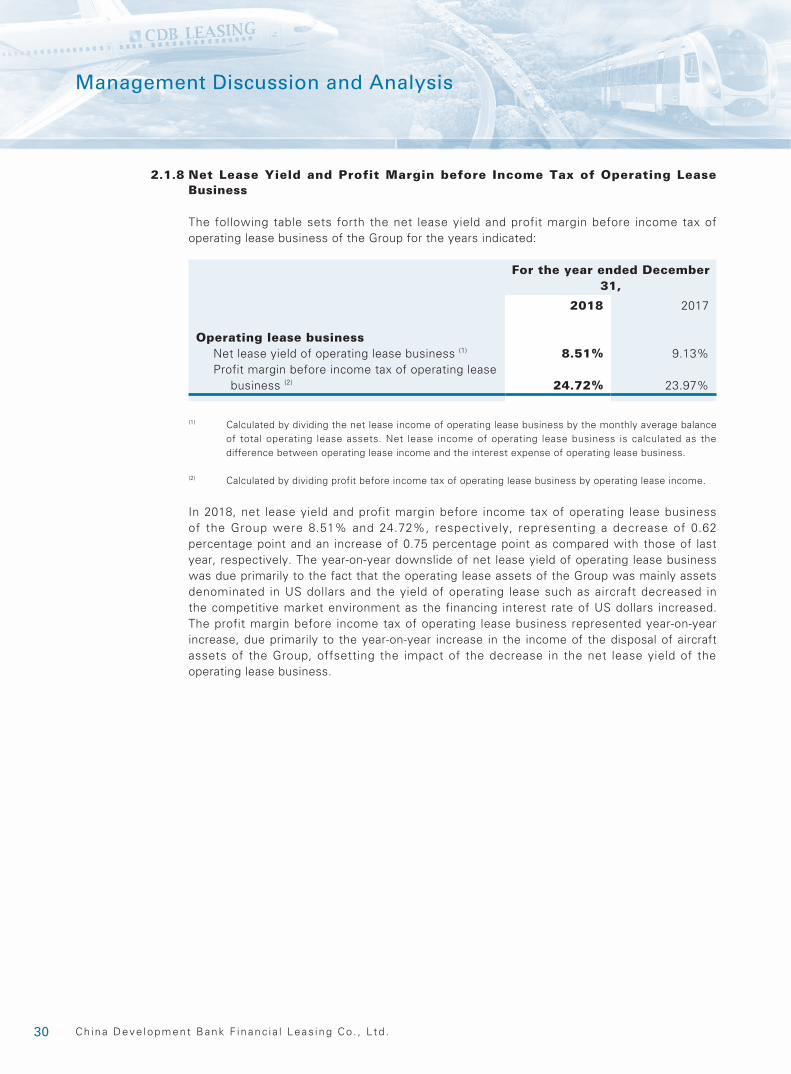
2.1.8 Net Lease Yield and Profit Margin before Income Tax of Operating Lease Business
The following table sets forth the net lease yield and profit margin before income tax of operating lease business of the Group for the years indicated:
For the year ended December 31,
2018 2017
Operating lease businessNet lease yield of operating lease business (1) 8.51% 9.13%Profit margin before income tax of operating lease
business (2) 24.72% 23.97%
(1) Calculated by dividing the net lease income of operating lease business by the monthly average balance of total operating lease assets. Net lease income of operating lease business is calculated as the difference between operating lease income and the interest expense of operating lease business.
(2) Calculated by dividing profit before income tax of operating lease business by operating lease income.
In 2018, net lease yield and profit margin before income tax of operating lease business of the Group were 8.51% and 24.72%, respectively, representing a decrease of 0.62 percentage point and an increase of 0.75 percentage point as compared with those of last year, respectively. The year-on-year downslide of net lease yield of operating lease business was due primarily to the fact that the operating lease assets of the Group was mainly assets denominated in US dollars and the yield of operating lease such as aircraft decreased in the competitive market environment as the financing interest rate of US dollars increased. The profit margin before income tax of operating lease business represented year-on-year increase, due primarily to the year-on-year increase in the income of the disposal of aircraft assets of the Group, offsetting the impact of the decrease in the net lease yield of the operating lease business.
312018 Annua l Report
Management Discussion and Analysis
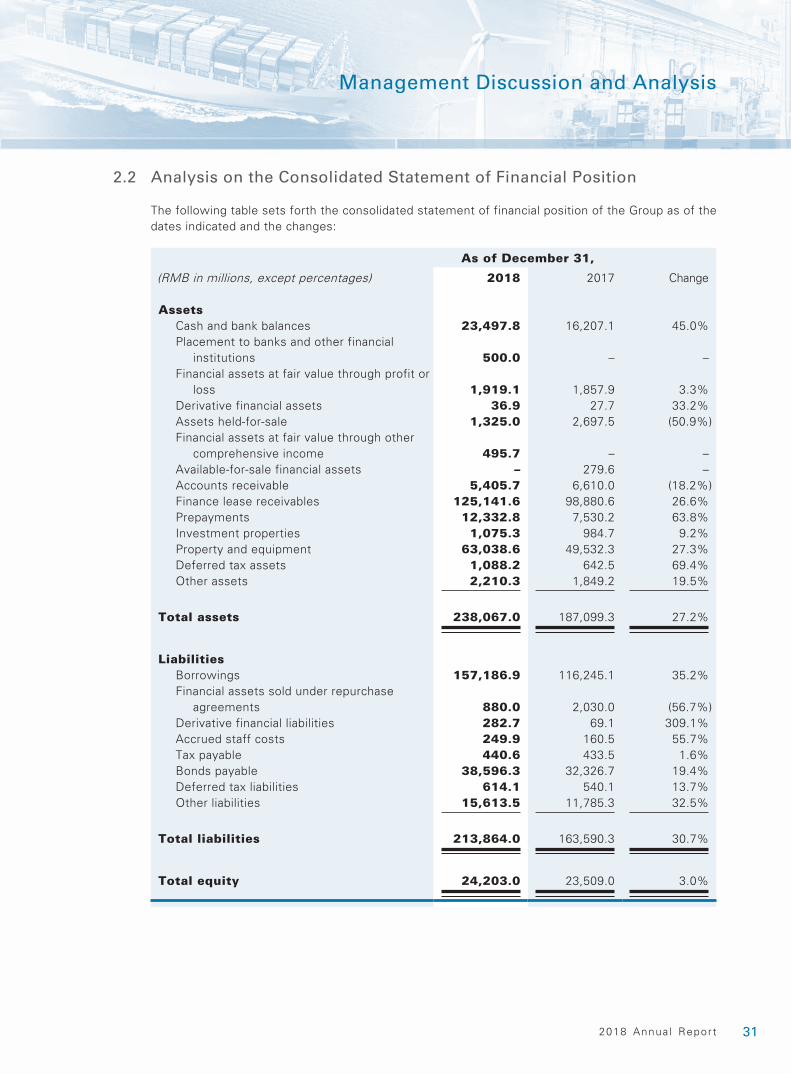
2.2 Analysis on the Consolidated Statement of Financial Position
The following table sets forth the consolidated statement of financial position of the Group as of the dates indicated and the changes:
As of December 31,
(RMB in millions, except percentages) 2018 2017 Change
AssetsCash and bank balances 23,497.8 16,207.1 45.0%Placement to banks and other financial
institutions 500.0 – –Financial assets at fair value through profit or
loss 1,919.1 1,857.9 3.3%Derivative financial assets 36.9 27.7 33.2%Assets held-for-sale 1,325.0 2,697.5 (50.9%)Financial assets at fair value through other
comprehensive income 495.7 – –Available-for-sale financial assets – 279.6 –Accounts receivable 5,405.7 6,610.0 (18.2%)Finance lease receivables 125,141.6 98,880.6 26.6%Prepayments 12,332.8 7,530.2 63.8%Investment properties 1,075.3 984.7 9.2%Property and equipment 63,038.6 49,532.3 27.3%Deferred tax assets 1,088.2 642.5 69.4%Other assets 2,210.3 1,849.2 19.5%
Total assets 238,067.0 187,099.3 27.2%
LiabilitiesBorrowings 157,186.9 116,245.1 35.2%Financial assets sold under repurchase
agreements 880.0 2,030.0 (56.7%)Derivative financial liabilities 282.7 69.1 309.1%Accrued staff costs 249.9 160.5 55.7%Tax payable 440.6 433.5 1.6%Bonds payable 38,596.3 32,326.7 19.4%Deferred tax liabilities 614.1 540.1 13.7%Other liabilities 15,613.5 11,785.3 32.5%
Total liabilities 213,864.0 163,590.3 30.7%
Total equity 24,203.0 23,509.0 3.0%
32 Ch ina Deve lopment Bank F inanc ia l Leas ing Co . , L td .
Management Discussion and Analysis
2.2.1 Total Assets
The principal components of the Group’s assets were cash and bank balances, accounts receivable, finance lease receivables, prepayments and property and equipment, collectively representing 96.4% of the Group’s total assets as of December 31, 2018. As of December 31, 2018, total assets of the Group amounted to RMB238,067.0 million, representing an increase of RMB50,967.7 million, or 27.2% as compared with that as of the end of last year, due primarily to further expansion of the Group’s business scale.
2.2.1.1 Accounts Receivable
The Group’s accounts receivable includes operating lease receivables, advances for finance lease projects and other accounts receivable. Operating lease receivables refer to the operating lease rentals receivable provided as of December 31, 2018, advances for finance lease projects refer to the payments in advance for those finance lease projects which were contracted but had not yet met all leasing conditions, and other accounts receivable refers to the accounts receivable incurred by the sale of leased assets. As of December 31, 2018, accounts receivable of the Group amounted to RMB5,405.7 million, representing a decrease of RMB1,204.3 million, or 18.2% as compared with that as of the end of last year, due primarily to the transfer of the Group’s advances for finance lease projects to finance lease receivables when leasing conditions were met upon conclusion and handover of finance lease assets.
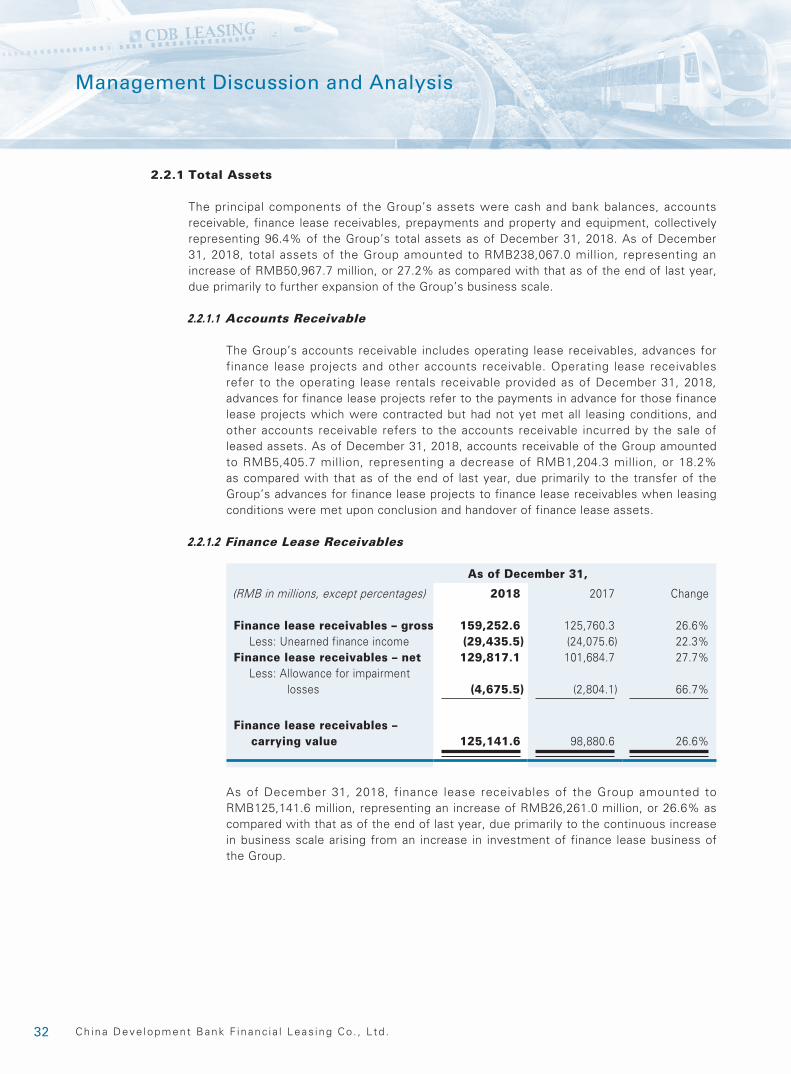
2.2.1.2 Finance Lease Receivables
(RMB in millions, except percentages)
As of December 31,
2018 2017 Change
Finance lease receivables – gross 159,252.6 125,760.3 26.6%Less: Unearned finance income (29,435.5) (24,075.6) 22.3%
Finance lease receivables – net 129,817.1 101,684.7 27.7%Less: A llowance for impairment
losses (4,675.5) (2,804.1) 66.7%
Finance lease receivables – carrying value 125,141.6 98,880.6 26.6%
As of December 31, 2018, finance lease receivables of the Group amounted to RMB125,141.6 million, representing an increase of RMB26,261.0 million, or 26.6% as compared with that as of the end of last year, due primarily to the continuous increase in business scale arising from an increase in investment of finance lease business of the Group.
332018 Annua l Report
Management Discussion and Analysis
2.2.1.3 Prepayments
As of December 31, 2018, prepayments of the Group amounted to RMB12,332.8 million, representing an increase in RMB4,802.6 million, or 63.8% as compared with that as of the end of last year. On the one hand, it was due to an increase prepayment arising from the increase in order of aircraft and ships; on the other hand, it was due to the impact of increase in exchange rate of US dollars to RMB.
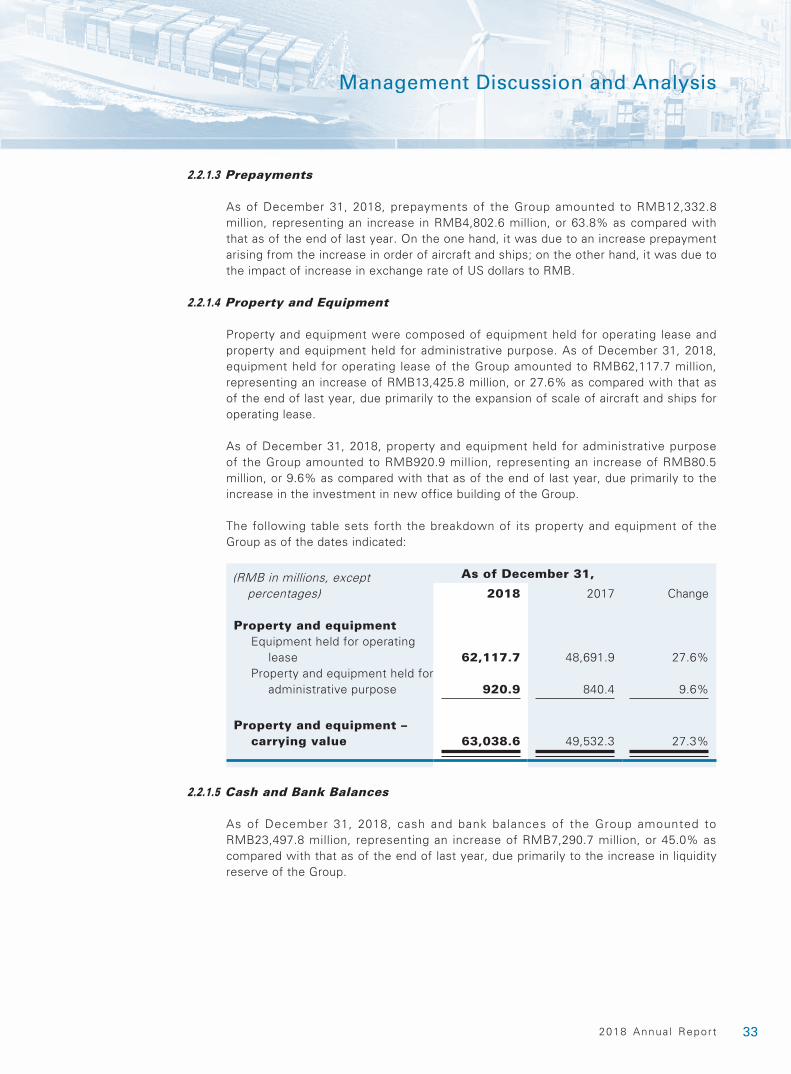
2.2.1.4 Property and Equipment
Property and equipment were composed of equipment held for operating lease and property and equipment held for administrative purpose. As of December 31, 2018, equipment held for operating lease of the Group amounted to RMB62,117.7 million, representing an increase of RMB13,425.8 million, or 27.6% as compared with that as of the end of last year, due primarily to the expansion of scale of aircraft and ships for operating lease.
As of December 31, 2018, property and equipment held for administrative purpose of the Group amounted to RMB920.9 million, representing an increase of RMB80.5 million, or 9.6% as compared with that as of the end of last year, due primarily to the increase in the investment in new office building of the Group.
The following table sets forth the breakdown of its property and equipment of the Group as of the dates indicated:
(RMB in millions, except percentages)
As of December 31,
2018 2017 Change
Property and equipmentEquipment held for operating
lease 62,117.7 48,691.9 27.6%Property and equipment held for
administrative purpose 920.9 840.4 9.6%
Property and equipment – carrying value 63,038.6 49,532.3 27.3%
2.2.1.5 Cash and Bank Balances
As of December 31, 2018, cash and bank balances of the Group amounted to RMB23,497.8 million, representing an increase of RMB7,290.7 million, or 45.0% as compared with that as of the end of last year, due primarily to the increase in liquidity reserve of the Group.
34 Ch ina Deve lopment Bank F inanc ia l Leas ing Co . , L td .
Management Discussion and Analysis
2.2.1.6 Other Assets
Other assets primarily included deductible input value-added tax, land use rights, maintenance right assets, other receivables and prepaid expenses. As of December 31, 2018, other assets of the Group amounted to RMB2,210.3 million, representing an increase of RMB361.1 million, or 19.5% as compared with that as of the end of last year, due primarily to increase in deductible input value-added tax.
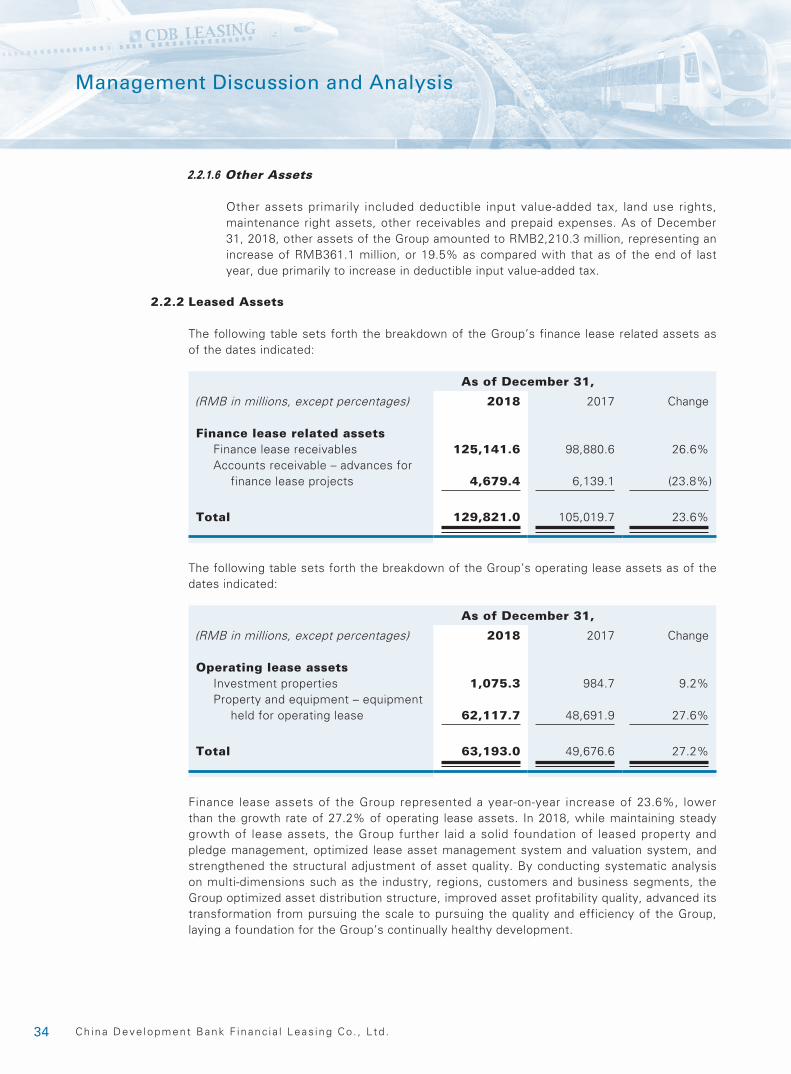
2.2.2 Leased Assets
The following table sets forth the breakdown of the Group’s finance lease related assets as of the dates indicated:
(RMB in millions, except percentages)
As of December 31,
2018 2017 Change
Finance lease related assetsFinance lease receivables 125,141.6 98,880.6 26.6%Accounts receivable – advances for
finance lease projects 4,679.4 6,139.1 (23.8%)
Total 129,821.0 105,019.7 23.6%
The following table sets forth the breakdown of the Group’s operating lease assets as of the dates indicated:
(RMB in millions, except percentages)
As of December 31,
2018 2017 Change
Operating lease assetsInvestment properties 1,075.3 984.7 9.2%Property and equipment – equipment
held for operating lease 62,117.7 48,691.9 27.6%
Total 63,193.0 49,676.6 27.2%
Finance lease assets of the Group represented a year-on-year increase of 23.6%, lower than the growth rate of 27.2% of operating lease assets. In 2018, while maintaining steady growth of lease assets, the Group further laid a solid foundation of leased property and pledge management, optimized lease asset management system and valuation system, and strengthened the structural adjustment of asset quality. By conducting systematic analysis on multi-dimensions such as the industry, regions, customers and business segments, the Group optimized asset distribution structure, improved asset profitability quality, advanced its transformation from pursuing the scale to pursuing the quality and efficiency of the Group, laying a foundation for the Group’s continually healthy development.
352018 Annua l Report
Management Discussion and Analysis
2.2.3 Total Liabilities
As of December 31, 2018, total liabilities of the Group amounted to RMB213,864.0 million, representing an increase of RMB50,273.7 million, or 30.7% as compared with that as of the end of last year, due primarily to the increases in borrowings and the balance of bonds payable.
2.2.3.1 Borrowings
As of December 31, 2018, the balance of borrowings of the Group amounted to RMB157,186.9 million, representing an increase of RMB40,941.8 million, or 35.2% as compared with that as of the end of last year, due primarily to the increase in financing for development of business scale.
2.2.3.2 Bonds Payable
As of December 31, 2018, the balance of bonds payable of the Group amounted to RMB38,596.3 million, representing an increase of RMB6,269.6 million, or 19.4% as compared with that as of the end of last year, due primarily to the Group’s optimization of financing structure and the increase in the scale of issuance of offshore bonds in 2018.
2.2.3.3 Other Liabilities
As of December 31, 2018, the balance of other liabilities of the Group amounted to RMB15,613.5 million, representing an increase of RMB3,828.2 million, or 32.5% as compared with that as of the end of last year, due primarily to the increase in security deposits paid by customers, lease discount liabilities arising from purchase and operating leaseback transactions and notes payable.
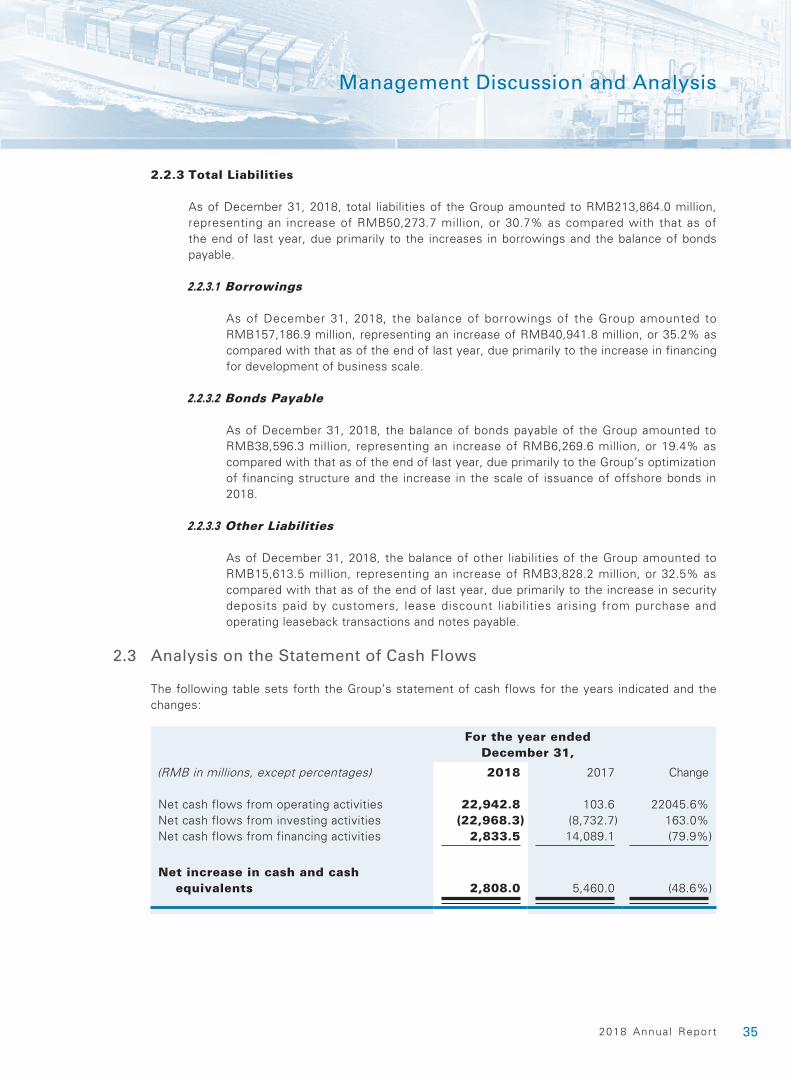
2.3 Analysis on the Statement of Cash Flows
The following table sets forth the Group’s statement of cash flows for the years indicated and the changes:
For the year ended December 31,
(RMB in millions, except percentages) 2018 2017 Change
Net cash flows from operating activities 22,942.8 103.6 22045.6%Net cash flows from investing activities (22,968.3) (8,732.7) 163.0%Net cash flows from financing activities 2,833.5 14,089.1 (79.9%)
Net increase in cash and cash equivalents 2,808.0 5,460.0 (48.6%)
36 Ch ina Deve lopment Bank F inanc ia l Leas ing Co . , L td .
Management Discussion and Analysis
In 2018, net cash inflow from operating activities of the Group amounted to RMB22,942.8 million, representing an increase of 22045.6% as compared with that of last year, due primarily to the increase in the scale of lease business of the Group as compared with that of last year. As a result, the financing scale of the Group increased, which was mainly through borrowings for financing from financial institutions, leading to the increase in cash inflows through operating activities. For the same period, net cash outflow from investing activities of the Group amounted to RMB22,968.3 million, representing an increase of 163.0% as compared with that of last year, due primarily to the increase in the amount of the Group’s investment in properties and equipment as compared with that of last year. Furthermore, in 2018, net cash inflow from financing activities of the Group amounted to RMB2,833.5 million, representing a decrease of RMB11,255.6 million as compared with that of last year, due primarily to the decrease in the scale of new issuance of offshore bonds of the Group.
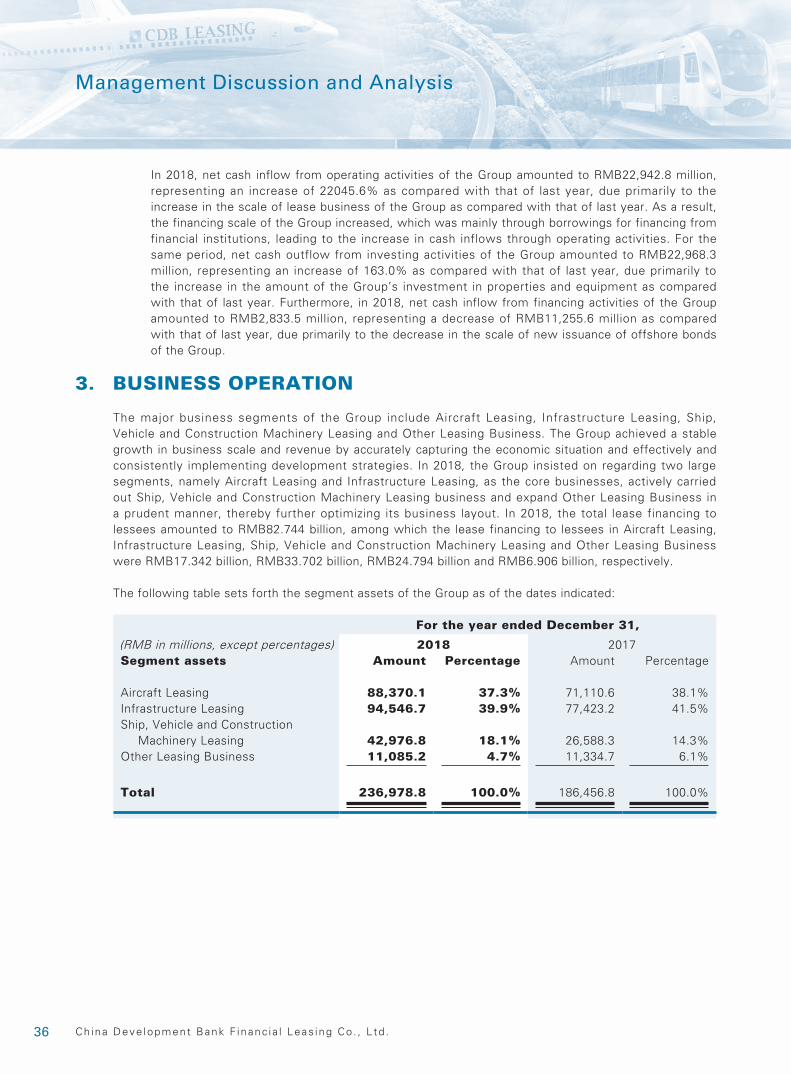
3. BUSINESS OPERATION
The major business segments of the Group include Aircraft Leasing, Infrastructure Leasing, Ship, Vehicle and Construction Machinery Leasing and Other Leasing Business. The Group achieved a stable growth in business scale and revenue by accurately capturing the economic situation and effectively and consistently implementing development strategies. In 2018, the Group insisted on regarding two large segments, namely Aircraft Leasing and Infrastructure Leasing, as the core businesses, actively carried out Ship, Vehicle and Construction Machinery Leasing business and expand Other Leasing Business in a prudent manner, thereby further optimizing its business layout. In 2018, the total lease financing to lessees amounted to RMB82.744 billion, among which the lease financing to lessees in Aircraft Leasing, Infrastructure Leasing, Ship, Vehicle and Construction Machinery Leasing and Other Leasing Business were RMB17.342 billion, RMB33.702 billion, RMB24.794 billion and RMB6.906 billion, respectively.
The following table sets forth the segment assets of the Group as of the dates indicated:
(RMB in millions, except percentages)
For the year ended December 31,
2018 2017Segment assets Amount Percentage Amount Percentage
Aircraft Leasing 88,370.1 37.3% 71,110.6 38.1%Infrastructure Leasing 94,546.7 39.9% 77,423.2 41.5%Ship, Vehicle and Construction
Machinery Leasing 42,976.8 18.1% 26,588.3 14.3%Other Leasing Business 11,085.2 4.7% 11,334.7 6.1%
Total 236,978.8 100.0% 186,456.8 100.0%
372018 Annua l Report
Management Discussion and Analysis
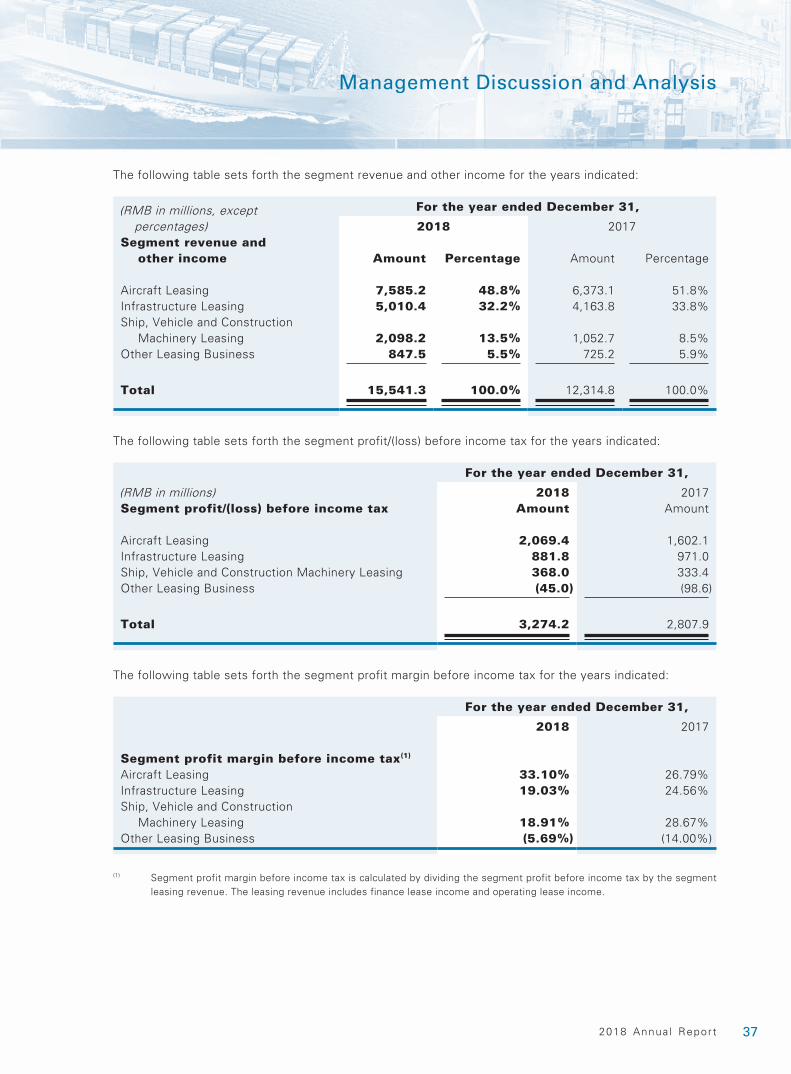
The following table sets forth the segment revenue and other income for the years indicated:
(RMB in millions, except percentages)
For the year ended December 31,
2018 2017Segment revenue and
other income Amount Percentage Amount Percentage
Aircraft Leasing 7,585.2 48.8% 6,373.1 51.8%Infrastructure Leasing 5,010.4 32.2% 4,163.8 33.8%Ship, Vehicle and Construction
Machinery Leasing 2,098.2 13.5% 1,052.7 8.5%Other Leasing Business 847.5 5.5% 725.2 5.9%
Total 15,541.3 100.0% 12,314.8 100.0%
The following table sets forth the segment profit/(loss) before income tax for the years indicated:
For the year ended December 31,
(RMB in millions) 2018 2017Segment profit/(loss) before income tax Amount Amount
Aircraft Leasing 2,069.4 1,602.1Infrastructure Leasing 881.8 971.0Ship, Vehicle and Construction Machinery Leasing 368.0 333.4Other Leasing Business (45.0) (98.6)
Total 3,274.2 2,807.9
The following table sets forth the segment profit margin before income tax for the years indicated:
For the year ended December 31,
2018 2017
Segment profit margin before income tax(1)
Aircraft Leasing 33.10% 26.79%Infrastructure Leasing 19.03% 24.56%Ship, Vehicle and Construction
Machinery Leasing 18.91% 28.67%Other Leasing Business (5.69%) (14.00%)
(1) Segment profit margin before income tax is calculated by dividing the segment profit before income tax by the segment leasing revenue. The leasing revenue includes finance lease income and operating lease income.
38 Ch ina Deve lopment Bank F inanc ia l Leas ing Co . , L td .
Management Discussion and Analysis
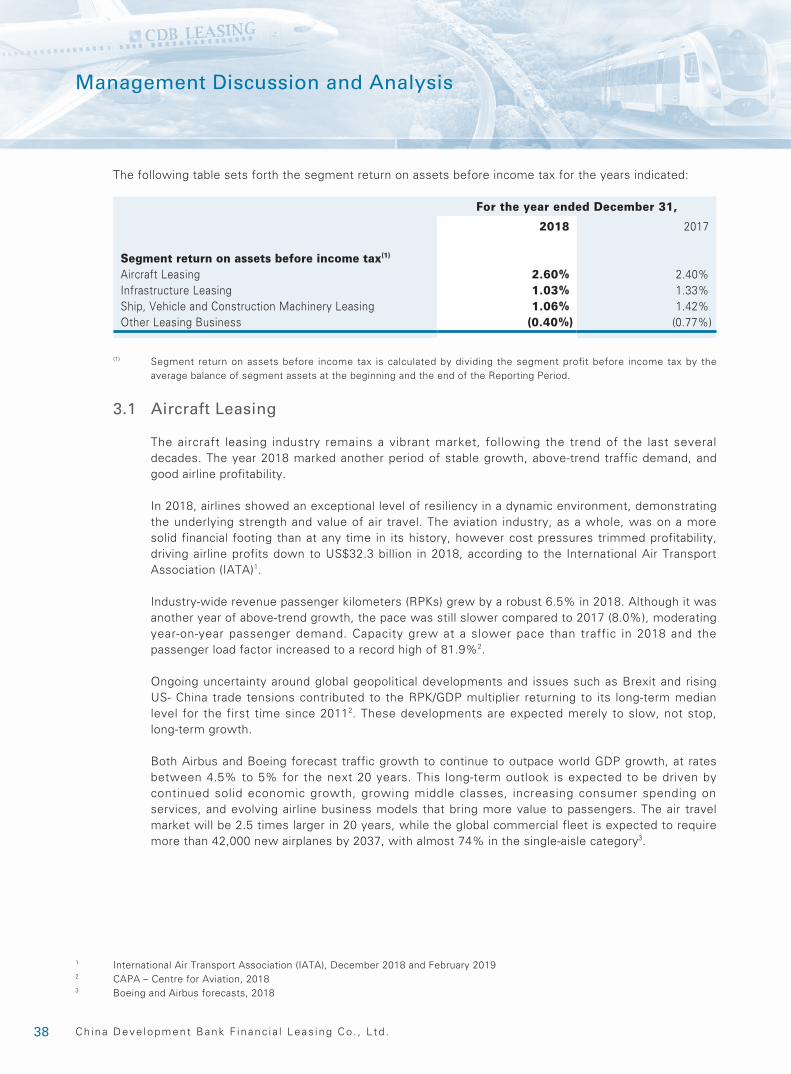
The following table sets forth the segment return on assets before income tax for the years indicated:
For the year ended December 31,
2018 2017
Segment return on assets before income tax(1)
Aircraft Leasing 2.60% 2.40%Infrastructure Leasing 1.03% 1.33%Ship, Vehicle and Construction Machinery Leasing 1.06% 1.42%Other Leasing Business (0.40%) (0.77%)
(1) Segment return on assets before income tax is calculated by dividing the segment profit before income tax by the average balance of segment assets at the beginning and the end of the Reporting Period.
3.1 Aircraft Leasing
The aircraft leasing industry remains a vibrant market, following the trend of the last several decades. The year 2018 marked another period of stable growth, above-trend traffic demand, and good airline profitability.
In 2018, airlines showed an exceptional level of resiliency in a dynamic environment, demonstrating the underlying strength and value of air travel. The aviation industry, as a whole, was on a more solid financial footing than at any time in its history, however cost pressures trimmed profitability, driving airline profits down to US$32.3 billion in 2018, according to the International Air Transport Association (IATA)1.
Industry-wide revenue passenger kilometers (RPKs) grew by a robust 6.5% in 2018. Although it was another year of above-trend growth, the pace was still slower compared to 2017 (8.0%), moderating year-on-year passenger demand. Capacity grew at a slower pace than traffic in 2018 and the passenger load factor increased to a record high of 81.9%2.
Ongoing uncertainty around global geopolitical developments and issues such as Brexit and rising US- China trade tensions contributed to the RPK/GDP multiplier returning to its long-term median level for the first time since 20112. These developments are expected merely to slow, not stop, long-term growth.
Both Airbus and Boeing forecast traffic growth to continue to outpace world GDP growth, at rates between 4.5% to 5% for the next 20 years. This long-term outlook is expected to be driven by continued solid economic growth, growing middle classes, increasing consumer spending on services, and evolving airline business models that bring more value to passengers. The air travel market will be 2.5 times larger in 20 years, while the global commercial fleet is expected to require more than 42,000 new airplanes by 2037, with almost 74% in the single-aisle category3.
1 International Air Transport Association (IATA), December 2018 and February 20192 CAPA – Centre for Aviation, 20183 Boeing and Airbus forecasts, 2018
392018 Annua l Report
Management Discussion and Analysis
In 2018, the airline industry continued to be resilient to external shocks and demonstrated consistent profitability underpinned by improved capacity management. Load factors and aircraft utilization improved substantially and made a major contribution to the improvement in profitability. Airlines added flying capacity to their networks in order to take advantage of the growing demand, particularly in Asia Pacific. As fuel costs were on the rise, airlines increasingly opted to add new generation aircraft with better fuel efficiency.
These factors continue to support the demand for leased aircraft. It is projected that leased aircraft will continue to grow as a percentage of the worldwide fleet. The share of leased aircraft in the commercial airline fleet has been nearing 50% for the past decade. The penetration of leased aircraft is highest in Latin America, Europe, and Asia Pacific2.
The number of operating lessors has increased significantly within the last decade, with lessors’ orderbooks at historic highs. Lessors continue to play a vital role in providing airlines access to capital funding2.
Competition from lessors and other investors remains heightened, as investors continue to be drawn to the aircraft leasing sector.
Amidst these market conditions, the Group has been able to leverage its aircraft leasing platform to deliver its strategies. With rising fuel prices, the Group is well positioned to serve airline customers with its orderbook, nearly all of which comprises the latest technology and most fuel-efficient aircraft types.
Aircraft Leasing is one of the core business segments of the Group. 2018 witnessed another growth year in which the Group executed an increased volume of transactions to support the continued growth of its industry-leading Aircraft Leasing platform. The growth in 2018 is evidence of the strength and scale of the Group’s Aircraft Leasing segment, and demonstrates its unwavering commitment to execution through a combination of its business model, cooperation opportunities with manufacturers and strong relationships with the airlines.
Major highlights for 2018 include:
• Signed lease transactions for 62 aircraft with 22 customers;
• Signed agreements to sell 17 aircraft and to acquire 28 aircraft;
• Acquired 42 aircraft on operating lease, representing over 20% growth by number of aircraft in the fleet at the start of 2018;
• Signed financing transactions for US$3.2 billion;
• Ended the year with 104 total employees, adding 36 new staff members in 2018; and
• Added 9 new airline customers.
40 Ch ina Deve lopment Bank F inanc ia l Leas ing Co . , L td .
Management Discussion and Analysis
As of December 31, 2018, the Group owned and managed a well-diversified portfolio of 231 aircraft assets on lease to 56 lessees in 29 jurisdictions. Total assets of the Aircraft Leasing segment of the Group amounted to RMB88,370.1 million, representing an increase of 24.3% compared to December 31, 2017, and the total revenue and other income of the Aircraft Leasing segment amounted to RMB7,585.2 million, representing an increase of 19.0% compared to the same period last year. The assets of the Aircraft Leasing segment accounted for 37.3% of the overall Group, representing a decrease of 0.8% compared to December 31, 2017. The revenue and other income of the Aircraft Leasing segment accounted for 48.8% of the overall Group, representing a decrease of 3.0% compared to the same period of last year.
In 2018, the Group delivered 33 new aircraft and acquired 9 aircraft by way of portfolio acquisition, all of which were leased to airlines under operating leases. As of December 31, 2018, the Group had a portfolio of 427 aircraft, consisting of 226 owned aircraft, 5 managed aircraft and 196 committed aircraft. As of December 31, 2018, 203 owned aircraft of the Group were held for operating leases and 23 owned aircraft of the Group were under finance leases; the Group also has three flight simulators under finance lease. As of December 31, 2018, the weighted average age by net book value of the Group’s owned aircraft on operating lease was 4.3 years, the weighted average remaining lease term by net book value of the Group’s owned aircraft held for operating leases was 7.0 years.
The Group’s owned and in-service fleet mainly includes narrow-body types such as Airbus A320 family and Boeing 737 NG family aircraft, and wide-body aircraft types such as the Airbus A330 and the Boeing 777–300ER. Weighted by net book value the aircraft portfolio consists of 65% narrow-body aircraft, 30% wide-body aircraft and 5% regional, cargo, and other aircraft types.
The Group’s orderbook contains next-generation, liquid, narrow-body types from the Airbus A320neo and Boeing 737 Max families. As of 31 December 2018, the Group has committed to purchase 100 aircraft from Boeing and 86 aircraft from Airbus. These aircraft are scheduled to deliver between 2019 and 2025. Of these total orders, 22 Boeing 737 aircraft were converted from the eight 787–9 aircraft in the original order book. The Group also has contractual commitments to acquire a further 10 aircraft under sale and leaseback and portfolio acquisition transactions. The aggregate of these commitments at manufacturer list prices is US$23,458 million.
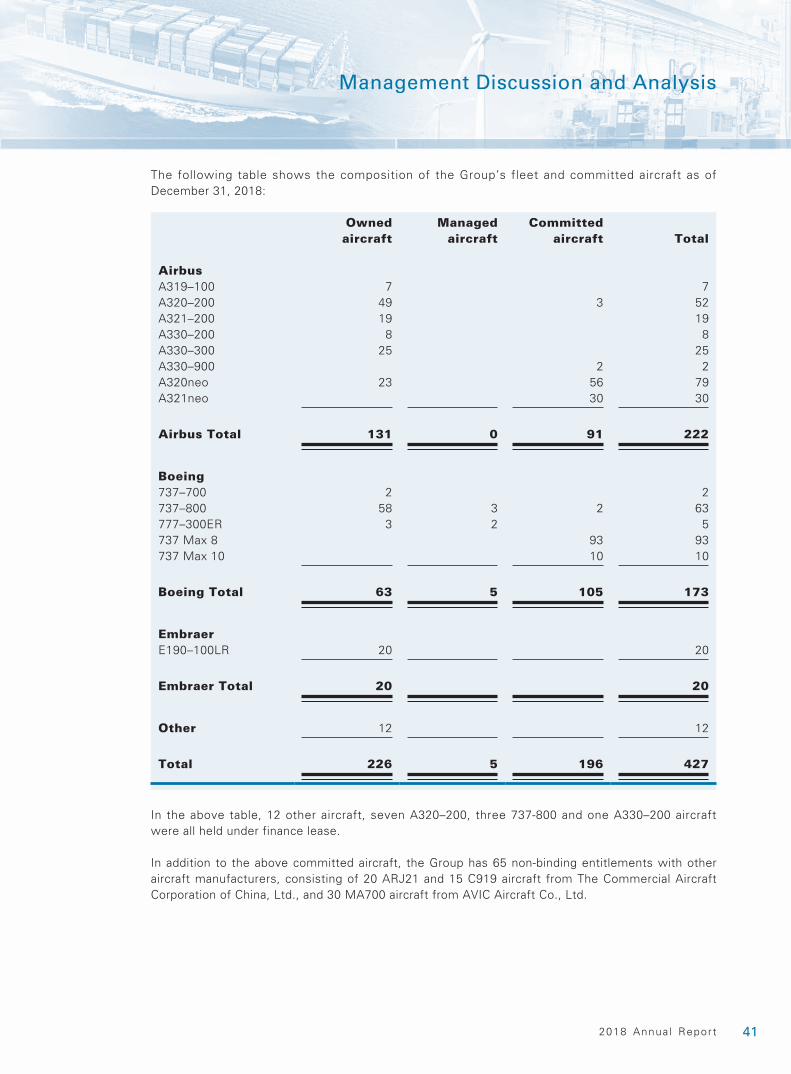
412018 Annua l Report
Management Discussion and Analysis
The following table shows the composition of the Group’s fleet and committed aircraft as of December 31, 2018:
Owned aircraft
Managed aircraft
Committed aircraft Total
AirbusA319–100 7 7 A320–200 49 3 52A321–200 19 19A330–200 8 8A330–300 25 25A330–900 2 2A320neo 23 56 79A321neo 30 30
Airbus Total 131 0 91 222
Boeing737–700 2 2737–800 58 3 2 63777–300ER 3 2 5737 Max 8 93 93737 Max 10 10 10
Boeing Total 63 5 105 173
EmbraerE190–100LR 20 20
Embraer Total 20 20
Other 12 12
Total 226 5 196 427
In the above table, 12 other aircraft, seven A320–200, three 737-800 and one A330–200 aircraft were all held under finance lease.
In addition to the above committed aircraft, the Group has 65 non-binding entitlements with other aircraft manufacturers, consisting of 20 ARJ21 and 15 C919 aircraft from The Commercial Aircraft Corporation of China, Ltd., and 30 MA700 aircraft from AVIC Aircraft Co., Ltd.
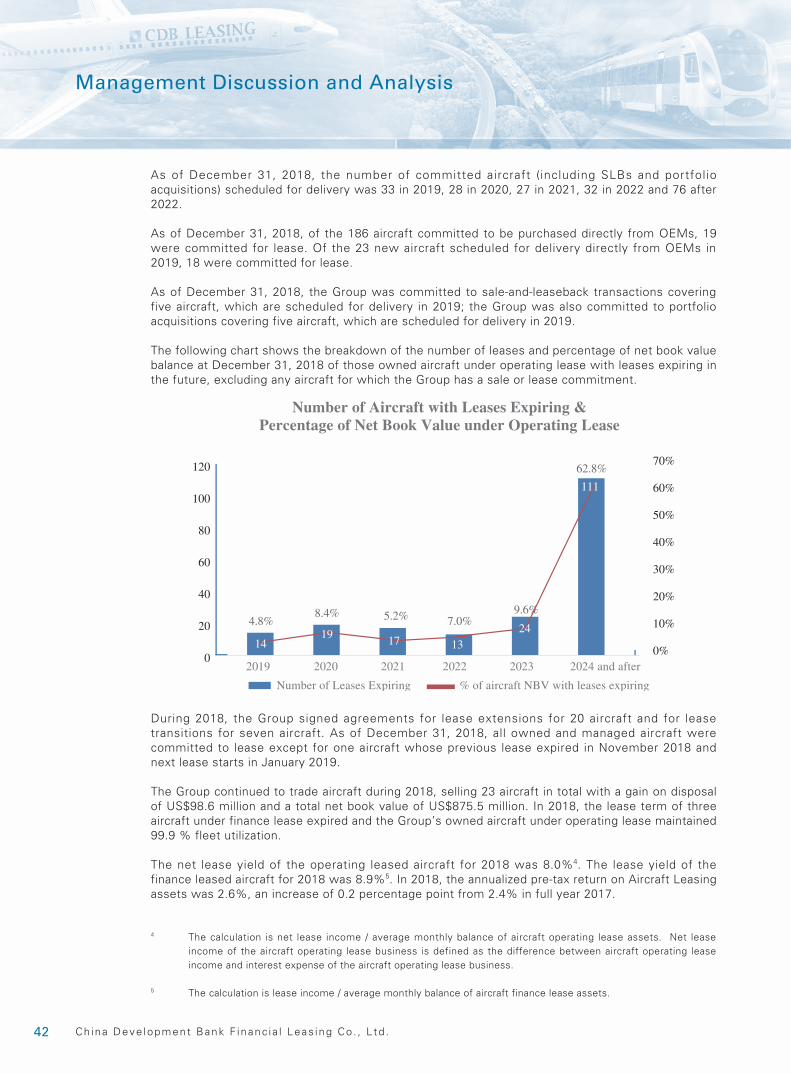
42 Ch ina Deve lopment Bank F inanc ia l Leas ing Co . , L td .
Management Discussion and Analysis
As of December 31, 2018, the number of committed aircraft (including SLBs and portfolio acquisitions) scheduled for delivery was 33 in 2019, 28 in 2020, 27 in 2021, 32 in 2022 and 76 after 2022.
As of December 31, 2018, of the 186 aircraft committed to be purchased directly from OEMs, 19 were committed for lease. Of the 23 new aircraft scheduled for delivery directly from OEMs in 2019, 18 were committed for lease.
As of December 31, 2018, the Group was committed to sale-and-leaseback transactions covering five aircraft, which are scheduled for delivery in 2019; the Group was also committed to portfolio acquisitions covering five aircraft, which are scheduled for delivery in 2019.
The following chart shows the breakdown of the number of leases and percentage of net book value balance at December 31, 2018 of those owned aircraft under operating lease with leases expiring in the future, excluding any aircraft for which the Group has a sale or lease commitment.
4.8% 5.2%8.4%7.0%
9.6%
62.8%
2019 2020 2021 2022 2023 2024 and after0
20
40
60
80
100
120
Number of Aircraft with Leases Expiring &Percentage of Net Book Value under Operating Lease
0%
10%
20%
30%
40%
50%
60%
70%
1419 17 13
24
111
Number of Leases Expiring % of aircraft NBV with leases expiring
During 2018, the Group signed agreements for lease extensions for 20 aircraft and for lease transitions for seven aircraft. As of December 31, 2018, all owned and managed aircraft were committed to lease except for one aircraft whose previous lease expired in November 2018 and next lease starts in January 2019.
The Group continued to trade aircraft during 2018, selling 23 aircraft in total with a gain on disposal of US$98.6 million and a total net book value of US$875.5 million. In 2018, the lease term of three aircraft under finance lease expired and the Group’s owned aircraft under operating lease maintained 99.9 % fleet utilization.
The net lease yield of the operating leased aircraft for 2018 was 8.0%4. The lease yield of the finance leased aircraft for 2018 was 8.9%5. In 2018, the annualized pre-tax return on Aircraft Leasing assets was 2.6%, an increase of 0.2 percentage point from 2.4% in full year 2017.
4 The calculation is net lease income / average monthly balance of aircraft operating lease assets. Net lease income of the aircraft operating lease business is defined as the difference between aircraft operating lease income and interest expense of the aircraft operating lease business.
5 The calculation is lease income / average monthly balance of aircraft finance lease assets.
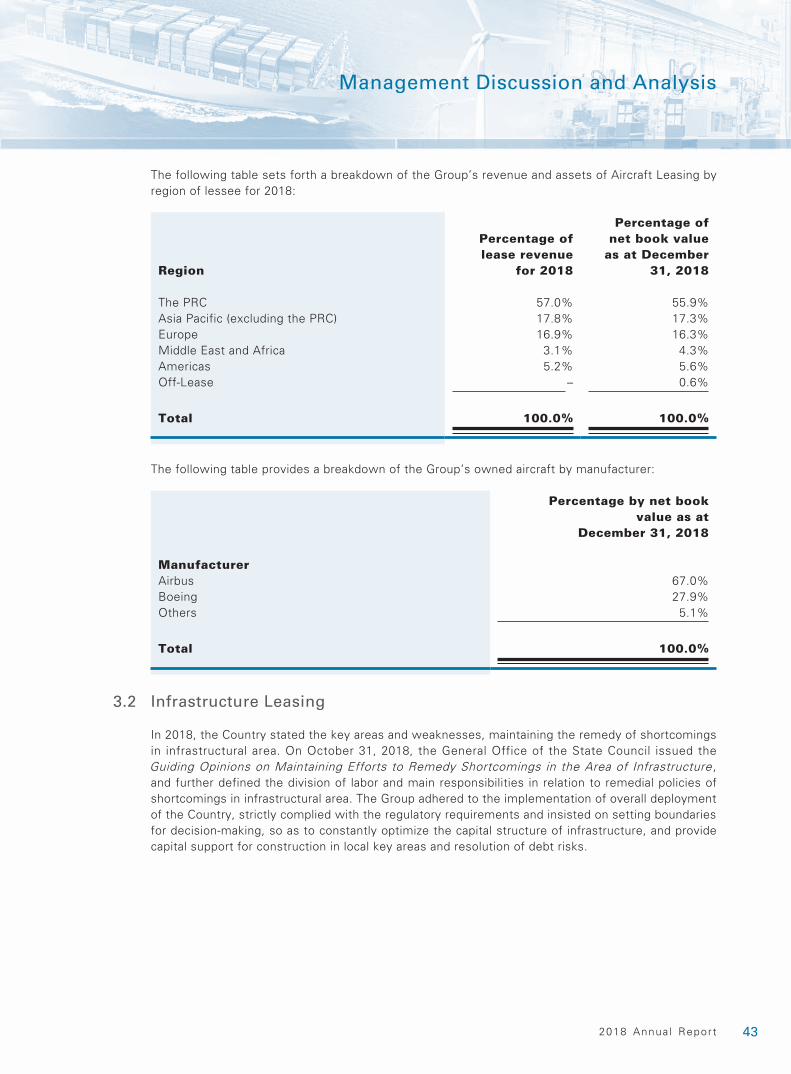
432018 Annua l Report
Management Discussion and Analysis
The following table sets forth a breakdown of the Group’s revenue and assets of Aircraft Leasing by region of lessee for 2018:
Region
Percentage of lease revenue
for 2018
Percentage of net book value
as at December 31, 2018
The PRC 57.0% 55.9%Asia Pacific (excluding the PRC) 17.8% 17.3%Europe 16.9% 16.3%Middle East and Africa 3.1% 4.3%Americas 5.2% 5.6%Off-Lease – 0.6%
Total 100.0% 100.0%
The following table provides a breakdown of the Group’s owned aircraft by manufacturer:
Percentage by net book value as at
December 31, 2018
ManufacturerAirbus 67.0%Boeing 27.9%Others 5.1%
Total 100.0%
3.2 Infrastructure Leasing
In 2018, the Country stated the key areas and weaknesses, maintaining the remedy of shortcomings in infrastructural area. On October 31, 2018, the General Office of the State Council issued the Guiding Opinions on Maintaining Efforts to Remedy Shortcomings in the Area of Infrastructure , and further defined the division of labor and main responsibilities in relation to remedial policies of shortcomings in infrastructural area. The Group adhered to the implementation of overall deployment of the Country, strictly complied with the regulatory requirements and insisted on setting boundaries for decision-making, so as to constantly optimize the capital structure of infrastructure, and provide capital support for construction in local key areas and resolution of debt risks.

44 Ch ina Deve lopment Bank F inanc ia l Leas ing Co . , L td .
Management Discussion and Analysis
In 2018, the Group adhered to legitimate and compliant operation, resolutely eliminated hidden debt projects involving local government, and maintained stable and compliant development of the infrastructure leasing business. The business of Infrastructure Leasing segment accounted for 47.9% of the newly increased investment amount of the Group throughout the year. On business development strategies, the Group conducted active synergy with the branches of China Development Bank, mainly cooperated with provincial and municipal financing platforms with controllable debt risks, reduced the county- and district-level platform business, actively explored high-quality customers such as central enterprises, provincial and municipal state-owned enterprises, and participated in and promoted market-oriented transformation of financing platforms to enhance business concentration and depth for quality customers.
The Group had established a relatively mature business model for the Infrastructure Leasing segment, accumulated extensive business experience and gradually enhanced business scale and profitability. As of December 31, 2018, the total assets of the Infrastructure Leasing segment of the Group amounted to RMB94,546.7 million, representing an increase of RMB17,123.5 million, or 22.1%, as compared with that as of the end of last year. In 2018, such business segment realized revenue and other income of RMB5,010.4 million, representing an increase of RMB846.6 million, or 20.3%, as compared with that of last year.
The majority of the Infrastructure Leasing business of the Group was under finance lease, while a minority was under operating lease, thus the overall asset quality was good. The finance leasing mode of Infrastructure Leasing of the Group is carried out primarily through sale-and-leaseback model, which effectively helps enterprises activate the existing assets.
Infrastructure Leasing business comprises Transportation Infrastructure Leasing (toll roads, rail transit equipment), Urban Infrastructure Leasing (municipal facilities and social housing) and Energy Infrastructure Leasing (energy and electric power equipment) as classified by the type of leased assets.
Transportation Infrastructure Leasing
Transportation Infrastructure Leasing business primarily comprises the leasing of toll roads and rail transit equipment. In order to obtain stable leasing income, the Group provides sale-and-leaseback services on fixed assets for highways, toll roads and bridges operating companies with stable toll revenue as well as rail transit operating companies with stable income from tickets, advertising, real estate rental and other rail transit management. Meanwhile, the Group requires the lessees to pledge the toll-collecting rights as a security so as to reduce business risks.
As of December 31, 2018, the existing leasing projects of the Group include toll roads in 10 provinces and rail transit equipment in 10 provinces in the PRC.
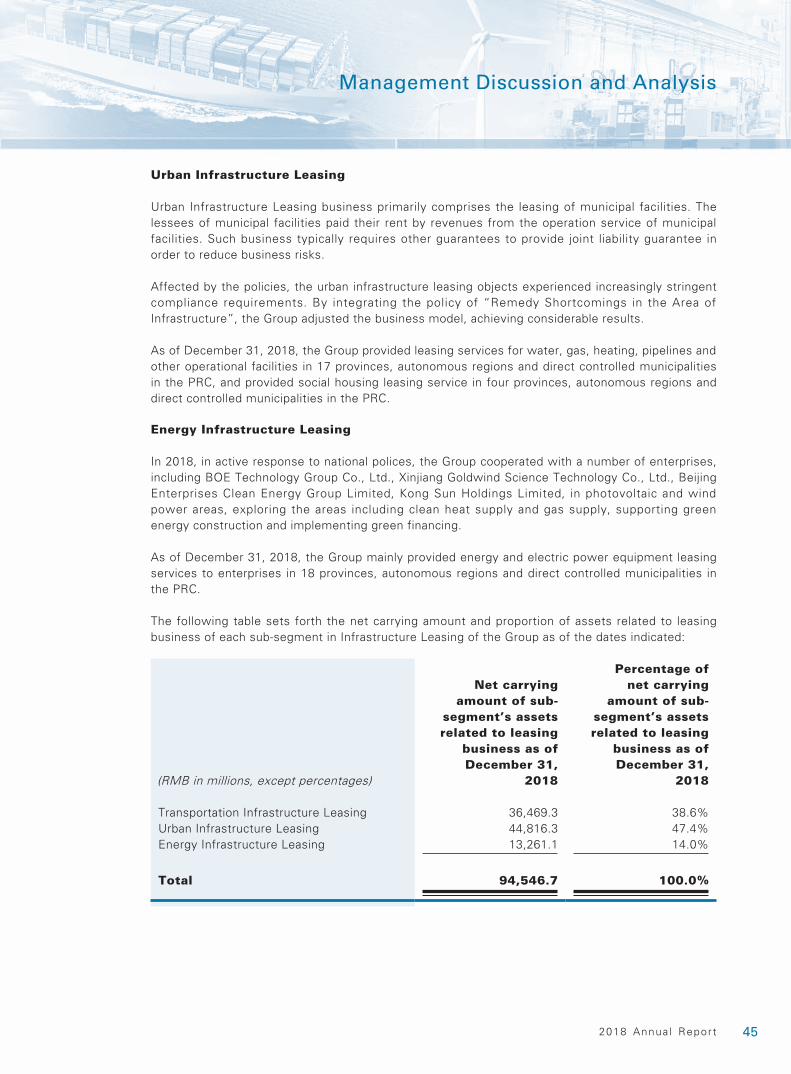
452018 Annua l Report
Management Discussion and Analysis
Urban Infrastructure Leasing
Urban Infrastructure Leasing business primarily comprises the leasing of municipal facilities. The lessees of municipal facilities paid their rent by revenues from the operation service of municipal facilities. Such business typically requires other guarantees to provide joint liability guarantee in order to reduce business risks.
Affected by the policies, the urban infrastructure leasing objects experienced increasingly stringent compliance requirements. By integrating the policy of “Remedy Shortcomings in the Area of Infrastructure”, the Group adjusted the business model, achieving considerable results.
As of December 31, 2018, the Group provided leasing services for water, gas, heating, pipelines and other operational facilities in 17 provinces, autonomous regions and direct controlled municipalities in the PRC, and provided social housing leasing service in four provinces, autonomous regions and direct controlled municipalities in the PRC.
Energy Infrastructure Leasing
In 2018, in active response to national polices, the Group cooperated with a number of enterprises, including BOE Technology Group Co., Ltd., Xinjiang Goldwind Science Technology Co., Ltd., Beijing Enterprises Clean Energy Group Limited, Kong Sun Holdings Limited, in photovoltaic and wind power areas, exploring the areas including clean heat supply and gas supply, supporting green energy construction and implementing green financing.
As of December 31, 2018, the Group mainly provided energy and electric power equipment leasing services to enterprises in 18 provinces, autonomous regions and direct controlled municipalities in the PRC.
The following table sets forth the net carrying amount and proportion of assets related to leasing business of each sub-segment in Infrastructure Leasing of the Group as of the dates indicated:
(RMB in millions, except percentages)
Net carrying amount of sub-
segment’s assets related to leasing
business as of December 31,
2018
Percentage of net carrying
amount of sub-segment’s assets related to leasing
business as of December 31,
2018
Transportation Infrastructure Leasing 36,469.3 38.6%Urban Infrastructure Leasing 44,816.3 47.4%Energy Infrastructure Leasing 13,261.1 14.0%
Total 94,546.7 100.0%

46 Ch ina Deve lopment Bank F inanc ia l Leas ing Co . , L td .
Management Discussion and Analysis
In 2019, the Group will stringently implement the requirements of policies in local debt management set by relevant ministries and commissions and local government at all levels, arrange the inspection of lease projects in regions with a higher rate of government debt, and set up risk prevention and control plan. Surrounding the strategy of serving the Country, the Group will take advantages of China Development Bank’s quality customer resources and rich experience in long-term loans in the area of infrastructure, carry out leasing business in the areas with sufficient cash flow and clear standards of property rights, such as toll roads, rail transit, water treatment, heat supply, gas supply and parking lot, and continuously provide support for local construction and resolution of risks.
3.3 Ship, Vehicle and Construction Machinery Leasing
In 2018, the Group focused on optimizing its business layout, selected quality leasing assets and quality clients with a prudent approach for ship and vehicle leasing business and advanced healthy development of construction machinery leasing business. As of December 31, 2018, total assets of the Ship, Vehicle and Construction Machinery Leasing segment amounted to RMB42,976.8 million, representing an increase of RMB16,388.5 million, or 61.6%, as compared with that as of the end of last year. In 2018, total revenue and other income of the Ship, Vehicle and Construction Machinery Leasing segment of the Group amounted to RMB2,098.2 million, representing an increase of RMB1,045.5 million, or 99.3%, as compared with that of last year, due primarily to the increase in the ship and construction machinery business.
Ship Leasing
In terms of Ship Leasing business, in 2018, BDI index remained a gradual upward trend of recovery. The average annual index amounted to 1,353.43 points, boosting 18.2% as compared to 1,145.23 points in 2017. The global seaborne trade volume (million ton) grew by 2.7%; the seaborne trade turnover (billion ton•Mile) increased by 3.1%, while the capacity increased by 2.6%.
Baltic Exchange Dry Index (BDI)
0.00
1,000.00
2,000.00
3,000.00
4,000.00
5,000.00
6,000.00
7,000.00
8,000.00
2001
2002
2003
2004
2005
2006
2007
2008
2009
2010
2011
2012
2013
2014
2015
2016
2017
2018
0
2,000
4,000
6,000
8,000
10,000
12,000
14,000
0
10,000
20,000
30,000
40,000
50,000
60,000
70,000
2001
2002
2003
2004
2005
2006
2007
2008
2009
2010
2011
2012
2013
2014
2015
2016
2017
2018
Turnover Seaborne Trade Volume
Global Seaborne Trade Volume Movement
(billion ton•Mile) (million ton)
Source: Clarksons, 2018.12
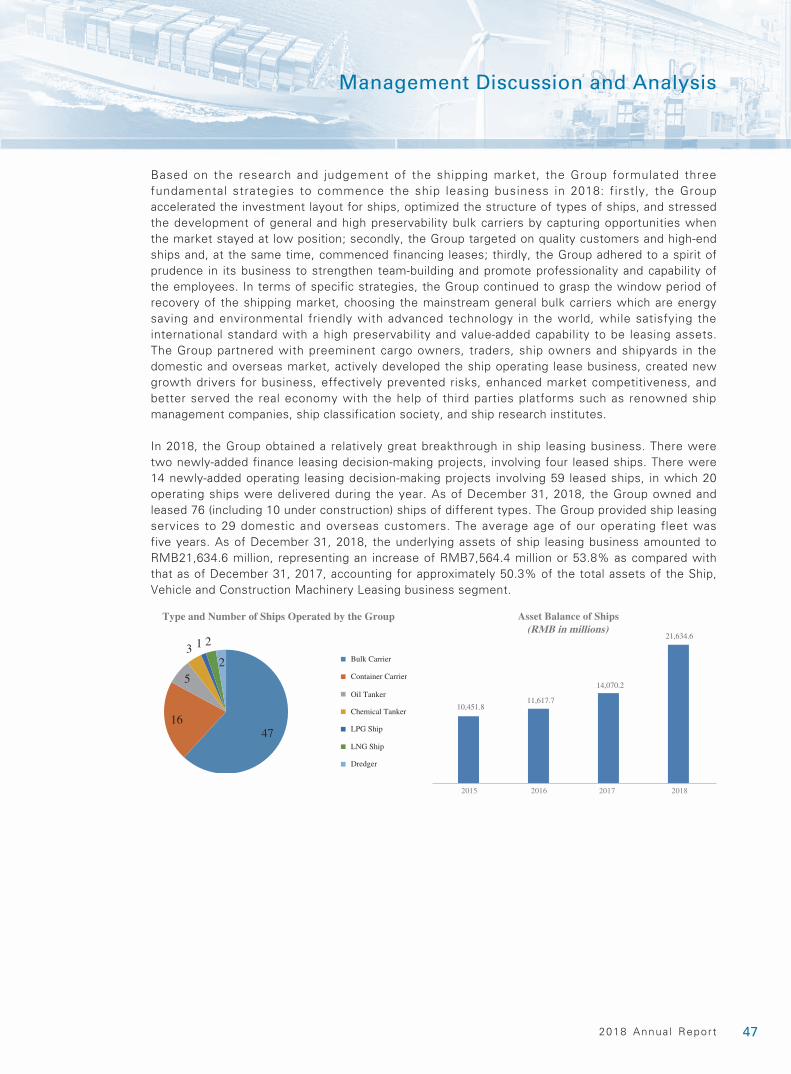
472018 Annua l Report
Management Discussion and Analysis
Based on the research and judgement of the shipping market, the Group formulated three fundamental strategies to commence the ship leasing business in 2018: firstly, the Group accelerated the investment layout for ships, optimized the structure of types of ships, and stressed the development of general and high preservability bulk carriers by capturing opportunities when the market stayed at low position; secondly, the Group targeted on quality customers and high-end ships and, at the same time, commenced financing leases; thirdly, the Group adhered to a spirit of prudence in its business to strengthen team-building and promote professionality and capability of the employees. In terms of specific strategies, the Group continued to grasp the window period of recovery of the shipping market, choosing the mainstream general bulk carriers which are energy saving and environmental friendly with advanced technology in the world, while satisfying the international standard with a high preservability and value-added capability to be leasing assets. The Group partnered with preeminent cargo owners, traders, ship owners and shipyards in the domestic and overseas market, actively developed the ship operating lease business, created new growth drivers for business, effectively prevented risks, enhanced market competitiveness, and better served the real economy with the help of third parties platforms such as renowned ship management companies, ship classification society, and ship research institutes.
In 2018, the Group obtained a relatively great breakthrough in ship leasing business. There were two newly-added finance leasing decision-making projects, involving four leased ships. There were 14 newly-added operating leasing decision-making projects involving 59 leased ships, in which 20 operating ships were delivered during the year. As of December 31, 2018, the Group owned and leased 76 (including 10 under construction) ships of different types. The Group provided ship leasing services to 29 domestic and overseas customers. The average age of our operating fleet was five years. As of December 31, 2018, the underlying assets of ship leasing business amounted to RMB21,634.6 million, representing an increase of RMB7,564.4 million or 53.8% as compared with that as of December 31, 2017, accounting for approximately 50.3% of the total assets of the Ship, Vehicle and Construction Machinery Leasing business segment.
4716
5
3 1 2
2
Type and Number of Ships Operated by the Group
Bulk Carrier
Container Carrier
Oil Tanker
Chemical Tanker
LPG Ship
LNG Ship
Dredger
10,451.811,617.7
14,070.2
21,634.6
2015 2016 2017 2018
Asset Balance of Ships(RMB in millions)
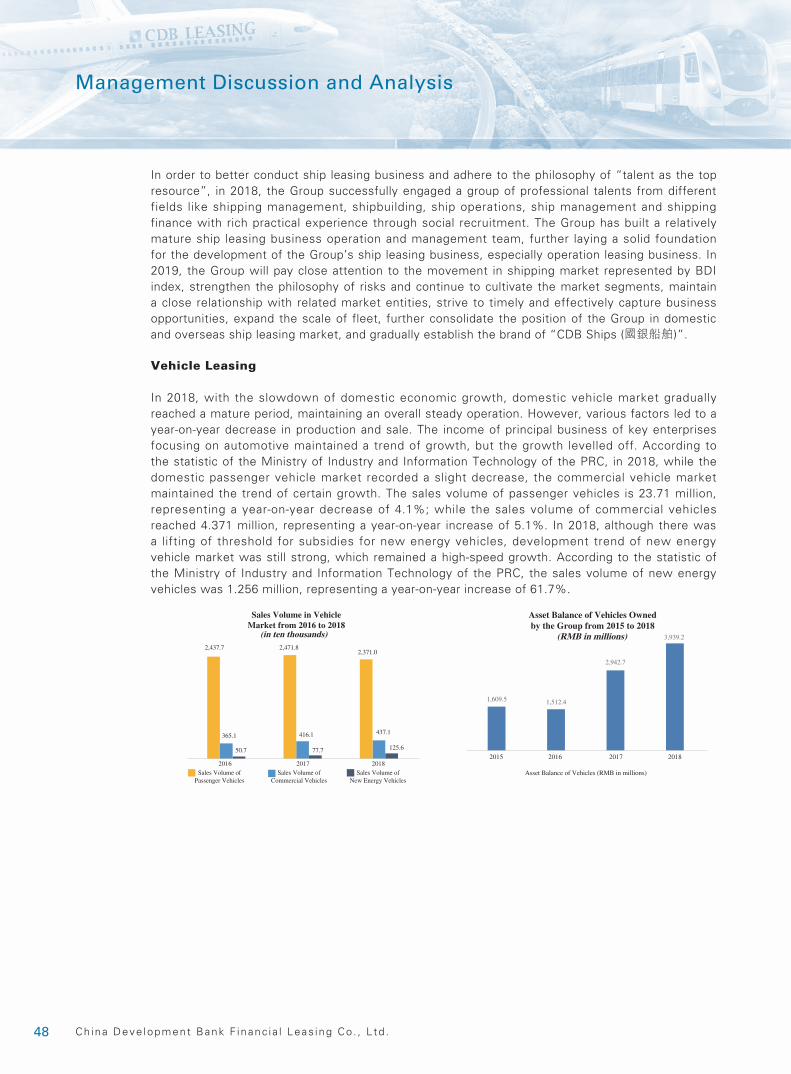
48 Ch ina Deve lopment Bank F inanc ia l Leas ing Co . , L td .
Management Discussion and Analysis
In order to better conduct ship leasing business and adhere to the philosophy of “talent as the top resource”, in 2018, the Group successfully engaged a group of professional talents from different fields like shipping management, shipbuilding, ship operations, ship management and shipping finance with rich practical experience through social recruitment. The Group has built a relatively mature ship leasing business operation and management team, further laying a solid foundation for the development of the Group’s ship leasing business, especially operation leasing business. In 2019, the Group will pay close attention to the movement in shipping market represented by BDI index, strengthen the philosophy of risks and continue to cultivate the market segments, maintain a close relationship with related market entities, strive to timely and effectively capture business opportunities, expand the scale of fleet, further consolidate the position of the Group in domestic and overseas ship leasing market, and gradually establish the brand of “CDB Ships (國銀船舶)”.
Vehicle Leasing
In 2018, with the slowdown of domestic economic growth, domestic vehicle market gradually reached a mature period, maintaining an overall steady operation. However, various factors led to a year-on-year decrease in production and sale. The income of principal business of key enterprises focusing on automotive maintained a trend of growth, but the growth levelled off. According to the statistic of the Ministry of Industry and Information Technology of the PRC, in 2018, while the domestic passenger vehicle market recorded a slight decrease, the commercial vehicle market maintained the trend of certain growth. The sales volume of passenger vehicles is 23.71 million, representing a year-on-year decrease of 4.1%; while the sales volume of commercial vehicles reached 4.371 million, representing a year-on-year increase of 5.1%. In 2018, although there was a lifting of threshold for subsidies for new energy vehicles, development trend of new energy vehicle market was still strong, which remained a high-speed growth. According to the statistic of the Ministry of Industry and Information Technology of the PRC, the sales volume of new energy vehicles was 1.256 million, representing a year-on-year increase of 61.7%.
2,437.7
Sales Volume ofPassenger Vehicles
Sales Volume ofCommercial Vehicles
Sales Volume ofNew Energy Vehicles
365.1
50.7
416.1
77.7
437.1
125.6
2,471.82,371.0
2016年 2017年 2018年2016 2017 2018
Sales Volume in VehicleMarket from 2016 to 2018
(in ten thousands)
1,609.5 1,512.4
2,942.7
3,939.2
2015 2016 2017 2018
Asset Balance of Vehicles Ownedby the Group from 2015 to 2018
Asset Balance of Vehicles (RMB in millions)
(RMB in millions)
492018 Annua l Report
Management Discussion and Analysis
Since 2015, the Country has been attaching great importance to the development of inclusive finance business. In particular, in 2018, the PBOC, the CBIRC, the China Securities Regulatory Commission, the National Development and Reform Commission of the PRC and the Ministry of Finance of the PRC have jointly issued a series of policies and measures for deepening financial services of small and micro enterprises and exerted greater efforts in addressing the financing issues faced by small and micro enterprises. For both commercial vehicles and passenger vehicles, downstream customers of vehicle leasing business involved medium, small and micro customer, which is highly in line with policy orientation and has a relatively stable market demand. Reliable financial services can be offered to medium, small and micro customers, to address the issue of “difficult, troubled and costly financing” faced by medium, small and micro customers through vehicle leasing business. Therefore, integrating the market needs and orientation of the policies, in 2018, the Group attempted to expand the passenger vehicle leasing business for the first time, and commenced asset portfolio sale-and-leaseback business of passenger vehicles with various leasing companies. Through the passenger vehicle leasing business, the Group enriched the types of vehicle financial leasing products, expanding suitable area of Vehicle Leasing business to lay a foundation for sustainable development of Vehicle Leasing business. Meanwhile, by combining the actual demand of major manufacturers, the Group selectively developed manufacturers cooperative mode, asset portfolio cooperation mode and other types of Vehicle Leasing business to better satisfy the demands of manufacturers for different products, and further enhanced the cooperative relationship with major manufacturers.
All vehicle leasing business of the Group is under finance leases, which is an ancillary financing service provided to the end-sales primarily through a wholesale business model with credit line granted to manufacturers or distributors and repurchase guarantee by manufacturers or joint and several liability guarantee by distributors. Under such model, sale-and-leaseback transactions and direct leasing transactions are conducted based on the nature of the leased assets. In addition, the Group carried out commercial vehicle leasing business and passenger vehicle leasing business with the leasing companies under manufacturers and professional leasing platforms through asset portfolio sale-and-leaseback business. On the one hand, the Group achieved a diversified cooperation with major manufacturers, thereby enhancing the loyalty of cooperation between the Group and major manufacturers. On the other hand, the Group opened up a cooperative channel for passenger vehicle leasing business, gradually forming a pattern of parallel development of multi-level vehicle financial leasing products.
In 2019, the Group will devote more efforts in the innovation of business varieties, expand the scope of cooperation, and further improve professional expertise in order to satisfy various financing needs from all levels and perspectives in the market under the complex economic situation. At the same time, the Group will pay close attention to the development trend of the vehicle market, moderately expand the passenger vehicle leasing business, consolidate the cooperation with key manufacturers of commercial vehicles, provide reliable channels for financing of small and medium enterprises and natural persons, and strive to build the inclusive finance system of the Group.
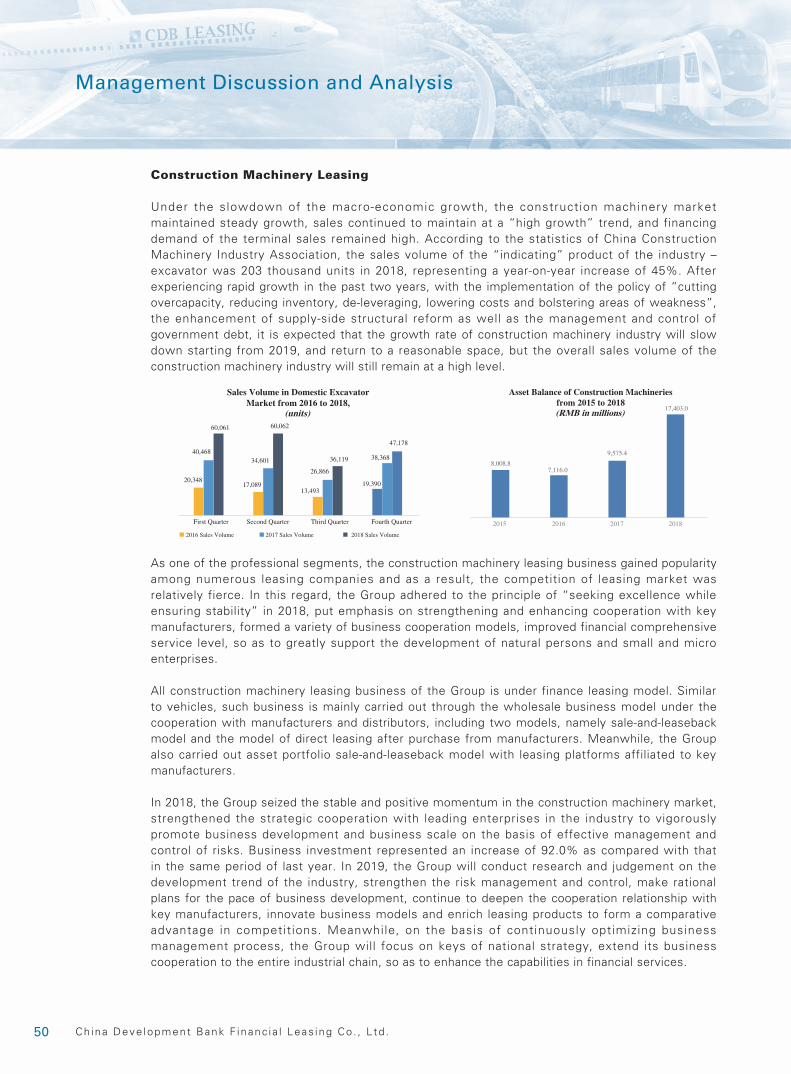
50 Ch ina Deve lopment Bank F inanc ia l Leas ing Co . , L td .
Management Discussion and Analysis
Construction Machinery Leasing
Under the slowdown of the macro-economic growth, the construction machinery market maintained steady growth, sales continued to maintain at a “high growth” trend, and financing demand of the terminal sales remained high. According to the statistics of China Construction Machinery Industry Association, the sales volume of the “indicating” product of the industry – excavator was 203 thousand units in 2018, representing a year-on-year increase of 45%. After experiencing rapid growth in the past two years, with the implementation of the policy of “cutting overcapacity, reducing inventory, de-leveraging, lowering costs and bolstering areas of weakness”, the enhancement of supply-side structural reform as well as the management and control of government debt, it is expected that the growth rate of construction machinery industry will slow down starting from 2019, and return to a reasonable space, but the overall sales volume of the construction machinery industry will still remain at a high level.
20,348
60,061
40,468
17,089
60,062
13,493
36,119
19,390
38,368
47,178
34,601
26,866
Sales Volume in Domestic ExcavatorMarket from 2016 to 2018,
Fourth QuarterFirst Quarter
2016 Sales Volume 2017 Sales Volume 2018 Sales Volume
Second Quarter Third Quarter
(units)
8,008.87,116.0
9,575.4
17,403.0
2015 2016 2017 2018
Asset Balance of Construction Machineriesfrom 2015 to 2018(RMB in millions)
As one of the professional segments, the construction machinery leasing business gained popularity among numerous leasing companies and as a result, the competition of leasing market was relatively fierce. In this regard, the Group adhered to the principle of “seeking excellence while ensuring stability” in 2018, put emphasis on strengthening and enhancing cooperation with key manufacturers, formed a variety of business cooperation models, improved financial comprehensive service level, so as to greatly support the development of natural persons and small and micro enterprises.
All construction machinery leasing business of the Group is under finance leasing model. Similar to vehicles, such business is mainly carried out through the wholesale business model under the cooperation with manufacturers and distributors, including two models, namely sale-and-leaseback model and the model of direct leasing after purchase from manufacturers. Meanwhile, the Group also carried out asset portfolio sale-and-leaseback model with leasing platforms affiliated to key manufacturers.
In 2018, the Group seized the stable and positive momentum in the construction machinery market, strengthened the strategic cooperation with leading enterprises in the industry to vigorously promote business development and business scale on the basis of effective management and control of risks. Business investment represented an increase of 92.0% as compared with that in the same period of last year. In 2019, the Group will conduct research and judgement on the development trend of the industry, strengthen the risk management and control, make rational plans for the pace of business development, continue to deepen the cooperation relationship with key manufacturers, innovate business models and enrich leasing products to form a comparative advantage in competit ions. Meanwhile, on the basis of continuously optimizing business management process, the Group will focus on keys of national strategy, extend its business cooperation to the entire industrial chain, so as to enhance the capabilities in financial services.
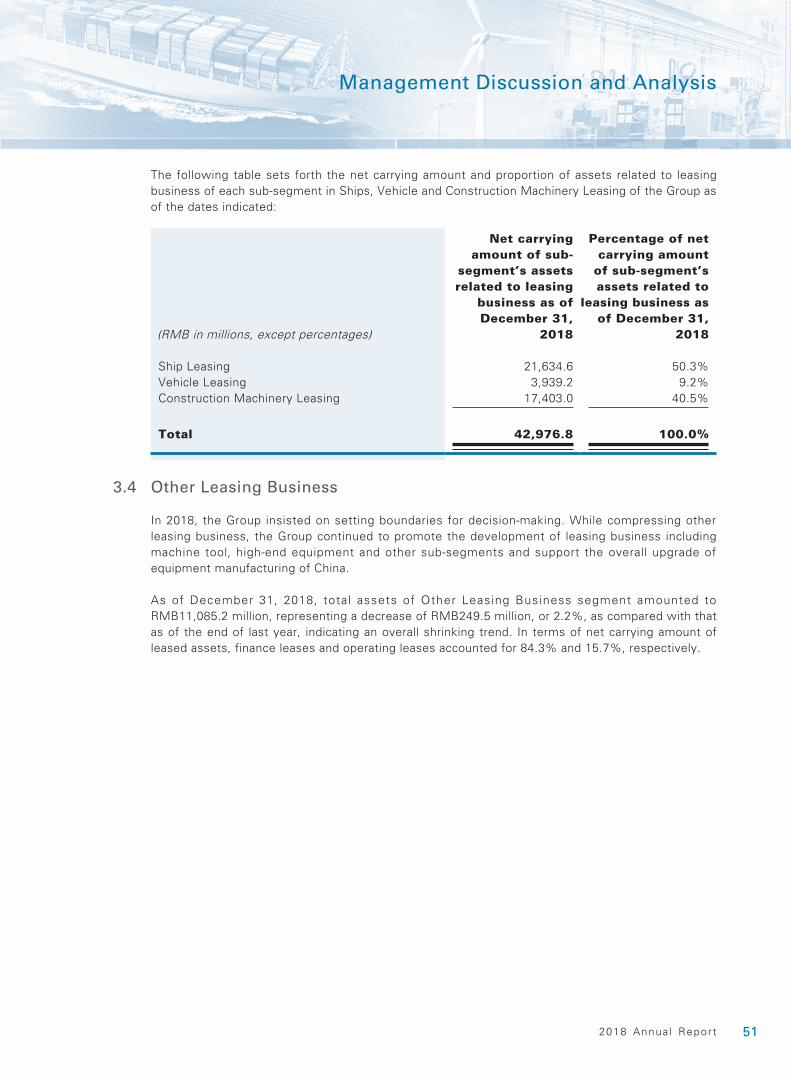
512018 Annua l Report
Management Discussion and Analysis
The following table sets forth the net carrying amount and proportion of assets related to leasing business of each sub-segment in Ships, Vehicle and Construction Machinery Leasing of the Group as of the dates indicated:
(RMB in millions, except percentages)
Net carrying amount of sub-
segment’s assets related to leasing
business as of December 31,
2018
Percentage of net carrying amount
of sub-segment’s assets related to
leasing business as of December 31,
2018
Ship Leasing 21,634.6 50.3%Vehicle Leasing 3,939.2 9.2%Construction Machinery Leasing 17,403.0 40.5%
Total 42,976.8 100.0%
3.4 Other Leasing Business
In 2018, the Group insisted on setting boundaries for decision-making. While compressing other leasing business, the Group continued to promote the development of leasing business including machine tool, high-end equipment and other sub-segments and support the overall upgrade of equipment manufacturing of China.
As of December 31, 2018, total assets of Other Leasing Business segment amounted to RMB11,085.2 million, representing a decrease of RMB249.5 million, or 2.2%, as compared with that as of the end of last year, indicating an overall shrinking trend. In terms of net carrying amount of leased assets, finance leases and operating leases accounted for 84.3% and 15.7%, respectively.
52 Ch ina Deve lopment Bank F inanc ia l Leas ing Co . , L td .
Management Discussion and Analysis
4. FINANCING
Benefiting from high credit ratings (“A1” by Moody’s, “A” by Standard & Poor’s, and “A+” by Fitch), the Group continuously enhanced its funding capability and diversified its financing channels. The Group continued to deepen its cooperation with domestic and overseas banks and other financial institutions to ensure that there would be sufficient funds available for business development. As of December 31, 2018, the Group had established business relationships with 109 banks and was granted uncommitted credit facilities amounting to a total of approximately RMB554.1 billion including unused uncommitted credit facilities of approximately RMB380.6 billion. Meanwhile, under the complex and ever-changing macroeconomic conditions in domestic and overseas markets, the Group timely adjusted financing strategies based on macroeconomic trend, innovated financing products and expanded financing channels continually to further optimize debt structure and maintain an appropriate financing costs. As for financing in debt capital market, the Group successively conducted issuances of a one-year US$100 million (tap issuance), a three-year US$500 million and a three-year US$400 million senior bonds in March, July and November 2018; In October 2018, the Group successfully issued the first offshore private placement bonds in non-dollar currency, and issued five private placement bonds with an accumulated amount of US$265 million throughout the year, further expanding the financing channels. As for RMB financing, the Group completed the bank borrowings amounted to a total of RMB3,375 million by way of US dollar pledging. In addition, the Group invested in lease projects amounted to RMB1,850 million by way of bank acceptance bills for the first time, of which the comprehensive financing costs were significantly lower than that by using other financing sources during the same period. The use of the abovementioned innovative financing sources and financing tools created positive effects in controlling the financing costs of the Group in 2018, and concurrently expanded sources and channels for future cost control.
In 2018, due to the fluctuation of international macroeconomic environment and the contraction of liquidity, the interest rates of US dollar continuously increased; since the domestic financial market was under increasingly stringent regulatory supervision, the inter-bank financing costs experienced a rapid increase in the first half of the year; while in the second half of the year, there were changes in macro environment and monetary policies turned to moderately easy to a certain extent. The Group took the initiative to grasp the changes in market trends, timely adjusted financing strategies and actively innovated financing instruments and financing sources to effectively control comprehensive financing costs. As for RMB financing, the strategic combination of short-term financings within three months and financings with tenors of 6–12 months were adopted to effectively manage the liquidity risks of the end of a quarter or a year and to effectively control the financing costs. The Group also actively made use of innovative financing instruments to expand financing channels and control financing costs through seizing the opportunities in the market. As for financing by US dollar, the Group continued to optimize the structure of interest-bearing liabilities by selection of financing products dominated in US dollars and strategic adjustment of term structure. Despite of the rate hike cycle of US dollars, the Group’s financing costs of US dollar remained at a relatively low level. In terms of the interest rate structure, the Group continued to maintain its original strategies for the risk management on interest rate, and actively managed the matching of the interest rate structure of assets and liabilities. In terms of the exchange rate structure, the Group continued to maintain its original strategies for the risk management on exposure of foreign exchange and maintained the matching of currency between assets and liabilities.
In 2018, the financing sources of the Group mainly included bank borrowings, issuance of bonds, bank acceptance bills and short term inter-bank borrowings through national interbank funding centre. As of December 31, 2018, the Group’s borrowings, bonds payable, bank acceptance bills and short term inter-bank borrowings through national interbank funding centre were RMB157,186.9 million, RMB38,596.3 million, RMB758.8 million and zero, respectively.
532018 Annua l Report
Management Discussion and Analysis
5. RISK MANAGEMENT
The Group is exposed to various risks in its ordinary course of business, including credit risk, market risk, liquidity risk, operational risk, information technology risk and reputation risk. The Group’s risk management regards the support for sustainable development of the business and enhancement of the Group’s value as the strategic objectives, and the Group has established and continually improved a comprehensive risk management system with a feature of “all round and comprehensive process with participation of all personnel”. This actively promotes and nurtures the risk philosophy and culture that “everyone shall be equal in the face of risks, everyone shall be responsible for risk control”, in which it forms an impeccable risk management framework and system with a detail-defined division among all business segments, risk management departments and internal audit department to constantly identify, evaluate and monitor the risks in the ordinary course of the Group’s operation, so as to achieve an appropriate balance between risks and benefits while reducing the potential negative impact as much as possible on the Group’s financial performance. The Group has, with the help of relevant risk evaluation resources and credit experience of China Development Bank, unleashed its potential in resources to improve the sense of activeness and forward-looking in risk management for safeguarding the business development.
The Group has established a comprehensive risk management system with “three layers of defence” consisting of the business departments, relevant risk management departments and internal audit department. All business departments, which act as the first layer of defence, are responsible for the direct management of the risks in the leasing business and operation segment in accordance with the business operation process and risk management system formulated by the Group, taking the first responsibility for the management of the comprehensive risks. The relevant risk management departments (including the Risk Management Department, the Office of the Board, Appraisal Department, Compliance Department, Legal Affairs Department and Accounting Department), which act as the second layer of defence, are responsible for the establishment of the comprehensive risk management system and the organization, coordination and support of comprehensive risk management. The internal audit department (Audit Department), which acts as the third layer of defence, is responsible for independent supervision and evaluation of the operation of the comprehensive risk management system. In particular, the Risk Management Department is the overall planning and management department of the Company’s comprehensive risk management, which is responsible for the management of the credit risk, market risk, liquidity risk, operational risk, country risk and information technology risk; the Office of the Board is responsible for the management of strategic risk and reputational risk; the Appraisal Department is responsible for the review and assessment of credit risk management; the Compliance Department is responsible for the management of the compliance risk, money laundry risk, related party transaction risk and internal control; the Legal Affairs Department is responsible for the management of legal risk; and the Accounting Department is responsible for the management of financial risk.
At present, the Group adopts a stable and prudent strategy in relation to risk preference. With regard to the selection of industries, the Group prefers industries and fields with mature business models, generating economies of scale and equipped with excellent asset quality. In terms of customer selection, the Group prefers large enterprises, leading enterprises in the industry or listed companies with high quality. In terms of leased assets operation, the Group will conduct scientific classification, value analysis and professional management and accelerate the transfer of leased assets by combining operation strategies, market environment and the features of leased properties. While realizing the steady growth of the business, the Group receives a return on its earnings that matches the risks, and controls its risks within an acceptable range.
54 Ch ina Deve lopment Bank F inanc ia l Leas ing Co . , L td .
Management Discussion and Analysis
The Group identifies, evaluates, monitors, warns, controls, mitigates and reports various risks based on the characteristics of the leasing industry. The Group continues to deepen its understanding of the risks of industry in which it operates, and actively promotes the construction of risk measurement system. Meanwhile, it also strengthens the proactive monitoring, warning and response management of risks. The Group reduces the overall business risks through the asset portfolio management in different countries, regions and industries. The Group proactively adjusts the operation strategies of the industry, strengthens the customer admission criteria, improves the risk pricing system and strives for the maximization of risk-return. By enhancing the Group’s business quality and efficiency of resource allocation, the creative value of risk management can be achieved.
In 2018, the Group strengthened the establishment of comprehensive risk management system, improved risk preference, limitation and warning management system, and further optimized comprehensive risk management system. The Group constantly optimized credit rating model and pricing plan, improved the measurement level of credit risk, enhanced the accuracy of risk management and control. The Group gradually improved the precise level of after-lease management, carried out various special risk troubleshooting work to improve forward-looking of risk management and control. The Group deepened the listing system management, strengthened the alert, monitor and control of risk-bearing projects, stably improved the efficiency of risk mitigation, management and control, strictly implemented the accountability system, strengthened special training of risks, positively guided the staff to develop the senses of compliance and responsibilities.
5.1 Credit risk
Credit risk refers to the risk of loss incurred by the Group due to the failure of fulfilment of contractual obligations by counterparties when due.
Credit risk is currently the major risk faced by the Group, primarily arising from finance lease business. The Group emphasizes the operating philosophy of keeping balance among “scale, efficiency and risks”, strictly complies with regulatory requirements and policy limits imposed in the industry, and conducts finance lease business in compliance with laws and regulations in a reasonable manner. The Group has regarded aircraft and infrastructure leasing segments as core business, proactively developed ship, vehicle and construction machinery leasing businesses, and prudently developed other leasing business. We attach great importance to the quantitative management technology of credit risks and the management application, establish a dual-dimensional rating system with credit rating and debt rating for all enterprise clients, and ensure the effectiveness of medium- to long-term credit risk management of the Group by reinforcing risk pricing capability, so as to guarantee a reasonable level of credit risk and revenue for clients. We maintain appropriate diversification of the Group’s finance lease assets portfolio in different countries, regions, industries, clients and products in order to control the concentration risks within a reasonable level. Regarding the elimination of non-performing and risk-bearing projects, we stabilize the assets quality and safeguard the bottom line against risks through various approaches such as stepping up the collection efforts, collecting according to the laws and bulk transfers. We maintain the high quality of our finance lease assets and the non-performing assets ratio is of leading level comparing with that of the peers in the domestic finance leasing industry.
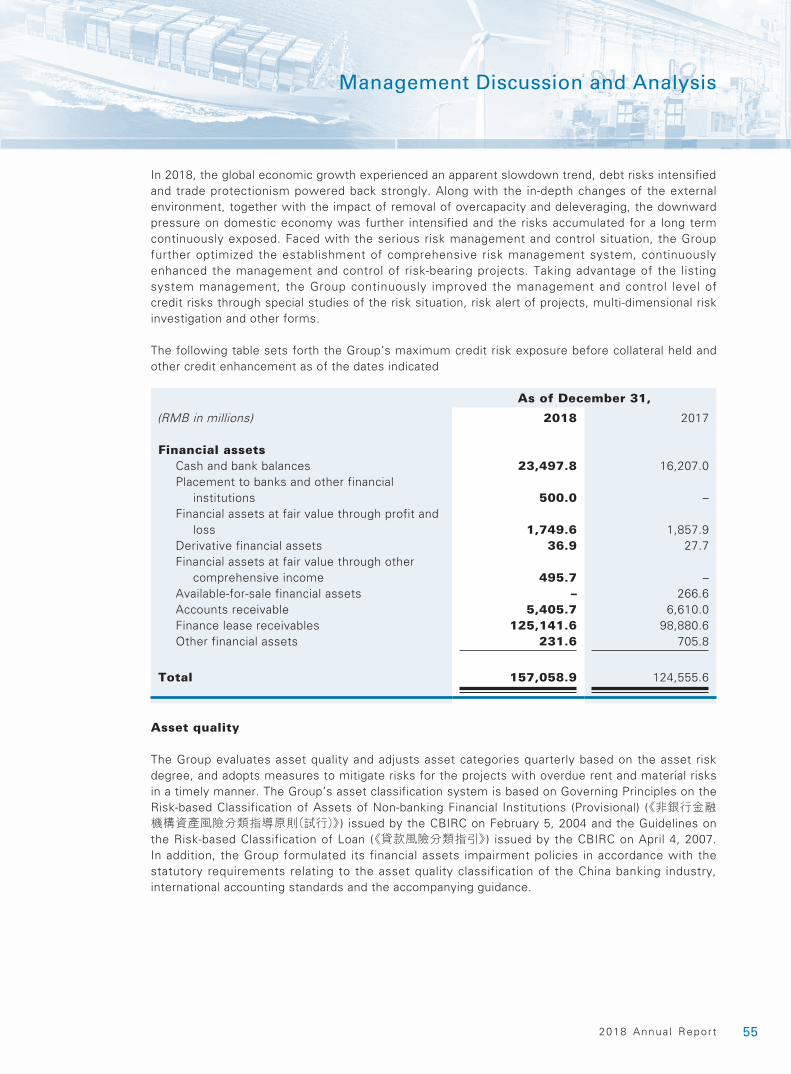
552018 Annua l Report
Management Discussion and Analysis
In 2018, the global economic growth experienced an apparent slowdown trend, debt risks intensified and trade protectionism powered back strongly. Along with the in-depth changes of the external environment, together with the impact of removal of overcapacity and deleveraging, the downward pressure on domestic economy was further intensified and the risks accumulated for a long term continuously exposed. Faced with the serious risk management and control situation, the Group further optimized the establishment of comprehensive risk management system, continuously enhanced the management and control of risk-bearing projects. Taking advantage of the listing system management, the Group continuously improved the management and control level of credit risks through special studies of the risk situation, risk alert of projects, multi-dimensional risk investigation and other forms.
The following table sets forth the Group’s maximum credit risk exposure before collateral held and other credit enhancement as of the dates indicated
As of December 31,
(RMB in millions) 2018 2017
Financial assetsCash and bank balances 23,497.8 16,207.0Placement to banks and other financial
institutions 500.0 –Financial assets at fair value through profit and
loss 1,749.6 1,857.9Derivative financial assets 36.9 27.7Financial assets at fair value through other
comprehensive income 495.7 –Available-for-sale financial assets – 266.6Accounts receivable 5,405.7 6,610.0Finance lease receivables 125,141.6 98,880.6Other financial assets 231.6 705.8
Total 157,058.9 124,555.6
Asset quality
The Group evaluates asset quality and adjusts asset categories quarterly based on the asset risk degree, and adopts measures to mitigate risks for the projects with overdue rent and material risks in a timely manner. The Group’s asset classification system is based on Governing Principles on the Risk-based Classification of Assets of Non-banking Financial Institutions (Provisional) (《非銀行金融機構資產風險分類指導原則(試行)》) issued by the CBIRC on February 5, 2004 and the Guidelines on the Risk-based Classification of Loan (《貸款風險分類指引》) issued by the CBIRC on April 4, 2007. In addition, the Group formulated its financial assets impairment policies in accordance with the statutory requirements relating to the asset quality classification of the China banking industry, international accounting standards and the accompanying guidance.
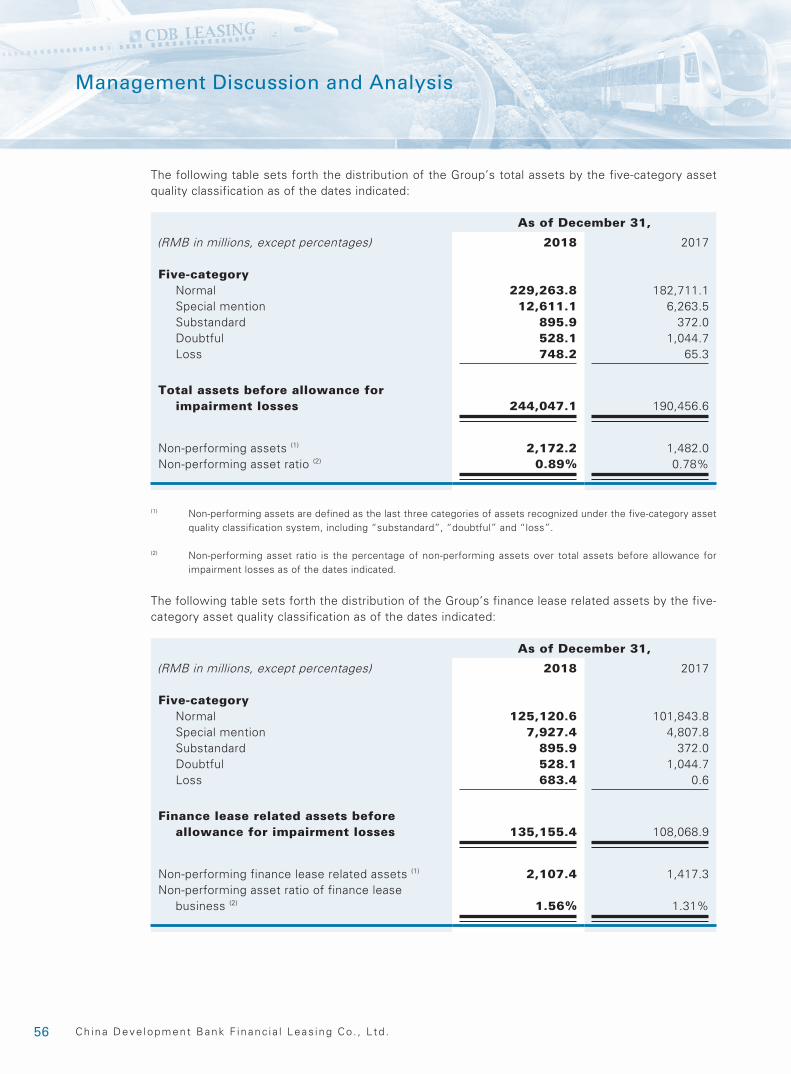
56 Ch ina Deve lopment Bank F inanc ia l Leas ing Co . , L td .
Management Discussion and Analysis
The following table sets forth the distribution of the Group’s total assets by the five-category asset quality classification as of the dates indicated:
As of December 31,
(RMB in millions, except percentages) 2018 2017
Five-categoryNormal 229,263.8 182,711.1Special mention 12,611.1 6,263.5Substandard 895.9 372.0Doubtful 528.1 1,044.7Loss 748.2 65.3
Total assets before allowance for impairment losses 244,047.1 190,456.6
Non-performing assets (1) 2,172.2 1,482.0Non-performing asset ratio (2) 0.89% 0.78%
(1) Non-performing assets are defined as the last three categories of assets recognized under the five-category asset quality classification system, including “substandard”, “doubtful” and “loss”.
(2) Non-performing asset ratio is the percentage of non-performing assets over total assets before allowance for impairment losses as of the dates indicated.
The following table sets forth the distribution of the Group’s finance lease related assets by the five-category asset quality classification as of the dates indicated:
As of December 31,
(RMB in millions, except percentages) 2018 2017
Five-categoryNormal 125,120.6 101,843.8Special mention 7,927.4 4,807.8Substandard 895.9 372.0Doubtful 528.1 1,044.7Loss 683.4 0.6
Finance lease related assets before allowance for impairment losses 135,155.4 108,068.9
Non-performing finance lease related assets (1) 2,107.4 1,417.3Non-performing asset ratio of finance lease
business (2) 1.56% 1.31%

572018 Annua l Report
Management Discussion and Analysis
(1) Non-performing finance lease related assets are defined as the last three categories of finance lease related assets recognized under the five-category asset quality classification system, including “substandard”, “doubtful” and “loss”.
(2) Non-performing asset ratio of finance lease business is the percentage of non-performing finance lease related assets over finance lease related assets before allowance for impairment losses as of the dates indicated.
As of December 31, 2018, the non-performing assets of the Group was RMB2,172.2 million, representing an increase of RMB690.2 million as compared with that as of the end of last year, while the non-performing asset ratio was 0.89%, representing an increase of 0.11 percentage point as compared with that as of the end of last year. As of December 31, 2018, the non-performing finance lease related assets of the Group were RMB2,107.4 million, representing an increase of RMB690.1 million as compared with that as of the end of last year, while the non-performing asset ratio of finance lease business was 1.56%, representing an increase of 0.25 percentage point as compared with that as of the end of last year. The Group will constantly promote the assets quality: for new businesses, the Group will follow the principle on the selection of industries and customers strictly; for existing businesses, the Group will take measures to mitigate risk at various stages of business including post-lease management and collateral management in order to strengthen credit risk management.
The following table sets forth, the distribution of the Group’s finance lease related assets by segments and the five-category asset quality classification as of December 31, 2018:
(RMB in millions, except percentages)
Aircraft leasing
Infrastructure leasing
Ship, Vehicle and
Construction Machinery
Leasing
Other Leasing
Business Total
Five-categoryNormal 2,041.8 86,196.4 28,862.4 8,020.0 125,120.6Special mention 1.1 2,377.5 5,062.4 486.4 7,927.4Substandard – 148.4 – 747.5 895.9Doubtful – – – 528.1 528.1Loss – – 514.9 168.5 683.4
Finance lease related assets before allowance for impairment losses 2,042.9 88,722.3 34,439.7 9,950.5 135,155.4
Non-performing finance lease related assets – 148.4 514.9 1,444.1 2,107.4
Non-performing asset ratio of finance lease business – 0.17% 1.50% 14.51% 1.56%
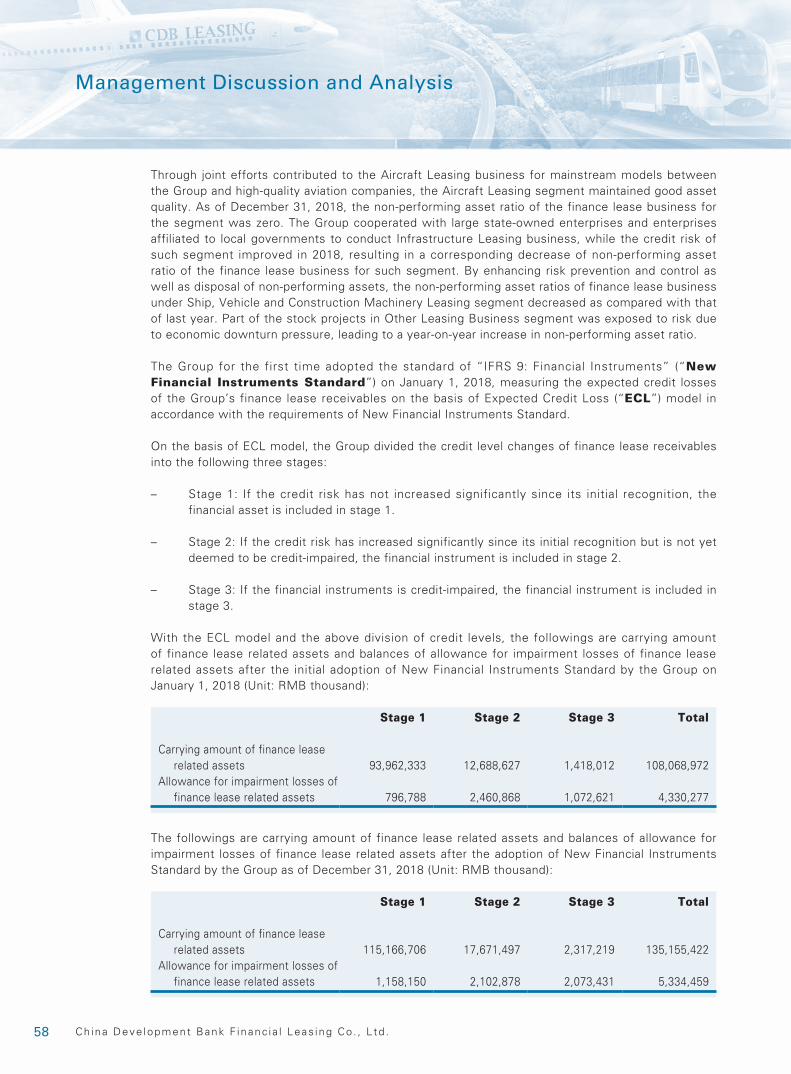
58 Ch ina Deve lopment Bank F inanc ia l Leas ing Co . , L td .
Management Discussion and Analysis
Through joint efforts contributed to the Aircraft Leasing business for mainstream models between the Group and high-quality aviation companies, the Aircraft Leasing segment maintained good asset quality. As of December 31, 2018, the non-performing asset ratio of the finance lease business for the segment was zero. The Group cooperated with large state-owned enterprises and enterprises affiliated to local governments to conduct Infrastructure Leasing business, while the credit risk of such segment improved in 2018, resulting in a corresponding decrease of non-performing asset ratio of the finance lease business for such segment. By enhancing risk prevention and control as well as disposal of non-performing assets, the non-performing asset ratios of finance lease business under Ship, Vehicle and Construction Machinery Leasing segment decreased as compared with that of last year. Part of the stock projects in Other Leasing Business segment was exposed to risk due to economic downturn pressure, leading to a year-on-year increase in non-performing asset ratio.
The Group for the first time adopted the standard of “IFRS 9: Financial Instruments” (“New Financial Instruments Standard”) on January 1, 2018, measuring the expected credit losses of the Group’s finance lease receivables on the basis of Expected Credit Loss (“ECL”) model in accordance with the requirements of New Financial Instruments Standard.
On the basis of ECL model, the Group divided the credit level changes of finance lease receivables into the following three stages:
– Stage 1: If the credit risk has not increased significantly since its initial recognition, the financial asset is included in stage 1.
– Stage 2: If the credit risk has increased significantly since its initial recognition but is not yet deemed to be credit-impaired, the financial instrument is included in stage 2.
– Stage 3: If the financial instruments is credit-impaired, the financial instrument is included in stage 3.
With the ECL model and the above division of credit levels, the followings are carrying amount of finance lease related assets and balances of allowance for impairment losses of finance lease related assets after the initial adoption of New Financial Instruments Standard by the Group on January 1, 2018 (Unit: RMB thousand):
Stage 1 Stage 2 Stage 3 Total
Carrying amount of finance lease related assets 93,962,333 12,688,627 1,418,012 108,068,972
Allowance for impairment losses of finance lease related assets 796,788 2,460,868 1,072,621 4,330,277
The followings are carrying amount of finance lease related assets and balances of allowance for impairment losses of finance lease related assets after the adoption of New Financial Instruments Standard by the Group as of December 31, 2018 (Unit: RMB thousand):
Stage 1 Stage 2 Stage 3 Total
Carrying amount of finance lease related assets 115,166,706 17,671,497 2,317,219 135,155,422
Allowance for impairment losses of finance lease related assets 1,158,150 2,102,878 2,073,431 5,334,459
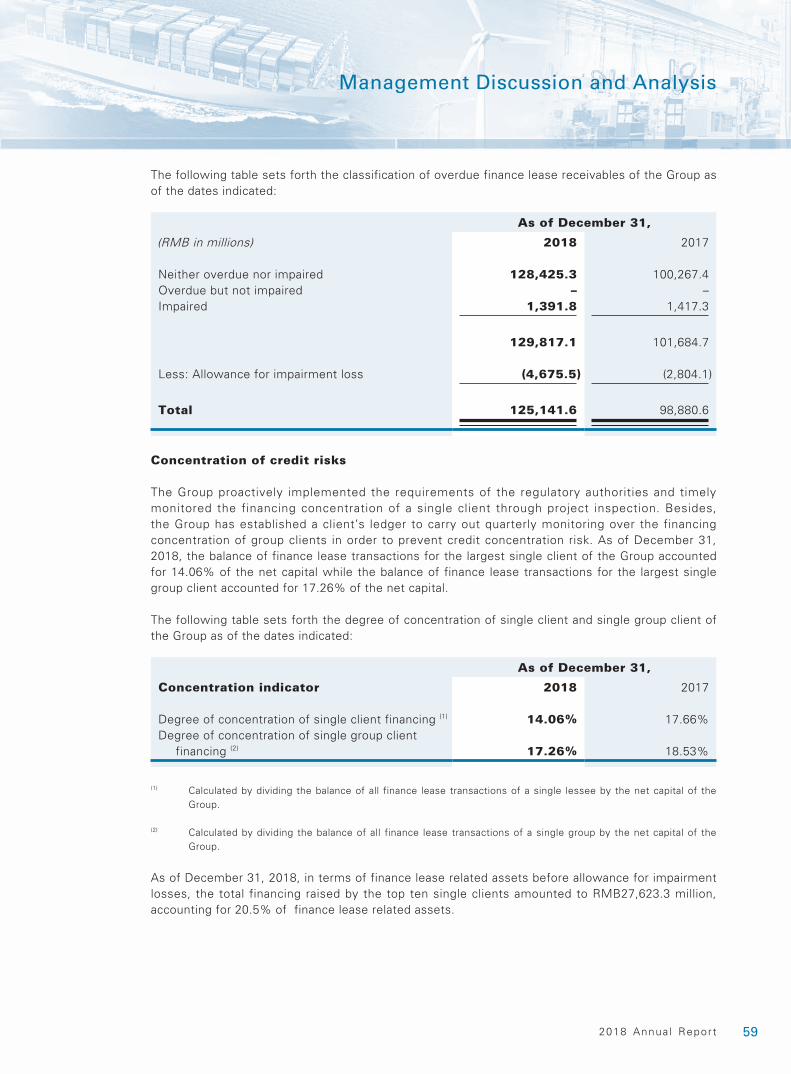
592018 Annua l Report
Management Discussion and Analysis
The following table sets forth the classification of overdue finance lease receivables of the Group as of the dates indicated:
As of December 31,
(RMB in millions) 2018 2017
Neither overdue nor impaired 128,425.3 100,267.4Overdue but not impaired – –Impaired 1,391.8 1,417.3
129,817.1 101,684.7
Less: Allowance for impairment loss (4,675.5) (2,804.1)
Total 125,141.6 98,880.6
Concentration of credit risks
The Group proactively implemented the requirements of the regulatory authorities and timely monitored the financing concentration of a single client through project inspection. Besides, the Group has established a client’s ledger to carry out quarterly monitoring over the financing concentration of group clients in order to prevent credit concentration risk. As of December 31, 2018, the balance of finance lease transactions for the largest single client of the Group accounted for 14.06% of the net capital while the balance of finance lease transactions for the largest single group client accounted for 17.26% of the net capital.
The following table sets forth the degree of concentration of single client and single group client of the Group as of the dates indicated:
As of December 31,
Concentration indicator 2018 2017
Degree of concentration of single client financing (1) 14.06% 17.66%Degree of concentration of single group client
financing (2) 17.26% 18.53%
(1) Calculated by dividing the balance of all finance lease transactions of a single lessee by the net capital of the Group.
(2) Calculated by dividing the balance of all finance lease transactions of a single group by the net capital of the Group.
As of December 31, 2018, in terms of finance lease related assets before allowance for impairment losses, the total financing raised by the top ten single clients amounted to RMB27,623.3 million, accounting for 20.5% of finance lease related assets.

60 Ch ina Deve lopment Bank F inanc ia l Leas ing Co . , L td .
Management Discussion and Analysis
The following table sets forth the financing amount raised by the top ten clients of the Group as of December 31, 2018:
(RMB in millions, except percentages) Business segment
Financing amount
Percentage of finance lease
related assets before
allowance for impairment
losses
Client A Infrastructure 3,778.4 2.8%Client B Infrastructure 3,778.2 2.8%Client C Infrastructure 3,626.6 2.7%Client D Infrastructure 3,011.9 2.2%Client E Transportation and
Construction Machinery
2,901.8 2.1%
Client F Infrastructure 2,425.3 1.8%Client G Transportation and
Construction Machinery
2,256.4 1.7%
Client H Infrastructure 2,133.5 1.6%Client I Infrastructure 1,867.1 1.4%Client J Transportation and
Construction Machinery
1,844.1 1.4%
Total 27,623.3 20.5%
If lessees are overly concentrated in a single industry or region, or have similarities in economic features, the credit risks of the lessor would be relatively higher. As the industrial distribution of finance lease receivables of the Group is rather diversified, there is no significant risk on industrial concentration.
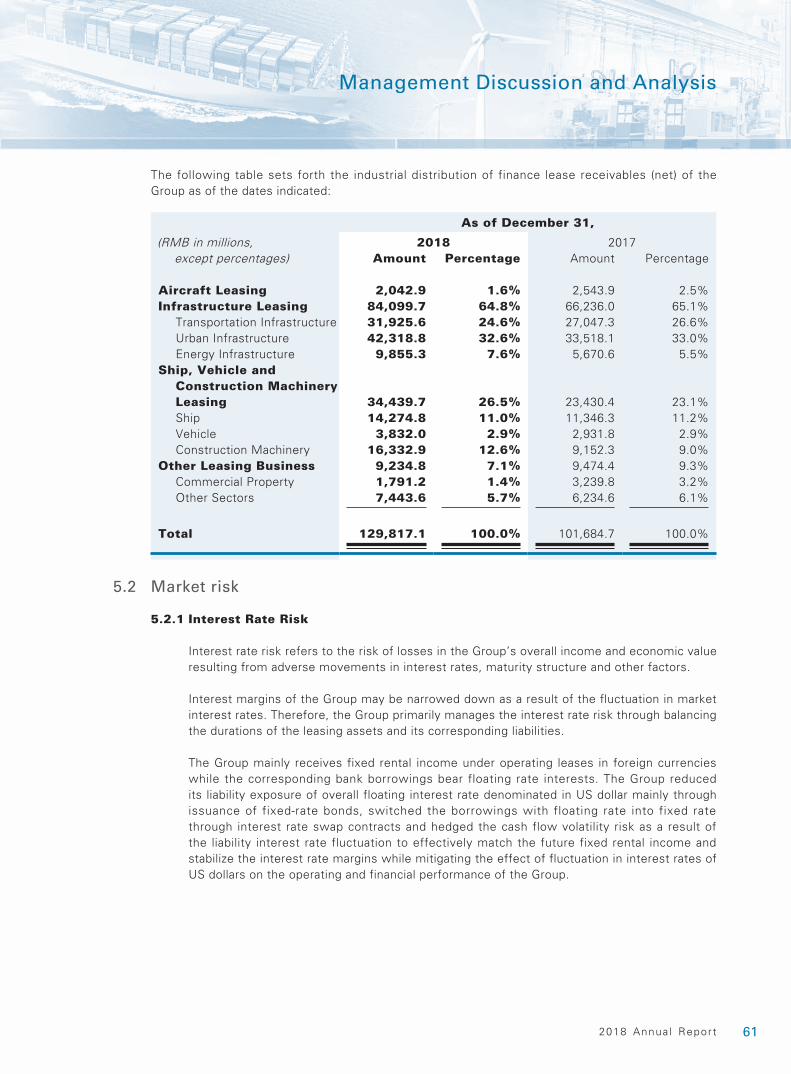
612018 Annua l Report
Management Discussion and Analysis
The following table sets forth the industrial distribution of finance lease receivables (net) of the Group as of the dates indicated:
(RMB in millions, except percentages)
As of December 31,
2018 2017Amount Percentage Amount Percentage
Aircraft Leasing 2,042.9 1.6% 2,543.9 2.5%Infrastructure Leasing 84,099.7 64.8% 66,236.0 65.1%
Transportation Infrastructure 31,925.6 24.6% 27,047.3 26.6%Urban Infrastructure 42,318.8 32.6% 33,518.1 33.0%Energy Infrastructure 9,855.3 7.6% 5,670.6 5.5%
Ship, Vehicle and Construction Machinery Leasing 34,439.7 26.5% 23,430.4 23.1%Ship 14,274.8 11.0% 11,346.3 11.2%Vehicle 3,832.0 2.9% 2,931.8 2.9%Construction Machinery 16,332.9 12.6% 9,152.3 9.0%
Other Leasing Business 9,234.8 7.1% 9,474.4 9.3%Commercial Property 1,791.2 1.4% 3,239.8 3.2%Other Sectors 7,443.6 5.7% 6,234.6 6.1%
Total 129,817.1 100.0% 101,684.7 100.0%
5.2 Market risk
5.2.1 Interest Rate Risk
Interest rate risk refers to the risk of losses in the Group’s overall income and economic value resulting from adverse movements in interest rates, maturity structure and other factors.
Interest margins of the Group may be narrowed down as a result of the fluctuation in market interest rates. Therefore, the Group primarily manages the interest rate risk through balancing the durations of the leasing assets and its corresponding liabilities.
The Group mainly receives fixed rental income under operating leases in foreign currencies while the corresponding bank borrowings bear floating rate interests. The Group reduced its liability exposure of overall floating interest rate denominated in US dollar mainly through issuance of fixed-rate bonds, switched the borrowings with floating rate into fixed rate through interest rate swap contracts and hedged the cash flow volatility risk as a result of the liability interest rate fluctuation to effectively match the future fixed rental income and stabilize the interest rate margins while mitigating the effect of fluctuation in interest rates of US dollars on the operating and financial performance of the Group.
62 Ch ina Deve lopment Bank F inanc ia l Leas ing Co . , L td .
Management Discussion and Analysis
The majority of rental income from RMB-denominated leasing business of the Group floats with the benchmark interest rate published by the PBOC, while liabilities mainly bear a fixed rate interest. For this particular situation, the Group proactively matches the duration of RMB-denominated liabilities with that of RMB-denominated lease assets to reduce interest rate risk.
5.2.2 Foreign Exchange Risk
Foreign exchange risk refers to the risk of losses in the Group’s overall income and economic value resulting from an adverse movement in foreign exchange rates. The foreign exchange risk exposure primarily arises from the US dollar-denominated profits generated from subsidiaries conducting US dollars-denominated leasing business and the exchange of proceeds raised in listing into US dollars.
The strategy for foreign exchange risk management is to proactively match the currencies of assets and liabilities in daily operations, to identify and measure the impact of exchange rate changes on operations through foreign currency exposure analysis, exchange rate sensitivity analysis and other instruments, and to hedge foreign exchange risk from exposure which affects profits through derivatives instruments. Most of the aircraft and ships under the operating lease and finance lease business of the Group are purchased and dominated in US dollars and the corresponding operating lease assets and finance lease receivables are denominated in US dollars, while the major funding sources of which are onshore and offshore US dollar-denominated bank borrowings and offshore US dollar-denominated bonds. Apart from Aircraft Leasing and Ship Leasing businesses, other leasing businesses of the Group are substantially denominated in Renminbi. Hence, there is no significant foreign exchange risk exposure.
As of December 31, 2018, the Group’s exposure for foreign exchange that affects profit or loss amounted to US$1,039.1 million, and the ending balance of notional amount for hedging transactions amounted to US$620.0 million. The Group effectively managed the foreign exchange risk and recorded exchange revenue of RMB144.4 million through monitoring the exposure, hedging by derivatives instruments, etc.
5.3 Liquidity Risk
Liquidity risk refers to the risk that the Group is unable to obtain funds at a reasonable cost to repay the liabilities or seize other investment opportunities. The target of the Group’s liquidity risk management is to maintain moderate liquidity reserves and sufficient funding resources at any time to meet the funding needs of matured liabilities and new investment in leasing businesses, and to achieve a higher interest rate margins level and lower management costs on condition that liquidity risks have been well managed.
632018 Annua l Report
Management Discussion and Analysis
The Group managed and balanced between liquidity risk and interest rate margin by adopting the following measures: proactively management of the maturity profile of our assets and liabilities and cash flow mismatch gap control to reduce structured liquidity risk; through adequate bank credit line, the Group established diversified funding sources and channels, thereby continuously increasing the transaction capability of the money market, the financing and the daily liquidity management capabilities of the Group, thus and so preserved sufficient funds to repay debts and fuel the Group’s business development. The Group established a three-level liquidity reserve system to mitigate and defuse liquidity risk. The three-level liquidity reserve system consists of quasi-cash assets from bank deposits and the money market, etc. as the first level liquidity reserve, bank-committed credit line of overdraft as the second level liquidity reserve and a portion of domestic quasi-sovereign bonds held by the Group as the third level liquidity reserve. As of December 31, 2018, the Group had an interbank borrowing and lending limit of RMB12.64 billion. In addition, the Group strived to improve its trading capacity in the money market, especially the online financing capacity through national interbank funding centre, where accumulated due to banks and other financial institutions (including bond collateral repo) amounted to RMB63.9 billion. Meanwhile, the Group maintained a bank-committed overdraft line of RMB1.45 billion and held a certain portion of domestic quasi-sovereign bonds, thus ensuring that its liquidity asset reserve can fully mitigate liquidity risk.
During 2018, the liquidity of the Group remained strong. According to the market liquidity situation, the Group arranged financing plans in a reasonable and orderly manner, further optimized the liquidity management mechanism, and gradually optimized the three-level liquidity reserve system to further improve the liquidity risk management capability.
5.4 Other risk
5.4.1 Operational risk
Operational risk refers to the risk of losses resulting from imperfect or problematic internal process, personnel and system or external events.
In 2018, the Group improved the overall operational risk management level, while the overall situation was steady. Firstly, the Group further optimized the internal control and management system, inspecting and remedying omissions in the reserve system as well as improving the system of the Group. Secondly, the Group strengthened the accountability management, improved risk and business trainings, increased the sense of risk responsibility and compliance of all employees. Thirdly, the Group improved the construction of information system, and launched a number of new systems such as leasing, fee control, accounting, capital, manpower, legal affairs and master information. Meanwhile, the Group realized the business and financial integration for the first time, and gradually improved the information system, providing technical support for further prevention of operation risk. Fourthly, the Group strengthened the management of weak aspects and further sorted out the risk points in all steps of the business by carrying out various types of special risk investigation.
64 Ch ina Deve lopment Bank F inanc ia l Leas ing Co . , L td .
Management Discussion and Analysis
5.4.2 Information Technology Risk
In 2018, the Group further optimized its management of information technology risk. Firstly, the Group reinforced the construction of information technology management system by establishing the Administrative Measures on Data Standards (《數據標準管理辦法》) and the Administrative Measures on Establishing an Information System (《信息系統建設管理辦法》), regulating the organizational structure, standard formulation, implementation, changes and review process for data standard management. The Group clarified the organizational structure of information system establishment and management, demand management and management of comprehensive flow for system construction. Optimization of system further improved the regulation of information technology management. Secondly, the Group set up risk monitoring indicators of information technology risk, and incorporated them into the risk appetite, risk limits and alert indicator system of the Group for centralized management, while monitoring, evaluating and reporting were conducted on a quarterly basis. Thirdly, the Group optimized the management process and technical management and control of the change in production to ensure that the change in production environment under massive development and production of system in 2018 were safe and controllable and reduced operational risks. The Group organized tests of data backup and recovery technology of important system newly operated to prevent the risk of losing important data.
5.4.3 Reputational risk
Reputational risk refers to the potential or existing risk of negative impact or damage to the image, reputation and brand value of the Group, arising when the operational, managerial and other behaviors or external incidents of the Group are noticed or reported by the media.
In 2018, the Group enhanced its reputational r isk management and focused on the reputational risk prevention and control as well as brand building. According to the Measures for the Management of Reputational Risks (《聲譽風險管理辦法》), the Group conducted regular self-inspection and investigation of reputational risk, and carried out daily public opinions monitoring through professional institutions, prevented reputation-related issues of the Group in advance and timely and promptly dealt with the issues, thereby effectively improving the capability of responding to the public sentiment and guiding public opinions. In addition, the Group facilitated the brand building of the Company in markets with great efforts through strengthening cooperation with domestic and foreign authoritative media, boarded the promotion channels of the Group by fully adapting to the features of new media, increased the flow of “Two Ws” (i.e. “Wechat and Weibo”), expanded the audience of the new media channels, strengthened positive advertising, accumulated positive energy and guided public opinions in an active manner through improving the operational quality of the Group’s new media channels. The reputational risk management of the Group was improved stably for the year, effectively safeguarding the sound corporate image and reputation.
6. CAPITAL MANAGEMENT
The Group’s major objectives of capital management activities are to maintain a reasonable capital sufficiency rate to meet the requirements of capital regulations and policies, to safeguard the Group’s ability of sustainable operation so as to continuously provide returns for Shareholders, and to maintain a strong capital base to support its business development. In accordance with relevant regulations promulgated by the CBIRC, capital adequacy ratio, leverage ratio and the utilization of regulatory capital are closely monitored by the management of the Group.
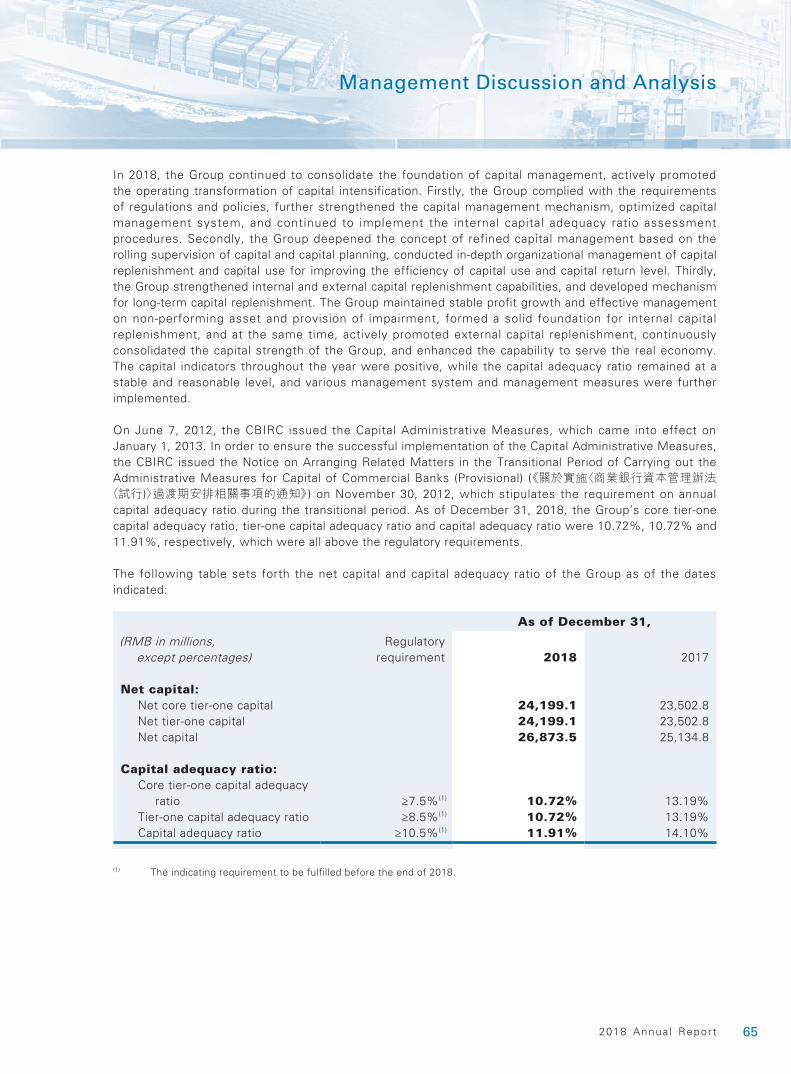
652018 Annua l Report
Management Discussion and Analysis
In 2018, the Group continued to consolidate the foundation of capital management, actively promoted the operating transformation of capital intensification. Firstly, the Group complied with the requirements of regulations and policies, further strengthened the capital management mechanism, optimized capital management system, and continued to implement the internal capital adequacy ratio assessment procedures. Secondly, the Group deepened the concept of refined capital management based on the rolling supervision of capital and capital planning, conducted in-depth organizational management of capital replenishment and capital use for improving the efficiency of capital use and capital return level. Thirdly, the Group strengthened internal and external capital replenishment capabilities, and developed mechanism for long-term capital replenishment. The Group maintained stable profit growth and effective management on non-performing asset and provision of impairment, formed a solid foundation for internal capital replenishment, and at the same time, actively promoted external capital replenishment, continuously consolidated the capital strength of the Group, and enhanced the capability to serve the real economy. The capital indicators throughout the year were positive, while the capital adequacy ratio remained at a stable and reasonable level, and various management system and management measures were further implemented.
On June 7, 2012, the CBIRC issued the Capital Administrative Measures, which came into effect on January 1, 2013. In order to ensure the successful implementation of the Capital Administrative Measures, the CBIRC issued the Notice on Arranging Related Matters in the Transitional Period of Carrying out the Administrative Measures for Capital of Commercial Banks (Provisional) (《關於實施〈商業銀行資本管理辦法(試行)〉過渡期安排相關事項的通知》) on November 30, 2012, which stipulates the requirement on annual capital adequacy ratio during the transitional period. As of December 31, 2018, the Group’s core tier-one capital adequacy ratio, tier-one capital adequacy ratio and capital adequacy ratio were 10.72%, 10.72% and 11.91%, respectively, which were all above the regulatory requirements.
The following table sets forth the net capital and capital adequacy ratio of the Group as of the dates indicated:
As of December 31,
(RMB in millions, except percentages)
Regulatory requirement 2018 2017
Net capital:Net core tier-one capital 24,199.1 23,502.8Net tier-one capital 24,199.1 23,502.8Net capital 26,873.5 25,134.8
Capital adequacy ratio:Core tier-one capital adequacy
ratio ≥7.5%(1) 10.72% 13.19%Tier-one capital adequacy ratio ≥8.5%(1) 10.72% 13.19%Capital adequacy ratio ≥10.5%(1) 11.91% 14.10%
(1) The indicating requirement to be fulfilled before the end of 2018.
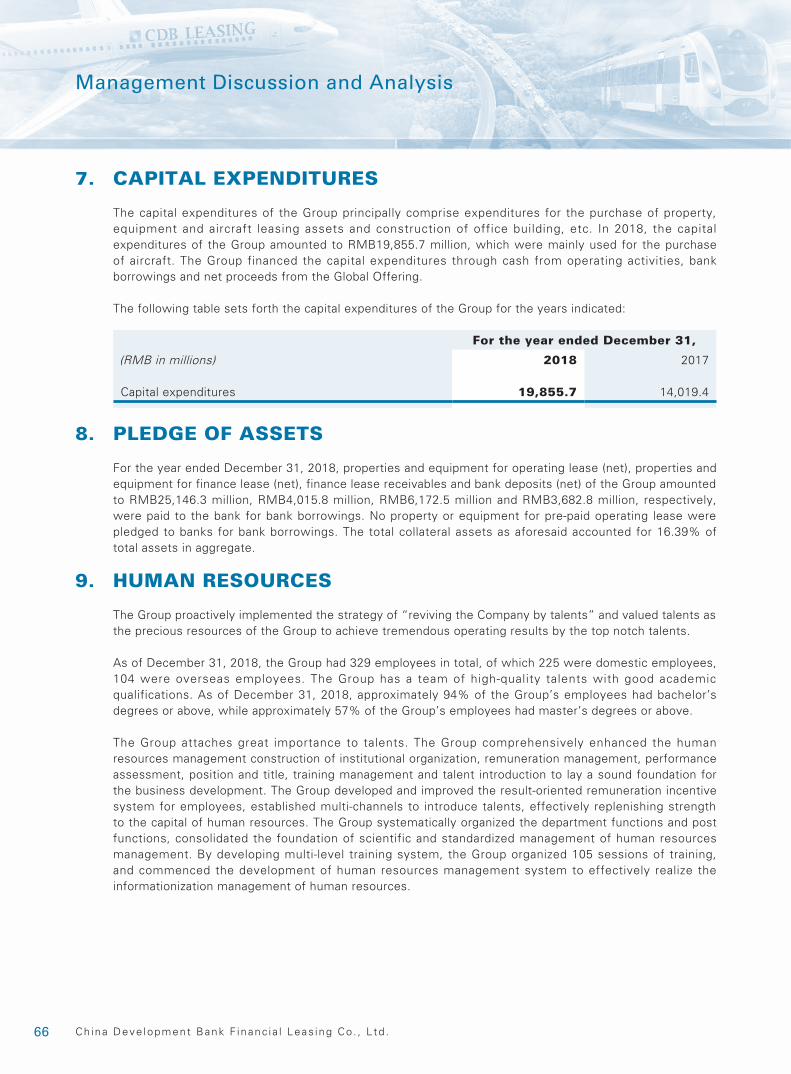
66 Ch ina Deve lopment Bank F inanc ia l Leas ing Co . , L td .
Management Discussion and Analysis
7. CAPITAL EXPENDITURES
The capital expenditures of the Group principally comprise expenditures for the purchase of property, equipment and aircraft leasing assets and construction of office building, etc. In 2018, the capital expenditures of the Group amounted to RMB19,855.7 million, which were mainly used for the purchase of aircraft. The Group financed the capital expenditures through cash from operating activities, bank borrowings and net proceeds from the Global Offering.
The following table sets forth the capital expenditures of the Group for the years indicated:
For the year ended December 31,
(RMB in millions) 2018 2017
Capital expenditures 19,855.7 14,019.4
8. PLEDGE OF ASSETS
For the year ended December 31, 2018, properties and equipment for operating lease (net), properties and equipment for finance lease (net), finance lease receivables and bank deposits (net) of the Group amounted to RMB25,146.3 million, RMB4,015.8 million, RMB6,172.5 million and RMB3,682.8 million, respectively, were paid to the bank for bank borrowings. No property or equipment for pre-paid operating lease were pledged to banks for bank borrowings. The total collateral assets as aforesaid accounted for 16.39% of total assets in aggregate.
9. HUMAN RESOURCES
The Group proactively implemented the strategy of “reviving the Company by talents” and valued talents as the precious resources of the Group to achieve tremendous operating results by the top notch talents.
As of December 31, 2018, the Group had 329 employees in total, of which 225 were domestic employees, 104 were overseas employees. The Group has a team of high-quality talents with good academic qualifications. As of December 31, 2018, approximately 94% of the Group’s employees had bachelor’s degrees or above, while approximately 57% of the Group’s employees had master’s degrees or above.
The Group attaches great importance to talents. The Group comprehensively enhanced the human resources management construction of institutional organization, remuneration management, performance assessment, position and title, training management and talent introduction to lay a sound foundation for the business development. The Group developed and improved the result-oriented remuneration incentive system for employees, established multi-channels to introduce talents, effectively replenishing strength to the capital of human resources. The Group systematically organized the department functions and post functions, consolidated the foundation of scientific and standardized management of human resources management. By developing multi-level training system, the Group organized 105 sessions of training, and commenced the development of human resources management system to effectively realize the informationization management of human resources.
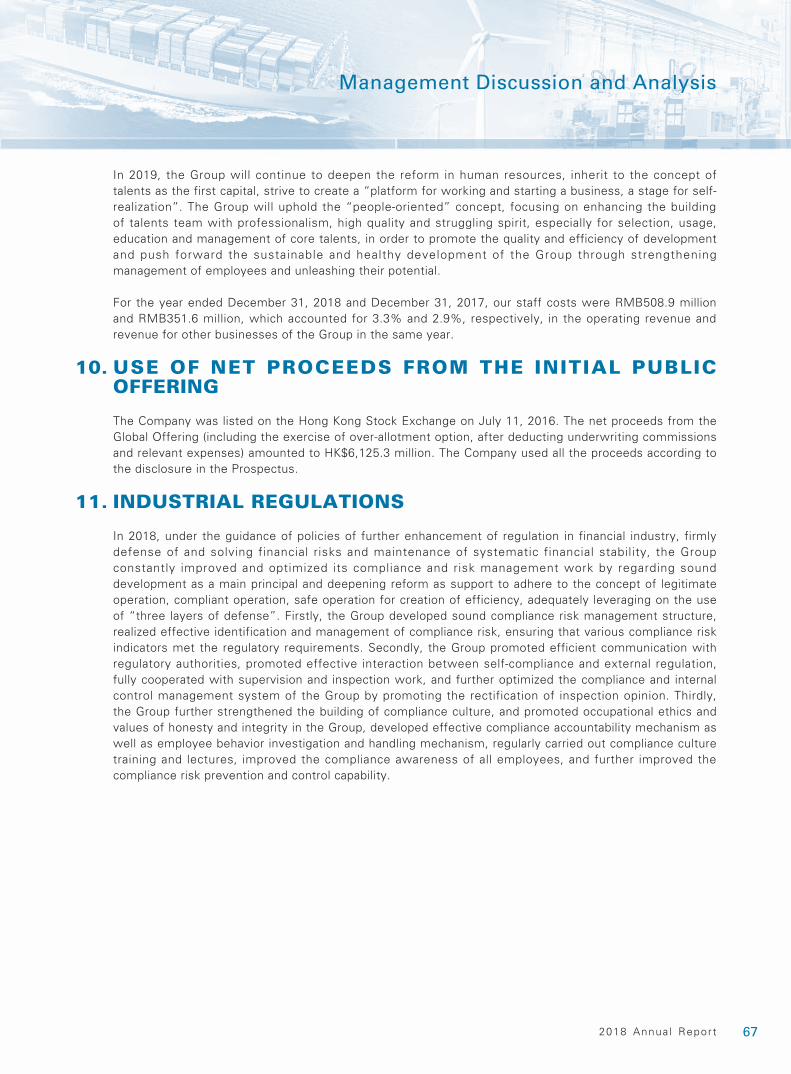
672018 Annua l Report
Management Discussion and Analysis
In 2019, the Group will continue to deepen the reform in human resources, inherit to the concept of talents as the first capital, strive to create a “platform for working and starting a business, a stage for self-realization”. The Group will uphold the “people-oriented” concept, focusing on enhancing the building of talents team with professionalism, high quality and struggling spirit, especially for selection, usage, education and management of core talents, in order to promote the quality and efficiency of development and push forward the sustainable and healthy development of the Group through strengthening management of employees and unleashing their potential.
For the year ended December 31, 2018 and December 31, 2017, our staff costs were RMB508.9 million and RMB351.6 million, which accounted for 3.3% and 2.9%, respectively, in the operating revenue and revenue for other businesses of the Group in the same year.
10. USE OF NET PROCEEDS FROM THE INITIAL PUBLIC OFFERING
The Company was listed on the Hong Kong Stock Exchange on July 11, 2016. The net proceeds from the Global Offering (including the exercise of over-allotment option, after deducting underwriting commissions and relevant expenses) amounted to HK$6,125.3 million. The Company used all the proceeds according to the disclosure in the Prospectus.
11. INDUSTRIAL REGULATIONS
In 2018, under the guidance of policies of further enhancement of regulation in financial industry, firmly defense of and solving financial risks and maintenance of systematic financial stability, the Group constantly improved and optimized its compliance and risk management work by regarding sound development as a main principal and deepening reform as support to adhere to the concept of legitimate operation, compliant operation, safe operation for creation of efficiency, adequately leveraging on the use of “three layers of defense”. Firstly, the Group developed sound compliance risk management structure, realized effective identification and management of compliance risk, ensuring that various compliance risk indicators met the regulatory requirements. Secondly, the Group promoted efficient communication with regulatory authorities, promoted effective interaction between self-compliance and external regulation, fully cooperated with supervision and inspection work, and further optimized the compliance and internal control management system of the Group by promoting the rectification of inspection opinion. Thirdly, the Group further strengthened the building of compliance culture, and promoted occupational ethics and values of honesty and integrity in the Group, developed effective compliance accountability mechanism as well as employee behavior investigation and handling mechanism, regularly carried out compliance culture training and lectures, improved the compliance awareness of all employees, and further improved the compliance risk prevention and control capability.
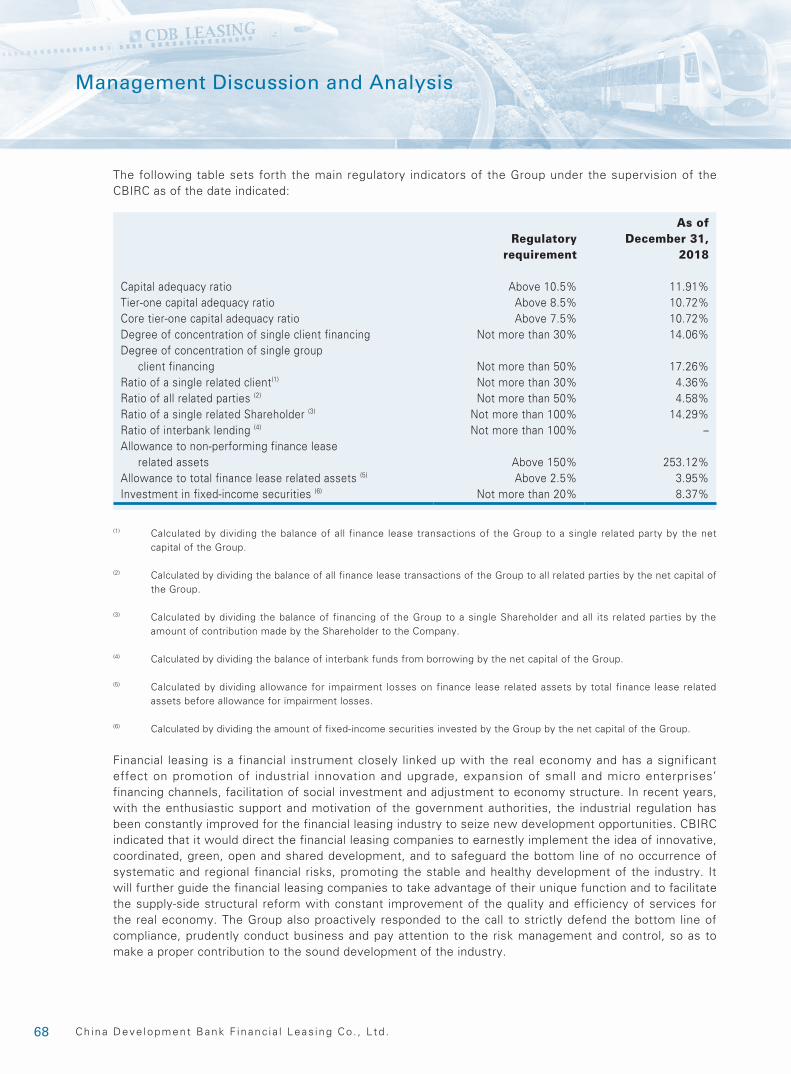
68 Ch ina Deve lopment Bank F inanc ia l Leas ing Co . , L td .
Management Discussion and Analysis
The following table sets forth the main regulatory indicators of the Group under the supervision of the CBIRC as of the date indicated:
Regulatory requirement
As of December 31,
2018
Capital adequacy ratio Above 10.5% 11.91%Tier-one capital adequacy ratio Above 8.5% 10.72%Core tier-one capital adequacy ratio Above 7.5% 10.72%Degree of concentration of single client financing Not more than 30% 14.06%Degree of concentration of single group
client financing Not more than 50% 17.26%Ratio of a single related client(1) Not more than 30% 4.36%Ratio of all related parties (2) Not more than 50% 4.58%Ratio of a single related Shareholder (3) Not more than 100% 14.29%Ratio of interbank lending (4) Not more than 100% –Allowance to non-performing finance lease
related assets Above 150% 253.12%Allowance to total finance lease related assets (5) Above 2.5% 3.95%Investment in fixed-income securities (6) Not more than 20% 8.37%
(1) Calculated by dividing the balance of all finance lease transactions of the Group to a single related party by the net capital of the Group.
(2) Calculated by dividing the balance of all finance lease transactions of the Group to all related parties by the net capital of the Group.
(3) Calculated by dividing the balance of financing of the Group to a single Shareholder and all its related parties by the amount of contribution made by the Shareholder to the Company.
(4) Calculated by dividing the balance of interbank funds from borrowing by the net capital of the Group.
(5) Calculated by dividing allowance for impairment losses on finance lease related assets by total finance lease related assets before allowance for impairment losses.
(6) Calculated by dividing the amount of fixed-income securities invested by the Group by the net capital of the Group.
Financial leasing is a financial instrument closely linked up with the real economy and has a significant effect on promotion of industrial innovation and upgrade, expansion of small and micro enterprises’ financing channels, facilitation of social investment and adjustment to economy structure. In recent years, with the enthusiastic support and motivation of the government authorities, the industrial regulation has been constantly improved for the financial leasing industry to seize new development opportunities. CBIRC indicated that it would direct the financial leasing companies to earnestly implement the idea of innovative, coordinated, green, open and shared development, and to safeguard the bottom line of no occurrence of systematic and regional financial risks, promoting the stable and healthy development of the industry. It will further guide the financial leasing companies to take advantage of their unique function and to facilitate the supply-side structural reform with constant improvement of the quality and efficiency of services for the real economy. The Group also proactively responded to the call to strictly defend the bottom line of compliance, prudently conduct business and pay attention to the risk management and control, so as to make a proper contribution to the sound development of the industry.
692018 Annua l Report
Management Discussion and Analysis
12. PROSPECTS
In 2019, the recovery of global real economy will enter a turning point, the downward pressure is increasingly emerging. The changes in the U.S. economy, the intensified trade war between the PRC and the U.S. as well as the rise in global debt burden will bring more uncertainties. China’s economy will still maintain a medium-high growth rate. Faced with steady internal and external situation with changes and concerns, the Group has to firmly seize the propitious moment when financial policies focus on tax reduction and fee reduction and the monetary policies become moderate, utilize the opportunities of renewal of the fleet in the international aviation market, the slow recovery in the ship and shipping industry and the infrastructure upgrading brought by the “remedy for weaknesses” policy, and strengthen the internal construction to promote the steady growth of our business.
In terms of business, the Group will continue to enhance professional capabilities in aircraft, ship, vehicle and construction machinery business, probe the policies, deepen the cooperation with key customers in the infrastructure sector, strengthen the business development in new energy and equipment manufacturing sector and put green finance and service entity economy into practice. In terms of internal management, the Group will insist on the guidance of compliance, accelerate the establishment of comprehensive compliance and risk management system, adequately acknowledge the importance in preventing and resolving significant risks, and strictly defense against the bottom line of risks. The Group will push forward the asset and liability management. At the asset side, the Group will steadily push forward the launch of “leasing+factoring”, asset securitization, listing and transfer in the Register and Transfer Centre for Credit Assets in Banking Industry and multi-channel asset transfer business to adjust the structure and increase the revenue. At the liability side, the Group will keep enriching the financing means by making use of the capital market to optimize financing structure to further reduce financing costs and to enhance capability of fixed income investment and trading of derivatives, reduce market and liquidity risks and expand sources of profits through better interest rate, exchange rate management.
In 2019, we will continually promote the Group to obtain new achievements and new progress in pushing forward all duties of operation and development, and return our Shareholders with brilliant results.
70 Ch ina Deve lopment Bank F inanc ia l Leas ing Co . , L td .
Directors, Supervisors and Senior Management
1. BIOGRAPHIES OF DIRECTORS, SUPERVISORS AND SENIOR MANAGEMENT
1.1. Directors
1.1.1 Executive Directors
Mr. Wang Xuedong (王學東), aged 55, joined the Company in August 2014. He is currently the chairman of the Board and an executive Director. Mr. Wang Xuedong successively held positions in the former State Planning Commission (currently known as National Development and Reform Commission) and the National Transportation Investment Corporation (國家交通投資公司) from August 1983 to March 1994. He served as the deputy head and head of the second division of water transportation under the transportation credit bureau of CDB successively from March 1994 to January 1997, and was the head of the first division under the eastern China credit bureau of CDB from January 1997 to December 1999. He served as the vice president of the Shanghai Branch of CDB from December 1999 to March 2008, and was the president of the Hunan Branch of CDB from March 2008 to August 2014. Mr. Wang Xuedong has served as the chairman of the Board and an executive Director since October 2014.
Mr. Wang Xuedong graduated from Dalian College of Technology (大連工學院) in Dalian, Liaoning Province, the PRC, majoring in port construction engineering, and obtained a bachelor’s degree in engineering in July 1983. He graduated from Central University of Finance and Economics in Beijing, the PRC, majoring in money and banking, and obtained a master’s degree in economics (part-time) in August 1999. Mr. Wang Xuedong obtained the qualification of senior engineer issued by CDB in November 1994. Mr. Wang also won the “National May 1st Labor Medal” (全國五一勞動獎章) in 2011, and was a representative of the 12th National People’s Congress.
Mr. Huang Min (黃敏), aged 35, joined the Company in March 2015. He is currently an executive Director, a vice president of the Company and the secretary to the Board. He served as the head of cadre appointment and removal at Hainan Airlines Co., Ltd. (海南航空股份有限公司) from October 2004 to October 2005. He served as the business head and the manager of the comprehensive management department in Chang Jiang Leasing Co., Ltd. (長江租賃有限公司) successively from May 2006 to July 2009, and was the acting manager of the human resources management department, the general manager of the comprehensive management department and the general manager of the fourth business department in Tianjin Bohai Leasing Co., Ltd. (天津渤海租賃股份有限公司) from September 2008 to November 2012. He held several positions in Wanjiang Financial Leasing Co., Ltd. (皖江金融租賃有限公司) successively from November 2012 to March 2015, including the secretary to the board of directors, the general manager of the strategic innovation department and general aviation department, and assistant to the president. Mr. Huang Min has served as the vice president and an executive Director since April and June 2015, respectively, and has served as the secretary to the Board since January 2016.
Mr. Huang Min graduated from Renmin University of China in Beijing, the PRC, majoring in international politics, and obtained a bachelor’s degree in laws in July 2004. He graduated from Tsinghua University School of Economics and Management in Beijing, the PRC, and obtained a master’s degree in business administration in June 2016.
712018 Annua l Report
Directors, Supervisors and Senior Management
1.1.2 Non-Executive Director
Mr. Li Yingbao (李英寶), aged 55, joined the Company in September 2015. He is currently a non-executive Director of the Company, as well as a senior appraisal manager of the first assessment bureau in CDB. Mr. Li Yingbao served as an engineer of the transportation project department in China International Engineering Consulting Corporation from August 1991 to February 1998, and held several positions in CDB successively from February 1998 to June 2012, including a clerk at section level of the transportation environmental assessment bureau, a clerk at section level and the head of division of the second assessment bureau, and the deputy head and head of division of the first assessment bureau. Mr. Li Yingbao has served as the senior assessment manager of the first assessment bureau of CDB since June 2012, and has served as a non-executive Director of the Company since September 2015.
Mr. Li Yingbao graduated from Xi’an College of Highway (西安公路學院) in Xi’an, Shaanxi Province, the PRC, majoring in highways and urban roads, and obtained a bachelor’s degree in engineering in July 1985. He then graduated from Xi’an College of Highway in Xi’an, Shaanxi Province, the PRC, majoring in highways and urban roads and obtained a master’s degree in engineering in April 1991. Mr. Li Yingbao obtained the qualification of senior engineer issued by CDB in November 1998. In May 2004, the research on the “Evaluation Methods of the Civil Airport Construction Project” led and completed by Mr. Li Yingbao was awarded the Second Prize for Civil Aviation Science and Technology Progress in 2001 by the Civil Aviation Administration of China. In December 2009, the “Feasibility Study Report on the Acquisition of Light Rail Airport Line Project by Capital Airport Holding Company” led and completed by Mr. Li Yingbao was awarded the Third Prize for National Excellent Engineering Consulting Achievement in 2009 by the China National Association of Engineering Consultants.
1.1.3 Independent Non-Executive Directors
Mr. Zheng Xueding (鄭學定), aged 55, joined the Company in January 2016. He is currently an independent non-executive Director of the Company, and has been a partner of Shenzhen Branch of Da Hua Certified Public Accountants (大華會計師事務所深圳分所) since January 2012. Mr. Zheng Xueding was a teacher in the department of accounting of Jiangxi College of Finance and Economics (currently known as Jiangxi University of Finance and Economics) from July 1984 to July 1988, and was a cadre of the accounting division under Shenzhen Municipal Bureau of Finance from January 1991 to January 1992. He served as the deputy secretary general and secretary general of Shenzhen Institute of Certified Public Accountants from January 1992 to December 2005 and a partner of Shenzhen Branch of Pan-China Certified Public Accountants (天健會計師事務所深圳分所) from January 2006 to December 2011. Mr. Zheng Xueding has been an independent director of Shenzhen Institute of Building Research Co., Ltd. (深圳市建築科學研究院股份有限公司) since September 2013 and an independent director of Shenzhen Glacier Network Technology Co. Ltd. (深圳冰川網絡技術股份有限公司) since September 2012. Mr. Zheng Xueding has served as a director of Jintian Industry since January 2014. Mr. Zheng Xueding confirmed that he is not in any way related to the loss of this company. Mr. Zheng Xueding served as an independent director of Ping An UOB Fund Management Co., Ltd. (平安大華基金公司) since January 2011 and has been an independent director of Shenzhen Infogem Technologies Co., Ltd. (深圳市銀之傑科技股份有限公司, a company listed on the Shenzhen Stock Exchange, stock code: 300085) since April 2014, an independent director of Qinhuangdao Tianye Tolian Heavy Industry Co., Ltd. (秦皇島天業通聯重工股份有限公司, a company listed on the Shenzhen Stock Exchange, stock code: 002459) since May 2014. Mr. Zheng Xueding has been a member of the sixth Standing Committee and the Planning and Budget Committee of the People’s Congress of Shenzhen since June 2015, and has served as an independent non-executive Director of the Company since January 2016.
72 Ch ina Deve lopment Bank F inanc ia l Leas ing Co . , L td .
Directors, Supervisors and Senior Management
Mr. Zheng Xueding graduated from the department of accounting of Jiangxi University of Finance and Economics in Nanchang, Jiangxi Province, the PRC, majoring in industry accounting, and obtained a bachelor’s degree in economics in July 1984. He then graduated from the financial accounting department of Jiangxi University of Finance and Economics in Nanchang, Jiangxi Province, the PRC, majoring in accounting, and obtained a master’s degree in economics in July 1991. Mr. Zheng Xueding was granted with the qualification of certified public accountant by the Chinese Institute of Certified Public Accountants in August 1995 and the qualification of senior accountant by the Personnel Department of Guangdong Province in January 1998.
Mr. Xu Jin (徐進), aged 60, joined the Company in January 2016. He is currently an independent non-executive Director, and has been a professor of the School of Economics of Shenzhen University since October 2001. He has been a member of the Academic Committee of the Finance Society of Shenzhen, the Budget and Accounting Research Society of Shenzhen, and the Accounting Society of Shenzhen since July 2013, as well as a specialist of the Advisory Committee for Policy Decision of Shenzhen since January 2016. Mr. Xu Jin was a tutor and lecturer in the finance department of Jilin Institute of Finance and Trade (吉林財貿學院, currently known as the finance department of Changchun Taxation College (長春稅務學院)) from July 1986 to August 1995, and served as an associate professor of the finance department of Changchun Taxation College (長春稅務學院, currently known as the Institute of Taxation of Jilin University of Finance and Economics (吉林財經大學稅務學院)) from July 1998 to October 2001. He has served in several positions successively at Shenzhen University since October 2001, including as an associate professor and professor of the School of Economics, the dean of the finance department, the director of the Fiscal and Taxation Research Institute and the head of Community Finance Research Centre of China Minsheng Bank Shenzhen Branch (民生銀行深圳分行小區金融研究中心). Meanwhile, Mr. Xu Jin served as a visiting professor majoring in finance in Tianjin College of Commerce (天津商學院) from November 2002 to July 2004, and a standing director of the Shenzhen Certified Tax Agents Association from August 2003 to July 2011. He was a standing director of Shenzhen Local Taxation Research Academy (深圳地方稅收研究會) and Shenzhen International Taxation Research Academy (深圳國際稅收研究會) from November 2007 to September 2011. Mr. Xu Jin served as an external director of Shenzhen Guangming New District Urban Construction & Investment Co., Ltd. (深圳光明新區城投公司) from January 2011 to November 2015, and an independent director of Guangdong Baolilai Investment Co., Ltd. (廣東寶利來投資股份有限公司, currently known as China High-Speed Railway Technology Co., Ltd. (神舟高鐵技術股份有限公司), a company listed on the Shenzhen Stock Exchange (stock code: 000008)) from May 2013 to August 2015. He has served as an independent non-executive Director of the Company since January 2016.
Mr. Xu Jin graduated from Jilin Institute of Economics and Trade (吉林經貿學院, currently known as the Jilin University of Finance and Economics) in Changchun, Jilin Province, the PRC, majoring in finance and obtained a bachelor’s degree in economics in July 1986, and graduated from the tutor course of the Central Institute of Finance and Economics (中央財政金融學院, currently known as the Central University of Finance and Economics) in Beijing, the PRC, majoring in finance, and completed his postgraduate course in July 1988. He graduated from Renmin University of China in Beijing, the PRC, majoring in finance, and obtained a doctoral degree in economics in July 1998. Mr. Xu Jin obtained the qualification of professor in December 2004 and was appointed as professor by Shenzhen University at the same time. He obtained the qualification of finance professor issued by the Personnel Department of Guangdong Province in March 2005.
732018 Annua l Report
Directors, Supervisors and Senior Management
Mr. Zhang Xianchu (張宪初), aged 64, joined the Company in January 2016. He is currently an independent non-executive Director of the Company, and has been a teacher, tenured professor at the Faculty of Law in the University of Hong Kong since July 1997, and deputy dean at the Faculty of Law in the University of Hong Kong from 2001 to 2004. He has served as a trustee of the Hong Kong Legal Education Trust Fund (香港法律教育信託基金) since May 2002 and a visiting professor of Fudan University since September 2003. He has served as an independent director of Jiangsu Nantong Xinhaixing (Group) Company (江蘇南通新海星(集團)公司) since 2004 and a visiting professor of Shantou University since 2006. He has been as a member of the Foreign Specialities Commission under the Trial Theory Study Committee of China Law Society (the Supreme People’s Court) (中國法學會(最高人民法院)審判理論研究會涉外專業委員會) since March 2011 and an arbitrator of the Shanghai International Economic and Trade Arbitration Commission since May 2012. He has served as one of the three editors of the series of books of Asian commercial laws, financial laws and economic laws, and Asian commercial laws and practices published by Edward Elgar Publishing in the UK since June 2012, and has been an arbitrator of the South China International Economic and Trade Arbitration Commission since December 2012 and the director of the Chinese Judicial Studies Academy (中華司法研究會) under the Supreme People’s Court since July 2015. He has also been a member of the editorial committee of the British Journal of Interdisciplinary Studies since September 2015 and an arbitrator of the Arbitration Commission of Tianjin Free Trade Zone in China since October 2015. He has served as a member of the editorial committee of University of Bologna Law Review since November 2015 and a visiting scholar of University of Michigan Law School since January 2016. Mr. Zhang Xianchu was a teacher at City University of Hong Kong from January 1995 to June 1997 and a senior researcher at Queen Mary University of London in Britain from May 1999 to May 2002. He served as a visiting professor of the Asian Transnational Program of Duke University-University of Hong Kong from June 1999 to June 2005 and a visiting professor of WTO Asia-pacific Trade Policy Training Program from June 2003 to June 2009. He was also a visiting scholar of Academia Sinica (中央研究院) in Taiwan from December 2008 to March 2009. Mr. Zhang Xianchu has been an independent non-executive Director of the Company since January 2016.
Mr. Zhang Xianchu graduated from China University of Political Science and Law in Beijing, the PRC, majoring in law, and obtained a bachelor’s degree in law in July 1983. He graduated from the Law School of Indiana University (Bloomington) in Bloomington, Indiana, the U.S., majoring in comparative law, and obtained a master’s degree in law in May 1988. He graduated from the Law School of Indiana University (Bloomington) in Bloomington, Indiana, the U.S., and obtained a doctoral degree in law in August 1992.

74 Ch ina Deve lopment Bank F inanc ia l Leas ing Co . , L td .
Directors, Supervisors and Senior Management
1.2. Supervisors
Mr. Jiang Daozhen (蔣道振), aged 52, joined the Company in March 2015. He is currently the chairman of the Board of Supervisors of the Company. Mr. Jiang Daozhen held several positions in CDB from April 1995 to March 2015 successively, including a staff member and a clerk at section level of the international financial organization loan division under the international finance bureau, a clerk at section level of the international business loan division and the foreign exchange credit management division under the international finance bureau, the deputy head of the foreign exchange credit management division under the international finance bureau, the secretary at deputy division level of the president office under the general office, the head of the second customer division under the business department of the head office, the deputy general manager of the business department of the head office and vice president of the Beijing Branch. Mr. Jiang Daozhen has served as the chairman of the Board of Supervisors since June 2015. He has served as the chairman of the Board of Supervisors of CDB Capital Co., Ltd since March 2018.
Mr. Jiang Daozhen graduated from Tsinghua University in Beijing, the PRC, majoring in water conservancy and hydropower engineering, and obtained a bachelor’s degree in engineering in July 1990. He then graduated from North China College of Water Resources and Electric Power (華北水利水電學院) in Zhengzhou, Henan Province, the PRC, majoring in hydraulics and river dynamics and obtained a master’s degree in engineering in April 1995.
Mr. Lei Yanzheng (雷閻正), aged 53, joined the Company in December 2013. He is currently a Supervisor of the Company. Mr. Lei Yanzheng has been the secretary of the board of directors of AVIC Aircraft Co., Ltd. (中航飛機股份有限公司) from December 2012 to September 2016 and a deputy general manager of AVIC Aircraft Co., Ltd. since September 2016. Mr. Lei Yanzheng served in several positions successively in Xi’an Aircraft Industry (Group) Company Ltd. (西安飛機工業(集團)有限責任公司) from July 1986 to July 2011, including a technician of the power section, the manager of the 56th Factory, the secretary of the board of directors, the head of the planning department and deputy general manager of Xi’an Aircraft International Corporation (西安飛機國際航空製造股份有限公司). Mr. Lei Yanzheng has been a Supervisor of the Company since December 2013.
Mr. Lei Yanzheng graduated from Xi’an Metallurgy and Architecture College (西安冶金建築學院) in Xi’an, Shaanxi Province, the PRC, majoring in heating and ventilating, and obtained a bachelor’s degree in engineering in July 1986. He then graduated from Northwestern Polytechnical University in Xi’an, Shaanxi Province, the PRC, majoring in management engineering, and obtained a master’s degree in engineering in May 1998.

752018 Annua l Report
Directors, Supervisors and Senior Management
Mr. Ma Yongyi (馬永義), aged 54, joined the Company in February 2018. He is currently an external Supervisor of the Company. Mr. Ma Yongyi has been serving as a postgraduate mentor of Tsinghua University and Research Institute for Fiscal Science of the PRC since July 2012. He has been working successively as the director of the distance education centre, the director of the academic department and the director of teacher management committee of Beijing National Accounting Institute (北京國家會計學院) since February 2004. Mr. Ma was an independent director of Glodon Software Co., Ltd. (廣聯達軟件股份有限公司, a company listed on the Shenzhen Stock Exchange, stock code: 002410) from April 2008 to April 2014, an independent director of Inner Mongolia Yuanxing Energy Co., Ltd. (內蒙古遠興能源股份有限公司, a company l isted on the Shenzhen Stock Exchange, stock code: 000683) from April 2009 to April 2013, an independent director of Xiamen Comfort Science & Technology Group Co., Ltd. (廈門蒙發利科技(集團)股份有限公司, a company listed on the Shenzhen Stock Exchange, stock code: 002614) from November 2010 to March 2012, an independent director of San’an Optoelectronics Co., Ltd. (三安光電股份有限公司, a company listed on the Shanghai Stock Exchange, stock code: 600703) from July 2011 to December 2013, an independent director of Cachet Pharmaceutical Co., Ltd. (嘉事堂藥業股份有限公司, a company listed on the Shenzhen Stock Exchange, stock code: 002462) from August 2012 to August 2014. He has been an independent supervisor of Chanjet Information Technology Company Limited (a company listed on the Hong Kong Stock Exchange, stock code: 1588) since April 2014, and an independent director of Zhejiang Dun’an Artificial Environment Co., Ltd. (浙江盾安人工環境股份有限公司, a company listed on the Shenzhen Stock Exchange, stock code: 002011) since April 2016.
Mr. Ma Yongyi has been recognised as a professor by the Ministry of Finance since October 2009. He has also been a director of the Accounting Society for Foreign Economic Relations and Trade of China (中國對外經濟貿易會計學會) since November 2010, a committee member of the education and training committee of the Chinese Institute of Certified Public Accountants (中國註冊會計師協會教育培訓委員會) since December 2010 and a director of the Accounting Society of China (中國會計學會) since March 2014, respectively. Mr. Ma obtained a doctorate degree in management from Central University of Finance and Economics (中央財經大學) in July 2003.
Ms. Huang Xuemei (黃雪梅), aged 45, joined the Company in March 2000. She is currently an employee representative Supervisor of the Company, the general manager of the Audit Department (the office of Board of Supervisors), a member of the labor union and a director of the Women Workers’ Committee of the Company. Ms. Huang Xuemei has served in several positions successively in the Company since March 2000, including an assistant to the director of the Capital Department, the director of the Finance Department and Capital Department, the general manager of the Treasury Department, the general manager of the Risk Management Department, the general manager of the Compliance Department and the general manager of the Audit Department (the office of Board of Supervisors). Ms. Huang Xuemei has served as a director in 20 domestic SPCs of the Company since July 2013, a Supervisor of the Company since May 2015, and a director in other 13 domestic SPVs of the Company since October 2015.
Ms. Huang Xuemei graduated from Capital University of Economics and Business in Beijing, the PRC, majoring in finance and insurance, and obtained a bachelor’s degree in economics in July 1997. She graduated from the Chinese University of Hong Kong in Hong Kong, majoring in business administration and obtained an MBA degree in business administration in December 2010. In October 1998, Ms. Huang Xuemei was granted with the qualification of intermediate economist by Ministry of Personnel of the PRC (now known as Ministry of Human Resources and Social Security of the PRC).
76 Ch ina Deve lopment Bank F inanc ia l Leas ing Co . , L td .
Directors, Supervisors and Senior Management
Mr. Wang Yiyun (王一雲), aged 53, has joined the Company since September 1999. He is currently serves as an employee representative Supervisor, the director of the discipline inspection and supervision office and the commissary in charge of studies of the labor union of the Company. Mr. Wang Yiyun was a loan officer and the deputy section head of the Hengyang Branch of Agricultural Bank of China (中國農業銀行衡陽市分行) and a senior staff member of the Hengyang Center Branch of People’s Bank of China (中國人民銀行衡陽市中心支行) from July 1986 to September 1999. He served as the office head and senior manager of Shenzhen Financial Leasing Company Limited (the predecessor of the Company) from September 1999 to May 2008, the senior manager and deputy director of the office, and the deputy general manager of the operation and management department of China Development Bank Financial Leasing Company Limited (the predecessor of the Company) from May 2008 to September 2015. He also served as the deputy general manager and director assistant of the operation and management department of the Company from September 2015 to January 2018, the director assistant of the operation and management department of the Company (in charge of the work at the discipline inspection and supervision office) from February 2018 to July 2018, and the director assistant of the discipline inspection and supervision office (in charge of work) from July 2018 to August 2018. He has been serving as the director of the discipline inspection and supervision office of the Company since August 2018.
Mr. Wang Yiyun graduated from Hunan University of Finance and Economics (湖南財經學院), majoring in finance, and obtained a bachelor’s degree in economics in July 1986. He was granted with the qualification of an economist by Hunan Branch of Agricultural Bank of China Limited.
1.3. Senior Management
Mr. Peng Zhong (彭忠), aged 50, joined the Company in October 2017. He is currently the president of the Company. He worked for the National Transportation Investment Corporation from July 1993. He joined China Development Bank in April 1994 and worked successively for the transportation credit bureau, the Chengdu Office, the southwest credit bureau, the second assessment bureau and the first assessment bureau thereof. He worked for the China Development Bank (Sichuan Branch) from August 2003 to September 2017, during which he served as the vice president and a committee member of the Communist Party of China.
Mr. Peng Zhong graduated from Renmin University of China in Beijing, the PRC, in July 1993, majoring in industrial enterprise management and obtained a master’s degree.
Mr. Ai Yang (艾陽), aged 48, joined the Company in March 2015. He is currently a vice president of the Company. Mr. Ai Yang was a cadre in the highway project department of National Transportation Investment Corporation from July 1993 to March 1994. He served in several positions successively in CDB from March 1994 to November 2002, including a staff member of the transportation credit bureau, a clerk at deputy section level of the transportation credit bureau and the Southwest credit bureau, and a clerk at section level of the Southwest credit bureau and the second assessment bureau. From November 2002 to March 2011, he served in several positions successively in CDB Shanghai Branch, including the deputy head of the project appraisal division, the head of the business innovation division, the head of the financial market division and the head of the international cooperation division. He was a vice president of CDB Ningbo Branch from March 2011 to March 2015. Mr. Ai Yang has been a vice president of the Company since April 2015.
Mr. Ai Yang graduated from Beijing University of Technology in Beijing, the PRC, majoring in transportation engineering, and obtained a bachelor’s degree in engineering in July 1993.
772018 Annua l Report
Directors, Supervisors and Senior Management
Mr. Li Jungang (李駿罡), aged 53, joined the Company in March 2015. He is currently a vice president of the Company. Mr. Li Jungang was a staff member of the Nantong Planning Committee from July 1990 to May 1993. He served as a deputy manager in Shenzhen Qingshuihe Industry Company Limited (深圳清水河實業公司) and its subsidiaries from May 1993 to February 1994. He was a principal staff member in China Southern Securities Company Limited (中國南方證券有限公司) from November 1994 to October 1996. He served in several positions successively in Shenzhen City Commercial Bank (深圳市商業銀行) from October 1996 to November 2007, including the deputy general manager of the corporate business department, the general manager of the credit and loan department, and the general manager of the asset and risk management department. From November 2007 to March 2015, he successively served as the head of client division III and client division I of CDB Shenzhen Branch. Mr. Li Jungang has been a vice president of the Company since April 2015.
Mr. Li Jungang graduated from Hefei University of Technology (合肥工業大學) in Hefei, Anhui Province, the PRC, majoring in industrial management engineering, with a bachelor’s degree in engineering in July 1987. He then graduated from Jiangxi College of Finance and Economics in Nanchang, Jiangxi Province, the PRC, majoring in industrial economics, with a master’s degree in economics in June 1990. He graduated from Xiamen University in Xiamen, Fujian Province, the PRC, majoring in world economy with a doctoral degree in economics in June 2008. In May 1996, Mr. Li Jungang was granted with the qualification of accountant by the Ministry of Personnel of the PRC (currently known as the Ministry of Human Resources and Social Security of the PRC).
Mr. Gu Zhonghui (顧仲輝), aged 45, joined the Company in August 2016. He currently serves as a vice president of the Company. Mr. Gu Zhonghui held various positions successively in CDB from July 1997 to July 2016, including a cadre of Shandong division under East China credit bureau, a cadre of Wuhan Branch, a clerk at deputy section level of the loan management bureau, a clerk at section level of the treasury bureau, the deputy head and the head of the monetary market division of the capital trading department under the treasury bureau, head of the trading division of the capital trading department under the treasury bureau and the deputy general manager of the capital trading department of the treasury bureau.
Mr. Gu Zhonghui graduated from the Central University of Finance and Economics and obtained a bachelor’s degree in June 1997. He graduated from Tsinghua University and obtained a master’s degree in business administration in June 2004.
Mr. Huang Min (黃敏) – for details of his biography, please refer to “Directors – Executive Directors” in this section.

78 Ch ina Deve lopment Bank F inanc ia l Leas ing Co . , L td .
Directors, Supervisors and Senior Management
Mr. Shi Yongkun (時永坤), aged 47, joined the Company in December 1999. He currently serves as chief risk officer and general manager of compliance management department of the Company. Mr. Shi Yongkun successively served as accountant and chief accountant of the financial department and head of the state-owned assets supervision and administration office of Shenzhen Nanfeng Pharmaceutical Plant (深圳南方製藥廠) from July 1995 to July 1998; he participated in equity interest and debt restructuring of Shenzhen Leasing Co., Ltd. (深圳租賃有限公司) from July 1998 to December 1999; he successively served as head of financial office and head of lease and credit department, head of risk management department, chief financial officer and head and deputy general manager of risk control office, and head of asset management department of Shenzhen Leasing Co., Ltd. from December 1999 to January 2008; he served as general manager of Shenzhen Yigong Industrial Development Co. Ltd. (深圳市益公實業發展有限公司) from January 2008 to May 2010; he has served as general manager of lease business third department, general manager of asset management department, general manager of asset management first department, general manager of compliance management department, chief risk officer and general manager of compliance management department since May 2010, respectively.
Mr. Shi Yongkun received a bachelor’s degree in economics from Jiangxi Institute of Finance and Economics (江西財經學院) in Jiangxi Province in the PRC in July 1995, majoring in accounting, and received a master’s degree in economics from Xiamen University (廈門大學) in Fujian Province in the PRC in July 2006, majoring in global management. Mr. Shi Yongkun possesses qualification of accountant issued by the Ministry of Finance.
Ms. Feng Qian (馮倩), aged 44, joined the Company in July 2018, currently serves as chief financial officer of the Company. Ms. Feng Qian successively worked in policy study department and poverty alleviation department of agricultural bureau of the Ministry of Finance, general office of financial bureau, department two of foreign government loans and department four of finance from August 1997 to July 2007; she successively served as deputy head and head of fund bureau, head of investment management office under fund and trading department, head of bond management office under bond business centre and head of customers and business office under fund and trading department of China Development Bank from July 2007 to July 2018. Ms. Feng has served as the chief financial officer of the Company since November 2018.
Ms. Feng received a bachelor’s degree in economics from Central University of Finance and Economics (中央財經大學) in August 1997, majoring in monetary and banking, and received a master’s degree in science in the University of Manchester (曼徹斯特大學) in the UK in September 2002, majoring in economics. Ms. Feng Qian possesses qualification of economist issued by the Ministry of Human Resources and Social Security of the People’s Republic of China.
792018 Annua l Report
Directors, Supervisors and Senior Management
2. CHANGES OF DIRECTORS, SUPERVISORS AND SENIOR MANAGEMENT AND THEIR INFORMATION
2.1. Directors of the Company
On June 19, 2018, due to his age, Mr. Geng Tiejun resigned as a non-executive Director of the Company and a member of the Related Party Transaction Control Committee and the Risk Management and Internal Control Committee of the Board.
On June 19, 2018, due to work adjustments, Ms. Liu Hui resigned as a non-executive Director of the Company and a member of Audit Committee, Nomination Committee and Risk Management and Internal Control Committee of the Board.
During the Reporting Period and as of the Latest Practicable Date, save as disclosed above, there was no change of other Directors and their information.
2.2. Supervisors of the Company
On January 10, 2018, due to work arrangement, Mr. Zhuang Ganlang resigned as an employee representative Supervisor, with effect from February 28, 2018. On January 10, 2018, Mr. Ma Yongyi was nominated as a candidate for external Supervisor, and his appointment as the external Supervisor was approved at the general meeting on February 28, 2018.
On October 25, 2018, due to work adjustment, Mr. Sun Zhikun resigned as a shareholder representative Supervisor, with effect from February 1, 2019.
On January 28, 2019, Mr. Wang Yiyun was appointed as an employee representative Supervisor at the employee representative conference, with effect from February 1, 2019.
During the Reporting Period and as of the Latest Practicable Date, save as disclosed above, there was no change of other Supervisors and their information.
2.3. Senior Management of the Company
On March 29, 2018, Ms. Hu Xiaoyun was removed as a chief financial officer due to change of work adjustments.
On August 27, 2018, Mr. Shi Yongkun was nominated as the chief risk officer, whose appointment was approved by CBRC Shenzhen Office on November 7, 2018.
On August 27, 2018, Ms. Feng Qian was nominated as the chief f inancial off icer, whose appointment was approved by CBRC Shenzhen Office on November 7, 2018.
During the Reporting Period and as of the Latest Practicable Date, save as disclosed above, there was no change of senior management of the Company and their information.

80 Ch ina Deve lopment Bank F inanc ia l Leas ing Co . , L td .
Directors, Supervisors and Senior Management
3. INFORMATION REGARDING ANNUAL REMUNERATION OF DIRECTORS, SUPERVISORS AND SENIOR MANAGEMENT
Remuneration of Directors and senior management is proposed by the Remuneration Committee according to their academic qualifications, working experience, work performance, performance of duties and appraisals. The remuneration of Directors is subject to approval and confirmation of the general meeting, while the remuneration of the senior management is subject to approval and confirmation of the Board. The remuneration of Supervisors is subject to approval and confirmation of the general meeting.
Details regarding the remuneration of the Directors, Supervisors and chief executives of the Company are set out in Note 47 to the financial statements. The range of remuneration of senior management of the Group is set out as follows:
Range of remuneration Number of persons
RMB0 to RMB500,000 1RMB500,001 to RMB1,000,000 1RMB1,000,001 to RMB1,500,000 1RMB1,500,001 to RMB2,000,000 5RMB2,000,001 to RMB2,500,000 –
812018 Annua l Report
Corporate Governance Report
1. OVERVIEW
The Board is pleased to present the corporate governance report of the Company for the year ended December 31, 2018.
Corporate Governance Practice
The Company is committed to maintaining high standards of corporate governance in order to safeguard the interests of Shareholders and enhance corporate value and accountability of the Company. The Company has adopted the Corporate Governance Code as its own code of corporate governance. During the Reporting Period, except for the code provision A.4.2 of the Corporate Governance Code, the Company has complied with all code provisions set out in the Corporate Governance Code. The Company will continue to review and monitor the Company’s corporate governance practice to ensure the compliance with the Corporate Governance Code.
Pursuant to code provision A.4.2 of the Corporate Governance Code, every director should be subject to retirement by rotation at least once every three years. The term of the first session of the Board of Directors and the Board of Supervisors expired on September 8, 2018. As the nomination of candidates for Directors and Supervisors of the second session of the Board of Directors and the Board of Supervisors has not been completed, the election of the Board of Directors and the Board of Supervisors is still in proactive preparation, and in order to ensure the continuity of the relevant work of the Company, the election of the Board of Directors and the Board of Supervisors has been postponed. The term of the Directors of the first session of the Board of Directors and the Supervisors of the first session of the Board of Supervisors will be extended till the election of the second session of the Board of Directors and the Board of Supervisors at a Shareholders’ general meeting of the Company, and the term of each special committee of the Board of Directors, the Board of Supervisors and the senior management will be correspondingly extended. The Company will determine relevant matters as soon as possible, actively promote the process of election of the Board of Directors and the Board of Supervisors, and fulfil its corresponding obligations of information disclosure in a timely manner. For details, please refer to the announcement published by the Company on the websites of the Hong Kong Stock Exchange and the Company on September 7, 2018. The Company will continue to review and monitor its corporate governance practice to ensure the compliance with the Corporate Governance Code.
2. SHAREHOLDERS’ GENERAL MEETINGS
2.1 Duties of Shareholders’ General Meetings
Shareholders’ general meeting is the organ of the authority of the Company comprising all Shareholders. The Shareholders’ general meeting is responsible for deciding on the operational policies, strategic development plans and investment plans of the Company; electing and replacing Directors and deciding on matters concerning their remuneration; electing and replacing Supervisors appointed from the Shareholder representatives, and deciding on matters concerning their remuneration; considering and approving reports of the Board and the Board of Supervisors; considering and approving the Company’s annual financial budget, final account proposals, profit distribution proposals, loss recovery proposals and share incentive plans; adopting resolutions concerning the increase or reduction of registered capital, merger, division, dissolution, liquidation or change of corporate form, annual plans for issuance of corporate bonds, the engagement, dismissal or non-reappointment of accounting firms and amendment to the Articles of Association; examining the material equity investment, bond investment, asset acquisition, asset disposal, write off of assets and external guarantee that shall be approved by the Shareholders’ general meeting as stipulated by laws, regulations and relevant regulations of the listing rules of the place where the shares are listed; considering external donation of RMB8 million or more; considering proposals raised by the Shareholders who hold more than five percent (including 5%) of the voting Shares.

82 Ch ina Deve lopment Bank F inanc ia l Leas ing Co . , L td .
Corporate Governance Report
2.2 Details of Shareholders’ General Meetings
During the Reporting Period, the Company held three Shareholders’ general meetings, the attendance of Directors at Shareholders’ general meetings is set out in the table below:
Directors
No. of meetings attended/No. of meetings eligible to
be attended
Mr. Wang Xuedong 3/3Mr. Huang Min 3/3Mr. Geng Tiejun1 1/2Ms. Liu Hui2 1/2Mr. Li Yingbao 0/3Mr. Zheng Xueding 2/3Mr. Xu Jin 3/3Mr. Zhang Xianchu 3/3
Notes: 1. Due to his age, Mr. Geng Tiejun resigned as a non-executive Director of the Company on June 19, 2018.
2. Due to work adjustments, Ms. Liu Hui resigned as a non-executive Director of the Company on June 19, 2018.
832018 Annua l Report
Corporate Governance Report
3. BOARD
3.1 Duties of the Board
The Board is the decision-making organ of the Company and is responsible to the Shareholders’ general meeting. The Board is responsible for convening Shareholders’ general meetings and reporting its work to the Shareholders’ general meetings, executing the resolutions passed by Shareholders’ general meetings, formulating the strategic development plans of the Company, deciding on the operational plans, investment proposals and annual specific operational targets of the Company, formulating the Company’s annual financial budget, final account proposals, profit distribution proposals, loss recovery plans, basic management system, working rules of the special committees of the Board, share incentive plans, formulating proposals for increase or decrease of the registered capital of the Company as well as formulating and approving bond issuance plans within the annual bond issuance plans approved at the Shareholders’ general meeting, including asset securitization plan of the Company as the initiating institution, proposing plans for the major acquisition, repurchase of Shares, merger, division, dissolution and change of the corporate form, amendments to the Articles of Association, rules of procedure of the Shareholders’ general meeting and the rules of procedure of the Board, electing the chairman and vice chairman of the Board, appointing or dismissing the president of the Company, the secretary to the Board and the chairman of the special committees of the Board, appointing or dismissing the vice president, person-in-charge of finance and other senior management members and deciding on the matters of their remuneration, reward and punishment, determining the structure of internal management departments of the Company and the establishment or revocation of the other branches, determining the establishment of the special committees of the Company and electing their members, determining the risk management system which includes risk assessment, financial control, internal audit and legal risk control and monitoring the implementation of the system, determining the positions, remuneration plan and performance appraisal plan of the senior management of the Company, managing the matters in relation to the information disclosure of the Company, proposing the appointment of or change in accounting firm to the Shareholders’ general meeting, considering and approving external donation amounting from RMB3 million to RMB8 million per donation, major financial accounting policies, accounting estimates changes and major matters of operational management, considering the material equity investment, bond investment, asset acquisition, asset disposal, write off of assets and external guarantee except for those which shall be approved by the Shareholders’ general meeting as stipulated by the Articles of Association, considering material related party transactions which shall be approved by the Board as stipulated by the laws, regulations and relevant regulations of the listing rules of the place where the Shares are listed.
84 Ch ina Deve lopment Bank F inanc ia l Leas ing Co . , L td .
Corporate Governance Report
The Board confirms that corporate governance shall be the joint responsibility among Directors and the corporate governance functions include:
(1) to formulate and review the Company’s policies and practice in the aspect of compliance with laws and regulatory requirements;
(2) to review and monitor the training and continuous professional development of Directors and senior management;
(3) to formulate, review and monitor the code of conduct and compliance manual (if any) applicable to employees, Supervisors and Directors;
(4) to formulate and review the Company’s policies and practice in corporate governance, and make recommendations and report relevant matters to the Board;
(5) to review the Company’s compliance with the Corporate Governance Code and the disclosure in the corporate governance report; and
(6) to review and monitor the Company’s compliance with the whistleblowing policy of the Company.
3.2 Composition of the Board
As of the Latest Practicable Date, the Board consists of 6 members, including 2 executive Directors, 1 non-executive Director and 3 independent non-executive Directors, details of which are as follows:
Executive Directors:Mr. Wang XuedongMr. Huang Min
Non-executive Director:Mr. Li Yingbao
Independent Non-executive Directors:Mr. Zheng XuedingMr. Xu JinMr. Zhang Xianchu
Biographies of Directors are set out in the section of “Directors, Supervisors and Senior Management” in this annual report.
Save as disclosed in the biographies of Directors set out in the section “Directors, Supervisors and Senior Management” in this annual report, none of the Directors had any personal relationships (including financial, business, family or other material/relevant relationships) with any other Directors, Supervisors or chief executives.
852018 Annua l Report
Corporate Governance Report
3.3 Board Meetings
The Company holds Board meetings regularly, and convenes at least one Board meeting every quarter. Notice of at least 14 days will be given to all Directors for the convening of regular Board meetings to let all Directors have opportunities to attend regular Board meetings and discuss items on the agenda.
During the Reporting Period, the Board held 11 Board meetings, the attendance of Directors is set out in the table below:
Directors
No. of meetings attended/No. of meetings eligible to
be attended
Mr. Wang Xuedong 11/11Mr. Geng Tiejun1 3/3Ms. Liu Hui2 3/3Mr. Li Yingbao 11/11Mr. Huang Min 11/11Mr. Zheng Xueding 11/11Mr. Xu Jin 11/11Mr. Zhang Xianchu 11/11
Notes: 1. Due to his age, Mr. Geng Tiejun resigned as a non-executive Director of the Company on June 19, 2018.
2. Due to work adjustments, Ms. Liu Hui resigned as a non-executive Director of the Company on June 19, 2018.
3.4 Chairman of the Board and President
Pursuant to the code provision A.2.1 of the Corporate Governance Code, the positions of the chairman and the president shall be separate and shall be held by different individuals.
The positions of chairman and president of the Company are held by Mr. Wang Xuedong and Mr. Peng Zhong, respectively, and the two different positions are clearly defined by their respective functions. Mr. Wang Xuedong, the chairman, is responsible for leadership of the Board and for ensuring that the Board functions effectively and performs its responsibilities and acts in the best interests of the Company. The chairman has:
(1) to preside over Shareholder’s general meetings, to convene and preside over meetings of the Board of Directors
(2) to procure and inspect the implementation of the resolutions of the Board of Directors, and listen to the relevant reports
(3) to procure, organize and establish various rules and regulations and harmonize the operation of the Board of Directors
(4) to sign the securities issued by the Company
86 Ch ina Deve lopment Bank F inanc ia l Leas ing Co . , L td .
Corporate Governance Report
(5) to sign the important documents of the Board
(6) to sign the legally binding and important documents with external parties in the name of the Company
(7) in case of serious natural disasters or other force majeure events, to exercise the special rights of disposal for the corporate affairs in a manner that is in the best interests of the Company and in compliance with laws, and to report to the Board and the general meeting of Shareholders thereafter
(8) other functions and powers conferred by the laws, regulations or the Articles of Association, and the Board of Directors.
As the president of the Company, Mr. Peng Zhong is responsible for implementing strategies established by the Board, leading the successful day-to-day operation of the Company and the achievement of its financial and operational objectives.
3.5 Duties of the Board and the Management
The Board retains its decision-making power over all major matters of the Company, including the approval and supervision of all policy matters, overall strategies and budgets, internal control and risk management systems, material transactions (in particular those that may involve conflict of interests), financial information, appointment of Directors and other significant financial and operational matters. Directors may seek for independent professional advice when performing their duties at the Company’s expenses. Directors are also encouraged to consult senior management of the Company independently.
The responsibility of day-to-day management, administration and operation of the Group is delegated to the senior management. The Board regularly reviews the delegated duties and responsibilities. The senior management shall obtain approval from the Board before entering into any material transactions.
3.6 Independent Non-executive Directors
During the Reporting Period, the Board has been in compliance with the Hong Kong Listing Rules regarding the stipulated requirements of appointing at least three independent non-executive Directors while the appointed independent non-executive Directors shall account for at least one-third of the total members of the Board, among which at least one of the appointees has relevant professional qualification or talent in accounting or relevant financial management. The qualifications of the three independent non-executive Directors are in full compliance with the requirements set out in Rules 3.10(1) and (2) of the Hong Kong Listing Rules.
The Company has received the confirmation of independence pursuant to Rule 3.13 of the Hong Kong Listing Rules from each of the independent non-executive Directors. As at the Latest Practicable Date, the Company considered that all the independent non-executive Directors are independent individuals pursuant to Rule 3.13 of the Hong Kong Listing Rules.
872018 Annua l Report
Corporate Governance Report
3.7 Non-executive Director
As at the Latest Practicable Date, the non-executive Director was Mr. Li Yingbao. Mr. Li Yingbao was nominated by the China Development Bank and his term of office commenced from the date of the appointment to the expiry date of the first session of the Board.
3.8 Directors’ Responsibility for the Financial Statements
The Board has acknowledged its responsibility for preparing the financial statements of the Company for the year ended December 31, 2018.
The Board is responsible for presenting a clear and understandable assessment of the annual and interim reports, inside information and other disclosures as required by the Hong Kong Listing Rules and other regulatory requirements. The management has provided such explanation and material to the Board as necessary to enable the Board to make an assessment of the financial information and status of the Company and for its approval.
The Company does not encounter any material uncertain events or situations that may incur significant doubt on the Company’s ability to continue business operation.
3.9 Training for Directors
All newly-appointed Directors are provided with necessary entry training and information to ensure their certain level of understanding of the operation and business of the Company and their responsibilities under relevant regulations, laws, rules and ordinance. The Company also arranges seminars for Directors on a regular basis to provide them with updated information regarding the latest development and changes of the Hong Kong Listing Rules and other relevant laws and regulatory requirements from time to time. Directors also receive updated information regarding the performance, status and outlook of the Company for all Directors and each Director of the Board to perform their duties. Part of the current Directors have gone through the training sessions about the responsibilities of the Directors and senior management after listing in 2018. During the Reporting Period, all Directors (namely, Mr. Wang Xuedong, Mr. Huang Min, Mr. Li Yingbao, Mr. Zheng Xueding, Mr. Xu Jin and Mr. Zhang Xianchu) has participated the training sessions about the responsibilities of directors of listed company held in 2018. Mr. Huang Min also participated the training session of secretary of the board of directors of company to be listed held by Shanghai Stock Exchange.
3.10 Model Code for Securities Transactions by Directors and Supervisors
The Company has formulated the Code of Dealing in Securities of the Company by Directors, Supervisors and Senior Management Members (《董事、監事和高級管理人員買賣本公司證券守則》) as the code of conduct of the securities transactions carried out by our Directors, Supervisors and senior management. The terms of which are not less favorable than those of the relevant laws, regulations and the Articles of Association. After specifically inquiring all Directors and Supervisors, all Directors and Supervisors confirmed that they have been complying with the Model Code during the Reporting Period.
88 Ch ina Deve lopment Bank F inanc ia l Leas ing Co . , L td .
Corporate Governance Report
4. SPECIAL COMMITTEES UNDER THE BOARD
4.1 Strategy Decision Committee
The Board approved the establishment of the Strategy Decision Committee on March 26, 2018. The Strategy Decision Committee consists of four members including one executive Director Mr. Wang Xuedong (chairman), one non-executive Director Mr. Li Yingbao and two independent non-executive Directors Mr. Zheng Xueding and Mr. Xu Jin.
The primary duties of the Strategy Decision Committee are as follows:
(1) to study the long-term development plan, operating objectives and development direction of the Company and make proposals;
(2) to study the operating strategies of the Company, including but not limited to product strategies, market strategies, marketing strategies, R&D strategies and talent strategies, and propose recommendations;
(3) to study material investments and financing plans which are subject to approval of the Board according to the Articles of Association and propose recommendations;
(4) to study the material capital operation and assets operating projects which are subject to approval of the Board according to the Articles of Association and propose recommendations;
(5) to study other significant matters that have impact on the development of the Company and propose recommendations;
(6) to conduct inspection on the implementation of matters (1) to (5);
(7) other functions and powers as required by the laws, regulations, the Hong Kong Listing Rules and the Articles of Association or authorized by the Board.
For the year ended at 31 December 2018, the Strategy Decision Committee convened two meetings, and its main work included:
(1) listened to presentations of the development strategy report of China Development Bank Financial Leasing Co., Ltd.
(2) considered 2018 business plans and the implementation of business plans
(3) considered the development plans of vessel business
892018 Annua l Report
Corporate Governance Report
The attendance of the members of the Strategy Decision Committee at the meetings is set out in the table below:
Directors
No. of meetings attended/No. of meetings eligible to
be attended
Mr. Wang Xuedong (chairman) 2/2Mr. Li Yingbao 2/2Mr. Zheng Xueding 2/2Mr. Xu Jin 2/2
4.2 Risk Management and Internal Control Committee
Risk Management and Internal Control Committee consists of four members including two executive Directors Mr. Wang Xuedong (chairman) and Mr. Huang Min, one non-executive Director Mr. Li Yingbao and one independent non-executive Director Mr. Zheng Xueding.
The primary duties of the Risk Management and Internal Control Committee are as follows:
(1) to supervise the situation of the senior management’s control on credit risk, liquidity risk, market risk, operational risk, compliance risk, reputational risk and other risks;
(2) to make a regular assessment of the Company’s risk policies, management status and risk tolerance capacity;
(3) to make recommendations on the optimization of risk management and internal control of the Company; and
(4) other matters required by the laws, regulations, regulatory documents, and rules of the securities regulatory authority of the place where the Shares are listed and the requirements of the Articles of Association, and as authorized by the Board.
The Company should ensure to check the validity of risk management and internal control systems at least once a year, while such checking should specifically include the following matters: the changes in the nature and severity of material risks since last year and the Company’s ability to respond to changes in its business and the external environment; our management continuously monitors the scope and quality of work for risk management and internal control systems, internal audit function and performance of other guarantee providers; report to the Board on the level of details and frequency of the monitoring result in order to assist the Board to appraise the effectiveness of monitoring and risk management of the Company, and the material monitoring faults occurred and material monitoring weakness discovered during the period, as well as the critical level of the unforeseeable consequences or emergency situations arising therefrom, while such consequences or situations have, would have or may have material impacts on the financial performance or status of the Company.
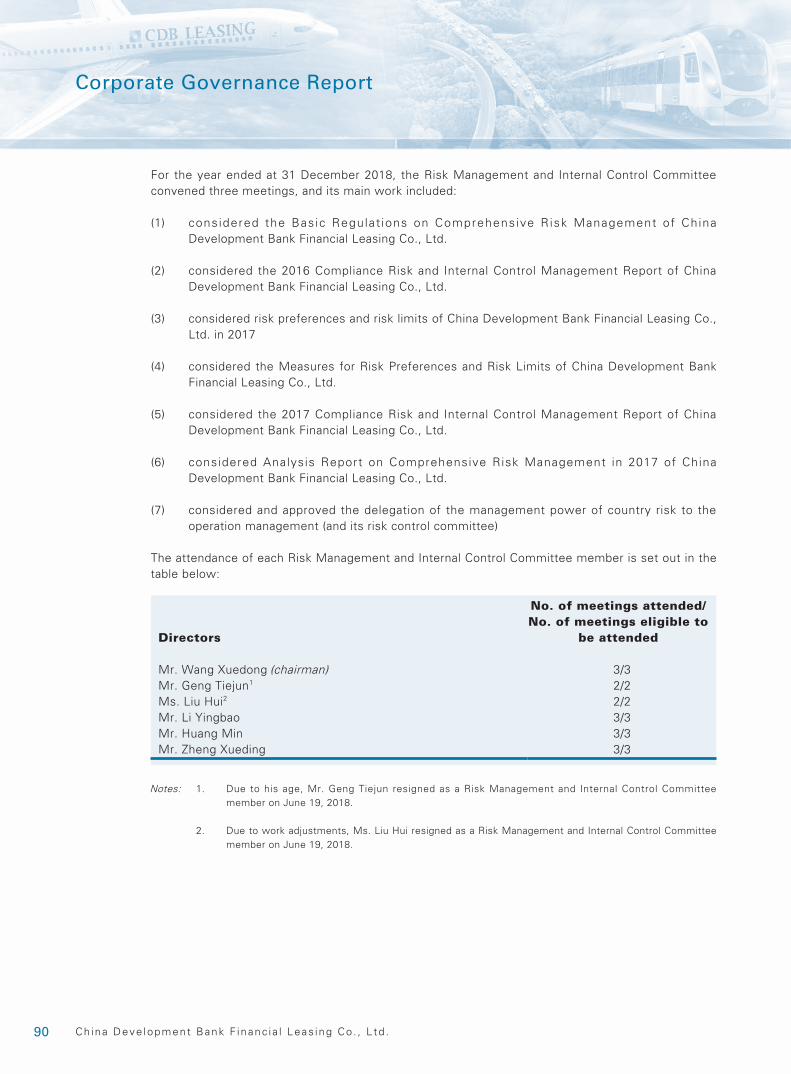
90 Ch ina Deve lopment Bank F inanc ia l Leas ing Co . , L td .
Corporate Governance Report
For the year ended at 31 December 2018, the Risk Management and Internal Control Committee convened three meetings, and its main work included:
(1) considered the Basic Regulat ions on Comprehensive Risk Management of China Development Bank Financial Leasing Co., Ltd.
(2) considered the 2016 Compliance Risk and Internal Control Management Report of China Development Bank Financial Leasing Co., Ltd.
(3) considered risk preferences and risk limits of China Development Bank Financial Leasing Co., Ltd. in 2017
(4) considered the Measures for Risk Preferences and Risk Limits of China Development Bank Financial Leasing Co., Ltd.
(5) considered the 2017 Compliance Risk and Internal Control Management Report of China Development Bank Financial Leasing Co., Ltd.
(6) considered Analysis Report on Comprehensive Risk Management in 2017 of China Development Bank Financial Leasing Co., Ltd.
(7) considered and approved the delegation of the management power of country risk to the operation management (and its risk control committee)
The attendance of each Risk Management and Internal Control Committee member is set out in the table below:
Directors
No. of meetings attended/No. of meetings eligible to
be attended
Mr. Wang Xuedong (chairman) 3/3Mr. Geng Tiejun1 2/2Ms. Liu Hui2 2/2Mr. Li Yingbao 3/3Mr. Huang Min 3/3Mr. Zheng Xueding 3/3
Notes: 1. Due to his age, Mr. Geng Tiejun resigned as a Risk Management and Internal Control Committee member on June 19, 2018.
2. Due to work adjustments, Ms. Liu Hui resigned as a Risk Management and Internal Control Committee member on June 19, 2018.
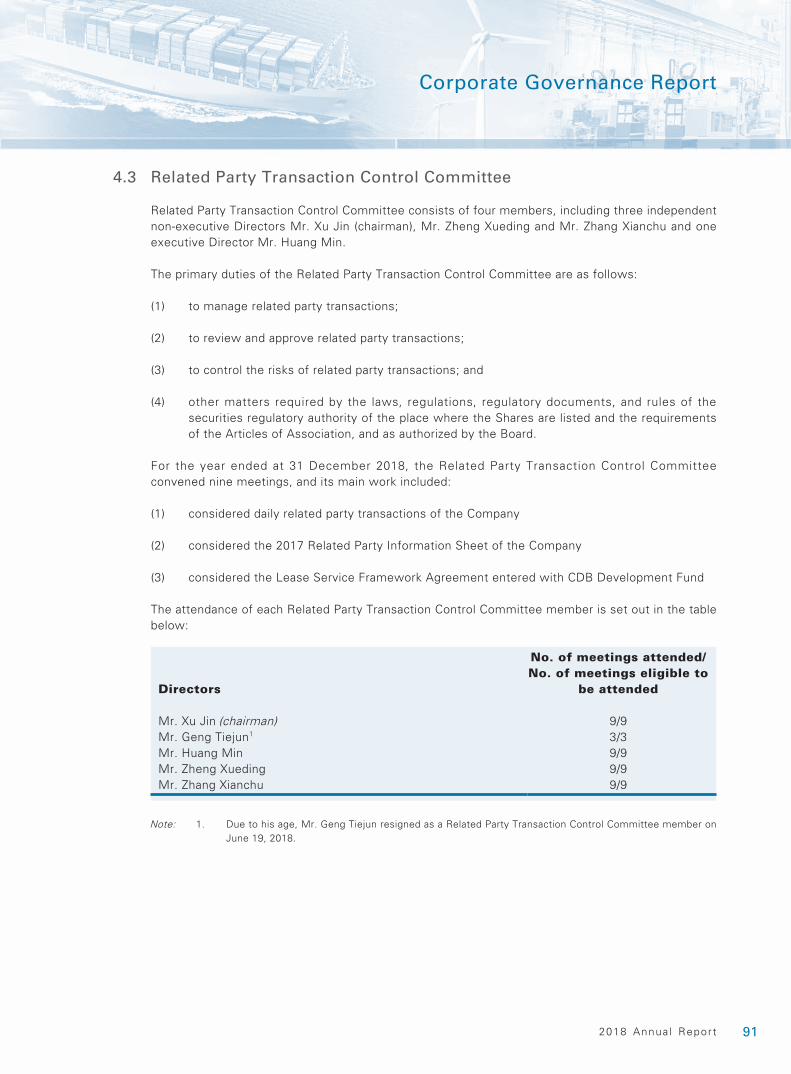
912018 Annua l Report
Corporate Governance Report
4.3 Related Party Transaction Control Committee
Related Party Transaction Control Committee consists of four members, including three independent non-executive Directors Mr. Xu Jin (chairman), Mr. Zheng Xueding and Mr. Zhang Xianchu and one executive Director Mr. Huang Min.
The primary duties of the Related Party Transaction Control Committee are as follows:
(1) to manage related party transactions;
(2) to review and approve related party transactions;
(3) to control the risks of related party transactions; and
(4) other matters required by the laws, regulations, regulatory documents, and rules of the securities regulatory authority of the place where the Shares are listed and the requirements of the Articles of Association, and as authorized by the Board.
For the year ended at 31 December 2018, the Related Party Transaction Control Committee convened nine meetings, and its main work included:
(1) considered daily related party transactions of the Company
(2) considered the 2017 Related Party Information Sheet of the Company
(3) considered the Lease Service Framework Agreement entered with CDB Development Fund
The attendance of each Related Party Transaction Control Committee member is set out in the table below:
Directors
No. of meetings attended/No. of meetings eligible to
be attended
Mr. Xu Jin (chairman) 9/9Mr. Geng Tiejun1 3/3Mr. Huang Min 9/9Mr. Zheng Xueding 9/9Mr. Zhang Xianchu 9/9
Note: 1. Due to his age, Mr. Geng Tiejun resigned as a Related Party Transaction Control Committee member on June 19, 2018.
92 Ch ina Deve lopment Bank F inanc ia l Leas ing Co . , L td .
Corporate Governance Report
4.4 Audit Committee
Audit Committee consists of four members including three independent non-executive Directors Mr. Zheng Xueding (chairman), Mr. Xu Jin and Mr. Zhang Xianchu and one non-executive Director Mr. Li Yingbao.
The primary duties of the Audit Committee are as follows:
(1) to review significant financial policies of the Company and their implementation, and supervise the financial activities of the Company;
(2) to review the financial information and relevant disclosures of the Company;
(3) to consider and approve the internal control evaluation proposal of the Company, and supervise and evaluate the internal control of the Company;
(4) to ensure adequate resources for the operation of internal auditing with appropriate position; supervise and evaluate the internal auditing of the Company; consider and approve the mid- and long-term auditing plan, annual work plan and internal auditing system setting plan of the Company, and report to the Board;
(5) to propose the appointment or dismissal of an external accounting firm, supervise the work of the external accounting firm, and evaluate the report of the external accounting firm to ensure that the external accounting firm undertakes its audit responsibilities;
(6) to facil itate communications and monitor the relationship between the internal audit department and the external accounting firm;
(7) to monitor the non-compliance of the Company in respect of the financial reports and internal control; and
(8) other matters required by laws, regulations, regulatory documents, the rules of the securities regulatory authority of the place where the Shares are listed and the requirements of the Articles of Association, the Rules of Procedure of the Board and as authorized by the Board.
Audit Committee reviews the annual reports and interim reports of the Company within the time limit required by the laws, administrative regulations, regulatory documents, expresses opinions regarding the authenticity, accuracy and completeness, and reports the opinions considered to the Board; timely urges the auditing of annual financial reports; timely examines and reports to the Board on the audit statement issued by external auditor to the senior management of the Company and any significant inquiry, any significant or unusual matters raised by the external auditor to the senior management or raised by the senior management on accounting records, financial accounts or internal control system, and procures the Board to make timely responses to the external auditor.
The Board considers and decides the content of the internal audit plan including audit strategies, audit scope and procedures, establishment of internal audit team, and also monitors the implementation of the aforesaid content. Audit Committee supervises and evaluates the internal auditing of the Company; ensures the adequate resources for the operation of internal auditing with appropriate position; and facilitates communications between the internal audit department and the external accounting institution. Internal audit department of the Company is accountable and should report duties to the Board, receives guidance from the Board of Supervisors, and receives the supervision and evaluation from Audit Committee.
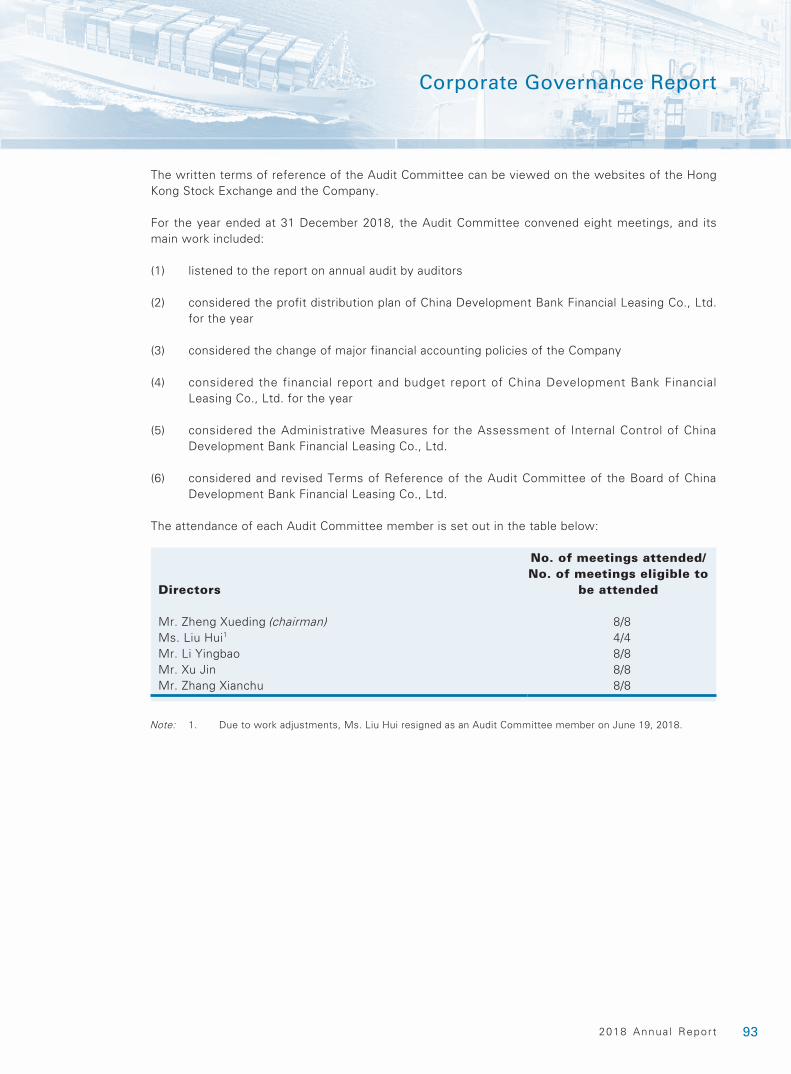
932018 Annua l Report
Corporate Governance Report
The written terms of reference of the Audit Committee can be viewed on the websites of the Hong Kong Stock Exchange and the Company.
For the year ended at 31 December 2018, the Audit Committee convened eight meetings, and its main work included:
(1) listened to the report on annual audit by auditors
(2) considered the profit distribution plan of China Development Bank Financial Leasing Co., Ltd. for the year
(3) considered the change of major financial accounting policies of the Company
(4) considered the financial report and budget report of China Development Bank Financial Leasing Co., Ltd. for the year
(5) considered the Administrative Measures for the Assessment of Internal Control of China Development Bank Financial Leasing Co., Ltd.
(6) considered and revised Terms of Reference of the Audit Committee of the Board of China Development Bank Financial Leasing Co., Ltd.
The attendance of each Audit Committee member is set out in the table below:
Directors
No. of meetings attended/No. of meetings eligible to
be attended
Mr. Zheng Xueding (chairman) 8/8Ms. Liu Hui1 4/4Mr. Li Yingbao 8/8Mr. Xu Jin 8/8Mr. Zhang Xianchu 8/8
Note: 1. Due to work adjustments, Ms. Liu Hui resigned as an Audit Committee member on June 19, 2018.
94 Ch ina Deve lopment Bank F inanc ia l Leas ing Co . , L td .
Corporate Governance Report
4.5 Remuneration Committee
Remuneration Committee consists of four members including three independent non-executive Directors Mr. Zhang Xianchu (chairman), Mr. Zheng Xueding and Mr. Xu Jin and one non-executive Director Mr. Li Yingbao.
Remuneration Committee analyzed and formulated the remuneration policies (including non-pecuniary interests, pension rights and compensation payments (including any compensation payable for the loss or termination of office or appointment)), and remuneration plan for Directors and senior management members, conducted review by integrating the Company’s directions and goals confirmed by the Board and made recommendations to the Board through formal and transparent procedures.
The primary duties of the Remuneration Committee are as follows:
(1) to organize and formulate the remuneration plans of Directors and senior management and submit to the Board for approval, and propose the remuneration distribution plan according to the performance evaluation of Directors and senior management and submit to the Board for approval; and
(2) other duties as provided by laws, regulations, regulatory documents, the rules of the securities regulatory authority of the place where the Shares are listed and the requirements of the Articles of Association, the Rules of Procedure of the Board meetings and other matters as authorized by the Board.
The written terms of reference of the Remuneration Committee can be viewed on the websites of the Hong Kong Stock Exchange and the Company.
For the year ended at 31 December 2018, the Remuneration Committee convened three meetings, and its main work included:
(1) listened to the report on current remuneration status and reform ideas of senior management
(2) considered the Remuneration Plans of China Development Bank Financial Leasing Co., Ltd.
(3) considered the Evaluation Measures for Senior Management of China Development Bank Financial Leasing Co., Ltd. (《國銀金融租賃股份有限公司高級管理人員考核評價辦法》)
(4) considered evaluation results of senior management of the Company for the year 2017
(5) considered individual performance plan of senior management of the Company
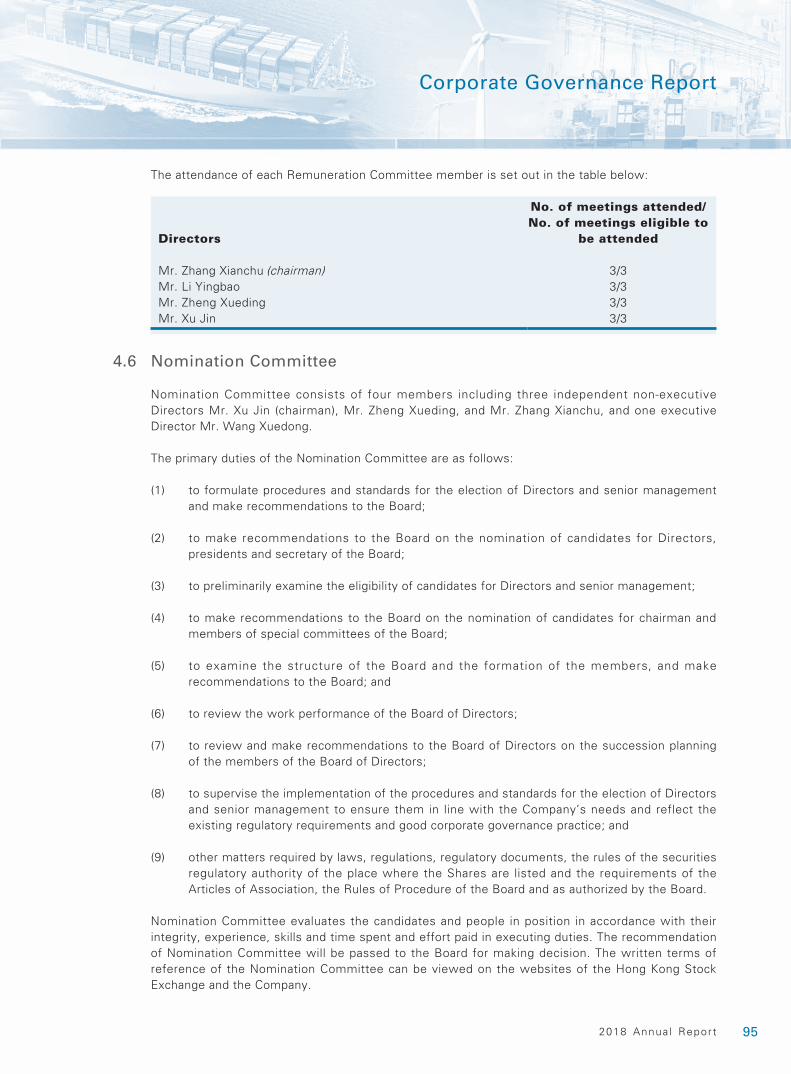
952018 Annua l Report
Corporate Governance Report
The attendance of each Remuneration Committee member is set out in the table below:
Directors
No. of meetings attended/No. of meetings eligible to
be attended
Mr. Zhang Xianchu (chairman) 3/3Mr. Li Yingbao 3/3Mr. Zheng Xueding 3/3Mr. Xu Jin 3/3
4.6 Nomination Committee
Nomination Committee consists of four members including three independent non-executive Directors Mr. Xu Jin (chairman), Mr. Zheng Xueding, and Mr. Zhang Xianchu, and one executive Director Mr. Wang Xuedong.
The primary duties of the Nomination Committee are as follows:
(1) to formulate procedures and standards for the election of Directors and senior management and make recommendations to the Board;
(2) to make recommendations to the Board on the nomination of candidates for Directors, presidents and secretary of the Board;
(3) to preliminarily examine the eligibility of candidates for Directors and senior management;
(4) to make recommendations to the Board on the nomination of candidates for chairman and members of special committees of the Board;
(5) to examine the structure of the Board and the formation of the members, and make recommendations to the Board; and
(6) to review the work performance of the Board of Directors;
(7) to review and make recommendations to the Board of Directors on the succession planning of the members of the Board of Directors;
(8) to supervise the implementation of the procedures and standards for the election of Directors and senior management to ensure them in line with the Company’s needs and reflect the existing regulatory requirements and good corporate governance practice; and
(9) other matters required by laws, regulations, regulatory documents, the rules of the securities regulatory authority of the place where the Shares are listed and the requirements of the Articles of Association, the Rules of Procedure of the Board and as authorized by the Board.
Nomination Committee evaluates the candidates and people in position in accordance with their integrity, experience, skills and time spent and effort paid in executing duties. The recommendation of Nomination Committee will be passed to the Board for making decision. The written terms of reference of the Nomination Committee can be viewed on the websites of the Hong Kong Stock Exchange and the Company.
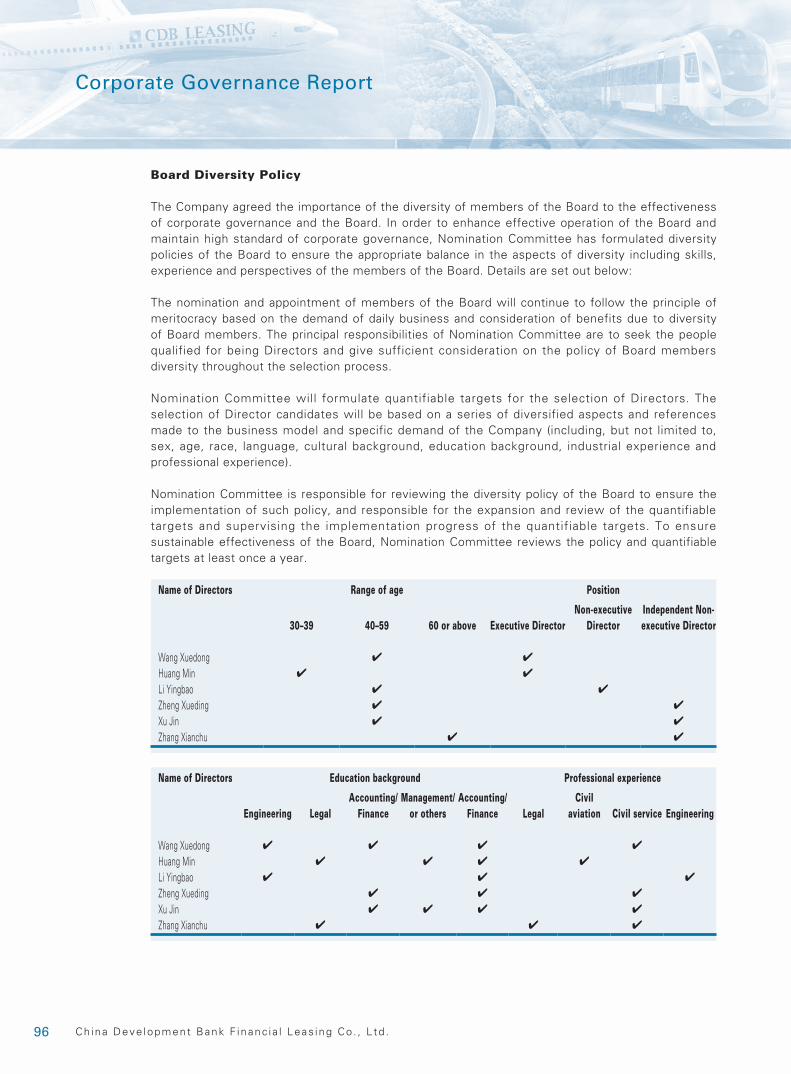
96 Ch ina Deve lopment Bank F inanc ia l Leas ing Co . , L td .
Corporate Governance Report
Board Diversity Policy
The Company agreed the importance of the diversity of members of the Board to the effectiveness of corporate governance and the Board. In order to enhance effective operation of the Board and maintain high standard of corporate governance, Nomination Committee has formulated diversity policies of the Board to ensure the appropriate balance in the aspects of diversity including skills, experience and perspectives of the members of the Board. Details are set out below:
The nomination and appointment of members of the Board will continue to follow the principle of meritocracy based on the demand of daily business and consideration of benefits due to diversity of Board members. The principal responsibilities of Nomination Committee are to seek the people qualified for being Directors and give sufficient consideration on the policy of Board members diversity throughout the selection process.
Nomination Committee will formulate quantifiable targets for the selection of Directors. The selection of Director candidates will be based on a series of diversified aspects and references made to the business model and specific demand of the Company (including, but not limited to, sex, age, race, language, cultural background, education background, industrial experience and professional experience).
Nomination Committee is responsible for reviewing the diversity policy of the Board to ensure the implementation of such policy, and responsible for the expansion and review of the quantifiable targets and supervising the implementation progress of the quantifiable targets. To ensure sustainable effectiveness of the Board, Nomination Committee reviews the policy and quantifiable targets at least once a year.
Name of Directors Range of age Position
30–39 40–59 60 or above Executive DirectorNon-executive
DirectorIndependent Non-executive Director
Wang Xuedong ✔ ✔
Huang Min ✔ ✔
Li Yingbao ✔ ✔
Zheng Xueding ✔ ✔
Xu Jin ✔ ✔
Zhang Xianchu ✔ ✔
Name of Directors Education background Professional experience
Engineering LegalAccounting/
FinanceManagement/
or othersAccounting/
Finance LegalCivil
aviation Civil service Engineering
Wang Xuedong ✔ ✔ ✔ ✔
Huang Min ✔ ✔ ✔ ✔
Li Yingbao ✔ ✔ ✔
Zheng Xueding ✔ ✔ ✔
Xu Jin ✔ ✔ ✔ ✔
Zhang Xianchu ✔ ✔ ✔
972018 Annua l Report
Corporate Governance Report
Nomination Policies of Directors and Standard for Selection and Recommendations
According to the Articles of Association, the methods and procedure for nomination of Directors are as follows:
(1) Nomination Committee and Shareholders individually or jointly holding more than 3% in aggregate of the number of the Company’s issued Shares with voting rights could also propose Director candidates to the Board;
(2) Nomination Committee carries out preliminary reviews of the qualifications and conditions of Director candidates and submits the qualified candidates to the Board for consideration. Upon consideration and approval of the Board, the Director candidates will be proposed in the Shareholders’ general meeting in writing;
(3) The Director candidates should give written undertaking prior to the convening of Shareholders’ general meeting to agree to accept the nomination, undertake the truthfulness and completeness of the public disclosure and guarantee to perform the duties of Directors after being elected;
(4) In order to guarantee the sufficient understanding of the Shareholders regarding the candidates during voting, the disclosure of detailed information of Director candidates should be made to the Shareholders by the Board in accordance with the requirements of laws, regulations and Articles of Association prior to the convening of the Shareholders’ general meeting;
(5) The Director candidates will be voted one by one in the Shareholders’ general meeting;
(6) If there is unplanned vacancy of Director needed to be filled, it should be proposed and submitted to the Board for consideration by Nomination Committee under the Board or Shareholders fulfilling the nomination conditions, and the election or replacement will be made in the Shareholders’ general meeting.
Nomination Committee held two meetings for the year ended December 31, 2018, and its main work included:
(1) listened to the nominations of and nominated Mr. Shi Yongkun as the chief risk officer of the Company and nominated Ms. Feng Qian as the chief financial officer of the Company
(2) considered and revised Terms of Reference of the Nomination Committee of the Board of Directors of China Development Bank Financial Leasing Co., Ltd.
98 Ch ina Deve lopment Bank F inanc ia l Leas ing Co . , L td .
Corporate Governance Report
The attendance of each Nomination Committee member is set out as the table below:
Directors
No. of meetings attended/No. of meetings eligible to
be attended
Mr. Xu Jin (chairman) 2/2Mr. Wang Xuedong 2/2Ms. Liu Hui1 0/0Mr. Zheng Xueding 2/2Mr. Zhang Xianchu 2/2
Note: 1. Due to work adjustments, Ms. Liu Hui resigned as a Nomination Committee member on June 19, 2018.
5. RISK MANAGEMENT AND INTERNAL CONTROL
The Board understands that the Board shall be responsible for maintaining adequate risk management and internal control systems to safeguard the Shareholders’ investment and the Company’s assets, and reviewing the effectiveness of the systems annually. The Board is also aware of the fact that such systems are designed to manage rather than eliminate the risk of failure to achieve business objectives, and can only provide reasonable and not absolute assurance against material misstatement or loss.
The internal control team of the Group plays an important role in monitoring the internal governance of the Company. The primary duties of the internal control team are to regulate and review the Company’s financial position and internal control matters, and to conduct review on all the subsidiaries of the Company.
The Board has reviewed the risk management and internal control systems of the Group, and considers that the risk management and internal control systems are effective and adequate.
For the procedures used to identify, evaluate and manage significant risks, the Company primarily adopts the following measures:
(1) Formulating warnings and limit indicator system of various risks according to risk appetite, continuously performing control on risk warnings and limit indicators and reporting the use of risk limits to the Board and senior management. Formulating corresponding remedial measures and submitting the measures to the Risk Management and Internal Control Committee under the senior management for consideration when the risk limit nearly reaches the supervision index limit, and adopting necessary measures for risk dispersal.
(2) Commencing stress tests of comprehensive risks under integrated situation on a regular basis, commencing special stress tests on an irregular basis, assessing the impact of major risk events, formulating corresponding risk emergency plan, if necessary, and applying stress test results to the risk management and decision-making of operations and management of the Company.
(3) Identifying and assessing various kinds of risks regularly, and incorporating the assessment situation and management recommendations into the report on comprehensive risk management, and submitting it to senior management and the Board for consideration.
992018 Annua l Report
Corporate Governance Report
The primary characteristics of the risk management and internal control systems of the Group are as follows:
(1) Full coverage of risk management and compliance requirements. Risk management and internal control systems cover various business lines in Renminbi or foreign currencies, inside and outside consolidated statement of financial position, domestic and overseas business, cover all departments, positions and staff, cover all types of risks and mutual impacts among different risks, penetrate the whole management process of decision-making, implementation and supervision, while the Basic Rules for Corporate Internal Control (《企業內部控制基本規範》) and Corporate Internal Control Supplementary Guide (《企業內部控制配套指引》) and the Hong Kong Listing Rules(《香港上市規則》) and other domestic and overseas regulatory requirements in relation to internal control and risk management are all covered by the risk management and internal control systems of the Company;
(2) Relative independence of risk management and internal control. The Company has established independent comprehensive risk management organizational structure and internal monitoring system, conferred adequate authorities, human resources and other allocation of resources to risk management line, established scientific and reasonable reporting channel, and formulated mechanism of check-and-balance among business lines;
(3) Insisting on the management of internal control with the risk-oriented principle. On the basis of fulfilling the internal control requirements of the Hong Kong Listing Rules, the Company adopted risk assessment approach, focused on the high-risk areas and management hotspots, screened significant business processes and key control sections, optimized relevant risk management requirements, and implemented them in relevant business management. With comprehensive risk management and all-stage internal control systems, the Company reasonably ensured the consistency between business risk appetite and the strategies of the Company and that the coordination of risk management was conducted in an orderly manner, effectively identified risks to avoid unnecessary losses suffered by the Company, reasonably ensured the accuracy of risk assessment approach and on-time delivery of risk reports, reasonably ensured effective operation of internal control mechanism and timely identified significant risks.
During the Reporting Period, the Company carried out internal control assessment work, conducted a thorough review of the internal control system of the Company by focusing on various internal control requirements of the Hong Kong Stock Exchange for listed companies. It completed control point review, effectiveness testing, deficiencies rectification and re-testing, and adopted effective measures to implement the rectification of the issues identified. In addition, the Company continued to optimize its governance structure, further regulated its internal authorization system, optimized related party transaction management, strengthened anti-money laundering and case prevention management, further promoted the effective implementation of internal control to continuously strengthen the execution of internal control, thereby effectively controlling major risks of the Company and continuously enhancing management level.
100 Ch ina Deve lopment Bank F inanc ia l Leas ing Co . , L td .
Corporate Governance Report
During the Reporting Period, in accordance with the Basic Standard for Enterprise Internal Control (《企業內部控制基本規範》) and its related guidelines and relevant requirements of the Hong Kong Listing Rules, in light of the actual situations of the internal control system of the Company, the Company carried out internal control assessment for the year 2017, and reviewed the risk management and internal monitoring systems of the Company, including corporate governance monitoring, financial monitoring, operational monitoring and compliance monitoring. The Board and the management have confirmed that these risk management and monitoring systems are sufficient and effective. The Company will continue to promote the rectification of weaknesses in the internal control and be concerned about the comprehensive effects to the Company in respect of changes in internal and external environment, focus on the constant identification, assessment and prevention of existing and new risks faced with the Company, perform regular assessment on comprehensiveness, systematicness and normativeness of the internal control system, and optimize the internal control system so that its internal control level and risk prevention abilities can adapt to the development of the Company to ensure the fulfillment of its strategic objectives.
The Company is aware of its obligations under the Securities and Futures Ordinance and the Hong Kong Listing Rules and the overriding principle is that the inside information shall be announced immediately after such information comes to the knowledge of the Company and/or it is the subject of a decision unless such inside information falls within the “Safe Harbours” set out in the Securities and Futures Ordinance. Meanwhile, the Company has formulated the Administrative Measures on Information Management and Information Disclosure (《信息管理和信息披露管理辦法》) to clarify the allocation of information management duties and the procedures of information dissemination. The Company carried out real-time monitoring on inside information potentially involved, organized intermediary organization to judge whether the information was inside information and practicable. If the disclosure standard was fulfilled, the Company would make disclosure as soon as practicable. Prior to the disclosure, the Company strictly controlled the scope of information, monitored the share price fluctuation until the completion of inside information disclosure. If the disclosure standard was not fulfilled, the Company would also keep the information strictly confidential.
6. JOINT COMPANY SECRETARIES
Mr. Huang Min is our joint company secretary and is responsible for making recommendations to the Board for the corporate governance affairs and ensuring that the Company follows the policies and procedures of the Board, applicable laws, rules and regulations.
For the purpose of maintaining good corporate governance and ensuring that the Company is in compliance with the Hong Kong Listing Rules and applicable Hong Kong laws, the Company also appointed Ms. Wong Sau Ping of TMF Hong Kong Limited (the company secretarial services supplier) as the other joint company secretary of the Company to provide assistance to Mr. Huang Min to perform the duties of the company secretary of the Company. Her main contact person at the Company is Mr. Huang Min.
During the Reporting Period, Mr. Huang Min and Ms. Wong Sau Ping had undertaken relevant professional trainings of not less than 15 hours which is in compliance with Rule 3.29 of the Hong Kong Listing Rules.
1012018 Annua l Report
Corporate Governance Report
7. AUDITOR AND ITS REMUNERATION
Since July 2016, in accordance with the rules of rotation of auditors of financial institution in the Notice on Issuing Administrative Measures for Tendering Procedures for the Election and Appointment of Accounting Firms by Financial Enterprises (Provisional) (Cai Jin [2010] No. 169) (《關於印發〈金融企業選聘會計師事務所招標管理辦法(試行)〉的通知》財金[2010]169號) issued by the Ministry of Finance, the Company has replaced the auditor Deloitte Touche Tohmatsu with PricewaterhouseCoopers to be the auditor of the Group. Other than that, there was no change in auditor of the Company in the past three years.
The declaration of PricewaterhouseCoopers, the auditor of the Company, regarding its responsibility for reporting on the consolidated financial statements to the Company is set out in the Independent Auditor’s Report on page 133 of this annual report.
For the year ended December 31, 2018, the approximate remuneration of the auditor for the provision of auditing and non-auditing services to the Company are set out below:
Service Category Amount (RMB)
Auditing service 9,423,409Non-auditing service regarding taxation consultation –
Total 9,423,409
102 Ch ina Deve lopment Bank F inanc ia l Leas ing Co . , L td .
Corporate Governance Report
8. RIGHTS OF SHAREHOLDERS
8.1 Procedure of Convening Extraordinary Shareholders’ General Meeting
According to the Articles of Association, the procedures of convening extraordinary general meeting or class meeting requested by Shareholders should be handled as follows:
(1) Shareholders who individually or jointly holding more than 10% of the Shares with voting rights have the rights to propose to the Board in writing for convening the extraordinary general meeting. Two or more Shareholders in aggregate holding more than 10% (inclusive) of the Shares with voting rights in the proposed meeting can sign one or several copies of identical written request for proposing to the Board to convene extraordinary general meeting or class meeting and state the agenda of the meeting. The Board should convene the extraordinary general meeting or class meeting as soon as possible right after receiving the aforesaid written request. The number of Shares held by the Shareholders shall be counted on the date of request in writing.
(2) If the Board does not issue the notice for convening the meeting within 30 days after receiving the aforesaid written request, the Shareholders who made the request can convene the meeting by themselves within four months after the Board has received the request. The procedures for convening the meeting should be the same as those for convening the Shareholder’s general meeting by the Board as possible.
Where the Shareholders call and convene the meeting on their own accord because the Board fails to convene the meeting in accordance with the aforesaid requirements, expenses reasonably incurred by the Shareholders shall be borne by the Company and deducted from payments due from the Company to the Director in default.
Except for those matters in relation to commercial secrets of the Company which cannot be made public at the Shareholders’ general meeting, the Board and the Board of Supervisors shall respond to and address the enquiries and recommendations of the Shareholders.
8.2 Procedures of Making Inquiries to the Board by Shareholders
Shareholders may make inquiries to the headquarter of the Company through e-mail or phone call if they wish to make inquiries to the Board in relation to information of the Company. Contact number is 0755–23980999 and the e-mail address is [email protected].
1032018 Annua l Report
Corporate Governance Report
8.3 Procedures of Proposing Proposals at Shareholders’ General Meetings
In accordance with the Articles of Association, when the Company convenes a Shareholders’ general meeting, Shareholders holding more than 3% (including 3%) of the total voting Shares shall be entitled to propose temporary proposals in writing to the Company. The Company shall include the matters in the temporary proposals which fall within the scope of duties of the Shareholders’ general meeting in the agenda of the meeting. Temporary proposals proposed by Shareholders shall meet the following requirements:
(1) the content shall fall within the business scope of the Company and the functions and powers of the Shareholders’ general meeting without violating any laws or regulations;
(2) containing definite subjects for discussion and specific matters to be resolved; and
(3) shall be delivered to or served on the Board in writing 10 days prior to the date of the Shareholders’ general meeting.
For the matters in relation to the nomination of candidates for Director by Shareholders, please refer to relevant procedures on the website of the Company.
9. DIVIDEND POLICY
The Company may distribute dividends in the form of cash or by other means that it considers appropriate. Any proposed distribution of dividends shall be formulated by the Board and will be subject to the Shareholders’ approval. A decision to declare or to pay any dividends in the future, and the amount of any dividends, will depend on a number of factors, including the Company’s results of operations, cash flows, financial condition, capital adequacy ratio, cash dividends paid by the subsidiaries to the Company, business prospects, statutory, regulatory and contractual restrictions on the Company’s declaration and payment of dividends, and other factors that the Board may consider important. The Company intends to distribute no less than 30% of the annual distributable profits as dividends for each year upon listing. However, the Company cannot assure Shareholders that we will declare or pay such or any amount of dividends for each or any year.
According to the applicable PRC laws and the Articles of Association, the Company will pay dividends out of the profit after tax only after we have made the following allocations:
• recovery of accumulated losses, if any;
• make appropriations for general risk reserves based on 1.5% of the risk asset as at the year-end;
• allocations to the statutory common reserve equivalent to 10% of the profit after tax, and, when the statutory reserve reaches or is maintained at or above 50% of the registered capital, no further allocations to this statutory reserve will be required; and
• allocations, if any, to a discretionary common reserve that are approved by the Shareholders at a Shareholders’ general meeting.
Dividends may be paid by the Company only out of distributable profits as determined under PRC GAAP or IFRS, whichever is lower. Any distributable profits that are not distributed in any given year will be retained and become available for distribution in subsequent years.
104 Ch ina Deve lopment Bank F inanc ia l Leas ing Co . , L td .
Corporate Governance Report
10. INVESTOR RELATIONS
The Company considers that effective communication with Shareholders is essential for enhancing investor relations and letting investors understand the business, performance and strategies of the Company. The Company prudently safeguards the right of all Shareholders, particularly small and medium investors, by adopting measures including strengthening information disclosure management, investor relation management and optimizing the operating system of Shareholders’ general meeting to enhance communication and interaction with Shareholders.
To promote effective communication, the Company adopts the Shareholders communication policy, aiming at establishing mutual relationship and communication between the Company and Shareholders. The Company also sets up a website (http://www.cdb-leasing.com) to publish the latest information in relation to its business operation and development, financial data, corporate governance practice and other information for public access.
11. AMENDMENT OF THE ARTICLES OF ASSOCIATION
During the Reporting Period, there were no material changes of the Articles in Association. After approval at the extraordinary general meeting convened by the Company on February 28, 2018, the Company proposed to amend the Articles of Association, the contents of which mainly include: (1) incorporation of Party-building work into the Articles of Association; (2) revision from “China Development Bank Corporation” to “China Development Bank” due to the change of Controlling Shareholder’s name; (3)change of the Company’s registered address in the PRC; (4) adjustments to the contents of chapters in relation to the Board of Supervisors; and (5) change of titles of certain senior management members. The above amendments are subject to the approval of CBIRC Shenzhen Office. For details, please refer to the announcements of the Company dated January 11, 2018 and January 12, 2018 and the circular dated January 31, 2018.
As of the Latest Practicable Date, in order to further improve equity management of the Company, in accordance with the requirements of relevant regulatory laws, regulations, and other regulatory documents and in light of actual conditions, the Board proposed to further amend the Articles of Association, to mainly supplement the relevant provisions in Article 19 and Article 28 of Interim Measures for the Equity Management of Commercial Banks ([2018] No. 1), Article 9 of the Administrative Measures on Financial Leasing Companies ([2014] No. 3) and Article 37 of the Company Law of the People’s Republic of China. Such amendments are subject to the approval of Shareholders’ general meeting and CBIRC Shenzhen Office. For details, please refer to the announcement of the Company dated March 27, 2019.
1052018 Annua l Report
Report of the Board of Directors
The Board is pleased to present its report and audited consolidated financial statements of the Group for the year ended December 31, 2018.
DIRECTORS AND SUPERVISORS
Executive Directors:
Mr. Wang Xuedong (chairman of the Board)Mr. Huang Min
Non-executive Director:
Mr. Li Yingbao
Independent Non-executive Directors:
Mr. Zheng XuedingMr. Xu JinMr. Zhang Xianchu
Supervisors:
Mr. Jiang Daozhen (chairman of the Board of Supervisors)Mr. Lei YanzhengMr. Ma Yongyi (appointed on February 28, 2018)Ms. Huang XuemeiMr. Wang Yiyun (appointed on February 1, 2019)
Notes:
1. On June 19, 2018, Mr. Geng Tiejun resigned as a non-executive Director, a member of the Related Party Transaction Control Committee and a member of the Risk Management and Internal Control Committee of the Board due to his age.
2. On June 19, 2018, Ms. Liu Hui resigned as a non-executive Director, a member of the Audit Committee, a member of the Nomination Committee and a member of the Risk Management and Internal Control Committee of the Board due to work adjustments.
3. On January 10, 2018, Mr. Zhuang Ganlang resigned as an employee representative Supervisor due to his work arrangements, effective from February 28, 2018. On January 10, 2018, Mr. Ma Yongyi was nominated as a candidate for external Supervisor, and was approved at the Shareholders’ general meeting on February 28, 2018.
4. On October 25, 2018, Mr. Sun Zhikun resigned as a shareholder representative Supervisor due to his work adjustment, effective from February 1, 2019. On January 28, 2019, Mr. Wang Yiyun was appointed as an employee representative Supervisor, effective from February 1, 2019.
Details of the biographies of Directors, Supervisors and senior managements of the Company are set out in pages 70 to 78 of this annual report.
106 Ch ina Deve lopment Bank F inanc ia l Leas ing Co . , L td .
Report of the Board of Directors
1. BUSINESS REVIEW
1.1 Principal Business
The principal business of the Company includes providing comprehensive leasing services to customers in industries including aviation, infrastructure, shipping, vehicle and construction machinery.
1.2 Business Review and Analysis of Key Indicators of F inancia l Performance
For business review and analysis of key indicators of financial performance of the Group for the year ended December 31, 2018, please refer to the sections of “Financial Highlights” and “Management Discussion and Analysis” in this annual report.
1.3 Environmental, Social and Governance Performance
As a listed company of the Hong Kong Stock Exchange, the Group attaches great importance to the performance of environmental, social and governance responsibilities, pursues long-term sustainable development, and strives to create a world brand in the China's lease industry.
(1) Actively performing environmental, social and governance responsibilities
While striving to achieve improvement in business, the Group also actively undertakes environmental, social and governance responsibilities. As such, the Group has formulated a series of environmental, social and governance policies, and adopted respective measures for implementation. In the environmental aspect, the Group focuses on integrating the concept of environmental protection into project development and corporate operation, actively develops financial leasing business in clean energy development and application, and advocates green office, energy conservation and environmental protection. In the social aspect, the Group also pays great attention to assurance of business quality, prevention of corruption, protection of intellectual property rights, protection of customers’ interests, support of social and public welfare, and optimization of employees’ protection system. Meanwhile, the Group also supports the development of inclusive finance, poverty alleviation development, infrastructure construction, transformation and upgrade of manufacturing industry and other relevant businesses.
In 2018, by performing duties proactively, the Group continued to be awarded the highest credit in the “Corporate Social Responsibility Evaluation in Shenzhen” and the “2017 Best Green Financial Award in Banking Industry in Shenzhen” (深圳市銀行業2017年度最佳綠色金融獎) issued by Shenzhen Banking Association, and was awarded as the “Most Socially Responsible Listed Enterprise” (最具社會責任上市公司) in”2018 Golden Hong Kong Shares”.
1072018 Annua l Report
Report of the Board of Directors
(2) Proactively disclosing environmental, social and governance information
On the basis of active performance of responsibility, the Group also actively carries out disclosure of environmental, social and governance information. Pursuant to the requirements of ESG Reporting Guidelines of the Hong Kong Stock Exchange, the Group is about to issue the environmental, social and governance report, disclosing the environmental, social and governance information of the Company for the year of 2018. During the preparation process of the environmental, social and governance report, the Group consistently attached great importance to the expectations of stakeholders, and carried out communication with important stakeholders such as government regulatory authorities, investors, business partners, customers, staff, suppliers and industry associations specifically on environmental, social and governance issues of the Group by means of questionnaires and interviews. The results thereof will be the strong evidence supporting the environmental, social and governance report to be disclosed by the Group. For more information regarding environmental, social and governance of the Group for the year 2018, please refer to the environmental, social and governance report to be issued by the Group. Upon issuance of the report, the report can be accessed or downloaded on the Company’s official website.
1.4 Compliance with Relevant Laws and Regulations
The Group is able to comply with relevant requirements of laws, regulations, rules and provisions, such as the Companies Ordinance, the Hong Kong Listing Rules, the SFO, the Company Law of the People’s Republic of China (《中華人民共和國公司法》), the Basic Norms of Enterprise Internal Control (《企業內部控制基本規範》) etc., on information disclosure, corporate governance and standard industry operation, etc. The Group is committed to maintaining a high standard of corporate governance practices. Information on the corporate governance practices adopted by the Company is set out in the Corporate Governance Report on pages 81 to 104 of this annual report.
As of December 31, 2018, the target total amount of pending litigation with the Company as defendant was RMB8.85 million. For details of which, please refer to Note 43 to the financial statements: Contingent liabilities. The Company expects that such pending litigations will not have a material adverse effect on the business, financial position or results of operations of the Company.
1.5 Major Risks and Uncertainties
For major risks and uncertainties during the Group for the year ended December 31, 2018, please refer to the section “Management Discussion and Analysis” in this annual report.
1.6 Future Development of the Group
For future development of the Group during the year ended December 31, 2018, please refer to the section “Management Discussion and Analysis” in this annual report.
1.7 Subsequent Event
There was no significant subsequent event occurred from January 1, 2019 to the Latest Practicable Date.
108 Ch ina Deve lopment Bank F inanc ia l Leas ing Co . , L td .
Report of the Board of Directors
2. SHARE CAPITAL
Details of the share capital of the Company are set out in Note 34 of the consolidated financial statement.
Public Float
Based on the information publicly available to the Company and to the best of Directors’ knowledge, at any time during the Reporting Period and up to the date of this annual report, at least 25% of the total issued Shares, being the minimum public float as required by the Hong Kong Stock Exchange and the Hong Kong Listing Rules, are held by the public.
3. DEBENTURES ISSUED
On May 30, 2018, the Shareholders approved and authorized the Company to issue foreign currency-denominated or Renminbi-denominated bonds with a maximum principal amount of RMB66.0 billion before the next annual general meeting.
In aspect of public issuances under the MTN programme, the Group issued a 5.5 year US$100 million senior bonds on March 9, 2018, carrying a coupon rate of 4.05% (tap issuance); issued a three-year US$500 million senior bonds on July 18, 2018, carrying a coupon rate of 3mLibor+115bp; and issued a three-year US$400 million senior bonds on November 15, 2018, carrying a coupon rate of 3mLibor+125bp. Proceeds were mainly used for the Group’s offshore operation, contributions to the overseas lease business and repayments of due amount of borrowings.
In addition, in 2018, the Group issued five tranches of offshore private placement bonds with an accumulated amount of US$265 million under the MTN programme, which continuously expanded offshore mid-term and long-term US dollars financing channels, optimized the term and interest structure of liabilities dominated in US dollars and enhanced the stability of the Company’s operation.
4. PROFIT DISTRIBUTIONS
4.1 Final Dividend
The Board recommended to distribute a final dividend of RMB0.8923 per 10 shares (inclusive of tax) for the year ended December 31, 2018. The net profit of the Group for the year 2018 amounted to RMB2,506,983,391, and the total amount of profit distribution amounted to RMB1,128,079,567, which accounted for 45% of the net profit of the Group for the year 2018. In principle, payments will be made to holders of Domestic Shares in Renminbi and to holders of H Shares in Hong Kong dollars. The exchange rate of HK$ will be the average closing price of RMB against HK$ announced by the PBOC for the five working days prior to the date of profit distribution. The proposed final dividend for the year is subject to the approval of the Shareholders at the 2018 annual general meeting and is currently expected to be paid on July 10, 2019 to the Shareholders whose names appear on the register of members of the Company.
1092018 Annua l Report
Report of the Board of Directors
4.2 Taxation
Pursuant to the PRC Individual Income Tax Law (《中華人民共和國個人所得稅法》), the Implementation Regulations of the PRC Individual Income Tax Law (《中華人民共和國個人所得稅法實施條例》), Notice on the Issues Concerning the Collection and Administration of Individual Income Tax Following the Repeal of Guo Shui Fa [1993] No. 45 (Guo Shui Han [2011] No. 348) (《國家稅務總局關於國稅發[1993]045號文件廢止後有關個人所得稅徵管問題的通知》(國稅函[2011]348號)) and Announcement of the State Administration of Taxation on Promulgation of the “Administrative Measures on Entitlement of Non-residents to Treatment under Tax Treaties” (Announcement No. 60 [2015] of the State Administration of Taxation) (《國家稅務總局關於發佈〈非居民納稅人享受稅收協定待遇管理辦法〉的公告》(國家稅務總局公告2015年第60號)) and relevant laws, regulations and regulatory documents, the Company shall, as a withholding agent, withhold and pay individual income tax for the Individual H Shares holders in respect of the 2018 H Shares final dividend to be distributed to them. Overseas resident individual shareholders of stocks issued by domestic non-foreign investment enterprises in Hong Kong are entitled to the relevant preferential tax treatment pursuant to the provisions in the tax agreements signed between the countries in which they are residents and China, or to the tax arrangements between mainland China and Hong Kong and Macau. Accordingly, 10% of the dividends to be distributed to the individual H Shares holders are generally withheld as individual income tax unless otherwise specified by the relevant tax laws, regulations and agreements.
For H Shares holders who are non-resident enterprises, in accordance with the provisions of the Notice on Issues concerning Withholding the Enterprise Income Tax on Dividends Paid by Chinese Resident Enterprises to H Shares holders who are Overseas Non-resident Enterprises (Guoshuihan [2008] No. 897) published by the State Administration of Taxation of PRC (國家稅務總局《關於中國居民企業向境外H股非居民企業股東派發股息代扣代繳企業所得稅有關問題的通知》(國稅函[2008]897號)), the enterprise income tax shall be withheld at a uniform rate of 10% by the Company. Non-resident enterprise shareholders may apply for tax refund for the difference in accordance with relevant requirements including tax agreements (arrangements).
For investors of the Shenzhen Stock Exchange (including enterprises and individuals) investing in the H Shares of the Company listed on the Hong Kong Stock Exchange (the “Southbound Trading”), the Shenzhen Branch of China Securities Depository and Clearing Corporation Limited, as the nominee of the H Shares holders for Southbound Trading, will receive cash dividends distributed by the Company and distribute the cash dividends to the relevant investors of H Shares of Southbound Trading through its depositary and clearing system.
110 Ch ina Deve lopment Bank F inanc ia l Leas ing Co . , L td .
Report of the Board of Directors
The cash dividends for the investors of H Shares of Southbound Trading will be paid in RMB. Pursuant to the relevant requirements under the Notice on the Tax Policies Related to the Pilot Program of the Shenzhen-Hong Kong Stock Connect (Caishui [2016] No. 127) (《關於深港股票市場交易互聯互通機制試點有關稅收政策的通知》(財稅[2016]127號)) promulgated by Ministry of Finance, State Administration of Taxation and CSRC on 5 November 2016:
1. For dividends received by domestic investors from investing in H Shares listed on the Hong Kong Stock Exchange through Shenzhen-Hong Kong Stock Connect, the company of such H Shares shall withhold and pay individual income tax at the rate of 20% on behalf of the investors of the Company. Individual investors may, by producing valid tax payment proofs, apply to the competent tax authority of China Securities Depository and Clearing Corporation Limited for tax credit relating to the withholding tax already paid abroad.
2. For dividends received by domestic enterprise investors from investing in Shares listed on the Hong Kong Stock Exchange through Shenzhen-Hong Kong Stock Connect, such amount shall be reckoned in their gross revenue and subject to corporate income tax pursuant to laws. In particular, for the dividends obtained by mainland resident enterprises from holding relevant H Shares for consecutive 12 months, the corporate income taxes shall be exempted pursuant to laws. The company of such H Shares will not withhold and pay the income tax of dividends for domestic enterprise investors and those domestic enterprise investors shall report and pay the relevant tax themselves. When declaring and paying enterprise income tax themselves, mainland corporate investors may apply for tax credit pursuant to laws in respect of dividend income tax which has been withheld and paid by non-H stock companies listed on the Hong Kong Stock Exchange.
If H Shareholders have any queries on the above arrangements, they should seek advice from their tax advisors on the tax impact in the PRC, Hong Kong and other country(ies) or region(s) in relation to the holding and disposing of H Shares.
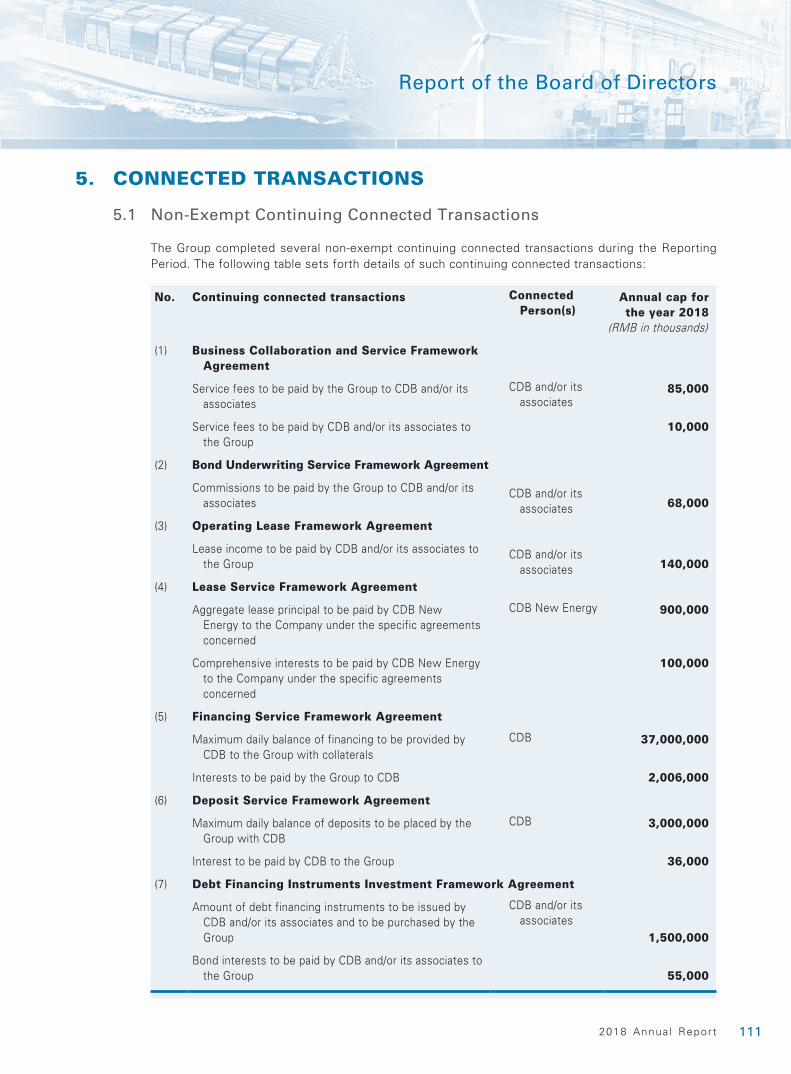
1112018 Annua l Report
Report of the Board of Directors
5. CONNECTED TRANSACTIONS
5.1 Non-Exempt Continuing Connected Transactions
The Group completed several non-exempt continuing connected transactions during the Reporting Period. The following table sets forth details of such continuing connected transactions:
No. Continuing connected transactions Connected Person(s)
Annual cap forthe year 2018
(RMB in thousands)
(1) Business Collaboration and Service Framework Agreement
Service fees to be paid by the Group to CDB and/or its associates
CDB and/or its associates
85,000
Service fees to be paid by CDB and/or its associates to the Group
10,000
(2) Bond Underwriting Service Framework Agreement
Commissions to be paid by the Group to CDB and/or its associates
CDB and/or its associates 68,000
(3) Operating Lease Framework Agreement
Lease income to be paid by CDB and/or its associates to the Group
CDB and/or its associates 140,000
(4) Lease Service Framework Agreement
Aggregate lease principal to be paid by CDB New Energy to the Company under the specific agreements concerned
CDB New Energy 900,000
Comprehensive interests to be paid by CDB New Energy to the Company under the specific agreements concerned
100,000
(5) Financing Service Framework Agreement
Maximum daily balance of financing to be provided by CDB to the Group with collaterals
CDB 37,000,000
Interests to be paid by the Group to CDB 2,006,000
(6) Deposit Service Framework Agreement
Maximum daily balance of deposits to be placed by the Group with CDB
CDB 3,000,000
Interest to be paid by CDB to the Group 36,000
(7) Debt Financing Instruments Investment Framework Agreement
Amount of debt financing instruments to be issued by CDB and/or its associates and to be purchased by the Group
CDB and/or its associates
1,500,000
Bond interests to be paid by CDB and/or its associates to the Group 55,000

112 Ch ina Deve lopment Bank F inanc ia l Leas ing Co . , L td .
Report of the Board of Directors
Notes:
1. With respect to the non-exempt continuing connected transactions Nos. 1 to 3 mentioned above, the Company obtained approval on such continuing connected transactions and their respective annual transaction amount caps for the years 2016, 2017 and 2018, and was exempt from compliance with the announcement requirement within the annual transaction caps upon listing.
2. With respect to the non-exempt continuing connected transaction No. 4 mentioned above, the Company published an announcement on the websites of the Hong Kong Stock Exchange and the Company on November 17, 2016 to disclose the annual transaction caps with respect to such continuing connected transaction for the years 2016, 2017 and 2018, and was exempt from compliance with the announcement requirements within the annual transaction caps.
3. With respect to the non-exempt continuing connected transactions Nos. 5 to 7 mentioned above, the Company obtained approval on such continuing connected transactions and their respective annual transaction caps for the years 2016, 2017 and 2018, and was exempt from compliance with the requirements of announcement and independent Shareholders’ approval within the annual transaction caps upon listing.
4. The Company is considering renewing the above continuing connected transaction framework agreements No. 1 to 7 with China Development Bank, and will comply with the announcement, reporting and/or independent Shareholders’ approval requirements in due course in compliance with Chapter 14A of the Listing Rules.
(1) Business Collaboration and Service Framework Agreement
Parties to the agreement
The Group and CDB
Principal terms
The Group entered into a Business Collaboration and Service Framework Agreement with CDB on June 13, 2016, pursuant to which the Company and CDB and/or its associates mutually provided business referral, project development, customer management, project consultation and bonds issue guarantee services, and service fees would be paid to the other party in respect of such services.
The period of the Business Collaboration and Service Framework Agreement was a fixed term effective from July 11, 2016 to December 31, 2018, subject to renewal upon the mutual consent of both parties.
Hong Kong Listing Rules Implications
Given that CDB is the Controlling Shareholder of the Company, CDB and its associates constituted Connected Persons of the Company pursuant to Chapter 14A of the Hong Kong Listing Rules. Therefore, the Business Collaboration and Service Framework Agreement entered into by the Group and CDB and/or its associates constituted continuing connected transactions of the Company under the Hong Kong Listing Rules.
In respect of the transactions under the Business Collaboration and Service Framework Agreement, as the highest applicable percentage ratio for the three years ended December 31, 2016, 2017 and 2018 calculated for the purpose of Chapter 14A of the Hong Kong Listing Rules was more than 0.1%, but less than 5% on an annual basis, such transactions were subject to the annual reporting requirement under Rules 14A.49 and 14A.71 of the Hong Kong Listing Rules and the announcement requirement under Rule 14A.35 of the Hong Kong Listing Rules, but were exempt from the independent Shareholders’ approval requirement under Rule 14A.36 of the Hong Kong Listing Rules.
1132018 Annua l Report
Report of the Board of Directors
The Company obtained approval on such continuing connected transactions and their annual transaction amount caps for 2016, 2017 and 2018 and was exempt from compliance with the announcement requirement within the annual transaction caps upon listing.
Brief description of the transactions and their purposes
The business collaboration and mutual provision of services between us and CDB and/or its associates enabled us to take advantage of the high quality and broad customer base and information resources of CDB and/or its associates to further developed our leasing business and maximized the interests of the Company and our Shareholders as a whole. In addition, CDB and/or its associates have been providing business referral, project development, customer management and bonds issue guarantee services to the Group during the three years ended December 31, 2013, 2014 and 2015, and have developed a deep understanding of our business model and business needs. Meanwhile, the provision of the above services by CDB and/or its associates to the Group was able to satisfy our business needs for project development and customer management, including the management of our rental account at CDB. In addition, our provision of business referral, project development, customer management and project consultation services to CDB and/or its associates will be conducive to further increase in our income.
For details of the above transactions, please refer to the Prospectus.
(2) Bond Underwriting Service Framework Agreement
Parties to the agreement
The Group and CDB
Principal terms
We entered into a Bond Underwriting Service Framework Agreement with CDB on June 13, 2016, pursuant to which CDB and/or its associates (such as its subsidiary CDB Securities) acted as one of the underwriters for bonds issuance, and in turn we paid commissions (including sales commissions and underwriting fees) to them based on the mutually agreed commission rates.
The period of the Bond Underwriting Service Framework Agreement was a fixed term effective from July 11, 2016 to December 31, 2018, subject to renewal upon the mutual consent of both parties.
Hong Kong Listing Rules Implications
Given that CDB is the Controlling Shareholder of the Company, CDB and its associates constituted Connected Persons of the Company pursuant to Chapter 14A of the Hong Kong Listing Rules. Therefore, the Bond Underwriting Service Framework Agreement entered into by the Group and CDB and/or its associates constituted continuing connected transactions of the Company under the Hong Kong Listing Rules.
114 Ch ina Deve lopment Bank F inanc ia l Leas ing Co . , L td .
Report of the Board of Directors
As the highest applicable percentage ratio of the transactions under the Bond Underwriting Service Framework Agreement for the three years ended December 31, 2016, 2017 and 2018 calculated for the purpose of Chapter 14A of the Hong Kong Listing Rules was more than 0.1%, but less than 5% on an annual basis, such transactions were subject to the annual reporting requirement under Rules 14A.49 and 14A.71 of the Hong Kong Listing Rules and the announcement requirement under Rule 14A.35 of the Hong Kong Listing Rules, but were exempt from the independent Shareholders’ approval requirement under Rule 14A.36 of the Hong Kong Listing Rules.
The Company obtained approval on such continuing connected transactions and their annual transaction amount caps for the years 2016, 2017 and 2018 and was exempt from compliance with the announcement requirements within the annual transaction caps upon listing.
Brief description of the transactions and their purposes
We proposed to issue one-off or multiple tranches of domestic bonds during the three years ended December 31, 2016, 2017 and 2018, including but not limited to the issuance of Renminbi-denominated financial institution bonds as approved by or filed with the CBIRC and/or other relevant regulatory authorities in accordance with the relevant PRC laws and regulations. As major underwriters in the PRC bond market, CDB and CDB Securities have extensive underwriting experience and strong sales and investment capacities. It is expected that CDB and/or its associates, acting as our underwriters, will greatly benefit the issuance, sale and pricing of our bonds.
For details of the above transactions, please refer to the Prospectus.
(3) Operating Lease Framework Agreement
Parties to the agreement
The Group and CDB
Principal terms
We, as the lessor, entered into an Operating Lease Framework Agreement with CDB, as the lessee, on June 13, 2016, pursuant to which we provided operating lease services to CDB and/or its associates, including but not limited to property leases and electronic equipment leases. In turn, we received lease income from CDB and/or its associates for the provision of such operating lease services.
The period of the Operating Lease Framework Agreement was a fixed term effective from July 11, 2016 to December 31, 2018, subject to renewal upon mutual consent of both parties.
Hong Kong Listing Rules Implications
Given that CDB is the Controlling Shareholder of the Company, CDB and its associates constituted Connected Persons of the Company pursuant to Chapter 14A of the Hong Kong Listing Rules. Therefore, the Operating Lease Framework Agreement entered into by the Group and CDB and/or its associates constituted continuing connected transactions of the Company under the Hong Kong Listing Rules.

1152018 Annua l Report
Report of the Board of Directors
In respect of the transactions under the Operating Lease Framework Agreement, as the highest applicable percentage ratio for the three years ended December 31, 2016, 2017 and 2018 calculated for the purpose of Chapter 14A of the Hong Kong Listing Rules was more than 0.1%, but less than 5% on an annual basis, such transactions were subject to the annual reporting requirement under Rules 14A.49 and 14A.71 of the Hong Kong Listing Rules and the announcement requirement under Rule 14A.35 of the Hong Kong Listing Rules, but were exempt from the independent Shareholders’ approval requirement under Rule 14A.36 of the Hong Kong Listing Rules.
The Company obtained approval on such continuing connected transactions and their annual transaction amount caps for the years 2016, 2017 and 2018 and was exempt from compliance with the announcement requirements within the annual transaction caps upon listing.
Brief description of the transactions and their purposes
The operating lease is a major part of our leasing business. Our provision of operating lease service to CDB and/or its associates was able to satisfy the business needs of both parties. On the one hand, as our quality customers, CDB and/or its associates have a strong capital background and solid financial strength. Engaging in operating lease business with CDB and/or its associates helped us obtain stable and low-risk income from the leasing business; and on the other hand, by providing operating lease services, we were able to meet the financing demand for property, electronic equipment and other fixed assets of CDB and its associates, such as CDB Capital and China-Africa Development Fund, etc.
For details of the above transactions, please refer to the Prospectus.
(4) Lease Service Framework Agreement
Parties to the agreement
(1) CDB New Energy, as lessee (the “Lessee”)
(2) The Company, as lessor (the “Lessor”)
Principal terms
Term of agreement
The Lease Service Framework Agreement became effective on November 17, 2016 (after trading hours) and remained effective until December 31, 2018.
Lease term
The Company and CDB New Energy entered into specific agreements in respect of each lease service. The lease term of each lease service under specific agreements was determined pursuant to the useful life of relevant power plant equipment (as defined below), financing demands of the Lessee and financial status of the Lessor, but the lease term did not exceed the useful life of power plant equipment.
116 Ch ina Deve lopment Bank F inanc ia l Leas ing Co . , L td .
Report of the Board of Directors
Lease target
The power plant equipment of CDB New Energy and/or its subsidiaries, including but not limited to photovoltaic on-grid power plant equipment and other new energy power generation facilities (the “Power Plant Equipment”).
Lease method
CDB New Energy, aiming at financing, paid rent and interest to the Company in accordance with the terms, conditions and interest rate pre-determined in the specific agreement concerned entered into from time to time by way of, including but not limited to, sale-and-leaseback and direct lease.
Guarantee
Pursuant to the Lease Service Framework Agreement, CDB New Energy or its subsidiaries used its assets, equity interests, accounts receivable and credit security as credit enhancement measures. In addition, the Company, pursuant to the specific agreement concerned, charged CDB New Energy with an amount of no less than the highest instalment of lease payment as the security deposit of the project on a one-off basis. The security deposit was repaid in full to CDB New Energy upon expiry of the specific agreement concerned.
Arrangements for leased properties
In respect of sale-and-leaseback services, upon expiry of the lease term, CDB New Energy was entitled to purchase back the power plant equipment at nominal value pursuant to the specific agreement concerned after paying all the rent and interest under the sale-and leaseback agreement.
Hong Kong Listing Rules Implications
Given that CDB is the Controlling Shareholder of the Company, and holds an approximately 30.46% of equity interest in CDB New Energy through its wholly-owned subsidiary CDB Capital (國開金融), CDB New Energy and its subsidiaries constituted Connected Persons of the Company pursuant to Chapter 14A of the Hong Kong Listing Rules. Therefore, the Lease Service Framework Agreement entered into by the Group and CDB New Energy constituted continuing connected transactions of the Company under the Hong Kong Listing Rules.
In respect of the transactions under the Lease Service Framework Agreement, as the highest applicable percentage ratio for the three years ended December 31, 2016, 2017 and 2018 calculated for the purpose of Chapter 14A of the Hong Kong Listing Rules was more than 0.1%, but less than 5% on an annual basis, such transactions were subject to the annual reporting requirement under Rules 14A.49 and 14A.71 of the Hong Kong Listing Rules and the announcement requirement under Rule 14A.35 of the Hong Kong Listing Rules, but were exempt from the independent Shareholders’ approval requirement under Rule 14A.36 of the Hong Kong Listing Rules.
1172018 Annua l Report
Report of the Board of Directors
Brief description of the transactions and their purposes
The lease service (including but not limited to sale-and-leaseback and direct lease services) is the core business of the Company. The provision of lease service by the Company to CDB New Energy was able to satisfy the business needs of both parties. On one hand, as our quality customers, CDB has a strong capital background and solid financial strength. Providing lease services to CDB New Energy and/or its subsidiaries, as Connected Persons of the Company, helped us obtain stable and low-risk income; and on the other hand, the lease services provided by the Company were able to meet the respective business demand of the Company and CDB New Energy.
For details of the above transactions, please refer to the announcement published by the Company on the websites of the Hong Kong Stock Exchange and the Company on November 17, 2016.
(5) Financing Service Framework Agreement
Parties to the agreement
The Group and CDB
Principal terms
We entered into a Financing Service Framework Agreement with CDB on June 13, 2016, pursuant to which CDB provided financing service to the Group, and in turn we paid interests to CDB. We also provided our leased assets, rental balance in the account with CDB or bonds held by us as collateral. Financing facilities provided by CDB were used to carry out our leasing business, including but not limited to aircraft leasing, ship leasing and infrastructure leasing, in order to meet the capital needs of daily business.
The period of the Financing Service Framework Agreement was a fixed term effective from July 11, 2016 to December 31, 2018, subject to renewal upon mutual consent of both parties.
Hong Kong Listing Rules Implications
Given that CDB is the Controlling Shareholder of the Company, CDB and its associates constituted Connected Persons of the Company pursuant to Chapter 14A of the Hong Kong Listing Rules. Therefore, the Financing Service Framework Agreement entered into by the Group and CDB and/or its associates constituted a continuing connected transactions of the Company under the Hong Kong Listing Rules.
As the highest applicable percentage ratio for the transactions under the Financing Service Framework Agreement for the three years ended December 31, 2016, 2017 and 2018 calculated for the purpose of Chapter 14A of the Hong Kong Listing Rules was more than 5% on an annual basis, such transactions were subject to the annual reporting requirement under Rules 14A.49 and 14A.71 of the Hong Kong Listing Rules, the announcement requirement under Rule 14A.35 of the Hong Kong Listing Rules, and the independent Shareholders’ approval requirement under Rule 14A.36 of the Hong Kong Listing Rules.
118 Ch ina Deve lopment Bank F inanc ia l Leas ing Co . , L td .
Report of the Board of Directors
The Company obtained approval on such continuing connected transactions and their annual transaction amount caps for 2016, 2017 and 2018 and was exempt from compliance with the requirements of announcement and independent Shareholders’ approval within the annual transaction cap upon listing.
Brief description of the transactions and their purposes
CDB has been providing financing facilities to the Group during the Track Record Period, thus it has developed a deep understanding of the leasing industry as well as our capital needs and business model. Its financing products were able to meet the diversified financing needs of the leasing business.
In addition, our financing from CDB is mainly medium- to long-term loans to support our financing needs in our leasing business. CDB enjoys a market leading position in China in domestic and overseas medium- to long-term loans with extensive industry experience in areas such as aviation, infrastructure and shipping, which are consistent with the scope of our core business. Therefore, the strength of CDB in medium- to long-term loans in the above areas will greatly benefit our leasing business, and its provision of financing service was able to meet the medium to long-term loan needs of our business.
For details of the above transactions, please refer to the Prospectus.
(6) Deposit Service Framework Agreement
Parties to the agreement
The Group and CDB
Principal terms
We entered into a Deposit Service Framework Agreement with CDB on June 13, 2016, pursuant to which CDB provided deposit service to the Group, including but not limited to demand deposits, term deposits and agreement deposits. In particular, we deposited cash balances into the bank accounts at CDB’s various branches, including: (a) cash generated from our daily business operations, including lease income and security deposits received from our leasing business; and (b) cash from financing facilities provided by CDB to the Group. In turn, CDB paid interests to the Group for such deposits.
The period of the Deposit Service Framework Agreement was a fixed term effective from July 11, 2016 to December 31, 2018, subject to renewal upon the mutual consent of both parties.
Hong Kong Listing Rules Implications
Given that CDB is the Controlling Shareholder of the Company, CDB and its associates constituted Connected Persons of the Company pursuant to Chapter 14A of the Hong Kong Listing Rules. Therefore, the Deposit Service Framework Agreement entered into by the Group and CDB and/or its associates constituted continuing connected transactions of the Company under the Hong Kong Listing Rules.
1192018 Annua l Report
Report of the Board of Directors
As the highest applicable percentage ratio of the transactions under the Deposit Service Framework Agreement for the three years ended December 31, 2016, 2017 and 2018 calculated for the purpose of Chapter 14A of the Hong Kong Listing Rules was more than 5% on an annual basis, such transactions were subject to the annual reporting requirement under Rules 14A.49 and 14A.71 of the Hong Kong Listing Rules, the announcement requirement under Rule 14A.35 of the Hong Kong Listing Rules and the independent Shareholders’ approval requirement under Rule 14A.36 of the Hong Kong Listing Rules.
The Company obtained approval on such continuing connected transactions and their annual transaction caps for the years 2016, 2017 and 2018 and was exempt from compliance with the requirements of announcement and independent Shareholders’ approval within the annual transaction caps upon listing.
Brief description of the transactions and their purposes
For the three years ended December 31, 2013, 2014 and 2015, CDB has been providing deposit service to the Group, thus it has developed a deep understanding of our capital needs and business model. CDB’s deposit service was able to satisfy our liquidity fund management needs. In addition, CDB has been providing financing service to the Group during the Track Record Period as detailed under “(5) Financing Service Framework Agreement” above, and such financing funds provided by CDB to the Group were also temporarily deposited in our accounts maintained at CDB.
For details of the above transactions, please refer to the Prospectus.
(7) Debt Financing Instruments Investment Framework Agreement
Parties to the agreement
The Group and CDB
Principal terms
We entered into a Debt Financing Instruments Investment Framework Agreement with CDB on June 13, 2016, pursuant to which, we invested in debt financing instruments issued by CDB and/or its associates. In turn, CDB and/or its associates paid bond interests to the Group.
The period of the Debt Financing Instruments Investment Framework Agreement was a fixed term effective from July 11, 2016 to December 31, 2018, subject to renewal upon mutual consent of both parties.
Hong Kong Listing Rules Implications
Given that CDB is the Controlling Shareholder of the Company, CDB and its associates constituted Connected Persons of the Company pursuant to Chapter 14A of the Hong Kong Listing Rules. Therefore, the Debt Financing Instruments Investment Framework Agreement entered into by the Group and CDB and/or its associates constituted continuing connected transactions of the Company under the Hong Kong Listing Rules.
120 Ch ina Deve lopment Bank F inanc ia l Leas ing Co . , L td .
Report of the Board of Directors
In respect of the transactions under the Debt Financing Instruments Investment Framework Agreement, as the highest applicable percentage ratio for the three years ended December 31, 2016, 2017 and 2018 calculated for the purpose of Chapter 14A of the Hong Kong Listing Rules was more than 5% on an annual basis, such transactions were subject to the annual reporting requirement under Rules 14A.49 and 14A.71 of the Hong Kong Listing Rules, the announcement requirement under Rule 14A.35 of the Hong Kong Listing Rules and the independent Shareholders’ approval requirement under Rule 14A.36 of the Hong Kong Listing Rules.
The Company obtained approval on such continuing connected transactions and their annual transaction caps for the years of 2016, 2017 and 2018 and was exempt from compliance with the requirements of the relevant announcement within the annual transaction caps upon listing.
Brief description of the transaction and its purpose
We were approved by the PBOC to participate in the interbank bond market on June 23, 2015, based on which we are allowed to purchase debt financing instruments issued in the nationwide bond market. In addition, according to the Measures on Financial Leasing Companies (《金融租賃公司管理辦法》) issued by the CBIRC, a finance lease company is allowed to invest in fixed-income financial products, including debt financing instruments. The debt financing instruments issued by CDB and/or its associates would be our principal investments in fixed-income financial products. CDB is the largest bond issuer in the domestic bond markets. The debt financing instruments issued by CDB were among the main investment products in the interbank market with high ratings, leading market share and ample liquidity. The investment in the debt financing instruments issued by CDB and/or its associates helped us to improve our investment returns and to function as one of our liquidity management reserve tools.
For details of the above transactions, please refer to the Prospectus.
5.2 Non-Exempt One-off Connected Transaction
Finance Lease Transaction
Parties to the agreement
(1) a state-owned enterprise located in Xiangtan City, Hunan Province, the PRC, as Lessee (the “Lessee”)
(2) the Company, as Lessor (the “Lessor”)
Principal terms
The Company (as the Lessor) entered into the Finance Lease Agreement with the Lessee dated May 9, 2018, pursuant to which (i) the Lessee has agreed to transfer the ownership of the Leased Assets under the name of the Lessor for a consideration of RMB650,000,000; and (ii) the Lessor has agreed to lease back the Leased Assets to the Lessee with the lease principal of RMB650,000,000, with the lease interest of approximately RMB99,022,829 (tax inclusive) and the total rent (lease principal and lease interest) of approximately RMB749,022,829.
1212018 Annua l Report
Report of the Board of Directors
The lease period shall be five years commencing from the date of payment of the transfer consideration to the Lessee by the Lessor.
Pursuant to the Finance Lease Agreement, the Lessor agreed to lease back the Leased Assets to the Lessee. The total rent, including value-added tax, comprised lease principal and lease interest. The lease interest was calculated based on the number of days, of which the calculation method was: lease interest = outstanding lease principal x actual days of the lease period x lease annual interest ÷ 360. The total rent was calculated and payable in RMB. After each quarter ends, the parties determine the rent (non-equivalent amount) for the corresponding quarter and the rent shall be payable by the Lessee to the Lessor and divided into 20 consecutive periods. The payment date for the first installment of rent is June 10, 2018, and on March 10, June 10, September 10 and December 10 of every subsequent year, the rest rent will be paid respectively. The last payment of rent is settled on the expiry date of the lease period.
Upon the expiration of the lease period, the Lessee may purchase back the Leased Assets from the Lessor at nominal value of RMB100.
Hong Kong Listing Rules Implications
Given that CDB is the Controlling Shareholder of the Company, and holds approximately 33% equity interest in the Lessee through its wholly-owned subsidiary CDB Development Fund Corporation, the Lessee constituted a Connected Person of the Company pursuant to Chapter 14A of the Listing Rules. Therefore, the transaction contemplated under the Finance Lease Agreement entered into between the Company and the Lessee constituted a connected transaction of the Company under Chapter 14A of the Listing Rules.
In respect of the transaction contemplated under the Finance Lease Agreement, as the highest applicable percentage ratio calculated for the purpose of Chapter 14A of the Hong Kong Listing Rules was over 0.1% but less than 5%, such transaction was subject to the annual reporting requirement under Rules 14A.49 and 14A.71 of the Hong Kong Listing Rules, and the announcement requirement under Rule 14A.35 of the Hong Kong Listing Rules, but exempt from the independent Shareholders’ approval requirement under Rule 14A.36 of the Hong Kong Listing Rules.
Brief description of the transaction and its purpose
The Finance Lease Agreement was entered into by the Company during its ordinary course of business. Entering into the Finance Lease Agreement with the Lessee was beneficial for the Company to increase the income of its finance lease business and was consistent with the Company’s business development strategy.
For details of the above transaction, please refer to the announcement published by the Company on the websites of the Hong Kong Stock Exchange and the Company on May 9, 2018.
122 Ch ina Deve lopment Bank F inanc ia l Leas ing Co . , L td .
Report of the Board of Directors
5.3 Confirmation from Independent Non-Executive Directors
The independent non-executive Directors have reviewed the above continuing connected transactions and confirmed that the transactions:
1. were entered into in our ordinary course of business of the Company;
2. were conducted on normal commercial terms or better terms; and
3. were conducted in accordance with relevant terms of the transaction agreements, and the transaction terms are fair and reasonable and in the interests of the Shareholders as a whole.
5.4 Confirmation from the Auditors
Pursuant to Rule 14A.56 of the Hong Kong Listing Rules, the Board engaged PricewaterhouseCoopers as the international auditor of the Company to conduct a limited assurance engagement on the above continuing connected transactions in accordance with Hong Kong Standard on Assurance Engagements 3000, Assurance Engagements Other Than Audits or Reviews of Historical Financial Information and with reference to Practice Note 740, Auditor’s Letter on Continuing Connected Transactions under the Hong Kong Listing Rules issued by the Hong Kong Institute of Certified Public Accountants. The Directors confirmed that the auditor has reported the results of their procedures to the Board stating that:
(1) nothing has come to the auditor’s attention that causes the auditor to believe that the disclosed continuing connected transactions have not been approved by the Board;
(2) for transactions involving the provision of goods or services by the Group, nothing has come to the auditor’s attention that causes the auditor to believe that the transactions were not, in all material respects, in accordance with the pricing policies of the Company;
(3) nothing has come to the auditor’s attention that causes the auditor to believe that the transactions were not entered into, in all material respects, in accordance with the relevant agreements governing such transactions;
(4) with respect to the aggregate amount of each of the continuing connected transactions set out above, nothing has come to the auditor’s attention that causes the auditor to believe that such continuing connected transactions have exceeded the applied maximum aggregate annual caps for the year 2018.
Related party transactions as described in the notes of the consolidated financial statements constitute connected transactions or continuing connected transactions as defined in Chapter 14A of the Listing Rules, and comply with the disclosure requirements of Chapter 14A of the Listing Rules.
Save as disclosed in this annual report, during the Reporting Period, none of the connected transactions or continuing connected transactions of the Company shall be disclosed pursuant to the provisions in respect of connected transaction disclosure under Chapter 14A of the Hong Kong Listing Rules.
1232018 Annua l Report
Report of the Board of Directors
6. MAJOR CUSTOMERS AND SUPPLIERS
6.1 Major Customers
For the year ended December 31, 2018, the transaction volume of the five largest customers of the Group accounted for 21.22% (2017: 22.86%) of the Group’s total revenue and the transaction volume of the Group’s single largest customer accounted for 8.58% (2017: 9.93%) of the total revenue of the Group.
During the Reporting Period, none of the Directors, any of their respective close associates or any Shareholders (holding more than 5% of the number of issued Shares to the knowledge of Directors) had an interest in the top five customers of the Group.
6.2 Major Suppliers
The Group has no major suppliers due to the nature of our business. During the Reporting Period, we purchased aircraft primarily from the aircraft manufacturers Airbus and Boeing.
6.3 Relations with Customers
The Group is always concerned about the needs of customers and understands clearly the importance of maintaining good customer relationship. The Group insists on providing quality services to domestic and overseas customers with professional attitude to continuously enhance customers’ trust to the Group, helping the Group consolidate its market position and create more sustainable development opportunities. As of the Latest Practicable Date, there were no legal proceedings constituting material impact on the Company.
6.4 Relations with Employees
The Company recognizes the importance of staff to the Company and considers that better employee development strengthens competitiveness of the Company and promotes sustainable development of the Company. Therefore, the Company actively establishes a good employee training system, facilitates career development for employees and promotes work-life balance of employees so as to enhance employees’ satisfaction towards the work. Moreover, the Company is currently striving to construct mid- and long-term incentive mechanism to encourage employees to put efforts on innovative development so as to create a good environment of result-sharing. As of the Latest Practicable Date, there were not any labour disputes of the Company affecting ordinary business operation.
In addition, the Company provides safe and healthy working environment to employees of the Company through regular checking and maintenance of office equipment, as well as cleaning carpets and air-conditioning systems regularly. As of the Latest Practicable Date, there were not any reports on serious work injuries received by the Company.
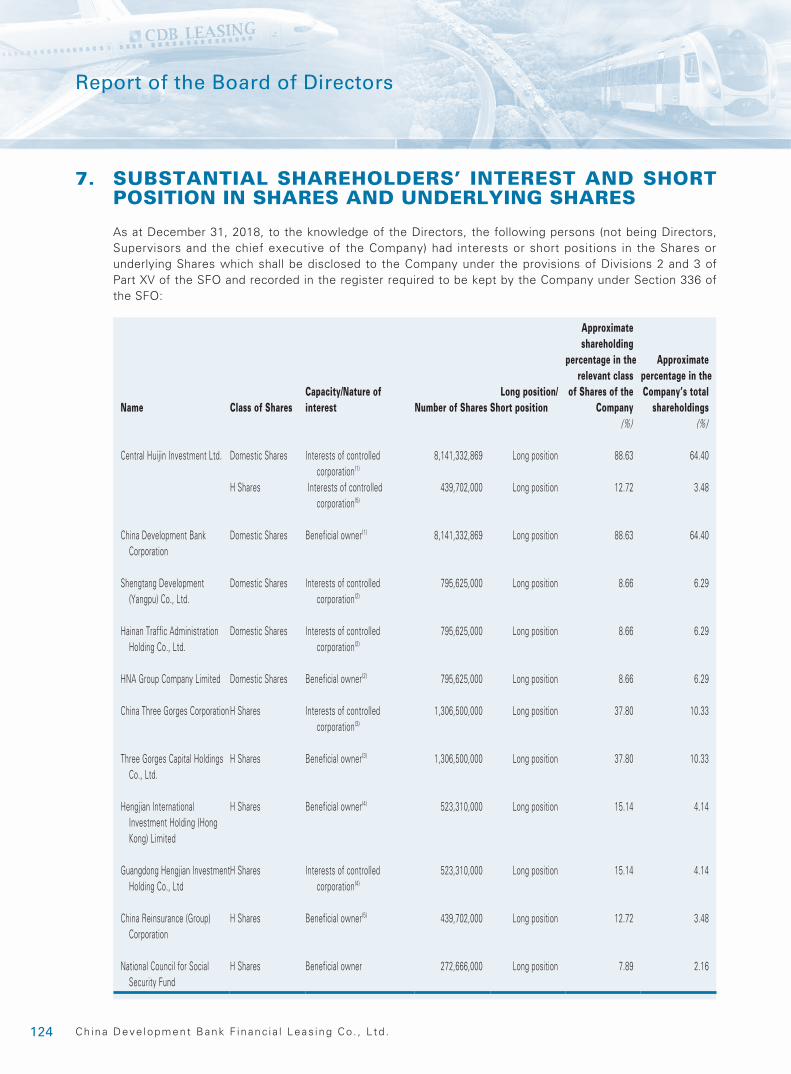
124 Ch ina Deve lopment Bank F inanc ia l Leas ing Co . , L td .
Report of the Board of Directors
7. SUBSTANTIAL SHAREHOLDERS’ INTEREST AND SHORT POSITION IN SHARES AND UNDERLYING SHARES
As at December 31, 2018, to the knowledge of the Directors, the following persons (not being Directors, Supervisors and the chief executive of the Company) had interests or short positions in the Shares or underlying Shares which shall be disclosed to the Company under the provisions of Divisions 2 and 3 of Part XV of the SFO and recorded in the register required to be kept by the Company under Section 336 of the SFO:
Name Class of SharesCapacity/Nature of interest Number of Shares
Long position/Short position
Approximate shareholding
percentage in the relevant class
of Shares of the Company
Approximate percentage in the Company’s total
shareholdings (%) (%)
Central Huijin Investment Ltd. Domestic Shares Interests of controlled corporation(1)
8,141,332,869 Long position 88.63 64.40
H Shares Interests of controlled corporation(5)
439,702,000 Long position 12.72 3.48
China Development Bank Corporation
Domestic Shares Beneficial owner(1) 8,141,332,869 Long position 88.63 64.40
Shengtang Development (Yangpu) Co., Ltd.
Domestic Shares Interests of controlled corporation(2)
795,625,000 Long position 8.66 6.29
Hainan Traffic Administration Holding Co., Ltd.
Domestic Shares Interests of controlled corporation(2)
795,625,000 Long position 8.66 6.29
HNA Group Company Limited Domestic Shares Beneficial owner(2) 795,625,000 Long position 8.66 6.29
China Three Gorges CorporationH Shares Interests of controlled corporation(3)
1,306,500,000 Long position 37.80 10.33
Three Gorges Capital Holdings Co., Ltd.
H Shares Beneficial owner(3) 1,306,500,000 Long position 37.80 10.33
Hengjian International Investment Holding (Hong Kong) Limited
H Shares Beneficial owner(4) 523,310,000 Long position 15.14 4.14
Guangdong Hengjian Investment Holding Co., Ltd
H Shares Interests of controlled corporation(4)
523,310,000 Long position 15.14 4.14
China Reinsurance (Group) Corporation
H Shares Beneficial owner(5) 439,702,000 Long position 12.72 3.48
National Council for Social Security Fund
H Shares Beneficial owner 272,666,000 Long position 7.89 2.16
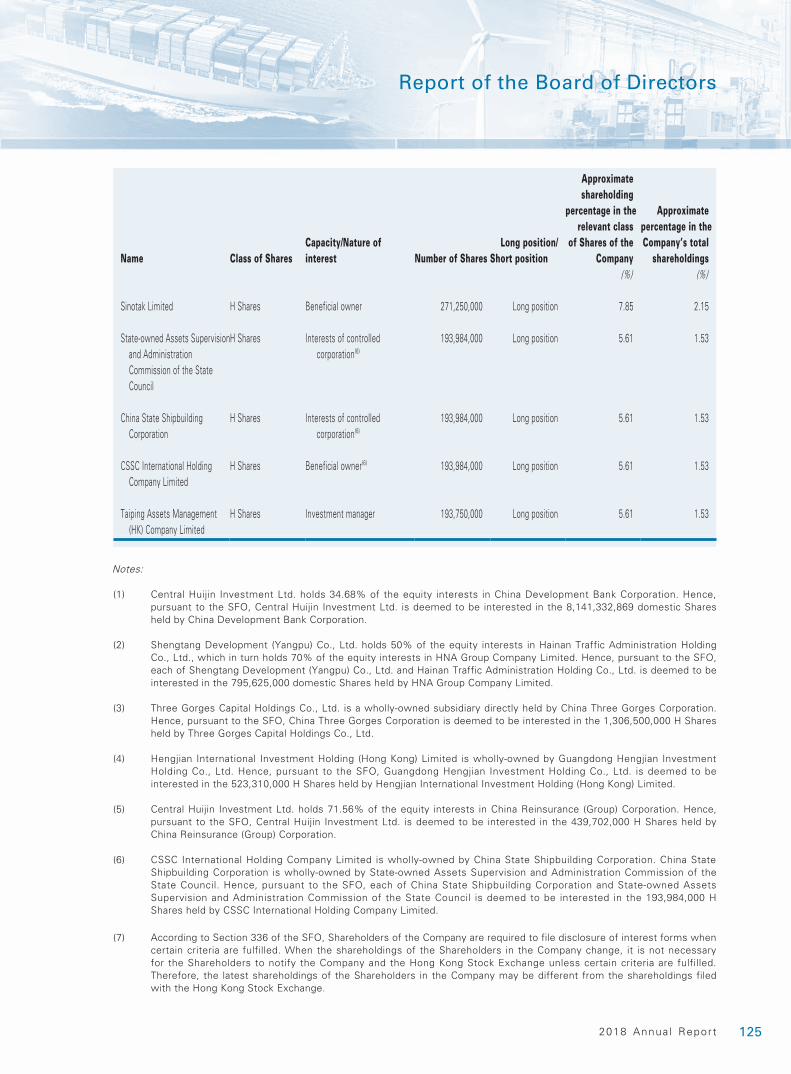
1252018 Annua l Report
Report of the Board of Directors
Name Class of SharesCapacity/Nature of interest Number of Shares
Long position/Short position
Approximate shareholding
percentage in the relevant class
of Shares of the Company
Approximate percentage in the Company’s total
shareholdings (%) (%)
Sinotak Limited H Shares Beneficial owner 271,250,000 Long position 7.85 2.15
State-owned Assets Supervision and Administration Commission of the State Council
H Shares Interests of controlled corporation(6)
193,984,000 Long position 5.61 1.53
China State Shipbuilding Corporation
H Shares Interests of controlled corporation(6)
193,984,000 Long position 5.61 1.53
CSSC International Holding Company Limited
H Shares Beneficial owner(6) 193,984,000 Long position 5.61 1.53
Taiping Assets Management (HK) Company Limited
H Shares Investment manager 193,750,000 Long position 5.61 1.53
Notes:
(1) Central Huijin Investment Ltd. holds 34.68% of the equity interests in China Development Bank Corporation. Hence, pursuant to the SFO, Central Huijin Investment Ltd. is deemed to be interested in the 8,141,332,869 domestic Shares held by China Development Bank Corporation.
(2) Shengtang Development (Yangpu) Co., Ltd. holds 50% of the equity interests in Hainan Traffic Administration Holding Co., Ltd., which in turn holds 70% of the equity interests in HNA Group Company Limited. Hence, pursuant to the SFO, each of Shengtang Development (Yangpu) Co., Ltd. and Hainan Traffic Administration Holding Co., Ltd. is deemed to be interested in the 795,625,000 domestic Shares held by HNA Group Company Limited.
(3) Three Gorges Capital Holdings Co., Ltd. is a wholly-owned subsidiary directly held by China Three Gorges Corporation. Hence, pursuant to the SFO, China Three Gorges Corporation is deemed to be interested in the 1,306,500,000 H Shares held by Three Gorges Capital Holdings Co., Ltd.
(4) Hengjian International Investment Holding (Hong Kong) Limited is wholly-owned by Guangdong Hengjian Investment Holding Co., Ltd. Hence, pursuant to the SFO, Guangdong Hengjian Investment Holding Co., Ltd. is deemed to be interested in the 523,310,000 H Shares held by Hengjian International Investment Holding (Hong Kong) Limited.
(5) Central Huijin Investment Ltd. holds 71.56% of the equity interests in China Reinsurance (Group) Corporation. Hence, pursuant to the SFO, Central Huijin Investment Ltd. is deemed to be interested in the 439,702,000 H Shares held by China Reinsurance (Group) Corporation.
(6) CSSC International Holding Company Limited is wholly-owned by China State Shipbuilding Corporation. China State Shipbuilding Corporation is wholly-owned by State-owned Assets Supervision and Administration Commission of the State Council. Hence, pursuant to the SFO, each of China State Shipbuilding Corporation and State-owned Assets Supervision and Administration Commission of the State Council is deemed to be interested in the 193,984,000 H Shares held by CSSC International Holding Company Limited.
(7) According to Section 336 of the SFO, Shareholders of the Company are required to file disclosure of interest forms when certain criteria are fulfilled. When the shareholdings of the Shareholders in the Company change, it is not necessary for the Shareholders to notify the Company and the Hong Kong Stock Exchange unless certain criteria are fulfilled. Therefore, the latest shareholdings of the Shareholders in the Company may be different from the shareholdings filed with the Hong Kong Stock Exchange.
126 Ch ina Deve lopment Bank F inanc ia l Leas ing Co . , L td .
Report of the Board of Directors
Save as disclosed above, as at December 31, 2018, to the knowledge of the Directors, no other persons (not being Directors, Supervisors and the chief executive of the Company) had interests or short positions in the Shares or underlying Shares which would fall to be disclosed to the Company under the provisions of Divisions 2 and 3 of Part XV of the SFO and recorded in the register required to be kept by the Company under Section 336 of the SFO.
8. INTERESTS AND SHORT POSITIONS OF THE DIRECTORS, SUPERVISORS AND CHIEF EXECUTIVES IN SHARES, UNDERLYING SHARES AND DEBENTURES
As at December 31, 2018, none of the Directors, Supervisors or the chief executive of the Company had any interests or short positions in the Shares, underlying Shares or debentures of the Company or any of its associated corporations (within the meaning of Part XV of the SFO) which were required to be notified to the Company and the Hong Kong Stock Exchange pursuant to Divisions 7 and 8 of Part XV of the SFO (including interests or short positions which any such Directors, Supervisors, chief executives or their respective associates are deemed to have under such provisions of the SFO), or which were required to be entered in the register required to be kept by the Company pursuant to Section 352 of the SFO, or which were otherwise required to be notified to the Company and the Hong Kong Stock Exchange pursuant to the Model Code.
9. D I R E C T O R S ’ R I G H T T O A C Q U I R E S H A R E S O R DEBENTURES
Save as disclosed in this annual report, at no time during the Reporting Period was the Company or its subsidiaries a party to any arrangements to enable the Directors or the Supervisors to acquire benefits by means of acquisition of Shares in, or debentures of, the Company or any other body corporate and none of the Directors, the Supervisors, their spouses or children under the age of 18, had any rights to subscribe for Shares in, or debt securities of the Company or any other body corporate, or had exercised any such rights during the period.
10. DIRECTORS’ INTERESTS IN COMPETING BUSINESS
Save as disclosed in this annual report, as at December 31, 2018, none of the Directors or their respective associates had interests in a business which competes or is likely to compete, either directly or indirectly, with the business of the Group.
11. CONTROLLING SHAREHOLDERS’ NON-COMPETING UNDERTAKING
During the Reporting Period, CDB, the Controlling Shareholder of the Company, has complied with the undertakings made in the Prospectus. For details of the undertakings concerned, please refer to the “Relationship with CDB” section of the Prospectus.
1272018 Annua l Report
Report of the Board of Directors
12. SERVICE CONTRACTS OF DIRECTORS AND SUPERVISORS
Apart from Mr. Ma Yongyi and Mr. Wang Yiyun who entered into service contracts with the Company on February 28, 2018 and February 1, 2019 respectively, each of the Directors and Supervisors has entered into a service contract with the Company on June 13, 2016.
During the Reporting Period, none of the Directors and Supervisors has entered into a service contract with the Company which cannot be terminated by the Company within one year without payment of compensation (other than statutory compensation).
13. INDEMNITIES OF DIRECTORS AND SUPERVISORS
At no time during the Reporting Period was or is there any permitted indemnity provision being in force for the benefit of any of the Directors or Supervisors (whether made by the Company or otherwise) or an associated company (if made by the Company). The Company has arranged appropriate liability insurance coverage for the Directors, Supervisors and officers.
14. D IRECTORS’ AND SUPERV ISORS’ INTERESTS IN M A T E R I A L T R A N S A C T I O N S, A R R A N G E M E N T O R CONTRACTS
During the Reporting Period, none of the Directors or Supervisors had material interests, either directly or indirectly in transactions, arrangement or contracts to which the Company, any of its subsidiaries or fellow subsidiaries was a party, and of significance to the business of the Group.
15. P U R C H A S E , R E D E M P T I O N O R S A L E O F L I S T E D SECURITIES
During the Reporting Period, the Company or any of its subsidiaries did not purchase, sell or redeem any of the listed securities of the Company.
16. PRE-EMPTIVE RIGHTS
There is no provision under the Articles of Association and the PRC laws regarding pre-emptive rights that requires the Company to offer new Shares to its existing Shareholders on a pro rata basis.
17. SHARE OPTION ARRANGEMENTS
As of the Latest Practicable Date, the Company did not have any share option incentive plan.
18. ADMINISTRATION CONTRACT
During the Reporting Period, the Company did not enter into any contracts in respect of management and administration work in relation to its entire or any significant parts of business.
19. DISTRIBUTABLE RESERVES
As at December 31, 2018, the distributable reserves of the Group amounted to RMB5,103,745,537 (as at December 31, 2017: RMB5,385,159,251), and the distributable reserves of the Company was RMB1,370,353,545 (as at December 31, 2017: RMB1,789,087,662).
128 Ch ina Deve lopment Bank F inanc ia l Leas ing Co . , L td .
Report of the Board of Directors
20. HOUSES, EQUIPMENT AND INVESTMENT PROPERTIES
Details of changes in houses, equipment and investment properties of the Company and the Group during the year ended December 31, 2018 are set forth in Note 26 to the consolidated financial statements.
21. RETIREMENT AND BENEFITS
Details of the retirement and employees benefit scheme of the Company are set forth in Note 9 to the consolidated financial statements.
22. DONATIONS
For the year ended December 31, 2018, no charity donations and other donations were made by the Group.
23. LOAN AGREEMENTS
During the Reporting Period, the Company entered into loan agreements with specific banks, of which loans in a total amount of approximately RMB24,698 million include a condition requiring that China Development Bank, the Controlling Shareholder of the Company, shall hold directly or indirectly, no less than 51% of the shares of the Company. The terms of such loan agreements range from one month to three years; Loans in a total amount of approximately RMB1,742 million include a condition requiring that China Development Bank shall remain as the single largest Shareholder of the Company. The terms of such loan agreements range from two months to one year.
24. AUDIT OF ANNUAL RESULTS
The accounting principles and practices adopted by the Group and the audited consolidated financial statements for the year ended December 31, 2018 have been jointly reviewed by the Audit Committee of the Company together with the management and the external auditor of the Company.
PricewaterhouseCoopers was appointed as the auditor of the Company for the year ended December 31, 2018. PricewaterhouseCoopers has audited the annexed financial statements prepared in accordance with the IFRS.
By order of the Board of DirectorsWang Xuedong
ChairmanShenzhen, PRC, March 27, 2019

1292018 Annua l Report
Report of the Board of Supervisors
During the Reporting Period, the Board of Supervisors and all members adhered to the principle of being faithful, diligent and prudent, focused on the major tasks of the Company, practically, efficiently and responsibly carried out the supervision of the Board of Supervisors, effectively monitored the performance of duties of the Board and senior management of the Company, financial activities, internal control, risk management and operating activities, and proposed independent opinions to the aforesaid matters, safeguarded the interests of Shareholders, the Company and employees, and at the same time tried to carry out constructive supervision for facilitating sustainable and healthy development of the Company pursuant to the Company Law of the People’s Republic of China (《中華人民共和國公司法》), Guidelines on Corporate Governance for Commercial Banks of China Banking Regulatory Commission (《中國銀監會商業銀行公司治理指引》), the Articles of Association of CDB Leasing, Rule of Procedures of the Board of Supervisors of CDB Leasing (《國銀金融租賃股份有限公司監事會議事規則》) and other relevant laws and regulations.
I. C O N V E N T I O N O F M E E T I N G S O F T H E B O A R D O F SUPERVISORS
In 2018, the Board of Supervisors convened eight meetings in total, including four ordinary meetings, three extraordinary meetings and one theme-based conference, in which 19 resolutions were considered and approved, 40 matters were considered, and four matters were discussed.
1. On January 5, 2018, the Board of Supervisors convened the first theme-based conference of the first session, in which related departments gave feedbacks regarding the financial inspection carried out by the office of the Board of Supervisors and the exclusive financial consultant of the Board of Supervisors on the Company’s bidding projects for the years 2015–2016 and the special audit report was discussed.
2. On January 10, 2018, the Board of Supervisors convened the 2018 first extraordinary meeting of the first session, in which two resolutions, namely the resignation of Mr. Zhuang Ganlang as an employee representative Supervisor by the Board of Supervisors, and nomination of Mr. Ma Yongyi as a candidate for external Supervisor of China Development Bank Financial Leasing Co., Ltd., were considered and approved.
3. On March 26 and 27, 2018, the Board of Supervisors convened the 2018 first ordinary meeting of the first session of the Board of Supervisors in two sections, in which the Board of Supervisors considered eight resolutions such as the 2017 Annual Report, the Profit Distribution Proposal for the year 2017, Assessment Report on Performance Appraisal of the Directors, Supervisors and Senior Management Members for the year 2017; reviewed 17 reported matters, including financial status for the year 2017, establishment of consolidated statement management mechanism and the effectiveness of the operation of consolidated statement management of the Company, as well as the compliance of internal control management for the year 2017; discussed three matters, including the 2018 training for the Board of Supervisors, investigation and research plan, the contents of the special financial investigation for the year 2018, the division of Supervisors’ supervision matters for the year 2018.
130 Ch ina Deve lopment Bank F inanc ia l Leas ing Co . , L td .
Report of the Board of Supervisors
4. On May 22, 2018, the Board of Supervisors convened the 2018 second extraordinary meeting of the first session of the Board of Supervisors, in which the Board of Supervisors considered three resolutions, including the Financial Accounts Report for the year 2017, Report on Financial Budget for the year 2018, and allowance plan for Mr. Ma Yongyi, an external Supervisor; and listened to the report of proposal of the management of external auditors.
5. On June 28, 2018, the Board of Supervisors convened the 2018 second ordinary meeting of the first session of the Board of Supervisors, in which the Board of Supervisors considered the resolution of the allowances for Supervisors of the Company; reviewed four reports, including the operation for the first quarter of 2018, the financial status for the first quarter of 2018, the risk management for the first quarter of 2018, and the compliance and internal control for the first quarter of 2018.
6. On August 23, 2018, the Board of Supervisors convened the 2018 third ordinary meeting of the first session of the Board of Supervisors, in which the Board of Supervisors considered three resolutions, including 2018 Interim Report, engagement of financial advising institution of the Board of Supervisors of the Company, and engagement of legal advising institution of the Board of Supervisors of the Company; reviewed nine reported matters including the operation management for the second quarter of 2018, the financial report for the second quarter of 2018 and the risk management for the second quarter of 2018.
7. On October 25, 2018, the Board of Supervisors convened the third extraordinary meeting of the first session of the Board of Supervisors, in which the Board of Supervisors considered two resolutions on application for resignation as the shareholder representative Supervisor to the Board of Supervisors by Mr. Sun Zhikun, and nomination of Mr. Guan Yu as a candidate for the shareholder representative Supervisor of CDB Leasing, to the Shareholders’ general meeting.
8. On November 30, 2018, the Board of Supervisors convened the fourth ordinary meeting of the first session of the Board of Supervisors 2018, in which the Board of Supervisors considered nine reported matters, including the operation management for the third quarter of 2018, the financial report for the third quarter of 2018 and the risk management for the third quarter of 2018.
II. CONDUCTING SUPERVISION AND EVALUATION ON PERFORMANCE
The supervision and evaluation on the performance of nine Directors and six senior management members of the Company in the year 2017 were conducted by the Board of Supervisors in the first quarter of 2018. Meanwhile, the Board of Supervisors also conducted the evaluation on the performance of five Supervisors. Evaluation on the performance included multiple evaluation dimensions such as self-evaluation, peer-evaluation, evaluation by the Board and the Board of Supervisors. The evaluation results have been prudently studied and formed correspondingly and the results of the evaluation on the performance have been reported to the Shareholders' general meeting and regulatory departments in accordance with the requirements.
1312018 Annua l Report
Report of the Board of Supervisors
III. O R G A N I S I N G A N D C O N D U C T I N G F I N A N C I A L SUPERVISION
The Board of Supervisors regularly listened to the financial work report and work plan including major financial indicators, asset and liabilities, gain or loss status, profits, overdue lease payment, fees, implementation of budget, inter-industry comparison and analysis on competitiveness. The Board of Supervisors suggested that the Company shall enhance financial management, and conduct penetration management on overseas subsidiaries, providing suitable management in accordance with relevant requirements.
IV. CONTINUOUSLY SUPERVISING THE OPERATION AND MANAGEMENT OF THE COMPANY
The Board of Supervisors quarterly debriefed the report on the overall operation of the Company by the operation and management department, including the asset scale, revenue arising from projects, quality of assets, the progress of annual operation plans and the next focus of work. The Board of Supervisors suggested that the Company shall enhance foresight, systematicness and strategy in operation and management. The development of the Company shall keep pace with the national development strategies and keep in line with the key points of national development to expand its business by following the national strategies. Meanwhile, the Board of Supervisors commenced special inspection activities for IT outsourcing in the third quarter of 2018.
V. EARNESTLY CONDUCTING SUPERVISION ON INTERNAL CONTROL
The Board of Supervisors regularly debriefed the work report of compliance and internal control and put forward opinion and suggestions about the related report, understood and followed up the issues such as the supervision updates, compliance risks and internal control management, monitoring and assessment of our compliance exposures and the implementation condition of the rectification of the deficiency in compliance, and proposed the comments and recommendations on the relevant reports. The Board of Supervisors suggested that the compliance management shall improve the rectification of the problems discovered by external inspection and internal auditing. The compliance management department shall strictly implement the policies of CBRC, especially reinforcing the management of the subsidiaries to make sure the subsidiaries are in compliance with laws and regulations. The compliance management department shall promote the implementation of the rectification of the problems discovered during on-site inspection of the CBRC in the previous years as soon as possible. Meanwhile, the Board of Supervisors commenced special inspection activities for IT outsourcing in the third quarter of 2018.
VI. CONTINUOUSLY REINFORCING SUPERVISION ON RISK MANAGEMENT
The Board of Supervisors regularly listened to the work report of comprehensive risk analysis and management, including asset structure, risk indicators and analysis of profit indicators, analysis of credit risk, industry risk, market risk, operational risk, stress test and other risks and further work arrangements for risk management. The Board of Supervisors suggested that the risk management department shall strengthen the awareness of the risk management of HNA projects and projects in aviation subsidiaries, and pay attention to the risk of non-state-owned enterprises.
132 Ch ina Deve lopment Bank F inanc ia l Leas ing Co . , L td .
Report of the Board of Supervisors
VII. FURTHER OPTIMIZING THE CONSTITUTION OF THE BOARD OF SUPERVISORS AND ADDING SUPPLEMENTAL EXTERNAL SUPERVISORS
After extensive investigation and research, as well as repeated demonstration, the Board of Supervisors has formulated the nomination, voting and election process, and the management procedures of external Supervisors. The Company completed the selection, engagement and approval of the external Supervisor, and the resolution was duly approved at the general meeting in February 2018. Expert and scholar with extensive experience in finance and taxation was selected to serve as an external Supervisor of the Company. Adding supplemental external Supervisor enabled the Board of Supervisors of the Company to form an ideal layout of Shareholders representative Supervisors, employee representative Supervisors and external Supervisors, thereby uplifting the professionalism and standardization of supervision work of the Board of Supervisors. At the same time, the Company further protected the interests of minority Shareholders and satisfied the compliance requirements of regulations.
VIII. O P T I M I Z I N G T H E E S T A B L I S H M E N T F O R T H E REGULATORY SYSTEM OF THE BOARD OF SUPERVISORS
The Board of Supervisors continuously promoted the construction of its policy system. On the basis of the appraisal of duty performance, supervision and management and other system, the Board of Supervisors has made re-amendment to the Rules of Procedure of the Board of Supervisors and Administrative Measures for the Allowances for Supervisors, and assisted with the amendments to the related contents of the Articles of Association. These amendments were considered and approved at the general meeting in February 2018. The optimization of certain rules will further inspire the working activity of Supervisors and promote independent supervision performance of Supervisors. The continuous optimization of the rules of the Board of Supervisors also strengthened the supervision and management functions of the Board of Supervisors, effectively ensuring the standardization and operation of the performance of members of the Board of Supervisors.
IX. CONDUCTING RELEVANT TRAINING AND INVESTIGATION AND RESEARCH, OPTIMIZING THE SELF-CONSTRUCTION OF THE BOARD OF SUPERVISORS, AND BOOSTING THE CAPABILITY OF SUPERVISION OF SUPERVISORS
The Board of Supervisors actively organized and arranged investigation and research in the shipping industry, and conducted on-site interviews with Shagang Group and Yangzijiang Shipbuilding Group, deepening the analysis and research of the Board of Supervisors on key industries of the Company and enhancing the management quality and effectiveness of the Board of Supervisors. The Board of Supervisors actively leveraged the professional advantages of its financial advisors and legal consultants, and organized theme-based lectures for all members of the Board of Supervisors to popularize and improve the knowledge and understanding of the members of the Board of Supervisors on the supervision functions of the Board of Supervisors. The Board of Supervisors organized the Supervisors and personnel of the office of the Board of Supervisors to participate in external theme-based trainings, and established post-training communication mechanism to enhance the overall working capability of the Board of Supervisors.
By order of the Board of Supervisors of China Development Bank Financial Leasing Co., Ltd.Chairman of the Board of Supervisors
Jiang DaozhenMarch 27, 2019
1332018 Annua l Report
Independent Auditor’s Report
To the Shareholders of China Development Bank Financial Leasing Co., Ltd.(incorporated in People’s Republic of China with limited liability)
Opinion
What we have audited
The consolidated financial statements of China Development Bank Financial Leasing Co., Ltd. (the “Company”) and its subsidiaries (the “Group”) set out on pages 138 to 256, which comprise:
• the consolidated statement of financial position as at 31 December 2018;
• the consolidated statement of profit or loss for the year then ended;
• the consolidated statement of comprehensive income for the year then ended;
• the consolidated statement of changes in equity for the year then ended;
• the consolidated statement of cash flows for the year then ended; and
• the notes to the consolidated financial statements, which include a summary of significant accounting policies.
Our opinion
In our opinion, the consolidated financial statements give a true and fair view of the consolidated financial position of the Group as at 31 December 2018, and of its consolidated financial performance and its consolidated cash flows for the year then ended in accordance with International Financial Reporting Standards (“IFRSs”) and have been properly prepared in compliance with the disclosure requirements of the Hong Kong Companies Ordinance.
Basis for Opinion
We conducted our audit in accordance with International Standards on Auditing (“ISAs”). Our responsibilities under those standards are further described in the Auditor’s Responsibilities for the Audit of the Consolidated Financial Statements section of our report.
We believe that the audit evidence we have obtained is sufficient and appropriate to provide a basis for our opinion.
Independence
We are independent of the Group in accordance with the International Ethics Standards Board for Accountants’ Code of Ethics for Professional Accountants (“IESBA Code”), and we have fulf i l led our other ethical responsibilities in accordance with the IESBA Code.
134 Ch ina Deve lopment Bank F inanc ia l Leas ing Co . , L td .
Independent Auditor’s Report (Continued)
Key Audit Matters
Key audit matters are those matters that, in our professional judgement, were of most significance in our audit of the consolidated financial statements of the current period. These matters were addressed in the context of our audit of the consolidated financial statements as a whole, and in forming our opinion thereon, and we do not provide a separate opinion on these matters.
Key audit matter identified in our audit is impairment of finance lease receivables and equipment held for operating lease business.
Key Audit Matter How our audit addressed the Key Audit Matter
Impairment of finance lease receivables, accounts receivable and equipment held for operating lease business
Refe r to Note 3 .1 , 3 .2 , 21, 22 and 26 to the consolidated financial statements.
We evaluated and tested the relevant controls, including those over the t imely identif icat ion of impairment i nd i ca to rs and the ca l cu l a t i on o f a l l owance fo r impairment losses.
For the impairment loss of finance lease receivables and accounts receivable, our substantive procedures included:
We reviewed the modelling methodologies for ECL measurement, and assessed the reasonableness of the portfol io segmentation, models selection, key parameters est imation, s ignif icant judgments and assumptions in relat ion to the models. We tested whether or not the measurement models ref lect the model l ing methodologies documented by the management.
We selected samples, in consideration of the financial information and non-financial information of the lessees, relevant external evidence and other factors, to assess the appropriateness of the management’s identification of receivables with significant increase in credit risk since initial recognition and credit-impaired receivables.
For fo rward- look ing measurement, we rev iewed the management’s model analysis of their selection of economic ind icators; economic scenar ios and weightings employed, assessed the reasonableness of the prediction of economic indicators and performed sensitivity analysis of economic indicators, economic scenarios and weightings.
We examined major data inputs to the ECL models on selected samples, including historical data and data at the measurement date, to assess their accuracy and completeness. We also performed reconciliation of the transmission of major data inputs between the models and the information systems, to verify their accuracy and completeness.
For finance lease receivables and accounts receivable in stage 3, we examined, on a sample basis, forecasted future cash flows prepared by the Group based on financial information of the lessees and other available information together with discount rates in supporting the computation of impairment loss.
As at 31 December 2018, the net carrying amounts of the Group’s finance lease receivables, accounts rece ivab le and equ ipment he ld fo r opera t ing l ease bus iness we re RMB125,141 .6 m i l l i on , RMB5,405.7 mi l l ion and RMB62,117.7 mi l l ion, respectively, in which allowance for impairment losses of RMB4,675.5 million, RMB662.6 million and RMB487.0 million were recorded.
The balances of impairment allowance for finance lease receivables and accounts receivable represent the management’s best estimates at the balance sheet date of expected credit losses (“ECL”) under International Financial Reporting Standard 9: Financial Instruments.
The Group assesses whether the credit r isk of financial lease receivables and accounts receivable have increased s ign i f icant ly s ince the i r in i t ia l recognition, and apply a three-stage impairment model to calculate their ECL. For financial lease receivables and accounts receivable c lassif ied into stages 1 and 2, the management assesses impairment losses using the risk parameter modelling approach that incorporates key parameters, including probability of default, loss given default, exposure at default and discount rates. For f inance lease receivables and accounts receivable in stage 3, the management assesses impai rment losses by estimating the cash flows from finance lease receivables and accounts receivable.
The measurement models of expected credit losses involves significant management judgments and assumptions, primarily including the following:
1352018 Annua l Report
Independent Auditor’s Report (Continued)
Key Audit Matter How our audit addressed the Key Audit Matter
Impairment of finance lease receivables, accounts receivable and equipment held for operating lease business
(1) Segmentation of business operations sharing similar credit risk characteristics, selection of appropriate models and determination of relevant key measurement parameters;
(2) Criteria for determining whether or not there was a significant increase in credit risk, or a default or impairment loss was incurred;
(3) Economic ind icators for forward- look ing measurement, and the application of economic scenarios and weightings;
(4) The estimated future cash flows for financial lease receivables and accounts receivable in stage 3.
The Group established governance processes and controls for the measurement of expected credit losses.
Management identifies operating lease equipment wi th impai rment ind icators and measures the recoverable amount of these assets at the higher of:
• fair value based on the market pricing data, less costs of disposal, and
• the est imated value in use based on the present value of the expected future cash flows from the lease.
We focused on the impairment assessment of finance lease receivables, accounts receivable and equipment held for operating lease business because management exercises significant judgements during impairment identification and assessment process.
For equipment held for operating lease business, we assessed management’s identification of impairment indicators. We validated the utilisation of equipment and assessed whether market pr ice of equipment declines. For fair value less costs of disposal method, we compared the carry ing amounts of equipment with the publicly available pricing data of the industry less the estimated costs of disposal. For value in use calculations, we tested the mathematical accuracy. We compared the rental used in forecasts of future cash flows against the rental set out in the lease contracts, and assessed the discount rates by considering the weighted average cost of capital of the Group.
Based on the procedures performed, we considered the methods and key assumptions adopted in the impairment assessment were supported by the evidence we gathered.
136 Ch ina Deve lopment Bank F inanc ia l Leas ing Co . , L td .
Independent Auditor’s Report (Continued)
Other Information
The directors of the Company are responsible for the other information. The other information comprises all of the information included in the annual report other than the consolidated financial statements and our auditor’s report thereon.
Our opinion on the consolidated financial statements does not cover the other information and we do not express any form of assurance conclusion thereon.
In connection with our audit of the consolidated financial statements, our responsibility is to read the other information and, in doing so, consider whether the other information is materially inconsistent with the consolidated financial statements or our knowledge obtained in the audit or otherwise appears to be materially misstated.
If, based on the work we have performed, we conclude that there is a material misstatement of this other information, we are required to report that fact. We have nothing to report in this regard.
Responsibilities of Directors and the Audit Committee for the Consolidated Financial Statements
The directors of the Company are responsible for the preparation of the consolidated financial statements that give a true and fair view in accordance with IFRSs and the disclosure requirements of the Hong Kong Companies Ordinance, and for such internal control as the directors determine is necessary to enable the preparation of consolidated financial statements that are free from material misstatement, whether due to fraud or error.
In preparing the consolidated financial statements, the directors are responsible for assessing the Group’s ability to continue as a going concern, disclosing, as applicable, matters related to going concern and using the going concern basis of accounting unless the directors either intend to liquidate the Group or to cease operations, or have no realistic alternative but to do so.
The audit committee is responsible for overseeing the Group’s financial reporting process.
Auditor’s Responsibilities for the Audit of the Consolidated Financial Statements
Our objectives are to obtain reasonable assurance about whether the consolidated financial statements as a whole are free from material misstatement, whether due to fraud or error, and to issue an auditor’s report that includes our opinion. We report our opinion solely to you, as a body, and for no other purpose. We do not assume responsibility towards or accept liability to any other person for the contents of this report. Reasonable assurance is a high level of assurance, but is not a guarantee that an audit conducted in accordance with ISAs will always detect a material misstatement when it exists. Misstatements can arise from fraud or error and are considered material if, individually or in the aggregate, they could reasonably be expected to influence the economic decisions of users taken on the basis of these consolidated financial statements.
As part of an audit in accordance with ISAs, we exercise professional judgement and maintain professional scepticism throughout the audit. We also:
• Identify and assess the risks of material misstatement of the consolidated financial statements, whether due to fraud or error, design and perform audit procedures responsive to those risks, and obtain audit evidence that is sufficient and appropriate to provide a basis for our opinion. The risk of not detecting a material misstatement resulting from fraud is higher than for one resulting from error, as fraud may involve collusion, forgery, intentional omissions, misrepresentations, or the override of internal control.

1372018 Annua l Report
Independent Auditor’s Report (Continued)
• Obtain an understanding of internal control relevant to the audit in order to design audit procedures that are appropriate in the circumstances, but not for the purpose of expressing an opinion on the effectiveness of the Group’s internal control.
• Evaluate the appropriateness of accounting policies used and the reasonableness of accounting estimates and related disclosures made by the directors.
• Conclude on the appropriateness of the directors’ use of the going concern basis of accounting and, based on the audit evidence obtained, whether a material uncertainty exists related to events or conditions that may cast significant doubt on the Group’s ability to continue as a going concern. If we conclude that a material uncertainty exists, we are required to draw attention in our auditor’s report to the related disclosures in the consolidated financial statements or, if such disclosures are inadequate, to modify our opinion. Our conclusions are based on the audit evidence obtained up to the date of our auditor’s report. However, future events or conditions may cause the Group to cease to continue as a going concern.
• Evaluate the overall presentation, structure and content of the consolidated financial statements, including the disclosures, and whether the consolidated financial statements represent the underlying transactions and events in a manner that achieves fair presentation.
• Obtain sufficient appropriate audit evidence regarding the financial information of the entities or business activities within the Group to express an opinion on the consolidated financial statements. We are responsible for the direction, supervision and performance of the group audit. We remain solely responsible for our audit opinion.
We communicate with the audit committee regarding, among other matters, the planned scope and timing of the audit and significant audit findings, including any significant deficiencies in internal control that we identify during our audit.
We also provide the audit committee with a statement that we have complied with relevant ethical requirements regarding independence, and to communicate with them all relationships and other matters that may reasonably be thought to bear on our independence, and where applicable, related safeguards.
From the matters communicated with the audit committee, we determine those matters that were of most significance in the audit of the consolidated financial statements of the current period and are therefore the key audit matters. We describe these matters in our auditor’s report unless law or regulation precludes public disclosure about the matter or when, in extremely rare circumstances, we determine that a matter should not be communicated in our report because the adverse consequences of doing so would reasonably be expected to outweigh the public interest benefits of such communication.
The engagement partner on the audit resulting in this independent auditor’s report is CHOW SAI KEUNG.
PricewaterhouseCoopersCertified Public Accountants
Hong Kong, 27 March 2019

138 Ch ina Deve lopment Bank F inanc ia l Leas ing Co . , L td .
Consolidated Statement of Profit or Loss
Year ended 31 December
2018 2017Note RMB’000 RMB’000
RevenueFinance lease income 5 7,036,316 5,784,289Operating lease income 5 6,584,804 6,016,001
Total revenue 13,621,120 11,800,290
Net investment gains 6 211,662 176,160Other income, gains or losses 7 1,708,528 338,272
Total revenue and other income 15,541,310 12,314,722
Depreciation and amortisation 8 (2,989,253) (2,701,887)Staff costs 9 (508,889) (351,644)Fee and commission expenses 10 (74,559) (61,986)Interest expense 11 (6,863,247) (4,984,470)Other operating expenses 12 (538,049) (493,965)Net Impairment losses on financial assets 13 (992,118) (851,572)Net Impairment losses on other assets 14 (300,974) (61,346)
Total expenses (12,267,089) (9,506,870)
Profit before income tax 3,274,221 2,807,852Income tax expense 15 (767,237) (676,889)
Profit for the year attributable to owners of the Company 2,506,984 2,130,963
Earnings per share attributable to owners of the Company (expressed in RMB Yuan per share)-Basic and diluted 16 0.20 0.17
The notes on pages 145 to 256 form an integral part of these consolidated financial statements.
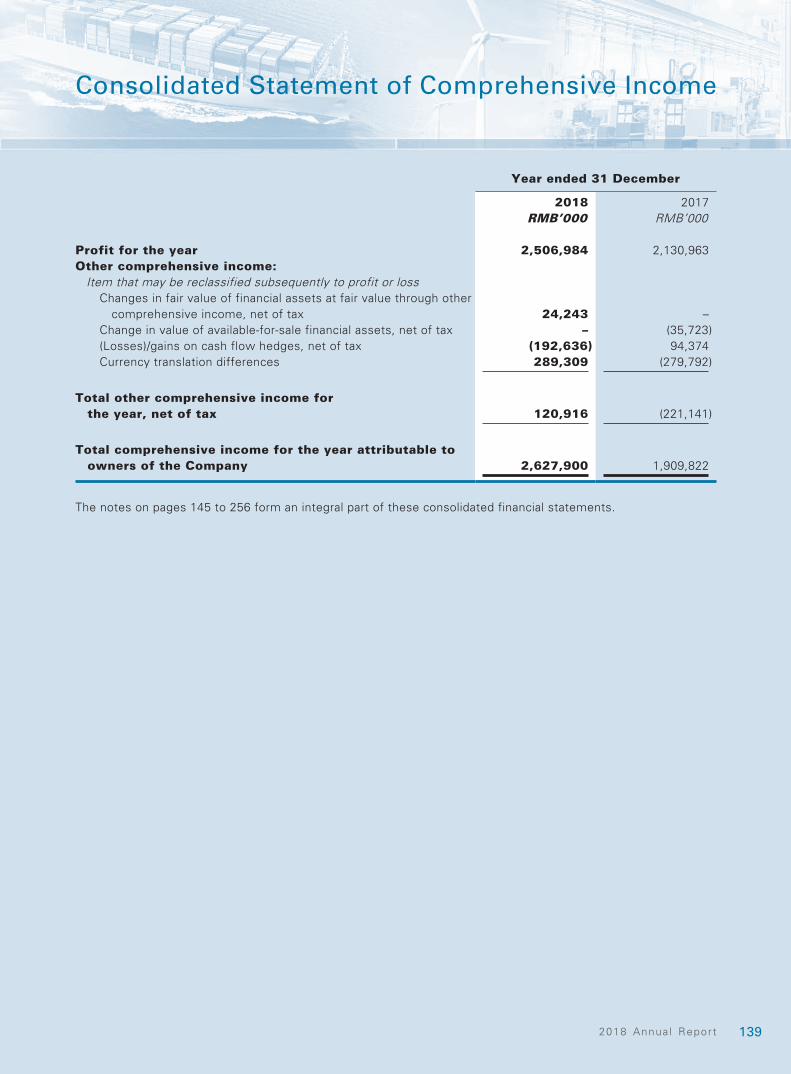
1392018 Annua l Report
Consolidated Statement of Comprehensive Income
Year ended 31 December
2018 2017RMB’000 RMB’000
Profit for the year 2,506,984 2,130,963Other comprehensive income:
Item that may be reclassified subsequently to profit or lossChanges in fair value of financial assets at fair value through other
comprehensive income, net of tax 24,243 –Change in value of available-for-sale financial assets, net of tax – (35,723)(Losses)/gains on cash flow hedges, net of tax (192,636) 94,374Currency translation differences 289,309 (279,792)
Total other comprehensive income for the year, net of tax 120,916 (221,141)
Total comprehensive income for the year attributable to owners of the Company 2,627,900 1,909,822
The notes on pages 145 to 256 form an integral part of these consolidated financial statements.
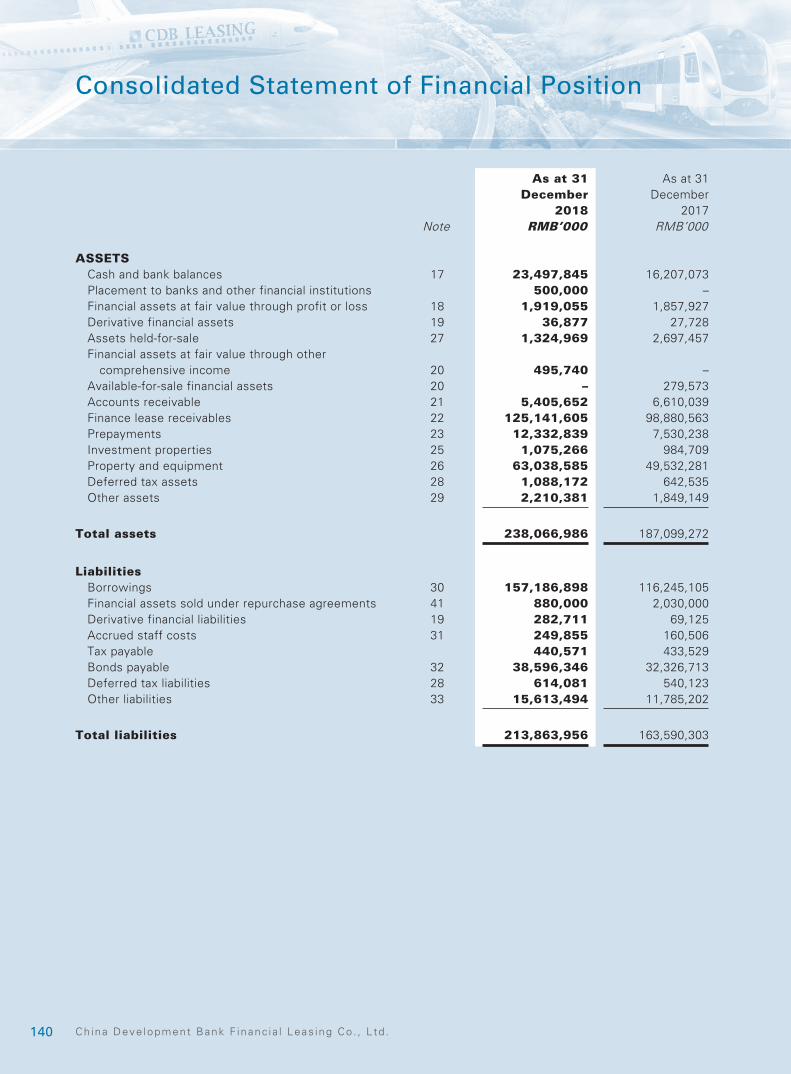
140 Ch ina Deve lopment Bank F inanc ia l Leas ing Co . , L td .
Consolidated Statement of Financial Position
As at 31 December
2018
As at 31 December
2017Note RMB’000 RMB’000
ASSETSCash and bank balances 17 23,497,845 16,207,073Placement to banks and other financial institutions 500,000 –Financial assets at fair value through profit or loss 18 1,919,055 1,857,927Derivative financial assets 19 36,877 27,728Assets held-for-sale 27 1,324,969 2,697,457Financial assets at fair value through other
comprehensive income 20 495,740 –Available-for-sale financial assets 20 – 279,573Accounts receivable 21 5,405,652 6,610,039Finance lease receivables 22 125,141,605 98,880,563Prepayments 23 12,332,839 7,530,238Investment properties 25 1,075,266 984,709Property and equipment 26 63,038,585 49,532,281Deferred tax assets 28 1,088,172 642,535Other assets 29 2,210,381 1,849,149
Total assets 238,066,986 187,099,272
LiabilitiesBorrowings 30 157,186,898 116,245,105Financial assets sold under repurchase agreements 41 880,000 2,030,000Derivative financial liabilities 19 282,711 69,125Accrued staff costs 31 249,855 160,506Tax payable 440,571 433,529Bonds payable 32 38,596,346 32,326,713Deferred tax liabilities 28 614,081 540,123Other liabilities 33 15,613,494 11,785,202
Total liabilities 213,863,956 163,590,303
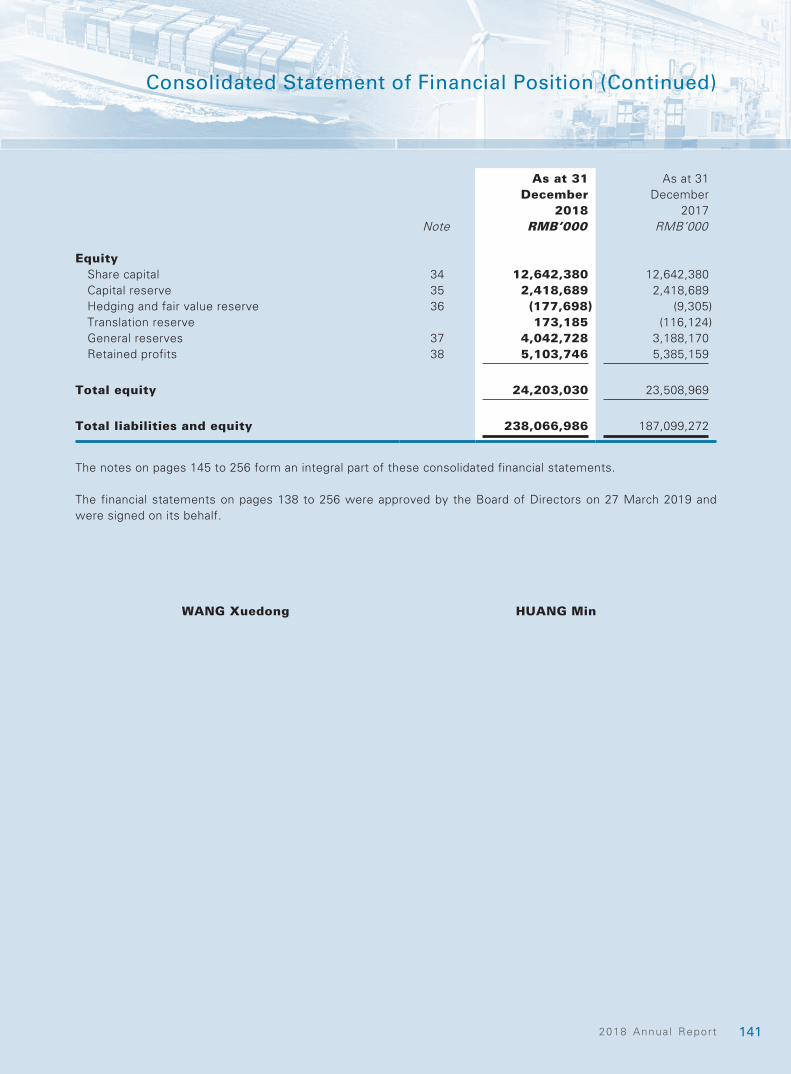
1412018 Annua l Report
Consolidated Statement of Financial Position (Continued)
As at 31 December
2018
As at 31 December
2017Note RMB’000 RMB’000
EquityShare capital 34 12,642,380 12,642,380Capital reserve 35 2,418,689 2,418,689Hedging and fair value reserve 36 (177,698) (9,305)Translation reserve 173,185 (116,124)General reserves 37 4,042,728 3,188,170Retained profits 38 5,103,746 5,385,159
Total equity 24,203,030 23,508,969
Total liabilities and equity 238,066,986 187,099,272
The notes on pages 145 to 256 form an integral part of these consolidated financial statements.
The financial statements on pages 138 to 256 were approved by the Board of Directors on 27 March 2019 and were signed on its behalf.
WANG Xuedong HUANG Min
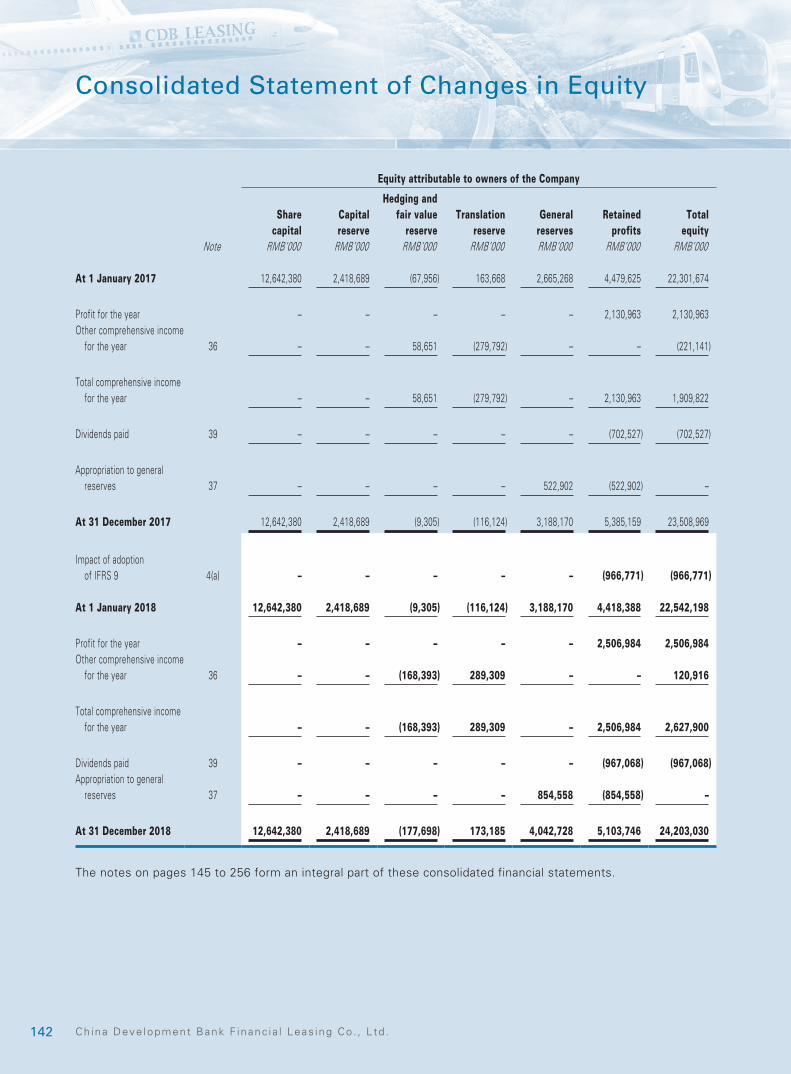
142 Ch ina Deve lopment Bank F inanc ia l Leas ing Co . , L td .
Consolidated Statement of Changes in Equity
Equity attributable to owners of the Company
Share capital
Capital reserve
Hedging and fair value
reserveTranslation
reserveGeneral
reservesRetained
profitsTotal
equityNote RMB’000 RMB’000 RMB’000 RMB’000 RMB’000 RMB’000 RMB’000
At 1 January 2017 12,642,380 2,418,689 (67,956) 163,668 2,665,268 4,479,625 22,301,674
Profit for the year – – – – – 2,130,963 2,130,963Other comprehensive income
for the year 36 – – 58,651 (279,792) – – (221,141)
Total comprehensive income for the year – – 58,651 (279,792) – 2,130,963 1,909,822
Dividends paid 39 – – – – – (702,527) (702,527)
Appropriation to general reserves 37 – – – – 522,902 (522,902) –
At 31 December 2017 12,642,380 2,418,689 (9,305) (116,124) 3,188,170 5,385,159 23,508,969
Impact of adoption of IFRS 9 4(a) – – – – – (966,771) (966,771)
At 1 January 2018 12,642,380 2,418,689 (9,305) (116,124) 3,188,170 4,418,388 22,542,198
Profit for the year – – – – – 2,506,984 2,506,984Other comprehensive income
for the year 36 – – (168,393) 289,309 – – 120,916
Total comprehensive income for the year – – (168,393) 289,309 – 2,506,984 2,627,900
Dividends paid 39 – – – – – (967,068) (967,068)Appropriation to general
reserves 37 – – – – 854,558 (854,558) –
At 31 December 2018 12,642,380 2,418,689 (177,698) 173,185 4,042,728 5,103,746 24,203,030
The notes on pages 145 to 256 form an integral part of these consolidated financial statements.

1432018 Annua l Report
Consolidated Statement of Cash Flows
Year ended 31 December
2018 2017Note RMB’000 RMB’000
OPERATING ACTIVITIESProfit before income tax 3,274,221 2,807,852Adjustments for:
Bonds payable interest expenses 11 1,244,488 815,948Depreciation and amortisation 8 2,989,253 2,701,887Net Impairment losses on financial assets 13 992,118 851,572Net Impairment losses on other assets 14 300,974 61,346Gains on disposal of equipment held for operating
lease business 7 (651,418) (41,098)Net realised losses from derivatives 6 – (6,296)Net realised gains from financial assets at fair value
through other comprehensive income 6 (75,757) –Net realised gains from financial assets at fair value
through profit or loss 6 (8,961) –Net realised gains from disposal of finance lease
receivables 6 (8,839) –Unrealised fair value changes from derivatives 6 (4,613) (12,943)Unrealised fair value changes in financial assets at fair
value through profit or loss 6 (113,492) (63,651)
Operating cash flow before movements in working capital 7,937,974 7,114,617
(Increase)/decrease in mandatory reserve deposits with central banks (71,463) 28,043
Decrease in accounts receivable 787,028 202,449Increase in finance lease receivables (28,297,989) (10,795,847)Increase in other assets (380,979) (694,450)Increase in borrowings 40,941,793 10,046,937Decrease in due to banks and other financial
institutions – (4,000,000)Decrease in financial assets sold under repurchase
agreements (1,150,000) (1,106,000)Increase in accrued staff costs 89,349 66,318Increase/(decrease) in other liabilities 3,889,786 (429,787)
Cash from operations 23,745,499 432,280
Income taxes paid (802,691) (328,660)
NET CASH FROM OPERATING ACTIVITIES 22,942,808 103,620
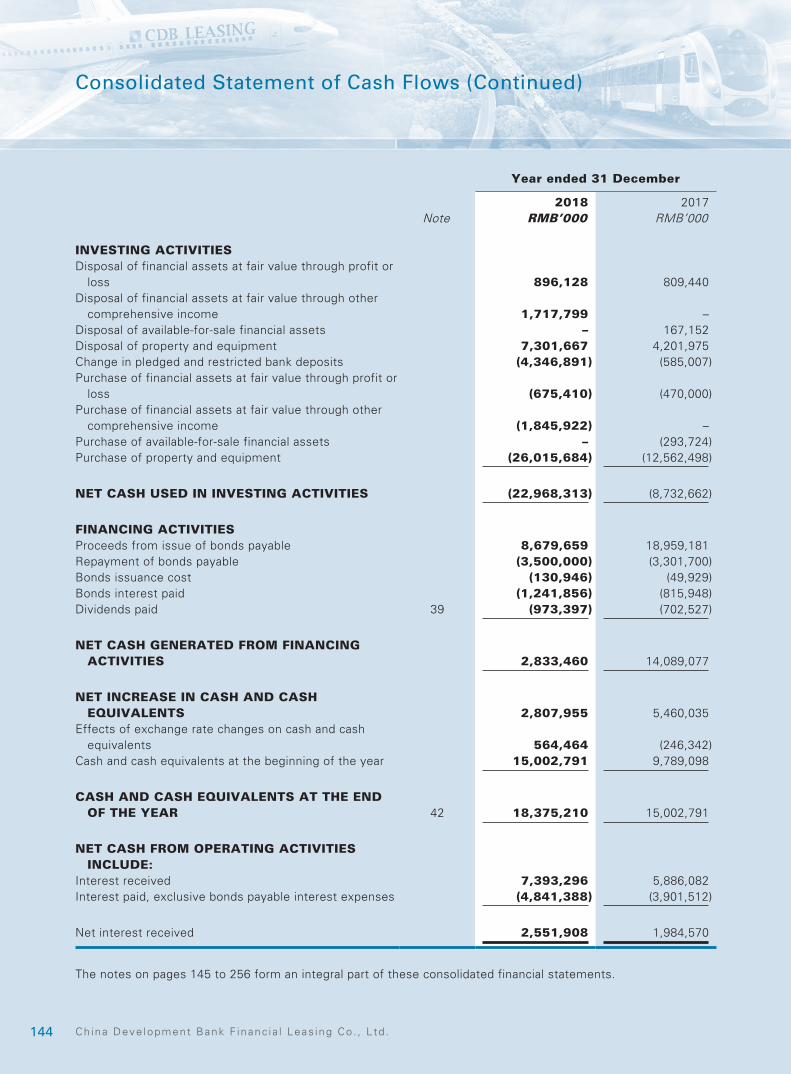
144 Ch ina Deve lopment Bank F inanc ia l Leas ing Co . , L td .
Consolidated Statement of Cash Flows (Continued)
Year ended 31 December
2018 2017Note RMB’000 RMB’000
INVESTING ACTIVITIESDisposal of financial assets at fair value through profit or
loss 896,128 809,440Disposal of financial assets at fair value through other
comprehensive income 1,717,799 –Disposal of available-for-sale financial assets – 167,152Disposal of property and equipment 7,301,667 4,201,975Change in pledged and restricted bank deposits (4,346,891) (585,007)Purchase of financial assets at fair value through profit or
loss (675,410) (470,000)Purchase of financial assets at fair value through other
comprehensive income (1,845,922) –Purchase of available-for-sale financial assets – (293,724)Purchase of property and equipment (26,015,684) (12,562,498)
NET CASH USED IN INVESTING ACTIVITIES (22,968,313) (8,732,662)
FINANCING ACTIVITIESProceeds from issue of bonds payable 8,679,659 18,959,181Repayment of bonds payable (3,500,000) (3,301,700)Bonds issuance cost (130,946) (49,929)Bonds interest paid (1,241,856) (815,948)Dividends paid 39 (973,397) (702,527)
NET CASH GENERATED FROM FINANCING ACTIVITIES 2,833,460 14,089,077
NET INCREASE IN CASH AND CASH EQUIVALENTS 2,807,955 5,460,035
Effects of exchange rate changes on cash and cash equivalents 564,464 (246,342)
Cash and cash equivalents at the beginning of the year 15,002,791 9,789,098
CASH AND CASH EQUIVALENTS AT THE END OF THE YEAR 42 18,375,210 15,002,791
NET CASH FROM OPERATING ACTIVITIES INCLUDE:
Interest received 7,393,296 5,886,082Interest paid, exclusive bonds payable interest expenses (4,841,388) (3,901,512)
Net interest received 2,551,908 1,984,570
The notes on pages 145 to 256 form an integral part of these consolidated financial statements.

1452018 Annua l Report
Notes to the Consolidated Financial Statements
1 GENERAL INFORMATION
The Company was established as Shenzhen Leasing Co., Ltd. (深圳租賃有限公司) on 25 December 1984, with the approval of the former Shenzhen Special Economic Zone Branch of People's Bank of China ("PBOC"), and subsequently renamed as Shenzhen Finance Leasing Co., Ltd. (深圳金融租賃有限公司) after reorganisation in December 1999. In 2008, China Development Bank Corporation ("China Development Bank") became the controlling shareholder of the Company, and the Company's total paid-in capital was increased to RMB8,000,000,000 and subsequently, the Company changed its name to CDB Leasing Co., Ltd. (國銀金融租賃有限公司). On 8 September 2015, pursuant to the resolution of shareholders' meeting, the Company's total paid-in capital was increased to RMB9,500,000,000. Pursuant to the approval of China Banking Regulatory Commission (the "CBRC"), the Company became a joint stock company by issuing a total of 9,500,000,000 shares to existing shareholders at par value of RMB1 each, representing 100% of share capital of the Company on 28 September 2015 (the "Financial Restructuring"). On the same date, the Company also changed its name to China Development Bank Financial Leasing Co., Ltd. (國銀金融租賃股份有限公司). The registered address of the Company’s office is CDB Financial Center, No. 2003 Fuzhong Third Road, Futian District, Shenzhen, Guangdong Province, the People’s Republic of China (“PRC”).
On 11 July 2016, the Company issued 3,100,000,000 new ordinary shares at the issue price of HK$2 each by way of initial public offering. The gross proceeds amounted to HK$6.2 billion. On the same date, the Company’s shares were listed on The Stock Exchange of Hong Kong Limited (the “Listing”). On 29 July 2016, the Company announced that the Over-allotment Option was partially exercised in respect of an aggregate of 42,380,000 new ordinary shares with an additional gross proceeds of HK$84.76 million.
The Company and its subsidiaries (together, “the Group”) principally engage in leasing business, import and export trade for leasing equipment and commodities, lease-related financial business and foreign exchange trade on behalf of clients.
These financial statements are presented in Renminbi ("RMB"), which is also the functional currency of the Company, unless otherwise stated.
2 SIGNIFICANT ACCOUNTING POLICIES
The principal accounting policies applied in the preparation of these consolidated financial statements are set out below. These policies have been consistently applied to all the years presented, unless otherwise stated.
2.1 Basis of presentation
The consolidated financial statements have been prepared in accordance with all applicable International Financial Reporting Standards (“IFRS”) and requirements of the Hong Kong Companies ordinance Cap. 622. The consolidated financial statements have been prepared under the historical cost convention, as modified by the revaluation of available-for-sale financial assets, and financial assets and financial liabilities (including derivative instruments) at fair value through profit or loss or through other comprehensive income, which are carried at fair value.
The preparation of financial statements in conformity with IFRS requires the use of certain critical accounting estimates. It also requires the management to exercise its judgement in the process of applying the Group’s accounting policies. The areas involving a higher degree of judgement or complexity, or areas where assumptions and estimates are significant to the consolidated financial statements are disclosed in Note 3.
146 Ch ina Deve lopment Bank F inanc ia l Leas ing Co . , L td .
Notes to the Consolidated Financial Statements (Continued)
2 SIGNIFICANT ACCOUNTING POLICIES (CONTINUED)
2.1 Basis of presentation (Continued)
2.1.1 Changes in accounting policy and disclosures
2.1.1.1 New and amended standards adopted by the Group
(a) New and amended standards adopted by the Group
A number of new or amended standards became applicable for the current reporting period and the Group had to change its accounting policies as a result of adopting the following standard:
• IFRS 9 Financial Instruments.
• IFRS 15 Revenue from contracts with customers.
The impact of the adoption of these standards are disclosed in Note 4 below. The other new and amended standards did not have any material impact on the Group’s accounting policies and did not require retrospective adjustments.
2.1.1.2 New standards and interpretations not yet adopted
A number of new standards and amendments to standards and interpretations are effective for annual periods beginning after 1 January 2019 and have not been applied in preparing these consolidated financial statements. None of these is expected to have a significant effect on the consolidated financial statements of the Group, except the following set out below:
2.1.1.2.1 IFRS 16 Lease
Nature of change
IFRS 16 was issued in January 2016. It will result in almost all leases being recognised on the lessee’s balance sheet, as the distinction between operating and finance leases is removed from lessee’s perspective. Under the new standard, an asset (the right to use the leased item) and a financial liability to pay rentals are recognised. The only exceptions are short-term and low-value leases.
In respect of the lessor accounting, IFRS 16 substantially carries forward the lessor accounting requirements in IAS 17. Accordingly, a lessor continues to classify its leases as operating leases or finance leases, and to account for those two types of leases differently.
1472018 Annua l Report
Notes to the Consolidated Financial Statements (Continued)
2 SIGNIFICANT ACCOUNTING POLICIES (CONTINUED)
2.1 Basis of presentation (Continued)
2.1.1 Changes in accounting policy and disclosures (Continued)
2.1.1.2 New standards and interpretations not yet adopted (Continued)
2.1.1.2.1 IFRS 16 Lease (Continued)
Nature of change (Continued)
As set out in Note 46, total operating lease commitment of the Group in respect of leased premises with terms more than 12 months as at 31 December 2018 amounted to RMB244 million. The directors of the Group do not expect the adoption of IFRS 16 as compared with the current accounting policy would result in significant impact on the Company’s result but it is expected that certain portion of these lease commitments will be required to be recognised in the consolidated statement of financial position as right-of-use assets and lease liabilities.
Mandatory for financial years commencing on or after 1 January 2019. At this stage, the Group does not intend to adopt the standard before its effective date.
There are no other standards that are not yet effective and that would be expected to have material impact on the entity in the current or future reporting periods and on foreseeable future transactions.
2.2 Basis of consolidation
The consolidated financial statements incorporates the financial statements of the Company and entities (including structured entities) controlled by the Company and its subsidiaries. Control is achieved where the Company:
• has power over the investee;
• is exposed, or has rights, to variable returns from its involvement with the investee; and
• has the ability to use its power to affect its returns.
The Company reassesses whether or not it controls an investee if facts and circumstances indicate that there are changes to one or more of the three elements of control listed above.
When the Group has less than a majority of the voting rights of an investee, it has power over the investee when the voting rights are sufficient to give it the practical ability to direct the relevant activities of the investee unilaterally. The Group considers all relevant facts and circumstances in assessing whether or not the Group’s voting rights in an investee are sufficient to give it power, including:
148 Ch ina Deve lopment Bank F inanc ia l Leas ing Co . , L td .
Notes to the Consolidated Financial Statements (Continued)
2 SIGNIFICANT ACCOUNTING POLICIES (CONTINUED)
2.2 Basis of consolidation (Continued)
• the size of the Group’s holding of voting rights relative to the size and dispersion of holdings of the other vote holders;
• potential voting rights held by the Group, other vote holders or other parties;
• rights arising from other contractual arrangements; and
• any additional facts and circumstances that indicate that the Group has, or does not have, the current ability to direct the relevant activities at the time that decisions need to be made, including voting patterns at previous shareholders’ meetings.
Consolidation of a subsidiary begins when the Group obtains control over the subsidiary and ceases when the Group loses control of the subsidiary. Specifically, income and expenses of a subsidiary acquired or disposed of during the year are included in the consolidated statement of profit or losses from the date the Group gains control until the date when the Group ceases to control the subsidiary.
Profit or loss and each item of other comprehensive income are attributed to the owners of the Company and to the non-controlling interests. Total comprehensive income of subsidiaries is attributed to the owners of the Company and to the non-controlling interests even if this results in the non-controlling interests having a deficit balance.
When necessary, adjustments are made to the financial statements of subsidiaries to bring their accounting policies into line with the Group’s accounting policies.
All intragroup assets and liabilities, equity, income, expenses and cash flows relating to transactions between members of the Group are eliminated in full on consolidation.
2.2.1 Changes in the Group’s ownership interests in existing subsidiaries
Changes in the Group’s ownership interests in subsidiaries that do not result in the Group losing control over the subsidiaries are accounted for as equity transactions. The carrying amounts of the Group’s interests and the non-controlling interests are adjusted to reflect the changes in their relative interests in the subsidiaries. Any difference between the amount by which the non-controlling interests are adjusted and the fair value of the consideration paid or received is recognised directly in equity and attributed to owners of the Company.
1492018 Annua l Report
Notes to the Consolidated Financial Statements (Continued)
2 SIGNIFICANT ACCOUNTING POLICIES (CONTINUED)
2.2 Basis of consolidation (Continued)
2.2.1 Changes in the Group’s ownership interests in existing subsidiaries (Continued)
When the Group loses control of a subsidiary, a gain or loss is recognised in profit or loss and is calculated as the difference between (1) the aggregate of the fair value of the consideration received and the fair value of any retained interest and (2) the previous carrying amount of the assets (including goodwill), and liabilities of the subsidiary and any non-controlling interests. All amounts previously recognised in other comprehensive income in relation to that subsidiary are accounted for as if the Group had directly disposed of the related assets or liabilities of the subsidiary (i.e. reclassified to profit or loss or transferred to another category of equity as specified/permitted by applicable IFRSs). The fair value of any investment retained in the former subsidiary at the date when control is lost is regarded as the fair value on initial recognition for subsequent accounting under IAS 39, when applicable, the cost on initial recognition of an investment in an associate or a joint venture.
2.3 Business combinations
Acquisitions of businesses are accounted for using the acquisition method. The consideration transferred in a business combination is measured at fair value, which is calculated as the sum of the acquisition-date fair values of the assets transferred by the Group, liabilities incurred by the Group to the former owners of the acquiree and the equity interests issued by the Group in exchange for control of the acquiree. Acquisition-related costs are generally recognised in profit or loss as incurred.
At the acquisition date, the identifiable assets acquired and the liabilities assumed are recognised at their fair value, except that:
• deferred tax assets or liabilities, and assets or liabilities related to employee benefit arrangements are recognised and measured in accordance with IAS 12 “Income taxes” and IAS 19 “Employee benefits” respectively;
• liabilities or equity instruments related to share-based payment arrangements of the acquiree or share-based payment arrangements of the Group entered into to replace share-based payment arrangements of the acquiree are measured in accordance with IFRS 2 “Share-based payment” at the acquisition date; and
• assets (or disposal groups) that are classified as held for sale in accordance with IFRS 5 “Non-current assets held for sale and discontinued operations” are measured in accordance with that standard.
150 Ch ina Deve lopment Bank F inanc ia l Leas ing Co . , L td .
Notes to the Consolidated Financial Statements (Continued)
2 SIGNIFICANT ACCOUNTING POLICIES (CONTINUED)
2.3 Business combinations (Continued)
Goodwill is measured as the excess of the sum of the consideration transferred, the amount of any non-controlling interests in the acquiree, and the fair value of the acquirer’s previously held equity interest in the acquiree (if any) over the net of the acquisition-date amounts of the identifiable assets acquired and the liabilities assumed. If, after re-assessment, the net of the acquisition-date amounts of the identifiable assets acquired and liabilities assumed exceeds the sum of the consideration transferred, the amount of any non-controlling interests in the acquiree and the fair value of the acquirer’s previously held interest in the acquiree (if any), the excess is recognised immediately in profit or loss as a bargain purchase gain.
Non-controlling interests that are present ownership interests and entitle their holders to a proportionate share of the entity’s net assets in the event of liquidation may be initially measured either at fair value or at the non-controlling interests’ proportionate share of the recognised amounts of the acquiree’s identifiable net assets. The choice of measurement basis is made on a transaction-by-transaction basis. Other types of non-controlling interests are measured at their fair value or, when applicable, on the basis specified in another IFRS.
When a business combination is achieved in stages, the Group’s previously held equity interest in the acquiree is remeasured to fair value at the acquisition date (i.e. the date when the Group obtains control), and the resulting gain or loss, if any, is recognized in profit or loss. Amounts arising from interests in the acquiree prior to the acquisition date that have previously been recognized in other comprehensive income are reclassified to retained profits where such treatment would be appropriate if that interest is disposed of.
2.4 Investments in subsidiaries
Investments in subsidiaries are included in the Company’s statement of financial position at cost less accumulated impairment losses, if any.
2.5 Revenue recognition
Revenue, is measured at the fair value of the consideration received or receivable, and represents the amounts receivable for goods or services provided in the normal course of business. Revenue is shown net of value-added tax. Specific revenue recognition criteria is set out below:
(i) Operating lease income is recognised on a straight-line basis over the term of the relevant lease;
(ii) Finance lease income is recognised as revenue in each period according to the effective interest rate method during the lease term;
(iii) Interest income from a financial asset is recognised when it is probable that the economic benefits will flow to the Group and the amount of income can be measured reliably. Interest income is accrued on a time basis, by reference to the principal outstanding and at the effective interest rate applicable, which is the rate that exactly discounts estimated future cash receipts through the expected life of the financial asset to that asset’s net carrying amount on initial recognition;

1512018 Annua l Report
Notes to the Consolidated Financial Statements (Continued)
2 SIGNIFICANT ACCOUNTING POLICIES (CONTINUED)
2.5 Revenue recognition (Continued)
(iv) Other income mainly includes consultancy fee income, leasing project management fee income and gains on disposal of equipment held for operating lease business. Consultancy fee income is recognised in accordance with the terms of the contract when the relevant services have been rendered.. Leasing project management fee income is recognised in accordance with the management service contracts and by reference to the agreed rate of management fee on a daily basis. Gains on disposal of equipment held for operating leasing business is recognised as income when control of the related equipment has transferred, being when the equipment is delivered to the buyer and there is no unfulfilled obligation that could affect the buyer’s acceptance of the equipment.
2.6 Leasing
Leases are classified as finance leases whenever the terms of the lease transfer substantially all the risks and rewards of ownership to the lessee. All other leases are classified as operating leases.
In many aircraft operating leases, the lessee has the obligation to make periodic payments that are calculated based on the utilization of airframes, engines and other major life-limited components (supplemental amounts). In such leases, upon the lessee presenting invoices evidencing the completion of qualifying maintenance on the aircraft, the Group reimburses the lessee for the cost of the maintenance, up to a maximum of the supplemental amounts received with respect to such work unless otherwise indicated in the lease. The Group recognises the periodic payments as maintenance deposits from lessees in other liabilities (Note 33).
2.6.1 The Group as lessee under operating leases
Operating lease payments are recognised on a straight-line basis over the term of the relevant lease. Initial direct costs incurred are charged to profit or loss for the period. Contingent rentals under operating lease are recognised as expenses in the periods in which they are incurred.
2.6.2 The Group as lessor under operating leases
Rental income from operating leases is recognised in profit or loss on a straight-line basis over the term of the relevant lease. Initial direct costs with more than an insignificant amount are capitalised when incurred, and are recognised in profit or loss on the same basis as rental income over the lease term. Other initial direct costs with an insignificant amount are charged to profit or loss in the period in which they are incurred.
In a purchase and leaseback transaction, if the purchase price paid for an asset is materially above or below current market value for that asset in exchange for materially above or below market lease rentals, the Group recognised a lease premium asset/discount liability which is equal to the difference between the fair value of the purchased asset and the price. Lease premium asset/discount liability are amortised over the lease term and recorded as a component of operating lease income. Lease premium asset or discount liability are presented under other assets or other liabilities, respectively.
152 Ch ina Deve lopment Bank F inanc ia l Leas ing Co . , L td .
Notes to the Consolidated Financial Statements (Continued)
2 SIGNIFICANT ACCOUNTING POLICIES (CONTINUED)
2.6 Leasing (Continued)
2.6.3 The Group as lessor under finance leases
At the commencement of the lease term, the aggregate of the minimum lease receivable at the inception of the lease and the initial direct costs is recognised as a finance lease receivable, and the unguaranteed residual value is recorded at the same time. The difference between the aggregate of the minimum lease receivable, the initial direct costs and the unguaranteed residual value, and the aggregate of their present values is recognised as unearned finance income.
Unearned finance income is recognised as finance income using the effective interest method over the lease term. Contingent rentals under finance lease are recognised as revenue in the periods in which they are incurred.
2.7 Cash and cash equivalents
Cash comprises cash on hand and deposits that can be readily withdrawn on demand. Cash equivalents are the Group’s short-term, highly liquid investments that are readily convertible to known amounts of cash and which are subject to an insignificant risk of changes in value.
2.8 Foreign currencies
In preparing the financial statements of each individual group entity, transactions in currencies other than the entity’s functional currency (foreign currencies) are recognised at the rates of exchange prevailing at the dates of the transactions. At the end of each reporting period, monetary items denominated in foreign currencies are retranslated at the rates prevailing at that date. Non-monetary items carried at fair value that are denominated in foreign currencies are retranslated at the rates prevailing at the date when the fair value was determined. Non-monetary items that are measured in terms of historical cost in a foreign currency are not retranslated.
For the purposes of presenting the consolidated financial statements, the assets and liabilities of the Group’s foreign operations are translated into RMB using exchange rates prevailing at the end of each reporting period. Income and expense items are translated at the average exchange rates for the period, unless exchange rates fluctuate significantly during that period, in which case the exchange rates at the dates of the transactions are used. Exchange differences arising, if any, are recognised in other comprehensive income and accumulated in equity.
1532018 Annua l Report
Notes to the Consolidated Financial Statements (Continued)
2 SIGNIFICANT ACCOUNTING POLICIES (CONTINUED)
2.8 Foreign currencies (Continued)
On the disposal of a foreign operation (i.e. a disposal of the Group’s entire interest in a foreign operation, a disposal involving loss of control over a subsidiary that includes a foreign operation, or a partial disposal of an interest in a joint arrangement or an associate that includes a foreign operation of which the retained interest becomes a financial asset), all of the exchange differences accumulated in equity in respect of that operation attributable to the owners of the Company are reclassified to profit or loss.
In addition, in relation to a partial disposal of a subsidiary that includes a foreign operation that does not result in the Group losing control over the subsidiary, the proportionate share of accumulated exchange differences are re-attributed to non-controlling interests and are not recognised in profit or loss. For all other partial disposals (i.e. partial disposals of associates or joint arrangements that do not result in the Group losing significant influence or joint control), the proportionate share of the accumulated exchange differences is reclassified to profit or loss.
2.9 Borrowing costs
Borrowing costs directly attributable to the acquisition, construction or production of qualifying assets, which are assets that necessarily take a substantial period of time to get ready for their intended use or sale, are added to the cost of those assets, until such time as the assets are substantially ready for their intended use or sale.
All other borrowing costs are recognised in profit or loss in the period in which they are incurred.
2.10 Government grants
Government grants are not recognised until there is reasonable assurance that the Group will comply with the conditions attaching to them and that the grants will be received.
Government grants are recognised in profit or loss on a systematic basis over the periods in which the Group recognises as expenses the related costs for which the grants are intended to compensate. Specifically, government grants whose primary condition is that the Group should purchase, construct or otherwise acquire non-current assets are recognised as deferred revenue in the consolidated statement of financial position and transferred to profit or loss on a systematic basis over the useful lives of the related assets.
Government grants that are receivable as compensation for expenses or losses already incurred or for the purpose of giving immediate financial support to the Group with no future related costs are recognised in profit or loss in the period in which they become receivable.
154 Ch ina Deve lopment Bank F inanc ia l Leas ing Co . , L td .
Notes to the Consolidated Financial Statements (Continued)
2 SIGNIFICANT ACCOUNTING POLICIES (CONTINUED)
2.11 Employee benefits
In the reporting period in which an employee has rendered services, the Group recognises the employee benefits expenses for those services in profit or loss.
2.11.1 Social welfare
Social welfare expenditure refers to payments for employees’ social welfare system established by the government of the PRC, including social pension insurance, health care insurance, housing funds and other social welfare contributions. The Group contributes on a regular basis to these funds based on certain percentage of the employees’ salaries and the contributions are recognised in profit or loss for the period when employees have rendered service entitling them to the contribution. The Group’s liabilities in respect of these funds are limited to the contribution payable in the reporting period.
2.11.2 Annuity scheme – defined contribution plan
The Group also sets up annuity scheme for qualified employees. Annuity contributions are accrued based on a certain percentage of the participants’ total salary when employees have rendered service entitling them to the contributions. The contribution is recognised in profit or loss.
2.12 Taxation
Income tax expense represents the sum of the tax currently payable and deferred tax.
2.12.1 Current tax
The tax currently payable is based on taxable profit for the year. Taxable profit differs from ‘profit before income tax’ as reported in the consolidated statement of profit or loss and other comprehensive income because of income or expense that are taxable or deductible in other years/periods and items that are never taxable or deductible. The Group’s current tax is calculated using tax rates that have been enacted or substantively enacted by the end of the reporting period.
2.12.2 Deferred tax
Deferred tax is recognised on temporary differences between the carrying amounts of assets and liabilities in the consolidated financial statements and the corresponding tax bases used in the computation of taxable profit. Deferred tax liabilities are generally recognised for all taxable temporary differences. Deferred tax assets are generally recognised for all deductible temporary differences to the extent that it is probable that taxable profits will be available against which those deductible temporary differences can be utilised. Such deferred tax assets and liabilities are not recognised if the temporary difference arises from the initial recognition (other than in a business combination) of assets and liabilities in a transaction that affects neither the taxable profit nor the accounting profit. In addition, deferred tax liabilities are not recognised if the temporary difference arises from the initial recognition of goodwill.
1552018 Annua l Report
Notes to the Consolidated Financial Statements (Continued)
2 SIGNIFICANT ACCOUNTING POLICIES (CONTINUED)
2.12 Taxation (Continued)
2.12.2 Deferred tax (Continued)
Deferred tax liabilities are recognised for taxable temporary differences associated with investments in subsidiaries, except where the Group is able to control the reversal of the temporary difference and it is probable that the temporary difference will not reverse in the foreseeable future. Deferred tax assets arising from deductible temporary differences associated with such investments and interests are only recognised to the extent that it is probable that there will be sufficient taxable profits against which to utilise the benefits of the temporary differences and they are expected to reverse in the foreseeable future.
The carrying amount of deferred tax assets is reviewed at the end of each reporting period and reduced to the extent that it is no longer probable that sufficient taxable profits will be available to allow all or part of the asset to be recovered.
Deferred tax liabilities and assets are measured at the tax rates that are expected to apply in the period in which the liability is settled or the asset realised, based on tax rates (and tax laws) that have been enacted or substantively enacted by the end of the reporting period.
The measurement of deferred tax liabilities and assets reflects the tax consequences that would follow from the manner in which the Group expects, at the end of the reporting period, to recover or settle the carrying amount of its assets and liabilities.
2.12.3 Current and deferred tax for the year
Current and deferred tax are recognised in profit or loss, except when they relate to items that are recognised in other comprehensive income or directly in equity, in which case, the current and deferred tax are also recognised in other comprehensive income or directly in equity respectively.
Deferred tax assets and liabilities are offset when there is a legally enforceable right to set off current tax assets against current tax liabilities and when they relate to income taxes levied by the same taxation authority and the Group intends to settle its current tax assets and liabilities on a net basis.
156 Ch ina Deve lopment Bank F inanc ia l Leas ing Co . , L td .
Notes to the Consolidated Financial Statements (Continued)
2 SIGNIFICANT ACCOUNTING POLICIES (CONTINUED)
2.13 Property and equipment
Property and equipment include buildings, computer and electronic equipment, motor vehicles, office equipment, leasehold improvements held by the Group for administrative purpose (other than properties under construction as described below), and aircraft, ships, special equipment, and electronic equipment held for operating lease businesses. Property and equipment are stated in the statements of financial position at historical cost less subsequent accumulated depreciation and subsequent accumulated impairment losses, if any. Historical cost includes expenditure that is directly attributable to the acquisition of the items.
Subsequent costs are included in the asset’s carrying amount or recognised as a separate asset, as appropriate, only when it is probable that future economic benefits associated with the item will flow to the Group and the cost of the item can be measured reliably. The carrying amount of any component accounted for as a separate asset is derecognised when replaced. All other repairs and maintenance are charged to profit or loss during the reporting period in which they are incurred.
Depreciation is recognised so as to write off the cost of items of property and equipment, other than construction in progress, less their residual values over their estimated useful lives, using the straight-line method. The estimated useful lives, residual values and depreciation method are reviewed at the end of each reporting period, with the effect of any changes in estimate accounted for on a prospective basis.
Construction in progress is carried at cost, less any recognised impairment loss. Cost includes professional fees and, for qualifying assets, borrowing costs capitalised in accordance with the Group’s accounting policy. Such properties are classified to the appropriate categories of property and equipment when completed and ready for intended use. Depreciation of these assets, on the same basis as other property assets, commences when the assets are ready for their intended use.
When aircraft with in-place leases are purchased, the Group identifies, measures and accounts for lease premium assets/lease discount liabilities, and maintenance right assets arising from the acquired in-place lease contracts.
Lease premium assets/lease discount liabilities represent the value of acquired leases with contractual rent payments that are materially above or below the market lease rentals at the date of acquisition. Lease rate premium assets/lease rate discount liabilities are amortised on a straight-line basis over the remaining lease term and recorded as a component of depreciation and amortisation.
Maintenance right assets represent the fair value of the contractual rights under acquired, in-place, leases to receive an aircraft in an improved maintenance condition as compared to the physical maintenance condition of the aircraft at the acquisition date. The amortisation of the maintenance right assets is triggered by maintenance events. Following a qualifying maintenance event a portion of the cost relating to the event is capitalised to aircraft cost and is then depreciated in accordance with the Group’s depreciation policy. On lease termination, any remaining maintenance right asset is offset against maintenance deposits from lessees or end of lease compensation, and any excess is recognised into profit or loss as other income.
Both lease premium assets and maintenance rights assets are presented under other assets (Note 29).
1572018 Annua l Report
Notes to the Consolidated Financial Statements (Continued)
2 SIGNIFICANT ACCOUNTING POLICIES (CONTINUED)
2.13 Property and equipment (Continued)
An item of property and equipment is derecognised upon disposal or when no future economic benefits are expected to arise from the continued use of the asset. Any gain or loss arising on the disposal or retirement of an item of property and equipment is determined as the difference between the sales proceeds and the carrying amount of the asset and is recognised in profit or loss.
The estimated residual value rates and useful lives of each class of property and equipment held by the Group for administrative purpose are as follows:
Classes
Estimated residual value
rates Useful lives
Buildings 5% 20 yearsComputers and electronic equipment 5% 3 – 5 yearsMotor vehicles 5% 5 yearsOffice equipment 5% 3 – 5 yearsLeasehold improvements 0% 2 – 10 years
The estimated residual value rates and useful lives of each class of equipment held for operating lease businesses of the Group are as follows:
Classes
Estimated residual
value rates Useful lives
Aircraft 15% 11 – 20 yearsShips 10% 20 yearsSpecial equipment 5% 10 yearsElectronic equipment 5% 3 years
158 Ch ina Deve lopment Bank F inanc ia l Leas ing Co . , L td .
Notes to the Consolidated Financial Statements (Continued)
2 SIGNIFICANT ACCOUNTING POLICIES (CONTINUED)
2.14 Investment properties
Investment properties are properties held to earn rentals.
Investment properties are initially measured at cost, including any directly attributable expenditure. Subsequent to initial recognition, investment properties are stated at cost less subsequent accumulated depreciation and any accumulated impairment losses. Depreciation is recognised so as to write off the cost of investment properties over their estimated useful lives and after taking into account their estimated residual value, using the straight-line method.
An investment property is derecognised upon disposal or when the investment property is permanently withdrawn from use and no future economic benefits are expected from its disposals. Any gain or loss arising on derecognition of the property (calculated as the difference between the net disposal proceeds and the carrying amount of the asset) is included in the profit or loss in the period in which the property is derecognised.
The estimated residual value rate and useful life of investment properties are 5% and 20-34 years respectively.
2.15 Intangible assets
2.15.1 Intangible assets acquired separately
Intangible assets with finite useful lives that are acquired separately are carried at cost less accumulated amortisation and any accumulated impairment losses. Amortisation for intangible assets with finite useful lives is recognised on a straight-line basis over their estimated useful lives. The estimated useful life and amortisation method are reviewed at the end of each reporting period, with the effect of any changes in estimates being accounted for on a prospective basis.
The intangible asset is computer software with the estimated useful life of 5 years.
2.15.2 Derecognition of intangible assets
An intangible asset is derecognised on disposal, or when no future economic benefits are expected from use or disposal. Gains or losses arising from derecognition of an intangible asset, which measured as the difference between the net disposal proceeds and the carrying amount of the asset, are recognised in profit or loss when the asset is derecognised.
1592018 Annua l Report
Notes to the Consolidated Financial Statements (Continued)
2 SIGNIFICANT ACCOUNTING POLICIES (CONTINUED)
2.16 Impairment on tangible and intangible assets other than goodwill and financial assets
At the end of each reporting period, the Group reviews the carrying amounts of its tangible and intangible assets to determine whether there is any indication that those assets have suffered an impairment loss. If any such indication exists, the recoverable amount of the asset is estimated in order to determine the extent of the impairment loss (if any). When it is not possible to estimate the recoverable amount of an individual asset, the Group estimates the recoverable amount of the cash-generating unit to which the asset belongs. When a reasonable and consistent basis of allocation can be identified, corporate assets are also allocated to individual cash-generating units, or otherwise they are allocated to the smallest group of cash-generating units for which a reasonable and consistent allocation basis can be identified.
Recoverable amount is the higher of fair value less costs of disposal and value in use. In assessing value in use, the estimated future cash flows are discounted to their present value using a pre-tax discount rate that reflects current market assessments of the time value of money and the risks specific to the asset for which the estimates of future cash flows have not been adjusted.
If the recoverable amount of an asset (or cash-generating unit) is estimated to be less than its carrying amount, the carrying amount of the asset (or cash-generating unit) is reduced to its recoverable amount. An impairment loss is recognised immediately in profit or loss.
When an impairment loss subsequently reverses, the carrying amount of the asset (or a cash-generating unit) is increased to the revised estimate of its recoverable amount, but so that the increased carrying amount does not exceed the carrying amount that would have been determined had no impairment loss been recognised for the asset (or cash-generating unit) in prior years. A reversal of an impairment loss is recognised immediately in profit or loss.
2.17 Provision
Provisions are recognised when the Group has a present obligation (legal or constructive) as a result of a past event, it is probable that the Group will be required to settle the obligation, and a reliable estimate can be made of the amount of the obligation.
The amount recognised as a provision is the best estimate of the consideration required to settle the present obligation at the end of the reporting period, taking into account the risks and uncertainties surrounding the obligation. When a provision is measured using the cash flows estimated to settle the present obligation, its carrying amount is the present value of those cash flows (when the effect of the time value of money is material).
When some or all of the economic benefits required to settle a provision are expected to be recovered from a third party, a receivable is recognised as an asset if it is virtually certain that reimbursement will be received and the amount of the receivable can be measured reliably.
160 Ch ina Deve lopment Bank F inanc ia l Leas ing Co . , L td .
Notes to the Consolidated Financial Statements (Continued)
2 SIGNIFICANT ACCOUNTING POLICIES (CONTINUED)
2.18 Non-current assets (or disposal groups) held-for-sale
Non-current assets (or disposal groups) are classified as held for sale when their carrying amount is to be recovered principally through a sale transaction and a sale is considered highly probable. The non-current assets (except for certain assets as explained below), (or disposal groups), are stated at the lower of carrying amount and fair value less costs to sell. Deferred tax assets, assets arising from employee benefits, financial assets (other than investments in subsidiaries and associates) and investment properties, which are classified as held for sale, would continue to be measured in accordance with the policies set out elsewhere in Note 2.
2.19 Financial assets and financial liabilities
2.19.1 Investments and other financial assets
2.19.1.1 Classification
From 1 January 2018, the Group classifies its financial assets in the following measurement categories:
• those to be measured subsequently at fair value (either through Other Comprehensive Income (OCI) or through profit or loss), and
• those to be measured at amortised cost.
The classification depends on the entity’s business model for managing the financial assets and the contractual terms of the cash flows.
For assets measured at fair value, gains and losses will either be recorded in profit or loss or OCI. For investments in equity instruments that are not held for trading, this will depend on whether the Group has made an irrevocable election at the time of initial recognition to account for the equity investment at fair value through other comprehensive income (FVOCI).
The Group reclassifies debt instruments when and only when its business model for managing those assets changes.
2.19.1.2 Recognition and derecognition
Regular way purchases and sales of financial assets are recognised on trade-date, the date on which the Group commits to purchase or sell the asset. Financial assets are derecognised when the rights to receive cash flows from the financial assets have expired or have been transferred and the Group has transferred substantially all the risks and rewards of ownership.
Finance lease receivables are regarded as financial assets for the purpose of derecognition.
1612018 Annua l Report
Notes to the Consolidated Financial Statements (Continued)
2 SIGNIFICANT ACCOUNTING POLICIES (CONTINUED)
2.19 Financial assets and financial liabilities (Continued)
2.19.1 Investments and other financial assets (Continued)
2.19.1.3 Measurement
At initial recognition, the Group measures a financial asset at its fair value plus, in the case of a financial asset not at fair value through profit or loss (FVTPL), transaction costs that are directly attributable to the acquisition of the financial asset. Transaction costs of financial assets carried at FVTPL are expensed in profit or loss.
Financial assets with embedded derivatives are considered in their entirety when determining whether their cash flows are solely payment of principal and interest.
2.19.1.3.1 Debt instruments
Subsequent measurement of debt instruments, including f inance lease receivables and advances for finance lease projects, depends on the Group’s business model for managing the asset and the cash flow characteristics of the asset. There are three measurement categories into which the group classifies its debt instruments:
• Amortised cost: Assets that are held for collection of contractual cash flows where those cash flows represent solely payments of principal and interest are measured at amortised cost. Finance lease income from finance lease receivables and advances for finance lease projects and interest income from other financial assets are included in revenue and net investment gains/(losses) respectively. Any gain or loss arising on derecognition is recognised directly in profit or loss and presented in other income, gains or losses, together with foreign exchange gains and losses. Impairment losses are presented as separate line item in the statement of profit or loss.
• FVOCI: Assets that are held for collection of contractual cash flows and for selling the financial assets, where the assets’ cash flows represent solely payments of principal and interest, are measured at FVOCI. Movements in the carrying amount are taken through OCI, except for the recognition of impairment gains or losses, interest revenue and foreign exchange gains and losses which are recognised in profit or loss. When the financial asset is derecognised, the cumulative gain or loss previously recognised in OCI is reclassified from equity to profit or loss and recognised in other income, gains or losses. Interest income from these financial assets is included in other income using the effective interest rate method. Foreign exchange gains and losses are presented in other income, gains or losses and impairment expenses are presented as separate line item in the statement of profit or loss.
• FVTPL: Assets that do not meet the criteria for amortised cost or FVOCI are measured at FVTPL. A gain or loss on a debt investment that is subsequently measured at FVTPL is recognised in profit or loss and presented net within other income, gains or losses in the period when it arises.
162 Ch ina Deve lopment Bank F inanc ia l Leas ing Co . , L td .
Notes to the Consolidated Financial Statements (Continued)
2 SIGNIFICANT ACCOUNTING POLICIES (CONTINUED)
2.19 Financial assets and financial liabilities (Continued)
2.19.1 Investments and other financial assets (Continued)
2.19.1.3 Measurement (Continued)
2.19.1.3.2 Equity instruments
The Group subsequently measures all equity investments at fair value. Where the Group’s management has elected to present fair value gains and losses on equity investments in OCI, there is no subsequent reclassification of fair value gains and losses to profit or loss following the derecognition of the investment. Dividends from such investments continue to be recognised in profit or loss as investment gains when the Group’s right to receive payments is established.
Changes in the fair value of financial assets at FVTPL are recognised in other income, gains or losses in the statement of profit or loss as applicable. Impairment losses (and reversal of impairment losses) on equity investments measured at FVOCI are not reported separately from other changes in fair value.
2.19.1.4 Impairment
From 1 January 2018, the Group assesses on a forward-looking basis the expected credit losses associated with its debt instruments, carried at amortised cost and FVOCI. The impairment methodology applied depends on whether there has been a significant increase in credit risk.
2.19.1.5 Accounting policies applied until 31 December 2017
The Group has applied IFRS 9 retrospectively, but has elected not to restate comparative information. As a result, the comparative information provided continues to be accounted for in accordance with the group’s previous accounting policy.
Until 31 December 2017, financial assets are classified into the following specified categor ies: FVTPL, “avai lable-for-sale” (AFS) f inancia l assets and loans and receivables. The classification depends on the nature and purpose of the financial assets and is determined at the time of initial recognition. All regular way purchases or sales of financial assets are recognised and derecognised on a trade date basis. Regular way purchases or sales are purchases or sales of financial assets that require delivery of assets within the time frame established by regulation or convention in the marketplace.
1632018 Annua l Report
Notes to the Consolidated Financial Statements (Continued)
2 SIGNIFICANT ACCOUNTING POLICIES (CONTINUED)
2.19 Financial assets and financial liabilities (Continued)
2.19.1 Financial assets (Continued)
2.19.1. 5 Accounting policies applied until 31 December 2017 (Continued)
2.19.1.5 1 Effective interest method
The effective interest method is a method of calculating the amortised cost of a financial asset and of allocating the interest income over the period. The effective interest rate is the rate that exactly discounts estimated future cash receipts through the expected life of the financial instrument or, where appropriate, a shorter period, to the net carrying amount on initial recognition. When calculating the effective interest rate, the Group estimates cash flows considering all contractual terms of the financial instrument but does not consider future credit losses. The calculation includes all fees and points received between parties to the contract that are an integral part of the effective interest rate, transaction costs and all other premiums or discounts.
2.19.1.5.2 Financial assets at FVTPL
Financial assets are classified as at FVTPL when the financial asset is either held for trading or it is designated as at FVTPL.
A financial asset is classified as held for trading if:
• it has been acquired principally for the purpose of selling it in the near term; or
• on init ial recognition it is part of a portfolio of identif ied financial instruments that the Group manages together and has a recent actual pattern of short-term profit-taking; or
• it is a derivative that is not designated and effective as a hedging instrument.
A financial asset other than a financial asset held for trading may be designated as at FVTPL upon initial recognition if:
• such designation eliminates or significantly reduces a measurement or recognition inconsistency that would otherwise arise; or
• the financial asset forms part of a group of financial assets or financial liabilities or both, which is managed and its performance is evaluated on a fair value basis, in accordance with the Group’s documented risk management or investment strategy, and information about the grouping is provided internally on that basis; or
164 Ch ina Deve lopment Bank F inanc ia l Leas ing Co . , L td .
Notes to the Consolidated Financial Statements (Continued)
2 SIGNIFICANT ACCOUNTING POLICIES (CONTINUED)
2.19 Financial assets and financial liabilities (Continued)
2.19.1 Financial assets (Continued)
2.19.1. 5 Accounting policies applied until 31 December 2017 (Continued)
2.19.1.5.2 Financial assets at FVTPL (Continued)
• it forms part of a contract containing one or more embedded derivatives, and IAS 39 permits the entire combined contract to be designated as at FVTPL.
Financial assets at FVTPL are stated at fair value, with any gains or losses arising on remeasurement recognised in profit or loss. The net gain or loss recognised in profit or loss incorporates any dividend or interest earned on the financial asset and is included in the net investment gains/losses line item.
2.19.1.5.3 Loans and receivables
Loans and receivables are non-derivative f inancial assets with f ixed or determinable payments that are not quoted in an active market. Loans and receivables (including cash and bank balances, placement to banks and other financial institutions, accounts receivable, finance lease receivables, interest receivable and other receivables) are measured at amortised cost using the effective interest method, less any impairment (see the accounting policy on impairment of financial assets below).
Interest income is recognised by applying the effective interest rate, except for short-term receivables when the effect of discounting is immaterial.
2.19.1.5.4 AFS financial assets
AFS financial assets are non-derivatives that are either designated as AFS financial assets or are not classified as (a) loans and receivables, (b) held-to-maturity investments or (c) financial assets at fair value through profit or loss.
AFS financial assets are measured at fair value at the end of the reporting period. Changes in fair value are recognised in other comprehensive income and accumulated in the investments revaluation reserve, until the financial asset is disposed of or is determined to be impaired, at which time, the cumulative gain or loss previously accumulated in the investments revaluation reserves reclassified to profit or loss (see the accounting policy on impairment on financial assets below).
1652018 Annua l Report
Notes to the Consolidated Financial Statements (Continued)
2 SIGNIFICANT ACCOUNTING POLICIES (CONTINUED)
2.19 Financial assets and financial liabilities (Continued)
2.19.1 Financial assets (Continued)
2.19.1. 5 Accounting policies applied until 31 December 2017 (Continued)
2.19.1.5.4 AFS financial assets (Continued)
AFS equity investments that do not have a quoted market price in an active market and whose fair value cannot be reliably measured and derivatives that are linked to and must be settled by delivery of such unquoted equity investments are measured at cost less any identified impairment losses at the end of each reporting period.
2.19.1.5.5 Impairment of financial assets
Financial assets, other than those at FVTPL, are assessed for indicators of impairment at the end of each reporting period. Financial assets are considered to be impaired when there is objective evidence that, as a result of one or more events that occurred after the initial recognition of the financial asset, the estimated future cash flows of the investment have been affected.
For AFS equity investments, a significant or prolonged decline in the fair value of the security below its cost is considered to be objective evidence of impairment.
For all other financial assets, objective evidence of impairment could include:
• significant financial difficulty of the issuer or counterparty; or
• breach of contract, such as default or delinquency in interest and principal payments; or
• it is probable that the borrower will enter bankruptcy or financial re-organization; or
• the disappearance of an active market for that financial asset because of financial difficulties.
For certain categories of financial assets, such as finance lease receivables, accounts receivable, interest receivable and other receivables, assets are assessed for impairment on a collective basis even if they were assessed not to be impaired individually. Objective evidence of impairment for a portfolio of receivables could include the Group’s past experience of collecting payments, an increase in the number of delayed payments in the portfolio past the agreed payment term, as well as observable changes in national or local economic conditions that correlate with default on receivables.
166 Ch ina Deve lopment Bank F inanc ia l Leas ing Co . , L td .
Notes to the Consolidated Financial Statements (Continued)
2 SIGNIFICANT ACCOUNTING POLICIES (CONTINUED)
2.19 Financial assets and financial liabilities (Continued)
2.19.1 Financial assets (Continued)
2.19.1. 5 Accounting policies applied until 31 December 2017 (Continued)
2.19.1.5.5 Impairment of financial assets (Continued)
Collective impairment allowances cover credit losses inherent in portfolios of loans receivable and other accounts with similar economic and credit risk characteristics where objective evidence for individual impaired items cannot be identified. In assessing the collective impairment, management makes assumptions both to define the way the Group assesses inherent losses and to determine the required input parameters, based on historical loss experience and current economic conditions. Changes in the carrying amount of the allowance account are recognised in profit or loss.
For financial assets carried at amortised cost, the amount of the impairment loss recognised is the difference between the asset’s carrying amount and the present value of estimated future cash flows, discounted at the financial asset’s original effective interest rate.
For financial assets that are carried at cost, the amount of the impairment loss is measured as the difference between the asset’s carrying amount and the present value of the estimated future cash flows discounted at the current market rate of return for a similar financial asset. Such impairment loss will not be reversed in subsequent periods.
The carrying amount of the financial asset is reduced by the impairment loss directly for all financial assets with the exception of finance lease receivables, accounts receivable, interest receivable and other receivables, where the carrying amount is reduced through the use of an allowance account. When a finance lease receivable, an account receivable, interest receivable or other receivable is considered uncollectible, it is written off against the allowance account. Subsequent recoveries of amounts previously written off are credited against the allowance account. Changes in the carrying amount of the allowance account are recognised in profit or loss.
When an AFS financial asset is considered to be impaired, cumulative gains or losses previously recognised in other comprehensive income are reclassified to profit or loss in the period.
For financial assets measured at amortised cost, if, in a subsequent period, the amount of the impairment loss decreases and the decrease can be related objectively to an event occurring after the impairment was recognised, the previously recognized impairment loss is reversed through profit or loss to the extent that the carrying amount of the investment at the date the impairment is reversed does not exceed what the amortised cost would have been had the impairment not been recognised.
1672018 Annua l Report
Notes to the Consolidated Financial Statements (Continued)
2 SIGNIFICANT ACCOUNTING POLICIES (CONTINUED)
2.19 Financial assets and financial liabilities (Continued)
2.19.1 Financial assets (Continued)
2.19.1. 5 Accounting policies applied until 31 December 2017 (Continued)
2.19.1.5.5 Impairment of financial assets (Continued)
In respect of AFS equity securities, impairment losses previously recognised in profit or loss are not reversed through profit or loss. Any increase in fair value subsequent to an impairment loss is recognised in other comprehensive income and accumulated under the heading of the investments revaluation reserve. In respect of AFS debt securities, impairment losses are subsequently reversed through profit or loss if an increase in the fair value of the investment can be objectively related to an event occurring after the recognition of the impairment loss.
2.19.1.5.6 Derecognition of financial assets
The Group derecognises a financial asset when the contractual rights to the cash flows from the asset expire, or when it transfers the financial asset and substantially all the risks and rewards of ownership of the asset to another party. If the Group neither transfers nor retains substantially all the risks and rewards of ownership and continues to control the transferred asset, the Group recognises its retained interest in the asset and an associated liability for amounts it may have to pay. If the Group retains substantially all the risks and rewards of ownership of a transferred financial asset, the Group continues to recognise the financial asset and also recognises a collateralised borrowing for the proceeds received.
On derecognition of a financial asset in its entirety, the difference between the asset’s carrying amount and the sum of the consideration received and receivable and the cumulative gain or loss that had been recognised in other comprehensive income and accumulated in equity is recognised in profit or loss.
On derecognition of a financial asset other than in its entirety (e.g. when the Group retains an option to repurchase part of a transferred asset), the Group allocates the previous carrying amount of the financial asset between the part it continues to recognize under continuing involvement, and the part it no longer recognises on the basis of the relative fair values of those parts on the date of the transfer. The difference between the carrying amount allocated to the part that is no longer recognised and the sum of the consideration received for the part no longer recognised and any cumulative gain or loss allocated to it that had been recognised in other comprehensive income is recognised in profit or loss. A cumulative gain or loss that had been recognised in other comprehensive income is allocated between the part that continues to be recognised and the part that is no longer recognised on the basis of the relative fair values of those parts.

168 Ch ina Deve lopment Bank F inanc ia l Leas ing Co . , L td .
Notes to the Consolidated Financial Statements (Continued)
2 SIGNIFICANT ACCOUNTING POLICIES (CONTINUED)
2.19 Financial assets and financial liabilities (Continued)
2.19.2 Financial liabilities and equity instruments
2.19.2.1 Classification as debt or equity
Debt and equity instruments issued by a group entity are classif ied either as financial liabilities or as equity in accordance with the substance of the contractual arrangements and the definitions of a financial liability and an equity instrument.
2.19.2.2 Equity instruments
An equity instrument is any contract that evidences a residual interest in the assets of an entity after deducting all of its liabilities. Equity instruments issued by a group entity are recognised at the proceeds received, net of direct issue costs.
Repurchase of the Company’s own equity instruments is recognised and deducted directly in equity. No gain or loss is recognised in profit or loss on the purchase, sale, issue or cancellation of the Company’s own equity instruments.
2.19.2.3 Financial liabilities
Financial liabilities are classified as either financial liabilities at FVTPL or other financial liabilities.
2.19.2.4 Financial liabilities at FVTPL
Financial liabilities are classified as at FVTPL when the financial liability is either held for trading or it is designated as at FVTPL.
Financial liabilities at FVTPL are stated at fair value, with any gains or losses arising on remeasurement recognised in profit or loss. The net gain or loss recognised in profit or loss incorporates any interest paid on the financial liabilities.
1692018 Annua l Report
Notes to the Consolidated Financial Statements (Continued)
2 SIGNIFICANT ACCOUNTING POLICIES (CONTINUED)
2.19 Financial assets and financial liabilities (Continued)
2.19.2 Financial liabilities and equity instruments (Continued)
2.19.2.5 Effective interest method
The effective interest method is a method of calculating the amortised cost of a financial liability and of allocating interest expense over the relevant period. The effective interest rate is the rate that exactly discounts estimated future cash payments (including all fees and points paid or received that form an integral part of the effective interest rate, transaction costs and other premiums or discounts) through the expected life of the financial liability, or (where appropriate) a shorter period, to the net carrying amount on initial recognition.
Interest expense is recognised on an effective interest basis.
2.19.2.6 Other financial liabilities
Other financial liabilities including borrowings, due to banks and other financial institutions, financial assets sold under repurchase agreements, bonds payable, dividends payable, interest payable, long-term accounts payable and other payables are subsequently measured at amortised cost using the effective interest method.
2.19.2.7 Derecognition of financial liabilities
The Group derecognises financial l iabil it ies when, and only when, the Group’s obligations are discharged, cancelled or they expire. The difference between the carrying amount of the financial liability derecognised and the consideration paid and payable is recognised in profit or loss.
170 Ch ina Deve lopment Bank F inanc ia l Leas ing Co . , L td .
Notes to the Consolidated Financial Statements (Continued)
2 SIGNIFICANT ACCOUNTING POLICIES (CONTINUED)
2.20 Derivatives and hedging activities
Derivatives are initially recognised at fair value on the date a derivative contract is entered into and are subsequently remeasured to their fair value at the end of each reporting period. The accounting for subsequent changes in fair value depends on whether the derivative is designated as a hedging instrument, and if so, the nature of the item being hedged. The Group designates certain derivatives as either:
• hedges of the fair value of recognised assets or liabilities or a firm commitment (fair value hedges)
• hedges of a particular risk associated with the cash flows of recognised assets and liabilities and highly probable forecast transactions (cash flow hedges), or
• hedges of a net investment in a foreign operation (net investment hedges)
At the inception of the hedging, The Group documents the economic, relationship between hedging instruments and hedged items, including whether changes in the cash flows of the hedging instruments are expected to offset changes in the cash flows of hedges items. The Group documents its risk management objective and strategy for undertaking its hedge transactions.
2.20.1 Cash flow hedge that quantity for hedge accounting
The effective portion of changes in the fair value of derivatives that are designated and qualify as cash flow hedges is recognised in the cash flow hedge reserve within equity. The gain or loss relating to the ineffective portion is recognised immediately in profit or loss, within other income, gains or losses.
When option contracts are used to hedge forecast transactions, the Group designates only the intrinsic value of the options as the hedging instrument.
Gains or losses relating to the effective portion of the change in intrinsic value of the options are recognised in the cash flow hedge reserve within equity. The changes in the time value of the options that relate to the hedged item (‘aligned time value’) are recognised within OCI in the costs of hedging reserve within equity.
When forward contracts are used to hedge forecast transactions, the Group generally designates only the change in fair value of the forward contract related to the spot component as the hedging instrument. Gains or losses relating to the effective portion of the change in the spot component of the forward contracts are recognised in the cash flow hedge reserve within equity. The change in the forward element of the contract that relates to the hedged item (‘aligned forward element’) is recognised within OCI in the costs of hedging reserve within equity. In some cases, the Group may designate the full change in fair value of the forward contract (including forward points) as the hedging instrument. In such cases, the gains or losses relating to the effective portion of the change in fair value of the entire forward contract are recognised in the cash flow hedge reserve within equity.
1712018 Annua l Report
Notes to the Consolidated Financial Statements (Continued)
2 SIGNIFICANT ACCOUNTING POLICIES (CONTINUED)
2.20 Derivatives and hedging activities (Continued)
2.20.1 Cash flow hedge that quantity for hedge accounting (Continued)
Amounts accumulated in equity are reclassified in the periods when the hedged item affects profit or loss, as follows:
• The gain or loss relating to the effective portion of the interest rate swaps hedging variable rate borrowings is recognised in profit or loss within finance cost at the same time as the interest expense on the hedged borrowings.
When a hedging instrument expires, or is sold or terminated, or when a hedge no longer meets the criteria for hedge accounting, any cumulative deferred gain or loss and deferred costs of hedging in equity at that time remains in equity until the forecast transaction occurs. When the forecast transaction is no longer expected to occur, the cumulative gain or loss and deferred costs of hedging that were reported in equity are immediately reclassified to profit or loss.
2.20.2 Net investment hedges
Hedges of net investments in foreign operations are accounted for similarly to cash flow hedges.
Any gain or loss on the hedging instrument relating to the effective portion of the hedge is recognised in OCI and accumulated in reserves in equity. The gain or loss relating to the ineffective portion is recognised immediately in profit or loss within other income, gains or losses.
Gains and losses accumulated in equity are reclassified to profit or loss when the foreign operation is partially disposed of or sold.
2.20.3 Derivatives that do not qualify for hedge accounting
Certain derivative instruments do not qualify for hedge accounting. Changes in the fair value of any derivative instrument that does not qualify for hedge accounting are recognised immediately in profit or loss and are included in other income, gains or losses.
2.21 Financial assets sold under repurchase agreements
Financial assets sold subject to agreements with a commitment to repurchase at a specific future date are not derecognized in the statements of financial position. The proceeds from selling such assets are presented under “financial assets sold under repurchase agreements” in the statements of financial position. The difference between the selling price and repurchasing price is recognised as interest expense during the term of the agreement using the effective interest method.
172 Ch ina Deve lopment Bank F inanc ia l Leas ing Co . , L td .
Notes to the Consolidated Financial Statements (Continued)
3 C R I T I C A L A C C O U N T I N G J U D G E M E N T A N D K E Y SOURCES OF ESTIMATION UNCERTAINTY
In the application of accounting policies as set out in Note 2, the Group is required to make judgements, estimates and assumptions about the carrying amounts of items in the financial statements that cannot be measured accurately. These judgements, estimates and assumptions are based on historical experience of the Group’s management as well as other factors that are considered to be relevant. Actual results may differ from these estimates.
The estimates and underlying assumptions are reviewed on an ongoing basis. Revisions to accounting estimates are recognised in the period in which the estimate is revised if the revision affects only that period or in the period of the revision and future periods if the revision affects both current and future periods.
The following are the critical judgements, estimate and key assumptions that the Group has made in the process of applying the accounting policies and that have significant effect on the amounts recognised in the consolidated financial statements:
3.1 Impairment loss for finance lease receivables and accounts receivable
The balances of impairment allowance for finance lease receivables and accounts receivable represent the management’s best estimates at the balance sheet date of expected credit. The Group assesses whether the credit risk of financial lease receivables and account receivable have increased significantly since their initial recognition, and apply a three-stage impairment model to calculate their ECL. For financial lease receivables and accounts receivable classified into stages 1 and 2, the management assesses impairment losses using the risk parameter modelling approach that incorporates key parameters, including probability of default, loss given default, exposure at default and discount rates. For finance lease receivables and accounts receivable in stage 3, the management assesses impairment loss by estimating the cash flows from finance lease receivables and accounts receivable.
The measurement models of expected credit losses involves significant management judgments and assumptions, primarily including the following:
(1) Segmentation of business operations sharing similar credit risk characteristics, selection of appropriate models and determination of relevant key measurement parameters;
(2) Criteria for determining whether or not there was a significant increase in credit risk, or a default or impairment loss was incurred;
(3) Economic indicators for forward-looking measurement, and the application of economic scenarios and weightings;
(4) The estimated future cash flows for financial lease receivables and accounts receivable in stage 3.
The Group established governance processes and controls for the measurement of expected credit losses. Explanation of the inputs, assumptions and estimation techniques used in measuring ECL is further detailed in Note 52.
1732018 Annua l Report
Notes to the Consolidated Financial Statements (Continued)
3 C R I T I C A L A C C O U N T I N G J U D G E M E N T A N D K E Y SOURCES OF ESTIMATION UNCERTAINTY (CONTINUED)
3.2 Impairment loss for equipment held for operating lease business
The majority of the Group’s equipment held for operating lease business are aircraft. According to the accounting policy stated in Note 2, management makes judgement regarding whether there is any indicator of assets impairment at the financial reporting date, and measures the recoverable amount of any assets with impairment indicators. The recoverable amount is the higher of the net amount of assets’ fair value minus the cost of disposal, and the estimated value in use. These measurements involve estimation.
3.3 Depreciation of operating lease assets
The Group calculates depreciation expense of operating lease assets based on management’s assumption on their useful life and residual value. The useful lives and the residual value of operating lease assets reflect the future economic benefit obtained from the use of the operating lease assets and the benefit from disposal estimated by the Group’s management. The estimation may differ due to actual physical wear and tear of the assets, changes of the technology innovation and market competition.
3.4 Income taxes
There are certain transactions and activities for which the ultimate tax determination is subject to the final approval of annual tax return the Group filed with relevant tax authorities. Where the final tax outcome of these matters is different from the amounts that were initially estimated, such differences will impact the current income tax and deferred income tax in the period during which such a determination is made.
3.5 Fair value of financial instruments
The Group has adopted valuation models to calculate the fair value for the financial instruments without active market price. Such valuation models include discounted cash flow model and other valuation models. In practice, the discounted cash flow model only use the observable data whenever possible, however, the management still needs to make assumption regarding the factors, such as counterparty’s credit risk, market volatility and correlations. The estimated fair value of the financial instruments will be affected for any changes of the above factors.
3.6 Classification of leases
The Group has entered into certain lease businesses whereby the Group has determined that it has transferred substantially all the risks and rewards incidental to ownership of the assets held for lease businesses to the lessees, as the present values of the minimum lease payments of the lease amount to at least substantially all of the fair value of the assets held for lease businesses at the inception of the leases. Accordingly, the Group has excluded the assets held for lease businesses under finance lease from its consolidated statements of financial position and has instead, recognised finance lease receivables (Note 22). On the other hand, the Group includes the assets held for lease businesses under operating lease in property and equipment, and investment property. The determination of whether the Group has transferred substantially all the risks and rewards incident to ownership depends on an assessment of the relevant arrangements relating to the lease, which involved critical judgements by management.
174 Ch ina Deve lopment Bank F inanc ia l Leas ing Co . , L td .
Notes to the Consolidated Financial Statements (Continued)
4 CHANGES IN ACCOUNTING POLICIES
(a) IFRS 9 Financial Instruments – Impact of adoption
IFRS 9 replaces the provisions of IAS 39 that relate to the recognition, classification and measurement of financial assets and financial liabilities, derecognition of financial instruments, impairment of financial assets and hedge accounting.
The adoption of IFRS 9 Financial Instruments from 1 January 2018 resulted in changes in accounting policies and adjustments to the amounts recognised in the financial statements. The new accounting policies are set out in Note 2 above. In accordance with the transitional provisions in IFRS 9(7.2.15) and (7.2.26), IFRS 9 was adopted by the Group without restating comparative information. The reclassifications and the adjustments arising from the new impairment rules are therefore not reflected in the balance sheet on 31 December 2017, but are recognised in the opening balance sheet on 1 January 2018.
The following tables show the adjustments recognised for each individual line item. Line items that were not affected by the initial adoption of IFRS 9 by the Group have not been included. The adjustments are explained in more detail below:
31 December 2017 Reclassification Revaluation 01 January 2018 Under IAS 39 Under IFRS 9
Balance sheet (extract) RMB’000 RMB’000 RMB’000 RMB’000
ASSETS Financial assets at fair value through profit or
loss 1,857,927 13,000 – 1,870,927Financial assets at fair value through other comprehensive income – 266,573 – 266,573Available-for-sale financial assets 279,573 (279,573) – –Accounts receivable 6,610,039 – (201,139) 6,408,900Finance lease receivables 98,880,563 – (1,079,839) 97,800,724Deferred tax assets 642,535 – 314,207 956,742
Equity Retained profits 5,385,159 – (966,771) 4,418,388
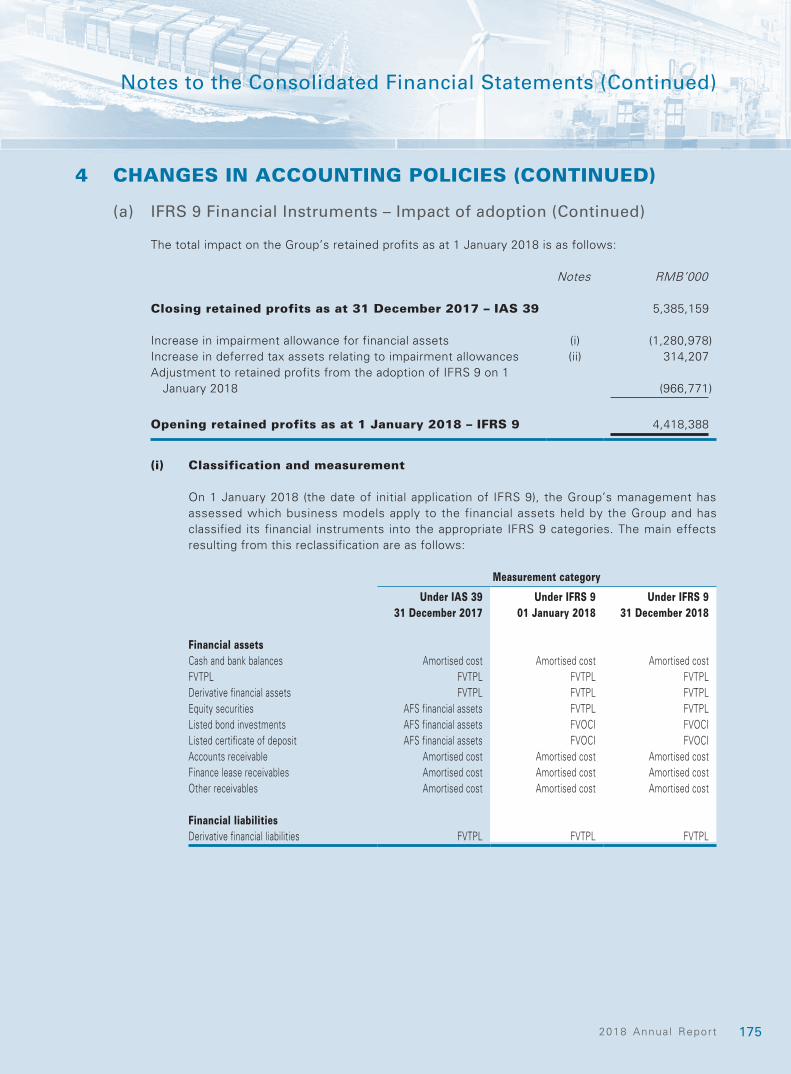
1752018 Annua l Report
Notes to the Consolidated Financial Statements (Continued)
4 CHANGES IN ACCOUNTING POLICIES (CONTINUED)
(a) IFRS 9 Financial Instruments – Impact of adoption (Continued)
The total impact on the Group’s retained profits as at 1 January 2018 is as follows:
Notes RMB’000
Closing retained profits as at 31 December 2017 – IAS 39 5,385,159
Increase in impairment allowance for financial assets (i) (1,280,978)Increase in deferred tax assets relating to impairment allowances (ii) 314,207Adjustment to retained profits from the adoption of IFRS 9 on 1
January 2018 (966,771)
Opening retained profits as at 1 January 2018 – IFRS 9 4,418,388
(i) Classification and measurement
On 1 January 2018 (the date of initial application of IFRS 9), the Group’s management has assessed which business models apply to the financial assets held by the Group and has classified its financial instruments into the appropriate IFRS 9 categories. The main effects resulting from this reclassification are as follows:
Measurement category Under IAS 39 Under IFRS 9 Under IFRS 9
31 December 2017 01 January 2018 31 December 2018
Financial assetsCash and bank balances Amortised cost Amortised cost Amortised costFVTPL FVTPL FVTPL FVTPLDerivative financial assets FVTPL FVTPL FVTPLEquity securities AFS financial assets FVTPL FVTPLListed bond investments AFS financial assets FVOCI FVOCIListed certificate of deposit AFS financial assets FVOCI FVOCIAccounts receivable Amortised cost Amortised cost Amortised costFinance lease receivables Amortised cost Amortised cost Amortised costOther receivables Amortised cost Amortised cost Amortised cost
Financial liabilitiesDerivative financial liabilities FVTPL FVTPL FVTPL
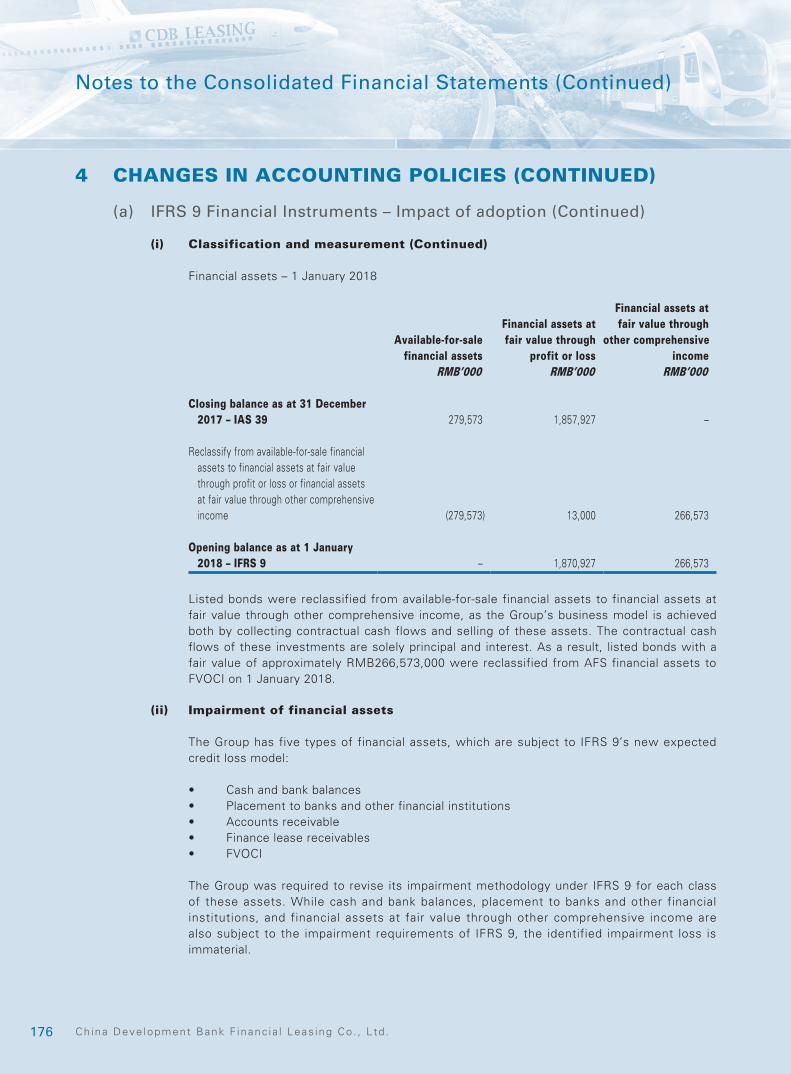
176 Ch ina Deve lopment Bank F inanc ia l Leas ing Co . , L td .
Notes to the Consolidated Financial Statements (Continued)
4 CHANGES IN ACCOUNTING POLICIES (CONTINUED)
(a) IFRS 9 Financial Instruments – Impact of adoption (Continued)
(i) Classification and measurement (Continued)
Financial assets – 1 January 2018
Available-for-sale financial assets
Financial assets at fair value through
profit or loss
Financial assets at fair value through
other comprehensive income
RMB’000 RMB’000 RMB’000
Closing balance as at 31 December 2017 – IAS 39 279,573 1,857,927 –
Reclassify from available-for-sale financial
assets to financial assets at fair value through profit or loss or financial assets at fair value through other comprehensive income (279,573) 13,000 266,573
Opening balance as at 1 January
2018 – IFRS 9 – 1,870,927 266,573
Listed bonds were reclassified from available-for-sale financial assets to financial assets at fair value through other comprehensive income, as the Group’s business model is achieved both by collecting contractual cash flows and selling of these assets. The contractual cash flows of these investments are solely principal and interest. As a result, listed bonds with a fair value of approximately RMB266,573,000 were reclassified from AFS financial assets to FVOCI on 1 January 2018.
(ii) Impairment of financial assets
The Group has five types of financial assets, which are subject to IFRS 9’s new expected credit loss model:
• Cash and bank balances• Placement to banks and other financial institutions• Accounts receivable• Finance lease receivables• FVOCI
The Group was required to revise its impairment methodology under IFRS 9 for each class of these assets. While cash and bank balances, placement to banks and other financial institutions, and financial assets at fair value through other comprehensive income are also subject to the impairment requirements of IFRS 9, the identified impairment loss is immaterial.
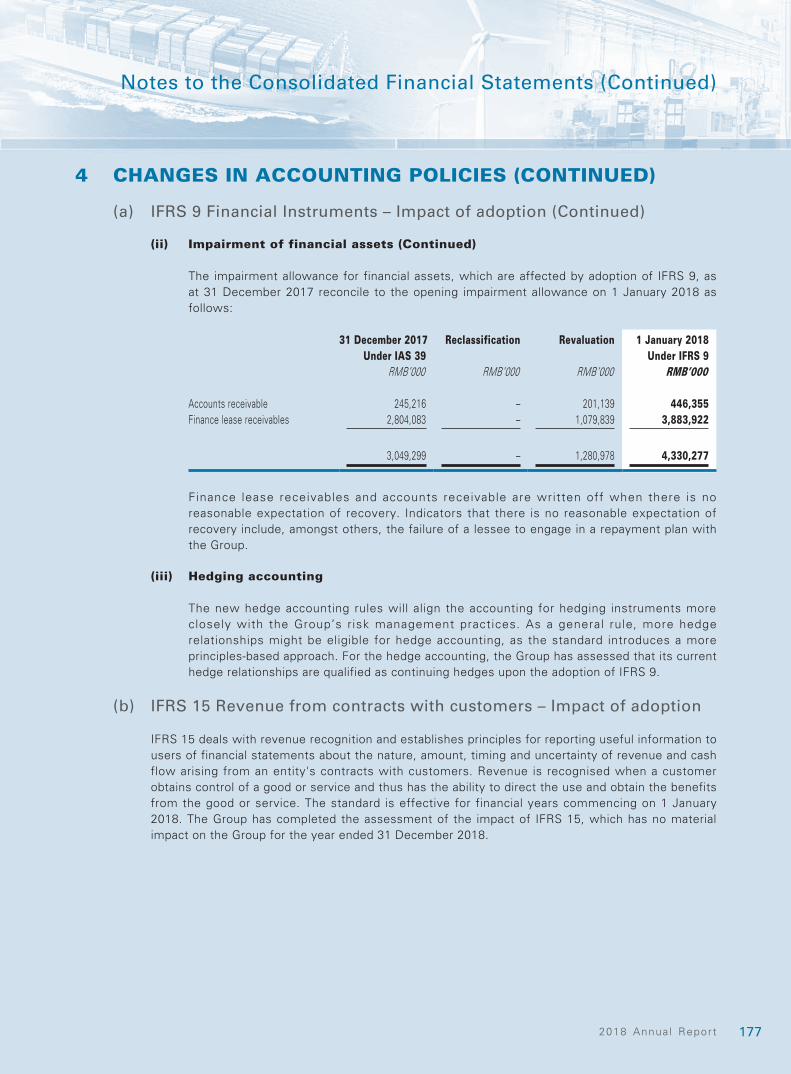
1772018 Annua l Report
Notes to the Consolidated Financial Statements (Continued)
4 CHANGES IN ACCOUNTING POLICIES (CONTINUED)
(a) IFRS 9 Financial Instruments – Impact of adoption (Continued)
(ii) Impairment of financial assets (Continued)
The impairment allowance for financial assets, which are affected by adoption of IFRS 9, as at 31 December 2017 reconcile to the opening impairment allowance on 1 January 2018 as follows:
31 December 2017 Reclassification Revaluation 1 January 2018Under IAS 39 Under IFRS 9
RMB’000 RMB’000 RMB’000 RMB’000 Accounts receivable 245,216 – 201,139 446,355Finance lease receivables 2,804,083 – 1,079,839 3,883,922
3,049,299 – 1,280,978 4,330,277
Finance lease receivables and accounts receivable are written off when there is no reasonable expectation of recovery. Indicators that there is no reasonable expectation of recovery include, amongst others, the failure of a lessee to engage in a repayment plan with the Group.
(iii) Hedging accounting
The new hedge accounting rules will align the accounting for hedging instruments more closely with the Group’s risk management practices. As a general rule, more hedge relationships might be eligible for hedge accounting, as the standard introduces a more principles-based approach. For the hedge accounting, the Group has assessed that its current hedge relationships are qualified as continuing hedges upon the adoption of IFRS 9.
(b) IFRS 15 Revenue from contracts with customers – Impact of adoption
IFRS 15 deals with revenue recognition and establishes principles for reporting useful information to users of financial statements about the nature, amount, timing and uncertainty of revenue and cash flow arising from an entity's contracts with customers. Revenue is recognised when a customer obtains control of a good or service and thus has the ability to direct the use and obtain the benefits from the good or service. The standard is effective for financial years commencing on 1 January 2018. The Group has completed the assessment of the impact of IFRS 15, which has no material impact on the Group for the year ended 31 December 2018.

178 Ch ina Deve lopment Bank F inanc ia l Leas ing Co . , L td .
Notes to the Consolidated Financial Statements (Continued)
5 TOTAL REVENUE
Year ended 31 December 2018 2017
RMB’000 RMB’000
Finance lease income (1) 7,036,316 5,784,289Operating lease income 6,584,804 6,016,001
13,621,120 11,800,290
(1) The Group recognised finance lease income of approximately RMB36,976,000 and RMB39,315,000 from non-performing finance lease receivables for the years ended of 2018 and 2017, respectively.
6 NET INVESTMENT GAINS
Year ended 31 December 2018 2017
RMB’000 RMB’000
Realised gains from financial assets at fair value through other comprehensive income 75,757 –
Realised gains from financial assets at fair value through profit or loss 8,961 –
Realised gains from disposal of finance lease receivables 8,839 –Realised gains from derivatives – 6,296Realised gains from available-for-sale financial assets – 93,270Unrealised fair value change of financial assets at fair value
through profit or loss 113,492 63,651Unrealised fair value change of derivatives 4,613 12,943
211,662 176,160
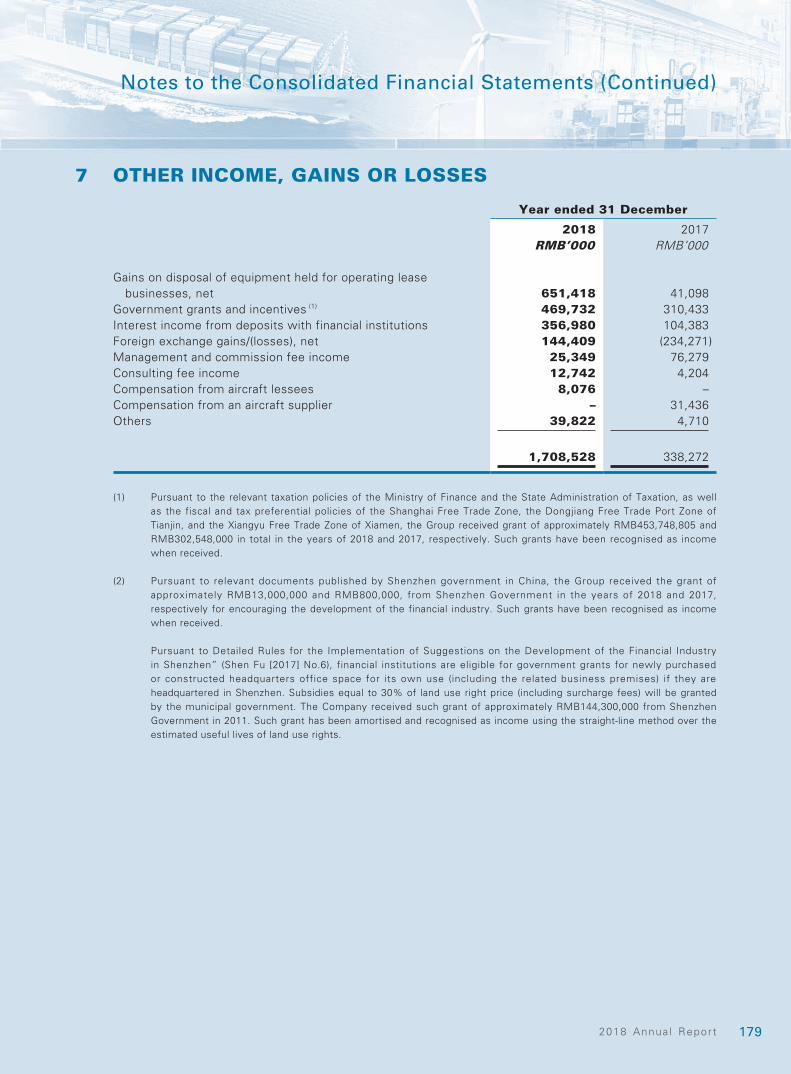
1792018 Annua l Report
Notes to the Consolidated Financial Statements (Continued)
7 OTHER INCOME, GAINS OR LOSSES
Year ended 31 December 2018 2017
RMB’000 RMB’000
Gains on disposal of equipment held for operating lease businesses, net 651,418 41,098
Government grants and incentives (1) 469,732 310,433Interest income from deposits with financial institutions 356,980 104,383Foreign exchange gains/(losses), net 144,409 (234,271)Management and commission fee income 25,349 76,279Consulting fee income 12,742 4,204Compensation from aircraft lessees 8,076 –Compensation from an aircraft supplier – 31,436Others 39,822 4,710
1,708,528 338,272
(1) Pursuant to the relevant taxation policies of the Ministry of Finance and the State Administration of Taxation, as well as the fiscal and tax preferential policies of the Shanghai Free Trade Zone, the Dongjiang Free Trade Port Zone of Tianjin, and the Xiangyu Free Trade Zone of Xiamen, the Group received grant of approximately RMB453,748,805 and RMB302,548,000 in total in the years of 2018 and 2017, respectively. Such grants have been recognised as income when received.
(2) Pursuant to relevant documents published by Shenzhen government in China, the Group received the grant of approximately RMB13,000,000 and RMB800,000, from Shenzhen Government in the years of 2018 and 2017, respectively for encouraging the development of the financial industry. Such grants have been recognised as income when received.
Pursuant to Detailed Rules for the Implementation of Suggestions on the Development of the Financial Industry in Shenzhen” (Shen Fu [2017] No.6), financial institutions are eligible for government grants for newly purchased or constructed headquarters office space for its own use (including the related business premises) if they are headquartered in Shenzhen. Subsidies equal to 30% of land use right price (including surcharge fees) will be granted by the municipal government. The Company received such grant of approximately RMB144,300,000 from Shenzhen Government in 2011. Such grant has been amortised and recognised as income using the straight-line method over the estimated useful lives of land use rights.
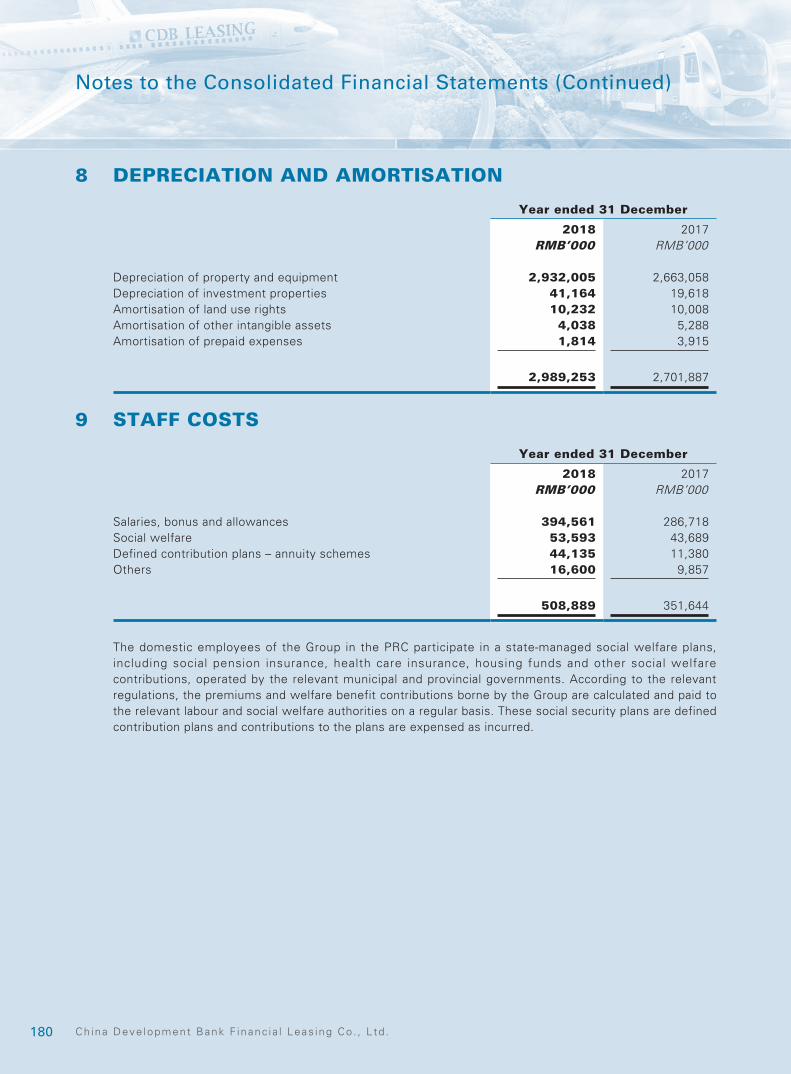
180 Ch ina Deve lopment Bank F inanc ia l Leas ing Co . , L td .
Notes to the Consolidated Financial Statements (Continued)
8 DEPRECIATION AND AMORTISATION
Year ended 31 December 2018 2017
RMB’000 RMB’000
Depreciation of property and equipment 2,932,005 2,663,058Depreciation of investment properties 41,164 19,618Amortisation of land use rights 10,232 10,008Amortisation of other intangible assets 4,038 5,288Amortisation of prepaid expenses 1,814 3,915
2,989,253 2,701,887
9 STAFF COSTS
Year ended 31 December 2018 2017
RMB’000 RMB’000
Salaries, bonus and allowances 394,561 286,718Social welfare 53,593 43,689Defined contribution plans – annuity schemes 44,135 11,380Others 16,600 9,857
508,889 351,644
The domestic employees of the Group in the PRC participate in a state-managed social welfare plans, including social pension insurance, health care insurance, housing funds and other social welfare contributions, operated by the relevant municipal and provincial governments. According to the relevant regulations, the premiums and welfare benefit contributions borne by the Group are calculated and paid to the relevant labour and social welfare authorities on a regular basis. These social security plans are defined contribution plans and contributions to the plans are expensed as incurred.
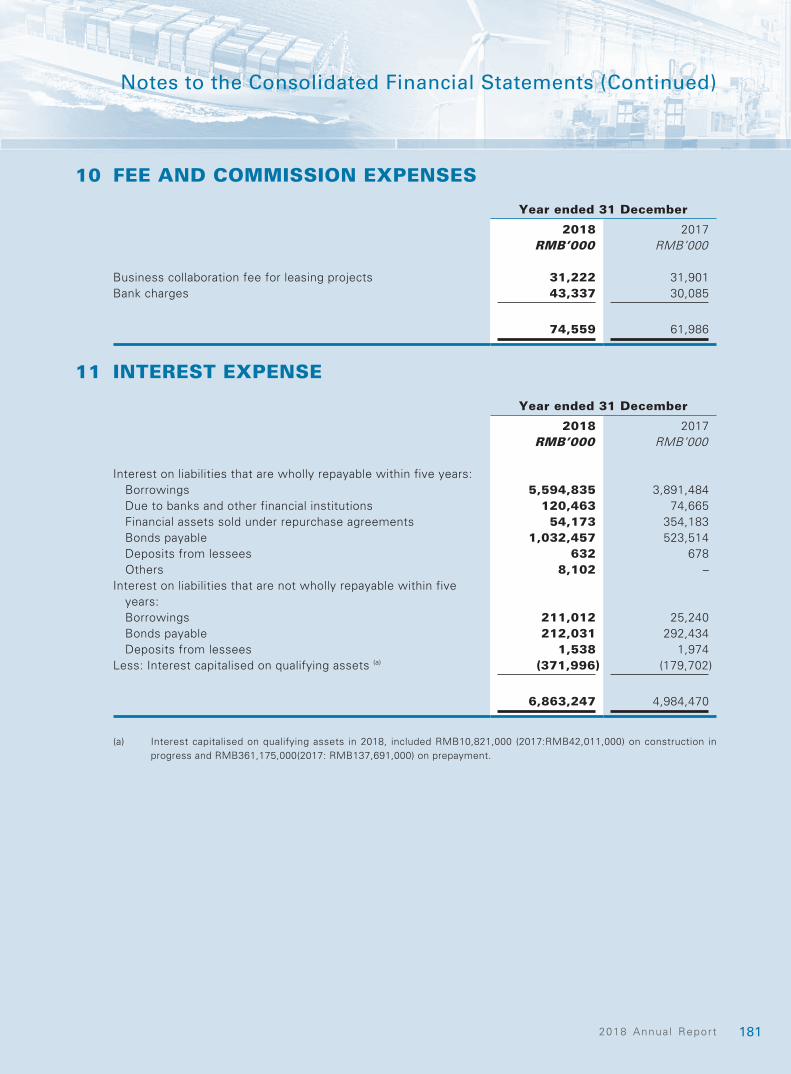
1812018 Annua l Report
Notes to the Consolidated Financial Statements (Continued)
10 FEE AND COMMISSION EXPENSES
Year ended 31 December 2018 2017
RMB’000 RMB’000
Business collaboration fee for leasing projects 31,222 31,901Bank charges 43,337 30,085
74,559 61,986
11 INTEREST EXPENSE
Year ended 31 December 2018 2017
RMB’000 RMB’000
Interest on liabilities that are wholly repayable within five years:Borrowings 5,594,835 3,891,484Due to banks and other financial institutions 120,463 74,665Financial assets sold under repurchase agreements 54,173 354,183Bonds payable 1,032,457 523,514Deposits from lessees 632 678Others 8,102 –
Interest on liabilities that are not wholly repayable within five years:Borrowings 211,012 25,240Bonds payable 212,031 292,434Deposits from lessees 1,538 1,974
Less: Interest capitalised on qualifying assets (a) (371,996) (179,702)
6,863,247 4,984,470
(a) Interest capitalised on qualifying assets in 2018, included RMB10,821,000 (2017:RMB42,011,000) on construction in progress and RMB361,175,000(2017: RMB137,691,000) on prepayment.
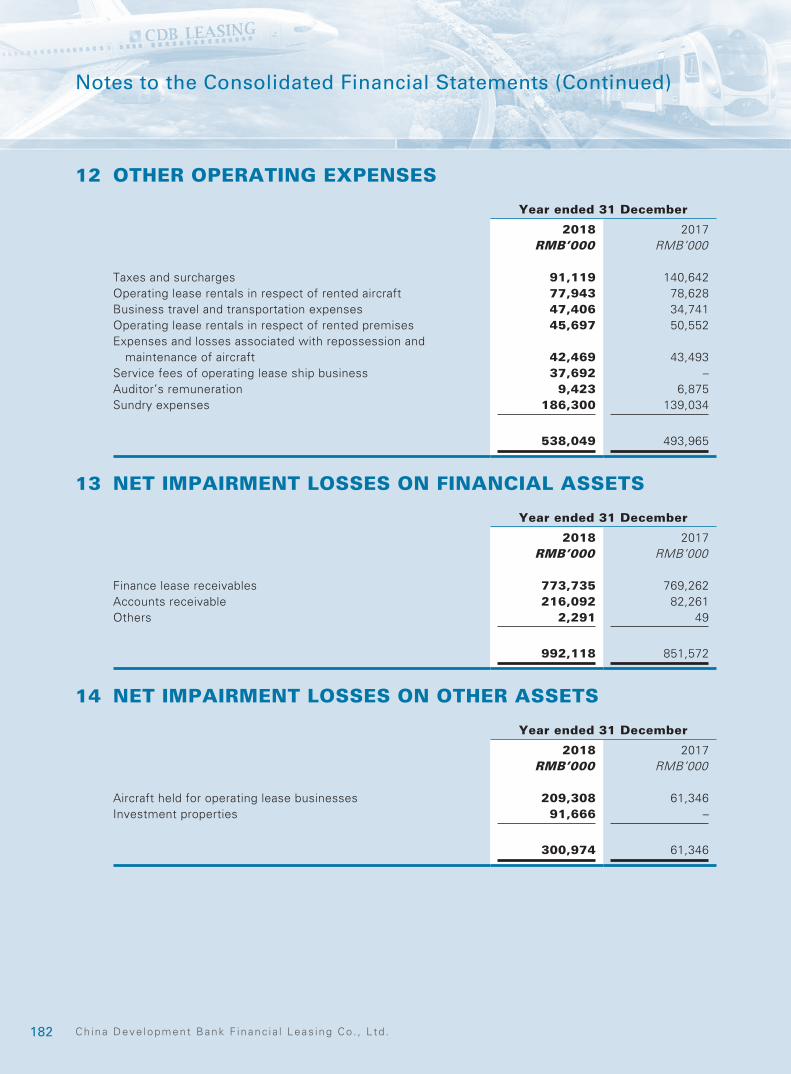
182 Ch ina Deve lopment Bank F inanc ia l Leas ing Co . , L td .
Notes to the Consolidated Financial Statements (Continued)
12 OTHER OPERATING EXPENSES
Year ended 31 December 2018 2017
RMB’000 RMB’000
Taxes and surcharges 91,119 140,642Operating lease rentals in respect of rented aircraft 77,943 78,628Business travel and transportation expenses 47,406 34,741Operating lease rentals in respect of rented premises 45,697 50,552Expenses and losses associated with repossession and
maintenance of aircraft 42,469 43,493Service fees of operating lease ship business 37,692 –Auditor’s remuneration 9,423 6,875Sundry expenses 186,300 139,034
538,049 493,965
13 NET IMPAIRMENT LOSSES ON FINANCIAL ASSETS
Year ended 31 December 2018 2017
RMB’000 RMB’000
Finance lease receivables 773,735 769,262Accounts receivable 216,092 82,261Others 2,291 49
992,118 851,572
14 NET IMPAIRMENT LOSSES ON OTHER ASSETS
Year ended 31 December 2018 2017
RMB’000 RMB’000
Aircraft held for operating lease businesses 209,308 61,346Investment properties 91,666 –
300,974 61,346
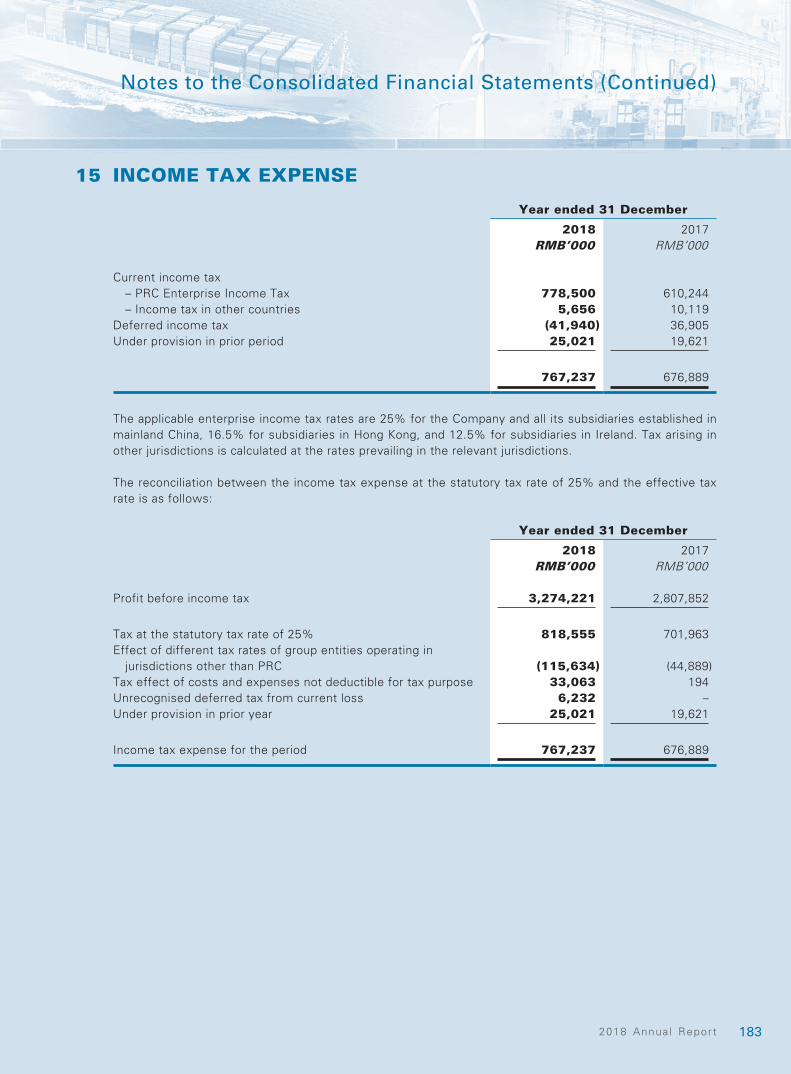
1832018 Annua l Report
Notes to the Consolidated Financial Statements (Continued)
15 INCOME TAX EXPENSE
Year ended 31 December 2018 2017
RMB’000 RMB’000
Current income tax– PRC Enterprise Income Tax 778,500 610,244– Income tax in other countries 5,656 10,119
Deferred income tax (41,940) 36,905Under provision in prior period 25,021 19,621
767,237 676,889
The applicable enterprise income tax rates are 25% for the Company and all its subsidiaries established in mainland China, 16.5% for subsidiaries in Hong Kong, and 12.5% for subsidiaries in Ireland. Tax arising in other jurisdictions is calculated at the rates prevailing in the relevant jurisdictions.
The reconciliation between the income tax expense at the statutory tax rate of 25% and the effective tax rate is as follows:
Year ended 31 December 2018 2017
RMB’000 RMB’000
Profit before income tax 3,274,221 2,807,852
Tax at the statutory tax rate of 25% 818,555 701,963Effect of different tax rates of group entities operating in
jurisdictions other than PRC (115,634) (44,889)Tax effect of costs and expenses not deductible for tax purpose 33,063 194Unrecognised deferred tax from current loss 6,232 –Under provision in prior year 25,021 19,621
Income tax expense for the period 767,237 676,889
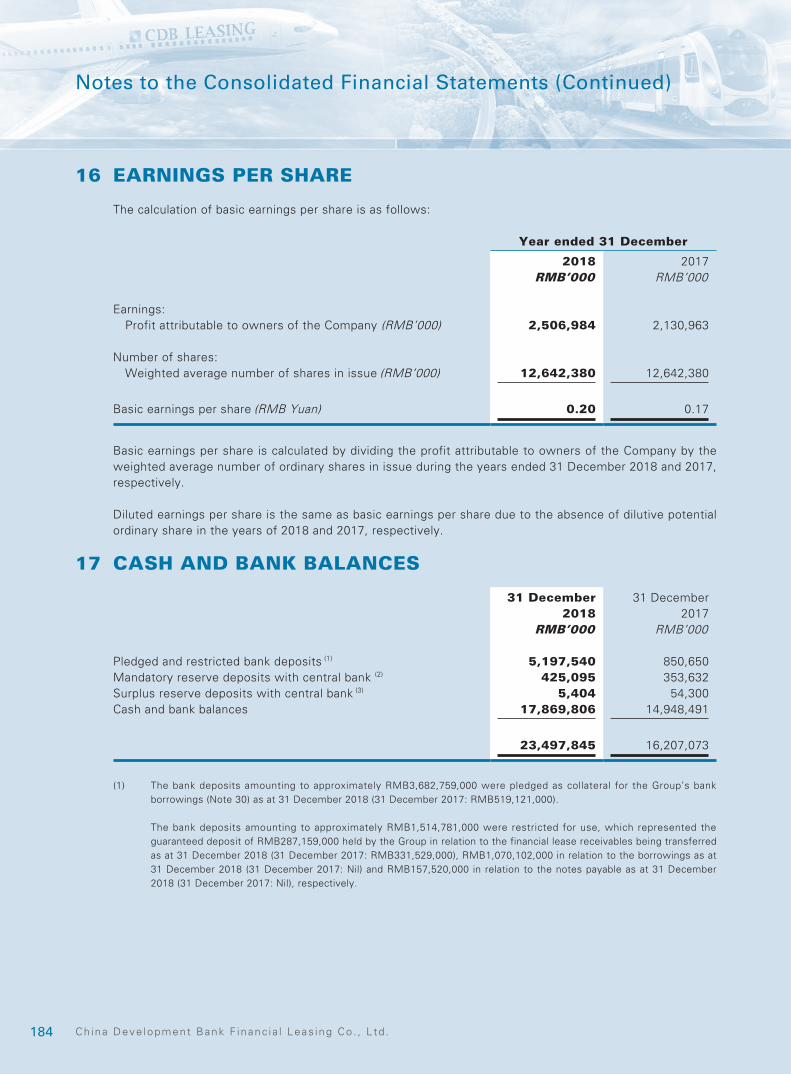
184 Ch ina Deve lopment Bank F inanc ia l Leas ing Co . , L td .
Notes to the Consolidated Financial Statements (Continued)
16 EARNINGS PER SHARE
The calculation of basic earnings per share is as follows:
Year ended 31 December 2018 2017
RMB’000 RMB’000
Earnings:Profit attributable to owners of the Company (RMB’000) 2,506,984 2,130,963
Number of shares:Weighted average number of shares in issue (RMB’000) 12,642,380 12,642,380
Basic earnings per share (RMB Yuan) 0.20 0.17
Basic earnings per share is calculated by dividing the profit attributable to owners of the Company by the weighted average number of ordinary shares in issue during the years ended 31 December 2018 and 2017, respectively.
Diluted earnings per share is the same as basic earnings per share due to the absence of dilutive potential ordinary share in the years of 2018 and 2017, respectively.
17 CASH AND BANK BALANCES
31 December 2018
31 December 2017
RMB’000 RMB’000
Pledged and restricted bank deposits (1) 5,197,540 850,650Mandatory reserve deposits with central bank (2) 425,095 353,632Surplus reserve deposits with central bank (3) 5,404 54,300Cash and bank balances 17,869,806 14,948,491
23,497,845 16,207,073
(1) The bank deposits amounting to approximately RMB3,682,759,000 were pledged as collateral for the Group’s bank borrowings (Note 30) as at 31 December 2018 (31 December 2017: RMB519,121,000).
The bank deposits amounting to approximately RMB1,514,781,000 were restricted for use, which represented the guaranteed deposit of RMB287,159,000 held by the Group in relation to the financial lease receivables being transferred as at 31 December 2018 (31 December 2017: RMB331,529,000), RMB1,070,102,000 in relation to the borrowings as at 31 December 2018 (31 December 2017: Nil) and RMB157,520,000 in relation to the notes payable as at 31 December 2018 (31 December 2017: Nil), respectively.
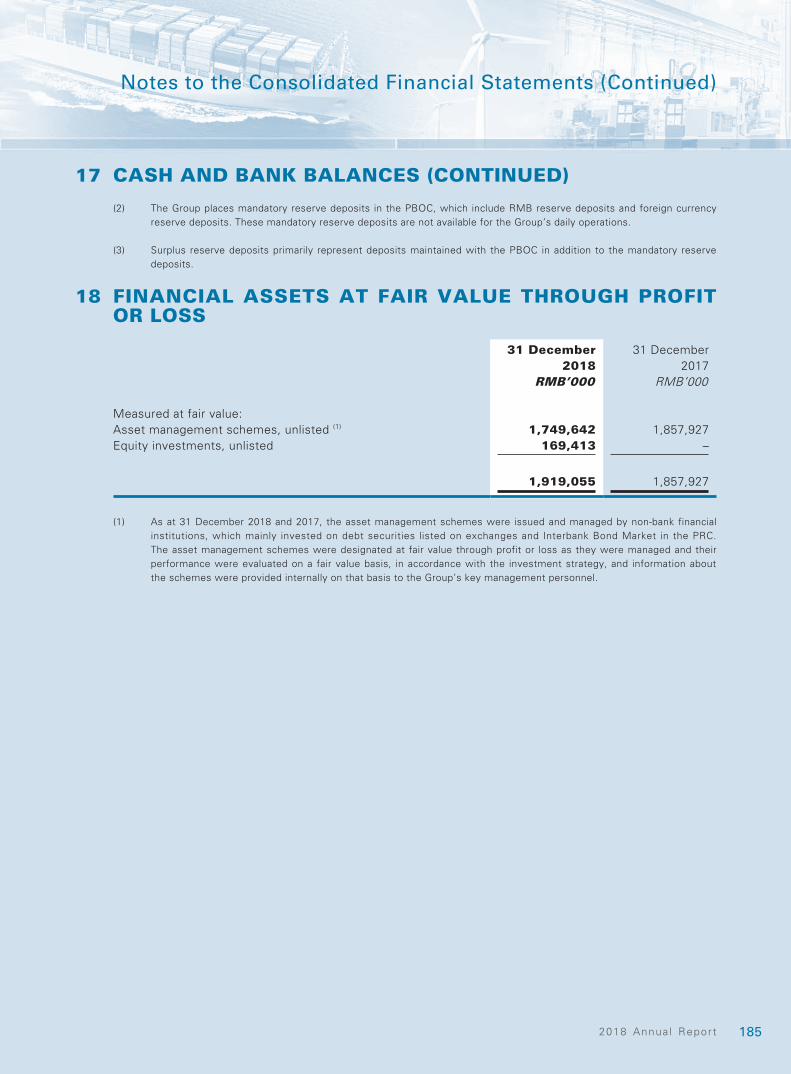
1852018 Annua l Report
Notes to the Consolidated Financial Statements (Continued)
17 CASH AND BANK BALANCES (CONTINUED)
(2) The Group places mandatory reserve deposits in the PBOC, which include RMB reserve deposits and foreign currency reserve deposits. These mandatory reserve deposits are not available for the Group’s daily operations.
(3) Surplus reserve deposits primarily represent deposits maintained with the PBOC in addition to the mandatory reserve deposits.
18 FINANCIAL ASSETS AT FAIR VALUE THROUGH PROFIT OR LOSS
31 December 2018
31 December 2017
RMB’000 RMB’000
Measured at fair value: Asset management schemes, unlisted (1) 1,749,642 1,857,927Equity investments, unlisted 169,413 –
1,919,055 1,857,927
(1) As at 31 December 2018 and 2017, the asset management schemes were issued and managed by non-bank financial institutions, which mainly invested on debt securities listed on exchanges and Interbank Bond Market in the PRC. The asset management schemes were designated at fair value through profit or loss as they were managed and their performance were evaluated on a fair value basis, in accordance with the investment strategy, and information about the schemes were provided internally on that basis to the Group’s key management personnel.
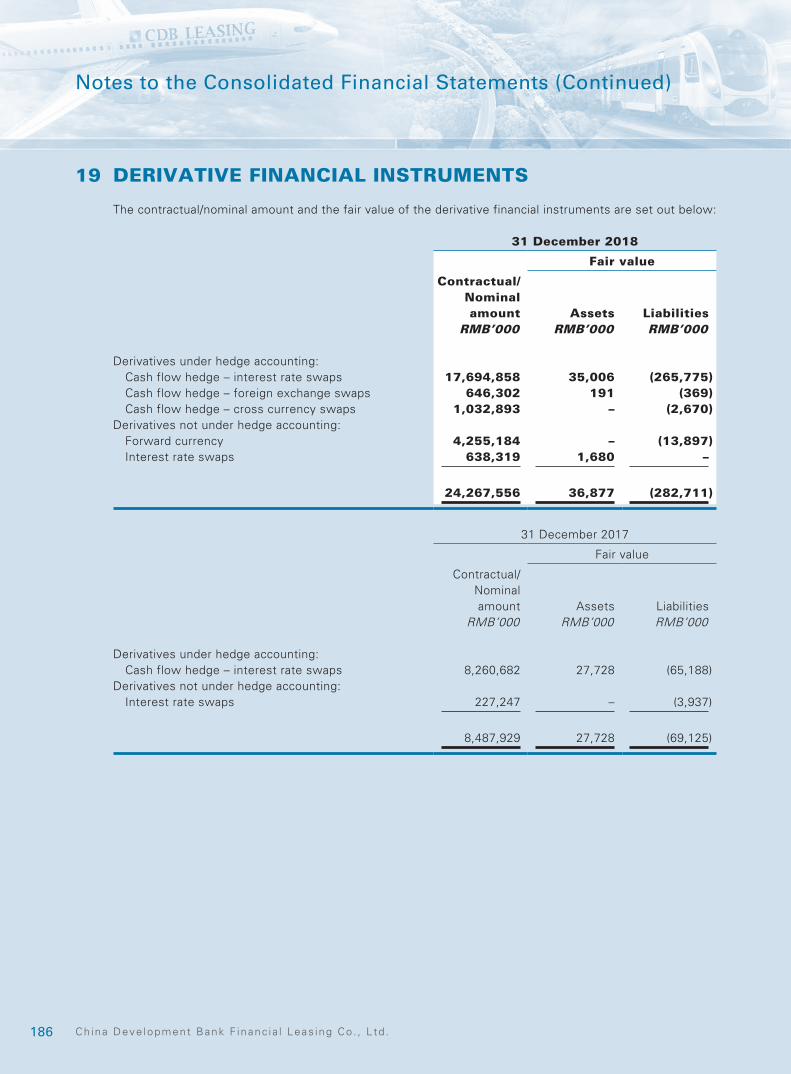
186 Ch ina Deve lopment Bank F inanc ia l Leas ing Co . , L td .
Notes to the Consolidated Financial Statements (Continued)
19 DERIVATIVE FINANCIAL INSTRUMENTS
The contractual/nominal amount and the fair value of the derivative financial instruments are set out below:
31 December 2018 Fair value
Contractual/Nominal amount Assets Liabilities
RMB’000 RMB’000 RMB’000
Derivatives under hedge accounting:Cash flow hedge – interest rate swaps 17,694,858 35,006 (265,775)Cash flow hedge – foreign exchange swaps 646,302 191 (369)Cash flow hedge – cross currency swaps 1,032,893 – (2,670)
Derivatives not under hedge accounting:Forward currency 4,255,184 – (13,897)Interest rate swaps 638,319 1,680 –
24,267,556 36,877 (282,711)
31 December 2017 Fair value
Contractual/Nominal
amount Assets LiabilitiesRMB’000 RMB’000 RMB’000
Derivatives under hedge accounting:Cash flow hedge – interest rate swaps 8,260,682 27,728 (65,188)
Derivatives not under hedge accounting: Interest rate swaps 227,247 – (3,937)
8,487,929 27,728 (69,125)

1872018 Annua l Report
Notes to the Consolidated Financial Statements (Continued)
20 FINANCIAL ASSETS AT FAIR VALUE THROUGH OTHER COMPREHENSIVE INCOME
31 December 2018
31 December 2017
RMB’000 RMB’000
Measured at fair value: Certificate of deposits – listed 495,740 –
Financial assets previously classified as AFS financial assets in 2017 were stated below:
31 December 2018
31 December 2017
RMB’000 RMB’000
Measured at cost: Equity investments – 13,000
Measured at fair value:
Bonds investments – listed – 266,573
– 279,573
21 ACCOUNTS RECEIVABLE
31 December 2018
31 December 2017
RMB’000 RMB’000
Operating lease receivables (1) 717,853 451,042Advances for finance lease projects (2) 5,338,291 6,384,326Other accounts receivable 12,083 19,887
6,068,227 6,855,255Less: Allowances for impairment losses
– Allowances for advances for finance lease projects (658,933) (245,216)– Allowances for operating lease receivables (3,642) –
5,405,652 6,610,039
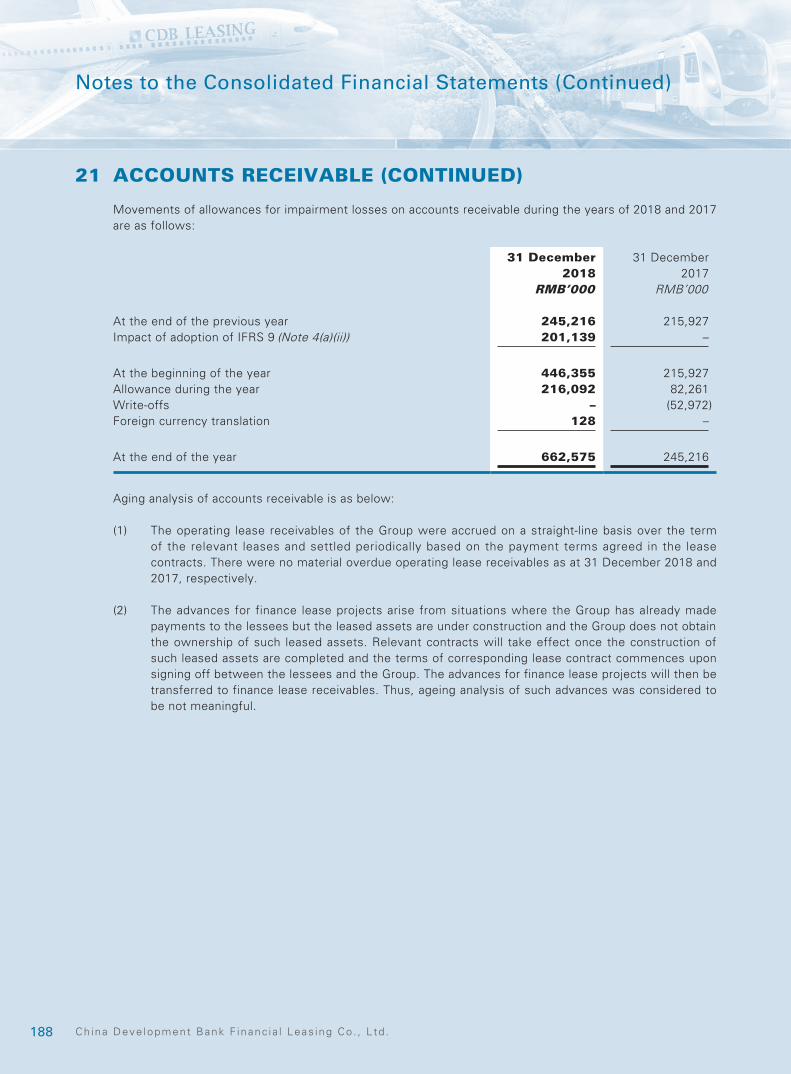
188 Ch ina Deve lopment Bank F inanc ia l Leas ing Co . , L td .
Notes to the Consolidated Financial Statements (Continued)
21 ACCOUNTS RECEIVABLE (CONTINUED)
Movements of allowances for impairment losses on accounts receivable during the years of 2018 and 2017 are as follows:
31 December 2018
31 December 2017
RMB’000 RMB’000
At the end of the previous year 245,216 215,927Impact of adoption of IFRS 9 (Note 4(a)(ii)) 201,139 –
At the beginning of the year 446,355 215,927Allowance during the year 216,092 82,261Write-offs – (52,972)Foreign currency translation 128 –
At the end of the year 662,575 245,216
Aging analysis of accounts receivable is as below:
(1) The operating lease receivables of the Group were accrued on a straight-line basis over the term of the relevant leases and settled periodically based on the payment terms agreed in the lease contracts. There were no material overdue operating lease receivables as at 31 December 2018 and 2017, respectively.
(2) The advances for finance lease projects arise from situations where the Group has already made payments to the lessees but the leased assets are under construction and the Group does not obtain the ownership of such leased assets. Relevant contracts will take effect once the construction of such leased assets are completed and the terms of corresponding lease contract commences upon signing off between the lessees and the Group. The advances for finance lease projects will then be transferred to finance lease receivables. Thus, ageing analysis of such advances was considered to be not meaningful.
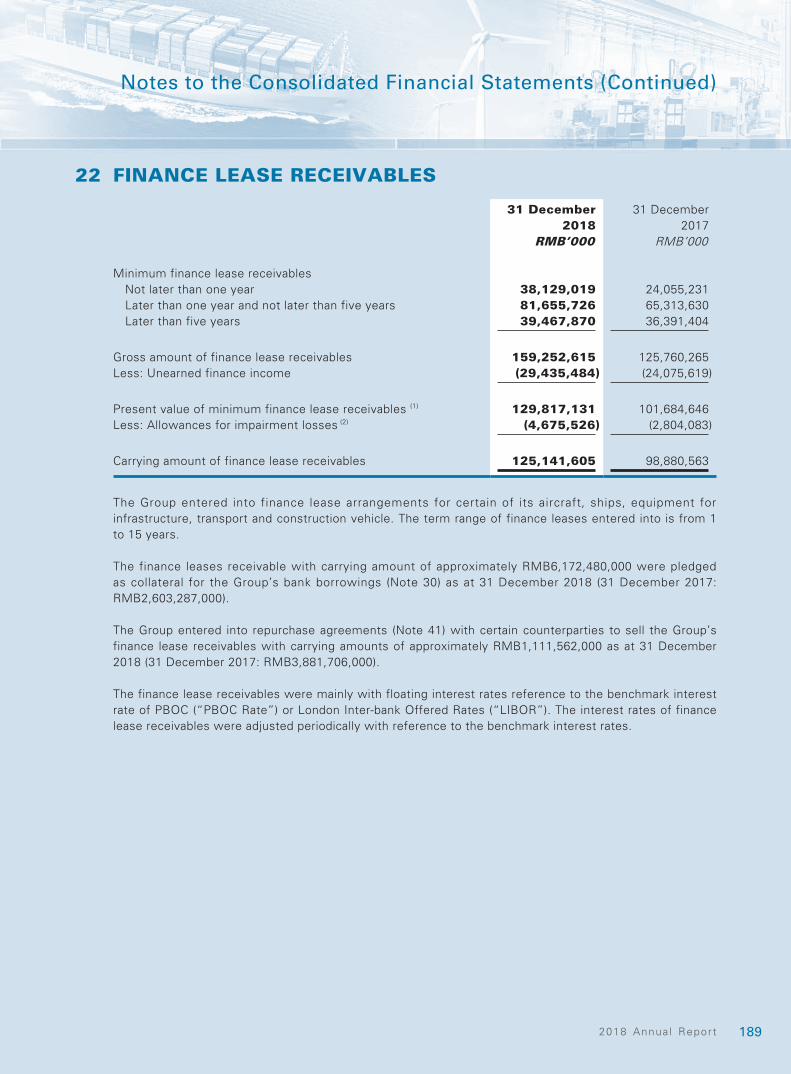
1892018 Annua l Report
Notes to the Consolidated Financial Statements (Continued)
22 FINANCE LEASE RECEIVABLES
31 December 2018
31 December 2017
RMB’000 RMB’000
Minimum finance lease receivables Not later than one year 38,129,019 24,055,231Later than one year and not later than five years 81,655,726 65,313,630Later than five years 39,467,870 36,391,404
Gross amount of finance lease receivables 159,252,615 125,760,265Less: Unearned finance income (29,435,484) (24,075,619)
Present value of minimum finance lease receivables (1) 129,817,131 101,684,646Less: Allowances for impairment losses (2) (4,675,526) (2,804,083)
Carrying amount of finance lease receivables 125,141,605 98,880,563
The Group entered into finance lease arrangements for certain of its aircraft, ships, equipment for infrastructure, transport and construction vehicle. The term range of finance leases entered into is from 1 to 15 years.
The finance leases receivable with carrying amount of approximately RMB6,172,480,000 were pledged as collateral for the Group’s bank borrowings (Note 30) as at 31 December 2018 (31 December 2017: RMB2,603,287,000).
The Group entered into repurchase agreements (Note 41) with certain counterparties to sell the Group’s finance lease receivables with carrying amounts of approximately RMB1,111,562,000 as at 31 December 2018 (31 December 2017: RMB3,881,706,000).
The finance lease receivables were mainly with floating interest rates reference to the benchmark interest rate of PBOC (“PBOC Rate”) or London Inter-bank Offered Rates (“LIBOR”). The interest rates of finance lease receivables were adjusted periodically with reference to the benchmark interest rates.
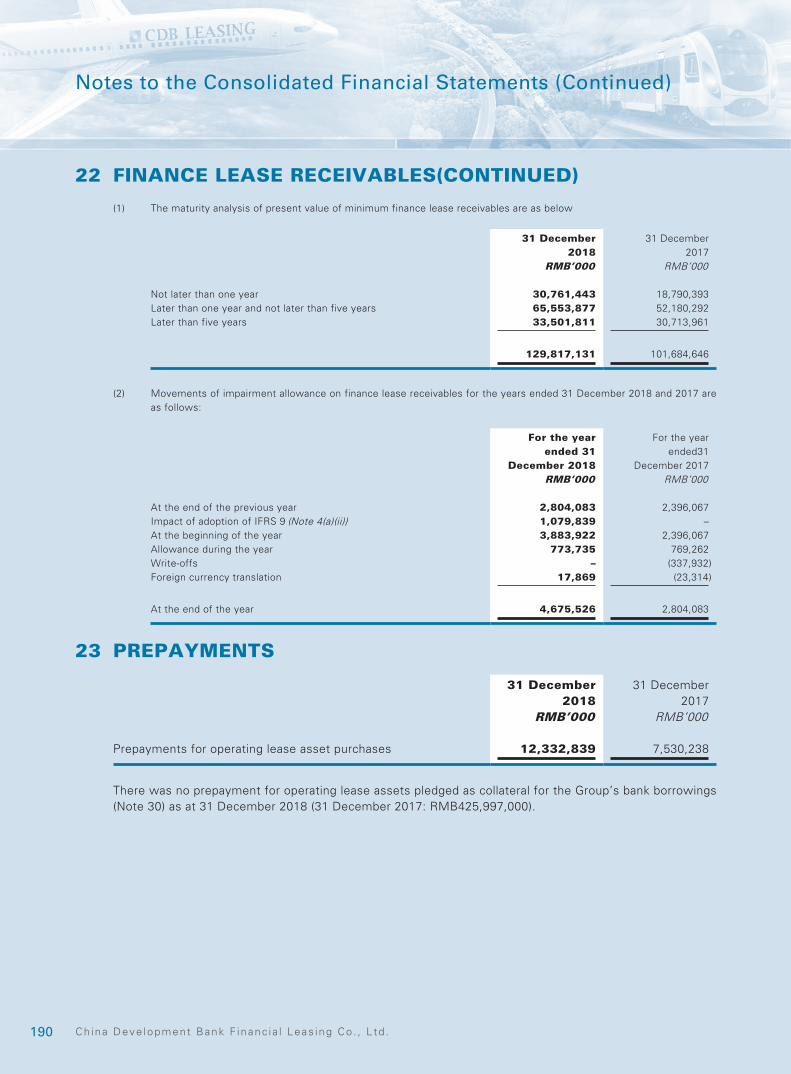
190 Ch ina Deve lopment Bank F inanc ia l Leas ing Co . , L td .
Notes to the Consolidated Financial Statements (Continued)
22 FINANCE LEASE RECEIVABLES(CONTINUED)
(1) The maturity analysis of present value of minimum finance lease receivables are as below
31 December 2018
31 December 2017
RMB’000 RMB’000
Not later than one year 30,761,443 18,790,393Later than one year and not later than five years 65,553,877 52,180,292Later than five years 33,501,811 30,713,961
129,817,131 101,684,646
(2) Movements of impairment allowance on finance lease receivables for the years ended 31 December 2018 and 2017 are as follows:
For the year ended 31
December 2018
For the year ended31
December 2017RMB’000 RMB’000
At the end of the previous year 2,804,083 2,396,067Impact of adoption of IFRS 9 (Note 4(a)(ii)) 1,079,839 –At the beginning of the year 3,883,922 2,396,067Allowance during the year 773,735 769,262Write-offs – (337,932)Foreign currency translation 17,869 (23,314)
At the end of the year 4,675,526 2,804,083
23 PREPAYMENTS
31 December 2018
31 December 2017
RMB’000 RMB’000
Prepayments for operating lease asset purchases 12,332,839 7,530,238
There was no prepayment for operating lease assets pledged as collateral for the Group’s bank borrowings (Note 30) as at 31 December 2018 (31 December 2017: RMB425,997,000).
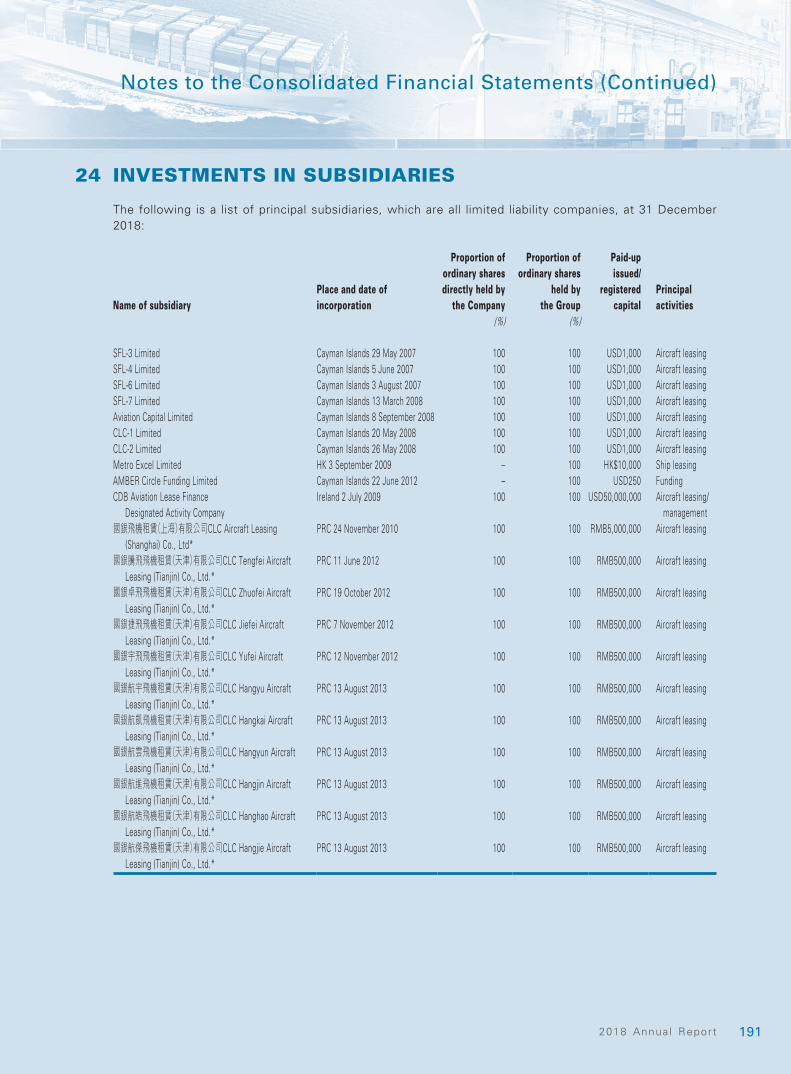
1912018 Annua l Report
Notes to the Consolidated Financial Statements (Continued)
24 INVESTMENTS IN SUBSIDIARIES
The following is a list of principal subsidiaries, which are all limited liability companies, at 31 December 2018:
Name of subsidiaryPlace and date of incorporation
Proportion of ordinary shares directly held by
the Company
Proportion of ordinary shares
held by the Group
Paid-up issued/
registered capital
Principal activities
(%) (%)
SFL-3 Limited Cayman Islands 29 May 2007 100 100 USD1,000 Aircraft leasingSFL-4 Limited Cayman Islands 5 June 2007 100 100 USD1,000 Aircraft leasingSFL-6 Limited Cayman Islands 3 August 2007 100 100 USD1,000 Aircraft leasingSFL-7 Limited Cayman Islands 13 March 2008 100 100 USD1,000 Aircraft leasingAviation Capital Limited Cayman Islands 8 September 2008 100 100 USD1,000 Aircraft leasingCLC-1 Limited Cayman Islands 20 May 2008 100 100 USD1,000 Aircraft leasingCLC-2 Limited Cayman Islands 26 May 2008 100 100 USD1,000 Aircraft leasingMetro Excel Limited HK 3 September 2009 – 100 HK$10,000 Ship leasingAMBER Circle Funding Limited Cayman Islands 22 June 2012 – 100 USD250 FundingCDB Aviation Lease Finance
Designated Activity CompanyIreland 2 July 2009 100 100 USD50,000,000 Aircraft leasing/
management國銀飛機租賃(上海)有限公司CLC Aircraft Leasing
(Shanghai) Co., Ltd*PRC 24 November 2010 100 100 RMB5,000,000 Aircraft leasing
國銀騰飛飛機租賃(天津)有限公司CLC Tengfei Aircraft Leasing (Tianjin) Co., Ltd.*
PRC 11 June 2012 100 100 RMB500,000 Aircraft leasing
國銀卓飛飛機租賃(天津)有限公司CLC Zhuofei Aircraft Leasing (Tianjin) Co., Ltd.*
PRC 19 October 2012 100 100 RMB500,000 Aircraft leasing
國銀捷飛飛機租賃(天津)有限公司CLC Jiefei Aircraft Leasing (Tianjin) Co., Ltd.*
PRC 7 November 2012 100 100 RMB500,000 Aircraft leasing
國銀宇飛飛機租賃(天津)有限公司CLC Yufei Aircraft Leasing (Tianjin) Co., Ltd.*
PRC 12 November 2012 100 100 RMB500,000 Aircraft leasing
國銀航宇飛機租賃(天津)有限公司CLC Hangyu Aircraft Leasing (Tianjin) Co., Ltd.*
PRC 13 August 2013 100 100 RMB500,000 Aircraft leasing
國銀航凱飛機租賃(天津)有限公司CLC Hangkai Aircraft Leasing (Tianjin) Co., Ltd.*
PRC 13 August 2013 100 100 RMB500,000 Aircraft leasing
國銀航雲飛機租賃(天津)有限公司CLC Hangyun Aircraft Leasing (Tianjin) Co., Ltd.*
PRC 13 August 2013 100 100 RMB500,000 Aircraft leasing
國銀航進飛機租賃(天津)有限公司CLC Hangjin Aircraft Leasing (Tianjin) Co., Ltd.*
PRC 13 August 2013 100 100 RMB500,000 Aircraft leasing
國銀航皓飛機租賃(天津)有限公司CLC Hanghao Aircraft Leasing (Tianjin) Co., Ltd.*
PRC 13 August 2013 100 100 RMB500,000 Aircraft leasing
國銀航傑飛機租賃(天津)有限公司CLC Hangjie Aircraft Leasing (Tianjin) Co., Ltd.*
PRC 13 August 2013 100 100 RMB500,000 Aircraft leasing

192 Ch ina Deve lopment Bank F inanc ia l Leas ing Co . , L td .
Notes to the Consolidated Financial Statements (Continued)
24 INVESTMENTS IN SUBSIDIARIES (CONTINUED)
Name of subsidiaryPlace and date of incorporation
Proportion of ordinary shares directly held by
the Company
Proportion of ordinary shares
held by the Group
Paid-up issued/
registered capital
Principal activities
(%) (%)
國銀航軒飛機租賃(天津)有限公司CLC Hangxuan Aircraft Leasing (Tianjin) Co., Ltd.*
PRC 13 August 2013 100 100 RMB500,000 Aircraft leasing
國銀航慶飛機租賃(天津)有限公司CLC Hangqing Aircraft Leasing (Tianjin) Co., Ltd.*
PRC 11 November 2014 100 100 RMB500,000 Aircraft leasing
國銀航遠飛機租賃(天津) 有限公司CLC Hangyuan Aircraft Leasing (Tianjin) Co., Ltd.*
PRC 11 November 2014 100 100 RMB500,000 Aircraft leasing
國銀航川飛機租賃(天津)有限公司CLC Hangchuan Aircraft Leasing (Tianjin) Co., Ltd.*
PRC 11 November 2014 100 100 RMB500,000 Aircraft leasing
國銀航隆飛機租賃(天津)有限公司CLC Hanglong Aircraft Leasing (Tianjin) Co., Ltd.*
PRC 12 November 2014 100 100 RMB500,000 Aircraft leasing
國銀航錦飛機租賃(天津)有限公司CLC Hangjin Aircraft Leasing (Tianjin) Co., Ltd.*
PRC 13 July 2015 100 100 RMB500,000 Aircraft leasing
國銀航鵬飛機租賃(天津)有限公司CLC Hangpeng Aircraft Leasing (Tianjin) Co., Ltd.*
PRC 13 July 2015 100 100 RMB500,000 Aircraft leasing
國銀航通飛機租賃(天津)有限公司CLC Hangtong Aircraft Leasing (Tianjin) Co., Ltd.*
PRC 13 July 2015 100 100 RMB500,000 Aircraft leasing
國銀慧天飛機租賃(廈門)有限公司CLC Huitian Aircraft Leasing (Xiamen) Co., Ltd.*
PRC 10 August 2015 100 100 RMB100,000 Aircraft leasing
* These subsidiaries do not have official English names. English translated names are for identification only.
The above table lists the subsidiaries of the Group which, in opinion of the management of the Group, principally affected the results of the year or formed a substantial portion of the net assets of the Group. To give details of other subsidiaries would result in particulars of excessive length.
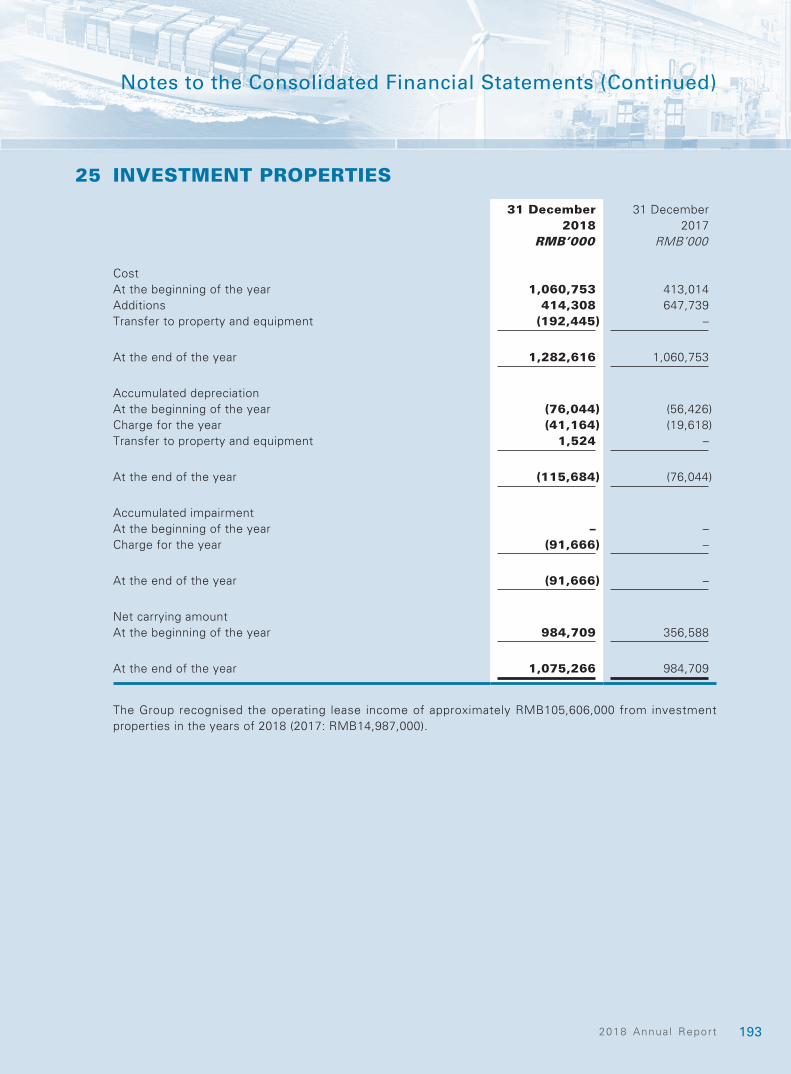
1932018 Annua l Report
Notes to the Consolidated Financial Statements (Continued)
25 INVESTMENT PROPERTIES
31 December 2018
31 December 2017
RMB’000 RMB’000
Cost At the beginning of the year 1,060,753 413,014Additions 414,308 647,739Transfer to property and equipment (192,445) –
At the end of the year 1,282,616 1,060,753
Accumulated depreciationAt the beginning of the year (76,044) (56,426)Charge for the year (41,164) (19,618)Transfer to property and equipment 1,524 –
At the end of the year (115,684) (76,044)
Accumulated impairmentAt the beginning of the year – –Charge for the year (91,666) –
At the end of the year (91,666) –
Net carrying amountAt the beginning of the year 984,709 356,588
At the end of the year 1,075,266 984,709
The Group recognised the operating lease income of approximately RMB105,606,000 from investment properties in the years of 2018 (2017: RMB14,987,000).
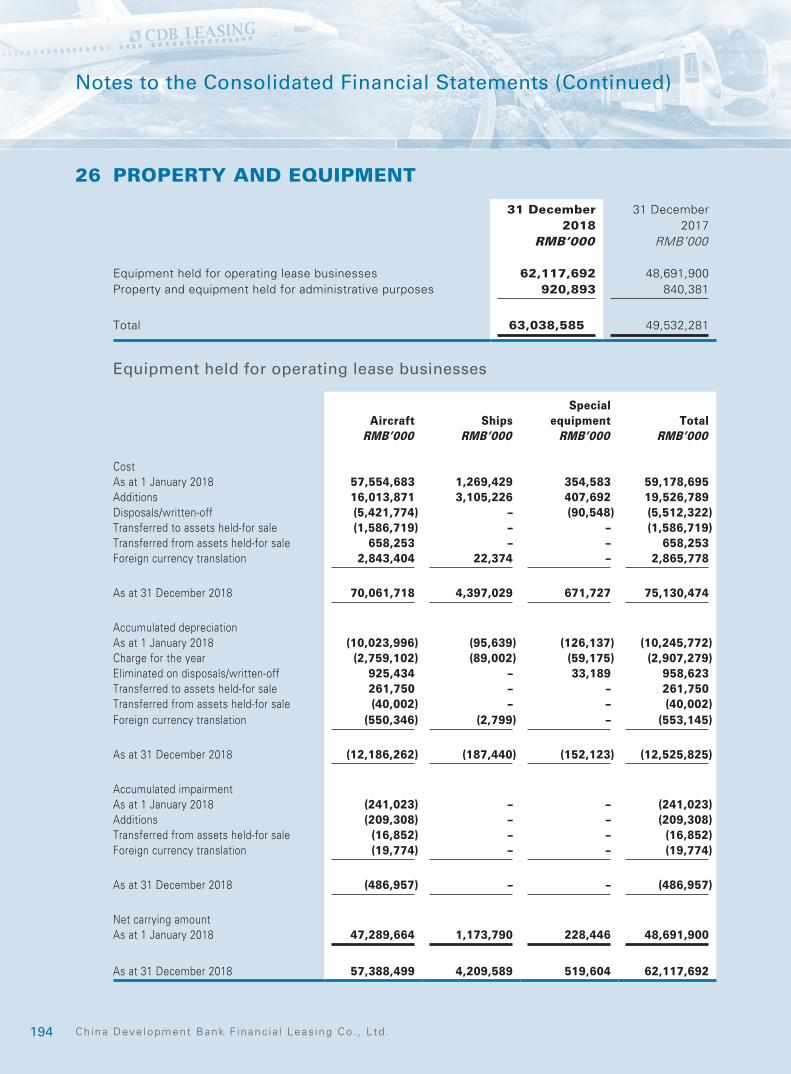
194 Ch ina Deve lopment Bank F inanc ia l Leas ing Co . , L td .
Notes to the Consolidated Financial Statements (Continued)
26 PROPERTY AND EQUIPMENT
31 December 2018
31 December 2017
RMB’000 RMB’000
Equipment held for operating lease businesses 62,117,692 48,691,900Property and equipment held for administrative purposes 920,893 840,381
Total 63,038,585 49,532,281
Equipment held for operating lease businesses
Aircraft ShipsSpecial
equipment TotalRMB’000 RMB’000 RMB’000 RMB’000
CostAs at 1 January 2018 57,554,683 1,269,429 354,583 59,178,695Additions 16,013,871 3,105,226 407,692 19,526,789Disposals/written-off (5,421,774) – (90,548) (5,512,322)Transferred to assets held-for sale (1,586,719) – – (1,586,719)Transferred from assets held-for sale 658,253 – – 658,253Foreign currency translation 2,843,404 22,374 – 2,865,778
As at 31 December 2018 70,061,718 4,397,029 671,727 75,130,474
Accumulated depreciationAs at 1 January 2018 (10,023,996) (95,639) (126,137) (10,245,772)Charge for the year (2,759,102) (89,002) (59,175) (2,907,279)Eliminated on disposals/written-off 925,434 – 33,189 958,623Transferred to assets held-for sale 261,750 – – 261,750Transferred from assets held-for sale (40,002) – – (40,002)Foreign currency translation (550,346) (2,799) – (553,145)
As at 31 December 2018 (12,186,262) (187,440) (152,123) (12,525,825)
Accumulated impairmentAs at 1 January 2018 (241,023) – – (241,023)Additions (209,308) – – (209,308)Transferred from assets held-for sale (16,852) – – (16,852)Foreign currency translation (19,774) – – (19,774)
As at 31 December 2018 (486,957) – – (486,957)
Net carrying amountAs at 1 January 2018 47,289,664 1,173,790 228,446 48,691,900
As at 31 December 2018 57,388,499 4,209,589 519,604 62,117,692
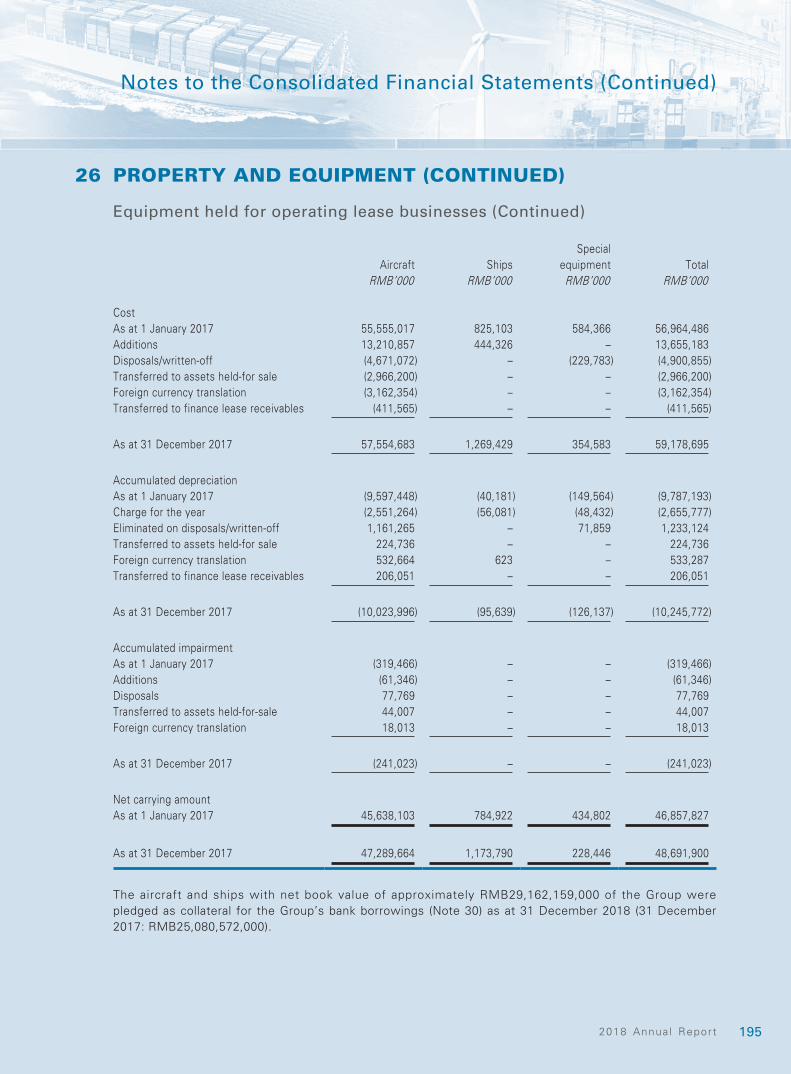
1952018 Annua l Report
Notes to the Consolidated Financial Statements (Continued)
26 PROPERTY AND EQUIPMENT (CONTINUED)
Equipment held for operating lease businesses (Continued)
Aircraft ShipsSpecial
equipment TotalRMB’000 RMB’000 RMB’000 RMB’000
CostAs at 1 January 2017 55,555,017 825,103 584,366 56,964,486Additions 13,210,857 444,326 – 13,655,183Disposals/written-off (4,671,072) – (229,783) (4,900,855)Transferred to assets held-for sale (2,966,200) – – (2,966,200)Foreign currency translation (3,162,354) – – (3,162,354)Transferred to finance lease receivables (411,565) – – (411,565)
As at 31 December 2017 57,554,683 1,269,429 354,583 59,178,695
Accumulated depreciationAs at 1 January 2017 (9,597,448) (40,181) (149,564) (9,787,193)Charge for the year (2,551,264) (56,081) (48,432) (2,655,777)Eliminated on disposals/written-off 1,161,265 – 71,859 1,233,124Transferred to assets held-for sale 224,736 – – 224,736Foreign currency translation 532,664 623 – 533,287Transferred to finance lease receivables 206,051 – – 206,051
As at 31 December 2017 (10,023,996) (95,639) (126,137) (10,245,772)
Accumulated impairmentAs at 1 January 2017 (319,466) – – (319,466)Additions (61,346) – – (61,346)Disposals 77,769 – – 77,769Transferred to assets held-for-sale 44,007 – – 44,007Foreign currency translation 18,013 – – 18,013
As at 31 December 2017 (241,023) – – (241,023)
Net carrying amountAs at 1 January 2017 45,638,103 784,922 434,802 46,857,827
As at 31 December 2017 47,289,664 1,173,790 228,446 48,691,900
The aircraft and ships with net book value of approximately RMB29,162,159,000 of the Group were pledged as collateral for the Group’s bank borrowings (Note 30) as at 31 December 2018 (31 December 2017: RMB25,080,572,000).
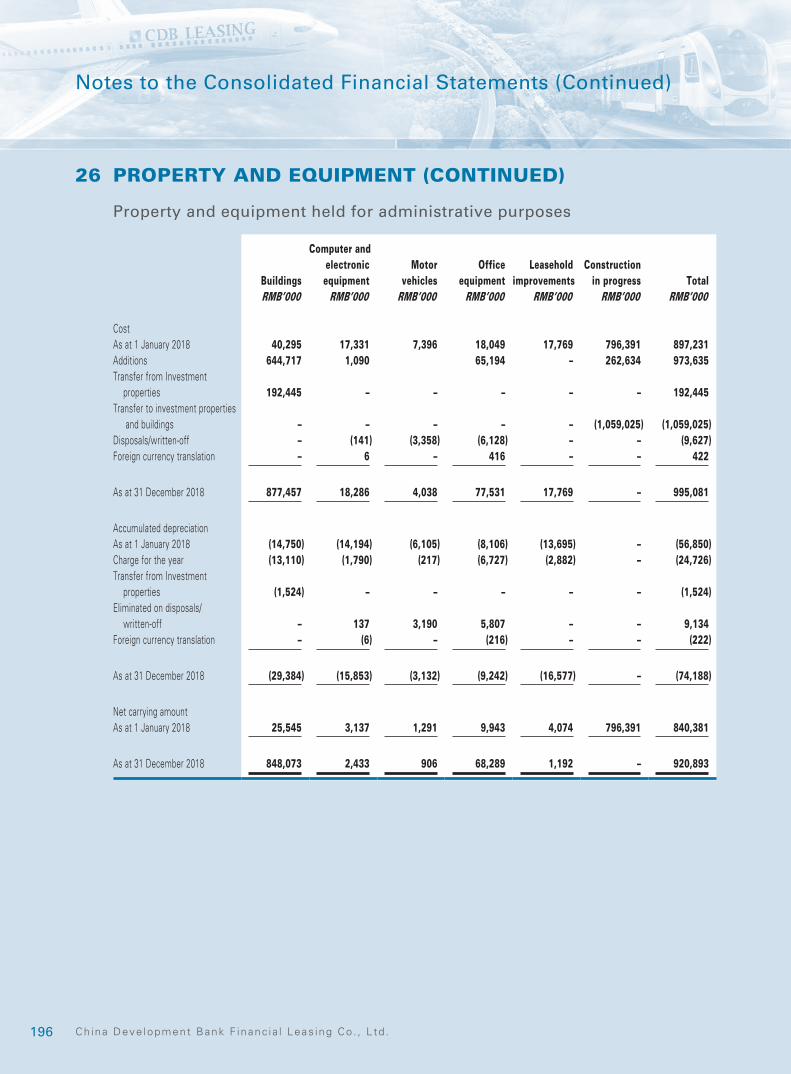
196 Ch ina Deve lopment Bank F inanc ia l Leas ing Co . , L td .
Notes to the Consolidated Financial Statements (Continued)
26 PROPERTY AND EQUIPMENT (CONTINUED)
Property and equipment held for administrative purposes
Buildings
Computer and electronic
equipmentMotor
vehiclesOffice
equipmentLeasehold
improvementsConstruction
in progress TotalRMB’000 RMB’000 RMB’000 RMB’000 RMB’000 RMB’000 RMB’000
CostAs at 1 January 2018 40,295 17,331 7,396 18,049 17,769 796,391 897,231Additions 644,717 1,090 65,194 – 262,634 973,635Transfer from Investment
properties 192,445 – – – – – 192,445Transfer to investment properties
and buildings – – – – – (1,059,025) (1,059,025)Disposals/written-off – (141) (3,358) (6,128) – – (9,627)Foreign currency translation – 6 – 416 – – 422
As at 31 December 2018 877,457 18,286 4,038 77,531 17,769 – 995,081
Accumulated depreciationAs at 1 January 2018 (14,750) (14,194) (6,105) (8,106) (13,695) – (56,850)Charge for the year (13,110) (1,790) (217) (6,727) (2,882) – (24,726)Transfer from Investment
properties (1,524) – – – – – (1,524)Eliminated on disposals/
written-off – 137 3,190 5,807 – – 9,134Foreign currency translation – (6) – (216) – – (222)
As at 31 December 2018 (29,384) (15,853) (3,132) (9,242) (16,577) – (74,188)
Net carrying amountAs at 1 January 2018 25,545 3,137 1,291 9,943 4,074 796,391 840,381
As at 31 December 2018 848,073 2,433 906 68,289 1,192 – 920,893
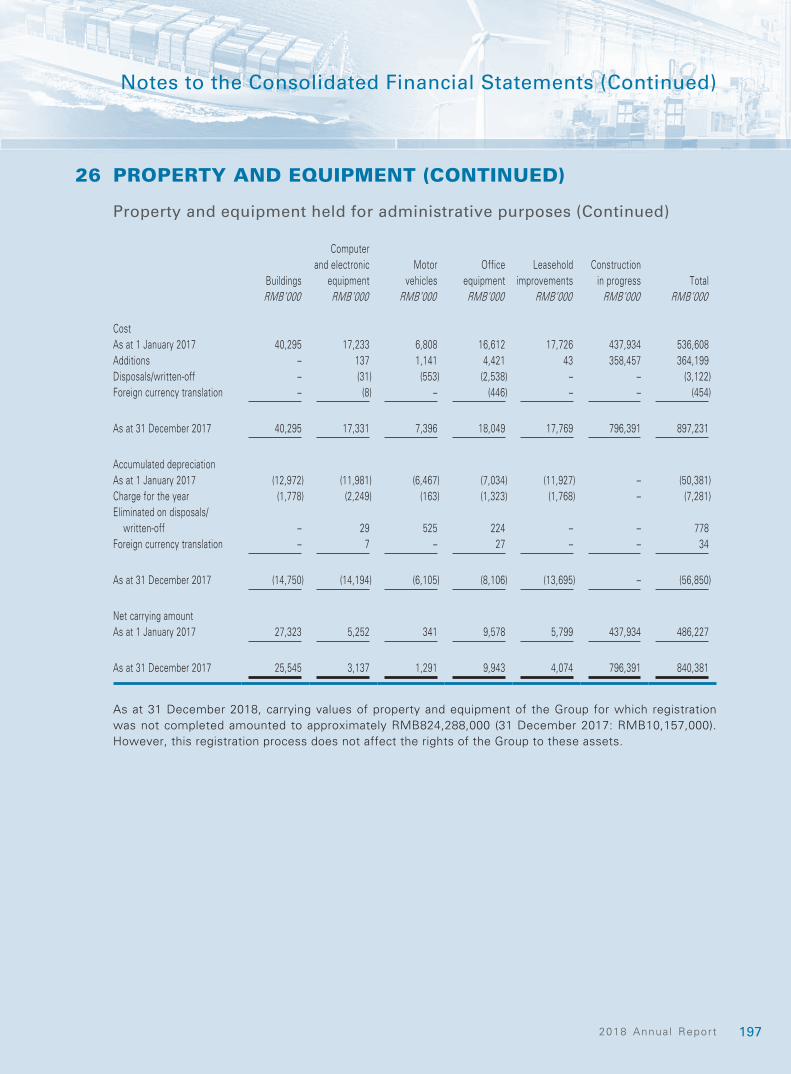
1972018 Annua l Report
Notes to the Consolidated Financial Statements (Continued)
26 PROPERTY AND EQUIPMENT (CONTINUED)
Property and equipment held for administrative purposes (Continued)
Buildings
Computer and electronic
equipmentMotor
vehiclesOffice
equipmentLeasehold
improvementsConstruction
in progress TotalRMB’000 RMB’000 RMB’000 RMB’000 RMB’000 RMB’000 RMB’000
CostAs at 1 January 2017 40,295 17,233 6,808 16,612 17,726 437,934 536,608Additions – 137 1,141 4,421 43 358,457 364,199Disposals/written-off – (31) (553) (2,538) – – (3,122)Foreign currency translation – (8) – (446) – – (454)
As at 31 December 2017 40,295 17,331 7,396 18,049 17,769 796,391 897,231
Accumulated depreciationAs at 1 January 2017 (12,972) (11,981) (6,467) (7,034) (11,927) – (50,381)Charge for the year (1,778) (2,249) (163) (1,323) (1,768) – (7,281)Eliminated on disposals/
written-off – 29 525 224 – – 778Foreign currency translation – 7 – 27 – – 34
As at 31 December 2017 (14,750) (14,194) (6,105) (8,106) (13,695) – (56,850)
Net carrying amountAs at 1 January 2017 27,323 5,252 341 9,578 5,799 437,934 486,227
As at 31 December 2017 25,545 3,137 1,291 9,943 4,074 796,391 840,381
As at 31 December 2018, carrying values of property and equipment of the Group for which registration was not completed amounted to approximately RMB824,288,000 (31 December 2017: RMB10,157,000). However, this registration process does not affect the rights of the Group to these assets.
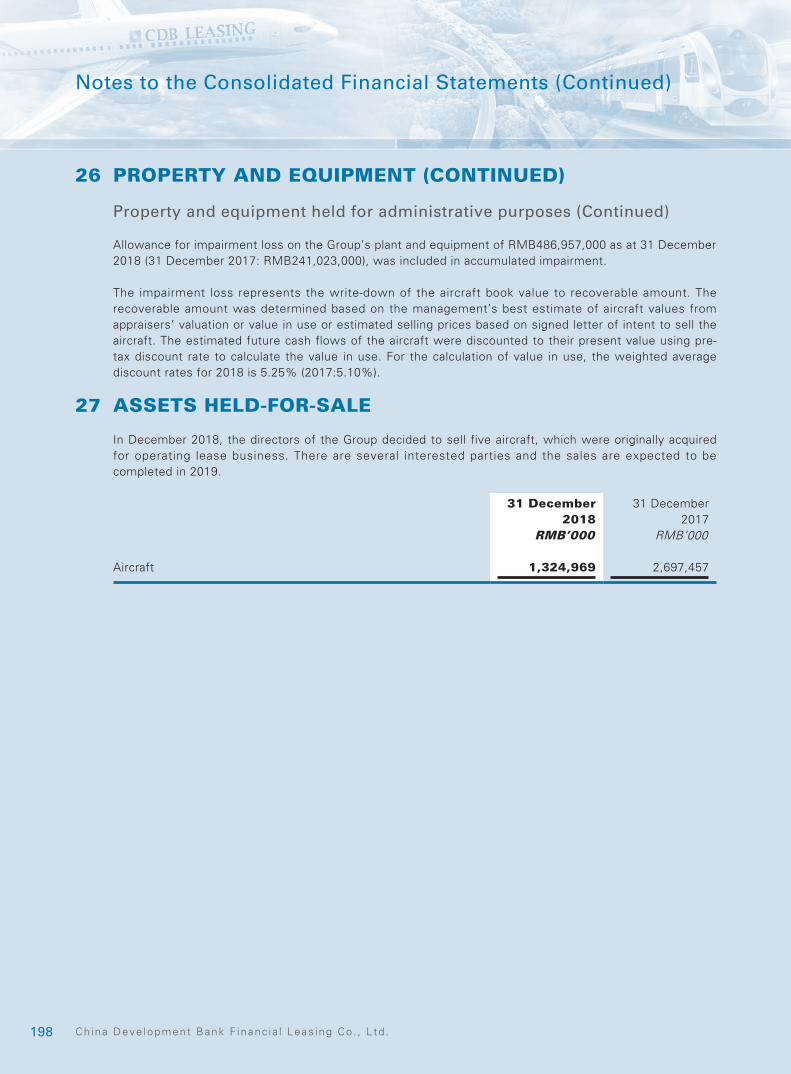
198 Ch ina Deve lopment Bank F inanc ia l Leas ing Co . , L td .
Notes to the Consolidated Financial Statements (Continued)
26 PROPERTY AND EQUIPMENT (CONTINUED)
Property and equipment held for administrative purposes (Continued)
Allowance for impairment loss on the Group’s plant and equipment of RMB486,957,000 as at 31 December 2018 (31 December 2017: RMB241,023,000), was included in accumulated impairment.
The impairment loss represents the write-down of the aircraft book value to recoverable amount. The recoverable amount was determined based on the management’s best estimate of aircraft values from appraisers’ valuation or value in use or estimated selling prices based on signed letter of intent to sell the aircraft. The estimated future cash flows of the aircraft were discounted to their present value using pre-tax discount rate to calculate the value in use. For the calculation of value in use, the weighted average discount rates for 2018 is 5.25% (2017:5.10%).
27 ASSETS HELD-FOR-SALE
In December 2018, the directors of the Group decided to sell five aircraft, which were originally acquired for operating lease business. There are several interested parties and the sales are expected to be completed in 2019.
31 December 2018
31 December 2017
RMB’000 RMB’000
Aircraft 1,324,969 2,697,457

1992018 Annua l Report
Notes to the Consolidated Financial Statements (Continued)
28 DEFERRED TAXATION
For presentation purpose, certain deferred tax assets and deferred tax liabilities have been offset. The following is an analysis of the deferred tax balances for financial reporting purposes:
31 December 2018
31 December 2017
RMB’000 RMB’000
Deferred tax assets – Deferred tax asset to be recovered after more than 12 months 1,083,049 635,225– Deferred tax asset to be recovered within 12 months 5,123 7,310
1,088,172 642,535
Deferred tax liabilities– Deferred tax liability to be recovered after more than 12 months (524,963) (540,123)– Deferred tax liability to be recovered within 12 months (89,118) –
(614,081) (540,123)
474,091 102,412
Deferred income tax liabilities of RMB256 million (2017: RMB78 million) have not been recognised for the taxable temporary differences arising from undistributed profit of foreign subsidiaries given that the timing of the reversal of the temporary difference is controlled by the Group and the directors of the Group are of the view that it is probable that the temporary differences will not be reversed in the foreseeable future.
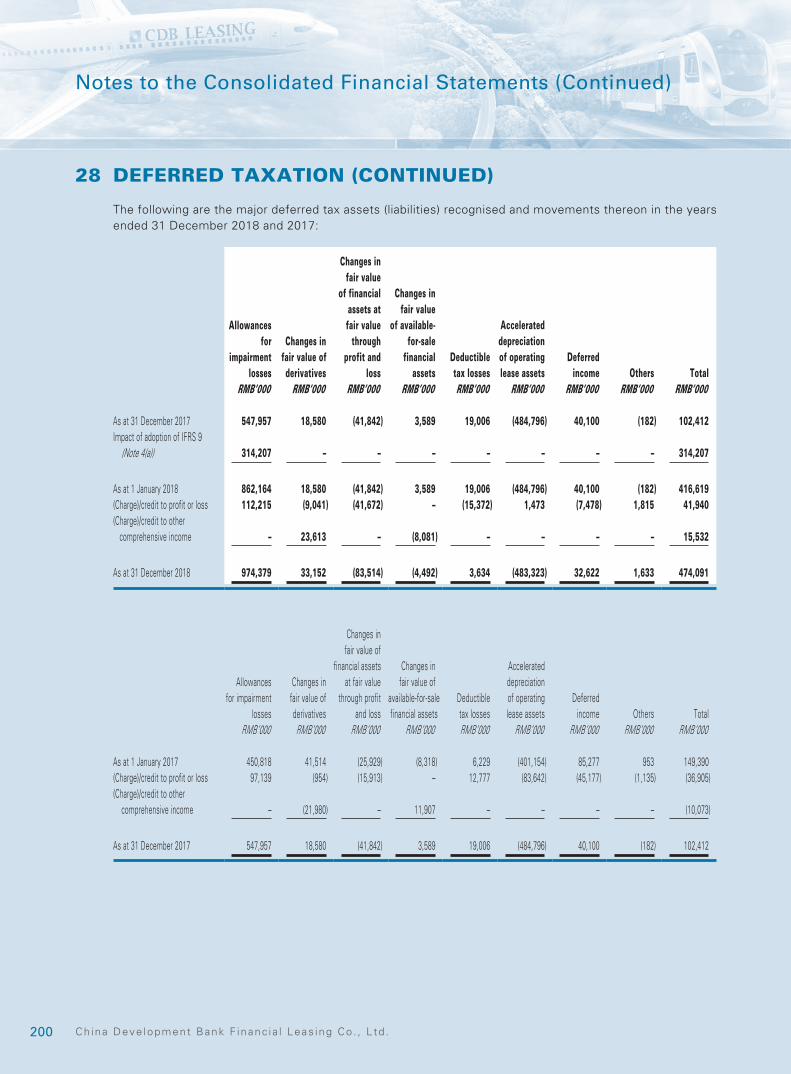
200 Ch ina Deve lopment Bank F inanc ia l Leas ing Co . , L td .
Notes to the Consolidated Financial Statements (Continued)
28 DEFERRED TAXATION (CONTINUED)
The following are the major deferred tax assets (liabilities) recognised and movements thereon in the years ended 31 December 2018 and 2017:
Allowances for
impairment losses
Changes in fair value of
derivatives
Changes in fair value
of financial assets at fair value
through profit and
loss
Changes in fair value
of available-for-sale
financial assets
Deductible tax losses
Accelerated depreciation of operating lease assets
Deferredincome Others Total
RMB’000 RMB’000 RMB’000 RMB’000 RMB’000 RMB’000 RMB’000 RMB’000 RMB’000
As at 31 December 2017 547,957 18,580 (41,842) 3,589 19,006 (484,796) 40,100 (182) 102,412Impact of adoption of IFRS 9
(Note 4(a)) 314,207 – – – – – – – 314,207
As at 1 January 2018 862,164 18,580 (41,842) 3,589 19,006 (484,796) 40,100 (182) 416,619(Charge)/credit to profit or loss 112,215 (9,041) (41,672) – (15,372) 1,473 (7,478) 1,815 41,940(Charge)/credit to other
comprehensive income – 23,613 – (8,081) – – – – 15,532
As at 31 December 2018 974,379 33,152 (83,514) (4,492) 3,634 (483,323) 32,622 1,633 474,091
Allowances for impairment
losses
Changes in fair value of
derivatives
Changes in fair value of
financial assets at fair value
through profit and loss
Changes in fair value of
available-for-sale financial assets
Deductible tax losses
Accelerated depreciation of operating lease assets
Deferred income Others Total
RMB’000 RMB’000 RMB’000 RMB’000 RMB’000 RMB’000 RMB’000 RMB’000 RMB’000
As at 1 January 2017 450,818 41,514 (25,929) (8,318) 6,229 (401,154) 85,277 953 149,390(Charge)/credit to profit or loss 97,139 (954) (15,913) – 12,777 (83,642) (45,177) (1,135) (36,905)(Charge)/credit to other
comprehensive income – (21,980) – 11,907 – – – – (10,073)
As at 31 December 2017 547,957 18,580 (41,842) 3,589 19,006 (484,796) 40,100 (182) 102,412
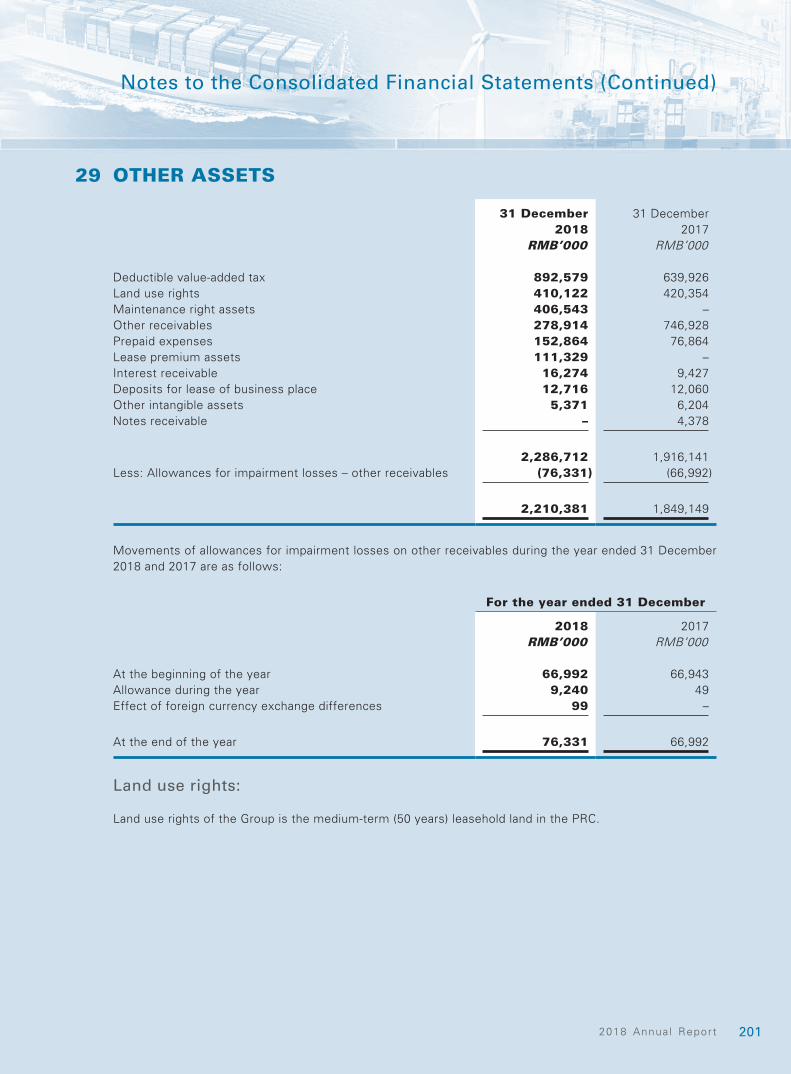
2012018 Annua l Report
Notes to the Consolidated Financial Statements (Continued)
29 OTHER ASSETS
31 December 2018
31 December 2017
RMB’000 RMB’000
Deductible value-added tax 892,579 639,926Land use rights 410,122 420,354Maintenance right assets 406,543 –Other receivables 278,914 746,928Prepaid expenses 152,864 76,864Lease premium assets 111,329 –Interest receivable 16,274 9,427Deposits for lease of business place 12,716 12,060Other intangible assets 5,371 6,204Notes receivable – 4,378
2,286,712 1,916,141Less: Allowances for impairment losses – other receivables (76,331) (66,992)
2,210,381 1,849,149
Movements of allowances for impairment losses on other receivables during the year ended 31 December 2018 and 2017 are as follows:
For the year ended 31 December
2018 2017RMB’000 RMB’000
At the beginning of the year 66,992 66,943Allowance during the year 9,240 49Effect of foreign currency exchange differences 99 –
At the end of the year 76,331 66,992
Land use rights:
Land use rights of the Group is the medium-term (50 years) leasehold land in the PRC.
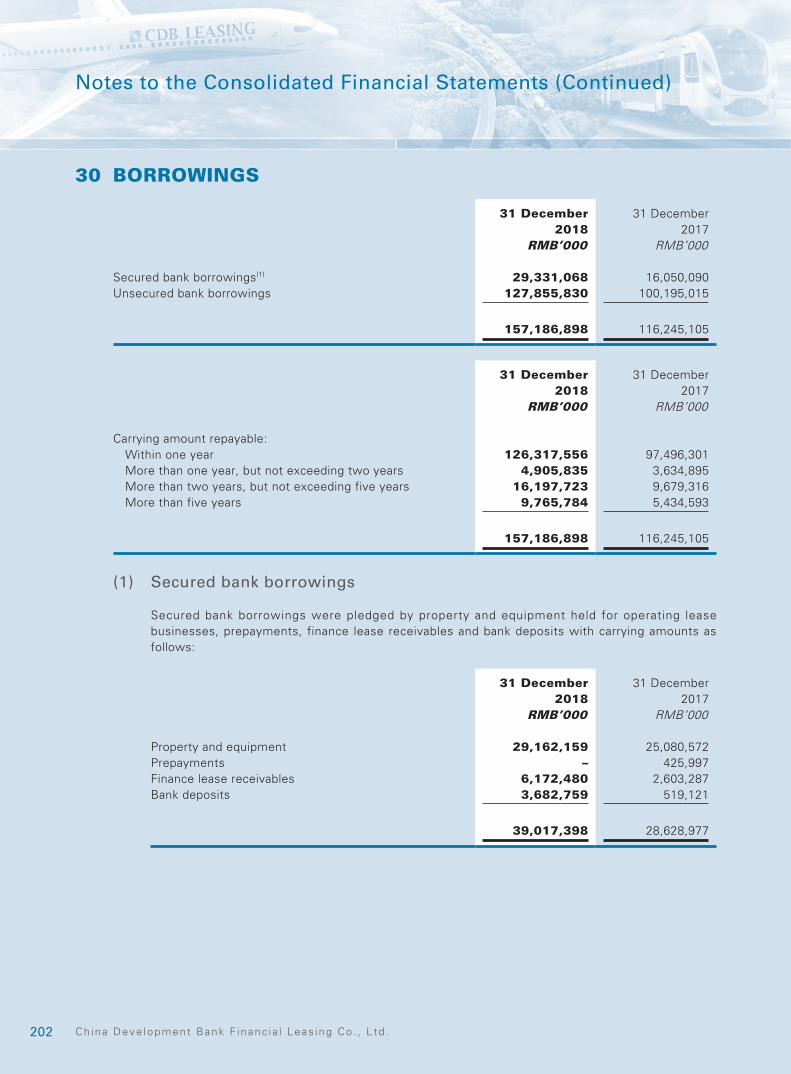
202 Ch ina Deve lopment Bank F inanc ia l Leas ing Co . , L td .
Notes to the Consolidated Financial Statements (Continued)
30 BORROWINGS
31 December 2018
31 December 2017
RMB’000 RMB’000
Secured bank borrowings(1) 29,331,068 16,050,090Unsecured bank borrowings 127,855,830 100,195,015
157,186,898 116,245,105
31 December 2018
31 December 2017
RMB’000 RMB’000
Carrying amount repayable:Within one year 126,317,556 97,496,301More than one year, but not exceeding two years 4,905,835 3,634,895More than two years, but not exceeding five years 16,197,723 9,679,316More than five years 9,765,784 5,434,593
157,186,898 116,245,105
(1) Secured bank borrowings
Secured bank borrowings were pledged by property and equipment held for operating lease businesses, prepayments, finance lease receivables and bank deposits with carrying amounts as follows:
31 December 2018
31 December 2017
RMB’000 RMB’000
Property and equipment 29,162,159 25,080,572Prepayments – 425,997Finance lease receivables 6,172,480 2,603,287Bank deposits 3,682,759 519,121
39,017,398 28,628,977
2032018 Annua l Report
Notes to the Consolidated Financial Statements (Continued)
30 BORROWINGS (CONTINUED)
(1) Secured bank borrowings
The exposure of the Group’s fixed-rate borrowings and the contractual maturity dates (or reset dates) are as follows:
31 December 2018
31 December 2017
RMB’000 RMB’000
Fixed-rate borrowings:Within one year 109,928,067 78,974,840More than one year, but not exceeding five years 4,063,970 2,694,504More than five years 2,687,831 5,209,022
116,679,868 86,878,366
In addition, the Group has variable-rate borrowings, which carry interest based on PBOC Rates, LIBOR or Shanghai Inter-bank Offered Rates (“SHIBOR”).
The ranges of effective interest rates (which approximate to contractual interest rates) on the Group’s borrowings are as follows:
31 December 2018 31 December 2017
Effective interest rate:Fixed-rate borrowing 1.32%–6.00% 1.32%–6.00%
Floating-rate borrowing
“LIBOR+0.15% to LIBOR+3.30% SHIBOR+0.79%
PBOC Rate*90.00%”
“LIBOR+0.15% to LIBOR+3.30% SHIBOR+0.79%
PBOC Rate*90.00%
204 Ch ina Deve lopment Bank F inanc ia l Leas ing Co . , L td .
Notes to the Consolidated Financial Statements (Continued)
31 ACCRUED STAFF COST
31 December 2018
31 December 2017
RMB’000 RMB’000
Salaries, bonus and allowances 187,713 141,776Social welfare and others 62,142 18,730
249,855 160,506
32 BONDS PAYABLE
31 December 2018
31 December 2017
RMB’000 RMB’000
Guaranteed unsecured bonds 32,105,445 22,344,343Unguaranteed unsecured bonds 6,490,901 9,982,370
38,596,346 32,326,713
2052018 Annua l Report
Notes to the Consolidated Financial Statements (Continued)
32 BONDS PAYABLE (CONTINUED)
Guaranteed unsecured bonds:
NamePrincipal
amountIssue price
Value date
Maturity date
Coupon rate
USD’000
Guaranteed unsecured bonds issued-due 2022(1) 1,000,000 99.22% 2012-12-4 2022-12-4 3.25%Guaranteed unsecured bonds issued-due 2019(2) 250,000 99.47% 2014-12-2 2019-12-2 3.25%Guaranteed unsecured bonds issued-due 2024(2) 400,000 99.09% 2014-12-2 2024-12-2 4.25%Guaranteed unsecured bonds issued-due 2020(6) 400,000 99.68% 2017-8-1 2020-8-1 2.63%Guaranteed unsecured bonds issued-due 2022(6) 600,000 99.51% 2017-8-1 2022-8-1 3.00%Guaranteed unsecured bonds issued-due 2023(7) 400,000 99.28% 2017-10-24 2023-4-24 3.00%Guaranteed unsecured bonds issued-due 2027(7) 400,000 99.27% 2017-10-24 2027-10-24 3.50%Guaranteed unsecured bonds issued-due 2023(8) 100,000 99.28% 2018-3-9 2023-4-24 4.05%Guaranteed unsecured bonds issued-due 2021(9) 500,000 99.49% 2018-7-18 2021-7-18 3MLibor+115BPGuaranteed unsecured bonds issued-due 2021(10) 400,000 99.72% 2018-11-15 2021-11-15 4.39%Guaranteed unsecured bonds issued-due 2019(11) 50,000 – 2018-11-30 2019-10-30 3.90%
NamePrincipal
amountIssue price
Value date
Maturity date
Coupon rate
HKD’000
Guaranteed unsecured bonds issued-due 2021(12) 601,000 – 2018-10-23 2021-10-23 3.50%Guaranteed unsecured bonds issued-due 2021(13) 338,000 – 2018-11-16 2021-11-16 3.60%Guaranteed unsecured bonds issued-due 2020(14) 240,000 – 2018-11-19 2020-11-19 3.50%Guaranteed unsecured bonds issued-due 2021(14) 500,000 – 2018-11-19 2019-08-16 0.00%
Unguaranteed unsecured bonds:
NamePrincipal
amountIssue price
Value date
Maturity date
Coupon rate
RMB’000
Unguaranteed unsecured bonds issued-due 2019(3) 3,000,000 100.00% 2016-10-27 2019-10-27 3.00%Unguaranteed unsecured bonds issued-due 2020(4) 2,000,000 100.00% 2017-8-24 2020-8-24 4.55%Unguaranteed unsecured bonds issued-due 2020(5) 1,500,000 100.00% 2017-10-24 2020-10-24 4.65%
206 Ch ina Deve lopment Bank F inanc ia l Leas ing Co . , L td .
Notes to the Consolidated Financial Statements (Continued)
32 BONDS PAYABLE (CONTINUED)(1) As at 4 December 2012, an overseas subsidiary of the Group issued bonds with principal amount of USD1,000,000,000
in Hong Kong. The bonds were guaranteed by the Group’s related party, the Hong Kong branch of China Development Bank, and the maturity dates for the bond is 4 December 2022.
(2) As at 2 December 2014, an overseas subsidiary of the Group issued bonds with principal amount of USD250,000,000 and USD400,000,000 in Hong Kong. The bonds were provided redemption safeguard via keepwell and asset purchase deed by the Company and were guaranteed by another overseas subsidiary of the Group, CDB Aviation Lease Finance Designated Activity Company, and the maturity dates for the bonds are 2 December 2019 and 2 December 2024 respectively.
(3) As at 27 October 2016, the Group issued bonds with principal amount of RMB3,000,000,000 in PRC. The maturity date for the bonds is 27 October 2019.
(4) As at 24 August 2017, the Group issued bonds with principal amount of RMB2,000,000,000 in PRC. The maturity date for the bonds is 24 August 2020.
(5) As at 24 October 2017, the Group issued bonds with principal amount of RMB1,500,000,000 in PRC. The maturity date for the bonds is 24 October 2020.
(6) As at 1 August 2017, CDBL Funding 2, a Hong Kong subsidiary of the Group issued bonds with principal amount of USD400,000,000 and USD600,000,000 in Hong Kong. The bonds were provided redemption safeguard via keepwell and asset purchase deed by the Company and were guaranteed by another overseas subsidiary of the Group, Metro Excel Limited, and the maturity dates for the bonds are 1 August 2020 and 1 August 2022 respectively.
(7) As at 1 August 2017, CDBL Funding 1, an Ireland subsidiary of the Group issued bonds with principal amount of USD400,000,000 and USD400,000,000 in Hong Kong. The bonds were provided redemption safeguard via keepwell and asset purchase deed by the Company and were guaranteed by another overseas subsidiary of the Group, CDB Aviation Lease Finance Designated Activity Company, and the maturity dates for the bonds are 23 April 2023 and 24 October 2027 respectively.
(8) As at 9 March 2018, CDBL Funding 1, an Ireland subsidiary of the Group issued bonds with principal amount of USD100,000,000 in Hong Kong. The bonds was provided redemption safeguard via keepwell and asset purchase deed by the Company and were guaranteed by another overseas subsidiary of the Group, CDB Aviation Lease Finance Designated Activity Company, and the maturity dates for the bonds is 24 April 2023.
(9) As at 18 July 2018, CDBL Funding 2, a Hong Kong subsidiary of the Group issued bonds with principal amount of USD500,000,000 in Hong Kong. The bonds was provided redemption safeguard via keepwell and asset purchase deed by the Company and was guaranteed by another overseas subsidiary of the Group, Metro Excel Limited, and the maturity dates for the bonds is 18 July 2021.
(10) As at 15 November 2018, CDBL Funding 1, an Ireland subsidiary of the Group issued bonds with principal amount of USD400,000,000 in Hong Kong. The bonds was provided redemption safeguard via keepwell and asset purchase deed by the Company and were guaranteed by another overseas subsidiary of the Group, CDB Aviation Lease Finance Designated Activity Company, and the maturity dates for the bonds is 15 November 2021.
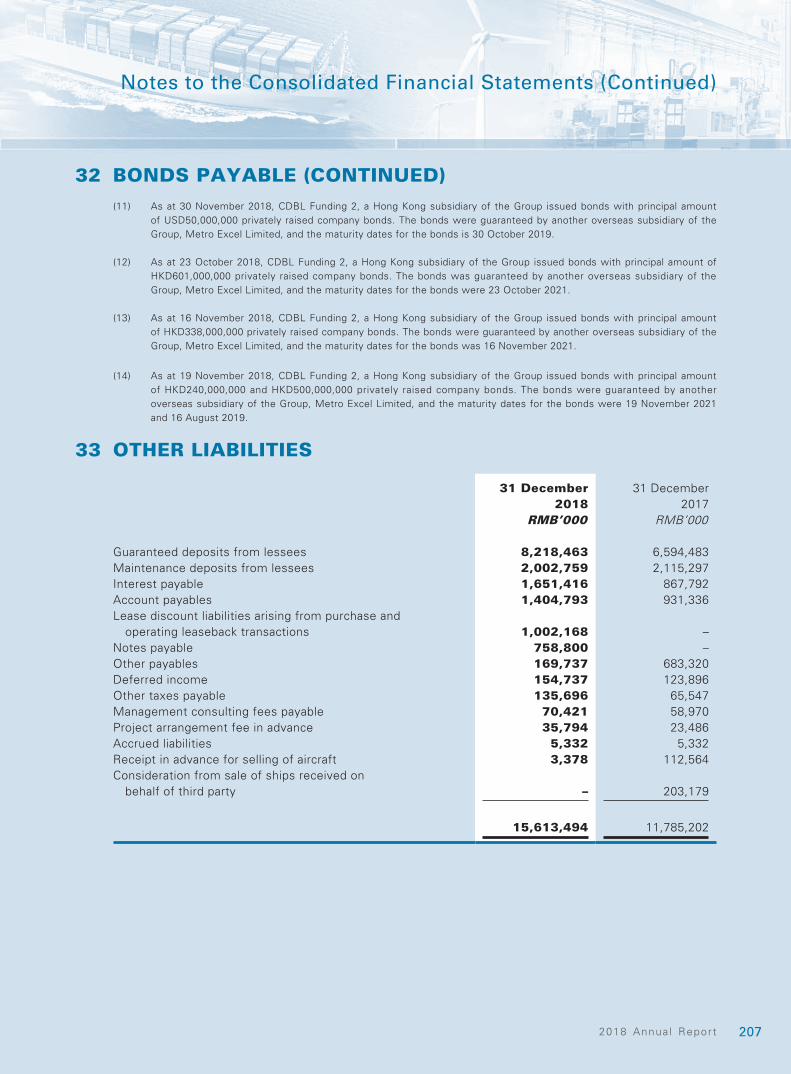
2072018 Annua l Report
Notes to the Consolidated Financial Statements (Continued)
32 BONDS PAYABLE (CONTINUED)(11) As at 30 November 2018, CDBL Funding 2, a Hong Kong subsidiary of the Group issued bonds with principal amount
of USD50,000,000 privately raised company bonds. The bonds were guaranteed by another overseas subsidiary of the Group, Metro Excel Limited, and the maturity dates for the bonds is 30 October 2019.
(12) As at 23 October 2018, CDBL Funding 2, a Hong Kong subsidiary of the Group issued bonds with principal amount of HKD601,000,000 privately raised company bonds. The bonds was guaranteed by another overseas subsidiary of the Group, Metro Excel Limited, and the maturity dates for the bonds were 23 October 2021.
(13) As at 16 November 2018, CDBL Funding 2, a Hong Kong subsidiary of the Group issued bonds with principal amount of HKD338,000,000 privately raised company bonds. The bonds were guaranteed by another overseas subsidiary of the Group, Metro Excel Limited, and the maturity dates for the bonds was 16 November 2021.
(14) As at 19 November 2018, CDBL Funding 2, a Hong Kong subsidiary of the Group issued bonds with principal amount of HKD240,000,000 and HKD500,000,000 privately raised company bonds. The bonds were guaranteed by another overseas subsidiary of the Group, Metro Excel Limited, and the maturity dates for the bonds were 19 November 2021 and 16 August 2019.
33 OTHER LIABILITIES
31 December 2018
31 December 2017
RMB’000 RMB’000
Guaranteed deposits from lessees 8,218,463 6,594,483Maintenance deposits from lessees 2,002,759 2,115,297Interest payable 1,651,416 867,792Account payables 1,404,793 931,336Lease discount liabilities arising from purchase and
operating leaseback transactions 1,002,168 –Notes payable 758,800 –Other payables 169,737 683,320Deferred income 154,737 123,896Other taxes payable 135,696 65,547Management consulting fees payable 70,421 58,970Project arrangement fee in advance 35,794 23,486Accrued liabilities 5,332 5,332Receipt in advance for selling of aircraft 3,378 112,564Consideration from sale of ships received on
behalf of third party – 203,179
15,613,494 11,785,202
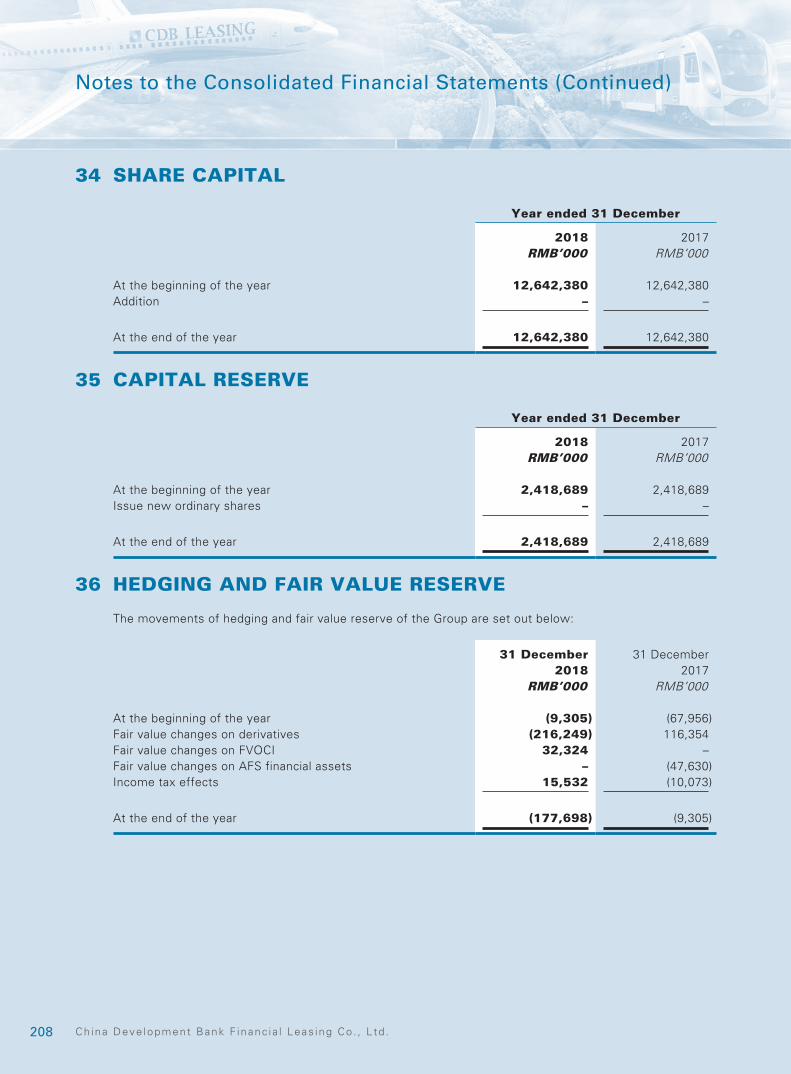
208 Ch ina Deve lopment Bank F inanc ia l Leas ing Co . , L td .
Notes to the Consolidated Financial Statements (Continued)
34 SHARE CAPITAL
Year ended 31 December
2018 2017RMB’000 RMB’000
At the beginning of the year 12,642,380 12,642,380Addition – –
At the end of the year 12,642,380 12,642,380
35 CAPITAL RESERVE
Year ended 31 December
2018 2017RMB’000 RMB’000
At the beginning of the year 2,418,689 2,418,689Issue new ordinary shares – –
At the end of the year 2,418,689 2,418,689
36 HEDGING AND FAIR VALUE RESERVE
The movements of hedging and fair value reserve of the Group are set out below:
31 December 2018
31 December 2017
RMB’000 RMB’000
At the beginning of the year (9,305) (67,956)Fair value changes on derivatives (216,249) 116,354Fair value changes on FVOCI 32,324 –Fair value changes on AFS financial assets – (47,630)Income tax effects 15,532 (10,073)
At the end of the year (177,698) (9,305)
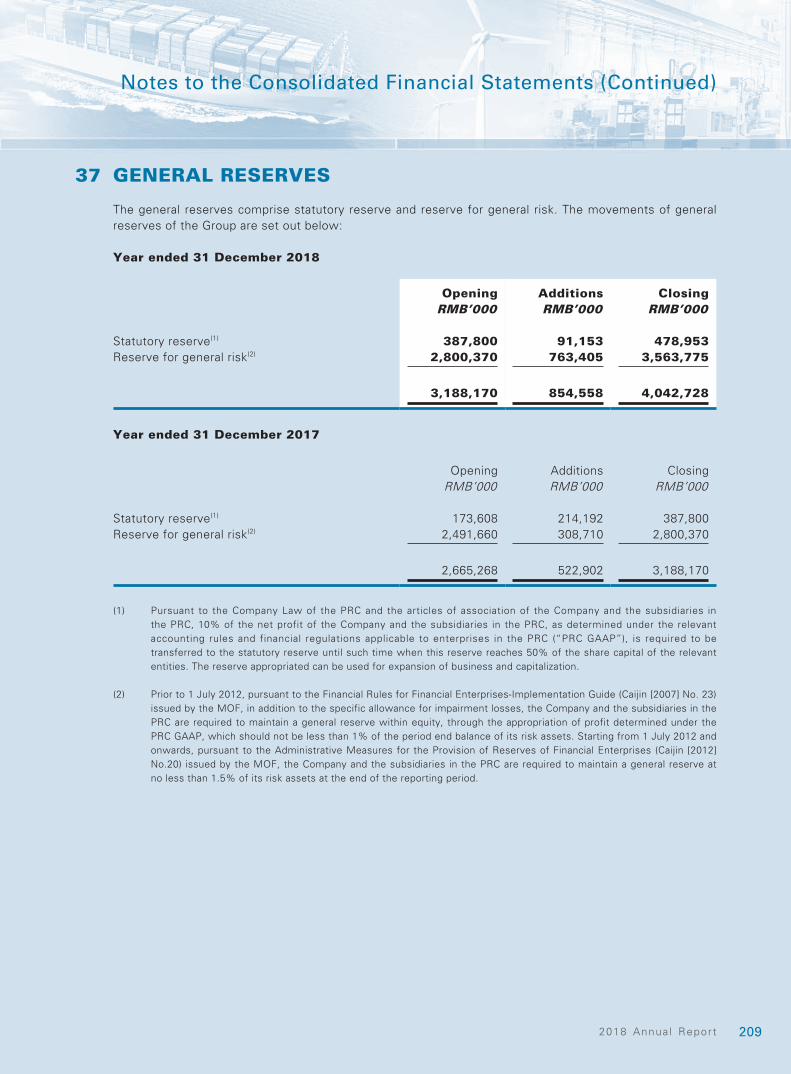
2092018 Annua l Report
Notes to the Consolidated Financial Statements (Continued)
37 GENERAL RESERVES
The general reserves comprise statutory reserve and reserve for general risk. The movements of general reserves of the Group are set out below:
Year ended 31 December 2018
Opening Additions ClosingRMB’000 RMB’000 RMB’000
Statutory reserve(1) 387,800 91,153 478,953Reserve for general risk(2) 2,800,370 763,405 3,563,775
3,188,170 854,558 4,042,728
Year ended 31 December 2017
Opening Additions ClosingRMB’000 RMB’000 RMB’000
Statutory reserve(1) 173,608 214,192 387,800Reserve for general risk(2) 2,491,660 308,710 2,800,370
2,665,268 522,902 3,188,170
(1) Pursuant to the Company Law of the PRC and the articles of association of the Company and the subsidiaries in the PRC, 10% of the net profit of the Company and the subsidiaries in the PRC, as determined under the relevant accounting rules and financial regulations applicable to enterprises in the PRC (“PRC GAAP”), is required to be transferred to the statutory reserve until such time when this reserve reaches 50% of the share capital of the relevant entities. The reserve appropriated can be used for expansion of business and capitalization.
(2) Prior to 1 July 2012, pursuant to the Financial Rules for Financial Enterprises-Implementation Guide (Caijin [2007] No. 23) issued by the MOF, in addition to the specific allowance for impairment losses, the Company and the subsidiaries in the PRC are required to maintain a general reserve within equity, through the appropriation of profit determined under the PRC GAAP, which should not be less than 1% of the period end balance of its risk assets. Starting from 1 July 2012 and onwards, pursuant to the Administrative Measures for the Provision of Reserves of Financial Enterprises (Caijin [2012] No.20) issued by the MOF, the Company and the subsidiaries in the PRC are required to maintain a general reserve at no less than 1.5% of its risk assets at the end of the reporting period.
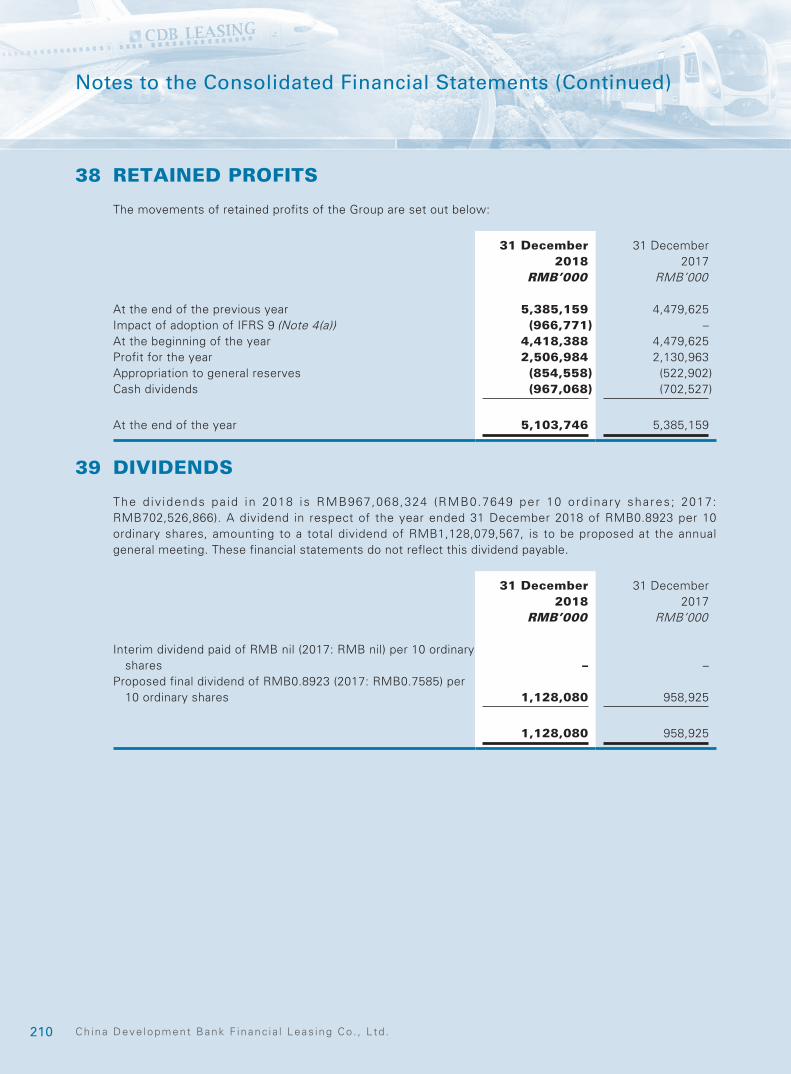
210 Ch ina Deve lopment Bank F inanc ia l Leas ing Co . , L td .
Notes to the Consolidated Financial Statements (Continued)
38 RETAINED PROFITS
The movements of retained profits of the Group are set out below:
31 December 2018
31 December 2017
RMB’000 RMB’000
At the end of the previous year 5,385,159 4,479,625Impact of adoption of IFRS 9 (Note 4(a)) (966,771) –At the beginning of the year 4,418,388 4,479,625Profit for the year 2,506,984 2,130,963Appropriation to general reserves (854,558) (522,902)Cash dividends (967,068) (702,527)
At the end of the year 5,103,746 5,385,159
39 DIVIDENDS
The d iv idends pa id in 2018 is RMB967,068,324 (RMB0.7649 per 10 ord inary shares; 2017: RMB702,526,866). A dividend in respect of the year ended 31 December 2018 of RMB0.8923 per 10 ordinary shares, amounting to a total dividend of RMB1,128,079,567, is to be proposed at the annual general meeting. These financial statements do not reflect this dividend payable.
31 December 2018
31 December 2017
RMB’000 RMB’000
Interim dividend paid of RMB nil (2017: RMB nil) per 10 ordinary shares – –
Proposed final dividend of RMB0.8923 (2017: RMB0.7585) per 10 ordinary shares 1,128,080 958,925
1,128,080 958,925
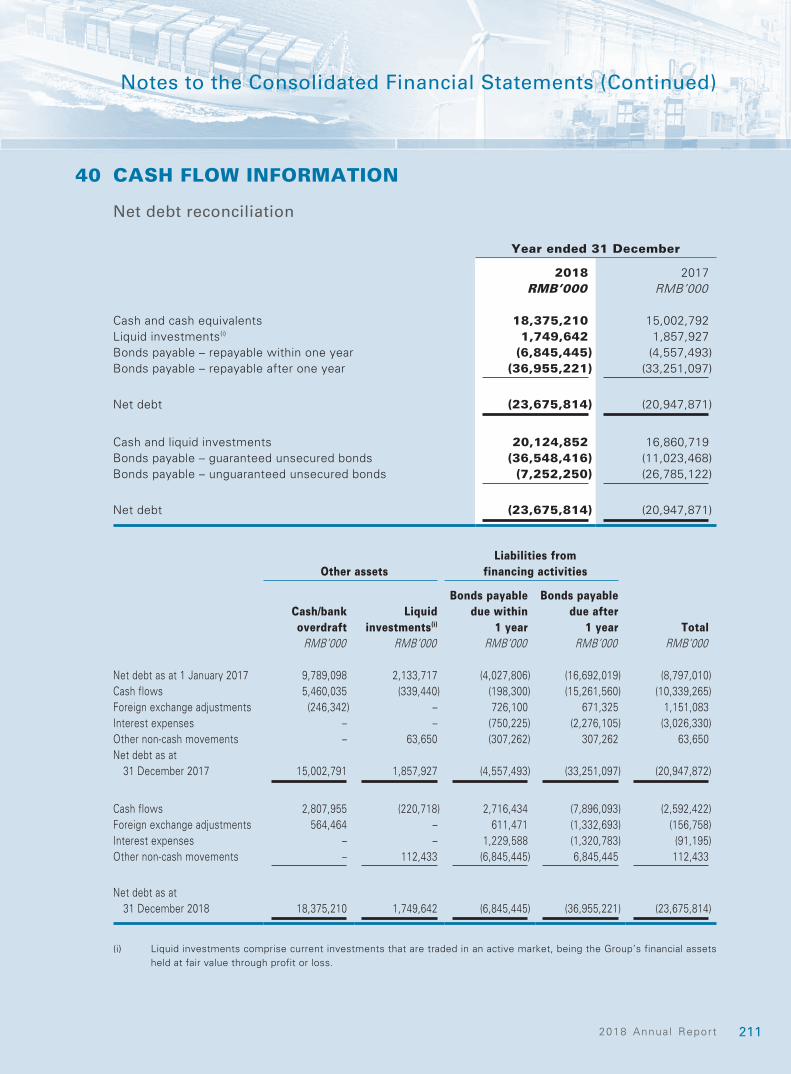
2112018 Annua l Report
Notes to the Consolidated Financial Statements (Continued)
40 CASH FLOW INFORMATION
Net debt reconciliation
Year ended 31 December
2018 2017RMB’000 RMB’000
Cash and cash equivalents 18,375,210 15,002,792Liquid investments(i) 1,749,642 1,857,927Bonds payable – repayable within one year (6,845,445) (4,557,493)Bonds payable – repayable after one year (36,955,221) (33,251,097)
Net debt (23,675,814) (20,947,871)
Cash and liquid investments 20,124,852 16,860,719Bonds payable – guaranteed unsecured bonds (36,548,416) (11,023,468)Bonds payable – unguaranteed unsecured bonds (7,252,250) (26,785,122)
Net debt (23,675,814) (20,947,871)
Other assetsLiabilities from
financing activities
Cash/bank overdraft
Liquid investments(i)
Bonds payable due within
1 year
Bonds payable due after
1 year TotalRMB’000 RMB’000 RMB’000 RMB’000 RMB’000
Net debt as at 1 January 2017 9,789,098 2,133,717 (4,027,806) (16,692,019) (8,797,010)Cash flows 5,460,035 (339,440) (198,300) (15,261,560) (10,339,265)Foreign exchange adjustments (246,342) – 726,100 671,325 1,151,083Interest expenses – – (750,225) (2,276,105) (3,026,330)Other non-cash movements – 63,650 (307,262) 307,262 63,650Net debt as at
31 December 2017 15,002,791 1,857,927 (4,557,493) (33,251,097) (20,947,872)
Cash flows 2,807,955 (220,718) 2,716,434 (7,896,093) (2,592,422)Foreign exchange adjustments 564,464 – 611,471 (1,332,693) (156,758)Interest expenses – – 1,229,588 (1,320,783) (91,195)Other non-cash movements – 112,433 (6,845,445) 6,845,445 112,433
Net debt as at 31 December 2018 18,375,210 1,749,642 (6,845,445) (36,955,221) (23,675,814)
(i) Liquid investments comprise current investments that are traded in an active market, being the Group’s financial assets held at fair value through profit or loss.
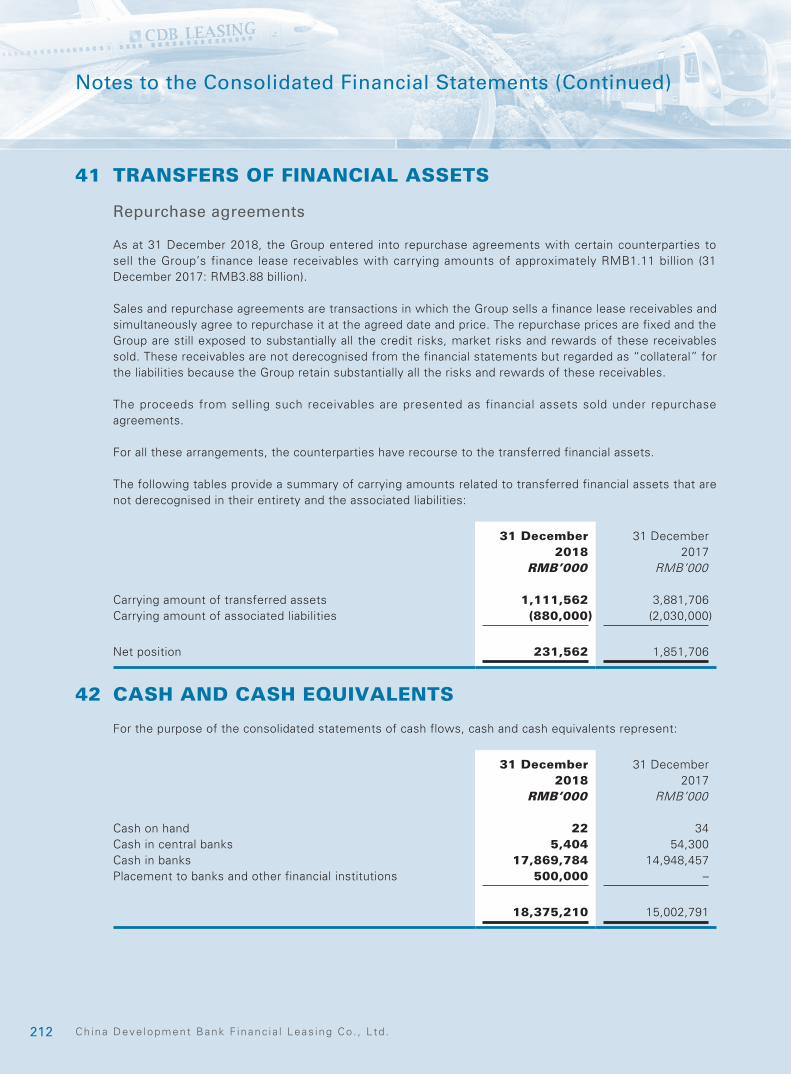
212 Ch ina Deve lopment Bank F inanc ia l Leas ing Co . , L td .
Notes to the Consolidated Financial Statements (Continued)
41 TRANSFERS OF FINANCIAL ASSETS
Repurchase agreements
As at 31 December 2018, the Group entered into repurchase agreements with certain counterparties to sell the Group’s finance lease receivables with carrying amounts of approximately RMB1.11 billion (31 December 2017: RMB3.88 billion).
Sales and repurchase agreements are transactions in which the Group sells a finance lease receivables and simultaneously agree to repurchase it at the agreed date and price. The repurchase prices are fixed and the Group are still exposed to substantially all the credit risks, market risks and rewards of these receivables sold. These receivables are not derecognised from the financial statements but regarded as “collateral” for the liabilities because the Group retain substantially all the risks and rewards of these receivables.
The proceeds from selling such receivables are presented as financial assets sold under repurchase agreements.
For all these arrangements, the counterparties have recourse to the transferred financial assets.
The following tables provide a summary of carrying amounts related to transferred financial assets that are not derecognised in their entirety and the associated liabilities:
31 December 2018
31 December 2017
RMB’000 RMB’000
Carrying amount of transferred assets 1,111,562 3,881,706Carrying amount of associated liabilities (880,000) (2,030,000)
Net position 231,562 1,851,706
42 CASH AND CASH EQUIVALENTS
For the purpose of the consolidated statements of cash flows, cash and cash equivalents represent:
31 December 2018
31 December 2017
RMB’000 RMB’000
Cash on hand 22 34Cash in central banks 5,404 54,300Cash in banks 17,869,784 14,948,457Placement to banks and other financial institutions 500,000 –
18,375,210 15,002,791
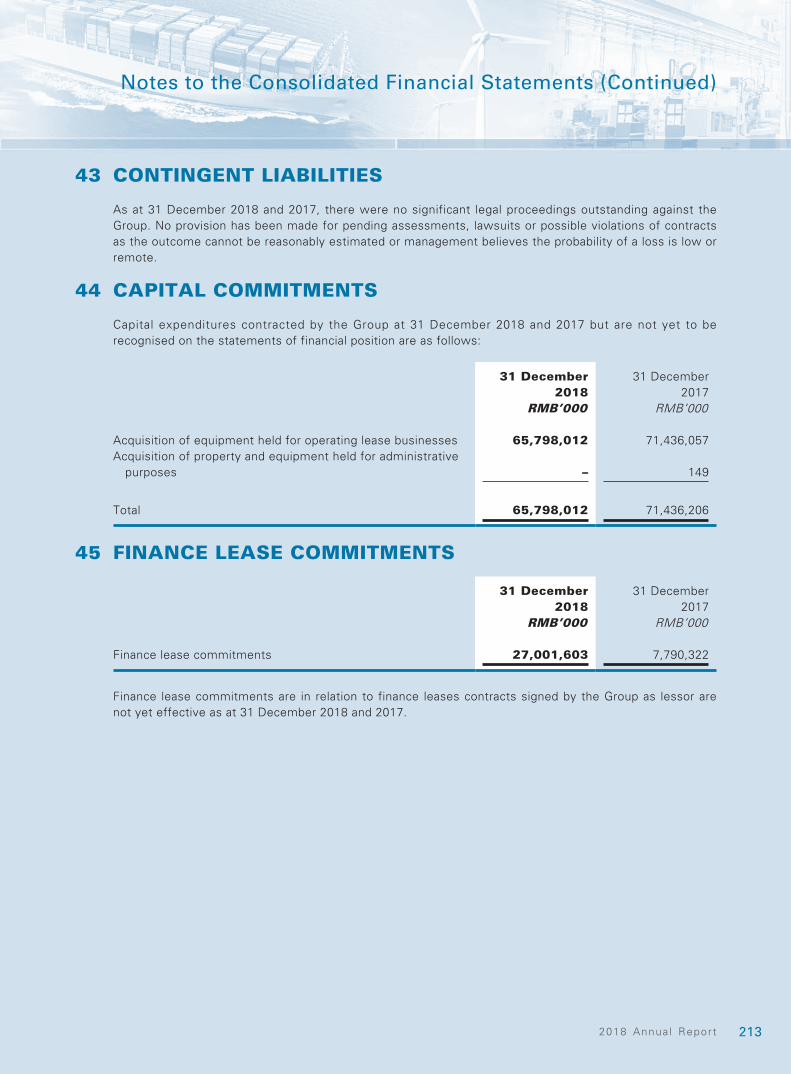
2132018 Annua l Report
Notes to the Consolidated Financial Statements (Continued)
43 CONTINGENT LIABILITIES
As at 31 December 2018 and 2017, there were no significant legal proceedings outstanding against the Group. No provision has been made for pending assessments, lawsuits or possible violations of contracts as the outcome cannot be reasonably estimated or management believes the probability of a loss is low or remote.
44 CAPITAL COMMITMENTS
Capital expenditures contracted by the Group at 31 December 2018 and 2017 but are not yet to be recognised on the statements of financial position are as follows:
31 December 2018
31 December 2017
RMB’000 RMB’000
Acquisition of equipment held for operating lease businesses 65,798,012 71,436,057Acquisition of property and equipment held for administrative
purposes – 149
Total 65,798,012 71,436,206
45 FINANCE LEASE COMMITMENTS
31 December 2018
31 December 2017
RMB’000 RMB’000
Finance lease commitments 27,001,603 7,790,322
Finance lease commitments are in relation to finance leases contracts signed by the Group as lessor are not yet effective as at 31 December 2018 and 2017.
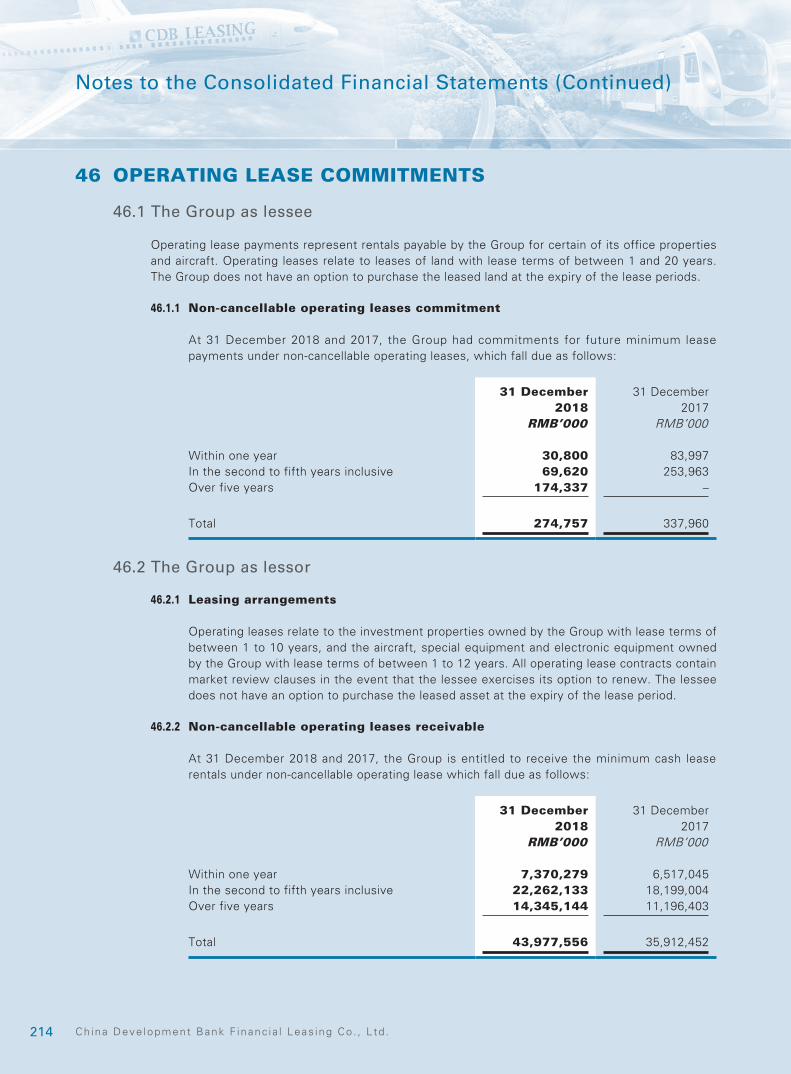
214 Ch ina Deve lopment Bank F inanc ia l Leas ing Co . , L td .
Notes to the Consolidated Financial Statements (Continued)
46 OPERATING LEASE COMMITMENTS
46.1 The Group as lessee
Operating lease payments represent rentals payable by the Group for certain of its office properties and aircraft. Operating leases relate to leases of land with lease terms of between 1 and 20 years. The Group does not have an option to purchase the leased land at the expiry of the lease periods.
46.1.1 Non-cancellable operating leases commitment
At 31 December 2018 and 2017, the Group had commitments for future minimum lease payments under non-cancellable operating leases, which fall due as follows:
31 December 2018
31 December 2017
RMB’000 RMB’000
Within one year 30,800 83,997In the second to fifth years inclusive 69,620 253,963Over five years 174,337 –
Total 274,757 337,960
46.2 The Group as lessor
46.2.1 Leasing arrangements
Operating leases relate to the investment properties owned by the Group with lease terms of between 1 to 10 years, and the aircraft, special equipment and electronic equipment owned by the Group with lease terms of between 1 to 12 years. All operating lease contracts contain market review clauses in the event that the lessee exercises its option to renew. The lessee does not have an option to purchase the leased asset at the expiry of the lease period.
46.2.2 Non-cancellable operating leases receivable
At 31 December 2018 and 2017, the Group is entitled to receive the minimum cash lease rentals under non-cancellable operating lease which fall due as follows:
31 December 2018
31 December 2017
RMB’000 RMB’000
Within one year 7,370,279 6,517,045In the second to fifth years inclusive 22,262,133 18,199,004Over five years 14,345,144 11,196,403
Total 43,977,556 35,912,452
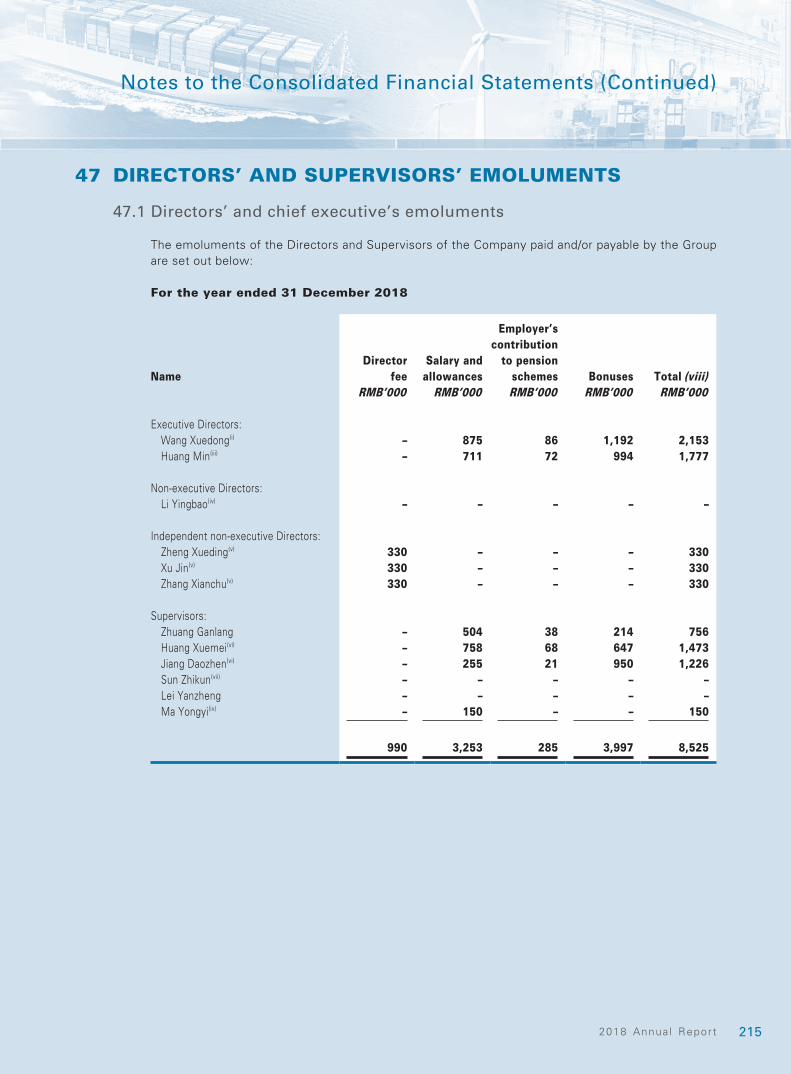
2152018 Annua l Report
Notes to the Consolidated Financial Statements (Continued)
47 DIRECTORS’ AND SUPERVISORS’ EMOLUMENTS
47.1 Directors’ and chief executive’s emoluments
The emoluments of the Directors and Supervisors of the Company paid and/or payable by the Group are set out below:
For the year ended 31 December 2018
NameDirector
feeSalary and
allowances
Employer’s contribution
to pension schemes Bonuses Total (viii)
RMB’000 RMB’000 RMB’000 RMB’000 RMB’000
Executive Directors:Wang Xuedong(i) – 875 86 1,192 2,153Huang Min(iii) – 711 72 994 1,777
Non-executive Directors:Li Yingbao(iv) – – – – –
Independent non-executive Directors:Zheng Xueding(v) 330 – – – 330Xu Jin(v) 330 – – – 330Zhang Xianchu(v) 330 – – – 330
Supervisors:Zhuang Ganlang – 504 38 214 756Huang Xuemei(vi) – 758 68 647 1,473Jiang Daozhen(vi) – 255 21 950 1,226Sun Zhikun(vii) – – – – –Lei Yanzheng – – – – –Ma Yongyi(ix) – 150 – – 150
990 3,253 285 3,997 8,525
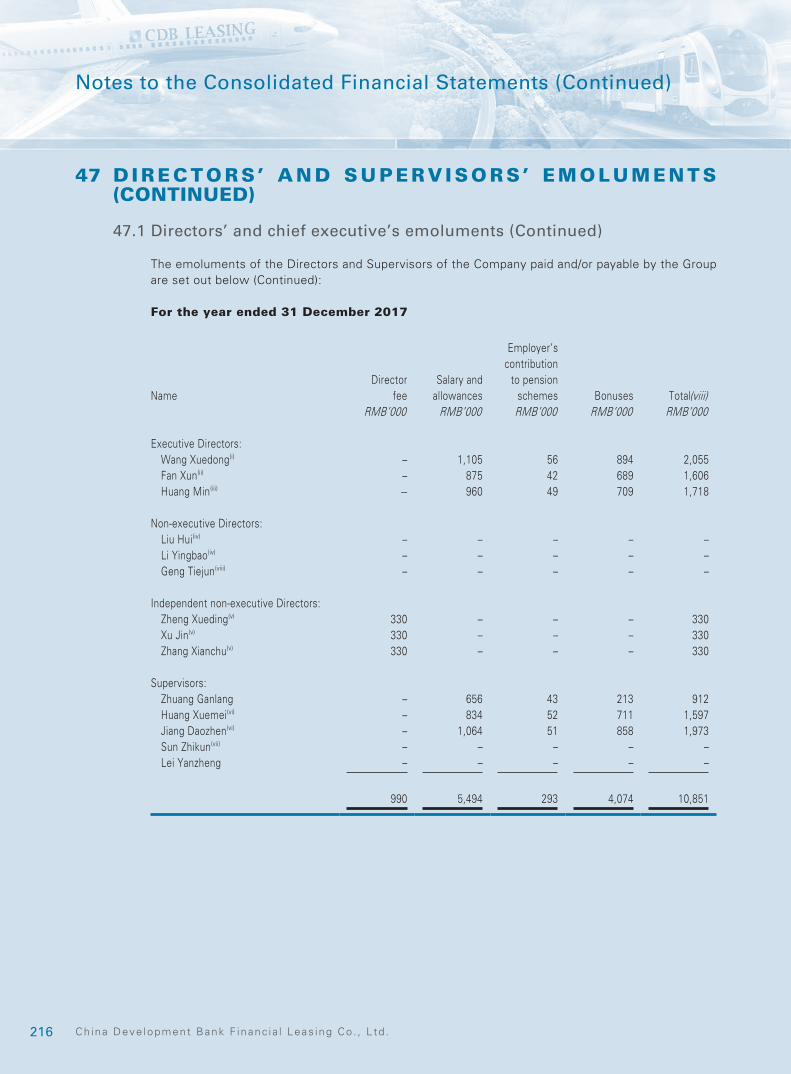
216 Ch ina Deve lopment Bank F inanc ia l Leas ing Co . , L td .
Notes to the Consolidated Financial Statements (Continued)
47 D IRECTORS’ AND SUPERV ISORS’ EMOLUMENTS (CONTINUED)
47.1 Directors’ and chief executive’s emoluments (Continued)
The emoluments of the Directors and Supervisors of the Company paid and/or payable by the Group are set out below (Continued):
For the year ended 31 December 2017
NameDirector
feeSalary and
allowances
Employer’s contribution
to pension schemes Bonuses Total(viii)
RMB’000 RMB’000 RMB’000 RMB’000 RMB’000
Executive Directors:Wang Xuedong(i) – 1,105 56 894 2,055Fan Xun(ii) – 875 42 689 1,606Huang Min(iii) – 960 49 709 1,718
Non-executive Directors:Liu Hui(iv) – – – – –Li Yingbao(iv) – – – – –Geng Tiejun(viii) – – – – –
Independent non-executive Directors:Zheng Xueding(v) 330 – – – 330Xu Jin(v) 330 – – – 330Zhang Xianchu(v) 330 – – – 330
Supervisors:Zhuang Ganlang – 656 43 213 912Huang Xuemei(vi) – 834 52 711 1,597Jiang Daozhen(vi) – 1,064 51 858 1,973Sun Zhikun(vii) – – – – –Lei Yanzheng – – – – –
990 5,494 293 4,074 10,851
2172018 Annua l Report
Notes to the Consolidated Financial Statements (Continued)
47 D IRECTORS’ AND SUPERV ISORS’ EMOLUMENTS (CONTINUED)
47.1 Directors’ and chief executive’s emoluments (Continued)
(i) Wang Xuedong was appointed as executive director and CEO in October 2014 and approved by Shenzhen Office of CBRC in January 2015.
(ii) Fan Xun resigned as executive directors in October 2017.
(iii) Huang Min were appointed as executive directors in September 2015.
(iv) Liu Hui and Li Yingbao were appointed as non-executive directors in September 2015. Liu Hui resigned in June 2018.
(v) Zheng Xueding, Xu Jin and Zhang Xianchu were appointed as independent non-executive directors in June 2016.
(vi) Huang Xuemei and Jiang Daozhen were appointed as supervisors in May 2015.
(vii) Sun Zhikun was appointed as supervisor in June 2015.
(viii) Geng Tiejun was appointed as non-executive director in April 2008. Geng Tiejun resigned in February 2018.
(ix) Ma Yongyi was appointed as supervisor in February 2018.
(x) The Company did not operate any share option scheme during the years of 2018 and 2017.
The bonuses are discretionary and determined with reference to the Group’s and the individuals’ performance.
During the years of 2018 and 2017, no directors or supervisors of the Company waived any emoluments and no emoluments were paid by the Company to any of the directors or supervisors as an inducement to join or upon joining the Group or as compensation for loss of office.
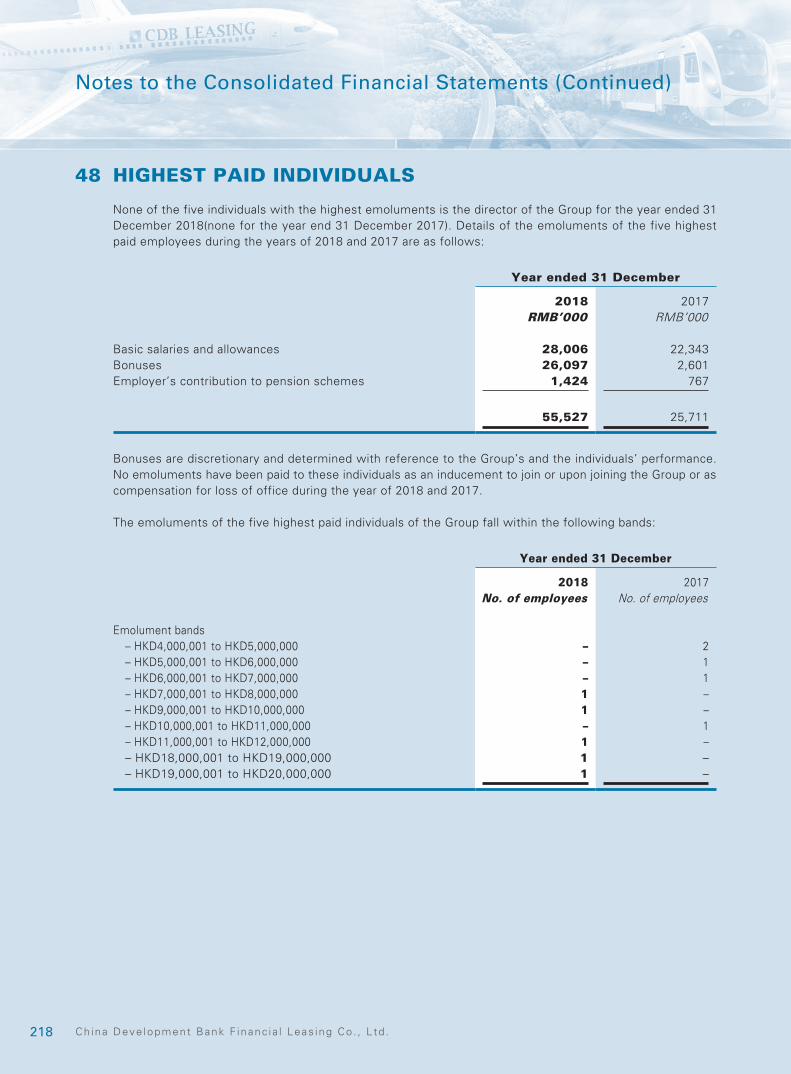
218 Ch ina Deve lopment Bank F inanc ia l Leas ing Co . , L td .
Notes to the Consolidated Financial Statements (Continued)
48 HIGHEST PAID INDIVIDUALS
None of the five individuals with the highest emoluments is the director of the Group for the year ended 31 December 2018(none for the year end 31 December 2017). Details of the emoluments of the five highest paid employees during the years of 2018 and 2017 are as follows:
Year ended 31 December
2018 2017RMB’000 RMB’000
Basic salaries and allowances 28,006 22,343Bonuses 26,097 2,601Employer’s contribution to pension schemes 1,424 767
55,527 25,711
Bonuses are discretionary and determined with reference to the Group’s and the individuals’ performance. No emoluments have been paid to these individuals as an inducement to join or upon joining the Group or as compensation for loss of office during the year of 2018 and 2017.
The emoluments of the five highest paid individuals of the Group fall within the following bands:
Year ended 31 December
2018 2017No. of employees No. of employees
Emolument bands– HKD4,000,001 to HKD5,000,000 – 2– HKD5,000,001 to HKD6,000,000 – 1– HKD6,000,001 to HKD7,000,000 – 1– HKD7,000,001 to HKD8,000,000 1 –– HKD9,000,001 to HKD10,000,000 1 –– HKD10,000,001 to HKD11,000,000 – 1– HKD11,000,001 to HKD12,000,000 1 –– HKD18,000,001 to HKD19,000,000 1 –– HKD19,000,001 to HKD20,000,000 1 –
2192018 Annua l Report
Notes to the Consolidated Financial Statements (Continued)
49 RELATED PARTY TRANSACTION
49.1 Parent Company
As at 31 December 2018, China Development Bank directly owned 64.4% of the share capital of the Company.
The Company is ultimately controlled by the PRC government and the Group operates in an economic environment currently predominated by entities controlled by the PRC government.
The Group have the following balances and entered into the following transactions with China Development Bank in its ordinary course of business:
The Group had the following balances with China Development Bank:
As at 31 December
2018 2017RMB’000 RMB’000
Bank balances 640,932 414,484Operating lease receivable 4,433 748Available-for-sale financial assets – 266,573Interest receivable – 9,427Other receivable 6,051 –Bank borrowings 9,719,240 16,123,342Interest payable 24,672 56,766Derivative financial liabilities 12,342 46,913
220 Ch ina Deve lopment Bank F inanc ia l Leas ing Co . , L td .
Notes to the Consolidated Financial Statements (Continued)
49 RELATED PARTY TRANSACTION (CONTINUED)
49.1 Parent Company (Continued)
The Group entered into the following transactions with China Development Bank:
For the year ended 31 December
2018 2017RMB’000 RMB’000
Interest income 35,831 687Interest expense 368,093 564,395Guarantee fee expenses 9,993 11,026Operating lease income 93,210 3,266Lease expenses – fee and commission expenses 31,222 29,826Net investment gains – 9,916Underwriting fees – 4,125Other operating expense 215 –
The Hong Kong branch of the China Development Bank provided guarantee to the Group for notes described in Note 32.
49.2 Other related parties
49.2.1 China Development Bank Securities Co., Limited
The Group and China Development Bank Securities Co., Limited are both ultimately controlled by the China Development Bank.
The Group had the following balances with China Development Bank Securities Co., Limited:
As at 31 December
2018 2017RMB’000 RMB’000
Bonds payable 100,860 –
2212018 Annua l Report
Notes to the Consolidated Financial Statements (Continued)
49 RELATED PARTY TRANSACTION (CONTINUED)
49.2 Other related parties (Continued)
49.2.1 China Development Bank Securities Co., Limited (Continued)
The Group entered into the following transactions with China Development Bank Securities Co., Limited:
For the year ended 31 December
2018 2017RMB’000 RMB’000
Operating lease income 1,826 –Underwriting fees – 4,170Service fees – 1,100
1,826 5,270
49.2.2 China Development Bank Capital Co., Limited and its subsidiaries
The Group and China Development Bank Capital Co., Limited are both ultimately controlled by the China Development Bank.
The Group had the following balances with China Development Bank Capital Co., Limited and its subsidiaries:
As at 31 December
2018 2017RMB’000 RMB’000
Accounts receivables 3,649 7,298Finance lease receivables 193,545 180,881Bonds payable 197,840 –
395,034 188,179
The Group entered into the following transactions with China Development Bank Capital Co., Limited and its subsidiaries:
For the year ended 31 December
2018 2017RMB’000 RMB’000
Finance lease income 11,533 32,228
222 Ch ina Deve lopment Bank F inanc ia l Leas ing Co . , L td .
Notes to the Consolidated Financial Statements (Continued)
49 RELATED PARTY TRANSACTION (CONTINUED)
49.2 Other related parties (Continued)
49.2.3 China Development Bank Fund Co., Limited and its subsidiaries
The Group and China Development Bank Fund Co., Limited are both ultimately controlled by the China Development Bank.
The Group had the following balances with China Development Bank Fund Co., Limited and its subsidiaries:
As at 31 December
2018 2017RMB’000 RMB’000
Finance lease receivables 953,754 102,797
The Group entered into the following transactions with China Development Bank Fund Co., Limited and its subsidiaries:
For the year ended 31 December
2018 2017RMB’000 RMB’000
Finance lease income 50,833 62
49.3 Key management personnel compensation
Key management personnel are those persons having authority and responsibility for planning, directing and controlling the activities of the Group, directly or indirectly, including directors and executive officers.
For the year ended 31 December
2018 2017RMB’000 RMB’000
Basic salaries and allowances 8,320 9,681Bonuses 8,881 6,876Employer’s contribution to pension schemes 658 484
17,859 17,041
2232018 Annua l Report
Notes to the Consolidated Financial Statements (Continued)
49 RELATED PARTY TRANSACTION (CONTINUED)
49.4 Transactions with other PRC state-owned entities
State-owned entities refer to those entities directly or indirectly owned by the PRC government through its government authorities, agencies, affiliations and other organisations. Transactions with other state-owned entities include but are not limited to: purchase, sale and leases of property and other assets; bank deposits and borrowings; purchase of bonds issued by other state-owned entities; and rendering and receiving of utilities and other services.
These transactions are conducted in the ordinary course of the Group’s business on terms similar to those that would have been entered into with non-state-owned entities. The Group’s pricing strategy and approval processes for major products and services, such as loans, deposits and commission income, do not depend on whether the customers are state-owned entities or not. Having due regard to the substance of the relationships, the Group is of the opinion that none of these transactions are material related party transactions that require separate disclosure.
50 SEGMENT REPORTING
Information reported to the chief operating decision maker (hereinafter refer to as the “CODM”), being the board of directors of the Company, for the purposes of resource allocation and assessment of segment performance focuses on the nature of services provided by the Group, which is also consistent with the Group’s basis of organisation, whereby the businesses are organised and managed separately as individual strategic business unit that serves different markets. Segment information is measured in accordance with the accounting policies and measurement criteria adopted by each segment when reporting to the board of directors of the Company, which are consistent with the accounting and measurement criteria in the preparation of the consolidated financial statements.
Specifically, the Group’s operating segments are as follows:
(a) Aircraft leasing: mainly engaged in the acquisition, leasing, management and disposal of commercial aircraft;
(b) Infrastructure leasing: mainly engaged in the leasing of transportation, urban and energy infrastructure;
(c) Ship, vehicle and construction machinery leasing: mainly engaged in the leasing of ships, vehicles and construction machinery; and
(d) Other leasing business: mainly engaged in the leasing of commercial property and manufacturing equipment in various sectors such as chemicals, papermaking, textile, coal and steel, strategic emerging industries, environmental protection industry, manufacturing sectors supported by national policies, wind power, nuclear power, photovoltaic and other industries etc..
Segment assets or liabilities are allocated to each segment, excluding deferred tax assets or liabilities, and the segment result excludes income tax expense. Segment revenue, results, assets and liabilities mainly include items directly attributable to a segment as well as those that can be allocated on a reasonable basis.
Expenses and assets of the headquarters are allocated according to the proportion of each segment’s net revenue (segment’s revenue deducting depreciation expenses of equipment held for operating lease businesses). Liabilities of the headquarters are allocated according to the proportion of each segment’s assets.
Inter-segment transactions, if any, are conducted with reference to the prices charged to third parties and there was no change in the basis during the years ended 31 December 2018 and 2017.

224 Ch ina Deve lopment Bank F inanc ia l Leas ing Co . , L td .
Notes to the Consolidated Financial Statements (Continued)
50 SEGMENT REPORTING (CONTINUED)
The operating and reportable segment information provided to the CODM during the years ended 31 December 2018 and 2017 is as follows:
Aircraft leasing
Infrastructure leasing
Vessel, commercial vehicle and
construction machinery
leasingOther leasing
businessConsolidated
totalRMB’000 RMB’000 RMB’000 RMB’000 RMB’000
For the year ended 31 December 2018Segment revenue and resultsFinance lease income 202,265 4,579,249 1,621,681 633,121 7,036,316Operating lease income 6,049,169 53,678 324,324 157,633 6,584,804
Segment revenue 6,251,434 4,632,927 1,946,005 790,754 13,621,120Segment other income, gains and losses 1,333,765 377,452 152,182 56,791 1,920,190
Segment revenue and other income 7,585,199 5,010,379 2,098,187 847,545 15,541,310Segment expenses (5,515,842) (4,128,540) (1,730,185) (892,522) (12,267,089)
Profit before impairment losses and income tax 2,264,080 1,435,742 628,098 239,393 4,567,313
Profit before income tax 2,069,357 881,839 368,002 (44,977) 3,274,221
As at 31 December 2018Segment assets and liabilitiesSegment assets 88,370,107 94,546,673 42,976,774 11,085,260 236,978,814Deferred tax assets 1,088,172
Group's total assets 238,066,986
Segment liabilities 79,340,007 85,195,092 38,725,955 9,988,821 213,249,875Deferred tax liabilities 614,081
Group's total liabilities 213,863,956
For the year ended 31 December 2018Other segment informationDepreciation of investment properties – – – (41,164) (41,164)Depreciation of properties and equipment (2,764,285) (37,488) (94,008) (36,224) (2,932,005)Amortisation (2,416) (7,764) (3,132) (2,772) (16,084)Impairment losses (194,723) (553,903) (260,096) (284,370) (1,293,092)
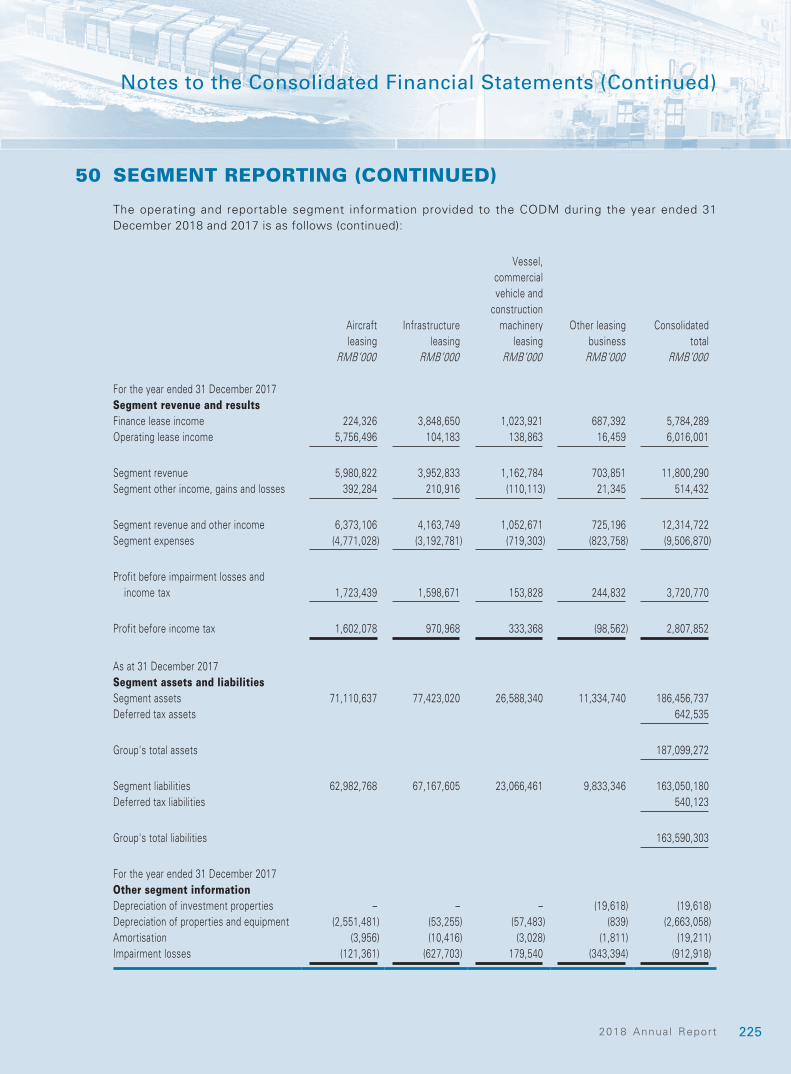
2252018 Annua l Report
Notes to the Consolidated Financial Statements (Continued)
50 SEGMENT REPORTING (CONTINUED)
The operating and reportable segment information provided to the CODM during the year ended 31 December 2018 and 2017 is as follows (continued):
Aircraft leasing
Infrastructure leasing
Vessel, commercial vehicle and
construction machinery
leasingOther leasing
businessConsolidated
totalRMB’000 RMB’000 RMB’000 RMB’000 RMB’000
For the year ended 31 December 2017Segment revenue and resultsFinance lease income 224,326 3,848,650 1,023,921 687,392 5,784,289Operating lease income 5,756,496 104,183 138,863 16,459 6,016,001
Segment revenue 5,980,822 3,952,833 1,162,784 703,851 11,800,290Segment other income, gains and losses 392,284 210,916 (110,113) 21,345 514,432
Segment revenue and other income 6,373,106 4,163,749 1,052,671 725,196 12,314,722Segment expenses (4,771,028) (3,192,781) (719,303) (823,758) (9,506,870)
Profit before impairment losses and income tax 1,723,439 1,598,671 153,828 244,832 3,720,770
Profit before income tax 1,602,078 970,968 333,368 (98,562) 2,807,852
As at 31 December 2017Segment assets and liabilitiesSegment assets 71,110,637 77,423,020 26,588,340 11,334,740 186,456,737Deferred tax assets 642,535
Group's total assets 187,099,272
Segment liabilities 62,982,768 67,167,605 23,066,461 9,833,346 163,050,180Deferred tax liabilities 540,123
Group's total liabilities 163,590,303
For the year ended 31 December 2017Other segment informationDepreciation of investment properties – – – (19,618) (19,618)Depreciation of properties and equipment (2,551,481) (53,255) (57,483) (839) (2,663,058)Amortisation (3,956) (10,416) (3,028) (1,811) (19,211)Impairment losses (121,361) (627,703) 179,540 (343,394) (912,918)
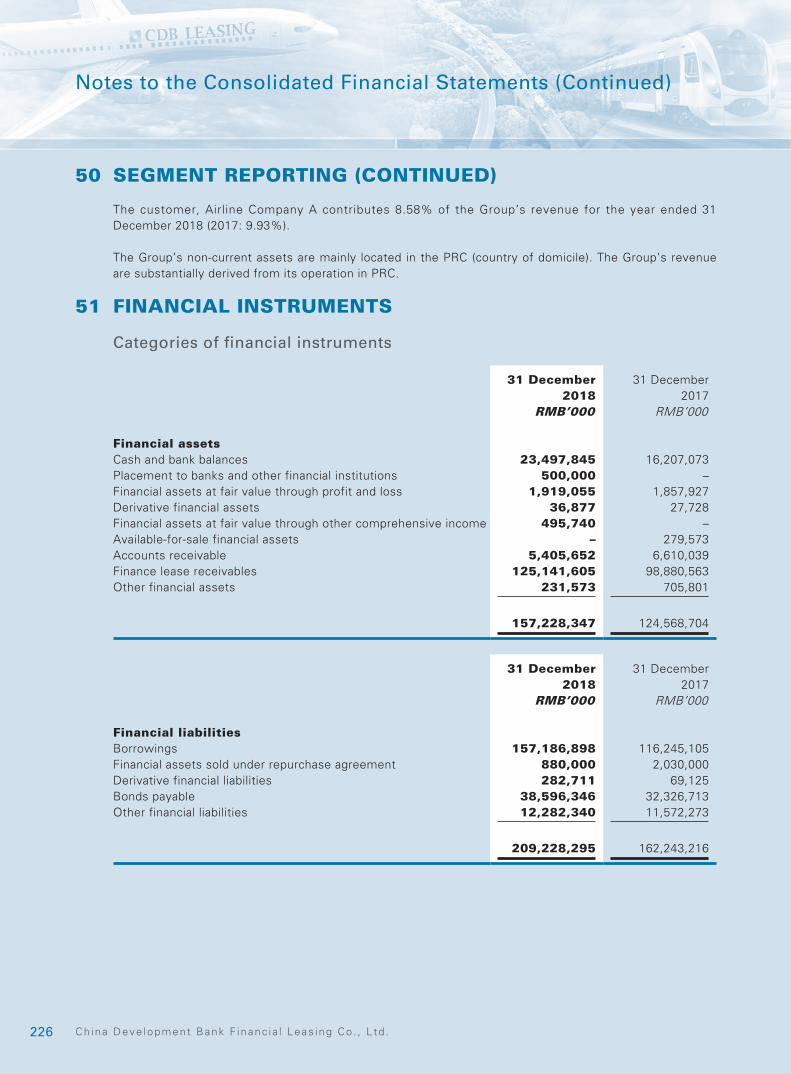
226 Ch ina Deve lopment Bank F inanc ia l Leas ing Co . , L td .
Notes to the Consolidated Financial Statements (Continued)
50 SEGMENT REPORTING (CONTINUED)
The customer, Airline Company A contributes 8.58% of the Group’s revenue for the year ended 31 December 2018 (2017: 9.93%).
The Group’s non-current assets are mainly located in the PRC (country of domicile). The Group’s revenue are substantially derived from its operation in PRC.
51 FINANCIAL INSTRUMENTS
Categories of financial instruments
31 December 2018
31 December 2017
RMB’000 RMB’000
Financial assetsCash and bank balances 23,497,845 16,207,073Placement to banks and other financial institutions 500,000 –Financial assets at fair value through profit and loss 1,919,055 1,857,927Derivative financial assets 36,877 27,728Financial assets at fair value through other comprehensive income 495,740 –Available-for-sale financial assets – 279,573Accounts receivable 5,405,652 6,610,039Finance lease receivables 125,141,605 98,880,563Other financial assets 231,573 705,801
157,228,347 124,568,704
31 December 2018
31 December 2017
RMB’000 RMB’000
Financial liabilitiesBorrowings 157,186,898 116,245,105Financial assets sold under repurchase agreement 880,000 2,030,000Derivative financial liabilities 282,711 69,125Bonds payable 38,596,346 32,326,713Other financial liabilities 12,282,340 11,572,273
209,228,295 162,243,216
2272018 Annua l Report
Notes to the Consolidated Financial Statements (Continued)
52 FINANCIAL RISK MANAGEMENT
52.1 Overview of financial risk management
The Group’s activities expose it to a variety of financial risks. The Group identifies, evaluates and monitors the risks continuously. The major financial risks of the Group are credit risk, liquidity risk and market risk. Market risk includes currency risk and interest rate risk. The Group’s objective is, therefore, to achieve an appropriate balance between risk and return and minimise potential adverse effects on the Group’s financial performance.
The major derivative financial instruments adopted by the Group are interest rate swaps and currency forwards. The objective for interest rate swap is to hedge against the cash flow volatility risk caused by interest rate fluctuations of borrowings; the objective for currency forwards contract is to hedge against the foreign exchange rate volatility risk caused by foreign currency risk exposure.
The board of directors of the Company established the Group’s risk management strategy. The senior management established related risk management policies and procedures, for credit risk, foreign exchange risk, interest rate risk, liquidity risk, and the use of derivative and non-derivative financial instruments, according to the risk management strategy approved by the board.
52.2 Credit risk
Credit risk for the Group represents the risk that the counterparty fails to meet its contractual obligations at the due date. Credit risk is considered as one of the most significant risk to the Group’s business operations. Management therefore carefully manages its exposure to credit risk. Credit risk primarily arises from leasing business and other financial assets, which include cash and bank balances, placement to banks and other financial institutions, derivative financial instruments, accounts receivable, FVOCI and other financial assets.
The Group establishes industry risk management framework and measurements which the Group will perform research by industry, implement credit evaluation, estimate the value on lease assets, monitor lessee business status and evaluate the impact from change in technology to lease assets, to strengthen the credit risk control and management.
228 Ch ina Deve lopment Bank F inanc ia l Leas ing Co . , L td .
Notes to the Consolidated Financial Statements (Continued)
52 FINANCIAL RISK MANAGEMENT (CONTINUED)
52.2 Credit risk (Continued)
52.2.1 Credit risk management
The Group enters into transactions only with recognised and creditworthy third parties. In accordance with the policy of the Group, the Group examines and verifies the credit risk of all customers with which the Group has credit transactions. In addition, the Group monitors the leases receivable regularly to mitigate the risk of significant exposures from non-performing assets.
The Group employs a range of policies and practices to mitigate credit risk of leasing business. The most typical of these is the taking of collateral, margin deposits and guarantees by third parties. The Group provides guidelines on acceptable types of collateral, which mainly includes:
• Civil aircraft and engines
• Ships
• Machinery and equipment
• Highway toll rights
• Land use rights
• Properties
The credit risk on bank balances and placement to banks and other financial institutions are limited because the counterparties are banks and other financial institutions with high credit ratings assigned by international credit-rating agencies.
The credit risk on financial assets at fair value through profit and loss is limited because the assets management schemes mainly invest in debt securities with high credit ratings and listed in exchanges or Interbank Bond Market in the PRC.
The assets management schemes held by the Group were issued by the well-known assets management companies in the PRC.

2292018 Annua l Report
Notes to the Consolidated Financial Statements (Continued)
52 FINANCIAL RISK MANAGEMENT (CONTINUED)
52.2 Credit risk (Continued)
52.2.2 Expected credit loss
From 1 January 2018, the Group formulates the credit losses of cash and bank balances, placement to banks and other financial institutions, accounts receivable, finance lease receivables and FVOCI.
For financial assets whose impairment losses are measured using ECL model, the Group assesses whether their credit risk has increased significantly since their initial recognition, and applies a three-stage impairment model to calculate their impairment allowance and recognise their ECL, as follows:
– Stage 1: If the credit risk has not increased significantly since its initial recognition, the financial asset is included in stage 1.
– Stage 2: If the credit risk has increased significantly since its initial recognition but is not yet deemed to be credit-impaired, the financial instrument is included in stage 2. The description of how the Group determines when a significant increase in credit risk has occurred is disclosed in the following section of “judgement of significant increase in credit risk”.
– Stage 3: If the financial instruments is credit-impaired, the financial instrument is included in stage 3. The definition of credit-impaired financial assets is disclosed in the following section of “the definition of credit-impaired assets”.
230 Ch ina Deve lopment Bank F inanc ia l Leas ing Co . , L td .
Notes to the Consolidated Financial Statements (Continued)
52 FINANCIAL RISK MANAGEMENT (CONTINUED)
52.2 Credit risk (Continued)
52.2. 2 Expected credit loss (Continued)
Parameters of ECL model
The parameters and assumptions involved in ECL model are described below.
The Group considers the credit risk characteristics of different financial instruments when determining if there is significant increase in credit risk. For financial instruments with or without significant increase in credit risk, 12-month or lifetime expected credit losses are provided respectively. The expected credit loss is the result of discounting the product of EAD, PD and LGD.
According to whether the credit risk has increased significantly or whether the assets have been impaired, the Group measures the loss allowance with the expected credit losses of 12-month or the lifetime due to the credit risk characteristics of different assets. The parameters and assumptions involved in ECL model are described below.
(i) Exposure at Default (EAD): EAD is based on the amounts the Group expects to be owed at the time of default, over the next 12 months (12M EAD) or over the remaining lifetime (Lifetime EAD).
(ii) Probabilities of Default (PD): The PD represents the likelihood of a borrower defaulting on its financial obligation, either over the next 12 months (12M PD), or over the remaining lifetime (Lifetime PD) of the obligation.
(iii) Loss given Default (LGD): LGD represents the Group’s expectation of the extent of loss in a defaulted exposure. LGD is expressed as a percentage loss per unit EAD. LGD is calculated on a 12-month or lifetime basis, where 12-month LGD is the percentage of loss expected to be made if the default occurs in the next 12 months and Lifetime LGD is the percentage of loss expected to be made if the default occurs over the remaining expected lifetime of the financial assets.
The Lifetime PD is developed by applying a maturity profile to the current 12M PD. The maturity profile looks at how defaults develop on a portfolio from the point of initial recognition throughout the lifetime. The maturity profile is based on historical observed data and is assumed to be the same across all assets within a portfolio and credit grading band. This is supported by historical analysis.

2312018 Annua l Report
Notes to the Consolidated Financial Statements (Continued)
52 FINANCIAL RISK MANAGEMENT (CONTINUED)
52.2 Credit risk (Continued)
52.2. 2 Expected credit loss (Continued)
Judgement of significant increase in credit risk (“SICR”)
Under IFRS 9, when considering the impairment stages for financial assets, the Group evaluates the credit risk at initial recognition and also whether there is any significant increase in credit risk for each reporting period.
The Group considers various reasonable supporting information to judge if there is significant increase in credit risk, including the forward-looking information, when determining the ECL staging for financial assets. Major factor being considered include regulatory and operating environment, internal and external credit ratings, solvency, and operational capabilities. The Group could base on individual financial instruments or portfolios of financial instruments with similar credit risk characteristics to determine ECL staging by comparing the credit risks of the financial instruments at the reporting date with initial recognition.
The Group set quantitative and qualitative criteria to judge whether the credit risk has SICR after initial recognition. The judgement criteria mainly includes the PD changes of the lessees, changes of credit risk categories and other indicators of SICR, etc. In the judgement of whether the credit risk has SICR after initial recognition, the Group has not rebutted the 30 days past due as presumption of SICR.
The definition of credit-impaired assets
Under IFRS 9, in order to determine whether credit impairment occurs, the defined standards adopted by the Group are consistent with the internal credit risk management objectives for relevant financial assets while considering quantitative and qualitative indicators. When the Group assesses whether the lessee has credit impairment, the following factors are mainly considered:
• Internal credit rating of the lessee is default grade
• The lessee has overdue more than 90 days after the lease contract payment date
• The lessee has significant financial difficulties
• The lessee is likely to go bankrupt or other financial restructuring
• The lessor gives the lessee concessions for economic or contractual reasons due to the lessee’s financial difficulties, where such concessions are normally reluctant to be made by the lessor
The Credit impairment of financial assets may be caused by the joint effects of multiple events, and may not be caused by separately identifiable event.

232 Ch ina Deve lopment Bank F inanc ia l Leas ing Co . , L td .
Notes to the Consolidated Financial Statements (Continued)
52 FINANCIAL RISK MANAGEMENT (CONTINUED)
52.2 Credit risk (Continued)
52.2. 2 Expected credit loss (Continued)
Forward-looking information
The determinations of 12 months and the lifetime EAD, PD and LGD also incorporates forward-looking information. The Group has performed historical data analysis and identified the key macroeconomic variables associated with credit risk and expected credit losses for each portfolio. The Group has developed macroeconomic forward-looking adjustment ECL models by establishing a basket of factors, preparing data, filtering model factors and adjusting forward-looking elements. The basket of macroeconomic factors including Gross Domestic Products (GDP), Customer Price Index (CPI), Producer Price Index (PPI), benchmark interest rate and other macroeconomic variables. The forecasting methods and critical assumptions applied have no material change during the year ended 31 December 2018.
In 2018, the Group used statistical analysis to determine the weights of 3 different scenarios, and also considered the range of possible outcomes represented by each scenario, including base, upside and downside scenarios, and determined the final macroeconomic assumptions and weights to measure the relevant expected credit loss.
Sensitivity analysis
Expected credit impairment allowance is sensitive to the parameters used in the model, the macroeconomic variables of the forward-looking forecast, the weight probabilities in the three scenarios, and other factors considered in the application of expert judgement. Change in these input parameters, assumptions, models, and judgements will have an impact on the significant increase in credit risk and the measurement of expected credit losses.
Assuming the weight for upside scenario rise by 10%, the weight for basic scenario fall by 10%, the expected credit impairment allowance will decrease by 141 million. If the weight for downside scenario increase by 10% and the weight for basic scenario decrease by 10%, then the expected credit impairment allowance will increase by 107 million.
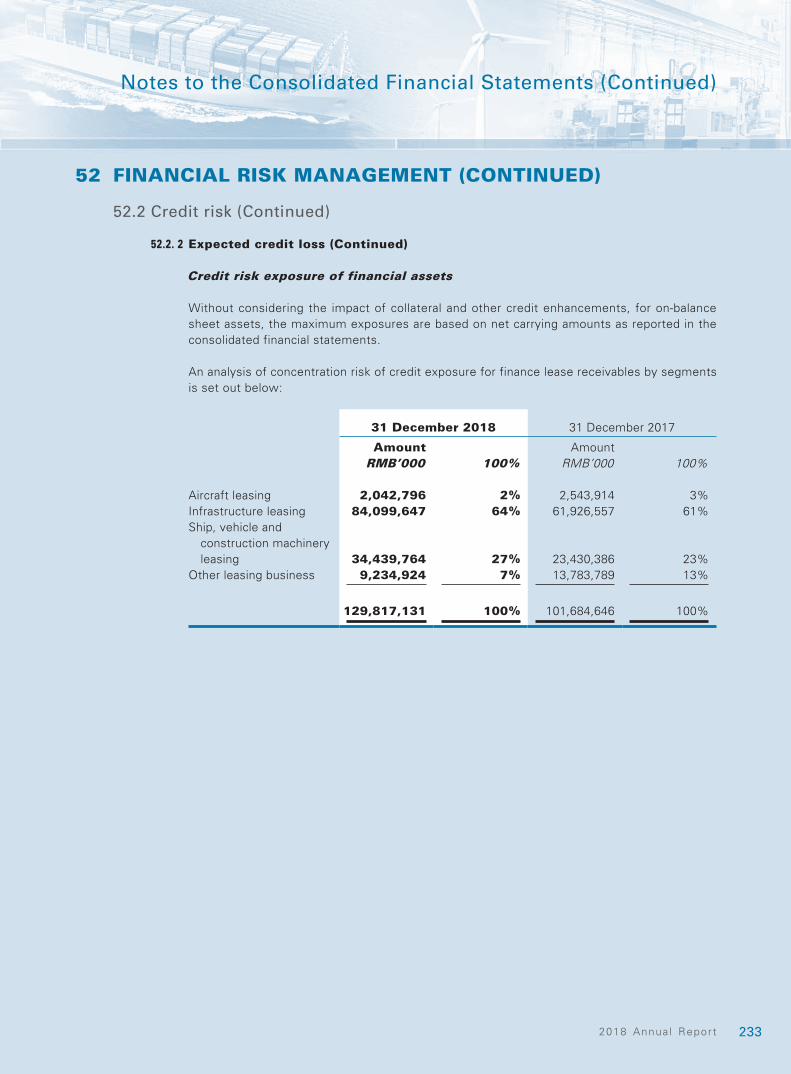
2332018 Annua l Report
Notes to the Consolidated Financial Statements (Continued)
52 FINANCIAL RISK MANAGEMENT (CONTINUED)
52.2 Credit risk (Continued)
52.2. 2 Expected credit loss (Continued)
Credit risk exposure of financial assets
Without considering the impact of collateral and other credit enhancements, for on-balance sheet assets, the maximum exposures are based on net carrying amounts as reported in the consolidated financial statements.
An analysis of concentration risk of credit exposure for finance lease receivables by segments is set out below:
31 December 2018 31 December 2017 Amount Amount
RMB’000 100% RMB’000 100%
Aircraft leasing 2,042,796 2% 2,543,914 3%Infrastructure leasing 84,099,647 64% 61,926,557 61%Ship, vehicle and
construction machinery leasing 34,439,764 27% 23,430,386 23%
Other leasing business 9,234,924 7% 13,783,789 13%
129,817,131 100% 101,684,646 100%
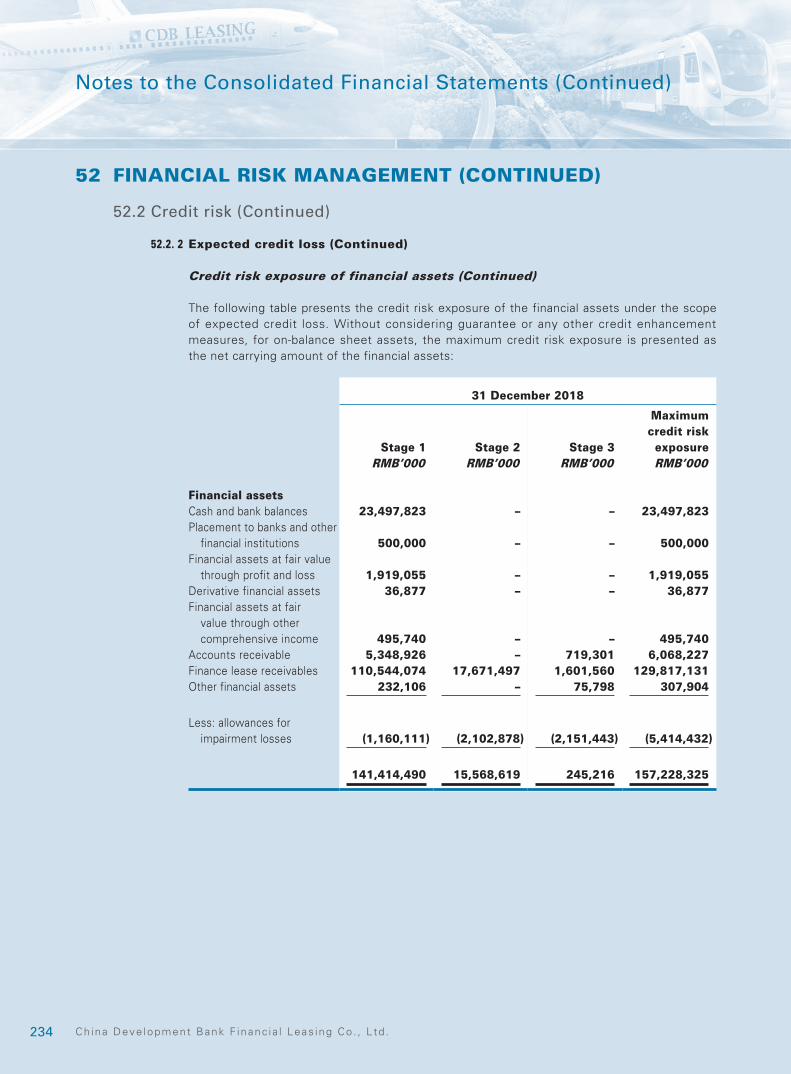
234 Ch ina Deve lopment Bank F inanc ia l Leas ing Co . , L td .
Notes to the Consolidated Financial Statements (Continued)
52 FINANCIAL RISK MANAGEMENT (CONTINUED)
52.2 Credit risk (Continued)
52.2. 2 Expected credit loss (Continued)
Credit risk exposure of financial assets (Continued)
The following table presents the credit risk exposure of the financial assets under the scope of expected credit loss. Without considering guarantee or any other credit enhancement measures, for on-balance sheet assets, the maximum credit risk exposure is presented as the net carrying amount of the financial assets:
31 December 2018
Stage 1 Stage 2 Stage 3
Maximum credit risk exposure
RMB’000 RMB’000 RMB’000 RMB’000
Financial assetsCash and bank balances 23,497,823 – – 23,497,823Placement to banks and other
financial institutions 500,000 – – 500,000Financial assets at fair value
through profit and loss 1,919,055 – – 1,919,055Derivative financial assets 36,877 – – 36,877Financial assets at fair
value through other comprehensive income 495,740 – – 495,740
Accounts receivable 5,348,926 – 719,301 6,068,227Finance lease receivables 110,544,074 17,671,497 1,601,560 129,817,131Other financial assets 232,106 – 75,798 307,904
Less: allowances for impairment losses (1,160,111) (2,102,878) (2,151,443) (5,414,432)
141,414,490 15,568,619 245,216 157,228,325
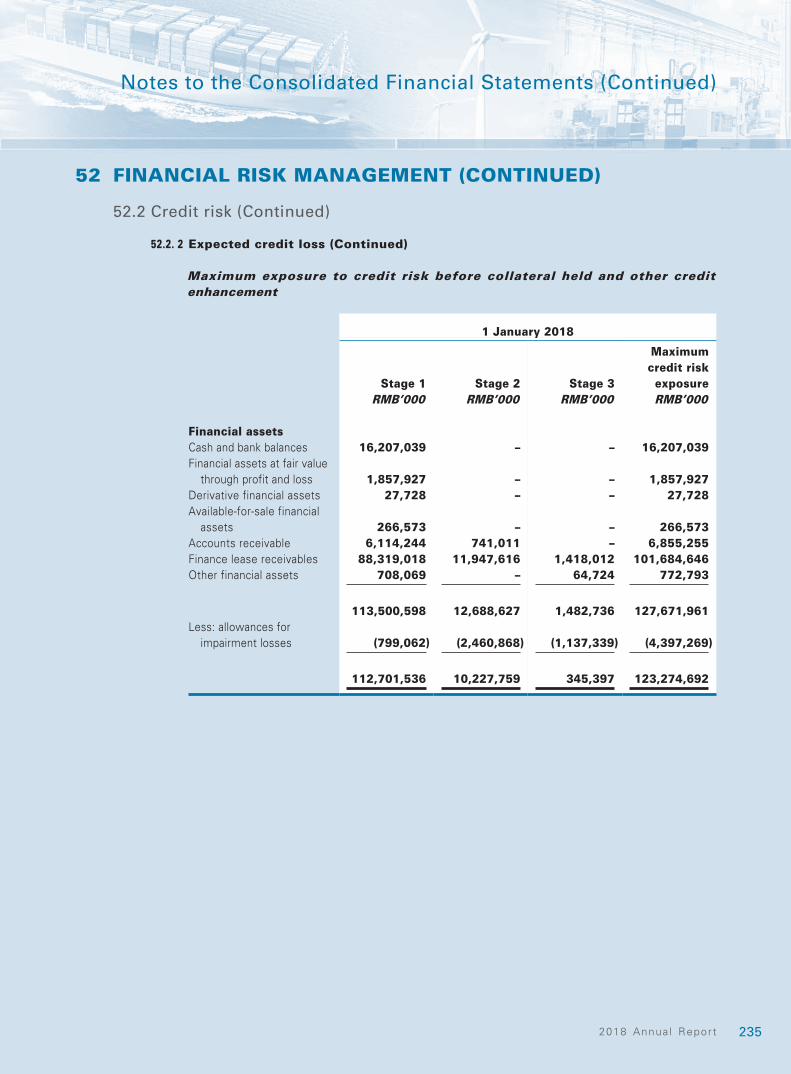
2352018 Annua l Report
Notes to the Consolidated Financial Statements (Continued)
52 FINANCIAL RISK MANAGEMENT (CONTINUED)
52.2 Credit risk (Continued)
52.2. 2 Expected credit loss (Continued)
Maximum exposure to credit risk before collateral held and other credit enhancement
1 January 2018
Stage 1 Stage 2 Stage 3
Maximum credit risk exposure
RMB’000 RMB’000 RMB’000 RMB’000
Financial assetsCash and bank balances 16,207,039 – – 16,207,039Financial assets at fair value
through profit and loss 1,857,927 – – 1,857,927Derivative financial assets 27,728 – – 27,728Available-for-sale financial
assets 266,573 – – 266,573Accounts receivable 6,114,244 741,011 – 6,855,255Finance lease receivables 88,319,018 11,947,616 1,418,012 101,684,646Other financial assets 708,069 – 64,724 772,793
113,500,598 12,688,627 1,482,736 127,671,961Less: allowances for
impairment losses (799,062) (2,460,868) (1,137,339) (4,397,269)
112,701,536 10,227,759 345,397 123,274,692
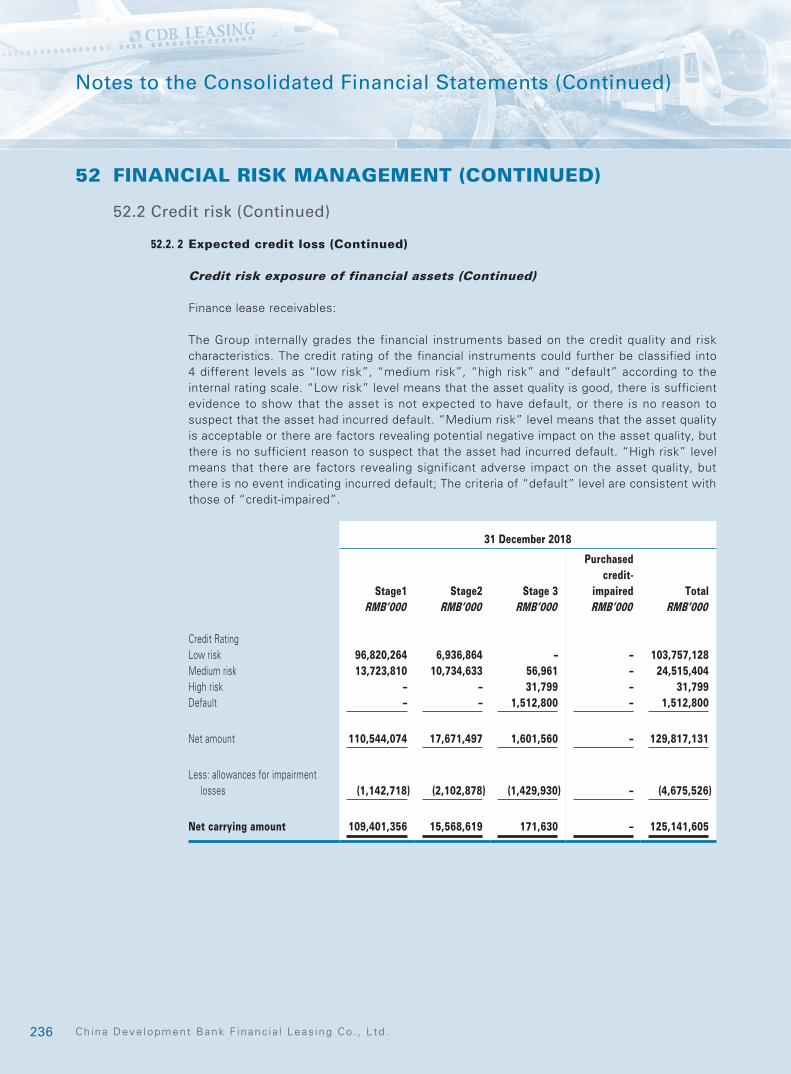
236 Ch ina Deve lopment Bank F inanc ia l Leas ing Co . , L td .
Notes to the Consolidated Financial Statements (Continued)
52 FINANCIAL RISK MANAGEMENT (CONTINUED)
52.2 Credit risk (Continued)
52.2. 2 Expected credit loss (Continued)
Credit risk exposure of financial assets (Continued)
Finance lease receivables:
The Group internally grades the financial instruments based on the credit quality and risk characteristics. The credit rating of the financial instruments could further be classified into 4 different levels as “low risk”, “medium risk”, “high risk” and “default” according to the internal rating scale. “Low risk” level means that the asset quality is good, there is sufficient evidence to show that the asset is not expected to have default, or there is no reason to suspect that the asset had incurred default. “Medium risk” level means that the asset quality is acceptable or there are factors revealing potential negative impact on the asset quality, but there is no sufficient reason to suspect that the asset had incurred default. “High risk” level means that there are factors revealing significant adverse impact on the asset quality, but there is no event indicating incurred default; The criteria of “default” level are consistent with those of “credit-impaired”.
31 December 2018
Stage1 Stage2 Stage 3
Purchased credit-
impaired TotalRMB’000 RMB’000 RMB’000 RMB’000 RMB’000
Credit RatingLow risk 96,820,264 6,936,864 – – 103,757,128Medium risk 13,723,810 10,734,633 56,961 – 24,515,404High risk – – 31,799 – 31,799Default – – 1,512,800 – 1,512,800
Net amount 110,544,074 17,671,497 1,601,560 – 129,817,131
Less: allowances for impairment losses (1,142,718) (2,102,878) (1,429,930) – (4,675,526)
Net carrying amount 109,401,356 15,568,619 171,630 – 125,141,605
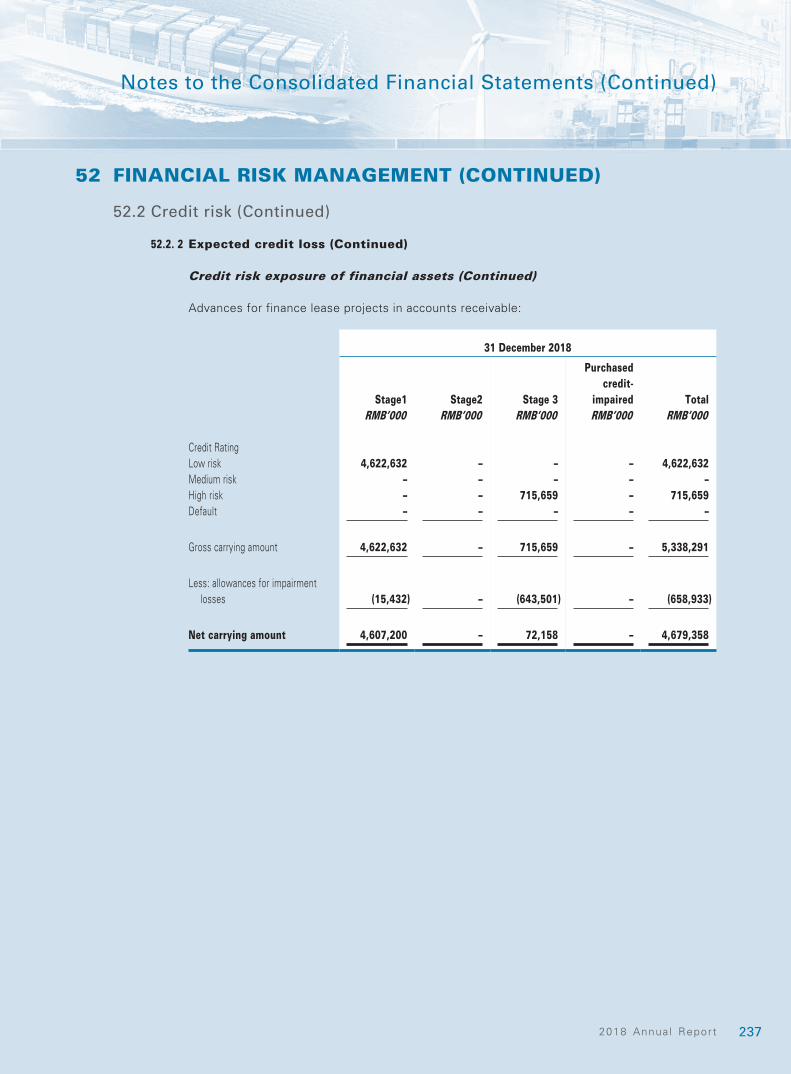
2372018 Annua l Report
Notes to the Consolidated Financial Statements (Continued)
52 FINANCIAL RISK MANAGEMENT (CONTINUED)
52.2 Credit risk (Continued)
52.2. 2 Expected credit loss (Continued)
Credit risk exposure of financial assets (Continued)
Advances for finance lease projects in accounts receivable:
31 December 2018
Stage1 Stage2 Stage 3
Purchased credit-
impaired TotalRMB’000 RMB’000 RMB’000 RMB’000 RMB’000
Credit RatingLow risk 4,622,632 – – – 4,622,632Medium risk – – – – –High risk – – 715,659 – 715,659Default – – – – –
Gross carrying amount 4,622,632 – 715,659 – 5,338,291
Less: allowances for impairment losses (15,432) – (643,501) – (658,933)
Net carrying amount 4,607,200 – 72,158 – 4,679,358
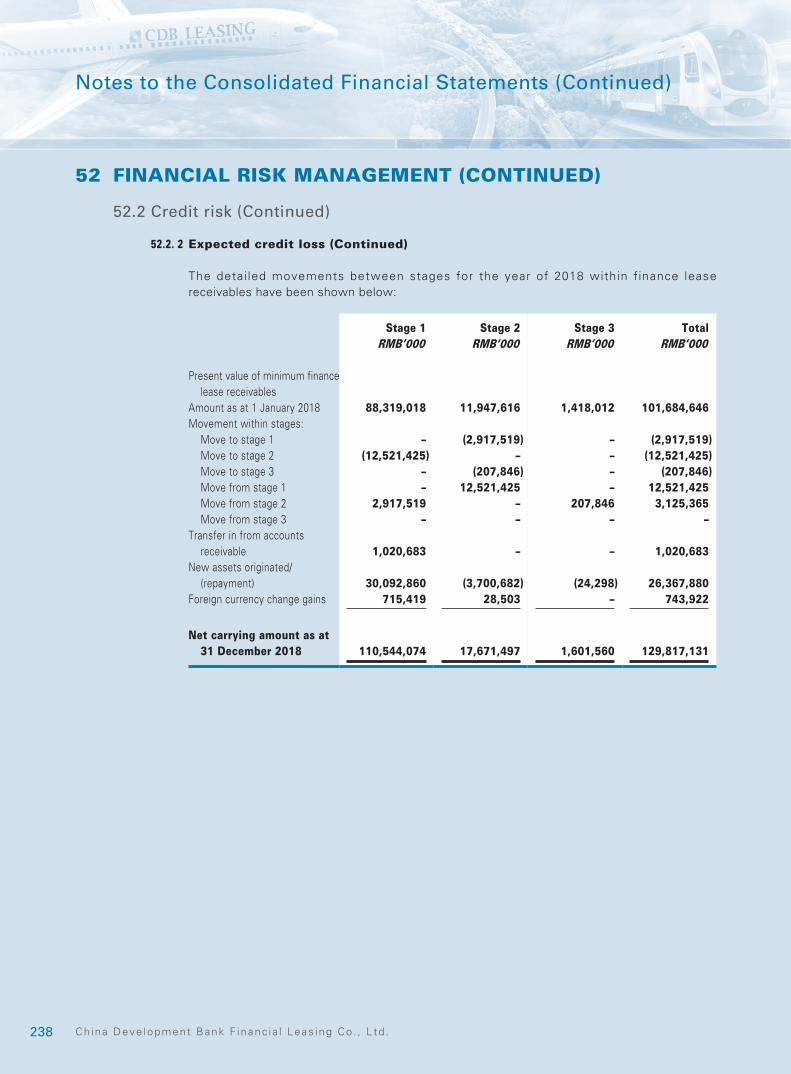
238 Ch ina Deve lopment Bank F inanc ia l Leas ing Co . , L td .
Notes to the Consolidated Financial Statements (Continued)
52 FINANCIAL RISK MANAGEMENT (CONTINUED)
52.2 Credit risk (Continued)
52.2. 2 Expected credit loss (Continued)
The detai led movements between stages for the year of 2018 within f inance lease receivables have been shown below:
Stage 1 Stage 2 Stage 3 TotalRMB’000 RMB’000 RMB’000 RMB’000
Present value of minimum finance lease receivables
Amount as at 1 January 2018 88,319,018 11,947,616 1,418,012 101,684,646Movement within stages:
Move to stage 1 – (2,917,519) – (2,917,519)Move to stage 2 (12,521,425) – – (12,521,425)Move to stage 3 – (207,846) – (207,846)Move from stage 1 – 12,521,425 – 12,521,425Move from stage 2 2,917,519 – 207,846 3,125,365Move from stage 3 – – – –
Transfer in from accounts receivable 1,020,683 – – 1,020,683
New assets originated/(repayment) 30,092,860 (3,700,682) (24,298) 26,367,880
Foreign currency change gains 715,419 28,503 – 743,922
Net carrying amount as at 31 December 2018 110,544,074 17,671,497 1,601,560 129,817,131
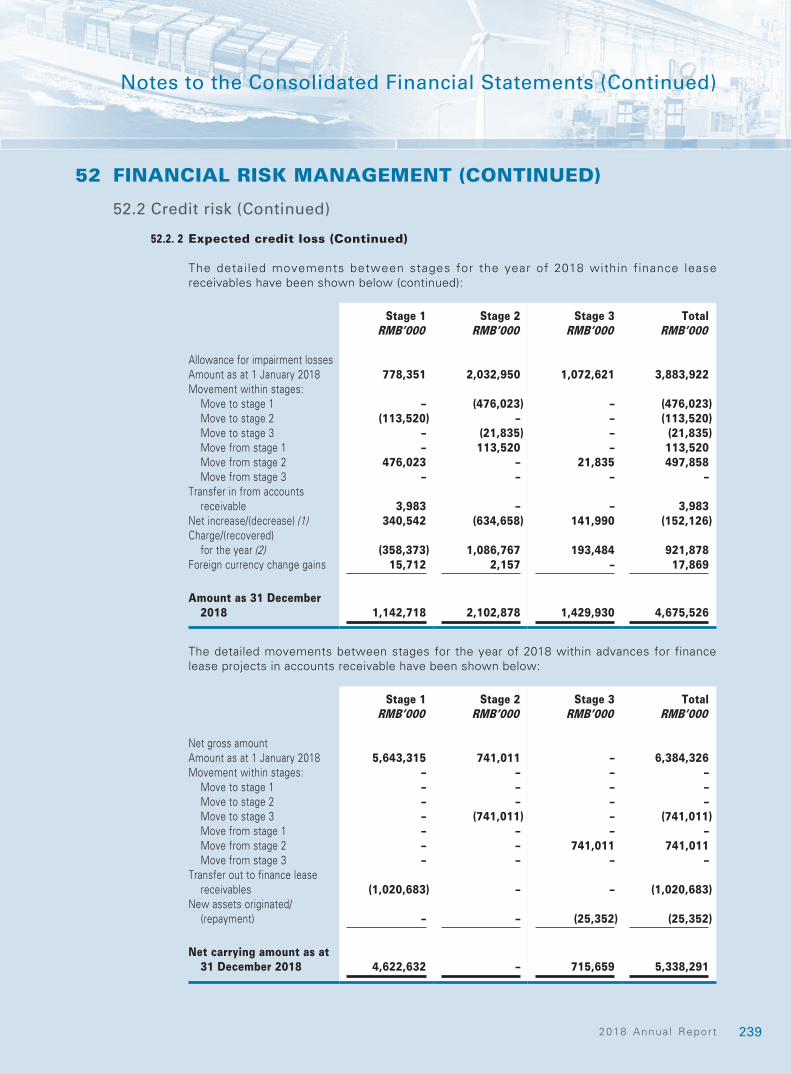
2392018 Annua l Report
Notes to the Consolidated Financial Statements (Continued)
52 FINANCIAL RISK MANAGEMENT (CONTINUED)
52.2 Credit risk (Continued)
52.2. 2 Expected credit loss (Continued)
The detai led movements between stages for the year of 2018 within f inance lease receivables have been shown below (continued):
Stage 1 Stage 2 Stage 3 TotalRMB’000 RMB’000 RMB’000 RMB’000
Allowance for impairment lossesAmount as at 1 January 2018 778,351 2,032,950 1,072,621 3,883,922Movement within stages:
Move to stage 1 – (476,023) – (476,023)Move to stage 2 (113,520) – – (113,520)Move to stage 3 – (21,835) – (21,835)Move from stage 1 – 113,520 – 113,520Move from stage 2 476,023 – 21,835 497,858Move from stage 3 – – – –
Transfer in from accounts receivable 3,983 – – 3,983
Net increase/(decrease) (1) 340,542 (634,658) 141,990 (152,126)Charge/(recovered)
for the year (2) (358,373) 1,086,767 193,484 921,878Foreign currency change gains 15,712 2,157 – 17,869
Amount as 31 December 2018 1,142,718 2,102,878 1,429,930 4,675,526
The detailed movements between stages for the year of 2018 within advances for finance lease projects in accounts receivable have been shown below:
Stage 1 Stage 2 Stage 3 TotalRMB’000 RMB’000 RMB’000 RMB’000
Net gross amountAmount as at 1 January 2018 5,643,315 741,011 – 6,384,326Movement within stages: – – – –
Move to stage 1 – – – –Move to stage 2 – – – –Move to stage 3 – (741,011) – (741,011)Move from stage 1 – – – –Move from stage 2 – – 741,011 741,011Move from stage 3 – – – –
Transfer out to finance lease receivables (1,020,683) – – (1,020,683)
New assets originated/(repayment) – – (25,352) (25,352)
Net carrying amount as at 31 December 2018 4,622,632 – 715,659 5,338,291
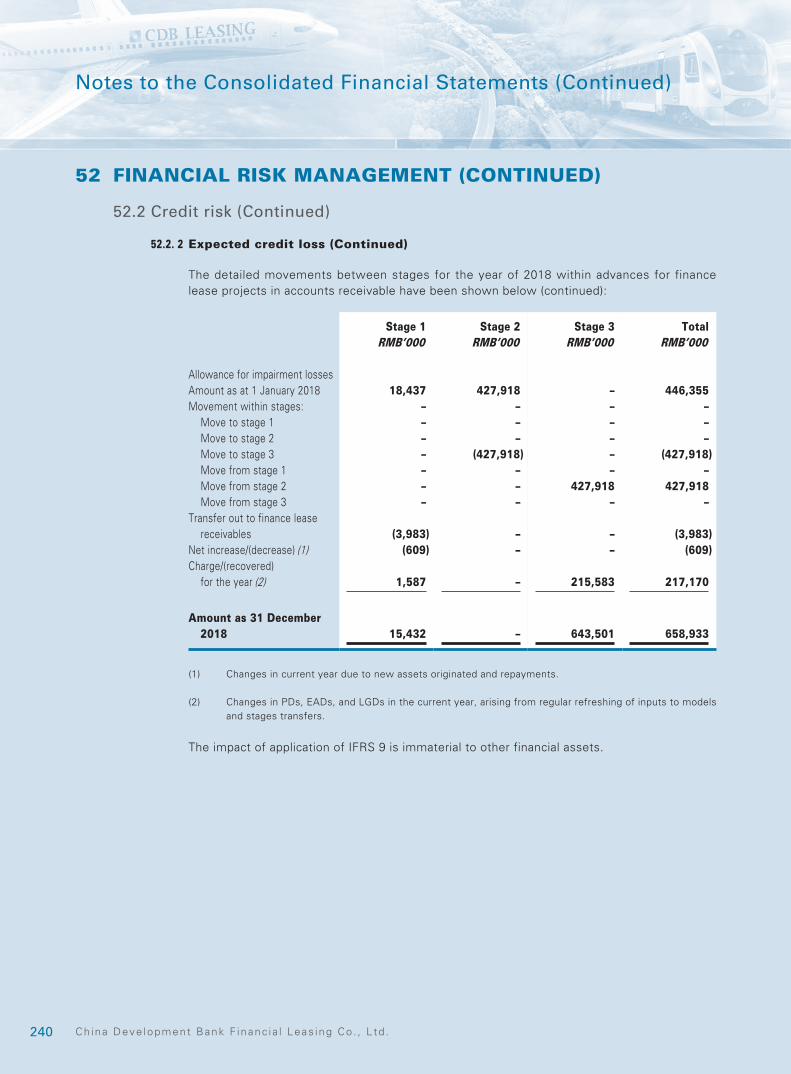
240 Ch ina Deve lopment Bank F inanc ia l Leas ing Co . , L td .
Notes to the Consolidated Financial Statements (Continued)
52 FINANCIAL RISK MANAGEMENT (CONTINUED)
52.2 Credit risk (Continued)
52.2. 2 Expected credit loss (Continued)
The detailed movements between stages for the year of 2018 within advances for finance lease projects in accounts receivable have been shown below (continued):
Stage 1 Stage 2 Stage 3 TotalRMB’000 RMB’000 RMB’000 RMB’000
Allowance for impairment lossesAmount as at 1 January 2018 18,437 427,918 – 446,355Movement within stages: – – – –
Move to stage 1 – – – –Move to stage 2 – – – –Move to stage 3 – (427,918) – (427,918)Move from stage 1 – – – –Move from stage 2 – – 427,918 427,918Move from stage 3 – – – –
Transfer out to finance lease receivables (3,983) – – (3,983)
Net increase/(decrease) (1) (609) – – (609)Charge/(recovered)
for the year (2) 1,587 – 215,583 217,170
Amount as 31 December 2018 15,432 – 643,501 658,933
(1) Changes in current year due to new assets originated and repayments.
(2) Changes in PDs, EADs, and LGDs in the current year, arising from regular refreshing of inputs to models and stages transfers.
The impact of application of IFRS 9 is immaterial to other financial assets.

2412018 Annua l Report
Notes to the Consolidated Financial Statements (Continued)
52 FINANCIAL RISK MANAGEMENT (CONTINUED)
52.3 Market risk
The Group is exposed to market risks that may cause losses to the Group as a result of adverse movements in market prices (including interest rates and exchange rates).
52.3.1 Market risks measurement techniques
The Group currently establishes position limits and uses sensitivity analysis to measure and control market risks. The Group regularly calculates and monitors the foreign exchange risk exposure, as well as the difference (exposure) between interest-bearing assets and liabilities which would mature in a certain period or need to be repriced, and then using the exposure information to perform sensitivity analysis under changing market interest rate and exchange rate.
52.3.2 Currency risk
The Group takes on exposures to the effects of fluctuations in the prevailing foreign currency exchange rates on its financial position and cash flows.
The principle of currency risk management is to match assets and liabilities denominated in different currencies, and hedge net currency risk exposure through currency derivative instruments when it is appropriate and necessary. Most aircraft held under finance and operating leases that the Group has purchased are denominated in US dollars; and the corresponding finance lease receivables and operating leases receivable are denominated in US dollars; and the main sources of fund are from bank borrowings and bond issuance denominated in US dollar. Other than aircraft and ship leasing, the Group’s remaining leasing businesses are mostly denominated in RMB, which does not expose to significant currency risk. The exchange rate risk exposure primarily arises from the profits of some of the Group’s overseas SPVs, which are denominated in foreign currencies.
The Group’s policy has been reviewed and, due to the increased volatility in USD, it was decided to hedge up to currency risk exposure that affect profit and loss. The Group utilises a rollover hedging strategy, such as foreign currency forward and foreign exchange swap (FX swap), to offset or limit the exposure currency risk. For the year ended 31 December 2018, the Group’s hedge relationship between the hedging instrument, such as FX swaps, and the designated hedged items were highly effective. The hedge ratios for the Group’s hedge relationships are 1:1. The maturity date of the Group’s foreign currency forward and FX swap is ranging from 04 January 2019 to 16 November 2021.
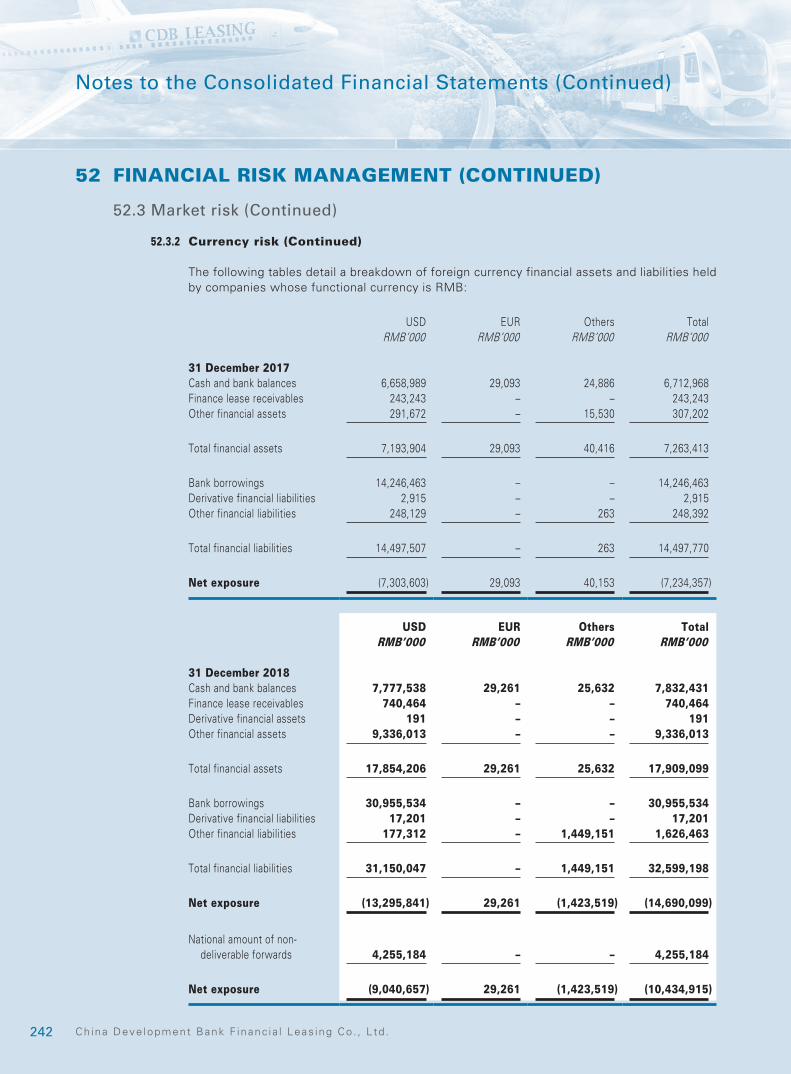
242 Ch ina Deve lopment Bank F inanc ia l Leas ing Co . , L td .
Notes to the Consolidated Financial Statements (Continued)
52 FINANCIAL RISK MANAGEMENT (CONTINUED)
52.3 Market risk (Continued)
52.3.2 Currency risk (Continued)
The following tables detail a breakdown of foreign currency financial assets and liabilities held by companies whose functional currency is RMB:
USD EUR Others TotalRMB’000 RMB’000 RMB’000 RMB’000
31 December 2017Cash and bank balances 6,658,989 29,093 24,886 6,712,968Finance lease receivables 243,243 – – 243,243Other financial assets 291,672 – 15,530 307,202
Total financial assets 7,193,904 29,093 40,416 7,263,413
Bank borrowings 14,246,463 – – 14,246,463Derivative financial liabilities 2,915 – – 2,915Other financial liabilities 248,129 – 263 248,392
Total financial liabilities 14,497,507 – 263 14,497,770
Net exposure (7,303,603) 29,093 40,153 (7,234,357)
USD EUR Others TotalRMB’000 RMB’000 RMB’000 RMB’000
31 December 2018Cash and bank balances 7,777,538 29,261 25,632 7,832,431Finance lease receivables 740,464 – – 740,464Derivative financial assets 191 – – 191Other financial assets 9,336,013 – – 9,336,013
Total financial assets 17,854,206 29,261 25,632 17,909,099
Bank borrowings 30,955,534 – – 30,955,534Derivative financial liabilities 17,201 – – 17,201Other financial liabilities 177,312 – 1,449,151 1,626,463
Total financial liabilities 31,150,047 – 1,449,151 32,599,198
Net exposure (13,295,841) 29,261 (1,423,519) (14,690,099)
National amount of non-deliverable forwards 4,255,184 – – 4,255,184
Net exposure (9,040,657) 29,261 (1,423,519) (10,434,915)
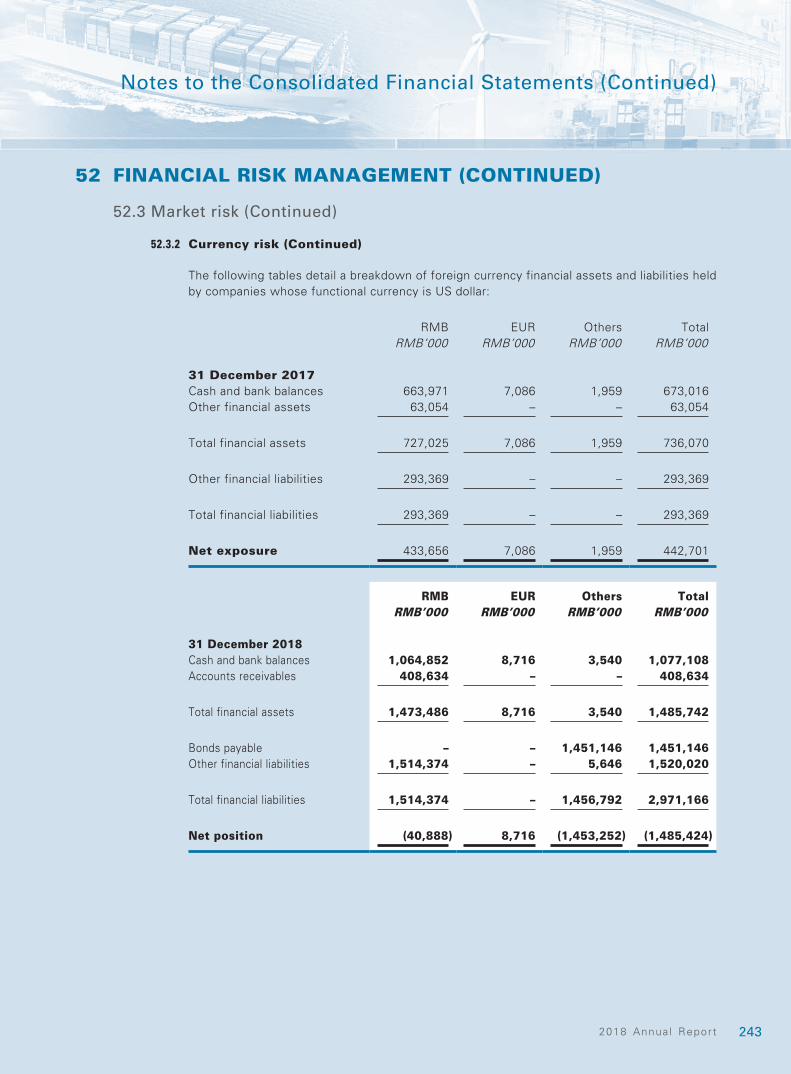
2432018 Annua l Report
Notes to the Consolidated Financial Statements (Continued)
52 FINANCIAL RISK MANAGEMENT (CONTINUED)
52.3 Market risk (Continued)
52.3.2 Currency risk (Continued)
The following tables detail a breakdown of foreign currency financial assets and liabilities held by companies whose functional currency is US dollar:
RMB EUR Others TotalRMB’000 RMB’000 RMB’000 RMB’000
31 December 2017Cash and bank balances 663,971 7,086 1,959 673,016Other financial assets 63,054 – – 63,054
Total financial assets 727,025 7,086 1,959 736,070
Other financial liabilities 293,369 – – 293,369
Total financial liabilities 293,369 – – 293,369
Net exposure 433,656 7,086 1,959 442,701
RMB EUR Others TotalRMB’000 RMB’000 RMB’000 RMB’000
31 December 2018Cash and bank balances 1,064,852 8,716 3,540 1,077,108Accounts receivables 408,634 – – 408,634
Total financial assets 1,473,486 8,716 3,540 1,485,742
Bonds payable – – 1,451,146 1,451,146Other financial liabilities 1,514,374 – 5,646 1,520,020
Total financial liabilities 1,514,374 – 1,456,792 2,971,166
Net position (40,888) 8,716 (1,453,252) (1,485,424)
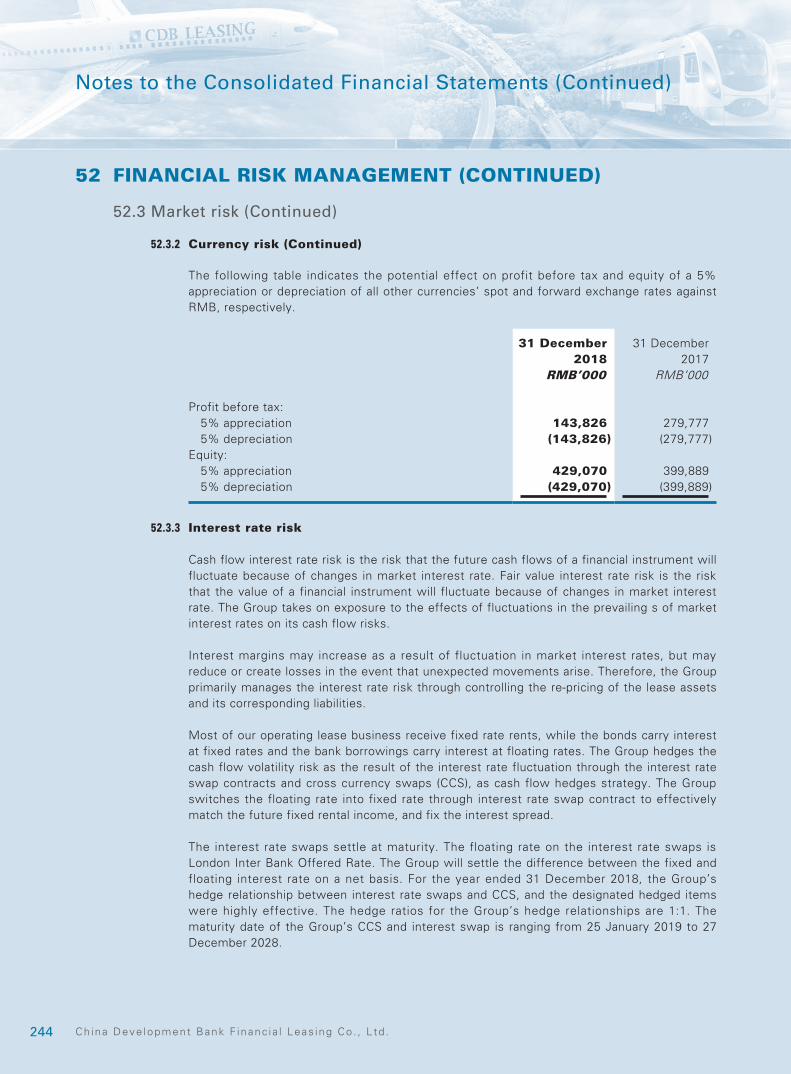
244 Ch ina Deve lopment Bank F inanc ia l Leas ing Co . , L td .
Notes to the Consolidated Financial Statements (Continued)
52 FINANCIAL RISK MANAGEMENT (CONTINUED)
52.3 Market risk (Continued)
52.3.2 Currency risk (Continued)
The following table indicates the potential effect on profit before tax and equity of a 5% appreciation or depreciation of all other currencies’ spot and forward exchange rates against RMB, respectively.
31 December 2018
31 December 2017
RMB’000 RMB’000
Profit before tax:5% appreciation 143,826 279,7775% depreciation (143,826) (279,777)
Equity:5% appreciation 429,070 399,8895% depreciation (429,070) (399,889)
52.3.3 Interest rate risk
Cash flow interest rate risk is the risk that the future cash flows of a financial instrument will fluctuate because of changes in market interest rate. Fair value interest rate risk is the risk that the value of a financial instrument will fluctuate because of changes in market interest rate. The Group takes on exposure to the effects of fluctuations in the prevailing s of market interest rates on its cash flow risks.
Interest margins may increase as a result of fluctuation in market interest rates, but may reduce or create losses in the event that unexpected movements arise. Therefore, the Group primarily manages the interest rate risk through controlling the re-pricing of the lease assets and its corresponding liabilities.
Most of our operating lease business receive fixed rate rents, while the bonds carry interest at fixed rates and the bank borrowings carry interest at floating rates. The Group hedges the cash flow volatility risk as the result of the interest rate fluctuation through the interest rate swap contracts and cross currency swaps (CCS), as cash flow hedges strategy. The Group switches the floating rate into fixed rate through interest rate swap contract to effectively match the future fixed rental income, and fix the interest spread.
The interest rate swaps settle at maturity. The floating rate on the interest rate swaps is London Inter Bank Offered Rate. The Group will settle the difference between the fixed and floating interest rate on a net basis. For the year ended 31 December 2018, the Group’s hedge relationship between interest rate swaps and CCS, and the designated hedged items were highly effective. The hedge ratios for the Group’s hedge relationships are 1:1. The maturity date of the Group’s CCS and interest swap is ranging from 25 January 2019 to 27 December 2028.
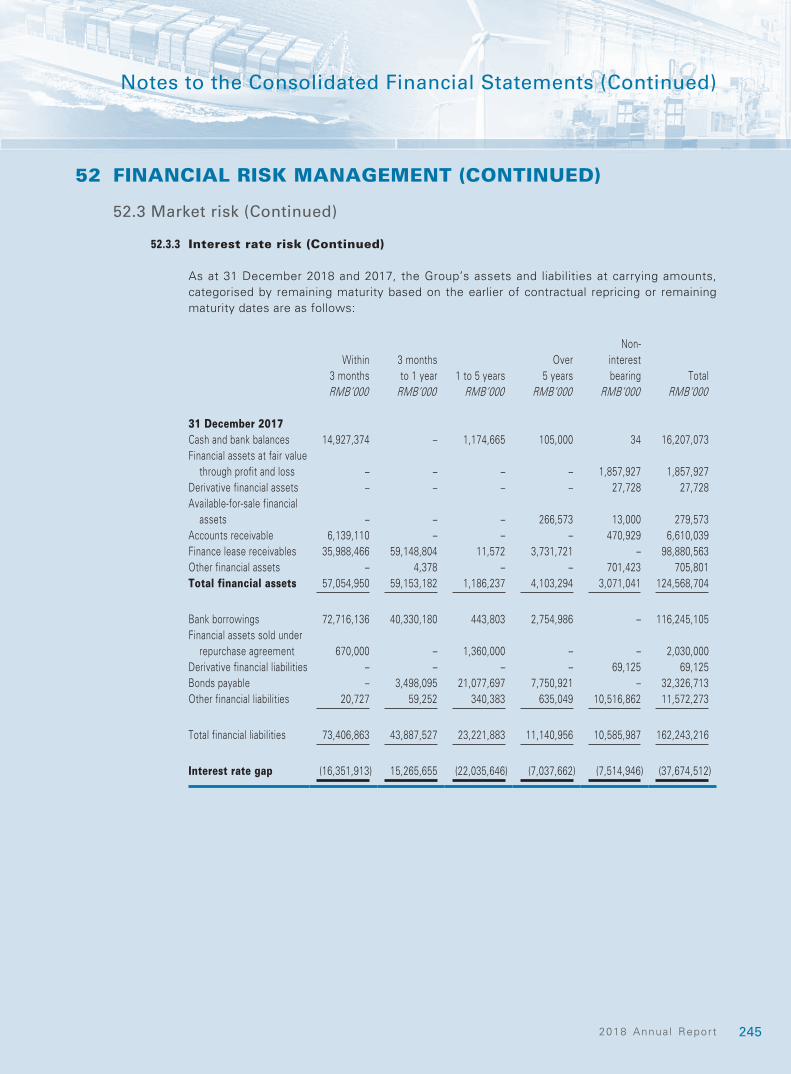
2452018 Annua l Report
Notes to the Consolidated Financial Statements (Continued)
52 FINANCIAL RISK MANAGEMENT (CONTINUED)
52.3 Market risk (Continued)
52.3.3 Interest rate risk (Continued)
As at 31 December 2018 and 2017, the Group’s assets and liabilities at carrying amounts, categorised by remaining maturity based on the earlier of contractual repricing or remaining maturity dates are as follows:
Within 3 months
3 months to 1 year 1 to 5 years
Over 5 years
Non- interest bearing Total
RMB’000 RMB’000 RMB’000 RMB’000 RMB’000 RMB’000
31 December 2017Cash and bank balances 14,927,374 – 1,174,665 105,000 34 16,207,073Financial assets at fair value
through profit and loss – – – – 1,857,927 1,857,927Derivative financial assets – – – – 27,728 27,728Available-for-sale financial
assets – – – 266,573 13,000 279,573Accounts receivable 6,139,110 – – – 470,929 6,610,039Finance lease receivables 35,988,466 59,148,804 11,572 3,731,721 – 98,880,563Other financial assets – 4,378 – – 701,423 705,801Total financial assets 57,054,950 59,153,182 1,186,237 4,103,294 3,071,041 124,568,704
Bank borrowings 72,716,136 40,330,180 443,803 2,754,986 – 116,245,105Financial assets sold under
repurchase agreement 670,000 – 1,360,000 – – 2,030,000Derivative financial liabilities – – – – 69,125 69,125Bonds payable – 3,498,095 21,077,697 7,750,921 – 32,326,713Other financial liabilities 20,727 59,252 340,383 635,049 10,516,862 11,572,273
Total financial liabilities 73,406,863 43,887,527 23,221,883 11,140,956 10,585,987 162,243,216
Interest rate gap (16,351,913) 15,265,655 (22,035,646) (7,037,662) (7,514,946) (37,674,512)

246 Ch ina Deve lopment Bank F inanc ia l Leas ing Co . , L td .
Notes to the Consolidated Financial Statements (Continued)
52 FINANCIAL RISK MANAGEMENT (CONTINUED)
52.3 Market risk (Continued)
52.3.3 Interest rate risk (Continued)
Within 3 months
3 months to 1 year 1 to 5 years
Over 5 years
Non- interest bearing Total
RMB’000 RMB’000 RMB’000 RMB’000 RMB’000 RMB’000
31 December 2018Cash and bank balances 18,300,283 – 5,092,540 105,000 22 23,497,845Placement to banks and other
financial institutions 500,000 – – – – 500,000Financial assets at fair value
through profit and loss – – – – 1,919,055 1,919,055Derivative financial assets – – – – 36,877 36,877Financial assets at fair value
through other comprehensive income 495,740 495,740
Accounts receivable – 4,679,359 – – 726,293 5,405,652Finance lease receivables 114,772,979 3,446,960 603,519 6,318,147 – 125,141,605Other financial assets 231,573 231,573 Total financial assets 133,573,262 8,126,319 5,696,059 6,423,147 3,409,560 157,228,347
Bank borrowings 84,004,855 65,255,196 6,402,479 1,524,368 – 157,186,898Financial assets sold under
repurchase agreement 880,000 – – – – 880,000Derivative financial liabilities – – – – 282,711 282,711Bonds payable 3,417,314 4,759,260 27,702,227 2,717,545 – 38,596,346Other financial liabilities 21,045 64,530 391,590 491,046 11,314,129 12,282,340
Total financial liabilities 88,323,214 70,078,986 34,496,296 4,732,959 11,596,840 209,228,295
Interest rate gap 45,250,048 (61,952,667) (28,800,237) 1,690,188 (8,187,280) (51,999,948)

2472018 Annua l Report
Notes to the Consolidated Financial Statements (Continued)
52 FINANCIAL RISK MANAGEMENT (CONTINUED)
52.3 Market risk (Continued)
52.3.3 Interest rate risk (Continued)
The following table illustrates the potential impact of a parallel upward or downward shift of 100 basis points in all financial instruments’ yield rate on the Group’s profit before tax and equity, based on the Group’s positions of interest-generating assets, interest-bearing liabilities and interest rate swap contracts at the end of 31 December, 2018 and 2017.
31 December 2018
31 December 2017
RMB’000 RMB’000
Profit before tax:+ 100 basis points 161,275 (85,867)- 100 basis points (161,275) 85,867
Equity+ 100 basis points 120,973 (64,775)- 100 basis points (120,973) 64,775
52.4 Liquidity risk
Liquidity risk refers to the risk that the Group is unable to obtain fund at a reasonable cost to repay the liabilities or seize other investment opportunities. The Group’s liquidity risk management target is to ensure sufficient capital resource at any time to meet the repayment needs of matured liabilities, as well as the financial demand of leasing business investment.
The major payment demand of the Group is the repayments of matured bank borrowings and withdraw request from lessees under finance leases.
52.4.1 Liquidity risk management policy
The Group implement the following procedures to manage the liquidity:
(a) proactive management of the maturity profi le of our assets and l iabil it ies and maintaining appropriate liquidity provision for mitigating the liquidity risk; and
(b) obtaining diversified funding via multiple channels, thereby preserving sufficient funds to purchase assets and repay debt.

248 Ch ina Deve lopment Bank F inanc ia l Leas ing Co . , L td .
Notes to the Consolidated Financial Statements (Continued)
52 FINANCIAL RISK MANAGEMENT (CONTINUED)
52.4 Liquidity risk (Continued)
52.4.2 Cash flow for non-derivative financial assets and liabilities
The table below presents the cash flows receivable and payable by the Group under non-derivative financial assets and liabil ities by remaining contractual maturities as at of 31 December, 2018 and 2017. The amounts disclosed in the table are the contractual undiscounted cash flows, whereas the Group manages the inherent liquidity risk based on expected undiscounted cash inflows:
Indefinite/Overdue/
On demandWithin
1 month1 to 3
months3 months to 1 year
1 to 5 years
Over 5 years Total
RMB’000 RMB’000 RMB’000 RMB’000 RMB’000 RMB’000 RMB’000
31 December 2017Cash and bank balances 14,984,347 2,100,941 – – 1,186,999 107,756 18,380,043Placement to banks and other
financial institutions – – – – – – –Financial assets at fair value
through profit and loss 1,857,927 – – – – – 1,857,927Available-for-sale financial
assets 13,000 636 – 10,388 55,120 294,350 373,494Accounts receivable 12,132 – 603,846 465,648 5,105,873 2,121,920 8,309,419Finance lease receivables 1,005,269 665,589 4,878,213 17,499,527 65,294,835 36,416,832 125,760,265Other financial assets – – – 25,864 746,928 – 772,792
Non-derivative financial assets total 17,872,675 2,767,166 5,482,059 18,001,427 72,389,755 38,940,858 155,453,940
Bank borrowings 656,337 19,541,289 30,116,385 50,237,880 15,944,251 6,419,954 122,916,096Due to banks and other
financial institutions – – – – – – –Financial assets sold under
repurchase agreement – – 692,348 43,605 1,461,626 – 2,197,579Bonds payable 208,278 135,585 53,097 4,160,534 24,690,181 8,560,915 37,808,590Other financial liabilities 3,178 8,734 26,956 2,484,521 2,437,234 6,235,099 11,195,722
Non-derivative financial liabilities total 867,793 19,685,608 30,888,786 56,926,540 44,533,292 21,215,968 174,117,987
Net position 17,004,882 (16,918,442) (25,406,727) (38,925,113) 27,856,463 17,724,890 (18,664,047)
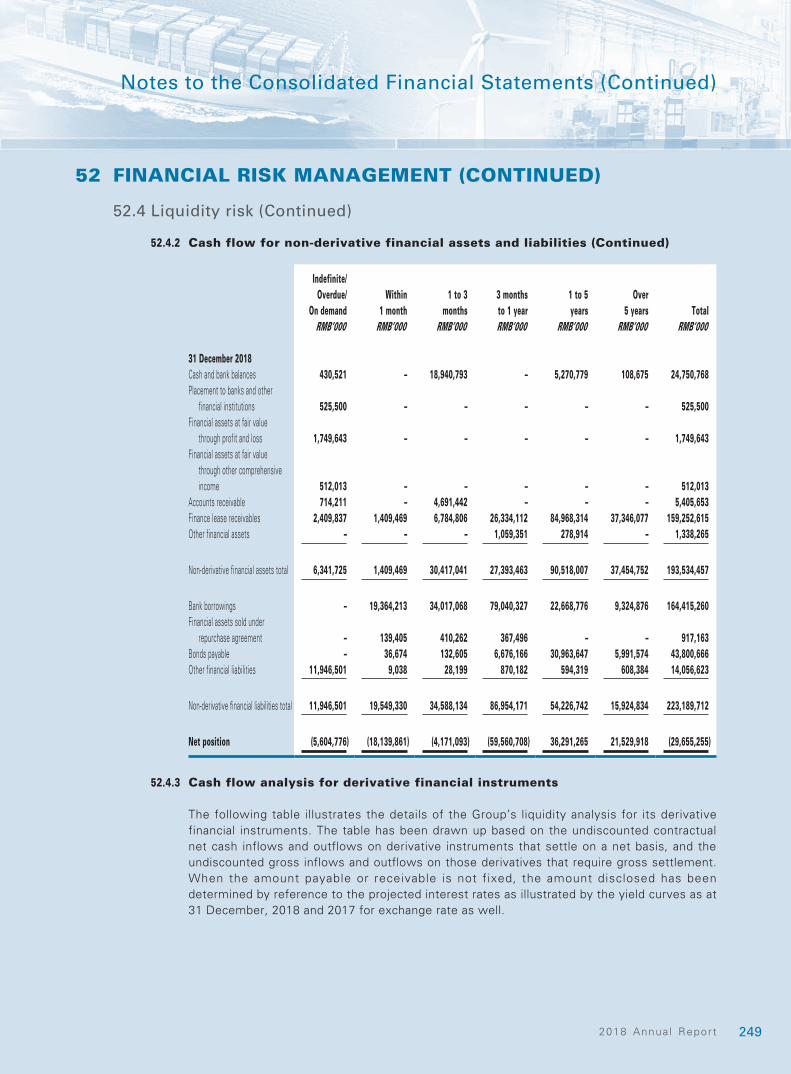
2492018 Annua l Report
Notes to the Consolidated Financial Statements (Continued)
52 FINANCIAL RISK MANAGEMENT (CONTINUED)
52.4 Liquidity risk (Continued)
52.4.2 Cash flow for non-derivative financial assets and liabilities (Continued)
Indefinite/Overdue/
On demandWithin
1 month1 to 3
months3 months to 1 year
1 to 5 years
Over 5 years Total
RMB’000 RMB’000 RMB’000 RMB’000 RMB’000 RMB’000 RMB’000
31 December 2018Cash and bank balances 430,521 – 18,940,793 – 5,270,779 108,675 24,750,768Placement to banks and other
financial institutions 525,500 – – – – – 525,500Financial assets at fair value
through profit and loss 1,749,643 – – – – – 1,749,643Financial assets at fair value
through other comprehensive income 512,013 – – – – – 512,013
Accounts receivable 714,211 – 4,691,442 – – – 5,405,653Finance lease receivables 2,409,837 1,409,469 6,784,806 26,334,112 84,968,314 37,346,077 159,252,615Other financial assets – – – 1,059,351 278,914 – 1,338,265
Non-derivative financial assets total 6,341,725 1,409,469 30,417,041 27,393,463 90,518,007 37,454,752 193,534,457
Bank borrowings – 19,364,213 34,017,068 79,040,327 22,668,776 9,324,876 164,415,260Financial assets sold under
repurchase agreement – 139,405 410,262 367,496 – – 917,163Bonds payable – 36,674 132,605 6,676,166 30,963,647 5,991,574 43,800,666Other financial liabilities 11,946,501 9,038 28,199 870,182 594,319 608,384 14,056,623
Non-derivative financial liabilities total 11,946,501 19,549,330 34,588,134 86,954,171 54,226,742 15,924,834 223,189,712
Net position (5,604,776) (18,139,861) (4,171,093) (59,560,708) 36,291,265 21,529,918 (29,655,255)
52.4.3 Cash flow analysis for derivative financial instruments
The following table illustrates the details of the Group’s liquidity analysis for its derivative financial instruments. The table has been drawn up based on the undiscounted contractual net cash inflows and outflows on derivative instruments that settle on a net basis, and the undiscounted gross inflows and outflows on those derivatives that require gross settlement. When the amount payable or receivable is not fixed, the amount disclosed has been determined by reference to the projected interest rates as illustrated by the yield curves as at 31 December, 2018 and 2017 for exchange rate as well.
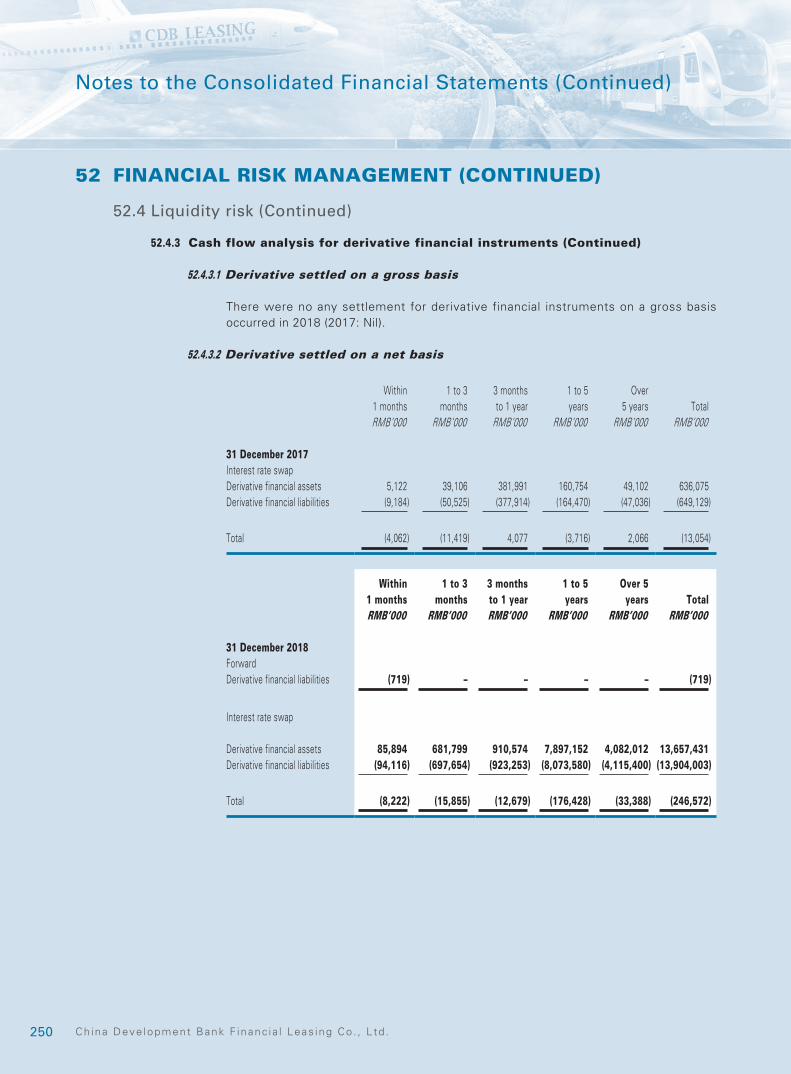
250 Ch ina Deve lopment Bank F inanc ia l Leas ing Co . , L td .
Notes to the Consolidated Financial Statements (Continued)
52 FINANCIAL RISK MANAGEMENT (CONTINUED)
52.4 Liquidity risk (Continued)
52.4.3 Cash flow analysis for derivative financial instruments (Continued)
52.4.3.1 Derivative settled on a gross basis
There were no any settlement for derivative financial instruments on a gross basis occurred in 2018 (2017: Nil).
52.4.3.2 Derivative settled on a net basis
Within 1 months
1 to 3 months
3 months to 1 year
1 to 5 years
Over 5 years Total
RMB’000 RMB’000 RMB’000 RMB’000 RMB’000 RMB’000
31 December 2017Interest rate swapDerivative financial assets 5,122 39,106 381,991 160,754 49,102 636,075Derivative financial liabilities (9,184) (50,525) (377,914) (164,470) (47,036) (649,129)
Total (4,062) (11,419) 4,077 (3,716) 2,066 (13,054)
Within 1 months
1 to 3 months
3 monthsto 1 year
1 to 5years
Over 5years Total
RMB’000 RMB’000 RMB’000 RMB’000 RMB’000 RMB’000
31 December 2018ForwardDerivative financial liabilities (719) – – – – (719) Interest rate swap
Derivative financial assets 85,894 681,799 910,574 7,897,152 4,082,012 13,657,431Derivative financial liabilities (94,116) (697,654) (923,253) (8,073,580) (4,115,400) (13,904,003)
Total (8,222) (15,855) (12,679) (176,428) (33,388) (246,572)
2512018 Annua l Report
Notes to the Consolidated Financial Statements (Continued)
53 CAPITAL MANAGEMENT
The Group’s objectives of managing its capital, which adopts a broader concept than the equity as presented on the consolidated statements of financial position, are:
• to comply with the capital requirements set by the regulators of the banking markets where the entities within the Group operates;
• to safeguard the Group’s ability to continue as a going concern so as to provide returns for shareholders; and
• to maintain a strong capital base to support its business development.
Capital adequacy and the utilisation of regulatory capital are closely monitored by the management in accordance with the guidelines developed by the Basel Commission and relevant regulations promulgated by the CBRC. The Group files the required information to CBRC quarterly. As at 31 December 2018, the capital adequacy ratio is 11.91% (31 December 2017: 14.10%).
54 FAIR VALUE OF THE FINANCIAL INSTRUMENTS
54.1 Determination of fair value and valuation techniques
Some of the Group’s financial assets and liabilities are measured at fair value or with fair value disclosed for financial reporting purposes. The board of directors of the Company has set up certain process to determine the appropriate valuation techniques and inputs for fair value measurements. The appropriateness of the process and the determination of fair value are reviewed by the board of directors periodically.
The fair value of financial instruments with quoted prices for identical instruments is determined by the open market quotations. And those instruments are classified as level 1 which include FVOCI (AFS financial assets in 2017) – Bonds investment in active markets and as level 2, which include bonds payable, FVTPL, foreign currency forward contracts and interest rate swaps, but exclude unlisted equity investments which the fair values have been determined based on present values and the discount rates used were adjusted for counterparty or own credit risk..
The Group uses valuation techniques to determine the fair value of financial instruments when it is unable to obtain the open market quotation in active markets, including:
• for interest rate swaps – the present value of the estimated future cash flows based on observable yield curves
• for forward currency forwards – present value of future cash flows based on forward exchange rates at the balance sheet date
• for foreign currency options – option pricing models (e.g. Black Scholes model), and
• for other financial instruments – discounted cash flow analysis.
The main parameters used in discounted cash flow model include recent transaction prices, relevant interest yield curves, foreign exchange rates, prepayment rates and counterparty credit spreads.
If those parameters used in valuation techniques for financial instruments held by the Group, which are substantially observable and obtainable from active open market, the instruments are classified as level 2.
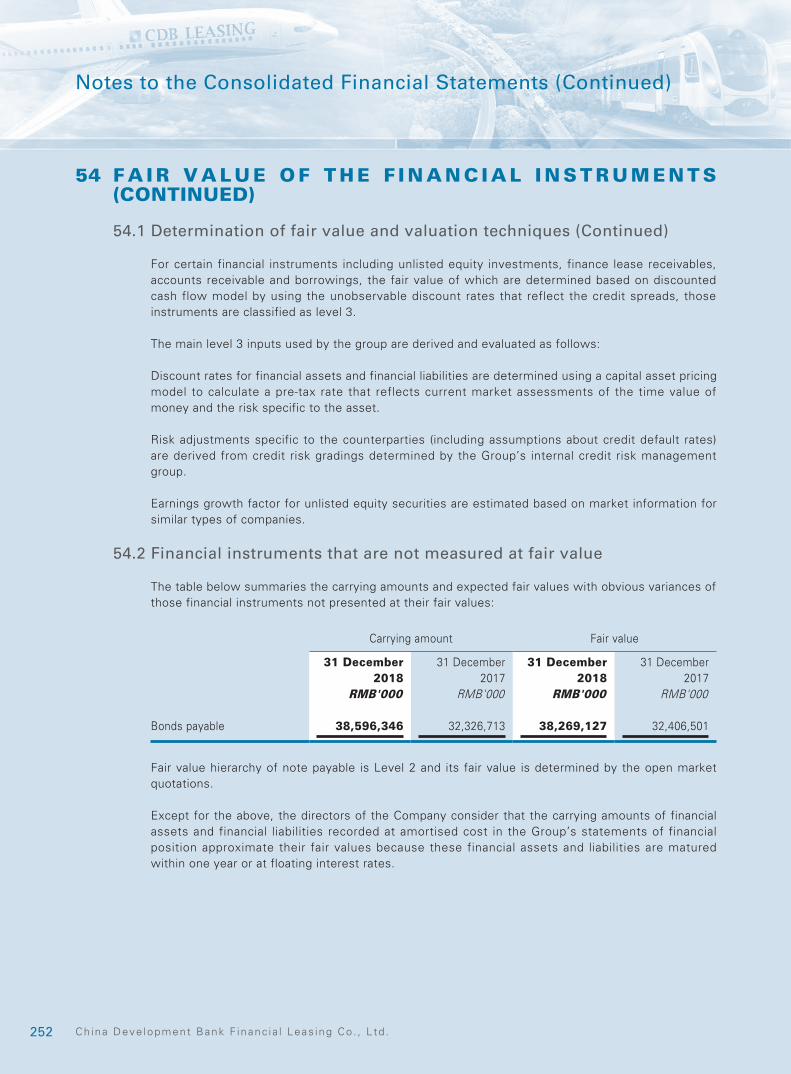
252 Ch ina Deve lopment Bank F inanc ia l Leas ing Co . , L td .
Notes to the Consolidated Financial Statements (Continued)
54 F A I R V A L U E O F T H E F I N A N C I A L I N S T R U M E N T S (CONTINUED)
54.1 Determination of fair value and valuation techniques (Continued)
For certain financial instruments including unlisted equity investments, finance lease receivables, accounts receivable and borrowings, the fair value of which are determined based on discounted cash flow model by using the unobservable discount rates that reflect the credit spreads, those instruments are classified as level 3.
The main level 3 inputs used by the group are derived and evaluated as follows:
Discount rates for financial assets and financial liabilities are determined using a capital asset pricing model to calculate a pre-tax rate that reflects current market assessments of the time value of money and the risk specific to the asset.
Risk adjustments specific to the counterparties (including assumptions about credit default rates) are derived from credit risk gradings determined by the Group’s internal credit risk management group.
Earnings growth factor for unlisted equity securities are estimated based on market information for similar types of companies.
54.2 Financial instruments that are not measured at fair value
The table below summaries the carrying amounts and expected fair values with obvious variances of those financial instruments not presented at their fair values:
Carrying amount Fair value
31 December 31 December 31 December 31 December2018 2017 2018 2017
RMB'000 RMB'000 RMB'000 RMB'000
Bonds payable 38,596,346 32,326,713 38,269,127 32,406,501
Fair value hierarchy of note payable is Level 2 and its fair value is determined by the open market quotations.
Except for the above, the directors of the Company consider that the carrying amounts of financial assets and financial liabilities recorded at amortised cost in the Group’s statements of financial position approximate their fair values because these financial assets and liabilities are matured within one year or at floating interest rates.
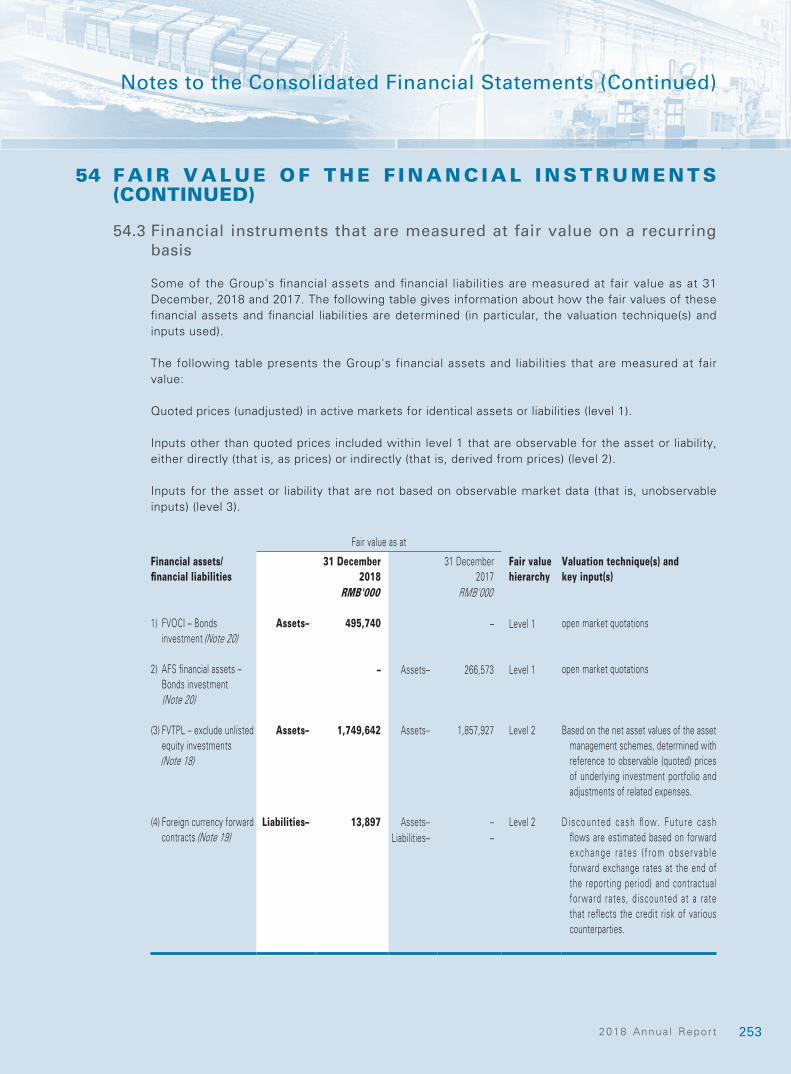
2532018 Annua l Report
Notes to the Consolidated Financial Statements (Continued)
54 F A I R V A L U E O F T H E F I N A N C I A L I N S T R U M E N T S (CONTINUED)
54.3 Financial instruments that are measured at fair value on a recurring basis
Some of the Group's financial assets and financial liabilities are measured at fair value as at 31 December, 2018 and 2017. The following table gives information about how the fair values of these financial assets and financial liabilities are determined (in particular, the valuation technique(s) and inputs used).
The following table presents the Group's financial assets and liabilities that are measured at fair value:
Quoted prices (unadjusted) in active markets for identical assets or liabilities (level 1).
Inputs other than quoted prices included within level 1 that are observable for the asset or liability, either directly (that is, as prices) or indirectly (that is, derived from prices) (level 2).
Inputs for the asset or liability that are not based on observable market data (that is, unobservable inputs) (level 3).
Fair value as at Financial assets/financial liabilities
31 December 2018
31 December 2017
Fair value hierarchy
Valuation technique(s) and key input(s)
RMB'000 RMB'000
1) FVOCI – Bonds investment (Note 20)
Assets– 495,740 – Level 1 open market quotations
2) AFS financial assets – Bonds investment (Note 20)
– Assets– 266,573 Level 1 open market quotations
(3) FVTPL – exclude unlisted equity investments (Note 18)
Assets– 1,749,642 Assets– 1,857,927 Level 2 Based on the net asset values of the asset management schemes, determined with reference to observable (quoted) prices of underlying investment portfolio and adjustments of related expenses.
(4) Foreign currency forward contracts (Note 19)
Liabilities– 13,897 Assets–Liabilities–
––
Level 2 D i scoun ted cash flow. Fu tu re cash flows are estimated based on forward exchange r a tes ( f r om obse rvab le forward exchange rates at the end of the reporting period) and contractual forward rates, discounted at a rate that reflects the credit risk of various counterparties.
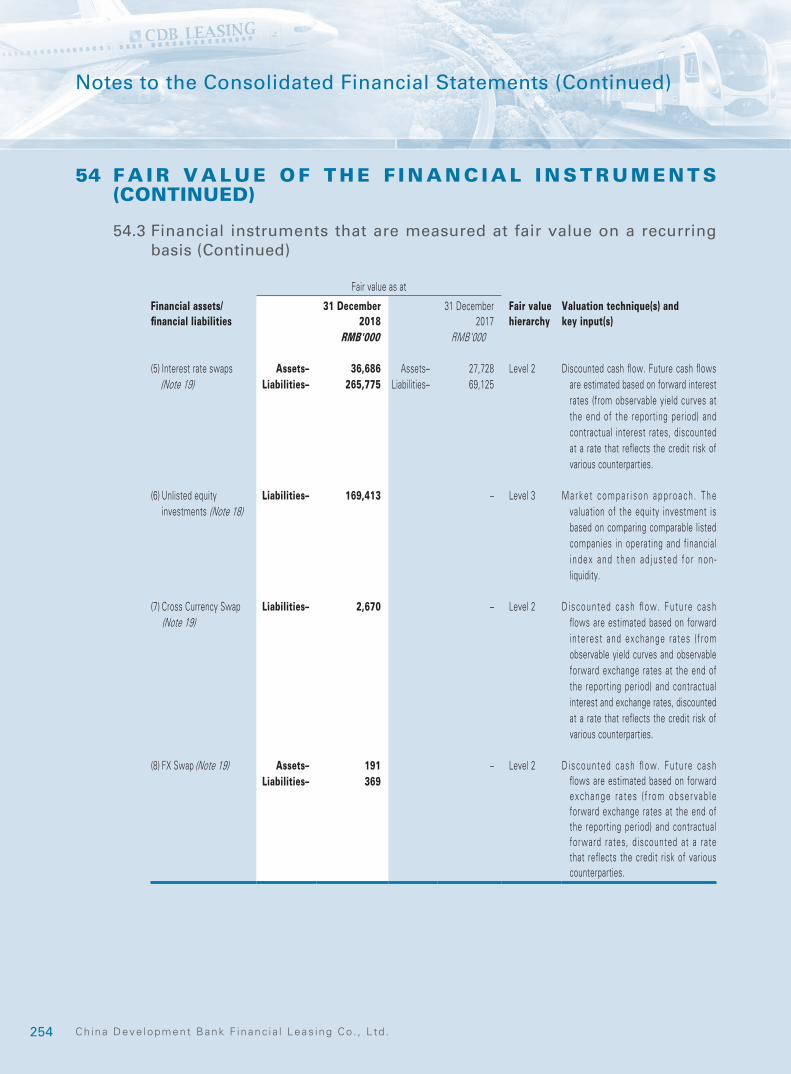
254 Ch ina Deve lopment Bank F inanc ia l Leas ing Co . , L td .
Notes to the Consolidated Financial Statements (Continued)
54 F A I R V A L U E O F T H E F I N A N C I A L I N S T R U M E N T S (CONTINUED)
54.3 Financial instruments that are measured at fair value on a recurring basis (Continued)
Fair value as at Financial assets/financial liabilities
31 December 2018
31 December 2017
Fair value hierarchy
Valuation technique(s) and key input(s)
RMB'000 RMB'000
(5) Interest rate swaps (Note 19)
Assets–Liabilities–
36,686265,775
Assets–Liabilities–
27,72869,125
Level 2 Discounted cash flow. Future cash flows are estimated based on forward interest rates (from observable yield curves at the end of the reporting period) and contractual interest rates, discounted at a rate that reflects the credit risk of various counterparties.
(6) Unlisted equity investments (Note 18)
Liabilities– 169,413 – Level 3 M a r k e t c o m p a r i s o n a p p r o a c h . T h e valuation of the equity investment is based on comparing comparable listed companies in operating and financial i ndex and then ad jus ted fo r non -liquidity.
(7) Cross Currency Swap (Note 19)
Liabilities– 2,670 – Level 2 D i scoun ted cash flow. Fu tu re cash flows are estimated based on forward interest and exchange rates (f rom observable yield curves and observable forward exchange rates at the end of the reporting period) and contractual interest and exchange rates, discounted at a rate that reflects the credit risk of various counterparties.
(8) FX Swap (Note 19) Assets–Liabilities–
191369
– Level 2 D i scoun ted cash flow. Fu tu re cash flows are estimated based on forward exchange r a tes ( f r om obse rvab le forward exchange rates at the end of the reporting period) and contractual forward rates, discounted at a rate that reflects the credit risk of various counterparties.
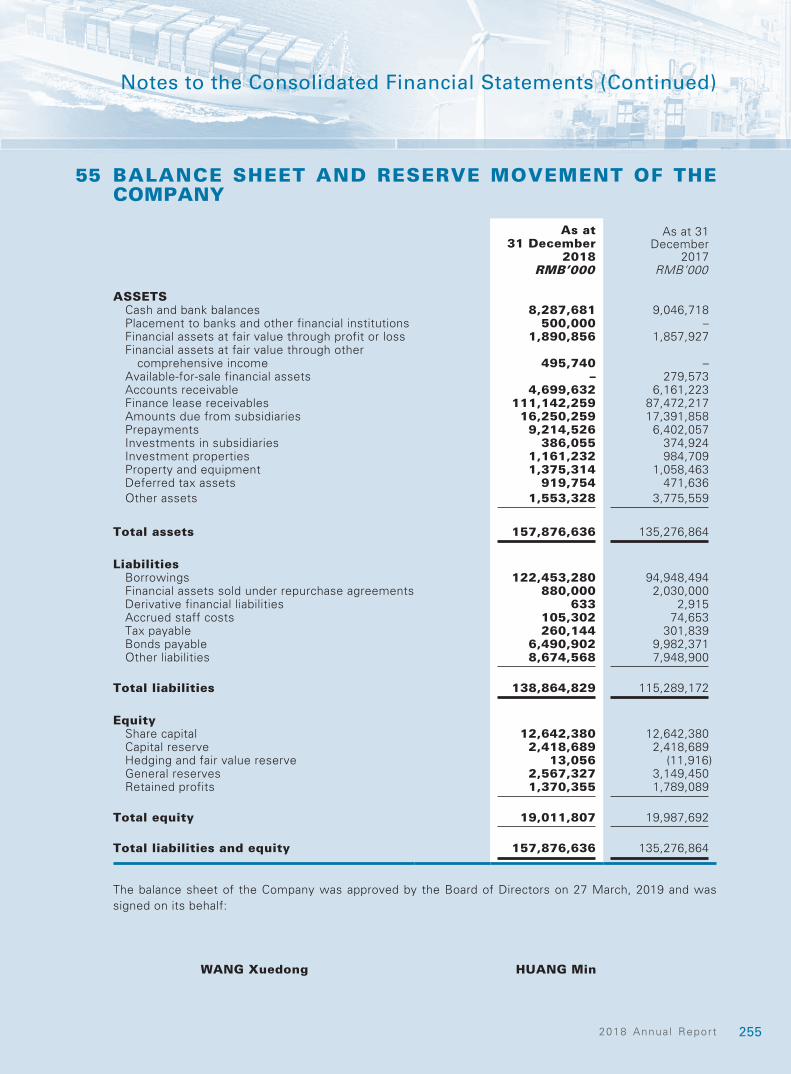
2552018 Annua l Report
Notes to the Consolidated Financial Statements (Continued)
55 BALANCE SHEET AND RESERVE MOVEMENT OF THE COMPANY
As at 31 December
2018
As at 31 December
2017RMB’000 RMB’000
ASSETSCash and bank balances 8,287,681 9,046,718Placement to banks and other financial institutions 500,000 –Financial assets at fair value through profit or loss 1,890,856 1,857,927Financial assets at fair value through other
comprehensive income 495,740 –Available-for-sale financial assets – 279,573Accounts receivable 4,699,632 6,161,223Finance lease receivables 111,142,259 87,472,217Amounts due from subsidiaries 16,250,259 17,391,858Prepayments 9,214,526 6,402,057Investments in subsidiaries 386,055 374,924Investment properties 1,161,232 984,709Property and equipment 1,375,314 1,058,463Deferred tax assets 919,754 471,636Other assets 1,553,328 3,775,559
Total assets 157,876,636 135,276,864
LiabilitiesBorrowings 122,453,280 94,948,494Financial assets sold under repurchase agreements 880,000 2,030,000Derivative financial liabilities 633 2,915Accrued staff costs 105,302 74,653Tax payable 260,144 301,839Bonds payable 6,490,902 9,982,371Other liabilities 8,674,568 7,948,900
Total liabilities 138,864,829 115,289,172
EquityShare capital 12,642,380 12,642,380Capital reserve 2,418,689 2,418,689Hedging and fair value reserve 13,056 (11,916)General reserves 2,567,327 3,149,450Retained profits 1,370,355 1,789,089
Total equity 19,011,807 19,987,692
Total liabilities and equity 157,876,636 135,276,864
The balance sheet of the Company was approved by the Board of Directors on 27 March, 2019 and was signed on its behalf:
WANG Xuedong HUANG Min
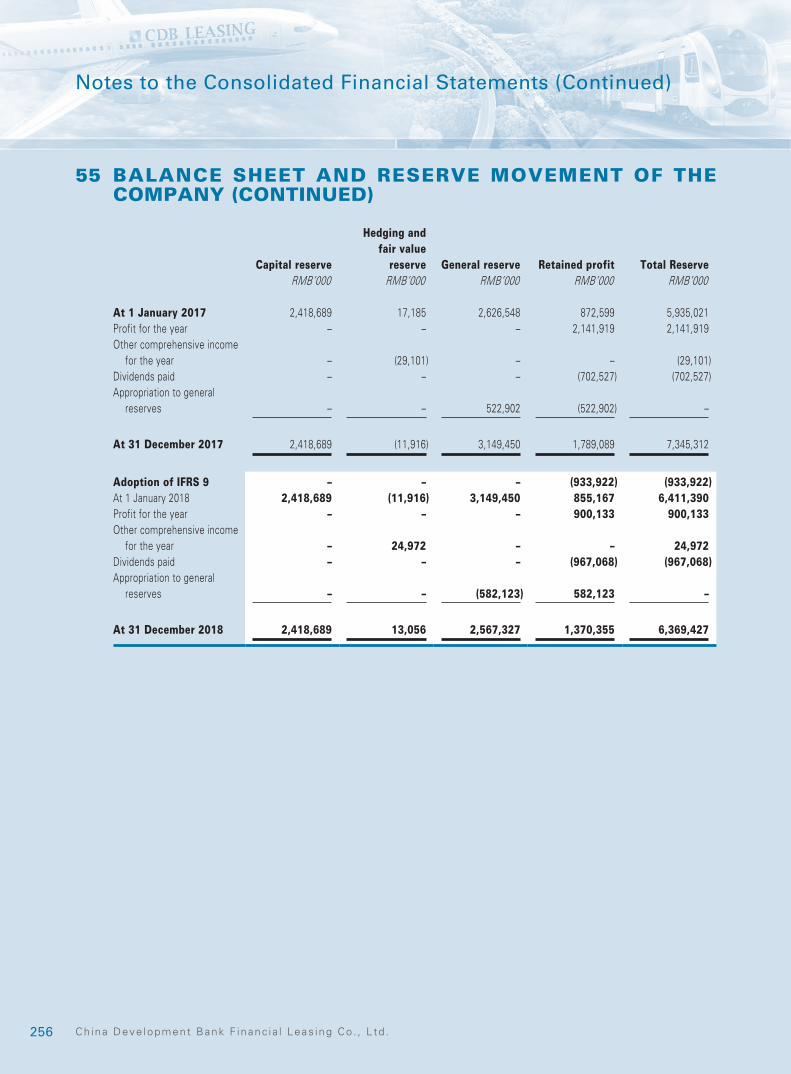
256 Ch ina Deve lopment Bank F inanc ia l Leas ing Co . , L td .
Notes to the Consolidated Financial Statements (Continued)
55 BALANCE SHEET AND RESERVE MOVEMENT OF THE COMPANY (CONTINUED)
Capital reserve
Hedging and fair value
reserve General reserve Retained profit Total ReserveRMB’000 RMB’000 RMB’000 RMB’000 RMB’000
At 1 January 2017 2,418,689 17,185 2,626,548 872,599 5,935,021Profit for the year – – – 2,141,919 2,141,919Other comprehensive income
for the year – (29,101) – – (29,101)Dividends paid – – – (702,527) (702,527)Appropriation to general
reserves – – 522,902 (522,902) –
At 31 December 2017 2,418,689 (11,916) 3,149,450 1,789,089 7,345,312
Adoption of IFRS 9 – – – (933,922) (933,922)At 1 January 2018 2,418,689 (11,916) 3,149,450 855,167 6,411,390Profit for the year – – – 900,133 900,133Other comprehensive income
for the year – 24,972 – – 24,972Dividends paid – – – (967,068) (967,068)Appropriation to general
reserves – – (582,123) 582,123 –
At 31 December 2018 2,418,689 13,056 2,567,327 1,370,355 6,369,427
2018 A
nnual Report