Annual report Annual report - Lifestyle International Holdings ...
Upload
khangminh22Category
view
0download
0
ANNUALREPORT2016
@fiffi
BANGLADESH TEA RESEARCH INSTITUTESRIMANGAL-321 O, MOULVIBAZAR
An organ ofBANGLADESH TEA BOARD17 1 -17 2, Baizid Bostami Road
Nasirabad, Chittagongwww.btri.gov.bd
+&1i .
rffireE,rea
Annual Report 2016
ANNUAL REPORT 2016
BANGLADESH TEA RESEARCH INSTITUTE
SRIMANGAL-3210, MOULVIBAZAR
An organ of
BANGLADESH TEA BOARD
171-172, Baizid Bostami Road
Nasirabad, Chittagong
www.btri.gov.bd
Annual Report 2016
ANNUAL REPORT 2016
Published by
Director Bangladesh Tea Research Institute Srimangal-3210, Moulvibazar
Publisher’s name Dr. Mohammad Ali
Published year 2017
Compiled by Mohammad Kamal Uddin
Librarian & Publication Officer
Printing press Fazlu Computers & Offset Printers
New Market, Station Road Srimangal-3210, Moulvibazar
RATE OF SUBSCRIPTION
Taka 250.00 per copy (Home) US $ 15.00 per copy (Abroad)
A complimentary copy is given to each of the enlisted tea estates only once at the time of publication. Additional copy is supplied on request with half the inland price if prints are available.
Annual Report 2016
CONTENTS Title Page no.
Director’s Report iv-viii
Soil Science Division 1-9
Biochemistry Division 10-13
Botany Division 14-35
Agronomy Division 36-44
Entomology Division 45-55
Plant Pathology Division 56-62
Statistics and Economics Division 63-65
Technology Division 66-68
Bilashcherra Experimental Farm 69-70
BTRI Sub-station- Fatikcharri, Chittagong 71
BTRI Sub-station-Kaliti, Kulaura 72
Regional station-Panchagarh 72
Miscellaneous 73
Annual Report 2016
DIRECTOR’S REPORT
STAFF
The report of the technical staff shows the position as on 31 December 2016
Director Up to 30 11.2016 : Dr. Mainuddin Ahmed M.Sc. (DU), B.Ed. (DU), M.Sc. (London) DIC (London), Ph.D.
TECHNICAL DIVISIONS
1. DEPARTMENT OF CHEMISTRY
Chief Scientific Officer : Vacant
A. SOIL SCIENCE DIVISION
Principal Scientific Officer (In charge) : Abdul Qayyum Khan B.Sc. (Hons). M.Sc. (DU)
M.Sc (Reading, UK)
Senior Scientific Officer : Ashim Kumar Saha B.Sc. (Hons), M.Sc. (DU)
Scientific Officer : Apu Biswas B.Sc. (Hons), M.S. (DU), PGD (India)
Scientific Officer : Kanij Fatema Tuz Zohora B.Sc. (Hons), M.S. (CU)
Scientific Officer : Naim Mustafa Ali B.S. (Hons), M.S. (DU)
B. BIOCHEMISTRY DIVISION
Scientific Officer : Md. Arif Mahmud Howlader B.Sc. (Hons), M.S. (DU)
2. DEPARTMENT OF CROP PRODUCTION
Chief Scientific Officer & : S.M. Altaf Hossain Director in-charge from 1.12.2016 B.Sc. (Hons), M.Sc. (RU)
M.Sc. (Reading, UK)
A. BOTANY DIVISION
Principal Scientific Officer : Md. Ismail Hossain B.Sc.Ag.(Hons), M.S. (BAU)
Senior Scientific Officer : Dr. Md. Abdul Aziz B.Sc. (Hons), M.Sc. (RU), Dipl. (China), Ph.D. (RU)
Scientific Officer (Deputation in Nilphamari) : Md. Abul Kasem B.Sc. (Hons), M.Sc. (CU)
Annual Report 2016
Scientific Officer : Md. Riyadh Arefin B.S.Ag.(Hons), M.S. (BSMRAU)
Senior Farm Assistant : Md. Majibur Rahman B.Sc. (CU)
B. AGRONOMY DIVISION
Senior Scientific Officer : Dr. Toufiq Ahmed B.Sc.Ag., M.S. (BAU), Ph.D. (Sri Lanka)
Senior Scientific Officer (Deputation in Chaina) : Mohammad Masud Rana B. Sc. Ag.(Hons), M.S. (BAU)
Scientific Officer : Md. Arifur Rahman B.Sc.Ag.(Hons), M.S. (SAU)
Scientific Officer : Md. Imran Hossen B.Sc.Ag.(Hons), M.S. (SAU)
3. DEPARTMENT OF PEST MANAGEMENT
Chief Scientific Officer : Dr. Mohammad Ali B.Sc. (Hons), M.Sc. (CU), M.Sc. (Newcastle, UK) PGD (India), Ph.D
A. ENTOMOLOGY DIVISION
Senior Scientific Officer : Mohammad Shameem Al Mamun B.Sc.Ag. (Hons.), M.S. (BAU), PGD (India)
Scientific Officer : Shovon Kumar Paul B.Sc.Ag. (Hons.) (KU), M.S. (BSMRAU)
Scientific Officer : Md. Jahangir Alam B.Sc.Ag.(Hons), M.S. (BAU)
B. PLANT PATHOLOGY DIVISION
Senior Scientific Officer : Mohammed Syeful Islam B.Sc.Ag., M.S. (BAU)
Scientific Officer : Md. Moshiur Rahman Akonda B.Sc.Ag. (Hons), M.S. (BAU)
TECHNOLOGY DIVISION
Scientific Officer (Deputation in Bandarban) : Dulal Chandra Dey B.Sc. Engg. Mech. (BUET)
Senior Tea Maker : Md. Amir Ali B.Sc. (RU)
Assistant Engineer (Civil) (PRL) : Sadeque Ahmed Dip-in-Engg. Civil, (Dhaka)
Annual Report 2016
Foreman : Nazrul Islam Chaudhury Dip-in-Engg. Elect. (Sylhet)
STATISTICS & ECONOMICS DIVISION
Senior Scientific Officer : Shefali Boonerjee B.Sc. (Hons), M.Sc. (RU)
BTRI SUB-STATION, FATIKCHARI, CHITTAGONG
Scientific Officer & Officer in-charge : Raihan Mujib Himel B.Sc.Ag. (Hons.), M.S. (BSMRAU)
Senior Farm Assistant : Ajit Chandra Choudhury B.A. (NU)
BTRI SUB-STATION, KALITI, KULAURA
Field Assistant : Aminul Islam Mandal Dip.-in-Agric. (Sherpur)
BTRI REGIONAL STATION, PANCHAGARH
Senior Farm Assistant : Md. Zayed Imam Siddique Dip.- in- Agric. (Rangpur)
BILASHCHERRA EXPERIMENTAL FARM
Assistant Farm Superintendent : Mohammad Sayadul Huq M.Sc (NU)
Farm Supervisor : Roni Debnath B.Sc. Ag. (Hons.), M.S. (SAU, Sylhet))
Field Assistant : Ajit Kumar Sarker Dip.- in- Agric. (Mymensingh)
Field Assistant : Zobayer Ahamed Dip.- in- Agric. (Rangpur)
Field Assistant (Deputation in Bandarban) : Md. Sabbir Mahedi Joy Dip.- in- Agric. (Rangpur)
LIBRARY & PUBLICATION
Librarian & Publication Officer : Mohammad Kamal Uddin M. Sc. (RUD), M.S.S. (NU), LL.B (NU) PGD in Lib. Sc. (Dhaka)
Annual Report 2016
RESEARCH
The importance of research and technology transfer system has also increased many folds. The research activities are designed and carried out keeping in view of the need of the industry towards maximum yield as well as the quality tea. Like previous years all out efforts were made by the Institute to maintain standard of the work relating to research, advisory, training, workshops, seminars, tea tasting session etc. Similar service was also extended from the Fatikchari and Panchagarh sub-station.
This report of Bangladesh Tea Research Institute covers the period from January to December, 2016.
During the year under report, a total of 58 experiments on different aspects of tea culture were in progress in different disciplines, research divisions during 2016. The salient features are briefly enumerated below:
Soil Science Division carried out researches on two major fields in respect of fertilizer efficiency and improvement of soil properties. Effect of dolomitic lime on the yield of tea and soil properties has been undertaken. Experiments on fertilizer requirement of mature tea in the tea growing areas of Panchagar and Lalmonirhat Districts in the Northern Zone are being continued. The importance of organic fertilizers and its sources were also encompassed. Besides, the most useful advisory services on planting, replanting, manuring, soil rehabilitation, extension and other aspects of tea husbandry were rendered to the tea industry through soil analysis. A total of 3021 soil, fertilizer including lime samples were analyzed during 2016.
Research activities of the biochemistry division are concerned with the improvement of quality of tea particularly the bio-chemical aspects (such as TF, TR, HPS, CI, Caffeine, Antioxidants etc.). Also the division is rendering advisory service through the chemical analysis of made tea samples. A total of 5 experiments were performed and analyzed. Moisture analyzer and pH meter were calibrated and standardized four times respectively during this year.
Plant improvement received top priority as usual amongst the research activities of Botany Division. Several new test clones were under different stages of long term yield and quality trials. Hybridization between clones and agrotypes, collection and preservation of germplasms of tea from home and exotic sources were continued.
Agronomy Division carried out researches on various cultural practices i.e. planting, pruning, tipping, plucking and related agro-techniques as well as determining ideal plant population, shade spacing, etc. Besides, this year, new experiments on the effect of some common shade plants on tea soil, water and yield of tea and its management of shade canopy for sustainable tea production in Bangladesh have been initiated.
Research of Entomology Division include screening of host preference of pests, susceptibility of tea clones for nematodes, studies on indigenous plant extracts, searching and identification of bio-control agents, standardization of pesticides against Helopeltis, red spider mites, termites, nematodes, aphids & flush worms and determination of residue level of pesticides in made tea of different tea agro-types. The Division also rendered all sorts of advisory services to tea estates on problems arising out of pests of tea and analyzed soil, water and cowdung for nematode count. The division also engaged in analyzing made tea samples for the detection of pesticide residue received from different tea estates, companies and organizations.
Plant Pathology Division was mainly concerned with the isolation and culture of major disease causing organisms of tea and ancillary crops, screening of different fungicides and herbicides, bio-ecology of disease causing organisms and integrated management of diseases and weeds, assessment of arbuscular mycorrhizal (AM) fungi in tea and tea associated plants. Determination of critical period of weed competition in young tea and evaluation of biofungicidal activities of some plant extracts against different foliar diseases of tea were the new areas of research of the division.
Annual Report 2016
Statistics and Economics division is working on the economics of tea cultivation and to study economic way of small holding tea cultivation in Bangladesh. The division also assists in designing experiments and related statistical analyses of data of other research divisions as and when required.
Normal manufacture of tea in the factory from the green leaves harvested from its Main station farm and Bilashcherra experimental farm and different experiments on the improvement of tea manufacturing technique were being conducted by Technology Division.
The supply of improved planting materials in the form of fresh as well as rooted cuttings and biclonal seeds was continued from BTRI and sub-stations during 2016. A total of 3,35,940 fresh cuttings, 4,400 rooted cuttings and 517 Kg. bi-clonal seeds were distributed to different tea estates in the year 2016. Technology disseminations through seminars, workshops and advisory visits were continued in the Main station and Sub-stations during the year.
TEA TASTING SESSIONS
As a regular annual feature and group exercise, two general tea tasting sessions were conducted for the tea planters to improve further the manufacturing of quality tea from the tea factories as a whole at BTRI Tea Tasting Room for Sylhet and one more in Chittagong Sub-station. In addition, Open Day Tea Tasting Sessions were also arranged in each of the four valley circle clubs.
VISITS
Scientific personnel of the institute and sub-stations paid a total of 61 experimental and advisory visits to different tea estates in order to solve various local problems connected with tea culture and experimental purposes during the period under report.
PUBLICATIONS
Annual Report 2015 was published in June 2016 and Circular no. 139 and Circular no. 140 was also published in October 2016.
ANNUAL COURSE / SEMINAR / WORKSHOP
The 51nd Annual course (6 day- duration) was held on ‘Tea Culture’ at the Institute for the covenanted staff of Tea Estates of greater Sylhet. Same courses were held at Chittagong and Panchagarh Sub-stations having two-day duration each. In these courses, Managers, Assistant Managers, Proprietors of different Tea Estates, Small tea growers, Scientific Officers of BTRI and Officers of PDU were participated.
MANAGEMENT TRAINING COURSE
Scientists of BTRI conducted a series of Management Training Modules on nursery, young and mature tea management, pruning, pest management, soil management, etc. organized by MTC of Bangladesh Tea Board for the management executives and staff of different Tea Estates during the period under report.
OFFICIAL CORRESPONDENCE
Total receipts - 1620 Total issues - 1652
LIBRARY
BTRI Library contained 4,616 books and 9,140 Periodicals, Journals, Pamphlets and Circulars, Newsletter, Research highlights, etc. (Dr. Mohammad Ali) Director, BTRI.
Annual Report 2016 Soil Science Division
1
SOIL SCIENCE DIVISION
Abdul Qayyum Khan Principal Scientific Officer (In- charge)
STAFF
Ms. Kanij Fatema Tuz Zohora, Scientific Officer transferred from Bangladesh Tea Board, Chittagong to Bangladesh Tea Research Institute, Srimangal on 10 July 2016. Mr. Naim Mustafa Ali joined as Scientific Officer on 28 February 2016. There was no other change in the personnel position of the division during the period under report
RESEARCH
A total of four experiments were conducted during the year 2016 by Soil Science Division. Progress of the experiments is given below:
SS 1: RESPONSE TO ORGANIC MANURE AND CHEMICAL FERTILIZER FOR MAXIMIZING YIELD OF TEA (2012-2016)
The long term (2012-2016) experiment has been undertaken to observe the performance of organic manure on different level in reducing the chemical fertilizer use at Bilashcherra Experimental Farm. Dolomitic lime and NPK were applied on the soil after a good shower i.e. when soil was moistened simultaneously organic manure (cow-dung) was also applied and mixed with the soil by light forking in two split doses. Usual cultural practices and pest control measures were taken as and when needed. Regular weekly plucking data was recorded during the plucking season. The experiment was laid out in the year 2012 and continued upto 2016. There were eight treatments in a Randomized Block Design with three replications. The unit plot size was 14.90 m2 .The treatment combinations are presented below:
T1= Control T2= BTRI Recommended dose of chemical fertilizer T3= Organic manure (2t/ha) T4= Organic manure (6t/ha)
T5= 85% of T2 + Organic manure (2t/ha) T6= 85% of T2 + Organic manure (6t/ha) T7= 70% of T2 + Organic manure (2t/ha) T8= 70% of T2 + Organic manure (6t/ha)
(Recommended Fertilizer dose: (N100, P30, K60 kg/ha)
Table 1. Fertility status of the initial soil of the experimental field
Location Texture pH O.C %
Total N %
Av. P ppm
Av. K
ppm
Av. Ca ppm
Av. Mg ppm
BEF SCl 4.3 1.03 0.106 5.12 52.4 43.2 6.3
Critical value SL - L 4.5-5.5 1.0 0.1 10 80 90 25
SCL- Sandy Clay Loam, SL- Sandy Loam L- Loam, O.C- Organic Carbon
Annual Report 2016 Soil Science Division
2
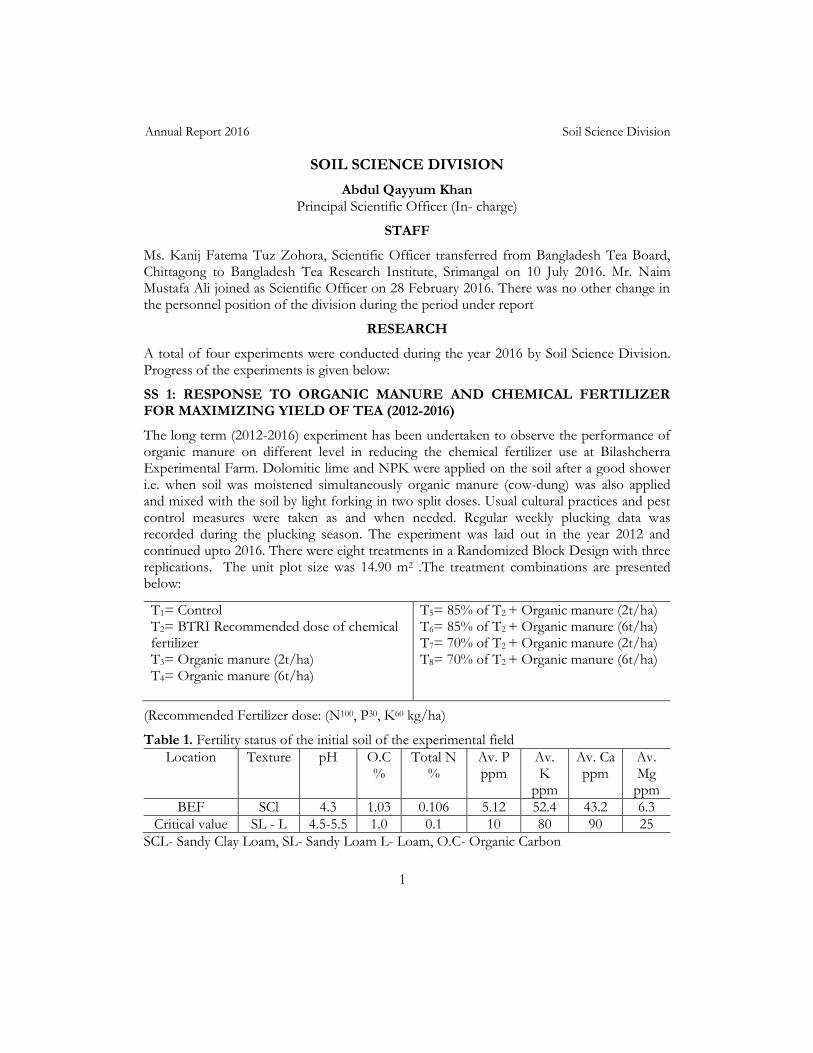
The result shows that, increased yield was recorded in every treatment over the control. The highest made tea yield (1684 kg/ha) was recorded in treatment T6, where 85% of the recommended dose of chemical fertilizer and 6 t/ha organic manure were applied. The rate of increase over the control was 9.00% in case of treatment T6. But the increase of yield due to different treatment was statistically insignificant.
15451567
1595
1629
16671684
1652 1656
1450
1500
1550
1600
1650
1700
T1 T2 T3 T4 T5 T6 T7 T8
Treatments
Yie
ld (
kg/h
a)
Fig 1. Effect of different treatments on the yield of tea (BEF, 2016)
Table 2. Soil analytical results at the end of the year 2016 Treatment Texture pH O.C % Total
N %
Av. P
ppm
Av. K
ppm
Av. Ca
ppm
Av. Mg
ppm
T1 SCl 4.2 0.98 0.099 10.88 50.97 58.41 8.25
T2 SCl 4.3 1.01 0.102 21.41 51.57 66.78 10.96
T3 SCl 4.3 1.25 0.127 21.63 51.79 68.25 11.62
T4 SCl 4.4 1.32 0.135 22.59 59.00 73.90 15.20
T5 SCl 4.6 1.29 0.131 31.22 77.83 81.52 16.46
T6 SCl 4.7 1.40 0.142 34.54 112.33 82.97 18.85
T7 SCl 4.5 1.22 0.125 28.07 63.37 77.80 15.92
T8 SCl 4.6 1.26 0.129 29.51 74.25 80.95 16.27
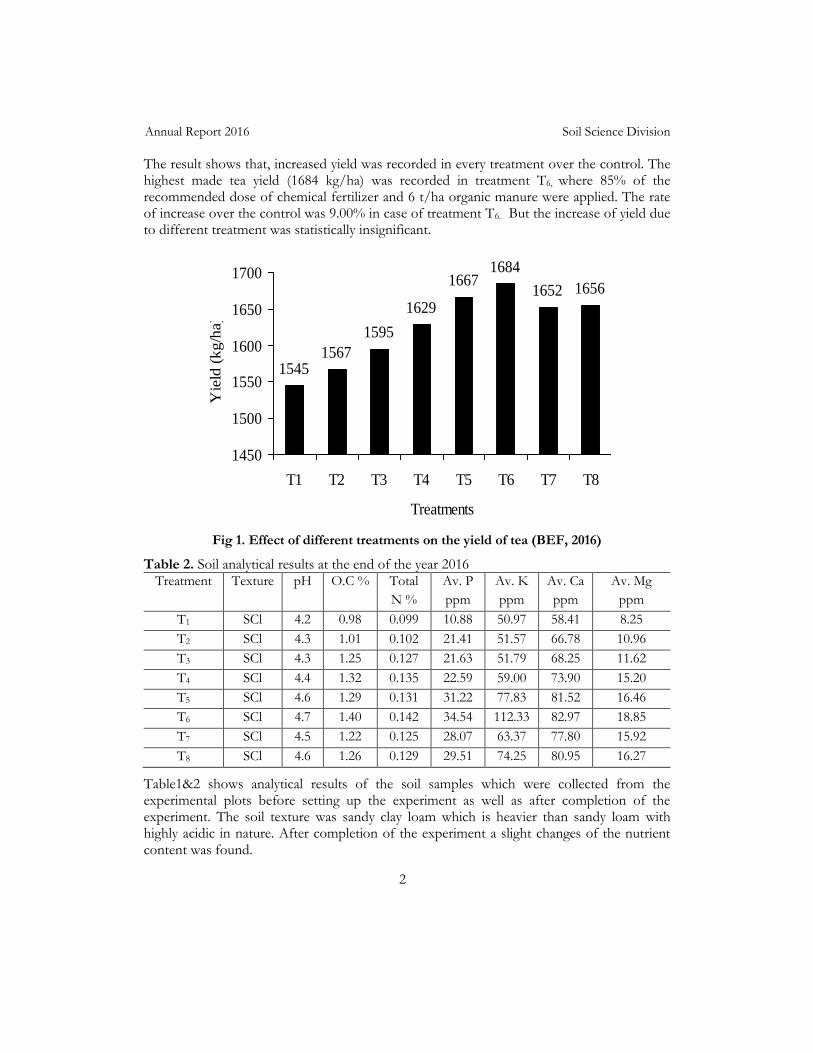
Table1&2 shows analytical results of the soil samples which were collected from the experimental plots before setting up the experiment as well as after completion of the experiment. The soil texture was sandy clay loam which is heavier than sandy loam with highly acidic in nature. After completion of the experiment a slight changes of the nutrient content was found.
Annual Report 2016 Soil Science Division
3
SS 2: STUDIES ON UPGRADING THE PRESENT FERTILIZER RECOMMENDATION (2012-2016)
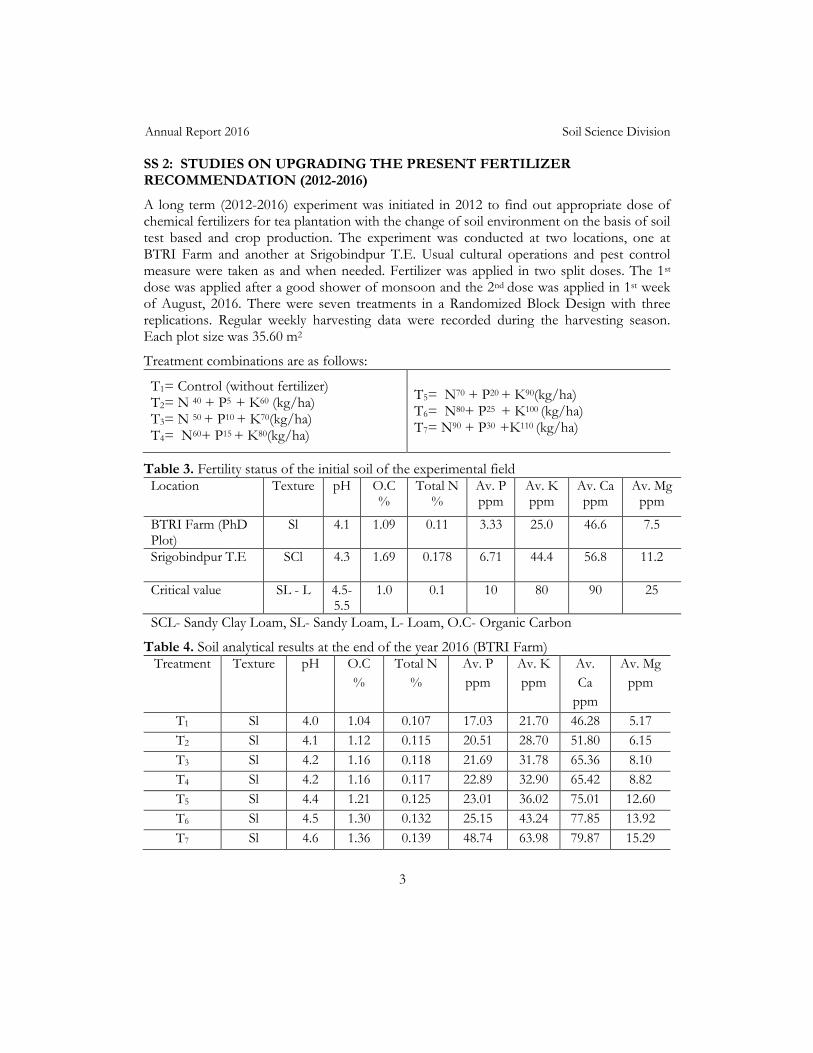
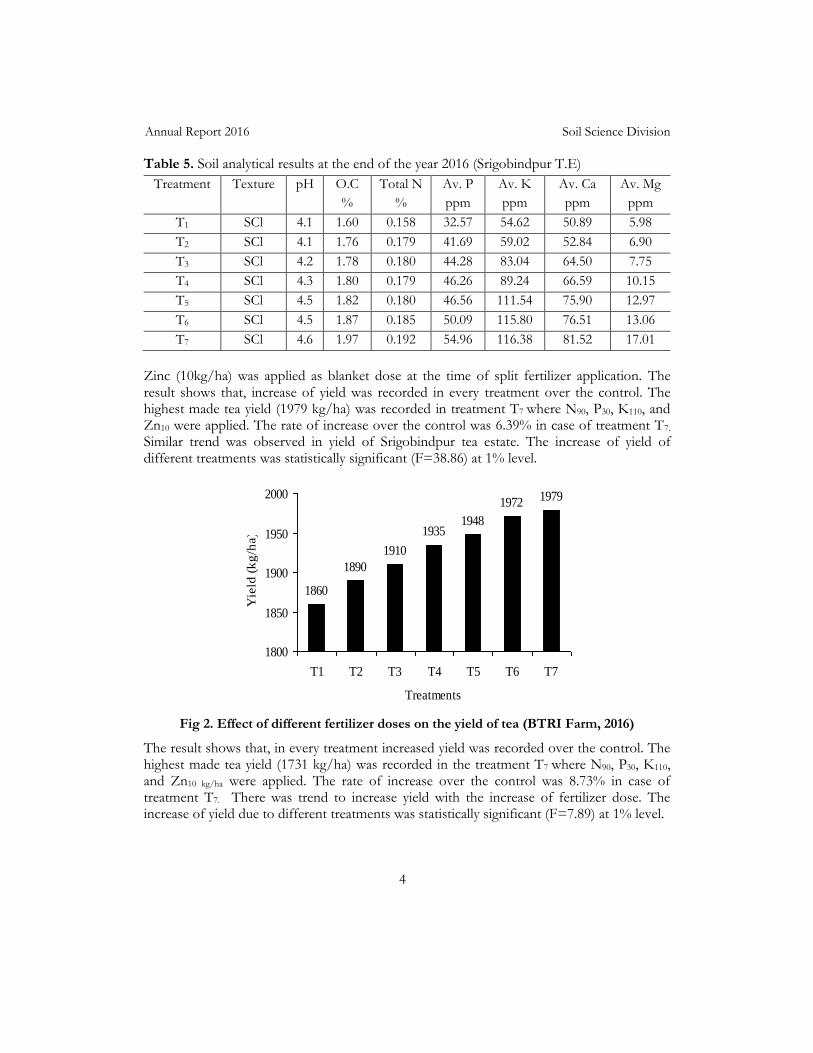
A long term (2012-2016) experiment was initiated in 2012 to find out appropriate dose of chemical fertilizers for tea plantation with the change of soil environment on the basis of soil test based and crop production. The experiment was conducted at two locations, one at BTRI Farm and another at Srigobindpur T.E. Usual cultural operations and pest control measure were taken as and when needed. Fertilizer was applied in two split doses. The 1st dose was applied after a good shower of monsoon and the 2nd dose was applied in 1st week of August, 2016. There were seven treatments in a Randomized Block Design with three replications. Regular weekly harvesting data were recorded during the harvesting season. Each plot size was 35.60 m2
Treatment combinations are as follows:
T1= Control (without fertilizer) T2= N 40 + P5
+ K60 (kg/ha) T3= N 50 + P10
+ K70(kg/ha) T4= N60+ P15 + K80(kg/ha)
T5= N70 + P20 + K90(kg/ha) T6= N80+ P25 + K100 (kg/ha) T7= N90 + P30
+K110 (kg/ha)
Table 3. Fertility status of the initial soil of the experimental field Location Texture pH O.C
% Total N
% Av. P ppm
Av. K ppm
Av. Ca ppm
Av. Mg ppm
BTRI Farm (PhD Plot)
Sl 4.1 1.09 0.11 3.33 25.0 46.6 7.5
Srigobindpur T.E SCl 4.3 1.69 0.178 6.71 44.4 56.8 11.2
Critical value SL - L 4.5-5.5
1.0 0.1 10 80 90 25
SCL- Sandy Clay Loam, SL- Sandy Loam, L- Loam, O.C- Organic Carbon
Table 4. Soil analytical results at the end of the year 2016 (BTRI Farm) Treatment Texture pH O.C
%
Total N
%
Av. P
ppm
Av. K
ppm
Av.
Ca
ppm
Av. Mg
ppm
T1 Sl 4.0 1.04 0.107 17.03 21.70 46.28 5.17
T2 Sl 4.1 1.12 0.115 20.51 28.70 51.80 6.15
T3 Sl 4.2 1.16 0.118 21.69 31.78 65.36 8.10
T4 Sl 4.2 1.16 0.117 22.89 32.90 65.42 8.82
T5 Sl 4.4 1.21 0.125 23.01 36.02 75.01 12.60
T6 Sl 4.5 1.30 0.132 25.15 43.24 77.85 13.92
T7 Sl 4.6 1.36 0.139 48.74 63.98 79.87 15.29
Annual Report 2016 Soil Science Division
4
Table 5. Soil analytical results at the end of the year 2016 (Srigobindpur T.E)
Treatment Texture pH O.C
%
Total N
%
Av. P
ppm
Av. K
ppm
Av. Ca
ppm
Av. Mg
ppm
T1 SCl 4.1 1.60 0.158 32.57 54.62 50.89 5.98
T2 SCl 4.1 1.76 0.179 41.69 59.02 52.84 6.90
T3 SCl 4.2 1.78 0.180 44.28 83.04 64.50 7.75
T4 SCl 4.3 1.80 0.179 46.26 89.24 66.59 10.15
T5 SCl 4.5 1.82 0.180 46.56 111.54 75.90 12.97
T6 SCl 4.5 1.87 0.185 50.09 115.80 76.51 13.06
T7 SCl 4.6 1.97 0.192 54.96 116.38 81.52 17.01
Zinc (10kg/ha) was applied as blanket dose at the time of split fertilizer application. The result shows that, increase of yield was recorded in every treatment over the control. The highest made tea yield (1979 kg/ha) was recorded in treatment T7 where N90, P30, K110, and Zn10 were applied. The rate of increase over the control was 6.39% in case of treatment T7. Similar trend was observed in yield of Srigobindpur tea estate. The increase of yield of different treatments was statistically significant (F=38.86) at 1% level.
1860
1890
1910
19351948
19721979
1800
1850
1900
1950
2000
T1 T2 T3 T4 T5 T6 T7
Treatments
Yie
ld (
kg
/ha)
Fig 2. Effect of different fertilizer doses on the yield of tea (BTRI Farm, 2016)
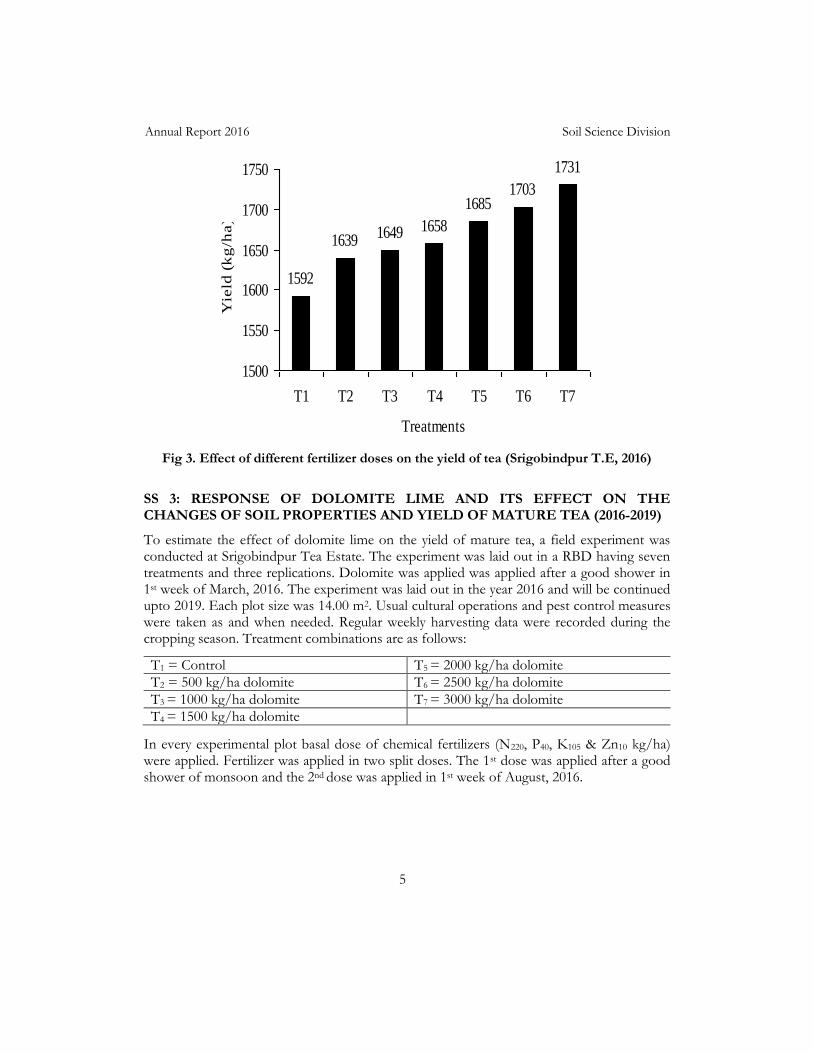
The result shows that, in every treatment increased yield was recorded over the control. The highest made tea yield (1731 kg/ha) was recorded in the treatment T7 where N90, P30, K110, and Zn10 kg/ha were applied. The rate of increase over the control was 8.73% in case of treatment T7. There was trend to increase yield with the increase of fertilizer dose. The increase of yield due to different treatments was statistically significant (F=7.89) at 1% level.
Annual Report 2016 Soil Science Division
5
1592
16391649 1658
16851703
1731
1500
1550
1600
1650
1700
1750
T1 T2 T3 T4 T5 T6 T7
Treatments
Yie
ld (
kg
/ha)
Fig 3. Effect of different fertilizer doses on the yield of tea (Srigobindpur T.E, 2016)
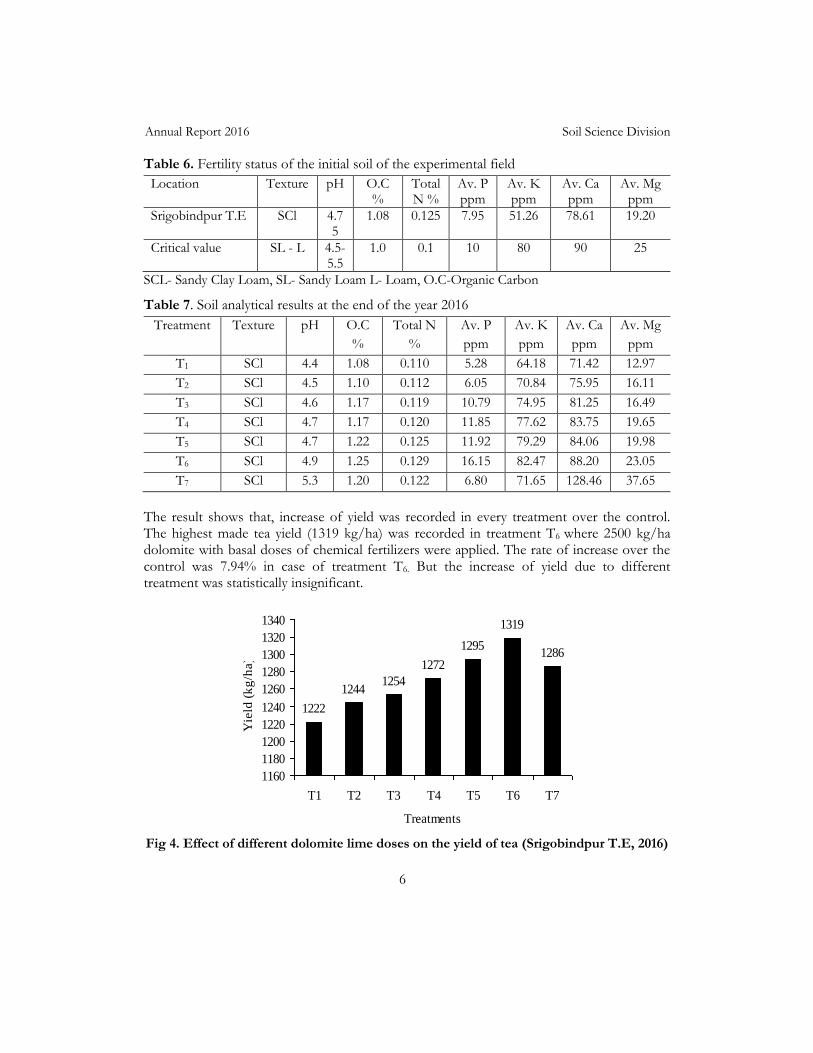
SS 3: RESPONSE OF DOLOMITE LIME AND ITS EFFECT ON THE CHANGES OF SOIL PROPERTIES AND YIELD OF MATURE TEA (2016-2019)
To estimate the effect of dolomite lime on the yield of mature tea, a field experiment was conducted at Srigobindpur Tea Estate. The experiment was laid out in a RBD having seven treatments and three replications. Dolomite was applied was applied after a good shower in 1st week of March, 2016. The experiment was laid out in the year 2016 and will be continued upto 2019. Each plot size was 14.00 m2. Usual cultural operations and pest control measures were taken as and when needed. Regular weekly harvesting data were recorded during the cropping season. Treatment combinations are as follows:
T1 = Control T5 = 2000 kg/ha dolomite
T2 = 500 kg/ha dolomite T6 = 2500 kg/ha dolomite
T3 = 1000 kg/ha dolomite T7 = 3000 kg/ha dolomite
T4 = 1500 kg/ha dolomite
In every experimental plot basal dose of chemical fertilizers (N220, P40, K105 & Zn10 kg/ha) were applied. Fertilizer was applied in two split doses. The 1st dose was applied after a good shower of monsoon and the 2nd dose was applied in 1st week of August, 2016.
Annual Report 2016 Soil Science Division
6
Table 6. Fertility status of the initial soil of the experimental field
Location Texture pH O.C %
Total N %
Av. P ppm
Av. K ppm
Av. Ca ppm
Av. Mg ppm
Srigobindpur T.E SCl 4.75
1.08 0.125 7.95 51.26 78.61 19.20
Critical value SL - L 4.5-5.5
1.0 0.1 10 80 90 25
SCL- Sandy Clay Loam, SL- Sandy Loam L- Loam, O.C-Organic Carbon
Table 7. Soil analytical results at the end of the year 2016
Treatment Texture pH O.C
%
Total N
%
Av. P
ppm
Av. K
ppm
Av. Ca
ppm
Av. Mg
ppm
T1 SCl 4.4 1.08 0.110 5.28 64.18 71.42 12.97
T2 SCl 4.5 1.10 0.112 6.05 70.84 75.95 16.11
T3 SCl 4.6 1.17 0.119 10.79 74.95 81.25 16.49
T4 SCl 4.7 1.17 0.120 11.85 77.62 83.75 19.65
T5 SCl 4.7 1.22 0.125 11.92 79.29 84.06 19.98
T6 SCl 4.9 1.25 0.129 16.15 82.47 88.20 23.05
T7 SCl 5.3 1.20 0.122 6.80 71.65 128.46 37.65
The result shows that, increase of yield was recorded in every treatment over the control. The highest made tea yield (1319 kg/ha) was recorded in treatment T6 where 2500 kg/ha dolomite with basal doses of chemical fertilizers were applied. The rate of increase over the control was 7.94% in case of treatment T6. But the increase of yield due to different treatment was statistically insignificant.
1222
12441254
1272
1295
1319
1286
1160
1180
1200
1220
1240
1260
1280
1300
1320
1340
T1 T2 T3 T4 T5 T6 T7
Treatments
Yie
ld (
kg
/ha)
Fig 4. Effect of different dolomite lime doses on the yield of tea (Srigobindpur T.E, 2016)
Annual Report 2016 Soil Science Division
7
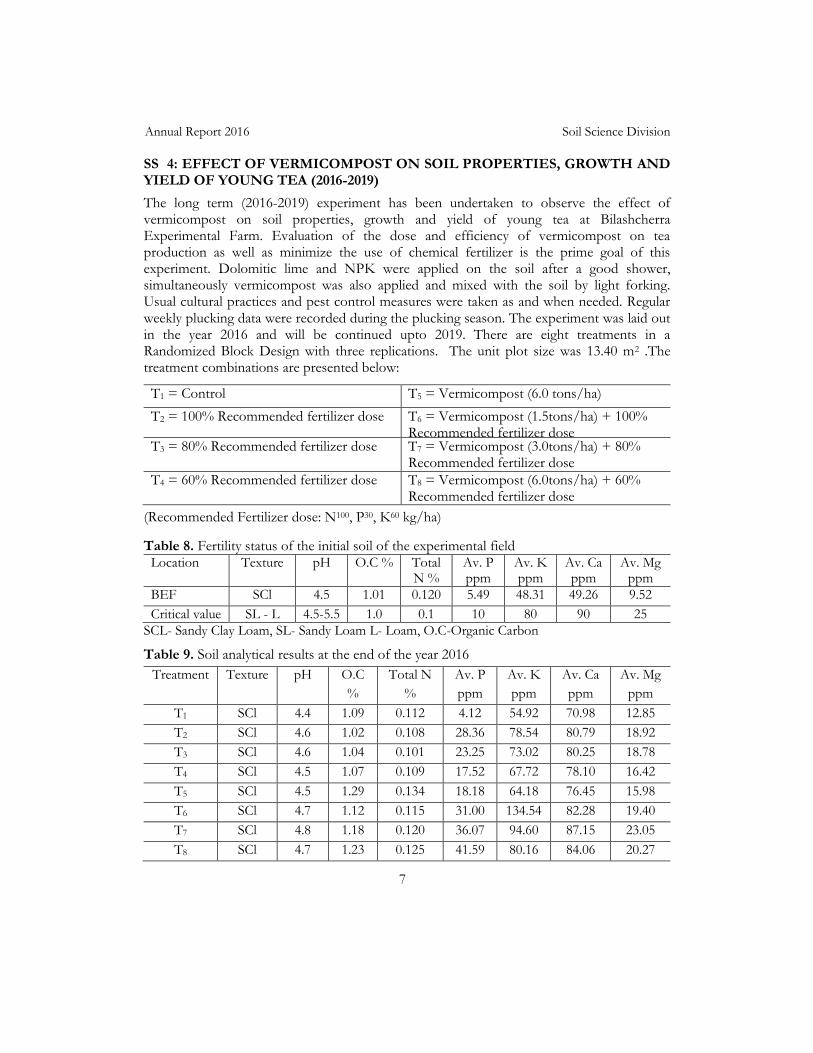
SS 4: EFFECT OF VERMICOMPOST ON SOIL PROPERTIES, GROWTH AND YIELD OF YOUNG TEA (2016-2019)
The long term (2016-2019) experiment has been undertaken to observe the effect of vermicompost on soil properties, growth and yield of young tea at Bilashcherra Experimental Farm. Evaluation of the dose and efficiency of vermicompost on tea production as well as minimize the use of chemical fertilizer is the prime goal of this experiment. Dolomitic lime and NPK were applied on the soil after a good shower, simultaneously vermicompost was also applied and mixed with the soil by light forking. Usual cultural practices and pest control measures were taken as and when needed. Regular weekly plucking data were recorded during the plucking season. The experiment was laid out in the year 2016 and will be continued upto 2019. There are eight treatments in a Randomized Block Design with three replications. The unit plot size was 13.40 m2 .The treatment combinations are presented below:
T1 = Control T5 = Vermicompost (6.0 tons/ha) T2 = 100% Recommended fertilizer dose T6 = Vermicompost (1.5tons/ha) + 100% Recommended fertilizer dose
T3 = 80% Recommended fertilizer dose T7 = Vermicompost (3.0tons/ha) + 80% Recommended fertilizer dose
T4 = 60% Recommended fertilizer dose T8 = Vermicompost (6.0tons/ha) + 60% Recommended fertilizer dose
(Recommended Fertilizer dose: N100, P30, K60 kg/ha)
Table 8. Fertility status of the initial soil of the experimental field
Location Texture pH O.C % Total N %
Av. P ppm
Av. K ppm
Av. Ca ppm
Av. Mg ppm
BEF SCl 4.5 1.01 0.120 5.49 48.31 49.26 9.52
Critical value SL - L 4.5-5.5 1.0 0.1 10 80 90 25
SCL- Sandy Clay Loam, SL- Sandy Loam L- Loam, O.C-Organic Carbon
Table 9. Soil analytical results at the end of the year 2016
Treatment Texture pH O.C
%
Total N
%
Av. P
ppm
Av. K
ppm
Av. Ca
ppm
Av. Mg
ppm
T1 SCl 4.4 1.09 0.112 4.12 54.92 70.98 12.85
T2 SCl 4.6 1.02 0.108 28.36 78.54 80.79 18.92
T3 SCl 4.6 1.04 0.101 23.25 73.02 80.25 18.78
T4 SCl 4.5 1.07 0.109 17.52 67.72 78.10 16.42
T5 SCl 4.5 1.29 0.134 18.18 64.18 76.45 15.98
T6 SCl 4.7 1.12 0.115 31.00 134.54 82.28 19.40
T7 SCl 4.8 1.18 0.120 36.07 94.60 87.15 23.05
T8 SCl 4.7 1.23 0.125 41.59 80.16 84.06 20.27

Annual Report 2016 Soil Science Division
8
The result shows that, increase of yield was recorded in every treatment over the control. The highest made tea (1440 kg/ha) was recorded in treatment T7 where 3.0 tons/ha vermicompost with 80% of the recommended doses of chemical fertilizers were applied (Fig. 5). The rate of increase over the control was 8.51% in case of treatment T7. The increase of yield due to different treatment was statistically significant (F= 7.56) at 1% level.
1327
1397
1366 13591347
14281440
1418
12601280130013201340136013801400142014401460
T1 T2 T3 T4 T5 T6 T7 T8
Treatments
Yie
ld (
kg/h
a)
Fig 5. Effect of vermicompost on the yield of tea (BEF, 2016)
OTHER ACTIVITIES
Advisory services
The advisory work is comprised of analysis of soil, water, fertilizer, lime, compost etc. collected or received from different tea estates. Soil samples were analyzed to find out their suitability for proposed new extension, replanting, rehabilitation and also to diagnose the cause of poor growth or failure of existing tea, to recommend appropriate fertilizer requirement and to study the suitability of establishing seed or V.P nursery. During the year under report a total of 2871 soil samples and 150 other samples from 83 tea estates were analyzed for different purposes, the breakup of which is presented in table 10.
Table 10. Number of samples analyzed
Year Soil Fertilizer Lime/Dolomite Water Compost Total (others)
(Soil & others)
2016 2871 91 43 04 12 150 3021
Annual Report 2016 Soil Science Division
9
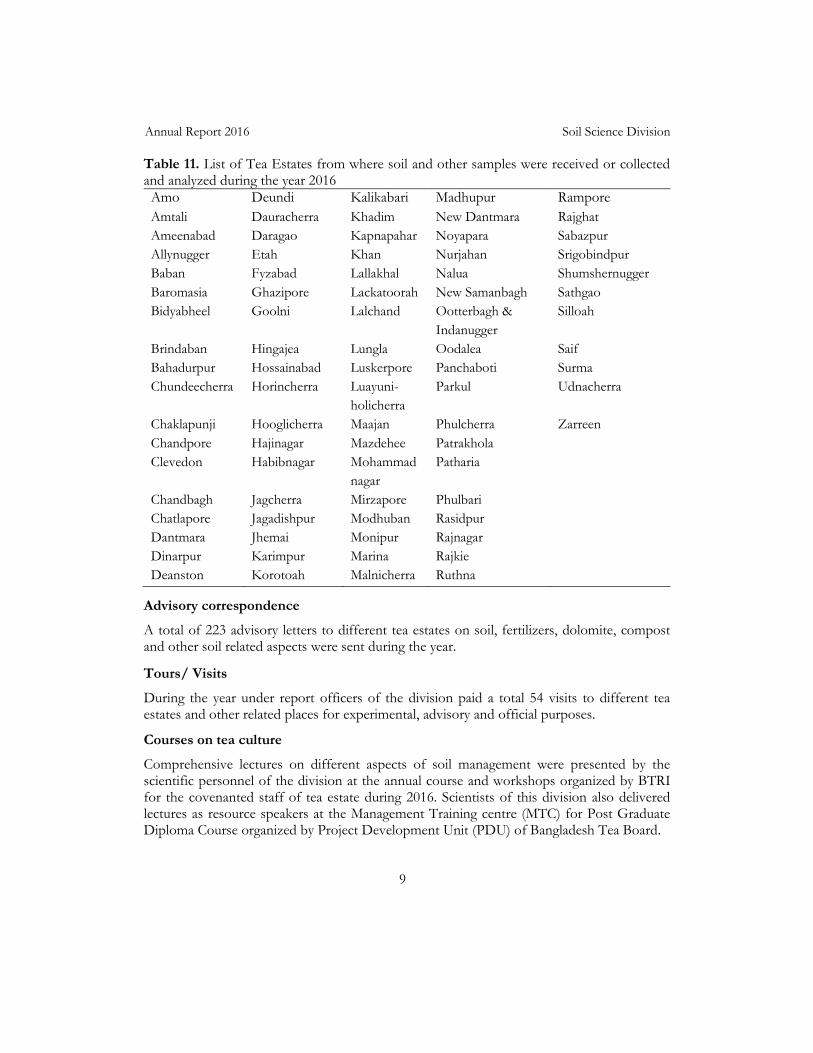
Table 11. List of Tea Estates from where soil and other samples were received or collected and analyzed during the year 2016
Amo Deundi Kalikabari Madhupur Rampore
Amtali Dauracherra Khadim New Dantmara Rajghat
Ameenabad Daragao Kapnapahar Noyapara Sabazpur
Allynugger Etah Khan Nurjahan Srigobindpur
Baban Fyzabad Lallakhal Nalua Shumshernugger
Baromasia Ghazipore Lackatoorah New Samanbagh Sathgao
Bidyabheel Goolni Lalchand Ootterbagh &
Indanugger
Silloah
Brindaban Hingajea Lungla Oodalea Saif
Bahadurpur Hossainabad Luskerpore Panchaboti Surma
Chundeecherra Horincherra Luayuni-
holicherra
Parkul Udnacherra
Chaklapunji Hooglicherra Maajan Phulcherra Zarreen
Chandpore Hajinagar Mazdehee Patrakhola
Clevedon Habibnagar Mohammad
nagar
Patharia
Chandbagh Jagcherra Mirzapore Phulbari
Chatlapore Jagadishpur Modhuban Rasidpur
Dantmara Jhemai Monipur Rajnagar
Dinarpur Karimpur Marina Rajkie
Deanston Korotoah Malnicherra Ruthna
Advisory correspondence
A total of 223 advisory letters to different tea estates on soil, fertilizers, dolomite, compost and other soil related aspects were sent during the year.
Tours/ Visits
During the year under report officers of the division paid a total 54 visits to different tea estates and other related places for experimental, advisory and official purposes.
Courses on tea culture
Comprehensive lectures on different aspects of soil management were presented by the scientific personnel of the division at the annual course and workshops organized by BTRI for the covenanted staff of tea estate during 2016. Scientists of this division also delivered lectures as resource speakers at the Management Training centre (MTC) for Post Graduate Diploma Course organized by Project Development Unit (PDU) of Bangladesh Tea Board.
Annual Report 2016 Biochemistry Division
10
BIOCHEMISTRY DIVISION Md. Arif Mahmud Howlader
Scientific Officer
STAFF
Mr. Md. Arif Mahmud Howlader joined as Scientific Officer on 2nd May, 2016. The posts of Principal Scientific Officer (PSO), Senior Scientific Officer (SSO), and Laboratory Helper (LH) were lying vacant during the period under report. There was no other change in the personnel position of the division during the year.
RESEARCH
Different experiments were carried out from May 02, 2016 to September 08, 2016 in Biochemistry division. Some experiments are in pipeline. All experimental progress of Biochemistry Division is summarized below:
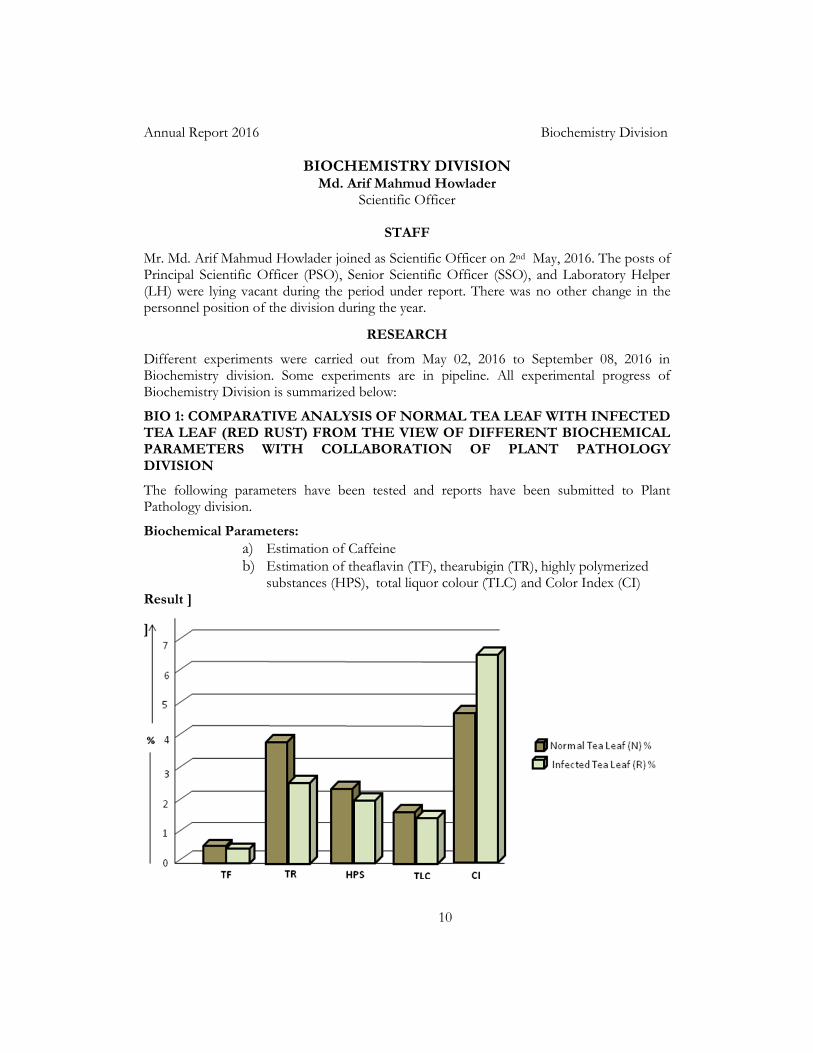
BIO 1: COMPARATIVE ANALYSIS OF NORMAL TEA LEAF WITH INFECTED TEA LEAF (RED RUST) FROM THE VIEW OF DIFFERENT BIOCHEMICAL PARAMETERS WITH COLLABORATION OF PLANT PATHOLOGY DIVISION
The following parameters have been tested and reports have been submitted to Plant Pathology division.
Biochemical Parameters:
a) Estimation of Caffeine
b) Estimation of theaflavin (TF), thearubigin (TR), highly polymerized substances (HPS), total liquor colour (TLC) and Color Index (CI)
Result ]
]
Annual Report 2016 Biochemistry Division
11
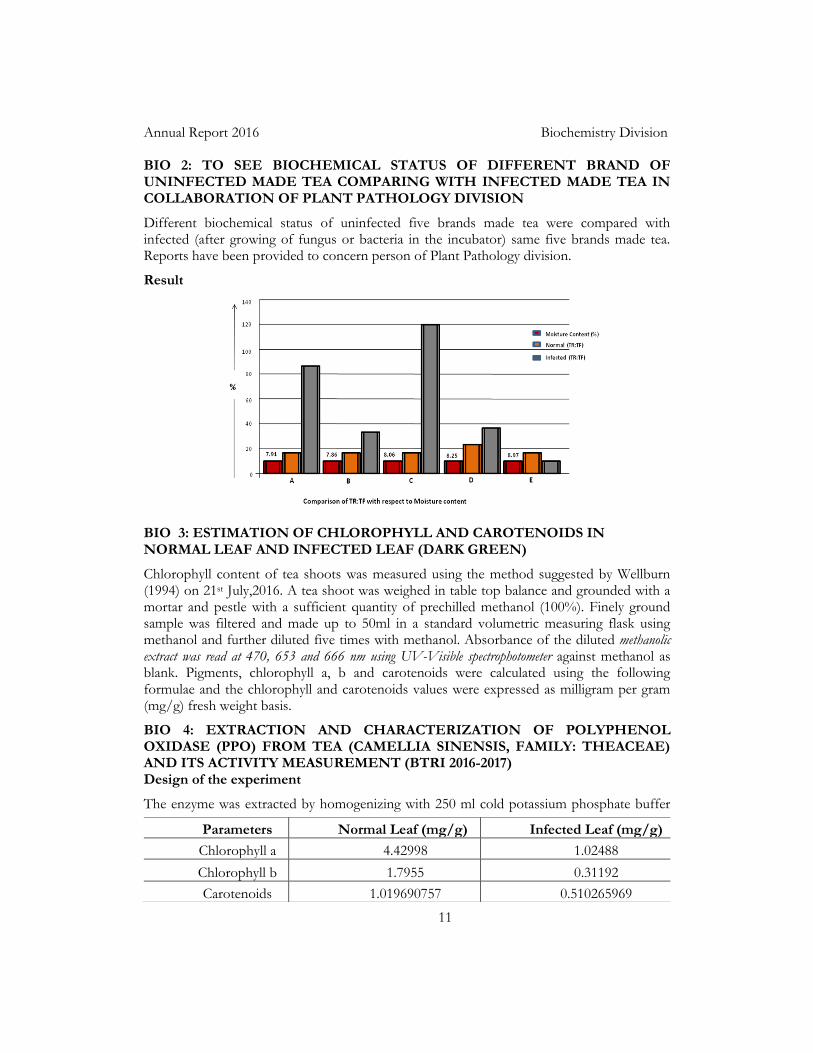
BIO 2: TO SEE BIOCHEMICAL STATUS OF DIFFERENT BRAND OF UNINFECTED MADE TEA COMPARING WITH INFECTED MADE TEA IN COLLABORATION OF PLANT PATHOLOGY DIVISION
Different biochemical status of uninfected five brands made tea were compared with infected (after growing of fungus or bacteria in the incubator) same five brands made tea. Reports have been provided to concern person of Plant Pathology division.
Result
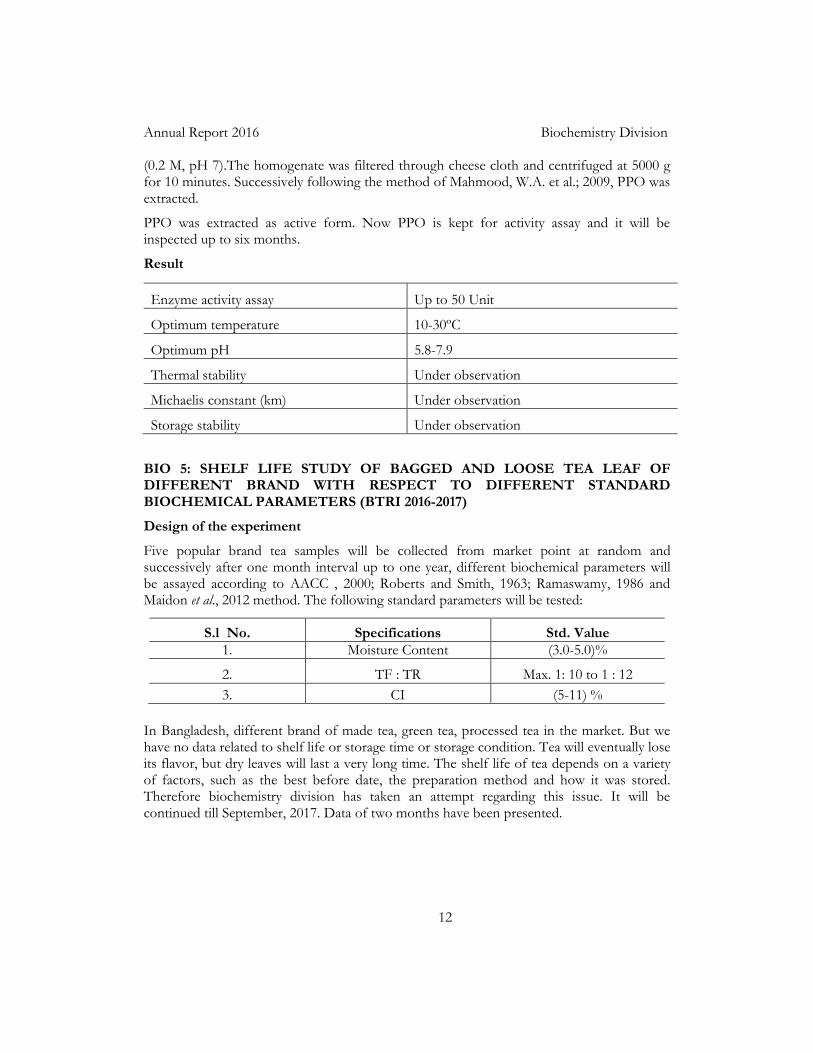
BIO 3: ESTIMATION OF CHLOROPHYLL AND CAROTENOIDS IN NORMAL LEAF AND INFECTED LEAF (DARK GREEN)
Chlorophyll content of tea shoots was measured using the method suggested by Wellburn (1994) on 21st July,2016. A tea shoot was weighed in table top balance and grounded with a mortar and pestle with a sufficient quantity of prechilled methanol (100%). Finely ground sample was filtered and made up to 50ml in a standard volumetric measuring flask using methanol and further diluted five times with methanol. Absorbance of the diluted methanolic extract was read at 470, 653 and 666 nm using UV-Visible spectrophotometer against methanol as blank. Pigments, chlorophyll a, b and carotenoids were calculated using the following formulae and the chlorophyll and carotenoids values were expressed as milligram per gram (mg/g) fresh weight basis.
BIO 4: EXTRACTION AND CHARACTERIZATION OF POLYPHENOL OXIDASE (PPO) FROM TEA (CAMELLIA SINENSIS, FAMILY: THEACEAE) AND ITS ACTIVITY MEASUREMENT (BTRI 2016-2017) Design of the experiment
The enzyme was extracted by homogenizing with 250 ml cold potassium phosphate buffer
Parameters Normal Leaf (mg/g) Infected Leaf (mg/g)
Chlorophyll a 4.42998 1.02488
Chlorophyll b 1.7955 0.31192
Carotenoids 1.019690757 0.510265969
Annual Report 2016 Biochemistry Division
12
(0.2 M, pH 7).The homogenate was filtered through cheese cloth and centrifuged at 5000 g for 10 minutes. Successively following the method of Mahmood, W.A. et al.; 2009, PPO was extracted.
PPO was extracted as active form. Now PPO is kept for activity assay and it will be inspected up to six months.
Result
Enzyme activity assay Up to 50 Unit
Optimum temperature 10-30ºC
Optimum pH 5.8-7.9
Thermal stability Under observation
Michaelis constant (km) Under observation
Storage stability Under observation
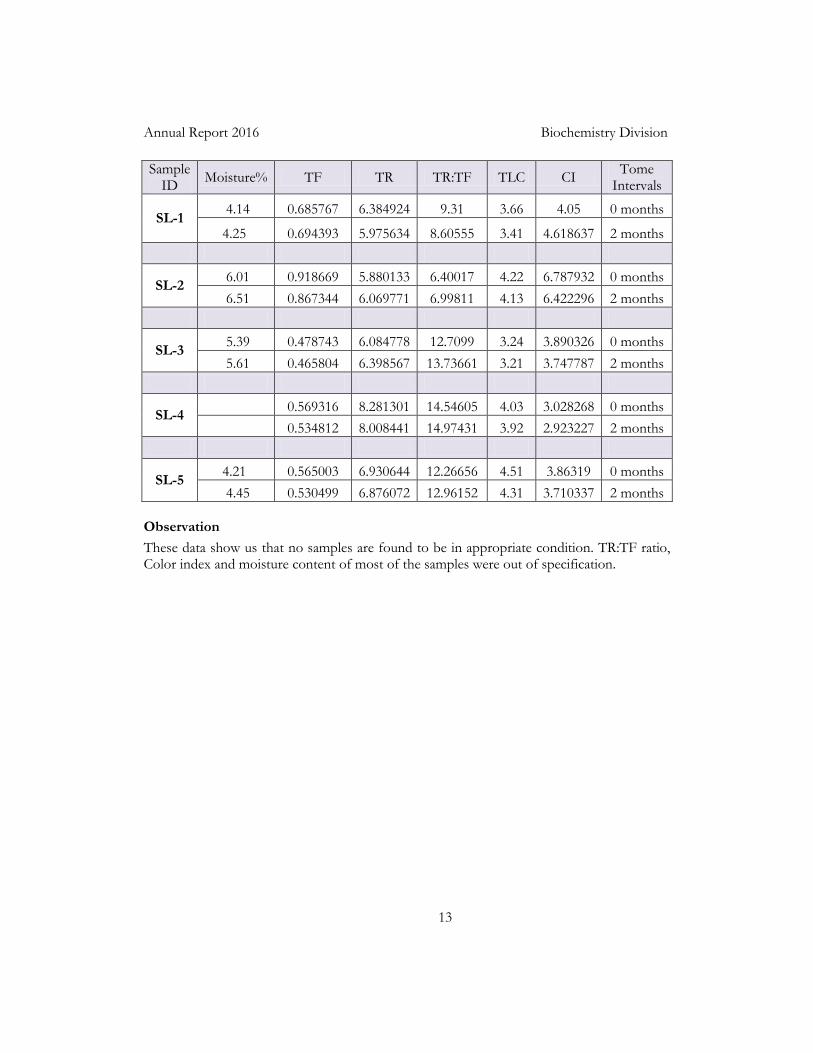
BIO 5: SHELF LIFE STUDY OF BAGGED AND LOOSE TEA LEAF OF DIFFERENT BRAND WITH RESPECT TO DIFFERENT STANDARD BIOCHEMICAL PARAMETERS (BTRI 2016-2017)
Design of the experiment
Five popular brand tea samples will be collected from market point at random and successively after one month interval up to one year, different biochemical parameters will be assayed according to AACC , 2000; Roberts and Smith, 1963; Ramaswamy, 1986 and Maidon et al., 2012 method. The following standard parameters will be tested:
S.l No. Specifications Std. Value
1. Moisture Content (3.0-5.0)%
2. TF : TR Max. 1: 10 to 1 : 12
3. CI (5-11) %
In Bangladesh, different brand of made tea, green tea, processed tea in the market. But we have no data related to shelf life or storage time or storage condition. Tea will eventually lose its flavor, but dry leaves will last a very long time. The shelf life of tea depends on a variety of factors, such as the best before date, the preparation method and how it was stored. Therefore biochemistry division has taken an attempt regarding this issue. It will be continued till September, 2017. Data of two months have been presented.
Annual Report 2016 Biochemistry Division
13
Sample ID
Moisture% TF TR TR:TF TLC CI Tome
Intervals
SL-1 4.14 0.685767 6.384924 9.31 3.66 4.05 0 months
4.25 0.694393 5.975634 8.60555 3.41 4.618637 2 months
SL-2 6.01 0.918669 5.880133 6.40017 4.22 6.787932 0 months
6.51 0.867344 6.069771 6.99811 4.13 6.422296 2 months
SL-3 5.39 0.478743 6.084778 12.7099 3.24 3.890326 0 months
5.61 0.465804 6.398567 13.73661 3.21 3.747787 2 months
SL-4 0.569316 8.281301 14.54605 4.03 3.028268 0 months
0.534812 8.008441 14.97431 3.92 2.923227 2 months
SL-5 4.21 0.565003 6.930644 12.26656 4.51 3.86319 0 months
4.45 0.530499 6.876072 12.96152 4.31 3.710337 2 months
Observation
These data show us that no samples are found to be in appropriate condition. TR:TF ratio, Color index and moisture content of most of the samples were out of specification.
Annual Report 2016 Botany Division
14
BOTANY DIVISION
Md. Ismail Hossain Principal Scientific Officer
STAFF
Mr. Md. Riyadh Arefin joined as Scientific Officer on 3 February, 2016. The post of one Scientific Officer and one Field Assistant were vacant. There were no other change in personnel position of the division during the period under report.
RESEARCH
Thirty two experiments in six programme areas namely–Preliminary selection of vegetative clones, Screening of drought tolerant variety of tea (camellia sinensis) at the nursery level and in the field condition, Long term yield and quality trial of provisionally selected clones, Breeding of tea, Survey and conservation of gene resources of tea in Bangladesh (BTRI, 1981), Developing a sustainable and cost effective protocol for manufacturing different kinds of tea rather than CTC tea and other experiments. Results are briefly discussed below:
B1: PRELIMINARY SELECTION OF VEGETATIVE CLONES
B1-27: Selection of Vegetative Clones at Shumshernugger T. E., Section Main Div. Sec. No. 9 (1993-2016)
From the estate 16 new bushes were selected during the period under report besides previous selections. Newly selected bushes were pruned in order to collect cuttings. A total of 2415 cuttings from 19 selected bushes of Shumshernugger T.E. were collected and put into the rooting trial.
B1-28: Selection of Vegetative Clones at Amo T. E., Section No. 8 (1993-2016)
Thirty three new bushes have been selected during the period under report. The selected bushes have been pruned for collecting cuttings for rooting trial. A total of 5526 cuttings from 35 bushes of section no. 1 of Amo Tea Estate were collected and planted in the nursery.
B1-31: Selection of Vegetative Clones at Baraoorah T. E., Section No. 8 (2007-2016)
Nineteen bushes have been selected during the period under report. The selected bushes have been pruned for collecting cuttings for rooting trial. A total of 2245 cuttings from 13 bushes of section no. 8 of Baraoorah Tea Estate were collected and planted in the nursery. B2: SCREENING OF DROUGHT TOLERANT VARIETY OF TEA AT THE NURSERY LEVEL AND IN THE FIELD CONDITION
B2-1: (a) Screening of drought tolerant variety of tea at the nursery level
Cuttings are collected from Baraoorah (T1), Shumshernugger (T2) and Mirzapure T. E. (T3) from November’15 to October’2017. Overall performance (6 months) are given below:
Annual Report 2016 Botany Division
15
Table 1. Rotting performance of different selected cuttings Parameter T1 T2 T3 BT2
Rotting Performance 93% 91% 92% 90%
B2-1: (b) Screening of drought tolerant variety of tea in the field condition upto 3 years of planting
Test clone collected from Shumshernugger, Mirzapure & Baraooarah T.E. (2014-2017). Average Depth of root (cm) of sorted rooted cutting in first 3 years is presented below:
Table 2. Average depth of root (cm) of sorted rooted cuttings
Parameter T1 T2 T3 BT2
Depth of root at 1st year (cm) 26.67 26.16 26.64 25.91
Depth of root at 2nd year (cm) 30.10 29.18 30.20 28.58
Depth of root at 3rd year (cm) 31.24 30.86 31.19 30.86
B3: LONG TERM YIELD & QUALITY TRIAL OF PROVISIONALLY SELECTED CLONES
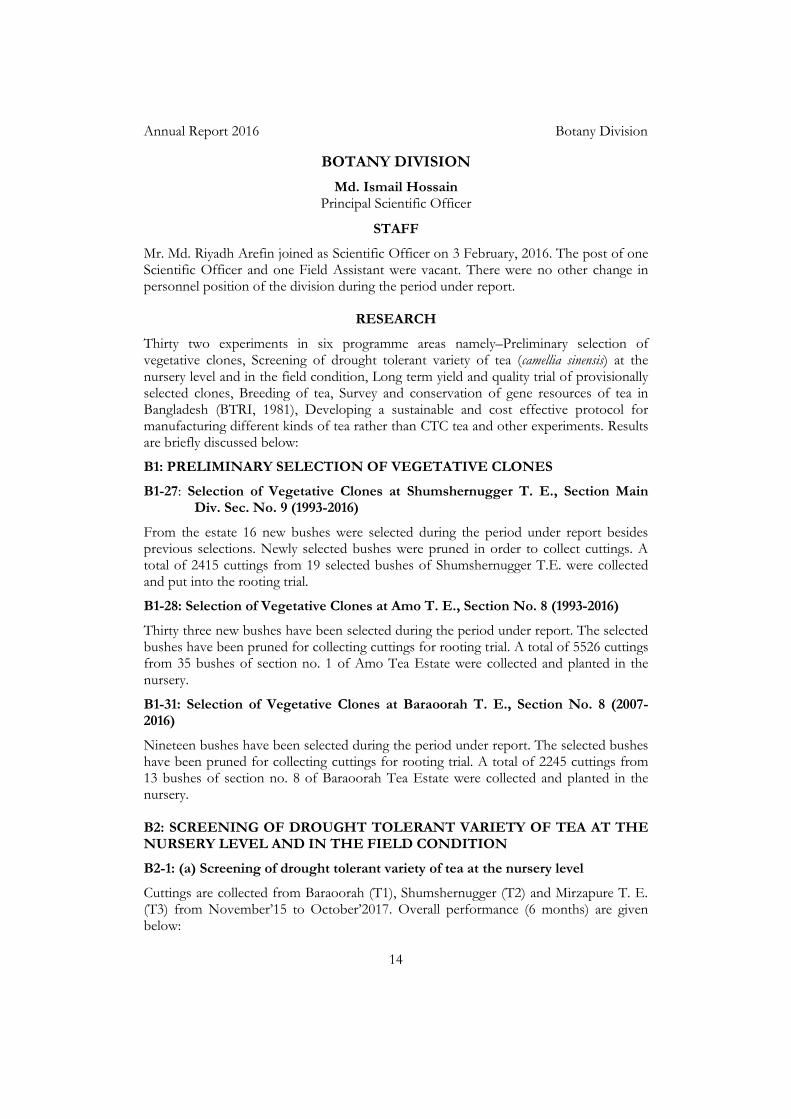
B2-35: Yield and Quality Trial of Test clones Selected from Shumshernugger and Amo T. Es., Test clones Sh/D/11/313, A/8/8, A/17/7 and A/22/39 against Control TV1 (BTRI, 1996-2016)
The plants of this trial were medium skiffed at 83 cm in 2016. There were 20 plucking rounds in 2016. The yield data were analyzed and presented in Table 3 and Fig. 1.
Table 3. Yield of green leaves (g/plant) in 2016
Clone SH/D/11/313 A/8/8 A/17/7 A/22/39 TV1
Treatment mean 1134 1158 1163 1144 1023.4
Treatment difference- LSD at 5% = 110.6
The analytical results reveal that yield difference was highly significant (5% level of significance) in 2016. Test clones A/17/7, A/8/8, A/22/39 and SH/D/11/313 were comparable in terms of yield while control TV1 performed lower yield than the test clones. The estimated made tea production in kg/ha is presented in Fig.1. The cup qualities of all the test clones were assessed organoleptically and the average values of the scores are presented in Table 4.
Fig. 1. Comparative yield of clones made tea (kg/ha)
Annual Report 2016 Botany Division
16
Table 4. Quality scores
Clone Infusion
Liquor colour
Briskness Strength Creaming down
Total Remarks
10 10 10 10 10 50
SH/D/11/313 A/8/8 A/17/7 A/22/39 TV1
7.35 7.77 7.51 7.43 7.78
7.66 7.79 7.69 7.52 7.83
7.22 7.52 7.51 7.34 7.73
7.28 7.53 7.51 7.41 7.79
2.73 3.55 2.81 2.75 3.16
32.24 34.56 33.03 32.45 34.29
AA E AA AA E
(A: Average, AA: Above Average, E: Excellent cup quality)
All the test clones were above average while the test clone A/8/8 and control TV1 were excellent in terms of cup quality. Consistent touch of sweet flavor was found in A/17/7. Test clones A/17/7 and A/8/8 were released as BT19 and BT20 respectively in 2016.
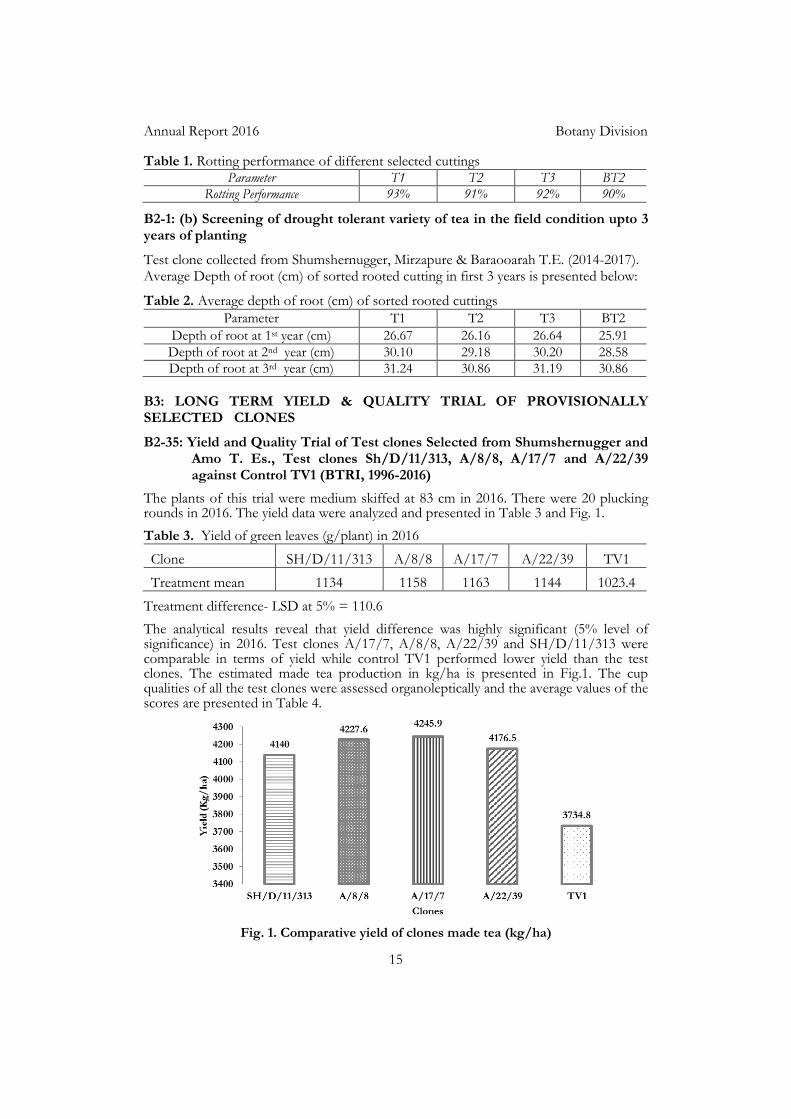
B3-36: Yield and Quality Trial of Test clones Selected from Amo T. E. Test clones A/8/01, A/17/22, A/22/27 and A/22/40 against Control BT1 (BTRI, 1996-2017)
The plants of this trial were medium skiffed at 83 cm in 2016. There were 20 plucking rounds in 2016. The yield data were analyzed and presented in Table 5.
Table 5. Yield of green leaves (g/plant) Clone Year A/8/01 A/17/22 A/22/27 A/22/40 BT1
Treatment mean
2016 649.43
681.79 729.46 634.47 749.9
Treatment difference: Insignificant
The analytical results revealed that all test clones are comparable in terms of yield. The estimated made tea production in kg/ha is presented in Fig.2. The cup quality of made tea for all the test clones were assessed organoleptically and average scores are presented in Table 6.
Fig. 2. Comparative yield of clones made tea (kg/ha)
Annual Report 2016 Botany Division
17
Table 6. Quality scores
Clone Infusion
Liquor colour
Briskness Strength Creaming
down Total
Remarks
10 10 10 10 10 50
A/8/01 A/17/22 A/22/27 A/22/40 BT1
7.55 7.24 7.65 7.53 7.53
7.59 7.23 7.50 7.53 7.71
7.23 7.14 7.39 7.43 7.46
7.42 7.24 7.32 7.38 7.41
2.35 2.49 2.20 2.87 2.91
32.23 31.34 32.49 32.74 33.12
AA A
AA AA AA
(A: Average, AA: Above Average, E: Excellent cup quality)
All the test clones excepting A/17/22 were comparable with the control BT1 in case of quality, Test clone A/17/22 was inferior in cup than that of control.
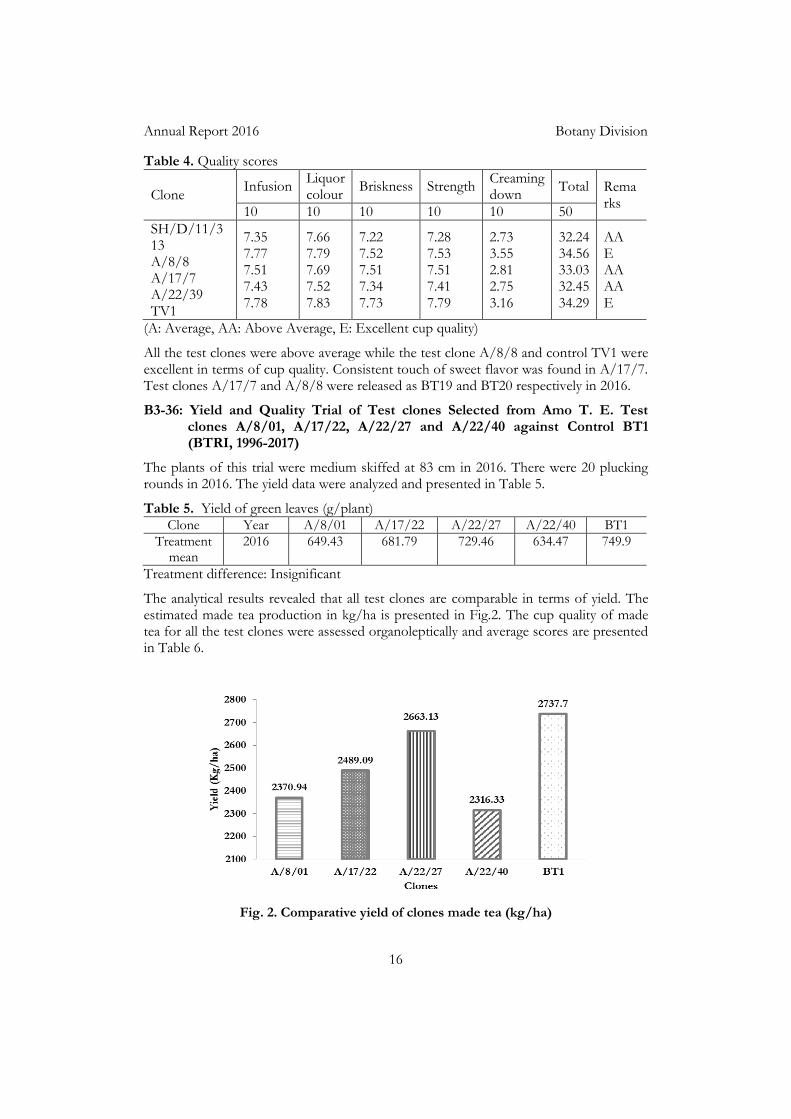
B3-38: Yield and Quality Trial of Test clones Selected from Chandpore, Shumshernugger and Amo T. Es.; Test clones C/J1/10, Sh/B/6/59, Sh/B/6/62 and A/8/24 against Control BT2 (BTRI, 2019)
The plants of this trial were deep skiffed at 76 cm in 2016. There were 27 plucking rounds in 2016. The yield data were analyzed and presented in Table-7.
Table 7. Yield of green leaves (g/plant) Clone Year CHA/J1/10 Sh/B/6/59 Sh/B/6/62 A/8/24 BT2
Treatment mean
2016 1230.77 1161.3 1027.7 1397.27 1170
Treatment difference: Insignificant.
The analytical results revealed that all test clones are comparable in terms of yield. The estimated made tea production in kg/ha is presented in Fig.3. The cup quality of made tea for all the test clones were assessed organoleptically and average scores are presented in Table 8.
Fig. 3. Comparative yield of clones made tea (kg/ha)
Annual Report 2016 Botany Division
18
Table 8. Quality scores
Clone Infusion
Liquor colour
Briskness Strength Creaming
down Total
Remarks 10 10 10 10 10 50
CHA/J1/10 Sh/B/6/59 Sh/B/6/62 A/8/24 BT2
7.68 7.11 7.32 7.41 7.52
7.34 7.18 7.32 7.34 7.63
7.38 7.28 7.83 7.48 7.39
7.40 7.25 7.67 7.39 7.24
2.84 2.47 2.84 2.68 2.93
32.45 31.42 33.21 32.29 32.75
AA A
AA AA AA
(A: Average, AA: Above Average, E: Excellent cup quality)
All the test clones excepting Sh/B/6/59 have got comparable cup quality with test clone BT2 excepting the test clone’s unique flavoury character. Test clone Sh/B/6/59 was inferior to the control BT1 in case of cup quality.
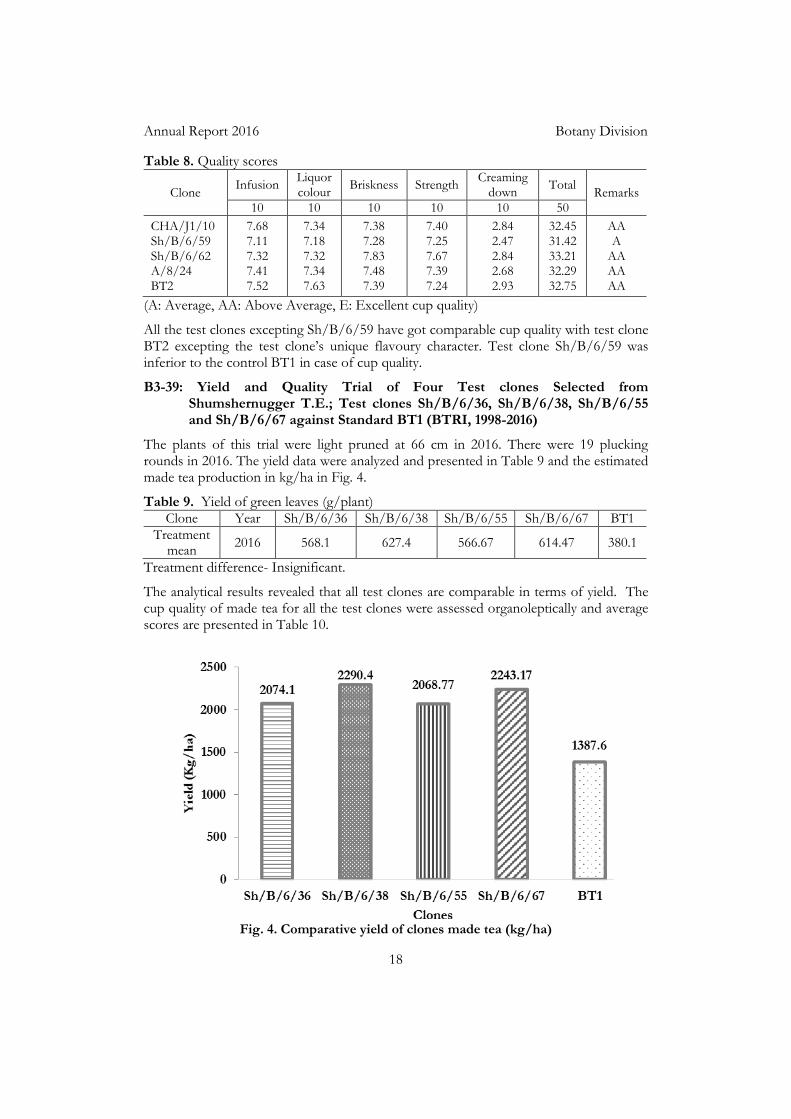
B3-39: Yield and Quality Trial of Four Test clones Selected from Shumshernugger T.E.; Test clones Sh/B/6/36, Sh/B/6/38, Sh/B/6/55 and Sh/B/6/67 against Standard BT1 (BTRI, 1998-2016)
The plants of this trial were light pruned at 66 cm in 2016. There were 19 plucking rounds in 2016. The yield data were analyzed and presented in Table 9 and the estimated made tea production in kg/ha in Fig. 4.
Table 9. Yield of green leaves (g/plant) Clone Year Sh/B/6/36 Sh/B/6/38 Sh/B/6/55 Sh/B/6/67 BT1
Treatment mean
2016 568.1 627.4 566.67 614.47 380.1
Treatment difference- Insignificant.
The analytical results revealed that all test clones are comparable in terms of yield. The cup quality of made tea for all the test clones were assessed organoleptically and average scores are presented in Table 10.
Fig. 4. Comparative yield of clones made tea (kg/ha)

Annual Report 2016 Botany Division
19
Table 10. Quality scores
Clone
Infusion
Liquor colour
Briskness Strength Creaming
down Total Remarks
10 10 10 10 10 50
Sh/B/6/36 Sh/B/6/38 Sh/B/6/55 Sh/B/6/67
BT1
7.11 7.36 7.13 7.77 7.26
7.31 7.41 7.13 7.41 7.41
7.95 7.57 7.02 7.15 7.54
7.24 7.35 7.16 7.37 7.34
2.90 2.76 2.80 2.82 2.96
32.51 32.45 31.24 32.52 32.51
AA AA A
AA AA
(A: Average, AA: Above Average, E: Excellent cup quality)
All the Test clones excepting Sh/B/6/55 were comparable in cup with the control BT1. Test clone Sh/B/6/55 was inferior to the control BT1 in the case of cup quality.
B3-40: Yield and Quality Trial of Six Test clones – MZ/39, E/4, D/13, B2T1, BR2/97 and SDL/1 against Standard BT2 (BTRI, 2000-2016)
The plants of this trial were medium skiffed at 78 cm in 2016. There were 22 plucking rounds in 2016. The yield data were analyzed and presented in Table 11.and the estimated made tea production in kg/ha in Fig.5.
Table 11. Yield of green leaves (g/plant) Clone Year MZ/39 E/4 D/13 B2T1 BR2/97 SDL/1 BT2
Treatment mean
2016 1240.6 925.6 848.3 1048.9 875.9 903.0 1105.6
Treatment difference- LSD at 5% = 193.95
The analytical results reveal that yield difference was highly significant (at 5% level of significance) in 2016. Test clones MZ/39, SDL/1, B2×T1, E/4 and BR2/97 were comparable in terms of yield with the control BT2 while the test clone D/13 performed lower yield than the control. The cup quality of made tea for all the test clones were assessed through organoleptic test and the average scores are presented in Table 12.
Fig. 5. Comparative yield of clones made tea (kg/ha)
Annual Report 2016 Botany Division
20
Table 12. Quality scores
Clone Infusion
Liquor colour
Briskness Strength Creaming
down Total
Remarks 10 10 10 10 10 50
MZ/39 E/4 D/13 B2T1 BR2/97 SDL/1 BT2
7.49 7.50 7.61 7.27 7.61 7.32 7.41
7.43 7.69 7.51 7.39 7.38 7.52 7.49
7.53 7.44 7.42 7.31 7.44 7.48 7.45
7.44 7.37 7.43 7.28 7.42 7.33 7.33
2.68 2.61 2.84 2.61 2.74 2.58 2.67
32.57 32.61 33.82 32.25 32.60 32.80 32.25
AA AA AA AA AA AA AA
(A: Average, AA: Above Average, E: Excellent cup quality)
All the Test clones were comparable in cup with the control BT2. However, the unique flavoury character of BT2 was not considered in the case of assessing cup quality.
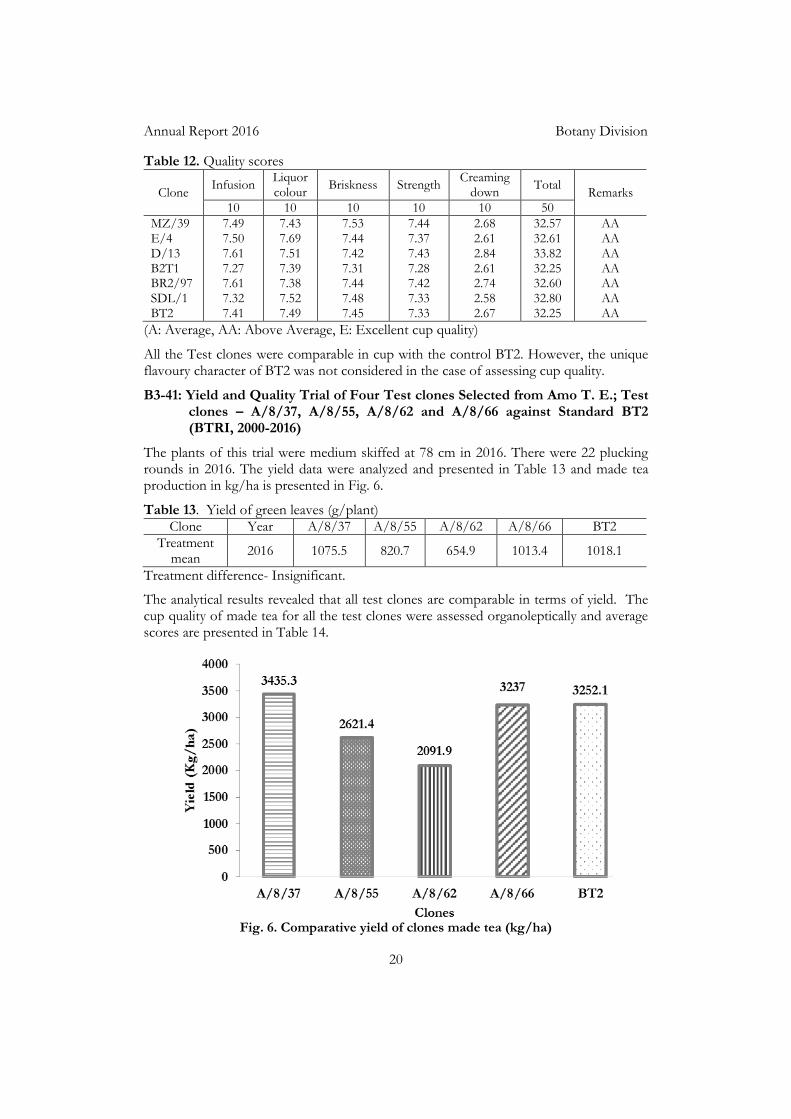
B3-41: Yield and Quality Trial of Four Test clones Selected from Amo T. E.; Test clones – A/8/37, A/8/55, A/8/62 and A/8/66 against Standard BT2 (BTRI, 2000-2016)
The plants of this trial were medium skiffed at 78 cm in 2016. There were 22 plucking rounds in 2016. The yield data were analyzed and presented in Table 13 and made tea production in kg/ha is presented in Fig. 6.
Table 13. Yield of green leaves (g/plant) Clone Year A/8/37 A/8/55 A/8/62 A/8/66 BT2
Treatment mean
2016 1075.5 820.7 654.9 1013.4 1018.1
Treatment difference- Insignificant.
The analytical results revealed that all test clones are comparable in terms of yield. The cup quality of made tea for all the test clones were assessed organoleptically and average scores are presented in Table 14.
Fig. 6. Comparative yield of clones made tea (kg/ha)
Annual Report 2016 Botany Division
21
Table 14. Quality scores
Clone Infusion
Liquor colour
Briskness
Strength Creaming
down Total
Remarks 10 10 10 10 10 50
A/8/37 A/8/55 A/8/62 A/8/66 BT2
7.52 7.32 7.40 7.50 7.56
7.38 7.37 7.55 7.53 7.76
7.74 7.29 7.68 7.37 7.38
7.62 7.31 7.41 7.43 7.38
2.79 2.25 2.81 2.76 2.67
33.06 31.54 32.65 32.59 32.45
AA A
AA AA AA
(A: Average, AA: Above Average, E: Excellent cup quality)
All the test clones excepting A/8/55 were comparable in terms of cup quality. The test clone A/8/55 was found inferior to the control. The flavoury character of BT2 was not considered in the case of assessing cup quality.
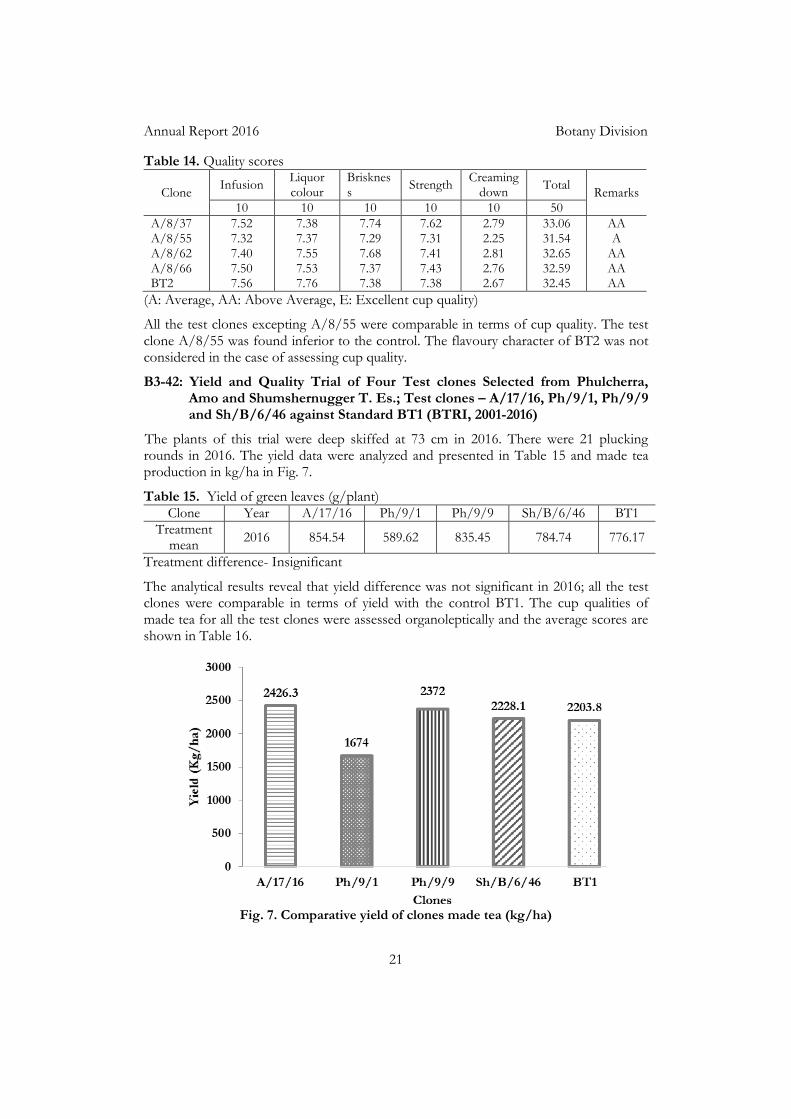
B3-42: Yield and Quality Trial of Four Test clones Selected from Phulcherra, Amo and Shumshernugger T. Es.; Test clones – A/17/16, Ph/9/1, Ph/9/9 and Sh/B/6/46 against Standard BT1 (BTRI, 2001-2016)
The plants of this trial were deep skiffed at 73 cm in 2016. There were 21 plucking rounds in 2016. The yield data were analyzed and presented in Table 15 and made tea production in kg/ha in Fig. 7.
Table 15. Yield of green leaves (g/plant) Clone Year A/17/16 Ph/9/1 Ph/9/9 Sh/B/6/46 BT1
Treatment mean
2016 854.54 589.62 835.45 784.74 776.17
Treatment difference- Insignificant
The analytical results reveal that yield difference was not significant in 2016; all the test clones were comparable in terms of yield with the control BT1. The cup qualities of made tea for all the test clones were assessed organoleptically and the average scores are shown in Table 16.
Fig. 7. Comparative yield of clones made tea (kg/ha)
Annual Report 2016 Botany Division
22
Table 16. Quality scores
Clone Infusion
Liquor colour
Brisk-ness
Strength Creaming
down Total
Remarks 10 10 10 10 10 50
A/17/16 Ph/9/1 Ph/9/9 Sh/B/6/46 BT1
7.34 7.32 7.42 7.44 7.38
7.39 7.29 7.55 7.36 7.60
7.34 7.28 7.60 7.47 7.75
7.34 7.22 7.30 7.26 7.33
2.90 2.53 2.57 2.77 2.87
32.31 31.64 32.40 32.30 32.93
AA A
AA AA AA
(A: Average, AA: Above Average, E: Excellent cup quality)
All the test clones excepting Ph/9/1 were comparable in cup with the control. The Test clone Ph/9/1 was found inferior to the control BT1.
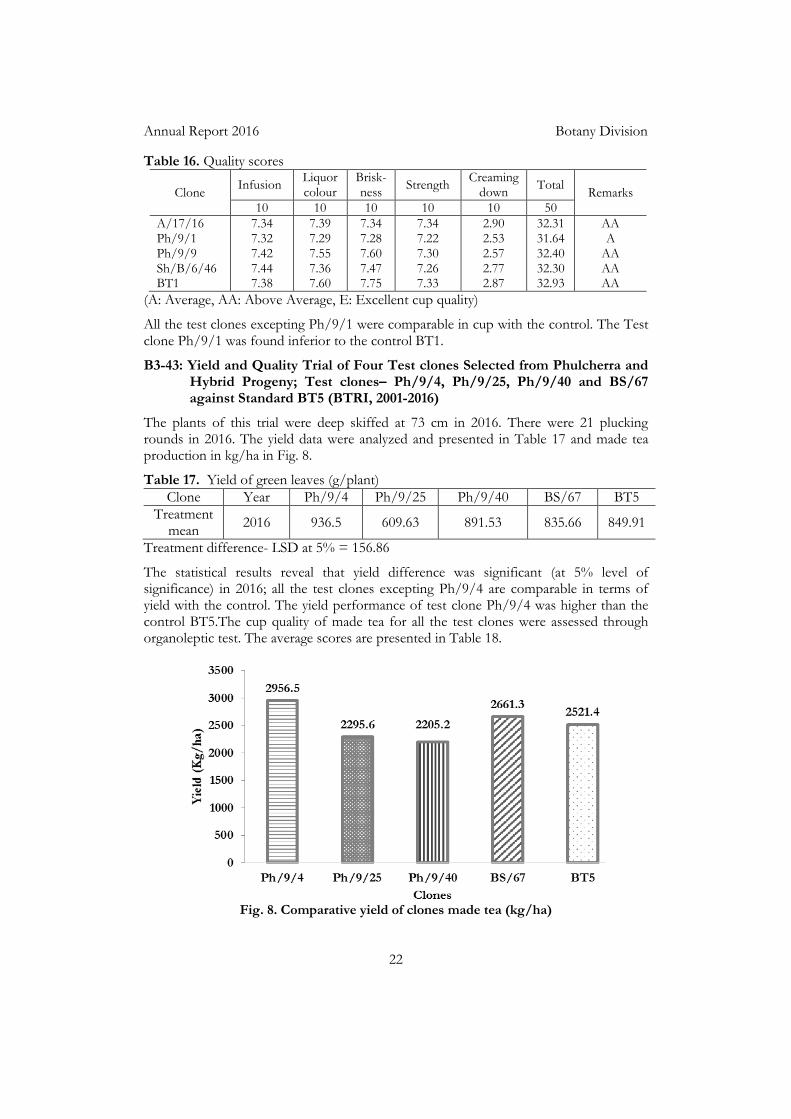
B3-43: Yield and Quality Trial of Four Test clones Selected from Phulcherra and Hybrid Progeny; Test clones– Ph/9/4, Ph/9/25, Ph/9/40 and BS/67 against Standard BT5 (BTRI, 2001-2016)
The plants of this trial were deep skiffed at 73 cm in 2016. There were 21 plucking rounds in 2016. The yield data were analyzed and presented in Table 17 and made tea production in kg/ha in Fig. 8.
Table 17. Yield of green leaves (g/plant)
Clone Year Ph/9/4 Ph/9/25 Ph/9/40 BS/67 BT5
Treatment mean
2016 936.5 609.63 891.53 835.66 849.91
Treatment difference- LSD at 5% = 156.86
The statistical results reveal that yield difference was significant (at 5% level of significance) in 2016; all the test clones excepting Ph/9/4 are comparable in terms of yield with the control. The yield performance of test clone Ph/9/4 was higher than the control BT5.The cup quality of made tea for all the test clones were assessed through organoleptic test. The average scores are presented in Table 18.
Fig. 8. Comparative yield of clones made tea (kg/ha)
Annual Report 2016 Botany Division
23
Table 18. Quality scores
Clone Infusion
Liquor colour
Briskness Strength Creaming
down Total
Remarks 10 10 10 10 10 50
Ph/9/4 Ph/9/25 Ph/9/40 BS/67 BT5
7.14 7.28 7.43 7.51 7.61
7.48 7.55 7.23 7.60 7.36
7.50 7.35 7.20 7.53 7.53
7.36 7.52 7.16 7.51 7.46
2.76 2.46 2.68 2.80 2.65
32.24 32.16 31.70 32.95 32.83
AA AA A
AA AA
(A: Average, AA: Above Average, E: Excellent cup quality)
All the test clones were comparable in terms of cup quality with the control BT5 excepting Ph/9/40 which was inferior to the control.
B3-44: Yield and Quality Trial of Three Test clones Selected from Amo and Phulcherra T. Es.; Test clones– A/8B/1, Ph/9B/1, Ph/9/11 and against Standard BT1 (BTRI, 2003-2016)
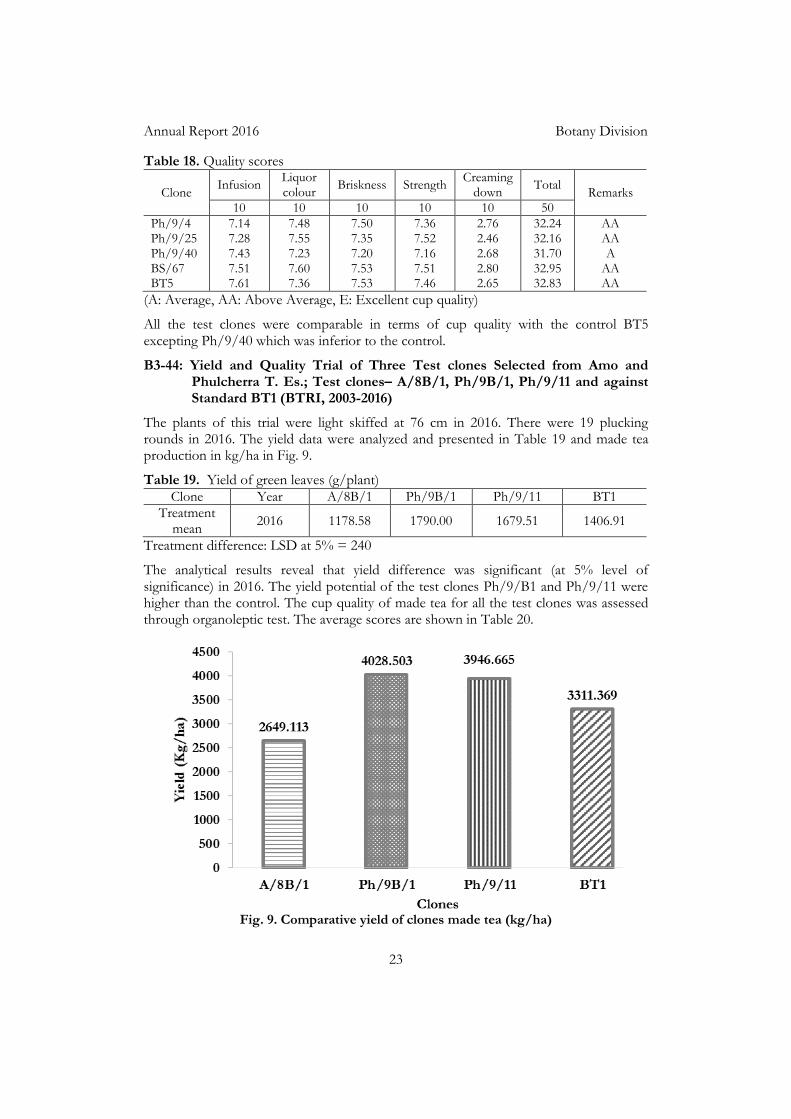
The plants of this trial were light skiffed at 76 cm in 2016. There were 19 plucking rounds in 2016. The yield data were analyzed and presented in Table 19 and made tea production in kg/ha in Fig. 9.
Table 19. Yield of green leaves (g/plant) Clone Year A/8B/1 Ph/9B/1 Ph/9/11 BT1
Treatment mean
2016 1178.58 1790.00 1679.51 1406.91
Treatment difference: LSD at 5% = 240
The analytical results reveal that yield difference was significant (at 5% level of significance) in 2016. The yield potential of the test clones Ph/9/B1 and Ph/9/11 were higher than the control. The cup quality of made tea for all the test clones was assessed through organoleptic test. The average scores are shown in Table 20.
Fig. 9. Comparative yield of clones made tea (kg/ha)
Annual Report 2016 Botany Division
24
Table 20. Quality scores
Clone Infusion
Liquor colour
Briskness Strength Creaming
down Total
Remarks 10 10 10 10 10 50
A/8B/1 Ph/9B/1 Ph/9/11 BT1
7.10 7.30 7.73 7.72
7.72 7.38 7.38 7.63
7.36 7.41 7.12 7.68
7.15 7.45 7.31 7.40
2.29 2.84 2.89 2.85
31.62 32.98 32.43 33.28
A AA AA AA
(A: Average, AA: Above Average, E: Excellent cup quality)
All the Test clones were comparable in terms of cup quality with the control BT1 excepting A/8B/1 which performed average cup quality with the control.
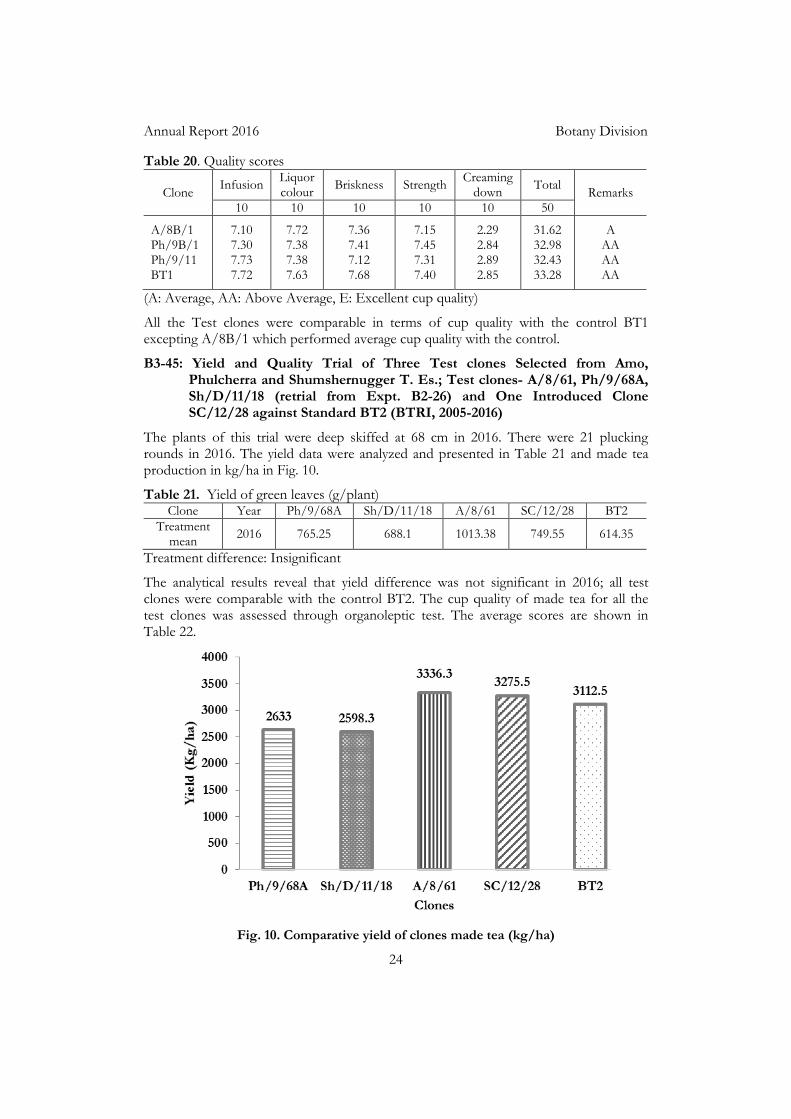
B3-45: Yield and Quality Trial of Three Test clones Selected from Amo, Phulcherra and Shumshernugger T. Es.; Test clones- A/8/61, Ph/9/68A, Sh/D/11/18 (retrial from Expt. B2-26) and One Introduced Clone SC/12/28 against Standard BT2 (BTRI, 2005-2016)
The plants of this trial were deep skiffed at 68 cm in 2016. There were 21 plucking rounds in 2016. The yield data were analyzed and presented in Table 21 and made tea production in kg/ha in Fig. 10.
Table 21. Yield of green leaves (g/plant) Clone Year Ph/9/68A Sh/D/11/18 A/8/61 SC/12/28 BT2
Treatment mean
2016 765.25 688.1 1013.38 749.55 614.35
Treatment difference: Insignificant
The analytical results reveal that yield difference was not significant in 2016; all test clones were comparable with the control BT2. The cup quality of made tea for all the test clones was assessed through organoleptic test. The average scores are shown in Table 22.
Fig. 10. Comparative yield of clones made tea (kg/ha)
Annual Report 2016 Botany Division
25
Table 22. Quality scores
Clone Infusion
Liquor colour
Briskness Strength Creaming
down Total
Remarks 10 10 10 10 10 50
A/8/61 Ph/9/68A Sh/D/11/18 SC/12/28 BT2
7.32 7.46 7.21 7.20 7.2
7.32 7.39 7.38 7.21 7.45
7.52 7.60 7.66 7.36 7.66
7.39 7.28 7.28 7.50 7.72
2.86 2.58 2.82 3.01 2.70
32.41 32.55 32.35 32.28 33.08
AA AA AA AA AA
(A: Average, AA: Above Average, E: Excellent cup quality)
All the test clones were comparable in terms of cup quality. However, the flavoury character of BT2 was not considered in the case of assessing cup quality.
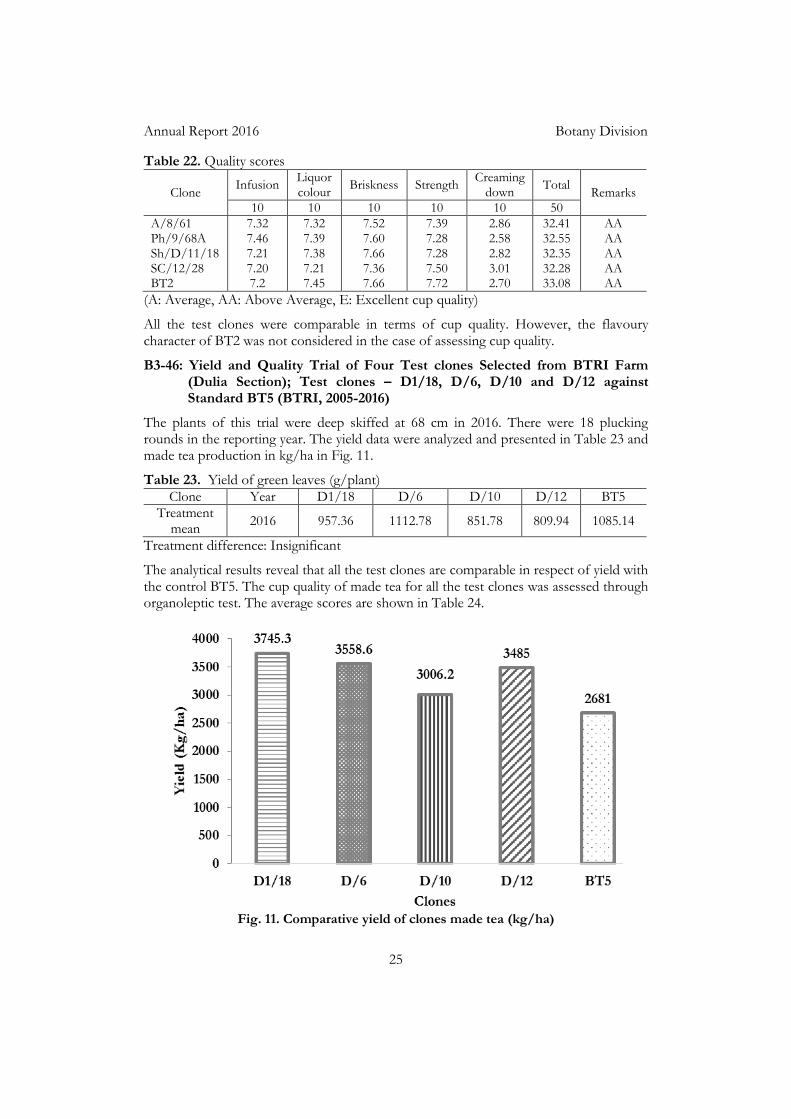
B3-46: Yield and Quality Trial of Four Test clones Selected from BTRI Farm (Dulia Section); Test clones – D1/18, D/6, D/10 and D/12 against Standard BT5 (BTRI, 2005-2016)
The plants of this trial were deep skiffed at 68 cm in 2016. There were 18 plucking rounds in the reporting year. The yield data were analyzed and presented in Table 23 and made tea production in kg/ha in Fig. 11.
Table 23. Yield of green leaves (g/plant) Clone Year D1/18 D/6 D/10 D/12 BT5
Treatment mean
2016 957.36 1112.78 851.78 809.94 1085.14
Treatment difference: Insignificant
The analytical results reveal that all the test clones are comparable in respect of yield with the control BT5. The cup quality of made tea for all the test clones was assessed through organoleptic test. The average scores are shown in Table 24.
Fig. 11. Comparative yield of clones made tea (kg/ha)
Annual Report 2016 Botany Division
26
Table 24. Quality scores
Clone Infusion Liquor colour
Briskness Strength Creaming down
Total Remarks
10 10 10 10 10 50
D1/18 D/6 D/10 D/12 BT5
7.70 7.54 7.14 7.23 7.16
7.40 7.34 7.55 7.16 7.25
7.62 7.65 7.34 7.29 7.63
7.55 7.78 7.67 7.27 7.43
2.79 2.82 2.65 2.30 2.78
33.06 33.13 32.35 31.25 32.25
AA AA AA A
AA
(A: Average, AA: Above Average, E: Excellent cup quality)
Test clones excepting D/12 are comparable with the control while D/12 is inferior to the control.
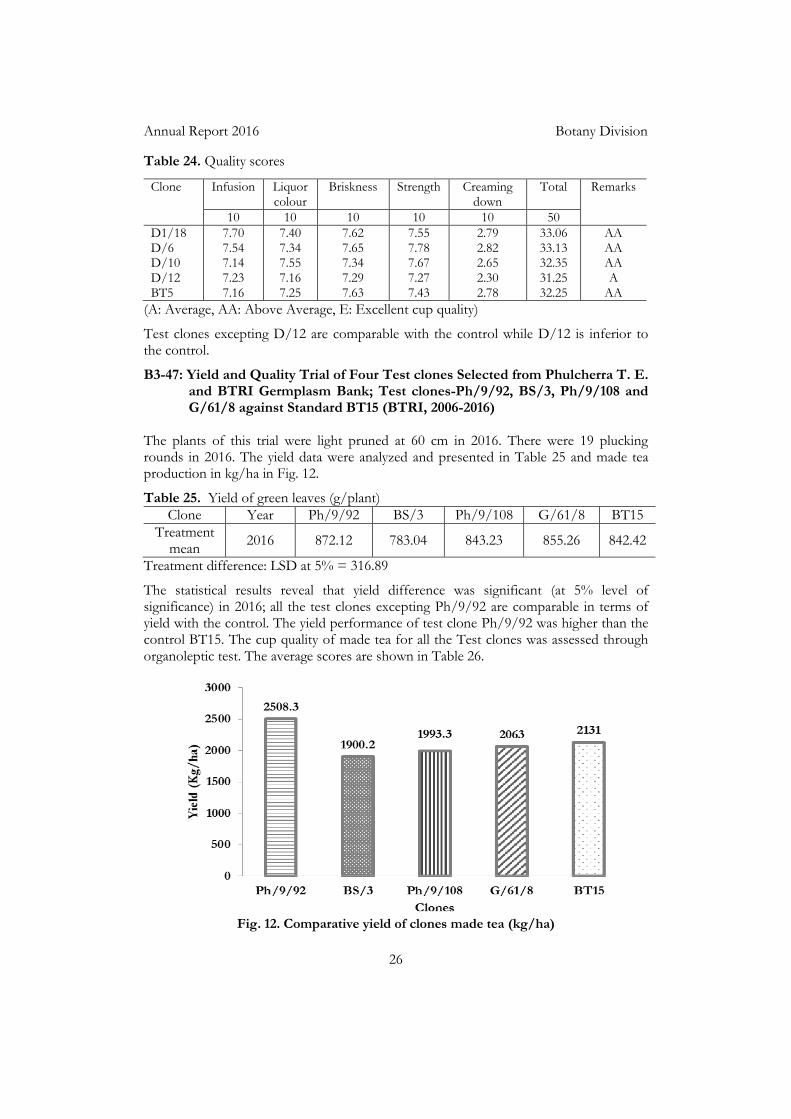
B3-47: Yield and Quality Trial of Four Test clones Selected from Phulcherra T. E. and BTRI Germplasm Bank; Test clones-Ph/9/92, BS/3, Ph/9/108 and G/61/8 against Standard BT15 (BTRI, 2006-2016)
The plants of this trial were light pruned at 60 cm in 2016. There were 19 plucking rounds in 2016. The yield data were analyzed and presented in Table 25 and made tea production in kg/ha in Fig. 12.
Table 25. Yield of green leaves (g/plant)
Clone Year Ph/9/92 BS/3 Ph/9/108 G/61/8 BT15
Treatment mean
2016 872.12 783.04 843.23 855.26 842.42
Treatment difference: LSD at 5% = 316.89
The statistical results reveal that yield difference was significant (at 5% level of significance) in 2016; all the test clones excepting Ph/9/92 are comparable in terms of yield with the control. The yield performance of test clone Ph/9/92 was higher than the control BT15. The cup quality of made tea for all the Test clones was assessed through organoleptic test. The average scores are shown in Table 26.
Fig. 12. Comparative yield of clones made tea (kg/ha)
Annual Report 2016 Botany Division
27
Table 26. Quality scores
Clone Infusion
Liquor colour
Briskness Strength Creaming
down Total
Remarks 10 10 10 10 10 50
Ph/9/92 BS/3 Ph/9/108 G/61/5 BT15
7.60 7.20 7.45 7.41 7.83
7.29 7.38 7.61 7.58 7.77
7.52 7.19 7.31 7.66 7.83
7.37 7.10 7.47 7.68 7.70
2.75 2.27 2.76 2.85 3.48
32.53 31.14 32.60 33.18 34.61
AA A
AA AA E
(A: Average, AA: Above Average, E: Excellent cup quality)
The test clones Ph/9/92, Ph/9/108 and G/61/5 gave above average cup quality while the control BT15 gave excellent cup quality. The test clone BS/3 gave average cup quality with the control.
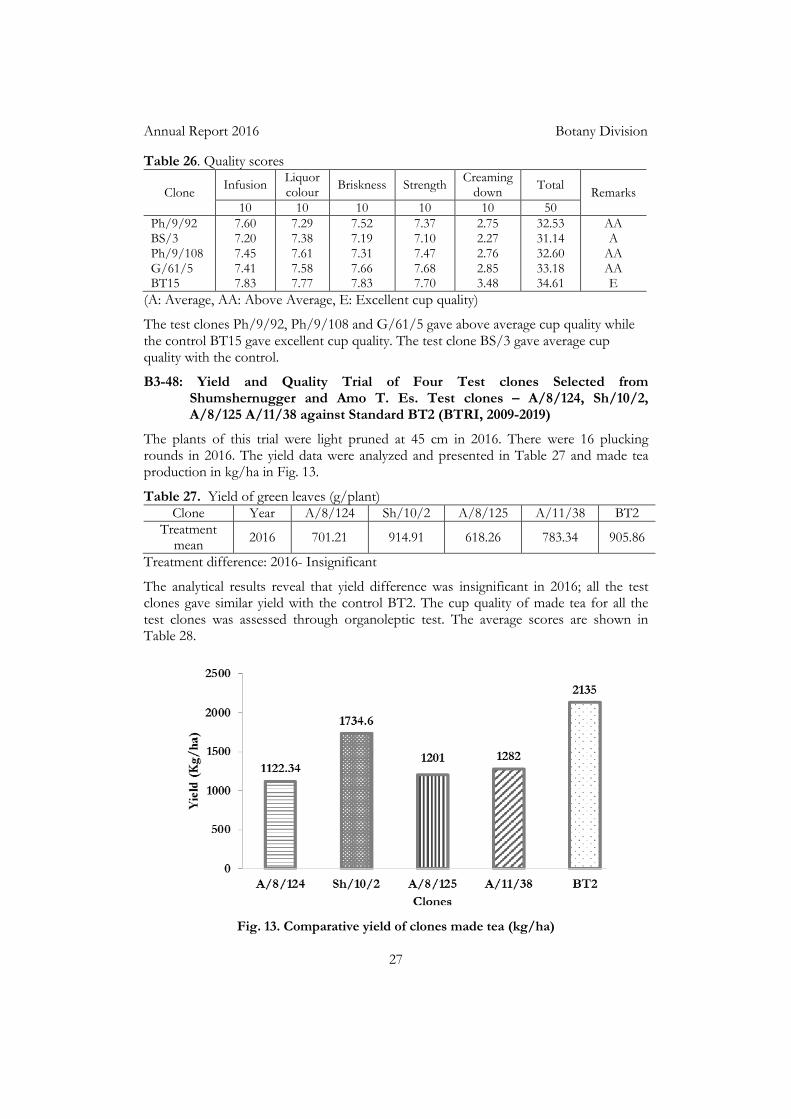
B3-48: Yield and Quality Trial of Four Test clones Selected from Shumshernugger and Amo T. Es. Test clones – A/8/124, Sh/10/2, A/8/125 A/11/38 against Standard BT2 (BTRI, 2009-2019)
The plants of this trial were light pruned at 45 cm in 2016. There were 16 plucking rounds in 2016. The yield data were analyzed and presented in Table 27 and made tea production in kg/ha in Fig. 13.
Table 27. Yield of green leaves (g/plant) Clone Year A/8/124 Sh/10/2 A/8/125 A/11/38 BT2
Treatment mean
2016 701.21 914.91 618.26 783.34 905.86
Treatment difference: 2016- Insignificant
The analytical results reveal that yield difference was insignificant in 2016; all the test clones gave similar yield with the control BT2. The cup quality of made tea for all the test clones was assessed through organoleptic test. The average scores are shown in Table 28.
Fig. 13. Comparative yield of clones made tea (kg/ha)
Annual Report 2016 Botany Division
28
Table 28. Quality scores
Clone Infusion
Liquor colour
Briskness
Strength Creaming
down Total
Remarks 10 10 10 10 10 50
A/8/124 Sh/10/2 A/8/125 A/11/38 BT2
7.42 7.34 7.56 7.51 7.51
7.51 7.62 7.58 7.16 7.65
7.36 7.73 7.79 7.24 7.41
7.43 7.34 7.32 7.53 7.65
2.85 2.78 2.78 2.84 2.74
32.57 32.82 33.03 32.29 32.96
AA AA AA AA AA
(A: Average, AA: Above Average, E: Excellent cup quality)
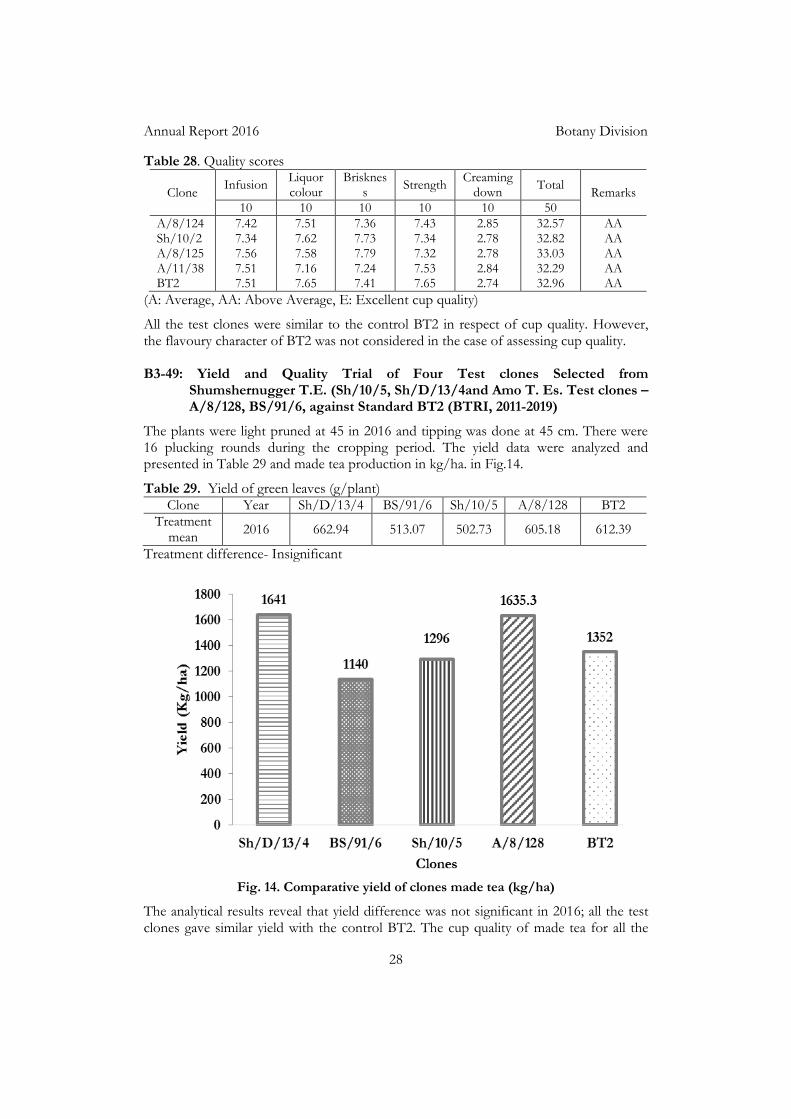
All the test clones were similar to the control BT2 in respect of cup quality. However, the flavoury character of BT2 was not considered in the case of assessing cup quality. B3-49: Yield and Quality Trial of Four Test clones Selected from
Shumshernugger T.E. (Sh/10/5, Sh/D/13/4and Amo T. Es. Test clones – A/8/128, BS/91/6, against Standard BT2 (BTRI, 2011-2019)
The plants were light pruned at 45 in 2016 and tipping was done at 45 cm. There were 16 plucking rounds during the cropping period. The yield data were analyzed and presented in Table 29 and made tea production in kg/ha. in Fig.14.
Table 29. Yield of green leaves (g/plant) Clone Year Sh/D/13/4 BS/91/6 Sh/10/5 A/8/128 BT2
Treatment mean
2016 662.94 513.07 502.73 605.18 612.39
Treatment difference- Insignificant
Fig. 14. Comparative yield of clones made tea (kg/ha)
The analytical results reveal that yield difference was not significant in 2016; all the test clones gave similar yield with the control BT2. The cup quality of made tea for all the
Annual Report 2016 Botany Division
29
test clones was assessed through organoleptic test. The average scores are shown in Table 30.
Table 30. Quality scores
Clone Infusion
Liquor colour
Briskness Strength Creaming
down Total
Remarks
10 10 10 10 10 50
Sh/D/13/4 BS/91/6 Sh/10/5 A/8/128 BT2
7.30 7.32 7.45 7.41 7.46
7.34 7.40 7.70 7.40 7.32
7.33 7.34 7.50 7.32 7.32
7.86 7.30 7.31 7.19 7.44
2.67 2.76 2.73 2.76 2.79
32.50 32.18 32.67 32.08 32.31
AA AA AA AA AA
(A: Average, AA: Above Average, E: Excellent cup quality)
All the test clones were similar to the control BT2 in respect of cup quality. However,
the flavoury character of BT2 was not considered in the case of assessing cup quality.
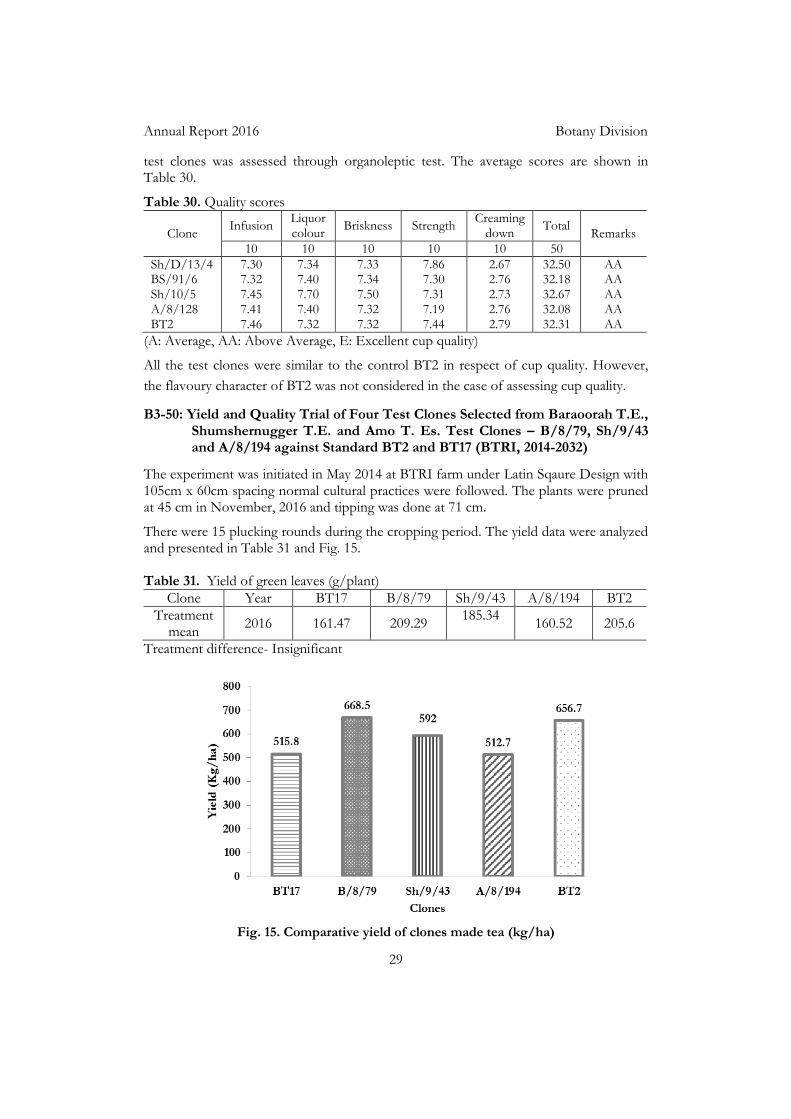
B3-50: Yield and Quality Trial of Four Test Clones Selected from Baraoorah T.E., Shumshernugger T.E. and Amo T. Es. Test Clones – B/8/79, Sh/9/43 and A/8/194 against Standard BT2 and BT17 (BTRI, 2014-2032)
The experiment was initiated in May 2014 at BTRI farm under Latin Sqaure Design with 105cm x 60cm spacing normal cultural practices were followed. The plants were pruned at 45 cm in November, 2016 and tipping was done at 71 cm.
There were 15 plucking rounds during the cropping period. The yield data were analyzed and presented in Table 31 and Fig. 15. Table 31. Yield of green leaves (g/plant)
Clone Year BT17 B/8/79 Sh/9/43 A/8/194 BT2
Treatment mean
2016 161.47 209.29 185.34
160.52 205.6
Treatment difference- Insignificant
Fig. 15. Comparative yield of clones made tea (kg/ha)

Annual Report 2016 Botany Division
30
The analytical results reveal that yield difference was insignificant in 2016; all the test
clones gave similar yield with the control.
B3-51: Yield and Quality Trial of Two Test Clones Selected from Baraoorah T.E.,
and Shumshernugger T.E. Test Clones – B/8/79 and Sh/9/71 against
Standard BT2, BT17 and BTS1 (BTRI, 2015-2032)
The experiment was initiated in May 2015 at BTRI farm under Latin Sqaure Design with
105cm x 60cm spacing normal cultural practices were followed. The plants were
breaking/de-centered at 15-22 cm in November, 2016 and tipping was done at 50 cm.
There were 11 plucking rounds during the cropping period in 2016. The yield data were
analyzed and presented in Table 32 and Fig. 16.
Table 32. Yield of green leaves (g/plant)
Clone Year BTS1 B/8/79 Sh/9/71 BT17 BT2
Treatment
mean 2016 48.4 55.5 59.72 41.59 49.74
Treatment difference- Insignificant
Fig. 16. Comparative yield of clones made tea (kg/ha)
The analytical results reveal that yield difference was insignificant in 2016; all the test clones gave similar yield with the control. B3-52: Yield and Quality Trial of Two Test Clones Selected from Baraoorah
T.E., and Shumshernugger T.E. Test Clones – B/8/66 and Sh/8/61, against Standard BT2, BT17 and BTS1 (BTRI, 2014-2031)
The experiment was initiated in May 2015 at BTRI farm under Latin Sqaure Design with 105cm x 60cm spacing normal cultural practices were followed. The plants were breaking/de-centered at 15-22 cm in November, 2015 and tipping was done at 50 cm.
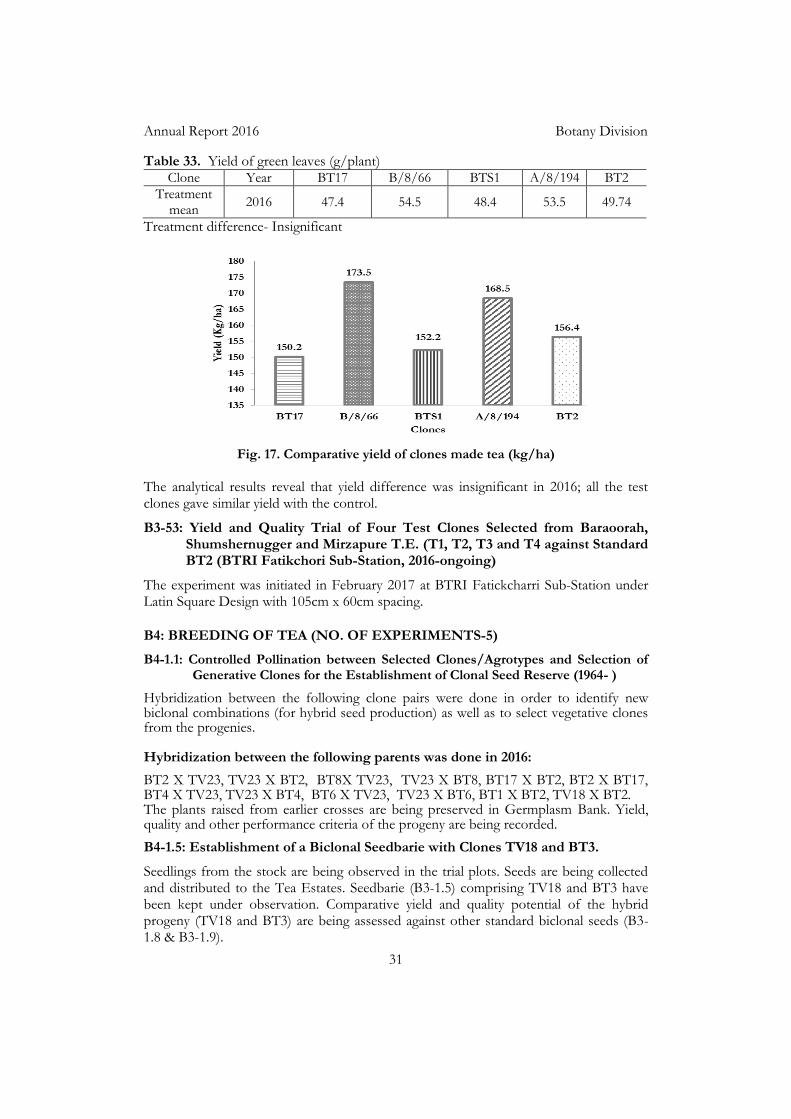
There were 11 plucking rounds during the cropping period in 2016. The yield data were analyzed and presented in Table 33 and Fig. 17.
Annual Report 2016 Botany Division
31
Table 33. Yield of green leaves (g/plant) Clone Year BT17 B/8/66 BTS1 A/8/194 BT2
Treatment mean
2016 47.4 54.5 48.4 53.5 49.74
Treatment difference- Insignificant
Fig. 17. Comparative yield of clones made tea (kg/ha)
The analytical results reveal that yield difference was insignificant in 2016; all the test clones gave similar yield with the control.
B3-53: Yield and Quality Trial of Four Test Clones Selected from Baraoorah, Shumshernugger and Mirzapure T.E. (T1, T2, T3 and T4 against Standard BT2 (BTRI Fatikchori Sub-Station, 2016-ongoing)
The experiment was initiated in February 2017 at BTRI Fatickcharri Sub-Station under Latin Square Design with 105cm x 60cm spacing.
B4: BREEDING OF TEA (NO. OF EXPERIMENTS-5)
B4-1.1: Controlled Pollination between Selected Clones/Agrotypes and Selection of Generative Clones for the Establishment of Clonal Seed Reserve (1964- )
Hybridization between the following clone pairs were done in order to identify new biclonal combinations (for hybrid seed production) as well as to select vegetative clones from the progenies. Hybridization between the following parents was done in 2016:
BT2 X TV23, TV23 X BT2, BT8X TV23, TV23 X BT8, BT17 X BT2, BT2 X BT17, BT4 X TV23, TV23 X BT4, BT6 X TV23, TV23 X BT6, BT1 X BT2, TV18 X BT2. The plants raised from earlier crosses are being preserved in Germplasm Bank. Yield, quality and other performance criteria of the progeny are being recorded.
B4-1.5: Establishment of a Biclonal Seedbarie with Clones TV18 and BT3.
Seedlings from the stock are being observed in the trial plots. Seeds are being collected and distributed to the Tea Estates. Seedbarie (B3-1.5) comprising TV18 and BT3 have been kept under observation. Comparative yield and quality potential of the hybrid progeny (TV18 and BT3) are being assessed against other standard biclonal seeds (B3-1.8 & B3-1.9).
Annual Report 2016 Botany Division
32
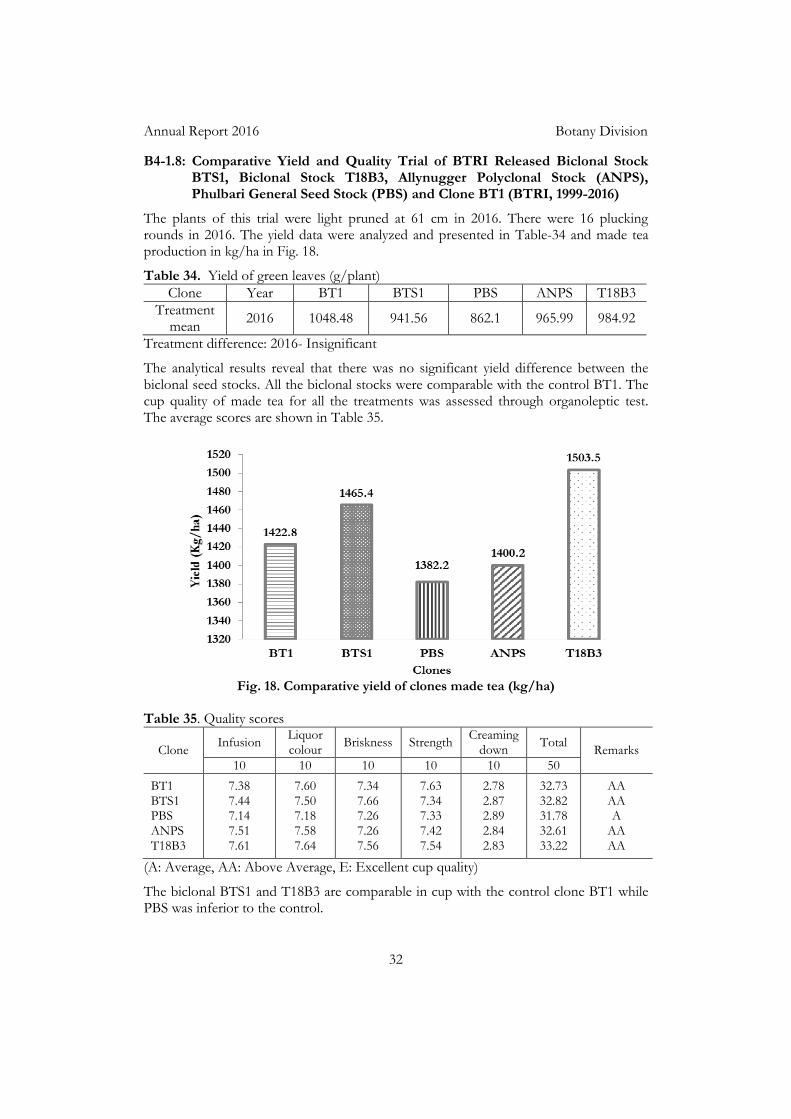
B4-1.8: Comparative Yield and Quality Trial of BTRI Released Biclonal Stock BTS1, Biclonal Stock T18B3, Allynugger Polyclonal Stock (ANPS), Phulbari General Seed Stock (PBS) and Clone BT1 (BTRI, 1999-2016)
The plants of this trial were light pruned at 61 cm in 2016. There were 16 plucking rounds in 2016. The yield data were analyzed and presented in Table-34 and made tea production in kg/ha in Fig. 18.
Table 34. Yield of green leaves (g/plant)
Clone Year BT1 BTS1 PBS ANPS T18B3
Treatment mean
2016 1048.48 941.56 862.1 965.99 984.92
Treatment difference: 2016- Insignificant
The analytical results reveal that there was no significant yield difference between the biclonal seed stocks. All the biclonal stocks were comparable with the control BT1. The cup quality of made tea for all the treatments was assessed through organoleptic test. The average scores are shown in Table 35.
Fig. 18. Comparative yield of clones made tea (kg/ha)
Table 35. Quality scores
Clone Infusion
Liquor colour
Briskness Strength Creaming
down Total
Remarks
10 10 10 10 10 50
BT1 BTS1 PBS ANPS T18B3
7.38 7.44 7.14 7.51 7.61
7.60 7.50 7.18 7.58 7.64
7.34 7.66 7.26 7.26 7.56
7.63 7.34 7.33 7.42 7.54
2.78 2.87 2.89 2.84 2.83
32.73 32.82 31.78 32.61 33.22
AA AA A
AA AA
(A: Average, AA: Above Average, E: Excellent cup quality)
The biclonal BTS1 and T18B3 are comparable in cup with the control clone BT1 while PBS was inferior to the control.
Annual Report 2016 Botany Division
33
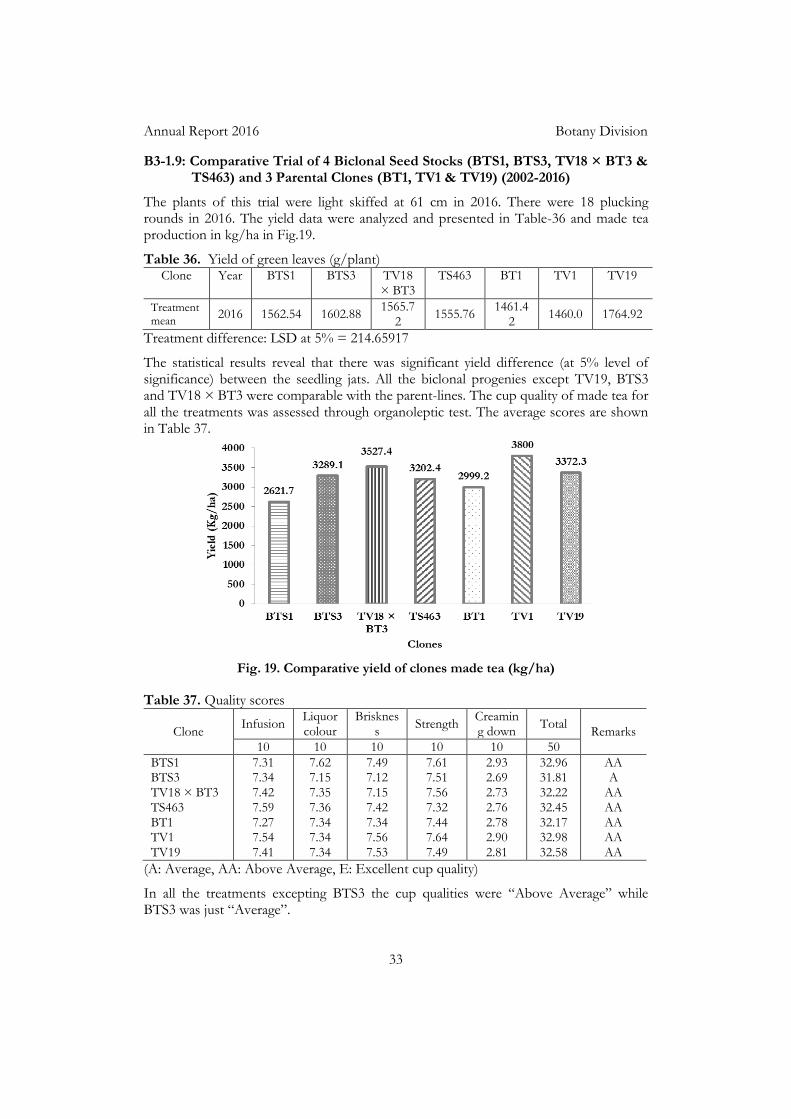
B3-1.9: Comparative Trial of 4 Biclonal Seed Stocks (BTS1, BTS3, TV18 × BT3 & TS463) and 3 Parental Clones (BT1, TV1 & TV19) (2002-2016)
The plants of this trial were light skiffed at 61 cm in 2016. There were 18 plucking rounds in 2016. The yield data were analyzed and presented in Table-36 and made tea production in kg/ha in Fig.19.
Table 36. Yield of green leaves (g/plant) Clone Year BTS1
BTS3
TV18 × BT3
TS463 BT1 TV1
TV19
Treatment mean
2016 1562.54 1602.88 1565.7
2 1555.76
1461.42
1460.0 1764.92
Treatment difference: LSD at 5% = 214.65917
The statistical results reveal that there was significant yield difference (at 5% level of significance) between the seedling jats. All the biclonal progenies except TV19, BTS3 and TV18 × BT3 were comparable with the parent-lines. The cup quality of made tea for all the treatments was assessed through organoleptic test. The average scores are shown in Table 37.
Fig. 19. Comparative yield of clones made tea (kg/ha)
Table 37. Quality scores
Clone Infusion
Liquor colour
Briskness
Strength Creaming down
Total Remarks
10 10 10 10 10 50
BTS1 BTS3 TV18 × BT3 TS463 BT1 TV1 TV19
7.31 7.34 7.42 7.59 7.27 7.54 7.41
7.62 7.15 7.35 7.36 7.34 7.34 7.34
7.49 7.12 7.15 7.42 7.34 7.56 7.53
7.61 7.51 7.56 7.32 7.44 7.64 7.49
2.93 2.69 2.73 2.76 2.78 2.90 2.81
32.96 31.81 32.22 32.45 32.17 32.98 32.58
AA A
AA AA AA AA AA
(A: Average, AA: Above Average, E: Excellent cup quality)
In all the treatments excepting BTS3 the cup qualities were “Above Average” while BTS3 was just “Average”.
Annual Report 2016 Botany Division
34
B5: SURVEY AND CONSERVATION OF GENE RESOURCES OF TEA IN
BANGLADESH (BTRI, 1981)
B5-8: Survey and Conservation of Gene Resources of Tea in Bangladesh (BTRI, 1981-)
A total of 516 tea germplasm has been maintained (ex-situ conservation) in the Germplasm Bank in order to use in future for varietal improvement.
B6: DEVELOPING A SUSTAINABLE AND COST EFFECTIVE PROTOCOL
FOR MANUFACTURING DIFFERENT KINDS OF TEA RATHER THAN
CTC TEA AND OTHER EXPERIMENTS
B6.1. Developing a sustainable and cost effective protocol for manufacturing health benefitted green tea and its derivatives (value added green tea)
This experiment started from August 2016. Data will be complied and analyzed after the completion of the experiment.
B5.2. Study on seasonal effect and different clonal effect on recovery percentages of green tea
This experiment started from August 2016. Data will be complied and analyzed after the completion of the experiment.
B5.3. Effect of different types of mulching materials on morpho-physiological characteristics of tea
This experiment will be conducted very soon.
4.2. Morphological characterization of BTRI released clones, some test clones and wild genotypes
This experiment will be conducted very soon.
OTHER ACTIVITIES
Tours/Visits
During 2016 Principal Scientific Officer, Senior Scientific Officer, Scientific Officer and Senior Farm Assistant of the division paid visits to different Tea Estates and other related places for the experimental, advisory and official purposes, which are summarized below:
Table 38. Tours/visits to different Tea Estates and other related places in 2016
Year Experimental Advisory Others Total
2016 26 11 - 37
Courses on Tea Culture
Principal Scientific Officer, Senior Scientific Officer, Scientific Officer and Senior Farm Assistant of the Division gave comprehensive lectures and practical demonstration on the method of tea improvement, clonal identification, establishment of biclonal seedbaries and NCP, tea tasting, nursery management, etc. at the 52h Annual Courses
Annual Report 2016 Botany Division
35
arranged at BTRI for the covenanted staff of Tea Estates and 7 day course on “Tea Tasting and Quality Control” for the officers of Bangladesh Army. Principal Scientific Officer also gave lectures on tea improvement and nursery management in the Annual Courses held at Fatickcharri and at Panchagarh Sub-stations. He delivered lectures as resource speaker at the Management Training Center (MTC) for the Post-Graduate Diploma course and Tea Production Courses organized by Project Development Unit (PDU) of Bangladesh Tea Board.
Tea Tasting Sessions
There were seven tea tasting sessions and three group tea tasting sessions organized in 2016 under the supervision of the Division. Representatives from tea broking houses and tea planters from different Tea Estates participated in the sessions. Summary of the tea tasting sessions are tabulated below: Table 39. Open day/Valley Tea Tasting Sessions in 2016
Open day/Valley Tea Tasting Sessions
Date Venue No. of Estates
No. of participants
1. BTRI 30.07.16 BTRI 81 111
2. BTRI Sub-station Oodaleah
12.11.16 BTRI Sub-
station Oodaleah
20 125
3. Monu-Doloi Valley 16.07.16 Monu-Doloi Valley Club
15 21
4. Juri 23.07.16 Juri Valley
Club 16 23
5. Luskerpore Valley 13.08.16 Loskerpore Valley Club
14 26
6. Lungla Valley 29.09.16 Chandbag Tea
Factory 15 22
7. North Sylhet Valley 30.10.16 Khadim Tea
Factory 12 20
Table 40. Group Tea Tasting Sessions in 2016
Group Tea Tasting Sessions
Date Venue No. of Estates
No. of participants
1. Group Tea Tasting Sessions-01
03.09.16 BTRI Mini Factory
08 11
2. Group Tea Tasting Sessions-02
15.10.16 BTRI Mini Factory
07 09
3. Group Tea Tasting Sessions-03
19.11.16 BTRI Mini Factory
07 10
Annual Report 2016 Agronomy Division
36
AGRONOMY DIVISION
Dr. Toufiq Ahmed Senior Scientific Officer
Agronomy Division
STAFF
During the reporting year, Mr. Masud Rana (Senior Scientific Officer) was on study leave to do his PhD in China. Mr. Arifur Rahman and Mr. Imran Hossen joined as Scientific Officer on 17th February 2016 and 14th March 2016, respectively. The posts of Principal Scientific Officer, Farm Supervisor and Field Assistant were vacant. There was no other change in personnel position of the division.
RESEARCH
Agronomy Division carried out six experiments under two research program namely- Standardization of cultural practices and Development of soil fertility. Results of six experiments on the basis of collected data are briefly discussed below:
AG 1: EFFECT OF DIFFERENT PRUNING CYCLES ON THE YIELD OF
DIFFERENT MATURE CLONAL TEA (BTRI Farm, long term: 2010-2023)
Treatments: T1 : LP -DS -MS
T2 : LP -DS -MS -LS
T3 : LP -LS -DS -MS
T4 : LP -LS -DS -MS -DS-LS
T5 : LP -DS -MS -LS -DS-MS-LS
Planting materials:
The clones BT1, BT2, BT5, BT11, BT12 and BT13 were used in the experiment. The experiment was laid out in a Split Plot Design with three replications and total number of plots under the experiment is 90.
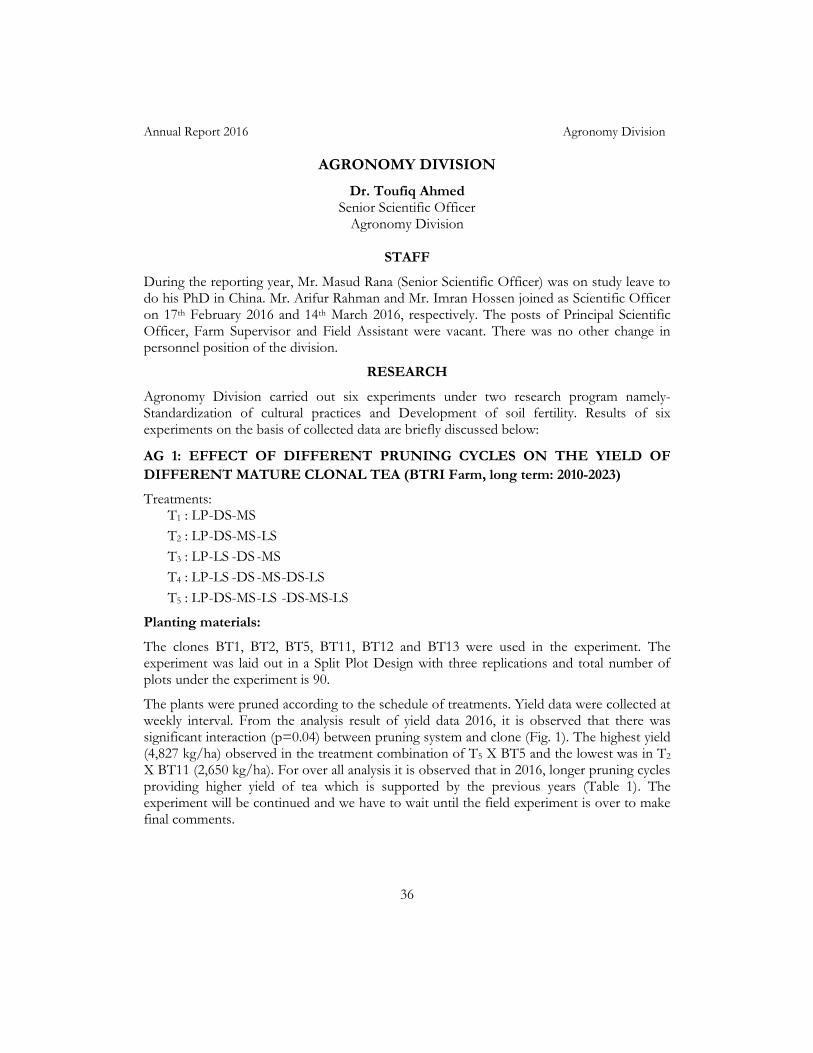
The plants were pruned according to the schedule of treatments. Yield data were collected at weekly interval. From the analysis result of yield data 2016, it is observed that there was significant interaction (p=0.04) between pruning system and clone (Fig. 1). The highest yield (4,827 kg/ha) observed in the treatment combination of T5 X BT5 and the lowest was in T2 X BT11 (2,650 kg/ha). For over all analysis it is observed that in 2016, longer pruning cycles providing higher yield of tea which is supported by the previous years (Table 1). The experiment will be continued and we have to wait until the field experiment is over to make final comments.
Annual Report 2016 Agronomy Division
37
Fig.1. Variation of made tea yield in 2016 Table 1. Made tea yield (kg/ha) of different treatments in 2016
Treatments Yield (kg/ha)
T1 (LP-DS-MS) 3002 c
T2 (LP-DS-MS-LS) 3212 c
T3 (LP-LS-DS-MS) 3316 c
T4 (LP-LS-DS-MS-DS-LS) 3891 b
T5 (LP-DS-MS-LS- DS-MS-LS) 4370 a
LSD (0.05) 415
CV (%) 10
AG 2: MANAGEMENT OF SHADE PLANT CANOPY FOR MAXIMIZING TEA PRODUCTION IN BANGLADESH (BTRI Farm, long term: 2011-2017)
Treatments:
T1: Control (normal practice – pruning is not done)
T2: Pruning at 2 meter height
T3: Pruning at 2 and 3 meter height (in the consecutive years)
T4: Pruning at 2, 3 and 4 meter height (in the consecutive years)
T5: Pruning at 2, 3, 4 and 5 meter height (in the consecutive years)
Annual Report 2016 Agronomy Division
38
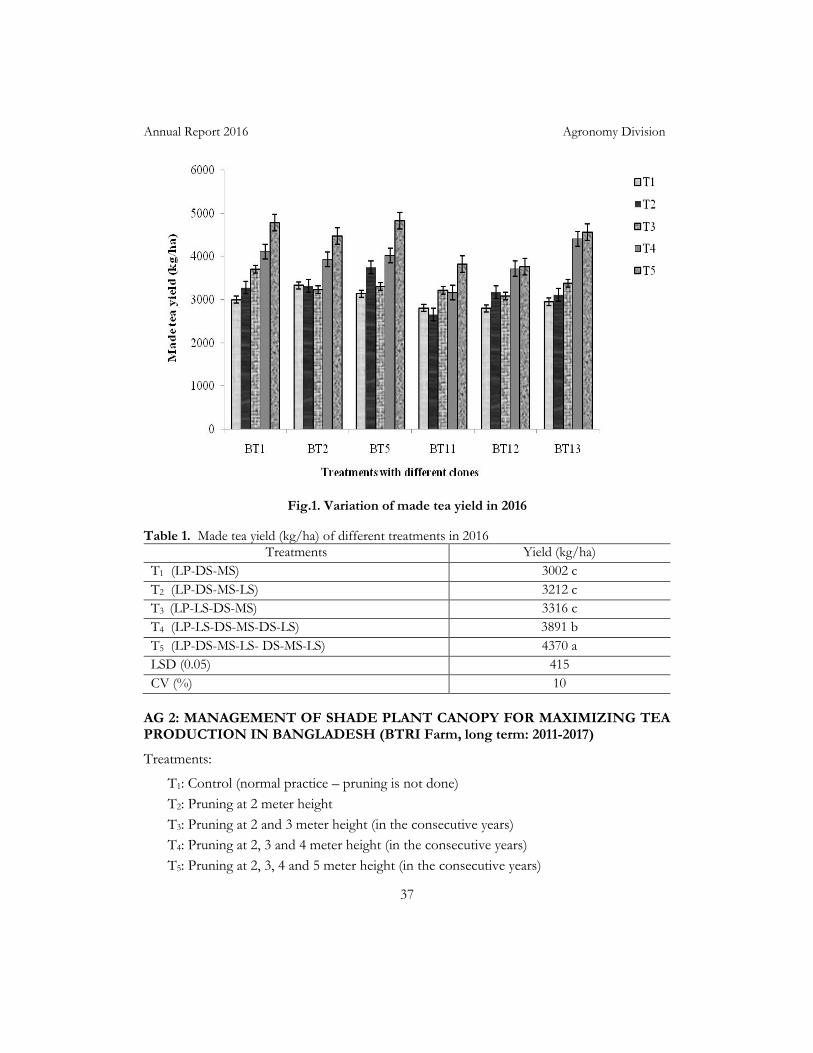
The experiment is laid out with Albizzia odoratissima shade tree. Increment of canopy coverage in the pruned shade plants is encouraging. For overall analysis, based on the canopy coverage data of shade tree in the year 2015 spreading of canopy was highly significant for treatments. Maximum spreading of shade tree canopy was observed in the treatment of T5 (pruning at 2, 3, 4 and 5 meter height in the consecutive years) which was similar with T4 (pruning at 2, 3 and 4 meter height in the consecutive years) but different with others. The experiment was continued in 2016 to know its effect on tea yield. After analysis of collected data, it is observed that there is significant effect of treatments on harvested leaf yield. Maximum yield (2949 kg/ha) was observed in T5 which was identical with T4 and different with others (Fig. 2).
Fig.2. Variation of made tea yield due to treatments
AG 3: EFFECT OF DIFFERENT DOSAGES OF CHEMICAL FERTILIZERS AND ORGANIC MANURES IN PIT ON THE ESTABLISHMENT OF CLONAL TEA (BTRI Farm, long term: 2014-2019)
Treatments:
T1: No fertilizer and manure is applied in pit
T2: 1 kg decomposed cow dung was applied
T3: 2 kg decomposed cow dung was applied
T4: ½ kg decomposed oil cake was applied
T5: 30 g TSP + 15 g MOP was applied
T6: 1 kg decomposed cow dung + ½ kg decomposed oil cake was applied
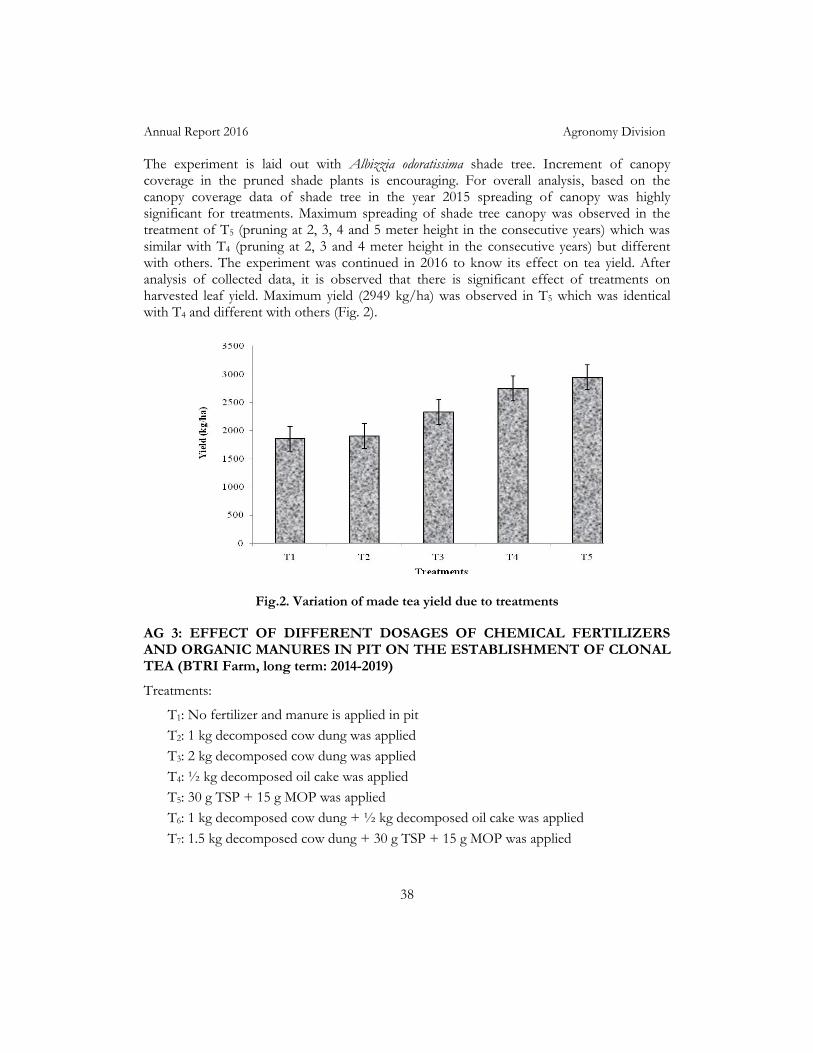
T7: 1.5 kg decomposed cow dung + 30 g TSP + 15 g MOP was applied
Annual Report 2016 Agronomy Division
39
During the time of plantation, manures and fertilizer were applied in the pit according to the treatments. Normal practices for intercultural operations were followed by BTRI recommendation. Different morphological characters of tea plants in each treatment were studied during de-centering i.e. 1 year later after plantation (in 2015). Similarly in 2016, at the time of 1st frame formation pruning different morphological parameters were recorded and analyzed. Number of branches were significantly different for treatments. Greater number of branches observed in a plant of T7 (1.5 kg decomposed cow dung + 30 gm TSP + 15 gm MOP is used) which was similar with T3 (2 kg decomposed cow dung is used) and T6 (1 kg decomposed cow dung + ½ kg oil-cake is used) but significantly different with others and the lowest number of leaves observed in T1 (control), presented in Fig. 3. For the fresh weight of plant, maximum weight observed in T7 and the minimum was in T1. The experiment will be continued to know the impact of treatments up to the bush formation.
Fig.3. Variation of branch number during the 2nd year pruning (FFP1)
AG 4: EFFECT OF DIFFERENT TIME OF PRUNING ON YIELD AND CROP DISTRIBUTION OF MATURE CLONAL TEA (BILASHCHERRA Ex. Field, short term: 2015-2017)
Treatments:
T1: Pruning in mid of October T2: Pruning in mid of November
T3: Pruning in mid of December (Control – Normal practice)
T4: Pruning in mid of January
T5: Pruning in mid of February
T6: Pruning in mid of March
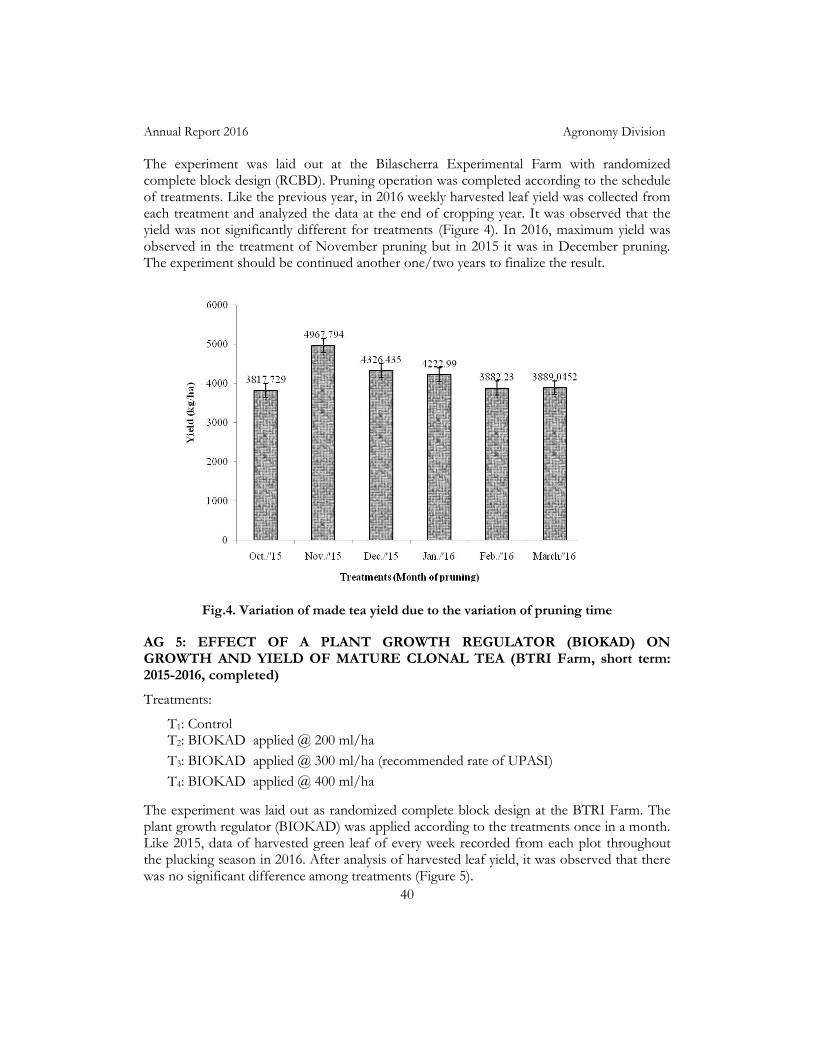
Annual Report 2016 Agronomy Division
40
The experiment was laid out at the Bilascherra Experimental Farm with randomized complete block design (RCBD). Pruning operation was completed according to the schedule of treatments. Like the previous year, in 2016 weekly harvested leaf yield was collected from each treatment and analyzed the data at the end of cropping year. It was observed that the yield was not significantly different for treatments (Figure 4). In 2016, maximum yield was observed in the treatment of November pruning but in 2015 it was in December pruning. The experiment should be continued another one/two years to finalize the result.
Fig.4. Variation of made tea yield due to the variation of pruning time
AG 5: EFFECT OF A PLANT GROWTH REGULATOR (BIOKAD) ON GROWTH AND YIELD OF MATURE CLONAL TEA (BTRI Farm, short term: 2015-2016, completed)
Treatments:
T1: Control T2: BIOKAD applied @ 200 ml/ha
T3: BIOKAD applied @ 300 ml/ha (recommended rate of UPASI)
T4: BIOKAD applied @ 400 ml/ha
The experiment was laid out as randomized complete block design at the BTRI Farm. The plant growth regulator (BIOKAD) was applied according to the treatments once in a month. Like 2015, data of harvested green leaf of every week recorded from each plot throughout the plucking season in 2016. After analysis of harvested leaf yield, it was observed that there was no significant difference among treatments (Figure 5).
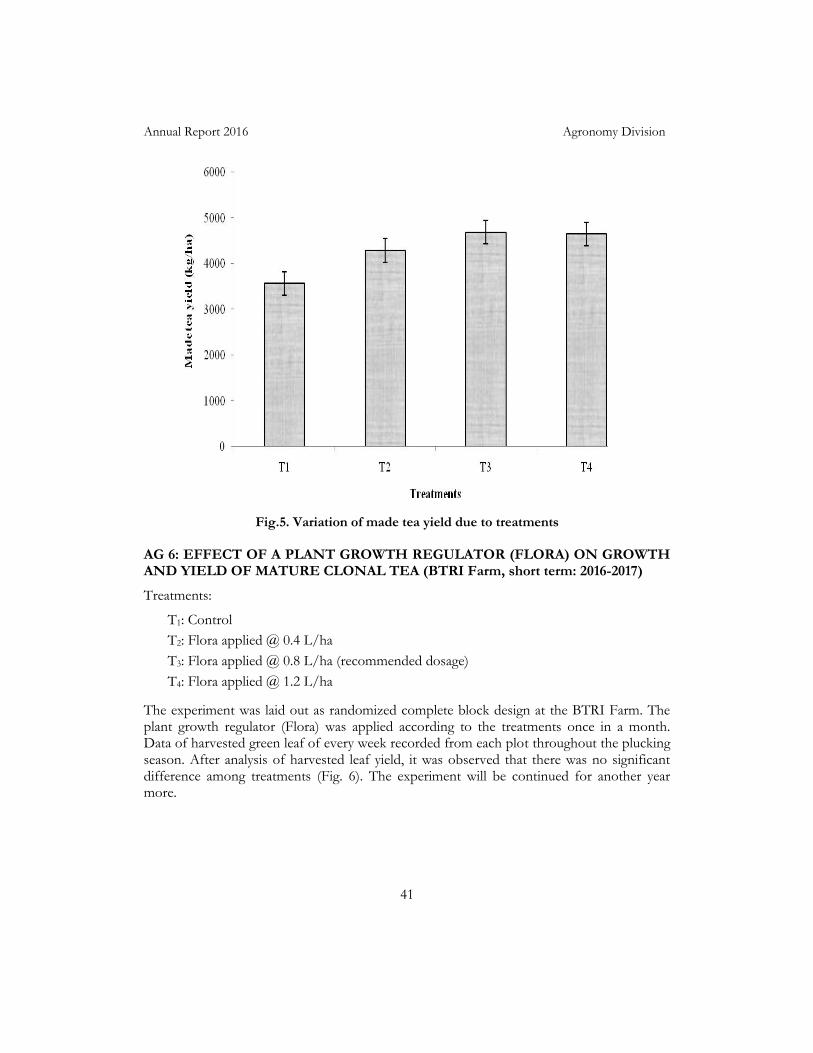
Annual Report 2016 Agronomy Division
41
Fig.5. Variation of made tea yield due to treatments
AG 6: EFFECT OF A PLANT GROWTH REGULATOR (FLORA) ON GROWTH AND YIELD OF MATURE CLONAL TEA (BTRI Farm, short term: 2016-2017)
Treatments:
T1: Control
T2: Flora applied @ 0.4 L/ha
T3: Flora applied @ 0.8 L/ha (recommended dosage)
T4: Flora applied @ 1.2 L/ha
The experiment was laid out as randomized complete block design at the BTRI Farm. The plant growth regulator (Flora) was applied according to the treatments once in a month. Data of harvested green leaf of every week recorded from each plot throughout the plucking season. After analysis of harvested leaf yield, it was observed that there was no significant difference among treatments (Fig. 6). The experiment will be continued for another year more.
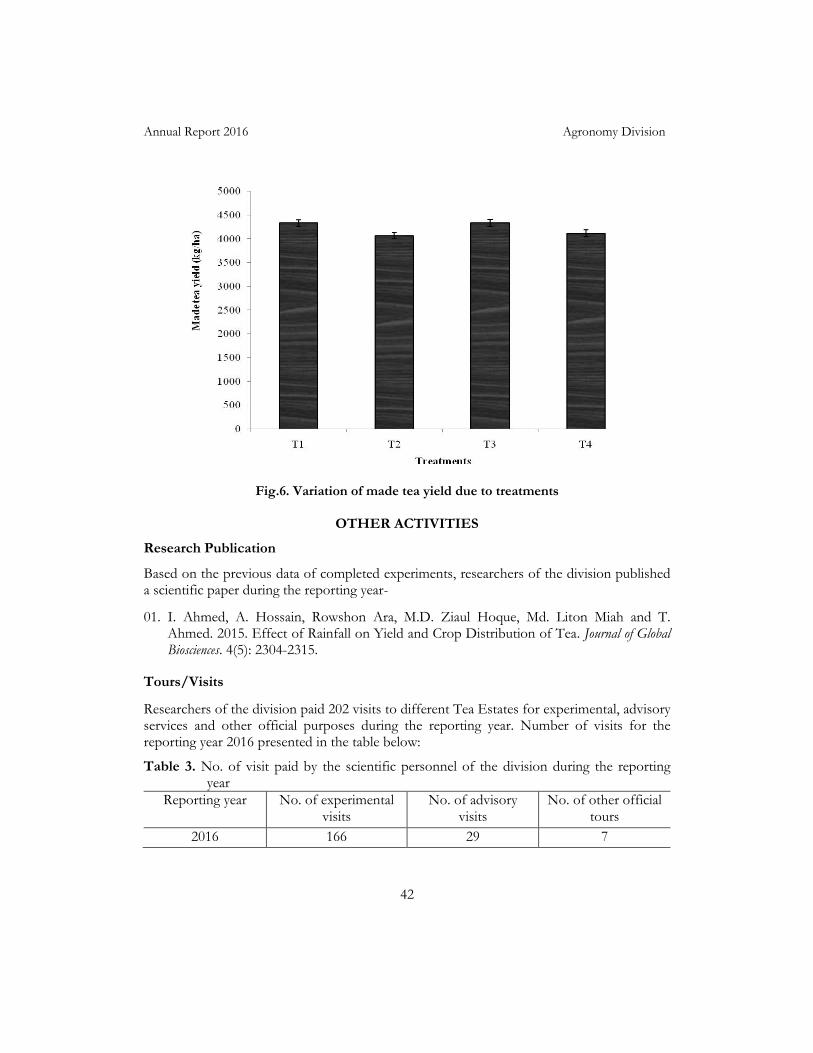
Annual Report 2016 Agronomy Division
42
Fig.6. Variation of made tea yield due to treatments
OTHER ACTIVITIES
Research Publication
Based on the previous data of completed experiments, researchers of the division published a scientific paper during the reporting year-
01. I. Ahmed, A. Hossain, Rowshon Ara, M.D. Ziaul Hoque, Md. Liton Miah and T. Ahmed. 2015. Effect of Rainfall on Yield and Crop Distribution of Tea. Journal of Global Biosciences. 4(5): 2304-2315.
Tours/Visits
Researchers of the division paid 202 visits to different Tea Estates for experimental, advisory services and other official purposes during the reporting year. Number of visits for the reporting year 2016 presented in the table below:
Table 3. No. of visit paid by the scientific personnel of the division during the reporting year
Reporting year No. of experimental visits
No. of advisory visits
No. of other official tours
2016 166 29 7
Annual Report 2016 Agronomy Division
43
Workshops / Seminars
Scientific personnel of Agronomy division arranged 33 workshops in different tea estates and BTRI to disseminate updated technologies among planters on plantation, pruning, tipping, plucking, drought management in tea etc.
Annual Course
Scientific personnel of the division delivered lectures on tea culture in the 51th BTRI annual course.
BTRI Main Farm
Md. Majibur Rahaman (Senior Field Assistant, Botany division) was acting as the Farm supervisor in-charge of BTRI Farm. The institute is spread over an area of 34.90 hectare and breakup of the land is as follows:
Under tea 1) Young clonal tea : 0.33 ha 2) Mature clonal tea : 4.64 “ 3) Mature seedling tea : 4.15 “ 4) Mother bush, seed bari etc. : 1.48 “ 5) Tea nursery : 0.62 “
Total : 11.22 ha
Other crops 1) Rehabilitation crops : 0.16 ha 2) Nursery : 1.09 “ 3) Mixed forest, Orchard, Lemon, Guava etc. : 5.21 “
Total : 6.46 ha
Other uses Office, Laboratory, Guest house, Mosque, School, Factory, Club house, labour line, roads etc. : 17.22 ha
Grand total : 34.90 ha
Improved planting materials supplied:
Year of supply No. of fresh cuttings No. of rooted cuttings
2016 3,35,940 4,200
Green leaf production and earning from other farm products:
Reporting year Green leaf production in kg Earning from other farm products in tk
2016 83,556 2,680/-
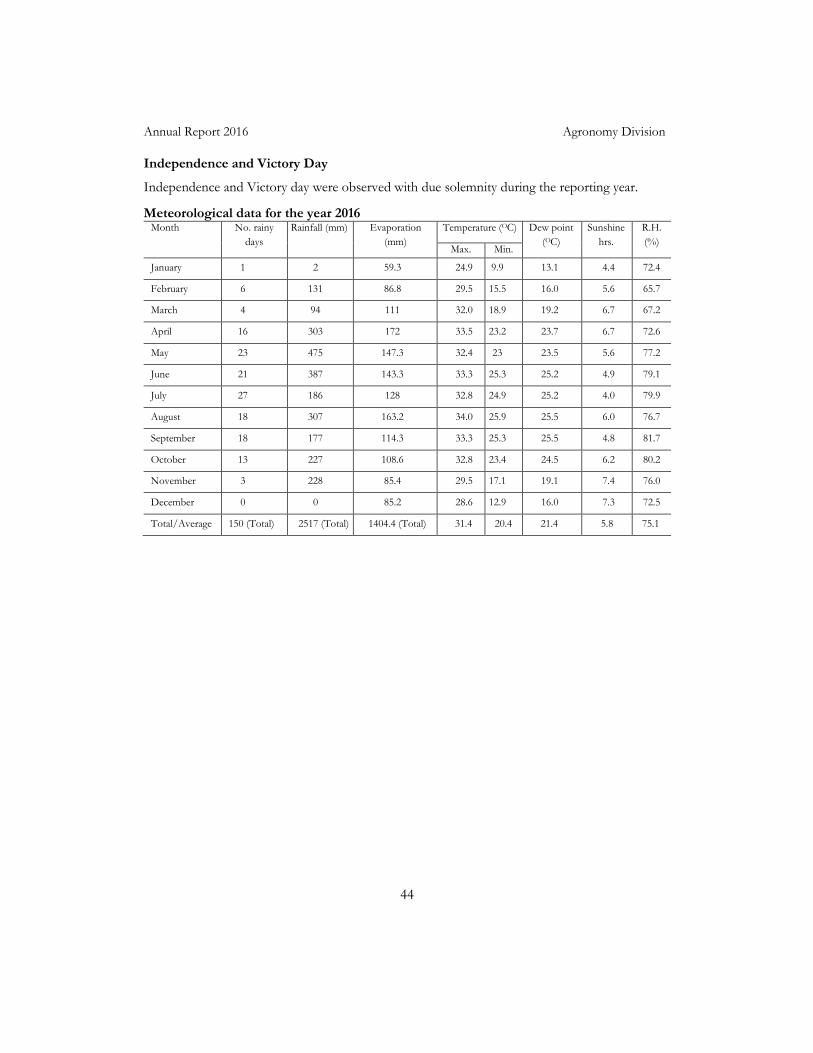
Annual Report 2016 Agronomy Division
44
Independence and Victory Day
Independence and Victory day were observed with due solemnity during the reporting year.
Meteorological data for the year 2016 Month No. rainy
days
Rainfall (mm) Evaporation
(mm)
Temperature (OC) Dew point
(OC)
Sunshine
hrs.
R.H.
(%) Max. Min.
January 1 2 59.3 24.9 9.9 13.1 4.4 72.4
February 6 131 86.8 29.5 15.5 16.0 5.6 65.7
March 4 94 111 32.0 18.9 19.2 6.7 67.2
April 16 303 172 33.5 23.2 23.7 6.7 72.6
May 23 475 147.3 32.4 23 23.5 5.6 77.2
June 21 387 143.3 33.3 25.3 25.2 4.9 79.1
July 27 186 128 32.8 24.9 25.2 4.0 79.9
August 18 307 163.2 34.0 25.9 25.5 6.0 76.7
September 18 177 114.3 33.3 25.3 25.5 4.8 81.7
October 13 227 108.6 32.8 23.4 24.5 6.2 80.2
November 3 228 85.4 29.5 17.1 19.1 7.4 76.0
December 0 0 85.2 28.6 12.9 16.0 7.3 72.5
Total/Average 150 (Total) 2517 (Total) 1404.4 (Total) 31.4 20.4 21.4 5.8 75.1
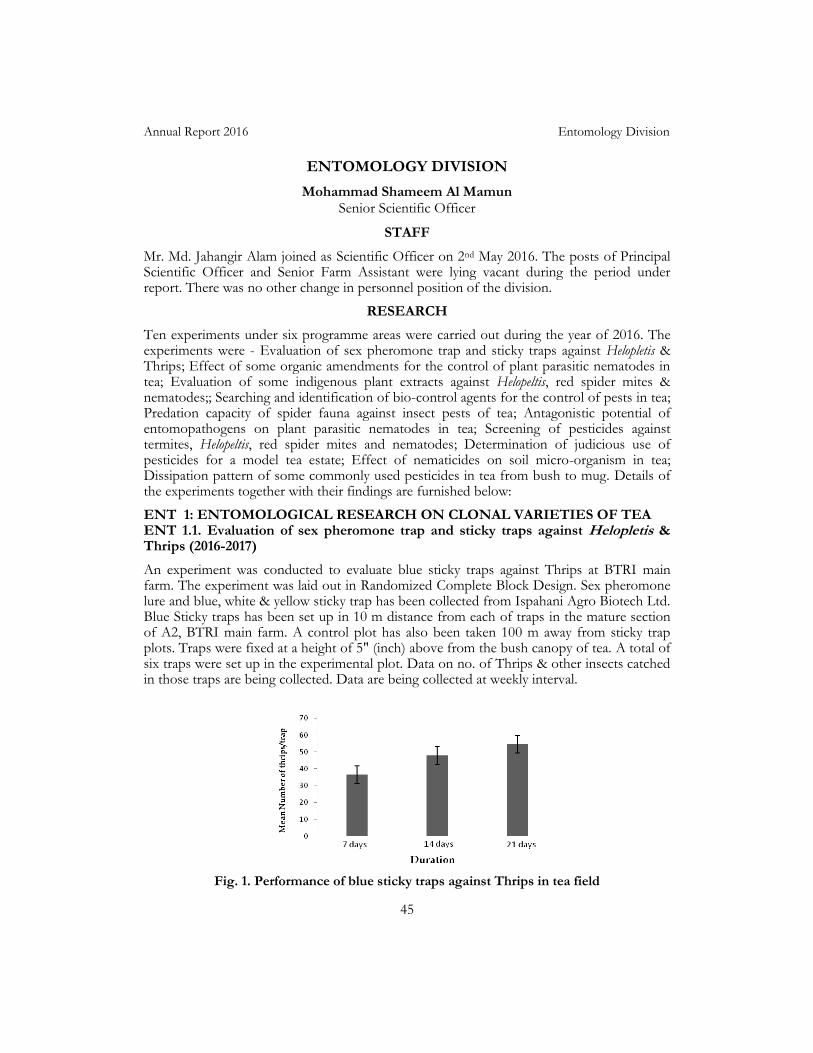
Annual Report 2016 Entomology Division
45
ENTOMOLOGY DIVISION
Mohammad Shameem Al Mamun Senior Scientific Officer
STAFF
Mr. Md. Jahangir Alam joined as Scientific Officer on 2nd May 2016. The posts of Principal Scientific Officer and Senior Farm Assistant were lying vacant during the period under report. There was no other change in personnel position of the division.
RESEARCH
Ten experiments under six programme areas were carried out during the year of 2016. The experiments were - Evaluation of sex pheromone trap and sticky traps against Helopletis & Thrips; Effect of some organic amendments for the control of plant parasitic nematodes in tea; Evaluation of some indigenous plant extracts against Helopeltis, red spider mites & nematodes;; Searching and identification of bio-control agents for the control of pests in tea; Predation capacity of spider fauna against insect pests of tea; Antagonistic potential of entomopathogens on plant parasitic nematodes in tea; Screening of pesticides against termites, Helopeltis, red spider mites and nematodes; Determination of judicious use of pesticides for a model tea estate; Effect of nematicides on soil micro-organism in tea; Dissipation pattern of some commonly used pesticides in tea from bush to mug. Details of the experiments together with their findings are furnished below:
ENT 1: ENTOMOLOGICAL RESEARCH ON CLONAL VARIETIES OF TEA ENT 1.1. Evaluation of sex pheromone trap and sticky traps against Helopletis & Thrips (2016-2017)
An experiment was conducted to evaluate blue sticky traps against Thrips at BTRI main farm. The experiment was laid out in Randomized Complete Block Design. Sex pheromone lure and blue, white & yellow sticky trap has been collected from Ispahani Agro Biotech Ltd. Blue Sticky traps has been set up in 10 m distance from each of traps in the mature section of A2, BTRI main farm. A control plot has also been taken 100 m away from sticky trap plots. Traps were fixed at a height of 5" (inch) above from the bush canopy of tea. A total of six traps were set up in the experimental plot. Data on no. of Thrips & other insects catched in those traps are being collected. Data are being collected at weekly interval.
Fig. 1. Performance of blue sticky traps against Thrips in tea field
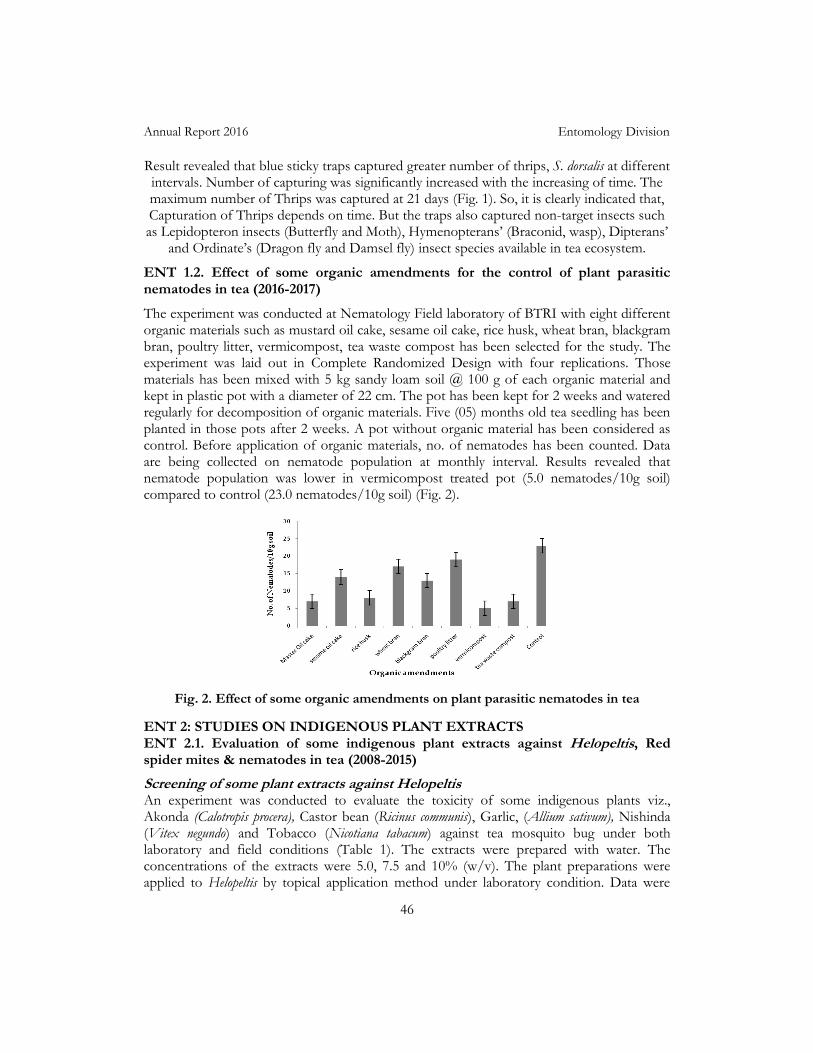
Annual Report 2016 Entomology Division
46
Result revealed that blue sticky traps captured greater number of thrips, S. dorsalis at different intervals. Number of capturing was significantly increased with the increasing of time. The maximum number of Thrips was captured at 21 days (Fig. 1). So, it is clearly indicated that, Capturation of Thrips depends on time. But the traps also captured non-target insects such as Lepidopteron insects (Butterfly and Moth), Hymenopterans’ (Braconid, wasp), Dipterans’
and Ordinate’s (Dragon fly and Damsel fly) insect species available in tea ecosystem.
ENT 1.2. Effect of some organic amendments for the control of plant parasitic nematodes in tea (2016-2017)
The experiment was conducted at Nematology Field laboratory of BTRI with eight different organic materials such as mustard oil cake, sesame oil cake, rice husk, wheat bran, blackgram bran, poultry litter, vermicompost, tea waste compost has been selected for the study. The experiment was laid out in Complete Randomized Design with four replications. Those materials has been mixed with 5 kg sandy loam soil @ 100 g of each organic material and kept in plastic pot with a diameter of 22 cm. The pot has been kept for 2 weeks and watered regularly for decomposition of organic materials. Five (05) months old tea seedling has been planted in those pots after 2 weeks. A pot without organic material has been considered as control. Before application of organic materials, no. of nematodes has been counted. Data are being collected on nematode population at monthly interval. Results revealed that nematode population was lower in vermicompost treated pot (5.0 nematodes/10g soil) compared to control (23.0 nematodes/10g soil) (Fig. 2).
Fig. 2. Effect of some organic amendments on plant parasitic nematodes in tea
ENT 2: STUDIES ON INDIGENOUS PLANT EXTRACTS ENT 2.1. Evaluation of some indigenous plant extracts against Helopeltis, Red spider mites & nematodes in tea (2008-2015)
Screening of some plant extracts against Helopeltis An experiment was conducted to evaluate the toxicity of some indigenous plants viz., Akonda (Calotropis procera), Castor bean (Ricinus communis), Garlic, (Allium sativum), Nishinda (Vitex negundo) and Tobacco (Nicotiana tabacum) against tea mosquito bug under both laboratory and field conditions (Table 1). The extracts were prepared with water. The concentrations of the extracts were 5.0, 7.5 and 10% (w/v). The plant preparations were applied to Helopeltis by topical application method under laboratory condition. Data were
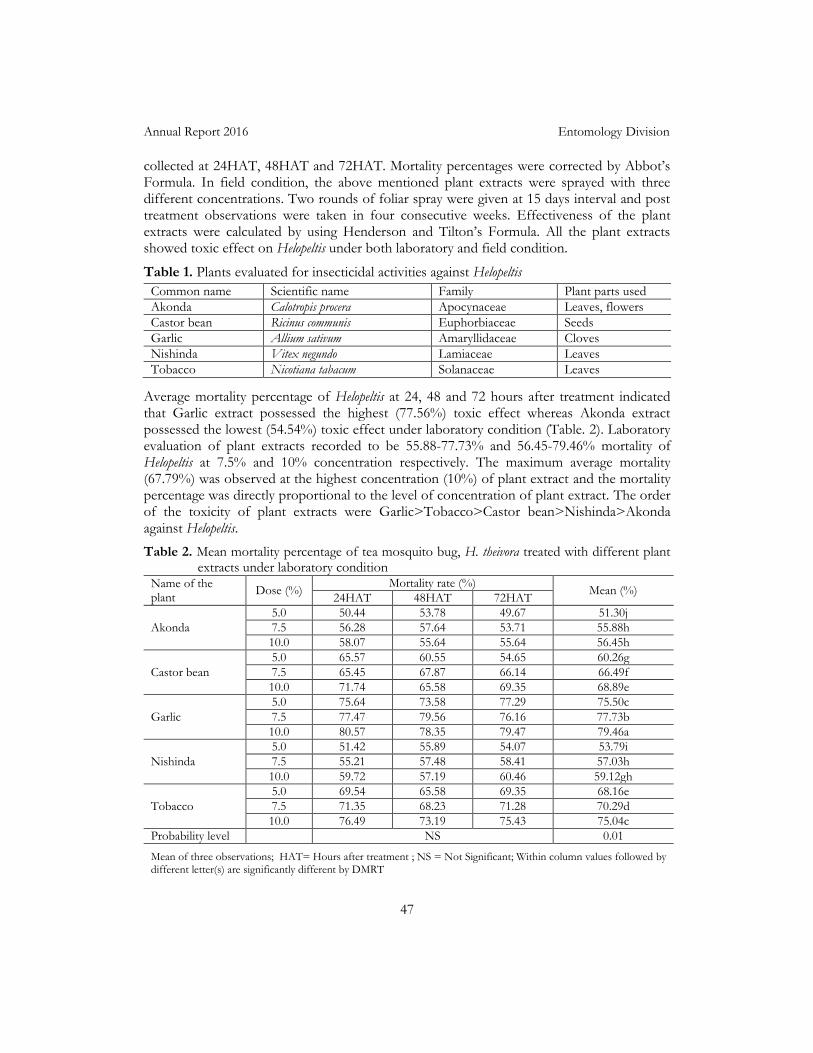
Annual Report 2016 Entomology Division
47
collected at 24HAT, 48HAT and 72HAT. Mortality percentages were corrected by Abbot’s Formula. In field condition, the above mentioned plant extracts were sprayed with three different concentrations. Two rounds of foliar spray were given at 15 days interval and post treatment observations were taken in four consecutive weeks. Effectiveness of the plant extracts were calculated by using Henderson and Tilton’s Formula. All the plant extracts showed toxic effect on Helopeltis under both laboratory and field condition.
Table 1. Plants evaluated for insecticidal activities against Helopeltis
Common name Scientific name Family Plant parts used
Akonda Calotropis procera Apocynaceae Leaves, flowers
Castor bean Ricinus communis Euphorbiaceae Seeds
Garlic Allium sativum Amaryllidaceae Cloves
Nishinda Vitex negundo Lamiaceae Leaves
Tobacco Nicotiana tabacum Solanaceae Leaves
Average mortality percentage of Helopeltis at 24, 48 and 72 hours after treatment indicated that Garlic extract possessed the highest (77.56%) toxic effect whereas Akonda extract possessed the lowest (54.54%) toxic effect under laboratory condition (Table. 2). Laboratory evaluation of plant extracts recorded to be 55.88-77.73% and 56.45-79.46% mortality of Helopeltis at 7.5% and 10% concentration respectively. The maximum average mortality (67.79%) was observed at the highest concentration (10%) of plant extract and the mortality percentage was directly proportional to the level of concentration of plant extract. The order of the toxicity of plant extracts were Garlic>Tobacco>Castor bean>Nishinda>Akonda against Helopeltis.
Table 2. Mean mortality percentage of tea mosquito bug, H. theivora treated with different plant extracts under laboratory condition
Name of the plant
Dose (%) Mortality rate (%)
Mean (%) 24HAT 48HAT 72HAT
Akonda
5.0 50.44 53.78 49.67 51.30j
7.5 56.28 57.64 53.71 55.88h
10.0 58.07 55.64 55.64 56.45h
Castor bean
5.0 65.57 60.55 54.65 60.26g
7.5 65.45 67.87 66.14 66.49f
10.0 71.74 65.58 69.35 68.89e
Garlic
5.0 75.64 73.58 77.29 75.50c
7.5 77.47 79.56 76.16 77.73b
10.0 80.57 78.35 79.47 79.46a
Nishinda
5.0 51.42 55.89 54.07 53.79i
7.5 55.21 57.48 58.41 57.03h
10.0 59.72 57.19 60.46 59.12gh
Tobacco
5.0 69.54 65.58 69.35 68.16e
7.5 71.35 68.23 71.28 70.29d
10.0 76.49 73.19 75.43 75.04c
Probability level NS 0.01
Mean of three observations; HAT= Hours after treatment ; NS = Not Significant; Within column values followed by different letter(s) are significantly different by DMRT
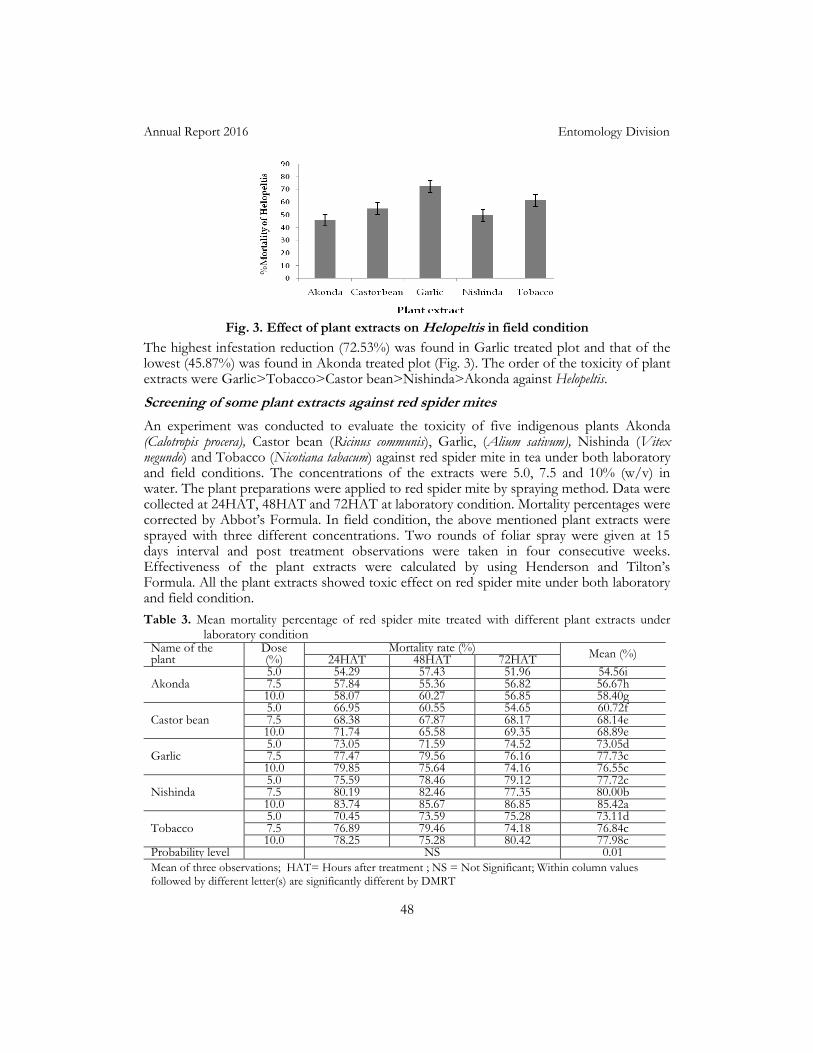
Annual Report 2016 Entomology Division
48
Fig. 3. Effect of plant extracts on Helopeltis in field condition
The highest infestation reduction (72.53%) was found in Garlic treated plot and that of the lowest (45.87%) was found in Akonda treated plot (Fig. 3). The order of the toxicity of plant extracts were Garlic>Tobacco>Castor bean>Nishinda>Akonda against Helopeltis.
Screening of some plant extracts against red spider mites
An experiment was conducted to evaluate the toxicity of five indigenous plants Akonda (Calotropis procera), Castor bean (Ricinus communis), Garlic, (Alium sativum), Nishinda (Vitex negundo) and Tobacco (Nicotiana tabacum) against red spider mite in tea under both laboratory and field conditions. The concentrations of the extracts were 5.0, 7.5 and 10% (w/v) in water. The plant preparations were applied to red spider mite by spraying method. Data were collected at 24HAT, 48HAT and 72HAT at laboratory condition. Mortality percentages were corrected by Abbot’s Formula. In field condition, the above mentioned plant extracts were sprayed with three different concentrations. Two rounds of foliar spray were given at 15 days interval and post treatment observations were taken in four consecutive weeks. Effectiveness of the plant extracts were calculated by using Henderson and Tilton’s Formula. All the plant extracts showed toxic effect on red spider mite under both laboratory and field condition.
Table 3. Mean mortality percentage of red spider mite treated with different plant extracts under laboratory condition
Name of the plant
Dose (%)
Mortality rate (%) Mean (%)
24HAT 48HAT 72HAT
Akonda 5.0 54.29 57.43 51.96 54.56i 7.5 57.84 55.36 56.82 56.67h 10.0 58.07 60.27 56.85 58.40g
Castor bean 5.0 66.95 60.55 54.65 60.72f 7.5 68.38 67.87 68.17 68.14e 10.0 71.74 65.58 69.35 68.89e
Garlic 5.0 73.05 71.59 74.52 73.05d 7.5 77.47 79.56 76.16 77.73c 10.0 79.85 75.64 74.16 76.55c
Nishinda 5.0 75.59 78.46 79.12 77.72c 7.5 80.19 82.46 77.35 80.00b 10.0 83.74 85.67 86.85 85.42a
Tobacco 5.0 70.45 73.59 75.28 73.11d 7.5 76.89 79.46 74.18 76.84c 10.0 78.25 75.28 80.42 77.98c
Probability level NS 0.01
Mean of three observations; HAT= Hours after treatment ; NS = Not Significant; Within column values followed by different letter(s) are significantly different by DMRT
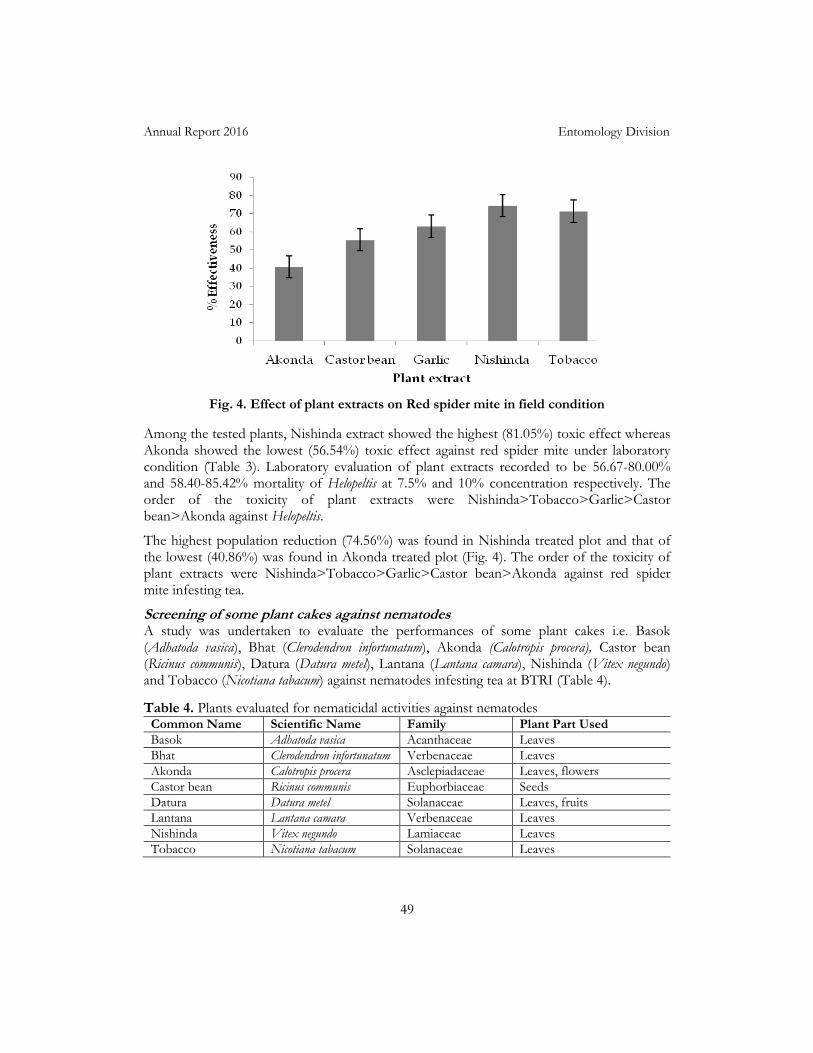
Annual Report 2016 Entomology Division
49
Fig. 4. Effect of plant extracts on Red spider mite in field condition
Among the tested plants, Nishinda extract showed the highest (81.05%) toxic effect whereas Akonda showed the lowest (56.54%) toxic effect against red spider mite under laboratory condition (Table 3). Laboratory evaluation of plant extracts recorded to be 56.67-80.00% and 58.40-85.42% mortality of Helopeltis at 7.5% and 10% concentration respectively. The order of the toxicity of plant extracts were Nishinda>Tobacco>Garlic>Castor bean>Akonda against Helopeltis.
The highest population reduction (74.56%) was found in Nishinda treated plot and that of the lowest (40.86%) was found in Akonda treated plot (Fig. 4). The order of the toxicity of plant extracts were Nishinda>Tobacco>Garlic>Castor bean>Akonda against red spider mite infesting tea.
Screening of some plant cakes against nematodes A study was undertaken to evaluate the performances of some plant cakes i.e. Basok (Adhatoda vasica), Bhat (Clerodendron infortunatum), Akonda (Calotropis procera), Castor bean (Ricinus communis), Datura (Datura metel), Lantana (Lantana camara), Nishinda (Vitex negundo) and Tobacco (Nicotiana tabacum) against nematodes infesting tea at BTRI (Table 4).
Table 4. Plants evaluated for nematicidal activities against nematodes
Common Name Scientific Name Family Plant Part Used
Basok Adhatoda vasica Acanthaceae Leaves
Bhat Clerodendron infortunatum Verbenaceae Leaves
Akonda Calotropis procera Asclepiadaceae Leaves, flowers
Castor bean Ricinus communis Euphorbiaceae Seeds
Datura Datura metel Solanaceae Leaves, fruits
Lantana Lantana camara Verbenaceae Leaves
Nishinda Vitex negundo Lamiaceae Leaves
Tobacco Nicotiana tabacum Solanaceae Leaves
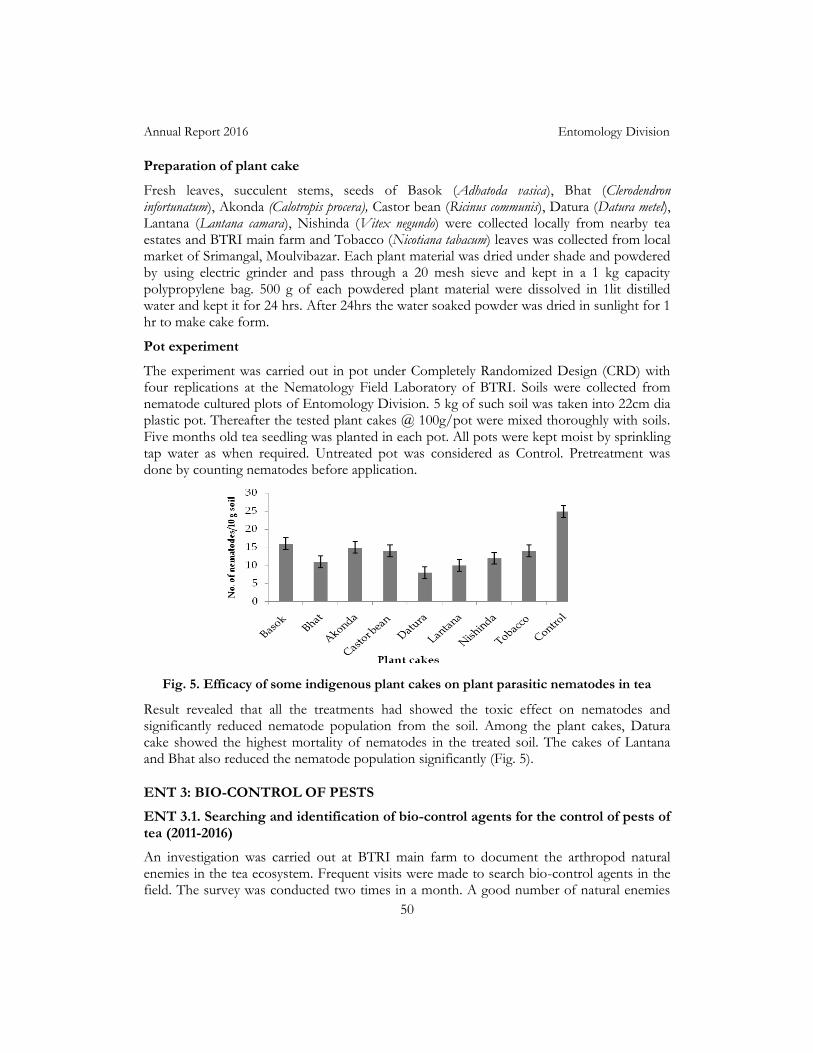
Annual Report 2016 Entomology Division
50
Preparation of plant cake
Fresh leaves, succulent stems, seeds of Basok (Adhatoda vasica), Bhat (Clerodendron infortunatum), Akonda (Calotropis procera), Castor bean (Ricinus communis), Datura (Datura metel), Lantana (Lantana camara), Nishinda (Vitex negundo) were collected locally from nearby tea estates and BTRI main farm and Tobacco (Nicotiana tabacum) leaves was collected from local market of Srimangal, Moulvibazar. Each plant material was dried under shade and powdered by using electric grinder and pass through a 20 mesh sieve and kept in a 1 kg capacity polypropylene bag. 500 g of each powdered plant material were dissolved in 1lit distilled water and kept it for 24 hrs. After 24hrs the water soaked powder was dried in sunlight for 1 hr to make cake form.
Pot experiment
The experiment was carried out in pot under Completely Randomized Design (CRD) with four replications at the Nematology Field Laboratory of BTRI. Soils were collected from nematode cultured plots of Entomology Division. 5 kg of such soil was taken into 22cm dia plastic pot. Thereafter the tested plant cakes @ 100g/pot were mixed thoroughly with soils. Five months old tea seedling was planted in each pot. All pots were kept moist by sprinkling tap water as when required. Untreated pot was considered as Control. Pretreatment was done by counting nematodes before application.
Fig. 5. Efficacy of some indigenous plant cakes on plant parasitic nematodes in tea
Result revealed that all the treatments had showed the toxic effect on nematodes and significantly reduced nematode population from the soil. Among the plant cakes, Datura cake showed the highest mortality of nematodes in the treated soil. The cakes of Lantana and Bhat also reduced the nematode population significantly (Fig. 5).
ENT 3: BIO-CONTROL OF PESTS
ENT 3.1. Searching and identification of bio-control agents for the control of pests of tea (2011-2016)
An investigation was carried out at BTRI main farm to document the arthropod natural enemies in the tea ecosystem. Frequent visits were made to search bio-control agents in the field. The survey was conducted two times in a month. A good number of natural enemies
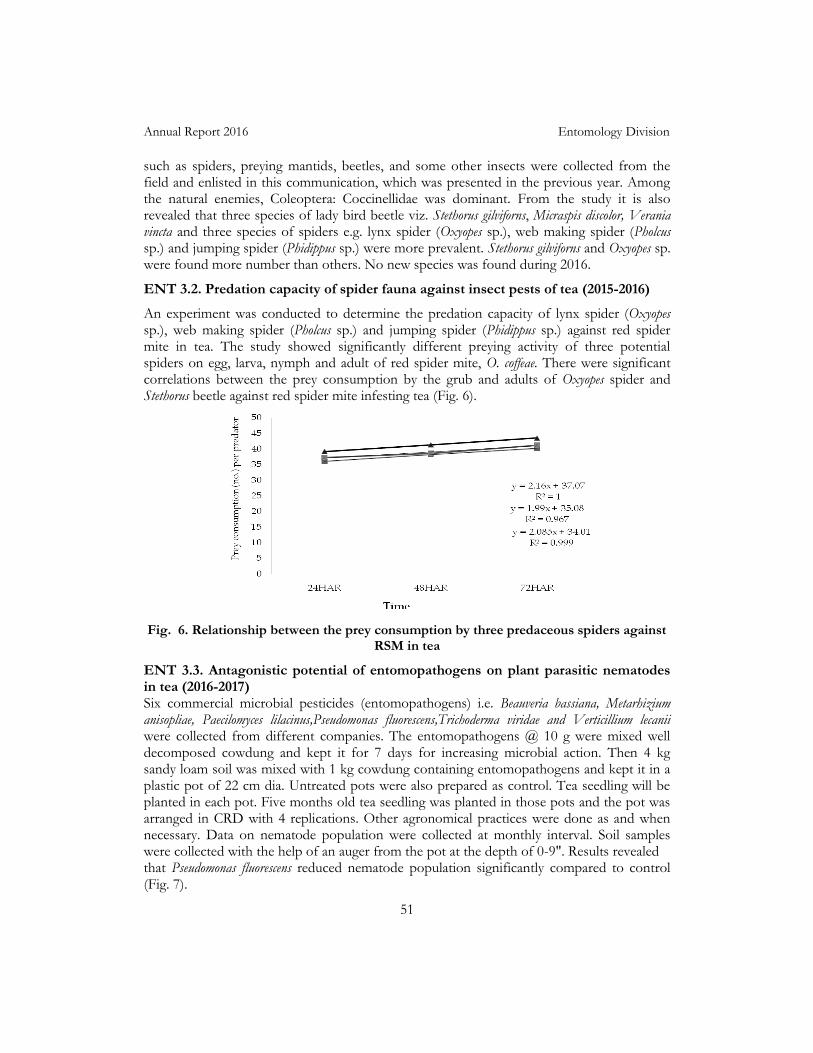
Annual Report 2016 Entomology Division
51
such as spiders, preying mantids, beetles, and some other insects were collected from the field and enlisted in this communication, which was presented in the previous year. Among the natural enemies, Coleoptera: Coccinellidae was dominant. From the study it is also revealed that three species of lady bird beetle viz. Stethorus gilviforns, Micraspis discolor, Verania vincta and three species of spiders e.g. lynx spider (Oxyopes sp.), web making spider (Pholcus sp.) and jumping spider (Phidippus sp.) were more prevalent. Stethorus gilviforns and Oxyopes sp. were found more number than others. No new species was found during 2016.
ENT 3.2. Predation capacity of spider fauna against insect pests of tea (2015-2016)
An experiment was conducted to determine the predation capacity of lynx spider (Oxyopes sp.), web making spider (Pholcus sp.) and jumping spider (Phidippus sp.) against red spider mite in tea. The study showed significantly different preying activity of three potential spiders on egg, larva, nymph and adult of red spider mite, O. coffeae. There were significant correlations between the prey consumption by the grub and adults of Oxyopes spider and Stethorus beetle against red spider mite infesting tea (Fig. 6).
Fig. 6. Relationship between the prey consumption by three predaceous spiders against RSM in tea
ENT 3.3. Antagonistic potential of entomopathogens on plant parasitic nematodes in tea (2016-2017) Six commercial microbial pesticides (entomopathogens) i.e. Beauveria bassiana, Metarhizium anisopliae, Paecilomyces lilacinus,Pseudomonas fluorescens,Trichoderma viridae and Verticillium lecanii were collected from different companies. The entomopathogens @ 10 g were mixed well decomposed cowdung and kept it for 7 days for increasing microbial action. Then 4 kg sandy loam soil was mixed with 1 kg cowdung containing entomopathogens and kept it in a plastic pot of 22 cm dia. Untreated pots were also prepared as control. Tea seedling will be planted in each pot. Five months old tea seedling was planted in those pots and the pot was arranged in CRD with 4 replications. Other agronomical practices were done as and when necessary. Data on nematode population were collected at monthly interval. Soil samples were collected with the help of an auger from the pot at the depth of 0-9". Results revealed that Pseudomonas fluorescens reduced nematode population significantly compared to control (Fig. 7).
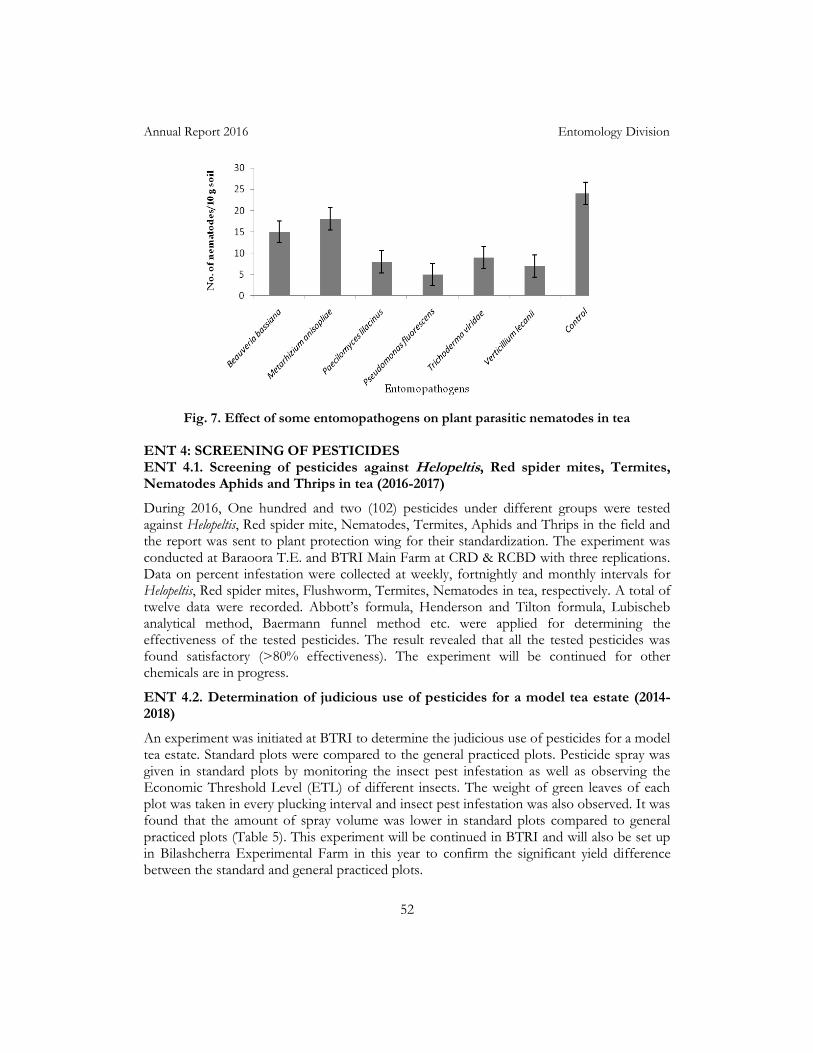
Annual Report 2016 Entomology Division
52
Fig. 7. Effect of some entomopathogens on plant parasitic nematodes in tea
ENT 4: SCREENING OF PESTICIDES ENT 4.1. Screening of pesticides against Helopeltis, Red spider mites, Termites, Nematodes Aphids and Thrips in tea (2016-2017)
During 2016, One hundred and two (102) pesticides under different groups were tested against Helopeltis, Red spider mite, Nematodes, Termites, Aphids and Thrips in the field and the report was sent to plant protection wing for their standardization. The experiment was conducted at Baraoora T.E. and BTRI Main Farm at CRD & RCBD with three replications. Data on percent infestation were collected at weekly, fortnightly and monthly intervals for Helopeltis, Red spider mites, Flushworm, Termites, Nematodes in tea, respectively. A total of twelve data were recorded. Abbott’s formula, Henderson and Tilton formula, Lubischeb analytical method, Baermann funnel method etc. were applied for determining the effectiveness of the tested pesticides. The result revealed that all the tested pesticides was found satisfactory (>80% effectiveness). The experiment will be continued for other chemicals are in progress.
ENT 4.2. Determination of judicious use of pesticides for a model tea estate (2014-2018)
An experiment was initiated at BTRI to determine the judicious use of pesticides for a model tea estate. Standard plots were compared to the general practiced plots. Pesticide spray was given in standard plots by monitoring the insect pest infestation as well as observing the Economic Threshold Level (ETL) of different insects. The weight of green leaves of each plot was taken in every plucking interval and insect pest infestation was also observed. It was found that the amount of spray volume was lower in standard plots compared to general practiced plots (Table 5). This experiment will be continued in BTRI and will also be set up in Bilashcherra Experimental Farm in this year to confirm the significant yield difference between the standard and general practiced plots.
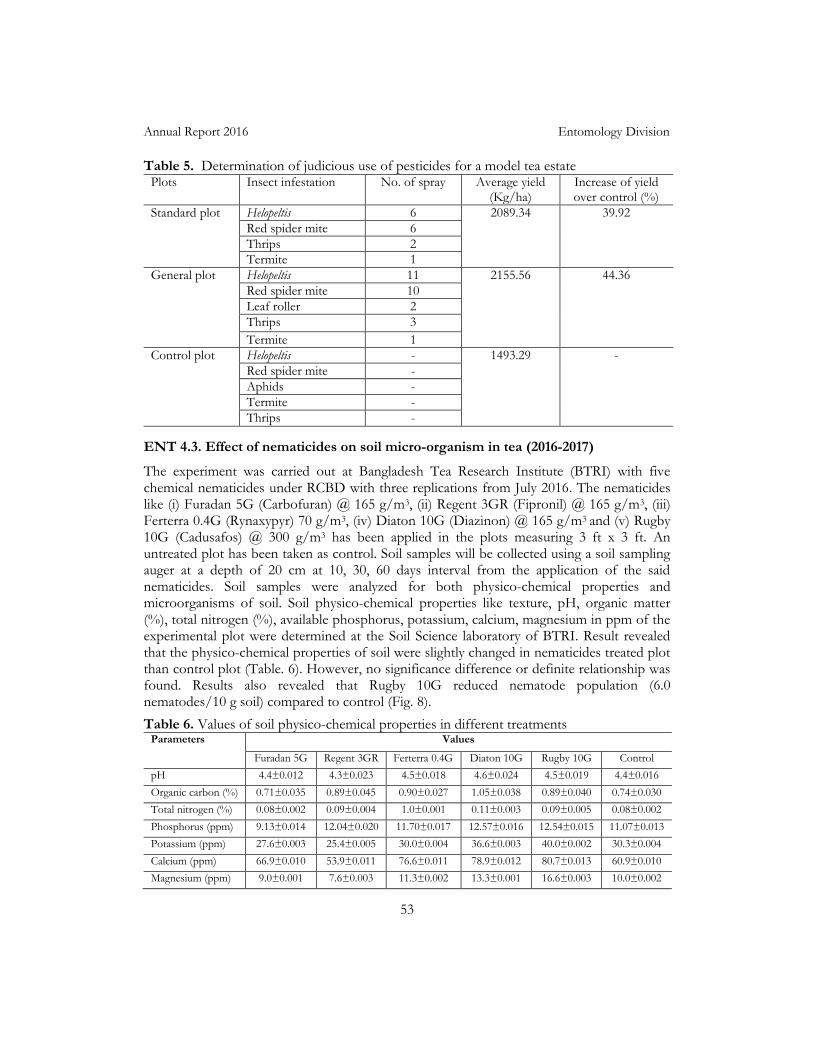
Annual Report 2016 Entomology Division
53
Table 5. Determination of judicious use of pesticides for a model tea estate
Plots Insect infestation No. of spray Average yield (Kg/ha)
Increase of yield over control (%)
Standard plot Helopeltis 6 2089.34 39.92
Red spider mite 6
Thrips 2
Termite 1
General plot Helopeltis 11 2155.56 44.36
Red spider mite 10
Leaf roller 2
Thrips 3
Termite 1
Control plot Helopeltis - 1493.29 -
Red spider mite -
Aphids -
Termite -
Thrips -
ENT 4.3. Effect of nematicides on soil micro-organism in tea (2016-2017)
The experiment was carried out at Bangladesh Tea Research Institute (BTRI) with five chemical nematicides under RCBD with three replications from July 2016. The nematicides like (i) Furadan 5G (Carbofuran) @ 165 g/m3, (ii) Regent 3GR (Fipronil) @ 165 g/m3, (iii) Ferterra 0.4G (Rynaxypyr) 70 g/m3, (iv) Diaton 10G (Diazinon) @ 165 g/m3 and (v) Rugby 10G (Cadusafos) @ 300 g/m3 has been applied in the plots measuring 3 ft x 3 ft. An untreated plot has been taken as control. Soil samples will be collected using a soil sampling auger at a depth of 20 cm at 10, 30, 60 days interval from the application of the said nematicides. Soil samples were analyzed for both physico-chemical properties and microorganisms of soil. Soil physico-chemical properties like texture, pH, organic matter (%), total nitrogen (%), available phosphorus, potassium, calcium, magnesium in ppm of the experimental plot were determined at the Soil Science laboratory of BTRI. Result revealed that the physico-chemical properties of soil were slightly changed in nematicides treated plot than control plot (Table. 6). However, no significance difference or definite relationship was found. Results also revealed that Rugby 10G reduced nematode population (6.0 nematodes/10 g soil) compared to control (Fig. 8).
Table 6. Values of soil physico-chemical properties in different treatments
Parameters Values
Furadan 5G Regent 3GR Ferterra 0.4G Diaton 10G Rugby 10G Control
pH 4.4±0.012 4.3±0.023 4.5±0.018 4.6±0.024 4.5±0.019 4.4±0.016
Organic carbon (%) 0.71±0.035 0.89±0.045 0.90±0.027 1.05±0.038 0.89±0.040 0.74±0.030
Total nitrogen (%) 0.08±0.002 0.09±0.004 1.0±0.001 0.11±0.003 0.09±0.005 0.08±0.002
Phosphorus (ppm) 9.13±0.014 12.04±0.020 11.70±0.017 12.57±0.016 12.54±0.015 11.07±0.013
Potassium (ppm) 27.6±0.003 25.4±0.005 30.0±0.004 36.6±0.003 40.0±0.002 30.3±0.004
Calcium (ppm) 66.9±0.010 53.9±0.011 76.6±0.011 78.9±0.012 80.7±0.013 60.9±0.010
Magnesium (ppm) 9.0±0.001 7.6±0.003 11.3±0.002 13.3±0.001 16.6±0.003 10.0±0.002
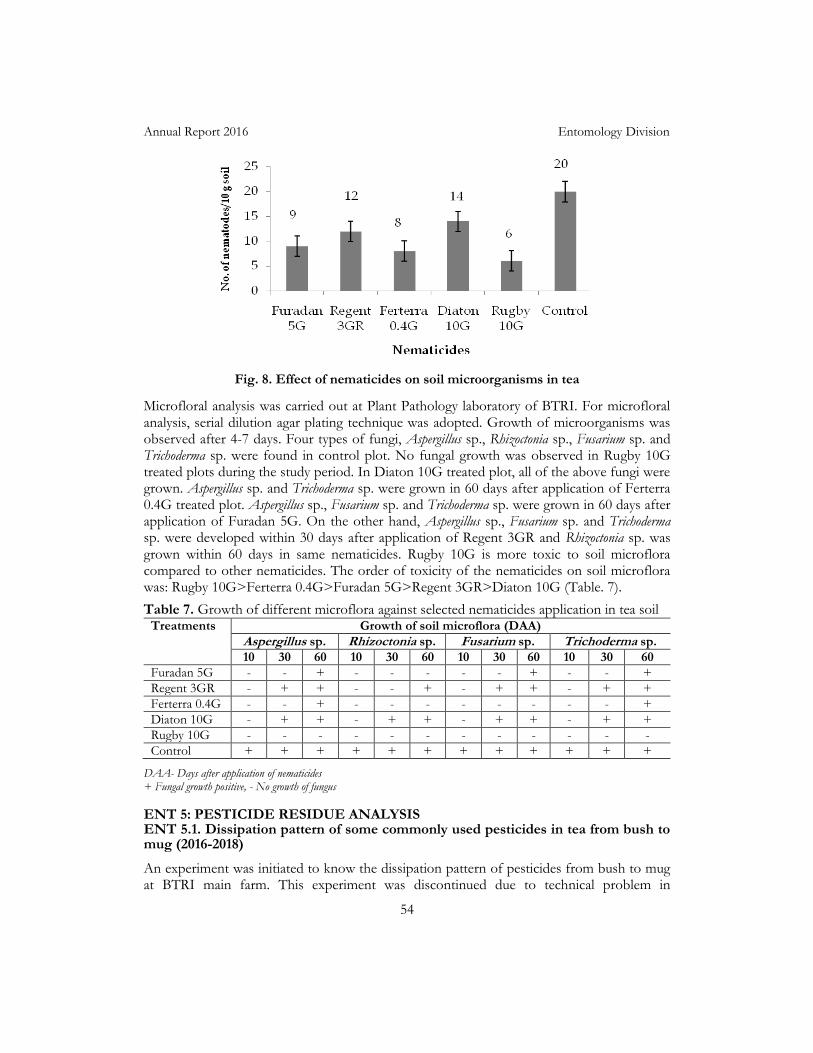
Annual Report 2016 Entomology Division
54
Fig. 8. Effect of nematicides on soil microorganisms in tea
Microfloral analysis was carried out at Plant Pathology laboratory of BTRI. For microfloral analysis, serial dilution agar plating technique was adopted. Growth of microorganisms was observed after 4-7 days. Four types of fungi, Aspergillus sp., Rhizoctonia sp., Fusarium sp. and Trichoderma sp. were found in control plot. No fungal growth was observed in Rugby 10G treated plots during the study period. In Diaton 10G treated plot, all of the above fungi were grown. Aspergillus sp. and Trichoderma sp. were grown in 60 days after application of Ferterra 0.4G treated plot. Aspergillus sp., Fusarium sp. and Trichoderma sp. were grown in 60 days after application of Furadan 5G. On the other hand, Aspergillus sp., Fusarium sp. and Trichoderma sp. were developed within 30 days after application of Regent 3GR and Rhizoctonia sp. was grown within 60 days in same nematicides. Rugby 10G is more toxic to soil microflora compared to other nematicides. The order of toxicity of the nematicides on soil microflora was: Rugby 10G>Ferterra 0.4G>Furadan 5G>Regent 3GR>Diaton 10G (Table. 7).
Table 7. Growth of different microflora against selected nematicides application in tea soil
Treatments Growth of soil microflora (DAA)
Aspergillus sp. Rhizoctonia sp. Fusarium sp. Trichoderma sp.
10 30 60 10 30 60 10 30 60 10 30 60
Furadan 5G - - + - - - - - + - - +
Regent 3GR - + + - - + - + + - + +
Ferterra 0.4G - - + - - - - - - - - +
Diaton 10G - + + - + + - + + - + +
Rugby 10G - - - - - - - - - - - -
Control + + + + + + + + + + + +
DAA- Days after application of nematicides + Fungal growth positive, - No growth of fungus
ENT 5: PESTICIDE RESIDUE ANALYSIS ENT 5.1. Dissipation pattern of some commonly used pesticides in tea from bush to mug (2016-2018)
An experiment was initiated to know the dissipation pattern of pesticides from bush to mug at BTRI main farm. This experiment was discontinued due to technical problem in
Annual Report 2016 Entomology Division
55
instrument. In the year of 2017, the commonly used pesticides in tea i.e. Ripcord 10EC (Cypermethrin) and Omite 57EC (Propergite) will be applied in experimental plots following BTRI recommended dose and their dissipation pattern will be determined in each and every steps from plucking to tea infusion. The residue analysis will be done according to the methods developed by Ahmed & Sarker (2002) at Central Science Laboratory (CSL) in U.K. (Method reference: PGD-95/01-07). The determination of residue will be done by Electron Captured Detector (ECD) and Flame Thermoionic Detector (FTD) using Gas Chromatograph (Shimadzu 14-B) with DB-5 Capillary Column.
OTHER ACTIVITIES
Advisory and Experimental visits
A total of Twenty eight (28) advisory visits were paid to different tea estates to identify and render advice on specific pest problems and Thirty (30) advisory letters issued to different tea estates in respect of identification of various pests and their control measures during the reporting year. Twelve (12) experimental visits were made with particular reference to experimental data collection in tea estates.
Analysis
A total of One hundred thirty four (134) soil and water samples were analyzed in the Laboratory for nematode count and reported to different tea estates. A total of 102 pesticides including insecticides, miticides, nematicides and termiticides were received from plant protection wing, Department of Agricultural Extension, Dhaka for field trial and reports were sent to plant protection wing for standardizations during the year 2016. One (01) pesticide for physical analysis was also done in the laboratory of the division.
Tours/Visits
A total of Eleven (11) official visits were paid by the Scientists of the division to different organizations for Official purposes. Courses on tea culture
The Scientific personnel of the division delivered lectures on tea pest management at Annual Courses held at BTRI Main Station, Srimangal; BTRI Sub-Station, Fatikchari, Chittagong and BTRI Sub-Station, Panchagarh as well as in Post graduation diploma course, MTC, BTB. The resource persons gave comprehensive lectures and practical demonstration on tea pest spectrum, their control options, pesticides and its residue in made tea and spraying techniques.
Workshop/Seminar
A total of Seventeen (17) workshops were conducted at different tea estates under different valley circles on tea pest management during 2016.

Annual Report 2016 Plant Pathology Division
56
PLANT PATHOLOGY DIVISION
Dr. Mohammad Ali Chief Scientific Officer
Department of Pest Management &
Mohammed Syeful Islam Senior Scientific Officer Plant Pathology Division
STAFF
Mr. Mohammed Syeful Islam, Senior Scientific Officer left for China on 25 April 2016 to
attend a training course entitled “2016 Seminar on Pollution free Tea Production
Technology for Developing Countries”. He returned and joined the division on 22 June
2016 after successfully completion of the training course. Mr. Raihan Mujib Himel, Scientific
Officer was transferred to BTRI substation, Fatickcherri, Chittagong on 1st August, 2016.
The posts of one Principal Scientific Officer and one Field Assistant were remained vacant.
There was no other change in the staff position of this division.
RESEARCH
The division carried out seven experiments during the year 2016 under three research areas. Results are briefly discussed below:
PP 3: DISEASE MANAGEMENT
PP 3.6: Study of microbial effects on made tea quality (BTRI: 2015- 2017)
Nine black tea and one Darjeeling green tea (mini pack) samples were collected from the
market for microbial loads. The initial moisture content for each black tea sample was more
than 7.8%, and 5.48% in Darjeeling green tea. In controlled condition, Aspergillus niger and
Penicillium spp. were found in all the samples (table 1). In open environment, Aspergillus spp.
was recorded in the black tea sample contained 11.89% moisture reaching from 4.9% after
20 days of plating. The Aspergillus spp was also recorded in drier mouth sample that
contained 2.5% initial moisture reached to 8.3% after 42 days of plating (table 2).
Theaflavins (TF), Thearubigins (TR), Total Liquor Color (TLC), Highly Polymerized
Substances (HPS) and Color Index (CI) of five black tea samples were measured in both pre-
and post-fugal growth stage (table 3).
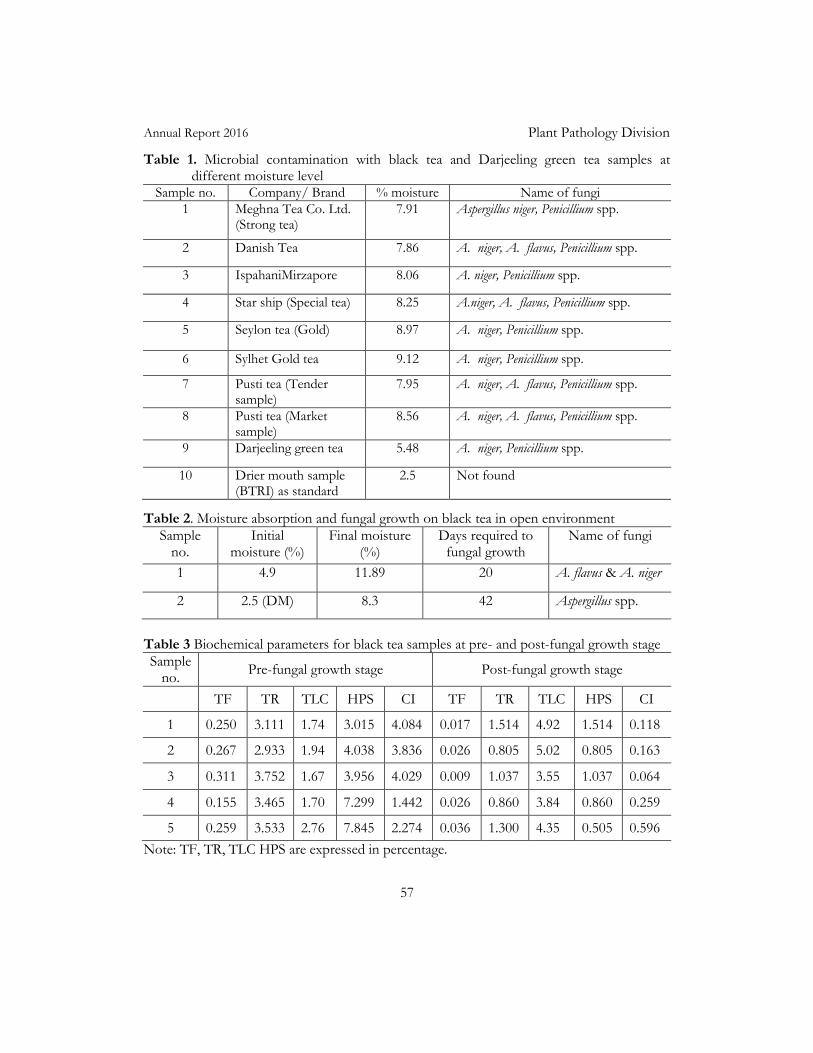
Annual Report 2016 Plant Pathology Division
57
Table 1. Microbial contamination with black tea and Darjeeling green tea samples at different moisture level
Sample no. Company/ Brand % moisture Name of fungi
1 Meghna Tea Co. Ltd. (Strong tea)
7.91 Aspergillus niger, Penicillium spp.
2 Danish Tea 7.86 A. niger, A. flavus, Penicillium spp.
3 IspahaniMirzapore 8.06 A. niger, Penicillium spp.
4 Star ship (Special tea) 8.25 A.niger, A. flavus, Penicillium spp.
5 Seylon tea (Gold) 8.97 A. niger, Penicillium spp.
6 Sylhet Gold tea 9.12 A. niger, Penicillium spp.
7 Pusti tea (Tender sample)
7.95 A. niger, A. flavus, Penicillium spp.
8 Pusti tea (Market sample)
8.56 A. niger, A. flavus, Penicillium spp.
9 Darjeeling green tea 5.48 A. niger, Penicillium spp.
10 Drier mouth sample (BTRI) as standard
2.5 Not found
Table 2. Moisture absorption and fungal growth on black tea in open environment
Sample no.
Initial moisture (%)
Final moisture (%)
Days required to fungal growth
Name of fungi
1 4.9 11.89 20 A. flavus & A. niger
2 2.5 (DM) 8.3 42 Aspergillus spp.
Table 3 Biochemical parameters for black tea samples at pre- and post-fungal growth stage
Sample no.
Pre-fungal growth stage Post-fungal growth stage
TF TR TLC HPS CI TF TR TLC HPS CI
1 0.250 3.111 1.74 3.015 4.084 0.017 1.514 4.92 1.514 0.118
2 0.267 2.933 1.94 4.038 3.836 0.026 0.805 5.02 0.805 0.163
3 0.311 3.752 1.67 3.956 4.029 0.009 1.037 3.55 1.037 0.064
4 0.155 3.465 1.70 7.299 1.442 0.026 0.860 3.84 0.860 0.259
5 0.259 3.533 2.76 7.845 2.274 0.036 1.300 4.35 0.505 0.596
Note: TF, TR, TLC HPS are expressed in percentage.
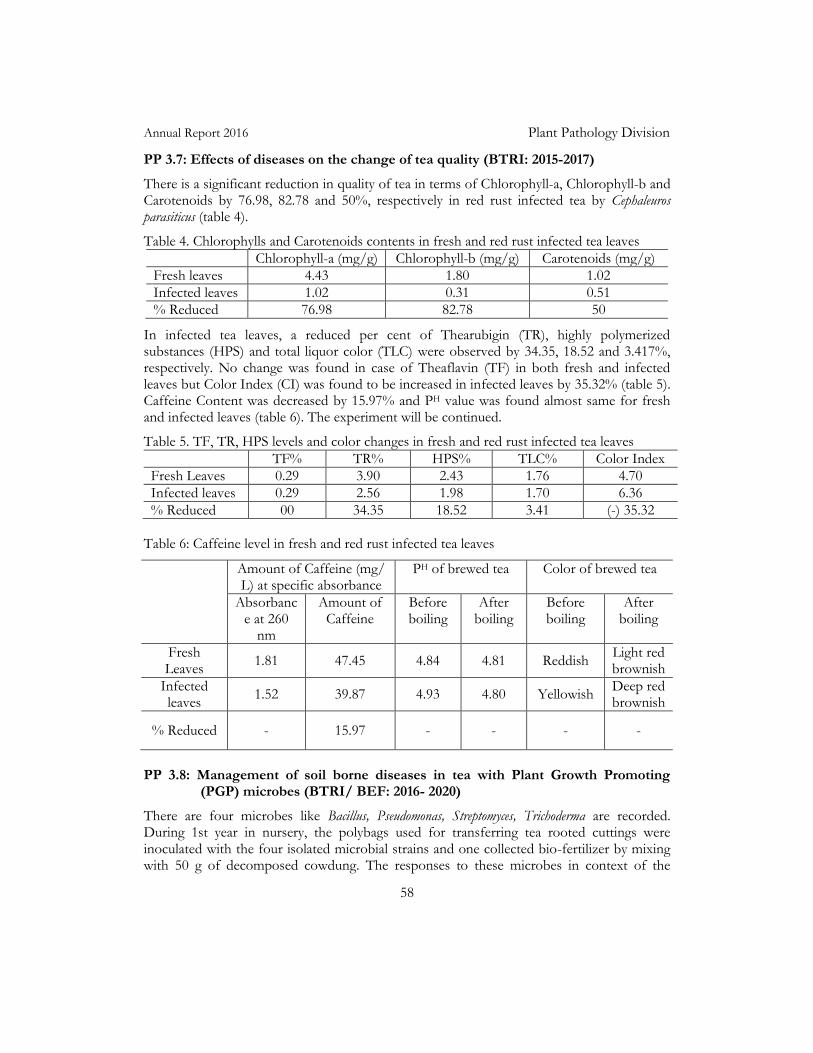
Annual Report 2016 Plant Pathology Division
58
PP 3.7: Effects of diseases on the change of tea quality (BTRI: 2015-2017)
There is a significant reduction in quality of tea in terms of Chlorophyll-a, Chlorophyll-b and Carotenoids by 76.98, 82.78 and 50%, respectively in red rust infected tea by Cephaleuros parasiticus (table 4).
Table 4. Chlorophylls and Carotenoids contents in fresh and red rust infected tea leaves
Chlorophyll-a (mg/g) Chlorophyll-b (mg/g) Carotenoids (mg/g)
Fresh leaves 4.43 1.80 1.02
Infected leaves 1.02 0.31 0.51
% Reduced 76.98 82.78 50
In infected tea leaves, a reduced per cent of Thearubigin (TR), highly polymerized substances (HPS) and total liquor color (TLC) were observed by 34.35, 18.52 and 3.417%, respectively. No change was found in case of Theaflavin (TF) in both fresh and infected leaves but Color Index (CI) was found to be increased in infected leaves by 35.32% (table 5). Caffeine Content was decreased by 15.97% and PH value was found almost same for fresh and infected leaves (table 6). The experiment will be continued.
Table 5. TF, TR, HPS levels and color changes in fresh and red rust infected tea leaves
TF% TR% HPS% TLC% Color Index
Fresh Leaves 0.29 3.90 2.43 1.76 4.70
Infected leaves 0.29 2.56 1.98 1.70 6.36
% Reduced 00 34.35 18.52 3.41 (-) 35.32
Table 6: Caffeine level in fresh and red rust infected tea leaves
Amount of Caffeine (mg/ L) at specific absorbance
PH of brewed tea Color of brewed tea
Absorbance at 260
nm
Amount of Caffeine
Before boiling
After boiling
Before boiling
After boiling
Fresh Leaves
1.81 47.45 4.84 4.81 Reddish Light red brownish
Infected leaves
1.52 39.87 4.93 4.80 Yellowish Deep red brownish
% Reduced - 15.97 - - - -
PP 3.8: Management of soil borne diseases in tea with Plant Growth Promoting
(PGP) microbes (BTRI/ BEF: 2016- 2020)
There are four microbes like Bacillus, Pseudomonas, Streptomyces, Trichoderma are recorded. During 1st year in nursery, the polybags used for transferring tea rooted cuttings were inoculated with the four isolated microbial strains and one collected bio-fertilizer by mixing with 50 g of decomposed cowdung. The responses to these microbes in context of the
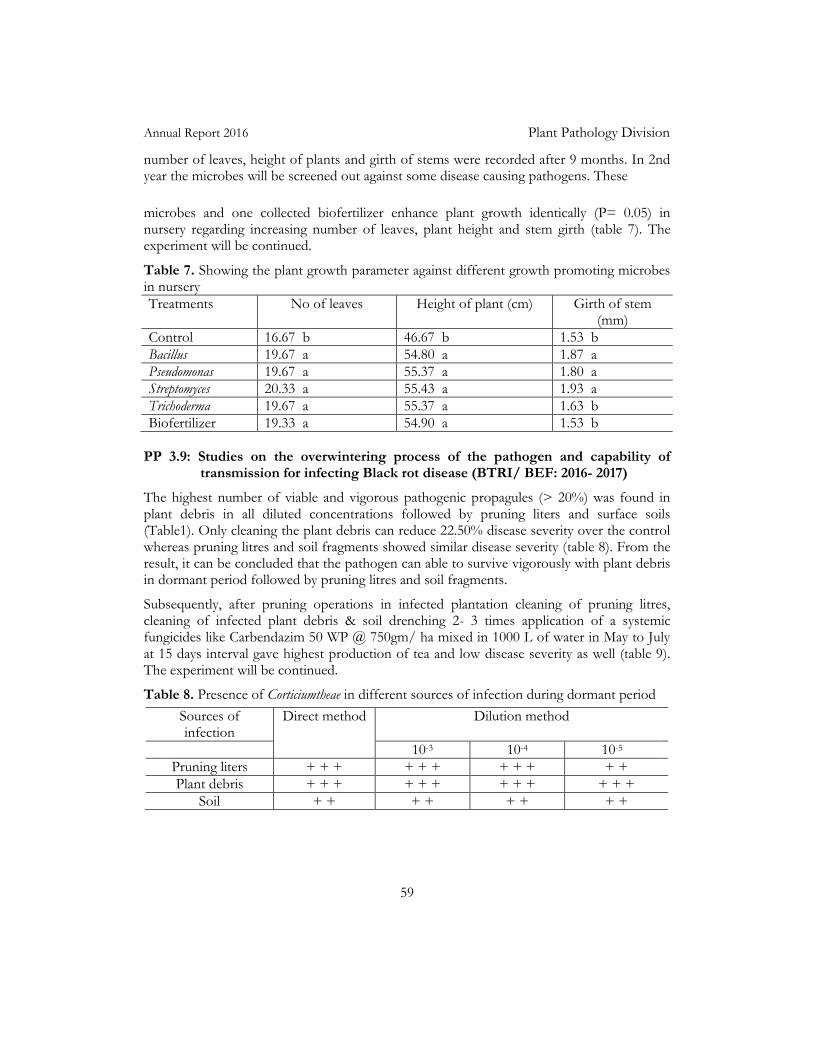
Annual Report 2016 Plant Pathology Division
59
number of leaves, height of plants and girth of stems were recorded after 9 months. In 2nd year the microbes will be screened out against some disease causing pathogens. These
microbes and one collected biofertilizer enhance plant growth identically (P= 0.05) in nursery regarding increasing number of leaves, plant height and stem girth (table 7). The experiment will be continued.
Table 7. Showing the plant growth parameter against different growth promoting microbes in nursery
Treatments No of leaves Height of plant (cm) Girth of stem (mm)
Control 16.67 b 46.67 b 1.53 b
Bacillus 19.67 a 54.80 a 1.87 a
Pseudomonas 19.67 a 55.37 a 1.80 a
Streptomyces 20.33 a 55.43 a 1.93 a
Trichoderma 19.67 a 55.37 a 1.63 b
Biofertilizer 19.33 a 54.90 a 1.53 b
PP 3.9: Studies on the overwintering process of the pathogen and capability of
transmission for infecting Black rot disease (BTRI/ BEF: 2016- 2017)
The highest number of viable and vigorous pathogenic propagules (> 20%) was found in plant debris in all diluted concentrations followed by pruning liters and surface soils (Table1). Only cleaning the plant debris can reduce 22.50% disease severity over the control whereas pruning litres and soil fragments showed similar disease severity (table 8). From the result, it can be concluded that the pathogen can able to survive vigorously with plant debris in dormant period followed by pruning litres and soil fragments.
Subsequently, after pruning operations in infected plantation cleaning of pruning litres, cleaning of infected plant debris & soil drenching 2- 3 times application of a systemic fungicides like Carbendazim 50 WP @ 750gm/ ha mixed in 1000 L of water in May to July at 15 days interval gave highest production of tea and low disease severity as well (table 9). The experiment will be continued.
Table 8. Presence of Corticiumtheae in different sources of infection during dormant period
Sources of infection
Direct method Dilution method
10-3 10-4 10-5
Pruning liters + + + + + + + + + + +
Plant debris + + + + + + + + + + + +
Soil + + + + + + + +
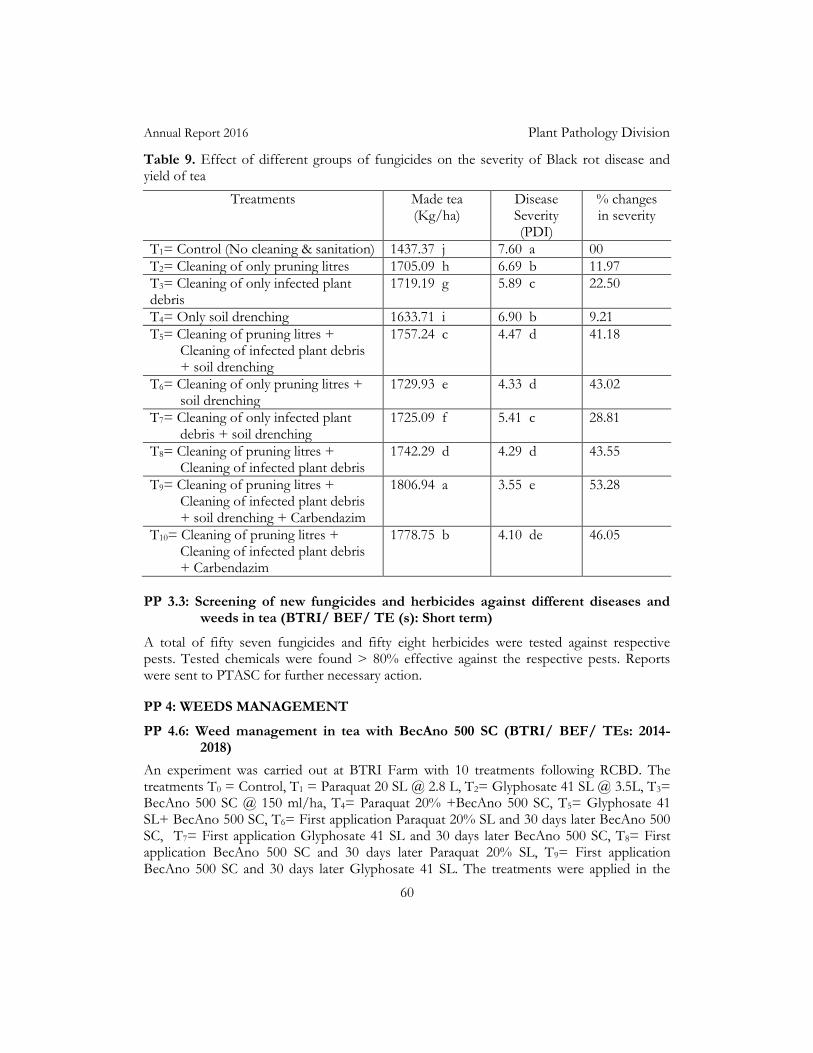
Annual Report 2016 Plant Pathology Division
60
Table 9. Effect of different groups of fungicides on the severity of Black rot disease and yield of tea
Treatments Made tea (Kg/ha)
Disease Severity (PDI)
% changes in severity
T1= Control (No cleaning & sanitation) 1437.37 j 7.60 a 00
T2= Cleaning of only pruning litres 1705.09 h 6.69 b 11.97
T3= Cleaning of only infected plant debris
1719.19 g 5.89 c 22.50
T4= Only soil drenching 1633.71 i 6.90 b 9.21
T5= Cleaning of pruning litres + Cleaning of infected plant debris + soil drenching
1757.24 c 4.47 d 41.18
T6= Cleaning of only pruning litres + soil drenching
1729.93 e 4.33 d 43.02
T7= Cleaning of only infected plant debris + soil drenching
1725.09 f 5.41 c 28.81
T8= Cleaning of pruning litres + Cleaning of infected plant debris
1742.29 d 4.29 d 43.55
T9= Cleaning of pruning litres + Cleaning of infected plant debris + soil drenching + Carbendazim
1806.94 a 3.55 e 53.28
T10= Cleaning of pruning litres + Cleaning of infected plant debris + Carbendazim
1778.75 b 4.10 de 46.05
PP 3.3: Screening of new fungicides and herbicides against different diseases and
weeds in tea (BTRI/ BEF/ TE (s): Short term)
A total of fifty seven fungicides and fifty eight herbicides were tested against respective pests. Tested chemicals were found > 80% effective against the respective pests. Reports were sent to PTASC for further necessary action.
PP 4: WEEDS MANAGEMENT
PP 4.6: Weed management in tea with BecAno 500 SC (BTRI/ BEF/ TEs: 2014- 2018)
An experiment was carried out at BTRI Farm with 10 treatments following RCBD. The treatments T0 = Control, T1 = Paraquat 20 SL @ 2.8 L, T2= Glyphosate 41 SL @ 3.5L, T3= BecAno 500 SC @ 150 ml/ha, T4= Paraquat 20% +BecAno 500 SC, T5= Glyphosate 41 SL+ BecAno 500 SC, T6= First application Paraquat 20% SL and 30 days later BecAno 500 SC, T7= First application Glyphosate 41 SL and 30 days later BecAno 500 SC, T8= First application BecAno 500 SC and 30 days later Paraquat 20% SL, T9= First application BecAno 500 SC and 30 days later Glyphosate 41 SL. The treatments were applied in the
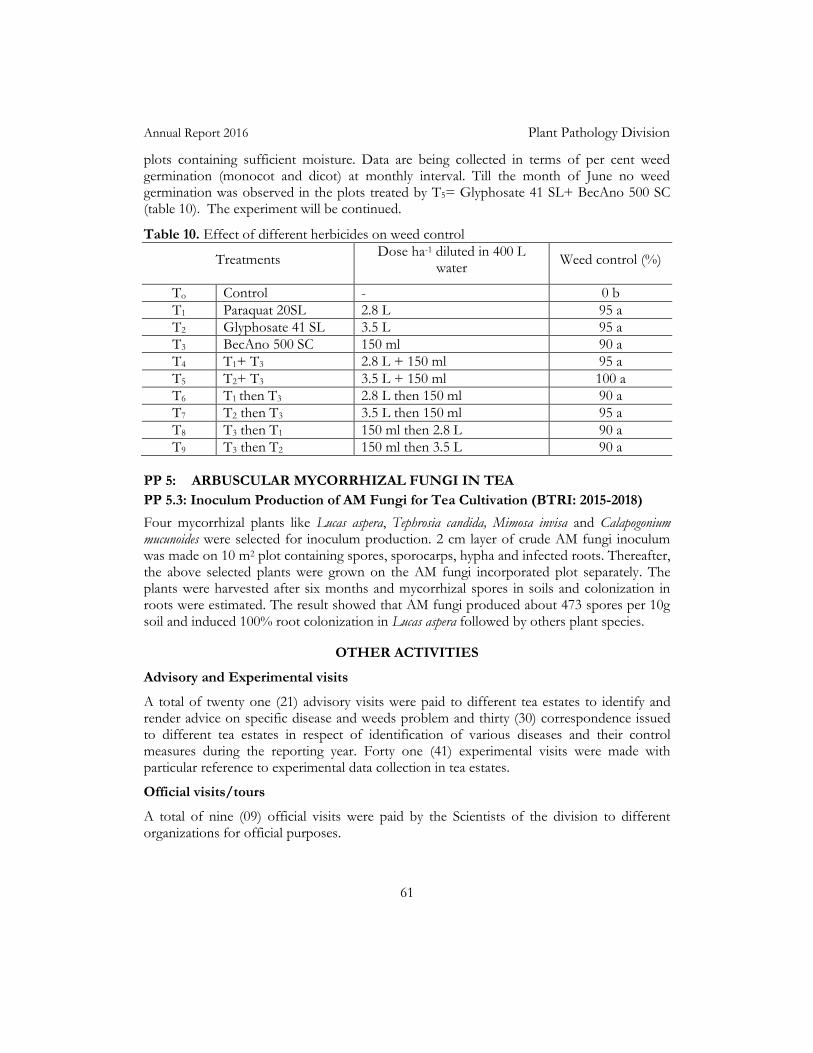
Annual Report 2016 Plant Pathology Division
61
plots containing sufficient moisture. Data are being collected in terms of per cent weed germination (monocot and dicot) at monthly interval. Till the month of June no weed germination was observed in the plots treated by T5= Glyphosate 41 SL+ BecAno 500 SC (table 10). The experiment will be continued.
Table 10. Effect of different herbicides on weed control
Treatments Dose ha-1 diluted in 400 L
water Weed control (%)
To Control - 0 b
T1 Paraquat 20SL 2.8 L 95 a
T2 Glyphosate 41 SL 3.5 L 95 a
T3 BecAno 500 SC 150 ml 90 a
T4 T1+ T3 2.8 L + 150 ml 95 a
T5 T2+ T3 3.5 L + 150 ml 100 a
T6 T1 then T3 2.8 L then 150 ml 90 a
T7 T2 then T3 3.5 L then 150 ml 95 a
T8 T3 then T1 150 ml then 2.8 L 90 a
T9 T3 then T2 150 ml then 3.5 L 90 a
PP 5: ARBUSCULAR MYCORRHIZAL FUNGI IN TEA
PP 5.3: Inoculum Production of AM Fungi for Tea Cultivation (BTRI: 2015-2018)
Four mycorrhizal plants like Lucas aspera, Tephrosia candida, Mimosa invisa and Calapogonium mucunoides were selected for inoculum production. 2 cm layer of crude AM fungi inoculum was made on 10 m2 plot containing spores, sporocarps, hypha and infected roots. Thereafter, the above selected plants were grown on the AM fungi incorporated plot separately. The plants were harvested after six months and mycorrhizal spores in soils and colonization in roots were estimated. The result showed that AM fungi produced about 473 spores per 10g soil and induced 100% root colonization in Lucas aspera followed by others plant species.
OTHER ACTIVITIES
Advisory and Experimental visits
A total of twenty one (21) advisory visits were paid to different tea estates to identify and render advice on specific disease and weeds problem and thirty (30) correspondence issued to different tea estates in respect of identification of various diseases and their control measures during the reporting year. Forty one (41) experimental visits were made with particular reference to experimental data collection in tea estates.
Official visits/tours
A total of nine (09) official visits were paid by the Scientists of the division to different organizations for official purposes.
Annual Report 2016 Plant Pathology Division
62
Courses on tea culture
The Scientific personnel of the division delivered lectures on tea diseases and weeds management at annual courses held at BTRI main station, Srimangal; BTRI Sub-station, Fatikchari, Chittagong and Panchagarh. They also delivered eight (08) hours comprehensive lectures in Post Graduation Diploma Course, MTC, BTB.
Workshop/Seminar
A total of eight (8) workshops were conducted at different tea estates under different valley circles on tea diseases and weeds management during the year.
Annual Report 2016 Statistics and Economics Division
63
STATISTICS & ECONOMICS DIVISION
Shefali Boonerjee Senior Scientific Officer
STAFF
Mrs. Shefali Boonerjee, Senior Scientific Officer joined on 23rd June 2015 in this Division. The posts of Principal Scientific Officer (PSO), and Statistical Assistant were lying vacant during the period under report. There was no other change in personnel position of the division.
RESEARCH
There were three experiments running in this division namely -Economic Efficiency of
tea production, Evaluation of technology and Economic Efficiency of tea factories. The
experiments were discontinued since last 3 years due to absence of researchers.
Necessary attempts are being done for the rearranging and conducting these experiments.
The present situation of these experiments is summarized below:
SE 1: ECONOMIC EFFICIENCY OF TEA PRODUCTION
SE 1.1. Economics of optimum fertilizer dose for some selective clones at BTRI farm.
The experiment is now under supervission for rearranging and analysing the data.
SE 2: EVALUATION OF TECHNOLOGIES SE 2.1. Adoption of BTRI Innovated Technologies and its Extension to Bangladesh Tea Industry.
The study conducted to examine the overall feature of implementation and its efficiency of the BTRI technologies to the tea estates. BTRI has innovated a number of technologies since last 60 years and made a great impact on tea improvement providing those technologies. Bangladesh tea has increased its productivity remarkably from the last few decades but it is still behind in terms of yield and quality than the other leading tea growing countries in the world. The yield trend is less than that of other tea producing countries like India, Kenya, Sri Lanka etc. The important reason of such low production is assumed due to improper utilization of scientific technologies like inferior planting materials, lack of authentic control measures of pest and disease management, absence of proper agronomic practices, soil fertility and pH condition etc. BTRI has so far released 20 outstanding clones and many other successful technologies which are effectively been used in the tea industry. But there is no information about the percentage of application of the technologies and its efficiency in implementation. So the current data regarding the disseminated technologies to the estate required to up-to-date. This database will be helpful to find out the adoption efficiency in the field and to find out the limitations of dissemination of the BTRI innovated technologies.
In the present experiment, the adoption percentages of both BT and TV clones in the tea
estates of different valleys are tried to explore. The calculated data on clonal plantation areas
of the tea estates are presented in the Table 1. During this study, it was recorded that,
among the 162, a total of 87 tea states were responded initially. They have sent their
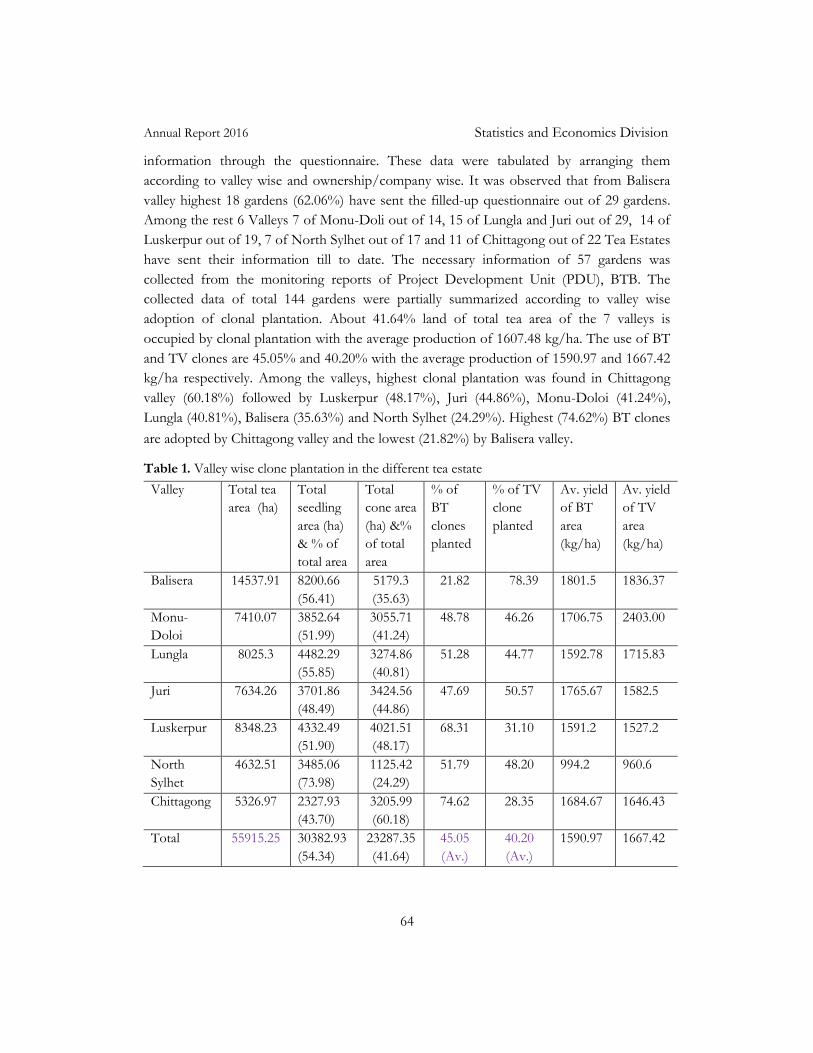
Annual Report 2016 Statistics and Economics Division
64
information through the questionnaire. These data were tabulated by arranging them
according to valley wise and ownership/company wise. It was observed that from Balisera
valley highest 18 gardens (62.06%) have sent the filled-up questionnaire out of 29 gardens.
Among the rest 6 Valleys 7 of Monu-Doli out of 14, 15 of Lungla and Juri out of 29, 14 of
Luskerpur out of 19, 7 of North Sylhet out of 17 and 11 of Chittagong out of 22 Tea Estates
have sent their information till to date. The necessary information of 57 gardens was
collected from the monitoring reports of Project Development Unit (PDU), BTB. The
collected data of total 144 gardens were partially summarized according to valley wise
adoption of clonal plantation. About 41.64% land of total tea area of the 7 valleys is
occupied by clonal plantation with the average production of 1607.48 kg/ha. The use of BT
and TV clones are 45.05% and 40.20% with the average production of 1590.97 and 1667.42
kg/ha respectively. Among the valleys, highest clonal plantation was found in Chittagong
valley (60.18%) followed by Luskerpur (48.17%), Juri (44.86%), Monu-Doloi (41.24%),
Lungla (40.81%), Balisera (35.63%) and North Sylhet (24.29%). Highest (74.62%) BT clones
are adopted by Chittagong valley and the lowest (21.82%) by Balisera valley.
Table 1. Valley wise clone plantation in the different tea estate
Valley Total tea
area (ha)
Total
seedling
area (ha)
& % of
total area
Total
cone area
(ha) &%
of total
area
% of
BT
clones
planted
% of TV
clone
planted
Av. yield
of BT
area
(kg/ha)
Av. yield
of TV
area
(kg/ha)
Balisera 14537.91 8200.66
(56.41)
5179.3
(35.63)
21.82 78.39 1801.5 1836.37
Monu-
Doloi
7410.07 3852.64
(51.99)
3055.71
(41.24)
48.78 46.26 1706.75 2403.00
Lungla 8025.3 4482.29
(55.85)
3274.86
(40.81)
51.28 44.77 1592.78 1715.83
Juri 7634.26 3701.86
(48.49)
3424.56
(44.86)
47.69 50.57 1765.67 1582.5
Luskerpur 8348.23 4332.49
(51.90)
4021.51
(48.17)
68.31 31.10 1591.2 1527.2
North
Sylhet
4632.51 3485.06
(73.98)
1125.42
(24.29)
51.79 48.20 994.2 960.6
Chittagong 5326.97 2327.93
(43.70)
3205.99
(60.18)
74.62 28.35 1684.67 1646.43
Total 55915.25 30382.93
(54.34)
23287.35
(41.64)
45.05
(Av.)
40.20
(Av.)
1590.97 1667.42
Annual Report 2016 Statistics and Economics Division
65
OTHER ACTIVITIES
Annual Returns of BTB and BCS
Annual returns of BTRI farms including Bilashcherra Experimental farm on land use, tea seeds, plants and tea waste (BTB return No. 2) and also on employment and employment cost (BTB return No. 4) were prepared for the period of 2015-1016 and sent to BTB. Annual statistical return of manpower and labor welfare (BCS form No. 2) and on tea garden land (BCS return No. 3) of BTRI farms for 2014-2015 also had sent to BCS office, Dhaka.
Annual Courses
The Senior Scientific Officer delivered lectures on “Tea statistics and Economics” in the 51nd Annual course on Tea Culture organized by BTRI for the covenanted staff of tea estates of greater Sylhet held at the institute during 2016.
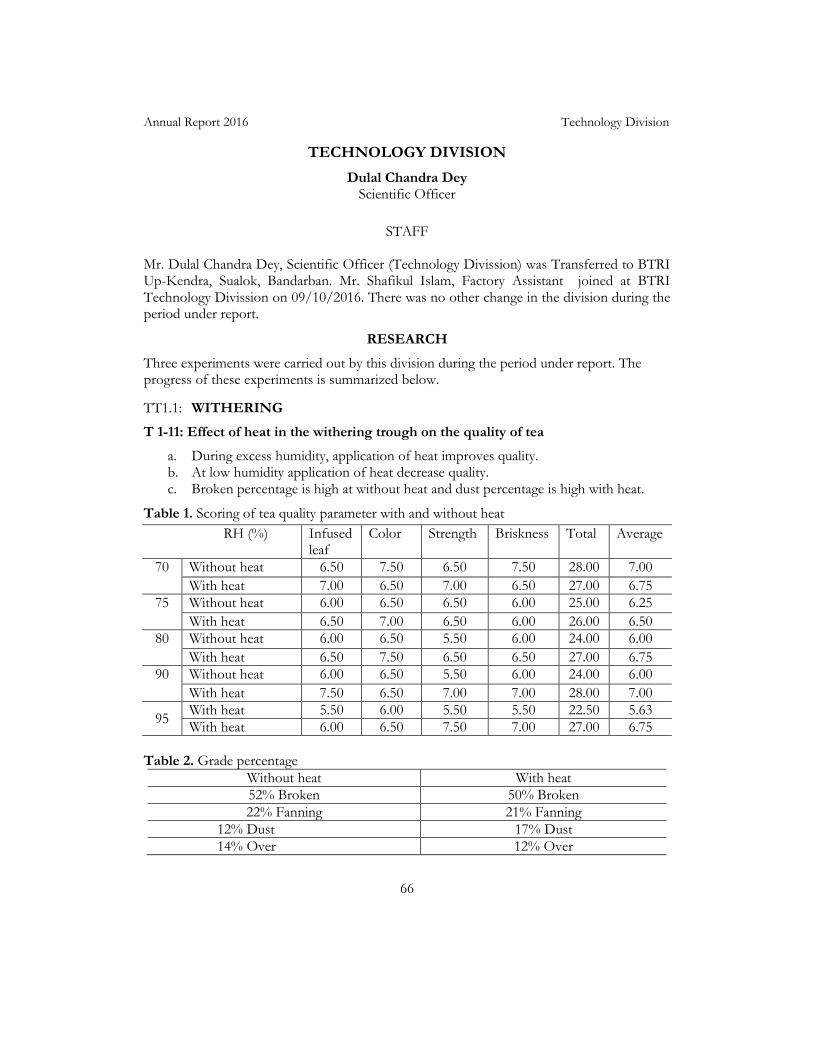
Annual Report 2016 Technology Division
66
TECHNOLOGY DIVISION
Dulal Chandra Dey Scientific Officer
STAFF
Mr. Dulal Chandra Dey, Scientific Officer (Technology Divission) was Transferred to BTRI Up-Kendra, Sualok, Bandarban. Mr. Shafikul Islam, Factory Assistant joined at BTRI Technology Divission on 09/10/2016. There was no other change in the division during the period under report.
RESEARCH
Three experiments were carried out by this division during the period under report. The progress of these experiments is summarized below.
TT1.1: WITHERING
T 1-11: Effect of heat in the withering trough on the quality of tea
a. During excess humidity, application of heat improves quality. b. At low humidity application of heat decrease quality. c. Broken percentage is high at without heat and dust percentage is high with heat.
Table 1. Scoring of tea quality parameter with and without heat
RH (%) Infused leaf
Color Strength Briskness Total Average
70 Without heat 6.50 7.50 6.50 7.50 28.00 7.00
With heat 7.00 6.50 7.00 6.50 27.00 6.75
75 Without heat 6.00 6.50 6.50 6.00 25.00 6.25
With heat 6.50 7.00 6.50 6.00 26.00 6.50
80 Without heat 6.00 6.50 5.50 6.00 24.00 6.00
With heat 6.50 7.50 6.50 6.50 27.00 6.75
90 Without heat 6.00 6.50 5.50 6.00 24.00 6.00
With heat 7.50 6.50 7.00 7.00 28.00 7.00
95 With heat 5.50 6.00 5.50 5.50 22.50 5.63
With heat 6.00 6.50 7.50 7.00 27.00 6.75
Table 2. Grade percentage
Without heat With heat
52% Broken 50% Broken
22% Fanning 21% Fanning
12% Dust 17% Dust
14% Over 12% Over
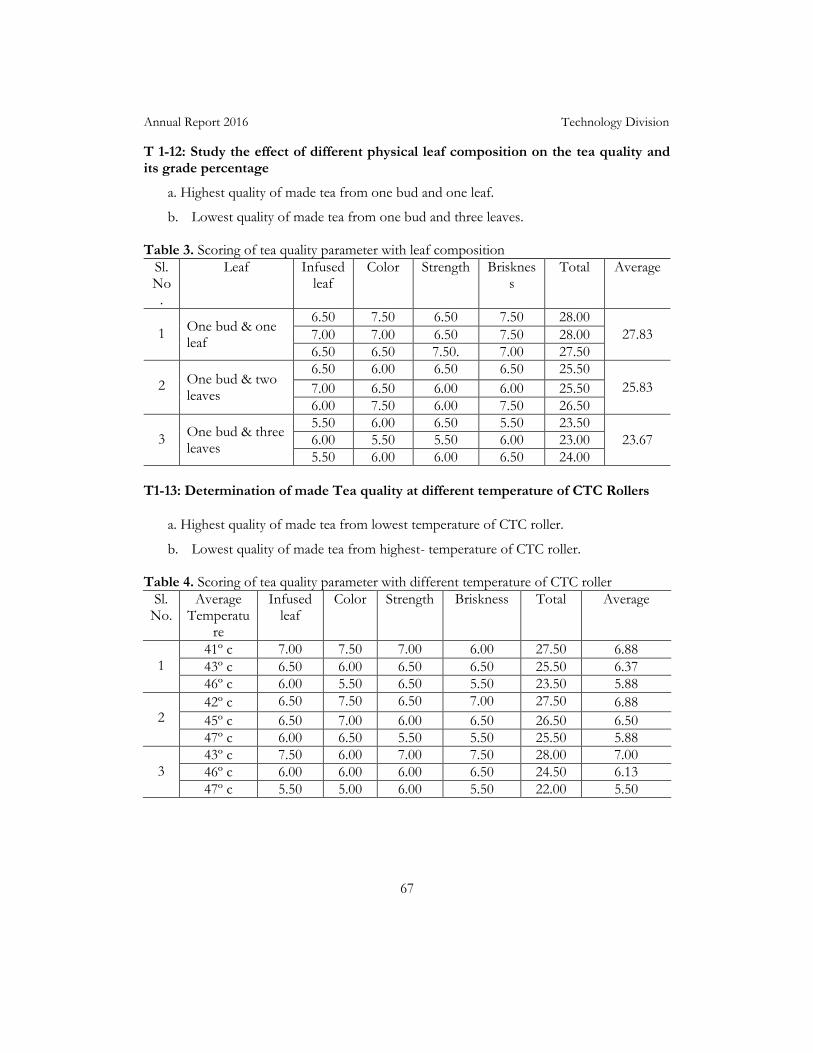
Annual Report 2016 Technology Division
67
T 1-12: Study the effect of different physical leaf composition on the tea quality and its grade percentage
a. Highest quality of made tea from one bud and one leaf.
b. Lowest quality of made tea from one bud and three leaves. Table 3. Scoring of tea quality parameter with leaf composition
Sl. No
.
Leaf Infused leaf
Color Strength Briskness
Total Average
1
One bud & one leaf
6.50 7.50 6.50 7.50 28.00
27.83 7.00 7.00 6.50 7.50 28.00
6.50 6.50 7.50. 7.00 27.50
2 One bud & two
leaves
6.50 6.00 6.50 6.50 25.50
25.83 7.00 6.50 6.00 6.00 25.50
6.00 7.50 6.00 7.50 26.50
3
One bud & three leaves
5.50 6.00 6.50 5.50 23.50
23.67 6.00 5.50 5.50 6.00 23.00
5.50 6.00 6.00 6.50 24.00
T1-13: Determination of made Tea quality at different temperature of CTC Rollers
a. Highest quality of made tea from lowest temperature of CTC roller.
b. Lowest quality of made tea from highest- temperature of CTC roller. Table 4. Scoring of tea quality parameter with different temperature of CTC roller
Sl. No.
Average Temperatu
re
Infused leaf
Color Strength Briskness Total Average
1
41º c 7.00 7.50 7.00 6.00 27.50 6.88
43º c 6.50 6.00 6.50 6.50 25.50 6.37
46º c 6.00 5.50 6.50 5.50 23.50 5.88
2
42º c 6.50 7.50 6.50 7.00 27.50 6.88
45º c 6.50 7.00 6.00 6.50 26.50 6.50
47º c 6.00 6.50 5.50 5.50 25.50 5.88
3
43º c 7.50 6.00 7.00 7.50 28.00 7.00
46º c 6.00 6.00 6.00 6.50 24.50 6.13
47º c 5.50 5.00 6.00 5.50 22.00 5.50

Annual Report 2016 Technology Division
68
Factory
Maintenance and repair works of the factory machinery were done as usual. Re- sharpening of CTC rollers was done at workshop with high degree of standard. Maintenance of power house and different kind of vehicles were done as usual.
OTHER ACTIVITIES
Advisory and Experimental visits
A total of four (04) advisory visits were paid to different tea estates.
Official visits/tours
A total of three (03) official visits were paid by the Scientists of the division to different organizations for official purposes.
Courses on tea culture
The Scientific personnel of the division delivered lectures on tea processing and manufacturing at annual courses held at BTRI for the covenanted staff of tea estates, Scientists and Officers of BTRI and PDU during 2016. Scientists of this division also delivered lectures as resource speakers at the Management Training centre (MTC) for Post Graduate Diploma Course organized by Project Development Unit (PDU) of Bangladesh Tea Board.
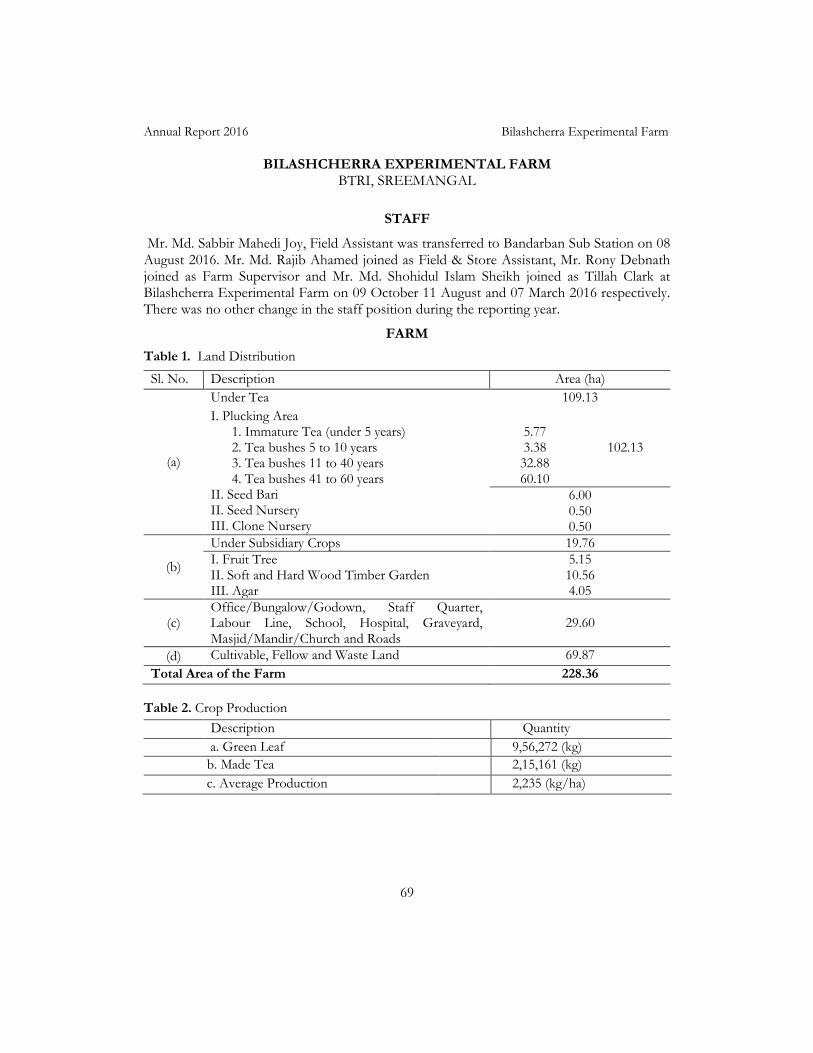
Annual Report 2016 Bilashcherra Experimental Farm
69
BILASHCHERRA EXPERIMENTAL FARM BTRI, SREEMANGAL
STAFF
Mr. Md. Sabbir Mahedi Joy, Field Assistant was transferred to Bandarban Sub Station on 08 August 2016. Mr. Md. Rajib Ahamed joined as Field & Store Assistant, Mr. Rony Debnath joined as Farm Supervisor and Mr. Md. Shohidul Islam Sheikh joined as Tillah Clark at Bilashcherra Experimental Farm on 09 October 11 August and 07 March 2016 respectively. There was no other change in the staff position during the reporting year.
FARM
Table 1. Land Distribution
Sl. No. Description Area (ha)
(a)
Under Tea 109.13
I. Plucking Area 1. Immature Tea (under 5 years) 2. Tea bushes 5 to 10 years 3. Tea bushes 11 to 40 years 4. Tea bushes 41 to 60 years II. Seed Bari II. Seed Nursery III. Clone Nursery
5.77 3.38 32.88 60.10
102.13
6.00 0.50 0.50
(b)
Under Subsidiary Crops 19.76
I. Fruit Tree II. Soft and Hard Wood Timber Garden III. Agar
5.15 10.56 4.05
(c) Office/Bungalow/Godown, Staff Quarter, Labour Line, School, Hospital, Graveyard, Masjid/Mandir/Church and Roads
29.60
(d) Cultivable, Fellow and Waste Land 69.87
Total Area of the Farm 228.36
Table 2. Crop Production
Description Quantity
a. Green Leaf 9,56,272 (kg)
b. Made Tea 2,15,161 (kg)
c. Average Production 2,235 (kg/ha)

Annual Report 2016 Bilashcherra Experimental Farm
70
Table 3. Green leaf Production of the Farm in the Year 2016
Month Month-wise crop production (kg)
January -
February -
March 28,573
April 57,491
May 25,805
June 1,88,262
July 29,412
August 1,72,197
September 1,70,473
October 1,26,474
November 1,14,543
December 43,078
Total 9,56,272 kg
Table 4. Production of Improved Bi-clonal Seed, Planting Materials and Sales of Farm Products
Bi-Clonal Seed production
(kg)
Institutional use (kg)
Sales of Bi-Clonal Seed (kg)
Sale amount (Tk)
Sales of Different Fruit (Tk)
589 30 559 83,850.00 25,000.00
Extension and Development
1.50 ha of land was newly planted in 2016. It has a nursery with the average capacity of 40,000 plants. Water supply, labor houses, roads and bridges were regularly maintained. Four thousand tea saplings were infilled in different sections in the year 2016. Experiments of different divisions had been facilitated at the period.
Miscellaneous
The Victory Day as well as the Independence Day were celebrated with due solemnity during the year. Prizes for sports and sweets were distributed among the labors of the farm and their children on both the occasions. Blankets were distributed among the labors as incentive of the year.
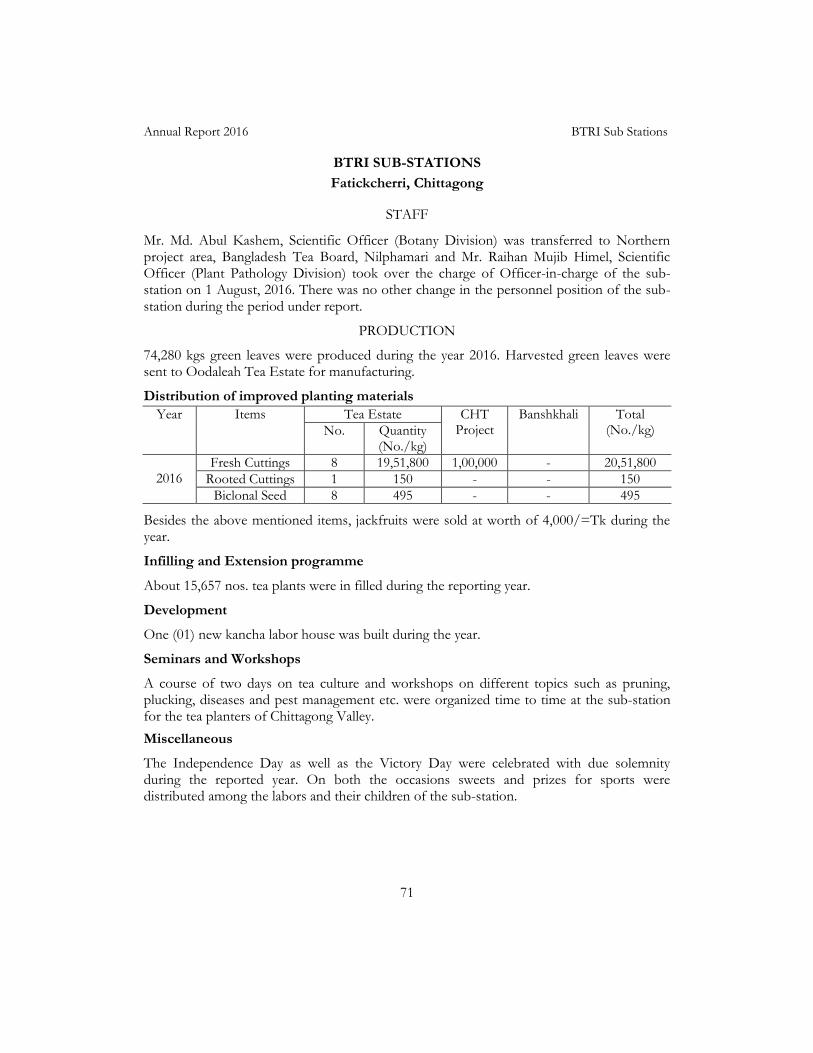
Annual Report 2016 BTRI Sub Stations
71
BTRI SUB-STATIONS
Fatickcherri, Chittagong
STAFF
Mr. Md. Abul Kashem, Scientific Officer (Botany Division) was transferred to Northern project area, Bangladesh Tea Board, Nilphamari and Mr. Raihan Mujib Himel, Scientific Officer (Plant Pathology Division) took over the charge of Officer-in-charge of the sub-station on 1 August, 2016. There was no other change in the personnel position of the sub-station during the period under report.
PRODUCTION
74,280 kgs green leaves were produced during the year 2016. Harvested green leaves were sent to Oodaleah Tea Estate for manufacturing.
Distribution of improved planting materials
Year Items Tea Estate CHT Project
Banshkhali Total (No./kg) No. Quantity
(No./kg)
2016
Fresh Cuttings 8 19,51,800 1,00,000 - 20,51,800
Rooted Cuttings 1 150 - - 150
Biclonal Seed 8 495 - - 495
Besides the above mentioned items, jackfruits were sold at worth of 4,000/=Tk during the year.
Infilling and Extension programme
About 15,657 nos. tea plants were in filled during the reporting year.
Development
One (01) new kancha labor house was built during the year.
Seminars and Workshops
A course of two days on tea culture and workshops on different topics such as pruning, plucking, diseases and pest management etc. were organized time to time at the sub-station for the tea planters of Chittagong Valley.
Miscellaneous
The Independence Day as well as the Victory Day were celebrated with due solemnity during the reported year. On both the occasions sweets and prizes for sports were distributed among the labors and their children of the sub-station.
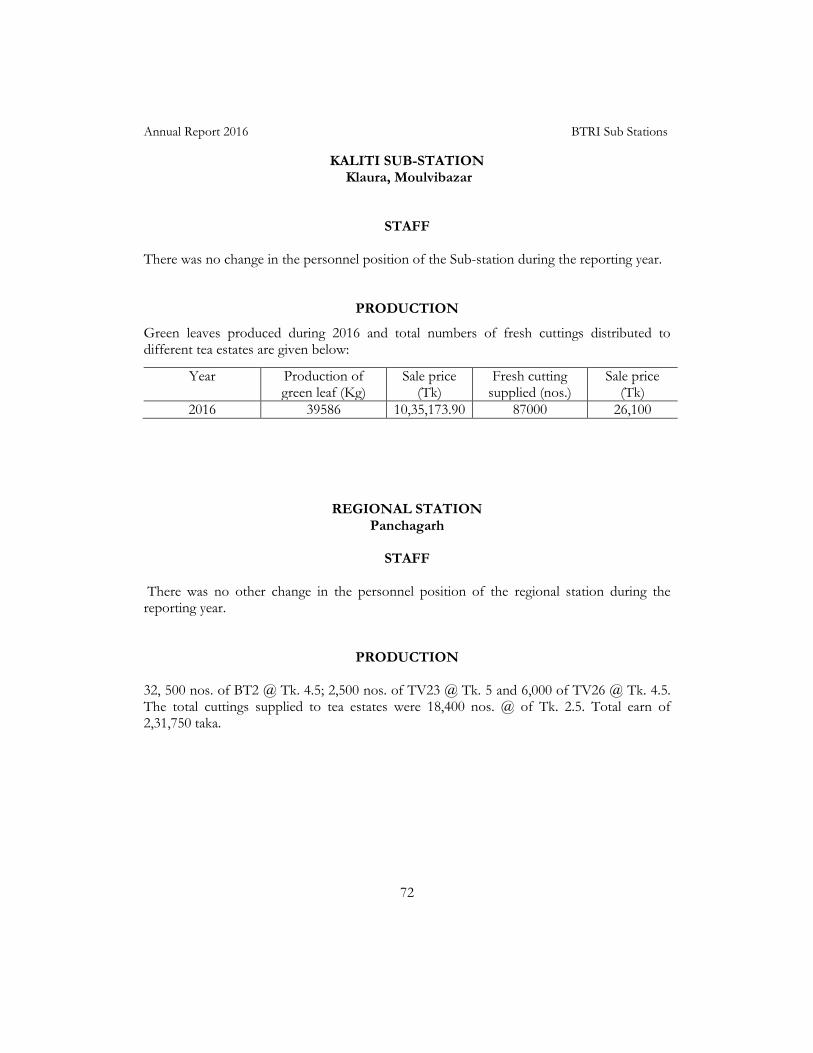
Annual Report 2016 BTRI Sub Stations
72
KALITI SUB-STATION Klaura, Moulvibazar
STAFF There was no change in the personnel position of the Sub-station during the reporting year.
PRODUCTION
Green leaves produced during 2016 and total numbers of fresh cuttings distributed to different tea estates are given below:
Year Production of green leaf (Kg)
Sale price (Tk)
Fresh cutting supplied (nos.)
Sale price (Tk)
2016 39586 10,35,173.90 87000 26,100
REGIONAL STATION Panchagarh
STAFF
There was no other change in the personnel position of the regional station during the reporting year.
PRODUCTION
32, 500 nos. of BT2 @ Tk. 4.5; 2,500 nos. of TV23 @ Tk. 5 and 6,000 of TV26 @ Tk. 4.5. The total cuttings supplied to tea estates were 18,400 nos. @ of Tk. 2.5. Total earn of 2,31,750 taka.
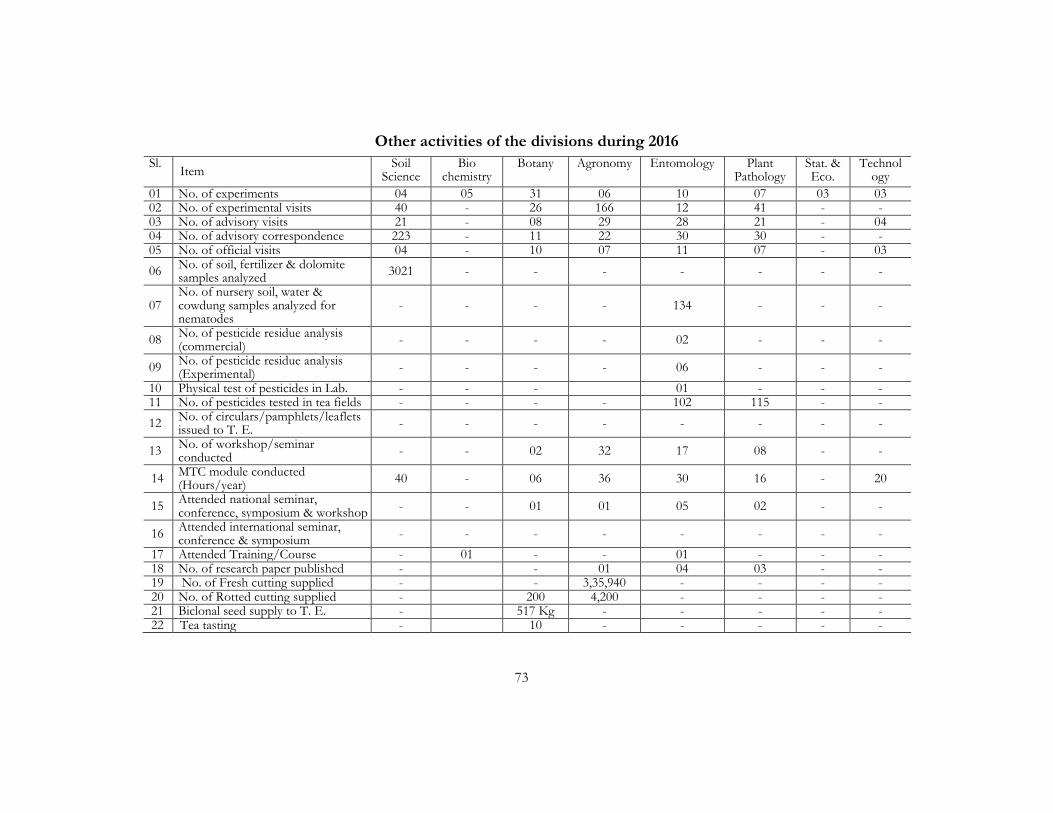
73
Other activities of the divisions during 2016
Sl. Item
Soil Science
Bio chemistry
Botany Agronomy Entomology Plant Pathology
Stat. & Eco.
Technology
01 No. of experiments 04 05 31 06 10 07 03 03 02 No. of experimental visits 40 - 26 166 12 41 - - 03 No. of advisory visits 21 - 08 29 28 21 - 04 04 No. of advisory correspondence 223 - 11 22 30 30 - - 05 No. of official visits 04 - 10 07 11 07 - 03
06 No. of soil, fertilizer & dolomite samples analyzed
3021 - - - - - - -
07 No. of nursery soil, water & cowdung samples analyzed for nematodes
- - - - 134 - - -
08 No. of pesticide residue analysis (commercial)
- - - - 02 - - -
09 No. of pesticide residue analysis (Experimental)
- - - - 06 - - -
10 Physical test of pesticides in Lab. - - - 01 - - - 11 No. of pesticides tested in tea fields - - - - 102 115 - -
12 No. of circulars/pamphlets/leaflets issued to T. E.
- - - - - - - -
13 No. of workshop/seminar conducted
- - 02 32 17 08 - -
14 MTC module conducted (Hours/year)
40 - 06 36 30 16 - 20
15 Attended national seminar, conference, symposium & workshop
- - 01 01 05 02 - -
16 Attended international seminar, conference & symposium
- - - - - - - -
17 Attended Training/Course - 01 - - 01 - - - 18 No. of research paper published - - 01 04 03 - - 19 No. of Fresh cutting supplied - - 3,35,940 - - - - 20 No. of Rotted cutting supplied - 200 4,200 - - - - 21 Biclonal seed supply to T. E. - 517 Kg - - - - - 22 Tea tasting - 10 - - - - -
il:
l:.
Institute
:*::t: ":''4.tlif '1&i .:.'.]':1q .' *E*-ffi.F_-#ffi.ffi#'_&*
ffiw;e
;*,#
j,.
:::
*i*.
'::*w
ii*1
ffii&ffi:&i
t&;asll*&.ii*.
;:x
.:s
t:
,*:#:ffi*$!c*
,1
w
Copyright © 2022 FDOKUMEN