The Regulation of Hedge Funds, Private Equity, and Sovereign Wealth Funds
Upload
khangminh22Category
view
0download
0
Annual ReportJune 30, 2020
SPDR® Series Trust - Equity FundsSPDR Dow Jones REIT ETF
SPDR S&P Biotech ETF
SPDR S&P Dividend ETF
Beginning on January 1, 2021, as permitted by regulations adopted by theU.S. Securities and Exchange Commission, paper copies of a Fund’s annual andsemi-annual shareholder reports will no longer be sent by mail, unless youspecifically request paper copies of the reports from the Fund (or from yourfinancial intermediary, such as a broker-dealer or bank). Instead, the reports willbe made available on a Fund’s website (www.ssga.com), and you will be notifiedby mail each time a report is posted, and provided with a website link to accessthe report. If you already elected to receive reports electronically, you will not beaffected by this change and you need not take any action. You may elect to receiveshareholder reports and other communications by contacting your financialintermediary.
You may elect to receive all future reports in paper free of charge. If you investthrough a financial intermediary, you can contact your financial intermediary torequest that you continue to receive paper copies of your shareholder reports.Your election to receive reports in paper will apply to all funds held in youraccount.
The information contained in this report is intended for the general information ofshareholders of the Trust. This report is not authorized for distribution toprospective investors unless preceded or accompanied by a current Trustprospectus which contains important information concerning the Trust. You mayobtain a current prospectus and SAI from the Distributor by calling 1-866-787-2257or visiting www.ssga.com. Please read the prospectus carefully before you invest.


TA B L E O F C O N T E N T S
Notes to Performance Summaries (Unaudited) . . . . . . . . . . . . . . . . . . . . . . . . . 1Management’s Discussion of Fund Performance, Performance Summaries
& Portfolio Statistics (Unaudited)SPDR Dow Jones REIT ETF (RWR) . . . . . . . . . . . . . . . . . . . . . . . . . . . . . . . . . . . . 2SPDR S&P Biotech ETF (XBI). . . . . . . . . . . . . . . . . . . . . . . . . . . . . . . . . . . . . . . . . 5SPDR S&P Dividend ETF (SDY). . . . . . . . . . . . . . . . . . . . . . . . . . . . . . . . . . . . . . . 8
Schedules of InvestmentsSPDR Dow Jones REIT ETF (RWR) . . . . . . . . . . . . . . . . . . . . . . . . . . . . . . . . . . . . 12SPDR S&P Biotech ETF (XBI). . . . . . . . . . . . . . . . . . . . . . . . . . . . . . . . . . . . . . . . . 17SPDR S&P Dividend ETF (SDY). . . . . . . . . . . . . . . . . . . . . . . . . . . . . . . . . . . . . . . 22
Financial Statements . . . . . . . . . . . . . . . . . . . . . . . . . . . . . . . . . . . . . . . . . . . . . . . . 29Financial Highlights . . . . . . . . . . . . . . . . . . . . . . . . . . . . . . . . . . . . . . . . . . . . . . . . . 34Notes to Financial Statements. . . . . . . . . . . . . . . . . . . . . . . . . . . . . . . . . . . . . . . . 37Report of Independent Registered Public Accounting Firm . . . . . . . . . . . . . . 49Other Information (Unaudited) . . . . . . . . . . . . . . . . . . . . . . . . . . . . . . . . . . . . . . . 51
The information contained in this report is intended for the general information ofshareholders of the Trust. This report is not authorized for distribution to prospectiveinvestors unless preceded or accompanied by a current Trust prospectus whichcontains important information concerning the Trust. You may obtain a currentprospectus and SAI from the Distributor by calling 1-866-787-2257 or visitingwww.ssga.com. Please read the prospectus carefully before you invest.

[This Page Intentionally Left Blank]
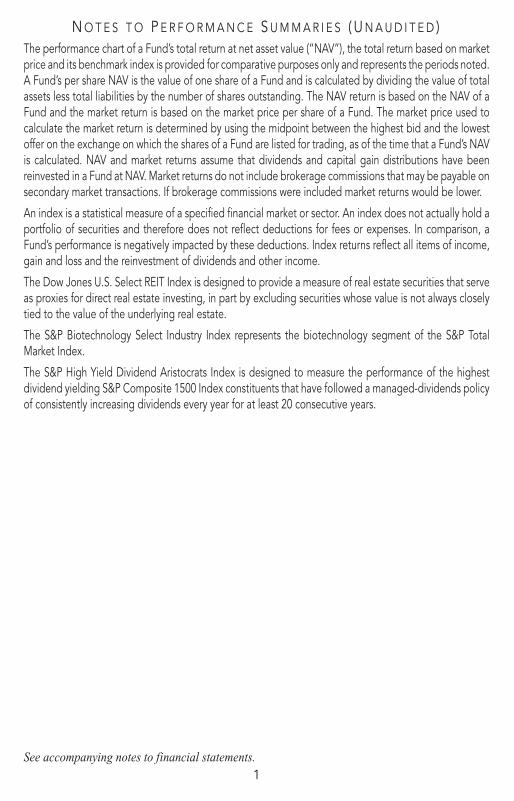
N O T E S T O P E R F O R M A N C E S U M M A R I E S ( U N A U D I T E D )The performance chart of a Fund’s total return at net asset value (“NAV”), the total return based on marketprice and its benchmark index is provided for comparative purposes only and represents the periods noted.A Fund’s per share NAV is the value of one share of a Fund and is calculated by dividing the value of totalassets less total liabilities by the number of shares outstanding. The NAV return is based on the NAV of aFund and the market return is based on the market price per share of a Fund. The market price used tocalculate the market return is determined by using the midpoint between the highest bid and the lowestoffer on the exchange on which the shares of a Fund are listed for trading, as of the time that a Fund’s NAVis calculated. NAV and market returns assume that dividends and capital gain distributions have beenreinvested in a Fund at NAV. Market returns do not include brokerage commissions that may be payable onsecondary market transactions. If brokerage commissions were included market returns would be lower.
An index is a statistical measure of a specified financial market or sector. An index does not actually hold aportfolio of securities and therefore does not reflect deductions for fees or expenses. In comparison, aFund’s performance is negatively impacted by these deductions. Index returns reflect all items of income,gain and loss and the reinvestment of dividends and other income.
The Dow Jones U.S. Select REIT Index is designed to provide a measure of real estate securities that serveas proxies for direct real estate investing, in part by excluding securities whose value is not always closelytied to the value of the underlying real estate.
The S&P Biotechnology Select Industry Index represents the biotechnology segment of the S&P TotalMarket Index.
The S&P High Yield Dividend Aristocrats Index is designed to measure the performance of the highestdividend yielding S&P Composite 1500 Index constituents that have followed a managed-dividends policyof consistently increasing dividends every year for at least 20 consecutive years.
See accompanying notes to financial statements.1

S P D R D O W J O N E S R E I T E T FM A N A G E M E N T ’ S D I S C U S S I O N O F F U N D P E R F O R M A N C E
( U N A U D I T E D )The SPDR Dow Jones REIT ETF (the “Fund”) seeks to provide investment results that, before fees andexpenses, correspond generally to the total return performance of an index that tracks the performance ofpublicly traded real estate investment trusts. The Fund’s benchmark is the Dow Jones U.S. Select REIT Index(the “Index”).
For the 12-month period ended June 30, 2020 (the “Reporting Period”), the total return for the Fund was–18.04%, and the Index was –17.71%. The Fund and Index returns reflect the reinvestment of dividendsand other income. The Fund’s performance reflects the expenses of managing the Fund, includingbrokerage and advisory expenses. The Index is unmanaged and Index returns do not reflect fees andexpenses of any kind, which would have a negative impact on returns. Fees and expenses, cash drag and thecumulative effect of security misweights contributed to the difference between the Fund’s performance andthat of the Index.
Real Estate Investment Trusts (“REITs”) traded in the U.S. struggled over the past fiscal year and trailed theS&P 500 for three out of the four fiscal quarters, as well as for the Reporting Period overall. Not surprisingly,the COVID-19 outbreak was a significant factor in the downward pressure on REITs. The Index was solidlypositive during the first fiscal quarter and even outperformed the S&P 500 during that time as REITsresponded well to two Federal Reserve rate cuts. Unfortunately, the Index underperformed the S&P 500 forthe remaining three quarters of the fiscal year. In Q4 of 2019, the Index turned slightly negative despite lowinterest rates and relative stability on the geopolitical front. As we welcomed in 2020, however, the globalCOVID-19 pandemic hit markets hard and REITs were among the hardest hit. Q1 2020 resulted insignificantly negative returns for the Index as offices, businesses, hotels and restaurants all grappled withthe new travel and social distancing restrictions. This raised additional concern about rent and mortgagepayments at a time when consumer demand for online shopping had already been increasing. The finalquarter of the fiscal year brought back some positive performance, but the rebound was not enough tocatch up with the S&P 500.
The Fund did not invest in derivatives during the Reporting Period.
On an individual security level, the top positive contributors to the Fund’s performance during the ReportingPeriod were Prologis, Digital Realty Trust and Duke Realty Corporation. The top negative contributors to theFund’s performance during the Reporting Period were Simon Property Group, AvalonBay Communities andEquity Residential.
The views expressed above reflect those of the Fund’s portfolio manager only through the Reporting Period,and do not necessarily represent the views of the Adviser as a whole. Any such views are subject to changeat any time based upon market or other conditions and the Adviser disclaims any responsibility to updatesuch views. These views may not be relied on as investment advice and, because investment decisions fora fund are based on numerous factors, may not be relied on as an indication of trading intent on behalf ofany fund.
See accompanying notes to financial statements.2

S P D R D O W J O N E S R E I T E T FP E R F O R M A N C E S U M M A R Y ( U N A U D I T E D )
Performance as of June 30, 2020
Cumulative Total Return Average Annual Total Return
NetAssetValue
MarketValue
Dow JonesU.S. Select REIT
Index
NetAssetValue
MarketValue
Dow JonesU.S. Select REIT
Index
ONE YEAR –18.04% –18.11% –17.71% –18.04% –18.11% –17.71%
FIVE YEARS 11.27% 11.20% 12.85% 2.16% 2.15% 2.45%
TEN YEARS 115.58% 115.27% 121.42% 7.98% 7.97% 8.27%
Comparison of Change in Value of a $10,000 Investment(Based on Net Asset Value)
SPDR Dow Jones REIT ETF (a) Dow Jones U.S Select REIT Index(b)
$5,000
$10,000
$15,000
$20,000
$25,000
$30,000
6/3
0/11
6/3
0/12
6/3
0/13
6/3
0/14
6/3
0/15
6/3
0/16
6/3
0/17
6/3
0/18
6/3
0/19
6/3
0/10
6/3
0/20
$22,142(b)$21,558(a)
Line graph is based on cumulative total return.
The total expense ratio for SPDR Dow Jones REIT ETF as stated in the Fees and Expenses table of themost recent prospectus is 0.25%. Please see the financial highlights for the total expense ratio for thefiscal period ended June 30, 2020.
Performance quoted represents past performance, which is no guarantee of future results. Investmentreturn and principal value will fluctuate, so you may have a gain or loss when shares are sold. Currentperformance may be higher or lower than that quoted. Visit www.ssga.com for most recentmonth-end performance. The returns do not reflect the deduction of taxes that a shareholder wouldpay on Fund distributions or on the redemption or sale of Fund shares. See �Notes to PerformanceSummaries� on page 1 for more information.
See accompanying notes to financial statements.3

S P D R D O W J O N E S R E I T E T FP O R T F O L I O S TAT I S T I C S ( U N A U D I T E D )
Top Ten Holdings as of June 30, 2020
Description % of Net Assets
Prologis, Inc. REIT 10.0%Digital Realty Trust, Inc. REIT 5.6Public Storage REIT 4.2AvalonBay Communities, Inc. REIT 3.2Welltower, Inc. REIT 3.1Simon Property Group, Inc. REIT 3.0Equity Residential REIT 3.0Alexandria Real Estate Equities, Inc. REIT 3.0Realty Income Corp. REIT 3.0Essex Property Trust, Inc. REIT 2.2
TOTAL 40.3%
(The ten largest holdings are subject to change, and there are no guaranteesthe Fund will continue to remain invested in any particular company.)
Industry Breakdown as of June 30, 2020
% of Net Assets
Residential REITS 22.0%Industrial REITS 17.2Specialized REITS 14.4Retail REITS 13.6Office REITS 13.1Health Care REITS 10.9Diversified REITS 4.9Hotel & Resort REITS 3.5Short-Term Investments 1.0Liabilities in Excess of Other Assets (0.6)
TOTAL 100.0%
(The Fund’s industry breakdown is expressed as a percentage of net assetsand may change over time.)
See accompanying notes to financial statements.4

S P D R S & P B I O T E C H E T FM A N A G E M E N T ’ S D I S C U S S I O N O F F U N D P E R F O R M A N C E
( U N A U D I T E D )The SPDR S&P Biotech ETF (the “Fund”) seeks to provide investment results that, before fees and expenses,correspond generally to the total return performance of an index derived from the biotechnology segmentof a U.S. total market composite index. The Fund’s benchmark is the S&P Biotechnology Select IndustryIndex (the “Index”).
For the 12-month period ended June 30, 2020 (the “Reporting Period”), the total return for the Fund was27.59%, and the Index was 27.70%. The Fund and Index returns reflect the reinvestment of dividends andother income. The Fund’s performance reflects the expenses of managing the Fund, including brokerageand advisory expenses. The Index is unmanaged and Index returns do not reflect fees and expenses of anykind, which would have a negative impact on returns. Fees and expenses/cash drag/cumulative effect ofsecurity misweights contributed to the difference between the Fund’s performance and that of the Index.
Individual company earnings and positive developments towards a coronavirus vaccine were primarydrivers of Fund performance during the Reporting Period.
The Fund has outpaced the broader US equity markets over the most recent Reporting Period. While therewere some negative months, performance of the Fund was mostly in positive territory. This is especially truefrom April through June of 2020, when the US economy began reopening after the initial wave of theCorona virus had a serious negative impact on the economy and stock prices.
One driver that has really helped the Fund’s performance is individual company earnings releases. Duringthe Reporting Period, positive earnings releases from companies held in the Fund have had a good impacton underlying stock returns and the Fund’s overall performance.
Another important driver is the hope for a coronavirus vaccine. Some of the Fund’s leading contributors topositive performance are amidst trials to test possible vaccines for the virus that has impacted the entireworld. Investors have been very interested in these companies, causing positive investment returns.
The Fund did not invest in derivatives during the Reporting Period.
On an individual security level, the top positive contributors to the Fund’s performance during the ReportingPeriod were Moderna, Inc., Seattle Genetics, Inc., and Immunomedics, Inc.. The top negative contributorsto the Fund’s performance during the Reporting Period were Clovis Oncology, Inc., bluebird bio, Inc., andSAGE Therapeutics, Inc..
The views expressed above reflect those of the Fund’s portfolio manager only through the Reporting Period,and do not necessarily represent the views of the Adviser as a whole. Any such views are subject to changeat any time based upon market or other conditions and the Adviser disclaims any responsibility to updatesuch views. These views may not be relied on as investment advice and, because investment decisions fora fund are based on numerous factors, may not be relied on as an indication of trading intent on behalf ofany fund.
See accompanying notes to financial statements.5

S P D R S & P B I O T E C H E T FP E R F O R M A N C E S U M M A R Y ( U N A U D I T E D )
Performance as of June 30, 2020
Cumulative Total Return Average Annual Total Return
NetAssetValue
MarketValue
S&PBiotechnologySelect Industry
Index
NetAssetValue
MarketValue
S&PBiotechnologySelect Industry
Index
ONE YEAR 27.59% 27.66% 27.70% 27.59% 27.66% 27.70%
FIVE YEARS 34.60% 34.56% 34.29% 6.12% 6.12% 6.07%
TEN YEARS 568.22% 568.32% 559.95% 20.92% 20.92% 20.77%
Comparison of Change in Value of a $10,000 Investment(Based on Net Asset Value)
SPDR S&P Biotech ETF (a) S&P Biotech Select IndustryIndex (b)
$8,000
$16,000
$24,000
$32,000
$40,000
$48,000
$56,000
$64,000
$72,000
6/3
0/11
6/3
0/12
6/3
0/13
6/3
0/14
6/3
0/15
6/3
0/16
6/3
0/17
6/3
0/18
6/3
0/19
6/3
0/10
6/3
0/20
$66,822(a)$65,995(b)
Line graph is based on cumulative total return.
The total expense ratio for SPDR S&P Biotech ETF as stated in the Fees and Expenses table of the mostrecent prospectus is 0.35%. Please see the financial highlights for the total expense ratio for the fiscalperiod ended June 30, 2020.
Performance quoted represents past performance, which is no guarantee of future results. Investmentreturn and principal value will fluctuate, so you may have a gain or loss when shares are sold. Currentperformance may be higher or lower than that quoted. Visit www.ssga.com for most recentmonth-end performance. The returns do not reflect the deduction of taxes that a shareholder wouldpay on Fund distributions or on the redemption or sale of Fund shares. See �Notes to PerformanceSummaries� on page 1 for more information.
See accompanying notes to financial statements.6

S P D R S & P B I O T E C H E T FP O R T F O L I O S TAT I S T I C S ( U N A U D I T E D )
Top Ten Holdings as of June 30, 2020
Description % of Net Assets
Inovio Pharmaceuticals, Inc. 2.0%Invitae Corp. 1.8Novavax, Inc. 1.8Amicus Therapeutics, Inc. 1.3OPKO Health, Inc. 1.3Arrowhead Pharmaceuticals, Inc. 1.3Natera, Inc. 1.2Alkermes PLC 1.2Alnylam Pharmaceuticals, Inc. 1.2Esperion Therapeutics, Inc. 1.2
TOTAL 14.3%
(The ten largest holdings are subject to change, and there are no guaranteesthe Fund will continue to remain invested in any particular company.)
Industry Breakdown as of June 30, 2020
% of Net Assets
Biotechnology 99.9%Short Term Investments 16.0Liabilities in Excess of Other Assets (15.9)
TOTAL 100.0%
(The Fund’s industry breakdown is expressed as a percentage of net assetsand may change over time.)
See accompanying notes to financial statements.7

S P D R S & P D I V I D E N D E T FM A N A G E M E N T ’ S D I S C U S S I O N O F F U N D P E R F O R M A N C E
( U N A U D I T E D )The SPDR S&P Dividend ETF (the “Fund”) seeks to provide investment results that, before fees andexpenses, correspond generally to the total return performance of an index that tracks the performance ofpublicly traded issuers that have historically followed a policy of making dividend payments. The Fund’sbenchmark is the S&P High Yield Dividend Aristocrats Index (the “Index”).
For the 12-month period ended June 30, 2020 (the “Reporting Period”), the total return for the Fund was–6.82%, and the Index was –6.58%. The Fund and Index returns reflect the reinvestment of dividends andother income. The Fund’s performance reflects the expenses of managing the Fund, including brokerageand advisory expenses. The Index is unmanaged and Index returns do not reflect fees and expenses of anykind, which would have a negative impact on returns. Fees and expenses, and cash drag contributed to thedifference between the Fund’s performance and that of the Index.
Markets entered the third quarter of 2019 with a sense of cautious optimism following the G20 summit inJapan, where the United States and China reached a truce on the ongoing trade conflict and also agreed torestart trade negotiations.
In the fourth quarter it did not take long before progress appeared to take shape on a couple of the mostprominent geopolitical issues overhanging the market. Reports that China would be willing to accept alimited trade deal so long as no further tariffs were introduced lifted spirits in early October. Around thesame time, European assets and currencies received a jolt as progress towards a Brexit deal was reported.Markets headed into the new year near record levels.
However, the spread of the Coronavirus Disease 2019 (COVID-19) wreaked havoc upon capital marketsduring the first quarter of 2020 and it was the treatment in the form of social distancing, temporarylock-downs and quarantines and other mobility restrictions that inflicted significant harm to the globaleconomy and financial markets.
Policy makers responded with massive, broad-based fiscal and monetary stimulus to support affectedworkers and businesses in record time. Markets recovered broadly in April and economic data in Mayindicated that the stimulus support and re-opening plans were working, and the economic recovery hadbegun. However, risks to recovery remained with increased geo-political tensions between theUnited States and China over Hong Kong and concerns around the further handling of COVID-19 crisisacross the world.
Dividend yield and large and midcap US equity exposures were primary drivers of Fund performance duringthe Reporting Period. With its focus on higher yielding, dividend companies, the Fund does tend to ownsecurities which are in industries considered defensive. However, with this market environment in 2020,Technology and Health Care names have performed best and some of the other traditional defensivesectors have been lagging. The Fund’s defensive traits meant that the Fund lagged the broader market overthe Reporting Period. In addition, high dividend companies have generally been characterized bysignificant overlap with value companies, and as a result, their comparative performance has often beensimilar. In this Reporting Period, value companies underperformed their growth counterparts, and highdividend companies produced similar underperformance to the overall market.
The Fund did not invest in derivatives during the Reporting Period.
See accompanying notes to financial statements.8

S P D R S & P D I V I D E N D E T FM A N A G E M E N T ’ S D I S C U S S I O N O F F U N D P E R F O R M A N C E
( U N A U D I T E D ) ( C O N T I N U E D )
On an individual security level, the top positive contributors to the Fund’s performance during the ReportingPeriod were Clorox Co, Abbvie Inc, and Target Corp. The top negative contributors to the Fund’sperformance during the Reporting Period were Kontoor Brands, Exxon Mobil Corp, and Helmerich & Payne.
The views expressed above reflect those of the Fund’s portfolio manager only through the Reporting Period,and do not necessarily represent the views of the Adviser as a whole. Any such views are subject to changeat any time based upon market or other conditions and the Adviser disclaims any responsibility to updatesuch views. These views may not be relied on as investment advice and, because investment decisions fora fund are based on numerous factors, may not be relied on as an indication of trading intent on behalf ofany fund.
See accompanying notes to financial statements.9

S P D R S & P D I V I D E N D E T FP E R F O R M A N C E S U M M A R Y ( U N A U D I T E D )
Performance as of June 30, 2020
Cumulative Total Return Average Annual Total Return
NetAssetValue
MarketValue
S&P High YieldDividend
Aristocrats Index
NetAssetValue
MarketValue
S&P High YieldDividend
Aristocrats Index
ONE YEAR –6.82% –6.89% –6.58% –6.82% –6.89% –6.58%
FIVE YEARS 45.88% 45.79% 48.74% 7.84% 7.83% 8.26%
TEN YEARS 196.14% 195.92% 207.70% 11.47% 11.46% 11.90%
Comparison of Change in Value of a $10,000 Investment(Based on Net Asset Value)
SPDR S&P Dividend ETF (a) S&P High Yield DividendAristocrats Index (b)
$5,000
$10,000
$15,000
$20,000
$25,000
$30,000
$35,000
6/3
0/11
6/3
0/12
6/3
0/13
6/3
0/14
6/3
0/15
6/3
0/16
6/3
0/17
6/3
0/18
6/3
0/19
6/3
0/10
6/3
0/20
$30,770(b)$29,614(a)
Line graph is based on cumulative total return.
The total expense ratio for SPDR S&P Dividend ETF as stated in the Fees and Expenses table of themost recent prospectus is 0.35%. Please see the financial highlights for the total expense ratio for thefiscal period ended June 30, 2020.
Performance quoted represents past performance, which is no guarantee of future results. Investmentreturn and principal value will fluctuate, so you may have a gain or loss when shares are sold. Currentperformance may be higher or lower than that quoted. Visit www.ssga.com for most recentmonth-end performance. The returns do not reflect the deduction of taxes that a shareholder wouldpay on Fund distributions or on the redemption or sale of Fund shares. See �Notes to PerformanceSummaries� on page 1 for more information.
See accompanying notes to financial statements.10

S P D R S & P D I V I D E N D E T FP O R T F O L I O S TAT I S T I C S ( U N A U D I T E D )
Top Ten Holdings as of June 30, 2020
Description % of Net Assets
Exxon Mobil Corp. 2.4%Franklin Resources, Inc. 2.1National Retail Properties, Inc. REIT 2.0Polaris, Inc. 1.9AbbVie, Inc. 1.8Chevron Corp. 1.8Bank OZK 1.8AT&T, Inc. 1.8Leggett & Platt, Inc. 1.8Amcor PLC 1.8
TOTAL 19.2%
(The ten largest holdings are subject to change, and there are no guaranteesthe Fund will continue to remain invested in any particular company.)
Sector Breakdown as of June 30, 2020
% of Net Assets
Financials 18.9%Industrials 18.8Consumer Staples 11.5Utilities 11.0Materials 9.9Consumer Discretionary 8.6Real Estate 6.2Health Care 5.0Energy 4.2Communication Services 3.4Information Technology 2.2Short-Term Investments 1.2Liabilities in Excess of Other Assets (0.9)
TOTAL 100.0%
(The Fund’s sector breakdown is expressed as a percentage of net assets andmay change over time.)
See accompanying notes to financial statements.11

Security Description Shares Value
COMMON STOCKS — 99.6%EQUITY REAL ESTATE INVESTMENT TRUSTS (REITS) — 99.6%Acadia Realty Trust REIT . . . . . . . . . . . . . . . . . . . . . . . . . . . . . . . 169,340 $ 2,198,033Agree Realty Corp. REIT. . . . . . . . . . . . . . . . . . . . . . . . . . . . . . . . 105,965 6,962,960Alexandria Real Estate Equities, Inc. REIT. . . . . . . . . . . . . . . . . . . . . 248,886 40,381,754American Assets Trust, Inc. REIT . . . . . . . . . . . . . . . . . . . . . . . . . . 94,516 2,631,325American Campus Communities, Inc. REIT . . . . . . . . . . . . . . . . . . . . 271,690 9,498,282American Homes 4 Rent Class A REIT . . . . . . . . . . . . . . . . . . . . . . . 503,849 13,553,538Americold Realty Trust REIT . . . . . . . . . . . . . . . . . . . . . . . . . . . . . 395,352 14,351,278Apartment Investment and Management Co. Class A REIT . . . . . . . . . . 293,894 11,062,170Apple Hospitality REIT, Inc.. . . . . . . . . . . . . . . . . . . . . . . . . . . . . . 412,668 3,986,373AvalonBay Communities, Inc. REIT . . . . . . . . . . . . . . . . . . . . . . . . . 277,625 42,931,930Boston Properties, Inc. REIT . . . . . . . . . . . . . . . . . . . . . . . . . . . . . 285,084 25,765,892Brandywine Realty Trust REIT . . . . . . . . . . . . . . . . . . . . . . . . . . . . 335,369 3,652,168Brixmor Property Group, Inc. REIT . . . . . . . . . . . . . . . . . . . . . . . . . 583,019 7,474,304Camden Property Trust REIT . . . . . . . . . . . . . . . . . . . . . . . . . . . . . 192,201 17,532,575CareTrust REIT, Inc. . . . . . . . . . . . . . . . . . . . . . . . . . . . . . . . . . . . 188,220 3,229,855Chatham Lodging Trust REIT . . . . . . . . . . . . . . . . . . . . . . . . . . . . . 92,377 565,347City Office REIT, Inc. . . . . . . . . . . . . . . . . . . . . . . . . . . . . . . . . . . 93,611 941,727Columbia Property Trust, Inc. REIT . . . . . . . . . . . . . . . . . . . . . . . . . 225,056 2,957,236Community Healthcare Trust, Inc. REIT . . . . . . . . . . . . . . . . . . . . . . 40,477 1,655,509Corporate Office Properties Trust REIT. . . . . . . . . . . . . . . . . . . . . . . 220,657 5,591,448Cousins Properties, Inc. REIT . . . . . . . . . . . . . . . . . . . . . . . . . . . . . 293,348 8,750,571CubeSmart REIT . . . . . . . . . . . . . . . . . . . . . . . . . . . . . . . . . . . . . 382,235 10,316,523DiamondRock Hospitality Co. REIT. . . . . . . . . . . . . . . . . . . . . . . . . 391,900 2,167,207Digital Realty Trust, Inc. REIT (a) . . . . . . . . . . . . . . . . . . . . . . . . . . 529,221 75,207,596Diversified Healthcare Trust REIT . . . . . . . . . . . . . . . . . . . . . . . . . . 467,923 2,070,559Douglas Emmett, Inc. REIT . . . . . . . . . . . . . . . . . . . . . . . . . . . . . . 325,475 9,979,064Duke Realty Corp. REIT . . . . . . . . . . . . . . . . . . . . . . . . . . . . . . . . 726,764 25,720,178Easterly Government Properties, Inc. REIT . . . . . . . . . . . . . . . . . . . . 147,734 3,415,610EastGroup Properties, Inc. REIT . . . . . . . . . . . . . . . . . . . . . . . . . . . 77,082 9,142,696Empire State Realty Trust, Inc. Class A REIT . . . . . . . . . . . . . . . . . . . 284,788 1,993,516EPR Properties REIT . . . . . . . . . . . . . . . . . . . . . . . . . . . . . . . . . . 152,366 5,047,886Equity Commonwealth REIT . . . . . . . . . . . . . . . . . . . . . . . . . . . . . 238,971 7,694,866Equity LifeStyle Properties, Inc. REIT . . . . . . . . . . . . . . . . . . . . . . . 359,381 22,454,125Equity Residential REIT . . . . . . . . . . . . . . . . . . . . . . . . . . . . . . . . 690,058 40,589,212Essential Properties Realty Trust, Inc. REIT . . . . . . . . . . . . . . . . . . . . 180,892 2,684,437Essex Property Trust, Inc. REIT. . . . . . . . . . . . . . . . . . . . . . . . . . . . 129,058 29,576,222Extra Space Storage, Inc. REIT . . . . . . . . . . . . . . . . . . . . . . . . . . . . 254,661 23,523,037Federal Realty Investment Trust REIT . . . . . . . . . . . . . . . . . . . . . . . . 138,905 11,836,095First Industrial Realty Trust, Inc. REIT . . . . . . . . . . . . . . . . . . . . . . . 251,231 9,657,320Four Corners Property Trust, Inc. REIT . . . . . . . . . . . . . . . . . . . . . . . 138,306 3,374,666
SPDR DOW JONES REIT ETFSCHEDULE OF INVESTMENTSJune 30, 2020
See accompanying notes to financial statements.12

Security Description Shares Value
Franklin Street Properties Corp. REIT. . . . . . . . . . . . . . . . . . . . . . . . 210,953 $ 1,073,751Front Yard Residential Corp. REIT . . . . . . . . . . . . . . . . . . . . . . . . . . 96,850 842,595Getty Realty Corp. REIT . . . . . . . . . . . . . . . . . . . . . . . . . . . . . . . . 67,597 2,006,279Global Net Lease, Inc. REIT . . . . . . . . . . . . . . . . . . . . . . . . . . . . . . 175,971 2,943,995Healthcare Realty Trust, Inc. REIT . . . . . . . . . . . . . . . . . . . . . . . . . . 265,378 7,772,922Healthcare Trust of America, Inc. Class A REIT . . . . . . . . . . . . . . . . . 431,381 11,440,224Healthpeak Properties, Inc. REIT . . . . . . . . . . . . . . . . . . . . . . . . . . . 1,061,969 29,267,866Hersha Hospitality Trust REIT . . . . . . . . . . . . . . . . . . . . . . . . . . . . 70,832 407,992Highwoods Properties, Inc. REIT. . . . . . . . . . . . . . . . . . . . . . . . . . . 204,354 7,628,535Host Hotels & Resorts, Inc. REIT . . . . . . . . . . . . . . . . . . . . . . . . . . 1,391,356 15,012,731Hudson Pacific Properties, Inc. REIT . . . . . . . . . . . . . . . . . . . . . . . . 301,552 7,587,048Independence Realty Trust, Inc. REIT (a). . . . . . . . . . . . . . . . . . . . . . 186,313 2,140,736Industrial Logistics Properties Trust REIT . . . . . . . . . . . . . . . . . . . . . 128,161 2,633,709Innovative Industrial Properties, Inc. REIT (a). . . . . . . . . . . . . . . . . . . 36,559 3,217,923Investors Real Estate Trust REIT . . . . . . . . . . . . . . . . . . . . . . . . . . . 23,905 1,685,063Invitation Homes, Inc. REIT . . . . . . . . . . . . . . . . . . . . . . . . . . . . . . 1,072,732 29,532,312JBG SMITH Properties REIT . . . . . . . . . . . . . . . . . . . . . . . . . . . . . 231,258 6,838,299Kilroy Realty Corp. REIT . . . . . . . . . . . . . . . . . . . . . . . . . . . . . . . 208,955 12,265,659Kimco Realty Corp. REIT . . . . . . . . . . . . . . . . . . . . . . . . . . . . . . . 854,007 10,965,450Kite Realty Group Trust REIT. . . . . . . . . . . . . . . . . . . . . . . . . . . . . 165,417 1,908,912Lexington Realty Trust REIT . . . . . . . . . . . . . . . . . . . . . . . . . . . . . 543,379 5,732,648Life Storage, Inc. REIT . . . . . . . . . . . . . . . . . . . . . . . . . . . . . . . . . 92,660 8,798,067LTC Properties, Inc. REIT . . . . . . . . . . . . . . . . . . . . . . . . . . . . . . . 77,148 2,906,165Macerich Co. REIT (a) . . . . . . . . . . . . . . . . . . . . . . . . . . . . . . . . . 228,705 2,051,484Mack-Cali Realty Corp. REIT. . . . . . . . . . . . . . . . . . . . . . . . . . . . . 178,158 2,724,036Mid-America Apartment Communities, Inc. REIT . . . . . . . . . . . . . . . . 225,629 25,872,877Monmouth Real Estate Investment Corp. REIT . . . . . . . . . . . . . . . . . . 192,543 2,789,948National Health Investors, Inc. REIT. . . . . . . . . . . . . . . . . . . . . . . . . 87,784 5,330,244National Retail Properties, Inc. REIT . . . . . . . . . . . . . . . . . . . . . . . . 339,482 12,044,821National Storage Affiliates Trust REIT . . . . . . . . . . . . . . . . . . . . . . . 121,971 3,495,689NexPoint Residential Trust, Inc. REIT. . . . . . . . . . . . . . . . . . . . . . . . 42,989 1,519,661Office Properties Income Trust REIT . . . . . . . . . . . . . . . . . . . . . . . . 94,762 2,460,969Omega Healthcare Investors, Inc. REIT . . . . . . . . . . . . . . . . . . . . . . . 447,853 13,314,670Paramount Group, Inc. REIT. . . . . . . . . . . . . . . . . . . . . . . . . . . . . . 375,125 2,892,214Park Hotels & Resorts, Inc. REIT. . . . . . . . . . . . . . . . . . . . . . . . . . . 463,351 4,582,541Pebblebrook Hotel Trust REIT (a) . . . . . . . . . . . . . . . . . . . . . . . . . . 257,211 3,513,502Pennsylvania Real Estate Investment Trust (a) . . . . . . . . . . . . . . . . . . . 119,502 162,523Piedmont Office Realty Trust, Inc. Class A REIT. . . . . . . . . . . . . . . . . 247,639 4,113,284Prologis, Inc. REIT. . . . . . . . . . . . . . . . . . . . . . . . . . . . . . . . . . . . 1,456,581 135,942,705PS Business Parks, Inc. REIT . . . . . . . . . . . . . . . . . . . . . . . . . . . . . 39,492 5,228,741Public Storage REIT . . . . . . . . . . . . . . . . . . . . . . . . . . . . . . . . . . . 296,498 56,895,001QTS Realty Trust, Inc. Class A REIT . . . . . . . . . . . . . . . . . . . . . . . . 119,112 7,633,888
SPDR DOW JONES REIT ETFSCHEDULE OF INVESTMENTS (continued)June 30, 2020
See accompanying notes to financial statements.13

Security Description Shares Value
Realty Income Corp. REIT . . . . . . . . . . . . . . . . . . . . . . . . . . . . . . . 677,458 $ 40,308,751Regency Centers Corp. REIT . . . . . . . . . . . . . . . . . . . . . . . . . . . . . 334,753 15,361,815Retail Opportunity Investments Corp. REIT (a) . . . . . . . . . . . . . . . . . . 228,883 2,593,244Retail Properties of America, Inc. Class A REIT . . . . . . . . . . . . . . . . . 421,154 3,082,847Rexford Industrial Realty, Inc. REIT . . . . . . . . . . . . . . . . . . . . . . . . . 242,224 10,035,340RLJ Lodging Trust REIT . . . . . . . . . . . . . . . . . . . . . . . . . . . . . . . . 324,775 3,065,876RPT Realty REIT. . . . . . . . . . . . . . . . . . . . . . . . . . . . . . . . . . . . . 158,473 1,102,972Ryman Hospitality Properties, Inc. REIT . . . . . . . . . . . . . . . . . . . . . . 108,155 3,742,163Seritage Growth Properties Class A REIT (a) (b) . . . . . . . . . . . . . . . . . 69,099 787,729Service Properties Trust REIT . . . . . . . . . . . . . . . . . . . . . . . . . . . . . 323,651 2,294,686Simon Property Group, Inc. REIT . . . . . . . . . . . . . . . . . . . . . . . . . . 603,090 41,239,294SITE Centers Corp. REIT . . . . . . . . . . . . . . . . . . . . . . . . . . . . . . . 292,478 2,369,072SL Green Realty Corp. REIT (a) . . . . . . . . . . . . . . . . . . . . . . . . . . . 150,533 7,419,772Spirit Realty Capital, Inc. REIT (a). . . . . . . . . . . . . . . . . . . . . . . . . . 202,488 7,058,732STAG Industrial, Inc. REIT . . . . . . . . . . . . . . . . . . . . . . . . . . . . . . 293,681 8,610,727STORE Capital Corp. REIT . . . . . . . . . . . . . . . . . . . . . . . . . . . . . . 439,312 10,460,019Summit Hotel Properties, Inc. REIT . . . . . . . . . . . . . . . . . . . . . . . . . 207,749 1,231,952Sun Communities, Inc. REIT . . . . . . . . . . . . . . . . . . . . . . . . . . . . . 193,894 26,307,538Sunstone Hotel Investors, Inc. REIT . . . . . . . . . . . . . . . . . . . . . . . . . 424,080 3,456,252Tanger Factory Outlet Centers, Inc. REIT (a) . . . . . . . . . . . . . . . . . . . 183,816 1,310,608Taubman Centers, Inc. REIT . . . . . . . . . . . . . . . . . . . . . . . . . . . . . . 121,216 4,577,116Terreno Realty Corp. REIT. . . . . . . . . . . . . . . . . . . . . . . . . . . . . . . 133,182 7,010,701UDR, Inc. REIT. . . . . . . . . . . . . . . . . . . . . . . . . . . . . . . . . . . . . . 581,827 21,748,693Universal Health Realty Income Trust REIT . . . . . . . . . . . . . . . . . . . . 24,846 1,975,009Urban Edge Properties REIT. . . . . . . . . . . . . . . . . . . . . . . . . . . . . . 217,699 2,584,087Ventas, Inc. REIT. . . . . . . . . . . . . . . . . . . . . . . . . . . . . . . . . . . . . 736,054 26,954,298VEREIT, Inc. . . . . . . . . . . . . . . . . . . . . . . . . . . . . . . . . . . . . . . . 2,127,485 13,679,729Vornado Realty Trust REIT . . . . . . . . . . . . . . . . . . . . . . . . . . . . . . 313,081 11,962,825Washington Prime Group, Inc. REIT (a) . . . . . . . . . . . . . . . . . . . . . . 368,534 309,863Washington Real Estate Investment Trust . . . . . . . . . . . . . . . . . . . . . . 161,896 3,594,091Weingarten Realty Investors REIT . . . . . . . . . . . . . . . . . . . . . . . . . . 236,879 4,484,119Welltower, Inc. REIT . . . . . . . . . . . . . . . . . . . . . . . . . . . . . . . . . . 823,483 42,615,245WP Carey, Inc. REIT . . . . . . . . . . . . . . . . . . . . . . . . . . . . . . . . . . 340,185 23,013,515Xenia Hotels & Resorts, Inc. REIT. . . . . . . . . . . . . . . . . . . . . . . . . . 223,136 2,081,859
TOTAL COMMON STOCKS(Cost $1,627,316,815) . . . . . . . . . . . . . . . . . . . . . . . . . . . . . . 1,347,733,308
SHORT-TERM INVESTMENTS — 1.0%State Street Institutional Liquid Reserves Fund, Premier Class 0.35%
(c) (d) . . . . . . . . . . . . . . . . . . . . . . . . . . . . . . . . . . . . . . . . 4,097,975 4,099,614
SPDR DOW JONES REIT ETFSCHEDULE OF INVESTMENTS (continued)June 30, 2020
See accompanying notes to financial statements.14

Security Description Shares Value
State Street Navigator Securities Lending Portfolio II (e) (f) . . . . . . . . 9,665,286 $ 9,665,286
TOTAL SHORT-TERM INVESTMENTS(Cost $13,764,900) . . . . . . . . . . . . . . . . . . . . . . . . . . . . . . . . . . . . . . . . . . . 13,764,900
TOTAL INVESTMENTS — 100.6%(Cost $1,641,081,715) . . . . . . . . . . . . . . . . . . . . . . . . . . . . . . . . . . . . . . . . . 1,361,498,208
LIABILITIES IN EXCESS OF OTHER ASSETS — (0.6)% . . . . . . . . . . . . . . . . (8,335,532)
NET ASSETS — 100.0% . . . . . . . . . . . . . . . . . . . . . . . . . . . . . . . . . . . . . . . . $ 1,353,162,676
(a) All or a portion of the shares of the security are on loan at June 30, 2020.(b) Non-income producing security.(c) The Fund invested in certain money market funds managed by SSGA Funds Management, Inc.
Amounts related to these transactions during the period ended June 30, 2020 are shown in the AffiliateTable below.
(d) The rate shown is the annualized seven-day yield at June 30, 2020.(e) The Fund invested in an affiliated entity. Amounts related to these transactions during the period ended
June 30, 2020 are shown in the Affiliate Table below.(f) Investment of cash collateral for securities loaned.
REIT Real Estate Investment Trust
The following table summarizes the value of the Fund’s investments according to thefair value hierarchy as of June 30, 2020.
DescriptionLevel 1 –
Quoted Prices
Level 2 –Other SignificantObservable Inputs
Level 3 –Significant
Unobservable Inputs Total
ASSETS:INVESTMENTS:Common Stocks . . . . . . . . . . . . . . . . . . . . $1,347,733,308 $— $— $1,347,733,308
Short-Term Investments . . . . . . . . . . . . . . . . 13,764,900 — — 13,764,900
TOTAL INVESTMENTS . . . . . . . . . . . . . . $1,361,498,208 $— $— $1,361,498,208
SPDR DOW JONES REIT ETFSCHEDULE OF INVESTMENTS (continued)June 30, 2020
See accompanying notes to financial statements.15

Affiliate Table
Number ofShares Held
at 6/30/19Value at6/30/19
Cost ofPurchases
Proceedsfrom
Shares SoldRealized
Gain (Loss)
Change inUnrealized
Appreciation/Depreciation
Number ofShares Held
at 6/30/20Value at6/30/20
DividendIncome
State Street Institutional Liquid Reserves Fund,Premier Class . . . . . . . . . . . . — $ — $149,757,636 $145,655,536 $(2,486) $— 4,097,975 $ 4,099,614 $ 35,991
State Street Institutional U.S. GovernmentMoney Market Fund, Class G Shares . . . 6,552,771 6,552,771 9,640,475 16,193,246 — — — — 6,343
State Street Navigator Securities LendingPortfolio II . . . . . . . . . . . . . — — 244,588,539 234,923,253 — — 9,665,286 9,665,286 179,230
State Street Navigator Securities LendingPortfolio III . . . . . . . . . . . . . 10,224,141 10,224,141 74,155,406 84,379,547 — — — — 29,297
Total . . . . . . . . . . . . . . . . . $16,776,912 $478,142,056 $481,151,582 $(2,486) $— $13,764,900 $250,861
SPDR DOW JONES REIT ETFSCHEDULE OF INVESTMENTS (continued)June 30, 2020
See accompanying notes to financial statements.16

Security Description Shares Value
COMMON STOCKS — 99.9%BIOTECHNOLOGY — 99.9%AbbVie, Inc. . . . . . . . . . . . . . . . . . . . . . . . . . . . . . . . . . . . . . 573,335 $ 56,290,030ACADIA Pharmaceuticals, Inc. (a) (b) . . . . . . . . . . . . . . . . . . . . 1,156,392 56,050,320Acceleron Pharma, Inc. (a) . . . . . . . . . . . . . . . . . . . . . . . . . . . . 555,904 52,960,974Achillon Pharmace (a) (b) . . . . . . . . . . . . . . . . . . . . . . . . . . . . 51,865 57,570Adverum Biotechnologies, Inc. (a) (b). . . . . . . . . . . . . . . . . . . . . 1,922,320 40,138,042Agenus, Inc. (a) . . . . . . . . . . . . . . . . . . . . . . . . . . . . . . . . . . . 3,814,396 14,990,576Agios Pharmaceuticals, Inc. (a) (b) . . . . . . . . . . . . . . . . . . . . . . . 1,124,621 60,144,731Aimmune Therapeutics, Inc. (a) (b) . . . . . . . . . . . . . . . . . . . . . . 2,790,073 46,622,120Akebia Therapeutics, Inc. (a) . . . . . . . . . . . . . . . . . . . . . . . . . . 2,380,450 32,326,511Alector, Inc. (a) (b) . . . . . . . . . . . . . . . . . . . . . . . . . . . . . . . . . 922,919 22,556,140Alexion Pharmaceuticals, Inc. (a). . . . . . . . . . . . . . . . . . . . . . . . 485,114 54,449,195Alkermes PLC (a) . . . . . . . . . . . . . . . . . . . . . . . . . . . . . . . . . 3,240,693 62,885,647Allakos, Inc. (a) (b) . . . . . . . . . . . . . . . . . . . . . . . . . . . . . . . . 705,951 50,729,639Allogene Therapeutics, Inc. (a) (b) . . . . . . . . . . . . . . . . . . . . . . . 1,268,151 54,302,226Alnylam Pharmaceuticals, Inc. (a) . . . . . . . . . . . . . . . . . . . . . . . 422,728 62,610,244Amgen, Inc. . . . . . . . . . . . . . . . . . . . . . . . . . . . . . . . . . . . . . 243,313 57,387,804Amicus Therapeutics, Inc. (a) (b) . . . . . . . . . . . . . . . . . . . . . . . . 4,850,668 73,148,073AnaptysBio, Inc. (a) . . . . . . . . . . . . . . . . . . . . . . . . . . . . . . . . 940,004 20,999,689Anika Therapeutics, Inc. (a) . . . . . . . . . . . . . . . . . . . . . . . . . . . 408,064 15,396,255Apellis Pharmaceuticals, Inc. (a) (b) . . . . . . . . . . . . . . . . . . . . . . 1,711,369 55,893,312Arcus Biosciences, Inc. (a) . . . . . . . . . . . . . . . . . . . . . . . . . . . . 879,188 21,751,111Ardelyx, Inc. (a) . . . . . . . . . . . . . . . . . . . . . . . . . . . . . . . . . . 1,694,422 11,725,400Arena Pharmaceuticals, Inc. (a) . . . . . . . . . . . . . . . . . . . . . . . . . 864,871 54,443,630Arrowhead Pharmaceuticals, Inc. (a) (b) . . . . . . . . . . . . . . . . . . . 1,619,860 69,961,753Assembly Biosciences, Inc. (a) . . . . . . . . . . . . . . . . . . . . . . . . . 417,242 9,730,083Atara Biotherapeutics, Inc. (a) . . . . . . . . . . . . . . . . . . . . . . . . . . 2,004,800 29,209,936Athenex, Inc. (a) (b) . . . . . . . . . . . . . . . . . . . . . . . . . . . . . . . . 1,116,296 15,360,233Athersys, Inc. (a) (b) . . . . . . . . . . . . . . . . . . . . . . . . . . . . . . . . 8,333,518 23,000,510Avrobio, Inc. (a) (b) . . . . . . . . . . . . . . . . . . . . . . . . . . . . . . . . 526,121 9,180,811BioCryst Pharmaceuticals, Inc. (a) (b) (c) . . . . . . . . . . . . . . . . . . 12,358,764 58,889,511Biogen, Inc. (a) . . . . . . . . . . . . . . . . . . . . . . . . . . . . . . . . . . . 189,812 50,784,201Biohaven Pharmaceutical Holding Co., Ltd. (a) (b). . . . . . . . . . . . . 803,384 58,735,404BioMarin Pharmaceutical, Inc. (a) . . . . . . . . . . . . . . . . . . . . . . . 501,469 61,851,186Bioxcel Therapeutics, Inc. (a) (b) . . . . . . . . . . . . . . . . . . . . . . . . 774,443 41,053,223Bluebird Bio, Inc. (a) (b) . . . . . . . . . . . . . . . . . . . . . . . . . . . . . 829,298 50,620,350Blueprint Medicines Corp. (a) . . . . . . . . . . . . . . . . . . . . . . . . . . 758,671 59,176,338Bridgebio Pharma, Inc. (a) (b) . . . . . . . . . . . . . . . . . . . . . . . . . . 1,849,182 60,301,825CareDx, Inc. (a) (b) . . . . . . . . . . . . . . . . . . . . . . . . . . . . . . . . 1,258,102 44,574,554Catalyst Pharmaceuticals, Inc. (a) (b) . . . . . . . . . . . . . . . . . . . . . 4,713,118 21,774,605CEL-SCI Corp. (a) (b) (c) . . . . . . . . . . . . . . . . . . . . . . . . . . . . 1,887,669 28,164,022
SPDR S&P BIOTECH ETFSCHEDULE OF INVESTMENTSJune 30, 2020
See accompanying notes to financial statements.17

Security Description Shares Value
ChemoCentryx, Inc. (a) . . . . . . . . . . . . . . . . . . . . . . . . . . . . . . 814,839 $ 46,885,836Clovis Oncology, Inc. (a) (b) (c). . . . . . . . . . . . . . . . . . . . . . . . . 7,843,117 52,941,040Coherus Biosciences, Inc. (a) (b) . . . . . . . . . . . . . . . . . . . . . . . . 3,297,148 58,887,063Constellation Pharmaceuticals, Inc. (a) . . . . . . . . . . . . . . . . . . . . 868,118 26,086,946Corbus Pharmaceuticals Holdings, Inc. (a) . . . . . . . . . . . . . . . . . . 1,770,830 14,857,264Cue Biopharma, Inc. (a). . . . . . . . . . . . . . . . . . . . . . . . . . . . . . 497,204 12,186,470Cytokinetics, Inc. (a) (b) . . . . . . . . . . . . . . . . . . . . . . . . . . . . . 1,208,765 28,490,591CytomX Therapeutics, Inc. (a). . . . . . . . . . . . . . . . . . . . . . . . . . 1,230,382 10,249,082Deciphera Pharmaceuticals, Inc. (a) . . . . . . . . . . . . . . . . . . . . . . 977,430 58,372,120Denali Therapeutics, Inc. (a) (b). . . . . . . . . . . . . . . . . . . . . . . . . 944,193 22,830,587Dicerna Pharmaceuticals, Inc. (a) . . . . . . . . . . . . . . . . . . . . . . . . 1,529,432 38,847,573Dynavax Technologies Corp. (a) (b) . . . . . . . . . . . . . . . . . . . . . . 3,263,799 28,949,897Eagle Pharmaceuticals, Inc. (a) . . . . . . . . . . . . . . . . . . . . . . . . . 446,099 21,403,830Editas Medicine, Inc. (a) (b) . . . . . . . . . . . . . . . . . . . . . . . . . . . 1,858,382 54,970,940Emergent BioSolutions, Inc. (a) . . . . . . . . . . . . . . . . . . . . . . . . . 770,850 60,958,818Enanta Pharmaceuticals, Inc. (a) . . . . . . . . . . . . . . . . . . . . . . . . 455,762 22,883,810Epizyme, Inc. (a) (b) . . . . . . . . . . . . . . . . . . . . . . . . . . . . . . . . 2,067,203 33,199,280Esperion Therapeutics, Inc. (a) (b) . . . . . . . . . . . . . . . . . . . . . . . 1,219,434 62,569,159Exact Sciences Corp. (a) (b) . . . . . . . . . . . . . . . . . . . . . . . . . . . 621,014 53,990,957Exelixis, Inc. (a) . . . . . . . . . . . . . . . . . . . . . . . . . . . . . . . . . . 2,367,891 56,213,732Fate Therapeutics, Inc. (a) (b) . . . . . . . . . . . . . . . . . . . . . . . . . . 1,724,110 59,154,214FibroGen, Inc. (a) (b) . . . . . . . . . . . . . . . . . . . . . . . . . . . . . . . 1,389,371 56,311,207Flexion Therapeutics, Inc. (a) (b) . . . . . . . . . . . . . . . . . . . . . . . . 1,660,933 21,841,269G1 Therapeutics, Inc. (a) (b) . . . . . . . . . . . . . . . . . . . . . . . . . . . 661,220 16,041,197Gilead Sciences, Inc.. . . . . . . . . . . . . . . . . . . . . . . . . . . . . . . . 724,354 55,731,797Global Blood Therapeutics, Inc. (a) . . . . . . . . . . . . . . . . . . . . . . 846,127 53,415,998Gossamer Bio, Inc. (a) (b) . . . . . . . . . . . . . . . . . . . . . . . . . . . . 932,419 12,121,447Halozyme Therapeutics, Inc. (a) (b) . . . . . . . . . . . . . . . . . . . . . . 2,323,339 62,288,719Heron Therapeutics, Inc. (a) (b) . . . . . . . . . . . . . . . . . . . . . . . . . 2,020,504 29,721,614Homology Medicines, Inc. (a) (b). . . . . . . . . . . . . . . . . . . . . . . . 789,698 11,995,513IGM Biosciences, Inc. (a). . . . . . . . . . . . . . . . . . . . . . . . . . . . . 180,482 13,175,186ImmunoGen, Inc. (a). . . . . . . . . . . . . . . . . . . . . . . . . . . . . . . . 5,617,549 25,840,725Immunomedics, Inc. (a) (b) . . . . . . . . . . . . . . . . . . . . . . . . . . . 1,714,085 60,747,172Incyte Corp. (a) . . . . . . . . . . . . . . . . . . . . . . . . . . . . . . . . . . . 575,880 59,874,244Inovio Pharmaceuticals, Inc. (a) (b) . . . . . . . . . . . . . . . . . . . . . . 4,072,007 109,740,589Insmed, Inc. (a) . . . . . . . . . . . . . . . . . . . . . . . . . . . . . . . . . . . 1,949,995 53,702,862Intellia Therapeutics, Inc. (a) (b) . . . . . . . . . . . . . . . . . . . . . . . . 1,351,443 28,407,332Intercept Pharmaceuticals, Inc. (a) (b) . . . . . . . . . . . . . . . . . . . . . 705,260 33,789,007Invitae Corp. (a) (b) . . . . . . . . . . . . . . . . . . . . . . . . . . . . . . . . 3,278,870 99,316,972Ionis Pharmaceuticals, Inc. (a). . . . . . . . . . . . . . . . . . . . . . . . . . 908,243 53,550,007Iovance Biotherapeutics, Inc. (a) (b) . . . . . . . . . . . . . . . . . . . . . . 1,796,615 49,317,082Ironwood Pharmaceuticals, Inc. (a) (b) . . . . . . . . . . . . . . . . . . . . 4,906,703 50,637,175
SPDR S&P BIOTECH ETFSCHEDULE OF INVESTMENTS (continued)June 30, 2020
See accompanying notes to financial statements.18

Security Description Shares Value
Kadmon Holdings, Inc. (a) (b). . . . . . . . . . . . . . . . . . . . . . . . . . 4,109,509 $ 21,040,686Karuna Therapeutics, Inc. (a) (b) . . . . . . . . . . . . . . . . . . . . . . . . 470,299 52,419,527Karyopharm Therapeutics, Inc. (a) (b) . . . . . . . . . . . . . . . . . . . . . 3,174,804 60,130,788Kodiak Sciences, Inc. (a) (b) . . . . . . . . . . . . . . . . . . . . . . . . . . . 654,134 35,401,732Krystal Biotech, Inc. (a) (b) . . . . . . . . . . . . . . . . . . . . . . . . . . . 428,315 17,740,807Kura Oncology, Inc. (a) . . . . . . . . . . . . . . . . . . . . . . . . . . . . . . 693,561 11,305,044Ligand Pharmaceuticals, Inc. (a) (b) . . . . . . . . . . . . . . . . . . . . . . 485,654 54,320,400MacroGenics, Inc. (a) . . . . . . . . . . . . . . . . . . . . . . . . . . . . . . . 561,751 15,684,088Madrigal Pharmaceuticals, Inc. (a) (b). . . . . . . . . . . . . . . . . . . . . 422,083 47,800,900Mersana Therapeutics, Inc. (a). . . . . . . . . . . . . . . . . . . . . . . . . . 649,756 15,204,290Mirati Therapeutics, Inc. (a) (b) . . . . . . . . . . . . . . . . . . . . . . . . . 517,959 59,135,379Moderna, Inc. (a) . . . . . . . . . . . . . . . . . . . . . . . . . . . . . . . . . . 855,213 54,913,227Momenta Pharmaceuticals, Inc. (a). . . . . . . . . . . . . . . . . . . . . . . 1,707,594 56,811,652Myriad Genetics, Inc. (a) . . . . . . . . . . . . . . . . . . . . . . . . . . . . . 2,945,020 33,396,527Natera, Inc. (a) (b) . . . . . . . . . . . . . . . . . . . . . . . . . . . . . . . . . 1,295,358 64,586,550Neurocrine Biosciences, Inc. (a) . . . . . . . . . . . . . . . . . . . . . . . . 461,868 56,347,896Novavax, Inc. (a) (b) . . . . . . . . . . . . . . . . . . . . . . . . . . . . . . . . 1,163,515 96,978,975OPKO Health, Inc. (a) (b) . . . . . . . . . . . . . . . . . . . . . . . . . . . . 21,378,657 72,901,220PDL BioPharma, Inc. (a) . . . . . . . . . . . . . . . . . . . . . . . . . . . . . 2,798,988 8,145,055Portola Pharmaceuticals, Inc. (a) (b) . . . . . . . . . . . . . . . . . . . . . . 1,909,705 34,355,593Principia Biopharma, Inc. (a) . . . . . . . . . . . . . . . . . . . . . . . . . . 650,331 38,883,291Prothena Corp. PLC (a) . . . . . . . . . . . . . . . . . . . . . . . . . . . . . . 639,130 6,685,300PTC Therapeutics, Inc. (a) (b) . . . . . . . . . . . . . . . . . . . . . . . . . . 1,076,272 54,610,041Puma Biotechnology, Inc. (a) (b) (c) . . . . . . . . . . . . . . . . . . . . . . 2,718,389 28,352,797Radius Health, Inc. (a) (b) . . . . . . . . . . . . . . . . . . . . . . . . . . . . 1,615,815 22,023,558Regeneron Pharmaceuticals, Inc. (a) . . . . . . . . . . . . . . . . . . . . . . 90,196 56,250,735REGENXBIO, Inc. (a) . . . . . . . . . . . . . . . . . . . . . . . . . . . . . . 1,181,413 43,511,441Retrophin, Inc. (a) . . . . . . . . . . . . . . . . . . . . . . . . . . . . . . . . . 956,879 19,529,900Rhythm Pharmaceuticals, Inc. (a) (b) . . . . . . . . . . . . . . . . . . . . . 480,410 10,713,143Rocket Pharmaceuticals, Inc. (a) (b) . . . . . . . . . . . . . . . . . . . . . . 824,382 17,254,315Sage Therapeutics, Inc. (a) (b) . . . . . . . . . . . . . . . . . . . . . . . . . . 1,464,297 60,885,469Sangamo Therapeutics, Inc. (a) (b) . . . . . . . . . . . . . . . . . . . . . . . 3,985,253 35,707,867Sarepta Therapeutics, Inc. (a) (b) . . . . . . . . . . . . . . . . . . . . . . . . 333,787 53,519,408Seattle Genetics, Inc. (a) . . . . . . . . . . . . . . . . . . . . . . . . . . . . . 350,792 59,606,577Sorrento Therapeutics, Inc. (a) (b) . . . . . . . . . . . . . . . . . . . . . . . 6,711,255 42,146,681Spectrum Pharmaceuticals, Inc. (a). . . . . . . . . . . . . . . . . . . . . . . 3,081,655 10,415,994TG Therapeutics, Inc. (a) (b) . . . . . . . . . . . . . . . . . . . . . . . . . . . 3,084,307 60,082,300Translate Bio, Inc. (a) (b) . . . . . . . . . . . . . . . . . . . . . . . . . . . . . 890,020 15,949,158Turning Point Therapeutics, Inc. (a) . . . . . . . . . . . . . . . . . . . . . . 560,562 36,206,700Twist Bioscience Corp. (a) (b) . . . . . . . . . . . . . . . . . . . . . . . . . . 978,774 44,338,462Ultragenyx Pharmaceutical, Inc. (a) (b) . . . . . . . . . . . . . . . . . . . . 779,018 60,934,788United Therapeutics Corp. (a) . . . . . . . . . . . . . . . . . . . . . . . . . . 459,288 55,573,848
SPDR S&P BIOTECH ETFSCHEDULE OF INVESTMENTS (continued)June 30, 2020
See accompanying notes to financial statements.19

Security Description Shares Value
Vanda Pharmaceuticals, Inc. (a) . . . . . . . . . . . . . . . . . . . . . . . . . 1,806,100 $ 20,661,784Veracyte, Inc. (a) (b) . . . . . . . . . . . . . . . . . . . . . . . . . . . . . . . . 1,201,467 31,117,995Vericel Corp. (a) (b) . . . . . . . . . . . . . . . . . . . . . . . . . . . . . . . . 1,821,646 25,175,148Vertex Pharmaceuticals, Inc. (a). . . . . . . . . . . . . . . . . . . . . . . . . 197,363 57,296,453Viela Bio, Inc. (a). . . . . . . . . . . . . . . . . . . . . . . . . . . . . . . . . . 278,311 12,056,433Viking Therapeutics, Inc. (a) (b) . . . . . . . . . . . . . . . . . . . . . . . . 2,913,435 21,005,866Voyager Therapeutics, Inc. (a) (b). . . . . . . . . . . . . . . . . . . . . . . . 777,313 9,809,690Xencor, Inc. (a) (b) . . . . . . . . . . . . . . . . . . . . . . . . . . . . . . . . . 1,080,070 34,983,467Y-mAbs Therapeutics, Inc. (a) . . . . . . . . . . . . . . . . . . . . . . . . . . 392,613 16,960,882ZIOPHARM Oncology, Inc. (a) (b). . . . . . . . . . . . . . . . . . . . . . . 3,550,940 11,647,084
TOTAL COMMON STOCKS(Cost $5,658,705,401) . . . . . . . . . . . . . . . . . . . . . . . . . . . . . 5,395,241,018
SHORT-TERM INVESTMENTS — 16.0%State Street Institutional Liquid Reserves Fund, Premier Class 0.35%
(d) (e) . . . . . . . . . . . . . . . . . . . . . . . . . . . . . . . . . . . . . . . 6,399,493 6,402,053State Street Navigator Securities Lending Portfolio II (f) (g) . . . . . . . 857,417,617 857,417,617
TOTAL SHORT-TERM INVESTMENTS(Cost $863,819,613) . . . . . . . . . . . . . . . . . . . . . . . . . . . . . . 863,819,670
TOTAL INVESTMENTS — 115.9%(Cost $6,522,525,014) . . . . . . . . . . . . . . . . . . . . . . . . . . . . . 6,259,060,688
LIABILITIES IN EXCESS OF OTHER ASSETS — (15.9)%. . . . (856,413,368)
NET ASSETS — 100.0% . . . . . . . . . . . . . . . . . . . . . . . . . . . . $ 5,402,647,320
(a) Non-income producing security.(b) All or a portion of the shares of the security are on loan at June 30, 2020.(c) These securities are affiliated investments as a result of the Fund owning 5% or more of the entity’s
outstanding shares. Amounts related to these transactions during the period ended June 30, 2020 areshown in the Affiliate Table below.
(d) The Fund invested in certain money market funds managed by SSGA Funds Management, Inc.Amounts related to these transactions during the period ended June 30, 2020 are shown in the AffiliateTable below.
(e) The rate shown is the annualized seven-day yield at June 30, 2020.(f) The Fund invested in an affiliated entity. Amounts related to these transactions during the period ended
June 30, 2020 are shown in the Affiliate Table below.(g) Investment of cash collateral for securities loaned.
SPDR S&P BIOTECH ETFSCHEDULE OF INVESTMENTS (continued)June 30, 2020
See accompanying notes to financial statements.20

The following table summarizes the value of the Fund’s investments according to thefair value hierarchy as of June 30, 2020.
DescriptionLevel 1 –
Quoted Prices
Level 2 –Other SignificantObservable Inputs
Level 3 –Significant
Unobservable Inputs Total
ASSETS:INVESTMENTS:Common Stocks . . . . . . . . . . . . . . . . . . . . $5,395,183,448 $57,570 $— $5,395,241,018
Short-Term Investments . . . . . . . . . . . . . . . . 863,819,670 — — 863,819,670
TOTAL INVESTMENTS . . . . . . . . . . . . . . $6,259,003,118 $57,570 $— $6,259,060,688
Affiliate Table
Number ofShares Held
at 6/30/19Value at6/30/19
Cost ofPurchases
Proceedsfrom
Shares SoldRealized
Gain (Loss)
Change inUnrealized
Appreciation/Depreciation(a)
Number ofShares Held
at 6/30/20Value at6/30/20
DividendIncome
Acorda Therapeutics, Inc. . . . . 2,503,039 $ 19,198,309 $ 3,419,376 $ 12,395,093 $ (36,549,619) $ —* — $ —*$ —
Adverum Biotechnologies, Inc. . 505,070 6,005,282 105,371,860 104,376,136 25,688,139 —* — —* —
AnaptysBio, Inc. . . . . . . . 470,813 26,563,269 82,567,730 75,787,869 (29,189,087) —* — —* —
BioCryst Pharmaceuticals, Inc. . 4,513,164 17,104,892 67,916,656 35,624,830 (5,776,904) 15,269,697 12,358,764 58,889,511 —
Catalyst Pharmaceuticals, Inc. . . — — 77,785,908 55,246,512 356,070 —* — —* —
CEL-SCI Corp. . . . . . . . . — — 27,902,164 1,872,662 201,560 1,932,960 1,887,669 28,164,022 —
Clovis Oncology, Inc. . . . . . 4,344,916 64,608,901 119,271,300 76,125,053 (122,121,378) 67,307,270 7,843,117 52,941,040 —
Puma Biotechnology, Inc. . . . . 4,163,214 52,914,450 89,353,026 104,877,027 (56,969,260) 47,931,608 2,718,389 28,352,797 —
State Street Institutional LiquidReserves Fund, PremierClass . . . . . . . . . . — — 250,801,918 244,393,084 (6,838) 57 6,399,493 6,402,053 65,445
State Street InstitutionalU.S. Government MoneyMarket Fund, Class GShares . . . . . . . . . 2,012,403 2,012,403 102,679,821 104,692,224 — — — — 37,546
State Street Navigator SecuritiesLending Portfolio II . . . . — — 2,030,603,981 1,173,186,364 — — 857,417,617 857,417,617 3,592,381
State Street Navigator SecuritiesLending Portfolio III . . . . 251,159,946 251,159,946 472,618,174 723,778,120 — — — — 1,428,465
Viking Therapeutics, Inc. . . . . 5,730,107 47,559,888 61,255,571 80,255,665 (40,323,008) —* — —* —
Total . . . . . . . . . . . . $487,127,340 $3,491,547,485 $2,792,610,639 $(264,690,325) $132,441,592 $1,032,167,040 $5,123,837
(a) Does not include change in unrealized appreciation and depreciation from investments that are nolonger affiliates at period ended June 30, 2020.
* As of June 30, 2020, no longer an affiliate.
SPDR S&P BIOTECH ETFSCHEDULE OF INVESTMENTS (continued)June 30, 2020
See accompanying notes to financial statements.21

Security Description Shares Value
COMMON STOCKS — 99.7%AEROSPACE & DEFENSE — 1.7%General Dynamics Corp. . . . . . . . . . . . . . . . . . . . . . . . . . . . . . . . 962,559 $ 143,864,068Raytheon Technologies Corp. . . . . . . . . . . . . . . . . . . . . . . . . . . . . 1,859,986 114,612,338
258,476,406
AIR FREIGHT & LOGISTICS — 1.3%C.H. Robinson Worldwide, Inc. (a). . . . . . . . . . . . . . . . . . . . . . . . . 1,651,463 130,564,665Expeditors International of Washington, Inc. . . . . . . . . . . . . . . . . . . 806,207 61,303,980
191,868,645
BANKS — 8.6%Bank OZK (a) (b) . . . . . . . . . . . . . . . . . . . . . . . . . . . . . . . . . . . 11,770,632 276,256,733Commerce Bancshares, Inc. (a) . . . . . . . . . . . . . . . . . . . . . . . . . . . 1,458,692 86,748,413Community Bank System, Inc. (a) . . . . . . . . . . . . . . . . . . . . . . . . . 1,772,942 101,093,153Cullen/Frost Bankers, Inc. (a) (b). . . . . . . . . . . . . . . . . . . . . . . . . . 3,189,184 238,263,937People’s United Financial, Inc. (b) . . . . . . . . . . . . . . . . . . . . . . . . . 21,697,953 251,045,316Prosperity Bancshares, Inc. . . . . . . . . . . . . . . . . . . . . . . . . . . . . . 2,919,314 173,348,865United Bankshares, Inc. (a) . . . . . . . . . . . . . . . . . . . . . . . . . . . . . 6,311,500 174,576,090
1,301,332,507
BEVERAGES — 2.0%Brown-Forman Corp. Class B . . . . . . . . . . . . . . . . . . . . . . . . . . . . 784,439 49,937,387Coca-Cola Co. . . . . . . . . . . . . . . . . . . . . . . . . . . . . . . . . . . . . . 3,106,000 138,776,080PepsiCo, Inc. . . . . . . . . . . . . . . . . . . . . . . . . . . . . . . . . . . . . . . 922,297 121,983,001
310,696,468
BIOTECHNOLOGY — 1.8%AbbVie, Inc. . . . . . . . . . . . . . . . . . . . . . . . . . . . . . . . . . . . . . . . 2,852,138 280,022,909
BUILDING PRODUCTS — 0.9%A.O. Smith Corp.. . . . . . . . . . . . . . . . . . . . . . . . . . . . . . . . . . . . 2,419,254 113,995,249Carrier Global Corp. (a) . . . . . . . . . . . . . . . . . . . . . . . . . . . . . . . 1,028,037 22,842,982
136,838,231
CAPITAL MARKETS — 5.7%Eaton Vance Corp. . . . . . . . . . . . . . . . . . . . . . . . . . . . . . . . . . . . 5,344,651 206,303,528FactSet Research Systems, Inc. (a) . . . . . . . . . . . . . . . . . . . . . . . . . 152,598 50,123,865Franklin Resources, Inc. (a) . . . . . . . . . . . . . . . . . . . . . . . . . . . . . 15,410,655 323,161,435S&P Global, Inc. . . . . . . . . . . . . . . . . . . . . . . . . . . . . . . . . . . . . 147,745 48,679,023SEI Investments Co. . . . . . . . . . . . . . . . . . . . . . . . . . . . . . . . . . . 1,178,816 64,811,304T Rowe Price Group, Inc. . . . . . . . . . . . . . . . . . . . . . . . . . . . . . . 1,404,284 173,429,074
866,508,229
SPDR S&P DIVIDEND ETFSCHEDULE OF INVESTMENTSJune 30, 2020
See accompanying notes to financial statements.22

Security Description Shares Value
CHEMICALS — 5.5%Air Products & Chemicals, Inc. . . . . . . . . . . . . . . . . . . . . . . . . . . . 480,088 $ 115,922,049Albemarle Corp. (a) . . . . . . . . . . . . . . . . . . . . . . . . . . . . . . . . . . 1,701,137 131,344,788Ecolab, Inc. . . . . . . . . . . . . . . . . . . . . . . . . . . . . . . . . . . . . . . . 260,380 51,802,601HB Fuller Co. (b). . . . . . . . . . . . . . . . . . . . . . . . . . . . . . . . . . . . 2,718,062 121,225,565Linde PLC . . . . . . . . . . . . . . . . . . . . . . . . . . . . . . . . . . . . . . . . 463,901 98,398,041PPG Industries, Inc. . . . . . . . . . . . . . . . . . . . . . . . . . . . . . . . . . . 1,018,224 107,992,837RPM International, Inc. . . . . . . . . . . . . . . . . . . . . . . . . . . . . . . . . 1,428,971 107,258,563Sherwin-Williams Co.. . . . . . . . . . . . . . . . . . . . . . . . . . . . . . . . . 88,306 51,027,622Stepan Co. . . . . . . . . . . . . . . . . . . . . . . . . . . . . . . . . . . . . . . . . 502,197 48,763,329
833,735,395
COMMERCIAL SERVICES & SUPPLIES — 2.4%ABM Industries, Inc. (a) (b) . . . . . . . . . . . . . . . . . . . . . . . . . . . . . 3,496,319 126,916,380Brady Corp. Class A. . . . . . . . . . . . . . . . . . . . . . . . . . . . . . . . . . 1,770,789 82,908,341Cintas Corp. . . . . . . . . . . . . . . . . . . . . . . . . . . . . . . . . . . . . . . . 278,862 74,277,682MSA Safety, Inc. (a) . . . . . . . . . . . . . . . . . . . . . . . . . . . . . . . . . . 648,112 74,169,937
358,272,340
CONTAINERS & PACKAGING — 3.2%Amcor PLC . . . . . . . . . . . . . . . . . . . . . . . . . . . . . . . . . . . . . . . 26,440,260 269,955,055AptarGroup, Inc. . . . . . . . . . . . . . . . . . . . . . . . . . . . . . . . . . . . . 520,280 58,260,954Sonoco Products Co. . . . . . . . . . . . . . . . . . . . . . . . . . . . . . . . . . 2,989,816 156,337,479
484,553,488
DISTRIBUTORS — 1.4%Genuine Parts Co. . . . . . . . . . . . . . . . . . . . . . . . . . . . . . . . . . . . 2,425,081 210,885,044
DIVERSIFIED TELECOMMUNICATION SERVICES — 1.8%AT&T, Inc.. . . . . . . . . . . . . . . . . . . . . . . . . . . . . . . . . . . . . . . . 9,136,053 276,182,882
ELECTRIC UTILITIES — 1.3%Eversource Energy . . . . . . . . . . . . . . . . . . . . . . . . . . . . . . . . . . . 1,266,529 105,463,870NextEra Energy, Inc. . . . . . . . . . . . . . . . . . . . . . . . . . . . . . . . . . 364,536 87,550,611
193,014,481
ELECTRICAL EQUIPMENT — 2.3%Emerson Electric Co. . . . . . . . . . . . . . . . . . . . . . . . . . . . . . . . . . 2,996,334 185,862,598nVent Electric PLC (b) . . . . . . . . . . . . . . . . . . . . . . . . . . . . . . . . 9,090,838 170,271,396
356,133,994
EQUITY REAL ESTATE INVESTMENT TRUSTS (REITS) — 6.2%Essex Property Trust, Inc. REIT . . . . . . . . . . . . . . . . . . . . . . . . . . 590,776 135,388,136Federal Realty Investment Trust REIT (a) . . . . . . . . . . . . . . . . . . . . 3,029,246 258,122,052
SPDR S&P DIVIDEND ETFSCHEDULE OF INVESTMENTS (continued)June 30, 2020
See accompanying notes to financial statements.23

Security Description Shares Value
National Retail Properties, Inc. REIT . . . . . . . . . . . . . . . . . . . . . . . 8,332,186 $ 295,625,959Realty Income Corp. REIT. . . . . . . . . . . . . . . . . . . . . . . . . . . . . . 4,294,564 255,526,558
944,662,705
FOOD & STAPLES RETAILING — 2.7%Casey’s General Stores, Inc. . . . . . . . . . . . . . . . . . . . . . . . . . . . . . 237,527 35,515,037Sysco Corp. . . . . . . . . . . . . . . . . . . . . . . . . . . . . . . . . . . . . . . . 2,994,921 163,702,382Walmart, Inc. . . . . . . . . . . . . . . . . . . . . . . . . . . . . . . . . . . . . . . 558,681 66,918,810Walgreens Boots Alliance, Inc. . . . . . . . . . . . . . . . . . . . . . . . . . . . 3,473,157 147,227,125
413,363,354
FOOD PRODUCTS — 3.4%Archer-Daniels-Midland Co. . . . . . . . . . . . . . . . . . . . . . . . . . . . . 4,325,851 172,601,455Hormel Foods Corp. (a). . . . . . . . . . . . . . . . . . . . . . . . . . . . . . . . 1,595,627 77,020,915J.M. Smucker Co. . . . . . . . . . . . . . . . . . . . . . . . . . . . . . . . . . . . 1,025,403 108,497,892Lancaster Colony Corp.. . . . . . . . . . . . . . . . . . . . . . . . . . . . . . . . 548,895 85,073,236McCormick & Co., Inc.. . . . . . . . . . . . . . . . . . . . . . . . . . . . . . . . 437,524 78,496,181
521,689,679
GAS UTILITIES — 5.8%Atmos Energy Corp.. . . . . . . . . . . . . . . . . . . . . . . . . . . . . . . . . . 863,935 86,030,648National Fuel Gas Co.. . . . . . . . . . . . . . . . . . . . . . . . . . . . . . . . . 4,312,353 180,816,961New Jersey Resources Corp.. . . . . . . . . . . . . . . . . . . . . . . . . . . . . 4,313,668 140,841,260Northwest Natural Holding Co. (b) . . . . . . . . . . . . . . . . . . . . . . . . 1,853,023 103,380,153South Jersey Industries, Inc. (a) (b) . . . . . . . . . . . . . . . . . . . . . . . . 6,542,373 163,493,901UGI Corp. . . . . . . . . . . . . . . . . . . . . . . . . . . . . . . . . . . . . . . . . 6,563,679 208,724,992
883,287,915
HEALTH CARE EQUIPMENT & SUPPLIES — 1.4%Abbott Laboratories . . . . . . . . . . . . . . . . . . . . . . . . . . . . . . . . . . 733,757 67,087,403Becton Dickinson and Co. . . . . . . . . . . . . . . . . . . . . . . . . . . . . . . 195,935 46,881,367Medtronic PLC . . . . . . . . . . . . . . . . . . . . . . . . . . . . . . . . . . . . . 944,083 86,572,411West Pharmaceutical Services, Inc. . . . . . . . . . . . . . . . . . . . . . . . . 84,749 19,252,430
219,793,611
HEALTH CARE PROVIDERS & SERVICES — 1.1%Cardinal Health, Inc. . . . . . . . . . . . . . . . . . . . . . . . . . . . . . . . . . 3,073,549 160,408,522
HOTELS, RESTAURANTS & LEISURE — 0.8%McDonald’s Corp. . . . . . . . . . . . . . . . . . . . . . . . . . . . . . . . . . . . 627,452 115,746,070
HOUSEHOLD DURABLES — 1.8%Leggett & Platt, Inc. (b). . . . . . . . . . . . . . . . . . . . . . . . . . . . . . . . 7,856,841 276,167,961
SPDR S&P DIVIDEND ETFSCHEDULE OF INVESTMENTS (continued)June 30, 2020
See accompanying notes to financial statements.24

Security Description Shares Value
HOUSEHOLD PRODUCTS — 3.3%Church & Dwight Co., Inc. . . . . . . . . . . . . . . . . . . . . . . . . . . . . . 799,596 $ 61,808,771Clorox Co. (a). . . . . . . . . . . . . . . . . . . . . . . . . . . . . . . . . . . . . . 486,681 106,763,211Colgate-Palmolive Co. . . . . . . . . . . . . . . . . . . . . . . . . . . . . . . . . 1,406,327 103,027,516Kimberly-Clark Corp. . . . . . . . . . . . . . . . . . . . . . . . . . . . . . . . . . 900,675 127,310,411Procter & Gamble Co.. . . . . . . . . . . . . . . . . . . . . . . . . . . . . . . . . 858,150 102,608,996
501,518,905
INDUSTRIAL CONGLOMERATES — 1.7%3M Co. . . . . . . . . . . . . . . . . . . . . . . . . . . . . . . . . . . . . . . . . . . 1,127,259 175,841,131Carlisle Cos., Inc. . . . . . . . . . . . . . . . . . . . . . . . . . . . . . . . . . . . 496,894 59,463,305Roper Technologies, Inc. . . . . . . . . . . . . . . . . . . . . . . . . . . . . . . . 79,106 30,713,696
266,018,132
INSURANCE — 4.7%Aflac, Inc. . . . . . . . . . . . . . . . . . . . . . . . . . . . . . . . . . . . . . . . . 3,525,986 127,041,276Brown & Brown, Inc. . . . . . . . . . . . . . . . . . . . . . . . . . . . . . . . . . 1,025,024 41,779,978Chubb, Ltd. . . . . . . . . . . . . . . . . . . . . . . . . . . . . . . . . . . . . . . . 974,801 123,429,303Cincinnati Financial Corp. . . . . . . . . . . . . . . . . . . . . . . . . . . . . . . 1,532,452 98,122,901Old Republic International Corp. . . . . . . . . . . . . . . . . . . . . . . . . . . 14,028,977 228,812,615RenaissanceRe Holdings, Ltd.. . . . . . . . . . . . . . . . . . . . . . . . . . . . 245,227 41,941,174RLI Corp. (a) . . . . . . . . . . . . . . . . . . . . . . . . . . . . . . . . . . . . . . 563,844 46,291,592
707,418,839
IT SERVICES — 2.2%Automatic Data Processing, Inc. . . . . . . . . . . . . . . . . . . . . . . . . . . 740,107 110,194,531International Business Machines Corp. . . . . . . . . . . . . . . . . . . . . . . 1,818,220 219,586,430
329,780,961
LEISURE EQUIPMENT & PRODUCTS — 1.9%Polaris, Inc. (b) . . . . . . . . . . . . . . . . . . . . . . . . . . . . . . . . . . . . . 3,164,816 292,903,721
MACHINERY — 6.8%Caterpillar, Inc. . . . . . . . . . . . . . . . . . . . . . . . . . . . . . . . . . . . . . 1,187,754 150,250,881Donaldson Co., Inc. . . . . . . . . . . . . . . . . . . . . . . . . . . . . . . . . . . 1,983,857 92,289,028Dover Corp. . . . . . . . . . . . . . . . . . . . . . . . . . . . . . . . . . . . . . . . 1,002,057 96,758,624Franklin Electric Co., Inc. . . . . . . . . . . . . . . . . . . . . . . . . . . . . . . 1,026,989 53,937,462Graco, Inc. . . . . . . . . . . . . . . . . . . . . . . . . . . . . . . . . . . . . . . . . 1,218,725 58,486,613Illinois Tool Works, Inc. . . . . . . . . . . . . . . . . . . . . . . . . . . . . . . . 733,332 128,223,100Lincoln Electric Holdings, Inc. . . . . . . . . . . . . . . . . . . . . . . . . . . . 1,438,761 121,201,226Nordson Corp. . . . . . . . . . . . . . . . . . . . . . . . . . . . . . . . . . . . . . 273,501 51,885,875Otis Worldwide Corp. . . . . . . . . . . . . . . . . . . . . . . . . . . . . . . . . . 514,041 29,228,371Pentair PLC . . . . . . . . . . . . . . . . . . . . . . . . . . . . . . . . . . . . . . . 3,152,217 119,752,724
SPDR S&P DIVIDEND ETFSCHEDULE OF INVESTMENTS (continued)June 30, 2020
See accompanying notes to financial statements.25
Security Description Shares Value
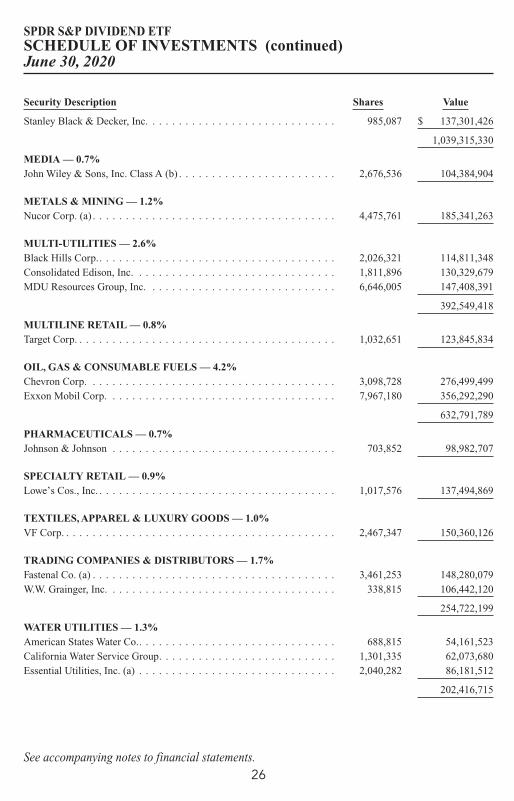
Stanley Black & Decker, Inc. . . . . . . . . . . . . . . . . . . . . . . . . . . . . 985,087 $ 137,301,426
1,039,315,330
MEDIA — 0.7%John Wiley & Sons, Inc. Class A (b) . . . . . . . . . . . . . . . . . . . . . . . . 2,676,536 104,384,904
METALS & MINING — 1.2%Nucor Corp. (a) . . . . . . . . . . . . . . . . . . . . . . . . . . . . . . . . . . . . . 4,475,761 185,341,263
MULTI-UTILITIES — 2.6%Black Hills Corp.. . . . . . . . . . . . . . . . . . . . . . . . . . . . . . . . . . . . 2,026,321 114,811,348Consolidated Edison, Inc. . . . . . . . . . . . . . . . . . . . . . . . . . . . . . . 1,811,896 130,329,679MDU Resources Group, Inc. . . . . . . . . . . . . . . . . . . . . . . . . . . . . 6,646,005 147,408,391
392,549,418
MULTILINE RETAIL — 0.8%Target Corp. . . . . . . . . . . . . . . . . . . . . . . . . . . . . . . . . . . . . . . . 1,032,651 123,845,834
OIL, GAS & CONSUMABLE FUELS — 4.2%Chevron Corp. . . . . . . . . . . . . . . . . . . . . . . . . . . . . . . . . . . . . . 3,098,728 276,499,499Exxon Mobil Corp. . . . . . . . . . . . . . . . . . . . . . . . . . . . . . . . . . . 7,967,180 356,292,290
632,791,789
PHARMACEUTICALS — 0.7%Johnson & Johnson . . . . . . . . . . . . . . . . . . . . . . . . . . . . . . . . . . 703,852 98,982,707
SPECIALTY RETAIL — 0.9%Lowe’s Cos., Inc. . . . . . . . . . . . . . . . . . . . . . . . . . . . . . . . . . . . . 1,017,576 137,494,869
TEXTILES, APPAREL & LUXURY GOODS — 1.0%VF Corp. . . . . . . . . . . . . . . . . . . . . . . . . . . . . . . . . . . . . . . . . . 2,467,347 150,360,126
TRADING COMPANIES & DISTRIBUTORS — 1.7%Fastenal Co. (a) . . . . . . . . . . . . . . . . . . . . . . . . . . . . . . . . . . . . . 3,461,253 148,280,079W.W. Grainger, Inc. . . . . . . . . . . . . . . . . . . . . . . . . . . . . . . . . . . 338,815 106,442,120
254,722,199
WATER UTILITIES — 1.3%American States Water Co.. . . . . . . . . . . . . . . . . . . . . . . . . . . . . . 688,815 54,161,523California Water Service Group. . . . . . . . . . . . . . . . . . . . . . . . . . . 1,301,335 62,073,680Essential Utilities, Inc. (a) . . . . . . . . . . . . . . . . . . . . . . . . . . . . . . 2,040,282 86,181,512
202,416,715
SPDR S&P DIVIDEND ETFSCHEDULE OF INVESTMENTS (continued)June 30, 2020
See accompanying notes to financial statements.26

Security Description Shares Value
WIRELESS TELECOMMUNICATION SERVICES — 0.9%Telephone & Data Systems, Inc. (b) . . . . . . . . . . . . . . . . . . . . . . . . 7,119,547 $ 141,536,594
TOTAL COMMON STOCKS(Cost $15,601,627,536) . . . . . . . . . . . . . . . . . . . . . . . . . . . . 15,155,023,142
SHORT-TERM INVESTMENTS — 1.2%State Street Institutional Liquid Reserves Fund, Premier Class 0.35%
(c) (d) . . . . . . . . . . . . . . . . . . . . . . . . . . . . . . . . . . . . . . . 16,175,997 16,182,467State Street Navigator Securities Lending Portfolio II (e) (f) . . . . . . . 160,240,114 160,240,114
TOTAL SHORT-TERM INVESTMENTS(Cost $176,410,308) . . . . . . . . . . . . . . . . . . . . . . . . . . . . . . . . . . . . . . . . . . 176,422,581
TOTAL INVESTMENTS — 100.9%(Cost $15,778,037,844) . . . . . . . . . . . . . . . . . . . . . . . . . . . . . . . . . . . . . . . . 15,331,445,723
LIABILITIES IN EXCESS OF OTHER ASSETS — (0.9)% . . . . . . . . . . . . . . . . (133,579,889)
NET ASSETS — 100.0% . . . . . . . . . . . . . . . . . . . . . . . . . . . . . . . . . . . . . . . . $ 15,197,865,834
(a) All or a portion of the shares of the security are on loan at June 30, 2020.(b) These securities are affiliated investments as a result of the Fund owning 5% or more of the entity’s
outstanding shares. Amounts related to these transactions during the period ended June 30, 2020 areshown in the Affiliate Table below.
(c) The Fund invested in certain money market funds managed by SSGA Funds Management, Inc.Amounts related to these transactions during the period ended June 30, 2020 are shown in the AffiliateTable below.
(d) The rate shown is the annualized seven-day yield at June 30, 2020.(e) The Fund invested in an affiliated entity. Amounts related to these transactions during the period ended
June 30, 2020 are shown in the Affiliate Table below.(f) Investment of cash collateral for securities loaned.
REIT Real Estate Investment Trust
The following table summarizes the value of the Fund’s investments according to thefair value hierarchy as of June 30, 2020.
DescriptionLevel 1 –
Quoted Prices
Level 2 –Other SignificantObservable Inputs
Level 3 –Significant
Unobservable Inputs Total
ASSETS:INVESTMENTS:Common Stocks . . . . . . . . . . . . . . . . . . . $15,155,023,142 $— $— $15,155,023,142
Short-Term Investments . . . . . . . . . . . . . . . 176,422,581 — — 176,422,581
TOTAL INVESTMENTS . . . . . . . . . . . . . $15,331,445,723 $— $— $15,331,445,723
SPDR S&P DIVIDEND ETFSCHEDULE OF INVESTMENTS (continued)June 30, 2020
See accompanying notes to financial statements.27

Affiliate Table
Number ofShares Held
at 6/30/19Value at6/30/19
Cost ofPurchases
Proceedsfrom
Shares SoldRealized
Gain (Loss)
Change inUnrealized
Appreciation/Depreciation(a)
Number ofShares Held
at 6/30/20Value at6/30/20
DividendIncome
ABM Industries, Inc. . . . . 3,755,454 $ 150,218,160 $ 74,902,209 $ 89,378,792 $ 7,525,804 $ (16,351,001) 3,496,319 $ 126,916,380 $ 2,373,808Bank OZK . . . . . . . . 7,011,092 210,963,759 156,821,007 38,351,659 (3,370,687) (49,805,687) 11,770,632 276,256,733 7,821,851Brady Corp. . . . . . . . 2,701,251 133,225,699 40,207,101 87,278,482 4,966,907 —* — —* 1,889,209Cullen/Frost Bankers, Inc. . . 1,912,497 179,124,469 166,860,421 65,155,349 8,892,052 (51,457,656) 3,189,184 238,263,937 7,279,560Eaton Vance Corp. . . . . . 5,890,022 254,036,649 92,450,906 117,922,762 15,628,948 —* — —* 8,138,430HB Fuller Co.. . . . . . . 1,886,785 87,546,824 63,861,591 32,418,598 (852,782) 3,088,530 2,718,062 121,225,565 1,230,642Helmerich & Payne, Inc. . . — — 457,238,655 233,766,289 (223,472,366) —* — —* 7,593,719John Wiley & Sons, Inc. . . 3,190,542 146,318,256 52,866,597 76,479,092 (17,535,338) (785,519) 2,676,536 104,384,904 3,857,777Kontoor Brands, Inc. . . . . 254,938 7,143,363 332,569,217 162,778,240 (177,059,719) —* — —* 7,536,637Leggett & Platt, Inc. . . . . 6,012,837 230,712,556 262,972,078 230,049,025 48,321,890 (35,789,538) 7,856,841 276,167,961 10,549,572Meredith Corp. . . . . . . 3,377,760 185,979,466 173,564,742 238,710,977 (131,690,869) —* — —* 6,345,141National Fuel Gas Co. . . . 3,323,623 175,321,113 179,396,000 120,748,179 (29,071,840) —* — —* 9,247,828Northwest Natural Holding
Co. . . . . . . . . . — — 143,352,174 11,435,698 (1,126,491) (27,409,832) 1,853,023 103,380,153 657,703nVent Electric PLC . . . . 6,616,421 164,021,077 158,242,105 108,177,295 (2,235,294) (41,579,197) 9,090,838 170,271,396 5,645,000People’s United Financial,
Inc. . . . . . . . . . 18,048,137 302,847,739 133,919,572 80,340,710 (6,220,626) (99,160,659) 21,697,953 251,045,316 14,065,416Polaris, Inc. . . . . . . . 2,121,915 193,582,305 158,025,240 88,215,093 5,355,225 24,156,044 3,164,816 292,903,721 5,607,644South Jersey Industries, Inc. . — — 218,951,489 18,289,389 (2,263,049) (34,905,150) 6,542,373 163,493,901 3,484,172State Street Institutional
Liquid Reserves Fund,Premier Class . . . . . — — 882,348,819 866,217,433 38,809 12,272 16,175,997 16,182,467 434,245
State Street InstitutionalU.S. Government MoneyMarket Fund, Class GShares . . . . . . . . 3,868,771 3,868,771 53,013,411 56,882,182 — —* — —* 79,583
State Street NavigatorSecurities LendingPortfolio II . . . . . . — — 1,854,036,169 1,693,796,055 — — 160,240,114 160,240,114 1,870,762
State Street NavigatorSecurities LendingPortfolio III . . . . . . 72,674,127 72,674,127 517,136,810 589,810,937 — —* — —* 489,080
Tanger Factory OutletCenters, Inc. . . . . . 12,260,632 198,744,845 169,688,283 334,605,621 (137,923,659) —* — —* 19,426,744
Telephone & Data Systems,Inc. . . . . . . . . . 4,740,780 144,119,712 107,368,919 42,145,833 (10,432,868) (57,373,336) 7,119,547 141,536,594 4,469,637
Total . . . . . . . . . . $2,840,448,890 $6,449,793,515 $5,382,953,690 $(652,525,953) $(387,360,729) $2,442,269,142 $130,094,160
(a) Does not include change in unrealized appreciation and depreciation from investments that are nolonger affiliates at period ended June 30, 2020.
* As of June 30, 2020, no longer an affiliate.
SPDR S&P DIVIDEND ETFSCHEDULE OF INVESTMENTS (continued)June 30, 2020
See accompanying notes to financial statements.28

SPDR Dow JonesREIT ETF
SPDR S&PBiotech ETF
SPDR S&PDividend ETF
ASSETSInvestments in unaffiliated issuers, at
value* . . . . . . . . . . . . . . . . . . . . . . $1,347,733,308 $ 5,226,893,648 $12,889,176,581Investments in affiliated issuers, at
value . . . . . . . . . . . . . . . . . . . . . . . 13,764,900 1,032,167,040 2,442,269,142
Total Investments . . . . . . . . . . . . . . 1,361,498,208 6,259,060,688 15,331,445,723Receivable for investments sold. . . . . . — 428 51,006,771Receivable for fund shares sold . . . . . . — 950,652 —Dividends receivable — unaffiliated
issuers . . . . . . . . . . . . . . . . . . . . . . 5,073,549 — 33,887,223Dividends receivable — affiliated
issuers . . . . . . . . . . . . . . . . . . . . . . 495 1,615 2,024,366Securities lending income receivable
— unaffiliated issuers . . . . . . . . . . . 2,822 168,213 18,367Securities lending income receivable
— affiliated issuers . . . . . . . . . . . . . 19,996 1,243,588 80,630
TOTAL ASSETS . . . . . . . . . . . . 1,366,595,070 6,261,425,184 15,418,463,080
LIABILITIESDue to custodian . . . . . . . . . . . . . . . . — 429 —Payable upon return of securities
loaned . . . . . . . . . . . . . . . . . . . . . . 9,665,286 857,417,617 160,240,114Payable for investments purchased. . . . 3,474,225 — 55,744,558Payable for fund shares repurchased . . — — 127,652Advisory fee payable . . . . . . . . . . . . . 291,477 1,357,740 4,475,448Trustees’ fees and expenses payable. . . 1,406 2,078 9,474
TOTAL LIABILITIES . . . . . . . 13,432,394 858,777,864 220,597,246
NET ASSETS . . . . . . . . . . . . . . $1,353,162,676 $ 5,402,647,320 $15,197,865,834
NET ASSETS CONSIST OF:Paid-in Capital. . . . . . . . . . . . . . . . . . $1,823,842,932 $ 8,385,604,445 $16,723,161,488Total distributable earnings (loss) . . . . (470,680,256) (2,982,957,125) (1,525,295,654)
NET ASSETS . . . . . . . . . . . . . . $1,353,162,676 $ 5,402,647,320 $15,197,865,834
NET ASSET VALUE PER SHARENet asset value per share. . . . . . . . . . . $ 78.07 $ 112.03 $ 91.25
Shares outstanding (unlimited amountauthorized, $0.01 par value) . . . . . . . 17,331,617 48,225,000 166,553,658
COST OF INVESTMENTS:Investments in unaffiliated issuers . . . . $1,627,316,815 $ 5,483,233,969 $12,978,009,966Investments in affiliated issuers. . . . . . 13,764,900 1,039,291,045 2,800,027,878
Total cost of investments. . . . . . . . . . . $1,641,081,715 $ 6,522,525,014 $15,778,037,844
* Includes investments in securities onloan, at value . . . . . . . . . . . . . . . . . $ 34,741,389 $ 1,251,274,590 $ 313,928,213
SPDR SERIES TRUSTSTATEMENTS OF ASSETS AND LIABILITIESJune 30, 2020
See accompanying notes to financial statements.29

SPDR Dow JonesREIT ETF
SPDR S&PBiotech ETF
SPDR S&PDividend ETF
INVESTMENT INCOMEDividend income — unaffiliated issuers. $ 63,428,972 $ 8,329,168 $ 446,806,049Dividend income — affiliated issuers . . 42,334 102,991 127,734,318Unaffiliated securities lending income . . 100,028 1,343,954 1,175,586Affiliated securities lending income . . . 208,527 5,020,846 2,359,842Foreign taxes withheld . . . . . . . . . . . . . (11,020) — —
TOTAL INVESTMENT INCOME(LOSS) . . . . . . . . . . . . . . . . . . . . . . 63,768,841 14,796,959 578,075,795
EXPENSESAdvisory fee . . . . . . . . . . . . . . . . . . . . 5,568,170 14,442,831 62,433,225Trustees’ fees and expenses . . . . . . . . . 34,242 54,403 260,879Miscellaneous expenses . . . . . . . . . . . . 2,046 3,568 13,278
TOTAL EXPENSES. . . . . . . . . . . . . . 5,604,458 14,500,802 62,707,382
NET INVESTMENT INCOME(LOSS) . . . . . . . . . . . . . . . . . . . . . . $ 58,164,383 $ 296,157 $ 515,368,413
REALIZED AND UNREALIZEDGAIN (LOSS)Net realized gain (loss) on:
Investments — unaffiliated issuers . . . (167,829,675) (280,044,086) (260,556,459)Investments — affiliated issuers. . . . . (2,486) (293,533,514) (732,498,747)In-kind redemptions — unaffiliated
issuers . . . . . . . . . . . . . . . . . . . . . 134,816,251 1,115,681,165 2,152,792,855In-kind redemptions — affiliated
issuers . . . . . . . . . . . . . . . . . . . . . — 28,843,189 79,972,794
Net realized gain (loss) . . . . . . . . . . . (33,015,910) 570,946,754 1,239,710,443
Net change in unrealizedappreciation/depreciation on:Investments — unaffiliated issuers . . . (401,412,206) 284,003,633 (2,943,067,905)Investment — affiliated issuers . . . . . — 193,963,271 (245,392,401)
Net change in unrealizedappreciation/depreciation . . . . . . . . (401,412,206) 477,966,904 (3,188,460,306)
NET REALIZED ANDUNREALIZED GAIN (LOSS) . . . . (434,428,116) 1,048,913,658 (1,948,749,863)
NET INCREASE (DECREASE) INNET ASSETS FROM OPERATIONS. $(376,263,733) $1,049,209,815 $(1,433,381,450)
SPDR SERIES TRUSTSTATEMENTS OF OPERATIONSFor theYear Ended June 30, 2020
See accompanying notes to financial statements.30

SPDR Dow Jones REIT ETF
Year Ended6/30/20
Year Ended6/30/19
INCREASE (DECREASE) IN NET ASSETS FROMOPERATIONS:Net investment income (loss) . . . . . . . . . . . . . . . . . . . . . $ 58,164,383 $ 75,636,619Net realized gain (loss) . . . . . . . . . . . . . . . . . . . . . . . . . (33,015,910) 260,714,090Net change in unrealized appreciation/depreciation . . . . . (401,412,206) (112,467,319)
Net increase (decrease) in net assets resulting fromoperations . . . . . . . . . . . . . . . . . . . . . . . . . . . . . . . . (376,263,733) 223,883,390
Net equalization credits and charges . . . . . . . . . . . . . . . . (2,277,335) 250,719
Distributions to shareholders . . . . . . . . . . . . . . . . . . . . . (76,076,130) (101,343,386)
FROM BENEFICIAL INTEREST TRANSACTIONS:Proceeds from shares sold . . . . . . . . . . . . . . . . . . . . . . . . . 491,798,632 999,735,367Cost of shares redeemed . . . . . . . . . . . . . . . . . . . . . . . . . . (1,219,091,891) (1,153,109,832)Net income equalization . . . . . . . . . . . . . . . . . . . . . . . . . . 2,277,335 (250,719)
Net increase (decrease) in net assets from beneficialinterest transactions . . . . . . . . . . . . . . . . . . . . . . . . . . . . (725,015,924) (153,625,184)
Net increase (decrease) in net assets during the period . . . (1,179,633,122) (30,834,461)
Net assets at beginning of period . . . . . . . . . . . . . . . . . . 2,532,795,798 2,563,630,259
NET ASSETS AT END OF PERIOD. . . . . . . . . . . . . . . . $ 1,353,162,676 $ 2,532,795,798
SHARES OF BENEFICIAL INTEREST:Shares sold . . . . . . . . . . . . . . . . . . . . . . . . . . . . . . . . . . . 5,300,000 10,400,000Shares redeemed . . . . . . . . . . . . . . . . . . . . . . . . . . . . . . . (13,600,000) (12,100,000)
Net increase (decrease) from share transactions . . . . . . . (8,300,000) (1,700,000)
SPDR SERIES TRUSTSTATEMENTS OF CHANGES IN NET ASSETS
See accompanying notes to financial statements.31

SPDR S&P Biotech ETF
Year Ended6/30/20
Year Ended6/30/19
INCREASE (DECREASE) IN NET ASSETS FROMOPERATIONS:Net investment income (loss) . . . . . . . . . . . . . . . . . . . $ 296,157 $ 2,330,693Net realized gain (loss) . . . . . . . . . . . . . . . . . . . . . . . 570,946,754 (227,333,914)Net change in unrealized appreciation/depreciation . . . 477,966,904 (314,583,650)
Net increase (decrease) in net assets resulting fromoperations . . . . . . . . . . . . . . . . . . . . . . . . . . . . . . 1,049,209,815 (539,586,871)
Net equalization credits and charges . . . . . . . . . . . . . . 35,202 215,871
Distributions to shareholders . . . . . . . . . . . . . . . . . . . (928,142) (4,996,708)
FROM BENEFICIAL INTERESTTRANSACTIONS:
Proceeds from shares sold . . . . . . . . . . . . . . . . . . . . . . . 18,679,802,929 14,940,138,891Cost of shares redeemed . . . . . . . . . . . . . . . . . . . . . . . . (18,738,305,166) (15,215,669,669)Net income equalization . . . . . . . . . . . . . . . . . . . . . . . . (35,202) (215,871)
Net increase (decrease) in net assets from beneficialinterest transactions . . . . . . . . . . . . . . . . . . . . . . . . . . (58,537,439) (275,746,649)
Net increase (decrease) in net assets during the period . 989,779,436 (820,114,357)
Net assets at beginning of period. . . . . . . . . . . . . . . . . 4,412,867,884 5,232,982,241
NET ASSETS AT END OF PERIOD . . . . . . . . . . . . . . $ 5,402,647,320 $ 4,412,867,884
SHARES OF BENEFICIAL INTEREST:Shares sold. . . . . . . . . . . . . . . . . . . . . . . . . . . . . . . . . . 208,575,000 173,950,000Shares redeemed. . . . . . . . . . . . . . . . . . . . . . . . . . . . . . (210,600,000) (178,650,000)
Net increase (decrease) from share transactions. . . . . . (2,025,000) (4,700,000)
SPDR SERIES TRUSTSTATEMENTS OF CHANGES IN NET ASSETS (continued)
See accompanying notes to financial statements.32

SPDR S&P Dividend ETF
Year Ended6/30/20
Year Ended6/30/19
INCREASE (DECREASE) IN NET ASSETS FROMOPERATIONS:Net investment income (loss) . . . . . . . . . . . . . . . . . . . . $ 515,368,413 $ 424,527,653Net realized gain (loss). . . . . . . . . . . . . . . . . . . . . . . . . 1,239,710,443 1,656,443,637Net change in unrealized appreciation/depreciation. . . . . (3,188,460,306) (65,735,810)
Net increase (decrease) in net assets resulting fromoperations . . . . . . . . . . . . . . . . . . . . . . . . . . . . . . . . (1,433,381,450) 2,015,235,480
Net equalization credits and charges . . . . . . . . . . . . . . . (7,547,203) 3,640,194
Distributions to shareholders. . . . . . . . . . . . . . . . . . . . . (509,825,739) (431,641,309)
FROM BENEFICIAL INTEREST TRANSACTIONS:Proceeds from shares sold . . . . . . . . . . . . . . . . . . . . . . . . 6,522,295,627 6,965,569,606Cost of shares redeemed . . . . . . . . . . . . . . . . . . . . . . . . . (8,079,251,362) (5,203,085,444)Net income equalization . . . . . . . . . . . . . . . . . . . . . . . . . 7,547,203 (3,640,194)
Net increase (decrease) in net assets from beneficialinterest transactions . . . . . . . . . . . . . . . . . . . . . . . . . . . (1,549,408,532) 1,758,843,968
Net increase (decrease) in net assets during the period. . . (3,500,162,924) 3,346,078,333
Net assets at beginning of period . . . . . . . . . . . . . . . . . . 18,698,028,758 15,351,950,425
NET ASSETS AT END OF PERIOD . . . . . . . . . . . . . . . $15,197,865,834 $18,698,028,758
SHARES OF BENEFICIAL INTEREST:Shares sold . . . . . . . . . . . . . . . . . . . . . . . . . . . . . . . . . . . 65,550,000 73,400,000Shares redeemed . . . . . . . . . . . . . . . . . . . . . . . . . . . . . . . (84,200,000) (53,900,000)
Net increase (decrease) from share transactions . . . . . . . (18,650,000) 19,500,000
SPDR SERIES TRUSTSTATEMENTS OF CHANGES IN NET ASSETS (continued)
See accompanying notes to financial statements.33

SPDR Dow Jones REIT ETF
YearEnded6/30/20
YearEnded6/30/19
YearEnded6/30/18
YearEnded6/30/17
YearEnded6/30/16
Net asset value, beginning of period . . . . . . . . . . $ 98.82 $ 93.80 $ 92.99 $ 99.44 $ 84.38
Income (loss) from investment operations:Net investment income (loss) (a) . . . . . . . . . . . . . 2.50 2.74 2.47 1.62 2.83Net realized and unrealized gain (loss) (b) . . . . . . . . (19.84) 5.92 1.20 (4.28) 15.72
Total from investment operations . . . . . . . . . . . . (17.34) 8.66 3.67 (2.66) 18.55
Net equalization credits and charges (a) . . . . . . . . . (0.10) 0.01 (0.04) (0.09) 0.03
Distributions to shareholders from:Net investment income. . . . . . . . . . . . . . . . . . (3.31) (3.65) (2.82) (3.70) (3.52)
Net asset value, end of period . . . . . . . . . . . . . $ 78.07 $ 98.82 $ 93.80 $ 92.99 $ 99.44
Total return (c) . . . . . . . . . . . . . . . . . . . . . (18.04)% 9.58% 4.03% (2.73)% 22.43%Ratios and Supplemental Data:Net assets, end of period (in 000s) . . . . . . . . . . . . $1,353,163 $2,532,796 $2,563,630 $3,015,901 $3,816,521Ratios to average net assets:Total expenses . . . . . . . . . . . . . . . . . . . . . . 0.25% 0.25% 0.25% 0.25% 0.25%Net investment income (loss) . . . . . . . . . . . . . . 2.61% 2.89% 2.72% 1.71% 3.14%Portfolio turnover rate (d) . . . . . . . . . . . . . . . . 17% 9% 6% 9% 10%
(a) Per share numbers have been calculated using average shares outstanding, which more appropriately presents theper share data for the year.
(b) Amounts shown in this caption for a share outstanding may not accord with the change in aggregate gains andlosses in securities for the fiscal period because of the timing of sales and repurchases of Fund shares in relationto fluctuating market values for the Fund.
(c) Total return is calculated assuming a purchase of shares at net asset value on the first day and a sale at net assetvalue on the last day of each period reported. Distributions are assumed, for the purpose of this calculation, to bereinvested at net asset value per share on the respective payment dates of each distribution. Total returns forperiods of less than one year are not annualized. Broker commission charges are not included in this calculation.
(d) Portfolio turnover rate excludes securities received or delivered from in-kind processing of creations orredemptions.
SPDR SERIES TRUSTFINANCIAL HIGHLIGHTSSelected data for a share outstanding throughout each period
See accompanying notes to financial statements.34

SPDR S&P Biotech ETF
YearEnded6/30/20
YearEnded6/30/19
YearEnded6/30/18
YearEnded6/30/17
YearEnded
6/30/16(a)
Net asset value, beginning of period . . . . . . . . . . $ 87.82 $ 95.23 $ 77.15 $ 54.16 $ 84.11
Income (loss) from investment operations:Net investment income (loss) (b). . . . . . . . . . . . . 0.01 0.04 0.20 0.20 0.29Net realized and unrealized gain (loss) (c) . . . . . . . . 24.22 (7.37) 18.06 22.97 (29.93)
Total from investment operations . . . . . . . . . . . . 24.23 (7.33) 18.26 23.17 (29.64)
Net equalization credits and charges (b) . . . . . . . . . 0.00(d) 0.00(d) 0.01 (0.00)(d) (0.01)
Distributions to shareholders from:Net investment income. . . . . . . . . . . . . . . . . . (0.02) (0.08) (0.19) (0.18) (0.30)
Net asset value, end of period . . . . . . . . . . . . . $ 112.03 $ 87.82 $ 95.23 $ 77.15 $ 54.16
Total return (e) . . . . . . . . . . . . . . . . . . . . . 27.59% (7.70)% 23.69% 42.80% (35.30)%Ratios and Supplemental Data:Net assets, end of period (in 000s) . . . . . . . . . . . . $5,402,647 $4,412,868 $5,232,982 $3,548,969 $1,873,833Ratios to average net assets:Total expenses . . . . . . . . . . . . . . . . . . . . . . 0.35% 0.35% 0.35% 0.35% 0.35%Net investment income (loss) . . . . . . . . . . . . . . 0.01% 0.05% 0.23% 0.30% 0.45%Portfolio turnover rate (f) . . . . . . . . . . . . . . . . 66% 45% 62% 59% 75%
(a) On September 8, 2015, the SPDR S&P Biotech ETF underwent a 3-for-1 share split. The per share datapresented here have been retroactively adjusted to reflect this split.
(b) Per share numbers have been calculated using average shares outstanding, which more appropriately presents theper share data for the year.
(c) Amounts shown in this caption for a share outstanding may not accord with the change in aggregate gains andlosses in securities for the fiscal period because of the timing of sales and repurchases of Fund shares in relationto fluctuating market values for the Fund.
(d) Amount is less than $0.005 per share.(e) Total return is calculated assuming a purchase of shares at net asset value on the first day and a sale at net asset
value on the last day of each period reported. Distributions are assumed, for the purpose of this calculation, to bereinvested at net asset value per share on the respective payment dates of each distribution. Total returns forperiods of less than one year are not annualized. Broker commission charges are not included in this calculation.
(f) Portfolio turnover rate excludes securities received or delivered from in-kind processing of creations orredemptions.
SPDR SERIES TRUSTFINANCIAL HIGHLIGHTS (continued)Selected data for a share outstanding throughout each period
See accompanying notes to financial statements.35

SPDR S&P Dividend ETF
YearEnded6/30/20
YearEnded6/30/19
YearEnded6/30/18
YearEnded6/30/17
YearEnded6/30/16
Net asset value, beginning of period . . . . . . . $ 100.96 $ 92.65 $ 88.93 $ 83.91 $ 76.23
Income (loss) from investment operations:Net investment income (loss) (a) . . . . . . . . . 2.84 2.41 2.31 1.81 2.01Net realized and unrealized gain (loss) (b). . . . . (9.68) 8.30 6.10 6.01 10.29
Total from investment operations . . . . . . . . . (6.84) 10.71 8.41 7.82 12.30
Net equalization credits and charges (a) . . . . . . (0.04) 0.02 (0.03) 0.01 0.01
Distributions to shareholders from:Net investment income . . . . . . . . . . . . . . (2.83) (2.42) (2.33) (2.22) (2.02)Net realized gains . . . . . . . . . . . . . . . . . — — (2.33) (0.59) (2.61)
Total distributions . . . . . . . . . . . . . . . . . (2.83) (2.42) (4.66) (2.81) (4.63)
Net asset value, end of period . . . . . . . . . . $ 91.25 $ 100.96 $ 92.65 $ 88.93 $ 83.91
Total return (c) . . . . . . . . . . . . . . . . . . (6.82)% 11.76% 9.44% 9.46% 16.94%Ratios and Supplemental Data:Net assets, end of period (in 000s). . . . . . . . . $15,197,866 $18,698,029 $15,351,950 $15,478,187 $14,009,561Ratios to average net assets:Total expenses . . . . . . . . . . . . . . . . . . . 0.35% 0.35% 0.35% 0.35% 0.35%Net investment income (loss) . . . . . . . . . . . 2.89% 2.49% 2.51% 2.10% 2.62%Portfolio turnover rate (d) . . . . . . . . . . . . . 31% 20% 24% 32% 32%
(a) Per share numbers have been calculated using average shares outstanding, which more appropriately presents theper share data for the year.
(b) Amounts shown in this caption for a share outstanding may not accord with the change in aggregate gains andlosses in securities for the fiscal period because of the timing of sales and repurchases of Fund shares in relationto fluctuating market values for the Fund.
(c) Total return is calculated assuming a purchase of shares at net asset value on the first day and a sale at net assetvalue on the last day of each period reported. Distributions are assumed, for the purpose of this calculation, to bereinvested at net asset value per share on the respective payment dates of each distribution. Total returns forperiods of less than one year are not annualized. Broker commission charges are not included in this calculation.
(d) Portfolio turnover rate excludes securities received or delivered from in-kind processing of creations orredemptions.
SPDR SERIES TRUSTFINANCIAL HIGHLIGHTS (continued)Selected data for a share outstanding throughout each period
See accompanying notes to financial statements.36

1. Organization
SPDR Series Trust (the “Trust”), a Massachusetts business trust, registered under theInvestment Company Act of 1940, as amended (“1940 Act”), is an open-endmanagement investment company.
As of June 30, 2020, the Trust consists of seventy-nine (79) series, each of whichrepresents a separate series of beneficial interest in the Trust. The Declaration of Trustpermits the Board of Trustees of the Trust (the “Board”) to authorize the issuance of anunlimited number of shares of beneficial interest at $0.01 par value. The financialstatements herein relate to the following series (each a “Fund”, and collectively, the“Funds”):
SPDR Dow Jones REIT ETFSPDR S&P Biotech ETFSPDR S&P Dividend ETF
Each Fund is classified as a non-diversified investment company under the 1940 Act.
Under the Trust’s organizational documents, its officers and trustees are indemnifiedagainst certain liabilities arising out of the performance of their duties to the Trust.Additionally, in the normal course of business, the Trust enters into contracts withservice providers that contain general indemnification clauses. The Trust’s maximumexposure under these arrangements is unknown as this would involve future claims thatmay be made against the Trust that have not yet occurred.
2. Summary of Significant Accounting Policies
The following is a summary of significant accounting policies followed by the Trust inthe preparation of its financial statements:
The preparation of financial statements in accordance with U.S. generally acceptedaccounting principles (“U.S. GAAP”) requires management to make estimates andassumptions that affect the reported amounts and disclosures in the financial statements.Actual results could differ from those estimates. Each Fund is an investment companyunder U.S. GAAP and follows the accounting and reporting guidance applicable toinvestment companies.
Security Valuation
Each Fund’s investments are valued at fair value each day that the New York StockExchange (“NYSE”) is open and, for financial reporting purposes, as of the report dateshould the reporting period end on a day that the NYSE is not open. Fair value isgenerally defined as the price a fund would receive to sell an asset or pay to transfer a
SPDR SERIES TRUSTNOTES TO FINANCIAL STATEMENTSJune 30, 2020
37

liability in an orderly transaction between market participants at the measurement date.By its nature, a fair value price is a good faith estimate of the valuation in a current saleand may not reflect an actual market price. The investments of each Fund are valuedpursuant to the policy and procedures developed by the Oversight Committee (the“Committee”) and approved by the Board. The Committee provides oversight of thevaluation of investments for the Funds. The Board has responsibility for overseeing thedetermination of the fair value of investments.
Valuation techniques used to value each Fund’s investments by major category are asfollows:
• Equity investments (including preferred stocks and registered investment companiesthat are exchange-traded funds) traded on a recognized securities exchange for whichmarket quotations are readily available are valued at the last sale price or officialclosing price, as applicable, on the primary market or exchange on which they trade.Equity investments traded on a recognized exchange for which there were no sales onthat day are valued at the last published sale price or at fair value.
• Investments in registered investment companies (including money market funds) orother unitized pooled investment vehicles that are not traded on an exchange arevalued at that day’s published net asset value (“NAV”) per share or unit.
In the event prices or quotations are not readily available or that the application of thesevaluation methods results in a price for an investment that is deemed to be notrepresentative of the fair value of such investment, fair value will be determined in goodfaith by the Committee, in accordance with the valuation policy and proceduresapproved by the Board.
Fair value pricing could result in a difference between the prices used to calculate aFund’s NAV and the prices used by the Funds’ underlying benchmarks. Various inputsare used in determining the value of the Funds’ investments.
The Funds value their assets and liabilities at fair value using a fair value hierarchyconsisting of three broad levels that prioritize the inputs to valuation techniques givingthe highest priority to readily available unadjusted quoted prices in active markets foridentical assets or liabilities (Level 1 measurements) and the lowest priority tounobservable inputs (Level 3 measurements) when market prices are not readilyavailable or reliable. The categorization of a value determined for an investment withinthe hierarchy is based upon the pricing transparency of the investment and is notnecessarily an indication of the risk associated with investing in it.
The three levels of the fair value hierarchy are as follows:
SPDR SERIES TRUSTNOTES TO FINANCIAL STATEMENTS (continued)June 30, 2020
38

• Level 1 – Unadjusted quoted prices in active markets for an identical asset or liability;
• Level 2 – Inputs other than quoted prices included within Level 1 that are observablefor the asset or liability either directly or indirectly, including quoted prices for similarassets or liabilities in active markets, quoted prices for identical or similar assets orliabilities in markets that are not considered to be active, inputs other than quotedprices that are observable for the asset or liability (such as exchange rates, financingterms, interest rates, yield curves, volatilities, prepayment speeds, loss severities,credit risks and default rates) or other market-corroborated inputs; and
• Level 3 – Unobservable inputs for the asset or liability, including the Committee’sassumptions used in determining the fair value of investments.
The value of each Fund’s investments, according to the fair value hierarchy as ofJune 30, 2020, is disclosed in each Fund’s respective Schedule of Investments.
Investment Transactions and Income Recognition
Investment transactions are accounted for on trade date for financial reporting purposes.Realized gains and losses from the sale or disposition of investments and foreignexchange transactions, if any, are determined using the identified cost method.
Dividend income and capital gain distributions, if any, are recognized on theex-dividend date, or when the information becomes available, net of any foreign taxeswithheld at source, if any. Non-cash dividends received in the form of stock, if any, arerecorded as dividend income at fair value. Distributions received by the Fund’s mayinclude a return of capital that is estimated by management. Such amounts are recordedas a reduction of the cost of investments or reclassified to capital gains.
Certain Funds invest in real estate investment trusts (“REITs”). REITs determine the taxcharacter of their distributions annually and may characterize a portion of theirdistributions as a return of capital or capital gain. The Funds’ policy is to record allREIT distributions initially as dividend income and re-designate a portion to return ofcapital or capital gain distributions at year end based on information provided by theREIT and/or SSGA Funds Management, Inc.’s (the “Adviser” or “SSGA FM”) estimatesof such re-designations for which actual information has not yet been reported.
Expenses
Certain expenses, which are directly identifiable to a specific Fund, are applied to thatFund within the Trust. Other expenses which cannot be attributed to a specific Fund areallocated in such a manner as deemed equitable, taking into consideration the nature andtype of expense and the relative net assets of the Fund within the Trust.
SPDR SERIES TRUSTNOTES TO FINANCIAL STATEMENTS (continued)June 30, 2020
39

Foreign Taxes
The Funds may be subject to foreign taxes (a portion of which may be reclaimable) onincome, stock dividends, realized and unrealized capital gains on investments or certainforeign currency transactions. Foreign taxes are recorded in accordance with SSGAFM’s understanding of the applicable foreign tax regulations and rates that exist in theforeign jurisdictions in which the Funds invest. These foreign taxes, if any, are paid bythe Fund and are reflected in the Statements of Operations, if applicable. Foreign taxespayable or deferred as of June 30, 2020, if any, are disclosed in the Funds’ Statements ofAssets and Liabilities.
Equalization
Certain Funds in the Trust follow the accounting practice known as “Equalization” bywhich a portion of the proceeds from sales and costs of reacquiring Fund shares,equivalent on a per share basis to the amount of distributable net investment income onthe date of the transaction, is credited or charged to undistributed net investmentincome. As a result, undistributed net investment income per share is unaffected by salesor reacquisition of Fund shares. Amounts related to Equalization can be found on theStatements of Changes in Net Assets.
The following Funds utilized equalization during the period ended June 30, 2020:
SPDR Dow Jones REIT ETFSPDR S&P Biotech ETFSPDR S&P Dividend ETF
Distributions
Distributions from net investment income, if any, are declared and paid quarterly. Netrealized capital gains, if any, are distributed annually. Dividends may be declared andpaid more frequently or at any other times to improve Index tracking or to comply withthe distribution requirements of the Internal Revenue Code of 1986, as amended (the“Internal Revenue Code”). The amount and character of income and capital gains to bedistributed are determined in accordance with applicable tax regulations which maydiffer from net investment income and realized gains recognized for U.S. GAAPpurposes.
SPDR SERIES TRUSTNOTES TO FINANCIAL STATEMENTS (continued)June 30, 2020
40

3. Fees and Transactions with Affiliates
Advisory Fee
The Trust, on behalf of each Fund, has entered into an Investment Advisory Agreementwith SSGA FM. For its advisory services to the Funds, facilities furnished, andexpenses borne by the Adviser, each Fund pays the Adviser a fee(“Management/Advisory fee”) accrued daily and paid monthly, based on a percentage ofeach Fund’s average daily net assets as shown in the following table:
Annual Rate
SPDR Dow Jones REIT ETF . . . . . . . . . . . . . . . . . . . . . . . . . . . . . . . . . . . . . . 0.25%
SPDR S&P Biotech ETF. . . . . . . . . . . . . . . . . . . . . . . . . . . . . . . . . . . . . . . . . 0.35
SPDR S&P Dividend ETF. . . . . . . . . . . . . . . . . . . . . . . . . . . . . . . . . . . . . . . . 0.35
From time to time, the Adviser may waive all or a portion of its fee. The Adviser hascontractually agreed to waive a portion of its management fee and/or reimburseexpenses in an amount equal to any acquired fund fees and expenses (excludingholdings in acquired funds for cash management purposes, if any) for each Fund untilOctober 31, 2020. This waiver and/or reimbursement does not provide for therecoupment by the Adviser of any amounts waived or reimbursed. This waiver and/orreimbursement may not be terminated prior to October 31, 2020 except with theapproval of the Fund’s Board.
The Adviser pays all the expenses of each Fund other than the Management fee,brokerage expenses, taxes, interest, fees and expenses of the Trust’s IndependentTrustees (including any Trustees’ counsel fees), acquired fund fees and expenses,litigation expenses, and other extraordinary expenses.
Administrator, Custodian, Sub-Administrator and Transfer Agent Fees
SSGA FM serves as administrator and State Street Bank and Trust Company (“StateStreet”), an affiliate of the Adviser, serves as custodian, sub-administrator and transferagent. State Street receives fees for its services as custodian, sub-administrator andtransfer agent from the Adviser.
Distributor
State Street Global Advisors Funds Distributors, LLC (“SSGA FD” or the“Distributor”), an affiliate of the Adviser, serves as the distributor of the Trust.
Other Transactions with Affiliates - Securities Lending
SPDR SERIES TRUSTNOTES TO FINANCIAL STATEMENTS (continued)June 30, 2020
41

State Street, an affiliate of the Funds, acts as the securities lending agent for the Funds,pursuant to an amended and restated securities lending authorization agreement datedJanuary 6, 2017, as amended.
Proceeds collected by State Street on investment of cash collateral or any fee income areallocated as follows (after deduction of such other amounts payable to State Street underthe terms of the securities lending agreement): 85% payable to the Funds, and 15%payable to State Street.
In addition, cash collateral from lending activities is invested in the State StreetNavigator Securities Lending Portfolio II, an affiliated fund, for which SSGA FM servesas investment adviser. See Note 8 for additional information regarding securitieslending.
Other Transactions with Affiliates
The Funds may invest in affiliated entities, including securities issued by State StreetCorporation, affiliated funds, or entities deemed to be affiliates as a result of the Fundsowning more than five percent of the entity’s voting securities or outstanding shares.Amounts relating to these transactions during the period ended June 30, 2020 aredisclosed in the Schedules of Investments.
Due to Custodian
In certain circumstances, the Fund may have cash overdrafts with the custodian due toexpense payments, capital transactions, trading of securities, investment operations orderivative transactions. The Due to custodian amount, if any, reflects cash overdrawnwith State Street, as custodian, who is an affiliate of the Fund.
4. Trustees’ Fees
The fees and expenses of the Trust’s trustees, who are not “interested persons” of theTrust, as defined in the 1940 Act (“Independent Trustees”), are paid directly by theFunds. The Independent Trustees are reimbursed for travel and other out-of-pocketexpenses in connection with meeting attendance and industry seminars.
SPDR SERIES TRUSTNOTES TO FINANCIAL STATEMENTS (continued)June 30, 2020
42

5. Investment Transactions
Purchases and sales of investments (excluding in-kind transactions and short terminvestments) for the period ended June 30, 2020, were as follows:
Purchases Sales
SPDR Dow Jones REIT ETF . . . . . . . . . . . . . . . . . . . . . . . . . . . $ 387,580,958 $ 375,289,545
SPDR S&P Biotech ETF . . . . . . . . . . . . . . . . . . . . . . . . . . . . . . 2,733,856,145 2,738,326,556
SPDR S&P Dividend ETF . . . . . . . . . . . . . . . . . . . . . . . . . . . . . 5,681,088,663 5,436,331,455
For the period ended June 30, 2020, the following Funds had in-kind contributions,redemptions and net realized gains/losses in the amounts as follows:
In-kindContributions
In-kindRedemptions
In-kind NetRealized
Gains/(Losses)
SPDR Dow Jones REIT ETF . . . . . . . . . . . . . . $ 477,378,234 $ 1,207,032,412 $ 134,816,251
SPDR S&P Biotech ETF. . . . . . . . . . . . . . . . . 12,444,983,213 12,502,414,560 1,144,524,354
SPDR S&P Dividend ETF. . . . . . . . . . . . . . . . 6,029,372,909 7,828,741,888 2,232,765,649
6. Shareholder Transactions
Each Fund issues and redeems its shares, at NAV, by each Fund only in aggregations ofa specified number of shares or multiples thereof (“Creation Units”). Except whenaggregated in Creation Units, shares of each Fund are not redeemable. Transactions incapital shares for each Fund are disclosed in detail in the Statements of Changes in NetAssets.
The consideration for the purchase of Creation Units of a Fund may consist of thein-kind deposit of a designated portfolio of securities and a specified amount of cash.Investors purchasing and redeeming Creation Units may pay a purchase transaction feeand a redemption transaction fee directly to the Trust and/or custodian, to offset transferand other transaction costs associated with the issuance and redemption of CreationUnits, including Creation Units for cash. An additional variable fee may be charged forcertain transactions. Such variable charges, if any, are included in “Other Capital” on theStatements of Changes in Net Assets.
7. Income Tax Information
The Funds have qualified and intend to continue to qualify as regulated investmentcompanies under Subchapter M of the Internal Revenue Code. Each Fund will not besubject to federal income taxes to the extent it distributes its taxable income, including
SPDR SERIES TRUSTNOTES TO FINANCIAL STATEMENTS (continued)June 30, 2020
43

any net realized capital gains, for each fiscal year. Therefore, no provision for federalincome tax is required.
The Funds file federal and various state and local tax returns as required. No income taxreturns are currently under examination. Generally, the federal returns are subject toexamination by the Internal Revenue Service (the �IRS�) for a period of three years fromdate of filing, while the state returns may remain open for an additional year dependingupon jurisdiction. SSGA FM has analyzed each Fund’s tax positions taken on taxreturns for all open years and does not believe there are any uncertain tax positions thatwould require recognition of a tax liability.
Distributions to shareholders are recorded on ex-dividend date. Income dividends andgain distributions are determined in accordance with income tax rules and regulations,which may differ from generally accepted accounting principles.
Certain capital accounts in the financial statements have been adjusted for permanentbook-tax differences. These adjustments have no impact on NAV or results ofoperations. Temporary book-tax differences will reverse in the future. These book-taxdifferences are primarily due to differing treatments for character of distributions, returnof capital basis adjustments, in-kind transactions, wash sale loss deferrals, anddistributions in excess of current earnings.
The tax character of distributions paid during the year ended June 30, 2020, was asfollows:
OrdinaryIncome
Long-TermCapital Gains Total
SPDR Dow Jones REIT ETF . . . . . . . . . . . . . . . . . . . $ 76,076,130 $— $ 76,076,130
SPDR S&P Biotech ETF . . . . . . . . . . . . . . . . . . . . . 928,142 — 928,142
SPDR S&P Dividend ETF . . . . . . . . . . . . . . . . . . . . 509,825,739 — 509,825,739
The tax character of distributions paid during the year ended June 30, 2019, was asfollows:
OrdinaryIncome
Long-TermCapital Gains Total
SPDR Dow Jones REIT ETF . . . . . . . . . . . . . . . . . . . $101,343,386 $— $101,343,386
SPDR S&P Biotech ETF . . . . . . . . . . . . . . . . . . . . . 4,996,708 — 4,996,708
SPDR S&P Dividend ETF . . . . . . . . . . . . . . . . . . . . 431,641,309 — 431,641,309
SPDR SERIES TRUSTNOTES TO FINANCIAL STATEMENTS (continued)June 30, 2020
44

At June 30, 2020, the components of distributable earnings on a tax basis were asfollows:
UndistributedOrdinary Income
Capital LossCarryforwards
UndistributedLong-Term
Capital GainsNet UnrealizedGains (Losses)
QualifiedLate-Year
Losses Total
SPDR Dow Jones REIT ETF. . . . . . . . . . . $ — $ (185,271,055) $— $(285,409,201) $— $ (470,680,256)
SPDR S&P Biotech ETF . . . . . . . . . . . . — (2,708,235,943) — (274,721,182) — (2,982,957,125)
SPDR S&P Dividend ETF . . . . . . . . . . . . 5,542,674 (1,064,279,794) — (466,558,534) — (1,525,295,654)
As of June 30, 2020, the following Funds had capital loss carryforwards available tooffset future realized capital gains as follows:
Non-ExpiringShort Term
Non-ExpiringLong Term
SPDR Dow Jones REIT ETF . . . . . . . . . . . . . . . . . . . . . . . . . . . $ 37,386,131 $ 147,884,924
SPDR S&P Biotech ETF . . . . . . . . . . . . . . . . . . . . . . . . . . . . . . 1,312,391,683 1,395,844,260
SPDR S&P Dividend ETF . . . . . . . . . . . . . . . . . . . . . . . . . . . . . 653,578,966 410,700,828
As of June 30, 2020, gross unrealized appreciation and gross unrealized depreciation ofinvestments based on cost for federal income tax purposes were as follows:
TaxCost
GrossUnrealized
Appreciation
GrossUnrealized
Depreciation
Net UnrealizedAppreciation
(Depreciation)
SPDR Dow Jones REIT ETF . . . . . . . . . . . . . . . . . . . . $ 1,646,907,409 $ 55,019,363 $ 340,428,564 $(285,409,201)
SPDR S&P Biotech ETF . . . . . . . . . . . . . . . . . . . . . . 6,533,781,870 385,116,290 659,837,472 (274,721,182)
SPDR S&P Dividend ETF . . . . . . . . . . . . . . . . . . . . . 15,798,004,257 1,011,214,720 1,477,773,254 (466,558,534)
8. Securities Lending
Each Fund may lend securities to qualified broker-dealers or institutional investors. Theloans are secured at all times by cash, cash equivalents or U.S. government securities inan amount at least equal to the market value of the securities loaned, plus accruedinterest and dividends, determined on a daily basis and adjusted accordingly. The valueof the collateral with respect to a loaned security may be temporarily more or less thanthe value of a security due to market fluctuations of securities values. With respect toeach loan, if on any U.S. business day the aggregate market value of securities collateralplus cash collateral is less than the aggregate market value of the securities which aresubject to the loan, the borrower will be notified to provide additional collateral on thenext business day.
SPDR SERIES TRUSTNOTES TO FINANCIAL STATEMENTS (continued)June 30, 2020
45

The Funds will regain record ownership of loaned securities to exercise certainbeneficial rights; however, the Funds may bear the risk of delay in recovery of, or evenloss of rights in the securities loaned should the borrower fail financially. In addition, aFund will bear the risk of loss of any cash collateral that it may invest. Each Fundreceives compensation for lending its securities from interest or dividends earned on thecash, cash equivalents or U.S. government securities held as collateral, net of fee rebatespaid to the borrower and net of fees paid to State Street as the lending agent.Additionally, a Fund will receive a fee from the borrower for non-cash collateral equalto a percentage of the market value of the loaned securities.
The market value of securities on loan as of June 30, 2020, and the value of the investedcash collateral are disclosed in the Funds’ Statements of Assets and Liabilities.Non-cash collateral is not disclosed in the Funds’ Statements of Assets and Liabilities asit is held by the lending agent on behalf of the Funds, and the Funds do not have theability to re-hypothecate those securities. Securities lending income, as disclosed in theFunds’ Statements of Operations, represents the income earned from the non-cashcollateral and the investment of cash collateral, net of fee rebates paid to the borrowerand net of fees paid to State Street as lending agent.
The following is a summary of each Fund’s securities lending agreements and relatedcash and non-cash collateral received as of June 30, 2020:
FundMarket Value of
Securities on Loan
CashCollateralReceived
Non-CashCollateralReceived*
TotalCollateralReceived
SPDR Dow Jones REIT ETF . . . $ 34,741,389 $ 9,665,286 $ 25,751,648 $ 35,416,934
SPDR S&P Biotech ETF . . . . . . 1,251,274,590 857,417,617 424,356,522 1,281,774,139
SPDR S&P Dividend ETF . . . . . 313,928,213 160,240,114 155,150,485 315,390,599
* The non-cash collateral includes U.S. Treasuries and U.S. Government Agency securities.
SPDR SERIES TRUSTNOTES TO FINANCIAL STATEMENTS (continued)June 30, 2020
46

The following table reflects a breakdown of transactions accounted for as securedborrowings, the gross obligation by the type of collateral pledged or securities loaned,and the remaining contractual maturity of those transactions as of June 30, 2020:
Remaining Contractual Maturity of the AgreementsAs of June 30, 2020
Fund
SecuritiesLending
Transactions
Overnightand
Continuous <30 Days
Between30 & 90
Days >90 DaysTotal
Borrowings
Gross Amountof RecognizedLiabilities for
Securities LendingTransactions
SPDR Dow Jones REIT ETF . . . . Common Stocks $ 9,665,286 $— $— $— $ 9,665,286 $ 9,665,286
SPDR S&P Biotech ETF . . . . . . Common Stocks 857,417,617 — — — 857,417,617 857,417,617
SPDR S&P Dividend ETF . . . . . Common Stocks 160,240,114 — — — 160,240,114 160,240,114
9. Risks
Concentration Risk
As a result of the Funds’ ability to invest a large percentage of their assets in obligationsof issuers within the same country, state, region, currency or economic sector, anadverse economic, business or political development may affect the value of the Funds’investments more than if the Funds were more broadly diversified.
Market and Credit Risk
Each Fund’s investments are subject to changes in general economic conditions, generalmarket fluctuations and the risks inherent in investment in securities markets.Investment markets can be volatile and prices of investments can change substantiallydue to various factors including, but not limited to, economic growth or recession,changes in interest rates, changes in the actual or perceived creditworthiness of issuers,and general market liquidity. Each Fund is subject to the risk that geopolitical eventswill disrupt securities markets and adversely affect global economies and markets.Local, regional or global events such as war, acts of terrorism, the spread of infectiousillness or other public health issues, or other events could have a significant impact on aFund and its investments.
An outbreak of a respiratory disease caused by a novel coronavirus (known asCOVID-19) first detected in China in December 2019 has resulted in a global pandemicand major disruptions to economies and markets around the world, including theUnited States. Financial markets have experienced extreme volatility and severe losses,and trading in many instruments has been disrupted. Liquidity for many instruments hasbeen greatly reduced for periods of time. Some interest rates are very low and in some
SPDR SERIES TRUSTNOTES TO FINANCIAL STATEMENTS (continued)June 30, 2020
47

cases yields are negative. Governments and central banks, including the Federal Reservein the United States, have taken extraordinary and unprecedented actions to supportlocal and global economies and the financial markets. The impact of these measures,and whether they will be effective to mitigate the economic and market disruption, willnot be known for some time. In addition, the outbreak of COVID-19, and measurestaken to mitigate its effects, could result in disruptions to the services provided to aFund by its service providers.
10. Subsequent Events
Management has evaluated the impact of all subsequent events on the Funds through thedate the financial statements were issued and has determined that there were nosubsequent events requiring adjustment or disclosure in the financial statements.
SPDR SERIES TRUSTNOTES TO FINANCIAL STATEMENTS (continued)June 30, 2020
48

To the Shareholders of SPDR Dow Jones REIT ETF, SPDR S&P Biotech ETF andSPDR S&P Dividend ETF and the Board of Trustees of SPDR® Series Trust
Opinion on the Financial Statements
We have audited the accompanying statements of assets and liabilities of SPDR DowJones REIT ETF, SPDR S&P Biotech ETF and SPDR S&P Dividend ETF (collectivelyreferred to as the “Funds”) (three of the funds constituting SPDR® Series Trust (the“Trust”)), including the schedules of investments, as of June 30, 2020, and the relatedstatements of operations for the year then ended, the statements of changes in net assetsfor each of the two years in the period then ended, the financial highlights for each ofthe five years in the period then ended and the related notes (collectively referred to asthe “financial statements”). In our opinion, the financial statements present fairly, in allmaterial respects, the financial position of each of the Funds (three of the fundsconstituting SPDR® Series Trust) at June 30, 2020, the results of their operations for theyear then ended, the changes in their net assets for each of the two years in the periodthen ended and their financial highlights for each of the five years in the period thenended, in conformity with U.S. generally accepted accounting principles.
Basis for Opinion
These financial statements are the responsibility of the Trust’s management. Ourresponsibility is to express an opinion on the Funds’ financial statements based on ouraudits. We are a public accounting firm registered with the Public Company AccountingOversight Board (United States) (“PCAOB”) and are required to be independent withrespect to the Trust in accordance with the U.S. federal securities laws and theapplicable rules and regulations of the Securities and Exchange Commission and thePCAOB.
We conducted our audits in accordance with the standards of the PCAOB. Thosestandards require that we plan and perform the audit to obtain reasonable assuranceabout whether the financial statements are free of material misstatement, whether due toerror or fraud. The Trust is not required to have, nor were we engaged to perform, anaudit of the Trust’s internal control over financial reporting. As part of our audits, we arerequired to obtain an understanding of internal control over financial reporting, but notfor the purpose of expressing an opinion on the effectiveness of the Trust’s internalcontrol over financial reporting. Accordingly, we express no such opinion.
Our audits included performing procedures to assess the risks of material misstatementof the financial statements, whether due to error or fraud, and performing proceduresthat respond to those risks. Such procedures included examining, on a test basis,evidence regarding the amounts and disclosures in the financial statements. Our
SPDR SERIES TRUSTREPORT OF INDEPENDENT REGISTERED PUBLICACCOUNTING FIRM
49

procedures included confirmation of securities owned as of June 30, 2020, bycorrespondence with the custodian, brokers and others or by other appropriate auditingprocedures where replies from brokers and others were not received. Our audits alsoincluded evaluating the accounting principles used and significant estimates made bymanagement, as well as evaluating the overall presentation of the financial statements.We believe that our audits provide a reasonable basis for our opinion.
We have served as the auditor of one or more State Street Global Advisors investmentcompanies since 2000.
Boston, MassachusettsAugust 28, 2020
SPDR SERIES TRUSTREPORT OF INDEPENDENT REGISTERED PUBLICACCOUNTING FIRM
50

Expense Example
As a shareholder of a Fund, you incur two types of costs: (1) transaction costs, includingsales charges (loads), if applicable, on purchase payments, reinvested dividends, or otherdistributions and (2) ongoing costs, including advisory fees and other Fund expenses.This example is intended to help you understand your ongoing costs (in dollars) ofinvesting in the Fund and to compare these costs with the ongoing costs of investing inother mutual funds. It is based on an investment of $1,000 made at the beginning of theperiod shown and held for the entire period from January 1, 2020 to June 30, 2020.
The table below illustrates your Fund’s cost in two ways:
Based on actual fund return ——This section helps you to estimate the actualexpenses that you paid over the period. The “Ending Account Value” shown is derivedfrom each Fund’s actual return, and the third column shows the dollar amount thatwould have been paid by an investor who started with $1,000 in the Fund. You may usethe information here, together with the amount you invested, to estimate the expensesthat you paid over the period. To do so, simply divide your account value by $1,000 (forexample, an $8,600 account value divided by $1,000 = 8.6), then multiply the result bythe number given for the Fund under the heading “Expenses Paid During Period”.
Based on hypothetical 5% return ——This section is intended to help you compareyour Fund’s costs with those of other mutual funds. It assumes that the Fund had ayearly return of 5% before expenses, but that the expense ratio is unchanged. In thiscase, because the return used is not the Fund’s actual return, the results do not apply toyour investment. The example is useful in making comparisons because theU.S. Securities and Exchange Commission (the “SEC”) requires all mutual funds tocalculate expenses based on a 5% return. You can assess your Fund’s costs bycomparing this hypothetical example with the hypothetical examples that appear inshareholder reports of other funds.
Please note that the expenses shown in the table are meant to highlight your ongoingcosts only and do not reflect any transaction costs, such as sales load charges (loads).Therefore, the hypothetical 5% return section of the table is useful in comparingongoing costs only, and will not help you determine the relative total costs of owningdifferent funds. In addition, if these transaction costs were included, your costs wouldhave been higher.
SPDR SERIES TRUSTOTHER INFORMATIONJune 30, 2020 (Unaudited)
51

SPDR DowJones REIT
ETFSPDR S&P
Biotech ETFSPDR S&P
Dividend ETF
Annualized Expense Ratio . . . . . . . . . . . . . . . . . 0.25% 0.35% 0.35%
Actual:
Ending Account Value. . . . . . . . . . . . . . . . . . . $ 778.10 $1,176.60 $ 862.20
Expenses Paid During Period(a) . . . . . . . . . . . . 1.11 1.89 1.62
Hypothetical (assuming a 5% return before
expenses):
Ending Account Value. . . . . . . . . . . . . . . . . . . 1,023.60 1,023.10 1,023.10
Expenses Paid During Period(a) . . . . . . . . . . . . 1.26 1.76 1.76
(a) Expenses are equal to the Fund’s annualized net expense ratio multiplied by the average account value of theperiod, multiplied by 182, then divided by 366.
SPDR SERIES TRUSTOTHER INFORMATION (continued)June 30, 2020 (Unaudited)
52

Tax Information
For federal income tax purposes, the following information is furnished with respect tothe distributions of the Trust for its fiscal year ended June 30, 2020.
Dividends Received Deduction
Each Fund reports the maximum amount allowable of its net taxable income as eligiblefor the corporate dividends received deduction.
Qualified Business Income Deduction
Each Fund reports the maximum amount allowable of qualified REIT dividends eligiblefor the 20% qualified business income deduction under Section 199A.
Qualified Dividend Income
A portion of dividends distributed by the Funds during the fiscal year ended June 30,2020 are considered qualified dividend income and are eligible for reduced tax rates.These lower rates range from 5% to 20% depending on the individual’s tax bracket.Each Fund reports the maximum amount allowable of its net taxable income asqualified dividend income as provided in the Jobs and Growth Tax Relief ReconciliationAct of 2003.
Premium/Discount Information
Information regarding how often the Shares of each Fund traded on the exchange at aprice above (i.e., at a premium) or below (i.e., at a discount) the NAV of the Fund duringthe past calendar year can be found at www.ssga.com.
Proxy Voting Policies and Procedures and Records
A description of the Trust’s proxy voting policies and procedures that are used by theFunds’ investment adviser to vote proxies relating to the Funds’ portfolio of securitiesare available (i) without charge, upon request by calling 1-866-787-2257 (toll free) or(ii) on the SEC’s website at www.sec.gov.
Information regarding how the investment adviser voted for the 12-month period endedJune 30, is available by August 31 of each year by calling the same number, on theSEC’s website at www.sec.gov, and on the Funds’ website at www.ssga.com.
SPDR SERIES TRUSTOTHER INFORMATION (continued)June 30, 2020 (Unaudited)
53

Quarterly Portfolio Schedule
Following the Funds’ first and third fiscal quarter-ends, a complete schedule ofinvestments is filed with the SEC as an exhibit on Form N-PORT, which can be foundon the SEC’s website at www.sec.gov. The Funds’ schedules of investments are availableupon request, without charge, by calling 1-866-787-2257 (toll free).
SPDR SERIES TRUSTOTHER INFORMATION (continued)June 30, 2020 (Unaudited)
54

Approval of Advisory Agreement
At a meeting held prior to June 30, 2020, the Board of Trustees of the Trust (the“Board”) evaluated proposals to continue the Investment Advisory Agreement (the“Agreement”) between the Trust and SSGA Funds Management, Inc. (the “Adviser” or“SSGA FM”) with respect to the equity series of the Trust (collectively, the “SPDRETFs”). The Trustees who are not “interested persons” of the Trust within the meaningof the Investment Company Act of 1940, as amended (the “Independent Trustees”), alsomet separately to consider the Agreement. The Independent Trustees were advised bytheir independent legal counsel throughout the process.
To evaluate the Agreement, the Board requested, and SSGA FM, the Trust’s investmentadviser and administrator, and State Street Bank and Trust Company, the Trust’ssub-administrator, transfer agent and custodian (“State Street”) provided, such materialsas the Board, with the advice of counsel, deemed reasonably necessary. In decidingwhether to approve the Agreement, the Board considered various factors, including the(i) nature, extent and quality of services provided by the Adviser with respect to theSPDR ETFs under the Agreement, (ii) investment performance of the SPDR ETFs, (iii)profits realized by the Adviser and its affiliates from its relationship with the Trust, (iv)fees charged to comparable funds, (v) other benefits to the Adviser, and (vi) extent towhich economies of scale would be shared as the SPDR ETFs grow.
Nature, Extent and Quality of Services
The Board considered the nature, extent and quality of services provided by the Adviser.In doing so, the Trustees relied on their prior experience in overseeing the managementof the Trust and materials provided prior to and at the meeting. The Board reviewed theAgreement and the Adviser’s responsibilities for managing investment operations ofeach of the SPDR ETFs in accordance with each SPDR ETF’s investment objectives andpolicies, and applicable legal and regulatory requirements. The Board appreciated thenature of the SPDR ETFs as exchange-traded funds and the experience and expertise ofthe Adviser with exchange-traded funds. The Board considered the background andexperience of the Adviser’s senior management, including those individuals responsiblefor portfolio management and regulatory compliance of the SPDR ETFs. The Boardalso considered the portfolio management resources, structures and practices of theAdviser, including those associated with monitoring and securing each SPDR ETF’scompliance with its investment objectives and policies and with applicable laws andregulations. The Board also considered information about the Adviser’s best executionprocedures and overall investment management business, noting that the Adviser servesa wide range of clients across a broad spectrum of asset classes. The Board looked at theAdviser’s general knowledge of the investment management business and that of itsaffiliates which make up State Street Global Advisors, through which the Adviser shares
SPDR SERIES TRUSTOTHER INFORMATION (continued)June 30, 2020 (Unaudited)
55

all of its senior personnel. The Board considered that the Adviser and its affiliatesconstitute one of the world’s largest investment management enterprises for indexedproducts generally and exchange-traded funds in particular. The Board specificallyconsidered the Adviser’s experience in managing equity exchange-traded funds withindex-based investment objectives.
Investment Performance
The Board then reviewed the SPDR ETFs’ performance, noting that the distinctiveindexed investment objective of each of the SPDR ETFs made analysis of investmentperformance, in absolute terms, less of a priority than that which normally attaches tothe performance of actively-managed funds. Instead, the Board focused on the extent towhich each SPDR ETF achieved its objective as a passively-managed index fund. TheBoard reviewed information regarding the SPDR ETFs’ index tracking.
Profits Realized by the Adviser
The Board considered the profitability of the advisory arrangement with the SPDRETFs to the Adviser, including data on the SPDR ETFs’ historical profitability to theAdviser. The Board, including the Independent Trustees with their independent legalcounsel, had the opportunity to discuss, with representatives of the Adviser and StateStreet, methodologies used in computing costs that formed the bases of profitabilitycalculations.
Fees Charged to Comparable Funds
The Board evaluated each SPDR ETF’s unitary fee through review of comparativeinformation with respect to fees paid by similar funds – i.e., exchange-traded fundstracking similar equity indexes. The Board reviewed the universe of similarexchange-traded funds for each SPDR ETF based upon data independently obtainedfrom Broadridge Financial Solutions, Inc. and related comparative information forsimilar exchange-traded funds. In doing so, the Board used a fund by fund analysis ofthe data.
Other Benefits
The Board also considered whether the Adviser or its affiliates benefited in other waysfrom its relationship with the Trust, noting that the Adviser does not maintain soft-dollararrangements in connection with the Trust’s brokerage transactions.
SPDR SERIES TRUSTOTHER INFORMATION (continued)June 30, 2020 (Unaudited)
56

Economies of Scale
The Board reviewed information regarding economies of scale or other efficiencies thatmay result as each SPDR ETF’s assets grow in size. The Board noted that theAgreement did not provide for breakpoints in each SPDR ETF’s advisory fee rates asassets of a SPDR ETF increase. However, the Board further noted the Adviser’sassertion that future economies of scale (among several factors) had been taken intoconsideration for the SPDR ETFs by fixing relatively low advisory fees, effectivelysharing the benefits of lower fees with the SPDR ETFs from inception. The Adviser alsoasserted that one of the benefits of the unitary fee was to provide an unvarying expensestructure, which could be lost or diluted with the addition of breakpoints. The Boardnoted that it intends to continue to monitor fees as the SPDR ETFs grow in size andassess whether fee breakpoints may be warranted.
Conclusion
After weighing the foregoing factors, none of which was dispositive in itself and mayhave been weighed differently by each Trustee, the Board, including the IndependentTrustees voting separately, approved the Agreement for each SPDR ETF. The Board’sconclusions with respect to the factors were as follows: (a) the nature and extent of theservices provided by the Adviser with respect to the SPDR ETFs were appropriate; (b)the performance and, more importantly, the index tracking, of each SPDR ETF had beensatisfactory; (c) the Adviser’s unitary fee for each SPDR ETF considered in relation toservices provided, and in relation to fees charged to comparable funds, was fair andreasonable; (d) the profitability of the Trust’s relationships with the Adviser was notexcessive; (e) any additional potential benefits to the Adviser or its affiliates were not ofa magnitude to materially affect the Board’s conclusions; and (f) the fees paid to theAdviser adequately shared the economies of scale with respect to the SPDR ETFs byway of the relatively low fee structure of the Trust.
SPDR SERIES TRUSTOTHER INFORMATION (continued)June 30, 2020 (Unaudited)
57

TRUSTEES AND OFFICERS INFORMATION
Name, Addressand Year of Birth
Position(s)with Funds
Term ofOffice andLength of
Time Served
PrincipalOccupation(s)During Past
5 Years
Numberof
Portfoliosin FundComplexOverseen
byTrustee†
OtherDirectorships
Held by TrusteeDuring thePast 5 Years
TrusteesIndependent TrusteesFRANK NESVET
c/o SPDR Series TrustOne Iron StreetBoston, MA 022101943
IndependentTrustee,Chairman,TrusteeCommitteeChair
Term: UnlimitedServed: sinceSeptember 2000
Retired. 123 None.
BONNY EUGENIA BOATMANc/o SPDR Series TrustOne Iron StreetBoston, MA 022101950
IndependentTrustee
Term: UnlimitedServed: sinceApril 2010
Retired. 123 None.
DWIGHT D. CHURCHILLc/o SPDR Series TrustOne Iron StreetBoston, MA 022101953
IndependentTrustee
Term: UnlimitedServed: sinceApril 2010
Self-employedconsultant since 2010;CEO and President,CFA Institute (June2014-January 2015).
123 AffiliatedManagers Group,Inc. (Chairman,Directorand AuditCommittee Chair).
CLARE S. RICHERc/o SPDR Series TrustOne Iron StreetBoston, MA 022101958
IndependentTrustee
Term: UnlimitedServed: sinceJuly 2018
Retired. ChiefFinancialOfficer, PutnamInvestments LLC(December 2008-May 2017).
123 Principal FinancialGroup (Director);Bain CapitalSpecialtyFinance(Director);Putnam AcquisitionFinancing Inc.(Director);Putnam AcquisitionFinancing LLC(Director); PutnamGPInc. (Director);Putnam InvestorServices, Inc.(Director); PutnamInvestments Limited(Director); Universityof Notre Dame(Trustee).
SPDR SERIES TRUSTOTHER INFORMATION (continued)June 30, 2020 (Unaudited)
58

Name, Addressand Year of Birth
Position(s)with Funds
Term ofOffice andLength of
Time Served
PrincipalOccupation(s)During Past
5 Years
Numberof
Portfoliosin FundComplexOverseen
byTrustee†
OtherDirectorships
Held by TrusteeDuring thePast 5 Years
SANDRA G. SPONEMc/o SPDR Series TrustOne Iron StreetBoston, MA 022101958
IndependentTrustee
Term: UnlimitedServed: sinceJuly 2018
Retired. ChiefFinancialOfficer, M.A.MortensonCompanies, Inc.(February 2007-April 2017).
123 Rydex Series Funds,Rydex DynamicFunds,Rydex Variable Trust,Guggenheim FundsTrust, GuggenheimVariable Funds Trust,Guggenheim StrategyFunds Trust,TransparentValue Trust,Fiduciary/Claymore EnergyInfrastructure Fund,Guggenheim TaxableMunicipal ManagedDuration Trust,Guggenheim StrategicOpportunities Fund,GuggenheimEnhancedEquity Income FundGuggenheim CreditAllocation Fund,Guggenheim Energy& Income Fund(Trusteeand Audit CommitteeChair).
CARL G. VERBONCOEURc/o SPDR Series TrustOne Iron StreetBoston, MA 022101952
IndependentTrustee,AuditCommitteeChair
Term: UnlimitedServed: sinceApril 2010
Self-employedconsultant since 2009.
123 The Motley FoolFunds Trust(Trustee).
SPDR SERIES TRUSTOTHER INFORMATION (continued)June 30, 2020 (Unaudited)
59

Name, Addressand Year of Birth
Position(s)with Funds
Term ofOffice andLength of
Time Served
PrincipalOccupation(s)During Past
5 Years
Numberof
Portfoliosin FundComplexOverseen
byTrustee†
OtherDirectorships
Held by TrusteeDuring thePast 5 Years
Interested TrusteeJAMES E. ROSS*
c/o SPDR Series TrustOne Iron StreetBoston, MA 022101965
InterestedTrustee
Term: UnlimitedServed asTrustee: sinceApril 2010
Non-ExecutiveChairman,Fusion AcquisitionCorp. (June2020 - Present);Retired Chairman andDirector,SSGA FundsManagement, Inc.(2005 - March 2020);RetiredExecutive VicePresident, StateStreet GlobalAdvisors (2012 -March 2020); RetiredChiefExecutive Officer andDirector,State Street GlobalAdvisorsFunds Distributors,LLC (May2017 - March 2020);Director,State Street GlobalMarkets,LLC (2013 - April2017);President, SSGAFundsManagement, Inc.(2005 -2012); Principal, StateStreetGlobal Advisors(2000 - 2005).
134 SSGA SPDRETFs Europe I plc(Director)(November 2016-present); SSGASPDR ETFsEurope II plc(Director)(November 2016-March 2020); StateStreet NavigatorSecurities LendingTrust (July2016 - March 2020);SSGAFunds (January 2014 -March2020); State StreetInstitutionalInvestment Trust(February2007 - March 2020);StateStreet Master Funds(February2007 - March 2020);ElfunFunds (July 2016 -December2018).
† For the purpose of determining the number of portfolios overseen by the Trustees, “Fund Complex” comprises registered investmentcompanies for which SSGA Funds Management, Inc. serves as investment adviser.
* Mr. Ross is an Interested Trustee because of his former position with the Adviser and ownership interest in an affiliate of the Adviser.
SPDR SERIES TRUSTOTHER INFORMATION (continued)June 30, 2020 (Unaudited)
60

Name, Addressand Year of Birth
Position(s)with Funds
Term ofOffice andLength of
Time ServedPrincipal Occupation(s) During the Past 5
Years
Officers
ELLEN M. NEEDHAMSSGA Funds Management, Inc.One Iron StreetBoston, MA 022101967
President Term: UnlimitedServed: sinceOctober 2012
Chairman, SSGA Funds Management Inc.(March 2020 - present); President and Director,SSGA Funds Management, Inc. (2001 -present)*; Senior Managing Director, StateStreet Global Advisors (1992 - present)*;Manager, State Street Global Advisors FundsDistributors, LLC (May 2017 - present).
BRUCE S. ROSENBERGSSGA Funds Management, Inc.One Iron StreetBoston, MA 022101961
Treasurer Term: UnlimitedServed: sinceFebruary 2016
Managing Director, State Street GlobalAdvisors and SSGA Funds Management, Inc.(July 2015 - present); Director, Credit Suisse(April 2008 - July 2015).
ANN M. CARPENTERSSGA Funds Management, Inc.One Iron StreetBoston, MA 022101966
VicePresident;DeputyTreasurer
Term: UnlimitedServed: sinceAugust 2012(with respect toVicePresident);since February2016 (withrespect toDeputyTreasurer)
Chief Operating Officer, SSGA FundsManagement, Inc. (2005 - Present)*; ManagingDirector, State Street Global Advisors (2005 -present).*
MICHAEL P. RILEYSSGA Funds Management, Inc.One Iron StreetBoston, MA 022101969
VicePresident
Term: UnlimitedServed: sinceFebruary 2005
Managing Director, State Street GlobalAdvisors (2005 - present).*
CHAD C. HALLETTSSGA Funds Management, Inc.One Iron StreetBoston, MA 022101969
DeputyTreasurer
Term: UnlimitedServed: sinceFebruary 2016
Vice President, State Street Global Advisorsand SSGA Funds Management, Inc. (November2014 - present); Vice President, State StreetBank and Trust Company (2001 - November2014).*
DARLENE ANDERSON-VASQUEZSSGA Funds Management, Inc.One Iron StreetBoston, MA 022101968
DeputyTreasurer
Term: UnlimitedServed: sinceNovember 2016
Managing Director, State Street GlobalAdvisors and SSGA Funds Management, Inc.(May 2016 - present); Senior Vice President,John Hancock Investments (September 2007 -May 2016).
SPDR SERIES TRUSTOTHER INFORMATION (continued)June 30, 2020 (Unaudited)
61

Name, Addressand Year of Birth
Position(s)with Funds
Term ofOffice andLength of
Time ServedPrincipal Occupation(s) During the Past 5
Years
ARTHUR A. JENSENSSGA Funds Management, Inc.1600 Summer StreetStamford, CT 069051966
DeputyTreasurer
Term: UnlimitedServed: SinceAugust 2017
Vice President at State Street Global Advisors(July 2016 – present); Mutual Funds Controllerof GE Asset Management Incorporated (April2011 - July 2016).
SUJATA UPRETISSGA Funds Management, Inc.One Iron StreetBoston, MA 022101974
AssistantTreasurer
Term: UnlimitedServed: sinceFebruary 2016
Vice President, State Street Global Advisorsand SSGA Funds Management, Inc. (May 2015- present).
DANIEL FOLEYSSGA Funds Management, Inc.One Iron StreetBoston, MA 022101972
AssistantTreasurer
Term: UnlimitedServed: sinceFebruary 2016
Vice President, State Street Global Advisorsand SSGA Funds Management, Inc. (April2007 - present).*
DANIEL G. PLOURDESSGA Funds Management, Inc.One Iron StreetBoston, MA 022101980
AssistantTreasurer
Term: UnlimitedServed: sinceMay 2017
Vice President, State Street Global Advisorsand SSGA Funds Management, Inc. (May 2015- present); Officer, State Street Bank and TrustCompany (March 2009 - May 2015).
BRIAN HARRISSSGA Funds Management, Inc.One Iron StreetBoston, MA 022101973
ChiefComplianceOfficer;Anti-MoneyLaunderingOfficer; CodeofEthicsComplianceOfficer
Term: UnlimitedServed: sinceNovember 2013
Managing Director, State Street GlobalAdvisors and SSGA Funds Management, Inc.(June 2013 - present)*; Senior Vice Presidentand Global Head of Investment Compliance,BofA Global Capital Management (2010 -2013).
SEAN O’MALLEYSSGA Funds Management, Inc.One Iron StreetBoston, MA 022101969
Chief LegalOfficer
Term: UnlimitedServed:sinceAugust 2019
Senior Vice President and Deputy GeneralCounsel, State Street Global Advisors(November 2013-Present).
ANDREW DELORMESSSGA Funds Management, Inc.One Iron StreetBoston, MA 022101975
Secretary Term: UnlimitedServed:sinceAugust 2019
Vice President and Senior Counsel, State StreetGlobal Advisors (April 2016 - present); VicePresident and Counsel, State Street GlobalAdvisors (August 2014 - March 2016).
SPDR SERIES TRUSTOTHER INFORMATION (continued)June 30, 2020 (Unaudited)
62

Name, Addressand Year of Birth
Position(s)with Funds
Term ofOffice andLength of
Time ServedPrincipal Occupation(s) During the Past 5
Years
KEVIN MORRISSSGA Funds Management, IncOne Iron StreetBoston, MA 022101982
AssistantSecretary
Term:UnlimitedServed:sinceAugust 2019
Vice President and Senior Counsel, State StreetGlobal Advisors (April 2019-Present); VicePresident and Counsel, State Street GlobalAdvisors (January 2016-April 2019); Director,Asset Management Compliance, FidelityInvestments (June 2015-January 2016); SeniorCompliance Advisor, Asset ManagementCompliance, Fidelity Investments (June2012-June 2015).
DAVID URMANSSGA Funds Management, IncOne Iron StreetBoston, MA 022101985
AssistantSecretary
Term:UnlimitedServed:sinceAugust 2019
Vice President and Senior Counsel, State StreetGlobal Advisors (April 2019-Present); VicePresident and Counsel, State Street GlobalAdvisors (August 2015-April 2019); Associate,Ropes & Gray LLP (November 2012-August2015).
* Served in various capacities and/or with various affiliated entities during noted time period.
The Statement of Additional Information (SAI) includes additional information about the Funds’ trustees and is available,without charge, upon request and by calling 1-866-787-2257.
SPDR SERIES TRUSTOTHER INFORMATION (continued)June 30, 2020 (Unaudited)
63

[This Page Intentionally Left Blank]

[This Page Intentionally Left Blank]

[This Page Intentionally Left Blank]

SPDR Series Trust
TrusteesBonny E. BoatmanDwight D. ChurchillFrank Nesvet, ChairmanClare S. RicherJames E. RossSandra G. SponemCarl G. Verboncoeur
Investment Manager andAdministratorSSGA Funds Management, Inc.One Iron StreetBoston, MA 02210
DistributorState Street Global Advisors FundsDistributors, LLCOne Iron StreetBoston, MA 02210
Custodian, Sub-Administratorand Transfer AgentState Street Bank and Trust CompanyOne Lincoln StreetBoston, MA 02111
Legal CounselMorgan, Lewis & Bockius LLP1111 Pennsylvania Avenue, NWWashington, DC 20004
Independent Registered PublicAccounting FirmErnst & Young LLP200 Clarendon StreetBoston, MA 02116
The information contained in this report is intended for the general informationof shareholders of the Trust. This report is not authorized for distribution toprospective investors unless preceded or accompanied by a current Trustprospectus which contains important information concerning the Trust. Youmay obtain a current prospectus and SAI from the Distributor by calling1-866-787-2257 or visiting www.ssga.com. Please read the prospectus carefullybefore you invest.

SPDR® Series Trust - Equity FundsFor more complete information, please call1.866.787.2257 or visit www.ssga.com today.
State Street Global AdvisorsOne Iron StreetBoston, MA 02210
ETFs trade like stocks, are subject to investment risk,fluctuate in market value and may trade at pricesabove or below the ETF's net asset value. Brokeragecommissions and ETF expenses will reduce returns.
Standard & Poor’s, S&P and SPDR are registeredtrademarks of Standard & Poor’s FinancialServices LLC (S&P); Dow Jones is a registeredtrademark of Dow Jones Trademark Holdings LLC(Dow Jones); and these trademarks have beenlicensed for use by S&P Dow Jones Indices LLC(SPDJI) and sublicensed for certain purposes byState Street Corporation. State Street Corporation’sfinancial products are not sponsored, endorsed, soldor promoted by SPDJI, Dow Jones, S&P, theirrespective affiliates and third party licensors and
none of such parties make any representationregarding the advisability of investing in suchproduct(s) nor do they have any liability in relationthereto, including for any errors, omissions, orinterruptions of any index.
Distributor: State Street Global Advisors FundsDistributors, LLC, member FINRA, SIPC, an indirectwholly owned subsidiary of State StreetCorporation. References to State Street may includeState Street Corporation and its affiliates. CertainState Street affiliates provide services and receivefees from the SPDR ETFs.
Before investing, consider a Fund’s investmentobjectives, risks, charges and expenses. To obtain aprospectus or summary prospectus which containsthis and other information, call 1.866.787.2257 orvisit www.ssga.com. Read it carefully.
Not FDIC Insured. No Bank Guarantee. May LoseValue.
The information contained in this report is intended for the general information of shareholders of theTrust. This report is not authorized for distribution to prospective investors unless preceded oraccompanied by a current Trust prospectus which contains important information concerning the Trust.You may obtain a current prospectus and SAI from the Distributor by calling 1-866-787-2257 or visitingwww.ssga.com. Please read the prospectus carefully before you invest.
© 2020 State Street Corporation - All Rights ReservedSPDRTOPEQAR
Copyright © 2022 FDOKUMEN