ANT COLONY SEARCH METHOD IN PRACTICAL STRUCTURAL OPTIMIZATION

ANIMAL BEHAVIOUR, 2007, 74, 567e575doi:10.1016/j.anbehav.2006.12.023
Nest ‘moulting’ in the ant Temnothorax albipennis
ANTONY S. ALEKSIEV*, ANA B. SENDOVA-FRANKS† & NIGEL R. FRANKS*
*School of Biological Sciences, University of Bristol
ySchool of Mathematical Sciences, University of the West of England, Bristol
(Received 27 July 2006; initial acceptance 22 September 2006;
final acceptance 2 December 2006; published online 22 August 2007; MS. number: 9063)
We showed how super-organisms, here ant colonies, modify their home according to their increasing ordecreasing space requirements. The ontogeny of wall building by colonies of the ant Temnothorax albipen-nis involves discontinuous rebuilding events that are reminiscent of moulting in insects. Here for the firsttime we manipulated worker density by changing nest cavity size instead of worker number, thus avoidingaccidentally shifting the balance of workers with different propensities for building tasks. Our results sug-gest for the first time that history influences wall building in ants when worker density decreases (e.g. withcolony diminution) as well as when it increases (e.g. with colony growth) as shown by earlier work. Fur-thermore, we found that ants used a greater number of the larger building blocks (big sand grains) bothafter cavity expansion and, more surprisingly, also after cavity contraction. The pattern of nest ‘moulting’we experimentally manipulated and analysed should provide insights into possible trade-offs between thevarious functions and structural properties of the nest that these animals may have to optimize.
� 2007 The Association for the Study of Animal Behaviour. Published by Elsevier Ltd. All rights reserved.
Keywords: ant; building; growth; moulting; Temnothorax albipennis
Individual animals, and animal groups, typically spendmuch of their lives growing, in size or in number; butgroups may also decline. Such individuals or groups oftenseek relative security in size-matched homes either builtby themselves or naturally available in their environment(Hansell 2005). Supply and demand in such a propertymarket (Chaise et al. 1988; Weissberg et al. 1991) might se-lect for house remodelling, extensions, upgrades or down-sizing as the animal or the group grows or shrinks (Chaiseet al. 1988; Weissberg et al. 1991).
Growth is an inherent feature of organisms. Someorganisms, like arthropods, can grow their body, or certainbody parts only discontinuously by moulting (Hutchin-son et al. 1997). The strategic implications of discontinu-ous growth may involve a constant rate of size increasebetween moults as predicted by Dyar’s Rule (Dyar 1890).Conversely, investment principles suggest that growthrate at each moult can vary and is flexibly optimised asa function of feeding rate and body size (Hutchinsonet al. 1997).
Correspondence: N. R. Franks, School of Biological Sciences, Universityof Bristol, Woodland Road, Bristol BS8 1UG, U.K. (email: [email protected]). A. B. Sendova-Franks is at the School of Mathe-matical Sciences, CEMS, University of the West of England, Bristol,Frenchay Campus, Coldharbour Lane, Bristol BS16 1QY, U.K.
560003e3472/07/$30.00/0 � 2007 The Association for the S
External structures like a nest may also grow with theorganism or organisms they accommodate. The nest canbe rebuilt so as to fit the expanding needs of the growingorganism. Alternatively, if the animal or group is usinga preformed cavity, it may need to move into another,more spacious one. The replacement of a cavity that hasbeen outgrown by its occupant will depend on availablechoice in the environment. It comes, however, at a cost;that of searching for and emigrating to a new home underincreased predation risk. A typical example of relocationto a new home when the old one becomes too tight is thechange of shells by hermit crabs (Turra & Leite 2003, 2004;Rotjan et al. 2004). Not only can such hermit crabs changetheir shells but a shell may also mould its occupant mor-phologically so that the crab may need to remain faithfulto a particular type of shell when it moves (Elwood et al.1979).
Size adjustment of a structure that requires rebuildingincurs costs not only of the reconstruction work but alsothose associated with risks in an incomplete home(Hansell 2005). Rebuilding can occur continuously or asepisodic ‘moults’ (Franks & Deneubourg 1997).
Nest rebuilding usually progresses towards nest expan-sion although in some cases animals reduce the space theyoccupy by building a smaller, tightly fitting structureinside the main nest. For instance, overwintering rodents
7tudy of Animal Behaviour. Published by Elsevier Ltd. All rights reserved.

ANIMAL BEHAVIOUR, 74, 3568
snuggle into a miniature nest inside their burrow toincrease insulation against cold (Merritt 1986).
Group builders like social insects often construct neststhat are impressive both in size and complexity (Camazineet al. 2001). They too modify their nests as the colonygrows. These animals may build arboreal, epigeal or sub-terranean nests and can also inhabit and build in pre-formed cavities. The size of the nest correlates positivelywith the population size of the colony (Deneubourg &Franks 1995; Tschinkel 2004). Smaller colonies tend totake longer to complete the same amount of buildingwork than larger colonies (Jeanne 1986).
The adjustment of nest size to the size of the colonymay be an adaptation for the regulation of colonyactivities like efficient brood care (Jeanne 1996; Jeanne &Bouwma 2002) or an antipredatory adaptation (as in socialmites, Mori & Saito 2004). The type of building materialused for the nest may also reflect different predation pres-sures and behavioural adaptations to different predatorsand predation techniques. For example, wasps buildingfragile paper nests and those building mud nests differin collective aggression towards intruders after nest distur-bance (O’Donnell & Jeanne 2002).
When ants excavate nests their work may be episodic,but in general the amount of excavation scales withworker numbers (Buhl et al. 2004). So population densitymay remain fairly similar as the colony grows (Mikheyev& Tschinkel 2004). In addition rebuilding typically sharesmany attributes of initial building (Rasse & Deneubourg2001).
A similar positive correlation between nest size andcolony size has been observed in an ant species that buildsabove ground, namely Temnothorax albipennis (Franks et al.1992; Franks & Deneubourg 1997). This species occupies, innature, preformed cavities in rock where a colony often en-circles itself with a dry-stone wall. The selection of materialfor the wall trades foraging efficiency for the mechanisticefficiency of the construction (Aleksiev et al. 2007a).
When T. albipennis colonies build de novo in associationwith an emigration to a new nest site, the average area perworker inside the perimeter wall of the nest is constant at5 mm2 so that per capita area is independent of the size ofthe colony (Franks et al. 1992). Temnothorax colonies pref-erentially choose cavities of 2000 mm2 that provide an op-timal accommodation for the growing colony, since thebiggest colonies typically have about 400 workers (Frankset al. 2006). Other work suggests that these colonies alsoprefer the solid walls of the cavity to the ones they canbuild themselves (Franks et al. 2006).
Franks & Deneubourg (1997) also examined the possibleeffects of rapid colony growth on nest rebuilding inT. albipennis. Their method was to partition colonies andthen to allow only one part of them to build before return-ing the other fraction. The amount of increase in the sizeof the wall depended on the amount of increase in colonysize after the colony was reunited. Smaller increases in col-ony size did not bring about wall rebuilding. Theoreticalconsiderations and certain data suggest that the growthin the size of the wall can show hysteresis, with changesin the nest size lagging behind changes in the colonysize (Franks & Deneubourg 1997).
The experimental work presented here uses a differentapproach to study the dynamics of wall ‘moulting’ inT. albipennis. We manipulated the size of the nest cavityinstead of colony size. For an interesting parallel see thework by Gravel et al. (2004) who provided hermit crabswith artificial nests. The manipulation of cavity sizesubjected Temnothorax colonies to different spatial con-straints. It also provided the opportunity to examine thedynamics of rebuilding in both expanding and contract-ing cavities. Finally, changing the size of the nest cavitymeant that colony densities could be manipulated with-out taking away or adding workers and thereby riskinga possible disturbance in the organization of task perfor-mance in the colony.
To manipulate the size of the nest cavity we designeda special type of nest with a piston-like device in one of itsthree solid walls. We increased or decreased cavity size bypulling the piston out or pushing the piston in, respec-tively. We examined the strategies T. albipennis coloniesuse to adjust the size of the nest to the size of the colonyby considering the amount of building and rebuildingwork they carried out across the wide nest entrance (ormissing fourth wall). We quantified their work as thearea occupied by this fourth wall built or rebuilt by theants themselves.
Earlier work (Aleksiev et al. 2007a) has shown thatthese ants, when given the option, will build a wall withboth large and small grains. Such mixed walls may havebeneficial properties. We, therefore, also looked at thechanging grain composition of walls during rebuildingevents.
METHODS
The Piston Nest
The piston nest was designed on the basis of thestandard nest for wall building in Temnothorax coloniesused in experiments by Aleksiev et al. (2007a). This stan-dard nest consisted of three fixed walls, giving ants the op-portunity to build the missing fourth wall out of sandgrains (Fig. 1). The new element in the piston nest wasthat the fixed short wall, opposite the missing one, wasreplaced by the piston (Fig. 1).
The piston, a rectangular 75 � 30 mm and 1 mm pieceof cardboard, could be pulled out or pushed in the cavitythereby increasing or decreasing cavity size. The size ofthe piston-nest cavity was 70 � 30 mm and 1 mm, thatis, the same as that of a standard nest, although, insertingthe piston increased the width up to 32 mm. This was the100% cavity size and it was achieved by inserting the pis-ton 5 mm into the nest. We achieved cavity sizes of 50%or 25% by inserting the piston 35 or 52 mm into thenest, respectively (Fig. 1).
Experimental Design
The piston-nest experiment was carried out between4 April and 30 May 2005 with 30 queen-right T. albipenniscolonies of medium size collected on 5 March 2005 from

ALEKSIEV ET AL.: NEST MOULTING IN ANTS 569
Dorset, England. It was designed in two parts. Each parthad three treatments and each treatment had two stages,giving a total of 12 treatment combinations. In the firstpart, the piston was pulled out of the nest to increase cav-ity size (Fig. 2). In the second part, cavity size was de-creased by pushing the piston in (Fig. 3). Each treatmentsubjected colonies to inhabiting cavities with one of threesizes: 100%, 50% or 25%. The manipulation of cavity sizeby moving the piston defined the two stages for eachtreatment: pre- and postmanipulation.
In the first, premanipulation stage, colonies werehoused for 48 h in nests with 100%, 50% and 25% sizecavities. These were pre-expansion cavities preceding cav-ity expansion by pulling the piston out in the first exper-imental part. The precontraction cavities preceded cavitycontraction by pushing the piston in during the secondexperimental part.
In the second, postmanipulation stage, the piston waspulled out in the 25% and 50% cavity treatments and thecolonies remained for 120 h in the cavities expanded to100% in the first part of the experiment. Here the 100%cavities served as controls. The piston was pushed in dur-ing the 50% and 100% cavity treatments and the coloniesremained for 120 h in the cavities contracted to 25% inthe second experimental part. Here the 25% cavitiesserved as controls. The cavities increasing in size after pull-ing the piston out were postexpansion cavities. The cavi-ties that decreased in size after pushing the piston inwere postcontraction cavities.
The piston-nest experiment had a balanced repeatedmeasures design (Table 1). Both the piston-out and the pis-ton-in part consisted of three runs each. A run involved
Standard nest
Piston
25%area
50%area
100%area
Figure 1. Design of the piston nest. The dots at the North end of
each nest represent the wall built by the ants themselves out ofsand grains.
the simultaneous execution of the three treatments,including the premanipulation stage, the manipulationof cavity size, and the postmanipulation stage, in a setof 10 colonies each. A run lasted a week (2 days for the pre-manipulation stage and 5 days for the postmanipulation
25% 50% 100%
0 h
Out
Out
Control
48 hlater
Figure 2. Piston-nest experiment with cavity expansion. Premanipu-
lation cavities of size 25% and 50% increase to 100% after pulling
the piston out. The 100% size cavities do not change in size andserve as controls.
25% 50% 100%
0 h
48 hlater
In
InControl
Figure 3. Piston-nest experiment with cavity contraction. Premani-
pulation cavities of size 50% and 100% decrease to 25% after push-ing the piston in. The 25% size cavities do not change in size and
serve as controls.

ANIMAL BEHAVIOUR, 74, 3570
stage of each treatment) and the end of one run markedthe start of the next run within a part of the experiment.The two parts of the experiment were separated by a2-week pause.
Before the experiment began, the participating 30colonies were randomly allocated to one of the threesets with 10 colonies each. In turn, the sets of colonieswere randomly allocated to a different treatment (cavitysize) within a run and between runs. The three sets ofcolonies were always treated simultaneously, each witha different treatment (cavity size) within a run. Thus, eachset and colony experienced every one of the treatments(cavity size) twice during the whole experiment: once inpart one when the piston was pulled out and once in parttwo when the piston was pushed in.
Each T. albinennis colony was treated in a 220 �220 mm petri dish containing a piston-nest and twosand piles providing building material (Fig. 4). The pis-ton-nest was placed at 105 mm, 75 mm, 85 mm and70 mm from the W, E, N and S wall of the dish, respec-tively. The two sand piles, one with big and the other
Table 1. Allocation of each of the three sets of 10 colonies to treat-ment runs in the two parts of the piston-nest experiment
Run 1 Run 2 Run 3
Experimental part 1: cavity expansion, piston-outColony set 1 100% area 50% area 25% areaColony set 2 25% area 100% area 50% areaColony set 3 50% area 25% area 100% area
Experimental part 2: cavity contraction, piston-inColony set 1 50% area 100% area 25% areaColony set 2 25% area 50% area 100% areaColony set 3 100% area 25% area 50% area
Petri dish
N
S
Sand piles
WColonybeforeemigration
Piston
E
Figure 4. Experimental set-up; N: north, S: south, W: west, E: east;
for more details see text.
with small grains, were 1 cm apart and 3 cm north fromthe entrance of the piston-nest. In half of the six runsthe big-grains pile was on the left and the small-grainspile on the right and in the other half of the runs theywere placed the other way round. The piston rested ona microscope slide between the south petri dish wall andthe bottom microscope slide of the nest. Emigration intothe piston-nest was induced by opening up the currentnest of the colony and placing its bottom microscope slide4 cm to the W from the new intact piston-nest (Fig. 4).
Data Collection and Analysis
Two data sets were collected, one on the area andanother on the number of big and small grains in thewall built by the colonies. The first set was used also toestimate the area occupied by a colony in the nest. Thesecond set included data on grain number for thepremanipulation and postmanipulation walls for differenttreatments (size cavities).
Wall area and colony areaThe area of the wall in the nest cavity was obtained by
digital analysis of pictures taken with a Nikon COOLPIX885 digital camera. The colonies were photographed ona white background in their piston nests and petri dishes.Pictures were taken once, 48 h after the start of the prema-nipulation stage, and every 24 h during the 120 h postma-nipulation stage in a treatment per colony. Thus, sixpictures were taken per colony over the two stages ofeach treatment in each experimental part. Therefore, thetotal number of pictures for the digital analysis was 1080(6 pictures � 3 treatments � 2 experimental parts � 30colonies).
Each picture captured the piston-nest, the colony in-side, the wall built across the nest entrance, and a label onthe left long cavity wall with the colony identity, treat-ment, manipulation type and the elapsed time to or afterthe manipulation of cavity size. The picture ‘JPEG’ files,each of 600e650 kb size, were converted into ‘TIF’ files of9 Mb each for the purposes of the digital analysis. We es-timated the area of the wall with the Scion Image software(http://www.scioncorp.com/). Scion Image computes thearea of demarcated pictorial objects in a prechosen unitof measurement.
Each colony entered the data analysis with one value forthe area of the premanipulation wall obtained from thepicture taken 48 h since the start of the treatment. Thevalue for the area of the postmanipulation wall was aver-aged across the values for wall area from each of the fivepostmanipulation pictures.
The colony area was computed by subtracting the areaof the wall from the total cavity area. The estimates for thetotal cavity area of different cavity sizes were the follow-ing: 100%: X� SE ¼ 21 0033� 4174 mm2, N ¼ 5; 50%:X� SE ¼ 10 4821� 3080 mm2, N ¼ 5; 25%: X� SE ¼54 860� 970 mm2, N ¼ 5. These estimates from the digitalpictures were approximately 94 times greater than the realvalues (total cavity area of real piston nests: 100%:2240 mm2, 50%: 1120 mm2, 25%: 576 mm2). Therefore,

ALEKSIEV ET AL.: NEST MOULTING IN ANTS 571
we divided the estimates for wall area and colony area by94 before analysing the data.
We used ManneWhitney tests for multiple pairwisecomparisons between treatment medians for each of thetwo manipulations, expansion and contraction, for each ofthe two response variables, wall area and colony area. Thatmeant four analyses with 15 possible pairwise comparisonseach. Therefore, we applied the Bonferroni method toensure that the probability of making a type I error in theentire series of tests in each analysis did not exceed thesignificance level a (Sokal & Rohlf 1995, page 240). Accord-ingly, the significance of each ManneWhitney test wasjudged according to significance level a00 ¼ a/k ¼ 0.05/15 ¼ 0.003, where k was the number of comparisons. Wechose this nonparametric method because our initial GLMmodel with factors (a) initial cavity size, (b) manipulationstage, (c) interaction between the two and (d) colony (a ran-dom factor) did not conform to model assumptions for atleast near normal residuals in any of the four analyses.
Data on wall area from the single premanipulationsampling and from each of the 5 days postmanipulationwere used to find out how quickly wall area changed afterthe manipulation of cavity size.
Grain number in the wallThe sand piles providing material for wall building
contained near constant numbers of either only big oronly small grains at the beginning of each treatment andrun. The initial number of big or small grains in the pilewas estimated by a conversion from the weight of the pileand the average weight of a big and a small grain,respectively. The average initial number of big grains inthe pile was X� SE ¼ 2718� 17:7 grains, N ¼ 5 for theexperimental part with cavity expansion and X� SE ¼2701� 47:3 grains, N ¼ 5 for the experimental part withcavity contraction. The average initial number of smallgrains was X� SE ¼ 10 013� 72 grains, N ¼ 5 for theexperimental part with cavity expansion and X� SE ¼11 452� 43 grains, N ¼ 5 for the experimental part withcavity contraction.
The pile with big grains and the pile with small grainsswapped positions relative to the nest entrance and eachother between runs. Thus, each colony experienced aneven number of instances with one of the piles left or rightfrom the other.
The estimation of the initial grain number in the pilesallowed the subsequent estimation of the number of bigand the number of small grains in the premanipulationwall. Before pulling the piston out or pushing the pistonin, the remaining grains in each pile were weighed againand the estimated number of grains was subtracted fromthe initial grain number for each grain size. The differencegave the number of big and the number of small grainsused for building the wall during the 48 h of the premani-pulation stage.
At the end of each treatment, the wall was tipped out ofthe nest, sieved and the sand was weighed and convertedinto numbers of big and small grains. This gave an estimatefor the number of different size grains in the postmanipu-lation wall over the 120 h of the postmanipulation stage.
Finally, the difference in the number of big and smallgrains between the premanipulation and the postmani-pulation wall was also computed by subtracting the grainnumbers in the premanipulation wall from the grainnumbers in the postmanipulation wall.
The data for the difference in grain number between post-and premanipulation walls consisted of 160 observations forcavity expansion and 180 observations for the cavitycontraction, that is, 30 colonies for each stage of eachtreatment except for the control for expansion (100e100%cavity size) where only 20 of the colonies were analysed.
RESULTS
Wall Area and Colony Area
Wall areaCavity expansion and cavity contraction differed in
their effect on wall area. Wall area was less variablebetween the three initial cavity sizes after contraction to25% cavity area (Fig. 5a). By contrast, the difference inwall area between different initial cavity sizes was main-tained after expansion to 100% cavity area (Fig. 5a).Wall area increased significantly when cavity area ex-panded from 25% to 100% (ManneWhitney U test:U ¼ 560, N1 ¼ 29, N2 ¼ 30, P < 0.001) but did not changesignificantly when cavity area increased from 50% to100% (U ¼ 822, N1 ¼ N2 ¼30, P ¼ 0.172; Fig. 5a). As ex-pected, there was no significant change in the control(100e100% expansion: U ¼ 782, N1 ¼ N2 ¼ 30, P ¼ 0.050;Fig. 5a). Despite the significant increase in the wall area forthe expansion from 25% to 100% nest cavity, the postex-pansion wall area was significantly smaller than the wallarea either for the postexpansion control (U ¼ 576,N1 ¼ N2 ¼ 30, P < 0.001) or the postexpansion 50% cavity(U ¼ 574, N1 ¼ N2 ¼ 30, P < 0.001; Fig. 5a).
Wall area decreased significantly when cavity areacontracted from 50% to 25% (ManneWhitney U test:U ¼ 662, N1 ¼ N2 ¼ 30, P < 0.001) and from 100% to25% (U ¼ 636, N1 ¼ N2 ¼ 30, P < 0.001; Fig. 5a). As ex-pected, there was no significant change in the control(25e25% contraction: U ¼ 844, N1 ¼ 29, N2 ¼ 30,P ¼ 0.699; Fig. 5a). The wall area for each of the contracted50% and 100% cavities was not significantly differentfrom the area of the control (25e25% contraction:U ¼ 857, N1 ¼ N2 ¼ 30, P ¼ 0.395; U ¼ 758, N1 ¼ N2 ¼ 30,P ¼ 0.021, respectively; Fig. 5a). Recall that for the seriesof tests for each manipulation the significance level wascorrected with the Bonferroni method to a00 ¼ a/k ¼0.05/15 ¼ 0.003.
The ant colonies responded to cavity size manipulationquickly. All significant changes in wall area after cavitysize expansion or contraction took place within the first24 h after the respective manipulation (Fig. 6). Thus, inthe case of pulling the piston out, where the only signifi-cant effect occurred when cavity area expanded from 25%to 100%, wall area increased within the first 24 h after themanipulation (ManneWhitney U test: U ¼ 640, N1 ¼N2 ¼ 30, P < 0.001; Fig. 6a). Similarly, in the case of push-ing the piston in, where a significant effect occurred when

ANIMAL BEHAVIOUR, 74, 3572
Wal
l ar
ea (
mm
2 )
800
700
600
500
400
300
200
100
0
305
37439
0
350
291
420
433
404
261
253
311
225
(a)
C C
NS NSNS*** *** ***
Type and stage of manipulation of cavity size
Col
ony
area
(m
m2 )
Post-Pre-Post-Pre-Post-Pre-Post-Pre-Post-Pre-Post-Pre-
Post-Pre-Post-Pre-Post-Pre-Post-Pre-Post-Pre-Post-Pre-
2000
1500
1000
500
0972
1860
1844
1885
293
695
1801
711
323
331
1923
359
(b)
25–100% 25–25% 50–100% 50–25% 100–100% 100–25%
C C
NS
NS
*** *** *** ***
Figure 5. (a) Wall area and (b) colony area before and after the manipulation of cavity size by expansion or contraction. Numbers above each
box-plot indicate median values. C: control cavity size, C: outlier, NS: statistically not significant difference, ***: statistically significant differ-ence at a00 < 0.001 for ManneWhitney U tests comparing the medians of the two box-plots within each panel; a00 ¼ a/k ¼ 0.05/15 ¼ 0.003,
a Bonferroni correction for the 15 possible multiple comparisons within a manipulation.
cavity size contracted from 50% to 25% and from 100% to25%, wall area decreased within the first 24 h in both cases(U ¼ 728, N1 ¼ N2 ¼ 30, P ¼ 0.006; U ¼ 695, N1 ¼ N2 ¼ 30,P ¼ 0.001, respectively; Fig. 6d, f).
Colony areaThe effect of cavity expansion and contraction on
colony area was similar to that on wall area in thatexpansion led to divergence while contraction led toconvergence. However, here, expansion led to a significanteffect in both the expanded 25% and 50% cavities(ManneWhitney U test: U ¼ 465, N1 ¼ N2 ¼ 30, P < 0.001;U ¼ 465, N1 ¼N2 ¼30, P < 0.001, respectively; Fig. 5b).The colony area for the expanded 25% cavities was signif-icantly greater than either the expanded 50% cavities
(U ¼ 574, N1 ¼ N2 ¼ 30, P < 0.001) or the control (100%cavities: U ¼ 576, N1 ¼ N2 ¼ 30, P < 0.001; Fig. 5b).
The effect of cavity contraction on colony area wassimilar to its effect on wall area (Fig. 5b).
Grain number in the wall
Pulling the piston out or pushing the piston in led toa change in the number of big and small grains inthe wall for the postmanipulated cavities compared tothe number of big and small grains in the wall for thepremanipulated cavities. Cavity expansion led to anincrease in the number of big grains and no change inthe number of small grains (Fig. 7). All differences in thenumber of big grains for the expanded cavities weresignificantly different from zero except for the control
ALEKSIEV ET AL.: NEST MOULTING IN ANTS 573
12096724824Pre-exp
700
600
500
400
300
200
100
0
314
30330
9
305
284
225
25–100%
(a)
12096724824Pre-contr
700
600
500
400
300
200
100
0
261
260
261
255
256
253
25–25%
(b)
Wal
l ar
ea (
mm
2 )
12096724824Pre-exp
700
600
500
400
300
200
100
0
416
442
405
449
422
404
50–100%
(c)
12096724824Pre-contr
700
600
500
400
300
200
100
0
291
300
320
33233
2
420
50–25%
(d)
12096724824Pre-exp
700
600
500
400
300
200
100
0
374
405
39641
7
358
350
100–100%
(e)
Time after expansion (h) Time after contraction (h)
12096724824Pre-contr
700
600
500
400
300
200
100
0
305
305
320
324
332
387
100–25%
(f)
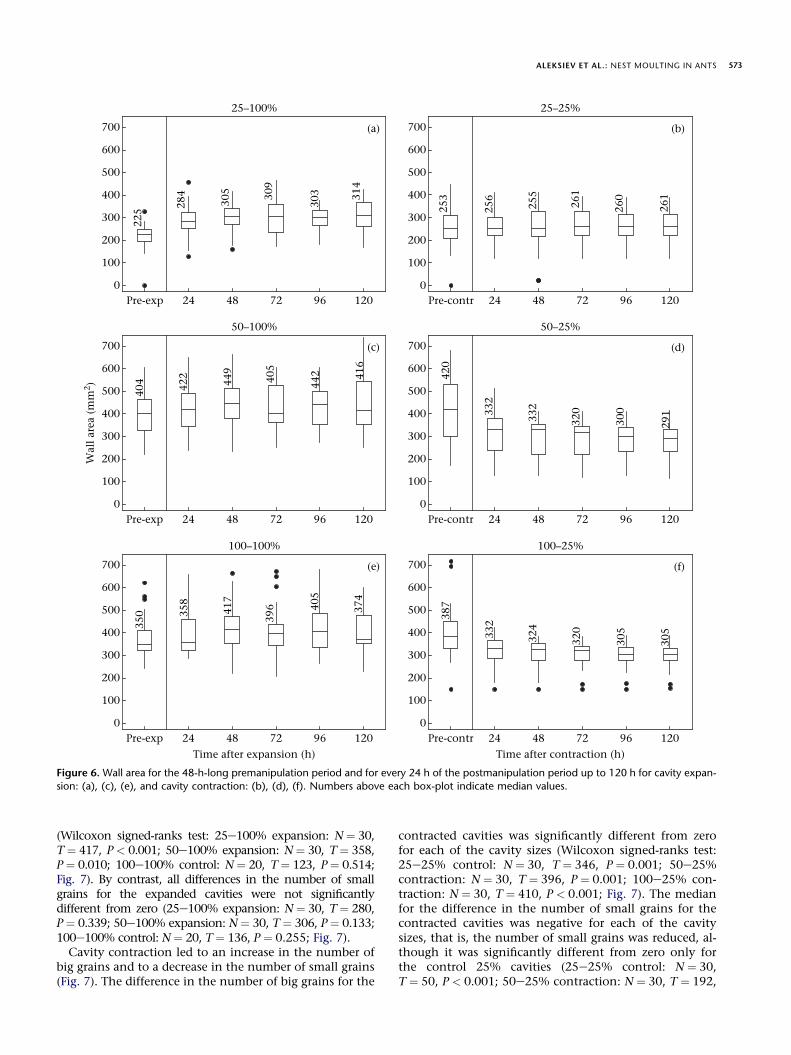
Figure 6. Wall area for the 48-h-long premanipulation period and for every 24 h of the postmanipulation period up to 120 h for cavity expan-
sion: (a), (c), (e), and cavity contraction: (b), (d), (f). Numbers above each box-plot indicate median values.
(Wilcoxon signed-ranks test: 25e100% expansion: N¼ 30,T¼ 417, P< 0.001; 50e100% expansion: N¼ 30, T¼ 358,P¼ 0.010; 100e100% control: N¼ 20, T¼ 123, P¼ 0.514;Fig. 7). By contrast, all differences in the number of smallgrains for the expanded cavities were not significantlydifferent from zero (25e100% expansion: N¼ 30, T¼ 280,P¼ 0.339; 50e100% expansion: N¼ 30, T¼ 306, P¼ 0.133;100e100% control: N¼ 20, T¼ 136, P ¼ 0.255; Fig. 7).
Cavity contraction led to an increase in the number ofbig grains and to a decrease in the number of small grains(Fig. 7). The difference in the number of big grains for the
contracted cavities was significantly different from zerofor each of the cavity sizes (Wilcoxon signed-ranks test:25e25% control: N ¼ 30, T ¼ 346, P ¼ 0.001; 50e25%contraction: N ¼ 30, T ¼ 396, P ¼ 0.001; 100e25% con-traction: N ¼ 30, T ¼ 410, P < 0.001; Fig. 7). The medianfor the difference in the number of small grains for thecontracted cavities was negative for each of the cavitysizes, that is, the number of small grains was reduced, al-though it was significantly different from zero only forthe control 25% cavities (25e25% control: N ¼ 30,T ¼ 50, P < 0.001; 50e25% contraction: N ¼ 30, T ¼ 192,

ANIMAL BEHAVIOUR, 74, 3574
Type of cavity size manipulation and grain size
Dif
fere
nce
in
wal
l gr
ain
nu
mbe
r
SmallBigSmallBigSmallBigSmallBigSmallBigSmallBig
4000
3000
2000
1000
0
–1000
–2000
–78
155
–37
162
–30410
26341
467
92
271
191
25–100% 50–100% 100–100% 25–25% 50–25% 100–25%
C
C
C
C
Figure 7. Differences in wall grain number between the post- and premanipulation stages according to the type of cavity size manipulation andgrain size. Numbers above each box-plot indicate median values; C: control cavity size; C: outlier.
P ¼ 0.589; 100e25% contraction: N ¼ 30, T ¼ 181,P ¼ 0.294; Fig. 7).
DISCUSSION
Nest reconstruction by the colonies of ants often involvesdiscontinuous rebuilding events. The magnitude of wallrebuilding seems to be determined by the history of thespatial constraints experienced by the colony. Moreover,colonies adjust the area occupied by the wall in responseto the size of the available cavity and their own colonysize, that is, as a function of their density. Rebuilding oftenoccurs shortly after substantial changes in the size of thecavity. The nature of change in cavity size also influencesthe type and number of grains used for the rebuilding.History matters for the growth of the construction just asit does for the growth of the colony.
The piston-nest experiment combined the reasoningfrom the experiments of Franks & Deneubourg (1997)with a novel experimental approach to examine the orga-nization of wall rebuilding by Temnothorax colonies. Thenest wall represents not only the ramparts of the colony’sfortress, but also the boundary of their factory. It delin-eates the area within which the colony moves inside thenest cavity and, therefore, may influence the colony’sactivities (Franks & Tofts 1994).
In the present piston-nest experiment, the size of thenest cavity was manipulated instead of the size of thecolony. This has the advantage over the experiments ofFranks & Deneubourg (1997) in that the colony remainsintact so that biases should not be introduced in the ratiosof workers who might be more or less likely to engage inbuilding.
In addition, the results from the present study suggestfor the first time that history influences wall building inants when worker density decreases as well as when itincreases (Franks & Deneubourg 1997). While cavity size
contraction (i.e. increase in worker density) predictablyled to convergence between colonies with initial 50%and 100% cavities in both wall area and colony area, cav-ity size expansion led to divergence, that is, there wasclearly an effect of history. When the piston was pulledout, colonies with initial 25% cavities increased theirwall area significantly. However, this increase was smallenough to allow them to increase their colony area signif-icantly too. By contrast, colonies with initial 50% cavitiestook full advantage of the increased cavity area after pull-ing the piston out in terms of increasing significantlycolony area only.
The differences between the changes in wall area asa function of the changes in cavity size could also beconsidered as a wall composition problem. The wall wasbuilt with two grain sizes: big and small. Big grains are fivetimes the volume of small grains and may constitute thebulk of the wall. Small grains may be incorporated in theconstruction to increase its strength and compactness(Aleksiev et al. 2007a). The cavity expansion or cavity con-traction can thus result in different strategies of collectingand using grains for the rebuilding of the wall. We used thedifference in the number of big grains and the difference inthe number of small grains between the post- and prema-nipulation walls to analyse those strategies.
We found that colonies use a greater number of biggrains in the wall after cavity size expansion. Intriguingly,they used a greater number of big grains after cavity sizecontraction as well. By contrast, the number of smallgrains in the wall after expansion did not change signif-icantly and there was even some evidence that theirnumber actually decreased after cavity size contraction.The number of big grains in the wall increases after cavityexpansion because this is the least costly way to increasewall area during rebuilding. The increase in the number ofbig grains after cavity contraction may be due to wallrebuilding when the colony finds itself very close to thenest entrance under the increased pressure for space.
ALEKSIEV ET AL.: NEST MOULTING IN ANTS 575
In other experiments (Aleksiev et al. 2007b) we haveshown that colonies first build with large grains andthen seem to infill and consolidate the wall with smallergrains. Walls fortified with mixed grains may be more sta-ble (Aleksiev et al. 2007a). Our results are consistent withthe ants using more large grains (and fewer small grains)when moving built walls and this should facilitate fasterrebuilding.
When social insect colonies grow they need to increasethe size of their nests. This often involves breaking downthe wall of the old nest and replacing it with a new onethat gives the colony room for further growth. Betweensuch demolition and reconstruction the colony losesmuch of the protection afforded by the nest. Similarly,when a solitary insect grows it must shed its constrainingbut protective cuticle (Riddiford 2003). In both cases, onemight expect such ‘moulting’ to occur episodically and ex-plosively. It should be episodic so that periods of vulnera-bility are few and far between. It should be explosive sothat periods of vulnerability are short and the new nestor the new exoskeleton is roomy: providing lots of poten-tial for growth before further moulting is required.
Acknowledgments
We gratefully acknowledge an ORS postgraduate student-ship for A.S.A. at the University of Bristol and thank allmembers of the Ant Lab for helpful discussions.
References
Aleksiev, A. S., Sendova-Franks, A. B. & Franks, N. R. 2007a. The
selection of building material for wall construction by ants. Animal
Behaviour, 73, 779e788.
Aleksiev,A.S., Longdon,B.,Christmas,M. J., Sendova-Franks,A.B.&Franks, N. R. 2007b. Individual choice of building material for nest
construction by worker ants and the collective outcome for their col-ony. Animal Behaviour, 74, 559e566.
Buhl, J., Gautrais, J., Deneubourg, J.-L. & Theraulaz, G. 2004. Nestexcavation in ants: group size effects on the size and structure of
tunnelling networks. Naturwissenschaften, 91, 602e606.
Camazine, S., Deneubourg, J.-L., Franks, N. R., Sneyd, J., Therau-laz, G. & Bonabeau, E. 2001. Self-organization in Biological Sys-
tems. Princeton, New Jersey: Princeton University Press.
Chaise, I. D., Weissburg, M. & Dewitt, T. H. 1988. The vacancy
chain process: a new mechanism of resource distribution in animals
with application to hermit crabs. Animal Behaviour, 36, 1265e1274.
Deneubourg, J.-L. & Franks, N. R. 1995. Collective control without
explicit coding: the case of communal nest excavation. Journal ofInsect Behavior, 8, 417e432.
Dyar, H. G. 1890. The number of moults of lepidopterous larvae.Psyche (Cambridge), 5, 420e422.
Elwood, R. W., McClean, A. & Webb, L. 1979. The development ofshell preferences by the hermit crab Pagurus bernhardus. Animal
Behaviour, 27, 940e946.
Franks, N. R. & Deneubourg, J.-L. 1997. Self-organizing nest con-
struction in ants: individual worker behaviour and the nest’s
dynamics. Animal Behaviour, 54, 779e796.
Franks, N. R. & Tofts, C. 1994. Foraging for work: how tasks allocate
workers. Animal Behaviour, 48, 470e472.
Franks, N. R., Willby, A., Silverman, B. W. & Tofts, C. 1992. Self-
organizing nest construction in ants: sophisticated building by
blind bulldozing. Animal Behaviour, 44, 357e375.
Franks, N. R., Dornhaus, A., Metherell, B. G., Nelson, T. R.,Lanfear, S. A. J. & Symes, W. S. 2006. Not everything that countscan be counted: ants use multiple metrics for a single trait.
Proceedings of the Royal Society of London, Series B, 273, 165e169.
Franks, N. R., Dornhaus, A., Best, C. S. & Jones, E. 2006. Decision-
making by small and large house-hunting colonies: one size fits all.
Animal Behaviour, 72, 611e616.
Gravel, B. E., Wong, P. Y., Starks, P. T. & Pechenik, J. A. 2004. The
use of artificial shells for exploring shell preference in the marine
hermit crab Pagurus longicarpus (Say). Annales Zoologici Fennici,41, 477e485.
Hansell, M. 2005. Animal Architecture. Oxford: Oxford UniversityPress.
Hutchinson, J. M. C., McNamara, J. N., Houston, A. I. & Vollrath, F.1997. Dyar’s Rule and the Investment Principle: optimal moulting
strategies if feeding rate is size-dependent and growth is discon-
tinuous. Philosophical Transactions of the Royal Society of London,
Series B, 352, 113e138.
Jeanne, R. L. 1986. The organization of work in Polybia occidentalis:
costs and benefits of specialization in a social wasp. Behavioral Ecol-ogy and Sociobiology, 19, 333e341.
Jeanne, R. L. 1996. Regulation of nest construction behaviour inPolybia occidentalis. Animal Behaviour, 52, 473e488.
Jeanne, R. L. & Bouwma, A. M. 2002. Scaling in nests of a socialwasp: a property of the social group. Biological Bulletin, 202,
289e295.
Merritt, J. F. 1986. Winter survival adaptations of the short-tailed
shrew (Blarina brevicauda) in an appalachian montane forest.
Journal of Mammalogy, 67, 450e464.
Mikheyev, A. S. & Tschinkel, W. R. 2004. Nest architecture of the
ant Formica pallidefulva: structure, costs and rules of excavation.
Insectes Sociaux, 51, 30e36.
Mori, K. & Saito, Y. 2004. Nest-size variation reflecting
anti-predator strategies in social spider mites of Stigmaeopsis(Acari: Tetranychidae). Behavioral Ecology and Sociobiology, 56,
201e206.
O’Donnell, S. & Jeanne, R. L. 2002. The nest as a fortress: defensive
behaviour of Polybia emaciata, a mud-nesting eusocial wasp.
Journal of Insect Science, 2, 5.
Rasse, P. & Deneubourg, J.-L. 2001. Dynamics of nest excavation
and nest size regulation of Lasius niger (Hymenoptera: Formici-
dae). Journal of Insect Behavior, 14, 433e449.
Riddiford, L. M. 2003. Molting. In: Encyclopedia of Insects (Ed. by
V. H. Resh & R. T. Carde), pp. 733e738. London: Academic Press.
Rotjan, R. D., Blum, J. & Lewis, S. M. 2004. Shell choice in Pa-
gurus longicarpus hermit crabs: does predation threat influenceshell selection behaviour? Behavioral Ecology and Sociobiology,
56, 171e176.
Sokal, R. R. & Rohlf, F. J. 1995. Biometry. 3rd edn. New York: W.H.Freeman.
Tschinkel, W. R. 2004. The nest architecture of the Florida harvesterant, Pogonomyrmex badius. Journal of Insect Science, 4, 19.
Turra, A. & Leite, F. P. P. 2003. The molding hypothesis: linkingshell use with hermit crab growth, morphology, and shell-species
selection. Marine Ecology-Progress Series, 265, 155e163.
Turra, A. & Leite, F. P. P. 2004. Shell-size selection by intertidal
sympatric hermit crabs. Marine Biology, 145, 251e257.
Weissberg, M., Roseman, L. & Chaise, I. D. 1991. Chains of oppor-
tunity: a Markov model for acquisition of reusable resources.
Evolutionary Ecology, 5, 105e117.
Copyright © 2022 FDOKUMEN