
Man Funds VI plc
325
Man Funds VI plc (An Investment Company with Variable Capital) Report and Financial Statements for the year ended 31 December 2019
-
Upload
khangminh22 -
Category
Documents
-
view
0 -
download
0
Transcript of Man Funds VI plc
Man Funds VI plc
(An Investment Company with Variable Capital) Report and Financial Statements for the year ended 31 December 2019
Man Funds VI plc
Fund and Class of Shares ISIN
Man GLG European Alpha Alternative Class DN EUR IE00B4YLN521Man GLG European Alpha Alternative Class DN H GBP IE00B4YLN745Man GLG European Alpha Alternative Class DN H USD IE00B4YLMY47Man GLG European Alpha Alternative Class IN EUR IE00B3VHWQ03Man GLG European Alpha Alternative Class IN H GBP IE00B3VHX450Man GLG European Alpha Alternative Class IN H USD IE00B3VHWN71Man GLG European Alpha Alternative Class INF EUR IE00BYVQYQ87
Man GLG Alpha Select Alternative Class DL GBP IE00B60K3800Man GLG Alpha Select Alternative Class DL H EUR IE00B5ZNKR51Man GLG Alpha Select Alternative Class DL H USD IE00B6116G19Man GLG Alpha Select Alternative Class DNY H EUR IE00BK6M1400Man GLG Alpha Select Alternative Class IL GBP IE00B60S2G54Man GLG Alpha Select Alternative Class IL GBP Dist IE00BF2WQN35Man GLG Alpha Select Alternative Class IL H EUR IE00B3LJVG97Man GLG Alpha Select Alternative Class IL H EUR Dist IE00BF2WQM28Man GLG Alpha Select Alternative Class IL H SEK IE00B57XDM94Man GLG Alpha Select Alternative Class IL H USD IE00B5ZN3H63Man GLG Alpha Select Alternative Class IL H USD Dist IE00BF2WQP58Man GLG Alpha Select Alternative Class IL U GBP IE00BYQG5598Man GLG Alpha Select Alternative Class IN H EUR IE00BJQ2XG97Man GLG Alpha Select Alternative Class IN H SEK IE00BJBK4F46Man GLG Alpha Select Alternative Class IN H USD IE00BJQ2XH05
Man GLG European Equity Alternative Class DN EUR IE00B5591813Man GLG European Equity Alternative Class DN H CHF IE00B3N8Z959Man GLG European Equity Alternative Class DN H GBP IE00B50LJD33Man GLG European Equity Alternative Class DN H NOK IE00B5BGS293Man GLG European Equity Alternative Class DN H SEK IE00B664J889Man GLG European Equity Alternative Class DN H USD IE00B55G5T10Man GLG European Equity Alternative Class DN U EUR IE00BGBWYN70Man GLG European Equity Alternative Class IN EUR IE00B5429P46Man GLG European Equity Alternative Class IN H GBP IE00B501WY55Man GLG European Equity Alternative Class IN H SEK IE00B5MLB684Man GLG European Equity Alternative Class IN H USD IE00B54VK141Man GLG European Equity Alternative Class INU EUR IE00BYZCNV02Man GLG European Equity Alternative Class INU H USD IE00BYZCNW19Man GLG European Equity Alternative Class INZ EUR IE00BDRVT323Man GLG European Equity Alternative Class INZ EUR Dist IE00BZ607T67Man GLG European Equity Alternative Class INZ H CHF Dist IE00BZ607S50Man GLG European Equity Alternative Class INZ H GBP Dist IE00BZ607V89Man GLG European Equity Alternative Class INZ H USD IE00BDRVT430Man GLG European Equity Alternative Class INZ H USD Dist IE00BZ607W96Man GLG European Equity Alternative Class IXXN EUR IE00BK77QN81Man GLG European Equity Alternative Class IXXN H USD IE00BK6GVG41
Man AHL Multi Strategy Alternative Class DN USD IE00BRJT7S37Man AHL Multi Strategy Alternative Class DN H EUR IE00BRJT7T44Man AHL Multi Strategy Alternative Class DN H GBP IE00BRJT7X89Man AHL Multi Strategy Alternative Class IN USD IE00BRJT8355Man AHL Multi Strategy Alternative Class IN H CHF IE00BRJT8579Man AHL Multi Strategy Alternative Class IN H EUR IE00BRJT8462Man AHL Multi Strategy Alternative Class IN H GBP IE00BRJT8793Man AHL Multi Strategy Alternative Class IN H SEK IE00BRJT8B35
Man AHL TargetRisk Class D USD IE00BRJT7498Man AHL TargetRisk Class D H CHF IE00BRJT7720Man AHL TargetRisk Class D H EUR IE00BRJT7613Man AHL TargetRisk Class D H GBP IE00BRJT7944Man AHL TargetRisk Class D H SEK IE00BRJT7D83Man AHL TargetRisk Class D H SGD IE00BRJT7F08
Man Funds VI plc
Fund and Class of Shares (continued) ISIN
Man AHL TargetRisk Class I USD IE00BRJT7H22Man AHL TargetRisk Class I H CHF IE00BRJT7L67Man AHL TargetRisk Class I H EUR IE00BRJT7K50Man AHL TargetRisk Class I H GBP IE00BRJT7N81Man AHL TargetRisk Class I H JPY IE00BRJT7P06Man AHL TargetRisk Class I H SEK IE00BRJT7R20Man AHL TargetRisk Class I H SGD IE00BRJT7J46Man AHL TargetRisk Class I H (BRL) USD IE00BKY59R06Man AHL TargetRisk Class INU USD IE00BDCY1W99
Man GLG European Mid-Cap Equity Alternative Class DN EUR IE00BWBSF561Man GLG European Mid-Cap Equity Alternative Class DN H USD IE00BWBSFF61Man GLG European Mid-Cap Equity Alternative Class DNY EUR IE00BWBSFG78Man GLG European Mid-Cap Equity Alternative Class IN EUR IE00BWBSFJ00Man GLG European Mid-Cap Equity Alternative Class IN F EUR IE00BYXWT366Man GLG European Mid-Cap Equity Alternative Class INF H GBP IE00BYXWT580Man GLG European Mid-Cap Equity Alternative Class INF H USD IE00BYXWT473Man GLG European Mid-Cap Equity Alternative Class IN H GBP IE00BWBSFM39Man GLG European Mid-Cap Equity Alternative Class IN H SEK IE00BWBSFQ76Man GLG European Mid-Cap Equity Alternative Class IN H USD IE00BWBSFV20
Man GLG Global Emerging Markets Debt Total Return Class D USD IE00BD3B6K23Man GLG Global Emerging Markets Debt Total Return Class D H CHF IE00BYXPSM70Man GLG Global Emerging Markets Debt Total Return Class D H EUR IE00BD3B9479Man GLG Global Emerging Markets Debt Total Return Class D H GBP IE00BD3B6H93Man GLG Global Emerging Markets Debt Total Return Class D H NOK IE00BZCGN561Man GLG Global Emerging Markets Debt Total Return Class DL USD IE00BD3B9693Man GLG Global Emerging Markets Debt Total Return Class DL H EUR IE00BD3B9586Man GLG Global Emerging Markets Debt Total Return Class DMF USD IE00BD8GLB82Man GLG Global Emerging Markets Debt Total Return Class DMF H EUR IE00BD8GL969Man GLG Global Emerging Markets Debt Total Return Class DR USD Dist IE00BYXQ8195Man GLG Global Emerging Markets Debt Total Return Class DY USD IE00BD37M462Man GLG Global Emerging Markets Debt Total Return Class DY H EUR IE00BF20KP72Man GLG Global Emerging Markets Debt Total Return Class I USD IE00BD3B6F79Man GLG Global Emerging Markets Debt Total Return Class I USD Dist IE00BYWC7X35Man GLG Global Emerging Markets Debt Total Return Class I H AUD IE00BYVW6714Man GLG Global Emerging Markets Debt Total Return Class I H CHF IE00BD37M355Man GLG Global Emerging Markets Debt Total Return Class I H EUR IE00BD3B6B32Man GLG Global Emerging Markets Debt Total Return Class I H EUR Dist IE00BDB77545Man GLG Global Emerging Markets Debt Total Return Class I H GBP IE00BD3B6C49Man GLG Global Emerging Markets Debt Total Return Class I H SEK IE00BD3B6D55Man GLG Global Emerging Markets Debt Total Return Class IL USD IE00BD3B9362Man GLG Global Emerging Markets Debt Total Return Class IL H EUR IE00BD3B6G86Man GLG Global Emerging Markets Debt Total Return Class IMF USD IE00BYZJRM02Man GLG Global Emerging Markets Debt Total Return Class IMF USD Dist IE00BYXZ2Y79Man GLG Global Emerging Markets Debt Total Return Class IMF H EUR IE00BD6GFC99Man GLG Global Emerging Markets Debt Total Return Class IMF H EUR Dist IE00BDB77768Man GLG Global Emerging Markets Debt Total Return Class IMF H GBP Dist IE00BD8GLC99
Man GLG Innovation Equity Alternative Class DN USD IE00BDRKSX26Man GLG Innovation Equity Alternative Class DN H CHF IE00BDRKSS72Man GLG Innovation Equity Alternative Class DN H EUR IE00BDRKST89Man GLG Innovation Equity Alternative Class DN H SEK IE00BDRKSW19Man GLG Innovation Equity Alternative Class DNF H EUR IE00BDRKSY33Man GLG Innovation Equity Alternative Class IN USD IE00BDRKT516Man GLG Innovation Equity Alternative Class INF USD IE00BDRKT730Man GLG Innovation Equity Alternative Class INF H EUR IE00BDRKT623Man GLG Innovation Equity Alternative Class INF H GBP IE00BYX7RF96Man GLG Innovation Equity Alternative Class IN H CHF IE00BDRKT060Man GLG Innovation Equity Alternative Class IN H EUR IE00BDRKT177Man GLG Innovation Equity Alternative Class IN H GBP IE00BDRKT284Man GLG Innovation Equity Alternative Class IN H SEK IE00BDRKT409Man GLG Innovation Equity Alternative Class INU H EUR IE00BFZ18L99Man GLG Innovation Equity Alternative Class INU H GBP IE00BYP55G81
Man Funds VI plc
Fund and Class of Shares (continued) ISIN
Man Alternative Style Risk Premia Class D USD IE00BF52FP54Man Alternative Style Risk Premia Class D H DKK IE00BJ9N8S60Man Alternative Style Risk Premia Class D H EUR IE00BF52FN31Man Alternative Style Risk Premia Class D H NOK IE00BJ9N8V99Man Alternative Style Risk Premia Class D H SEK IE00BJ9N8T77Man Alternative Style Risk Premia Class I USD IE00BF52FK00Man Alternative Style Risk Premia Class I H AUD IE00BG0HKK25Man Alternative Style Risk Premia Class I H CHF IE00BF52FF56Man Alternative Style Risk Premia Class I H EUR IE00BF52FG63Man Alternative Style Risk Premia Class I H GBP IE00BF52FH70Man Alternative Style Risk Premia Class I H JPY IE00BD3HVN80Man Alternative Style Risk Premia Class I H SEK IE00BF52FJ94Man Alternative Style Risk Premia Class INU H EUR IE00BD5FCH16Man Alternative Style Risk Premia Class INU USD IE00BZ7PF851
Man AHL Active Balanced Class I H EUR IE00BGGLHH44Man AHL Active Balanced Class I H GBP IE00BGGLHJ67Man AHL Active Balanced Class I H JPY IE00BGGLHK72Man AHL Active Balanced Class I H USD IE00BGGLHL89
Man GLG High Yield Opportunities Class D EUR IE00BDTYYP61Man GLG High Yield Opportunities Class I EUR IE00BDTYYL24Man GLG High Yield Opportunities Class I H GBP IE00BDTYYN48Man GLG High Yield Opportunities Class I H USD IE00BDTYYM31Man GLG High Yield Opportunities Class IF EUR IE00BJXMVL37Man GLG High Yield Opportunities Class IF H GBP IE00BJ5K4V63Man GLG High Yield Opportunities Class IF H GBP Dist IE00BHZHG737Man GLG High Yield Opportunities Class IF H GBP G-Dist IE00BHZHG844Man GLG High Yield Opportunities Class ILU H GBP G-Dist IE00BGLSPX24
Man GLG Credit Multi-Strategy Alternative Class DN H EUR IE00BDVJ5T00Man GLG Credit Multi-Strategy Alternative Class IN USD IE00BDVJ5R85Man GLG Credit Multi-Strategy Alternative Class IN H EUR IE00BDVJ5Q78Man GLG Credit Multi-Strategy Alternative Class IN H SEK IE00BDVJ5S92Man GLG Credit Multi-Strategy Alternative Class INU H GBP IE00BJJNGT35
Man GLG Event Driven Alternative Class DNFY H EUR IE00BKDV7869Man GLG Event Driven Alternative Class DNFY USD IE00BKDV7752Man GLG Event Driven Alternative Class IN H EUR IE00BJJNH014Man GLG Event Driven Alternative Class IN H GBP IE00BJJNGX70Man GLG Event Driven Alternative Class IN H SEK IE00BJJNGY87Man GLG Event Driven Alternative Class IN USD IE00BJJNGV56Man GLG Event Driven Alternative Class INF H EUR IE00BJBLGJ52Man GLG Event Driven Alternative Class INF USD IE00BJBLGK67
Man GLG Global Debt Total Return Class I C EUR IE00BJR66947Man GLG Global Debt Total Return Class I C USD IE00BJR66830
Man GLG High Yield Opportunities DE Class I EUR IE00BKRQZ499Man GLG High Yield Opportunities DE Class I EUR Dist IE00BKRQZ382
Man GLG US Absolute Alpha Class IN USD IE00BGMJW227
Man Funds VI plc Table of contents
1
Page
Directory 2
Investment Managers’ reports 3
Directors’ report 27
Report from the Depositary to the Shareholders 37
Statement of financial position 39
Statement of changes in net assets 47
Statement of comprehensive income 51
Statement of cash flows 59
Notes to the financial statements 67
Independent Auditors’ report 200
Schedule of investments: Man GLG European Alpha Alternative 203 Man GLG Alpha Select Alternative 206 Man GLG European Equity Alternative 210 Man AHL Multi Strategy Alternative 227 Man AHL TargetRisk 264 Man GLG European Mid-Cap Equity Alternative 268 Man GLG Global Emerging Markets Debt Total Return 271 Man GLG Innovation Equity Alternative 273 Man Alternative Style Risk Premia 276 Man AHL Active Balanced 281 Man GLG High Yield Opportunities 283 Man GLG Credit Multi-Strategy Alternative 285 Man GLG Event Driven Alternative 290 Man GLG Global Debt Total Return 292 Man GLG High Yield Opportunities DE 294 Statements of significant purchases and sales (Unaudited): Man GLG European Alpha Alternative 296 Man GLG Alpha Select Alternative 297 Man GLG European Equity Alternative 298 Man AHL Multi Strategy Alternative 299 Man AHL TargetRisk 300 Man GLG European Mid-Cap Equity Alternative 301 Man Numeric Market Neutral Alternative 302 Man GLG Unconstrained Emerging Equity 303 Man GLG Global Emerging Markets Debt Total Return 304 Man GLG Innovation Equity Alternative 305 Man NewSmith UK Equity Alternative 306 Man Alternative Style Risk Premia 307 Man AHL Active Balanced 308 Man GLG High Yield Opportunities 309 Man GLG Credit Multi-Strategy Alternative 310 Man GLG Event Driven Alternative 311 Man GLG Global Debt Total Return 312 Man GLG High Yield Opportunities DE 313 Supplementary information 314 Unaudited reporting requirement in respect of the Securities Financing Transactions Regulation 315

Man Funds VI plc Directory
2
Board of Directors: Ronan Daly (British citizen, Irish resident) Eric Fortier (Canadian) John Morton (British) Bronwyn Wright (Irish)
Secretary and Registered Office: Matsack Trust Limited, 70 Sir John Rogerson’s Quay, Dublin 2, Ireland
Manager: Man Asset Management (Ireland) Limited, 70 Sir John Rogerson’s Quay, Dublin 2, Ireland
Investment Manager in respect of the GLG LLC Portfolios: GLG LLC, 452 Fifth Avenue, 27th Floor, New York, New York 10018, United States of America
Depositary*: The Bank of New York Mellon SA/NV, Dublin Branch Riverside II Sir John Rogerson’s Quay Grand Canal Dock, Dublin 2, Ireland
Legal Advisers as to matters of Irish law: Matheson, 70 Sir John Rogerson’s Quay, Dublin 2, Ireland
Independent Auditor: Ernst & Young, Chartered Accountants, Ernst & Young Building, Harcourt Centre, Harcourt Street, Dublin 2, Ireland
Swiss Representative: Man Investments AG, Huobstrasse 3, 8808 Pfäffikon SZ, Switzerland
Administrator: BNY Mellon Fund Services (Ireland) Designated Activity Company, One Dockland Central, Guild Street, IFSC, Dublin 1, Ireland
Investment Manager and Distributor in relation to the Man GLGPortfolios: GLG Partners LP, Riverbank House, 2 Swan Lane, London EC4R 3AD, England
Investment Manager in relation to the Man AHL Portfolios: AHL Partners LLP, Riverbank House, 2 Swan Lane, London EC4R 3AD, England
Investment Manager in relation to the Man Numeric Portfolios: Numeric Investors LLC, 200 Pier 4 Boulevard, 5th Floor, Boston, MA 02210, United States of America
Investment Manager in relation to the Man Solutions Portfolios: Man Solutions Limited, Riverbank House, 2 Swan Lane, London EC4R 3AD, England
Distributor in relation to the Portfolios: Man Investments AG, Huobstrasse 3, 8808 Pfäffikon SZ, Switzerland
Swiss Paying Agent: RBC Investor Services Bank S.A., Esch-sur Alzette, Zurich Branch, Bleicherweg 7, 8027 Zurich, Switzerland
A detailed list of investments purchased and sold during the year is available upon request from the registered office of the Fund free of charge. *Effective 1 December 2019, BNY Mellon Trust Company (Ireland) Limited, One Dockland Central, Guild Street, IFSC, Dublin 1, merged into The Bank of New York Mellon SA/NV (the “European Bank”) and as of that date, depositary services were provided by the Dublin branch of the European Bank.
Man Funds VI plc Investment Managers’ reports
3
Man GLG Global Emerging Markets Debt Total Return --- Annual Report Commentary Market Review: The key driver of Emerging Markets hard (HC)1 and local currency (LC) debt in 2019 was the decrease in yields in developed market countries (DM), particularly U.S. Treasuries, which had started late in 2018 and deepened in June. The decline in global yields came on the back of the marked dovish2 shift in DM central banks, as lingering trade concerns increased the downside risks to global economic activity, and was further boosted by the monetary expansionary effect of the USD 237 billion drop in the U.S. Treasury’s cash cushion from the beginning of May to the end of July (equivalent to an annualised quantitative easing of USD950bn).
In 2019 H2, following the extension of the U.S. debt ceiling negotiated in late July, the U.S. Treasury started to rebuild its cash balances which worked as quantitative tightening since liquidity was drained out of the system and deposited at the Fed3. The strains caused by this reversion were visible in U.S. repo rates that spiked higher and forced the Fed to intervene to add to the supply of reserves by supplying short-term liquidity via open market operations and the purchase of T-bills on a daily basis. The Fed's purchases of T-bills provided support in the front end of the rate market, although higher Treasury net issuance, investors’ improved confidence in the U.S. growth outlook and firmer U.S. inflation led the longer end of the yield curve to move gradually higher into the year end.
The sharp dovish tilt by DM central banks was mirrored by their EM counterparts, led by Turkey (12% of rate cuts in 2019), Egypt (4.5%), Ukraine (4.5%), Brazil (2%), and Russia (1.5%). Elsewhere, in countries such as China, Indonesia and the Philippines, there were also sizeable reductions in the required reserve ratios.
Underpinned by this risk-supportive backdrop, EM yields dropped without much regard for higher debt metrics and overall deteriorating macroeconomic dynamics, political profile or capital control risks. HC returned 14.4% in 2019, while LC returned 13.5%4. Within HC, Investment Grade countries, buoyed by the decrease in DM rates, returned +16.9%. Although lower rated countries from bellwethers such as Ukraine to frontier markets5 in both Africa and Asia were among the best performing countries in 2019, the high yield segment overall was up by a smaller +10.8%, as credit stress events started to be priced in countries such as Argentina, Lebanon and Suriname6.
In the local bond universe, carry (+6.1%) and rate return (+6.0%) were the largest contributors to performance, while currency performance only contributed 1%. Russia was the best performing country (+20.0%) as it was supported by the recovery in energy prices and lower global yields, while Argentina was the worst performer at -66.9% as the currency weakness experienced after August’s primary elections forced the administration to extend the maturities of local debt and impose capital controls.
Outlook:
In our view, 2019 performance is unlikely to be repeated as the effects of last year’s global synchronized monetary easing tails off and the ongoing increase in duration supply from U.S. Government debt (roughly USD 600 bn net on an annual basis since the end of 2017) will not be easily offset even under ECB’s last year’s round of QE, adding to the upward pressure on yields.
Meanwhile, fundamentals for most EM countries are weak, valuations are tight and positions massively crowded in both hard currency and local rates with most investors positioned for a continued benign EM market performance in 2020. With positive news such as the U.S. and China phase-one trade accord priced in by market participants, such a long investor positioning may add to market volatility this year, as trade uncertainties are likely to linger, geopolitical uncertainty (from Iran, to Turkey, and North Korea) remain high, social unrest around the world continues to spread and EM sovereign defaults are likely to rise.
Fund Activity:
In light of expensive valuations, crowded positioning, deteriorating fundamentals in some countries and the expected impact in global liquidity of the increase in U.S. Treasury debt issuance, we viewed the EM asset class expected return skewed to the downside, and thus kept the portfolio defensive positioning.
In LC, the fund short currency exposure7 of the fund to EM currencies stood at -18.4% at year-end (versus -12.2% at the close of 2018), comprised of a short exposure to BRL (-6.3%), IDR (-5.7%), ZAR (3.2%) and COP (-3.2%). Through the course of 2019H1 we partially reduced the short in COP while simultaneously increasing the short in ZAR. In August, ahead of the primary elections in Argentina we gradually reduced the ARS long to 3.9% (from 7.2% at the end of July)8. Likewise, we reduced the short BRL in a similar proportion to -5.7%. We let the remaining ARS exposure to steadily roll-out to zero by early November.
1Hard Currency: investments made in securities issued by EM sovereign or quasi-sovereign denominated in hard currency, in this case the U.S. dollar. 2Dovish is a term that refers to the general sentiment of the central bank of a country. It is associated with a looser, more accommodating monetary policy that usually involves lower interest rates because to promote growth. 3From a minimum of USD125bn in the week of August 21, cash balances at the Fed increased to USD 314bn in the week of September 25, equivalent to an annualized QT of USD1.900bn. Source: Federal Reserve. 4HC segment return measured by JP Morgan EMBIG family Index and LC segment return measured by JP Morgan GBI-EM GD family of indexes. 5Frontier Market or Next Generation Market, means USD-denominated debt issued by sovereign and quasi sovereign from next generation countries. Next Generation countries are smaller, less liquid population of emerging market economies, where investment opportunities in the external debt market are limited relative to the larger emerging economies countries where external debt issuance is frequent and large. 6The organisations/financial instruments mentioned are for reference purposes only. The content of this material should not be construed as a recommendation for their purchase or sale. 7Currency exposure is a term referring to the vulnerability of an investment, cash flow or financial position to variations in the exchange rate of two currencies. 8The fund’s ARS long exposure was via NDFs (off-shore) and the fund has no exposure in the Argentine local market. When setting up the ARS position, we did it through NDFs as we have learned from experience that local authorities tend to resort to capital controls when they run into stress, making it difficult and painful to exit from local positions in such events.
Man Funds VI plc Investment Managers’ reports (continued)
4
Man GLG Global Emerging Markets Debt Total Return --- Annual Report Commentary (continued) Fund Activity (continued): In local rates, the fund kept the -0.5 years short in local currency duration9 weighted exposure (DWE)10 in local currency DWE in Brazil unchanged. In HC, in light of our view for U.S. Treasury yields to go higher, the fund closed the year with a duration weighted exposure (DWE) of 0.2 years, at the low end of the strategy’s historical range of between 0 to 4 years. In light of expensive valuations, we increased the short credit spread DWE of the Fund by -0.6 years to -3.3 years in January, as the majority of the countries where we run shorts tightened to levels close to the lows seen in the last nine years. We ended the year at -3.2 years (compared to -2.6 y ears at the end of 2018), also at the low end of historical ranges. In 2019 Q4, as a credit event in Lebanon got priced in, we took profit on the short credit spread exposure to the sovereign and further reduced the short position to -0.5% exposure (-5.1% exposure at the end of 2018). Performance: In 2019, the Fund estimated gross and net returns11 were -1.8% and -2.8% respectively. The weekly volatility of its returns was 3.3%. The major source of the negative return at a time when the EMD asset class experienced a positive return, was the defensive position of the portfolio. In 2019, the Fund’s cash exposure contributed to performance with 2.1% to its -1.8% total estimated gross performance, while the LC and HC short exposures detracted by -1.6% and -2.3%, respectively. Despite the portfolio’s negative -0.5 beta to the EMD asset class in a period that EMD HC and LC rallied, the impact on performance was limited by positive alpha coming from the short credit spread exposure to Lebanon (+1.8%) in the HC and the long exposure to ARS in LC. Past performance is not indicative of future results. Returns may increase or decrease as a result of currency fluctuations.
9Duration: Expressed in years and measures the sensitivity of a bond’s price to a change in interest rates. There is an inverse relationship between bond prices and interest rates. 10DWE corresponds to each country’s contribution to the overall duration of the fund. 11Performance data is shown net of fees with income reinvested, and does not take into account sales and redemption charges where such costs are applicable.

Man Funds VI plc Investment Managers’ reports (continued)
5
Man GLG Global Debt Total Return --- Annual Report Commentary Performance:
In 2019, the Fund estimated gross and net returns1 were +0.99% and 0.72% respectively.
Market Review
The key driver of global debt markets in 2019 was the decrease in yields in developed market countries (DM), particularly U.S. Treasuries, which had started late in 2018 and deepened in the late May to early August period. The decline in global yields came on the back of the marked dovish2 shift in DM central banks, as lingering trade concerns increased the downside risks to global economic activity, and was further boosted by the monetary expansionary effect of the USD 237 billion drop in the U.S. Treasury’s cash cushion held at the Federal Reserve from the beginning of May to the end of July (with an impact equivalent to an annualised quantitative easing of USD950bn).
The sharp dovish tilt by DM central banks was mirrored by their EM counterparts, led by Turkey (12% of rate cuts in 2019), Egypt (4.5%), Ukraine (4.5%), Brazil (2%), and Russia (1.5%). Elsewhere, in countries such as China, Indonesia and the Philippines, there were also sizeable reductions in the required reserve ratios.
In 2019 H2, following the extension of the U.S. debt ceiling negotiated in late July, the U.S. Treasury started to rebuild its cash balances, which worked as quantitative tightening since liquidity was drained out of the system and deposited at the Fed3. The strains caused by this reversion were visible in U.S. repo rates that spiked higher and forced the Fed to intervene to add to the supply of reserves by supplying short-term liquidity via open market operations and the purchase of T-bills on a daily basis. In Europe, the ECB restarted its corporate bond QE (CSPP) program in November. In our view, the investment of the liquidity held by the largest US banks as a consequence of the Fed’s liquidity injections triggered a portfolio displacement effect similar to that of quantitative easing again supporting risk asset prices.
Underpinned by this risk-supportive backdrop, DM credit rallied, EM yields dropped without much regard for higher debt metrics and overall deteriorating fundamentals. The fund, which run with an underweight in USD duration, in EM currencies, and EM credit suffered as a consequence.
Outlook:
In our view, 2019 performance for rates and credit is unlikely to be repeated in 2020 as the effects of last year’s global synchronized monetary easing tails off and the ongoing increase in duration supply from U.S. Government debt (roughly USD 600bn net on an annual basis since the end of 2017) will not be easily offset even under ECB’s last year’s round of QE, adding to the upward pressure on yields.
Slowing global growth, trade disputes, geopolitical uncertainty (from Iran, to Turkey, and North Korea) and social unrest around the EM world all argue for caution. However, despite vulnerable fundamentals, stretched valuations and crowded market positioning, most investors seem to be positioned for a continued benign credit market performance in 2020. With positive news such as the U.S. and China phase-one trade accord priced in by market participants, such a long investor positioning may add to market volatility this year.
Past Performance is not indicative of future performance. Returns may increase or decrease as a result of currency fluctuations. GLG LLC, 452 Fifth Avenue, 27th Floor, New York, New York 10018, United States of America February 2020* Source: GLG LLC The organisations and/or financial instruments mentioned are for reference purposes only. The content of this material should not be construed as a recommendation for their purchase or sale. For all the sub-funds past performance is not indicative of future results. Returns may increase or decrease as a result of currency fluctuations. Performance is net of all fees and is disclosed for the reporting share class. The value of an investment and any income derived from it can go down as well as up and investors may not get back their original amount invested. Alternative investments can involve significant additional risks. The limits and/or targets illustrate the Investment Manager’s current intentions, and are subject to change without notice. *The above Investment Manager’s reports are commentaries for the year 1 January 2019 to 31 December 2019. They do not include or take account of any movements, returns or market information for subsequent periods.
1Performance data is shown net of fees with income reinvested, and does not take into account sales and redemption charges where such costs are applicable. Returns are calculated net of 0.40% management fees. Other share classes may charge higher fees. 2Dovish is a terms that refer to the general sentiment of the central bank of a country. It is associated with a looser, more accommodating monetary policy that usually involves lower interest rates because to promote growth. 3From a minimum of USD125bn in the week of August 21, cash balances at the Fed increased to USD 314bn in the week of September 25, equivalent to an annualized QT of USD1.900bn. Source: Federal Reserve.
Man Funds VI plc Investment Managers’ reports (continued)
6
Man GLG European Alpha Alternative --- Annual Report Commentary Strategy Performance Man GLG European Alpha Alternative (‘the Fund’) ended 2019 up 0.7% in the EUR class, and 3.7% in the USD class net of fees1. Needless to say, this is subdued performance, and remains apologetically sub-trend for the Fund after an unflattering 2018. Whilst acutely aware of this, we feel in a strong position, on which we will elaborate below.
Environment & Outlook
The Euro Stoxx 600’s2 performance was up 23.2% for 2019, almost entirely driven by multiple expansion. This contrasts with the sense of gloom markets exuded at the year’s outset. However, the US Federal Reserve gave up on its normalisation path early on. The macro was well supported in the US, with GDP likely to match expectations at the start of the year. Other geographies were weaker, with Germany in particular surprising to the downside for the second year in a row. Brexit played a key consideration through the year, whilst Sino-US trade negotiations provided several bouts of volatility. With yields intermittently rising, value over momentum started to recover following acute underperformance. The markets ended the year on strong note, thanks to increasingly constructive dialogue between the US and China on a phase 1 trade deal, the largest conservative majority in the UK in 3 decades, a few macro-economic data points improving, and $6bn of inflows into Global Equities.
There is no doubt that momentum is currently in equity markets. We have signs of potential cyclical recovery, with valuations seemingly cheap when compared to interest rates; and at the stock level, earnings estimates for the more cyclical parts of the markets have begun to recover.
While these signs are encouraging, we would strike a note of caution on several fronts:
1. The well-publicised, though tentative, value over defensives rotation of H2 ‘19 failed to materially assert itself. 2. Yields attempted to move back up, but their efforts remain febrile. 3. For all the positive macro data points recorded in December, the key ISM survey was undoubtedly weak. 4. Though valuations vs. interest rates are reasonably attractive, on an absolute basis, multiples are above long-term averages. 5. A sustained rotation from defensives to value has now become consensus among sell-side strategists.
We also note a substantial change in the political landscape, resulting from the new type of approach adopted by the Trump administration, and the new style of Conservative policies propagated by Boris Johnson.
We therefore adopt the view that markets are likely to be capricious in 2020. For the Fund, we are constructive on three principal accounts:
1. The environment of the past few years has posed challenges for active management and we believe this is set to improve. There has been little value in portfolio diversification in the recent past, which contrasts with appetite for factor hedging and the like. Portfolios concentrated towards secure and inherently defensive growth have materially outperformed, and in their ascendency, have encouraged greater appreciation for momentum, which diverse portfolios have over-hedged - we have regrettably fallen into this category. Should markets show a greater degree of vulnerability, there are so many assets parked in so few secure growth names, that the merits of diversification are likely to re-emerge.
2. As market capriciousness surfaces, volatility may increase. If so, returns dispersion will be higher and the likelihood of mispricings should rise.
3. We believe our toolkit has never been better, not merely due to the signals, but also due to considerably improved functionality.
Process Update
In 2019, we instigated a project at Man Group to record the setup of a stock through our 5 different lenses at the time each trade was instigated, and throughout the life of our holding period. The project is designed to: (i) aggregate data faster and more effectively, (ii) flexibly store the data at the time of trade, (iii) create a dynamic trading tool and state of the art post trade analytics functionality.
Top Attribution Winners & Losers
For the year as a whole, the top 3 attributions winners were Barco (88 bps), JD Sports (87 bps) and Teleperformance (63 bps). Barco has been a story of continued upward revision to numbers as consensus naturally assumes a steady state cinema replacement market, and has underestimated the potential of the company to outperform on Clickshare and margins. JD Sports is one of few UK retailers seemingly having success globally thanks to its strong execution and its ability to capture the casualisation of society, backed by the world’s two leading sports brands: Nike and Adidas. Meanwhile, Teleperformance goes from strength to strength, as it has continued to surprise positively on organic growth driven by its unique capabilities that operate across multiple communication channels3.
The top 3 attribution losers were Swedish Match (46 bps), Subsea (21 bps) and Cineworld (20 bps). We were able to respect a minimum 2:1 pay-off ratio, but are particularly displeased with our execution of Swedish Match. Whilst we maintained our discipline on the name, our rules coincided with executing the stop losses at precisely the wrong times. Past Performance is not indicative of future performance. Returns may increase or decrease as a result of currency fluctuations.
1Performance data is shown net of fees with income reinvested, and does not take into account sales and redemption charges where such costs are applicable. 2The index is not a benchmark and is not representative of the Fund's investment strategy. The information is shown for comparison purposes only. 3The organisations and/or financial instruments mentioned are for reference purposes only. The content of this material should not be construed as a recommendation for their purchase or sale.
Man Funds VI plc Investment Managers’ reports (continued)
7
Man GLG Alpha Select Alternative --- Annual Report Commentary The sharp equity market declines in the fourth quarter of 2018 were quickly forgotten in 2019: the level of pessimism and cautiousness as we entered 2019 meant that cyclicals managed to perform well, especially where corporate management teams delivered on their plans. The main catalyst for the reversal in market performance was a return to central banks easing monetary policy, and growth of their respective balance sheets. The market move was augmented by increasing economic optimism, aided by progress being delivered on US-China trade negotiations, Brexit and a UK election that resulted in a significant Conservative majority. Economic data remained robust in the US during 2019. There was less improvement during 2019 than in Europe or China, but the US economy was less depressed, to start with. Recent data has been more mixed with the US manufacturing PMI making new lows, although this is at odds with other PMI surveys and lead indicators. Whilst we see few red flags that would prevent ongoing positive equity market returns, we would note that P/E multiples are high, especially in the US. All else being equal, this should point to lower returns going forward. In the short-term, investor sentiment has improved markedly over the last 12 months, and central banks have loosened monetary policy aggressively 2019. These tailwinds are unlikely to be as strong in 2020, especially as the rate of central bank balance sheet expansion is starting to peak. However, in the medium-term, we would note that in an environment where bond yields have reached levels not seen for decades, if not longer, there remains the potential for an ongoing rerating of equities relative to bonds. ESG considerations are an important part of any investment strategy. Whilst environmental and social concerns have been playing an increasing role in everyday life, 2019 felt like a watershed moment, both from an investment, but also broader, perspective. Numerous governments pledged to adopt ‘net zero’ carbon targets and, in June, the UK became the first major economy in the world to pass a 2050 net zero carbon target into law. This has several impacts on our strategy. We have always been strong believers that well-run businesses will outperform in the medium-term. It is hard to argue that a business can be well-run if it doesn’t have the correct governance and oversight in place, but also if it doesn’t understand how it impacts the environment and society in which it operates. History would suggest that consumer demands, environmental policy, or tax regimes will adapt to limit poor or incorrect behaviour with regard to these issues. As a result, these considerations have always been part of our investment process. We must decide what the key drivers of a company and its share price are. These can be wide ranging, and include ESG considerations, although many other issues as well, perhaps the most obvious being valuation. ESG analysis can often be subjective in nature. However, we have tools internally that allow us to be more quantitative in that analysis. Whilst ESG considerations may not be the overarching driver of any position, we think their importance is only going to increase. This can clearly be seen in management behaviour. For example, EasyJet this year announced that the company would invest £25m in ensuring that, going forward, it will be carbon neutral. Fund Performance The fund was up 7% for the year1. This lagged equity markets, but the fund has managed to deliver positive returns in 2018 and 2019, with market conditions in those two years diverging hugely (if not being broadly polar opposites), and therefore demonstrated the fund’s ability to generate returns, regardless of both the market environment and its direction. Stock selection accounted for nearly 90% of the fund’s returns in 2019, with options also making a positive contribution. Sector allocation made an immaterial positive return. We were pleased with the fund’s stock picking. Performance attribution highlighted that only one stock detracted from the fund’s stock selection by an absolute amount that would have made it into the top ten positive holdings. Sector attribution, whilst positive, was impacted by the fund’s long exposure to energy, which detracted from performance. It is worth noting, that industry exposure was a big positive contributor to performance in 2018. This highlights the importance of having a diverse strategy, with several factors contributing to performance, as the main drivers in any one year are hard to forecast. The strategy remains focused on large cap stocks, with some exposure to mid and small cap stocks, the extent of which varies depending on the opportunity set that presents itself. Currently the fund is 89% exposed to large and mega cap stocks, with the balance in mid and small cap stocks. There is no exposure to microcaps or unlisted securities. Past performance is not indicative of future results. Returns may increase or decrease as a result of currency fluctuations.
1Performance data is shown net of fees with income reinvested, and does not take into account sales and redemption charges where such costs are applicable. Returns are calculated net of 0.75% management fees 20%. Other share classes may charge higher fees.
Man Funds VI plc Investment Managers’ reports (continued)
8
Man GLG European Equity Alternative --- Annual Report Commentary Overview After a difficult end to 2018 for the equity markets, the beginning of 2019 saw risk assets rebound as investor sentiment improved. The positive momentum seen in the first quarter was primarily driven by central banks after the US Federal Reserve performed a dovish U-turn and surprised markets in March by stating that there would not be any further rate hikes in 2019. By the beginning of May, however, escalating US-China trade tensions weighed on sentiment, sending markets lower. Equity markets recovered in June as the prospect of the US Federal Reserve cutting interest rates outweighed ongoing geopolitical and trade tensions. The US Federal Reserve would go on to cut interest rates in July, September, and October. The European Central Bank also followed suit in September, restarting quantitative easing. September was also marked by a violent rotation in underlying factors, as bond yields backed up from low levels in August, and momentum winners collapsed, to the benefit of value laggards. Equity markets moved higher towards the end of the year as the geopolitical risks that weighed on investors throughout the year begin to ease. Most notably, the US and China agreed to a phase one trade deal, removing the threat of further escalation and boosting investor sentiment. Markets also responded favourably to the increased clarity over Brexit following the definitive result of the UK general election. Performance The Man GLG European Equity Alternative Fund (the ‘Fund’) ended the year down 1.71%1 net of fees. Looking at the underlying book2 returns, we saw strong contributions come from the UK Core (+2.25%), Risk Arbitrage (+1.37%), and Centre Book (1.14%). UK Core found success with a long positions in Rio Tinio and CRH, while Risk Arbitrage benefitted Fiserv’s acquisition of First Data. Pleasingly, Centre Book also had a strong year, bouncing back from a difficult 2018, contributing 1.14% to returns. On the negative side, it was a difficult year for our Mining strategy (-1.47%) which struggled with its short book. Europe Materials also had a difficult year (-1.13%), losing money on a long position in Covestro3 after the chemical maker reported a fall in profits. Despite a strong start to the year Global Healthcare (-0.63%) also found market conditions challenging, losing money on a long position in Aclaris Therapeutics after the pharmaceutical company reported disappointing clinical trial results. At a single stock contribution level, the biggest positive contributors to Specific returns were Pearson (+65bps) and Marks & Spencer (+53bps). Interestingly, both were short positions held across several strategies as well as Centre Book. Pearson has had a difficult year in its publishing business, punctuated by a weak trading update in September, and the announcement of the departure of the CEO in December. M&S has suffered sequential negative same store sales growth since Q4 2017, with earnings revisions consistently under pressure throughout the year. The biggest negative detractors to Specific returns were Fortescue Metals and DCC plc. Fortescue Metals was a short position in the Mining and Centre Book, which was buoyed substantially by the rally in the iron ore price. Turning to factor attribution (how much performance can be explained from Barra4 defined exposures), this year saw the Fund’s alpha recover, with our returns from Specific risk contributing 7.71% in 2019. This positive return, however, was offset by a combination of negative returns from other risk attributes. Within the detracting risk attributes, Industry (-57bps) was notable. The most material detractor was Style (-106bps). Given the core philosophy underpinning the Fund’s portfolio construction is to maximise exposures to Specific risk and to constrain factors, it is notable that this risk attribute, which typically is between 10% and 20% of overall risk, should detract over 100bps. We have two observations about this impact. First, it reaffirms to us the importance of limiting exposures to factors or styles in this Fund, as they are inherently hard to predict and come with higher volatility. Second, losses on factors occurred in the last four months of the year, following September’s severe factor rotation. In our view, it is notable that these losses were accompanied by an acceleration in gains from Specific risk, due to the opportunities created from the dislocation of the factor rotation. While these factor losses were costly, ultimately the period was positive for the Fund. Looking ahead Despite somewhat lacklustre performance in 2019, we enter 2020 with considerable optimism. A number of important initiatives focused on improving the performance have been launched in 2019 that we are hopeful they will continue to gain traction throughout the course of this year. More recent performance trends have certainly been encouraging. We are hopeful we can build on this in 2020.
1Performance data is shown net of fees for the Man GLG European Equity Alternative IN EUR with income reinvested, and does not take into account sales and redemption charges where such costs are applicable. Returns are calculated net of 2% management fees 20%. Other share classes may charge higher fees 2As a multi-manager fund, capital is allocated to portfolio managers who autonomously run their own portfolios, or books. 3The organisations/financial instruments mentioned are for reference purposes only. The content of this material should not be construed as a recommendation for their purchase or sale. 4Barra Risk Factor Analysis is a multi-factor model, created by Barra Inc., used to measure the overall risk associated with a security relative to the market. Barra Risk Factor Analysis incorporates over 40 data metrics, including earnings growth, share turnover and senior debt rating. The model then measures risk factors associated with three main components: industry risk, risk from exposure to different investment themes and company-specific risk.
Man Funds VI plc Investment Managers’ reports (continued)
9
Man GLG European Mid-Cap Equity Alternative --- Annual Report Commentary For the year 2019 as a whole the Fund increased by 3.1%1 (net of fees). The Stoxx Europe Mid 200 Index (MCXP)2 increased by 23% in Euros (21% in Dollars) as trade war fears abated, monetary policy eased and optimism over a macroeconomic recovery took hold.
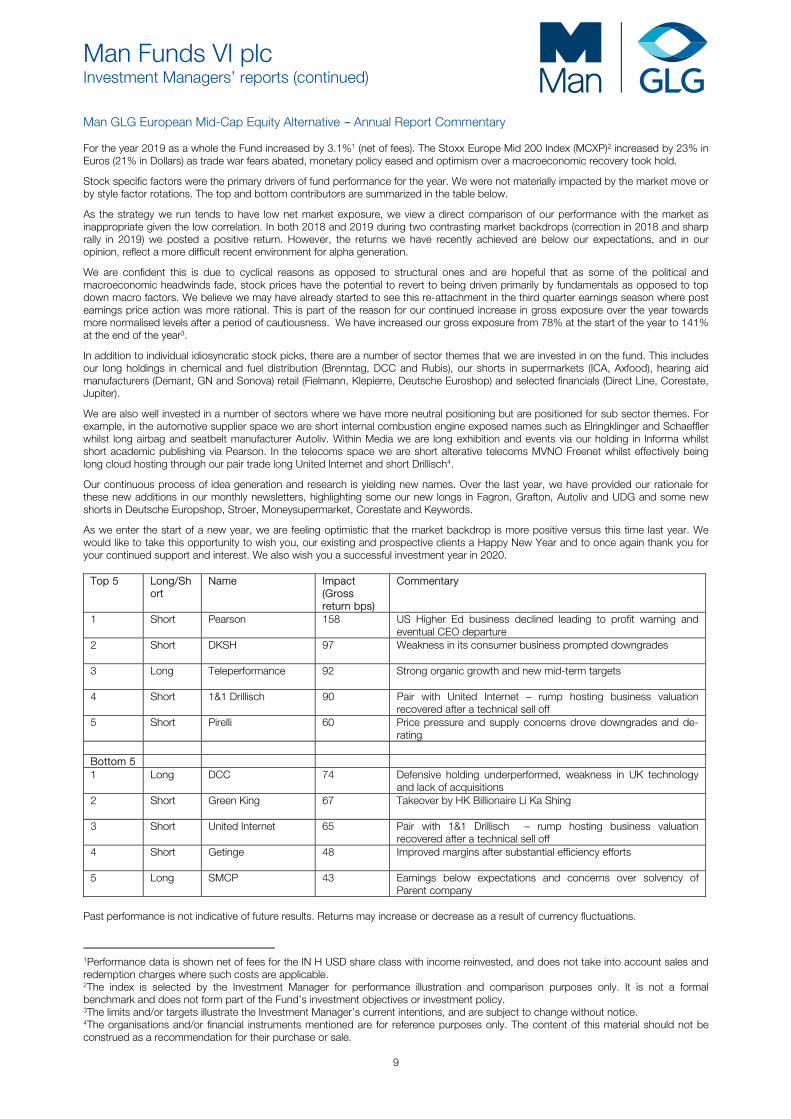
Stock specific factors were the primary drivers of fund performance for the year. We were not materially impacted by the market move or by style factor rotations. The top and bottom contributors are summarized in the table below.
As the strategy we run tends to have low net market exposure, we view a direct comparison of our performance with the market as inappropriate given the low correlation. In both 2018 and 2019 during two contrasting market backdrops (correction in 2018 and sharp rally in 2019) we posted a positive return. However, the returns we have recently achieved are below our expectations, and in our opinion, reflect a more difficult recent environment for alpha generation.
We are confident this is due to cyclical reasons as opposed to structural ones and are hopeful that as some of the political and macroeconomic headwinds fade, stock prices have the potential to revert to being driven primarily by fundamentals as opposed to top down macro factors. We believe we may have already started to see this re-attachment in the third quarter earnings season where post earnings price action was more rational. This is part of the reason for our continued increase in gross exposure over the year towards more normalised levels after a period of cautiousness. We have increased our gross exposure from 78% at the start of the year to 141% at the end of the year3.
In addition to individual idiosyncratic stock picks, there are a number of sector themes that we are invested in on the fund. This includes our long holdings in chemical and fuel distribution (Brenntag, DCC and Rubis), our shorts in supermarkets (ICA, Axfood), hearing aid manufacturers (Demant, GN and Sonova) retail (Fielmann, Klepierre, Deutsche Euroshop) and selected financials (Direct Line, Corestate, Jupiter).
We are also well invested in a number of sectors where we have more neutral positioning but are positioned for sub sector themes. For example, in the automotive supplier space we are short internal combustion engine exposed names such as Elringklinger and Schaeffler whilst long airbag and seatbelt manufacturer Autoliv. Within Media we are long exhibition and events via our holding in Informa whilst short academic publishing via Pearson. In the telecoms space we are short alterative telecoms MVNO Freenet whilst effectively being long cloud hosting through our pair trade long United Internet and short Drillisch4.
Our continuous process of idea generation and research is yielding new names. Over the last year, we have provided our rationale for these new additions in our monthly newsletters, highlighting some our new longs in Fagron, Grafton, Autoliv and UDG and some new shorts in Deutsche Europshop, Stroer, Moneysupermarket, Corestate and Keywords.
As we enter the start of a new year, we are feeling optimistic that the market backdrop is more positive versus this time last year. We would like to take this opportunity to wish you, our existing and prospective clients a Happy New Year and to once again thank you for your continued support and interest. We also wish you a successful investment year in 2020.
Top 5 Long/Short
Name Impact (Gross return bps)
Commentary
1
Short Pearson 158 US Higher Ed business declined leading to profit warning and eventual CEO departure
2
Short DKSH 97 Weakness in its consumer business prompted downgrades
3
Long Teleperformance 92 Strong organic growth and new mid-term targets
4
Short 1&1 Drillisch 90 Pair with United Internet – rump hosting business valuation recovered after a technical sell off
5
Short Pirelli 60 Price pressure and supply concerns drove downgrades and de-rating
Bottom 5 1
Long DCC 74 Defensive holding underperformed, weakness in UK technology and lack of acquisitions
2
Short Green King 67 Takeover by HK Billionaire Li Ka Shing
3
Short United Internet 65 Pair with 1&1 Drillisch – rump hosting business valuation recovered after a technical sell off
4
Short Getinge 48 Improved margins after substantial efficiency efforts
5
Long SMCP 43 Earnings below expectations and concerns over solvency of Parent company
Past performance is not indicative of future results. Returns may increase or decrease as a result of currency fluctuations.
1Performance data is shown net of fees for the IN H USD share class with income reinvested, and does not take into account sales and redemption charges where such costs are applicable. 2The index is selected by the Investment Manager for performance illustration and comparison purposes only. It is not a formal benchmark and does not form part of the Fund’s investment objectives or investment policy. 3The limits and/or targets illustrate the Investment Manager’s current intentions, and are subject to change without notice. 4The organisations and/or financial instruments mentioned are for reference purposes only. The content of this material should not be construed as a recommendation for their purchase or sale.

Man Funds VI plc Investment Managers’ reports (continued)
10
Man GLG Innovation Equity Alternative --- Annual Report Commentary The Man GLG Global Innovation Equity Alternative investment strategy focuses on sectors that are predominantly driven by company specific fundamental changes rather than macro. Taking this approach most often leads us to Technology, Consumer Discretionary, Industrials and occasionally Telecoms. This is an approach the fund manager has undertaken for over 15 years. It is both systematic and fundamental and primarily focused on liquid stocks with large market capitalisation (companies whose markets value is above USD 10 bn). The strategy seeks to generate alpha (excess return of an investment relative to the return of a reference index) by focusing on areas where consensus expectations are wrong both on the long strategy and the short strategy over some duration.
A successful third year post launch
2019 was the third year of the launch of our UCITS fund at Man GLG (with an investment process that the fund manager originated, followed and evolved over 15 years) which has continued, in our view, to prove successful reflected in the low level volatility experienced this year and positive returns in spite of at times choppy macro data and violent equity stylistic rotations. The new team hires from 2018 have bedded down well and contributing to the process effectively. We believe this is reflected in the fund’s AUM which has risen from $20 million on December 30th 2016 to $482 million exiting 2019.
Performance in 2019
In 2019, the fund returned +5.29% net of fees for the IN USD share class which results in a +14.89% return since inception1. This compares to the Hedge Fund Research HFRU Equity Hedge Index2 having returns of +6.36% and +6.42% respectively, the fund’s reference index. The wider equity markets recovered their losses of 2018 and more with the S&P500 returning +28.88% and STOXX 3 Europe 600 Price Index +23.16%. On a gross return alpha attribution analysis basis, the stock selection attribution was +3.56% while hedge selection attribution at +1.24% was also positive in spite of rising equity markets. Market attribution was also positive while sector and country were small negatives. Since inception, the fund has had annualised volatility of 2.57% despite focusing on some very high volatility areas, while the worst monthly drawdown (peak to trough decline during a recorded period) has been -1.38%.
On a stock level, the biggest single stock long “winners” for the fund this year were all stocks that have been in the fund’s long book since inception reflecting the ongoing long-term duration of the investment approach: Mastercard, Microsoft, Adobe and Visa4. On the short side, strong absolute and alpha winners were in the area of educational publishing and US telco equipment. The team continues to focus on identifying strategic investment opportunities that are mispriced fundamentally researched, and with good risk reward.
Outlook
Equity markets were more jovial in 2019 than 2018 especially as central banks pumped liquidity back into the market towards the end of the year (especially the US Fed that reversed over half of the drop in its total balance sheet assets seen since the start of 2017). We also saw other positive catalysts in the form of: the announcement of a “phase-1” trade agreement between the US and China (yet to be signed), the Tories winning the UK general election with a solid majority, the US Fed remaining accommodating and improved economic data out of Europe and China.
The 2019 rise in equity markets were not however purely driven by earnings upgrades but instead primarily by higher valuation multiples. Indeed, Goldman Sachs indicated that of the +29% S&P500 rally in 2019, 92% of it can be explained by valuation expansion alone while Morgan Stanley believes that the multiple expansion of 2019 (the biggest since 1988) will put pressure on companies to deliver on estimates this year - more of a “show me” moment. We continue to be valuation conscious and selective on the long side given markets may potentially be overly complacent of shocks as reflected in low levels of volatility (biggest YoY drop since 2009). Our long book is composed of both long duration secular growth names where we continue to expect upward revisions along with some deep value and turnaround names that are trading well under their intrinsic value and where we expect catalysts to turn around the stocks including industry repair.
The team has attended a number of conferences and meetings this past quarter resulting in 103 corporate interactions. This has offered an opportunity to work on some new ideas heading into 2020. The team is also focused on the fourth quarter of 2019 earnings season and aiming to take advantage of situations where market expectations appear to be mispricing fundamental changes occurring at companies (e.g. new product introductions, new business model…). We will also look to use options when volatility is low to buy some tail protection to hedge the market exposure. The escalation of US-Iran tensions last week are a healthy reminder that left field shocks can occur from time to time and we will continue to ensure the portfolio remains as resilient as possible to these as was the case in 2018 (GLG Innovation Equity Alternative +2.08%5, MSCI World Net Total Return index6 -8.71%, S&P500 -6.24% and STOXX Europe 600 -13.24%).
In closing, we would like to thank all of our investors and the various teams at Man GLG for the support they have provided for the last twelve months and look forward to their continued support in 2020 and beyond.
Past Performance is not indicative of future performance. Returns may increase or decrease as a result of currency fluctuations.
1Performance data is shown net of fees with income reinvested, and does not take into account sales and redemption charges where such costs are applicable. Returns are calculated net of 1.0% management fees and 20.0% performance fees. Other share classes may charge higher fees. 2The HFRX is selected by the Investment Manager for performance illustration and comparison purposes only. It is not a formal benchmark and does not form part of the Fund’s investment objectives or investment policy. 3These indices are not benchmarks and are not representative of the Fund's investment strategy. The information is shown for comparison purposes only. 4The organisations and/or financial instruments mentioned are for reference purposes only. The content of this material should not be construed as a recommendation for their purchase or sale. 5Performance data is shown net of fees with income reinvested, and does not take into account sales and redemption charges where such costs are applicable. Returns are calculated net of 1.0% management fees and 20.0% performance fees. Other share classes may charge higher fees. 6These indices are not benchmarks and are not representative of the Fund's investment strategy. The information is shown for comparison purposes only.
Man Funds VI plc Investment Managers’ reports (continued)
11
Man GLG High Yield Opportunities --- Annual Report Commentary Market overview After a difficult end to 2018 for markets, the beginning of 2019 saw risk assets rebound as investor sentiment improved. The positive momentum seen in the first quarter was driven by a combination of factors, including constructive US-China trade talks, though central banks were the key architects of the market rally. After a period of increasing rate expectations, the US Federal Reserve performed a dovish U-turn and surprised markets in March by stating that there would not be any further rate hikes in 2019. Similarly, the European Central Bank (ECB) were also dovish in their message and stated that rates will remain unchanged “at least through the end of 2019”. Despite the market rally, macroeconomic data during the first quarter was a mixed bag with a notable slowdown in global manufacturing and export activity, though labour markets showed some resilience. Risk assets continued their ascent during the spring months, despite a wobble in May due to trade-war tensions. Following the US announcement of an increase in tariffs on Chinese imports, China in-turn responded with tariffs of their own. Central banks once again lifted sentiment in June with dovish rhetoric, which led market participants to price in rate cuts and potential monetary stimulus. Macroeconomic data continued to show a slowdown in global growth and signs of weakness began to creep into labour market reports. The summer months were eventful with a number of themes in focus including ongoing dovishness from central banks and geopolitical uncertainty. The Fed eventually cut rates for the first time since 2007 and then proceeded with another rate cut in September. Similarly, outgoing ECB President Draghi announced rate cuts and a new quantitative easing program. On the geopolitical front, trade war tensions were in the spotlight as President Trump announced new tariffs on Chinese imports while China countered by increasing tariffs on US imports. Macroeconomic data continued to point to a weaker economic outlook with a notable slowdown in global manufacturing data and business climate surveys. The final stretch of the year saw risk assets continue their move higher as investor sentiment was lifted by a number of factors including the phase one trade deal agreement between the US and China, stabilisation of global macroeconomic data and the Fed’s move to cut rates. In the UK, the Conservative party’s landslide election victory was well received by markets given the increase in clarity regarding Brexit. Against this backdrop, global high yield credit benefitted from the rally in risk assets and posted positive returns for the year. Performance summary Man GLG High Yield Opportunities launched on 16th January 2019 and delivered a positive return for the year. Since the Fund’s launch, positioning has remained predominantly focused on Europe and the UK as well as on cash-generative non-cyclicals. Positions in idiosyncratic, situational type investments that are the main focus of the Fund drove performance. The key positive contributors included one of our special situations / distressed investments in a Spanish construction firm that performed well following an announcement after Christmas that an A-rated, much larger Chinese competitor is acquiring a 75% stake in the business. As a result, the bond price nearly doubled to the mid-90s. We initiated a position at an average price of c. 50, and led the formation of a bondholder group with the intention to initiate financial restructuring discussions with the company and the company’s bank lenders. In addition, a position in a German real estate company (where we were an anchor investor in the bond issue earlier in the year and in a tap issue in the Autumn) also performed well after the company announced that an IG-rated competitor is acquiring a 22% stake in the business, with an option to purchase an additional 51%. Furthermore, long positions in a Euro area sovereign and a Brazilian energy firm undergoing an operational restructuring also performed well1. The main negative contributor was a position in an Italian engineering services company where we are currently engaged in active discussions with all stakeholders regarding restructuring the balance sheet and repositioning the business. Furthermore, a short position in an auto OEM also detracted after the firm posted better than expected results and announced an equity injection from its ultimate owner. Outlook It is shaping up to be an eventful year for investors with January alone presenting two unforeseen events – an escalation in US-Iran tensions and fears about the impact of the Coronavirus outbreak. This, combined with the upcoming US elections, trade-war uncertainty and the low growth environment, presents an assortment of risks for investors to consider. The policy U-turn by the major central banks has extended the credit cycle and our base case assumption is that they will remain accommodative for the foreseeable future. As a result, yields have collapsed for higher quality fixed income and this provides support to our bearish view on investment grade credit, as we believe it is exceptionally rich at current levels. Given the stabilising, low growth and low inflation backdrop, along with our primary investment focus, we are bullish on high yield bonds as they are more suited to this environment, since it provides issuers an opportunity to generate free cash flow. We believe this to be a sweet spot for high yield credit, as there is typically sufficient nominal growth for issuers to generate cash to pay coupons and ultimately repay debt.
1The organisations and/or financial instruments mentioned are for reference purposes only. The content of this material should not be construed as a recommendation for their purchase or sale.
Man Funds VI plc Investment Managers’ reports (continued)
12
Man GLG High Yield Opportunities --- Annual Report Commentary (continued) Outlook (continued) We see value in credit specific and special situation type investments in the mid to lower echelons of the market. We do not envisage a secular default rate cycle given negative real rates globally and believe that defaults could peak in low to mid-single digit range across European and US markets for the year. On a regional basis, at present we are bullish on the risk-return profile of cash-generative, non-cyclical, high yield issuers in the UK and Europe, while our view is that the US credit market appears to be overvalued. Dispersion is likely to remain present in markets and underperforming, overleveraged companies could find conditions challenging and struggle to service their debt. This environment lends itself well to fundamentally driven, bottom-up credit selection while we also value the importance of assessing secular drivers that could affect the business models of issuers. The demanding outlook for 2020 presents an opportune time for our strategy given the heavy focus on fundamental, bottom-up credit selection. Past performance is not indicative of future results. Returns may increase or decrease as a result of currency fluctuations.
Man Funds VI plc Investment Managers’ reports (continued)
13
Man GLG Credit Multi-Strategy Alternative --- Annual Report Commentary Market overview After a difficult end to 2018 for markets, the beginning of 2019 saw risk assets rebound as investor sentiment improved. The positive momentum seen in the first quarter was driven by a combination of factors, including constructive US-China trade talks, though central banks were the key architects of the market rally. After a period of increasing rate expectations, the US Federal Reserve performed a dovish U-turn and surprised markets in March by stating that there would not be any further rate hikes in 2019. Similarly, the European Central Bank (ECB) were also dovish in their message and stated that rates will remain unchanged “at least through the end of 2019”. Despite the market rally, macroeconomic data during the first quarter was a mixed bag with a notable slowdown in global manufacturing and export activity, though labour markets showed some resilience. Risk assets continued their ascent during the spring months, despite a wobble in May due to trade-war tensions. Following the US announcement of an increase in tariffs on Chinese imports, China in-turn responded with tariffs of their own. Central banks once again lifted sentiment in June with dovish rhetoric, which led market participants to price in rate cuts and potential monetary stimulus. Macroeconomic data continued to show a slowdown in global growth and signs of weakness began to creep into labour market reports. The summer months were eventful with a number of themes in focus including ongoing dovishness from central banks and geopolitical uncertainty. The Fed eventually cut rates for the first time since 2007 and then proceeded with another rate cut in September. Similarly, outgoing ECB President Draghi announced rate cuts and a new quantitative easing program. On the geopolitical front, trade war tensions were in the spotlight as President Trump announced new tariffs on Chinese imports while China responded by increasing tariffs on US imports. Macroeconomic data continued to point to a weaker economic outlook with a notable slowdown in global manufacturing data and business climate surveys. The final stretch of the year saw risk assets continue their move higher as investor sentiment was lifted by a number of factors including a phase one trade deal agreement between the US and China, stabilisation of global macroeconomic data and the Fed’s move to cut rates. In the UK, the Conservative party’s landslide election victory was well received by markets given the increase in clarity regarding Brexit. Performance summary Convertible Arbitrage: Convertible arbitrage performed well as all regions generated positive returns. CB US saw string performance as US convertibles advanced given the underlying strength seen in US equity markets. Credit L/S: The Credit L/S strategy was the best overall performer for the Fund, with Asia and EM the top underlying books, followed by credit Europe. The Asia book benefitted from strong security selection, particularly in China while event driven opportunities in India and Indonesia also proved to be favourable. The EM book saw tactical bank capital positions prove to be profitable, while attractive carry opportunities and avoiding certain commodity names was beneficial. Past performance is no indicator of future performance. Returns may increase or decrease as a result of currency fluctuations.
Man Funds VI plc Investment Managers’ reports (continued)
14
Man GLG Event Driven Alternative --- Annual Report Commentary Market review Globally, 2019 has seen pending or completed deals totalling USD 3.9 trillion, the fourth-highest level on record. Megadeals were a key factor during 2019, with a 28% increase in M&A activity greater than USD 10 billion when compared to the previous year. Despite this geopolitical uncertainty loomed over the M&A market for much of 2019, cross-border activity fell to its lowest level since 2013, with declining deal making across European and Asian markets. Activity did however, remain strong as companies continued to use M&A to strengthen their core businesses. US Deals dominated 2019, with nearly half of all global M&A deals reported in 2019 involving a US target, a 6 per cent rise from 2018, US companies accounted for 15 out of the years’ 20 largest deals. The top five sectors in the US by volume were Technology, Healthcare, Oil & Gas, Chemicals and Finance. Many companies focused on core assets through divestitures and spinoffs in 2019. Multi-industry firms started to face pressure from both activist and traditional shareholders especially where there were limited synergies between businesses. Companies were urged to put themselves up for sale or divest assets in order to maximize shareholder value. Fund summary (positioning and performance) Launching in July 2019, the fund has had a strong start generating 3.4%1 net of fees, with stable and consistent positive returns in all six months. The high levels of deal activity towards the end of 2019 has allowed the team to establish a diversified portfolio. The portfolio has been positioned conservatively, with moderate levels of sizing and leverage, the portfolio now has the potential to capitalise on new opportunities and the widening of spreads. Outlook M&A activity is expected to remain strong in 2020, driven by companies looking to strengthen their businesses. The economic factors that have powered the multi-year run of deal-making remains intact as cheap debt, modest economic growth and fears of disruption by tech giants has led chief executives and boards to turn to M&A. Size and scale continue to be the most convenient ways for companies to retain dominance as well as keeping tech companies at bay. Private equity will be another key factor in 2020. Private equity firms have amassed almost USD 1.5 trillion in unspent capital, the highest year-end total on record. Private equity firms are able to provide alternatives to companies that are unable to maximize shareholder value. If valuation multiples decline and listed companies are unable to deliver capital appreciation to their shareholders, this may increase the amount of M&A transactions in 2020. Pressure on private equity firms to use their dry powder is likely to grow, M&A activity could, therefore, be on a scale not seen since the financial crisis. Shareholder activism is likely to remain key to global M&A markets. M&A-driven activism is expected to continue its development outside the US, along with a stronger stance on Environmental, social, and governance (ESG) issues. Past performance is no indicator of future performance. Returns may increase or decrease as a result of currency fluctuations.
1Performance data is shown net of fees with income reinvested, and does not take into account sales and redemption charges where such costs are applicable. Returns are calculated net of 1.0% management fees and 20.0% performance fees. Other share classes may charge higher fees.
Man Funds VI plc Investment Managers’ reports (continued)
15
Man GLG High Yield Opportunities DE --- Annual Report Commentary The Fund launched in late November and was ramped up over the course of November and December. Other than the specific vehicle restrictions, the Fund is managed parallel to the Dublin domiciled UCITs and UK OEIC funds which launched in January and June of 2019 respectively. At present, the Fund is invested predominantly in Europe and in the UK, with a focus on non-cyclical, cash-generative companies. GLG Partners LP, Riverbank House, 2 Swan Lane, London EC4R 3AD, England February 2020* Source: GLG Partners LP The organisations and/or financial instruments mentioned are for reference purposes only. The content of this material should not be construed as a recommendation for their purchase or sale. For all the sub-funds past performance is not indicative of future results. Returns may increase or decrease as a result of currency fluctuations. Performance is net of all fees and is disclosed for the reporting share class. The value of an investment and any income derived from it can go down as well as up and investors may not get back their original amount invested. Alternative investments can involve significant additional risks. The limits and/or targets illustrate the Investment Manager’s current intentions, and are subject to change without notice. *The above Investment Manager’s reports are commentaries for the year 1 January 2019 to 31 December 2019. They do not include or take account of any movements, returns or market information for subsequent periods.
Man Funds VI plc Investment Managers’ reports (continued)
16
Man AHL Multi Strategy Alternative --- Annual Report Commentary Summary The AHL Multi Strategy Programme (‘AMS’) had a successful year in 2019. More generally, the year was a very positive one for stocks, albeit with rocky patches, with pronounced dollar strength for most of the year. Bonds rallied strongly until around September when a reversal began which was sustained through year-end. Performance review by style During 2019, four of five styles of trading within the fund were profitable with only equity trading ending the year with a small loss. Diversification between styles was much in evidence as fundamental, momentum and technical trading styles all contributed significantly and volatility trading also additive. Equity trading was the only unprofitable style although internally it was only actually trading in Japan which caused problems and offset the positive performance from US trading. In terms of model types, value models were responsible for most of the losses whereas momentum style models were more successful. Volatility trading was affected by mid-year turbulence which wiped out profits from the first half of the year. The subsequent recovery was steady through the second half of the year though, to end up in profit. In terms of market sectors, currency options trading contributed the lion’s share with equity index options trading also additive and volatility futures trading the only real detractor. Technical trading performance was driven in almost equal measure by machine learning models, fixed income relative value curve trading and short-term technical currency trading. The short-term currency trading and machine learning models both did particularly well in the mid-year turbulence which effectively compensated for the aforementioned losses from volatility trading over the same period --- a good example of model diversification in action. Momentum trading had a solid year, driven by trends in the first half of year in the case of the more traditional trend models and performance in the second half from more machine learning driven momentum trading. In terms of market sectors, fixed income trading dominated returns. Fundamental trading finished the top style for 2019 with positive performance across currency carry models, currency economic fundamentals models, stock index relative value trading and, especially, fixed income carry trading1. Outlook The fund showed some pleasing diversification in 2019 with trading styles combining well to deliver performance. Whilst we cannot predict the market environment for the future with any certainty, we continue to rely on the fundamental principles of market and model diversification to minimise our reliance on any particular market regime.
1The financial instruments mentioned are for reference purposes only. The content of this material should not be construed as a recommendation for their purchase or sale.
Man Funds VI plc Investment Managers’ reports (continued)
17
Man AHL TargetRisk --- Annual Report Commentary Following 2018, a year marked by solid growth and poor asset performance, 2019 has delivered the exact opposite. Global growth forecasts and fundamentals have weakened substantially, yet a simple 60/40 portfolio had the best risk-adjusted return in two decades, highlighting the difficulty in accurately forecasting returns. Indeed in 2019, a bull year, TargetRisk returned positive returns net of fees and outperformed both the 60/40 portfolio and Morningstar’s USD Moderate Allocation index1. TargetRisk celebrated its five-year anniversary in 2019 with an annualized net return since inception of 10.9%2 and a Sharpe ratio3 of 1.16. This performance was achieved throughout different market environments. 2016, 2017 and 2019 will certainly be remembered as bull years, in our view, while 2015 and 2018 were years marked by violent reversals across most asset classes and spikes in equity/bond correlation. TargetRisk’s performance across this succession of bull and bear years demonstrates resilience and an ability to adapt to different market conditions 2019 was a year characterized by slowing economic fundamentals as well as trade wars between the US and China. Remarkably, however, returns across markets were solid, driven largely by the US Federal Reserve’s (‘Fed’) sudden dovish pivot from tightening monetary policy to lowering rates and expanding its balance sheet. The European Central Bank (‘ECB’) as well as other central banks around the world followed suit and extended their dovish monetary policies pushing rates globally to record lows. 2019 was a year characterized by slowing economic fundamentals as well as trade wars between the US and China. Remarkably, however, returns across markets were solid, driven largely by the US Federal Reserve’s (‘Fed’) sudden dovish pivot from tightening monetary policy to lowering rates and expanding its balance sheet. The European Central Bank (‘ECB’) as well as other central banks around the world followed suit and extended their dovish monetary policies pushing rates globally to record lows. This monetary policy shift at a late stage of the cycle was unexpected, yet helped comfort equity investors which benefitted from the so-called ‘‘Powell put’’ and pushed equity indices towards new highs. In fact global equity indices had one of their best years following the recovery from the 2008 Credit Crisis. We believe that investors see this dichotomy between high asset prices (bond yields at or near all-time lows and equity indices at all-time highs) and geopolitical uncertainties coupled with a weakening growth outlook as raising questions on the sustainability of the market rally at this late stage of the cycle. TargetRisk was able to reap the benefits of rallying markets, most asset classes performed strongly in 2019 and TargetRisk benefited from this, with positive attributions from bonds, equities, credit and inflation. The strategy ran most of the time at full allocation to the asset classes it trades. The intraday correlation monitor remained inactive during the year, while the momentum and volatility overlays were only occasionally active in commodities, bonds and inflation-linked bonds during short bouts of weakness. Past performance is not indicative of future results. Returns may increase or decrease as a result of currency fluctuations.
1The index used is selected by the Investment Manager for performance illustration and comparison purposes only. It is not a formal benchmark and does not form part of the Fund’s investment objectives or investment policy. 2The data is based on a representative investment product or products that fully invest in the strategy. AHL TargetRisk Programme is net of estimated fees and service cost of 0.95% in USD. 3Sharpe ratio is a measure of risk-adjusted performance that indicates the level of excess return per unit of risk. It is calculated using the risk-free rate (3 month interbank rate) in the appropriate currency over the period analysed. Where an investment has underperformed the risk-free rate, the Sharpe ratio will be negative. As the Sharpe ratio is an absolute measure of risk-adjusted return, negative Sharpe ratios can be misleading and are therefore shown as n/a.
Man Funds VI plc Investment Managers’ reports (continued)
18
Man AHL Active Balanced --- Annual Report Commentary Following 2018, a year marked by solid growth and poor asset performance, 2019 has delivered the exact opposite. Global growth forecasts and fundamentals have weakened substantially, yet a simple 60/40 portfolio had the best risk-adjusted return in two decades, highlighting the difficulty in accurately forecasting returns. Indeed in 2019, a bull year, Active Balanced returned positive returns net of fees and outperformed both the 60/40 portfolio and Morningstar’s USD Moderate Allocation index1. 2019 was a year characterized by slowing economic fundamentals as well as trade wars between the US and China. Remarkably, however, returns across markets were solid, driven largely by the US Federal Reserve’s (‘Fed’) sudden dovish pivot from tightening monetary policy to lowering rates and expanding its balance sheet. The European Central Bank (‘ECB’) as well as other central banks around the world followed suit and extended their dovish monetary policies pushing rates globally to record lows. This monetary policy shift at a late stage of the cycle was unexpected, yet helped comfort equity investors which benefitted from the so-called ‘‘Powell put’’ and pushed equity indices towards new highs. In fact global equity indices had one of their best years following the recovery from the 2008 Credit Crisis. We believe that investors see this dichotomy between high asset prices (bond yields at or near all-time lows and equity indices at all-time highs) and geopolitical uncertainties coupled with a weakening growth outlook as raising questions on the sustainability of the market rally at this late stage of the cycle. Active Balanced was able to reap the benefits of rallying markets, most asset classes performed strongly in 2019 and Active Balanced benefited from this, with positive attributions from both bonds and equities. The strategy ran most of the time at full allocation to the asset classes it trades. The intraday correlation monitor remained inactive during the year, while the momentum and volatility overlays were only occasionally active in bonds during short bouts of weakness. AHL Partners LLP, Riverbank House, 2 Swan Lane, London EC4R 3AD, England February 2020* Source: AHL Partners LLP The organisations and/or financial instruments mentioned are for reference purposes only. The content of this material should not be construed as a recommendation for their purchase or sale. For all the sub-funds past performance is not indicative of future results. Returns may increase or decrease as a result of currency fluctuations. Performance is net of all fees and is disclosed for the reporting share class. The value of an investment and any income derived from it can go down as well as up and investors may not get back their original amount invested. Alternative investments can involve significant additional risks. The limits and/or targets illustrate the Investment Manager’s current intentions, and are subject to change without notice. *The above Investment Manager’s reports are commentaries for the reporting year 1 January 2019 to 31 December 2019. They do not include or take account of any movements, returns or market information for subsequent periods.
1The index is selected by the Investment Manager for performance illustration and comparison purposes only. It is not a formal benchmark and does not form part of the Fund’s investment objectives or investment policy.
Man Funds VI plc Investment Managers’ reports (continued)
19
Man Alternative Style Risk Premia --- Annual Report Commentary Market Summary In contrast to a negative outlook due to increased political risk and escalating US-China trade conflict, global assets delivered a strong performance during 2019, with gains most pronounced for US equities, both corporate and long-dated government bonds, as well as gold. Whilst both the risk of a disorderly Brexit and the inverted US 2s-10s yield curve faded away during Q3, probably the biggest factor contributing to the positive market development was the unexpected decision of the US Federal Reserve (Fed) to cut rates and continue its expansionary policy. Meanwhile, global growth has been record-low, the Global Manufacturing Purchasing Managers’ Index (PMIs) stayed below 50 since May and hit its history low in October and the OECD Global Leading Indicator was also at new cycle lows since 2008. As a result, a number of sectors have entered into recessionary territory putting a strain on their market performance.
For central banks, 2019 has seen a year of monetary policy reversals. Following the interest rates hikes in 2018, the Fed delivered its first three rate cuts in 11 years during Q3 and Q4, and promised not to shrink its balance sheet from September onwards amid slowing growth concerns. Over in Europe, the European Central Bank (ECB) delivered further interest rate cut in September and announced it will re-start QE in November. Politically, the persisting uncertainty around the timing and economic impact of Brexit and the US’ reappraisal of global trading relationships have been the main themes of the year.
Man Alternative Risk Premia
The Fund recorded a profit for the full year, and in the simplest possible terms, the first three quarters of performance were good both relative to mandate and relative to peers, but the last quarter was weak.
For the first three quarters of 2019 performance was steady and consistently positive. By the end of September, the worst month had been March with a flat return posted, and cumulative performance had reached a healthy gain. In the two months when the MSCI World Index1 was down, the Fund’s performance was positive. During this period, the performance of the macro strategies was notably more consistent than the equity strategies in general, but the strongest return drivers were the Fixed Income strategy and Low Beta strategy.
In Q4 we suffered a material reversal of fortune, with losses in October and November, and further losses in the first week of December. In October, all but the Volatility strategy detracted, while in November the macro strategies recovered but were outweighed by continued negative performance across the board in equities. In December we saw a modest recovery. On the whole for 2019, our macro strategies did well, as did the Low Beta strategy, while the equity market neutral strategies did poorly.
Work on the Fund’s strategies has been continuous with model enhancements and upgrades to risk processes implemented over all four quarters of the year. We made an enhancement to the Volatility strategy which causes it to exit the short volatility position when the VIX forward curve becomes inverted i.e. when there is no carry opportunity to target. We no longer scale the position sizes in the VIX to recent delivered volatility of the contract since this created turnover without adding value. We have substantially added to and amended the FX Premia strategy. The bulk of the signal weights are to new models, which focus on the use of Credit Default Swaps, equities and economic surprises as drivers of FX prices. A small weight to the slow value signal is retained, and a rather better engineered FX carry in developed markets is also included again (it was removed altogether in May 2017). On the Fixed Income strategy work has been carried out on the cross-sectional carry models seeking to introduce continuous scaling proportionate to pairwise yield spreads, and a feature to attenuate exposure to uncorrelated pairs. And within the Equity Value strategy, firstly the universe of stocks traded was expanded by about 100 names of comparable liquidity. Secondly, a global REITS model was incorporated with two new models also being introduced into the global part of the Trend Following model score. Thirdly, ESG based alphas were introduced as part of the Quality model within Equity Value, and fourth Machine Learning based alpha was incorporated for US names. And finally, the seasonality strategy was introduced to trade calendar effects. Annually recurring patterns are determined on a rolling basis using multiple window lengths (1 year and 10 year) with no static calendar rules (long stocks in January, or ‘‘sell in May and go away’’). The strategy trades across the four major asset classes (Equities, Fixed Income, FX and Commodities) with individual markets chosen on the basis of liquidity and capacity.
Man Solutions Limited, Riverbank House, 2 Swan Lane, London EC4R 3AD, England
February 2020*
Source: Man Solutions Limited The organisations and/or financial instruments mentioned are for reference purposes only. The content of this material should not be construed as a recommendation for their purchase or sale.
For all the sub-funds past performance is not indicative of future results. Returns may increase or decrease as a result of currency fluctuations. Performance is net of all fees and is disclosed for the reporting share class. The value of an investment and any income derived from it can go down as well as up and investors may not get back their original amount invested. Alternative investments can involve significant additional risks.
The limits and/or targets illustrate the Investment Manager’s current intentions, and are subject to change without notice.
*The above Investment Manager’s Reports are commentaries for the year from 1 January 2019 to 31 December 2019. They do not include or take account of any movements, returns or market information for subsequent periods.
1The index is selected by the Investment Manager for performance illustration and comparison purposes only. It is not a formal benchmark and does not form part of the Fund’s investment objectives or investment policy.
Man Funds VI plc Investment Managers’ reports (continued)
20
Indices definitions CBOE Volatility Index (VIX index)
Index measuring the market’s expectation of future volatility. The VIX Index is based on options of the S&P 500® Index, considered the leading indicator of the broad U.S. stock market. The VIX Index is recognized as the world’s premier gauge of U.S. equity market volatility. For more information go to http://www.cboe.com/vix
Consumer Price Index (CPI) The Consumer Price Index (CPI) is a measure of the average change over time in the prices paid by urban consumers for a market basket of consumer goods and services in the U.S.
Euro Stoxx 600 The STOXX Europe 600 Index is derived from the STOXX Europe Total Market Index (TMI) and is a subset of the STOXX Global 1800 Index. With a fixed number of 600 components, the STOXX Europe 600 Index represents large, mid and small capitalization companies across 17 countries of the European region: Austria, Belgium, Denmark, Finland, France, Germany, Ireland, Italy, Luxembourg, the Netherlands, Norway, Poland, Portugal, Spain, Sweden, Switzerland and the United Kingdom. For more information go to www.stoxx.com
FTSE 100 Index The FTSE 100 is a market-capitalisation weighted index of UK-listed blue chip companies. The index is part of the FTSE UK Index Series and is designed to measure the performance of the 100 largest companies traded on the London Stock Exchange that pass screening for size and liquidity. For more information go to https://www.ftserussell.com/index-series/index-spotlights/uk-equity-indexes.
ICE BofA Merrill Lynch 91-Day Treasury Bill Index.
Index consisting of U.S. Treasury Bills maturing in 90 days.
MSCI All Country World Index (MSCI ACWI)
The MSCI ACWI Index, MSCI’s flagship global equity index, is designed to represent performance of the full opportunity set of large- and mid-cap stocks across 23 developed and 24 emerging markets.1 As of September 2018, it covers more than 2,700 constituents across 11 sectors and approximately 85% of the free float-adjusted market capitalization in each market. For more information go to www.msci.com
MSCI Emerging Markets Index
The MSCI Emerging Markets Index captures large and mid-cap representation across 24 Emerging Markets (EM) countries*. With 1,136 constituents, the index covers approximately 85% of the free float-adjusted market capitalization in each country. For more information go to www.msci.com
MSCI World Index The MSCI World Index captures large and mid-cap representation across 23 Developed Markets (DM) countries*. With 1,634 constituents, the index covers approximately 85% of the free float-adjusted market capitalization in each country. For more information go to www.msci.com
Nasdaq-100 Index The Nasdaq-100 Index includes 100 of the largest domestic and international non-financial companies listed on The Nasdaq Stock Market based on market capitalization. The Index reflects companies across major industry groups including computer hardware and software, telecommunications, retail/wholesale trade and biotechnology. It does not contain securities of financial companies including investment companies. For more information go to www.nasdaq.com
S&P 500 Index is a widely recognized gauge of the U.S. equities market. This index is an unmanaged capitalization-weighted index consisting of 500 of the largest capitalization U.S. common stocks. The returns of the S&P 500 include the reinvestment of dividends. For more information go to https://eu.spindices.com/
STOXX Europe Mid 200 Index
The STOXX Europe Mid 200 Index is a fixed component number index designed to provide a representation of mid capitalization companies in Europe. The index is derived from the STOXX Europe 600 Index and covers Austria, Belgium, Denmark, Finland, France, Germany, Ireland, Italy, Luxembourg, the Netherlands, Norway, Poland, Portugal, Spain, Sweden, Switzerland and the United Kingdom. For more information go to www.stoxx.com
Man Funds VI plc Investment Managers’ reports (continued)
21
GLOSSARY Absolute return Refers to investment strategies which target a return that is above zero, and in some cases, above a
positive hurdle rate such as Libor. The hurdle rate is an investment performance numerical value, which is used as a target to be beaten by a portfolio manager. Absolute return can also refer to the total return (that is total gain or loss) of a portfolio or fund, as opposed to its relative return (that is relative gain or loss) against a benchmark. It is called relative because many funds’ performance is benchmarked against an index.
Active management Active management is the use of a human element, such as a single manager, co-managers or a team of managers, to actively manage a fund's portfolio. Active managers rely on analytical research, forecasts, and their own judgment and experience in making investment decisions on what securities to buy, hold and sell. The opposite of active management is passive management, better known as ‘‘indexing.’’
Ancillary assets
Assets which are not the main assets of a company.
Appreciation An increase in the market value of an asset, such as a stock, bond, commodity or piece of real estate, or in the value of one currency with respect to another. The opposite of depreciation.
Asset Any item of economic value owned by an individual or corporation, especially that which could be converted to cash. Examples are cash, securities, accounts receivable, inventory, office equipment, real estate, a car, and other property. On a balance sheet, assets are equal to the sum of liabilities, common stock, preferred stock, and retained earnings.
Asset class An asset class is a group of securities that exhibits similar characteristics, behaves similarly in the marketplace and is subject to the same laws and regulations. The three main asset classes are equities, or stocks; fixed income, or bonds; and cash equivalents, or money market instruments. Some investment professionals add real estate, commodities, and increasingly, cryptocurrencies such as Bitcoin, to the asset class mix.
Balance of payments Statement of a country's net financial transactions with other countries over a defined period of time.
Balance sheet Financial statement that provides a snapshot of what a company owns and owes, as well as the amount invested by shareholders.
Bankers’ acceptance A bankers' acceptance (BA) is A short-term credit investment created by a non-financial firm and guaranteed by a bank to make payment. Acceptances are traded at discounts from face value in the secondary market.
Benchmark A standard against which the performance of a fund can be measured and compared (eg. a stock market index such as the FTSE 100 or an interest rate, such as LIBOR).
Blue Chip company
The stock of a major company with a record of strong earnings, reliable dividend payments and steady share price performance. Blue chips are normally the largest capitalised stocks in a particular market and among the most widely traded.
Buyback A buyback, also known as a share repurchase, is when a company buys its own outstanding shares to
reduce the number of shares available on the open market. Companies buy back shares for a number of reasons, such as to increase the value of remaining shares available by reducing the supply or to prevent other shareholders from taking a controlling stake.
Cash Equivalents Cash equivalents are investments securities that are for short-term investing, and they have high credit quality and are highly liquid. These securities have a low-risk, low-return profile and include Treasury bills, certificates of deposit, bankers' acceptances, commercial papers and other money market instruments.
Certificates of deposit (CDs) Interest-bearing certificate issued by a bank to a depositor. Interest is paid at maturity.
Collective investment scheme
A type of investment scheme that involves collecting money from different investors and then combining all the money collected to fund the investment.
Compound interest Earning interest on interest, or, more precisely, the interest earned on the sum of the principal amount and the interest already accumulated. A return on an investment is compounded if it takes into account compound interest, i.e. the interest is reinvested.
Commercial paper A type of borrowing by companies and institutions in the form of loans where lenders do not have the right to take the assets of the borrower if they fail to repay. These loans are given for a period of a year or less
Commodity A good produced in bulk. Many commodities, such as coffee, meat and grain, and raw materials such as metals and oil, are traded on local, regional and/or international markets called commodity exchanges, either on a spot basis or through futures contracts, which allow the purchase or sale of a commodity at a predetermined price on a particular date in the future.

Man Funds VI plc Investment Managers’ reports (continued)
22
GLOSSARY (continued) Common stock See Ordinary shares
Contract for differences (CFDs)
A contract for differences (CFD) is an arrangement made in a futures contract whereby differences in settlement are made through cash payments, rather than by the delivery of physical goods or securities. This is generally an easier method of settlement, because both losses and gains are paid in cash. CFDs provide investors with the all the benefits and risks of owning a security without actually owning it.
Consumer staples Consumer staples are essential products, such as food, beverages, tobacco and household items. Consumer staples are goods that people are unable or unwilling to cut out of their budgets regardless of their financial situation (Investopedia).
Convertible bond A bond issued by a company that has a set maturity date and pays interest in the form of a coupon. It has features of both a bond and stock and its valuation reflects both types of investments. It gives the holder the option to convert the bond into a specific number of shares of the issuing company --- in other words, it has an 'embedded option'.
Country risk Country risk is a term for the risks involved when someone invests in a particular country. Country risk varies from one country to the next, and can include political risk, exchange-rate risk, economic risk, and transfer risk. In particular, country risk denotes the risk that a foreign government will default on its bonds or other financial commitments. In a broader sense, country risk is the degree to which political and economic unrest affect the securities of issuers doing business in a particular country.
Credit rating Ratings issued by credit ratings agencies which represent the agency’s evaluation of qualitative and quantitative information for a company or government. Ratings are used to rank companies and governments on the probability of them defaulting on their obligations (i.e. to repay their debts).
Credit risk Usually used when referring to investment in bonds, credit risk is the risk of a loss deriving from the inability of the issuer of a bond to make the interest payments and repay the capital at the end of the life of the bond in full and as scheduled. Triple A' or 'investment grade rated' are assessed as being the lowest credit risk while non-investment grade bonds - also known as high-yield debt (or 'junk bonds') - are assessed as the highest credit risk.The higher the credit risk, the higher the interest rate the borrower will have to attract lenders
Currency forward A binding contract in the foreign exchange market that locks in the exchange rate for the purchase or sale of a currency on a future date. A currency forward is essentially a hedging tool that does not involve any upfront payment.
Current account (Balance of payment current account)
Movements of money into and out of a country, relating to trade between private individuals, for example workers sending money to their families in another country. The current account includes the visible balance of trade (the net difference between exports and imports of merchandise goods) and the invisible trade balance (payments and receipts for services such as shipping, banking and tourism).
Debt security Debt security refers to a debt instrument, such as a government bond, corporate bond, certificate of deposit (CD), municipal bond or preferred stock, that can be bought or sold between two parties and has basic terms defined, such as notional amount (amount borrowed), interest rate, and maturity and renewal date.
Deflation Deflation is the general decline in prices for goods and services occurring when the inflation rate falls below 0%. Deflation happens naturally when the money supply of an economy is fixed. In times of deflation, the purchasing power of currency and wages are higher than they otherwise would have been.
Derivatives Financial contracts such as futures, options and various securities that offer 'synthetic' access to an underlying asset such as a commodity, stock market or fixed income security. The price movements of a derivative generally follow the price movements of the underlying asset but derivatives generally require only small amounts of capital (margin) to gain exposure to the underlying asset.
Developed markets Countries that have sound, well-established economies with a high level of economic growth and security. They are therefore thought to offer safer, more stable investment opportunities than developing markets
Dividend yield See Yield (3rd definition)
Earnings per Share (EPS) Profit, net of tax and dividends to preferred shareholders, divided by the total amount of ordinary shares outstanding. Most income statements include a calculation of earnings per share. This calculation tells you how much money shareholders would receive for each share of stock they own if the company distributed all of its net income for the period. In reality, however, companies would not distribute all of their earnings. Usually they reinvest them in the business.
Man Funds VI plc Investment Managers’ reports (continued)
23
GLOSSARY (continued) Emerging markets Emerging market is a term use to describe a developing country, in which investment would be
expected to achieve higher returns but be accompanied by greater risk. Global index providers sometimes include in this category relatively wealthy countries whose economies are still considered underdeveloped from a regulatory point of view
Equity An ownership right representing an interest in a company.
Equity-linked security A type of debt instrument whereby the return is linked to the performance of a group of underlying stocks or equities that are also linked to the security.
Equity Swaps An equity swap is an exchange of future cash flows between two parties that allows each party to diversify its income for a specified period of time while still holding its original assets.
EPS See Earnings per share
Exchange Traded Funds (ETFs)
Index-tracking funds that can be traded on exchanges just like a stock – so they combine the diversified holdings of a fund with the low cost and tradability of a share.
Exposure Exposure (or market exposure) refers to the currency amount of funds, or percentage of a portfolio, invested in a particular type of security, market sector or industry, which is usually expressed as a percentage of total portfolio holdings. It represents the amount an investor can lose from the risks unique to a particular investment.
External account See Current account
Financial Derivative instruments
See Derivatives
Fixed income
Term used to denote bonds and other debt instruments, because they normally pay a fixed interest rate
Foreign exchange Foreign exchange is the exchange of one currency for another or the conversion of one currency into another currency. Foreign exchange also refers to the global market where currencies are traded virtually around the clock.
Forward contract A forward contract is a customised contract between two counterparties to buy or sell a specific asset on a future date at an agreed price. As opposed to stocks and bonds, a forward contract is a derivative instrument, the value of which depends on an underlying asset. Unlike standard futures contracts, forward contracts are not traded on a centralised exchange and are highly customisable.
Fund Sector Funds are into sectors to facilitate comparisons between funds with similar investment objectives and types of investment.
Futures contract An agreement to buy or sell a stated amount of a security, currency or commodity at a specific future date and at a pre-agreed price.
GDP See Gross Domestic Product
GNP See Gross National Product
Government Bond Bonds issued by a government.
Gross Domestic Product (GDP)
The total value of an economy's domestic output of goods and services, which is one of the key indicators of economic growth with GNP.
Gross National Product (GNP)
Same as GDP except that it adds what a country earns from overseas investments and subtracts what foreigners earn in a country and send back home.
Index An index is a portfolio of stocks, chosen according to simple, pre-defined rules, and designed to capture a particular investment style.
Inflation Rate at which the general level of prices for goods and services is rising and, consequently, the purchasing power of currency is falling.
Interest rate Interest rate is the amount charged, expressed as a percentage of principal, by a lender to a borrower for the use of assets. Interest rates are typically noted on an annual basis, known as the annual percentage rate (APR). The assets borrowed could include cash, consumer goods, and large assets such as a vehicle or building.
Liquidity A relative term to describe the speed at which an asset or assets can be converted into cash (liquidated) and vice versa.
Liquid asset A liquid asset is an asset that can be converted into cash speedily, with little impact to the price received in the open market. Liquid assets include money market instruments and government bonds.
Man Funds VI plc Investment Managers’ reports (continued)
24
GLOSSARY (continued) Listed In relation to the shares of a company, or some funds, when those shares have been accepted for
trading on an exchange they are referred to as 'listed' investments. The exchange will have ‘listing requirements’, which all companies/funds must meet before they are 'accepted for listing'. The opposite of listed is over-the-counter.
Local currency The most commonly form of currency used in a country. This usually encompasses the national currency of the country.
Long position A security that is bought in expectation that it will rise in value.
Market capitalisation Market value of a company's issued share capital --- in other words. the number of shares multiplied by the current price of those shares on the stock market. Companies are ranked as large-cap, mid-cap and small-cap depending on their market capitalisation (market cap), though the actual criteria for classification depend on the market concerned.
Maturity date The maturity date is the date on which the principal amount of a debt instrument becomes due and is repaid to the investor and interest payments stop.
Money market instruments Instruments used by government and companies and others who wish to borrow money for short periods, usually less than a year. They are also called short term debt instruments. They include certificates of deposit, commercial paper and short term gilts.
Municipal Bond A bond issued by a state or local government (or related entities) in the US to cover capital expenditures.
Option A derivative instrument that gives the holder the right, without obligation, to buy (call) or sell (put) a security or asset at a fixed price within a specified period or at a particular future date.
Ordinary shares Securities (called common stock in the US) that confer ownership in a publicly listed company. Holders are entitled to the dividends declared by the company and have the right to vote on the appointment of directors and other important matters. However they rank below holders of preferred shares.
Over the counter (OTC) Generally refers to a stock (but can also refers to other financial instruments) that is not listed on an exchange and traded via a dealer network .
Overvalued When a share price or market is trading at levels above those justified by fundamentals.
Overweight Investment portfolio that holds an excess amount of a particular security when compared to the security's weight in the underlying benchmark portfolio. Actively managed portfolios will make a security overweight when doing so allows the portfolio to achieve excess returns. Overweight can also refer to an investment analyst's opinion that the security will outperform its industry, its sector or the entire market.
Passive management Passive management is a style of management where a fund's portfolio mirrors a market index. Passive management is the opposite of active management. Passive management is also referred to as "passive strategy," "passive investing" or ‘‘index investing.’’
Preference shares
Also called preferred shares. Shares that entitle the holder to a fixed-rate dividend, paid before any dividend is distributed to holders of ordinary shares.
Preferred stock See Preference shares
Price-to-Book Ratio (P/B ratio)
The P/B ratio reflects the value that market participants attach to a company's equity relative to its book value (total assets minus total liabilities) of equity. A stock's market value is a forward-looking metric that reflects a company's future cash flows. The book value of equity is an accounting measure based on the historic cost principle, and reflects past issuances of equity, augmented by any profits or losses, and reduced by dividends and share buybacks. The higher the ratio, the higher the premium the market is willing to pay for the company above its hard assets. A low ratio may signal a good investment opportunity, but it could also mean something is fundamentally wrong with the company. The ratio is less meaningful for some types of companies, such as those in technology sectors. This is because such companies have hidden assets such as intellectual property which are of great value, but not reflected in the book value.
Primary market The market for new securities issues. In the primary market the security is purchased directly from the issuer.
Quantitative analysis Quantitative analysis (QA) is a technique that seeks to understand behaviour by using mathematical and statistical modelling, measurement, and research. Quantitative analysts aim to represent a given reality in terms of a numerical value. Quantitative analysis is employed for several reasons, including measurement, performance evaluation or valuation of a financial instrument, and predicting real-world events, such as changes in a country's gross domestic product (GDP).
Man Funds VI plc Investment Managers’ reports (continued)
25
GLOSSARY (continued) Quantitative easing (QE) Quantitative easing is an unconventional monetary policy in which a central bank purchases
government securities or other securities from the market in order to lower interest rates and increase the money supply. Quantitative easing increases the money supply by flooding financial institutions with capital in an effort to promote increased lending and liquidity. When short-term interest rates are at or approaching zero, and when the printing of new banknotes isn't an option, quantitative easing can be considered.
Quantitative trading A form of investing in which computers are used to sort through financial data and identify predictable patterns. Quantitative traders take advantage of modern technology, mathematics and the availability of comprehensive databases for making rational trading decisions to identify trading opportunities.
Reference index An index used as a benchmark for performance comparison purposes but which is not a formal benchmark as per fund’s prospectus.
Return on capital The profit on an investment in relation to the amount invested which is not considered as a taxable event and not taxed as income.
Risk-adjusted return Risk-adjusted return defines an investment's return by measuring how much risk is involved in producing that return, which is generally expressed as a number or rating. Risk-adjusted returns are applied to individual securities, investment funds and portfolios.
Secondary market A market in which an investor purchases a security from another investor rather than the issuer, subsequent to the original issuance in the primary market.
Sector A sector is an area of the economy in which businesses share the same or a related product or service. It can also be thought of as an industry or market that shares common operating characteristics. Dividing an economy into different pieces allows for more in-depth analysis of the economy as a whole
Share See Equity
Short position Fund managers use this technique to borrow a security and then sell it with the intention of buying it back for less when the price falls. The position profits if the security falls in value. Within UCITS funds, derivatives --- such as contracts for difference (CFDs) --- can be used to simulate a short position.
Security A general term for stocks, bonds, options, subscription rights, warrants and other tradable investments that confer a right to income or ownership.
Sovereign debt Sovereign debt is a central government's debt. It is debt issued by the national government in a foreign currency in order to finance the issuing country's growth and development. The stability of the issuing government can be provided by the country's sovereign credit ratings which help investors weigh risks when assessing sovereign debt investments.
Sovereign risk See Country Risk
Stock See Equity
Stock option The right to buy or sell a particular stock at a given price on or after a certain date. Stock options are often used as an employee incentive at start-ups or large public companies.
Swap An exchange of streams of payments between two parties, typically in order to reduce interest rate or currency risk.
Synthetic Term given to financial instruments that are created artificially by simulating other instruments with different cash flow patterns. Synthetic products are structured to suit the cash flow needs of the investor. They are created in the form of a contract and, therefore, given the name "synthetic."
Transferable security Any security that can be traded in the capital markets
Treasury bill (T-bill) A Treasury Bill (T-Bill) is a short-term debt obligation backed by the Treasury Department of the U.S. government with a maturity of less than one year, sold in denominations of $1,000 up to a maximum purchase of $5 million on noncompetitive bids. T-bills have various maturities and are issued at a discount from par. Investors do not receive regular interest payments but a T-Bill does include interest, reflected in the amount it pays when it matures.
Total output The total amount of goods and services produced within an economy.
Total return Total return is the full return on an investment over a given period, including the income generated from dividend, interest or rental payments, and any gains or losses from a change in the asset's market value. This is normally expressed as a percentage of the purchase cost, annualised if the period is less than a year.
Undervalued When a share price or market is trading at levels below those justified by fundamentals.
Man Funds VI plc Investment Managers’ reports (continued)
26
GLOSSARY (continued) Underweight An underweight portfolio does not hold a sufficient amount of a particular security when compared to
the weight of that security held in the underlying benchmark portfolio. Underweight can also refer to an analyst's opinion regarding the future performance of a security in scenarios where it is expected to underperform.
Volatility The extent to which the price of a security or commodity, or the level of a market, interest rate or currency, changes over time. High volatility implies rapid and large upward and downward movements over a relatively short period of time; low volatility implies much smaller and less frequent changes in value.
Warrant A financial instrument, normally attached to a bond or other security, that entitles the holder to purchase a certain amount of ordinary shares at a fixed price for a period of years or to perpetuity. The price at which the underlying shares can be bought or sold is referred to as the exercise price or strike price.
Yield 1. The annual rate of return on an investment, expressed as a percentage. 2. For bonds and notes, the coupon rate divided by the market price. This is not an accurate measure of total return, since it does not factor in capital gains. 3. For securities, the annual dividends divided by the purchase price. This is not an accurate measure of total return, since it does not factor in capital gains. here, also called dividend yield or current yield
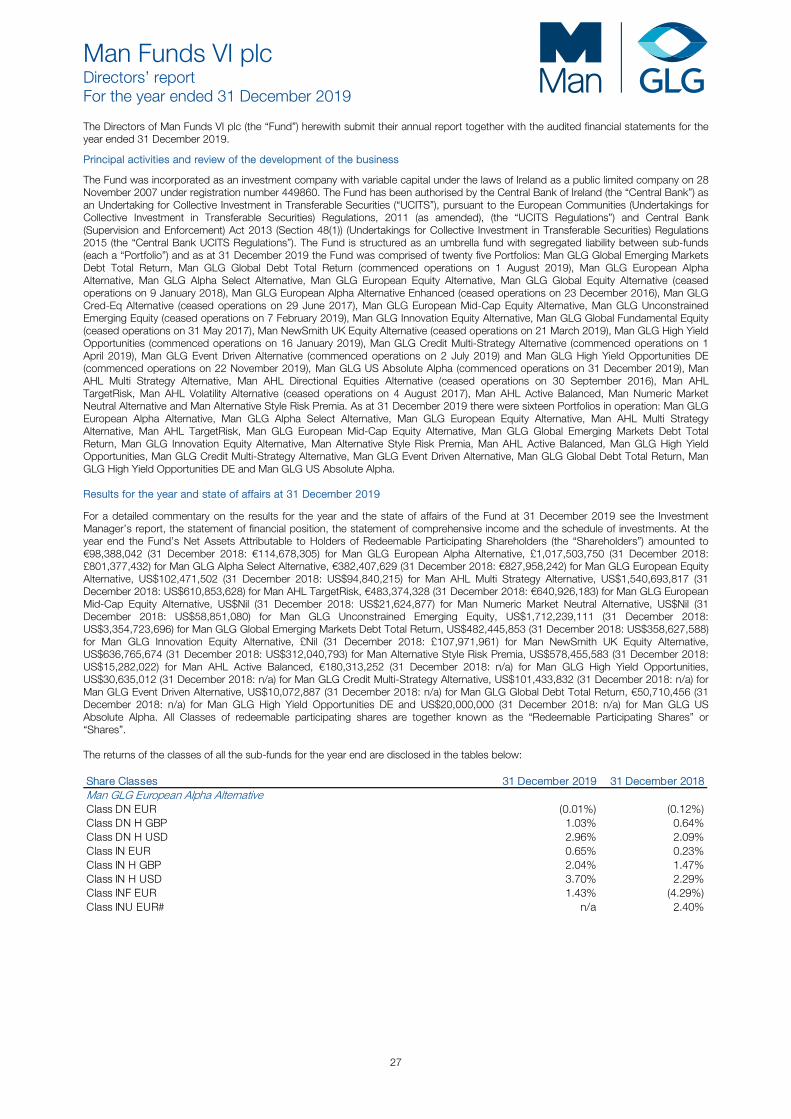
Man Funds VI plc Directors’ report For the year ended 31 December 2019
27
The Directors of Man Funds VI plc (the “Fund”) herewith submit their annual report together with the audited financial statements for the year ended 31 December 2019.
Principal activities and review of the development of the business
The Fund was incorporated as an investment company with variable capital under the laws of Ireland as a public limited company on 28 November 2007 under registration number 449860. The Fund has been authorised by the Central Bank of Ireland (the “Central Bank”) as an Undertaking for Collective Investment in Transferable Securities (“UCITS”), pursuant to the European Communities (Undertakings for Collective Investment in Transferable Securities) Regulations, 2011 (as amended), (the “UCITS Regulations”) and Central Bank (Supervision and Enforcement) Act 2013 (Section 48(1)) (Undertakings for Collective Investment in Transferable Securities) Regulations 2015 (the “Central Bank UCITS Regulations”). The Fund is structured as an umbrella fund with segregated liability between sub-funds (each a “Portfolio”) and as at 31 December 2019 the Fund was comprised of twenty five Portfolios: Man GLG Global Emerging Markets Debt Total Return, Man GLG Global Debt Total Return (commenced operations on 1 August 2019), Man GLG European Alpha Alternative, Man GLG Alpha Select Alternative, Man GLG European Equity Alternative, Man GLG Global Equity Alternative (ceased operations on 9 January 2018), Man GLG European Alpha Alternative Enhanced (ceased operations on 23 December 2016), Man GLG Cred-Eq Alternative (ceased operations on 29 June 2017), Man GLG European Mid-Cap Equity Alternative, Man GLG Unconstrained Emerging Equity (ceased operations on 7 February 2019), Man GLG Innovation Equity Alternative, Man GLG Global Fundamental Equity (ceased operations on 31 May 2017), Man NewSmith UK Equity Alternative (ceased operations on 21 March 2019), Man GLG High Yield Opportunities (commenced operations on 16 January 2019), Man GLG Credit Multi-Strategy Alternative (commenced operations on 1 April 2019), Man GLG Event Driven Alternative (commenced operations on 2 July 2019) and Man GLG High Yield Opportunities DE (commenced operations on 22 November 2019), Man GLG US Absolute Alpha (commenced operations on 31 December 2019), Man AHL Multi Strategy Alternative, Man AHL Directional Equities Alternative (ceased operations on 30 September 2016), Man AHL TargetRisk, Man AHL Volatility Alternative (ceased operations on 4 August 2017), Man AHL Active Balanced, Man Numeric Market Neutral Alternative and Man Alternative Style Risk Premia. As at 31 December 2019 there were sixteen Portfolios in operation: Man GLG European Alpha Alternative, Man GLG Alpha Select Alternative, Man GLG European Equity Alternative, Man AHL Multi Strategy Alternative, Man AHL TargetRisk, Man GLG European Mid-Cap Equity Alternative, Man GLG Global Emerging Markets Debt Total Return, Man GLG Innovation Equity Alternative, Man Alternative Style Risk Premia, Man AHL Active Balanced, Man GLG High Yield Opportunities, Man GLG Credit Multi-Strategy Alternative, Man GLG Event Driven Alternative, Man GLG Global Debt Total Return, Man GLG High Yield Opportunities DE and Man GLG US Absolute Alpha. Results for the year and state of affairs at 31 December 2019
For a detailed commentary on the results for the year and the state of affairs of the Fund at 31 December 2019 see the Investment Manager’s report, the statement of financial position, the statement of comprehensive income and the schedule of investments. At the year end the Fund’s Net Assets Attributable to Holders of Redeemable Participating Shareholders (the “Shareholders”) amounted to €98,388,042 (31 December 2018: €114,678,305) for Man GLG European Alpha Alternative, £1,017,503,750 (31 December 2018: £801,377,432) for Man GLG Alpha Select Alternative, €382,407,629 (31 December 2018: €827,958,242) for Man GLG European Equity Alternative, US$102,471,502 (31 December 2018: US$94,840,215) for Man AHL Multi Strategy Alternative, US$1,540,693,817 (31 December 2018: US$610,853,628) for Man AHL TargetRisk, €483,374,328 (31 December 2018: €640,926,183) for Man GLG European Mid-Cap Equity Alternative, US$Nil (31 December 2018: US$21,624,877) for Man Numeric Market Neutral Alternative, US$Nil (31 December 2018: US$58,851,080) for Man GLG Unconstrained Emerging Equity, US$1,712,239,111 (31 December 2018: US$3,354,723,696) for Man GLG Global Emerging Markets Debt Total Return, US$482,445,853 (31 December 2018: US$358,627,588) for Man GLG Innovation Equity Alternative, £Nil (31 December 2018: £107,971,961) for Man NewSmith UK Equity Alternative, US$636,765,674 (31 December 2018: US$312,040,793) for Man Alternative Style Risk Premia, US$578,455,583 (31 December 2018: US$15,282,022) for Man AHL Active Balanced, €180,313,252 (31 December 2018: n/a) for Man GLG High Yield Opportunities, US$30,635,012 (31 December 2018: n/a) for Man GLG Credit Multi-Strategy Alternative, US$101,433,832 (31 December 2018: n/a) for Man GLG Event Driven Alternative, US$10,072,887 (31 December 2018: n/a) for Man GLG Global Debt Total Return, €50,710,456 (31 December 2018: n/a) for Man GLG High Yield Opportunities DE and US$20,000,000 (31 December 2018: n/a) for Man GLG US Absolute Alpha. All Classes of redeemable participating shares are together known as the “Redeemable Participating Shares” or “Shares”. The returns of the classes of all the sub-funds for the year end are disclosed in the tables below: Share Classes 31 December 2019 31 December 2018Man GLG European Alpha AlternativeClass DN EUR (0.01%) (0.12%)Class DN H GBP 1.03% 0.64%Class DN H USD 2.96% 2.09%Class IN EUR 0.65% 0.23%Class IN H GBP 2.04% 1.47%Class IN H USD 3.70% 2.29%Class INF EUR 1.43% (4.29%)Class INU EUR# n/a 2.40%
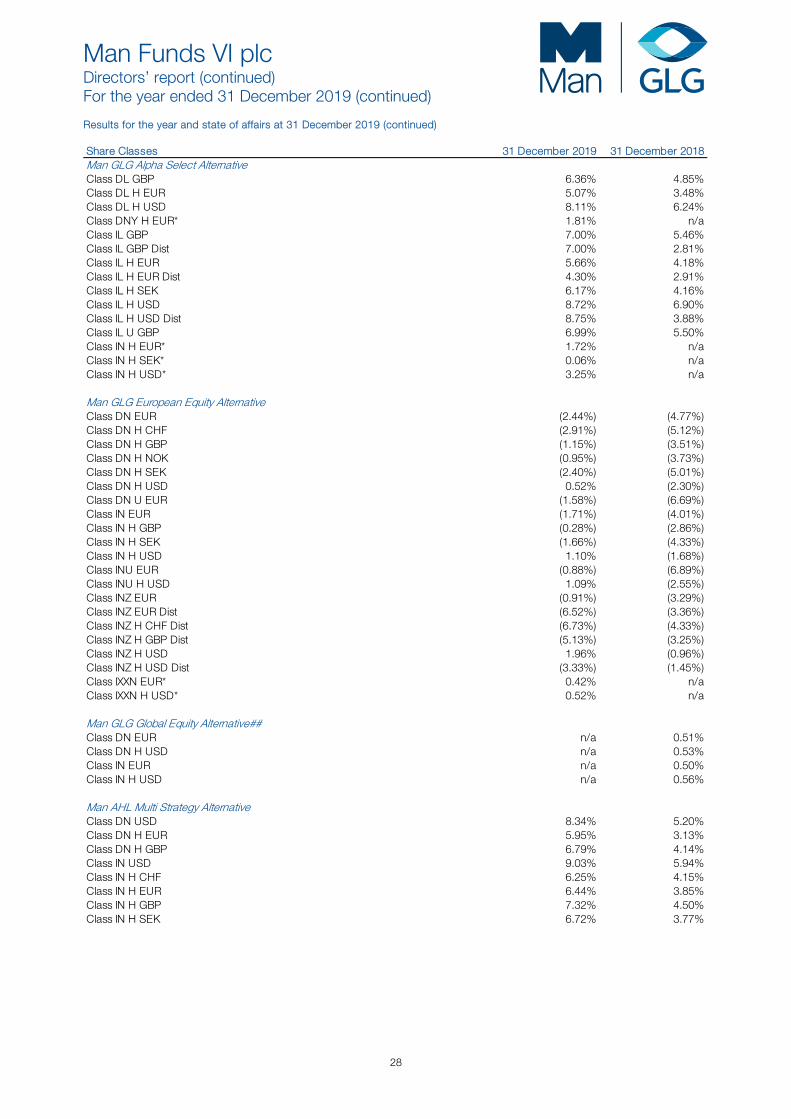
Man Funds VI plc Directors’ report (continued) For the year ended 31 December 2019 (continued)
28
Results for the year and state of affairs at 31 December 2019 (continued) Share Classes 31 December 2019 31 December 2018Man GLG Alpha Select AlternativeClass DL GBP 6.36% 4.85%Class DL H EUR 5.07% 3.48%Class DL H USD 8.11% 6.24%Class DNY H EUR* 1.81% n/aClass IL GBP 7.00% 5.46%Class IL GBP Dist 7.00% 2.81%Class IL H EUR 5.66% 4.18%Class IL H EUR Dist 4.30% 2.91%Class IL H SEK 6.17% 4.16%Class IL H USD 8.72% 6.90%Class IL H USD Dist 8.75% 3.88%Class IL U GBP 6.99% 5.50%Class IN H EUR* 1.72% n/aClass IN H SEK* 0.06% n/aClass IN H USD* 3.25% n/a
Man GLG European Equity AlternativeClass DN EUR (2.44%) (4.77%)Class DN H CHF (2.91%) (5.12%)Class DN H GBP (1.15%) (3.51%)Class DN H NOK (0.95%) (3.73%)Class DN H SEK (2.40%) (5.01%)Class DN H USD 0.52% (2.30%)Class DN U EUR (1.58%) (6.69%)Class IN EUR (1.71%) (4.01%)Class IN H GBP (0.28%) (2.86%)Class IN H SEK (1.66%) (4.33%)Class IN H USD 1.10% (1.68%)Class INU EUR (0.88%) (6.89%)Class INU H USD 1.09% (2.55%)Class INZ EUR (0.91%) (3.29%)Class INZ EUR Dist (6.52%) (3.36%)Class INZ H CHF Dist (6.73%) (4.33%)Class INZ H GBP Dist (5.13%) (3.25%)Class INZ H USD 1.96% (0.96%)Class INZ H USD Dist (3.33%) (1.45%)Class IXXN EUR* 0.42% n/aClass IXXN H USD* 0.52% n/a
Man GLG Global Equity Alternative##Class DN EUR n/a 0.51%Class DN H USD n/a 0.53%Class IN EUR n/a 0.50%Class IN H USD n/a 0.56%
Man AHL Multi Strategy AlternativeClass DN USD 8.34% 5.20%Class DN H EUR 5.95% 3.13%Class DN H GBP 6.79% 4.14%Class IN USD 9.03% 5.94%Class IN H CHF 6.25% 4.15%Class IN H EUR 6.44% 3.85%Class IN H GBP 7.32% 4.50%Class IN H SEK 6.72% 3.77%
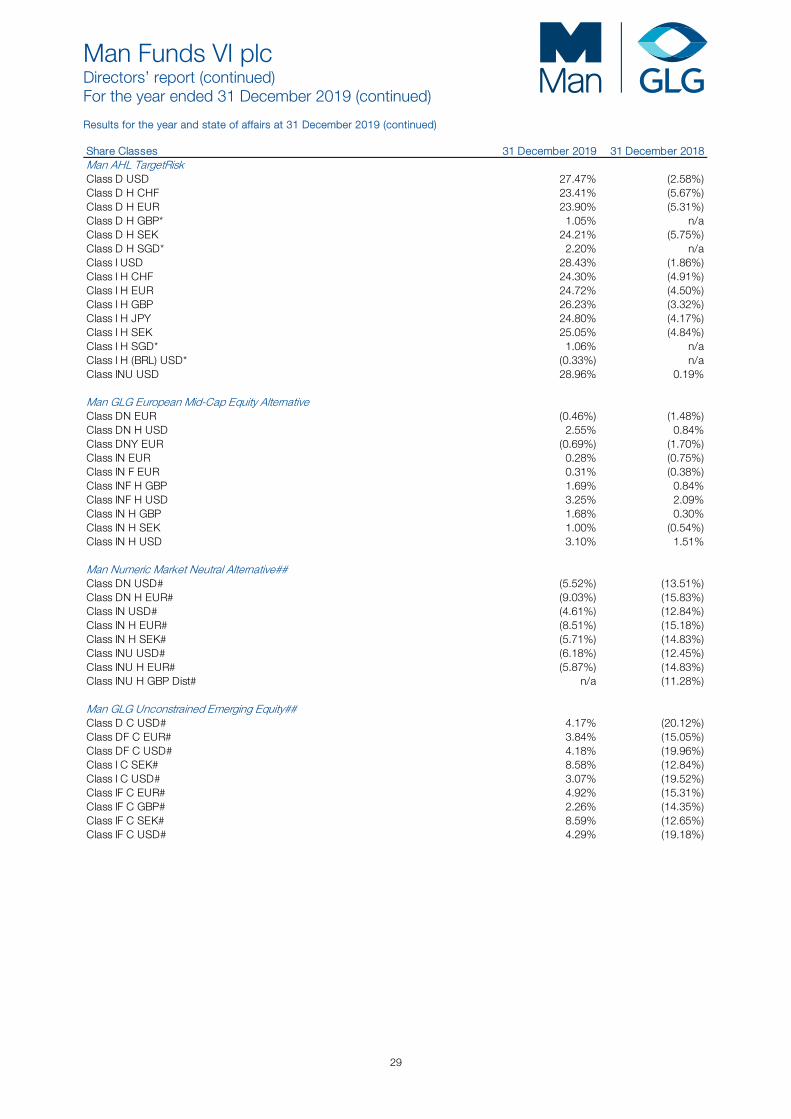
Man Funds VI plc Directors’ report (continued) For the year ended 31 December 2019 (continued)
29
Results for the year and state of affairs at 31 December 2019 (continued) Share Classes 31 December 2019 31 December 2018Man AHL TargetRiskClass D USD 27.47% (2.58%)Class D H CHF 23.41% (5.67%)Class D H EUR 23.90% (5.31%)Class D H GBP* 1.05% n/aClass D H SEK 24.21% (5.75%)Class D H SGD* 2.20% n/aClass I USD 28.43% (1.86%)Class I H CHF 24.30% (4.91%)Class I H EUR 24.72% (4.50%)Class I H GBP 26.23% (3.32%)Class I H JPY 24.80% (4.17%)Class I H SEK 25.05% (4.84%)Class I H SGD* 1.06% n/aClass I H (BRL) USD* (0.33%) n/aClass INU USD 28.96% 0.19%
Man GLG European Mid-Cap Equity AlternativeClass DN EUR (0.46%) (1.48%)Class DN H USD 2.55% 0.84%Class DNY EUR (0.69%) (1.70%)Class IN EUR 0.28% (0.75%)Class IN F EUR 0.31% (0.38%)Class INF H GBP 1.69% 0.84%Class INF H USD 3.25% 2.09%Class IN H GBP 1.68% 0.30%Class IN H SEK 1.00% (0.54%)Class IN H USD 3.10% 1.51%
Man Numeric Market Neutral Alternative##Class DN USD# (5.52%) (13.51%)Class DN H EUR# (9.03%) (15.83%)Class IN USD# (4.61%) (12.84%)Class IN H EUR# (8.51%) (15.18%)Class IN H SEK# (5.71%) (14.83%)Class INU USD# (6.18%) (12.45%)Class INU H EUR# (5.87%) (14.83%)Class INU H GBP Dist# n/a (11.28%)
Man GLG Unconstrained Emerging Equity##Class D C USD# 4.17% (20.12%)Class DF C EUR# 3.84% (15.05%)Class DF C USD# 4.18% (19.96%)Class I C SEK# 8.58% (12.84%)Class I C USD# 3.07% (19.52%)Class IF C EUR# 4.92% (15.31%)Class IF C GBP# 2.26% (14.35%)Class IF C SEK# 8.59% (12.65%)Class IF C USD# 4.29% (19.18%)
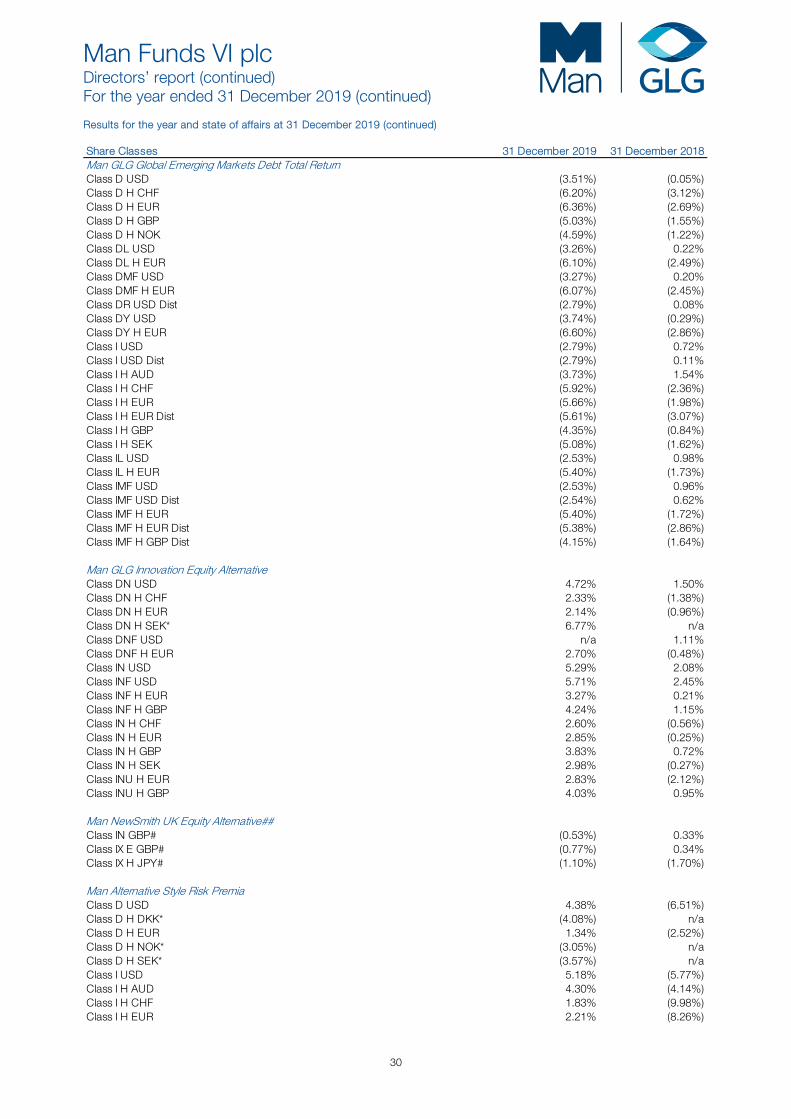
Man Funds VI plc Directors’ report (continued) For the year ended 31 December 2019 (continued)
30
Results for the year and state of affairs at 31 December 2019 (continued) Share Classes 31 December 2019 31 December 2018Man GLG Global Emerging Markets Debt Total ReturnClass D USD (3.51%) (0.05%)Class D H CHF (6.20%) (3.12%)Class D H EUR (6.36%) (2.69%)Class D H GBP (5.03%) (1.55%)Class D H NOK (4.59%) (1.22%)Class DL USD (3.26%) 0.22%Class DL H EUR (6.10%) (2.49%)Class DMF USD (3.27%) 0.20%Class DMF H EUR (6.07%) (2.45%)Class DR USD Dist (2.79%) 0.08%Class DY USD (3.74%) (0.29%)Class DY H EUR (6.60%) (2.86%)Class I USD (2.79%) 0.72%Class I USD Dist (2.79%) 0.11%Class I H AUD (3.73%) 1.54%Class I H CHF (5.92%) (2.36%)Class I H EUR (5.66%) (1.98%)Class I H EUR Dist (5.61%) (3.07%)Class I H GBP (4.35%) (0.84%)Class I H SEK (5.08%) (1.62%)Class IL USD (2.53%) 0.98%Class IL H EUR (5.40%) (1.73%)Class IMF USD (2.53%) 0.96%Class IMF USD Dist (2.54%) 0.62%Class IMF H EUR (5.40%) (1.72%)Class IMF H EUR Dist (5.38%) (2.86%)Class IMF H GBP Dist (4.15%) (1.64%)
Man GLG Innovation Equity AlternativeClass DN USD 4.72% 1.50%Class DN H CHF 2.33% (1.38%)Class DN H EUR 2.14% (0.96%)Class DN H SEK* 6.77% n/aClass DNF USD n/a 1.11%Class DNF H EUR 2.70% (0.48%)Class IN USD 5.29% 2.08%Class INF USD 5.71% 2.45%Class INF H EUR 3.27% 0.21%Class INF H GBP 4.24% 1.15%Class IN H CHF 2.60% (0.56%)Class IN H EUR 2.85% (0.25%)Class IN H GBP 3.83% 0.72%Class IN H SEK 2.98% (0.27%)Class INU H EUR 2.83% (2.12%)Class INU H GBP 4.03% 0.95%
Man NewSmith UK Equity Alternative##Class IN GBP# (0.53%) 0.33%Class IX E GBP# (0.77%) 0.34%Class IX H JPY# (1.10%) (1.70%)
Man Alternative Style Risk PremiaClass D USD 4.38% (6.51%)Class D H DKK* (4.08%) n/aClass D H EUR 1.34% (2.52%)Class D H NOK* (3.05%) n/aClass D H SEK* (3.57%) n/aClass I USD 5.18% (5.77%)Class I H AUD 4.30% (4.14%)Class I H CHF 1.83% (9.98%)Class I H EUR 2.21% (8.26%)
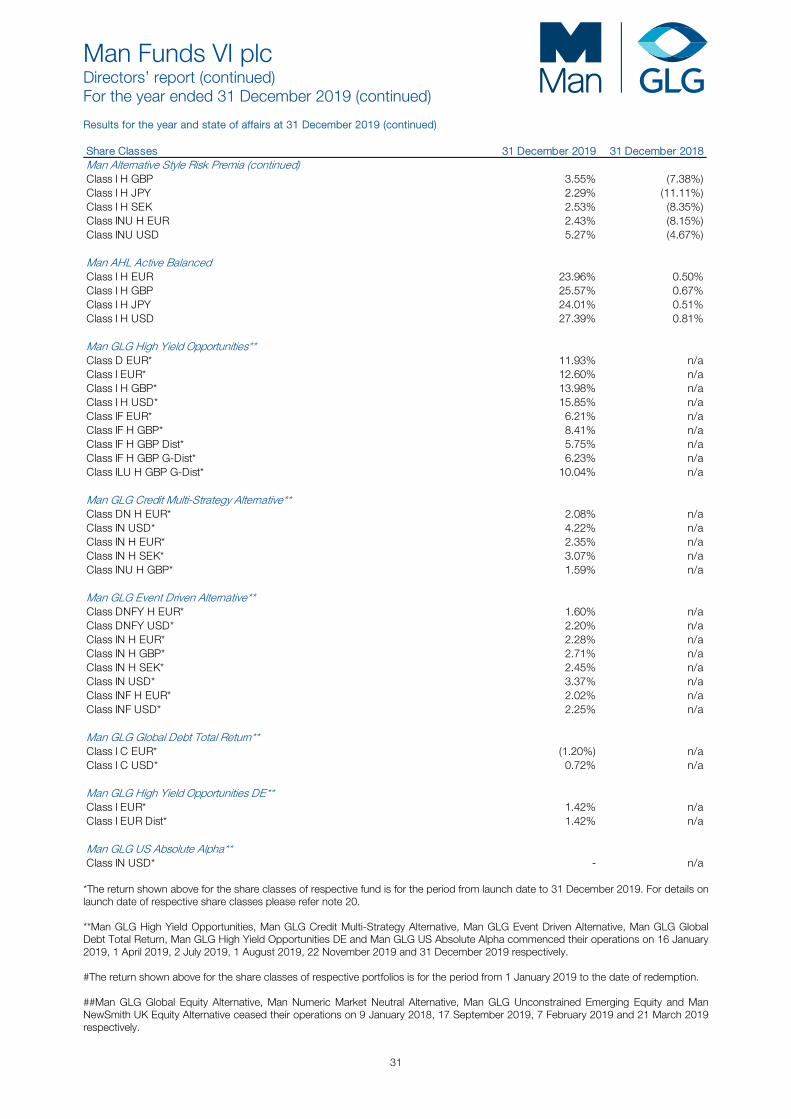
Man Funds VI plc Directors’ report (continued) For the year ended 31 December 2019 (continued)
31
Results for the year and state of affairs at 31 December 2019 (continued) Share Classes 31 December 2019 31 December 2018Man Alternative Style Risk Premia (continued)Class I H GBP 3.55% (7.38%)Class I H JPY 2.29% (11.11%)Class I H SEK 2.53% (8.35%)Class INU H EUR 2.43% (8.15%)Class INU USD 5.27% (4.67%)
Man AHL Active BalancedClass I H EUR 23.96% 0.50%Class I H GBP 25.57% 0.67%Class I H JPY 24.01% 0.51%Class I H USD 27.39% 0.81%
Man GLG High Yield Opportunities**Class D EUR* 11.93% n/aClass I EUR* 12.60% n/aClass I H GBP* 13.98% n/aClass I H USD* 15.85% n/aClass IF EUR* 6.21% n/aClass IF H GBP* 8.41% n/aClass IF H GBP Dist* 5.75% n/aClass IF H GBP G-Dist* 6.23% n/aClass ILU H GBP G-Dist* 10.04% n/a
Man GLG Credit Multi-Strategy Alternative**Class DN H EUR* 2.08% n/aClass IN USD* 4.22% n/aClass IN H EUR* 2.35% n/aClass IN H SEK* 3.07% n/aClass INU H GBP* 1.59% n/a
Man GLG Event Driven Alternative**Class DNFY H EUR* 1.60% n/aClass DNFY USD* 2.20% n/aClass IN H EUR* 2.28% n/aClass IN H GBP* 2.71% n/aClass IN H SEK* 2.45% n/aClass IN USD* 3.37% n/aClass INF H EUR* 2.02% n/aClass INF USD* 2.25% n/a
Man GLG Global Debt Total Return**Class I C EUR* (1.20%) n/aClass I C USD* 0.72% n/a
Man GLG High Yield Opportunities DE**Class I EUR* 1.42% n/aClass I EUR Dist* 1.42% n/a
Man GLG US Absolute Alpha**Class IN USD* - n/a
*The return shown above for the share classes of respective fund is for the period from launch date to 31 December 2019. For details on launch date of respective share classes please refer note 20. **Man GLG High Yield Opportunities, Man GLG Credit Multi-Strategy Alternative, Man GLG Event Driven Alternative, Man GLG Global Debt Total Return, Man GLG High Yield Opportunities DE and Man GLG US Absolute Alpha commenced their operations on 16 January 2019, 1 April 2019, 2 July 2019, 1 August 2019, 22 November 2019 and 31 December 2019 respectively. #The return shown above for the share classes of respective portfolios is for the period from 1 January 2019 to the date of redemption. ##Man GLG Global Equity Alternative, Man Numeric Market Neutral Alternative, Man GLG Unconstrained Emerging Equity and Man NewSmith UK Equity Alternative ceased their operations on 9 January 2018, 17 September 2019, 7 February 2019 and 21 March 2019 respectively.
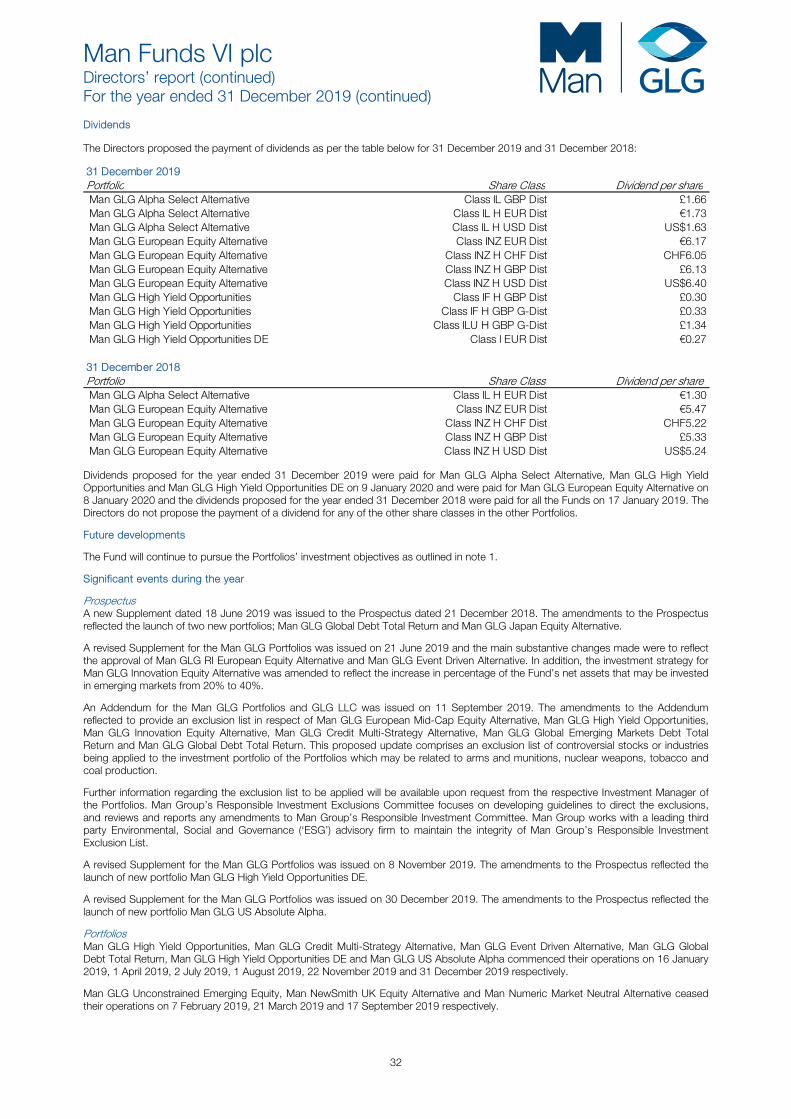
Man Funds VI plc Directors’ report (continued) For the year ended 31 December 2019 (continued)
32
Dividends The Directors proposed the payment of dividends as per the table below for 31 December 2019 and 31 December 2018:
31 December 2019Portfolio Share Class Dividend per shareMan GLG Alpha Select Alternative Class IL GBP Dist £1.66Man GLG Alpha Select Alternative Class IL H EUR Dist €1.73Man GLG Alpha Select Alternative Class IL H USD Dist US$1.63Man GLG European Equity Alternative Class INZ EUR Dist €6.17Man GLG European Equity Alternative Class INZ H CHF Dist CHF6.05Man GLG European Equity Alternative Class INZ H GBP Dist £6.13 Man GLG European Equity Alternative Class INZ H USD Dist US$6.40Man GLG High Yield Opportunities Class IF H GBP Dist £0.30 Man GLG High Yield Opportunities Class IF H GBP G-Dist £0.33 Man GLG High Yield Opportunities Class ILU H GBP G-Dist £1.34 Man GLG High Yield Opportunities DE Class I EUR Dist €0.27
31 December 2018Portfolio Share Class Dividend per shareMan GLG Alpha Select Alternative Class IL H EUR Dist €1.30Man GLG European Equity Alternative Class INZ EUR Dist €5.47Man GLG European Equity Alternative Class INZ H CHF Dist CHF5.22Man GLG European Equity Alternative Class INZ H GBP Dist £5.33Man GLG European Equity Alternative Class INZ H USD Dist US$5.24
Dividends proposed for the year ended 31 December 2019 were paid for Man GLG Alpha Select Alternative, Man GLG High Yield Opportunities and Man GLG High Yield Opportunities DE on 9 January 2020 and were paid for Man GLG European Equity Alternative on 8 January 2020 and the dividends proposed for the year ended 31 December 2018 were paid for all the Funds on 17 January 2019. The Directors do not propose the payment of a dividend for any of the other share classes in the other Portfolios.
Future developments
The Fund will continue to pursue the Portfolios’ investment objectives as outlined in note 1.
Significant events during the year
Prospectus A new Supplement dated 18 June 2019 was issued to the Prospectus dated 21 December 2018. The amendments to the Prospectus reflected the launch of two new portfolios; Man GLG Global Debt Total Return and Man GLG Japan Equity Alternative.
A revised Supplement for the Man GLG Portfolios was issued on 21 June 2019 and the main substantive changes made were to reflect the approval of Man GLG RI European Equity Alternative and Man GLG Event Driven Alternative. In addition, the investment strategy for Man GLG Innovation Equity Alternative was amended to reflect the increase in percentage of the Fund’s net assets that may be invested in emerging markets from 20% to 40%.
An Addendum for the Man GLG Portfolios and GLG LLC was issued on 11 September 2019. The amendments to the Addendum reflected to provide an exclusion list in respect of Man GLG European Mid-Cap Equity Alternative, Man GLG High Yield Opportunities, Man GLG Innovation Equity Alternative, Man GLG Credit Multi-Strategy Alternative, Man GLG Global Emerging Markets Debt Total Return and Man GLG Global Debt Total Return. This proposed update comprises an exclusion list of controversial stocks or industries being applied to the investment portfolio of the Portfolios which may be related to arms and munitions, nuclear weapons, tobacco and coal production.
Further information regarding the exclusion list to be applied will be available upon request from the respective Investment Manager of the Portfolios. Man Group’s Responsible Investment Exclusions Committee focuses on developing guidelines to direct the exclusions, and reviews and reports any amendments to Man Group’s Responsible Investment Committee. Man Group works with a leading third party Environmental, Social and Governance (‘ESG’) advisory firm to maintain the integrity of Man Group’s Responsible Investment Exclusion List.
A revised Supplement for the Man GLG Portfolios was issued on 8 November 2019. The amendments to the Prospectus reflected the launch of new portfolio Man GLG High Yield Opportunities DE.
A revised Supplement for the Man GLG Portfolios was issued on 30 December 2019. The amendments to the Prospectus reflected the launch of new portfolio Man GLG US Absolute Alpha.
Portfolios Man GLG High Yield Opportunities, Man GLG Credit Multi-Strategy Alternative, Man GLG Event Driven Alternative, Man GLG Global Debt Total Return, Man GLG High Yield Opportunities DE and Man GLG US Absolute Alpha commenced their operations on 16 January 2019, 1 April 2019, 2 July 2019, 1 August 2019, 22 November 2019 and 31 December 2019 respectively.
Man GLG Unconstrained Emerging Equity, Man NewSmith UK Equity Alternative and Man Numeric Market Neutral Alternative ceased their operations on 7 February 2019, 21 March 2019 and 17 September 2019 respectively.
Man Funds VI plc Directors’ report (continued) For the year ended 31 December 2019 (continued)
33
Significant events during the year (continued) Share Class A revised Supplement for the AHL Partners LLP Portfolios was issued on 28 August 2019 and the only change made were to reflect the inclusion of “IU” share class in Man AHL TargetRisk.
A revised Supplement for the Man GLG Portfolios was issued on 27 November 2019 and the only change made were to reflect the inclusion of “DN” and “DNY” share classes in Man GLG Alpha Select Alternative.
For detailed information on new share classes launched during the year please refer note 20.
Effective 1 December 2019, BNY Mellon Trust Company (Ireland) Limited, One Dockland Central, Guild Street, IFSC, Dublin 1, merged into The Bank of New York Mellon SA/NV (the “European Bank”) and as of that date, depositary services were provided by the Dublin branch of the European Bank.
There were no other significant events during the year ended 31 December 2019.
Subsequent events since the year end
Dividends proposed for the year ended 31 December 2019 were paid on 9 January 2020.
The Directors and the Investment Managers acknowledge the current COVID-19 pandemic which is an unprecedented event and the eventual impact on the global economy and markets will largely depend on the scale and duration of the outbreak. The Board will continue to monitor this situation with the investment manager and service providers.
Investors are reminded that the Liquidity Risk highlighted in the company prospectus is particularly relevant at this time. Trading volumes in the underlying investments of the Portfolios may fluctuate significantly due to unprecedented levels of investor uncertainty and market volatility. There is a risk that investments made by the Portfolios may become less liquid in response to market developments, adverse investor perceptions or regulatory and government intervention (including the possibility of trading suspensions implemented by domestic regulators). In extreme market conditions, there may be no willing buyer for an investment and that investment cannot be readily sold at the desired time or price, and consequently the relevant Portfolio may have to accept a lower price to sell the relevant investment or may not be able to sell the investment at all. An inability to sell a particular investment or portion of a Portfolio’s assets can have a negative impact of the value of the relevant Portfolio or prevent the relevant Portfolio from being able to take advantage of other investment opportunities.
Liquidity risk also includes the risk that relevant Portfolios, including those Portfolios with a concentrated exposure to such issuers, sectors or industries, may be forced to defer redemptions, issue in specie redemptions or suspend dealing because of stressed market conditions, an unusually high volume of redemption requests, or other factors beyond the control of the Investment Manager. To meet redemption requests, the relevant Portfolios may be forced to sell investments at an unfavourable time and/or conditions, which may have a negative impact on the value of your investment.
There have been no other significant events since the year end that impact the Fund and require disclosure in the financial statements.
Investment objectives
The investment objectives of each sub-fund are as stated in note 1. Investment in the Fund carries with it a degree of risk including but not limited to the risks referred to in note 6 of these Financial Statements. For a more detailed description of risks associated with investment in the Fund, please refer to the Prospectus.
Directors and Secretary
The Directors and Secretary during the year and up to 22 April 2020 are listed on page 2. Unless indicated, they served for the entire year.
Directors’ and Secretary’s interests
Neither the Directors, nor their families, nor the secretary (Matsack Trust Limited), nor the Investment Manager had any interests in the Shares of the Fund during the year ended 31 December 2019, with the exception of one Subscriber Shares held by Man Asset Management (Ireland) Limited in a nominee capacity.
The Directors' remuneration for the year ended 31 December 2019 and 31 December 2018 is disclosed in note 9.
Directors’ responsibilities
The Directors are responsible for preparing the Directors’ Report and the financial statements in accordance with Irish law.
Irish company law requires the Directors to prepare financial statements giving a true and fair view of the state of affairs of the Fund and the profit or loss of the Fund for each financial year. Under that law the Directors have elected to prepare the financial statements in accordance with International Financial Reporting Standards (“IFRS”) as adopted by the European Union. Under company law, the directors must not approve the financial statements unless they are satisfied that they give a true and fair view of the assets, liabilities and financial position of the company as at the financial year end date and of the profit or loss of the Fund for the financial year and otherwise comply with the Companies Act 2014 (as amended).
Man Funds VI plc Directors’ report (continued) For the year ended 31 December 2019 (continued)
34
Directors’ responsibilities (continued) In preparing these financial statements, the Directors are required to:
• select suitable accounting policies and then apply them consistently; • make judgments and accounting estimates that are reasonable and prudent; • state whether the financial statements have been prepared in accordance with applicable accounting standards and identify the
standards in question and note the effects and the reasons for any material departure from those standards; and • prepare the financial statements on the going concern basis unless it is inappropriate to presume that the Fund will continue in
business.
The Directors are responsible for ensuring that the Fund keeps or causes to be kept adequate accounting records which correctly explain and record the transactions of the company, enable at any time the assets, liabilities, financial position and profit or loss of the Fund to be determined with the reasonable accuracy, enable them to ensure that the financial statements and Directors’ report comply with the Companies Act 2014 (as amended) and enable these financial statements to be audited. They are also responsible for safeguarding the assets of the Fund and hence for taking reasonable steps for the prevention and detection of fraud and other irregularities. Legislation in Ireland governing the preparation and dissemination of financial statements may differ from legislation in other jurisdictions.
Accounting records
The Directors are responsible for ensuring that proper accounting records as outlined in Section 281 to 285 of the Companies Act 2014 (as amended) are kept by the Fund. To achieve this, the Directors have appointed an experienced third party fund administrator to ensure that the requirements of Section 281 to 285 of the Companies Act 2014 (as amended) are complied with. The books and accounting records are maintained at the Administrator’s office at One Dockland Central, Guild Street, IFSC, Dublin 1, Ireland. Independent Auditor
The Independent Auditor, Ernst & Young, Chartered Accountants, will continue in office in accordance with Section 383 (2) of the Companies Act 2014 (as amended).
Corporate governance
The European Communities (Directive 2006/46/EC) Regulations (S.I. 450 of 2009 and S.I. 83 of 2010) (the “Regulations”) requires the inclusion of a corporate governance statement in the Directors’ Report.
Although there is no specific statutory corporate governance code applicable to Irish collective investment schemes, the Fund is subject to corporate governance practices imposed by:
i) The Irish Companies Act 2014 which is available for inspection at the registered office of the Fund; ii) The Articles of Association of the Fund which are available for inspection at the registered office of the Fund; iii) The Central Bank in their UCITS Notices and Guidance Notes which can be obtained from the Central Bank website at:
https://www.centralbank.ie/regulation/industry-market-sectors/funds/ucits and are available for inspection at the registered office of the Fund; and
The Irish Funds (“IF”) has published the IF Code that may be adopted on a voluntary basis by Irish authorised collective investment schemes. It should be noted that the IF Code reflects existing corporate governance practices imposed on Irish authorized collective investment schemes, as noted above. If the IF Code is adopted on a voluntary basis, it can be referred to in the disclosures made in the Directors Report in compliance with the provisions of the European Communities (Directive 2006/46/EC) Regulations (i.e. S.I. 450 of 2009 and S.I. 83 of 2010).
The Board of Directors is responsible for establishing and maintaining adequate internal control and risk management systems of the Fund in relation to the financial reporting process. Such systems are designed to manage rather than eliminate the risk of error or fraud in achieving the Fund’s financial reporting objectives and can only provide reasonable and not absolute assurance against material misstatement or loss.
The Board of Directors has procedures in place to ensure all relevant books of account are properly maintained and are readily available, including production of annual financial statements. The annual financial statements of the Fund are required to be approved by the Board of Directors of the Fund and the annual financial statements of the Fund are required to be filed with the Central Bank. The statutory financial statements are required to be audited by independent auditors who report annually to the board on their findings.
The Board of Directors evaluates and discusses significant accounting and reporting issues as the need arises.
The convening and conduct of shareholders’ meetings are governed by the Articles of Association of the Fund and the Companies Act. Although the Directors may convene an extraordinary general meeting of the Fund at any time, the Directors are required to convene an annual general meeting of the Fund within twelve months of the date of the previous annual general meeting. Shareholders representing not less than ninety-five per cent of the paid up share capital of the Fund may also request the directors to convene a shareholders’ meeting. Not less than twenty one days’ notice of every annual general meeting and any meeting convened for the passing of a special resolution must be given to shareholders and fourteen days’ notice must be given in the case of any other general meeting unless the auditors of the Fund and all the shareholders of the Fund entitled to attend and vote agree to shorter notice.
Two members present either in person or by proxy constitute a quorum at a general meeting.
The Fund may from time to time by ordinary resolution increase the share capital by such amount and/or number as the resolution may prescribe.
Man Funds VI plc Directors’ report (continued) For the year ended 31 December 2019 (continued)
35
Corporate governance (continued) The Fund may also by ordinary resolution:
1) consolidate all or any of its share capital into Shares of larger amount; 2) subject to the provision of the Companies Act subdivide its Shares, or any of them, into Shares of smaller amount or value and
provide for any of such Shares resulting from such sub-division to have, as compared with the others, any such preferred, deferred or other rights or be subject to any such restrictions as the Fund has power to attach to unissued or new Shares;
3) cancel any Shares which, at the date of the passing of the resolution, have not been taken or agreed to be taken by any person and reduce the amount of its authorised share capital by the amount of the Shares so cancelled; or
4) re-denominate the currency of any class of Shares.
Every holder of participating shares or non-participating shares present in person or by proxy who votes on a show of hands is entitled to one vote. On a poll, every holder of participating shares present in person or by proxy is entitled to one vote in respect of each share held by him and every holder of non-participating shares is entitled to one vote in respect of all non-participating shares held by him. Shareholders may resolve to sanction an ordinary resolution or special resolution at a shareholders’ meeting. An ordinary resolution of the Fund requires a simple majority of the votes cast by the shareholders voting in person or by proxy at the meeting at which the resolution is proposed. A special resolution of the Fund requires a majority of not less than seventy five per cent of the shareholders present in person or by proxy and voting in general meeting in order to pass a special resolution including a resolution to amend the Articles of Association.
Unless otherwise determined by an ordinary resolution of the Fund in general meeting, the number of Directors may not be less than one nor more than ten. Currently the Board of Directors of the Fund is composed of four Directors, being those listed in the corporate information in these financial statements.
The business of the Fund is managed by the Directors, who exercise all such powers of the Fund as are not by the Companies Act 2014 (as amended) (“Act”) or by the Articles of Association of the Fund required to be exercised by the Fund in general meeting. A Director may, and the company secretary of the Fund on the requisition of a Director will, at any time summon a meeting of the Directors. Questions arising at any meeting of the Directors are determined by a majority of votes. In the case of an equality of votes, the chairman shall not have a casting vote and the resolution shall fail. The quorum necessary for the transaction of business at a meeting of the Directors is two. The Board has adopted the voluntary Irish Funds (IF) Corporate Governance Code for Irish Domiciled Collective Investment Schemes and Management Companies, issued 14 December 2011 (the “Code”), with effect from 31 December 2012. The Board has reviewed and assessed the measures included in the Code and considers its corporate governance practices and procedures since the adoption of the Code as consistent therewith. The Directors acknowledge that they are responsible for securing the company’s compliance with the relevant obligations as set out in section 225 of the Companies Act 2014 (as amended). The Directors confirm that:
1) A compliance policy document has been drawn up that sets out policies, that in our opinion are appropriate to the company, respecting compliance by the company with its relevant obligations
2) appropriate arrangements or structures are in place that are, in our opinion, designed to secure material compliance with the company's relevant obligations, and
3) during the financial year, the arrangements or structures referred to in (2) have been reviewed The Directors confirm that during the financial year end 31 December 2019:
a) so far as the Directors are aware, there is no relevant audit information of which the Company’s statutory auditors are unaware; and
b) the Directors have taken all steps that ought to have been taken by the Directors in order to make themselves aware of any relevant audit information and to establish that the Company’s auditors are aware of that information.
Audit Committee The Board of Directors has decided it was not necessary to constitute an audit committee given the frequency of the meetings of the Board of Directors throughout the year and the size of the Board of Directors. Instead, it is deemed more appropriate that the entirety of the Board of Directors carry out the activities that would otherwise be carried out by an audit committee. The Fund has adopted the corporate governance code for collective investment schemes and management companies issued by the Irish Funds (the “IF Code”).The Directors are satisfied that they act independently and in the interests of the Fund as a whole and have determined that Eric Fortier and Ronan Daly are independent directors as that term is defined in the IF Code. Cybersecurity risk Cybersecurity breaches may occur allowing an unauthorized party to gain access to assets of the Portfolios, Shareholder data, or proprietary information, or may cause the Fund, the Investment Manager, the Distributor, the Administrator or the Custodian to suffer data corruption or lose operational functionality.
Man Funds VI plc Directors’ report (continued) For the year ended 31 December 2019 (continued)
36
Cybersecurity risk (continued)
The Portfolios may be affected by intentional cybersecurity breaches which include unauthorized access to systems, networks, or devices (such as through “hacking” activity); infection from computer viruses or other malicious software code; and attacks that shut down, disable, slow, or otherwise disrupt operations, business processes, or website access or functionality. In addition, unintentional incidents can occur, such as the inadvertent release of confidential information (possibly resulting in the violation of applicable privacy laws). A cybersecurity breach could result in the loss or theft of Shareholder data or funds, the inability to access electronic systems, loss or theft of proprietary information or corporate data, physical damage to a computer or network system, or costs associated with system repairs. Such incidents could cause the Fund, the Investment Manager, the Distributor, the Administrator, the Custodian, or other service providers to incur regulatory penalties, reputational damage, additional compliance costs, or financial loss. Consequently, shareholders may lose some or all of their invested capital. In addition, such incidents could affect issuers in which a Portfolio invests, and thereby cause a Portfolio’s investments to lose value, as a result of which investors, including the relevant Portfolio and its shareholders, could potentially lose all or a portion of their investment with that issuer.
Custody and title risk
The Depositary is under a duty to take into custody such financial instruments that can be held in custody and to hold such assets of each Portfolio of the Fund on behalf of its shareholders. The Central Bank of Ireland requires the Depositary to hold separately the non-cash assets of each Portfolio and to maintain sufficient records to clearly identify the nature and amount of all assets that it holds, the ownership of each asset and where the documents of title to such assets are physically located. When the Depositary employs a Sub-Custodian the Depositary retains responsibility for the assets of the Portfolio save where it has discharged itself of liability in accordance with the relevant EU Directive.
However, it should be noted that not all jurisdictions have the same rules and regulations as Ireland regarding the custody of assets and the recognition of the interests of a beneficial owner such as a Portfolio. Therefore, in such jurisdictions, there is a risk that if a Sub-Custodian becomes bankrupt or insolvent, the Portfolio’s beneficial ownership of the assets held by such Sub-Custodian may not be recognised and consequently the creditors of the Sub-Custodian may seek to have recourse to the assets of the Portfolio. In those jurisdictions where the Portfolio’s beneficial ownership of its assets is ultimately recognised, the Portfolio may suffer delay and cost in recovering those assets. The Portfolios may invest in markets where custodial and/or settlement systems are not fully developed, the assets of a Portfolio which are traded in such markets and which have been entrusted to sub-custodians, in circumstances where the use of such sub-custodians is necessary, may be exposed to risk in circumstances whereby the Depositary will have no liability.
CRS Data Protection Information Notice
The Portfolio hereby provides the following data protection information notice to all shareholders in the Portfolio either as at 31 December 2019 or at any point of time since this date.
For the avoidance of doubt, this notice applies equally to any shareholders that have ceased to hold shares in the Portfolio since 1 January 2019. Furthermore, it should be noted that this notice may be applicable to Controlling Persons of certain shareholders.
The Portfolio hereby confirm that they intend to take such steps as may be required to satisfy any obligations imposed by (i) the OECD’s Standard for Automatic Exchange of Financial Account Information in Tax Matters (“the Standard”), which therein contains the Common Reporting Standard (“CRS”), as applied in Ireland by means of the relevant international legal framework and Irish tax legislation and (ii) EU Council Directive 2014/107/EU, amending Directive 2011/16/EU as regards mandatory automatic exchange information in the field of taxation (“DAC2”), as applied in Ireland by means of the relevant Irish tax legislation, so as to ensure compliance or deemed compliance (as the case may be) with the Standard/CRS and the DAC2 from 1 January 2019.
In this regard, the Manager on behalf of the Portfolio is obliged under Section 891F and Section 891G of the Irish Taxes Consolidation Act, 1997 (as amended) and regulations made pursuant to those sections to collect certain information about each shareholder’s tax arrangements (and also collect information in relation to relevant Controlling Persons of specific shareholders).
In certain circumstances, the Manager on behalf of the Portfolio may be legally obliged to share this information and other financial information with respect to a shareholder’s interests in the Portfolio with the Irish Revenue Commissioners (and, in particular situations, also share information in relation to relevant Controlling Persons of specific shareholders). In turn, and to the extent the account has been identified as a Reportable Account, the Irish Revenue Commissioners will exchange this information with the country of residence of the Reportable Person(s) in respect of that Reportable Account.
In particular, information that may be reported in respect of a shareholder (and relevant Controlling Persons, if applicable) includes name, address, date of birth, place of birth, account number, account balance or value at year end (or, if the account was closed during such year, the balance or value at the date of closure of the account), any payments (including redemption and dividend/interest payments) made with respect to the account during the calendar year, tax residency(ies) and tax identification number(s).
Connected party transactions
The Directors are satisfied that there are arrangements in place to ensure that transactions carried out with connected parties of the Fund are carried out as if negotiated at arm’s length and any such transactions are in the best interests of the Shareholders of the Fund. The Directors are satisfied that any transactions entered into with connected parties during the year complied with the aforementioned obligation.
On behalf of the Board
Director Director
Date: 22 April 2020
The Bank of New York Mellon SA/NV, T +353 1 900 7920
Dublin Branch F +353 1 829 1024
Riverside Two, Sir John Rogerson’s Quay
Dublin 2, D02 KV60, Ireland.
Registered in Ireland No. 907126, VAT No. IE9578054E
The Bank of New York Mellon SA/NV, trading as The Bank of New York Mellon SA/NV, Dublin Branch is authorised by the National Bank of Belgium.
The Bank of New York Mellon SA/NV, 46 Rue Montoyerstraat, B-1000 Brussels, Belgium - Tel. (32) 2 545 81 11, V.A.T. BE 0806.743.159 - RPM-RPR Brussels Company
No. 0806.743.159. The Bank of New York Mellon SA/NV is a Belgian limited liability company, authorized and regulated as a significant credit institution by the
European Central Bank and the National Bank of Belgium under the Single Supervisory Mechanism and by the Belgian Financial Services and Markets Authority.
REPORT FROM THE DEPOSITARY TO THE SHAREHOLDERS
DATED 22 APRIL 2020
For the period from 1 January 2019 to 31 December 2019 (the “Period”)
The Bank of New York Mellon SA/NV, Dublin Branch (the “Depositary” “us”, “we”, or “our”) has
enquired into the conduct of Man Funds VI plc (the “Company”) for the Period, in its capacity as
Depositary to the Company.
This report including the opinion has been prepared for and solely for the shareholders in the Company, in
accordance with our role as Depositary to the Company and for no other purpose. We do not, in giving
this opinion, accept or assume responsibility for any other purpose or to any other person to whom this
report is shown.
Responsibilities of the Depositary
Our duties and responsibilities are outlined in Regulation 34 of the of the European Communities
(Undertakings for Collective Investment in Transferable Securities) Regulations 2011 (S.I. No 352 of
2011), as amended (the “Regulations”).
Our report shall state whether, in our opinion, the Company has been managed in that period in accordance
with the provisions of the Company’s constitutional documentation and the Regulations. It is the overall
responsibility of the Company to comply with these provisions. If the Company has not been so managed,
we as Depositary must state in what respects it has not been so managed and the steps which we have taken
in respect thereof.
Basis of Depositary Opinion
The Depositary conducts such reviews as it, in its reasonable opinion, considers necessary in order to
comply with its duties and to ensure that, in all material respects, the Company has been managed (i) in
accordance with the limitations imposed on its investment and borrowing powers by the provisions of its
constitutional documentation and the appropriate regulations and (ii) otherwise in accordance with the
Company’s constitutional documentation and the appropriate regulations.
Opinion
In our opinion, the Company has been managed during the Period, in all material respects:
(i) in accordance with the limitations imposed on the investment and borrowing powers of the Company
by the constitutional documentation and the Regulations; and
(ii) otherwise in accordance with the provisions of the constitutional documentation and the Regulations.
__________________________ For and on behalf of The Bank of New York Mellon SA/NV, Dublin Branch,
Riverside II,
Sir John Rogerson’s Quay,
Dublin 2,
Ireland.
Date: 22 April 2020

38
Page left blank intentionally
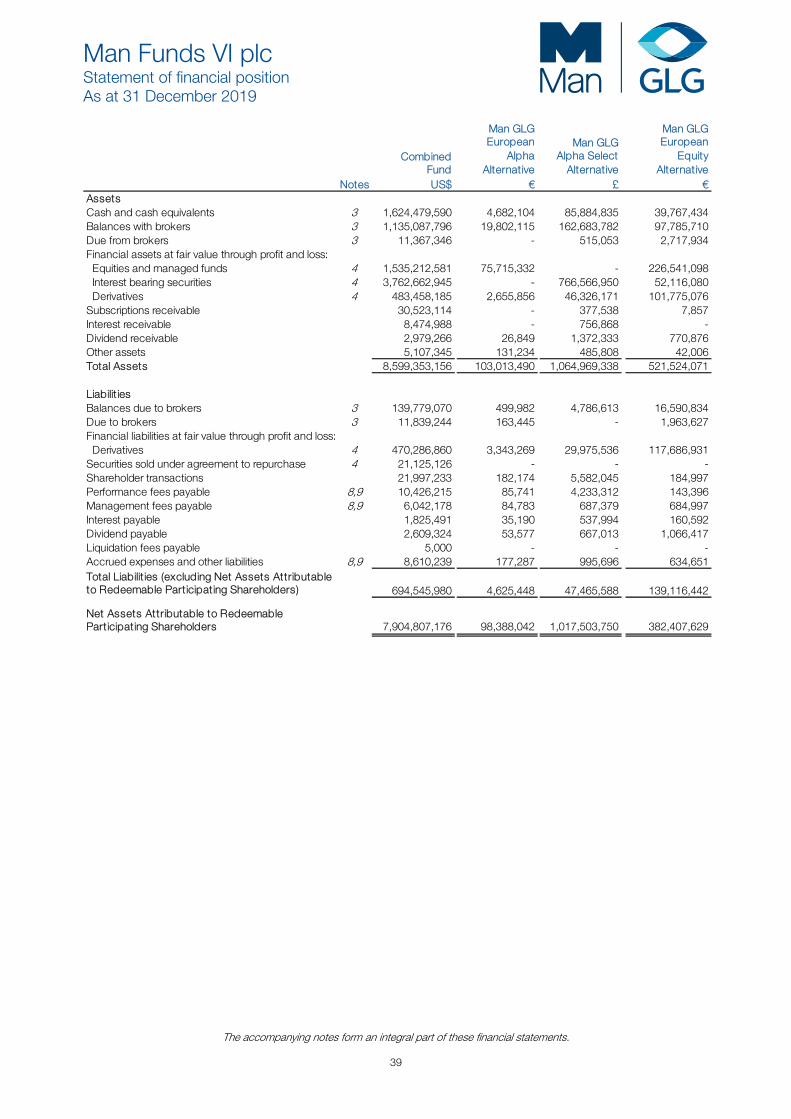
Man Funds VI plc Statement of financial position As at 31 December 2019
The accompanying notes form an integral part of these financial statements.
39
CombinedFund
Man GLGEuropean
AlphaAlternative
Man GLGAlpha Select
Alternative
Man GLGEuropean
EquityAlternative
Notes US$ € £ €AssetsCash and cash equivalents 3 1,624,479,590 4,682,104 85,884,835 39,767,434 Balances with brokers 3 1,135,087,796 19,802,115 162,683,782 97,785,710 Due from brokers 3 11,367,346 - 515,053 2,717,934 Financial assets at fair value through profit and loss: Equities and managed funds 4 1,535,212,581 75,715,332 - 226,541,098 Interest bearing securities 4 3,762,662,945 - 766,566,950 52,116,080 Derivatives 4 483,458,185 2,655,856 46,326,171 101,775,076 Subscriptions receivable 30,523,114 - 377,538 7,857 Interest receivable 8,474,988 - 756,868 - Dividend receivable 2,979,266 26,849 1,372,333 770,876 Other assets 5,107,345 131,234 485,808 42,006 Total Assets 8,599,353,156 103,013,490 1,064,969,338 521,524,071
Liabilit iesBalances due to brokers 3 139,779,070 499,982 4,786,613 16,590,834 Due to brokers 3 11,839,244 163,445 - 1,963,627 Financial liabilities at fair value through profit and loss: Derivatives 4 470,286,860 3,343,269 29,975,536 117,686,931 Securities sold under agreement to repurchase 4 21,125,126 - - - Shareholder transactions 21,997,233 182,174 5,582,045 184,997 Performance fees payable 8,9 10,426,215 85,741 4,233,312 143,396 Management fees payable 8,9 6,042,178 84,783 687,379 684,997 Interest payable 1,825,491 35,190 537,994 160,592 Dividend payable 2,609,324 53,577 667,013 1,066,417 Liquidation fees payable 5,000 - - - Accrued expenses and other liabilities 8,9 8,610,239 177,287 995,696 634,651 Total Liabilit ies (excluding Net Assets Attributableto Redeemable Participating Shareholders) 694,545,980 4,625,448 47,465,588 139,116,442
Net Assets Attributable to Redeemable Participating Shareholders 7,904,807,176 98,388,042 1,017,503,750 382,407,629
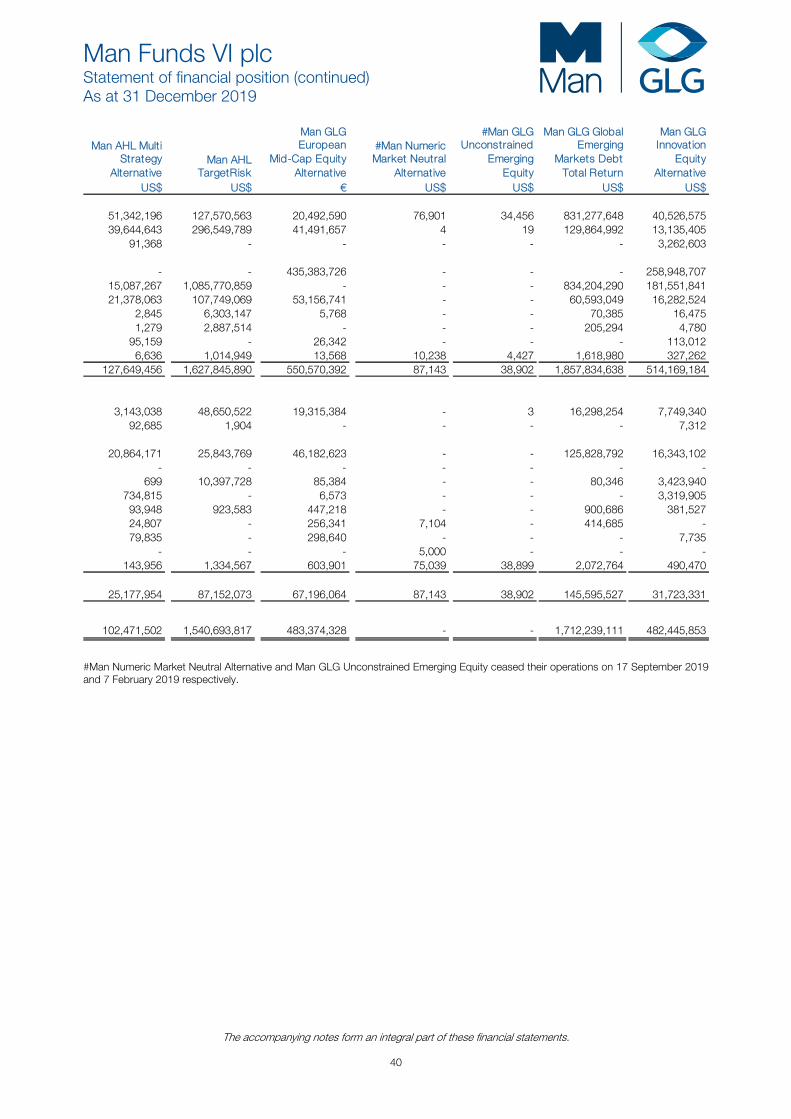
Man Funds VI plc Statement of financial position (continued) As at 31 December 2019
The accompanying notes form an integral part of these financial statements.
40
Man AHL MultiStrategy
AlternativeMan AHL
TargetRisk
Man GLGEuropean
Mid-Cap EquityAlternative
#Man NumericMarket Neutral
Alternative
#Man GLGUnconstrained
Emerging Equity
Man GLG GlobalEmerging
Markets DebtTotal Return
Man GLGInnovation
EquityAlternative
US$ US$ € US$ US$ US$ US$
51,342,196 127,570,563 20,492,590 76,901 34,456 831,277,648 40,526,575 39,644,643 296,549,789 41,491,657 4 19 129,864,992 13,135,405 91,368 - - - - - 3,262,603
- - 435,383,726 - - - 258,948,707 15,087,267 1,085,770,859 - - - 834,204,290 181,551,841 21,378,063 107,749,069 53,156,741 - - 60,593,049 16,282,524 2,845 6,303,147 5,768 - - 70,385 16,475 1,279 2,887,514 - - - 205,294 4,780 95,159 - 26,342 - - - 113,012 6,636 1,014,949 13,568 10,238 4,427 1,618,980 327,262 127,649,456 1,627,845,890 550,570,392 87,143 38,902 1,857,834,638 514,169,184
3,143,038 48,650,522 19,315,384 - 3 16,298,254 7,749,340 92,685 1,904 - - - - 7,312
20,864,171 25,843,769 46,182,623 - - 125,828,792 16,343,102 - - - - - - -
699 10,397,728 85,384 - - 80,346 3,423,940 734,815 - 6,573 - - - 3,319,905 93,948 923,583 447,218 - - 900,686 381,527 24,807 - 256,341 7,104 - 414,685 - 79,835 - 298,640 - - - 7,735 - - - 5,000 - - -
143,956 1,334,567 603,901 75,039 38,899 2,072,764 490,470
25,177,954 87,152,073 67,196,064 87,143 38,902 145,595,527 31,723,331
102,471,502 1,540,693,817 483,374,328 - - 1,712,239,111 482,445,853
#Man Numeric Market Neutral Alternative and Man GLG Unconstrained Emerging Equity ceased their operations on 17 September 2019 and 7 February 2019 respectively.
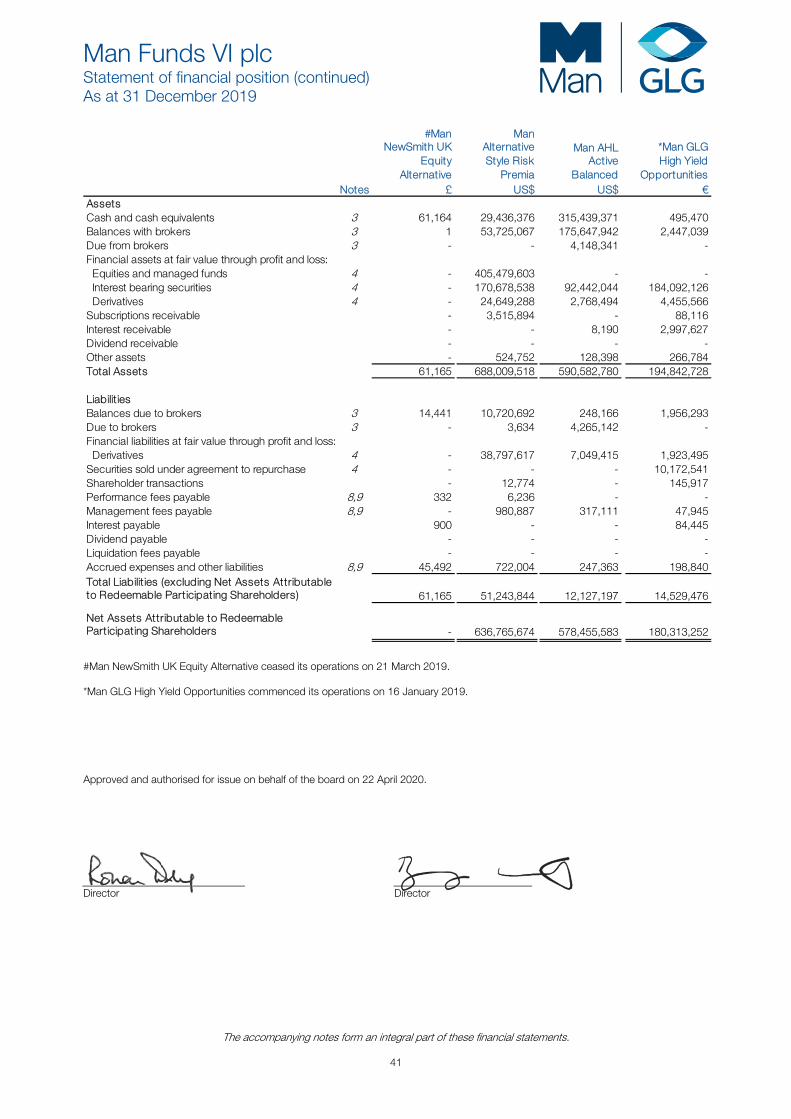
Man Funds VI plc Statement of financial position (continued) As at 31 December 2019
The accompanying notes form an integral part of these financial statements.
41
#Man NewSmith UK
Equity Alternative
Man Alternative Style Risk
Premia
Man AHL Active
Balanced
*Man GLGHigh Yield
OpportunitiesNotes £ US$ US$ €
AssetsCash and cash equivalents 3 61,164 29,436,376 315,439,371 495,470 Balances with brokers 3 1 53,725,067 175,647,942 2,447,039 Due from brokers 3 - - 4,148,341 - Financial assets at fair value through profit and loss: Equities and managed funds 4 - 405,479,603 - - Interest bearing securities 4 - 170,678,538 92,442,044 184,092,126 Derivatives 4 - 24,649,288 2,768,494 4,455,566 Subscriptions receivable - 3,515,894 - 88,116 Interest receivable - - 8,190 2,997,627 Dividend receivable - - - - Other assets - 524,752 128,398 266,784 Total Assets 61,165 688,009,518 590,582,780 194,842,728
Liabilit iesBalances due to brokers 3 14,441 10,720,692 248,166 1,956,293 Due to brokers 3 - 3,634 4,265,142 - Financial liabilities at fair value through profit and loss: Derivatives 4 - 38,797,617 7,049,415 1,923,495 Securities sold under agreement to repurchase 4 - - - 10,172,541 Shareholder transactions - 12,774 - 145,917 Performance fees payable 8,9 332 6,236 - - Management fees payable 8,9 - 980,887 317,111 47,945 Interest payable 900 - - 84,445 Dividend payable - - - - Liquidation fees payable - - - - Accrued expenses and other liabilities 8,9 45,492 722,004 247,363 198,840 Total Liabilit ies (excluding Net Assets Attributableto Redeemable Participating Shareholders) 61,165 51,243,844 12,127,197 14,529,476
Net Assets Attributable to Redeemable Participating Shareholders - 636,765,674 578,455,583 180,313,252
#Man NewSmith UK Equity Alternative ceased its operations on 21 March 2019. *Man GLG High Yield Opportunities commenced its operations on 16 January 2019. Approved and authorised for issue on behalf of the board on 22 April 2020.
Director Director
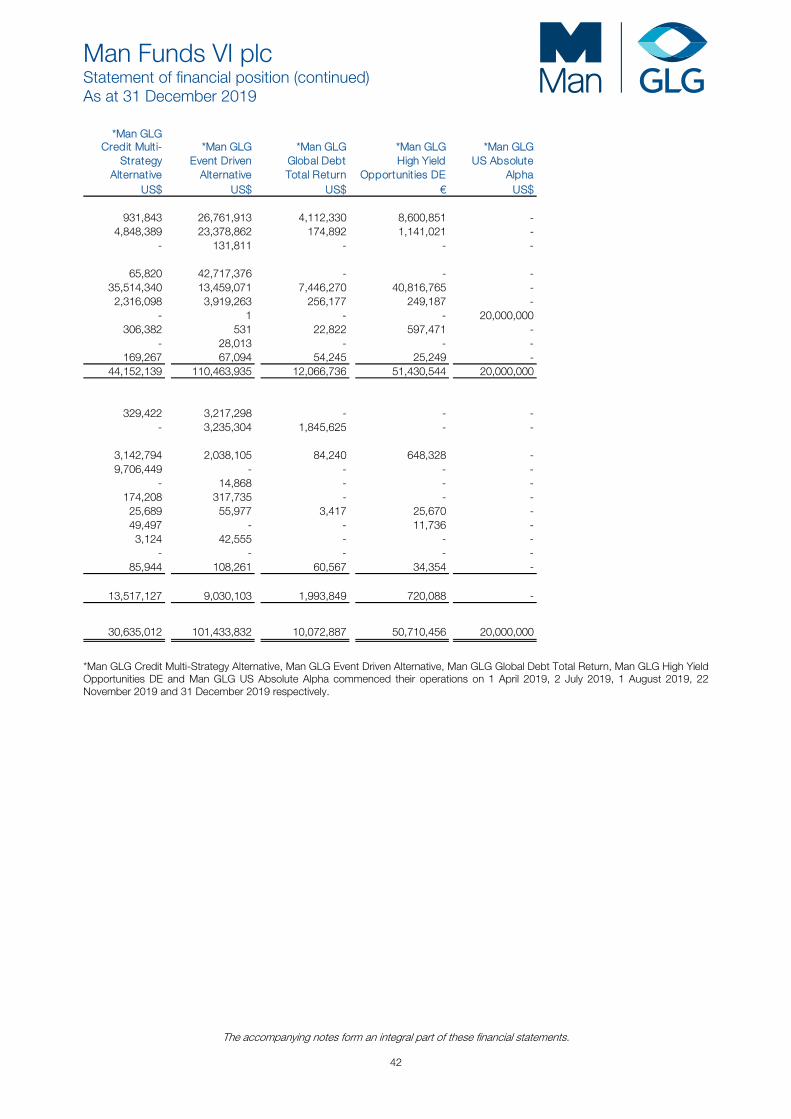
Man Funds VI plc Statement of financial position (continued) As at 31 December 2019
The accompanying notes form an integral part of these financial statements.
42
*Man GLG Credit Multi-
StrategyAlternative
*Man GLG Event Driven
Alternative
*Man GLGGlobal DebtTotal Return
*Man GLG High Yield
Opportunities DE
*Man GLGUS Absolute
AlphaUS$ US$ US$ € US$
931,843 26,761,913 4,112,330 8,600,851 - 4,848,389 23,378,862 174,892 1,141,021 - - 131,811 - - -
65,820 42,717,376 - - - 35,514,340 13,459,071 7,446,270 40,816,765 - 2,316,098 3,919,263 256,177 249,187 - - 1 - - 20,000,000
306,382 531 22,822 597,471 - - 28,013 - - -
169,267 67,094 54,245 25,249 - 44,152,139 110,463,935 12,066,736 51,430,544 20,000,000
329,422 3,217,298 - - - - 3,235,304 1,845,625 - -
3,142,794 2,038,105 84,240 648,328 - 9,706,449 - - - - - 14,868 - - -
174,208 317,735 - - - 25,689 55,977 3,417 25,670 - 49,497 - - 11,736 - 3,124 42,555 - - - - - - - -
85,944 108,261 60,567 34,354 -
13,517,127 9,030,103 1,993,849 720,088 -
30,635,012 101,433,832 10,072,887 50,710,456 20,000,000
*Man GLG Credit Multi-Strategy Alternative, Man GLG Event Driven Alternative, Man GLG Global Debt Total Return, Man GLG High Yield Opportunities DE and Man GLG US Absolute Alpha commenced their operations on 1 April 2019, 2 July 2019, 1 August 2019, 22 November 2019 and 31 December 2019 respectively.
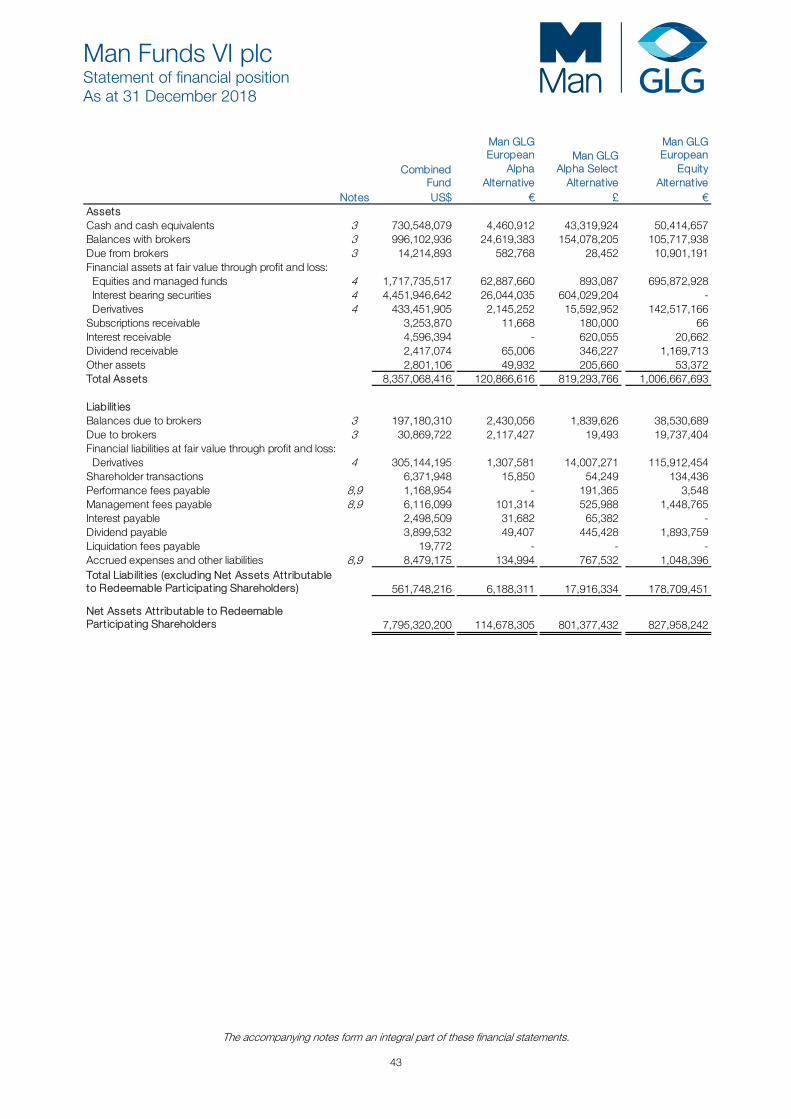
Man Funds VI plc Statement of financial position As at 31 December 2018
The accompanying notes form an integral part of these financial statements.
43
CombinedFund
Man GLGEuropean
AlphaAlternative
Man GLGAlpha Select
Alternative
Man GLGEuropean
EquityAlternative
Notes US$ € £ €AssetsCash and cash equivalents 3 730,548,079 4,460,912 43,319,924 50,414,657 Balances with brokers 3 996,102,936 24,619,383 154,078,205 105,717,938 Due from brokers 3 14,214,893 582,768 28,452 10,901,191 Financial assets at fair value through profit and loss: Equities and managed funds 4 1,717,735,517 62,887,660 893,087 695,872,928 Interest bearing securities 4 4,451,946,642 26,044,035 604,029,204 - Derivatives 4 433,451,905 2,145,252 15,592,952 142,517,166 Subscriptions receivable 3,253,870 11,668 180,000 66 Interest receivable 4,596,394 - 620,055 20,662 Dividend receivable 2,417,074 65,006 346,227 1,169,713 Other assets 2,801,106 49,932 205,660 53,372 Total Assets 8,357,068,416 120,866,616 819,293,766 1,006,667,693
Liabilit iesBalances due to brokers 3 197,180,310 2,430,056 1,839,626 38,530,689 Due to brokers 3 30,869,722 2,117,427 19,493 19,737,404 Financial liabilities at fair value through profit and loss: Derivatives 4 305,144,195 1,307,581 14,007,271 115,912,454 Shareholder transactions 6,371,948 15,850 54,249 134,436 Performance fees payable 8,9 1,168,954 - 191,365 3,548 Management fees payable 8,9 6,116,099 101,314 525,988 1,448,765 Interest payable 2,498,509 31,682 65,382 - Dividend payable 3,899,532 49,407 445,428 1,893,759 Liquidation fees payable 19,772 - - - Accrued expenses and other liabilities 8,9 8,479,175 134,994 767,532 1,048,396 Total Liabilit ies (excluding Net Assets Attributableto Redeemable Participating Shareholders) 561,748,216 6,188,311 17,916,334 178,709,451
Net Assets Attributable to Redeemable Participating Shareholders 7,795,320,200 114,678,305 801,377,432 827,958,242

Man Funds VI plc Statement of financial position (continued) As at 31 December 2018
The accompanying notes form an integral part of these financial statements.
44
*Man GLGGlobal Equity
Alternative
Man AHL MultiStrategy
AlternativeMan AHL
TargetRisk
Man GLGEuropean
Mid-Cap EquityAlternative
Man NumericMarket Neutral
Alternative
Man GLGUnconstrained
Emerging Equity
Man GLG Global
EmergingMarkets Debt
Total Return€ US$ US$ € US$ US$ US$
162,680 47,346,921 85,307,646 48,898,072 1,189,686 7,060,275 259,452,238 193 26,798,642 121,123,428 187,407,321 43,515,331 18,851,509 116,207,154 - 401,104 - - - - -
- - - 409,188,457 20,609,821 44,784,594 - - 21,374,580 403,222,676 - - 4,991,228 2,980,209,660 - 17,800,252 23,020,452 22,689,774 1,988,569 467,484 126,332,308 - 3,572 8,316 30 - - 107,636
80 2,073 1,005,301 - 17,232 19,873 2,610,383 - 83,179 - 39,860 - 100,312 -
31,458 - 315,172 10,179 61,963 87,680 1,222,686 194,411 113,810,323 634,002,991 668,233,693 67,382,602 76,362,955 3,486,142,065
110,294 2,599,560 6,858,892 368,539 44,878,495 14,808,927 48,904,011 87 342,866 868 - - 10 -
- 14,896,731 12,480,342 24,683,074 637,033 2,493,979 75,165,577 - - 2,832,850 522 - - 356,541 - 807,686 - 1,616 - - 28 - 87,465 318,260 560,462 46,556 39,028 1,782,194
1,634 30,431 - 268,452 13,584 24,251 2,000,886 - 51,823 - 774,304 - - -
12,922 - - - - 5,000 - 69,474 153,546 658,151 650,541 182,057 140,680 3,209,132
194,411 18,970,108 23,149,363 27,307,510 45,757,725 17,511,875 131,418,369
- 94,840,215 610,853,628 640,926,183 21,624,877 58,851,080 3,354,723,696
*Man GLG Global Equity Alternative ceased its operations on 9 January 2018.
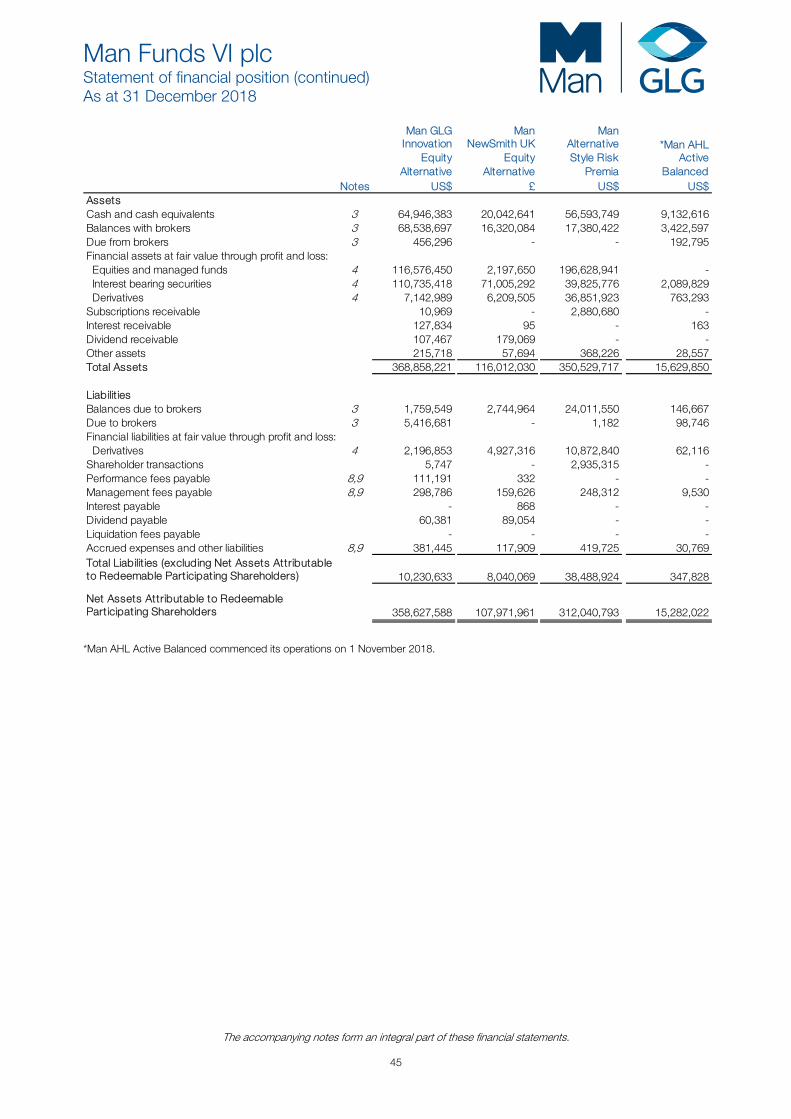
Man Funds VI plc Statement of financial position (continued) As at 31 December 2018
The accompanying notes form an integral part of these financial statements.
45
Man GLGInnovation
EquityAlternative
Man NewSmith UK
Equity Alternative
Man Alternative Style Risk
Premia
*Man AHL Active
BalancedNotes US$ £ US$ US$
AssetsCash and cash equivalents 3 64,946,383 20,042,641 56,593,749 9,132,616 Balances with brokers 3 68,538,697 16,320,084 17,380,422 3,422,597 Due from brokers 3 456,296 - - 192,795 Financial assets at fair value through profit and loss: Equities and managed funds 4 116,576,450 2,197,650 196,628,941 - Interest bearing securities 4 110,735,418 71,005,292 39,825,776 2,089,829 Derivatives 4 7,142,989 6,209,505 36,851,923 763,293 Subscriptions receivable 10,969 - 2,880,680 - Interest receivable 127,834 95 - 163 Dividend receivable 107,467 179,069 - - Other assets 215,718 57,694 368,226 28,557 Total Assets 368,858,221 116,012,030 350,529,717 15,629,850
Liabilit iesBalances due to brokers 3 1,759,549 2,744,964 24,011,550 146,667 Due to brokers 3 5,416,681 - 1,182 98,746 Financial liabilities at fair value through profit and loss: Derivatives 4 2,196,853 4,927,316 10,872,840 62,116 Shareholder transactions 5,747 - 2,935,315 - Performance fees payable 8,9 111,191 332 - - Management fees payable 8,9 298,786 159,626 248,312 9,530 Interest payable - 868 - - Dividend payable 60,381 89,054 - - Liquidation fees payable - - - - Accrued expenses and other liabilities 8,9 381,445 117,909 419,725 30,769 Total Liabilit ies (excluding Net Assets Attributableto Redeemable Participating Shareholders) 10,230,633 8,040,069 38,488,924 347,828
Net Assets Attributable to Redeemable Participating Shareholders 358,627,588 107,971,961 312,040,793 15,282,022
*Man AHL Active Balanced commenced its operations on 1 November 2018.

46
Page left intentionally blank
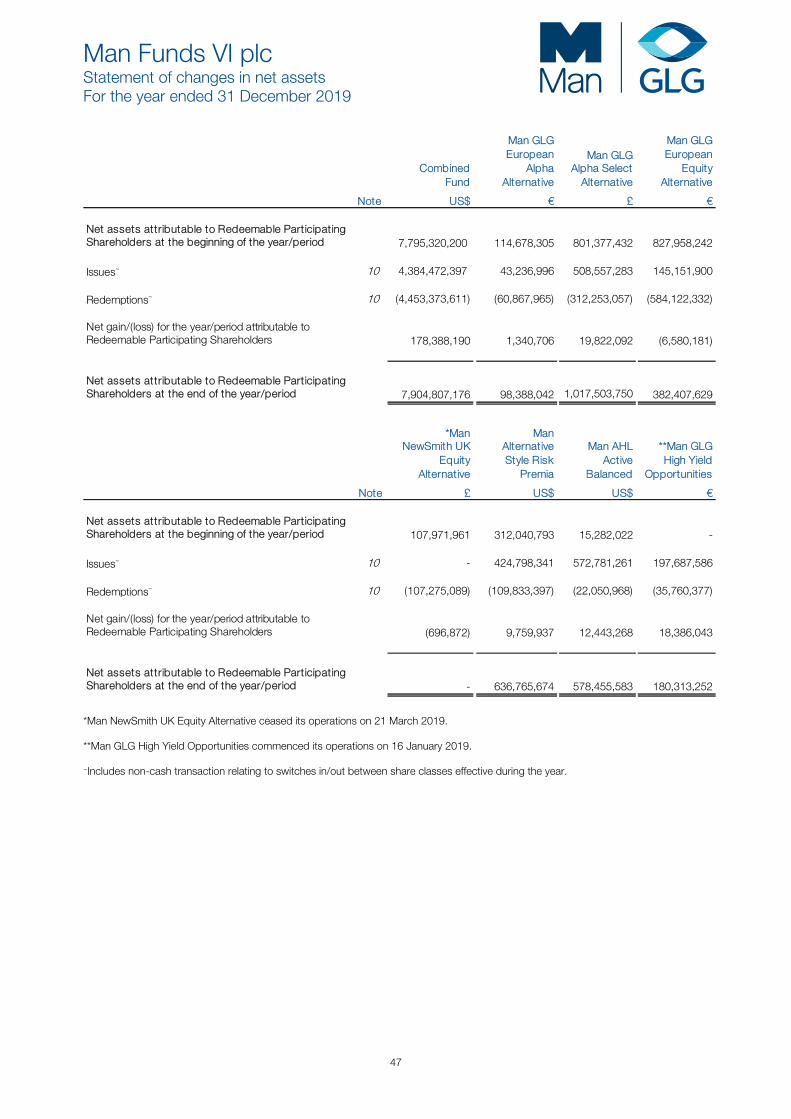
Man Funds VI plc Statement of changes in net assets For the year ended 31 December 2019
47
CombinedFund
Man GLGEuropean
AlphaAlternative
Man GLGAlpha Select
Alternative
Man GLGEuropean
EquityAlternative
Note US$ € £ €
Net assets attributable to Redeemable Participating Shareholders at the beginning of the year/period 7,795,320,200 114,678,305 801,377,432 827,958,242
Issues~ 10 4,384,472,397 43,236,996 508,557,283 145,151,900
Redemptions~ 10 (4,453,373,611) (60,867,965) (312,253,057) (584,122,332)
Net gain/(loss) for the year/period attributable to Redeemable Participating Shareholders 178,388,190 1,340,706 19,822,092 (6,580,181)
Net assets attributable to Redeemable Participating Shareholders at the end of the year/period 7,904,807,176 98,388,042
1,017,503,750 382,407,629
*Man NewSmith UK
Equity Alternative
Man Alternative Style Risk
Premia
Man AHLActive
Balanced
**Man GLGHigh Yield
Opportunities
Note £ US$ US$ €
Net assets attributable to Redeemable Participating Shareholders at the beginning of the year/period 107,971,961 312,040,793 15,282,022 -
Issues~ 10 - 424,798,341 572,781,261 197,687,586
Redemptions~ 10 (107,275,089) (109,833,397) (22,050,968) (35,760,377)
Net gain/(loss) for the year/period attributable to Redeemable Participating Shareholders (696,872) 9,759,937 12,443,268 18,386,043
Net assets attributable to Redeemable Participating Shareholders at the end of the year/period - 636,765,674 578,455,583 180,313,252
*Man NewSmith UK Equity Alternative ceased its operations on 21 March 2019. **Man GLG High Yield Opportunities commenced its operations on 16 January 2019. ~Includes non-cash transaction relating to switches in/out between share classes effective during the year.
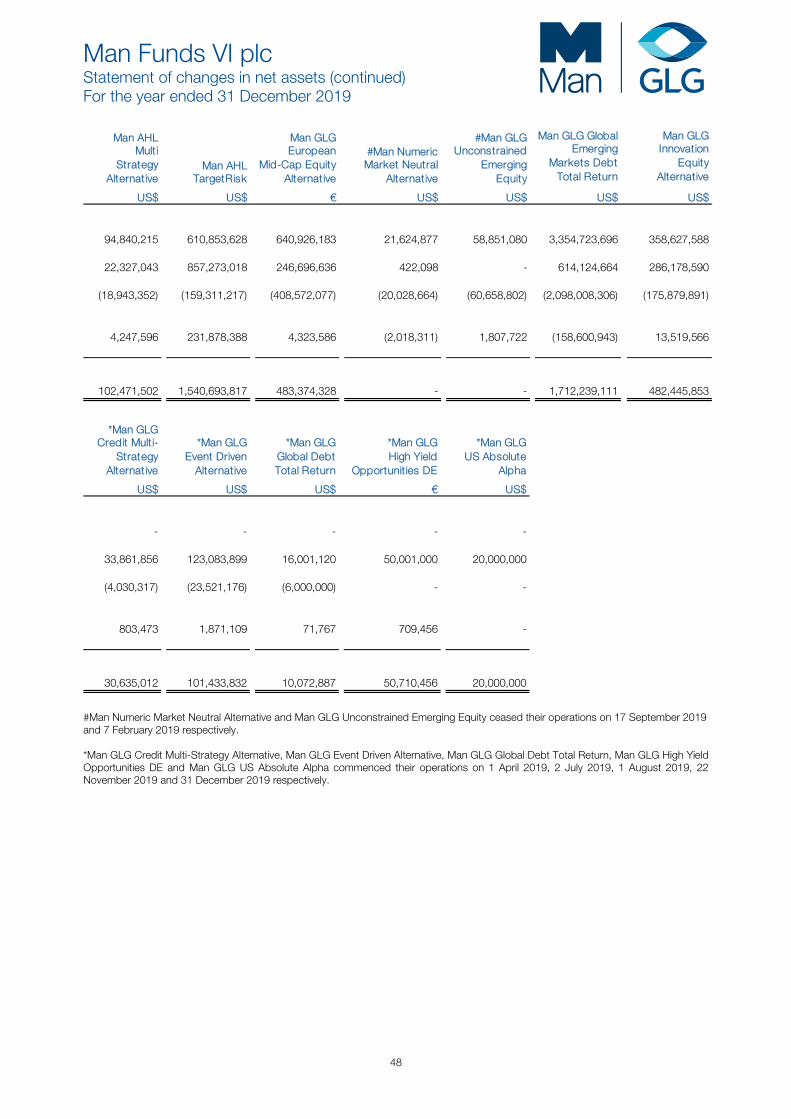
Man Funds VI plc Statement of changes in net assets (continued) For the year ended 31 December 2019
48
Man AHL Multi
StrategyAlternative
Man AHLTargetRisk
Man GLGEuropean
Mid-Cap EquityAlternative
#Man NumericMarket Neutral
Alternative
#Man GLGUnconstrained
Emerging Equity
Man GLG GlobalEmerging
Markets DebtTotal Return
Man GLGInnovation
EquityAlternative
US$ US$ € US$ US$ US$ US$
94,840,215 610,853,628 640,926,183 21,624,877 58,851,080 3,354,723,696 358,627,588
22,327,043 857,273,018 246,696,636 422,098 - 614,124,664 286,178,590
(18,943,352) (159,311,217) (408,572,077) (20,028,664) (60,658,802) (2,098,008,306) (175,879,891)
4,247,596 231,878,388 4,323,586 (2,018,311) 1,807,722 (158,600,943) 13,519,566
102,471,502 1,540,693,817 483,374,328 - - 1,712,239,111 482,445,853
*Man GLG Credit Multi-
StrategyAlternative
*Man GLG Event Driven
Alternative
*Man GLG Global DebtTotal Return
*Man GLG High Yield
Opportunities DE
*Man GLGUS Absolute
Alpha
US$ US$ US$ € US$
- - - - -
33,861,856 123,083,899 16,001,120 50,001,000 20,000,000
(4,030,317) (23,521,176) (6,000,000) - -
803,473 1,871,109 71,767 709,456 -
30,635,012 101,433,832 10,072,887 50,710,456 20,000,000
#Man Numeric Market Neutral Alternative and Man GLG Unconstrained Emerging Equity ceased their operations on 17 September 2019 and 7 February 2019 respectively. *Man GLG Credit Multi-Strategy Alternative, Man GLG Event Driven Alternative, Man GLG Global Debt Total Return, Man GLG High Yield Opportunities DE and Man GLG US Absolute Alpha commenced their operations on 1 April 2019, 2 July 2019, 1 August 2019, 22 November 2019 and 31 December 2019 respectively.
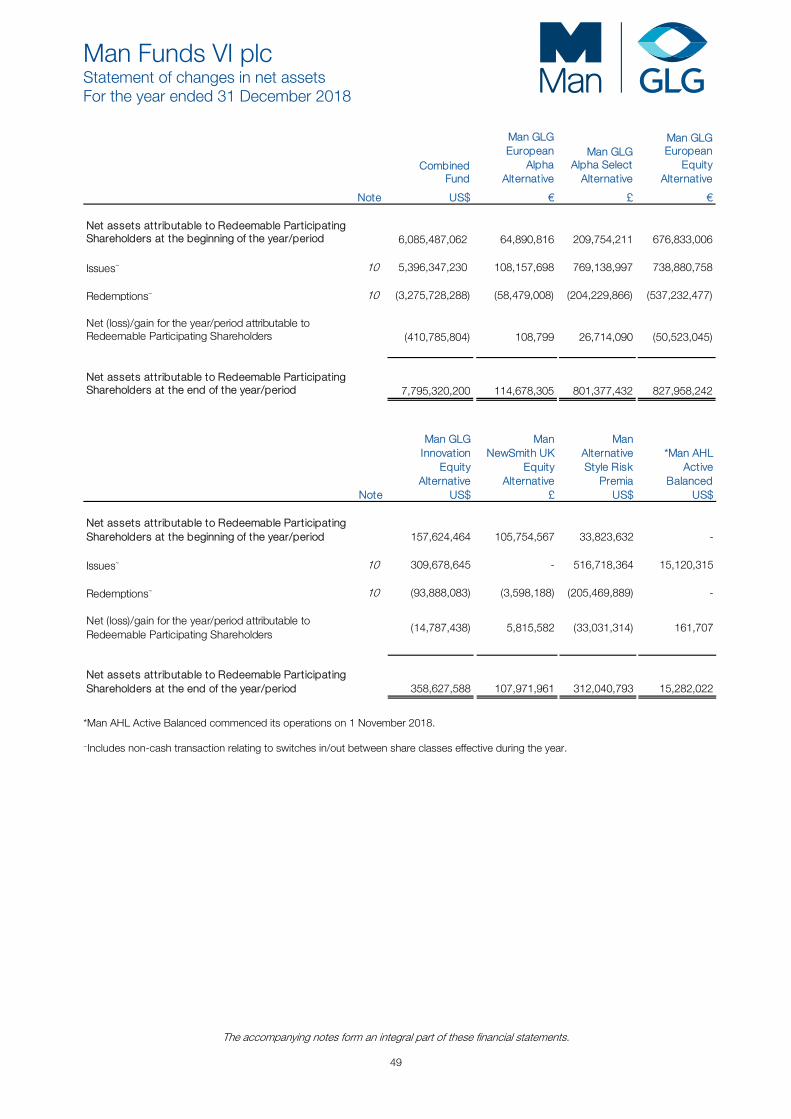
Man Funds VI plc Statement of changes in net assets For the year ended 31 December 2018
The accompanying notes form an integral part of these financial statements.
49
CombinedFund
Man GLGEuropean
AlphaAlternative
Man GLGAlpha Select
Alternative
Man GLGEuropean
EquityAlternative
Note US$ € £ €
Net assets attributable to Redeemable Participating Shareholders at the beginning of the year/period 6,085,487,062 64,890,816 209,754,211 676,833,006
Issues~ 10 5,396,347,230 108,157,698 769,138,997 738,880,758
Redemptions~ 10 (3,275,728,288) (58,479,008) (204,229,866) (537,232,477)
Net (loss)/gain for the year/period attributable to Redeemable Participating Shareholders (410,785,804) 108,799 26,714,090 (50,523,045)
Net assets attributable to Redeemable Participating Shareholders at the end of the year/period 7,795,320,200 114,678,305 801,377,432 827,958,242
Man GLGInnovation
EquityAlternative
Man NewSmith UK
Equity Alternative
ManAlternativeStyle Risk
Premia
*Man AHLActive
BalancedNote US$ £ US$ US$
Net assets attributable to Redeemable Participating Shareholders at the beginning of the year/period 157,624,464 105,754,567 33,823,632 -
Issues~ 10 309,678,645 - 516,718,364 15,120,315
Redemptions~ 10 (93,888,083) (3,598,188) (205,469,889) -
Net (loss)/gain for the year/period attributable to Redeemable Participating Shareholders
(14,787,438) 5,815,582 (33,031,314) 161,707
Net assets attributable to Redeemable Participating Shareholders at the end of the year/period 358,627,588 107,971,961 312,040,793 15,282,022
*Man AHL Active Balanced commenced its operations on 1 November 2018. ~Includes non-cash transaction relating to switches in/out between share classes effective during the year.
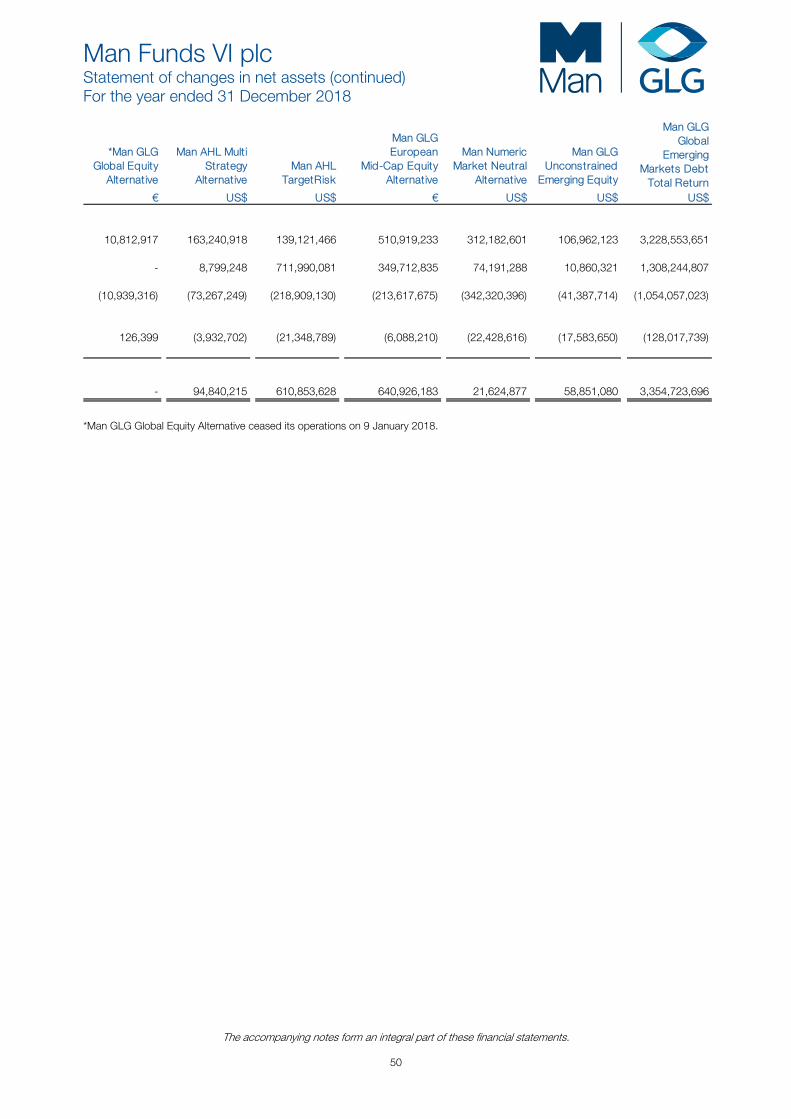
Man Funds VI plc Statement of changes in net assets (continued) For the year ended 31 December 2018
The accompanying notes form an integral part of these financial statements.
50
*Man GLGGlobal Equity
Alternative
Man AHL MultiStrategy
Alternative Man AHL
TargetRisk
Man GLGEuropean
Mid-Cap EquityAlternative
Man NumericMarket Neutral
Alternative
Man GLGUnconstrained
Emerging Equity
Man GLG Global
EmergingMarkets Debt
Total Return € US$ US$ € US$ US$ US$
10,812,917 163,240,918 139,121,466 510,919,233 312,182,601 106,962,123 3,228,553,651
- 8,799,248 711,990,081 349,712,835 74,191,288 10,860,321 1,308,244,807
(10,939,316) (73,267,249) (218,909,130) (213,617,675) (342,320,396) (41,387,714) (1,054,057,023)
126,399 (3,932,702) (21,348,789) (6,088,210) (22,428,616) (17,583,650) (128,017,739)
- 94,840,215 610,853,628 640,926,183 21,624,877 58,851,080 3,354,723,696
*Man GLG Global Equity Alternative ceased its operations on 9 January 2018.
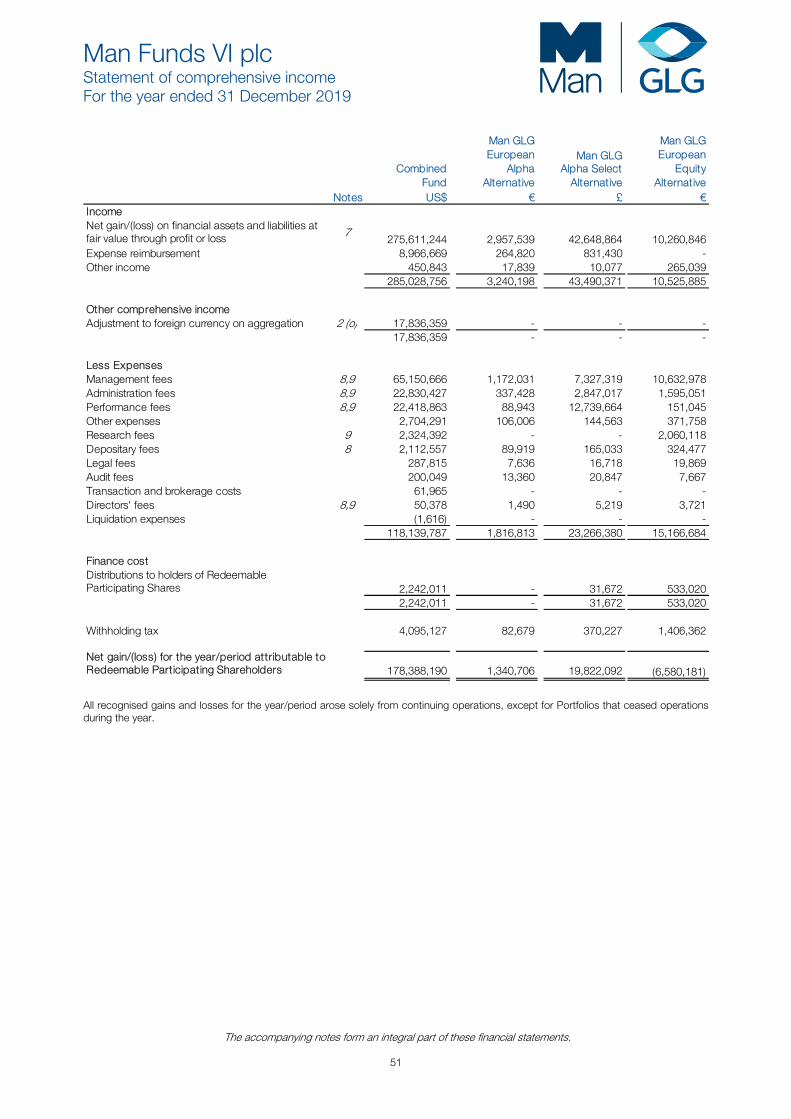
Man Funds VI plc Statement of comprehensive income For the year ended 31 December 2019
The accompanying notes form an integral part of these financial statements.
51
CombinedFund
Man GLGEuropean
AlphaAlternative
Man GLGAlpha Select
Alternative
Man GLGEuropean
EquityAlternative
Notes US$ € £ € IncomeNet gain/(loss) on financial assets and liabilities at fair value through profit or loss 7
275,611,244 2,957,539 42,648,864 10,260,846 Expense reimbursement 8,966,669 264,820 831,430 - Other income 450,843 17,839 10,077 265,039
285,028,756 3,240,198 43,490,371 10,525,885
Other comprehensive incomeAdjustment to foreign currency on aggregation 2 (o) 17,836,359 - - -
17,836,359 - - -
Less ExpensesManagement fees 8,9 65,150,666 1,172,031 7,327,319 10,632,978 Administration fees 8,9 22,830,427 337,428 2,847,017 1,595,051 Performance fees 8,9 22,418,863 88,943 12,739,664 151,045 Other expenses 2,704,291 106,006 144,563 371,758 Research fees 9 2,324,392 - - 2,060,118 Depositary fees 8 2,112,557 89,919 165,033 324,477 Legal fees 287,815 7,636 16,718 19,869 Audit fees 200,049 13,360 20,847 7,667 Transaction and brokerage costs 61,965 - - - Directors' fees 8,9 50,378 1,490 5,219 3,721 Liquidation expenses (1,616) - - -
118,139,787 1,816,813 23,266,380 15,166,684
Finance costDistributions to holders of Redeemable Participating Shares 2,242,011 - 31,672 533,020
2,242,011 - 31,672 533,020
Withholding tax 4,095,127 82,679 370,227 1,406,362
Net gain/(loss) for the year/period attributable to Redeemable Participating Shareholders 178,388,190 1,340,706 19,822,092 (6,580,181)
All recognised gains and losses for the year/period arose solely from continuing operations, except for Portfolios that ceased operations during the year.
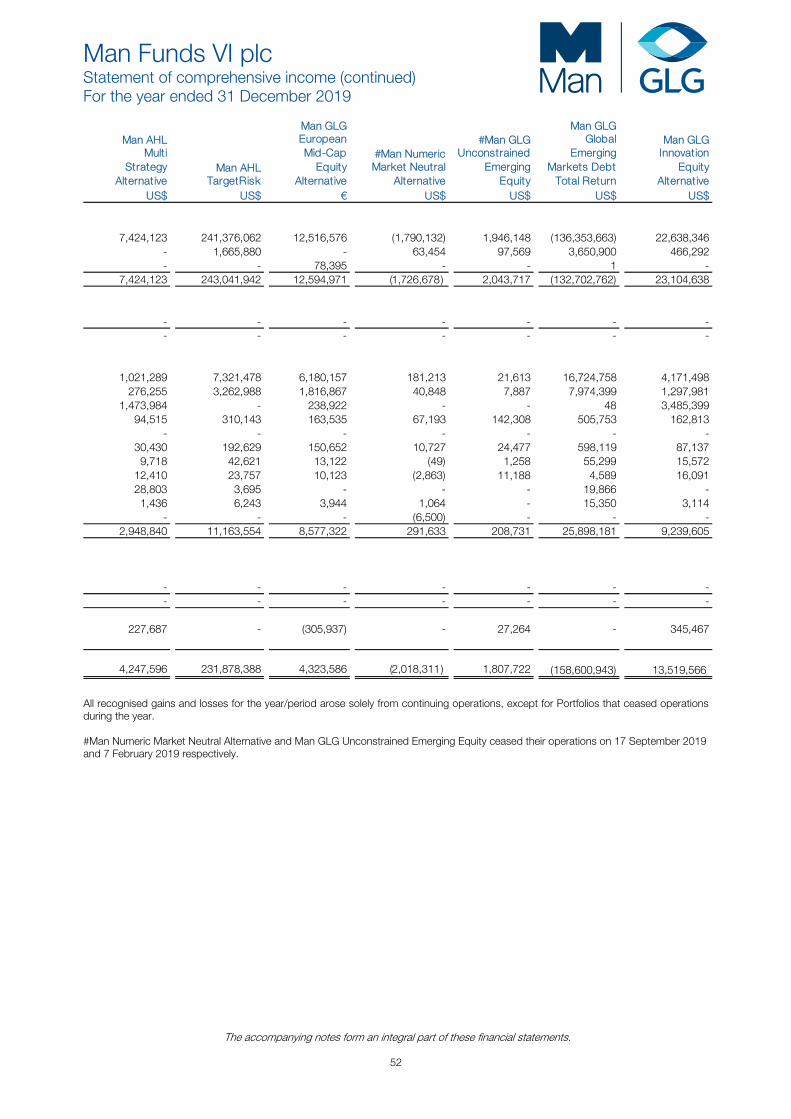
Man Funds VI plc Statement of comprehensive income (continued) For the year ended 31 December 2019
The accompanying notes form an integral part of these financial statements.
52
Man AHL Multi
StrategyAlternative
Man AHLTargetRisk
Man GLGEuropeanMid-Cap
EquityAlternative
#Man NumericMarket Neutral
Alternative
#Man GLGUnconstrained
Emerging Equity
Man GLG Global
EmergingMarkets Debt
Total Return
Man GLGInnovation
EquityAlternative
US$ US$ € US$ US$ US$ US$
7,424,123 241,376,062 12,516,576 (1,790,132) 1,946,148 (136,353,663) 22,638,346 - 1,665,880 - 63,454 97,569 3,650,900 466,292 - - 78,395 - - 1 -
7,424,123 243,041,942 12,594,971 (1,726,678 ) 2,043,717 (132,702,762) 23,104,638
- - - - - - - - - - - - - -
1,021,289 7,321,478 6,180,157 181,213 21,613 16,724,758 4,171,498 276,255 3,262,988 1,816,867 40,848 7,887 7,974,399 1,297,981 1,473,984 - 238,922 - - 48 3,485,399 94,515 310,143 163,535 67,193 142,308 505,753 162,813 - - - - - - - 30,430 192,629 150,652 10,727 24,477 598,119 87,137 9,718 42,621 13,122 (49) 1,258 55,299 15,572 12,410 23,757 10,123 (2,863) 11,188 4,589 16,091 28,803 3,695 - - - 19,866 - 1,436 6,243 3,944 1,064 - 15,350 3,114 - - - (6,500) - - -
2,948,840 11,163,554 8,577,322 291,633 208,731 25,898,181 9,239,605
- - - - - - - - - - - - - -
227,687 - (305,937) - 27,264 - 345,467
4,247,596 231,878,388 4,323,586 (2,018,311 ) 1,807,722 (158,600,943) 13,519,566
All recognised gains and losses for the year/period arose solely from continuing operations, except for Portfolios that ceased operations during the year. #Man Numeric Market Neutral Alternative and Man GLG Unconstrained Emerging Equity ceased their operations on 17 September 2019 and 7 February 2019 respectively.
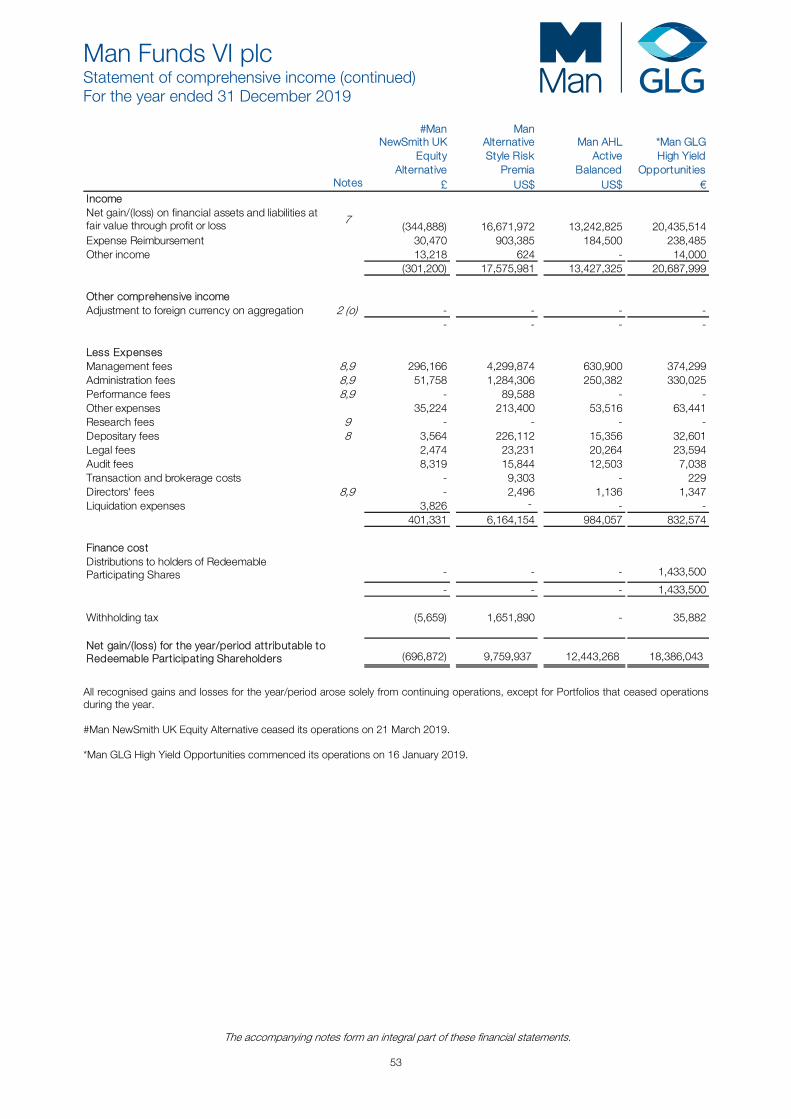
Man Funds VI plc Statement of comprehensive income (continued) For the year ended 31 December 2019
The accompanying notes form an integral part of these financial statements.
53
#Man NewSmith UK
Equity Alternative
Man Alternative Style Risk
Premia
Man AHLActive
Balanced
*Man GLGHigh Yield
OpportunitiesNotes £ US$ US$ €
IncomeNet gain/(loss) on financial assets and liabilities at fair value through profit or loss 7
(344,888) 16,671,972 13,242,825 20,435,514 Expense Reimbursement 30,470 903,385 184,500 238,485 Other income 13,218 624 - 14,000
(301,200) 17,575,981 13,427,325 20,687,999
Other comprehensive incomeAdjustment to foreign currency on aggregation 2 (o) - - - -
- - - -
Less ExpensesManagement fees 8,9 296,166 4,299,874 630,900 374,299 Administration fees 8,9 51,758 1,284,306 250,382 330,025 Performance fees 8,9 - 89,588 - - Other expenses 35,224 213,400 53,516 63,441 Research fees 9 - - - - Depositary fees 8 3,564 226,112 15,356 32,601 Legal fees 2,474 23,231 20,264 23,594 Audit fees 8,319 15,844 12,503 7,038 Transaction and brokerage costs - 9,303 - 229 Directors' fees 8,9 - 2,496 1,136 1,347 Liquidation expenses 3,826 - - -
401,331 6,164,154 984,057 832,574
Finance costDistributions to holders of Redeemable Participating Shares - - - 1,433,500
- - - 1,433,500
Withholding tax (5,659) 1,651,890 - 35,882
Net gain/(loss) for the year/period attributable to Redeemable Participating Shareholders (696,872) 9,759,937 12,443,268 18,386,043
All recognised gains and losses for the year/period arose solely from continuing operations, except for Portfolios that ceased operations during the year. #Man NewSmith UK Equity Alternative ceased its operations on 21 March 2019. *Man GLG High Yield Opportunities commenced its operations on 16 January 2019.
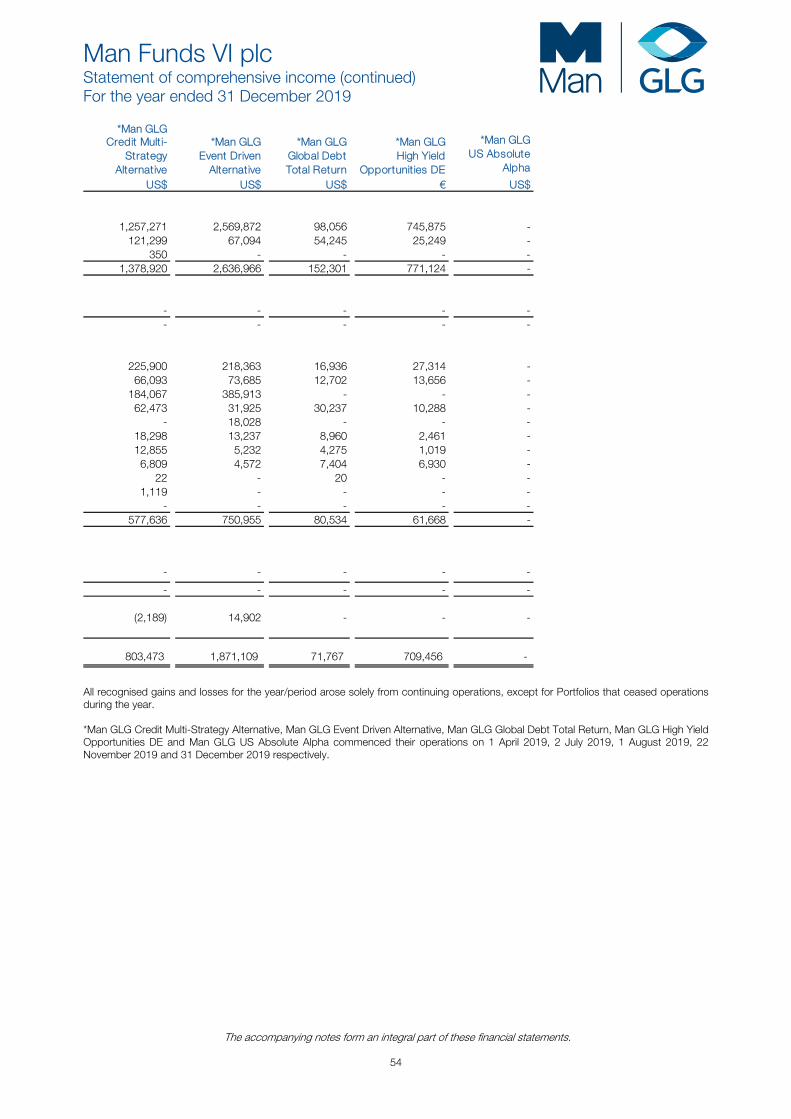
Man Funds VI plc Statement of comprehensive income (continued) For the year ended 31 December 2019
The accompanying notes form an integral part of these financial statements.
54
*Man GLG Credit Multi-
StrategyAlternative
*Man GLG Event Driven
Alternative
*Man GLG Global DebtTotal Return
*Man GLG High Yield
Opportunities DE
*Man GLGUS Absolute
Alpha
US$ US$ US$ € US$
1,257,271 2,569,872 98,056 745,875 - 121,299 67,094 54,245 25,249 - 350 - - - - 1,378,920 2,636,966 152,301 771,124 -
- - - - - - - - - -
225,900 218,363 16,936 27,314 - 66,093 73,685 12,702 13,656 - 184,067 385,913 - - - 62,473 31,925 30,237 10,288 - - 18,028 - - - 18,298 13,237 8,960 2,461 - 12,855 5,232 4,275 1,019 - 6,809 4,572 7,404 6,930 - 22 - 20 - - 1,119 - - - - - - - - - 577,636 750,955 80,534 61,668 -
- - - - -
- - - - -
(2,189) 14,902 - - -
803,473 1,871,109 71,767 709,456 -
All recognised gains and losses for the year/period arose solely from continuing operations, except for Portfolios that ceased operations during the year. *Man GLG Credit Multi-Strategy Alternative, Man GLG Event Driven Alternative, Man GLG Global Debt Total Return, Man GLG High Yield Opportunities DE and Man GLG US Absolute Alpha commenced their operations on 1 April 2019, 2 July 2019, 1 August 2019, 22 November 2019 and 31 December 2019 respectively.
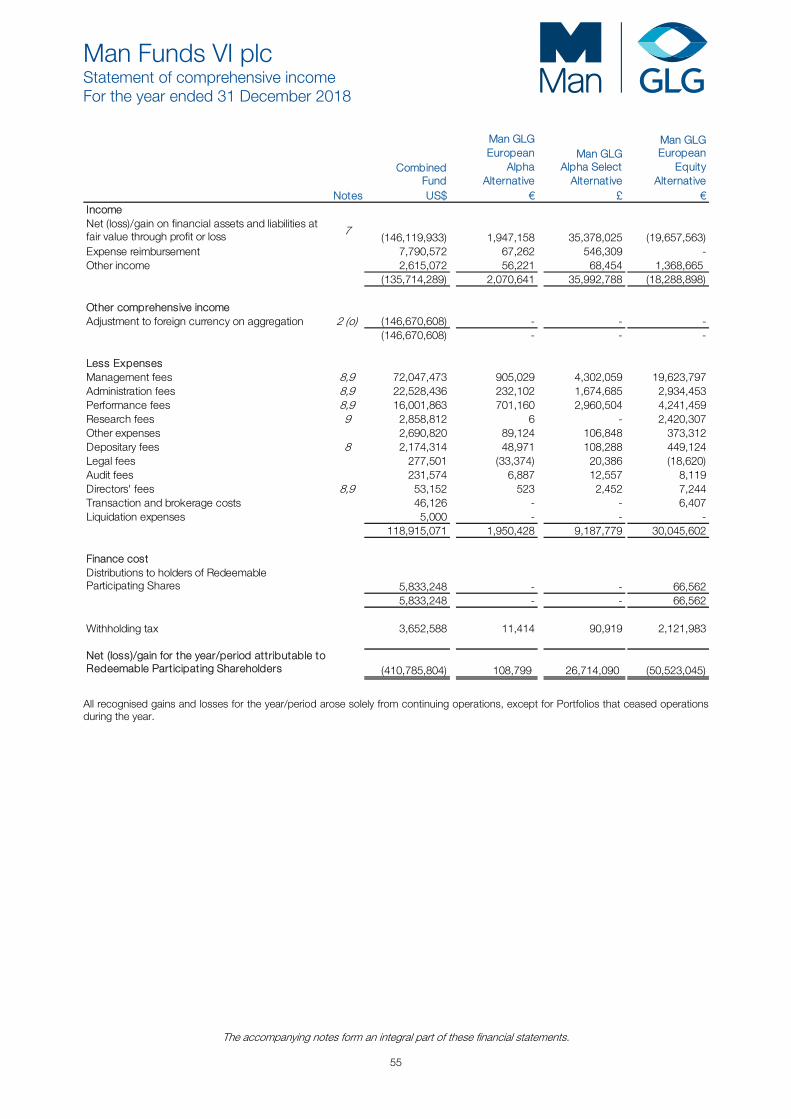
Man Funds VI plc Statement of comprehensive income For the year ended 31 December 2018
The accompanying notes form an integral part of these financial statements.
55
CombinedFund
Man GLGEuropean
AlphaAlternative
Man GLGAlpha Select
Alternative
Man GLGEuropean
EquityAlternative
Notes US$ € £ € IncomeNet (loss)/gain on financial assets and liabilities at fair value through profit or loss 7
(146,119,933) 1,947,158 35,378,025 (19,657,563)Expense reimbursement 7,790,572 67,262 546,309 - Other income 2,615,072 56,221 68,454 1,368,665
(135,714,289) 2,070,641 35,992,788 (18,288,898)
Other comprehensive incomeAdjustment to foreign currency on aggregation 2 (o) (146,670,608) - - -
(146,670,608) - - -
Less ExpensesManagement fees 8,9 72,047,473 905,029 4,302,059 19,623,797 Administration fees 8,9 22,528,436 232,102 1,674,685 2,934,453 Performance fees 8,9 16,001,863 701,160 2,960,504 4,241,459 Research fees 9 2,858,812 6 - 2,420,307 Other expenses 2,690,820 89,124 106,848 373,312 Depositary fees 8 2,174,314 48,971 108,288 449,124 Legal fees 277,501 (33,374) 20,386 (18,620)Audit fees 231,574 6,887 12,557 8,119 Directors' fees 8,9 53,152 523 2,452 7,244 Transaction and brokerage costs 46,126 - - 6,407 Liquidation expenses 5,000 - - -
118,915,071 1,950,428 9,187,779 30,045,602
Finance costDistributions to holders of Redeemable Participating Shares 5,833,248 - - 66,562
5,833,248 - - 66,562
Withholding tax 3,652,588 11,414 90,919 2,121,983
Net (loss)/gain for the year/period attributable to Redeemable Participating Shareholders (410,785,804) 108,799 26,714,090 (50,523,045)
All recognised gains and losses for the year/period arose solely from continuing operations, except for Portfolios that ceased operations during the year.
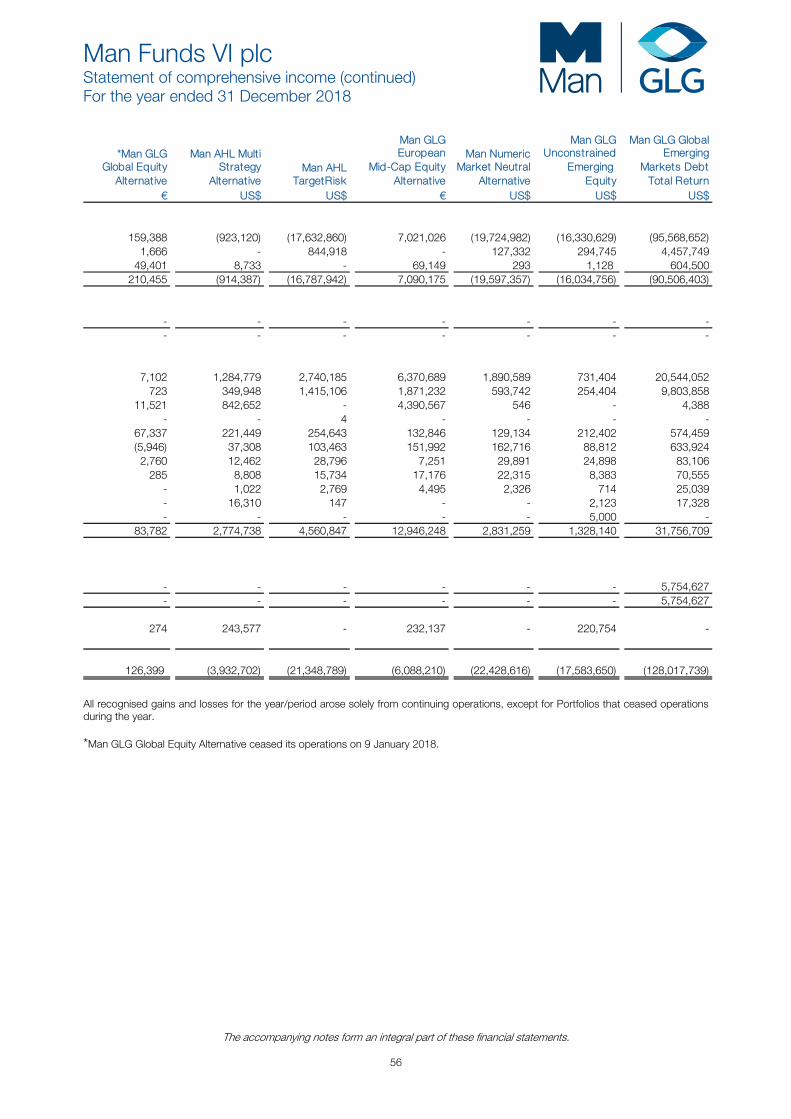
Man Funds VI plc Statement of comprehensive income (continued) For the year ended 31 December 2018
The accompanying notes form an integral part of these financial statements.
56
*Man GLGGlobal Equity
Alternative
Man AHL MultiStrategy
Alternative Man AHL
TargetRisk
Man GLGEuropean
Mid-Cap EquityAlternative
Man NumericMarket Neutral
Alternative
Man GLGUnconstrained
Emerging Equity
Man GLG GlobalEmerging
Markets DebtTotal Return
€ US$ US$ € US$ US$ US$
159,388 (923,120) (17,632,860) 7,021,026 (19,724,982) (16,330,629) (95,568,652) 1,666 - 844,918 - 127,332 294,745 4,457,749 49,401 8,733 - 69,149 293 1,128 604,500
210,455 (914,387) (16,787,942) 7,090,175 (19,597,357) (16,034,756) (90,506,403)
- - - - - - - - - - - - - -
7,102 1,284,779 2,740,185 6,370,689 1,890,589 731,404 20,544,052 723 349,948 1,415,106 1,871,232 593,742 254,404 9,803,858 11,521 842,652 - 4,390,567 546 - 4,388 - - 4 - - - - 67,337 221,449 254,643 132,846 129,134 212,402 574,459 (5,946) 37,308 103,463 151,992 162,716 88,812 633,924 2,760 12,462 28,796 7,251 29,891 24,898 83,106 285 8,808 15,734 17,176 22,315 8,383 70,555 - 1,022 2,769 4,495 2,326 714 25,039 - 16,310 147 - - 2,123 17,328 - - - - - 5,000 -
83,782 2,774,738 4,560,847 12,946,248 2,831,259 1,328,140 31,756,709
- - - - - - 5,754,627 - - - - - - 5,754,627
274 243,577 - 232,137 - 220,754 -
126,399 (3,932,702) (21,348,789) (6,088,210) (22,428,616) (17,583,650) (128,017,739)
All recognised gains and losses for the year/period arose solely from continuing operations, except for Portfolios that ceased operations during the year. *Man GLG Global Equity Alternative ceased its operations on 9 January 2018.
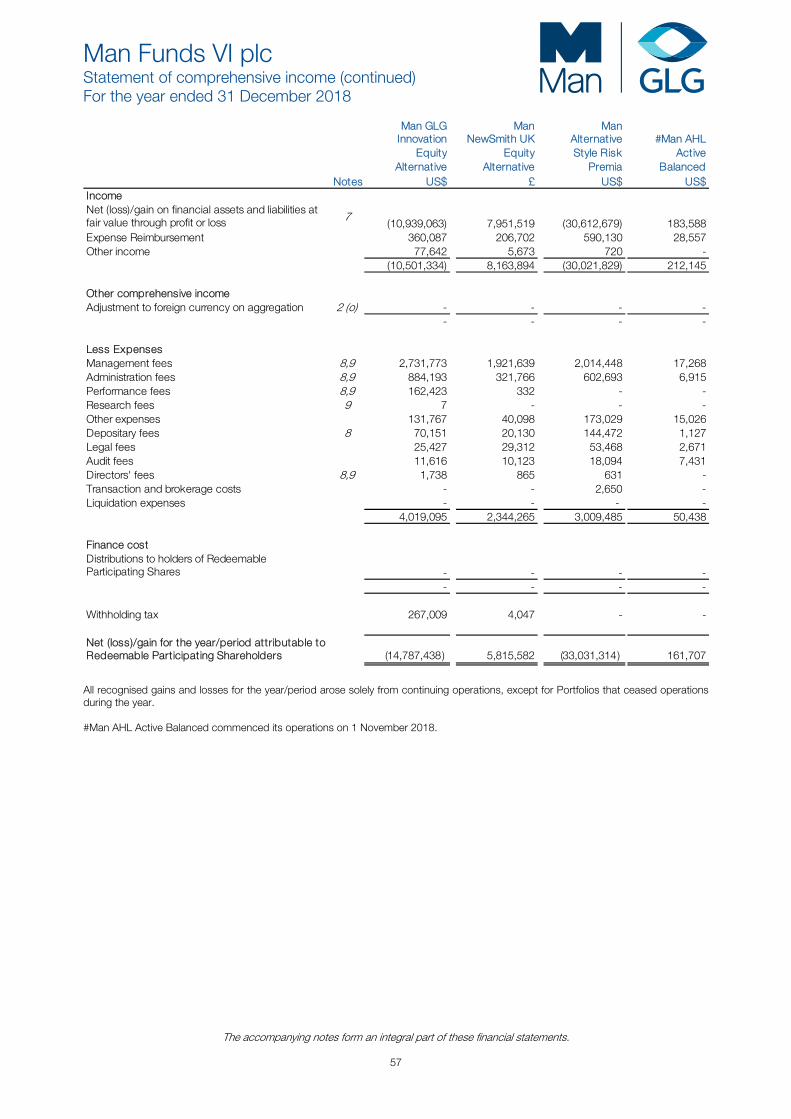
Man Funds VI plc Statement of comprehensive income (continued) For the year ended 31 December 2018
The accompanying notes form an integral part of these financial statements.
57
Man GLGInnovation
EquityAlternative
Man NewSmith UK
Equity Alternative
Man AlternativeStyle Risk
Premia
#Man AHLActive
BalancedNotes US$ £ US$ US$
IncomeNet (loss)/gain on financial assets and liabilities at fair value through profit or loss 7
(10,939,063) 7,951,519 (30,612,679) 183,588 Expense Reimbursement 360,087 206,702 590,130 28,557 Other income 77,642 5,673 720 -
(10,501,334) 8,163,894 (30,021,829) 212,145
Other comprehensive incomeAdjustment to foreign currency on aggregation 2 (o) - - - -
- - - -
Less ExpensesManagement fees 8,9 2,731,773 1,921,639 2,014,448 17,268 Administration fees 8,9 884,193 321,766 602,693 6,915 Performance fees 8,9 162,423 332 - - Research fees 9 7 - - - Other expenses 131,767 40,098 173,029 15,026 Depositary fees 8 70,151 20,130 144,472 1,127 Legal fees 25,427 29,312 53,468 2,671 Audit fees 11,616 10,123 18,094 7,431 Directors' fees 8,9 1,738 865 631 - Transaction and brokerage costs - - 2,650 - Liquidation expenses - - - -
4,019,095 2,344,265 3,009,485 50,438
Finance costDistributions to holders of Redeemable Participating Shares - - - -
- - - -
Withholding tax 267,009 4,047 - -
Net (loss)/gain for the year/period attributable to Redeemable Participating Shareholders (14,787,438 ) 5,815,582 (33,031,314 ) 161,707
All recognised gains and losses for the year/period arose solely from continuing operations, except for Portfolios that ceased operations during the year. #Man AHL Active Balanced commenced its operations on 1 November 2018.

58
Page left intentionally blank
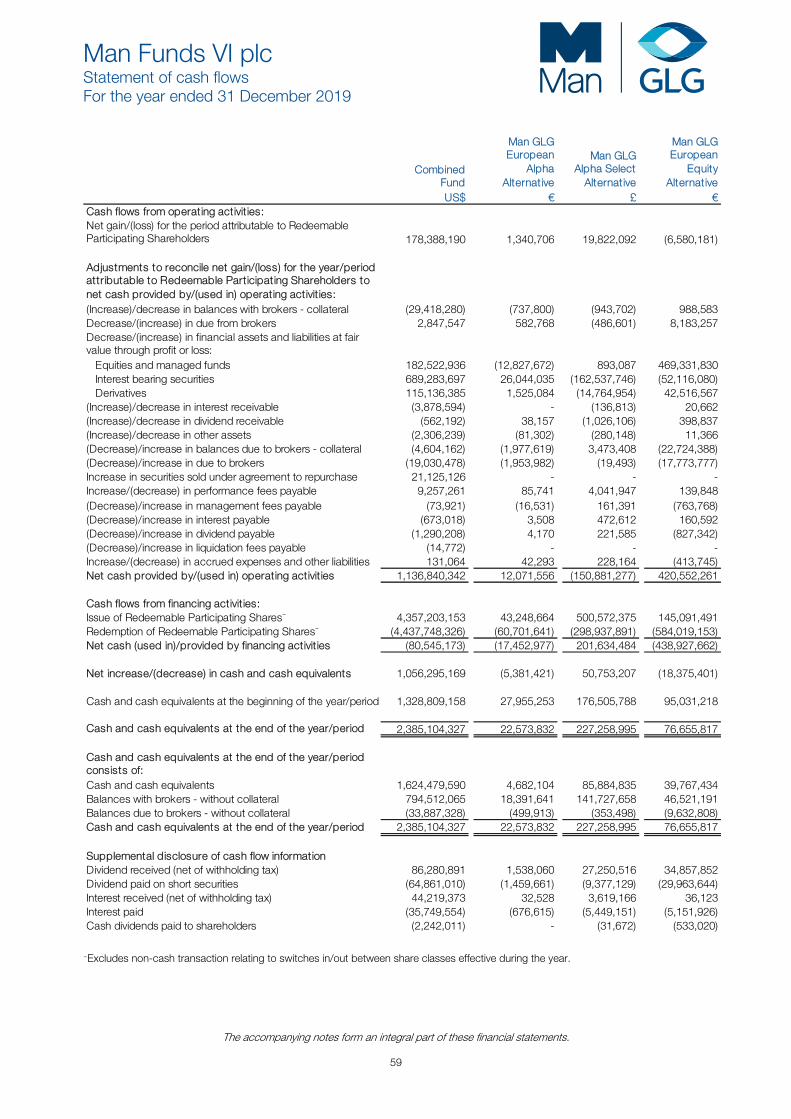
Man Funds VI plc Statement of cash flows For the year ended 31 December 2019
The accompanying notes form an integral part of these financial statements.
59
Combined Fund
Man GLGEuropean
AlphaAlternative
Man GLGAlpha Select
Alternative
Man GLGEuropean
EquityAlternative
US$ € £ € Cash flows from operating activities:Net gain/(loss) for the period attributable to Redeemable Participating Shareholders 178,388,190 1,340,706 19,822,092 (6,580,181)
Adjustments to reconcile net gain/(loss) for the year/period attributable to Redeemable Participating Shareholders to net cash provided by/(used in) operating activities:(Increase)/decrease in balances with brokers - collateral (29,418,280) (737,800) (943,702) 988,583 Decrease/(increase) in due from brokers 2,847,547 582,768 (486,601) 8,183,257 Decrease/(increase) in financial assets and liabilities at fair value through profit or loss: Equities and managed funds 182,522,936 (12,827,672) 893,087 469,331,830 Interest bearing securities 689,283,697 26,044,035 (162,537,746) (52,116,080) Derivatives 115,136,385 1,525,084 (14,764,954) 42,516,567 (Increase)/decrease in interest receivable (3,878,594) - (136,813) 20,662 (Increase)/decrease in dividend receivable (562,192) 38,157 (1,026,106) 398,837 (Increase)/decrease in other assets (2,306,239) (81,302) (280,148) 11,366 (Decrease)/increase in balances due to brokers - collateral (4,604,162) (1,977,619) 3,473,408 (22,724,388)(Decrease)/increase in due to brokers (19,030,478) (1,953,982) (19,493) (17,773,777)Increase in securities sold under agreement to repurchase 21,125,126 - - - Increase/(decrease) in performance fees payable 9,257,261 85,741 4,041,947 139,848 (Decrease)/increase in management fees payable (73,921) (16,531) 161,391 (763,768)(Decrease)/increase in interest payable (673,018) 3,508 472,612 160,592 (Decrease)/increase in dividend payable (1,290,208) 4,170 221,585 (827,342)(Decrease)/increase in liquidation fees payable (14,772) - - - Increase/(decrease) in accrued expenses and other liabilities 131,064 42,293 228,164 (413,745)Net cash provided by/(used in) operating activities 1,136,840,342 12,071,556 (150,881,277) 420,552,261
Cash flows from financing activities:Issue of Redeemable Participating Shares~ 4,357,203,153 43,248,664 500,572,375 145,091,491 Redemption of Redeemable Participating Shares~ (4,437,748,326) (60,701,641) (298,937,891) (584,019,153)Net cash (used in)/provided by financing activities (80,545,173) (17,452,977) 201,634,484 (438,927,662)
Net increase/(decrease) in cash and cash equivalents 1,056,295,169 (5,381,421) 50,753,207 (18,375,401)
Cash and cash equivalents at the beginning of the year/period 1,328,809,158 27,955,253 176,505,788 95,031,218
Cash and cash equivalents at the end of the year/period 2,385,104,327 22,573,832 227,258,995 76,655,817
Cash and cash equivalents at the end of the year/period consists of:Cash and cash equivalents 1,624,479,590 4,682,104 85,884,835 39,767,434 Balances with brokers - without collateral 794,512,065 18,391,641 141,727,658 46,521,191 Balances due to brokers - without collateral (33,887,328) (499,913) (353,498) (9,632,808)Cash and cash equivalents at the end of the year/period 2,385,104,327 22,573,832 227,258,995 76,655,817
Supplemental disclosure of cash flow informationDividend received (net of withholding tax) 86,280,891 1,538,060 27,250,516 34,857,852 Dividend paid on short securities (64,861,010) (1,459,661) (9,377,129) (29,963,644)Interest received (net of withholding tax) 44,219,373 32,528 3,619,166 36,123 Interest paid (35,749,554) (676,615) (5,449,151) (5,151,926)Cash dividends paid to shareholders (2,242,011) - (31,672) (533,020)
~Excludes non-cash transaction relating to switches in/out between share classes effective during the year.
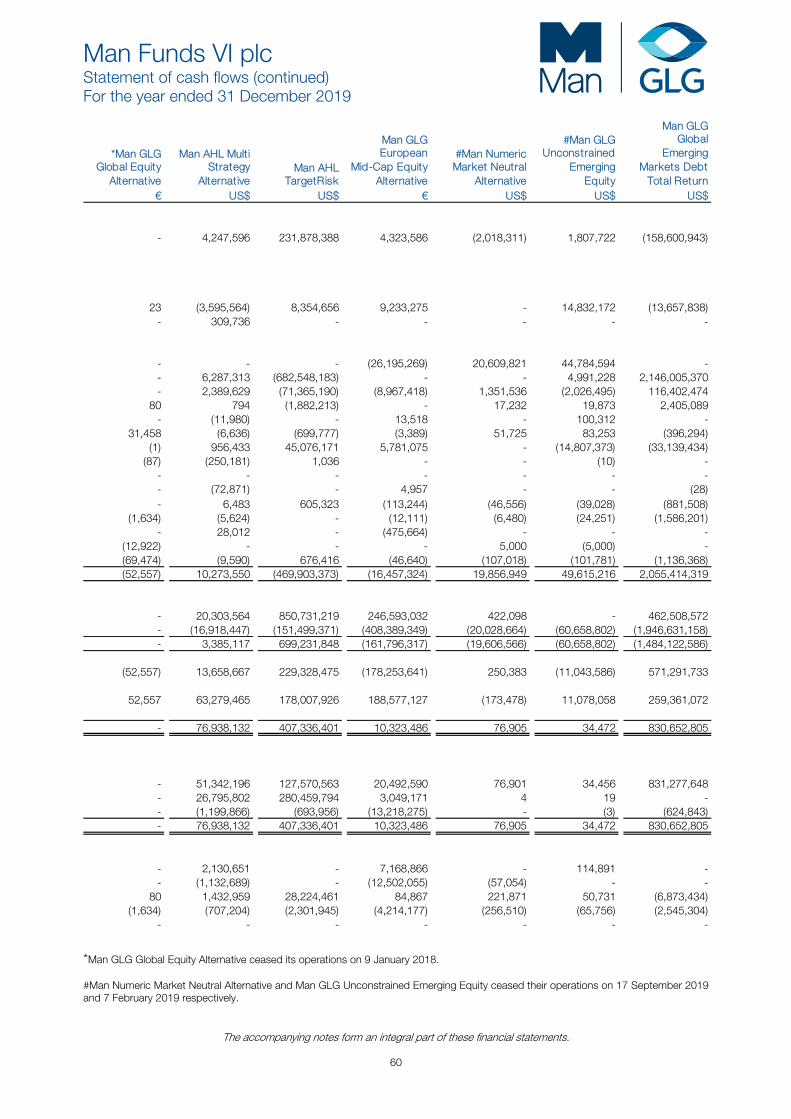
Man Funds VI plc Statement of cash flows (continued) For the year ended 31 December 2019
The accompanying notes form an integral part of these financial statements.
60
*Man GLGGlobal Equity
Alternative
Man AHL MultiStrategy
Alternative Man AHL
TargetRisk
Man GLGEuropean
Mid-Cap EquityAlternative
#Man NumericMarket Neutral
Alternative
#Man GLGUnconstrained
Emerging Equity
Man GLG Global
EmergingMarkets Debt
Total Return € US$ US$ € US$ US$ US$
- 4,247,596 231,878,388 4,323,586 (2,018,311) 1,807,722 (158,600,943)
23 (3,595,564) 8,354,656 9,233,275 - 14,832,172 (13,657,838) - 309,736 - - - - -
- - - (26,195,269) 20,609,821 44,784,594 - - 6,287,313 (682,548,183) - - 4,991,228 2,146,005,370 - 2,389,629 (71,365,190) (8,967,418) 1,351,536 (2,026,495) 116,402,474
80 794 (1,882,213) - 17,232 19,873 2,405,089 - (11,980) - 13,518 - 100,312 -
31,458 (6,636) (699,777) (3,389) 51,725 83,253 (396,294) (1) 956,433 45,076,171 5,781,075 - (14,807,373) (33,139,434) (87) (250,181) 1,036 - - (10) -
- - - - - - - - (72,871) - 4,957 - - (28) - 6,483 605,323 (113,244) (46,556) (39,028) (881,508)
(1,634) (5,624) - (12,111) (6,480) (24,251) (1,586,201) - 28,012 - (475,664) - - -
(12,922) - - - 5,000 (5,000) - (69,474) (9,590) 676,416 (46,640) (107,018) (101,781) (1,136,368) (52,557) 10,273,550 (469,903,373) (16,457,324) 19,856,949 49,615,216 2,055,414,319
- 20,303,564 850,731,219 246,593,032 422,098 - 462,508,572 - (16,918,447) (151,499,371) (408,389,349) (20,028,664) (60,658,802) (1,946,631,158) - 3,385,117 699,231,848 (161,796,317) (19,606,566) (60,658,802) (1,484,122,586)
(52,557) 13,658,667 229,328,475 (178,253,641) 250,383 (11,043,586) 571,291,733
52,557 63,279,465 178,007,926 188,577,127 (173,478) 11,078,058 259,361,072
- 76,938,132 407,336,401 10,323,486 76,905 34,472 830,652,805
- 51,342,196 127,570,563 20,492,590 76,901 34,456 831,277,648 - 26,795,802 280,459,794 3,049,171 4 19 - - (1,199,866) (693,956) (13,218,275) - (3) (624,843) - 76,938,132 407,336,401 10,323,486 76,905 34,472 830,652,805
- 2,130,651 - 7,168,866 - 114,891 - - (1,132,689) - (12,502,055) (57,054) - -
80 1,432,959 28,224,461 84,867 221,871 50,731 (6,873,434) (1,634) (707,204) (2,301,945) (4,214,177) (256,510) (65,756) (2,545,304)
- - - - - - -
*Man GLG Global Equity Alternative ceased its operations on 9 January 2018. #Man Numeric Market Neutral Alternative and Man GLG Unconstrained Emerging Equity ceased their operations on 17 September 2019 and 7 February 2019 respectively.
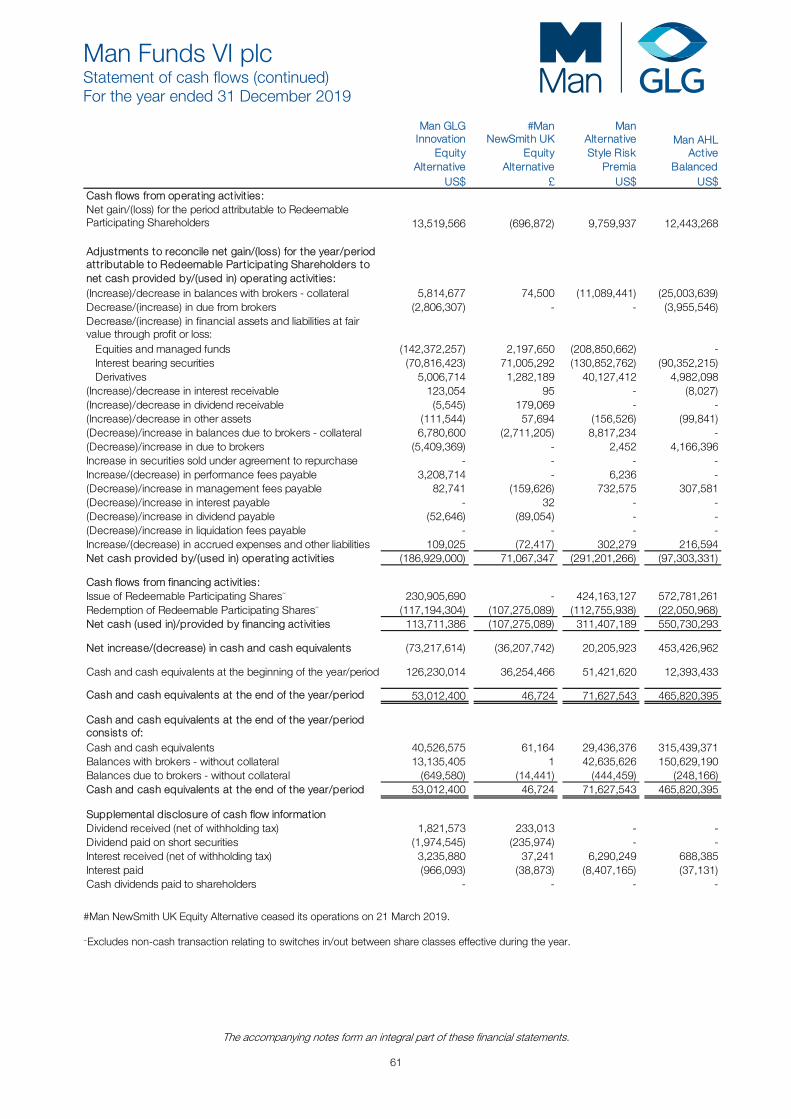
Man Funds VI plc Statement of cash flows (continued) For the year ended 31 December 2019
The accompanying notes form an integral part of these financial statements.
61
Man GLGInnovation
EquityAlternative
#Man NewSmith UK
Equity Alternative
Man Alternative Style Risk
Premia
Man AHL Active
Balanced US$ £ US$ US$
Cash flows from operating activities:Net gain/(loss) for the period attributable to Redeemable Participating Shareholders 13,519,566 (696,872) 9,759,937 12,443,268
Adjustments to reconcile net gain/(loss) for the year/period attributable to Redeemable Participating Shareholders to net cash provided by/(used in) operating activities:(Increase)/decrease in balances with brokers - collateral 5,814,677 74,500 (11,089,441) (25,003,639)Decrease/(increase) in due from brokers (2,806,307) - - (3,955,546)Decrease/(increase) in financial assets and liabilities at fair value through profit or loss: Equities and managed funds (142,372,257) 2,197,650 (208,850,662) - Interest bearing securities (70,816,423) 71,005,292 (130,852,762) (90,352,215) Derivatives 5,006,714 1,282,189 40,127,412 4,982,098 (Increase)/decrease in interest receivable 123,054 95 - (8,027)(Increase)/decrease in dividend receivable (5,545) 179,069 - - (Increase)/decrease in other assets (111,544) 57,694 (156,526) (99,841)(Decrease)/increase in balances due to brokers - collateral 6,780,600 (2,711,205) 8,817,234 - (Decrease)/increase in due to brokers (5,409,369) - 2,452 4,166,396 Increase in securities sold under agreement to repurchase - - - - Increase/(decrease) in performance fees payable 3,208,714 - 6,236 - (Decrease)/increase in management fees payable 82,741 (159,626) 732,575 307,581 (Decrease)/increase in interest payable - 32 - - (Decrease)/increase in dividend payable (52,646) (89,054) - - (Decrease)/increase in liquidation fees payable - - - - Increase/(decrease) in accrued expenses and other liabilities 109,025 (72,417) 302,279 216,594 Net cash provided by/(used in) operating activities (186,929,000) 71,067,347 (291,201,266) (97,303,331)
Cash flows from financing activities:Issue of Redeemable Participating Shares~ 230,905,690 - 424,163,127 572,781,261 Redemption of Redeemable Participating Shares~ (117,194,304) (107,275,089) (112,755,938) (22,050,968)Net cash (used in)/provided by financing activities 113,711,386 (107,275,089) 311,407,189 550,730,293
Net increase/(decrease) in cash and cash equivalents (73,217,614) (36,207,742) 20,205,923 453,426,962
Cash and cash equivalents at the beginning of the year/period 126,230,014 36,254,466 51,421,620 12,393,433
Cash and cash equivalents at the end of the year/period 53,012,400 46,724 71,627,543 465,820,395
Cash and cash equivalents at the end of the year/period consists of:Cash and cash equivalents 40,526,575 61,164 29,436,376 315,439,371 Balances with brokers - without collateral 13,135,405 1 42,635,626 150,629,190 Balances due to brokers - without collateral (649,580) (14,441) (444,459) (248,166)Cash and cash equivalents at the end of the year/period 53,012,400 46,724 71,627,543 465,820,395
Supplemental disclosure of cash flow informationDividend received (net of withholding tax) 1,821,573 233,013 - - Dividend paid on short securities (1,974,545) (235,974) - - Interest received (net of withholding tax) 3,235,880 37,241 6,290,249 688,385 Interest paid (966,093) (38,873) (8,407,165) (37,131)Cash dividends paid to shareholders - - - -
#Man NewSmith UK Equity Alternative ceased its operations on 21 March 2019. ~Excludes non-cash transaction relating to switches in/out between share classes effective during the year.
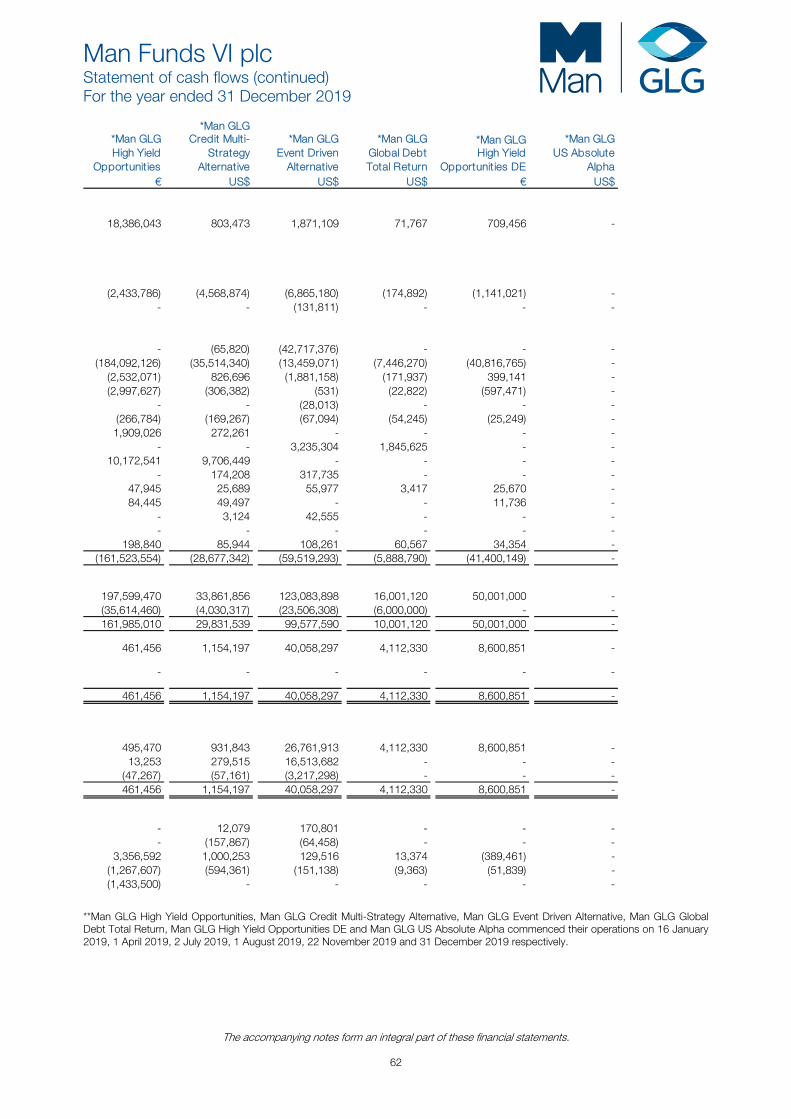
Man Funds VI plc Statement of cash flows (continued) For the year ended 31 December 2019
The accompanying notes form an integral part of these financial statements.
62
*Man GLGHigh Yield
Opportunities
*Man GLG Credit Multi-
StrategyAlternative
*Man GLG
Event DrivenAlternative
*Man GLG
Global DebtTotal Return
*Man GLG High Yield
Opportunities DE
*Man GLG
US AbsoluteAlpha
€ US$ US$ US$ € US$
18,386,043 803,473 1,871,109 71,767 709,456 -
(2,433,786) (4,568,874) (6,865,180) (174,892) (1,141,021) - - - (131,811) - - -
- (65,820) (42,717,376) - - - (184,092,126) (35,514,340) (13,459,071) (7,446,270) (40,816,765) - (2,532,071) 826,696 (1,881,158) (171,937) 399,141 - (2,997,627) (306,382) (531) (22,822) (597,471) -
- - (28,013) - - - (266,784) (169,267) (67,094) (54,245) (25,249) - 1,909,026 272,261 - - - -
- - 3,235,304 1,845,625 - - 10,172,541 9,706,449 - - - -
- 174,208 317,735 - - - 47,945 25,689 55,977 3,417 25,670 - 84,445 49,497 - - 11,736 -
- 3,124 42,555 - - - - - - - - -
198,840 85,944 108,261 60,567 34,354 - (161,523,554) (28,677,342) (59,519,293) (5,888,790) (41,400,149) -
197,599,470 33,861,856 123,083,898 16,001,120 50,001,000 - (35,614,460) (4,030,317) (23,506,308) (6,000,000) - - 161,985,010 29,831,539 99,577,590 10,001,120 50,001,000 -
461,456 1,154,197 40,058,297 4,112,330 8,600,851 -
- - - - - -
461,456 1,154,197 40,058,297 4,112,330 8,600,851 -
495,470 931,843 26,761,913 4,112,330 8,600,851 - 13,253 279,515 16,513,682 - - - (47,267) (57,161) (3,217,298) - - - 461,456 1,154,197 40,058,297 4,112,330 8,600,851 -
- 12,079 170,801 - - - - (157,867) (64,458) - - -
3,356,592 1,000,253 129,516 13,374 (389,461) - (1,267,607) (594,361) (151,138) (9,363) (51,839) - (1,433,500) - - - - -
**Man GLG High Yield Opportunities, Man GLG Credit Multi-Strategy Alternative, Man GLG Event Driven Alternative, Man GLG Global Debt Total Return, Man GLG High Yield Opportunities DE and Man GLG US Absolute Alpha commenced their operations on 16 January 2019, 1 April 2019, 2 July 2019, 1 August 2019, 22 November 2019 and 31 December 2019 respectively.
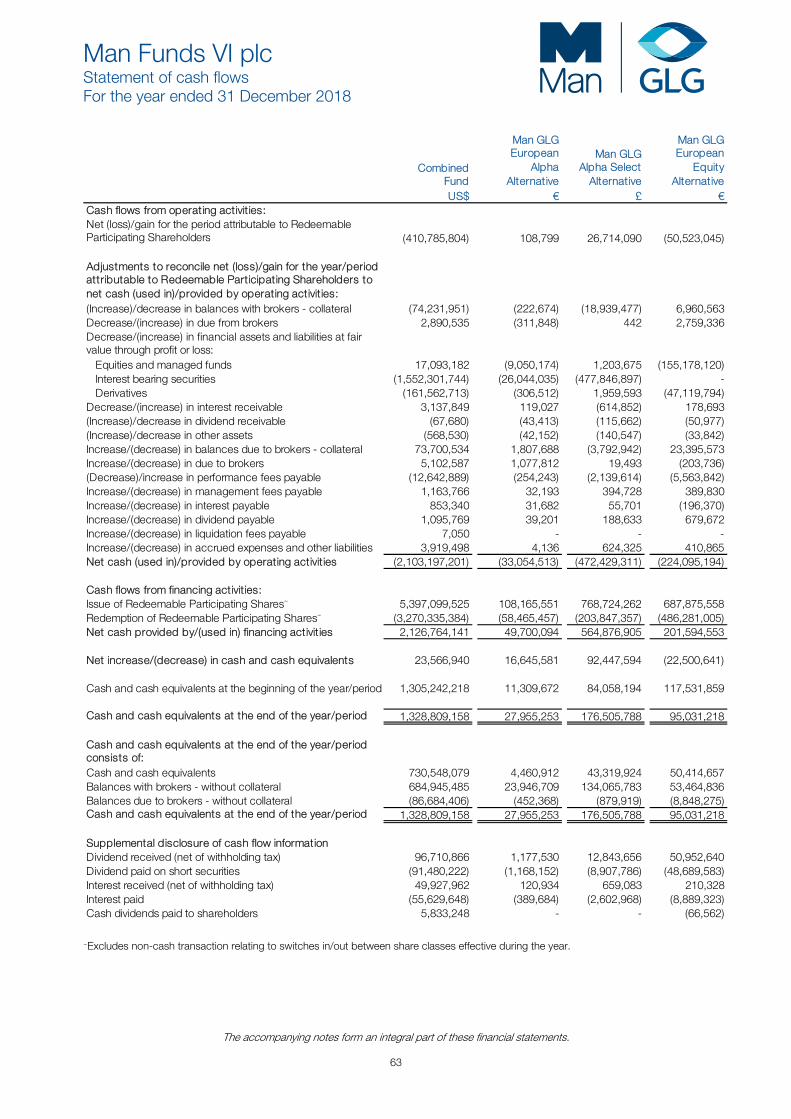
Man Funds VI plc Statement of cash flows For the year ended 31 December 2018
The accompanying notes form an integral part of these financial statements.
63
Combined Fund
Man GLGEuropean
AlphaAlternative
Man GLGAlpha Select
Alternative
Man GLGEuropean
EquityAlternative
US$ € £ € Cash flows from operating activit ies:Net (loss)/gain for the period attributable to Redeemable Participating Shareholders (410,785,804) 108,799 26,714,090 (50,523,045)
Adjustments to reconcile net (loss)/gain for the year/period attributable to Redeemable Participating Shareholders to net cash (used in)/provided by operating activities:(Increase)/decrease in balances with brokers - collateral (74,231,951) (222,674) (18,939,477) 6,960,563 Decrease/(increase) in due from brokers 2,890,535 (311,848) 442 2,759,336 Decrease/(increase) in financial assets and liabilities at fair value through profit or loss: Equities and managed funds 17,093,182 (9,050,174) 1,203,675 (155,178,120) Interest bearing securities (1,552,301,744) (26,044,035) (477,846,897) - Derivatives (161,562,713) (306,512) 1,959,593 (47,119,794)Decrease/(increase) in interest receivable 3,137,849 119,027 (614,852) 178,693 (Increase)/decrease in dividend receivable (67,680) (43,413) (115,662) (50,977)(Increase)/decrease in other assets (568,530) (42,152) (140,547) (33,842)Increase/(decrease) in balances due to brokers - collateral 73,700,534 1,807,688 (3,792,942) 23,395,573 Increase/(decrease) in due to brokers 5,102,587 1,077,812 19,493 (203,736)(Decrease)/increase in performance fees payable (12,642,889) (254,243) (2,139,614) (5,563,842)Increase/(decrease) in management fees payable 1,163,766 32,193 394,728 389,830 Increase/(decrease) in interest payable 853,340 31,682 55,701 (196,370)Increase/(decrease) in dividend payable 1,095,769 39,201 188,633 679,672 Increase/(decrease) in liquidation fees payable 7,050 - - - Increase/(decrease) in accrued expenses and other liabilities 3,919,498 4,136 624,325 410,865 Net cash (used in)/provided by operating activities (2,103,197,201) (33,054,513) (472,429,311) (224,095,194)
Cash flows from financing activities:Issue of Redeemable Participating Shares~ 5,397,099,525 108,165,551 768,724,262 687,875,558 Redemption of Redeemable Participating Shares~ (3,270,335,384) (58,465,457) (203,847,357) (486,281,005)Net cash provided by/(used in) financing activit ies 2,126,764,141 49,700,094 564,876,905 201,594,553
Net increase/(decrease) in cash and cash equivalents 23,566,940 16,645,581 92,447,594 (22,500,641)
Cash and cash equivalents at the beginning of the year/period 1,305,242,218 11,309,672 84,058,194 117,531,859
Cash and cash equivalents at the end of the year/period 1,328,809,158 27,955,253 176,505,788 95,031,218
Cash and cash equivalents at the end of the year/period consists of:Cash and cash equivalents 730,548,079 4,460,912 43,319,924 50,414,657 Balances with brokers - without collateral 684,945,485 23,946,709 134,065,783 53,464,836 Balances due to brokers - without collateral (86,684,406) (452,368) (879,919) (8,848,275)Cash and cash equivalents at the end of the year/period 1,328,809,158 27,955,253 176,505,788 95,031,218
Supplemental disclosure of cash flow informationDividend received (net of withholding tax) 96,710,866 1,177,530 12,843,656 50,952,640 Dividend paid on short securities (91,480,222) (1,168,152) (8,907,786) (48,689,583)Interest received (net of withholding tax) 49,927,962 120,934 659,083 210,328 Interest paid (55,629,648) (389,684) (2,602,968) (8,889,323)Cash dividends paid to shareholders 5,833,248 - - (66,562)
~Excludes non-cash transaction relating to switches in/out between share classes effective during the year.
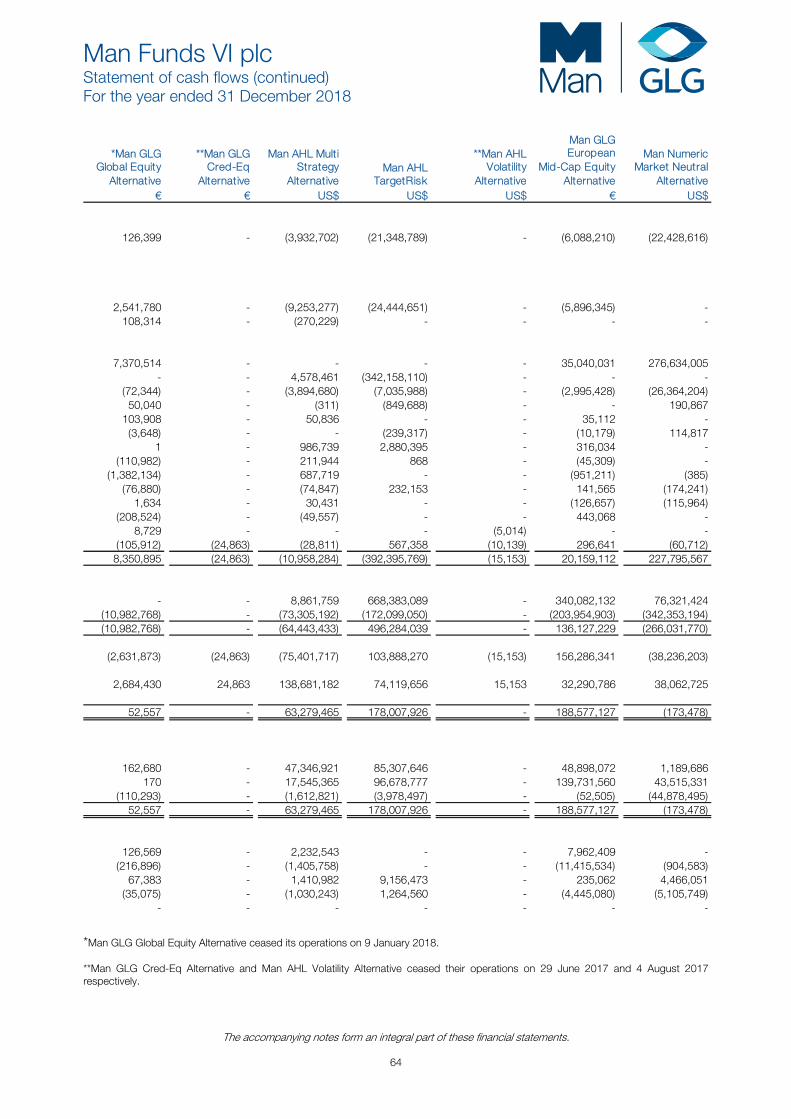
Man Funds VI plc Statement of cash flows (continued) For the year ended 31 December 2018
The accompanying notes form an integral part of these financial statements.
64
*Man GLGGlobal Equity
Alternative
**Man GLG Cred-Eq
Alternative
Man AHL MultiStrategy
Alternative Man AHL
TargetRisk
**Man AHL Volatility
Alternative
Man GLG European
Mid-Cap EquityAlternative
Man NumericMarket Neutral
Alternative € € US$ US$ US$ € US$
126,399 - (3,932,702) (21,348,789) - (6,088,210) (22,428,616)
2,541,780 - (9,253,277) (24,444,651) - (5,896,345) - 108,314 - (270,229) - - - -
7,370,514 - - - - 35,040,031 276,634,005 - - 4,578,461 (342,158,110) - - -
(72,344) - (3,894,680) (7,035,988) - (2,995,428) (26,364,204) 50,040 - (311) (849,688) - - 190,867 103,908 - 50,836 - - 35,112 - (3,648) - - (239,317) - (10,179) 114,817 1 - 986,739 2,880,395 - 316,034 - (110,982) - 211,944 868 - (45,309) - (1,382,134) - 687,719 - - (951,211) (385) (76,880) - (74,847) 232,153 - 141,565 (174,241) 1,634 - 30,431 - - (126,657) (115,964) (208,524) - (49,557) - - 443,068 - 8,729 - - - (5,014) - - (105,912) (24,863) (28,811) 567,358 (10,139) 296,641 (60,712) 8,350,895 (24,863) (10,958,284) (392,395,769) (15,153) 20,159,112 227,795,567
- - 8,861,759 668,383,089 - 340,082,132 76,321,424 (10,982,768) - (73,305,192) (172,099,050) - (203,954,903) (342,353,194) (10,982,768) - (64,443,433) 496,284,039 - 136,127,229 (266,031,770)
(2,631,873) (24,863) (75,401,717) 103,888,270 (15,153) 156,286,341 (38,236,203)
2,684,430 24,863 138,681,182 74,119,656 15,153 32,290,786 38,062,725
52,557 - 63,279,465 178,007,926 - 188,577,127 (173,478)
162,680 - 47,346,921 85,307,646 - 48,898,072 1,189,686 170 - 17,545,365 96,678,777 - 139,731,560 43,515,331 (110,293) - (1,612,821) (3,978,497) - (52,505) (44,878,495) 52,557 - 63,279,465 178,007,926 - 188,577,127 (173,478)
126,569 - 2,232,543 - - 7,962,409 - (216,896) - (1,405,758) - - (11,415,534) (904,583) 67,383 - 1,410,982 9,156,473 - 235,062 4,466,051 (35,075) - (1,030,243) 1,264,560 - (4,445,080) (5,105,749)
- - - - - - -
*Man GLG Global Equity Alternative ceased its operations on 9 January 2018. **Man GLG Cred-Eq Alternative and Man AHL Volatility Alternative ceased their operations on 29 June 2017 and 4 August 2017 respectively.
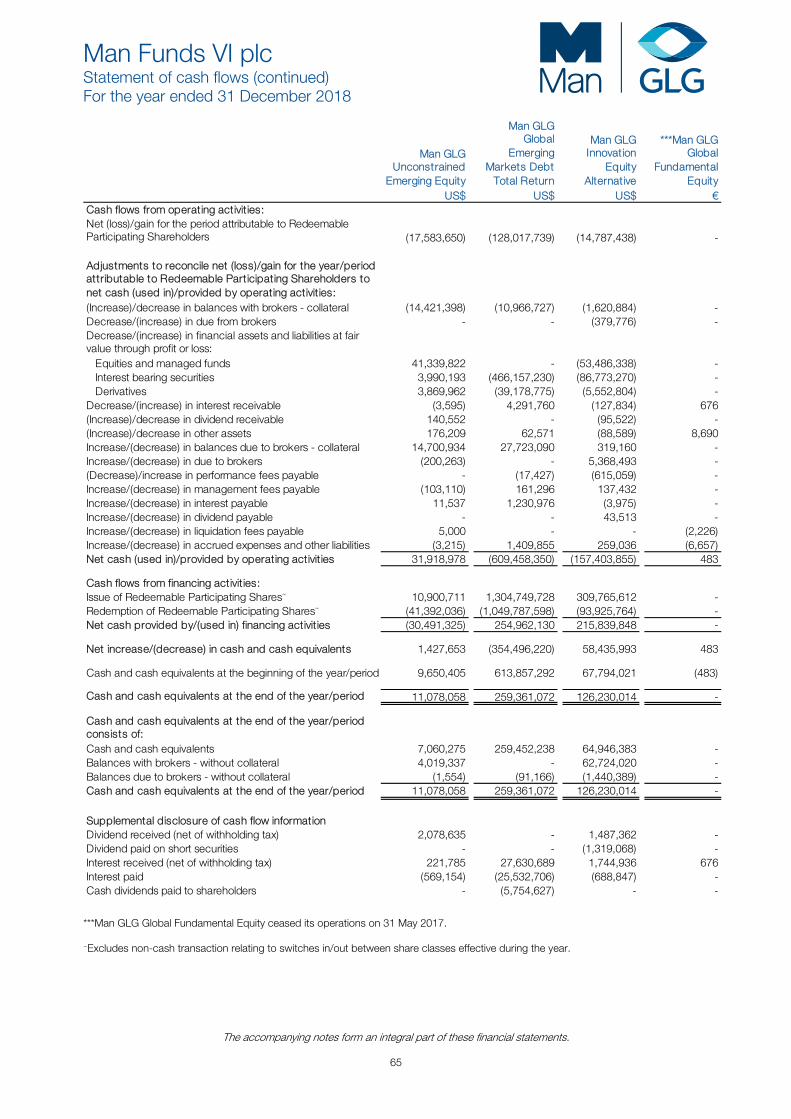
Man Funds VI plc Statement of cash flows (continued) For the year ended 31 December 2018
The accompanying notes form an integral part of these financial statements.
65
Man GLGUnconstrained
Emerging Equity
Man GLG Global
EmergingMarkets Debt
Total Return
Man GLG Innovation
Equity Alternative
***Man GLG Global
Fundamental Equity
US$ US$ US$ € Cash flows from operating activities:Net (loss)/gain for the period attributable to Redeemable Participating Shareholders (17,583,650) (128,017,739) (14,787,438) -
Adjustments to reconcile net (loss)/gain for the year/period attributable to Redeemable Participating Shareholders to net cash (used in)/provided by operating activities:(Increase)/decrease in balances with brokers - collateral (14,421,398) (10,966,727) (1,620,884) - Decrease/(increase) in due from brokers - - (379,776) - Decrease/(increase) in financial assets and liabilities at fair value through profit or loss: Equities and managed funds 41,339,822 - (53,486,338) - Interest bearing securities 3,990,193 (466,157,230) (86,773,270) - Derivatives 3,869,962 (39,178,775) (5,552,804) - Decrease/(increase) in interest receivable (3,595) 4,291,760 (127,834) 676 (Increase)/decrease in dividend receivable 140,552 - (95,522) - (Increase)/decrease in other assets 176,209 62,571 (88,589) 8,690 Increase/(decrease) in balances due to brokers - collateral 14,700,934 27,723,090 319,160 - Increase/(decrease) in due to brokers (200,263) - 5,368,493 - (Decrease)/increase in performance fees payable - (17,427) (615,059) - Increase/(decrease) in management fees payable (103,110) 161,296 137,432 - Increase/(decrease) in interest payable 11,537 1,230,976 (3,975) - Increase/(decrease) in dividend payable - - 43,513 - Increase/(decrease) in liquidation fees payable 5,000 - - (2,226)Increase/(decrease) in accrued expenses and other liabilities (3,215) 1,409,855 259,036 (6,657)Net cash (used in)/provided by operating activities 31,918,978 (609,458,350) (157,403,855) 483
Cash flows from financing activities:Issue of Redeemable Participating Shares~ 10,900,711 1,304,749,728 309,765,612 - Redemption of Redeemable Participating Shares~ (41,392,036) (1,049,787,598) (93,925,764) - Net cash provided by/(used in) financing activities (30,491,325) 254,962,130 215,839,848 -
Net increase/(decrease) in cash and cash equivalents 1,427,653 (354,496,220) 58,435,993 483
Cash and cash equivalents at the beginning of the year/period 9,650,405 613,857,292 67,794,021 (483)
Cash and cash equivalents at the end of the year/period 11,078,058 259,361,072 126,230,014 -
Cash and cash equivalents at the end of the year/period consists of:Cash and cash equivalents 7,060,275 259,452,238 64,946,383 - Balances with brokers - without collateral 4,019,337 - 62,724,020 - Balances due to brokers - without collateral (1,554) (91,166) (1,440,389) - Cash and cash equivalents at the end of the year/period 11,078,058 259,361,072 126,230,014 -
Supplemental disclosure of cash flow informationDividend received (net of withholding tax) 2,078,635 - 1,487,362 - Dividend paid on short securities - - (1,319,068) - Interest received (net of withholding tax) 221,785 27,630,689 1,744,936 676 Interest paid (569,154) (25,532,706) (688,847) - Cash dividends paid to shareholders - (5,754,627) - -
***Man GLG Global Fundamental Equity ceased its operations on 31 May 2017. ~Excludes non-cash transaction relating to switches in/out between share classes effective during the year.
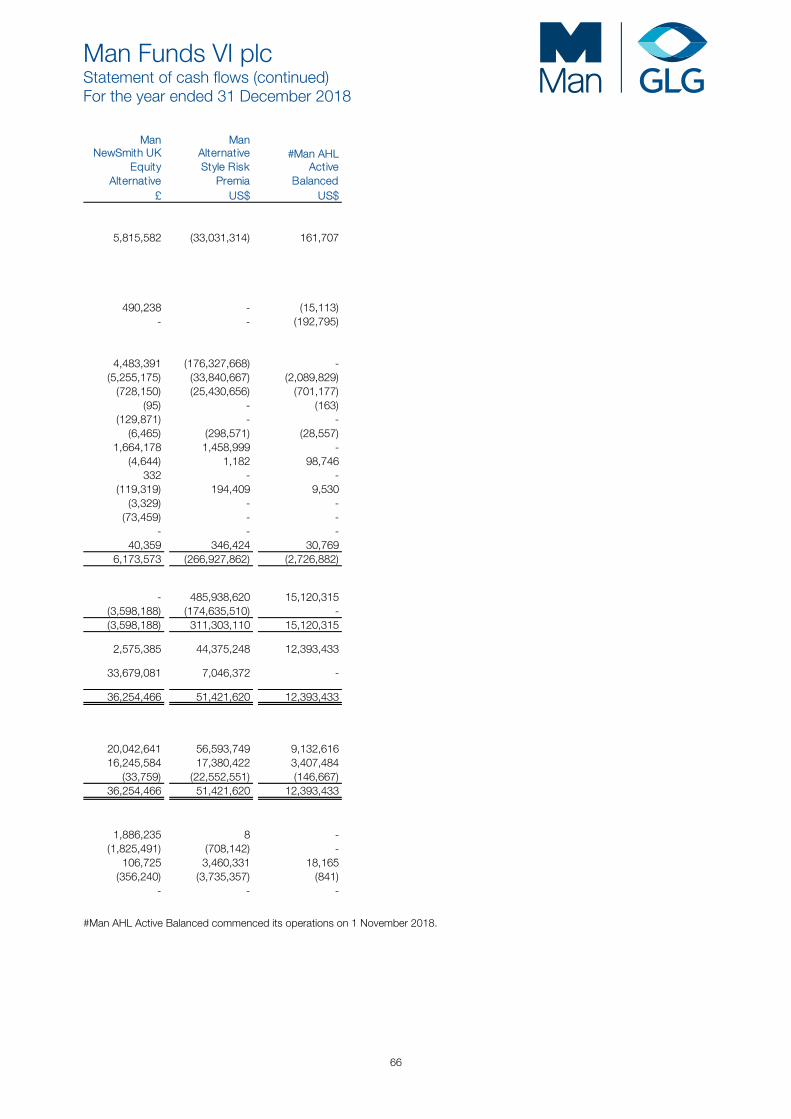
Man Funds VI plc Statement of cash flows (continued) For the year ended 31 December 2018
66
ManNewSmith UK
EquityAlternative
ManAlternativeStyle Risk
Premia
#Man AHL Active
Balanced £ US$ US$
5,815,582 (33,031,314) 161,707
490,238 - (15,113) - - (192,795)
4,483,391 (176,327,668) - (5,255,175) (33,840,667) (2,089,829) (728,150) (25,430,656) (701,177) (95) - (163) (129,871) - - (6,465) (298,571) (28,557) 1,664,178 1,458,999 - (4,644) 1,182 98,746 332 - - (119,319) 194,409 9,530 (3,329) - - (73,459) - -
- - - 40,359 346,424 30,769 6,173,573 (266,927,862) (2,726,882)
- 485,938,620 15,120,315 (3,598,188) (174,635,510) - (3,598,188) 311,303,110 15,120,315
2,575,385 44,375,248 12,393,433
33,679,081 7,046,372 -
36,254,466 51,421,620 12,393,433
20,042,641 56,593,749 9,132,616 16,245,584 17,380,422 3,407,484 (33,759) (22,552,551) (146,667) 36,254,466 51,421,620 12,393,433
1,886,235 8 - (1,825,491) (708,142) - 106,725 3,460,331 18,165 (356,240) (3,735,357) (841)
- - -
#Man AHL Active Balanced commenced its operations on 1 November 2018.
Man Funds VI plc Notes to the financial statements For the year ended 31 December 2019
67
1. General Man Funds VI plc (the “Fund”) was incorporated as an investment company with variable capital and segregated liability between sub-funds under the laws of Ireland as a public limited company on 28 November 2007 under registration number 449860. The Fund has been authorised by the Central Bank of Ireland (the “Central Bank”) as an Undertaking for Collective Investment in Transferable Securities (“UCITS”), pursuant to the European Communities (Undertaking for Collective Investment in Transferable Securities) Regulations 2011 (as amended) (the “UCITS Regulations”) and Central Bank (Supervision and Enforcement) Act 2013 (Section 48(1)) (Undertakings for Collective Investment in Transferable Securities) Regulations 2015 (the "Central Bank UCITS Regulations"). The Fund’s investment manager is GLG LLC for GLG LLC Portfolios, GLG Partners LP for Man GLG Portfolios, AHL Partners LLP for Man AHL Portfolios, Numeric Investors LLC for Numeric Portfolios and Man Solutions Limited for Man Solution Portfolios (the “Investment Managers”). The Fund’s registered office is at 70 Sir John Rogerson’s Quay, Dublin, Ireland. The Fund has no employees.
The Fund is structured as an umbrella fund with segregated liability between sub-funds (each a “Portfolio”) which means that different Portfolios may be created from time to time by the Directors with the approval of the Central Bank. Each Portfolio will be represented by a different series of Redeemable Participating Shares (the “Shares”) and will be invested in accordance with the investment objectives and policies applicable to such Portfolio. As at 31 December 2019 the Fund was comprised of twenty five Portfolios.
GLG LLC Portfolio Man GLG Global Emerging Markets Debt Total Return and Man GLG Global Debt Total Return (commenced operations on 1 August 2019). Man GLG Portfolios Man GLG European Alpha Alternative, Man GLG Alpha Select Alternative, Man GLG European Equity Alternative, Man GLG Global Equity Alternative (ceased operations on 9 January 2018), Man GLG European Alpha Alternative Enhanced (ceased operations on 23 December 2016), Man GLG Cred-Eq Alternative (ceased operations on 29 June 2017), Man GLG European Mid-Cap Equity Alternative, Man GLG Unconstrained Emerging Equity (ceased operations on 7 February 2019), Man GLG Innovation Equity Alternative, Man GLG Global Fundamental Equity (ceased operations on 31 May 2017), Man NewSmith UK Equity Alternative (ceased operations on 21 March 2019), Man GLG High Yield Opportunities (commenced operations on 16 January 2019), Man GLG Credit Multi-Strategy Alternative (commenced operations on 1 April 2019), Man GLG Event Driven Alternative (commenced operations on 2 July 2019), Man GLG High Yield Opportunities DE (commenced operations on 22 November 2019) and Man GLG US Absolute Alpha (commenced operations on 31 December 2019). Man AHL Portfolios Man AHL Multi Strategy Alternative, Man AHL Directional Equities Alternative (ceased operations on 30 September 2016), Man AHL TargetRisk, Man AHL Volatility Alternative (ceased operations on 4 August 2017) and Man AHL Active Balanced (commenced operations on 1 November 2018). Numeric Portfolio Man Numeric Market Neutral Alternative (ceased operations on 17 September 2019). Man Solutions Portfolio Man Alternative Style Risk Premia. All Classes of Redeemable Participating Shares are together referred to as the ‘‘Redeemable Participating Shares’’ or ‘‘Shares’’. As at 31 December 2019, the following Portfolios were registered with Swiss Financial Market Supervisory Authority FINMA: Man GLG European Alpha Alternative, Man GLG Alpha Select Alternative, Man GLG European Equity Alternative, Man AHL Multi Strategy Alternative, Man AHL TargetRisk, Man Numeric Market Neutral Alternative, Man GLG European Mid-Cap Equity Alternative, Man GLG Unconstrained Emerging Equity, Man GLG Global Emerging Markets Debt Total Return, Man GLG Innovation Equity Alternative, Man Alternative Style Risk Premia, Man GLG High Yield Opportunities, Man GLG Credit Multi-Strategy Alternative and Man GLG Event Driven Alternative. The investment objectives and policies of each active Portfolio are detailed below. Man GLG European Alpha Alternative Man GLG European Alpha Alternative’s investment objective is to provide a positive absolute return for investors while maintaining a low volatility, regardless of market conditions, through stock selection and the utilising of long/short strategies. The Portfolio invests primarily in securities of issuers in Europe or of issuers which derive a substantial part of their revenues from activities in Europe. The Portfolio invests predominantly in common stocks and other equity and equity linked instruments of such issuers, including, without limitation, equity derivatives. As at 31 December 2019, Class DN EUR, Class DN H GBP, Class DN H USD, Class IN EUR, Class IN H GBP, Class IN H USD and Class INF EUR were in operation. Man GLG Alpha Select Alternative Man GLG Alpha Select Alternative’s investment objective is to provide investors with positive returns through investments primarily in the United Kingdom securities markets. The Portfolio invests primarily in common stock and other equity and equity-linked securities (which may include but are not limited to such instruments as options and swaps) of issuers in the United Kingdom or of issuers which derive a substantial part of their revenues from activities in the United Kingdom and may invest the remainder in equity and equity linked securities of issuers and on markets located outside the United Kingdom. Although it is not intended to provide for any geographic or sectorial specialisation other than the above, it is anticipated that the Portfolio’s investments will primarily be in mid and large capitalisation companies including companies in the FTSE 100 Index.
Man Funds VI plc Notes to the financial statements (continued) For the year ended 31 December 2019
68
1. General (continued) Man GLG Alpha Select Alternative (continued) As at 31 December 2019, Class DL GBP, Class DL H EUR, Class DL H USD, Class DNY H EUR, Class IL GBP, Class IL GBP Dist, Class IL H EUR, Class IL H EUR Dist, Class IL H SEK, Class IL H USD, Class IL H USD Dist, Class IL U GBP, Class IN H EUR, Class IN H SEK and Class IN H USD were in operation. Man GLG European Equity Alternative Man GLG European Equity Alternative’s investment objective is to provide investors with positive returns primarily through investments in issuers in Europe and of issuers which derive a substantial part of their revenues from activities in Europe. The Portfolio’s policy is to achieve those returns through investments in short, medium and, to a lesser extent, long-term investment opportunities. This policy will be pursued through a strategy of active trading with the Portfolio primarily investing in listed equities including, without limitation, common stock and other equity and equity-linked securities (which may include, but are not limited to, such instruments as options and swaps), of issuers in Europe and of issuers which derive a substantial part of their revenues from activities in Europe. As at 31 December 2019, Class DN EUR, Class DN H CHF, Class DN H GBP, Class DN H NOK, Class DN H SEK, Class DN H USD, Class DN U EUR, Class IN EUR, Class IN H GBP, Class IN H SEK, Class IN H USD, Class INU EUR Class INU H USD, Class INZ EUR, Class INZ EUR Dist, Class INZ H CHF Dist, Class INZ H GBP Dist, Class INZ H USD, Class INZ H USD Dist, Class IXXN EUR and Class IXXN H USD were in operation. Man AHL Multi Strategy Alternative Man AHL Multi Strategy Alternative aims to achieve medium-term capital growth in all market conditions by being broadly diversified along system styles, asset classes, regions, and time horizons. The Portfolio seeks to achieve its objective by allocating all or substantially all of its assets in accordance with the AHL Multi-Strategy Programme (as described in further detail in the Prospectus). As at 31 December 2019, Class DN USD, Class DN H EUR, Class DN H GBP, Class IN USD, Class IN H CHF, Class IN H EUR, Class IN H GBP and Class IN H SEK were in operation. Man AHL TargetRisk The Man AHL TargetRisk Portfolio aims to generate capital growth over the medium to long term. The Portfolio seeks to achieve its objective by allocating all or substantially all of its assets in accordance with a proprietary quantitative model, the ‘Man TargetRisk’ strategy, by providing dynamic long only exposure to a range of assets and to provide an excess return stream with a stable level of volatility regardless of market conditions. As at 31 December 2019, Class D USD, Class D H CHF, Class D H EUR, Class D H GBP, Class D H SEK, Class D H SGD, Class I USD, Class I H CHF, Class I H EUR, Class I H GBP, Class I H JPY, Class I H SEK, Class I H SGD, Class I H (BRL) USD and Class INU USD were in operation. Man GLG European Mid-Cap Equity Alternative The Portfolio’s investment objective is to seek to provide an attractive risk-adjusted total return, through appreciation and income. The Portfolio seeks to achieve these returns primarily through long and synthetically short investments in equity securities or equity derivatives. The Portfolio may invest up to 20% of its Net Asset Value in emerging markets or in currencies of Organisation for Economic Co-Ordination and Development (‘‘OECD’’) countries and/or derivatives. As at 31 December 2019, Class DN EUR, Class DN H USD, Class DNY EUR, Class IN EUR, Class IN F EUR, Class INF H GBP, Class INF H USD, Class IN H GBP, Class IN H SEK and Class IN H USD were in operation.
Man Numeric Market Neutral Alternative Man Numeric Market Neutral Alternative’s investment objective was to earn an average return on investment, after fees, which was appreciably higher than the total return (assuming reinvestment of dividends) in USD of the Merrill Lynch 91-day Treasury Bills Index.
The Portfolio sought to apply a long/short investment strategy and intends to invest in derivatives providing long and “synthetic short” positions.
The Portfolio ceased operations on 17 September 2019.
Man GLG Unconstrained Emerging Equity Man GLG Unconstrained Emerging Equity’s investment objective was to achieve capital gains in the medium to long-term, through investment in emerging market equities.
The Portfolio sought to achieve the above objective primarily through investment in emerging market equities. Such equities were generally be listed or traded on Recognised Markets in emerging markets worldwide and the Portfolio was not having a particular sectoral, industry or market capitalisation focus.
The Portfolio ceased operations on 7 February 2019.
Man Funds VI plc Notes to the financial statements (continued) For the year ended 31 December 2019
69
1. General (continued) Man GLG Global Emerging Markets Debt Total Return Man GLG Global Emerging Markets Debt Total Return’s investment objective is to achieve a return in all market conditions over the long term primarily through investment in a portfolio of fixed income securities denominated in local currency. As at 31 December 2019, Class D USD, Class D H CHF, Class D H EUR, Class D H GBP, Class D H NOK, Class DL USD, Class DL H EUR, Class DMF USD, Class DMF H EUR, Class DR USD Dist, Class DY USD, Class DY H EUR, Class I USD, Class I USD Dist, Class I H AUD, Class I H CHF, Class I H EUR, Class I H EUR Dist, Class I H GBP, Class I H SEK, Class IL USD, Class IL H EUR, Class IMF USD, Class IMF USD Dist, Class IMF H EUR, Class IMF H EUR Dist and Class IMF H GBP Dist were in operation. Man GLG Innovation Equity Alternative Man GLG Innovation Equity Alternative’s investment objective is to provide investors with absolute returns by taking both long and short positions in equities issued by companies globally. The Portfolio seeks to apply a long/short investment strategy and intends to take full advantage of the ability to invest in derivatives providing long and “synthetic short” positions. As at 31 December 2019, Class DN USD, Class DN H CHF, Class DN H EUR, Class DN H SEK, Class DNF H EUR, Class IN USD, Class INF USD, Class INF H EUR, Class INF H GBP, Class IN H CHF, Class IN H EUR, Class IN H GBP, Class IN H SEK, Class INU H EUR and Class INU H GBP were in operation. Man NewSmith UK Equity Alternative Man NewSmith UK Equity Alternative’s investment objective was to maximise absolute returns. The Portfolio sought to achieve its objective by employing a long/short equity strategy. The Portfolio ceased operations on 21 March 2019. Man Alternative Style Risk Premia Man Alternative Style Risk Premia’s investment objective is to achieve medium-term absolute returns in all market conditions across liquid asset classes. The Portfolio seeks to achieve its objective by allocating all or substantially all of its assets in accordance with the Styles and Strategies adopted such as by investing all or part of the net proceeds of Shares in transferable securities listed or traded on Recognised Markets. As at 31 December 2019, Class D USD, Class D H DKK, Class D H EUR, Class D H NOK, Class D H SEK, Class I USD, Class I H AUD, Class I H CHF, Class I H EUR, Class I H GBP, Class I H JPY, Class I H SEK, Class INU H EUR and Class INU USD were in operation. Man AHL Active Balanced The Man AHL Active Balanced aims to generate capital growth over the medium to long term by providing dynamic exposure to a range of assets and to provide an excess return stream with a stable level of volatility regardless of market conditions. The Portfolio seeks to achieve its objective by allocating all or substantially all of its assets in accordance with a proprietary quantitative model, the ‘Man Active Balanced’ strategy, to provide an excess return stream with a stable level of volatility regardless of market conditions. As at 31 December 2019, Class I H EUR, Class I H GBP, Class I H JPY and Class I USD were in operation. Man GLG High Yield Opportunities Man GLG High Yield Opportunities’ investment objective is to provide income and capital growth by investing directly or indirectly in fixed and floating rate securities worldwide. The Portfolio seeks to achieve its objective by allocating all or substantially all of its assets in accordance with the investment approach adopted such as by investing all or part of the net proceeds of Shares in transferable securities, exchange traded and OTC financial derivative instruments, money market instruments, other collective investment schemes and deposits, cash or cash equivalents. As at 31 December 2019, Class D EUR, Class I EUR, Class I H GBP, Class I H USD, Class IF EUR, Class IF H GBP, Class IF H GBP Dist, Class IF H GBP G-Dist and Class ILU H GBP G-Dist were in operation. Man GLG Credit Multi-Strategy Alternative Man GLG Credit Multi-Strategy Alternative’s investment objective is to provide investors with an absolute return over rolling three-year periods independent of market conditions, with a low correlation to credit, interest rates and equities. The Portfolio seeks to apply a long/short investment strategy and intends to take full advantage of the ability to invest in derivatives providing long and “synthetic short” positions. As at 31 December 2019, Class DN H EUR, Class IN USD, Class IN H EUR, Class IN H SEK and Class INU H GBP were in operation.
Man Funds VI plc Notes to the financial statements (continued) For the year ended 31 December 2019
70
1. General (continued) Man GLG Event Driven Alternative Man GLG Event Driven Alternative’s investment objective is to provide investors with absolute returns over a rolling three-year period by taking both long and short positions utilising event driven strategies.
The Portfolio seeks to apply a long/short investment strategy and intends to take full advantage of the ability to invest in derivatives providing long and “synthetic short” positions.
As at 31 December 2019, Class DNFY H EUR, Class DNFY USD, Class IN H EUR, Class IN H GBP, Class IN H SEK, Class IN USD, Class INF H EUR and Class INF USD were in operation.
Man GLG Global Debt Total Return Man GLG Global Debt Total Return’s investment objective is to achieve a return in all market conditions over the long term primarily through investment in a portfolio of fixed income securities denominated in local currency or in the currencies of OECD countries and/or derivatives.
As at 31 December 2019, Class I C EUR and Class I C USD were in operation.
Man GLG High Yield Opportunities DE Man GLG High Yield Opportunities DE investment objective is to provide income and capital growth by investing directly or indirectly in fixed and floating rate securities worldwide.
As at 31 December 2019, Class I EUR and Class I EUR Dist were in operation.
Man GLG US Absolute Alpha Man GLG US Absolute Alpha’s investment objective is to provide investors with an absolute return through a long/short strategy investing primarily in the US equity market.
The Portfolio seeks to apply a long/short investment strategy and intends to take full advantage of the ability to invest in derivatives providing long and “synthetic short” positions.
As at 31 December 2019, Class IN USD was in operation.
2. Significant accounting policies (a) Accounting convention The financial statements are prepared in accordance with International Financial Reporting Standards (“IFRS”) as adopted by the European Union (“EU”). The financial statements have been prepared using the historical cost basis except for financial assets and liabilities held at fair value through profit or loss which have been measured at fair value. (b) Changes in accounting policy and disclosure The accounting policies adopted in the preparation of the financial statements are consistent with those followed in the preparation of the Fund’s financial statements for the year ended 31 December 2018, except for the adoption of new standards and interpretations effective on the dates described below. New standards, interpretations and amendments adopted by the Fund: IFRIC Interpretation 23 - Uncertainty over Income Tax Treatment The interpretation addresses the accounting for income taxes when tax treatments involve uncertainty that affects the application of IAS 12 and does not apply to taxes or levies outside the scope of IAS 12, nor does it specifically include requirements relating to interest and penalties associated with uncertain tax treatments. The interpretation specifically addresses the following:
• Whether an entity considers uncertain tax treatments separately; • The assumptions an entity makes about the examination of tax treatments by taxation authorities; • How an entity determines taxable profit (tax loss), tax bases, unused tax losses, unused tax credits and tax rates; • How an entity considers changes in facts and circumstances.
An entity must determine whether to consider each uncertain tax treatment separately or together with one or more other uncertain tax treatments. The approach that better predicts the resolution of the uncertainty should be followed. The interpretation is effective for annual reporting periods beginning on or after 1 January 2019, but certain transition reliefs are available. This standard update has been adopted by the Fund. The adoption of this standard has had no impact on the financial statements of the Fund. IFRIC Interpretation 23, Uncertainty over Income Tax Treatment clarifies the accounting for income taxes when tax treatments involve uncertainty that affects the application of IAS 12 in the Fund’s financial statements. Management evaluates such tax positions to determine whether, for all tax years still subject to assessment or challenge by the relevant taxation authorities, the tax positions are probable to be accepted on examination by the relevant tax authorities. If it is probable that the Fund’s tax positions are accepted the taxable profit (tax loss) should be consistent with the Fund’s tax filings. If not probable the Fund must reflect the effect of the uncertainty in determining its taxable profit (tax loss). The effect of the uncertain tax treatment is determined by applying the expected value method or by applying the most likely method. At the date of authorisation of the financial statements there were a number of other Standards and Interpretations which were in issue but not yet effective. Management anticipate that the adoption of these Standards and Interpretations in future periods will have no material impact on the financial statements of the Fund.
Man Funds VI plc Notes to the financial statements (continued) For the year ended 31 December 2019
71
2. Significant accounting policies (continued) (c) Use of accounting judgements and estimates The preparation of financial statements in accordance with IFRS requires management to make judgements, estimates and assumptions that affect the amounts reported and disclosures made in these financial statements and accompanying notes, including certain valuation assumptions. Uncertainty about these assumptions and estimates could result in outcomes that require a material adjustment to the carrying amount of assets or liabilities in the future.
(d) Going concern Management has made an assessment of the Fund’s ability to continue as a going concern and are satisfied that the Fund has resources to continue in business for a period of at least one year beyond the date these financial statements are available to be issued. Furthermore, the management is not aware of any material uncertainties that may cast significant doubt upon the Fund’s ability to continue as a going concern; therefore, the financial statements are prepared on a going concern basis.
(e) Interest income and expenses Interest income and expense is recognised in the statement of comprehensive income as it accrues, on an effective interest rate basis. (f) Dividend income and expense Dividend income from financial assets at fair value through profit or loss is recognised in the statement of comprehensive income within dividends when the Fund’s right to receive payments is established. Dividend income is recognised gross of withholding tax, if any. (g) Financial assets and liabilities Financial assets and liabilities at fair value through profit or loss For Net Asset Value (“NAV”) purposes, the valuation of financial assets and liabilities is calculated in accordance with the Prospectus. For financial statements purposes, financial assets and liabilities have been valued in accordance with IFRS using the policies outlined below. At 31 December 2019 and 31 December 2018, there are no material differences between these valuation methods. In accordance with IFRS 9, the Fund classifies its financial assets and liabilities at initial recognition into the categories of financial assets and financial liabilities as discussed below. In applying that classification, a financial asset or financial liability is considered to be held for trading if it is acquired or incurred principally for the purpose of selling or repurchasing in the short term. Derivatives are also categorised as held for trading as the Fund does not designate any derivatives as hedges in a hedging relationship. Therefore, they meet the held-for-trading criteria and are required to be measured at fair value through profit or loss. Financial assets designated by Management at fair value through profit or loss at initial recognition include financial assets that are not held for trading. These financial assets and liabilities (“financial instruments”) are designated upon initial recognition on the basis that they are part of a group of financial instruments which are managed and have their performance evaluated on a fair value basis, in accordance with risk management and investment strategies of the Fund. The financial information about these financial instruments is provided internally on that basis to the Investment Manager. The Fund recognises a financial asset or a financial liability when, and only when, it becomes a party to the contractual provisions of the instrument. Regular-way purchases and sales of investments are recognised on the trade date, which is the date on which the Fund commits to purchase or sell the asset. Financial assets and liabilities at fair value through profit or loss are initially recognised at fair value. All transaction costs for such instruments are recognised directly in the statement of comprehensive income. After initial measurement, the Fund measures financial instruments, which are classified as at fair value through profit or loss, at their fair values. The fair value of financial instruments traded in active markets (such as publicly traded derivatives and exchange traded securities) is based on quoted market prices at the statement of financial position date. In circumstances where the last traded price is not within the bid-ask spread, management will determine the point within the bid-ask spread that is most representative of fair value. The Directors have appointed an Independent Pricing Committee ("IPC") to undertake certain services concerning the valuation policies and procedures relating to the Fund. The IPC is an independent body set up to: (1) establish a pricing matrix (a table which lays out a pricing source for certain assets and liabilities) which the Directors have adopted for the Fund and which is used by the Administrator to calculate the value of the assets and liabilities held by the Fund; and (2) to establish the prices of any positions held in the Fund that do not have an independently ascertainable value as per the pricing matrix. In addition, the IPC provides general governance and oversight of the valuation process.
Man Funds VI plc Notes to the financial statements (continued) For the year ended 31 December 2019
72
2. Significant accounting policies (continued) (g) Financial assets and liabilities (continued) Financial assets and liabilities at fair value through profit or loss (continued) The Fund may from time to time invest in financial instruments or securities that are not traded in an active market (for example over-the-counter (‘‘OTC’’) derivatives and private placements of both equities and fixed income securities). These financial instruments are valued at their fair value in the manner described in subsequent accounting policies. Any exchange traded derivative instruments (including, but not limited to, options and futures) dealt in on a market are valued at the settlement price on the relevant Valuation Day for such instruments on such a market. If the settlement price is not available, their probable realisation value shall be determined with care and in good faith by the Fund. The investments in managed funds (“managed funds”) are initially measured at fair value and then carried at their NAV per unit at the statement of financial position date. This measure approximately represents the fair value of such investments. If their stated NAV per unit is not available, managed funds are valued at the latest available stated NAV per unit. Investments are derecognised when the rights to receive cash flows have expired or the Fund has transferred substantially all of the risks and rewards of ownership. (h) Securities sold short The Fund may sell securities short. A short sale is a transaction in which the Fund sells a security it does not own. The proceeds received for short sales are recorded as liabilities and the Fund records an unrealised gain or loss to the extent of the difference between the proceeds received and the value of the open short position. The Fund records a realised gain or loss when the short position is closed. By entering into short sales, the Fund bears the market risk of an unfavourable change in the price of the security sold short in excess of the proceeds received. Short sales expose the Fund to potentially unlimited liability. (i) Offsetting financial instruments Financial assets and liabilities are offset and the net amount reported in the statement of financial position when there is a legally enforceable right to offset the recognised amounts and there is an intention to settle on a net basis or realise the assets and settle the liabilities simultaneously. As at 31 December 2019 and 31 December 2018, no financial assets and liabilities are offset in the statement of financial position. Please refer to note 5. (j) Derivatives The Fund may trade in derivative financial instruments whose values are based upon an underlying asset, index, currency or interest rate. The net unrealised gains or losses, rather than contracts or notional amounts, represents the approximate future cash flows from trading.
The Fund engaged in contracts for difference, forward currency contracts, futures contracts, option contracts, swap contracts, credit default swaps, interest rate swaps, total return swaps and warrants. - Contracts for difference (‘‘CFD’’) An unfunded contract for difference (‘‘CFD’’) is an agreement between the Fund and a third party which allows the Fund to acquire an exposure to the price movement of specific securities without actually purchasing the securities. Upon entering into an unfunded CFD, the Fund is required to deposit with a broker an initial cash margin equal to a certain percentage of the contract amount. Variation margin payments are made or received by the Fund depending upon the fluctuation in the value of the underlying securities. The changes in contract values are recorded as unrealised gains or losses and the Fund recognises a realised gain or loss when the contract is closed. CFDs are similar to total return swaps, but are more standardised and primarily used in the UK and Ireland. - Forward currency contracts Forward currency contracts are recorded on the trade date and are valued at the applicable foreign exchange rates on the last business day of the year. The difference between the fair value of the original contract amount and the fair value of the open forward currency contract position is reflected as financial assets or liabilities in the statement of financial position and as net gain/(loss) on financial assets and liabilities at fair value through profit or loss in the statement of comprehensive income. Realised gains or losses are recognised on the maturity or trade date of the contract and are included in net gain/(loss) on financial assets and liabilities at fair value through profit or loss in the statement of comprehensive income. - Futures contracts Futures contracts are recorded on the trade date and are valued at the last traded price on the last business day of the year. The difference between the original contract amount and the fair value of the open futures position is reflected as financial assets or financial liabilities at fair value through profit or loss in the statement of financial position and as net gain/(loss) on financial assets and liabilities at fair value through profit or loss in the statement of comprehensive income. Realised gains or losses are recognised on the closing or trade date of the contract and are included in net gain/(loss) on financial assets and liabilities at fair value through profit or loss in the statement of comprehensive income.
Man Funds VI plc Notes to the financial statements (continued) For the year ended 31 December 2019
73
2. Significant accounting policies (continued) (j) Derivatives (continued)
- Option contracts The Fund may invest in option contracts. An option contract gives the owner the right, but not the obligation, to buy (‘‘call option’’) or to sell (‘‘put option’’) a specified item at a fixed price during a specified year for a non-refundable fee (‘‘premium’’). The maximum loss to a buyer of an option is the loss of the premium. The writer of a call option has to bear the risk of an unfavourable change in the value underlying the option and, unless an offsetting long position is owned, the theoretical loss is unlimited. The loss to the writer of a put option is limited to the exercise price of the option, versus the premium collected on its sale. Option contracts are held at fair value with reference to quoted market prices, when available, or based on pricing models that consider the time value of money, volatility and the current market and contractual prices of the underlying financial instruments. - Swap contracts Swap contracts are contractual agreements between two parties to exchange streams of payments over time based on specified notional amounts. The swap contracts are valued at an amount equal to the gain or loss that would be realised if the position was closed out on the valuation date. The Fund’s main swap contracts consist of credit default swaps, interest rate swaps and total return swaps. Swap contracts are marked-to-market daily and changes in value are recorded as unrealised gain/(loss). When a swap contract is terminated, the Fund will record a realised gain/(loss) equal to the difference between the proceeds from (or cost of) the closing transaction and the Fund’s basis in the contract, if any. Swap transactions involve, to varying degrees, elements of credit and market risk in excess of the amounts recognised in the statement of financial position. Such risks involve the possibility that there will be no liquid market for these agreements, that the counterparty to the agreements may default on its obligation to perform or disagree as to the meaning of the contractual terms in the agreements, and that there may be unfavourable changes in interest rates and/or market values associated with these transactions. - Credit default swaps The Fund may enter into credit default swaps to manage its exposure to certain sectors of the market or to reduce credit risk. The Fund may enter into credit default swap agreements to provide a measure of protection against the default of an issuer (as buyer of protection) and/or gain credit exposure to an issuer to which it is not otherwise exposed (as seller of protection). Credit default swaps are agreements in which one party pays fixed periodic payments to counterparty in consideration for a guarantee from the counterparty to make a specific payment should a negative credit event take place (e.g. default, bankruptcy or debt restructuring). The Fund may either buy or sell (write) credit default swaps. As a buyer, the Fund will either receive from the seller an amount equal to the notional amount of the swap and deliver the referenced security or underlying securities comprising of an index or receive a net settlement of cash equal to the notional amount of the swap less the recovery value of the security or underlying securities comprising of an index. As a seller (writer), the Fund will either pay the buyer an amount equal to the notional amount of the swap and take delivery of the referenced security or underlying securities comprising of an index or pay a net settlement of cash equal to the notional amount of the swap less the recovery value of the security or underlying securities comprising of an index. In the event of default by the counterparty, the Fund may recover amounts paid under the agreement either partially or in total by offsetting any payables and/or receivables with collateral held or pledged. These periodic payments received or made by the Fund are included in net realised gain/(loss) on investments at fair value through profit or loss in the statement of comprehensive income. - Interest rate swaps Interest rate swaps relate to contracts taken out by the Fund with major brokers in which the Fund either receives or pays a floating rate of interest in return for paying or receiving, respectively, a fixed rate of interest. The payment flows are usually netted against each other, with the difference being paid by one party to the other. Changes in the value of the interest rate swap agreements and amounts received or paid in connection with them are recognised as net gain/(loss) on financial assets and liabilities at fair value through profit or loss in the statement of comprehensive income. - Total return swaps Total return swaps are contracts in which the Fund pays or receives a series of cash flows based upon the total return of a specified asset in return for paying or receiving, respectively, a fixed or floating rate of interest based upon that same specified asset. - Warrants The Fund invests in warrants through listed exchanges and OTC markets. The listed warrants are traded on recognised exchanges and valued at the last traded price. OTC traded warrants are valued by reference to quoted prices. Change in realised and unrealised gains and losses are recorded in the statement of comprehensive income. (k) Realised and unrealised gains and losses All realised and unrealised gains and losses on securities and derivatives are recognised as net gain/(loss) on financial assets and liabilities at fair value through profit or loss in the statement of comprehensive income. The cost of securities is accounted for on a specific identification basis. Unrealised gains and losses comprise changes in the fair value of financial instruments for the year and from reversal of prior year’s unrealised gains and losses for financial instruments which were realised in the reporting year. Realised gains and losses represent the difference between an instrument’s initial carrying amount and disposal amount, or cash payments or receipts made in respect of derivative contracts (excluding payments or receipts on collateral margin accounts for such instruments).
Man Funds VI plc Notes to the financial statements (continued) For the year ended 31 December 2019
74
2. Significant accounting policies (continued) (l) Transaction costs Transaction costs are incremental costs, which are separately identifiable and directly attributable to the acquisition, issue or disposal of a financial asset or financial liability. Transaction costs incurred by the Fund during the year are recognised in the statement of comprehensive income as part of net gain/(loss) on financial assets and liabilities at fair value through profit or loss. (m) Functional and presentation currency The Fund seeks to generate returns in United States Dollars (“US$”), its capital-raising currency. The liquidity of the Fund is managed on a day-to-day basis in United States Dollars in order to handle the issue and redemption of the Fund’s Redeemable Participating Shares. The Fund’s performance is also evaluated in United States Dollars. Therefore, as the United States Dollar is considered as the currency that most faithfully represents the economic effects of the underlying transactions, events and conditions. The Fund’s functional and presentational currency is United States Dollar. (n) Securities sold under agreements to repurchase and securities purchased under agreements to resell Securities sold under agreement to repurchase at a specified future date are not derecognised from the statement of financial position as the Fund retains substantially all the risks and rewards of ownership. The corresponding cash received is recognised in the statement of financial position with a corresponding obligation to repay it, reflecting its economic substance as a loan to the Fund. The difference between the sale and repurchase prices is treated as interest expense and is accrued over the life of the agreement and is included in the statement of comprehensive income. Where the counterparty has the right to sell or pledge the securities sold to it then the assets are separately disclosed as securities purchased under agreement to resell. Securities purchased under agreements to resell at a specified future date (“Reverse Repurchase Agreements”) are not recognised in the statement of financial position unless they are subsequently sold to third parties (‘rehypothecation’), in which case, the obligation to return the securities is recorded as a short sale within trading liabilities and measured at fair value with any gains or losses included in the statement of comprehensive income. The corresponding cash paid is derecognised and a corresponding receivable is recorded in the statement of financial position reflecting the Fund’s right to receive it back. The difference between the purchase and resale prices is treated as interest revenue, accrued over the life of the agreement and included in the statement of comprehensive income. (o) Foreign currency Transactions during the year denominated in foreign currencies have been translated at the rates of exchange ruling at the dates of transactions. Assets and liabilities denominated in foreign currencies are translated at the rates of exchange in effect at the date of the statement of financial position. For investment transactions and investments held as at year end denominated in foreign currency, resulting gains or losses are included in the net gain/(loss) on financial assets and liabilities at fair value through profit or loss in the statement of comprehensive income. All other foreign currency gains and losses are also included in the net gain/(loss) on financial assets and liabilities at fair value through profit or loss in the statement of comprehensive income. The combined fund balances are expressed in US$, being the presentation currency of the Fund as a whole. For combined fund balances in the statement of financial position, the non US$ Portfolios are translated using the exchange rate at the date of statement of financial position. For combined fund balances in the statement of comprehensive income, the non US$ Portfolios are translated at the average exchange rate prevailing during the year. The combined subscriptions and redemptions in the statement of changes in net assets are also translated at the average rate prevailing during the current year. The translation gain/(loss) resulting from the preparation of the combined company balances in the financial statements amounting to gain of US$17,836,359 (31 December 2018: loss of US$146,670,608) has been shown in the combined fund column of statement of comprehensive income. The gain/loss does not have any effect on the individual Portfolios. (p) Other expenses Other expenses are recognised in the statement of comprehensive income on an accruals basis. (q) Investor Money Regulations In response to the CBI publishing the Central Bank (Supervision and Enforcement) Act 2013 (Section 48(1)) Investor Money Regulations 2015 for Fund Service Providers (the “Investor Money Regulations” or “IMR”) in March 2015 (effective from 1 July 2016), the Manager undertook, together with BNY Mellon Fund Services (Ireland) Designated Activity Company, a review of the way in which subscription, distribution and redemption monies are routed to and from the Fund or the relevant sub-fund. As a result of this review, subscription and redemption monies are routed through a sub-fund cash collection account in the name of the sub-fund. Pending issue of the units and / or payment of subscription proceeds to an account in the name of the sub-funds, and pending payment of redemption proceeds or distributions, the relevant investor will be an unsecured creditor of the sub-fund in respect of amounts paid by or due to it.
Man Funds VI plc Notes to the financial statements (continued) For the year ended 31 December 2019
75
2. Significant accounting policies (continued) (r) Redeemable Participating Shares Redeemable shares are classified as equity instruments when:
• The redeemable shares entitle the holder to a pro rata share of the Fund’s net assets in the event of the Fund’s liquidation; • The redeemable shares are in the class of instruments that is subordinate to all other classes of instruments; • All redeemable shares in the class of instruments that is subordinate to all other classes of instruments have identical features; • The redeemable shares do not include any contractual obligation to deliver cash or another financial asset other than the
holder’s rights to a pro rata share of the Fund’s net assets; • The total expected cash flows attributable to the redeemable shares over the life of the instrument are based substantially on
the profit or loss, the change in the recognised net assets or the change in the fair value of the recognised and unrecognised net assets of the Fund over the life of the instrument.
In addition to the redeemable shares having all of the above features, the Fund must have no other financial instrument or contract that has:
• Total cash flows based substantially on the profit or loss, the change in the recognised net assets or the change in the fair value of the recognised and unrecognised net assets of the Fund;
• The effect of substantially restricting or fixing the residual return to the redeemable shareholders. The Fund continuously assesses the classification of the Redeemable Participating Shares. If the Redeemable Participating Shares cease to have all the features, or meet all the conditions set out, to be classified as equity, the Fund will reclassify them as financial liabilities and measure them at fair value at the date of reclassification, with any differences from the previous carrying amount recognised in equity. If the Redeemable Participating Shares subsequently have all the features and meet the conditions to be classified as equity, the Fund will reclassify them as equity instruments and measure them at the carrying amount of the liabilities at the date of the reclassification. As at 31 December 2019, the Fund classified its Redeemable Participating Shares as a liability. Share Transaction include subscriptions received in advance and redemptions in the process of being paid. (s) Cash and cash equivalents Cash and cash equivalents in the statement of financial position may consist of cash at bank, demand deposits, short-term deposits in financial institutions and short-term highly liquid investments that are readily convertible to known amounts of cash and which are subject to an insignificant risk of changes in value, with original maturities of three months or less. Short-term investments that are not held for the purpose of meeting short-term cash commitments and restricted margin accounts are not considered cash and cash equivalents. For the purpose of the statement of cash flows, cash and cash equivalents consist of cash and cash equivalents as defined above, net of outstanding bank overdrafts when applicable. (t) Balances with brokers/due to brokers Balances with brokers and balances due to brokers includes unrestricted cash balances held with brokers, margin account balances held at the Fund’s brokers and balances payable to the Fund’s brokers at the year end, and can include amounts transferred as collateral (and therefore subject to a security interest) against open derivative contracts. (u) Due from and to brokers Due from brokers include receivables for securities sold (in a regular way transaction) that have been contracted for but not yet delivered on the statement of financial position date. These are carried at amortised cost using the effective interest method less any allowance for impairment. Due to brokers are payables for securities purchased (in a regular way transaction) that have been contracted for but not yet delivered on the statement of financial position date. These are measured at amortised cost using the effective interest method. (v) Distributions to shareholders In accordance with the Fund’s Prospectus, the Fund may fully distribute its distributable income to shareholders. Distributable income includes capital gains arising from the disposal of investments. Unrealised gains and losses are included in the net assets attributable to shareholders and are not distributable until realised. Capital losses are not distributed to shareholders, but are retained to be offset against any future realised capital gains. Distributions to shareholders are recognised in the statement of comprehensive income as finance costs. (w) Preliminary expenses The Fund has borne its organisational expenses, including, without limitation, legal, accounting, filing and administration expenses associated with the organisation of the Fund and the offering of shares in the year in which they were incurred. For NAV purposes the organisational costs are amortised over the 36 months of trading of the Fund.
Man Funds VI plc Notes to the financial statements (continued) For the year ended 31 December 2019
76
3. Cash and cash equivalents, balances with brokers and balances due to brokers At the year end, amounts disclosed as cash and cash equivalents, balances with brokers and balances due to brokers were held at the Bank of New York Mellon (London Branch), Bank of America Merrill Lynch, Bank of Nova Scotia, Barclays Plc, BNP Paribas, Citibank N.A., Credit Suisse AG Ireland, Credit Suisse Securities (Europe) Limited, Deutsche Bank AG, Goldman Sachs International, HSBC Bank Plc, JP Morgan Securities Plc, Morgan Stanley & Co. International Plc, Nomura Holdings, Royal Bank of Scotland and UBS AG. Balances with brokers represent the margin account balances held with the broker and balances due to broker represents an amount payable to broker as a result of margin or collateral amount payable at the year end. These include amounts transferred as collateral (which is subject to a security) against open derivatives, short positions or financial instruments purchased on margin, deposits held at call with banks and other short term highly liquid investments with original maturities of three months or less. Included in cash and cash equivalents balances at 31 December 2019 are US T-bills with a fair value of US$Nil (cost: US$Nil) (2018: US$US$1,000,000 (cost: US$994,830) for Man AHL TargetRisk, a fair value of US$782,030,456 (cost: US$780,257,785) (2018: US$205,400,170 (cost: US$203,946,809)) for Man GLG Global Emerging Markets Debt Total Return, a fair value of US$24,912,518 (cost: US$24,841,112) (2018: US$44,894,697 (cost: US$44,658,969)) for Man GLG Innovation Equity Alternative, a fair value of US$Nil (cost: US$Nil) (2018: US$42,935,364 (cost: US$42,629,891)) for Man Alternative Style Risk Premia, a fair value of US$81,431,678 (cost: US$80,565,707) (2018: US$99,766 (cost: US$99,456)) for Man AHL Active Balanced, a fair value of US$22,561,542 (cost: US$22,508,182) (2018: n/a (cost: n/a)) for Man GLG Event Driven Alternative and a fair value of US$3,968,248 (cost: US$3,958,522) (2018: n/a (cost: n/a)) for Man GLG Global Debt Total Return. Due from brokers and to brokers represent receivables for financial instruments sold and payables for financial instruments purchased that have been contracted for but not yet settled or delivered on the statement of financial position date respectively. The portion of balance with/due to brokers represented by collateral as at 31 December 2019 and 31 December 2018 is outlined below:
31 December 2019 31 December 2018Man GLG European Alpha Alternative €1,410,405 (€1,305,014)Man GLG Alpha Select Alternative £16,523,009 £19,052,715Man GLG European Equity Alternative €44,306,493 €22,570,688Man GLG Global Equity Alternative n/a €22Man AHL Multi Strategy Alternative US$10,905,669 US$8,266,538 Man AHL TargetRisk (US$31,866,571) US$21,564,256 Man GLG European Mid-Cap Equity Alternative €32,345,377 €47,359,727Man GLG Unconstrained Emerging Equity - US$24,799 Man GLG Global Emerging Markets Debt Total Return US$114,191,581 US$67,394,309 Man GLG Innovation Equity Alternative (US$7,099,760) US$5,495,517 Man NewSmith UK Equity Alternative - (£2,636,705)Man Alternative Style Risk Premia US$813,208 (US$1,458,999)Man AHL Active Balanced US$25,018,752 US$15,113 Man GLG High Yield Opportunities €524,760 n/aMan GLG Credit Multi-Strategy Alternative US$4,296,613 n/aMan GLG Event Driven Alternative US$6,865,180 n/aMan GLG Global Debt Total Return US$174,892 n/aMan GLG High Yield Opportunities DE €1,141,021 n/aMan GLG US Absolute Alpha - n/a
4. Financial assets and liabilities at fair value through profit or loss Collateral received Repurchase agreements:
31 December 2019 31 December 2018 US$ US$
Liabilit iesRepurchase agreements 21,125,126 n/a
21,125,126 n/a
As at 31 December 2019, the fair value of securities pledged as collateral in relation to the repurchase agreements was €12,256,069 (2018: €Nil) for Man GLG High Yield Opportunities and US$12,090,857 (2018: US$Nil) for Man GLG Credit Multi-Strategy Alternative.
Man Funds VI plc Notes to the financial statements (continued) For the year ended 31 December 2019
77
4. Financial assets and liabilities at fair value through profit or loss (continued) Fair value of financial instruments The Fund classifies fair value measurements using a fair value hierarchy that reflects the significance of the inputs used in determining the measurements in line with IFRS 13. The fair value hierarchy has the following levels:
• Level 1 – Quoted market price in an active market for an identical instrument. • Level 2 – Valuation techniques based on observable inputs. This category includes instruments valued using: quoted market
prices in active markets for similar instruments; quoted prices for similar instruments in markets that are considered less than active; or other valuation techniques where all significant inputs are directly or indirectly observable from market data.
• Level 3 – Valuation techniques using significant unobservable inputs. This category includes all instruments where the valuation technique includes inputs not based on observable data and the unobservable inputs could have a significant impact on the instrument’s valuation. This category includes instruments that are valued based on quoted prices for similar instruments where significant unobservable adjustments or assumptions are required to reflect differences between the instruments.
Valuation techniques Listed or publicly traded investment in equity and debt securities, managed funds and derivatives When fair values of listed securities and debt securities at the reporting date, as well as publicly traded derivatives, are based on quoted market prices or binding dealer price quotations, without any deduction for transaction costs, the instruments are included within Level 1 of the hierarchy. Unlisted debt securities and treasury bills The Fund invests in debt securities, corporate and government bonds and treasury securities. In the absence of a quoted price in an active market, they are valued using observable inputs such as recently executed transaction prices in securities of the issuer or comparable issuers and yield curves. Adjustments are made to the valuations when necessary to recognise differences in the instruments terms. To the extent that the significant inputs are observable, the Fund categorises these investments as Level 2. Over-the-counter derivatives The Fund uses widely recognised valuation models for determining fair values of over-the-counter interest rate swaps, currency swaps and forward foreign exchange contracts. The most frequently applied valuation techniques include forward pricing and swap models, using present value calculations. The models incorporate various inputs including both credit and debit valuation adjustments for counterparty and own credit risk, foreign exchange spot and forward rates and interest rate curves. For these financial instruments, significant inputs into models are market observable and are included within Level 2. Unlisted equity investments The Fund invests in private equity companies which are not quoted in an active market. Transactions in such investments do not occur on a regular basis. The Fund uses a market based valuation technique for these positions. The Investment Manager determines comparable public companies (peers) based on industry, size, leverage and strategy, and calculates an appropriate earnings multiple for each comparable company identified. The multiple is calculated by dividing the enterprise value of the comparable company by an earnings measure. The trading multiple is then discounted for considerations such as illiquidity and size differences between the comparable companies based on company-specific facts and circumstances. The discounted multiple is applied to the corresponding earnings measure of the investee company to measure the fair value. The Fund classifies the fair value of these investments as Level 3. For all other financial instruments, fair value is determined using valuation techniques. Valuation techniques include net present value techniques, comparison to similar instruments for which market observable prices exist, options pricing models and other relevant valuation models.
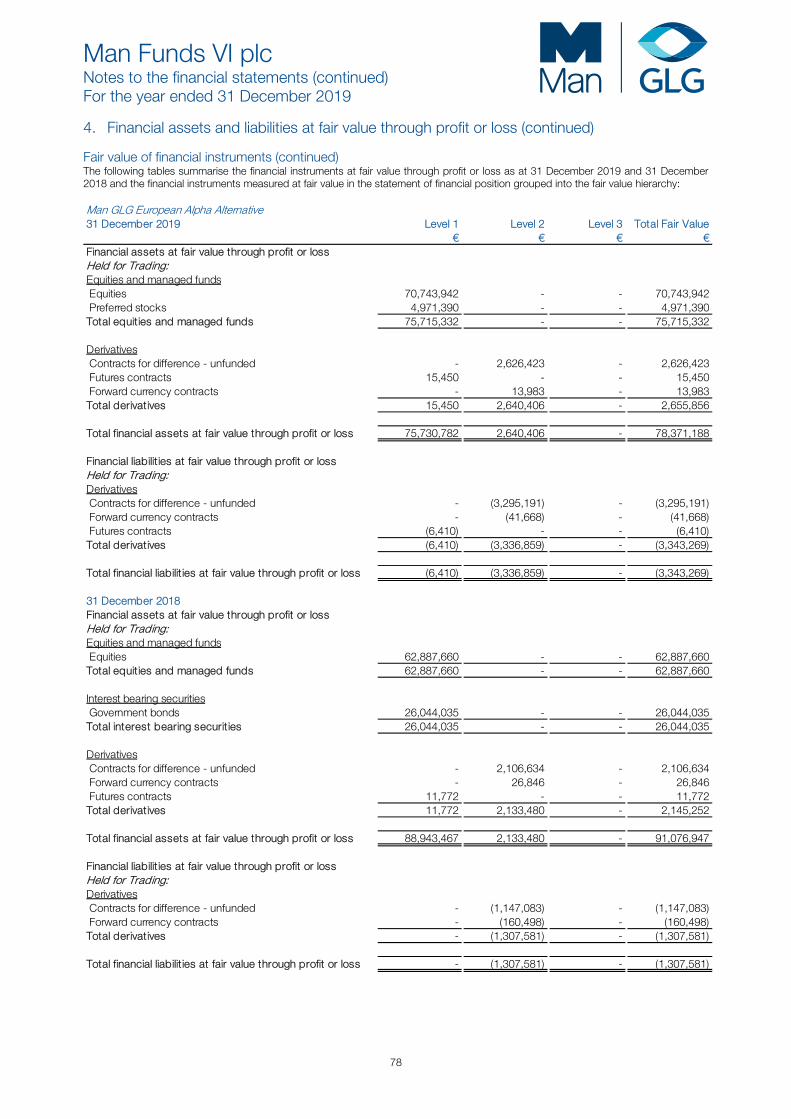
Man Funds VI plc Notes to the financial statements (continued) For the year ended 31 December 2019
78
4. Financial assets and liabilities at fair value through profit or loss (continued) Fair value of financial instruments (continued) The following tables summarise the financial instruments at fair value through profit or loss as at 31 December 2019 and 31 December 2018 and the financial instruments measured at fair value in the statement of financial position grouped into the fair value hierarchy: Man GLG European Alpha Alternative31 December 2019 Level 1 Level 2 Level 3 Total Fair Value
€ € € € Financial assets at fair value through profit or lossHeld for Trading:Equities and managed funds Equities 70,743,942 - - 70,743,942 Preferred stocks 4,971,390 - - 4,971,390 Total equities and managed funds 75,715,332 - - 75,715,332
Derivatives Contracts for difference - unfunded - 2,626,423 - 2,626,423 Futures contracts 15,450 - - 15,450 Forward currency contracts - 13,983 - 13,983 Total derivatives 15,450 2,640,406 - 2,655,856
Total financial assets at fair value through profit or loss 75,730,782 2,640,406 - 78,371,188
Financial liabilit ies at fair value through profit or lossHeld for Trading:Derivatives Contracts for difference - unfunded - (3,295,191) - (3,295,191) Forward currency contracts - (41,668) - (41,668) Futures contracts (6,410) - - (6,410)Total derivatives (6,410) (3,336,859) - (3,343,269)
Total financial liabilit ies at fair value through profit or loss (6,410) (3,336,859) - (3,343,269)
31 December 2018Financial assets at fair value through profit or lossHeld for Trading:Equities and managed funds Equities 62,887,660 - - 62,887,660 Total equities and managed funds 62,887,660 - - 62,887,660
Interest bearing securities Government bonds 26,044,035 - - 26,044,035 Total interest bearing securities 26,044,035 - - 26,044,035
Derivatives Contracts for difference - unfunded - 2,106,634 - 2,106,634 Forward currency contracts - 26,846 - 26,846 Futures contracts 11,772 - - 11,772 Total derivatives 11,772 2,133,480 - 2,145,252
Total financial assets at fair value through profit or loss 88,943,467 2,133,480 - 91,076,947
Financial liabilit ies at fair value through profit or lossHeld for Trading:Derivatives Contracts for difference - unfunded - (1,147,083) - (1,147,083) Forward currency contracts - (160,498) - (160,498)Total derivatives - (1,307,581) - (1,307,581)
Total financial liabilit ies at fair value through profit or loss - (1,307,581) - (1,307,581)

Man Funds VI plc Notes to the financial statements (continued) For the year ended 31 December 2019
79
4. Financial assets and liabilities at fair value through profit or loss (continued) Fair value of financial instruments (continued) Man GLG Alpha Select Alternative31 December 2019 Level 1 Level 2 Level 3 Total Fair Value
£ £ £ £ Financial assets at fair value through profit or lossHeld for Trading:Interest bearing securities Government bonds 716,199,450 50,367,500 - 766,566,950 Total interest bearing securities 716,199,450 50,367,500 - 766,566,950
Derivatives Contracts for difference - unfunded - 46,311,097 - 46,311,097 Forward currency contracts - 15,074 - 15,074 Total derivatives - 46,326,171 - 46,326,171
Total financial assets at fair value through profit or loss 716,199,450 96,693,671 - 812,893,121
Financial liabilit ies at fair value through profit or lossHeld for Trading:Derivatives Contracts for difference - unfunded - (14,954,983) - (14,954,983) Forward currency contracts - (11,093,298) - (11,093,298) Futures contracts (3,927,255) - - (3,927,255)Total derivatives (3,927,255) (26,048,281) - (29,975,536)
Total financial liabilit ies at fair value through profit or loss (3,927,255) (26,048,281) - (29,975,536)
31 December 2018Financial assets at fair value through profit or lossHeld for Trading:Equities and managed funds Equities 893,087 - - 893,087 Total equities and managed funds 893,087 - - 893,087
Interest bearing securities Government bonds 560,743,254 43,285,950 - 604,029,204 Total interest bearing securities 560,743,254 43,285,950 - 604,029,204
Derivatives Contracts for difference - unfunded - 15,576,438 - 15,576,438 Forward currency contracts - 12,957 - 12,957 Option contracts 3,557 - - 3,557 Total derivatives 3,557 15,589,395 - 15,592,952
Total financial assets at fair value through profit or loss 561,639,898 58,875,345 - 620,515,243
Financial liabilit ies at fair value through profit or lossHeld for Trading:Derivatives Contracts for difference - unfunded - (11,584,332) - (11,584,332) Forward currency contracts - (2,287,494) - (2,287,494) Futures contracts (135,445) - - (135,445)Total derivatives (135,445) (13,871,826) - (14,007,271)
Total financial liabilit ies at fair value through profit or loss (135,445) (13,871,826) - (14,007,271)
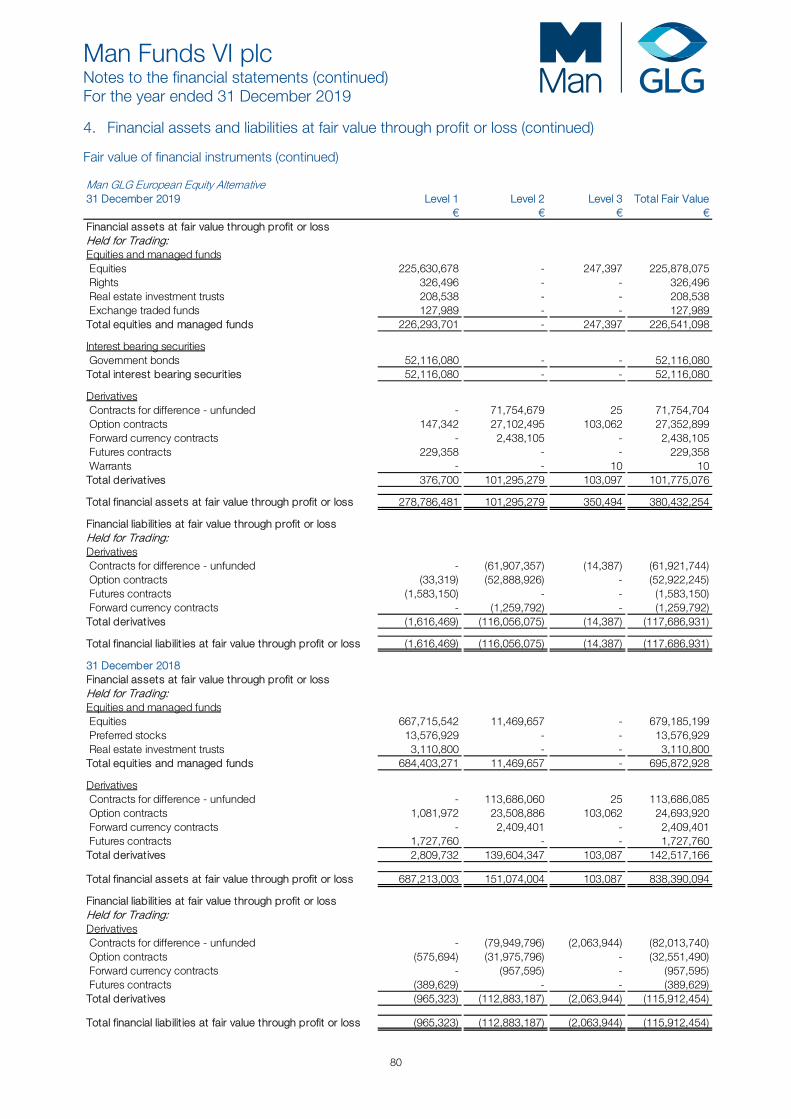
Man Funds VI plc Notes to the financial statements (continued) For the year ended 31 December 2019
80
4. Financial assets and liabilities at fair value through profit or loss (continued) Fair value of financial instruments (continued) Man GLG European Equity Alternative31 December 2019 Level 1 Level 2 Level 3 Total Fair Value
€ € € € Financial assets at fair value through profit or lossHeld for Trading:Equities and managed funds Equities 225,630,678 - 247,397 225,878,075 Rights 326,496 - - 326,496 Real estate investment trusts 208,538 - - 208,538 Exchange traded funds 127,989 - - 127,989 Total equities and managed funds 226,293,701 - 247,397 226,541,098
Interest bearing securities Government bonds 52,116,080 - - 52,116,080 Total interest bearing securities 52,116,080 - - 52,116,080
Derivatives Contracts for difference - unfunded - 71,754,679 25 71,754,704 Option contracts 147,342 27,102,495 103,062 27,352,899 Forward currency contracts - 2,438,105 - 2,438,105 Futures contracts 229,358 - - 229,358 Warrants - - 10 10 Total derivatives 376,700 101,295,279 103,097 101,775,076
Total financial assets at fair value through profit or loss 278,786,481 101,295,279 350,494 380,432,254
Financial liabilit ies at fair value through profit or lossHeld for Trading:Derivatives Contracts for difference - unfunded - (61,907,357) (14,387) (61,921,744) Option contracts (33,319) (52,888,926) - (52,922,245) Futures contracts (1,583,150) - - (1,583,150) Forward currency contracts - (1,259,792) - (1,259,792)Total derivatives (1,616,469) (116,056,075) (14,387) (117,686,931)
Total financial liabilit ies at fair value through profit or loss (1,616,469) (116,056,075) (14,387) (117,686,931)
31 December 2018Financial assets at fair value through profit or lossHeld for Trading:Equities and managed funds Equities 667,715,542 11,469,657 - 679,185,199 Preferred stocks 13,576,929 - - 13,576,929 Real estate investment trusts 3,110,800 - - 3,110,800 Total equities and managed funds 684,403,271 11,469,657 - 695,872,928
Derivatives Contracts for difference - unfunded - 113,686,060 25 113,686,085 Option contracts 1,081,972 23,508,886 103,062 24,693,920 Forward currency contracts - 2,409,401 - 2,409,401 Futures contracts 1,727,760 - - 1,727,760 Total derivatives 2,809,732 139,604,347 103,087 142,517,166
Total financial assets at fair value through profit or loss 687,213,003 151,074,004 103,087 838,390,094
Financial liabilit ies at fair value through profit or lossHeld for Trading:Derivatives Contracts for difference - unfunded - (79,949,796) (2,063,944) (82,013,740) Option contracts (575,694) (31,975,796) - (32,551,490) Forward currency contracts - (957,595) - (957,595) Futures contracts (389,629) - - (389,629)Total derivatives (965,323) (112,883,187) (2,063,944) (115,912,454)
Total financial liabilit ies at fair value through profit or loss (965,323) (112,883,187) (2,063,944) (115,912,454)
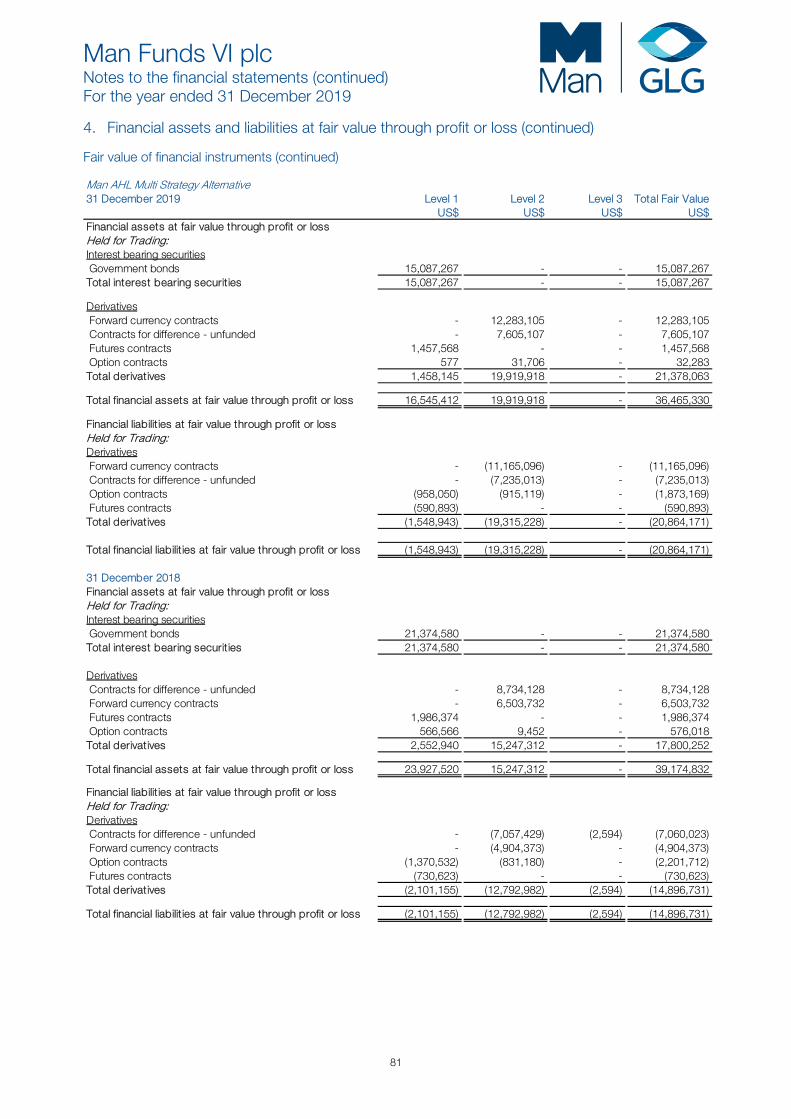
Man Funds VI plc Notes to the financial statements (continued) For the year ended 31 December 2019
81
4. Financial assets and liabilities at fair value through profit or loss (continued) Fair value of financial instruments (continued) Man AHL Multi Strategy Alternative31 December 2019 Level 1 Level 2 Level 3 Total Fair Value
US$ US$ US$ US$ Financial assets at fair value through profit or lossHeld for Trading:Interest bearing securities Government bonds 15,087,267 - - 15,087,267 Total interest bearing securities 15,087,267 - - 15,087,267
Derivatives Forward currency contracts - 12,283,105 - 12,283,105 Contracts for difference - unfunded - 7,605,107 - 7,605,107 Futures contracts 1,457,568 - - 1,457,568 Option contracts 577 31,706 - 32,283 Total derivatives 1,458,145 19,919,918 - 21,378,063
Total financial assets at fair value through profit or loss 16,545,412 19,919,918 - 36,465,330
Financial liabilit ies at fair value through profit or lossHeld for Trading:Derivatives Forward currency contracts - (11,165,096) - (11,165,096) Contracts for difference - unfunded - (7,235,013) - (7,235,013) Option contracts (958,050) (915,119) - (1,873,169) Futures contracts (590,893) - - (590,893)Total derivatives (1,548,943) (19,315,228) - (20,864,171)
Total financial liabilit ies at fair value through profit or loss (1,548,943) (19,315,228) - (20,864,171)
31 December 2018Financial assets at fair value through profit or lossHeld for Trading:Interest bearing securities Government bonds 21,374,580 - - 21,374,580 Total interest bearing securities 21,374,580 - - 21,374,580
Derivatives Contracts for difference - unfunded - 8,734,128 - 8,734,128 Forward currency contracts - 6,503,732 - 6,503,732 Futures contracts 1,986,374 - - 1,986,374 Option contracts 566,566 9,452 - 576,018 Total derivatives 2,552,940 15,247,312 - 17,800,252
Total financial assets at fair value through profit or loss 23,927,520 15,247,312 - 39,174,832
Financial liabilit ies at fair value through profit or lossHeld for Trading:Derivatives Contracts for difference - unfunded - (7,057,429) (2,594) (7,060,023) Forward currency contracts - (4,904,373) - (4,904,373) Option contracts (1,370,532) (831,180) - (2,201,712) Futures contracts (730,623) - - (730,623)Total derivatives (2,101,155) (12,792,982) (2,594) (14,896,731)
Total financial liabilit ies at fair value through profit or loss (2,101,155) (12,792,982) (2,594) (14,896,731)
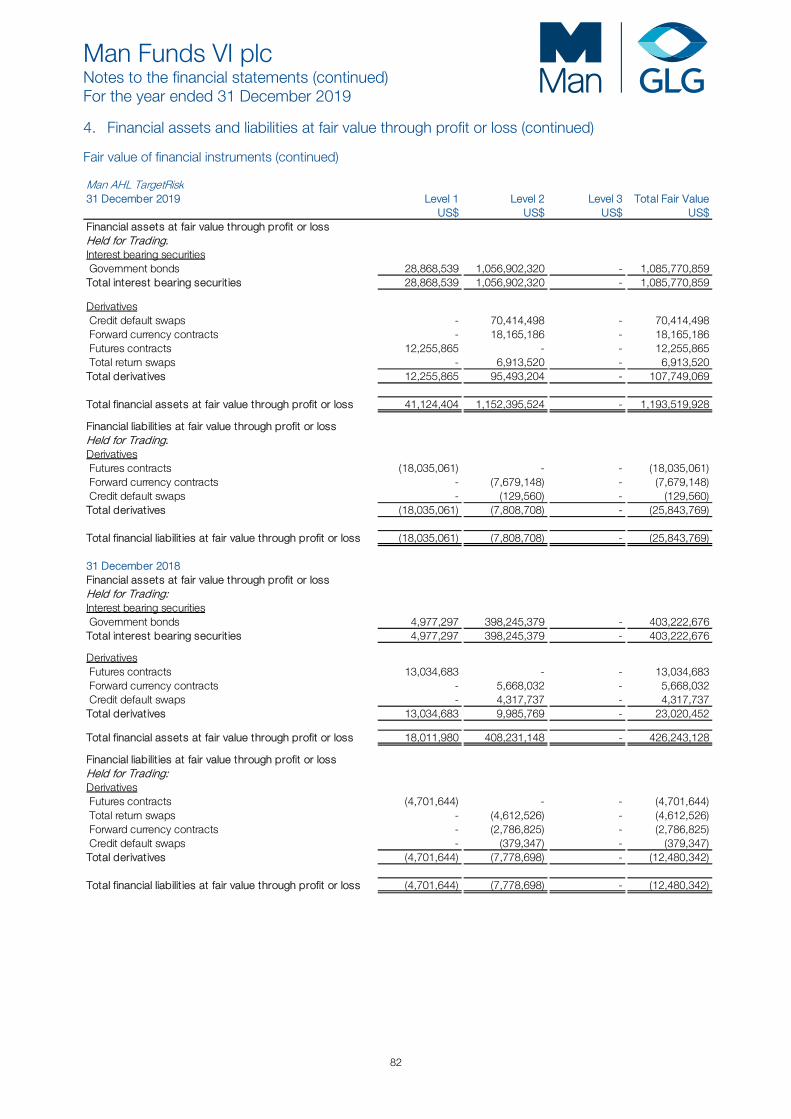
Man Funds VI plc Notes to the financial statements (continued) For the year ended 31 December 2019
82
4. Financial assets and liabilities at fair value through profit or loss (continued) Fair value of financial instruments (continued) Man AHL TargetRisk US$ US$ US$ US$ 31 December 2019 Level 1 Level 2 Level 3 Total Fair Value
US$ US$ US$ US$ Financial assets at fair value through profit or lossHeld for Trading:Interest bearing securities Government bonds 28,868,539 1,056,902,320 - 1,085,770,859 Total interest bearing securities 28,868,539 1,056,902,320 - 1,085,770,859
Derivatives Credit default swaps - 70,414,498 - 70,414,498 Forward currency contracts - 18,165,186 - 18,165,186 Futures contracts 12,255,865 - - 12,255,865 Total return swaps - 6,913,520 - 6,913,520 Total derivatives 12,255,865 95,493,204 - 107,749,069
Total financial assets at fair value through profit or loss 41,124,404 1,152,395,524 - 1,193,519,928
Financial liabilit ies at fair value through profit or lossHeld for Trading:Derivatives Futures contracts (18,035,061) - - (18,035,061) Forward currency contracts - (7,679,148) - (7,679,148) Credit default swaps - (129,560) - (129,560)Total derivatives (18,035,061) (7,808,708) - (25,843,769)
Total financial liabilit ies at fair value through profit or loss (18,035,061) (7,808,708) - (25,843,769)
31 December 2018Financial assets at fair value through profit or lossHeld for Trading:Interest bearing securities Government bonds 4,977,297 398,245,379 - 403,222,676 Total interest bearing securities 4,977,297 398,245,379 - 403,222,676
Derivatives Futures contracts 13,034,683 - - 13,034,683 Forward currency contracts - 5,668,032 - 5,668,032 Credit default swaps - 4,317,737 - 4,317,737 Total derivatives 13,034,683 9,985,769 - 23,020,452
Total financial assets at fair value through profit or loss 18,011,980 408,231,148 - 426,243,128
Financial liabilit ies at fair value through profit or lossHeld for Trading:Derivatives Futures contracts (4,701,644) - - (4,701,644) Total return swaps - (4,612,526) - (4,612,526) Forward currency contracts - (2,786,825) - (2,786,825) Credit default swaps - (379,347) - (379,347)Total derivatives (4,701,644) (7,778,698) - (12,480,342)
Total financial liabilit ies at fair value through profit or loss (4,701,644) (7,778,698) - (12,480,342)
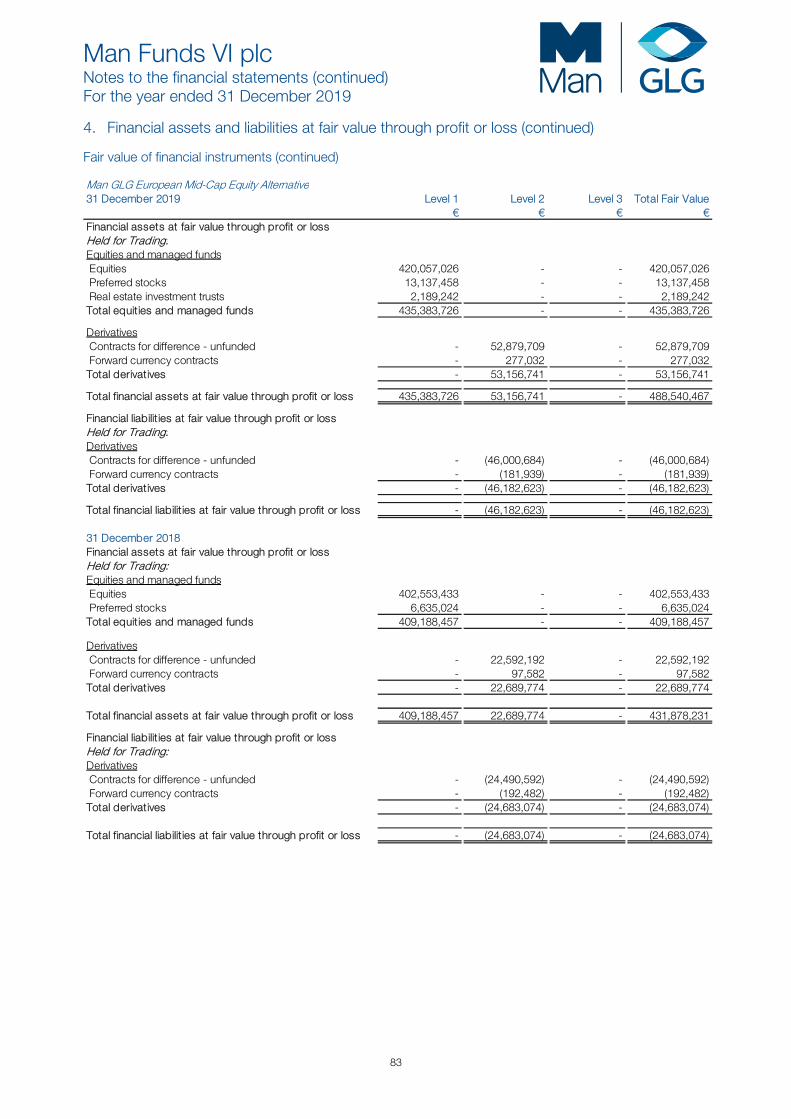
Man Funds VI plc Notes to the financial statements (continued) For the year ended 31 December 2019
83
4. Financial assets and liabilities at fair value through profit or loss (continued) Fair value of financial instruments (continued) Man GLG European Mid-Cap Equity Alternative31 December 2019 Level 1 Level 2 Level 3 Total Fair Value
€ € € € Financial assets at fair value through profit or lossHeld for Trading:Equities and managed funds Equities 420,057,026 - - 420,057,026 Preferred stocks 13,137,458 - - 13,137,458 Real estate investment trusts 2,189,242 - - 2,189,242 Total equities and managed funds 435,383,726 - - 435,383,726
Derivatives Contracts for difference - unfunded - 52,879,709 - 52,879,709 Forward currency contracts - 277,032 - 277,032 Total derivatives - 53,156,741 - 53,156,741
Total financial assets at fair value through profit or loss 435,383,726 53,156,741 - 488,540,467
Financial liabilit ies at fair value through profit or lossHeld for Trading:Derivatives Contracts for difference - unfunded - (46,000,684) - (46,000,684) Forward currency contracts - (181,939) - (181,939)Total derivatives - (46,182,623) - (46,182,623)
Total financial liabilit ies at fair value through profit or loss - (46,182,623) - (46,182,623)
31 December 2018Financial assets at fair value through profit or lossHeld for Trading:Equities and managed funds Equities 402,553,433 - - 402,553,433 Preferred stocks 6,635,024 - - 6,635,024 Total equities and managed funds 409,188,457 - - 409,188,457
Derivatives Contracts for difference - unfunded - 22,592,192 - 22,592,192 Forward currency contracts - 97,582 - 97,582 Total derivatives - 22,689,774 - 22,689,774
Total financial assets at fair value through profit or loss 409,188,457 22,689,774 - 431,878,231
Financial liabilit ies at fair value through profit or lossHeld for Trading:Derivatives Contracts for difference - unfunded - (24,490,592) - (24,490,592) Forward currency contracts - (192,482) - (192,482)Total derivatives - (24,683,074) - (24,683,074)
Total financial liabilit ies at fair value through profit or loss - (24,683,074) - (24,683,074)
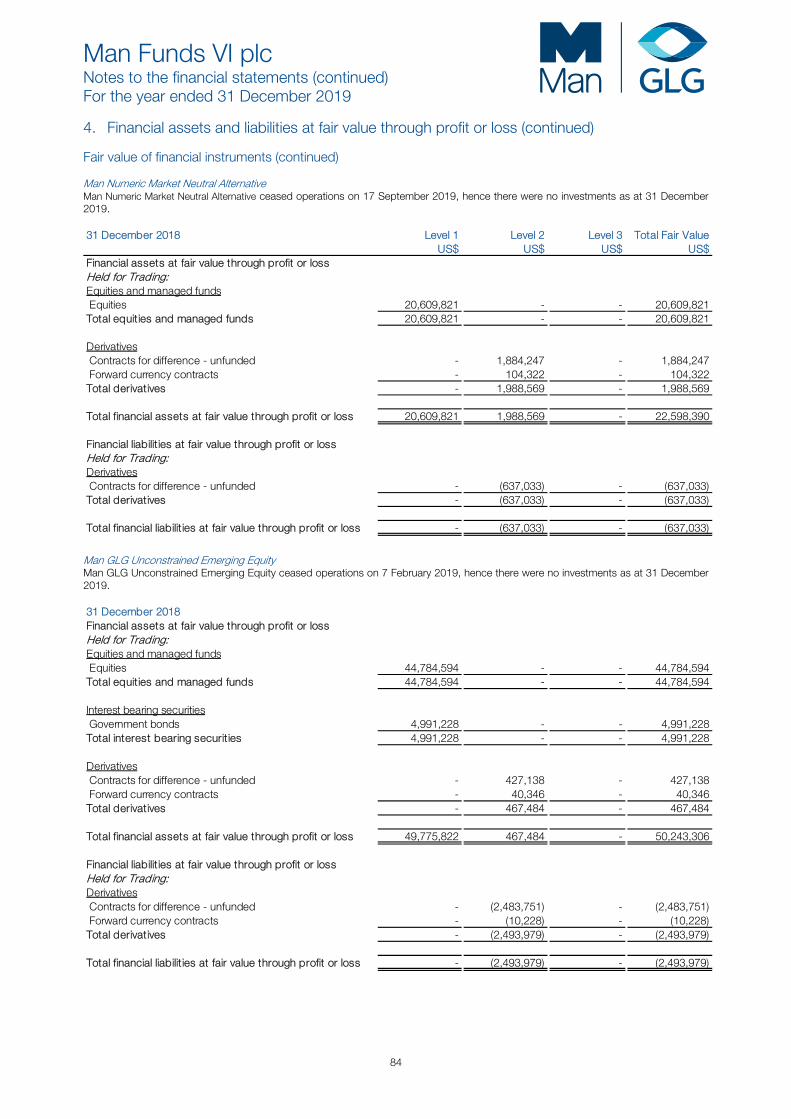
Man Funds VI plc Notes to the financial statements (continued) For the year ended 31 December 2019
84
4. Financial assets and liabilities at fair value through profit or loss (continued) Fair value of financial instruments (continued) Man Numeric Market Neutral Alternative Man Numeric Market Neutral Alternative ceased operations on 17 September 2019, hence there were no investments as at 31 December 2019. 31 December 2018 Level 1 Level 2 Level 3 Total Fair Value
US$ US$ US$ US$ Financial assets at fair value through profit or lossHeld for Trading:Equities and managed funds Equities 20,609,821 - - 20,609,821 Total equities and managed funds 20,609,821 - - 20,609,821
Derivatives Contracts for difference - unfunded - 1,884,247 - 1,884,247 Forward currency contracts - 104,322 - 104,322 Total derivatives - 1,988,569 - 1,988,569
Total financial assets at fair value through profit or loss 20,609,821 1,988,569 - 22,598,390
Financial liabilit ies at fair value through profit or lossHeld for Trading:Derivatives Contracts for difference - unfunded - (637,033) - (637,033)Total derivatives - (637,033) - (637,033)
Total financial liabilit ies at fair value through profit or loss - (637,033) - (637,033)
Man GLG Unconstrained Emerging Equity Man GLG Unconstrained Emerging Equity ceased operations on 7 February 2019, hence there were no investments as at 31 December 2019. 31 December 2018Financial assets at fair value through profit or lossHeld for Trading:Equities and managed funds Equities 44,784,594 - - 44,784,594 Total equities and managed funds 44,784,594 - - 44,784,594
Interest bearing securities Government bonds 4,991,228 - - 4,991,228 Total interest bearing securities 4,991,228 - - 4,991,228
Derivatives Contracts for difference - unfunded - 427,138 - 427,138 Forward currency contracts - 40,346 - 40,346 Total derivatives - 467,484 - 467,484
Total financial assets at fair value through profit or loss 49,775,822 467,484 - 50,243,306
Financial liabilit ies at fair value through profit or lossHeld for Trading:Derivatives Contracts for difference - unfunded - (2,483,751) - (2,483,751) Forward currency contracts - (10,228) - (10,228)Total derivatives - (2,493,979) - (2,493,979)
Total financial liabilit ies at fair value through profit or loss - (2,493,979) - (2,493,979)
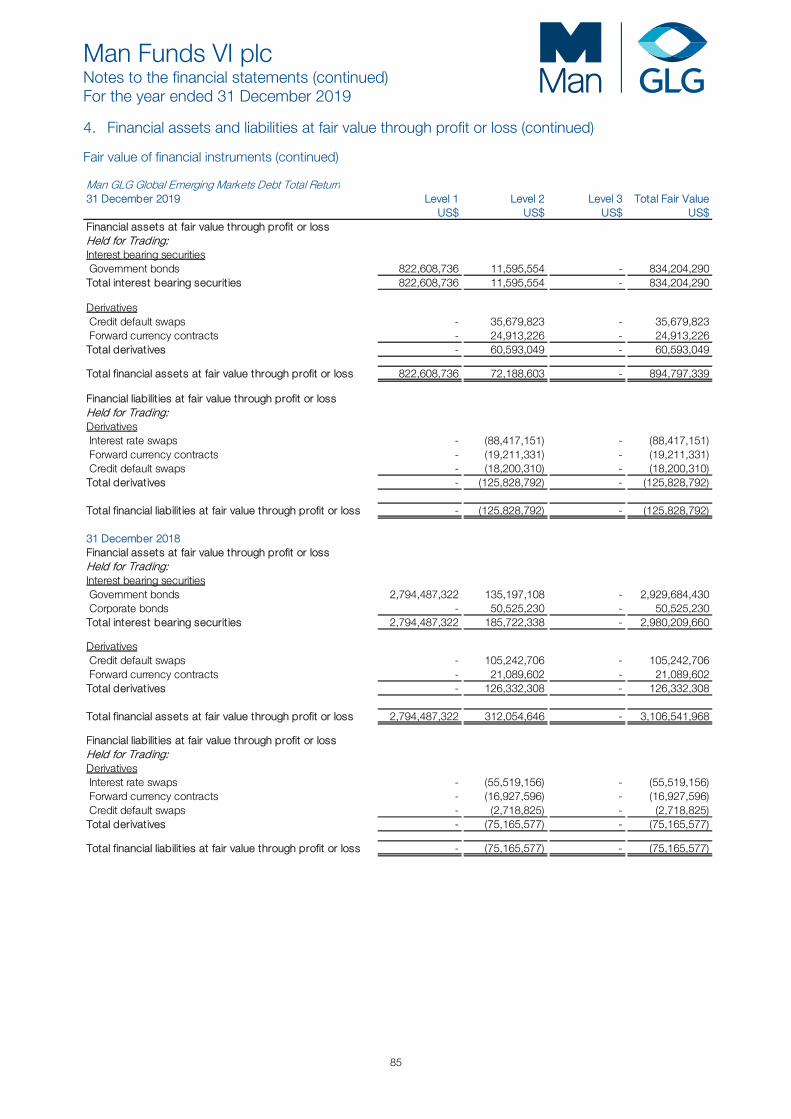
Man Funds VI plc Notes to the financial statements (continued) For the year ended 31 December 2019
85
4. Financial assets and liabilities at fair value through profit or loss (continued) Fair value of financial instruments (continued) Man GLG Global Emerging Markets Debt Total Return31 December 2019 Level 1 Level 2 Level 3 Total Fair Value
US$ US$ US$ US$ Financial assets at fair value through profit or lossHeld for Trading:Interest bearing securities Government bonds 822,608,736 11,595,554 - 834,204,290 Total interest bearing securities 822,608,736 11,595,554 - 834,204,290
Derivatives Credit default swaps - 35,679,823 - 35,679,823 Forward currency contracts - 24,913,226 - 24,913,226 Total derivatives - 60,593,049 - 60,593,049
Total financial assets at fair value through profit or loss 822,608,736 72,188,603 - 894,797,339
Financial liabilit ies at fair value through profit or lossHeld for Trading:Derivatives Interest rate swaps - (88,417,151) - (88,417,151) Forward currency contracts - (19,211,331) - (19,211,331) Credit default swaps - (18,200,310) - (18,200,310)Total derivatives - (125,828,792) - (125,828,792)
Total financial liabilit ies at fair value through profit or loss - (125,828,792) - (125,828,792)
31 December 2018Financial assets at fair value through profit or lossHeld for Trading:Interest bearing securities Government bonds 2,794,487,322 135,197,108 - 2,929,684,430 Corporate bonds - 50,525,230 - 50,525,230 Total interest bearing securities 2,794,487,322 185,722,338 - 2,980,209,660
Derivatives Credit default swaps - 105,242,706 - 105,242,706 Forward currency contracts - 21,089,602 - 21,089,602 Total derivatives - 126,332,308 - 126,332,308
Total financial assets at fair value through profit or loss 2,794,487,322 312,054,646 - 3,106,541,968
Financial liabilit ies at fair value through profit or lossHeld for Trading:Derivatives Interest rate swaps - (55,519,156) - (55,519,156) Forward currency contracts - (16,927,596) - (16,927,596) Credit default swaps - (2,718,825) - (2,718,825)Total derivatives - (75,165,577) - (75,165,577)
Total financial liabilit ies at fair value through profit or loss - (75,165,577) - (75,165,577)
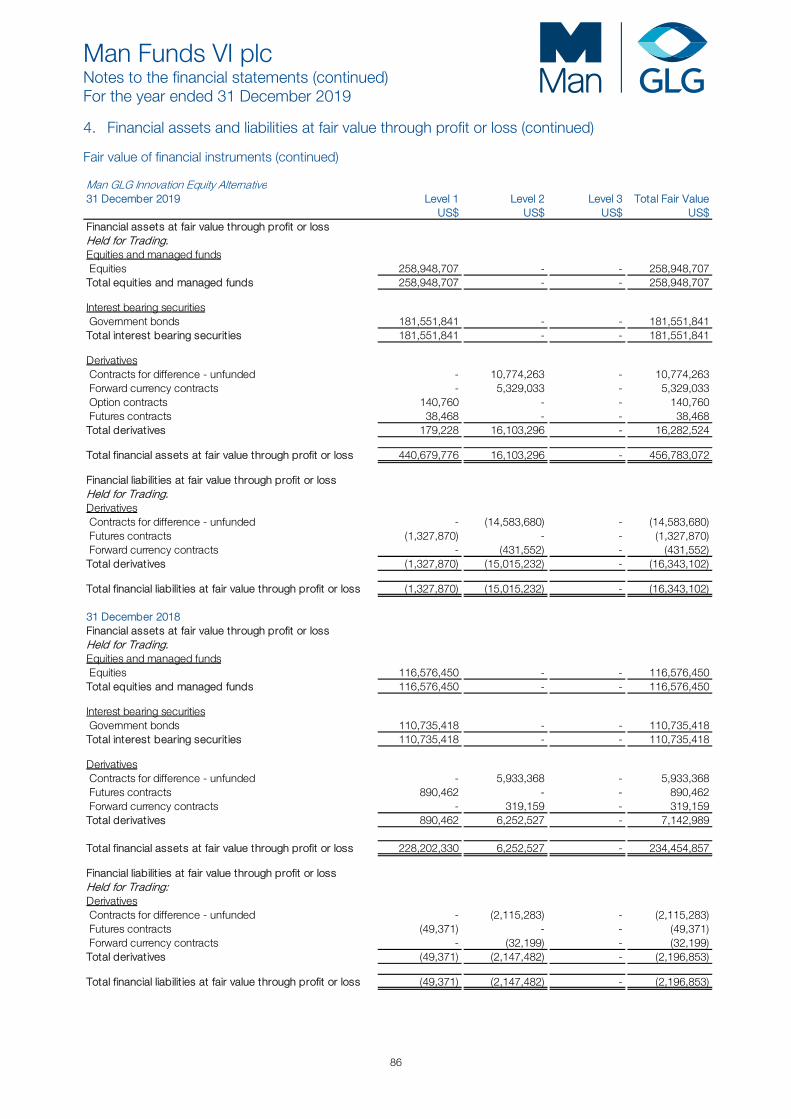
Man Funds VI plc Notes to the financial statements (continued) For the year ended 31 December 2019
86
4. Financial assets and liabilities at fair value through profit or loss (continued) Fair value of financial instruments (continued) Man GLG Innovation Equity Alternative31 December 2019 Level 1 Level 2 Level 3 Total Fair Value
US$ US$ US$ US$ Financial assets at fair value through profit or lossHeld for Trading:Equities and managed funds Equities 258,948,707 - - 258,948,707 Total equities and managed funds 258,948,707 - - 258,948,707
Interest bearing securities Government bonds 181,551,841 - - 181,551,841 Total interest bearing securities 181,551,841 - - 181,551,841
Derivatives Contracts for difference - unfunded - 10,774,263 - 10,774,263 Forward currency contracts - 5,329,033 - 5,329,033 Option contracts 140,760 - - 140,760 Futures contracts 38,468 - - 38,468 Total derivatives 179,228 16,103,296 - 16,282,524
Total financial assets at fair value through profit or loss 440,679,776 16,103,296 - 456,783,072
Financial liabilit ies at fair value through profit or lossHeld for Trading:Derivatives Contracts for difference - unfunded - (14,583,680) - (14,583,680) Futures contracts (1,327,870) - - (1,327,870) Forward currency contracts - (431,552) - (431,552)Total derivatives (1,327,870) (15,015,232) - (16,343,102)
Total financial liabilit ies at fair value through profit or loss (1,327,870) (15,015,232) - (16,343,102)
31 December 2018Financial assets at fair value through profit or loss € € € € Held for Trading:Equities and managed funds Equities 116,576,450 - - 116,576,450 Total equities and managed funds 116,576,450 - - 116,576,450
Interest bearing securities Government bonds 110,735,418 - - 110,735,418 Total interest bearing securities 110,735,418 - - 110,735,418
Derivatives Contracts for difference - unfunded - 5,933,368 - 5,933,368 Futures contracts 890,462 - - 890,462 Forward currency contracts - 319,159 - 319,159 Total derivatives 890,462 6,252,527 - 7,142,989
Total financial assets at fair value through profit or loss 228,202,330 6,252,527 - 234,454,857
Financial liabilit ies at fair value through profit or lossHeld for Trading:Derivatives Contracts for difference - unfunded - (2,115,283) - (2,115,283) Futures contracts (49,371) - - (49,371) Forward currency contracts - (32,199) - (32,199)Total derivatives (49,371) (2,147,482) - (2,196,853)
Total financial liabilit ies at fair value through profit or loss (49,371) (2,147,482) - (2,196,853)
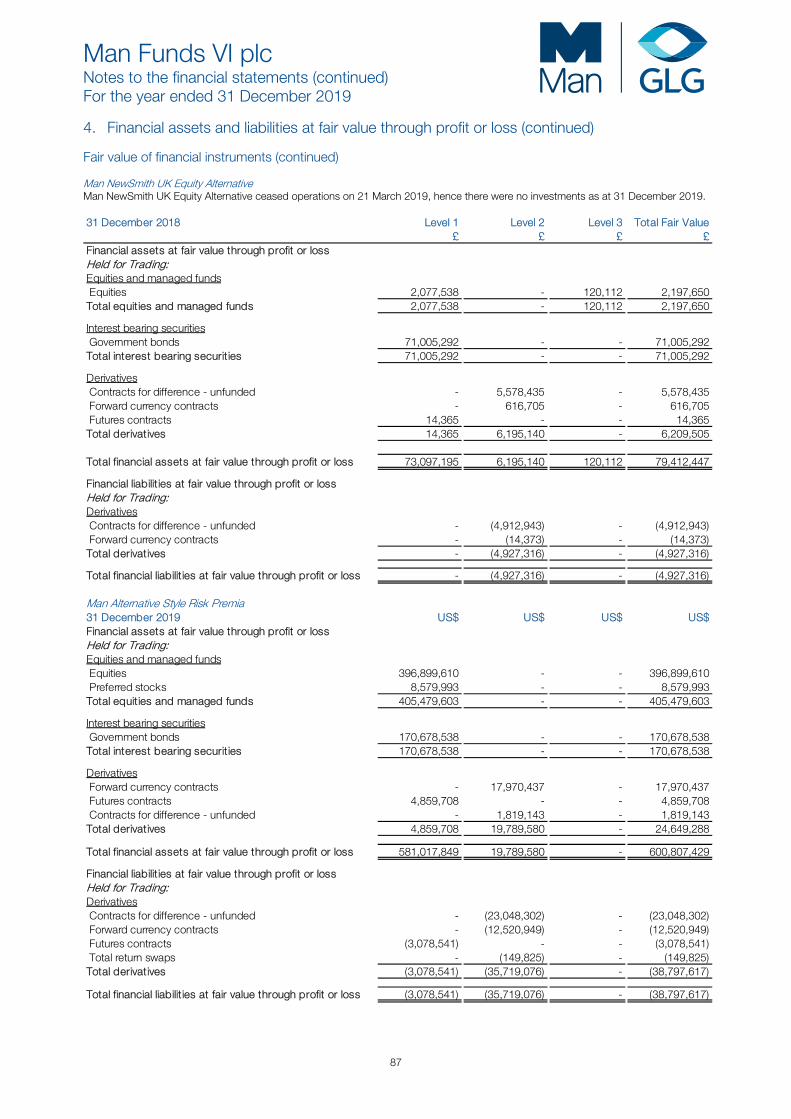
Man Funds VI plc Notes to the financial statements (continued) For the year ended 31 December 2019
87
4. Financial assets and liabilities at fair value through profit or loss (continued) Fair value of financial instruments (continued) Man NewSmith UK Equity Alternative Man NewSmith UK Equity Alternative ceased operations on 21 March 2019, hence there were no investments as at 31 December 2019. 31 December 2018 Level 1 Level 2 Level 3 Total Fair Value
£ £ £ £ Financial assets at fair value through profit or lossHeld for Trading:Equities and managed funds Equities 2,077,538 - 120,112 2,197,650 Total equities and managed funds 2,077,538 - 120,112 2,197,650
Interest bearing securities Government bonds 71,005,292 - - 71,005,292 Total interest bearing securities 71,005,292 - - 71,005,292
Derivatives Contracts for difference - unfunded - 5,578,435 - 5,578,435 Forward currency contracts - 616,705 - 616,705 Futures contracts 14,365 - - 14,365 Total derivatives 14,365 6,195,140 - 6,209,505
Total financial assets at fair value through profit or loss 73,097,195 6,195,140 120,112 79,412,447
Financial liabilit ies at fair value through profit or lossHeld for Trading:Derivatives Contracts for difference - unfunded - (4,912,943) - (4,912,943) Forward currency contracts - (14,373) - (14,373)Total derivatives - (4,927,316) - (4,927,316)
Total financial liabilit ies at fair value through profit or loss - (4,927,316) - (4,927,316)
Man Alternative Style Risk Premia31 December 2019 US$ US$ US$ US$ Financial assets at fair value through profit or lossHeld for Trading:Equities and managed funds Equities 396,899,610 - - 396,899,610 Preferred stocks 8,579,993 - - 8,579,993 Total equities and managed funds 405,479,603 - - 405,479,603
Interest bearing securities Government bonds 170,678,538 - - 170,678,538 Total interest bearing securities 170,678,538 - - 170,678,538
Derivatives Forward currency contracts - 17,970,437 - 17,970,437 Futures contracts 4,859,708 - - 4,859,708 Contracts for difference - unfunded - 1,819,143 - 1,819,143 Total derivatives 4,859,708 19,789,580 - 24,649,288
Total financial assets at fair value through profit or loss 581,017,849 19,789,580 - 600,807,429
Financial liabilit ies at fair value through profit or lossHeld for Trading:Derivatives Contracts for difference - unfunded - (23,048,302) - (23,048,302) Forward currency contracts - (12,520,949) - (12,520,949) Futures contracts (3,078,541) - - (3,078,541) Total return swaps - (149,825) - (149,825)Total derivatives (3,078,541) (35,719,076) - (38,797,617)
Total financial liabilit ies at fair value through profit or loss (3,078,541) (35,719,076) - (38,797,617)
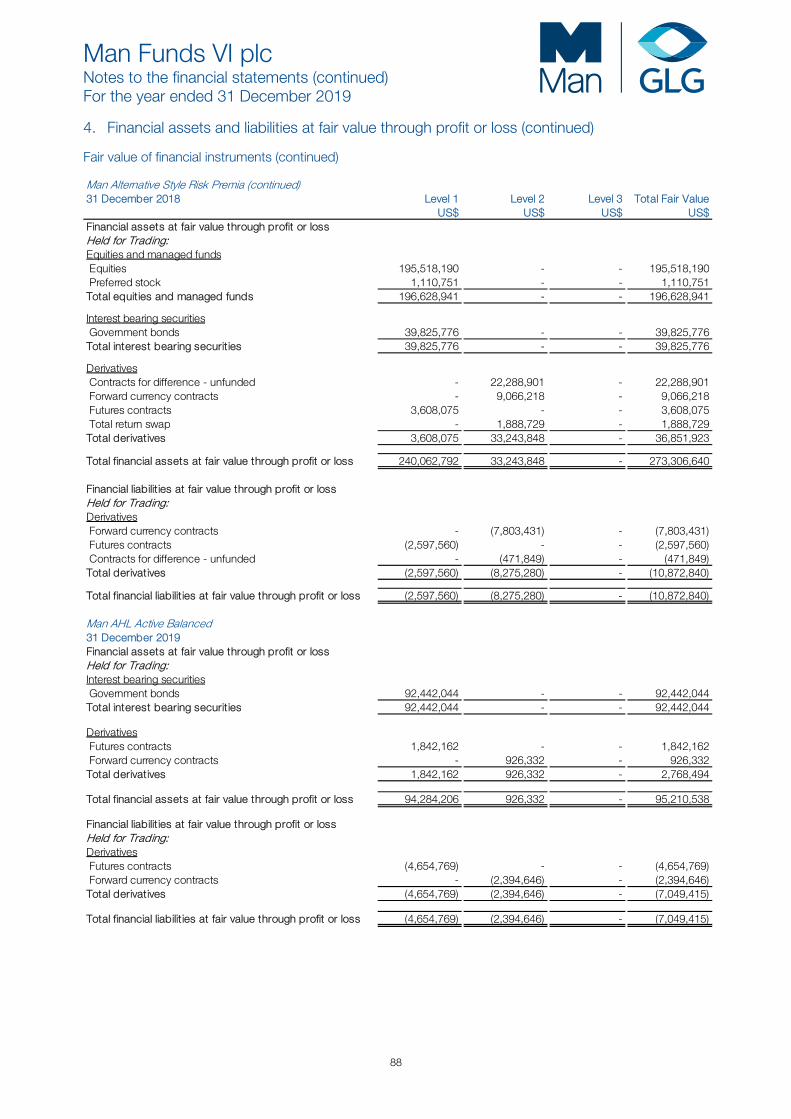
Man Funds VI plc Notes to the financial statements (continued) For the year ended 31 December 2019
88
4. Financial assets and liabilities at fair value through profit or loss (continued) Fair value of financial instruments (continued) Man Alternative Style Risk Premia (continued)31 December 2018 Level 1 Level 2 Level 3 Total Fair Value
US$ US$ US$ US$ Financial assets at fair value through profit or lossHeld for Trading:Equities and managed funds Equities 195,518,190 - - 195,518,190 Preferred stock 1,110,751 - - 1,110,751 Total equities and managed funds 196,628,941 - - 196,628,941
Interest bearing securities Government bonds 39,825,776 - - 39,825,776 Total interest bearing securities 39,825,776 - - 39,825,776
Derivatives Contracts for difference - unfunded - 22,288,901 - 22,288,901 Forward currency contracts - 9,066,218 - 9,066,218 Futures contracts 3,608,075 - - 3,608,075 Total return swap - 1,888,729 - 1,888,729 Total derivatives 3,608,075 33,243,848 - 36,851,923
Total financial assets at fair value through profit or loss 240,062,792 33,243,848 - 273,306,640
Financial liabilit ies at fair value through profit or lossHeld for Trading:Derivatives Forward currency contracts - (7,803,431) - (7,803,431) Futures contracts (2,597,560) - - (2,597,560) Contracts for difference - unfunded - (471,849) - (471,849)Total derivatives (2,597,560) (8,275,280) - (10,872,840)
Total financial liabilit ies at fair value through profit or loss (2,597,560) (8,275,280) - (10,872,840)
Man AHL Active Balanced31 December 2019Financial assets at fair value through profit or lossHeld for Trading:Interest bearing securities Government bonds 92,442,044 - - 92,442,044 Total interest bearing securities 92,442,044 - - 92,442,044
Derivatives Futures contracts 1,842,162 - - 1,842,162 Forward currency contracts - 926,332 - 926,332 Total derivatives 1,842,162 926,332 - 2,768,494
Total financial assets at fair value through profit or loss 94,284,206 926,332 - 95,210,538
Financial liabilit ies at fair value through profit or lossHeld for Trading:Derivatives Futures contracts (4,654,769) - - (4,654,769) Forward currency contracts - (2,394,646) - (2,394,646)Total derivatives (4,654,769) (2,394,646) - (7,049,415)
Total financial liabilit ies at fair value through profit or loss (4,654,769) (2,394,646) - (7,049,415)
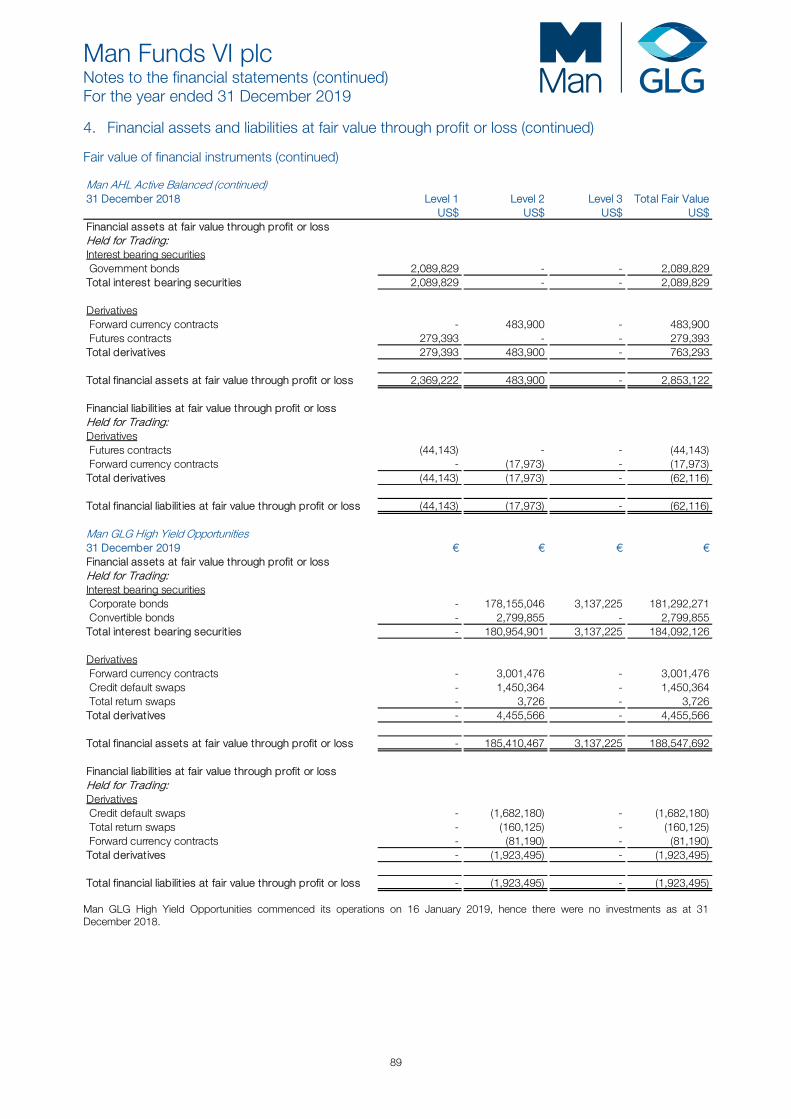
Man Funds VI plc Notes to the financial statements (continued) For the year ended 31 December 2019
89
4. Financial assets and liabilities at fair value through profit or loss (continued) Fair value of financial instruments (continued) Man AHL Active Balanced (continued)31 December 2018 Level 1 Level 2 Level 3 Total Fair Value
US$ US$ US$ US$ Financial assets at fair value through profit or lossHeld for Trading:Interest bearing securities Government bonds 2,089,829 - - 2,089,829 Total interest bearing securities 2,089,829 - - 2,089,829
Derivatives Forward currency contracts - 483,900 - 483,900 Futures contracts 279,393 - - 279,393 Total derivatives 279,393 483,900 - 763,293
Total financial assets at fair value through profit or loss 2,369,222 483,900 - 2,853,122
Financial liabilit ies at fair value through profit or lossHeld for Trading:Derivatives Futures contracts (44,143) - - (44,143) Forward currency contracts - (17,973) - (17,973)Total derivatives (44,143) (17,973) - (62,116)
Total financial liabilit ies at fair value through profit or loss (44,143) (17,973) - (62,116)
Man GLG High Yield Opportunities31 December 2019 € € € € Financial assets at fair value through profit or lossHeld for Trading:Interest bearing securities Corporate bonds - 178,155,046 3,137,225 181,292,271 Convertible bonds - 2,799,855 - 2,799,855 Total interest bearing securities - 180,954,901 3,137,225 184,092,126
Derivatives Forward currency contracts - 3,001,476 - 3,001,476 Credit default swaps - 1,450,364 - 1,450,364 Total return swaps - 3,726 - 3,726 Total derivatives - 4,455,566 - 4,455,566
Total financial assets at fair value through profit or loss - 185,410,467 3,137,225 188,547,692
Financial liabilit ies at fair value through profit or lossHeld for Trading:Derivatives Credit default swaps - (1,682,180) - (1,682,180) Total return swaps - (160,125) - (160,125) Forward currency contracts - (81,190) - (81,190)Total derivatives - (1,923,495) - (1,923,495)
Total financial liabilit ies at fair value through profit or loss - (1,923,495) - (1,923,495)
Man GLG High Yield Opportunities commenced its operations on 16 January 2019, hence there were no investments as at 31 December 2018.
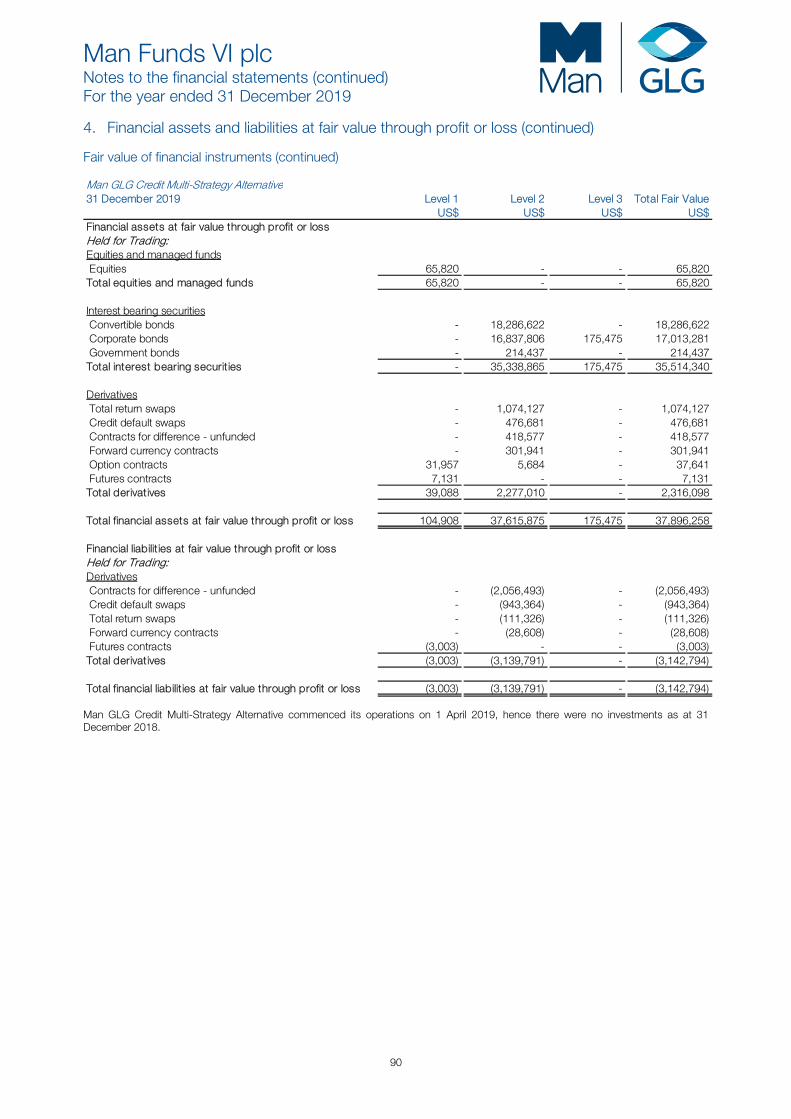
Man Funds VI plc Notes to the financial statements (continued) For the year ended 31 December 2019
90
4. Financial assets and liabilities at fair value through profit or loss (continued) Fair value of financial instruments (continued) Man GLG Credit Multi-Strategy Alternative31 December 2019 Level 1 Level 2 Level 3 Total Fair Value
US$ US$ US$ US$ Financial assets at fair value through profit or lossHeld for Trading:Equities and managed funds Equities 65,820 - - 65,820 Total equities and managed funds 65,820 - - 65,820
Interest bearing securities Convertible bonds - 18,286,622 - 18,286,622 Corporate bonds - 16,837,806 175,475 17,013,281 Government bonds - 214,437 - 214,437 Total interest bearing securities - 35,338,865 175,475 35,514,340
Derivatives Total return swaps - 1,074,127 - 1,074,127 Credit default swaps - 476,681 - 476,681 Contracts for difference - unfunded - 418,577 - 418,577 Forward currency contracts - 301,941 - 301,941 Option contracts 31,957 5,684 - 37,641 Futures contracts 7,131 - - 7,131 Total derivatives 39,088 2,277,010 - 2,316,098
Total financial assets at fair value through profit or loss 104,908 37,615,875 175,475 37,896,258
Financial liabilit ies at fair value through profit or lossHeld for Trading:Derivatives Contracts for difference - unfunded - (2,056,493) - (2,056,493) Credit default swaps - (943,364) - (943,364) Total return swaps - (111,326) - (111,326) Forward currency contracts - (28,608) - (28,608) Futures contracts (3,003) - - (3,003)Total derivatives (3,003) (3,139,791) - (3,142,794)
Total financial liabilit ies at fair value through profit or loss (3,003) (3,139,791) - (3,142,794)
Man GLG Credit Multi-Strategy Alternative commenced its operations on 1 April 2019, hence there were no investments as at 31 December 2018.
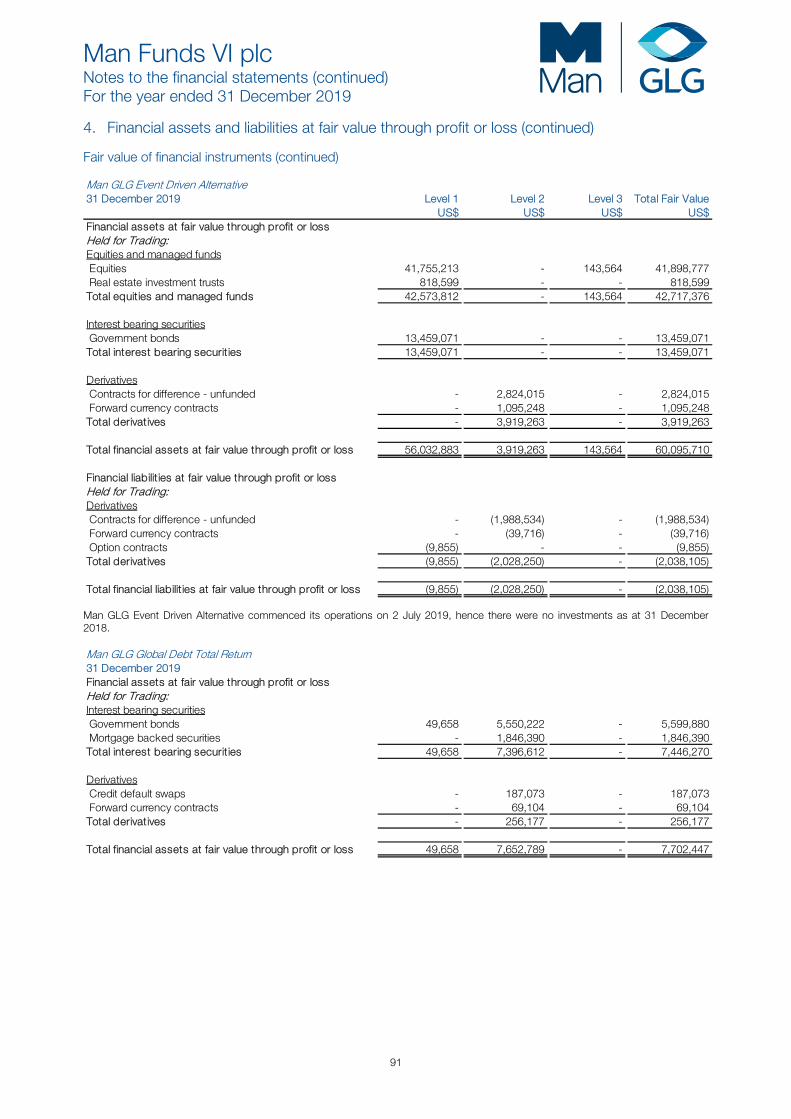
Man Funds VI plc Notes to the financial statements (continued) For the year ended 31 December 2019
91
4. Financial assets and liabilities at fair value through profit or loss (continued) Fair value of financial instruments (continued) Man GLG Event Driven Alternative31 December 2019 Level 1 Level 2 Level 3 Total Fair Value
US$ US$ US$ US$ Financial assets at fair value through profit or lossHeld for Trading:Equities and managed funds Equities 41,755,213 - 143,564 41,898,777 Real estate investment trusts 818,599 - - 818,599 Total equities and managed funds 42,573,812 - 143,564 42,717,376
Interest bearing securities Government bonds 13,459,071 - - 13,459,071 Total interest bearing securities 13,459,071 - - 13,459,071
Derivatives Contracts for difference - unfunded - 2,824,015 - 2,824,015 Forward currency contracts - 1,095,248 - 1,095,248 Total derivatives - 3,919,263 - 3,919,263
Total financial assets at fair value through profit or loss 56,032,883 3,919,263 143,564 60,095,710
Financial liabilit ies at fair value through profit or lossHeld for Trading:Derivatives Contracts for difference - unfunded - (1,988,534) - (1,988,534) Forward currency contracts - (39,716) - (39,716) Option contracts (9,855) - - (9,855)Total derivatives (9,855) (2,028,250) - (2,038,105)
Total financial liabilit ies at fair value through profit or loss (9,855) (2,028,250) - (2,038,105)
Man GLG Event Driven Alternative commenced its operations on 2 July 2019, hence there were no investments as at 31 December 2018. Man GLG Global Debt Total Return31 December 2019Financial assets at fair value through profit or lossHeld for Trading:Interest bearing securities Government bonds 49,658 5,550,222 - 5,599,880 Mortgage backed securities - 1,846,390 - 1,846,390 Total interest bearing securities 49,658 7,396,612 - 7,446,270
Derivatives Credit default swaps - 187,073 - 187,073 Forward currency contracts - 69,104 - 69,104 Total derivatives - 256,177 - 256,177
Total financial assets at fair value through profit or loss 49,658 7,652,789 - 7,702,447

Man Funds VI plc Notes to the financial statements (continued) For the year ended 31 December 2019
92
4. Financial assets and liabilities at fair value through profit or loss (continued) Fair value of financial instruments (continued) Man GLG Global Debt Total Return (continued)31 December 2019 Level 1 Level 2 Level 3 Total Fair Value
US$ US$ US$ US$ Financial liabilit ies at fair value through profit or lossHeld for Trading:Derivatives Forward currency contracts - (42,525) - (42,525) Credit default swaps - (26,779) - (26,779) Interest rate swaps - (14,936) - (14,936)Total derivatives - (84,240) - (84,240)
Total financial liabilit ies at fair value through profit or loss - (84,240) - (84,240)
Man GLG Global Debt Total Return commenced its operations on 1 August 2019, hence there were no investments as at 31 December 2018. Man GLG High Yield Opportunities DE31 December 2019 € € € € Financial assets at fair value through profit or lossHeld for Trading:Interest bearing securities Corporate bonds - 39,650,159 - 39,650,159 Convertible bonds - 1,166,606 - 1,166,606 Total interest bearing securities - 40,816,765 - 40,816,765
Derivatives Forward currency contracts - 224,398 - 224,398 Credit default swaps - 24,789 - 24,789 Total derivatives - 249,187 - 249,187
Total financial assets at fair value through profit or loss - 41,065,952 - 41,065,952
Financial liabilit ies at fair value through profit or lossHeld for Trading:Derivatives Credit default swaps - (621,829) - (621,829) Total return swaps - (23,235) - (23,235) Forward currency contracts - (3,264) - (3,264)Total derivatives - (648,328) - (648,328)
Total financial liabilit ies at fair value through profit or loss - (648,328) - (648,328)
Man GLG High Yield Opportunities DE commenced its operations on 22 November 2019, hence there were no investments as at 31 December 2018. Man GLG US Absolute Alpha commenced its operations on 31 December 2019, hence there were no investments as at 31 December 2019 and 31 December 2018.
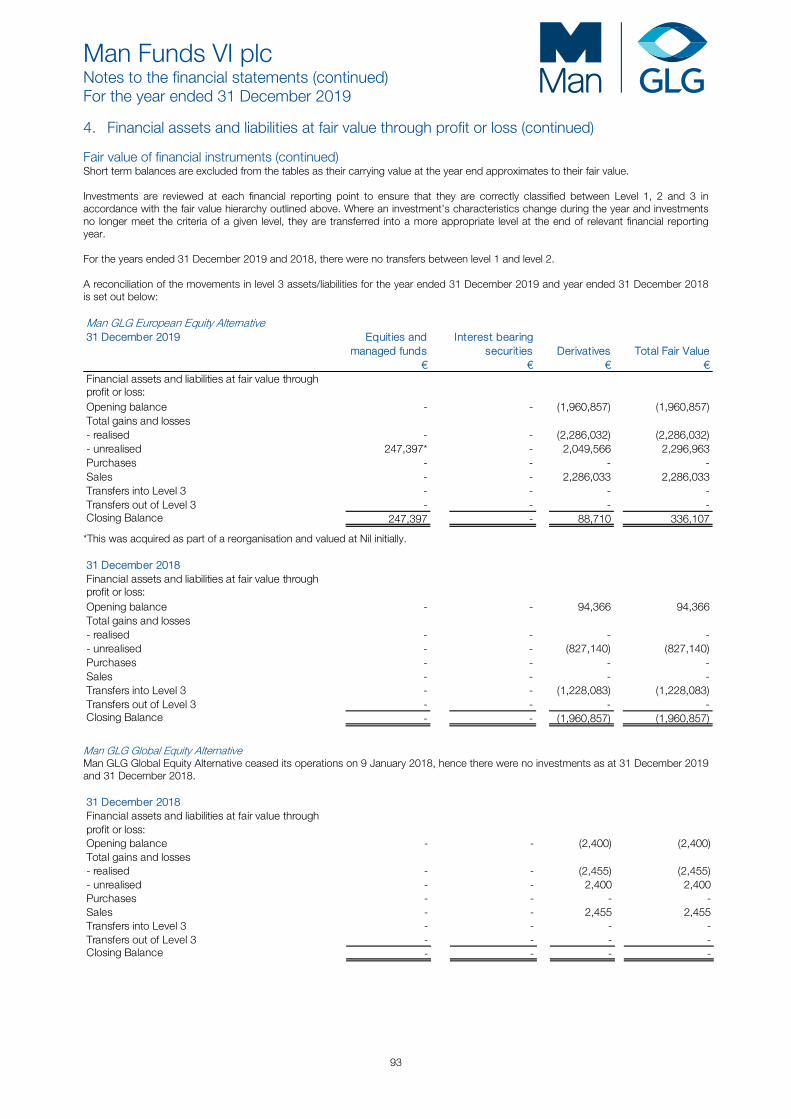
Man Funds VI plc Notes to the financial statements (continued) For the year ended 31 December 2019
93
4. Financial assets and liabilities at fair value through profit or loss (continued) Fair value of financial instruments (continued) Short term balances are excluded from the tables as their carrying value at the year end approximates to their fair value. Investments are reviewed at each financial reporting point to ensure that they are correctly classified between Level 1, 2 and 3 in accordance with the fair value hierarchy outlined above. Where an investment’s characteristics change during the year and investments no longer meet the criteria of a given level, they are transferred into a more appropriate level at the end of relevant financial reporting year. For the years ended 31 December 2019 and 2018, there were no transfers between level 1 and level 2. A reconciliation of the movements in level 3 assets/liabilities for the year ended 31 December 2019 and year ended 31 December 2018 is set out below: Man GLG European Equity Alternative31 December 2019 Equities and Interest bearing
managed funds securities Derivatives Total Fair Value € € € €
Financial assets and liabilities at fair value through profit or loss:Opening balance - - (1,960,857) (1,960,857)Total gains and losses- realised - - (2,286,032) (2,286,032)- unrealised 247,397* - 2,049,566 2,296,963 Purchases - - - - Sales - - 2,286,033 2,286,033 Transfers into Level 3 - - - - Transfers out of Level 3 - - - - Closing Balance 247,397 - 88,710 336,107
*This was acquired as part of a reorganisation and valued at Nil initially. 31 December 2018Financial assets and liabilities at fair value through profit or loss:Opening balance - - 94,366 94,366 Total gains and losses- realised - - - - - unrealised - - (827,140) (827,140)Purchases - - - - Sales - - - - Transfers into Level 3 - - (1,228,083) (1,228,083)Transfers out of Level 3 - - - - Closing Balance - - (1,960,857) (1,960,857)
Man GLG Global Equity Alternative Man GLG Global Equity Alternative ceased its operations on 9 January 2018, hence there were no investments as at 31 December 2019 and 31 December 2018. 31 December 2018Financial assets and liabilities at fair value through profit or loss:Opening balance - - (2,400) (2,400)Total gains and losses- realised - - (2,455) (2,455)- unrealised - - 2,400 2,400 Purchases - - - - Sales - - 2,455 2,455 Transfers into Level 3 - - - - Transfers out of Level 3 - - - - Closing Balance - - - -
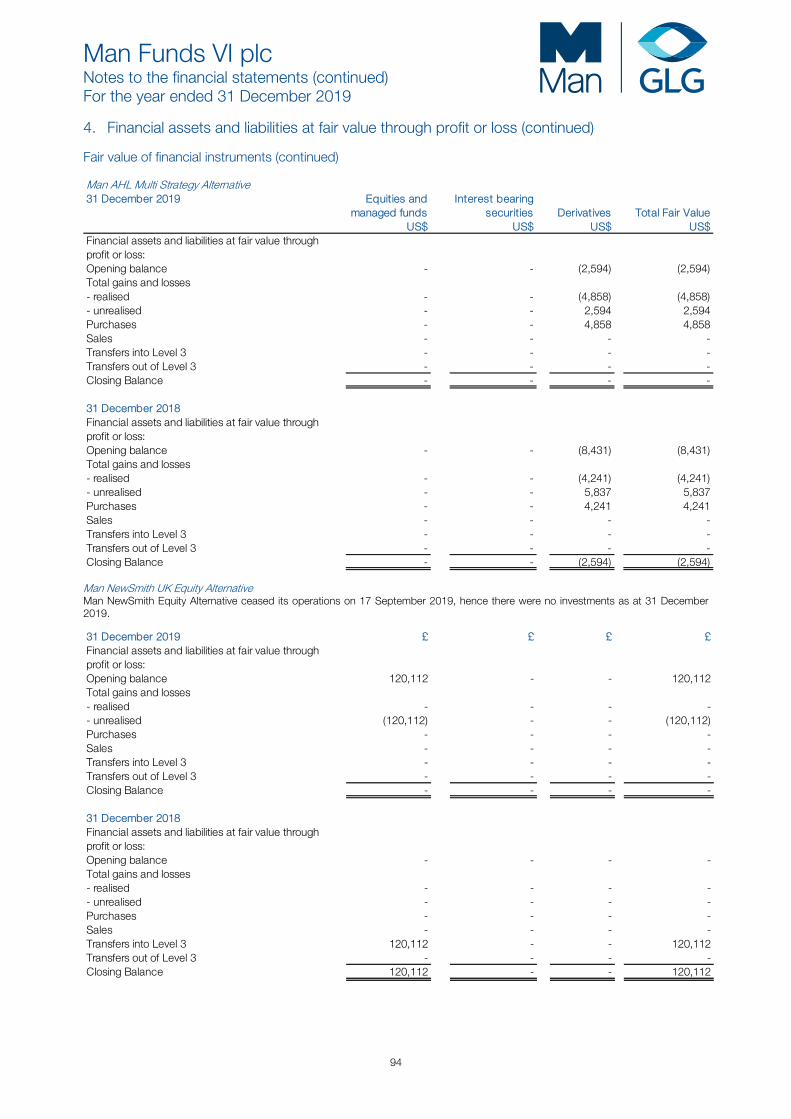
Man Funds VI plc Notes to the financial statements (continued) For the year ended 31 December 2019
94
4. Financial assets and liabilities at fair value through profit or loss (continued) Fair value of financial instruments (continued) Man AHL Multi Strategy Alternative31 December 2019 Equities and Interest bearing
managed funds securities Derivatives Total Fair Value US$ US$ US$ US$
Financial assets and liabilities at fair value through profit or loss:Opening balance - - (2,594) (2,594)Total gains and losses- realised - - (4,858) (4,858)- unrealised - - 2,594 2,594 Purchases - - 4,858 4,858 Sales - - - - Transfers into Level 3 - - - - Transfers out of Level 3 - - - - Closing Balance - - - -
31 December 2018Financial assets and liabilities at fair value through profit or loss:Opening balance - - (8,431) (8,431)Total gains and losses- realised - - (4,241) (4,241)- unrealised - - 5,837 5,837 Purchases - - 4,241 4,241 Sales - - - - Transfers into Level 3 - - - - Transfers out of Level 3 - - - - Closing Balance - - (2,594) (2,594)
Man NewSmith UK Equity Alternative Man NewSmith Equity Alternative ceased its operations on 17 September 2019, hence there were no investments as at 31 December 2019.
31 December 2019 £ £ £ £Financial assets and liabilities at fair value through profit or loss:Opening balance 120,112 - - 120,112 Total gains and losses- realised - - - - - unrealised (120,112) - - (120,112)Purchases - - - - Sales - - - - Transfers into Level 3 - - - - Transfers out of Level 3 - - - - Closing Balance - - - -
31 December 2018Financial assets and liabilities at fair value through profit or loss:Opening balance - - - - Total gains and losses- realised - - - - - unrealised - - - - Purchases - - - - Sales - - - - Transfers into Level 3 120,112 - - 120,112 Transfers out of Level 3 - - - - Closing Balance 120,112 - - 120,112
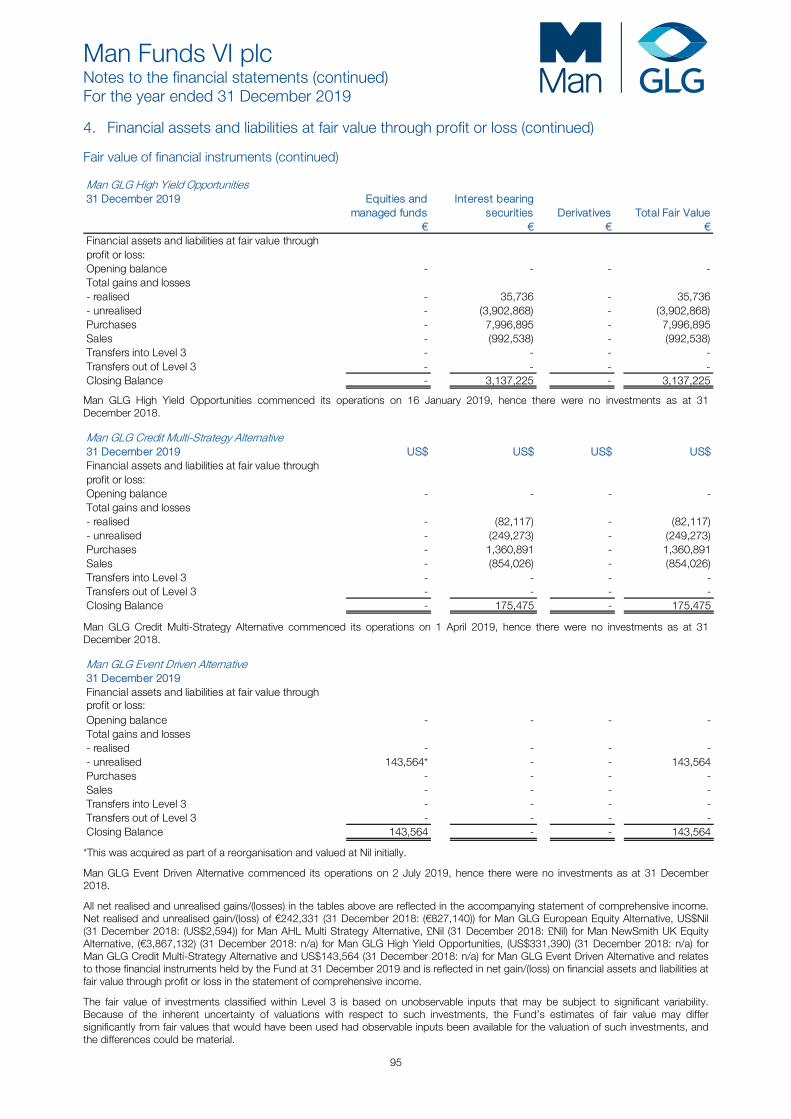
Man Funds VI plc Notes to the financial statements (continued) For the year ended 31 December 2019
95
4. Financial assets and liabilities at fair value through profit or loss (continued) Fair value of financial instruments (continued) Man GLG High Yield Opportunities31 December 2019 Equities and Interest bearing
managed funds securities Derivatives Total Fair Value € € € €
Financial assets and liabilities at fair value through profit or loss:Opening balance - - - - Total gains and losses- realised - 35,736 - 35,736 - unrealised - (3,902,868) - (3,902,868)Purchases - 7,996,895 - 7,996,895 Sales - (992,538) - (992,538)Transfers into Level 3 - - - - Transfers out of Level 3 - - - - Closing Balance - 3,137,225 - 3,137,225
Man GLG High Yield Opportunities commenced its operations on 16 January 2019, hence there were no investments as at 31 December 2018. Man GLG Credit Multi-Strategy Alternative31 December 2019 US$ US$ US$ US$Financial assets and liabilities at fair value through profit or loss:Opening balance - - - - Total gains and losses- realised - (82,117) - (82,117)- unrealised - (249,273) - (249,273)Purchases - 1,360,891 - 1,360,891 Sales - (854,026) - (854,026)Transfers into Level 3 - - - - Transfers out of Level 3 - - - - Closing Balance - 175,475 - 175,475
Man GLG Credit Multi-Strategy Alternative commenced its operations on 1 April 2019, hence there were no investments as at 31 December 2018. Man GLG Event Driven Alternative31 December 2019Financial assets and liabilities at fair value through profit or loss:Opening balance - - - - Total gains and losses- realised - - - - - unrealised 143,564* - - 143,564 Purchases - - - - Sales - - - - Transfers into Level 3 - - - - Transfers out of Level 3 - - - - Closing Balance 143,564 - - 143,564
*This was acquired as part of a reorganisation and valued at Nil initially.
Man GLG Event Driven Alternative commenced its operations on 2 July 2019, hence there were no investments as at 31 December 2018.
All net realised and unrealised gains/(losses) in the tables above are reflected in the accompanying statement of comprehensive income. Net realised and unrealised gain/(loss) of €242,331 (31 December 2018: (€827,140)) for Man GLG European Equity Alternative, US$Nil (31 December 2018: (US$2,594)) for Man AHL Multi Strategy Alternative, £Nil (31 December 2018: £Nil) for Man NewSmith UK Equity Alternative, (€3,867,132) (31 December 2018: n/a) for Man GLG High Yield Opportunities, (US$331,390) (31 December 2018: n/a) for Man GLG Credit Multi-Strategy Alternative and US$143,564 (31 December 2018: n/a) for Man GLG Event Driven Alternative and relates to those financial instruments held by the Fund at 31 December 2019 and is reflected in net gain/(loss) on financial assets and liabilities at fair value through profit or loss in the statement of comprehensive income.
The fair value of investments classified within Level 3 is based on unobservable inputs that may be subject to significant variability. Because of the inherent uncertainty of valuations with respect to such investments, the Fund’s estimates of fair value may differ significantly from fair values that would have been used had observable inputs been available for the valuation of such investments, and the differences could be material.

Man Funds VI plc Notes to the financial statements (continued) For the year ended 31 December 2019
96
4. Financial assets and liabilities at fair value through profit or loss (continued) Fair value of financial instruments (continued) The table below discloses the valuation technique used in the valuation for Level 3 investments and quantifies the effect of significant unobservable inputs used to value investments that fall in this category. The ranges of these inputs are not representative of the appropriate inputs to use when calculating the fair value of any one Level 3 asset or liability. Accordingly, the ranges of inputs presented below do not represent uncertainty in, or possible ranges of fair value measurements of the Fund’s Level 3 assets/liabilities.
Man GLG European Equity Alternative Fair Value Valuation Unobservable 31 December 2019 € Technique Input RangeContracts for difference - unfunded (14,362) Cost None No rangeEquities 247,397 Single broker quotation None No rangeOption contracts 103,062 Cost None No rangeWarrants 10 Single broker quotation None No range
31 December 2018Contracts for difference - unfunded (9,311) Estimated recovery Future cash flows €Nil - €9,311Contracts for difference - unfunded (1,228,083) Estimated recovery Future cash flows £Nil - £158,972Contracts for difference - unfunded (826,525) Cost None No rangeOption contracts 103,062 Cost None No range
Man AHL Multi Strategy Alternative31 December 2018 US$Contracts for difference - unfunded (2,594) Cost None No range
Man NewSmith UK Equity Alternative31 December 2018 £Equities 120,112 Estimated recovery Future cash flows £Nil - £120,112
Man GLG High Yield Opportunities31 December 2019 €Corporate bonds 3,137,225 Single broker quotation None No range
Man GLG Credit Multi-Strategy Alternative31 December 2019 US$Corporate bonds 175,475 Single broker quotation None No range
Man GLG Event Driven Alternative31 December 2019 US$Equities 143,564 Single broker quotation None No range
The fair value impact of the discount range disclosed above is the Investment Manager’s assessment of the range of possible illiquidity discounts. The Investment Manager’s Independent Pricing Committee has assessed that, based on the information available, there is no reason that the net asset value provided by the underlying managed funds managers or their administrators should not represent the most appropriate basis for valuing these assets and therefore no fair value adjustment is applied. The impact of the range of possible unobservable impacts on the fair value of investments is an increase/decrease of up to €Nil (31 December 2018: €186,416) for Man GLG European Equity Alternative, n/a (31 December 2018: US$Nil) for Man AHL Multi Strategy Alternative, £Nil (31 December 2018: £120,112) for Man NewSmith UK Equity Alternative, €Nil (31 December 2018: n/a) for Man GLG High Yield Opportunities, US$Nil (31 December 2018: n/a) for Man GLG Credit Multi-Strategy Alternative and increase/decrease of up to US$Nil (31 December 2018: n/a) for Man GLG Event Driven Alternative.
Forward currency contracts As part of its portfolio management techniques, the Fund may use forward currency contracts to economically hedge any non-functional currency exposure (although formal hedge accounting is not used). Forward currency contracts may also be used for trading purposes. Forward currency contracts entered into by the Fund represent a firm commitment to buy or sell an underlying asset, or currency at a specified value and point in time based upon an agreed or contracted quantity.
Forward currency contracts may expose the Fund to the risks associated with the absence of an exchange market on which to close out an open position. The investment manager closely monitors the Fund’s exposure under forward currency contracts as part of the overall management of the Fund’s market risk.
Derivative financial instruments The Fund may trade derivative financial instruments, including contracts for difference, futures contracts, forward currency contracts, currencies, swaps contracts and options contracts whose values are based upon an underlying asset, index, currency or interest rate.
The Fund is subject to both market and credit risk in trading derivative financial instruments. Market risk is the potential for changes in value due to changes in market interest rates, foreign exchange rates, indices and changes in the value of the underlying financial instruments. Credit risk is the possibility that a loss may occur if a counterparty fails to perform according to the terms of the contract. Substantially all derivative contracts are transacted on a margin basis. Such transactions may expose the Fund to significant off-balance sheet risk in the event margin deposits and collateral investments are not sufficient to cover losses incurred.
The Investment Manager manages the risk associated with these transactions by maintaining margin deposits and collateral investments with its brokers in compliance with individual exchange regulations and internal guidelines. The Investment Manager also takes an active role in managing and controlling the Fund’s market and counterparty risks and monitoring trading activities and margin levels daily, and, as necessary, deposits additional collateral or reduces positions.
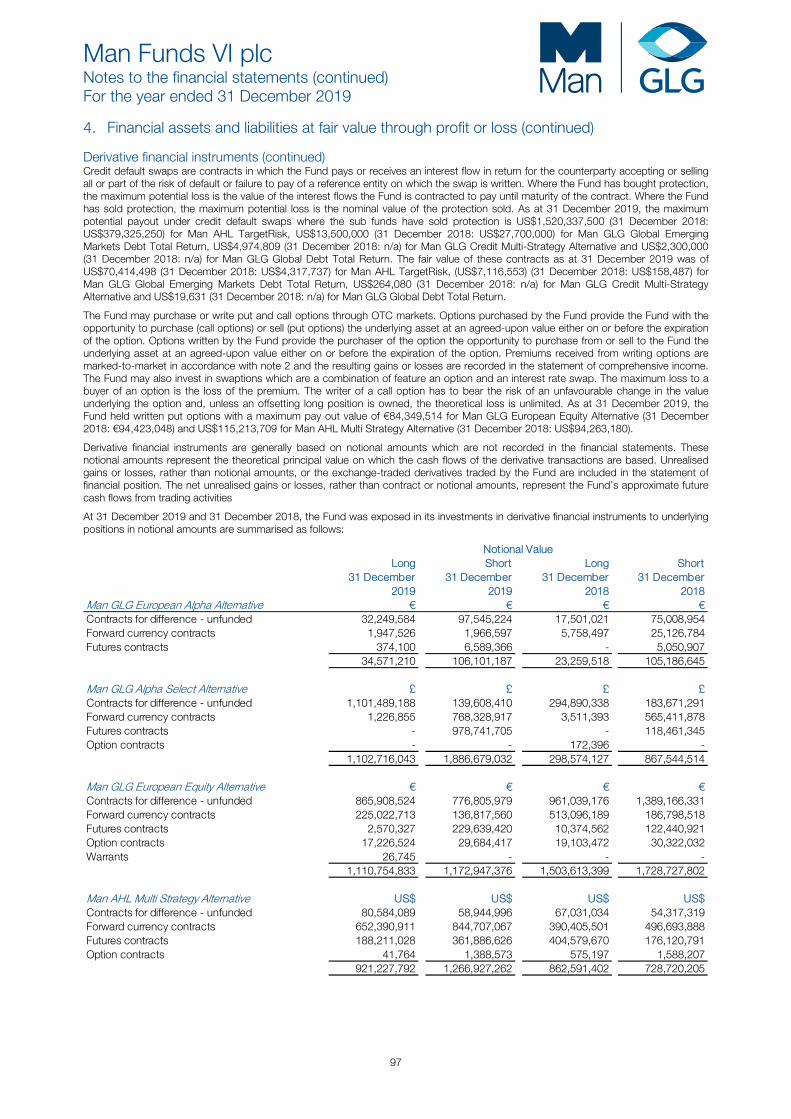
Man Funds VI plc Notes to the financial statements (continued) For the year ended 31 December 2019
97
4. Financial assets and liabilities at fair value through profit or loss (continued) Derivative financial instruments (continued) Credit default swaps are contracts in which the Fund pays or receives an interest flow in return for the counterparty accepting or selling all or part of the risk of default or failure to pay of a reference entity on which the swap is written. Where the Fund has bought protection, the maximum potential loss is the value of the interest flows the Fund is contracted to pay until maturity of the contract. Where the Fund has sold protection, the maximum potential loss is the nominal value of the protection sold. As at 31 December 2019, the maximum potential payout under credit default swaps where the sub funds have sold protection is US$1,520,337,500 (31 December 2018: US$379,325,250) for Man AHL TargetRisk, US$13,500,000 (31 December 2018: US$27,700,000) for Man GLG Global Emerging Markets Debt Total Return, US$4,974,809 (31 December 2018: n/a) for Man GLG Credit Multi-Strategy Alternative and US$2,300,000 (31 December 2018: n/a) for Man GLG Global Debt Total Return. The fair value of these contracts as at 31 December 2019 was of US$70,414,498 (31 December 2018: US$4,317,737) for Man AHL TargetRisk, (US$7,116,553) (31 December 2018: US$158,487) for Man GLG Global Emerging Markets Debt Total Return, US$264,080 (31 December 2018: n/a) for Man GLG Credit Multi-Strategy Alternative and US$19,631 (31 December 2018: n/a) for Man GLG Global Debt Total Return.
The Fund may purchase or write put and call options through OTC markets. Options purchased by the Fund provide the Fund with the opportunity to purchase (call options) or sell (put options) the underlying asset at an agreed-upon value either on or before the expiration of the option. Options written by the Fund provide the purchaser of the option the opportunity to purchase from or sell to the Fund the underlying asset at an agreed-upon value either on or before the expiration of the option. Premiums received from writing options are marked-to-market in accordance with note 2 and the resulting gains or losses are recorded in the statement of comprehensive income. The Fund may also invest in swaptions which are a combination of feature an option and an interest rate swap. The maximum loss to a buyer of an option is the loss of the premium. The writer of a call option has to bear the risk of an unfavourable change in the value underlying the option and, unless an offsetting long position is owned, the theoretical loss is unlimited. As at 31 December 2019, the Fund held written put options with a maximum pay out value of €84,349,514 for Man GLG European Equity Alternative (31 December 2018: €94,423,048) and US$115,213,709 for Man AHL Multi Strategy Alternative (31 December 2018: US$94,263,180).
Derivative financial instruments are generally based on notional amounts which are not recorded in the financial statements. These notional amounts represent the theoretical principal value on which the cash flows of the derivative transactions are based. Unrealised gains or losses, rather than notional amounts, or the exchange-traded derivatives traded by the Fund are included in the statement of financial position. The net unrealised gains or losses, rather than contract or notional amounts, represent the Fund’s approximate future cash flows from trading activities
At 31 December 2019 and 31 December 2018, the Fund was exposed in its investments in derivative financial instruments to underlying positions in notional amounts are summarised as follows:
Long Short Long Short31 December
201931 December
201931 December
201831 December
2018Man GLG European Alpha Alternative € € € €Contracts for difference - unfunded 32,249,584 97,545,224 17,501,021 75,008,954 Forward currency contracts 1,947,526 1,966,597 5,758,497 25,126,784 Futures contracts 374,100 6,589,366 - 5,050,907
34,571,210 106,101,187 23,259,518 105,186,645
Man GLG Alpha Select Alternative £ £ £ £Contracts for difference - unfunded 1,101,489,188 139,608,410 294,890,338 183,671,291 Forward currency contracts 1,226,855 768,328,917 3,511,393 565,411,878 Futures contracts - 978,741,705 - 118,461,345 Option contracts - - 172,396 -
1,102,716,043 1,886,679,032 298,574,127 867,544,514
Man GLG European Equity Alternative € € € €Contracts for difference - unfunded 865,908,524 776,805,979 961,039,176 1,389,166,331 Forward currency contracts 225,022,713 136,817,560 513,096,189 186,798,518 Futures contracts 2,570,327 229,639,420 10,374,562 122,440,921 Option contracts 17,226,524 29,684,417 19,103,472 30,322,032 Warrants 26,745 - - -
1,110,754,833 1,172,947,376 1,503,613,399 1,728,727,802
Man AHL Multi Strategy Alternative US$ US$ US$ US$Contracts for difference - unfunded 80,584,089 58,944,996 67,031,034 54,317,319 Forward currency contracts 652,390,911 844,707,067 390,405,501 496,693,888 Futures contracts 188,211,028 361,886,626 404,579,670 176,120,791 Option contracts 41,764 1,388,573 575,197 1,588,207
921,227,792 1,266,927,262 862,591,402 728,720,205
Notional Value
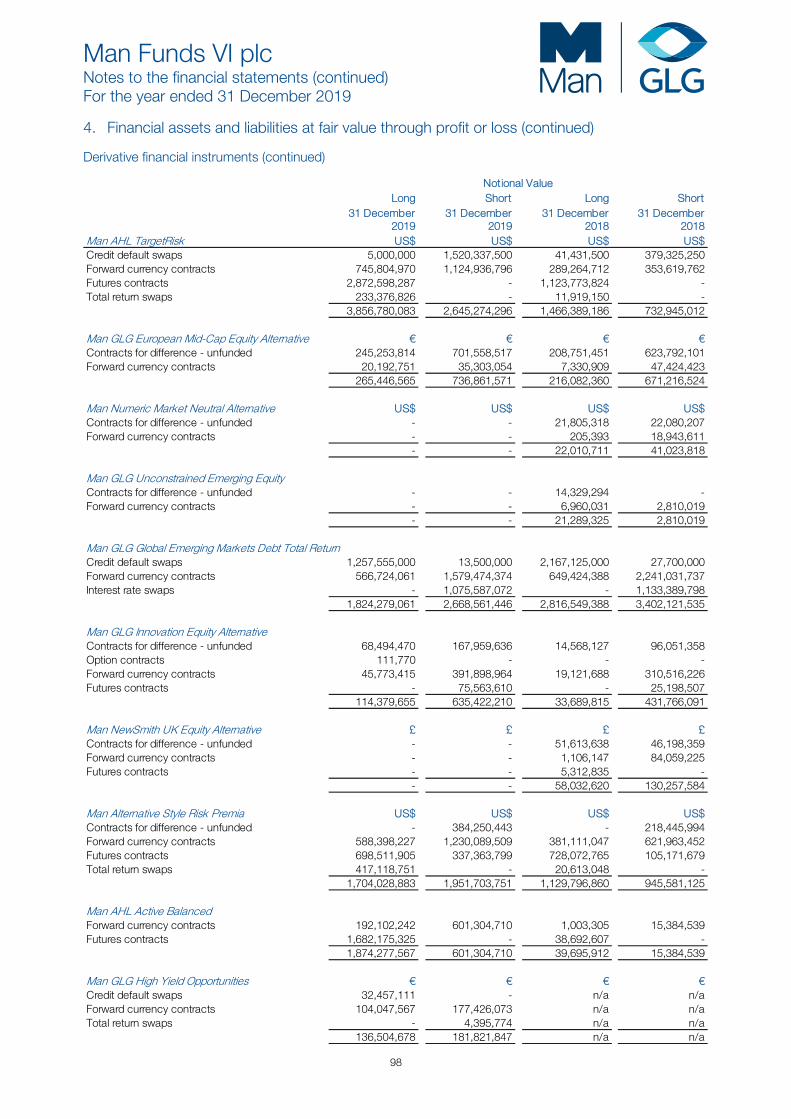
Man Funds VI plc Notes to the financial statements (continued) For the year ended 31 December 2019
98
4. Financial assets and liabilities at fair value through profit or loss (continued) Derivative financial instruments (continued)
Long Short Long Short31 December
201931 December
201931 December
201831 December
2018Man AHL TargetRisk US$ US$ US$ US$Credit default swaps 5,000,000 1,520,337,500 41,431,500 379,325,250 Forward currency contracts 745,804,970 1,124,936,796 289,264,712 353,619,762 Futures contracts 2,872,598,287 - 1,123,773,824 - Total return swaps 233,376,826 - 11,919,150 -
3,856,780,083 2,645,274,296 1,466,389,186 732,945,012
Man GLG European Mid-Cap Equity Alternative € € € €Contracts for difference - unfunded 245,253,814 701,558,517 208,751,451 623,792,101 Forward currency contracts 20,192,751 35,303,054 7,330,909 47,424,423
265,446,565 736,861,571 216,082,360 671,216,524
Man Numeric Market Neutral Alternative US$ US$ US$ US$Contracts for difference - unfunded - - 21,805,318 22,080,207 Forward currency contracts - - 205,393 18,943,611
- - 22,010,711 41,023,818
Man GLG Unconstrained Emerging EquityContracts for difference - unfunded - - 14,329,294 - Forward currency contracts - - 6,960,031 2,810,019
- - 21,289,325 2,810,019
Man GLG Global Emerging Markets Debt Total ReturnCredit default swaps 1,257,555,000 13,500,000 2,167,125,000 27,700,000 Forward currency contracts 566,724,061 1,579,474,374 649,424,388 2,241,031,737 Interest rate swaps - 1,075,587,072 - 1,133,389,798
1,824,279,061 2,668,561,446 2,816,549,388 3,402,121,535
Man GLG Innovation Equity AlternativeContracts for difference - unfunded 68,494,470 167,959,636 14,568,127 96,051,358 Option contracts 111,770 - - - Forward currency contracts 45,773,415 391,898,964 19,121,688 310,516,226 Futures contracts - 75,563,610 - 25,198,507
114,379,655 635,422,210 33,689,815 431,766,091
Man NewSmith UK Equity Alternative £ £ £ £Contracts for difference - unfunded - - 51,613,638 46,198,359 Forward currency contracts - - 1,106,147 84,059,225 Futures contracts - - 5,312,835 -
- - 58,032,620 130,257,584
Man Alternative Style Risk Premia US$ US$ US$ US$Contracts for difference - unfunded - 384,250,443 - 218,445,994 Forward currency contracts 588,398,227 1,230,089,509 381,111,047 621,963,452 Futures contracts 698,511,905 337,363,799 728,072,765 105,171,679 Total return swaps 417,118,751 - 20,613,048 -
1,704,028,883 1,951,703,751 1,129,796,860 945,581,125
Man AHL Active BalancedForward currency contracts 192,102,242 601,304,710 1,003,305 15,384,539 Futures contracts 1,682,175,325 - 38,692,607 -
1,874,277,567 601,304,710 39,695,912 15,384,539
Man GLG High Yield Opportunities € € € €Credit default swaps 32,457,111 - n/a n/a Forward currency contracts 104,047,567 177,426,073 n/a n/a Total return swaps - 4,395,774 n/a n/a
136,504,678 181,821,847 n/a n/a
Notional Value
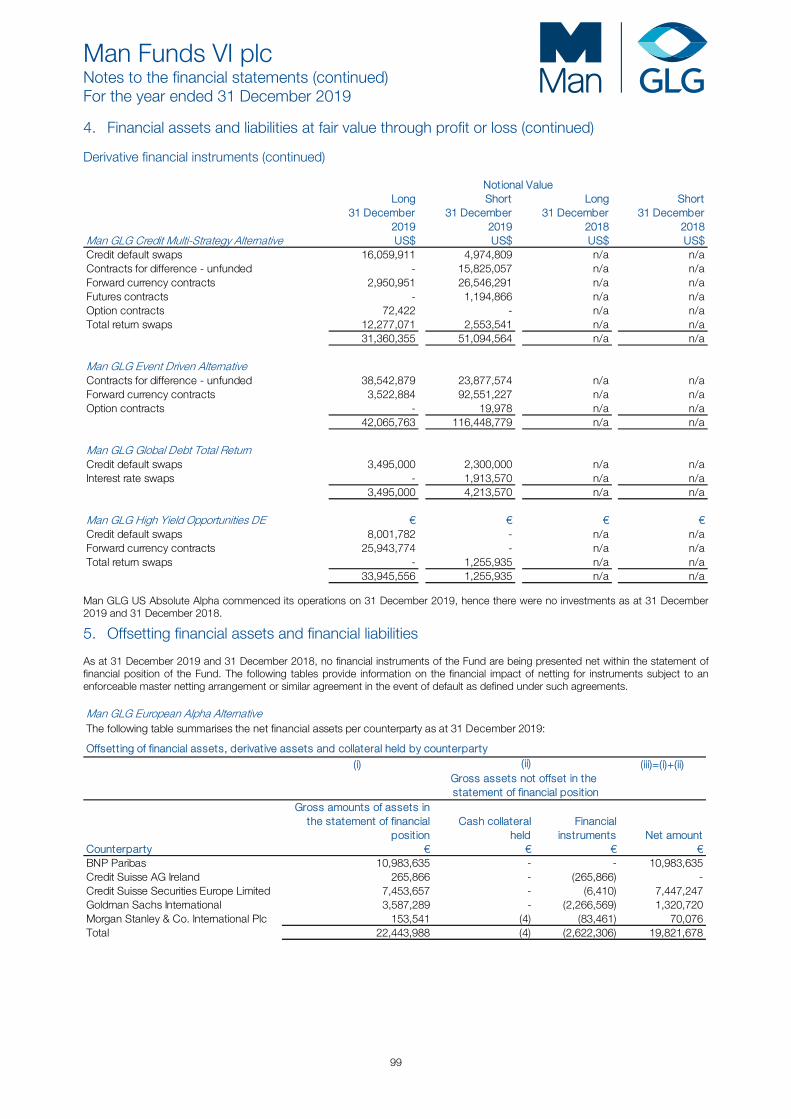
Man Funds VI plc Notes to the financial statements (continued) For the year ended 31 December 2019
99
4. Financial assets and liabilities at fair value through profit or loss (continued) Derivative financial instruments (continued)
Long Short Long Short31 December
201931 December
201931 December
201831 December
2018Man GLG Credit Multi-Strategy Alternative US$ US$ US$ US$Credit default swaps 16,059,911 4,974,809 n/a n/a Contracts for difference - unfunded - 15,825,057 n/a n/a Forward currency contracts 2,950,951 26,546,291 n/a n/a Futures contracts - 1,194,866 n/a n/a Option contracts 72,422 - n/a n/a Total return swaps 12,277,071 2,553,541 n/a n/a
31,360,355 51,094,564 n/a n/a
Man GLG Event Driven AlternativeContracts for difference - unfunded 38,542,879 23,877,574 n/a n/a Forward currency contracts 3,522,884 92,551,227 n/a n/a Option contracts - 19,978 n/a n/a
42,065,763 116,448,779 n/a n/a
Man GLG Global Debt Total ReturnCredit default swaps 3,495,000 2,300,000 n/a n/a Interest rate swaps - 1,913,570 n/a n/a
3,495,000 4,213,570 n/a n/a
Man GLG High Yield Opportunities DE € € € €Credit default swaps 8,001,782 - n/a n/a Forward currency contracts 25,943,774 - n/a n/a Total return swaps - 1,255,935 n/a n/a
33,945,556 1,255,935 n/a n/a
Notional Value
Man GLG US Absolute Alpha commenced its operations on 31 December 2019, hence there were no investments as at 31 December 2019 and 31 December 2018.
5. Offsetting financial assets and financial liabilities As at 31 December 2019 and 31 December 2018, no financial instruments of the Fund are being presented net within the statement of financial position of the Fund. The following tables provide information on the financial impact of netting for instruments subject to an enforceable master netting arrangement or similar agreement in the event of default as defined under such agreements. Man GLG European Alpha AlternativeThe following table summarises the net financial assets per counterparty as at 31 December 2019:
(i) (iii)=(i)+(ii)
Gross amounts of assets in the statement of financial
positionCash collateral
heldFinancial
instruments Net amountCounterparty € € € €BNP Paribas 10,983,635 - - 10,983,635 Credit Suisse AG Ireland 265,866 - (265,866) - Credit Suisse Securities Europe Limited 7,453,657 - (6,410) 7,447,247 Goldman Sachs International 3,587,289 - (2,266,569) 1,320,720 Morgan Stanley & Co. International Plc 153,541 (4) (83,461) 70,076 Total 22,443,988 (4) (2,622,306) 19,821,678
Offsetting of financial assets, derivative assets and collateral held by counterparty(ii)
Gross assets not offset in the statement of financial position
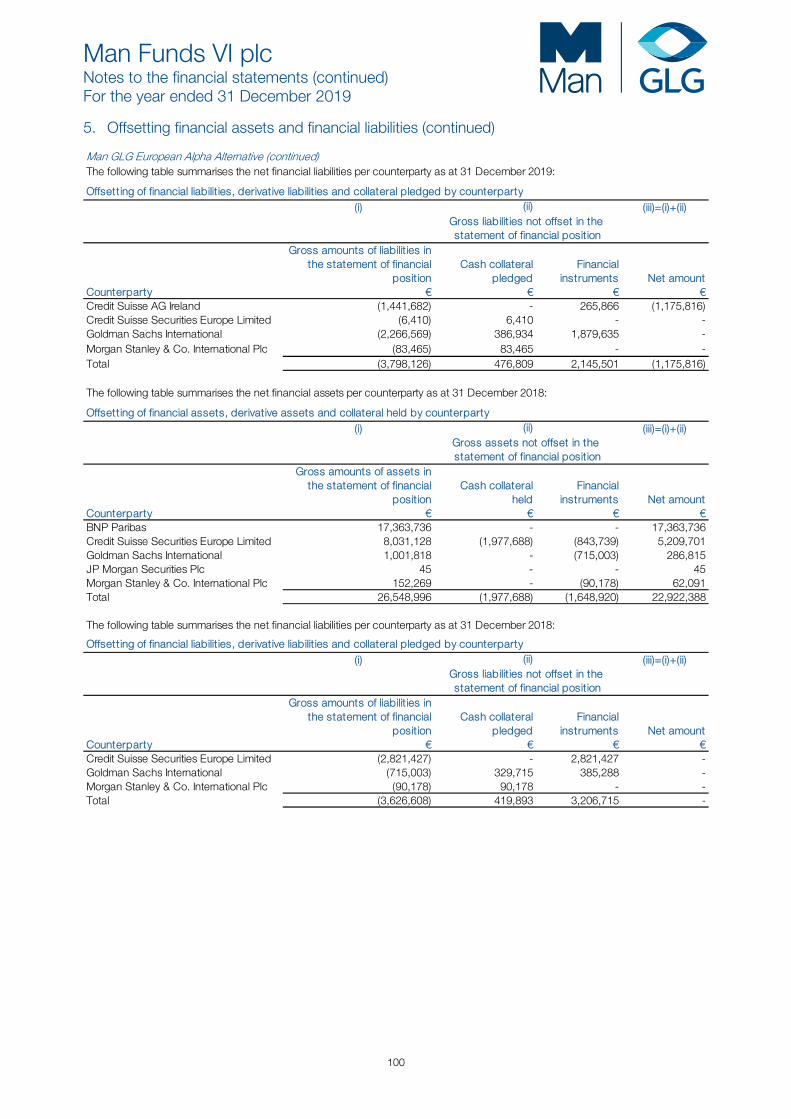
Man Funds VI plc Notes to the financial statements (continued) For the year ended 31 December 2019
100
5. Offsetting financial assets and financial liabilities (continued) Man GLG European Alpha Alternative (continued)The following table summarises the net financial liabilities per counterparty as at 31 December 2019:
(i) (iii)=(i)+(ii)
Gross amounts of liabilit ies in the statement of financial
positionCash collateral
pledgedFinancial
instruments Net amountCounterparty € € € €Credit Suisse AG Ireland (1,441,682) - 265,866 (1,175,816)Credit Suisse Securities Europe Limited (6,410) 6,410 - - Goldman Sachs International (2,266,569) 386,934 1,879,635 - Morgan Stanley & Co. International Plc (83,465) 83,465 - - Total (3,798,126) 476,809 2,145,501 (1,175,816)
The following table summarises the net financial assets per counterparty as at 31 December 2018:
(i) (iii)=(i)+(ii)
Gross amounts of assets in the statement of financial
positionCash collateral
heldFinancial
instruments Net amountCounterparty € € € €BNP Paribas 17,363,736 - - 17,363,736 Credit Suisse Securities Europe Limited 8,031,128 (1,977,688) (843,739) 5,209,701 Goldman Sachs International 1,001,818 - (715,003) 286,815 JP Morgan Securities Plc 45 - - 45 Morgan Stanley & Co. International Plc 152,269 - (90,178) 62,091 Total 26,548,996 (1,977,688) (1,648,920) 22,922,388
The following table summarises the net financial liabilities per counterparty as at 31 December 2018:
(i) (iii)=(i)+(ii)
Gross amounts of liabilit ies in the statement of financial
positionCash collateral
pledgedFinancial
instruments Net amountCounterparty € € € €Credit Suisse Securities Europe Limited (2,821,427) - 2,821,427 - Goldman Sachs International (715,003) 329,715 385,288 - Morgan Stanley & Co. International Plc (90,178) 90,178 - - Total (3,626,608) 419,893 3,206,715 -
Offsetting of financial assets, derivative assets and collateral held by counterparty(ii)
Gross assets not offset in the statement of financial position
Offsetting of financial liabilit ies, derivative liabilit ies and collateral pledged by counterparty(ii)
Gross liabilit ies not offset in the statement of financial position
Offsetting of financial liabilit ies, derivative liabilit ies and collateral pledged by counterparty(ii)
Gross liabilit ies not offset in the statement of financial position

Man Funds VI plc Notes to the financial statements (continued) For the year ended 31 December 2019
101
5. Offsetting financial assets and financial liabilities (continued) Man GLG Alpha Select AlternativeThe following table summarises the net financial assets per counterparty as at 31 December 2019:
(i) (iii)=(i)+(ii)
Gross amounts of assets in the statement of financial
positionCash collateral
heldFinancial
instruments Net amountCounterparty £ £ £ £Bank of America Merrill Lynch 10,267 (115) - 10,152 BNP Paribas 84,027,515 - - 84,027,515 Credit Suisse Securities Europe Limited 14,667,123 - (7,630,164) 7,036,959 Goldman Sachs International 52,520,992 - (3,927,255) 48,593,737 JP Morgan Securities Plc 53,592,744 - (7,512,111) 46,080,633 Morgan Stanley & Co. International Plc 101,712 - - 101,712 Total 204,920,353 (115) (19,069,530) 185,850,708
The following table summarises the net financial liabilities per counterparty as at 31 December 2019:
(i) (iii)=(i)+(ii)
Gross amounts of liabilit ies in the statement of financial
positionCash collateral
pledgedFinancial
instruments Net amountCounterparty £ £ £ £Bank of America Merrill Lynch (115) 115 - - Credit Suisse AG Ireland (4,433,000) - - (4,433,000)Credit Suisse Securities Europe Limited (7,630,164) - 7,630,164 - Goldman Sachs International (3,927,255) - 3,927,255 - JP Morgan Securities Plc (7,512,111) 7,512,111 - - Total (23,502,645) 7,512,226 11,557,419 (4,433,000)
The following table summarises the net financial assets per counterparty as at 31 December 2018:
(i) (iii)=(i)+(ii)
Gross amounts of assets in the statement of financial
positionCash collateral
heldFinancial
instruments Net amountCounterparty £ £ £ £Bank of America Merrill Lynch 1,954 (47) - 1,907 BNP Paribas 123,251,594 - - 123,251,594 Credit Suisse AG Ireland 7,551 (7,551) - - Credit Suisse Securities Europe Limited 8,998,320 - (8,037,246) 961,074 Goldman Sachs International 8,203,471 - (135,445) 8,068,026 JP Morgan Securities Plc 16,223,352 - (4,354,044) 11,869,308 Morgan Stanley & Co. International Plc 12,997,904 - (92,329) 12,905,575 Total 169,684,146 (7,598) (12,619,064) 157,057,484
Offsetting of financial assets, derivative assets and collateral held by counterparty(ii)
Gross assets not offset in the statement of financial position
Offsetting of financial assets, derivative assets and collateral held by counterparty(ii)
Gross assets not offset in the statement of financial position
Offsetting of financial liabilit ies, derivative liabilit ies and collateral pledged by counterparty(ii)
Gross liabilit ies not offset in the statement of financial position
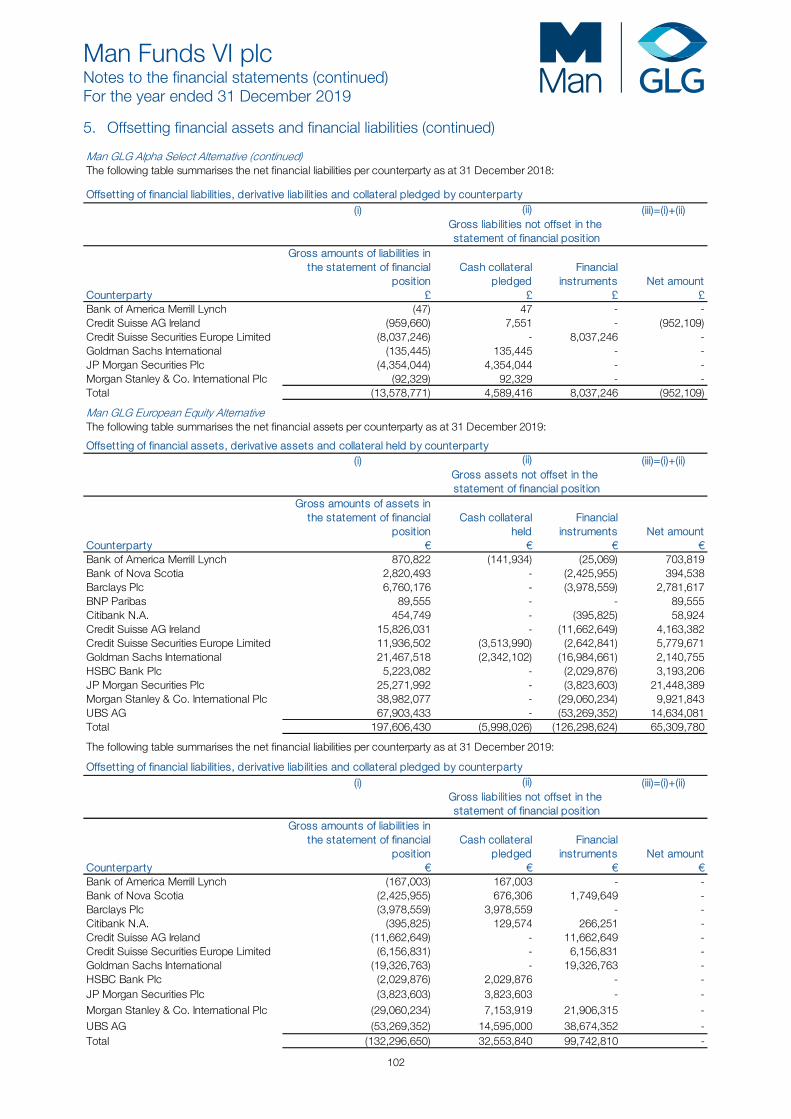
Man Funds VI plc Notes to the financial statements (continued) For the year ended 31 December 2019
102
5. Offsetting financial assets and financial liabilities (continued) Man GLG Alpha Select Alternative (continued)The following table summarises the net financial liabilities per counterparty as at 31 December 2018:
(i) (iii)=(i)+(ii)
Gross amounts of liabilit ies in the statement of financial
positionCash collateral
pledgedFinancial
instruments Net amountCounterparty £ £ £ £Bank of America Merrill Lynch (47) 47 - - Credit Suisse AG Ireland (959,660) 7,551 - (952,109)Credit Suisse Securities Europe Limited (8,037,246) - 8,037,246 - Goldman Sachs International (135,445) 135,445 - - JP Morgan Securities Plc (4,354,044) 4,354,044 - - Morgan Stanley & Co. International Plc (92,329) 92,329 - - Total (13,578,771) 4,589,416 8,037,246 (952,109)
Man GLG European Equity AlternativeThe following table summarises the net financial assets per counterparty as at 31 December 2019:
(i) (iii)=(i)+(ii)
Gross amounts of assets in the statement of financial
positionCash collateral
heldFinancial
instruments Net amountCounterparty € € € €Bank of America Merrill Lynch 870,822 (141,934) (25,069) 703,819 Bank of Nova Scotia 2,820,493 - (2,425,955) 394,538 Barclays Plc 6,760,176 - (3,978,559) 2,781,617 BNP Paribas 89,555 - - 89,555 Citibank N.A. 454,749 - (395,825) 58,924 Credit Suisse AG Ireland 15,826,031 - (11,662,649) 4,163,382 Credit Suisse Securities Europe Limited 11,936,502 (3,513,990) (2,642,841) 5,779,671 Goldman Sachs International 21,467,518 (2,342,102) (16,984,661) 2,140,755 HSBC Bank Plc 5,223,082 - (2,029,876) 3,193,206 JP Morgan Securities Plc 25,271,992 - (3,823,603) 21,448,389 Morgan Stanley & Co. International Plc 38,982,077 - (29,060,234) 9,921,843 UBS AG 67,903,433 - (53,269,352) 14,634,081 Total 197,606,430 (5,998,026) (126,298,624) 65,309,780
The following table summarises the net financial liabilities per counterparty as at 31 December 2019:
(i) (iii)=(i)+(ii)
Gross amounts of liabilit ies in the statement of financial
positionCash collateral
pledgedFinancial
instruments Net amountCounterparty € € € €Bank of America Merrill Lynch (167,003) 167,003 - - Bank of Nova Scotia (2,425,955) 676,306 1,749,649 - Barclays Plc (3,978,559) 3,978,559 - - Citibank N.A. (395,825) 129,574 266,251 - Credit Suisse AG Ireland (11,662,649) - 11,662,649 - Credit Suisse Securities Europe Limited (6,156,831) - 6,156,831 - Goldman Sachs International (19,326,763) - 19,326,763 - HSBC Bank Plc (2,029,876) 2,029,876 - - JP Morgan Securities Plc (3,823,603) 3,823,603 - - Morgan Stanley & Co. International Plc (29,060,234) 7,153,919 21,906,315 - UBS AG (53,269,352) 14,595,000 38,674,352 - Total (132,296,650) 32,553,840 99,742,810 -
Offsetting of financial liabilit ies, derivative liabilit ies and collateral pledged by counterparty(ii)
Gross liabilit ies not offset in the statement of financial position
Offsetting of financial assets, derivative assets and collateral held by counterparty(ii)
Gross assets not offset in the statement of financial position
Offsetting of financial liabilit ies, derivative liabilit ies and collateral pledged by counterparty(ii)
Gross liabilit ies not offset in the statement of financial position
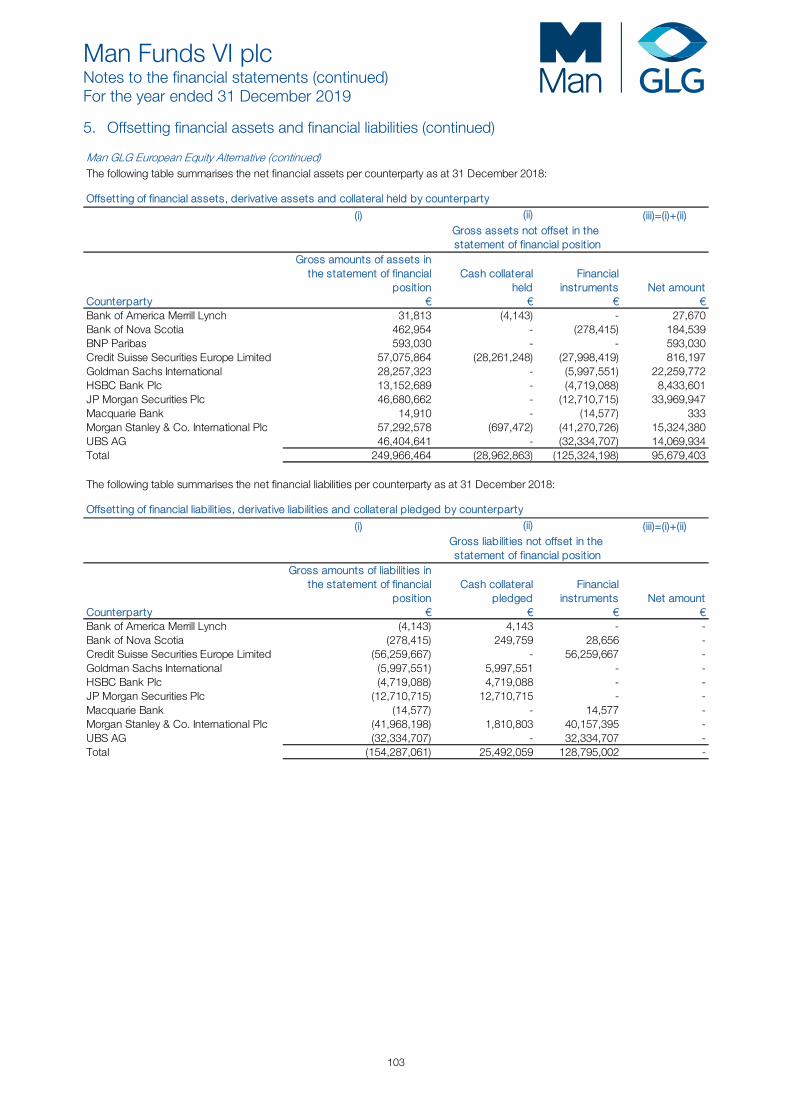
Man Funds VI plc Notes to the financial statements (continued) For the year ended 31 December 2019
103
5. Offsetting financial assets and financial liabilities (continued) Man GLG European Equity Alternative (continued)The following table summarises the net financial assets per counterparty as at 31 December 2018:
(i) (iii)=(i)+(ii)
Gross amounts of assets in the statement of financial
positionCash collateral
heldFinancial
instruments Net amountCounterparty € € € €Bank of America Merrill Lynch 31,813 (4,143) - 27,670 Bank of Nova Scotia 462,954 - (278,415) 184,539 BNP Paribas 593,030 - - 593,030 Credit Suisse Securities Europe Limited 57,075,864 (28,261,248) (27,998,419) 816,197 Goldman Sachs International 28,257,323 - (5,997,551) 22,259,772 HSBC Bank Plc 13,152,689 - (4,719,088) 8,433,601 JP Morgan Securities Plc 46,680,662 - (12,710,715) 33,969,947 Macquarie Bank 14,910 - (14,577) 333 Morgan Stanley & Co. International Plc 57,292,578 (697,472) (41,270,726) 15,324,380 UBS AG 46,404,641 - (32,334,707) 14,069,934 Total 249,966,464 (28,962,863) (125,324,198) 95,679,403
The following table summarises the net financial liabilities per counterparty as at 31 December 2018:
(i) (iii)=(i)+(ii)
Gross amounts of liabilit ies in the statement of financial
positionCash collateral
pledgedFinancial
instruments Net amountCounterparty € € € €Bank of America Merrill Lynch (4,143) 4,143 - - Bank of Nova Scotia (278,415) 249,759 28,656 - Credit Suisse Securities Europe Limited (56,259,667) - 56,259,667 - Goldman Sachs International (5,997,551) 5,997,551 - - HSBC Bank Plc (4,719,088) 4,719,088 - - JP Morgan Securities Plc (12,710,715) 12,710,715 - - Macquarie Bank (14,577) - 14,577 - Morgan Stanley & Co. International Plc (41,968,198) 1,810,803 40,157,395 - UBS AG (32,334,707) - 32,334,707 - Total (154,287,061) 25,492,059 128,795,002 -
Offsetting of financial assets, derivative assets and collateral held by counterparty(ii)
Gross assets not offset in the statement of financial position
Offsetting of financial liabilit ies, derivative liabilit ies and collateral pledged by counterparty(ii)
Gross liabilit ies not offset in the statement of financial position
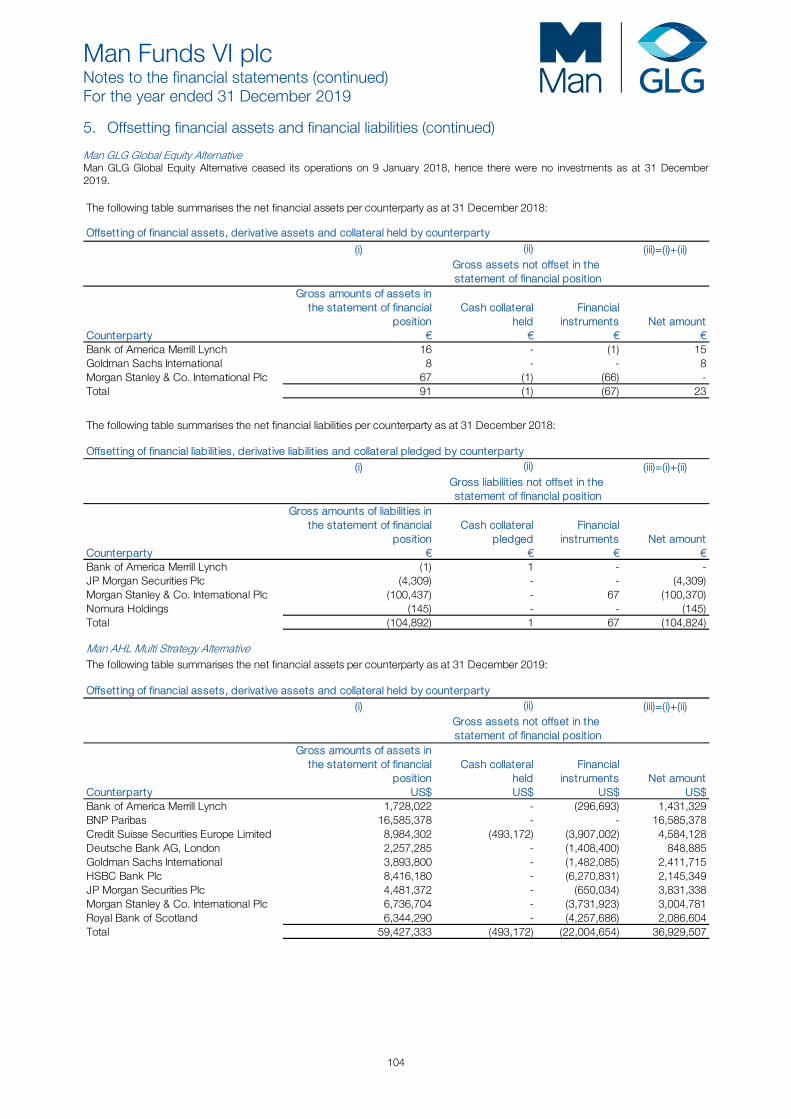
Man Funds VI plc Notes to the financial statements (continued) For the year ended 31 December 2019
104
5. Offsetting financial assets and financial liabilities (continued) Man GLG Global Equity Alternative Man GLG Global Equity Alternative ceased its operations on 9 January 2018, hence there were no investments as at 31 December 2019. The following table summarises the net financial assets per counterparty as at 31 December 2018:
(i) (iii)=(i)+(ii)
Gross amounts of assets in the statement of financial
positionCash collateral
heldFinancial
instruments Net amountCounterparty € € € €Bank of America Merrill Lynch 16 - (1) 15 Goldman Sachs International 8 - - 8 Morgan Stanley & Co. International Plc 67 (1) (66) - Total 91 (1) (67) 23
The following table summarises the net financial liabilities per counterparty as at 31 December 2018:
Offsetting of financial liabilit ies, derivative liabilit ies and collateral pledged by counterparty(i) (iii)=(i)+(ii)
Gross amounts of liabilit ies in the statement of financial
positionCash collateral
pledgedFinancial
instruments Net amountCounterparty € € € €Bank of America Merrill Lynch (1) 1 - - JP Morgan Securities Plc (4,309) - - (4,309)Morgan Stanley & Co. International Plc (100,437) - 67 (100,370)Nomura Holdings (145) - - (145)Total (104,892) 1 67 (104,824)
Man AHL Multi Strategy AlternativeThe following table summarises the net financial assets per counterparty as at 31 December 2019:
Offsetting of financial assets, derivative assets and collateral held by counterparty(i) (iii)=(i)+(ii)
Gross amounts of assets in the statement of financial
positionCash collateral
heldFinancial
instruments Net amountCounterparty US$ US$ US$ US$Bank of America Merrill Lynch 1,728,022 - (296,693) 1,431,329 BNP Paribas 16,585,378 - - 16,585,378 Credit Suisse Securities Europe Limited 8,984,302 (493,172) (3,907,002) 4,584,128 Deutsche Bank AG, London 2,257,285 - (1,408,400) 848,885 Goldman Sachs International 3,893,800 - (1,482,085) 2,411,715 HSBC Bank Plc 8,416,180 - (6,270,831) 2,145,349 JP Morgan Securities Plc 4,481,372 - (650,034) 3,831,338 Morgan Stanley & Co. International Plc 6,736,704 - (3,731,923) 3,004,781 Royal Bank of Scotland 6,344,290 - (4,257,686) 2,086,604 Total 59,427,333 (493,172) (22,004,654) 36,929,507
(ii)
(ii)Gross liabilit ies not offset in the statement of financial position
Gross assets not offset in the statement of financial position
(ii)
Offsetting of financial assets, derivative assets and collateral held by counterparty
Gross assets not offset in the statement of financial position
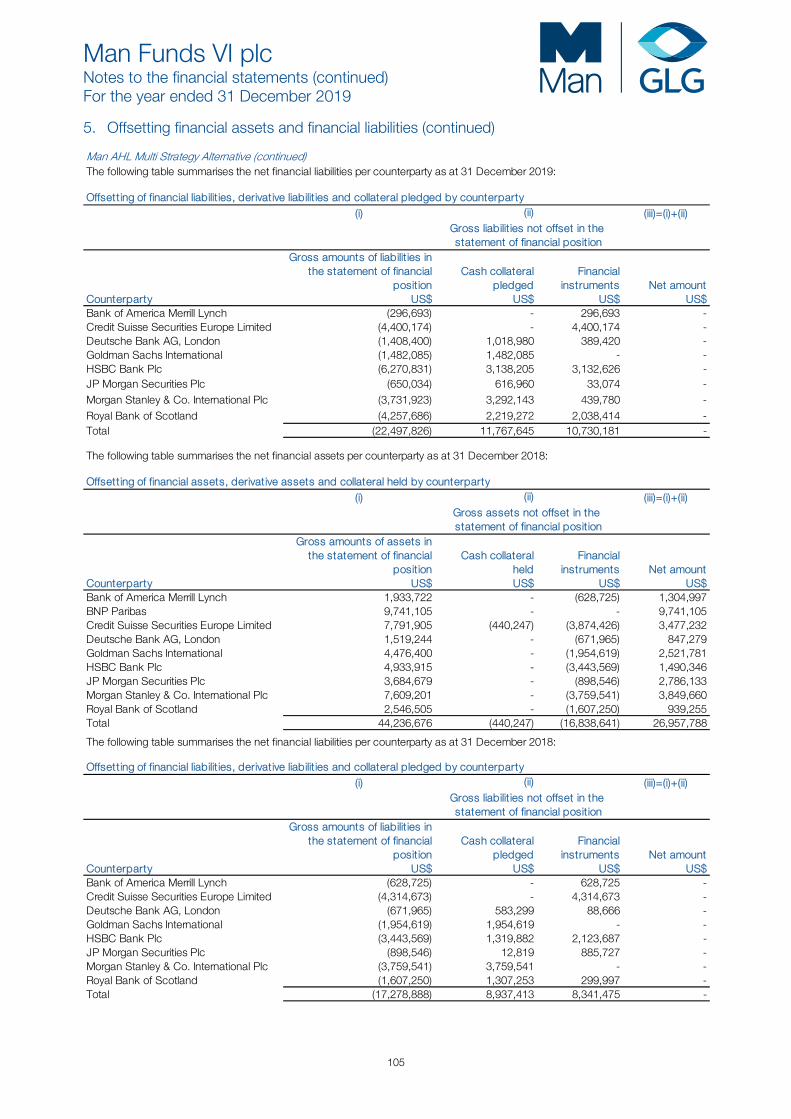
Man Funds VI plc Notes to the financial statements (continued) For the year ended 31 December 2019
105
5. Offsetting financial assets and financial liabilities (continued) Man AHL Multi Strategy Alternative (continued)The following table summarises the net financial liabilities per counterparty as at 31 December 2019:
Offsetting of financial liabilit ies, derivative liabilit ies and collateral pledged by counterparty(i) (iii)=(i)+(ii)
Gross amounts of liabilit ies in the statement of financial
positionCash collateral
pledgedFinancial
instruments Net amountCounterparty US$ US$ US$ US$Bank of America Merrill Lynch (296,693) - 296,693 - Credit Suisse Securities Europe Limited (4,400,174) - 4,400,174 - Deutsche Bank AG, London (1,408,400) 1,018,980 389,420 - Goldman Sachs International (1,482,085) 1,482,085 - - HSBC Bank Plc (6,270,831) 3,138,205 3,132,626 - JP Morgan Securities Plc (650,034) 616,960 33,074 - Morgan Stanley & Co. International Plc (3,731,923) 3,292,143 439,780 - Royal Bank of Scotland (4,257,686) 2,219,272 2,038,414 - Total (22,497,826) 11,767,645 10,730,181 -
The following table summarises the net financial assets per counterparty as at 31 December 2018:
Offsetting of financial assets, derivative assets and collateral held by counterparty(i) (iii)=(i)+(ii)
Gross amounts of assets in the statement of financial
positionCash collateral
heldFinancial
instruments Net amountCounterparty US$ US$ US$ US$Bank of America Merrill Lynch 1,933,722 - (628,725) 1,304,997 BNP Paribas 9,741,105 - - 9,741,105 Credit Suisse Securities Europe Limited 7,791,905 (440,247) (3,874,426) 3,477,232 Deutsche Bank AG, London 1,519,244 - (671,965) 847,279 Goldman Sachs International 4,476,400 - (1,954,619) 2,521,781 HSBC Bank Plc 4,933,915 - (3,443,569) 1,490,346 JP Morgan Securities Plc 3,684,679 - (898,546) 2,786,133 Morgan Stanley & Co. International Plc 7,609,201 - (3,759,541) 3,849,660 Royal Bank of Scotland 2,546,505 - (1,607,250) 939,255 Total 44,236,676 (440,247) (16,838,641) 26,957,788
The following table summarises the net financial liabilities per counterparty as at 31 December 2018:
Offsetting of financial liabilit ies, derivative liabilit ies and collateral pledged by counterparty(i) (iii)=(i)+(ii)
Gross amounts of liabilit ies in the statement of financial
positionCash collateral
pledgedFinancial
instruments Net amountCounterparty US$ US$ US$ US$Bank of America Merrill Lynch (628,725) - 628,725 - Credit Suisse Securities Europe Limited (4,314,673) - 4,314,673 - Deutsche Bank AG, London (671,965) 583,299 88,666 - Goldman Sachs International (1,954,619) 1,954,619 - - HSBC Bank Plc (3,443,569) 1,319,882 2,123,687 - JP Morgan Securities Plc (898,546) 12,819 885,727 - Morgan Stanley & Co. International Plc (3,759,541) 3,759,541 - - Royal Bank of Scotland (1,607,250) 1,307,253 299,997 - Total (17,278,888) 8,937,413 8,341,475 -
(ii)Gross liabilit ies not offset in the statement of financial position
(ii)Gross assets not offset in the statement of financial position
(ii)Gross liabilit ies not offset in the statement of financial position
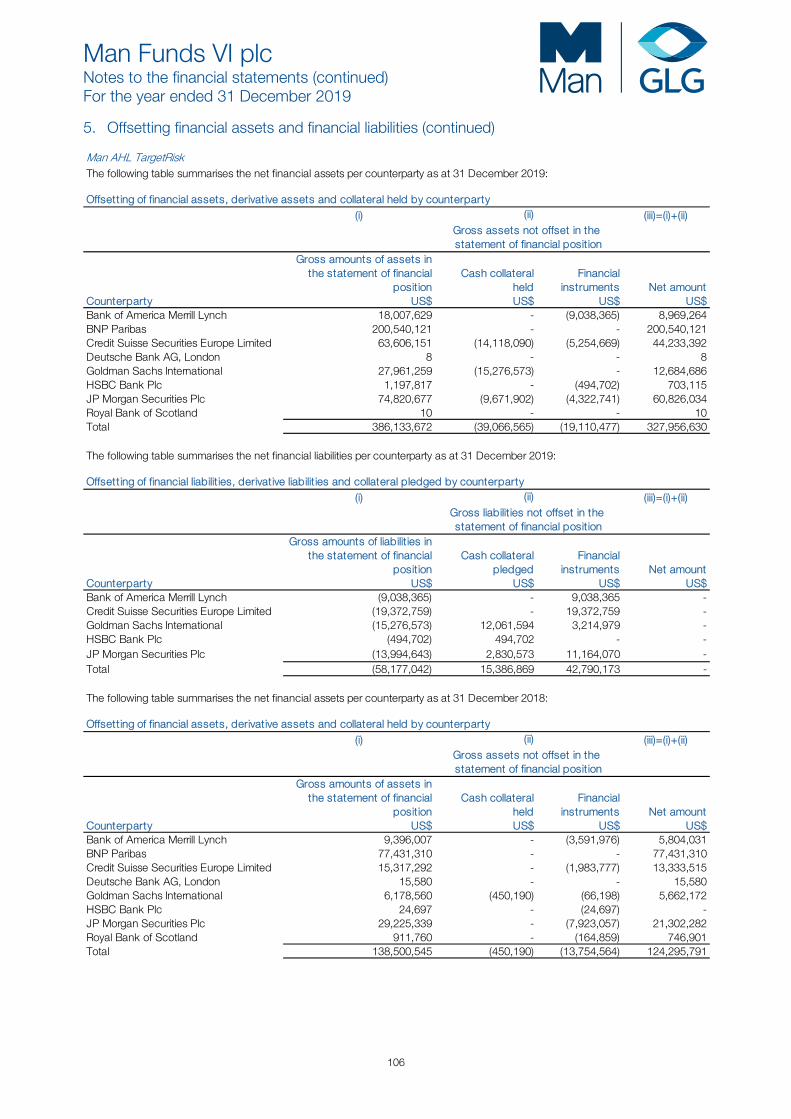
Man Funds VI plc Notes to the financial statements (continued) For the year ended 31 December 2019
106
5. Offsetting financial assets and financial liabilities (continued) Man AHL TargetRiskThe following table summarises the net financial assets per counterparty as at 31 December 2019:
Offsetting of financial assets, derivative assets and collateral held by counterparty(i) (iii)=(i)+(ii)
Gross amounts of assets in the statement of financial
positionCash collateral
heldFinancial
instruments Net amountCounterparty US$ US$ US$ US$Bank of America Merrill Lynch 18,007,629 - (9,038,365) 8,969,264 BNP Paribas 200,540,121 - - 200,540,121 Credit Suisse Securities Europe Limited 63,606,151 (14,118,090) (5,254,669) 44,233,392 Deutsche Bank AG, London 8 - - 8 Goldman Sachs International 27,961,259 (15,276,573) - 12,684,686 HSBC Bank Plc 1,197,817 - (494,702) 703,115 JP Morgan Securities Plc 74,820,677 (9,671,902) (4,322,741) 60,826,034 Royal Bank of Scotland 10 - - 10 Total 386,133,672 (39,066,565) (19,110,477) 327,956,630
The following table summarises the net financial liabilities per counterparty as at 31 December 2019:
Offsetting of financial liabilit ies, derivative liabilit ies and collateral pledged by counterparty(i) (iii)=(i)+(ii)
Gross amounts of liabilit ies in the statement of financial
positionCash collateral
pledgedFinancial
instruments Net amountCounterparty US$ US$ US$ US$Bank of America Merrill Lynch (9,038,365) - 9,038,365 - Credit Suisse Securities Europe Limited (19,372,759) - 19,372,759 - Goldman Sachs International (15,276,573) 12,061,594 3,214,979 - HSBC Bank Plc (494,702) 494,702 - - JP Morgan Securities Plc (13,994,643) 2,830,573 11,164,070 - Total (58,177,042) 15,386,869 42,790,173 -
The following table summarises the net financial assets per counterparty as at 31 December 2018:
Offsetting of financial assets, derivative assets and collateral held by counterparty(i) (iii)=(i)+(ii)
Gross amounts of assets in the statement of financial
positionCash collateral
heldFinancial
instruments Net amountCounterparty US$ US$ US$ US$Bank of America Merrill Lynch 9,396,007 - (3,591,976) 5,804,031 BNP Paribas 77,431,310 - - 77,431,310 Credit Suisse Securities Europe Limited 15,317,292 - (1,983,777) 13,333,515 Deutsche Bank AG, London 15,580 - - 15,580 Goldman Sachs International 6,178,560 (450,190) (66,198) 5,662,172 HSBC Bank Plc 24,697 - (24,697) - JP Morgan Securities Plc 29,225,339 - (7,923,057) 21,302,282 Royal Bank of Scotland 911,760 - (164,859) 746,901 Total 138,500,545 (450,190) (13,754,564) 124,295,791
(ii)Gross liabilit ies not offset in the statement of financial position
(ii)Gross assets not offset in the statement of financial position
(ii)Gross assets not offset in the statement of financial position
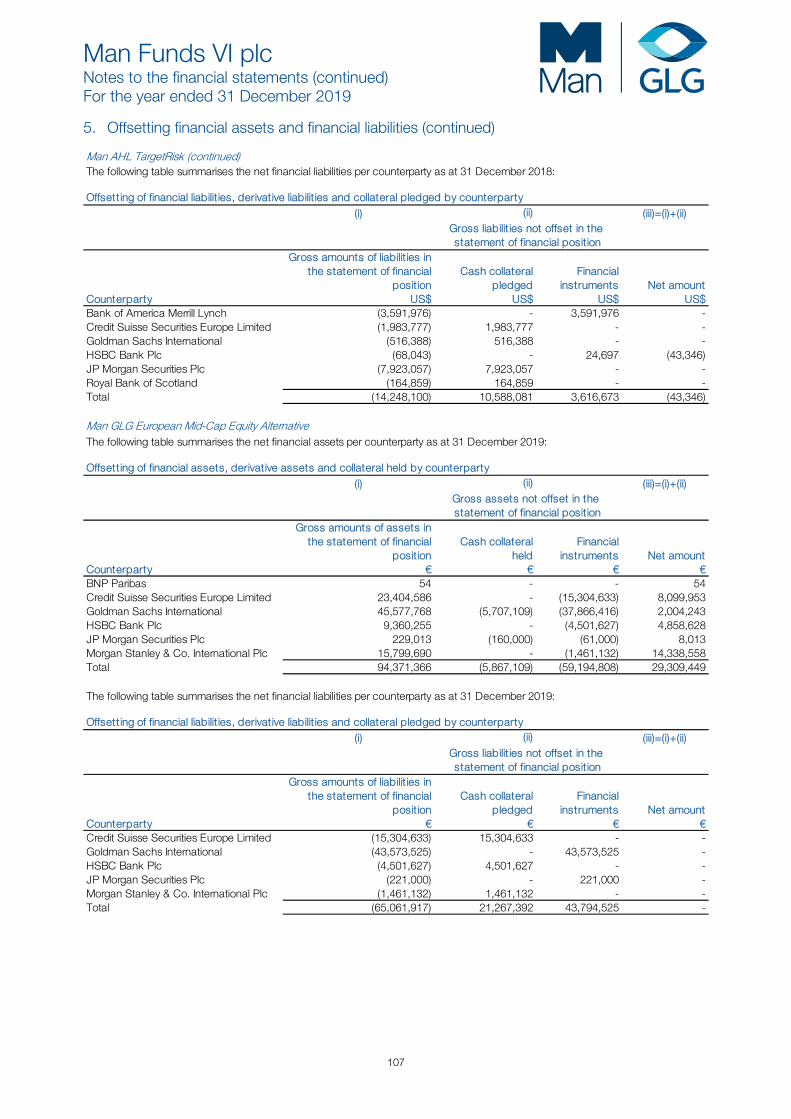
Man Funds VI plc Notes to the financial statements (continued) For the year ended 31 December 2019
107
5. Offsetting financial assets and financial liabilities (continued) Man AHL TargetRisk (continued)The following table summarises the net financial liabilities per counterparty as at 31 December 2018:
Offsetting of financial liabilit ies, derivative liabilit ies and collateral pledged by counterparty(i) (iii)=(i)+(ii)
Gross amounts of liabilit ies in the statement of financial
positionCash collateral
pledgedFinancial
instruments Net amountCounterparty US$ US$ US$ US$Bank of America Merrill Lynch (3,591,976) - 3,591,976 - Credit Suisse Securities Europe Limited (1,983,777) 1,983,777 - - Goldman Sachs International (516,388) 516,388 - - HSBC Bank Plc (68,043) - 24,697 (43,346)JP Morgan Securities Plc (7,923,057) 7,923,057 - - Royal Bank of Scotland (164,859) 164,859 - - Total (14,248,100) 10,588,081 3,616,673 (43,346)
Man GLG European Mid-Cap Equity AlternativeThe following table summarises the net financial assets per counterparty as at 31 December 2019:
Offsetting of financial assets, derivative assets and collateral held by counterparty(i) (iii)=(i)+(ii)
Gross amounts of assets in the statement of financial
positionCash collateral
heldFinancial
instruments Net amountCounterparty € € € €BNP Paribas 54 - - 54 Credit Suisse Securities Europe Limited 23,404,586 - (15,304,633) 8,099,953 Goldman Sachs International 45,577,768 (5,707,109) (37,866,416) 2,004,243 HSBC Bank Plc 9,360,255 - (4,501,627) 4,858,628 JP Morgan Securities Plc 229,013 (160,000) (61,000) 8,013 Morgan Stanley & Co. International Plc 15,799,690 - (1,461,132) 14,338,558 Total 94,371,366 (5,867,109) (59,194,808) 29,309,449
The following table summarises the net financial liabilities per counterparty as at 31 December 2019:
Offsetting of financial liabilit ies, derivative liabilit ies and collateral pledged by counterparty(i) (iii)=(i)+(ii)
Gross amounts of liabilit ies in the statement of financial
positionCash collateral
pledgedFinancial
instruments Net amountCounterparty € € € €Credit Suisse Securities Europe Limited (15,304,633) 15,304,633 - - Goldman Sachs International (43,573,525) - 43,573,525 - HSBC Bank Plc (4,501,627) 4,501,627 - - JP Morgan Securities Plc (221,000) - 221,000 - Morgan Stanley & Co. International Plc (1,461,132) 1,461,132 - - Total (65,061,917) 21,267,392 43,794,525 -
(ii)
(ii)Gross liabilit ies not offset in the statement of financial position
Gross assets not offset in the statement of financial position
(ii)Gross liabilit ies not offset in the statement of financial position
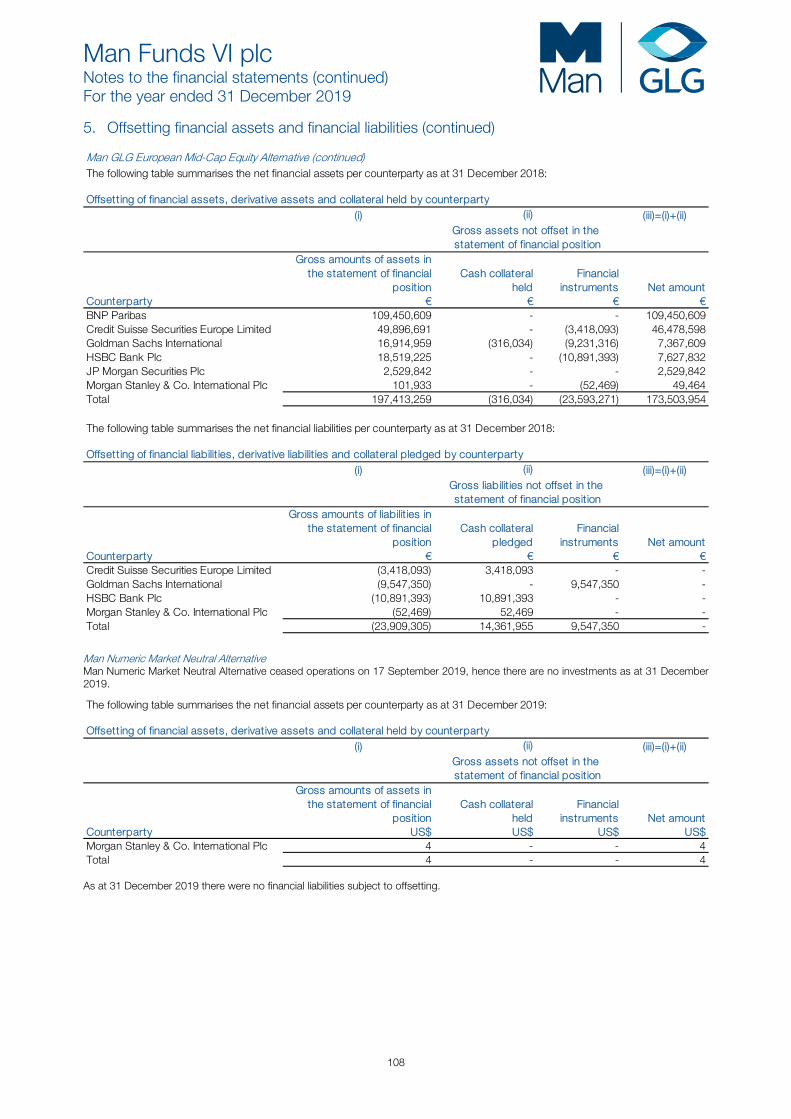
Man Funds VI plc Notes to the financial statements (continued) For the year ended 31 December 2019
108
5. Offsetting financial assets and financial liabilities (continued) Man GLG European Mid-Cap Equity Alternative (continued)The following table summarises the net financial assets per counterparty as at 31 December 2018:
Offsetting of financial assets, derivative assets and collateral held by counterparty(i) (iii)=(i)+(ii)
Gross amounts of assets in the statement of financial
positionCash collateral
heldFinancial
instruments Net amountCounterparty € € € €BNP Paribas 109,450,609 - - 109,450,609 Credit Suisse Securities Europe Limited 49,896,691 - (3,418,093) 46,478,598 Goldman Sachs International 16,914,959 (316,034) (9,231,316) 7,367,609 HSBC Bank Plc 18,519,225 - (10,891,393) 7,627,832 JP Morgan Securities Plc 2,529,842 - - 2,529,842 Morgan Stanley & Co. International Plc 101,933 - (52,469) 49,464 Total 197,413,259 (316,034) (23,593,271) 173,503,954
The following table summarises the net financial liabilities per counterparty as at 31 December 2018:
Offsetting of financial liabilit ies, derivative liabilit ies and collateral pledged by counterparty(i) (iii)=(i)+(ii)
Gross amounts of liabilit ies in the statement of financial
positionCash collateral
pledgedFinancial
instruments Net amountCounterparty € € € €Credit Suisse Securities Europe Limited (3,418,093) 3,418,093 - - Goldman Sachs International (9,547,350) - 9,547,350 - HSBC Bank Plc (10,891,393) 10,891,393 - - Morgan Stanley & Co. International Plc (52,469) 52,469 - - Total (23,909,305) 14,361,955 9,547,350 -
(ii)
(ii)Gross liabilit ies not offset in the statement of financial position
Gross assets not offset in the statement of financial position
Man Numeric Market Neutral Alternative Man Numeric Market Neutral Alternative ceased operations on 17 September 2019, hence there are no investments as at 31 December 2019.
The following table summarises the net financial assets per counterparty as at 31 December 2019:
Offsetting of financial assets, derivative assets and collateral held by counterparty(i) (iii)=(i)+(ii)
Gross amounts of assets in the statement of financial
positionCash collateral
heldFinancial
instruments Net amountCounterparty US$ US$ US$ US$Morgan Stanley & Co. International Plc 4 - - 4 Total 4 - - 4
(ii)Gross assets not offset in the statement of financial position
As at 31 December 2019 there were no financial liabilities subject to offsetting.
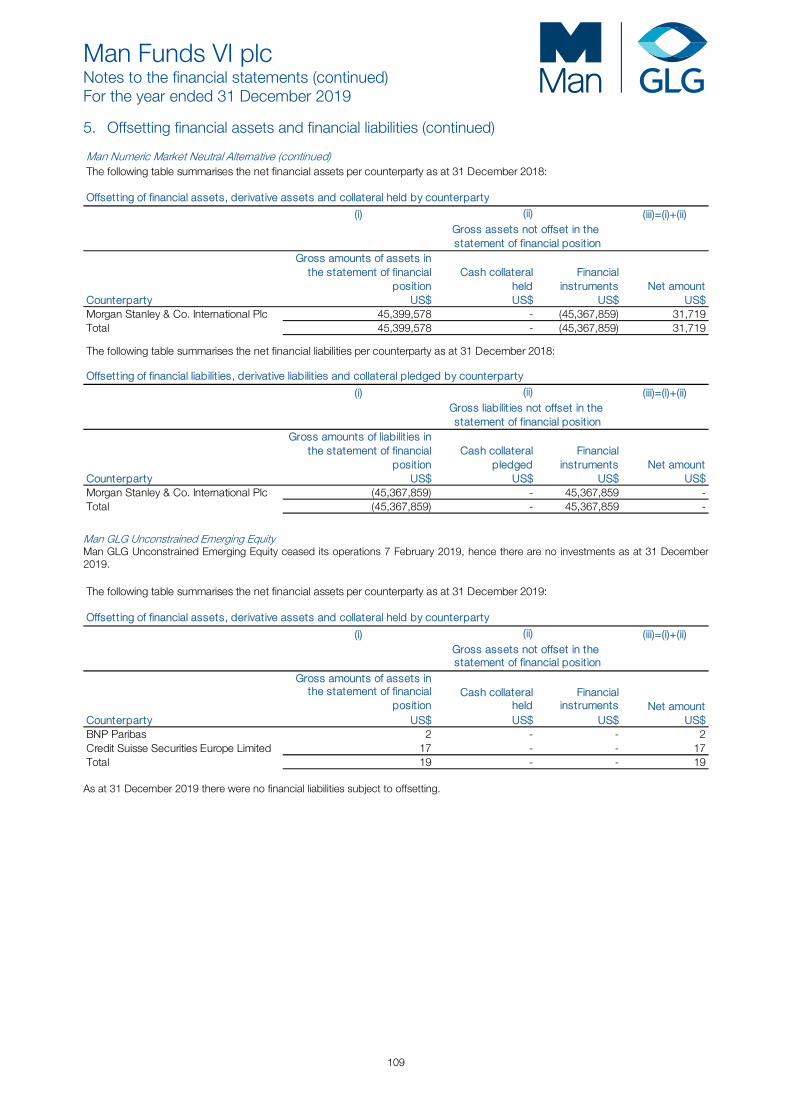
Man Funds VI plc Notes to the financial statements (continued) For the year ended 31 December 2019
109
5. Offsetting financial assets and financial liabilities (continued) Man Numeric Market Neutral Alternative (continued)The following table summarises the net financial assets per counterparty as at 31 December 2018:
(i) (iii)=(i)+(ii)
Gross amounts of assets in the statement of financial
positionCash collateral
heldFinancial
instruments Net amountCounterparty US$ US$ US$ US$Morgan Stanley & Co. International Plc 45,399,578 - (45,367,859) 31,719 Total 45,399,578 - (45,367,859) 31,719
The following table summarises the net financial liabilities per counterparty as at 31 December 2018:
(i) (iii)=(i)+(ii)
Gross amounts of liabilit ies in the statement of financial
positionCash collateral
pledgedFinancial
instruments Net amountCounterparty US$ US$ US$ US$Morgan Stanley & Co. International Plc (45,367,859) - 45,367,859 - Total (45,367,859) - 45,367,859 -
Gross assets not offset in the statement of financial position
Offsetting of financial liabilit ies, derivative liabilit ies and collateral pledged by counterparty(ii)
Gross liabilit ies not offset in the statement of financial position
Offsetting of financial assets, derivative assets and collateral held by counterparty(ii)
Man GLG Unconstrained Emerging Equity Man GLG Unconstrained Emerging Equity ceased its operations 7 February 2019, hence there are no investments as at 31 December 2019. The following table summarises the net financial assets per counterparty as at 31 December 2019:
(i) (iii)=(i)+(ii)
Gross amounts of assets in the statement of financial
positionCash collateral
heldFinancial
instruments Net amountCounterparty US$ US$ US$ US$BNP Paribas 2 - - 2 Credit Suisse Securities Europe Limited 17 - - 17 Total 19 - - 19
Gross assets not offset in the statement of financial position
Offsetting of financial assets, derivative assets and collateral held by counterparty(ii)
As at 31 December 2019 there were no financial liabilities subject to offsetting.
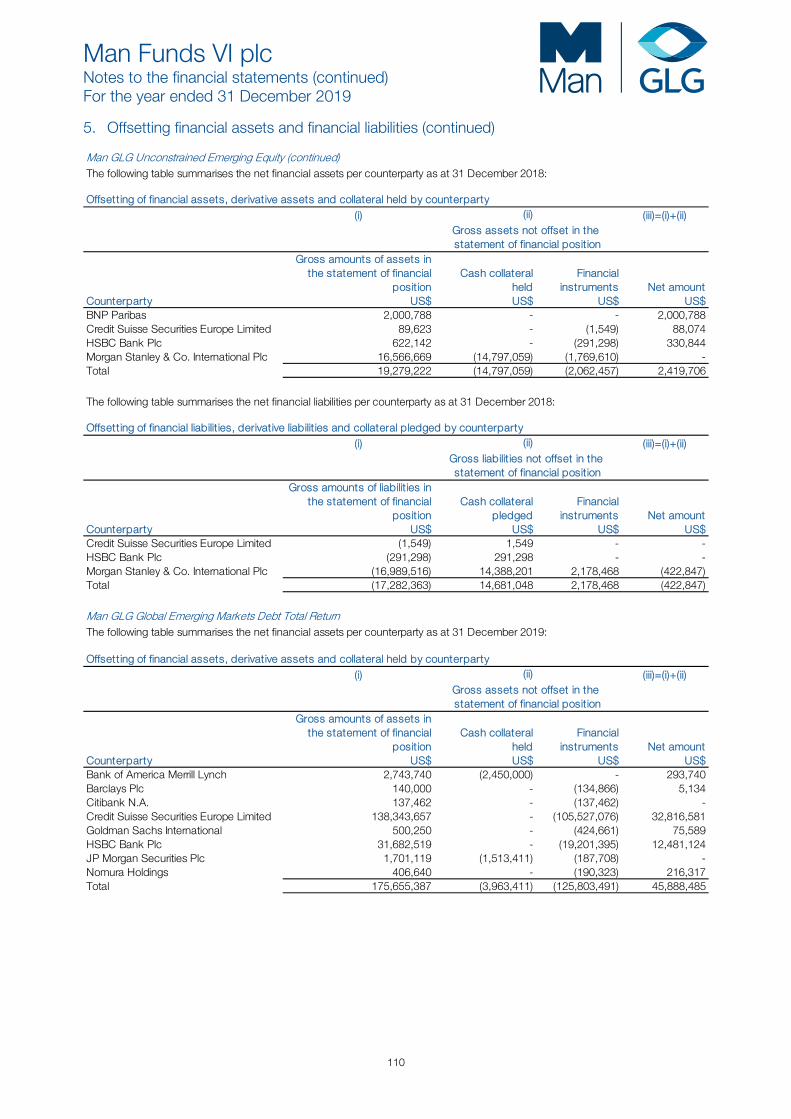
Man Funds VI plc Notes to the financial statements (continued) For the year ended 31 December 2019
110
5. Offsetting financial assets and financial liabilities (continued) Man GLG Unconstrained Emerging Equity (continued)The following table summarises the net financial assets per counterparty as at 31 December 2018:
Offsetting of financial assets, derivative assets and collateral held by counterparty(i) (iii)=(i)+(ii)
Gross amounts of assets in the statement of financial
positionCash collateral
heldFinancial
instruments Net amountCounterparty US$ US$ US$ US$BNP Paribas 2,000,788 - - 2,000,788 Credit Suisse Securities Europe Limited 89,623 - (1,549) 88,074 HSBC Bank Plc 622,142 - (291,298) 330,844 Morgan Stanley & Co. International Plc 16,566,669 (14,797,059) (1,769,610) - Total 19,279,222 (14,797,059) (2,062,457) 2,419,706
The following table summarises the net financial liabilities per counterparty as at 31 December 2018:
Offsetting of financial liabilit ies, derivative liabilit ies and collateral pledged by counterparty(i) (iii)=(i)+(ii)
Gross amounts of liabilit ies in the statement of financial
positionCash collateral
pledgedFinancial
instruments Net amountCounterparty US$ US$ US$ US$Credit Suisse Securities Europe Limited (1,549) 1,549 - - HSBC Bank Plc (291,298) 291,298 - - Morgan Stanley & Co. International Plc (16,989,516) 14,388,201 2,178,468 (422,847)Total (17,282,363) 14,681,048 2,178,468 (422,847)
Man GLG Global Emerging Markets Debt Total ReturnThe following table summarises the net financial assets per counterparty as at 31 December 2019:
Offsetting of financial assets, derivative assets and collateral held by counterparty(i) (iii)=(i)+(ii)
Gross amounts of assets in the statement of financial
positionCash collateral
heldFinancial
instruments Net amountCounterparty US$ US$ US$ US$Bank of America Merrill Lynch 2,743,740 (2,450,000) - 293,740 Barclays Plc 140,000 - (134,866) 5,134 Citibank N.A. 137,462 - (137,462) - Credit Suisse Securities Europe Limited 138,343,657 - (105,527,076) 32,816,581 Goldman Sachs International 500,250 - (424,661) 75,589 HSBC Bank Plc 31,682,519 - (19,201,395) 12,481,124 JP Morgan Securities Plc 1,701,119 (1,513,411) (187,708) - Nomura Holdings 406,640 - (190,323) 216,317 Total 175,655,387 (3,963,411) (125,803,491) 45,888,485
(ii)
(ii)
Gross assets not offset in the statement of financial position
(ii)
Gross liabilit ies not offset in the statement of financial position
Gross assets not offset in the statement of financial position
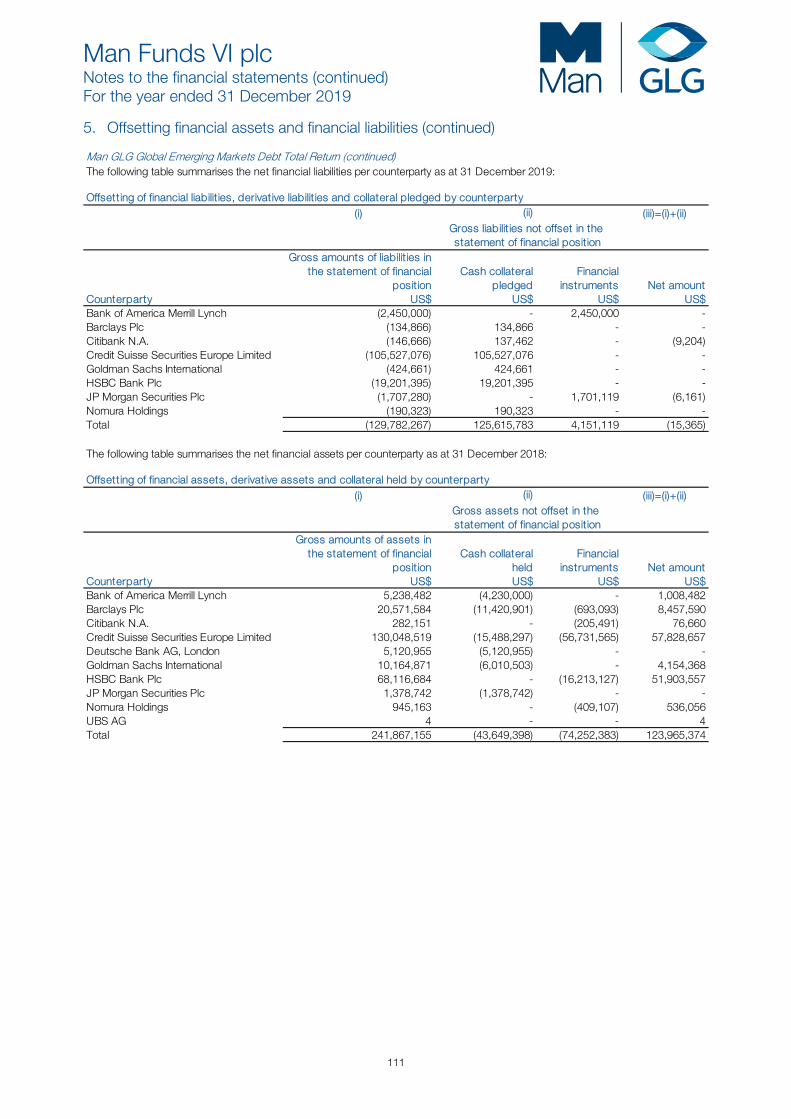
Man Funds VI plc Notes to the financial statements (continued) For the year ended 31 December 2019
111
5. Offsetting financial assets and financial liabilities (continued) Man GLG Global Emerging Markets Debt Total Return (continued)The following table summarises the net financial liabilities per counterparty as at 31 December 2019:
Offsetting of financial liabilit ies, derivative liabilit ies and collateral pledged by counterparty(i) (iii)=(i)+(ii)
Gross amounts of liabilit ies in the statement of financial
positionCash collateral
pledgedFinancial
instruments Net amountCounterparty US$ US$ US$ US$Bank of America Merrill Lynch (2,450,000) - 2,450,000 - Barclays Plc (134,866) 134,866 - - Citibank N.A. (146,666) 137,462 - (9,204)Credit Suisse Securities Europe Limited (105,527,076) 105,527,076 - - Goldman Sachs International (424,661) 424,661 - - HSBC Bank Plc (19,201,395) 19,201,395 - - JP Morgan Securities Plc (1,707,280) - 1,701,119 (6,161)Nomura Holdings (190,323) 190,323 - - Total (129,782,267) 125,615,783 4,151,119 (15,365)
The following table summarises the net financial assets per counterparty as at 31 December 2018:
Offsetting of financial assets, derivative assets and collateral held by counterparty(i) (iii)=(i)+(ii)
Gross amounts of assets in the statement of financial
positionCash collateral
heldFinancial
instruments Net amountCounterparty US$ US$ US$ US$Bank of America Merrill Lynch 5,238,482 (4,230,000) - 1,008,482 Barclays Plc 20,571,584 (11,420,901) (693,093) 8,457,590 Citibank N.A. 282,151 - (205,491) 76,660 Credit Suisse Securities Europe Limited 130,048,519 (15,488,297) (56,731,565) 57,828,657 Deutsche Bank AG, London 5,120,955 (5,120,955) - - Goldman Sachs International 10,164,871 (6,010,503) - 4,154,368 HSBC Bank Plc 68,116,684 - (16,213,127) 51,903,557 JP Morgan Securities Plc 1,378,742 (1,378,742) - - Nomura Holdings 945,163 - (409,107) 536,056 UBS AG 4 - - 4 Total 241,867,155 (43,649,398) (74,252,383) 123,965,374
(ii)
(ii)Gross liabilit ies not offset in the statement of financial position
Gross assets not offset in the statement of financial position
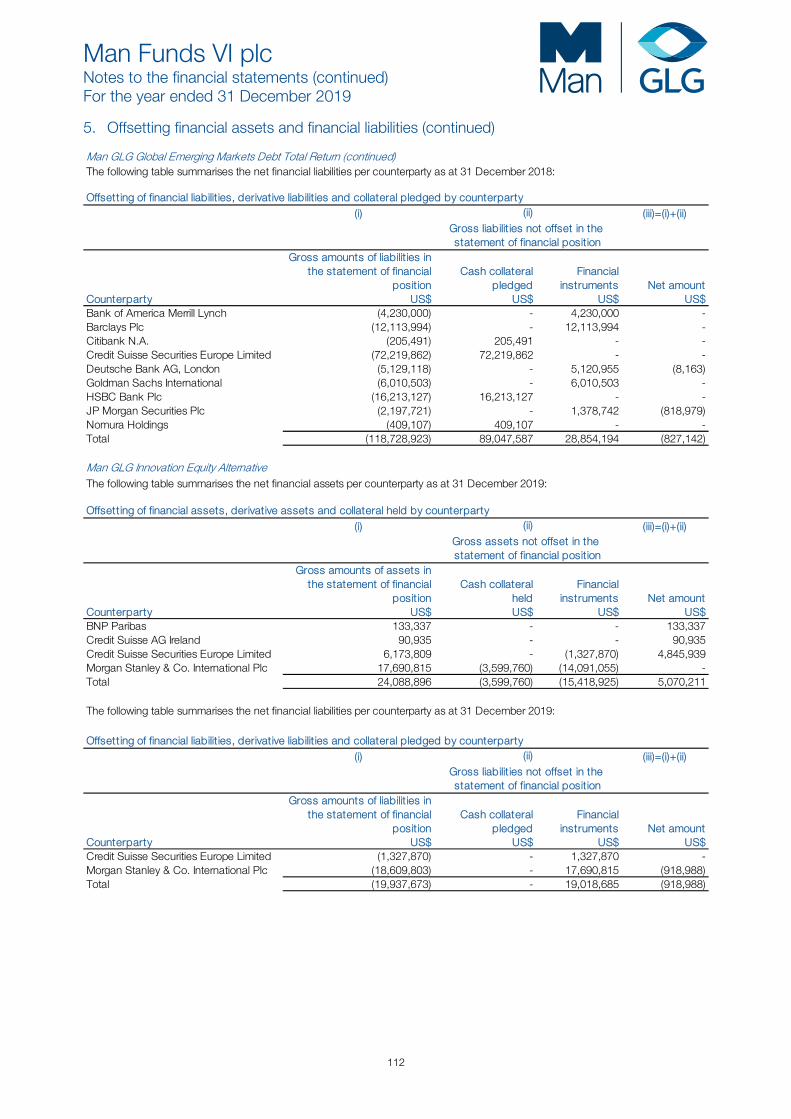
Man Funds VI plc Notes to the financial statements (continued) For the year ended 31 December 2019
112
5. Offsetting financial assets and financial liabilities (continued) Man GLG Global Emerging Markets Debt Total Return (continued)The following table summarises the net financial liabilities per counterparty as at 31 December 2018:
Offsetting of financial liabilit ies, derivative liabilit ies and collateral pledged by counterparty(i) (iii)=(i)+(ii)
Gross amounts of liabilit ies in the statement of financial
positionCash collateral
pledgedFinancial
instruments Net amountCounterparty US$ US$ US$ US$Bank of America Merrill Lynch (4,230,000) - 4,230,000 - Barclays Plc (12,113,994) - 12,113,994 - Citibank N.A. (205,491) 205,491 - - Credit Suisse Securities Europe Limited (72,219,862) 72,219,862 - - Deutsche Bank AG, London (5,129,118) - 5,120,955 (8,163)Goldman Sachs International (6,010,503) - 6,010,503 - HSBC Bank Plc (16,213,127) 16,213,127 - - JP Morgan Securities Plc (2,197,721) - 1,378,742 (818,979)Nomura Holdings (409,107) 409,107 - - Total (118,728,923) 89,047,587 28,854,194 (827,142)
Man GLG Innovation Equity AlternativeThe following table summarises the net financial assets per counterparty as at 31 December 2019:
Offsetting of financial assets, derivative assets and collateral held by counterparty(i) (iii)=(i)+(ii)
Gross amounts of assets in the statement of financial
positionCash collateral
heldFinancial
instruments Net amountCounterparty US$ US$ US$ US$BNP Paribas 133,337 - - 133,337 Credit Suisse AG Ireland 90,935 - - 90,935 Credit Suisse Securities Europe Limited 6,173,809 - (1,327,870) 4,845,939 Morgan Stanley & Co. International Plc 17,690,815 (3,599,760) (14,091,055) - Total 24,088,896 (3,599,760) (15,418,925) 5,070,211
The following table summarises the net financial liabilities per counterparty as at 31 December 2019:
Offsetting of financial liabilit ies, derivative liabilit ies and collateral pledged by counterparty(i) (iii)=(i)+(ii)
Gross amounts of liabilit ies in the statement of financial
positionCash collateral
pledgedFinancial
instruments Net amountCounterparty US$ US$ US$ US$Credit Suisse Securities Europe Limited (1,327,870) - 1,327,870 - Morgan Stanley & Co. International Plc (18,609,803) - 17,690,815 (918,988)Total (19,937,673) - 19,018,685 (918,988)
(ii)
(ii)
(ii)Gross liabilit ies not offset in the statement of financial position
Gross assets not offset in the statement of financial position
Gross liabilit ies not offset in the statement of financial position
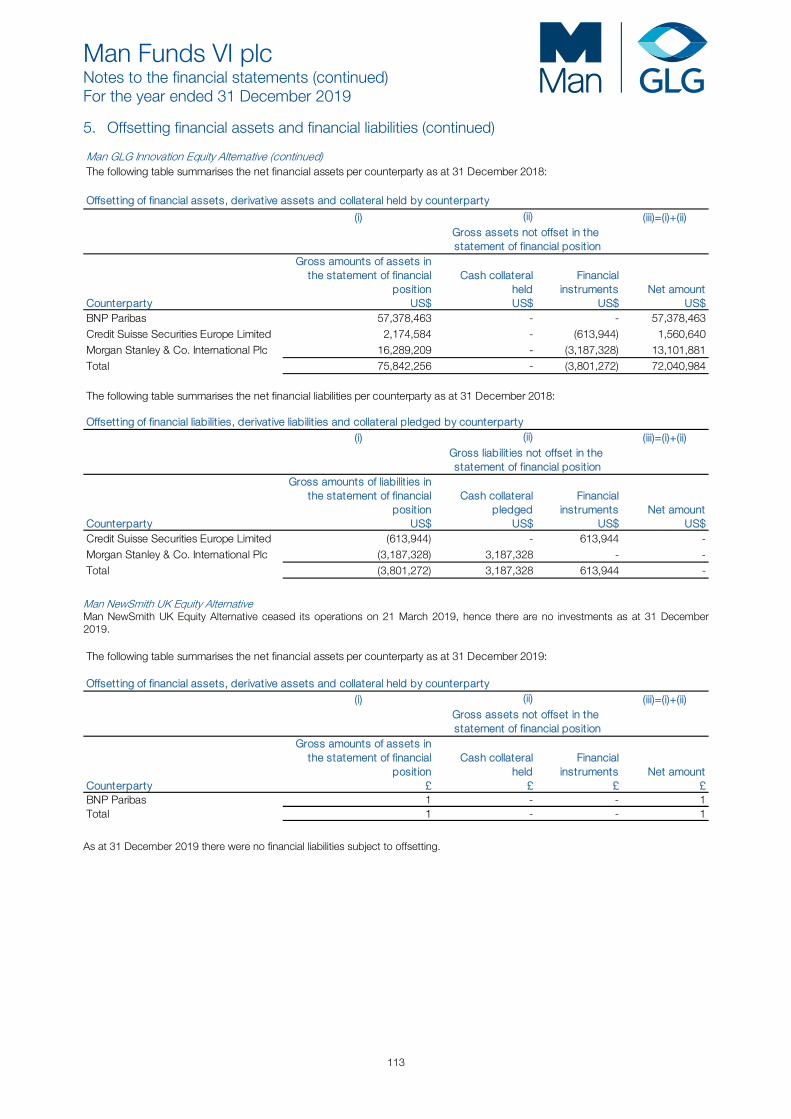
Man Funds VI plc Notes to the financial statements (continued) For the year ended 31 December 2019
113
5. Offsetting financial assets and financial liabilities (continued) Man GLG Innovation Equity Alternative (continued)The following table summarises the net financial assets per counterparty as at 31 December 2018:
(i) (iii)=(i)+(ii)
Gross amounts of assets in the statement of financial
positionCash collateral
heldFinancial
instruments Net amountCounterparty US$ US$ US$ US$BNP Paribas 57,378,463 - - 57,378,463 Credit Suisse Securities Europe Limited 2,174,584 - (613,944) 1,560,640 Morgan Stanley & Co. International Plc 16,289,209 - (3,187,328) 13,101,881 Total 75,842,256 - (3,801,272) 72,040,984
The following table summarises the net financial liabilities per counterparty as at 31 December 2018:
Offsetting of financial liabilit ies, derivative liabilit ies and collateral pledged by counterparty(i) (iii)=(i)+(ii)
Gross amounts of liabilit ies in the statement of financial
positionCash collateral
pledgedFinancial
instruments Net amountCounterparty US$ US$ US$ US$Credit Suisse Securities Europe Limited (613,944) - 613,944 - Morgan Stanley & Co. International Plc (3,187,328) 3,187,328 - - Total (3,801,272) 3,187,328 613,944 -
(ii)Gross liabilit ies not offset in the statement of financial position
Offsetting of financial assets, derivative assets and collateral held by counterparty(ii)
Gross assets not offset in the statement of financial position
Man NewSmith UK Equity Alternative Man NewSmith UK Equity Alternative ceased its operations on 21 March 2019, hence there are no investments as at 31 December 2019. The following table summarises the net financial assets per counterparty as at 31 December 2019:
Offsetting of financial assets, derivative assets and collateral held by counterparty(i) (iii)=(i)+(ii)
Gross amounts of assets in the statement of financial
positionCash collateral
heldFinancial
instruments Net amountCounterparty £ £ £ £BNP Paribas 1 - - 1 Total 1 - - 1
(ii)Gross assets not offset in the statement of financial position
As at 31 December 2019 there were no financial liabilities subject to offsetting.
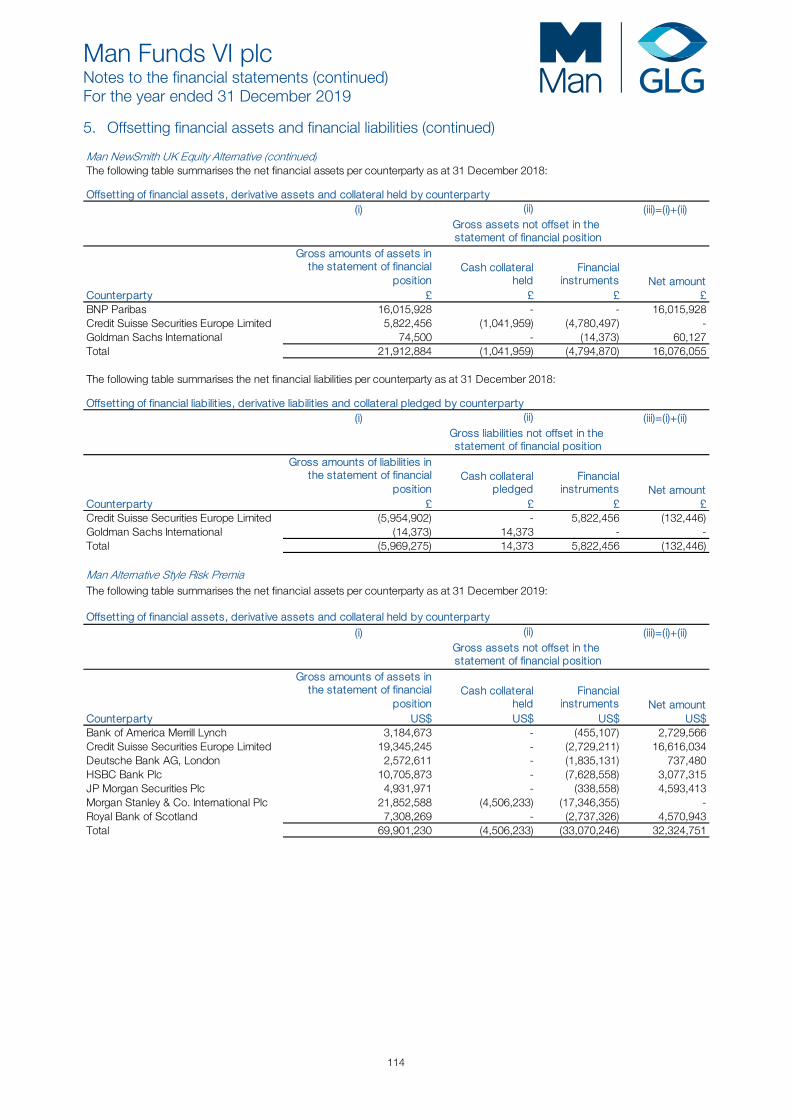
Man Funds VI plc Notes to the financial statements (continued) For the year ended 31 December 2019
114
5. Offsetting financial assets and financial liabilities (continued) Man NewSmith UK Equity Alternative (continued)The following table summarises the net financial assets per counterparty as at 31 December 2018:
Offsetting of financial assets, derivative assets and collateral held by counterparty(i) (iii)=(i)+(ii)
Gross amounts of assets in the statement of financial
positionCash collateral
heldFinancial
instruments Net amountCounterparty £ £ £ £BNP Paribas 16,015,928 - - 16,015,928 Credit Suisse Securities Europe Limited 5,822,456 (1,041,959) (4,780,497) - Goldman Sachs International 74,500 - (14,373) 60,127 Total 21,912,884 (1,041,959) (4,794,870) 16,076,055
The following table summarises the net financial liabilities per counterparty as at 31 December 2018:
Offsetting of financial liabilit ies, derivative liabilit ies and collateral pledged by counterparty(i) (iii)=(i)+(ii)
Gross amounts of liabilit ies in the statement of financial
positionCash collateral
pledgedFinancial
instruments Net amountCounterparty £ £ £ £Credit Suisse Securities Europe Limited (5,954,902) - 5,822,456 (132,446)Goldman Sachs International (14,373) 14,373 - - Total (5,969,275) 14,373 5,822,456 (132,446)
Man Alternative Style Risk PremiaThe following table summarises the net financial assets per counterparty as at 31 December 2019:
Offsetting of financial assets, derivative assets and collateral held by counterparty(i) (iii)=(i)+(ii)
Gross amounts of assets in the statement of financial
positionCash collateral
heldFinancial
instruments Net amountCounterparty US$ US$ US$ US$Bank of America Merrill Lynch 3,184,673 - (455,107) 2,729,566 Credit Suisse Securities Europe Limited 19,345,245 - (2,729,211) 16,616,034 Deutsche Bank AG, London 2,572,611 - (1,835,131) 737,480 HSBC Bank Plc 10,705,873 - (7,628,558) 3,077,315 JP Morgan Securities Plc 4,931,971 - (338,558) 4,593,413 Morgan Stanley & Co. International Plc 21,852,588 (4,506,233) (17,346,355) - Royal Bank of Scotland 7,308,269 - (2,737,326) 4,570,943 Total 69,901,230 (4,506,233) (33,070,246) 32,324,751
(ii)
(ii)
(ii)Gross assets not offset in the statement of financial position
Gross liabilit ies not offset in the statement of financial position
Gross assets not offset in the statement of financial position
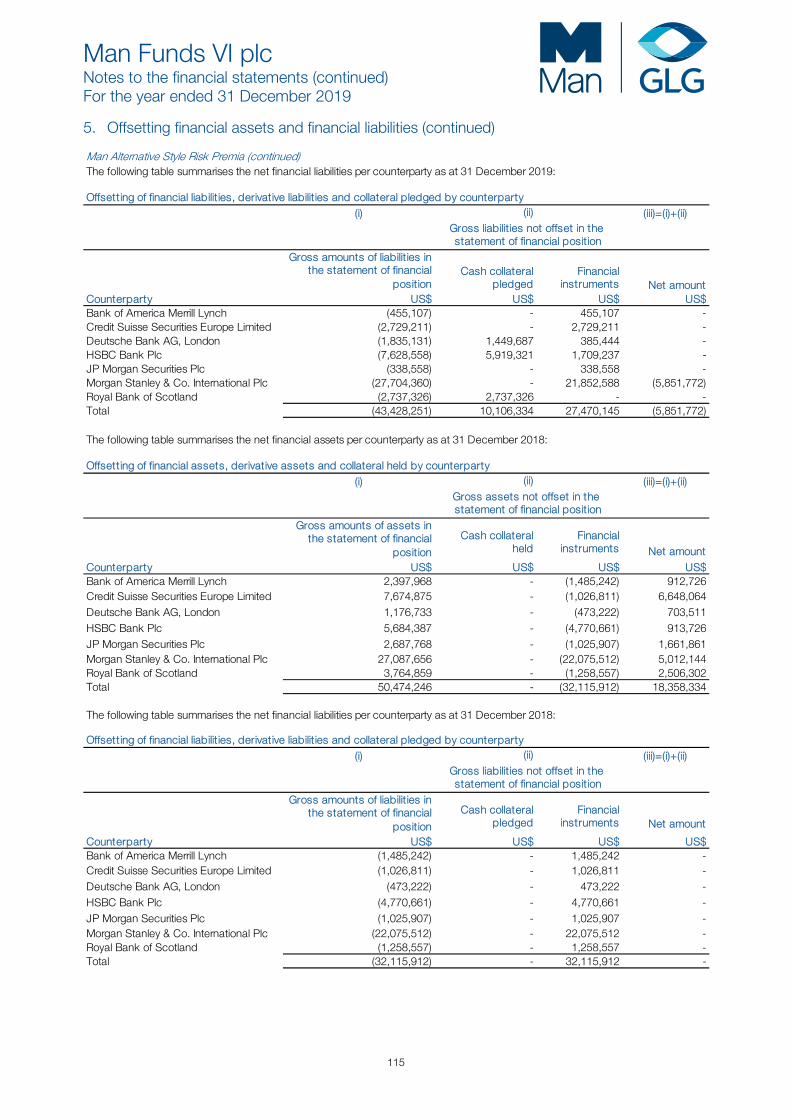
Man Funds VI plc Notes to the financial statements (continued) For the year ended 31 December 2019
115
5. Offsetting financial assets and financial liabilities (continued) Man Alternative Style Risk Premia (continued)The following table summarises the net financial liabilities per counterparty as at 31 December 2019:
Offsetting of financial liabilit ies, derivative liabilit ies and collateral pledged by counterparty(i) (iii)=(i)+(ii)
Gross amounts of liabilit ies in the statement of financial
positionCash collateral
pledgedFinancial
instruments Net amountCounterparty US$ US$ US$ US$Bank of America Merrill Lynch (455,107) - 455,107 - Credit Suisse Securities Europe Limited (2,729,211) - 2,729,211 - Deutsche Bank AG, London (1,835,131) 1,449,687 385,444 - HSBC Bank Plc (7,628,558) 5,919,321 1,709,237 - JP Morgan Securities Plc (338,558) - 338,558 - Morgan Stanley & Co. International Plc (27,704,360) - 21,852,588 (5,851,772)Royal Bank of Scotland (2,737,326) 2,737,326 - - Total (43,428,251) 10,106,334 27,470,145 (5,851,772)
The following table summarises the net financial assets per counterparty as at 31 December 2018:
Offsetting of financial assets, derivative assets and collateral held by counterparty(i) (iii)=(i)+(ii)
Gross amounts of assets in the statement of financial
position
Cash collateral held
Financial instruments Net amount
Counterparty US$ US$ US$ US$Bank of America Merrill Lynch 2,397,968 - (1,485,242) 912,726 Credit Suisse Securities Europe Limited 7,674,875 - (1,026,811) 6,648,064 Deutsche Bank AG, London 1,176,733 - (473,222) 703,511 HSBC Bank Plc 5,684,387 - (4,770,661) 913,726 JP Morgan Securities Plc 2,687,768 - (1,025,907) 1,661,861 Morgan Stanley & Co. International Plc 27,087,656 - (22,075,512) 5,012,144 Royal Bank of Scotland 3,764,859 - (1,258,557) 2,506,302 Total 50,474,246 - (32,115,912) 18,358,334
The following table summarises the net financial liabilities per counterparty as at 31 December 2018:
Offsetting of financial liabilit ies, derivative liabilit ies and collateral pledged by counterparty(i) (iii)=(i)+(ii)
Gross amounts of liabilit ies in the statement of financial
position
Cash collateral pledged
Financial instruments Net amount
Counterparty US$ US$ US$ US$Bank of America Merrill Lynch (1,485,242) - 1,485,242 - Credit Suisse Securities Europe Limited (1,026,811) - 1,026,811 - Deutsche Bank AG, London (473,222) - 473,222 - HSBC Bank Plc (4,770,661) - 4,770,661 - JP Morgan Securities Plc (1,025,907) - 1,025,907 - Morgan Stanley & Co. International Plc (22,075,512) - 22,075,512 - Royal Bank of Scotland (1,258,557) - 1,258,557 - Total (32,115,912) - 32,115,912 -
(ii)
(ii)
(ii)Gross liabilit ies not offset in the statement of financial position
Gross assets not offset in the statement of financial position
Gross liabilit ies not offset in the statement of financial position
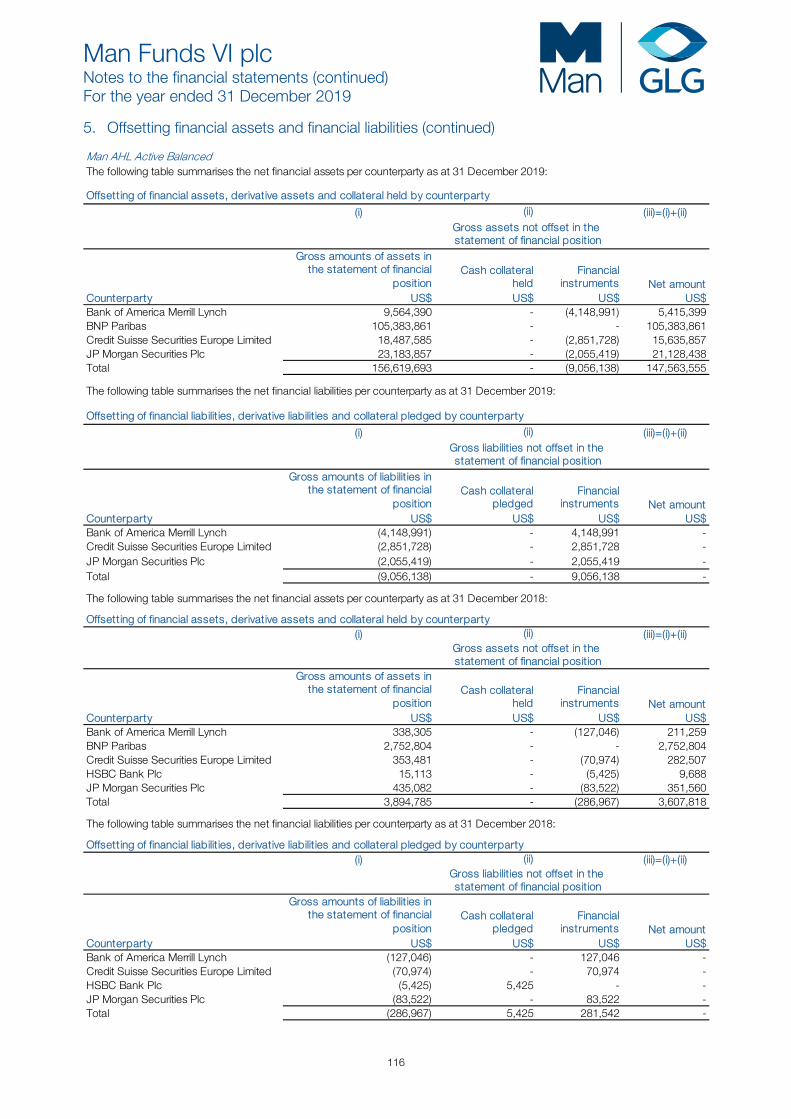
Man Funds VI plc Notes to the financial statements (continued) For the year ended 31 December 2019
116
5. Offsetting financial assets and financial liabilities (continued) Man AHL Active BalancedThe following table summarises the net financial assets per counterparty as at 31 December 2019:
(i) (iii)=(i)+(ii)
Gross amounts of assets in the statement of financial
positionCash collateral
heldFinancial
instruments Net amountCounterparty US$ US$ US$ US$Bank of America Merrill Lynch 9,564,390 - (4,148,991) 5,415,399 BNP Paribas 105,383,861 - - 105,383,861 Credit Suisse Securities Europe Limited 18,487,585 - (2,851,728) 15,635,857 JP Morgan Securities Plc 23,183,857 - (2,055,419) 21,128,438 Total 156,619,693 - (9,056,138) 147,563,555
The following table summarises the net financial liabilities per counterparty as at 31 December 2019:
(i) (iii)=(i)+(ii)
Gross amounts of liabilit ies in the statement of financial
positionCash collateral
pledgedFinancial
instruments Net amountCounterparty US$ US$ US$ US$Bank of America Merrill Lynch (4,148,991) - 4,148,991 - Credit Suisse Securities Europe Limited (2,851,728) - 2,851,728 - JP Morgan Securities Plc (2,055,419) - 2,055,419 - Total (9,056,138) - 9,056,138 -
The following table summarises the net financial assets per counterparty as at 31 December 2018:
(i) (iii)=(i)+(ii)
Gross amounts of assets in the statement of financial
positionCash collateral
heldFinancial
instruments Net amountCounterparty US$ US$ US$ US$Bank of America Merrill Lynch 338,305 - (127,046) 211,259 BNP Paribas 2,752,804 - - 2,752,804 Credit Suisse Securities Europe Limited 353,481 - (70,974) 282,507 HSBC Bank Plc 15,113 - (5,425) 9,688 JP Morgan Securities Plc 435,082 - (83,522) 351,560 Total 3,894,785 - (286,967) 3,607,818
The following table summarises the net financial liabilities per counterparty as at 31 December 2018:
(i) (iii)=(i)+(ii)
Gross amounts of liabilit ies in the statement of financial
positionCash collateral
pledgedFinancial
instruments Net amountCounterparty US$ US$ US$ US$Bank of America Merrill Lynch (127,046) - 127,046 - Credit Suisse Securities Europe Limited (70,974) - 70,974 - HSBC Bank Plc (5,425) 5,425 - - JP Morgan Securities Plc (83,522) - 83,522 - Total (286,967) 5,425 281,542 -
Offsetting of financial assets, derivative assets and collateral held by counterparty(ii)
Gross assets not offset in the statement of financial position
Offsetting of financial liabilit ies, derivative liabilit ies and collateral pledged by counterparty(ii)
Gross liabilit ies not offset in the statement of financial position
Offsetting of financial assets, derivative assets and collateral held by counterparty(ii)
Gross assets not offset in the statement of financial position
Offsetting of financial liabilit ies, derivative liabilit ies and collateral pledged by counterparty(ii)
Gross liabilit ies not offset in the statement of financial position

Man Funds VI plc Notes to the financial statements (continued) For the year ended 31 December 2019
117
5. Offsetting financial assets and financial liabilities (continued) Man GLG High Yield OpportunitiesThe following table summarises the net financial assets per counterparty as at 31 December 2019:
(i) (iii)=(i)+(ii)
Gross amounts of assets in the statement of financial
positionCash collateral
heldFinancial
instruments Net amountCounterparty € € € €Barclays Plc 12,685,230 - (10,667,716) 2,017,514 BNP Paribas 97 - - 97 Citibank N.A. 119,646 - (126,011) (6,365)Credit Suisse Securities Europe Limited 620,028 - (167,214) 452,814 Goldman Sachs International 798,312 - (768,006) 30,306 JP Morgan Securities Plc 1,491,838 (109,026) (69,131) 1,313,681 Morgan Stanley & Co. International Plc 442,048 - (56,643) 385,405 Total 16,157,199 (109,026) (11,854,721) 4,193,452
The following table summarises the net financial liabilities per counterparty as at 31 December 2019:
(i) (iii)=(i)+(ii)
Gross amounts of liabilit ies in the statement of financial
positionCash collateral
pledgedFinancial
instruments Net amountCounterparty € € € €Barclays Plc (10,667,716) 429,161 10,238,555 - Citibank N.A. (126,011) 119,646 6,365 - Credit Suisse AG Ireland (164,724) - - (164,724)Credit Suisse Securities Europe Limited (167,214) 167,214 - - Goldman Sachs International (768,006) 768,006 - - JP Morgan Securities Plc (178,157) 178,157 - - Morgan Stanley & Co. International Plc (56,643) 25,192 31,451 - Total (12,128,471) 1,687,376 10,276,371 (164,724)
Offsetting of financial liabilit ies, derivative liabilit ies and collateral pledged by counterparty(ii)
Gross liabilit ies not offset in the statement of financial position
Offsetting of financial assets, derivative assets and collateral held by counterparty(ii)
Gross assets not offset in the statement of financial position
Man GLG High Yield Opportunities commenced its operations on 16 January 2019, hence there were no investments as at 31 December 2018.

Man Funds VI plc Notes to the financial statements (continued) For the year ended 31 December 2019
118
5. Offsetting financial assets and financial liabilities (continued) Man GLG Credit Multi-Strategy AlternativeThe following table summarises the net financial assets per counterparty as at 31 December 2019:
(i) (iii)=(i)+(ii)
Gross amounts of assets in the statement of financial
positionCash collateral
heldFinancial
instruments Net amountCounterparty US$ US$ US$ US$Bank of Nova Scotia 2,040,951 - (538,722) 1,502,229 Barclays Plc 10,268,387 - (8,189,110) 2,079,277 Citibank N.A. 296,666 - (178,327) 118,339 Credit Suisse AG Ireland 5,514 - (5,514) - Credit Suisse Securities Europe Limited 1,090,801 - - 1,090,801 Goldman Sachs International 375,104 - (226,926) 148,178 JP Morgan Securities Plc 2,537,496 (71,841) (1,165,673) 1,299,982 Morgan Stanley & Co. International Plc 399,178 (420) (278,074) 120,684 Nomura Holdings 1,940,600 - (1,601,500) 339,100 Total 18,954,697 (72,261) (12,183,846) 6,698,590
The following table summarises the net financial liabilities per counterparty as at 31 December 2019:
(i) (iii)=(i)+(ii)
Gross amounts of liabilit ies in the statement of financial
positionCash collateral
pledgedFinancial
instruments Net amountCounterparty US$ US$ US$ US$Bank of America Merrill Lynch (14,108) - - (14,108)Bank of Nova Scotia (538,722) 538,722 - - Barclays Plc (8,189,110) 273,511 7,915,599 - Citibank N.A. (178,327) 178,327 - - Credit Suisse AG Ireland (634,172) - 5,514 (628,658)Goldman Sachs International (226,926) 226,926 - - HSBC Bank Plc (50,895) - - (50,895)JP Morgan Securities Plc (1,237,514) 1,237,514 - - Morgan Stanley & Co. International Plc (278,494) - 278,494 - Nomura Holdings (1,601,500) - 1,601,500 - Total (12,949,768) 2,455,000 9,801,107 (693,661)
Offsetting of financial assets, derivative assets and collateral held by counterparty(ii)
Gross assets not offset in the statement of financial position
Offsetting of financial liabilit ies, derivative liabilit ies and collateral pledged by counterparty(ii)
Gross liabilit ies not offset in the statement of financial position
Man GLG Credit Multi-Strategy Alternative commenced its operations on 1 April 2019, hence there were no investments as at 31 December 2018.
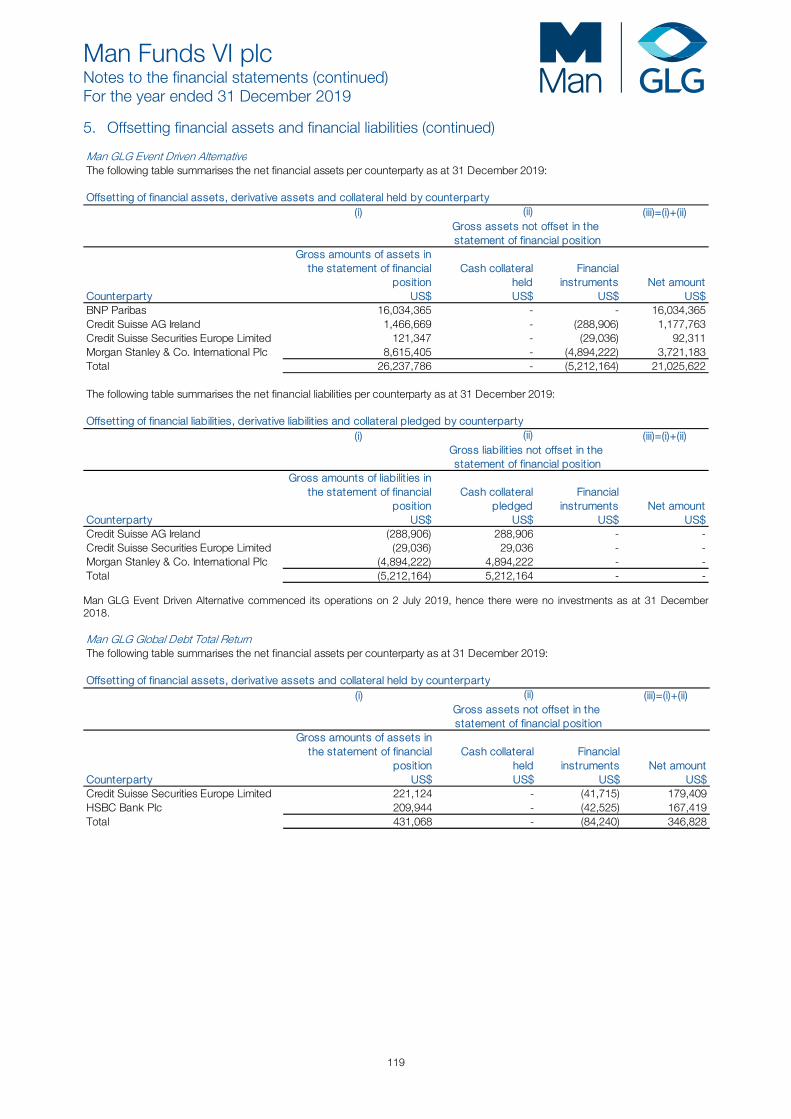
Man Funds VI plc Notes to the financial statements (continued) For the year ended 31 December 2019
119
5. Offsetting financial assets and financial liabilities (continued) Man GLG Event Driven AlternativeThe following table summarises the net financial assets per counterparty as at 31 December 2019:
(i) (iii)=(i)+(ii)
Gross amounts of assets in the statement of financial
positionCash collateral
heldFinancial
instruments Net amountCounterparty US$ US$ US$ US$BNP Paribas 16,034,365 - - 16,034,365 Credit Suisse AG Ireland 1,466,669 - (288,906) 1,177,763 Credit Suisse Securities Europe Limited 121,347 - (29,036) 92,311 Morgan Stanley & Co. International Plc 8,615,405 - (4,894,222) 3,721,183 Total 26,237,786 - (5,212,164) 21,025,622
The following table summarises the net financial liabilities per counterparty as at 31 December 2019:
(i) (iii)=(i)+(ii)
Gross amounts of liabilit ies in the statement of financial
positionCash collateral
pledgedFinancial
instruments Net amountCounterparty US$ US$ US$ US$Credit Suisse AG Ireland (288,906) 288,906 - - Credit Suisse Securities Europe Limited (29,036) 29,036 - - Morgan Stanley & Co. International Plc (4,894,222) 4,894,222 - - Total (5,212,164) 5,212,164 - -
Offsetting of financial liabilit ies, derivative liabilit ies and collateral pledged by counterparty(ii)
Gross liabilit ies not offset in the statement of financial position
Offsetting of financial assets, derivative assets and collateral held by counterparty(ii)
Gross assets not offset in the statement of financial position
Man GLG Event Driven Alternative commenced its operations on 2 July 2019, hence there were no investments as at 31 December 2018. Man GLG Global Debt Total ReturnThe following table summarises the net financial assets per counterparty as at 31 December 2019:
(i) (iii)=(i)+(ii)
Gross amounts of assets in the statement of financial
positionCash collateral
heldFinancial
instruments Net amountCounterparty US$ US$ US$ US$Credit Suisse Securities Europe Limited 221,124 - (41,715) 179,409 HSBC Bank Plc 209,944 - (42,525) 167,419 Total 431,068 - (84,240) 346,828
Offsetting of financial assets, derivative assets and collateral held by counterparty(ii)
Gross assets not offset in the statement of financial position
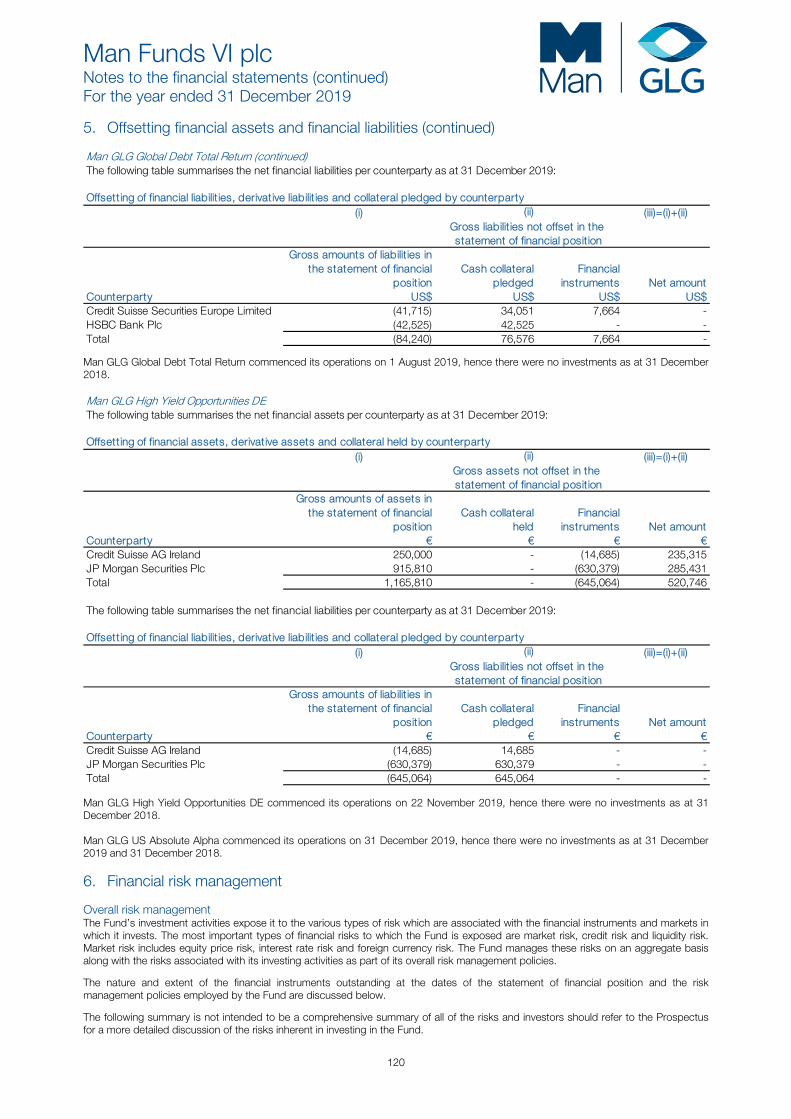
Man Funds VI plc Notes to the financial statements (continued) For the year ended 31 December 2019
120
5. Offsetting financial assets and financial liabilities (continued) Man GLG Global Debt Total Return (continued)The following table summarises the net financial liabilities per counterparty as at 31 December 2019:
(i) (iii)=(i)+(ii)
Gross amounts of liabilit ies in the statement of financial
positionCash collateral
pledgedFinancial
instruments Net amountCounterparty US$ US$ US$ US$Credit Suisse Securities Europe Limited (41,715) 34,051 7,664 - HSBC Bank Plc (42,525) 42,525 - - Total (84,240) 76,576 7,664 -
Offsetting of financial liabilit ies, derivative liabilit ies and collateral pledged by counterparty(ii)
Gross liabilit ies not offset in the statement of financial position
Man GLG Global Debt Total Return commenced its operations on 1 August 2019, hence there were no investments as at 31 December 2018. Man GLG High Yield Opportunities DEThe following table summarises the net financial assets per counterparty as at 31 December 2019:
(i) (iii)=(i)+(ii)
Gross amounts of assets in the statement of financial
positionCash collateral
heldFinancial
instruments Net amountCounterparty € € € €Credit Suisse AG Ireland 250,000 - (14,685) 235,315 JP Morgan Securities Plc 915,810 - (630,379) 285,431 Total 1,165,810 - (645,064) 520,746
The following table summarises the net financial liabilities per counterparty as at 31 December 2019:
(i) (iii)=(i)+(ii)
Gross amounts of liabilit ies in the statement of financial
positionCash collateral
pledgedFinancial
instruments Net amountCounterparty € € € €Credit Suisse AG Ireland (14,685) 14,685 - - JP Morgan Securities Plc (630,379) 630,379 - - Total (645,064) 645,064 - -
Offsetting of financial assets, derivative assets and collateral held by counterparty(ii)
Gross assets not offset in the statement of financial position
Offsetting of financial liabilit ies, derivative liabilit ies and collateral pledged by counterparty(ii)
Gross liabilit ies not offset in the statement of financial position
Man GLG High Yield Opportunities DE commenced its operations on 22 November 2019, hence there were no investments as at 31 December 2018. Man GLG US Absolute Alpha commenced its operations on 31 December 2019, hence there were no investments as at 31 December 2019 and 31 December 2018.
6. Financial risk management Overall risk management The Fund’s investment activities expose it to the various types of risk which are associated with the financial instruments and markets in which it invests. The most important types of financial risks to which the Fund is exposed are market risk, credit risk and liquidity risk. Market risk includes equity price risk, interest rate risk and foreign currency risk. The Fund manages these risks on an aggregate basis along with the risks associated with its investing activities as part of its overall risk management policies.
The nature and extent of the financial instruments outstanding at the dates of the statement of financial position and the risk management policies employed by the Fund are discussed below.
The following summary is not intended to be a comprehensive summary of all of the risks and investors should refer to the Prospectus for a more detailed discussion of the risks inherent in investing in the Fund.
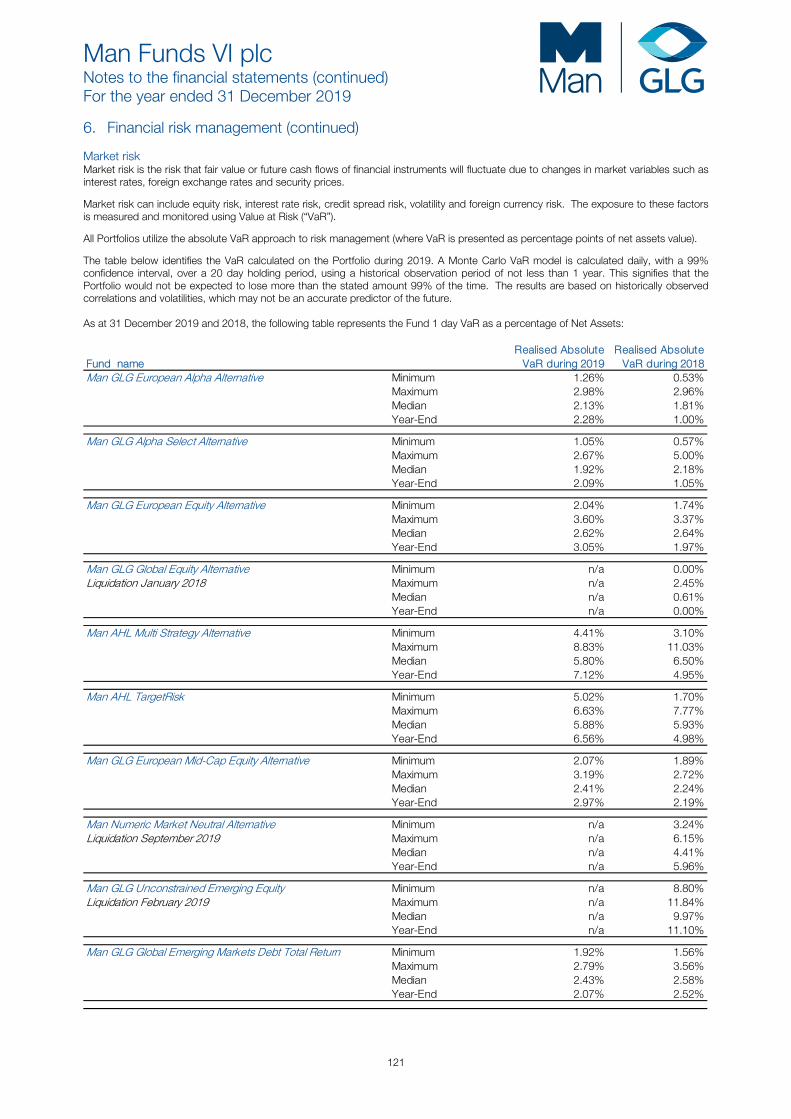
Man Funds VI plc Notes to the financial statements (continued) For the year ended 31 December 2019
121
6. Financial risk management (continued) Market risk Market risk is the risk that fair value or future cash flows of financial instruments will fluctuate due to changes in market variables such as interest rates, foreign exchange rates and security prices.
Market risk can include equity risk, interest rate risk, credit spread risk, volatility and foreign currency risk. The exposure to these factors is measured and monitored using Value at Risk (“VaR”).
All Portfolios utilize the absolute VaR approach to risk management (where VaR is presented as percentage points of net assets value).
The table below identifies the VaR calculated on the Portfolio during 2019. A Monte Carlo VaR model is calculated daily, with a 99% confidence interval, over a 20 day holding period, using a historical observation period of not less than 1 year. This signifies that the Portfolio would not be expected to lose more than the stated amount 99% of the time. The results are based on historically observed correlations and volatilities, which may not be an accurate predictor of the future. As at 31 December 2019 and 2018, the following table represents the Fund 1 day VaR as a percentage of Net Assets:
Fund nameRealised Absolute
VaR during 2019Realised Absolute VaR during 2018
Man GLG European Alpha Alternative Minimum 1.26% 0.53%Maximum 2.98% 2.96%Median 2.13% 1.81%Year-End 2.28% 1.00%
Man GLG Alpha Select Alternative Minimum 1.05% 0.57%Maximum 2.67% 5.00%Median 1.92% 2.18%Year-End 2.09% 1.05%
Man GLG European Equity Alternative Minimum 2.04% 1.74%Maximum 3.60% 3.37%Median 2.62% 2.64%Year-End 3.05% 1.97%
Man GLG Global Equity Alternative Minimum n/a 0.00%Liquidation January 2018 Maximum n/a 2.45%
Median n/a 0.61%Year-End n/a 0.00%
Man AHL Multi Strategy Alternative Minimum 4.41% 3.10%Maximum 8.83% 11.03%Median 5.80% 6.50%Year-End 7.12% 4.95%
Man AHL TargetRisk Minimum 5.02% 1.70%Maximum 6.63% 7.77%Median 5.88% 5.93%Year-End 6.56% 4.98%
Man GLG European Mid-Cap Equity Alternative Minimum 2.07% 1.89%Maximum 3.19% 2.72%Median 2.41% 2.24%Year-End 2.97% 2.19%
Man Numeric Market Neutral Alternative Minimum n/a 3.24%Liquidation September 2019 Maximum n/a 6.15%
Median n/a 4.41%Year-End n/a 5.96%
Man GLG Unconstrained Emerging Equity Minimum n/a 8.80%Liquidation February 2019 Maximum n/a 11.84%
Median n/a 9.97%Year-End n/a 11.10%
Man GLG Global Emerging Markets Debt Total Return Minimum 1.92% 1.56%Maximum 2.79% 3.56%Median 2.43% 2.58%Year-End 2.07% 2.52%
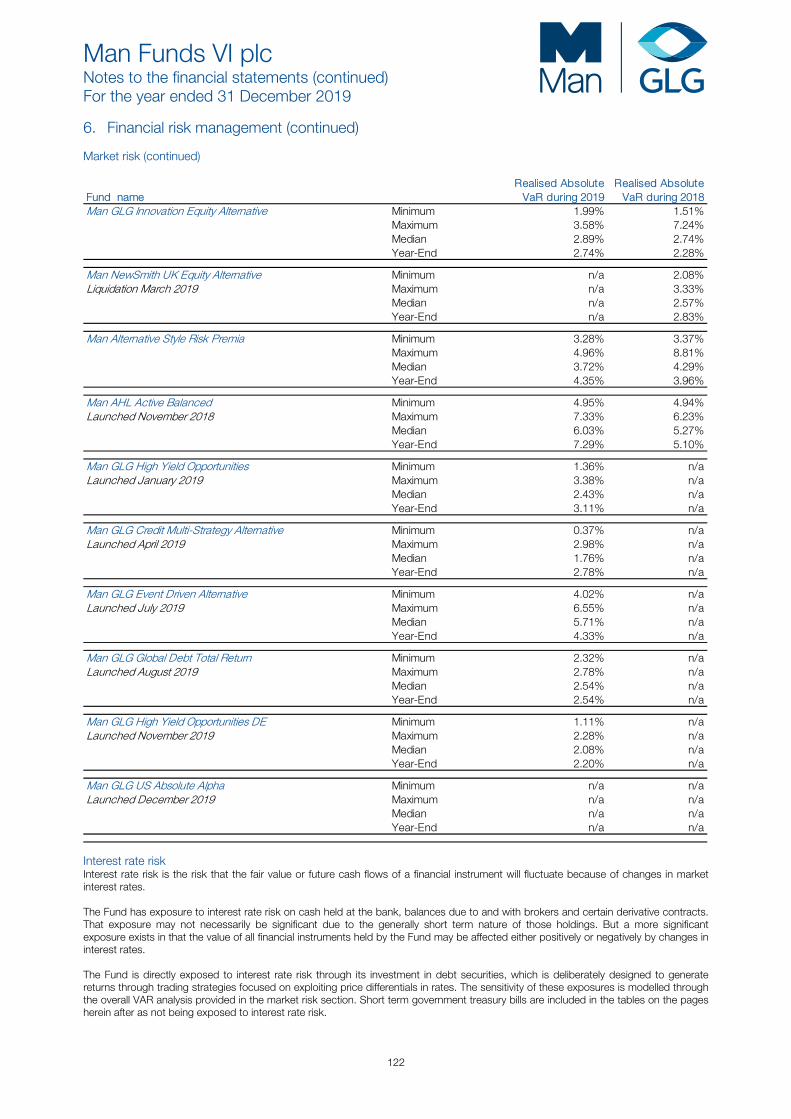
Man Funds VI plc Notes to the financial statements (continued) For the year ended 31 December 2019
122
6. Financial risk management (continued) Market risk (continued)
Fund nameRealised Absolute VaR during 2019
Realised Absolute VaR during 2018
Man GLG Innovation Equity Alternative Minimum 1.99% 1.51%Maximum 3.58% 7.24%Median 2.89% 2.74%Year-End 2.74% 2.28%
Man NewSmith UK Equity Alternative Minimum n/a 2.08%Liquidation March 2019 Maximum n/a 3.33%
Median n/a 2.57%Year-End n/a 2.83%
Man Alternative Style Risk Premia Minimum 3.28% 3.37%Maximum 4.96% 8.81%Median 3.72% 4.29%Year-End 4.35% 3.96%
Man AHL Active Balanced Minimum 4.95% 4.94%Launched November 2018 Maximum 7.33% 6.23%
Median 6.03% 5.27%Year-End 7.29% 5.10%
Man GLG High Yield Opportunities Minimum 1.36% n/aLaunched January 2019 Maximum 3.38% n/a
Median 2.43% n/aYear-End 3.11% n/a
Man GLG Credit Multi-Strategy Alternative Minimum 0.37% n/aLaunched April 2019 Maximum 2.98% n/a
Median 1.76% n/aYear-End 2.78% n/a
Man GLG Event Driven Alternative Minimum 4.02% n/aLaunched July 2019 Maximum 6.55% n/a
Median 5.71% n/aYear-End 4.33% n/a
Man GLG Global Debt Total Return Minimum 2.32% n/aLaunched August 2019 Maximum 2.78% n/a
Median 2.54% n/aYear-End 2.54% n/a
Man GLG High Yield Opportunities DE Minimum 1.11% n/aLaunched November 2019 Maximum 2.28% n/a
Median 2.08% n/aYear-End 2.20% n/a
Man GLG US Absolute Alpha Minimum n/a n/aLaunched December 2019 Maximum n/a n/a
Median n/a n/aYear-End n/a n/a
Interest rate risk Interest rate risk is the risk that the fair value or future cash flows of a financial instrument will fluctuate because of changes in market interest rates. The Fund has exposure to interest rate risk on cash held at the bank, balances due to and with brokers and certain derivative contracts. That exposure may not necessarily be significant due to the generally short term nature of those holdings. But a more significant exposure exists in that the value of all financial instruments held by the Fund may be affected either positively or negatively by changes in interest rates. The Fund is directly exposed to interest rate risk through its investment in debt securities, which is deliberately designed to generate returns through trading strategies focused on exploiting price differentials in rates. The sensitivity of these exposures is modelled through the overall VAR analysis provided in the market risk section. Short term government treasury bills are included in the tables on the pages herein after as not being exposed to interest rate risk.
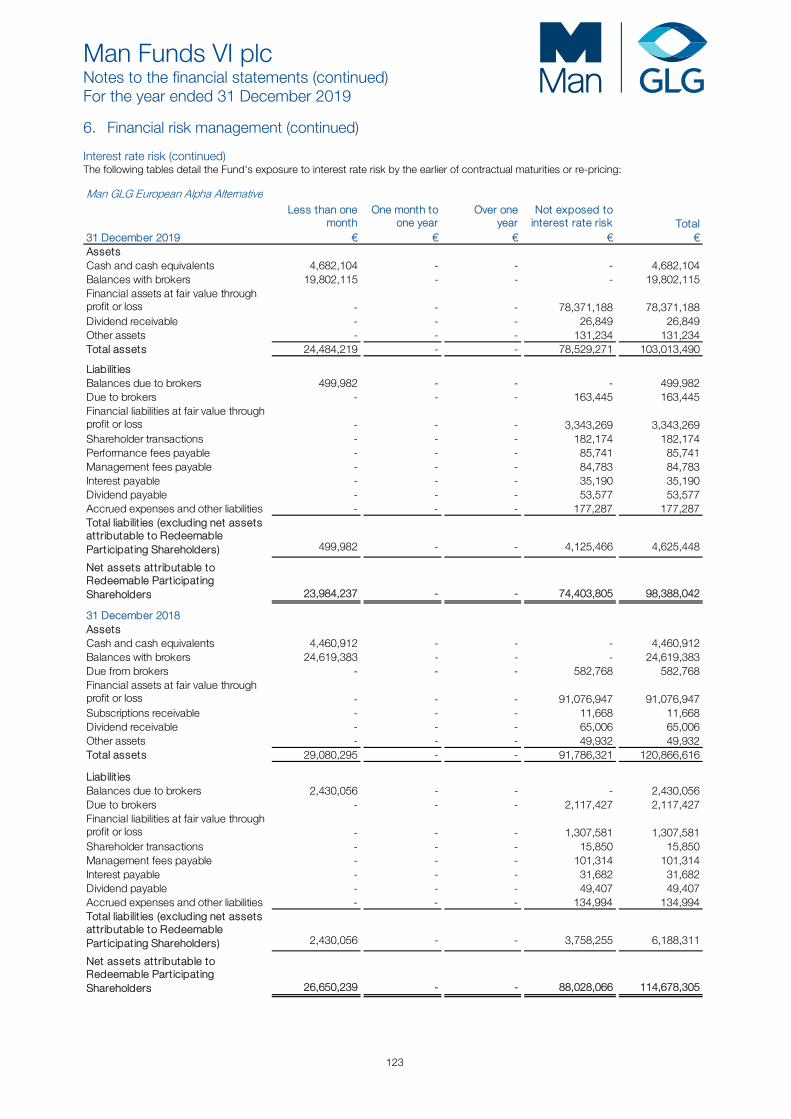
Man Funds VI plc Notes to the financial statements (continued) For the year ended 31 December 2019
123
6. Financial risk management (continued) Interest rate risk (continued) The following tables detail the Fund's exposure to interest rate risk by the earlier of contractual maturities or re-pricing: Man GLG European Alpha Alternative
Less than onemonth
One month toone year
Over oneyear
Not exposed tointerest rate risk Total
31 December 2019 € € € € €AssetsCash and cash equivalents 4,682,104 - - - 4,682,104 Balances with brokers 19,802,115 - - - 19,802,115 Financial assets at fair value through profit or loss - - - 78,371,188 78,371,188 Dividend receivable - - - 26,849 26,849 Other assets - - - 131,234 131,234 Total assets 24,484,219 - - 78,529,271 103,013,490
Liabilit iesBalances due to brokers 499,982 - - - 499,982 Due to brokers - - - 163,445 163,445 Financial liabilities at fair value through profit or loss - - - 3,343,269 3,343,269 Shareholder transactions - - - 182,174 182,174 Performance fees payable - - - 85,741 85,741 Management fees payable - - - 84,783 84,783 Interest payable - - - 35,190 35,190 Dividend payable - - - 53,577 53,577 Accrued expenses and other liabilities - - - 177,287 177,287 Total liabilit ies (excluding net assets attributable to Redeemable Participating Shareholders) 499,982 - - 4,125,466 4,625,448
Net assets attributable to Redeemable Participating Shareholders 23,984,237 - - 74,403,805 98,388,042
31 December 2018AssetsCash and cash equivalents 4,460,912 - - - 4,460,912 Balances with brokers 24,619,383 - - - 24,619,383 Due from brokers - - - 582,768 582,768 Financial assets at fair value through profit or loss - - - 91,076,947 91,076,947 Subscriptions receivable - - - 11,668 11,668 Dividend receivable - - - 65,006 65,006 Other assets - - - 49,932 49,932 Total assets 29,080,295 - - 91,786,321 120,866,616
Liabilit iesBalances due to brokers 2,430,056 - - - 2,430,056 Due to brokers - - - 2,117,427 2,117,427 Financial liabilities at fair value through profit or loss - - - 1,307,581 1,307,581 Shareholder transactions - - - 15,850 15,850 Management fees payable - - - 101,314 101,314 Interest payable - - - 31,682 31,682 Dividend payable - - - 49,407 49,407 Accrued expenses and other liabilities - - - 134,994 134,994 Total liabilit ies (excluding net assets attributable to Redeemable Participating Shareholders) 2,430,056 - - 3,758,255 6,188,311
Net assets attributable to Redeemable Participating Shareholders 26,650,239 - - 88,028,066 114,678,305
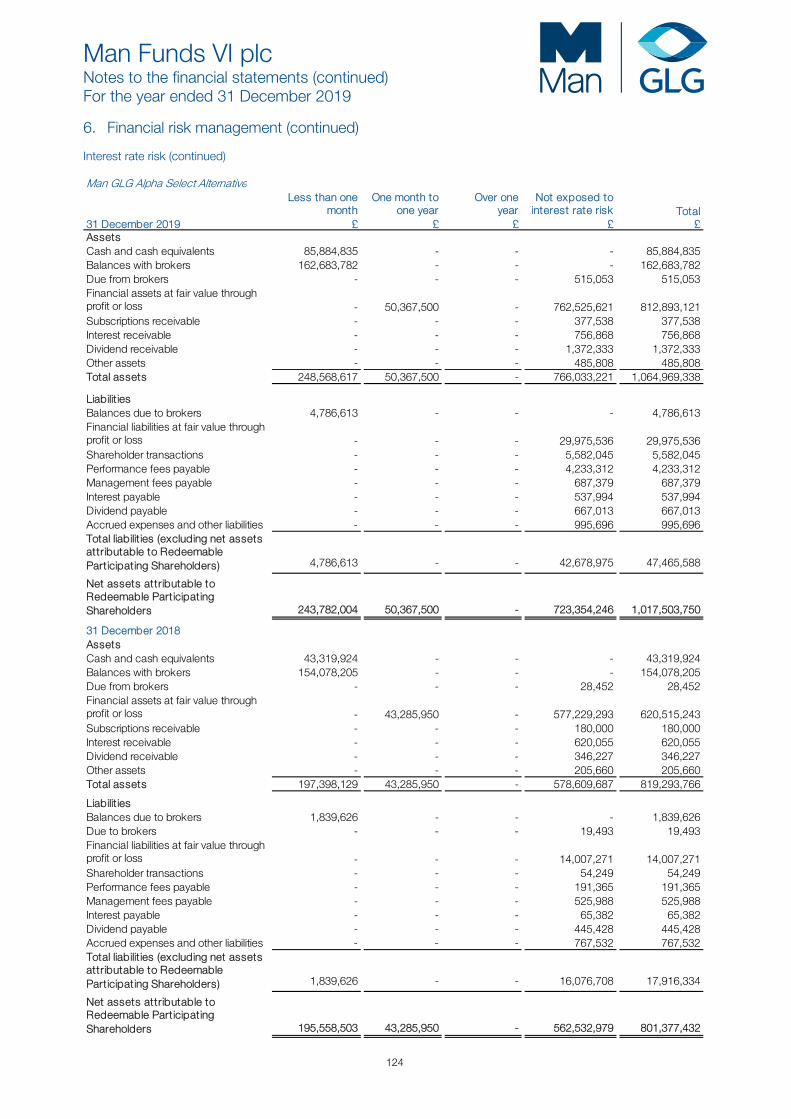
Man Funds VI plc Notes to the financial statements (continued) For the year ended 31 December 2019
124
6. Financial risk management (continued) Interest rate risk (continued) Man GLG Alpha Select Alternative
Less than onemonth
One month toone year
Over oneyear
Not exposed tointerest rate risk Total
31 December 2019 £ £ £ £ £AssetsCash and cash equivalents 85,884,835 - - - 85,884,835 Balances with brokers 162,683,782 - - - 162,683,782 Due from brokers - - - 515,053 515,053 Financial assets at fair value through profit or loss - 50,367,500 - 762,525,621 812,893,121 Subscriptions receivable - - - 377,538 377,538 Interest receivable - - - 756,868 756,868 Dividend receivable - - - 1,372,333 1,372,333 Other assets - - - 485,808 485,808 Total assets 248,568,617 50,367,500 - 766,033,221 1,064,969,338
Liabilit iesBalances due to brokers 4,786,613 - - - 4,786,613 Financial liabilities at fair value through profit or loss - - - 29,975,536 29,975,536 Shareholder transactions - - - 5,582,045 5,582,045 Performance fees payable - - - 4,233,312 4,233,312 Management fees payable - - - 687,379 687,379 Interest payable - - - 537,994 537,994 Dividend payable - - - 667,013 667,013 Accrued expenses and other liabilities - - - 995,696 995,696 Total liabilit ies (excluding net assets attributable to Redeemable Participating Shareholders) 4,786,613 - - 42,678,975 47,465,588
Net assets attributable to Redeemable Participating Shareholders 243,782,004 50,367,500 - 723,354,246 1,017,503,750
31 December 2018AssetsCash and cash equivalents 43,319,924 - - - 43,319,924 Balances with brokers 154,078,205 - - - 154,078,205 Due from brokers - - - 28,452 28,452 Financial assets at fair value through profit or loss - 43,285,950 - 577,229,293 620,515,243 Subscriptions receivable - - - 180,000 180,000 Interest receivable - - - 620,055 620,055 Dividend receivable - - - 346,227 346,227 Other assets - - - 205,660 205,660 Total assets 197,398,129 43,285,950 - 578,609,687 819,293,766
Liabilit iesBalances due to brokers 1,839,626 - - - 1,839,626 Due to brokers - - - 19,493 19,493 Financial liabilities at fair value through profit or loss - - - 14,007,271 14,007,271 Shareholder transactions - - - 54,249 54,249 Performance fees payable - - - 191,365 191,365 Management fees payable - - - 525,988 525,988 Interest payable - - - 65,382 65,382 Dividend payable - - - 445,428 445,428 Accrued expenses and other liabilities - - - 767,532 767,532 Total liabilit ies (excluding net assets attributable to Redeemable Participating Shareholders) 1,839,626 - - 16,076,708 17,916,334
Net assets attributable to Redeemable Participating Shareholders 195,558,503 43,285,950 - 562,532,979 801,377,432
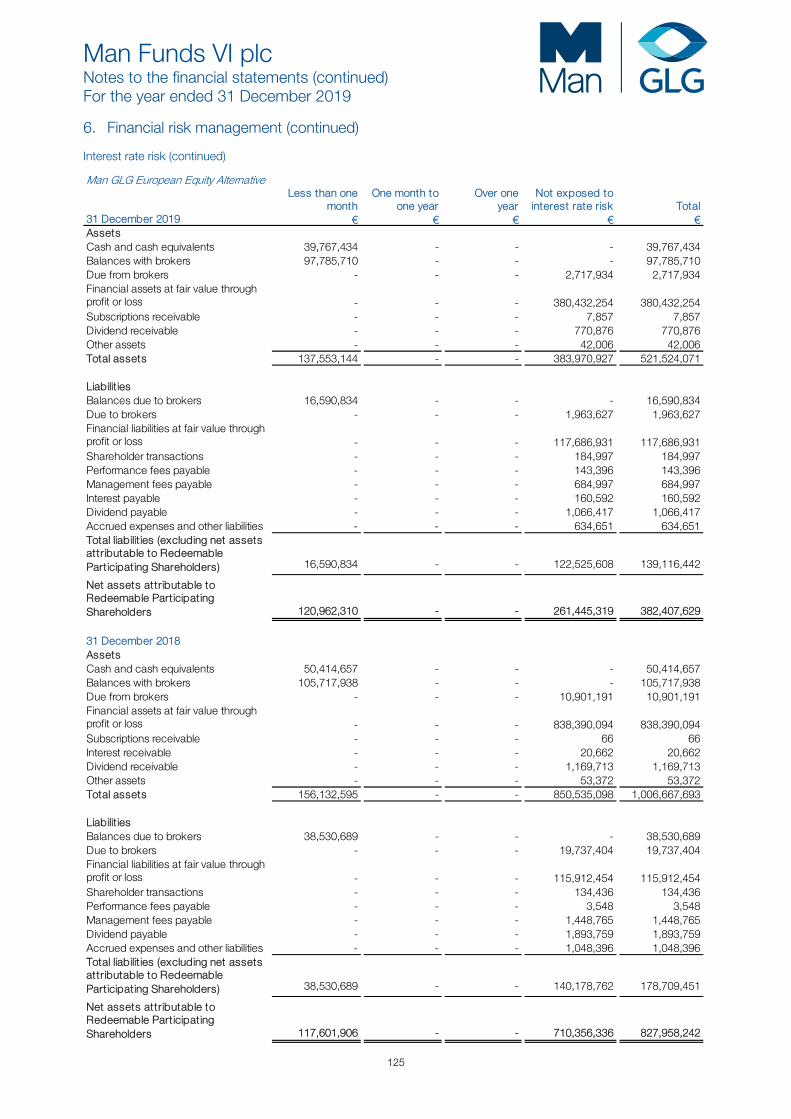
Man Funds VI plc Notes to the financial statements (continued) For the year ended 31 December 2019
125
6. Financial risk management (continued) Interest rate risk (continued)
Man GLG European Equity AlternativeLess than one
monthOne month to
one yearOver one
yearNot exposed to
interest rate risk Total31 December 2019 € € € € €AssetsCash and cash equivalents 39,767,434 - - - 39,767,434 Balances with brokers 97,785,710 - - - 97,785,710 Due from brokers - - - 2,717,934 2,717,934 Financial assets at fair value through profit or loss - - - 380,432,254 380,432,254 Subscriptions receivable - - - 7,857 7,857 Dividend receivable - - - 770,876 770,876 Other assets - - - 42,006 42,006 Total assets 137,553,144 - - 383,970,927 521,524,071
Liabilit iesBalances due to brokers 16,590,834 - - - 16,590,834 Due to brokers - - - 1,963,627 1,963,627 Financial liabilities at fair value through profit or loss - - - 117,686,931 117,686,931 Shareholder transactions - - - 184,997 184,997 Performance fees payable - - - 143,396 143,396 Management fees payable - - - 684,997 684,997 Interest payable - - - 160,592 160,592 Dividend payable - - - 1,066,417 1,066,417 Accrued expenses and other liabilities - - - 634,651 634,651 Total liabilit ies (excluding net assets attributable to Redeemable Participating Shareholders) 16,590,834 - - 122,525,608 139,116,442
Net assets attributable to Redeemable Participating Shareholders 120,962,310 - - 261,445,319 382,407,629
31 December 2018AssetsCash and cash equivalents 50,414,657 - - - 50,414,657 Balances with brokers 105,717,938 - - - 105,717,938 Due from brokers - - - 10,901,191 10,901,191 Financial assets at fair value through profit or loss - - - 838,390,094 838,390,094 Subscriptions receivable - - - 66 66 Interest receivable - - - 20,662 20,662 Dividend receivable - - - 1,169,713 1,169,713 Other assets - - - 53,372 53,372 Total assets 156,132,595 - - 850,535,098 1,006,667,693
Liabilit iesBalances due to brokers 38,530,689 - - - 38,530,689 Due to brokers - - - 19,737,404 19,737,404 Financial liabilities at fair value through profit or loss - - - 115,912,454 115,912,454 Shareholder transactions - - - 134,436 134,436 Performance fees payable - - - 3,548 3,548 Management fees payable - - - 1,448,765 1,448,765 Dividend payable - - - 1,893,759 1,893,759 Accrued expenses and other liabilities - - - 1,048,396 1,048,396 Total liabilit ies (excluding net assets attributable to Redeemable Participating Shareholders) 38,530,689 - - 140,178,762 178,709,451
Net assets attributable to Redeemable Participating Shareholders 117,601,906 - - 710,356,336 827,958,242
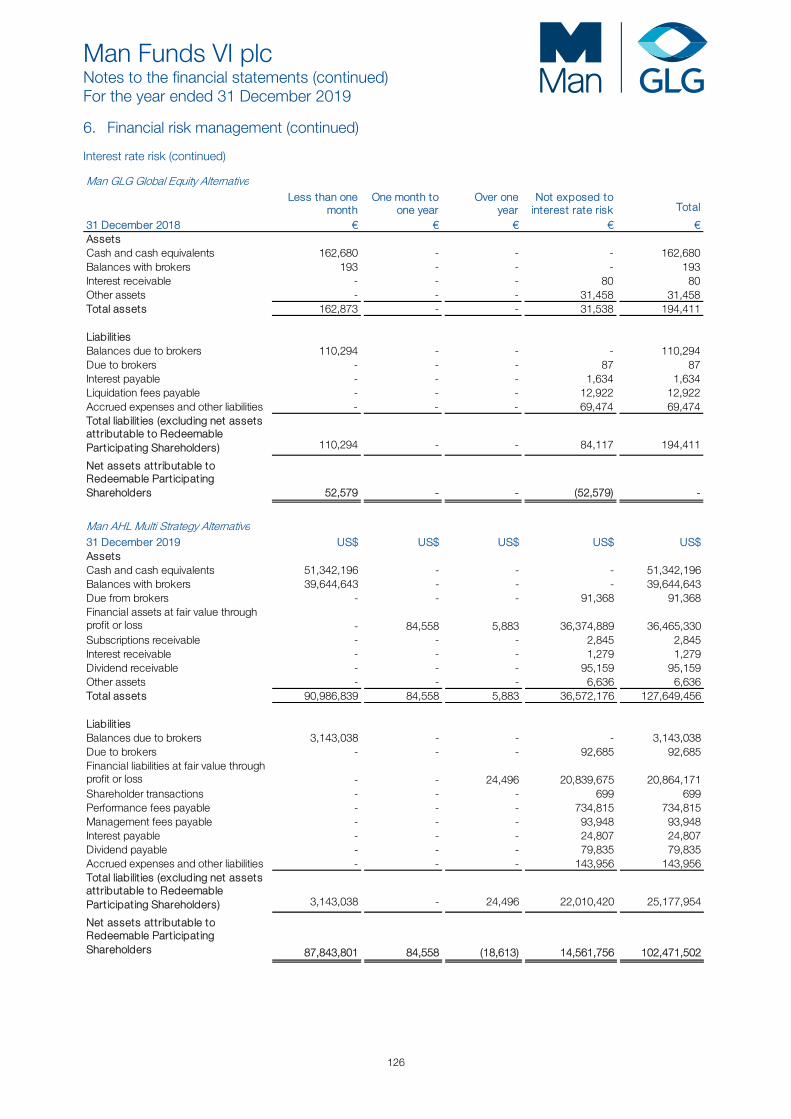
Man Funds VI plc Notes to the financial statements (continued) For the year ended 31 December 2019
126
6. Financial risk management (continued) Interest rate risk (continued) Man GLG Global Equity Alternative
Less than onemonth
One month toone year
Over oneyear
Not exposed tointerest rate risk Total
31 December 2018 € € € € €AssetsCash and cash equivalents 162,680 - - - 162,680 Balances with brokers 193 - - - 193 Interest receivable - - - 80 80 Other assets - - - 31,458 31,458 Total assets 162,873 - - 31,538 194,411
Liabilit iesBalances due to brokers 110,294 - - - 110,294 Due to brokers - - - 87 87 Interest payable - - - 1,634 1,634 Liquidation fees payable - - - 12,922 12,922 Accrued expenses and other liabilities - - - 69,474 69,474 Total liabilit ies (excluding net assets attributable to Redeemable Participating Shareholders) 110,294 - - 84,117 194,411
Net assets attributable to Redeemable Participating Shareholders 52,579 - - (52,579) -
Man AHL Multi Strategy Alternative31 December 2019 US$ US$ US$ US$ US$AssetsCash and cash equivalents 51,342,196 - - - 51,342,196 Balances with brokers 39,644,643 - - - 39,644,643 Due from brokers - - - 91,368 91,368 Financial assets at fair value through profit or loss - 84,558 5,883 36,374,889 36,465,330 Subscriptions receivable - - - 2,845 2,845 Interest receivable - - - 1,279 1,279 Dividend receivable - - - 95,159 95,159 Other assets - - - 6,636 6,636 Total assets 90,986,839 84,558 5,883 36,572,176 127,649,456
Liabilit iesBalances due to brokers 3,143,038 - - - 3,143,038 Due to brokers - - - 92,685 92,685 Financial liabilities at fair value through profit or loss - - 24,496 20,839,675 20,864,171 Shareholder transactions - - - 699 699 Performance fees payable - - - 734,815 734,815 Management fees payable - - - 93,948 93,948 Interest payable - - - 24,807 24,807 Dividend payable - - - 79,835 79,835 Accrued expenses and other liabilities - - - 143,956 143,956 Total liabilit ies (excluding net assets attributable to Redeemable Participating Shareholders) 3,143,038 - 24,496 22,010,420 25,177,954
Net assets attributable to Redeemable Participating Shareholders 87,843,801 84,558 (18,613) 14,561,756 102,471,502
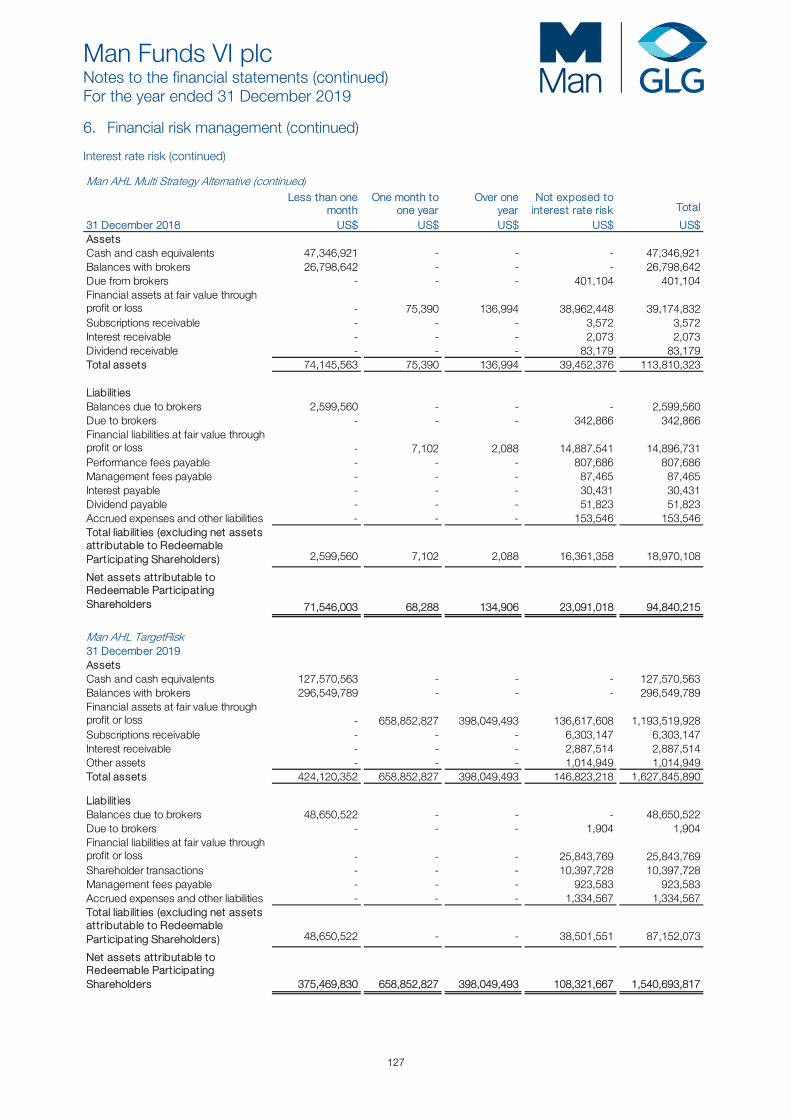
Man Funds VI plc Notes to the financial statements (continued) For the year ended 31 December 2019
127
6. Financial risk management (continued) Interest rate risk (continued) Man AHL Multi Strategy Alternative (continued)
Less than onemonth
One month toone year
Over oneyear
Not exposed tointerest rate risk Total
31 December 2018 US$ US$ US$ US$ US$AssetsCash and cash equivalents 47,346,921 - - - 47,346,921 Balances with brokers 26,798,642 - - - 26,798,642 Due from brokers - - - 401,104 401,104 Financial assets at fair value through profit or loss - 75,390 136,994 38,962,448 39,174,832 Subscriptions receivable - - - 3,572 3,572 Interest receivable - - - 2,073 2,073 Dividend receivable - - - 83,179 83,179 Total assets 74,145,563 75,390 136,994 39,452,376 113,810,323
Liabilit iesBalances due to brokers 2,599,560 - - - 2,599,560 Due to brokers - - - 342,866 342,866 Financial liabilities at fair value through profit or loss - 7,102 2,088 14,887,541 14,896,731 Performance fees payable - - - 807,686 807,686 Management fees payable - - - 87,465 87,465 Interest payable - - - 30,431 30,431 Dividend payable - - - 51,823 51,823 Accrued expenses and other liabilities - - - 153,546 153,546 Total liabilit ies (excluding net assets attributable to Redeemable Participating Shareholders) 2,599,560 7,102 2,088 16,361,358 18,970,108
Net assets attributable to Redeemable Participating Shareholders 71,546,003 68,288 134,906 23,091,018 94,840,215
Man AHL TargetRisk31 December 2019AssetsCash and cash equivalents 127,570,563 - - - 127,570,563 Balances with brokers 296,549,789 - - - 296,549,789 Financial assets at fair value through profit or loss - 658,852,827 398,049,493 136,617,608 1,193,519,928 Subscriptions receivable - - - 6,303,147 6,303,147 Interest receivable - - - 2,887,514 2,887,514 Other assets - - - 1,014,949 1,014,949 Total assets 424,120,352 658,852,827 398,049,493 146,823,218 1,627,845,890
Liabilit iesBalances due to brokers 48,650,522 - - - 48,650,522 Due to brokers - - - 1,904 1,904 Financial liabilities at fair value through profit or loss - - - 25,843,769 25,843,769 Shareholder transactions - - - 10,397,728 10,397,728 Management fees payable - - - 923,583 923,583 Accrued expenses and other liabilities - - - 1,334,567 1,334,567 Total liabilit ies (excluding net assets attributable to Redeemable Participating Shareholders) 48,650,522 - - 38,501,551 87,152,073
Net assets attributable to Redeemable Participating Shareholders 375,469,830 658,852,827 398,049,493 108,321,667 1,540,693,817
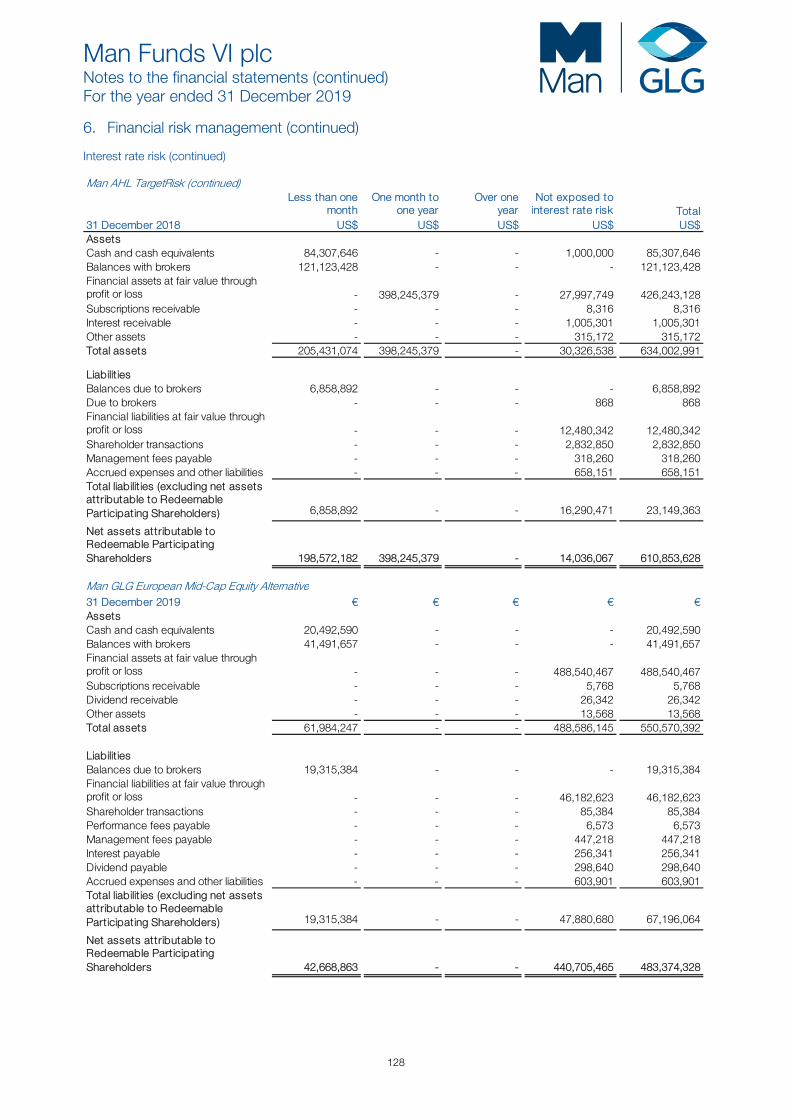
Man Funds VI plc Notes to the financial statements (continued) For the year ended 31 December 2019
128
6. Financial risk management (continued) Interest rate risk (continued) Man AHL TargetRisk (continued)
Less than onemonth
One month toone year
Over oneyear
Not exposed tointerest rate risk Total
31 December 2018 US$ US$ US$ US$ US$AssetsCash and cash equivalents 84,307,646 - - 1,000,000 85,307,646 Balances with brokers 121,123,428 - - - 121,123,428 Financial assets at fair value through profit or loss - 398,245,379 - 27,997,749 426,243,128 Subscriptions receivable - - - 8,316 8,316 Interest receivable - - - 1,005,301 1,005,301 Other assets - - - 315,172 315,172 Total assets 205,431,074 398,245,379 - 30,326,538 634,002,991
Liabilit iesBalances due to brokers 6,858,892 - - - 6,858,892 Due to brokers - - - 868 868 Financial liabilities at fair value through profit or loss - - - 12,480,342 12,480,342 Shareholder transactions - - - 2,832,850 2,832,850 Management fees payable - - - 318,260 318,260 Accrued expenses and other liabilities - - - 658,151 658,151 Total liabilit ies (excluding net assets attributable to Redeemable Participating Shareholders) 6,858,892 - - 16,290,471 23,149,363
Net assets attributable to Redeemable Participating Shareholders 198,572,182 398,245,379 - 14,036,067 610,853,628
Man GLG European Mid-Cap Equity Alternative31 December 2019 € € € € €AssetsCash and cash equivalents 20,492,590 - - - 20,492,590 Balances with brokers 41,491,657 - - - 41,491,657 Financial assets at fair value through profit or loss - - - 488,540,467 488,540,467 Subscriptions receivable - - - 5,768 5,768 Dividend receivable - - - 26,342 26,342 Other assets - - - 13,568 13,568 Total assets 61,984,247 - - 488,586,145 550,570,392
Liabilit iesBalances due to brokers 19,315,384 - - - 19,315,384 Financial liabilities at fair value through profit or loss - - - 46,182,623 46,182,623 Shareholder transactions - - - 85,384 85,384 Performance fees payable - - - 6,573 6,573 Management fees payable - - - 447,218 447,218 Interest payable - - - 256,341 256,341 Dividend payable - - - 298,640 298,640 Accrued expenses and other liabilities - - - 603,901 603,901 Total liabilit ies (excluding net assets attributable to Redeemable Participating Shareholders) 19,315,384 - - 47,880,680 67,196,064
Net assets attributable to Redeemable Participating Shareholders 42,668,863 - - 440,705,465 483,374,328

Man Funds VI plc Notes to the financial statements (continued) For the year ended 31 December 2019
129
6. Financial risk management (continued) Interest rate risk (continued) Man GLG European Mid-Cap Equity Alternative (continued)
Less than onemonth
One month toone year
Over oneyear
Not exposed tointerest rate risk Total
31 December 2018 € € € € €AssetsCash and cash equivalents 48,898,072 - - - 48,898,072 Balances with brokers 187,407,321 - - - 187,407,321 Financial assets at fair value through profit or loss - - - 431,878,231 431,878,231 Subscriptions receivable - - - 30 30 Dividend receivable - - - 39,860 39,860 Other assets - - - 10,179 10,179 Total assets 236,305,393 - - 431,928,300 668,233,693
Liabilit iesBalances due to brokers 368,539 - - - 368,539 Financial liabilities at fair value through profit or loss - - - 24,683,074 24,683,074 Shareholder transactions - - - 522 522 Performance fees payable - - - 1,616 1,616 Management fees payable - - - 560,462 560,462 Interest payable - - - 268,452 268,452 Dividend payable - - - 774,304 774,304 Accrued expenses and other liabilities - - - 650,541 650,541 Total liabilit ies (excluding net assets attributable to Redeemable Participating Shareholders) 368,539 - - 26,938,971 27,307,510
Net assets attributable to Redeemable Participating Shareholders 235,936,854 - - 404,989,329 640,926,183
Man Numeric Market Neutral Alternative31 December 2019 US$ US$ US$ US$ US$AssetsCash and cash equivalents 76,901 - - - 76,901 Balances with brokers 4 - - - 4 Other assets - - - 10,238 10,238 Total assets 76,905 - - 10,238 87,143
Liabilit iesInterest payable - - - 7,104 7,104 Liquidation fees payable - - - 5,000 5,000 Accrued expenses and other liabilities - - - 75,039 75,039 Total liabilit ies (excluding net assets attributable to Redeemable Participating Shareholders) - - - 87,143 87,143
Net assets attributable to Redeemable Participating Shareholders 76,905 - - (76,905) -
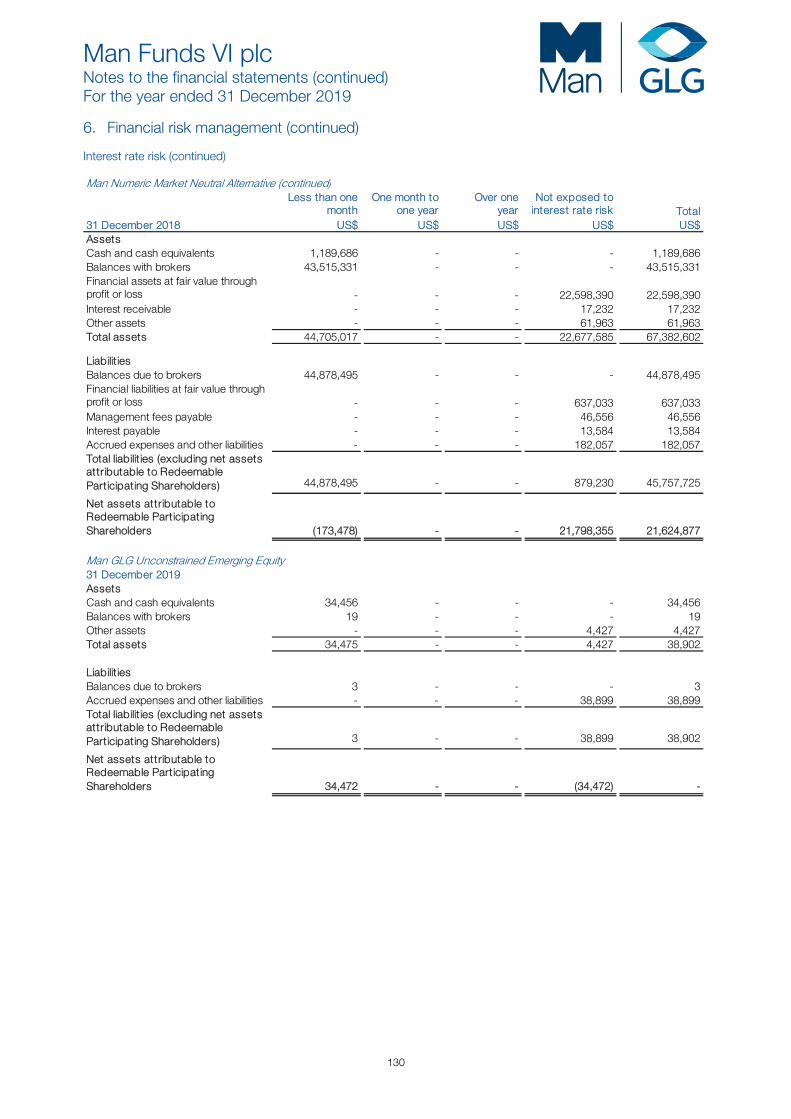
Man Funds VI plc Notes to the financial statements (continued) For the year ended 31 December 2019
130
6. Financial risk management (continued) Interest rate risk (continued) Man Numeric Market Neutral Alternative (continued)
Less than onemonth
One month toone year
Over oneyear
Not exposed tointerest rate risk Total
31 December 2018 US$ US$ US$ US$ US$AssetsCash and cash equivalents 1,189,686 - - - 1,189,686 Balances with brokers 43,515,331 - - - 43,515,331 Financial assets at fair value through profit or loss - - - 22,598,390 22,598,390 Interest receivable - - - 17,232 17,232 Other assets - - - 61,963 61,963 Total assets 44,705,017 - - 22,677,585 67,382,602
Liabilit iesBalances due to brokers 44,878,495 - - - 44,878,495 Financial liabilities at fair value through profit or loss - - - 637,033 637,033 Management fees payable - - - 46,556 46,556 Interest payable - - - 13,584 13,584 Accrued expenses and other liabilities - - - 182,057 182,057 Total liabilit ies (excluding net assets attributable to Redeemable Participating Shareholders) 44,878,495 - - 879,230 45,757,725
Net assets attributable toRedeemable ParticipatingShareholders (173,478) - - 21,798,355 21,624,877
Man GLG Unconstrained Emerging Equity31 December 2019AssetsCash and cash equivalents 34,456 - - - 34,456 Balances with brokers 19 - - - 19 Other assets - - - 4,427 4,427 Total assets 34,475 - - 4,427 38,902
Liabilit iesBalances due to brokers 3 - - - 3 Accrued expenses and other liabilities - - - 38,899 38,899 Total liabilit ies (excluding net assets attributable to Redeemable Participating Shareholders) 3 - - 38,899 38,902
Net assets attributable toRedeemable ParticipatingShareholders 34,472 - - (34,472) -
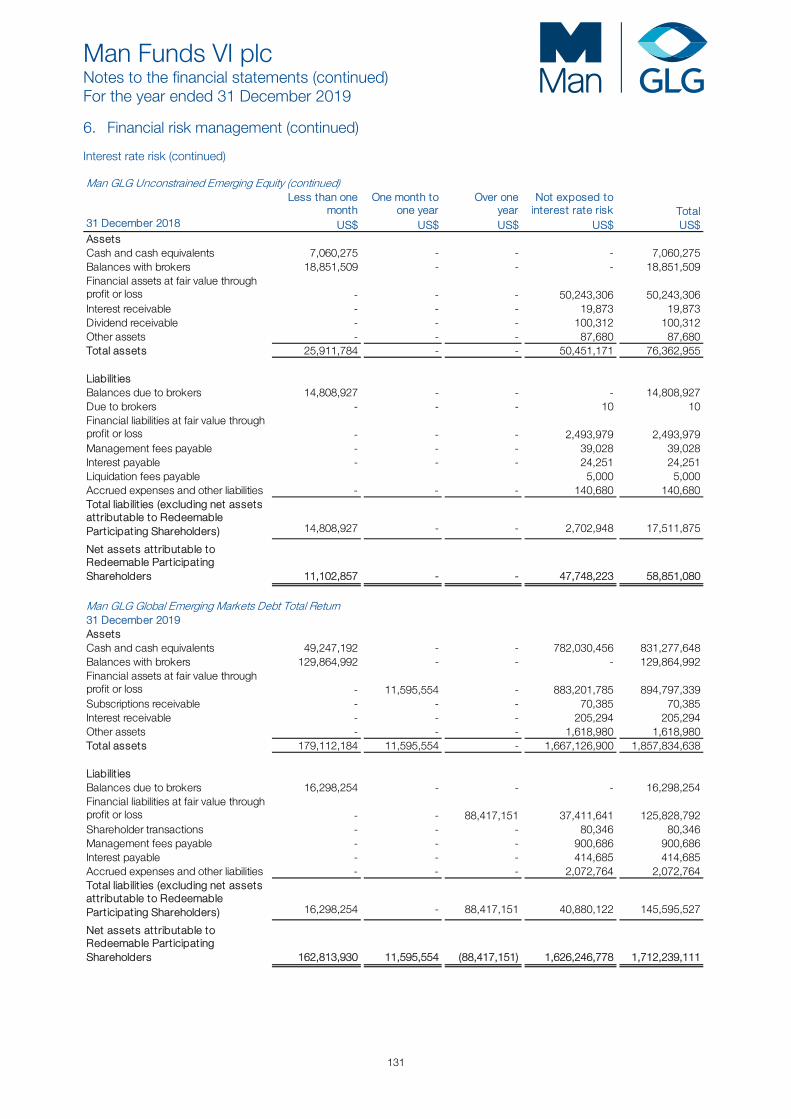
Man Funds VI plc Notes to the financial statements (continued) For the year ended 31 December 2019
131
6. Financial risk management (continued) Interest rate risk (continued) Man GLG Unconstrained Emerging Equity (continued)
Less than onemonth
One month toone year
Over oneyear
Not exposed tointerest rate risk Total
31 December 2018 US$ US$ US$ US$ US$AssetsCash and cash equivalents 7,060,275 - - - 7,060,275 Balances with brokers 18,851,509 - - - 18,851,509 Financial assets at fair value through profit or loss - - - 50,243,306 50,243,306 Interest receivable - - - 19,873 19,873 Dividend receivable - - - 100,312 100,312 Other assets - - - 87,680 87,680 Total assets 25,911,784 - - 50,451,171 76,362,955
Liabilit iesBalances due to brokers 14,808,927 - - - 14,808,927 Due to brokers - - - 10 10 Financial liabilities at fair value through profit or loss - - - 2,493,979 2,493,979 Management fees payable - - - 39,028 39,028 Interest payable - - - 24,251 24,251 Liquidation fees payable 5,000 5,000 Accrued expenses and other liabilities - - - 140,680 140,680 Total liabilit ies (excluding net assets attributable to Redeemable Participating Shareholders) 14,808,927 - - 2,702,948 17,511,875
Net assets attributable to Redeemable Participating Shareholders 11,102,857 - - 47,748,223 58,851,080
Man GLG Global Emerging Markets Debt Total Return31 December 2019AssetsCash and cash equivalents 49,247,192 - - 782,030,456 831,277,648 Balances with brokers 129,864,992 - - - 129,864,992 Financial assets at fair value through profit or loss - 11,595,554 - 883,201,785 894,797,339 Subscriptions receivable - - - 70,385 70,385 Interest receivable - - - 205,294 205,294 Other assets - - - 1,618,980 1,618,980 Total assets 179,112,184 11,595,554 - 1,667,126,900 1,857,834,638
Liabilit iesBalances due to brokers 16,298,254 - - - 16,298,254 Financial liabilities at fair value through profit or loss - - 88,417,151 37,411,641 125,828,792 Shareholder transactions - - - 80,346 80,346 Management fees payable - - - 900,686 900,686 Interest payable - - - 414,685 414,685 Accrued expenses and other liabilities - - - 2,072,764 2,072,764 Total liabilit ies (excluding net assets attributable to Redeemable Participating Shareholders) 16,298,254 - 88,417,151 40,880,122 145,595,527
Net assets attributable to Redeemable Participating Shareholders 162,813,930 11,595,554 (88,417,151) 1,626,246,778 1,712,239,111
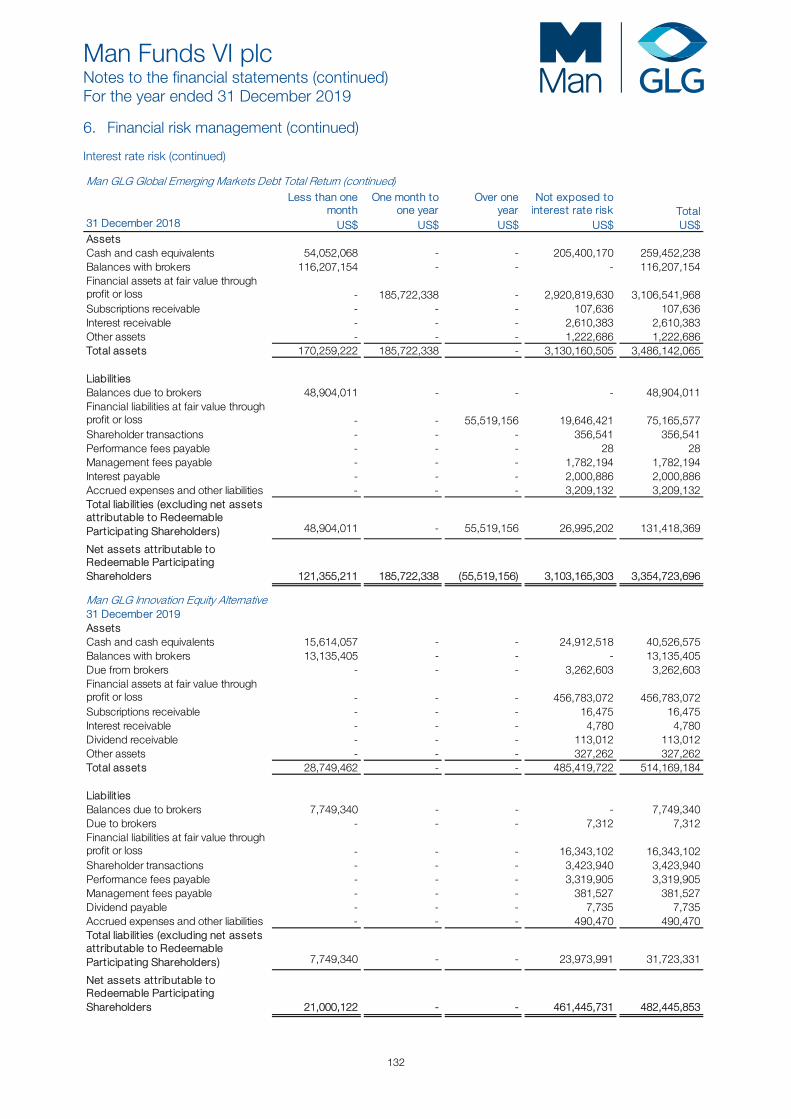
Man Funds VI plc Notes to the financial statements (continued) For the year ended 31 December 2019
132
6. Financial risk management (continued) Interest rate risk (continued) Man GLG Global Emerging Markets Debt Total Return (continued)
Less than onemonth
One month toone year
Over oneyear
Not exposed tointerest rate risk Total
31 December 2018 US$ US$ US$ US$ US$AssetsCash and cash equivalents 54,052,068 - - 205,400,170 259,452,238 Balances with brokers 116,207,154 - - - 116,207,154 Financial assets at fair value through profit or loss - 185,722,338 - 2,920,819,630 3,106,541,968 Subscriptions receivable - - - 107,636 107,636 Interest receivable - - - 2,610,383 2,610,383 Other assets - - - 1,222,686 1,222,686 Total assets 170,259,222 185,722,338 - 3,130,160,505 3,486,142,065
Liabilit iesBalances due to brokers 48,904,011 - - - 48,904,011 Financial liabilities at fair value through profit or loss - - 55,519,156 19,646,421 75,165,577 Shareholder transactions - - - 356,541 356,541 Performance fees payable - - - 28 28 Management fees payable - - - 1,782,194 1,782,194 Interest payable - - - 2,000,886 2,000,886 Accrued expenses and other liabilities - - - 3,209,132 3,209,132 Total liabilit ies (excluding net assets attributable to Redeemable Participating Shareholders) 48,904,011 - 55,519,156 26,995,202 131,418,369
Net assets attributable to Redeemable Participating Shareholders 121,355,211 185,722,338 (55,519,156) 3,103,165,303 3,354,723,696
Man GLG Innovation Equity Alternative31 December 2019 US$ US$ US$ US$ US$AssetsCash and cash equivalents 15,614,057 - - 24,912,518 40,526,575 Balances with brokers 13,135,405 - - - 13,135,405 Due from brokers - - - 3,262,603 3,262,603 Financial assets at fair value through profit or loss - - - 456,783,072 456,783,072 Subscriptions receivable - - - 16,475 16,475 Interest receivable - - - 4,780 4,780 Dividend receivable - - - 113,012 113,012 Other assets - - - 327,262 327,262 Total assets 28,749,462 - - 485,419,722 514,169,184
Liabilit iesBalances due to brokers 7,749,340 - - - 7,749,340 Due to brokers - - - 7,312 7,312 Financial liabilities at fair value through profit or loss - - - 16,343,102 16,343,102 Shareholder transactions - - - 3,423,940 3,423,940 Performance fees payable - - - 3,319,905 3,319,905 Management fees payable - - - 381,527 381,527 Dividend payable - - - 7,735 7,735 Accrued expenses and other liabilities - - - 490,470 490,470 Total liabilit ies (excluding net assets attributable to Redeemable Participating Shareholders) 7,749,340 - - 23,973,991 31,723,331
Net assets attributable to Redeemable Participating Shareholders 21,000,122 - - 461,445,731 482,445,853
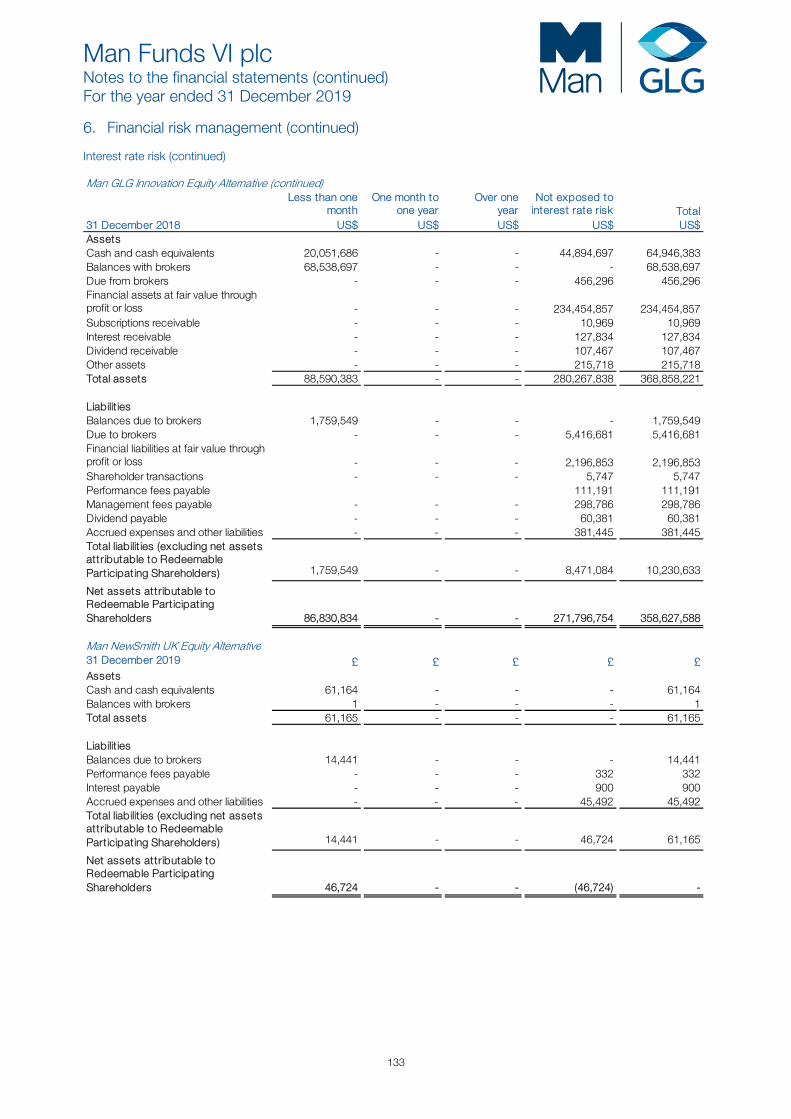
Man Funds VI plc Notes to the financial statements (continued) For the year ended 31 December 2019
133
6. Financial risk management (continued) Interest rate risk (continued) Man GLG Innovation Equity Alternative (continued)
Less than onemonth
One month toone year
Over oneyear
Not exposed tointerest rate risk Total
31 December 2018 US$ US$ US$ US$ US$AssetsCash and cash equivalents 20,051,686 - - 44,894,697 64,946,383 Balances with brokers 68,538,697 - - - 68,538,697 Due from brokers - - - 456,296 456,296 Financial assets at fair value through profit or loss - - - 234,454,857 234,454,857 Subscriptions receivable - - - 10,969 10,969 Interest receivable - - - 127,834 127,834 Dividend receivable - - - 107,467 107,467 Other assets - - - 215,718 215,718 Total assets 88,590,383 - - 280,267,838 368,858,221
Liabilit iesBalances due to brokers 1,759,549 - - - 1,759,549 Due to brokers - - - 5,416,681 5,416,681 Financial liabilities at fair value through profit or loss - - - 2,196,853 2,196,853 Shareholder transactions - - - 5,747 5,747 Performance fees payable 111,191 111,191 Management fees payable - - - 298,786 298,786 Dividend payable - - - 60,381 60,381 Accrued expenses and other liabilities - - - 381,445 381,445 Total liabilit ies (excluding net assets attributable to Redeemable Participating Shareholders) 1,759,549 - - 8,471,084 10,230,633
Net assets attributable to Redeemable Participating Shareholders 86,830,834 - - 271,796,754 358,627,588
Man NewSmith UK Equity Alternative31 December 2019 £ £ £ £ £AssetsCash and cash equivalents 61,164 - - - 61,164 Balances with brokers 1 - - - 1 Total assets 61,165 - - - 61,165
Liabilit iesBalances due to brokers 14,441 - - - 14,441 Performance fees payable - - - 332 332 Interest payable - - - 900 900 Accrued expenses and other liabilities - - - 45,492 45,492 Total liabilit ies (excluding net assets attributable to Redeemable Participating Shareholders) 14,441 - - 46,724 61,165
Net assets attributable to Redeemable Participating Shareholders 46,724 - - (46,724) -
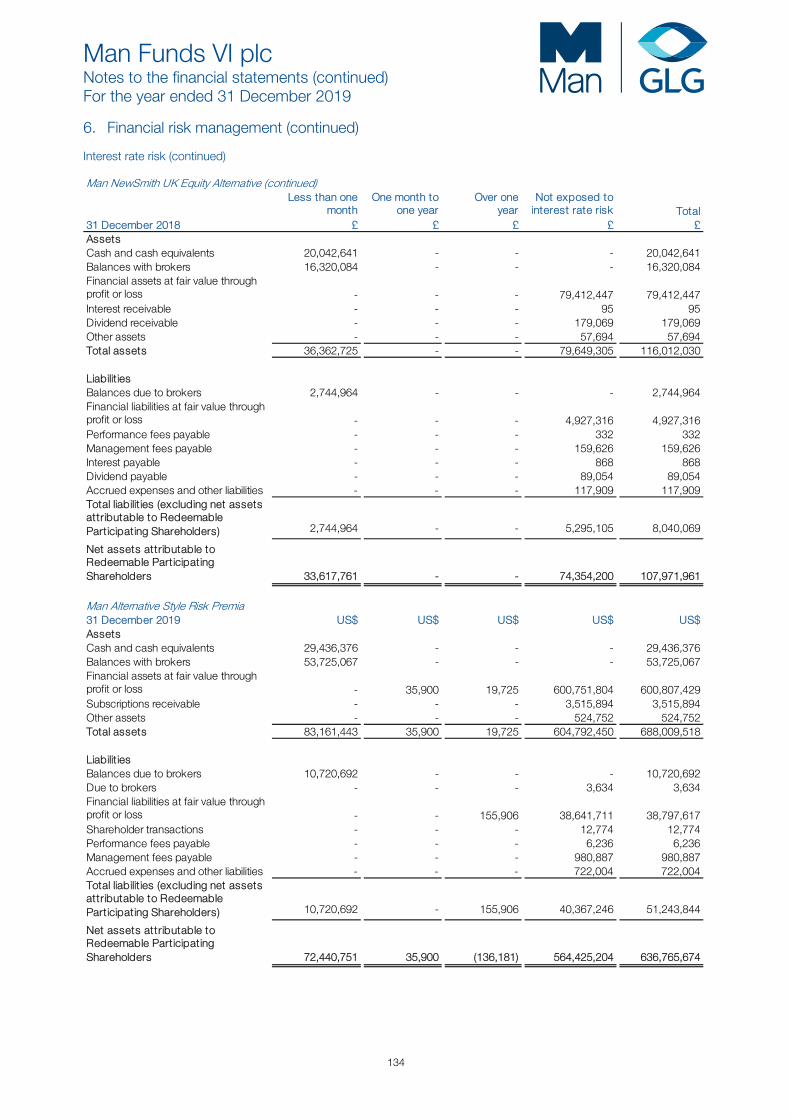
Man Funds VI plc Notes to the financial statements (continued) For the year ended 31 December 2019
134
6. Financial risk management (continued) Interest rate risk (continued) Man NewSmith UK Equity Alternative (continued)
Less than onemonth
One month toone year
Over oneyear
Not exposed tointerest rate risk Total
31 December 2018 £ £ £ £ £AssetsCash and cash equivalents 20,042,641 - - - 20,042,641 Balances with brokers 16,320,084 - - - 16,320,084 Financial assets at fair value through profit or loss - - - 79,412,447 79,412,447 Interest receivable - - - 95 95 Dividend receivable - - - 179,069 179,069 Other assets - - - 57,694 57,694 Total assets 36,362,725 - - 79,649,305 116,012,030
Liabilit iesBalances due to brokers 2,744,964 - - - 2,744,964 Financial liabilities at fair value through profit or loss - - - 4,927,316 4,927,316 Performance fees payable - - - 332 332 Management fees payable - - - 159,626 159,626 Interest payable - - - 868 868 Dividend payable - - - 89,054 89,054 Accrued expenses and other liabilities - - - 117,909 117,909 Total liabilit ies (excluding net assets attributable to Redeemable Participating Shareholders) 2,744,964 - - 5,295,105 8,040,069
Net assets attributable to Redeemable Participating Shareholders 33,617,761 - - 74,354,200 107,971,961
Man Alternative Style Risk Premia31 December 2019 US$ US$ US$ US$ US$AssetsCash and cash equivalents 29,436,376 - - - 29,436,376 Balances with brokers 53,725,067 - - - 53,725,067 Financial assets at fair value through profit or loss - 35,900 19,725 600,751,804 600,807,429 Subscriptions receivable - - - 3,515,894 3,515,894 Other assets - - - 524,752 524,752 Total assets 83,161,443 35,900 19,725 604,792,450 688,009,518
Liabilit iesBalances due to brokers 10,720,692 - - - 10,720,692 Due to brokers - - - 3,634 3,634 Financial liabilities at fair value through profit or loss - - 155,906 38,641,711 38,797,617 Shareholder transactions - - - 12,774 12,774 Performance fees payable - - - 6,236 6,236 Management fees payable - - - 980,887 980,887 Accrued expenses and other liabilities - - - 722,004 722,004 Total liabilit ies (excluding net assets attributable to Redeemable Participating Shareholders) 10,720,692 - 155,906 40,367,246 51,243,844
Net assets attributable to Redeemable Participating Shareholders 72,440,751 35,900 (136,181) 564,425,204 636,765,674
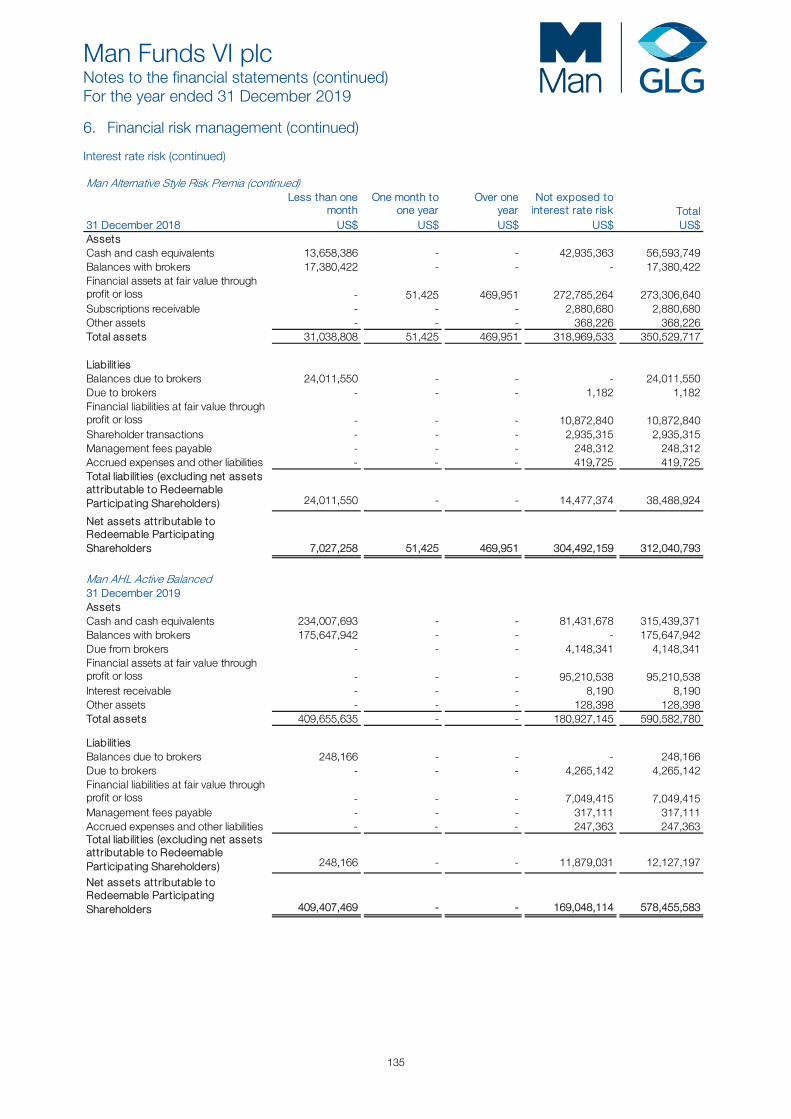
Man Funds VI plc Notes to the financial statements (continued) For the year ended 31 December 2019
135
6. Financial risk management (continued) Interest rate risk (continued) Man Alternative Style Risk Premia (continued)
Less than onemonth
One month toone year
Over oneyear
Not exposed tointerest rate risk Total
31 December 2018 US$ US$ US$ US$ US$AssetsCash and cash equivalents 13,658,386 - - 42,935,363 56,593,749 Balances with brokers 17,380,422 - - - 17,380,422 Financial assets at fair value through profit or loss - 51,425 469,951 272,785,264 273,306,640 Subscriptions receivable - - - 2,880,680 2,880,680 Other assets - - - 368,226 368,226 Total assets 31,038,808 51,425 469,951 318,969,533 350,529,717
Liabilit iesBalances due to brokers 24,011,550 - - - 24,011,550 Due to brokers - - - 1,182 1,182 Financial liabilities at fair value through profit or loss - - - 10,872,840 10,872,840 Shareholder transactions - - - 2,935,315 2,935,315 Management fees payable - - - 248,312 248,312 Accrued expenses and other liabilities - - - 419,725 419,725 Total liabilit ies (excluding net assets attributable to Redeemable Participating Shareholders) 24,011,550 - - 14,477,374 38,488,924
Net assets attributable to Redeemable Participating Shareholders 7,027,258 51,425 469,951 304,492,159 312,040,793
Man AHL Active Balanced31 December 2019AssetsCash and cash equivalents 234,007,693 - - 81,431,678 315,439,371 Balances with brokers 175,647,942 - - - 175,647,942 Due from brokers - - - 4,148,341 4,148,341 Financial assets at fair value through profit or loss - - - 95,210,538 95,210,538 Interest receivable - - - 8,190 8,190 Other assets - - - 128,398 128,398 Total assets 409,655,635 - - 180,927,145 590,582,780
Liabilit iesBalances due to brokers 248,166 - - - 248,166 Due to brokers - - - 4,265,142 4,265,142 Financial liabilities at fair value through profit or loss - - - 7,049,415 7,049,415 Management fees payable - - - 317,111 317,111 Accrued expenses and other liabilities - - - 247,363 247,363 Total liabilit ies (excluding net assets attributable to Redeemable Participating Shareholders) 248,166 - - 11,879,031 12,127,197
Net assets attributable to Redeemable Participating Shareholders 409,407,469 - - 169,048,114 578,455,583
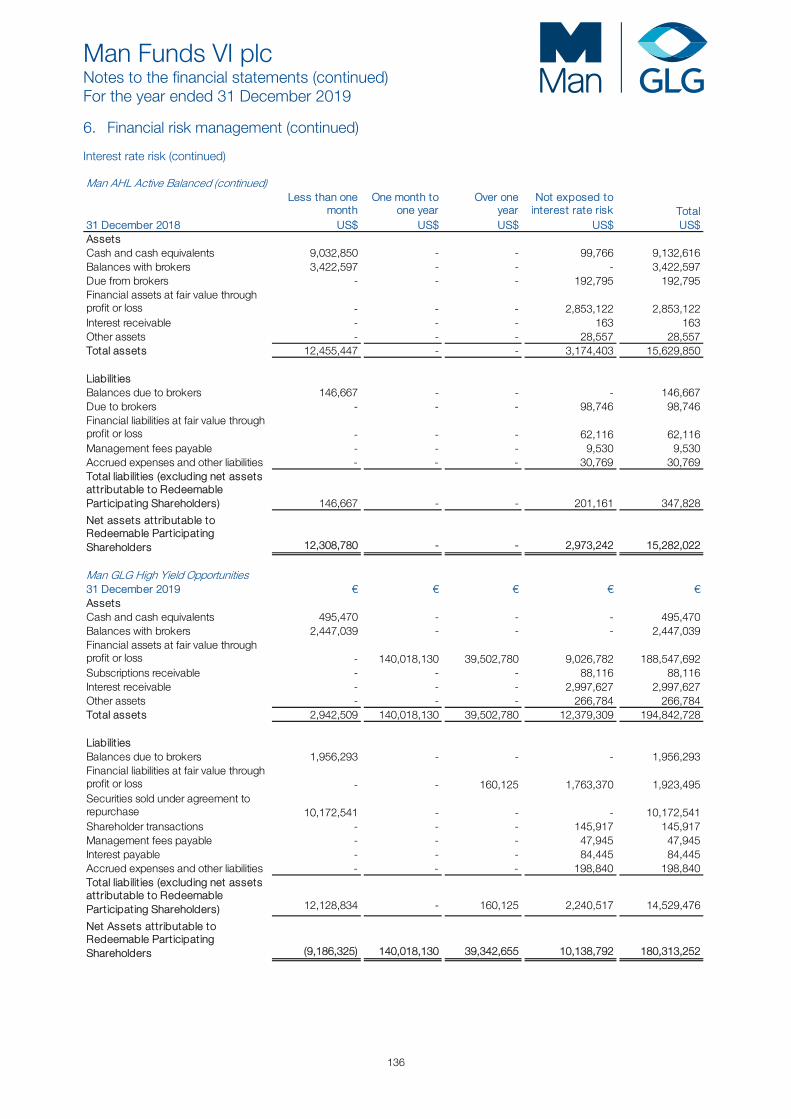
Man Funds VI plc Notes to the financial statements (continued) For the year ended 31 December 2019
136
6. Financial risk management (continued) Interest rate risk (continued) Man AHL Active Balanced (continued)
Less than onemonth
One month toone year
Over oneyear
Not exposed tointerest rate risk Total
31 December 2018 US$ US$ US$ US$ US$AssetsCash and cash equivalents 9,032,850 - - 99,766 9,132,616 Balances with brokers 3,422,597 - - - 3,422,597 Due from brokers - - - 192,795 192,795 Financial assets at fair value through profit or loss - - - 2,853,122 2,853,122 Interest receivable - - - 163 163 Other assets - - - 28,557 28,557 Total assets 12,455,447 - - 3,174,403 15,629,850
Liabilit iesBalances due to brokers 146,667 - - - 146,667 Due to brokers - - - 98,746 98,746 Financial liabilities at fair value through profit or loss - - - 62,116 62,116 Management fees payable - - - 9,530 9,530 Accrued expenses and other liabilities - - - 30,769 30,769 Total liabilit ies (excluding net assets attributable to Redeemable Participating Shareholders) 146,667 - - 201,161 347,828
Net assets attributable to Redeemable Participating Shareholders 12,308,780 - - 2,973,242 15,282,022
Man GLG High Yield Opportunities31 December 2019 € € € € €AssetsCash and cash equivalents 495,470 - - - 495,470 Balances with brokers 2,447,039 - - - 2,447,039 Financial assets at fair value through profit or loss - 140,018,130 39,502,780 9,026,782 188,547,692 Subscriptions receivable - - - 88,116 88,116 Interest receivable - - - 2,997,627 2,997,627 Other assets - - - 266,784 266,784 Total assets 2,942,509 140,018,130 39,502,780 12,379,309 194,842,728
Liabilit iesBalances due to brokers 1,956,293 - - - 1,956,293 Financial liabilities at fair value through profit or loss - - 160,125 1,763,370 1,923,495 Securities sold under agreement to repurchase 10,172,541 - - - 10,172,541 Shareholder transactions - - - 145,917 145,917 Management fees payable - - - 47,945 47,945 Interest payable - - - 84,445 84,445 Accrued expenses and other liabilities - - - 198,840 198,840 Total liabilit ies (excluding net assets attributable to Redeemable Participating Shareholders) 12,128,834 - 160,125 2,240,517 14,529,476
Net Assets attributable to Redeemable Participating Shareholders (9,186,325) 140,018,130 39,342,655 10,138,792 180,313,252
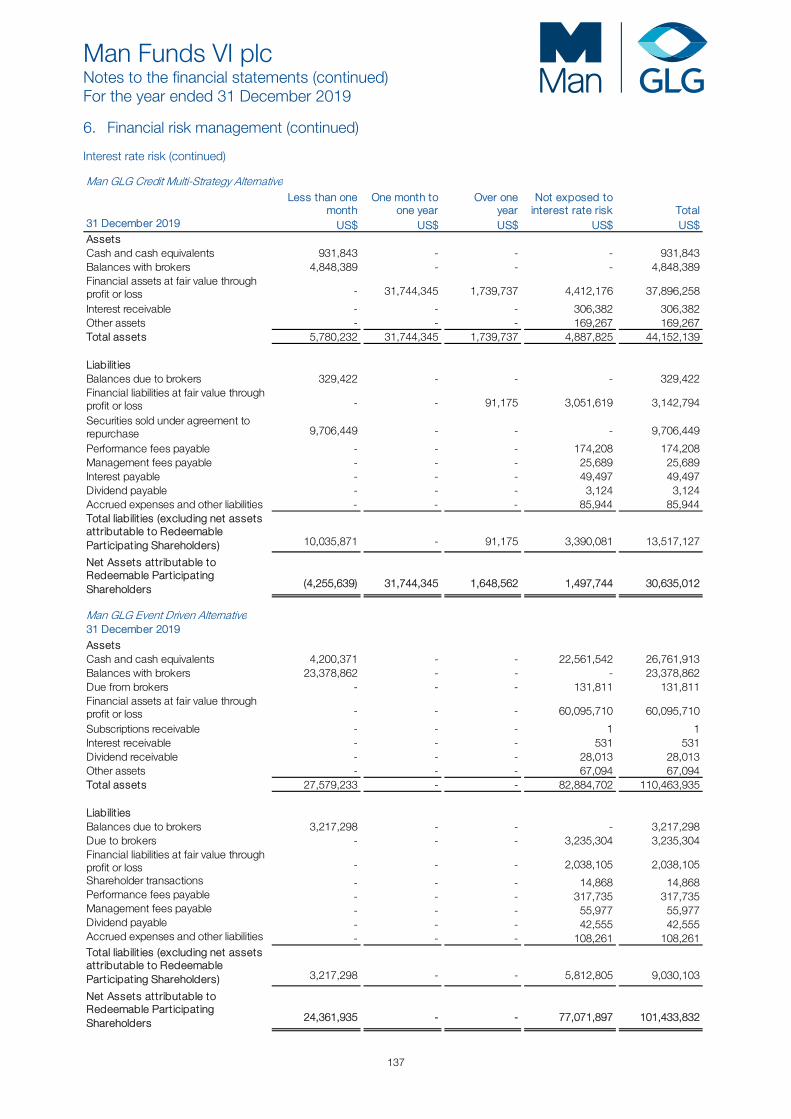
Man Funds VI plc Notes to the financial statements (continued) For the year ended 31 December 2019
137
6. Financial risk management (continued) Interest rate risk (continued) Man GLG Credit Multi-Strategy Alternative
Less than onemonth
One month toone year
Over oneyear
Not exposed tointerest rate risk Total
31 December 2019 US$ US$ US$ US$ US$AssetsCash and cash equivalents 931,843 - - - 931,843 Balances with brokers 4,848,389 - - - 4,848,389 Financial assets at fair value through profit or loss - 31,744,345 1,739,737 4,412,176 37,896,258
Interest receivable - - - 306,382 306,382 Other assets - - - 169,267 169,267 Total assets 5,780,232 31,744,345 1,739,737 4,887,825 44,152,139
Liabilit iesBalances due to brokers 329,422 - - - 329,422 Financial liabilities at fair value through profit or loss - - 91,175 3,051,619 3,142,794
Securities sold under agreement to repurchase 9,706,449 - - - 9,706,449
Performance fees payable - - - 174,208 174,208 Management fees payable - - - 25,689 25,689 Interest payable - - - 49,497 49,497 Dividend payable - - - 3,124 3,124 Accrued expenses and other liabilities - - - 85,944 85,944 Total liabilit ies (excluding net assets attributable to Redeemable Participating Shareholders) 10,035,871 - 91,175 3,390,081 13,517,127
Net Assets attributable to Redeemable Participating Shareholders (4,255,639) 31,744,345 1,648,562 1,497,744 30,635,012
Man GLG Event Driven Alternative31 December 2019AssetsCash and cash equivalents 4,200,371 - - 22,561,542 26,761,913 Balances with brokers 23,378,862 - - - 23,378,862 Due from brokers - - - 131,811 131,811 Financial assets at fair value through profit or loss - - - 60,095,710 60,095,710
Subscriptions receivable - - - 1 1 Interest receivable - - - 531 531 Dividend receivable - - - 28,013 28,013 Other assets - - - 67,094 67,094 Total assets 27,579,233 - - 82,884,702 110,463,935
Liabilit iesBalances due to brokers 3,217,298 - - - 3,217,298 Due to brokers - - - 3,235,304 3,235,304 Financial liabilities at fair value through profit or loss - - - 2,038,105 2,038,105 Shareholder transactions - - - 14,868 14,868 Performance fees payable - - - 317,735 317,735 Management fees payable - - - 55,977 55,977 Dividend payable - - - 42,555 42,555 Accrued expenses and other liabilities - - - 108,261 108,261 Total liabilit ies (excluding net assets attributable to Redeemable Participating Shareholders) 3,217,298 - - 5,812,805 9,030,103
Net Assets attributable to Redeemable Participating Shareholders 24,361,935 - - 77,071,897 101,433,832
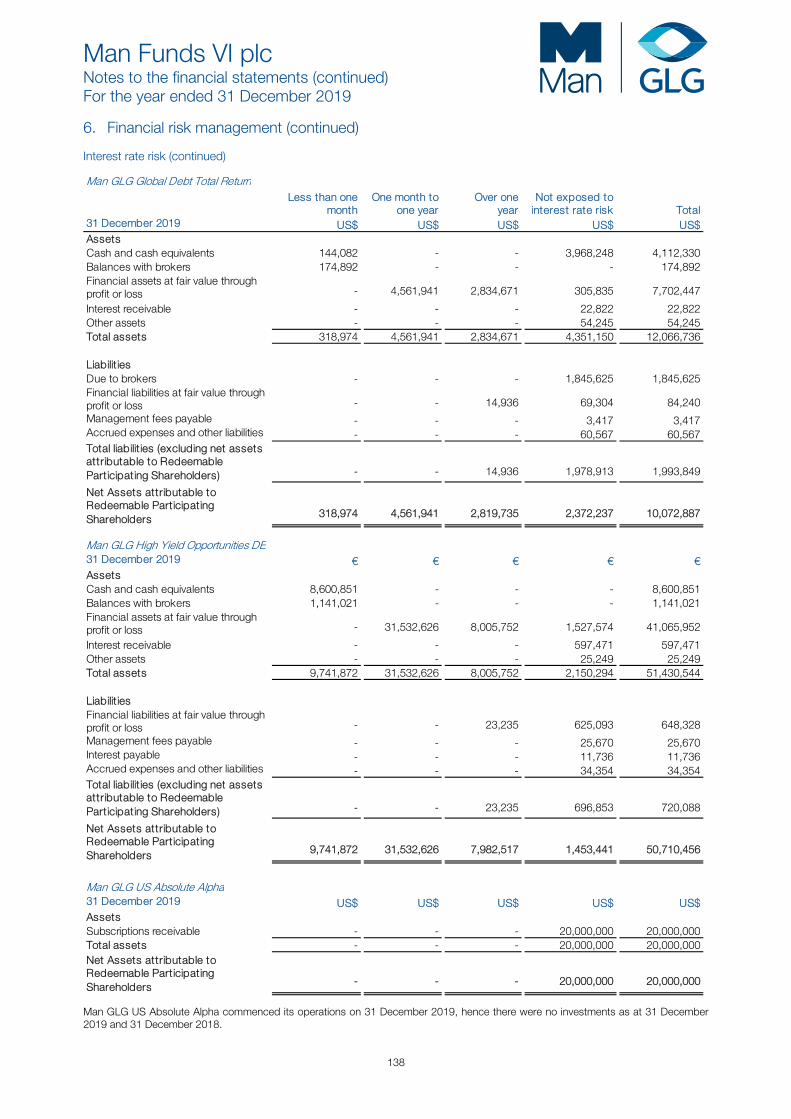
Man Funds VI plc Notes to the financial statements (continued) For the year ended 31 December 2019
138
6. Financial risk management (continued) Interest rate risk (continued) Man GLG Global Debt Total Return
Less than onemonth
One month toone year
Over oneyear
Not exposed tointerest rate risk Total
31 December 2019 US$ US$ US$ US$ US$AssetsCash and cash equivalents 144,082 - - 3,968,248 4,112,330 Balances with brokers 174,892 - - - 174,892 Financial assets at fair value through profit or loss - 4,561,941 2,834,671 305,835 7,702,447
Interest receivable - - - 22,822 22,822 Other assets - - - 54,245 54,245 Total assets 318,974 4,561,941 2,834,671 4,351,150 12,066,736
Liabilit iesDue to brokers - - - 1,845,625 1,845,625 Financial liabilities at fair value through profit or loss - - 14,936 69,304 84,240 Management fees payable - - - 3,417 3,417 Accrued expenses and other liabilities - - - 60,567 60,567 Total liabilit ies (excluding net assets attributable to Redeemable Participating Shareholders) - - 14,936 1,978,913 1,993,849
Net Assets attributable to Redeemable Participating Shareholders 318,974 4,561,941 2,819,735 2,372,237 10,072,887
Man GLG High Yield Opportunities DE31 December 2019 € € € € €AssetsCash and cash equivalents 8,600,851 - - - 8,600,851 Balances with brokers 1,141,021 - - - 1,141,021 Financial assets at fair value through profit or loss - 31,532,626 8,005,752 1,527,574 41,065,952
Interest receivable - - - 597,471 597,471 Other assets - - - 25,249 25,249 Total assets 9,741,872 31,532,626 8,005,752 2,150,294 51,430,544
Liabilit iesFinancial liabilities at fair value through profit or loss - - 23,235 625,093 648,328 Management fees payable - - - 25,670 25,670 Interest payable - - - 11,736 11,736 Accrued expenses and other liabilities - - - 34,354 34,354 Total liabilit ies (excluding net assets attributable to Redeemable Participating Shareholders) - - 23,235 696,853 720,088
Net Assets attributable to Redeemable Participating Shareholders 9,741,872 31,532,626 7,982,517 1,453,441 50,710,456
Man GLG US Absolute Alpha31 December 2019 US$ US$ US$ US$ US$AssetsSubscriptions receivable - - - 20,000,000 20,000,000 Total assets - - - 20,000,000 20,000,000 Net Assets attributable to Redeemable Participating Shareholders - - - 20,000,000 20,000,000
Man GLG US Absolute Alpha commenced its operations on 31 December 2019, hence there were no investments as at 31 December 2019 and 31 December 2018.
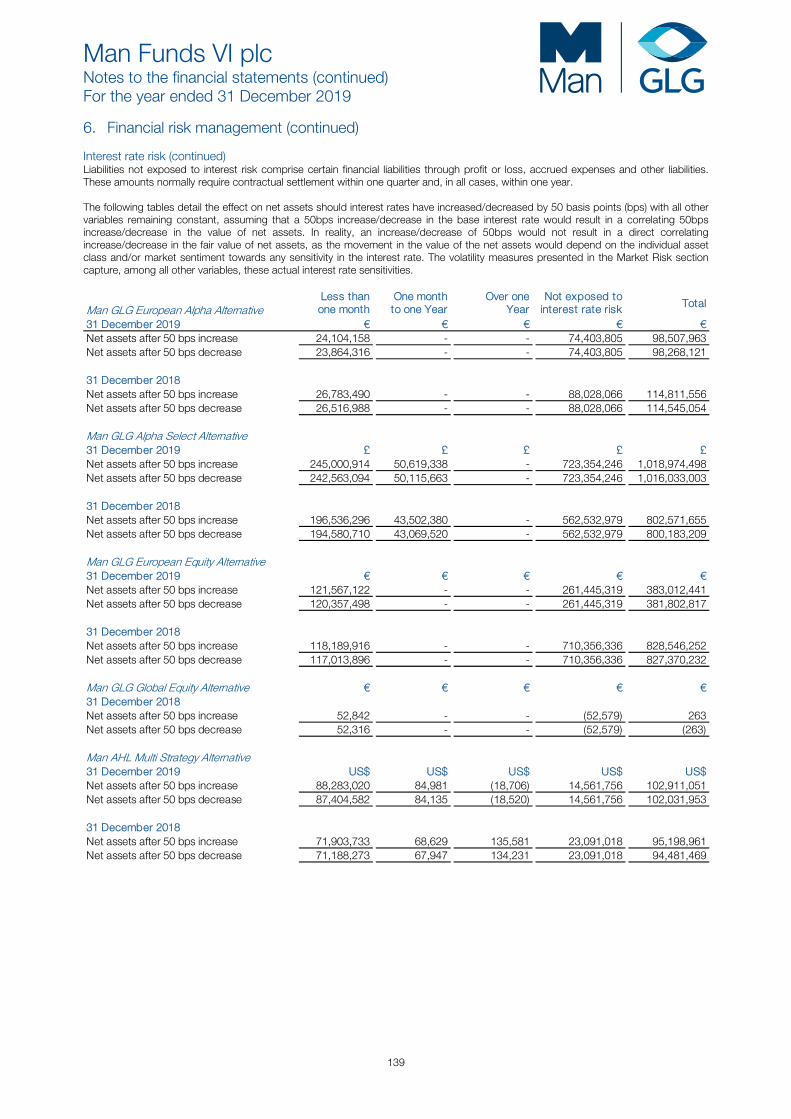
Man Funds VI plc Notes to the financial statements (continued) For the year ended 31 December 2019
139
6. Financial risk management (continued) Interest rate risk (continued) Liabilities not exposed to interest risk comprise certain financial liabilities through profit or loss, accrued expenses and other liabilities. These amounts normally require contractual settlement within one quarter and, in all cases, within one year. The following tables detail the effect on net assets should interest rates have increased/decreased by 50 basis points (bps) with all other variables remaining constant, assuming that a 50bps increase/decrease in the base interest rate would result in a correlating 50bps increase/decrease in the value of net assets. In reality, an increase/decrease of 50bps would not result in a direct correlating increase/decrease in the fair value of net assets, as the movement in the value of the net assets would depend on the individual asset class and/or market sentiment towards any sensitivity in the interest rate. The volatility measures presented in the Market Risk section capture, among all other variables, these actual interest rate sensitivities.
Man GLG European Alpha AlternativeLess thanone month
One monthto one Year
Over oneYear
Not exposed tointerest rate risk Total
31 December 2019 € € € € €Net assets after 50 bps increase 24,104,158 - - 74,403,805 98,507,963 Net assets after 50 bps decrease 23,864,316 - - 74,403,805 98,268,121
31 December 2018Net assets after 50 bps increase 26,783,490 - - 88,028,066 114,811,556 Net assets after 50 bps decrease 26,516,988 - - 88,028,066 114,545,054
Man GLG Alpha Select Alternative31 December 2019 £ £ £ £ £Net assets after 50 bps increase 245,000,914 50,619,338 - 723,354,246 1,018,974,498 Net assets after 50 bps decrease 242,563,094 50,115,663 - 723,354,246 1,016,033,003
31 December 2018Net assets after 50 bps increase 196,536,296 43,502,380 - 562,532,979 802,571,655 Net assets after 50 bps decrease 194,580,710 43,069,520 - 562,532,979 800,183,209
Man GLG European Equity Alternative31 December 2019 € € € € €Net assets after 50 bps increase 121,567,122 - - 261,445,319 383,012,441 Net assets after 50 bps decrease 120,357,498 - - 261,445,319 381,802,817
31 December 2018Net assets after 50 bps increase 118,189,916 - - 710,356,336 828,546,252 Net assets after 50 bps decrease 117,013,896 - - 710,356,336 827,370,232
Man GLG Global Equity Alternative € € € € €31 December 2018Net assets after 50 bps increase 52,842 - - (52,579) 263 Net assets after 50 bps decrease 52,316 - - (52,579) (263)
Man AHL Multi Strategy Alternative31 December 2019 US$ US$ US$ US$ US$Net assets after 50 bps increase 88,283,020 84,981 (18,706) 14,561,756 102,911,051 Net assets after 50 bps decrease 87,404,582 84,135 (18,520) 14,561,756 102,031,953
31 December 2018Net assets after 50 bps increase 71,903,733 68,629 135,581 23,091,018 95,198,961 Net assets after 50 bps decrease 71,188,273 67,947 134,231 23,091,018 94,481,469
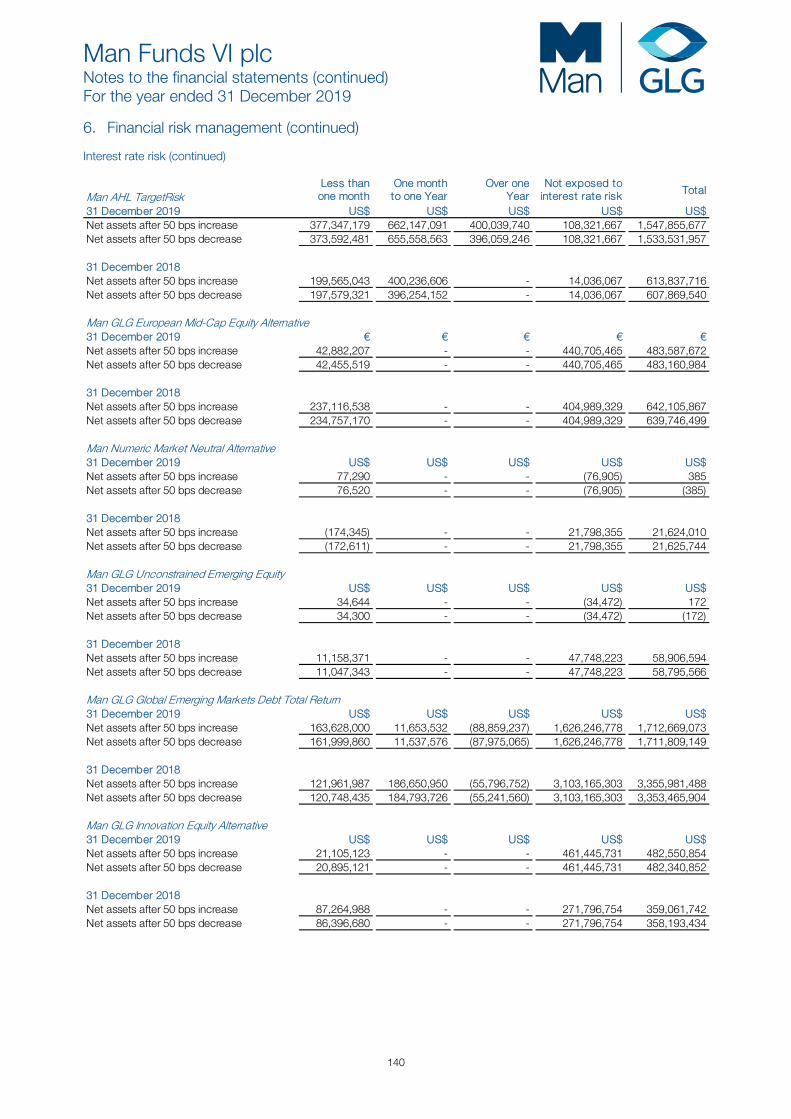
Man Funds VI plc Notes to the financial statements (continued) For the year ended 31 December 2019
140
6. Financial risk management (continued) Interest rate risk (continued)
Man AHL TargetRiskLess thanone month
One monthto one Year
Over oneYear
Not exposed tointerest rate risk Total
31 December 2019 US$ US$ US$ US$ US$Net assets after 50 bps increase 377,347,179 662,147,091 400,039,740 108,321,667 1,547,855,677 Net assets after 50 bps decrease 373,592,481 655,558,563 396,059,246 108,321,667 1,533,531,957
31 December 2018Net assets after 50 bps increase 199,565,043 400,236,606 - 14,036,067 613,837,716 Net assets after 50 bps decrease 197,579,321 396,254,152 - 14,036,067 607,869,540
Man GLG European Mid-Cap Equity Alternative31 December 2019 € € € € €Net assets after 50 bps increase 42,882,207 - - 440,705,465 483,587,672 Net assets after 50 bps decrease 42,455,519 - - 440,705,465 483,160,984
31 December 2018Net assets after 50 bps increase 237,116,538 - - 404,989,329 642,105,867 Net assets after 50 bps decrease 234,757,170 - - 404,989,329 639,746,499
Man Numeric Market Neutral Alternative31 December 2019 US$ US$ US$ US$ US$Net assets after 50 bps increase 77,290 - - (76,905) 385 Net assets after 50 bps decrease 76,520 - - (76,905) (385)
31 December 2018Net assets after 50 bps increase (174,345) - - 21,798,355 21,624,010 Net assets after 50 bps decrease (172,611) - - 21,798,355 21,625,744
Man GLG Unconstrained Emerging Equity31 December 2019 US$ US$ US$ US$ US$Net assets after 50 bps increase 34,644 - - (34,472) 172 Net assets after 50 bps decrease 34,300 - - (34,472) (172)
31 December 2018Net assets after 50 bps increase 11,158,371 - - 47,748,223 58,906,594 Net assets after 50 bps decrease 11,047,343 - - 47,748,223 58,795,566
Man GLG Global Emerging Markets Debt Total Return31 December 2019 US$ US$ US$ US$ US$Net assets after 50 bps increase 163,628,000 11,653,532 (88,859,237) 1,626,246,778 1,712,669,073 Net assets after 50 bps decrease 161,999,860 11,537,576 (87,975,065) 1,626,246,778 1,711,809,149
31 December 2018Net assets after 50 bps increase 121,961,987 186,650,950 (55,796,752) 3,103,165,303 3,355,981,488 Net assets after 50 bps decrease 120,748,435 184,793,726 (55,241,560) 3,103,165,303 3,353,465,904
Man GLG Innovation Equity Alternative31 December 2019 US$ US$ US$ US$ US$Net assets after 50 bps increase 21,105,123 - - 461,445,731 482,550,854 Net assets after 50 bps decrease 20,895,121 - - 461,445,731 482,340,852
31 December 2018Net assets after 50 bps increase 87,264,988 - - 271,796,754 359,061,742 Net assets after 50 bps decrease 86,396,680 - - 271,796,754 358,193,434

Man Funds VI plc Notes to the financial statements (continued) For the year ended 31 December 2019
141
6. Financial risk management (continued) Interest rate risk (continued)
Man NewSmith UK Equity AlternativeLess thanone month
One monthto one Year
Over oneYear
Not exposed tointerest rate risk Total
31 December 2019 £ £ £ £ £Net assets after 50 bps increase 46,958 - - (46,724) 234 Net assets after 50 bps decrease 46,490 - - (46,724) (234)
31 December 2018Net assets after 50 bps increase 33,785,850 - - 74,354,200 108,140,050 Net assets after 50 bps decrease 33,449,672 - - 74,354,200 107,803,872
Man Alternative Style Risk Premia31 December 2019 US$ US$ US$ US$ US$Net assets after 50 bps increase 72,802,955 36,080 (136,862) 564,425,204 637,127,377 Net assets after 50 bps decrease 72,078,547 35,721 (135,500) 564,425,204 636,403,972
31 December 2018Net assets after 50 bps increase 7,062,394 51,682 472,301 304,492,159 312,078,536 Net assets after 50 bps decrease 6,992,122 51,168 467,601 304,492,159 312,003,050
Man AHL Active Balanced31 December 2019 US$ US$ US$ US$ US$Net assets after 50 bps increase 411,454,506 - - 169,048,114 580,502,620 Net assets after 50 bps decrease 407,360,432 - - 169,048,114 576,408,546
31 December 2018Net assets after 50 bps increase 12,370,324 - - 2,973,242 15,343,566 Net assets after 50 bps decrease 12,247,236 - - 2,973,242 15,220,478
Man GLG High Yield Opportunities31 December 2019 € € € € €Net assets after 50 bps increase (9,232,257) 140,718,221 39,539,368 10,138,792 181,164,124 Net assets after 50 bps decrease (9,140,393) 139,318,039 39,145,942 10,138,792 179,462,380
Man GLG Credit Multi-Strategy Alternative31 December 2019 US$ US$ US$ US$ US$Net assets after 50 bps increase (4,276,917) 31,903,067 1,656,805 1,497,744 30,780,699 Net assets after 50 bps decrease (4,234,361) 31,585,623 1,640,319 1,497,744 30,489,325
Man GLG Event Driven Alternative31 December 2019 US$ US$ US$ US$ US$Net assets after 50 bps increase 24,483,745 - - 77,071,897 101,555,642 Net assets after 50 bps decrease 24,240,125 - - 77,071,897 101,312,022
Man GLG Global Debt Total Return31 December 2019 US$ US$ US$ US$ US$Net assets after 50 bps increase 320,569 4,584,751 2,833,834 2,372,237 10,111,391 Net assets after 50 bps decrease 317,379 4,539,131 2,805,636 2,372,237 10,034,383
Man GLG High Yield Opportunities DE31 December 2019 € € € € €Net assets after 50 bps increase 9,790,581 31,690,289 8,022,430 1,453,441 50,956,741 Net assets after 50 bps decrease 9,693,163 31,374,963 7,942,604 1,453,441 50,464,171
Man GLG US Absolute Alpha31 December 2019 US$ US$ US$ US$ US$Net assets after 50 bps increase - - - 20,000,000 20,000,000 Net assets after 50 bps decrease - - - 20,000,000 20,000,000
The Fund is indirectly exposed to interest rate risk through its investment strategy, which is deliberately designed to generate returns through trading strategies focused on exploiting price differentials in rates. The sensitivity of these exposures is modelled through the overall VaR analysis provided in the market risk section.
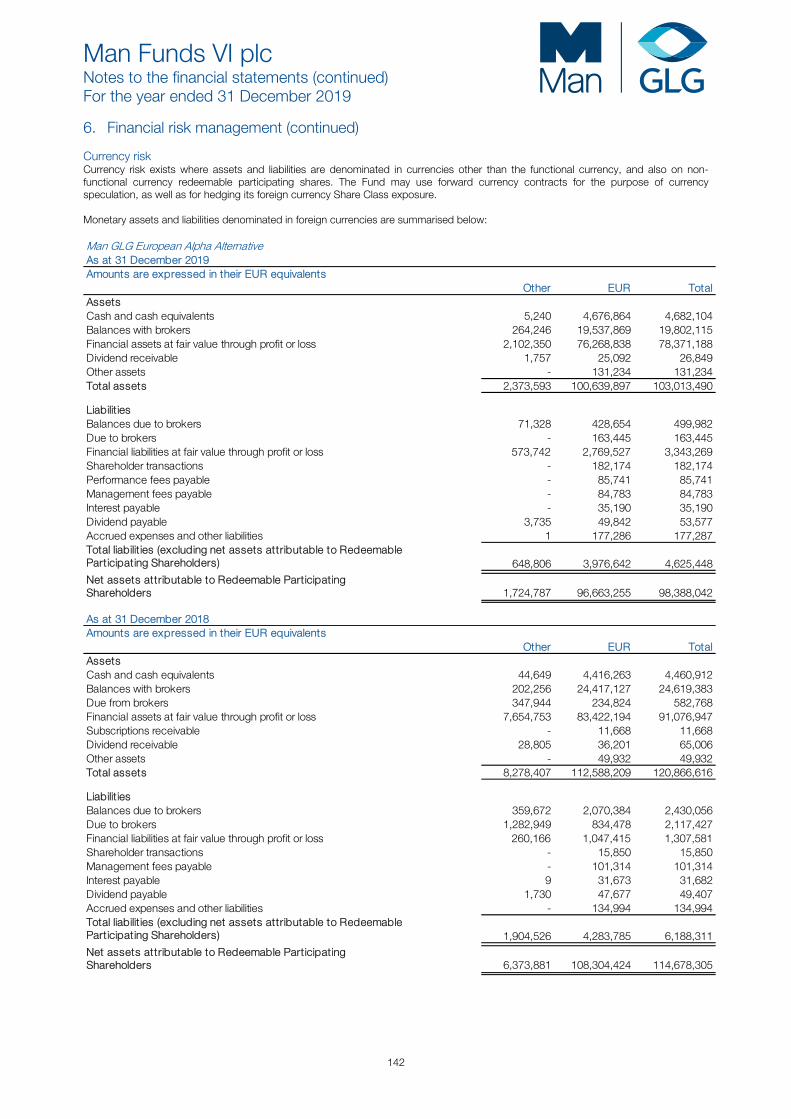
Man Funds VI plc Notes to the financial statements (continued) For the year ended 31 December 2019
142
6. Financial risk management (continued) Currency risk Currency risk exists where assets and liabilities are denominated in currencies other than the functional currency, and also on non-functional currency redeemable participating shares. The Fund may use forward currency contracts for the purpose of currency speculation, as well as for hedging its foreign currency Share Class exposure. Monetary assets and liabilities denominated in foreign currencies are summarised below: Man GLG European Alpha AlternativeAs at 31 December 2019Amounts are expressed in their EUR equivalents
Other EUR TotalAssetsCash and cash equivalents 5,240 4,676,864 4,682,104 Balances with brokers 264,246 19,537,869 19,802,115 Financial assets at fair value through profit or loss 2,102,350 76,268,838 78,371,188 Dividend receivable 1,757 25,092 26,849 Other assets - 131,234 131,234 Total assets 2,373,593 100,639,897 103,013,490
Liabilit iesBalances due to brokers 71,328 428,654 499,982 Due to brokers - 163,445 163,445 Financial liabilities at fair value through profit or loss 573,742 2,769,527 3,343,269 Shareholder transactions - 182,174 182,174 Performance fees payable - 85,741 85,741 Management fees payable - 84,783 84,783 Interest payable - 35,190 35,190 Dividend payable 3,735 49,842 53,577 Accrued expenses and other liabilities 1 177,286 177,287
648,806 3,976,642 4,625,448
1,724,787 96,663,255 98,388,042
Total liabilit ies (excluding net assets attributable to RedeemableParticipating Shareholders)
Net assets attributable to Redeemable ParticipatingShareholders
As at 31 December 2018Amounts are expressed in their EUR equivalents
Other EUR TotalAssetsCash and cash equivalents 44,649 4,416,263 4,460,912 Balances with brokers 202,256 24,417,127 24,619,383 Due from brokers 347,944 234,824 582,768 Financial assets at fair value through profit or loss 7,654,753 83,422,194 91,076,947 Subscriptions receivable - 11,668 11,668 Dividend receivable 28,805 36,201 65,006 Other assets - 49,932 49,932 Total assets 8,278,407 112,588,209 120,866,616
Liabilit iesBalances due to brokers 359,672 2,070,384 2,430,056 Due to brokers 1,282,949 834,478 2,117,427 Financial liabilities at fair value through profit or loss 260,166 1,047,415 1,307,581 Shareholder transactions - 15,850 15,850 Management fees payable - 101,314 101,314 Interest payable 9 31,673 31,682 Dividend payable 1,730 47,677 49,407 Accrued expenses and other liabilities - 134,994 134,994
1,904,526 4,283,785 6,188,311
6,373,881 108,304,424 114,678,305
Total liabilit ies (excluding net assets attributable to RedeemableParticipating Shareholders)
Net assets attributable to Redeemable ParticipatingShareholders
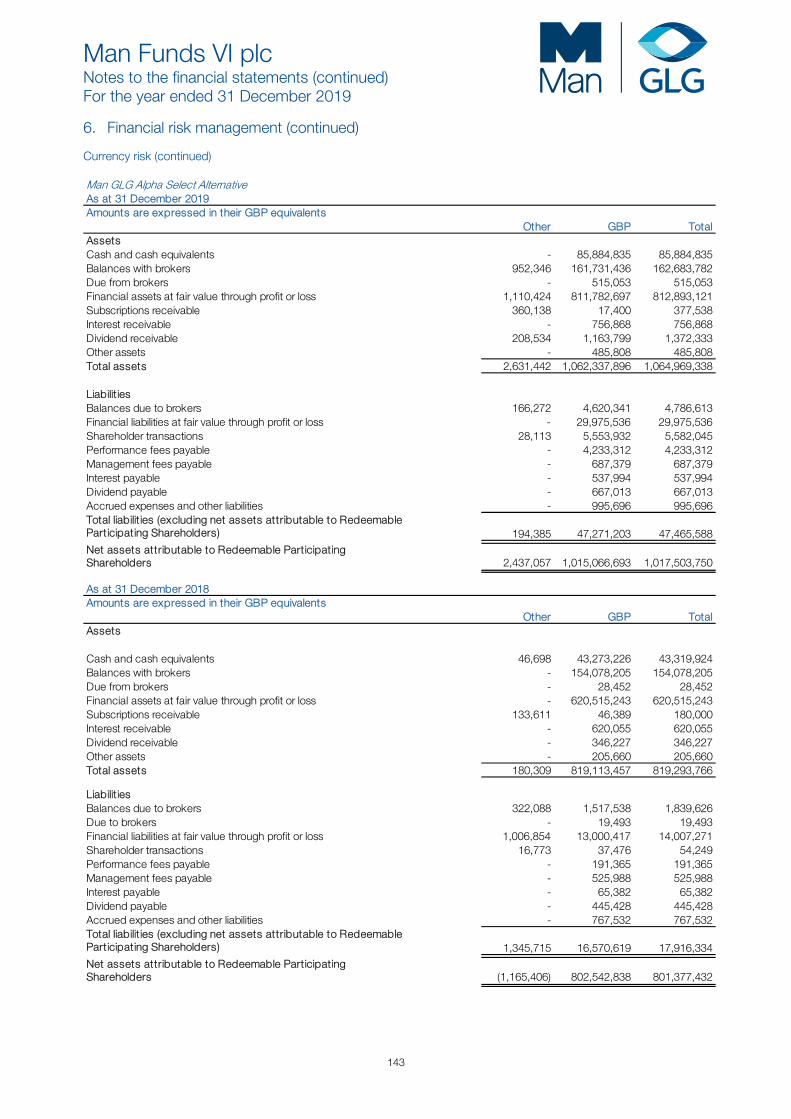
Man Funds VI plc Notes to the financial statements (continued) For the year ended 31 December 2019
143
6. Financial risk management (continued) Currency risk (continued)
Man GLG Alpha Select AlternativeAs at 31 December 2019Amounts are expressed in their GBP equivalents
Other GBP TotalAssetsCash and cash equivalents - 85,884,835 85,884,835 Balances with brokers 952,346 161,731,436 162,683,782 Due from brokers - 515,053 515,053 Financial assets at fair value through profit or loss 1,110,424 811,782,697 812,893,121 Subscriptions receivable 360,138 17,400 377,538 Interest receivable - 756,868 756,868 Dividend receivable 208,534 1,163,799 1,372,333 Other assets - 485,808 485,808 Total assets 2,631,442 1,062,337,896 1,064,969,338
Liabilit iesBalances due to brokers 166,272 4,620,341 4,786,613 Financial liabilities at fair value through profit or loss - 29,975,536 29,975,536 Shareholder transactions 28,113 5,553,932 5,582,045 Performance fees payable - 4,233,312 4,233,312 Management fees payable - 687,379 687,379 Interest payable - 537,994 537,994 Dividend payable - 667,013 667,013 Accrued expenses and other liabilities - 995,696 995,696
194,385 47,271,203 47,465,588
2,437,057 1,015,066,693 1,017,503,750
Total liabilit ies (excluding net assets attributable to RedeemableParticipating Shareholders)
Net assets attributable to Redeemable ParticipatingShareholders
As at 31 December 2018Amounts are expressed in their GBP equivalents
Other GBP TotalAssets
Cash and cash equivalents 46,698 43,273,226 43,319,924 Balances with brokers - 154,078,205 154,078,205 Due from brokers - 28,452 28,452 Financial assets at fair value through profit or loss - 620,515,243 620,515,243 Subscriptions receivable 133,611 46,389 180,000 Interest receivable - 620,055 620,055 Dividend receivable - 346,227 346,227 Other assets - 205,660 205,660 Total assets 180,309 819,113,457 819,293,766
Liabilit iesBalances due to brokers 322,088 1,517,538 1,839,626 Due to brokers - 19,493 19,493 Financial liabilities at fair value through profit or loss 1,006,854 13,000,417 14,007,271 Shareholder transactions 16,773 37,476 54,249 Performance fees payable - 191,365 191,365 Management fees payable - 525,988 525,988 Interest payable - 65,382 65,382 Dividend payable - 445,428 445,428 Accrued expenses and other liabilities - 767,532 767,532
1,345,715 16,570,619 17,916,334
(1,165,406) 802,542,838 801,377,432
Total liabilit ies (excluding net assets attributable to RedeemableParticipating Shareholders)
Net assets attributable to Redeemable ParticipatingShareholders
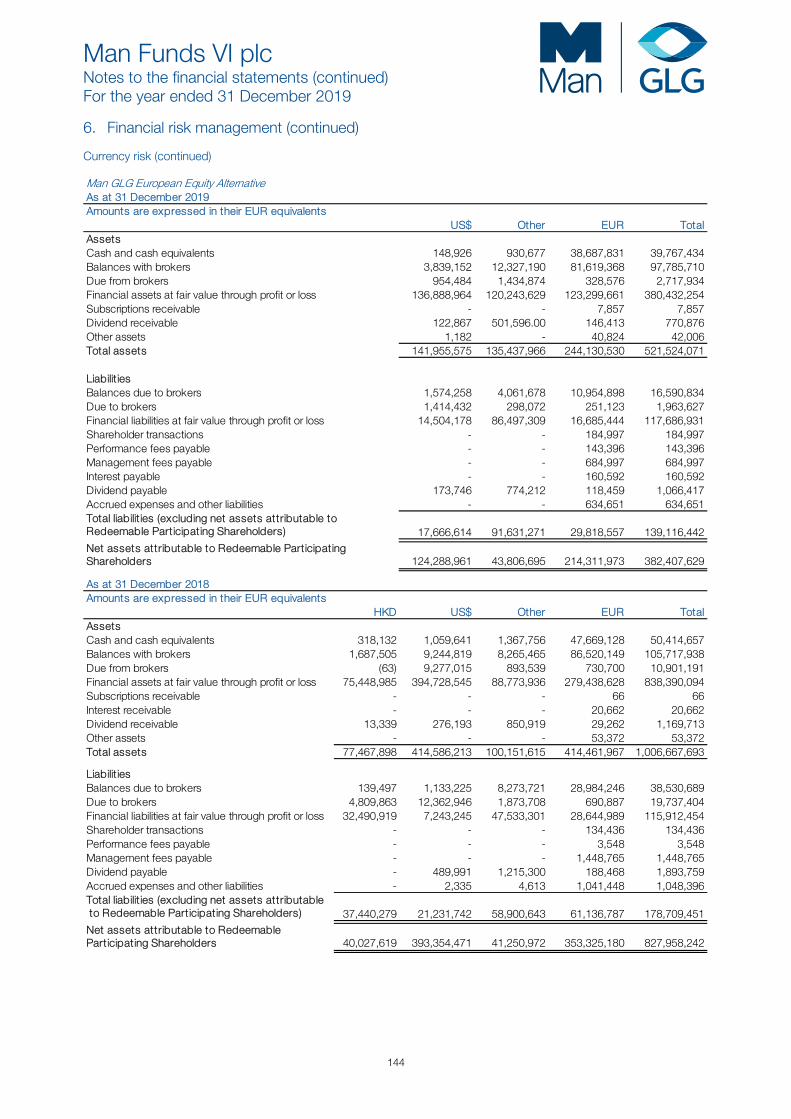
Man Funds VI plc Notes to the financial statements (continued) For the year ended 31 December 2019
144
6. Financial risk management (continued) Currency risk (continued) Man GLG European Equity AlternativeAs at 31 December 2019Amounts are expressed in their EUR equivalents
US$ Other EUR TotalAssetsCash and cash equivalents 148,926 930,677 38,687,831 39,767,434 Balances with brokers 3,839,152 12,327,190 81,619,368 97,785,710 Due from brokers 954,484 1,434,874 328,576 2,717,934 Financial assets at fair value through profit or loss 136,888,964 120,243,629 123,299,661 380,432,254 Subscriptions receivable - - 7,857 7,857 Dividend receivable 122,867 501,596.00 146,413 770,876 Other assets 1,182 - 40,824 42,006 Total assets 141,955,575 135,437,966 244,130,530 521,524,071
Liabilit iesBalances due to brokers 1,574,258 4,061,678 10,954,898 16,590,834 Due to brokers 1,414,432 298,072 251,123 1,963,627 Financial liabilities at fair value through profit or loss 14,504,178 86,497,309 16,685,444 117,686,931 Shareholder transactions - - 184,997 184,997 Performance fees payable - - 143,396 143,396 Management fees payable - - 684,997 684,997 Interest payable - - 160,592 160,592 Dividend payable 173,746 774,212 118,459 1,066,417 Accrued expenses and other liabilities - - 634,651 634,651
17,666,614 91,631,271 29,818,557 139,116,442
124,288,961 43,806,695 214,311,973 382,407,629
Total liabilit ies (excluding net assets attributable toRedeemable Participating Shareholders)
Net assets attributable to Redeemable ParticipatingShareholders
As at 31 December 2018Amounts are expressed in their EUR equivalents
HKD US$ Other EUR TotalAssetsCash and cash equivalents 318,132 1,059,641 1,367,756 47,669,128 50,414,657 Balances with brokers 1,687,505 9,244,819 8,265,465 86,520,149 105,717,938 Due from brokers (63) 9,277,015 893,539 730,700 10,901,191 Financial assets at fair value through profit or loss 75,448,985 394,728,545 88,773,936 279,438,628 838,390,094 Subscriptions receivable - - - 66 66 Interest receivable - - - 20,662 20,662 Dividend receivable 13,339 276,193 850,919 29,262 1,169,713 Other assets - - - 53,372 53,372 Total assets 77,467,898 414,586,213 100,151,615 414,461,967 1,006,667,693
Liabilit iesBalances due to brokers 139,497 1,133,225 8,273,721 28,984,246 38,530,689 Due to brokers 4,809,863 12,362,946 1,873,708 690,887 19,737,404 Financial liabilities at fair value through profit or loss 32,490,919 7,243,245 47,533,301 28,644,989 115,912,454 Shareholder transactions - - - 134,436 134,436 Performance fees payable - - - 3,548 3,548 Management fees payable - - - 1,448,765 1,448,765 Dividend payable - 489,991 1,215,300 188,468 1,893,759 Accrued expenses and other liabilities - 2,335 4,613 1,041,448 1,048,396
37,440,279 21,231,742 58,900,643 61,136,787 178,709,451
40,027,619 393,354,471 41,250,972 353,325,180 827,958,242
Total liabilit ies (excluding net assets attributable to Redeemable Participating Shareholders)
Net assets attributable to Redeemable Participating Shareholders

Man Funds VI plc Notes to the financial statements (continued) For the year ended 31 December 2019
145
6. Financial risk management (continued) Currency risk (continued) Man GLG Global Equity AlternativeAs at 31 December 2018Amounts are expressed in their EUR equivalents
Other EUR TotalAssetsCash and cash equivalents 35,138 127,542 162,680 Balances with brokers 90 103 193 Interest receivable 51 29 80 Other assets - 31,458 31,458 Total assets 35,279 159,132 194,411
Liabilit iesBalances due to brokers 9,712 100,582 110,294 Due to brokers 87 - 87 Interest payable 938 696 1,634 Liquidation fees payable (44) 12,966 12,922 Accrued expenses and other liabilities - 69,474 69,474
10,693 183,718 194,411
24,586 (24,586) -
Total liabilit ies (excluding net assets attributable toRedeemable Participating Shareholders)
Net assets attributable to Redeemable ParticipatingShareholders
Man AHL Multi Strategy AlternativeAs at 31 December 2019Amounts are expressed in their US$ equivalents
EUR Other US$ TotalAssetsCash and cash equivalents 477,464 21,108 50,843,624 51,342,196 Balances with brokers 3,056,757 6,625,458 29,962,428 39,644,643 Due from brokers 15,603 43,906 31,859 91,368 Financial assets at fair value through profit or loss 7,202,630 4,207,205 25,055,495 36,465,330 Subscriptions receivable 2,845 - - 2,845 Interest receivable - - 1,279 1,279 Dividend receivable 3,081 73,039 19,039 95,159 Other assets - - 6,636 6,636 Total assets 10,758,380 10,970,716 105,920,360 127,649,456
Liabilit iesBalances due to brokers 271,600 781,332 2,090,106 3,143,038 Due to brokers 17,215 50,930 24,540 92,685 Financial liabilities at fair value through profit or loss 1,806,403 4,093,553 14,964,215 20,864,171 Shareholder transactions - 699 - 699 Performance fees payable - - 734,815 734,815 Management fees payable - - 93,948 93,948 Interest payable - - 24,807 24,807 Dividend payable 75 65,422 14,338 79,835 Accrued expenses and other liabilities - - 143,956 143,956
2,095,293 4,991,936 18,090,725 25,177,954
8,663,087 5,978,780 87,829,635 102,471,502
Total liabilit ies (excluding net assets attributable toRedeemable Participating Shareholders)
Net assets attributable to Redeemable ParticipatingShareholders

Man Funds VI plc Notes to the financial statements (continued) For the year ended 31 December 2019
146
6. Financial risk management (continued) Currency risk (continued) Man AHL Multi Strategy Alternative (continued)As at 31 December 2018Amounts are expressed in their US$ equivalents
EUR JPY Other US$ TotalAssetsCash and cash equivalents - 38,389 178,209 47,130,323 47,346,921 Balances with brokers 1,104,960 2,844,985 4,560,717 18,287,980 26,798,642 Due from brokers 6,072 278,781 7,492 108,759 401,104 Financial assets at fair value through profit or loss 2,377,628 2,465,267 2,422,360 31,909,577 39,174,832 Subscriptions receivable 2,108 - 636 828 3,572 Interest receivable - - - 2,073 2,073 Dividend receivable 5,583 22,575 39,030 15,991 83,179 Total assets 3,496,351 5,649,997 7,208,444 97,455,531 113,810,323
Liabilit iesBalances due to brokers 253,986 16,883 938,965 1,389,726 2,599,560 Due to brokers 10,822 250,764 27,778 53,502 342,866 Financial liabilities at fair value through profit or loss 1,347,492 2,288,426 2,496,505 8,764,308 14,896,731 Performance fees payable - - - 807,686 807,686 Management fees payable - - - 87,465 87,465 Interest payable - - - 30,431 30,431 Dividend payable 202 16,715 26,433 8,473 51,823 Accrued expenses and other liabilities - - - 153,546 153,546
1,612,502 2,572,788 3,489,681 11,295,137 18,970,108
1,883,849 3,077,209 3,718,763 86,160,394 94,840,215
Total liabilit ies (excluding net assets attributableto Redeemable Participating Shareholders) Net assets attributable to RedeemableParticipating Shareholders
Man AHL TargetRiskAs at 31 December 2019Amounts are expressed in their US$ equivalents
EUR GBP Other US$ TotalAssetsCash and cash equivalents 7,598,893 - 7,270 119,964,400 127,570,563 Balances with brokers 20,322,515 11,811,299 19,684,872 244,731,103 296,549,789 Financial assets at fair value through profit or loss 430,291,238 250,705,662 2,622,352 509,900,676 1,193,519,928 Subscriptions receivable 241,078 24,038 19,413 6,018,617 6,303,147 Interest receivable 1,351,819 79,108 - 1,456,587 2,887,514 Other assets - - - 1,014,949 1,014,949 Total assets 459,805,543 262,620,107 22,333,907 883,086,332 1,627,845,890
Liabilit iesBalances due to brokers 24,777,754 80,851 613,061 23,178,856 48,650,522 Due to brokers - - 1,904 - 1,904 Financial liabilities at fair value through profit or loss 3,949,057 3,741,281 1,815,765 16,337,666 25,843,769 Shareholder transactions 1,559 31,798 1,738 10,362,633 10,397,728 Management fees payable - - - 923,583 923,583 Accrued expenses and other liabilities - - - 1,334,567 1,334,567
28,728,370 3,853,930 2,432,468 52,137,305 87,152,073
431,077,173 258,766,177 19,901,439 830,949,027 1,540,693,817
Total liabilit ies (excluding net assets attributableto Redeemable Participating Shareholders)
Net assets attributable to RedeemableParticipating Shareholders
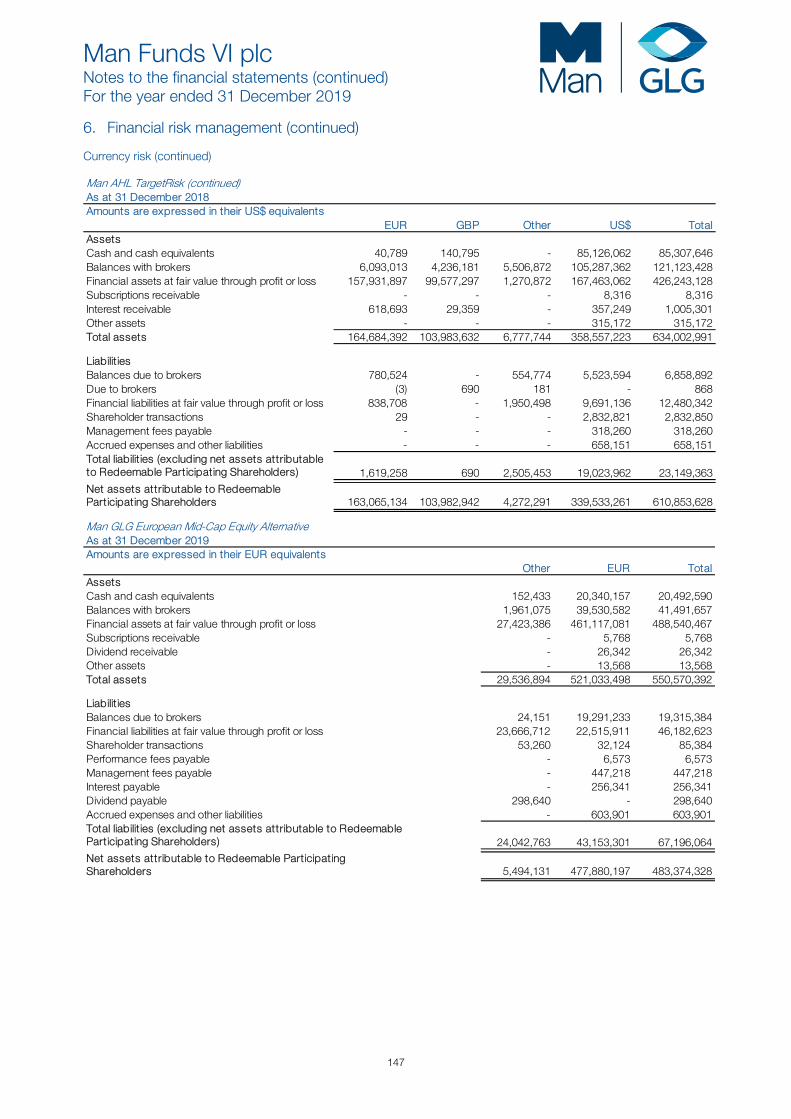
Man Funds VI plc Notes to the financial statements (continued) For the year ended 31 December 2019
147
6. Financial risk management (continued) Currency risk (continued) Man AHL TargetRisk (continued)As at 31 December 2018Amounts are expressed in their US$ equivalents
EUR GBP Other US$ TotalAssetsCash and cash equivalents 40,789 140,795 - 85,126,062 85,307,646 Balances with brokers 6,093,013 4,236,181 5,506,872 105,287,362 121,123,428 Financial assets at fair value through profit or loss 157,931,897 99,577,297 1,270,872 167,463,062 426,243,128 Subscriptions receivable - - - 8,316 8,316 Interest receivable 618,693 29,359 - 357,249 1,005,301 Other assets - - - 315,172 315,172 Total assets 164,684,392 103,983,632 6,777,744 358,557,223 634,002,991
Liabilit iesBalances due to brokers 780,524 - 554,774 5,523,594 6,858,892 Due to brokers (3) 690 181 - 868 Financial liabilities at fair value through profit or loss 838,708 - 1,950,498 9,691,136 12,480,342 Shareholder transactions 29 - - 2,832,821 2,832,850 Management fees payable - - - 318,260 318,260 Accrued expenses and other liabilities - - - 658,151 658,151
1,619,258 690 2,505,453 19,023,962 23,149,363
163,065,134 103,982,942 4,272,291 339,533,261 610,853,628 Net assets attributable to RedeemableParticipating Shareholders
Total liabilit ies (excluding net assets attributableto Redeemable Participating Shareholders)
Man GLG European Mid-Cap Equity AlternativeAs at 31 December 2019Amounts are expressed in their EUR equivalents
Other EUR TotalAssetsCash and cash equivalents 152,433 20,340,157 20,492,590 Balances with brokers 1,961,075 39,530,582 41,491,657 Financial assets at fair value through profit or loss 27,423,386 461,117,081 488,540,467 Subscriptions receivable - 5,768 5,768 Dividend receivable - 26,342 26,342 Other assets - 13,568 13,568 Total assets 29,536,894 521,033,498 550,570,392
Liabilit iesBalances due to brokers 24,151 19,291,233 19,315,384 Financial liabilities at fair value through profit or loss 23,666,712 22,515,911 46,182,623 Shareholder transactions 53,260 32,124 85,384 Performance fees payable - 6,573 6,573 Management fees payable - 447,218 447,218 Interest payable - 256,341 256,341 Dividend payable 298,640 - 298,640 Accrued expenses and other liabilities - 603,901 603,901
24,042,763 43,153,301 67,196,064
5,494,131 477,880,197 483,374,328
Total liabilit ies (excluding net assets attributable to RedeemableParticipating Shareholders)
Net assets attributable to Redeemable ParticipatingShareholders
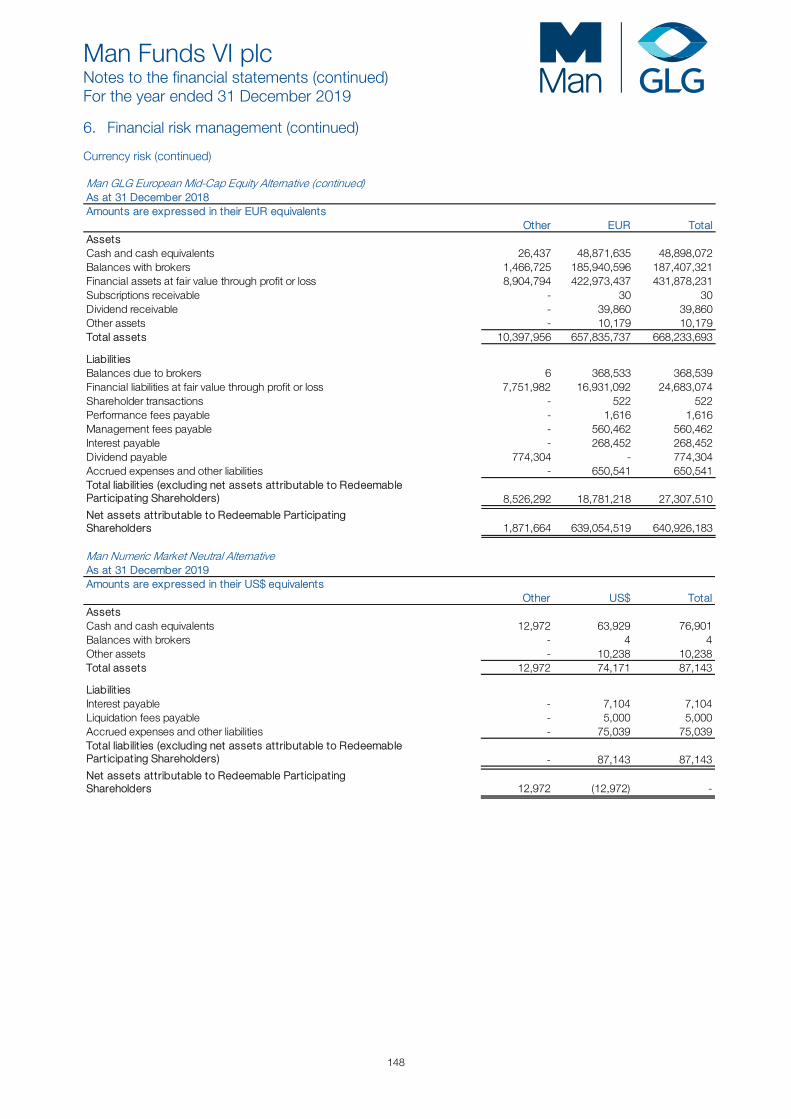
Man Funds VI plc Notes to the financial statements (continued) For the year ended 31 December 2019
148
6. Financial risk management (continued) Currency risk (continued) Man GLG European Mid-Cap Equity Alternative (continued)As at 31 December 2018Amounts are expressed in their EUR equivalents
Other EUR TotalAssetsCash and cash equivalents 26,437 48,871,635 48,898,072 Balances with brokers 1,466,725 185,940,596 187,407,321 Financial assets at fair value through profit or loss 8,904,794 422,973,437 431,878,231 Subscriptions receivable - 30 30 Dividend receivable - 39,860 39,860 Other assets - 10,179 10,179 Total assets 10,397,956 657,835,737 668,233,693
Liabilit iesBalances due to brokers 6 368,533 368,539 Financial liabilities at fair value through profit or loss 7,751,982 16,931,092 24,683,074 Shareholder transactions - 522 522 Performance fees payable - 1,616 1,616 Management fees payable - 560,462 560,462 Interest payable - 268,452 268,452 Dividend payable 774,304 - 774,304 Accrued expenses and other liabilities - 650,541 650,541
8,526,292 18,781,218 27,307,510
1,871,664 639,054,519 640,926,183 Net assets attributable to Redeemable ParticipatingShareholders
Total liabilit ies (excluding net assets attributable to RedeemableParticipating Shareholders)
Man Numeric Market Neutral AlternativeAs at 31 December 2019Amounts are expressed in their US$ equivalents
Other US$ TotalAssetsCash and cash equivalents 12,972 63,929 76,901 Balances with brokers - 4 4 Other assets - 10,238 10,238 Total assets 12,972 74,171 87,143
Liabilit iesInterest payable - 7,104 7,104 Liquidation fees payable - 5,000 5,000
- 75,039 75,039
- 87,143 87,143
12,972 (12,972) - Net assets attributable to Redeemable ParticipatingShareholders
Accrued expenses and other liabilitiesTotal liabilit ies (excluding net assets attributable to RedeemableParticipating Shareholders)

Man Funds VI plc Notes to the financial statements (continued) For the year ended 31 December 2019
149
6. Financial risk management (continued) Currency risk (continued) Man Numeric Market Neutral Alternative (continued)As at 31 December 2018Amounts are expressed in their US$ equivalents
CHF EUR SEK Other US$ TotalAssetsCash and cash equivalents - 1 - 6,803 1,182,882 1,189,686 Balances with brokers - - - - 43,515,331 43,515,331
2,945,650 14,433,985 3,401,182 1,713,251 104,322 22,598,390 Interest receivable - - - - 17,232 17,232 Other assets - - - - 61,963 61,963 Total assets 2,945,650 14,433,986 3,401,182 1,720,054 44,881,730 67,382,602
Liabilit iesBalances due to brokers 1,093 16,540 7 29 44,860,826 44,878,495
1,041 270,455 142,365 - 223,172 637,033 Management fees payable - - - - 46,556 46,556 Interest payable - - - - 13,584 13,584
- - - - 182,057 182,057
2,134 286,995 142,372 29 45,326,195 45,757,725
2,943,516 14,146,991 3,258,810 1,720,025 (444,465) 21,624,877
Net assets attributable toRedeemable ParticipatingShareholders
Financial assets at fair value throughprofit or loss
Financial liabilities at fair value throughprofit or loss
Accrued expenses and other liabilitiesTotal liabilit ies (excluding net assetsattributable to RedeemableParticipating Shareholders)
Man GLG Unconstrained Emerging EquityAs at 31 December 2019Amounts are expressed in their US$ equivalents
Other US$ TotalAssetsCash and cash equivalents 37 34,419 34,456 Balances with brokers 6 13 19 Other assets - 4,427 4,427 Total assets 43 38,859 38,902
Liabilit iesBalances due to brokers 3 - 3
- 38,899 38,899
3 38,899 38,902
40 (40) -
Accrued expenses and other liabilitiesTotal liabilit ies (excluding net assets attributable to RedeemableParticipating Shareholders)
Net assets attributable to Redeemable ParticipatingShareholders
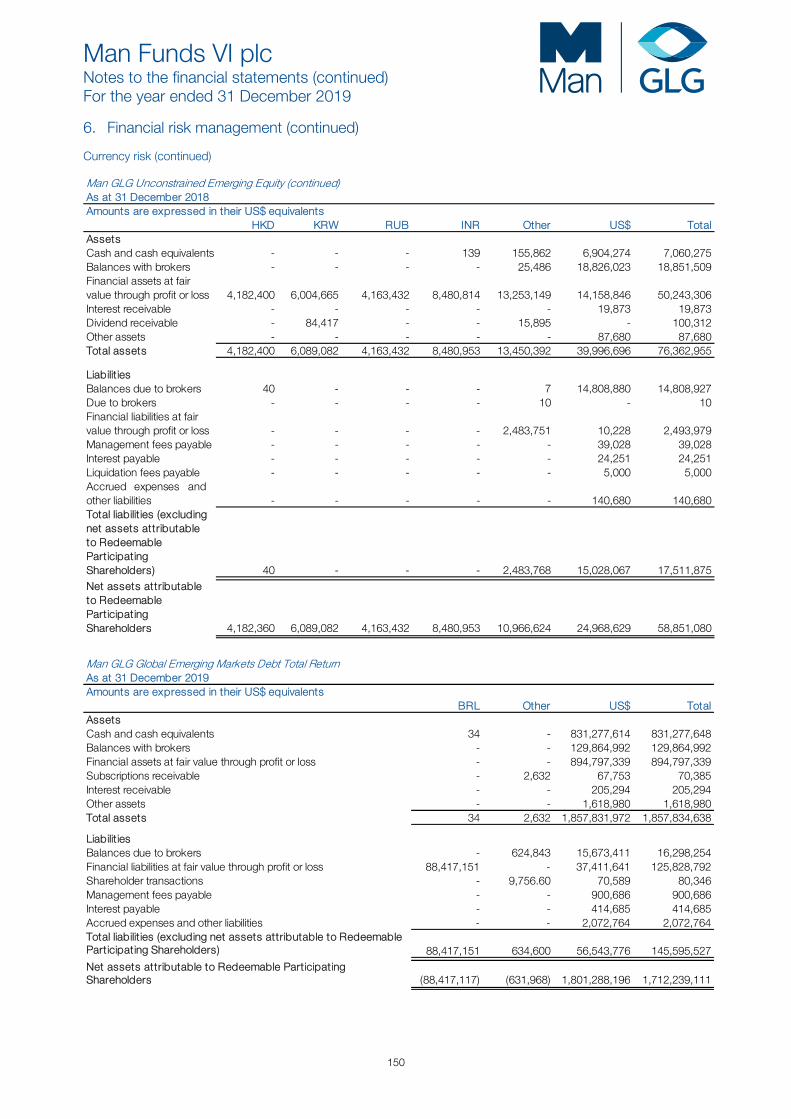
Man Funds VI plc Notes to the financial statements (continued) For the year ended 31 December 2019
150
6. Financial risk management (continued) Currency risk (continued) Man GLG Unconstrained Emerging Equity (continued)As at 31 December 2018Amounts are expressed in their US$ equivalents
HKD KRW RUB INR Other US$ TotalAssets Cash and cash equivalents - - - 139 155,862 6,904,274 7,060,275 Balances with brokers - - - - 25,486 18,826,023 18,851,509 Financial assets at fair value through profit or loss 4,182,400 6,004,665 4,163,432 8,480,814 13,253,149 14,158,846 50,243,306 Interest receivable - - - - - 19,873 19,873 Dividend receivable - 84,417 - - 15,895 - 100,312 Other assets - - - - - 87,680 87,680 Total assets 4,182,400 6,089,082 4,163,432 8,480,953 13,450,392 39,996,696 76,362,955
Liabilit iesBalances due to brokers 40 - - - 7 14,808,880 14,808,927 Due to brokers - - - - 10 - 10 Financial liabilities at fair value through profit or loss - - - - 2,483,751 10,228 2,493,979 Management fees payable - - - - - 39,028 39,028 Interest payable - - - - - 24,251 24,251 Liquidation fees payable - - - - - 5,000 5,000 Accrued expenses andother liabilities - - - - - 140,680 140,680 Total liabilit ies (excludingnet assets attributableto RedeemableParticipatingShareholders) 40 - - - 2,483,768 15,028,067 17,511,875 Net assets attributableto RedeemableParticipatingShareholders 4,182,360 6,089,082 4,163,432 8,480,953 10,966,624 24,968,629 58,851,080
Man GLG Global Emerging Markets Debt Total ReturnAs at 31 December 2019Amounts are expressed in their US$ equivalents
BRL Other US$ TotalAssetsCash and cash equivalents 34 - 831,277,614 831,277,648 Balances with brokers - - 129,864,992 129,864,992 Financial assets at fair value through profit or loss - - 894,797,339 894,797,339 Subscriptions receivable - 2,632 67,753 70,385 Interest receivable - - 205,294 205,294 Other assets - - 1,618,980 1,618,980 Total assets 34 2,632 1,857,831,972 1,857,834,638
Liabilit iesBalances due to brokers - 624,843 15,673,411 16,298,254 Financial liabilities at fair value through profit or loss 88,417,151 - 37,411,641 125,828,792 Shareholder transactions - 9,756.60 70,589 80,346 Management fees payable - - 900,686 900,686 Interest payable - - 414,685 414,685 Accrued expenses and other liabilities - - 2,072,764 2,072,764
88,417,151 634,600 56,543,776 145,595,527
(88,417,117) (631,968) 1,801,288,196 1,712,239,111
Total liabilit ies (excluding net assets attributable to RedeemableParticipating Shareholders)
Net assets attributable to Redeemable ParticipatingShareholders
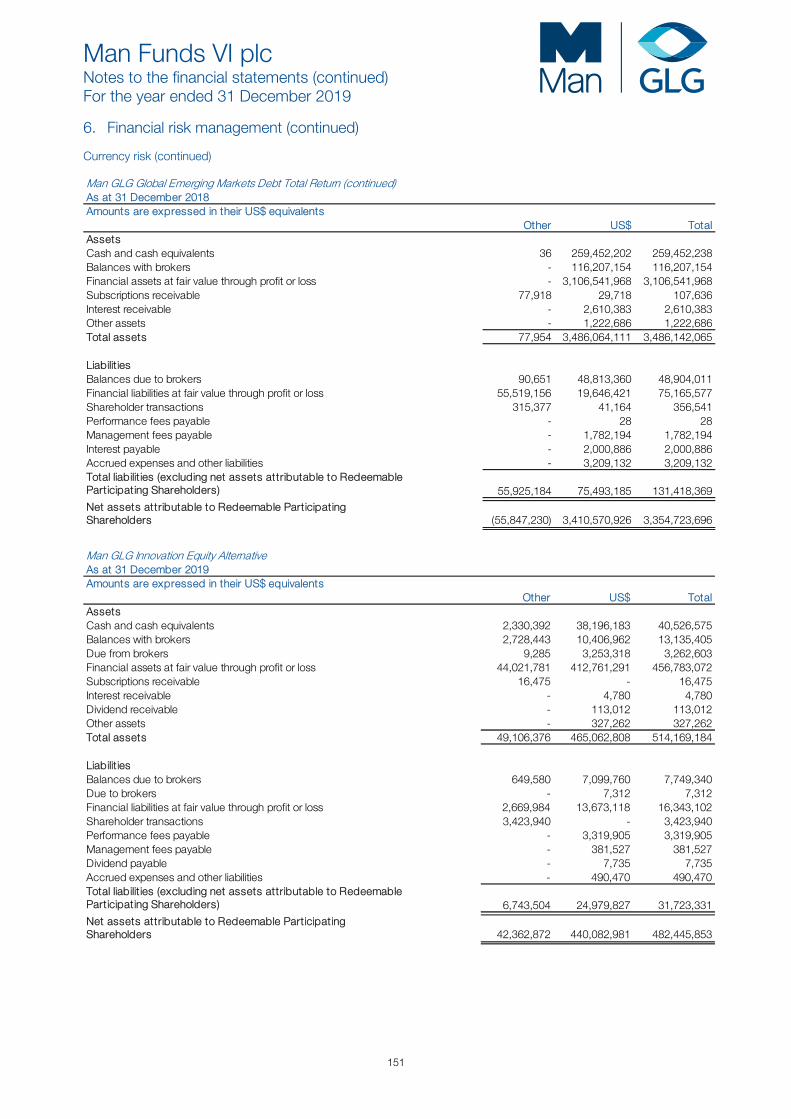
Man Funds VI plc Notes to the financial statements (continued) For the year ended 31 December 2019
151
6. Financial risk management (continued) Currency risk (continued) Man GLG Global Emerging Markets Debt Total Return (continued)As at 31 December 2018Amounts are expressed in their US$ equivalents
Other US$ TotalAssetsCash and cash equivalents 36 259,452,202 259,452,238 Balances with brokers - 116,207,154 116,207,154 Financial assets at fair value through profit or loss - 3,106,541,968 3,106,541,968 Subscriptions receivable 77,918 29,718 107,636 Interest receivable - 2,610,383 2,610,383 Other assets - 1,222,686 1,222,686 Total assets 77,954 3,486,064,111 3,486,142,065
Liabilit iesBalances due to brokers 90,651 48,813,360 48,904,011 Financial liabilities at fair value through profit or loss 55,519,156 19,646,421 75,165,577 Shareholder transactions 315,377 41,164 356,541 Performance fees payable - 28 28 Management fees payable - 1,782,194 1,782,194 Interest payable - 2,000,886 2,000,886 Accrued expenses and other liabilities - 3,209,132 3,209,132
55,925,184 75,493,185 131,418,369
(55,847,230) 3,410,570,926 3,354,723,696
Total liabilit ies (excluding net assets attributable to RedeemableParticipating Shareholders)
Net assets attributable to Redeemable ParticipatingShareholders
Man GLG Innovation Equity AlternativeAs at 31 December 2019Amounts are expressed in their US$ equivalents
Other US$ TotalAssetsCash and cash equivalents 2,330,392 38,196,183 40,526,575 Balances with brokers 2,728,443 10,406,962 13,135,405 Due from brokers 9,285 3,253,318 3,262,603 Financial assets at fair value through profit or loss 44,021,781 412,761,291 456,783,072 Subscriptions receivable 16,475 - 16,475 Interest receivable - 4,780 4,780 Dividend receivable - 113,012 113,012 Other assets - 327,262 327,262 Total assets 49,106,376 465,062,808 514,169,184
Liabilit iesBalances due to brokers 649,580 7,099,760 7,749,340 Due to brokers - 7,312 7,312 Financial liabilities at fair value through profit or loss 2,669,984 13,673,118 16,343,102 Shareholder transactions 3,423,940 - 3,423,940 Performance fees payable - 3,319,905 3,319,905 Management fees payable - 381,527 381,527 Dividend payable - 7,735 7,735 Accrued expenses and other liabilities - 490,470 490,470
6,743,504 24,979,827 31,723,331
42,362,872 440,082,981 482,445,853
Total liabilit ies (excluding net assets attributable to RedeemableParticipating Shareholders)
Net assets attributable to Redeemable ParticipatingShareholders
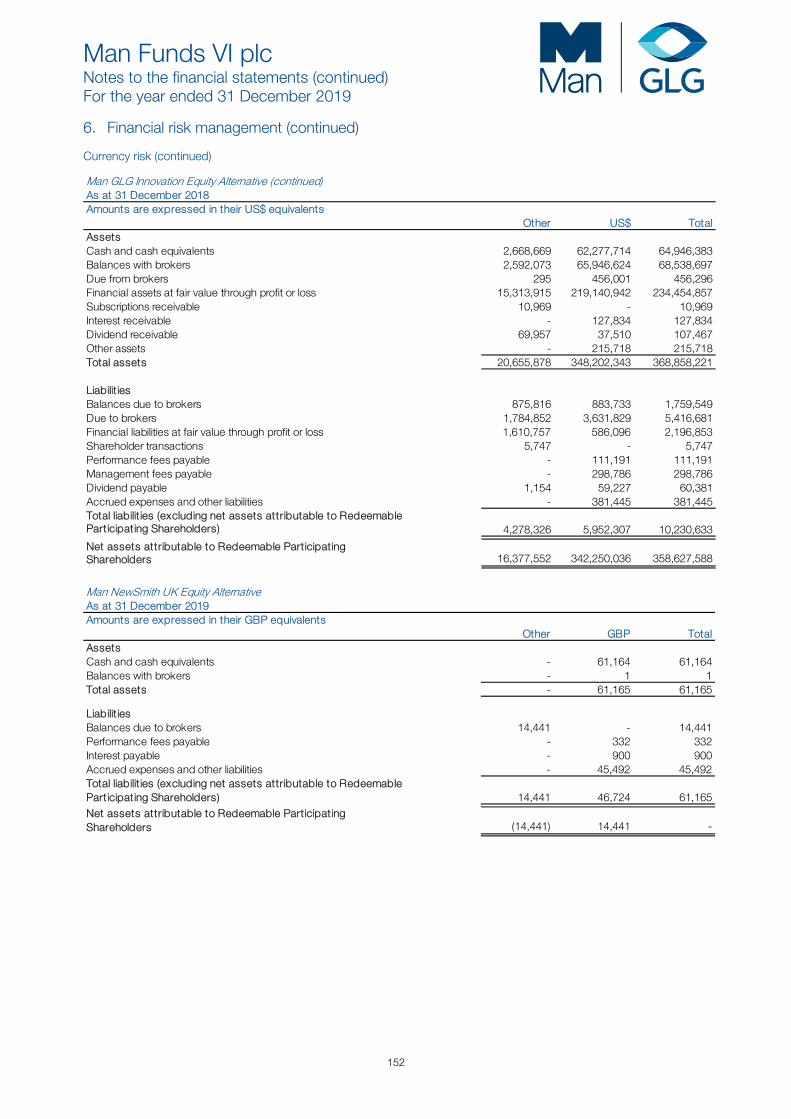
Man Funds VI plc Notes to the financial statements (continued) For the year ended 31 December 2019
152
6. Financial risk management (continued) Currency risk (continued) Man GLG Innovation Equity Alternative (continued)As at 31 December 2018Amounts are expressed in their US$ equivalents
Other US$ TotalAssetsCash and cash equivalents 2,668,669 62,277,714 64,946,383 Balances with brokers 2,592,073 65,946,624 68,538,697 Due from brokers 295 456,001 456,296 Financial assets at fair value through profit or loss 15,313,915 219,140,942 234,454,857 Subscriptions receivable 10,969 - 10,969 Interest receivable - 127,834 127,834 Dividend receivable 69,957 37,510 107,467 Other assets - 215,718 215,718 Total assets 20,655,878 348,202,343 368,858,221
Liabilit iesBalances due to brokers 875,816 883,733 1,759,549 Due to brokers 1,784,852 3,631,829 5,416,681 Financial liabilities at fair value through profit or loss 1,610,757 586,096 2,196,853 Shareholder transactions 5,747 - 5,747 Performance fees payable - 111,191 111,191 Management fees payable - 298,786 298,786 Dividend payable 1,154 59,227 60,381 Accrued expenses and other liabilities - 381,445 381,445
4,278,326 5,952,307 10,230,633
16,377,552 342,250,036 358,627,588
Total liabilit ies (excluding net assets attributable to RedeemableParticipating Shareholders)
Net assets attributable to Redeemable ParticipatingShareholders
Man NewSmith UK Equity AlternativeAs at 31 December 2019Amounts are expressed in their GBP equivalents
Other GBP TotalAssetsCash and cash equivalents - 61,164 61,164 Balances with brokers - 1 1 Total assets - 61,165 61,165
Liabilit iesBalances due to brokers 14,441 - 14,441 Performance fees payable - 332 332 Interest payable - 900 900 Accrued expenses and other liabilities - 45,492 45,492
14,441 46,724 61,165
(14,441) 14,441 -
Total liabilit ies (excluding net assets attributable to RedeemableParticipating Shareholders) Net assets attributable to Redeemable ParticipatingShareholders

Man Funds VI plc Notes to the financial statements (continued) For the year ended 31 December 2019
153
6. Financial risk management (continued) Currency risk (continued) Man NewSmith UK Equity Alternative (continued)As at 31 December 2018Amounts are expressed in their GBP equivalents
Other GBP TotalAssetsCash and cash equivalents - 20,042,641 20,042,641 Balances with brokers - 16,320,084 16,320,084 Financial assets at fair value through profit or loss 1,247,691 78,164,756 79,412,447 Interest receivable - 95 95 Dividend receivable 13,514 165,555 179,069 Other assets - 57,694 57,694 Total assets 1,261,205 114,750,825 116,012,030
Liabilit iesBalances due to brokers 33,759 2,711,205 2,744,964 Financial liabilities at fair value through profit or loss - 4,927,316 4,927,316 Performance fees payable - 332 332 Management fees payable - 159,626 159,626 Interest payable - 868 868 Dividend payable - 89,054 89,054 Accrued expenses and other liabilities - 117,909 117,909
33,759 8,006,310 8,040,069
1,227,446 106,744,515 107,971,961 Net assets attributable to Redeemable ParticipatingShareholders
Total liabilit ies (excluding net assets attributable to RedeemableParticipating Shareholders)
Man Alternative Style Risk PremiaAs at 31 December 2019Amounts are expressed in their US$ equivalents
CHF EUR SEK Other US$ TotalAssetsCash and cash equivalents 10,311 - 26,687 1,723,971 27,675,407 29,436,376 Balances with brokers - 5,843,691 253,579 5,197,752 42,430,045 53,725,067
60,643,071 246,390,532 77,839,253 23,872,760 192,061,813 600,807,429 Subscriptions receivable - 3,367,500 - 148,394 - 3,515,894 Other assets - - - - 524,752 524,752 Total assets 60,653,382 255,601,723 78,119,519 30,942,877 262,692,017 688,009,518
Liabilit iesBalances due to brokers - 3,382,789 - (2,938,330) 10,276,233 10,720,692 Due to brokers - - 952 2,682 - 3,634
3,235,262 18,209,990 1,701,922 2,923,030 12,727,413 38,797,617 Shareholder transactions - - - - 12,774 12,774 Performance fees payable - - - - 6,236 6,236 Management fees payable - - - 1 980,886 980,887 Accrued expenses and other liabilities - - - - 722,004 722,004
3,235,262 21,592,779 1,702,874 (12,617) 24,725,546 51,243,844
57,418,120 234,008,944 76,416,645 30,955,494 237,966,471 636,765,674
Total liabilit ies (excluding net assetsattributable to RedeemableParticipating Shareholders)
Net assets attributable to RedeemableParticipating Shareholders
Financial liabilities at fair value through profit or loss
Financial assets at fair value through profit or loss
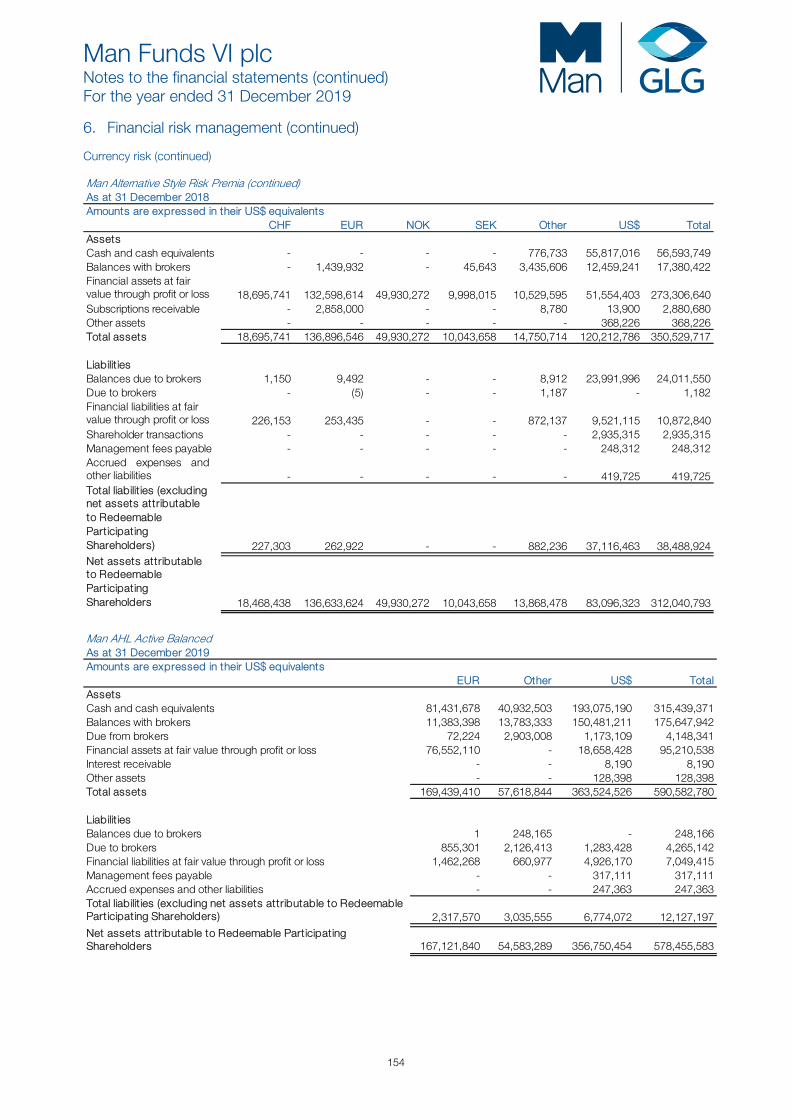
Man Funds VI plc Notes to the financial statements (continued) For the year ended 31 December 2019
154
6. Financial risk management (continued) Currency risk (continued) Man Alternative Style Risk Premia (continued)As at 31 December 2018Amounts are expressed in their US$ equivalents
CHF EUR NOK SEK Other US$ TotalAssets Cash and cash equivalents - - - - 776,733 55,817,016 56,593,749 Balances with brokers - 1,439,932 - 45,643 3,435,606 12,459,241 17,380,422 Financial assets at fair value through profit or loss 18,695,741 132,598,614 49,930,272 9,998,015 10,529,595 51,554,403 273,306,640 Subscriptions receivable - 2,858,000 - - 8,780 13,900 2,880,680 Other assets - - - - - 368,226 368,226 Total assets 18,695,741 136,896,546 49,930,272 10,043,658 14,750,714 120,212,786 350,529,717
Liabilit iesBalances due to brokers 1,150 9,492 - - 8,912 23,991,996 24,011,550 Due to brokers - (5) - - 1,187 - 1,182 Financial liabilities at fair value through profit or loss 226,153 253,435 - - 872,137 9,521,115 10,872,840 Shareholder transactions - - - - - 2,935,315 2,935,315 Management fees payable - - - - - 248,312 248,312 Accrued expenses andother liabilities - - - - - 419,725 419,725 Total liabilit ies (excludingnet assets attributableto RedeemableParticipatingShareholders) 227,303 262,922 - - 882,236 37,116,463 38,488,924 Net assets attributableto RedeemableParticipatingShareholders 18,468,438 136,633,624 49,930,272 10,043,658 13,868,478 83,096,323 312,040,793
Man AHL Active Balanced As at 31 December 2019Amounts are expressed in their US$ equivalents
EUR Other US$ TotalAssetsCash and cash equivalents 81,431,678 40,932,503 193,075,190 315,439,371 Balances with brokers 11,383,398 13,783,333 150,481,211 175,647,942 Due from brokers 72,224 2,903,008 1,173,109 4,148,341 Financial assets at fair value through profit or loss 76,552,110 - 18,658,428 95,210,538 Interest receivable - - 8,190 8,190 Other assets - - 128,398 128,398 Total assets 169,439,410 57,618,844 363,524,526 590,582,780
Liabilit iesBalances due to brokers 1 248,165 - 248,166 Due to brokers 855,301 2,126,413 1,283,428 4,265,142 Financial liabilities at fair value through profit or loss 1,462,268 660,977 4,926,170 7,049,415 Management fees payable - - 317,111 317,111 Accrued expenses and other liabilities - - 247,363 247,363
2,317,570 3,035,555 6,774,072 12,127,197
167,121,840 54,583,289 356,750,454 578,455,583
Total liabilit ies (excluding net assets attributable to RedeemableParticipating Shareholders)
Net assets attributable to Redeemable ParticipatingShareholders
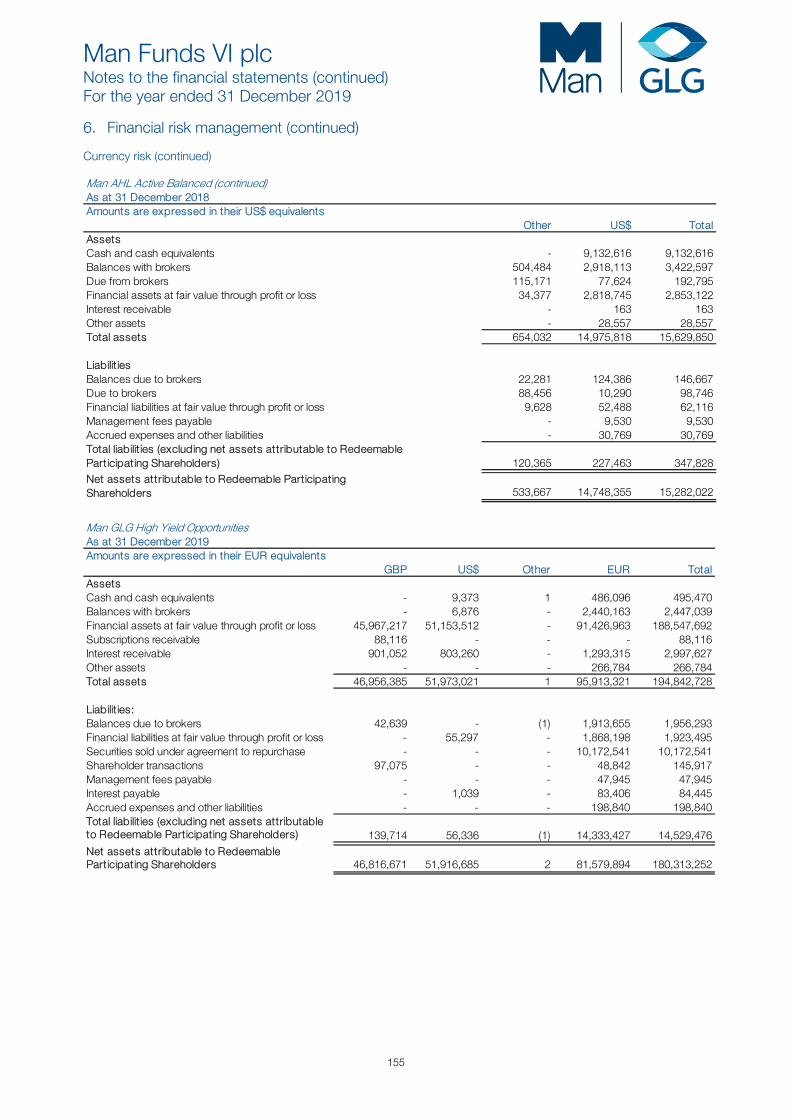
Man Funds VI plc Notes to the financial statements (continued) For the year ended 31 December 2019
155
6. Financial risk management (continued) Currency risk (continued) Man AHL Active Balanced (continued)As at 31 December 2018Amounts are expressed in their US$ equivalents
Other US$ TotalAssetsCash and cash equivalents - 9,132,616 9,132,616 Balances with brokers 504,484 2,918,113 3,422,597 Due from brokers 115,171 77,624 192,795 Financial assets at fair value through profit or loss 34,377 2,818,745 2,853,122 Interest receivable - 163 163 Other assets - 28,557 28,557 Total assets 654,032 14,975,818 15,629,850
Liabilit iesBalances due to brokers 22,281 124,386 146,667 Due to brokers 88,456 10,290 98,746 Financial liabilities at fair value through profit or loss 9,628 52,488 62,116 Management fees payable - 9,530 9,530 Accrued expenses and other liabilities - 30,769 30,769
120,365 227,463 347,828
533,667 14,748,355 15,282,022
Total liabilit ies (excluding net assets attributable to RedeemableParticipating Shareholders) Net assets attributable to Redeemable ParticipatingShareholders
Man GLG High Yield OpportunitiesAs at 31 December 2019Amounts are expressed in their EUR equivalents
GBP US$ Other EUR TotalAssetsCash and cash equivalents - 9,373 1 486,096 495,470 Balances with brokers - 6,876 - 2,440,163 2,447,039 Financial assets at fair value through profit or loss 45,967,217 51,153,512 - 91,426,963 188,547,692 Subscriptions receivable 88,116 - - - 88,116 Interest receivable 901,052 803,260 - 1,293,315 2,997,627 Other assets - - - 266,784 266,784 Total assets 46,956,385 51,973,021 1 95,913,321 194,842,728
Liabilit ies:Balances due to brokers 42,639 - (1) 1,913,655 1,956,293 Financial liabilities at fair value through profit or loss - 55,297 - 1,868,198 1,923,495 Securities sold under agreement to repurchase - - - 10,172,541 10,172,541 Shareholder transactions 97,075 - - 48,842 145,917 Management fees payable - - - 47,945 47,945 Interest payable - 1,039 - 83,406 84,445 Accrued expenses and other liabilities - - - 198,840 198,840
139,714 56,336 (1) 14,333,427 14,529,476
46,816,671 51,916,685 2 81,579,894 180,313,252
Total liabilit ies (excluding net assets attributableto Redeemable Participating Shareholders)
Net assets attributable to RedeemableParticipating Shareholders
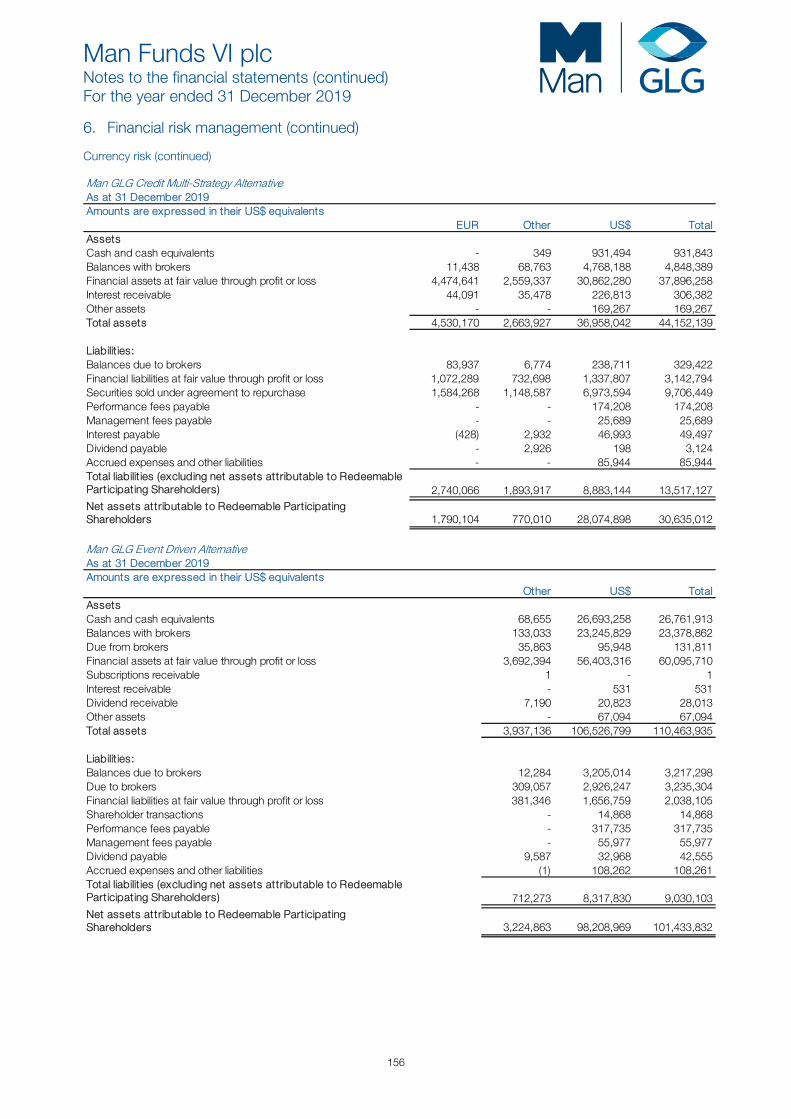
Man Funds VI plc Notes to the financial statements (continued) For the year ended 31 December 2019
156
6. Financial risk management (continued) Currency risk (continued) Man GLG Credit Multi-Strategy AlternativeAs at 31 December 2019Amounts are expressed in their US$ equivalents
EUR Other US$ TotalAssetsCash and cash equivalents - 349 931,494 931,843 Balances with brokers 11,438 68,763 4,768,188 4,848,389 Financial assets at fair value through profit or loss 4,474,641 2,559,337 30,862,280 37,896,258 Interest receivable 44,091 35,478 226,813 306,382 Other assets - - 169,267 169,267 Total assets 4,530,170 2,663,927 36,958,042 44,152,139
Liabilit ies:Balances due to brokers 83,937 6,774 238,711 329,422 Financial liabilities at fair value through profit or loss 1,072,289 732,698 1,337,807 3,142,794 Securities sold under agreement to repurchase 1,584,268 1,148,587 6,973,594 9,706,449 Performance fees payable - - 174,208 174,208 Management fees payable - - 25,689 25,689 Interest payable (428) 2,932 46,993 49,497 Dividend payable - 2,926 198 3,124 Accrued expenses and other liabilities - - 85,944 85,944
2,740,066 1,893,917 8,883,144 13,517,127
1,790,104 770,010 28,074,898 30,635,012
Man GLG Event Driven AlternativeAs at 31 December 2019Amounts are expressed in their US$ equivalents
Other US$ TotalAssetsCash and cash equivalents 68,655 26,693,258 26,761,913 Balances with brokers 133,033 23,245,829 23,378,862 Due from brokers 35,863 95,948 131,811 Financial assets at fair value through profit or loss 3,692,394 56,403,316 60,095,710 Subscriptions receivable 1 - 1 Interest receivable - 531 531 Dividend receivable 7,190 20,823 28,013 Other assets - 67,094 67,094 Total assets 3,937,136 106,526,799 110,463,935
Liabilit ies:Balances due to brokers 12,284 3,205,014 3,217,298 Due to brokers 309,057 2,926,247 3,235,304 Financial liabilities at fair value through profit or loss 381,346 1,656,759 2,038,105 Shareholder transactions - 14,868 14,868 Performance fees payable - 317,735 317,735 Management fees payable - 55,977 55,977 Dividend payable 9,587 32,968 42,555 Accrued expenses and other liabilities (1) 108,262 108,261
712,273 8,317,830 9,030,103
3,224,863 98,208,969 101,433,832
Total liabilit ies (excluding net assets attributable to RedeemableParticipating Shareholders)
Net assets attributable to Redeemable ParticipatingShareholders
Total liabilit ies (excluding net assets attributable to RedeemableParticipating Shareholders)
Net assets attributable to Redeemable ParticipatingShareholders
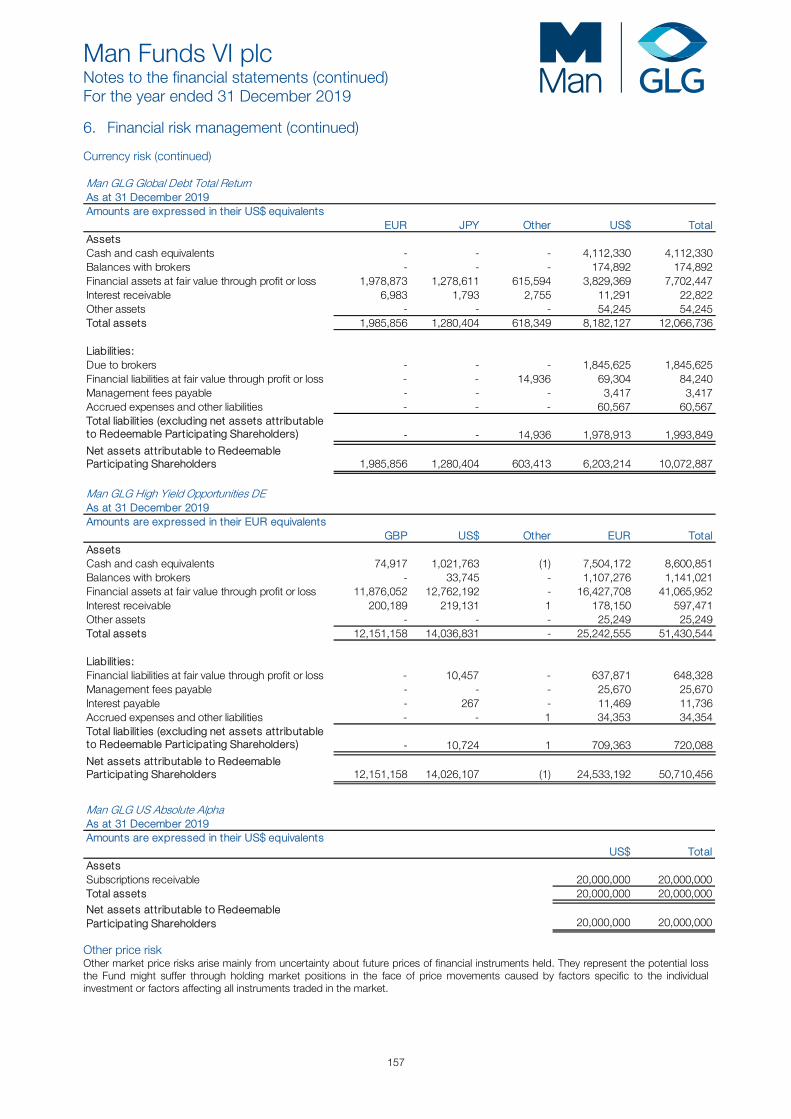
Man Funds VI plc Notes to the financial statements (continued) For the year ended 31 December 2019
157
6. Financial risk management (continued) Currency risk (continued) Man GLG Global Debt Total ReturnAs at 31 December 2019Amounts are expressed in their US$ equivalents
EUR JPY Other US$ TotalAssetsCash and cash equivalents - - - 4,112,330 4,112,330 Balances with brokers - - - 174,892 174,892 Financial assets at fair value through profit or loss 1,978,873 1,278,611 615,594 3,829,369 7,702,447 Interest receivable 6,983 1,793 2,755 11,291 22,822 Other assets - - - 54,245 54,245 Total assets 1,985,856 1,280,404 618,349 8,182,127 12,066,736
Liabilit ies:Due to brokers - - - 1,845,625 1,845,625 Financial liabilities at fair value through profit or loss - - 14,936 69,304 84,240 Management fees payable - - - 3,417 3,417 Accrued expenses and other liabilities - - - 60,567 60,567
- - 14,936 1,978,913 1,993,849
1,985,856 1,280,404 603,413 6,203,214 10,072,887
Man GLG High Yield Opportunities DEAs at 31 December 2019Amounts are expressed in their EUR equivalents
GBP US$ Other EUR TotalAssetsCash and cash equivalents 74,917 1,021,763 (1) 7,504,172 8,600,851 Balances with brokers - 33,745 - 1,107,276 1,141,021 Financial assets at fair value through profit or loss 11,876,052 12,762,192 - 16,427,708 41,065,952 Interest receivable 200,189 219,131 1 178,150 597,471 Other assets - - - 25,249 25,249 Total assets 12,151,158 14,036,831 - 25,242,555 51,430,544
Liabilit ies:Financial liabilities at fair value through profit or loss - 10,457 - 637,871 648,328 Management fees payable - - - 25,670 25,670 Interest payable - 267 - 11,469 11,736 Accrued expenses and other liabilities - - 1 34,353 34,354
- 10,724 1 709,363 720,088
12,151,158 14,026,107 (1) 24,533,192 50,710,456
Total liabilit ies (excluding net assets attributableto Redeemable Participating Shareholders)
Net assets attributable to RedeemableParticipating Shareholders
Total liabilit ies (excluding net assets attributableto Redeemable Participating Shareholders)
Net assets attributable to RedeemableParticipating Shareholders
Man GLG US Absolute AlphaAs at 31 December 2019Amounts are expressed in their US$ equivalents
US$ TotalAssetsSubscriptions receivable 20,000,000 20,000,000 Total assets 20,000,000 20,000,000
20,000,000 20,000,000 Net assets attributable to RedeemableParticipating Shareholders
Other price risk Other market price risks arise mainly from uncertainty about future prices of financial instruments held. They represent the potential loss the Fund might suffer through holding market positions in the face of price movements caused by factors specific to the individual investment or factors affecting all instruments traded in the market.
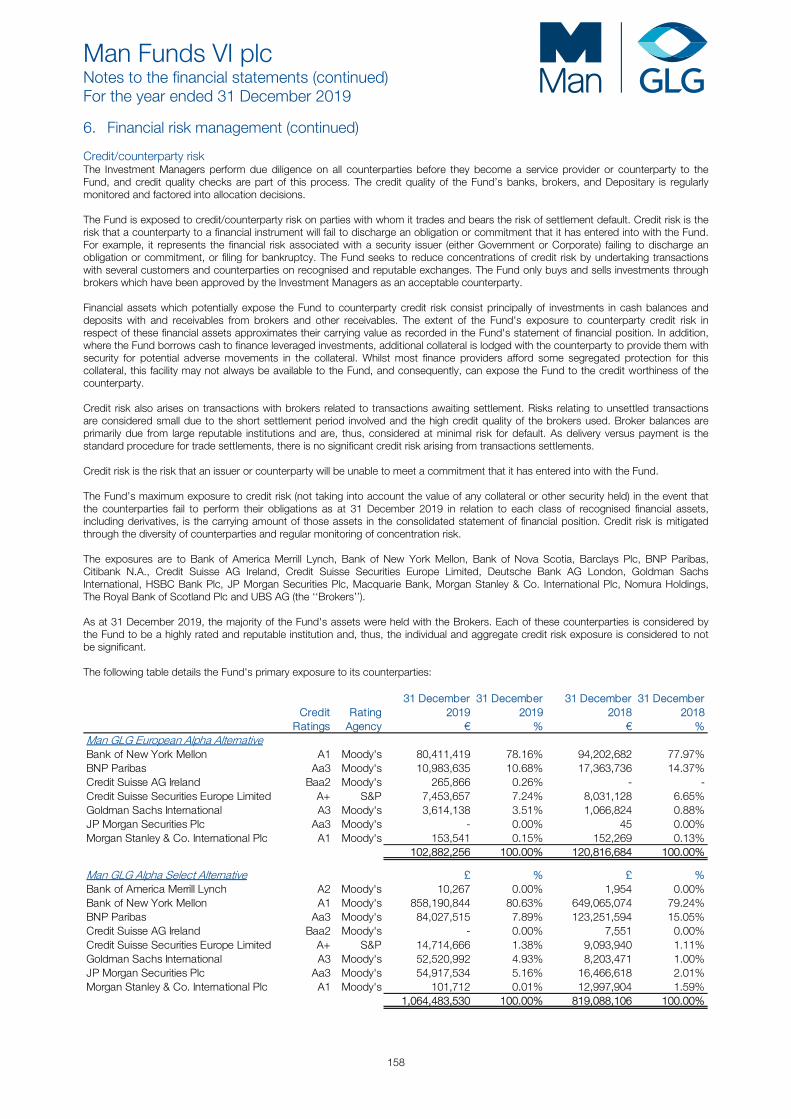
Man Funds VI plc Notes to the financial statements (continued) For the year ended 31 December 2019
158
6. Financial risk management (continued) Credit/counterparty risk The Investment Managers perform due diligence on all counterparties before they become a service provider or counterparty to the Fund, and credit quality checks are part of this process. The credit quality of the Fund’s banks, brokers, and Depositary is regularly monitored and factored into allocation decisions. The Fund is exposed to credit/counterparty risk on parties with whom it trades and bears the risk of settlement default. Credit risk is the risk that a counterparty to a financial instrument will fail to discharge an obligation or commitment that it has entered into with the Fund. For example, it represents the financial risk associated with a security issuer (either Government or Corporate) failing to discharge an obligation or commitment, or filing for bankruptcy. The Fund seeks to reduce concentrations of credit risk by undertaking transactions with several customers and counterparties on recognised and reputable exchanges. The Fund only buys and sells investments through brokers which have been approved by the Investment Managers as an acceptable counterparty. Financial assets which potentially expose the Fund to counterparty credit risk consist principally of investments in cash balances and deposits with and receivables from brokers and other receivables. The extent of the Fund's exposure to counterparty credit risk in respect of these financial assets approximates their carrying value as recorded in the Fund's statement of financial position. In addition, where the Fund borrows cash to finance leveraged investments, additional collateral is lodged with the counterparty to provide them with security for potential adverse movements in the collateral. Whilst most finance providers afford some segregated protection for this collateral, this facility may not always be available to the Fund, and consequently, can expose the Fund to the credit worthiness of the counterparty. Credit risk also arises on transactions with brokers related to transactions awaiting settlement. Risks relating to unsettled transactions are considered small due to the short settlement period involved and the high credit quality of the brokers used. Broker balances are primarily due from large reputable institutions and are, thus, considered at minimal risk for default. As delivery versus payment is the standard procedure for trade settlements, there is no significant credit risk arising from transactions settlements. Credit risk is the risk that an issuer or counterparty will be unable to meet a commitment that it has entered into with the Fund. The Fund’s maximum exposure to credit risk (not taking into account the value of any collateral or other security held) in the event that the counterparties fail to perform their obligations as at 31 December 2019 in relation to each class of recognised financial assets, including derivatives, is the carrying amount of those assets in the consolidated statement of financial position. Credit risk is mitigated through the diversity of counterparties and regular monitoring of concentration risk. The exposures are to Bank of America Merrill Lynch, Bank of New York Mellon, Bank of Nova Scotia, Barclays Plc, BNP Paribas, Citibank N.A., Credit Suisse AG Ireland, Credit Suisse Securities Europe Limited, Deutsche Bank AG London, Goldman Sachs International, HSBC Bank Plc, JP Morgan Securities Plc, Macquarie Bank, Morgan Stanley & Co. International Plc, Nomura Holdings, The Royal Bank of Scotland Plc and UBS AG (the ‘‘Brokers’’). As at 31 December 2019, the majority of the Fund's assets were held with the Brokers. Each of these counterparties is considered by the Fund to be a highly rated and reputable institution and, thus, the individual and aggregate credit risk exposure is considered to not be significant. The following table details the Fund's primary exposure to its counterparties:
Credit Rating31 December
201931 December
201931 December
201831 December
2018Ratings Agency € % € %
Man GLG European Alpha AlternativeBank of New York Mellon A1 Moody's 80,411,419 78.16% 94,202,682 77.97%BNP Paribas Aa3 Moody's 10,983,635 10.68% 17,363,736 14.37%Credit Suisse AG Ireland Baa2 Moody's 265,866 0.26% - - Credit Suisse Securities Europe Limited A+ S&P 7,453,657 7.24% 8,031,128 6.65%Goldman Sachs International A3 Moody's 3,614,138 3.51% 1,066,824 0.88%JP Morgan Securities Plc Aa3 Moody's - 0.00% 45 0.00%Morgan Stanley & Co. International Plc A1 Moody's 153,541 0.15% 152,269 0.13%
102,882,256 100.00% 120,816,684 100.00%
Man GLG Alpha Select Alternative £ % £ %Bank of America Merrill Lynch A2 Moody's 10,267 0.00% 1,954 0.00%Bank of New York Mellon A1 Moody's 858,190,844 80.63% 649,065,074 79.24%BNP Paribas Aa3 Moody's 84,027,515 7.89% 123,251,594 15.05%Credit Suisse AG Ireland Baa2 Moody's - 0.00% 7,551 0.00%Credit Suisse Securities Europe Limited A+ S&P 14,714,666 1.38% 9,093,940 1.11%Goldman Sachs International A3 Moody's 52,520,992 4.93% 8,203,471 1.00%JP Morgan Securities Plc Aa3 Moody's 54,917,534 5.16% 16,466,618 2.01%Morgan Stanley & Co. International Plc A1 Moody's 101,712 0.01% 12,997,904 1.59%
1,064,483,530 100.00% 819,088,106 100.00%
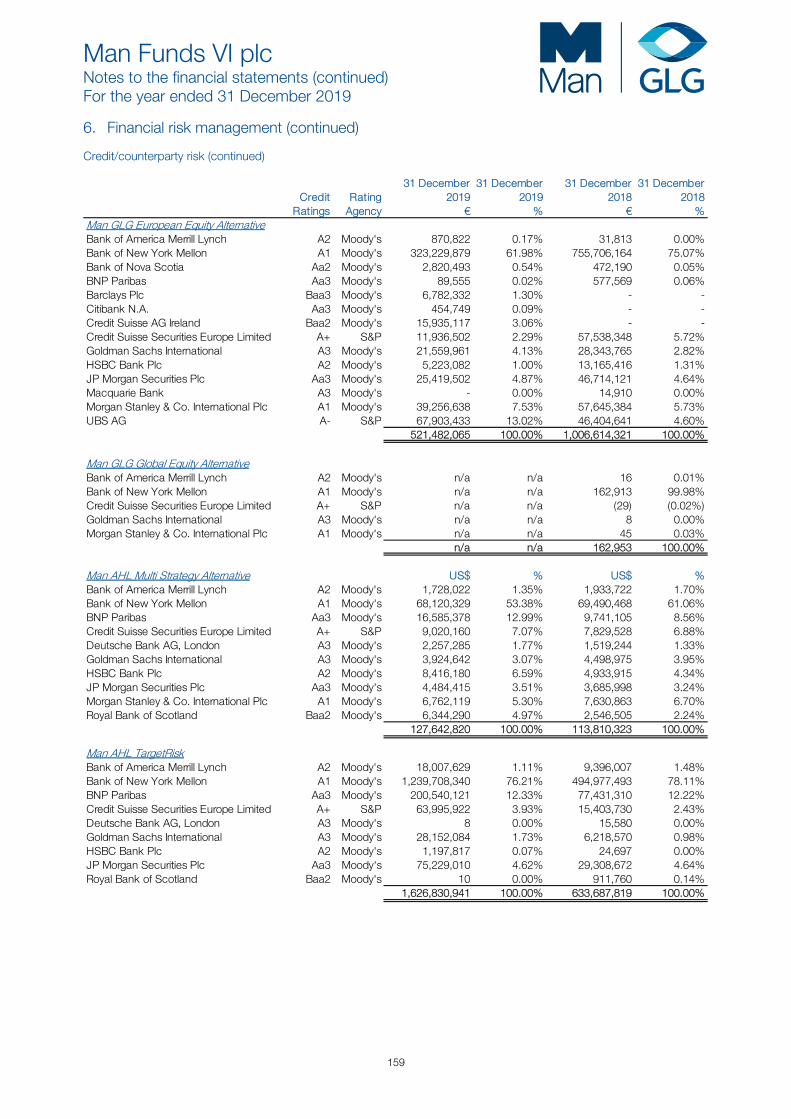
Man Funds VI plc Notes to the financial statements (continued) For the year ended 31 December 2019
159
6. Financial risk management (continued) Credit/counterparty risk (continued)
Credit Rating31 December
201931 December
201931 December
201831 December
2018Ratings Agency € % € %
Man GLG European Equity AlternativeBank of America Merrill Lynch A2 Moody's 870,822 0.17% 31,813 0.00%Bank of New York Mellon A1 Moody's 323,229,879 61.98% 755,706,164 75.07%Bank of Nova Scotia Aa2 Moody's 2,820,493 0.54% 472,190 0.05%BNP Paribas Aa3 Moody's 89,555 0.02% 577,569 0.06%Barclays Plc Baa3 Moody's 6,782,332 1.30% - - Citibank N.A. Aa3 Moody's 454,749 0.09% - - Credit Suisse AG Ireland Baa2 Moody's 15,935,117 3.06% - - Credit Suisse Securities Europe Limited A+ S&P 11,936,502 2.29% 57,538,348 5.72%Goldman Sachs International A3 Moody's 21,559,961 4.13% 28,343,765 2.82%HSBC Bank Plc A2 Moody's 5,223,082 1.00% 13,165,416 1.31%JP Morgan Securities Plc Aa3 Moody's 25,419,502 4.87% 46,714,121 4.64%Macquarie Bank A3 Moody's - 0.00% 14,910 0.00%Morgan Stanley & Co. International Plc A1 Moody's 39,256,638 7.53% 57,645,384 5.73%UBS AG A- S&P 67,903,433 13.02% 46,404,641 4.60%
521,482,065 100.00% 1,006,614,321 100.00%
Man GLG Global Equity AlternativeBank of America Merrill Lynch A2 Moody's n/a n/a 16 0.01%Bank of New York Mellon A1 Moody's n/a n/a 162,913 99.98%Credit Suisse Securities Europe Limited A+ S&P n/a n/a (29) (0.02%)Goldman Sachs International A3 Moody's n/a n/a 8 0.00%Morgan Stanley & Co. International Plc A1 Moody's n/a n/a 45 0.03%
n/a n/a 162,953 100.00%
Man AHL Multi Strategy Alternative US$ % US$ %Bank of America Merrill Lynch A2 Moody's 1,728,022 1.35% 1,933,722 1.70%Bank of New York Mellon A1 Moody's 68,120,329 53.38% 69,490,468 61.06%BNP Paribas Aa3 Moody's 16,585,378 12.99% 9,741,105 8.56%Credit Suisse Securities Europe Limited A+ S&P 9,020,160 7.07% 7,829,528 6.88%Deutsche Bank AG, London A3 Moody's 2,257,285 1.77% 1,519,244 1.33%Goldman Sachs International A3 Moody's 3,924,642 3.07% 4,498,975 3.95%HSBC Bank Plc A2 Moody's 8,416,180 6.59% 4,933,915 4.34%JP Morgan Securities Plc Aa3 Moody's 4,484,415 3.51% 3,685,998 3.24%Morgan Stanley & Co. International Plc A1 Moody's 6,762,119 5.30% 7,630,863 6.70%Royal Bank of Scotland Baa2 Moody's 6,344,290 4.97% 2,546,505 2.24%
127,642,820 100.00% 113,810,323 100.00%
Man AHL TargetRiskBank of America Merrill Lynch A2 Moody's 18,007,629 1.11% 9,396,007 1.48%Bank of New York Mellon A1 Moody's 1,239,708,340 76.21% 494,977,493 78.11%BNP Paribas Aa3 Moody's 200,540,121 12.33% 77,431,310 12.22%Credit Suisse Securities Europe Limited A+ S&P 63,995,922 3.93% 15,403,730 2.43%Deutsche Bank AG, London A3 Moody's 8 0.00% 15,580 0.00%Goldman Sachs International A3 Moody's 28,152,084 1.73% 6,218,570 0.98%HSBC Bank Plc A2 Moody's 1,197,817 0.07% 24,697 0.00%JP Morgan Securities Plc Aa3 Moody's 75,229,010 4.62% 29,308,672 4.64%Royal Bank of Scotland Baa2 Moody's 10 0.00% 911,760 0.14%
1,626,830,941 100.00% 633,687,819 100.00%
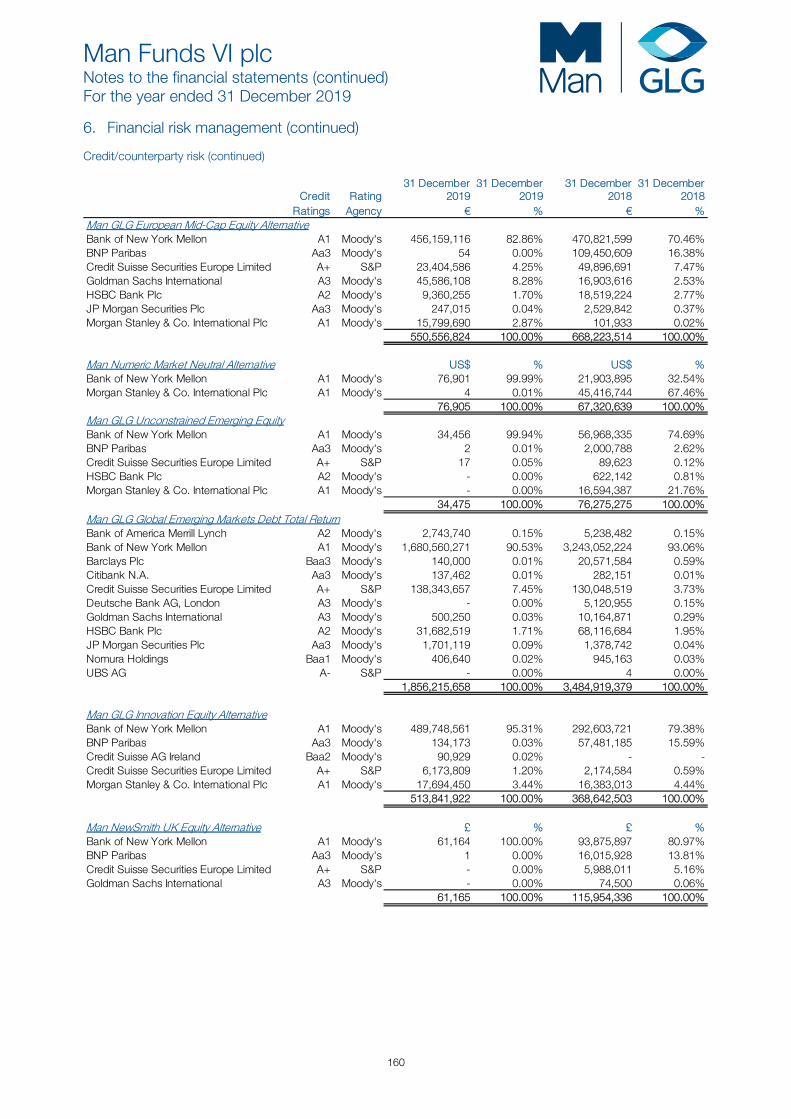
Man Funds VI plc Notes to the financial statements (continued) For the year ended 31 December 2019
160
6. Financial risk management (continued) Credit/counterparty risk (continued)
Credit Rating31 December
201931 December
201931 December
201831 December
2018Ratings Agency € % € %
Man GLG European Mid-Cap Equity AlternativeBank of New York Mellon A1 Moody's 456,159,116 82.86% 470,821,599 70.46%BNP Paribas Aa3 Moody's 54 0.00% 109,450,609 16.38%Credit Suisse Securities Europe Limited A+ S&P 23,404,586 4.25% 49,896,691 7.47%Goldman Sachs International A3 Moody's 45,586,108 8.28% 16,903,616 2.53%HSBC Bank Plc A2 Moody's 9,360,255 1.70% 18,519,224 2.77%JP Morgan Securities Plc Aa3 Moody's 247,015 0.04% 2,529,842 0.37%Morgan Stanley & Co. International Plc A1 Moody's 15,799,690 2.87% 101,933 0.02%
550,556,824 100.00% 668,223,514 100.00%
Man Numeric Market Neutral Alternative US$ % US$ %Bank of New York Mellon A1 Moody's 76,901 99.99% 21,903,895 32.54%Morgan Stanley & Co. International Plc A1 Moody's 4 0.01% 45,416,744 67.46%
76,905 100.00% 67,320,639 100.00%Man GLG Unconstrained Emerging EquityBank of New York Mellon A1 Moody's 34,456 99.94% 56,968,335 74.69%BNP Paribas Aa3 Moody's 2 0.01% 2,000,788 2.62%Credit Suisse Securities Europe Limited A+ S&P 17 0.05% 89,623 0.12%HSBC Bank Plc A2 Moody's - 0.00% 622,142 0.81%Morgan Stanley & Co. International Plc A1 Moody's - 0.00% 16,594,387 21.76%
34,475 100.00% 76,275,275 100.00%Man GLG Global Emerging Markets Debt Total ReturnBank of America Merrill Lynch A2 Moody's 2,743,740 0.15% 5,238,482 0.15%Bank of New York Mellon A1 Moody's 1,680,560,271 90.53% 3,243,052,224 93.06%Barclays Plc Baa3 Moody's 140,000 0.01% 20,571,584 0.59%Citibank N.A. Aa3 Moody's 137,462 0.01% 282,151 0.01%Credit Suisse Securities Europe Limited A+ S&P 138,343,657 7.45% 130,048,519 3.73%Deutsche Bank AG, London A3 Moody's - 0.00% 5,120,955 0.15%Goldman Sachs International A3 Moody's 500,250 0.03% 10,164,871 0.29%HSBC Bank Plc A2 Moody's 31,682,519 1.71% 68,116,684 1.95%JP Morgan Securities Plc Aa3 Moody's 1,701,119 0.09% 1,378,742 0.04%Nomura Holdings Baa1 Moody's 406,640 0.02% 945,163 0.03%UBS AG A- S&P - 0.00% 4 0.00%
1,856,215,658 100.00% 3,484,919,379 100.00%
Man GLG Innovation Equity AlternativeBank of New York Mellon A1 Moody's 489,748,561 95.31% 292,603,721 79.38%BNP Paribas Aa3 Moody's 134,173 0.03% 57,481,185 15.59%Credit Suisse AG Ireland Baa2 Moody's 90,929 0.02% - - Credit Suisse Securities Europe Limited A+ S&P 6,173,809 1.20% 2,174,584 0.59%Morgan Stanley & Co. International Plc A1 Moody's 17,694,450 3.44% 16,383,013 4.44%
513,841,922 100.00% 368,642,503 100.00%
Man NewSmith UK Equity Alternative £ % £ %Bank of New York Mellon A1 Moody's 61,164 100.00% 93,875,897 80.97%BNP Paribas Aa3 Moody's 1 0.00% 16,015,928 13.81%Credit Suisse Securities Europe Limited A+ S&P - 0.00% 5,988,011 5.16%Goldman Sachs International A3 Moody's - 0.00% 74,500 0.06%
61,165 100.00% 115,954,336 100.00%
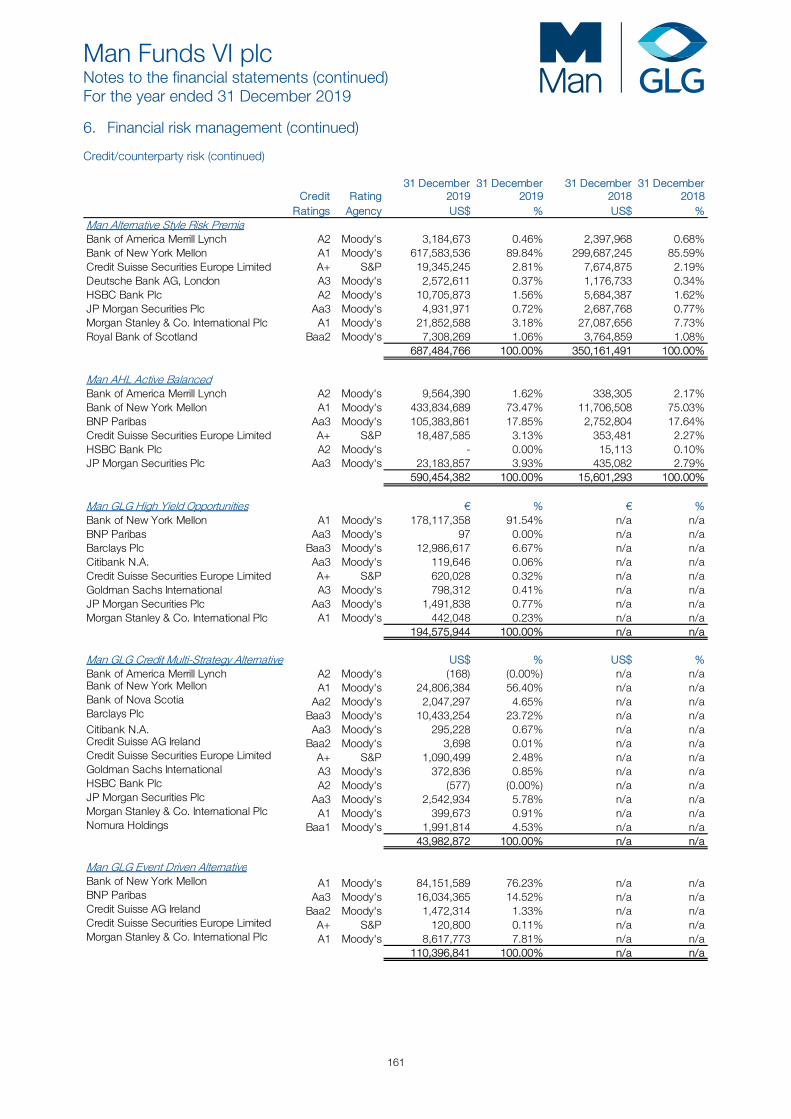
Man Funds VI plc Notes to the financial statements (continued) For the year ended 31 December 2019
161
6. Financial risk management (continued) Credit/counterparty risk (continued)
Credit Rating31 December
201931 December
201931 December
201831 December
2018Ratings Agency US$ % US$ %
Man Alternative Style Risk PremiaBank of America Merrill Lynch A2 Moody's 3,184,673 0.46% 2,397,968 0.68%Bank of New York Mellon A1 Moody's 617,583,536 89.84% 299,687,245 85.59%Credit Suisse Securities Europe Limited A+ S&P 19,345,245 2.81% 7,674,875 2.19%Deutsche Bank AG, London A3 Moody's 2,572,611 0.37% 1,176,733 0.34%HSBC Bank Plc A2 Moody's 10,705,873 1.56% 5,684,387 1.62%JP Morgan Securities Plc Aa3 Moody's 4,931,971 0.72% 2,687,768 0.77%Morgan Stanley & Co. International Plc A1 Moody's 21,852,588 3.18% 27,087,656 7.73%Royal Bank of Scotland Baa2 Moody's 7,308,269 1.06% 3,764,859 1.08%
687,484,766 100.00% 350,161,491 100.00%
Man AHL Active BalancedBank of America Merrill Lynch A2 Moody's 9,564,390 1.62% 338,305 2.17%Bank of New York Mellon A1 Moody's 433,834,689 73.47% 11,706,508 75.03%BNP Paribas Aa3 Moody's 105,383,861 17.85% 2,752,804 17.64%Credit Suisse Securities Europe Limited A+ S&P 18,487,585 3.13% 353,481 2.27%HSBC Bank Plc A2 Moody's - 0.00% 15,113 0.10%JP Morgan Securities Plc Aa3 Moody's 23,183,857 3.93% 435,082 2.79%
590,454,382 100.00% 15,601,293 100.00%
Man GLG High Yield Opportunities € % € %Bank of New York Mellon A1 Moody's 178,117,358 91.54% n/a n/a BNP Paribas Aa3 Moody's 97 0.00% n/a n/a Barclays Plc Baa3 Moody's 12,986,617 6.67% n/a n/a Citibank N.A. Aa3 Moody's 119,646 0.06% n/a n/a Credit Suisse Securities Europe Limited A+ S&P 620,028 0.32% n/a n/a Goldman Sachs International A3 Moody's 798,312 0.41% n/a n/a JP Morgan Securities Plc Aa3 Moody's 1,491,838 0.77% n/a n/a Morgan Stanley & Co. International Plc A1 Moody's 442,048 0.23% n/a n/a
194,575,944 100.00% n/a n/a
Man GLG Credit Multi-Strategy Alternative US$ % US$ %Bank of America Merrill Lynch A2 Moody's (168) (0.00%) n/a n/a Bank of New York Mellon A1 Moody's 24,806,384 56.40% n/a n/a Bank of Nova Scotia Aa2 Moody's 2,047,297 4.65% n/a n/a Barclays Plc Baa3 Moody's 10,433,254 23.72% n/a n/a Citibank N.A. Aa3 Moody's 295,228 0.67% n/a n/a Credit Suisse AG Ireland Baa2 Moody's 3,698 0.01% n/a n/a Credit Suisse Securities Europe Limited A+ S&P 1,090,499 2.48% n/a n/a Goldman Sachs International A3 Moody's 372,836 0.85% n/a n/a HSBC Bank Plc A2 Moody's (577) (0.00%) n/a n/a JP Morgan Securities Plc Aa3 Moody's 2,542,934 5.78% n/a n/a Morgan Stanley & Co. International Plc A1 Moody's 399,673 0.91% n/a n/a Nomura Holdings Baa1 Moody's 1,991,814 4.53% n/a n/a
43,982,872 100.00% n/a n/a
Man GLG Event Driven AlternativeBank of New York Mellon A1 Moody's 84,151,589 76.23% n/a n/a BNP Paribas Aa3 Moody's 16,034,365 14.52% n/a n/a Credit Suisse AG Ireland Baa2 Moody's 1,472,314 1.33% n/a n/a Credit Suisse Securities Europe Limited A+ S&P 120,800 0.11% n/a n/a Morgan Stanley & Co. International Plc A1 Moody's 8,617,773 7.81% n/a n/a
110,396,841 100.00% n/a n/a
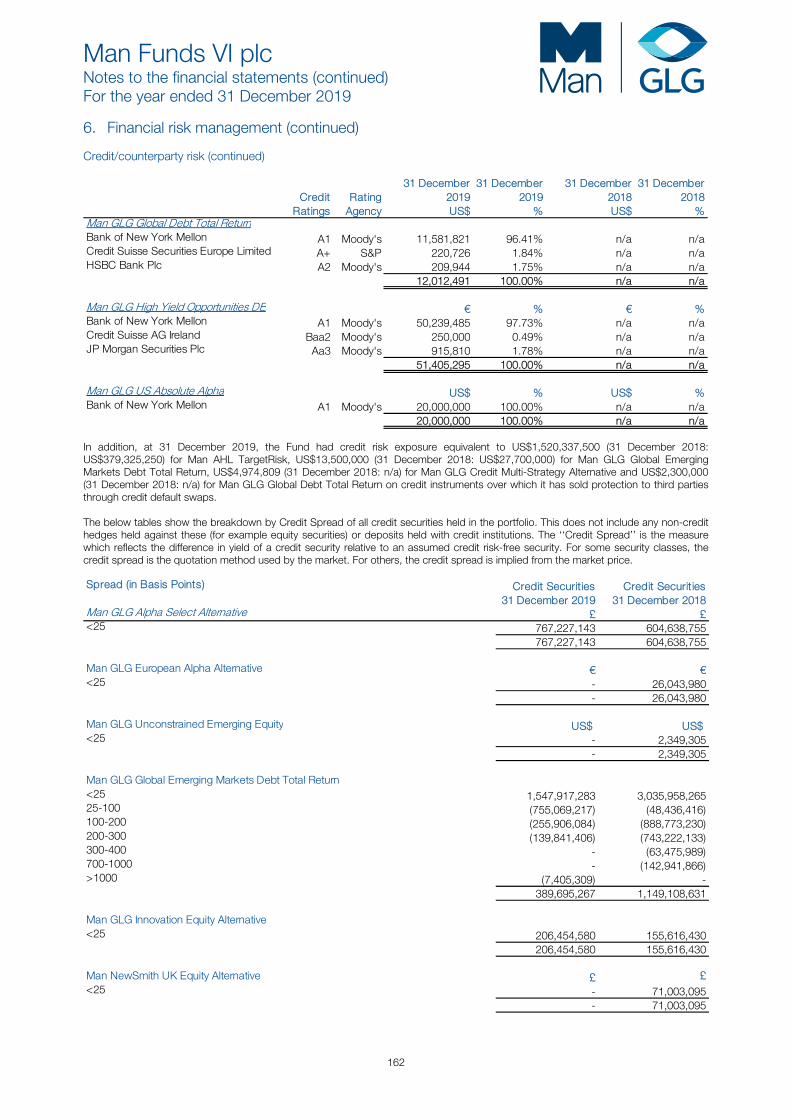
Man Funds VI plc Notes to the financial statements (continued) For the year ended 31 December 2019
162
6. Financial risk management (continued) Credit/counterparty risk (continued)
Credit Rating31 December
201931 December
201931 December
201831 December
2018Ratings Agency US$ % US$ %
Man GLG Global Debt Total ReturnBank of New York Mellon A1 Moody's 11,581,821 96.41% n/a n/a Credit Suisse Securities Europe Limited A+ S&P 220,726 1.84% n/a n/a HSBC Bank Plc A2 Moody's 209,944 1.75% n/a n/a
12,012,491 100.00% n/a n/a
Man GLG High Yield Opportunities DE € % € %Bank of New York Mellon A1 Moody's 50,239,485 97.73% n/a n/a Credit Suisse AG Ireland Baa2 Moody's 250,000 0.49% n/a n/a JP Morgan Securities Plc Aa3 Moody's 915,810 1.78% n/a n/a
51,405,295 100.00% n/a n/a
Man GLG US Absolute Alpha US$ % US$ %Bank of New York Mellon A1 Moody's 20,000,000 100.00% n/a n/a
20,000,000 100.00% n/a n/a
In addition, at 31 December 2019, the Fund had credit risk exposure equivalent to US$1,520,337,500 (31 December 2018: US$379,325,250) for Man AHL TargetRisk, US$13,500,000 (31 December 2018: US$27,700,000) for Man GLG Global Emerging Markets Debt Total Return, US$4,974,809 (31 December 2018: n/a) for Man GLG Credit Multi-Strategy Alternative and US$2,300,000 (31 December 2018: n/a) for Man GLG Global Debt Total Return on credit instruments over which it has sold protection to third parties through credit default swaps. The below tables show the breakdown by Credit Spread of all credit securities held in the portfolio. This does not include any non-credit hedges held against these (for example equity securities) or deposits held with credit institutions. The ‘‘Credit Spread’’ is the measure which reflects the difference in yield of a credit security relative to an assumed credit risk-free security. For some security classes, the credit spread is the quotation method used by the market. For others, the credit spread is implied from the market price. Spread (in Basis Points) Credit Securities Credit Securities
31 December 2019 31 December 2018Man GLG Alpha Select Alternative £ £<25 767,227,143 604,638,755
767,227,143 604,638,755
Man GLG European Alpha Alternative € €<25 - 26,043,980
- 26,043,980
Man GLG Unconstrained Emerging Equity US$ US$ <25 - 2,349,305
- 2,349,305
Man GLG Global Emerging Markets Debt Total Return<25 1,547,917,283 3,035,958,265 25-100 (755,069,217) (48,436,416)100-200 (255,906,084) (888,773,230)200-300 (139,841,406) (743,222,133)300-400 - (63,475,989)700-1000 - (142,941,866)>1000 (7,405,309) -
389,695,267 1,149,108,631
Man GLG Innovation Equity Alternative<25 206,454,580 155,616,430
206,454,580 155,616,430
Man NewSmith UK Equity Alternative £ £<25 - 71,003,095
- 71,003,095

Man Funds VI plc Notes to the financial statements (continued) For the year ended 31 December 2019
163
6. Financial risk management (continued) Credit/counterparty risk (continued) Spread (in Basis Points) Credit Securities Credit Securities
31 December 2019 31 December 2018Man GLG Event Driven Alternative US$ US$ <25 36,019,016 n/a
36,019,016 n/a
Man GLG High Yield Opportunities € €25-100 (20,327,017) n/a 100-200 (6,117,850) n/a 200-300 21,808,547 n/a 300-400 17,259,844 n/a 400-500 36,382,903 n/a 500-700 34,698,151 n/a 700-1000 31,223,450 n/a >1000 31,875,222 n/a
146,803,250 n/a
Man GLG High Yield Opportunities DE25-100 (5,791,158) n/a 100-200 (2,255,578) n/a 200-300 3,249,109 n/a 300-400 6,849,343 n/a 400-500 12,023,752 n/a 500-700 7,322,441 n/a 700-1000 5,236,735 n/a >1000 4,906,540 n/a
31,541,184 n/a
As at 31 December 2019, the value of the Portfolio’s assets which are considered to be past due or impaired was €3,137,225 for Man GLG High Yield Opportunities (2018: €Nil). Liquidity risk Liquidity risk is defined as the risk that the Fund will encounter difficulty in meeting its obligations associated with financial liabilities that are settled by delivering cash or another financial asset. Redeemable Participating Shareholder redemption requests are the main liquidity risk for the Fund. The Fund’s Redeemable Participating Shares are redeemable as outlined in note 10. The exposure to liquidity risk through Redeemable Participating Shareholder redemption requests is managed by specifically setting the redemption notice period to accommodate the expected liquidity of the underlying investments as agreed by the Investment Manager. The Fund is therefore potentially exposed to daily redemptions by its shareholders. The Fund’s financial instruments include Level 1 financial instruments which are considered readily realisable as they are all listed on major recognised exchanges. The Fund’s financial instruments also include investments in Level 2 and 3 financial Instruments, which are not quoted in an active public market and which generally may be illiquid. As a result, the Fund may not be able to liquidate quickly some of its investments in these instruments at an amount close to their fair value in order to meet its liquidity requirements. The main liability of the Fund is associated with the need to satisfy Redeemable Participating Shareholder’s request for redemptions. The Fund seeks to mitigate this risk by investing primarily in securities that are listed or traded on recognised markets, thus assets comprise mainly realisable securities, which can be readily sold.
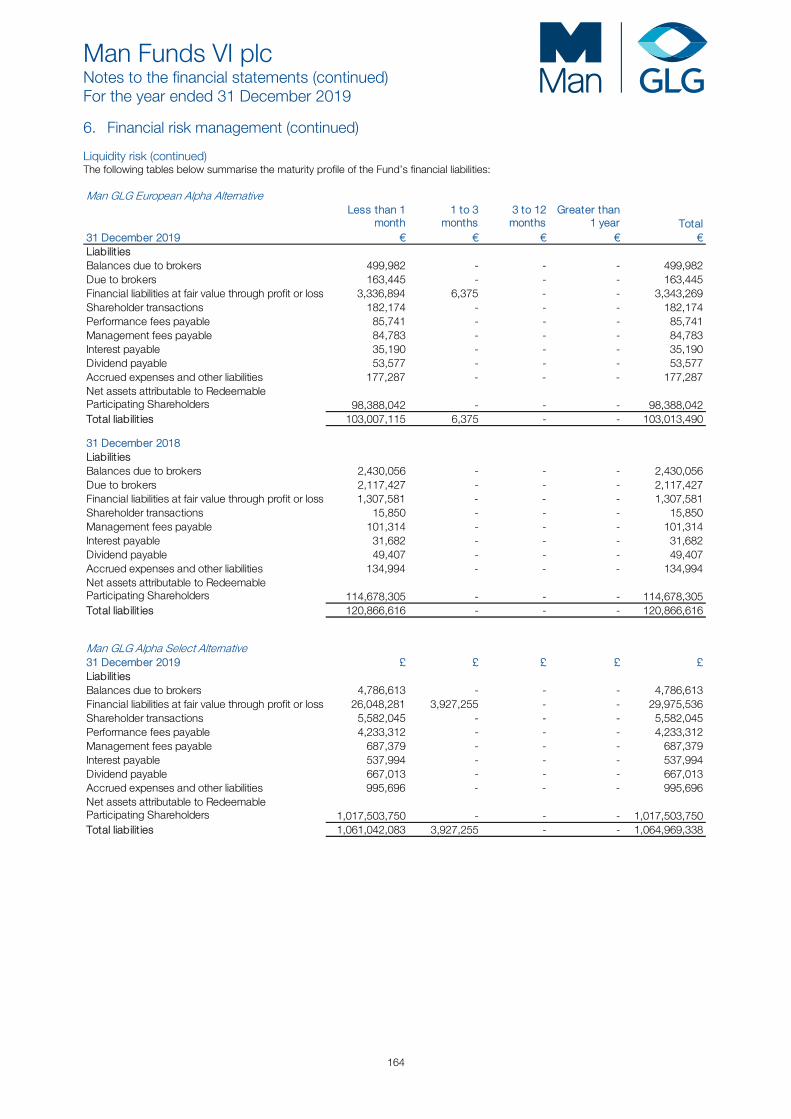
Man Funds VI plc Notes to the financial statements (continued) For the year ended 31 December 2019
164
6. Financial risk management (continued) Liquidity risk (continued) The following tables below summarise the maturity profile of the Fund’s financial liabilities: Man GLG European Alpha Alternative
Less than 1month
1 to 3months
3 to 12months
Greater than1 year Total
31 December 2019 € € € € €Liabilit iesBalances due to brokers 499,982 - - - 499,982 Due to brokers 163,445 - - - 163,445 Financial liabilities at fair value through profit or loss 3,336,894 6,375 - - 3,343,269 Shareholder transactions 182,174 - - - 182,174 Performance fees payable 85,741 - - - 85,741 Management fees payable 84,783 - - - 84,783 Interest payable 35,190 - - - 35,190 Dividend payable 53,577 - - - 53,577 Accrued expenses and other liabilities 177,287 - - - 177,287 Net assets attributable to Redeemable Participating Shareholders 98,388,042 - - - 98,388,042 Total liabilit ies 103,007,115 6,375 - - 103,013,490
31 December 2018Liabilit iesBalances due to brokers 2,430,056 - - - 2,430,056 Due to brokers 2,117,427 - - - 2,117,427 Financial liabilities at fair value through profit or loss 1,307,581 - - - 1,307,581 Shareholder transactions 15,850 - - - 15,850 Management fees payable 101,314 - - - 101,314 Interest payable 31,682 - - - 31,682 Dividend payable 49,407 - - - 49,407 Accrued expenses and other liabilities 134,994 - - - 134,994 Net assets attributable to Redeemable Participating Shareholders 114,678,305 - - - 114,678,305 Total liabilit ies 120,866,616 - - - 120,866,616
Man GLG Alpha Select Alternative31 December 2019 £ £ £ £ £Liabilit iesBalances due to brokers 4,786,613 - - - 4,786,613 Financial liabilities at fair value through profit or loss 26,048,281 3,927,255 - - 29,975,536 Shareholder transactions 5,582,045 - - - 5,582,045 Performance fees payable 4,233,312 - - - 4,233,312 Management fees payable 687,379 - - - 687,379 Interest payable 537,994 - - - 537,994 Dividend payable 667,013 - - - 667,013 Accrued expenses and other liabilities 995,696 - - - 995,696 Net assets attributable to Redeemable Participating Shareholders 1,017,503,750 - - - 1,017,503,750 Total liabilit ies 1,061,042,083 3,927,255 - - 1,064,969,338
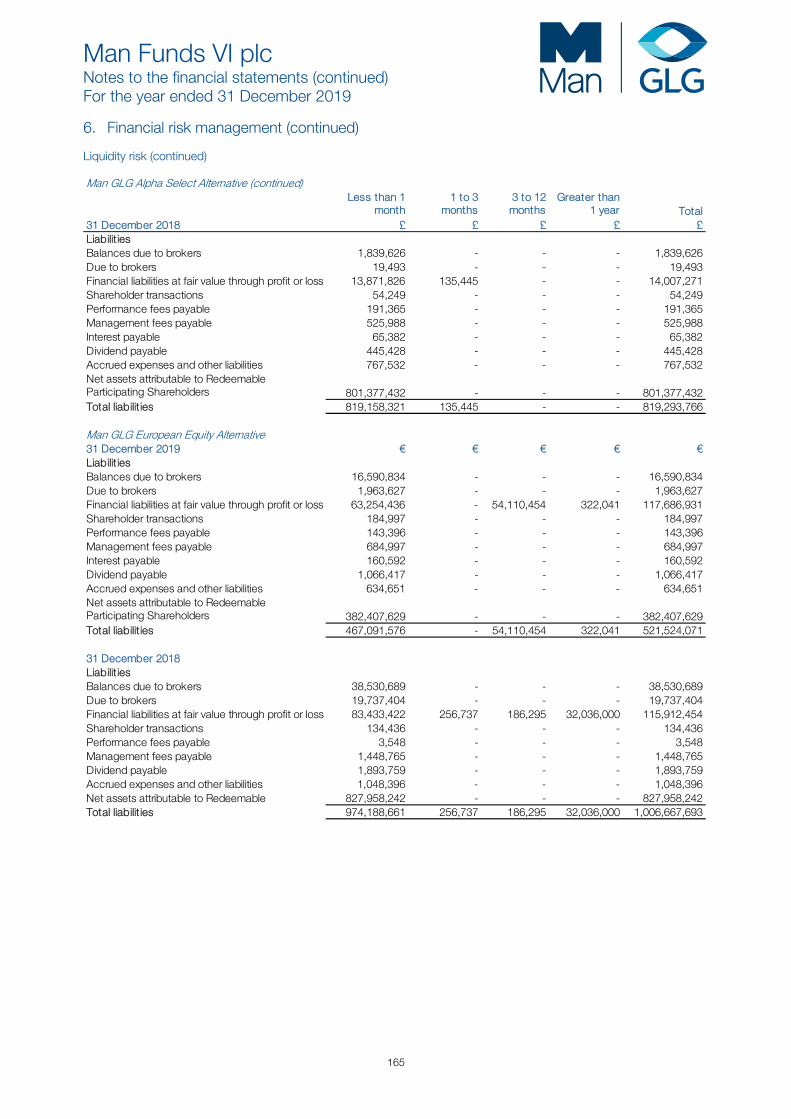
Man Funds VI plc Notes to the financial statements (continued) For the year ended 31 December 2019
165
6. Financial risk management (continued) Liquidity risk (continued) Man GLG Alpha Select Alternative (continued)
Less than 1month
1 to 3months
3 to 12months
Greater than1 year Total
31 December 2018 £ £ £ £ £Liabilit iesBalances due to brokers 1,839,626 - - - 1,839,626 Due to brokers 19,493 - - - 19,493 Financial liabilities at fair value through profit or loss 13,871,826 135,445 - - 14,007,271 Shareholder transactions 54,249 - - - 54,249 Performance fees payable 191,365 - - - 191,365 Management fees payable 525,988 - - - 525,988 Interest payable 65,382 - - - 65,382 Dividend payable 445,428 - - - 445,428 Accrued expenses and other liabilities 767,532 - - - 767,532 Net assets attributable to Redeemable Participating Shareholders 801,377,432 - - - 801,377,432 Total liabilit ies 819,158,321 135,445 - - 819,293,766
Man GLG European Equity Alternative31 December 2019 € € € € €Liabilit iesBalances due to brokers 16,590,834 - - - 16,590,834 Due to brokers 1,963,627 - - - 1,963,627 Financial liabilities at fair value through profit or loss 63,254,436 - 54,110,454 322,041 117,686,931 Shareholder transactions 184,997 - - - 184,997 Performance fees payable 143,396 - - - 143,396 Management fees payable 684,997 - - - 684,997 Interest payable 160,592 - - - 160,592 Dividend payable 1,066,417 - - - 1,066,417 Accrued expenses and other liabilities 634,651 - - - 634,651 Net assets attributable to Redeemable Participating Shareholders 382,407,629 - - - 382,407,629 Total liabilit ies 467,091,576 - 54,110,454 322,041 521,524,071
31 December 2018 € € € € €Liabilit iesBalances due to brokers 38,530,689 - - - 38,530,689 Due to brokers 19,737,404 - - - 19,737,404 Financial liabilities at fair value through profit or loss 83,433,422 256,737 186,295 32,036,000 115,912,454 Shareholder transactions 134,436 - - - 134,436 Performance fees payable 3,548 - - - 3,548 Management fees payable 1,448,765 - - - 1,448,765 Dividend payable 1,893,759 - - - 1,893,759 Accrued expenses and other liabilities 1,048,396 - - - 1,048,396 Net assets attributable to Redeemable 827,958,242 - - - 827,958,242 Total liabilit ies 974,188,661 256,737 186,295 32,036,000 1,006,667,693
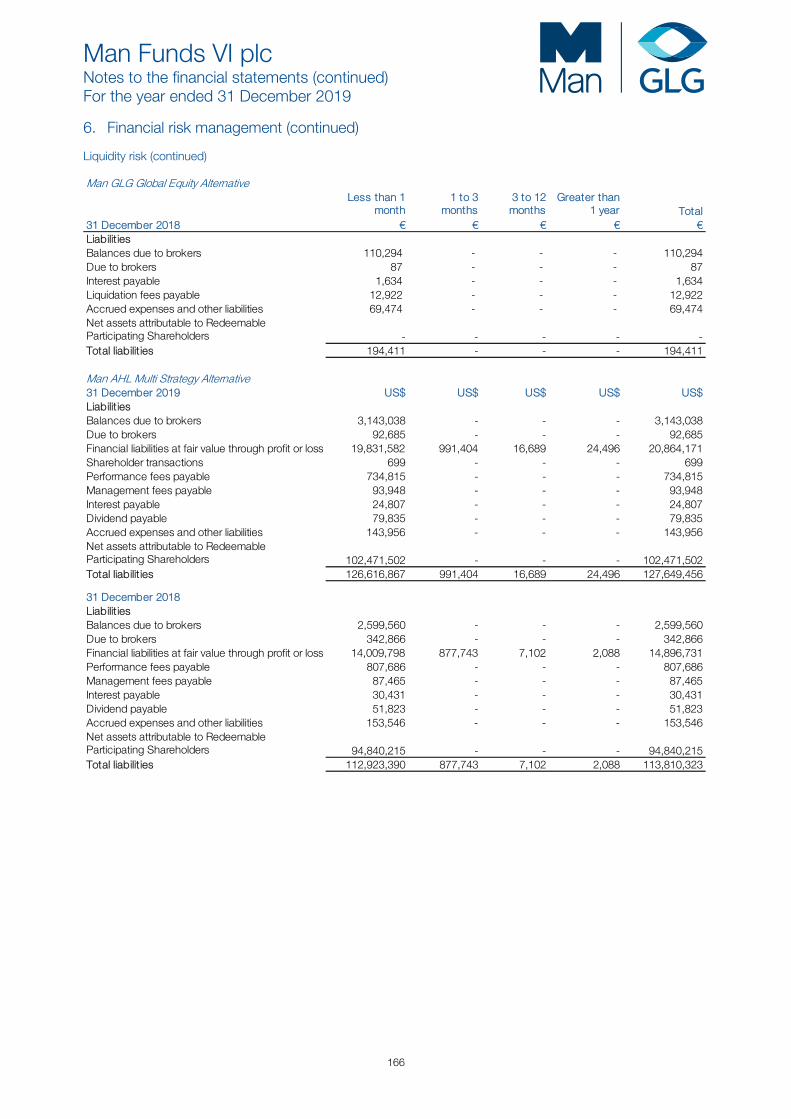
Man Funds VI plc Notes to the financial statements (continued) For the year ended 31 December 2019
166
6. Financial risk management (continued) Liquidity risk (continued) Man GLG Global Equity Alternative
Less than 1month
1 to 3months
3 to 12months
Greater than1 year Total
31 December 2018 € € € € €Liabilit iesBalances due to brokers 110,294 - - - 110,294 Due to brokers 87 - - - 87 Interest payable 1,634 - - - 1,634 Liquidation fees payable 12,922 - - - 12,922 Accrued expenses and other liabilities 69,474 - - - 69,474 Net assets attributable to Redeemable Participating Shareholders - - - - - Total liabilit ies 194,411 - - - 194,411
Man AHL Multi Strategy Alternative31 December 2019 US$ US$ US$ US$ US$Liabilit iesBalances due to brokers 3,143,038 - - - 3,143,038 Due to brokers 92,685 - - - 92,685 Financial liabilities at fair value through profit or loss 19,831,582 991,404 16,689 24,496 20,864,171 Shareholder transactions 699 - - - 699 Performance fees payable 734,815 - - - 734,815 Management fees payable 93,948 - - - 93,948 Interest payable 24,807 - - - 24,807 Dividend payable 79,835 - - - 79,835 Accrued expenses and other liabilities 143,956 - - - 143,956 Net assets attributable to Redeemable Participating Shareholders 102,471,502 - - - 102,471,502 Total liabilit ies 126,616,867 991,404 16,689 24,496 127,649,456
31 December 2018Liabilit iesBalances due to brokers 2,599,560 - - - 2,599,560 Due to brokers 342,866 - - - 342,866 Financial liabilities at fair value through profit or loss 14,009,798 877,743 7,102 2,088 14,896,731 Performance fees payable 807,686 - - - 807,686 Management fees payable 87,465 - - - 87,465 Interest payable 30,431 - - - 30,431 Dividend payable 51,823 - - - 51,823 Accrued expenses and other liabilities 153,546 - - - 153,546 Net assets attributable to Redeemable Participating Shareholders 94,840,215 - - - 94,840,215 Total liabilit ies 112,923,390 877,743 7,102 2,088 113,810,323
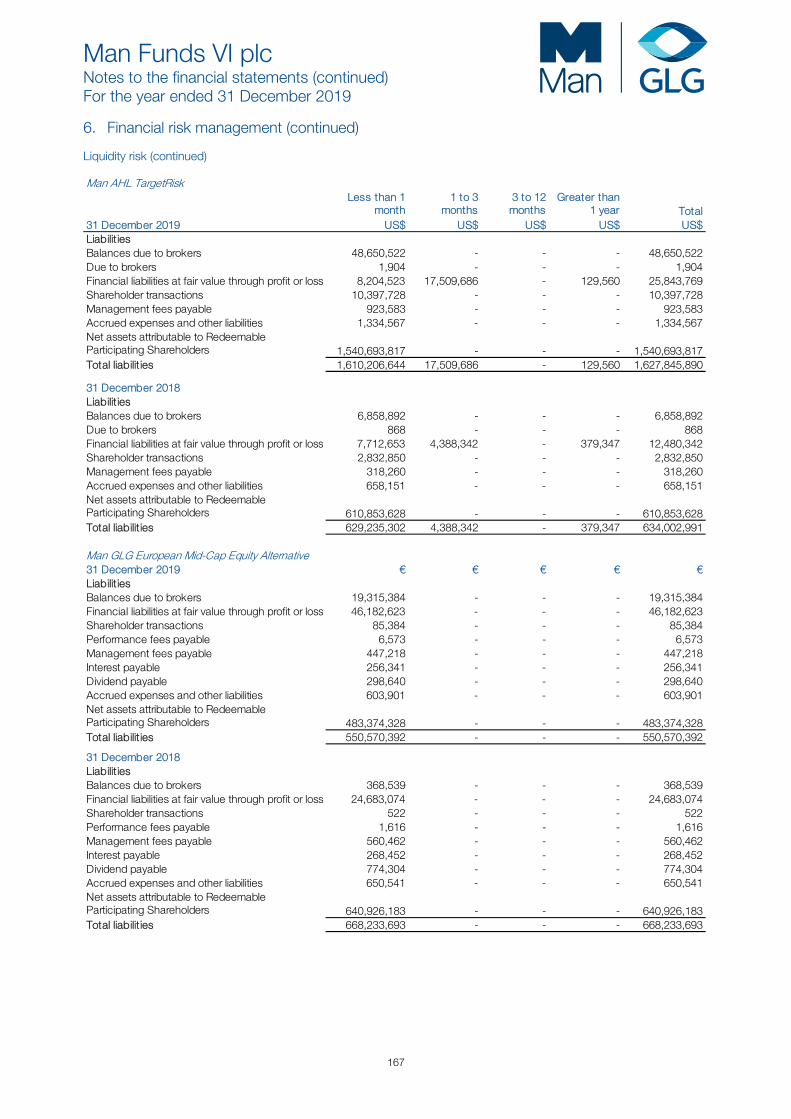
Man Funds VI plc Notes to the financial statements (continued) For the year ended 31 December 2019
167
6. Financial risk management (continued) Liquidity risk (continued) Man AHL TargetRisk
Less than 1month
1 to 3months
3 to 12months
Greater than1 year Total
31 December 2019 US$ US$ US$ US$ US$Liabilit iesBalances due to brokers 48,650,522 - - - 48,650,522 Due to brokers 1,904 - - - 1,904 Financial liabilities at fair value through profit or loss 8,204,523 17,509,686 - 129,560 25,843,769 Shareholder transactions 10,397,728 - - - 10,397,728 Management fees payable 923,583 - - - 923,583 Accrued expenses and other liabilities 1,334,567 - - - 1,334,567 Net assets attributable to Redeemable Participating Shareholders 1,540,693,817 - - - 1,540,693,817 Total liabilit ies 1,610,206,644 17,509,686 - 129,560 1,627,845,890
31 December 2018Liabilit iesBalances due to brokers 6,858,892 - - - 6,858,892 Due to brokers 868 - - - 868 Financial liabilities at fair value through profit or loss 7,712,653 4,388,342 - 379,347 12,480,342 Shareholder transactions 2,832,850 - - - 2,832,850 Management fees payable 318,260 - - - 318,260 Accrued expenses and other liabilities 658,151 - - - 658,151 Net assets attributable to Redeemable Participating Shareholders 610,853,628 - - - 610,853,628 Total liabilit ies 629,235,302 4,388,342 - 379,347 634,002,991
Man GLG European Mid-Cap Equity Alternative31 December 2019 € € € € €Liabilit iesBalances due to brokers 19,315,384 - - - 19,315,384 Financial liabilities at fair value through profit or loss 46,182,623 - - - 46,182,623 Shareholder transactions 85,384 - - - 85,384 Performance fees payable 6,573 - - - 6,573 Management fees payable 447,218 - - - 447,218 Interest payable 256,341 - - - 256,341 Dividend payable 298,640 - - - 298,640 Accrued expenses and other liabilities 603,901 - - - 603,901 Net assets attributable to Redeemable Participating Shareholders 483,374,328 - - - 483,374,328 Total liabilit ies 550,570,392 - - - 550,570,392
31 December 2018Liabilit iesBalances due to brokers 368,539 - - - 368,539 Financial liabilities at fair value through profit or loss 24,683,074 - - - 24,683,074 Shareholder transactions 522 - - - 522 Performance fees payable 1,616 - - - 1,616 Management fees payable 560,462 - - - 560,462 Interest payable 268,452 - - - 268,452 Dividend payable 774,304 - - - 774,304 Accrued expenses and other liabilities 650,541 - - - 650,541 Net assets attributable to Redeemable Participating Shareholders 640,926,183 - - - 640,926,183 Total liabilit ies 668,233,693 - - - 668,233,693

Man Funds VI plc Notes to the financial statements (continued) For the year ended 31 December 2019
168
6. Financial risk management (continued) Liquidity risk (continued) Man Numeric Market Neutral Alternative
Less than 1month
1 to 3months
3 to 12months
Greater than1 year Total
31 December 2019 US$ US$ US$ US$ US$Liabilit iesInterest payable 7,104 - - - 7,104 Liquidation fees payable 5,000 - - - 5,000 Accrued expenses and other liabilities 75,039 - - - 75,039 Net assets attributable to Redeemable Participating Shareholders - - - - - Total liabilit ies 87,143 - - - 87,143
31 December 2018Liabilit iesBalances due to brokers 44,878,495 - - - 44,878,495 Financial liabilities at fair value through profit or loss 637,033 - - - 637,033 Management fees payable 46,556 - - - 46,556 Interest payable 13,584 - - - 13,584 Accrued expenses and other liabilities 182,057 - - - 182,057 Net assets attributable to Redeemable Participating Shareholders 21,624,877 - - - 21,624,877 Total liabilit ies 67,382,602 - - - 67,382,602
Man GLG Unconstrained Emerging Equity31 December 2019Liabilit iesBalances due to brokers 3 - - - 3 Accrued expenses and other liabilities 38,899 - - - 38,899 Net assets attributable to Redeemable Participating Shareholders - - - - - Total liabilit ies 38,902 - - - 38,902
31 December 2018Liabilit iesBalances due to brokers 14,808,927 - - - 14,808,927 Due to brokers 10 - - - 10 Financial liabilities at fair value through profit or loss 2,483,751 - 10,228 - 2,493,979 Management fees payable 39,028 - - - 39,028 Interest payable 24,251 - - - 24,251 Liquidation fees payable 5,000 - - - 5,000 Accrued expenses and other liabilities 140,680 - - - 140,680 Net assets attributable to Redeemable Participating Shareholders 58,851,080 - - - 58,851,080 Total liabilit ies 76,352,727 - 10,228 - 76,362,955
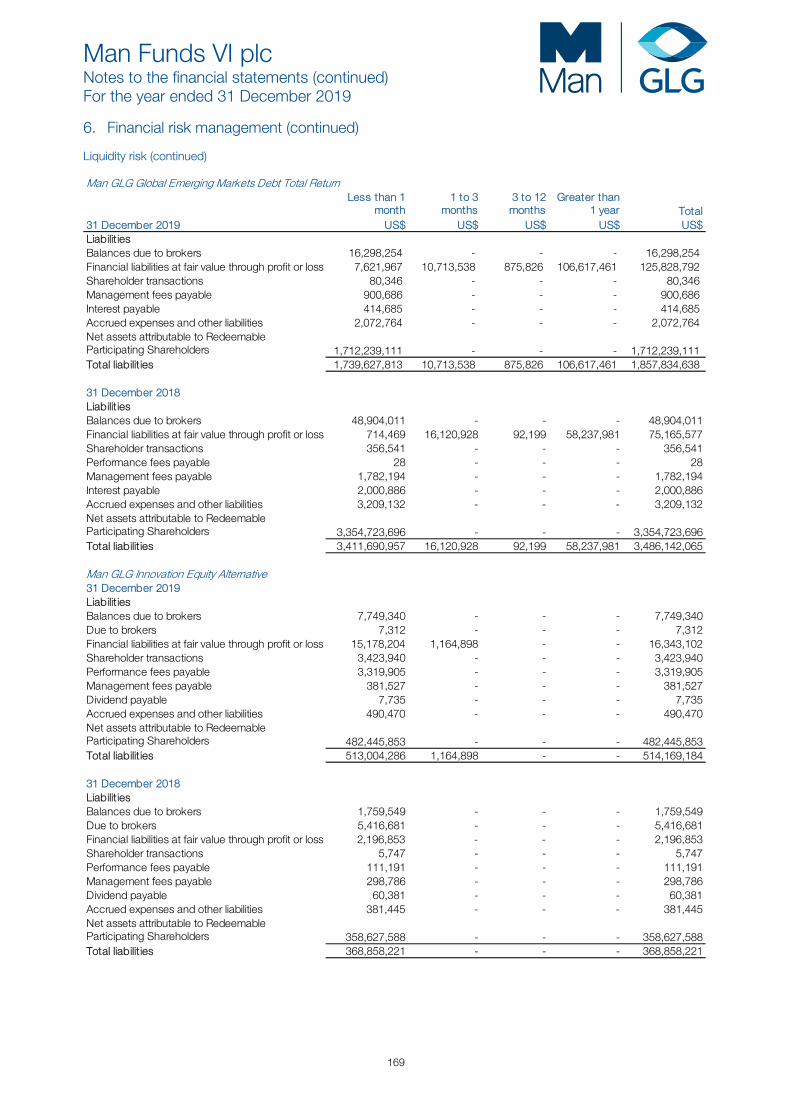
Man Funds VI plc Notes to the financial statements (continued) For the year ended 31 December 2019
169
6. Financial risk management (continued) Liquidity risk (continued) Man GLG Global Emerging Markets Debt Total Return
Less than 1month
1 to 3months
3 to 12months
Greater than1 year Total
31 December 2019 US$ US$ US$ US$ US$Liabilit iesBalances due to brokers 16,298,254 - - - 16,298,254 Financial liabilities at fair value through profit or loss 7,621,967 10,713,538 875,826 106,617,461 125,828,792 Shareholder transactions 80,346 - - - 80,346 Management fees payable 900,686 - - - 900,686 Interest payable 414,685 - - - 414,685 Accrued expenses and other liabilities 2,072,764 - - - 2,072,764 Net assets attributable to Redeemable Participating Shareholders 1,712,239,111 - - - 1,712,239,111 Total liabilit ies 1,739,627,813 10,713,538 875,826 106,617,461 1,857,834,638
31 December 2018 US$ US$ US$ US$ US$Liabilit iesBalances due to brokers 48,904,011 - - - 48,904,011 Financial liabilities at fair value through profit or loss 714,469 16,120,928 92,199 58,237,981 75,165,577 Shareholder transactions 356,541 - - - 356,541 Performance fees payable 28 - - - 28 Management fees payable 1,782,194 - - - 1,782,194 Interest payable 2,000,886 - - - 2,000,886 Accrued expenses and other liabilities 3,209,132 - - - 3,209,132 Net assets attributable to Redeemable Participating Shareholders 3,354,723,696 - - - 3,354,723,696 Total liabilit ies 3,411,690,957 16,120,928 92,199 58,237,981 3,486,142,065
Man GLG Innovation Equity Alternative31 December 2019Liabilit iesBalances due to brokers 7,749,340 - - - 7,749,340 Due to brokers 7,312 - - - 7,312 Financial liabilities at fair value through profit or loss 15,178,204 1,164,898 - - 16,343,102 Shareholder transactions 3,423,940 - - - 3,423,940 Performance fees payable 3,319,905 - - - 3,319,905 Management fees payable 381,527 - - - 381,527 Dividend payable 7,735 - - - 7,735 Accrued expenses and other liabilities 490,470 - - - 490,470 Net assets attributable to Redeemable Participating Shareholders 482,445,853 - - - 482,445,853 Total liabilit ies 513,004,286 1,164,898 - - 514,169,184
31 December 2018Liabilit iesBalances due to brokers 1,759,549 - - - 1,759,549 Due to brokers 5,416,681 - - - 5,416,681 Financial liabilities at fair value through profit or loss 2,196,853 - - - 2,196,853 Shareholder transactions 5,747 - - - 5,747 Performance fees payable 111,191 - - - 111,191 Management fees payable 298,786 - - - 298,786 Dividend payable 60,381 - - - 60,381 Accrued expenses and other liabilities 381,445 - - - 381,445 Net assets attributable to Redeemable Participating Shareholders 358,627,588 - - - 358,627,588 Total liabilit ies 368,858,221 - - - 368,858,221

Man Funds VI plc Notes to the financial statements (continued) For the year ended 31 December 2019
170
6. Financial risk management (continued) Liquidity risk (continued) Man NewSmith UK Equity Alternative
Less than 1month
1 to 3months
3 to 12months
Greater than1 year Total
31 December 2019 £ £ £ £ £Liabilit iesBalances due to brokers 14,441 - - - 14,441 Performance fees payable 332 - - - 332 Interest payable 900 - - - 900 Accrued expenses and other liabilities 45,492 - - - 45,492 Net assets attributable to Redeemable Participating Shareholders - - - - - Total liabilit ies 61,165 - - - 61,165
31 December 2018 £ £ £ £ £Liabilit iesBalances due to brokers 2,744,964 - - - 2,744,964 Financial liabilities at fair value through profit or loss 4,927,316 - - - 4,927,316 Performance fees payable 332 - - - 332 Management fees payable 159,626 - - - 159,626 Interest payable 868 - - - 868 Dividend payable 89,054 - - - 89,054 Accrued expenses and other liabilities 117,909 - - - 117,909 Net assets attributable to Redeemable Participating Shareholders 107,971,961 - - - 107,971,961 Total liabilit ies 116,012,030 - - - 116,012,030
Man Alternative Style Risk Premia31 December 2019 US$ US$ US$ US$ US$Liabilit iesBalances due to brokers 10,720,692 - - - 10,720,692 Due to brokers 3,634 - - - 3,634 Financial liabilities at fair value through profit or loss 35,745,746 2,895,965 - 155,906 38,797,617 Shareholder transactions 12,774 - - - 12,774 Performance fees payable 6,236 - - - 6,236 Management fees payable 980,887 - - - 980,887 Accrued expenses and other liabilities 722,004 - - - 722,004 Net assets attributable to Redeemable Participating Shareholders 636,765,674 - - - 636,765,674 Total liabilit ies 684,957,647 2,895,965 - 155,906 688,009,518
31 December 2018 US$ US$ US$ US$ US$Liabilit iesBalances due to brokers 24,011,550 - - - 24,011,550 Due to brokers 1,182 - - - 1,182 Financial liabilities at fair value through profit or loss 9,102,366 1,770,474 - - 10,872,840 Shareholder transactions 2,935,315 - - - 2,935,315 Management fees payable 248,312 - - - 248,312 Accrued expenses and other liabilities 419,725 - - - 419,725 Net assets attributable to Redeemable Participating Shareholders 312,040,793 - - - 312,040,793 Total liabilit ies 348,759,243 1,770,474 - - 350,529,717

Man Funds VI plc Notes to the financial statements (continued) For the year ended 31 December 2019
171
6. Financial risk management (continued) Liquidity risk (continued) Man AHL Active Balanced
Less than 1month
1 to 3months
3 to 12months
Greater than1 year Total
31 December 2019 US$ US$ US$ US$ US$Liabilit iesBalances due to brokers 248,166 - - - 248,166 Due to brokers 4,265,142 - - - 4,265,142 Financial liabilities at fair value through profit or loss 2,394,646 4,654,769 - - 7,049,415 Management fees payable 317,111 - - - 317,111 Accrued expenses and other liabilities 247,363 - - - 247,363 Net assets attributable to Redeemable Participating Shareholders 578,455,583 - - - 578,455,583 Total liabilit ies 585,928,011 4,654,769 - - 590,582,780
31 December 2018 US$ US$ US$ US$ US$Liabilit iesBalances due to brokers 146,667 - - - 146,667 Due to brokers 98,746 - - - 98,746 Financial liabilities at fair value through profit or loss 17,973 44,143 - - 62,116 Management fees payable 9,530 - - - 9,530 Accrued expenses and other liabilities 30,769 - - - 30,769 Net assets attributable to Redeemable Participating Shareholders 15,282,022 - - - 15,282,022 Total liabilit ies 15,585,707 44,143 - - 15,629,850
Man GLG High Yield Opportunities31 December 2019 € € € € €Liabilit iesBalances due to brokers 1,956,293 - - - 1,956,293 Financial liabilities at fair value through profit or loss 81,190 - - 1,842,305 1,923,495 Securities sold under agreement to repurchase 10,172,541 - - - 10,172,541 Shareholder transactions 145,917 - - - 145,917 Management fees payable 47,945 - - - 47,945 Interest payable 84,445 - - - 84,445 Accrued expenses and other liabilities 198,840 - - - 198,840 Net assets attributable to Redeemable Participating Shareholders 180,313,252 - - - 180,313,252 Total liabilit ies 193,000,423 - - 1,842,305 194,842,728
Man GLG Credit Multi-Strategy Alternative31 December 2019 US$ US$ US$ US$ US$Liabilit iesBalances due to brokers 329,422 - - - 329,422 Financial liabilities at fair value through profit or loss 2,085,101 3,003 - 1,054,690 3,142,794 Securities sold under agreement to repurchase 9,706,449 - - - 9,706,449 Performance fees payable 174,208 - - - 174,208 Management fees payable 25,689 - - - 25,689 Interest payable 49,497 - - - 49,497 Dividend payable 3,124 - - - 3,124 Accrued expenses and other liabilities 85,944 - - - 85,944 Net assets attributable to Redeemable Participating Shareholders 30,635,012 - - - 30,635,012 Total liabilit ies 43,094,446 3,003 - 1,054,690 44,152,139
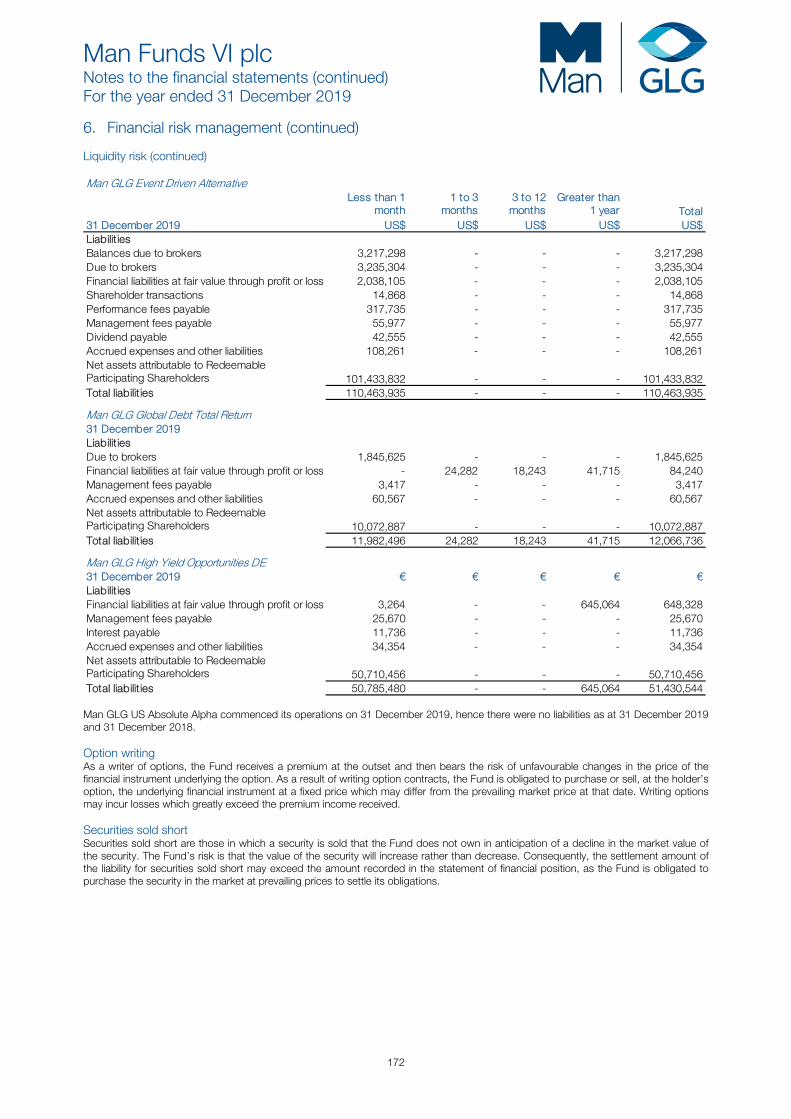
Man Funds VI plc Notes to the financial statements (continued) For the year ended 31 December 2019
172
6. Financial risk management (continued) Liquidity risk (continued) Man GLG Event Driven Alternative
Less than 1month
1 to 3months
3 to 12months
Greater than1 year Total
31 December 2019 US$ US$ US$ US$ US$Liabilit iesBalances due to brokers 3,217,298 - - - 3,217,298 Due to brokers 3,235,304 - - - 3,235,304 Financial liabilities at fair value through profit or loss 2,038,105 - - - 2,038,105 Shareholder transactions 14,868 - - - 14,868 Performance fees payable 317,735 - - - 317,735 Management fees payable 55,977 - - - 55,977 Dividend payable 42,555 - - - 42,555 Accrued expenses and other liabilities 108,261 - - - 108,261 Net assets attributable to Redeemable Participating Shareholders 101,433,832 - - - 101,433,832 Total liabilit ies 110,463,935 - - - 110,463,935
Man GLG Global Debt Total Return31 December 2019Liabilit iesDue to brokers 1,845,625 - - - 1,845,625 Financial liabilities at fair value through profit or loss - 24,282 18,243 41,715 84,240 Management fees payable 3,417 - - - 3,417 Accrued expenses and other liabilities 60,567 - - - 60,567 Net assets attributable to Redeemable Participating Shareholders 10,072,887 - - - 10,072,887 Total liabilit ies 11,982,496 24,282 18,243 41,715 12,066,736
Man GLG High Yield Opportunities DE31 December 2019 € € € € €Liabilit iesFinancial liabilities at fair value through profit or loss 3,264 - - 645,064 648,328 Management fees payable 25,670 - - - 25,670 Interest payable 11,736 - - - 11,736 Accrued expenses and other liabilities 34,354 - - - 34,354 Net assets attributable to Redeemable Participating Shareholders 50,710,456 - - - 50,710,456 Total liabilit ies 50,785,480 - - 645,064 51,430,544
Man GLG US Absolute Alpha commenced its operations on 31 December 2019, hence there were no liabilities as at 31 December 2019 and 31 December 2018. Option writing As a writer of options, the Fund receives a premium at the outset and then bears the risk of unfavourable changes in the price of the financial instrument underlying the option. As a result of writing option contracts, the Fund is obligated to purchase or sell, at the holder’s option, the underlying financial instrument at a fixed price which may differ from the prevailing market price at that date. Writing options may incur losses which greatly exceed the premium income received. Securities sold short Securities sold short are those in which a security is sold that the Fund does not own in anticipation of a decline in the market value of the security. The Fund’s risk is that the value of the security will increase rather than decrease. Consequently, the settlement amount of the liability for securities sold short may exceed the amount recorded in the statement of financial position, as the Fund is obligated to purchase the security in the market at prevailing prices to settle its obligations.
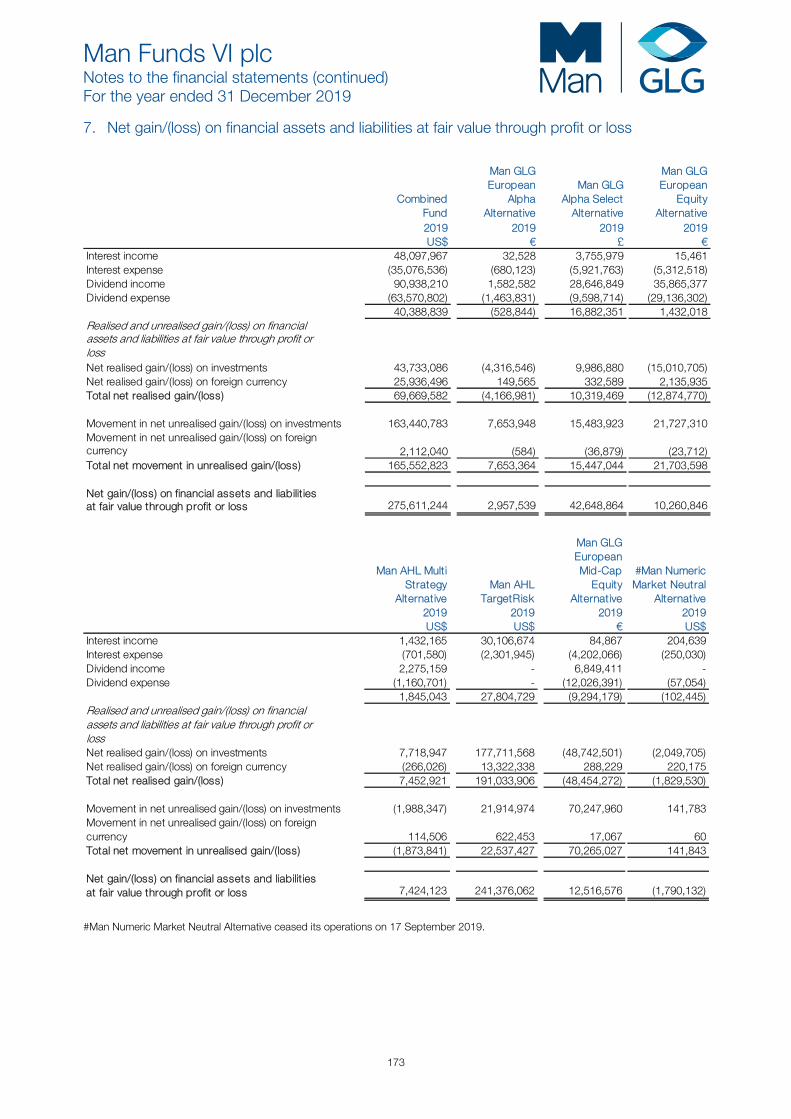
Man Funds VI plc Notes to the financial statements (continued) For the year ended 31 December 2019
173
7. Net gain/(loss) on financial assets and liabilities at fair value through profit or loss
CombinedFund
Man GLGEuropean
AlphaAlternative
Man GLGAlpha Select
Alternative
Man GLGEuropean
EquityAlternative
2019 2019 2019 2019 US$ € £ €
Interest income 48,097,967 32,528 3,755,979 15,461 Interest expense (35,076,536) (680,123) (5,921,763) (5,312,518)Dividend income 90,938,210 1,582,582 28,646,849 35,865,377 Dividend expense (63,570,802) (1,463,831) (9,598,714) (29,136,302)
40,388,839 (528,844) 16,882,351 1,432,018 Realised and unrealised gain/(loss) on financial assets and liabilities at fair value through profit or lossNet realised gain/(loss) on investments 43,733,086 (4,316,546) 9,986,880 (15,010,705)Net realised gain/(loss) on foreign currency 25,936,496 149,565 332,589 2,135,935 Total net realised gain/(loss) 69,669,582 (4,166,981) 10,319,469 (12,874,770)
Movement in net unrealised gain/(loss) on investments 163,440,783 7,653,948 15,483,923 21,727,310 Movement in net unrealised gain/(loss) on foreign currency 2,112,040 (584) (36,879) (23,712)Total net movement in unrealised gain/(loss) 165,552,823 7,653,364 15,447,044 21,703,598
Net gain/(loss) on financial assets and liabilit ies at fair value through profit or loss 275,611,244 2,957,539 42,648,864 10,260,846
Man AHL MultiStrategy
AlternativeMan AHL
TargetRisk
Man GLGEuropeanMid-Cap
EquityAlternative
#Man NumericMarket Neutral
Alternative2019 2019 2019 2019US$ US$ € US$
Interest income 1,432,165 30,106,674 84,867 204,639 Interest expense (701,580) (2,301,945) (4,202,066) (250,030)Dividend income 2,275,159 - 6,849,411 - Dividend expense (1,160,701) - (12,026,391) (57,054)
1,845,043 27,804,729 (9,294,179) (102,445)Realised and unrealised gain/(loss) on financial assets and liabilities at fair value through profit or lossNet realised gain/(loss) on investments 7,718,947 177,711,568 (48,742,501) (2,049,705)Net realised gain/(loss) on foreign currency (266,026) 13,322,338 288,229 220,175 Total net realised gain/(loss) 7,452,921 191,033,906 (48,454,272) (1,829,530)
Movement in net unrealised gain/(loss) on investments (1,988,347) 21,914,974 70,247,960 141,783 Movement in net unrealised gain/(loss) on foreign currency 114,506 622,453 17,067 60 Total net movement in unrealised gain/(loss) (1,873,841) 22,537,427 70,265,027 141,843
Net gain/(loss) on financial assets and liabilit ies at fair value through profit or loss 7,424,123 241,376,062 12,516,576 (1,790,132)
#Man Numeric Market Neutral Alternative ceased its operations on 17 September 2019.

Man Funds VI plc Notes to the financial statements (continued) For the year ended 31 December 2019
174
7. Net gain/(loss) on financial assets and liabilities at fair value through profit or loss (continued)
#Man GLGUnconstrained
Emerging Equity
Man GLG Global
EmergingMarkets Debt
Total Return
Man GLGInnovation
EquityAlternative
#Man NewSmithUK EquityAlternative
2019 2019 2019 2019US$ US$ US$ £
Interest income 30,858 (9,278,523) 3,112,826 37,146 Interest expense (41,505) (959,103) (966,093) (38,905)Dividend income 41,843 - 2,172,585 48,285 Dividend expense - - (1,921,899) (146,920)
31,196 (10,237,626) 2,397,419 (100,394)Realised and unrealised gain/(loss) on financial assets and liabilities at fair value through profit or lossNet realised gain/(loss) on investments (2,994,025) (87,095,921) (12,490,944) (3,883,293)Net realised gain/(loss) on foreign currency (706,478) 5,842,281 1,676,532 4,093,889 Total net realised gain/(loss) (3,700,503) (81,253,640) (10,814,412) 210,596
Movement in net unrealised gain/(loss) on investments 5,615,937 (45,166,798) 31,185,006 (455,702)Movement in net unrealised gain/(loss) on foreign currency (482) 304,401 (129,667) 612 Total net movement in unrealised gain/(loss) 5,615,455 (44,862,397) 31,055,339 (455,090)
Net gain/(loss) on financial assets and liabilit ies at fair value through profit or loss 1,946,148 (136,353,663) 22,638,346 (344,888)
#Man GLG Unconstrained Emerging Equity and Man NewSmith UK Equity Alternative ceased their operations on 7 February 2019 and 21 March 2019 respectively.
ManAlternativeStyle Risk
Premia
Man AHLActive
Balanced
*Man GLGHigh Yield
Opportunities
*Man GLG Credit Multi-
StrategyAlternative
2019 2019 2019 2019US$ US$ € US$
Interest income 7,942,139 696,412 6,390,101 1,306,635 Interest expense (8,407,165) (37,131) (1,352,052) (643,858)Dividend income - - - 9,890 Dividend expense - - - (160,991)
(465,026) 659,281 5,038,049 511,676 Realised and unrealised gain/(loss) on financial assets and liabilities at fair value through profit or lossNet realised gain/(loss) on investments 15,859,055 14,078,661 2,294,025 (2,052,821)Net realised gain/(loss) on foreign currency (2,354,930) 959,965 (191,757) 120,482 Total net realised gain/(loss) 13,504,125 15,038,626 2,102,268 (1,932,339)
Movement in net unrealised gain/(loss) on investments 3,745,898 (3,772,406) 13,295,630 2,677,586 Movement in net unrealised gain/(loss) on foreign currency (113,025) 1,317,324 (433) 348
Total net movement in unrealised gain/(loss) 3,632,873 (2,455,082) 13,295,197 2,677,934
Net gain/(loss) on financial assets and liabilit ies at fair value through profit or loss 16,671,972 13,242,825 20,435,514 1,257,271
*Man GLG High Yield Opportunities and Man GLG Credit Multi-Strategy Alternative commenced their operations on 16 January 2019 and 1 April 2019 respectively.
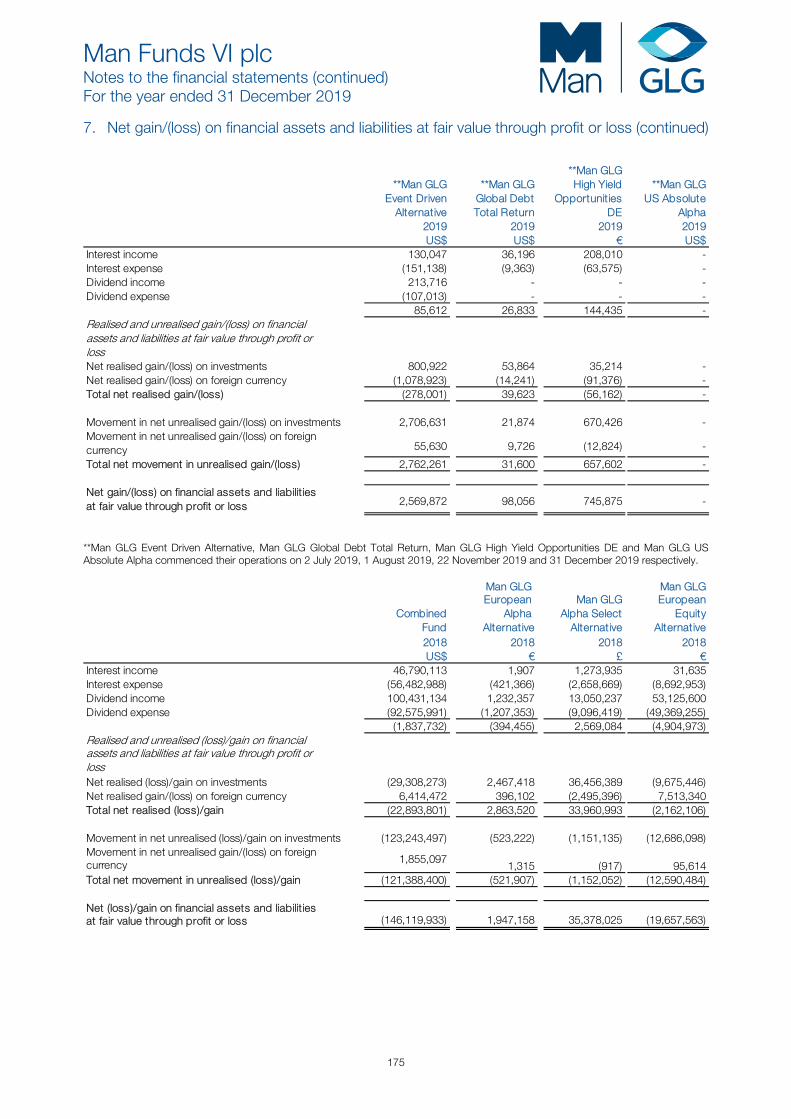
Man Funds VI plc Notes to the financial statements (continued) For the year ended 31 December 2019
175
7. Net gain/(loss) on financial assets and liabilities at fair value through profit or loss (continued)
**Man GLG Event Driven
Alternative
**Man GLGGlobal DebtTotal Return
**Man GLG High Yield
OpportunitiesDE
**Man GLGUS Absolute
Alpha2019 2019 2019 2019US$ US$ € US$
Interest income 130,047 36,196 208,010 - Interest expense (151,138) (9,363) (63,575) - Dividend income 213,716 - - - Dividend expense (107,013) - - -
85,612 26,833 144,435 - Realised and unrealised gain/(loss) on financial assets and liabilities at fair value through profit or lossNet realised gain/(loss) on investments 800,922 53,864 35,214 - Net realised gain/(loss) on foreign currency (1,078,923) (14,241) (91,376) - Total net realised gain/(loss) (278,001) 39,623 (56,162) -
Movement in net unrealised gain/(loss) on investments 2,706,631 21,874 670,426 - Movement in net unrealised gain/(loss) on foreign currency 55,630 9,726 (12,824) -
Total net movement in unrealised gain/(loss) 2,762,261 31,600 657,602 -
Net gain/(loss) on financial assets and liabilit ies at fair value through profit or loss 2,569,872 98,056 745,875 -
**Man GLG Event Driven Alternative, Man GLG Global Debt Total Return, Man GLG High Yield Opportunities DE and Man GLG US Absolute Alpha commenced their operations on 2 July 2019, 1 August 2019, 22 November 2019 and 31 December 2019 respectively.
CombinedFund
Man GLG European
Alpha Alternative
Man GLGAlpha Select
Alternative
Man GLGEuropean
EquityAlternative
2018 2018 2018 2018 US$ € £ €
Interest income 46,790,113 1,907 1,273,935 31,635 Interest expense (56,482,988) (421,366) (2,658,669) (8,692,953)Dividend income 100,431,134 1,232,357 13,050,237 53,125,600 Dividend expense (92,575,991) (1,207,353) (9,096,419) (49,369,255)
(1,837,732) (394,455) 2,569,084 (4,904,973)Realised and unrealised (loss)/gain on financial assets and liabilities at fair value through profit or lossNet realised (loss)/gain on investments (29,308,273) 2,467,418 36,456,389 (9,675,446)Net realised gain/(loss) on foreign currency 6,414,472 396,102 (2,495,396) 7,513,340 Total net realised (loss)/gain (22,893,801) 2,863,520 33,960,993 (2,162,106)
Movement in net unrealised (loss)/gain on investments (123,243,497) (523,222) (1,151,135) (12,686,098)Movement in net unrealised gain/(loss) on foreign currency 1,855,097
1,315 (917) 95,614 Total net movement in unrealised (loss)/gain (121,388,400) (521,907) (1,152,052) (12,590,484)
Net (loss)/gain on financial assets and liabilit ies at fair value through profit or loss (146,119,933) 1,947,158 35,378,025 (19,657,563)
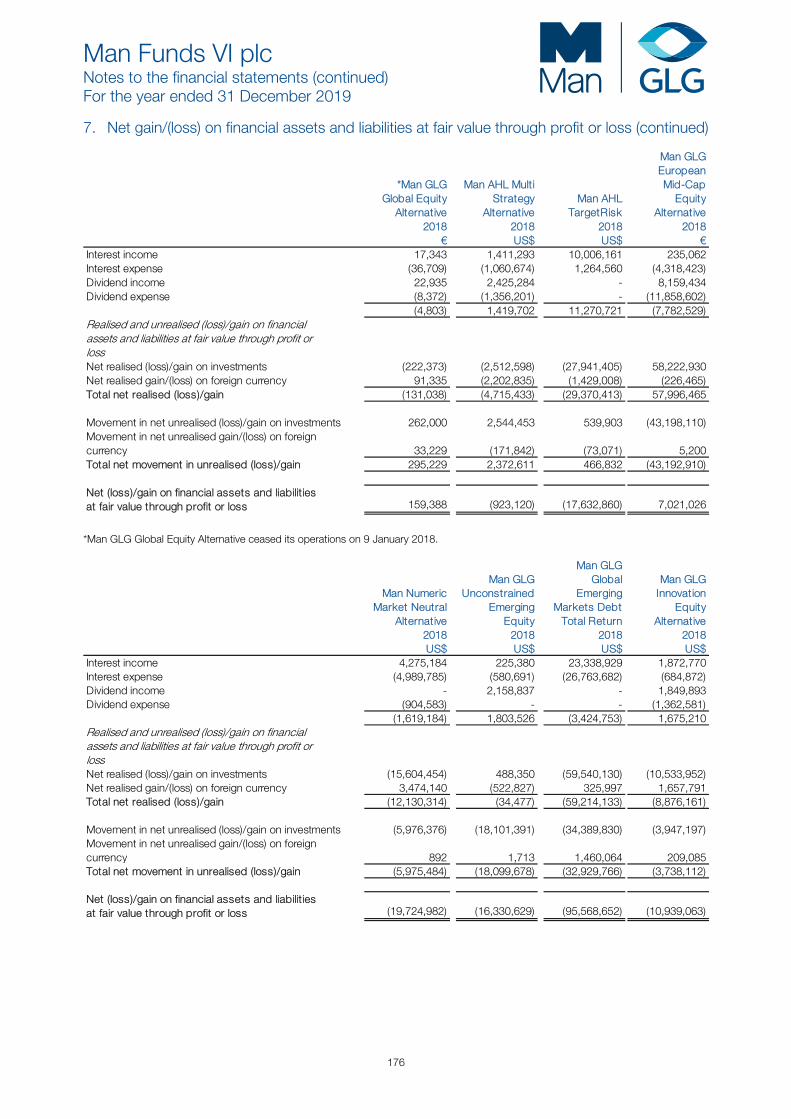
Man Funds VI plc Notes to the financial statements (continued) For the year ended 31 December 2019
176
7. Net gain/(loss) on financial assets and liabilities at fair value through profit or loss (continued)
*Man GLGGlobal Equity
Alternative
Man AHL MultiStrategy
AlternativeMan AHL
TargetRisk
Man GLGEuropeanMid-Cap
EquityAlternative
2018 2018 2018 2018€ US$ US$ €
Interest income 17,343 1,411,293 10,006,161 235,062 Interest expense (36,709) (1,060,674) 1,264,560 (4,318,423)Dividend income 22,935 2,425,284 - 8,159,434 Dividend expense (8,372) (1,356,201) - (11,858,602)
(4,803) 1,419,702 11,270,721 (7,782,529)Realised and unrealised (loss)/gain on financial assets and liabilities at fair value through profit or lossNet realised (loss)/gain on investments (222,373) (2,512,598) (27,941,405) 58,222,930 Net realised gain/(loss) on foreign currency 91,335 (2,202,835) (1,429,008) (226,465)Total net realised (loss)/gain (131,038) (4,715,433) (29,370,413) 57,996,465
Movement in net unrealised (loss)/gain on investments 262,000 2,544,453 539,903 (43,198,110)Movement in net unrealised gain/(loss) on foreign currency 33,229 (171,842) (73,071) 5,200 Total net movement in unrealised (loss)/gain 295,229 2,372,611 466,832 (43,192,910)
Net (loss)/gain on financial assets and liabilit ies at fair value through profit or loss 159,388 (923,120) (17,632,860) 7,021,026
*Man GLG Global Equity Alternative ceased its operations on 9 January 2018.
Man NumericMarket Neutral
Alternative
Man GLGUnconstrained
Emerging Equity
Man GLG Global
EmergingMarkets Debt
Total Return
Man GLGInnovation
EquityAlternative
2018 2018 2018 2018US$ US$ US$ US$
Interest income 4,275,184 225,380 23,338,929 1,872,770 Interest expense (4,989,785) (580,691) (26,763,682) (684,872)Dividend income - 2,158,837 - 1,849,893 Dividend expense (904,583) - - (1,362,581)
(1,619,184) 1,803,526 (3,424,753) 1,675,210 Realised and unrealised (loss)/gain on financial assets and liabilities at fair value through profit or lossNet realised (loss)/gain on investments (15,604,454) 488,350 (59,540,130) (10,533,952)Net realised gain/(loss) on foreign currency 3,474,140 (522,827) 325,997 1,657,791 Total net realised (loss)/gain (12,130,314) (34,477) (59,214,133) (8,876,161)
Movement in net unrealised (loss)/gain on investments (5,976,376) (18,101,391) (34,389,830) (3,947,197)Movement in net unrealised gain/(loss) on foreign currency 892 1,713 1,460,064 209,085 Total net movement in unrealised (loss)/gain (5,975,484) (18,099,678) (32,929,766) (3,738,112)
Net (loss)/gain on financial assets and liabilit ies at fair value through profit or loss (19,724,982) (16,330,629) (95,568,652) (10,939,063)
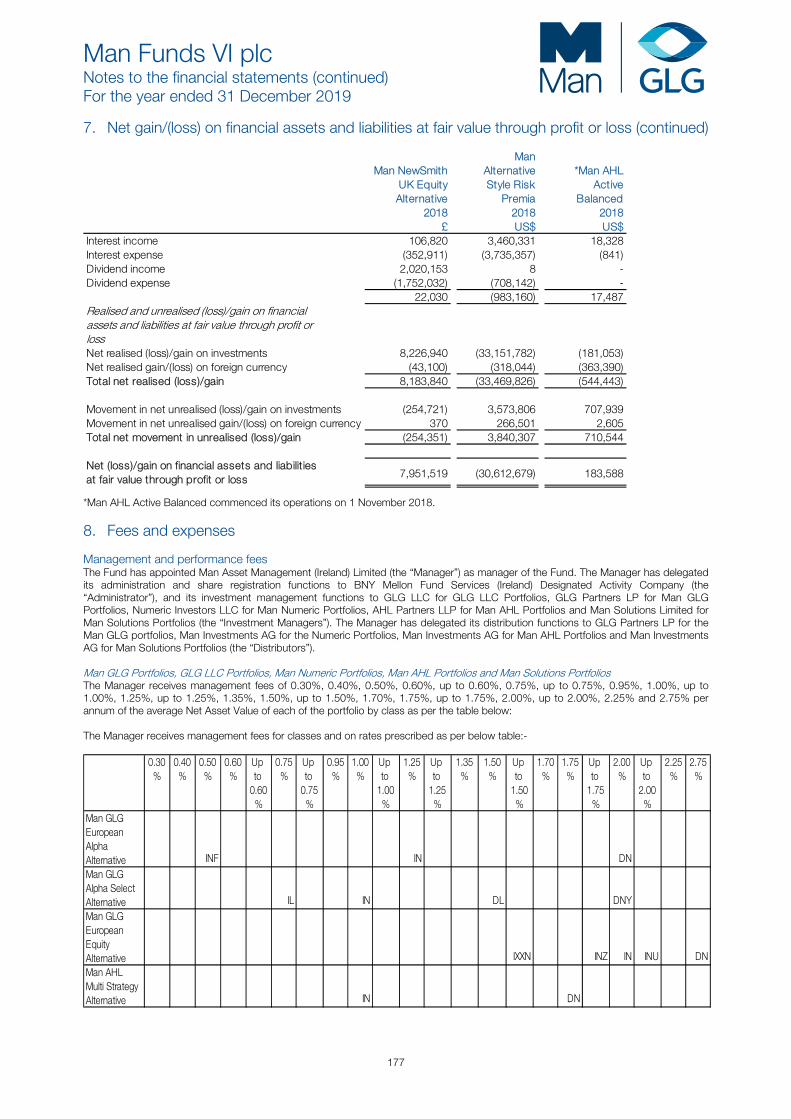
Man Funds VI plc Notes to the financial statements (continued) For the year ended 31 December 2019
177
7. Net gain/(loss) on financial assets and liabilities at fair value through profit or loss (continued)
Man NewSmithUK EquityAlternative
ManAlternativeStyle Risk
Premia
*Man AHLActive
Balanced2018 2018 2018
£ US$ US$Interest income 106,820 3,460,331 18,328 Interest expense (352,911) (3,735,357) (841)Dividend income 2,020,153 8 - Dividend expense (1,752,032) (708,142) -
22,030 (983,160) 17,487 Realised and unrealised (loss)/gain on financial assets and liabilities at fair value through profit or lossNet realised (loss)/gain on investments 8,226,940 (33,151,782) (181,053)Net realised gain/(loss) on foreign currency (43,100) (318,044) (363,390)Total net realised (loss)/gain 8,183,840 (33,469,826) (544,443)
Movement in net unrealised (loss)/gain on investments (254,721) 3,573,806 707,939 Movement in net unrealised gain/(loss) on foreign currency 370 266,501 2,605 Total net movement in unrealised (loss)/gain (254,351) 3,840,307 710,544
Net (loss)/gain on financial assets and liabilit ies at fair value through profit or loss 7,951,519 (30,612,679) 183,588
*Man AHL Active Balanced commenced its operations on 1 November 2018.
8. Fees and expenses Management and performance fees The Fund has appointed Man Asset Management (Ireland) Limited (the “Manager”) as manager of the Fund. The Manager has delegated its administration and share registration functions to BNY Mellon Fund Services (Ireland) Designated Activity Company (the “Administrator”), and its investment management functions to GLG LLC for GLG LLC Portfolios, GLG Partners LP for Man GLG Portfolios, Numeric Investors LLC for Man Numeric Portfolios, AHL Partners LLP for Man AHL Portfolios and Man Solutions Limited for Man Solutions Portfolios (the “Investment Managers”). The Manager has delegated its distribution functions to GLG Partners LP for the Man GLG portfolios, Man Investments AG for the Numeric Portfolios, Man Investments AG for Man AHL Portfolios and Man Investments AG for Man Solutions Portfolios (the “Distributors”). Man GLG Portfolios, GLG LLC Portfolios, Man Numeric Portfolios, Man AHL Portfolios and Man Solutions Portfolios The Manager receives management fees of 0.30%, 0.40%, 0.50%, 0.60%, up to 0.60%, 0.75%, up to 0.75%, 0.95%, 1.00%, up to 1.00%, 1.25%, up to 1.25%, 1.35%, 1.50%, up to 1.50%, 1.70%, 1.75%, up to 1.75%, 2.00%, up to 2.00%, 2.25% and 2.75% per annum of the average Net Asset Value of each of the portfolio by class as per the table below: The Manager receives management fees for classes and on rates prescribed as per below table:-
0.30%
0.40%
0.50%
0.60%
Up to
0.60%
0.75%
Up to
0.75%
0.95%
1.00%
Up to
1.00%
1.25%
Up to
1.25%
1.35%
1.50%
Up to
1.50%
1.70%
1.75%
Up to
1.75%
2.00%
Up to
2.00%
2.25%
2.75%
Man GLG European Alpha Alternative INF IN DNMan GLG Alpha Select Alternative IL IN DL DNYMan GLG European Equity Alternative IXXN INZ IN INU DNMan AHL Multi Strategy Alternative IN DN

Man Funds VI plc Notes to the financial statements (continued) For the year ended 31 December 2019
178
8. Fees and expenses (continued) Management and performance fees (continued)
0.30%
0.40%
0.50%
0.60%
Up to
0.60%
0.75%
Up to
0.75%
0.95%
1.00%
Up to
1.00%
1.25%
Up to
1.25%
1.35%
1.50%
Up to
1.50%
1.70%
1.75%
Up to
1.75%
2.00%
Up to
2.00%
2.25%
2.75%
Man AHL TargetRisk I INU D
Man GLG European Mid-Cap Equity Alternative
IN, INF DN DNY
Man Numeric Market Neutral Alternative IN INU DNMan GLG UnconstrainedEmerging Equity IF I DF D
Man GLG Global Emerging Markets Debt Total Return
IMF,IL I
DL, DMF D DR DY
Man GLG Innovation Equity Alternative INF IN INU DNF DNMan NewSmith UK Equity Alternative IN IX
Man Alternative Style Risk Premia INU I DMan AHL Active Balanced IMan GLG High Yield Opportunities IF I ILU DMan GLG Credit Multi-Strategy Alternative IN INU DNMan GLG Event Driven Alternative INF IN DNFYMan GLG Global Debt Total Return IMan GLG High Yield Opportunities DE IMan GLG USAbsoluteAlpha IN
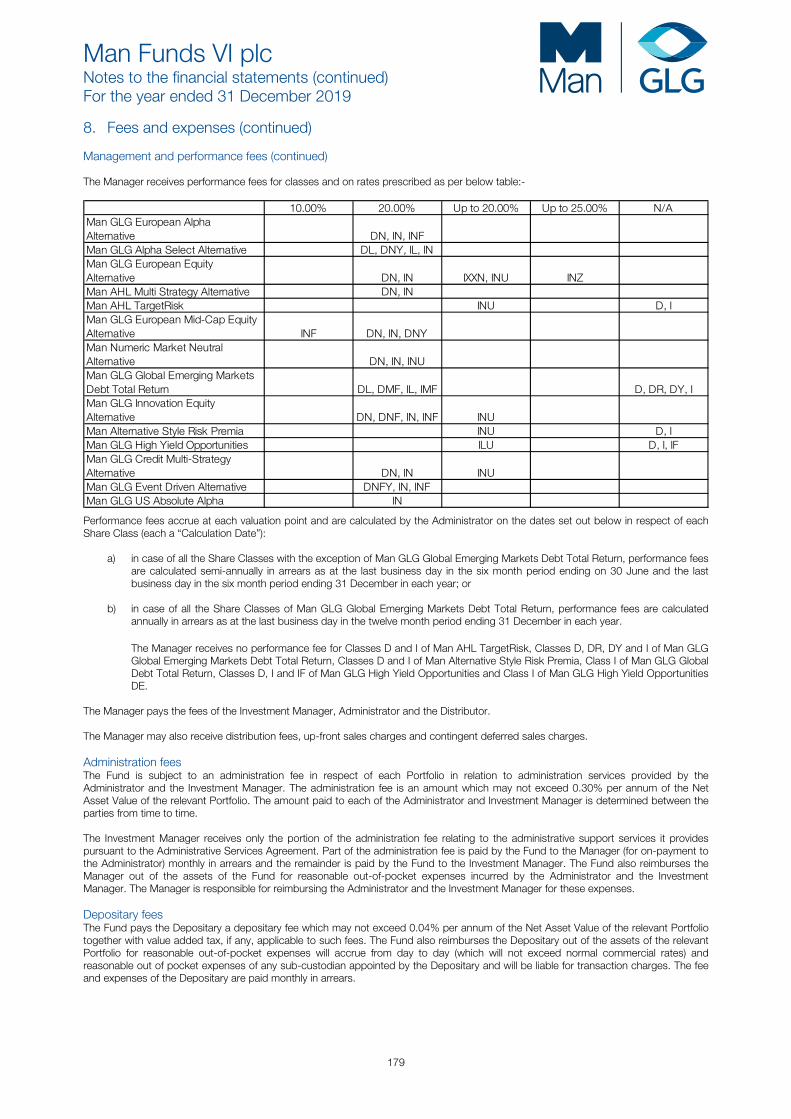
Man Funds VI plc Notes to the financial statements (continued) For the year ended 31 December 2019
179
8. Fees and expenses (continued) Management and performance fees (continued) The Manager receives performance fees for classes and on rates prescribed as per below table:-
10.00% 20.00% Up to 20.00% Up to 25.00% N/AMan GLG European Alpha Alternative DN, IN, INFMan GLG Alpha Select Alternative DL, DNY, IL, INMan GLG European Equity Alternative DN, IN IXXN, INU INZMan AHL Multi Strategy Alternative DN, INMan AHL TargetRisk INU D, IMan GLG European Mid-Cap Equity Alternative INF DN, IN, DNYMan Numeric Market Neutral Alternative DN, IN, INUMan GLG Global Emerging Markets Debt Total Return DL, DMF, IL, IMF D, DR, DY, IMan GLG Innovation Equity Alternative DN, DNF, IN, INF INUMan Alternative Style Risk Premia INU D, IMan GLG High Yield Opportunities ILU D, I, IFMan GLG Credit Multi-Strategy Alternative DN, IN INUMan GLG Event Driven Alternative DNFY, IN, INFMan GLG US Absolute Alpha IN
Performance fees accrue at each valuation point and are calculated by the Administrator on the dates set out below in respect of each Share Class (each a “Calculation Date”):
a) in case of all the Share Classes with the exception of Man GLG Global Emerging Markets Debt Total Return, performance fees are calculated semi-annually in arrears as at the last business day in the six month period ending on 30 June and the last business day in the six month period ending 31 December in each year; or
b) in case of all the Share Classes of Man GLG Global Emerging Markets Debt Total Return, performance fees are calculated
annually in arrears as at the last business day in the twelve month period ending 31 December in each year. The Manager receives no performance fee for Classes D and I of Man AHL TargetRisk, Classes D, DR, DY and I of Man GLG Global Emerging Markets Debt Total Return, Classes D and I of Man Alternative Style Risk Premia, Class I of Man GLG Global Debt Total Return, Classes D, I and IF of Man GLG High Yield Opportunities and Class I of Man GLG High Yield Opportunities DE.
The Manager pays the fees of the Investment Manager, Administrator and the Distributor. The Manager may also receive distribution fees, up-front sales charges and contingent deferred sales charges. Administration fees The Fund is subject to an administration fee in respect of each Portfolio in relation to administration services provided by the Administrator and the Investment Manager. The administration fee is an amount which may not exceed 0.30% per annum of the Net Asset Value of the relevant Portfolio. The amount paid to each of the Administrator and Investment Manager is determined between the parties from time to time. The Investment Manager receives only the portion of the administration fee relating to the administrative support services it provides pursuant to the Administrative Services Agreement. Part of the administration fee is paid by the Fund to the Manager (for on-payment to the Administrator) monthly in arrears and the remainder is paid by the Fund to the Investment Manager. The Fund also reimburses the Manager out of the assets of the Fund for reasonable out-of-pocket expenses incurred by the Administrator and the Investment Manager. The Manager is responsible for reimbursing the Administrator and the Investment Manager for these expenses. Depositary fees The Fund pays the Depositary a depositary fee which may not exceed 0.04% per annum of the Net Asset Value of the relevant Portfolio together with value added tax, if any, applicable to such fees. The Fund also reimburses the Depositary out of the assets of the relevant Portfolio for reasonable out-of-pocket expenses will accrue from day to day (which will not exceed normal commercial rates) and reasonable out of pocket expenses of any sub-custodian appointed by the Depositary and will be liable for transaction charges. The fee and expenses of the Depositary are paid monthly in arrears.
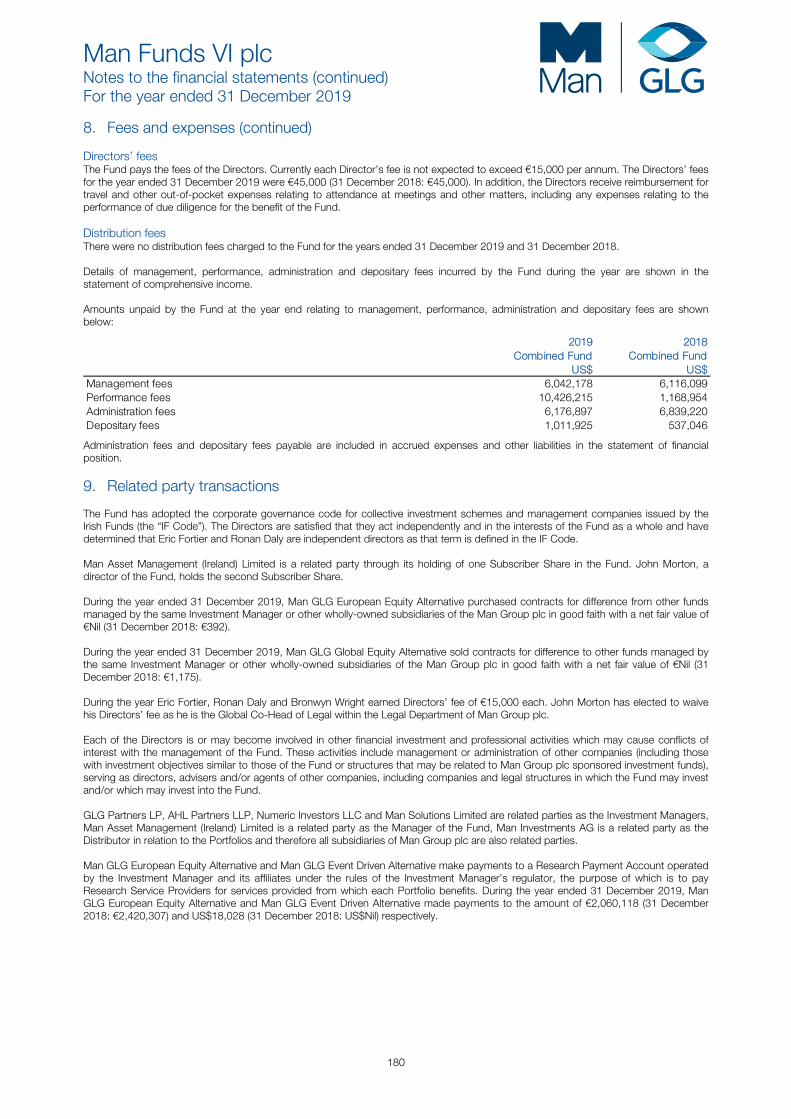
Man Funds VI plc Notes to the financial statements (continued) For the year ended 31 December 2019
180
8. Fees and expenses (continued) Directors’ fees The Fund pays the fees of the Directors. Currently each Director’s fee is not expected to exceed €15,000 per annum. The Directors’ fees for the year ended 31 December 2019 were €45,000 (31 December 2018: €45,000). In addition, the Directors receive reimbursement for travel and other out-of-pocket expenses relating to attendance at meetings and other matters, including any expenses relating to the performance of due diligence for the benefit of the Fund. Distribution fees There were no distribution fees charged to the Fund for the years ended 31 December 2019 and 31 December 2018. Details of management, performance, administration and depositary fees incurred by the Fund during the year are shown in the statement of comprehensive income. Amounts unpaid by the Fund at the year end relating to management, performance, administration and depositary fees are shown below:
2019 2018Combined Fund Combined Fund
US$ US$Management fees 6,042,178 6,116,099 Performance fees 10,426,215 1,168,954 Administration fees 6,176,897 6,839,220 Depositary fees 1,011,925 537,046
Administration fees and depositary fees payable are included in accrued expenses and other liabilities in the statement of financial position.
9. Related party transactions The Fund has adopted the corporate governance code for collective investment schemes and management companies issued by the Irish Funds (the “IF Code”). The Directors are satisfied that they act independently and in the interests of the Fund as a whole and have determined that Eric Fortier and Ronan Daly are independent directors as that term is defined in the IF Code. Man Asset Management (Ireland) Limited is a related party through its holding of one Subscriber Share in the Fund. John Morton, a director of the Fund, holds the second Subscriber Share. During the year ended 31 December 2019, Man GLG European Equity Alternative purchased contracts for difference from other funds managed by the same Investment Manager or other wholly-owned subsidiaries of the Man Group plc in good faith with a net fair value of €Nil (31 December 2018: €392). During the year ended 31 December 2019, Man GLG Global Equity Alternative sold contracts for difference to other funds managed by the same Investment Manager or other wholly-owned subsidiaries of the Man Group plc in good faith with a net fair value of €Nil (31 December 2018: €1,175). During the year Eric Fortier, Ronan Daly and Bronwyn Wright earned Directors’ fee of €15,000 each. John Morton has elected to waive his Directors’ fee as he is the Global Co-Head of Legal within the Legal Department of Man Group plc. Each of the Directors is or may become involved in other financial investment and professional activities which may cause conflicts of interest with the management of the Fund. These activities include management or administration of other companies (including those with investment objectives similar to those of the Fund or structures that may be related to Man Group plc sponsored investment funds), serving as directors, advisers and/or agents of other companies, including companies and legal structures in which the Fund may invest and/or which may invest into the Fund. GLG Partners LP, AHL Partners LLP, Numeric Investors LLC and Man Solutions Limited are related parties as the Investment Managers, Man Asset Management (Ireland) Limited is a related party as the Manager of the Fund, Man Investments AG is a related party as the Distributor in relation to the Portfolios and therefore all subsidiaries of Man Group plc are also related parties. Man GLG European Equity Alternative and Man GLG Event Driven Alternative make payments to a Research Payment Account operated by the Investment Manager and its affiliates under the rules of the Investment Manager’s regulator, the purpose of which is to pay Research Service Providers for services provided from which each Portfolio benefits. During the year ended 31 December 2019, Man GLG European Equity Alternative and Man GLG Event Driven Alternative made payments to the amount of €2,060,118 (31 December 2018: €2,420,307) and US$18,028 (31 December 2018: US$Nil) respectively.
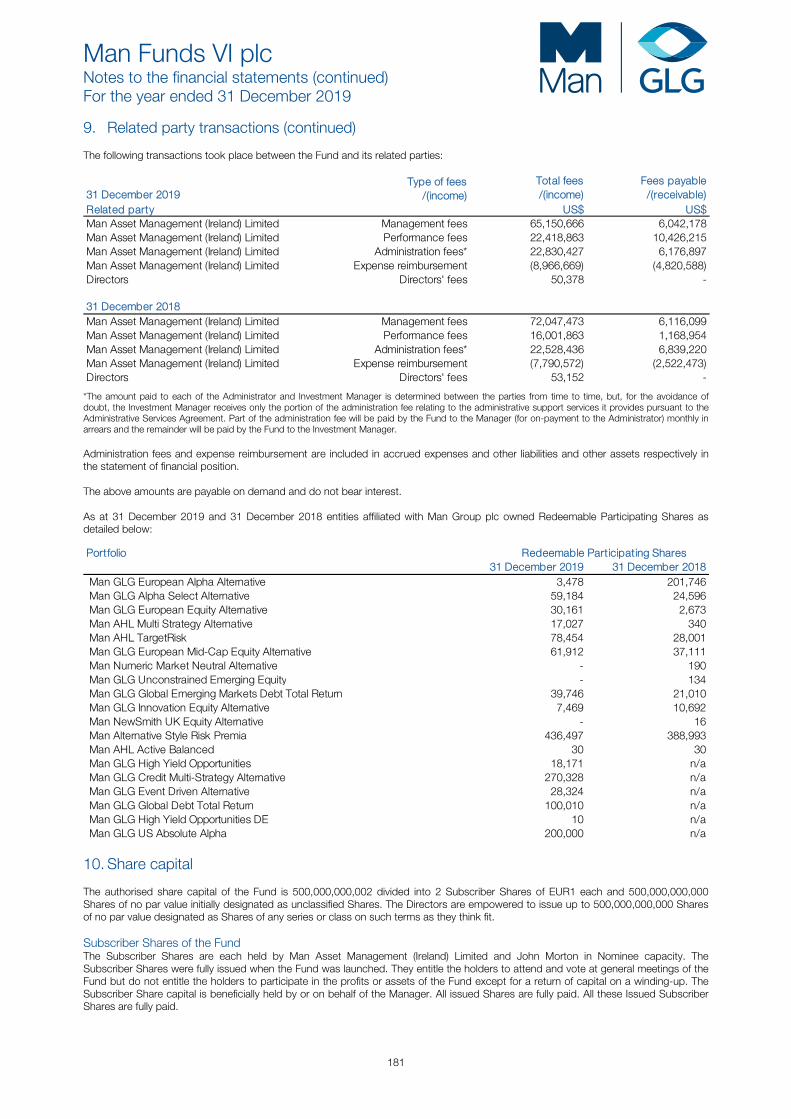
Man Funds VI plc Notes to the financial statements (continued) For the year ended 31 December 2019
181
9. Related party transactions (continued) The following transactions took place between the Fund and its related parties:
Type of fees Total fees Fees payable31 December 2019 /(income) /(income) /(receivable)Related party US$ US$Man Asset Management (Ireland) Limited Management fees 65,150,666 6,042,178 Man Asset Management (Ireland) Limited Performance fees 22,418,863 10,426,215 Man Asset Management (Ireland) Limited Administration fees* 22,830,427 6,176,897 Man Asset Management (Ireland) Limited Expense reimbursement (8,966,669) (4,820,588)Directors Directors' fees 50,378 -
31 December 2018Man Asset Management (Ireland) Limited Management fees 72,047,473 6,116,099 Man Asset Management (Ireland) Limited Performance fees 16,001,863 1,168,954 Man Asset Management (Ireland) Limited Administration fees* 22,528,436 6,839,220 Man Asset Management (Ireland) Limited Expense reimbursement (7,790,572) (2,522,473)Directors Directors' fees 53,152 -
*The amount paid to each of the Administrator and Investment Manager is determined between the parties from time to time, but, for the avoidance of doubt, the Investment Manager receives only the portion of the administration fee relating to the administrative support services it provides pursuant to the Administrative Services Agreement. Part of the administration fee will be paid by the Fund to the Manager (for on-payment to the Administrator) monthly in arrears and the remainder will be paid by the Fund to the Investment Manager. Administration fees and expense reimbursement are included in accrued expenses and other liabilities and other assets respectively in the statement of financial position. The above amounts are payable on demand and do not bear interest. As at 31 December 2019 and 31 December 2018 entities affiliated with Man Group plc owned Redeemable Participating Shares as detailed below: Portfolio
31 December 2019 31 December 2018Man GLG European Alpha Alternative 3,478 201,746 Man GLG Alpha Select Alternative 59,184 24,596 Man GLG European Equity Alternative 30,161 2,673 Man AHL Multi Strategy Alternative 17,027 340 Man AHL TargetRisk 78,454 28,001 Man GLG European Mid-Cap Equity Alternative 61,912 37,111 Man Numeric Market Neutral Alternative - 190 Man GLG Unconstrained Emerging Equity - 134 Man GLG Global Emerging Markets Debt Total Return 39,746 21,010 Man GLG Innovation Equity Alternative 7,469 10,692 Man NewSmith UK Equity Alternative - 16 Man Alternative Style Risk Premia 436,497 388,993 Man AHL Active Balanced 30 30 Man GLG High Yield Opportunities 18,171 n/a Man GLG Credit Multi-Strategy Alternative 270,328 n/a Man GLG Event Driven Alternative 28,324 n/a Man GLG Global Debt Total Return 100,010 n/a Man GLG High Yield Opportunities DE 10 n/a Man GLG US Absolute Alpha 200,000 n/a
Redeemable Participating Shares
10. Share capital The authorised share capital of the Fund is 500,000,000,002 divided into 2 Subscriber Shares of EUR1 each and 500,000,000,000 Shares of no par value initially designated as unclassified Shares. The Directors are empowered to issue up to 500,000,000,000 Shares of no par value designated as Shares of any series or class on such terms as they think fit. Subscriber Shares of the Fund The Subscriber Shares are each held by Man Asset Management (Ireland) Limited and John Morton in Nominee capacity. The Subscriber Shares were fully issued when the Fund was launched. They entitle the holders to attend and vote at general meetings of the Fund but do not entitle the holders to participate in the profits or assets of the Fund except for a return of capital on a winding-up. The Subscriber Share capital is beneficially held by or on behalf of the Manager. All issued Shares are fully paid. All these Issued Subscriber Shares are fully paid.
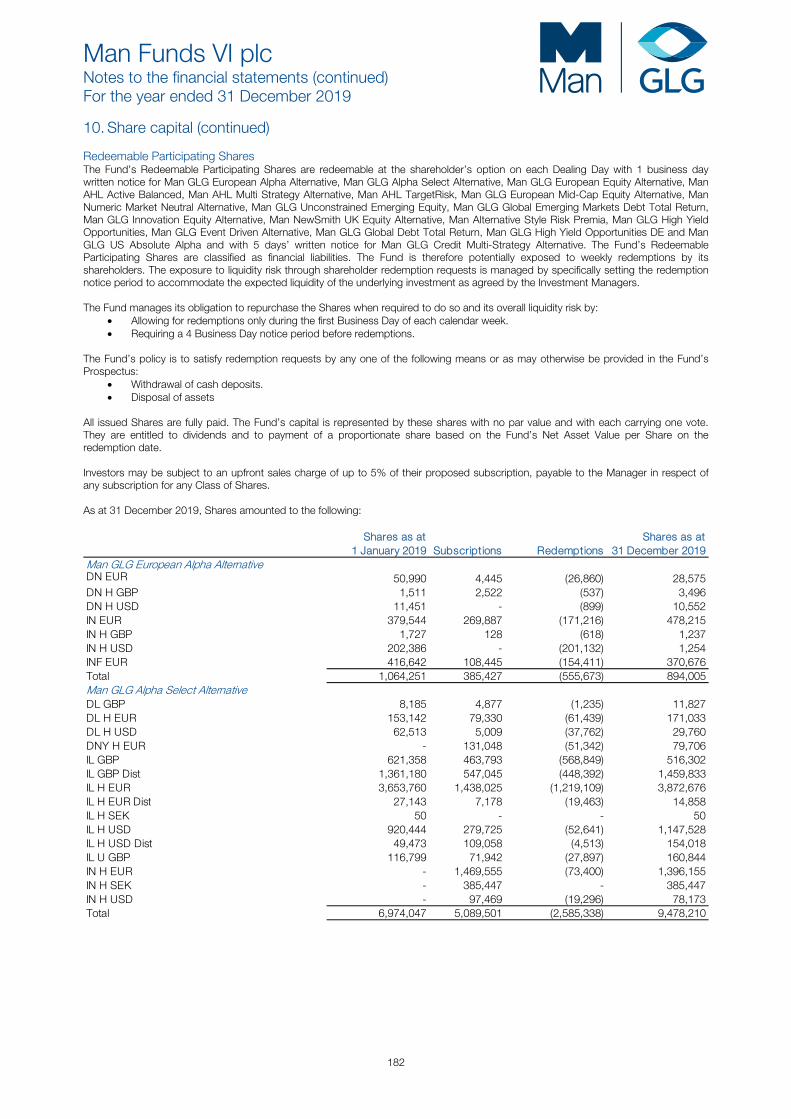
Man Funds VI plc Notes to the financial statements (continued) For the year ended 31 December 2019
182
10. Share capital (continued) Redeemable Participating Shares The Fund’s Redeemable Participating Shares are redeemable at the shareholder’s option on each Dealing Day with 1 business day written notice for Man GLG European Alpha Alternative, Man GLG Alpha Select Alternative, Man GLG European Equity Alternative, Man AHL Active Balanced, Man AHL Multi Strategy Alternative, Man AHL TargetRisk, Man GLG European Mid-Cap Equity Alternative, Man Numeric Market Neutral Alternative, Man GLG Unconstrained Emerging Equity, Man GLG Global Emerging Markets Debt Total Return, Man GLG Innovation Equity Alternative, Man NewSmith UK Equity Alternative, Man Alternative Style Risk Premia, Man GLG High Yield Opportunities, Man GLG Event Driven Alternative, Man GLG Global Debt Total Return, Man GLG High Yield Opportunities DE and Man GLG US Absolute Alpha and with 5 days’ written notice for Man GLG Credit Multi-Strategy Alternative. The Fund’s Redeemable Participating Shares are classified as financial liabilities. The Fund is therefore potentially exposed to weekly redemptions by its shareholders. The exposure to liquidity risk through shareholder redemption requests is managed by specifically setting the redemption notice period to accommodate the expected liquidity of the underlying investment as agreed by the Investment Managers. The Fund manages its obligation to repurchase the Shares when required to do so and its overall liquidity risk by:
• Allowing for redemptions only during the first Business Day of each calendar week. • Requiring a 4 Business Day notice period before redemptions.
The Fund’s policy is to satisfy redemption requests by any one of the following means or as may otherwise be provided in the Fund’s Prospectus:
• Withdrawal of cash deposits. • Disposal of assets
All issued Shares are fully paid. The Fund’s capital is represented by these shares with no par value and with each carrying one vote. They are entitled to dividends and to payment of a proportionate share based on the Fund’s Net Asset Value per Share on the redemption date. Investors may be subject to an upfront sales charge of up to 5% of their proposed subscription, payable to the Manager in respect of any subscription for any Class of Shares. As at 31 December 2019, Shares amounted to the following:
Shares as at Shares as at1 January 2019 Subscriptions Redemptions 31 December 2019
Man GLG European Alpha AlternativeDN EUR 50,990 4,445 (26,860) 28,575 DN H GBP 1,511 2,522 (537) 3,496 DN H USD 11,451 - (899) 10,552 IN EUR 379,544 269,887 (171,216) 478,215 IN H GBP 1,727 128 (618) 1,237 IN H USD 202,386 - (201,132) 1,254 INF EUR 416,642 108,445 (154,411) 370,676 Total 1,064,251 385,427 (555,673) 894,005 Man GLG Alpha Select AlternativeDL GBP 8,185 4,877 (1,235) 11,827 DL H EUR 153,142 79,330 (61,439) 171,033 DL H USD 62,513 5,009 (37,762) 29,760 DNY H EUR - 131,048 (51,342) 79,706 IL GBP 621,358 463,793 (568,849) 516,302 IL GBP Dist 1,361,180 547,045 (448,392) 1,459,833 IL H EUR 3,653,760 1,438,025 (1,219,109) 3,872,676 IL H EUR Dist 27,143 7,178 (19,463) 14,858 IL H SEK 50 - - 50 IL H USD 920,444 279,725 (52,641) 1,147,528 IL H USD Dist 49,473 109,058 (4,513) 154,018 IL U GBP 116,799 71,942 (27,897) 160,844 IN H EUR - 1,469,555 (73,400) 1,396,155 IN H SEK - 385,447 - 385,447 IN H USD - 97,469 (19,296) 78,173 Total 6,974,047 5,089,501 (2,585,338) 9,478,210
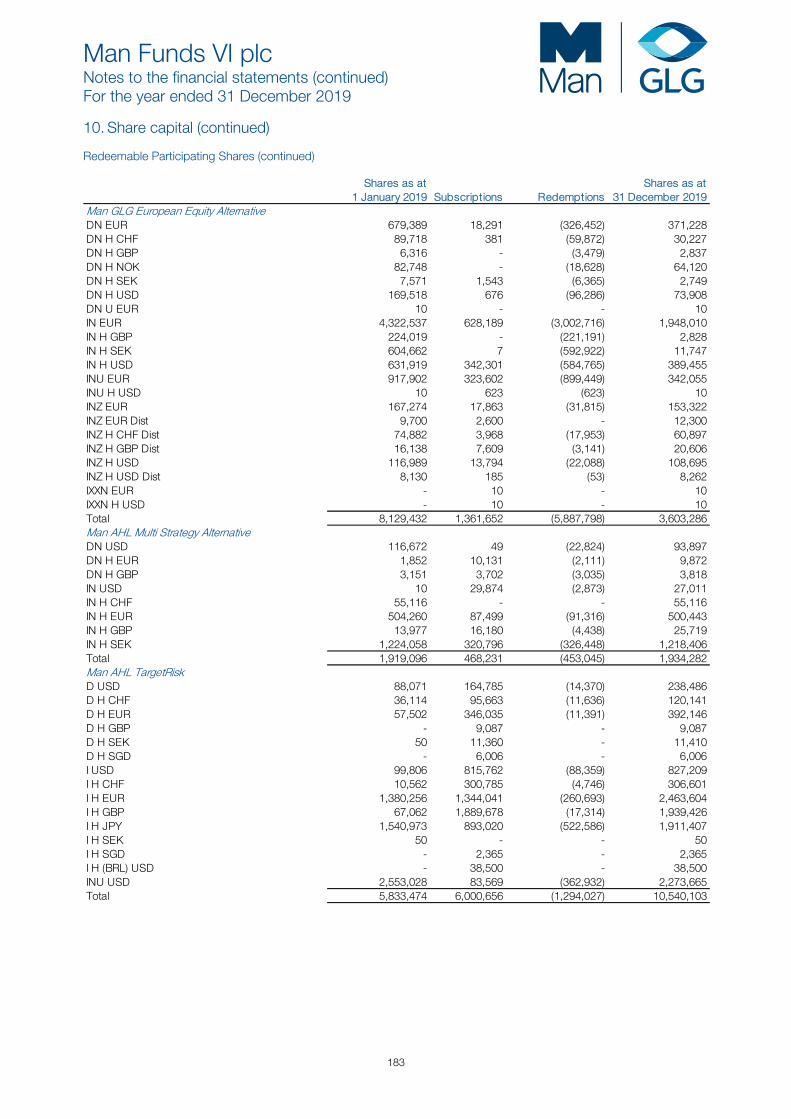
Man Funds VI plc Notes to the financial statements (continued) For the year ended 31 December 2019
183
10. Share capital (continued) Redeemable Participating Shares (continued)
Shares as at Shares as at1 January 2019 Subscriptions Redemptions 31 December 2019
Man GLG European Equity AlternativeDN EUR 679,389 18,291 (326,452) 371,228 DN H CHF 89,718 381 (59,872) 30,227 DN H GBP 6,316 - (3,479) 2,837 DN H NOK 82,748 - (18,628) 64,120 DN H SEK 7,571 1,543 (6,365) 2,749 DN H USD 169,518 676 (96,286) 73,908 DN U EUR 10 - - 10 IN EUR 4,322,537 628,189 (3,002,716) 1,948,010 IN H GBP 224,019 - (221,191) 2,828 IN H SEK 604,662 7 (592,922) 11,747 IN H USD 631,919 342,301 (584,765) 389,455 INU EUR 917,902 323,602 (899,449) 342,055 INU H USD 10 623 (623) 10 INZ EUR 167,274 17,863 (31,815) 153,322 INZ EUR Dist 9,700 2,600 - 12,300 INZ H CHF Dist 74,882 3,968 (17,953) 60,897 INZ H GBP Dist 16,138 7,609 (3,141) 20,606 INZ H USD 116,989 13,794 (22,088) 108,695 INZ H USD Dist 8,130 185 (53) 8,262 IXXN EUR - 10 - 10 IXXN H USD - 10 - 10 Total 8,129,432 1,361,652 (5,887,798) 3,603,286 Man AHL Multi Strategy AlternativeDN USD 116,672 49 (22,824) 93,897 DN H EUR 1,852 10,131 (2,111) 9,872 DN H GBP 3,151 3,702 (3,035) 3,818 IN USD 10 29,874 (2,873) 27,011 IN H CHF 55,116 - - 55,116 IN H EUR 504,260 87,499 (91,316) 500,443 IN H GBP 13,977 16,180 (4,438) 25,719 IN H SEK 1,224,058 320,796 (326,448) 1,218,406 Total 1,919,096 468,231 (453,045) 1,934,282 Man AHL TargetRiskD USD 88,071 164,785 (14,370) 238,486 D H CHF 36,114 95,663 (11,636) 120,141 D H EUR 57,502 346,035 (11,391) 392,146 D H GBP - 9,087 - 9,087 D H SEK 50 11,360 - 11,410 D H SGD - 6,006 - 6,006 I USD 99,806 815,762 (88,359) 827,209 I H CHF 10,562 300,785 (4,746) 306,601 I H EUR 1,380,256 1,344,041 (260,693) 2,463,604 I H GBP 67,062 1,889,678 (17,314) 1,939,426 I H JPY 1,540,973 893,020 (522,586) 1,911,407 I H SEK 50 - - 50 I H SGD - 2,365 - 2,365 I H (BRL) USD - 38,500 - 38,500 INU USD 2,553,028 83,569 (362,932) 2,273,665 Total 5,833,474 6,000,656 (1,294,027) 10,540,103
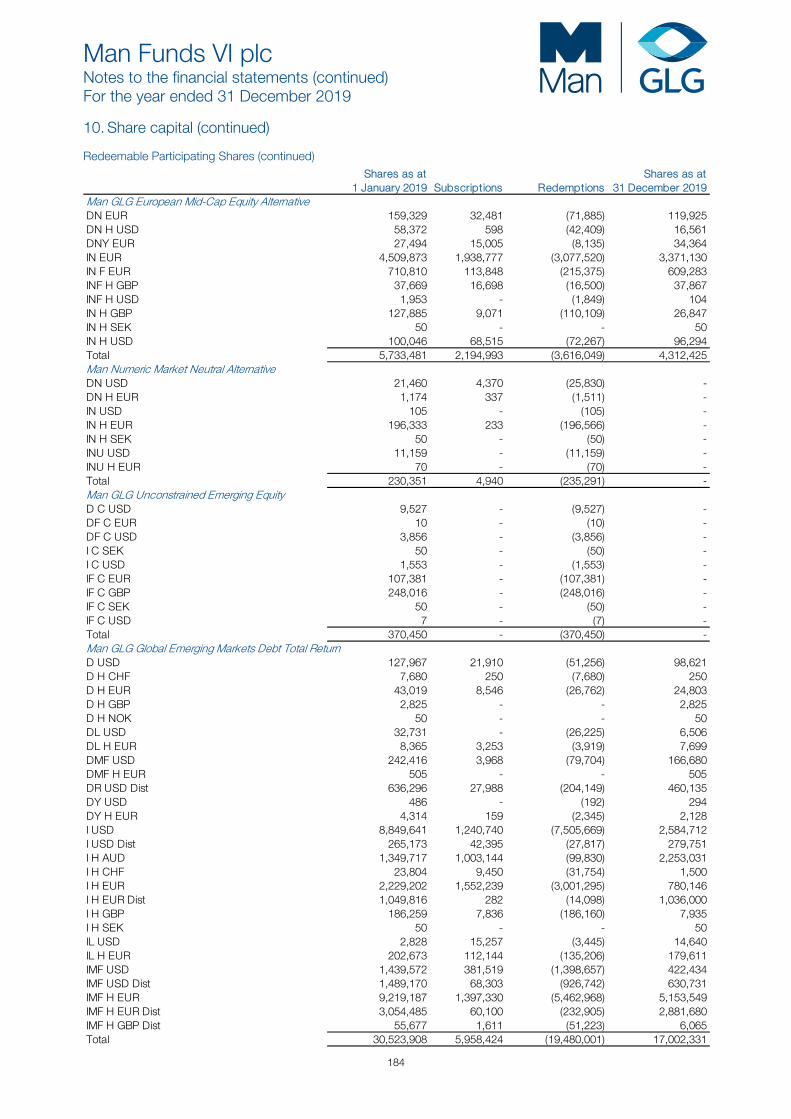
Man Funds VI plc Notes to the financial statements (continued) For the year ended 31 December 2019
184
10. Share capital (continued) Redeemable Participating Shares (continued)
Shares as at Shares as at1 January 2019 Subscriptions Redemptions 31 December 2019
Man GLG European Mid-Cap Equity AlternativeDN EUR 159,329 32,481 (71,885) 119,925 DN H USD 58,372 598 (42,409) 16,561 DNY EUR 27,494 15,005 (8,135) 34,364 IN EUR 4,509,873 1,938,777 (3,077,520) 3,371,130 IN F EUR 710,810 113,848 (215,375) 609,283 INF H GBP 37,669 16,698 (16,500) 37,867 INF H USD 1,953 - (1,849) 104 IN H GBP 127,885 9,071 (110,109) 26,847 IN H SEK 50 - - 50 IN H USD 100,046 68,515 (72,267) 96,294 Total 5,733,481 2,194,993 (3,616,049) 4,312,425 Man Numeric Market Neutral AlternativeDN USD 21,460 4,370 (25,830) - DN H EUR 1,174 337 (1,511) - IN USD 105 - (105) - IN H EUR 196,333 233 (196,566) - IN H SEK 50 - (50) - INU USD 11,159 - (11,159) - INU H EUR 70 - (70) - Total 230,351 4,940 (235,291) - Man GLG Unconstrained Emerging EquityD C USD 9,527 - (9,527) - DF C EUR 10 - (10) - DF C USD 3,856 - (3,856) - I C SEK 50 - (50) - I C USD 1,553 - (1,553) - IF C EUR 107,381 - (107,381) - IF C GBP 248,016 - (248,016) - IF C SEK 50 - (50) - IF C USD 7 - (7) - Total 370,450 - (370,450) - Man GLG Global Emerging Markets Debt Total ReturnD USD 127,967 21,910 (51,256) 98,621 D H CHF 7,680 250 (7,680) 250 D H EUR 43,019 8,546 (26,762) 24,803 D H GBP 2,825 - - 2,825 D H NOK 50 - - 50 DL USD 32,731 - (26,225) 6,506 DL H EUR 8,365 3,253 (3,919) 7,699 DMF USD 242,416 3,968 (79,704) 166,680 DMF H EUR 505 - - 505 DR USD Dist 636,296 27,988 (204,149) 460,135 DY USD 486 - (192) 294 DY H EUR 4,314 159 (2,345) 2,128 I USD 8,849,641 1,240,740 (7,505,669) 2,584,712 I USD Dist 265,173 42,395 (27,817) 279,751 I H AUD 1,349,717 1,003,144 (99,830) 2,253,031 I H CHF 23,804 9,450 (31,754) 1,500 I H EUR 2,229,202 1,552,239 (3,001,295) 780,146 I H EUR Dist 1,049,816 282 (14,098) 1,036,000 I H GBP 186,259 7,836 (186,160) 7,935 I H SEK 50 - - 50 IL USD 2,828 15,257 (3,445) 14,640 IL H EUR 202,673 112,144 (135,206) 179,611 IMF USD 1,439,572 381,519 (1,398,657) 422,434 IMF USD Dist 1,489,170 68,303 (926,742) 630,731 IMF H EUR 9,219,187 1,397,330 (5,462,968) 5,153,549 IMF H EUR Dist 3,054,485 60,100 (232,905) 2,881,680 IMF H GBP Dist 55,677 1,611 (51,223) 6,065 Total 30,523,908 5,958,424 (19,480,001) 17,002,331
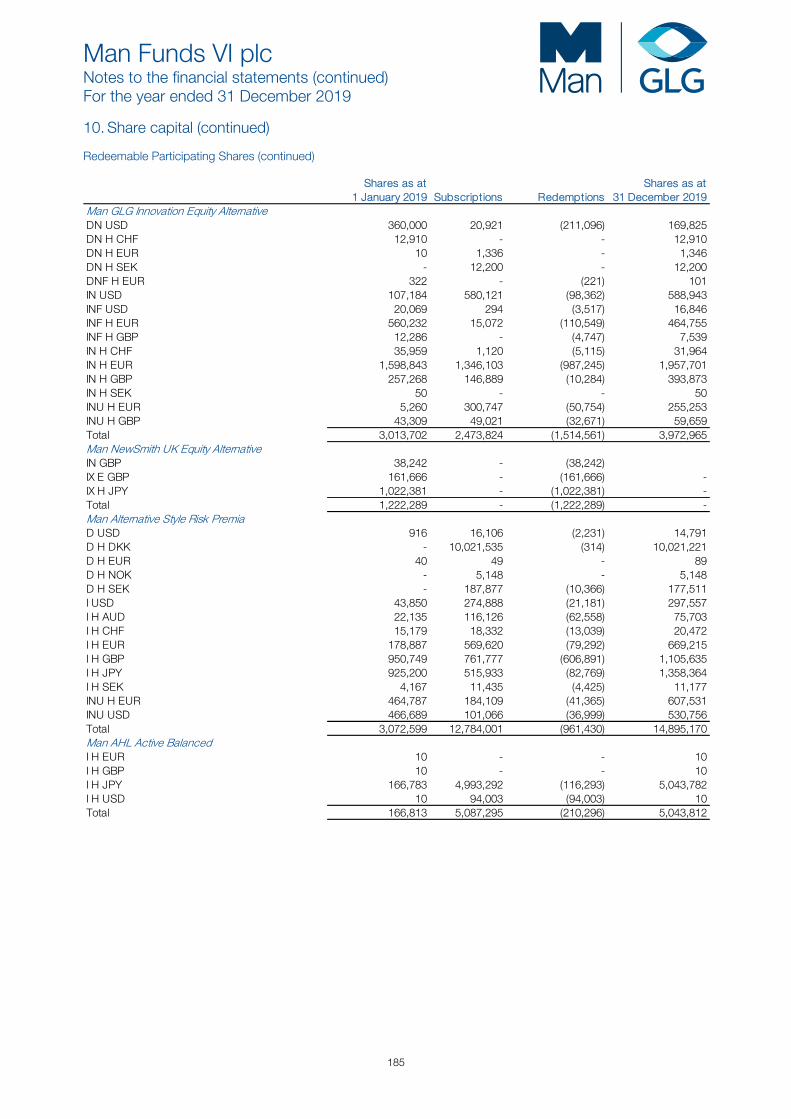
Man Funds VI plc Notes to the financial statements (continued) For the year ended 31 December 2019
185
10. Share capital (continued) Redeemable Participating Shares (continued)
Shares as at Shares as at1 January 2019 Subscriptions Redemptions 31 December 2019
Man GLG Innovation Equity AlternativeDN USD 360,000 20,921 (211,096) 169,825 DN H CHF 12,910 - - 12,910 DN H EUR 10 1,336 - 1,346 DN H SEK - 12,200 - 12,200 DNF H EUR 322 - (221) 101 IN USD 107,184 580,121 (98,362) 588,943 INF USD 20,069 294 (3,517) 16,846 INF H EUR 560,232 15,072 (110,549) 464,755 INF H GBP 12,286 - (4,747) 7,539 IN H CHF 35,959 1,120 (5,115) 31,964 IN H EUR 1,598,843 1,346,103 (987,245) 1,957,701 IN H GBP 257,268 146,889 (10,284) 393,873 IN H SEK 50 - - 50 INU H EUR 5,260 300,747 (50,754) 255,253 INU H GBP 43,309 49,021 (32,671) 59,659 Total 3,013,702 2,473,824 (1,514,561) 3,972,965 Man NewSmith UK Equity AlternativeIN GBP 38,242 - (38,242)IX E GBP 161,666 - (161,666) - IX H JPY 1,022,381 - (1,022,381) - Total 1,222,289 - (1,222,289) - Man Alternative Style Risk PremiaD USD 916 16,106 (2,231) 14,791 D H DKK - 10,021,535 (314) 10,021,221 D H EUR 40 49 - 89 D H NOK - 5,148 - 5,148 D H SEK - 187,877 (10,366) 177,511 I USD 43,850 274,888 (21,181) 297,557 I H AUD 22,135 116,126 (62,558) 75,703 I H CHF 15,179 18,332 (13,039) 20,472 I H EUR 178,887 569,620 (79,292) 669,215 I H GBP 950,749 761,777 (606,891) 1,105,635 I H JPY 925,200 515,933 (82,769) 1,358,364 I H SEK 4,167 11,435 (4,425) 11,177 INU H EUR 464,787 184,109 (41,365) 607,531 INU USD 466,689 101,066 (36,999) 530,756 Total 3,072,599 12,784,001 (961,430) 14,895,170 Man AHL Active BalancedI H EUR 10 - - 10 I H GBP 10 - - 10 I H JPY 166,783 4,993,292 (116,293) 5,043,782 I H USD 10 94,003 (94,003) 10 Total 166,813 5,087,295 (210,296) 5,043,812
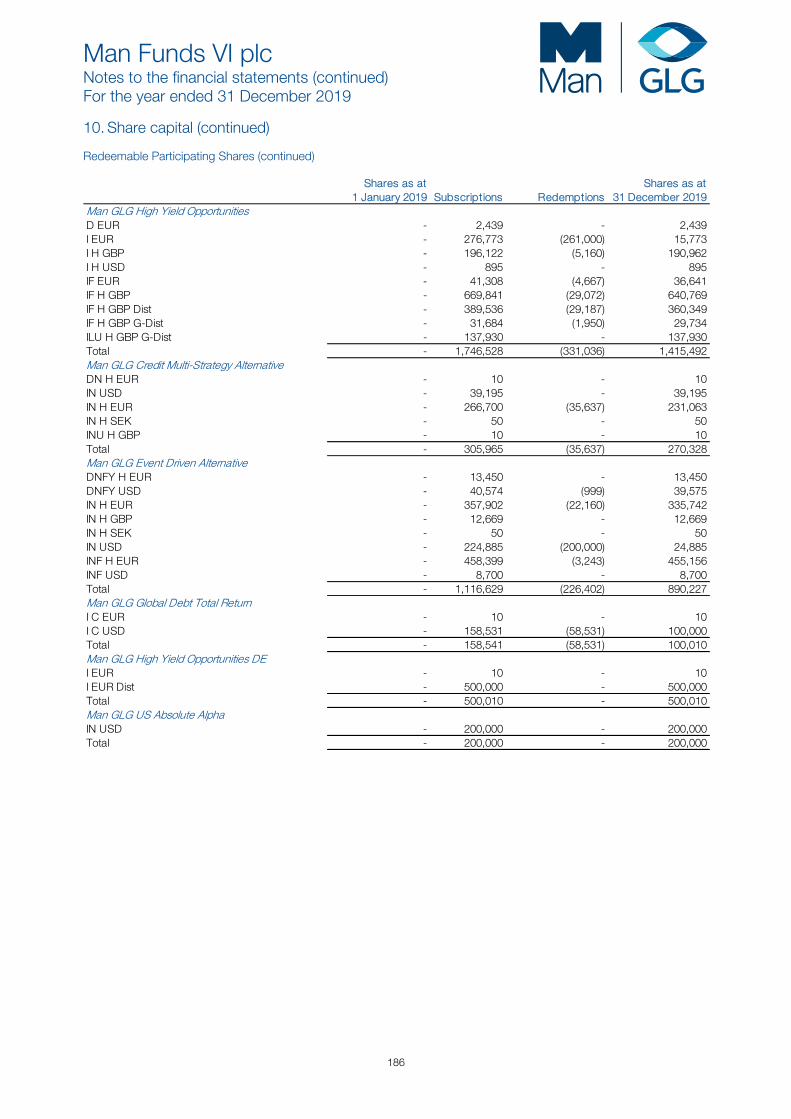
Man Funds VI plc Notes to the financial statements (continued) For the year ended 31 December 2019
186
10. Share capital (continued) Redeemable Participating Shares (continued)
Shares as at Shares as at1 January 2019 Subscriptions Redemptions 31 December 2019
Man GLG High Yield OpportunitiesD EUR - 2,439 - 2,439 I EUR - 276,773 (261,000) 15,773 I H GBP - 196,122 (5,160) 190,962 I H USD - 895 - 895 IF EUR - 41,308 (4,667) 36,641 IF H GBP - 669,841 (29,072) 640,769 IF H GBP Dist - 389,536 (29,187) 360,349 IF H GBP G-Dist - 31,684 (1,950) 29,734 ILU H GBP G-Dist - 137,930 - 137,930 Total - 1,746,528 (331,036) 1,415,492 Man GLG Credit Multi-Strategy AlternativeDN H EUR - 10 - 10 IN USD - 39,195 - 39,195 IN H EUR - 266,700 (35,637) 231,063 IN H SEK - 50 - 50 INU H GBP - 10 - 10 Total - 305,965 (35,637) 270,328 Man GLG Event Driven AlternativeDNFY H EUR - 13,450 - 13,450 DNFY USD - 40,574 (999) 39,575 IN H EUR - 357,902 (22,160) 335,742 IN H GBP - 12,669 - 12,669 IN H SEK - 50 - 50 IN USD - 224,885 (200,000) 24,885 INF H EUR - 458,399 (3,243) 455,156 INF USD - 8,700 - 8,700 Total - 1,116,629 (226,402) 890,227 Man GLG Global Debt Total ReturnI C EUR - 10 - 10 I C USD - 158,531 (58,531) 100,000 Total - 158,541 (58,531) 100,010 Man GLG High Yield Opportunities DEI EUR - 10 - 10 I EUR Dist - 500,000 - 500,000 Total - 500,010 - 500,010 Man GLG US Absolute AlphaIN USD - 200,000 - 200,000 Total - 200,000 - 200,000
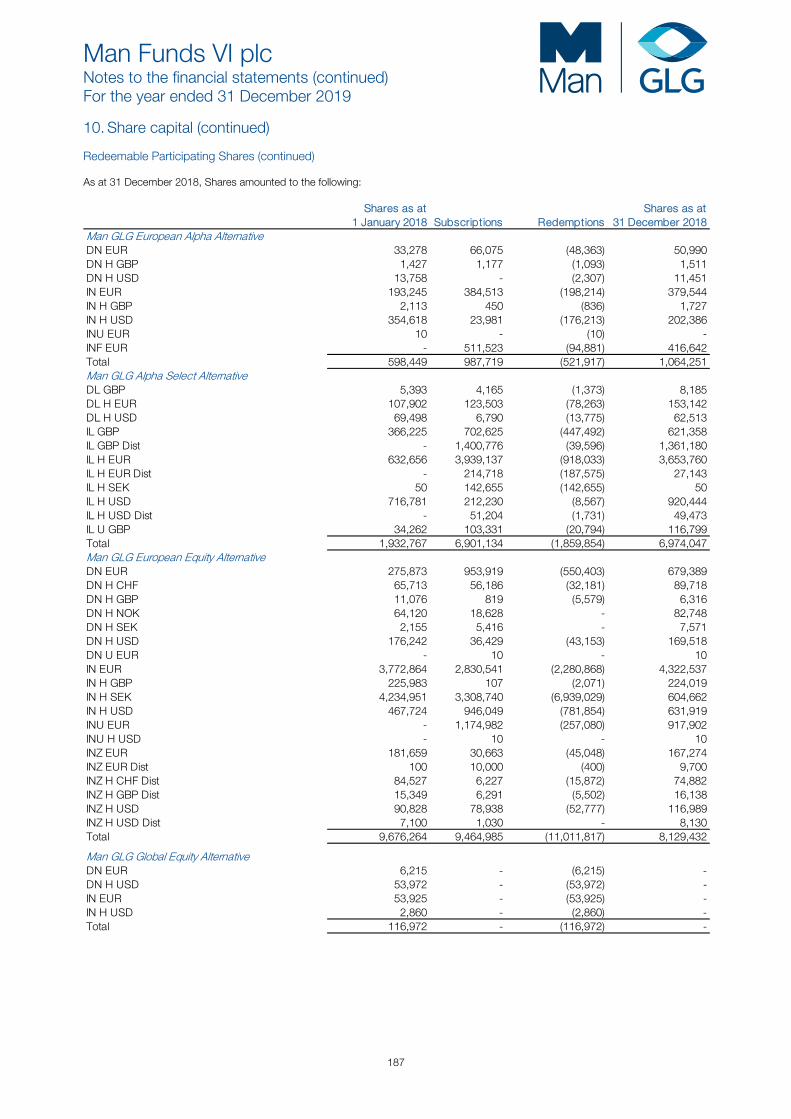
Man Funds VI plc Notes to the financial statements (continued) For the year ended 31 December 2019
187
10. Share capital (continued) Redeemable Participating Shares (continued) As at 31 December 2018, Shares amounted to the following:
Shares as at Shares as at1 January 2018 Subscriptions Redemptions 31 December 2018
Man GLG European Alpha AlternativeDN EUR 33,278 66,075 (48,363) 50,990 DN H GBP 1,427 1,177 (1,093) 1,511 DN H USD 13,758 - (2,307) 11,451 IN EUR 193,245 384,513 (198,214) 379,544 IN H GBP 2,113 450 (836) 1,727 IN H USD 354,618 23,981 (176,213) 202,386 INU EUR 10 - (10) - INF EUR - 511,523 (94,881) 416,642 Total 598,449 987,719 (521,917) 1,064,251 Man GLG Alpha Select AlternativeDL GBP 5,393 4,165 (1,373) 8,185 DL H EUR 107,902 123,503 (78,263) 153,142 DL H USD 69,498 6,790 (13,775) 62,513 IL GBP 366,225 702,625 (447,492) 621,358 IL GBP Dist - 1,400,776 (39,596) 1,361,180 IL H EUR 632,656 3,939,137 (918,033) 3,653,760 IL H EUR Dist - 214,718 (187,575) 27,143 IL H SEK 50 142,655 (142,655) 50 IL H USD 716,781 212,230 (8,567) 920,444 IL H USD Dist - 51,204 (1,731) 49,473 IL U GBP 34,262 103,331 (20,794) 116,799 Total 1,932,767 6,901,134 (1,859,854) 6,974,047 Man GLG European Equity AlternativeDN EUR 275,873 953,919 (550,403) 679,389 DN H CHF 65,713 56,186 (32,181) 89,718 DN H GBP 11,076 819 (5,579) 6,316 DN H NOK 64,120 18,628 - 82,748 DN H SEK 2,155 5,416 - 7,571 DN H USD 176,242 36,429 (43,153) 169,518 DN U EUR - 10 - 10 IN EUR 3,772,864 2,830,541 (2,280,868) 4,322,537 IN H GBP 225,983 107 (2,071) 224,019 IN H SEK 4,234,951 3,308,740 (6,939,029) 604,662 IN H USD 467,724 946,049 (781,854) 631,919 INU EUR - 1,174,982 (257,080) 917,902 INU H USD - 10 - 10 INZ EUR 181,659 30,663 (45,048) 167,274 INZ EUR Dist 100 10,000 (400) 9,700 INZ H CHF Dist 84,527 6,227 (15,872) 74,882 INZ H GBP Dist 15,349 6,291 (5,502) 16,138 INZ H USD 90,828 78,938 (52,777) 116,989 INZ H USD Dist 7,100 1,030 - 8,130 Total 9,676,264 9,464,985 (11,011,817) 8,129,432
Man GLG Global Equity AlternativeDN EUR 6,215 - (6,215) - DN H USD 53,972 - (53,972) - IN EUR 53,925 - (53,925) - IN H USD 2,860 - (2,860) - Total 116,972 - (116,972) -
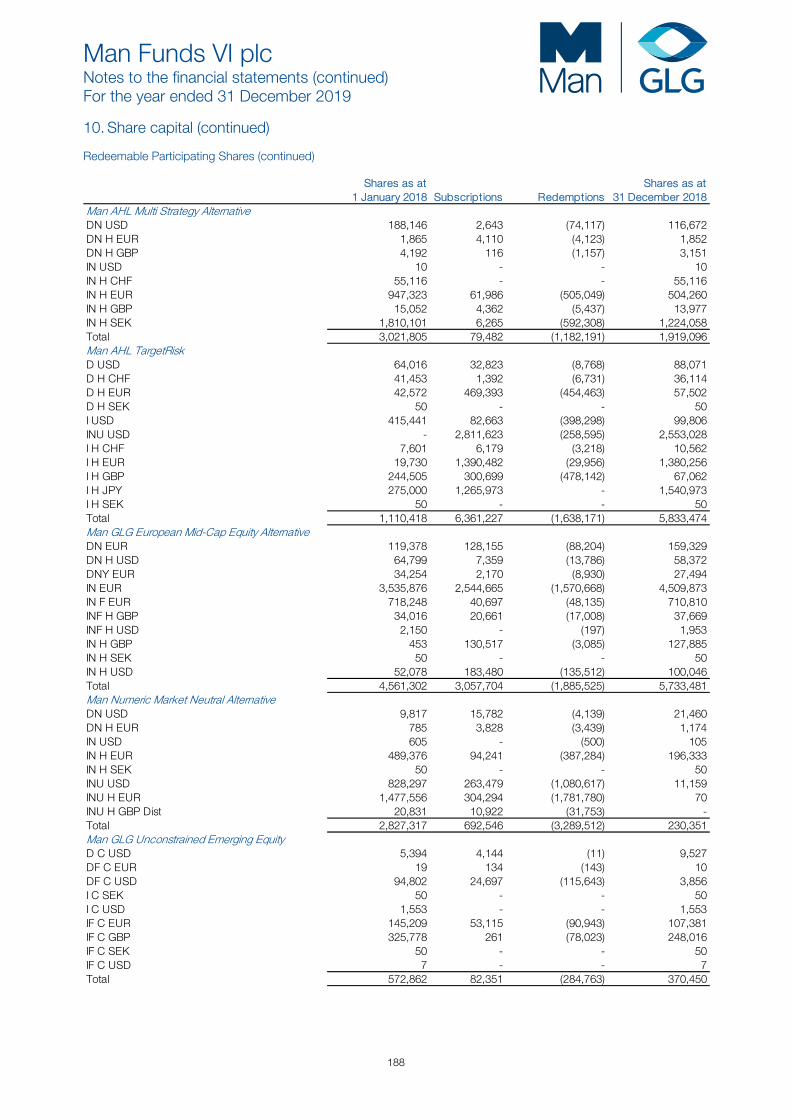
Man Funds VI plc Notes to the financial statements (continued) For the year ended 31 December 2019
188
10. Share capital (continued) Redeemable Participating Shares (continued)
Shares as at Shares as at1 January 2018 Subscriptions Redemptions 31 December 2018
Man AHL Multi Strategy AlternativeDN USD 188,146 2,643 (74,117) 116,672 DN H EUR 1,865 4,110 (4,123) 1,852 DN H GBP 4,192 116 (1,157) 3,151 IN USD 10 - - 10 IN H CHF 55,116 - - 55,116 IN H EUR 947,323 61,986 (505,049) 504,260 IN H GBP 15,052 4,362 (5,437) 13,977 IN H SEK 1,810,101 6,265 (592,308) 1,224,058 Total 3,021,805 79,482 (1,182,191) 1,919,096 Man AHL TargetRiskD USD 64,016 32,823 (8,768) 88,071 D H CHF 41,453 1,392 (6,731) 36,114 D H EUR 42,572 469,393 (454,463) 57,502 D H SEK 50 - - 50 I USD 415,441 82,663 (398,298) 99,806 INU USD - 2,811,623 (258,595) 2,553,028 I H CHF 7,601 6,179 (3,218) 10,562 I H EUR 19,730 1,390,482 (29,956) 1,380,256 I H GBP 244,505 300,699 (478,142) 67,062 I H JPY 275,000 1,265,973 - 1,540,973 I H SEK 50 - - 50 Total 1,110,418 6,361,227 (1,638,171) 5,833,474 Man GLG European Mid-Cap Equity AlternativeDN EUR 119,378 128,155 (88,204) 159,329 DN H USD 64,799 7,359 (13,786) 58,372 DNY EUR 34,254 2,170 (8,930) 27,494 IN EUR 3,535,876 2,544,665 (1,570,668) 4,509,873 IN F EUR 718,248 40,697 (48,135) 710,810 INF H GBP 34,016 20,661 (17,008) 37,669 INF H USD 2,150 - (197) 1,953 IN H GBP 453 130,517 (3,085) 127,885 IN H SEK 50 - - 50 IN H USD 52,078 183,480 (135,512) 100,046 Total 4,561,302 3,057,704 (1,885,525) 5,733,481 Man Numeric Market Neutral AlternativeDN USD 9,817 15,782 (4,139) 21,460 DN H EUR 785 3,828 (3,439) 1,174 IN USD 605 - (500) 105 IN H EUR 489,376 94,241 (387,284) 196,333 IN H SEK 50 - - 50 INU USD 828,297 263,479 (1,080,617) 11,159 INU H EUR 1,477,556 304,294 (1,781,780) 70 INU H GBP Dist 20,831 10,922 (31,753) - Total 2,827,317 692,546 (3,289,512) 230,351 Man GLG Unconstrained Emerging EquityD C USD 5,394 4,144 (11) 9,527 DF C EUR 19 134 (143) 10 DF C USD 94,802 24,697 (115,643) 3,856 I C SEK 50 - - 50 I C USD 1,553 - - 1,553 IF C EUR 145,209 53,115 (90,943) 107,381 IF C GBP 325,778 261 (78,023) 248,016 IF C SEK 50 - - 50 IF C USD 7 - - 7 Total 572,862 82,351 (284,763) 370,450
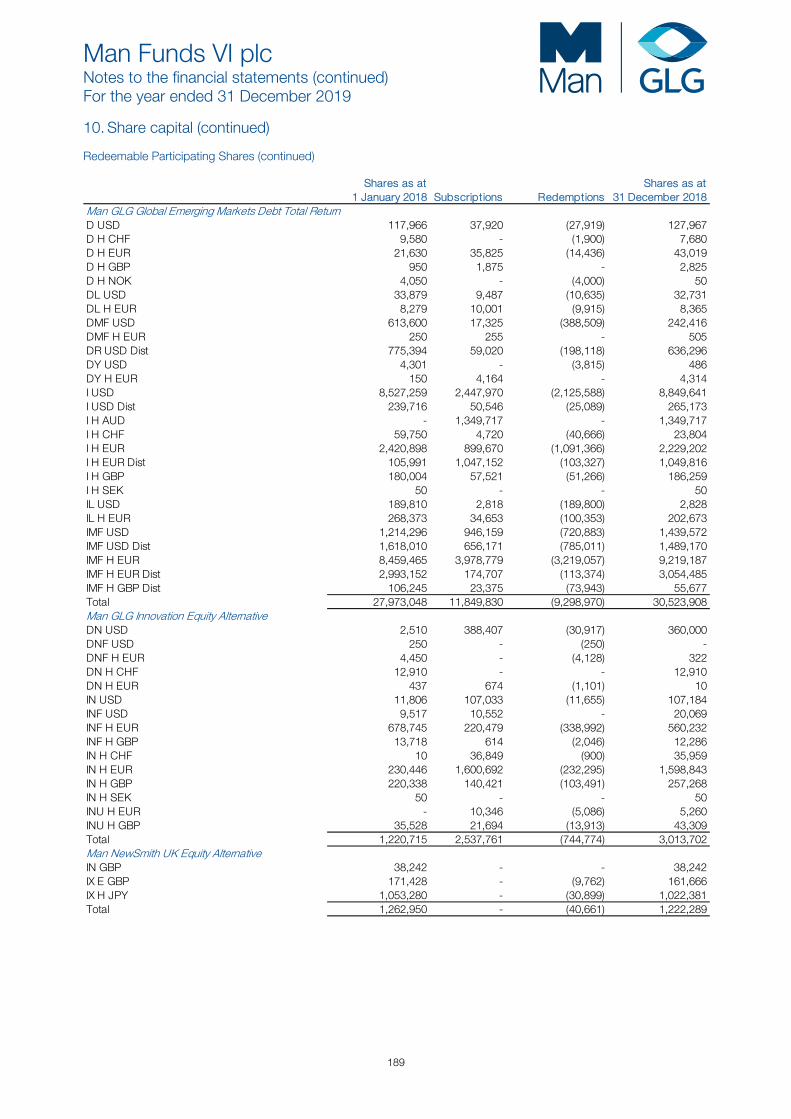
Man Funds VI plc Notes to the financial statements (continued) For the year ended 31 December 2019
189
10. Share capital (continued) Redeemable Participating Shares (continued)
Shares as at Shares as at1 January 2018 Subscriptions Redemptions 31 December 2018
Man GLG Global Emerging Markets Debt Total ReturnD USD 117,966 37,920 (27,919) 127,967 D H CHF 9,580 - (1,900) 7,680 D H EUR 21,630 35,825 (14,436) 43,019 D H GBP 950 1,875 - 2,825 D H NOK 4,050 - (4,000) 50 DL USD 33,879 9,487 (10,635) 32,731 DL H EUR 8,279 10,001 (9,915) 8,365 DMF USD 613,600 17,325 (388,509) 242,416 DMF H EUR 250 255 - 505 DR USD Dist 775,394 59,020 (198,118) 636,296 DY USD 4,301 - (3,815) 486 DY H EUR 150 4,164 - 4,314 I USD 8,527,259 2,447,970 (2,125,588) 8,849,641 I USD Dist 239,716 50,546 (25,089) 265,173 I H AUD - 1,349,717 - 1,349,717 I H CHF 59,750 4,720 (40,666) 23,804 I H EUR 2,420,898 899,670 (1,091,366) 2,229,202 I H EUR Dist 105,991 1,047,152 (103,327) 1,049,816 I H GBP 180,004 57,521 (51,266) 186,259 I H SEK 50 - - 50 IL USD 189,810 2,818 (189,800) 2,828 IL H EUR 268,373 34,653 (100,353) 202,673 IMF USD 1,214,296 946,159 (720,883) 1,439,572 IMF USD Dist 1,618,010 656,171 (785,011) 1,489,170 IMF H EUR 8,459,465 3,978,779 (3,219,057) 9,219,187 IMF H EUR Dist 2,993,152 174,707 (113,374) 3,054,485 IMF H GBP Dist 106,245 23,375 (73,943) 55,677 Total 27,973,048 11,849,830 (9,298,970) 30,523,908 Man GLG Innovation Equity AlternativeDN USD 2,510 388,407 (30,917) 360,000 DNF USD 250 - (250) - DNF H EUR 4,450 - (4,128) 322 DN H CHF 12,910 - - 12,910 DN H EUR 437 674 (1,101) 10 IN USD 11,806 107,033 (11,655) 107,184 INF USD 9,517 10,552 - 20,069 INF H EUR 678,745 220,479 (338,992) 560,232 INF H GBP 13,718 614 (2,046) 12,286 IN H CHF 10 36,849 (900) 35,959 IN H EUR 230,446 1,600,692 (232,295) 1,598,843 IN H GBP 220,338 140,421 (103,491) 257,268 IN H SEK 50 - - 50 INU H EUR - 10,346 (5,086) 5,260 INU H GBP 35,528 21,694 (13,913) 43,309 Total 1,220,715 2,537,761 (744,774) 3,013,702 Man NewSmith UK Equity AlternativeIN GBP 38,242 - - 38,242 IX E GBP 171,428 - (9,762) 161,666 IX H JPY 1,053,280 - (30,899) 1,022,381 Total 1,262,950 - (40,661) 1,222,289
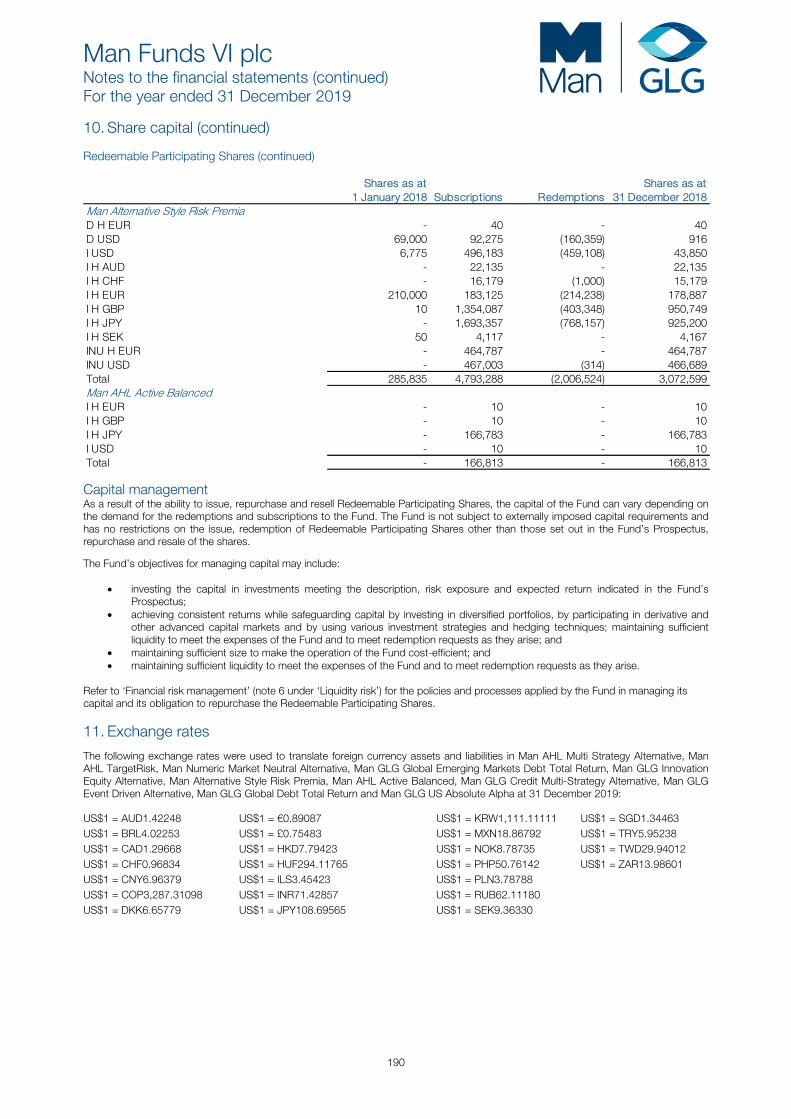
Man Funds VI plc Notes to the financial statements (continued) For the year ended 31 December 2019
190
10. Share capital (continued) Redeemable Participating Shares (continued)
Shares as at Shares as at1 January 2018 Subscriptions Redemptions 31 December 2018
Man Alternative Style Risk PremiaD H EUR - 40 - 40 D USD 69,000 92,275 (160,359) 916 I USD 6,775 496,183 (459,108) 43,850 I H AUD - 22,135 - 22,135 I H CHF - 16,179 (1,000) 15,179 I H EUR 210,000 183,125 (214,238) 178,887 I H GBP 10 1,354,087 (403,348) 950,749 I H JPY - 1,693,357 (768,157) 925,200 I H SEK 50 4,117 - 4,167 INU H EUR - 464,787 - 464,787 INU USD - 467,003 (314) 466,689 Total 285,835 4,793,288 (2,006,524) 3,072,599 Man AHL Active BalancedI H EUR - 10 - 10 I H GBP - 10 - 10 I H JPY - 166,783 - 166,783 I USD - 10 - 10 Total - 166,813 - 166,813
Capital management As a result of the ability to issue, repurchase and resell Redeemable Participating Shares, the capital of the Fund can vary depending on the demand for the redemptions and subscriptions to the Fund. The Fund is not subject to externally imposed capital requirements and has no restrictions on the issue, redemption of Redeemable Participating Shares other than those set out in the Fund’s Prospectus, repurchase and resale of the shares.
The Fund’s objectives for managing capital may include:
• investing the capital in investments meeting the description, risk exposure and expected return indicated in the Fund’s Prospectus;
• achieving consistent returns while safeguarding capital by investing in diversified portfolios, by participating in derivative and other advanced capital markets and by using various investment strategies and hedging techniques; maintaining sufficient liquidity to meet the expenses of the Fund and to meet redemption requests as they arise; and
• maintaining sufficient size to make the operation of the Fund cost-efficient; and • maintaining sufficient liquidity to meet the expenses of the Fund and to meet redemption requests as they arise.
Refer to ‘Financial risk management’ (note 6 under ‘Liquidity risk’) for the policies and processes applied by the Fund in managing its capital and its obligation to repurchase the Redeemable Participating Shares.
11. Exchange rates
The following exchange rates were used to translate foreign currency assets and liabilities in Man AHL Multi Strategy Alternative, Man AHL TargetRisk, Man Numeric Market Neutral Alternative, Man GLG Global Emerging Markets Debt Total Return, Man GLG Innovation Equity Alternative, Man Alternative Style Risk Premia, Man AHL Active Balanced, Man GLG Credit Multi-Strategy Alternative, Man GLG Event Driven Alternative, Man GLG Global Debt Total Return and Man GLG US Absolute Alpha at 31 December 2019:
US$1 = AUD1.42248 US$1 = €0.89087 US$1 = KRW1,111.11111 US$1 = SGD1.34463 US$1 = BRL4.02253 US$1 = £0.75483 US$1 = MXN18.86792 US$1 = TRY5.95238 US$1 = CAD1.29668 US$1 = HKD7.79423 US$1 = NOK8.78735 US$1 = TWD29.94012 US$1 = CHF0.96834 US$1 = HUF294.11765 US$1 = PHP50.76142 US$1 = ZAR13.98601 US$1 = CNY6.96379 US$1 = ILS3.45423 US$1 = PLN3.78788 US$1 = COP3,287.31098 US$1 = INR71.42857 US$1 = RUB62.11180 US$1 = DKK6.65779 US$1 = JPY108.69565 US$1 = SEK9.36330
Man Funds VI plc Notes to the financial statements (continued) For the year ended 31 December 2019
191
11. Exchange rates (continued) The following exchange rates were used to translate foreign currency assets and liabilities in Man GLG European Alpha Alternative, Man GLG European Equity Alternative, Man GLG European Mid-Cap Equity Alternative, Man GLG High Yield Opportunities and Man GLG High Yield Opportunities DE at 31 December 2019:
€1 = AED4.12381 €1 = COP3,741.66666 €1 = JPY122.01087 €1 = SEK10.51030 €1 = ARS67.21557 €1 = CZK25.39592 €1 = KRW1,247.22222 €1 = SGD1.50935 €1 = AUD1.59673 €1 = DKK7.47337 €1 = MXN21.17924 €1 = TRY6.68155 €1 = BRL4.51529 €1 = £0.84730 €1 = MYR4.59100 €1 = TWD33.60778 €1 = CAD1.45552 €1 = HKD8.74902 €1 = NOK9.86380 €1 = UAH26.72619 €1 = CHF1.08696 €1 = HUF330.14706 €1 = NZD1.66370 €1 = US$1.12250 €1 = CLP863.46154 €1 = ILS3.87737 €1 = PLN4.25190 €1 = ZAR15.69930 €1 = CNY7.81685 €1 = INR80.17857 €1 = RUB69.72050 The following exchange rates were used to translate foreign currency assets and liabilities in the Man GLG Alpha Select Alternative at 31 December 2019:
£1 = AUD1.88450 £1 = €1.18022 £1 = JPY144.00000 £1 = US$1.32480
£1 = CHF1.28286 £1 = HKD10.32580 £1 = NOK11.64148 £1 = SEK12.40449
The following exchange rates were used to translate foreign currency assets and liabilities in Man AHL Multi Strategy Alternative, Man AHL TargetRisk, Man Numeric Market Neutral Alternative, Man GLG Unconstrained Emerging Equity, Man GLG Global Emerging Markets Debt Total Return, Man GLG Innovation Equity Alternative, Man Alternative Style Risk Premia and Man AHL Active Balanced at 31 December 2018:
US$1 = AUD1.4205 US$1 = €0.8747 US$1 = JPY109.8901 US$1 = RUB69.4444 US$1 = BRL3.8760 US$1 = £0.7852 US$1 = KRW1,111.111 US$1 = SEK8.8653 US$1 = CAD1.3658 US$1 = HKD7.8309 US$1 = MXN19.6850 US$1 = SGD1.3630 US$1 = CHF0.9858 US$1 = HUF277.7778 US$1 = NOK8.6580 US$1 = TRY5.3192 US$1 = CNY6.6834 US$1 = ILS3.7369 US$1 = PHP52.6316 US$1 = ZAR14.3885 US$1 = COP3,333.3333 US$1 = INR69.93007 US$1 = PLN3.7566 The following exchange rates were used to translate foreign currency assets and liabilities in Man GLG European Alpha Alternative, Man GLG European Equity Alternative, Man GLG Global Equity Alternative, and Man GLG European Mid-Cap Equity Alternative at 31 December 2018: €1 = AED4.1999 €1 = COP3,810.6667 €1 = JPY125.6263 €1 = SEK10.1348 €1 = ARS42.9774 €1 = CZK25.7477 €1 = KRW1,270.2222 €1 = SGD1.55812 €1 = AUD1.6239 €1 = DKK7.4621 €1 = MXN22.5039 €1 = TRY6.08084 €1 = BRL4.4310 €1 = £0.8976 €1 = MYR4.7240 €1 = TWD35.1753 €1 = CAD1.5613 €1 = HKD8.9522 €1 = NOK9.89781 €1 = UAH31.6676 €1 = CHF1.1270 €1 = HUF317.5556 €1 = NZD1.70474 €1 = US$1.1432 €1 = CLP 816.5714 €1 = ILS4.2721 €1 = PLN4.2945 €1 = ZAR16.4489 €1 = CNY7.8462 €1 = INR79.9441 €1 = RUB79.3889 The following exchange rates were used to translate foreign currency assets and liabilities in the Man GLG Alpha Select Alternative and Man NewSmith UK Equity Alternative at 31 December 2018:
£1 = AUD1.8091 £1 = HKD9.9734 £1 = JPY139.9560 £1 = US$1.2736
£1 = CHF1.2555 £1 = €1.1141 £1 = NOK11.0268
Man Funds VI plc Notes to the financial statements (continued) For the year ended 31 December 2019
192
12. Net asset valuation comparison
OutstandingShares as at31-Dec-2019 31-Dec-2019 31-Dec-2018 31-Dec-2017 31-Dec-2019 31-Dec-2018 31-Dec-2017
Man GLG European Alpha AlternativeDN EUR 28,575 111.89 111.90 112.04 3,197,116 5,705,787 3,728,591 DN H GBP 3,496 118.36 117.15 116.40 413,738 177,031 166,060 DN H USD 10,552 122.61 119.09 116.65 1,293,812 1,363,688 1,604,925 IN EUR 478,215 119.70 118.93 118.66 57,242,862 45,139,357 22,930,320 IN H GBP 1,237 121.49 119.06 117.34 150,254 205,570 247,971 IN H USD 1,254 130.86 126.19 123.36 164,098 25,539,733 43,747,419 INF EUR 370,676 97.08 95.71 - 35,985,394 39,876,514 - INU EUR - - - 101.46 - - 1,015
Man GLG Alpha Select AlternativeDL GBP 11,827 140.58 132.17 126.06 1,662,766 1,081,876 679,810 DL H EUR 171,033 130.98 124.66 120.47 22,401,164 19,091,249 12,999,281 DL H USD 29,760 141.09 130.51 122.84 4,198,815 8,158,495 8,537,152 DNY H EUR 79,706 101.81 - - 8,115,277 - - IL GBP 516,302 148.45 138.74 131.56 76,644,421 86,205,423 48,180,677 IL GBP Dist 1,459,833 110.01 102.81 - 160,590,514 139,936,157 - IL H EUR 3,872,676 138.63 131.20 125.94 536,853,102 479,374,634 79,673,560 IL H EUR Dist 14,858 107.34 102.91 - 1,594,872 2,793,370 - IL H SEK 50 124.77 117.52 112.83 6,239 5,876 5,642 IL H USD 1,147,528 150.05 138.02 129.11 172,181,432 127,041,384 92,546,687 IL H USD Dist 154,018 112.97 103.88 - 17,399,727 5,139,185 - IL U GBP 160,844 128.67 120.26 113.99 20,695,136 14,045,913 3,905,615 IN H EUR 1,396,155 101.72 - - 142,011,459 - - IN H SEK 385,447 100.06 - - 38,568,946 - - IN H USD 78,173 103.25 - - 8,071,291 - -
Man GLG European Equity AlternativeDN EUR 371,228 107.02 109.70 115.20 39,728,609 74,525,979 31,780,412 DN H CHF 30,227 101.59 104.64 110.29 3,070,861 9,388,352 7,247,164 DN H GBP 2,837 110.42 111.70 115.76 313,292 705,469 1,282,243 DN H NOK 64,120 119.43 120.57 125.24 7,658,170 9,977,251 8,030,571 DN H SEK 2,749 109.16 111.84 117.74 300,037 846,720 253,761 DN H USD 73,908 118.20 117.59 120.36 8,736,127 19,934,020 21,212,675 DN U EUR 10 91.84 93.31 - 918 933 - IN EUR 1,948,010 113.57 115.55 120.38 221,234,826 499,463,145 454,158,889 IN H GBP 2,828 118.54 118.87 122.37 335,227 26,629,724 27,653,846 IN H SEK 11,747 106.37 108.17 113.06 1,249,553 65,405,783 478,807,425 IN H USD 389,455 122.73 121.40 123.48 47,796,097 76,717,675 57,752,926 INU EUR 342,055 92.29 93.11 - 31,569,375 85,463,727 - INU H USD 10 98.51 97.45 - 985 975 - INZ EUR 153,322 100.73 101.66 105.12 15,443,392 17,004,325 19,096,807 INZ EUR Dist 12,300 90.34 96.64 100.00 1,111,124 937,449 10,000 INZ H CHF Dist 60,897 89.68 96.15 100.50 5,461,151 7,199,588 8,495,105 INZ H GBP Dist 20,606 93.56 98.62 101.93 1,927,934 1,591,622 1,564,557 INZ H USD 108,695 107.76 105.69 106.71 11,713,227 12,364,446 9,692,668 INZ H USD Dist 8,262 95.78 99.08 100.54 791,369 805,549 713,829 IXXN EUR 10 100.42 - - 1,004 - - IXXN H USD 10 100.52 - - 1,005 - -
Man GLG Global Equity AlternativeDN EUR - - - 99.38 - - 617,588 DN H USD - - - 100.97 - - 5,449,461 IN EUR - - - 100.37 - - 5,412,735 IN H USD - - - 102.65 - - 293,590
Net Asset Value per Share as at Net Assets as at

Man Funds VI plc Notes to the financial statements (continued) For the year ended 31 December 2019
193
12. Net asset valuation comparison (continued)
OutstandingShares as at31-Dec-2019 31-Dec-2019 31-Dec-2018 31-Dec-2017 31-Dec-2019 31-Dec-2018 31-Dec-2017
Man AHL Multi Strategy AlternativeDN USD 93,897 119.50 110.30 104.85 11,221,103 12,868,377 19,727,202 DN H EUR 9,872 111.23 104.98 101.79 1,098,056 194,441 189,894 DN H GBP 3,818 109.89 102.90 98.81 419,518 324,266 414,173 IN USD 27,011 123.56 113.33 106.98 3,337,359 1,082 1,022 IN H CHF 55,116 106.06 99.82 95.84 5,845,485 5,501,748 5,282,146 IN H EUR 500,443 109.98 103.33 99.50 55,040,157 52,105,196 94,254,343 IN H GBP 25,719 116.04 108.13 103.47 2,984,471 1,511,399 1,557,376 IN H SEK 1,218,406 110.27 103.33 99.58 134,348,946 126,475,912 180,257,309
Man AHL TargetRiskD USD 238,486 140.93 110.56 113.49 33,608,933 9,736,774 7,265,336 D H CHF 120,141 125.32 101.55 107.65 15,055,584 3,667,294 4,462,300 D H EUR 392,146 130.69 105.48 111.40 51,247,598 6,065,355 4,742,730 D H GBP 9,087 101.05 - - 918,199 - - D H SEK 11,410 130.62 105.16 111.57 1,490,339 5,258 5,579 D H SGD 6,006 102.20 - - 613,812 - - I USD 827,209 168.86 131.48 133.97 139,683,015 13,122,808 55,656,326 I H CHF 306,601 130.50 104.99 110.41 40,011,193 1,108,845 839,238 I H EUR 2,463,604 138.86 111.34 116.59 342,097,010 153,671,101 2,300,230 I H GBP 1,939,426 139.28 110.34 114.13 270,124,700 7,399,851 27,904,484 I H JPY 1,911,407 12,028.28 9,638.10 10,057.88 22,990,932,340 14,852,049,156 2,765,915,697 I H SEK 50 133.33 106.62 112.04 6,666 5,331 5,602 I H SGD 2,365 101.06 - - 239,033 - - I H (BRL) USD 38,500 99.67 - - 3,837,125 - - INU USD 2,273,665 129.21 100.19 - 293,783,642 255,781,223 -
Man GLG European Mid-Cap Equity AlternativeDN EUR 119,925 104.80 105.28 106.86 12,567,572 16,773,465 12,756,287 DN H USD 16,561 120.77 117.77 116.79 2,000,104 6,874,280 7,567,728 DNY EUR 34,364 102.88 103.59 105.38 3,535,227 2,848,176 3,609,783 IN EUR 3,371,130 111.77 111.46 112.30 376,798,619 502,672,787 397,064,610 IN F EUR 609,283 113.32 112.97 113.40 69,044,040 80,300,029 81,446,106 INF H GBP 37,867 115.37 113.45 112.50 4,368,598 4,273,594 3,826,731 INF H USD 104 122.32 118.47 116.04 12,736 231,393 249,440 IN H GBP 26,847 119.77 117.79 117.44 3,215,545 15,063,016 53,254 IN H SEK 50 105.83 104.78 105.35 5,291 5,239 5,268 IN H USD 96,294 124.55 120.80 119.00 11,993,409 12,085,160 6,197,083
Man Numeric Market Neutral AlternativeDN USD - - 86.42 99.92 - 1,854,577 980,839 DN H EUR - - 83.38 99.06 - 97,848 77,803 IN USD - - 88.89 101.98 - 9,358 61,727 IN H EUR - - 83.28 98.19 - 16,349,826 48,054,209 IN H SEK - - 86.18 101.19 - 4,309 5,060 INU USD - - 85.46 97.61 - 953,668 80,852,842 INU H EUR - - 81.50 95.69 - 5,697 141,383,947 INU H GBP Dist - - - 96.39 - - 2,007,939
Man GLG Unconstrained Emerging EquityD C USD - - 101.53 127.10 - 967,335 685,480 DF C EUR - - 89.59 105.46 - 914 2,054 DF C USD - - 101.56 126.88 - 391,627 12,028,030 I C SEK - - 117.20 134.47 - 5,860 6,724 I C USD - - 111.14 138.09 - 172,556 214,391 IF C EUR - - 112.38 132.70 - 12,067,491 19,268,525 IF C GBP - - 137.78 160.86 - 34,172,022 52,405,497 IF C SEK - - 105.10 120.32 - 5,255 6,016 IF C USD - - 114.60 141.79 - 824 1,020
Net Asset Value per Share as at Net Assets as at
Man Funds VI plc Notes to the financial statements (continued) For the year ended 31 December 2019
194
12. Net asset valuation comparison (continued)
OutstandingShares as at31-Dec-2019 31-Dec-2019 31-Dec-2018 31-Dec-2017 31-Dec-2019 31-Dec-2018 31-Dec-2017
Man GLG Global Emerging Markets Debt Total ReturnD USD 98,621 103.22 106.97 107.02 10,179,664 13,689,090 12,624,352 D H CHF 250 88.44 94.29 97.33 22,110 724,154 932,421 D H EUR 24,803 94.46 100.88 103.67 2,342,968 4,339,933 2,242,368 D H GBP 2,825 98.76 103.99 105.63 278,990 293,761 100,353 D H NOK 50 96.70 101.35 102.60 4,835 5,068 415,516 DL USD 6,506 96.06 99.30 99.08 624,900 3,250,141 3,356,808 DL H EUR 7,699 93.80 99.89 102.44 722,227 835,567 848,039 DMF USD 166,680 99.54 102.90 102.69 16,591,189 24,945,326 63,008,587 DMF H EUR 505 90.78 96.65 99.08 45,858 48,824 24,771 DR USD Dist 460,135 96.30 99.06 98.98 44,311,177 63,029,853 76,747,948 DY USD 294 98.93 102.77 103.07 29,085 49,909 443,349 DY H EUR 2,128 89.18 95.48 98.29 189,787 411,861 14,733 I USD 2,584,712 105.96 109.00 108.22 273,888,883 964,596,049 922,839,260 I USD Dist 279,751 96.90 99.68 99.57 27,109,053 26,431,891 23,868,603 I H AUD 2,253,031 97.75 101.54 - 220,241,997 137,053,351 - I H CHF 1,500 92.47 98.29 100.67 138,706 2,339,682 6,015,253 I H EUR 780,146 97.19 103.02 105.10 75,821,479 229,660,150 254,427,403 I H EUR Dist 1,036,000 93.52 99.08 102.22 96,882,396 104,019,290 10,834,037 I H GBP 7,935 101.09 105.69 106.58 802,090 19,686,152 19,184,401 I H SEK 50 97.80 103.03 104.73 4,890 5,152 5,237 IL USD 14,640 105.87 108.62 107.57 1,549,948 307,168 20,417,585 IL H EUR 179,611 97.22 102.77 104.58 17,462,036 20,827,872 28,067,574 IMF USD 422,434 106.15 108.91 107.87 44,839,526 156,783,015 130,984,217 IMF USD Dist 630,731 97.43 99.97 99.35 61,449,822 148,868,702 160,750,674 IMF H EUR 5,153,549 94.86 100.28 102.04 488,874,382 924,537,114 863,222,976 IMF H EUR Dist 2,881,680 95.39 100.81 103.78 274,872,501 307,930,064 310,616,399 IMF H GBP Dist 6,065 96.48 100.66 102.34 585,124 5,604,640 10,873,560
Man GLG Innovation Equity AlternativeDN USD 169,825 112.41 107.34 105.75 19,090,799 38,641,637 265,427 DN H CHF 12,910 105.12 102.73 104.17 1,357,043 1,326,260 1,344,899 DN H EUR 1,346 105.51 103.30 104.30 142,013 1,033 45,578 DN H SEK 12,200 106.77 - - 1,302,641 - - DNF USD - - - 100.64 - - 25,160 DNF H EUR 101 101.86 99.18 99.66 10,273 31,960 443,501 IN USD 588,943 114.89 109.12 106.90 67,663,101 11,695,613 1,262,088 INF USD 16,846 114.41 108.23 105.64 1,927,305 2,172,032 1,005,356 INF H EUR 464,755 109.03 105.58 105.36 50,672,646 59,149,211 71,511,132 INF H GBP 7,539 110.41 105.92 104.72 832,390 1,301,331 1,436,596 IN H CHF 31,964 106.87 104.16 104.75 3,416,120 3,745,468 1,048 IN H EUR 1,957,701 107.23 104.26 104.52 209,924,740 166,701,801 24,086,200 IN H GBP 393,873 110.50 106.42 105.66 43,524,733 27,378,256 23,281,034 IN H SEK 50 107.79 104.67 104.95 5,390 5,233 5,247 INU H EUR 255,253 100.65 97.88 - 25,690,166 514,869 - INU H GBP 59,659 106.35 102.23 101.27 6,344,539 4,427,331 3,598,006
Man NewSmith UK Equity AlternativeIN GBP - - 126.973 126.550 - 4,855,640 4,839,488 IX E GBP - - 117.546 117.145 - 19,003,171 20,081,881 IX H JPY - - 11,496.090 11,694.854 - 11,753,386,827 12,317,951,721
Net Asset Value per Share as at Net Assets as at
Man Funds VI plc Notes to the financial statements (continued) For the year ended 31 December 2019
195
12. Net asset valuation comparison (continued)
OutstandingShares as at31-Dec-2019 31-Dec-2019 31-Dec-2018 31-Dec-2017 31-Dec-2019 31-Dec-2018 31-Dec-2017
Man Alternative Style Risk PremiaD USD 14,791 97.47 93.38 99.88 1,441,785 85,533 6,891,754 D H DKK 10,021,221 95.92 - - 961,282,975 - - D H EUR 89 98.79 97.48 - 8,815 3,919 - D H NOK 5,148 96.95 - - 499,098 - - D H SEK 177,511 96.43 - - 17,118,186 - - I USD 297,557 103.55 98.45 104.48 30,814,690 4,317,333 707,911 I H AUD 75,703 99.98 95.86 - 7,568,986 2,121,880 - I H CHF 20,472 91.67 90.02 - 1,876,775 1,366,547 - I H EUR 669,215 97.50 95.39 103.98 65,248,801 17,064,576 21,837,041 I H GBP 1,105,635 100.01 96.58 104.28 110,585,104 91,823,646 1,043 I H JPY 1,358,364 9,092.95 8,889.38 - 12,351,538,828 8,224,460,423 - I H SEK 11,177 98.16 95.74 104.46 1,097,238 398,983 5,223 INU H EUR 607,531 94.08 91.85 - 57,157,718 42,691,382 - INU USD 530,756 100.35 95.33 - 53,261,439 44,489,540 -
Man AHL Active BalancedI H EUR 10 124.58 100.50 - 1,246 1,005 - I H GBP 10 126.41 100.67 - 1,264 1,007 - I H JPY 5,043,782 12,463.50 10,050.73 - 62,863,187,005 1,676,289,791 - I H USD 10 128.42 100.81 - 1,284 1,008 -
Man GLG High Yield OpportunitiesD EUR 2,439 111.93 - - 272,989 - - I EUR 15,773 112.60 - - 1,775,984 - - I H GBP 190,962 113.98 - - 21,766,477 - - I H USD 895 115.85 - - 103,682 - - IF EUR 36,641 106.21 - - 3,891,597 - - IF H GBP 640,769 108.41 - - 69,462,722 - - IF H GBP Dist 360,349 105.75 - - 38,108,145 - - IF H GBP G-Dist 29,734 106.23 - - 3,158,736 - - ILU H GBP G-Dist 137,930 110.04 - - 15,177,560 - -
Man GLG Credit Multi-Strategy AlternativeDN H EUR 10 102.08 - - 1,021 - - IN USD 39,195 104.22 - - 4,084,782 - - IN H EUR 231,063 102.35 - - 23,650,058 - - IN H SEK 50 103.07 - - 5,153 - - INU H GBP 10 101.59 - - 1,016 - -
Man GLG Event Driven AlternativeDNFY H EUR 13,450 101.60 - - 1,366,509 - - DNFY USD 39,575 102.20 - - 4,044,605 - - IN H EUR 335,742 102.28 - - 34,339,068 - - IN H GBP 12,669 102.71 - - 1,301,257 - - IN H SEK 50 102.45 - - 5,123 - - IN USD 24,885 103.37 - - 2,572,255 - - INF H EUR 455,156 102.02 - - 46,435,215 - - INF USD 8,700 102.25 - - 889,546 - -
Man GLG Global Debt Total ReturnI C EUR 10 98.80 - - 988 - - I C USD 100,000 100.72 - - 10,071,778 - -
Man GLG High Yield Opportunities DEI EUR 10 101.42 - - 1,014 - - I EUR Dist 500,000 101.42 - - 50,709,441 - -
Man GLG US Absolute AlphaIN USD 200,000 100.00 - - 20,000,000 - -
Net Asset Value per Share as at Net Assets as at
Man Funds VI plc Notes to the financial statements (continued) For the year ended 31 December 2019
196
13. Segregation of liabilities between portfolios At an Extraordinary General Meeting held on 22 May 2007, the Fund availed of the provisions of the Investment Funds, Companies and Miscellaneous Provisions Act, 2005 to segregate liabilities between each Portfolio. The Fund will not be liable as a whole to third parties for the liability of each Portfolio.
14. Securities owned and securities sold, not yet purchased Possession of securities owned is maintained by major multinational broker-dealers as at 31 December 2019 and 31 December 2018. Securities sold, not yet purchased represent obligations of the Fund to purchase the securities at prevailing market prices. The future satisfaction of such obligations may be for an amount greater than the amount recorded.
15. Taxation The Fund qualifies as an investment undertaking as defined in Section 739 B of the Taxes (Consolidation) Acts 1997. It is not chargeable to Irish tax on its income or capital gains. Tax may arise on the happening of a chargeable event. A chargeable event includes any distribution payments to Shareholders or any encashment, redemption or transfer of Shares. No tax will arise on the Fund in respect of chargeable events regarding:
(i) a Shareholder who is not Irish resident and not ordinarily resident in Ireland at the time of the chargeable event, provided the necessary signed statutory declarations are held by the Fund; or
(ii) certain exempted Irish resident investors who have provided the Fund with the necessary signed statutory declarations; or (iii) Shares held in a recognised clearing system as designated by the order of the Irish Revenue Commissioners.
Following legislative changes in the Finance Act 2006, the holding of Shares at the end of a relevant year will, in respect of Irish Resident investors, also constitute a chargeable event. To the extent that any tax issues arise on such a chargeable event, such tax will be allowed as a credit against any tax payable on the subsequent encashment, redemption, cancellation or transfer of the relevant Shares. Relevant Year is defined as a period of 8 years beginning with the acquisition of a share by a shareholder and each subsequent period of 8 years beginning immediately after the preceding relevant year.
16. Soft commissions The Investment Manager has entered into arrangements with the brokerage houses from which the Fund derives benefit. These commission sharing agreements are in conformity with the rules of the Investment Manager’s UK regulator, the UK’s Financial Conduct Authority.
17. Auditor’s remuneration For the year ended 31 December 2019, the Fund incurred audit fees as disclosed in the statement of comprehensive income; these amounts represent a provision. The actual audit fees are US$230,133 (31 December 2018: US$189,789). During the year there were fees for tax advisory services, other assurance services or other non-audit services provided by the auditors of the Fund of US$110,520 (31 December 2018: US$82,467).
18. Efficient portfolio management The Fund may employ investment techniques and instruments for efficient portfolio management of the assets of any Portfolio including hedging against market movements, currency exchange or interest rate risks under the conditions and within the limits stipulated by the Central Bank under the UCITS Regulations and described below. Techniques and instruments which are used for the purpose of efficient portfolio management, including FDIs which are not used for direct investment purposes, shall be understood as a reference to techniques and instruments which fulfil the following criteria: (i) they are economically appropriate in that they are realised in a cost effective way; (ii) they are entered into for one or more of the following specific aims:
(a) reduction of risk; (b) reduction of cost; (c) generation of additional capital or income for a Portfolio with an appropriate level of risk taking into account the risk profile of
the Portfolio as described in the Prospectus, the risk diversification rules set out in UCITS Notice 9 and the general provisions of the UCITS Regulations
(iii) their risks are adequately captured by the risk management procedures implemented by the Fund, and (iv) they cannot result in a change to a Portfolio’s declared investment objective or add substantial supplementary risks in comparison
to the general risk policy as described in its sales documents. While the use of such techniques and instruments will be in line with the best interests of the Fund, individual techniques may result in increased counterparty risk and potential conflicts of interest. Details of the proposed efficient portfolio management techniques and policies adopted by the Fund in relation to their use by the Portfolios and details of the relevant risks are set out in the Prospectus.

Man Funds VI plc Notes to the financial statements (continued) For the year ended 31 December 2019
197
19. Transaction costs For the years ended 31 December 2019 and 31 December 2018, the Fund incurred transaction costs, disclosed in the statement of comprehensive income as part of net gain/(loss) on financial assets and liabilities at fair value through profit or loss, as follows:
31 December 2019 31 December 2018Man GLG European Alpha Alternative €220,258 €215,922Man GLG Alpha Select Alternative £5,441,618 £5,371,063Man GLG European Equity Alternative €6,945,872 €10,617,847Man GLG Global Equity Alternative n/a €4,943Man AHL Multi Strategy Alternative US$307,425 US$883,252 Man AHL TargetRisk US$214,741 US$98,912 Man GLG European Mid-Cap Equity Alternative €282,680 €421,109Man GLG Unconstrained Emerging Equity US$113,634 US$252,473 Man GLG Innovation Equity Alternative US$608,533 US$526,660 Man NewSmith UK Equity Alternative £41,210 £167,357Man Alternative Style Risk Premia US$115,930 US$78,318 Man AHL Active Balanced US$41,873 US$1,162 Man GLG High Yield Opportunities €543 n/aMan GLG Credit Multi-Strategy Alternative US$10,564 n/aMan GLG Event Driven Alternative US$73,771 n/a
20. Significant events during the year Prospectus A new Supplement dated 18 June 2019 was issued to the Prospectus dated 21 December 2018. The amendments to the Prospectus reflected the launch of two new portfolios; Man GLG Global Debt Total Return and Man GLG Japan Equity Alternative.
A revised Supplement for the Man GLG Portfolios was issued on 21 June 2019 and the main substantive changes made were to reflect the approval of Man GLG RI European Equity Alternative and Man GLG Event Driven Alternative. In addition, the investment strategy for Man GLG Innovation Equity Alternative was amended to reflect the increase in percentage of the Fund’s net assets that may be invested in emerging markets from 20% to 40%.
An Addendum for the Man GLG Portfolios and GLG LLC was issued on 11 September 2019. The amendments to the Addendum reflected to provide an exclusion list in respect of Man GLG European Mid-Cap Equity Alternative, Man GLG High Yield Opportunities, Man GLG Innovation Equity Alternative, Man GLG Credit Multi-Strategy Alternative, Man GLG Global Emerging Markets Debt Total Return and Man GLG Global Debt Total Return. This proposed update comprises an exclusion list of controversial stocks or industries being applied to the investment portfolio of the Portfolios which may be related to arms and munitions, nuclear weapons, tobacco and coal production.
Further information regarding the exclusion list to be applied will be available upon request from the respective Investment Manager of the Portfolios. Man Group’s Responsible Investment Exclusions Committee focuses on developing guidelines to direct the exclusions, and reviews and reports any amendments to Man Group’s Responsible Investment Committee. Man Group works with a leading third party Environmental, Social and Governance (‘ESG’) advisory firm to maintain the integrity of Man Group’s Responsible Investment Exclusion List.
A revised Supplement for the Man GLG Portfolios was issued on 8 November 2019. The amendments to the Prospectus reflected the launch of new portfolio Man GLG High Yield Opportunities DE.
A revised Supplement for the Man GLG Portfolios was issued on 30 December 2019. The amendments to the Prospectus reflected the launch of new portfolio Man GLG US Absolute Alpha. Portfolios Man GLG High Yield Opportunities, Man GLG Credit Multi-Strategy Alternative, Man GLG Event Driven Alternative, Man GLG Global Debt Total Return, Man GLG High Yield Opportunities DE and Man GLG US Absolute Alpha commenced their operations on 16 January 2019, 1 April 2019, 2 July 2019, 1 August 2019, 22 November 2019 and 31 December 2019 respectively.
Man GLG Unconstrained Emerging Equity, Man NewSmith UK Equity Alternative and Man Numeric Market Neutral Alternative ceased their operations on 7 February 2019, 21 March 2019 and 17 September 2019 respectively.
Man Funds VI plc Notes to the financial statements (continued) For the year ended 31 December 2019
198
20. Significant events during the year (continued) Share Class A revised Supplement for the AHL Partners LLP Portfolios was issued on 28 August 2019 and the only change made were to reflect the inclusion of “IU” share class in Man AHL TargetRisk. A revised Supplement for the Man GLG Portfolios was issued on 27 November 2019 and the only change made were to reflect the inclusion of “DN” and “DNY” share classes in Man GLG Alpha Select Alternative. Below is the list of share classes which were launched during the year ended 31 December 2019: Sub Fund Share Class Launch DateMan GLG Alpha Select Alternative Class DNY H EUR 22 July 2019Man GLG Alpha Select Alternative Class IN H EUR 24 May 2019Man GLG Alpha Select Alternative Class IN H SEK 30 December 2019Man GLG Alpha Select Alternative Class IN H USD 28 May 2019Man GLG European Equity Alternative Class IXXN EUR 17 December 2019Man GLG European Equity Alternative Class IXXN H USD 17 December 2019Man AHL TargetRisk Class D H GBP 10 September 2019Man AHL TargetRisk Class D H SGD 20 August 2019Man AHL TargetRisk Class I H SGD 27 September 2019Man AHL TargetRisk Class I H (BRL) USD 30 December 2019Man GLG Innovation Equity Alternative Class DN H SEK 17 July 2019Man Alternative Style Risk Premia Class D H DKK 03 September 2019Man Alternative Style Risk Premia Class D H NOK 29 August 2019Man Alternative Style Risk Premia Class D H SEK 29 August 2019Man GLG High Yield Opportunities Class D EUR 17 January 2019Man GLG High Yield Opportunities Class I EUR 16 January 2019Man GLG High Yield Opportunities Class I H GBP 17 January 2019Man GLG High Yield Opportunities Class I H USD 17 January 2019Man GLG High Yield Opportunities Class IF EUR 18 April 2019Man GLG High Yield Opportunities Class IF H GBP 05 April 2019Man GLG High Yield Opportunities Class IF H GBP Dist 02 April 2019Man GLG High Yield Opportunities Class IF H GBP G Dist 22 March 2019Man GLG High Yield Opportunities Class ILU H GBP G Dist 04 February 2019Man GLG Credit Multi-Strategy Alternative Class DN H EUR 01 April 2019Man GLG Credit Multi-Strategy Alternative Class IN USD 01 April 2019Man GLG Credit Multi-Strategy Alternative Class IN H EUR 29 March 2019Man GLG Credit Multi-Strategy Alternative Class IN H SEK 01 April 2019Man GLG Credit Multi-Strategy Alternative Class INU H GBP 15 July 2019Man GLG Event Driven Alternative Class DNFY H EUR 17 September 2019Man GLG Event Driven Alternative Class DNFY USD 17 September 2019Man GLG Event Driven Alternative Class IN H EUR 03 July 2019Man GLG Event Driven Alternative Class IN H GBP 03 July 2019Man GLG Event Driven Alternative Class IN H SEK 03 July 2019Man GLG Event Driven Alternative Class IN USD 02 July 2019Man GLG Event Driven Alternative Class INF H EUR 19 September 2019Man GLG Event Driven Alternative Class INF USD 10 October 2019Man GLG Global Debt Total Return Class I C EUR 01 August 2019Man GLG Global Debt Total Return Class I C USD 31 July 2019Man GLG High Yield Opportunities DE Class I EUR 22 November 2019Man GLG High Yield Opportunities DE Class I EUR Dist 28 November 2019Man GLG US Absolute Alpha Class IN USD 31 December 2019
Effective 1 December 2019, BNY Mellon Trust Company (Ireland) Limited, One Dockland Central, Guild Street, IFSC, Dublin 1, merged into The Bank of New York Mellon SA/NV (the “European Bank”) and as of that date, depositary services were provided by the Dublin branch of the European Bank. There were no other significant events during the year ended 31 December 2019.
Man Funds VI plc Notes to the financial statements (continued) For the year ended 31 December 2019
199
21. Subsequent events since the year end
The Investment Managers are actively monitoring developments closely and there is ongoing communication with the Manager. Given the nature of the outbreak and the on-going developments, there is a high degree of uncertainty and it is not possible at this time to predict the extent and nature of the overall future impact on the Fund. Since the year end the Investment manager has received redemption requests from investors in some of the Portfolios which have been met fully and in a timely manner however, at this time the Fund is financially viable and there are no material risk management or liquidity concerns.
The Directors and the Investment Managers have concluded that the developments in the global financial markets after the year end did not provide evidence of conditions that existed at the end of the reporting period and have therefore assessed any impact they had as non-adjusting.
There have been no other significant events since the year end that impact the Fund and require disclosure in the financial statements.
22. Stock lending The Fund may enter into stock lending programmes organised by generally recognised International Central Securities Depositaries Systems provided that the programme is subject to a guarantee from the system operator. As at 31 December 2019 and 31 December 2018, the Fund has a stock lending programme in place with Bank of New York Mellon, (London Branch).
23. Dividends On 31 December 2019 and 31 December 2018 the Directors propose the payment of dividends as per the table below: 31 December 2019Portfolio Share Class Dividend per shareMan GLG Alpha Select Alternative Class IL GBP Dist £1.66Man GLG Alpha Select Alternative Class IL H EUR Dist €1.73Man GLG Alpha Select Alternative Class IL H USD Dist US$1.63Man GLG European Equity Alternative Class INZ EUR Dist €6.17Man GLG European Equity Alternative Class INZ H CHF Dist CHF6.05Man GLG European Equity Alternative Class INZ H GBP Dist £6.13 Man GLG European Equity Alternative Class INZ H USD Dist US$6.40Man GLG High Yield Opportunities Class IF H GBP Dist £0.30 Man GLG High Yield Opportunities Class IF H GBP G-Dist £0.33 Man GLG High Yield Opportunities Class ILU H GBP G-Dist £1.34 Man GLG High Yield Opportunities DE Class I EUR Dist €0.27
31 December 2018Portfolio Share Class Dividend per shareMan GLG Alpha Select Alternative Class IL H EUR Dist €1.30Man GLG European Equity Alternative Class INZ EUR Dist €5.47Man GLG European Equity Alternative Class INZ H CHF Dist CHF5.22Man GLG European Equity Alternative Class INZ H GBP Dist £5.33Man GLG European Equity Alternative Class INZ H USD Dist US$5.24
Dividends proposed for the year ended 31 December 2019 were paid for Man GLG Alpha Select Alternative, Man GLG High Yield Opportunities and Man GLG High Yield Opportunities DE on 9 January 2020 and were paid for Man GLG European Equity Alternative on 8 January 2020 and the dividends proposed for the year ended 31 December 2018 were paid for all the Funds on 17 January 2019. The Directors do not propose the payment of a dividend for any of the other share classes in the other Portfolios.
24. Contingent liabilities and commitments
There were no contingent liabilities or commitments other than those already disclosed in these financial statements as at 31 December 2019 (31 December 2018: none).
25. Reclassification of prior year comparative figures
Certain prior year comparatives have been reclassified to conform to the current year presentation.
26. Approval of financial statements
The Directors approved these financial statements on 22 April 2020.
Dividends proposed for the year ended 31 December 2019 were paid on 9 January 2020. The Directors and the Investment Managers acknowledge the current outbreak of COVID-19 which is causing economic disruption in most countries and its potentially adverse economic impact on the issuers of the instruments in which the Fund invests. This is an additional risk factor which has impacted the operations and valuation of the Fund’s assets after the year end. The manager and delegates have implemented their business continuity arrangements and the situation is being kept under ongoing review by the Board and the Manager.
200
INDEPENDENT AUDITOR’S REPORT TO THE MEMBERS OF MAN FUNDS VI PLC
Opinion
We have audited the financial statements of Man Funds VI plc (‘the Fund’) for the year ended 31 December 2019, which comprise the Statement of financial position, Statement of changes in net assets, Statement of comprehensive income, Statement of cash flows and notes to the financial statements, including the summary of significant accounting policies set out in note 2. The financial reporting framework that has been applied in their preparation is Irish Law and International Financial Reporting Standards (IFRS) as adopted by the European Union as applied in accordance with the provisions of the Companies Act 2014.
In our opinion the financial statements:
give a true and fair view of the assets, liabilities and financial position of the Fund as at 31 December 2019 and of its profit for the year then ended;
have been properly prepared in accordance with IFRS as adopted by the European Union; and
have been properly prepared in accordance with the requirements of the Companies Act 2014, the European Communities (Undertakings for Collective Investment in Transferable Securities) Regulations, 2011, and the Central Bank (Supervision and Enforcement) Act 2013 (Section 48(1)) (Undertakings for Collective Investment in Transferable Securities) Regulations 2015.
Basis for opinion
We conducted our audit in accordance with International Standards on Auditing (Ireland) (ISAs (Ireland)) and applicable law. Our responsibilities under those standards are further described in the Auditor's Responsibilities for the Audit of the Financial Statements section of our report. We are independent of the Fund in accordance with ethical requirements that are relevant to our audit of financial statements in Ireland, including the Ethical Standard issued by the Irish Auditing and Accounting Supervisory Authority (IAASA), and we have fulfilled our other ethical responsibilities in accordance with these requirements.
We believe that the audit evidence we have obtained is sufficient and appropriate to provide a basis for our opinion.
Conclusions relating to going concern
We have nothing to report in respect of the following matters, in relation to which ISAs (Ireland) require us to report to you where:
the directors’ use of the going concern basis of accounting in the preparation of the financial statements is not appropriate: or
the directors have not disclosed in the financial statements any identified material uncertainties that may cast significant doubt about the Fund’s ability to continue to adopt the going concern basis of accounting for a period of at least twelve months from the date when the financial statements are authorised for issue.
Continued /…
201
INDEPENDENT AUDITOR’S REPORT TO THE MEMBERS OF MAN FUNDS VI PLC (CONTINUED)
Other information
The directors are responsible for the other information. The other information comprises the information included in the annual report other than the financial statements and our auditor’s report thereon. Our opinion on the financial statements does not cover the other information and, except to the extent otherwise explicitly stated in our report, we do not express any form of assurance conclusion thereon.
In connection with our audit of the financial statements, our responsibility is to read the other information and, in doing so, consider whether the other information is materially inconsistent with the financial statements or our knowledge obtained in the audit or otherwise appears to be materially misstated. If we identify such material inconsistencies or apparent material misstatements, we are required to determine whether there is a material misstatement in the financial statements or a material misstatement of the other information. If, based on the work we have performed, we conclude that there is a material misstatement of this other information, we are required to report that fact.
We have nothing to report in this regard.
Opinions on other matters prescribed by the Companies Act 2014
Based solely on the work undertaken in the course of the audit, we report that:
in our opinion, the information given in the directors’ report is consistent with the financial statements; and
in our opinion, the directors’ report has been prepared in accordance with the Companies Act 2014
We have obtained all the information and explanations which we consider necessary for the purposes of our audit.
In our opinion the accounting records of the Fund were sufficient to permit the financial statements to be readily and properly audited and the Statement of financial position is in agreement with the accounting records.
Matters on which we are required to report by exception
Based on the knowledge and understanding of the Fund and its environment obtained in the course of the audit, we have not identified material misstatements in the directors' report.
The Companies Act 2014 requires us to report to you if, in our opinion, the disclosures of directors’ remuneration and transactions required by sections 305 to 312 of the Act are not made. We have nothing to report in this regard.
Continued /…
202
INDEPENDENT AUDITOR’S REPORT TO THE MEMBERS OF MAN FUNDS VI PLC (CONTINUED)
Respective responsibilities
Responsibilities of directors for the financial statements
As explained more fully in the directors’ responsibilities statement set on page 33, the directors are responsible for the preparation of the financial statements and for being satisfied that they give a true and fair view, and for such internal control as they determine is necessary to enable the preparation of financial statements that are free from material misstatement, whether due to fraud or error.
In preparing the financial statements, the directors are responsible for assessing the Fund’s ability to continue as a going concern, disclosing, as applicable, matters related to going concern and using the going concern basis of accounting unless management either intends to liquidate the Fund or to cease operations, or has no realistic alternative but to do so.
Auditor’s responsibilities for the audit of the financial statements
Our objectives are to obtain reasonable assurance about whether the financial statements as a whole are free from material misstatement, whether due to fraud or error, and to issue an auditor's report that includes our opinion. Reasonable assurance is a high level of assurance, but is not a guarantee that an audit conducted in accordance with ISAs (Ireland) will always detect a material misstatement when it exists. Misstatements can arise from fraud or error and are considered material if, individually or in the aggregate, they could reasonably be expected to influence the economic decisions of users taken on the basis of these financial statements.
A further description of our responsibilities for the audit of the financial statements is located on the IAASA's website at: http://www.iaasa.ie/getmedia/b2389013-1cf6-458b-9b8f-a98202dc9c3a/Description_of_auditors_responsiblities_for_audit.pdf .
This description forms part of our auditor's report.
The purpose of our audit work and to whom we owe our responsibilities
Our report is made solely to the Fund’s members, as a body, in accordance with section 391 of the Companies Act 2014. Our audit work has been undertaken so that we might state to the Fund’s members those matters we are required to state to them in an auditor’s report and for no other purpose. To the fullest extent permitted by law, we do not accept or assume responsibility to anyone other than the Fund and the Fund’s members, as a body, for our audit work, for this report, or for the opinions we have formed.
Vincent Bergin for and on behalf of Ernst & Young Chartered Accountants and Statutory Audit Firm
Dublin
30 April 2020
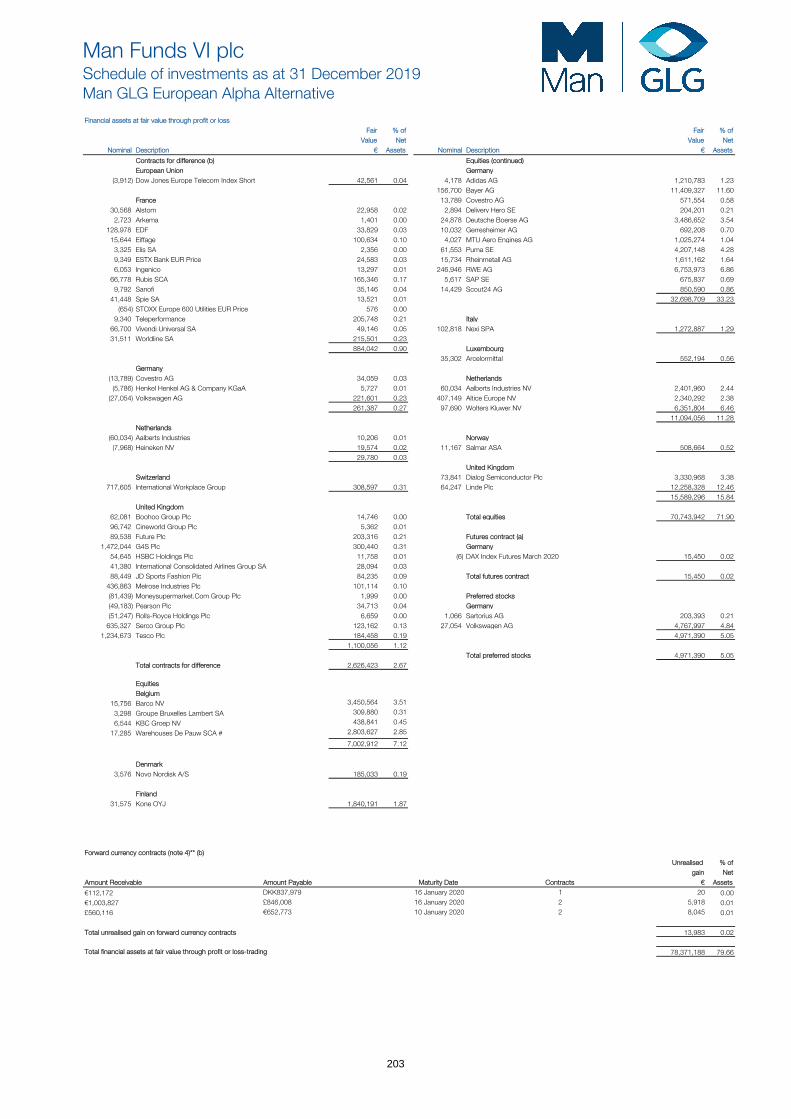
Man Funds VI plcSchedule of investments as at 31 December 2019Man GLG European Alpha Alternative
Financial assets at fair value through profit or loss Fair % of Fair % of
Value Net Value Net Nominal Description € Assets Nominal Description € Assets
Contracts for difference (b) Equities (continued)European Union Germany
(3,912) Dow Jones Europe Telecom Index Short 42,561 0.04 4,178 Adidas AG 1,210,783 1.23 156,700 Bayer AG 11,409,327 11.60
France 13,789 Covestro AG 571,554 0.5830,568 Alstom 22,958 0.02 2,894 Delivery Hero SE 204,201 0.21
2,723 Arkema 1,401 0.00 24,878 Deutsche Boerse AG 3,486,652 3.54128,978 EDF 33,829 0.03 10,032 Gerresheimer AG 692,208 0.70
15,644 Eiffage 100,634 0.10 4,027 MTU Aero Engines AG 1,025,274 1.043,325 Elis SA 2,356 0.00 61,553 Puma SE 4,207,148 4.289,349 ESTX Bank EUR Price 24,583 0.03 15,734 Rheinmetall AG 1,611,162 1.646,053 Ingenico 13,297 0.01 246,946 RWE AG 6,753,973 6.86
66,778 Rubis SCA 165,346 0.17 5,617 SAP SE 675,837 0.699,792 Sanofi 35,146 0.04 14,429 Scout24 AG 850,590 0.86
41,448 Spie SA 13,521 0.01 32,698,709 33.23(654) STOXX Europe 600 Utilities EUR Price 576 0.00
9,340 Teleperformance 205,748 0.21 Italy 66,700 Vivendi Universal SA 49,146 0.05 102,818 Nexi SPA 1,272,887 1.2931,511 Worldline SA 215,501 0.23
884,042 0.90 Luxembourg 35,302 Arcelormittal 552,194 0.56
Germany (13,789) Covestro AG 34,059 0.03 Netherlands
(5,786) Henkel Henkel AG & Company KGaA 5,727 0.01 60,034 Aalberts Industries NV 2,401,960 2.44(27,054) Volkswagen AG 221,601 0.23 407,149 Altice Europe NV 2,340,292 2.38
261,387 0.27 97,690 Wolters Kluwer NV 6,351,804 6.46 11,094,056 11.28
Netherlands (60,034) Aalberts Industries 10,206 0.01 Norway
(7,968) Heineken NV 19,574 0.02 11,167 Salmar ASA 508,664 0.52 29,780 0.03
United Kingdom Switzerland 73,841 Dialog Semiconductor Plc 3,330,968 3.38
717,605 International Workplace Group 308,597 0.31 64,247 Linde Plc 12,258,328 12.46 15,589,296 15.84
United Kingdom 62,081 Boohoo Group Plc 14,746 0.00 Total equities 70,743,942 71.9096,742 Cineworld Group Plc 5,362 0.01 89,538 Future Plc 203,316 0.21 Futures contract (a)
1,472,044 G4S Plc 300,440 0.31 Germany 54,645 HSBC Holdings Plc 11,758 0.01 (6) DAX Index Futures March 2020 15,450 0.0241,380 International Consolidated Airlines Group SA 28,094 0.03 88,449 JD Sports Fashion Plc 84,235 0.09 Total futures contract 15,450 0.02
436,863 Melrose Industries Plc 101,114 0.10 (81,439) Moneysupermarket.Com Group Plc 1,999 0.00 Preferred stocks (49,183) Pearson Plc 34,713 0.04 Germany (51,247) Rolls-Royce Holdings Plc 6,659 0.00 1,066 Sartorius AG 203,393 0.21
635,327 Serco Group Plc 123,162 0.13 27,054 Volkswagen AG 4,767,997 4.841,234,673 Tesco Plc 184,458 0.19 4,971,390 5.05
1,100,056 1.12 Total preferred stocks 4,971,390 5.05
Total contracts for difference 2,626,423 2.67
Equities
Belgium
15,756 Barco NV 3,450,564 3.51
3,298 Groupe Bruxelles Lambert SA 309,880 0.31
6,544 KBC Groep NV 438,841 0.45
17,285 Warehouses De Pauw SCA # 2,803,627 2.85
7,002,912 7.12
Denmark
3,576 Novo Nordisk A/S 185,033 0.19
Finland 31,575 Kone OYJ 1,840,191 1.87
Forward currency contracts (note 4)** (b) Unrealised % of
gain Net Amount Receivable Amount Payable Maturity Date Contracts € Assets
€112,172 DKK837,979 16 January 2020 1 20 0.00 €1,003,827 £846,008 16 January 2020 2 5,918 0.01 £560,116 €652,773 10 January 2020 2 8,045 0.01
Total unrealised gain on forward currency contracts 13,983 0.02
Total financial assets at fair value through profit or loss-trading 78,371,188 79.66
203
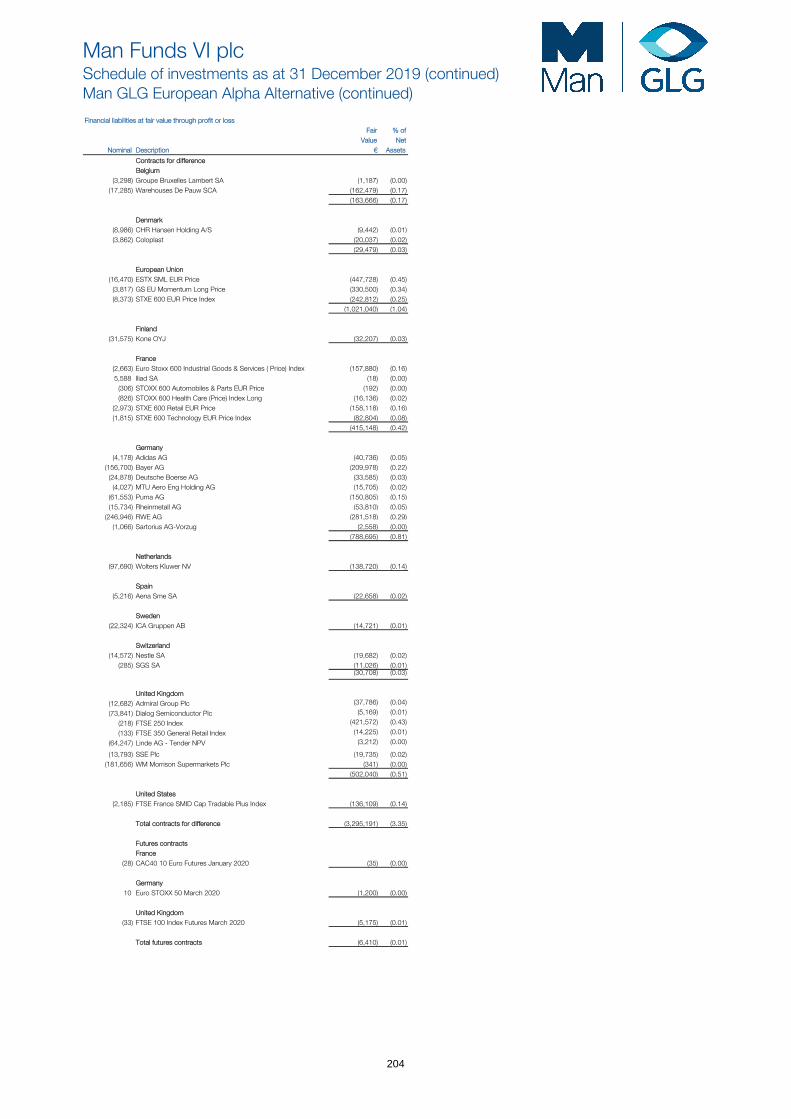
Man Funds VI plcSchedule of investments as at 31 December 2019 (continued)Man GLG European Alpha Alternative (continued)
Financial liabilities at fair value through profit or loss Fair % of
Value Net Nominal Description € Assets
Contracts for differenceBelgium
(3,298) Groupe Bruxelles Lambert SA (1,187) (0.00) (17,285) Warehouses De Pauw SCA (162,479) (0.17)
(163,666) (0.17)
Denmark (8,986) CHR Hansen Holding A/S (9,442) (0.01)(3,862) Coloplast (20,037) (0.02)
(29,479) (0.03)
European Union (16,470) ESTX SML EUR Price (447,728) (0.45)
(3,817) GS EU Momentum Long Price (330,500) (0.34)(8,373) STXE 600 EUR Price Index (242,812) (0.25)
(1,021,040) (1.04)
Finland (31,575) Kone OYJ (32,207) (0.03)
France
(2,663) Euro Stoxx 600 Industrial Goods & Services ( Price) Index (157,880) (0.16)5,588 Iliad SA (18) (0.00)
(306) STOXX 600 Automobiles & Parts EUR Price (192) (0.00) (826) STOXX 600 Health Care (Price) Index Long (16,136) (0.02)
(2,973) STXE 600 Retail EUR Price (158,118) (0.16)(1,815) STXE 600 Technology EUR Price Index (82,804) (0.08)
(415,148) (0.42)
Germany (4,178) Adidas AG (40,736) (0.05)
(156,700) Bayer AG (209,978) (0.22)(24,878) Deutsche Boerse AG (33,585) (0.03)
(4,027) MTU Aero Eng Holding AG (15,705) (0.02)(61,553) Puma AG (150,805) (0.15)(15,734) Rheinmetall AG (53,810) (0.05)
(246,946) RWE AG (281,518) (0.29)(1,066) Sartorius AG-Vorzug (2,558) (0.00)
(788,695) (0.81)
Netherlands (97,690) Wolters Kluwer NV (138,720) (0.14)
Spain
(5,216) Aena Sme SA (22,658) (0.02)
Sweden (22,324) ICA Gruppen AB (14,721) (0.01)
Switzerland
(14,572) Nestle SA (19,682) (0.02)(285) SGS SA (11,026) (0.01)
(30,708) (0.03)
United Kingdom
(12,682) Admiral Group Plc (37,786) (0.04)
(73,841) Dialog Semiconductor Plc (5,169) (0.01)
(218) FTSE 250 Index (421,572) (0.43)
(133) FTSE 350 General Retail Index (14,225) (0.01)
(64,247) Linde AG - Tender NPV (3,212) (0.00)
(13,793) SSE Plc (19,735) (0.02)(181,656) WM Morrison Supermarkets Plc (341) (0.00)
(502,040) (0.51)
United States (2,185) FTSE France SMID Cap Tradable Plus Index (136,109) (0.14)
Total contracts for difference (3,295,191) (3.35)
Futures contracts France
(28) CAC40 10 Euro Futures January 2020 (35) (0.00)
Germany 10 Euro STOXX 50 March 2020 (1,200) (0.00)
United Kingdom
(33) FTSE 100 Index Futures March 2020 (5,175) (0.01)
Total futures contracts (6,410) (0.01)
204

Man Funds VI plcSchedule of investments as at 31 December 2019 (continued)Man GLG European Alpha Alternative (continued)
Financial liabilities at fair value through profit or loss (continued)
Forward currency contracts (note 4)** Unrealised % of
loss Net Amount Receivable Amount Payable Maturity Date Contracts € Assets
€41,029 £34,905 16 January 2020 1 (143) (0.00) €790,499 NOK8,068,855 16 January 2020 1 (26,779) (0.03)£1,578 €1,863 10 January 2020 1 (2) (0.00) US$1,457,034 €1,311,960 10 January 2020 4 (14,744) (0.01)
Total unrealised loss on forward currency contracts (41,668) (0.04)
Total financial liabilities at fair value through profit or loss-trading (3,343,269) (3.40)
Total financial assets at fair value through profit or loss-trading 78,371,188 79.66
Total financial liabilities at fair value through profit or loss - trading (3,343,269) (3.40)
Other net assets 23,360,123 23.74
Net Assets Attributable to Holders of Redeemable Participating Shares 98,388,042 100.00
**The forward currency contracts are held with The Bank of New York Mellon.
Classifications:(a) Exchange traded derivative instruments(b) OTC financial derivative instruments*Transferable securities dealt on another regulated market#Transferable securities other than those listed on an official stock exchange or dealt on another regulated market
All other investments held at the year end are transferable securities listed on an official stock exchange
% of TotalAnalysis of Total Assets AssetsTransferable securities listed on an official stock exchange 70.78
Exchage traded financial derivative instruments described in classification (a) above 0.01
Transferable securities as described # above 2.72OTC financial derivative instruments described in classification (b) above 2.56Other current assets 23.93
100.00Analysis of Total Assets rather than Net Assets is required under UCITS Notice 8.2 appendix B.
205
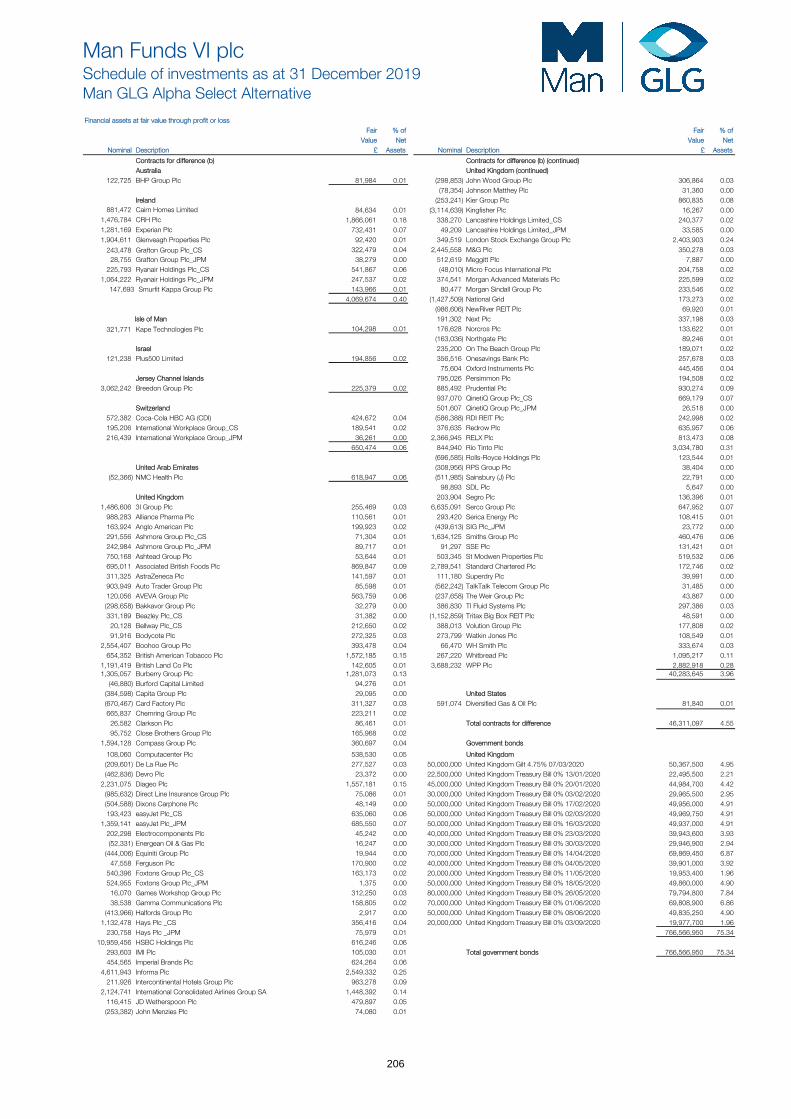
Man Funds VI plcSchedule of investments as at 31 December 2019Man GLG Alpha Select Alternative
Financial assets at fair value through profit or loss Fair % of Fair % of
Value Net Value Net Nominal Description £ Assets Nominal Description £ Assets
Contracts for difference (b) Contracts for difference (b) (continued)Australia United Kingdom (continued)
122,725 BHP Group Plc 81,984 0.01 (298,853) John Wood Group Plc 306,864 0.03(78,354) Johnson Matthey Plc 31,360 0.00
(253,241) Kier Group Plc 860,835 0.0884,634 0.01 (3,114,639) Kingfisher Plc 16,267 0.00
1,866,061 0.18 338,270 Lancashire Holdings Limited_CS 240,377 0.02732,431 0.07 49,209 Lancashire Holdings Limited_JPM 33,585 0.00
92,420 0.01 349,519 London Stock Exchange Group Plc 2,403,903 0.24322,479 0.04 2,445,558 M&G Plc 350,278 0.03
38,279 0.00 512,619 Meggitt Plc 7,887 0.00541,867 0.06 (48,010) Micro Focus International Plc 204,758 0.02247,537 0.02 374,541 Morgan Advanced Materials Plc 225,599 0.02143,966 0.01 80,477 Morgan Sindall Group Plc 233,546 0.02
4,069,674 0.40 (1,427,509) National Grid 173,273 0.02(986,606) NewRiver REIT Plc 69,920 0.01191,302 Next Plc 337,198 0.03
Ireland 881,472 Cairn Homes Limited 1,476,784 CRH Plc 1,281,169 Experian Plc 1,904,611 Glenveagh Properties Plc
243,478 Grafton Group Plc_CS 28,755 Grafton Group Plc_JPM
225,793 Ryanair Holdings Plc_CS 1,064,222 Ryanair Holdings Plc_JPM 147,693 Smurfit Kappa Group Plc
Isle of Man
321,771 Kape Technologies Plc 104,298 0.01 176,628 Norcros Plc 133,622 0.01(163,036) Northgate Plc 89,246 0.01
Israel 235,200 On The Beach Group Plc 189,071 0.02121,238 Plus500 Limited 194,856 0.02 356,516 Onesavings Bank Plc 257,678 0.03
75,604 Oxford Instruments Plc 445,456 0.04Jersey Channel Islands 795,026 Persimmon Plc 194,508 0.02
3,062,242 Breedon Group Plc 225,379 0.02 885,492 Prudential Plc 930,274 0.09937,070 QinetiQ Group Plc_CS 669,179 0.07
Switzerland 501,607 QinetiQ Group Plc_JPM 26,518 0.00572,382 Coca-Cola HBC AG (CDI) 424,672 0.04 (586,388) RDI REIT Plc 242,998 0.02195,206 International Workplace Group_CS 189,541 0.02 376,635 Redrow Plc 635,957 0.06216,439 International Workplace Group_JPM 36,261 0.00 2,366,945 RELX Plc 813,473 0.08
650,474 0.06 844,940 Rio Tinto Plc 3,034,780 0.31(696,585) Rolls-Royce Holdings Plc 123,544 0.01
United Arab Emirates (308,956) RPS Group Plc 38,404 0.00(52,366) NMC Health Plc 618,947 0.06 (511,985) Sainsbury (J) Plc 22,791 0.00
98,893 SDL Plc 5,647 0.00United Kingdom 203,904 Segro Plc 136,396 0.01
1,486,606 3I Group Plc 255,469 0.03 6,635,091 Serco Group Plc 647,952 0.07988,283 Alliance Pharma Plc 110,561 0.01 293,420 Serica Energy Plc 108,415 0.01163,924 Anglo American Plc 199,923 0.02 (439,613) SIG Plc_JPM 23,772 0.00291,556 Ashmore Group Plc_CS 71,304 0.01 1,634,125 Smiths Group Plc 460,476 0.06242,984 Ashmore Group Plc_JPM 89,717 0.01 91,297 SSE Plc 131,421 0.01750,168 Ashtead Group Plc 53,644 0.01 503,345 St Modwen Properties Plc 519,532 0.06695,011 Associated British Foods Plc 869,847 0.09 2,789,541 Standard Chartered Plc 172,746 0.02311,325 AstraZeneca Plc 141,597 0.01 111,180 Superdry Plc 39,991 0.00903,949 Auto Trader Group Plc 85,598 0.01 (562,242) TalkTalk Telecom Group Plc 31,485 0.00120,056 AVEVA Group Plc 563,759 0.06 (237,658) The Weir Group Plc 43,867 0.00(298,658) Bakkavor Group Plc 32,279 0.00 386,830 TI Fluid Systems Plc 297,386 0.03331,189 Beazley Plc_CS 31,382 0.00 (1,152,859) Tritax Big Box REIT Plc 48,591 0.00
20,128 Bellway Plc_CS 212,650 0.02 388,013 Volution Group Plc 177,808 0.0291,916 Bodycote Plc 272,325 0.03 273,799 Watkin Jones Plc 108,549 0.01
2,554,407 Boohoo Group Plc 393,478 0.04 66,470 WH Smith Plc 333,674 0.03654,352 British American Tobacco Plc 1,572,185 0.15 267,220 Whitbread Plc 1,095,217 0.11
1,191,419 British Land Co Plc 142,605 0.01 3,688,232 WPP Plc 2,882,918 0.281,305,057 Burberry Group Plc 1,281,073 0.13 40,283,645 3.96
(46,880) Burford Capital Limited 94,276 0.01(384,598) Capita Group Plc 29,095 0.00 United States(670,467) Card Factory Plc 311,327 0.03 591,074 Diversified Gas & Oil Plc 81,840 0.01665,837 Chemring Group Plc 223,211 0.02
26,582 Clarkson Plc 86,461 0.01 Total contracts for difference 46,311,097 4.5595,752 Close Brothers Group Plc 165,968 0.02
1,594,128 Compass Group Plc 360,697 0.04 Government bonds
108,060 Computacenter Plc 538,530 0.05 United Kingdom(209,601) De La Rue Plc 277,527 0.03 50,000,000 United Kingdom Gilt 4.75% 07/03/2020 50,367,500 4.95(462,836) Devro Plc 23,372 0.00 22,500,000 United Kingdom Treasury Bill 0% 13/01/2020 22,495,500 2.21
2,231,075 Diageo Plc 1,557,181 0.15 45,000,000 United Kingdom Treasury Bill 0% 20/01/2020 44,984,700 4.42(985,632) Direct Line Insurance Group Plc 75,086 0.01 30,000,000 United Kingdom Treasury Bill 0% 03/02/2020 29,965,500 2.95(504,588) Dixons Carphone Plc 48,149 0.00 50,000,000 United Kingdom Treasury Bill 0% 17/02/2020 49,956,000 4.91193,423 easyJet Plc_CS 635,060 0.06 50,000,000 United Kingdom Treasury Bill 0% 02/03/2020 49,969,750 4.91
1,359,141 easyJet Plc_JPM 685,550 0.07 50,000,000 United Kingdom Treasury Bill 0% 16/03/2020 49,937,000 4.91202,298 Electrocomponents Plc 45,242 0.00 40,000,000 United Kingdom Treasury Bill 0% 23/03/2020 39,943,600 3.93(52,331) Energean Oil & Gas Plc 16,247 0.00 30,000,000 United Kingdom Treasury Bill 0% 30/03/2020 29,946,900 2.94
(444,006) Equiniti Group Plc 19,944 0.00 70,000,000 United Kingdom Treasury Bill 0% 14/04/2020 69,869,450 6.8747,558 Ferguson Plc 170,900 0.02 40,000,000 United Kingdom Treasury Bill 0% 04/05/2020 39,901,000 3.92
540,396 Foxtons Group Plc_CS 163,173 0.02 20,000,000 United Kingdom Treasury Bill 0% 11/05/2020 19,953,400 1.96524,955 Foxtons Group Plc_JPM 1,375 0.00 50,000,000 United Kingdom Treasury Bill 0% 18/05/2020 49,860,000 4.90
16,070 Games Workshop Group Plc 312,250 0.03 80,000,000 United Kingdom Treasury Bill 0% 26/05/2020 79,794,800 7.8438,538 Gamma Communications Plc 158,805 0.02 70,000,000 United Kingdom Treasury Bill 0% 01/06/2020 69,808,900 6.86
(413,966) Halfords Group Plc 2,917 0.00 50,000,000 United Kingdom Treasury Bill 0% 08/06/2020 49,835,250 4.901,132,478 Hays Plc _CS 356,416 0.04 20,000,000 United Kingdom Treasury Bill 0% 03/09/2020 19,977,700 1.96
230,758 Hays Plc _JPM 75,979 0.01 766,566,950 75.3410,959,456 HSBC Holdings Plc 616,246 0.06
293,603 IMI Plc 105,030 0.01 Total government bonds 766,566,950 75.34454,565 Imperial Brands Plc 624,264 0.06
4,611,943 Informa Plc 2,549,332 0.25211,926 Intercontinental Hotels Group Plc 963,278 0.09
2,124,741 International Consolidated Airlines Group SA 1,448,392 0.14116,415 JD Wetherspoon Plc 479,897 0.05(253,382) John Menzies Plc 74,080 0.01
206
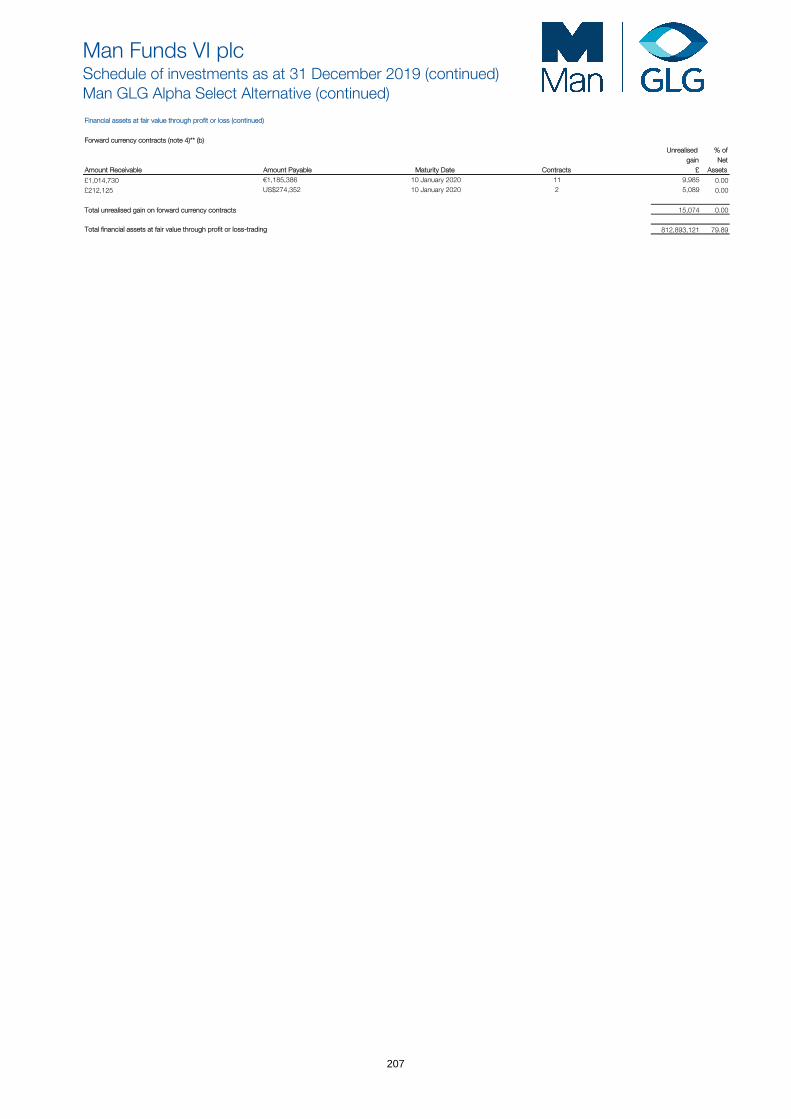
Man Funds VI plcSchedule of investments as at 31 December 2019 (continued)Man GLG Alpha Select Alternative (continued)
Financial assets at fair value through profit or loss (continued)
Forward currency contracts (note 4)** (b) Unrealised % of
gain Net Amount Receivable Amount Payable Maturity Date Contracts £ Assets
£1,014,730 €1,185,386 10 January 2020 11 9,985 0.00 £212,125 US$274,352 10 January 2020 2 5,089 0.00
Total unrealised gain on forward currency contracts 15,074 0.00
Total financial assets at fair value through profit or loss-trading 812,893,121 79.89
207
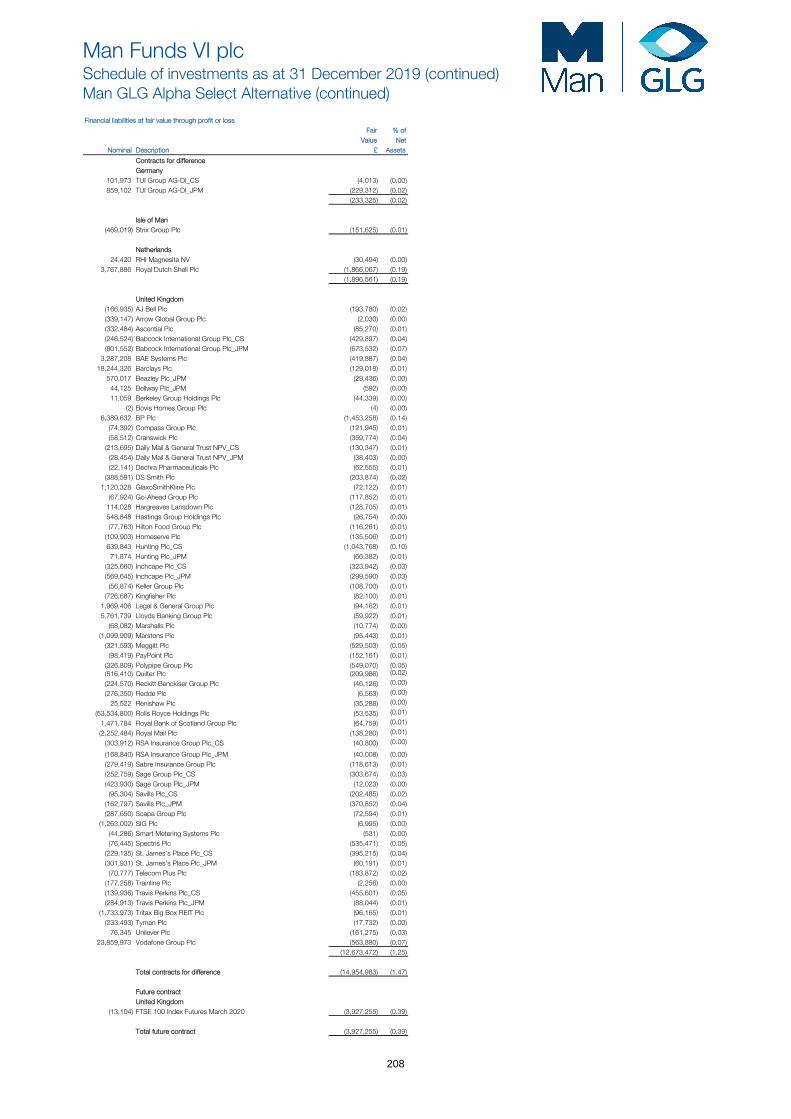
Man Funds VI plcSchedule of investments as at 31 December 2019 (continued)Man GLG Alpha Select Alternative (continued)
Financial liabilities at fair value through profit or loss Fair % of
Value Net Nominal Description £ Assets
Contracts for differenceGermany
101,973 TUI Group AG-DI_CS (4,013) (0.00) 859,102 TUI Group AG-DI_JPM (229,312) (0.02)
(233,325) (0.02)
Isle of Man(469,019) Strix Group Plc (151,625) (0.01)
Netherlands24,420 RHI Magnesita NV (30,494) (0.00)
3,767,886 Royal Dutch Shell Plc (1,866,067) (0.19)(1,896,561) (0.19)
United Kingdom(166,935) AJ Bell Plc (193,780) (0.02)(339,147) Arrow Global Group Plc (2,030) (0.00) (332,484) Ascential Plc (85,270) (0.01)(246,524) Babcock International Group Plc_CS (429,897) (0.04)(801,552) Babcock International Group Plc_JPM (673,532) (0.07)
3,287,208 BAE Systems Plc (419,887) (0.04)18,244,326 Barclays Plc (129,018) (0.01)
570,017 Beazley Plc_JPM (29,436) (0.00) 44,125 Bellway Plc_JPM (592) (0.00)11,059 Berkeley Group Holdings Plc (44,339) (0.00)
(2) Bovis Homes Group Plc (4) (0.00) 6,389,632 BP Plc (1,453,258) (0.14)
(74,392) Compass Group Plc (121,945) (0.01)(58,512) Cranswick Plc (359,774) (0.04)
(213,695) Daily Mail & General Trust NPV_CS (130,347) (0.01)(28,454) Daily Mail & General Trust NPV_JPM (38,403) (0.00) (22,141) Dechra Pharmaceuticals Plc (62,555) (0.01)
(388,591) DS Smith Plc (203,874) (0.02)1,120,328 GlaxoSmithKline Plc (72,122) (0.01)
(67,924) Go-Ahead Group Plc (117,852) (0.01)114,028 Hargreaves Lansdown Plc (128,705) (0.01)548,848 Hastings Group Holdings Plc (26,754) (0.00) (77,763) Hilton Food Group Plc (116,261) (0.01)
(109,903) Homeserve Plc (135,506) (0.01)639,843 Hunting Plc_CS (1,043,768) (0.10)
71,874 Hunting Plc_JPM (66,382) (0.01)(325,660) Inchcape Plc_CS (323,942) (0.03)(569,645) Inchcape Plc_JPM (299,590) (0.03)
(56,874) Keller Group Plc (108,700) (0.01)(726,687) Kingfisher Plc (82,100) (0.01)
1,969,406 Legal & General Group Plc (94,162) (0.01)5,761,739 Lloyds Banking Group Plc (59,922) (0.01)
(68,082) Marshalls Plc (10,774) (0.00) (1,099,909) Marstons Plc (95,443) (0.01)
(321,593) Meggitt Plc (529,503) (0.05)(98,419) PayPoint Plc (152,161) (0.01)
(326,809) Polypipe Group Plc (549,070) (0.05)(816,410) Quilter Plc (209,986) (0.02)
(224,570) Reckitt Benckiser Group Plc (46,126) (0.00)
(276,350) Redde Plc (6,563) (0.00)
25,522 Renishaw Plc (35,288) (0.00)
(53,534,800) Rolls Royce Holdings Plc (53,535) (0.01)
1,471,784 Royal Bank of Scotland Group Plc (64,759) (0.01)
(2,252,484) Royal Mail Plc (138,280) (0.01)
(303,912) RSA Insurance Group Plc_CS (40,800) (0.00)
(168,840) RSA Insurance Group Plc_JPM (40,008) (0.00) (279,419) Sabre Insurance Group Plc (118,613) (0.01)(252,759) Sage Group Plc_CS (303,674) (0.03)(423,930) Sage Group Plc_JPM (12,023) (0.00)
(95,304) Savills Plc_CS (202,485) (0.02)(162,797) Savills Plc_JPM (370,852) (0.04)(287,650) Scapa Group Plc (72,594) (0.01)
(1,263,002) SIG Plc (6,995) (0.00) (44,286) Smart Metering Systems Plc (531) (0.00)(76,445) Spectris Plc (535,471) (0.05)
(229,135) St. James's Place Plc_CS (395,215) (0.04)(301,931) St. James's Place Plc_JPM (60,191) (0.01)
(70,777) Telecom Plus Plc (183,872) (0.02)(177,258) Trainline Plc (2,256) (0.00)(139,936) Travis Perkins Plc_CS (455,601) (0.05)(284,913) Travis Perkins Plc_JPM (88,044) (0.01)
(1,733,973) Tritax Big Box REIT Plc (96,165) (0.01)(233,493) Tyman Plc (17,732) (0.00)
76,345 Unilever Plc (161,275) (0.03)23,859,973 Vodafone Group Plc (563,880) (0.07)
(12,673,472) (1.25)
Total contracts for difference (14,954,983) (1.47)
Future contractUnited Kingdom
(13,104) FTSE 100 Index Futures March 2020 (3,927,255) (0.39)
Total future contract (3,927,255) (0.39)
208
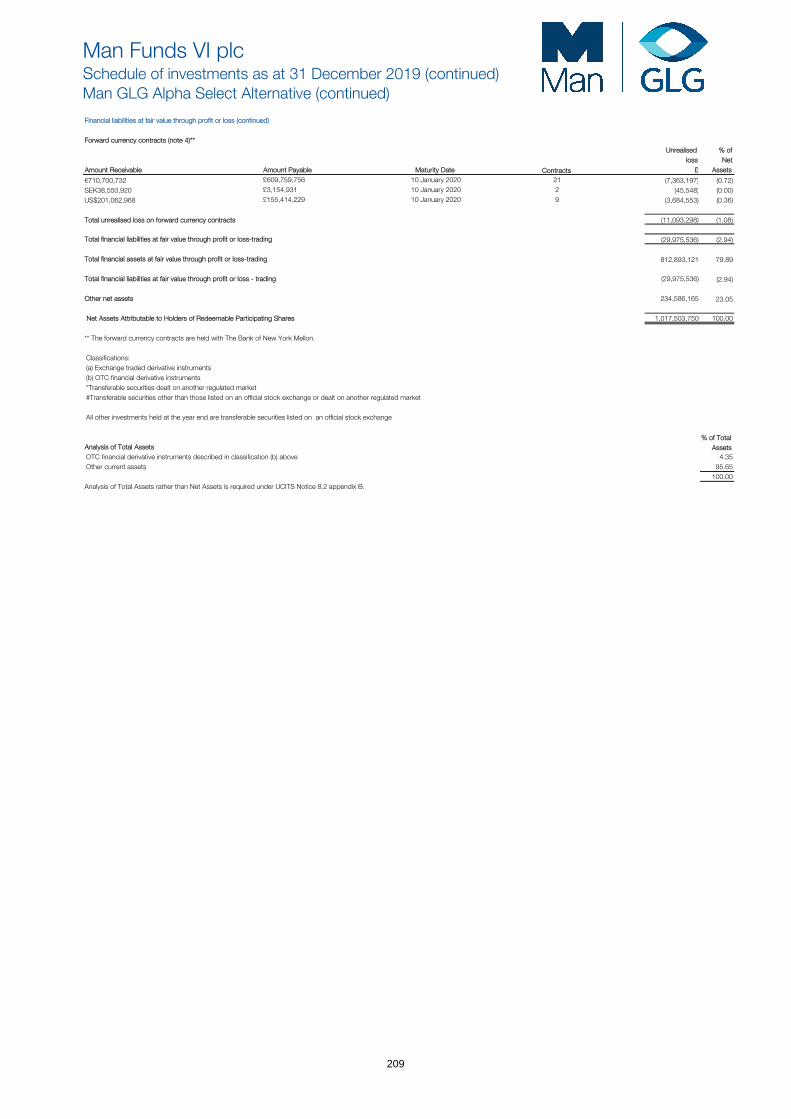
Man Funds VI plcSchedule of investments as at 31 December 2019 (continued)Man GLG Alpha Select Alternative (continued)
Financial liabilities at fair value through profit or loss (continued)
Forward currency contracts (note 4)** Unrealised % of
loss Net Amount Receivable Amount Payable Maturity Date Contracts £ Assets
€710,700,732 £609,759,756 10 January 2020 21 (7,363,197) (0.72)SEK38,550,920 £3,154,931 10 January 2020 2 (45,548) (0.00) US$201,062,968 £155,414,229 10 January 2020 9 (3,684,553) (0.36)
Total unrealised loss on forward currency contracts (11,093,298) (1.08)
Total financial liabilities at fair value through profit or loss-trading (29,975,536) (2.94)
Total financial assets at fair value through profit or loss-trading 812,893,121 79.89
Total financial liabilities at fair value through profit or loss - trading (29,975,536) (2.94)
Other net assets 234,586,165 23.05
Net Assets Attributable to Holders of Redeemable Participating Shares 1,017,503,750 100.00
** The forward currency contracts are held with The Bank of New York Mellon.
Classifications:(a) Exchange traded derivative instruments(b) OTC financial derivative instruments*Transferable securities dealt on another regulated market#Transferable securities other than those listed on an official stock exchange or dealt on another regulated market
All other investments held at the year end are transferable securities listed on an official stock exchange
% of TotalAnalysis of Total Assets AssetsOTC financial derivative instruments described in classification (b) above 4.35Other current assets 95.65
100.00Analysis of Total Assets rather than Net Assets is required under UCITS Notice 8.2 appendix B.
209
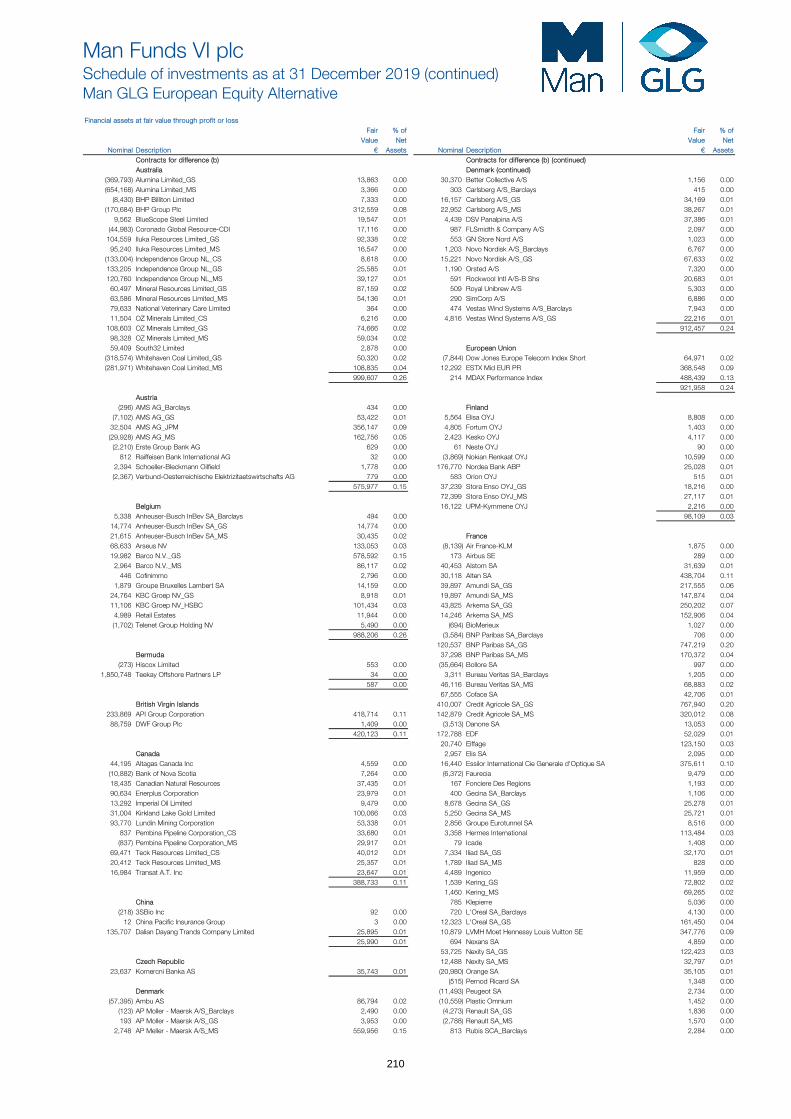
Man Funds VI plcSchedule of investments as at 31 December 2019 (continued)Man GLG European Equity Alternative
Financial assets at fair value through profit or loss Fair % of Fair % of
Value Net Value Net Nominal Description € Assets Nominal Description € Assets
Contracts for difference (b) Contracts for difference (b) (continued)Australia Denmark (continued)
(369,793) Alumina Limited_GS 13,863 0.00 30,370 Better Collective A/S 1,156 0.00(654,168) Alumina Limited_MS 3,366 0.00 303 Carlsberg A/S_Barclays 415 0.00
(8,430) BHP Billiton Limited 7,333 0.00 16,157 Carlsberg A/S_GS 34,169 0.01(170,684) BHP Group Plc 312,559 0.08 22,952 Carlsberg A/S_MS 38,267 0.01
9,562 BlueScope Steel Limited 19,547 0.01 4,439 DSV Panalpina A/S 37,386 0.01(44,983) Coronado Global Resource-CDI 17,116 0.00 987 FLSmidth & Company A/S 2,097 0.00
104,559 Iluka Resources Limited_GS 92,338 0.02 553 GN Store Nord A/S 1,023 0.0095,240 Iluka Resources Limited_MS 16,547 0.00 1,203 Novo Nordisk A/S_Barclays 6,767 0.00
(133,004) Independence Group NL_CS 8,618 0.00 15,221 Novo Nordisk A/S_GS 67,633 0.02133,205 Independence Group NL_GS 25,585 0.01 1,190 Orsted A/S 7,320 0.00120,760 Independence Group NL_MS 39,127 0.01 591 Rockwool Intl A/S-B Shs 20,683 0.01
60,497 Mineral Resources Limited_GS 87,159 0.02 509 Royal Unibrew A/S 5,303 0.0063,586 Mineral Resources Limited_MS 54,136 0.01 290 SimCorp A/S 6,886 0.0079,633 National Veterinary Care Limited 364 0.00 474 Vestas Wind Systems A/S_Barclays 7,943 0.0011,504 OZ Minerals Limited_CS 6,216 0.00 4,816 Vestas Wind Systems A/S_GS 22,216 0.01
108,603 OZ Minerals Limited_GS 74,666 0.02 912,457 0.2498,328 OZ Minerals Limited_MS 59,034 0.02 59,409 South32 Limited 2,878 0.00 European Union
(318,574) Whitehaven Coal Limited_GS 50,320 0.02 (7,844) Dow Jones Europe Telecom Index Short 64,971 0.02(281,971) Whitehaven Coal Limited_MS 108,835 0.04 12,292 ESTX Mid EUR PR 368,548 0.09
999,607 0.26 214 MDAX Performance Index 488,439 0.13 921,958 0.24
Austria (296) AMS AG_Barclays 434 0.00 Finland
(7,102) AMS AG_GS 53,422 0.01 5,564 Elisa OYJ 8,808 0.0032,504 AMS AG_JPM 356,147 0.09 4,805 Fortum OYJ 1,403 0.00(29,928) AMS AG_MS 162,756 0.05 2,423 Kesko OYJ 4,117 0.00
(2,210) Erste Group Bank AG 629 0.00 61 Neste OYJ 90 0.00812 Raiffeisen Bank International AG 32 0.00 (3,869) Nokian Renkaat OYJ 10,599 0.00
2,394 Schoeller-Bleckmann Oilfield 1,778 0.00 176,770 Nordea Bank ABP 25,028 0.01(2,367) Verbund-Oesterreichische Elektrizitaetswirtschafts AG 779 0.00 583 Orion OYJ 515 0.01
575,977 0.15 37,239 Stora Enso OYJ_GS 18,216 0.00 72,399 Stora Enso OYJ_MS 27,117 0.01
Belgium 16,122 UPM-Kymmene OYJ 2,216 0.005,338 Anheuser-Busch InBev SA_Barclays 494 0.00 98,109 0.03
14,774 Anheuser-Busch InBev SA_GS 14,774 0.00 21,615 Anheuser-Busch InBev SA_MS 30,435 0.02 France 68,633 Arseus NV 133,053 0.03 (8,139) Air France-KLM 1,875 0.0019,982 Barco N.V._GS 578,592 0.15 173 Airbus SE 289 0.00
2,964 Barco N.V._MS 86,117 0.02 40,453 Alstom SA 31,639 0.01446 Cofinimmo 2,796 0.00 30,118 Alten SA 438,704 0.11
1,879 Groupe Bruxelles Lambert SA 14,159 0.00 39,897 Amundi SA_GS 217,555 0.0624,764 KBC Groep NV_GS 8,918 0.01 19,897 Amundi SA_MS 147,874 0.0411,106 KBC Groep NV_HSBC 101,434 0.03 43,825 Arkema SA_GS 250,202 0.07
4,989 Retail Estates 11,944 0.00 14,246 Arkema SA_MS 152,906 0.04(1,702) Telenet Group Holding NV 5,490 0.00 (694) BioMerieux 1,027 0.00
988,206 0.26 (3,584) BNP Paribas SA_Barclays 706 0.00 120,537 BNP Paribas SA_GS 747,219 0.20
Bermuda 37,298 BNP Paribas SA_MS 170,372 0.04(273) Hiscox Limited 553 0.00 (35,664) Bollore SA 997 0.00
1,850,748 Teekay Offshore Partners LP 34 0.00 3,311 Bureau Veritas SA_Barclays 1,205 0.00 587 0.00 46,116 Bureau Veritas SA_MS 68,883 0.02
67,555 Coface SA 42,706 0.01British Virgin Islands 410,007 Credit Agricole SA_GS 767,940 0.20
233,869 API Group Corporation 418,714 0.11 142,879 Credit Agricole SA_MS 320,012 0.0888,759 DWF Group Plc 1,409 0.00 (3,513) Danone SA 13,053 0.00
420,123 0.11 172,788 EDF 52,029 0.01 20,740 Eiffage 123,150 0.03
Canada 2,957 Elis SA 2,095 0.0044,195 Altagas Canada Inc 4,559 0.00 16,440 Essilor International Cie Generale d'Optique SA 375,611 0.10(10,882) Bank of Nova Scotia 7,264 0.00 (6,372) Faurecia 9,479 0.0018,435 Canadian Natural Resources 37,435 0.01 167 Fonciere Des Regions 1,193 0.0090,634 Enerplus Corporation 23,979 0.01 400 Gecina SA_Barclays 1,106 0.0013,292 Imperial Oil Limited 9,479 0.00 8,678 Gecina SA_GS 25,278 0.0131,004 Kirkland Lake Gold Limited 100,066 0.03 5,250 Gecina SA_MS 25,721 0.0193,770 Lundin Mining Corporation 53,338 0.01 2,856 Groupe Eurotunnel SA 8,516 0.00
837 Pembina Pipeline Corporation_CS 33,680 0.01 3,358 Hermes International 113,484 0.03(837) Pembina Pipeline Corporation_MS 29,917 0.01 79 Icade 1,408 0.00
69,471 Teck Resources Limited_CS 40,012 0.01 7,334 Iliad SA_GS 32,170 0.0120,412 Teck Resources Limited_MS 25,357 0.01 1,789 Iliad SA_MS 828 0.0016,984 Transat A.T. Inc 23,647 0.01 4,489 Ingenico 11,959 0.00
388,733 0.11 1,539 Kering_GS 72,802 0.02 1,460 Kering_MS 69,265 0.02
China 785 Klepierre 5,036 0.00(218) 3SBio Inc 92 0.00 720 L'Oreal SA_Barclays 4,130 0.00
12 China Pacific Insurance Group 3 0.00 12,323 L'Oreal SA_GS 161,450 0.04135,707 Dalian Dayang Trands Company Limited 25,895 0.01 10,879 LVMH Moet Hennessy Louis Vuitton SE 347,776 0.09
25,990 0.01 694 Nexans SA 4,859 0.00 53,725 Nexity SA_GS 122,423 0.03
Czech Republic 12,488 Nexity SA_MS 32,797 0.0123,637 Komercni Banka AS 35,743 0.01 (20,980) Orange SA 35,105 0.01
(515) Pernod Ricard SA 1,348 0.00Denmark (11,493) Peugeot SA 2,734 0.00
(57,395) Ambu AS 86,794 0.02 (10,559) Plastic Omnium 1,452 0.00(123) AP Moller - Maersk A/S_Barclays 2,490 0.00 (4,273) Renault SA_GS 1,836 0.00193 AP Moller - Maersk A/S_GS 3,953 0.00 (2,788) Renault SA_MS 1,570 0.00
2,748 AP Meller - Maersk A/S_MS 559,956 0.15 813 Rubis SCA_Barclays 2,284 0.00
210
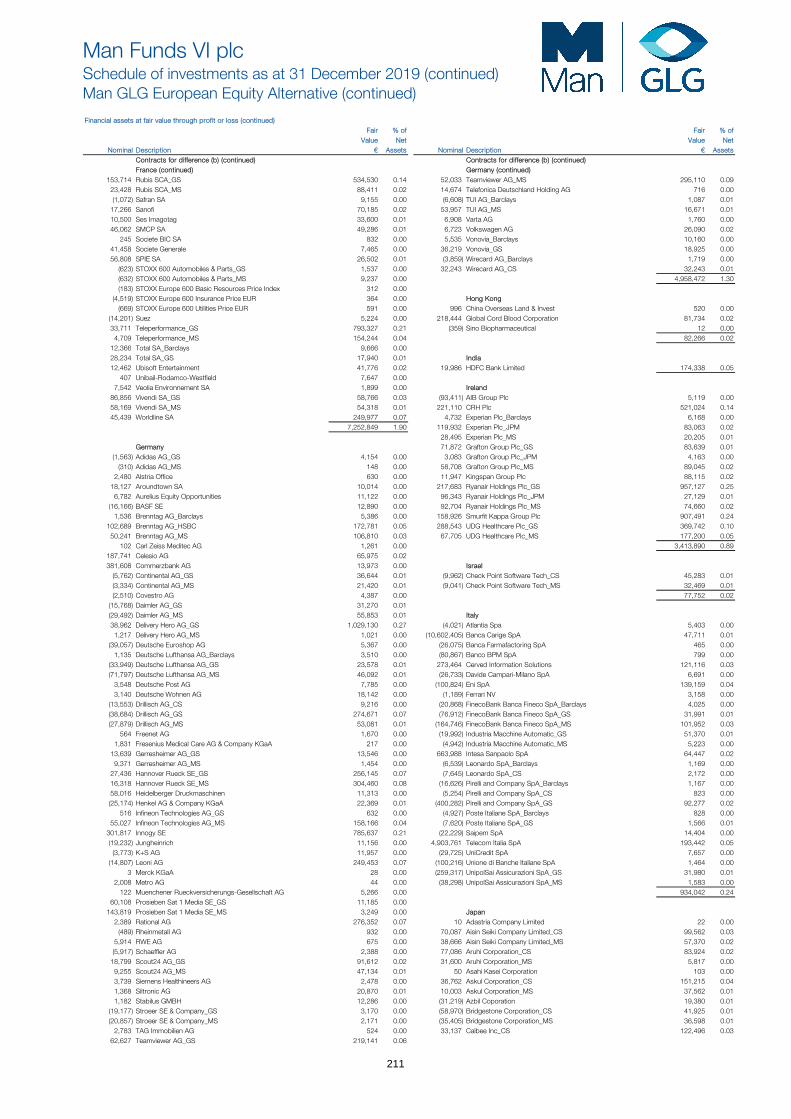
Man Funds VI plcSchedule of investments as at 31 December 2019 (continued)Man GLG European Equity Alternative (continued)
Financial assets at fair value through profit or loss (continued) Fair % of Fair % of
Value Net Value Net Nominal Description € Assets Nominal Description € Assets
Contracts for difference (b) (continued) Contracts for difference (b) (continued)France (continued) Germany (continued)
153,714 Rubis SCA_GS 534,530 0.14 52,033 Teamviewer AG_MS 295,110 0.0923,428 Rubis SCA_MS 88,411 0.02 14,674 Telefonica Deutschland Holding AG 716 0.00(1,072) Safran SA 9,155 0.00 (6,608) TUI AG_Barclays 1,087 0.01
17,266 Sanofi 70,185 0.02 53,957 TUI AG_MS 16,671 0.0110,500 Ses Imagotag 33,600 0.01 6,908 Varta AG 1,760 0.0046,062 SMCP SA 49,286 0.01 6,723 Volkswagen AG 26,090 0.02
245 Societe BIC SA 832 0.00 5,535 Vonovia_Barclays 10,160 0.0041,458 Societe Generale 7,465 0.00 36,219 Vonovia_GS 18,925 0.0056,808 SPIE SA 26,502 0.01 (3,859) Wirecard AG_Barclays 1,719 0.00
(623) STOXX 600 Automobiles & Parts_GS 1,537 0.00 32,243 Wirecard AG_CS 32,243 0.01(632) STOXX 600 Automobiles & Parts_MS 9,237 0.00 4,958,472 1.30(183) STOXX Europe 600 Basic Resources Price Index 312 0.00
(4,519) STOXX Europe 600 Insurance Price EUR 364 0.00 Hong Kong (669) STOXX Europe 600 Utilities Price EUR 591 0.00 996 China Overseas Land & Invest 520 0.00
(14,201) Suez 5,224 0.00 218,444 Global Cord Blood Corporation 81,734 0.0233,711 Teleperformance_GS 793,327 0.21 (359) Sino Biopharmaceutical 12 0.00
4,709 Teleperformance_MS 154,244 0.04 82,266 0.0212,366 Total SA_Barclays 9,666 0.00 28,234 Total SA_GS 17,940 0.01 India 12,462 Ubisoft Entertainment 41,776 0.02 19,986 HDFC Bank Limited 174,338 0.05
407 Unibail-Rodamco-Westfield 7,647 0.00 7,542 Veolia Environnement SA 1,899 0.00 Ireland
86,856 Vivendi SA_GS 58,766 0.03 (93,411) AIB Group Plc 5,119 0.0058,169 Vivendi SA_MS 54,318 0.01 221,110 CRH Plc 521,024 0.1445,439 Worldline SA 249,977 0.07 4,732 Experian Plc_Barclays 6,168 0.00
7,252,849 1.90 119,932 Experian Plc_JPM 83,063 0.02 28,495 Experian Plc_MS 20,205 0.01
Germany 71,872 Grafton Group Plc_GS 83,639 0.01(1,563) Adidas AG_GS 4,154 0.00 3,083 Grafton Group Plc_JPM 4,163 0.00
(310) Adidas AG_MS 148 0.00 58,708 Grafton Group Plc_MS 89,045 0.022,480 Alstria Office 630 0.00 11,947 Kingspan Group Plc 88,115 0.02
18,127 Aroundtown SA 10,014 0.00 217,683 Ryanair Holdings Plc_GS 957,127 0.256,782 Aurelius Equity Opportunities 11,122 0.00 96,343 Ryanair Holdings Plc_JPM 27,129 0.01
(16,166) BASF SE 12,890 0.00 92,704 Ryanair Holdings Plc_MS 74,660 0.021,536 Brenntag AG_Barclays 5,386 0.00 158,926 Smurfit Kappa Group Plc 907,491 0.24
102,689 Brenntag AG_HSBC 172,781 0.05 288,543 UDG Healthcare Plc_GS 369,742 0.1050,241 Brenntag AG_MS 106,810 0.03 67,705 UDG Healthcare Plc_MS 177,200 0.05
102 Carl Zeiss Meditec AG 1,261 0.00 3,413,890 0.89187,741 Celesio AG 65,975 0.02 381,608 Commerzbank AG 13,973 0.00 Israel
(5,762) Continental AG_GS 36,644 0.01 (9,962) Check Point Software Tech_CS 45,283 0.01(3,334) Continental AG_MS 21,420 0.01 (9,041) Check Point Software Tech_MS 32,469 0.01(2,510) Covestro AG 4,387 0.00 77,752 0.02
(15,768) Daimler AG_GS 31,270 0.01 (29,492) Daimler AG_MS 55,853 0.01 Italy 38,962 Delivery Hero AG_GS 1,029,130 0.27 (4,021) Atlantia Spa 5,403 0.00
1,217 Delivery Hero AG_MS 1,021 0.00 (10,602,405) Banca Carige SpA 47,711 0.01(39,057) Deutsche Euroshop AG 5,367 0.00 (26,075) Banca Farmafactoring SpA 465 0.00
1,135 Deutsche Lufthansa AG_Barclays 3,510 0.00 (80,867) Banco BPM SpA 799 0.00(33,949) Deutsche Lufthansa AG_GS 23,578 0.01 273,464 Cerved Information Solutions 121,116 0.03(71,797) Deutsche Lufthansa AG_MS 46,092 0.01 (26,733) Davide Campari-Milano SpA 6,691 0.00
3,548 Deutsche Post AG 7,785 0.00 (100,824) Eni SpA 139,159 0.043,140 Deutsche Wohnen AG 18,142 0.00 (1,189) Ferrari NV 3,158 0.00
(13,553) Drillisch AG_CS 9,216 0.00 (20,868) FinecoBank Banca Fineco SpA_Barclays 4,025 0.00(38,684) Drillisch AG_GS 274,671 0.07 (76,912) FinecoBank Banca Fineco SpA_GS 31,991 0.01(27,879) Drillisch AG_MS 53,081 0.01 (164,746) FinecoBank Banca Fineco SpA_MS 101,952 0.03
564 Freenet AG 1,670 0.00 (19,992) Industria Macchine Automatic_GS 51,370 0.011,831 Fresenius Medical Care AG & Company KGaA 217 0.00 (4,942) Industria Macchine Automatic_MS 5,223 0.00
13,639 Gerresheimer AG_GS 13,546 0.00 663,988 Intesa Sanpaolo SpA 64,447 0.029,371 Gerresheimer AG_MS 1,454 0.00 (6,539) Leonardo SpA_Barclays 1,169 0.00
27,436 Hannover Rueck SE_GS 256,145 0.07 (7,645) Leonardo SpA_CS 2,172 0.0016,318 Hannover Rueck SE_MS 304,460 0.08 (16,626) Pirelli and Company SpA_Barclays 1,167 0.0058,016 Heidelberger Druckmaschinen 11,313 0.00 (5,254) Pirelli and Company SpA_CS 823 0.00(25,174) Henkel AG & Company KGaA 22,369 0.01 (400,282) Pirelli and Company SpA_GS 92,277 0.02
516 Infineon Technologies AG_GS 632 0.00 (4,927) Poste Italiane SpA_Barclays 828 0.0055,027 Infineon Technologies AG_MS 158,166 0.04 (7,620) Poste Italiane SpA_GS 1,566 0.01
301,817 Innogy SE 785,637 0.21 (22,229) Saipem SpA 14,404 0.00(19,232) Jungheinrich 11,156 0.00 4,903,761 Telecom Italia SpA 193,442 0.05
(3,773) K+S AG 11,957 0.00 (29,725) UniCredit SpA 7,657 0.00(14,807) Leoni AG 249,453 0.07 (100,216) Unione di Banche Italiane SpA 1,464 0.00
3 Merck KGaA 28 0.00 (259,317) UnipolSai Assicurazioni SpA_GS 31,980 0.012,008 Metro AG 44 0.00 (38,298) UnipolSai Assicurazioni SpA_MS 1,583 0.00
122 Muenchener Rueckversicherungs-Gesellschaft AG 5,266 0.00 934,042 0.2460,108 Prosieben Sat 1 Media SE_GS 11,185 0.00
143,819 Prosieben Sat 1 Media SE_MS 3,249 0.00 Japan 2,389 Rational AG 276,352 0.07 10 Adastria Company Limited 22 0.00
(489) Rheinmetall AG 932 0.00 70,087 Aisin Seiki Company Limited_CS 99,562 0.035,914 RWE AG 675 0.00 38,666 Aisin Seiki Company Limited_MS 57,370 0.02(5,917) Schaeffler AG 2,388 0.00 77,086 Aruhi Corporation_CS 83,924 0.02
18,799 Scout24 AG_GS 91,612 0.02 31,600 Aruhi Corporation_MS 5,817 0.009,255 Scout24 AG_MS 47,134 0.01 50 Asahi Kasei Corporation 103 0.003,739 Siemens Healthineers AG 2,478 0.00 36,762 Askul Corporation_CS 151,215 0.041,368 Siltronic AG 20,870 0.01 10,003 Askul Corporation_MS 37,562 0.011,182 Stabilus GMBH 12,286 0.00 (31,219) Azbil Coporation 19,380 0.01
(19,177) Stroeer SE & Company_GS 3,170 0.00 (58,970) Bridgestone Corporation_CS 41,925 0.01(20,857) Stroeer SE & Company_MS 2,171 0.00 (35,405) Bridgestone Corporation_MS 36,598 0.01
2,783 TAG Immobilien AG 524 0.00 33,137 Calbee Inc_CS 122,496 0.0362,627 Teamviewer AG_GS 219,141 0.06
211
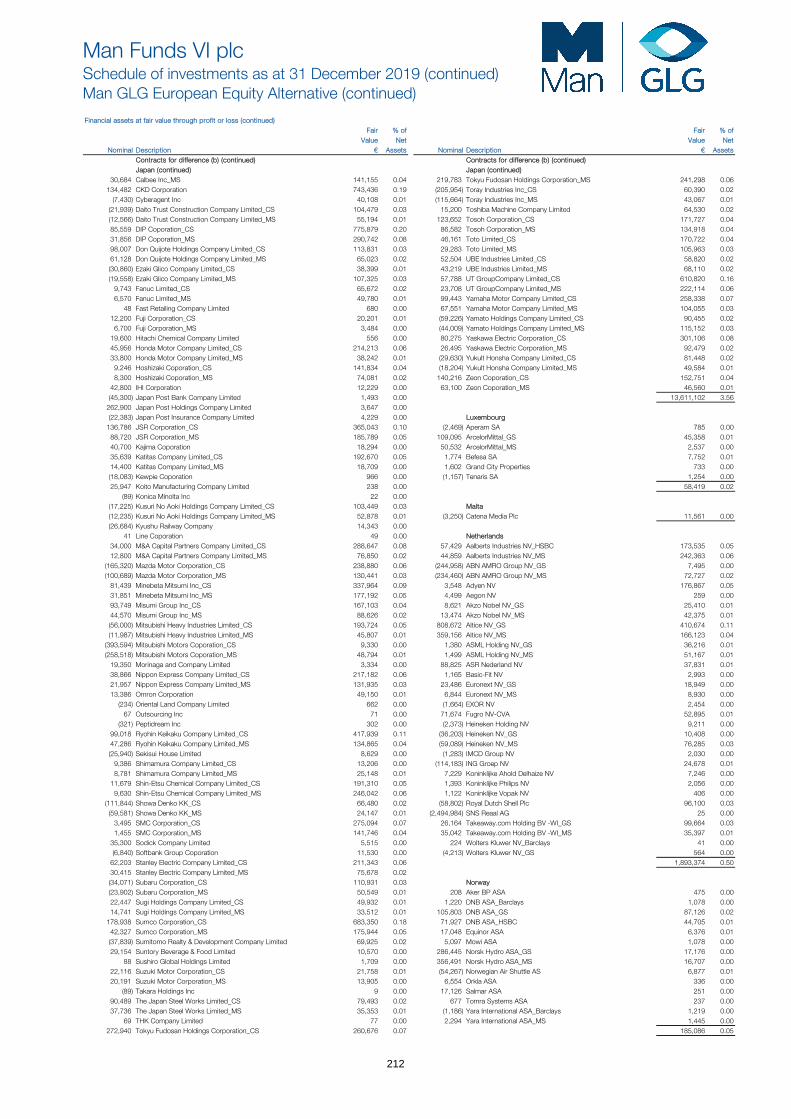
Man Funds VI plcSchedule of investments as at 31 December 2019 (continued)Man GLG European Equity Alternative (continued)
Financial assets at fair value through profit or loss (continued) Fair % of Fair % of
Value Net Value Net Nominal Description € Assets Nominal Description € Assets
Contracts for difference (b) (continued) Contracts for difference (b) (continued)Japan (continued) Japan (continued)
30,684 Calbee Inc_MS 141,155 0.04 219,783 Tokyu Fudosan Holdings Corporation_MS 241,298 0.06134,482 CKD Corporation 743,436 0.19 (205,954) Toray Industries Inc_CS 60,390 0.02
(7,430) Cyberagent Inc 40,108 0.01 (115,664) Toray Industries Inc_MS 43,067 0.01(21,939) Daito Trust Construction Company Limited_CS 104,479 0.03 15,200 Toshiba Machine Company Limited 64,530 0.02(12,566) Daito Trust Construction Company Limited_MS 55,194 0.01 123,652 Tosoh Corporation_CS 171,727 0.0485,559 DIP Coporation_CS 775,879 0.20 86,582 Tosoh Corporation_MS 134,918 0.0431,856 DIP Coporation_MS 290,742 0.08 46,161 Toto Limited_CS 170,722 0.0498,007 Don Quijote Holdings Company Limited_CS 113,831 0.03 29,283 Toto Limited_MS 105,963 0.0361,128 Don Quijote Holdings Company Limited_MS 65,023 0.02 52,504 UBE Industries Limited_CS 58,820 0.02(30,860) Ezaki Glico Company Limited_CS 38,399 0.01 43,219 UBE Industries Limited_MS 68,110 0.02(19,558) Ezaki Glico Company Limited_MS 107,325 0.03 57,788 UT GroupCompany Limited_CS 610,820 0.16
9,743 Fanuc Limited_CS 65,672 0.02 23,708 UT GroupCompany Limited_MS 222,114 0.066,570 Fanuc Limited_MS 49,780 0.01 99,443 Yamaha Motor Company Limited_CS 258,338 0.07
48 Fast Retailing Company Limited 680 0.00 67,551 Yamaha Motor Company Limited_MS 104,055 0.0312,200 Fuji Corporation_CS 20,201 0.01 (59,226) Yamato Holdings Company Limited_CS 90,455 0.02
6,700 Fuji Corporation_MS 3,484 0.00 (44,009) Yamato Holdings Company Limited_MS 115,152 0.0319,600 Hitachi Chemical Company Limited 556 0.00 80,275 Yaskawa Electric Corporation_CS 301,106 0.0845,956 Honda Motor Company Limited_CS 214,213 0.06 26,495 Yaskawa Electric Corporation_MS 92,479 0.0233,800 Honda Motor Company Limited_MS 38,242 0.01 (29,630) Yukult Honsha Company Limited_CS 81,448 0.02
9,246 Hoshizaki Coporation_CS 141,834 0.04 (18,204) Yukult Honsha Company Limited_MS 49,584 0.018,300 Hoshizaki Coporation_MS 74,081 0.02 140,216 Zeon Coporation_CS 152,751 0.04
42,800 IHI Corporation 12,229 0.00 63,100 Zeon Coporation_MS 46,560 0.01(45,300) Japan Post Bank Company Limited 1,493 0.00 13,611,102 3.56
262,900 Japan Post Holdings Company Limited 3,647 0.00 (22,383) Japan Post Insurance Company Limited 4,229 0.00 Luxembourg
136,786 JSR Corporation_CS 365,043 0.10 (2,469) Aperam SA 785 0.0088,720 JSR Corporation_MS 185,789 0.05 109,095 ArcelorMittal_GS 45,358 0.0140,700 Kajima Coporation 18,294 0.00 50,532 ArcelorMittal_MS 2,537 0.0035,639 Katitas Company Limited_CS 192,670 0.05 1,774 Befesa SA 7,752 0.0114,400 Katitas Company Limited_MS 18,709 0.00 1,602 Grand City Properties 733 0.00(18,083) Kewpie Coporation 966 0.00 (1,157) Tenaris SA 1,254 0.0025,947 Koito Manufacturing Company Limited 238 0.00 58,419 0.02
(89) Konica Minolta Inc 22 0.00 (17,225) Kusuri No Aoki Holdings Company Limited_CS 103,449 0.03 Malta (12,235) Kusuri No Aoki Holdings Company Limited_MS 52,878 0.01 (3,250) Catena Media Plc 11,561 0.00(26,684) Kyushu Railway Company 14,343 0.00
41 Line Coporation 49 0.00 Netherlands 34,000 M&A Capital Partners Company Limited_CS 288,647 0.08 57,429 Aalberts Industries NV_HSBC 173,535 0.0512,800 M&A Capital Partners Company Limited_MS 76,850 0.02 44,859 Aalberts Industries NV_MS 242,363 0.06
(165,320) Mazda Motor Corporation_CS 238,880 0.06 (244,958) ABN AMRO Group NV_GS 7,495 0.00(100,689) Mazda Motor Corporation_MS 130,441 0.03 (234,460) ABN AMRO Group NV_MS 72,727 0.02
81,439 Minebeta Mitsumi Inc_CS 337,964 0.09 3,548 Adyen NV 176,867 0.0531,851 Minebeta Mitsumi Inc_MS 177,192 0.05 4,499 Aegon NV 259 0.0093,749 Misumi Group Inc_CS 167,103 0.04 8,621 Akzo Nobel NV_GS 25,410 0.0144,570 Misumi Group Inc_MS 88,626 0.02 13,474 Akzo Nobel NV_MS 42,375 0.01(56,000) Mitsubishi Heavy Industries Limited_CS 193,724 0.05 808,672 Altice NV_GS 410,674 0.11(11,987) Mitsubishi Heavy Industries Limited_MS 45,807 0.01 359,156 Altice NV_MS 166,123 0.04
(393,594) Mitsubishi Motors Coporation_CS 9,330 0.00 1,380 ASML Holding NV_GS 36,216 0.01(258,518) Mitsubishi Motors Coporation_MS 48,794 0.01 1,499 ASML Holding NV_MS 51,167 0.01
19,350 Morinaga and Company Limited 3,334 0.00 88,825 ASR Nederland NV 37,831 0.0138,866 Nippon Express Company Limited_CS 217,182 0.06 1,165 Basic-Fit NV 2,993 0.0021,957 Nippon Express Company Limited_MS 131,935 0.03 23,486 Euronext NV_GS 18,949 0.0013,386 Omron Corporation 49,150 0.01 6,844 Euronext NV_MS 8,930 0.00
(234) Oriental Land Company Limited 662 0.00 (1,664) EXOR NV 2,454 0.0067 Outsourcing Inc 71 0.00 71,674 Fugro NV-CVA 52,895 0.01
(321) Peptidream Inc 302 0.00 (2,373) Heineken Holding NV 9,211 0.0099,018 Ryohin Keikaku Company Limited_CS 417,939 0.11 (36,203) Heineken NV_GS 10,408 0.0047,286 Ryohin Keikaku Company Limited_MS 134,865 0.04 (59,089) Heineken NV_MS 76,285 0.03(25,940) Sekisui House Limited 8,629 0.00 (1,283) IMCD Group NV 2,030 0.00
9,386 Shimamura Company Limited_CS 13,206 0.00 (114,183) ING Groep NV 24,678 0.018,781 Shimamura Company Limited_MS 25,148 0.01 7,229 Koninklijke Ahold Delhaize NV 7,246 0.00
11,679 Shin-Etsu Chemical Company Limited_CS 191,310 0.05 1,393 Koninklijke Philips NV 2,056 0.009,630 Shin-Etsu Chemical Company Limited_MS 246,042 0.06 1,122 Koninklijke Vopak NV 406 0.00
(111,844) Showa Denko KK_CS 66,480 0.02 (58,802) Royal Dutch Shell Plc 96,100 0.03(59,581) Showa Denko KK_MS 24,147 0.01 (2,494,984) SNS Reaal AG 25 0.00
3,495 SMC Corporation_CS 275,094 0.07 26,164 Takeaway.com Holding BV -WI_GS 99,664 0.031,455 SMC Corporation_MS 141,746 0.04 35,042 Takeaway.com Holding BV -WI_MS 35,397 0.01
35,300 Sodick Company Limited 5,515 0.00 224 Wolters Kluwer NV_Barclays 41 0.00(6,840) Softbank Group Coporation 11,530 0.00 (4,213) Wolters Kluwer NV_GS 564 0.00
62,203 Stanley Electric Company Limited_CS 211,343 0.06 1,893,374 0.5030,415 Stanley Electric Company Limited_MS 75,678 0.02 (34,071) Subaru Corporation_CS 110,931 0.03 Norway (23,902) Subaru Corporation_MS 50,549 0.01 208 Aker BP ASA 475 0.0022,447 Sugi Holdings Company Limited_CS 49,932 0.01 1,220 DNB ASA_Barclays 1,078 0.0014,741 Sugi Holdings Company Limited_MS 33,512 0.01 105,803 DNB ASA_GS 87,126 0.02
178,938 Sumco Corporation_CS 683,350 0.18 71,927 DNB ASA_HSBC 44,705 0.0142,327 Sumco Corporation_MS 175,944 0.05 17,048 Equinor ASA 6,376 0.01(37,839) Sumitomo Realty & Development Company Limited 69,925 0.02 5,097 Mowi ASA 1,078 0.0029,154 Suntory Beverage & Food Limited 10,570 0.00 286,445 Norsk Hydro ASA_GS 17,176 0.00
88 Sushiro Global Holdings Limited 1,709 0.00 356,491 Norsk Hydro ASA_MS 16,707 0.0022,116 Suzuki Motor Corporation_CS 21,758 0.01 (54,267) Norwegian Air Shuttle AS 6,877 0.0120,191 Suzuki Motor Corporation_MS 13,905 0.00 6,554 Orkla ASA 336 0.00
(89) Takara Holdings Inc 9 0.00 17,126 Salmar ASA 251 0.0090,489 The Japan Steel Works Limited_CS 79,493 0.02 677 Tomra Systems ASA 237 0.0037,736 The Japan Steel Works Limited_MS 35,353 0.01 (1,186) Yara International ASA_Barclays 1,219 0.00
69 THK Company Limited 77 0.00 2,294 Yara International ASA_MS 1,445 0.00272,940 Tokyu Fudosan Holdings Corporation_CS 260,676 0.07 185,086 0.05
212
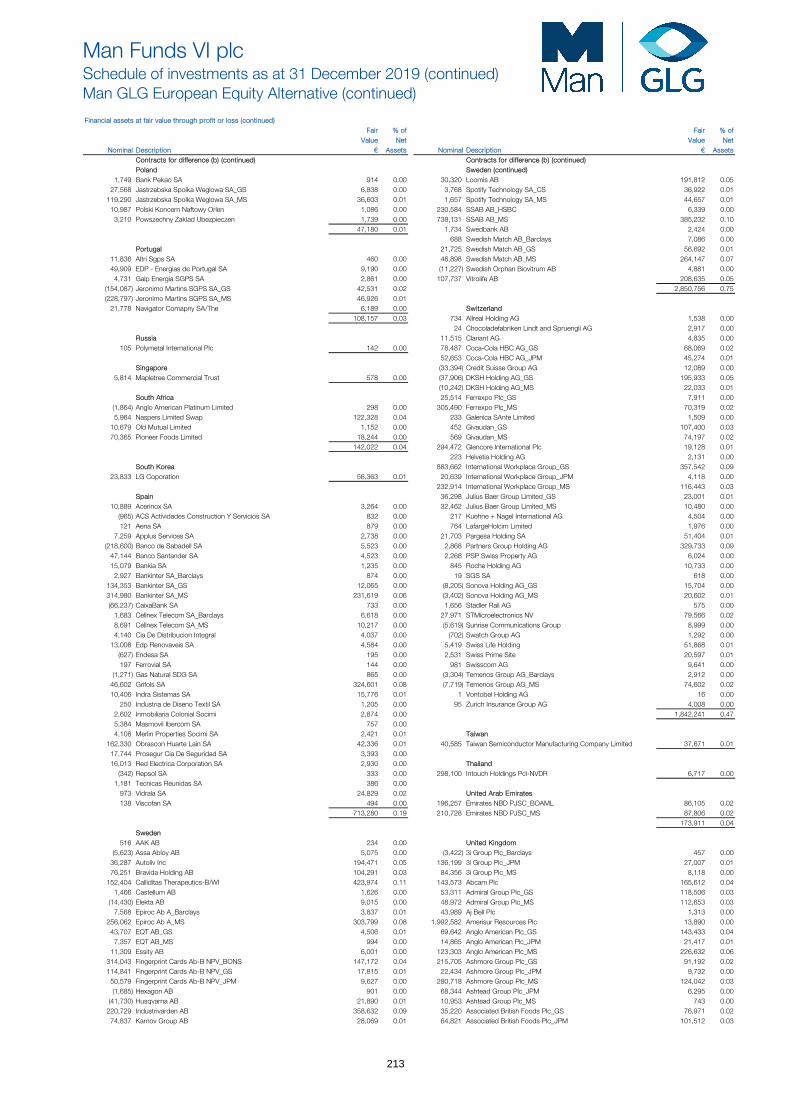
Man Funds VI plcSchedule of investments as at 31 December 2019 (continued)Man GLG European Equity Alternative (continued)
Financial assets at fair value through profit or loss (continued) Fair % of Fair % of
Value Net Value Net Nominal Description € Assets Nominal Description € Assets
Contracts for difference (b) (continued) Contracts for difference (b) (continued)Poland Sweden (continued)
1,749 Bank Pekao SA 914 0.00 30,320 Loomis AB 191,812 0.0527,568 Jastrzebska Spolka Weglowa SA_GS 6,838 0.00 3,768 Spotify Technology SA_CS 36,922 0.01
119,290 Jastrzebska Spolka Weglowa SA_MS 36,603 0.01 1,657 Spotify Technology SA_MS 44,657 0.0110,987 Polski Koncern Naftowy Orlen 1,086 0.00 230,584 SSAB AB_HSBC 6,339 0.00
3,210 Powszechny Zaklad Ubezpieczen 1,739 0.00 738,131 SSAB AB_MS 385,232 0.10 47,180 0.01 1,734 Swedbank AB 2,424 0.00
688 Swedish Match AB_Barclays 7,086 0.00Portugal 21,725 Swedish Match AB_GS 56,692 0.01
11,836 Altri Sgps SA 460 0.00 46,898 Swedish Match AB_MS 264,147 0.0749,909 EDP - Energias de Portugal SA 9,190 0.00 (11,227) Swedish Orphan Biovitrum AB 4,881 0.00
4,731 Galp Energia SGPS SA 2,861 0.00 107,737 Vitrolife AB 208,635 0.05(154,087) Jeronimo Martins SGPS SA_GS 42,531 0.02 2,850,756 0.75(228,797) Jeronimo Martins SGPS SA_MS 46,926 0.01
21,778 Navigator Comapny SA/The 6,189 0.00 Switzerland 108,157 0.03 734 Allreal Holding AG 1,538 0.00
24 Chocoladefabriken Lindt and Spruengli AG 2,917 0.00Russia 11,515 Clariant AG 4,835 0.00
105 Polymetal International Plc 142 0.00 78,487 Coca-Cola HBC AG_GS 68,069 0.02 52,653 Coca-Cola HBC AG_JPM 45,274 0.01
Singapore (33,394) Credit Suisse Group AG 12,089 0.005,814 Mapletree Commercial Trust 578 0.00 (37,906) DKSH Holding AG_GS 195,933 0.05
(10,242) DKSH Holding AG_MS 22,033 0.01South Africa 25,514 Ferrexpo Plc_GS 7,911 0.00
(1,864) Anglo American Platinum Limited 298 0.00 305,490 Ferrexpo Plc_MS 70,319 0.025,964 Naspers Limited Swap 122,328 0.04 233 Galenica SAnte Limited 1,509 0.00
10,679 Old Mutual Limited 1,152 0.00 452 Givaudan_GS 107,400 0.0370,365 Pioneer Foods Limited 18,244 0.00 569 Givaudan_MS 74,197 0.02
142,022 0.04 294,472 Glencore International Plc 19,128 0.01 223 Helvetia Holding AG 2,131 0.00
South Korea 883,662 International Workplace Group_GS 357,542 0.0923,833 LG Coporation 56,363 0.01 20,639 International Workplace Group_JPM 4,118 0.00
232,914 International Workplace Group_MS 116,443 0.03Spain 36,298 Julius Baer Group Limited_GS 23,001 0.01
10,889 Acerinox SA 3,264 0.00 32,462 Julius Baer Group Limited_MS 10,480 0.00(965) ACS Actividades Construction Y Servicios SA 832 0.00 217 Kuehne + Nagel International AG 4,504 0.00121 Aena SA 879 0.00 764 LafargeHolcim Limited 1,976 0.00
7,259 Applus Services SA 2,738 0.00 21,703 Pargesa Holding SA 51,404 0.01(218,600) Banco de Sabadell SA 5,523 0.00 2,868 Partners Group Holding AG 329,733 0.09
47,144 Banco Santander SA 4,523 0.00 2,268 PSP Swiss Property AG 6,024 0.0015,079 Bankia SA 1,235 0.00 845 Roche Holding AG 10,733 0.00
2,927 Bankinter SA_Barclays 874 0.00 19 SGS SA 618 0.00134,353 Bankinter SA_GS 12,065 0.00 (8,205) Sonova Holding AG_GS 15,704 0.00314,980 Bankinter SA_MS 231,619 0.06 (3,402) Sonova Holding AG_MS 20,602 0.01(66,237) CaixaBank SA 733 0.00 1,656 Stadler Rail AG 575 0.00
1,683 Cellnex Telecom SA_Barclays 6,618 0.00 27,971 STMicroelectronics NV 79,566 0.028,691 Cellnex Telecom SA_MS 10,217 0.00 (5,619) Sunrise Communications Group 8,999 0.004,140 Cia De Distribucion Integral 4,037 0.00 (702) Swatch Group AG 1,292 0.00
13,008 Edp Renovaveis SA 4,584 0.00 5,419 Swiss Life Holding 51,868 0.01(627) Endesa SA 195 0.00 2,531 Swiss Prime Site 20,597 0.01197 Ferrovial SA 144 0.00 981 Swisscom AG 9,641 0.00
(1,271) Gas Natural SDG SA 865 0.00 (3,304) Temenos Group AG_Barclays 2,912 0.0046,602 Grifols SA 324,601 0.08 (7,719) Temenos Group AG_MS 74,602 0.0210,406 Indra Sistemas SA 15,776 0.01 1 Vontobel Holding AG 16 0.00
250 Industria de Diseno Textil SA 1,205 0.00 95 Zurich Insurance Group AG 4,008 0.002,602 Inmobiliaria Colonial Socimi 2,874 0.00 1,842,241 0.475,384 Masmovil Ibercom SA 757 0.00 4,108 Merlin Properties Socimi SA 2,421 0.01 Taiwan
162,330 Obrascon Huarte Lain SA 42,336 0.01 40,585 Taiwan Semiconductor Manufacturing Company Limited 37,671 0.0117,744 Prosegur Cia De Seguridad SA 3,393 0.00 16,013 Red Electrica Corporation SA 2,930 0.00 Thailand
(342) Repsol SA 333 0.00 298,100 Intouch Holdings Pcl-NVDR 6,717 0.001,181 Tecnicas Reunidas SA 386 0.00
973 Vidrala SA 24,829 0.02 United Arab Emirates 138 Viscofan SA 494 0.00 196,257 Emirates NBD PJSC_BOAML 86,105 0.02
713,280 0.19 210,728 Emirates NBD PJSC_MS 87,806 0.02 173,911 0.04
Sweden 516 AAK AB 234 0.00 United Kingdom
(5,623) Assa Abloy AB 5,075 0.00 (3,422) 3i Group Plc_Barclays 457 0.0036,287 Autoliv Inc 194,471 0.05 136,199 3i Group Plc_JPM 27,007 0.0176,251 Bravida Holding AB 104,291 0.03 84,356 3i Group Plc_MS 8,118 0.00
152,404 Calliditas Therapeutics-B/WI 423,974 0.11 143,573 Abcam Plc 165,612 0.041,466 Castellum AB 1,626 0.00 53,311 Admiral Group Plc_GS 118,506 0.03
(14,430) Elekta AB 9,015 0.00 48,972 Admiral Group Plc_MS 112,653 0.037,568 Epiroc Ab A_Barclays 3,837 0.01 43,989 Aj Bell Plc 1,313 0.00
256,062 Epiroc Ab A_MS 303,799 0.08 1,992,582 Amerisur Resources Plc 13,890 0.0043,707 EQT AB_GS 4,506 0.01 69,642 Anglo American Plc_GS 143,433 0.04
7,357 EQT AB_MS 994 0.00 14,865 Anglo American Plc_JPM 21,417 0.0111,309 Essity AB 6,001 0.00 123,303 Anglo American Plc_MS 226,632 0.06
314,043 Fingerprint Cards Ab-B NPV_BONS 147,172 0.04 215,705 Ashmore Group Plc_GS 91,192 0.02114,841 Fingerprint Cards Ab-B NPV_GS 17,815 0.01 22,434 Ashmore Group Plc_JPM 9,732 0.00
50,579 Fingerprint Cards Ab-B NPV_JPM 9,627 0.00 280,718 Ashmore Group Plc_MS 124,042 0.03(1,685) Hexagon AB 901 0.00 68,344 Ashtead Group Plc_JPM 6,295 0.00
(41,730) Husqvarna AB 21,890 0.01 10,953 Ashtead Group Plc_MS 743 0.00220,729 Industrivarden AB 358,632 0.09 35,220 Associated British Foods Plc_GS 76,971 0.02
74,837 Karnov Group AB 28,069 0.01 64,821 Associated British Foods Plc_JPM 101,512 0.03
213

Man Funds VI plcSchedule of investments as at 31 December 2019 (continued)Man GLG European Equity Alternative (continued)
Financial assets at fair value through profit or loss (continued) Fair % of Fair % of
Value Net Value Net Nominal Description € Assets Nominal Description € Assets
Contracts for difference (b) (continued) Contracts for difference (b) (continued)United Kingdom (continued) United Kingdom (continued)
78,255 Associated British Foods Plc_MS 283,181 0.07 (27,297) Investec Plc 3,124 0.004,528 AstraZeneca Plc_Barclays 6,814 0.00 (28,040) ITV Plc 781 0.00
45,743 AstraZeneca Plc_GS 201,603 0.05 18,625 J Sainsbury Plc_Barclays 8,867 0.0027,811 AstraZeneca Plc_JPM 13,047 0.00 382,470 J Sainsbury Plc_GS 26,989 0.0120,119 AstraZeneca Plc_MS 272,607 0.07 351,514 J Sainsbury Plc_MS 48,637 0.0179,772 Auto Trader Group Plc 8,754 0.00 117,396 JD Sports Fashion Plc_GS 95,580 0.03
8,671 Avast Plc 6,038 0.00 26,808 JD Sports Fashion Plc_MS 42,165 0.0111,656 Aveva Group Plc_JPM 66,983 0.02 10,388 John Wood Group Plc 7,406 0.0014,453 Aveva Group Plc_MS 144,056 0.04 (7,230) Johnson Matthey Plc 3,415 0.00(84,615) Barclays Plc_MS 5,374 0.00 (2,200) Jupiter Fund Management 35 0.00
(1,003) Beazley Plc_Barclays 374 0.00 179,858 Just Eat Plc 153,497 0.0534,592 Beazley Plc_MS 2,255 0.00 (36,532) KAZ Minerals Plc_GS 5,252 0.00(3,109) Berkeley Group Holdings Plc 3,707 0.00 (52,306) KAZ Minerals Plc_MS 8,060 0.00
713,712 Boohoo.com Plc_GS 124,232 0.03 (71,755) Kier Group Plc 63,470 0.02242,599 Boohoo.com Plc_JPM 43,328 0.01 (295,729) Kingfisher Plc 1,783 0.00615,464 Boohoo.com Plc_MS 106,729 0.03 4,693 Lancashire Holdings Limited 3,879 0.00
61,250 British American Tobacco Plc 176,868 0.05 343 Land Securities Group Plc 559 0.003,406 British Land Company Plc_Barclays 6,203 0.00 166,950 Legal and General Group Plc 51,841 0.01
109,572 British Land Company Plc_JPM 15,467 0.00 (22,224) Liberty Global Plc 57,538 0.0223,134 British Land Company Plc_MS 7,329 0.00 (3,080) Livanova Plc 4,704 0.00
1,215 Britvic Plc_Barclays 592 0.00 (248,684) Lloyds Banking Group Plc 1,385 0.00(12,757) Britvic Plc_MS 9,070 0.00 31,985 London Stock Exchange Group Plc_JPM 261,665 0.0749,085 BT Group Plc 14,861 0.00 5,078 London Stock Exchange Group Plc_MS 19,276 0.01
5,321 Bunzl Plc 3,292 0.00 224,374 M&G Plc_JPM 37,662 0.0133,005 Burberry Group Plc_GS 38,710 0.01 153,846 M&G Plc_MS 1,914 0.00
122,663 Burberry Group Plc_JPM 139,485 0.04 (101,765) Marks & Spencer Group Plc 5,111 0.00120,142 Burberry Group Plc_MS 114,377 0.03 45,238 Meggitt Plc 978 0.00(13,523) Capita Group Plc 2,381 0.00 600,806 Melrose Industries Plc_GS 99,696 0.03
420,568 Capital & Counties Properties Plc_GS 11,941 0.00 60,706 Melrose Industries Plc_MS 48,329 0.01542,003 Capital & Counties Properties Plc_MS 234,766 0.06 (40,700) Metro Bank Plc 39,291 0.01
(9,842) Cineworld Group Plc_Barclays 910 0.00 (330,445) Moneysupermarket.Com Group Plc_GS 48,700 0.01141,997 Cineworld Group Plc_GS 5,858 0.00 (145,434) Moneysupermarket.Com Group Plc_MS 17,420 0.00
379 Close Brothers Group Plc 1,479 0.00 2 Motorpoint Group Plc-Wi 2 0.00(15,517) CNH Industrial NV 1,935 0.00 51,109 National Grid Plc_Barclays 4,762 0.00(39,702) CNH Industrial NV_Barclays 2,598 0.01 (134,515) National Grid Plc_JPM 19,365 0.01
7,646 Codemasters Group Holdings 4,998 0.00 (91,889) National Grid Plc_MS 13,769 0.00152,619 Compass Group Plc 40,116 0.01 447 Next Plc_Barclays 6,981 0.00
6,011 ConvaTec Group Plc_Barclays 472 0.01 17,877 Next Plc_JPM 42,090 0.01136,593 ConvaTec Group Plc_GS 25,677 0.01 108,524 Ocado Group Plc 139,381 0.04390,370 ConvaTec Group Plc_MS 47,003 0.01 (538,739) Pearson Plc_GS 833,176 0.22
709 Dechra Pharmaceuticals Plc 437 0.01 (539,779) Pearson Plc_MS 606,664 0.1634,606 Derwent Valley Holdings Plc_GS 249,544 0.07 90,268 Pebble Group Limited 36,221 0.0142,626 Derwent Valley Holdings Plc_MS 224,484 0.06 3,440 Pennon Group Plc 12,016 0.01
207,626 Diageo Plc 166,248 0.04 73,088 Persimmon Plc_JPM 24,421 0.016,509 Direct Line Insurance Group Plc 1,161 0.00 712 Persimmon Plc_MS 6,475 0.01
125,575 EasyJet Plc_JPM 77,221 0.02 670,897 Premier Foods Plc 10,471 0.0042,324 EasyJet Plc_MS 39,220 0.01 82,188 Prudential Plc_JPM 102,967 0.0318,139 Electrocomponents Plc_JPM 4,981 0.00 22,183 Prudential Plc_MS 82,196 0.0266,429 Electrocomponents Plc_MS 27,546 0.01 43,865 Qinetiq Group Plc 2,737 0.00(1,995) Evraz Plc 2,302 0.00 (19,783) Quilter Plc 153 0.004,651 Ferguson Plc_JPM 20,439 0.01 4,262 Reckitt Benckiser Group Plc 1,676 0.016,210 Ferguson Plc_MS 10,622 0.00 222,660 Relx Plc_JPM 88,775 0.02
(217,708) Fiat Chrysler Automobiles NV 94,252 0.02 165,856 Relx Plc_MS 49,153 0.01109 FTSE 100 Index 22,190 0.01 7,734 Rio Tinto Plc_Barclays 3,247 0.00
(3) FTSE 350 Mining Index 148 0.00 106,954 Rio Tinto Plc_MS 484,082 0.13118,577 Future Plc_GS 166,106 0.04 (71,984) Rolls-Royce Holdings Plc_GS 11,194 0.01
10,130 Future Plc_MS 2,192 0.00 (65,356) Rolls-Royce Holdings Plc_JPM 13,738 0.012,070,530 G4S Plc_GS 350,054 0.09 (634,271) Rolls-Royce Holdings Plc_MS 482,056 0.13
326,236 G4S Plc_MS 137,531 0.04 (130,818) Royal Bank of Scotland Group Plc_Barclays 12,680 0.002,735 Gamma Communications Plc 8,997 0.00 (628,078) Royal Bank of Scotland Group Plc_GS 98,273 0.041,643 Great Portland Estates Plc 3,578 0.00 (772,252) Royal Bank of Scotland Group Plc_MS 3,559 0.006,225 Hammerson Plc 7,241 0.00 133 Russell UK MID 150 Index 39,162 0.01(7,148) Hargreaves Lansdown Plc_Barclays 7,666 0.00 778 Segro Plc_Barclays 1,328 0.00
86,364 Hargreaves Lansdown Plc_MS 45,497 0.01 18,961 Segro Plc_JPM 14,969 0.0024,678 Hays Plc 9,589 0.00 50,562 Segro Plc_MS 38,403 0.01
2,517 Hikma Pharmaceuticals Plc 750 0.00 927,860 Serco Group Plc_GS 171,824 0.0411,498 Hotel Chocolat Group Limited 13,434 0.00 567,042 Serco Group Plc_JPM 54,427 0.01
288,837 Howden Joinery Group Plc_GS 518,533 0.14 135,285 Serco Group Plc_MS 15,153 0.0069,380 Howden Joinery Group Plc_MS 33,644 0.01 1,107 Severn Trent Plc 6,317 0.0074,738 HSBC Holdings Plc_GS 15,109 0.00 (38,444) Sig Plc 2,453 0.00
1,010,349 HSBC Holdings Plc_JPM 65,482 0.02 (17,989) Signature Aviation Plc 12,884 0.00540,339 HSBC Holdings Plc_MS 17,374 0.00 152,043 Smiths Group Plc_JPM 50,157 0.01
4,835 IG Group Holdings Plc 8,096 0.00 70,180 Smiths Group Plc_MS 45,043 0.01(2,393) IMI Plc_Barclays 339 0.00 18,406 SSE Plc_Barclays 18,561 0.00
28,094 IMI Plc_JPM 13,750 0.00 8,265 SSE Plc_JPM 14,063 0.0035,736 IMI Plc_MS 28,896 0.01 (12,463) St. James's Place Plc_Barclays 1,555 0.0017,594 Imperial Brands Plc_Barclays 2,851 0.00 (21,024) St. James's Place Plc_MS 2,541 0.0033,834 Imperial Brands Plc_GS 51,563 0.01 262,388 Standard Chartered Plc 17,808 0.0043,061 Imperial Brands Plc_JPM 69,652 0.02 180 Subsea 7 SA 248 0.00
631,769 Informa Plc_GS 216,779 0.06 3,975 Tate and Lyle Plc 2,243 0.00429,971 Informa Plc_JPM 273,674 0.07 28,890 Tesco Plc_Barclays 1,076 0.00480,135 Informa Plc_MS 341,151 0.09 1,872,272 Tesco Plc_GS 312,975 0.0820,680 Intercontinental Hotels Group Plc_JPM 111,366 0.03 1,270,741 Tesco Plc_MS 334,607 0.09
8,794 Intercontinental Hotels Group Plc_MS 46,633 0.01 5,317 Tritax Big Box Reit Plc 260 0.0051,809 International Consolidated Airlines Group SA_GS 176 0.00 118,322 Tullow Oil Plc 28,957 0.02
194,026 International Consolidated Airlines Group SA_JPM 156,019 0.04 (82) Unilever NV 255 0.0076,568 International Consolidated Airlines Group SA_MS 76,938 0.02 706 Unite Group Plc 1,818 0.00
(2,506,855) Intu Properties Plc 1,567,878 0.41 2,644 United Utilities Group Plc 4,729 0.00
214
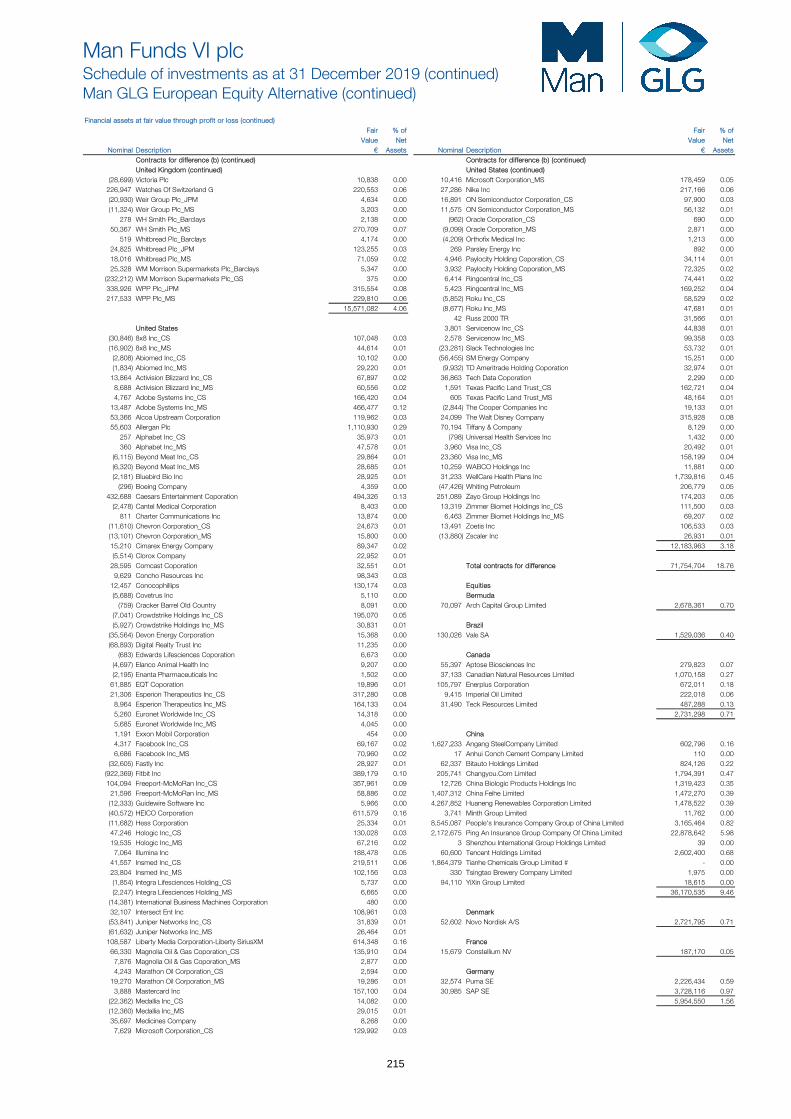
Man Funds VI plcSchedule of investments as at 31 December 2019 (continued)Man GLG European Equity Alternative (continued)
Financial assets at fair value through profit or loss (continued) Fair % of Fair % of
Value Net Value Net Nominal Description € Assets Nominal Description € Assets
Contracts for difference (b) (continued) Contracts for difference (b) (continued)United Kingdom (continued) United States (continued)
(28,699) Victoria Plc 10,838 0.00 10,416 Microsoft Corporation_MS 178,459 0.05226,947 Watches Of Switzerland G 220,553 0.06 27,286 Nike Inc 217,166 0.06(20,930) Weir Group Plc_JPM 4,634 0.00 16,891 ON Semiconductor Corporation_CS 97,900 0.03(11,324) Weir Group Plc_MS 3,203 0.00 11,575 ON Semiconductor Corporation_MS 56,132 0.01
278 WH Smith Plc_Barclays 2,138 0.00 (962) Oracle Corporation_CS 690 0.0050,367 WH Smith Plc_MS 270,709 0.07 (9,099) Oracle Corporation_MS 2,871 0.00
519 Whitbread Plc_Barclays 4,174 0.00 (4,209) Orthofix Medical Inc 1,213 0.0024,825 Whitbread Plc_JPM 123,255 0.03 269 Parsley Energy Inc 892 0.0018,016 Whitbread Plc_MS 71,059 0.02 4,946 Paylocity Holding Coporation_CS 34,114 0.0125,328 WM Morrison Supermarkets Plc_Barclays 5,347 0.00 3,932 Paylocity Holding Coporation_MS 72,325 0.02
(232,212) WM Morrison Supermarkets Plc_GS 375 0.00 6,414 Ringcentral Inc_CS 74,441 0.02338,926 WPP Plc_JPM 315,554 0.08 5,423 Ringcentral Inc_MS 169,252 0.04217,533 WPP Plc_MS 229,810 0.06 (5,852) Roku Inc_CS 58,529 0.02
15,571,082 4.06 (8,677) Roku Inc_MS 47,681 0.01 42 Russ 2000 TR 31,566 0.01
United States 3,801 Servicenow Inc_CS 44,838 0.01(30,846) 8x8 Inc_CS 107,048 0.03 2,578 Servicenow Inc_MS 99,358 0.03(16,902) 8x8 Inc_MS 44,614 0.01 (23,281) Slack Technologies Inc 53,732 0.01
(2,808) Abiomed Inc_CS 10,102 0.00 (56,455) SM Energy Company 15,251 0.00(1,834) Abiomed Inc_MS 29,220 0.01 (9,932) TD Ameritrade Holding Coporation 32,974 0.01
13,864 Activision Blizzard Inc_CS 67,897 0.02 36,863 Tech Data Coporation 2,299 0.008,688 Activision Blizzard Inc_MS 60,556 0.02 1,591 Texas Pacific Land Trust_CS 162,721 0.044,767 Adobe Systems Inc_CS 166,420 0.04 605 Texas Pacific Land Trust_MS 48,164 0.01
13,487 Adobe Systems Inc_MS 466,477 0.12 (2,844) The Cooper Companies Inc 19,133 0.0153,366 Alcoa Upstream Corporation 119,962 0.03 24,099 The Walt Disney Company 315,928 0.0855,603 Allergan Plc 1,110,930 0.29 70,194 Tiffany & Company 8,129 0.00
257 Alphabet Inc_CS 35,973 0.01 (798) Universal Health Services Inc 1,432 0.00360 Alphabet Inc_MS 47,578 0.01 3,960 Visa Inc_CS 20,492 0.01
(6,115) Beyond Meat Inc_CS 29,864 0.01 23,360 Visa Inc_MS 158,199 0.04(6,320) Beyond Meat Inc_MS 28,685 0.01 10,259 WABCO Holdings Inc 11,881 0.00(2,181) Bluebird Bio Inc 28,925 0.01 31,233 WellCare Health Plans Inc 1,739,816 0.45
(296) Boeing Company 4,359 0.00 (47,426) Whiting Petroleum 206,779 0.05432,688 Caesars Entertainment Coporation 494,326 0.13 251,089 Zayo Group Holdings Inc 174,203 0.05
(2,478) Cantel Medical Corporation 8,403 0.00 13,319 Zimmer Biomet Holdings Inc_CS 111,500 0.03811 Charter Communications Inc 13,874 0.00 6,463 Zimmer Biomet Holdings Inc_MS 69,207 0.02
(11,610) Chevron Corporation_CS 24,673 0.01 13,491 Zoetis Inc 106,533 0.03(13,101) Chevron Corporation_MS 15,800 0.00 (13,880) Zscaler Inc 26,931 0.0115,210 Cimarex Energy Company 89,347 0.02 12,183,963 3.18(5,514) Clorox Company 22,952 0.01
28,595 Comcast Coporation 32,551 0.01 Total contracts for difference 71,754,704 18.769,629 Concho Resources Inc 98,343 0.03
12,457 Conocophillips 130,174 0.03 Equities (5,688) Covetrus Inc 5,110 0.00 Bermuda
(759) Cracker Barrel Old Country 8,091 0.00 70,097 Arch Capital Group Limited 2,678,361 0.70(7,041) Crowdstrike Holdings Inc_CS 195,070 0.05 (5,927) Crowdstrike Holdings Inc_MS 30,831 0.01 Brazil
(35,564) Devon Energy Corporation 15,368 0.00 130,026 Vale SA 1,529,036 0.40(68,893) Digital Realty Trust Inc 11,235 0.00
(683) Edwards Lifesciences Coporation 6,673 0.00 Canada (4,697) Elanco Animal Health Inc 9,207 0.00 55,397 Aptose Biosciences Inc 279,823 0.07(2,195) Enanta Pharmaceuticals Inc 1,502 0.00 37,133 Canadian Natural Resources Limited 1,070,158 0.27
61,885 EQT Coporation 19,896 0.01 105,797 Enerplus Corporation 672,011 0.1821,306 Esperion Therapeutics Inc_CS 317,280 0.08 9,415 Imperial Oil Limited 222,018 0.06
8,964 Esperion Therapeutics Inc_MS 164,133 0.04 31,490 Teck Resources Limited 487,288 0.135,260 Euronet Worldwide Inc_CS 14,318 0.00 2,731,298 0.715,685 Euronet Worldwide Inc_MS 4,045 0.00 1,191 Exxon Mobil Corporation 454 0.00 China 4,317 Facebook Inc_CS 69,167 0.02 1,627,233 Angang SteelCompany Limited 602,796 0.166,686 Facebook Inc_MS 70,960 0.02 17 Anhui Conch Cement Company Limited 110 0.00
(32,605) Fastly Inc 28,927 0.01 62,337 Bitauto Holdings Limited 824,126 0.22(922,369) Fitbit Inc 389,179 0.10 205,741 Changyou.Com Limited 1,794,391 0.47104,094 Freeport-McMoRan Inc_CS 357,961 0.09 12,726 China Biologic Products Holdings Inc 1,319,423 0.35
21,596 Freeport-McMoRan Inc_MS 58,886 0.02 1,407,312 China Feihe Limited 1,472,270 0.39(12,333) Guidewire Software Inc 5,966 0.00 4,267,852 Huaneng Renewables Corporation Limited 1,478,522 0.39(40,572) HEICO Corporation 611,579 0.16 3,741 Minth Group Limited 11,762 0.00(11,682) Hess Corporation 25,334 0.01 8,545,087 People's Insurance Company Group of China Limited 3,165,464 0.8247,246 Hologic Inc_CS 130,028 0.03 2,172,675 Ping An Insurance Group Company Of China Limited 22,878,642 5.9819,535 Hologic Inc_MS 67,216 0.02 3 Shenzhou International Group Holdings Limited 39 0.00
7,064 Illumina Inc 188,478 0.05 60,600 Tencent Holdings Limited 2,602,400 0.6841,557 Insmed Inc_CS 219,511 0.06 1,864,379 Tianhe Chemicals Group Limited # - 0.0023,804 Insmed Inc_MS 102,156 0.03 330 Tsingtao Brewery Company Limited 1,975 0.00(1,854) Integra Lifesciences Holding_CS 5,737 0.00 94,110 YiXin Group Limited 18,615 0.00(2,247) Integra Lifesciences Holding_MS 6,665 0.00 36,170,535 9.46
(14,381) International Business Machines Corporation 480 0.00 32,107 Intersect Ent Inc 108,961 0.03 Denmark (53,841) Juniper Networks Inc_CS 31,839 0.01 52,602 Novo Nordisk A/S 2,721,795 0.71(61,632) Juniper Networks Inc_MS 26,464 0.01
108,587 Liberty Media Corporation-Liberty SiriusXM 614,348 0.16 France 66,330 Magnolia Oil & Gas Coporation_CS 135,910 0.04 15,679 Constellium NV 187,170 0.05
7,876 Magnolia Oil & Gas Coporation_MS 2,877 0.00 4,243 Marathon Oil Corporation_CS 2,594 0.00 Germany
19,270 Marathon Oil Corporation_MS 19,286 0.01 32,574 Puma SE 2,226,434 0.593,888 Mastercard Inc 157,100 0.04 30,985 SAP SE 3,728,116 0.97
(22,362) Medallia Inc_CS 14,082 0.00 5,954,550 1.56(12,360) Medallia Inc_MS 29,015 0.0135,697 Medicines Company 8,268 0.00
7,629 Microsoft Corporation_CS 129,992 0.03
215
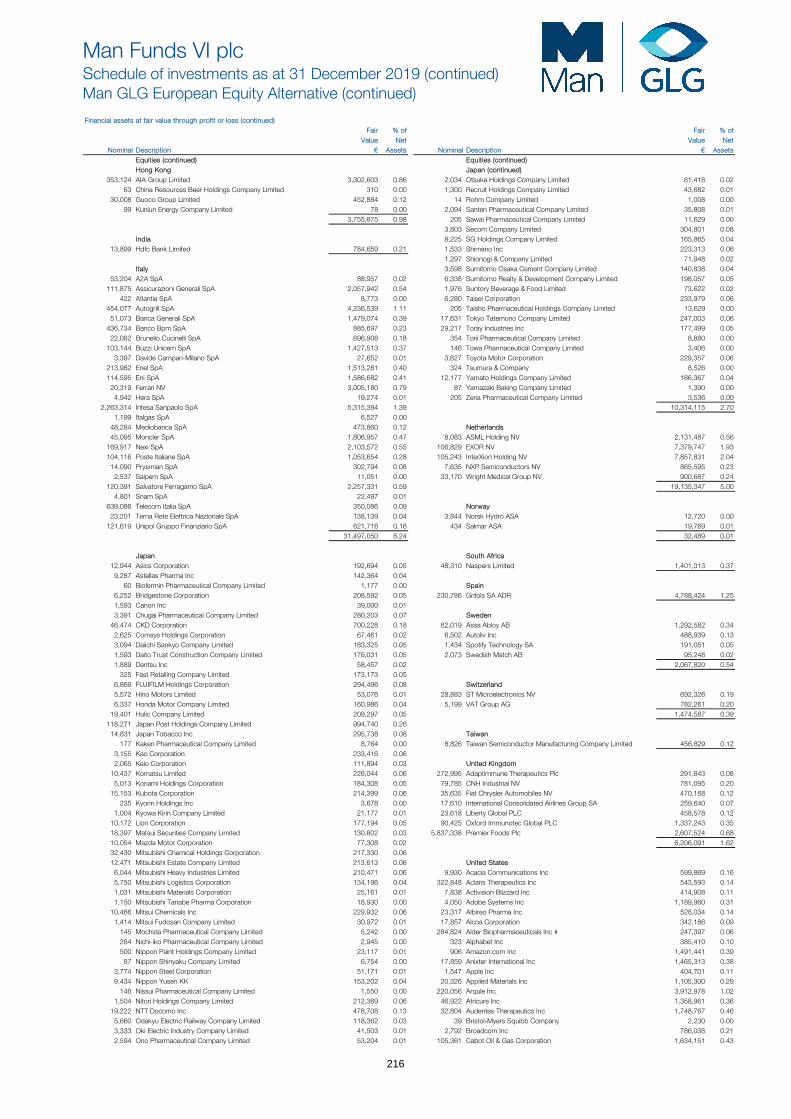
Man Funds VI plcSchedule of investments as at 31 December 2019 (continued)Man GLG European Equity Alternative (continued)
Financial assets at fair value through profit or loss (continued) Fair % of Fair % of
Value Net Value Net Nominal Description € Assets Nominal Description € Assets
Equities (continued) Equities (continued)Hong Kong Japan (continued)
353,124 AIA Group Limited 3,302,603 0.86 2,034 Otsuka Holdings Company Limited 81,418 0.0263 China Resources Beer Holdings Company Limited 310 0.00 1,300 Recruit Holdings Company Limited 43,682 0.01
30,008 Guoco Group Limited 452,884 0.12 14 Rohm Company Limited 1,008 0.0099 Kunlun Energy Company Limited 78 0.00 2,094 Santen Pharmaceutical Company Limited 35,808 0.01
3,755,875 0.98 205 Sawai Pharmaceutical Company Limited 11,629 0.00 3,803 Secom Company Limited 304,801 0.08
India 8,225 SG Holdings Company Limited 165,865 0.0413,899 Hdfc Bank Limited 784,659 0.21 1,533 Shimano Inc 223,313 0.06
1,297 Shionogi & Company Limited 71,948 0.02Italy 3,598 Sumitomo Osaka Cement Company Limited 140,838 0.04
53,204 A2A SpA 88,957 0.02 6,338 Sumitomo Realty & Development Company Limited 198,057 0.05111,875 Assicurazioni Generali SpA 2,057,942 0.54 1,976 Suntory Beverage & Food Limited 73,622 0.02
422 Atlantia SpA 8,773 0.00 6,280 Taisei Corporation 233,979 0.06454,077 Autogrill SpA 4,236,539 1.11 205 Taisho Pharmaceutical Holdings Company Limited 13,629 0.00
51,073 Banca Generali SpA 1,479,074 0.39 17,631 Tokyo Tatemono Company Limited 247,003 0.06436,734 Banco Bpm SpA 885,697 0.23 29,217 Toray Industries Inc 177,499 0.05
22,082 Brunello Cucinelli SpA 696,908 0.18 354 Torii Pharmaceutical Company Limited 8,880 0.00103,144 Buzzi Unicem SpA 1,427,513 0.37 146 Towa Pharmaceutical Company Limited 3,406 0.00
3,397 Davide Campari-Milano SpA 27,652 0.01 3,627 Toyota Motor Corporation 229,357 0.06213,982 Enel SpA 1,513,281 0.40 324 Tsumura & Company 8,526 0.00114,595 Eni SpA 1,586,682 0.41 12,177 Yamato Holdings Company Limited 186,367 0.04
20,319 Ferrari NV 3,005,180 0.79 87 Yamazaki Baking Company Limited 1,390 0.004,942 Hera SpA 19,274 0.01 205 Zeria Pharmaceutical Company Limited 3,536 0.00
2,263,314 Intesa Sanpaolo SpA 5,315,394 1.39 10,314,115 2.701,199 Italgas SpA 6,527 0.00
48,284 Mediobanca SpA 473,860 0.12 Netherlands 45,095 Moncler SpA 1,806,957 0.47 8,083 ASML Holding NV 2,131,487 0.56
169,917 Nexi SpA 2,103,572 0.55 106,829 EXOR NV 7,379,747 1.93104,116 Poste Italiane SpA 1,053,654 0.28 105,243 InterXion Holding NV 7,857,831 2.04
14,090 Prysmian SpA 302,794 0.08 7,635 NXP Semiconductors NV 865,595 0.232,537 Saipem SpA 11,051 0.00 33,170 Wright Medical Group NV 900,687 0.24
120,391 Salvatore Ferragamo SpA 2,257,331 0.59 19,135,347 5.004,801 Snam SpA 22,497 0.01
639,086 Telecom Italia SpA 350,086 0.09 Norway 23,201 Terna Rete Elettrica Nazionale SpA 138,139 0.04 3,844 Norsk Hydro ASA 12,720 0.00
121,619 Unipol Gruppo Finanziario SpA 621,716 0.16 434 Salmar ASA 19,769 0.01 31,497,050 8.24 32,489 0.01
Japan South Africa
12,944 Asics Corporation 192,694 0.05 48,310 Naspers Limited 1,401,313 0.379,287 Astellas Pharma Inc 142,364 0.04
60 Biofermin Pharmaceutical Company Limited 1,177 0.00 Spain 6,252 Bridgestone Corporation 208,592 0.05 230,786 Grifols SA ADR 4,788,424 1.251,593 Canon Inc 39,000 0.01 3,391 Chugai Pharmaceutical Company Limited 280,203 0.07 Sweden
46,474 CKD Corporation 700,228 0.18 62,019 Assa Abloy AB 1,292,582 0.342,625 Comsys Holdings Corporation 67,461 0.02 6,502 Autoliv Inc 488,939 0.133,094 Daiichi Sankyo Company Limited 183,325 0.05 1,434 Spotify Technology SA 191,051 0.051,593 Daito Trust Construction Company Limited 176,031 0.05 2,073 Swedish Match AB 95,248 0.021,889 Dentsu Inc 58,457 0.02 2,067,820 0.54
325 Fast Retailing Company Limited 173,173 0.05 6,869 FUJIFILM Holdings Corporation 294,496 0.08 Switzerland 5,572 Hino Motors Limited 53,076 0.01 28,883 ST Microelectronics NV 692,326 0.196,337 Honda Motor Company Limited 160,986 0.04 5,199 VAT Group AG 782,261 0.20
19,401 Hulic Company Limited 209,297 0.05 1,474,587 0.39118,271 Japan Post Holdings Company Limited 994,740 0.26
14,831 Japan Tobacco Inc 295,738 0.08 Taiwan 177 Kaken Pharmaceutical Company Limited 8,764 0.00 8,826 Taiwan Semiconductor Manufacturing Company Limited 456,829 0.12
3,155 Kao Corporation 233,416 0.06 2,065 Keio Corporation 111,894 0.03 United Kingdom
10,437 Komatsu Limited 226,044 0.06 272,995 Adaptimmune Therapeutics Plc 291,843 0.085,013 Konami Holdings Corporation 184,308 0.05 79,785 CNH Industrial NV 781,095 0.20
15,153 Kubota Corporation 214,399 0.06 35,635 Fiat Chrysler Automobiles NV 470,168 0.12235 Kyorin Holdings Inc 3,678 0.00 17,610 International Consolidated Airlines Group SA 259,640 0.07
1,004 Kyowa Kirin Company Limited 21,177 0.01 23,618 Liberty Global PLC 458,578 0.1210,172 Lion Corporation 177,194 0.05 90,425 Oxford Immunotec Global PLC 1,337,243 0.3518,397 Matsui Securities Company Limited 130,602 0.03 5,837,338 Premier Foods Plc 2,607,524 0.6810,054 Mazda Motor Corporation 77,308 0.02 6,206,091 1.6232,430 Mitsubishi Chemical Holdings Corporation 217,330 0.06 12,471 Mitsubishi Estate Company Limited 213,613 0.06 United States
6,044 Mitsubishi Heavy Industries Limited 210,471 0.06 9,930 Acacia Communications Inc 599,869 0.165,750 Mitsubishi Logistics Corporation 134,196 0.04 322,848 Aclaris Therapeutics Inc 543,593 0.141,031 Mitsubishi Materials Corporation 25,161 0.01 7,838 Activision Blizzard Inc 414,908 0.111,150 Mitsubishi Tanabe Pharma Corporation 18,930 0.00 4,050 Adobe Systems Inc 1,189,960 0.31
10,466 Mitsui Chemicals Inc 229,932 0.06 23,317 Albireo Pharma Inc 528,034 0.141,414 Mitsui Fudosan Company Limited 30,972 0.01 17,857 Alcoa Corporation 342,186 0.09
145 Mochida Pharmaceutical Company Limited 5,242 0.00 284,824 Alder Biopharmaceuticals Inc # 247,397 0.06264 Nichi-iko Pharmaceutical Company Limited 2,945 0.00 323 Alphabet Inc 385,410 0.10500 Nippon Paint Holdings Company Limited 23,117 0.01 906 Amazon.com Inc 1,491,441 0.3987 Nippon Shinyaku Company Limited 6,754 0.00 17,859 Anixter International Inc 1,465,313 0.38
3,774 Nippon Steel Corporation 51,171 0.01 1,547 Apple Inc 404,701 0.119,434 Nippon Yusen KK 153,202 0.04 20,326 Applied Materials Inc 1,105,300 0.29
146 Nissui Pharmaceutical Company Limited 1,550 0.00 220,056 Arqule Inc 3,912,978 1.021,504 Nitori Holdings Company Limited 212,369 0.06 46,922 Atricure Inc 1,358,961 0.36
19,222 NTT Docomo Inc 478,708 0.13 32,804 Audentes Therapeutics Inc 1,748,767 0.465,660 Odakyu Electric Railway Company Limited 118,362 0.03 39 Bristol-Myers Squibb Company 2,230 0.003,333 Oki Electric Industry Company Limited 41,503 0.01 2,792 Broadcom Inc 786,038 0.212,594 Ono Pharmaceutical Company Limited 53,204 0.01 105,361 Cabot Oil & Gas Corporation 1,634,151 0.43
216
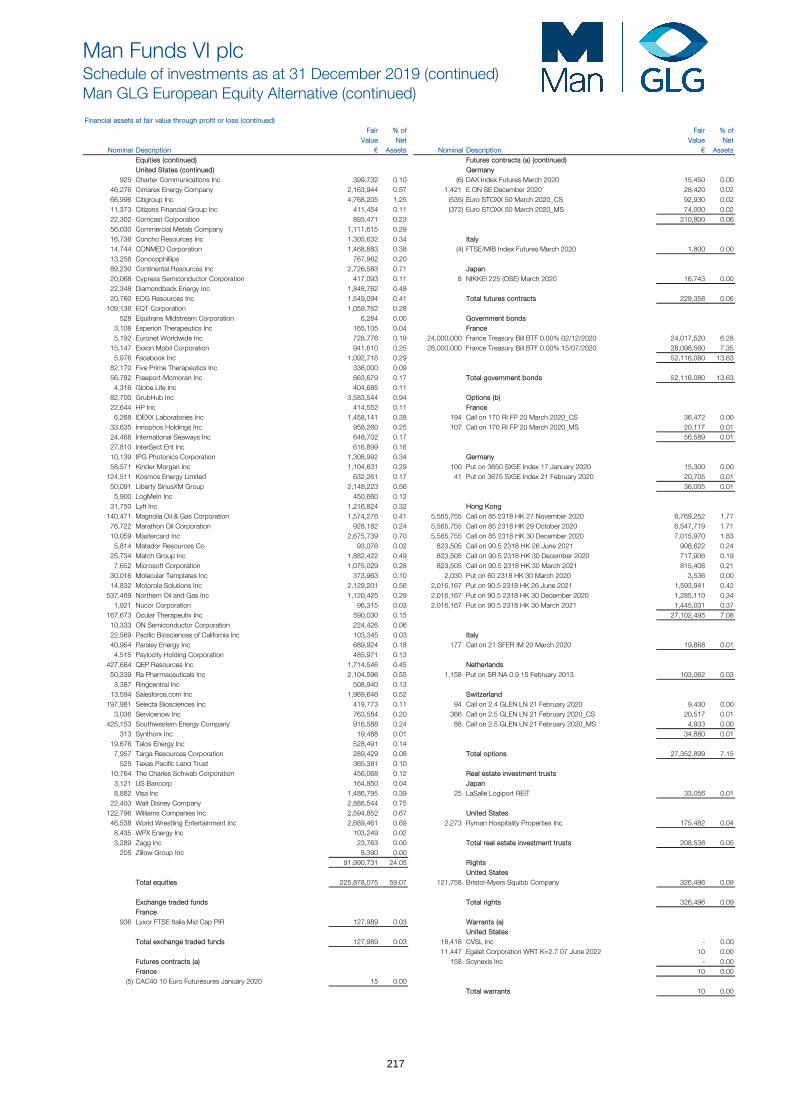
Man Funds VI plcSchedule of investments as at 31 December 2019 (continued)Man GLG European Equity Alternative (continued)
Financial assets at fair value through profit or loss (continued) Fair % of Fair % of
Value Net Value Net Nominal Description € Assets Nominal Description € Assets
Equities (continued) Futures contracts (a) (continued)United States (continued) Germany
925 Charter Communications Inc 399,732 0.10 (6) DAX Index Futures March 2020 15,450 0.0046,276 Cimarex Energy Company 2,163,944 0.57 1,421 E.ON SE December 2020 28,420 0.0266,996 Citigroup Inc 4,768,205 1.25 (535) Euro STOXX 50 March 2020_CS 92,930 0.0211,373 Citizens Financial Group Inc 411,454 0.11 (372) Euro STOXX 50 March 2020_MS 74,000 0.0222,302 Comcast Corporation 893,471 0.23 210,800 0.0656,030 Commercial Metals Company 1,111,615 0.2916,736 Concho Resources Inc 1,305,632 0.34 Italy 14,744 CONMED Corporation 1,468,883 0.38 (4) FTSE/MIB Index Futures March 2020 1,800 0.0013,256 Conocophillips 767,962 0.20 89,230 Continental Resources Inc 2,726,583 0.71 Japan 20,068 Cypress Semiconductor Corporation 417,093 0.11 8 NIKKEI 225 (OSE) March 2020 16,743 0.0022,348 Diamondback Energy Inc 1,848,762 0.48 20,760 EOG Resources Inc 1,549,094 0.41 Total futures contracts 229,358 0.06
109,136 EQT Corporation 1,059,762 0.28 528 Equitrans Midstream Corporation 6,284 0.00 Government bonds
3,108 Esperion Therapeutics Inc 165,105 0.04 France 5,192 Euronet Worldwide Inc 728,776 0.19 24,000,000 France Treasury Bill BTF 0.00% 02/12/2020 24,017,520 6.28
15,147 Exxon Mobil Corporation 941,610 0.25 28,000,000 France Treasury Bill BTF 0.00% 15/07/2020 28,098,560 7.355,976 Facebook Inc 1,092,716 0.29 52,116,080 13.63
82,170 Five Prime Therapeutics Inc 336,000 0.09 56,782 Freeport-Mcmoran Inc 663,679 0.17 Total government bonds 52,116,080 13.63
4,316 Globe Life Inc 404,685 0.11 82,700 GrubHub Inc 3,583,544 0.94 Options (b) 22,644 HP Inc 414,552 0.11 France
6,268 IDEXX Laboratories Inc 1,458,141 0.38 194 Call on 170 RI FP 20 March 2020_CS 36,472 0.0033,635 Innophos Holdings Inc 958,260 0.25 107 Call on 170 RI FP 20 March 2020_MS 20,117 0.0124,468 International Seaways Inc 648,702 0.17 56,589 0.0127,810 InterSect Ent Inc 616,899 0.16 10,139 IPG Photonics Corporation 1,308,992 0.34 Germany 58,571 Kinder Morgan Inc 1,104,631 0.29 100 Put on 3650 SX5E Index 17 January 2020 15,300 0.00
124,511 Kosmos Energy Limited 632,261 0.17 41 Put on 3675 SX5E Index 21 February 2020 20,705 0.0150,091 Liberty SiriusXM Group 2,148,223 0.56 36,005 0.01
5,900 LogMeIn Inc 450,660 0.12 31,750 Lyft Inc 1,216,824 0.32 Hong Kong
140,471 Magnolia Oil & Gas Corporation 1,574,276 0.41 5,565,755 Call on 85 2318 HK 27 November 2020 6,769,252 1.7776,722 Marathon Oil Corporation 928,182 0.24 5,565,755 Call on 85 2318 HK 29 October 2020 6,547,719 1.7110,059 Mastercard Inc 2,675,739 0.70 5,565,755 Call on 85 2318 HK 30 December 2020 7,015,970 1.83
5,814 Matador Resources Co 93,076 0.02 823,505 Call on 90.5 2318 HK 26 June 2021 908,622 0.2425,734 Match Group Inc 1,882,422 0.49 823,505 Call on 90.5 2318 HK 30 December 2020 717,906 0.19
7,652 Microsoft Corporation 1,075,029 0.28 823,505 Call on 90.5 2318 HK 30 March 2021 815,408 0.2130,016 Molecular Templates Inc 373,963 0.10 2,030 Put on 60 2318 HK 30 March 2020 3,536 0.0014,832 Motorola Solutions Inc 2,129,201 0.56 2,016,167 Put on 90.5 2318 HK 26 June 2021 1,593,941 0.42
537,469 Northern Oil and Gas Inc 1,120,425 0.29 2,016,167 Put on 90.5 2318 HK 30 December 2020 1,285,110 0.341,921 Nucor Corporation 96,315 0.03 2,016,167 Put on 90.5 2318 HK 30 March 2021 1,445,031 0.37
167,673 Ocular Therapeutix Inc 590,030 0.15 27,102,495 7.0810,333 ON Semiconductor Corporation 224,426 0.06 22,569 Pacific Biosciences of California Inc 103,345 0.03 Italy 40,954 Parsley Energy Inc 689,924 0.18 177 Call on 21 SFER IM 20 March 2020 19,868 0.01
4,515 Paylocity Holding Corporation 485,971 0.13 427,684 QEP Resources Inc 1,714,546 0.45 Netherlands
50,339 Ra Pharmaceuticals Inc 2,104,596 0.55 1,158 Put on SR NA 0.9 15 February 2013 103,062 0.033,387 Ringcentral Inc 508,940 0.13
13,594 Salesforce.com Inc 1,969,646 0.52 Switzerland 197,981 Selecta Biosciences Inc 419,773 0.11 94 Call on 2.4 GLEN LN 21 February 2020 9,430 0.00
3,036 Servicenow Inc 763,584 0.20 366 Call on 2.5 GLEN LN 21 February 2020_CS 20,517 0.01425,153 Southwestern Energy Company 916,588 0.24 88 Call on 2.5 GLEN LN 21 February 2020_MS 4,933 0.00
313 Synthorx Inc 19,488 0.01 34,880 0.0119,676 Talos Energy Inc 528,491 0.14
7,957 Targa Resources Corporation 289,429 0.08 Total options 27,352,899 7.15525 Texas Pacific Land Trust 365,381 0.10
10,764 The Charles Schwab Corporation 456,068 0.12 Real estate investment trusts 3,121 US Bancorp 164,850 0.04 Japan 8,882 Visa Inc 1,486,795 0.39 25 LaSalle Logiport REIT 33,056 0.01
22,403 Walt Disney Company 2,886,544 0.75 122,796 Williams Companies Inc 2,594,852 0.67 United States
46,538 World Wrestling Entertainment Inc 2,689,461 0.69 2,273 Ryman Hospitality Properties Inc 175,482 0.048,435 WPX Energy Inc 103,249 0.02 3,289 Zagg Inc 23,763 0.00 Total real estate investment trusts 208,538 0.05
205 Zillow Group Inc 8,390 0.00 91,990,731 24.05 Rights
United States Total equities 225,878,075 59.07 121,758 Bristol-Myers Squibb Company 326,496 0.09
Exchange traded funds Total rights 326,496 0.09France
936 Lyxor FTSE Italia Mid Cap PIR 127,989 0.03 Warrants (a) United States
Total exchange traded funds 127,989 0.03 18,416 CVSL Inc - 0.00 11,447 Egalet Corporation WRT K=2.7 07 June 2022 10 0.00
Futures contracts (a) 158 Scynexis Inc - 0.00France 10 0.00
(5) CAC40 10 Euro Futuresures January 2020 15 0.00 Total warrants 10 0.00
217
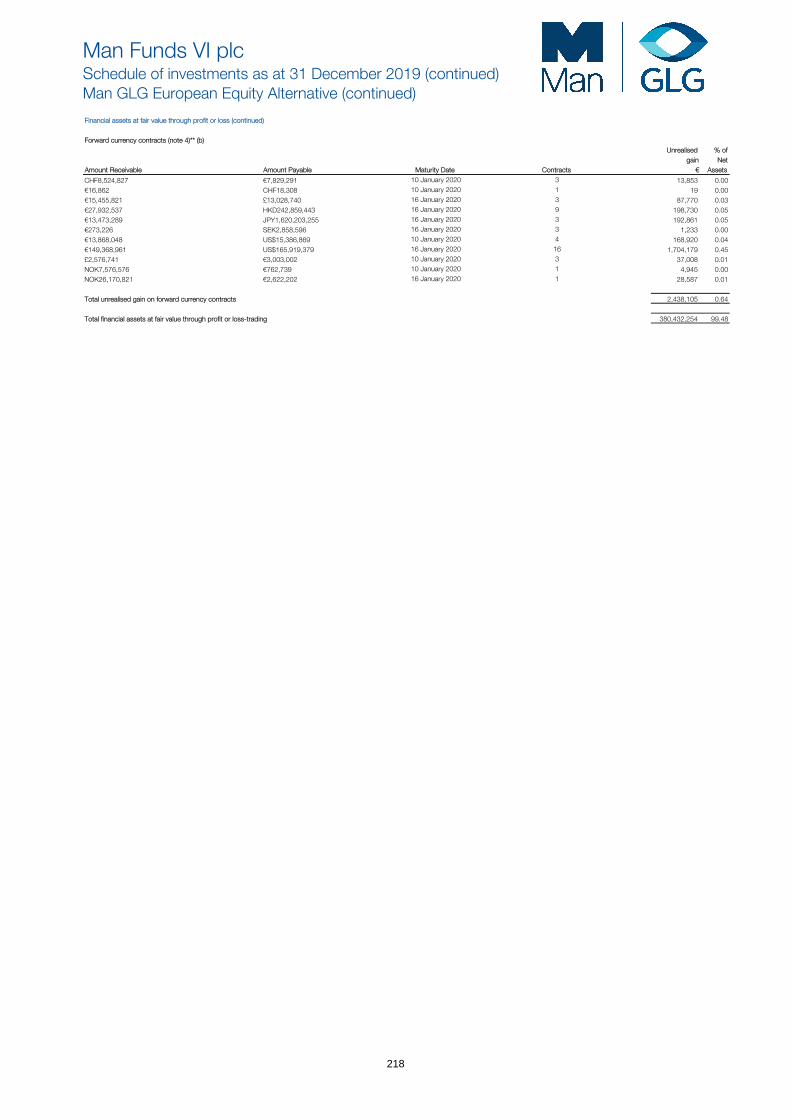
Man Funds VI plcSchedule of investments as at 31 December 2019 (continued)Man GLG European Equity Alternative (continued)
Financial assets at fair value through profit or loss (continued)
Forward currency contracts (note 4)** (b) Unrealised % of
gain Net Amount Receivable Amount Payable Maturity Date Contracts € Assets
CHF8,524,827 €7,829,291 10 January 2020 3 13,853 0.00€16,862 CHF18,308 10 January 2020 1 19 0.00€15,455,821 £13,028,740 16 January 2020 3 87,770 0.03€27,932,537 HKD242,859,443 16 January 2020 9 198,730 0.05€13,473,289 JPY1,620,203,255 16 January 2020 3 192,861 0.05€273,226 SEK2,858,596 16 January 2020 3 1,233 0.00€13,868,048 US$15,386,869 10 January 2020 4 168,920 0.04€149,368,961 US$165,919,379 16 January 2020 16 1,704,179 0.45£2,576,741 €3,003,002 10 January 2020 3 37,008 0.01NOK7,576,576 €762,739 10 January 2020 1 4,945 0.00NOK26,170,821 €2,622,202 16 January 2020 1 28,587 0.01
Total unrealised gain on forward currency contracts 2,438,105 0.64
Total financial assets at fair value through profit or loss-trading 380,432,254 99.48
218
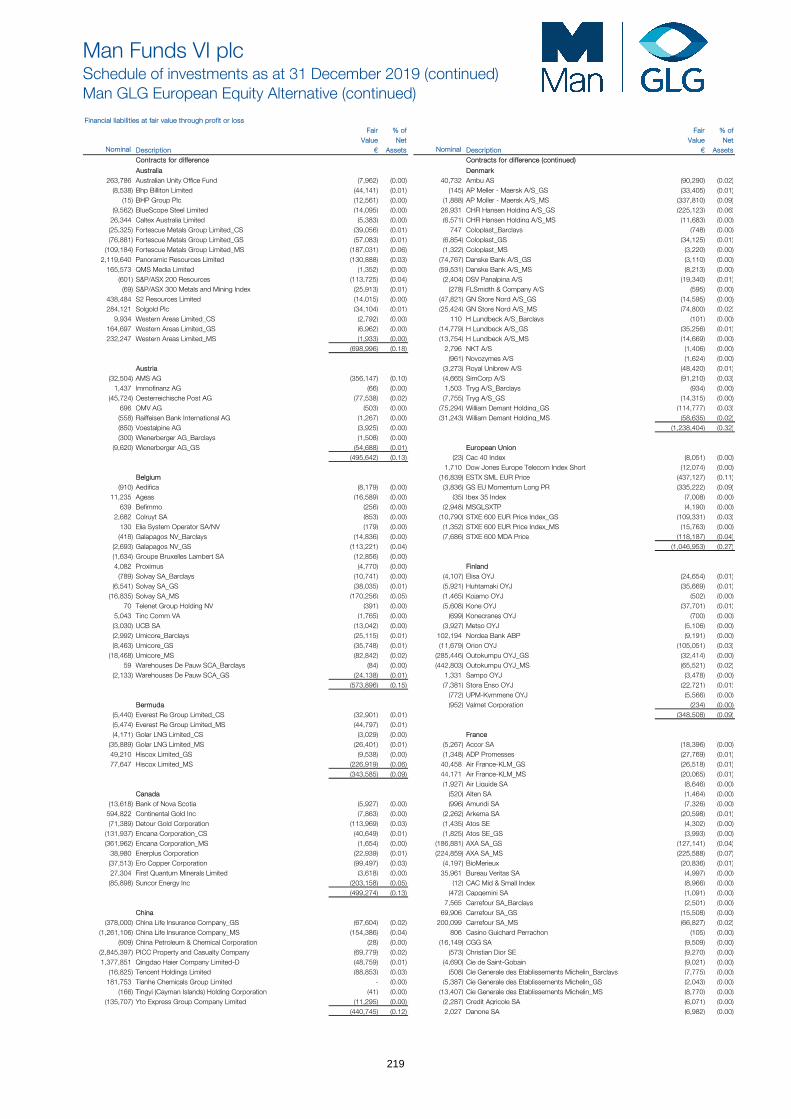
Man Funds VI plcSchedule of investments as at 31 December 2019 (continued)Man GLG European Equity Alternative (continued)
Financial liabilities at fair value through profit or loss Fair % of Fair % of
Value Net Value NetNominal Description € Assets Nominal Description € Assets
Contracts for difference Contracts for difference (continued)
Australia Denmark 263,786 Australian Unity Office Fund (7,962) (0.00) 40,732 Ambu AS (90,290) (0.02)
(8,538) Bhp Billiton Limited (44,141) (0.01) (145) AP Meller - Maersk A/S_GS (33,405) (0.01)(15) BHP Group Plc (12,561) (0.00) (1,888) AP Moller - Maersk A/S_MS (337,810) (0.09)
(9,562) BlueScope Steel Limited (14,095) (0.00) 26,931 CHR Hansen Holding A/S_GS (225,123) (0.06)26,344 Caltex Australia Limited (5,383) (0.00) (6,571) CHR Hansen Holding A/S_MS (11,683) (0.00) (25,325) Fortescue Metals Group Limited_CS (39,056) (0.01) 747 Coloplast_Barclays (748) (0.00) (76,881) Fortescue Metals Group Limited_GS (57,083) (0.01) (6,854) Coloplast_GS (34,125) (0.01)
(109,184) Fortescue Metals Group Limited_MS (187,031) (0.06) (1,322) Coloplast_MS (3,220) (0.00) 2,119,640 Panoramic Resources Limited (130,888) (0.03) (74,767) Danske Bank A/S_GS (3,110) (0.00)
165,573 QMS Media Limited (1,352) (0.00) (59,531) Danske Bank A/S_MS (8,213) (0.00) (601) S&P/ASX 200 Resources (113,725) (0.04) (2,404) DSV Panalpina A/S (19,340) (0.01)
(69) S&P/ASX 300 Metals and Mining Index (25,913) (0.01) (278) FLSmidth & Company A/S (595) (0.00) 438,484 S2 Resources Limited (14,015) (0.00) (47,821) GN Store Nord A/S_GS (14,595) (0.00) 284,121 Solgold Plc (34,104) (0.01) (25,424) GN Store Nord A/S_MS (74,800) (0.02)
9,934 Western Areas Limited_CS (2,792) (0.00) 110 H Lundbeck A/S_Barclays (101) (0.00) 164,697 Western Areas Limited_GS (6,962) (0.00) (14,779) H Lundbeck A/S_GS (35,256) (0.01)232,247 Western Areas Limited_MS (1,933) (0.00) (13,754) H Lundbeck A/S_MS (14,669) (0.00)
(698,996) (0.18) 2,796 NKT A/S (1,406) (0.00) (961) Novozymes A/S (1,624) (0.00)
Austria (3,273) Royal Unibrew A/S (48,420) (0.01)(32,504) AMS AG (356,147) (0.10) (4,665) SimCorp A/S (91,210) (0.03)
1,437 Immofinanz AG (66) (0.00) 1,503 Tryg A/S_Barclays (934) (0.00) (45,724) Oesterreichische Post AG (77,538) (0.02) (7,755) Tryg A/S_GS (14,315) (0.00)
696 OMV AG (503) (0.00) (75,294) William Demant Holding_GS (114,777) (0.03)(558) Raiffeisen Bank International AG (1,267) (0.00) (31,243) William Demant Holding_MS (58,635) (0.02)(850) Voestalpine AG (3,925) (0.00) (1,238,404) (0.32)(300) Wienerberger AG_Barclays (1,508) (0.00)
(9,620) Wienerberger AG_GS (54,688) (0.01) European Union (495,642) (0.13) (23) Cac 40 Index (8,051) (0.00)
1,710 Dow Jones Europe Telecom Index Short (12,074) (0.00) Belgium (16,839) ESTX SML EUR Price (437,127) (0.11)
(910) Aedifica (8,179) (0.00) (3,836) GS EU Momentum Long PR (335,222) (0.09)11,235 Ageas (16,589) (0.00) (35) Ibex 35 Index (7,008) (0.00)
639 Befimmo (256) (0.00) (2,948) MSGLSXTP (4,190) (0.00) 2,682 Colruyt SA (853) (0.00) (10,790) STXE 600 EUR Price Index_GS (109,331) (0.03)
130 Elia System Operator SA/NV (179) (0.00) (1,352) STXE 600 EUR Price Index_MS (15,763) (0.00) (418) Galapagos NV_Barclays (14,836) (0.00) (7,686) STXE 600 MDA Price (118,187) (0.04)
(2,693) Galapagos NV_GS (113,221) (0.04) (1,046,953) (0.27)(1,634) Groupe Bruxelles Lambert SA (12,856) (0.00) 4,082 Proximus (4,770) (0.00) Finland
(789) Solvay SA_Barclays (10,741) (0.00) (4,107) Elisa OYJ (24,654) (0.01)(6,541) Solvay SA_GS (38,035) (0.01) (5,921) Huhtamaki OYJ (35,669) (0.01)
(16,835) Solvay SA_MS (170,256) (0.05) (1,465) Kojamo OYJ (502) (0.00) 70 Telenet Group Holding NV (391) (0.00) (5,608) Kone OYJ (37,701) (0.01)
5,043 Tinc Comm VA (1,765) (0.00) (699) Konecranes OYJ (700) (0.00) (3,030) UCB SA (13,042) (0.00) (3,927) Metso OYJ (5,106) (0.00) (2,992) Umicore_Barclays (25,115) (0.01) 102,194 Nordea Bank ABP (9,191) (0.00) (8,463) Umicore_GS (35,748) (0.01) (11,679) Orion OYJ (105,051) (0.03)
(18,468) Umicore_MS (82,842) (0.02) (285,446) Outokumpu OYJ_GS (32,414) (0.00) 59 Warehouses De Pauw SCA_Barclays (84) (0.00) (442,803) Outokumpu OYJ_MS (65,521) (0.02)
(2,133) Warehouses De Pauw SCA_GS (24,138) (0.01) 1,331 Sampo OYJ (3,478) (0.00) (573,896) (0.15) (7,381) Stora Enso OYJ (22,721) (0.01)
(772) UPM-Kymmene OYJ (5,566) (0.00) Bermuda (952) Valmet Corporation (234) (0.00)
(5,440) Everest Re Group Limited_CS (32,901) (0.01) (348,508) (0.09)(5,474) Everest Re Group Limited_MS (44,797) (0.01) (4,171) Golar LNG Limited_CS (3,029) (0.00) France
(35,889) Golar LNG Limited_MS (26,401) (0.01) (5,267) Accor SA (18,396) (0.00) 49,210 Hiscox Limited_GS (9,538) (0.00) (1,348) ADP Promesses (27,769) (0.01)77,647 Hiscox Limited_MS (226,919) (0.06) 40,458 Air France-KLM_GS (26,518) (0.01)
(343,585) (0.09) 44,171 Air France-KLM_MS (20,065) (0.01) (1,927) Air Liquide SA (8,646) (0.00)
Canada (520) Alten SA (1,464) (0.00) (13,618) Bank of Nova Scotia (5,927) (0.00) (996) Amundi SA (7,326) (0.00)
594,822 Continental Gold Inc (7,863) (0.00) (2,262) Arkema SA (20,598) (0.01)(71,389) Detour Gold Corporation (113,969) (0.03) (1,435) Atos SE (4,302) (0.00)
(131,937) Encana Corporation_CS (40,649) (0.01) (1,825) Atos SE_GS (3,993) (0.00) (361,962) Encana Corporation_MS (1,654) (0.00) (186,881) AXA SA_GS (127,141) (0.04)
38,980 Enerplus Corporation (22,939) (0.01) (224,859) AXA SA_MS (225,588) (0.07)(37,513) Ero Copper Corporation (99,497) (0.03) (4,197) BioMerieux (20,836) (0.01)27,304 First Quantum Minerals Limited (3,618) (0.00) 35,961 Bureau Veritas SA (4,997) (0.00) (85,898) Suncor Energy Inc (203,158) (0.05) (12) CAC Mid & Small Index (8,966) (0.00)
(499,274) (0.13) (472) Capgemini SA (1,091) (0.00) 7,565 Carrefour SA_Barclays (2,501) (0.00)
China 69,906 Carrefour SA_GS (15,508) (0.00) (378,000) China Life Insurance Company_GS (67,604) (0.02) 200,099 Carrefour SA_MS (66,827) (0.02)
(1,261,106) China Life Insurance Company_MS (154,386) (0.04) 806 Casino Guichard Perrachon (105) (0.00) (909) China Petroleum & Chemical Corporation (28) (0.00) (16,149) CGG SA (9,509) (0.00)
(2,845,397) PICC Property and Casualty Company (69,779) (0.02) (573) Christian Dior SE (9,270) (0.00) 1,377,851 Qingdao Haier Company Limited-D (48,759) (0.01) (4,690) Cie de Saint-Gobain (9,021) (0.00)
(16,825) Tencent Holdings Limited (88,853) (0.03) (508) Cie Generale des Etablissements Michelin_Barclays (7,775) (0.00) 181,753 Tianhe Chemicals Group Limited - (0.00) (5,387) Cie Generale des Etablissements Michelin_GS (2,043) (0.00)
(166) Tingyi (Cayman Islands) Holding Corporation (41) (0.00) (13,407) Cie Generale des Etablissements Michelin_MS (8,770) (0.00) (135,707) Yto Express Group Company Limited (11,295) (0.00) (2,287) Credit Agricole SA (6,071) (0.00)
(440,745) (0.12) 2,027 Danone SA (6,982) (0.00)
219
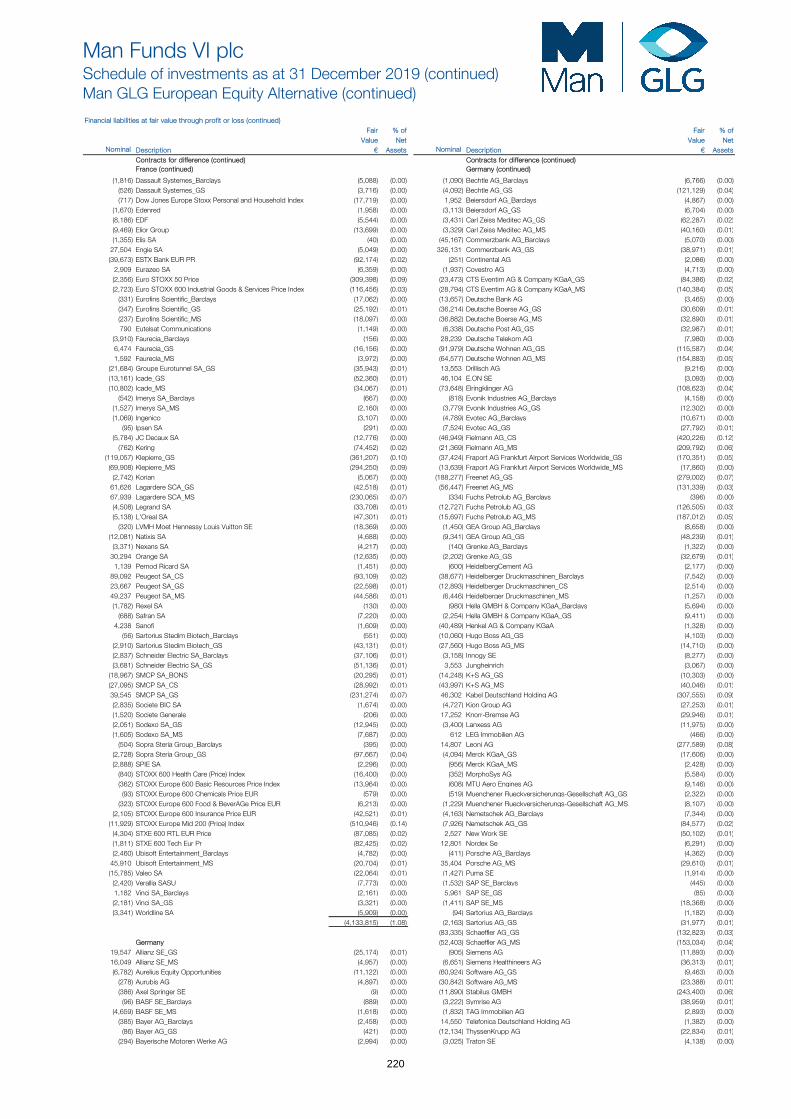
Man Funds VI plcSchedule of investments as at 31 December 2019 (continued)Man GLG European Equity Alternative (continued)
Financial liabilities at fair value through profit or loss (continued) Fair % of Fair % of
Value Net Value NetNominal Description € Assets Nominal Description € Assets
Contracts for difference (continued) Contracts for difference (continued)France (continued) Germany (continued)
(1,816) Dassault Systemes_Barclays (5,088) (0.00) (1,090) Bechtle AG_Barclays (6,766) (0.00) (526) Dassault Systemes_GS (3,716) (0.00) (4,092) Bechtle AG_GS (121,129) (0.04)(717) Dow Jones Europe Stoxx Personal and Household Index (17,719) (0.00) 1,952 Beiersdorf AG_Barclays (4,867) (0.00)
(1,670) Edenred (1,958) (0.00) (3,113) Beiersdorf AG_GS (6,704) (0.00) (8,186) EDF (5,544) (0.00) (3,431) Carl Zeiss Meditec AG_GS (62,287) (0.02)(9,469) Elior Group (13,699) (0.00) (3,329) Carl Zeiss Meditec AG_MS (40,160) (0.01)(1,355) Elis SA (40) (0.00) (45,167) Commerzbank AG_Barclays (5,070) (0.00)
27,504 Engie SA (5,049) (0.00) 326,131 Commerzbank AG_GS (38,971) (0.01)(39,673) ESTX Bank EUR PR (92,174) (0.02) (251) Continental AG (2,086) (0.00)
2,909 Eurazeo SA (6,359) (0.00) (1,937) Covestro AG (4,713) (0.00) (2,356) Euro STOXX 50 Price (309,398) (0.09) (23,473) CTS Eventim AG & Company KGaA_GS (84,386) (0.02)(2,723) Euro STOXX 600 Industrial Goods & Services Price Index (116,456) (0.03) (28,794) CTS Eventim AG & Company KGaA_MS (140,384) (0.05)
(331) Eurofins Scientific_Barclays (17,062) (0.00) (13,657) Deutsche Bank AG (3,465) (0.00) (347) Eurofins Scientific_GS (25,192) (0.01) (36,214) Deutsche Boerse AG_GS (30,609) (0.01)(237) Eurofins Scientific_MS (18,097) (0.00) (36,882) Deutsche Boerse AG_MS (32,890) (0.01)790 Eutelsat Communications (1,149) (0.00) (6,338) Deutsche Post AG_GS (32,987) (0.01)
(3,910) Faurecia_Barclays (156) (0.00) 28,239 Deutsche Telekom AG (7,980) (0.00) 6,474 Faurecia_GS (16,156) (0.00) (91,979) Deutsche Wohnen AG_GS (115,587) (0.04)1,592 Faurecia_MS (3,972) (0.00) (64,577) Deutsche Wohnen AG_MS (154,883) (0.05)
(21,684) Groupe Eurotunnel SA_GS (35,943) (0.01) 13,553 Drillisch AG (9,216) (0.00) (13,161) Icade_GS (52,360) (0.01) 46,104 E.ON SE (3,093) (0.00) (10,802) Icade_MS (34,067) (0.01) (73,648) Elringklinger AG (108,623) (0.04)
(542) Imerys SA_Barclays (667) (0.00) (818) Evonik Industries AG_Barclays (4,158) (0.00) (1,527) Imerys SA_MS (2,160) (0.00) (3,779) Evonik Industries AG_GS (12,302) (0.00) (1,069) Ingenico (3,107) (0.00) (4,789) Evotec AG_Barclays (10,671) (0.00)
(95) Ipsen SA (291) (0.00) (7,524) Evotec AG_GS (27,792) (0.01)(5,784) JC Decaux SA (12,776) (0.00) (46,949) Fielmann AG_CS (420,226) (0.12)
(762) Kering (74,452) (0.02) (21,369) Fielmann AG_MS (209,792) (0.06)(119,057) Klepierre_GS (361,207) (0.10) (37,424) Fraport AG Frankfurt Airport Services Worldwide_GS (170,351) (0.05)
(69,908) Klepierre_MS (294,250) (0.09) (13,639) Fraport AG Frankfurt Airport Services Worldwide_MS (17,860) (0.00) (2,742) Korian (5,067) (0.00) (188,277) Freenet AG_GS (279,002) (0.07)
61,626 Lagardere SCA_GS (42,518) (0.01) (56,447) Freenet AG_MS (131,339) (0.03)67,939 Lagardere SCA_MS (230,065) (0.07) (334) Fuchs Petrolub AG_Barclays (396) (0.00) (4,508) Legrand SA (33,708) (0.01) (12,727) Fuchs Petrolub AG_GS (126,505) (0.03)(5,138) L'Oreal SA (47,301) (0.01) (15,697) Fuchs Petrolub AG_MS (187,012) (0.05)
(320) LVMH Moet Hennessy Louis Vuitton SE (18,369) (0.00) (1,450) GEA Group AG_Barclays (8,658) (0.00) (12,081) Natixis SA (4,688) (0.00) (9,341) GEA Group AG_GS (48,239) (0.01)
(3,371) Nexans SA (4,217) (0.00) (140) Grenke AG_Barclays (1,322) (0.00) 30,294 Orange SA (12,635) (0.00) (2,202) Grenke AG_GS (32,679) (0.01)
1,139 Pernod Ricard SA (1,451) (0.00) (600) HeidelbergCement AG (2,177) (0.00) 89,092 Peugeot SA_CS (93,109) (0.02) (38,677) Heidelberger Druckmaschinen_Barclays (7,542) (0.00) 23,667 Peugeot SA_GS (22,598) (0.01) (12,893) Heidelberger Druckmaschinen_CS (2,514) (0.00) 49,237 Peugeot SA_MS (44,586) (0.01) (6,446) Heidelberger Druckmaschinen_MS (1,257) (0.00) (1,782) Rexel SA (130) (0.00) (980) Hella GMBH & Company KGaA_Barclays (5,694) (0.00)
(688) Safran SA (7,220) (0.00) (2,254) Hella GMBH & Company KGaA_GS (9,411) (0.00) 4,238 Sanofi (1,609) (0.00) (40,489) Henkel AG & Company KGaA (1,328) (0.00)
(56) Sartorius Stedim Biotech_Barclays (551) (0.00) (10,060) Hugo Boss AG_GS (4,103) (0.00) (2,910) Sartorius Stedim Biotech_GS (43,131) (0.01) (27,560) Hugo Boss AG_MS (14,710) (0.00) (2,837) Schneider Electric SA_Barclays (37,106) (0.01) (3,158) Innogy SE (8,277) (0.00) (3,681) Schneider Electric SA_GS (51,136) (0.01) 3,553 Jungheinrich (3,067) (0.00)
(18,967) SMCP SA_BONS (20,295) (0.01) (14,248) K+S AG_GS (10,303) (0.00) (27,095) SMCP SA_CS (28,992) (0.01) (43,997) K+S AG_MS (40,046) (0.01)39,545 SMCP SA_GS (231,274) (0.07) 46,302 Kabel Deutschland Holding AG (307,555) (0.09)(2,835) Societe BIC SA (1,674) (0.00) (4,727) Kion Group AG (27,253) (0.01)(1,520) Societe Generale (206) (0.00) 17,252 Knorr-Bremse AG (29,946) (0.01)(2,051) Sodexo SA_GS (12,945) (0.00) (3,400) Lanxess AG (11,975) (0.00) (1,605) Sodexo SA_MS (7,687) (0.00) 612 LEG Immobilien AG (466) (0.00)
(504) Sopra Steria Group_Barclays (395) (0.00) 14,807 Leoni AG (277,589) (0.08)(2,728) Sopra Steria Group_GS (97,667) (0.04) (4,094) Merck KGaA_GS (17,606) (0.00) (2,888) SPIE SA (2,296) (0.00) (956) Merck KGaA_MS (2,428) (0.00)
(840) STOXX 600 Health Care (Price) Index (16,400) (0.00) (352) MorphoSys AG (5,584) (0.00) (362) STOXX Europe 600 Basic Resources Price Index (13,964) (0.00) (608) MTU Aero Engines AG (9,146) (0.00)
(93) STOXX Europe 600 Chemicals Price EUR (579) (0.00) (519) Muenchener Rueckversicherungs-Gesellschaft AG_GS (2,322) (0.00) (323) STOXX Europe 600 Food & BeverAGe Price EUR (6,213) (0.00) (1,229) Muenchener Rueckversicherungs-Gesellschaft AG_MS (8,107) (0.00)
(2,105) STOXX Europe 600 Insurance Price EUR (42,521) (0.01) (4,163) Nemetschek AG_Barclays (7,344) (0.00) (11,929) STOXX Europe Mid 200 (Price) Index (510,946) (0.14) (7,926) Nemetschek AG_GS (84,577) (0.02)
(4,304) STXE 600 RTL EUR Price (87,085) (0.02) 2,527 New Work SE (50,102) (0.01)(1,811) STXE 600 Tech Eur Pr (82,425) (0.02) 12,801 Nordex Se (6,291) (0.00) (2,460) Ubisoft Entertainment_Barclays (4,782) (0.00) (411) Porsche AG_Barclays (4,362) (0.00)
45,910 Ubisoft Entertainment_MS (20,704) (0.01) 35,404 Porsche AG_MS (29,610) (0.01)(15,785) Valeo SA (22,064) (0.01) (1,427) Puma SE (1,914) (0.00)
(2,420) Verallia SASU (7,773) (0.00) (1,532) SAP SE_Barclays (445) (0.00) 1,182 Vinci SA_Barclays (2,161) (0.00) 5,961 SAP SE_GS (85) (0.00) (2,181) Vinci SA_GS (3,321) (0.00) (1,411) SAP SE_MS (18,368) (0.00) (3,341) Worldline SA (5,909) (0.00) (94) Sartorius AG_Barclays (1,182) (0.00)
(4,133,815) (1.08) (2,163) Sartorius AG_GS (31,977) (0.01) (83,335) Schaeffler AG_GS (132,823) (0.03)
Germany (52,403) Schaeffler AG_MS (153,034) (0.04)19,547 Allianz SE_GS (25,174) (0.01) (905) Siemens AG (11,893) (0.00) 16,049 Allianz SE_MS (4,957) (0.00) (6,651) Siemens Healthineers AG (36,313) (0.01)(6,782) Aurelius Equity Opportunities (11,122) (0.00) (60,924) Software AG_GS (9,463) (0.00)
(278) Aurubis AG (4,897) (0.00) (30,842) Software AG_MS (23,388) (0.01)(386) Axel Springer SE (9) (0.00) (11,890) Stabilus GMBH (243,400) (0.06)
(96) BASF SE_Barclays (889) (0.00) (3,222) Symrise AG (38,959) (0.01)(4,659) BASF SE_MS (1,618) (0.00) (1,832) TAG Immobilien AG (2,893) (0.00)
(385) Bayer AG_Barclays (2,458) (0.00) 14,550 Telefonica Deutschland Holding AG (1,382) (0.00) (86) Bayer AG_GS (421) (0.00) (12,134) ThyssenKrupp AG (22,834) (0.01)
(294) Bayerische Motoren Werke AG (2,994) (0.00) (3,025) Traton SE (4,138) (0.00)
220
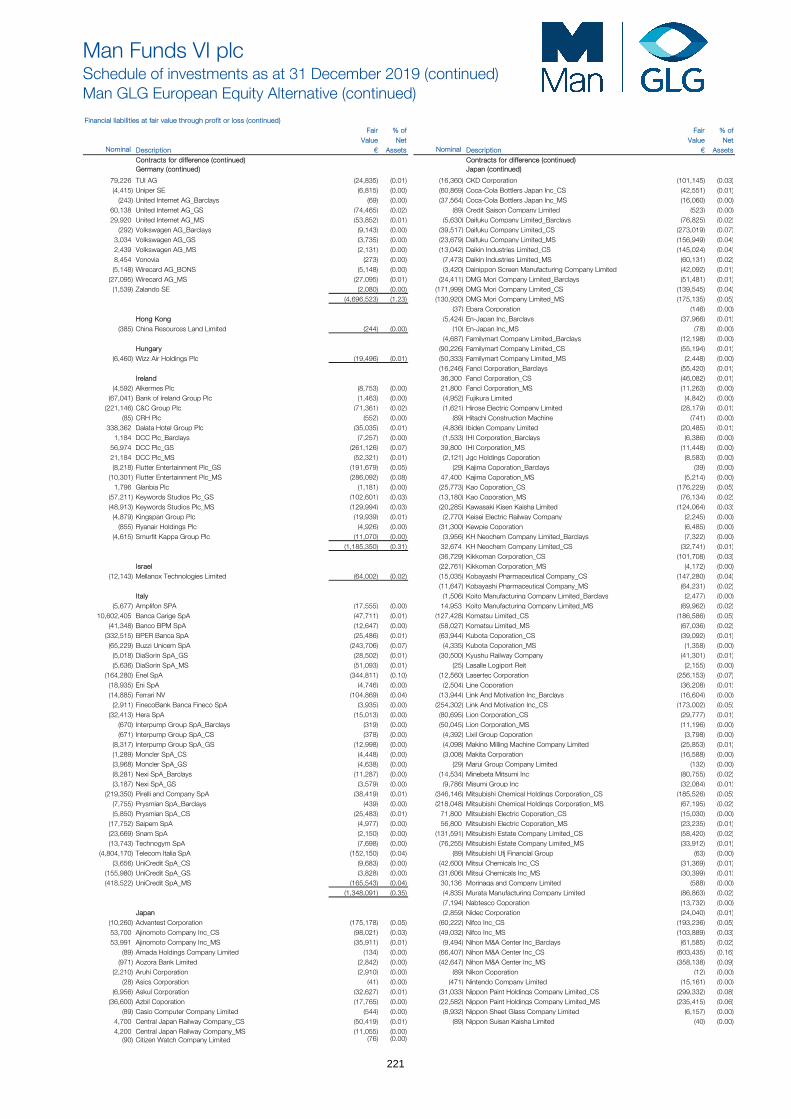
Man Funds VI plcSchedule of investments as at 31 December 2019 (continued)Man GLG European Equity Alternative (continued)
Financial liabilities at fair value through profit or loss (continued) Fair % of Fair % of
Value Net Value NetNominal Description € Assets Nominal Description € Assets
Contracts for difference (continued) Contracts for difference (continued)Germany (continued) Japan (continued)
79,226 TUI AG (24,835) (0.01) (16,360) CKD Corporation (101,145) (0.03)(4,415) Uniper SE (6,815) (0.00) (60,869) Coca-Cola Bottlers Japan Inc_CS (42,551) (0.01)
(243) United Internet AG_Barclays (69) (0.00) (37,564) Coca-Cola Bottlers Japan Inc_MS (16,060) (0.00) 60,138 United Internet AG_GS (74,465) (0.02) (89) Credit Saison Company Limited (523) (0.00) 29,920 United Internet AG_MS (53,852) (0.01) (5,630) Daifuku Company Limited_Barclays (76,825) (0.02)
(292) Volkswagen AG_Barclays (9,143) (0.00) (39,517) Daifuku Company Limited_CS (273,019) (0.07)3,034 Volkswagen AG_GS (3,735) (0.00) (23,679) Daifuku Company Limited_MS (156,949) (0.04)2,439 Volkswagen AG_MS (2,131) (0.00) (13,042) Daikin Industries Limited_CS (145,024) (0.04)8,454 Vonovia (273) (0.00) (7,473) Daikin Industries Limited_MS (60,131) (0.02)(5,148) Wirecard AG_BONS (5,148) (0.00) (3,420) Dainippon Screen Manufacturing Company Limited (42,092) (0.01)
(27,095) Wirecard AG_MS (27,095) (0.01) (24,411) DMG Mori Company Limited_Barclays (51,481) (0.01)(1,539) Zalando SE (2,080) (0.00) (171,999) DMG Mori Company Limited_CS (139,545) (0.04)
(4,696,523) (1.23) (130,920) DMG Mori Company Limited_MS (175,135) (0.05) (37) Ebara Corporation (146) (0.00)
Hong Kong (5,424) En-Japan Inc_Barclays (37,966) (0.01)(385) China Resources Land Limited (244) (0.00) (10) En-Japan Inc_MS (78) (0.00)
(4,687) Familymart Company Limited_Barclays (12,198) (0.00) Hungary (90,226) Familymart Company Limited_CS (55,194) (0.01)
(6,460) Wizz Air Holdings Plc (19,496) (0.01) (50,333) Familymart Company Limited_MS (2,448) (0.00) (16,246) Fancl Corporation_Barclays (55,420) (0.01)
Ireland 36,300 Fancl Corporation_CS (46,082) (0.01)(4,592) Alkermes Plc (8,753) (0.00) 21,800 Fancl Corporation_MS (11,263) (0.00)
(67,041) Bank of Ireland Group Plc (1,463) (0.00) (4,952) Fujikura Limited (4,842) (0.00) (221,146) C&C Group Plc (71,361) (0.02) (1,621) Hirose Electric Company Limited (28,179) (0.01)
(85) CRH Plc (552) (0.00) (89) Hitachi Construction Machine (741) (0.00) 338,362 Dalata Hotel Group Plc (35,035) (0.01) (4,836) Ibiden Company Limited (20,485) (0.01)
1,184 DCC Plc_Barclays (7,257) (0.00) (1,533) IHI Corporation_Barclays (6,386) (0.00) 56,974 DCC Plc_GS (261,126) (0.07) 39,800 IHI Corporation_MS (11,448) (0.00) 21,184 DCC Plc_MS (52,321) (0.01) (2,121) Jgc Holdings Coporation (8,583) (0.00) (8,218) Flutter Entertainment Plc_GS (191,679) (0.05) (29) Kajima Coporation_Barclays (39) (0.00)
(10,301) Flutter Entertainment Plc_MS (286,092) (0.08) 47,400 Kajima Coporation_MS (5,214) (0.00) 1,796 Glanbia Plc (1,181) (0.00) (25,773) Kao Coporation_CS (176,229) (0.05)
(57,211) Keywords Studios Plc_GS (102,601) (0.03) (13,180) Kao Coporation_MS (76,134) (0.02)(48,913) Keywords Studios Plc_MS (129,994) (0.03) (20,285) Kawasaki Kisen Kaisha Limited (124,064) (0.03)
(4,879) Kingspan Group Plc (19,939) (0.01) (2,770) Keisei Electric Railway Company (2,245) (0.00) (855) Ryanair Holdings Plc (4,926) (0.00) (31,300) Kewpie Coporation (6,485) (0.00)
(4,615) Smurfit Kappa Group Plc (11,070) (0.00) (3,956) KH Neochem Company Limited_Barclays (7,322) (0.00) (1,185,350) (0.31) 32,674 KH Neochem Company Limited_CS (32,741) (0.01)
(36,729) Kikkoman Corporation_CS (101,708) (0.03)Israel (22,761) Kikkoman Corporation_MS (4,172) (0.00)
(12,143) Mellanox Technologies Limited (64,002) (0.02) (15,035) Kobayashi Pharmaceutical Company_CS (147,280) (0.04) (11,647) Kobayashi Pharmaceutical Company_MS (64,231) (0.02)
Italy (1,506) Koito Manufacturing Company Limited_Barclays (2,477) (0.00) (5,677) Amplifon SPA (17,555) (0.00) 14,953 Koito Manufacturing Company Limited_MS (69,962) (0.02)
10,602,405 Banca Carige SpA (47,711) (0.01) (127,428) Komatsu Limited_CS (186,586) (0.05)(41,348) Banco BPM SpA (12,647) (0.00) (58,027) Komatsu Limited_MS (67,036) (0.02)
(332,515) BPER Banca SpA (25,486) (0.01) (63,944) Kubota Coporation_CS (39,092) (0.01)(65,229) Buzzi Unicem SpA (243,706) (0.07) (4,335) Kubota Coporation_MS (1,358) (0.00)
(5,018) DiaSorin SpA_GS (28,502) (0.01) (30,500) Kyushu Railway Company (41,301) (0.01)(5,636) DiaSorin SpA_MS (51,093) (0.01) (25) Lasalle Logiport Reit (2,155) (0.00)
(164,280) Enel SpA (344,811) (0.10) (12,560) Lasertec Corporation (256,153) (0.07)(18,935) Eni SpA (4,746) (0.00) (2,504) Line Coporation (36,208) (0.01)(14,885) Ferrari NV (104,869) (0.04) (13,944) Link And Motivation Inc_Barclays (16,604) (0.00)
(2,911) FinecoBank Banca Fineco SpA (3,935) (0.00) (254,302) Link And Motivation Inc_CS (173,002) (0.05)(32,413) Hera SpA (15,013) (0.00) (80,695) Lion Corporation_CS (29,777) (0.01)
(670) Interpump Group SpA_Barclays (319) (0.00) (50,045) Lion Corporation_MS (11,196) (0.00) (671) Interpump Group SpA_CS (378) (0.00) (4,392) Lixil Group Coporation (3,798) (0.00)
(8,317) Interpump Group SpA_GS (12,998) (0.00) (4,098) Makino Milling Machine Company Limited (25,853) (0.01)(1,289) Moncler SpA_CS (4,448) (0.00) (3,008) Makita Corporation (16,588) (0.00) (3,968) Moncler SpA_GS (4,638) (0.00) (29) Marui Group Company Limited (132) (0.00) (8,281) Nexi SpA_Barclays (11,287) (0.00) (14,534) Minebeta Mitsumi Inc (80,755) (0.02)(3,187) Nexi SpA_GS (3,579) (0.00) (9,786) Misumi Group Inc (32,084) (0.01)
(219,350) Pirelli and Company SpA (38,419) (0.01) (346,146) Mitsubishi Chemical Holdings Corporation_CS (185,526) (0.05)(7,755) Prysmian SpA_Barclays (439) (0.00) (218,048) Mitsubishi Chemical Holdings Corporation_MS (67,195) (0.02)(5,850) Prysmian SpA_CS (25,483) (0.01) 71,800 Mitsubishi Electric Coporation_CS (15,030) (0.00)
(17,752) Saipem SpA (4,977) (0.00) 56,800 Mitsubishi Electric Coporation_MS (23,235) (0.01)(23,669) Snam SpA (2,150) (0.00) (131,591) Mitsubishi Estate Company Limited_CS (58,420) (0.02)(13,743) Technogym SpA (7,698) (0.00) (76,255) Mitsubishi Estate Company Limited_MS (33,912) (0.01)
(4,804,170) Telecom Italia SpA (152,150) (0.04) (89) Mitsubishi Ufj Financial Group (63) (0.00) (3,656) UniCredit SpA_CS (9,683) (0.00) (42,600) Mitsui Chemicals Inc_CS (31,369) (0.01)
(155,980) UniCredit SpA_GS (3,828) (0.00) (31,606) Mitsui Chemicals Inc_MS (30,399) (0.01)(418,522) UniCredit SpA_MS (165,543) (0.04) 30,136 Morinaga and Company Limited (588) (0.00)
(1,348,091) (0.35) (4,835) Murata Manufacturing Company Limited (86,863) (0.02) (7,194) Nabtesco Coporation (13,732) (0.00)
Japan (2,859) Nidec Corporation (24,040) (0.01)(10,260) Advantest Corporation (175,178) (0.05) (60,222) Nifco Inc_CS (193,236) (0.05)53,700 Ajinomoto Company Inc_CS (98,021) (0.03) (49,032) Nifco Inc_MS (103,889) (0.03)53,991 Ajinomoto Company Inc_MS (35,911) (0.01) (9,494) Nihon M&A Center Inc_Barclays (61,585) (0.02)
(89) Amada Holdings Company Limited (134) (0.00) (66,407) Nihon M&A Center Inc_CS (603,435) (0.16)(971) Aozora Bank Limited (2,842) (0.00) (42,647) Nihon M&A Center Inc_MS (358,138) (0.09)
(2,210) Aruhi Corporation (2,910) (0.00) (89) Nikon Coporation (12) (0.00) (28) Asics Corporation (41) (0.00) (471) Nintendo Company Limited (15,161) (0.00)
(6,956) Askul Corporation (32,627) (0.01) (31,033) Nippon Paint Holdings Company Limited_CS (299,332) (0.08)(36,600) Azbil Coporation (17,765) (0.00) (22,582) Nippon Paint Holdings Company Limited_MS (235,415) (0.06)
(89) Casio Computer Company Limited (544) (0.00) (8,932) Nippon Sheet Glass Company Limited (6,157) (0.00) 4,700 Central Japan Railway Company_CS (50,419) (0.01) (89) Nippon Suisan Kaisha Limited (40) (0.00) 4,200 Central Japan Railway Company_MS (11,055) (0.00)
(90) Citizen Watch Company Limited (76) (0.00)
221
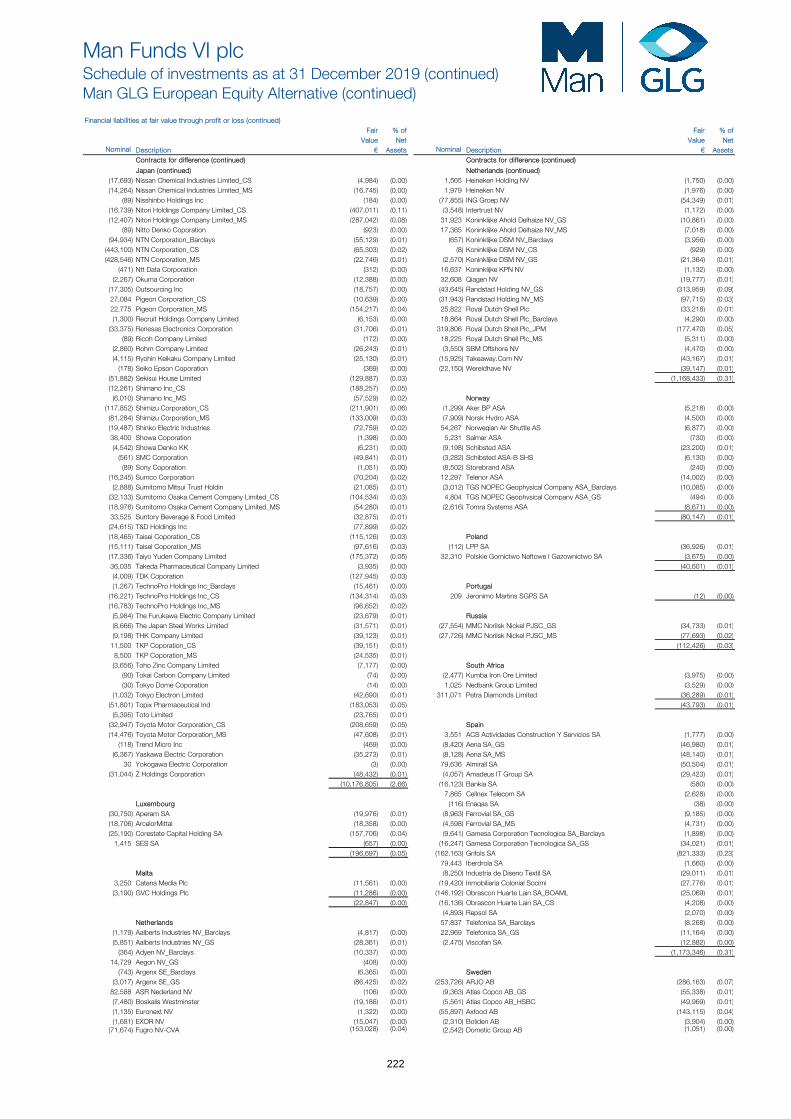
Man Funds VI plcSchedule of investments as at 31 December 2019 (continued)Man GLG European Equity Alternative (continued)
Financial liabilities at fair value through profit or loss (continued) Fair % of Fair % of
Value Net Value NetNominal Description € Assets Nominal Description € Assets
Contracts for difference (continued) Contracts for difference (continued)
Japan (continued) Netherlands (continued)(17,693) Nissan Chemical Industries Limited_CS (4,984) (0.00) 1,565 Heineken Holding NV (1,750) (0.00) (14,264) Nissan Chemical Industries Limited_MS (16,745) (0.00) 1,979 Heineken NV (1,976) (0.00)
(89) Nisshinbo Holdings Inc (184) (0.00) (77,855) ING Groep NV (54,349) (0.01)(16,739) Nitori Holdings Company Limited_CS (407,011) (0.11) (3,548) Intertrust NV (1,172) (0.00) (12,407) Nitori Holdings Company Limited_MS (287,042) (0.08) 31,923 Koninklijke Ahold Delhaize NV_GS (10,861) (0.00)
(89) Nitto Denko Coporation (923) (0.00) 17,365 Koninklijke Ahold Delhaize NV_MS (7,018) (0.00) (94,934) NTN Corporation_Barclays (55,129) (0.01) (657) Koninklijke DSM NV_Barclays (3,956) (0.00)
(443,100) NTN Corporation_CS (65,303) (0.02) (8) Koninklijke DSM NV_CS (929) (0.00) (428,546) NTN Corporation_MS (22,746) (0.01) (2,570) Koninklijke DSM NV_GS (21,364) (0.01)
(471) Ntt Data Corporation (312) (0.00) 16,637 Koninklijke KPN NV (1,132) (0.00) (2,267) Okuma Corporation (12,388) (0.00) 32,608 Qiagen NV (19,777) (0.01)
(17,305) Outsourcing Inc (18,757) (0.00) (43,645) Randstad Holding NV_GS (313,959) (0.09)27,084 Pigeon Corporation_CS (10,639) (0.00) (31,943) Randstad Holding NV_MS (97,715) (0.03)22,775 Pigeon Corporation_MS (154,217) (0.04) 25,822 Royal Dutch Shell Plc (33,218) (0.01)(1,300) Recruit Holdings Company Limited (6,153) (0.00) 18,864 Royal Dutch Shell Plc_Barclays (4,290) (0.00)
(33,375) Renesas Electronics Corporation (31,706) (0.01) 319,806 Royal Dutch Shell Plc_JPM (177,470) (0.05)(89) Ricoh Company Limited (172) (0.00) 18,225 Royal Dutch Shell Plc_MS (5,311) (0.00)
(2,860) Rohm Company Limited (26,243) (0.01) (3,550) SBM Offshore NV (4,470) (0.00) (4,115) Ryohin Keikaku Company Limited (25,130) (0.01) (15,925) Takeaway.Com NV (43,167) (0.01)
(178) Seiko Epson Coporation (369) (0.00) (22,150) Wereldhave NV (39,147) (0.01)(51,882) Sekisui House Limited (129,887) (0.03) (1,168,433) (0.31)(12,261) Shimano Inc_CS (188,257) (0.05)
(6,010) Shimano Inc_MS (57,529) (0.02) Norway (117,852) Shimizu Corporation_CS (211,901) (0.06) (1,299) Aker BP ASA (5,218) (0.00)
(81,284) Shimizu Corporation_MS (133,009) (0.03) (7,909) Norsk Hydro ASA (4,500) (0.00) (19,487) Shinko Electric Industries (72,759) (0.02) 54,267 Norwegian Air Shuttle AS (6,877) (0.00) 38,400 Showa Coporation (1,398) (0.00) 5,231 Salmar ASA (730) (0.00) (4,542) Showa Denko KK (6,231) (0.00) (9,198) Schibsted ASA (23,200) (0.01)
(561) SMC Corporation (49,841) (0.01) (3,282) Schibsted ASA-B SHS (6,130) (0.00) (89) Sony Coporation (1,051) (0.00) (8,502) Storebrand ASA (240) (0.00)
(16,245) Sumco Corporation (70,204) (0.02) 12,297 Telenor ASA (14,002) (0.00) (2,888) Sumitomo Mitsui Trust Holdin (21,085) (0.01) (3,012) TGS NOPEC Geophysical Company ASA_Barclays (10,085) (0.00)
(32,133) Sumitomo Osaka Cement Company Limited_CS (104,534) (0.03) 4,804 TGS NOPEC Geophysical Company ASA_GS (494) (0.00) (18,976) Sumitomo Osaka Cement Company Limited_MS (54,280) (0.01) (2,616) Tomra Systems ASA (8,671) (0.00) 33,525 Suntory Beverage & Food Limited (32,875) (0.01) (80,147) (0.01)(24,615) T&D Holdings Inc (77,899) (0.02) (18,465) Taisei Coporation_CS (115,126) (0.03) Poland (15,111) Taisei Coporation_MS (97,616) (0.03) (112) LPP SA (36,926) (0.01)(17,336) Taiyo Yuden Company Limited (175,372) (0.05) 32,310 Polskie Gornictwo Naftowe I Gazownictwo SA (3,675) (0.00) 36,035 Takeda Pharmaceutical Company Limited (3,935) (0.00) (40,601) (0.01)(4,009) TDK Coporation (127,945) (0.03) (1,267) TechnoPro Holdings Inc_Barclays (15,461) (0.00) Portugal
(16,221) TechnoPro Holdings Inc_CS (134,314) (0.03) 209 Jeronimo Martins SGPS SA (12) (0.00) (16,783) TechnoPro Holdings Inc_MS (96,652) (0.02)
(5,984) The Furukawa Electric Company Limited (23,679) (0.01) Russia (8,666) The Japan Steel Works Limited (31,571) (0.01) (27,554) MMC Norilsk Nickel PJSC_GS (34,733) (0.01)(9,198) THK Company Limited (39,123) (0.01) (27,726) MMC Norilsk Nickel PJSC_MS (77,693) (0.02)
11,500 TKP Coporation_CS (39,151) (0.01) (112,426) (0.03)8,500 TKP Coporation_MS (24,535) (0.01) (3,656) Toho Zinc Company Limited (7,177) (0.00) South Africa
(90) Tokai Carbon Company Limited (74) (0.00) (2,477) Kumba Iron Ore Limited (3,975) (0.00) (30) Tokyo Dome Coporation (14) (0.00) 1,025 Nedbank Group Limited (3,529) (0.00)
(1,032) Tokyo Electron Limited (42,690) (0.01) 311,071 Petra Diamonds Limited (36,289) (0.01)(51,801) Topix Pharmaceutical Ind (183,053) (0.05) (43,793) (0.01)
(5,395) Toto Limited (23,765) (0.01) (32,947) Toyota Motor Corporation_CS (208,659) (0.05) Spain (14,476) Toyota Motor Corporation_MS (47,608) (0.01) 3,551 ACS Actividades Construction Y Servicios SA (1,777) (0.00)
(118) Trend Micro Inc (469) (0.00) (8,420) Aena SA_GS (46,980) (0.01)(6,367) Yaskawa Electric Corporation (35,273) (0.01) (8,128) Aena SA_MS (48,140) (0.01)
30 Yokogawa Electric Corporation (3) (0.00) 79,636 Almirall SA (50,504) (0.01)(31,044) Z Holdings Corporation (48,432) (0.01) (4,057) Amadeus IT Group SA (29,423) (0.01)
(10,176,805) (2.66) (16,123) Bankia SA (580) (0.00) 7,865 Cellnex Telecom SA (2,628) (0.00)
Luxembourg (116) Enagas SA (38) (0.00) (30,750) Aperam SA (19,976) (0.01) (8,963) Ferrovial SA_GS (9,185) (0.00) (18,706) ArcelorMittal (18,358) (0.00) (4,598) Ferrovial SA_MS (4,731) (0.00) (25,190) Corestate Capital Holding SA (157,706) (0.04) (9,641) Gamesa Corporation Tecnologica SA_Barclays (1,898) (0.00)
1,415 SES SA (657) (0.00) (16,247) Gamesa Corporation Tecnologica SA_GS (34,021) (0.01) (196,697) (0.05) (162,163) Grifols SA (821,333) (0.23)
79,443 Iberdrola SA (1,660) (0.00) Malta (8,250) Industria de Diseno Textil SA (29,011) (0.01)
3,250 Catena Media Plc (11,561) (0.00) (19,420) Inmobiliaria Colonial Socimi (27,776) (0.01)(3,190) GVC Holdings Plc (11,286) (0.00) (146,192) Obrascon Huarte Lain SA_BOAML (25,069) (0.01)
(22,847) (0.00) (16,136) Obrascon Huarte Lain SA_CS (4,208) (0.00) (4,893) Repsol SA (2,070) (0.00)
Netherlands 57,837 Telefonica SA_Barclays (8,268) (0.00) (1,179) Aalberts Industries NV_Barclays (4,817) (0.00) 22,969 Telefonica SA_GS (11,164) (0.00) (5,851) Aalberts Industries NV_GS (28,361) (0.01) (2,475) Viscofan SA (12,882) (0.00)
(364) Adyen NV_Barclays (10,337) (0.00) (1,173,346) (0.31)14,729 Aegon NV_GS (408) (0.00)
(743) Argenx SE_Barclays (6,365) (0.00) Sweden (3,017) Argenx SE_GS (86,425) (0.02) (253,726) ARJO AB (286,163) (0.07)
82,588 ASR Nederland NV (106) (0.00) (9,363) Atlas Copco AB_GS (55,338) (0.01)(7,480) Boskalis Westminster (19,186) (0.01) (5,561) Atlas Copco AB_HSBC (49,969) (0.01)(1,135) Euronext NV (1,322) (0.00) (55,897) Axfood AB (143,115) (0.04)(1,681) EXOR NV (15,047) (0.00) (2,310) Boliden AB (3,904) (0.00)
(71,674) Fugro NV-CVA (153,028) (0.04) (2,542) Dometic Group AB (1,051) (0.00)
222
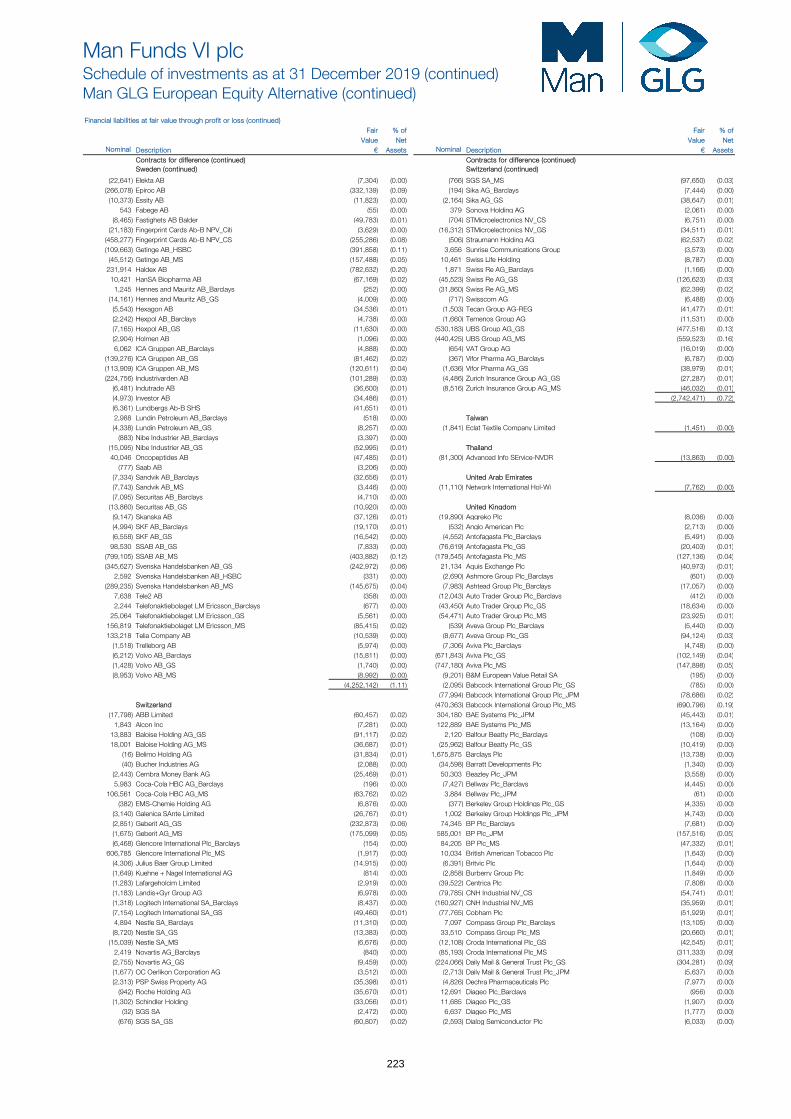
Man Funds VI plcSchedule of investments as at 31 December 2019 (continued)Man GLG European Equity Alternative (continued)
Financial liabilities at fair value through profit or loss (continued) Fair % of Fair % of
Value Net Value NetNominal Description € Assets Nominal Description € Assets
Contracts for difference (continued) Contracts for difference (continued)Sweden (continued) Switzerland (continued)
(22,641) Elekta AB (7,304) (0.00) (766) SGS SA_MS (97,650) (0.03)(266,078) Epiroc AB (332,139) (0.09) (194) Sika AG_Barclays (7,444) (0.00)
(10,373) Essity AB (11,823) (0.00) (2,164) Sika AG_GS (38,647) (0.01)543 Fabege AB (55) (0.00) 379 Sonova Holding AG (2,061) (0.00)
(8,465) Fastighets AB Balder (49,783) (0.01) (704) STMicroelectronics NV_CS (6,751) (0.00) (21,183) Fingerprint Cards Ab-B NPV_Citi (3,629) (0.00) (16,312) STMicroelectronics NV_GS (34,511) (0.01)
(458,277) Fingerprint Cards Ab-B NPV_CS (255,286) (0.08) (506) Straumann Holding AG (62,537) (0.02)(109,663) Getinge AB_HSBC (391,858) (0.11) 3,656 Sunrise Communications Group (3,573) (0.00)
(45,512) Getinge AB_MS (157,488) (0.05) 10,461 Swiss Life Holding (8,787) (0.00) 231,914 Haldex AB (782,632) (0.20) 1,871 Swiss Re AG_Barclays (1,166) (0.00)
10,421 HanSA Biopharma AB (67,169) (0.02) (45,523) Swiss Re AG_GS (126,623) (0.03)1,245 Hennes and Mauritz AB_Barclays (252) (0.00) (31,860) Swiss Re AG_MS (62,399) (0.02)
(14,161) Hennes and Mauritz AB_GS (4,009) (0.00) (717) Swisscom AG (6,488) (0.00) (5,543) Hexagon AB (34,536) (0.01) (1,503) Tecan Group AG-REG (41,477) (0.01)(2,242) Hexpol AB_Barclays (4,738) (0.00) (1,660) Temenos Group AG (11,531) (0.00) (7,165) Hexpol AB_GS (11,630) (0.00) (530,183) UBS Group AG_GS (477,516) (0.13)(2,904) Holmen AB (1,096) (0.00) (440,425) UBS Group AG_MS (559,523) (0.16)6,062 ICA Gruppen AB_Barclays (4,888) (0.00) (654) VAT Group AG (16,019) (0.00)
(139,276) ICA Gruppen AB_GS (81,462) (0.02) (367) Vifor Pharma AG_Barclays (6,787) (0.00) (113,909) ICA Gruppen AB_MS (120,611) (0.04) (1,636) Vifor Pharma AG_GS (38,979) (0.01)(224,756) Industrivarden AB (101,289) (0.03) (4,486) Zurich Insurance Group AG_GS (27,287) (0.01)
(6,481) Indutrade AB (36,600) (0.01) (8,516) Zurich Insurance Group AG_MS (46,032) (0.01)(4,973) Investor AB (34,486) (0.01) (2,742,471) (0.72)(6,361) Lundbergs Ab-B SHS (41,651) (0.01) 2,988 Lundin Petroleum AB_Barclays (518) (0.00) Taiwan (4,338) Lundin Petroleum AB_GS (8,257) (0.00) (1,841) Eclat Textile Company Limited (1,451) (0.00)
(883) Nibe Industrier AB_Barclays (3,397) (0.00) (15,095) Nibe Industrier AB_GS (52,995) (0.01) Thailand 40,046 Oncopeptides AB (47,485) (0.01) (81,300) Advanced Info SErvice-NVDR (13,863) (0.00)
(777) Saab AB (3,206) (0.00) (7,334) Sandvik AB_Barclays (32,656) (0.01) United Arab Emirates (7,743) Sandvik AB_MS (3,446) (0.00) (11,110) Network International Hol-Wi (7,762) (0.00) (7,095) Securitas AB_Barclays (4,710) (0.00)
(13,860) Securitas AB_GS (10,920) (0.00) United Kingdom (9,147) Skanska AB (37,126) (0.01) (19,890) Aggreko Plc (8,036) (0.00) (4,994) SKF AB_Barclays (19,170) (0.01) (532) Anglo American Plc (2,713) (0.00) (6,558) SKF AB_GS (16,542) (0.00) (4,552) Antofagasta Plc_Barclays (5,491) (0.00)
98,530 SSAB AB_GS (7,833) (0.00) (76,619) Antofagasta Plc_GS (20,403) (0.01)(799,105) SSAB AB_MS (403,882) (0.12) (179,545) Antofagasta Plc_MS (127,136) (0.04)(345,627) Svenska Handelsbanken AB_GS (242,972) (0.06) 21,134 Aquis Exchange Plc (40,973) (0.01)
2,592 Svenska Handelsbanken AB_HSBC (331) (0.00) (2,690) Ashmore Group Plc_Barclays (601) (0.00) (289,235) Svenska Handelsbanken AB_MS (145,675) (0.04) (7,983) Ashtead Group Plc_Barclays (17,057) (0.00)
7,638 Tele2 AB (358) (0.00) (12,043) Auto Trader Group Plc_Barclays (412) (0.00) 2,244 Telefonaktiebolaget LM Ericsson_Barclays (677) (0.00) (43,450) Auto Trader Group Plc_GS (18,634) (0.00)
25,064 Telefonaktiebolaget LM Ericsson_GS (5,561) (0.00) (54,471) Auto Trader Group Plc_MS (23,925) (0.01)156,819 Telefonaktiebolaget LM Ericsson_MS (85,415) (0.02) (539) Aveva Group Plc_Barclays (5,440) (0.00) 133,218 Telia Company AB (10,539) (0.00) (8,677) Aveva Group Plc_GS (94,124) (0.03)
(1,518) Trelleborg AB (5,974) (0.00) (7,306) Aviva Plc_Barclays (4,748) (0.00) (6,212) Volvo AB_Barclays (15,811) (0.00) (671,843) Aviva Plc_GS (102,149) (0.04)(1,428) Volvo AB_GS (1,740) (0.00) (747,180) Aviva Plc_MS (147,898) (0.05)(8,953) Volvo AB_MS (8,992) (0.00) (9,201) B&M European Value Retail SA (195) (0.00)
(4,252,142) (1.11) (2,095) Babcock International Group Plc_GS (785) (0.00) (77,994) Babcock International Group Plc_JPM (78,686) (0.02)
Switzerland (470,363) Babcock International Group Plc_MS (690,796) (0.19)(17,798) ABB Limited (60,457) (0.02) 304,180 BAE Systems Plc_JPM (45,443) (0.01)
1,843 Alcon Inc (7,281) (0.00) 122,889 BAE Systems Plc_MS (13,164) (0.00) 13,883 Baloise Holding AG_GS (91,117) (0.02) 2,120 Balfour Beatty Plc_Barclays (108) (0.00) 18,001 Baloise Holding AG_MS (36,687) (0.01) (25,962) Balfour Beatty Plc_GS (10,419) (0.00)
(16) Belimo Holding AG (31,834) (0.01) 1,675,875 Barclays Plc (13,738) (0.00) (40) Bucher Industries AG (2,088) (0.00) (34,598) Barratt Developments Plc (1,340) (0.00)
(2,443) Cembra Money Bank AG (25,469) (0.01) 50,303 Beazley Plc_JPM (3,558) (0.00) 5,983 Coca-Cola HBC AG_Barclays (196) (0.00) (7,427) Bellway Plc_Barclays (4,445) (0.00)
106,561 Coca-Cola HBC AG_MS (63,762) (0.02) 3,884 Bellway Plc_JPM (61) (0.00) (382) EMS-Chemie Holding AG (6,876) (0.00) (377) Berkeley Group Holdings Plc_GS (4,335) (0.00)
(3,140) Galenica SAnte Limited (26,767) (0.01) 1,002 Berkeley Group Holdings Plc_JPM (4,743) (0.00) (2,851) Geberit AG_GS (232,873) (0.06) 74,345 BP Plc_Barclays (7,681) (0.00) (1,675) Geberit AG_MS (175,099) (0.05) 585,001 BP Plc_JPM (157,516) (0.05)(6,468) Glencore International Plc_Barclays (154) (0.00) 84,205 BP Plc_MS (47,332) (0.01)
606,785 Glencore International Plc_MS (1,917) (0.00) 10,034 British American Tobacco Plc (1,643) (0.00) (4,306) Julius Baer Group Limited (14,915) (0.00) (6,391) Britvic Plc (1,644) (0.00) (1,649) Kuehne + Nagel International AG (814) (0.00) (2,858) Burberry Group Plc (1,849) (0.00) (1,283) Lafargeholcim Limited (2,919) (0.00) (39,522) Centrica Plc (7,808) (0.00) (1,183) Landis+Gyr Group AG (6,978) (0.00) (79,785) CNH Industrial NV_CS (54,741) (0.01)(1,318) Logitech International SA_Barclays (8,437) (0.00) (160,927) CNH Industrial NV_MS (35,959) (0.01)(7,154) Logitech International SA_GS (49,460) (0.01) (77,765) Cobham Plc (51,929) (0.01)4,894 Nestle SA_Barclays (11,310) (0.00) 7,097 Compass Group Plc_Barclays (13,105) (0.00) (8,720) Nestle SA_GS (13,383) (0.00) 33,510 Compass Group Plc_MS (20,660) (0.01)
(15,039) Nestle SA_MS (6,676) (0.00) (12,108) Croda International Plc_GS (42,545) (0.01)2,419 Novartis AG_Barclays (840) (0.00) (85,193) Croda International Plc_MS (311,333) (0.09)(2,755) Novartis AG_GS (9,459) (0.00) (224,066) Daily Mail & General Trust Plc_GS (304,281) (0.09)(1,677) OC Oerlikon Corporation AG (3,512) (0.00) (2,713) Daily Mail & General Trust Plc_JPM (5,637) (0.00) (2,313) PSP Swiss Property AG (35,398) (0.01) (4,826) Dechra Pharmaceuticals Plc (7,977) (0.00)
(942) Roche Holding AG (35,670) (0.01) 12,691 Diageo Plc_Barclays (956) (0.00) (1,302) Schindler Holding (33,056) (0.01) 11,685 Diageo Plc_GS (1,907) (0.00)
(32) SGS SA (2,472) (0.00) 6,637 Diageo Plc_MS (1,777) (0.00) (676) SGS SA_GS (60,807) (0.02) (2,593) Dialog Semiconductor Plc (6,033) (0.00)
223
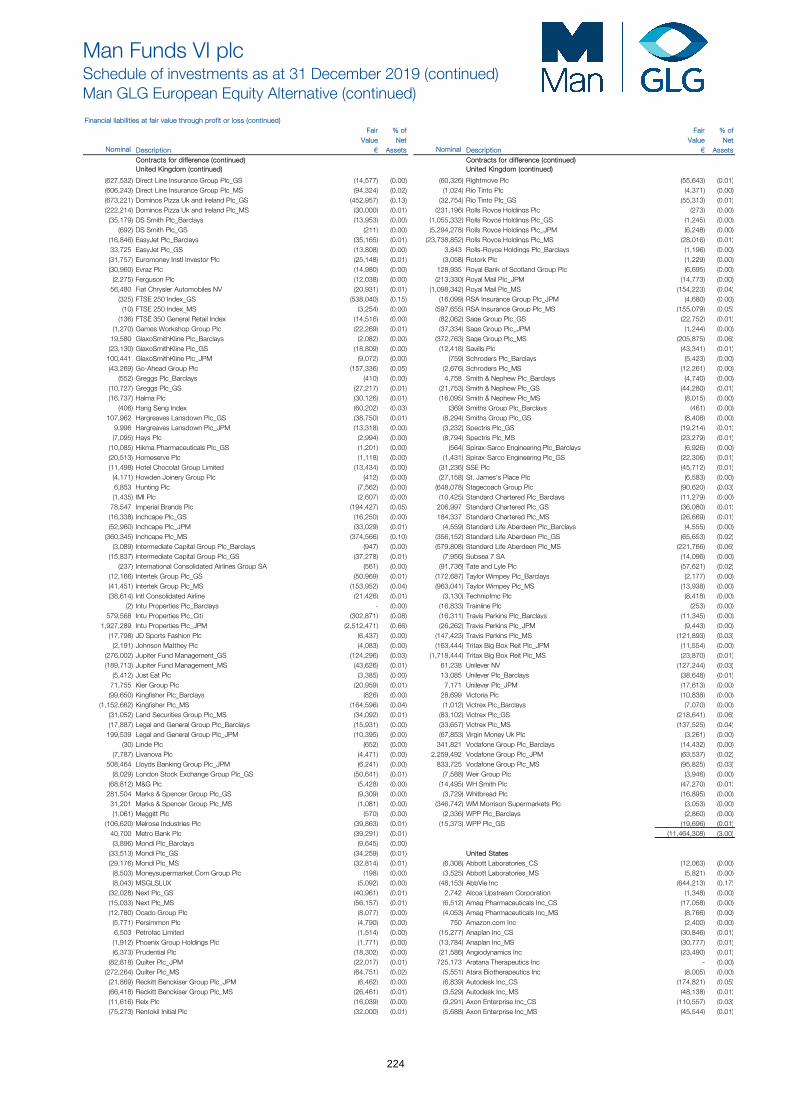
Man Funds VI plcSchedule of investments as at 31 December 2019 (continued)Man GLG European Equity Alternative (continued)
Financial liabilities at fair value through profit or loss (continued) Fair % of Fair % of
Value Net Value NetNominal Description € Assets Nominal Description € Assets
Contracts for difference (continued) Contracts for difference (continued)United Kingdom (continued) United Kingdom (continued)
(627,532) Direct Line Insurance Group Plc_GS (14,577) (0.00) (60,326) Rightmove Plc (55,643) (0.01)(606,243) Direct Line Insurance Group Plc_MS (94,324) (0.02) (1,024) Rio Tinto Plc (4,371) (0.00) (673,221) Dominos Pizza Uk and Ireland Plc_GS (452,957) (0.13) (32,754) Rio Tinto Plc_GS (55,313) (0.01)(222,214) Dominos Pizza Uk and Ireland Plc_MS (30,000) (0.01) (231,196) Rolls Royce Holdings Plc (273) (0.00)
(35,179) DS Smith Plc_Barclays (13,953) (0.00) (1,055,332) Rolls Royce Holdings Plc_GS (1,245) (0.00) (692) DS Smith Plc_GS (211) (0.00) (5,294,278) Rolls Royce Holdings Plc_JPM (6,248) (0.00)
(16,846) EasyJet Plc_Barclays (35,165) (0.01) (23,738,852) Rolls Royce Holdings Plc_MS (28,016) (0.01)33,725 EasyJet Plc_GS (13,808) (0.00) 3,843 Rolls-Royce Holdings Plc_Barclays (1,196) (0.00) (31,757) Euromoney Instl Investor Plc (25,148) (0.01) (3,058) Rotork Plc (1,229) (0.00) (30,960) Evraz Plc (14,980) (0.00) 128,935 Royal Bank of Scotland Group Plc (6,695) (0.00)
(2,275) Ferguson Plc (12,038) (0.00) (213,330) Royal Mail Plc_JPM (14,773) (0.00) 56,480 Fiat Chrysler Automobiles NV (20,931) (0.01) (1,098,342) Royal Mail Plc_MS (154,223) (0.04)
(325) FTSE 250 Index_GS (538,040) (0.15) (16,099) RSA Insurance Group Plc_JPM (4,680) (0.00) (10) FTSE 250 Index_MS (3,254) (0.00) (597,655) RSA Insurance Group Plc_MS (155,079) (0.05)
(136) FTSE 350 General Retail Index (14,516) (0.00) (82,062) Sage Group Plc_GS (22,752) (0.01)(1,270) Games Workshop Group Plc (22,269) (0.01) (37,334) Sage Group Plc_JPM (1,244) (0.00)
19,580 GlaxoSmithKline Plc_Barclays (2,082) (0.00) (372,763) Sage Group Plc_MS (205,875) (0.06)(23,130) GlaxoSmithKline Plc_GS (18,809) (0.00) (12,418) Savills Plc (43,341) (0.01)
100,441 GlaxoSmithKline Plc_JPM (9,072) (0.00) (759) Schroders Plc_Barclays (5,423) (0.00) (43,269) Go-Ahead Group Plc (157,336) (0.05) (2,676) Schroders Plc_MS (12,261) (0.00)
(552) Greggs Plc_Barclays (410) (0.00) 4,758 Smith & Nephew Plc_Barclays (4,740) (0.00) (10,727) Greggs Plc_GS (27,217) (0.01) (21,753) Smith & Nephew Plc_GS (44,280) (0.01)(16,737) Halma Plc (30,126) (0.01) (16,095) Smith & Nephew Plc_MS (8,015) (0.00)
(406) Hang Seng Index (60,202) (0.03) (369) Smiths Group Plc_Barclays (461) (0.00) 107,962 Hargreaves Lansdown Plc_GS (38,750) (0.01) (8,294) Smiths Group Plc_GS (8,408) (0.00)
9,996 Hargreaves Lansdown Plc_JPM (13,318) (0.00) (3,232) Spectris Plc_GS (19,214) (0.01)(7,095) Hays Plc (2,994) (0.00) (8,794) Spectris Plc_MS (23,279) (0.01)
(10,085) Hikma Pharmaceuticals Plc_GS (1,201) (0.00) (564) Spirax-Sarco Engineering Plc_Barclays (6,926) (0.00) (20,513) Homeserve Plc (1,118) (0.00) (1,431) Spirax-Sarco Engineering Plc_GS (22,306) (0.01)(11,498) Hotel Chocolat Group Limited (13,434) (0.00) (31,236) SSE Plc (45,712) (0.01)
(4,171) Howden Joinery Group Plc (412) (0.00) (27,158) St. James's Place Plc (6,583) (0.00) 6,853 Hunting Plc (7,562) (0.00) (648,078) Stagecoach Group Plc (90,620) (0.03)(1,435) IMI Plc (2,607) (0.00) (10,425) Standard Chartered Plc_Barclays (11,279) (0.00)
78,547 Imperial Brands Plc (194,427) (0.05) 206,997 Standard Chartered Plc_GS (36,080) (0.01)(16,338) Inchcape Plc_GS (16,250) (0.00) 184,337 Standard Chartered Plc_MS (26,669) (0.01)(52,960) Inchcape Plc_JPM (33,029) (0.01) (4,559) Standard Life Aberdeen Plc_Barclays (4,555) (0.00)
(360,345) Inchcape Plc_MS (374,566) (0.10) (356,152) Standard Life Aberdeen Plc_GS (65,653) (0.02)(3,089) Intermediate Capital Group Plc_Barclays (947) (0.00) (579,808) Standard Life Aberdeen Plc_MS (221,766) (0.06)
(15,837) Intermediate Capital Group Plc_GS (37,278) (0.01) (7,956) Subsea 7 SA (14,096) (0.00) (237) International Consolidated Airlines Group SA (561) (0.00) (91,736) Tate and Lyle Plc (57,621) (0.02)
(12,166) Intertek Group Plc_GS (50,969) (0.01) (172,687) Taylor Wimpey Plc_Barclays (2,177) (0.00) (41,451) Intertek Group Plc_MS (153,952) (0.04) (963,041) Taylor Wimpey Plc_MS (13,938) (0.00) (38,614) Intl Consolidated Airline (21,426) (0.01) (3,130) Technipfmc Plc (8,418) (0.00)
(2) Intu Properties Plc_Barclays - (0.00) (16,833) Trainline Plc (253) (0.00) 579,568 Intu Properties Plc_Citi (302,871) (0.08) (16,311) Travis Perkins Plc_Barclays (11,345) (0.00)
1,927,289 Intu Properties Plc_JPM (2,512,471) (0.66) (26,262) Travis Perkins Plc_JPM (9,443) (0.00) (17,798) JD Sports Fashion Plc (6,437) (0.00) (147,423) Travis Perkins Plc_MS (121,893) (0.03)
(2,191) Johnson Matthey Plc (4,083) (0.00) (163,444) Tritax Big Box Reit Plc_JPM (11,554) (0.00) (276,002) Jupiter Fund Management_GS (124,296) (0.03) (1,718,444) Tritax Big Box Reit Plc_MS (23,870) (0.01)(189,713) Jupiter Fund Management_MS (43,626) (0.01) 61,238 Unilever NV (127,244) (0.03)
(5,412) Just Eat Plc (3,385) (0.00) 13,085 Unilever Plc_Barclays (38,648) (0.01)71,755 Kier Group Plc (20,959) (0.01) 7,171 Unilever Plc_JPM (17,613) (0.00) (99,650) Kingfisher Plc_Barclays (826) (0.00) 28,699 Victoria Plc (10,838) (0.00)
(1,152,662) Kingfisher Plc_MS (164,596) (0.04) (1,012) Victrex Plc_Barclays (7,070) (0.00) (31,052) Land Securities Group Plc_MS (34,092) (0.01) (83,102) Victrex Plc_GS (218,641) (0.06)(17,887) Legal and General Group Plc_Barclays (15,931) (0.00) (33,657) Victrex Plc_MS (137,525) (0.04)
199,539 Legal and General Group Plc_JPM (10,395) (0.00) (67,853) Virgin Money Uk Plc (3,261) (0.00) (30) Linde Plc (652) (0.00) 341,821 Vodafone Group Plc_Barclays (14,432) (0.00)
(7,787) Livanova Plc (4,471) (0.00) 2,259,492 Vodafone Group Plc_JPM (63,537) (0.02)508,464 Lloyds Banking Group Plc_JPM (6,241) (0.00) 833,725 Vodafone Group Plc_MS (95,825) (0.03)
(8,029) London Stock Exchange Group Plc_GS (50,641) (0.01) (7,588) Weir Group Plc (3,946) (0.00) (68,812) M&G Plc (5,428) (0.00) (14,495) WH Smith Plc (47,270) (0.01)
281,504 Marks & Spencer Group Plc_GS (9,309) (0.00) (3,729) Whitbread Plc (16,895) (0.00) 31,201 Marks & Spencer Group Plc_MS (1,081) (0.00) (346,742) WM Morrison Supermarkets Plc (3,053) (0.00) (1,061) Meggitt Plc (570) (0.00) (2,336) WPP Plc_Barclays (2,860) (0.00)
(106,620) Melrose Industries Plc (39,863) (0.01) (15,373) WPP Plc_GS (19,696) (0.01)40,700 Metro Bank Plc (39,291) (0.01) (11,464,308) (3.00)(3,896) Mondi Plc_Barclays (9,645) (0.00)
(33,513) Mondi Plc_GS (34,259) (0.01) United States (29,176) Mondi Plc_MS (32,814) (0.01) (6,308) Abbott Laboratories_CS (12,063) (0.00)
(8,503) Moneysupermarket.Com Group Plc (198) (0.00) (3,525) Abbott Laboratories_MS (5,821) (0.00) (8,043) MSGLSLUX (5,092) (0.00) (48,153) AbbVie Inc (644,213) (0.17)
(32,028) Next Plc_GS (40,961) (0.01) 2,742 Alcoa Upstream Corporation (1,348) (0.00) (15,033) Next Plc_MS (56,157) (0.01) (6,512) Amag Pharmaceuticals Inc_CS (17,058) (0.00) (12,780) Ocado Group Plc (8,077) (0.00) (4,053) Amag Pharmaceuticals Inc_MS (8,766) (0.00)
(5,771) Persimmon Plc (4,790) (0.00) 750 Amazon.com Inc (2,400) (0.00) 6,503 Petrofac Limited (1,514) (0.00) (15,277) Anaplan Inc_CS (30,846) (0.01)(1,912) Phoenix Group Holdings Plc (1,771) (0.00) (13,784) Anaplan Inc_MS (30,777) (0.01)(6,373) Prudential Plc (18,302) (0.00) (21,586) Angiodynamics Inc (23,490) (0.01)
(82,818) Quilter Plc_JPM (22,017) (0.01) 725,173 Aratana Therapeutics Inc - (0.00) (272,264) Quilter Plc_MS (64,751) (0.02) (5,551) Atara Biotherapeutics Inc (8,005) (0.00)
(21,869) Reckitt Benckiser Group Plc_JPM (6,462) (0.00) (6,839) Autodesk Inc_CS (174,821) (0.05)(66,418) Reckitt Benckiser Group Plc_MS (26,461) (0.01) (3,529) Autodesk Inc_MS (48,138) (0.01)(11,616) Relx Plc (16,039) (0.00) (9,291) Axon Enterprise Inc_CS (110,557) (0.03)(75,273) Rentokil Initial Plc (32,000) (0.01) (5,688) Axon Enterprise Inc_MS (45,544) (0.01)
224
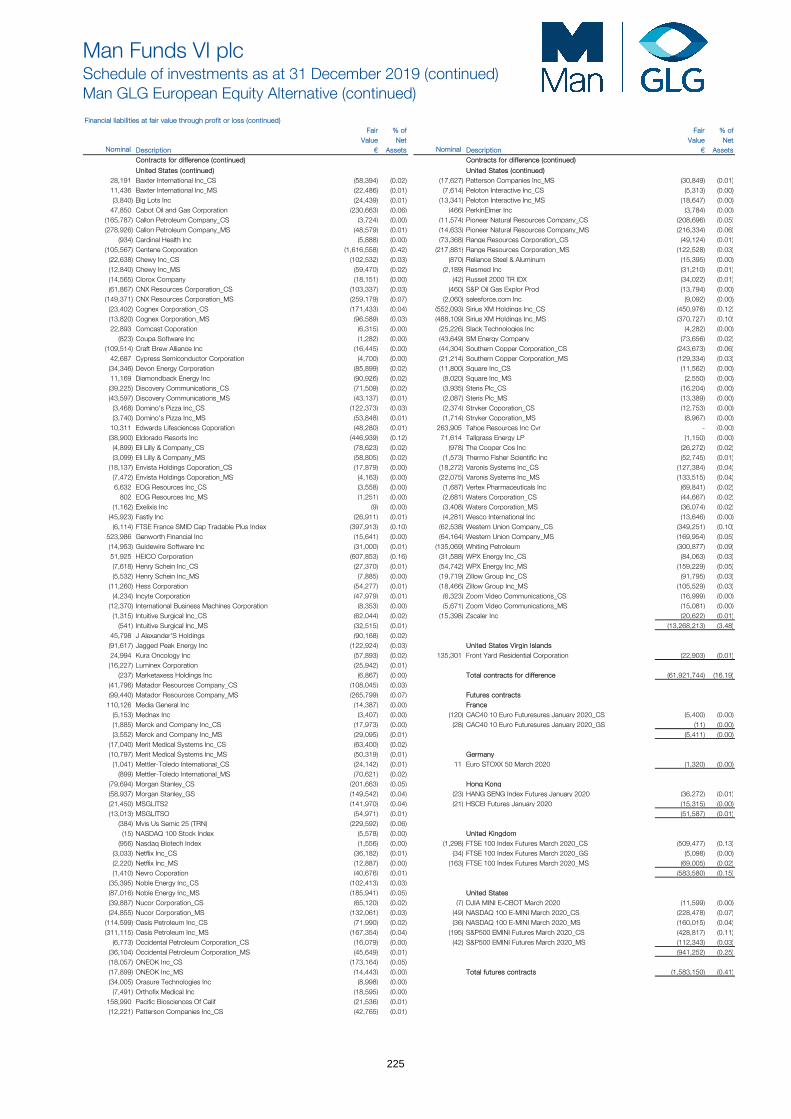
Man Funds VI plcSchedule of investments as at 31 December 2019 (continued)Man GLG European Equity Alternative (continued)
Financial liabilities at fair value through profit or loss (continued) Fair % of Fair % of
Value Net Value NetNominal Description € Assets Nominal Description € Assets
Contracts for difference (continued) Contracts for difference (continued)
United States (continued) United States (continued)28,191 Baxter International Inc_CS (58,394) (0.02) (17,627) Patterson Companies Inc_MS (30,849) (0.01)11,436 Baxter International Inc_MS (22,486) (0.01) (7,614) Peloton Interactive Inc_CS (5,313) (0.00) (3,840) Big Lots Inc (24,439) (0.01) (13,341) Peloton Interactive Inc_MS (18,647) (0.00)
47,850 Cabot Oil and Gas Corporation (230,663) (0.06) (466) PerkinElmer Inc (3,784) (0.00) (165,787) Callon Petroleum Company_CS (3,724) (0.00) (11,574) Pioneer Natural Resources Company_CS (208,696) (0.05)(278,926) Callon Petroleum Company_MS (48,579) (0.01) (14,633) Pioneer Natural Resources Company_MS (216,334) (0.06)
(934) Cardinal Health Inc (5,888) (0.00) (73,368) Range Resources Corporation_CS (49,124) (0.01)(105,567) Centene Corporation (1,616,558) (0.42) (217,881) Range Resources Corporation_MS (122,528) (0.03)
(22,638) Chewy Inc_CS (102,532) (0.03) (870) Reliance Steel & Aluminum (15,395) (0.00) (12,840) Chewy Inc_MS (59,470) (0.02) (2,189) Resmed Inc (31,210) (0.01)(14,565) Clorox Company (18,151) (0.00) (42) Russell 2000 TR IDX (34,022) (0.01)(61,867) CNX Resources Corporation_CS (103,337) (0.03) (460) S&P Oil Gas Explor Prod (13,794) (0.00)
(149,371) CNX Resources Corporation_MS (259,179) (0.07) (2,060) salesforce.com Inc (9,092) (0.00) (23,402) Cognex Corporation_CS (171,433) (0.04) (552,093) Sirius XM Holdings Inc_CS (450,976) (0.12)(13,820) Cognex Corporation_MS (96,589) (0.03) (488,109) Sirius XM Holdings Inc_MS (370,727) (0.10)22,893 Comcast Coporation (6,315) (0.00) (25,226) Slack Technologies Inc (4,282) (0.00)
(823) Coupa Software Inc (1,282) (0.00) (43,649) SM Energy Company (73,656) (0.02)(109,514) Craft Brew Alliance Inc (16,445) (0.00) (44,304) Southern Copper Corporation_CS (243,673) (0.06)
42,687 Cypress Semiconductor Corporation (4,700) (0.00) (21,214) Southern Copper Corporation_MS (129,334) (0.03)(34,346) Devon Energy Corporation (85,899) (0.02) (11,800) Square Inc_CS (11,562) (0.00) 11,169 Diamondback Energy Inc (90,926) (0.02) (8,020) Square Inc_MS (2,550) (0.00) (39,225) Discovery Communications_CS (71,509) (0.02) (3,935) Steris Plc_CS (16,204) (0.00) (43,597) Discovery Communications_MS (43,137) (0.01) (2,087) Steris Plc_MS (13,389) (0.00)
(3,468) Domino's Pizza Inc_CS (122,373) (0.03) (2,374) Stryker Coporation_CS (12,753) (0.00) (3,740) Domino's Pizza Inc_MS (53,848) (0.01) (1,714) Stryker Coporation_MS (8,967) (0.00)
10,311 Edwards Lifesciences Coporation (48,280) (0.01) 263,905 Tahoe Resources Inc Cvr - (0.00) (38,900) Eldorado Resorts Inc (446,939) (0.12) 71,614 Tallgrass Energy LP (1,150) (0.00)
(4,899) Eli Lilly & Company_CS (78,623) (0.02) (978) The Cooper Cos Inc (26,272) (0.02)(3,099) Eli Lilly & Company_MS (58,805) (0.02) (1,573) Thermo Fisher Scientific Inc (52,745) (0.01)
(18,137) Envista Holdings Coporation_CS (17,879) (0.00) (18,272) Varonis Systems Inc_CS (127,384) (0.04)(7,472) Envista Holdings Coporation_MS (4,163) (0.00) (22,075) Varonis Systems Inc_MS (133,515) (0.04)6,632 EOG Resources Inc_CS (3,558) (0.00) (1,687) Vertex Pharmaceuticals Inc (69,841) (0.02)
802 EOG Resources Inc_MS (1,251) (0.00) (2,681) Waters Corporation_CS (44,667) (0.02)(1,162) Exelixis Inc (9) (0.00) (3,408) Waters Corporation_MS (36,074) (0.02)
(45,923) Fastly Inc (26,911) (0.01) (4,281) Wesco International Inc (13,646) (0.00) (6,114) FTSE France SMID Cap Tradable Plus Index (397,913) (0.10) (62,538) Western Union Company_CS (349,251) (0.10)
523,986 Genworth Financial Inc (15,641) (0.00) (64,164) Western Union Company_MS (169,954) (0.05)(14,953) Guidewire Software Inc (31,000) (0.01) (135,069) Whiting Petroleum (300,877) (0.09)51,925 HEICO Corporation (607,853) (0.16) (31,588) WPX Energy Inc_CS (84,063) (0.03)(7,618) Henry Schein Inc_CS (27,370) (0.01) (54,742) WPX Energy Inc_MS (159,229) (0.05)(5,532) Henry Schein Inc_MS (7,885) (0.00) (19,719) Zillow Group Inc_CS (91,795) (0.03)
(11,260) Hess Corporation (54,277) (0.01) (18,466) Zillow Group Inc_MS (105,529) (0.03)(4,234) Incyte Corporation (47,979) (0.01) (6,323) Zoom Video Communications_CS (16,999) (0.00)
(12,370) International Business Machines Corporation (8,353) (0.00) (5,671) Zoom Video Communications_MS (15,081) (0.00) (1,315) Intuitive Surgical Inc_CS (62,044) (0.02) (15,398) Zscaler Inc (20,622) (0.01)
(541) Intuitive Surgical Inc_MS (32,515) (0.01) (13,268,213) (3.48)45,798 J Alexander'S Holdings (90,168) (0.02) (91,617) Jagged Peak Energy Inc (122,924) (0.03) United States Virgin Islands 24,994 Kura Oncology Inc (57,893) (0.02) 135,301 Front Yard Residential Corporation (22,903) (0.01)(16,227) Luminex Corporation (25,942) (0.01)
(237) Marketaxess Holdings Inc (6,867) (0.00) Total contracts for difference (61,921,744) (16.19)(41,796) Matador Resources Company_CS (108,045) (0.03) (99,440) Matador Resources Company_MS (265,799) (0.07) Futures contracts
110,126 Media General Inc (14,387) (0.00) France (5,153) Mednax Inc (3,407) (0.00) (120) CAC40 10 Euro Futuresures January 2020_CS (5,400) (0.00) (1,885) Merck and Company Inc_CS (17,973) (0.00) (28) CAC40 10 Euro Futuresures January 2020_GS (11) (0.00) (3,552) Merck and Company Inc_MS (29,095) (0.01) (5,411) (0.00)
(17,040) Merit Medical Systems Inc_CS (63,400) (0.02) (10,797) Merit Medical Systems Inc_MS (50,319) (0.01) Germany
(1,041) Mettler-Toledo International_CS (24,142) (0.01) 11 Euro STOXX 50 March 2020 (1,320) (0.00) (899) Mettler-Toledo International_MS (70,621) (0.02)
(79,694) Morgan Stanley_CS (201,663) (0.05) Hong Kong (58,937) Morgan Stanley_GS (149,542) (0.04) (23) HANG SENG Index Futures January 2020 (36,272) (0.01)(21,450) MSGLITS2 (141,970) (0.04) (21) HSCEI Futures January 2020 (15,315) (0.00) (13,013) MSGLITSO (54,971) (0.01) (51,587) (0.01)
(384) Mvis Us Semic 25 (TRN) (229,592) (0.06) (15) NASDAQ 100 Stock Index (5,578) (0.00) United Kingdom
(956) Nasdaq Biotech Index (1,556) (0.00) (1,298) FTSE 100 Index Futures March 2020_CS (509,477) (0.13)(3,033) Netflix Inc_CS (36,182) (0.01) (34) FTSE 100 Index Futures March 2020_GS (5,098) (0.00) (2,220) Netflix Inc_MS (12,887) (0.00) (163) FTSE 100 Index Futures March 2020_MS (69,005) (0.02)(1,410) Nevro Coporation (40,676) (0.01) (583,580) (0.15)
(35,395) Noble Energy Inc_CS (102,413) (0.03) (87,016) Noble Energy Inc_MS (185,941) (0.05) United States (39,887) Nucor Corporation_CS (65,120) (0.02) (7) DJIA MINI E-CBOT March 2020 (11,599) (0.00) (24,855) Nucor Corporation_MS (132,061) (0.03) (49) NASDAQ 100 E-MINI March 2020_CS (228,478) (0.07)
(114,599) Oasis Petroleum Inc_CS (71,990) (0.02) (36) NASDAQ 100 E-MINI March 2020_MS (160,015) (0.04)(311,115) Oasis Petroleum Inc_MS (167,354) (0.04) (195) S&P500 EMINI Futures March 2020_CS (428,817) (0.11)
(6,773) Occidental Petroleum Corporation_CS (16,079) (0.00) (42) S&P500 EMINI Futures March 2020_MS (112,343) (0.03)(36,104) Occidental Petroleum Corporation_MS (45,649) (0.01) (941,252) (0.25)(18,057) ONEOK Inc_CS (173,164) (0.05) (17,899) ONEOK Inc_MS (14,443) (0.00) Total futures contracts (1,583,150) (0.41)(34,005) Orasure Technologies Inc (8,998) (0.00)
(7,491) Orthofix Medical Inc (18,595) (0.00) 158,990 Pacific Biosciences Of Calif (21,536) (0.01)(12,221) Patterson Companies Inc_CS (42,765) (0.01)
225

Man Funds VI plcSchedule of investments as at 31 December 2019 (continued)Man GLG European Equity Alternative (continued)
Financial liabilities at fair value through profit or loss (continued) Fair % of
Value NetNominal Description € Assets
Option contractsChina
(20) Call on 2318 HK 97.5 30 March 2030 (1,463) (0.00)
France(194) Call on 180 RI FP 20 March 2020_CS (10,282) (0.00) (107) Call on 180 RI FP 20 March 2020_MS (5,672) (0.00)
(15,954) (0.00)
Hong Kong(4,543,474) Call on 60 2318 HK 27 November 2020 (16,804,408) (4.39)(4,543,474) Call on 60 2318 HK 29 October 2020 (16,740,757) (4.38)(4,543,474) Call on 60 2318 HK 30 December 2020 (16,876,001) (4.41)
(2,461) Call on 87.5 2318 HK 30 March 2020 (879,692) (0.23)(2,839,672) Put on 56 2318 HK 26 June 2021 (176,550) (0.06)(2,839,672) Put on 56 2318 HK 30 December 2020 (106,158) (0.03)(2,839,672) Put on 56 2318 HK 30 March 2021 (145,491) (0.04)(1,022,281) Put on 85 2318 HK 27 November 2020 (385,658) (0.10)(1,022,281) Put on 85 2318 HK 29 October 2020 (357,116) (0.09)(1,022,281) Put on 85 2318 HK 30 December 2020 (417,095) (0.11)
(52,888,926) (13.84)
United States(1,190) Call on 20 ARQL US 17 January 2020 (15,902) (0.00)
Total option contracts (52,922,245) (13.84)
Forward currency contracts (note 4)** Unrealised % of
loss Net Amount Receivable Amount Payable Maturity Date Contracts € Assets
DKK1,071,015 €143,369 16 January 2020 1 (29) (0.00)
€28,847 CHF31,405 10 January 2020 3 (47) (0.00)
€249,101 DKK1,861,261 16 January 2020 1 (3) (0.00)
€32,717 £27,839 10 January 2020 3 (127) (0.00)
€4,209,899 £3,586,309 16 January 2020 6 (20,332) (0.01)
€4,608 JPY562,462 16 January 2020 1 (2) (0.00)
€99,248 NOK995,987 16 January 2020 3 (1,634) (0.00)
€9,550 PLN41,057 16 January 2020 1 (98) (0.00)
£4,290,000 €5,098,839 16 January 2020 1 (38,569) (0.01)
HKD130,995,002 €15,064,376 16 January 2020 6 (105,147) (0.03)
SEK1,538,510 €147,120 10 January 2020 3 (718) (0.00)
US$84,222,711 €75,841,000 10 January 2020 11 (856,434) (0.21)
US$29,291,666 €26,305,623 16 January 2020 6 (236,652) (0.06)
Total unrealised loss on forward currency contracts (1,259,792) (0.32)
Total financial liabilities at fair value through profit or loss - trading (117,686,931) (30.76)
Total financial assets at fair value through profit or loss - trading 380,432,254 99.48
Total financial liabilities at fair value through profit or loss - trading (117,686,931) (30.76)
Other net assets 119,662,306 31.28
Net Assets Attributable to Holders of Redeemable Participating Shares 382,407,629 100.00
**The forward currency contracts are held with the Bank of New York Mellon and Morgan Stanley & Fund International Plc
Classifications:(a) Exchange traded derivative instruments(b) OTC financial derivative instruments*Transferable securities dealt on another regulated market#Transferable securities other than those listed on an official stock exchange or dealt on another regulated market
All other investments held at the year end are transferable securities listed on an official stock exchange
% of TotalAnalysis of Total Assets AssetsTransferable securities listed on an official stock exchange 43.39
Exchange traded financial derivative instruments described in classification (a) above 0.04
Transferable Securities as described in # above 0.05OTC financial derivative instruments described in classification (b) above 19.47Other current assets 37.05
100.00
Analysis of Total Assets rather than Net Assets is required under UCITS Notice 8.2 appendix B.
226
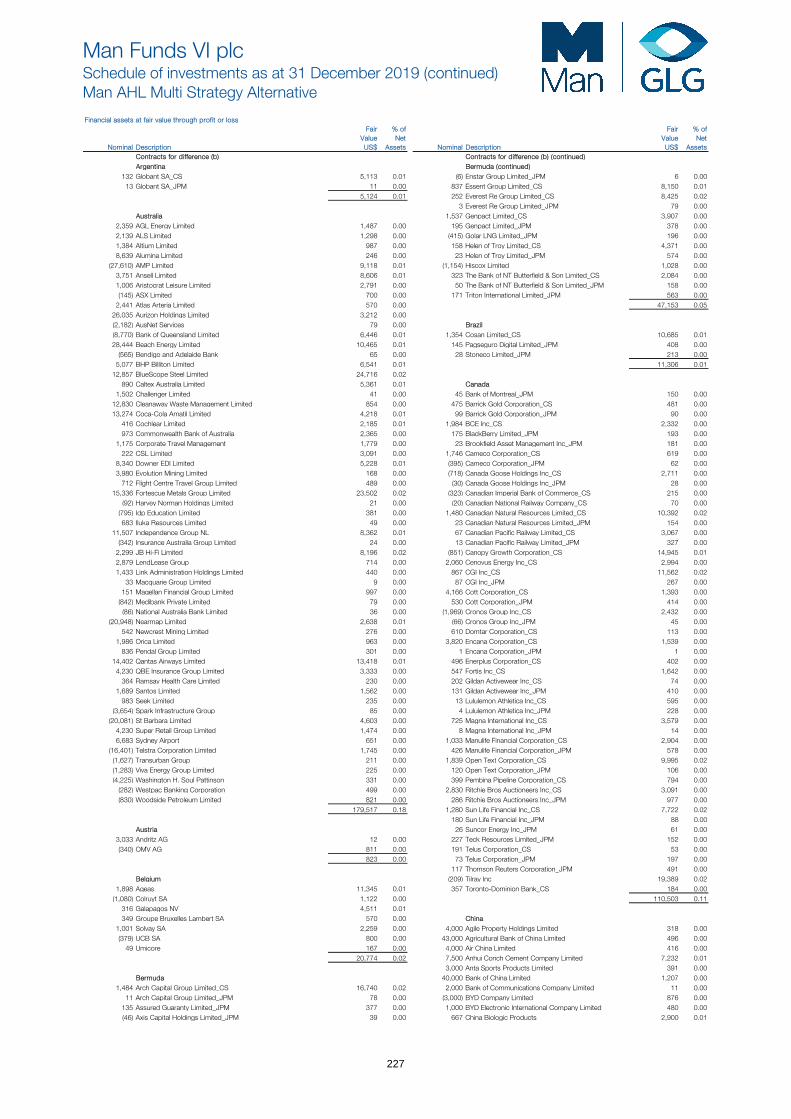
Man Funds VI plcSchedule of investments as at 31 December 2019 (continued)Man AHL Multi Strategy Alternative
Financial assets at fair value through profit or loss
Fair % of Fair % of Value Net Value Net
Nominal Description US$ Assets Nominal Description US$ Assets Contracts for difference (b) Contracts for difference (b) (continued) Argentina Bermuda (continued)
132 Globant SA_CS 5,113 0.01 (6) Enstar Group Limited_JPM 6 0.00 13 Globant SA_JPM 11 0.00 837 Essent Group Limited_CS 8,150 0.01
5,124 0.01 252 Everest Re Group Limited_CS 8,425 0.02 3 Everest Re Group Limited_JPM 79 0.00 Australia 1,537 Genpact Limited_CS 3,907 0.00
2,359 AGL Energy Limited 1,487 0.00 195 Genpact Limited_JPM 378 0.00 2,139 ALS Limited 1,298 0.00 (415) Golar LNG Limited_JPM 196 0.00 1,384 Altium Limited 987 0.00 158 Helen of Troy Limited_CS 4,371 0.00 8,639 Alumina Limited 246 0.00 23 Helen of Troy Limited_JPM 574 0.00 (27,610) AMP Limited 9,118 0.01 (1,154) Hiscox Limited 1,028 0.00 3,751 Ansell Limited 8,606 0.01 323 The Bank of NT Butterfield & Son Limited_CS 2,084 0.00 1,006 Aristocrat Leisure Limited 2,791 0.00 50 The Bank of NT Butterfield & Son Limited_JPM 158 0.00 (145) ASX Limited 700 0.00 171 Triton International Limited_JPM 563 0.00 2,441 Atlas Arteria Limited 570 0.00 47,153 0.05 26,035 Aurizon Holdings Limited 3,212 0.00 (2,182) AusNet Services 79 0.00 Brazil (8,770) Bank of Queensland Limited 6,446 0.01 1,354 Cosan Limited_CS 10,685 0.01 28,444 Beach Energy Limited 10,465 0.01 145 Pagseguro Digital Limited_JPM 408 0.00 (565) Bendigo and Adelaide Bank 65 0.00 28 Stoneco Limited_JPM 213 0.00 5,077 BHP Billiton Limited 6,541 0.01 11,306 0.01 12,857 BlueScope Steel Limited 24,716 0.02 890 Caltex Australia Limited 5,361 0.01 Canada 1,502 Challenger Limited 41 0.00 45 Bank of Montreal_JPM 150 0.00 12,830 Cleanaway Waste Management Limited 854 0.00 475 Barrick Gold Corporation_CS 481 0.00 13,274 Coca-Cola Amatil Limited 4,218 0.01 99 Barrick Gold Corporation_JPM 90 0.00 416 Cochlear Limited 2,185 0.01 1,984 BCE Inc_CS 2,332 0.00 973 Commonwealth Bank of Australia 2,365 0.00 175 BlackBerry Limited_JPM 193 0.00 1,175 Corporate Travel Management 1,779 0.00 23 Brookfield Asset Management Inc_JPM 181 0.00 222 CSL Limited 3,091 0.00 1,746 Cameco Corporation_CS 619 0.00 8,340 Downer EDI Limited 5,228 0.01 (395) Cameco Corporation_JPM 62 0.00 3,980 Evolution Mining Limited 168 0.00 (718) Canada Goose Holdings Inc_CS 2,711 0.00 712 Flight Centre Travel Group Limited 489 0.00 (30) Canada Goose Holdings Inc_JPM 28 0.00 15,336 Fortescue Metals Group Limited 23,502 0.02 (323) Canadian Imperial Bank of Commerce_CS 215 0.00 (92) Harvey Norman Holdings Limited 21 0.00 (20) Canadian National Railway Company_CS 70 0.00 (795) Idp Education Limited 381 0.00 1,480 Canadian Natural Resources Limited_CS 10,392 0.02 683 Iluka Resources Limited 49 0.00 23 Canadian Natural Resources Limited_JPM 154 0.00 11,507 Independence Group NL 8,362 0.01 67 Canadian Pacific Railway Limited_CS 3,067 0.00 (342) Insurance Australia Group Limited 24 0.00 13 Canadian Pacific Railway Limited_JPM 327 0.00 2,299 JB Hi-Fi Limited 8,196 0.02 (851) Canopy Growth Corporation_CS 14,945 0.01 2,879 LendLease Group 714 0.00 2,060 Cenovus Energy Inc_CS 2,994 0.00 1,433 Link Administration Holdings Limited 440 0.00 867 CGI Inc_CS 11,562 0.02 33 Macquarie Group Limited 9 0.00 87 CGI Inc_JPM 267 0.00 151 Magellan Financial Group Limited 997 0.00 4,166 Cott Corporation_CS 1,393 0.00 (842) Medibank Private Limited 79 0.00 530 Cott Corporation_JPM 414 0.00 (86) National Australia Bank Limited 36 0.00 (1,969) Cronos Group Inc_CS 2,432 0.00 (20,948) Nearmap Limited 2,638 0.01 (66) Cronos Group Inc_JPM 45 0.00 542 Newcrest Mining Limited 276 0.00 610 Domtar Corporation_CS 113 0.00 1,986 Orica Limited 963 0.00 3,820 Encana Corporation_CS 1,539 0.00 836 Pendal Group Limited 301 0.00 1 Encana Corporation_JPM 1 0.00 14,402 Qantas Airways Limited 13,418 0.01 496 Enerplus Corporation_CS 402 0.00 4,230 QBE Insurance Group Limited 3,333 0.00 547 Fortis Inc_CS 1,642 0.00 364 Ramsay Health Care Limited 230 0.00 202 Gildan Activewear Inc_CS 74 0.00 1,689 Santos Limited 1,562 0.00 131 Gildan Activewear Inc_JPM 410 0.00 983 Seek Limited 235 0.00 13 Lululemon Athletica Inc_CS 595 0.00 (3,654) Spark Infrastructure Group 85 0.00 4 Lululemon Athletica Inc_JPM 228 0.00 (20,081) St Barbara Limited 4,603 0.00 725 Magna International Inc_CS 3,579 0.00 4,230 Super Retail Group Limited 1,474 0.00 8 Magna International Inc_JPM 14 0.00 6,683 Sydney Airport 651 0.00 1,033 Manulife Financial Corporation_CS 2,904 0.00 (16,401) Telstra Corporation Limited 1,745 0.00 426 Manulife Financial Corporation_JPM 578 0.00 (1,627) Transurban Group 211 0.00 1,839 Open Text Corporation_CS 9,995 0.02 (1,283) Viva Energy Group Limited 225 0.00 120 Open Text Corporation_JPM 106 0.00 (4,225) Washington H. Soul Pattinson 331 0.00 399 Pembina Pipeline Corporation_CS 794 0.00 (282) Westpac Banking Corporation 499 0.00 2,830 Ritchie Bros Auctioneers Inc_CS 3,091 0.00 (830) Woodside Petroleum Limited 821 0.00 286 Ritchie Bros Auctioneers Inc_JPM 977 0.00
179,517 0.18 1,280 Sun Life Financial Inc_CS 7,722 0.02 180 Sun Life Financial Inc_JPM 88 0.00 Austria 26 Suncor Energy Inc_JPM 61 0.00
3,033 Andritz AG 12 0.00 227 Teck Resources Limited_JPM 152 0.00 (340) OMV AG 811 0.00 191 Telus Corporation_CS 53 0.00
823 0.00 73 Telus Corporation_JPM 197 0.00 117 Thomson Reuters Corporation_JPM 491 0.00 Belgium (209) Tilray Inc 19,389 0.02
1,898 Ageas 11,345 0.01 357 Toronto-Dominion Bank_CS 184 0.00 (1,080) Colruyt SA 1,122 0.00 110,503 0.11 316 Galapagos NV 4,511 0.01 349 Groupe Bruxelles Lambert SA 570 0.00 China 1,001 Solvay SA 2,259 0.00 4,000 Agile Property Holdings Limited 318 0.00 (379) UCB SA 800 0.00 43,000 Agricultural Bank of China Limited 496 0.00 49 Umicore 167 0.00 4,000 Air China Limited 416 0.00
20,774 0.02 7,500 Anhui Conch Cement Company Limited 7,232 0.01 3,000 Anta Sports Products Limited 391 0.00 Bermuda 40,000 Bank of China Limited 1,207 0.00
1,484 Arch Capital Group Limited_CS 16,740 0.02 2,000 Bank of Communications Company Limited 11 0.00 11 Arch Capital Group Limited_JPM 78 0.00 (3,000) BYD Company Limited 876 0.00 135 Assured Guaranty Limited_JPM 377 0.00 1,000 BYD Electronic International Company Limited 480 0.00 (46) Axis Capital Holdings Limited_JPM 39 0.00 667 China Biologic Products 2,900 0.01
227
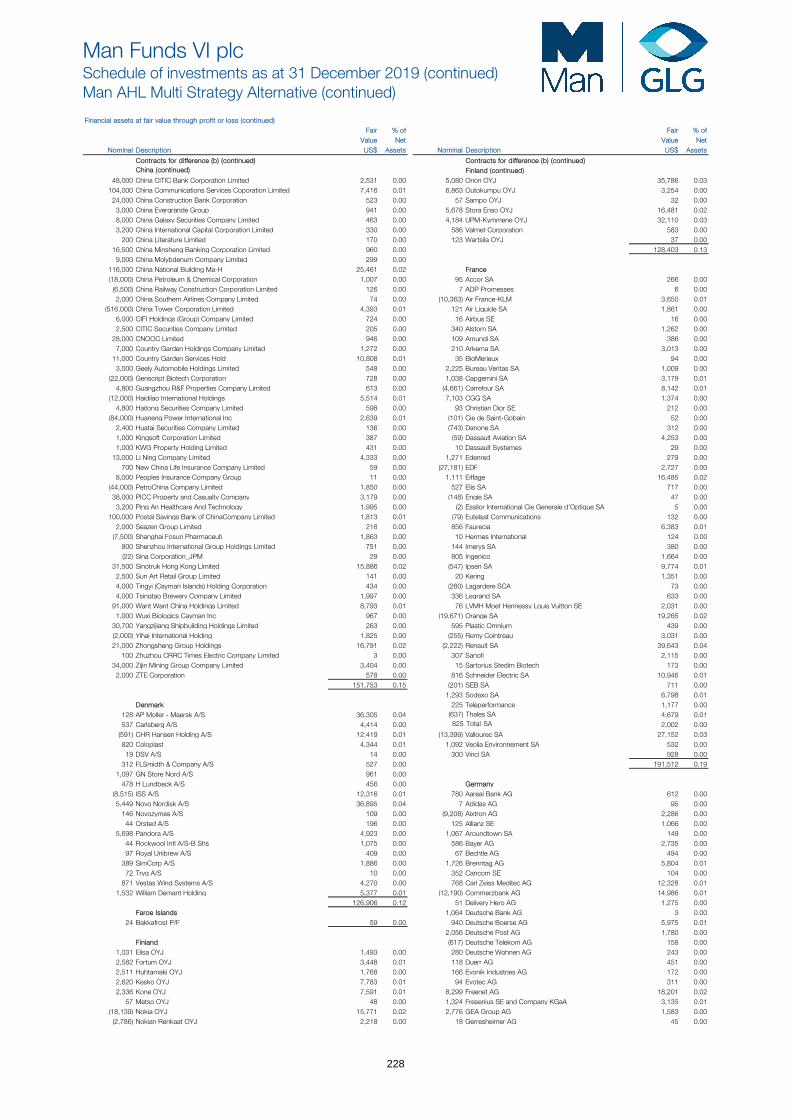
Man Funds VI plcSchedule of investments as at 31 December 2019 (continued)Man AHL Multi Strategy Alternative (continued)
Financial assets at fair value through profit or loss (continued) Fair % of Fair % of
Value Net Value Net Nominal Description US$ Assets Nominal Description US$ Assets
Contracts for difference (b) (continued) Contracts for difference (b) (continued)China (continued) Finland (continued)
48,000 China CITIC Bank Corporation Limited 2,531 0.00 5,080 Orion OYJ 35,786 0.03 104,000 China Communications Services Coporation Limited 7,416 0.01 6,863 Outokumpu OYJ 3,254 0.00
24,000 China Construction Bank Corporation 523 0.00 57 Sampo OYJ 32 0.00 3,000 China Evergrande Group 941 0.00 5,678 Stora Enso OYJ 16,481 0.02 8,000 China Galaxy Securities Company Limited 463 0.00 4,184 UPM-Kymmene OYJ 32,110 0.03 3,200 China International Capital Corporation Limited 330 0.00 586 Valmet Corporation 583 0.00
200 China Literature Limited 170 0.00 123 Wartsila OYJ 37 0.00 16,500 China Minsheng Banking Corporation Limited 960 0.00 128,403 0.13
9,000 China Molybdenum Company Limited 299 0.00 116,000 China National Building Ma-H 25,461 0.02 France
(18,000) China Petroleum & Chemical Corporation 1,007 0.00 95 Accor SA 266 0.00 (6,500) China Railway Construction Corporation Limited 126 0.00 7 ADP Promesses 6 0.00 2,000 China Southern Airlines Company Limited 74 0.00 (10,363) Air France-KLM 3,650 0.01
(516,000) China Tower Corporation Limited 4,393 0.01 121 Air Liquide SA 1,861 0.00 6,000 CIFI Holdings (Group) Company Limited 724 0.00 16 Airbus SE 16 0.00 2,500 CITIC Securities Company Limited 205 0.00 340 Alstom SA 1,262 0.00
28,000 CNOOC Limited 946 0.00 109 Amundi SA 386 0.00 7,000 Country Garden Holdings Company Limited 1,272 0.00 210 Arkema SA 3,013 0.00
11,000 Country Garden Services Hold 10,808 0.01 35 BioMerieux 94 0.00 3,000 Geely Automobile Holdings Limited 548 0.00 2,225 Bureau Veritas SA 1,009 0.00
(22,000) Genscript Biotech Corporation 728 0.00 1,038 Capgemini SA 3,179 0.01 4,800 Guangzhou R&F Properties Company Limited 613 0.00 (4,661) Carrefour SA 8,142 0.01
(12,000) Haidilao International Holdings 5,514 0.01 7,103 CGG SA 1,374 0.00 4,800 Haitong Securities Company Limited 598 0.00 93 Christian Dior SE 212 0.00
(84,000) Huaneng Power International Inc 2,639 0.01 (101) Cie de Saint-Gobain 52 0.00 2,400 Huatai Securities Company Limited 136 0.00 (743) Danone SA 312 0.00 1,000 Kingsoft Corporation Limited 387 0.00 (59) Dassault Aviation SA 4,253 0.00 1,000 KWG Property Holding Limited 431 0.00 10 Dassault Systemes 29 0.00
13,000 Li Ning Company Limited 4,333 0.00 1,271 Edenred 279 0.00 700 New China Life Insurance Company Limited 59 0.00 (27,181) EDF 2,727 0.00
8,000 Peoples Insurance Company Group 11 0.00 1,111 Eiffage 16,485 0.02 (44,000) PetroChina Company Limited 1,850 0.00 527 Elis SA 717 0.00 38,000 PICC Property and Casualty Company 3,179 0.00 (148) Engie SA 47 0.00
3,200 Ping An Healthcare And Technology 1,995 0.00 (2) Essilor International Cie Generale d'Optique SA 5 0.00 100,000 Postal Savings Bank of ChinaCompany Limited 1,813 0.01 (79) Eutelsat Communications 132 0.00
2,000 Seazen Group Limited 218 0.00 856 Faurecia 6,383 0.01 (7,500) Shanghai Fosun Pharmaceuti 1,863 0.00 10 Hermes International 124 0.00
800 Shenzhou International Group Holdings Limited 751 0.00 144 Imerys SA 380 0.00 (22) Sina Corporation_JPM 29 0.00 805 Ingenico 1,664 0.00
31,500 Sinotruk Hong Kong Limited 15,886 0.02 (547) Ipsen SA 9,774 0.01 2,500 Sun Art Retail Group Limited 141 0.00 20 Kering 1,351 0.00 4,000 Tingyi (Cayman Islands) Holding Corporation 434 0.00 (260) Lagardere SCA 73 0.00 4,000 Tsingtao Brewery Company Limited 1,997 0.00 336 Legrand SA 633 0.00
91,000 Want Want China Holdings Limited 8,793 0.01 76 LVMH Moet Hennessy Louis Vuitton SE 2,031 0.00 1,000 Wuxi Biologics Cayman Inc 967 0.00 (19,671) Orange SA 19,265 0.02
30,700 Yangzijiang Shipbuilding Holdings Limited 263 0.00 595 Plastic Omnium 439 0.00 (2,000) Yihai International Holding 1,825 0.00 (255) Remy Cointreau 3,031 0.00 21,000 Zhongsheng Group Holdings 16,791 0.02 (2,222) Renault SA 39,643 0.04
100 Zhuzhou CRRC Times Electric Company Limited 3 0.00 307 Sanofi 2,115 0.00 34,000 Zijin Mining Group Company Limited 3,404 0.00 15 Sartorius Stedim Biotech 173 0.00
2,000 ZTE Corporation 578 0.00 816 Schneider Electric SA 10,946 0.01 151,753 0.15 (201) SEB SA 711 0.00
1,293 Sodexo SA 6,798 0.01 Denmark 225 Teleperformance 1,177 0.00
128 AP Moller - Maersk A/S 36,305 0.04 4,679 0.01 537 Carlsberg A/S 4,414 0.00
(637) Thales SA825 Total SA 2,002 0.00
(591) CHR Hansen Holding A/S 12,419 0.01 (13,399) Vallourec SA 27,152 0.03 820 Coloplast 4,344 0.01 1,092 Veolia Environnement SA 532 0.00
19 DSV A/S 14 0.00 300 Vinci SA 928 0.00 312 FLSmidth & Company A/S 527 0.00 191,512 0.19
1,097 GN Store Nord A/S 961 0.00 478 H Lundbeck A/S 456 0.00 Germany
(8,515) ISS A/S 12,316 0.01 780 Aareal Bank AG 612 0.00 5,449 Novo Nordisk A/S 36,895 0.04 7 Adidas AG 95 0.00
146 Novozymes A/S 109 0.00 (9,208) Aixtron AG 2,286 0.00 44 Orsted A/S 196 0.00 125 Allianz SE 1,066 0.00
5,698 Pandora A/S 4,923 0.00 1,067 Aroundtown SA 149 0.00 44 Rockwool Intl A/S-B Shs 1,075 0.00 586 Bayer AG 2,735 0.00 97 Royal Unibrew A/S 409 0.00 67 Bechtle AG 494 0.00
389 SimCorp A/S 1,886 0.00 1,726 Brenntag AG 5,804 0.01 72 Tryg A/S 10 0.00 352 Cancom SE 104 0.00
871 Vestas Wind Systems A/S 4,270 0.00 768 Carl Zeiss Meditec AG 12,328 0.01 1,532 William Demant Holding 5,377 0.01 (12,190) Commerzbank AG 14,986 0.01
126,906 0.12 51 Delivery Hero AG 1,275 0.00 Faroe Islands 1,064 Deutsche Bank AG 3 0.00
24 Bakkafrost P/F 59 0.00 940 Deutsche Boerse AG 5,975 0.01 2,056 Deutsche Post AG 1,780 0.00
Finland (617) Deutsche Telekom AG 158 0.00 1,031 Elisa OYJ 1,493 0.00 280 Deutsche Wohnen AG 243 0.00 2,582 Fortum OYJ 3,448 0.01 118 Duerr AG 451 0.00 2,511 Huhtamaki OYJ 1,768 0.00 166 Evonik Industries AG 172 0.00 2,620 Kesko OYJ 7,783 0.01 94 Evotec AG 311 0.00 2,336 Kone OYJ 7,591 0.01 8,299 Freenet AG 18,201 0.02
57 Metso OYJ 48 0.00 1,324 Fresenius SE and Company KGaA 3,135 0.01 (18,139) Nokia OYJ 15,771 0.02 2,776 GEA Group AG 1,583 0.00
(2,786) Nokian Renkaat OYJ 2,218 0.00 18 Gerresheimer AG 45 0.00
228
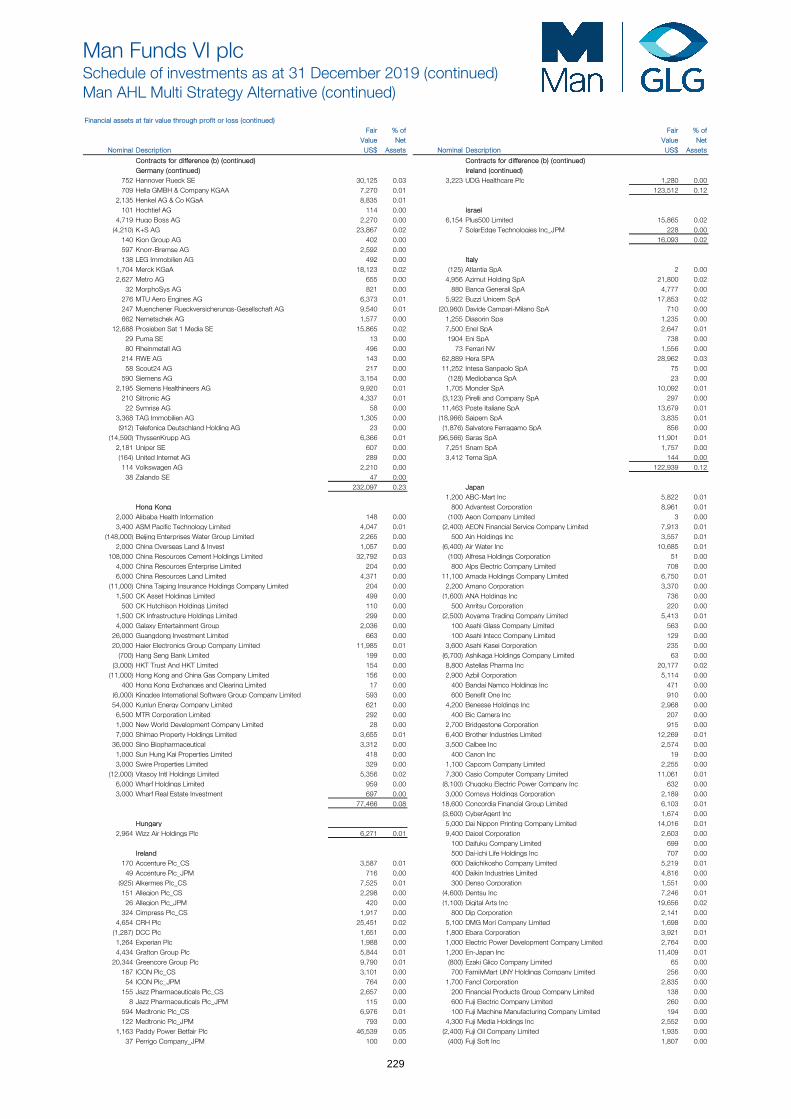
Man Funds VI plcSchedule of investments as at 31 December 2019 (continued)Man AHL Multi Strategy Alternative (continued)
Financial assets at fair value through profit or loss (continued) Fair % of Fair % of
Value Net Value Net Nominal Description US$ Assets Nominal Description US$ Assets
Contracts for difference (b) (continued) Contracts for difference (b) (continued)Germany (continued) Ireland (continued)
752 Hannover Rueck SE 30,125 0.03 3,223 UDG Healthcare Plc 1,280 0.00 709 Hella GMBH & Company KGAA 7,270 0.01 123,512 0.12 2,135 Henkel AG & Co KGaA 8,835 0.01 101 Hochtief AG 114 0.00 Israel 4,719 Hugo Boss AG 2,270 0.00 6,154 Plus500 Limited 15,865 0.02 (4,210) K+S AG 23,867 0.02 7 SolarEdge Technologies Inc_JPM 228 0.00 140 Kion Group AG 402 0.00 16,093 0.02 597 Knorr-Bremse AG 2,592 0.00 138 LEG Immobilien AG 492 0.00 Italy 1,704 Merck KGaA 18,123 0.02 (125) Atlantia SpA 2 0.00 2,627 Metro AG 655 0.00 4,956 Azimut Holding SpA 21,800 0.02 32 MorphoSys AG 821 0.00 880 Banca Generali SpA 4,777 0.00 276 MTU Aero Engines AG 6,373 0.01 5,922 Buzzi Unicem SpA 17,853 0.02 247 Muenchener Rueckversicherungs-Gesellschaft AG 9,540 0.01 (20,960) Davide Campari-Milano SpA 710 0.00 662 Nemetschek AG 1,577 0.00 1,255 Diasorin Spa 1,235 0.00 12,688 Prosieben Sat 1 Media SE 15,865 0.02 7,500 Enel SpA 2,647 0.01 29 Puma SE 13 0.00 1904 Eni SpA 738 0.00 80 Rheinmetall AG 496 0.00 73 Ferrari NV 1,556 0.00 214 RWE AG 143 0.00 62,889 Hera SPA 28,962 0.03 58 Scout24 AG 217 0.00 11,252 Intesa Sanpaolo SpA 75 0.00 590 Siemens AG 3,154 0.00 (128) Mediobanca SpA 23 0.00 2,195 Siemens Healthineers AG 9,920 0.01 1,705 Moncler SpA 10,092 0.01 210 Siltronic AG 4,337 0.01 (3,123) Pirelli and Company SpA 297 0.00 22 Symrise AG 58 0.00 11,463 Poste Italiane SpA 13,679 0.01 3,368 TAG Immobilien AG 1,305 0.00 (18,966) Saipem SpA 3,835 0.01 (912) Telefonica Deutschland Holding AG 23 0.00 (1,876) Salvatore Ferragamo SpA 856 0.00 (14,590) ThyssenKrupp AG 6,366 0.01 (96,566) Saras SpA 11,901 0.01 2,181 Uniper SE 607 0.00 7,251 Snam SpA 1,757 0.00 (164) United Internet AG 289 0.00 3,412 Terna SpA 144 0.00 114 Volkswagen AG 2,210 0.00 122,939 0.12 38 Zalando SE 47 0.00
232,097 0.23 Japan 1,200 ABC-Mart Inc 5,822 0.01 Hong Kong 800 Advantest Corporation 8,961 0.01
2,000 Alibaba Health Information 148 0.00 (100) Aeon Company Limited 3 0.00 3,400 ASM Pacific Technology Limited 4,047 0.01 (2,400) AEON Financial Service Company Limited 7,913 0.01 (148,000) Beijing Enterprises Water Group Limited 2,265 0.00 500 Ain Holdings Inc 3,557 0.01 2,000 China Overseas Land & Invest 1,057 0.00 (6,400) Air Water Inc 10,685 0.01 108,000 China Resources Cement Holdings Limited 32,792 0.03 (100) Alfresa Holdings Corporation 51 0.00 4,000 China Resources Enterprise Limited 204 0.00 800 Alps Electric Company Limited 708 0.00 6,000 China Resources Land Limited 4,371 0.00 11,100 Amada Holdings Company Limited 6,750 0.01 (11,000) China Taiping Insurance Holdings Company Limited 204 0.00 2,200 Amano Corporation 3,370 0.00 1,500 CK Asset Holdings Limited 499 0.00 (1,600) ANA Holdings Inc 736 0.00 500 CK Hutchison Holdings Limited 110 0.00 500 Anritsu Corporation 220 0.00 1,500 CK Infrastructure Holdings Limited 299 0.00 (2,500) Aoyama Trading Company Limited 5,413 0.01 4,000 Galaxy Entertainment Group 2,036 0.00 100 Asahi Glass Company Limited 563 0.00 26,000 Guangdong Investment Limited 663 0.00 100 Asahi Intecc Company Limited 129 0.00 20,000 Haier Electronics Group Company Limited 11,985 0.01 3,600 Asahi Kasei Corporation 235 0.00 (700) Hang Seng Bank Limited 199 0.00 (6,700) Ashikaga Holdings Company Limited 63 0.00 (3,000) HKT Trust And HKT Limited 154 0.00 8,800 Astellas Pharma Inc 20,177 0.02 (11,000) Hong Kong and China Gas Company Limited 156 0.00 2,900 Azbil Corporation 5,114 0.00 400 Hong Kong Exchanges and Clearing Limited 17 0.00 400 Bandai Namco Holdings Inc 471 0.00 (6,000) Kingdee International Software Group Company Limited 593 0.00 600 Benefit One Inc 910 0.00 54,000 Kunlun Energy Company Limited 621 0.00 4,200 Benesse Holdings Inc 2,968 0.00 6,500 MTR Corporation Limited 292 0.00 400 Bic Camera Inc 207 0.00 1,000 New World Development Company Limited 28 0.00 2,700 Bridgestone Corporation 915 0.00 7,000 Shimao Property Holdings Limited 3,655 0.01 6,400 Brother Industries Limited 12,269 0.01 36,000 Sino Biopharmaceutical 3,312 0.00 3,500 Calbee Inc 2,574 0.00 1,000 Sun Hung Kai Properties Limited 418 0.00 400 Canon Inc 19 0.00 3,000 Swire Properties Limited 329 0.00 1,100 Capcom Company Limited 2,255 0.00 (12,000) Vitasoy Intl Holdings Limited 5,356 0.02 7,300 Casio Computer Company Limited 11,061 0.01 6,000 Wharf Holdings Limited 959 0.00 (8,100) Chugoku Electric Power Company Inc 632 0.00 3,000 Wharf Real Estate Investment 697 0.00 3,000 Comsys Holdings Corporation 2,189 0.00
77,466 0.08 18,600 Concordia Financial Group Limited 6,103 0.01 (3,600) CyberAgent Inc 1,674 0.00 Hungary 5,000 Dai Nippon Printing Company Limited 14,016 0.01
2,964 Wizz Air Holdings Plc 6,271 0.01 9,400 Daicel Corporation 2,603 0.00 100 Daifuku Company Limited 699 0.00 Ireland 500 Dai-ichi Life Holdings Inc 707 0.00
170 Accenture Plc_CS 3,587 0.01 600 Daiichikosho Company Limited 5,219 0.01 49 Accenture Plc_JPM 716 0.00 400 Daikin Industries Limited 4,816 0.00 (925) Alkermes Plc_CS 7,525 0.01 300 Denso Corporation 1,551 0.00 151 Allegion Plc_CS 2,298 0.00 (4,600) Dentsu Inc 7,246 0.01 26 Allegion Plc_JPM 420 0.00 (1,100) Digital Arts Inc 19,656 0.02 324 Cimpress Plc_CS 1,917 0.00 800 Dip Corporation 2,141 0.00 4,654 CRH Plc 25,451 0.02 5,100 DMG Mori Company Limited 1,698 0.00 (1,287) DCC Plc 1,651 0.00 1,800 Ebara Corporation 3,921 0.01 1,264 Experian Plc 1,988 0.00 1,000 Electric Power Development Company Limited 2,764 0.00 4,434 Grafton Group Plc 5,844 0.01 1,200 En-Japan Inc 11,409 0.01 20,344 Greencore Group Plc 9,790 0.01 (800) Ezaki Glico Company Limited 65 0.00 187 ICON Plc_CS 3,101 0.00 700 FamilyMart UNY Holdings Company Limited 256 0.00 54 ICON Plc_JPM 764 0.00 1,700 Fancl Corporation 2,835 0.00 155 Jazz Pharmaceuticals Plc_CS 2,657 0.00 200 Financial Products Group Company Limited 138 0.00 8 Jazz Pharmaceuticals Plc_JPM 115 0.00 600 Fuji Electric Company Limited 260 0.00 594 Medtronic Plc_CS 6,976 0.01 100 Fuji Machine Manufacturing Company Limited 194 0.00 122 Medtronic Plc_JPM 793 0.00 4,300 Fuji Media Holdings Inc 2,552 0.00 1,163 Paddy Power Betfair Plc 46,539 0.05 (2,400) Fuji Oil Company Limited 1,935 0.00 37 Perrigo Company_JPM 100 0.00 (400) Fuji Soft Inc 1,807 0.00
229
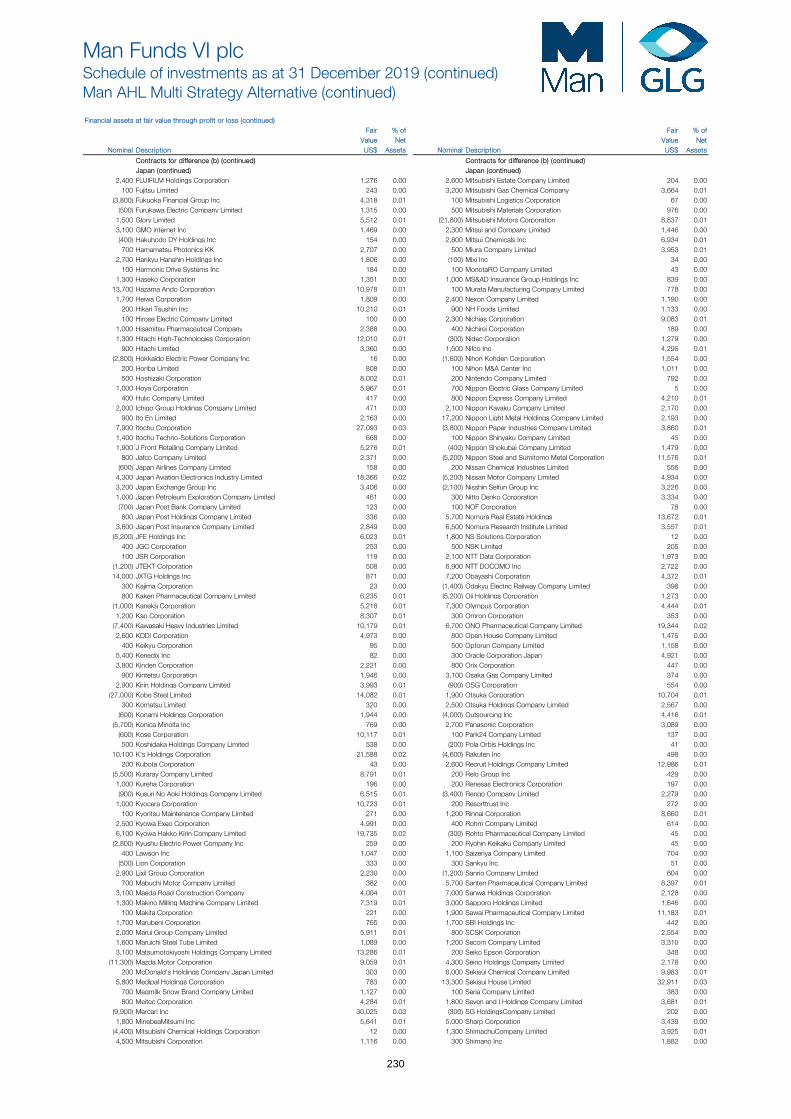
Man Funds VI plcSchedule of investments as at 31 December 2019 (continued)Man AHL Multi Strategy Alternative (continued)
Financial assets at fair value through profit or loss (continued) Fair % of Fair % of
Value Net Value Net Nominal Description US$ Assets Nominal Description US$ Assets
Contracts for difference (b) (continued) Contracts for difference (b) (continued)Japan (continued) Japan (continued)
2,400 FUJIFILM Holdings Corporation 1,276 0.00 2,600 Mitsubishi Estate Company Limited 204 0.00 100 Fujitsu Limited 243 0.00 3,200 Mitsubishi Gas Chemical Company 3,664 0.01 (3,800) Fukuoka Financial Group Inc 4,318 0.01 100 Mitsubishi Logistics Corporation 67 0.00 (500) Furukawa Electric Company Limited 1,315 0.00 500 Mitsubishi Materials Corporation 976 0.00 1,500 Glory Limited 5,512 0.01 (21,800) Mitsubishi Motors Corporation 8,837 0.01 3,100 GMO internet Inc 1,469 0.00 2,300 Mitsui and Company Limited 1,446 0.00 (400) Hakuhodo DY Holdings Inc 154 0.00 2,800 Mitsui Chemicals Inc 6,934 0.01 700 Hamamatsu Photonics KK 2,707 0.00 500 Miura Company Limited 3,953 0.01 2,700 Hankyu Hanshin Holdings Inc 1,806 0.00 (100) Mixi Inc 34 0.00 100 Harmonic Drive Systems Inc 184 0.00 100 MonotaRO Company Limited 43 0.00 1,300 Haseko Corporation 1,351 0.00 1,000 MS&AD Insurance Group Holdings Inc 839 0.00 13,700 Hazama Ando Corporation 10,978 0.01 100 Murata Manufacturing Company Limited 778 0.00 1,700 Heiwa Corporation 1,809 0.00 2,400 Nexon Company Limited 1,190 0.00 200 Hikari Tsushin Inc 10,210 0.01 900 NH Foods Limited 1,133 0.00 100 Hirose Electric Company Limited 100 0.00 2,300 Nichias Corporation 9,083 0.01 1,000 Hisamitsu Pharmaceutical Company 2,388 0.00 400 Nichirei Corporation 189 0.00 1,300 Hitachi High-Technologies Corporation 12,010 0.01 (300) Nidec Corporation 1,279 0.00 900 Hitachi Limited 3,360 0.00 1,500 Nifco Inc 4,295 0.01 (2,800) Hokkaido Electric Power Company Inc 16 0.00 (1,600) Nihon Kohden Corporation 1,554 0.00
200 Horiba Limited 808 0.00 100 Nihon M&A Center Inc 1,011 0.00 500 Hoshizaki Corporation 8,002 0.01 200 Nintendo Company Limited 792 0.00 1,000 Hoya Corporation 5,967 0.01 700 Nippon Electric Glass Company Limited 5 0.00 400 Hulic Company Limited 417 0.00 800 Nippon Express Company Limited 4,210 0.01 2,000 Ichigo Group Holdings Company Limited 471 0.00 2,100 Nippon Kayaku Company Limited 2,170 0.00 900 Ito En Limited 2,163 0.00 17,200 Nippon Light Metal Holdings Company Limited 2,193 0.00 7,900 Itochu Corporation 27,093 0.03 (3,800) Nippon Paper Industries Company Limited 3,860 0.01 1,400 Itochu Techno-Solutions Corporation 668 0.00 100 Nippon Shinyaku Company Limited 45 0.00 1,900 J Front Retailing Company Limited 5,276 0.01 (400) Nippon Shokubai Company Limited 1,479 0.00 800 Jafco Company Limited 2,371 0.00 (5,200) Nippon Steel and Sumitomo Metal Corporation 11,576 0.01 (600) Japan Airlines Company Limited 158 0.00 200 Nissan Chemical Industries Limited 556 0.00 4,300 Japan Aviation Electronics Industry Limited 18,366 0.02 (5,200) Nissan Motor Company Limited 4,934 0.00 3,200 Japan Exchange Group Inc 3,406 0.00 (2,100) Nisshin Seifun Group Inc 3,226 0.00 1,000 Japan Petroleum Exploration Company Limited 461 0.00 300 Nitto Denko Corporation 3,334 0.00 (700) Japan Post Bank Company Limited 123 0.00 100 NOF Corporation 78 0.00 800 Japan Post Holdings Company Limited 336 0.00 5,700 Nomura Real Estate Holdings 13,672 0.01 3,600 Japan Post Insurance Company Limited 2,849 0.00 6,500 Nomura Research Institute Limited 3,557 0.01 (5,200) JFE Holdings Inc 6,023 0.01 1,800 NS Solutions Corporation 12 0.00 400 JGC Corporation 253 0.00 500 NSK Limited 205 0.00 100 JSR Corporation 119 0.00 2,100 NTT Data Corporation 1,973 0.00 (1,200) JTEKT Corporation 508 0.00 6,900 NTT DOCOMO Inc 2,722 0.00 14,000 JXTG Holdings Inc 871 0.00 7,200 Obayashi Corporation 4,372 0.01 300 Kajima Corporation 23 0.00 (1,400) Odakyu Electric Railway Company Limited 398 0.00 800 Kaken Pharmaceutical Company Limited 6,235 0.01 (5,200) Oji Holdings Corporation 1,273 0.00 (1,000) Kaneka Corporation 5,218 0.01 7,300 Olympus Corporation 4,444 0.01 1,200 Kao Corporation 8,307 0.01 300 Omron Corporation 353 0.00 (7,400) Kawasaki Heavy Industries Limited 10,179 0.01 6,700 ONO Pharmaceutical Company Limited 19,344 0.02 2,600 KDDI Corporation 4,973 0.00 800 Open House Company Limited 1,475 0.00 400 Keikyu Corporation 95 0.00 500 Optorun Company Limited 1,158 0.00 5,400 Kenedix Inc 82 0.00 300 Oracle Corporation Japan 4,921 0.00 3,800 Kinden Corporation 2,221 0.00 800 Orix Corporation 447 0.00 900 Kintetsu Corporation 1,946 0.00 3,100 Osaka Gas Company Limited 374 0.00 2,900 Kirin Holdings Company Limited 3,993 0.01 (900) OSG Corporation 554 0.00 (27,000) Kobe Steel Limited 14,082 0.01 1,900 Otsuka Corporation 10,704 0.01 300 Komatsu Limited 320 0.00 2,500 Otsuka Holdings Company Limited 2,567 0.00 (600) Konami Holdings Corporation 1,944 0.00 (4,000) Outsourcing Inc 4,416 0.01 (5,700) Konica Minolta Inc 769 0.00 2,700 Panasonic Corporation 3,089 0.00 (600) Kose Corporation 10,117 0.01 100 Park24 Company Limited 137 0.00 500 Koshidaka Holdings Company Limited 538 0.00 (200) Pola Orbis Holdings Inc 41 0.00 10,100 K's Holdings Corporation 21,588 0.02 (4,600) Rakuten Inc 498 0.00 200 Kubota Corporation 43 0.00 2,600 Recruit Holdings Company Limited 12,986 0.01 (5,500) Kuraray Company Limited 8,791 0.01 200 Relo Group Inc 429 0.00 1,000 Kureha Corporation 196 0.00 200 Renesas Electronics Corporation 197 0.00 (900) Kusuri No Aoki Holdings Company Limited 6,515 0.01 (3,400) Rengo Company Limited 2,279 0.00 1,000 Kyocera Corporation 10,723 0.01 200 Resorttrust Inc 272 0.00 100 Kyoritsu Maintenance Company Limited 271 0.00 1,200 Rinnai Corporation 8,660 0.01 2,500 Kyowa Exeo Corporation 4,991 0.00 400 Rohm Company Limited 614 0.00 6,100 Kyowa Hakko Kirin Company Limited 19,735 0.02 (300) Rohto Pharmaceutical Company Limited 45 0.00 (2,800) Kyushu Electric Power Company Inc 259 0.00 200 Ryohin Keikaku Company Limited 45 0.00 400 Lawson Inc 1,047 0.00 1,100 Saizeriya Company Limited 704 0.00 (500) Lion Corporation 333 0.00 300 Sankyu Inc 51 0.00 2,900 Lixil Group Corporation 2,230 0.00 (1,200) Sanrio Company Limited 604 0.00 700 Mabuchi Motor Company Limited 382 0.00 5,700 Santen Pharmaceutical Company Limited 8,397 0.01 3,100 Maeda Road Construction Company 4,004 0.01 7,000 Sanwa Holdings Corporation 2,128 0.00 1,300 Makino Milling Machine Company Limited 7,319 0.01 3,000 Sapporo Holdings Limited 1,646 0.00 100 Makita Corporation 221 0.00 1,900 Sawai Pharmaceutical Company Limited 11,183 0.01 1,700 Marubeni Corporation 765 0.00 1,700 SBI Holdings Inc 442 0.00 2,000 Marui Group Company Limited 5,911 0.01 800 SCSK Corporation 2,554 0.00 1,600 Maruichi Steel Tube Limited 1,089 0.00 1,200 Secom Company Limited 3,310 0.00 3,100 Matsumotokiyoshi Holdings Company Limited 13,286 0.01 200 Seiko Epson Corporation 348 0.00 (11,300) Mazda Motor Corporation 9,059 0.01 4,300 Seino Holdings Company Limited 2,178 0.00 200 McDonald's Holdings Company Japan Limited 303 0.00 6,000 Sekisui Chemical Company Limited 9,983 0.01 5,800 Medipal Holdings Corporation 783 0.00 13,300 Sekisui House Limited 32,911 0.03 700 Megmilk Snow Brand Company Limited 1,127 0.00 100 Seria Company Limited 383 0.00 800 Meitec Corporation 4,284 0.01 1,800 Seven and I Holdings Company Limited 3,681 0.01 (9,900) Mercari Inc 30,025 0.03 (300) SG HoldingsCompany Limited 202 0.00 1,800 MinebeaMitsumi Inc 5,641 0.01 5,000 Sharp Corporation 3,439 0.00 (4,400) Mitsubishi Chemical Holdings Corporation 12 0.00 1,300 ShimachuCompany Limited 3,925 0.01 4,500 Mitsubishi Corporation 1,116 0.00 300 Shimano Inc 1,882 0.00
230
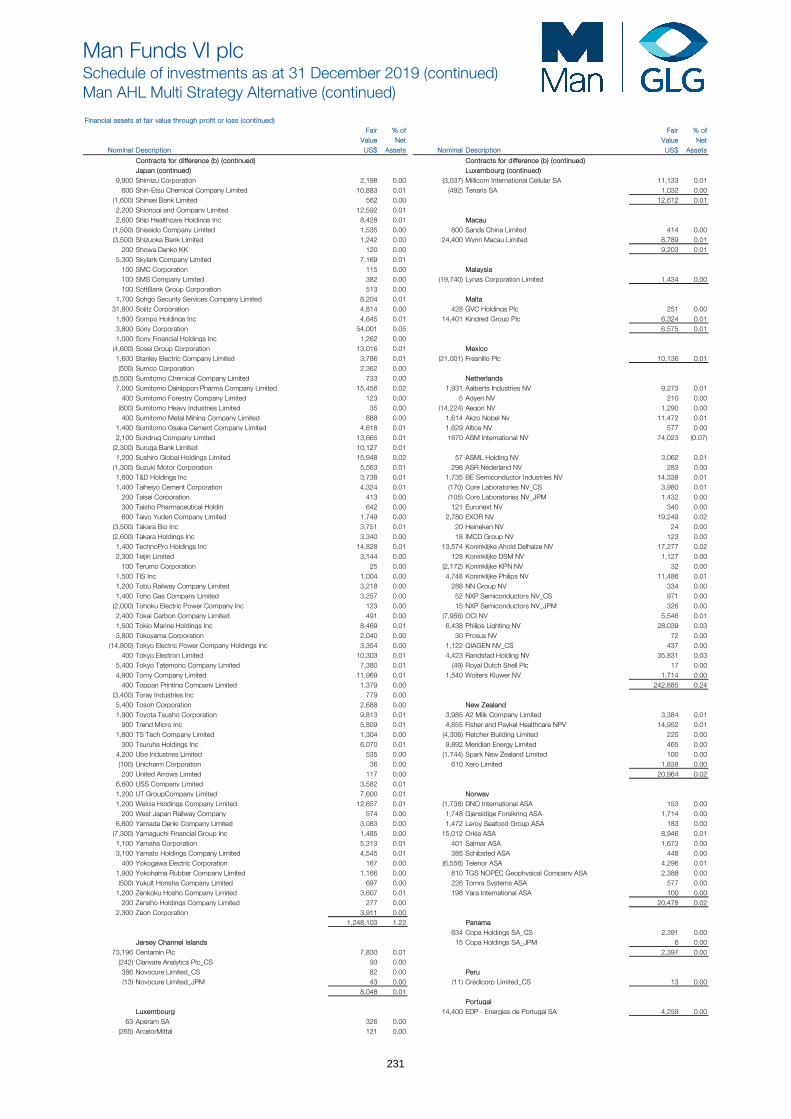
Man Funds VI plcSchedule of investments as at 31 December 2019 (continued)Man AHL Multi Strategy Alternative (continued)
Financial assets at fair value through profit or loss (continued) Fair % of Fair % of
Value Net Value Net Nominal Description US$ Assets Nominal Description US$ Assets
Contracts for difference (b) (continued) Contracts for difference (b) (continued)Japan (continued) Luxembourg (continued)
9,900 Shimizu Corporation 2,198 0.00 (3,037) Millicom International Cellular SA 11,133 0.01 600 Shin-Etsu Chemical Company Limited 10,883 0.01 (492) Tenaris SA 1,032 0.00 (1,600) Shinsei Bank Limited 562 0.00 12,612 0.01 2,200 Shionogi and Company Limited 12,592 0.01 2,600 Ship Healthcare Holdings Inc 8,428 0.01 Macau (1,500) Shiseido Company Limited 1,535 0.00 800 Sands China Limited 414 0.00 (3,500) Shizuoka Bank Limited 1,242 0.00 24,400 Wynn Macau Limited 8,789 0.01 200 Showa Denko KK 120 0.00 9,203 0.01 5,300 Skylark Company Limited 7,169 0.01 100 SMC Corporation 115 0.00 Malaysia 100 SMS Company Limited 382 0.00 (19,740) Lynas Corporation Limited 1,434 0.00 100 SoftBank Group Corporation 513 0.00 1,700 Sohgo Security Services Company Limited 8,204 0.01 Malta 31,800 Sojitz Corporation 4,814 0.00 428 GVC Holdings Plc 251 0.00 1,800 Sompo Holdings Inc 4,645 0.01 14,401 Kindred Group Plc 6,324 0.01 3,800 Sony Corporation 54,001 0.05 6,575 0.01 1,000 Sony Financial Holdings Inc 1,262 0.00 (4,600) Sosei Group Corporation 13,016 0.01 Mexico 1,600 Stanley Electric Company Limited 3,786 0.01 (21,001) Fresnillo Plc 10,136 0.01 (500) Sumco Corporation 2,362 0.00 (5,500) Sumitomo Chemical Company Limited 733 0.00 Netherlands 7,000 Sumitomo Dainippon Pharma Company Limited 15,456 0.02 1,931 Aalberts Industries NV 9,273 0.01 400 Sumitomo Forestry Company Limited 123 0.00 5 Adyen NV 210 0.00 (800) Sumitomo Heavy Industries Limited 35 0.00 (14,224) Aegon NV 1,290 0.00 400 Sumitomo Metal Mining Company Limited 888 0.00 1,614 Akzo Nobel Nv 11,472 0.01 1,400 Sumitomo Osaka Cement Company Limited 4,618 0.01 1,629 Altice NV 577 0.00 2,100 Sundrug Company Limited 13,665 0.01 1670 ASM International NV 74,023 (0.07) (2,300) Suruga Bank Limited 10,127 0.01 1,200 Sushiro Global Holdings Limited 15,948 0.02 57 ASML Holding NV 3,062 0.01 (1,300) Suzuki Motor Corporation 5,563 0.01 298 ASR Nederland NV 283 0.00 1,600 T&D Holdings Inc 3,738 0.01 1,735 BE Semiconductor Industries NV 14,338 0.01 1,400 Taiheiyo Cement Corporation 4,324 0.01 (170) Core Laboratories NV_CS 3,980 0.01 200 Taisei Corporation 413 0.00 (105) Core Laboratories NV_JPM 1,432 0.00 300 Taisho Pharmaceutical Holdin 642 0.00 121 Euronext NV 340 0.00 600 Taiyo Yuden Company Limited 1,749 0.00 2,780 EXOR NV 19,249 0.02 (3,500) Takara Bio Inc 3,751 0.01 20 Heineken NV 24 0.00 (2,600) Takara Holdings Inc 3,340 0.00 18 IMCD Group NV 123 0.00 1,400 TechnoPro Holdings Inc 14,828 0.01 13,574 Koninklijke Ahold Delhaize NV 17,277 0.02 2,300 Teijin Limited 3,144 0.00 128 Koninklijke DSM NV 1,127 0.00 100 Terumo Corporation 25 0.00 (2,172) Koninklijke KPN NV 32 0.00 1,500 TIS Inc 1,004 0.00 4,748 Koninklijke Philips NV 11,486 0.01 1,200 Tobu Railway Company Limited 3,218 0.00 288 NN Group NV 334 0.00 1,400 Toho Gas Company Limited 3,257 0.00 52 NXP Semiconductors NV_CS 971 0.00 (2,000) Tohoku Electric Power Company Inc 123 0.00 15 NXP Semiconductors NV_JPM 326 0.00 2,400 Tokai Carbon Company Limited 491 0.00 (7,956) OCI NV 5,546 0.01 1,500 Tokio Marine Holdings Inc 8,469 0.01 6,438 Philips Lighting NV 28,039 0.03 3,800 Tokuyama Corporation 2,040 0.00 30 Prosus NV 72 0.00 (14,800) Tokyo Electric Power Company Holdings Inc 3,354 0.00 1,122 QIAGEN NV_CS 437 0.00 400 Tokyo Electron Limited 10,303 0.01 4,423 Randstad Holding NV 35,831 0.03 5,400 Tokyo Tatemono Company Limited 7,380 0.01 (49) Royal Dutch Shell Plc 17 0.00 4,900 Tomy Company Limited 11,969 0.01 1,540 Wolters Kluwer NV 1,714 0.00 400 Toppan Printing Company Limited 1,379 0.00 242,885 0.24 (3,400) Toray Industries Inc 779 0.00 5,400 Tosoh Corporation 2,688 0.00 New Zealand 1,900 Toyota Tsusho Corporation 9,813 0.01 3,985 A2 Milk Company Limited 3,384 0.01 900 Trend Micro Inc 5,809 0.01 4,855 Fisher and Paykel Healthcare NPV 14,952 0.01 1,800 TS Tech Company Limited 1,304 0.00 (4,306) Fletcher Building Limited 225 0.00 300 Tsuruha Holdings Inc 6,070 0.01 9,892 Meridian Energy Limited 465 0.00 4,200 Ube Industries Limited 535 0.00 (1,744) Spark New Zealand Limited 100 0.00 (100) Unicharm Corporation 36 0.00 610 Xero Limited 1,838 0.00 200 United Arrows Limited 117 0.00 20,964 0.02 6,600 USS Company Limited 3,582 0.01 1,200 UT GroupCompany Limited 7,600 0.01 Norway 1,200 Welcia Holdings Company Limited 12,657 0.01 (1,738) DNO International ASA 153 0.00 200 West Japan Railway Company 574 0.00 1,748 Gjensidige Forsikring ASA 1,714 0.00 6,600 Yamada Denki Company Limited 3,083 0.00 1,472 Leroy Seafood Group ASA 183 0.00 (7,300) Yamaguchi Financial Group Inc 1,485 0.00 15,012 Orkla ASA 8,946 0.01 1,100 Yamaha Corporation 5,313 0.01 401 Salmar ASA 1,673 0.00 3,100 Yamato Holdings Company Limited 4,545 0.01 385 Schibsted ASA 448 0.00 400 Yokogawa Electric Corporation 167 0.00 (6,556) Telenor ASA 4,296 0.01 1,900 Yokohama Rubber Company Limited 1,166 0.00 810 TGS NOPEC Geophysical Company ASA 2,388 0.00 (500) Yukult Honsha Company Limited 697 0.00 226 Tomra Systems ASA 577 0.00 1,200 Zenkoku Hosho Company Limited 3,607 0.01 198 Yara International ASA 100 0.00 200 Zensho Holdings Company Limited 277 0.00 20,478 0.02 2,300 Zeon Corporation 3,911 0.00
1,248,103 1.22 Panama 634 Copa Holdings SA_CS 2,391 0.00 Jersey Channel Islands 15 Copa Holdings SA_JPM 6 0.00
73,196 Centamin Plc 7,830 0.01 2,397 0.00 (242) Clarivate Analytics Plc_CS 93 0.00 386 Novocure Limited_CS 82 0.00 Peru (13) Novocure Limited_JPM 43 0.00 (11) Credicorp Limited_CS 13 0.00
8,048 0.01 Portugal
Luxembourg 14,400 EDP - Energias de Portugal SA 4,259 0.00 63 Aperam SA 326 0.00 (265) ArcelorMittal 121 0.00
231
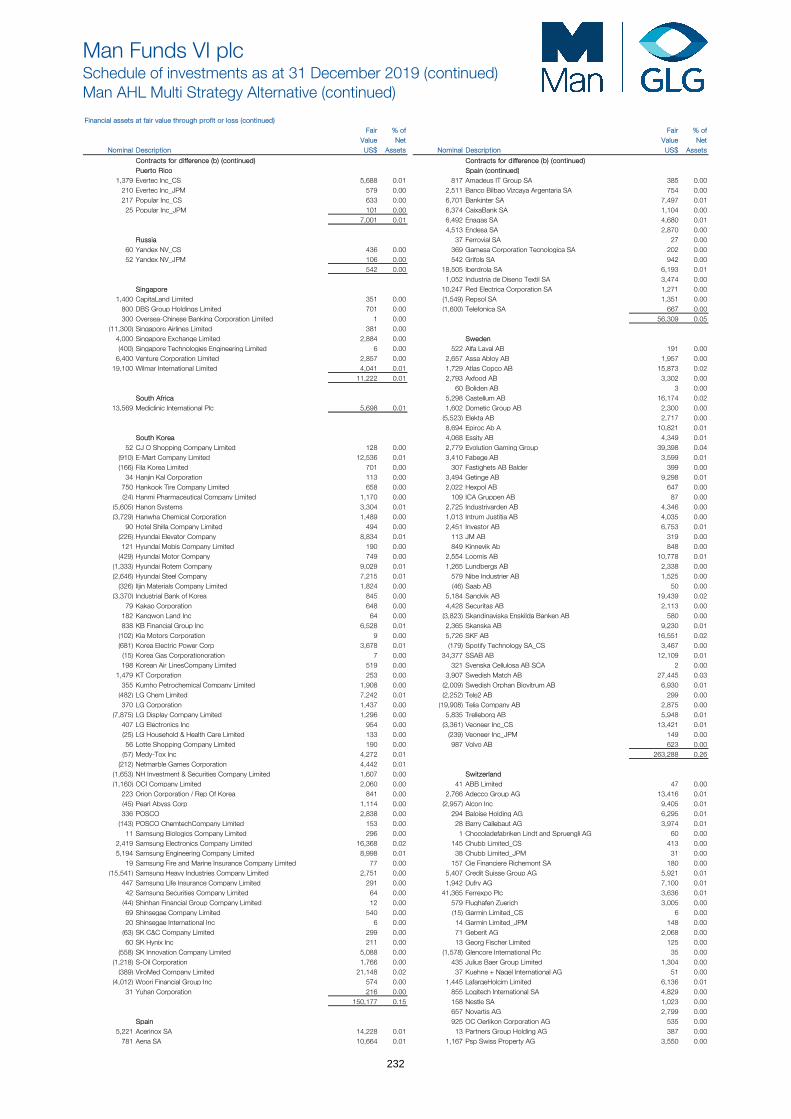
Man Funds VI plcSchedule of investments as at 31 December 2019 (continued)Man AHL Multi Strategy Alternative (continued)
Financial assets at fair value through profit or loss (continued) Fair % of Fair % of
Value Net Value Net Nominal Description US$ Assets Nominal Description US$ Assets
Contracts for difference (b) (continued) Contracts for difference (b) (continued) Puerto Rico Spain (continued)
1,379 Evertec Inc_CS 5,688 0.01 817 Amadeus IT Group SA 385 0.00 210 Evertec Inc_JPM 579 0.00 2,511 Banco Bilbao Vizcaya Argentaria SA 754 0.00 217 Popular Inc_CS 633 0.00 6,701 Bankinter SA 7,497 0.01 25 Popular Inc_JPM 101 0.00 6,374 CaixaBank SA 1,104 0.00
7,001 0.01 6,492 Enagas SA 4,680 0.01 4,513 Endesa SA 2,870 0.00 Russia 37 Ferrovial SA 27 0.00
60 Yandex NV_CS 436 0.00 369 Gamesa Corporation Tecnologica SA 202 0.00 52 Yandex NV_JPM 106 0.00 542 Grifols SA 942 0.00
542 0.00 18,505 Iberdrola SA 6,193 0.01 1,052 Industria de Diseno Textil SA 3,474 0.00 Singapore 10,247 Red Electrica Corporation SA 1,271 0.00
1,400 CapitaLand Limited 351 0.00 (1,549) Repsol SA 1,351 0.00 800 DBS Group Holdings Limited 701 0.00 (1,600) Telefonica SA 667 0.00 300 Oversea-Chinese Banking Corporation Limited 1 0.00 56,309 0.05 (11,300) Singapore Airlines Limited 381 0.00 4,000 Singapore Exchange Limited 2,884 0.00 Sweden (400) Singapore Technologies Engineering Limited 6 0.00 522 Alfa Laval AB 191 0.00 6,400 Venture Corporation Limited 2,857 0.00 2,657 Assa Abloy AB 1,957 0.00 19,100 Wilmar International Limited 4,041 0.01 1,729 Atlas Copco AB 15,873 0.02
11,222 0.01 2,793 Axfood AB 3,302 0.00 60 Boliden AB 3 0.00 South Africa 5,298 Castellum AB 16,174 0.02
13,569 Mediclinic International Plc 5,698 0.01 1,602 Dometic Group AB 2,300 0.00 (5,523) Elekta AB 2,717 0.00
8,694 Epiroc Ab A 10,821 0.01 South Korea 4,068 Essity AB 4,349 0.01
52 CJ O Shopping Company Limited 128 0.00 2,779 Evolution Gaming Group 39,398 0.04 (910) E-Mart Company Limited 12,536 0.01 3,410 Fabege AB 3,599 0.01 (166) Fila Korea Limited 701 0.00 307 Fastighets AB Balder 399 0.00 34 Hanjin Kal Corporation 113 0.00 3,494 Getinge AB 9,298 0.01 750 Hankook Tire Company Limited 658 0.00 2,022 Hexpol AB 647 0.00 (24) Hanmi Pharmaceutical Company Limited 1,170 0.00 109 ICA Gruppen AB 87 0.00 (5,605) Hanon Systems 3,304 0.01 2,725 Industrivarden AB 4,346 0.00 (3,729) Hanwha Chemical Corporation 1,489 0.00 1,013 Intrum Justitia AB 4,035 0.00 90 Hotel Shilla Company Limited 494 0.00 2,451 Investor AB 6,753 0.01 (226) Hyundai Elevator Company 8,834 0.01 113 JM AB 319 0.00 121 Hyundai Mobis Company Limited 190 0.00 849 Kinnevik Ab 848 0.00 (429) Hyundai Motor Company 749 0.00 2,554 Loomis AB 10,778 0.01 (1,333) Hyundai Rotem Company 9,029 0.01 1,265 Lundbergs AB 2,338 0.00 (2,646) Hyundai Steel Company 7,215 0.01 579 Nibe Industrier AB 1,525 0.00 (326) Iljin Materials Company Limited 1,824 0.00 (46) Saab AB 50 0.00 (3,370) Industrial Bank of Korea 845 0.00 5,184 Sandvik AB 19,439 0.02 79 Kakao Corporation 648 0.00 4,428 Securitas AB 2,113 0.00 182 Kangwon Land Inc 64 0.00 (3,823) Skandinaviska Enskilda Banken AB 580 0.00 838 KB Financial Group Inc 6,528 0.01 2,365 Skanska AB 9,230 0.01 (102) Kia Motors Corporation 9 0.00 5,726 SKF AB 16,551 0.02 (681) Korea Electric Power Corp 3,678 0.01 (179) Spotify Technology SA_CS 3,467 0.00 (15) Korea Gas Corporationoration 7 0.00 34,377 SSAB AB 12,109 0.01 198 Korean Air LinesCompany Limited 519 0.00 321 Svenska Cellulosa AB SCA 2 0.00 1,479 KT Corporation 253 0.00 3,907 Swedish Match AB 27,445 0.03 355 Kumho Petrochemical Company Limited 1,908 0.00 (2,009) Swedish Orphan Biovitrum AB 6,930 0.01 (482) LG Chem Limited 7,242 0.01 (2,252) Tele2 AB 299 0.00 370 LG Corporation 1,437 0.00 (19,908) Telia Company AB 2,875 0.00 (7,875) LG Display Company Limited 1,296 0.00 5,835 Trelleborg AB 5,948 0.01 407 LG Electronics Inc 954 0.00 (3,361) Veoneer Inc_CS 13,421 0.01 (25) LG Household & Health Care Limited 133 0.00 (239) Veoneer Inc_JPM 149 0.00 56 Lotte Shopping Company Limited 190 0.00 987 Volvo AB 623 0.00 (57) Medy-Tox Inc 4,272 0.01 263,288 0.26 (212) Netmarble Games Corporation 4,442 0.01 (1,653) NH Investment & Securities Company Limited 1,607 0.00 Switzerland (1,160) OCI Company Limited 2,060 0.00 41 ABB Limited 47 0.00 223 Orion Corporation / Rep Of Korea 841 0.00 2,766 Adecco Group AG 13,416 0.01 (45) Pearl Abyss Corp 1,114 0.00 (2,957) Alcon Inc 9,405 0.01 336 POSCO 2,838 0.00 294 Baloise Holding AG 6,295 0.01 (143) POSCO ChemtechCompany Limited 153 0.00 28 Barry Callebaut AG 3,974 0.01 11 Samsung Biologics Company Limited 296 0.00 1 Chocoladefabriken Lindt and Spruengli AG 60 0.00 2,419 Samsung Electronics Company Limited 16,368 0.02 145 Chubb Limited_CS 413 0.00 5,194 Samsung Engineering Company Limited 8,998 0.01 38 Chubb Limited_JPM 31 0.00 19 Samsung Fire and Marine Insurance Company Limited 77 0.00 157 Cie Financiere Richemont SA 180 0.00 (15,541) Samsung Heavy Industries Company Limited 2,751 0.00 5,407 Credit Suisse Group AG 5,921 0.01 447 Samsung Life Insurance Company Limited 291 0.00 1,942 Dufry AG 7,100 0.01 42 Samsung Securities Company Limited 64 0.00 41,365 Ferrexpo Plc 3,636 0.01 (44) Shinhan Financial Group Company Limited 12 0.00 579 Flughafen Zuerich 3,005 0.00 69 Shinsegae Company Limited 540 0.00 (15) Garmin Limited_CS 6 0.00 20 Shinsegae International Inc 6 0.00 14 Garmin Limited_JPM 148 0.00 (63) SK C&C Company Limited 299 0.00 71 Geberit AG 2,068 0.00 60 SK Hynix Inc 211 0.00 13 Georg Fischer Limited 125 0.00 (558) SK Innovation Company Limited 5,088 0.00 (1,578) Glencore International Plc 35 0.00 (1,218) S-Oil Corporation 1,766 0.00 435 Julius Baer Group Limited 1,304 0.00 (389) ViroMed Company Limited 21,148 0.02 37 Kuehne + Nagel International AG 51 0.00 (4,012) Woori Financial Group Inc 574 0.00 1,445 LafargeHolcim Limited 6,136 0.01 31 Yuhan Corporation 216 0.00 855 Logitech International SA 4,829 0.00
150,177 0.15 158 Nestle SA 1,023 0.00 657 Novartis AG 2,799 0.00 Spain 925 OC Oerlikon Corporation AG 535 0.00
5,221 Acerinox SA 14,228 0.01 13 Partners Group Holding AG 387 0.00 781 Aena SA 10,664 0.01 1,167 Psp Swiss Property AG 3,550 0.00
232
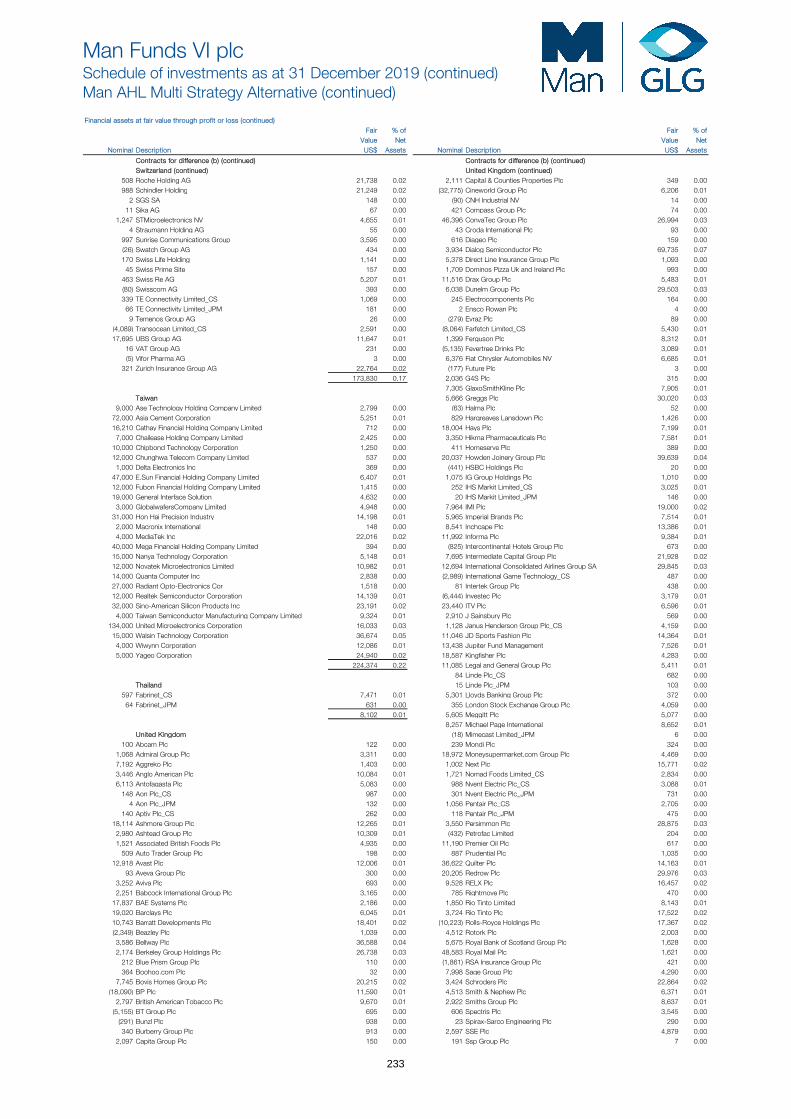
Man Funds VI plcSchedule of investments as at 31 December 2019 (continued)Man AHL Multi Strategy Alternative (continued)
Financial assets at fair value through profit or loss (continued) Fair % of Fair % of
Value Net Value Net Nominal Description US$ Assets Nominal Description US$ Assets
Contracts for difference (b) (continued) Contracts for difference (b) (continued)Switzerland (continued) United Kingdom (continued)
508 Roche Holding AG 21,738 0.02 2,111 Capital & Counties Properties Plc 349 0.00 988 Schindler Holding 21,249 0.02 (32,775) Cineworld Group Plc 6,206 0.01 2 SGS SA 148 0.00 (90) CNH Industrial NV 14 0.00 11 Sika AG 67 0.00 421 Compass Group Plc 74 0.00 1,247 STMicroelectronics NV 4,655 0.01 46,396 ConvaTec Group Plc 26,994 0.03 4 Straumann Holding AG 55 0.00 43 Croda International Plc 93 0.00 997 Sunrise Communications Group 3,595 0.00 616 Diageo Plc 159 0.00 (26) Swatch Group AG 434 0.00 3,934 Dialog Semiconductor Plc 69,735 0.07 170 Swiss Life Holding 1,141 0.00 5,378 Direct Line Insurance Group Plc 1,093 0.00 45 Swiss Prime Site 157 0.00 1,709 Dominos Pizza Uk and Ireland Plc 993 0.00 463 Swiss Re AG 5,207 0.01 11,516 Drax Group Plc 5,483 0.01 (80) Swisscom AG 393 0.00 6,038 Dunelm Group Plc 29,503 0.03 339 TE Connectivity Limited_CS 1,069 0.00 245 Electrocomponents Plc 164 0.00 66 TE Connectivity Limited_JPM 181 0.00 2 Ensco Rowan Plc 4 0.00 9 Temenos Group AG 26 0.00 (279) Evraz Plc 89 0.00 (4,089) Transocean Limited_CS 2,591 0.00 (8,064) Farfetch Limited_CS 5,430 0.01 17,695 UBS Group AG 11,647 0.01 1,399 Ferguson Plc 8,312 0.01 16 VAT Group AG 231 0.00 (5,135) Fevertree Drinks Plc 3,089 0.01 (5) Vifor Pharma AG 3 0.00 6,376 Fiat Chrysler Automobiles NV 6,685 0.01 321 Zurich Insurance Group AG 22,764 0.02 (177) Future Plc 3 0.00
173,830 0.17 2,036 G4S Plc 315 0.00 7,305 GlaxoSmithKline Plc 7,905 0.01 Taiwan 5,666 Greggs Plc 30,020 0.03
9,000 Ase Technology Holding Company Limited 2,799 0.00 (63) Halma Plc 52 0.00 72,000 Asia Cement Corporation 5,251 0.01 829 Hargreaves Lansdown Plc 1,426 0.00 16,210 Cathay Financial Holding Company Limited 712 0.00 18,004 Hays Plc 7,199 0.01 7,000 Chailease Holding Company Limited 2,425 0.00 3,350 Hikma Pharmaceuticals Plc 7,581 0.01 10,000 Chipbond Technology Corporation 1,250 0.00 411 Homeserve Plc 389 0.00 12,000 Chunghwa Telecom Company Limited 537 0.00 20,037 Howden Joinery Group Plc 39,639 0.04 1,000 Delta Electronics Inc 369 0.00 (441) HSBC Holdings Plc 20 0.00 47,000 E.Sun Financial Holding Company Limited 6,407 0.01 1,075 IG Group Holdings Plc 1,010 0.00 12,000 Fubon Financial Holding Company Limited 1,415 0.00 252 IHS Markit Limited_CS 3,025 0.01 19,000 General Interface Solution 4,632 0.00 20 IHS Markit Limited_JPM 146 0.00 3,000 GlobalwafersCompany Limited 4,948 0.00 7,964 IMI Plc 19,000 0.02 31,000 Hon Hai Precision Industry 14,198 0.01 5,965 Imperial Brands Plc 7,514 0.01 2,000 Macronix International 148 0.00 8,541 Inchcape Plc 13,386 0.01 4,000 MediaTek Inc 22,016 0.02 11,992 Informa Plc 9,384 0.01 40,000 Mega Financial Holding Company Limited 394 0.00 (825) Intercontinental Hotels Group Plc 673 0.00 15,000 Nanya Technology Corporation 5,148 0.01 7,695 Intermediate Capital Group Plc 21,928 0.02 12,000 Novatek Microelectronics Limited 10,982 0.01 12,694 International Consolidated Airlines Group SA 29,845 0.03 14,000 Quanta Computer Inc 2,838 0.00 (2,989) International Game Technology_CS 487 0.00 27,000 Radiant Opto-Electronics Cor 1,518 0.00 81 Intertek Group Plc 438 0.00 12,000 Realtek Semiconductor Corporation 14,139 0.01 (6,444) Investec Plc 3,179 0.01 32,000 Sino-American Silicon Products Inc 23,191 0.02 23,440 ITV Plc 6,596 0.01 4,000 Taiwan Semiconductor Manufacturing Company Limited 9,324 0.01 2,910 J Sainsbury Plc 569 0.00 134,000 United Microelectronics Corporation 16,033 0.03 1,128 Janus Henderson Group Plc_CS 4,159 0.00 15,000 Walsin Technology Corporation 36,674 0.05 11,046 JD Sports Fashion Plc 14,364 0.01 4,000 Wiwynn Corporation 12,086 0.01 13,438 Jupiter Fund Management 7,526 0.01 5,000 Yageo Corporation 24,940 0.02 18,587 Kingfisher Plc 4,283 0.00
224,374 0.22 11,085 Legal and General Group Plc 5,411 0.01 84 Linde Plc_CS 682 0.00 Thailand 15 Linde Plc_JPM 103 0.00
597 Fabrinet_CS 7,471 0.01 5,301 Lloyds Banking Group Plc 372 0.00 64 Fabrinet_JPM 631 0.00 355 London Stock Exchange Group Plc 4,059 0.00
8,102 0.01 5,605 Meggitt Plc 5,077 0.00 8,257 Michael Page International 8,652 0.01 United Kingdom (18) Mimecast Limited_JPM 6 0.00
100 Abcam Plc 122 0.00 239 Mondi Plc 324 0.00 1,068 Admiral Group Plc 3,311 0.00 18,972 Moneysupermarket.com Group Plc 4,469 0.00 7,192 Aggreko Plc 1,403 0.00 1,002 Next Plc 15,771 0.02 3,446 Anglo American Plc 10,084 0.01 1,721 Nomad Foods Limited_CS 2,834 0.00 6,113 Antofagasta Plc 5,083 0.00 988 Nvent Electric Plc_CS 3,088 0.01 148 Aon Plc_CS 987 0.00 301 Nvent Electric Plc_JPM 731 0.00 4 Aon Plc_JPM 132 0.00 1,056 Pentair Plc_CS 2,705 0.00 140 Aptiv Plc_CS 262 0.00 118 Pentair Plc_JPM 475 0.00 18,114 Ashmore Group Plc 12,265 0.01 3,550 Persimmon Plc 28,875 0.03 2,980 Ashtead Group Plc 10,309 0.01 (432) Petrofac Limited 204 0.00 1,521 Associated British Foods Plc 4,935 0.00 11,190 Premier Oil Plc 617 0.00 509 Auto Trader Group Plc 198 0.00 887 Prudential Plc 1,035 0.00 12,918 Avast Plc 12,006 0.01 36,622 Quilter Plc 14,163 0.01 93 Aveva Group Plc 300 0.00 20,205 Redrow Plc 29,976 0.03 3,252 Aviva Plc 693 0.00 9,528 RELX Plc 16,457 0.02 2,251 Babcock International Group Plc 3,165 0.00 785 Rightmove Plc 470 0.00 17,837 BAE Systems Plc 2,186 0.00 1,850 Rio Tinto Limited 8,143 0.01 19,020 Barclays Plc 6,045 0.01 3,724 Rio Tinto Plc 17,522 0.02 10,743 Barratt Developments Plc 18,401 0.02 (10,223) Rolls-Royce Holdings Plc 17,367 0.02 (2,349) Beazley Plc 1,039 0.00 4,512 Rotork Plc 2,003 0.00 3,586 Bellway Plc 36,588 0.04 5,675 Royal Bank of Scotland Group Plc 1,628 0.00 2,174 Berkeley Group Holdings Plc 26,738 0.03 48,583 Royal Mail Plc 1,621 0.00 212 Blue Prism Group Plc 110 0.00 (1,861) RSA Insurance Group Plc 421 0.00 364 Boohoo.com Plc 32 0.00 7,998 Sage Group Plc 4,290 0.00 7,745 Bovis Homes Group Plc 20,215 0.02 3,424 Schroders Plc 22,864 0.02 (18,090) BP Plc 11,590 0.01 4,513 Smith & Nephew Plc 6,371 0.01 2,797 British American Tobacco Plc 9,670 0.01 2,922 Smiths Group Plc 8,637 0.01 (5,155) BT Group Plc 695 0.00 606 Spectris Plc 3,545 0.00 (291) Bunzl Plc 938 0.00 23 Spirax-Sarco Engineering Plc 290 0.00 340 Burberry Group Plc 913 0.00 2,597 SSE Plc 4,879 0.00 2,097 Capita Group Plc 150 0.00 191 Ssp Group Plc 7 0.00
233
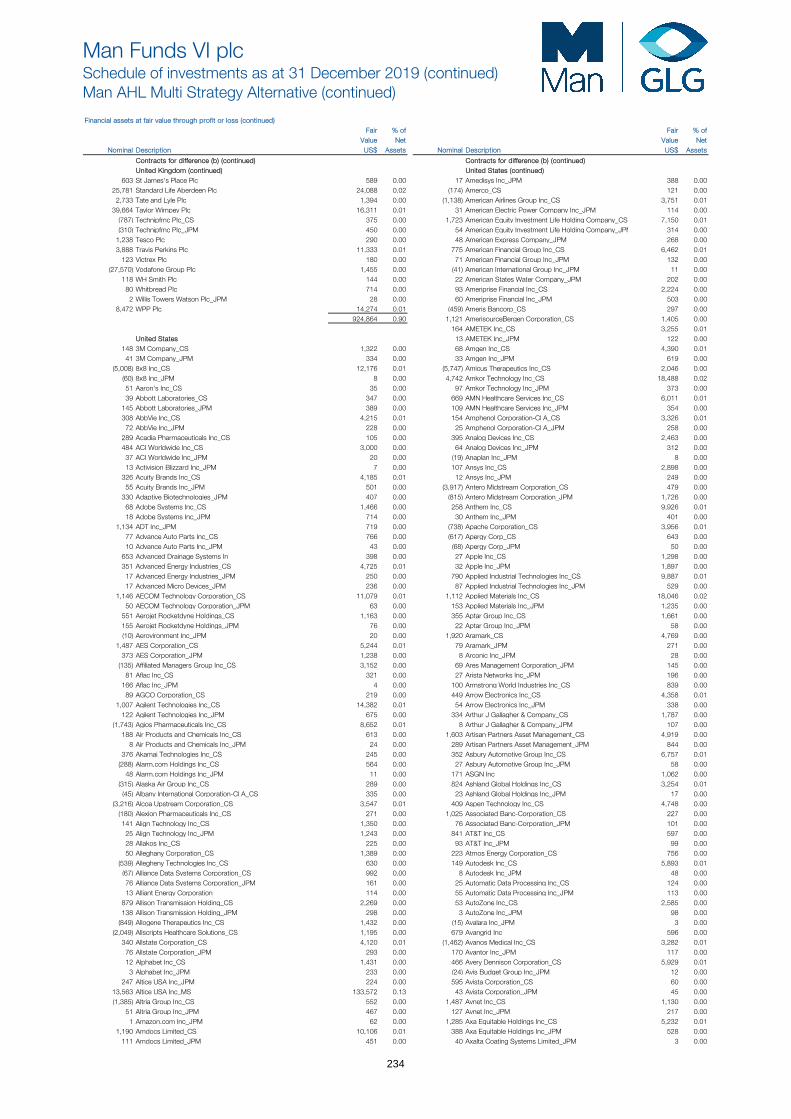
Man Funds VI plcSchedule of investments as at 31 December 2019 (continued)Man AHL Multi Strategy Alternative (continued)
Financial assets at fair value through profit or loss (continued) Fair % of Fair % of
Value Net Value Net Nominal Description US$ Assets Nominal Description US$ Assets
Contracts for difference (b) (continued) Contracts for difference (b) (continued)United Kingdom (continued) United States (continued)
603 St James's Place Plc 589 0.00 17 Amedisys Inc_JPM 388 0.00 25,781 Standard Life Aberdeen Plc 24,088 0.02 (174) Amerco_CS 121 0.00 2,733 Tate and Lyle Plc 1,394 0.00 (1,138) American Airlines Group Inc_CS 3,751 0.01 39,664 Taylor Wimpey Plc 16,311 0.01 31 American Electric Power Company Inc_JPM 114 0.00 (787) Technipfmc Plc_CS 375 0.00 1,723 American Equity Investment Life Holding Company_CS 7,150 0.01 (310) Technipfmc Plc_JPM 450 0.00 54 American Equity Investment Life Holding Company_JPM 314 0.00 1,238 Tesco Plc 290 0.00 48 American Express Company_JPM 268 0.00 3,888 Travis Perkins Plc 11,333 0.01 775 American Financial Group Inc_CS 6,462 0.01 123 Victrex Plc 180 0.00 71 American Financial Group Inc_JPM 132 0.00 (27,570) Vodafone Group Plc 1,455 0.00 (41) American International Group Inc_JPM 11 0.00 118 WH Smith Plc 144 0.00 22 American States Water Company_JPM 202 0.00 80 Whitbread Plc 714 0.00 93 Ameriprise Financial Inc_CS 2,224 0.00 2 Willis Towers Watson Plc_JPM 28 0.00 60 Ameriprise Financial Inc_JPM 503 0.00 8,472 WPP Plc 14,274 0.01 (459) Ameris Bancorp_CS 297 0.00
924,864 0.90 1,121 AmerisourceBergen Corporation_CS 1,405 0.00 164 AMETEK Inc_CS 3,255 0.01
United States 13 AMETEK Inc_JPM 122 0.00 148 3M Company_CS 1,322 0.00 68 Amgen Inc_CS 4,390 0.01 41 3M Company_JPM 334 0.00 33 Amgen Inc_JPM 619 0.00 (5,008) 8x8 Inc_CS 12,176 0.01 (5,747) Amicus Therapeutics Inc_CS 2,046 0.00 (60) 8x8 Inc_JPM 8 0.00 4,742 Amkor Technology Inc_CS 18,488 0.02 51 Aaron's Inc_CS 35 0.00 97 Amkor Technology Inc_JPM 373 0.00 39 Abbott Laboratories_CS 347 0.00 669 AMN Healthcare Services Inc_CS 6,011 0.01 145 Abbott Laboratories_JPM 389 0.00 109 AMN Healthcare Services Inc_JPM 354 0.00 308 AbbVie Inc_CS 4,215 0.01 154 Amphenol Corporation-Cl A_CS 3,326 0.01 72 AbbVie Inc_JPM 228 0.00 25 Amphenol Corporation-Cl A_JPM 258 0.00 289 Acadia Pharmaceuticals Inc_CS 105 0.00 395 Analog Devices Inc_CS 2,463 0.00 484 ACI Worldwide Inc_CS 3,000 0.00 64 Analog Devices Inc_JPM 312 0.00 37 ACI Worldwide Inc_JPM 20 0.00 (19) Anaplan Inc_JPM 8 0.00 13 Activision Blizzard Inc_JPM 7 0.00 107 Ansys Inc_CS 2,898 0.00 326 Acuity Brands Inc_CS 4,185 0.01 12 Ansys Inc_JPM 249 0.00 55 Acuity Brands Inc_JPM 501 0.00 (3,917) Antero Midstream Corporation_CS 479 0.00 330 Adaptive Biotechnologies_JPM 407 0.00 (815) Antero Midstream Corporation_JPM 1,726 0.00 68 Adobe Systems Inc_CS 1,466 0.00 258 Anthem Inc_CS 9,926 0.01 18 Adobe Systems Inc_JPM 714 0.00 30 Anthem Inc_JPM 401 0.00 1,134 ADT Inc_JPM 719 0.00 (738) Apache Corporation_CS 3,956 0.01 77 Advance Auto Parts Inc_CS 766 0.00 (617) Apergy Corp_CS 643 0.00 10 Advance Auto Parts Inc_JPM 43 0.00 (68) Apergy Corp_JPM 50 0.00 653 Advanced Drainage Systems In 398 0.00 27 Apple Inc_CS 1,298 0.00 351 Advanced Energy Industries_CS 4,725 0.01 32 Apple Inc_JPM 1,897 0.00 17 Advanced Energy Industries_JPM 250 0.00 790 Applied Industrial Technologies Inc_CS 9,887 0.01 17 Advanced Micro Devices_JPM 236 0.00 87 Applied Industrial Technologies Inc_JPM 529 0.00 1,146 AECOM Technology Corporation_CS 11,079 0.01 1,112 Applied Materials Inc_CS 18,046 0.02 50 AECOM Technology Corporation_JPM 63 0.00 153 Applied Materials Inc_JPM 1,235 0.00 551 Aerojet Rocketdyne Holdings_CS 1,163 0.00 355 Aptar Group Inc_CS 1,661 0.00 155 Aerojet Rocketdyne Holdings_JPM 76 0.00 22 Aptar Group Inc_JPM 58 0.00 (10) Aerovironment Inc_JPM 20 0.00 1,920 Aramark_CS 4,769 0.00 1,487 AES Corporation_CS 5,244 0.01 79 Aramark_JPM 271 0.00 373 AES Corporation_JPM 1,238 0.00 8 Arconic Inc_JPM 28 0.00 (135) Affiliated Managers Group Inc_CS 3,152 0.00 69 Ares Management Corporation_JPM 145 0.00 81 Aflac Inc_CS 321 0.00 27 Arista Networks Inc_JPM 196 0.00 166 Aflac Inc_JPM 4 0.00 100 Armstrong World Industries Inc_CS 839 0.00 89 AGCO Corporation_CS 219 0.00 449 Arrow Electronics Inc_CS 4,358 0.01 1,007 Agilent Technologies Inc_CS 14,382 0.01 54 Arrow Electronics Inc_JPM 338 0.00 122 Agilent Technologies Inc_JPM 675 0.00 334 Arthur J Gallagher & Company_CS 1,787 0.00 (1,743) Agios Pharmaceuticals Inc_CS 8,652 0.01 8 Arthur J Gallagher & Company_JPM 107 0.00 188 Air Products and Chemicals Inc_CS 613 0.00 1,603 Artisan Partners Asset Management_CS 4,919 0.00 8 Air Products and Chemicals Inc_JPM 24 0.00 289 Artisan Partners Asset Management_JPM 844 0.00 376 Akamai Technologies Inc_CS 245 0.00 352 Asbury Automotive Group Inc_CS 6,757 0.01 (288) Alarm.com Holdings Inc_CS 564 0.00 27 Asbury Automotive Group Inc_JPM 58 0.00 48 Alarm.com Holdings Inc_JPM 11 0.00 171 ASGN Inc 1,062 0.00 (315) Alaska Air Group Inc_CS 289 0.00 824 Ashland Global Holdings Inc_CS 3,254 0.01 (45) Albany International Corporation-Cl A_CS 335 0.00 23 Ashland Global Holdings Inc_JPM 17 0.00 (3,216) Alcoa Upstream Corporation_CS 3,547 0.01 409 Aspen Technology Inc_CS 4,748 0.00 (180) Alexion Pharmaceuticals Inc_CS 271 0.00 1,025 Associated Banc-Corporation_CS 227 0.00 141 Align Technology Inc_CS 1,350 0.00 76 Associated Banc-Corporation_JPM 101 0.00 25 Align Technology Inc_JPM 1,243 0.00 841 AT&T Inc_CS 597 0.00 28 Allakos Inc_CS 225 0.00 93 AT&T Inc_JPM 99 0.00 50 Alleghany Corporation_CS 1,389 0.00 223 Atmos Energy Corporation_CS 756 0.00 (539) Allegheny Technologies Inc_CS 630 0.00 149 Autodesk Inc_CS 5,893 0.01 (67) Alliance Data Systems Corporation_CS 992 0.00 8 Autodesk Inc_JPM 48 0.00 76 Alliance Data Systems Corporation_JPM 161 0.00 25 Automatic Data Processing Inc_CS 124 0.00 13 Alliant Energy Corporation 114 0.00 55 Automatic Data Processing Inc_JPM 113 0.00 879 Allison Transmission Holding_CS 2,269 0.00 53 AutoZone Inc_CS 2,585 0.00 138 Allison Transmission Holding_JPM 298 0.00 3 AutoZone Inc_JPM 98 0.00 (849) Allogene Therapeutics Inc_CS 1,432 0.00 (15) Avalara Inc_JPM 3 0.00 (2,049) Allscripts Healthcare Solutions_CS 1,195 0.00 679 Avangrid Inc 596 0.00 340 Allstate Corporation_CS 4,120 0.01 (1,462) Avanos Medical Inc_CS 3,282 0.01 76 Allstate Corporation_JPM 293 0.00 170 Avantor Inc_JPM 117 0.00 12 Alphabet Inc_CS 1,431 0.00 466 Avery Dennison Corporation_CS 5,929 0.01 3 Alphabet Inc_JPM 233 0.00 (24) Avis Budget Group Inc_JPM 12 0.00 247 Altice USA Inc_JPM 224 0.00 595 Avista Corporation_CS 60 0.00 13,563 Altice USA Inc_MS 133,572 0.13 43 Avista Corporation_JPM 45 0.00 (1,385) Altria Group Inc_CS 552 0.00 1,487 Avnet Inc_CS 1,130 0.00 51 Altria Group Inc_JPM 467 0.00 127 Avnet Inc_JPM 217 0.00 1 Amazon.com Inc_JPM 62 0.00 1,285 Axa Equitable Holdings Inc_CS 5,232 0.01 1,190 Amdocs Limited_CS 10,106 0.01 388 Axa Equitable Holdings Inc_JPM 528 0.00 111 Amdocs Limited_JPM 451 0.00 40 Axalta Coating Systems Limited_JPM 3 0.00
234

Man Funds VI plcSchedule of investments as at 31 December 2019 (continued)Man AHL Multi Strategy Alternative (continued)
Financial assets at fair value through profit or loss (continued) Fair % of Fair % of
Value Net Value Net Nominal Description US$ Assets Nominal Description US$ Assets
Contracts for difference (b) (continued) Contracts for difference (b) (continued)United States (continued) United States (continued)
164 Axos Financial Inc_JPM 141 0.00 (5) Cantel Medical Corporation_JPM 3 0.00 162 Bancorpsouth Bank_CS 370 0.00 73 Capital One Financial Corporation_JPM 436 0.00 99 Bank of America Corporation 479 0.00 999 Cardinal Health Inc_CS 5,658 0.01 91 Bank of Hawaii Corporation_CS 1,114 0.00 360 Carlisle Companies Inc_CS 2,136 0.00 14 Bank of Hawaii Corporation_JPM 110 0.00 32 Carlisle Companies Inc_JPM 218 0.00 457 Bank of New York Mellon Corporation_CS 1,237 0.00 219 CarMax Inc_CS 349 0.00 224 Bank of New York Mellon Corporation_JPM 339 0.00 686 Carnival Plc 1,615 0.00 49 Bank Ozk_JPM 36 0.00 62 Cars.com Inc 219 0.00 271 BankUnited Inc_CS 842 0.00 153 Carters Inc_CS 1,383 0.00 48 BankUnited Inc_JPM 64 0.00 61 Carters Inc_JPM 827 0.00 390 Banner Corporation_CS 197 0.00 488 Catalent Inc_CS 4,736 0.01 9 Barnes Group Inc_JPM 6 0.00 53 Caterpillar Inc_CS 887 0.00 116 Baxter International Inc_JPM 325 0.00 60 Caterpillar Inc_JPM 576 0.00 1,719 Beacon Roofing Supply Inc_CS 2,359 0.00 171 Cathay General Bancorp_CS 520 0.00 229 Becton Dickinson and Company_CS 6,049 0.01 23 Cathay General Bancorp_JPM 23 0.00 42 Becton Dickinson and Company_JPM 876 0.00 5 CBOE Holdings Inc_JPM 111 0.00 121 Bed Bath & Beyond Inc_JPM 189 0.00 4 CBRE Group Inc_JPM 35 0.00 44 Belden Inc_JPM 75 0.00 67 CDK Global Inc_JPM 48 0.00 36 Berry Global Group Inc_JPM 206 0.00 156 CDW Corporation_CS 5,631 0.01 156 Best Buy Company Inc_CS 76 0.00 40 CDW Corporation_JPM 777 0.00 49 Best Buy Company Inc_JPM 698 0.00 126 Celanese Corporation_CS 3,085 0.00 (1,167) Beyond Meat Inc_CS 3,503 0.01 140 Centene Corporation_CS 2,494 0.00 (18) Beyond Meat Inc_JPM 27 0.00 121 Centene Corporation_JPM 731 0.00 886 BGC Partners Inc_JPM 154 0.00 (2,746) CenterPoint Energy Inc_CS 3,557 0.01 31 BioMarin Pharmaceutical Inc_JPM 85 0.00 (20) CenterPoint Energy Inc_JPM 27 0.00 212 Bio-Rad Laboratories Inc_CS 9,936 0.01 4 Ceridian HCM Holding Inc_JPM 30 0.00 27 Bio-Rad Laboratories Inc_JPM 279 0.00 93 Cerner Corporation_JPM 345 0.00 39 Bio-Techne Corporation_CS 1,014 0.00 33 CF Industries Holdings Inc_JPM 33 0.00 31 Bio-Techne Corporation_JPM 167 0.00 146 Charles River Laboratories International Inc_CS 2,055 0.00 55 Biotelemetry Inc_JPM 45 0.00 60 Charles River Laboratories International Inc_JPM 662 0.00 (3,353) BJ's Wholesale Club Holdings Inc_CS 6,862 0.01 319 Charles Schwab Corporation_CS 3,317 0.01 21 Black Knight Inc_CS 35 0.00 243 Charles Schwab Corporation_JPM 660 0.00 82 Black Knight Inc_JPM 254 0.00 (1,326) Chart Industries Inc_CS 5,349 0.01 (262) Blackbaud Inc_CS 2,883 0.00 47 Charter Communications Inc_CS 326 0.00 365 Blackline Inc_CS 460 0.00 6 Charter Communications Inc_JPM 67 0.00 (25) Blackline Inc_JPM 20 0.00 212 Chemed Corporation_CS 19,111 0.02 3 BlackRock Inc_CS 242 0.00 15 Chemed Corporation_JPM 427 0.00 7 BlackRock Inc_JPM 157 0.00 137 Chemours Company_JPM 85 0.00 9 Blackstone Group Inc/The_JPM 81 0.00 (108) Cheniere Energy Inc_CS 478 0.00 964 Bloomin Brands Inc_CS 3,698 0.01 (155) Cheniere Energy Inc_JPM 459 0.00 420 Bloomin Brands Inc_JPM 527 0.00 309 Chevron Corporation_CS 1,280 0.00 (876) Bluebird Bio Inc_CS 27,676 0.03 9 Chevron Corporation_JPM - 0.00 (157) Boeing Company_CS 3,906 0.01 1 Chipotle Mexican Grill Inc_JPM 131 0.00 9 Booking Holdings Inc_CS 911 0.00 337 Choice Hotels International Inc_CS 5,494 0.01 2 Booking Holdings Inc_JPM 295 0.00 7 Choice Hotels International Inc_JPM 111 0.00 37 Booz Allen Hamilton Holding Corporation_CS 158 0.00 804 Church & Dwight Company Inc_CS 726 0.00 727 BorgWarner Inc_CS 1,687 0.00 10 Churchill Downs Inc_JPM 371 0.00 (20) BorgWarner Inc_JPM 10 0.00 627 Ciena Corporation_CS 129 0.00 (3) Boston Beer Company Inc_JPM 4 0.00 104 Ciena Corporation_JPM 82 0.00 1,297 Boston Scientific Corporation_CS 4,351 0.01 245 Cigna Corporation_CS 10,623 0.01 42 Boston Scientific Corporation_JPM 230 0.00 45 Cigna Corporation_JPM 698 0.00 5 Bottomline Technologies de Inc_JPM 29 0.00 (110) Cimarex Energy Company_JPM 57 0.00 (737) Box Inc_CS 2,094 0.00 451 Cincinnati Financial Corporation_CS 9,104 0.01 (72) Box Inc_JPM 22 0.00 19 Cintas Corporation_CS 213 0.00 171 Boyd Gaming Corporation_JPM 175 0.00 40 Cintas Corporation_JPM 577 0.00 1,951 Brady Corporation_CS 14,633 0.01 311 Cirrus Logic Inc_CS 13,569 0.01 174 Brady Corporation_JPM 640 0.00 76 Cirrus Logic Inc_JPM 2,125 0.00 77 Bright Horizons Family Solutions Inc_CS 65 0.00 1,476 Cisco Systems Inc_CS 719 0.00 7 Bright Horizons Family Solutions Inc_JPM 161 0.00 23 CIT Group Inc_JPM 21 0.00 387 Brinker International Inc_CS 642 0.00 31 Citigroup Inc_CS 329 0.00 (161) Brinks Company_CS 90 0.00 53 Citigroup Inc_JPM 444 0.00 175 Bristol-Myers Squibb Company_CS 3,085 0.00 59 Citizens Financial Group_JPM 260 0.00 61 Bristol-Myers Squibb Company_JPM 472 0.00 232 Citrix Systems Inc_CS 4,034 0.01 93 Broadcom Inc_CS 2,713 0.00 59 Citrix Systems Inc_JPM 112 0.00 23 Broadcom Inc_JPM 516 0.00 604 Clean Harbors Inc_CS 2,488 0.00 59 Brooks Automation Inc_JPM 60 0.00 14 Clean Harbors Inc_JPM 129 0.00 514 Brown & Brown Inc_CS 1,648 0.00 566 Cleveland-Cliffs Inc_JPM 397 0.00 10 Brown & Brown Inc_JPM 88 0.00 25 Clorox Company_JPM 80 0.00 110 Brown-Forman Corporation_JPM 822 0.00 (191) CME Group Inc_CS 989 0.00 1,185 Bruker Corporation_CS 9,690 0.01 1,324 CMS Energy Corporation_CS 4,788 0.00 135 Bruker Corporation_JPM 165 0.00 15 CMS Energy Corporation_JPM 125 0.00 3,317 Builders FirstSource Inc_CS 25,970 0.03 1,177 CNO Financial Group Inc_CS 2,714 0.00 348 Builders FirstSource Inc_JPM 751 0.00 360 CNO Financial Group Inc_JPM 305 0.00 121 Burlington Stores Inc_CS 3,190 0.01 27 Coca-Cola Bottling Co Consol_JPM 202 0.00 2 Burlington Stores Inc_JPM 9 0.00 215 Coca-Cola Company_CS 576 0.00 905 BWX Technologies Inc_CS 1,491 0.00 30 Coca-Cola Company_JPM 283 0.00 18 BWX Technologies Inc_JPM 62 0.00 1,006 Cogent Communications Holdings Inc_CS 5,866 0.01 27 C.H. Robinson Worldwide Inc_JPM 40 0.00 241 Cognex Corporation_CS 1,423 0.00 1,649 Cabot Corporation_CS 9,787 0.01 130 Cognizant Technology Solutions Corporation_CS 210 0.00 10 Cabot Corporation_JPM 5 0.00 172 Coherent Inc_CS 1,971 0.00 69 CACI International Inc_CS 2,789 0.00 2 Coherent Inc_JPM 6 0.00 33 CACI International Inc_JPM 617 0.00 827 Colgate-Palmolive Company_CS 2,156 0.00 (19) Cadence BanCorp_JPM 18 0.00 162 Columbia Banking System Inc_CS 1,039 0.00 824 Cadence Design Systems Inc_CS 5,471 0.01 129 Comcast Corporation 143 0.00 66 Cadence Design Systems Inc_JPM 128 0.00 200 Comerica Inc_CS 299 0.00 538 Campbell Soup Company_CS 1,423 0.00 30 Comerica Inc_JPM 98 0.00 253 Campbell Soup Company_JPM 840 0.00 712 Commercial Metals Company_CS 1,332 0.00 (100) Cantel Medical Corporation_CS 6 0.00 155 Conagra Foods Inc_JPM 228 0.00
235

Man Funds VI plcSchedule of investments as at 31 December 2019 (continued)Man AHL Multi Strategy Alternative (continued)
Financial assets at fair value through profit or loss (continued) Fair % of Fair % of
Value Net Value Net Nominal Description US$ Assets Nominal Description US$ Assets
Contracts for difference (b) (continued) Contracts for difference (b) (continued)United States (continued) United States (continued)
(103) Concho Resources Inc_JPM 158 0.00 (10) Eagle Bancorp Inc_JPM 12 0.00 (6,281) Conduent Inc_CS 1,964 0.00 322 Eastman Chemical Company_CS 1,532 0.00 491 CONMED Corporation_CS 3,014 0.00 465 Eaton Corporation Plc_CS 4,010 0.01 314 ConocoPhillips_CS 293 0.00 97 Eaton Corporation Plc_JPM 564 0.00 19 ConocoPhillips_JPM 187 0.00 690 Eaton Vance Corporation_CS 1,714 0.00 17 Consolidated Edison Inc_JPM 48 0.00 34 Eaton Vance Corporation_JPM 25 0.00 (716) Constellation Brands Inc_CS 2,353 0.00 997 EchoStar Corporation_CS 9,508 0.01 126 Cooper Companies Inc_CS 163 0.00 113 EchoStar Corporation_JPM 548 0.00 28 Cooper Companies Inc_JPM 317 0.00 70 Ecolab Inc_CS 1,441 0.00 (93) Cooper Tire & Rubber Company_JPM 30 0.00 11 Ecolab Inc_JPM 55 0.00 1,438 Copart Inc_CS 25,698 0.03 222 Edwards Lifesciences Corporation_CS 39 0.00 25 Copart Inc_JPM 361 0.00 9 Edwards Lifesciences Corporation_JPM 359 0.00 1,118 CoreLogic Inc_CS 3,882 0.01 (848) Elanco Animal Health Inc_CS 2,496 0.00 166 CoreLogic Inc_JPM 486 0.00 (750) Elastic NV_CS 8,296 0.01 (479) Corning Inc_CS 1,020 0.00 (22) Elastic NV_JPM 3 0.00 32 Corning Inc_JPM 27 0.00 10 Eldorado Resorts Inc_JPM 101 0.00 3 CoStar Group Inc_JPM 20 0.00 733 Electronic Arts Inc_CS 5,798 0.01 21 Costco Wholesale Corporation_JPM 140 0.00 39 Electronic Arts Inc_JPM 80 0.00 (2,907) Coty Inc_CS 1,470 0.00 32 Eli Lilly & Company_JPM 667 0.00 (932) Coty Inc_JPM 95 0.00 985 EMCOR Group Inc_CS 7,621 0.01 (61) Coupa Software Inc_CS 86 0.00 (1,649) Emergent BioSolutions Inc_CS 772 0.00 (7) Coupa Software Inc_JPM 25 0.00 587 Emerson Electric Company_CS 2,857 0.00 (483) Covanta Holding Corporation_CS 1,308 0.00 116 Emerson Electric Company_JPM 510 0.00 (33) Cracker Barrel Old Country Store Inc_CS 62 0.00 42 Encompass Health Corp_JPM 112 0.00 305 Crane Company_CS 1,700 0.00 (6,231) EnLink Midstream LLC_CS 8,654 0.01 67 Crane Company_JPM 326 0.00 (1,492) EnLink Midstream LLC_JPM 3,060 0.00 9 Credit Acceptance Corporation_CS 53 0.00 242 Enpro Industries Inc_CS 348 0.00 (1,235) Cree Inc_CS 699 0.00 59 Enpro Industries Inc_JPM 51 0.00 (22) Cree Inc_JPM 45 0.00 932 Entegris Inc_CS 3,556 0.01 523 Crown Holdings Inc_CS 1,687 0.00 37 Entegris Inc_JPM 164 0.00 82 CSX Corporation_JPM 78 0.00 9 Entergy Corporation_JPM 201 0.00 (19) Cubic Corporation_JPM 117 0.00 (27) Envestnet Inc_JPM 39 0.00 39 Cummins Inc_JPM 107 0.00 333 Envista Holdings Corporation_CS 152 0.00 446 Curtiss-Wright Corporation_CS 11,664 0.01 303 Envista Holdings Corporation_JPM 383 0.00 64 Curtiss-Wright Corporation_JPM 400 0.00 415 EOG Resources Inc_CS 2,800 0.00 (598) CVB Financial Corporation_CS 106 0.00 9 EOG Resources Inc_JPM 145 0.00 20 CVB Financial Corporation_JPM 2 0.00 17 EPAM Systems Inc_JPM 300 0.00 (10) CVR Energy Inc_JPM 4 0.00 (3,381) EQT Corporation_CS 6,123 0.01 615 CVS Health Corporation_CS 270 0.00 (201) EQT Corporation_JPM 362 0.00 92 CVS Health Corporation_JPM 115 0.00 (3,352) Equitrans Midstrea Com NPV WI_CS 2,699 0.00 1,304 D.R. Horton Inc_CS 3,711 0.01 (764) Equitrans Midstrea Com NPV WI_JPM 1,540 0.00 23 Danaher Corporation_CS 358 0.00 (71) Erie Indemnity Company_CS 174 0.00 12 Danaher Corporation_JPM 136 0.00 545 Esco Technologies Inc 2,229 0.00 3,467 Darling Ingredients Inc_CS 26,441 0.03 96 Estee Lauder Companies Inc_CS 1,519 0.00 229 DaVita Inc_CS 1,437 0.00 691 E-Trade Financial Corporation_CS 2,878 0.00 91 DaVita Inc_JPM 365 0.00 216 E-Trade Financial Corporation_JPM 407 0.00 37 Deckers Outdoor Corporation_JPM 497 0.00 (641) Etsy Inc_CS 6,938 0.01 36 Deere and Company_CS 378 0.00 (25) Etsy Inc_JPM 210 0.00 14 Deere and Company_JPM 53 0.00 106 Euronet Worldwide Inc_CS 367 0.00 (32) Delek Holdco Inc_JPM 4 0.00 51 Euronet Worldwide Inc_JPM 84 0.00 67 Delta Air Lines Inc 155 0.00 (10) Everbridge Inc_JPM 18 0.00 919 Deluxe Corporation_CS 344 0.00 99 Evergy Inc_JPM 14 0.00 179 Deluxe Corporation_JPM 278 0.00 271 Eversource Energy_CS 580 0.00 936 Dentsply Sirona Inc_CS 2,439 0.00 12 Eversource Energy_JPM 98 0.00 162 Dentsply Sirona Inc_JPM 18 0.00 (32) Evoqua Water Technologies Company_JPM 26 0.00 780 Devon Energy Corporation_CS 212 0.00 (848) Exact Sciences Corporation_CS 7,322 0.01 35 Devon Energy Corporation_JPM 197 0.00 12 Exact Sciences Corporation_JPM 26 0.00 (96) Diamondback Energy Inc_JPM 183 0.00 296 Exelixis Inc 144 0.00 75 Dicks Sporting Goods Inc_CS 1,043 0.00 275 ExlService Holdings Inc_CS 466 0.00 60 Dicks Sporting Goods Inc_JPM 561 0.00 87 ExlService Holdings Inc_JPM 32 0.00 142 Dillards Inc_CS 557 0.00 615 Expeditors International of Washington Inc_CS 1,738 0.00 30 Dillards Inc_JPM 98 0.00 24 Expeditors International of Washington Inc_JPM 37 0.00 128 Diodes Inc_JPM 1,630 0.00 857 Exponent Inc_CS 6,318 0.01 82 Discover Financial Services 89 0.00 53 Exponent Inc_JPM 284 0.00 162 Discovery Communications_JPM 23 0.00 33 Facebook Inc_CS 1,229 0.00 2,171 DISH Network Corporation_CS 4,143 0.01 148 Fair Isaac Corporation_CS 11,870 0.01 44 DocuSign Inc_CS 68 0.00 10 Fair Isaac Corporation_JPM 391 0.00 1,143 Dolby Laboratories Inc_CS 4,273 0.01 372 Fastenal Company_CS 5 0.00 83 Dolby Laboratories Inc_JPM 350 0.00 18 Fastenal Company_JPM 4 0.00 394 Dollar General Corporation_CS 1,970 0.00 (505) FedEx Corporation_CS 3,137 0.00 6 Dollar General Corporation_JPM 6 0.00 (8) FedEx Corporation_JPM 21 0.00 (329) Dollar Tree Inc_CS 2,080 0.00 12 Fidelity National Information Services Inc_JPM 81 0.00 (15) Dollar Tree Inc_JPM 61 0.00 83 Fifth Third Bancorp_JPM 200 0.00 24 Dominion Energy Inc_JPM 48 0.00 (62) FireEye Inc_JPM 12 0.00 5 Domino's Pizza Inc_JPM 202 0.00 (401) First Cash Financial Services Inc_CS 7,897 0.01 35 Donaldson Company Inc_JPM 85 0.00 3 First Citizens BancShares Inc 86 0.00 (40) Dorman Products Inc 100 0.00 702 First Financial BanCorporation_CS 1,205 0.00 44 Dover Corporation_JPM 383 0.00 1,001 First Hawaiian Inc_CS 1,054 0.00 532 Dow Inc_CS 1,107 0.00 927 First Horizon National Corporation_CS 277 0.00 59 Dow Inc_JPM 69 0.00 161 FirstEnergy Corporation_JPM 293 0.00 387 DTE Energy Company_CS 489 0.00 18 Fiserv Inc_JPM 349 0.00 17 Duke Energy Corporation_JPM 54 0.00 (29) Five9 Inc_JPM 14 0.00 419 Dunkin' Brands Group Inc_CS 252 0.00 165 Flagstar Bancorp Inc_JPM 183 0.00 (938) Dupont De Nemours Inc_CS 9,477 0.01 48 FleetCor Technologies Inc_CS 1,855 0.00 (18) Dupont De Nemours Inc_JPM 353 0.00 3,761 Flowers Foods Inc_CS 1,197 0.00 727 DXC Technology Company_CS 1,198 0.00 54 Flowserve Corporation_JPM 58 0.00 (1,155) Dycom Industries Inc_CS 3,316 0.01 127 FNF Group_JPM 30 0.00 299 Eagle Bancorp Inc_CS 1,328 0.00 475 Fortinet Inc_CS 7,478 0.01
236
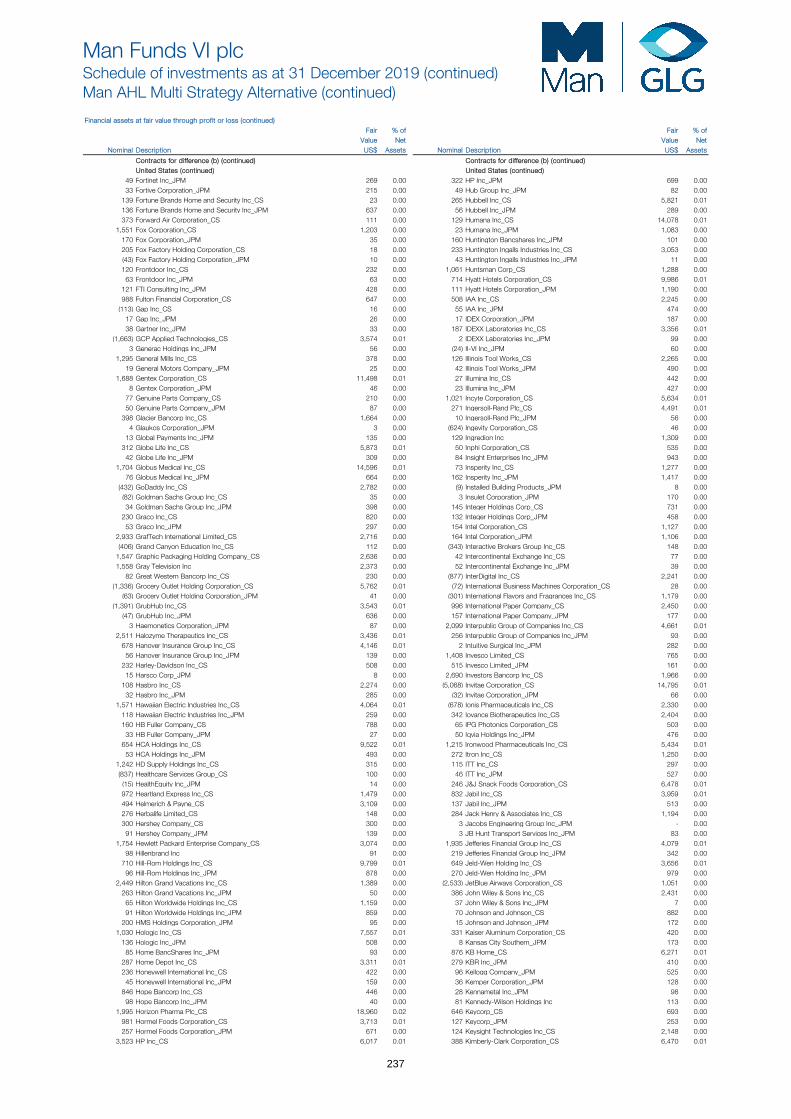
Man Funds VI plcSchedule of investments as at 31 December 2019 (continued)Man AHL Multi Strategy Alternative (continued)
Financial assets at fair value through profit or loss (continued) Fair % of Fair % of
Value Net Value Net Nominal Description US$ Assets Nominal Description US$ Assets
Contracts for difference (b) (continued) Contracts for difference (b) (continued)United States (continued) United States (continued)
49 Fortinet Inc_JPM 269 0.00 322 HP Inc_JPM 699 0.00 33 Fortive Corporation_JPM 215 0.00 49 Hub Group Inc_JPM 82 0.00 139 Fortune Brands Home and Security Inc_CS 23 0.00 265 Hubbell Inc_CS 5,821 0.01 136 Fortune Brands Home and Security Inc_JPM 637 0.00 56 Hubbell Inc_JPM 289 0.00 373 Forward Air Corporation_CS 111 0.00 129 Humana Inc_CS 14,078 0.01 1,551 Fox Corporation_CS 1,203 0.00 23 Humana Inc_JPM 1,083 0.00 170 Fox Corporation_JPM 35 0.00 160 Huntington Bancshares Inc_JPM 101 0.00 205 Fox Factory Holding Corporation_CS 18 0.00 233 Huntington Ingalls Industries Inc_CS 3,053 0.00 (43) Fox Factory Holding Corporation_JPM 10 0.00 43 Huntington Ingalls Industries Inc_JPM 11 0.00 120 Frontdoor Inc_CS 232 0.00 1,061 Huntsman Corp_CS 1,288 0.00 63 Frontdoor Inc_JPM 63 0.00 714 Hyatt Hotels Corporation_CS 9,986 0.01 121 FTI Consulting Inc_JPM 428 0.00 111 Hyatt Hotels Corporation_JPM 1,190 0.00 988 Fulton Financial Corporation_CS 647 0.00 508 IAA Inc_CS 2,245 0.00 (113) Gap Inc_CS 16 0.00 55 IAA Inc_JPM 474 0.00 17 Gap Inc_JPM 26 0.00 17 IDEX Corporation_JPM 187 0.00 38 Gartner Inc_JPM 33 0.00 187 IDEXX Laboratories Inc_CS 3,356 0.01 (1,663) GCP Applied Technologies_CS 3,574 0.01 2 IDEXX Laboratories Inc_JPM 99 0.00 3 Generac Holdings Inc_JPM 56 0.00 (24) II-VI Inc_JPM 60 0.00 1,295 General Mills Inc_CS 378 0.00 126 Illinois Tool Works_CS 2,265 0.00 19 General Motors Company_JPM 25 0.00 42 Illinois Tool Works_JPM 490 0.00 1,688 Gentex Corporation_CS 11,498 0.01 27 Illumina Inc_CS 442 0.00 8 Gentex Corporation_JPM 46 0.00 23 Illumina Inc_JPM 427 0.00 77 Genuine Parts Company_CS 210 0.00 1,021 Incyte Corporation_CS 5,634 0.01 50 Genuine Parts Company_JPM 87 0.00 271 Ingersoll-Rand Plc_CS 4,491 0.01 398 Glacier Bancorp Inc_CS 1,664 0.00 10 Ingersoll-Rand Plc_JPM 56 0.00 4 Glaukos Corporation_JPM 3 0.00 (624) Ingevity Corporation_CS 46 0.00 13 Global Payments Inc_JPM 135 0.00 129 Ingredion Inc 1,309 0.00 312 Globe Life Inc_CS 5,873 0.01 50 Inphi Corporation_CS 535 0.00 42 Globe Life Inc_JPM 309 0.00 84 Insight Enterprises Inc_JPM 943 0.00 1,704 Globus Medical Inc_CS 14,596 0.01 73 Insperity Inc_CS 1,277 0.00 76 Globus Medical Inc_JPM 664 0.00 162 Insperity Inc_JPM 1,417 0.00 (432) GoDaddy Inc_CS 2,782 0.00 (9) Installed Building Products_JPM 8 0.00 (82) Goldman Sachs Group Inc_CS 35 0.00 3 Insulet Corporation_JPM 170 0.00 34 Goldman Sachs Group Inc_JPM 398 0.00 145 Integer Holdings Corp_CS 731 0.00 230 Graco Inc_CS 820 0.00 132 Integer Holdings Corp_JPM 458 0.00 53 Graco Inc_JPM 297 0.00 154 Intel Corporation_CS 1,127 0.00 2,933 GrafTech International Limited_CS 2,716 0.00 164 Intel Corporation_JPM 1,106 0.00 (406) Grand Canyon Education Inc_CS 112 0.00 (343) Interactive Brokers Group Inc_CS 148 0.00 1,547 Graphic Packaging Holding Company_CS 2,636 0.00 42 Intercontinental Exchange Inc_CS 77 0.00 1,558 Gray Television Inc 2,373 0.00 52 Intercontinental Exchange Inc_JPM 39 0.00 82 Great Western Bancorp Inc_CS 230 0.00 (877) InterDigital Inc_CS 2,241 0.00 (1,336) Grocery Outlet Holding Corporation_CS 5,762 0.01 (72) International Business Machines Corporation_CS 28 0.00 (63) Grocery Outlet Holding Corporation_JPM 41 0.00 (301) International Flavors and Fragrances Inc_CS 1,179 0.00 (1,391) GrubHub Inc_CS 3,543 0.01 996 International Paper Company_CS 2,450 0.00 (47) GrubHub Inc_JPM 636 0.00 157 International Paper Company_JPM 177 0.00 3 Haemonetics Corporation_JPM 87 0.00 2,099 Interpublic Group of Companies Inc_CS 4,661 0.01 2,511 Halozyme Therapeutics Inc_CS 3,436 0.01 256 Interpublic Group of Companies Inc_JPM 93 0.00 678 Hanover Insurance Group Inc_CS 4,146 0.01 2 Intuitive Surgical Inc_JPM 282 0.00 56 Hanover Insurance Group Inc_JPM 139 0.00 1,408 Invesco Limited_CS 765 0.00 232 Harley-Davidson Inc_CS 508 0.00 515 Invesco Limited_JPM 161 0.00 15 Harsco Corp_JPM 8 0.00 2,690 Investors Bancorp Inc_CS 1,966 0.00 108 Hasbro Inc_CS 2,274 0.00 (5,068) Invitae Corporation_CS 14,795 0.01 32 Hasbro Inc_JPM 285 0.00 (32) Invitae Corporation_JPM 66 0.00 1,571 Hawaiian Electric Industries Inc_CS 4,064 0.01 (678) Ionis Pharmaceuticals Inc_CS 2,330 0.00 118 Hawaiian Electric Industries Inc_JPM 259 0.00 342 Iovance Biotherapeutics Inc_CS 2,404 0.00 160 HB Fuller Company_CS 788 0.00 65 IPG Photonics Corporation_CS 503 0.00 33 HB Fuller Company_JPM 27 0.00 50 Iqvia Holdings Inc_JPM 476 0.00 654 HCA Holdings Inc_CS 9,522 0.01 1,215 Ironwood Pharmaceuticals Inc_CS 5,434 0.01 53 HCA Holdings Inc_JPM 493 0.00 272 Itron Inc_CS 1,250 0.00 1,242 HD Supply Holdings Inc_CS 315 0.00 115 ITT Inc_CS 297 0.00 (837) Healthcare Services Group_CS 100 0.00 46 ITT Inc_JPM 527 0.00 (15) HealthEquity Inc_JPM 14 0.00 246 J&J Snack Foods Corporation_CS 6,478 0.01 972 Heartland Express Inc_CS 1,479 0.00 832 Jabil Inc_CS 3,959 0.01 494 Helmerich & Payne_CS 3,109 0.00 137 Jabil Inc_JPM 513 0.00 276 Herbalife Limited_CS 148 0.00 284 Jack Henry & Associates Inc_CS 1,194 0.00 300 Hershey Company_CS 300 0.00 3 Jacobs Engineering Group Inc_JPM - 0.00 91 Hershey Company_JPM 139 0.00 3 JB Hunt Transport Services Inc_JPM 83 0.00 1,754 Hewlett Packard Enterprise Company_CS 3,074 0.00 1,935 Jefferies Financial Group Inc_CS 4,079 0.01 98 Hillenbrand Inc 91 0.00 219 Jefferies Financial Group Inc_JPM 342 0.00 710 Hill-Rom Holdings Inc_CS 9,799 0.01 649 Jeld-Wen Holding Inc_CS 3,656 0.01 96 Hill-Rom Holdings Inc_JPM 878 0.00 270 Jeld-Wen Holding Inc_JPM 979 0.00 2,449 Hilton Grand Vacations Inc_CS 1,389 0.00 (2,533) JetBlue Airways Corporation_CS 1,051 0.00 263 Hilton Grand Vacations Inc_JPM 50 0.00 386 John Wiley & Sons Inc_CS 2,431 0.00 65 Hilton Worldwide Holdings Inc_CS 1,159 0.00 37 John Wiley & Sons Inc_JPM 7 0.00 91 Hilton Worldwide Holdings Inc_JPM 859 0.00 70 Johnson and Johnson_CS 882 0.00 200 HMS Holdings Corporation_JPM 95 0.00 15 Johnson and Johnson_JPM 172 0.00 1,030 Hologic Inc_CS 7,557 0.01 331 Kaiser Aluminum Corporation_CS 420 0.00 136 Hologic Inc_JPM 508 0.00 8 Kansas City Southern_JPM 173 0.00 85 Home BancShares Inc_JPM 93 0.00 876 KB Home_CS 6,271 0.01 287 Home Depot Inc_CS 3,311 0.01 279 KBR Inc_JPM 410 0.00 236 Honeywell International Inc_CS 422 0.00 96 Kellogg Company_JPM 525 0.00 45 Honeywell International Inc_JPM 159 0.00 36 Kemper Corporation_JPM 128 0.00 846 Hope Bancorp Inc_CS 446 0.00 28 Kennametal Inc_JPM 98 0.00 98 Hope Bancorp Inc_JPM 40 0.00 81 Kennedy-Wilson Holdings Inc 113 0.00 1,995 Horizon Pharma Plc_CS 18,960 0.02 646 Keycorp_CS 693 0.00 981 Hormel Foods Corporation_CS 3,713 0.01 127 Keycorp_JPM 253 0.00 257 Hormel Foods Corporation_JPM 671 0.00 124 Keysight Technologies Inc_CS 2,148 0.00 3,523 HP Inc_CS 6,017 0.01 388 Kimberly-Clark Corporation_CS 6,470 0.01
237

Man Funds VI plcSchedule of investments as at 31 December 2019 (continued)Man AHL Multi Strategy Alternative (continued)
Financial assets at fair value through profit or loss (continued) Fair % of Fair % of
Value Net Value Net Nominal Description US$ Assets Nominal Description US$ Assets
Contracts for difference (b) (continued) Contracts for difference (b) (continued)United States (continued) United States (continued)
40 KKR & Company Inc_JPM 115 0.00 503 MDC Holdings Inc_CS 42 0.00 272 KLA Tencor Corporation_CS 14,420 0.01 3,141 MDU Resources Group Inc_CS 2,573 0.00 34 KLA Tencor Corporation_JPM 1,063 0.00 9 MDU Resources Group Inc_JPM 27 0.00 (457) Knight Swift Transportation_CS 42 0.00 1,074 MEDNAX Inc_CS 6,755 0.01 128 Knowles Corporation_CS 434 0.00 211 MEDNAX Inc_JPM 331 0.00 418 Kohl's Corporation_CS 1,268 0.00 375 Medpace Holdings Inc_CS 8,440 0.01 276 Korn Ferry International_JPM 958 0.00 101 Medpace Holdings Inc_JPM 842 0.00 349 Kraft Heinz Company_JPM 203 0.00 82 Merck and Company Inc_CS 55 0.00 (3,323) Kratos Defense & Security_CS 2,221 0.00 21 Merck and Company Inc_JPM 137 0.00 (69) Kratos Defense & Security_JPM 84 0.00 (57) Mercury General Corporation_CS 32 0.00 728 Kroger Company_CS 2,395 0.00 (515) Mercury Systems Inc_CS 802 0.00 307 Kroger Company_JPM 893 0.00 (9) Mercury Systems Inc_JPM 19 0.00 128 L Brands Inc_JPM 50 0.00 6 Meredith Corporation_JPM 3 0.00 547 Laboratory Corporation of America Holdings_CS 1,089 0.00 1,076 Meritage Homes Corporation_CS 8,886 0.01 217 Lam Research Corporation_CS 17,312 0.02 173 Meritor Inc_CS 350 0.00 32 Lam Research Corporation_JPM 1,661 0.00 245 Meritor Inc_JPM 889 0.00 29 Lamb Weston Holdings_JPM 431 0.00 262 MetLife Inc_CS 812 0.00 304 Lancaster Colony Corporation_CS 4,627 0.01 154 MetLife Inc_JPM 454 0.00 33 Lancaster Colony Corporation_JPM 580 0.00 58 Mettler-Toledo International Inc_CS 4,143 0.01 422 Landstar System Inc_CS 2,741 0.00 13 Mettler-Toledo International Inc_JPM 885 0.00 156 Las Vegas Sands Corporation_JPM 948 0.00 202 MGIC Investment Corporation_JPM 71 0.00 420 Lattice Semiconductor Corporation_CS 84 0.00 28 MGM Resorts International_JPM 46 0.00 (60) Lattice Semiconductor Corporation_JPM 15 0.00 103 Microchip Technology Inc_CS 698 0.00 4,809 Laureate Education Inc-A_CS 2,909 0.00 56 Microchip Technology Inc_JPM 535 0.00 378 Laureate Education Inc-A_JPM 216 0.00 163 Micron Technology Inc_JPM 1,044 0.00 283 LCI Industries_CS 4,818 0.00 99 Microsoft Corporation_CS 2,207 0.00 285 Lear Corporation 989 0.00 50 Microsoft Corporation_JPM 558 0.00 (517) Legg Mason Inc_CS 842 0.00 585 Minerals Technologies Inc_CS 1,559 0.00 8 Leggett & Platt Inc_JPM 70 0.00 9 MKS Instruments Inc_JPM 208 0.00 54 Leidos Holdings Inc_CS 977 0.00 618 Mobile Mini Inc_CS 35 0.00 89 Leidos Holdings Inc_JPM 804 0.00 179 Mobile Mini Inc_JPM 16 0.00 (266) Lendingtree Inc_CS 7,462 0.01 68 Mohawk Industries Inc_JPM 215 0.00 115 LHC Group Inc_CS 2,012 0.00 49 Molina Healthcare Inc_JPM 341 0.00 8 LHC Group Inc_JPM 57 0.00 213 Molson Coors Brewing Company_JPM 13 0.00 601 Liberty Broadband Corporation_CS 13,773 0.01 220 Mondelez International Inc_JPM 396 0.00 403 Liberty Media Corporation-Liberty Formula One_CS 3,059 0.00 (8) Mongodb Inc_JPM 17 0.00 27 Lincoln Electric Holdings_CS 240 0.00 260 Monolithic Power Systems Inc_CS 5,778 0.01 61 Lincoln Electric Holdings_JPM 327 0.00 (2) Monolithic Power Systems Inc_JPM 2 0.00 139 Lithia Motors Inc_CS 5,551 0.01 (14) Monro Muffler Brake Inc 1 0.00 27 Lithia Motors Inc_JPM 30 0.00 60 Monster Beverage Corporation_JPM 343 0.00 72 Littelfuse Inc_CS 634 0.00 124 Moody's Corporation_CS 1,230 0.00 21 Littelfuse Inc_JPM 230 0.00 7 Moody's Corporation_JPM 310 0.00 (2,119) Liveperson Inc_CS 606 0.00 491 Moog Inc_CS 763 0.00 (21) Liveperson Inc_JPM 29 0.00 45 Moog Inc_JPM 21 0.00 175 LKQ Corporation_JPM 322 0.00 469 Morgan Stanley_CS 3,489 0.01 26 Loews Corporation_JPM 33 0.00 251 Morgan Stanley_JPM 798 0.00 158 Louisiana-Pacific Corporation_JPM 66 0.00 (186) Morningstar Inc_CS 357 0.00 502 Lowe's Companies Inc_CS 8,802 0.01 4 Morningstar Inc_JPM 86 0.00 25 Lowe's Companies Inc_JPM 222 0.00 (207) Motorola Solutions Inc_CS 1,312 0.00 901 LPL Financial Holdings Inc_CS 9,641 0.01 51 MSA Safety Inc_JPM 859 0.00 107 LPL Financial Holdings Inc_JPM 434 0.00 1,255 MSC Industrial Direct Company Inc_CS 7,375 0.01 (782) Lyft Inc_CS 3,031 0.00 77 MSC Industrial Direct Company Inc_JPM 269 0.00 (35) Lyft Inc_JPM 97 0.00 4 MSCI Inc_JPM 91 0.00 245 Lyondellbasell Industries_CS 3,727 0.01 919 Mueller Water Products Inc_CS 917 0.00 14 M&T Bank Corporation_JPM 171 0.00 327 Murphy USA Inc_CS 10,805 0.01 57 Macquarie Infrastructure Corporation_JPM 125 0.00 1,278 Mylan NV_CS 2,594 0.00 1,304 Macy's Inc_CS 1,828 0.00 (54) Mylan NV_JPM 125 0.00 176 Macy's Inc_JPM 255 0.00 95 Myriad Genetics Inc_JPM 174 0.00 1,216 Magellan Health Inc_CS 12,833 0.01 43 Nasdaq Inc_JPM 177 0.00 52 Magellan Health Inc_JPM 24 0.00 (21) Natera Inc_JPM 37 0.00 156 Manhattan Associates Inc_CS 2,239 0.00 1,282 National Beverage Corporation_CS 1,950 0.00 50 Manhattan Associates Inc_JPM 89 0.00 257 National Beverage Corporation_JPM 1,852 0.00 479 ManpowerGroup Inc_CS 1,321 0.00 1,581 National Fuel Gas Company_CS 951 0.00 166 ManpowerGroup Inc_JPM 1,002 0.00 15 National Fuel Gas Company_JPM 9 0.00 674 Mantech International Corporation-A_CS 1,729 0.00 124 National Instruments Corporation_JPM 30 0.00 82 Mantech International Corporation-A_JPM 182 0.00 561 National Vision Holdings Inc_CS 2,917 0.00 (136) Marathon Oil Corporation_JPM 17 0.00 1,516 Navient Corporation_CS 1,342 0.00 255 Marathon Petroleum Corporation 1,176 0.00 385 NCR Corporation_CS 818 0.00 64 MarketAxess Holdings Inc_CS 3,254 0.01 84 NCR Corporation_JPM 330 0.00 2 MarketAxess Holdings Inc_JPM 291 0.00 4 Neogen Corporation_JPM 9 0.00 395 Marriott International_CS 9,065 0.01 62 Neogenomics Inc_JPM 107 0.00 49 Marriott International_JPM 755 0.00 418 NetApp Inc_CS 5,114 0.00 66 Marriott Vacations Worldwide Corporation_JPM 333 0.00 115 NetApp Inc_JPM 705 0.00 11 Marsh & Mclennan Companies_JPM 183 0.00 (158) NetScout Systems Inc_CS 12 0.00 176 Martin Marietta Materials Inc_CS 2,765 0.00 147 NetScout Systems Inc_JPM 145 0.00 5 Martin Marietta Materials Inc_JPM 40 0.00 274 Nevro Corporation_CS 4,357 0.01 688 Masco Corporation_CS 1,843 0.00 5 Nevro Corporation_JPM 293 0.00 174 Masco Corporation_JPM 479 0.00 (22) New Relic Inc_JPM 48 0.00 231 Masimo Corporation_CS 5,354 0.01 770 New York Community Bancorp Inc_CS 41 0.00 8 Masimo Corporation_JPM 104 0.00 161 New York Times Company_CS 195 0.00 896 Masonite International Corporation_CS 7,390 0.01 477 Newell Brands Inc_JPM 33 0.00 114 Masonite International Corporation_JPM 931 0.00 557 Newmark Group Inc-Class A_JPM 208 0.00 760 MasTec Inc_CS 2,825 0.00 147 NewMarket Corporation_CS 3,640 0.01 1,082 Maxim Integrated Products Inc_CS 3,961 0.01 75 Newmont Mining Corporation_JPM 190 0.00 132 Maxim Integrated Products Inc_JPM 217 0.00 2,205 News Corporation_CS 1,112 0.00 231 McCormick & Company Inc_CS 1,426 0.00 26 News Corporation_JPM - 0.00 47 McCormick & Company Inc_JPM 513 0.00 59 Nexstar Media Group Inc_CS 972 0.00 119 McKesson Corporation_CS 332 0.00 4 Nexstar Media Group Inc_JPM 34 0.00
238
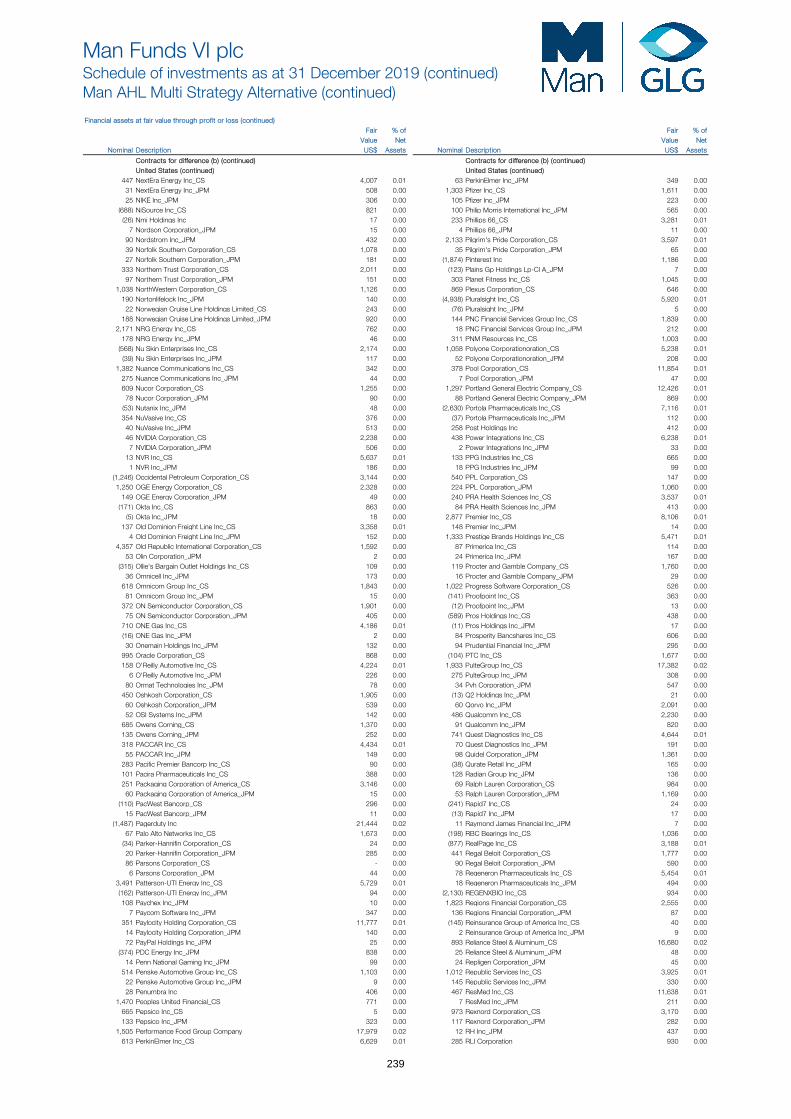
Man Funds VI plcSchedule of investments as at 31 December 2019 (continued)Man AHL Multi Strategy Alternative (continued)
Financial assets at fair value through profit or loss (continued) Fair % of Fair % of
Value Net Value Net Nominal Description US$ Assets Nominal Description US$ Assets
Contracts for difference (b) (continued) Contracts for difference (b) (continued)United States (continued) United States (continued)
447 NextEra Energy Inc_CS 4,007 0.01 63 PerkinElmer Inc_JPM 349 0.00 31 NextEra Energy Inc_JPM 508 0.00 1,303 Pfizer Inc_CS 1,611 0.00 25 NIKE Inc_JPM 306 0.00 105 Pfizer Inc_JPM 223 0.00 (688) NiSource Inc_CS 821 0.00 100 Philip Morris International Inc_JPM 565 0.00 (26) Nmi Holdings Inc 17 0.00 233 Phillips 66_CS 3,281 0.01 7 Nordson Corporation_JPM 15 0.00 4 Phillips 66_JPM 11 0.00 90 Nordstrom Inc_JPM 432 0.00 2,133 Pilgrim's Pride Corporation_CS 3,597 0.01 39 Norfolk Southern Corporation_CS 1,078 0.00 35 Pilgrim's Pride Corporation_JPM 65 0.00 27 Norfolk Southern Corporation_JPM 181 0.00 (1,874) Pinterest Inc 1,186 0.00 333 Northern Trust Corporation_CS 2,011 0.00 (123) Plains Gp Holdings Lp-Cl A_JPM 7 0.00 97 Northern Trust Corporation_JPM 151 0.00 303 Planet Fitness Inc_CS 1,045 0.00 1,038 NorthWestern Corporation_CS 1,126 0.00 869 Plexus Corporation_CS 646 0.00 190 Nortonlifelock Inc_JPM 140 0.00 (4,938) Pluralsight Inc_CS 5,920 0.01 22 Norwegian Cruise Line Holdings Limited_CS 243 0.00 (76) Pluralsight Inc_JPM 5 0.00 188 Norwegian Cruise Line Holdings Limited_JPM 920 0.00 144 PNC Financial Services Group Inc_CS 1,839 0.00 2,171 NRG Energy Inc_CS 762 0.00 18 PNC Financial Services Group Inc_JPM 212 0.00 178 NRG Energy Inc_JPM 46 0.00 311 PNM Resources Inc_CS 1,003 0.00 (568) Nu Skin Enterprises Inc_CS 2,174 0.00 1,058 Polyone Corporationoration_CS 5,238 0.01 (39) Nu Skin Enterprises Inc_JPM 117 0.00 52 Polyone Corporationoration_JPM 208 0.00 1,382 Nuance Communications Inc_CS 342 0.00 378 Pool Corporation_CS 11,854 0.01 275 Nuance Communications Inc_JPM 44 0.00 7 Pool Corporation_JPM 47 0.00 609 Nucor Corporation_CS 1,255 0.00 1,297 Portland General Electric Company_CS 12,426 0.01 78 Nucor Corporation_JPM 90 0.00 88 Portland General Electric Company_JPM 869 0.00 (53) Nutanix Inc_JPM 48 0.00 (2,630) Portola Pharmaceuticals Inc_CS 7,116 0.01 354 NuVasive Inc_CS 376 0.00 (37) Portola Pharmaceuticals Inc_JPM 112 0.00 40 NuVasive Inc_JPM 513 0.00 258 Post Holdings Inc 412 0.00 46 NVIDIA Corporation_CS 2,238 0.00 438 Power Integrations Inc_CS 6,238 0.01 7 NVIDIA Corporation_JPM 506 0.00 2 Power Integrations Inc_JPM 33 0.00 13 NVR Inc_CS 5,637 0.01 133 PPG Industries Inc_CS 665 0.00 1 NVR Inc_JPM 186 0.00 18 PPG Industries Inc_JPM 99 0.00 (1,246) Occidental Petroleum Corporation_CS 3,144 0.00 540 PPL Corporation_CS 147 0.00 1,250 OGE Energy Corporation_CS 2,328 0.00 224 PPL Corporation_JPM 1,060 0.00 149 OGE Energy Corporation_JPM 49 0.00 240 PRA Health Sciences Inc_CS 3,537 0.01 (171) Okta Inc_CS 863 0.00 84 PRA Health Sciences Inc_JPM 413 0.00 (5) Okta Inc_JPM 18 0.00 2,877 Premier Inc_CS 8,106 0.01 137 Old Dominion Freight Line Inc_CS 3,358 0.01 148 Premier Inc_JPM 14 0.00 4 Old Dominion Freight Line Inc_JPM 152 0.00 1,333 Prestige Brands Holdings Inc_CS 5,471 0.01 4,357 Old Republic International Corporation_CS 1,592 0.00 87 Primerica Inc_CS 114 0.00 53 Olin Corporation_JPM 2 0.00 24 Primerica Inc_JPM 167 0.00 (315) Ollie's Bargain Outlet Holdings Inc_CS 109 0.00 119 Procter and Gamble Company_CS 1,760 0.00 36 Omnicell Inc_JPM 173 0.00 16 Procter and Gamble Company_JPM 29 0.00 618 Omnicom Group Inc_CS 1,843 0.00 1,022 Progress Software Corporation_CS 526 0.00 81 Omnicom Group Inc_JPM 15 0.00 (141) Proofpoint Inc_CS 363 0.00 372 ON Semiconductor Corporation_CS 1,901 0.00 (12) Proofpoint Inc_JPM 13 0.00 75 ON Semiconductor Corporation_JPM 405 0.00 (589) Pros Holdings Inc_CS 438 0.00 710 ONE Gas Inc_CS 4,186 0.01 (11) Pros Holdings Inc_JPM 17 0.00 (16) ONE Gas Inc_JPM 2 0.00 84 Prosperity Bancshares Inc_CS 606 0.00 30 Onemain Holdings Inc_JPM 132 0.00 94 Prudential Financial Inc_JPM 295 0.00 995 Oracle Corporation_CS 868 0.00 (104) PTC Inc_CS 1,677 0.00 158 O'Reilly Automotive Inc_CS 4,224 0.01 1,933 PulteGroup Inc_CS 17,382 0.02 6 O'Reilly Automotive Inc_JPM 226 0.00 275 PulteGroup Inc_JPM 308 0.00 80 Ormat Technologies Inc_JPM 78 0.00 34 Pvh Corporation_JPM 547 0.00 450 Oshkosh Corporation_CS 1,905 0.00 (13) Q2 Holdings Inc_JPM 21 0.00 60 Oshkosh Corporation_JPM 539 0.00 60 Qorvo Inc_JPM 2,091 0.00 52 OSI Systems Inc_JPM 142 0.00 486 Qualcomm Inc_CS 2,230 0.00 685 Owens Corning_CS 1,370 0.00 91 Qualcomm Inc_JPM 820 0.00 135 Owens Corning_JPM 252 0.00 741 Quest Diagnostics Inc_CS 4,644 0.01 318 PACCAR Inc_CS 4,434 0.01 70 Quest Diagnostics Inc_JPM 191 0.00 55 PACCAR Inc_JPM 149 0.00 98 Quidel Corporation_JPM 1,361 0.00 283 Pacific Premier Bancorp Inc_CS 90 0.00 (38) Qurate Retail Inc_JPM 165 0.00 101 Pacira Pharmaceuticals Inc_CS 388 0.00 128 Radian Group Inc_JPM 136 0.00 251 Packaging Corporation of America_CS 3,146 0.00 69 Ralph Lauren Corporation_CS 984 0.00 60 Packaging Corporation of America_JPM 15 0.00 53 Ralph Lauren Corporation_JPM 1,169 0.00 (110) PacWest Bancorp_CS 296 0.00 (241) Rapid7 Inc_CS 24 0.00 15 PacWest Bancorp_JPM 11 0.00 (13) Rapid7 Inc_JPM 17 0.00 (1,487) Pagerduty Inc 21,444 0.02 11 Raymond James Financial Inc_JPM 7 0.00 67 Palo Alto Networks Inc_CS 1,673 0.00 (198) RBC Bearings Inc_CS 1,036 0.00 (34) Parker-Hannifin Corporation_CS 24 0.00 (877) RealPage Inc_CS 3,188 0.01 20 Parker-Hannifin Corporation_JPM 285 0.00 441 Regal Beloit Corporation_CS 1,777 0.00 86 Parsons Corporation_CS - 0.00 90 Regal Beloit Corporation_JPM 590 0.00 6 Parsons Corporation_JPM 44 0.00 78 Regeneron Pharmaceuticals Inc_CS 5,454 0.01 3,491 Patterson-UTI Energy Inc_CS 5,729 0.01 18 Regeneron Pharmaceuticals Inc_JPM 494 0.00 (162) Patterson-UTI Energy Inc_JPM 94 0.00 (2,130) REGENXBIO Inc_CS 934 0.00 108 Paychex Inc_JPM 10 0.00 1,823 Regions Financial Corporation_CS 2,555 0.00 7 Paycom Software Inc_JPM 347 0.00 136 Regions Financial Corporation_JPM 87 0.00 351 Paylocity Holding Corporation_CS 11,777 0.01 (145) Reinsurance Group of America Inc_CS 40 0.00 14 Paylocity Holding Corporation_JPM 140 0.00 2 Reinsurance Group of America Inc_JPM 9 0.00 72 PayPal Holdings Inc_JPM 25 0.00 893 Reliance Steel & Aluminum_CS 16,680 0.02 (374) PDC Energy Inc_JPM 838 0.00 25 Reliance Steel & Aluminum_JPM 48 0.00 14 Penn National Gaming Inc_JPM 99 0.00 24 Repligen Corporation_JPM 45 0.00 514 Penske Automotive Group Inc_CS 1,103 0.00 1,012 Republic Services Inc_CS 3,925 0.01 22 Penske Automotive Group Inc_JPM 9 0.00 145 Republic Services Inc_JPM 330 0.00 28 Penumbra Inc 406 0.00 467 ResMed Inc_CS 11,638 0.01 1,470 Peoples United Financial_CS 771 0.00 7 ResMed Inc_JPM 211 0.00 665 Pepsico Inc_CS 5 0.00 973 Rexnord Corporation_CS 3,170 0.00 133 Pepsico Inc_JPM 323 0.00 117 Rexnord Corporation_JPM 282 0.00 1,505 Performance Food Group Company 17,979 0.02 12 RH Inc_JPM 437 0.00 613 PerkinElmer Inc_CS 6,629 0.01 285 RLI Corporation 930 0.00
239
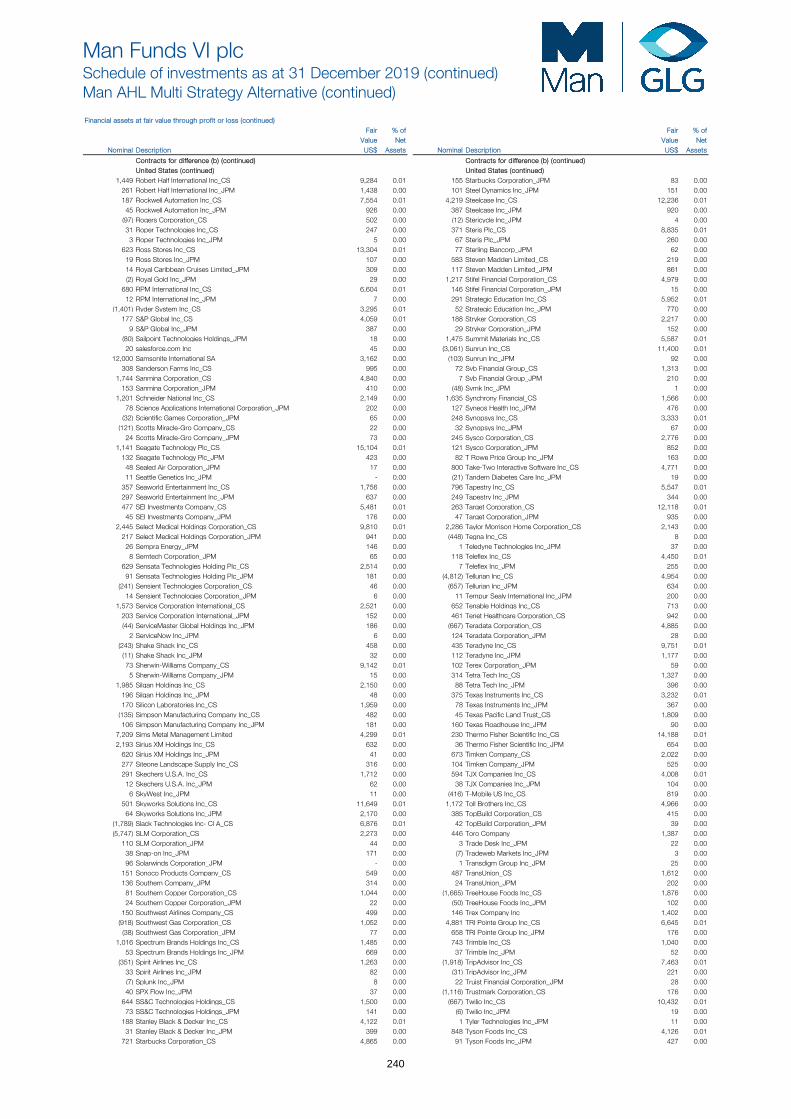
Man Funds VI plcSchedule of investments as at 31 December 2019 (continued)Man AHL Multi Strategy Alternative (continued)
Financial assets at fair value through profit or loss (continued) Fair % of Fair % of
Value Net Value Net Nominal Description US$ Assets Nominal Description US$ Assets
Contracts for difference (b) (continued) Contracts for difference (b) (continued)United States (continued) United States (continued)
1,449 Robert Half International Inc_CS 9,284 0.01 155 Starbucks Corporation_JPM 83 0.00 261 Robert Half International Inc_JPM 1,438 0.00 101 Steel Dynamics Inc_JPM 151 0.00 187 Rockwell Automation Inc_CS 7,554 0.01 4,219 Steelcase Inc_CS 12,236 0.01 45 Rockwell Automation Inc_JPM 926 0.00 387 Steelcase Inc_JPM 920 0.00 (97) Rogers Corporation_CS 502 0.00 (12) Stericycle Inc_JPM 4 0.00 31 Roper Technologies Inc_CS 247 0.00 371 Steris Plc_CS 8,835 0.01 3 Roper Technologies Inc_JPM 5 0.00 67 Steris Plc_JPM 260 0.00 623 Ross Stores Inc_CS 13,304 0.01 77 Sterling Bancorp_JPM 62 0.00 19 Ross Stores Inc_JPM 107 0.00 583 Steven Madden Limited_CS 219 0.00 14 Royal Caribbean Cruises Limited_JPM 309 0.00 117 Steven Madden Limited_JPM 861 0.00 (2) Royal Gold Inc_JPM 29 0.00 1,217 Stifel Financial Corporation_CS 4,979 0.00 680 RPM International Inc_CS 6,604 0.01 146 Stifel Financial Corporation_JPM 15 0.00 12 RPM International Inc_JPM 7 0.00 291 Strategic Education Inc_CS 5,952 0.01 (1,401) Ryder System Inc_CS 3,295 0.01 52 Strategic Education Inc_JPM 770 0.00 177 S&P Global Inc_CS 4,059 0.01 188 Stryker Corporation_CS 2,217 0.00 9 S&P Global Inc_JPM 387 0.00 29 Stryker Corporation_JPM 152 0.00 (80) Sailpoint Technologies Holdings_JPM 18 0.00 1,475 Summit Materials Inc_CS 5,587 0.01 20 salesforce.com Inc 45 0.00 (3,061) Sunrun Inc_CS 11,400 0.01 12,000 Samsonite International SA 3,162 0.00 (103) Sunrun Inc_JPM 92 0.00 308 Sanderson Farms Inc_CS 995 0.00 72 Svb Financial Group_CS 1,313 0.00 1,744 Sanmina Corporation_CS 4,840 0.00 7 Svb Financial Group_JPM 210 0.00 153 Sanmina Corporation_JPM 410 0.00 (48) Svmk Inc_JPM 1 0.00 1,201 Schneider National Inc_CS 2,149 0.00 1,635 Synchrony Financial_CS 1,566 0.00 78 Science Applications International Corporation_JPM 202 0.00 127 Syneos Health Inc_JPM 476 0.00 (32) Scientific Games Corporation_JPM 65 0.00 248 Synopsys Inc_CS 3,333 0.01 (121) Scotts Miracle-Gro Company_CS 22 0.00 32 Synopsys Inc_JPM 67 0.00 24 Scotts Miracle-Gro Company_JPM 73 0.00 245 Sysco Corporation_CS 2,776 0.00 1,141 Seagate Technology Plc_CS 15,104 0.01 121 Sysco Corporation_JPM 852 0.00 132 Seagate Technology Plc_JPM 423 0.00 82 T Rowe Price Group Inc_JPM 163 0.00 48 Sealed Air Corporation_JPM 17 0.00 800 Take-Two Interactive Software Inc_CS 4,771 0.00 11 Seattle Genetics Inc_JPM - 0.00 (21) Tandem Diabetes Care Inc_JPM 19 0.00 357 Seaworld Entertainment Inc_CS 1,756 0.00 796 Tapestry Inc_CS 5,547 0.01 297 Seaworld Entertainment Inc_JPM 637 0.00 249 Tapestry Inc_JPM 344 0.00 477 SEI Investments Company_CS 5,481 0.01 263 Target Corporation_CS 12,118 0.01 45 SEI Investments Company_JPM 176 0.00 47 Target Corporation_JPM 935 0.00 2,445 Select Medical Holdings Corporation_CS 9,810 0.01 2,286 Taylor Morrison Home Corporation_CS 2,143 0.00 217 Select Medical Holdings Corporation_JPM 941 0.00 (448) Tegna Inc_CS 8 0.00 26 Sempra Energy_JPM 146 0.00 1 Teledyne Technologies Inc_JPM 37 0.00 8 Semtech Corporation_JPM 65 0.00 118 Teleflex Inc_CS 4,450 0.01 629 Sensata Technologies Holding Plc_CS 2,514 0.00 7 Teleflex Inc_JPM 255 0.00 91 Sensata Technologies Holding Plc_JPM 181 0.00 (4,812) Tellurian Inc_CS 4,954 0.00 (241) Sensient Technologies Corporation_CS 46 0.00 (657) Tellurian Inc_JPM 634 0.00 14 Sensient Technologies Corporation_JPM 6 0.00 11 Tempur Sealy International Inc_JPM 200 0.00 1,573 Service Corporation International_CS 2,521 0.00 652 Tenable Holdings Inc_CS 713 0.00 203 Service Corporation International_JPM 152 0.00 461 Tenet Healthcare Corporation_CS 942 0.00 (44) ServiceMaster Global Holdings Inc_JPM 186 0.00 (667) Teradata Corporation_CS 4,885 0.00 2 ServiceNow Inc_JPM 6 0.00 124 Teradata Corporation_JPM 28 0.00 (243) Shake Shack Inc_CS 458 0.00 435 Teradyne Inc_CS 9,751 0.01 (11) Shake Shack Inc_JPM 32 0.00 112 Teradyne Inc_JPM 1,177 0.00 73 Sherwin-Williams Company_CS 9,142 0.01 102 Terex Corporation_JPM 59 0.00 5 Sherwin-Williams Company_JPM 15 0.00 314 Tetra Tech Inc_CS 1,327 0.00 1,985 Silgan Holdings Inc_CS 2,150 0.00 88 Tetra Tech Inc_JPM 396 0.00 196 Silgan Holdings Inc_JPM 48 0.00 375 Texas Instruments Inc_CS 3,232 0.01 170 Silicon Laboratories Inc_CS 1,959 0.00 78 Texas Instruments Inc_JPM 367 0.00 (135) Simpson Manufacturing Company Inc_CS 482 0.00 45 Texas Pacific Land Trust_CS 1,809 0.00 106 Simpson Manufacturing Company Inc_JPM 181 0.00 160 Texas Roadhouse Inc_JPM 90 0.00 7,209 Sims Metal Management Limited 4,299 0.01 230 Thermo Fisher Scientific Inc_CS 14,188 0.01 2,193 Sirius XM Holdings Inc_CS 632 0.00 36 Thermo Fisher Scientific Inc_JPM 654 0.00 620 Sirius XM Holdings Inc_JPM 41 0.00 673 Timken Company_CS 2,022 0.00 277 Siteone Landscape Supply Inc_CS 316 0.00 104 Timken Company_JPM 525 0.00 291 Skechers U.S.A. Inc_CS 1,712 0.00 594 TJX Companies Inc_CS 4,008 0.01 12 Skechers U.S.A. Inc_JPM 62 0.00 38 TJX Companies Inc_JPM 104 0.00 6 SkyWest Inc_JPM 11 0.00 (416) T-Mobile US Inc_CS 819 0.00 501 Skyworks Solutions Inc_CS 11,649 0.01 1,172 Toll Brothers Inc_CS 4,966 0.00 64 Skyworks Solutions Inc_JPM 2,170 0.00 385 TopBuild Corporation_CS 415 0.00 (1,789) Slack Technologies Inc- Cl A_CS 6,876 0.01 42 TopBuild Corporation_JPM 39 0.00 (5,747) SLM Corporation_CS 2,273 0.00 446 Toro Company 1,387 0.00 110 SLM Corporation_JPM 44 0.00 3 Trade Desk Inc_JPM 22 0.00 38 Snap-on Inc_JPM 171 0.00 (7) Tradeweb Markets Inc_JPM 3 0.00 96 Solarwinds Corporation_JPM - 0.00 1 Transdigm Group Inc_JPM 25 0.00 151 Sonoco Products Company_CS 549 0.00 487 TransUnion_CS 1,612 0.00 136 Southern Company_JPM 314 0.00 24 TransUnion_JPM 202 0.00 81 Southern Copper Corporation_CS 1,044 0.00 (1,665) TreeHouse Foods Inc_CS 1,876 0.00 24 Southern Copper Corporation_JPM 22 0.00 (50) TreeHouse Foods Inc_JPM 102 0.00 150 Southwest Airlines Company_CS 499 0.00 146 Trex Company Inc 1,402 0.00 (918) Southwest Gas Corporation_CS 1,052 0.00 4,881 TRI Pointe Group Inc_CS 6,645 0.01 (38) Southwest Gas Corporation_JPM 77 0.00 658 TRI Pointe Group Inc_JPM 176 0.00 1,016 Spectrum Brands Holdings Inc_CS 1,485 0.00 743 Trimble Inc_CS 1,040 0.00 53 Spectrum Brands Holdings Inc_JPM 669 0.00 37 Trimble Inc_JPM 52 0.00 (351) Spirit Airlines Inc_CS 1,263 0.00 (1,918) TripAdvisor Inc_CS 7,463 0.01 33 Spirit Airlines Inc_JPM 82 0.00 (31) TripAdvisor Inc_JPM 221 0.00 (7) Splunk Inc_JPM 8 0.00 22 Truist Financial Corporation_JPM 28 0.00 40 SPX Flow Inc_JPM 37 0.00 (1,116) Trustmark Corporation_CS 176 0.00 644 SS&C Technologies Holdings_CS 1,500 0.00 (667) Twilio Inc_CS 10,432 0.01 73 SS&C Technologies Holdings_JPM 141 0.00 (6) Twilio Inc_JPM 19 0.00 188 Stanley Black & Decker Inc_CS 4,122 0.01 1 Tyler Technologies Inc_JPM 11 0.00 31 Stanley Black & Decker Inc_JPM 399 0.00 848 Tyson Foods Inc_CS 4,126 0.01 721 Starbucks Corporation_CS 4,865 0.00 91 Tyson Foods Inc_JPM 427 0.00
240
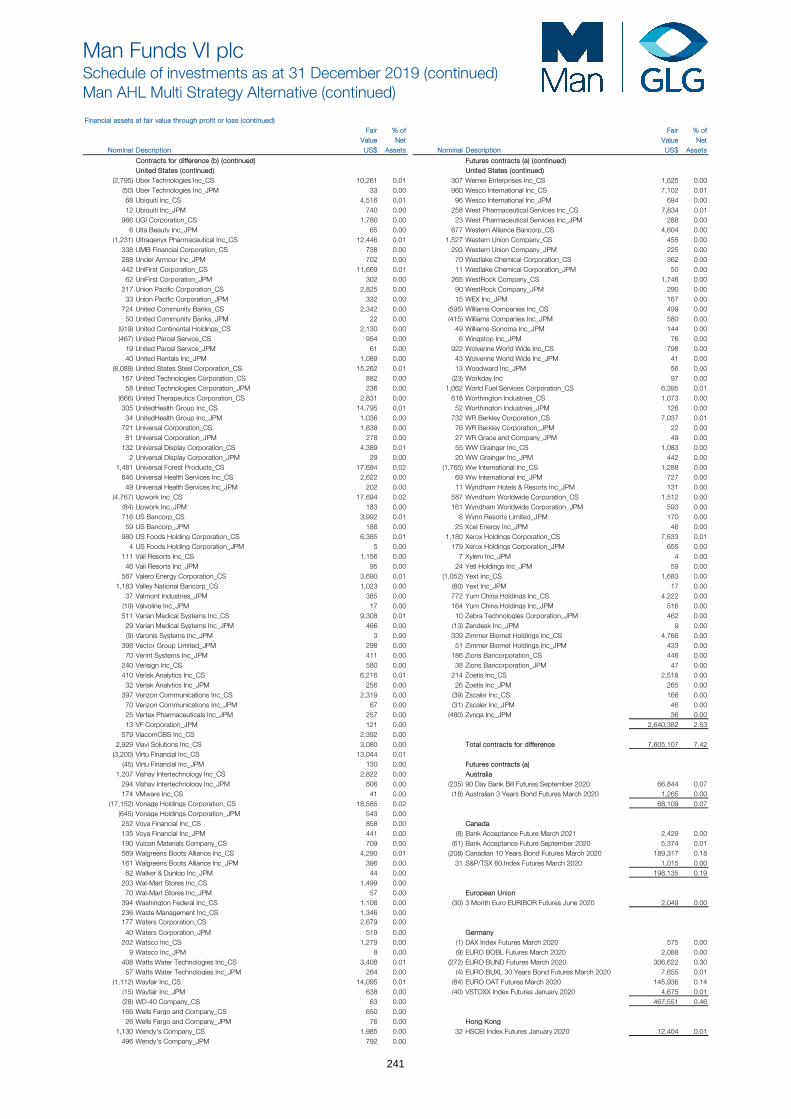
Man Funds VI plcSchedule of investments as at 31 December 2019 (continued)Man AHL Multi Strategy Alternative (continued)
Financial assets at fair value through profit or loss (continued) Fair % of Fair % of
Value Net Value Net Nominal Description US$ Assets Nominal Description US$ Assets
Contracts for difference (b) (continued) Futures contracts (a) (continued)United States (continued) United States (continued)
(2,795) Uber Technologies Inc_CS 10,261 0.01 307 Werner Enterprises Inc_CS 1,625 0.00 (50) Uber Technologies Inc_JPM 33 0.00 960 Wesco International Inc_CS 7,102 0.01 68 Ubiquiti Inc_CS 4,516 0.01 96 Wesco International Inc_JPM 694 0.00 12 Ubiquiti Inc_JPM 740 0.00 258 West Pharmaceutical Services Inc_CS 7,834 0.01 966 UGI Corporation_CS 1,780 0.00 23 West Pharmaceutical Services Inc_JPM 288 0.00 6 Ulta Beauty Inc_JPM 65 0.00 677 Western Alliance Bancorp_CS 4,604 0.00 (1,231) Ultragenyx Pharmaceutical Inc_CS 12,446 0.01 1,527 Western Union Company_CS 455 0.00 338 UMB Financial Corporation_CS 738 0.00 293 Western Union Company_JPM 225 0.00 288 Under Armour Inc_JPM 702 0.00 70 Westlake Chemical Corporation_CS 362 0.00 442 UniFirst Corporation_CS 11,669 0.01 11 Westlake Chemical Corporation_JPM 50 0.00 62 UniFirst Corporation_JPM 302 0.00 265 WestRock Company_CS 1,746 0.00 217 Union Pacific Corporation_CS 2,825 0.00 90 WestRock Company_JPM 290 0.00 33 Union Pacific Corporation_JPM 332 0.00 15 WEX Inc_JPM 167 0.00 724 United Community Banks_CS 2,342 0.00 (595) Williams Companies Inc_CS 499 0.00 50 United Community Banks_JPM 22 0.00 (415) Williams Companies Inc_JPM 580 0.00 (919) United Continental Holdings_CS 2,130 0.00 49 Williams-Sonoma Inc_JPM 144 0.00 (467) United Parcel Service_CS 954 0.00 6 Wingstop Inc_JPM 76 0.00 19 United Parcel Service_JPM 61 0.00 922 Wolverine World Wide Inc_CS 798 0.00 40 United Rentals Inc_JPM 1,089 0.00 43 Wolverine World Wide Inc_JPM 41 0.00 (8,089) United States Steel Corporation_CS 15,262 0.01 13 Woodward Inc_JPM 56 0.00 167 United Technologies Corporation_CS 882 0.00 (23) Workday Inc 97 0.00 58 United Technologies Corporation_JPM 236 0.00 1,062 World Fuel Services Corporation_CS 6,395 0.01 (666) United Therapeutics Corporation_CS 2,831 0.00 618 Worthington Industries_CS 1,073 0.00 305 UnitedHealth Group Inc_CS 14,795 0.01 52 Worthington Industries_JPM 126 0.00 34 UnitedHealth Group Inc_JPM 1,036 0.00 732 WR Berkley Corporation_CS 7,037 0.01 721 Universal Corporation_CS 1,838 0.00 76 WR Berkley Corporation_JPM 22 0.00 81 Universal Corporation_JPM 278 0.00 27 WR Grace and Company_JPM 49 0.00 132 Universal Display Corporation_CS 4,389 0.01 55 WW Grainger Inc_CS 1,083 0.00 2 Universal Display Corporation_JPM 29 0.00 20 WW Grainger Inc_JPM 442 0.00 1,481 Universal Forest Products_CS 17,694 0.02 (1,765) Ww International Inc_CS 1,288 0.00 646 Universal Health Services Inc_CS 2,622 0.00 69 Ww International Inc_JPM 727 0.00 49 Universal Health Services Inc_JPM 202 0.00 11 Wyndham Hotels & Resorts Inc_JPM 131 0.00 (4,767) Upwork Inc_CS 17,694 0.02 587 Wyndham Worldwide Corporation_CS 1,512 0.00 (84) Upwork Inc_JPM 183 0.00 161 Wyndham Worldwide Corporation_JPM 593 0.00 716 US Bancorp_CS 3,992 0.01 8 Wynn Resorts Limited_JPM 170 0.00 59 US Bancorp_JPM 188 0.00 25 Xcel Energy Inc_JPM 46 0.00 980 US Foods Holding Corporation_CS 6,385 0.01 1,180 Xerox Holdings Corporation_CS 7,633 0.01 4 US Foods Holding Corporation_JPM 5 0.00 179 Xerox Holdings Corporation_JPM 655 0.00 111 Vail Resorts Inc_CS 1,156 0.00 7 Xylem Inc_JPM 4 0.00 46 Vail Resorts Inc_JPM 95 0.00 24 Yeti Holdings Inc_JPM 59 0.00 567 Valero Energy Corporation_CS 3,690 0.01 (1,052) Yext Inc_CS 1,683 0.00 1,183 Valley National Bancorp_CS 1,023 0.00 (60) Yext Inc_JPM 17 0.00 37 Valmont Industries_JPM 385 0.00 772 Yum China Holdings Inc_CS 4,222 0.00 (19) Valvoline Inc_JPM 17 0.00 164 Yum China Holdings Inc_JPM 516 0.00 511 Varian Medical Systems Inc_CS 9,308 0.01 10 Zebra Technologies Corporation_JPM 462 0.00 29 Varian Medical Systems Inc_JPM 466 0.00 (13) Zendesk Inc_JPM 9 0.00 (9) Varonis Systems Inc_JPM 3 0.00 339 Zimmer Biomet Holdings Inc_CS 4,766 0.00 398 Vector Group Limited_JPM 298 0.00 51 Zimmer Biomet Holdings Inc_JPM 433 0.00 70 Verint Systems Inc_JPM 411 0.00 186 Zions Bancorporation_CS 446 0.00 240 Verisign Inc_CS 580 0.00 38 Zions Bancorporation_JPM 47 0.00 410 Verisk Analytics Inc_CS 6,216 0.01 214 Zoetis Inc_CS 2,518 0.00 32 Verisk Analytics Inc_JPM 256 0.00 26 Zoetis Inc_JPM 265 0.00 397 Verizon Communications Inc_CS 2,319 0.00 (39) Zscaler Inc_CS 166 0.00 70 Verizon Communications Inc_JPM 67 0.00 (31) Zscaler Inc_JPM 46 0.00 25 Vertex Pharmaceuticals Inc_JPM 257 0.00 (480) Zynga Inc_JPM 36 0.00 13 VF Corporation_JPM 121 0.00 2,640,382 2.53 579 ViacomCBS Inc_CS 2,392 0.00 2,929 Viavi Solutions Inc_CS 3,080 0.00 Total contracts for difference 7,605,107 7.42 (3,200) Virtu Financial Inc_CS 13,044 0.01 (45) Virtu Financial Inc_JPM 130 0.00 Futures contracts (a) 1,207 Vishay Intertechnology Inc_CS 2,822 0.00 Australia 294 Vishay Intertechnology Inc_JPM 806 0.00 (235) 90 Day Bank Bill Futures September 2020 66,844 0.07 174 VMware Inc_CS 41 0.00 (18) Australian 3 Years Bond Futures March 2020 1,265 0.00 (17,152) Vonage Holdings Corporation_CS 18,585 0.02 68,109 0.07 (645) Vonage Holdings Corporation_JPM 543 0.00 252 Voya Financial Inc_CS 858 0.00 Canada 135 Voya Financial Inc_JPM 441 0.00 (8) Bank Acceptance Future March 2021 2,429 0.00 190 Vulcan Materials Company_CS 709 0.00 (61) Bank Acceptance Future September 2020 5,374 0.01 569 Walgreens Boots Alliance Inc_CS 4,290 0.01 (208) Canadian 10 Years Bond Futures March 2020 189,317 0.18 161 Walgreens Boots Alliance Inc_JPM 396 0.00 31 S&P/TSX 60 Index Futures March 2020 1,015 0.00 82 Walker & Dunlop Inc_JPM 44 0.00 198,135 0.19 203 Wal-Mart Stores Inc_CS 1,499 0.00 70 Wal-Mart Stores Inc_JPM 57 0.00 European Union 394 Washington Federal Inc_CS 1,108 0.00 (30) 3 Month Euro EURIBOR Futures June 2020 2,049 0.00 236 Waste Management Inc_CS 1,346 0.00 177 Waters Corporation_CS 2,679 0.00
40 Waters Corporation_JPM 519 0.00 Germany 202 Watsco Inc_CS 1,279 0.00 (1) DAX Index Futures March 2020 575 0.00 9 Watsco Inc_JPM 8 0.00 (9) EURO BOBL Futures March 2020 2,088 0.00 408 Watts Water Technologies Inc_CS 3,408 0.01 (272) EURO BUND Futures March 2020 306,622 0.30 57 Watts Water Technologies Inc_JPM 264 0.00 (4) EURO BUXL 30 Years Bond Futures March 2020 7,655 0.01 (1,112) Wayfair Inc_CS 14,095 0.01 (84) EURO OAT Futures March 2020 145,936 0.14 (15) Wayfair Inc_JPM 638 0.00 (40) VSTOXX Index Futures January 2020 4,675 0.01 (28) WD-40 Company_CS 63 0.00 467,551 0.46 166 Wells Fargo and Company_CS 650 0.00 26 Wells Fargo and Company_JPM 76 0.00 Hong Kong 1,130 Wendy's Company_CS 1,985 0.00 32 HSCEI Index Futures January 2020 12,404 0.01 496 Wendy's Company_JPM 792 0.00
241
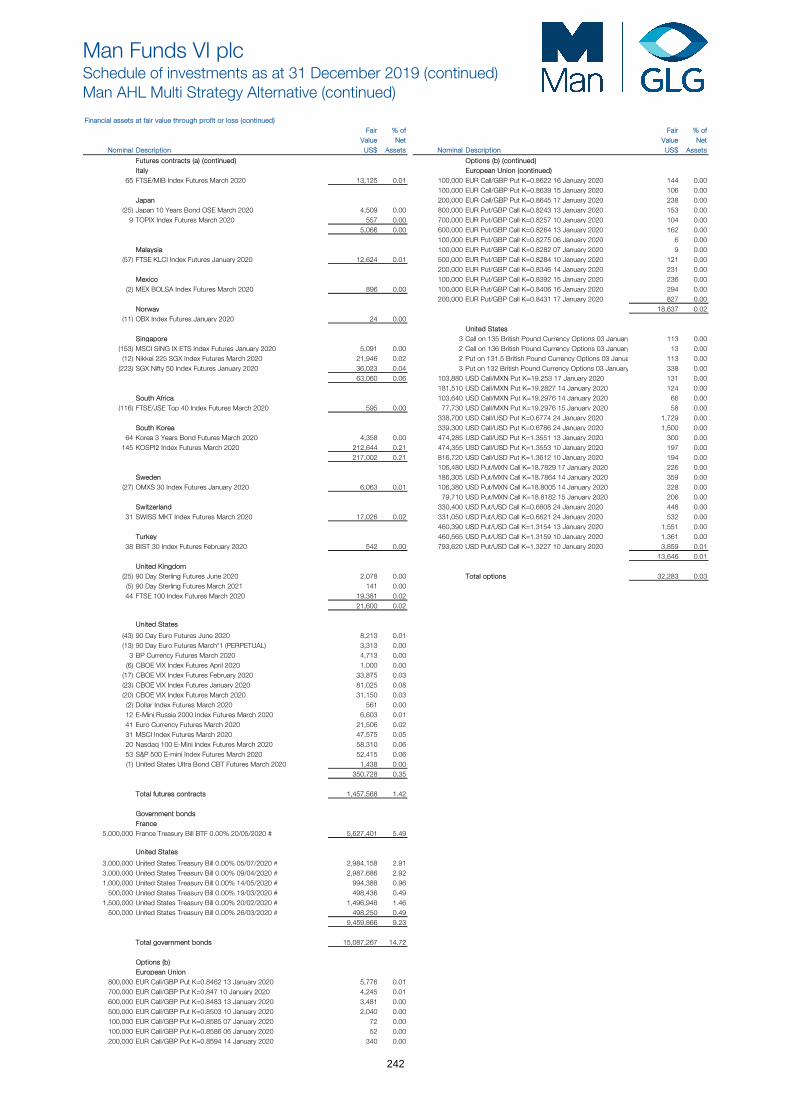
Man Funds VI plcSchedule of investments as at 31 December 2019 (continued)Man AHL Multi Strategy Alternative (continued)
Financial assets at fair value through profit or loss (continued) Fair % of Fair % of
Value Net Value Net Nominal Description US$ Assets Nominal Description US$ Assets
Futures contracts (a) (continued) Options (b) (continued) Italy European Union (continued)
65 FTSE/MIB Index Futures March 2020 13,125 0.01 100,000 EUR Call/GBP Put K=0.8622 16 January 2020 144 0.00 100,000 EUR Call/GBP Put K=0.8639 15 January 2020 106 0.00
Japan 200,000 EUR Call/GBP Put K=0.8645 17 January 2020 238 0.00 (25) Japan 10 Years Bond OSE March 2020 4,509 0.00 800,000 EUR Put/GBP Call K=0.8243 13 January 2020 153 0.00 9 TOPIX Index Futures March 2020 557 0.00 700,000 EUR Put/GBP Call K=0.8257 10 January 2020 104 0.00
5,066 0.00 600,000 EUR Put/GBP Call K=0.8264 13 January 2020 162 0.00 100,000 EUR Put/GBP Call K=0.8275 06 January 2020 6 0.00 Malaysia 100,000 EUR Put/GBP Call K=0.8282 07 January 2020 9 0.00
(57) FTSE KLCI Index Futures January 2020 12,624 0.01 500,000 EUR Put/GBP Call K=0.8284 10 January 2020 121 0.00 200,000 EUR Put/GBP Call K=0.8346 14 January 2020 231 0.00 Mexico 100,000 EUR Put/GBP Call K=0.8392 15 January 2020 236 0.00
(2) MEX BOLSA Index Futures March 2020 896 0.00 100,000 EUR Put/GBP Call K=0.8406 16 January 2020 294 0.00 200,000 EUR Put/GBP Call K=0.8431 17 January 2020 827 0.00 Norway 18,637 0.02
(11) OBX Index Futures January 2020 24 0.00 United States Singapore 3 Call on 135 British Pound Currency Options 03 January 113 0.00
(153) MSCI SING IX ETS Index Futures January 2020 5,091 0.00 2 Call on 136 British Pound Currency Options 03 January 13 0.00 (12) Nikkei 225 SGX Index Futures March 2020 21,946 0.02 2 Put on 131.5 British Pound Currency Options 03 Janua 113 0.00 (223) SGX Nifty 50 Index Futures January 2020 36,023 0.04 3 Put on 132 British Pound Currency Options 03 January 338 0.00
63,060 0.06 103,880 USD Call/MXN Put K=19.253 17 January 2020 131 0.00 181,510 USD Call/MXN Put K=19.2827 14 January 2020 124 0.00 South Africa 103,640 USD Call/MXN Put K=19.2976 14 January 2020 66 0.00
(116) FTSE/JSE Top 40 Index Futures March 2020 595 0.00 77,730 USD Call/MXN Put K=19.2976 15 January 2020 58 0.00 338,700 USD Call/USD Put K=0.6774 24 January 2020 1,729 0.00 South Korea 339,300 USD Call/USD Put K=0.6786 24 January 2020 1,500 0.00
64 Korea 3 Years Bond Futures March 2020 4,358 0.00 474,285 USD Call/USD Put K=1.3551 13 January 2020 300 0.00 145 KOSPI2 Index Futures March 2020 212,644 0.21 474,355 USD Call/USD Put K=1.3553 10 January 2020 197 0.00
217,002 0.21 816,720 USD Call/USD Put K=1.3612 10 January 2020 194 0.00 106,480 USD Put/MXN Call K=18.7829 17 January 2020 226 0.00 Sweden 186,305 USD Put/MXN Call K=18.7864 14 January 2020 359 0.00
(27) OMXS 30 Index Futures January 2020 6,063 0.01 106,380 USD Put/MXN Call K=18.8005 14 January 2020 228 0.00 79,710 USD Put/MXN Call K=18.8182 15 January 2020 206 0.00 Switzerland 330,400 USD Put/USD Call K=0.6608 24 January 2020 448 0.00
31 SWISS MKT Index Futures March 2020 17,026 0.02 331,050 USD Put/USD Call K=0.6621 24 January 2020 532 0.00 460,390 USD Put/USD Call K=1.3154 13 January 2020 1,551 0.00 Turkey 460,565 USD Put/USD Call K=1.3159 10 January 2020 1,361 0.00
38 BIST 30 Index Futures February 2020 542 0.00 793,620 USD Put/USD Call K=1.3227 10 January 2020 3,859 0.01 13,646 0.01 United Kingdom
(25) 90 Day Sterling Futures June 2020 2,078 0.00 Total options 32,283 0.03 (5) 90 Day Sterling Futures March 2021 141 0.00 44 FTSE 100 Index Futures March 2020 19,381 0.02
21,600 0.02 United States
(43) 90 Day Euro Futures June 2020 8,213 0.01 (13) 90 Day Euro Futures March*1 (PERPETUAL) 3,313 0.00 3 BP Currency Futures March 2020 4,713 0.00 (6) CBOE VIX Index Futures April 2020 1,000 0.00 (17) CBOE VIX Index Futures February 2020 33,875 0.03 (23) CBOE VIX Index Futures January 2020 81,025 0.08 (20) CBOE VIX Index Futures March 2020 31,150 0.03 (2) Dollar Index Futures March 2020 561 0.00 12 E-Mini Russia 2000 Index Futures March 2020 6,603 0.01 41 Euro Currency Futures March 2020 21,506 0.02 31 MSCI Index Futures March 2020 47,575 0.05 20 Nasdaq 100 E-Mini Index Futures March 2020 58,310 0.06 53 S&P 500 E-mini Index Futures March 2020 52,415 0.06 (1) United States Ultra Bond CBT Futures March 2020 1,438 0.00
350,728 0.35
Total futures contracts 1,457,568 1.42
Government bonds France
5,000,000 France Treasury Bill BTF 0.00% 20/05/2020 # 5,627,401 5.49 United States
3,000,000 United States Treasury Bill 0.00% 05/07/2020 # 2,984,158 2.91 3,000,000 United States Treasury Bill 0.00% 09/04/2020 # 2,987,686 2.92 1,000,000 United States Treasury Bill 0.00% 14/05/2020 # 994,388 0.96 500,000 United States Treasury Bill 0.00% 19/03/2020 # 498,436 0.49 1,500,000 United States Treasury Bill 0.00% 20/02/2020 # 1,496,948 1.46 500,000 United States Treasury Bill 0.00% 26/03/2020 # 498,250 0.49
9,459,866 9.23
Total government bonds 15,087,267 14.72
Options (b) European Union
800,000 EUR Call/GBP Put K=0.8462 13 January 2020 5,776 0.01 700,000 EUR Call/GBP Put K=0.847 10 January 2020 4,245 0.01 600,000 EUR Call/GBP Put K=0.8483 13 January 2020 3,481 0.00 500,000 EUR Call/GBP Put K=0.8503 10 January 2020 2,040 0.00 100,000 EUR Call/GBP Put K=0.8585 07 January 2020 72 0.00 100,000 EUR Call/GBP Put K=0.8586 06 January 2020 52 0.00 200,000 EUR Call/GBP Put K=0.8594 14 January 2020 340 0.00
242
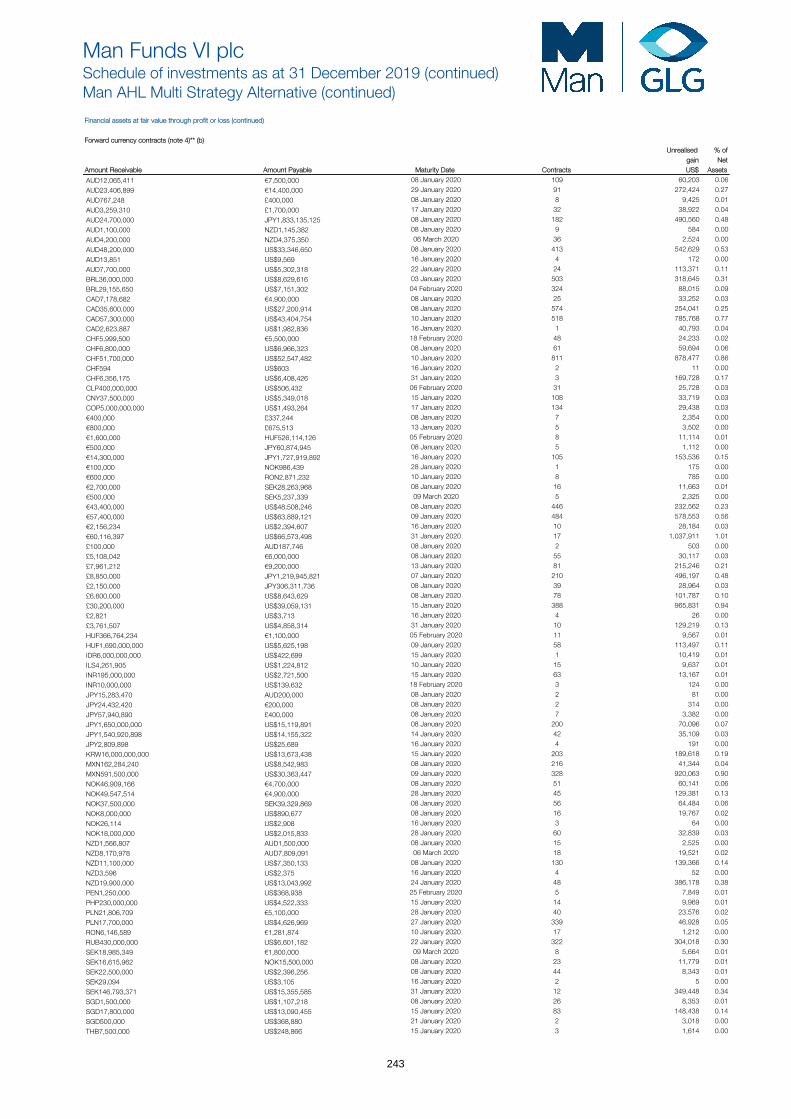
Man Funds VI plcSchedule of investments as at 31 December 2019 (continued)Man AHL Multi Strategy Alternative (continued)
Financial assets at fair value through profit or loss (continued)
Forward currency contracts (note 4)** (b) Unrealised % of
gain Net Amount Receivable Amount Payable Maturity Date Contracts US$ Assets
AUD12,065,411 €7,500,000 08 January 2020 109 60,203 0.06
AUD23,406,899 €14,400,000 29 January 2020 91 272,424 0.27
AUD767,248 £400,000 08 January 2020 8 9,425 0.01
AUD3,259,310 £1,700,000 17 January 2020 32 38,922 0.04
AUD24,700,000 JPY1,833,135,125 08 January 2020 182 490,560 0.48
AUD1,100,000 NZD1,145,382 08 January 2020 9 584 0.00
AUD4,200,000 NZD4,375,350 06 March 2020 36 2,524 0.00
AUD48,200,000 US$33,346,650 08 January 2020 413 542,629 0.53
AUD13,851 US$9,569 16 January 2020 4 172 0.00
AUD7,700,000 US$5,302,318 22 January 2020 24 113,371 0.11
BRL36,000,000 US$8,629,616 03 January 2020 503 318,645 0.31
BRL29,155,650 US$7,151,302 04 February 2020 324 88,015 0.09
CAD7,178,682 €4,900,000 08 January 2020 25 33,252 0.03
CAD35,600,000 US$27,200,914 08 January 2020 574 254,041 0.25
CAD57,300,000 US$43,404,754 10 January 2020 518 785,768 0.77
CAD2,623,887 US$1,982,836 16 January 2020 1 40,793 0.04
CHF5,999,500 €5,500,000 18 February 2020 48 24,233 0.02
CHF6,800,000 US$6,966,323 08 January 2020 61 59,694 0.06
CHF51,700,000 US$52,547,482 10 January 2020 811 878,477 0.86
CHF594 US$603 16 January 2020 2 11 0.00
CHF6,356,175 US$6,408,426 31 January 2020 3 169,728 0.17
CLP400,000,000 US$506,432 06 February 2020 31 25,728 0.03
CNY37,500,000 US$5,349,018 15 January 2020 108 33,719 0.03
COP5,000,000,000 US$1,493,264 17 January 2020 134 29,438 0.03
€400,000 £337,244 08 January 2020 7 2,354 0.00
€800,000 £675,513 13 January 2020 5 3,502 0.00
€1,600,000 HUF526,114,126 05 February 2020 8 11,114 0.01
€500,000 JPY60,874,945 08 January 2020 5 1,112 0.00
€14,300,000 JPY1,727,919,892 16 January 2020 105 153,536 0.15
€100,000 NOK986,439 28 January 2020 1 175 0.00
€600,000 RON2,871,232 10 January 2020 8 785 0.00
€2,700,000 SEK28,263,968 08 January 2020 16 11,663 0.01
€500,000 SEK5,237,339 09 March 2020 5 2,325 0.00
€43,400,000 US$48,508,246 08 January 2020 446 232,562 0.23
€57,400,000 US$63,889,121 09 January 2020 484 578,553 0.56
€2,156,234 US$2,394,607 16 January 2020 10 28,184 0.03
€60,116,397 US$66,573,498 31 January 2020 17 1,037,911 1.01
£100,000 AUD187,746 08 January 2020 2 503 0.00
£5,108,042 €6,000,000 08 January 2020 55 30,117 0.03
£7,961,212 €9,200,000 13 January 2020 81 215,246 0.21
£8,850,000 JPY1,219,945,821 07 January 2020 210 496,197 0.48
£2,150,000 JPY306,311,736 08 January 2020 39 28,964 0.03
£6,600,000 US$8,643,629 08 January 2020 78 101,787 0.10
£30,200,000 US$39,059,131 15 January 2020 388 965,831 0.94
£2,821 US$3,713 16 January 2020 4 26 0.00
£3,761,507 US$4,858,314 31 January 2020 10 129,219 0.13
HUF366,764,234 €1,100,000 05 February 2020 11 9,567 0.01
HUF1,690,000,000 US$5,625,198 09 January 2020 58 113,497 0.11
IDR6,000,000,000 US$422,699 15 January 2020 1 10,419 0.01
ILS4,261,905 US$1,224,812 10 January 2020 15 9,637 0.01
INR195,000,000 US$2,721,500 15 January 2020 63 13,167 0.01
INR10,000,000 US$139,632 18 February 2020 3 124 0.00
JPY15,283,470 AUD200,000 08 January 2020 2 81 0.00
JPY24,432,420 €200,000 08 January 2020 2 314 0.00
JPY57,940,890 £400,000 08 January 2020 7 3,382 0.00
JPY1,650,000,000 US$15,119,891 08 January 2020 200 70,096 0.07
JPY1,540,920,898 US$14,155,322 14 January 2020 42 35,109 0.03
JPY2,809,898 US$25,689 16 January 2020 4 191 0.00
KRW16,000,000,000 US$13,673,438 15 January 2020 203 189,618 0.19
MXN162,284,240 US$8,542,983 08 January 2020 216 41,344 0.04
MXN591,500,000 US$30,363,447 09 January 2020 328 920,063 0.90
NOK46,909,166 €4,700,000 08 January 2020 51 60,141 0.06
NOK49,547,514 €4,900,000 28 January 2020 45 129,381 0.13
NOK37,500,000 SEK39,329,869 08 January 2020 56 64,484 0.06
NOK8,000,000 US$890,677 08 January 2020 16 19,767 0.02
NOK26,114 US$2,908 16 January 2020 3 64 0.00
NOK18,000,000 US$2,015,833 28 January 2020 60 32,839 0.03
NZD1,566,807 AUD1,500,000 08 January 2020 15 2,525 0.00
NZD8,170,978 AUD7,809,091 06 March 2020 18 19,521 0.02
NZD11,100,000 US$7,350,133 08 January 2020 130 139,366 0.14
NZD3,596 US$2,375 16 January 2020 4 52 0.00
NZD19,900,000 US$13,043,992 24 January 2020 48 386,178 0.38
PEN1,250,000 US$368,938 25 February 2020 5 7,849 0.01
PHP230,000,000 US$4,522,333 15 January 2020 14 9,969 0.01
PLN21,806,709 €5,100,000 28 January 2020 40 23,576 0.02
PLN17,700,000 US$4,626,969 27 January 2020 339 46,928 0.05
RON6,146,589 €1,281,874 10 January 2020 17 1,212 0.00
RUB430,000,000 US$6,601,182 22 January 2020 322 304,018 0.30
SEK18,985,349 €1,800,000 09 March 2020 8 5,664 0.01
SEK16,615,962 NOK15,500,000 08 January 2020 23 11,779 0.01
SEK22,500,000 US$2,396,256 08 January 2020 44 8,343 0.01
SEK29,094 US$3,105 16 January 2020 2 5 0.00
SEK146,793,371 US$15,355,585 31 January 2020 12 349,448 0.34
SGD1,500,000 US$1,107,218 08 January 2020 26 8,353 0.01
SGD17,800,000 US$13,090,455 15 January 2020 83 148,438 0.14
SGD500,000 US$368,880 21 January 2020 2 3,018 0.00
THB7,500,000 US$248,866 15 January 2020 3 1,614 0.00
243
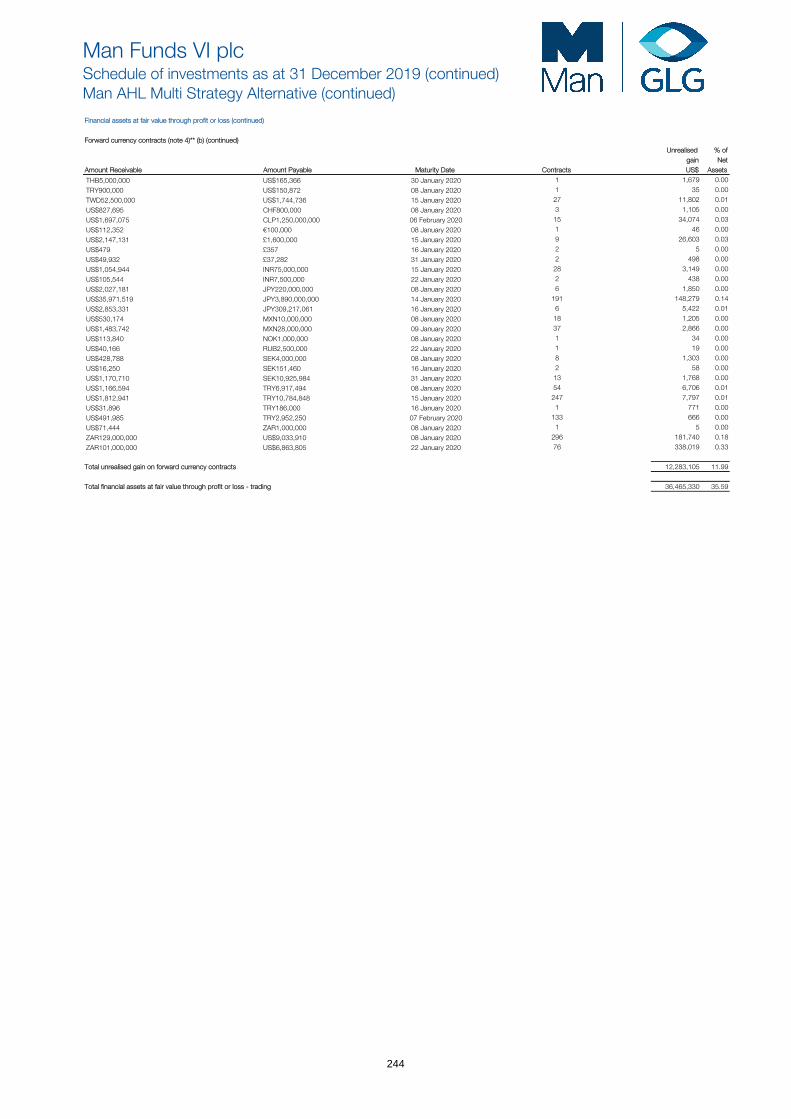
Man Funds VI plcSchedule of investments as at 31 December 2019 (continued)Man AHL Multi Strategy Alternative (continued)
Financial assets at fair value through profit or loss (continued)
Forward currency contracts (note 4)** (b) (continued) Unrealised % of
gain Net Amount Receivable Amount Payable Maturity Date Contracts US$ Assets
THB5,000,000 US$165,366 30 January 2020 1 1,679 0.00
TRY900,000 US$150,872 08 January 2020 1 35 0.00
TWD52,500,000 US$1,744,736 15 January 2020 27 11,802 0.01
US$827,695 CHF800,000 08 January 2020 3 1,105 0.00
US$1,697,075 CLP1,250,000,000 06 February 2020 15 34,074 0.03
US$112,352 €100,000 08 January 2020 1 46 0.00
US$2,147,131 £1,600,000 15 January 2020 9 26,603 0.03
US$479 £357 16 January 2020 2 5 0.00
US$49,932 £37,282 31 January 2020 2 498 0.00
US$1,054,944 INR75,000,000 15 January 2020 28 3,149 0.00
US$105,544 INR7,500,000 22 January 2020 2 438 0.00
US$2,027,181 JPY220,000,000 08 January 2020 6 1,850 0.00
US$35,971,519 JPY3,890,000,000 14 January 2020 191 148,279 0.14
US$2,853,331 JPY309,217,061 16 January 2020 6 5,422 0.01
US$530,174 MXN10,000,000 08 January 2020 18 1,205 0.00
US$1,483,742 MXN28,000,000 09 January 2020 37 2,866 0.00
US$113,840 NOK1,000,000 08 January 2020 1 34 0.00
US$40,166 RUB2,500,000 22 January 2020 1 19 0.00
US$428,788 SEK4,000,000 08 January 2020 8 1,303 0.00
US$16,250 SEK151,460 16 January 2020 2 58 0.00
US$1,170,710 SEK10,925,984 31 January 2020 13 1,768 0.00
US$1,166,594 TRY6,917,494 08 January 2020 54 6,706 0.01
US$1,812,941 TRY10,784,848 15 January 2020 247 7,797 0.01
US$31,896 TRY186,000 16 January 2020 1 771 0.00
US$491,985 TRY2,952,250 07 February 2020 133 666 0.00
US$71,444 ZAR1,000,000 08 January 2020 1 5 0.00
ZAR129,000,000 US$9,033,910 08 January 2020 296 181,740 0.18
ZAR101,000,000 US$6,863,805 22 January 2020 76 338,019 0.33
Total unrealised gain on forward currency contracts 12,283,105 11.99
Total financial assets at fair value through profit or loss - trading 36,465,330 35.59
244
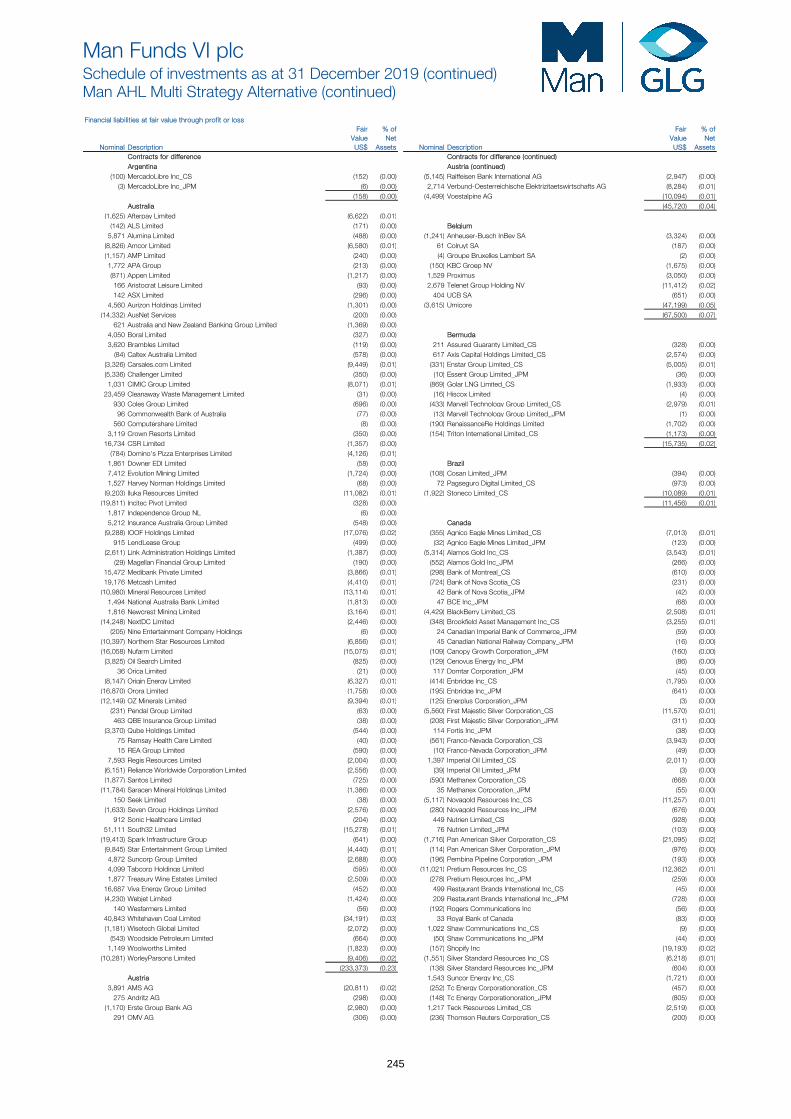
Man Funds VI plcSchedule of investments as at 31 December 2019 (continued) Man AHL Multi Strategy Alternative (continued)
Financial liabilities at fair value through profit or loss Fair % of Fair % of
Value Net Value Net Nominal Description US$ Assets Nominal Description US$ Assets
Contracts for difference Contracts for difference (continued) Argentina Austria (continued)
(100) MercadoLibre Inc_CS (152) (0.00) (5,145) Raiffeisen Bank International AG (2,947) (0.00) (3) MercadoLibre Inc_JPM (6) (0.00) 2,714 Verbund-Oesterreichische Elektrizitaetswirtschafts AG (8,284) (0.01)
(158) (0.00) (4,499) Voestalpine AG (10,094) (0.01) Australia (45,720) (0.04)
(1,625) Afterpay Limited (6,622) (0.01)(142) ALS Limited (171) (0.00) Belgium
5,871 Alumina Limited (488) (0.00) (1,241) Anheuser-Busch InBev SA (3,324) (0.00) (8,826) Amcor Limited (6,580) (0.01) 61 Colruyt SA (187) (0.00) (1,157) AMP Limited (240) (0.00) (4) Groupe Bruxelles Lambert SA (2) (0.00) 1,772 APA Group (213) (0.00) (150) KBC Groep NV (1,675) (0.00) (871) Appen Limited (1,217) (0.00) 1,529 Proximus (3,050) (0.00) 166 Aristocrat Leisure Limited (93) (0.00) 2,679 Telenet Group Holding NV (11,412) (0.02)142 ASX Limited (296) (0.00) 404 UCB SA (651) (0.00)
4,560 Aurizon Holdings Limited (1,301) (0.00) (3,615) Umicore (47,199) (0.05) (14,332) AusNet Services (200) (0.00) (67,500) (0.07)
621 Australia and New Zealand Banking Group Limited (1,369) (0.00) 4,050 Boral Limited (327) (0.00) Bermuda 3,620 Brambles Limited (119) (0.00) 211 Assured Guaranty Limited_CS (328) (0.00)
(84) Caltex Australia Limited (578) (0.00) 617 Axis Capital Holdings Limited_CS (2,574) (0.00) (3,326) Carsales.com Limited (9,449) (0.01) (331) Enstar Group Limited_CS (5,005) (0.01) (5,336) Challenger Limited (350) (0.00) (10) Essent Group Limited_JPM (36) (0.00) 1,031 CIMIC Group Limited (8,071) (0.01) (869) Golar LNG Limited_CS (1,933) (0.00) 23,459 Cleanaway Waste Management Limited (31) (0.00) (16) Hiscox Limited (4) (0.00)
930 Coles Group Limited (696) (0.00) (433) Marvell Technology Group Limited_CS (2,979) (0.01)96 Commonwealth Bank of Australia (77) (0.00) (13) Marvell Technology Group Limited_JPM (1) (0.00)
560 Computershare Limited (8) (0.00) (190) RenaissanceRe Holdings Limited (1,702) (0.00) 3,119 Crown Resorts Limited (350) (0.00) (154) Triton International Limited_CS (1,173) (0.00) 16,734 CSR Limited (1,357) (0.00) (15,735) (0.02)
(784) Domino's Pizza Enterprises Limited (4,126) (0.01)1,861 Downer EDI Limited (58) (0.00) Brazil7,412 Evolution Mining Limited (1,724) (0.00) (108) Cosan Limited_JPM (394) (0.00) 1,527 Harvey Norman Holdings Limited (68) (0.00) 72 Pagseguro Digital Limited_CS (973) (0.00)
(9,203) Iluka Resources Limited (11,082) (0.01) (1,922) Stoneco Limited_CS (10,089) (0.01)(19,811) Incitec Pivot Limited (328) (0.00) (11,456) (0.01)
1,817 Independence Group NL (6) (0.00) 5,212 Insurance Australia Group Limited (548) (0.00) Canada (9,288) IOOF Holdings Limited (17,076) (0.02) (355) Agnico Eagle Mines Limited_CS (7,013) (0.01)
915 LendLease Group (499) (0.00) (32) Agnico Eagle Mines Limited_JPM (123) (0.00) (2,611) Link Administration Holdings Limited (1,387) (0.00) (5,314) Alamos Gold Inc_CS (3,543) (0.01)
(29) Magellan Financial Group Limited (190) (0.00) (552) Alamos Gold Inc_JPM (266) (0.00) 15,472 Medibank Private Limited (3,866) (0.01) (298) Bank of Montreal_CS (610) (0.00) 19,176 Metcash Limited (4,410) (0.01) (724) Bank of Nova Scotia_CS (231) (0.00) (10,980) Mineral Resources Limited (13,114) (0.01) 42 Bank of Nova Scotia_JPM (42) (0.00) 1,494 National Australia Bank Limited (1,813) (0.00) 47 BCE Inc_JPM (68) (0.00) 1,816 Newcrest Mining Limited (3,164) (0.01) (4,429) BlackBerry Limited_CS (2,508) (0.01) (14,248) NextDC Limited (2,446) (0.00) (348) Brookfield Asset Management Inc_CS (3,255) (0.01)
(205) Nine Entertainment Company Holdings (6) (0.00) 24 Canadian Imperial Bank of Commerce_JPM (59) (0.00) (10,397) Northern Star Resources Limited (6,856) (0.01) 45 Canadian National Railway Company_JPM (16) (0.00) (16,058) Nufarm Limited (15,075) (0.01) (109) Canopy Growth Corporation_JPM (160) (0.00) (3,825) Oil Search Limited (825) (0.00) (129) Cenovus Energy Inc_JPM (86) (0.00)
36 Orica Limited (21) (0.00) 117 Domtar Corporation_JPM (45) (0.00) (8,147) Origin Energy Limited (6,327) (0.01) (414) Enbridge Inc_CS (1,795) (0.00) (16,870) Orora Limited (1,758) (0.00) (195) Enbridge Inc_JPM (641) (0.00) (12,149) OZ Minerals Limited (9,394) (0.01) (125) Enerplus Corporation_JPM (3) (0.00)
(231) Pendal Group Limited (63) (0.00) (5,560) First Majestic Silver Corporation_CS (11,570) (0.01)463 QBE Insurance Group Limited (38) (0.00) (208) First Majestic Silver Corporation_JPM (311) (0.00)
(3,370) Qube Holdings Limited (544) (0.00) 114 Fortis Inc_JPM (38) (0.00) 75 Ramsay Health Care Limited (40) (0.00) (561) Franco-Nevada Corporation_CS (3,943) (0.00) 15 REA Group Limited (590) (0.00) (10) Franco-Nevada Corporation_JPM (49) (0.00)
7,593 Regis Resources Limited (2,004) (0.00) 1,397 Imperial Oil Limited_CS (2,011) (0.00) (6,151) Reliance Worldwide Corporation Limited (2,556) (0.00) (39) Imperial Oil Limited_JPM (3) (0.00) (1,877) Santos Limited (725) (0.00) (590) Methanex Corporation_CS (668) (0.00) (11,784) Saracen Mineral Holdings Limited (1,386) (0.00) 35 Methanex Corporation_JPM (55) (0.00)
150 Seek Limited (38) (0.00) (5,117) Novagold Resources Inc_CS (11,257) (0.01) (1,633) Seven Group Holdings Limited (2,576) (0.00) (280) Novagold Resources Inc_JPM (676) (0.00)
912 Sonic Healthcare Limited (204) (0.00) 449 Nutrien Limited_CS (928) (0.00) 51,111 South32 Limited (15,278) (0.01) 76 Nutrien Limited_JPM (103) (0.00) (19,413) Spark Infrastructure Group (641) (0.00) (1,716) Pan American Silver Corporation_CS (21,095) (0.02) (9,845) Star Entertainment Group Limited (4,440) (0.01) (114) Pan American Silver Corporation_JPM (976) (0.00) 4,872 Suncorp Group Limited (2,688) (0.00) (196) Pembina Pipeline Corporation_JPM (193) (0.00) 4,099 Tabcorp Holdings Limited (595) (0.00) (11,021) Pretium Resources Inc_CS (12,362) (0.01) 1,877 Treasury Wine Estates Limited (2,509) (0.00) (278) Pretium Resources Inc_JPM (259) (0.00) 16,687 Viva Energy Group Limited (452) (0.00) 499 Restaurant Brands International Inc_CS (45) (0.00) (4,230) Webjet Limited (1,424) (0.00) 209 Restaurant Brands International Inc_JPM (728) (0.00)
140 Wesfarmers Limited (56) (0.00) (192) Rogers Communications Inc (56) (0.00) 40,843 Whitehaven Coal Limited (34,191) (0.03) 33 Royal Bank of Canada (83) (0.00) (1,181) Wisetech Global Limited (2,072) (0.00) 1,022 Shaw Communications Inc_CS (9) (0.00)
(543) Woodside Petroleum Limited (664) (0.00) (50) Shaw Communications Inc_JPM (44) (0.00) 1,149 Woolworths Limited (1,823) (0.00) (157) Shopify Inc (19,193) (0.02)
(10,281) WorleyParsons Limited (9,406) (0.02) (1,551) Silver Standard Resources Inc_CS (6,218) (0.01) (233,373) (0.23) (138) Silver Standard Resources Inc_JPM (604) (0.00)
Austria 1,543 Suncor Energy Inc_CS (1,721) (0.00) 3,891 AMS AG (20,811) (0.02) (252) Tc Energy Corporationoration_CS (457) (0.00)
275 Andritz AG (298) (0.00) (148) Tc Energy Corporationoration_JPM (805) (0.00) (1,170) Erste Group Bank AG (2,980) (0.00) 1,217 Teck Resources Limited_CS (2,519) (0.00)
291 OMV AG (306) (0.00) (236) Thomson Reuters Corporation_CS (200) (0.00)
245

Man Funds VI plcSchedule of investments as at 31 December 2019 (continued)Man AHL Multi Strategy Alternative (continued)
Financial liabilities at fair value through profit or loss (continued) Fair % of Fair % of
Value Net Value Net Nominal Description US$ Assets Nominal Description US$ Assets
Contracts for difference (continued) Contracts for difference (continued)Canada (continued) Faroe Islands
63 Toronto-Dominion Bank_JPM (85) (0.00) (830) Bakkafrost P/F (2,173) (0.00) (725) Vermilion Energy Inc_CS (1,384) (0.00)
(86) Vermilion Energy Inc_JPM (69) (0.00) Finland(282) Wheaton Precious Metals Corporation_CS (2,048) (0.00) (20) Huhtamaki OYJ (152) (0.00)
(60) Wheaton Precious Metals Corporation_JPM (108) (0.00) (1,754) Metso OYJ (1,359) (0.00) (123,337) (0.12) (1,750) Neste OYJ (1,241) (0.00)
(798) Nokia OYJ (53) (0.00) China (67) Nokian Renkaat OYJ (51) (0.00)
18,500 3SBio Inc (4,941) (0.00) (7,909) Nordea Bank ABP (5,413) (0.01) (6,500) Aac Technologies Holdings (19,239) (0.02) (514) Outokumpu OYJ (88) (0.00) (10,000) Agile Property Holdings Limited (1,680) (0.00) 1,720 Sampo OYJ (3,200) (0.00) (1,000) Airtac International Group (1,063) (0.00) 158 UPM-Kymmene OYJ (16) (0.00) 10,000 Bank of China Limited (16) (0.00) 2,627 Valmet Corporation (3,924) (0.00) 18,000 Bank of Communications Company Limited (1,961) (0.00) (9,817) Wartsila OYJ (4,411) (0.01) (26,000) BYD Electronic International Company Limited (8,224) (0.01) (19,908) (0.02) (4,000) China Aoyuan Group Limited (1,769) (0.00) 6,000 China CITIC Bank Corporation Limited (30) (0.00) France (3,000) China Conch Venture Holdings Limited (2,916) (0.01) (3,443) Accor SA (20,388) (0.02) (7,000) China Evergrande Group (3,025) (0.01) (319) ADP Promesses (7,243) (0.01) (90,000) China Galaxy Securities Company Limited (5,680) (0.01) 429 Air France-KLM (147) (0.00) (6,400) China International Capital Corporation Limited (1,052) (0.00) (298) Airbus SE (3,198) (0.00) (14,000) China Mengniu Dairy Company (1,960) (0.00) (683) Alstom SA (3,163) (0.00)
500 China Merchants Bank Company Limited (40) (0.00) 75 Arkema SA (114) (0.00) (123,000) China Molybdenum Company Limited (13,219) (0.01) (1,394) Atos SE (7,936) (0.01) (2,800) China Pacific Insurance Group Company Limited (1,193) (0.00) (1,307) AXA SA (2,019) (0.00) (6,000) China Petroleum & Chemical Corporation (140) (0.00) (342) BioMerieux (1,758) (0.00) (13,000) China Railway Group Limited (109) (0.00) (316) BNP Paribas SA (1,924) (0.00) (6,500) China Shenhua Energy Company Limited (463) (0.00) (550) Bouygues SA (2,876) (0.00) (38,000) China Southern Airlines Company Limited (2,385) (0.00) (4,821) CGG SA (5,395) (0.01) 56,000 China Telecom Corporation Limited (1,437) (0.00) (373) Cie de Saint-Gobain (1,101) (0.00) (146,000) China Tower Corporation Limited (1,768) (0.00) (489) Cie Generale des Etablissements Michelin (2,709) (0.00) (2,700) China Vanke Company Limited (2,132) (0.00) 4,498 CNP Assurances (6,951) (0.01) (5,000) CITIC Securities Company Limited (1,948) (0.00) (5,675) Credit Agricole SA (10,637) (0.02) (5,000) Country Garden Holdings Company Limited (1,937) (0.00) 224 Danone SA (374) (0.00) (7,000) CRRC Corporation Limited (155) (0.00) 2 Dassault Aviation SA (396) (0.00) (76,000) Dongfeng Motor Group Company Limited (8,696) (0.01) (236) Dassault Systemes (2,798) (0.00) 2,800 ENN Energy Holdings Limited (11) (0.00) (410) EDF (285) (0.00) (19,500) Fosun International (4,265) (0.01) (1,094) Elis SA (5,650) (0.01) (31,500) Great Wall Motor Company Limited (3,915) (0.00) (9,085) Engie SA (603) (0.00) (16,000) Guangzhou Automobile Group Company Limited (4,436) (0.00) (3,070) Eramet (11,975) (0.01) (15,200) Guangzhou R&F Properties Company Limited (3,207) (0.00) (220) Essilor International Cie Generale d'Optique SA (5,433) (0.01) (9,600) Haitong Securities Company Limited (2,376) (0.00) 623 Eurazeo SA (2,024) (0.00) (8,500) Hengan International Group Company Limited (2,119) (0.00) (226) Eurofins Scientific (38,785) (0.04) (46,000) Hua Hong SemiConductor Limited (17,982) (0.02) 2,133 Eutelsat Communications (6,029) (0.01) (16,200) Huatai Securities Company Limited (4,503) (0.01) (2,339) Groupe Eurotunnel SA (5,459) (0.01) 1,000 Industrial & Commercial Bank of China Limited (726) (0.00) (2,321) Iliad SA (66,134) (0.06) (16,000) Kingsoft Corporation Limited (12,580) (0.01) 430 Imerys SA (73) (0.00) (7,500) KWG Property Holding Limited (2,996) (0.00) 246 Ipsen SA (3,481) (0.00) 46,000 Lenovo Group Limited (969) (0.00) 870 Lagardere SCA (80) (0.00) 1,000 Li Ning Company Limited (313) (0.00) (258) L'Oreal SA (3,575) (0.00)
(900) Meituan Dianping (4,404) (0.00) 3,983 Natixis SA (321) (0.00) (4,900) New China Life Insurance Company Limited (1,269) (0.00) (2,210) Orpea (15,246) (0.01)
(22,000) PetroChina Company Limited (28) (0.00) 224 Pernod Ricard SA (822) (0.00) 500 Ping An Insurance Group Company (20) (0.00) (33) Plastic Omnium (58) (0.00)
5,000 Postal Savings Bank of ChinaCompany Limited (40) (0.00) 3,992 Publicis Groupe SA (5,669) (0.01) (6,000) Seazen Group Limited (2,347) (0.00) 39 Remy Cointreau (579) (0.00) (44,000) Semiconductor Manufacturing International Corporation (17,238) (0.03) (9,497) Rexel SA (23,856) (0.02) (2,000) Shanghai Fosun Pharmaceuti (242) (0.00) (943) Rubis SCA (4,317) (0.00) (2,860) Sina Corporation_CS (9,195) (0.01) 836 Safran SA (4,811) (0.00) (14,800) Sinopharm Group Company Limited (3,725) (0.01) (266) Sanofi (1,927) (0.00) (21,000) Sun Art Retail Group Limited (6,253) (0.01) (298) Sartorius Stedim Biotech (4,834) (0.00) (1,000) Sunac China Holdings Limited (1,808) (0.00) 2,140 SCOR Regroupe (837) (0.00)
(100) Sunny Optical Technology Group Company Limited (551) (0.00) 63 SEB SA (838) (0.00) (100) Tencent Holdings Limited (221) (0.00) 347 Societe BIC SA (1,226) (0.00)
(16,000) Tingyi (Cayman Islands) Holding Corporation (4,412) (0.01) (2,433) Societe Generale (22,555) (0.02) (42,200) Xiaomi Corporation (3,476) (0.00) (33) Soitec (972) (0.00) (38,000) Xinyi Solar Holdings Limited (6,307) (0.01) 3,396 Suez (1,453) (0.00)
(900) Yangzijiang Shipbuilding Holdings Limited (124) (0.00) (28) Total SA (10) (0.00) (8,400) Zhuzhou CRRC Times Electric Company Limited (1,261) (0.00) (551) Ubisoft Entertainment (6,805) (0.01)(2,200) ZTE Corporation (512) (0.00) 487 Valeo SA (1,913) (0.00)
(213,009) (0.21) (39) Veolia Environnement SA (16) (0.00) 86 Vinci SA (25) (0.00)
Denmark (3,962) Vivendi SA (4,014) (0.01) (3,688) Ambu A/S (8,927) (0.01) 641 Wendel Investissement (4,166) (0.01)
35 CHR Hansen Holding A/S (13) (0.00) (1,079) Worldline SA (3,902) (0.01)(401) Danske Bank A/S (1,012) (0.00) (341,885) (0.33)(458) DSV A/S (4,954) (0.00)
(2,229) FLSmidth & Company A/S (3,703) (0.01) Germany(22) Genmab A/S (35) (0.00) (190) Adidas AG (3,302) (0.00)
5,047 H Lundbeck A/S (6,300) (0.01) (98) Aixtron AG (9) (0.00) (2,215) Jyske Bank A/S (11,778) (0.01) 71 Allianz SE (93) (0.00)
126 Novozymes A/S (24) (0.00) (5,973) Aroundtown SA (4,840) (0.00) (161) Orsted A/S (2,051) (0.00) (2,165) Aurubis AG (32,973) (0.03)481 Rockwool Intl A/S-B Shs (3,252) (0.00) 138 BASF SE (122) (0.00)
(340) Royal Unibrew A/S (2,457) (0.00) (1,525) Bayerische Motoren Werke AG (7,574) (0.01)895 Tryg A/S (647) (0.00) (12) Bechtle AG (359) (0.00)
(45,153) (0.04) (992) Beiersdorf AG (803) (0.00)
246
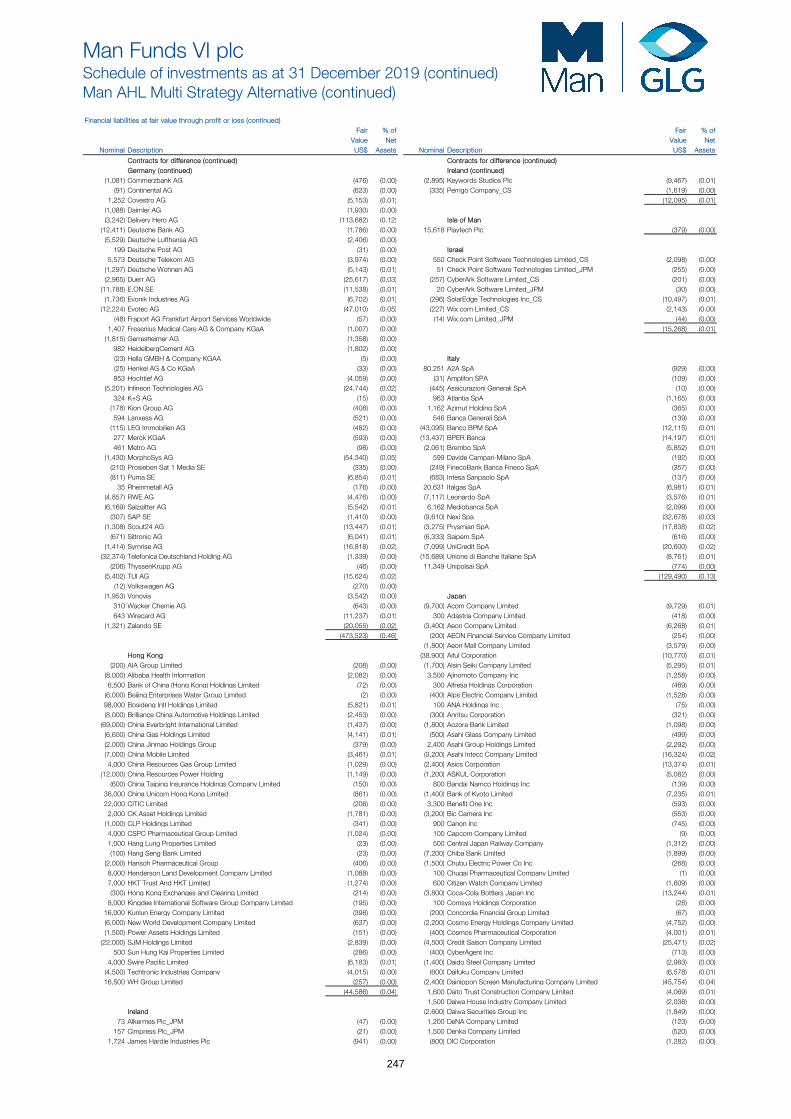
Man Funds VI plcSchedule of investments as at 31 December 2019 (continued)Man AHL Multi Strategy Alternative (continued)
Financial liabilities at fair value through profit or loss (continued) Fair % of Fair % of
Value Net Value Net Nominal Description US$ Assets Nominal Description US$ Assets
Contracts for difference (continued) Contracts for difference (continued)Germany (continued) Ireland (continued)
(1,081) Commerzbank AG (476) (0.00) (2,895) Keywords Studios Plc (9,467) (0.01) (91) Continental AG (623) (0.00) (335) Perrigo Company_CS (1,619) (0.00) 1,252 Covestro AG (5,153) (0.01) (12,095) (0.01) (1,088) Daimler AG (1,930) (0.00) (3,242) Delivery Hero AG (113,682) (0.12) Isle of Man (12,411) Deutsche Bank AG (1,786) (0.00) 15,618 Playtech Plc (379) (0.00) (5,529) Deutsche Lufthansa AG (2,406) (0.00) 199 Deutsche Post AG (31) (0.00) Israel 5,573 Deutsche Telekom AG (3,974) (0.00) 550 Check Point Software Technologies Limited_CS (2,098) (0.00) (1,297) Deutsche Wohnen AG (5,143) (0.01) 51 Check Point Software Technologies Limited_JPM (255) (0.00) (2,965) Duerr AG (25,617) (0.03) (257) CyberArk Software Limited_CS (201) (0.00) (11,788) E.ON SE (11,538) (0.01) 20 CyberArk Software Limited_JPM (30) (0.00) (1,736) Evonik Industries AG (6,702) (0.01) (296) SolarEdge Technologies Inc_CS (10,497) (0.01) (12,224) Evotec AG (47,010) (0.05) (227) Wix.com Limited_CS (2,143) (0.00) (48) Fraport AG Frankfurt Airport Services Worldwide (57) (0.00) (14) Wix.com Limited_JPM (44) (0.00) 1,407 Fresenius Medical Care AG & Company KGaA (1,007) (0.00) (15,268) (0.01) (1,815) Gerresheimer AG (1,358) (0.00) 982 HeidelbergCement AG (1,802) (0.00) (23) Hella GMBH & Company KGAA (5) (0.00) Italy (25) Henkel AG & Co KGaA (33) (0.00) 80,251 A2A SpA (929) (0.00) 853 Hochtief AG (4,059) (0.00) (31) Amplifon SPA (109) (0.00) (5,201) Infineon Technologies AG (24,744) (0.02) (445) Assicurazioni Generali SpA (10) (0.00) 324 K+S AG (15) (0.00) 963 Atlantia SpA (1,165) (0.00) (178) Kion Group AG (408) (0.00) 1,162 Azimut Holding SpA (365) (0.00) 594 Lanxess AG (521) (0.00) 546 Banca Generali SpA (139) (0.00) (115) LEG Immobilien AG (482) (0.00) (43,095) Banco BPM SpA (12,115) (0.01) 277 Merck KGaA (593) (0.00) (13,437) BPER Banca (14,197) (0.01) 461 Metro AG (98) (0.00) (2,061) Brembo SpA (5,852) (0.01) (1,430) MorphoSys AG (54,340) (0.05) 599 Davide Campari-Milano SpA (192) (0.00) (210) Prosieben Sat 1 Media SE (335) (0.00) (249) FinecoBank Banca Fineco SpA (357) (0.00) (811) Puma SE (6,854) (0.01) (683) Intesa Sanpaolo SpA (137) (0.00) 35 Rheinmetall AG (176) (0.00) 20,631 Italgas SpA (6,981) (0.01) (4,857) RWE AG (4,476) (0.00) (7,117) Leonardo SpA (3,576) (0.01) (6,169) Salzgitter AG (5,542) (0.01) 6,162 Mediobanca SpA (2,099) (0.00) (307) SAP SE (1,410) (0.00) (9,610) Nexi Spa (32,678) (0.03) (1,308) Scout24 AG (13,447) (0.01) (3,275) Prysmian SpA (17,838) (0.02) (671) Siltronic AG (6,041) (0.01) (6,333) Saipem SpA (616) (0.00) (1,414) Symrise AG (16,818) (0.02) (7,099) UniCredit SpA (20,600) (0.02) (32,374) Telefonica Deutschland Holding AG (1,339) (0.00) (15,689) Unione di Banche Italiane SpA (8,761) (0.01) (206) ThyssenKrupp AG (46) (0.00) 11,349 Unipolsai SpA (774) (0.00) (5,402) TUI AG (15,624) (0.02) (129,490) (0.13) (12) Volkswagen AG (270) (0.00) (1,953) Vonovia (3,542) (0.00) Japan 310 Wacker Chemie AG (643) (0.00) (9,700) Acom Company Limited (9,729) (0.01) 643 Wirecard AG (11,237) (0.01) 300 Adastria Company Limited (418) (0.00) (1,321) Zalando SE (20,055) (0.02) (3,400) Aeon Company Limited (6,268) (0.01)
(473,523) (0.46) (200) AEON Financial Service Company Limited (254) (0.00) (1,800) Aeon Mall Company Limited (3,579) (0.00) Hong Kong (38,900) Aiful Corporation (10,770) (0.01)
(200) AIA Group Limited (208) (0.00) (1,700) Aisin Seiki Company Limited (5,295) (0.01) (8,000) Alibaba Health Information (2,082) (0.00) 3,500 Ajinomoto Company Inc (1,258) (0.00) 6,500 Bank of China (Hong Kong) Holdings Limited (72) (0.00) 300 Alfresa Holdings Corporation (469) (0.00) (6,000) Beijing Enterprises Water Group Limited (2) (0.00) (400) Alps Electric Company Limited (1,528) (0.00) 98,000 Bosideng Intl Holdings Limited (5,821) (0.01) 100 ANA Holdings Inc (75) (0.00) (8,000) Brilliance China Automotive Holdings Limited (2,453) (0.00) (300) Anritsu Corporation (321) (0.00) (69,000) China Everbright International Limited (1,437) (0.00) (1,800) Aozora Bank Limited (1,098) (0.00) (6,600) China Gas Holdings Limited (4,141) (0.01) (500) Asahi Glass Company Limited (499) (0.00) (2,000) China Jinmao Holdings Group (379) (0.00) 2,400 Asahi Group Holdings Limited (2,292) (0.00) (7,000) China Mobile Limited (3,461) (0.01) (3,200) Asahi Intecc Company Limited (16,324) (0.02) 4,000 China Resources Gas Group Limited (1,029) (0.00) (2,400) Asics Corporation (13,374) (0.01) (12,000) China Resources Power Holding (1,149) (0.00) (1,200) ASKUL Corporation (5,082) (0.00) (600) China Taiping Insurance Holdings Company Limited (150) (0.00) 800 Bandai Namco Holdings Inc (139) (0.00) 36,000 China Unicom Hong Kong Limited (861) (0.00) (1,400) Bank of Kyoto Limited (7,235) (0.01) 22,000 CITIC Limited (206) (0.00) 3,300 Benefit One Inc (593) (0.00) 2,000 CK Asset Holdings Limited (1,781) (0.00) (3,200) Bic Camera Inc (553) (0.00) (1,000) CLP Holdings Limited (341) (0.00) 900 Canon Inc (745) (0.00) 4,000 CSPC Pharmaceutical Group Limited (1,024) (0.00) 100 Capcom Company Limited (9) (0.00) 1,000 Hang Lung Properties Limited (23) (0.00) 500 Central Japan Railway Company (1,312) (0.00) (100) Hang Seng Bank Limited (23) (0.00) (7,200) Chiba Bank Limited (1,899) (0.00) (2,000) Hansoh Pharmaceutical Group (406) (0.00) (1,500) Chubu Electric Power Co Inc (268) (0.00) 8,000 Henderson Land Development Company Limited (1,088) (0.00) 100 Chugai Pharmaceutical Company Limited (1) (0.00) 7,000 HKT Trust And HKT Limited (1,274) (0.00) 600 Citizen Watch Company Limited (1,609) (0.00) (300) Hong Kong Exchanges and Clearing Limited (214) (0.00) (3,800) Coca-Cola Bottlers Japan Inc (13,244) (0.01) 8,000 Kingdee International Software Group Company Limited (195) (0.00) 100 Comsys Holdings Corporation (28) (0.00) 16,000 Kunlun Energy Company Limited (398) (0.00) (200) Concordia Financial Group Limited (67) (0.00) (6,000) New World Development Company Limited (637) (0.00) (2,200) Cosmo Energy Holdings Company Limited (4,752) (0.00) (1,500) Power Assets Holdings Limited (151) (0.00) (400) Cosmos Pharmaceutical Corporation (4,001) (0.01) (22,000) SJM Holdings Limited (2,839) (0.00) (4,500) Credit Saison Company Limited (25,471) (0.02) 500 Sun Hung Kai Properties Limited (286) (0.00) (400) CyberAgent Inc (713) (0.00) 4,000 Swire Pacific Limited (6,183) (0.01) (1,400) Daido Steel Company Limited (2,983) (0.00) (4,500) Techtronic Industries Company (4,015) (0.00) (600) Daifuku Company Limited (6,578) (0.01) 16,500 WH Group Limited (257) (0.00) (2,400) Dainippon Screen Manufacturing Company Limited (45,754) (0.04)
(44,586) (0.04) 1,600 Daito Trust Construction Company Limited (4,069) (0.01) 1,500 Daiwa House Industry Company Limited (2,038) (0.00) Ireland (2,600) Daiwa Securities Group Inc (1,849) (0.00)
73 Alkermes Plc_JPM (47) (0.00) 1,200 DeNA Company Limited (123) (0.00) 157 Cimpress Plc_JPM (21) (0.00) 1,500 Denka Company Limited (520) (0.00) 1,724 James Hardie Industries Plc (941) (0.00) (800) DIC Corporation (1,282) (0.00)
247
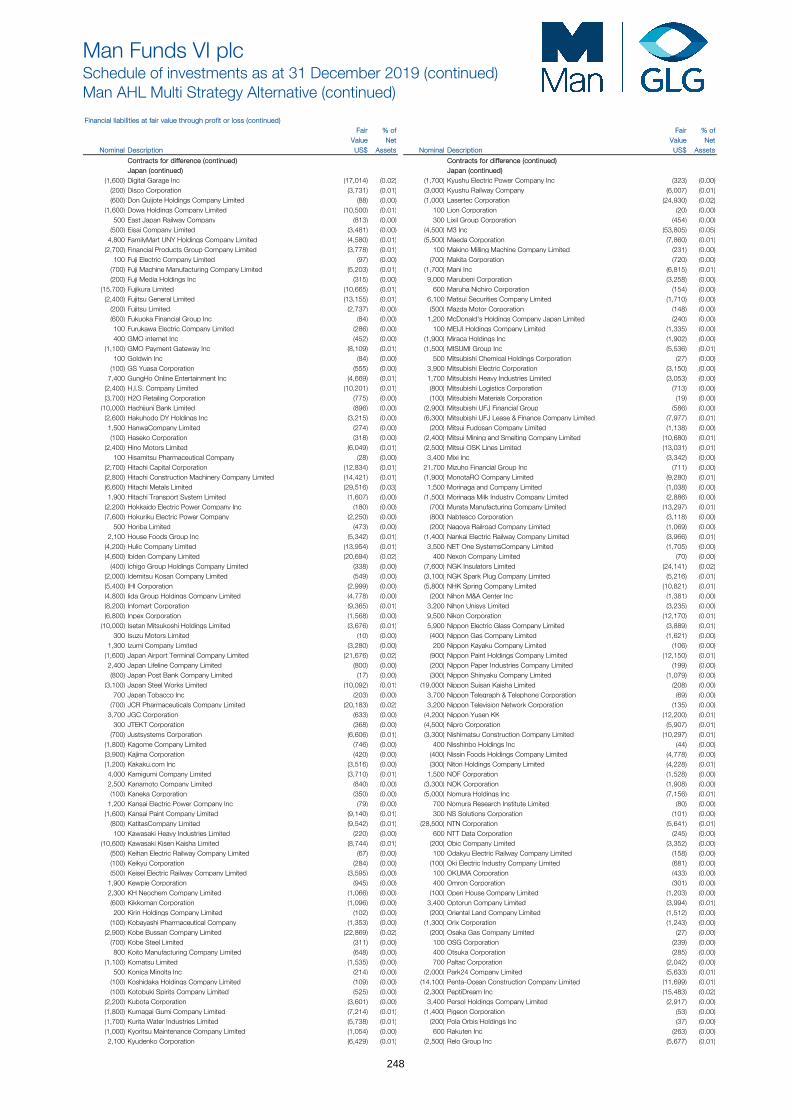
Man Funds VI plcSchedule of investments as at 31 December 2019 (continued)Man AHL Multi Strategy Alternative (continued)
Financial liabilities at fair value through profit or loss (continued) Fair % of Fair % of
Value Net Value Net Nominal Description US$ Assets Nominal Description US$ Assets
Contracts for difference (continued) Contracts for difference (continued)Japan (continued) Japan (continued)
(1,600) Digital Garage Inc (17,014) (0.02) (1,700) Kyushu Electric Power Company Inc (323) (0.00) (200) Disco Corporation (3,731) (0.01) (3,000) Kyushu Railway Company (6,007) (0.01) (600) Don Quijote Holdings Company Limited (88) (0.00) (1,000) Lasertec Corporation (24,930) (0.02) (1,600) Dowa Holdings Company Limited (10,500) (0.01) 100 Lion Corporation (20) (0.00) 500 East Japan Railway Company (813) (0.00) 300 Lixil Group Corporation (454) (0.00) (500) Eisai Company Limited (3,481) (0.00) (4,500) M3 Inc (53,805) (0.05) 4,800 FamilyMart UNY Holdings Company Limited (4,580) (0.01) (5,500) Maeda Corporation (7,860) (0.01) (2,700) Financial Products Group Company Limited (3,778) (0.01) 100 Makino Milling Machine Company Limited (231) (0.00) 100 Fuji Electric Company Limited (97) (0.00) (700) Makita Corporation (720) (0.00) (700) Fuji Machine Manufacturing Company Limited (5,203) (0.01) (1,700) Mani Inc (6,815) (0.01) (200) Fuji Media Holdings Inc (315) (0.00) 9,000 Marubeni Corporation (3,258) (0.00) (15,700) Fujikura Limited (10,665) (0.01) 600 Maruha Nichiro Corporation (154) (0.00) (2,400) Fujitsu General Limited (13,155) (0.01) 6,100 Matsui Securities Company Limited (1,710) (0.00) (200) Fujitsu Limited (2,737) (0.00) (500) Mazda Motor Corporation (148) (0.00) (600) Fukuoka Financial Group Inc (84) (0.00) 1,200 McDonald's Holdings Company Japan Limited (240) (0.00) 100 Furukawa Electric Company Limited (286) (0.00) 100 MEIJI Holdings Company Limited (1,335) (0.00) 400 GMO internet Inc (452) (0.00) (1,900) Miraca Holdings Inc (1,902) (0.00) (1,100) GMO Payment Gateway Inc (8,109) (0.01) (1,500) MISUMI Group Inc (5,536) (0.01) 100 Goldwin Inc (84) (0.00) 500 Mitsubishi Chemical Holdings Corporation (27) (0.00) (100) GS Yuasa Corporation (555) (0.00) 3,900 Mitsubishi Electric Corporation (3,150) (0.00) 7,400 GungHo Online Entertainment Inc (4,669) (0.01) 1,700 Mitsubishi Heavy Industries Limited (3,053) (0.00) (2,400) H.I.S. Company Limited (10,201) (0.01) (800) Mitsubishi Logistics Corporation (713) (0.00) (3,700) H2O Retailing Corporation (775) (0.00) (100) Mitsubishi Materials Corporation (19) (0.00) (10,000) Hachijuni Bank Limited (896) (0.00) (2,900) Mitsubishi UFJ Financial Group (586) (0.00) (2,600) Hakuhodo DY Holdings Inc (3,215) (0.00) (6,300) Mitsubishi UFJ Lease & Finance Company Limited (7,977) (0.01) 1,500 HanwaCompany Limited (274) (0.00) (200) Mitsui Fudosan Company Limited (1,138) (0.00) (100) Haseko Corporation (318) (0.00) (2,400) Mitsui Mining and Smelting Company Limited (10,680) (0.01) (2,400) Hino Motors Limited (6,049) (0.01) (2,500) Mitsui OSK Lines Limited (13,031) (0.01) 100 Hisamitsu Pharmaceutical Company (28) (0.00) 3,400 Mixi Inc (3,342) (0.00) (2,700) Hitachi Capital Corporation (12,834) (0.01) 21,700 Mizuho Financial Group Inc (711) (0.00) (2,800) Hitachi Construction Machinery Company Limited (14,421) (0.01) (1,900) MonotaRO Company Limited (9,280) (0.01) (6,600) Hitachi Metals Limited (29,516) (0.03) 1,500 Morinaga and Company Limited (1,038) (0.00) 1,900 Hitachi Transport System Limited (1,607) (0.00) (1,500) Morinaga Milk Industry Company Limited (2,886) (0.00) (2,200) Hokkaido Electric Power Company Inc (180) (0.00) (700) Murata Manufacturing Company Limited (13,297) (0.01) (7,600) Hokuriku Electric Power Company (2,250) (0.00) (800) Nabtesco Corporation (3,118) (0.00) 500 Horiba Limited (473) (0.00) (200) Nagoya Railroad Company Limited (1,069) (0.00) 2,100 House Foods Group Inc (5,342) (0.01) (1,400) Nankai Electric Railway Company Limited (3,966) (0.01) (4,200) Hulic Company Limited (13,954) (0.01) 3,500 NET One SystemsCompany Limited (1,705) (0.00) (4,600) Ibiden Company Limited (20,694) (0.02) 400 Nexon Company Limited (70) (0.00) (400) Ichigo Group Holdings Company Limited (338) (0.00) (7,600) NGK Insulators Limited (24,141) (0.02) (2,000) Idemitsu Kosan Company Limited (549) (0.00) (3,100) NGK Spark Plug Company Limited (5,216) (0.01) (5,400) IHI Corporation (2,999) (0.00) (5,800) NHK Spring Company Limited (10,821) (0.01) (4,800) Iida Group Holdings Company Limited (4,778) (0.00) (200) Nihon M&A Center Inc (1,381) (0.00) (8,200) Infomart Corporation (9,365) (0.01) 3,200 Nihon Unisys Limited (3,235) (0.00) (6,800) Inpex Corporation (1,568) (0.00) 9,500 Nikon Corporation (12,170) (0.01) (10,000) Isetan Mitsukoshi Holdings Limited (3,676) (0.01) 5,900 Nippon Electric Glass Company Limited (3,889) (0.01) 300 Isuzu Motors Limited (10) (0.00) (400) Nippon Gas Company Limited (1,621) (0.00) 1,300 Izumi Company Limited (3,280) (0.00) 200 Nippon Kayaku Company Limited (106) (0.00) (1,600) Japan Airport Terminal Company Limited (21,676) (0.02) (900) Nippon Paint Holdings Company Limited (12,150) (0.01) 2,400 Japan Lifeline Company Limited (800) (0.00) (200) Nippon Paper Industries Company Limited (199) (0.00) (800) Japan Post Bank Company Limited (17) (0.00) (300) Nippon Shinyaku Company Limited (1,079) (0.00) (3,100) Japan Steel Works Limited (10,092) (0.01) (19,000) Nippon Suisan Kaisha Limited (208) (0.00) 700 Japan Tobacco Inc (203) (0.00) 3,700 Nippon Telegraph & Telephone Corporation (69) (0.00) (700) JCR Pharmaceuticals Company Limited (20,183) (0.02) 3,200 Nippon Television Network Corporation (135) (0.00) 3,700 JGC Corporation (633) (0.00) (4,200) Nippon Yusen KK (12,200) (0.01) 300 JTEKT Corporation (368) (0.00) (4,500) Nipro Corporation (5,907) (0.01) (700) Justsystems Corporation (6,606) (0.01) (3,300) Nishimatsu Construction Company Limited (10,297) (0.01) (1,800) Kagome Company Limited (746) (0.00) 400 Nisshinbo Holdings Inc (44) (0.00) (3,900) Kajima Corporation (420) (0.00) (400) Nissin Foods Holdings Company Limited (4,778) (0.00) (1,200) Kakaku.com Inc (3,516) (0.00) (300) Nitori Holdings Company Limited (4,228) (0.01) 4,000 Kamigumi Company Limited (3,710) (0.01) 1,500 NOF Corporation (1,528) (0.00) 2,500 Kanamoto Company Limited (840) (0.00) (3,300) NOK Corporation (1,908) (0.00) (100) Kaneka Corporation (350) (0.00) (5,000) Nomura Holdings Inc (7,156) (0.01) 1,200 Kansai Electric Power Company Inc (79) (0.00) 700 Nomura Research Institute Limited (80) (0.00) (1,600) Kansai Paint Company Limited (9,140) (0.01) 300 NS Solutions Corporation (101) (0.00) (800) KatitasCompany Limited (9,542) (0.01) (28,500) NTN Corporation (5,641) (0.01) 100 Kawasaki Heavy Industries Limited (220) (0.00) 600 NTT Data Corporation (245) (0.00) (10,600) Kawasaki Kisen Kaisha Limited (8,744) (0.01) (200) Obic Company Limited (3,352) (0.00) (500) Keihan Electric Railway Company Limited (67) (0.00) 100 Odakyu Electric Railway Company Limited (158) (0.00) (100) Keikyu Corporation (284) (0.00) (100) Oki Electric Industry Company Limited (681) (0.00) (500) Keisei Electric Railway Company Limited (3,595) (0.00) 100 OKUMA Corporation (433) (0.00) 1,900 Kewpie Corporation (945) (0.00) 400 Omron Corporation (301) (0.00) 2,300 KH Neochem Company Limited (1,066) (0.00) (100) Open House Company Limited (1,203) (0.00) (600) Kikkoman Corporation (1,096) (0.00) 3,400 Optorun Company Limited (3,994) (0.01) 200 Kirin Holdings Company Limited (102) (0.00) (200) Oriental Land Company Limited (1,512) (0.00) (100) Kobayashi Pharmaceutical Company (1,353) (0.00) (1,300) Orix Corporation (1,243) (0.00) (2,900) Kobe Bussan Company Limited (22,869) (0.02) (200) Osaka Gas Company Limited (27) (0.00) (700) Kobe Steel Limited (311) (0.00) 100 OSG Corporation (239) (0.00) 800 Koito Manufacturing Company Limited (648) (0.00) 400 Otsuka Corporation (285) (0.00) (1,100) Komatsu Limited (1,535) (0.00) 700 Paltac Corporation (2,042) (0.00) 500 Konica Minolta Inc (214) (0.00) (2,000) Park24 Company Limited (5,633) (0.01) (100) Koshidaka Holdings Company Limited (109) (0.00) (14,100) Penta-Ocean Construction Company Limited (11,699) (0.01) (100) Kotobuki Spirits Company Limited (525) (0.00) (2,300) PeptiDream Inc (15,483) (0.02) (2,200) Kubota Corporation (3,601) (0.00) 3,400 Persol Holdings Company Limited (2,917) (0.00) (1,800) Kumagai Gumi Company Limited (7,214) (0.01) (1,400) Pigeon Corporation (53) (0.00) (1,700) Kurita Water Industries Limited (5,738) (0.01) (200) Pola Orbis Holdings Inc (37) (0.00) (1,000) Kyoritsu Maintenance Company Limited (1,054) (0.00) 600 Rakuten Inc (263) (0.00) 2,100 Kyudenko Corporation (6,429) (0.01) (2,500) Relo Group Inc (5,677) (0.01)
248

Man Funds VI plcSchedule of investments as at 31 December 2019 (continued)Man AHL Multi Strategy Alternative (continued)
Financial liabilities at fair value through profit or loss (continued) Fair % of Fair % of
Value Net Value Net Nominal Description US$ Assets Nominal Description US$ Assets
Contracts for difference (continued) Contracts for difference (continued)Japan (continued) Japan (continued)
(200) Rengo Company Limited (131) (0.00) (1,000) Workman Company Limited (18,402) (0.02) 13,100 Resona Holdings Inc (10,187) (0.01) (12,000) Yahoo Japan Corporation (8,936) (0.01) (2,100) Resorttrust Inc (2,159) (0.00) (1,600) Yamaha Motor Company Limited (99) (0.00) (6,500) Ricoh Company Limited (10,110) (0.01) (1,300) Yamazaki Baking Company Limited (3,530) (0.00) 12,200 Round One Corporation (33,928) (0.03) (1,300) Yaskawa Electric Corporation (5,399) (0.01) (5,000) Ryohin Keikaku Company Limited (26,492) (0.03) (2,800) Yoshinoya Holdings Company Limited (17,420) (0.02) 2,000 Sankyo Company Limited (1,914) (0.00) (2,500) Zensho Holdings Company Limited (3,665) (0.01) 1,900 Sankyu Inc (2,402) (0.00) (1,455,069) (1.42) 800 Sanwa Holdings Corporation (153) (0.00) 200 SCSK Corporation (157) (0.00) Jersey Channel Islands (2,000) Sega Sammy Holdings Inc (4,733) (0.01) (649) Centamin Plc (127) (0.00) 4,900 Seibu Holdings Inc (4,721) (0.01) 20 Clarivate Analytics Plc_JPM (5) (0.00) (1,700) Seiko Epson Corporation (1,022) (0.00) (132) (0.00) (500) Seria Company Limited (474) (0.00) 400 Seven and I Holdings Company Limited (377) (0.00) Luxembourg (7,900) Seven Bank Limited (5,227) (0.01) (1,574) ArcelorMittal (2,047) (0.00) 200 SG HoldingsCompany Limited (323) (0.00) (311) Millicom International Cellular SA (136) (0.00) 2,100 Shikoku Electric Power Company Inc (409) (0.00) 8,944 SES SA (7,663) (0.01) 2,100 Shima Seiki Manufacturing Limited (560) (0.00) (582) Tenaris SA (300) (0.00) 300 ShimachuCompany Limited (149) (0.00) (10,146) (0.01) (800) Shimadzu Corporation (6,877) (0.01) 500 Shimamura Company Limited (3,612) (0.01) Macau 100 Shin-Etsu Chemical Company Limited (93) (0.00) (30,400) MGM China Holdings Limited (2,009) (0.00) (8,600) Shinko Electric Industries (20,821) (0.02) (200) Shinsei Bank Limited (24) (0.00) Malaysia (300) Sho-Bond Holdings Company Limited (2,191) (0.00) 1,302 Lynas Corporation Limited (27) (0.00) 5,600 Showa Denko KK (7,524) (0.01) (800) SMS Company Limited (8,499) (0.01) 3,300 Softbank Corporation (346) (0.00) Malta (2,500) SoftBank Group Corporation (2,692) (0.00) (1,892) GVC Holdings Plc (7,125) (0.01) (2,100) Square Enix Holdings Company Limited (14,184) (0.01) 1,123 Kindred Group Plc (144) (0.00) 700 Subaru Corporation (1,260) (0.00) (7,269) (0.01) 2,000 Sugi Holdings Company Limited (4,715) (0.01) (100) Sumitomo Bakelite Company Limited (350) (0.00) Mexico 600 Sumitomo Chemical Company Limited (16) (0.00) (1,303) Fresnillo Plc (323) (0.00) 5,700 Sumitomo Corporation (1,062) (0.00) (900) Sumitomo Electric Industries Limited (1,562) (0.00) Netherlands (2,500) Sumitomo Forestry Company Limited (4,093) (0.01) 1,439 ABN AMRO Group NV (4,575) (0.00) 100 Sumitomo Heavy Industries Limited (182) (0.00) (60) Adyen NV (10,027) (0.01) (8,400) Sumitomo Mitsui Construction (7,643) (0.01) (728) AerCap Holdings NV_CS (8,585) (0.01) (1,200) Sumitomo Mitsui Financial Group Inc (2,963) (0.00) 7 AerCap Holdings NV_JPM (4) (0.00) (500) Sumitomo Mitsui Trust Holdings Inc (1,361) (0.00) (28,448) Altice NV (58,617) (0.06) 100 Sumitomo Osaka Cement Company Limited (5) (0.00) (1,240) Argenx Se (38,016) (0.04) 1,900 Sumitomo Realty & Development Company Limited (1,633) (0.00) 116 ASR Nederland NV (177) (0.00) 2,400 Sumitomo Rubber Industries Limited (1,305) (0.00) (4,194) Boskalis Westminster (16,580) (0.02) 4,100 Suntory Beverage & Food Limited (6,024) (0.01) (673) Heineken NV (1,718) (0.00) 600 Suzuken Company Limited (4,701) (0.01) (374) IMCD Group NV (3,698) (0.00) (400) Sysmex Corporation (303) (0.00) (3,772) ING Groep NV (3,957) (0.00) (1,800) Systena Corporation (1,179) (0.00) 482 Koninklijke Ahold Delhaize NV (285) (0.00) (7,500) Tadano Limited (1,143) (0.00) 55 Koninklijke DSM NV (3) (0.00) (300) Taisei Corporation (774) (0.00) 19,585 Koninklijke KPN NV (1,924) (0.00) 100 Taisho Pharmaceutical Holdin (208) (0.00) (2,007) Koninklijke Vopak NV (12,678) (0.01) (2,500) Taiyo Nippon Sanso Corporation (19,222) (0.02) 481 NN Group NV (1,098) (0.00) (1,000) Taiyo Yuden Company Limited (13,104) (0.01) (13,958) PostNL NV (898) (0.00) (7,700) Takashimaya Company Limited (2,524) (0.00) (1,515) Prosus NV (6,534) (0.01) (2,300) Takeda Pharmaceutical Company Limited (7,451) (0.01) 164 QIAGEN NV_JPM (752) (0.00) (600) TDK Corporation (24,849) (0.02) 4,379 Royal Dutch Shell Plc (5,899) (0.01) 200 Teijin Limited (151) (0.00) (5,464) SBM Offshore NV (7,065) (0.01) (1,900) Terumo Corporation (8,333) (0.01) (2,388) Takeaway.com Holding BV -WI (16,028) (0.02) (1,300) THK Company Limited (6,899) (0.01) (2,055) Tomtom (557) (0.00) 200 Tobu Railway Company Limited (134) (0.00) (583) Uniqure NV_CS (10,486) (0.01) (5,000) Toda Corporation (5,132) (0.01) (13) Uniqure NV_JPM (378) (0.00) (800) Toho Company Limited (1,743) (0.00) (210,539) (0.21) (2,100) Tokyo Broadcasting System Holdings Inc (1,918) (0.00) (700) Tokyo Century Corporation (7,778) (0.01) New Zealand 4,000 Tokyo Gas Company Limited (971) (0.00) 6,040 Auckland Intl Airport Limited (1,542) (0.00) (700) Tokyo Ohka Kogyo Company Limited (900) (0.00) 13,049 Contact Energy Limited (1,021) (0.00) (1,200) Tokyo Seimitsu Company Limited (10,917) (0.01) (409) Meridian Energy Limited (27) (0.00) 8,500 Tokyo Steel Manufacturing Company Limited (2,720) (0.00) 6,594 Spark New Zealand Limited (533) (0.00) (2,500) Tokyu Corporation (3,387) (0.00) (3,123) (0.00) (12,800) Tokyu Fudosan Holdings Corporation (15,493) (0.02) 1,600 Topcon Corporation (858) (0.00) Norway (300) Toppan Printing Company Limited (1,664) (0.00) (1,284) Aker Asa (15,821) (0.02) 300 Toray Industries Inc (146) (0.00) (976) Aker BP ASA (2,722) (0.00) (1,900) TORIDOLL Holdings Corporation (11,462) (0.01) (3,748) DNB ASA (2,710) (0.00) (2,900) Toshiba Corporation (6,246) (0.01) 26,265 DNO International ASA (525) (0.00) (1,100) Toyo Seikan Group Holdings Limited (624) (0.00) (19) Equinor ASA (5) (0.00) 700 Toyo Suisan Kaisha Limited (675) (0.00) 9,107 Leroy Seafood Group ASA (1,144) (0.00) (8,600) Toyo Tire & Rubber Company Limited (12,266) (0.02) (9,052) Mowi ASA (12,625) (0.01) (4,200) Toyobo Company Limited (9,479) (0.01) (31,211) Norsk Hydro ASA (7,322) (0.01) (1,200) Toyoda Gosei Company Limited (4,460) (0.01) (1,010) Salmar ASA (4,845) (0.00) (2,700) Toyota Boshoku Corporation (3,515) (0.00) (159) Schibsted ASA (270) (0.00) (400) Toyota Industries Corporation (1,765) (0.00) (997) SFL Corporation Limited_CS (1,913) (0.00) (1,700) Tsumura & Company (3,518) (0.00) (412) SFL Corporation Limited_JPM (505) (0.00) 200 Ulvac Inc (318) (0.00) (8,544) Storebrand ASA (11,437) (0.01) 200 United Arrows Limited (521) (0.00) (86) TGS NOPEC Geophysical Company ASA (88) (0.00) (1,200) Universal Entertainment Corporation (3,441) (0.00) (3,835) Tomra Systems ASA (18,356) (0.03) 300 West Japan Railway Company (898) (0.00) 17 Yara International ASA (1) (0.00)
(80,289) (0.08)
249
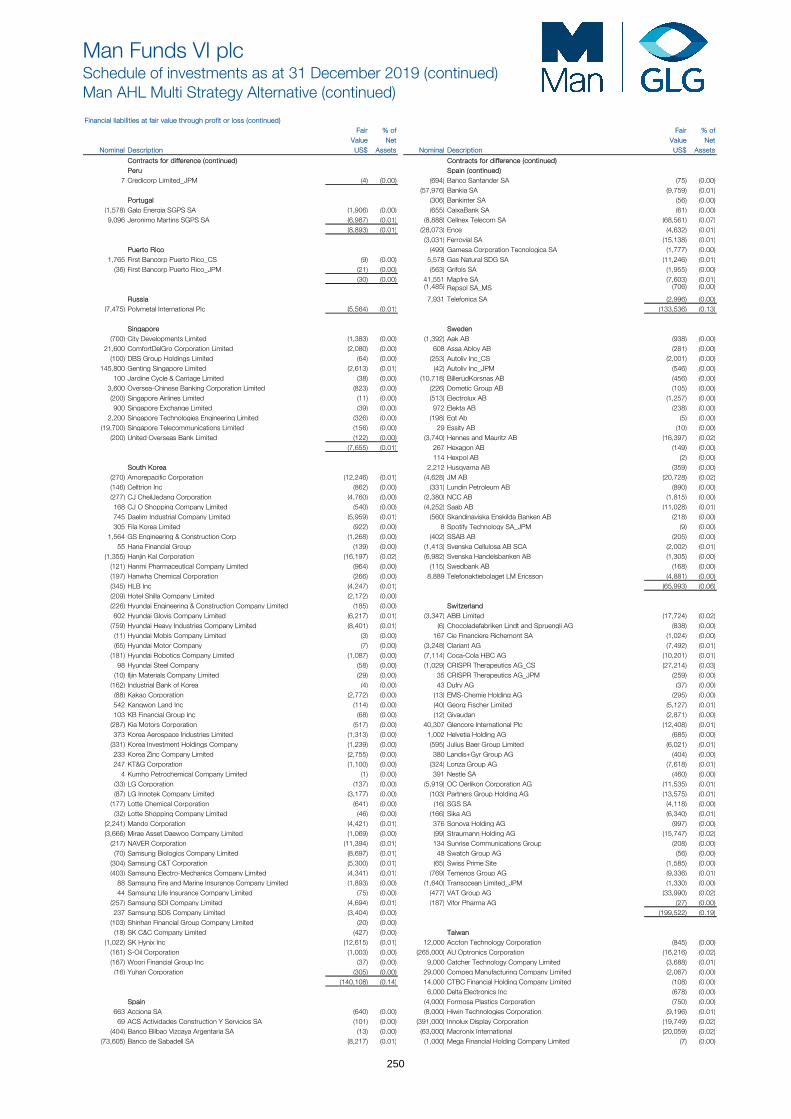
Man Funds VI plcSchedule of investments as at 31 December 2019 (continued)Man AHL Multi Strategy Alternative (continued)
Financial liabilities at fair value through profit or loss (continued) Fair % of Fair % of
Value Net Value Net Nominal Description US$ Assets Nominal Description US$ Assets
Contracts for difference (continued) Contracts for difference (continued) Peru Spain (continued)
7 Credicorp Limited_JPM (4) (0.00) (694) Banco Santander SA (75) (0.00) (57,976) Bankia SA (9,759) (0.01) Portugal (306) Bankinter SA (56) (0.00)
(1,578) Galp Energia SGPS SA (1,906) (0.00) (655) CaixaBank SA (61) (0.00) 9,096 Jeronimo Martins SGPS SA (6,987) (0.01) (8,888) Cellnex Telecom SA (68,561) (0.07)
(8,893) (0.01) (28,073) Ence (4,632) (0.01) (3,031) Ferrovial SA (15,138) (0.01) Puerto Rico (499) Gamesa Corporation Tecnologica SA (1,777) (0.00)
1,765 First Bancorp Puerto Rico_CS (9) (0.00) 5,578 Gas Natural SDG SA (11,246) (0.01) (36) First Bancorp Puerto Rico_JPM (21) (0.00) (563) Grifols SA (1,955) (0.00)
(30) (0.00) 41,551 Mapfre SA (7,603) (0.01) (1,485) Repsol SA_MS (706) (0.00)
Russia 7,931 Telefonica SA (2,996) (0.00) (7,475) Polymetal International Plc (5,564) (0.01) (133,536) (0.13)
Singapore Sweden
(700) City Developments Limited (1,383) (0.00) (1,392) Aak AB (938) (0.00) 21,600 ComfortDelGro Corporation Limited (2,080) (0.00) 608 Assa Abloy AB (281) (0.00) (100) DBS Group Holdings Limited (64) (0.00) (253) Autoliv Inc_CS (2,001) (0.00) 145,800 Genting Singapore Limited (2,613) (0.01) (42) Autoliv Inc_JPM (546) (0.00) 100 Jardine Cycle & Carriage Limited (38) (0.00) (10,718) BillerudKorsnas AB (456) (0.00) 3,600 Oversea-Chinese Banking Corporation Limited (823) (0.00) (226) Dometic Group AB (105) (0.00) (200) Singapore Airlines Limited (11) (0.00) (513) Electrolux AB (1,257) (0.00) 900 Singapore Exchange Limited (39) (0.00) 972 Elekta AB (238) (0.00) 2,200 Singapore Technologies Engineering Limited (326) (0.00) (198) Eqt Ab (5) (0.00) (19,700) Singapore Telecommunications Limited (156) (0.00) 29 Essity AB (10) (0.00) (200) United Overseas Bank Limited (122) (0.00) (3,740) Hennes and Mauritz AB (16,397) (0.02)
(7,655) (0.01) 267 Hexagon AB (149) (0.00) 114 Hexpol AB (2) (0.00)
South Korea 2,212 Husqvarna AB (359) (0.00) (270) Amorepacific Corporation (12,246) (0.01) (4,628) JM AB (20,728) (0.02) (146) Celltrion Inc (862) (0.00) (331) Lundin Petroleum AB (890) (0.00) (277) CJ CheilJedang Corporation (4,760) (0.00) (2,380) NCC AB (1,815) (0.00) 168 CJ O Shopping Company Limited (540) (0.00) (4,252) Saab AB (11,028) (0.01) 745 Daelim Industrial Company Limited (5,959) (0.01) (560) Skandinaviska Enskilda Banken AB (218) (0.00) 305 Fila Korea Limited (922) (0.00) 8 Spotify Technology SA_JPM (9) (0.00) 1,564 GS Engineering & Construction Corp (1,268) (0.00) (402) SSAB AB (205) (0.00) 55 Hana Financial Group (139) (0.00) (1,413) Svenska Cellulosa AB SCA (2,002) (0.01) (1,355) Hanjin Kal Corporation (16,197) (0.02) (6,982) Svenska Handelsbanken AB (1,305) (0.00) (121) Hanmi Pharmaceutical Company Limited (964) (0.00) (115) Swedbank AB (168) (0.00) (197) Hanwha Chemical Corporation (266) (0.00) 8,889 Telefonaktiebolaget LM Ericsson (4,881) (0.00) (345) HLB Inc (4,247) (0.01) (65,993) (0.06) (209) Hotel Shilla Company Limited (2,172) (0.00) (226) Hyundai Engineering & Construction Company Limited (185) (0.00) Switzerland 602 Hyundai Glovis Company Limited (6,217) (0.01) (3,347) ABB Limited (17,724) (0.02) (759) Hyundai Heavy Industries Company Limited (8,401) (0.01) (6) Chocoladefabriken Lindt and Spruengli AG (838) (0.00) (11) Hyundai Mobis Company Limited (3) (0.00) 167 Cie Financiere Richemont SA (1,024) (0.00) (65) Hyundai Motor Company (7) (0.00) (3,248) Clariant AG (7,492) (0.01) (181) Hyundai Robotics Company Limited (1,087) (0.00) (7,114) Coca-Cola HBC AG (10,201) (0.01) 98 Hyundai Steel Company (58) (0.00) (1,029) CRISPR Therapeutics AG_CS (27,214) (0.03) (10) Iljin Materials Company Limited (29) (0.00) 35 CRISPR Therapeutics AG_JPM (259) (0.00) (162) Industrial Bank of Korea (4) (0.00) 43 Dufry AG (37) (0.00) (88) Kakao Corporation (2,772) (0.00) (13) EMS-Chemie Holding AG (295) (0.00) 542 Kangwon Land Inc (114) (0.00) (40) Georg Fischer Limited (5,127) (0.01) 103 KB Financial Group Inc (68) (0.00) (12) Givaudan (2,871) (0.00) (287) Kia Motors Corporation (517) (0.00) 40,307 Glencore International Plc (12,408) (0.01) 373 Korea Aerospace Industries Limited (1,313) (0.00) 1,002 Helvetia Holding AG (685) (0.00) (331) Korea Investment Holdings Company (1,239) (0.00) (595) Julius Baer Group Limited (6,021) (0.01) 233 Korea Zinc Company Limited (2,755) (0.00) 380 Landis+Gyr Group AG (404) (0.00) 247 KT&G Corporation (1,100) (0.00) (324) Lonza Group AG (7,618) (0.01) 4 Kumho Petrochemical Company Limited (1) (0.00) 391 Nestle SA (460) (0.00) (33) LG Corporation (137) (0.00) (5,919) OC Oerlikon Corporation AG (11,535) (0.01) (87) LG Innotek Company Limited (3,177) (0.00) (103) Partners Group Holding AG (13,575) (0.01) (177) Lotte Chemical Corporation (641) (0.00) (16) SGS SA (4,118) (0.00) (32) Lotte Shopping Company Limited (46) (0.00) (166) Sika AG (6,340) (0.01) (2,241) Mando Corporation (4,421) (0.01) 376 Sonova Holding AG (997) (0.00) (3,666) Mirae Asset Daewoo Company Limited (1,069) (0.00) (99) Straumann Holding AG (15,747) (0.02) (217) NAVER Corporation (11,394) (0.01) 134 Sunrise Communications Group (208) (0.00) (70) Samsung Biologics Company Limited (8,697) (0.01) 48 Swatch Group AG (56) (0.00) (304) Samsung C&T Corporation (5,300) (0.01) (65) Swiss Prime Site (1,585) (0.00) (403) Samsung Electro-Mechanics Company Limited (4,341) (0.01) (769) Temenos Group AG (9,336) (0.01) 88 Samsung Fire and Marine Insurance Company Limited (1,893) (0.00) (1,640) Transocean Limited_JPM (1,330) (0.00) 44 Samsung Life Insurance Company Limited (75) (0.00) (477) VAT Group AG (33,990) (0.02) (257) Samsung SDI Company Limited (4,694) (0.01) (187) Vifor Pharma AG (27) (0.00) 237 Samsung SDS Company Limited (3,404) (0.00) (199,522) (0.19) (103) Shinhan Financial Group Company Limited (20) (0.00) (18) SK C&C Company Limited (427) (0.00) Taiwan (1,022) SK Hynix Inc (12,615) (0.01) 12,000 Accton Technology Corporation (845) (0.00) (161) S-Oil Corporation (1,003) (0.00) (265,000) AU Optronics Corporation (16,216) (0.02) (167) Woori Financial Group Inc (37) (0.00) 9,000 Catcher Technology Company Limited (3,688) (0.01) (16) Yuhan Corporation (305) (0.00) 29,000 Compeq Manufacturing Company Limited (2,067) (0.00)
(140,108) (0.14) 14,000 CTBC Financial Holding Company Limited (108) (0.00) 6,000 Delta Electronics Inc (678) (0.00)
Spain (4,000) Formosa Plastics Corporation (750) (0.00) 663 Acciona SA (640) (0.00) (8,000) Hiwin Technologies Corporation (9,196) (0.01) 69 ACS Actividades Construction Y Servicios SA (101) (0.00) (391,000) Innolux Display Corporation (19,749) (0.02) (404) Banco Bilbao Vizcaya Argentaria SA (13) (0.00) (63,000) Macronix International (20,059) (0.02) (73,605) Banco de Sabadell SA (8,217) (0.01) (1,000) Mega Financial Holding Company Limited (7) (0.00)
250
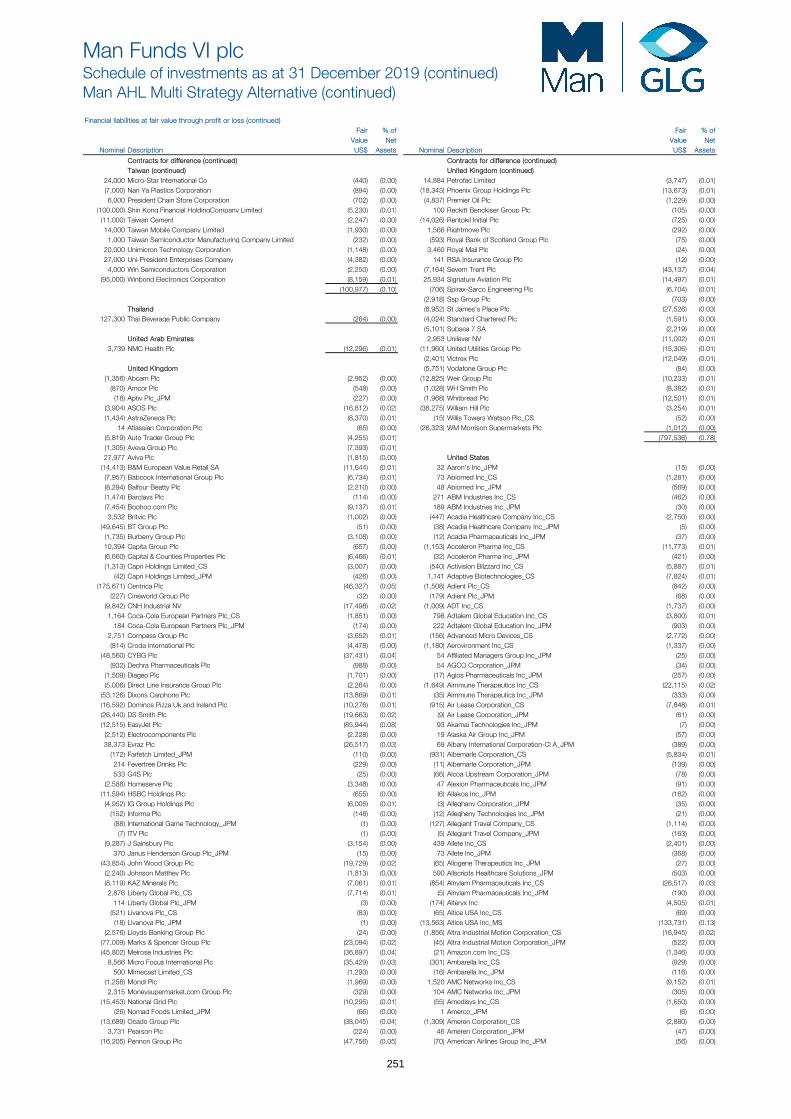
Man Funds VI plcSchedule of investments as at 31 December 2019 (continued)Man AHL Multi Strategy Alternative (continued)
Financial liabilities at fair value through profit or loss (continued) Fair % of Fair % of
Value Net Value Net Nominal Description US$ Assets Nominal Description US$ Assets
Contracts for difference (continued) Contracts for difference (continued)Taiwan (continued) United Kingdom (continued)
24,000 Micro-Star International Co (440) (0.00) 14,884 Petrofac Limited (3,747) (0.01) (7,000) Nan Ya Plastics Corporation (894) (0.00) (18,343) Phoenix Group Holdings Plc (13,673) (0.01) 6,000 President Chain Store Corporation (702) (0.00) (4,837) Premier Oil Plc (1,229) (0.00) (100,000) Shin Kong Financial HoldingCompany Limited (5,230) (0.01) 100 Reckitt Benckiser Group Plc (105) (0.00) (11,000) Taiwan Cement (2,247) (0.00) (14,026) Rentokil Initial Plc (725) (0.00) 14,000 Taiwan Mobile Company Limited (1,930) (0.00) 1,566 Rightmove Plc (292) (0.00) 1,000 Taiwan Semiconductor Manufacturing Company Limited (232) (0.00) (593) Royal Bank of Scotland Group Plc (75) (0.00) 20,000 Unimicron Technology Corporation (1,148) (0.00) 3,460 Royal Mail Plc (24) (0.00) 27,000 Uni-President Enterprises Company (4,382) (0.00) 141 RSA Insurance Group Plc (12) (0.00) 4,000 Win Semiconductors Corporation (2,250) (0.00) (7,164) Severn Trent Plc (43,137) (0.04) (95,000) Winbond Electronics Corporation (8,159) (0.01) 25,934 Signature Aviation Plc (14,497) (0.01)
(100,977) (0.10) (706) Spirax-Sarco Engineering Plc (6,704) (0.01) (2,918) Ssp Group Plc (703) (0.00) Thailand (8,952) St James's Place Plc (27,526) (0.03)
127,300 Thai Beverage Public Company (264) (0.00) (4,024) Standard Chartered Plc (1,591) (0.00) (5,101) Subsea 7 SA (2,219) (0.00) United Arab Emirates 2,953 Unilever NV (11,002) (0.01)
3,739 NMC Health Plc (12,296) (0.01) (11,960) United Utilities Group Plc (15,306) (0.01) (2,401) Victrex Plc (12,049) (0.01) United Kingdom (5,751) Vodafone Group Plc (84) (0.00)
(1,356) Abcam Plc (2,952) (0.00) (12,825) Weir Group Plc (10,233) (0.01) (870) Amcor Plc (548) (0.00) (1,028) WH Smith Plc (8,382) (0.01) (18) Aptiv Plc_JPM (227) (0.00) (1,968) Whitbread Plc (12,501) (0.01) (3,904) ASOS Plc (16,812) (0.02) (38,275) William Hill Plc (3,254) (0.01) (1,434) AstraZeneca Plc (8,370) (0.01) (15) Willis Towers Watson Plc_CS (52) (0.00) 14 Atlassian Corporation Plc (65) (0.00) (26,323) WM Morrison Supermarkets Plc (1,012) (0.00) (5,819) Auto Trader Group Plc (4,255) (0.01) (797,536) (0.78) (1,305) Aveva Group Plc (7,393) (0.01) 27,977 Aviva Plc (1,815) (0.00) United States (14,413) B&M European Value Retail SA (11,644) (0.01) 32 Aaron's Inc_JPM (15) (0.00) (7,957) Babcock International Group Plc (6,734) (0.01) 73 Abiomed Inc_CS (1,281) (0.00) (8,294) Balfour Beatty Plc (2,210) (0.00) 48 Abiomed Inc_JPM (569) (0.00) (1,474) Barclays Plc (114) (0.00) 271 ABM Industries Inc_CS (462) (0.00) (7,454) Boohoo.com Plc (9,137) (0.01) 189 ABM Industries Inc_JPM (30) (0.00) 3,532 Britvic Plc (1,002) (0.00) (447) Acadia Healthcare Company Inc_CS (2,750) (0.00) (49,645) BT Group Plc (51) (0.00) (38) Acadia Healthcare Company Inc_JPM (5) (0.00) (1,735) Burberry Group Plc (3,108) (0.00) (12) Acadia Pharmaceuticals Inc_JPM (37) (0.00) 10,394 Capita Group Plc (657) (0.00) (1,153) Acceleron Pharma Inc_CS (11,773) (0.01) (6,660) Capital & Counties Properties Plc (6,466) (0.01) (32) Acceleron Pharma Inc_JPM (421) (0.00) (1,313) Capri Holdings Limited_CS (3,007) (0.00) (540) Activision Blizzard Inc_CS (5,887) (0.01) (42) Capri Holdings Limited_JPM (426) (0.00) 1,141 Adaptive Biotechnologies_CS (7,824) (0.01) (175,671) Centrica Plc (46,327) (0.05) (1,508) Adient Plc_CS (842) (0.00) (227) Cineworld Group Plc (32) (0.00) (179) Adient Plc_JPM (68) (0.00) (9,842) CNH Industrial NV (17,498) (0.02) (1,009) ADT Inc_CS (1,737) (0.00) 1,164 Coca-Cola European Partners Plc_CS (1,851) (0.00) 798 Adtalem Global Education Inc_CS (3,800) (0.01) 184 Coca-Cola European Partners Plc_JPM (174) (0.00) 222 Adtalem Global Education Inc_JPM (903) (0.00) 2,751 Compass Group Plc (3,652) (0.01) (156) Advanced Micro Devices_CS (2,772) (0.00) (814) Croda International Plc (4,478) (0.00) (1,180) Aerovironment Inc_CS (1,337) (0.00) (48,560) CYBG Plc (37,431) (0.04) 54 Affiliated Managers Group Inc_JPM (25) (0.00) (932) Dechra Pharmaceuticals Plc (988) (0.00) 54 AGCO Corporation_JPM (34) (0.00) (1,509) Diageo Plc (1,701) (0.00) (17) Agios Pharmaceuticals Inc_JPM (257) (0.00) (5,006) Direct Line Insurance Group Plc (2,264) (0.00) (1,649) Aimmune Therapeutics Inc_CS (22,115) (0.02) (53,126) Dixons Carphone Plc (13,869) (0.01) (35) Aimmune Therapeutics Inc_JPM (333) (0.00) (16,592) Dominos Pizza Uk and Ireland Plc (10,276) (0.01) (915) Air Lease Corporation_CS (7,848) (0.01) (26,440) DS Smith Plc (19,663) (0.02) (9) Air Lease Corporation_JPM (61) (0.00) (12,515) EasyJet Plc (85,944) (0.08) 93 Akamai Technologies Inc_JPM (7) (0.00) (2,512) Electrocomponents Plc (2,228) (0.00) 19 Alaska Air Group Inc_JPM (57) (0.00) 38,373 Evraz Plc (26,517) (0.03) 69 Albany International Corporation-Cl A_JPM (389) (0.00) (172) Farfetch Limited_JPM (110) (0.00) (931) Albemarle Corporation_CS (5,834) (0.01) 214 Fevertree Drinks Plc (229) (0.00) (11) Albemarle Corporation_JPM (139) (0.00) 533 G4S Plc (25) (0.00) (66) Alcoa Upstream Corporation_JPM (78) (0.00) (2,588) Homeserve Plc (3,348) (0.00) 47 Alexion Pharmaceuticals Inc_JPM (91) (0.00) (11,594) HSBC Holdings Plc (655) (0.00) (6) Allakos Inc_JPM (162) (0.00) (4,952) IG Group Holdings Plc (6,005) (0.01) (3) Alleghany Corporation_JPM (35) (0.00) (152) Informa Plc (148) (0.00) (12) Allegheny Technologies Inc_JPM (21) (0.00) (88) International Game Technology_JPM (1) (0.00) (127) Allegiant Travel Company_CS (1,114) (0.00) (7) ITV Plc (1) (0.00) (5) Allegiant Travel Company_JPM (163) (0.00) (9,287) J Sainsbury Plc (3,154) (0.00) 439 Allete Inc_CS (2,401) (0.00) 370 Janus Henderson Group Plc_JPM (15) (0.00) 73 Allete Inc_JPM (368) (0.00) (43,854) John Wood Group Plc (19,729) (0.02) (65) Allogene Therapeutics Inc_JPM (27) (0.00) (2,240) Johnson Matthey Plc (1,813) (0.00) 590 Allscripts Healthcare Solutions_JPM (503) (0.00) (8,119) KAZ Minerals Plc (7,061) (0.01) (854) Alnylam Pharmaceuticals Inc_CS (26,517) (0.03) 2,876 Liberty Global Plc_CS (7,714) (0.01) (5) Alnylam Pharmaceuticals Inc_JPM (190) (0.00) 114 Liberty Global Plc_JPM (3) (0.00) (174) Alteryx Inc (4,505) (0.01) (521) Livanova Plc_CS (83) (0.00) (65) Altice USA Inc_CS (69) (0.00) (18) Livanova Plc_JPM (1) (0.00) (13,563) Altice USA Inc_MS (133,731) (0.13) (2,576) Lloyds Banking Group Plc (24) (0.00) (1,856) Altra Industrial Motion Corporation_CS (16,945) (0.02) (77,009) Marks & Spencer Group Plc (23,094) (0.02) (45) Altra Industrial Motion Corporation_JPM (522) (0.00) (45,802) Melrose Industries Plc (36,897) (0.04) (21) Amazon.com Inc_CS (1,346) (0.00) 8,566 Micro Focus International Plc (35,429) (0.03) (301) Ambarella Inc_CS (929) (0.00) 500 Mimecast Limited_CS (1,293) (0.00) (16) Ambarella Inc_JPM (116) (0.00) (1,258) Mondi Plc (1,969) (0.00) 1,520 AMC Networks Inc_CS (9,152) (0.01) 2,315 Moneysupermarket.com Group Plc (329) (0.00) 104 AMC Networks Inc_JPM (305) (0.00) (15,453) National Grid Plc (10,295) (0.01) (55) Amedisys Inc_CS (1,650) (0.00) (26) Nomad Foods Limited_JPM (66) (0.00) 1 Amerco_JPM (6) (0.00) (13,689) Ocado Group Plc (38,045) (0.04) (1,309) Ameren Corporation_CS (2,880) (0.00) 3,731 Pearson Plc (224) (0.00) 46 Ameren Corporation_JPM (47) (0.00) (16,205) Pennon Group Plc (47,756) (0.05) (70) American Airlines Group Inc_JPM (56) (0.00)
251
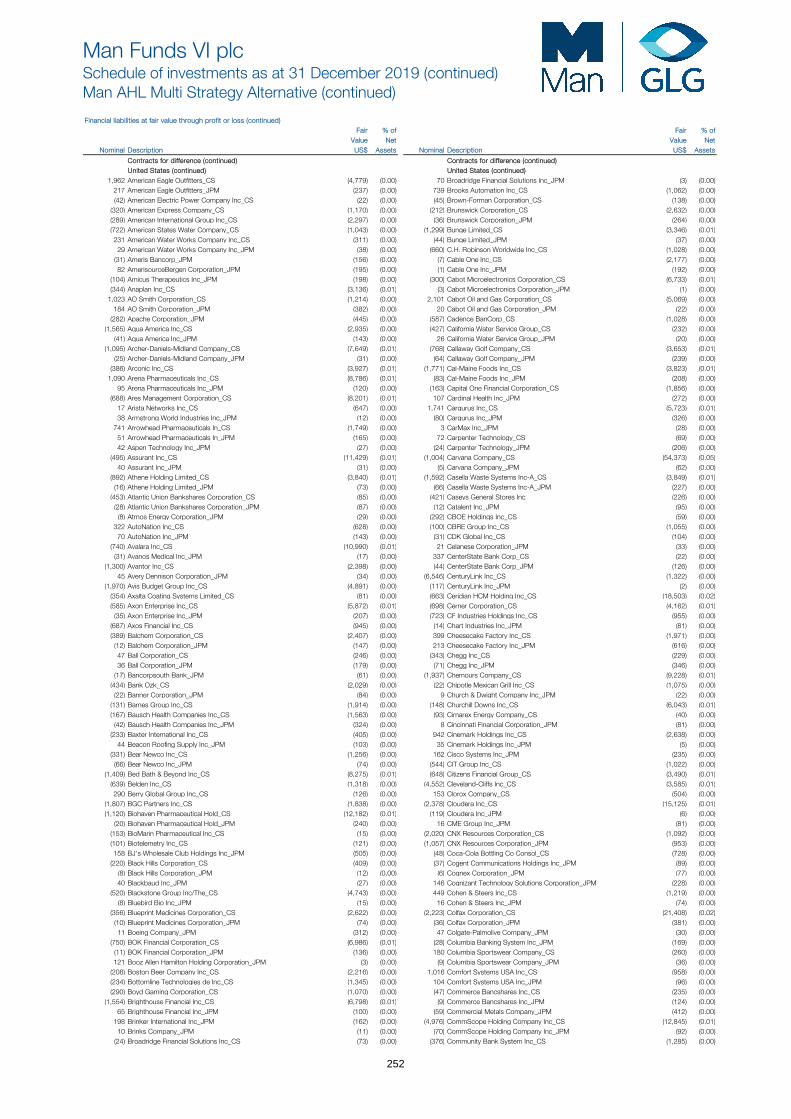
Man Funds VI plcSchedule of investments as at 31 December 2019 (continued)Man AHL Multi Strategy Alternative (continued)
Financial liabilities at fair value through profit or loss (continued) Fair % of Fair % of
Value Net Value Net Nominal Description US$ Assets Nominal Description US$ Assets
Contracts for difference (continued) Contracts for difference (continued)United States (continued) United States (continued)
1,962 American Eagle Outfitters_CS (4,779) (0.00) 70 Broadridge Financial Solutions Inc_JPM (3) (0.00) 217 American Eagle Outfitters_JPM (237) (0.00) 739 Brooks Automation Inc_CS (1,062) (0.00) (42) American Electric Power Company Inc_CS (22) (0.00) (45) Brown-Forman Corporation_CS (138) (0.00) (320) American Express Company_CS (1,170) (0.00) (212) Brunswick Corporation_CS (2,632) (0.00) (289) American International Group Inc_CS (2,297) (0.00) (36) Brunswick Corporation_JPM (264) (0.00) (722) American States Water Company_CS (1,043) (0.00) (1,299) Bunge Limited_CS (3,346) (0.01) 231 American Water Works Company Inc_CS (311) (0.00) (44) Bunge Limited_JPM (37) (0.00) 29 American Water Works Company Inc_JPM (38) (0.00) (660) C.H. Robinson Worldwide Inc_CS (1,028) (0.00) (31) Ameris Bancorp_JPM (156) (0.00) (7) Cable One Inc_CS (2,177) (0.00) 82 AmerisourceBergen Corporation_JPM (195) (0.00) (1) Cable One Inc_JPM (192) (0.00) (104) Amicus Therapeutics Inc_JPM (198) (0.00) (300) Cabot Microelectronics Corporation_CS (6,733) (0.01) (344) Anaplan Inc_CS (3,136) (0.01) (3) Cabot Microelectronics Corporation_JPM (1) (0.00) 1,023 AO Smith Corporation_CS (1,214) (0.00) 2,101 Cabot Oil and Gas Corporation_CS (5,069) (0.00) 184 AO Smith Corporation_JPM (382) (0.00) 20 Cabot Oil and Gas Corporation_JPM (22) (0.00) (282) Apache Corporation_JPM (445) (0.00) (587) Cadence BanCorp_CS (1,028) (0.00) (1,565) Aqua America Inc_CS (2,935) (0.00) (427) California Water Service Group_CS (232) (0.00) (41) Aqua America Inc_JPM (143) (0.00) 26 California Water Service Group_JPM (20) (0.00) (1,095) Archer-Daniels-Midland Company_CS (7,649) (0.01) (768) Callaway Golf Company_CS (3,653) (0.01) (25) Archer-Daniels-Midland Company_JPM (31) (0.00) (64) Callaway Golf Company_JPM (239) (0.00) (386) Arconic Inc_CS (3,927) (0.01) (1,771) Cal-Maine Foods Inc_CS (3,823) (0.01) 1,090 Arena Pharmaceuticals Inc_CS (8,786) (0.01) (83) Cal-Maine Foods Inc_JPM (208) (0.00) 95 Arena Pharmaceuticals Inc_JPM (120) (0.00) (163) Capital One Financial Corporation_CS (1,856) (0.00) (688) Ares Management Corporation_CS (8,201) (0.01) 107 Cardinal Health Inc_JPM (272) (0.00) 17 Arista Networks Inc_CS (647) (0.00) 1,741 Cargurus Inc_CS (5,723) (0.01) 38 Armstrong World Industries Inc_JPM (12) (0.00) (80) Cargurus Inc_JPM (326) (0.00) 741 Arrowhead Pharmaceuticals In_CS (1,749) (0.00) 3 CarMax Inc_JPM (28) (0.00) 51 Arrowhead Pharmaceuticals In_JPM (165) (0.00) 72 Carpenter Technology_CS (69) (0.00) 42 Aspen Technology Inc_JPM (27) (0.00) (24) Carpenter Technology_JPM (206) (0.00) (495) Assurant Inc_CS (11,429) (0.01) (1,004) Carvana Company_CS (54,373) (0.05) 40 Assurant Inc_JPM (31) (0.00) (5) Carvana Company_JPM (62) (0.00) (892) Athene Holding Limited_CS (3,840) (0.01) (1,592) Casella Waste Systems Inc-A_CS (3,849) (0.01) (16) Athene Holding Limited_JPM (73) (0.00) (66) Casella Waste Systems Inc-A_JPM (227) (0.00) (453) Atlantic Union Bankshares Corporation_CS (85) (0.00) (421) Caseys General Stores Inc (226) (0.00) (28) Atlantic Union Bankshares Corporation_JPM (87) (0.00) (12) Catalent Inc_JPM (95) (0.00) (8) Atmos Energy Corporation_JPM (29) (0.00) (292) CBOE Holdings Inc_CS (59) (0.00) 322 AutoNation Inc_CS (628) (0.00) (100) CBRE Group Inc_CS (1,055) (0.00) 70 AutoNation Inc_JPM (143) (0.00) (31) CDK Global Inc_CS (104) (0.00) (740) Avalara Inc_CS (10,990) (0.01) 21 Celanese Corporation_JPM (33) (0.00) (31) Avanos Medical Inc_JPM (17) (0.00) 337 CenterState Bank Corp_CS (22) (0.00) (1,300) Avantor Inc_CS (2,398) (0.00) (44) CenterState Bank Corp_JPM (126) (0.00) 45 Avery Dennison Corporation_JPM (34) (0.00) (6,546) CenturyLink Inc_CS (1,322) (0.00) (1,970) Avis Budget Group Inc_CS (4,891) (0.00) (117) CenturyLink Inc_JPM (2) (0.00) (354) Axalta Coating Systems Limited_CS (81) (0.00) (663) Ceridian HCM Holding Inc_CS (18,503) (0.02) (585) Axon Enterprise Inc_CS (5,872) (0.01) (698) Cerner Corporation_CS (4,162) (0.01) (35) Axon Enterprise Inc_JPM (207) (0.00) (723) CF Industries Holdings Inc_CS (955) (0.00) (687) Axos Financial Inc_CS (945) (0.00) (14) Chart Industries Inc_JPM (81) (0.00) (389) Balchem Corporation_CS (2,407) (0.00) 399 Cheesecake Factory Inc_CS (1,971) (0.00) (12) Balchem Corporation_JPM (147) (0.00) 213 Cheesecake Factory Inc_JPM (616) (0.00) 47 Ball Corporation_CS (246) (0.00) (343) Chegg Inc_CS (229) (0.00) 36 Ball Corporation_JPM (179) (0.00) (71) Chegg Inc_JPM (346) (0.00) (17) Bancorpsouth Bank_JPM (61) (0.00) (1,937) Chemours Company_CS (9,228) (0.01) (434) Bank Ozk_CS (2,029) (0.00) (22) Chipotle Mexican Grill Inc_CS (1,075) (0.00) (22) Banner Corporation_JPM (84) (0.00) 9 Church & Dwight Company Inc_JPM (22) (0.00) (131) Barnes Group Inc_CS (1,914) (0.00) (148) Churchill Downs Inc_CS (6,043) (0.01) (167) Bausch Health Companies Inc_CS (1,563) (0.00) (93) Cimarex Energy Company_CS (40) (0.00) (42) Bausch Health Companies Inc_JPM (324) (0.00) 8 Cincinnati Financial Corporation_JPM (81) (0.00) (233) Baxter International Inc_CS (405) (0.00) 942 Cinemark Holdings Inc_CS (2,638) (0.00) 44 Beacon Roofing Supply Inc_JPM (103) (0.00) 35 Cinemark Holdings Inc_JPM (5) (0.00) (331) Bear Newco Inc_CS (1,256) (0.00) 162 Cisco Systems Inc_JPM (235) (0.00) (66) Bear Newco Inc_JPM (74) (0.00) (544) CIT Group Inc_CS (1,022) (0.00) (1,409) Bed Bath & Beyond Inc_CS (8,275) (0.01) (648) Citizens Financial Group_CS (3,490) (0.01) (639) Belden Inc_CS (1,318) (0.00) (4,552) Cleveland-Cliffs Inc_CS (3,585) (0.01) 290 Berry Global Group Inc_CS (126) (0.00) 153 Clorox Company_CS (504) (0.00) (1,807) BGC Partners Inc_CS (1,838) (0.00) (2,378) Cloudera Inc_CS (15,125) (0.01) (1,120) Biohaven Pharmaceutical Hold_CS (12,182) (0.01) (119) Cloudera Inc_JPM (6) (0.00) (20) Biohaven Pharmaceutical Hold_JPM (240) (0.00) 16 CME Group Inc_JPM (81) (0.00) (153) BioMarin Pharmaceutical Inc_CS (15) (0.00) (2,020) CNX Resources Corporation_CS (1,092) (0.00) (101) Biotelemetry Inc_CS (121) (0.00) (1,057) CNX Resources Corporation_JPM (953) (0.00) 158 BJ's Wholesale Club Holdings Inc_JPM (505) (0.00) (48) Coca-Cola Bottling Co Consol_CS (728) (0.00) (220) Black Hills Corporation_CS (409) (0.00) (37) Cogent Communications Holdings Inc_JPM (89) (0.00) (8) Black Hills Corporation_JPM (12) (0.00) (6) Cognex Corporation_JPM (77) (0.00) 40 Blackbaud Inc_JPM (27) (0.00) 146 Cognizant Technology Solutions Corporation_JPM (228) (0.00) (520) Blackstone Group Inc/The_CS (4,743) (0.00) 449 Cohen & Steers Inc_CS (1,219) (0.00) (8) Bluebird Bio Inc_JPM (15) (0.00) 16 Cohen & Steers Inc_JPM (74) (0.00) (356) Blueprint Medicines Corporation_CS (2,622) (0.00) (2,223) Colfax Corporation_CS (21,408) (0.02) (10) Blueprint Medicines Corporation_JPM (74) (0.00) (36) Colfax Corporation_JPM (381) (0.00) 11 Boeing Company_JPM (312) (0.00) 47 Colgate-Palmolive Company_JPM (30) (0.00) (750) BOK Financial Corporation_CS (6,986) (0.01) (28) Columbia Banking System Inc_JPM (169) (0.00) (11) BOK Financial Corporation_JPM (136) (0.00) 180 Columbia Sportswear Company_CS (260) (0.00) 121 Booz Allen Hamilton Holding Corporation_JPM (3) (0.00) (9) Columbia Sportswear Company_JPM (36) (0.00) (208) Boston Beer Company Inc_CS (2,216) (0.00) 1,016 Comfort Systems USA Inc_CS (958) (0.00) (234) Bottomline Technologies de Inc_CS (1,345) (0.00) 104 Comfort Systems USA Inc_JPM (96) (0.00) (290) Boyd Gaming Corporation_CS (1,070) (0.00) (47) Commerce Bancshares Inc_CS (235) (0.00) (1,554) Brighthouse Financial Inc_CS (6,798) (0.01) (9) Commerce Bancshares Inc_JPM (124) (0.00) 65 Brighthouse Financial Inc_JPM (100) (0.00) (59) Commercial Metals Company_JPM (412) (0.00) 198 Brinker International Inc_JPM (162) (0.00) (4,976) CommScope Holding Company Inc_CS (12,845) (0.01) 10 Brinks Company_JPM (11) (0.00) (70) CommScope Holding Company Inc_JPM (92) (0.00) (24) Broadridge Financial Solutions Inc_CS (73) (0.00) (376) Community Bank System Inc_CS (1,285) (0.00)
252
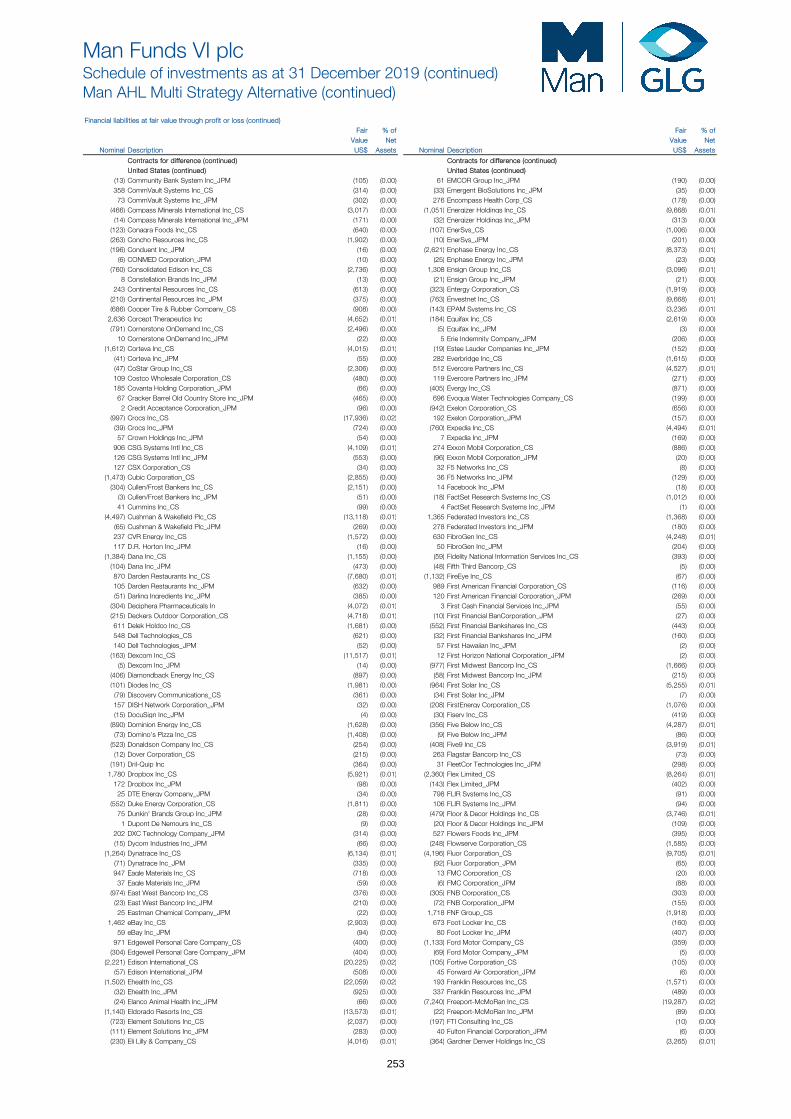
Man Funds VI plcSchedule of investments as at 31 December 2019 (continued)Man AHL Multi Strategy Alternative (continued)
Financial liabilities at fair value through profit or loss (continued) Fair % of Fair % of
Value Net Value Net Nominal Description US$ Assets Nominal Description US$ Assets
Contracts for difference (continued) Contracts for difference (continued)United States (continued) United States (continued)
(13) Community Bank System Inc_JPM (105) (0.00) 61 EMCOR Group Inc_JPM (190) (0.00) 358 CommVault Systems Inc_CS (314) (0.00) (33) Emergent BioSolutions Inc_JPM (35) (0.00) 73 CommVault Systems Inc_JPM (302) (0.00) 276 Encompass Health Corp_CS (178) (0.00) (466) Compass Minerals International Inc_CS (3,017) (0.00) (1,051) Energizer Holdings Inc_CS (9,668) (0.01) (14) Compass Minerals International Inc_JPM (171) (0.00) (32) Energizer Holdings Inc_JPM (313) (0.00) (123) Conagra Foods Inc_CS (640) (0.00) (107) EnerSys_CS (1,006) (0.00) (263) Concho Resources Inc_CS (1,902) (0.00) (10) EnerSys_JPM (201) (0.00) (196) Conduent Inc_JPM (16) (0.00) (2,621) Enphase Energy Inc_CS (8,373) (0.01) (6) CONMED Corporation_JPM (10) (0.00) (25) Enphase Energy Inc_JPM (23) (0.00) (760) Consolidated Edison Inc_CS (2,736) (0.00) 1,308 Ensign Group Inc_CS (3,096) (0.01) 8 Constellation Brands Inc_JPM (13) (0.00) (21) Ensign Group Inc_JPM (21) (0.00) 243 Continental Resources Inc_CS (613) (0.00) (323) Entergy Corporation_CS (1,919) (0.00) (210) Continental Resources Inc_JPM (375) (0.00) (763) Envestnet Inc_CS (9,668) (0.01) (686) Cooper Tire & Rubber Company_CS (908) (0.00) (143) EPAM Systems Inc_CS (3,236) (0.01) 2,636 Corcept Therapeutics Inc (4,652) (0.01) (184) Equifax Inc_CS (2,619) (0.00) (791) Cornerstone OnDemand Inc_CS (2,496) (0.00) (5) Equifax Inc_JPM (3) (0.00) 10 Cornerstone OnDemand Inc_JPM (22) (0.00) 5 Erie Indemnity Company_JPM (206) (0.00) (1,612) Corteva Inc_CS (4,015) (0.01) (19) Estee Lauder Companies Inc_JPM (152) (0.00) (41) Corteva Inc_JPM (55) (0.00) 282 Everbridge Inc_CS (1,615) (0.00) (47) CoStar Group Inc_CS (2,306) (0.00) 512 Evercore Partners Inc_CS (4,527) (0.01) 109 Costco Wholesale Corporation_CS (480) (0.00) 119 Evercore Partners Inc_JPM (271) (0.00) 185 Covanta Holding Corporation_JPM (66) (0.00) (405) Evergy Inc_CS (871) (0.00) 67 Cracker Barrel Old Country Store Inc_JPM (465) (0.00) 696 Evoqua Water Technologies Company_CS (199) (0.00) 2 Credit Acceptance Corporation_JPM (96) (0.00) (942) Exelon Corporation_CS (656) (0.00) (997) Crocs Inc_CS (17,936) (0.02) 192 Exelon Corporation_JPM (157) (0.00) (39) Crocs Inc_JPM (724) (0.00) (760) Expedia Inc_CS (4,494) (0.01) 57 Crown Holdings Inc_JPM (54) (0.00) 7 Expedia Inc_JPM (169) (0.00) 906 CSG Systems Intl Inc_CS (4,109) (0.01) 274 Exxon Mobil Corporation_CS (886) (0.00) 126 CSG Systems Intl Inc_JPM (553) (0.00) (96) Exxon Mobil Corporation_JPM (20) (0.00) 127 CSX Corporation_CS (34) (0.00) 32 F5 Networks Inc_CS (8) (0.00) (1,473) Cubic Corporation_CS (2,855) (0.00) 36 F5 Networks Inc_JPM (129) (0.00) (304) Cullen/Frost Bankers Inc_CS (2,151) (0.00) 14 Facebook Inc_JPM (18) (0.00) (3) Cullen/Frost Bankers Inc_JPM (51) (0.00) (18) FactSet Research Systems Inc_CS (1,012) (0.00) 41 Cummins Inc_CS (99) (0.00) 4 FactSet Research Systems Inc_JPM (1) (0.00) (4,497) Cushman & Wakefield Plc_CS (13,118) (0.01) 1,365 Federated Investors Inc_CS (1,368) (0.00) (65) Cushman & Wakefield Plc_JPM (269) (0.00) 278 Federated Investors Inc_JPM (180) (0.00) 237 CVR Energy Inc_CS (1,572) (0.00) 630 FibroGen Inc_CS (4,248) (0.01) 117 D.R. Horton Inc_JPM (16) (0.00) 50 FibroGen Inc_JPM (204) (0.00) (1,384) Dana Inc_CS (1,155) (0.00) (59) Fidelity National Information Services Inc_CS (393) (0.00) (104) Dana Inc_JPM (473) (0.00) (48) Fifth Third Bancorp_CS (5) (0.00) 870 Darden Restaurants Inc_CS (7,680) (0.01) (1,132) FireEye Inc_CS (67) (0.00) 105 Darden Restaurants Inc_JPM (632) (0.00) 989 First American Financial Corporation_CS (116) (0.00) (51) Darling Ingredients Inc_JPM (385) (0.00) 120 First American Financial Corporation_JPM (269) (0.00) (304) Deciphera Pharmaceuticals In (4,072) (0.01) 3 First Cash Financial Services Inc_JPM (55) (0.00) (215) Deckers Outdoor Corporation_CS (4,718) (0.01) (10) First Financial BanCorporation_JPM (27) (0.00) 611 Delek Holdco Inc_CS (1,681) (0.00) (552) First Financial Bankshares Inc_CS (443) (0.00) 548 Dell Technologies_CS (621) (0.00) (32) First Financial Bankshares Inc_JPM (160) (0.00) 140 Dell Technologies_JPM (52) (0.00) 57 First Hawaiian Inc_JPM (2) (0.00) (163) Dexcom Inc_CS (11,517) (0.01) 12 First Horizon National Corporation_JPM (2) (0.00) (5) Dexcom Inc_JPM (14) (0.00) (977) First Midwest Bancorp Inc_CS (1,666) (0.00) (406) Diamondback Energy Inc_CS (897) (0.00) (58) First Midwest Bancorp Inc_JPM (215) (0.00) (101) Diodes Inc_CS (1,981) (0.00) (964) First Solar Inc_CS (5,255) (0.01) (79) Discovery Communications_CS (361) (0.00) (34) First Solar Inc_JPM (7) (0.00) 157 DISH Network Corporation_JPM (32) (0.00) (208) FirstEnergy Corporation_CS (1,076) (0.00) (15) DocuSign Inc_JPM (4) (0.00) (30) Fiserv Inc_CS (419) (0.00) (890) Dominion Energy Inc_CS (1,628) (0.00) (356) Five Below Inc_CS (4,287) (0.01) (73) Domino's Pizza Inc_CS (1,408) (0.00) (9) Five Below Inc_JPM (86) (0.00) (523) Donaldson Company Inc_CS (254) (0.00) (408) Five9 Inc_CS (3,919) (0.01) (12) Dover Corporation_CS (215) (0.00) 263 Flagstar Bancorp Inc_CS (73) (0.00) (191) Dril-Quip Inc (364) (0.00) 31 FleetCor Technologies Inc_JPM (298) (0.00) 1,780 Dropbox Inc_CS (5,921) (0.01) (2,360) Flex Limited_CS (8,264) (0.01) 172 Dropbox Inc_JPM (98) (0.00) (143) Flex Limited_JPM (402) (0.00) 25 DTE Energy Company_JPM (34) (0.00) 798 FLIR Systems Inc_CS (91) (0.00) (552) Duke Energy Corporation_CS (1,811) (0.00) 106 FLIR Systems Inc_JPM (94) (0.00) 75 Dunkin' Brands Group Inc_JPM (28) (0.00) (479) Floor & Decor Holdings Inc_CS (3,746) (0.01) 1 Dupont De Nemours Inc_CS (9) (0.00) (20) Floor & Decor Holdings Inc_JPM (109) (0.00) 202 DXC Technology Company_JPM (314) (0.00) 527 Flowers Foods Inc_JPM (395) (0.00) (15) Dycom Industries Inc_JPM (66) (0.00) (248) Flowserve Corporation_CS (1,585) (0.00) (1,264) Dynatrace Inc_CS (6,134) (0.01) (4,196) Fluor Corporation_CS (9,705) (0.01) (71) Dynatrace Inc_JPM (335) (0.00) (92) Fluor Corporation_JPM (65) (0.00) 947 Eagle Materials Inc_CS (718) (0.00) 13 FMC Corporation_CS (20) (0.00) 37 Eagle Materials Inc_JPM (59) (0.00) (6) FMC Corporation_JPM (88) (0.00) (974) East West Bancorp Inc_CS (376) (0.00) (305) FNB Corporation_CS (303) (0.00) (23) East West Bancorp Inc_JPM (210) (0.00) (72) FNB Corporation_JPM (155) (0.00) 25 Eastman Chemical Company_JPM (22) (0.00) 1,718 FNF Group_CS (1,918) (0.00) 1,462 eBay Inc_CS (2,903) (0.00) 673 Foot Locker Inc_CS (160) (0.00) 59 eBay Inc_JPM (94) (0.00) 80 Foot Locker Inc_JPM (407) (0.00) 971 Edgewell Personal Care Company_CS (400) (0.00) (1,133) Ford Motor Company_CS (359) (0.00) (304) Edgewell Personal Care Company_JPM (404) (0.00) (69) Ford Motor Company_JPM (5) (0.00) (2,221) Edison International_CS (20,225) (0.02) (105) Fortive Corporation_CS (105) (0.00) (57) Edison International_JPM (508) (0.00) 45 Forward Air Corporation_JPM (6) (0.00) (1,502) Ehealth Inc_CS (22,059) (0.02) 193 Franklin Resources Inc_CS (1,571) (0.00) (32) Ehealth Inc_JPM (925) (0.00) 337 Franklin Resources Inc_JPM (489) (0.00) (24) Elanco Animal Health Inc_JPM (66) (0.00) (7,240) Freeport-McMoRan Inc_CS (19,287) (0.02) (1,140) Eldorado Resorts Inc_CS (13,573) (0.01) (22) Freeport-McMoRan Inc_JPM (89) (0.00) (723) Element Solutions Inc_CS (2,037) (0.00) (197) FTI Consulting Inc_CS (10) (0.00) (111) Element Solutions Inc_JPM (283) (0.00) 40 Fulton Financial Corporation_JPM (6) (0.00) (230) Eli Lilly & Company_CS (4,016) (0.01) (364) Gardner Denver Holdings Inc_CS (3,265) (0.01)
253
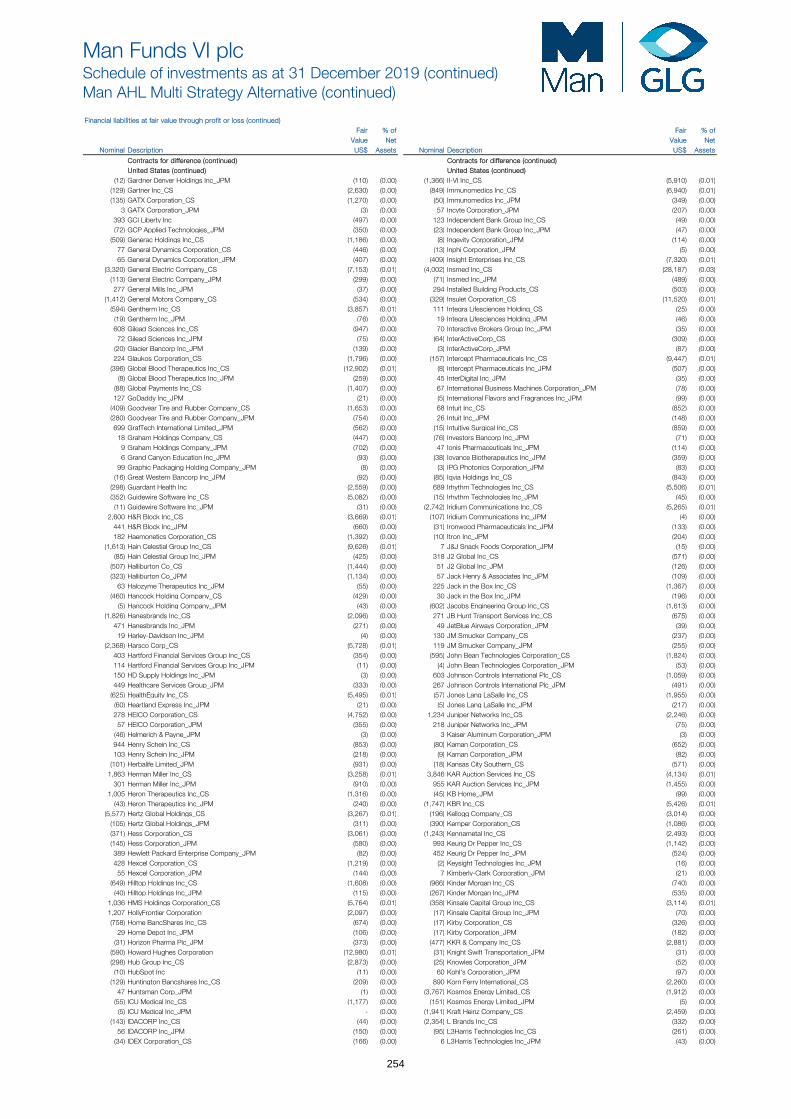
Man Funds VI plcSchedule of investments as at 31 December 2019 (continued)Man AHL Multi Strategy Alternative (continued)
Financial liabilities at fair value through profit or loss (continued) Fair % of Fair % of
Value Net Value Net Nominal Description US$ Assets Nominal Description US$ Assets
Contracts for difference (continued) Contracts for difference (continued)United States (continued) United States (continued)
(12) Gardner Denver Holdings Inc_JPM (110) (0.00) (1,366) II-VI Inc_CS (5,910) (0.01) (129) Gartner Inc_CS (2,630) (0.00) (849) Immunomedics Inc_CS (6,940) (0.01) (135) GATX Corporation_CS (1,270) (0.00) (50) Immunomedics Inc_JPM (349) (0.00) 3 GATX Corporation_JPM (3) (0.00) 57 Incyte Corporation_JPM (207) (0.00) 393 GCI Liberty Inc (497) (0.00) 123 Independent Bank Group Inc_CS (49) (0.00) (72) GCP Applied Technologies_JPM (350) (0.00) (23) Independent Bank Group Inc_JPM (47) (0.00) (509) Generac Holdings Inc_CS (1,186) (0.00) (8) Ingevity Corporation_JPM (114) (0.00) 77 General Dynamics Corporation_CS (446) (0.00) (13) Inphi Corporation_JPM (5) (0.00) 65 General Dynamics Corporation_JPM (407) (0.00) (409) Insight Enterprises Inc_CS (7,320) (0.01) (3,320) General Electric Company_CS (7,153) (0.01) (4,002) Insmed Inc_CS (28,187) (0.03) (113) General Electric Company_JPM (299) (0.00) (71) Insmed Inc_JPM (489) (0.00) 277 General Mills Inc_JPM (37) (0.00) 294 Installed Building Products_CS (503) (0.00) (1,412) General Motors Company_CS (534) (0.00) (329) Insulet Corporation_CS (11,520) (0.01) (594) Gentherm Inc_CS (3,857) (0.01) 111 Integra Lifesciences Holding_CS (25) (0.00) (19) Gentherm Inc_JPM (76) (0.00) 19 Integra Lifesciences Holding_JPM (46) (0.00) 608 Gilead Sciences Inc_CS (947) (0.00) 70 Interactive Brokers Group Inc_JPM (35) (0.00) 72 Gilead Sciences Inc_JPM (75) (0.00) (64) InterActiveCorp_CS (309) (0.00) (20) Glacier Bancorp Inc_JPM (139) (0.00) (3) InterActiveCorp_JPM (87) (0.00) 224 Glaukos Corporation_CS (1,796) (0.00) (157) Intercept Pharmaceuticals Inc_CS (9,447) (0.01) (396) Global Blood Therapeutics Inc_CS (12,902) (0.01) (8) Intercept Pharmaceuticals Inc_JPM (507) (0.00) (8) Global Blood Therapeutics Inc_JPM (259) (0.00) 45 InterDigital Inc_JPM (35) (0.00) (88) Global Payments Inc_CS (1,407) (0.00) 67 International Business Machines Corporation_JPM (78) (0.00) 127 GoDaddy Inc_JPM (21) (0.00) (5) International Flavors and Fragrances Inc_JPM (99) (0.00) (409) Goodyear Tire and Rubber Company_CS (1,653) (0.00) 68 Intuit Inc_CS (852) (0.00) (280) Goodyear Tire and Rubber Company_JPM (754) (0.00) 26 Intuit Inc_JPM (148) (0.00) 699 GrafTech International Limited_JPM (562) (0.00) (15) Intuitive Surgical Inc_CS (859) (0.00) 18 Graham Holdings Company_CS (447) (0.00) (76) Investors Bancorp Inc_JPM (71) (0.00) 9 Graham Holdings Company_JPM (702) (0.00) 47 Ionis Pharmaceuticals Inc_JPM (114) (0.00) 6 Grand Canyon Education Inc_JPM (93) (0.00) (38) Iovance Biotherapeutics Inc_JPM (359) (0.00) 99 Graphic Packaging Holding Company_JPM (8) (0.00) (3) IPG Photonics Corporation_JPM (83) (0.00) (16) Great Western Bancorp Inc_JPM (92) (0.00) (85) Iqvia Holdings Inc_CS (843) (0.00) (298) Guardant Health Inc (2,559) (0.00) 689 Irhythm Technologies Inc_CS (5,506) (0.01) (352) Guidewire Software Inc_CS (5,082) (0.00) (15) Irhythm Technologies Inc_JPM (45) (0.00) (11) Guidewire Software Inc_JPM (31) (0.00) (2,742) Iridium Communications Inc_CS (5,265) (0.01) 2,600 H&R Block Inc_CS (3,669) (0.01) (107) Iridium Communications Inc_JPM (4) (0.00) 441 H&R Block Inc_JPM (660) (0.00) (31) Ironwood Pharmaceuticals Inc_JPM (133) (0.00) 182 Haemonetics Corporation_CS (1,392) (0.00) (10) Itron Inc_JPM (204) (0.00) (1,613) Hain Celestial Group Inc_CS (9,626) (0.01) 7 J&J Snack Foods Corporation_JPM (15) (0.00) (85) Hain Celestial Group Inc_JPM (425) (0.00) 318 J2 Global Inc_CS (571) (0.00) (507) Halliburton Co_CS (1,444) (0.00) 51 J2 Global Inc_JPM (126) (0.00) (323) Halliburton Co_JPM (1,134) (0.00) 57 Jack Henry & Associates Inc_JPM (109) (0.00) 63 Halozyme Therapeutics Inc_JPM (55) (0.00) 225 Jack in the Box Inc_CS (1,367) (0.00) (460) Hancock Holding Company_CS (429) (0.00) 30 Jack in the Box Inc_JPM (196) (0.00) (5) Hancock Holding Company_JPM (43) (0.00) (602) Jacobs Engineering Group Inc_CS (1,613) (0.00) (1,826) Hanesbrands Inc_CS (2,096) (0.00) 271 JB Hunt Transport Services Inc_CS (675) (0.00) 471 Hanesbrands Inc_JPM (271) (0.00) 49 JetBlue Airways Corporation_JPM (39) (0.00) 19 Harley-Davidson Inc_JPM (4) (0.00) 130 JM Smucker Company_CS (237) (0.00) (2,368) Harsco Corp_CS (5,728) (0.01) 119 JM Smucker Company_JPM (255) (0.00) 403 Hartford Financial Services Group Inc_CS (354) (0.00) (595) John Bean Technologies Corporation_CS (1,824) (0.00) 114 Hartford Financial Services Group Inc_JPM (11) (0.00) (4) John Bean Technologies Corporation_JPM (53) (0.00) 150 HD Supply Holdings Inc_JPM (3) (0.00) 603 Johnson Controls International Plc_CS (1,059) (0.00) 449 Healthcare Services Group_JPM (333) (0.00) 267 Johnson Controls International Plc_JPM (491) (0.00) (625) HealthEquity Inc_CS (5,495) (0.01) (57) Jones Lang LaSalle Inc_CS (1,955) (0.00) (60) Heartland Express Inc_JPM (21) (0.00) (5) Jones Lang LaSalle Inc_JPM (217) (0.00) 278 HEICO Corporation_CS (4,752) (0.00) 1,234 Juniper Networks Inc_CS (2,246) (0.00) 57 HEICO Corporation_JPM (355) (0.00) 218 Juniper Networks Inc_JPM (75) (0.00) (46) Helmerich & Payne_JPM (3) (0.00) 3 Kaiser Aluminum Corporation_JPM (3) (0.00) 944 Henry Schein Inc_CS (853) (0.00) (80) Kaman Corporation_CS (652) (0.00) 103 Henry Schein Inc_JPM (218) (0.00) (9) Kaman Corporation_JPM (82) (0.00) (101) Herbalife Limited_JPM (931) (0.00) (18) Kansas City Southern_CS (571) (0.00) 1,863 Herman Miller Inc_CS (3,258) (0.01) 3,846 KAR Auction Services Inc_CS (4,134) (0.01) 301 Herman Miller Inc_JPM (910) (0.00) 955 KAR Auction Services Inc_JPM (1,455) (0.00) 1,005 Heron Therapeutics Inc_CS (1,316) (0.00) (45) KB Home_JPM (99) (0.00) (43) Heron Therapeutics Inc_JPM (240) (0.00) (1,747) KBR Inc_CS (5,426) (0.01) (5,577) Hertz Global Holdings_CS (3,267) (0.01) (196) Kellogg Company_CS (3,014) (0.00) (105) Hertz Global Holdings_JPM (311) (0.00) (390) Kemper Corporation_CS (1,086) (0.00) (371) Hess Corporation_CS (3,061) (0.00) (1,243) Kennametal Inc_CS (2,493) (0.00) (145) Hess Corporation_JPM (580) (0.00) 993 Keurig Dr Pepper Inc_CS (1,142) (0.00) 389 Hewlett Packard Enterprise Company_JPM (82) (0.00) 452 Keurig Dr Pepper Inc_JPM (524) (0.00) 428 Hexcel Corporation_CS (1,219) (0.00) (2) Keysight Technologies Inc_JPM (16) (0.00) 55 Hexcel Corporation_JPM (144) (0.00) 7 Kimberly-Clark Corporation_JPM (21) (0.00) (649) Hilltop Holdings Inc_CS (1,608) (0.00) (966) Kinder Morgan Inc_CS (740) (0.00) (40) Hilltop Holdings Inc_JPM (115) (0.00) (267) Kinder Morgan Inc_JPM (535) (0.00) 1,036 HMS Holdings Corporation_CS (5,764) (0.01) (358) Kinsale Capital Group Inc_CS (3,114) (0.01) 1,207 HollyFrontier Corporation (2,097) (0.00) (17) Kinsale Capital Group Inc_JPM (70) (0.00) (758) Home BancShares Inc_CS (674) (0.00) (17) Kirby Corporation_CS (326) (0.00) 29 Home Depot Inc_JPM (106) (0.00) (17) Kirby Corporation_JPM (182) (0.00) (31) Horizon Pharma Plc_JPM (373) (0.00) (477) KKR & Company Inc_CS (2,881) (0.00) (590) Howard Hughes Corporation (12,980) (0.01) (31) Knight Swift Transportation_JPM (31) (0.00) (298) Hub Group Inc_CS (2,873) (0.00) (25) Knowles Corporation_JPM (52) (0.00) (10) HubSpot Inc (11) (0.00) 60 Kohl's Corporation_JPM (97) (0.00) (129) Huntington Bancshares Inc_CS (209) (0.00) 890 Korn Ferry International_CS (2,260) (0.00) 47 Huntsman Corp_JPM (1) (0.00) (3,767) Kosmos Energy Limited_CS (1,912) (0.00) (55) ICU Medical Inc_CS (1,177) (0.00) (151) Kosmos Energy Limited_JPM (5) (0.00) (5) ICU Medical Inc_JPM - (0.00) (1,941) Kraft Heinz Company_CS (2,459) (0.00) (143) IDACORP Inc_CS (44) (0.00) (2,354) L Brands Inc_CS (332) (0.00) 56 IDACORP Inc_JPM (150) (0.00) (95) L3Harris Technologies Inc_CS (261) (0.00) (34) IDEX Corporation_CS (166) (0.00) 6 L3Harris Technologies Inc_JPM (43) (0.00)
254
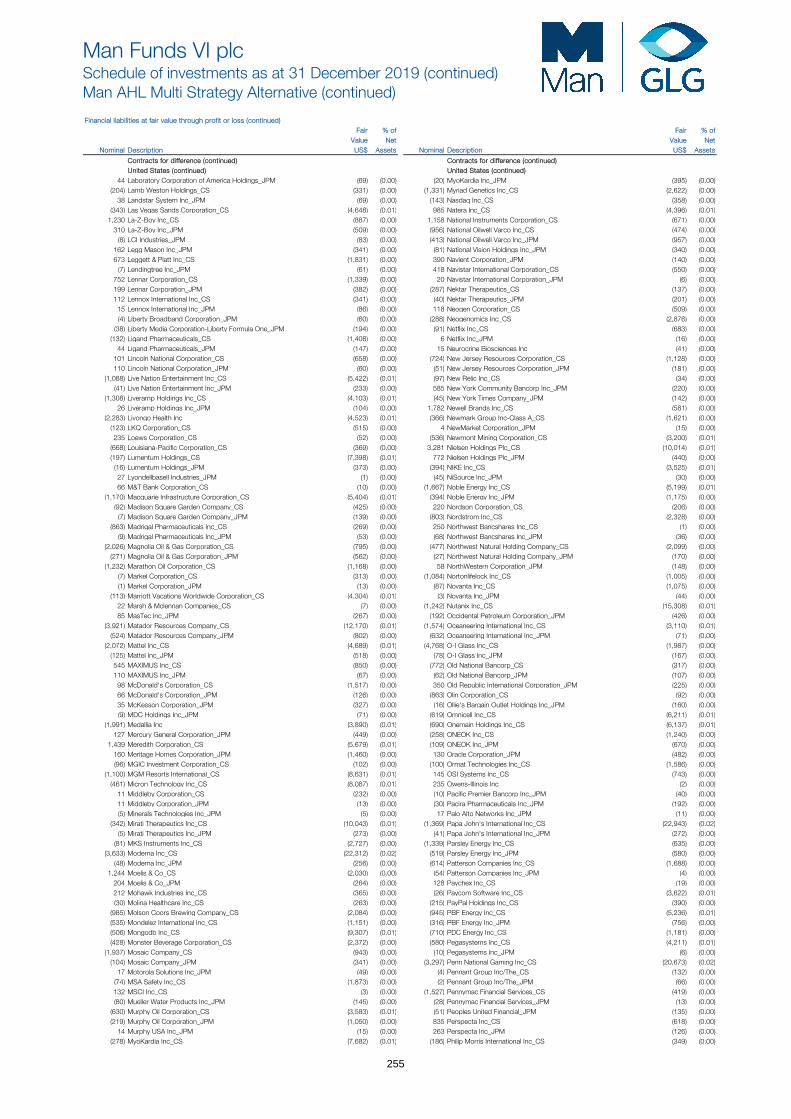
Man Funds VI plcSchedule of investments as at 31 December 2019 (continued)Man AHL Multi Strategy Alternative (continued)
Financial liabilities at fair value through profit or loss (continued) Fair % of Fair % of
Value Net Value Net Nominal Description US$ Assets Nominal Description US$ Assets
Contracts for difference (continued) Contracts for difference (continued)United States (continued) United States (continued)
44 Laboratory Corporation of America Holdings_JPM (69) (0.00) (20) MyoKardia Inc_JPM (395) (0.00) (204) Lamb Weston Holdings_CS (331) (0.00) (1,331) Myriad Genetics Inc_CS (2,622) (0.00) 38 Landstar System Inc_JPM (69) (0.00) (143) Nasdaq Inc_CS (358) (0.00) (343) Las Vegas Sands Corporation_CS (4,648) (0.01) 985 Natera Inc_CS (4,396) (0.01) 1,230 La-Z-Boy Inc_CS (887) (0.00) 1,158 National Instruments Corporation_CS (671) (0.00) 310 La-Z-Boy Inc_JPM (509) (0.00) (956) National Oilwell Varco Inc_CS (474) (0.00) (8) LCI Industries_JPM (83) (0.00) (413) National Oilwell Varco Inc_JPM (957) (0.00) 162 Legg Mason Inc_JPM (341) (0.00) (81) National Vision Holdings Inc_JPM (340) (0.00) 673 Leggett & Platt Inc_CS (1,831) (0.00) 390 Navient Corporation_JPM (140) (0.00) (7) Lendingtree Inc_JPM (61) (0.00) 418 Navistar International Corporation_CS (550) (0.00) 752 Lennar Corporation_CS (1,339) (0.00) 20 Navistar International Corporation_JPM (6) (0.00) 199 Lennar Corporation_JPM (382) (0.00) (287) Nektar Therapeutics_CS (137) (0.00) 112 Lennox International Inc_CS (341) (0.00) (40) Nektar Therapeutics_JPM (201) (0.00) 15 Lennox International Inc_JPM (86) (0.00) 118 Neogen Corporation_CS (509) (0.00) (4) Liberty Broadband Corporation_JPM (60) (0.00) (288) Neogenomics Inc_CS (2,876) (0.00) (38) Liberty Media Corporation-Liberty Formula One_JPM (194) (0.00) (91) Netflix Inc_CS (683) (0.00) (132) Ligand Pharmaceuticals_CS (1,408) (0.00) 6 Netflix Inc_JPM (16) (0.00) 44 Ligand Pharmaceuticals_JPM (147) (0.00) 15 Neurocrine Biosciences Inc (41) (0.00) 101 Lincoln National Corporation_CS (658) (0.00) (724) New Jersey Resources Corporation_CS (1,128) (0.00) 110 Lincoln National Corporation_JPM (60) (0.00) (51) New Jersey Resources Corporation_JPM (181) (0.00) (1,088) Live Nation Entertainment Inc_CS (5,422) (0.01) (97) New Relic Inc_CS (34) (0.00) (41) Live Nation Entertainment Inc_JPM (233) (0.00) 585 New York Community Bancorp Inc_JPM (220) (0.00) (1,308) Liveramp Holdings Inc_CS (4,103) (0.01) (45) New York Times Company_JPM (142) (0.00) 26 Liveramp Holdings Inc_JPM (104) (0.00) 1,782 Newell Brands Inc_CS (581) (0.00) (2,283) Livongo Health Inc (4,523) (0.01) (366) Newmark Group Inc-Class A_CS (1,621) (0.00) (123) LKQ Corporation_CS (515) (0.00) 4 NewMarket Corporation_JPM (15) (0.00) 235 Loews Corporation_CS (52) (0.00) (536) Newmont Mining Corporation_CS (3,200) (0.01) (668) Louisiana-Pacific Corporation_CS (369) (0.00) 3,281 Nielsen Holdings Plc_CS (10,014) (0.01) (197) Lumentum Holdings_CS (7,398) (0.01) 772 Nielsen Holdings Plc_JPM (440) (0.00) (16) Lumentum Holdings_JPM (373) (0.00) (394) NIKE Inc_CS (3,525) (0.01) 27 Lyondellbasell Industries_JPM (1) (0.00) (45) NiSource Inc_JPM (30) (0.00) 66 M&T Bank Corporation_CS (10) (0.00) (1,667) Noble Energy Inc_CS (5,199) (0.01) (1,170) Macquarie Infrastructure Corporation_CS (5,404) (0.01) (394) Noble Energy Inc_JPM (1,175) (0.00) (92) Madison Square Garden Company_CS (425) (0.00) 220 Nordson Corporation_CS (206) (0.00) (7) Madison Square Garden Company_JPM (139) (0.00) (803) Nordstrom Inc_CS (2,328) (0.00) (863) Madrigal Pharmaceuticals Inc_CS (269) (0.00) 250 Northwest Bancshares Inc_CS (1) (0.00) (9) Madrigal Pharmaceuticals Inc_JPM (53) (0.00) (68) Northwest Bancshares Inc_JPM (36) (0.00) (2,026) Magnolia Oil & Gas Corporation_CS (795) (0.00) (477) Northwest Natural Holding Company_CS (2,099) (0.00) (271) Magnolia Oil & Gas Corporation_JPM (562) (0.00) (27) Northwest Natural Holding Company_JPM (170) (0.00) (1,232) Marathon Oil Corporation_CS (1,168) (0.00) 58 NorthWestern Corporation_JPM (148) (0.00) (7) Markel Corporation_CS (313) (0.00) (1,084) Nortonlifelock Inc_CS (1,005) (0.00) (1) Markel Corporation_JPM (13) (0.00) (87) Novanta Inc_CS (1,075) (0.00) (113) Marriott Vacations Worldwide Corporation_CS (4,304) (0.01) (3) Novanta Inc_JPM (44) (0.00) 22 Marsh & Mclennan Companies_CS (7) (0.00) (1,242) Nutanix Inc_CS (15,308) (0.01) 85 MasTec Inc_JPM (267) (0.00) (192) Occidental Petroleum Corporation_JPM (426) (0.00) (3,921) Matador Resources Company_CS (12,170) (0.01) (1,574) Oceaneering International Inc_CS (3,110) (0.01) (524) Matador Resources Company_JPM (802) (0.00) (632) Oceaneering International Inc_JPM (71) (0.00) (2,072) Mattel Inc_CS (4,689) (0.01) (4,768) O-I Glass Inc_CS (1,987) (0.00) (125) Mattel Inc_JPM (518) (0.00) (78) O-I Glass Inc_JPM (167) (0.00) 545 MAXIMUS Inc_CS (850) (0.00) (772) Old National Bancorp_CS (317) (0.00) 110 MAXIMUS Inc_JPM (67) (0.00) (62) Old National Bancorp_JPM (107) (0.00) 98 McDonald's Corporation_CS (1,517) (0.00) 350 Old Republic International Corporation_JPM (225) (0.00) 66 McDonald's Corporation_JPM (126) (0.00) (863) Olin Corporation_CS (92) (0.00) 35 McKesson Corporation_JPM (327) (0.00) (16) Ollie's Bargain Outlet Holdings Inc_JPM (160) (0.00) (9) MDC Holdings Inc_JPM (71) (0.00) (619) Omnicell Inc_CS (6,211) (0.01) (1,991) Medallia Inc (3,890) (0.01) (690) Onemain Holdings Inc_CS (6,137) (0.01) 127 Mercury General Corporation_JPM (449) (0.00) (258) ONEOK Inc_CS (1,240) (0.00) 1,439 Meredith Corporation_CS (5,679) (0.01) (109) ONEOK Inc_JPM (670) (0.00) 160 Meritage Homes Corporation_JPM (1,460) (0.00) 130 Oracle Corporation_JPM (482) (0.00) (96) MGIC Investment Corporation_CS (102) (0.00) (100) Ormat Technologies Inc_CS (1,586) (0.00) (1,100) MGM Resorts International_CS (8,631) (0.01) 145 OSI Systems Inc_CS (743) (0.00) (461) Micron Technology Inc_CS (8,087) (0.01) 235 Owens-Illinois Inc (2) (0.00) 11 Middleby Corporation_CS (232) (0.00) (10) Pacific Premier Bancorp Inc_JPM (40) (0.00) 11 Middleby Corporation_JPM (13) (0.00) (30) Pacira Pharmaceuticals Inc_JPM (192) (0.00) (5) Minerals Technologies Inc_JPM (5) (0.00) 17 Palo Alto Networks Inc_JPM (11) (0.00) (342) Mirati Therapeutics Inc_CS (10,043) (0.01) (1,369) Papa John's International Inc_CS (22,943) (0.02) (5) Mirati Therapeutics Inc_JPM (273) (0.00) (41) Papa John's International Inc_JPM (272) (0.00) (81) MKS Instruments Inc_CS (2,727) (0.00) (1,339) Parsley Energy Inc_CS (635) (0.00) (3,633) Moderna Inc_CS (22,312) (0.02) (519) Parsley Energy Inc_JPM (580) (0.00) (48) Moderna Inc_JPM (256) (0.00) (614) Patterson Companies Inc_CS (1,688) (0.00) 1,244 Moelis & Co_CS (2,030) (0.00) (54) Patterson Companies Inc_JPM (4) (0.00) 204 Moelis & Co_JPM (264) (0.00) 128 Paychex Inc_CS (19) (0.00) 212 Mohawk Industries Inc_CS (365) (0.00) (26) Paycom Software Inc_CS (3,622) (0.01) (30) Molina Healthcare Inc_CS (263) (0.00) (215) PayPal Holdings Inc_CS (390) (0.00) (985) Molson Coors Brewing Company_CS (2,084) (0.00) (945) PBF Energy Inc_CS (5,236) (0.01) (535) Mondelez International Inc_CS (1,151) (0.00) (316) PBF Energy Inc_JPM (756) (0.00) (506) Mongodb Inc_CS (9,307) (0.01) (710) PDC Energy Inc_CS (1,181) (0.00) (428) Monster Beverage Corporation_CS (2,372) (0.00) (580) Pegasystems Inc_CS (4,211) (0.01) (1,937) Mosaic Company_CS (943) (0.00) (10) Pegasystems Inc_JPM (6) (0.00) (104) Mosaic Company_JPM (341) (0.00) (3,297) Penn National Gaming Inc_CS (20,673) (0.02) 17 Motorola Solutions Inc_JPM (49) (0.00) (4) Pennant Group Inc/The_CS (132) (0.00) (74) MSA Safety Inc_CS (1,873) (0.00) (2) Pennant Group Inc/The_JPM (66) (0.00) 132 MSCI Inc_CS (3) (0.00) (1,527) Pennymac Financial Services_CS (419) (0.00) (80) Mueller Water Products Inc_JPM (145) (0.00) (28) Pennymac Financial Services_JPM (13) (0.00) (630) Murphy Oil Corporation_CS (3,583) (0.01) (51) Peoples United Financial_JPM (135) (0.00) (219) Murphy Oil Corporation_JPM (1,050) (0.00) 835 Perspecta Inc_CS (618) (0.00) 14 Murphy USA Inc_JPM (15) (0.00) 263 Perspecta Inc_JPM (126) (0.00) (278) MyoKardia Inc_CS (7,682) (0.01) (186) Philip Morris International Inc_CS (349) (0.00)
255
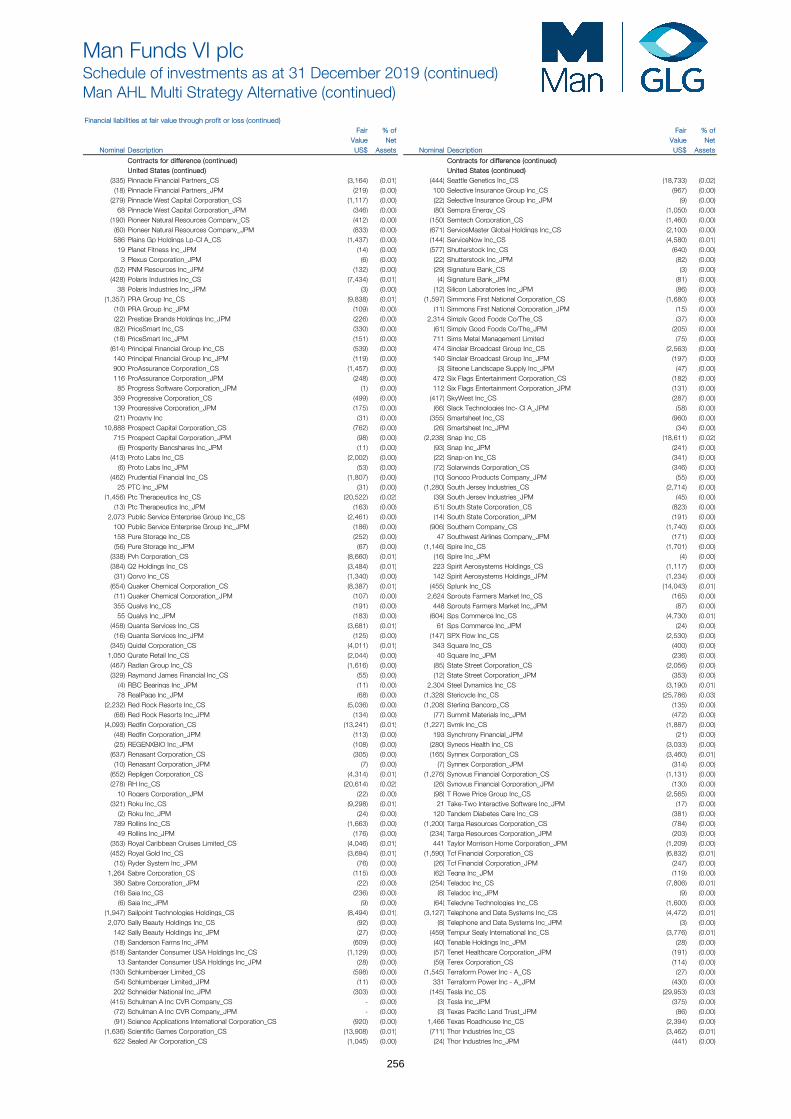
Man Funds VI plcSchedule of investments as at 31 December 2019 (continued)Man AHL Multi Strategy Alternative (continued)
Financial liabilities at fair value through profit or loss (continued) Fair % of Fair % of
Value Net Value Net Nominal Description US$ Assets Nominal Description US$ Assets
Contracts for difference (continued) Contracts for difference (continued)United States (continued) United States (continued)
(335) Pinnacle Financial Partners_CS (3,164) (0.01) (444) Seattle Genetics Inc_CS (18,733) (0.02) (18) Pinnacle Financial Partners_JPM (219) (0.00) 100 Selective Insurance Group Inc_CS (967) (0.00) (279) Pinnacle West Capital Corporation_CS (1,117) (0.00) (22) Selective Insurance Group Inc_JPM (9) (0.00) 68 Pinnacle West Capital Corporation_JPM (346) (0.00) (80) Sempra Energy_CS (1,050) (0.00) (190) Pioneer Natural Resources Company_CS (412) (0.00) (150) Semtech Corporation_CS (1,460) (0.00) (60) Pioneer Natural Resources Company_JPM (833) (0.00) (671) ServiceMaster Global Holdings Inc_CS (2,100) (0.00) 586 Plains Gp Holdings Lp-Cl A_CS (1,437) (0.00) (144) ServiceNow Inc_CS (4,580) (0.01) 19 Planet Fitness Inc_JPM (14) (0.00) (577) Shutterstock Inc_CS (640) (0.00) 3 Plexus Corporation_JPM (6) (0.00) (22) Shutterstock Inc_JPM (82) (0.00) (52) PNM Resources Inc_JPM (132) (0.00) (29) Signature Bank_CS (3) (0.00) (428) Polaris Industries Inc_CS (7,434) (0.01) (4) Signature Bank_JPM (81) (0.00) 38 Polaris Industries Inc_JPM (3) (0.00) (12) Silicon Laboratories Inc_JPM (86) (0.00) (1,357) PRA Group Inc_CS (9,838) (0.01) (1,597) Simmons First National Corporation_CS (1,680) (0.00) (10) PRA Group Inc_JPM (109) (0.00) (11) Simmons First National Corporation_JPM (15) (0.00) (22) Prestige Brands Holdings Inc_JPM (226) (0.00) 2,314 Simply Good Foods Co/The_CS (37) (0.00) (82) PriceSmart Inc_CS (330) (0.00) (61) Simply Good Foods Co/The_JPM (205) (0.00) (18) PriceSmart Inc_JPM (151) (0.00) 711 Sims Metal Management Limited (75) (0.00) (614) Principal Financial Group Inc_CS (539) (0.00) 474 Sinclair Broadcast Group Inc_CS (2,563) (0.00) 140 Principal Financial Group Inc_JPM (119) (0.00) 140 Sinclair Broadcast Group Inc_JPM (197) (0.00) 900 ProAssurance Corporation_CS (1,457) (0.00) (3) Siteone Landscape Supply Inc_JPM (47) (0.00) 116 ProAssurance Corporation_JPM (248) (0.00) 472 Six Flags Entertainment Corporation_CS (182) (0.00) 85 Progress Software Corporation_JPM (1) (0.00) 112 Six Flags Entertainment Corporation_JPM (131) (0.00) 359 Progressive Corporation_CS (499) (0.00) (417) SkyWest Inc_CS (287) (0.00) 139 Progressive Corporation_JPM (175) (0.00) (66) Slack Technologies Inc- Cl A_JPM (58) (0.00) (21) Progyny Inc (31) (0.00) (355) Smartsheet Inc_CS (960) (0.00) 10,888 Prospect Capital Corporation_CS (762) (0.00) (26) Smartsheet Inc_JPM (34) (0.00) 715 Prospect Capital Corporation_JPM (98) (0.00) (2,238) Snap Inc_CS (18,611) (0.02) (6) Prosperity Bancshares Inc_JPM (11) (0.00) (93) Snap Inc_JPM (241) (0.00) (413) Proto Labs Inc_CS (2,002) (0.00) (22) Snap-on Inc_CS (341) (0.00) (6) Proto Labs Inc_JPM (53) (0.00) (72) Solarwinds Corporation_CS (346) (0.00) (462) Prudential Financial Inc_CS (1,807) (0.00) (10) Sonoco Products Company_JPM (55) (0.00) 25 PTC Inc_JPM (31) (0.00) (1,280) South Jersey Industries_CS (2,714) (0.00) (1,456) Ptc Therapeutics Inc_CS (20,522) (0.02) (39) South Jersey Industries_JPM (45) (0.00) (13) Ptc Therapeutics Inc_JPM (163) (0.00) (51) South State Corporation_CS (823) (0.00) 2,073 Public Service Enterprise Group Inc_CS (2,461) (0.00) (14) South State Corporation_JPM (191) (0.00) 100 Public Service Enterprise Group Inc_JPM (186) (0.00) (906) Southern Company_CS (1,740) (0.00) 158 Pure Storage Inc_CS (252) (0.00) 47 Southwest Airlines Company_JPM (171) (0.00) (56) Pure Storage Inc_JPM (67) (0.00) (1,146) Spire Inc_CS (1,701) (0.00) (338) Pvh Corporation_CS (8,660) (0.01) (16) Spire Inc_JPM (4) (0.00) (384) Q2 Holdings Inc_CS (3,484) (0.01) 223 Spirit Aerosystems Holdings_CS (1,117) (0.00) (31) Qorvo Inc_CS (1,340) (0.00) 142 Spirit Aerosystems Holdings_JPM (1,234) (0.00) (654) Quaker Chemical Corporation_CS (8,387) (0.01) (455) Splunk Inc_CS (14,043) (0.01) (11) Quaker Chemical Corporation_JPM (107) (0.00) 2,624 Sprouts Farmers Market Inc_CS (165) (0.00) 355 Qualys Inc_CS (191) (0.00) 448 Sprouts Farmers Market Inc_JPM (87) (0.00) 55 Qualys Inc_JPM (183) (0.00) (604) Sps Commerce Inc_CS (4,730) (0.01) (458) Quanta Services Inc_CS (3,681) (0.01) 61 Sps Commerce Inc_JPM (24) (0.00) (16) Quanta Services Inc_JPM (125) (0.00) (147) SPX Flow Inc_CS (2,530) (0.00) (345) Quidel Corporation_CS (4,011) (0.01) 343 Square Inc_CS (400) (0.00) 1,050 Qurate Retail Inc_CS (2,044) (0.00) 40 Square Inc_JPM (236) (0.00) (467) Radian Group Inc_CS (1,616) (0.00) (85) State Street Corporation_CS (2,056) (0.00) (329) Raymond James Financial Inc_CS (55) (0.00) (12) State Street Corporation_JPM (353) (0.00) (4) RBC Bearings Inc_JPM (11) (0.00) 2,304 Steel Dynamics Inc_CS (3,190) (0.01) 78 RealPage Inc_JPM (68) (0.00) (1,328) Stericycle Inc_CS (25,786) (0.03) (2,232) Red Rock Resorts Inc_CS (5,036) (0.00) (1,208) Sterling Bancorp_CS (135) (0.00) (68) Red Rock Resorts Inc_JPM (134) (0.00) (77) Summit Materials Inc_JPM (472) (0.00) (4,093) Redfin Corporation_CS (13,241) (0.01) (1,227) Svmk Inc_CS (1,887) (0.00) (48) Redfin Corporation_JPM (113) (0.00) 193 Synchrony Financial_JPM (21) (0.00) (25) REGENXBIO Inc_JPM (108) (0.00) (280) Syneos Health Inc_CS (3,033) (0.00) (637) Renasant Corporation_CS (305) (0.00) (165) Synnex Corporation_CS (3,460) (0.01) (10) Renasant Corporation_JPM (7) (0.00) (7) Synnex Corporation_JPM (314) (0.00) (652) Repligen Corporation_CS (4,314) (0.01) (1,276) Synovus Financial Corporation_CS (1,131) (0.00) (278) RH Inc_CS (20,614) (0.02) (26) Synovus Financial Corporation_JPM (130) (0.00) 10 Rogers Corporation_JPM (22) (0.00) (98) T Rowe Price Group Inc_CS (2,565) (0.00) (321) Roku Inc_CS (9,298) (0.01) 21 Take-Two Interactive Software Inc_JPM (17) (0.00) (2) Roku Inc_JPM (24) (0.00) 120 Tandem Diabetes Care Inc_CS (381) (0.00) 789 Rollins Inc_CS (1,663) (0.00) (1,200) Targa Resources Corporation_CS (784) (0.00) 49 Rollins Inc_JPM (176) (0.00) (234) Targa Resources Corporation_JPM (203) (0.00) (353) Royal Caribbean Cruises Limited_CS (4,046) (0.01) 441 Taylor Morrison Home Corporation_JPM (1,209) (0.00) (452) Royal Gold Inc_CS (3,694) (0.01) (1,590) Tcf Financial Corporation_CS (6,832) (0.01) (15) Ryder System Inc_JPM (76) (0.00) (26) Tcf Financial Corporation_JPM (247) (0.00) 1,264 Sabre Corporation_CS (115) (0.00) (62) Tegna Inc_JPM (119) (0.00) 380 Sabre Corporation_JPM (22) (0.00) (254) Teladoc Inc_CS (7,806) (0.01) (16) Saia Inc_CS (236) (0.00) (8) Teladoc Inc_JPM (9) (0.00) (6) Saia Inc_JPM (9) (0.00) (64) Teledyne Technologies Inc_CS (1,600) (0.00) (1,947) Sailpoint Technologies Holdings_CS (8,494) (0.01) (3,127) Telephone and Data Systems Inc_CS (4,472) (0.01) 2,070 Sally Beauty Holdings Inc_CS (92) (0.00) (8) Telephone and Data Systems Inc_JPM (3) (0.00) 142 Sally Beauty Holdings Inc_JPM (27) (0.00) (459) Tempur Sealy International Inc_CS (3,776) (0.01) (18) Sanderson Farms Inc_JPM (609) (0.00) (40) Tenable Holdings Inc_JPM (28) (0.00) (518) Santander Consumer USA Holdings Inc_CS (1,129) (0.00) (57) Tenet Healthcare Corporation_JPM (191) (0.00) 13 Santander Consumer USA Holdings Inc_JPM (28) (0.00) (59) Terex Corporation_CS (114) (0.00) (130) Schlumberger Limited_CS (598) (0.00) (1,545) Terraform Power Inc - A_CS (27) (0.00) (54) Schlumberger Limited_JPM (11) (0.00) 331 Terraform Power Inc - A_JPM (430) (0.00) 202 Schneider National Inc_JPM (303) (0.00) (145) Tesla Inc_CS (29,953) (0.03) (415) Schulman A Inc CVR Company_CS - (0.00) (3) Tesla Inc_JPM (375) (0.00) (72) Schulman A Inc CVR Company_JPM - (0.00) (3) Texas Pacific Land Trust_JPM (86) (0.00) (91) Science Applications International Corporation_CS (920) (0.00) 1,466 Texas Roadhouse Inc_CS (2,394) (0.00) (1,636) Scientific Games Corporation_CS (13,908) (0.01) (711) Thor Industries Inc_CS (3,462) (0.01) 622 Sealed Air Corporation_CS (1,045) (0.00) (24) Thor Industries Inc_JPM (441) (0.00)
256

Man Funds VI plcSchedule of investments as at 31 December 2019 (continued)Man AHL Multi Strategy Alternative (continued)
Financial liabilities at fair value through profit or loss (continued) Fair % of Fair % of
Value Net Value Net Nominal Description US$ Assets Nominal Description US$ Assets
Contracts for difference (continued) Contracts for difference (continued)United States (continued) United States (continued)
(122) T-Mobile US Inc_JPM (292) (0.00) (524) Wintrust Financial Corporation_CS (5,012) (0.00) 271 Toll Brothers Inc_JPM (112) (0.00) (18) Wintrust Financial Corporation_JPM (165) (0.00) 431 Tractor Supply Company_CS (1,753) (0.00) (151) Woodward Inc_CS (1,732) (0.00) 27 Tractor Supply Company_JPM (27) (0.00) (521) Workiva Inc_CS (145) (0.00) (60) Trade Desk Inc_CS (9,381) (0.01) 23 Workiva Inc_JPM (17) (0.00) (525) Tradeweb Markets Inc_CS (1,460) (0.00) (25) World Fuel Services Corporation_JPM (114) (0.00) 7 Transdigm Group Inc_CS (119) (0.00) (374) World Wrestling Entertainment Inc_CS (2,436) (0.00) 29 Travelers Companies Inc_CS (287) (0.00) (40) World Wrestling Entertainment Inc_JPM (317) (0.00) 56 Travelers Companies Inc_JPM (179) (0.00) (3,559) WPX Energy Inc_CS (13,373) (0.01) (1,555) TriNet Group Inc_CS (4,255) (0.01) (676) WPX Energy Inc_JPM (1,722) (0.00) 181 TriNet Group Inc_JPM (511) (0.00) (185) WR Grace and Company_CS (151) (0.00) (4,109) Trinity Industries Inc_CS (9,507) (0.01) (821) WSFS Financial Corporation_CS (270) (0.00) (22) Trinity Industries Inc_JPM (117) (0.00) (25) WSFS Financial Corporation_JPM (10) (0.00) 1,638 Trinseo SA_CS (2,616) (0.00) (114) Wyndham Hotels & Resorts Inc_CS (1,002) (0.00) 26 Trinseo SA_JPM (58) (0.00) (632) Wynn Resorts Limited_CS (12,649) (0.01) (331) Truist Financial Corporation_CS (2,357) (0.00) (970) Xcel Energy Inc_CS (2,348) (0.00) 29 Trustmark Corporation_JPM (18) (0.00) 674 Xencor Inc_CS (293) (0.00) (1,235) Twitter Inc_CS (3,180) (0.01) 92 Xencor Inc_JPM (297) (0.00) 68 Twitter Inc_JPM (16) (0.00) 196 Xilinx Inc_CS (402) (0.00) (95) Tyler Technologies Inc_CS (2,102) (0.00) 84 Xilinx Inc_JPM (244) (0.00) (32) UGI Corporation_JPM (10) (0.00) (236) XPO Logistics Inc_CS (134) (0.00) (175) Ulta Beauty Inc_CS (1,054) (0.00) 24 XPO Logistics Inc_JPM (91) (0.00) (35) Ultragenyx Pharmaceutical Inc_JPM (20) (0.00) (128) Xylem Inc_CS (378) (0.00) (17) UMB Financial Corporation_JPM (78) (0.00) (1,661) Yelp Inc (591) (0.00) (1,549) Umpqua Holdings Corporation (1,892) (0.00) (1,074) Yeti Holdings Inc_CS (9,487) (0.01) (2,790) Under Armour Inc_CS (8,496) (0.01) (53) Yum! Brands Inc_CS (42) (0.00) (391) United Bankshares Inc_CS (148) (0.00) 86 Yum! Brands Inc_JPM (216) (0.00) 7 United Bankshares Inc_JPM (9) (0.00) (103) Zebra Technologies Corporation_CS (4,731) (0.01) 20 United Continental Holdings_JPM (99) (0.00) (184) Zendesk Inc_CS (557) (0.00) (94) United Rentals Inc_CS (5,027) (0.00) (3,155) Zillow Group Inc_CS (37,739) (0.03) 88 United States Steel Corporation_JPM (155) (0.00) (96) Zillow Group Inc_JPM (1,443) (0.00) (12) United Therapeutics Corporation_JPM (102) (0.00) (2,009) Zogenix Inc_CS (18,098) (0.01) (1,732) Univar Inc_CS (7,890) (0.01) (33) Zogenix Inc_JPM (371) (0.00) (67) Univar Inc_JPM (373) (0.00) (764) Zoom Video Communications_CS (2,229) (0.00) 170 Universal Forest Products_JPM (186) (0.00) 17 Zoom Video Communications_JPM (63) (0.00) 1,289 Unum Group_CS (5,775) (0.01) 3,822 Zynga Inc_CS (398) (0.00) 238 Unum Group_JPM (68) (0.00) (2,198,961) (2.15) (1,037) Urban Outfitters Inc_CS (96) (0.00)
95 Urban Outfitters Inc_JPM (175) (0.00) Total contracts for difference (7,235,013) (7.06) (837) Usana Health Sciences Inc_CS (9,474) (0.01)
(15) Usana Health Sciences Inc_JPM (101) (0.00) Futures contracts (13) Valero Energy Corporation_JPM (48) (0.00) Australia 151 Valley National Bancorp_JPM (82) (0.00) 53 Australian 10 Years Bond Futures March 2020 (89,572) (0.09) 56 Valmont Industries_CS (3) (0.00) 51 SPI 200 Futures Index March 2020 (148,112) (0.14) 1,563 Valvoline Inc_CS (926) (0.00) (237,684) (0.23) (307) Varonis Systems Inc_CS (3,396) (0.01)
(4,855) Vector Group Limited_CS (9,176) (0.01) European Union 343 Veeva Systems Inc_CS (36) (0.00) 20 3 Month Euro EURIBOR Futures December 2021 (4,911) (0.00) 3 Veeva Systems Inc_JPM (21) (0.00) 37 3 Month Euro EURIBOR Futures September*2 (PERPETUAL) (13,849) (0.02) (185) Verint Systems Inc_CS (1,733) (0.00) (18,760) (0.02) 46 Verisign Inc_JPM (20) (0.00)
(2,170) Verra Mobility Corporation_CS (266) (0.00) France 400 Verra Mobility Corporation_JPM (196) (0.00) 100 CAC 40 10 Euro Index Futures January 2020 (10,099) (0.01) (247) Vertex Pharmaceuticals Inc_CS (7,678) (0.01)
(65) VF Corporation_CS (1,166) (0.00) Germany 97 ViacomCBS Inc_JPM (266) (0.00) 88 EURO BTP Futures March 2020 (52,074) (0.06) (130) Viasat Inc_CS (63) (0.00) 28 Euro STOXX 50 Index Futures March 2020 (14,458) (0.01) 7 Viasat Inc_JPM (88) (0.00) (20) Short Euro BTP Futures March 2020 (4,299) (0.00) (68) Viavi Solutions Inc_JPM (92) (0.00) (17) VSTOXX Index Futures February 2020 (1,403) (0.00) 24 Visteon Corporation_CS (193) (0.00) (72,234) (0.07) (37) Visteon Corporation_JPM (905) (0.00) 4,222 Vistra Energy Corporation_CS (7,288) (0.01) Hong Kong 193 Vistra Energy Corporation_JPM (654) (0.00) (17) Hang Seng Index Futures January 2020 (23,895) (0.02) 42 VMware Inc_JPM (391) (0.00)
(2) Vulcan Materials Company_JPM - (0.00) Japan (697) Wabtec Corporation_CS (6,429) (0.01) 10 Nikkei 225 OSE Index Futures March 2020 (28,065) (0.03) (13) Wabtec Corporation_JPM (155) (0.00)
473 Walker & Dunlop Inc_CS (144) (0.00) Netherlands 164 Walt Disney Company_CS (344) (0.00) 28 Amsterdam Index Futures January 2020 (22,187) (0.02) 27 Walt Disney Company_JPM (46) (0.00)
106 Washington Federal Inc_JPM (12) (0.00) Singapore 32 Waste Management Inc_JPM (35) (0.00) (26) FTSE CHINA A50 Index Futures January 2020 (5,919) (0.01) (5) WD-40 Company_JPM (17) (0.00) 24 MSCI TAIWAN Index Futures January 2020 (2,976) (0.00) (89) Webster Financial Corporation_CS (15) (0.00) (8,895) (0.01) (20) Webster Financial Corporation_JPM (194) (0.00)
128 WEC Energy Group Inc_CS (2) (0.00) South Korea 65 WEC Energy Group Inc_JPM (95) (0.00) 37 Korea 10 Years Bond Futures March 2020 (8,362) (0.01) (2,598) Welbilt Inc_CS (2,811) (0.00)
29 Welbilt Inc_JPM (47) (0.00) Thailand 57 Werner Enterprises Inc_JPM (76) (0.00) (383) SET50 Index Futures March 2020 (4,394) (0.00) (9) Western Alliance Bancorp_JPM (130) (0.00)
(29) Western Digital Corporation_CS (273) (0.00) United Kingdom (14) Western Digital Corporation_JPM (79) (0.00) 9 3 Month Euro EURIBOR Futures March 2021 (1,445) (0.00) (265) WEX Inc_CS (2,845) (0.00) 22 90 Day Sterling Futures December 2021 (1,416) (0.00) 240 Whirlpool Corporation_CS (1,889) (0.00) (3) Long Gilt Futures March 2020 (2,398) (0.01) 74 Whirlpool Corporation_JPM (488) (0.00) (5,259) (0.01) (142) Williams-Sonoma Inc_CS (1,299) (0.00)
73 Wingstop Inc_CS (15) (0.00)
257
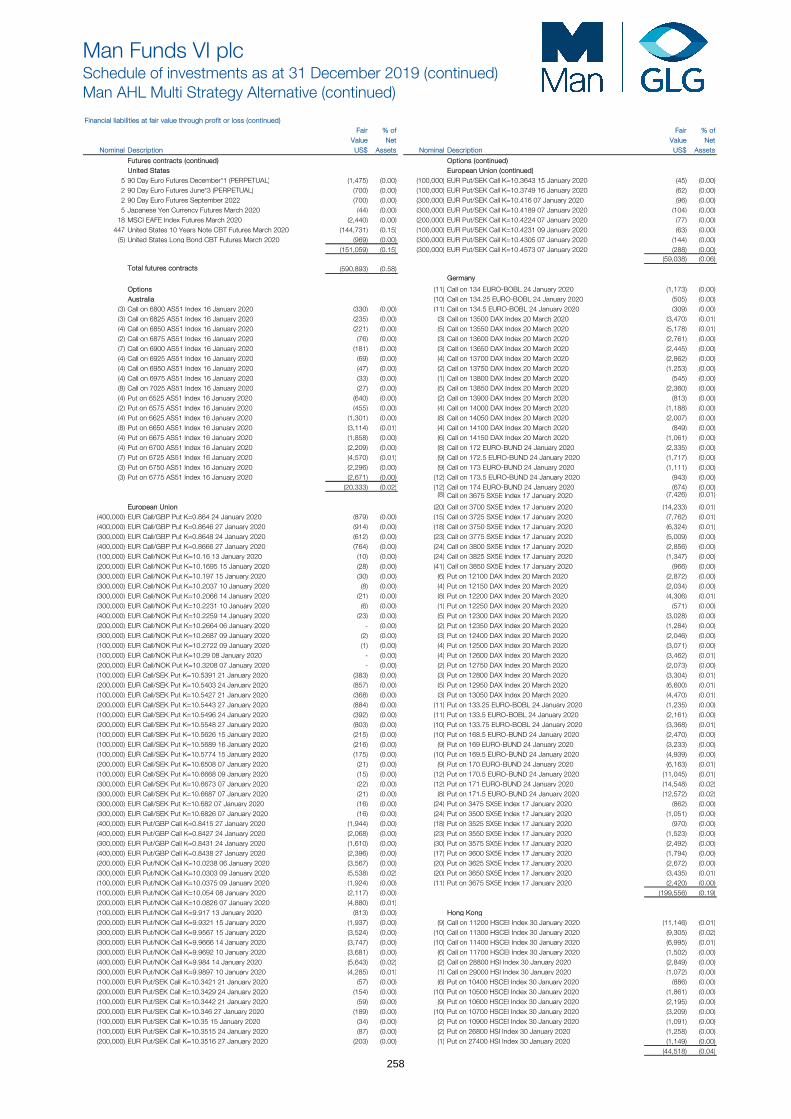
Man Funds VI plcSchedule of investments as at 31 December 2019 (continued)Man AHL Multi Strategy Alternative (continued)
Financial liabilities at fair value through profit or loss (continued) Fair % of Fair % of
Value Net Value Net Nominal Description US$ Assets Nominal Description US$ Assets
Futures contracts (continued) Options (continued) United States European Union (continued)
5 90 Day Euro Futures December*1 (PERPETUAL) (1,475) (0.00) (100,000) EUR Put/SEK Call K=10.3643 15 January 2020 (45) (0.00) 2 90 Day Euro Futures June*3 (PERPETUAL) (700) (0.00) (100,000) EUR Put/SEK Call K=10.3749 16 January 2020 (62) (0.00) 2 90 Day Euro Futures September 2022 (700) (0.00) (300,000) EUR Put/SEK Call K=10.416 07 January 2020 (96) (0.00) 5 Japanese Yen Currency Futures March 2020 (44) (0.00) (300,000) EUR Put/SEK Call K=10.4189 07 January 2020 (104) (0.00) 18 MSCI EAFE Index Futures March 2020 (2,440) (0.00) (200,000) EUR Put/SEK Call K=10.4224 07 January 2020 (77) (0.00) 447 United States 10 Years Note CBT Futures March 2020 (144,731) (0.15) (100,000) EUR Put/SEK Call K=10.4231 09 January 2020 (63) (0.00) (5) United States Long Bond CBT Futures March 2020 (969) (0.00) (300,000) EUR Put/SEK Call K=10.4305 07 January 2020 (144) (0.00)
(151,059) (0.15) (300,000) EUR Put/SEK Call K=10.4573 07 January 2020 (288) (0.00) (59,038) (0.06) Total futures contracts (590,893) (0.58) Germany
Options (11) Call on 134 EURO-BOBL 24 January 2020 (1,173) (0.00) Australia (10) Call on 134.25 EURO-BOBL 24 January 2020 (505) (0.00)
(3) Call on 6800 AS51 Index 16 January 2020 (330) (0.00) (11) Call on 134.5 EURO-BOBL 24 January 2020 (309) (0.00) (3) Call on 6825 AS51 Index 16 January 2020 (235) (0.00) (3) Call on 13500 DAX Index 20 March 2020 (3,470) (0.01) (4) Call on 6850 AS51 Index 16 January 2020 (221) (0.00) (5) Call on 13550 DAX Index 20 March 2020 (5,178) (0.01) (2) Call on 6875 AS51 Index 16 January 2020 (76) (0.00) (3) Call on 13600 DAX Index 20 March 2020 (2,761) (0.00) (7) Call on 6900 AS51 Index 16 January 2020 (181) (0.00) (3) Call on 13650 DAX Index 20 March 2020 (2,445) (0.00) (4) Call on 6925 AS51 Index 16 January 2020 (69) (0.00) (4) Call on 13700 DAX Index 20 March 2020 (2,862) (0.00) (4) Call on 6950 AS51 Index 16 January 2020 (47) (0.00) (2) Call on 13750 DAX Index 20 March 2020 (1,253) (0.00) (4) Call on 6975 AS51 Index 16 January 2020 (33) (0.00) (1) Call on 13800 DAX Index 20 March 2020 (545) (0.00) (8) Call on 7025 AS51 Index 16 January 2020 (27) (0.00) (5) Call on 13850 DAX Index 20 March 2020 (2,360) (0.00) (4) Put on 6525 AS51 Index 16 January 2020 (640) (0.00) (2) Call on 13900 DAX Index 20 March 2020 (813) (0.00) (2) Put on 6575 AS51 Index 16 January 2020 (455) (0.00) (4) Call on 14000 DAX Index 20 March 2020 (1,188) (0.00) (4) Put on 6625 AS51 Index 16 January 2020 (1,301) (0.00) (8) Call on 14050 DAX Index 20 March 2020 (2,007) (0.00) (8) Put on 6650 AS51 Index 16 January 2020 (3,114) (0.01) (4) Call on 14100 DAX Index 20 March 2020 (849) (0.00) (4) Put on 6675 AS51 Index 16 January 2020 (1,858) (0.00) (6) Call on 14150 DAX Index 20 March 2020 (1,061) (0.00) (4) Put on 6700 AS51 Index 16 January 2020 (2,209) (0.00) (8) Call on 172 EURO-BUND 24 January 2020 (2,335) (0.00) (7) Put on 6725 AS51 Index 16 January 2020 (4,570) (0.01) (9) Call on 172.5 EURO-BUND 24 January 2020 (1,717) (0.00) (3) Put on 6750 AS51 Index 16 January 2020 (2,296) (0.00) (9) Call on 173 EURO-BUND 24 January 2020 (1,111) (0.00) (3) Put on 6775 AS51 Index 16 January 2020 (2,671) (0.00) (12) Call on 173.5 EURO-BUND 24 January 2020 (943) (0.00)
(20,333) (0.02) (12) Call on 174 EURO-BUND 24 January 2020 (674) (0.00) (8) Call on 3675 SX5E Index 17 January 2020 (7,426) (0.01)
European Union (20) Call on 3700 SX5E Index 17 January 2020 (14,233) (0.01) (400,000) EUR Call/GBP Put K=0.864 24 January 2020 (879) (0.00) (15) Call on 3725 SX5E Index 17 January 2020 (7,762) (0.01) (400,000) EUR Call/GBP Put K=0.8646 27 January 2020 (914) (0.00) (18) Call on 3750 SX5E Index 17 January 2020 (6,324) (0.01) (300,000) EUR Call/GBP Put K=0.8648 24 January 2020 (612) (0.00) (23) Call on 3775 SX5E Index 17 January 2020 (5,009) (0.00) (400,000) EUR Call/GBP Put K=0.8666 27 January 2020 (764) (0.00) (24) Call on 3800 SX5E Index 17 January 2020 (2,856) (0.00) (100,000) EUR Call/NOK Put K=10.16 13 January 2020 (10) (0.00) (24) Call on 3825 SX5E Index 17 January 2020 (1,347) (0.00) (200,000) EUR Call/NOK Put K=10.1695 15 January 2020 (28) (0.00) (41) Call on 3850 SX5E Index 17 January 2020 (966) (0.00) (300,000) EUR Call/NOK Put K=10.197 15 January 2020 (30) (0.00) (6) Put on 12100 DAX Index 20 March 2020 (2,872) (0.00) (300,000) EUR Call/NOK Put K=10.2037 10 January 2020 (8) (0.00) (4) Put on 12150 DAX Index 20 March 2020 (2,034) (0.00) (300,000) EUR Call/NOK Put K=10.2066 14 January 2020 (21) (0.00) (8) Put on 12200 DAX Index 20 March 2020 (4,306) (0.01) (300,000) EUR Call/NOK Put K=10.2231 10 January 2020 (6) (0.00) (1) Put on 12250 DAX Index 20 March 2020 (571) (0.00) (400,000) EUR Call/NOK Put K=10.2259 14 January 2020 (23) (0.00) (5) Put on 12300 DAX Index 20 March 2020 (3,028) (0.00) (200,000) EUR Call/NOK Put K=10.2664 06 January 2020 - (0.00) (2) Put on 12350 DAX Index 20 March 2020 (1,284) (0.00) (300,000) EUR Call/NOK Put K=10.2687 09 January 2020 (2) (0.00) (3) Put on 12400 DAX Index 20 March 2020 (2,046) (0.00) (100,000) EUR Call/NOK Put K=10.2722 09 January 2020 (1) (0.00) (4) Put on 12500 DAX Index 20 March 2020 (3,071) (0.00) (100,000) EUR Call/NOK Put K=10.29 08 January 2020 - (0.00) (4) Put on 12600 DAX Index 20 March 2020 (3,462) (0.01) (200,000) EUR Call/NOK Put K=10.3208 07 January 2020 - (0.00) (2) Put on 12750 DAX Index 20 March 2020 (2,073) (0.00) (100,000) EUR Call/SEK Put K=10.5391 21 January 2020 (383) (0.00) (3) Put on 12800 DAX Index 20 March 2020 (3,304) (0.01) (200,000) EUR Call/SEK Put K=10.5403 24 January 2020 (857) (0.00) (5) Put on 12950 DAX Index 20 March 2020 (6,600) (0.01) (100,000) EUR Call/SEK Put K=10.5427 21 January 2020 (368) (0.00) (3) Put on 13050 DAX Index 20 March 2020 (4,470) (0.01) (200,000) EUR Call/SEK Put K=10.5443 27 January 2020 (884) (0.00) (11) Put on 133.25 EURO-BOBL 24 January 2020 (1,235) (0.00) (100,000) EUR Call/SEK Put K=10.5496 24 January 2020 (392) (0.00) (11) Put on 133.5 EURO-BOBL 24 January 2020 (2,161) (0.00) (200,000) EUR Call/SEK Put K=10.5548 27 January 2020 (803) (0.00) (10) Put on 133.75 EURO-BOBL 24 January 2020 (3,368) (0.01) (100,000) EUR Call/SEK Put K=10.5626 15 January 2020 (215) (0.00) (10) Put on 168.5 EURO-BUND 24 January 2020 (2,470) (0.00) (100,000) EUR Call/SEK Put K=10.5689 16 January 2020 (216) (0.00) (9) Put on 169 EURO-BUND 24 January 2020 (3,233) (0.00) (100,000) EUR Call/SEK Put K=10.5774 15 January 2020 (175) (0.00) (10) Put on 169.5 EURO-BUND 24 January 2020 (4,939) (0.00) (200,000) EUR Call/SEK Put K=10.6508 07 January 2020 (21) (0.00) (9) Put on 170 EURO-BUND 24 January 2020 (6,163) (0.01) (100,000) EUR Call/SEK Put K=10.6668 09 January 2020 (15) (0.00) (12) Put on 170.5 EURO-BUND 24 January 2020 (11,045) (0.01) (300,000) EUR Call/SEK Put K=10.6673 07 January 2020 (22) (0.00) (12) Put on 171 EURO-BUND 24 January 2020 (14,548) (0.02) (300,000) EUR Call/SEK Put K=10.6687 07 January 2020 (21) (0.00) (8) Put on 171.5 EURO-BUND 24 January 2020 (12,572) (0.02) (300,000) EUR Call/SEK Put K=10.682 07 January 2020 (16) (0.00) (24) Put on 3475 SX5E Index 17 January 2020 (862) (0.00) (300,000) EUR Call/SEK Put K=10.6826 07 January 2020 (16) (0.00) (24) Put on 3500 SX5E Index 17 January 2020 (1,051) (0.00) (400,000) EUR Put/GBP Call K=0.8415 27 January 2020 (1,944) (0.00) (18) Put on 3525 SX5E Index 17 January 2020 (970) (0.00) (400,000) EUR Put/GBP Call K=0.8427 24 January 2020 (2,068) (0.00) (23) Put on 3550 SX5E Index 17 January 2020 (1,523) (0.00) (300,000) EUR Put/GBP Call K=0.8431 24 January 2020 (1,610) (0.00) (30) Put on 3575 SX5E Index 17 January 2020 (2,492) (0.00) (400,000) EUR Put/GBP Call K=0.8438 27 January 2020 (2,396) (0.00) (17) Put on 3600 SX5E Index 17 January 2020 (1,794) (0.00) (200,000) EUR Put/NOK Call K=10.0238 06 January 2020 (3,567) (0.00) (20) Put on 3625 SX5E Index 17 January 2020 (2,672) (0.00) (300,000) EUR Put/NOK Call K=10.0303 09 January 2020 (5,538) (0.02) (20) Put on 3650 SX5E Index 17 January 2020 (3,435) (0.01) (100,000) EUR Put/NOK Call K=10.0375 09 January 2020 (1,924) (0.00) (11) Put on 3675 SX5E Index 17 January 2020 (2,420) (0.00) (100,000) EUR Put/NOK Call K=10.054 08 January 2020 (2,117) (0.00) (199,556) (0.19) (200,000) EUR Put/NOK Call K=10.0826 07 January 2020 (4,880) (0.01) (100,000) EUR Put/NOK Call K=9.917 13 January 2020 (813) (0.00) Hong Kong (200,000) EUR Put/NOK Call K=9.9321 15 January 2020 (1,937) (0.00) (9) Call on 11200 HSCEI Index 30 January 2020 (11,146) (0.01) (300,000) EUR Put/NOK Call K=9.9567 15 January 2020 (3,524) (0.00) (10) Call on 11300 HSCEI Index 30 January 2020 (9,305) (0.02) (300,000) EUR Put/NOK Call K=9.9666 14 January 2020 (3,747) (0.00) (10) Call on 11400 HSCEI Index 30 January 2020 (6,995) (0.01) (300,000) EUR Put/NOK Call K=9.9692 10 January 2020 (3,681) (0.00) (6) Call on 11700 HSCEI Index 30 January 2020 (1,502) (0.00) (400,000) EUR Put/NOK Call K=9.984 14 January 2020 (5,643) (0.02) (2) Call on 28800 HSI Index 30 January 2020 (2,849) (0.00) (300,000) EUR Put/NOK Call K=9.9897 10 January 2020 (4,285) (0.01) (1) Call on 29000 HSI Index 30 January 2020 (1,072) (0.00) (100,000) EUR Put/SEK Call K=10.3421 21 January 2020 (57) (0.00) (6) Put on 10400 HSCEI Index 30 January 2020 (886) (0.00) (200,000) EUR Put/SEK Call K=10.3429 24 January 2020 (154) (0.00) (10) Put on 10500 HSCEI Index 30 January 2020 (1,861) (0.00) (100,000) EUR Put/SEK Call K=10.3442 21 January 2020 (59) (0.00) (9) Put on 10600 HSCEI Index 30 January 2020 (2,195) (0.00) (200,000) EUR Put/SEK Call K=10.346 27 January 2020 (189) (0.00) (10) Put on 10700 HSCEI Index 30 January 2020 (3,209) (0.00) (100,000) EUR Put/SEK Call K=10.35 15 January 2020 (34) (0.00) (2) Put on 10900 HSCEI Index 30 January 2020 (1,091) (0.00) (100,000) EUR Put/SEK Call K=10.3515 24 January 2020 (87) (0.00) (2) Put on 26800 HSI Index 30 January 2020 (1,258) (0.00) (200,000) EUR Put/SEK Call K=10.3516 27 January 2020 (203) (0.00) (1) Put on 27400 HSI Index 30 January 2020 (1,149) (0.00)
(44,518) (0.04)
258
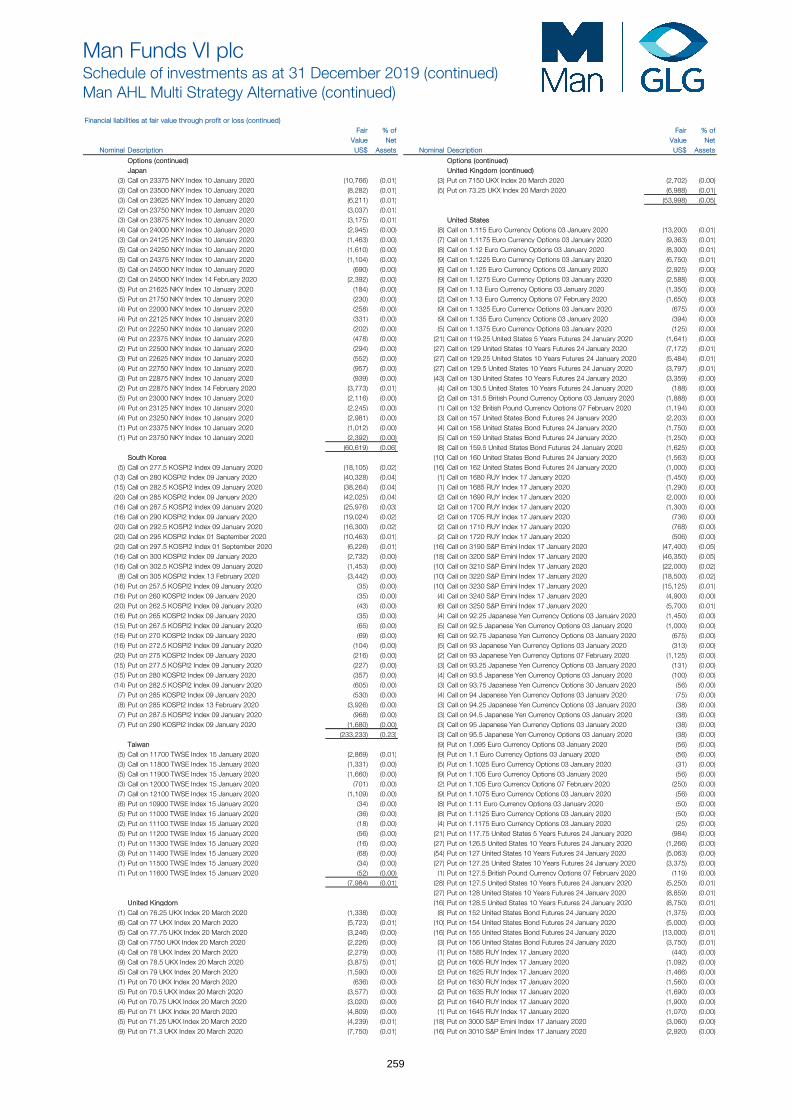
Man Funds VI plcSchedule of investments as at 31 December 2019 (continued)Man AHL Multi Strategy Alternative (continued)
Financial liabilities at fair value through profit or loss (continued) Fair % of Fair % of
Value Net Value Net Nominal Description US$ Assets Nominal Description US$ Assets
Options (continued) Options (continued) Japan United Kingdom (continued)
(3) Call on 23375 NKY Index 10 January 2020 (10,766) (0.01) (3) Put on 7150 UKX Index 20 March 2020 (2,702) (0.00) (3) Call on 23500 NKY Index 10 January 2020 (8,282) (0.01) (5) Put on 73.25 UKX Index 20 March 2020 (6,988) (0.01) (3) Call on 23625 NKY Index 10 January 2020 (6,211) (0.01) (53,998) (0.05) (2) Call on 23750 NKY Index 10 January 2020 (3,037) (0.01) (3) Call on 23875 NKY Index 10 January 2020 (3,175) (0.01) United States (4) Call on 24000 NKY Index 10 January 2020 (2,945) (0.00) (8) Call on 1.115 Euro Currency Options 03 January 2020 (13,200) (0.01) (3) Call on 24125 NKY Index 10 January 2020 (1,463) (0.00) (7) Call on 1.1175 Euro Currency Options 03 January 2020 (9,363) (0.01) (5) Call on 24250 NKY Index 10 January 2020 (1,610) (0.00) (8) Call on 1.12 Euro Currency Options 03 January 2020 (8,300) (0.01) (5) Call on 24375 NKY Index 10 January 2020 (1,104) (0.00) (9) Call on 1.1225 Euro Currency Options 03 January 2020 (6,750) (0.01) (5) Call on 24500 NKY Index 10 January 2020 (690) (0.00) (6) Call on 1.125 Euro Currency Options 03 January 2020 (2,925) (0.00) (2) Call on 24500 NKY Index 14 February 2020 (2,392) (0.00) (9) Call on 1.1275 Euro Currency Options 03 January 2020 (2,588) (0.00) (5) Put on 21625 NKY Index 10 January 2020 (184) (0.00) (9) Call on 1.13 Euro Currency Options 03 January 2020 (1,350) (0.00) (5) Put on 21750 NKY Index 10 January 2020 (230) (0.00) (2) Call on 1.13 Euro Currency Options 07 February 2020 (1,650) (0.00) (4) Put on 22000 NKY Index 10 January 2020 (258) (0.00) (9) Call on 1.1325 Euro Currency Options 03 January 2020 (675) (0.00) (4) Put on 22125 NKY Index 10 January 2020 (331) (0.00) (9) Call on 1.135 Euro Currency Options 03 January 2020 (394) (0.00) (2) Put on 22250 NKY Index 10 January 2020 (202) (0.00) (5) Call on 1.1375 Euro Currency Options 03 January 2020 (125) (0.00) (4) Put on 22375 NKY Index 10 January 2020 (478) (0.00) (21) Call on 119.25 United States 5 Years Futures 24 January 2020 (1,641) (0.00) (2) Put on 22500 NKY Index 10 January 2020 (294) (0.00) (27) Call on 129 United States 10 Years Futures 24 January 2020 (7,172) (0.01) (3) Put on 22625 NKY Index 10 January 2020 (552) (0.00) (27) Call on 129.25 United States 10 Years Futures 24 January 2020 (5,484) (0.01) (4) Put on 22750 NKY Index 10 January 2020 (957) (0.00) (27) Call on 129.5 United States 10 Years Futures 24 January 2020 (3,797) (0.01) (3) Put on 22875 NKY Index 10 January 2020 (939) (0.00) (43) Call on 130 United States 10 Years Futures 24 January 2020 (3,359) (0.00) (2) Put on 22875 NKY Index 14 February 2020 (3,773) (0.01) (4) Call on 130.5 United States 10 Years Futures 24 January 2020 (188) (0.00) (5) Put on 23000 NKY Index 10 January 2020 (2,116) (0.00) (2) Call on 131.5 British Pound Currency Options 03 January 2020 (1,888) (0.00) (4) Put on 23125 NKY Index 10 January 2020 (2,245) (0.00) (1) Call on 132 British Pound Currency Options 07 February 2020 (1,194) (0.00) (4) Put on 23250 NKY Index 10 January 2020 (2,981) (0.00) (3) Call on 157 United States Bond Futures 24 January 2020 (2,203) (0.00) (1) Put on 23375 NKY Index 10 January 2020 (1,012) (0.00) (4) Call on 158 United States Bond Futures 24 January 2020 (1,750) (0.00) (1) Put on 23750 NKY Index 10 January 2020 (2,392) (0.00) (5) Call on 159 United States Bond Futures 24 January 2020 (1,250) (0.00)
(60,619) (0.06) (8) Call on 159.5 United States Bond Futures 24 January 2020 (1,625) (0.00) South Korea (10) Call on 160 United States Bond Futures 24 January 2020 (1,563) (0.00)
(5) Call on 277.5 KOSPI2 Index 09 January 2020 (18,105) (0.02) (16) Call on 162 United States Bond Futures 24 January 2020 (1,000) (0.00) (13) Call on 280 KOSPI2 Index 09 January 2020 (40,328) (0.04) (1) Call on 1680 RUY Index 17 January 2020 (1,450) (0.00) (15) Call on 282.5 KOSPI2 Index 09 January 2020 (38,264) (0.04) (1) Call on 1685 RUY Index 17 January 2020 (1,290) (0.00) (20) Call on 285 KOSPI2 Index 09 January 2020 (42,025) (0.04) (2) Call on 1690 RUY Index 17 January 2020 (2,000) (0.00) (16) Call on 287.5 KOSPI2 Index 09 January 2020 (25,976) (0.03) (2) Call on 1700 RUY Index 17 January 2020 (1,300) (0.00) (16) Call on 290 KOSPI2 Index 09 January 2020 (19,024) (0.02) (2) Call on 1705 RUY Index 17 January 2020 (736) (0.00) (20) Call on 292.5 KOSPI2 Index 09 January 2020 (16,300) (0.02) (2) Call on 1710 RUY Index 17 January 2020 (768) (0.00) (20) Call on 295 KOSPI2 Index 01 September 2020 (10,463) (0.01) (2) Call on 1720 RUY Index 17 January 2020 (506) (0.00) (20) Call on 297.5 KOSPI2 Index 01 September 2020 (6,226) (0.01) (16) Call on 3190 S&P Emini Index 17 January 2020 (47,400) (0.05) (16) Call on 300 KOSPI2 Index 09 January 2020 (2,732) (0.00) (18) Call on 3200 S&P Emini Index 17 January 2020 (46,350) (0.05) (16) Call on 302.5 KOSPI2 Index 09 January 2020 (1,453) (0.00) (10) Call on 3210 S&P Emini Index 17 January 2020 (22,000) (0.02) (8) Call on 305 KOSPI2 Index 13 February 2020 (3,442) (0.00) (10) Call on 3220 S&P Emini Index 17 January 2020 (18,500) (0.02) (16) Put on 257.5 KOSPI2 Index 09 January 2020 (35) (0.00) (10) Call on 3230 S&P Emini Index 17 January 2020 (15,125) (0.01) (16) Put on 260 KOSPI2 Index 09 January 2020 (35) (0.00) (4) Call on 3240 S&P Emini Index 17 January 2020 (4,900) (0.00) (20) Put on 262.5 KOSPI2 Index 09 January 2020 (43) (0.00) (6) Call on 3250 S&P Emini Index 17 January 2020 (5,700) (0.01) (16) Put on 265 KOSPI2 Index 09 January 2020 (35) (0.00) (4) Call on 92.25 Japanese Yen Currency Options 03 January 2020 (1,450) (0.00) (15) Put on 267.5 KOSPI2 Index 09 January 2020 (65) (0.00) (5) Call on 92.5 Japanese Yen Currency Options 03 January 2020 (1,000) (0.00) (16) Put on 270 KOSPI2 Index 09 January 2020 (69) (0.00) (6) Call on 92.75 Japanese Yen Currency Options 03 January 2020 (675) (0.00) (16) Put on 272.5 KOSPI2 Index 09 January 2020 (104) (0.00) (5) Call on 93 Japanese Yen Currency Options 03 January 2020 (313) (0.00) (20) Put on 275 KOSPI2 Index 09 January 2020 (216) (0.00) (2) Call on 93 Japanese Yen Currency Options 07 February 2020 (1,125) (0.00) (15) Put on 277.5 KOSPI2 Index 09 January 2020 (227) (0.00) (3) Call on 93.25 Japanese Yen Currency Options 03 January 2020 (131) (0.00) (15) Put on 280 KOSPI2 Index 09 January 2020 (357) (0.00) (4) Call on 93.5 Japanese Yen Currency Options 03 January 2020 (100) (0.00) (14) Put on 282.5 KOSPI2 Index 09 January 2020 (605) (0.00) (3) Call on 93.75 Japanese Yen Currency Options 30 January 2020 (56) (0.00) (7) Put on 285 KOSPI2 Index 09 January 2020 (530) (0.00) (4) Call on 94 Japanese Yen Currency Options 03 January 2020 (75) (0.00) (8) Put on 285 KOSPI2 Index 13 February 2020 (3,926) (0.00) (3) Call on 94.25 Japanese Yen Currency Options 03 January 2020 (38) (0.00) (7) Put on 287.5 KOSPI2 Index 09 January 2020 (968) (0.00) (3) Call on 94.5 Japanese Yen Currency Options 03 January 2020 (38) (0.00) (7) Put on 290 KOSPI2 Index 09 January 2020 (1,680) (0.00) (3) Call on 95 Japanese Yen Currency Options 03 January 2020 (38) (0.00)
(233,233) (0.23) (3) Call on 95.5 Japanese Yen Currency Options 03 January 2020 (38) (0.00) Taiwan (9) Put on 1.095 Euro Currency Options 03 January 2020 (56) (0.00)
(5) Call on 11700 TWSE Index 15 January 2020 (2,869) (0.01) (9) Put on 1.1 Euro Currency Options 03 January 2020 (56) (0.00) (3) Call on 11800 TWSE Index 15 January 2020 (1,331) (0.00) (5) Put on 1.1025 Euro Currency Options 03 January 2020 (31) (0.00) (5) Call on 11900 TWSE Index 15 January 2020 (1,660) (0.00) (9) Put on 1.105 Euro Currency Options 03 January 2020 (56) (0.00) (3) Call on 12000 TWSE Index 15 January 2020 (701) (0.00) (2) Put on 1.105 Euro Currency Options 07 February 2020 (250) (0.00) (7) Call on 12100 TWSE Index 15 January 2020 (1,109) (0.00) (9) Put on 1.1075 Euro Currency Options 03 January 2020 (56) (0.00) (6) Put on 10900 TWSE Index 15 January 2020 (34) (0.00) (8) Put on 1.11 Euro Currency Options 03 January 2020 (50) (0.00) (5) Put on 11000 TWSE Index 15 January 2020 (36) (0.00) (8) Put on 1.1125 Euro Currency Options 03 January 2020 (50) (0.00) (2) Put on 11100 TWSE Index 15 January 2020 (18) (0.00) (4) Put on 1.1175 Euro Currency Options 03 January 2020 (25) (0.00) (5) Put on 11200 TWSE Index 15 January 2020 (56) (0.00) (21) Put on 117.75 United States 5 Years Futures 24 January 2020 (984) (0.00) (1) Put on 11300 TWSE Index 15 January 2020 (16) (0.00) (27) Put on 126.5 United States 10 Years Futures 24 January 2020 (1,266) (0.00) (3) Put on 11400 TWSE Index 15 January 2020 (68) (0.00) (54) Put on 127 United States 10 Years Futures 24 January 2020 (5,063) (0.00) (1) Put on 11500 TWSE Index 15 January 2020 (34) (0.00) (27) Put on 127.25 United States 10 Years Futures 24 January 2020 (3,375) (0.00) (1) Put on 11600 TWSE Index 15 January 2020 (52) (0.00) (1) Put on 127.5 British Pound Currency Options 07 February 2020 (119) (0.00)
(7,984) (0.01) (28) Put on 127.5 United States 10 Years Futures 24 January 2020 (5,250) (0.01) (27) Put on 128 United States 10 Years Futures 24 January 2020 (8,859) (0.01)
United Kingdom (16) Put on 128.5 United States 10 Years Futures 24 January 2020 (8,750) (0.01) (1) Call on 76.25 UKX Index 20 March 2020 (1,338) (0.00) (8) Put on 152 United States Bond Futures 24 January 2020 (1,375) (0.00) (6) Call on 77 UKX Index 20 March 2020 (5,723) (0.01) (10) Put on 154 United States Bond Futures 24 January 2020 (5,000) (0.00) (5) Call on 77.75 UKX Index 20 March 2020 (3,246) (0.00) (16) Put on 155 United States Bond Futures 24 January 2020 (13,000) (0.01) (3) Call on 7750 UKX Index 20 March 2020 (2,226) (0.00) (3) Put on 156 United States Bond Futures 24 January 2020 (3,750) (0.01) (4) Call on 78 UKX Index 20 March 2020 (2,279) (0.00) (1) Put on 1585 RUY Index 17 January 2020 (440) (0.00) (9) Call on 78.5 UKX Index 20 March 2020 (3,875) (0.01) (2) Put on 1605 RUY Index 17 January 2020 (1,092) (0.00) (5) Call on 79 UKX Index 20 March 2020 (1,590) (0.00) (2) Put on 1625 RUY Index 17 January 2020 (1,466) (0.00) (1) Put on 70 UKX Index 20 March 2020 (636) (0.00) (2) Put on 1630 RUY Index 17 January 2020 (1,560) (0.00) (5) Put on 70.5 UKX Index 20 March 2020 (3,577) (0.00) (2) Put on 1635 RUY Index 17 January 2020 (1,690) (0.00) (4) Put on 70.75 UKX Index 20 March 2020 (3,020) (0.00) (2) Put on 1640 RUY Index 17 January 2020 (1,900) (0.00) (6) Put on 71 UKX Index 20 March 2020 (4,809) (0.00) (1) Put on 1645 RUY Index 17 January 2020 (1,070) (0.00) (5) Put on 71.25 UKX Index 20 March 2020 (4,239) (0.01) (18) Put on 3000 S&P Emini Index 17 January 2020 (3,060) (0.00) (9) Put on 71.3 UKX Index 20 March 2020 (7,750) (0.01) (16) Put on 3010 S&P Emini Index 17 January 2020 (2,920) (0.00)
259
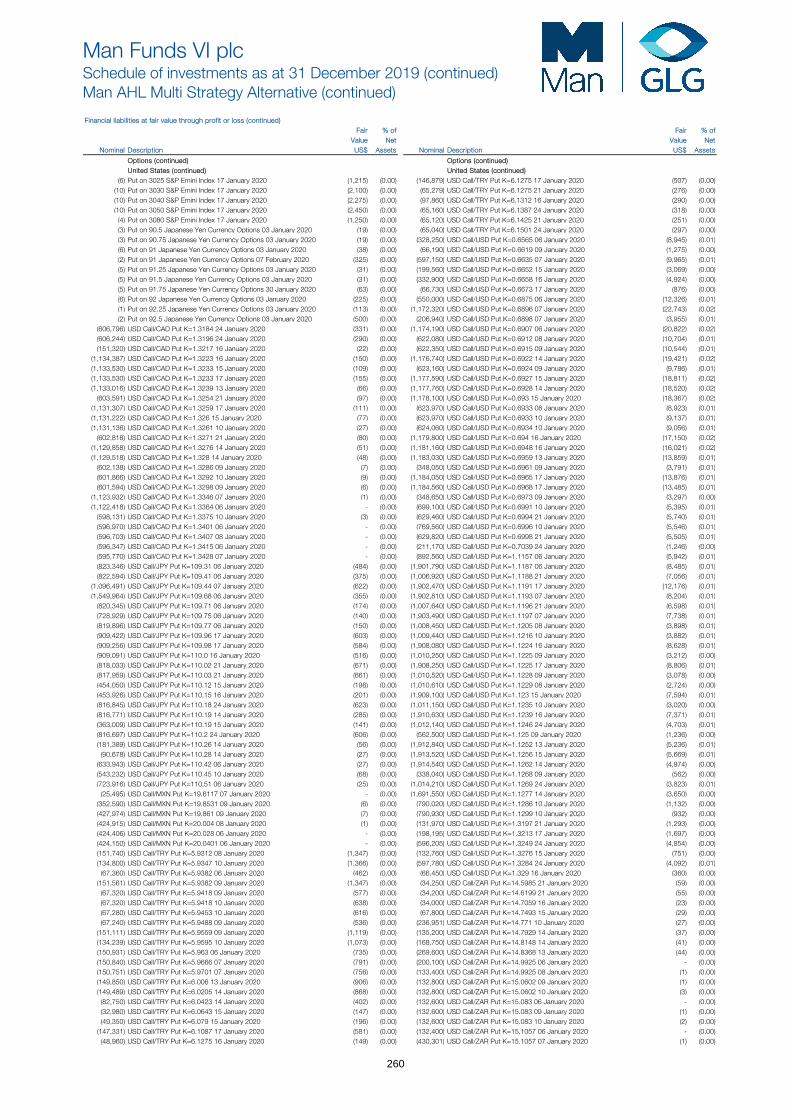
Man Funds VI plcSchedule of investments as at 31 December 2019 (continued)Man AHL Multi Strategy Alternative (continued)
Financial liabilities at fair value through profit or loss (continued) Fair % of Fair % of
Value Net Value Net Nominal Description US$ Assets Nominal Description US$ Assets
Options (continued) Options (continued)United States (continued) United States (continued)
(6) Put on 3025 S&P Emini Index 17 January 2020 (1,215) (0.00) (146,879) USD Call/TRY Put K=6.1275 17 January 2020 (507) (0.00) (10) Put on 3030 S&P Emini Index 17 January 2020 (2,100) (0.00) (65,279) USD Call/TRY Put K=6.1275 21 January 2020 (276) (0.00) (10) Put on 3040 S&P Emini Index 17 January 2020 (2,275) (0.00) (97,860) USD Call/TRY Put K=6.1312 16 January 2020 (290) (0.00) (10) Put on 3050 S&P Emini Index 17 January 2020 (2,450) (0.00) (65,160) USD Call/TRY Put K=6.1387 24 January 2020 (318) (0.00)
(4) Put on 3080 S&P Emini Index 17 January 2020 (1,250) (0.00) (65,120) USD Call/TRY Put K=6.1425 21 January 2020 (251) (0.00) (3) Put on 90.5 Japanese Yen Currency Options 03 January 2020 (19) (0.00) (65,040) USD Call/TRY Put K=6.1501 24 January 2020 (297) (0.00) (3) Put on 90.75 Japanese Yen Currency Options 03 January 2020 (19) (0.00) (328,250) USD Call/USD Put K=0.6565 06 January 2020 (8,945) (0.01)(6) Put on 91 Japanese Yen Currency Options 03 January 2020 (38) (0.00) (66,190) USD Call/USD Put K=0.6619 09 January 2020 (1,275) (0.00) (2) Put on 91 Japanese Yen Currency Options 07 February 2020 (325) (0.00) (597,150) USD Call/USD Put K=0.6635 07 January 2020 (9,965) (0.01)(5) Put on 91.25 Japanese Yen Currency Options 03 January 2020 (31) (0.00) (199,560) USD Call/USD Put K=0.6652 15 January 2020 (3,069) (0.00) (5) Put on 91.5 Japanese Yen Currency Options 03 January 2020 (31) (0.00) (332,900) USD Call/USD Put K=0.6658 16 January 2020 (4,924) (0.00) (5) Put on 91.75 Japanese Yen Currency Options 30 January 2020 (63) (0.00) (66,730) USD Call/USD Put K=0.6673 17 January 2020 (876) (0.00) (6) Put on 92 Japanese Yen Currency Options 03 January 2020 (225) (0.00) (550,000) USD Call/USD Put K=0.6875 06 January 2020 (12,326) (0.01)(1) Put on 92.25 Japanese Yen Currency Options 03 January 2020 (113) (0.00) (1,172,320) USD Call/USD Put K=0.6896 07 January 2020 (22,743) (0.02)(2) Put on 92.5 Japanese Yen Currency Options 03 January 2020 (500) (0.00) (206,940) USD Call/USD Put K=0.6898 07 January 2020 (3,955) (0.01)
(606,796) USD Call/CAD Put K=1.3184 24 January 2020 (331) (0.00) (1,174,190) USD Call/USD Put K=0.6907 06 January 2020 (20,822) (0.02) (606,244) USD Call/CAD Put K=1.3196 24 January 2020 (290) (0.00) (622,080) USD Call/USD Put K=0.6912 08 January 2020 (10,704) (0.01) (151,320) USD Call/CAD Put K=1.3217 16 January 2020 (22) (0.00) (622,350) USD Call/USD Put K=0.6915 09 January 2020 (10,544) (0.01) (1,134,387) USD Call/CAD Put K=1.3223 16 January 2020 (150) (0.00) (1,176,740) USD Call/USD Put K=0.6922 14 January 2020 (19,421) (0.02) (1,133,530) USD Call/CAD Put K=1.3233 15 January 2020 (109) (0.00) (623,160) USD Call/USD Put K=0.6924 09 January 2020 (9,786) (0.01) (1,133,530) USD Call/CAD Put K=1.3233 17 January 2020 (155) (0.00) (1,177,590) USD Call/USD Put K=0.6927 15 January 2020 (18,811) (0.02) (1,133,016) USD Call/CAD Put K=1.3239 13 January 2020 (66) (0.00) (1,177,760) USD Call/USD Put K=0.6928 14 January 2020 (18,520) (0.02) (603,591) USD Call/CAD Put K=1.3254 21 January 2020 (97) (0.00) (1,178,100) USD Call/USD Put K=0.693 15 January 2020 (18,367) (0.02) (1,131,307) USD Call/CAD Put K=1.3259 17 January 2020 (111) (0.00) (623,970) USD Call/USD Put K=0.6933 08 January 2020 (8,923) (0.01) (1,131,222) USD Call/CAD Put K=1.326 15 January 2020 (77) (0.00) (623,970) USD Call/USD Put K=0.6933 10 January 2020 (9,137) (0.01) (1,131,136) USD Call/CAD Put K=1.3261 10 January 2020 (27) (0.00) (624,060) USD Call/USD Put K=0.6934 10 January 2020 (9,056) (0.01) (602,818) USD Call/CAD Put K=1.3271 21 January 2020 (80) (0.00) (1,179,800) USD Call/USD Put K=0.694 16 January 2020 (17,150) (0.02) (1,129,858) USD Call/CAD Put K=1.3276 14 January 2020 (51) (0.00) (1,181,160) USD Call/USD Put K=0.6948 16 January 2020 (16,021) (0.02) (1,129,518) USD Call/CAD Put K=1.328 14 January 2020 (48) (0.00) (1,183,030) USD Call/USD Put K=0.6959 13 January 2020 (13,859) (0.01) (602,138) USD Call/CAD Put K=1.3286 09 January 2020 (7) (0.00) (348,050) USD Call/USD Put K=0.6961 09 January 2020 (3,791) (0.01) (601,866) USD Call/CAD Put K=1.3292 10 January 2020 (9) (0.00) (1,184,050) USD Call/USD Put K=0.6965 17 January 2020 (13,876) (0.01) (601,594) USD Call/CAD Put K=1.3298 09 January 2020 (6) (0.00) (1,184,560) USD Call/USD Put K=0.6968 17 January 2020 (13,485) (0.01) (1,123,932) USD Call/CAD Put K=1.3346 07 January 2020 (1) (0.00) (348,650) USD Call/USD Put K=0.6973 09 January 2020 (3,297) (0.00) (1,122,418) USD Call/CAD Put K=1.3364 06 January 2020 - (0.00) (699,100) USD Call/USD Put K=0.6991 10 January 2020 (5,395) (0.01) (598,131) USD Call/CAD Put K=1.3375 10 January 2020 (3) (0.00) (629,460) USD Call/USD Put K=0.6994 21 January 2020 (5,740) (0.01) (596,970) USD Call/CAD Put K=1.3401 06 January 2020 - (0.00) (769,560) USD Call/USD Put K=0.6996 10 January 2020 (5,546) (0.01) (596,703) USD Call/CAD Put K=1.3407 08 January 2020 - (0.00) (629,820) USD Call/USD Put K=0.6998 21 January 2020 (5,505) (0.01) (596,347) USD Call/CAD Put K=1.3415 06 January 2020 - (0.00) (211,170) USD Call/USD Put K=0.7039 24 January 2020 (1,246) (0.00) (595,770) USD Call/CAD Put K=1.3428 07 January 2020 - (0.00) (892,560) USD Call/USD Put K=1.1157 06 January 2020 (5,942) (0.01) (823,346) USD Call/JPY Put K=109.31 06 January 2020 (484) (0.00) (1,901,790) USD Call/USD Put K=1.1187 06 January 2020 (8,485) (0.01) (822,594) USD Call/JPY Put K=109.41 06 January 2020 (375) (0.00) (1,006,920) USD Call/USD Put K=1.1188 21 January 2020 (7,056) (0.01) (1,096,491) USD Call/JPY Put K=109.44 07 January 2020 (622) (0.00) (1,902,470) USD Call/USD Put K=1.1191 17 January 2020 (12,176) (0.01) (1,549,964) USD Call/JPY Put K=109.68 06 January 2020 (355) (0.00) (1,902,810) USD Call/USD Put K=1.1193 07 January 2020 (8,204) (0.01) (820,345) USD Call/JPY Put K=109.71 06 January 2020 (174) (0.00) (1,007,640) USD Call/USD Put K=1.1196 21 January 2020 (6,598) (0.01) (728,929) USD Call/JPY Put K=109.75 06 January 2020 (140) (0.00) (1,903,490) USD Call/USD Put K=1.1197 07 January 2020 (7,738) (0.01) (819,896) USD Call/JPY Put K=109.77 06 January 2020 (150) (0.00) (1,008,450) USD Call/USD Put K=1.1205 08 January 2020 (3,898) (0.01) (909,422) USD Call/JPY Put K=109.96 17 January 2020 (603) (0.00) (1,009,440) USD Call/USD Put K=1.1216 10 January 2020 (3,882) (0.01) (909,256) USD Call/JPY Put K=109.98 17 January 2020 (584) (0.00) (1,908,080) USD Call/USD Put K=1.1224 16 January 2020 (8,628) (0.01) (909,091) USD Call/JPY Put K=110.0 16 January 2020 (516) (0.00) (1,010,250) USD Call/USD Put K=1.1225 09 January 2020 (3,212) (0.00) (818,033) USD Call/JPY Put K=110.02 21 January 2020 (671) (0.00) (1,908,250) USD Call/USD Put K=1.1225 17 January 2020 (8,806) (0.01) (817,959) USD Call/JPY Put K=110.03 21 January 2020 (661) (0.00) (1,010,520) USD Call/USD Put K=1.1228 09 January 2020 (3,078) (0.00) (454,050) USD Call/JPY Put K=110.12 15 January 2020 (198) (0.00) (1,010,610) USD Call/USD Put K=1.1229 08 January 2020 (2,724) (0.00) (453,926) USD Call/JPY Put K=110.15 16 January 2020 (201) (0.00) (1,909,100) USD Call/USD Put K=1.123 15 January 2020 (7,594) (0.01) (816,845) USD Call/JPY Put K=110.18 24 January 2020 (623) (0.00) (1,011,150) USD Call/USD Put K=1.1235 10 January 2020 (3,020) (0.00) (816,771) USD Call/JPY Put K=110.19 14 January 2020 (285) (0.00) (1,910,630) USD Call/USD Put K=1.1239 16 January 2020 (7,371) (0.01) (363,009) USD Call/JPY Put K=110.19 15 January 2020 (141) (0.00) (1,012,140) USD Call/USD Put K=1.1246 24 January 2020 (4,703) (0.01) (816,697) USD Call/JPY Put K=110.2 24 January 2020 (606) (0.00) (562,500) USD Call/USD Put K=1.125 09 January 2020 (1,236) (0.00) (181,389) USD Call/JPY Put K=110.26 14 January 2020 (56) (0.00) (1,912,840) USD Call/USD Put K=1.1252 13 January 2020 (5,236) (0.01) (90,678) USD Call/JPY Put K=110.28 14 January 2020 (27) (0.00) (1,913,520) USD Call/USD Put K=1.1256 15 January 2020 (5,669) (0.01) (633,943) USD Call/JPY Put K=110.42 06 January 2020 (27) (0.00) (1,914,540) USD Call/USD Put K=1.1262 14 January 2020 (4,974) (0.00) (543,232) USD Call/JPY Put K=110.45 10 January 2020 (68) (0.00) (338,040) USD Call/USD Put K=1.1268 09 January 2020 (562) (0.00) (723,916) USD Call/JPY Put K=110.51 06 January 2020 (25) (0.00) (1,014,210) USD Call/USD Put K=1.1269 24 January 2020 (3,823) (0.01) (25,495) USD Call/MXN Put K=19.6117 07 January 2020 - (0.00) (1,691,550) USD Call/USD Put K=1.1277 14 January 2020 (3,650) (0.00) (352,590) USD Call/MXN Put K=19.8531 09 January 2020 (6) (0.00) (790,020) USD Call/USD Put K=1.1286 10 January 2020 (1,132) (0.00) (427,974) USD Call/MXN Put K=19.861 09 January 2020 (7) (0.00) (790,930) USD Call/USD Put K=1.1299 10 January 2020 (932) (0.00) (424,915) USD Call/MXN Put K=20.004 08 January 2020 (1) (0.00) (131,970) USD Call/USD Put K=1.3197 21 January 2020 (1,293) (0.00) (424,406) USD Call/MXN Put K=20.028 06 January 2020 - (0.00) (198,195) USD Call/USD Put K=1.3213 17 January 2020 (1,697) (0.00) (424,150) USD Call/MXN Put K=20.0401 06 January 2020 - (0.00) (596,205) USD Call/USD Put K=1.3249 24 January 2020 (4,854) (0.00) (151,740) USD Call/TRY Put K=5.9312 08 January 2020 (1,347) (0.00) (132,760) USD Call/USD Put K=1.3276 15 January 2020 (751) (0.00) (134,800) USD Call/TRY Put K=5.9347 10 January 2020 (1,366) (0.00) (597,780) USD Call/USD Put K=1.3284 24 January 2020 (4,092) (0.01) (67,360) USD Call/TRY Put K=5.9382 06 January 2020 (462) (0.00) (66,450) USD Call/USD Put K=1.329 16 January 2020 (360) (0.00) (151,561) USD Call/TRY Put K=5.9382 09 January 2020 (1,347) (0.00) (34,250) USD Call/ZAR Put K=14.5985 21 January 2020 (59) (0.00) (67,320) USD Call/TRY Put K=5.9418 09 January 2020 (577) (0.00) (34,200) USD Call/ZAR Put K=14.6199 21 January 2020 (55) (0.00) (67,320) USD Call/TRY Put K=5.9418 10 January 2020 (638) (0.00) (34,000) USD Call/ZAR Put K=14.7059 16 January 2020 (23) (0.00) (67,280) USD Call/TRY Put K=5.9453 10 January 2020 (616) (0.00) (67,800) USD Call/ZAR Put K=14.7493 15 January 2020 (29) (0.00) (67,240) USD Call/TRY Put K=5.9488 09 January 2020 (536) (0.00) (236,951) USD Call/ZAR Put K=14.771 10 January 2020 (27) (0.00) (151,111) USD Call/TRY Put K=5.9559 09 January 2020 (1,119) (0.00) (135,200) USD Call/ZAR Put K=14.7929 14 January 2020 (37) (0.00) (134,239) USD Call/TRY Put K=5.9595 10 January 2020 (1,073) (0.00) (168,750) USD Call/ZAR Put K=14.8148 14 January 2020 (41) (0.00) (150,931) USD Call/TRY Put K=5.963 06 January 2020 (735) (0.00) (269,600) USD Call/ZAR Put K=14.8368 13 January 2020 (44) (0.00) (150,840) USD Call/TRY Put K=5.9666 07 January 2020 (791) (0.00) (200,100) USD Call/ZAR Put K=14.9925 06 January 2020 - (0.00) (150,751) USD Call/TRY Put K=5.9701 07 January 2020 (756) (0.00) (133,400) USD Call/ZAR Put K=14.9925 08 January 2020 (1) (0.00) (149,850) USD Call/TRY Put K=6.006 13 January 2020 (906) (0.00) (132,800) USD Call/ZAR Put K=15.0602 09 January 2020 (1) (0.00) (149,489) USD Call/TRY Put K=6.0205 14 January 2020 (868) (0.00) (132,800) USD Call/ZAR Put K=15.0602 10 January 2020 (3) (0.00) (82,750) USD Call/TRY Put K=6.0423 14 January 2020 (402) (0.00) (132,600) USD Call/ZAR Put K=15.083 06 January 2020 - (0.00) (32,980) USD Call/TRY Put K=6.0643 15 January 2020 (147) (0.00) (132,600) USD Call/ZAR Put K=15.083 09 January 2020 (1) (0.00) (49,350) USD Call/TRY Put K=6.079 15 January 2020 (196) (0.00) (132,600) USD Call/ZAR Put K=15.083 10 January 2020 (2) (0.00) (147,331) USD Call/TRY Put K=6.1087 17 January 2020 (581) (0.00) (132,400) USD Call/ZAR Put K=15.1057 06 January 2020 - (0.00) (48,960) USD Call/TRY Put K=6.1275 16 January 2020 (149) (0.00) (430,301) USD Call/ZAR Put K=15.1057 07 January 2020 (1) (0.00)
260
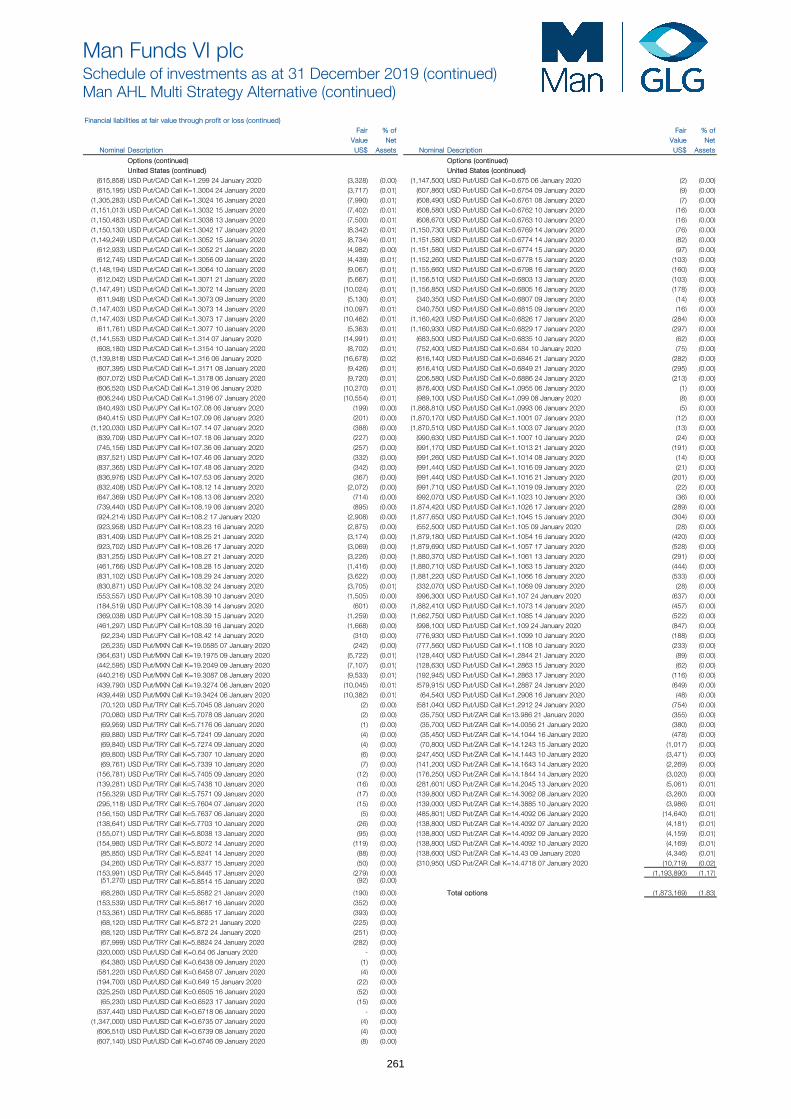
Man Funds VI plcSchedule of investments as at 31 December 2019 (continued) Man AHL Multi Strategy Alternative (continued)
Financial liabilities at fair value through profit or loss (continued) Fair % of Fair % of
Value Net Value Net Nominal Description US$ Assets Nominal Description US$ Assets
Options (continued) Options (continued)United States (continued) United States (continued)
(615,858) USD Put/CAD Call K=1.299 24 January 2020 (3,328) (0.00) (1,147,500) USD Put/USD Call K=0.675 06 January 2020 (2) (0.00) (615,195) USD Put/CAD Call K=1.3004 24 January 2020 (3,717) (0.01) (607,860) USD Put/USD Call K=0.6754 09 January 2020 (9) (0.00) (1,305,283) USD Put/CAD Call K=1.3024 16 January 2020 (7,990) (0.01) (608,490) USD Put/USD Call K=0.6761 08 January 2020 (7) (0.00) (1,151,013) USD Put/CAD Call K=1.3032 15 January 2020 (7,402) (0.01) (608,580) USD Put/USD Call K=0.6762 10 January 2020 (16) (0.00) (1,150,483) USD Put/CAD Call K=1.3038 13 January 2020 (7,500) (0.01) (608,670) USD Put/USD Call K=0.6763 10 January 2020 (16) (0.00) (1,150,130) USD Put/CAD Call K=1.3042 17 January 2020 (8,342) (0.01) (1,150,730) USD Put/USD Call K=0.6769 14 January 2020 (76) (0.00) (1,149,249) USD Put/CAD Call K=1.3052 15 January 2020 (8,734) (0.01) (1,151,580) USD Put/USD Call K=0.6774 14 January 2020 (82) (0.00) (612,933) USD Put/CAD Call K=1.3052 21 January 2020 (4,982) (0.00) (1,151,580) USD Put/USD Call K=0.6774 15 January 2020 (97) (0.00) (612,745) USD Put/CAD Call K=1.3056 09 January 2020 (4,439) (0.01) (1,152,260) USD Put/USD Call K=0.6778 15 January 2020 (103) (0.00) (1,148,194) USD Put/CAD Call K=1.3064 10 January 2020 (9,067) (0.01) (1,155,660) USD Put/USD Call K=0.6798 16 January 2020 (160) (0.00) (612,042) USD Put/CAD Call K=1.3071 21 January 2020 (5,667) (0.01) (1,156,510) USD Put/USD Call K=0.6803 13 January 2020 (103) (0.00) (1,147,491) USD Put/CAD Call K=1.3072 14 January 2020 (10,024) (0.01) (1,156,850) USD Put/USD Call K=0.6805 16 January 2020 (178) (0.00) (611,948) USD Put/CAD Call K=1.3073 09 January 2020 (5,130) (0.01) (340,350) USD Put/USD Call K=0.6807 09 January 2020 (14) (0.00) (1,147,403) USD Put/CAD Call K=1.3073 14 January 2020 (10,097) (0.01) (340,750) USD Put/USD Call K=0.6815 09 January 2020 (16) (0.00) (1,147,403) USD Put/CAD Call K=1.3073 17 January 2020 (10,462) (0.01) (1,160,420) USD Put/USD Call K=0.6826 17 January 2020 (284) (0.00) (611,761) USD Put/CAD Call K=1.3077 10 January 2020 (5,363) (0.01) (1,160,930) USD Put/USD Call K=0.6829 17 January 2020 (297) (0.00) (1,141,553) USD Put/CAD Call K=1.314 07 January 2020 (14,991) (0.01) (683,500) USD Put/USD Call K=0.6835 10 January 2020 (62) (0.00) (608,180) USD Put/CAD Call K=1.3154 10 January 2020 (8,702) (0.01) (752,400) USD Put/USD Call K=0.684 10 January 2020 (75) (0.00) (1,139,818) USD Put/CAD Call K=1.316 06 January 2020 (16,678) (0.02) (616,140) USD Put/USD Call K=0.6846 21 January 2020 (282) (0.00) (607,395) USD Put/CAD Call K=1.3171 08 January 2020 (9,426) (0.01) (616,410) USD Put/USD Call K=0.6849 21 January 2020 (295) (0.00) (607,072) USD Put/CAD Call K=1.3178 06 January 2020 (9,720) (0.01) (206,580) USD Put/USD Call K=0.6886 24 January 2020 (213) (0.00) (606,520) USD Put/CAD Call K=1.319 06 January 2020 (10,270) (0.01) (876,400) USD Put/USD Call K=1.0955 06 January 2020 (1) (0.00) (606,244) USD Put/CAD Call K=1.3196 07 January 2020 (10,554) (0.01) (989,100) USD Put/USD Call K=1.099 08 January 2020 (8) (0.00) (840,493) USD Put/JPY Call K=107.08 06 January 2020 (199) (0.00) (1,868,810) USD Put/USD Call K=1.0993 06 January 2020 (5) (0.00) (840,415) USD Put/JPY Call K=107.09 06 January 2020 (201) (0.00) (1,870,170) USD Put/USD Call K=1.1001 07 January 2020 (12) (0.00) (1,120,030) USD Put/JPY Call K=107.14 07 January 2020 (388) (0.00) (1,870,510) USD Put/USD Call K=1.1003 07 January 2020 (13) (0.00) (839,709) USD Put/JPY Call K=107.18 06 January 2020 (227) (0.00) (990,630) USD Put/USD Call K=1.1007 10 January 2020 (24) (0.00) (745,156) USD Put/JPY Call K=107.36 06 January 2020 (257) (0.00) (991,170) USD Put/USD Call K=1.1013 21 January 2020 (191) (0.00) (837,521) USD Put/JPY Call K=107.46 06 January 2020 (332) (0.00) (991,260) USD Put/USD Call K=1.1014 08 January 2020 (14) (0.00) (837,365) USD Put/JPY Call K=107.48 06 January 2020 (342) (0.00) (991,440) USD Put/USD Call K=1.1016 09 January 2020 (21) (0.00) (836,976) USD Put/JPY Call K=107.53 06 January 2020 (367) (0.00) (991,440) USD Put/USD Call K=1.1016 21 January 2020 (201) (0.00) (832,408) USD Put/JPY Call K=108.12 14 January 2020 (2,072) (0.00) (991,710) USD Put/USD Call K=1.1019 09 January 2020 (22) (0.00) (647,369) USD Put/JPY Call K=108.13 06 January 2020 (714) (0.00) (992,070) USD Put/USD Call K=1.1023 10 January 2020 (36) (0.00) (739,440) USD Put/JPY Call K=108.19 06 January 2020 (895) (0.00) (1,874,420) USD Put/USD Call K=1.1026 17 January 2020 (289) (0.00) (924,214) USD Put/JPY Call K=108.2 17 January 2020 (2,908) (0.00) (1,877,650) USD Put/USD Call K=1.1045 15 January 2020 (304) (0.00) (923,958) USD Put/JPY Call K=108.23 16 January 2020 (2,875) (0.00) (552,500) USD Put/USD Call K=1.105 09 January 2020 (28) (0.00) (831,409) USD Put/JPY Call K=108.25 21 January 2020 (3,174) (0.00) (1,879,180) USD Put/USD Call K=1.1054 16 January 2020 (420) (0.00) (923,702) USD Put/JPY Call K=108.26 17 January 2020 (3,069) (0.00) (1,879,690) USD Put/USD Call K=1.1057 17 January 2020 (528) (0.00) (831,255) USD Put/JPY Call K=108.27 21 January 2020 (3,226) (0.00) (1,880,370) USD Put/USD Call K=1.1061 13 January 2020 (291) (0.00) (461,766) USD Put/JPY Call K=108.28 15 January 2020 (1,416) (0.00) (1,880,710) USD Put/USD Call K=1.1063 15 January 2020 (444) (0.00) (831,102) USD Put/JPY Call K=108.29 24 January 2020 (3,622) (0.00) (1,881,220) USD Put/USD Call K=1.1066 16 January 2020 (533) (0.00) (830,871) USD Put/JPY Call K=108.32 24 January 2020 (3,705) (0.01) (332,070) USD Put/USD Call K=1.1069 09 January 2020 (28) (0.00) (553,557) USD Put/JPY Call K=108.39 10 January 2020 (1,505) (0.00) (996,300) USD Put/USD Call K=1.107 24 January 2020 (637) (0.00) (184,519) USD Put/JPY Call K=108.39 14 January 2020 (601) (0.00) (1,882,410) USD Put/USD Call K=1.1073 14 January 2020 (457) (0.00) (369,038) USD Put/JPY Call K=108.39 15 January 2020 (1,259) (0.00) (1,662,750) USD Put/USD Call K=1.1085 14 January 2020 (522) (0.00) (461,297) USD Put/JPY Call K=108.39 16 January 2020 (1,668) (0.00) (998,100) USD Put/USD Call K=1.109 24 January 2020 (847) (0.00) (92,234) USD Put/JPY Call K=108.42 14 January 2020 (310) (0.00) (776,930) USD Put/USD Call K=1.1099 10 January 2020 (188) (0.00) (26,235) USD Put/MXN Call K=19.0585 07 January 2020 (242) (0.00) (777,560) USD Put/USD Call K=1.1108 10 January 2020 (233) (0.00) (364,631) USD Put/MXN Call K=19.1975 09 January 2020 (5,722) (0.01) (128,440) USD Put/USD Call K=1.2844 21 January 2020 (89) (0.00) (442,595) USD Put/MXN Call K=19.2049 09 January 2020 (7,107) (0.01) (128,630) USD Put/USD Call K=1.2863 15 January 2020 (62) (0.00) (440,216) USD Put/MXN Call K=19.3087 08 January 2020 (9,533) (0.01) (192,945) USD Put/USD Call K=1.2863 17 January 2020 (116) (0.00) (439,790) USD Put/MXN Call K=19.3274 06 January 2020 (10,045) (0.01) (579,915) USD Put/USD Call K=1.2887 24 January 2020 (649) (0.00) (439,449) USD Put/MXN Call K=19.3424 06 January 2020 (10,382) (0.01) (64,540) USD Put/USD Call K=1.2908 16 January 2020 (48) (0.00) (70,120) USD Put/TRY Call K=5.7045 08 January 2020 (2) (0.00) (581,040) USD Put/USD Call K=1.2912 24 January 2020 (754) (0.00) (70,080) USD Put/TRY Call K=5.7078 08 January 2020 (2) (0.00) (35,750) USD Put/ZAR Call K=13.986 21 January 2020 (355) (0.00) (69,959) USD Put/TRY Call K=5.7176 06 January 2020 (1) (0.00) (35,700) USD Put/ZAR Call K=14.0056 21 January 2020 (380) (0.00) (69,880) USD Put/TRY Call K=5.7241 09 January 2020 (4) (0.00) (35,450) USD Put/ZAR Call K=14.1044 16 January 2020 (478) (0.00) (69,840) USD Put/TRY Call K=5.7274 09 January 2020 (4) (0.00) (70,800) USD Put/ZAR Call K=14.1243 15 January 2020 (1,017) (0.00) (69,800) USD Put/TRY Call K=5.7307 10 January 2020 (6) (0.00) (247,450) USD Put/ZAR Call K=14.1443 10 January 2020 (3,471) (0.00) (69,761) USD Put/TRY Call K=5.7339 10 January 2020 (7) (0.00) (141,200) USD Put/ZAR Call K=14.1643 14 January 2020 (2,269) (0.00) (156,781) USD Put/TRY Call K=5.7405 09 January 2020 (12) (0.00) (176,250) USD Put/ZAR Call K=14.1844 14 January 2020 (3,020) (0.00) (139,281) USD Put/TRY Call K=5.7438 10 January 2020 (16) (0.00) (281,601) USD Put/ZAR Call K=14.2045 13 January 2020 (5,061) (0.01) (156,329) USD Put/TRY Call K=5.7571 09 January 2020 (17) (0.00) (139,800) USD Put/ZAR Call K=14.3062 08 January 2020 (3,260) (0.00) (295,118) USD Put/TRY Call K=5.7604 07 January 2020 (15) (0.00) (139,000) USD Put/ZAR Call K=14.3885 10 January 2020 (3,986) (0.01) (156,150) USD Put/TRY Call K=5.7637 06 January 2020 (5) (0.00) (485,801) USD Put/ZAR Call K=14.4092 06 January 2020 (14,640) (0.01) (138,641) USD Put/TRY Call K=5.7703 10 January 2020 (26) (0.00) (138,800) USD Put/ZAR Call K=14.4092 07 January 2020 (4,181) (0.01) (155,071) USD Put/TRY Call K=5.8038 13 January 2020 (95) (0.00) (138,800) USD Put/ZAR Call K=14.4092 09 January 2020 (4,159) (0.01) (154,980) USD Put/TRY Call K=5.8072 14 January 2020 (119) (0.00) (138,800) USD Put/ZAR Call K=14.4092 10 January 2020 (4,169) (0.01) (85,850) USD Put/TRY Call K=5.8241 14 January 2020 (88) (0.00) (138,600) USD Put/ZAR Call K=14.43 09 January 2020 (4,346) (0.01) (34,260) USD Put/TRY Call K=5.8377 15 January 2020 (50) (0.00) (310,950) USD Put/ZAR Call K=14.4718 07 January 2020 (10,719) (0.02) (153,991) USD Put/TRY Call K=5.8445 17 January 2020 (279) (0.00) (1,193,890) (1.17) (51,270) USD Put/TRY Call K=5.8514 15 January 2020 (92) (0.00)
(68,280) USD Put/TRY Call K=5.8582 21 January 2020 (190) (0.00) Total options (1,873,169) (1.83) (153,539) USD Put/TRY Call K=5.8617 16 January 2020 (352) (0.00) (153,361) USD Put/TRY Call K=5.8685 17 January 2020 (393) (0.00) (68,120) USD Put/TRY Call K=5.872 21 January 2020 (225) (0.00) (68,120) USD Put/TRY Call K=5.872 24 January 2020 (251) (0.00) (67,999) USD Put/TRY Call K=5.8824 24 January 2020 (282) (0.00) (320,000) USD Put/USD Call K=0.64 06 January 2020 - (0.00) (64,380) USD Put/USD Call K=0.6438 09 January 2020 (1) (0.00) (581,220) USD Put/USD Call K=0.6458 07 January 2020 (4) (0.00) (194,700) USD Put/USD Call K=0.649 15 January 2020 (22) (0.00) (325,250) USD Put/USD Call K=0.6505 16 January 2020 (52) (0.00) (65,230) USD Put/USD Call K=0.6523 17 January 2020 (15) (0.00) (537,440) USD Put/USD Call K=0.6718 06 January 2020 - (0.00) (1,347,000) USD Put/USD Call K=0.6735 07 January 2020 (4) (0.00) (606,510) USD Put/USD Call K=0.6739 08 January 2020 (4) (0.00) (607,140) USD Put/USD Call K=0.6746 09 January 2020 (8) (0.00)
261
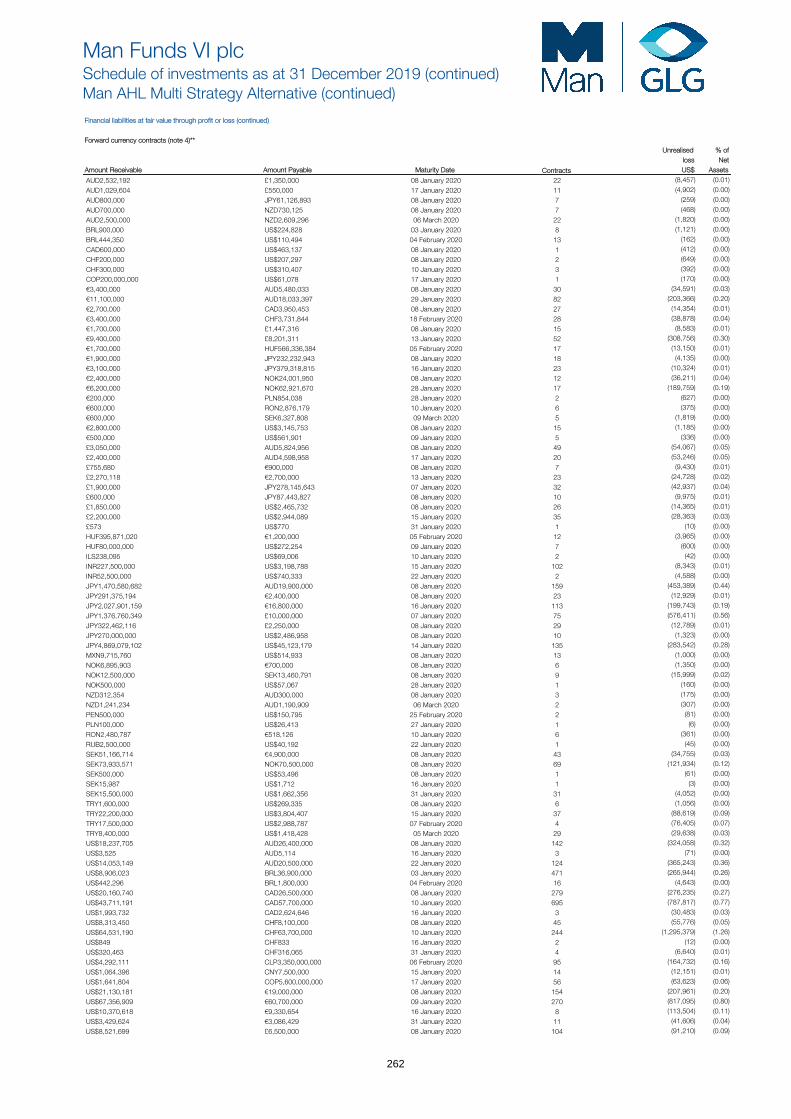
Man Funds VI plcSchedule of investments as at 31 December 2019 (continued)Man AHL Multi Strategy Alternative (continued)
Financial liabilities at fair value through profit or loss (continued)
Forward currency contracts (note 4)** Unrealised % of
loss Net Amount Receivable Amount Payable Maturity Date Contracts US$ Assets
AUD2,532,192 £1,350,000 08 January 2020 22 (8,457) (0.01)
AUD1,029,604 £550,000 17 January 2020 11 (4,902) (0.00)
AUD800,000 JPY61,126,893 08 January 2020 7 (259) (0.00)
AUD700,000 NZD730,125 08 January 2020 7 (468) (0.00)
AUD2,500,000 NZD2,609,296 06 March 2020 22 (1,820) (0.00)
BRL900,000 US$224,828 03 January 2020 8 (1,121) (0.00)
BRL444,350 US$110,494 04 February 2020 13 (162) (0.00)
CAD600,000 US$463,137 08 January 2020 1 (412) (0.00)
CHF200,000 US$207,297 08 January 2020 2 (649) (0.00)
CHF300,000 US$310,407 10 January 2020 3 (392) (0.00)
COP200,000,000 US$61,078 17 January 2020 1 (170) (0.00)
€3,400,000 AUD5,480,033 08 January 2020 30 (34,591) (0.03)
€11,100,000 AUD18,033,397 29 January 2020 82 (203,366) (0.20)
€2,700,000 CAD3,950,453 08 January 2020 27 (14,354) (0.01)
€3,400,000 CHF3,731,844 18 February 2020 28 (38,878) (0.04)
€1,700,000 £1,447,316 08 January 2020 15 (8,583) (0.01)
€9,400,000 £8,201,311 13 January 2020 52 (308,756) (0.30)
€1,700,000 HUF566,336,384 05 February 2020 17 (13,150) (0.01)
€1,900,000 JPY232,232,943 08 January 2020 18 (4,135) (0.00)
€3,100,000 JPY379,318,815 16 January 2020 23 (10,324) (0.01)
€2,400,000 NOK24,001,950 08 January 2020 12 (36,211) (0.04)
€6,200,000 NOK62,921,670 28 January 2020 17 (189,759) (0.19)
€200,000 PLN854,038 28 January 2020 2 (627) (0.00)
€600,000 RON2,876,179 10 January 2020 6 (375) (0.00)
€600,000 SEK6,327,808 09 March 2020 5 (1,819) (0.00)
€2,800,000 US$3,145,753 08 January 2020 15 (1,185) (0.00)
€500,000 US$561,901 09 January 2020 5 (336) (0.00)
£3,050,000 AUD5,824,956 08 January 2020 49 (54,067) (0.05)
£2,400,000 AUD4,598,958 17 January 2020 20 (53,246) (0.05)
£755,680 €900,000 08 January 2020 7 (9,430) (0.01)
£2,270,118 €2,700,000 13 January 2020 23 (24,728) (0.02)
£1,900,000 JPY278,145,643 07 January 2020 32 (42,937) (0.04)
£600,000 JPY87,443,827 08 January 2020 10 (9,975) (0.01)
£1,850,000 US$2,465,732 08 January 2020 26 (14,365) (0.01)
£2,200,000 US$2,944,089 15 January 2020 35 (28,363) (0.03)
£573 US$770 31 January 2020 1 (10) (0.00)
HUF395,871,020 €1,200,000 05 February 2020 12 (3,965) (0.00)
HUF80,000,000 US$272,254 09 January 2020 7 (600) (0.00)
ILS238,095 US$69,006 10 January 2020 2 (42) (0.00)
INR227,500,000 US$3,198,788 15 January 2020 102 (8,343) (0.01)
INR52,500,000 US$740,333 22 January 2020 2 (4,588) (0.00)
JPY1,470,580,682 AUD19,900,000 08 January 2020 159 (453,389) (0.44)
JPY291,375,194 €2,400,000 08 January 2020 23 (12,929) (0.01)
JPY2,027,901,159 €16,800,000 16 January 2020 113 (199,743) (0.19)
JPY1,376,760,349 £10,000,000 07 January 2020 75 (576,411) (0.56)
JPY322,462,116 £2,250,000 08 January 2020 29 (12,789) (0.01)
JPY270,000,000 US$2,486,958 08 January 2020 10 (1,323) (0.00)
JPY4,869,079,102 US$45,123,179 14 January 2020 135 (283,542) (0.28)
MXN9,715,760 US$514,933 08 January 2020 13 (1,000) (0.00)
NOK6,895,903 €700,000 08 January 2020 6 (1,350) (0.00)
NOK12,500,000 SEK13,460,791 08 January 2020 9 (15,999) (0.02)
NOK500,000 US$57,067 28 January 2020 1 (160) (0.00)
NZD312,354 AUD300,000 08 January 2020 3 (175) (0.00)
NZD1,241,234 AUD1,190,909 06 March 2020 2 (307) (0.00)
PEN500,000 US$150,795 25 February 2020 2 (81) (0.00)
PLN100,000 US$26,413 27 January 2020 1 (6) (0.00)
RON2,480,787 €518,126 10 January 2020 6 (361) (0.00)
RUB2,500,000 US$40,192 22 January 2020 1 (45) (0.00)
SEK51,166,714 €4,900,000 08 January 2020 43 (34,755) (0.03)
SEK73,933,571 NOK70,500,000 08 January 2020 69 (121,934) (0.12)
SEK500,000 US$53,496 08 January 2020 1 (61) (0.00)
SEK15,987 US$1,712 16 January 2020 1 (3) (0.00)
SEK15,500,000 US$1,662,356 31 January 2020 31 (4,052) (0.00)
TRY1,600,000 US$269,335 08 January 2020 6 (1,056) (0.00)
TRY22,200,000 US$3,804,407 15 January 2020 37 (88,619) (0.09)
TRY17,500,000 US$2,988,787 07 February 2020 4 (76,405) (0.07)
TRY8,400,000 US$1,418,428 05 March 2020 29 (29,638) (0.03)
US$18,237,705 AUD26,400,000 08 January 2020 142 (324,058) (0.32)
US$3,525 AUD5,114 16 January 2020 3 (71) (0.00)
US$14,053,149 AUD20,500,000 22 January 2020 124 (365,243) (0.36)
US$8,906,023 BRL36,900,000 03 January 2020 471 (265,944) (0.26)
US$442,296 BRL1,800,000 04 February 2020 16 (4,643) (0.00)
US$20,160,740 CAD26,500,000 08 January 2020 279 (276,235) (0.27)
US$43,711,191 CAD57,700,000 10 January 2020 695 (787,817) (0.77)
US$1,993,732 CAD2,624,646 16 January 2020 3 (30,483) (0.03)
US$8,313,450 CHF8,100,000 08 January 2020 45 (55,776) (0.05)
US$64,531,190 CHF63,700,000 10 January 2020 244 (1,295,379) (1.26)
US$849 CHF833 16 January 2020 2 (12) (0.00)
US$320,463 CHF316,065 31 January 2020 4 (6,640) (0.01)
US$4,292,111 CLP3,350,000,000 06 February 2020 95 (164,732) (0.16)
US$1,064,396 CNY7,500,000 15 January 2020 14 (12,151) (0.01)
US$1,641,804 COP5,600,000,000 17 January 2020 56 (63,623) (0.06)
US$21,130,181 €19,000,000 08 January 2020 154 (207,961) (0.20)
US$67,356,909 €60,700,000 09 January 2020 270 (817,095) (0.80)
US$10,370,618 €9,330,654 16 January 2020 8 (113,504) (0.11)
US$3,429,624 €3,086,429 31 January 2020 11 (41,606) (0.04)
US$8,521,699 £6,500,000 08 January 2020 104 (91,210) (0.09)
262
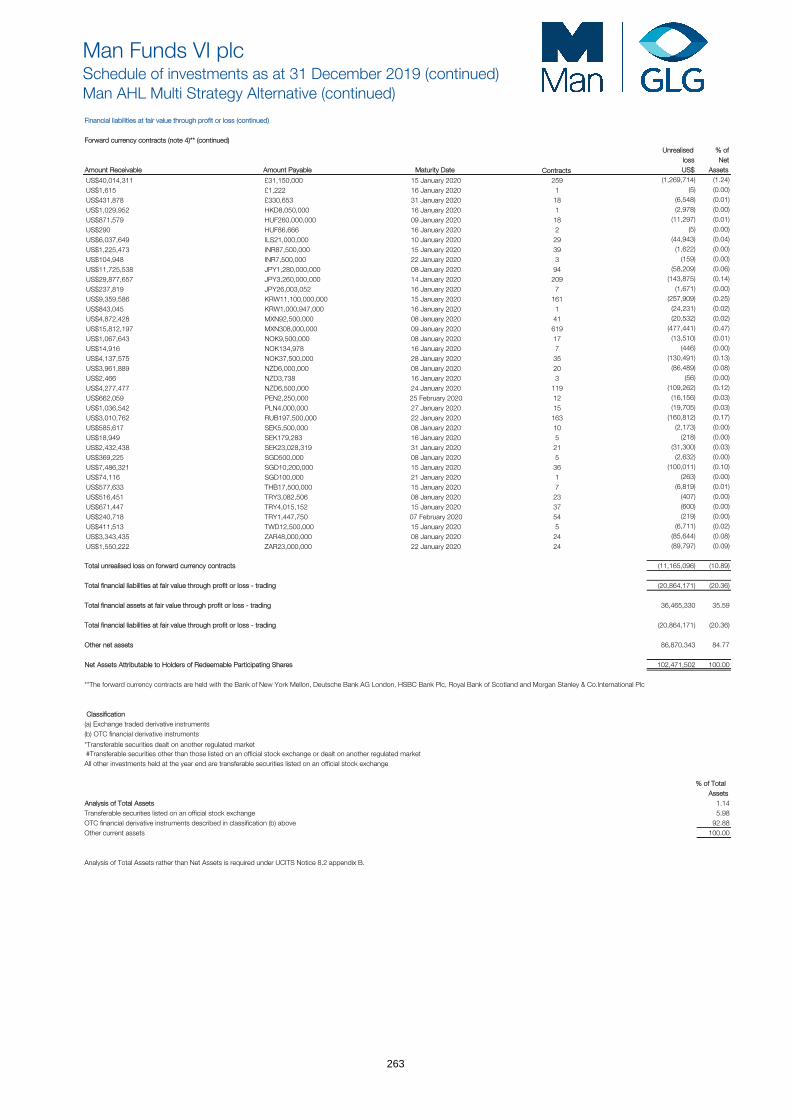
Man Funds VI plcSchedule of investments as at 31 December 2019 (continued)Man AHL Multi Strategy Alternative (continued)
Financial liabilities at fair value through profit or loss (continued)
Forward currency contracts (note 4)** (continued) Unrealised % of
loss Net Amount Receivable Amount Payable Maturity Date Contracts US$ Assets
US$40,014,311 £31,150,000 15 January 2020 259 (1,269,714) (1.24)
US$1,615 £1,222 16 January 2020 1 (5) (0.00)
US$431,878 £330,653 31 January 2020 18 (6,548) (0.01)
US$1,029,952 HKD8,050,000 16 January 2020 1 (2,978) (0.00)
US$871,579 HUF260,000,000 09 January 2020 18 (11,297) (0.01)
US$290 HUF86,666 16 January 2020 2 (5) (0.00)
US$6,037,649 ILS21,000,000 10 January 2020 29 (44,943) (0.04)
US$1,225,473 INR87,500,000 15 January 2020 39 (1,622) (0.00)
US$104,948 INR7,500,000 22 January 2020 3 (159) (0.00)
US$11,725,538 JPY1,280,000,000 08 January 2020 94 (58,209) (0.06)
US$29,877,657 JPY3,260,000,000 14 January 2020 209 (143,875) (0.14)
US$237,819 JPY26,003,052 16 January 2020 7 (1,671) (0.00)
US$9,359,586 KRW11,100,000,000 15 January 2020 161 (257,909) (0.25)
US$843,045 KRW1,000,947,000 16 January 2020 1 (24,231) (0.02)
US$4,872,428 MXN92,500,000 08 January 2020 41 (20,532) (0.02)
US$15,812,197 MXN308,000,000 09 January 2020 619 (477,441) (0.47)
US$1,067,643 NOK9,500,000 08 January 2020 17 (13,510) (0.01)
US$14,916 NOK134,978 16 January 2020 7 (446) (0.00)
US$4,137,575 NOK37,500,000 28 January 2020 35 (130,491) (0.13)
US$3,961,889 NZD6,000,000 08 January 2020 20 (86,489) (0.08)
US$2,466 NZD3,738 16 January 2020 3 (56) (0.00)
US$4,277,477 NZD6,500,000 24 January 2020 119 (109,262) (0.12)
US$662,059 PEN2,250,000 25 February 2020 12 (16,156) (0.03)
US$1,036,542 PLN4,000,000 27 January 2020 15 (19,705) (0.03)
US$3,010,762 RUB197,500,000 22 January 2020 163 (160,812) (0.17)
US$585,617 SEK5,500,000 08 January 2020 10 (2,173) (0.00)
US$18,949 SEK179,283 16 January 2020 5 (218) (0.00)
US$2,432,438 SEK23,028,319 31 January 2020 21 (31,300) (0.03)
US$369,225 SGD500,000 08 January 2020 5 (2,632) (0.00)
US$7,486,321 SGD10,200,000 15 January 2020 36 (100,011) (0.10)
US$74,116 SGD100,000 21 January 2020 1 (263) (0.00)
US$577,633 THB17,500,000 15 January 2020 7 (6,819) (0.01)
US$516,451 TRY3,082,506 08 January 2020 23 (407) (0.00)
US$671,447 TRY4,015,152 15 January 2020 37 (600) (0.00)
US$240,718 TRY1,447,750 07 February 2020 54 (219) (0.00)
US$411,513 TWD12,500,000 15 January 2020 5 (6,711) (0.02)
US$3,343,435 ZAR48,000,000 08 January 2020 24 (85,644) (0.08)
US$1,550,222 ZAR23,000,000 22 January 2020 24 (89,797) (0.09)
Total unrealised loss on forward currency contracts (11,165,096) (10.89)
Total financial liabilities at fair value through profit or loss - trading (20,864,171) (20.36)
Total financial assets at fair value through profit or loss - trading 36,465,330 35.59
Total financial liabilities at fair value through profit or loss - trading (20,864,171) (20.36)
Other net assets 86,870,343 84.77
Net Assets Attributable to Holders of Redeemable Participating Shares 102,471,502 100.00
**The forward currency contracts are held with the Bank of New York Mellon, Deutsche Bank AG London, HSBC Bank Plc, Royal Bank of Scotland and Morgan Stanley & Co.International Plc
Classification(a) Exchange traded derivative instruments(b) OTC financial derivative instruments
*Transferable securities dealt on another regulated market#Transferable securities other than those listed on an official stock exchange or dealt on another regulated marketAll other investments held at the year end are transferable securities listed on an official stock exchange
% of Total Assets
Analysis of Total Assets 1.14Transferable securities listed on an official stock exchange 5.98OTC financial derivative instruments described in classification (b) above 92.88Other current assets 100.00
Analysis of Total Assets rather than Net Assets is required under UCITS Notice 8.2 appendix B.
263
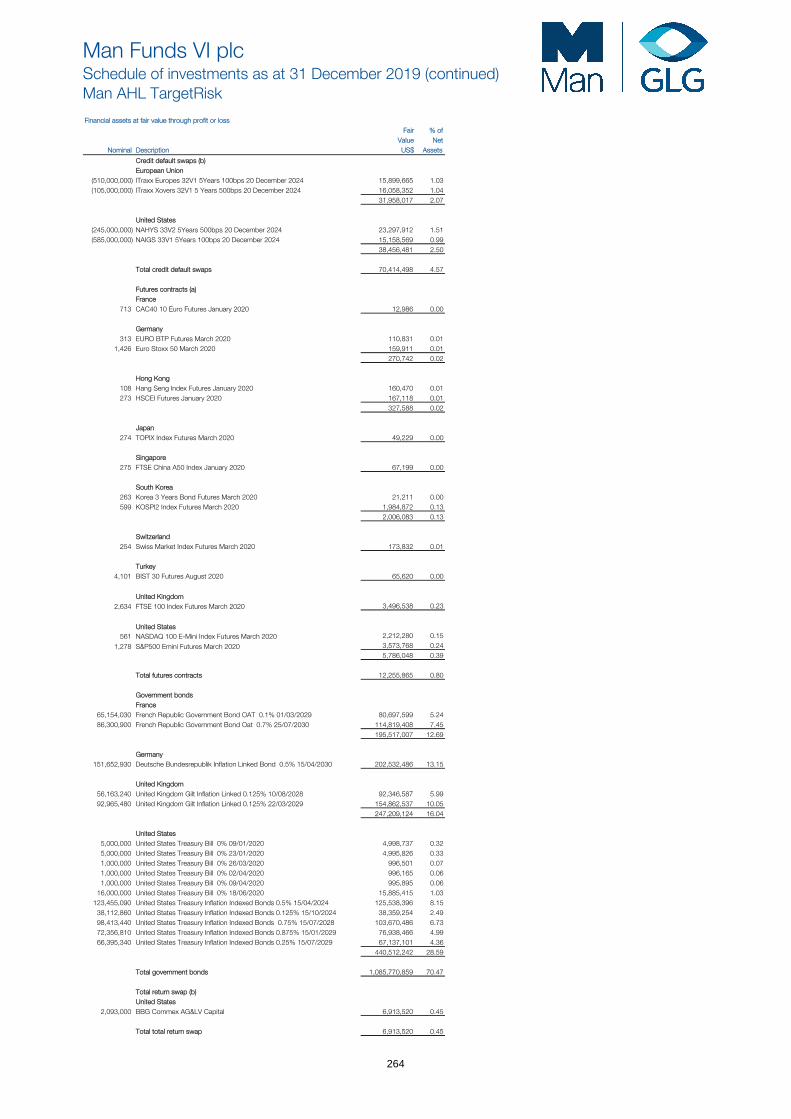
Man Funds VI plcSchedule of investments as at 31 December 2019 (continued)Man AHL TargetRisk
Financial assets at fair value through profit or loss Fair % of
Value Net Nominal Description US$ Assets
Credit default swaps (b)European Union
(510,000,000) ITraxx Europes 32V1 5Years 100bps 20 December 2024 15,899,665 1.03(105,000,000) ITraxx Xovers 32V1 5 Years 500bps 20 December 2024 16,058,352 1.04
31,958,017 2.07
United States(245,000,000) NAHYS 33V2 5Years 500bps 20 December 2024 23,297,912 1.51(585,000,000) NAIGS 33V1 5Years 100bps 20 December 2024 15,158,569 0.99
38,456,481 2.50
Total credit default swaps 70,414,498 4.57
Futures contracts (a)France
713 CAC40 10 Euro Futures January 2020 12,986 0.00
Germany313 EURO BTP Futures March 2020 110,831 0.01
1,426 Euro Stoxx 50 March 2020 159,911 0.01270,742 0.02
Hong Kong108 Hang Seng Index Futures January 2020 160,470 0.01273 HSCEI Futures January 2020 167,118 0.01
327,588 0.02
Japan274 TOPIX Index Futures March 2020 49,229 0.00
Singapore275 FTSE China A50 Index January 2020 67,199 0.00
South Korea263 Korea 3 Years Bond Futures March 2020 21,211 0.00599 KOSPI2 Index Futures March 2020 1,984,872 0.13
2,006,083 0.13
Switzerland254 Swiss Market Index Futures March 2020 173,832 0.01
65,620 0.00
3,496,538 0.23
2,212,280 0.15
Turkey 4,101 BIST 30 Futures August 2020
United Kingdom 2,634 FTSE 100 Index Futures March 2020
United States 561 NASDAQ 100 E-Mini Index Futures March 2020
1,278 S&P500 Emini Futures March 2020 3,573,768 0.245,786,048 0.39
Total futures contracts 12,255,865 0.80
Government bondsFrance
65,154,030 French Republic Government Bond OAT 0.1% 01/03/2029 80,697,599 5.2486,300,900 French Republic Government Bond Oat 0.7% 25/07/2030 114,819,408 7.45
195,517,007 12.69
Germany151,652,930 Deutsche Bundesrepublik Inflation Linked Bond 0.5% 15/04/2030 202,532,486 13.15
United Kingdom56,163,240 United Kingdom Gilt Inflation Linked 0.125% 10/08/2028 92,346,587 5.9992,965,480 United Kingdom Gilt Inflation Linked 0.125% 22/03/2029 154,862,537 10.05
247,209,124 16.04
United States5,000,000 United States Treasury Bill 0% 09/01/2020 4,998,737 0.325,000,000 United States Treasury Bill 0% 23/01/2020 4,995,826 0.331,000,000 United States Treasury Bill 0% 26/03/2020 996,501 0.071,000,000 United States Treasury Bill 0% 02/04/2020 996,165 0.061,000,000 United States Treasury Bill 0% 09/04/2020 995,895 0.06
16,000,000 United States Treasury Bill 0% 18/06/2020 15,885,415 1.03123,455,090 United States Treasury Inflation Indexed Bonds 0.5% 15/04/2024 125,538,396 8.15
38,112,860 United States Treasury Inflation Indexed Bonds 0.125% 15/10/2024 38,359,254 2.4998,413,440 United States Treasury Inflation Indexed Bonds 0.75% 15/07/2028 103,670,486 6.7372,356,810 United States Treasury Inflation Indexed Bonds 0.875% 15/01/2029 76,938,466 4.9966,395,340 United States Treasury Inflation Indexed Bonds 0.25% 15/07/2029 67,137,101 4.36
440,512,242 28.59
Total government bonds 1,085,770,859 70.47
Total return swap (b)United States
2,093,000 BBG Commex AG&LV Capital 6,913,520 0.45
Total total return swap 6,913,520 0.45
264
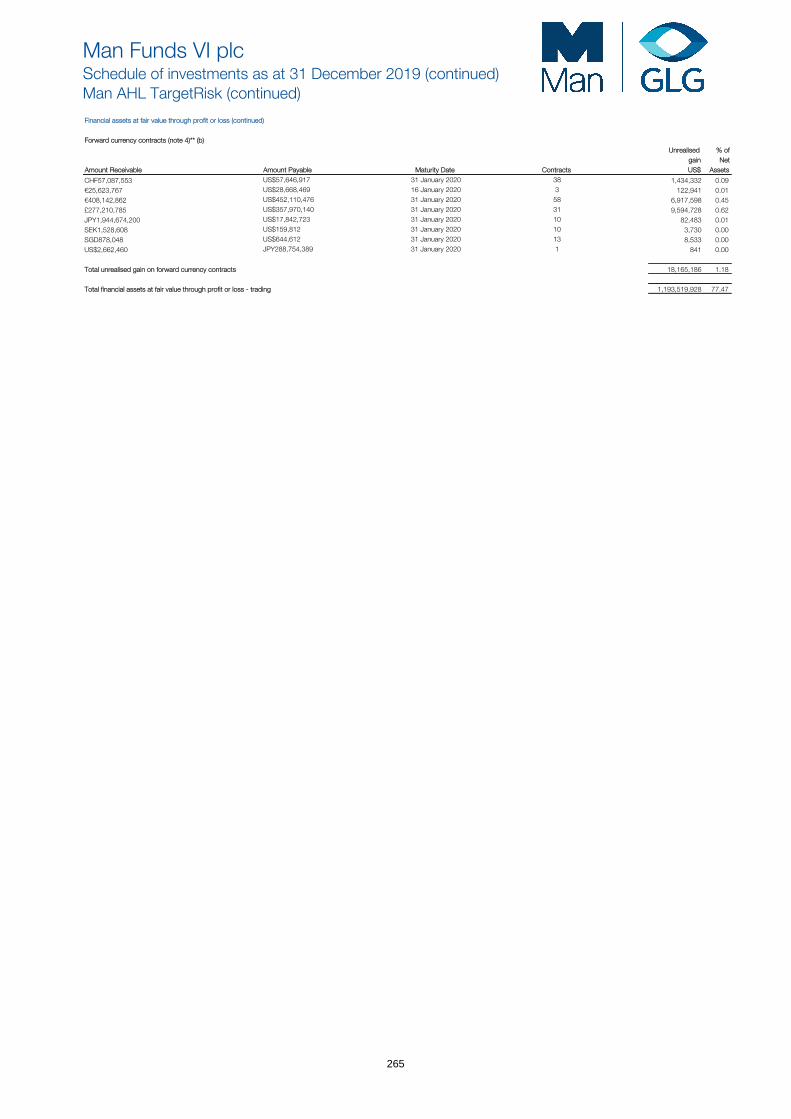
Man Funds VI plcSchedule of investments as at 31 December 2019 (continued)Man AHL TargetRisk (continued)
Financial assets at fair value through profit or loss (continued)
Forward currency contracts (note 4)** (b) Unrealised % of
gain Net Amount Receivable Amount Payable Maturity Date Contracts US$ Assets
CHF57,087,553 US$57,646,917 31 January 2020 38 1,434,332 0.09€25,623,767 US$28,668,469 16 January 2020 3 122,941 0.01€408,142,862 US$452,110,476 31 January 2020 58 6,917,598 0.45£277,210,785 US$357,970,140 31 January 2020 31 9,594,728 0.62JPY1,944,674,200 US$17,842,723 31 January 2020 10 82,483 0.01SEK1,528,608 US$159,812 31 January 2020 10 3,730 0.00SGD878,048 US$644,612 31 January 2020 13 8,533 0.00US$2,662,460 JPY288,754,389 31 January 2020 1 841 0.00
Total unrealised gain on forward currency contracts 18,165,186 1.18
Total financial assets at fair value through profit or loss - trading 1,193,519,928 77.47
265
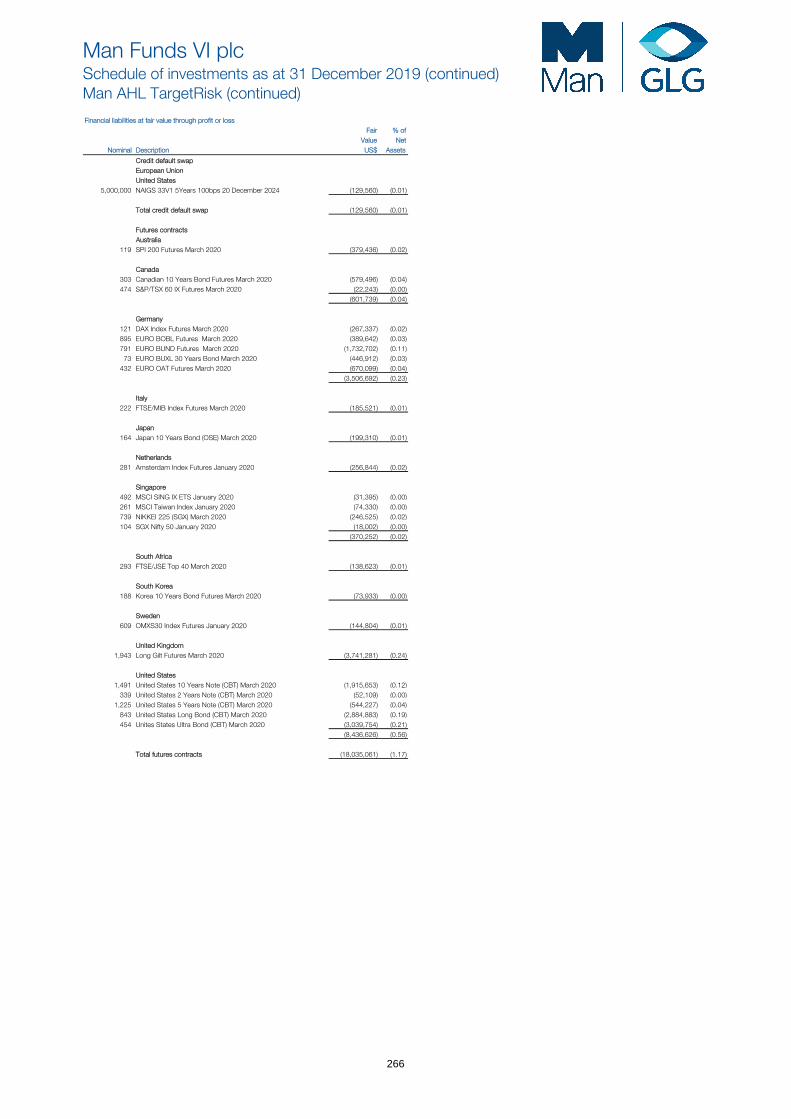
Man Funds VI plcSchedule of investments as at 31 December 2019 (continued)Man AHL TargetRisk (continued)
Financial liabilities at fair value through profit or loss Fair % of
Value Net Nominal Description US$ Assets
Credit default swapEuropean UnionUnited States
5,000,000 NAIGS 33V1 5Years 100bps 20 December 2024 (129,560) (0.01)
Total credit default swap (129,560) (0.01)
Futures contractsAustralia
119 SPI 200 Futures March 2020 (379,436) (0.02)
Canada303 Canadian 10 Years Bond Futures March 2020 (579,496) (0.04)474 S&P/TSX 60 IX Futures March 2020 (22,243) (0.00)
(601,739) (0.04)
Germany121 DAX Index Futures March 2020 (267,337) (0.02)895 EURO BOBL Futures March 2020 (389,642) (0.03)791 EURO BUND Futures March 2020 (1,732,702) (0.11)
73 EURO BUXL 30 Years Bond March 2020 (446,912) (0.03)432 EURO OAT Futures March 2020 (670,099) (0.04)
(3,506,692) (0.23)
Italy222 FTSE/MIB Index Futures March 2020 (185,521) (0.01)
Japan164 Japan 10 Years Bond (OSE) March 2020 (199,310) (0.01)
Netherlands281 Amsterdam Index Futures January 2020 (256,844) (0.02)
Singapore492 MSCI SING IX ETS January 2020 (31,395) (0.00) 261 MSCI Taiwan Index January 2020 (74,330) (0.00) 739 NIKKEI 225 (SGX) March 2020 (246,525) (0.02)104 SGX Nifty 50 January 2020 (18,002) (0.00)
(370,252) (0.02)
South Africa293 FTSE/JSE Top 40 March 2020 (138,623) (0.01)
South Korea188 Korea 10 Years Bond Futures March 2020 (73,933) (0.00)
Sweden609 OMXS30 Index Futures January 2020 (144,804) (0.01)
United Kingdom1,943 Long Gilt Futures March 2020 (3,741,281) (0.24)
United States1,491 United States 10 Years Note (CBT) March 2020 (1,915,653) (0.12)
339 United States 2 Years Note (CBT) March 2020 (52,109) (0.00) 1,225 United States 5 Years Note (CBT) March 2020 (544,227) (0.04)
843 United States Long Bond (CBT) March 2020 (2,884,883) (0.19)454 Unites States Ultra Bond (CBT) March 2020 (3,039,754) (0.21)
(8,436,626) (0.56)
Total futures contracts (18,035,061) (1.17)
266
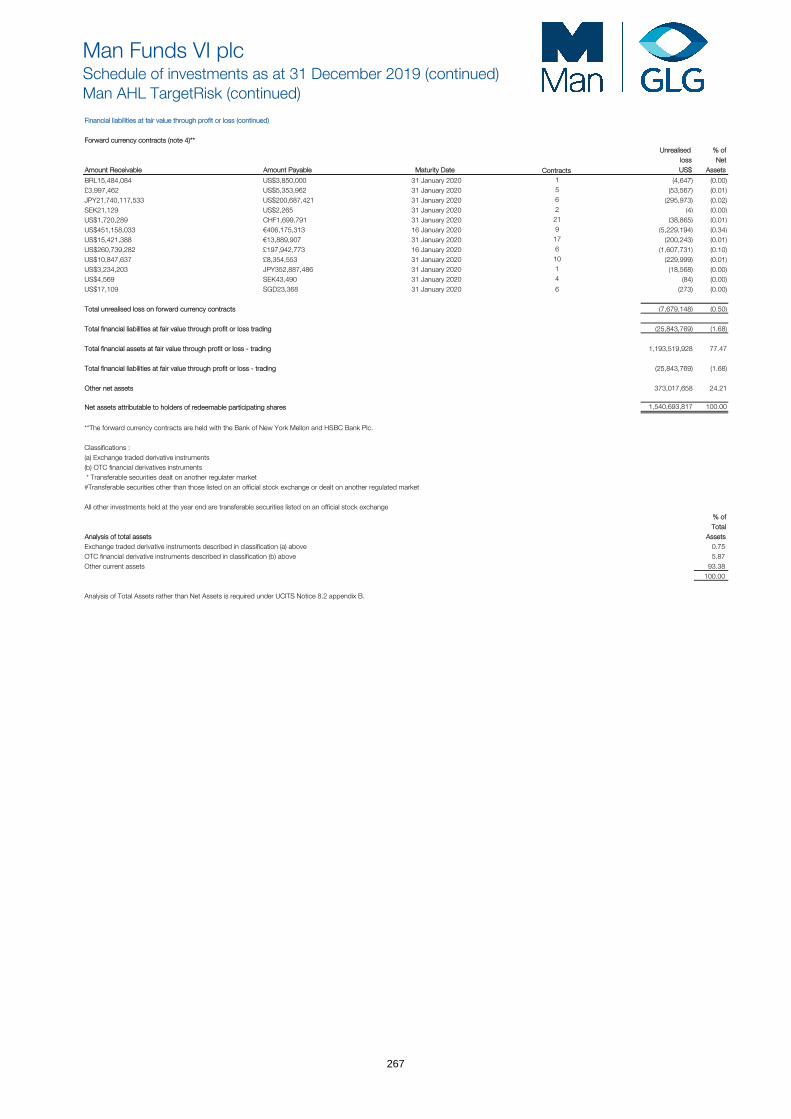
Man Funds VI plcSchedule of investments as at 31 December 2019 (continued)Man AHL TargetRisk (continued)
Financial liabilities at fair value through profit or loss (continued)
Forward currency contracts (note 4)** Unrealised % of
loss Net Amount Receivable Amount Payable Maturity Date Contracts US$ Assets
BRL15,484,084 US$3,850,000 31 January 2020 1 (4,647) (0.00) £3,997,462 US$5,353,962 31 January 2020 5 (53,567) (0.01)JPY21,740,117,533 US$200,687,421 31 January 2020 6 (295,973) (0.02)SEK21,129 US$2,265 31 January 2020 2 (4) (0.00) US$1,720,289 CHF1,699,791 31 January 2020 21 (38,865) (0.01)US$451,158,033 €406,175,313 16 January 2020 9 (5,229,194) (0.34)US$15,421,388 €13,889,907 31 January 2020 17 (200,243) (0.01)US$260,739,282 £197,942,773 16 January 2020 6 (1,607,731) (0.10)US$10,847,637 £8,354,553 31 January 2020 10 (229,999) (0.01)US$3,234,203 JPY352,887,486 31 January 2020 1 (18,568) (0.00) US$4,569 SEK43,490 31 January 2020 4 (84) (0.00) US$17,109 SGD23,368 31 January 2020 6 (273) (0.00)
Total unrealised loss on forward currency contracts (7,679,148) (0.50)
Total financial liabilities at fair value through profit or loss trading (25,843,769) (1.68)
Total financial assets at fair value through profit or loss - trading 1,193,519,928 77.47
Total financial liabilities at fair value through profit or loss - trading (25,843,769) (1.68)
Other net assets 373,017,658 24.21
Net assets attributable to holders of redeemable participating shares 1,540,693,817 100.00
**The forward currency contracts are held with the Bank of New York Mellon and HSBC Bank Plc.
Classifications :(a) Exchange traded derivative instruments(b) OTC financial derivatives instruments * Transferable securities dealt on another regulater market #Transferable securities other than those listed on an official stock exchange or dealt on another regulated market
All other investments held at the year end are transferable securities listed on an official stock exchange% of Total
Analysis of total assets AssetsExchange traded derivative instruments described in classification (a) above 0.75 OTC financial derivative instruments described in classification (b) above 5.87 Other current assets 93.38
100.00
Analysis of Total Assets rather than Net Assets is required under UCITS Notice 8.2 appendix B.
267
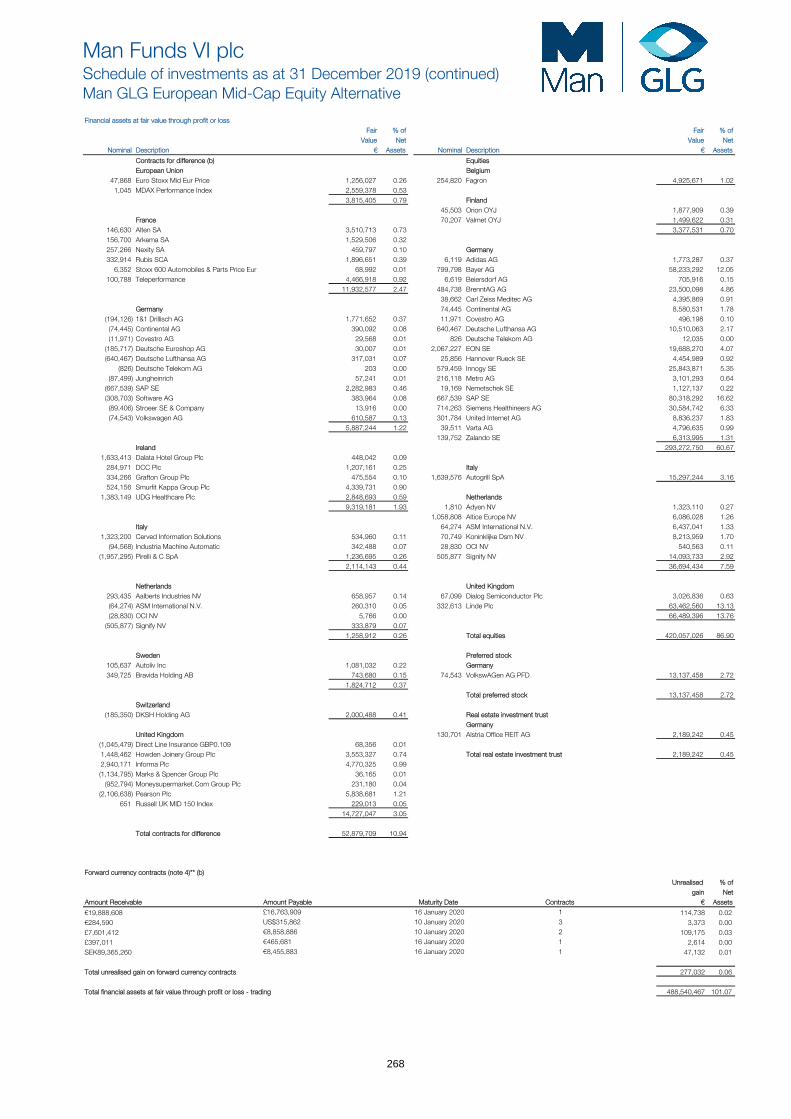
Man Funds VI plcSchedule of investments as at 31 December 2019 (continued)Man GLG European Mid-Cap Equity Alternative
Financial assets at fair value through profit or loss Fair % of Fair % of
Value Net Value Net Nominal Description € Assets Nominal Description € Assets
Contracts for difference (b) EquitiesEuropean Union Belgium
47,868 Euro Stoxx Mid Eur Price 1,256,027 0.26 254,820 Fagron 4,925,671 1.021,045 MDAX Performance Index 2,559,378 0.53
3,815,405 0.79 Finland45,503 Orion OYJ 1,877,909 0.39
France 70,207 Valmet OYJ 1,499,622 0.31146,630 Alten SA 3,510,713 0.73 3,377,531 0.70156,700 Arkema SA 1,529,506 0.32257,266 Nexity SA 459,797 0.10 Germany332,914 Rubis SCA 1,896,651 0.39 6,119 Adidas AG 1,773,287 0.37
6,352 Stoxx 600 Automobiles & Parts Price Eur 68,992 0.01 799,798 Bayer AG 58,233,292 12.05100,788 Teleperformance 4,466,918 0.92 6,619 Beiersdorf AG 705,916 0.15
11,932,577 2.47 484,738 BrenntAG AG 23,500,098 4.8638,662 Carl Zeiss Meditec AG 4,395,869 0.91
Germany 74,445 Continental AG 8,580,531 1.78(194,126) 1&1 Drillisch AG 1,771,652 0.37 11,971 Covestro AG 496,198 0.10
(74,445) Continental AG 390,092 0.08 640,467 Deutsche Lufthansa AG 10,510,063 2.17(11,971) Covestro AG 29,568 0.01 826 Deutsche Telekom AG 12,035 0.00
(185,717) Deutsche Euroshop AG 30,007 0.01 2,067,227 EON SE 19,688,270 4.07(640,467) Deutsche Lufthansa AG 317,031 0.07 25,856 Hannover Rueck SE 4,454,989 0.92
(826) Deutsche Telekom AG 203 0.00 579,459 Innogy SE 25,843,871 5.35(87,499) Jungheinrich 57,241 0.01 216,118 Metro AG 3,101,293 0.64
(667,539) SAP SE 2,282,983 0.46 19,169 Nemetschek SE 1,127,137 0.22(308,703) Software AG 383,964 0.08 667,539 SAP SE 80,318,292 16.62
(89,406) Stroeer SE & Company 13,916 0.00 714,263 Siemens Healthineers AG 30,584,742 6.33(74,543) Volkswagen AG 610,587 0.13 301,784 United Internet AG 8,836,237 1.83
5,887,244 1.22 39,511 Varta AG 4,796,635 0.99139,752 Zalando SE 6,313,995 1.31
Ireland 293,272,750 60.671,633,413 Dalata Hotel Group Plc 448,042 0.09
284,971 DCC Plc 1,207,161 0.25 Italy334,266 Grafton Group Plc 475,554 0.10 1,639,576 Autogrill SpA 15,297,244 3.16524,156 Smurfit Kappa Group Plc 4,339,731 0.90
1,383,149 UDG Healthcare Plc 2,848,693 0.59 Netherlands9,319,181 1.93 1,810 Adyen NV 1,323,110 0.27
1,058,808 Altice Europe NV 6,086,028 1.26Italy 64,274 ASM International N.V. 6,437,041 1.33
1,323,200 Cerved Information Solutions 534,960 0.11 70,749 Koninklijke Dsm NV 8,213,959 1.70(94,568) Industria Machine Automatic 342,488 0.07 28,830 OCI NV 540,563 0.11
(1,957,295) Pirelli & C SpA 1,236,695 0.26 505,877 Signify NV 14,093,733 2.922,114,143 0.44 36,694,434 7.59
Netherlands United Kingdom293,435 Aalberts Industries NV 658,957 0.14 67,099 Dialog Semiconductor Plc 3,026,836 0.63(64,274) ASM International N.V. 260,310 0.05 332,613 Linde Plc 63,462,560 13.13(28,830) OCI NV 5,766 0.00 66,489,396 13.76
(505,877) Signify NV 333,879 0.071,258,912 0.26 Total equities 420,057,026 86.90
Sweden Preferred stock105,637 Autoliv Inc 1,081,032 0.22 Germany349,725 Bravida Holding AB 743,680 0.15 74,543 VolkswAGen AG PFD 13,137,458 2.72
1,824,712 0.37Total preferred stock 13,137,458 2.72
Switzerland(185,350) DKSH Holding AG 2,000,488 0.41 Real estate investment trust
GermanyUnited Kingdom 130,701 Alstria Office REIT AG 2,189,242 0.45
(1,045,479) Direct Line Insurance GBP0.109 68,356 0.011,448,462 Howden Joinery Group Plc 3,553,327 0.74 Total real estate investment trust 2,189,242 0.452,940,171 Informa Plc 4,770,325 0.99(1,134,795) Marks & Spencer Group Plc 36,165 0.01
(952,794) Moneysupermarket.Com Group Plc 231,180 0.04(2,106,638) Pearson Plc 5,838,681 1.21
651 Russell UK MID 150 Index 229,013 0.0514,727,047 3.05
Total contracts for difference 52,879,709 10.94
Forward currency contracts (note 4)** (b) Unrealised % of
gain Net Amount Receivable Amount Payable Maturity Date Contracts € Assets
€19,888,608 £16,763,909 16 January 2020 1 114,738 0.02€284,590 US$315,862 10 January 2020 3 3,373 0.00£7,601,412 €8,858,886 10 January 2020 2 109,175 0.03£397,011 €465,681 16 January 2020 1 2,614 0.00SEK89,365,260 €8,455,883 16 January 2020 1 47,132 0.01
Total unrealised gain on forward currency contracts 277,032 0.06
Total financial assets at fair value through profit or loss - trading 488,540,467 101.07
268
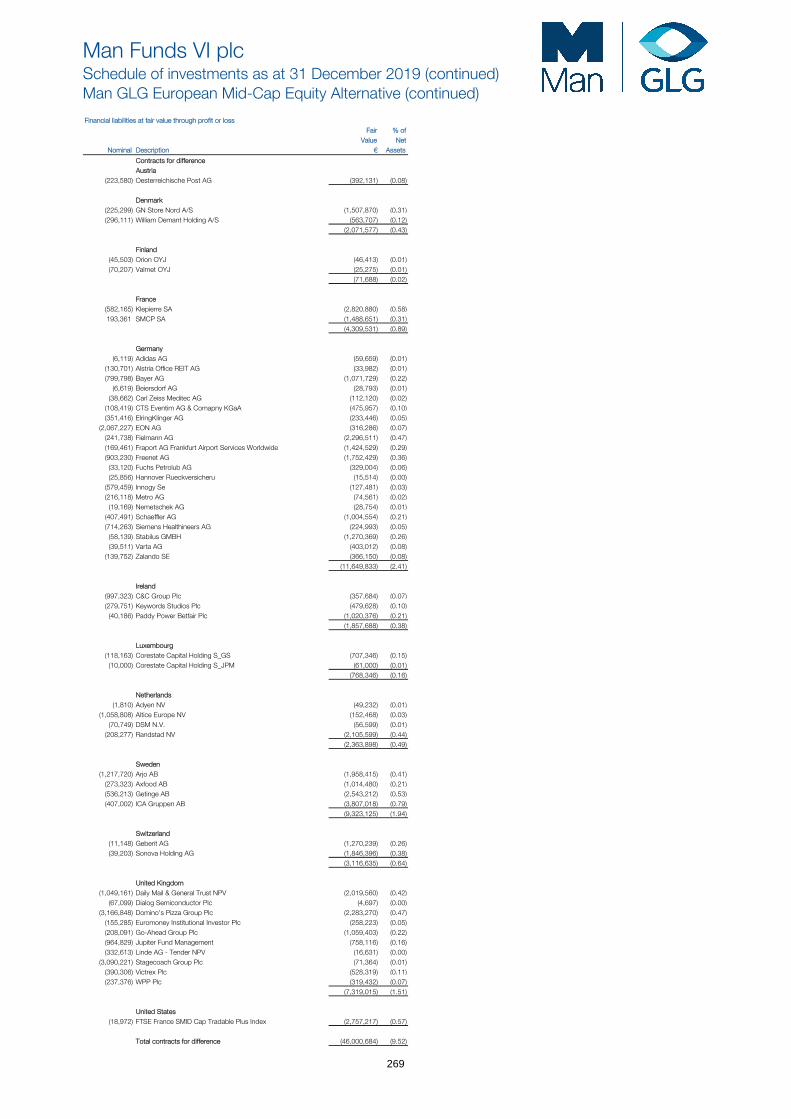
Man Funds VI plcSchedule of investments as at 31 December 2019 (continued)Man GLG European Mid-Cap Equity Alternative (continued)
Financial liabilities at fair value through profit or loss Fair % of
Value Net Nominal Description € Assets
Contracts for differenceAustria
(223,580) Oesterreichische Post AG (392,131) (0.08)
Denmark(225,299) GN Store Nord A/S (1,507,870) (0.31)(296,111) William Demant Holding A/S (563,707) (0.12)
(2,071,577) (0.43)
Finland(45,503) Orion OYJ (46,413) (0.01)(70,207) Valmet OYJ (25,275) (0.01)
(71,688) (0.02)
France(582,165) Klepierre SA (2,820,880) (0.58)193,361 SMCP SA (1,488,651) (0.31)
(4,309,531) (0.89)
Germany(6,119) Adidas AG (59,659) (0.01)
(130,701) Alstria Office REIT AG (33,982) (0.01)(799,798) Bayer AG (1,071,729) (0.22)
(6,619) Beiersdorf AG (28,793) (0.01)(38,662) Carl Zeiss Meditec AG (112,120) (0.02)
(108,419) CTS Eventim AG & Comapny KGaA (475,957) (0.10)(351,416) ElringKlinger AG (233,446) (0.05)
(2,067,227) EON AG (316,286) (0.07)(241,738) Fielmann AG (2,296,511) (0.47)(169,461) Fraport AG Frankfurt Airport Services Worldwide (1,424,529) (0.29)(903,230) Freenet AG (1,752,429) (0.36)
(33,120) Fuchs Petrolub AG (329,004) (0.06)(25,856) Hannover Rueckversicheru (15,514) (0.00)
(579,459) Innogy Se (127,481) (0.03)(216,118) Metro AG (74,561) (0.02)
(19,169) Nemetschek AG (28,754) (0.01)(407,491) Schaeffler AG (1,004,554) (0.21)(714,263) Siemens Healthineers AG (224,993) (0.05)
(58,139) Stabilus GMBH (1,270,369) (0.26)(39,511) Varta AG (403,012) (0.08)
(139,752) Zalando SE (366,150) (0.08)(11,649,833) (2.41)
Ireland(997,323) C&C Group Plc (357,684) (0.07)(279,751) Keywords Studios Plc (479,628) (0.10)
(40,186) Paddy Power Betfair Plc (1,020,376) (0.21)(1,857,688) (0.38)
Luxembourg(118,163) Corestate Capital Holding S_GS (707,346) (0.15)
(10,000) Corestate Capital Holding S_JPM (61,000) (0.01)(768,346) (0.16)
Netherlands(1,810) Adyen NV (49,232) (0.01)
(1,058,808) Altice Europe NV (152,468) (0.03)(70,749) DSM N.V. (56,599) (0.01)
(208,277) Randstad NV (2,105,599) (0.44)(2,363,898) (0.49)
Sweden(1,217,720) Arjo AB (1,958,415) (0.41)
(273,323) Axfood AB (1,014,480) (0.21)(536,213) Getinge AB (2,543,212) (0.53)(407,002) ICA Gruppen AB (3,807,018) (0.79)
(9,323,125) (1.94)
Switzerland(11,148) Geberit AG (1,270,239) (0.26)(39,203) Sonova Holding AG (1,846,396) (0.38)
(3,116,635) (0.64)
United Kingdom(1,049,161) Daily Mail & General Trust NPV (2,019,560) (0.42)
(67,099) Dialog Semiconductor Plc (4,697) (0.00) (3,166,848) Domino's Pizza Group Plc (2,283,270) (0.47)
(155,285) Euromoney Institutional Investor Plc (258,223) (0.05)(208,091) Go-Ahead Group Plc (1,059,403) (0.22)(964,829) Jupiter Fund Management (758,116) (0.16)(332,613) Linde AG - Tender NPV (16,631) (0.00)
(3,090,221) Stagecoach Group Plc (71,364) (0.01)(390,306) Victrex Plc (528,319) (0.11)(237,376) WPP Plc (319,432) (0.07)
(7,319,015) (1.51)
United States(18,972) FTSE France SMID Cap Tradable Plus Index (2,757,217) (0.57)
Total contracts for difference (46,000,684) (9.52)
269
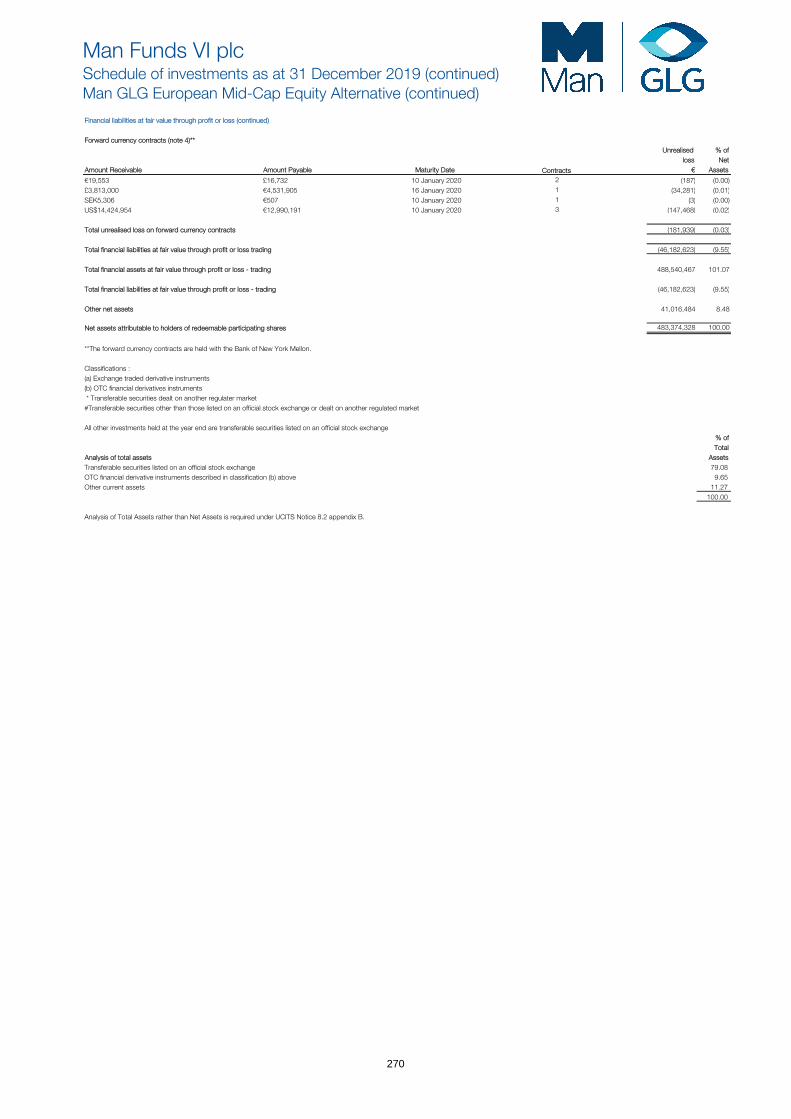
Man Funds VI plcSchedule of investments as at 31 December 2019 (continued)Man GLG European Mid-Cap Equity Alternative (continued)
Financial liabilities at fair value through profit or loss (continued)
Forward currency contracts (note 4)** Unrealised % of
loss Net Amount Receivable Amount Payable Maturity Date Contracts € Assets
€19,553 £16,732 10 January 2020 2 (187) (0.00) £3,813,000 €4,531,905 16 January 2020 1 (34,281) (0.01)SEK5,306 €507 10 January 2020 1 (3) (0.00) US$14,424,954 €12,990,191 10 January 2020 3 (147,468) (0.02)
Total unrealised loss on forward currency contracts (181,939) (0.03)
Total financial liabilities at fair value through profit or loss trading (46,182,623) (9.55)
Total financial assets at fair value through profit or loss - trading 488,540,467 101.07
Total financial liabilities at fair value through profit or loss - trading (46,182,623) (9.55)
Other net assets 41,016,484 8.48
Net assets attributable to holders of redeemable participating shares 483,374,328 100.00
**The forward currency contracts are held with the Bank of New York Mellon.
Classifications :(a) Exchange traded derivative instruments(b) OTC financial derivatives instruments * Transferable securities dealt on another regulater market #Transferable securities other than those listed on an official stock exchange or dealt on another regulated market
All other investments held at the year end are transferable securities listed on an official stock exchange% of Total
Analysis of total assets AssetsTransferable securities listed on an official stock exchange 79.08 OTC financial derivative instruments described in classification (b) above 9.65 Other current assets 11.27
100.00
Analysis of Total Assets rather than Net Assets is required under UCITS Notice 8.2 appendix B.
270
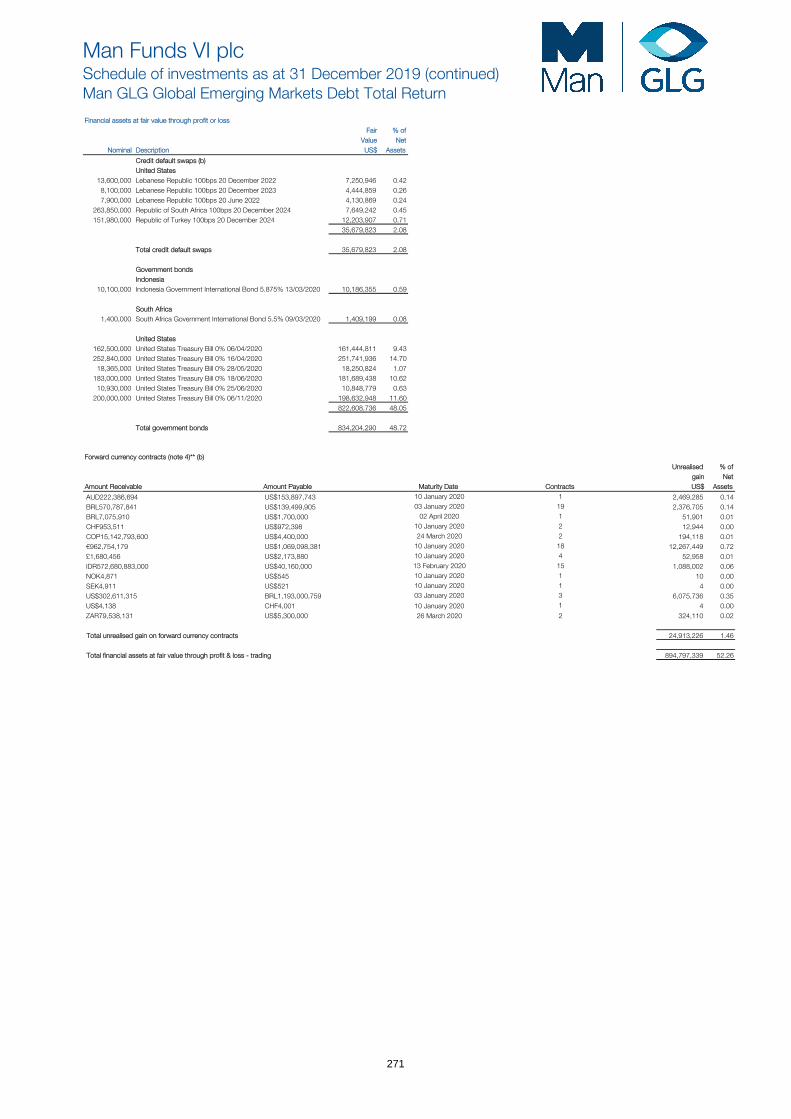
Man Funds VI plcSchedule of investments as at 31 December 2019 (continued)Man GLG Global Emerging Markets Debt Total Return
Financial assets at fair value through profit or loss Fair % of
Value Net Nominal Description US$ Assets
Credit default swaps (b)United States
13,600,000 Lebanese Republic 100bps 20 December 2022 7,250,946 0.428,100,000 Lebanese Republic 100bps 20 December 2023 4,444,859 0.267,900,000 Lebanese Republic 100bps 20 June 2022 4,130,869 0.24
263,850,000 Republic of South Africa 100bps 20 December 2024 7,649,242 0.45151,980,000 Republic of Turkey 100bps 20 December 2024 12,203,907 0.71
35,679,823 2.08
Total credit default swaps 35,679,823 2.08
Government bondsIndonesia
10,100,000 Indonesia Government International Bond 5.875% 13/03/2020 10,186,355 0.59
South Africa1,400,000 South Africa Government International Bond 5.5% 09/03/2020 1,409,199 0.08
United States162,500,000 United States Treasury Bill 0% 06/04/2020 161,444,811 9.43252,840,000 United States Treasury Bill 0% 16/04/2020 251,741,936 14.70
18,365,000 United States Treasury Bill 0% 28/05/2020 18,250,824 1.07183,000,000 United States Treasury Bill 0% 18/06/2020 181,689,438 10.62
10,930,000 United States Treasury Bill 0% 25/06/2020 10,848,779 0.63200,000,000 United States Treasury Bill 0% 06/11/2020 198,632,948 11.60
822,608,736 48.05
Total government bonds 834,204,290 48.72
Forward currency contracts (note 4)** (b) Unrealised % of
gain Net Amount Receivable Amount Payable Maturity Date Contracts US$ Assets
AUD222,386,694 US$153,897,743 10 January 2020 1 2,469,285 0.14BRL570,787,841 US$139,499,905 03 January 2020 19 2,376,705 0.14BRL7,075,910 US$1,700,000 02 April 2020 1 51,901 0.01CHF953,511 US$972,398 10 January 2020 2 12,944 0.00COP15,142,793,600 US$4,400,000 24 March 2020 2 194,118 0.01€962,754,179 US$1,069,098,381 10 January 2020 18 12,267,449 0.72£1,680,456 US$2,173,880 10 January 2020 4 52,958 0.01IDR572,680,883,000 US$40,160,000 13 February 2020 15 1,088,002 0.06NOK4,871 US$545 10 January 2020 1 10 0.00SEK4,911 US$521 10 January 2020 1 4 0.00US$302,611,315 BRL1,193,000,759 03 January 2020 3 6,075,736 0.35US$4,138 CHF4,001 10 January 2020 1 4 0.00ZAR79,538,131 US$5,300,000 26 March 2020 2 324,110 0.02
Total unrealised gain on forward currency contracts 24,913,226 1.46
Total financial assets at fair value through profit & loss - trading 894,797,339 52.26
271

Man Funds VI plcSchedule of investments as at 31 December 2019 (continued)Man GLG Global Emerging Markets Debt Total Return (continued)
Financial liabilities at fair value through profit or loss Fair % of
Value Net Nominal Description US$ Assets
Credit default swapsUnited States
218,700,000 Fed Republic of Brazil 100bps 20 December 2024 (92,062) (0.01)89,675,000 Federation of Malaysia 100bps 20 December 2024 (2,779,669) (0.16)(7,900,000) Lebanese Republic 100bps 20 June 2022 (4,130,869) (0.24)(5,600,000) Lebanese Republic 100bps 20 December 2022 (2,985,684) (0.17)
262,800,000 Republic of Colombia 100bps 20 December 2024 (3,410,559) (0.20)174,250,000 Republic of Indonesia 100bps 20 December 2024 (3,070,177) (0.18)
28,200,000 Republic of Kazakhstan 100bps 20 December 2021 (475,401) (0.03)10,000,000 Republic of Kazakhstan 100bps 20 June 2022 (190,323) (0.01)28,500,000 Republic of Korea 100bps 20 December 2024 (1,065,566) (0.06)
(18,200,310) (1.06)
Total credit default swaps (18,200,310) (1.06)
Interest rate swapsBrazil
(90,000,000) Payable BRL 10.04% Vs CDI 0BP 20 June 2017 (2,626,803) (0.15)(364,100,000) Payable BRL 10.26% Vs CDI 0BP 30 May 2017 (11,164,308) (0.65)(342,800,000) Payable BRL 10.355% Vs CDI 0BP 26 May 2017 (10,728,054) (0.63)
(95,500,000) Payable BRL 8.65% Vs CDI 0BP 15 February 2018 (1,803,056) (0.11)(185,400,000) Payable BRL 8.745% Vs CDI 0BP 28 September 2017 (3,806,380) (0.22)(138,000,000) Payable BRL 8.805% Vs CDI 0BP 16 January 2018 (2,773,803) (0.16)(104,700,000) Payable BRL 8.8525% Vs CDI 0BP 13 September 2017 (2,229,600) (0.13)
(77,700,000) Payable BRL 9.075% Vs CDI 0BP 4 August 2017 (1,769,018) (0.10)(165,300,000) Payable BRL 9.1175% Vs CDI 0BP 27 November 2017 (3,723,789) (0.22)(801,500,000) Payable BRL 9.17% Vs CDI 0BP 8 August 2017 (18,761,037) (1.10)(136,000,000) Payable BRL 9.19% Vs CDI 0BP 19 December 2017 (3,088,772) (0.17)(174,700,000) Payable BRL 9.3% Vs CDI 0BP 16 August 2017 (4,240,057) (0.25)(709,700,000) Payable BRL 9.53% Vs CDI 0BP 18 July 2017 (18,311,932) (1.07)(154,000,000) Payable BRL 9.8875% Vs CDI 0BP 11 September 2018 (3,390,542) (0.20)
(88,417,151) (5.16)
Total interest rate swaps (88,417,151) (5.16)
Forward currency contracts (note 4)** Unrealised % of
loss Net Amount Receivable Amount Payable Maturity Date Contracts US$ Assets
BRL622,212,918 US$162,271,000 03 January 2020 14 (7,612,030) (0.44)
US$17,563,450 BRL74,476,054 02 April 2020 1 (875,826) (0.06)
US$808,318 CHF788,421 10 January 2020 1 (6,424) (0.00)
US$56,013,378 COP193,704,062,900 24 March 2020 2 (2,753,804) (0.16)
US$542,808 €486,377 10 January 2020 11 (3,491) (0.00)
US$2,109 £1,608 10 January 2020 2 (22) (0.00)
US$132,297,870 IDR1,901,980,309,268 13 February 2020 2 (4,694,459) (0.28)
US$56,880,675 ZAR850,604,994 26 March 2020 1 (3,265,275) (0.19)
Total unrealised loss on forward currency contracts (19,211,331) (1.13)
Total financial liabilities at fair value through profit & loss - trading (125,828,792) (7.35)
Total financial assets at fair value through profit & loss - trading 894,797,339 52.26
Total financial liabilities at fair value through profit & loss - trading (125,828,792) (7.35)
Other net assets 943,270,564 55.09
Net Assets Attributable to Holders of Redeemable Participating Shares 1,712,239,111 100.00
**The forward currency contracts are held with the Bank of New York Mellon & HSBC Bank Plc
Classifications :(a) Exchange traded derivative instruments(b) OTC financial derivatives instruments * Transferable securities dealt on another regulated market #Transferable securities other than those listed on an official stock exchange or dealt on another regulated market
All other investments held at the year end are transferable securities listed on an official stock exchange
% of TotalAnalysis of Total Assets AssetsOTC financial derivative instruments described in classification (b) above 3.26
Other current assets 96.74100.00
Analysis of Total Assets rather than Net Assets is required under UCITS Notice 8.2 appendix B.
272
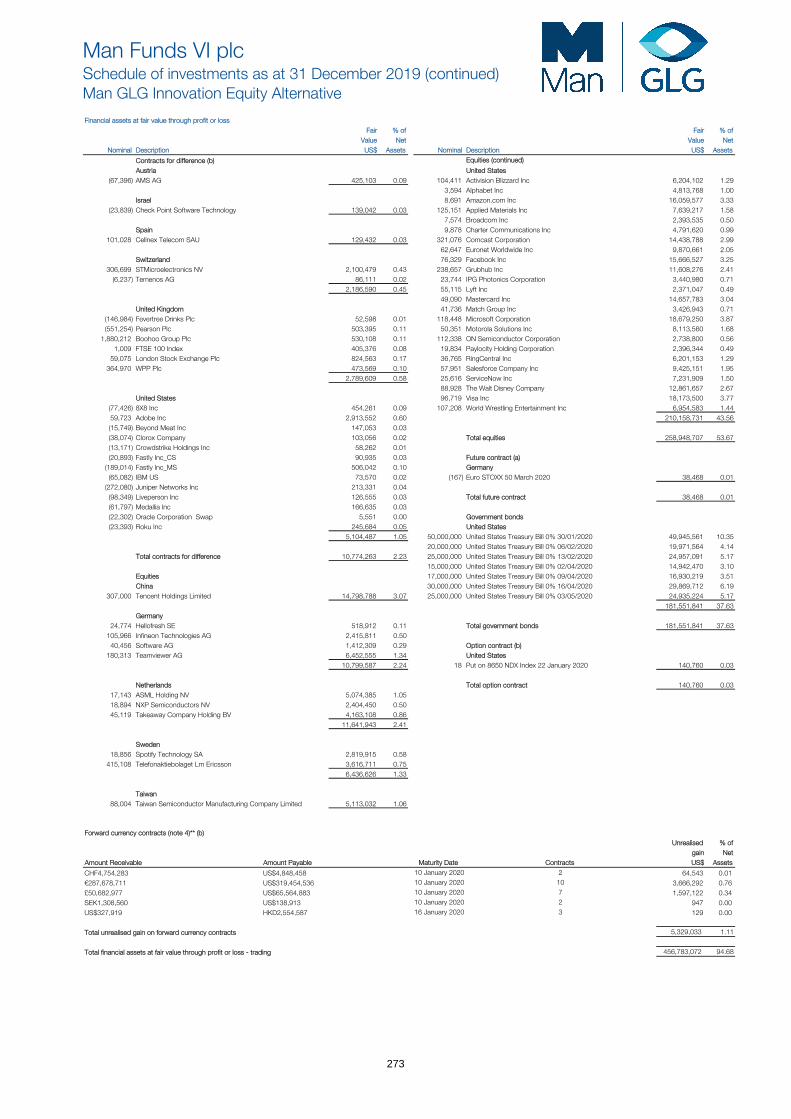
Man Funds VI plcSchedule of investments as at 31 December 2019 (continued)Man GLG Innovation Equity Alternative
Financial assets at fair value through profit or loss Fair % of Fair % of
Value Net Value Net Nominal Description US$ Assets Nominal Description US$ Assets
Contracts for difference (b) Equities (continued)
Austria United States(67,396) AMS AG 425,103 0.09 104,411 Activision Blizzard Inc 6,204,102 1.29
3,594 Alphabet Inc 4,813,768 1.00Israel 8,691 Amazon.com Inc 16,059,577 3.33
(23,839) Check Point Software Technology 139,042 0.03 125,151 Applied Materials Inc 7,639,217 1.587,574 Broadcom Inc 2,393,535 0.50
Spain 9,878 Charter Communications Inc 4,791,620 0.99101,028 Cellnex Telecom SAU 129,432 0.03 321,076 Comcast Corporation 14,438,788 2.99
62,647 Euronet Worldwide Inc 9,870,661 2.05Switzerland 76,329 Facebook Inc 15,666,527 3.25
306,699 STMicroelectronics NV 2,100,479 0.43 238,657 Grubhub Inc 11,608,276 2.41(6,237) Temenos AG 86,111 0.02 23,744 IPG Photonics Corporation 3,440,980 0.71
2,186,590 0.45 55,115 Lyft Inc 2,371,047 0.4949,090 Mastercard Inc 14,657,783 3.04
United Kingdom 41,736 Match Group Inc 3,426,943 0.71(146,984) Fevertree Drinks Plc 52,598 0.01 118,448 Microsoft Corporation 18,679,250 3.87(551,254) Pearson Plc 503,395 0.11 50,351 Motorola Solutions Inc 8,113,560 1.68
1,880,212 Boohoo Group Plc 530,108 0.11 112,338 ON Semiconductor Corporation 2,738,800 0.561,009 FTSE 100 Index 405,376 0.08 19,834 Paylocity Holding Corporation 2,396,344 0.49
59,075 London Stock Exchange Plc 824,563 0.17 36,765 RingCentral Inc 6,201,153 1.29364,970 WPP Plc 473,569 0.10 57,951 Salesforce Company Inc 9,425,151 1.95
2,789,609 0.58 25,616 ServiceNow Inc 7,231,909 1.5088,928 The Walt Disney Company 12,861,657 2.67
United States 96,719 Visa Inc 18,173,500 3.77(77,426) 8X8 Inc 454,261 0.09 107,208 World Wrestling Entertainment Inc 6,954,583 1.4459,723 Adobe Inc 2,913,552 0.60 210,158,731 43.56(15,749) Beyond Meat Inc 147,053 0.03(38,074) Clorox Company 103,056 0.02 Total equities 258,948,707 53.67(13,171) Crowdstrike Holdings Inc 58,262 0.01(20,893) Fastly Inc_CS 90,935 0.03 Future contract (a)
(189,014) Fastly Inc_MS 506,042 0.10 Germany(65,082) IBM US 73,570 0.02 (167) Euro STOXX 50 March 2020 38,468 0.01
(272,080) Juniper Networks Inc 213,331 0.04(98,349) Liveperson Inc 126,555 0.03 Total future contract 38,468 0.01(61,797) Medallia Inc 166,635 0.03(22,302) Oracle Corporation Swap 5,551 0.00 Government bonds(23,393) Roku Inc 245,684 0.05 United States
5,104,487 1.05 50,000,000 United States Treasury Bill 0% 30/01/2020 49,945,561 10.3520,000,000 United States Treasury Bill 0% 06/02/2020 19,971,564 4.14
Total contracts for difference 10,774,263 2.23 25,000,000 United States Treasury Bill 0% 13/02/2020 24,957,091 5.1715,000,000 United States Treasury Bill 0% 02/04/2020 14,942,470 3.10
Equities 17,000,000 United States Treasury Bill 0% 09/04/2020 16,930,219 3.51China 30,000,000 United States Treasury Bill 0% 16/04/2020 29,869,712 6.19
307,000 Tencent Holdings Limited 14,798,788 3.07 25,000,000 United States Treasury Bill 0% 03/05/2020 24,935,224 5.17181,551,841 37.63
Germany24,774 Hellofresh SE 518,912 0.11 Total government bonds 181,551,841 37.63
105,966 Infineon Technologies AG 2,415,811 0.5040,456 Software AG 1,412,309 0.29 Option contract (b)
180,313 Teamviewer AG 6,452,555 1.34 United States10,799,587 2.24 18 Put on 8650 NDX Index 22 January 2020 140,760 0.03
Netherlands Total option contract 140,760 0.0317,143 ASML Holding NV 5,074,385 1.0518,894 NXP Semiconductors NV 2,404,450 0.5045,119 Takeaway Company Holding BV 4,163,108 0.86
11,641,943 2.41
Sweden18,856 Spotify Technology SA 2,819,915 0.58
415,108 Telefonaktiebolaget Lm Ericsson 3,616,711 0.756,436,626 1.33
Taiwan88,004 Taiwan Semiconductor Manufacturing Company Limited 5,113,032 1.06
Forward currency contracts (note 4)** (b) Unrealised % of
gain Net Amount Receivable Amount Payable Maturity Date Contracts US$ Assets
CHF4,754,283 US$4,848,458 10 January 2020 2 64,543 0.01€287,678,711 US$319,454,536 10 January 2020 10 3,666,292 0.76£50,682,977 US$65,564,883 10 January 2020 7 1,597,122 0.34SEK1,308,560 US$138,913 10 January 2020 2 947 0.00US$327,919 HKD2,554,587 16 January 2020 3 129 0.00
Total unrealised gain on forward currency contracts 5,329,033 1.11
Total financial assets at fair value through profit or loss - trading 456,783,072 94.68
273
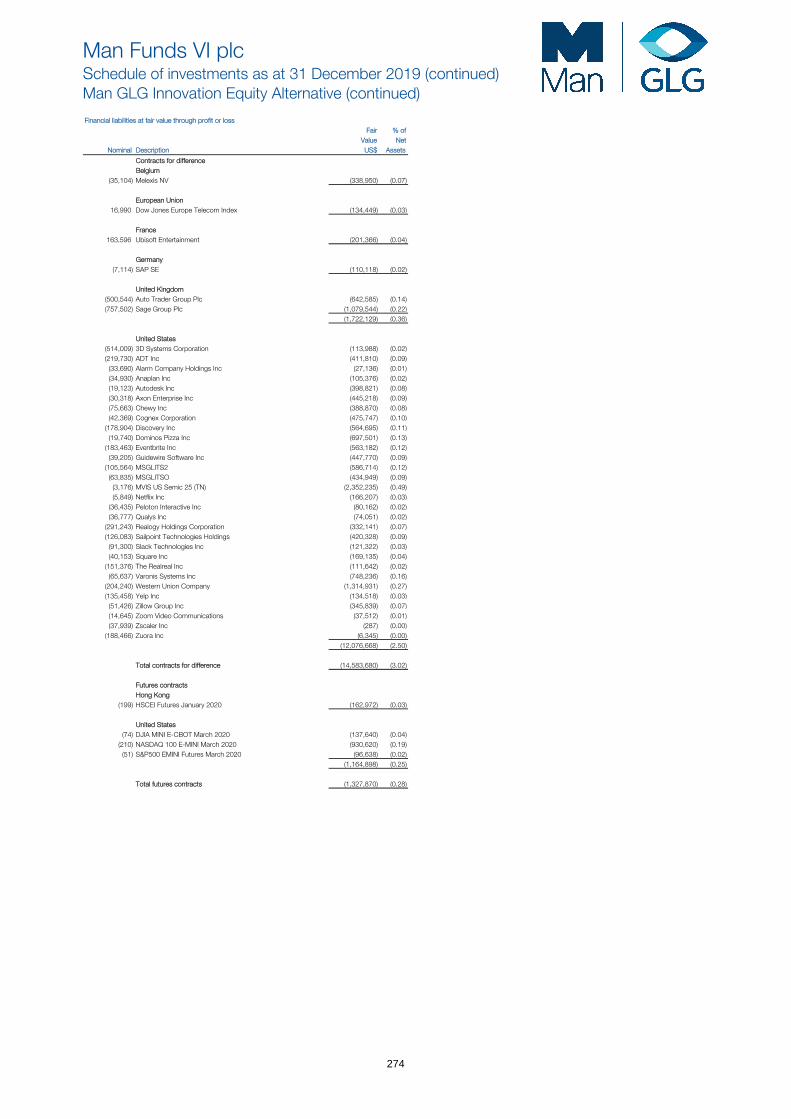
Man Funds VI plcSchedule of investments as at 31 December 2019 (continued)Man GLG Innovation Equity Alternative (continued)
Financial liabilities at fair value through profit or loss Fair % of
Value Net Nominal Description US$ Assets
Contracts for differenceBelgium
(35,104) Melexis NV (338,950) (0.07)
European Union16,990 Dow Jones Europe Telecom Index (134,449) (0.03)
France163,596 Ubisoft Entertainment (201,366) (0.04)
Germany(7,114) SAP SE (110,118) (0.02)
United Kingdom(500,544) Auto Trader Group Plc (642,585) (0.14)(757,502) Sage Group Plc (1,079,544) (0.22)
(1,722,129) (0.36)
United States(514,009) 3D Systems Corporation (113,988) (0.02)(219,730) ADT Inc (411,810) (0.09)
(33,690) Alarm Company Holdings Inc (27,136) (0.01)(34,930) Anaplan Inc (105,376) (0.02)(19,123) Autodesk Inc (398,821) (0.08)(30,318) Axon Enterprise Inc (445,218) (0.09)(75,663) Chewy Inc (388,870) (0.08)(42,369) Cognex Corporation (475,747) (0.10)
(178,904) Discovery Inc (564,695) (0.11)(19,740) Dominos Pizza Inc (697,501) (0.13)
(183,463) Eventbrite Inc (563,182) (0.12)(39,205) Guidewire Software Inc (447,770) (0.09)
(105,564) MSGLITS2 (586,714) (0.12)(63,835) MSGLITSO (434,949) (0.09)
(3,176) MVIS US Semic 25 (TN) (2,352,235) (0.49)(5,849) Netflix Inc (166,207) (0.03)
(36,435) Peloton Interactive Inc (80,162) (0.02)(36,777) Qualys Inc (74,051) (0.02)
(291,243) Realogy Holdings Corporation (332,141) (0.07)(126,083) Sailpoint Technologies Holdings (420,328) (0.09)
(91,300) Slack Technologies Inc (121,322) (0.03)(40,153) Square Inc (169,135) (0.04)
(151,376) The Realreal Inc (111,642) (0.02)(65,637) Varonis Systems Inc (748,236) (0.16)
(204,240) Western Union Company (1,314,931) (0.27)(135,458) Yelp Inc (134,518) (0.03)
(51,426) Zillow Group Inc (345,839) (0.07)(14,645) Zoom Video Communications (37,512) (0.01)(37,939) Zscaler Inc (287) (0.00)
(188,466) Zuora Inc (6,345) (0.00) (12,076,668) (2.50)
Total contracts for difference (14,583,680) (3.02)
Futures contractsHong Kong
(199) HSCEI Futures January 2020 (162,972) (0.03)
United States(74) DJIA MINI E-CBOT March 2020 (137,640) (0.04)
(210) NASDAQ 100 E-MINI March 2020 (930,620) (0.19)(51) S&P500 EMINI Futures March 2020 (96,638) (0.02)
(1,164,898) (0.25)
Total futures contracts (1,327,870) (0.28)
274

Man Funds VI plcSchedule of investments as at 31 December 2019 (continued)Man GLG Innovation Equity Alternative (continued)
Financial liabilities at fair value through profit or loss (continued)
Forward currency contracts (note 4)** Unrealised % of
loss Net Amount Receivable Amount Payable Maturity Date Contracts US$ AssetsSEK17,610,764 US$1,892,174 16 January 2020 1 (9,382) (0.00)
US$2,842,012 €2,559,216 10 January 2020 6 (32,500) (0.01)
US$21,658,052 €19,472,607 16 January 2020 4 (221,784) (0.05)
US$153,204 £117,140 10 January 2020 3 (2,022) (0.00)
US$15,140,242 HKD118,513,023 16 January 2020 5 (66,661) (0.01)
US$5,651,986 SEK53,793,945 16 January 2020 1 (99,203) (0.02)
Total unrealised loss on forward currency contracts (431,552) (0.09)
Total financial liabilities at fair value through profit & loss - trading (16,343,102) (3.39)
Total financial assets at fair value through profit & loss - trading 456,783,072 94.68
Total financial liabilities at fair value through profit & loss - trading (16,343,102) (3.39)
Other net assets 42,005,883 8.71
Net Assets Attributable to Holders of Redeemable Participating Shares 482,445,853 100.00
**The forward currency contracts are held with the Bank of New York Mellon & Morgan Stanley & Co. International Plc
Classifications :(a) Exchange traded derivative instruments(b) OTC financial derivatives instruments * Transferable securities dealt on another regulated market #Transferable securities other than those listed on an official stock exchange or dealt on another regulated market
All other investments held at the year end are transferable securities listed on an official stock exchange
% of TotalAnalysis of Total Assets AssetsTransferable securities listed on an official stock exchange 50.36Exchage traded financial derivative instruments described in classification (a) above 0.01OTC financial derivative instruments described in classification (b) above 3.16Other current assets 46.47
100.00
Analysis of Total Assets rather than Net Assets is required under UCITS Notice 8.2 appendix B.
275
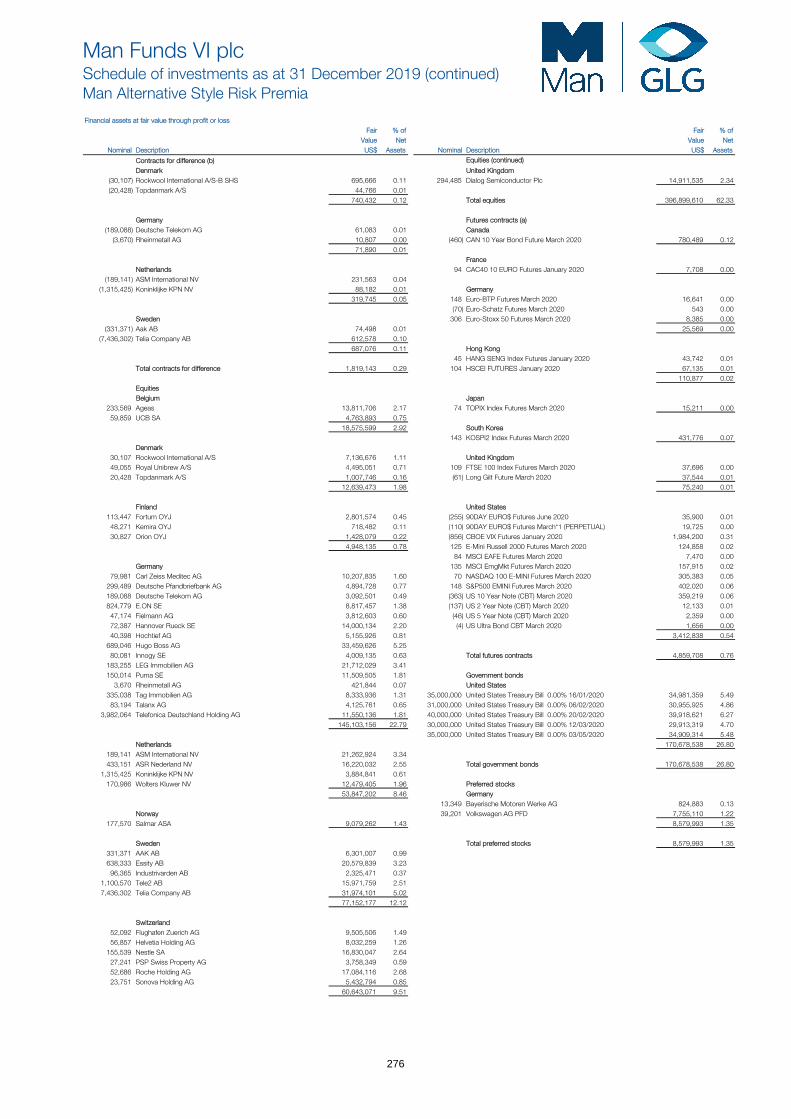
Man Funds VI plcSchedule of investments as at 31 December 2019 (continued)Man Alternative Style Risk Premia
Financial assets at fair value through profit or loss Fair % of Fair % of
Value Net Value Net Nominal Description US$ Assets Nominal Description US$ Assets
Contracts for difference (b) Equities (continued)
Denmark United Kingdom(30,107) Rockwool International A/S-B SHS 695,666 0.11 294,485 Dialog Semiconductor Plc 14,911,535 2.34(20,428) Topdanmark A/S 44,766 0.01
740,432 0.12 Total equities 396,899,610 62.33
Germany Futures contracts (a)(189,088) Deutsche Telekom AG 61,083 0.01 Canada
(3,670) Rheinmetall AG 10,807 0.00 (460) CAN 10 Year Bond Future March 2020 780,489 0.1271,890 0.01
FranceNetherlands 94 CAC40 10 EURO Futures January 2020 7,708 0.00
(189,141) ASM International NV 231,563 0.04(1,315,425) Koninklijke KPN NV 88,182 0.01 Germany
319,745 0.05 148 Euro-BTP Futures March 2020 16,641 0.00(70) Euro-Schatz Futures March 2020 543 0.00
Sweden 306 Euro-Stoxx 50 Futures March 2020 8,385 0.00(331,371) Aak AB 74,498 0.01 25,569 0.00
(7,436,302) Telia Company AB 612,578 0.10687,076 0.11 Hong Kong
45 HANG SENG Index Futures January 2020 43,742 0.01Total contracts for difference 1,819,143 0.29 104 HSCEI FUTURES January 2020 67,135 0.01
110,877 0.02EquitiesBelgium Japan
233,569 Ageas 13,811,706 2.17 74 TOPIX Index Futures March 2020 15,211 0.0059,859 UCB SA 4,763,893 0.75
18,575,599 2.92 South Korea143 KOSPI2 Index Futures March 2020 431,776 0.07
Denmark30,107 Rockwool International A/S 7,136,676 1.11 United Kingdom49,055 Royal Unibrew A/S 4,495,051 0.71 109 FTSE 100 Index Futures March 2020 37,696 0.0020,428 Topdanmark A/S 1,007,746 0.16 (61) Long Gilt Future March 2020 37,544 0.01
12,639,473 1.98 75,240 0.01
Finland United States113,447 Fortum OYJ 2,801,574 0.45 (255) 90DAY EURO$ Futures June 2020 35,900 0.01
48,271 Kemira OYJ 718,482 0.11 (110) 90DAY EURO$ Futures March*1 (PERPETUAL) 19,725 0.0030,827 Orion OYJ 1,428,079 0.22 (856) CBOE VIX Futures January 2020 1,984,200 0.31
4,948,135 0.78 125 E-Mini Russell 2000 Futures March 2020 124,858 0.0284 MSCI EAFE Futures March 2020 7,470 0.00
Germany 135 MSCI EmgMkt Futures March 2020 157,915 0.0279,981 Carl Zeiss Meditec AG 10,207,835 1.60 70 NASDAQ 100 E-MINI Futures March 2020 305,383 0.05
299,489 Deutsche Pfandbriefbank AG 4,894,728 0.77 148 S&P500 EMINI Futures March 2020 402,020 0.06189,088 Deutsche Telekom AG 3,092,501 0.49 (363) US 10 Year Note (CBT) March 2020 359,219 0.06824,779 E.ON SE 8,817,457 1.38 (137) US 2 Year Note (CBT) March 2020 12,133 0.01
47,174 Fielmann AG 3,812,603 0.60 (46) US 5 Year Note (CBT) March 2020 2,359 0.0072,387 Hannover Rueck SE 14,000,134 2.20 (4) US Ultra Bond CBT March 2020 1,656 0.0040,398 Hochtief AG 5,155,926 0.81 3,412,838 0.54
689,046 Hugo Boss AG 33,459,626 5.2580,081 Innogy SE 4,009,135 0.63 Total futures contracts 4,859,708 0.76
183,255 LEG Immobilien AG 21,712,029 3.41150,014 Puma SE 11,509,505 1.81 Government bonds
3,670 Rheinmetall AG 421,844 0.07 United States335,038 Tag Immobilien AG 8,333,936 1.31 35,000,000 United States Treasury Bill 0.00% 16/01/2020 34,981,359 5.49
83,194 Talanx AG 4,125,761 0.65 31,000,000 United States Treasury Bill 0.00% 06/02/2020 30,955,925 4.863,982,064 Telefonica Deutschland Holding AG 11,550,136 1.81 40,000,000 United States Treasury Bill 0.00% 20/02/2020 39,918,621 6.27
145,103,156 22.79 30,000,000 United States Treasury Bill 0.00% 12/03/2020 29,913,319 4.7035,000,000 United States Treasury Bill 0.00% 03/05/2020 34,909,314 5.48
Netherlands 170,678,538 26.80189,141 ASM International NV 21,262,924 3.34433,151 ASR Nederland NV 16,220,032 2.55 Total government bonds 170,678,538 26.80
1,315,425 Koninklijke KPN NV 3,884,841 0.61170,986 Wolters Kluwer NV 12,479,405 1.96 Preferred stocks
53,847,202 8.46 Germany13,349 Bayerische Motoren Werke AG 824,883 0.13
Norway 39,201 Volkswagen AG PFD 7,755,110 1.22177,570 Salmar ASA 9,079,262 1.43 8,579,993 1.35
Sweden Total preferred stocks 8,579,993 1.35331,371 AAK AB 6,301,007 0.99638,333 Essity AB 20,579,839 3.23
96,365 Industrivarden AB 2,325,471 0.371,100,570 Tele2 AB 15,971,759 2.517,436,302 Telia Company AB 31,974,101 5.02
77,152,177 12.12
Switzerland52,092 Flughafen Zuerich AG 9,505,506 1.4956,857 Helvetia Holding AG 8,032,259 1.26
155,539 Nestle SA 16,830,047 2.6427,241 PSP Swiss Property AG 3,758,349 0.5952,686 Roche Holding AG 17,084,116 2.6823,751 Sonova Holding AG 5,432,794 0.85
60,643,071 9.51
276
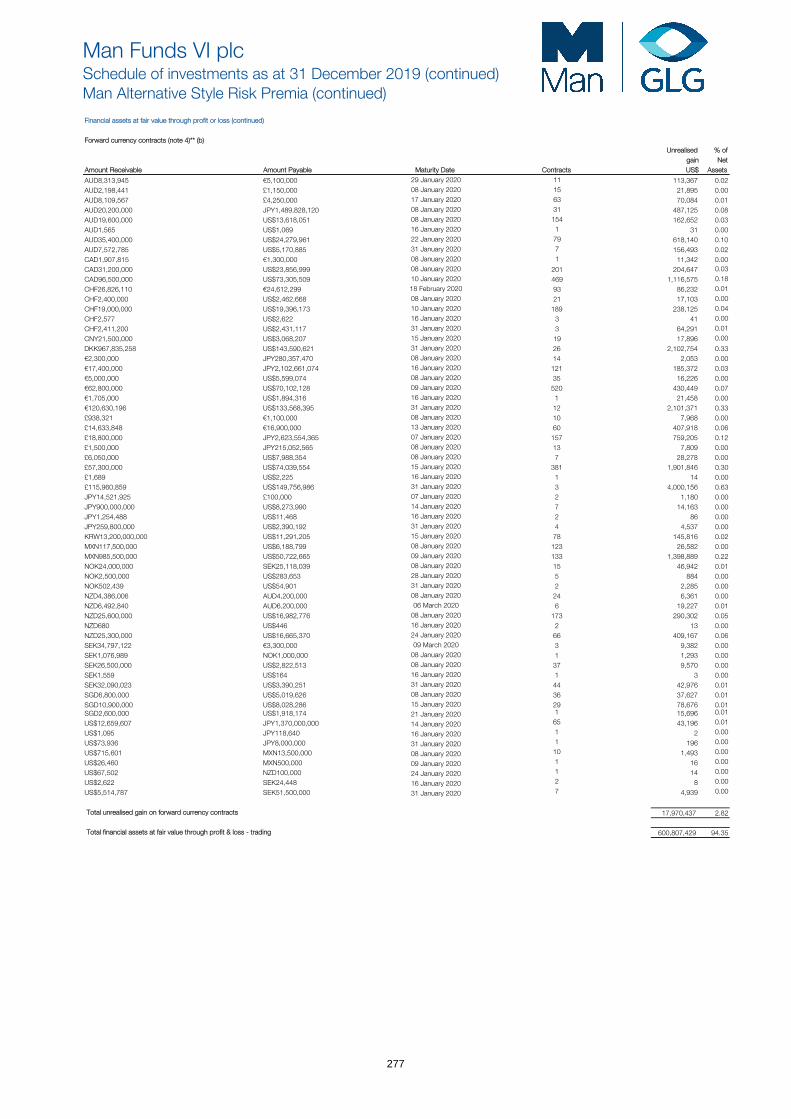
Man Funds VI plcSchedule of investments as at 31 December 2019 (continued)Man Alternative Style Risk Premia (continued)
Financial assets at fair value through profit or loss (continued)
Forward currency contracts (note 4)** (b) Unrealised % of
gain Net Amount Receivable Amount Payable Maturity Date Contracts US$ Assets
AUD8,313,945 €5,100,000 29 January 2020 11 113,367 0.02AUD2,198,441 £1,150,000 08 January 2020 15 21,895 0.00AUD8,109,567 £4,250,000 17 January 2020 63 70,084 0.01AUD20,200,000 JPY1,489,828,120 08 January 2020 31 487,125 0.08AUD19,600,000 US$13,618,051 08 January 2020 154 162,652 0.03AUD1,565 US$1,069 16 January 2020 1 31 0.00AUD35,400,000 US$24,279,961 22 January 2020 79 618,140 0.10AUD7,572,785 US$5,170,885 31 January 2020 7 156,493 0.02CAD1,907,815 €1,300,000 08 January 2020 1 11,342 0.00CAD31,200,000 US$23,856,999 08 January 2020 201 204,647 0.03
CAD96,500,000 US$73,305,509 10 January 2020 469 1,116,575 0.18
CHF26,826,110 €24,612,299 18 February 2020 93 86,232 0.01
CHF2,400,000 US$2,462,668 08 January 2020 21 17,103 0.00
CHF19,000,000 US$19,396,173 10 January 2020 189 238,125 0.04
CHF2,577 US$2,622 16 January 2020 3 41 0.00
CHF2,411,200 US$2,431,117 31 January 2020 3 64,291 0.01
CNY21,500,000 US$3,068,207 15 January 2020 19 17,896 0.00
DKK967,835,258 US$143,590,621 31 January 2020 26 2,102,754 0.33€2,300,000 JPY280,357,470 08 January 2020 14 2,053 0.00€17,400,000 JPY2,102,661,074 16 January 2020 121 185,372 0.03€5,000,000 US$5,599,074 08 January 2020 35 16,226 0.00€62,800,000 US$70,102,128 09 January 2020 520 430,449 0.07€1,705,000 US$1,894,316 16 January 2020 1 21,458 0.00€120,630,196 US$133,568,395 31 January 2020 12 2,101,371 0.33£938,321 €1,100,000 08 January 2020 10 7,968 0.00£14,633,848 €16,900,000 13 January 2020 60 407,918 0.06£18,800,000 JPY2,623,554,365 07 January 2020 157 759,205 0.12£1,500,000 JPY215,052,565 08 January 2020 13 7,809 0.00£6,050,000 US$7,988,354 08 January 2020 7 28,278 0.00£57,300,000 US$74,039,554 15 January 2020 381 1,901,846 0.30£1,689 US$2,225 16 January 2020 1 14 0.00£115,960,859 US$149,756,986 31 January 2020 3 4,000,156 0.63JPY14,521,925 £100,000 07 January 2020 2 1,180 0.00JPY900,000,000 US$8,273,990 14 January 2020 7 14,163 0.00JPY1,254,488 US$11,468 16 January 2020 2 86 0.00JPY259,800,000 US$2,390,192 31 January 2020 4 4,537 0.00KRW13,200,000,000 US$11,291,205 15 January 2020 78 145,816 0.02MXN117,500,000 US$6,188,799 08 January 2020 123 26,582 0.00MXN985,500,000 US$50,722,665 09 January 2020 133 1,398,889 0.22NOK24,000,000 SEK25,118,039 08 January 2020 15 46,942 0.01NOK2,500,000 US$283,653 28 January 2020 5 884 0.00NOK502,439 US$54,901 31 January 2020 2 2,285 0.00NZD4,386,006 AUD4,200,000 08 January 2020 24 6,361 0.00NZD6,492,840 AUD6,200,000 06 March 2020 6 19,227 0.01NZD25,600,000 US$16,982,776 08 January 2020 173 290,302 0.05NZD680 US$446 16 January 2020 2 13 0.00NZD25,300,000 US$16,665,370 24 January 2020 66 409,167 0.06SEK34,797,122 €3,300,000 09 March 2020 3 9,382 0.00SEK1,076,989 NOK1,000,000 08 January 2020 1 1,293 0.00SEK26,500,000 US$2,822,513 08 January 2020 37 9,570 0.00SEK1,559 US$164 16 January 2020 1 3 0.00SEK32,090,023 US$3,390,251 31 January 2020 44 42,976 0.01SGD6,800,000 US$5,019,626 08 January 2020 36 37,627 0.01SGD10,900,000 US$8,028,286 15 January 2020 29 78,676 0.01SGD2,600,000 US$1,918,174 21 January 2020 1 15,696 0.01
US$12,659,607 JPY1,370,000,000 14 January 2020 65 43,196 0.01
US$1,095 JPY118,640 16 January 2020 1 2 0.00
US$73,936 JPY8,000,000 31 January 2020 1 196 0.00
US$715,601 MXN13,500,000 08 January 2020 10 1,493 0.00
US$26,460 MXN500,000 09 January 2020 1 16 0.00
US$67,502 NZD100,000 24 January 2020 1 14 0.00
US$2,622 SEK24,448 16 January 2020 2 8 0.00
US$5,514,787 SEK51,500,000 31 January 2020 7 4,939 0.00
Total unrealised gain on forward currency contracts 17,970,437 2.82
Total financial assets at fair value through profit & loss - trading 600,807,429 94.35
277
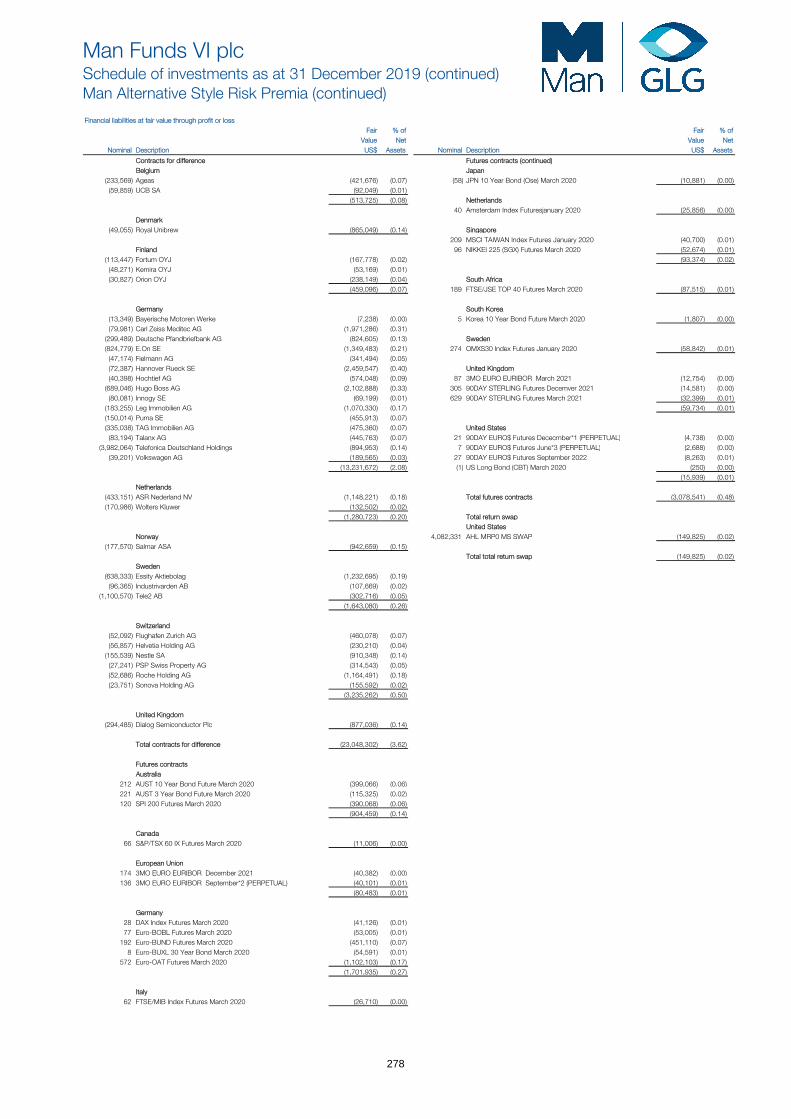
Man Funds VI plcSchedule of investments as at 31 December 2019 (continued)Man Alternative Style Risk Premia (continued)
Financial liabilities at fair value through profit or loss Fair % of Fair % of
Value Net Value Net Nominal Description US$ Assets Nominal Description US$ Assets
Contracts for difference Futures contracts (continued)Belgium Japan
(233,569) Ageas (421,676) (0.07) (58) JPN 10 Year Bond (Ose) March 2020 (10,881) (0.00) (59,859) UCB SA (92,049) (0.01)
(513,725) (0.08) Netherlands40 Amsterdam Index Futuresjanuary 2020 (25,856) (0.00)
Denmark(49,055) Royal Unibrew (865,049) (0.14) Singapore
209 MSCI TAIWAN Index Futures January 2020 (40,700) (0.01)Finland 96 NIKKEI 225 (SGX) Futures March 2020 (52,674) (0.01)
(113,447) Fortum OYJ (167,778) (0.02) (93,374) (0.02)(48,271) Kemira OYJ (53,169) (0.01)(30,827) Orion OYJ (238,149) (0.04) South Africa
(459,096) (0.07) 189 FTSE/JSE TOP 40 Futures March 2020 (87,515) (0.01)
Germany South Korea(13,349) Bayerische Motoren Werke (7,238) (0.00) 5 Korea 10 Year Bond Future March 2020 (1,807) (0.00) (79,981) Carl Zeiss Meditec AG (1,971,286) (0.31)
(299,489) Deutsche Pfandbriefbank AG (824,605) (0.13) Sweden(824,779) E.On SE (1,349,483) (0.21) 274 OMXS30 Index Futures January 2020 (58,842) (0.01)
(47,174) Fielmann AG (341,494) (0.05)(72,387) Hannover Rueck SE (2,459,547) (0.40) United Kingdom(40,398) Hochtief AG (574,048) (0.09) 87 3MO EURO EURIBOR March 2021 (12,754) (0.00)
(689,046) Hugo Boss AG (2,102,888) (0.33) 305 90DAY STERLING Futures Decemver 2021 (14,581) (0.00) (80,081) Innogy SE (69,199) (0.01) 629 90DAY STERLING Futures March 2021 (32,399) (0.01)
(183,255) Leg Immobilien AG (1,070,330) (0.17) (59,734) (0.01)(150,014) Puma SE (455,913) (0.07)(335,038) TAG Immobilien AG (475,360) (0.07) United States
(83,194) Talanx AG (445,763) (0.07) 21 90DAY EURO$ Futures Dececmber*1 (PERPETUAL) (4,738) (0.00) (3,982,064) Telefonica Deutschland Holdings (894,953) (0.14) 7 90DAY EURO$ Futures June*3 (PERPETUAL) (2,688) (0.00)
(39,201) Volkswagen AG (189,565) (0.03) 27 90DAY EURO$ Futures September 2022 (8,263) (0.01)(13,231,672) (2.08) (1) US Long Bond (CBT) March 2020 (250) (0.00)
(15,939) (0.01)Netherlands
(433,151) ASR Nederland NV (1,148,221) (0.18) Total futures contracts (3,078,541) (0.48)(170,986) Wolters Kluwer (132,502) (0.02)
(1,280,723) (0.20) Total return swapUnited States
Norway 4,082,331 AHL MRP0 MS SWAP (149,825) (0.02)(177,570) Salmar ASA (942,659) (0.15)
Total total return swap (149,825) (0.02)Sweden
(638,333) Essity Aktiebolag (1,232,695) (0.19)(96,365) Industrivarden AB (107,669) (0.02)
(1,100,570) Tele2 AB (302,716) (0.05)(1,643,080) (0.26)
Switzerland(52,092) Flughafen Zurich AG (460,078) (0.07)(56,857) Helvetia Holding AG (230,210) (0.04)
(155,539) Nestle SA (910,348) (0.14)(27,241) PSP Swiss Property AG (314,543) (0.05)(52,686) Roche Holding AG (1,164,491) (0.18)(23,751) Sonova Holding AG (155,592) (0.02)
(3,235,262) (0.50)
United Kingdom(294,485) Dialog Semiconductor Plc (877,036) (0.14)
Total contracts for difference (23,048,302) (3.62)
Futures contractsAustralia
212 AUST 10 Year Bond Future March 2020 (399,066) (0.06)221 AUST 3 Year Bond Future March 2020 (115,325) (0.02)120 SPI 200 Futures March 2020 (390,068) (0.06)
(904,459) (0.14)
Canada66 S&P/TSX 60 IX Futures March 2020 (11,006) (0.00)
European Union174 3MO EURO EURIBOR December 2021 (40,382) (0.00) 136 3MO EURO EURIBOR September*2 (PERPETUAL) (40,101) (0.01)
(80,483) (0.01)
Germany28 DAX Index Futures March 2020 (41,126) (0.01)77 Euro-BOBL Futures March 2020 (53,005) (0.01)
192 Euro-BUND Futures March 2020 (451,110) (0.07)8 Euro-BUXL 30 Year Bond March 2020 (54,591) (0.01)
572 Euro-OAT Futures March 2020 (1,102,103) (0.17)(1,701,935) (0.27)
Italy62 FTSE/MIB Index Futures March 2020 (26,710) (0.00)
278
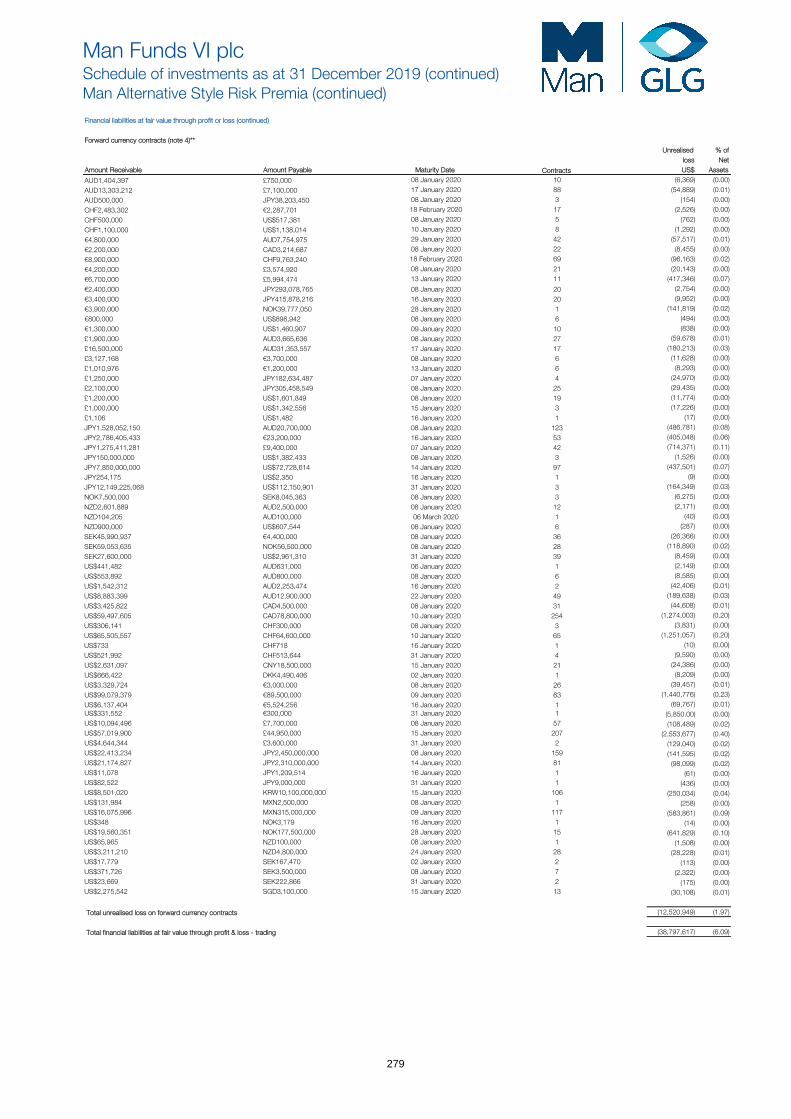
Man Funds VI plcSchedule of investments as at 31 December 2019 (continued)Man Alternative Style Risk Premia (continued)
Financial liabilities at fair value through profit or loss (continued)
Forward currency contracts (note 4)** Unrealised % of
loss Net Amount Receivable Amount Payable Maturity Date Contracts US$ Assets
AUD1,404,397 £750,000 08 January 2020 10 (6,369) (0.00)
AUD13,303,212 £7,100,000 17 January 2020 88 (54,889) (0.01)
AUD500,000 JPY38,203,450 08 January 2020 3 (154) (0.00)
CHF2,483,302 €2,287,701 18 February 2020 17 (2,526) (0.00)
CHF500,000 US$517,381 08 January 2020 5 (762) (0.00)
CHF1,100,000 US$1,138,014 10 January 2020 8 (1,292) (0.00)
€4,800,000 AUD7,754,975 29 January 2020 42 (57,517) (0.01)
€2,200,000 CAD3,214,687 08 January 2020 22 (8,455) (0.00)
€8,900,000 CHF9,763,240 18 February 2020 69 (96,163) (0.02)
€4,200,000 £3,574,920 08 January 2020 21 (20,143) (0.00)
€6,700,000 £5,994,474 13 January 2020 11 (417,346) (0.07)
€2,400,000 JPY293,078,765 08 January 2020 20 (2,754) (0.00)
€3,400,000 JPY415,878,216 16 January 2020 20 (9,952) (0.00)
€3,900,000 NOK39,777,050 28 January 2020 1 (141,819) (0.02)
€800,000 US$898,942 08 January 2020 6 (494) (0.00)
€1,300,000 US$1,460,907 09 January 2020 10 (838) (0.00)
£1,900,000 AUD3,665,636 08 January 2020 27 (59,678) (0.01)
£16,500,000 AUD31,353,557 17 January 2020 17 (180,213) (0.03)
£3,127,168 €3,700,000 08 January 2020 6 (11,628) (0.00)
£1,010,976 €1,200,000 13 January 2020 6 (8,293) (0.00)
£1,250,000 JPY182,634,487 07 January 2020 4 (24,970) (0.00)
£2,100,000 JPY305,458,549 08 January 2020 25 (29,435) (0.00)
£1,200,000 US$1,601,849 08 January 2020 19 (11,774) (0.00)
£1,000,000 US$1,342,556 15 January 2020 3 (17,226) (0.00)
£1,106 US$1,482 16 January 2020 1 (17) (0.00)
JPY1,528,052,150 AUD20,700,000 08 January 2020 123 (486,781) (0.08)
JPY2,786,405,433 €23,200,000 16 January 2020 53 (405,048) (0.06)
JPY1,275,411,281 £9,400,000 07 January 2020 42 (714,371) (0.11)
JPY150,000,000 US$1,382,433 08 January 2020 3 (1,526) (0.00)
JPY7,850,000,000 US$72,728,614 14 January 2020 97 (437,501) (0.07)
JPY254,175 US$2,350 16 January 2020 1 (9) (0.00)
JPY12,149,225,068 US$112,150,901 31 January 2020 3 (164,349) (0.03)
NOK7,500,000 SEK8,045,363 08 January 2020 3 (6,275) (0.00)
NZD2,601,889 AUD2,500,000 08 January 2020 12 (2,171) (0.00)
NZD104,205 AUD100,000 06 March 2020 1 (40) (0.00)
NZD900,000 US$607,544 08 January 2020 6 (287) (0.00)
SEK45,990,937 €4,400,000 08 January 2020 36 (26,366) (0.00)
SEK59,053,635 NOK56,500,000 08 January 2020 28 (118,890) (0.02)
SEK27,600,000 US$2,961,310 31 January 2020 39 (8,459) (0.00)
US$441,482 AUD631,000 06 January 2020 1 (2,149) (0.00)
US$553,892 AUD800,000 08 January 2020 6 (8,585) (0.00)
US$1,542,312 AUD2,253,474 16 January 2020 2 (42,406) (0.01)
US$8,883,399 AUD12,900,000 22 January 2020 49 (189,638) (0.03)
US$3,425,822 CAD4,500,000 08 January 2020 31 (44,608) (0.01)
US$59,497,605 CAD78,800,000 10 January 2020 254 (1,274,003) (0.20)
US$306,141 CHF300,000 08 January 2020 3 (3,831) (0.00)
US$65,505,557 CHF64,600,000 10 January 2020 65 (1,251,057) (0.20)
US$733 CHF718 16 January 2020 1 (10) (0.00)
US$521,992 CHF513,644 31 January 2020 4 (9,590) (0.00)
US$2,631,097 CNY18,500,000 15 January 2020 21 (24,386) (0.00)
US$666,422 DKK4,490,406 02 January 2020 1 (8,209) (0.00)
US$3,329,724 €3,000,000 08 January 2020 26 (39,457) (0.01)
US$99,079,379 €89,500,000 09 January 2020 63 (1,440,776) (0.23)
US$6,137,404 €5,524,256 16 January 2020 1 (69,767) (0.01)US$331,552 €300,000 31 January 2020 1 (5,850.00) (0.00) US$10,094,496 £7,700,000 08 January 2020 57 (108,489) (0.02)US$57,019,900 £44,950,000 15 January 2020 207 (2,553,677) (0.40)US$4,644,344 £3,600,000 31 January 2020 2 (129,040) (0.02)US$22,413,234 JPY2,450,000,000 08 January 2020 159 (141,595) (0.02)US$21,174,827 JPY2,310,000,000 14 January 2020 81 (98,099) (0.02)US$11,078 JPY1,209,514 16 January 2020 1 (61) (0.00) US$82,522 JPY9,000,000 31 January 2020 1 (436) (0.00) US$8,501,020 KRW10,100,000,000 15 January 2020 106 (250,034) (0.04)US$131,984 MXN2,500,000 08 January 2020 1 (258) (0.00) US$16,075,996 MXN315,000,000 09 January 2020 117 (583,861) (0.09)US$348 NOK3,179 16 January 2020 1 (14) (0.00) US$19,560,351 NOK177,500,000 28 January 2020 15 (641,829) (0.10)US$65,965 NZD100,000 08 January 2020 1 (1,508) (0.00) US$3,211,210 NZD4,800,000 24 January 2020 28 (28,228) (0.01)US$17,779 SEK167,470 02 January 2020 2 (113) (0.00) US$371,726 SEK3,500,000 08 January 2020 7 (2,322) (0.00) US$23,669 SEK222,866 31 January 2020 2 (175) (0.00) US$2,275,542 SGD3,100,000 15 January 2020 13 (30,108) (0.01)
Total unrealised loss on forward currency contracts (12,520,949) (1.97)
Total financial liabilities at fair value through profit & loss - trading (38,797,617) (6.09)
279
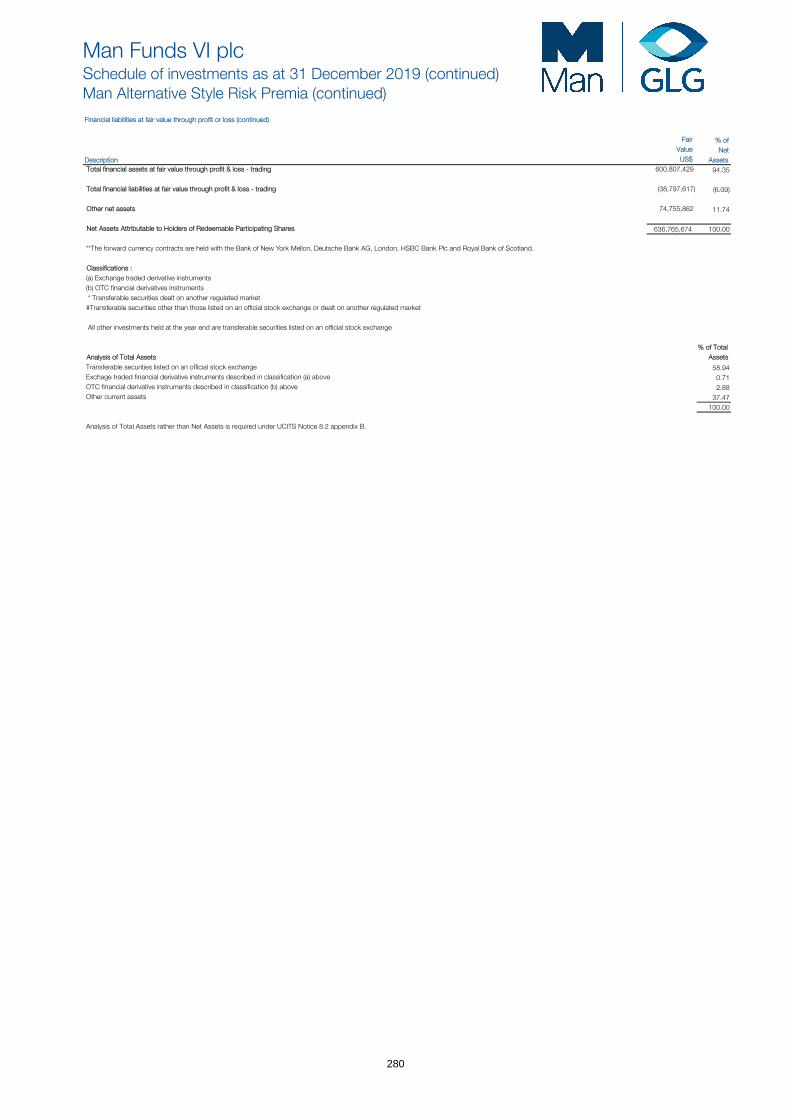
Man Funds VI plcSchedule of investments as at 31 December 2019 (continued)Man Alternative Style Risk Premia (continued)
Financial liabilities at fair value through profit or loss (continued)
Fair % of Value Net
Description US$ Assets Total financial assets at fair value through profit & loss - trading 600,807,429 94.35
Total financial liabilities at fair value through profit & loss - trading (38,797,617) (6.09)
Other net assets 74,755,862 11.74
Net Assets Attributable to Holders of Redeemable Participating Shares 636,765,674 100.00
**The forward currency contracts are held with the Bank of New York Mellon, Deutsche Bank AG, London, HSBC Bank Plc and Royal Bank of Scotland.
Classifications :(a) Exchange traded derivative instruments(b) OTC financial derivatives instruments* Transferable securities dealt on another regulated market
#Transferable securities other than those listed on an official stock exchange or dealt on another regulated market
All other investments held at the year end are transferable securities listed on an official stock exchange
% of TotalAnalysis of Total Assets AssetsTransferable securities listed on an official stock exchange 58.94 Exchage traded financial derivative instruments described in classification (a) above 0.71 OTC financial derivative instruments described in classification (b) above 2.88 Other current assets 37.47
100.00
Analysis of Total Assets rather than Net Assets is required under UCITS Notice 8.2 appendix B.
280
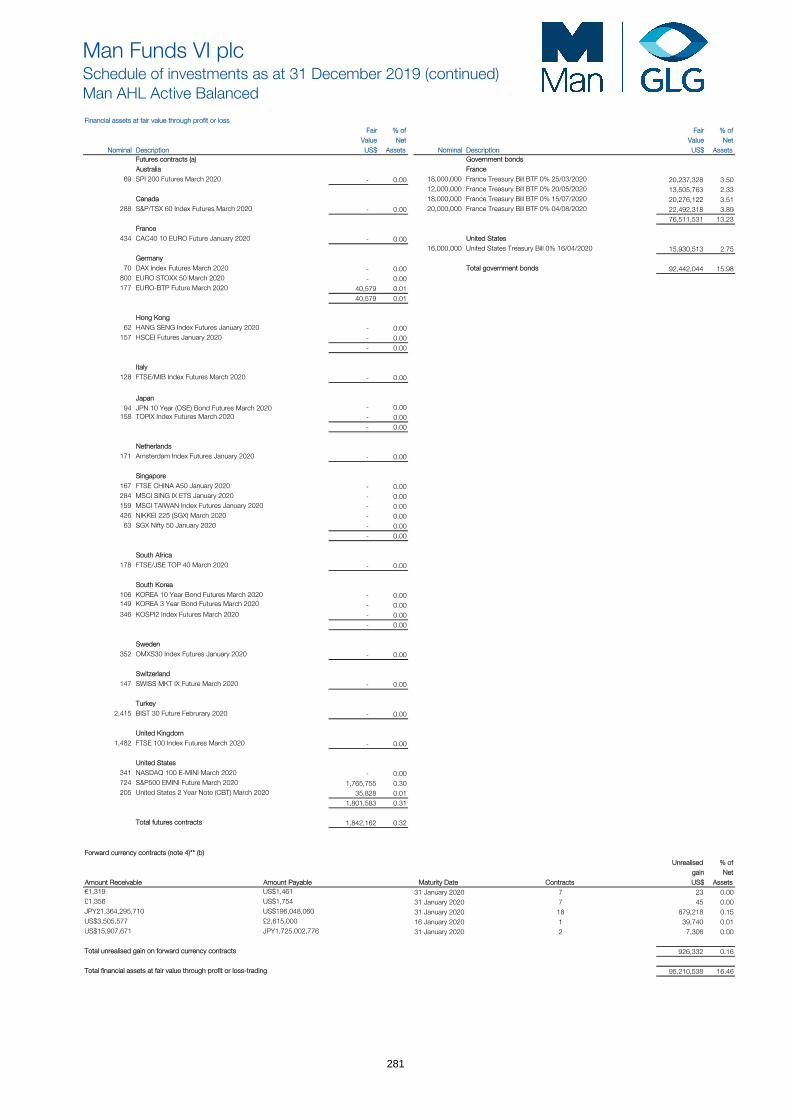
Man Funds VI plcSchedule of investments as at 31 December 2019 (continued)Man AHL Active Balanced
Financial assets at fair value through profit or loss Fair % of Fair % of
Value Net Value Net Nominal Description US$ Assets Nominal Description US$ Assets
Futures contracts (a) Government bondsAustralia France
69 SPI 200 Futures March 2020 - 0.00 18,000,000 France Treasury Bill BTF 0% 25/03/2020 20,237,328 3.5012,000,000 France Treasury Bill BTF 0% 20/05/2020 13,505,763 2.33
Canada 18,000,000 France Treasury Bill BTF 0% 15/07/2020 20,276,122 3.51288 S&P/TSX 60 Index Futures March 2020 - 0.00 20,000,000 France Treasury Bill BTF 0% 04/08/2020 22,492,318 3.89
76,511,531 13.23France
434 CAC40 10 EURO Future January 2020 - 0.00 United States16,000,000 United States Treasury Bill 0% 16/04/2020 15,930,513 2.75
Germany70 DAX Index Futures March 2020 - 0.00 Total government bonds 92,442,044 15.98
800 EURO STOXX 50 March 2020 - 0.00177 EURO-BTP Future March 2020 40,579 0.01
40,579 0.01
Hong Kong62 HANG SENG Index Futures January 2020 - 0.00
157 HSCEI Futures January 2020 - 0.00- 0.00
Italy128 FTSE/MIB Index Futures March 2020 - 0.00
Japan94 JPN 10 Year (OSE) Bond Futures March 2020 - 0.00
158 TOPIX Index Futures March 2020 - 0.00- 0.00
Netherlands171 Amsterdam Index Futures January 2020 - 0.00
Singapore167 FTSE CHINA A50 January 2020 - 0.00284 MSCI SING IX ETS January 2020 - 0.00159 MSCI TAIWAN Index Futures January 2020 - 0.00426 NIKKEI 225 (SGX) March 2020 - 0.00
63 SGX Nifty 50 January 2020 - 0.00- 0.00
South Africa178 FTSE/JSE TOP 40 March 2020 - 0.00
South Korea106 KOREA 10 Year Bond Futures March 2020 - 0.00149 KOREA 3 Year Bond Futures March 2020 - 0.00346 KOSPI2 Index Futures March 2020 - 0.00
- 0.00
Sweden352 OMXS30 Index Futures January 2020 - 0.00
Switzerland147 SWISS MKT IX Future March 2020 - 0.00
Turkey2,415 BIST 30 Future Februrary 2020 - 0.00
United Kingdom1,482 FTSE 100 Index Futures March 2020 - 0.00
United States341 NASDAQ 100 E-MINI March 2020 - 0.00724 S&P500 EMINI Future March 2020 1,765,755 0.30205 United States 2 Year Note (CBT) March 2020 35,828 0.01
1,801,583 0.31
Total futures contracts 1,842,162 0.32
Forward currency contracts (note 4)** (b) Unrealised % of
gain Net Amount Receivable Amount Payable Maturity Date Contracts US$ Assets€1,319 US$1,461 31 January 2020 7 23 0.00£1,356 US$1,754 31 January 2020 7 45 0.00JPY21,364,295,710 US$196,048,060 31 January 2020 18 879,218 0.15US$3,505,577 £2,615,000 16 January 2020 1 39,740 0.01US$15,907,671 JPY1,725,002,776 31 January 2020 2 7,306 0.00
Total unrealised gain on forward currency contracts 926,332 0.16
Total financial assets at fair value through profit or loss-trading 95,210,538 16.46
281
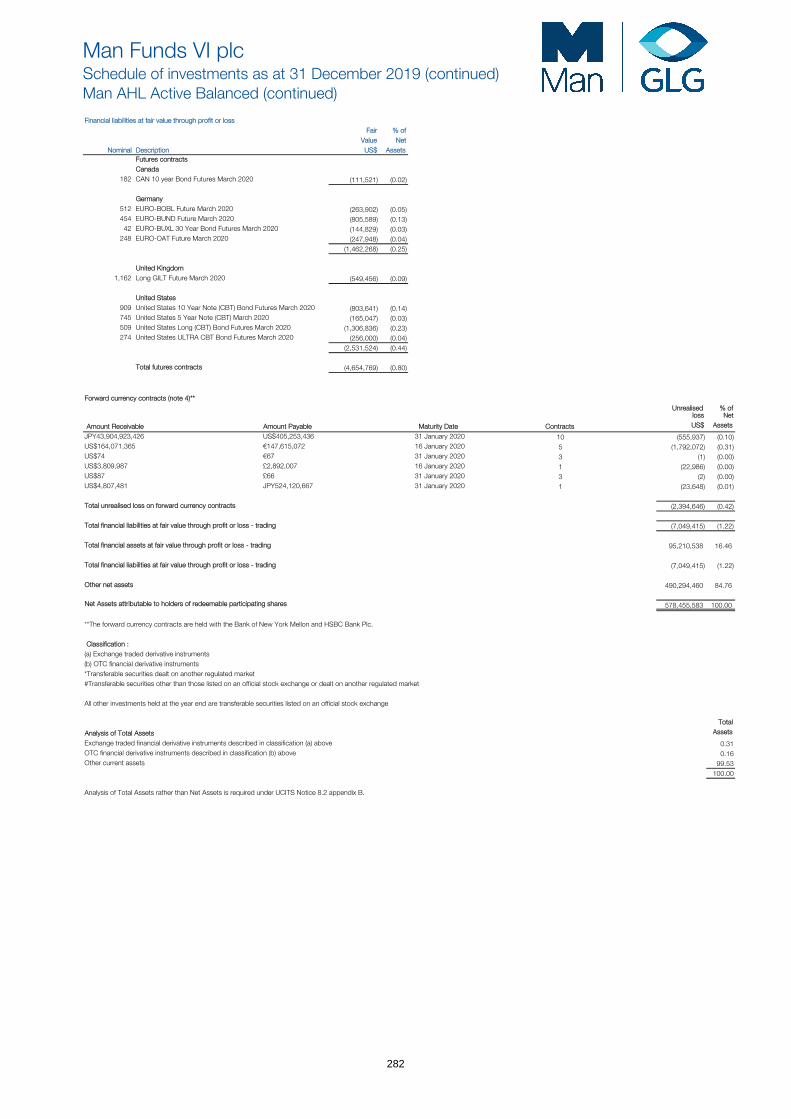
Man Funds VI plcSchedule of investments as at 31 December 2019 (continued)Man AHL Active Balanced (continued)
Financial liabilities at fair value through profit or loss Fair % of
Value Net Nominal Description US$ Assets
Futures contractsCanada
182 CAN 10 year Bond Futures March 2020 (111,521) (0.02)
Germany512 EURO-BOBL Future March 2020 (263,902) (0.05)454 EURO-BUND Future March 2020 (805,589) (0.13)
42 EURO-BUXL 30 Year Bond Futures March 2020 (144,829) (0.03)248 EURO-OAT Future March 2020 (247,948) (0.04)
(1,462,268) (0.25)
United Kingdom1,162 Long GILT Future March 2020 (549,456) (0.09)
United States909 United States 10 Year Note (CBT) Bond Futures March 2020 (803,641) (0.14)745 United States 5 Year Note (CBT) March 2020 (165,047) (0.03)509 United States Long (CBT) Bond Futures March 2020 (1,306,836) (0.23)274 United States ULTRA CBT Bond Futures March 2020 (256,000) (0.04)
(2,531,524) (0.44)
Total futures contracts (4,654,769) (0.80)
Forward currency contracts (note 4)** Unrealised % of
loss Net
Amount Receivable Amount Payable Maturity Date Contracts US$ Assets
JPY43,904,923,426 US$405,253,436 31 January 2020 10 (555,937) (0.10)US$164,071,365 €147,615,072 16 January 2020 5 (1,792,072) (0.31)US$74 €67 31 January 2020 3 (1) (0.00)US$3,809,987 £2,892,007 16 January 2020 1 (22,986) (0.00)US$87 £66 31 January 2020 3 (2) (0.00)US$4,807,481 JPY524,120,667 31 January 2020 1 (23,648) (0.01)
Total unrealised loss on forward currency contracts (2,394,646) (0.42)
Total financial liabilities at fair value through profit or loss - trading (7,049,415) (1.22)
Total financial assets at fair value through profit or loss - trading 95,210,538 16.46
Total financial liabilities at fair value through profit or loss - trading (7,049,415) (1.22)
Other net assets 490,294,460 84.76
Net Assets attributable to holders of redeemable participating shares 578,455,583 100.00
**The forward currency contracts are held with the Bank of New York Mellon and HSBC Bank Plc.
Classification :(a) Exchange traded derivative instruments(b) OTC financial derivative instruments*Transferable securities dealt on another regulated market#Transferable securities other than those listed on an official stock exchange or dealt on another regulated market
All other investments held at the year end are transferable securities listed on an official stock exchange
Total
Analysis of Total Assets Assets
Exchange traded financial derivative instruments described in classification (a) above 0.31 OTC financial derivative instruments described in classification (b) above 0.16 Other current assets 99.53
100.00
Analysis of Total Assets rather than Net Assets is required under UCITS Notice 8.2 appendix B.
282
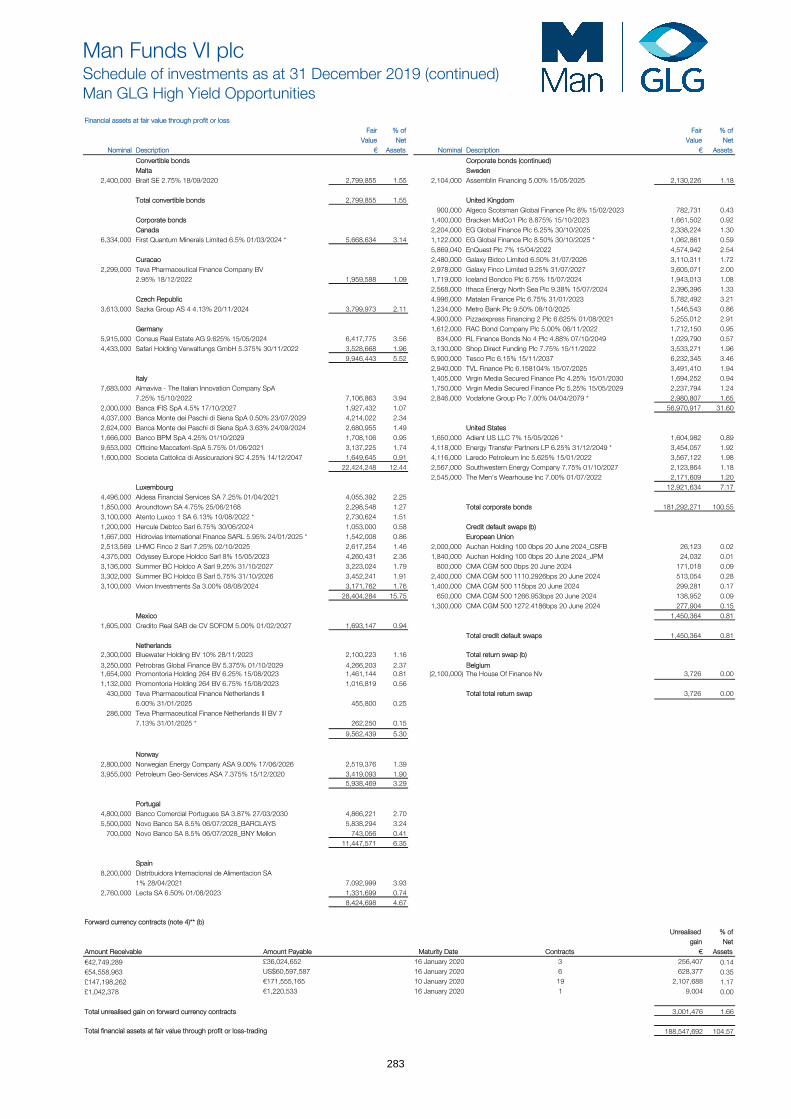
Man Funds VI plcSchedule of investments as at 31 December 2019 (continued)Man GLG High Yield Opportunities
Financial assets at fair value through profit or loss Fair % of Fair % of
Value Net Value Net Nominal Description € Assets Nominal Description € Assets
Convertible bonds Corporate bonds (continued)Malta Sweden
2,400,000 Brait SE 2.75% 18/09/2020 2,799,855 1.55 2,104,000 Assemblin Financing 5.00% 15/05/2025 2,130,226 1.18
Total convertible bonds 2,799,855 1.55 United Kingdom900,000 Algeco Scotsman Global Finance Plc 8% 15/02/2023 782,731 0.43
Corporate bonds 1,400,000 Bracken MidCo1 Plc 8.875% 15/10/2023 1,661,502 0.92Canada 2,204,000 EG Global Finance Plc 6.25% 30/10/2025 2,338,224 1.30
6,334,000 First Quantum Minerals Limited 6.5% 01/03/2024 * 5,668,634 3.14 1,122,000 EG Global Finance Plc 8.50% 30/10/2025 * 1,062,861 0.595,869,040 EnQuest Plc 7% 15/04/2022 4,574,942 2.54
Curacao 2,480,000 Galaxy Bidco Limited 6.50% 31/07/2026 3,110,311 1.722,299,000 Teva Pharmaceutical Finance Company BV 2,978,000 Galaxy Finco Limited 9.25% 31/07/2027 3,605,071 2.00
2.95% 18/12/2022 1,959,588 1.09 1,719,000 Iceland Bondco Plc 6.75% 15/07/2024 1,943,013 1.082,568,000 Ithaca Energy North Sea Plc 9.38% 15/07/2024 2,396,396 1.33
Czech Republic 4,996,000 Matalan Finance Plc 6.75% 31/01/2023 5,782,492 3.213,613,000 Sazka Group AS 4 4.13% 20/11/2024 3,799,973 2.11 1,234,000 Metro Bank Plc 9.50% 08/10/2025 1,546,543 0.86
4,900,000 Pizzaexpress Financing 2 Plc 6.625% 01/08/2021 5,255,012 2.91Germany 1,612,000 RAC Bond Company Plc 5.00% 06/11/2022 1,712,150 0.95
5,915,000 Consus Real Estate AG 9.625% 15/05/2024 6,417,775 3.56 834,000 RL Finance Bonds No 4 Plc 4.88% 07/10/2049 1,029,790 0.574,433,000 Safari Holding Verwaltungs GmbH 5.375% 30/11/2022 3,528,668 1.96 3,130,000 Shop Direct Funding Plc 7.75% 15/11/2022 3,533,271 1.96
9,946,443 5.52 5,900,000 Tesco Plc 6.15% 15/11/2037 6,232,345 3.462,940,000 TVL Finance Plc 6.158104% 15/07/2025 3,491,410 1.94
Italy 1,405,000 Virgin Media Secured Finance Plc 4.25% 15/01/2030 1,694,252 0.947,683,000 Almaviva - The Italian Innovation Company SpA 1,750,000 Virgin Media Secured Finance Plc 5.25% 15/05/2029 2,237,794 1.24
7.25% 15/10/2022 7,106,863 3.94 2,846,000 Vodafone Group Plc 7.00% 04/04/2079 * 2,980,807 1.652,000,000 Banca IFIS SpA 4.5% 17/10/2027 1,927,432 1.07 56,970,917 31.604,037,000 Banca Monte dei Paschi di Siena SpA 0.50% 23/07/2029 4,214,022 2.342,624,000 Banca Monte dei Paschi di Siena SpA 3.63% 24/09/2024 2,680,955 1.49 United States1,666,000 Banco BPM SpA 4.25% 01/10/2029 1,708,106 0.95 1,650,000 Adient US LLC 7% 15/05/2026 * 1,604,982 0.899,653,000 Officine Maccaferri-SpA 5.75% 01/06/2021 3,137,225 1.74 4,118,000 Energy Transfer Partners LP 6.25% 31/12/2049 * 3,454,057 1.921,600,000 Societa Cattolica di Assicurazioni SC 4.25% 14/12/2047 1,649,645 0.91 4,116,000 Laredo Petroleum Inc 5.625% 15/01/2022 3,567,122 1.98
22,424,248 12.44 2,567,000 Southwestern Energy Company 7.75% 01/10/2027 2,123,864 1.182,545,000 The Men's Wearhouse Inc 7.00% 01/07/2022 2,171,609 1.20
Luxembourg 12,921,634 7.174,496,000 Aldesa Financial Services SA 7.25% 01/04/2021 4,055,392 2.251,850,000 Aroundtown SA 4.75% 25/06/2168 2,298,548 1.27 Total corporate bonds 181,292,271 100.553,100,000 Atento Luxco 1 SA 6.13% 10/08/2022 * 2,730,624 1.511,200,000 Hercule Debtco Sarl 6.75% 30/06/2024 1,053,000 0.58 Credit default swaps (b)1,667,000 Hidrovias International Finance SARL 5.95% 24/01/2025 * 1,542,008 0.86 European Union2,513,569 LHMC Finco 2 Sarl 7.25% 02/10/2025 2,617,254 1.46 2,000,000 Auchan Holding 100 0bps 20 June 2024_CSFB 26,123 0.024,375,000 Odyssey Europe Holdco Sarl 8% 15/05/2023 4,260,431 2.36 1,840,000 Auchan Holding 100 0bps 20 June 2024_JPM 24,032 0.013,136,000 Summer BC Holdco A Sarl 9.25% 31/10/2027 3,223,024 1.79 800,000 CMA CGM 500 0bps 20 June 2024 171,018 0.093,302,000 Summer BC Holdco B Sarl 5.75% 31/10/2026 3,452,241 1.91 2,400,000 CMA CGM 500 1110.2926bps 20 June 2024 513,054 0.283,100,000 Vivion Investments Sa 3.00% 08/08/2024 3,171,762 1.76 1,400,000 CMA CGM 500 115bps 20 June 2024 299,281 0.17
28,404,284 15.75 650,000 CMA CGM 500 1266.953bps 20 June 2024 138,952 0.091,300,000 CMA CGM 500 1272.4186bps 20 June 2024 277,904 0.15
Mexico 1,450,364 0.811,605,000 Credito Real SAB de CV SOFOM 5.00% 01/02/2027 1,693,147 0.94
Total credit default swaps 1,450,364 0.81Netherlands
2,300,000 Bluewater Holding BV 10% 28/11/2023 2,100,223 1.16 Total return swap (b)
3,250,000 Petrobras Global Finance BV 5.375% 01/10/2029 4,266,203 2.37 Belgium1,654,000 Promontoria Holding 264 BV 6.25% 15/08/2023 1,461,144 0.81 (2,100,000) The House Of Finance NV 3,726 0.001,132,000 Promontoria Holding 264 BV 6.75% 15/08/2023 1,016,819 0.56
430,000 Teva Pharmaceutical Finance Netherlands II Total total return swap 3,726 0.006.00% 31/01/2025 455,800 0.25
286,000 Teva Pharmaceutical Finance Netherlands III BV 7 7.13% 31/01/2025 * 262,250 0.15
9,562,439 5.30
Norway2,800,000 Norwegian Energy Company ASA 9.00% 17/06/2026 2,519,376 1.393,955,000 Petroleum Geo-Services ASA 7.375% 15/12/2020 3,419,093 1.90
5,938,469 3.29
Portugal4,800,000 Banco Comercial Portugues SA 3.87% 27/03/2030 4,866,221 2.705,500,000 Novo Banco SA 8.5% 06/07/2028_BARCLAYS 5,838,294 3.24
700,000 Novo Banco SA 8.5% 06/07/2028_BNY Mellon 743,056 0.4111,447,571 6.35
Spain8,200,000 Distribuidora Internacional de Alimentacion SA
1% 28/04/2021 7,092,999 3.932,760,000 Lecta SA 6.50% 01/08/2023 1,331,699 0.74
8,424,698 4.67
Forward currency contracts (note 4)** (b) Unrealised % of
gain Net Amount Receivable Amount Payable Maturity Date Contracts € Assets
€42,749,289 £36,024,652 16 January 2020 3 256,407 0.14€54,558,963 US$60,597,587 16 January 2020 6 628,377 0.35£147,198,262 €171,555,165 10 January 2020 19 2,107,688 1.17£1,042,378 €1,220,533 16 January 2020 1 9,004 0.00
Total unrealised gain on forward currency contracts 3,001,476 1.66
Total financial assets at fair value through profit or loss-trading 188,547,692 104.57
283
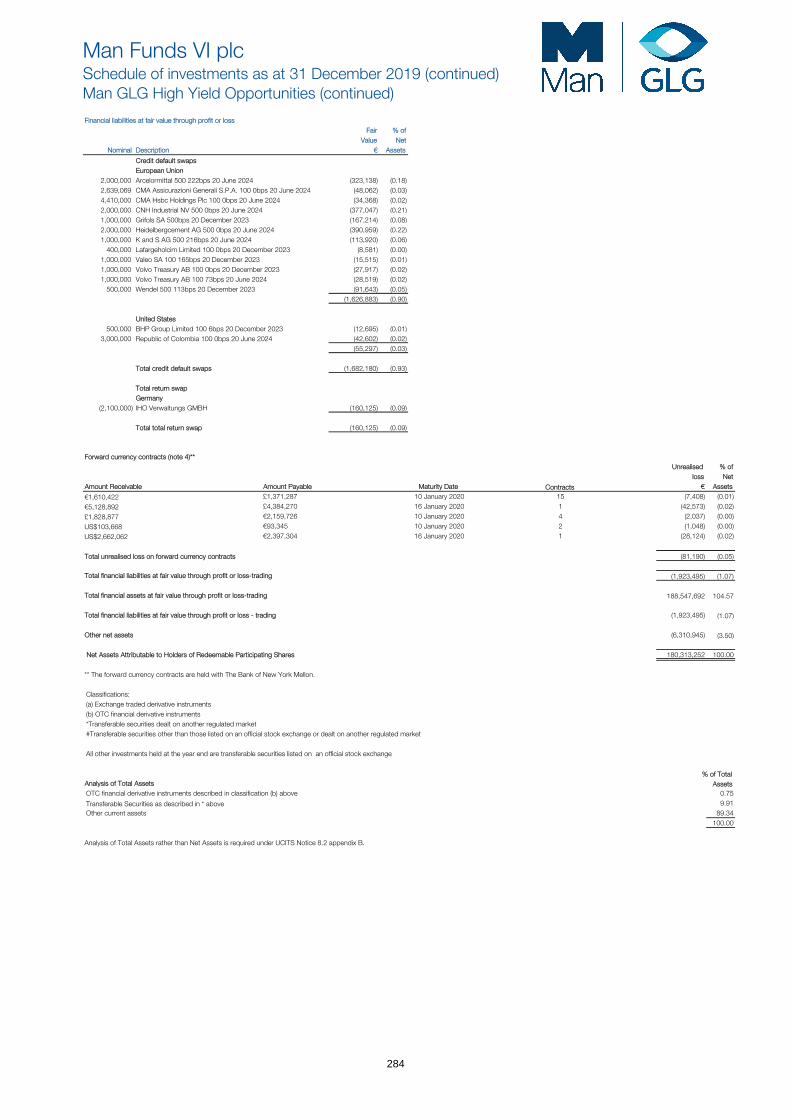
Man Funds VI plcSchedule of investments as at 31 December 2019 (continued)Man GLG High Yield Opportunities (continued)
Financial liabilities at fair value through profit or loss Fair % of
Value Net Nominal Description € Assets
Credit default swapsEuropean Union
2,000,000 Arcelormittal 500 222bps 20 June 2024 (323,138) (0.18)2,639,069 CMA Assicurazioni Generali S.P.A. 100 0bps 20 June 2024 (48,062) (0.03)4,410,000 CMA Hsbc Holdings Plc 100 0bps 20 June 2024 (34,368) (0.02)2,000,000 CNH Industrial NV 500 0bps 20 June 2024 (377,047) (0.21)1,000,000 Grifols SA 500bps 20 December 2023 (167,214) (0.08)2,000,000 Heidelbergcement AG 500 0bps 20 June 2024 (390,959) (0.22)1,000,000 K and S AG 500 216bps 20 June 2024 (113,920) (0.06)
400,000 Lafargeholcim Limited 100 0bps 20 December 2023 (8,581) (0.00) 1,000,000 Valeo SA 100 165bps 20 December 2023 (15,515) (0.01)1,000,000 Volvo Treasury AB 100 0bps 20 December 2023 (27,917) (0.02)1,000,000 Volvo Treasury AB 100 73bps 20 June 2024 (28,519) (0.02)
500,000 Wendel 500 113bps 20 December 2023 (91,643) (0.05)(1,626,883) (0.90)
United States500,000 BHP Group Limited 100 6bps 20 December 2023 (12,695) (0.01)
3,000,000 Republic of Colombia 100 0bps 20 June 2024 (42,602) (0.02)(55,297) (0.03)
Total credit default swaps (1,682,180) (0.93)
Total return swapGermany
(2,100,000) IHO Verwaltungs GMBH (160,125) (0.09)
Total total return swap (160,125) (0.09)
Forward currency contracts (note 4)** Unrealised % of
loss Net Amount Receivable Amount Payable Maturity Date Contracts € Assets
€1,610,422 £1,371,287 10 January 2020 15 (7,408) (0.01)
€5,128,892 £4,384,270 16 January 2020 1 (42,573) (0.02)
£1,828,877 €2,159,726 10 January 2020 4 (2,037) (0.00)
US$103,668 €93,345 10 January 2020 2 (1,048) (0.00)
US$2,662,062 €2,397,304 16 January 2020 1 (28,124) (0.02)
Total unrealised loss on forward currency contracts (81,190) (0.05)
Total financial liabilities at fair value through profit or loss-trading (1,923,495) (1.07)
Total financial assets at fair value through profit or loss-trading 188,547,692 104.57
Total financial liabilities at fair value through profit or loss - trading (1,923,495) (1.07)
Other net assets (6,310,945) (3.50)
Net Assets Attributable to Holders of Redeemable Participating Shares 180,313,252 100.00
** The forward currency contracts are held with The Bank of New York Mellon.
Classifications:(a) Exchange traded derivative instruments(b) OTC financial derivative instruments*Transferable securities dealt on another regulated market#Transferable securities other than those listed on an official stock exchange or dealt on another regulated market
All other investments held at the year end are transferable securities listed on an official stock exchange
% of TotalAnalysis of Total Assets AssetsOTC financial derivative instruments described in classification (b) above 0.75
Transferable Securities as described in * above 9.91Other current assets 89.34
100.00
Analysis of Total Assets rather than Net Assets is required under UCITS Notice 8.2 appendix B.
284
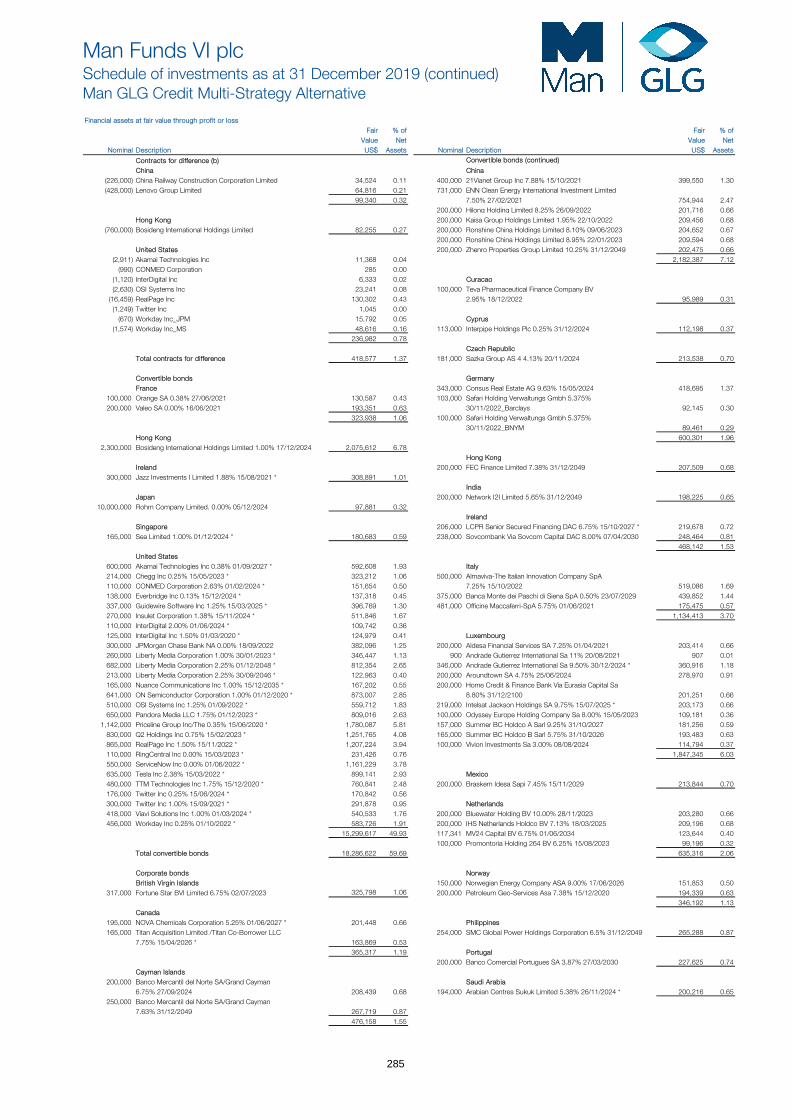
Man Funds VI plcSchedule of investments as at 31 December 2019 (continued)Man GLG Credit Multi-Strategy Alternative
Financial assets at fair value through profit or loss Fair % of Fair % of
Value Net Value Net Nominal Description US$ Assets Nominal Description US$ Assets
Contracts for difference (b) Convertible bonds (continued)
China China(226,000) China Railway Construction Corporation Limited 34,524 0.11 400,000 21Vianet Group Inc 7.88% 15/10/2021 399,550 1.30(428,000) Lenovo Group Limited 64,816 0.21 731,000 ENN Clean Energy International Investment Limited
99,340 0.32 7.50% 27/02/2021 754,944 2.47200,000 Hilong Holding Limited 8.25% 26/09/2022 201,716 0.66
Hong Kong 200,000 Kaisa Group Holdings Limited 1.95% 22/10/2022 209,456 0.68(760,000) Bosideng International Holdings Limited 82,255 0.27 200,000 Ronshine China Holdings Limited 8.10% 09/06/2023 204,652 0.67
200,000 Ronshine China Holdings Limited 8.95% 22/01/2023 209,594 0.68United States 200,000 Zhenro Properties Group Limited 10.25% 31/12/2049 202,475 0.66
(2,911) Akamai Technologies Inc 11,368 0.04 2,182,387 7.12(990) CONMED Corporation 285 0.00
(1,120) InterDigital Inc 6,333 0.02 Curacao(2,630) OSI Systems Inc 23,241 0.08 100,000 Teva Pharmaceutical Finance Company BV
(16,459) RealPage Inc 130,302 0.43 2.95% 18/12/2022 95,989 0.31(1,249) Twitter Inc 1,045 0.00
(670) Workday Inc_JPM 15,792 0.05 Cyprus(1,574) Workday Inc_MS 48,616 0.16 113,000 Interpipe Holdings Plc 0.25% 31/12/2024 112,198 0.37
236,982 0.78Czech Republic
Total contracts for difference 418,577 1.37 181,000 Sazka Group AS 4 4.13% 20/11/2024 213,538 0.70
Convertible bonds GermanyFrance 343,000 Consus Real Estate AG 9.63% 15/05/2024 418,695 1.37
100,000 Orange SA 0.38% 27/06/2021 130,587 0.43 103,000 Safari Holding Verwaltungs Gmbh 5.375% 200,000 Valeo SA 0.00% 16/06/2021 193,351 0.63 30/11/2022_Barclays 92,145 0.30
323,938 1.06 100,000 Safari Holding Verwaltungs Gmbh 5.375% 30/11/2022_BNYM 89,461 0.29
Hong Kong 600,301 1.962,300,000 Bosideng International Holdings Limited 1.00% 17/12/2024 2,075,612 6.78
Hong KongIreland 200,000 FEC Finance Limited 7.38% 31/12/2049 207,509 0.68
300,000 Jazz Investments I Limited 1.88% 15/08/2021 * 308,891 1.01India
Japan 200,000 Network I2I Limited 5.65% 31/12/2049 198,225 0.6510,000,000 Rohm Company Limited. 0.00% 05/12/2024 97,881 0.32
IrelandSingapore 206,000 LCPR Senior Secured Financing DAC 6.75% 15/10/2027 * 219,678 0.72
165,000 Sea Limited 1.00% 01/12/2024 * 180,683 0.59 238,000 Sovcombank Via Sovcom Capital DAC 8.00% 07/04/2030 248,464 0.81468,142 1.53
United States600,000 Akamai Technologies Inc 0.38% 01/09/2027 * 592,608 1.93 Italy214,000 Chegg Inc 0.25% 15/05/2023 * 323,212 1.06 500,000 Almaviva-The Italian Innovation Company SpA 110,000 CONMED Corporation 2.63% 01/02/2024 * 151,654 0.50 7.25% 15/10/2022 519,086 1.69138,000 Everbridge Inc 0.13% 15/12/2024 * 137,318 0.45 375,000 Banca Monte dei Paschi di Siena SpA 0.50% 23/07/2029 439,852 1.44337,000 Guidewire Software Inc 1.25% 15/03/2025 * 396,769 1.30 481,000 Officine Maccaferri-SpA 5.75% 01/06/2021 175,475 0.57270,000 Insulet Corporation 1.38% 15/11/2024 * 511,846 1.67 1,134,413 3.70110,000 InterDigital 2.00% 01/06/2024 * 109,742 0.36125,000 InterDigital Inc 1.50% 01/03/2020 * 124,979 0.41 Luxembourg300,000 JPMorgan Chase Bank NA 0.00% 18/09/2022 382,096 1.25 200,000 Aldesa Financial Services SA 7.25% 01/04/2021 203,414 0.66260,000 Liberty Media Corporation 1.00% 30/01/2023 * 346,447 1.13 900 Andrade Gutierrez International Sa 11% 20/08/2021 907 0.01682,000 Liberty Media Corporation 2.25% 01/12/2048 * 812,354 2.65 346,000 Andrade Gutierrez International Sa 9.50% 30/12/2024 * 360,916 1.18213,000 Liberty Media Corporation 2.25% 30/09/2046 * 122,963 0.40 200,000 Aroundtown SA 4.75% 25/06/2024 278,970 0.91165,000 Nuance Communications Inc 1.00% 15/12/2035 * 167,202 0.55 200,000 Home Credit & Finance Bank Via Eurasia Capital Sa 641,000 ON Semiconductor Corporation 1.00% 01/12/2020 * 873,007 2.85 8.80% 31/12/2100 201,251 0.66510,000 OSI Systems Inc 1.25% 01/09/2022 * 559,712 1.83 219,000 Intelsat Jackson Holdings SA 9.75% 15/07/2025 * 203,173 0.66650,000 Pandora Media LLC 1.75% 01/12/2023 * 809,016 2.63 100,000 Odyssey Europe Holding Company Sa 8.00% 15/05/2023 109,181 0.36
1,142,000 Priceline Group Inc/The 0.35% 15/06/2020 * 1,780,087 5.81 157,000 Summer BC Holdco A Sarl 9.25% 31/10/2027 181,256 0.59830,000 Q2 Holdings Inc 0.75% 15/02/2023 * 1,251,765 4.08 165,000 Summer BC Holdco B Sarl 5.75% 31/10/2026 193,483 0.63865,000 RealPage Inc 1.50% 15/11/2022 * 1,207,224 3.94 100,000 Vivion Investments Sa 3.00% 08/08/2024 114,794 0.37110,000 RingCentral Inc 0.00% 15/03/2023 * 231,426 0.76 1,847,345 6.03550,000 ServiceNow Inc 0.00% 01/06/2022 * 1,161,229 3.78635,000 Tesla Inc 2.38% 15/03/2022 * 899,141 2.93 Mexico480,000 TTM Technologies Inc 1.75% 15/12/2020 * 760,841 2.48 200,000 Braskem Idesa Sapi 7.45% 15/11/2029 213,844 0.70176,000 Twitter Inc 0.25% 15/06/2024 * 170,842 0.56300,000 Twitter Inc 1.00% 15/09/2021 * 291,878 0.95 Netherlands418,000 Viavi Solutions Inc 1.00% 01/03/2024 * 540,533 1.76 200,000 Bluewater Holding BV 10.00% 28/11/2023 203,280 0.66456,000 Workday Inc 0.25% 01/10/2022 * 583,726 1.91 200,000 IHS Netherlands Holdco BV 7.13% 18/03/2025 209,196 0.68
15,299,617 49.93 117,341 MV24 Capital BV 6.75% 01/06/2034 123,644 0.40100,000 Promontoria Holding 264 BV 6.25% 15/08/2023 99,196 0.32
Total convertible bonds 18,286,622 59.69 635,316 2.06
Corporate bonds NorwayBritish Virgin Islands 150,000 Norwegian Energy Company ASA 9.00% 17/06/2026 151,853 0.50
317,000 Fortune Star BVI Limited 6.75% 02/07/2023 325,798 1.06 200,000 Petroleum Geo-Services Asa 7.38% 15/12/2020 194,339 0.63346,192 1.13
Canada195,000 NOVA Chemicals Corporation 5.25% 01/06/2027 * 201,448 0.66 Philippines165,000 Titan Acquisition Limited /Titan Co-Borrower LLC 254,000 SMC Global Power Holdings Corporation 6.5% 31/12/2049 265,288 0.87
7.75% 15/04/2026 * 163,869 0.53365,317 1.19 Portugal
200,000 Banco Comercial Portugues SA 3.87% 27/03/2030 227,625 0.74Cayman Islands
200,000 Banco Mercantil del Norte SA/Grand Cayman Saudi Arabia6.75% 27/09/2024 208,439 0.68 194,000 Arabian Centres Sukuk Limited 5.38% 26/11/2024 * 200,216 0.65
250,000 Banco Mercantil del Norte SA/Grand Cayman 7.63% 31/12/2049 267,719 0.87
476,158 1.55
285
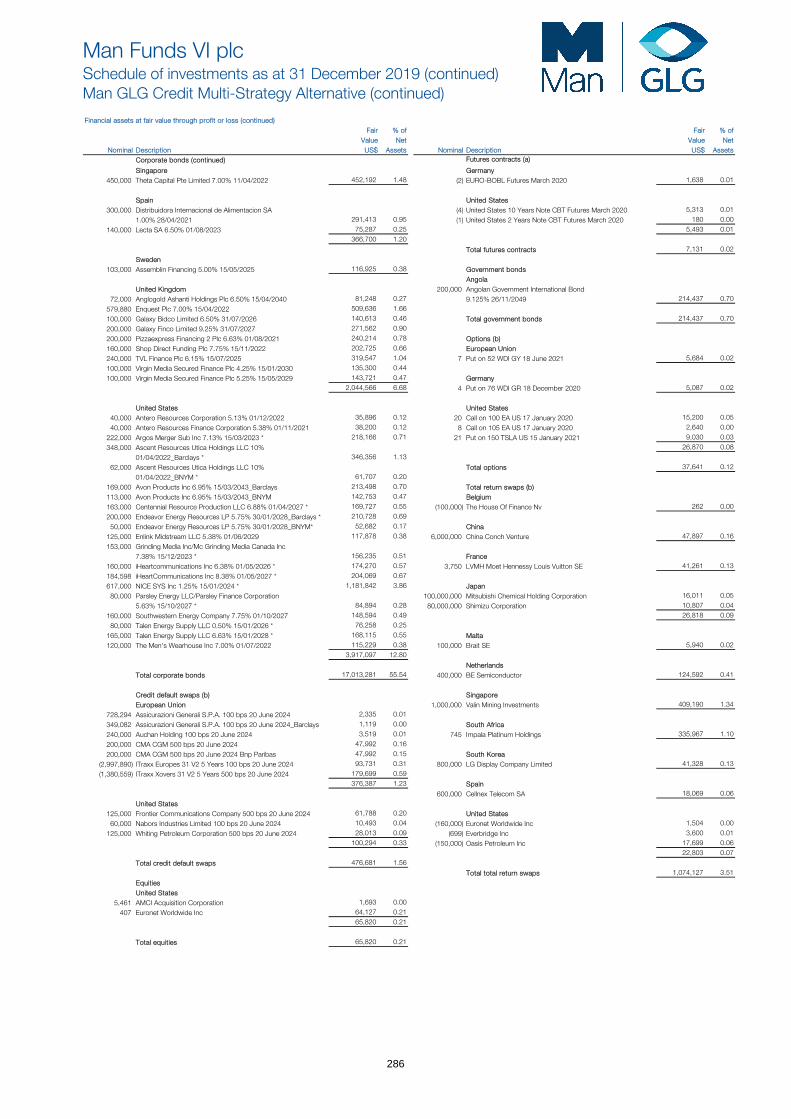
Man Funds VI plcSchedule of investments as at 31 December 2019 (continued)Man GLG Credit Multi-Strategy Alternative (continued)
Financial assets at fair value through profit or loss (continued) Fair % of Fair % of
Value Net Value Net Nominal Description US$ Assets Nominal Description US$ Assets
Corporate bonds (continued) Futures contracts (a)
Singapore Germany450,000 Theta Capital Pte Limited 7.00% 11/04/2022 452,192 1.48 (2) EURO-BOBL Futures March 2020 1,638 0.01
Spain United States300,000 Distribuidora Internacional de Alimentacion SA (4) United States 10 Years Note CBT Futures March 2020 5,313 0.01
1.00% 28/04/2021 291,413 0.95 (1) United States 2 Years Note CBT Futures March 2020 180 0.00
140,000 Lecta SA 6.50% 01/08/2023 75,287 0.25 5,493 0.01366,700 1.20
Total futures contracts 7,131 0.02
Sweden103,000 Assemblin Financing 5.00% 15/05/2025 116,925 0.38 Government bonds
AngolaUnited Kingdom 200,000 Angolan Government International Bond
72,000 Anglogold Ashanti Holdings Plc 6.50% 15/04/2040 81,248 0.27 9.125% 26/11/2049 214,437 0.70
579,880 Enquest Plc 7.00% 15/04/2022 509,636 1.66
100,000 Galaxy Bidco Limited 6.50% 31/07/2026 140,613 0.46 Total government bonds 214,437 0.70
200,000 Galaxy Finco Limited 9.25% 31/07/2027 271,562 0.90
200,000 Pizzaexpress Financing 2 Plc 6.63% 01/08/2021 240,214 0.78 Options (b)160,000 Shop Direct Funding Plc 7.75% 15/11/2022 202,725 0.66 European Union240,000 TVL Finance Plc 6.15% 15/07/2025 319,547 1.04 7 Put on 52 WDI GY 18 June 2021 5,684 0.02
100,000 Virgin Media Secured Finance Plc 4.25% 15/01/2030 135,300 0.44
100,000 Virgin Media Secured Finance Plc 5.25% 15/05/2029 143,721 0.47 Germany2,044,566 6.68 4 Put on 76 WDI GR 18 December 2020 5,087 0.02
United States United States40,000 Antero Resources Corporation 5.13% 01/12/2022 35,896 0.12 20 Call on 100 EA US 17 January 2020 15,200 0.05
40,000 Antero Resources Finance Corporation 5.38% 01/11/2021 38,200 0.12 8 Call on 105 EA US 17 January 2020 2,640 0.00
222,000 Argos Merger Sub Inc 7.13% 15/03/2023 * 218,166 0.71 21 Put on 150 TSLA US 15 January 2021 9,030 0.03
348,000 Ascent Resources Utica Holdings LLC 10% 26,870 0.08
01/04/2022_Barclays * 346,356 1.13
62,000 Ascent Resources Utica Holdings LLC 10% Total options 37,641 0.12
01/04/2022_BNYM * 61,707 0.20
169,000 Avon Products Inc 6.95% 15/03/2043_Barclays 213,498 0.70 Total return swaps (b)113,000 Avon Products Inc 6.95% 15/03/2043_BNYM 142,753 0.47 Belgium163,000 Centennial Resource Production LLC 6.88% 01/04/2027 * 169,727 0.55 (100,000) The House Of Finance Nv 262 0.00
200,000 Endeavor Energy Resources LP 5.75% 30/01/2028_Barclays * 210,728 0.69
50,000 Endeavor Energy Resources LP 5.75% 30/01/2028_BNYM* 52,682 0.17 China125,000 Enlink Midstream LLC 5.38% 01/06/2029 117,878 0.38 6,000,000 China Conch Venture 47,897 0.16
153,000 Grinding Media Inc/Mc Grinding Media Canada Inc 7.38% 15/12/2023 * 156,235 0.51 France
160,000 iHeartcommunications Inc 6.38% 01/05/2026 * 174,270 0.57 3,750 LVMH Moet Hennessy Louis Vuitton SE 41,261 0.13
184,598 iHeartCommunications Inc 8.38% 01/05/2027 * 204,069 0.67
617,000 NICE SYS Inc 1.25% 15/01/2024 * 1,181,842 3.86 Japan80,000 Parsley Energy LLC/Parsley Finance Corporation 100,000,000 Mitsubishi Chemical Holding Corporation 16,011 0.05
5.63% 15/10/2027 * 84,894 0.28 80,000,000 Shimizu Corporation 10,807 0.04
160,000 Southwestern Energy Company 7.75% 01/10/2027 148,594 0.49 26,818 0.09
80,000 Talen Energy Supply LLC 0.50% 15/01/2026 * 76,258 0.25
165,000 Talen Energy Supply LLC 6.63% 15/01/2028 * 168,115 0.55 Malta120,000 The Men's Wearhouse Inc 7.00% 01/07/2022 115,229 0.38 100,000 Brait SE 5,940 0.02
3,917,097 12.80
NetherlandsTotal corporate bonds 17,013,281 55.54 400,000 BE Semiconductor 124,592 0.41
Credit default swaps (b) SingaporeEuropean Union 1,000,000 Valin Mining Investments 409,190 1.34
728,294 Assicurazioni Generali S.P.A. 100 bps 20 June 2024 2,335 0.01
349,082 Assicurazioni Generali S.P.A. 100 bps 20 June 2024_Barclays 1,119 0.00 South Africa240,000 Auchan Holding 100 bps 20 June 2024 3,519 0.01 745 Impala Platinum Holdings 335,967 1.10
200,000 CMA CGM 500 bps 20 June 2024 47,992 0.16
200,000 CMA CGM 500 bps 20 June 2024 Bnp Paribas 47,992 0.15 South Korea(2,997,890) ITraxx Europes 31 V2 5 Years 100 bps 20 June 2024 93,731 0.31 800,000 LG Display Company Limited 41,328 0.13
(1,380,559) ITraxx Xovers 31 V2 5 Years 500 bps 20 June 2024 179,699 0.59376,387 1.23 Spain
600,000 Cellnex Telecom SA 18,069 0.06
United States125,000 Frontier Communications Company 500 bps 20 June 2024 61,788 0.20 United States
60,000 Nabors Industries Limited 100 bps 20 June 2024 10,493 0.04 (160,000) Euronet Worldwide Inc 1,504 0.00
125,000 Whiting Petroleum Corporation 500 bps 20 June 2024 28,013 0.09 (699) Everbridge Inc 3,600 0.01100,294 0.33 (150,000) Oasis Petroleum Inc 17,699 0.06
22,803 0.07
Total credit default swaps 476,681 1.56
Total total return swaps 1,074,127 3.51
EquitiesUnited States
5,461 AMCI Acquisition Corporation 1,693 0.00
407 Euronet Worldwide Inc 64,127 0.2165,820 0.21
Total equities 65,820 0.21
286
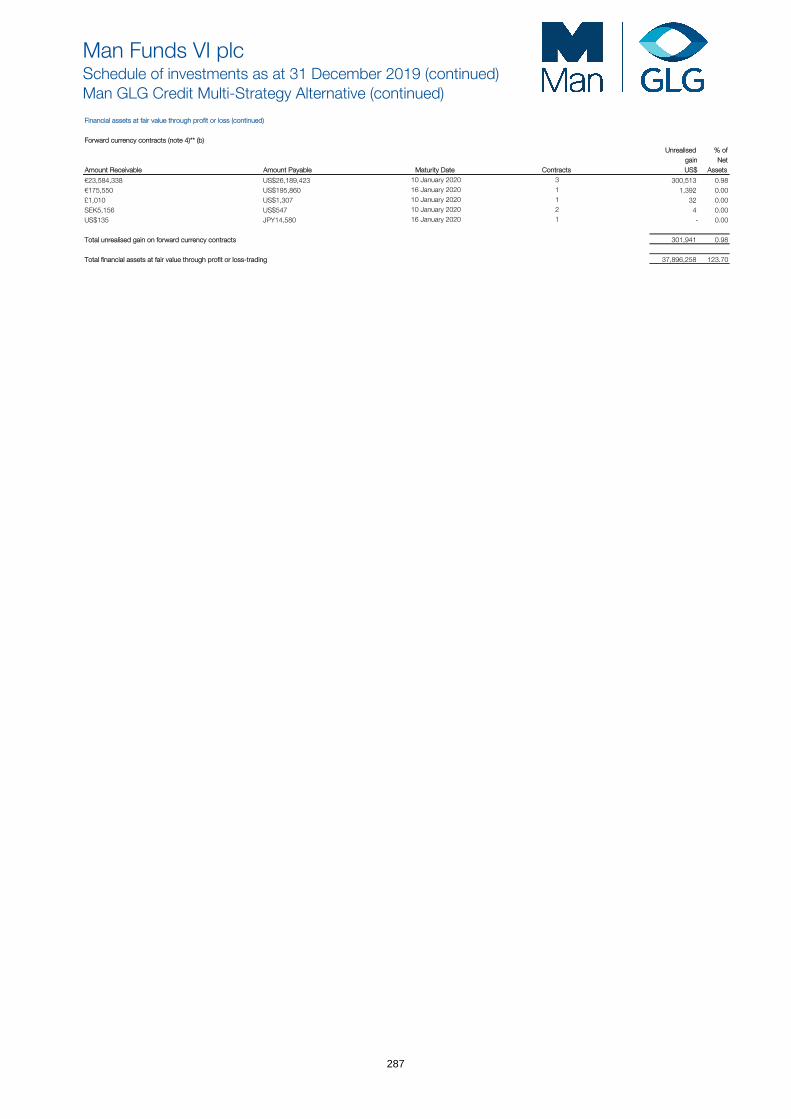
Man Funds VI plcSchedule of investments as at 31 December 2019 (continued)Man GLG Credit Multi-Strategy Alternative (continued)
Financial assets at fair value through profit or loss (continued)
Forward currency contracts (note 4)** (b) Unrealised % of
gain Net Amount Receivable Amount Payable Maturity Date Contracts US$ Assets
€23,584,338 US$26,189,423 10 January 2020 3 300,513 0.98€175,550 US$195,860 16 January 2020 1 1,392 0.00£1,010 US$1,307 10 January 2020 1 32 0.00SEK5,156 US$547 10 January 2020 2 4 0.00US$135 JPY14,580 16 January 2020 1 - 0.00
Total unrealised gain on forward currency contracts 301,941 0.98
Total financial assets at fair value through profit or loss-trading 37,896,258 123.70
287

Man Funds VI plcSchedule of investments as at 31 December 2019 (continued)Man GLG Credit Multi-Strategy Alternative (continued)
Financial liabilities at fair value through profit or loss Fair % of Fair % of
Value Net Value Net Nominal Description US$ Assets Nominal Description US$ Assets
Contracts for difference Total return swapsAustralia Canada
(183,179) Fortescue Metals Group Limited (275,718) (0.90) (400,000) Bausch Health Companies Inc (4,460) (0.01)
France China(1,958) LVMH Moet Hennessy Louis Vuitton SE (41,265) (0.13) 1,000,000 China Railway Construct (14,800) (0.05)
1,000,000 Lenovo Group Limited (30,850) (0.10)Ireland (45,650) (0.15)
(375) Jazz Pharmaceuticals Plc (7,227) (0.02)Germany
Israel (100,000) IHO Verwaltungs GmbH (8,487) (0.03)(281) Nice Limited_JPM (1,799) (0.01)
(6,892) Nice Limited_MS (83,119) (0.27) Japan(84,918) (0.28) 60,000,000 Kyushu Electric Power Company (5,251) (0.02)
500,000 Shizuoka Bank Limited (100) (0.00) Japan (5,351) (0.02)
(20,000) Mitsubishi Chemical Holdings Corporation (644) (0.00) Luxembourg
Netherlands (200,000) Ineos Group Holdings SA (4,872) (0.02)(830) BE Semiconductor Industries NV_JPM (29) (0.00)
(16,455) BE Semiconductor Industries NV_Bank of Nova Scotia (144,476) (0.47) United States(144,505) (0.47) (250,000) B&G Foods Inc (10,925) (0.04)
(250,000) CNX Resources Corporation (19,333) (0.06)Singapore (80,000) Commscope Inc (4,747) (0.01)
(829) Sea Limited (2,109) (0.01) (350,000) Dell International LLC / EMC Corporation (599) (0.00) (80,000) EQT Corporation (4,980) (0.01)
South Africa (300,000) Targa Resources Partners (1,922) (0.01)(158,811) Impala Platinum Holdings Limited (451,085) (1.47) (42,506) (0.13)
Spain Total total return swaps (111,326) (0.36)(11,357) Cellnex Telecom SA (64,066) (0.21)
United States(1,909) AT&T Inc (11,009) (0.04)
(837) Booking Holdings Inc (142,029) (0.46)(6,486) Chegg Inc (7,620) (0.02)(2,036) Guidewire Software Inc (4,068) (0.01)(2,593) Insulet Corporation (13,507) (0.04)(5,619) Liberty Media Corporation-Liberty Formula One (38,110) (0.12)(1,584) Live Nation Entertainment Inc_GS (2,240) (0.01)(5,134) Live Nation Entertainment Inc_JPM (20,787) (0.07)(2,736) Nuance Communications Inc (773) (0.00)
(26,053) ON Semiconductor Corporation (136,261) (0.44)(11,776) Q2 Holdings Inc (62,801) (0.20)
(1,312) RingCentral Inc (41,326) (0.14)(3,811) ServiceNow Inc (143,071) (0.48)
(54,981) Sirius XM Holdings Inc (50,100) (0.17)(1,357) Tesla Inc (113,293) (0.38)
(42,323) TTM Technologies Inc (154,564) (0.50)(406) Twitter Inc (1,320) (0.00)
(5,160) Viavi Solutions Inc_CS (8,772) (0.03)(18,591) Viavi Solutions Inc_JPM (33,305) (0.11)
(984,956) (3.22)
Total contracts for difference (2,056,493) (6.71)
Credit default swapsEuropean Union
450,000 Anheuser-Busch Inbev SA/NV 100 bps 20 June 2024 (14,108) (0.05)281,905 Cellnex Telecom S.A. 500 bps 20 June 2024 (53,025) (0.17)
87,246 CNH Industrial N.V. 500 bps 20 June 2024 (18,463) (0.06)1,634,831 Daimler AG 100 bps 20 June 2024 (44,861) (0.15)
586,361 Daimler AG 100 bps 20 June 2024_HSBC (16,090) (0.05)955,816 Deutsche Telekom AG 100 bps 20 June 2024 (34,805) (0.11)700,000 Grifols Sa 500 bps 20 June 2024_GS (143,499) (0.47)
2,997,890 ITraxx Europes 31 V2 5 Years 100 bps 20 June 2024 (93,731) (0.31)1,368,027 ITraxx Xovers 31 V2 5 Years 500 bps 20 June 2024 (178,068) (0.58)
700,000 Lafargeholcim Limited 100 bps 20 June 2024 (15,616) (0.05)869,535 Unitymedia Kabel BW Gmbh 500 bps
20-Jun-24 (201,700) (0.66)(813,966) (2.66)
United States350,000 Amkor Technology Inc. 126 bps 20 June 2024 (71,392) (0.23)(60,000) Nabors Industries Limited 100 bps 20 June 2024 (9,350) (0.03)
1,000,000 Peoples Rep Of China 100 bps 20 June 2024 (31,235) (0.10)320,000 United States Steel Corporation 500 bps 20 June 2024 (14,949) (0.05)218,173 Valeo Sa 100 bps 20 June 2024 (2,472) (0.01)
(129,398) (0.42)
Total credit default swaps (943,364) (3.08)
Futures contractUnited States
(1) S&P 500 EMINI Futures March 2020 (3,003) (0.01)
Total futures contract (3,003) (0.01)
288

Man Funds VI plcSchedule of investments as at 31 December 2019 (continued)Man GLG Credit Multi-Strategy Alternative (continued)
Financial liabilities at fair value through profit or loss (continued)
Forward currency contracts (note 4)** Unrealised % of
loss Net Amount Receivable Amount Payable Maturity Date Contracts US$ Assets
£119,003 US$159,153 16 January 2020 1 (1,429) (0.01)
US$1,932,677 €1,739,813 16 January 2020 5 (22,215) (0.07)
US$775,733 £588,827 16 January 2020 1 (4,680) (0.02)
US$242,407 HKD1,891,378 16 January 2020 2 (284) (0.00)
Total unrealised loss on forward currency contracts (28,608) (0.10)
Total financial liabilities at fair value through profit or loss-trading (3,142,794) (10.26)
Total financial assets at fair value through profit or loss-trading 37,896,258 123.70
Total financial liabilities at fair value through profit or loss - trading (3,142,794) (10.26)
Other net liabilities (4,118,452) (13.44)
Net Assets Attributable to Holders of Redeemable Participating Shares 30,635,012 100.00
**The forward currency contracts are held with The Bank of New York Mellon.
Classifications:(a) Exchange traded derivative instruments(b) OTC financial derivative instruments*Transferable securities dealt on another regulated market#Transferable securities other than those listed on an official stock exchange or dealt on another regulated market
All other investments held at the year end are transferable securities listed on an official stock exchange
% of Total Analysis of Total Assets AssetsTransferable securities listed on an official stock exchange 0.15Exchange traded financial derivative instruments described in classification (a) above 0.02OTC financial derivative instruments described in classification (b) above 5.23
Transferable securities as described in * above 44.98Other current assets 49.62
100.00
Analysis of Total Assets rather than Net Assets is required under UCITS Notice 8.2 appendix B.
289
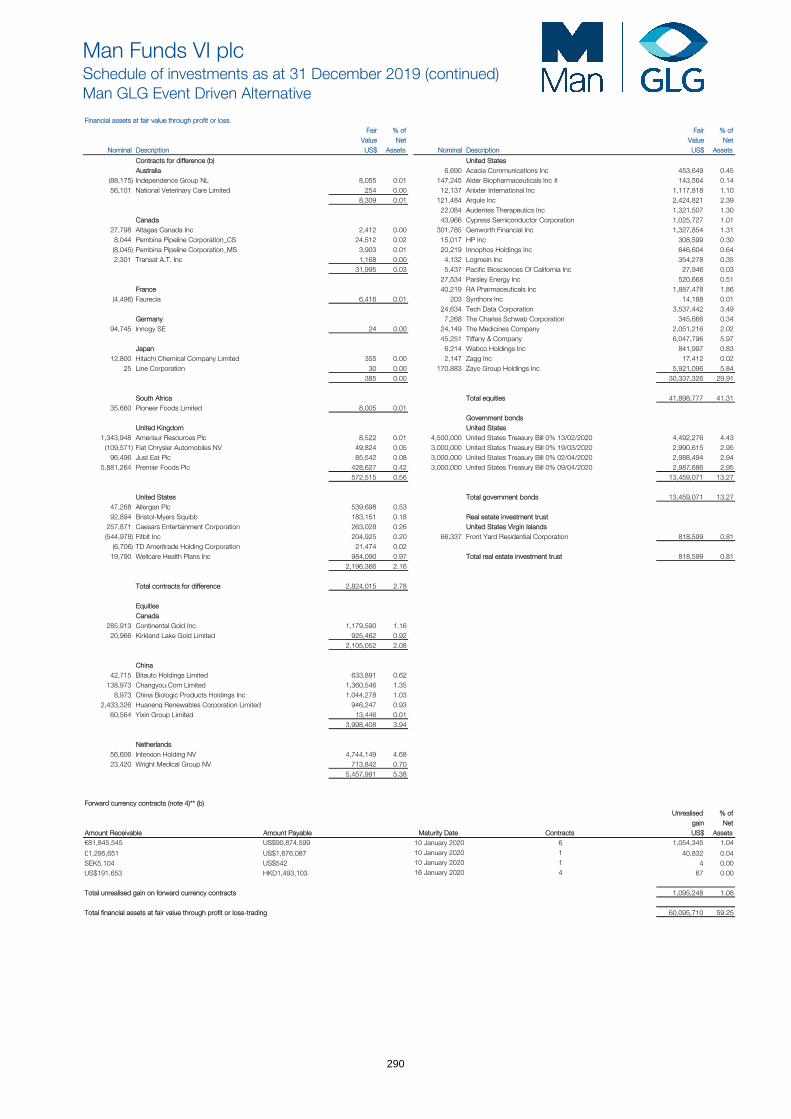
Man Funds VI plcSchedule of investments as at 31 December 2019 (continued)Man GLG Event Driven Alternative
Financial assets at fair value through profit or loss Fair % of Fair % of
Value Net Value Net Nominal Description US$ Assets Nominal Description US$ Assets
Contracts for difference (b) United StatesAustralia 6,690 Acacia Communications Inc 453,649 0.45
(88,175) Independence Group NL 8,055 0.01 147,245 Alder Biopharmaceuticals Inc # 143,564 0.1456,101 National Veterinary Care Limited 254 0.00 12,137 Anixter International Inc 1,117,818 1.10
8,309 0.01 121,484 Arqule Inc 2,424,821 2.3922,084 Audentes Therapeutics Inc 1,321,507 1.30
Canada 43,966 Cypress Semiconductor Corporation 1,025,727 1.0127,798 Altagas Canada Inc 2,412 0.00 301,785 Genworth Financial Inc 1,327,854 1.31
8,044 Pembina Pipeline Corporation_CS 24,512 0.02 15,017 HP Inc 308,599 0.30(8,045) Pembina Pipeline Corporation_MS 3,903 0.01 20,219 Innophos Holdings Inc 646,604 0.642,301 Transat A.T. Inc 1,168 0.00 4,132 Logmein Inc 354,278 0.35
31,995 0.03 5,437 Pacific Biosciences Of California Inc 27,946 0.0327,534 Parsley Energy Inc 520,668 0.51
France 40,219 RA Pharmaceuticals Inc 1,887,478 1.86(4,496) Faurecia 6,416 0.01 203 Synthorx Inc 14,188 0.01
24,634 Tech Data Corporation 3,537,442 3.49Germany 7,268 The Charles Schwab Corporation 345,666 0.34
94,745 Innogy SE 24 0.00 24,149 The Medicines Company 2,051,216 2.0245,251 Tiffany & Company 6,047,796 5.97
Japan 6,214 Wabco Holdings Inc 841,997 0.8312,800 Hitachi Chemical Company Limited 355 0.00 2,147 Zagg Inc 17,412 0.02
25 Line Corporation 30 0.00 170,883 Zayo Group Holdings Inc 5,921,096 5.84385 0.00 30,337,326 29.91
South Africa Total equities 41,898,777 41.3135,660 Pioneer Foods Limited 8,005 0.01
Government bondsUnited Kingdom United States
1,343,948 Amerisur Resources Plc 8,522 0.01 4,500,000 United States Treasury Bill 0% 13/02/2020 4,492,276 4.43(109,571) Fiat Chrysler Automobiles NV 49,824 0.05 3,000,000 United States Treasury Bill 0% 19/03/2020 2,990,615 2.95
96,496 Just Eat Plc 85,542 0.08 3,000,000 United States Treasury Bill 0% 02/04/2020 2,988,494 2.945,881,264 Premier Foods Plc 428,627 0.42 3,000,000 United States Treasury Bill 0% 09/04/2020 2,987,686 2.95
572,515 0.56 13,459,071 13.27
United States Total government bonds 13,459,071 13.2747,268 Allergan Plc 539,698 0.5392,894 Bristol-Myers Squibb 183,151 0.18 Real estate investment trust
257,871 Caesars Entertainment Corporation 263,028 0.26 United States Virgin Islands(544,978) Fitbit Inc 204,925 0.20 66,337 Front Yard Residential Corporation 818,599 0.81
(6,706) TD Ameritrade Holding Corporation 21,474 0.0219,790 Wellcare Health Plans Inc 984,090 0.97 Total real estate investment trust 818,599 0.81
2,196,366 2.16
Total contracts for difference 2,824,015 2.78
EquitiesCanada
285,913 Continental Gold Inc 1,179,590 1.1620,966 Kirkland Lake Gold Limited 925,462 0.92
2,105,052 2.08
China42,715 Bitauto Holdings Limited 633,891 0.62
138,973 Changyou.Com Limited 1,360,546 1.358,973 China Biologic Products Holdings Inc 1,044,278 1.03
2,433,326 Huaneng Renewables Corporation Limited 946,247 0.9360,564 Yixin Group Limited 13,446 0.01
3,998,408 3.94
Netherlands56,606 Interxion Holding NV 4,744,149 4.6823,420 Wright Medical Group NV 713,842 0.70
5,457,991 5.38
Forward currency contracts (note 4)** (b) Unrealised % of
gain Net Amount Receivable Amount Payable Maturity Date Contracts US$ Assets€81,845,545 US$90,874,599 10 January 2020 6 1,054,345 1.04
£1,295,651 US$1,676,087 10 January 2020 1 40,832 0.04SEK5,104 US$542 10 January 2020 1 4 0.00US$191,653 HKD1,493,103 16 January 2020 4 67 0.00
Total unrealised gain on forward currency contracts 1,095,248 1.08
Total financial assets at fair value through profit or loss-trading 60,095,710 59.25
290
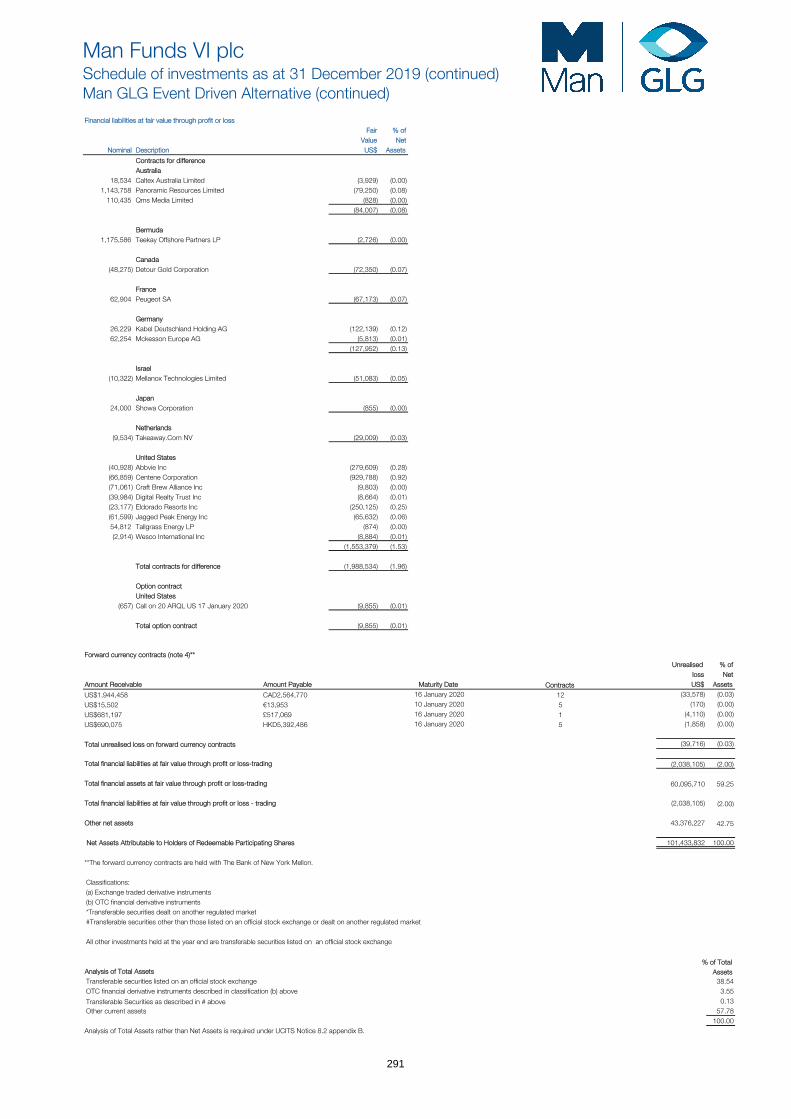
Man Funds VI plcSchedule of investments as at 31 December 2019 (continued)Man GLG Event Driven Alternative (continued)
Financial liabilities at fair value through profit or loss Fair % of
Value Net Nominal Description US$ Assets
Contracts for differenceAustralia
18,534 Caltex Australia Limited (3,929) (0.00) 1,143,758 Panoramic Resources Limited (79,250) (0.08)
110,435 Qms Media Limited (828) (0.00) (84,007) (0.08)
Bermuda1,175,586 Teekay Offshore Partners LP (2,726) (0.00)
Canada(48,275) Detour Gold Corporation (72,350) (0.07)
France62,904 Peugeot SA (67,173) (0.07)
Germany26,229 Kabel Deutschland Holding AG (122,139) (0.12)62,254 Mckesson Europe AG (5,813) (0.01)
(127,952) (0.13)
Israel(10,322) Mellanox Technologies Limited (51,083) (0.05)
Japan24,000 Showa Corporation (855) (0.00)
Netherlands(9,534) Takeaway.Com NV (29,009) (0.03)
United States(40,928) Abbvie Inc (279,609) (0.28)(66,859) Centene Corporation (929,788) (0.92)(71,061) Craft Brew Alliance Inc (9,803) (0.00) (39,984) Digital Realty Trust Inc (8,664) (0.01)(23,177) Eldorado Resorts Inc (250,125) (0.25)(61,599) Jagged Peak Energy Inc (65,632) (0.06)54,812 Tallgrass Energy LP (874) (0.00) (2,914) Wesco International Inc (8,884) (0.01)
(1,553,379) (1.53)
Total contracts for difference (1,988,534) (1.96)
Option contractUnited States
(657) Call on 20 ARQL US 17 January 2020 (9,855) (0.01)
Total option contract (9,855) (0.01)
Forward currency contracts (note 4)** Unrealised % of
loss Net Amount Receivable Amount Payable Maturity Date Contracts US$ Assets
US$1,944,458 CAD2,564,770 16 January 2020 12 (33,578) (0.03)
US$15,502 €13,953 10 January 2020 5 (170) (0.00)
US$681,197 £517,069 16 January 2020 1 (4,110) (0.00)
US$690,075 HKD5,392,486 16 January 2020 5 (1,858) (0.00)
Total unrealised loss on forward currency contracts (39,716) (0.03)
Total financial liabilities at fair value through profit or loss-trading (2,038,105) (2.00)
Total financial assets at fair value through profit or loss-trading 60,095,710 59.25
Total financial liabilities at fair value through profit or loss - trading (2,038,105) (2.00)
Other net assets 43,376,227 42.75
Net Assets Attributable to Holders of Redeemable Participating Shares 101,433,832 100.00
**The forward currency contracts are held with The Bank of New York Mellon.
Classifications:(a) Exchange traded derivative instruments(b) OTC financial derivative instruments*Transferable securities dealt on another regulated market#Transferable securities other than those listed on an official stock exchange or dealt on another regulated market
All other investments held at the year end are transferable securities listed on an official stock exchange
% of TotalAnalysis of Total Assets AssetsTransferable securities listed on an official stock exchange 38.54OTC financial derivative instruments described in classification (b) above 3.55
Transferable Securities as described in # above 0.13Other current assets 57.78
100.00Analysis of Total Assets rather than Net Assets is required under UCITS Notice 8.2 appendix B.
291

Man Funds VI plcSchedule of investments as at 31 December 2019 (continued)Man GLG Global Debt Total Return
Financial assets at fair value through profit or loss Fair % of
Value Net Nominal Description US$ Assets
Credit default swaps (b)United States
200,000 Lebanese Republic 100bps 20 December 2024 110,923 1.10
(2,300,000) Naics 33 V 1 10 Year 100 bps 20 December 2029 19,631 0.19
750,000 Republic of South Africa 100bps 20 December 2024 22,829 0.23
420,000 Republic of Turkey 100bps 20 December 2024 33,690 0.34187,073 1.86
Total credit default swaps 187,073 1.86
Government bondsCanada
198,000 Canadian Government Bond 5.75% 06/01/2033 225,466 2.24
France638,000 French Republic Government Bond Oat 0.75% 25/05/2028 762,841 7.57
Germany534,000 Bundesrepublik Deutschland Bundesanleihe 0.5% 15/02/2028 639,546 6.35
Italy289,000 Italy Buoni Poliennali Del Tesoro 2.2% 01/06/2027 351,046 3.49
Japan84,150,000 Japan Government 10 Year Bond 0.1% 20/09/2027 786,496 7.81
23,750,000 Japan Government 30 Year Bond 1.9% 20/09/2042 294,205 2.92
19,400,000 Japan Government 30 Year Bond 0.8% 20/03/2046 197,910 1.961,278,611 12.69
Spain184,000 Spain Government Bond 1.45% 31/10/2027 225,440 2.24
United Kingdom272,000 United Kingdom Gilt 1.75% 07/09/2037 390,128 3.87
United States50,000 United States Treasury Bill 0% 06/11/2020 49,658 0.49
100,000 United States Treasury Note/Bond 1.625% 30/09/2026 98,758 0.981,508,000 United States Treasury Note/Bond 1.75% 31/07/2024 1,512,241 15.01
60,000 United States Treasury Note/Bond 2.875% 15/05/2049 66,145 0.661,726,802 17.14
Total government bonds 5,599,880 55.59
Mortgage backed securitiesUnited States
977,000 Fannie Mae Pool 3.5 1,004,937 9.98
316,000 Fannie Mae Pool 4 328,689 3.26
497,000 Ginnie Mae II Pool 3.5 512,764 5.091,846,390 18.33
Total mortgage backed securities 1,846,390 18.33
Forward currency contracts (note 4)** (b) Unrealised % of
gain Net Amount Receivable Amount Payable Maturity Date Contracts US$ Assets
AUD178,027 US$122,051 02 March 2020 1 3,285 0.03BRL1,712,250 US$407,389 03 January 2020 2 18,214 0.18BRL318,972 US$76,000 02 April 2020 1 2,973 0.03CAD41,751 US$31,985 28 February 2020 1 219 0.00CHF53,990 US$54,850 02 March 2020 1 1,147 0.02CNY1,061,445 US$150,038 02 March 2020 1 2,107 0.02CZK206,712 US$8,964 27 March 2020 1 168 0.00DKK159,469 US$23,885 28 February 2020 1 167 0.00€362,909 US$401,505 18 February 2020 1 7,107 0.07£69,621 US$89,736 03 March 2020 1 2,654 0.03ILS41,787 US$11,893 28 February 2020 1 242 0.00KRW142,631,170 US$122,116 03 March 2020 1 1,573 0.02MXN523,718 US$26,511 27 March 2020 1 868 0.01NOK87,449 US$9,519 28 February 2020 1 435 0.00NZD15,128 US$9,656 28 February 2020 1 559 0.01PLN80,812 US$20,746 26 March 2020 1 596 0.01RUB1,024,848 US$15,841 23 March 2020 1 497 0.00SEK398,805 US$41,449 02 March 2020 1 1,281 0.02SGD27,330 US$20,078 03 March 2020 1 258 0.00THB1,043,562 US$34,557 31 March 2020 1 356 0.00US$450,000 BRL1,712,250 03 January 2020 1 24,398 0.24
Total unrealised gain on forward currency contracts 69,104 0.69
Total financial assets at fair value through profit or loss-trading 7,702,447 76.47
292
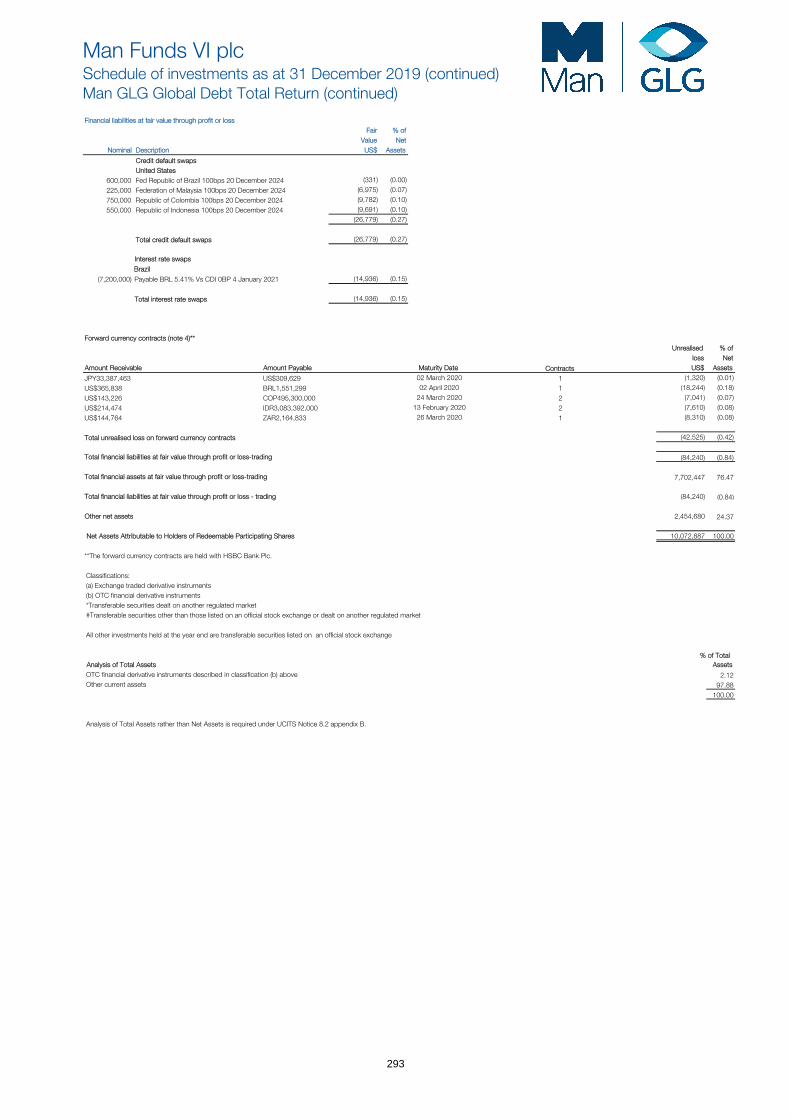
Man Funds VI plcSchedule of investments as at 31 December 2019 (continued)Man GLG Global Debt Total Return (continued)
Financial liabilities at fair value through profit or loss Fair % of
Value Net Nominal Description US$ Assets
Credit default swapsUnited States
600,000 Fed Republic of Brazil 100bps 20 December 2024 (331) (0.00)
225,000 Federation of Malaysia 100bps 20 December 2024 (6,975) (0.07)
750,000 Republic of Colombia 100bps 20 December 2024 (9,782) (0.10)
550,000 Republic of Indonesia 100bps 20 December 2024 (9,691) (0.10)(26,779) (0.27)
Total credit default swaps (26,779) (0.27)
Interest rate swaps
Brazil
(7,200,000) Payable BRL 5.41% Vs CDI 0BP 4 January 2021 (14,936) (0.15)
Total interest rate swaps (14,936) (0.15)
Forward currency contracts (note 4)** Unrealised % of
loss Net Amount Receivable Amount Payable Maturity Date Contracts US$ Assets
JPY33,387,463 US$309,629 02 March 2020 1 (1,320) (0.01)
US$365,838 BRL1,551,299 02 April 2020 1 (18,244) (0.18)
US$143,226 COP495,300,000 24 March 2020 2 (7,041) (0.07)
US$214,474 IDR3,083,392,000 13 February 2020 2 (7,610) (0.08)
US$144,764 ZAR2,164,833 26 March 2020 1 (8,310) (0.08)
Total unrealised loss on forward currency contracts (42,525) (0.42)
Total financial liabilities at fair value through profit or loss-trading (84,240) (0.84)
Total financial assets at fair value through profit or loss-trading 7,702,447 76.47
Total financial liabilities at fair value through profit or loss - trading (84,240) (0.84)
Other net assets 2,454,680 24.37
Net Assets Attributable to Holders of Redeemable Participating Shares 10,072,887 100.00
**The forward currency contracts are held with HSBC Bank Plc.
Classifications:(a) Exchange traded derivative instruments(b) OTC financial derivative instruments*Transferable securities dealt on another regulated market#Transferable securities other than those listed on an official stock exchange or dealt on another regulated market
All other investments held at the year end are transferable securities listed on an official stock exchange
% of Total Analysis of Total Assets AssetsOTC financial derivative instruments described in classification (b) above 2.12Other current assets 97.88
100.00
Analysis of Total Assets rather than Net Assets is required under UCITS Notice 8.2 appendix B.
293

Man Funds VI plcSchedule of investments as at 31 December 2019 (continued)Man GLG High Yield Opportunities DE
Financial assets at fair value through profit or loss Fair % of Fair % of
Value Net Value Net Nominal Description € Assets Nominal Description € Assets
Convertible bond Corporate bonds (continued)Malta United Kingdom
1,000,000 Brait SE 2.75% 18/09/2020 1,166,606 2.30 270,000 Algeco Scotsman Global Finance Plc 8.00% 15/02/2023 234,819 0.46630,000 EG Global Finance Plc 6.25% 30/10/2025 668,367 1.32
Total convertible bond 1,166,606 2.30 320,000 EG Global Finance Plc 8.50% 30/10/2025 * 303,133 0.601,640,000 Enquest Plc 7.00% 15/04/2022 1,278,387 2.52
Corporate bonds 1,460,000 Galaxy Bidco Limited 6.50% 31/07/2026 1,831,070 3.61Canada 500,000 Iceland Bondco Plc 6.75% 15/07/2024 565,158 1.11
1,840,000 First Quantum Minerals Limited 6.50% 01/03/2024 * 1,646,714 3.25 780,000 Ithaca Energy North Sea Plc 9.38% 15/07/2024 727,877 1.441,397,000 Matalan Finance Plc 6.75% 31/01/2023 1,616,922 3.19
Curacao 400,000 Metro Bank Plc 9.50% 08/10/2025 501,310 0.99660,000 Teva Pharmaceutical Finance Company BV 2.95% 18/12/2022 562,561 1.11 412,000 RAC Bond Company Plc 5.00% 06/11/2022 437,597 0.86
250,000 RL Finance Bonds No. 4 Plc 4.88% 07/10/2049 308,690 0.61Germany 910,000 Shop Direct Funding Plc 7.75% 15/11/2022 1,027,245 2.03
1,820,000 Consus Real Estate AG 9.63% 15/05/2024 1,974,700 3.89 850,000 TVL Finance Plc 6.15% 15/07/2025 1,009,421 1.991,089,000 Safari Holding Verwaltungs Gmbh 5.38% 30/11/2022 866,844 1.71 430,000 Virgin Media Secured Finance Plc 4.25% 15/01/2030 518,525 1.02
2,841,544 5.60 500,000 Virgin Media Secured Finance Plc 5.25% 15/05/2029 639,370 1.26820,000 Vodafone Group Plc 7.00% 04/04/2079 * 858,841 1.69
Italy 12,526,732 24.702,130,000 Almaviva-The Italian Innovation Company SPA 7.25% 15/10/2022 1,970,276 3.881,250,000 Banca IFIS SpA 4.50% 17/10/2027 1,204,645 2.37 United States1,750,000 Banca Monte dei Paschi di Siena SpA 3.63% 24/09/2024 1,787,984 3.53 520,000 Adient US LLA 7.00% 15/05/2026 * 505,812 1.01
500,000 Banco BPM SpA 4.25% 01/10/2029 512,637 1.01 1,040,000 Energy Transfer Partners LP 6.25% 31/12/2049 * 872,321 1.72500,000 Societa Cattolica di Assicurazioni SC 4.25% 14/12/2047 515,514 1.02 1,190,000 Laredo Petroleum Inc 5.63% 15/01/2022 1,031,311 2.03
5,991,056 11.81 734,000 Southwestern Energy Company 7.75% 01/10/2027 607,291 1.20718,000 The Men's Wearhouse Inc 7.00% 01/07/2022 612,658 1.21
Luxembourg 3,629,393 7.17800,000 Aroundtown SA 4.75% 25/06/2024 993,967 1.96910,000 Atento Luxco 1 SA 6.13% 10/08/2022 * 801,570 1.58 Total corporate bonds 39,650,159 78.19530,000 Hidrovias International Finance Sarl 5.95% 24/01/2025 * 490,261 0.96
1,248,000 Odyssey Europe Holding Company SA 8.00% 15/05/2023 1,215,319 2.40 Credit default swap (b)1,000,000 Summer BC Holdco B Sarl 5.75% 31/10/2026 1,045,500 2.06 European Union
900,000 Vivion Investments SA 3.00% 08/08/2024 920,834 1.82 1,100,000 Auchan Holding Sa 100bps 20 December 2024 24,789 0.055,467,451 10.78
Total credit default swap 24,789 0.05Mexico
480,000 Credito Real SAB de CV SOFOM 5.00% 01/02/2027 506,362 1.00
Netherlands700,000 Bluewater Holding Bv 10.00% 28/11/2023 639,198 1.26960,000 Petrobras Global Finance Bv 5.38% 01/10/2029 1,260,171 2.49810,000 Promontoria Holding 264 BV 6.75% 15/08/2023 727,583 1.43240,000 Teva Pharmaceutical Finance Netherlands II 6.00% 31/01/2025 254,400 0.50
2,881,352 5.68
Norway
700,000 Norwegian Energy Company ASA 9.00% 17/06/2026 629,844 1.241,110,000 Petroleum Geo-Services Asa 7.38% 15/12/2020 959,594 1.89
1,589,438 3.13
Portugal1,400,000 Banco Comercial Portugues SA 3.87% 27/03/2030 1,419,314 2.80
Sweden581,000 Assemblin Financing 5.00% 15/05/2025 588,242 1.16
Forward currency contracts (note 4)** (b) Unrealised % of
gain Net Amount Receivable Amount Payable Maturity Date Contracts € Assets
€11,145,534 £9,385,202 16 January 2020 5 75,219 0.15€13,863,817 US$15,410,066 16 January 2020 4 149,179 0.29
Total unrealised gain on forward currency contracts 224,398 0.44
Total financial assets at fair value through profit or loss-trading 41,065,952 80.98
294
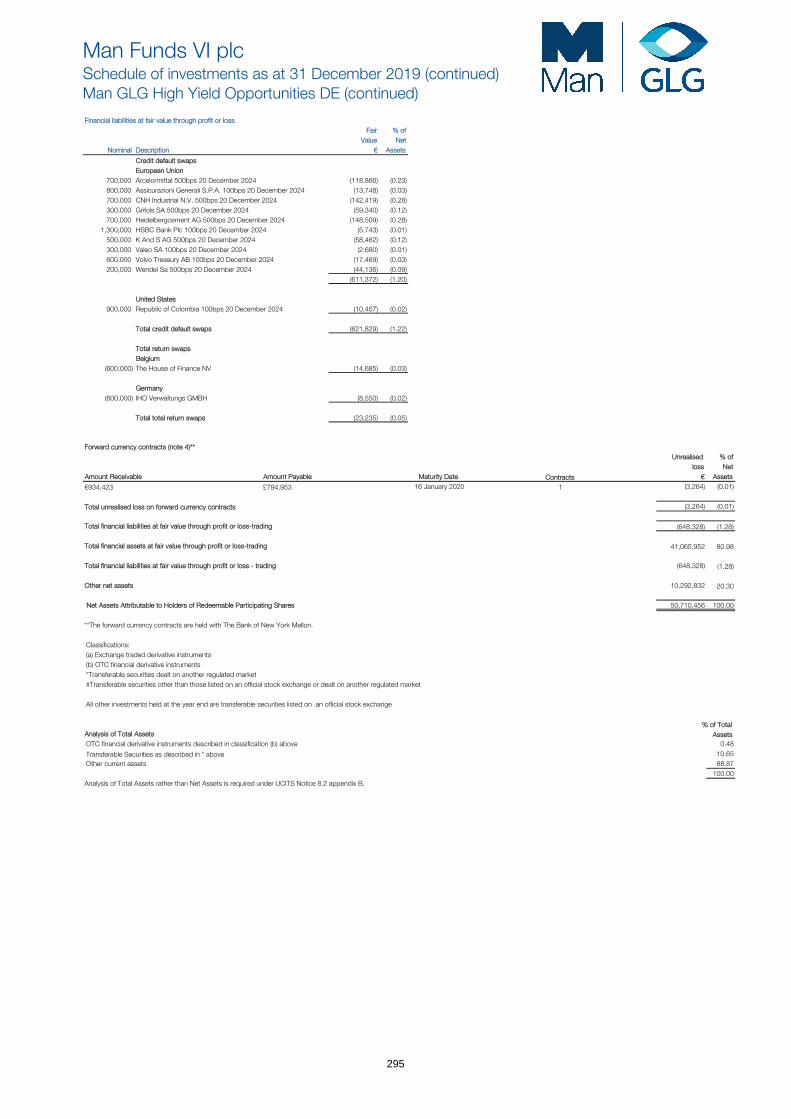
Man Funds VI plcSchedule of investments as at 31 December 2019 (continued)Man GLG High Yield Opportunities DE (continued)
Financial liabilities at fair value through profit or loss Fair % of
Value Net Nominal Description € Assets
Credit default swapsEuropean Union
700,000 Arcelormittal 500bps 20 December 2024 (118,866) (0.23)800,000 Assicurazioni Generali S.P.A. 100bps 20 December 2024 (13,748) (0.03)700,000 CNH Industrial N.V. 500bps 20 December 2024 (142,419) (0.28)300,000 Grifols SA 500bps 20 December 2024 (59,340) (0.12)700,000 Heidelbergcement AG 500bps 20 December 2024 (148,509) (0.28)
1,300,000 HSBC Bank Plc 100bps 20 December 2024 (5,743) (0.01)500,000 K And S AG 500bps 20 December 2024 (58,462) (0.12)300,000 Valeo SA 100bps 20 December 2024 (2,680) (0.01)600,000 Volvo Treasury AB 100bps 20 December 2024 (17,469) (0.03)200,000 Wendel Sa 500bps 20 December 2024 (44,136) (0.09)
(611,372) (1.20)
United States900,000 Republic of Colombia 100bps 20 December 2024 (10,457) (0.02)
Total credit default swaps (621,829) (1.22)
Total return swapsBelgium
(600,000) The House of Finance NV (14,685) (0.03)
Germany(600,000) IHO Verwaltungs GMBH (8,550) (0.02)
Total total return swaps (23,235) (0.05)
Forward currency contracts (note 4)** Unrealised % of
loss Net Amount Receivable Amount Payable Maturity Date Contracts € Assets
€934,423 £794,953 16 January 2020 1 (3,264) (0.01)
Total unrealised loss on forward currency contracts (3,264) (0.01)
Total financial liabilities at fair value through profit or loss-trading (648,328) (1.28)
Total financial assets at fair value through profit or loss-trading 41,065,952 80.98
Total financial liabilities at fair value through profit or loss - trading (648,328) (1.28)
Other net assets 10,292,832 20.30
Net Assets Attributable to Holders of Redeemable Participating Shares 50,710,456 100.00
**The forward currency contracts are held with The Bank of New York Mellon.
Classifications:(a) Exchange traded derivative instruments(b) OTC financial derivative instruments*Transferable securities dealt on another regulated market#Transferable securities other than those listed on an official stock exchange or dealt on another regulated market
All other investments held at the year end are transferable securities listed on an official stock exchange
% of TotalAnalysis of Total Assets AssetsOTC financial derivative instruments described in classification (b) above 0.48
Transferable Securities as described in * above 10.65Other current assets 88.87
100.00Analysis of Total Assets rather than Net Assets is required under UCITS Notice 8.2 appendix B.
295
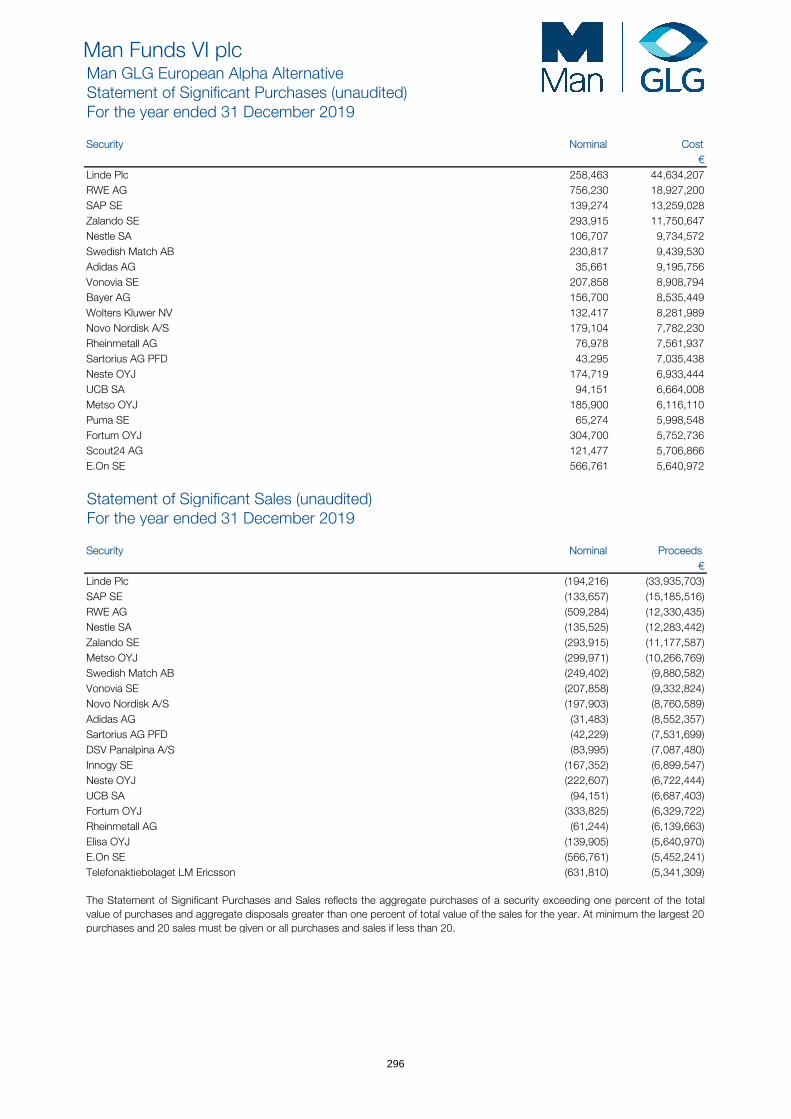
Man Funds VI plcMan GLG European Alpha AlternativeStatement of Significant Purchases (unaudited)For the year ended 31 December 2019
Security Nominal Cost €
Linde Plc 258,463 44,634,207 RWE AG 756,230 18,927,200 SAP SE 139,274 13,259,028 Zalando SE 293,915 11,750,647 Nestle SA 106,707 9,734,572 Swedish Match AB 230,817 9,439,530 Adidas AG 35,661 9,195,756 Vonovia SE 207,858 8,908,794 Bayer AG 156,700 8,535,449 Wolters Kluwer NV 132,417 8,281,989 Novo Nordisk A/S 179,104 7,782,230 Rheinmetall AG 76,978 7,561,937 Sartorius AG PFD 43,295 7,035,438 Neste OYJ 174,719 6,933,444 UCB SA 94,151 6,664,008 Metso OYJ 185,900 6,116,110 Puma SE 65,274 5,998,548 Fortum OYJ 304,700 5,752,736 Scout24 AG 121,477 5,706,866 E.On SE 566,761 5,640,972
Statement of Significant Sales (unaudited)For the year ended 31 December 2019
Security Nominal Proceeds €
Linde Plc (194,216) (33,935,703)SAP SE (133,657) (15,185,516)RWE AG (509,284) (12,330,435)Nestle SA (135,525) (12,283,442)Zalando SE (293,915) (11,177,587)Metso OYJ (299,971) (10,266,769)Swedish Match AB (249,402) (9,880,582)Vonovia SE (207,858) (9,332,824)Novo Nordisk A/S (197,903) (8,760,589)Adidas AG (31,483) (8,552,357)Sartorius AG PFD (42,229) (7,531,699)DSV Panalpina A/S (83,995) (7,087,480)Innogy SE (167,352) (6,899,547)Neste OYJ (222,607) (6,722,444)UCB SA (94,151) (6,687,403)Fortum OYJ (333,825) (6,329,722)Rheinmetall AG (61,244) (6,139,663)Elisa OYJ (139,905) (5,640,970)E.On SE (566,761) (5,452,241)Telefonaktiebolaget LM Ericsson (631,810) (5,341,309)
The Statement of Significant Purchases and Sales reflects the aggregate purchases of a security exceeding one percent of the totalvalue of purchases and aggregate disposals greater than one percent of total value of the sales for the year. At minimum the largest 20 purchases and 20 sales must be given or all purchases and sales if less than 20.
296
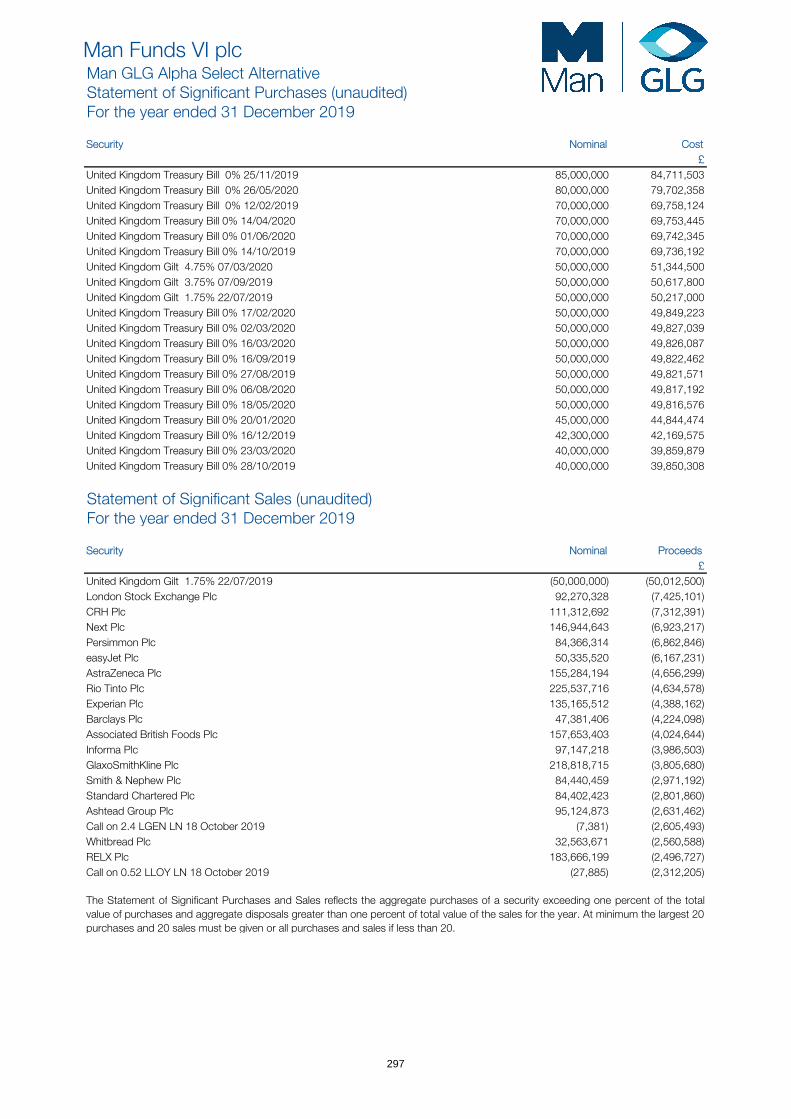
Man Funds VI plcMan GLG Alpha Select AlternativeStatement of Significant Purchases (unaudited)For the year ended 31 December 2019
Security Nominal Cost £
United Kingdom Treasury Bill 0% 25/11/2019 85,000,000 84,711,503 United Kingdom Treasury Bill 0% 26/05/2020 80,000,000 79,702,358 United Kingdom Treasury Bill 0% 12/02/2019 70,000,000 69,758,124 United Kingdom Treasury Bill 0% 14/04/2020 70,000,000 69,753,445 United Kingdom Treasury Bill 0% 01/06/2020 70,000,000 69,742,345 United Kingdom Treasury Bill 0% 14/10/2019 70,000,000 69,736,192 United Kingdom Gilt 4.75% 07/03/2020 50,000,000 51,344,500 United Kingdom Gilt 3.75% 07/09/2019 50,000,000 50,617,800 United Kingdom Gilt 1.75% 22/07/2019 50,000,000 50,217,000 United Kingdom Treasury Bill 0% 17/02/2020 50,000,000 49,849,223 United Kingdom Treasury Bill 0% 02/03/2020 50,000,000 49,827,039 United Kingdom Treasury Bill 0% 16/03/2020 50,000,000 49,826,087 United Kingdom Treasury Bill 0% 16/09/2019 50,000,000 49,822,462 United Kingdom Treasury Bill 0% 27/08/2019 50,000,000 49,821,571 United Kingdom Treasury Bill 0% 06/08/2020 50,000,000 49,817,192 United Kingdom Treasury Bill 0% 18/05/2020 50,000,000 49,816,576 United Kingdom Treasury Bill 0% 20/01/2020 45,000,000 44,844,474 United Kingdom Treasury Bill 0% 16/12/2019 42,300,000 42,169,575 United Kingdom Treasury Bill 0% 23/03/2020 40,000,000 39,859,879 United Kingdom Treasury Bill 0% 28/10/2019 40,000,000 39,850,308
Statement of Significant Sales (unaudited)For the year ended 31 December 2019
Security Nominal Proceeds £
United Kingdom Gilt 1.75% 22/07/2019 (50,000,000) (50,012,500)London Stock Exchange Plc 92,270,328 (7,425,101)CRH Plc 111,312,692 (7,312,391)Next Plc 146,944,643 (6,923,217)Persimmon Plc 84,366,314 (6,862,846)easyJet Plc 50,335,520 (6,167,231)AstraZeneca Plc 155,284,194 (4,656,299)Rio Tinto Plc 225,537,716 (4,634,578)Experian Plc 135,165,512 (4,388,162)Barclays Plc 47,381,406 (4,224,098)Associated British Foods Plc 157,653,403 (4,024,644)Informa Plc 97,147,218 (3,986,503)GlaxoSmithKline Plc 218,818,715 (3,805,680)Smith & Nephew Plc 84,440,459 (2,971,192)Standard Chartered Plc 84,402,423 (2,801,860)Ashtead Group Plc 95,124,873 (2,631,462)Call on 2.4 LGEN LN 18 October 2019 (7,381) (2,605,493)Whitbread Plc 32,563,671 (2,560,588)RELX Plc 183,666,199 (2,496,727)Call on 0.52 LLOY LN 18 October 2019 (27,885) (2,312,205)
The Statement of Significant Purchases and Sales reflects the aggregate purchases of a security exceeding one percent of the totalvalue of purchases and aggregate disposals greater than one percent of total value of the sales for the year. At minimum the largest 20 purchases and 20 sales must be given or all purchases and sales if less than 20.
297

Man Funds VI plcMan GLG European Equity AlternativeStatement of Significant Purchases (unaudited)For the year ended 31 December 2019
Security Nominal Cost €
Ping An Insurance Group Company of China Limited 10,779,419 109,641,707 SAP SE 458,504 51,615,732 Ferrari NV 203,023 29,632,031 France Treasury Bill BTF 0% 15/07/2020 28,000,000 28,169,357 Moncler SpA 705,328 25,297,768 RWE AG 1,112,886 24,706,069 France Treasury Bill BTF 0% 02/12/2020 24,000,000 24,071,463 Innogy SE 534,946 21,499,044 Fiat Chrysler Automobiles NV 1,536,080 20,079,012 Mediobanca SpA 2,100,885 19,807,051 EXOR NV 309,297 18,933,486 Intesa Sanpaolo SpA 8,737,953 18,444,802 Nexi SpA 1,950,873 18,205,336 Freeport-McMoRan Inc 1,706,778 17,727,059 ASR Nederland NV 451,481 17,698,055 Celgene Corporation 188,101 15,108,310 Tencent Holdings Limited 368,342 14,465,855 Alcoa Corporation 572,864 13,619,234 Alibaba Group Holding Limited 87,537 12,734,634 Rheinmetall AG 126,102 11,974,447
Statement of Significant Sales (unaudited)For the year ended 31 December 2019
Security Nominal Proceeds €
Ping An Insurance Group Company of China Limited (12,998,453) (132,007,511)Innogy SE (1,359,642) (57,134,161)RWE AG (2,521,982) (53,208,484)SAP SE (424,819) (46,463,422)Ferrari NV 1,295,223 (26,811,742)Moncler SpA (745,511) (26,326,622)Freeport-McMoRan Inc (2,490,873) (26,163,490)Fiat Chrysler Automobiles NV (1,864,404) (24,984,848)MAN SE (273,600) (24,706,080)Alcoa Corporation (887,173) (21,030,287)Mediobanca SpA (2,064,222) (19,957,473)Volkswagen AG PFD (133,448) (19,427,282)Software AG (675,790) (19,362,734)Carl Zeiss Meditec AG (225,000) (17,808,750)Nexi SpA (1,766,484) (17,085,658)ASR Nederland NV (451,481) (16,479,057)Dialog Semiconductor Plc (347,400) (15,042,420)Luxottica Group SpA (281,869) (14,576,603)Tencent Holdings Limited (367,476) (14,325,593)Intesa Sanpaolo SpA (6,474,639) (13,919,587)
The Statement of Significant Purchases and Sales reflects the aggregate purchases of a security exceeding one percent of the totalvalue of purchases and aggregate disposals greater than one percent of total value of the sales for the year. At minimum the largest 20 purchases and 20 sales must be given or all purchases and sales if less than 20.
298
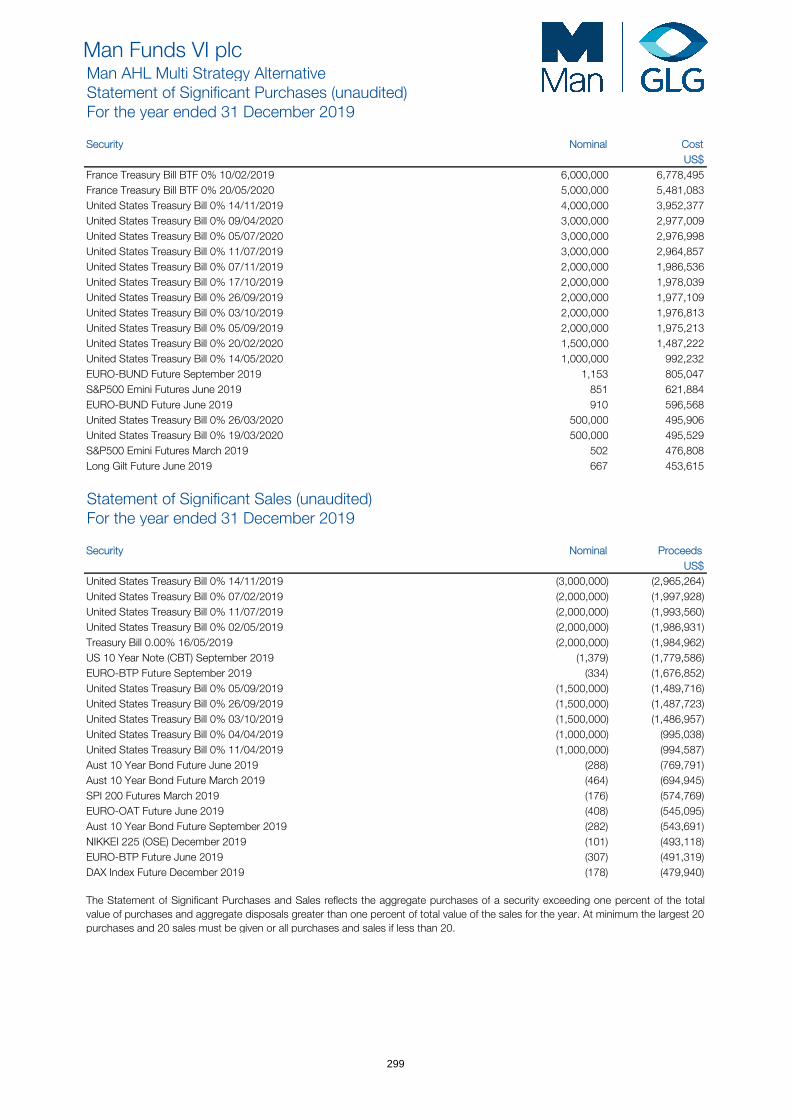
Man Funds VI plcMan AHL Multi Strategy AlternativeStatement of Significant Purchases (unaudited)For the year ended 31 December 2019
Security Nominal Cost US$
France Treasury Bill BTF 0% 10/02/2019 6,000,000 6,778,495 France Treasury Bill BTF 0% 20/05/2020 5,000,000 5,481,083 United States Treasury Bill 0% 14/11/2019 4,000,000 3,952,377 United States Treasury Bill 0% 09/04/2020 3,000,000 2,977,009 United States Treasury Bill 0% 05/07/2020 3,000,000 2,976,998 United States Treasury Bill 0% 11/07/2019 3,000,000 2,964,857 United States Treasury Bill 0% 07/11/2019 2,000,000 1,986,536 United States Treasury Bill 0% 17/10/2019 2,000,000 1,978,039 United States Treasury Bill 0% 26/09/2019 2,000,000 1,977,109 United States Treasury Bill 0% 03/10/2019 2,000,000 1,976,813 United States Treasury Bill 0% 05/09/2019 2,000,000 1,975,213 United States Treasury Bill 0% 20/02/2020 1,500,000 1,487,222 United States Treasury Bill 0% 14/05/2020 1,000,000 992,232 EURO-BUND Future September 2019 1,153 805,047 S&P500 Emini Futures June 2019 851 621,884 EURO-BUND Future June 2019 910 596,568 United States Treasury Bill 0% 26/03/2020 500,000 495,906 United States Treasury Bill 0% 19/03/2020 500,000 495,529 S&P500 Emini Futures March 2019 502 476,808 Long Gilt Future June 2019 667 453,615
Statement of Significant Sales (unaudited)For the year ended 31 December 2019
Security Nominal Proceeds US$
United States Treasury Bill 0% 14/11/2019 (3,000,000) (2,965,264)United States Treasury Bill 0% 07/02/2019 (2,000,000) (1,997,928)United States Treasury Bill 0% 11/07/2019 (2,000,000) (1,993,560)United States Treasury Bill 0% 02/05/2019 (2,000,000) (1,986,931)Treasury Bill 0.00% 16/05/2019 (2,000,000) (1,984,962)US 10 Year Note (CBT) September 2019 (1,379) (1,779,586)EURO-BTP Future September 2019 (334) (1,676,852)United States Treasury Bill 0% 05/09/2019 (1,500,000) (1,489,716)United States Treasury Bill 0% 26/09/2019 (1,500,000) (1,487,723)United States Treasury Bill 0% 03/10/2019 (1,500,000) (1,486,957)United States Treasury Bill 0% 04/04/2019 (1,000,000) (995,038)United States Treasury Bill 0% 11/04/2019 (1,000,000) (994,587)Aust 10 Year Bond Future June 2019 (288) (769,791)Aust 10 Year Bond Future March 2019 (464) (694,945)SPI 200 Futures March 2019 (176) (574,769)EURO-OAT Future June 2019 (408) (545,095)Aust 10 Year Bond Future September 2019 (282) (543,691)NIKKEI 225 (OSE) December 2019 (101) (493,118)EURO-BTP Future June 2019 (307) (491,319)DAX Index Future December 2019 (178) (479,940)
The Statement of Significant Purchases and Sales reflects the aggregate purchases of a security exceeding one percent of the totalvalue of purchases and aggregate disposals greater than one percent of total value of the sales for the year. At minimum the largest 20 purchases and 20 sales must be given or all purchases and sales if less than 20.
299
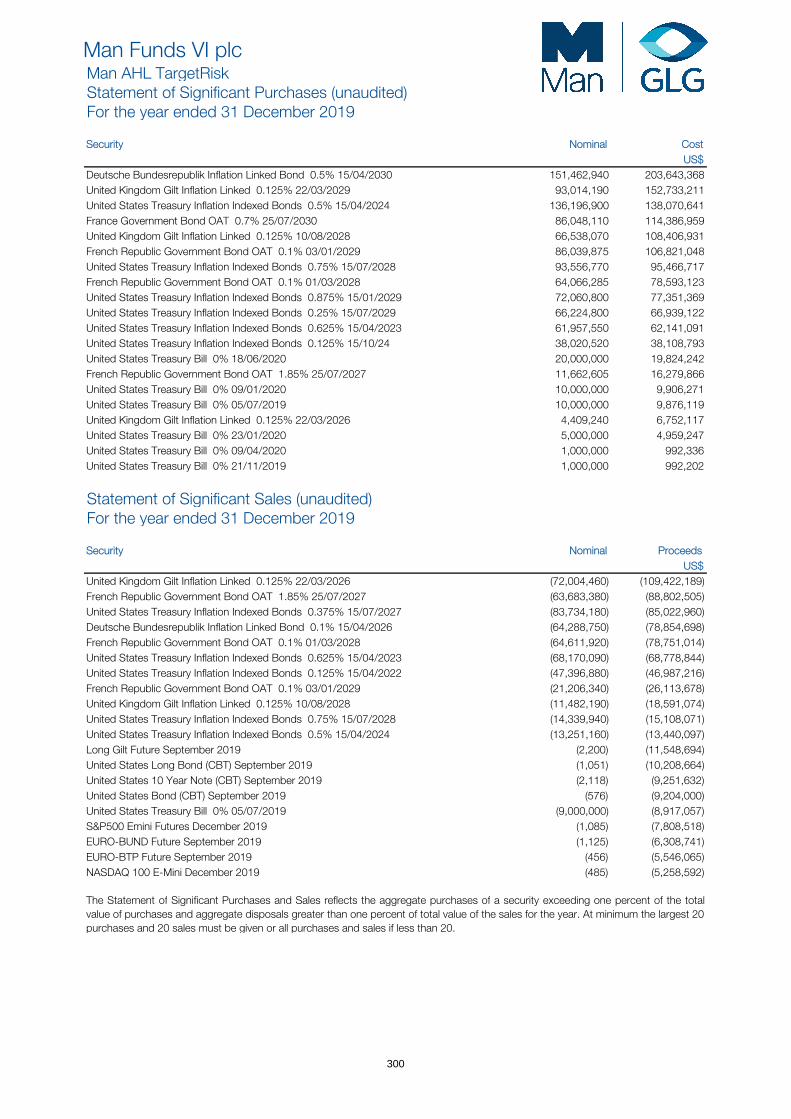
Man Funds VI plcMan AHL TargetRiskStatement of Significant Purchases (unaudited)For the year ended 31 December 2019
Security Nominal Cost US$
Deutsche Bundesrepublik Inflation Linked Bond 0.5% 15/04/2030 151,462,940 203,643,368 United Kingdom Gilt Inflation Linked 0.125% 22/03/2029 93,014,190 152,733,211 United States Treasury Inflation Indexed Bonds 0.5% 15/04/2024 136,196,900 138,070,641 France Government Bond OAT 0.7% 25/07/2030 86,048,110 114,386,959 United Kingdom Gilt Inflation Linked 0.125% 10/08/2028 66,538,070 108,406,931 French Republic Government Bond OAT 0.1% 03/01/2029 86,039,875 106,821,048 United States Treasury Inflation Indexed Bonds 0.75% 15/07/2028 93,556,770 95,466,717 French Republic Government Bond OAT 0.1% 01/03/2028 64,066,285 78,593,123 United States Treasury Inflation Indexed Bonds 0.875% 15/01/2029 72,060,800 77,351,369 United States Treasury Inflation Indexed Bonds 0.25% 15/07/2029 66,224,800 66,939,122 United States Treasury Inflation Indexed Bonds 0.625% 15/04/2023 61,957,550 62,141,091 United States Treasury Inflation Indexed Bonds 0.125% 15/10/24 38,020,520 38,108,793 United States Treasury Bill 0% 18/06/2020 20,000,000 19,824,242 French Republic Government Bond OAT 1.85% 25/07/2027 11,662,605 16,279,866 United States Treasury Bill 0% 09/01/2020 10,000,000 9,906,271 United States Treasury Bill 0% 05/07/2019 10,000,000 9,876,119 United Kingdom Gilt Inflation Linked 0.125% 22/03/2026 4,409,240 6,752,117 United States Treasury Bill 0% 23/01/2020 5,000,000 4,959,247 United States Treasury Bill 0% 09/04/2020 1,000,000 992,336 United States Treasury Bill 0% 21/11/2019 1,000,000 992,202
Statement of Significant Sales (unaudited)For the year ended 31 December 2019
Security Nominal Proceeds US$
United Kingdom Gilt Inflation Linked 0.125% 22/03/2026 (72,004,460) (109,422,189)French Republic Government Bond OAT 1.85% 25/07/2027 (63,683,380) (88,802,505)United States Treasury Inflation Indexed Bonds 0.375% 15/07/2027 (83,734,180) (85,022,960)Deutsche Bundesrepublik Inflation Linked Bond 0.1% 15/04/2026 (64,288,750) (78,854,698)French Republic Government Bond OAT 0.1% 01/03/2028 (64,611,920) (78,751,014)United States Treasury Inflation Indexed Bonds 0.625% 15/04/2023 (68,170,090) (68,778,844)United States Treasury Inflation Indexed Bonds 0.125% 15/04/2022 (47,396,880) (46,987,216)French Republic Government Bond OAT 0.1% 03/01/2029 (21,206,340) (26,113,678)United Kingdom Gilt Inflation Linked 0.125% 10/08/2028 (11,482,190) (18,591,074)United States Treasury Inflation Indexed Bonds 0.75% 15/07/2028 (14,339,940) (15,108,071)United States Treasury Inflation Indexed Bonds 0.5% 15/04/2024 (13,251,160) (13,440,097)Long Gilt Future September 2019 (2,200) (11,548,694)United States Long Bond (CBT) September 2019 (1,051) (10,208,664)United States 10 Year Note (CBT) September 2019 (2,118) (9,251,632)United States Bond (CBT) September 2019 (576) (9,204,000)United States Treasury Bill 0% 05/07/2019 (9,000,000) (8,917,057)S&P500 Emini Futures December 2019 (1,085) (7,808,518)EURO-BUND Future September 2019 (1,125) (6,308,741)EURO-BTP Future September 2019 (456) (5,546,065)NASDAQ 100 E-Mini December 2019 (485) (5,258,592)
The Statement of Significant Purchases and Sales reflects the aggregate purchases of a security exceeding one percent of the totalvalue of purchases and aggregate disposals greater than one percent of total value of the sales for the year. At minimum the largest 20 purchases and 20 sales must be given or all purchases and sales if less than 20.
300
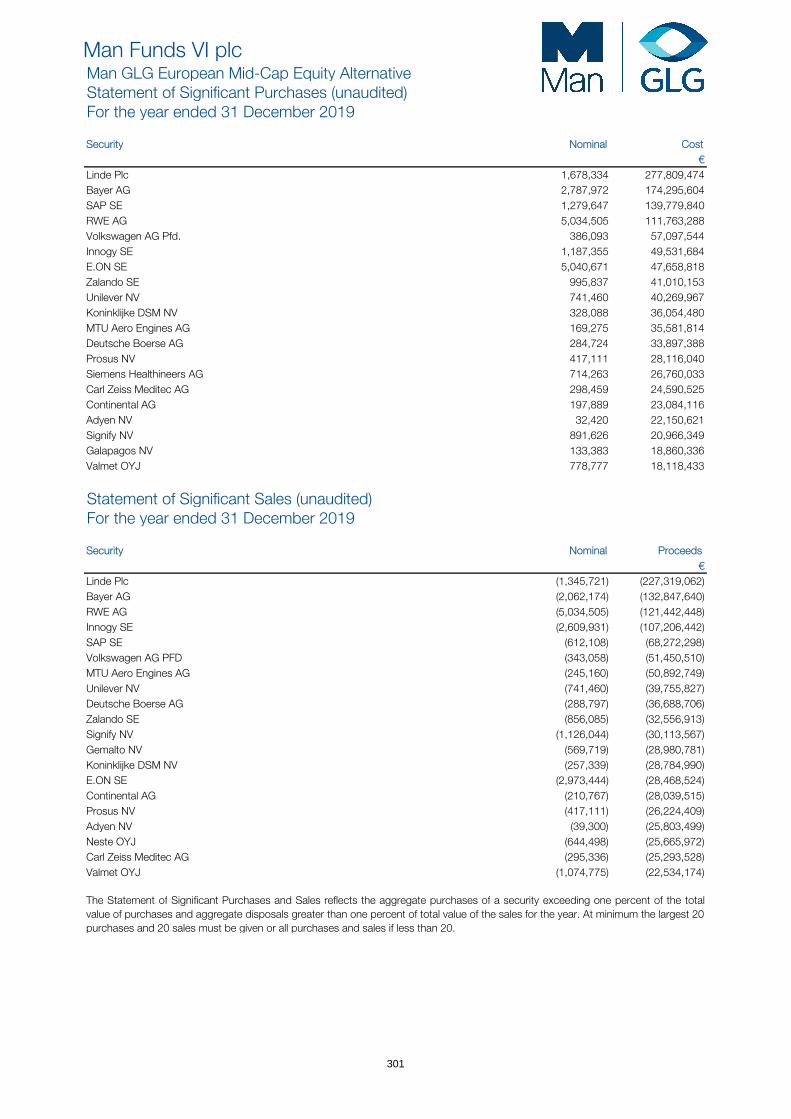
Man Funds VI plcMan GLG European Mid-Cap Equity AlternativeStatement of Significant Purchases (unaudited)For the year ended 31 December 2019
Security Nominal Cost €
Linde Plc 1,678,334 277,809,474 Bayer AG 2,787,972 174,295,604 SAP SE 1,279,647 139,779,840 RWE AG 5,034,505 111,763,288 Volkswagen AG Pfd. 386,093 57,097,544 Innogy SE 1,187,355 49,531,684 E.ON SE 5,040,671 47,658,818 Zalando SE 995,837 41,010,153 Unilever NV 741,460 40,269,967 Koninklijke DSM NV 328,088 36,054,480 MTU Aero Engines AG 169,275 35,581,814 Deutsche Boerse AG 284,724 33,897,388 Prosus NV 417,111 28,116,040 Siemens Healthineers AG 714,263 26,760,033 Carl Zeiss Meditec AG 298,459 24,590,525 Continental AG 197,889 23,084,116 Adyen NV 32,420 22,150,621 Signify NV 891,626 20,966,349 Galapagos NV 133,383 18,860,336 Valmet OYJ 778,777 18,118,433
Statement of Significant Sales (unaudited)For the year ended 31 December 2019
Security Nominal Proceeds €
Linde Plc (1,345,721) (227,319,062)Bayer AG (2,062,174) (132,847,640)RWE AG (5,034,505) (121,442,448)Innogy SE (2,609,931) (107,206,442)SAP SE (612,108) (68,272,298)Volkswagen AG PFD (343,058) (51,450,510)MTU Aero Engines AG (245,160) (50,892,749)Unilever NV (741,460) (39,755,827)Deutsche Boerse AG (288,797) (36,688,706)Zalando SE (856,085) (32,556,913)Signify NV (1,126,044) (30,113,567)Gemalto NV (569,719) (28,980,781)Koninklijke DSM NV (257,339) (28,784,990)E.ON SE (2,973,444) (28,468,524)Continental AG (210,767) (28,039,515)Prosus NV (417,111) (26,224,409)Adyen NV (39,300) (25,803,499)Neste OYJ (644,498) (25,665,972)Carl Zeiss Meditec AG (295,336) (25,293,528)Valmet OYJ (1,074,775) (22,534,174)
The Statement of Significant Purchases and Sales reflects the aggregate purchases of a security exceeding one percent of the totalvalue of purchases and aggregate disposals greater than one percent of total value of the sales for the year. At minimum the largest 20 purchases and 20 sales must be given or all purchases and sales if less than 20.
301
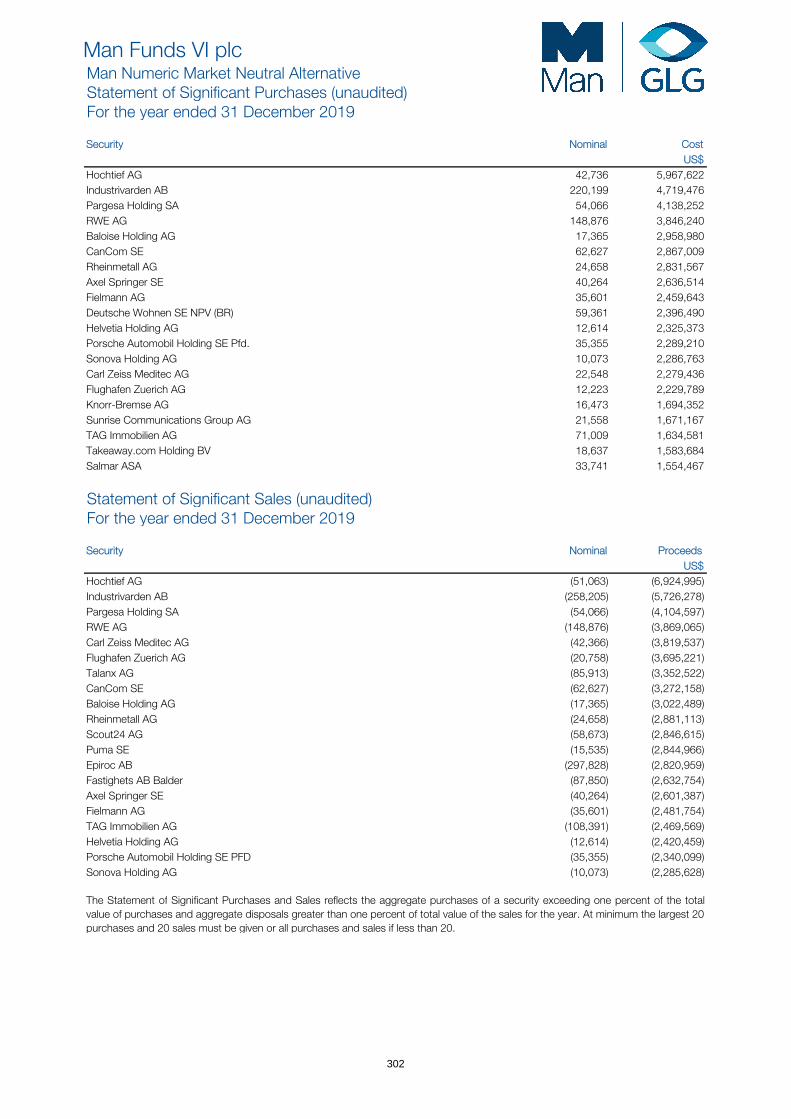
Man Funds VI plcMan Numeric Market Neutral AlternativeStatement of Significant Purchases (unaudited)For the year ended 31 December 2019
Security Nominal Cost US$
Hochtief AG 42,736 5,967,622 Industrivarden AB 220,199 4,719,476 Pargesa Holding SA 54,066 4,138,252 RWE AG 148,876 3,846,240 Baloise Holding AG 17,365 2,958,980 CanCom SE 62,627 2,867,009 Rheinmetall AG 24,658 2,831,567 Axel Springer SE 40,264 2,636,514 Fielmann AG 35,601 2,459,643 Deutsche Wohnen SE NPV (BR) 59,361 2,396,490 Helvetia Holding AG 12,614 2,325,373 Porsche Automobil Holding SE Pfd. 35,355 2,289,210 Sonova Holding AG 10,073 2,286,763 Carl Zeiss Meditec AG 22,548 2,279,436 Flughafen Zuerich AG 12,223 2,229,789 Knorr-Bremse AG 16,473 1,694,352 Sunrise Communications Group AG 21,558 1,671,167 TAG Immobilien AG 71,009 1,634,581 Takeaway.com Holding BV 18,637 1,583,684 Salmar ASA 33,741 1,554,467
Statement of Significant Sales (unaudited)For the year ended 31 December 2019
Security Nominal Proceeds US$
Hochtief AG (51,063) (6,924,995)Industrivarden AB (258,205) (5,726,278)Pargesa Holding SA (54,066) (4,104,597)RWE AG (148,876) (3,869,065)Carl Zeiss Meditec AG (42,366) (3,819,537)Flughafen Zuerich AG (20,758) (3,695,221)Talanx AG (85,913) (3,352,522)CanCom SE (62,627) (3,272,158)Baloise Holding AG (17,365) (3,022,489)Rheinmetall AG (24,658) (2,881,113)Scout24 AG (58,673) (2,846,615)Puma SE (15,535) (2,844,966)Epiroc AB (297,828) (2,820,959)Fastighets AB Balder (87,850) (2,632,754)Axel Springer SE (40,264) (2,601,387)Fielmann AG (35,601) (2,481,754)TAG Immobilien AG (108,391) (2,469,569)Helvetia Holding AG (12,614) (2,420,459)Porsche Automobil Holding SE PFD (35,355) (2,340,099)Sonova Holding AG (10,073) (2,285,628)
The Statement of Significant Purchases and Sales reflects the aggregate purchases of a security exceeding one percent of the totalvalue of purchases and aggregate disposals greater than one percent of total value of the sales for the year. At minimum the largest 20 purchases and 20 sales must be given or all purchases and sales if less than 20.
302
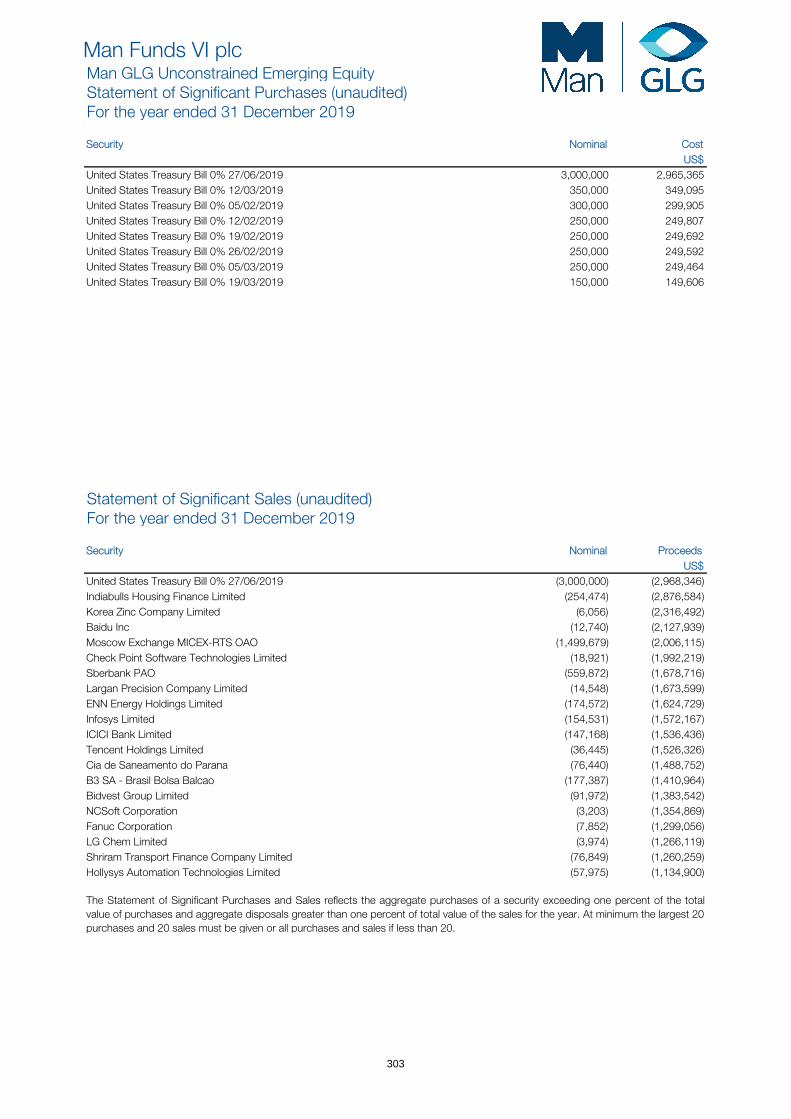
Man Funds VI plcMan GLG Unconstrained Emerging EquityStatement of Significant Purchases (unaudited)For the year ended 31 December 2019
Security Nominal Cost US$
United States Treasury Bill 0% 27/06/2019 3,000,000 2,965,365 United States Treasury Bill 0% 12/03/2019 350,000 349,095 United States Treasury Bill 0% 05/02/2019 300,000 299,905 United States Treasury Bill 0% 12/02/2019 250,000 249,807 United States Treasury Bill 0% 19/02/2019 250,000 249,692 United States Treasury Bill 0% 26/02/2019 250,000 249,592 United States Treasury Bill 0% 05/03/2019 250,000 249,464 United States Treasury Bill 0% 19/03/2019 150,000 149,606
Statement of Significant Sales (unaudited)For the year ended 31 December 2019
Security Nominal Proceeds US$
United States Treasury Bill 0% 27/06/2019 (3,000,000) (2,968,346)Indiabulls Housing Finance Limited (254,474) (2,876,584)Korea Zinc Company Limited (6,056) (2,316,492)Baidu Inc (12,740) (2,127,939)Moscow Exchange MICEX-RTS OAO (1,499,679) (2,006,115)Check Point Software Technologies Limited (18,921) (1,992,219)Sberbank PAO (559,872) (1,678,716)Largan Precision Company Limited (14,548) (1,673,599)ENN Energy Holdings Limited (174,572) (1,624,729)Infosys Limited (154,531) (1,572,167)ICICI Bank Limited (147,168) (1,536,436)Tencent Holdings Limited (36,445) (1,526,326)Cia de Saneamento do Parana (76,440) (1,488,752)B3 SA - Brasil Bolsa Balcao (177,387) (1,410,964)Bidvest Group Limited (91,972) (1,383,542)NCSoft Corporation (3,203) (1,354,869)Fanuc Corporation (7,852) (1,299,056)LG Chem Limited (3,974) (1,266,119)Shriram Transport Finance Company Limited (76,849) (1,260,259)Hollysys Automation Technologies Limited (57,975) (1,134,900)
The Statement of Significant Purchases and Sales reflects the aggregate purchases of a security exceeding one percent of the totalvalue of purchases and aggregate disposals greater than one percent of total value of the sales for the year. At minimum the largest 20 purchases and 20 sales must be given or all purchases and sales if less than 20.
303
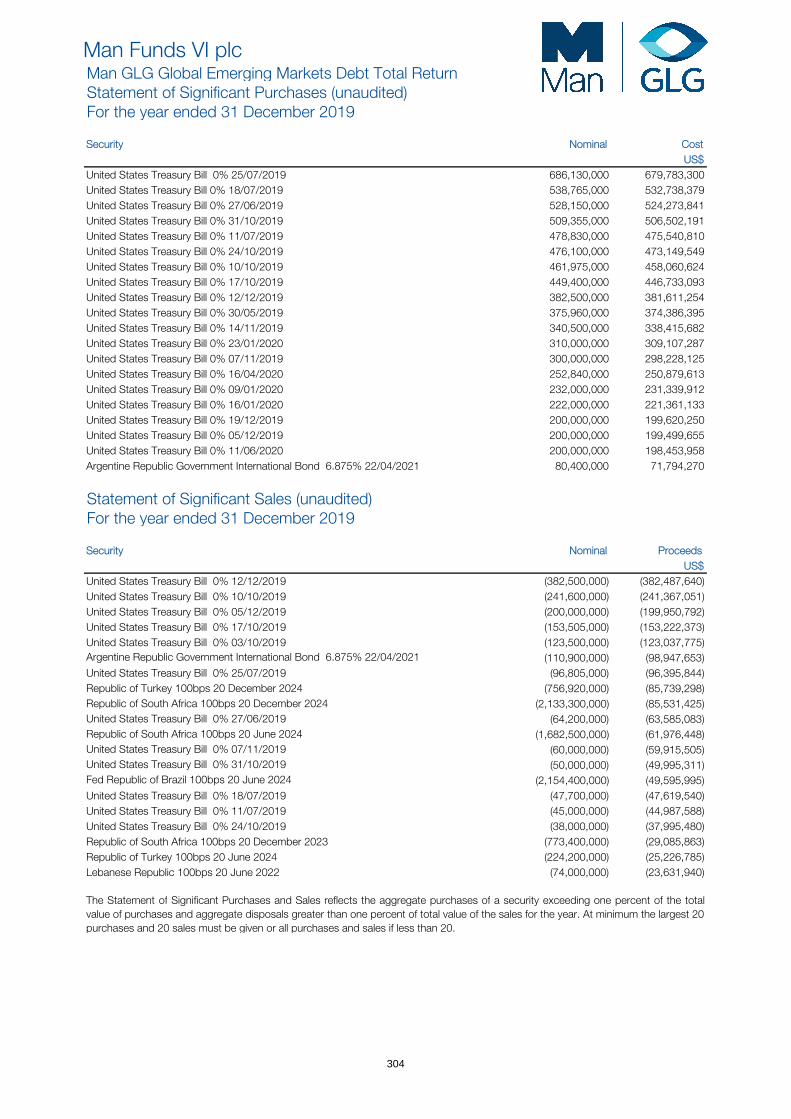
Man Funds VI plcMan GLG Global Emerging Markets Debt Total ReturnStatement of Significant Purchases (unaudited)For the year ended 31 December 2019
Security Nominal Cost US$
United States Treasury Bill 0% 25/07/2019 686,130,000 679,783,300 United States Treasury Bill 0% 18/07/2019 538,765,000 532,738,379 United States Treasury Bill 0% 27/06/2019 528,150,000 524,273,841 United States Treasury Bill 0% 31/10/2019 509,355,000 506,502,191 United States Treasury Bill 0% 11/07/2019 478,830,000 475,540,810 United States Treasury Bill 0% 24/10/2019 476,100,000 473,149,549 United States Treasury Bill 0% 10/10/2019 461,975,000 458,060,624 United States Treasury Bill 0% 17/10/2019 449,400,000 446,733,093 United States Treasury Bill 0% 12/12/2019 382,500,000 381,611,254 United States Treasury Bill 0% 30/05/2019 375,960,000 374,386,395 United States Treasury Bill 0% 14/11/2019 340,500,000 338,415,682 United States Treasury Bill 0% 23/01/2020 310,000,000 309,107,287 United States Treasury Bill 0% 07/11/2019 300,000,000 298,228,125 United States Treasury Bill 0% 16/04/2020 252,840,000 250,879,613 United States Treasury Bill 0% 09/01/2020 232,000,000 231,339,912 United States Treasury Bill 0% 16/01/2020 222,000,000 221,361,133 United States Treasury Bill 0% 19/12/2019 200,000,000 199,620,250 United States Treasury Bill 0% 05/12/2019 200,000,000 199,499,655 United States Treasury Bill 0% 11/06/2020 200,000,000 198,453,958 Argentine Republic Government International Bond 6.875% 22/04/2021 80,400,000 71,794,270
Statement of Significant Sales (unaudited)For the year ended 31 December 2019
Security Nominal Proceeds US$
United States Treasury Bill 0% 12/12/2019 (382,500,000) (382,487,640)United States Treasury Bill 0% 10/10/2019 (241,600,000) (241,367,051)United States Treasury Bill 0% 05/12/2019 (200,000,000) (199,950,792)United States Treasury Bill 0% 17/10/2019 (153,505,000) (153,222,373)United States Treasury Bill 0% 03/10/2019 (123,500,000) (123,037,775)
(110,900,000) (98,947,653)(96,805,000) (96,395,844)
(756,920,000) (85,739,298) (2,133,300,000) (85,531,425)
(64,200,000) (63,585,083) (1,682,500,000) (61,976,448)
(60,000,000) (59,915,505)(50,000,000) (49,995,311)
Argentine Republic Government International Bond 6.875% 22/04/2021
United States Treasury Bill 0% 25/07/2019Republic of Turkey 100bps 20 December 2024Republic of South Africa 100bps 20 December 2024United States Treasury Bill 0% 27/06/2019Republic of South Africa 100bps 20 June 2024United States Treasury Bill 0% 07/11/2019 United States Treasury Bill 0% 31/10/2019Fed Republic of Brazil 100bps 20 June 2024 (2,154,400,000) (49,595,995)United States Treasury Bill 0% 18/07/2019 (47,700,000) (47,619,540)United States Treasury Bill 0% 11/07/2019 (45,000,000) (44,987,588)United States Treasury Bill 0% 24/10/2019 (38,000,000) (37,995,480)Republic of South Africa 100bps 20 December 2023 (773,400,000) (29,085,863)Republic of Turkey 100bps 20 June 2024 (224,200,000) (25,226,785)Lebanese Republic 100bps 20 June 2022 (74,000,000) (23,631,940)
The Statement of Significant Purchases and Sales reflects the aggregate purchases of a security exceeding one percent of the totalvalue of purchases and aggregate disposals greater than one percent of total value of the sales for the year. At minimum the largest 20 purchases and 20 sales must be given or all purchases and sales if less than 20.
304
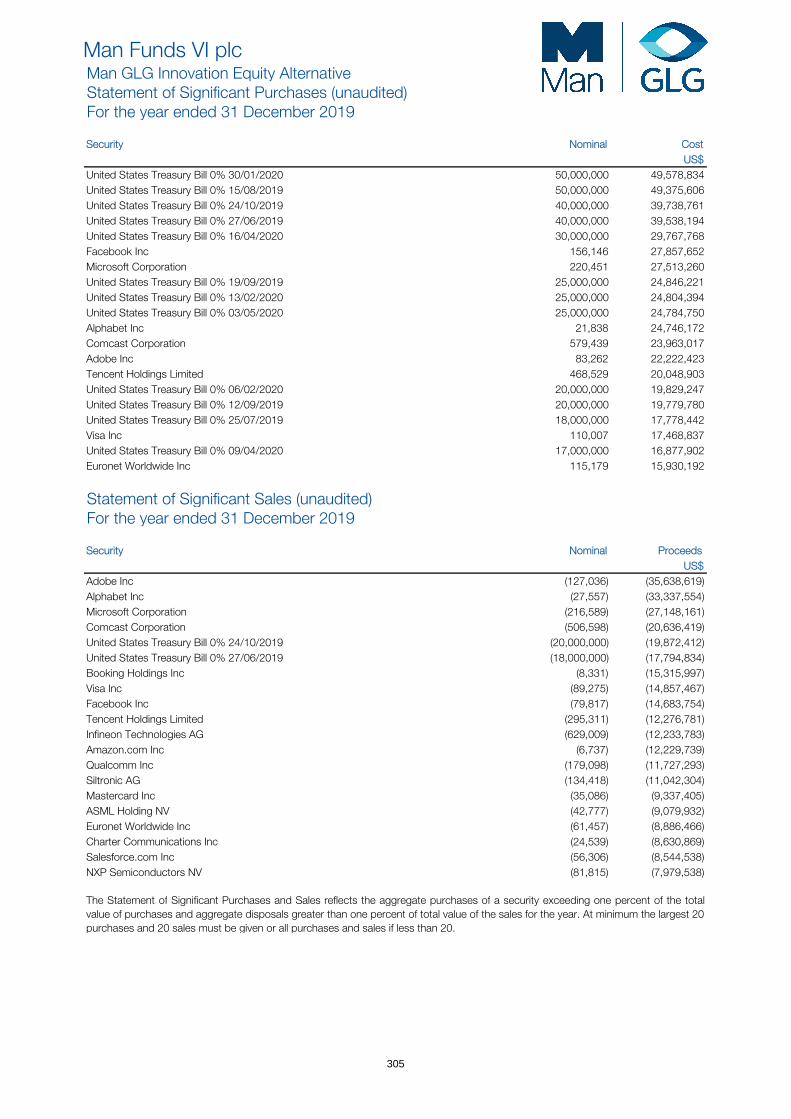
Man Funds VI plcMan GLG Innovation Equity AlternativeStatement of Significant Purchases (unaudited)For the year ended 31 December 2019
Security Nominal Cost US$
United States Treasury Bill 0% 30/01/2020 50,000,000 49,578,834 United States Treasury Bill 0% 15/08/2019 50,000,000 49,375,606 United States Treasury Bill 0% 24/10/2019 40,000,000 39,738,761 United States Treasury Bill 0% 27/06/2019 40,000,000 39,538,194 United States Treasury Bill 0% 16/04/2020 30,000,000 29,767,768 Facebook Inc 156,146 27,857,652 Microsoft Corporation 220,451 27,513,260 United States Treasury Bill 0% 19/09/2019 25,000,000 24,846,221 United States Treasury Bill 0% 13/02/2020 25,000,000 24,804,394 United States Treasury Bill 0% 03/05/2020 25,000,000 24,784,750 Alphabet Inc 21,838 24,746,172 Comcast Corporation 579,439 23,963,017 Adobe Inc 83,262 22,222,423 Tencent Holdings Limited 468,529 20,048,903 United States Treasury Bill 0% 06/02/2020 20,000,000 19,829,247 United States Treasury Bill 0% 12/09/2019 20,000,000 19,779,780 United States Treasury Bill 0% 25/07/2019 18,000,000 17,778,442 Visa Inc 110,007 17,468,837 United States Treasury Bill 0% 09/04/2020 17,000,000 16,877,902 Euronet Worldwide Inc 115,179 15,930,192
Statement of Significant Sales (unaudited)For the year ended 31 December 2019
Security Nominal Proceeds US$
Adobe Inc (127,036) (35,638,619)Alphabet Inc (27,557) (33,337,554)Microsoft Corporation (216,589) (27,148,161)Comcast Corporation (506,598) (20,636,419)United States Treasury Bill 0% 24/10/2019 (20,000,000) (19,872,412)United States Treasury Bill 0% 27/06/2019 (18,000,000) (17,794,834)Booking Holdings Inc (8,331) (15,315,997)Visa Inc (89,275) (14,857,467)Facebook Inc (79,817) (14,683,754)Tencent Holdings Limited (295,311) (12,276,781)Infineon Technologies AG (629,009) (12,233,783)Amazon.com Inc (6,737) (12,229,739)Qualcomm Inc (179,098) (11,727,293)Siltronic AG (134,418) (11,042,304)Mastercard Inc (35,086) (9,337,405)ASML Holding NV (42,777) (9,079,932)Euronet Worldwide Inc (61,457) (8,886,466)Charter Communications Inc (24,539) (8,630,869)Salesforce.com Inc (56,306) (8,544,538)NXP Semiconductors NV (81,815) (7,979,538)
The Statement of Significant Purchases and Sales reflects the aggregate purchases of a security exceeding one percent of the totalvalue of purchases and aggregate disposals greater than one percent of total value of the sales for the year. At minimum the largest 20 purchases and 20 sales must be given or all purchases and sales if less than 20.
305
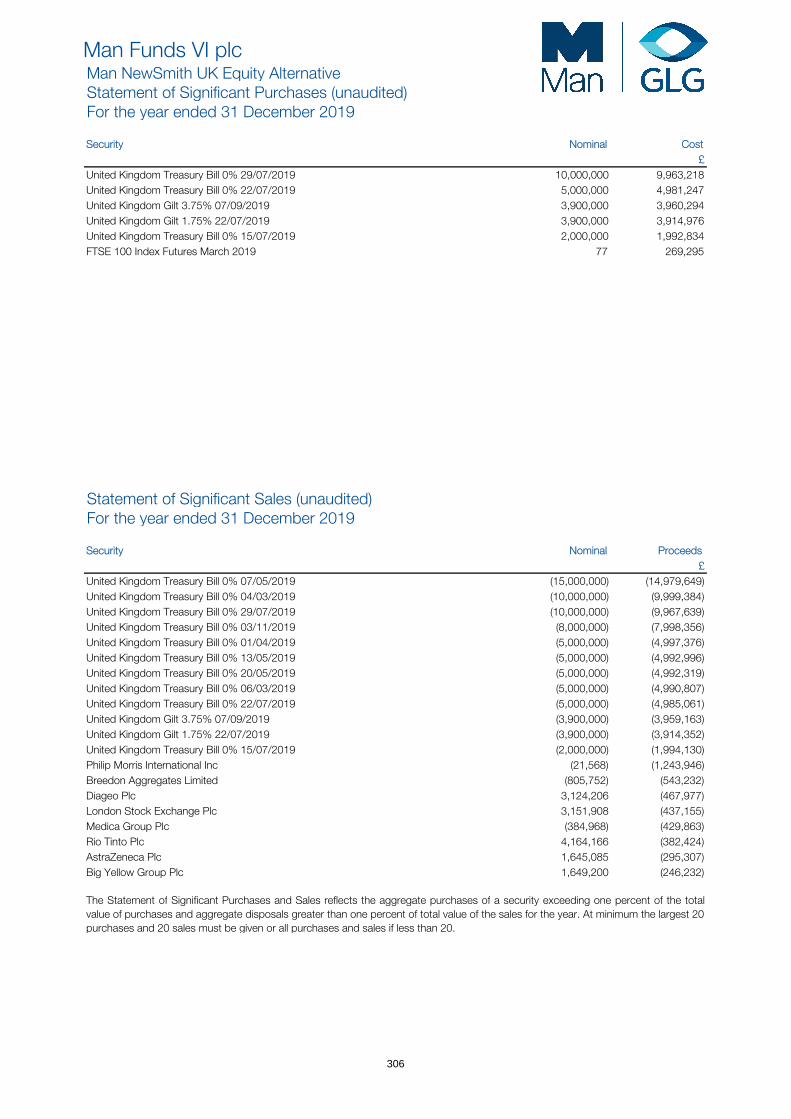
Man Funds VI plcMan NewSmith UK Equity AlternativeStatement of Significant Purchases (unaudited)For the year ended 31 December 2019
Security Nominal Cost £
United Kingdom Treasury Bill 0% 29/07/2019 10,000,000 9,963,218 United Kingdom Treasury Bill 0% 22/07/2019 5,000,000 4,981,247 United Kingdom Gilt 3.75% 07/09/2019 3,900,000 3,960,294 United Kingdom Gilt 1.75% 22/07/2019 3,900,000 3,914,976 United Kingdom Treasury Bill 0% 15/07/2019 2,000,000 1,992,834 FTSE 100 Index Futures March 2019 77 269,295
Statement of Significant Sales (unaudited)For the year ended 31 December 2019
Security Nominal Proceeds £
United Kingdom Treasury Bill 0% 07/05/2019 (15,000,000) (14,979,649)United Kingdom Treasury Bill 0% 04/03/2019 (10,000,000) (9,999,384)United Kingdom Treasury Bill 0% 29/07/2019 (10,000,000) (9,967,639)United Kingdom Treasury Bill 0% 03/11/2019 (8,000,000) (7,998,356)United Kingdom Treasury Bill 0% 01/04/2019 (5,000,000) (4,997,376)United Kingdom Treasury Bill 0% 13/05/2019 (5,000,000) (4,992,996)United Kingdom Treasury Bill 0% 20/05/2019 (5,000,000) (4,992,319)United Kingdom Treasury Bill 0% 06/03/2019 (5,000,000) (4,990,807)United Kingdom Treasury Bill 0% 22/07/2019 (5,000,000) (4,985,061)United Kingdom Gilt 3.75% 07/09/2019 (3,900,000) (3,959,163)United Kingdom Gilt 1.75% 22/07/2019 (3,900,000) (3,914,352)United Kingdom Treasury Bill 0% 15/07/2019 (2,000,000) (1,994,130)Philip Morris International Inc (21,568) (1,243,946)Breedon Aggregates Limited (805,752) (543,232)Diageo Plc 3,124,206 (467,977)London Stock Exchange Plc 3,151,908 (437,155)Medica Group Plc (384,968) (429,863)Rio Tinto Plc 4,164,166 (382,424)AstraZeneca Plc 1,645,085 (295,307)Big Yellow Group Plc 1,649,200 (246,232)
The Statement of Significant Purchases and Sales reflects the aggregate purchases of a security exceeding one percent of the totalvalue of purchases and aggregate disposals greater than one percent of total value of the sales for the year. At minimum the largest 20 purchases and 20 sales must be given or all purchases and sales if less than 20.
306
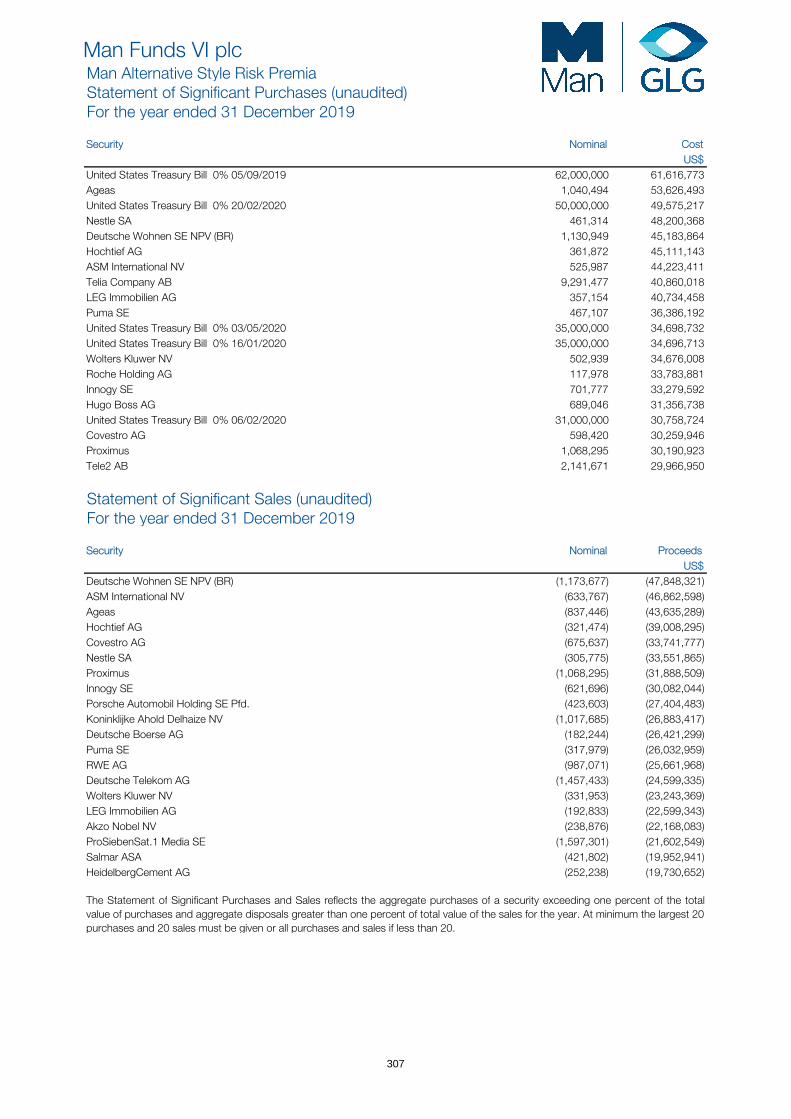
Man Funds VI plcMan Alternative Style Risk PremiaStatement of Significant Purchases (unaudited)For the year ended 31 December 2019
Security Nominal Cost US$
United States Treasury Bill 0% 05/09/2019 62,000,000 61,616,773 Ageas 1,040,494 53,626,493 United States Treasury Bill 0% 20/02/2020 50,000,000 49,575,217 Nestle SA 461,314 48,200,368 Deutsche Wohnen SE NPV (BR) 1,130,949 45,183,864 Hochtief AG 361,872 45,111,143 ASM International NV 525,987 44,223,411 Telia Company AB 9,291,477 40,860,018 LEG Immobilien AG 357,154 40,734,458 Puma SE 467,107 36,386,192 United States Treasury Bill 0% 03/05/2020 35,000,000 34,698,732 United States Treasury Bill 0% 16/01/2020 35,000,000 34,696,713 Wolters Kluwer NV 502,939 34,676,008 Roche Holding AG 117,978 33,783,881 Innogy SE 701,777 33,279,592 Hugo Boss AG 689,046 31,356,738 United States Treasury Bill 0% 06/02/2020 31,000,000 30,758,724 Covestro AG 598,420 30,259,946 Proximus 1,068,295 30,190,923 Tele2 AB 2,141,671 29,966,950
Statement of Significant Sales (unaudited)For the year ended 31 December 2019
Security Nominal Proceeds US$
Deutsche Wohnen SE NPV (BR) (1,173,677) (47,848,321)ASM International NV (633,767) (46,862,598)Ageas (837,446) (43,635,289)Hochtief AG (321,474) (39,008,295)Covestro AG (675,637) (33,741,777)Nestle SA (305,775) (33,551,865)Proximus (1,068,295) (31,888,509)Innogy SE (621,696) (30,082,044)Porsche Automobil Holding SE Pfd. (423,603) (27,404,483)Koninklijke Ahold Delhaize NV (1,017,685) (26,883,417)Deutsche Boerse AG (182,244) (26,421,299)Puma SE (317,979) (26,032,959)RWE AG (987,071) (25,661,968)Deutsche Telekom AG (1,457,433) (24,599,335)Wolters Kluwer NV (331,953) (23,243,369)LEG Immobilien AG (192,833) (22,599,343)Akzo Nobel NV (238,876) (22,168,083)ProSiebenSat.1 Media SE (1,597,301) (21,602,549)Salmar ASA (421,802) (19,952,941)HeidelbergCement AG (252,238) (19,730,652)
The Statement of Significant Purchases and Sales reflects the aggregate purchases of a security exceeding one percent of the totalvalue of purchases and aggregate disposals greater than one percent of total value of the sales for the year. At minimum the largest 20 purchases and 20 sales must be given or all purchases and sales if less than 20.
307
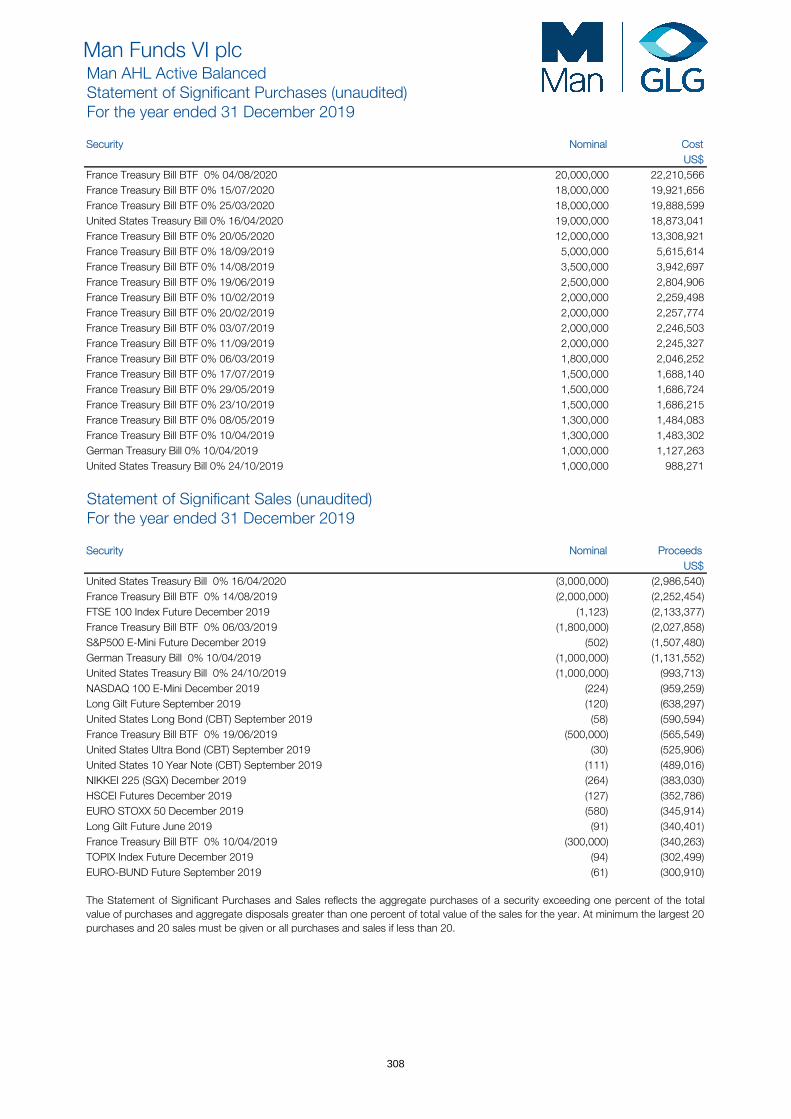
Man Funds VI plcMan AHL Active BalancedStatement of Significant Purchases (unaudited)For the year ended 31 December 2019
Security Nominal Cost US$
France Treasury Bill BTF 0% 04/08/2020 20,000,000 22,210,566 France Treasury Bill BTF 0% 15/07/2020 18,000,000 19,921,656 France Treasury Bill BTF 0% 25/03/2020 18,000,000 19,888,599 United States Treasury Bill 0% 16/04/2020 19,000,000 18,873,041 France Treasury Bill BTF 0% 20/05/2020 12,000,000 13,308,921 France Treasury Bill BTF 0% 18/09/2019 5,000,000 5,615,614 France Treasury Bill BTF 0% 14/08/2019 3,500,000 3,942,697 France Treasury Bill BTF 0% 19/06/2019 2,500,000 2,804,906 France Treasury Bill BTF 0% 10/02/2019 2,000,000 2,259,498 France Treasury Bill BTF 0% 20/02/2019 2,000,000 2,257,774 France Treasury Bill BTF 0% 03/07/2019 2,000,000 2,246,503 France Treasury Bill BTF 0% 11/09/2019 2,000,000 2,245,327 France Treasury Bill BTF 0% 06/03/2019 1,800,000 2,046,252 France Treasury Bill BTF 0% 17/07/2019 1,500,000 1,688,140 France Treasury Bill BTF 0% 29/05/2019 1,500,000 1,686,724 France Treasury Bill BTF 0% 23/10/2019 1,500,000 1,686,215 France Treasury Bill BTF 0% 08/05/2019 1,300,000 1,484,083 France Treasury Bill BTF 0% 10/04/2019 1,300,000 1,483,302 German Treasury Bill 0% 10/04/2019 1,000,000 1,127,263 United States Treasury Bill 0% 24/10/2019 1,000,000 988,271
Statement of Significant Sales (unaudited)For the year ended 31 December 2019
Security Nominal Proceeds US$
United States Treasury Bill 0% 16/04/2020 (3,000,000) (2,986,540)France Treasury Bill BTF 0% 14/08/2019 (2,000,000) (2,252,454)FTSE 100 Index Future December 2019 (1,123) (2,133,377)France Treasury Bill BTF 0% 06/03/2019 (1,800,000) (2,027,858)S&P500 E-Mini Future December 2019 (502) (1,507,480)German Treasury Bill 0% 10/04/2019 (1,000,000) (1,131,552)United States Treasury Bill 0% 24/10/2019 (1,000,000) (993,713)NASDAQ 100 E-Mini December 2019 (224) (959,259)Long Gilt Future September 2019 (120) (638,297)United States Long Bond (CBT) September 2019 (58) (590,594)France Treasury Bill BTF 0% 19/06/2019 (500,000) (565,549)United States Ultra Bond (CBT) September 2019 (30) (525,906)United States 10 Year Note (CBT) September 2019 (111) (489,016)NIKKEI 225 (SGX) December 2019 (264) (383,030)HSCEI Futures December 2019 (127) (352,786)EURO STOXX 50 December 2019 (580) (345,914)Long Gilt Future June 2019 (91) (340,401)France Treasury Bill BTF 0% 10/04/2019 (300,000) (340,263)TOPIX Index Future December 2019 (94) (302,499)EURO-BUND Future September 2019 (61) (300,910)
The Statement of Significant Purchases and Sales reflects the aggregate purchases of a security exceeding one percent of the totalvalue of purchases and aggregate disposals greater than one percent of total value of the sales for the year. At minimum the largest 20 purchases and 20 sales must be given or all purchases and sales if less than 20.
308

Man Funds VI plcMan GLG High Yield OpportunitiesStatement of Significant Purchases (unaudited)For the year ended 31 December 2019
Security Nominal Cost €
Novo Banco SA 8.5% 06/07/2028 14,200,000 13,520,768 Petrobras Global Finance BV 5.375% 01/10/2029 10,250,000 11,631,615 Distribuidora Internacional de Alimentacion SA 1% 28/04/2021 14,800,000 11,412,987 Almaviva-The Italian Innovation Company SpA 7.25% 15/10/2022 14,356,000 10,918,607 Consus Real Estate AG 9.625% 15/05/2024 11,830,000 10,771,477 Italy Buoni Poliennali Del Tesoro 3.1% 01/03/2040 9,490,000 9,659,927 Matalan Finance Plc 6.75% 31/01/2023 8,937,000 8,613,760 Spain Government Bond 2.7% 31/10/2048 7,500,000 8,575,993 Officine Maccaferri-SpA 5.75% 01/06/2021 10,728,000 7,996,895 Safari Holding Verwaltungs GmbH 5.375% 30/11/2022 8,120,000 7,040,470 Tesco Plc 6.15% 15/11/2037 5,900,000 5,917,417 First Quantum Minerals Limited 6.5% 01/03/2024 6,334,000 5,482,964 Societa Cattolica di Assicurazioni SC 4.25% 14/12/2047 5,100,000 5,033,048 Pizzaexpress Financing 2 Plc 6.625% 01/08/2021 4,900,000 4,958,080 Brait SE 2.75% 18/09/2020 4,600,000 4,832,526 Banco Comercial Portugues SA 3.871% 27/03/2030 4,800,000 4,792,450 Telecom Italia SpA Milano 4% 11/04/2024 4,625,000 4,738,688 EnQuest Plc 7% 15/04/2022 6,535,000 4,710,194 Italy Buoni Poliennali Del Tesoro 3.85% 01/09/2049 3,590,000 4,452,606 Laredo Petroleum Inc 5.625% 15/01/2022 5,116,000 4,281,035
Statement of Significant Sales (unaudited)For the year ended 31 December 2019
Security Nominal Proceeds €
Italy Buoni Poliennali Del Tesoro 3.1% 01/03/2040 (9,490,000) (10,188,423)Spain Government Bond 2.7% 31/10/2048 (7,500,000) (9,187,662)Petrobras Global Finance BV 5.375% 01/10/2029 (7,000,000) (7,825,701)Novo Banco SA 8.5% 06/07/2028 (8,000,000) (7,066,768)Consus Real Estate AG 9.625% 15/05/2024 (5,915,000) (4,977,802)Telecom Italia SpA Milano 4% 11/04/2024 (4,625,000) (4,947,594)Distribuidora Internacional de Alimentacion SA 1% 28/04/2021 (6,600,000) (4,663,737)Italy Buoni Poliennali Del Tesoro 3.85% 01/09/2049 (3,590,000) (4,494,089)Prime Security Services Borrower LLC / Prime Finance Inc 5.25% 15/04/2024 (4,500,000) (4,266,245)Almaviva-The Italian Innovation Company SpA 7.25% 15/10/2022 (6,673,000) (4,145,771)Co-Operative Group Limited 5.125% 17/05/2024 (3,500,000) (4,113,251)Banco de Sabadell SA 5.375% 12/12/2028 (4,000,000) (4,103,166)Adient Global Holdings Limited 3.5% 15/08/2024 (4,200,000) (3,497,824)Societa Cattolica di Assicurazioni SC 4.25% 14/12/2047 (3,500,000) (3,408,675)Codere Finance 2 Luxembourg SA 6.75% 01/11/2021 (3,735,000) (3,396,477)Bausch Health Companies Inc 5.75% 15/08/2027 (3,366,000) (3,276,887)Achmea BV 2.5% 24/09/2039 (3,332,000) (3,265,360)Matalan Finance Plc 6.75% 31/01/2023 (3,941,000) (3,254,092)Unione di Banche Italiane SpA 4.375% 07/12/2029 (3,150,000) (3,224,888)Jaguar Land Rover Automotive Plc 2.2% 15/01/2024 (3,500,000) (3,211,250)
The Statement of Significant Purchases and Sales reflects the aggregate purchases of a security exceeding one percent of the totalvalue of purchases and aggregate disposals greater than one percent of total value of the sales for the year. At minimum the largest 20 purchases and 20 sales must be given or all purchases and sales if less than 20.
309
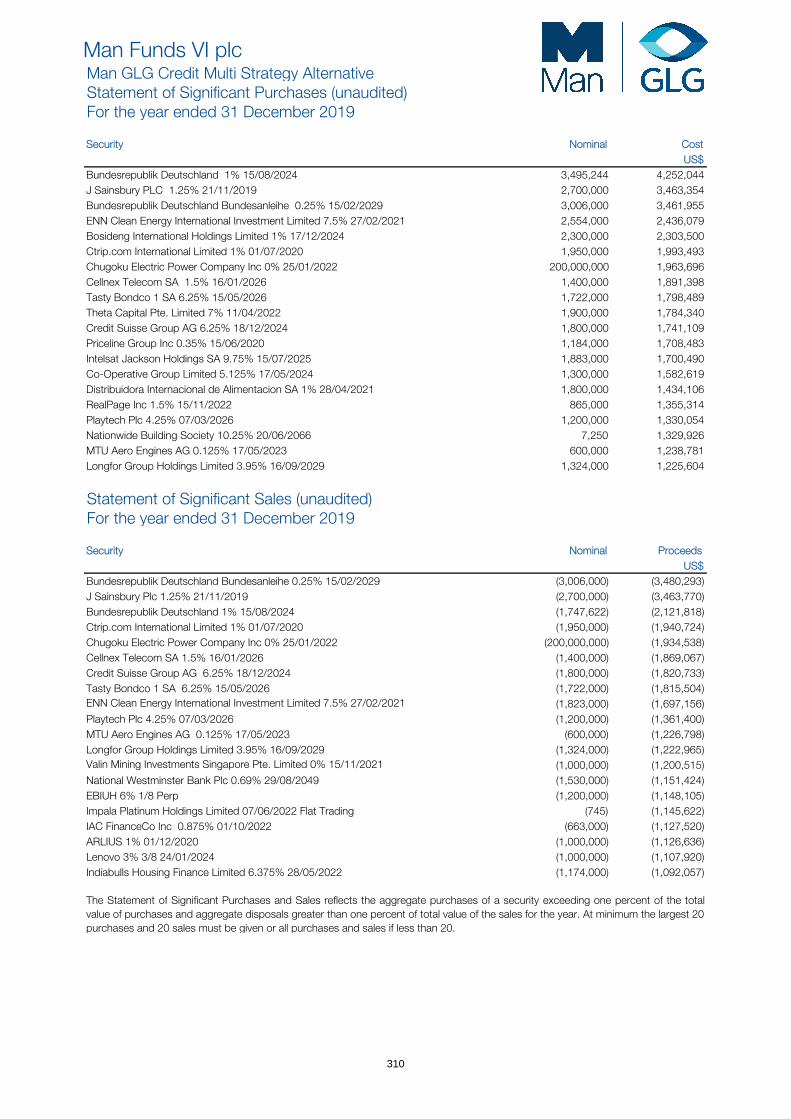
Man Funds VI plcMan GLG Credit Multi Strategy AlternativeStatement of Significant Purchases (unaudited)For the year ended 31 December 2019
Security Nominal Cost US$
Bundesrepublik Deutschland 1% 15/08/2024 3,495,244 4,252,044 J Sainsbury PLC 1.25% 21/11/2019 2,700,000 3,463,354 Bundesrepublik Deutschland Bundesanleihe 0.25% 15/02/2029 3,006,000 3,461,955 ENN Clean Energy International Investment Limited 7.5% 27/02/2021 2,554,000 2,436,079 Bosideng International Holdings Limited 1% 17/12/2024 2,300,000 2,303,500 Ctrip.com International Limited 1% 01/07/2020 1,950,000 1,993,493 Chugoku Electric Power Company Inc 0% 25/01/2022 200,000,000 1,963,696 Cellnex Telecom SA 1.5% 16/01/2026 1,400,000 1,891,398 Tasty Bondco 1 SA 6.25% 15/05/2026 1,722,000 1,798,489 Theta Capital Pte. Limited 7% 11/04/2022 1,900,000 1,784,340 Credit Suisse Group AG 6.25% 18/12/2024 1,800,000 1,741,109 Priceline Group Inc 0.35% 15/06/2020 1,184,000 1,708,483 Intelsat Jackson Holdings SA 9.75% 15/07/2025 1,883,000 1,700,490 Co-Operative Group Limited 5.125% 17/05/2024 1,300,000 1,582,619 Distribuidora Internacional de Alimentacion SA 1% 28/04/2021 1,800,000 1,434,106 RealPage Inc 1.5% 15/11/2022 865,000 1,355,314 Playtech Plc 4.25% 07/03/2026 1,200,000 1,330,054 Nationwide Building Society 10.25% 20/06/2066 7,250 1,329,926 MTU Aero Engines AG 0.125% 17/05/2023 600,000 1,238,781 Longfor Group Holdings Limited 3.95% 16/09/2029 1,324,000 1,225,604
Statement of Significant Sales (unaudited)For the year ended 31 December 2019
Security Nominal Proceeds US$
(3,006,000) (3,480,293)(2,700,000) (3,463,770)(1,747,622) (2,121,818)(1,950,000) (1,940,724)
(200,000,000) (1,934,538)(1,400,000) (1,869,067)(1,800,000) (1,820,733)(1,722,000) (1,815,504)(1,823,000) (1,697,156)(1,200,000) (1,361,400)
(600,000) (1,226,798)(1,324,000) (1,222,965)(1,000,000) (1,200,515)(1,530,000) (1,151,424)(1,200,000) (1,148,105)
(745) (1,145,622)(663,000) (1,127,520)
(1,000,000) (1,126,636)(1,000,000) (1,107,920)
Bundesrepublik Deutschland Bundesanleihe 0.25% 15/02/2029J Sainsbury Plc 1.25% 21/11/2019Bundesrepublik Deutschland 1% 15/08/2024Ctrip.com International Limited 1% 01/07/2020Chugoku Electric Power Company Inc 0% 25/01/2022Cellnex Telecom SA 1.5% 16/01/2026Credit Suisse Group AG 6.25% 18/12/2024Tasty Bondco 1 SA 6.25% 15/05/2026ENN Clean Energy International Investment Limited 7.5% 27/02/2021
Playtech Plc 4.25% 07/03/2026MTU Aero Engines AG 0.125% 17/05/2023Longfor Group Holdings Limited 3.95% 16/09/2029 Valin Mining Investments Singapore Pte. Limited 0% 15/11/2021
National Westminster Bank Plc 0.69% 29/08/2049EBIUH 6% 1/8 PerpImpala Platinum Holdings Limited 07/06/2022 Flat Trading IAC FinanceCo Inc 0.875% 01/10/2022ARLIUS 1% 01/12/2020Lenovo 3% 3/8 24/01/2024Indiabulls Housing Finance Limited 6.375% 28/05/2022 (1,174,000) (1,092,057)
The Statement of Significant Purchases and Sales reflects the aggregate purchases of a security exceeding one percent of the totalvalue of purchases and aggregate disposals greater than one percent of total value of the sales for the year. At minimum the largest 20 purchases and 20 sales must be given or all purchases and sales if less than 20.
310
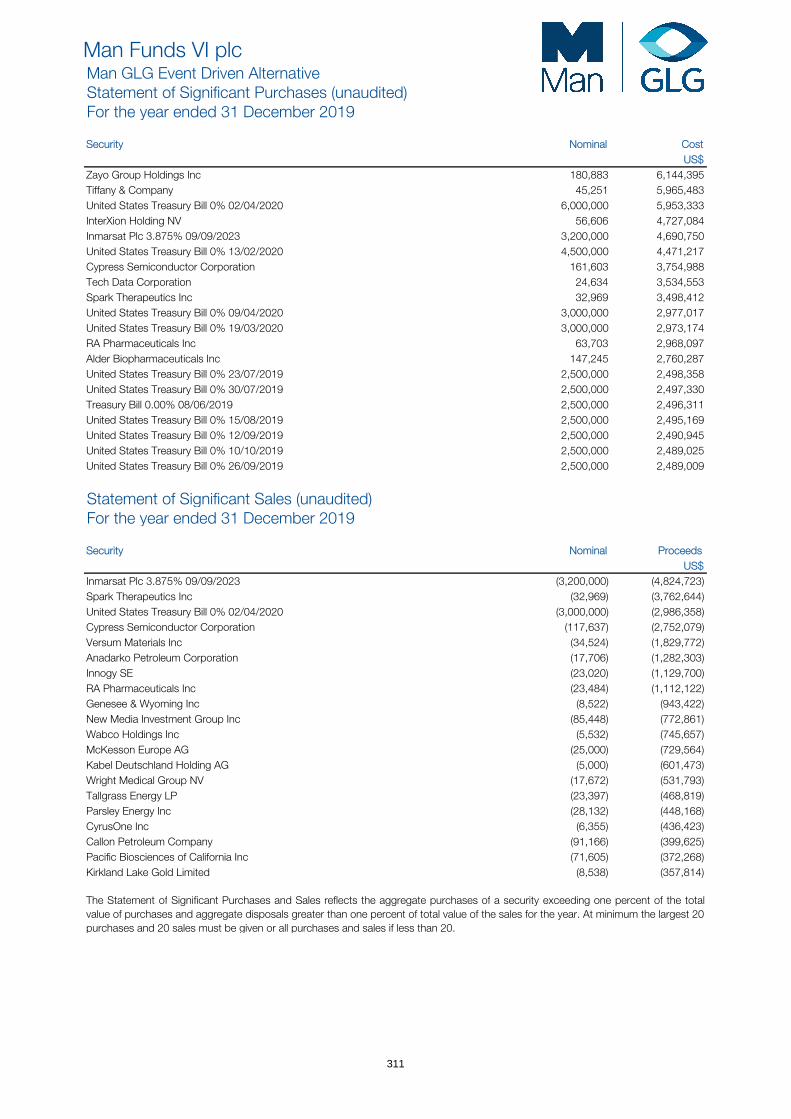
Man Funds VI plcMan GLG Event Driven AlternativeStatement of Significant Purchases (unaudited)For the year ended 31 December 2019
Security Nominal Cost US$
Zayo Group Holdings Inc 180,883 6,144,395 Tiffany & Company 45,251 5,965,483 United States Treasury Bill 0% 02/04/2020 6,000,000 5,953,333 InterXion Holding NV 56,606 4,727,084 Inmarsat Plc 3.875% 09/09/2023 3,200,000 4,690,750 United States Treasury Bill 0% 13/02/2020 4,500,000 4,471,217 Cypress Semiconductor Corporation 161,603 3,754,988 Tech Data Corporation 24,634 3,534,553 Spark Therapeutics Inc 32,969 3,498,412 United States Treasury Bill 0% 09/04/2020 3,000,000 2,977,017 United States Treasury Bill 0% 19/03/2020 3,000,000 2,973,174 RA Pharmaceuticals Inc 63,703 2,968,097 Alder Biopharmaceuticals Inc 147,245 2,760,287 United States Treasury Bill 0% 23/07/2019 2,500,000 2,498,358 United States Treasury Bill 0% 30/07/2019 2,500,000 2,497,330 Treasury Bill 0.00% 08/06/2019 2,500,000 2,496,311 United States Treasury Bill 0% 15/08/2019 2,500,000 2,495,169 United States Treasury Bill 0% 12/09/2019 2,500,000 2,490,945 United States Treasury Bill 0% 10/10/2019 2,500,000 2,489,025 United States Treasury Bill 0% 26/09/2019 2,500,000 2,489,009
Statement of Significant Sales (unaudited)For the year ended 31 December 2019
Security Nominal Proceeds US$
Inmarsat Plc 3.875% 09/09/2023 (3,200,000) (4,824,723)Spark Therapeutics Inc (32,969) (3,762,644)United States Treasury Bill 0% 02/04/2020 (3,000,000) (2,986,358)Cypress Semiconductor Corporation (117,637) (2,752,079)Versum Materials Inc (34,524) (1,829,772)Anadarko Petroleum Corporation (17,706) (1,282,303)Innogy SE (23,020) (1,129,700)RA Pharmaceuticals Inc (23,484) (1,112,122)Genesee & Wyoming Inc (8,522) (943,422)New Media Investment Group Inc (85,448) (772,861)Wabco Holdings Inc (5,532) (745,657)McKesson Europe AG (25,000) (729,564)Kabel Deutschland Holding AG (5,000) (601,473)Wright Medical Group NV (17,672) (531,793)Tallgrass Energy LP (23,397) (468,819)Parsley Energy Inc (28,132) (448,168)CyrusOne Inc (6,355) (436,423)Callon Petroleum Company (91,166) (399,625)Pacific Biosciences of California Inc (71,605) (372,268)Kirkland Lake Gold Limited (8,538) (357,814)
The Statement of Significant Purchases and Sales reflects the aggregate purchases of a security exceeding one percent of the totalvalue of purchases and aggregate disposals greater than one percent of total value of the sales for the year. At minimum the largest 20 purchases and 20 sales must be given or all purchases and sales if less than 20.
311
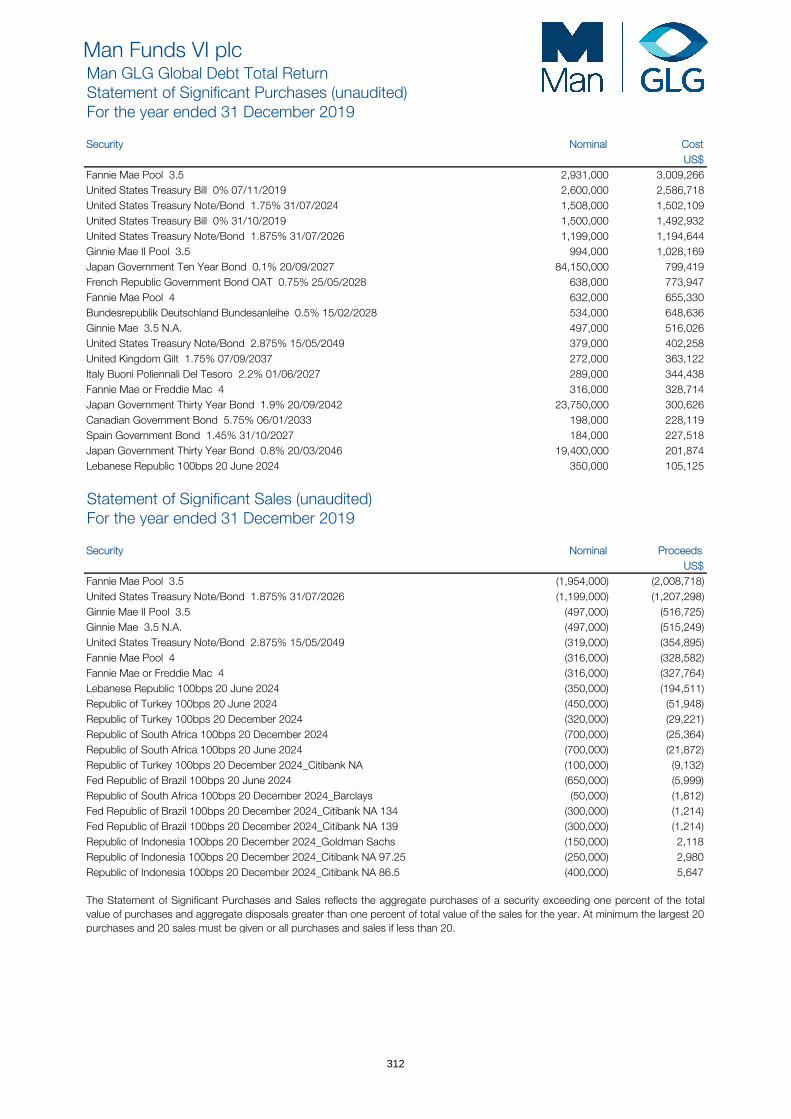
Man Funds VI plcMan GLG Global Debt Total ReturnStatement of Significant Purchases (unaudited)For the year ended 31 December 2019
Security Nominal Cost US$
Fannie Mae Pool 3.5 2,931,000 3,009,266 United States Treasury Bill 0% 07/11/2019 2,600,000 2,586,718 United States Treasury Note/Bond 1.75% 31/07/2024 1,508,000 1,502,109 United States Treasury Bill 0% 31/10/2019 1,500,000 1,492,932 United States Treasury Note/Bond 1.875% 31/07/2026 1,199,000 1,194,644 Ginnie Mae II Pool 3.5 994,000 1,028,169 Japan Government Ten Year Bond 0.1% 20/09/2027 84,150,000 799,419 French Republic Government Bond OAT 0.75% 25/05/2028 638,000 773,947 Fannie Mae Pool 4 632,000 655,330 Bundesrepublik Deutschland Bundesanleihe 0.5% 15/02/2028 534,000 648,636 Ginnie Mae 3.5 N.A. 497,000 516,026 United States Treasury Note/Bond 2.875% 15/05/2049 379,000 402,258 United Kingdom Gilt 1.75% 07/09/2037 272,000 363,122 Italy Buoni Poliennali Del Tesoro 2.2% 01/06/2027 289,000 344,438 Fannie Mae or Freddie Mac 4 316,000 328,714 Japan Government Thirty Year Bond 1.9% 20/09/2042 23,750,000 300,626 Canadian Government Bond 5.75% 06/01/2033 198,000 228,119 Spain Government Bond 1.45% 31/10/2027 184,000 227,518 Japan Government Thirty Year Bond 0.8% 20/03/2046 19,400,000 201,874 Lebanese Republic 100bps 20 June 2024 350,000 105,125
Statement of Significant Sales (unaudited)For the year ended 31 December 2019
Security Nominal Proceeds US$
Fannie Mae Pool 3.5 (1,954,000) (2,008,718)United States Treasury Note/Bond 1.875% 31/07/2026 (1,199,000) (1,207,298)Ginnie Mae II Pool 3.5 (497,000) (516,725)Ginnie Mae 3.5 N.A. (497,000) (515,249)United States Treasury Note/Bond 2.875% 15/05/2049 (319,000) (354,895)Fannie Mae Pool 4 (316,000) (328,582)Fannie Mae or Freddie Mac 4 (316,000) (327,764)Lebanese Republic 100bps 20 June 2024 (350,000) (194,511)Republic of Turkey 100bps 20 June 2024 (450,000) (51,948)Republic of Turkey 100bps 20 December 2024 (320,000) (29,221)Republic of South Africa 100bps 20 December 2024 (700,000) (25,364)Republic of South Africa 100bps 20 June 2024 (700,000) (21,872)Republic of Turkey 100bps 20 December 2024_Citibank NA (100,000) (9,132)Fed Republic of Brazil 100bps 20 June 2024 (650,000) (5,999)Republic of South Africa 100bps 20 December 2024_Barclays (50,000) (1,812)Fed Republic of Brazil 100bps 20 December 2024_Citibank NA 134 (300,000) (1,214)Fed Republic of Brazil 100bps 20 December 2024_Citibank NA 139 (300,000) (1,214)Republic of Indonesia 100bps 20 December 2024_Goldman Sachs (150,000) 2,118 Republic of Indonesia 100bps 20 December 2024_Citibank NA 97.25 (250,000) 2,980 Republic of Indonesia 100bps 20 December 2024_Citibank NA 86.5 (400,000) 5,647
The Statement of Significant Purchases and Sales reflects the aggregate purchases of a security exceeding one percent of the totalvalue of purchases and aggregate disposals greater than one percent of total value of the sales for the year. At minimum the largest 20 purchases and 20 sales must be given or all purchases and sales if less than 20.
312
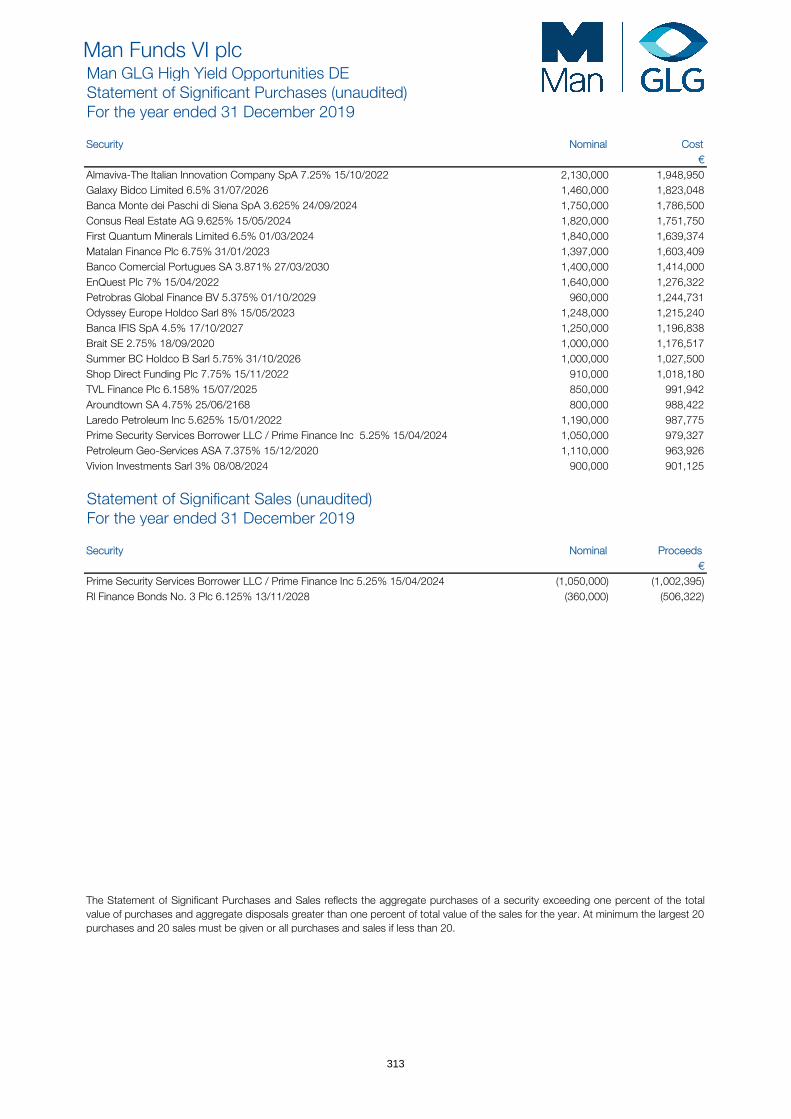
Man Funds VI plcMan GLG High Yield Opportunities DEStatement of Significant Purchases (unaudited)For the year ended 31 December 2019
Security Nominal Cost €
Almaviva-The Italian Innovation Company SpA 7.25% 15/10/2022 2,130,000 1,948,950 Galaxy Bidco Limited 6.5% 31/07/2026 1,460,000 1,823,048 Banca Monte dei Paschi di Siena SpA 3.625% 24/09/2024 1,750,000 1,786,500 Consus Real Estate AG 9.625% 15/05/2024 1,820,000 1,751,750 First Quantum Minerals Limited 6.5% 01/03/2024 1,840,000 1,639,374 Matalan Finance Plc 6.75% 31/01/2023 1,397,000 1,603,409 Banco Comercial Portugues SA 3.871% 27/03/2030 1,400,000 1,414,000 EnQuest Plc 7% 15/04/2022 1,640,000 1,276,322 Petrobras Global Finance BV 5.375% 01/10/2029 960,000 1,244,731 Odyssey Europe Holdco Sarl 8% 15/05/2023 1,248,000 1,215,240 Banca IFIS SpA 4.5% 17/10/2027 1,250,000 1,196,838 Brait SE 2.75% 18/09/2020 1,000,000 1,176,517 Summer BC Holdco B Sarl 5.75% 31/10/2026 1,000,000 1,027,500 Shop Direct Funding Plc 7.75% 15/11/2022 910,000 1,018,180 TVL Finance Plc 6.158% 15/07/2025 850,000 991,942 Aroundtown SA 4.75% 25/06/2168 800,000 988,422 Laredo Petroleum Inc 5.625% 15/01/2022 1,190,000 987,775 Prime Security Services Borrower LLC / Prime Finance Inc 5.25% 15/04/2024 1,050,000 979,327 Petroleum Geo-Services ASA 7.375% 15/12/2020 1,110,000 963,926 Vivion Investments Sarl 3% 08/08/2024 900,000 901,125
Statement of Significant Sales (unaudited)For the year ended 31 December 2019
Security Nominal Proceeds €
Prime Security Services Borrower LLC / Prime Finance Inc 5.25% 15/04/2024 (1,050,000) (1,002,395)Rl Finance Bonds No. 3 Plc 6.125% 13/11/2028 (360,000) (506,322)
The Statement of Significant Purchases and Sales reflects the aggregate purchases of a security exceeding one percent of the totalvalue of purchases and aggregate disposals greater than one percent of total value of the sales for the year. At minimum the largest 20 purchases and 20 sales must be given or all purchases and sales if less than 20.
313

Man Funds VI plc Supplementary information (unaudited) For the year ended 31 December 2019
314
Report of Directors’ Remuneration (Unaudited) The directors of the Fund who are also employees of Man Group plc and companies within its group structure (‘‘Man Group’’) do not receive any remuneration in respect of their services as directors of the Fund. The other directors receive fixed remuneration in respect of their services which is set at a level determined by the Board as a whole and which is not performance related. This is detailed in note 9 of these financial statements. None of the directors are currently in receipt of variable remuneration in respect of their services as directors of the Fund and none of the directors are currently in receipt of a pension from the Fund. The Fund has appointed Man Asset Management (Ireland) Limited as its UCITS management company. As such, the provisions of Article 14b of Directive 2009/65/EC in relation to remuneration are not applicable to the Fund. However, they do apply to Man Asset Management (Ireland) Limited, which has adopted a remuneration policy to ensure compliance.
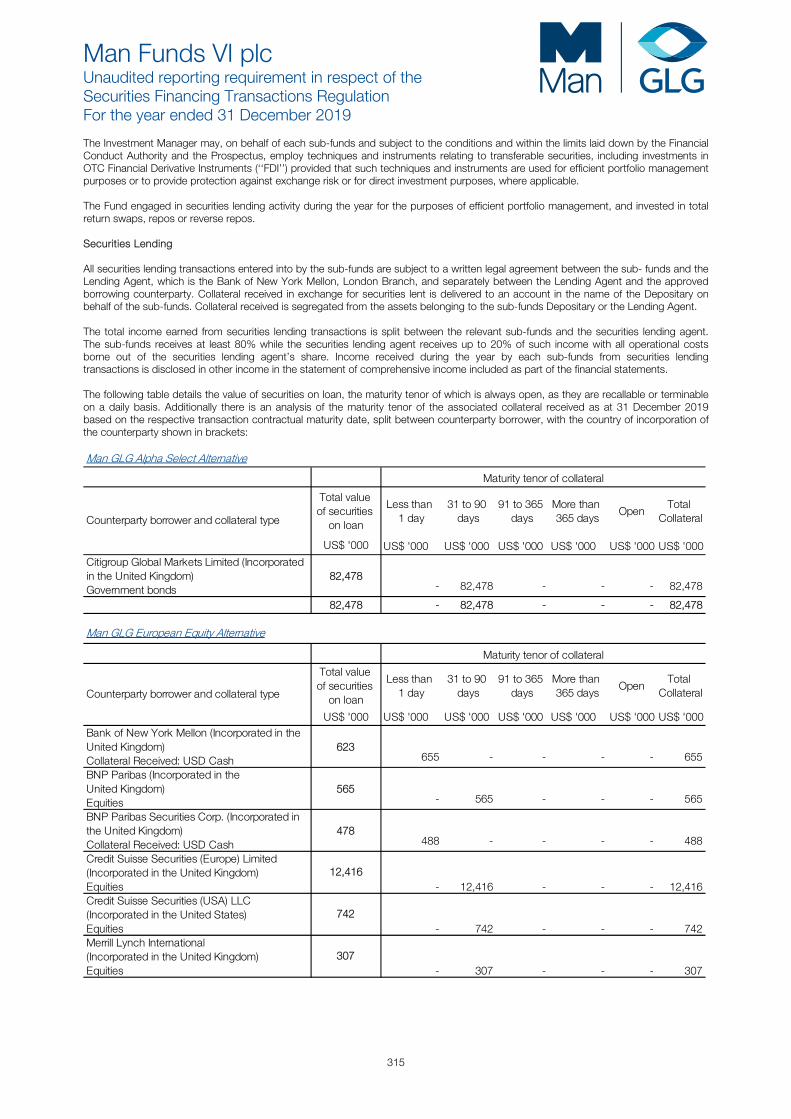
Man Funds VI plc Unaudited reporting requirement in respect of the Securities Financing Transactions Regulation For the year ended 31 December 2019
315
The Investment Manager may, on behalf of each sub-funds and subject to the conditions and within the limits laid down by the Financial Conduct Authority and the Prospectus, employ techniques and instruments relating to transferable securities, including investments in OTC Financial Derivative Instruments (‘‘FDI’’) provided that such techniques and instruments are used for efficient portfolio management purposes or to provide protection against exchange risk or for direct investment purposes, where applicable. The Fund engaged in securities lending activity during the year for the purposes of efficient portfolio management, and invested in total return swaps, repos or reverse repos. Securities Lending All securities lending transactions entered into by the sub-funds are subject to a written legal agreement between the sub- funds and the Lending Agent, which is the Bank of New York Mellon, London Branch, and separately between the Lending Agent and the approved borrowing counterparty. Collateral received in exchange for securities lent is delivered to an account in the name of the Depositary on behalf of the sub-funds. Collateral received is segregated from the assets belonging to the sub-funds Depositary or the Lending Agent. The total income earned from securities lending transactions is split between the relevant sub-funds and the securities lending agent. The sub-funds receives at least 80% while the securities lending agent receives up to 20% of such income with all operational costs borne out of the securities lending agent’s share. Income received during the year by each sub-funds from securities lending transactions is disclosed in other income in the statement of comprehensive income included as part of the financial statements. The following table details the value of securities on loan, the maturity tenor of which is always open, as they are recallable or terminable on a daily basis. Additionally there is an analysis of the maturity tenor of the associated collateral received as at 31 December 2019 based on the respective transaction contractual maturity date, split between counterparty borrower, with the country of incorporation of the counterparty shown in brackets: Man GLG Alpha Select Alternative
Total value of securities
on loan
Less than 1 day
31 to 90 days
91 to 365 days
More than 365 days
OpenTotal
Collateral
US$ '000 US$ '000 US$ '000 US$ '000 US$ '000 US$ '000 US$ '000Citigroup Global Markets Limited (Incorporated in the United Kingdom)Government bonds
82,478 - 82,478 - - - 82,478
82,478 - 82,478 - - - 82,478
Maturity tenor of collateral
Counterparty borrower and collateral type
Man GLG European Equity Alternative
Total value of securities
on loan
Less than 1 day
31 to 90 days
91 to 365 days
More than 365 days
OpenTotal
Collateral
US$ '000 US$ '000 US$ '000 US$ '000 US$ '000 US$ '000 US$ '000Bank of New York Mellon (Incorporated in the United Kingdom)Collateral Received: USD Cash
623 655 - - - - 655
BNP Paribas (Incorporated in theUnited Kingdom)Equities
565 - 565 - - - 565
BNP Paribas Securities Corp. (Incorporated inthe United Kingdom)Collateral Received: USD Cash
478 488 - - - - 488
Credit Suisse Securities (Europe) Limited(Incorporated in the United Kingdom)Equities - 12,416 - - - 12,416 Credit Suisse Securities (USA) LLC(Incorporated in the United States)Equities - 742 - - - 742 Merrill Lynch International(Incorporated in the United Kingdom)Equities - 307 - - - 307
Maturity tenor of collateral
Counterparty borrower and collateral type
12,416
742
307
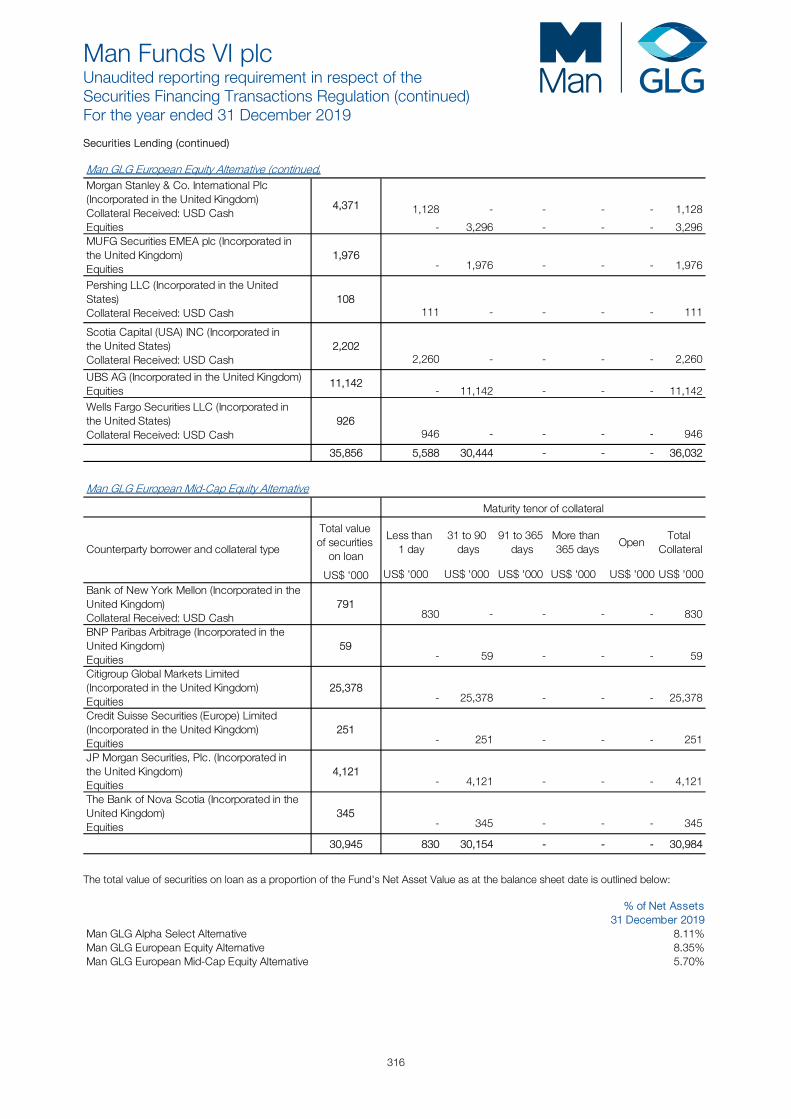
Man Funds VI plc Unaudited reporting requirement in respect of the Securities Financing Transactions Regulation (continued) For the year ended 31 December 2019
316
Securities Lending (continued) Man GLG European Equity Alternative (continued)Morgan Stanley & Co. International Plc(Incorporated in the United Kingdom)Collateral Received: USD Cash 1,128 - - - - 1,128
Equities - 3,296 - - - 3,296 MUFG Securities EMEA plc (Incorporated in the United Kingdom)Equities
1,976 - 1,976 - - - 1,976
Pershing LLC (Incorporated in the United States)Collateral Received: USD Cash
108 111 - - - - 111
Scotia Capital (USA) INC (Incorporated inthe United States)Collateral Received: USD Cash
2,202 2,260 - - - - 2,260
UBS AG (Incorporated in the United Kingdom)Equities - 11,142 - - - 11,142 Wells Fargo Securities LLC (Incorporated inthe United States)Collateral Received: USD Cash
926 946 - - - - 946
35,856 5,588 30,444 - - - 36,032
4,371
11,142
Man GLG European Mid-Cap Equity Alternative
Total value of securities
on loan
Less than 1 day
31 to 90 days
91 to 365 days
More than 365 days
OpenTotal
Collateral
US$ '000 US$ '000 US$ '000 US$ '000 US$ '000 US$ '000 US$ '000Bank of New York Mellon (Incorporated in the United Kingdom)Collateral Received: USD Cash
791 830 - - - - 830
BNP Paribas Arbitrage (Incorporated in theUnited Kingdom)Equities
59 - 59 - - - 59
Citigroup Global Markets Limited(Incorporated in the United Kingdom)Equities
25,378 - 25,378 - - - 25,378
Credit Suisse Securities (Europe) Limited(Incorporated in the United Kingdom)Equities
251 - 251 - - - 251
JP Morgan Securities, Plc. (Incorporated inthe United Kingdom)Equities
4,121 - 4,121 - - - 4,121
The Bank of Nova Scotia (Incorporated in the United Kingdom)Equities
345 - 345 - - - 345
30,945 830 30,154 - - - 30,984
Maturity tenor of collateral
Counterparty borrower and collateral type
The total value of securities on loan as a proportion of the Fund's Net Asset Value as at the balance sheet date is outlined below:
% of Net Assets31 December 2019
Man GLG Alpha Select Alternative 8.11%Man GLG European Equity Alternative 8.35%Man GLG European Mid-Cap Equity Alternative 5.70%
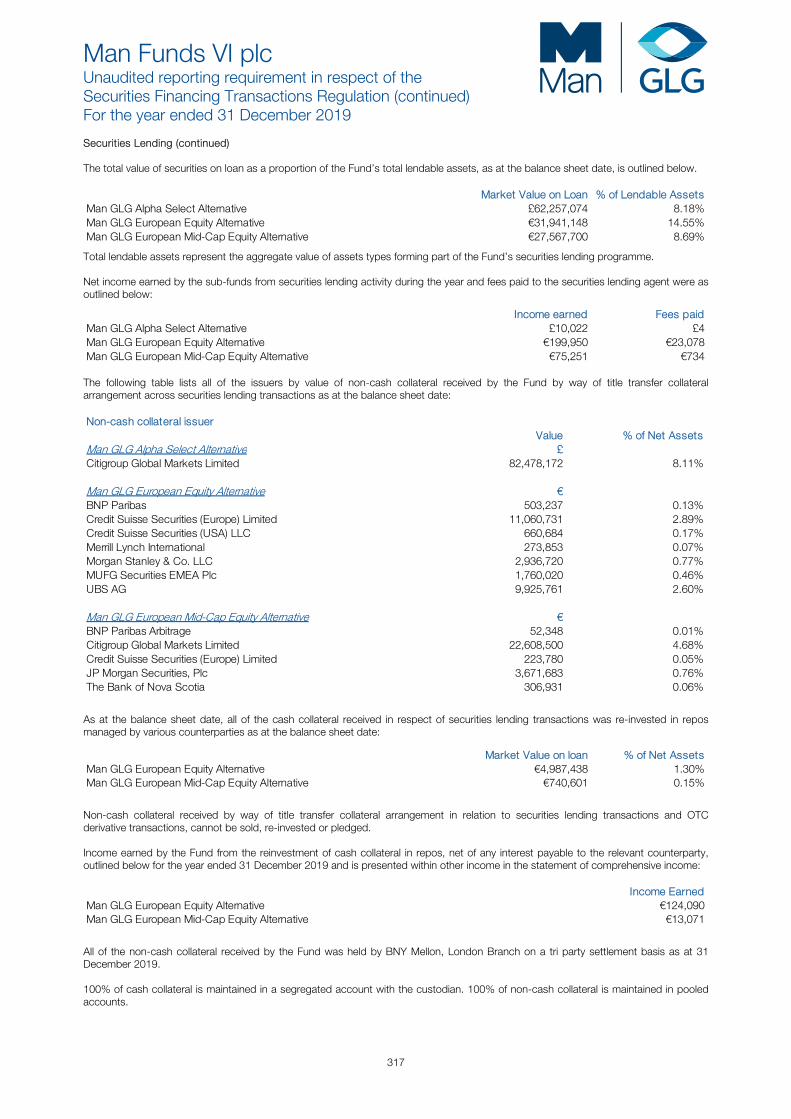
Man Funds VI plc Unaudited reporting requirement in respect of the Securities Financing Transactions Regulation (continued) For the year ended 31 December 2019
317
Securities Lending (continued) The total value of securities on loan as a proportion of the Fund’s total lendable assets, as at the balance sheet date, is outlined below.
Market Value on Loan % of Lendable AssetsMan GLG Alpha Select Alternative £62,257,074 8.18%Man GLG European Equity Alternative €31,941,148 14.55%Man GLG European Mid-Cap Equity Alternative €27,567,700 8.69%
Total lendable assets represent the aggregate value of assets types forming part of the Fund’s securities lending programme. Net income earned by the sub-funds from securities lending activity during the year and fees paid to the securities lending agent were as outlined below:
Income earned Fees paidMan GLG Alpha Select Alternative £10,022 £4Man GLG European Equity Alternative €199,950 €23,078Man GLG European Mid-Cap Equity Alternative €75,251 €734
The following table lists all of the issuers by value of non-cash collateral received by the Fund by way of title transfer collateral arrangement across securities lending transactions as at the balance sheet date: Non-cash collateral issuer
Value % of Net AssetsMan GLG Alpha Select Alternative £Citigroup Global Markets Limited 82,478,172 8.11%
Man GLG European Equity Alternative €BNP Paribas 503,237 0.13%Credit Suisse Securities (Europe) Limited 11,060,731 2.89%Credit Suisse Securities (USA) LLC 660,684 0.17%Merrill Lynch International 273,853 0.07%Morgan Stanley & Co. LLC 2,936,720 0.77%MUFG Securities EMEA Plc 1,760,020 0.46%UBS AG 9,925,761 2.60%
Man GLG European Mid-Cap Equity Alternative €BNP Paribas Arbitrage 52,348 0.01%Citigroup Global Markets Limited 22,608,500 4.68%Credit Suisse Securities (Europe) Limited 223,780 0.05%JP Morgan Securities, Plc 3,671,683 0.76%The Bank of Nova Scotia 306,931 0.06%
As at the balance sheet date, all of the cash collateral received in respect of securities lending transactions was re-invested in repos managed by various counterparties as at the balance sheet date:
Market Value on loan % of Net AssetsMan GLG European Equity Alternative €4,987,438 1.30%Man GLG European Mid-Cap Equity Alternative €740,601 0.15%
Non-cash collateral received by way of title transfer collateral arrangement in relation to securities lending transactions and OTC derivative transactions, cannot be sold, re-invested or pledged. Income earned by the Fund from the reinvestment of cash collateral in repos, net of any interest payable to the relevant counterparty, outlined below for the year ended 31 December 2019 and is presented within other income in the statement of comprehensive income:
Income Earned Man GLG European Equity Alternative €124,090Man GLG European Mid-Cap Equity Alternative €13,071
All of the non-cash collateral received by the Fund was held by BNY Mellon, London Branch on a tri party settlement basis as at 31 December 2019. 100% of cash collateral is maintained in a segregated account with the custodian. 100% of non-cash collateral is maintained in pooled accounts.
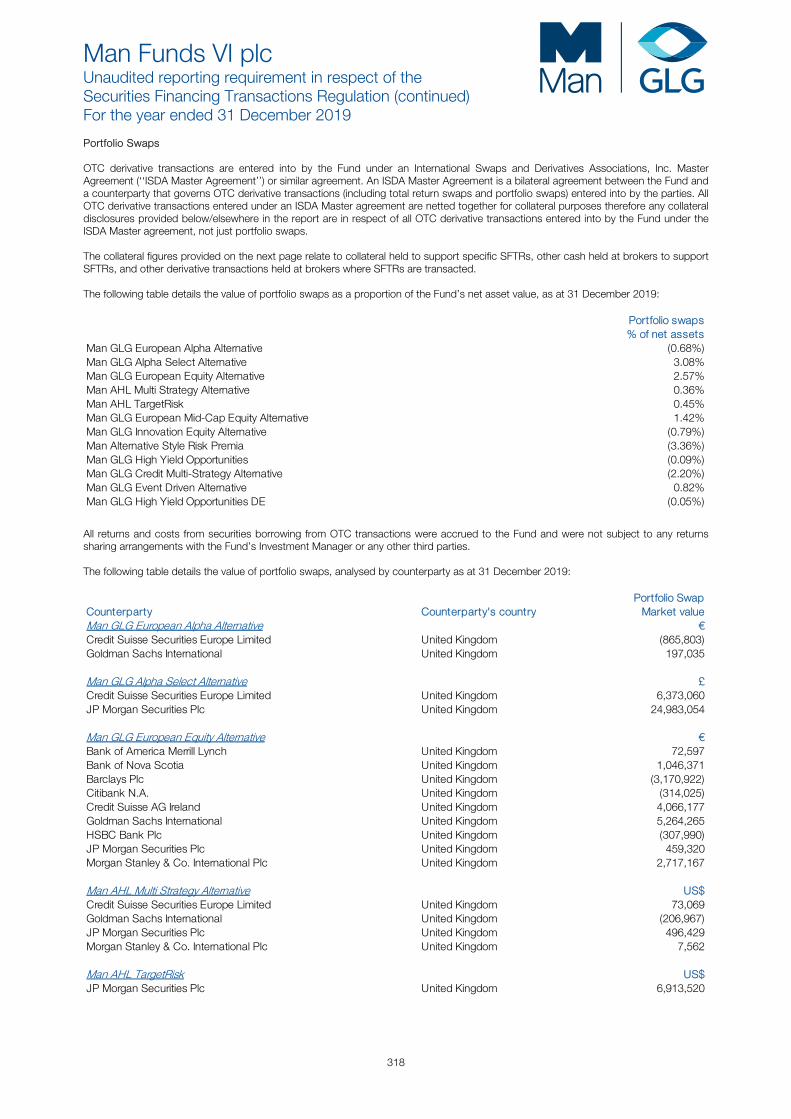
Man Funds VI plc Unaudited reporting requirement in respect of the Securities Financing Transactions Regulation (continued) For the year ended 31 December 2019
318
Portfolio Swaps OTC derivative transactions are entered into by the Fund under an International Swaps and Derivatives Associations, Inc. Master Agreement (‘‘ISDA Master Agreement’’) or similar agreement. An ISDA Master Agreement is a bilateral agreement between the Fund and a counterparty that governs OTC derivative transactions (including total return swaps and portfolio swaps) entered into by the parties. All OTC derivative transactions entered under an ISDA Master agreement are netted together for collateral purposes therefore any collateral disclosures provided below/elsewhere in the report are in respect of all OTC derivative transactions entered into by the Fund under the ISDA Master agreement, not just portfolio swaps. The collateral figures provided on the next page relate to collateral held to support specific SFTRs, other cash held at brokers to support SFTRs, and other derivative transactions held at brokers where SFTRs are transacted. The following table details the value of portfolio swaps as a proportion of the Fund’s net asset value, as at 31 December 2019:
Portfolio swaps% of net assets
Man GLG European Alpha Alternative (0.68%)Man GLG Alpha Select Alternative 3.08%Man GLG European Equity Alternative 2.57%Man AHL Multi Strategy Alternative 0.36%Man AHL TargetRisk 0.45%Man GLG European Mid-Cap Equity Alternative 1.42%Man GLG Innovation Equity Alternative (0.79%)Man Alternative Style Risk Premia (3.36%)Man GLG High Yield Opportunities (0.09%)Man GLG Credit Multi-Strategy Alternative (2.20%)Man GLG Event Driven Alternative 0.82%Man GLG High Yield Opportunities DE (0.05%)
All returns and costs from securities borrowing from OTC transactions were accrued to the Fund and were not subject to any returns sharing arrangements with the Fund’s Investment Manager or any other third parties. The following table details the value of portfolio swaps, analysed by counterparty as at 31 December 2019:
Counterparty Counterparty's countryPortfolio Swap
Market value Man GLG European Alpha Alternative €Credit Suisse Securities Europe Limited United Kingdom (865,803)Goldman Sachs International United Kingdom 197,035
Man GLG Alpha Select Alternative £Credit Suisse Securities Europe Limited United Kingdom 6,373,060 JP Morgan Securities Plc United Kingdom 24,983,054
Man GLG European Equity Alternative €Bank of America Merrill Lynch United Kingdom 72,597 Bank of Nova Scotia United Kingdom 1,046,371 Barclays Plc United Kingdom (3,170,922)Citibank N.A. United Kingdom (314,025)Credit Suisse AG Ireland United Kingdom 4,066,177 Goldman Sachs International United Kingdom 5,264,265 HSBC Bank Plc United Kingdom (307,990)JP Morgan Securities Plc United Kingdom 459,320 Morgan Stanley & Co. International Plc United Kingdom 2,717,167
Man AHL Multi Strategy Alternative US$Credit Suisse Securities Europe Limited United Kingdom 73,069 Goldman Sachs International United Kingdom (206,967)JP Morgan Securities Plc United Kingdom 496,429 Morgan Stanley & Co. International Plc United Kingdom 7,562
Man AHL TargetRisk US$JP Morgan Securities Plc United Kingdom 6,913,520
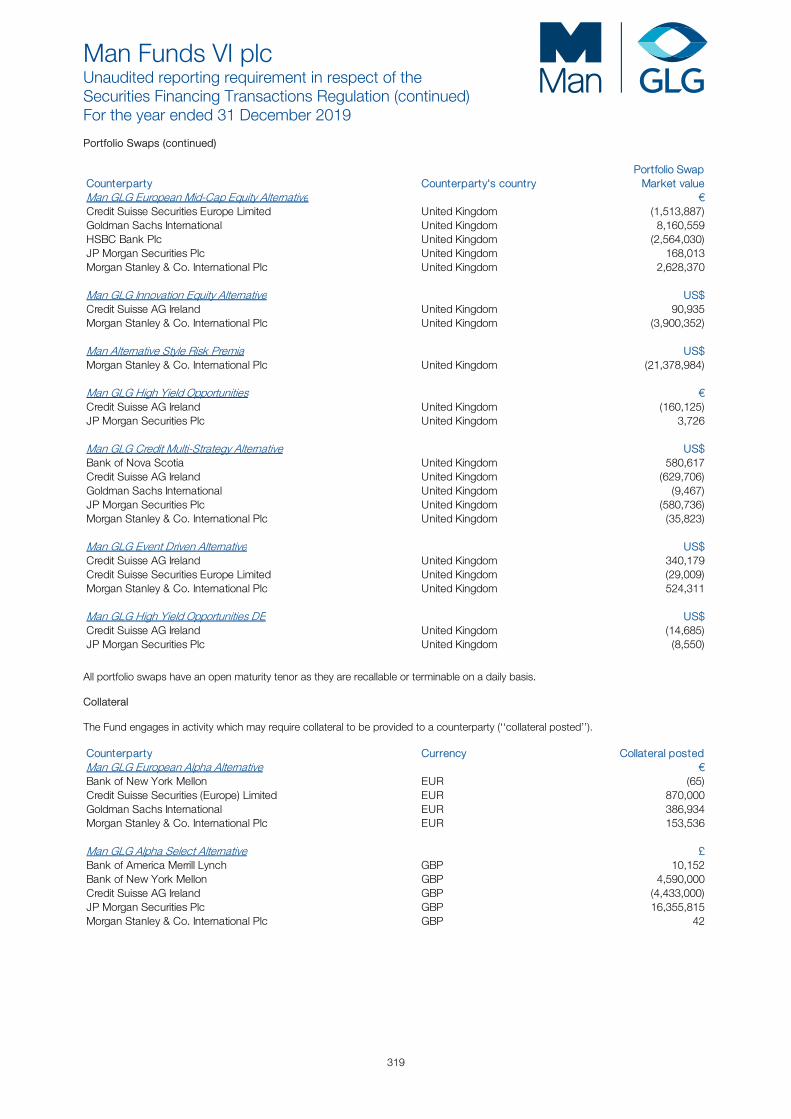
Man Funds VI plc Unaudited reporting requirement in respect of the Securities Financing Transactions Regulation (continued) For the year ended 31 December 2019
319
Portfolio Swaps (continued)
Counterparty Counterparty's countryPortfolio Swap
Market value Man GLG European Mid-Cap Equity Alternative €Credit Suisse Securities Europe Limited United Kingdom (1,513,887)Goldman Sachs International United Kingdom 8,160,559 HSBC Bank Plc United Kingdom (2,564,030)JP Morgan Securities Plc United Kingdom 168,013 Morgan Stanley & Co. International Plc United Kingdom 2,628,370
Man GLG Innovation Equity Alternative US$Credit Suisse AG Ireland United Kingdom 90,935 Morgan Stanley & Co. International Plc United Kingdom (3,900,352)
Man Alternative Style Risk Premia US$Morgan Stanley & Co. International Plc United Kingdom (21,378,984)
Man GLG High Yield Opportunities €Credit Suisse AG Ireland United Kingdom (160,125)JP Morgan Securities Plc United Kingdom 3,726
Man GLG Credit Multi-Strategy Alternative US$Bank of Nova Scotia United Kingdom 580,617 Credit Suisse AG Ireland United Kingdom (629,706)Goldman Sachs International United Kingdom (9,467)JP Morgan Securities Plc United Kingdom (580,736)Morgan Stanley & Co. International Plc United Kingdom (35,823)
Man GLG Event Driven Alternative US$Credit Suisse AG Ireland United Kingdom 340,179 Credit Suisse Securities Europe Limited United Kingdom (29,009)Morgan Stanley & Co. International Plc United Kingdom 524,311
Man GLG High Yield Opportunities DE US$Credit Suisse AG Ireland United Kingdom (14,685)JP Morgan Securities Plc United Kingdom (8,550)
All portfolio swaps have an open maturity tenor as they are recallable or terminable on a daily basis. Collateral The Fund engages in activity which may require collateral to be provided to a counterparty (‘‘collateral posted’’). Counterparty Currency Collateral postedMan GLG European Alpha Alternative €Bank of New York Mellon EUR (65)Credit Suisse Securities (Europe) Limited EUR 870,000 Goldman Sachs International EUR 386,934 Morgan Stanley & Co. International Plc EUR 153,536
Man GLG Alpha Select Alternative £Bank of America Merrill Lynch GBP 10,152 Bank of New York Mellon GBP 4,590,000 Credit Suisse AG Ireland GBP (4,433,000)JP Morgan Securities Plc GBP 16,355,815 Morgan Stanley & Co. International Plc GBP 42
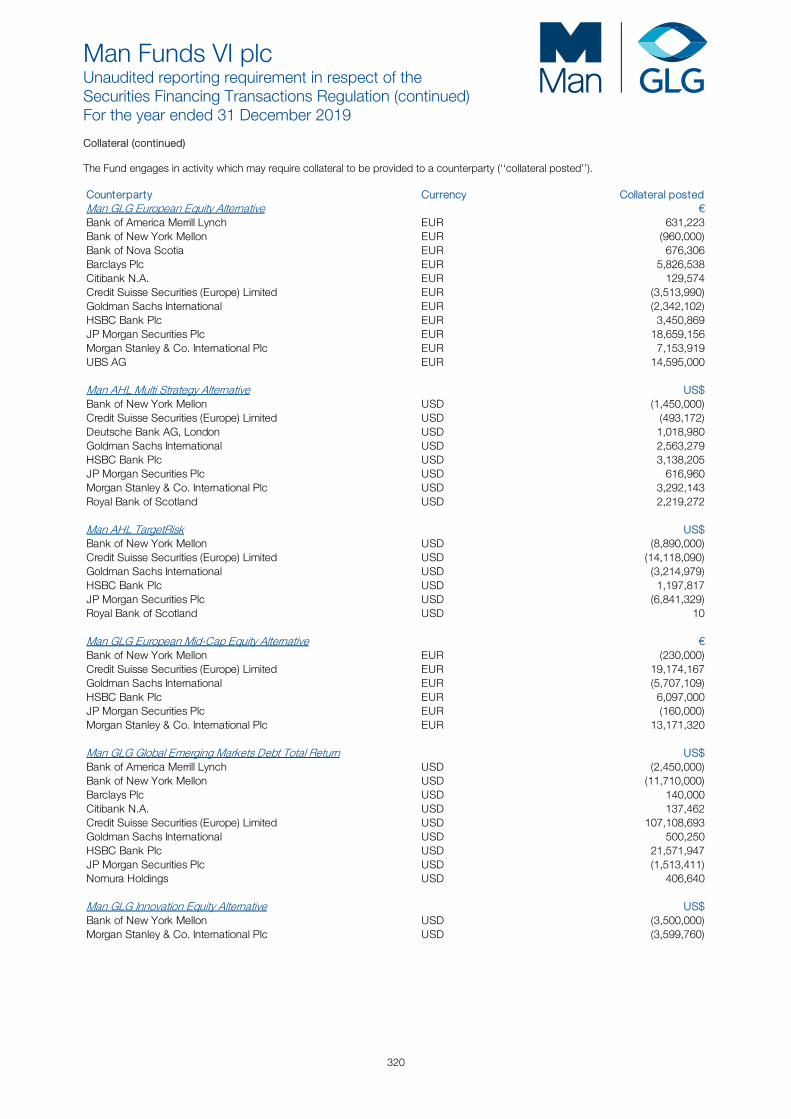
Man Funds VI plc Unaudited reporting requirement in respect of the Securities Financing Transactions Regulation (continued) For the year ended 31 December 2019
320
Collateral (continued) The Fund engages in activity which may require collateral to be provided to a counterparty (‘‘collateral posted’’). Counterparty Currency Collateral postedMan GLG European Equity Alternative €Bank of America Merrill Lynch EUR 631,223 Bank of New York Mellon EUR (960,000)Bank of Nova Scotia EUR 676,306 Barclays Plc EUR 5,826,538 Citibank N.A. EUR 129,574 Credit Suisse Securities (Europe) Limited EUR (3,513,990)Goldman Sachs International EUR (2,342,102)HSBC Bank Plc EUR 3,450,869 JP Morgan Securities Plc EUR 18,659,156 Morgan Stanley & Co. International Plc EUR 7,153,919 UBS AG EUR 14,595,000
Man AHL Multi Strategy Alternative US$Bank of New York Mellon USD (1,450,000)Credit Suisse Securities (Europe) Limited USD (493,172)Deutsche Bank AG, London USD 1,018,980 Goldman Sachs International USD 2,563,279 HSBC Bank Plc USD 3,138,205 JP Morgan Securities Plc USD 616,960 Morgan Stanley & Co. International Plc USD 3,292,143 Royal Bank of Scotland USD 2,219,272
Man AHL TargetRisk US$Bank of New York Mellon USD (8,890,000)Credit Suisse Securities (Europe) Limited USD (14,118,090)Goldman Sachs International USD (3,214,979)HSBC Bank Plc USD 1,197,817 JP Morgan Securities Plc USD (6,841,329)Royal Bank of Scotland USD 10
Man GLG European Mid-Cap Equity Alternative €Bank of New York Mellon EUR (230,000)Credit Suisse Securities (Europe) Limited EUR 19,174,167 Goldman Sachs International EUR (5,707,109)HSBC Bank Plc EUR 6,097,000 JP Morgan Securities Plc EUR (160,000)Morgan Stanley & Co. International Plc EUR 13,171,320
Man GLG Global Emerging Markets Debt Total Return US$Bank of America Merrill Lynch USD (2,450,000)Bank of New York Mellon USD (11,710,000)Barclays Plc USD 140,000 Citibank N.A. USD 137,462 Credit Suisse Securities (Europe) Limited USD 107,108,693 Goldman Sachs International USD 500,250 HSBC Bank Plc USD 21,571,947 JP Morgan Securities Plc USD (1,513,411)Nomura Holdings USD 406,640
Man GLG Innovation Equity Alternative US$Bank of New York Mellon USD (3,500,000)Morgan Stanley & Co. International Plc USD (3,599,760)
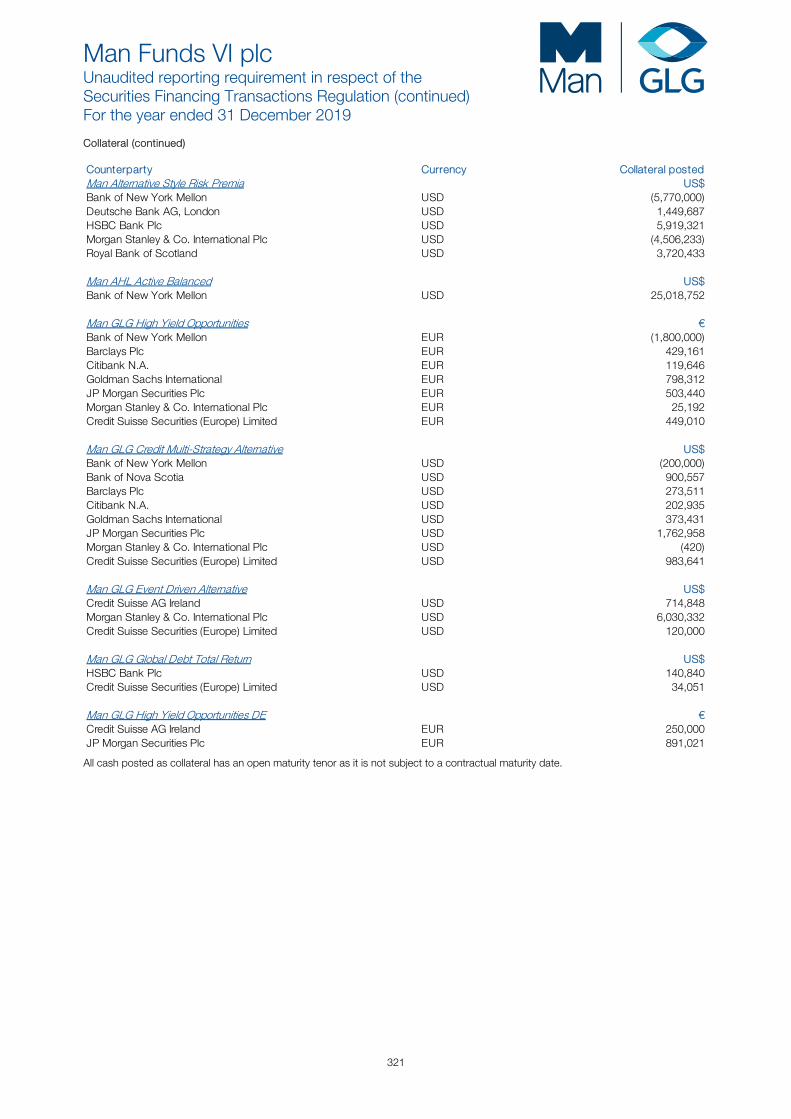
Man Funds VI plc Unaudited reporting requirement in respect of the Securities Financing Transactions Regulation (continued) For the year ended 31 December 2019
321
Collateral (continued) Counterparty Currency Collateral postedMan Alternative Style Risk Premia US$Bank of New York Mellon USD (5,770,000)Deutsche Bank AG, London USD 1,449,687 HSBC Bank Plc USD 5,919,321 Morgan Stanley & Co. International Plc USD (4,506,233)Royal Bank of Scotland USD 3,720,433
Man AHL Active Balanced US$Bank of New York Mellon USD 25,018,752
Man GLG High Yield Opportunities €Bank of New York Mellon EUR (1,800,000)Barclays Plc EUR 429,161 Citibank N.A. EUR 119,646 Goldman Sachs International EUR 798,312 JP Morgan Securities Plc EUR 503,440 Morgan Stanley & Co. International Plc EUR 25,192 Credit Suisse Securities (Europe) Limited EUR 449,010
Man GLG Credit Multi-Strategy Alternative US$Bank of New York Mellon USD (200,000)Bank of Nova Scotia USD 900,557 Barclays Plc USD 273,511 Citibank N.A. USD 202,935 Goldman Sachs International USD 373,431 JP Morgan Securities Plc USD 1,762,958 Morgan Stanley & Co. International Plc USD (420)Credit Suisse Securities (Europe) Limited USD 983,641
Man GLG Event Driven Alternative US$Credit Suisse AG Ireland USD 714,848 Morgan Stanley & Co. International Plc USD 6,030,332 Credit Suisse Securities (Europe) Limited USD 120,000
Man GLG Global Debt Total Return US$HSBC Bank Plc USD 140,840 Credit Suisse Securities (Europe) Limited USD 34,051
Man GLG High Yield Opportunities DE €Credit Suisse AG Ireland EUR 250,000 JP Morgan Securities Plc EUR 891,021
All cash posted as collateral has an open maturity tenor as it is not subject to a contractual maturity date.