Sanlam Universal Funds plc - 99 COMPANY XYZ LIMITED
291
SANLAM UNIVERSAL FUNDS PLC Unaudited condensed interim financial statements for the six months ended 30 June 2013
-
Upload
khangminh22 -
Category
Documents
-
view
0 -
download
0
Transcript of Sanlam Universal Funds plc - 99 COMPANY XYZ LIMITED

SANLAM UNIVERSAL FUNDS PLC Unaudited condensed interim financial statements for the six months ended 30 June 2013

SANLAM UNIVERSAL FUNDS PLC
UNAUDITED CONDENSED INTERIM FINANCIAL STATEMENTS for the six months ended 30 June 2013 Contents Page(s) Company information 1 – 6 Economic & market review 7 – 10 Investment Manager’s reports 11 - 39 Statement of comprehensive income
of the Company 40 of the Funds 41 - 48
Statement of financial position
of the Company 49 of the Funds 50 - 57
Statement of changes in net assets attributable to holders of redeemable participating shares
of the Company 58 of the Funds 59 - 66
Statement of cash flows
of the Company 67 of the Funds 68 - 75
Portfolio of investments 76 - 191
8IP Asia Equity Opportunities Fund 76 - 78 8IP Asia Pacific Equity Fund 79 - 81 Centre Global Equity Fund 82 - 85 Grindrod International Property Fund 86 - 87 P-Solve Inflation Plus Fund 88 - 89 Sanlam African Frontier Markets Fund 90 - 91 Sanlam Global Best Ideas Fund 92 - 93 Sanlam Global Bond Fund 94 - 102 Sanlam Global Financial Fund 103 - 105 Sanlam Global Property Fund 106 - 110 Sanlam Strategic Cash Fund 111 - 112 Sanlam World Equity Fund 113 - 126 Sanlam World Equity Tracker Fund 127 - 144 SIIP India Opportunities Fund 145 - 146 SIM Global Equity Income Fund 147 - 148 SPI Strategic Investment Grade Bond Fund 149 - 152 Sanlam Fund of Alternative UCITS Fund 153 Sanlam Accel Income Fund 154 Sanlam North America Equity Tracker Fund 155 - 165

SANLAM UNIVERSAL FUNDS PLC
UNAUDITED CONDENSED INTERIM FINANCIAL STATEMENTS for the six months ended 30 June 2013 Contents (continued) Page(s) Portfolio of investments (continued)
Sanlam UK Equity Tracker Fund 166 - 168 Sanlam Europe (ex UK) Equity Fund 169 - 175 Sanlam Equity Allocation Fund 176 - 179 Sanlam Emerging Market Equity Tracker Fund 180 - 191
Notes to the unaudited condensed interim financial statements 192 - 264 Statement of changes in composition of the portfolios 265 – 287

SANLAM UNIVERSAL FUNDS PLC
1
COMPANY INFORMATION Directors of Sanlam Global Peter Murray – Irish* Funds Plc (the “Company”) Paul Dobbyn – Irish* Anton Gildenhuys – South African* *non-executive Director Registered number 267451 Funds of the Company 8IP Asia Equity Opportunities Fund 8IP Asia Pacific Equity Fund Centre Global Equity Fund* Grindrod International Property Fund P-Solve Inflation Plus Fund Sanlam African Frontier Markets Fund Sanlam Global Best Ideas Fund Sanlam Global Bond Fund** Sanlam Global Financial Fund Sanlam Global Property Fund Sanlam Strategic Cash Fund Sanlam World Equity Fund*** Sanlam World Equity Tracker Fund SIIP India Opportunities Fund SIM Global Equity Income Fund SPI Strategic Investment Grade Bond Fund**** Sanlam Fund of Alternative UCITS Fund Sanlam Accel Income Fund Sanlam North America Equity Tracker Fund Sanlam UK Equity Tracker Fund Sanlam Europe (ex UK) Equity Fund Sanlam Equity Allocation Fund Sanlam Emerging Market Equity Tracker Fund Registered office of the Company Beech House
Beech Hill Road Dublin 4 Ireland
Manager & secretary Sanlam Asset Management (Ireland) Limited Beech House Beech Hill Road Dublin 4 Ireland *The SPI Global Equity Fund's name was changed to Centre Global Equity Fund on 31 August 2012. **The Sanlam Universal Bond Fund's name was changed to Sanlam Global Bond Fund on 9 October 2012. ***The Sanlam Universal Equity Fund's name was changed to Sanlam World Equity Fund on 9 October 2012. ****The Sanlam Principal Monthly Income Investment Grade Bond Fund name was changed to SPI Strategic Investment Grade Bond Fund on 24 September 2012.

SANLAM UNIVERSAL FUNDS PLC
2
COMPANY INFORMATION (CONTINUED) Administrator* Sanlam Asset Management (Ireland) Limited Beech House Beech Hill Road Dublin 4 Ireland Registrar & Transfer Agent J.P. Morgan Administration Services (Ireland) Limited JPMorgan House IFSC Dublin 1 Ireland Investment manager** Sanlam Investment Management (Pty) Limited 55 Willie Van Schoor Avenue Bellville 7530 South Africa Investment manager – Centre Global Centre Asset Management LLC Equity Fund 48 Wall Street Suite 1100 New York, N.Y. 10005 United States of America Investment manager – SPI Sanlam Private Investments (UK) Limited Strategic Investment Grade Bond 16 South Park Fund and Sanlam Strategic Cash Sevenoaks Fund Kent TN13 1AN United Kingdom Investment manager – Sanlam Alliance Bernstein Limited Global Property Fund 50 Berkeley Street London W1J 8HA United Kingdom Investment manager – Grindrod Grindrod Bank Limited International Property Fund 5 Arundel Close Kingsmead Office Park Durban, KZN 4001 South Africa Investment managers – P-Solve P-Solve Investments Limited Inflation Plus Fund 11 Strand London WC2N 5HR United Kingdom Investment manager – 8IP Asia Eight Investment Partners (Pty) Limited Equity Opportunities Fund and Level 11, 131 Macquarie Street 8IP Asia Pacific Equity Fund Sydney New South Wales Australia, 2000

SANLAM UNIVERSAL FUNDS PLC
3
COMPANY INFORMATION (CONTINUED) Investment manager – Sanlam BlackRock Investment Management UK Limited Global Bond Fund 33 King William Street London EC4R 9AS United Kingdom Investment managers – Sanlam FOUR Capital Partners Limited World Equity Fund 6-8 Long Lane London, EC1A 9HF United Kingdom Sanlam Investment Management (Pty) Limited
55 Willie Van Schoor Avenue Bellville 7530 South Africa Eight Investment Partners (Pty) Limited Level 11, 131 Macquarie Street Sydney New South Wales Australia, 2000 Centre Asset Management LLC 48 Wall Street Suite 1100 New York N.Y. 10005 United States of America Sanlam International Investments Limited 4th Floor 52/54 Brook Street London W1K 5DS United Kingdom Alliance Bernstein Limited 50 Berkeley Street London W1J 8HA United Kingdom Investment Manager – Sanlam Fund of Sanlam International Investments Limited Alternative UCITS Fund and Sanlam 4th Floor Accel Income Fund 52/54 Brook Street London W1K 5DS United Kingdom Investment Manager - Sanlam Equity FOUR Capital Partners Limited Allocation Fund 1 Ely Place London, EC1N 6RY United Kingdom

SANLAM UNIVERSAL FUNDS PLC
4
COMPANY INFORMATION (CONTINUED) Investment allocation manager**** Sanlam International Investments Limited 52/54 Brook Street London, W1K 5DS United Kingdom Investment transition managers Morgan Stanley & Co. International Limited 25 Cabot Square Canary Wharf London E14 4QA United Kingdom State Street Bank Europe Limited 1 Royal Exchange London EC3V 3LL United Kingdom J.P. Morgan Securities Limited 60 Victoria Embankment London EC4G 0JP United Kingdom Investment Advisor Sanlam International Investments Limited 4th Floor 52/54 Brook Street London W1K 5DS United Kingdom Custodian Northern Trust Fiduciary Services (Ireland) Limited George's Court 54-62 Townsend Street Dublin 2 Ireland Sub-custodian J.P. Morgan (Ireland) plc J.P. Morgan House IFSC Dublin 1 Ireland Broker NCB Stockbrokers Limited 3 George’s Dock IFSC Dublin 1 Ireland Auditor*** Ernst & Young Harcourt Centre Harcourt Street Dublin 2 Ireland

SANLAM UNIVERSAL FUNDS PLC
5
COMPANY INFORMATION (CONTINUED) Legal adviser Maples and Calder 75 St. Stephens Green Dublin 2 Ireland Stock lending agent J.P. Morgan Chase Bank (London Branch) 125 London Wall London EC2Y 5AJ United Kingdom Distributors Sanlam Collective Investments Limited 2 Strand Road Bellville 7530 South Africa Sanlam Investment Management (Pty) Limited 55 Willie van Schoor Avenue Bellville 7530 South Africa P-Solve Investments Limited 126 Jermyn Street London SW1Y 4UJ United Kingdom

SANLAM UNIVERSAL FUNDS PLC
6
COMPANY INFORMATION (CONTINUED) Distributors (continued) P-Solve Investments Limited 11 Strand London WC2N 5HR United Kingdom Acordias Limited 91 Peterborough Road London SW6 3 BU United Kingdom Grindrod Bank Limited 20 Kingsmead Boulevard Durban 4001 South Africa Grindrod Bank Limited 5 Arundel Close Kingsmead Office Park PO Box 3211 Durban, KwaZulu Natal, 4001 South Africa Eight Investment Partners Pty Limited
Level 11, 131 Macquarie Street Sydney New South Wales
Australia 2000 *Sanlam Asset Management (Ireland) Limited was appointed Administrator to Sanlam Global Funds Plc with effect from 11.59pm on 31st December 2012, replacing J.P. Morgan Administration Services (Ireland) Limited. **The Sanlam World Equity Tracker Fund, SIIP India Opportunities Fund, Sanlam African Frontier Markets Fund, Sanlam Global Financial Fund, Sanlam Global Best Ideas Fund, Sanlam North Anerica Equity Tracker Fund, Sanlam UK Equity Tracker Fund, Sanlam Europe (ex UK) Equity Fund, Sanlam Emerging Market Equity Tracker Fund and SIM Global Equity Income Fund are managed by Sanlam Investment Management (Pty) Limited. ***The auditor has not expressed an opinion nor have they reviewed the unaudited condensed interim financial statements for the six months ended 30 June 2013. **** Sanlam International Investments Limited is the investment allocation manager to 8IP Asia Equity Opportunities, 8IP Asia Pacific Equity Fund, Centre Global Equity Fund, Sanlam Global Bond Fund, Sanlam Global Property Fund, Sanlam Strategic Cash Fund, Sanlam World Equity Fund, Sanlam World Equity Tracker Fund, SIIP India Opportunities Fund, Sanlam Fund of Alternative UCITS Fund, Sanlam North America Equity Tracker Fund, Sanlam UK Equity Tracker Fund, Sanlam Europe (ex UK) Equity, and Sanlam Equity Allocation Fund.

SANLAM UNIVERSAL FUNDS PLC
7
ECONOMIC & MARKET REVIEW for the six months ended 30 June 2013 Economic Review Monetary policy decisions and “market guidance” by central banks dominated economics news in the second quarter of 2013. In April this year, the Bank of Japan (BOJ) announced an extraordinarily large expansion of its balance sheet, through which the Bank aims, roughly, to double the size of the country’s monetary base, in a bid to end deflation and achieve a 2% inflation target by end-2014. The US Federal Reserve, however, signalled a possible slowdown in the pace of asset purchases, with Chairman Ben Bernanke indicating on May 22, 2013 that the US Federal Open Market Committee (FOMC) may consider scaling back quantitative easing within the “next few meetings” if US real economic activity data continued to improve. Subsequently, the FOMC left the Federal funds target rate unchanged at the conclusion of its June 19 meeting and indicated the current low range of the Federal funds target rate of 0 to 0.25% would be appropriate for as long as unemployment remains above 6.5%; inflation forecasts between one to two years forward do not exceed 2.5 % and long-term inflation expectations remain anchored. This statement clears up the Federal Reserve’s position on interest rates. The policy rate is unlikely to go up for quite some time – possibly not before 2015. But the prospect of expected moderation in the pace of asset purchases caused heightened volatility in global debt and currency markets. In response to the ensuing increase in bond yields, the European Central Bank (ECB) moved to calm debt markets and announced in early July it expected policy rates to stay low for an extended period, while leaving the door ajar for a possible further cut in interest rates. In a similar move, the Bank of England (BOE) indicated it considered the accompanying increase in UK interest rates “unwarranted”. The BOE is expected to supply more detailed forward guidance in August 2013. On the growth front, global real economic activity has continued along a modest path and reflects a marked divergence between regions. Currently, the global PMI (manufacturing) remains consistent with positive, but low single-digit industrial production growth. The PMI survey data has shown a relative improvement in the Euro area in recent months, but has been disappointing in the emerging markets of Asia, including China. Although emerging markets (EM) growth continues to outperform in absolute terms, a broader improvement in real economy outcomes in developed markets (DM) has been evident in 1H13 relative to EM. In particular, EM has experienced a slowdown in productivity growth (and rising labour costs), while also being adversely impacted by a slowdown in global trade growth. Amongst DM the US and Japan fared better than Europe in 1H13. In the US, house sales have increased and house prices advanced by double digits over the past year; the unemployment rate has declined and growth in private sector credit extension is in positive territory. In Japan, the advance in GDP growth has lifted in 1H13, driven by consumption and exports. The former has, partially, benefited from positive wealth effects that reflect the bounce in the equity market. The latter has benefited from the depreciation of the currency against the backdrop of the announcement on large – scale quantitative easing by the Bank of Japan. But, even so, it is clear central bank balance sheet expansion in developed markets has failed to ignite a strong recovery in real economic activity. Global real GDP growth has continued to disappoint in the aftermath of the Great Recession.

SANLAM UNIVERSAL FUNDS PLC
8
ECONOMIC & MARKET REVIEW (CONTINUED) for the six months ended 30 June 2013 Economic Review (continued) Meanwhile, the ECBs July 2013 Bank Lending Survey indicates banks in Europe have continued deleveraging as they adjust to new bank legislation. At least, however, business surveys, including PMI (manufacturing) data suggest the Euro area economy is stabilising. Also, the relative slowdown in unit labour cost growth amongst some economies of the periphery of Europe, relative to Germany, is encouraging. Elsewhere, in China, concern has emerged around the uncomfortably high level of debt to GDP, which suggests vulnerability in the event of any sustained slowdown in real economic activity. Concomitantly, the Peoples’ Bank of China (PBOC) appears to be moving to rein in excessive leverage – notably the boom in off-balance sheet lending. China, seemingly, still has room on the fiscal policy front to boost real economic activity. However, policymakers appear increasingly preoccupied with a shift away from growth driven by state spending towards growth through private sector spending, implying an attempted shift towards the more efficient allocation of available savings to more productive endeavours. Even so, it seems unlikely China can return to and sustain the levels of productivity growth that characterised its earlier development. Given the moderate growth backdrop, global inflation remains benign. Softer commodity prices have dampened the annual advance in headline CPI, while core CPI remains contained at close to 2%. That said inflation is generally more elevated in EM relative to DM, notably in the emerging markets of Europe and Africa, as well as Latin America. This has necessitated the Central Bank of Brazil, for example, to hike interest rates, despite softer real economic activity data. Economic outlook The apparent stabilisation of the Euro area economy is a welcome development, not least because the recession in Europe has been partly responsible for the underperformance of EM exports. While Europe is unlikely to return to robust growth anytime soon, this development may lift global real economic activity to an extent in 2H13. But, ultimately, we do not believe the current environment of a high level of government claims on available savings; restraint of financial sector activity and weakened productivity growth are conducive to a robust global economic upswing. On balance, despite some possible acceleration in 2H13, growth generally appears set to continue at a moderate pace through the remainder of 2013 and into 2014. Although EM continues to deliver relatively stronger growth than DM in absolute terms they are not without risk. Weaker productivity growth and higher labour costs suggest lower returns on capital. Moreover, although timing and extent are uncertain, a slower pace of asset accumulation (and the eventual termination of quantitative easing) in the US could heighten volatility in EM debt and currency markets – as witnessed in recent months. Risk also lingers in DM. The continued sluggish performance of the Euro area economy implies it remains difficult to stabilise and reduce sovereign debt levels to comfortable levels. Given lower commodity prices relative to a year ago and low, stable core inflation, global headline CPI appears set to remain benign for the foreseeable future. One risk to the sanguine outlook for inflation would be any incidence of unsustainable fiscal policy. Also, EM inflation is relatively sticky compared with DM, with rising labour costs in some countries. Hence, the scope for maintaining very loose monetary policy stances appears to be drawing to a close in EM generally. In DM, given modest real GDP growth, low inflation and high unemployment rates, DM central banks are expected to maintain their policy rates at a low level for an extended period.

SANLAM UNIVERSAL FUNDS PLC
9
ECONOMIC & MARKET REVIEW (CONTINUED) for the six months ended 30 June 2013 Market Review At the turn of the year, the US fiscal cliff was the key issue of focus in many investors’ minds, while the pending new Chinese leadership was an additional potential concern. Additionally, the looming threat of the US sequester also represented a potential significant drag on US economic growth. However, despite these issues, and others including the Cypriot crisis, and the temporary stalemate in the Italian elections, the overall global economy has moved forward over the first half of 2013. Perhaps the most radical developments over the period, which were unlikely to be predicted, much, if at all, before the last quarter of 2012, are the events in Japan. The depreciation in the Japanese yen, the extent of monetary easing planned in Japan and the overall rhetoric at least symbolise some significant changes occurring in Japan. The challenge for the government and Bank of Japan is to ensure that these are converted into genuine reform and economic growth that will lift the country out of the stagnation it has experienced for so many years. The US economy has delivered signs of continuation on the path to economic recovery, so much so that the US Federal Reserve’s comments towards the end of May, about the ending, at a future point in time, of the low US interest rate environment, spooked markets, and led to a market sell-off. With greater perspective the market has subsequently realised that the positive side to the Federal Reserve’s comments were that the US economy was clearly recovering and that this should have positive effects for the rest of the world. The concern that has developed, primarily during the second quarter, has been in the emerging markets, especially in China, where the level of economic growth has not been to the levels that Chinese officials, nor market participants, had been expecting or hoping for. Meanwhile, in the second quarter the euro-zone has been relatively absence from attracting any material headlines, especially of a negative economic nature, and this hints at the stabilisation that is occurring within that region. Equity Market Review From a market perspective 2013 started in a very similar manner to both 2012 and 2011. For the first quarter global equity markets as measured by the MSCI World Index delivered a return of 7.73%.1 The quarter saw positive returns produced in all three months of the period, though it was in January when markets rose over 5% that drove the overall quarterly return. The first quarter did exhibit some perverse qualities as the market rally, was somewhat unusually, primarily led by lower beta stocks. This was reinforced by the under-performance of emerging market securities during the first quarter which saw them fail to even deliver a positive absolute return. The second quarter started with the positive sentiment and confidence from the market rally over the first quarter, and so April again saw equity markets continue to rise. This also continued into May, but was brought to a sudden halt by the comments of the US Federal Reserve. This saw markets rapidly sell-off for almost a month, though signs of a rebound did emerge before the end of the quarter. This enabled global equity markets to produce a small positive absolute return for the second quarter of 0.65%. Consequently for 2013 to the end of June the MSCI World Index has risen by 8.43%, and by almost 13% over the last twelve months. This indicates the overall strength of equity markets over 2013 so far and more broadly since the European Central Bank’s comments in July 2012 about them being prepared to do whatever it takes to support the euro.
1 All performance figures are quoted in US dollar terms unless stated otherwise.

SANLAM UNIVERSAL FUNDS PLC
10
ECONOMIC & MARKET REVIEW (CONTINUED) for the six months ended 30 June 2013 Equity Market Review (continued) At a sector level all sectors, except one, delivered positive absolute returns over the first half of 2013. Additionally, the relative performance of the sectors over the first and second quarters was fairly consistent, although there were some differences. The weakest sector by far has been the material sector, which declined by -11.76% in 2013 so far. This was the weakest sector in both the first and second quarters, and has struggled on the back of the slowdown in China, and their demand for raw materials. The next weakest sector has been the Energy sector, which in contrast to Materials, did produce a positive absolute return of not quite 3%, but it was increasingly weak as the year has progressed to the end of June. The strongest sectors have been Health Care and Consumer Discretionary rising by 17.33% and 16.64% respectively; both of these sectors have performed consistently well during 2013. The difference between those two sectors and the third best performing sector, Consumer Staples, which returned 10.54%, indicates the extent of the out-performance of both the Health Care and Consumer Discretionary sectors. At a regional level there have been some significant divergences. North America has performed strongly and has out-performed the overall MSCI World Index, by returning 11.64% for 2013 so far. However, Japan has fared even better and produced a return of 16.55%, which in local yen terms was almost 34%. All developed market regions produced positive absolute returns in local terms, but in US dollar terms the Pacific excluding Japan region was the weakest region, declining by -4.65%. Meanwhile Europe managed to produce a moderate gain of 2.18%. However, the really regional distortion during 2013 has been the weakness of emerging markets, which fell by -9.57% in the first six months of 2013. This is a differential of 18% between the performance of developed and emerging markets, and in an environment where economic prospects are improving and the wider global equity market is making positive progress. Fixed Income Market Review 2013 has proved to be a challenging market environment for fixed income investors. The first quarter saw global fixed income markets decline by -2.10%, as measured by the Barclays Capital Global Aggregate Bond Index. This saw the market decline in all three months of the quarter, with March being a more moderate decline than January and February. Furthermore none of the market declines were substantial, but just a steady drift downwards. In the second quarter, things started well, with April producing a positive absolute return of nearly 1.4% – the first month to do so since September 2012 – though market sentiment subsequently deteriorated and this caused the market to fall by almost -3% in May and by over -1% in June. As a result the second quarter saw global bond markets drop -2.79%, which was the worst quarterly return since the first quarter of 2009. Consequently, global bond markets have fallen -4.83% in the first six months of 2013. Bonds are therefore under-performing equities by almost -13% in 2013 so far. The reason for the negative sentiment in fixed income markets has been primarily related to the expectation of rising interest rates at some future point. Investors are aware that the current low interest rate environment will not last, and are gradually adjusting their expectations. Given the low interest rate environment it is also very difficult to see how yields can fall much further, if at all, and so the most likely trend to develop is to a scenario of rising interest rates. This is negative for bond returns and has led to the negative sentiment in global bond markets, and consequently declining fixed income markets. Within the fixed income market global corporate bonds have generally fared better than their sovereign counterparts. For the first quarter corporate bonds, as measured by the Barclays Capital Global Aggregate Corporate Index, declined -1.13%, and in the second quarter they fell -2.51%. However, on both occasions this segment of the global bond market out-performed the wider overall bond market. The primary reason behind this is that sovereign bonds have been the area most directly impacted by the expectation of rising interest rates, and so sovereign bonds have weakened significantly. Corporate bonds however, have been more indirectly impacted; it is difficult for corporate bonds to produce positive absolute returns in an environment where yields look set to rise, and hence why corporate bonds too have delivered negative absolute returns.

SANLAM UNIVERSAL FUNDS PLC
11
8IP ASIA EQUITY OPPORTUNITIES FUND Investment Objective The investment objective of the 8IP Asia Equity Opportunities Fund (the “Fund”) is to provide long-term capital growth. Fund Performance
Note: Fund launched 12 October 2010. Performance figures shorter than 12 months are annualised. Figures are quoted gross of fees. The Fund is benchmarked against the MSCI Asia Pacific excluding Japan Index (NDUEACAPF). The Fund has continued to perform poorly during 2013 so far. In the first quarter the Fund under-performed its benchmark by -2.66%, while in the second quarter the Fund under-performed by -1.10%. It is also worth noting that the market conditions over the two quarters did contain some material differences, although the Fund was unable to out-perform in either environment. As a result for 2013 year-to-date the Fund finds itself -3.55% behind its benchmark and the Fund has also produced a negative absolute return of -9.35%. Over the last twelve months the Fund has just managed to deliver a positive absolute return, with a rise of 1.89%, but this is substantially behind its benchmark, which means the Fund has under-performed by -7.53%. Since inception the Fund continues to materially under-perform its benchmark, and is now -8.73% behind.
Fund Outlook The outlook for the Fund and Asia Pacific excluding Japan equity market is heavily dependent on the overall equity market environment. While things certainly appear to be improving in the USA, and the situation in Europe looks to be stabilising, the situation in emerging markets, Asia Pacific and Japan is less clear. The major problem in the Asia Pacific excluding Japan region today appears to be the slowdown in Chinese economic growth, which has come under increasing scrutiny in recent months. The challenge for the new Chinese leadership is to maintain economic growth at a sustainably high level, without generating other issues within the economy. The knock-on effects to the other countries in the region are substantial and so the need for China to grow at high single digit levels is crucial to the development of the overall region. If China does succeed in achieving this then the region should start to perform much better. Investment Managers Eight Investment Partners (Pty) Limited.
-20%
-10%
0%
10%
20%
1st Qtr 2013 2nd Qtr 2013 Year to date 12 Months Inception Fund USD-terms -0.69% -8.71% -9.35% 1.89% -7.54% Benchmark 1.97% -7.61% -5.80% 9.42% 1.19% Excess return -2.66% -1.10% -3.55% -7.53% -8.73%

SANLAM UNIVERSAL FUNDS PLC
12
8IP ASIA PACIFIC EQUITY FUND Investment Objective The investment objective of the 8IP Asia Pacific Equity Fund (the “Fund”) is to provide long-term capital growth. Fund Performance
Note: Fund launched 13 September 2010. Performance figures shorter than 12 months are annualised. Figures are quoted gross of fees. The Fund is benchmarked against the MSCI Asia Pacific Index (NDUEACAP). The Fund has continued to perform poorly during 2013 so far. In the first quarter the Fund under-performed its benchmark by -2.68%, while in the second quarter the Fund under-performed by -1.17%. It is also worth noting that the market conditions over the two quarters did contain some material differences, although the Fund was unable to out-perform in either environment. As a result for 2013 year-to-date the Fund finds itself -3.80% behind its benchmark and the Fund has also produced a negative absolute return of -1.54%. Over the last twelve months the Fund has delivered an absolute return of approaching 9%, but this is substantially behind its benchmark, which means the Fund has under-performed by -5.65%. Since inception the Fund continues to materially under-perform its benchmark, and is now -4.51% behind. Fund Outlook The outlook for the Fund and Asia Pacific equity market is heavily dependent on the overall equity market environment. While things certainly appear to be improving in the USA, and the situation in Europe looks to be stabilising, the situation in emerging markets, Asia Pacific and Japan is less clear. Japan is clearly undertaking some substantial measures to reignite economic growth there, but it is still not clear how successful those will be. The major problem in the Asia Pacific region today appears to be the slowdown in Chinese economic growth, which has come under increasing scrutiny in recent months. The challenge for the new Chinese leadership is to maintain economic growth at a sustainably high level, without generating other issues within the economy. The knock-on effects to the other countries in the region are substantial and so the need for China to grow at high single digit levels is crucial to the development of the overall region. If China does succeed in achieving this then the region should start to perform much better. Investment Managers Eight Investment Partners (Pty) Limited.
-20%
-15%
-10%
-5%
0%
5%
10%
15%
20%
1st Qtr 2013 2nd Qtr 2013 Year to date 12 Months Inception Fund USD-terms 2.78% -4.20% -1.54% 8.68% 1.19% Benchmark 5.46% -3.03% 2.26% 14.33% 5.70% Excess return -2.68% -1.17% -3.80% -5.65% -4.51%

SANLAM UNIVERSAL FUNDS PLC
13
CENTRE GLOBAL EQUITY FUND Investment Objective The Centre Global Equity Fund (the “Fund”) aims to provide above average long-term capital growth by investing in global equity markets. Fund Performance
Note: The Fund launched 20 December 2006. Performance figures longer than 12 months are annualised. Figures are quoted gross of fees. The Fund is benchmarked against MSCI AC World Index. The Fund has struggled during 2013, due primarily to the under-performance of emerging market equities witnessed in 2013 so far. In the first quarter the Fund failed to keep up with the market rally and under-performed its benchmark by -4.22%. In the second quarter the Fund fared somewhat better, but produced a negative absolute return and also under-performed its benchmark by -1.51% for the period. As a result for 2013 so far the Fund has just managed to deliver a positive absolute return, but the Fund is almost -6% behind its benchmark. This has caused the Fund to under-perform by -3.82% over the last twelve months. The Fund’s track record since inception remains over -2% behind its benchmark, but the overwhelming majority of that was attributable to the investment manager appointed to the Fund prior to April 2011.
Fund Outlook The outlook for global equity markets will determine the Fund’s future direction and return profile. While some regional equity markets, and indeed the MSCI All Country World Index, have recently reached all time highs, there still remains scope for further progress, if global economic growth can be achieved, and also if the under-performance of emerging markets can reverse. The extent and timing of economic growth will be a significant factor in determining whether equity markets can move forward, and the regional differences are likely to contribute to performance differences in regional equity markets. In the short-term the immediate direction for the market is unclear, especially with the under-performance of emerging markets in 2013 so far, but as the signs of economic growth emerge, it means that it is probably more likely that equity markets will move higher. This Fund will benefit further if emerging markets do at least stop materially under-performing. Investment Managers Centre Asset Management LLC
-15%
-10%
-5%
0%
5%
10%
15%
20%
1st Qtr 2013 2nd Qtr 2013 Year to date 12 Months Inception Fund USD-terms 2.28% -1.94% 0.30% 12.75% -1.14% Benchmark 6.50% -0.42% 6.05% 16.57% 1.05% Excess return -4.22% -1.51% -5.75% -3.82% -2.19%

SANLAM UNIVERSAL FUNDS PLC
14
GRINDROD INTERNATIONAL PROPERTY FUND Investment Objective The Grindrod International Property Fund (the “Fund”) aims to provide investors with a high level of current income, as well as long-term income and capital growth, by investing primarily in a global range of transferable securities of real estate companies and real estate related companies, or in companies which own significant real estate assets at the time of investment or in Real Estate Investment Trusts (REITS) including publicly traded closed-ended real estate funds listed or traded on a regulated stock exchange or market. Fund Performance
Note: The Fund launched 17 November 2010. Performance figures longer than 12 months are annualised. Figures are quoted gross of fees. The Fund is benchmarked against the GPR 250 REIT Index.
Recent comments from Federal Reserve Chairman, Ben Bernanke, which suggested an imminent end to quantitative easing in the United States, sent global bond yields higher during the second quarter of 2013. Investors responded by offloading investments in other interest-rate sensitive sectors and global REITs registered their first quarterly decline since the third quarter of 2011. The Fund marginally underperformed the GPR 250 REIT Index during the second quarter, due to an overweight allocation to the Healthcare sector in the United States, as well as an overweight position in Canadian REITS. The Fund has recently built up a cash balance equivalent to 12% of the value of the Fund which will be invested on market pullbacks. Fund Outlook
The prospect of a steady increase in global yields is likely to dampen further substantial price increases in global listed real estate markets, despite a moderate pick-up in property fundamentals in many of the world’s supply-constrained markets. In the short-term, investors should therefore expect higher levels of price volatility, although an improvement in property fundamentals should lead to higher earnings and capital growth in the longer-term. Over and above the improvement in property fundamentals, many REITs have focused on creating additional value in their property portfolios, through redevelopments or refurbishments, which should support an acceleration in earnings growth during 2014 and 2015. Investment Managers
Grindrod Bank Limited
-10.00%
-5.00%
0.00%
5.00%
10.00%
15.00%
1st Qtr 2013 2nd Qtr 2013 Year to date 12 Months Inception Fund USD-terms 8.76% -5.14% 3.17% 13.77% 6.59% Benchmark 7.43% -4.22% 2.90% 10.68% 13.21% Excess return 1.33% -0.92% 0.27% 3.09% -6.62%
SANLAM UNIVERSAL FUNDS PLC
15
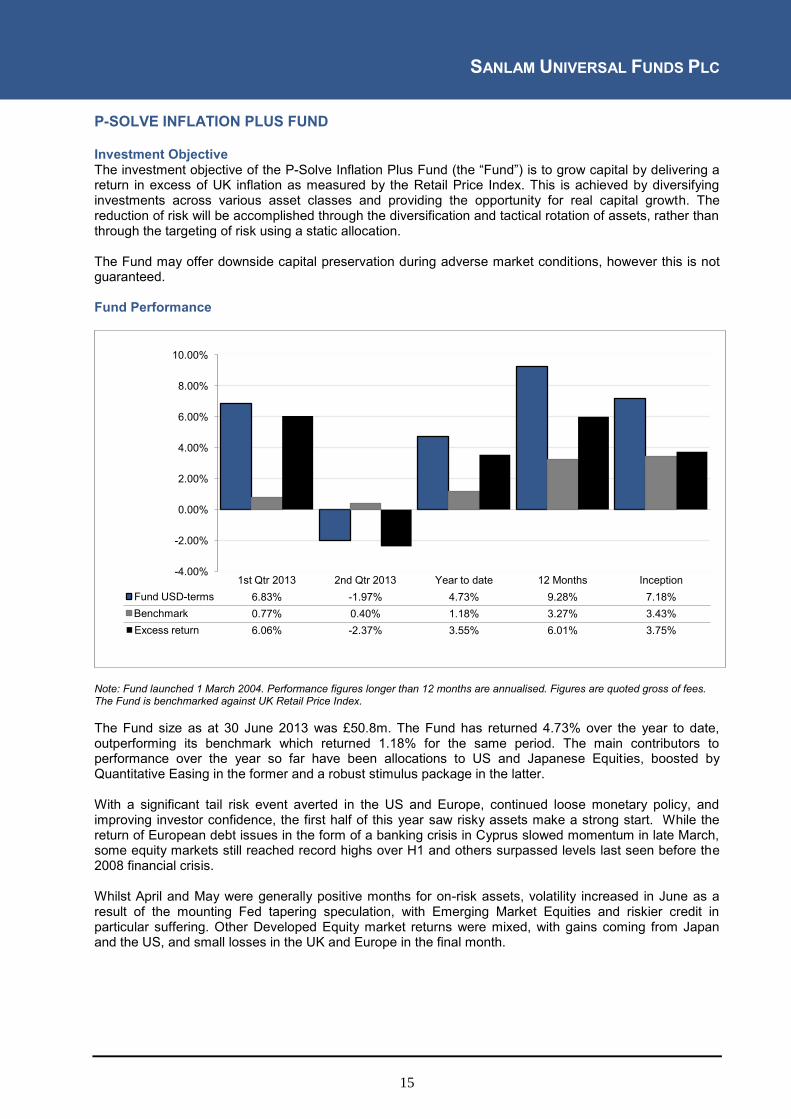
P-SOLVE INFLATION PLUS FUND Investment Objective The investment objective of the P-Solve Inflation Plus Fund (the “Fund”) is to grow capital by delivering a return in excess of UK inflation as measured by the Retail Price Index. This is achieved by diversifying investments across various asset classes and providing the opportunity for real capital growth. The reduction of risk will be accomplished through the diversification and tactical rotation of assets, rather than through the targeting of risk using a static allocation. The Fund may offer downside capital preservation during adverse market conditions, however this is not guaranteed. Fund Performance
Note: Fund launched 1 March 2004. Performance figures longer than 12 months are annualised. Figures are quoted gross of fees. The Fund is benchmarked against UK Retail Price Index. The Fund size as at 30 June 2013 was £50.8m. The Fund has returned 4.73% over the year to date, outperforming its benchmark which returned 1.18% for the same period. The main contributors to performance over the year so far have been allocations to US and Japanese Equities, boosted by Quantitative Easing in the former and a robust stimulus package in the latter. With a significant tail risk event averted in the US and Europe, continued loose monetary policy, and improving investor confidence, the first half of this year saw risky assets make a strong start. While the return of European debt issues in the form of a banking crisis in Cyprus slowed momentum in late March, some equity markets still reached record highs over H1 and others surpassed levels last seen before the 2008 financial crisis. Whilst April and May were generally positive months for on-risk assets, volatility increased in June as a result of the mounting Fed tapering speculation, with Emerging Market Equities and riskier credit in particular suffering. Other Developed Equity market returns were mixed, with gains coming from Japan and the US, and small losses in the UK and Europe in the final month.
-4.00%
-2.00%
0.00%
2.00%
4.00%
6.00%
8.00%
10.00%
1st Qtr 2013 2nd Qtr 2013 Year to date 12 Months Inception Fund USD-terms 6.83% -1.97% 4.73% 9.28% 7.18% Benchmark 0.77% 0.40% 1.18% 3.27% 3.43% Excess return 6.06% -2.37% 3.55% 6.01% 3.75%

SANLAM UNIVERSAL FUNDS PLC
16
P-SOLVE INFLATION PLUS FUND (CONTINUED) Fund Outlook
In the short term going forward we have reason to be nervous as possible tapering from the Fed later this year could have a dramatic effect on equity markets should fundamental economic data in the US continue to recover. Until economic fundamentals dramatically improve in the Eurozone, there is still a possibility an event could flare up leading to a pullback in risky assets. Overall, asset movements over the last couple of months have shown us that in the short term unconventional economic policy such as QE can create significant volatility in markets, whether it is the prospect of increases in Japan or tapering in the US. We still believe that in the long term fundamentals will play out as the underlying economics and policies still need to be in place to stimulate growth.
Investment Managers
P-Solve Investments Limited

SANLAM UNIVERSAL FUNDS PLC
17
SANLAM AFRICAN FRONTIER MARKETS FUND Investment Objective The Sanlam African Frontier Markets Fund (the “Fund”) aims to achieve long-term capital growth by investing in listed African equities (excluding South Africa) that offer above average growth potential. Fund Performance
Note: Fund launched 5 January 2009 and started trading 1 March 2010. Performance figures shorter than 12 months are annualised. Figures are quoted gross of fees. The Fund is benchmarked against MSCI EFM Africa ex South Africa. The Fund outperformed the benchmark by 5.90% for the six months to June 2013. On a quarterly basis, the fund also outperformed the benchmark by 2.64%. In the first half of the year, the best performing market in USD terms was Ghana which posted a 47% return while the worst performing market was Egypt which declined by 21%. However, the month of June saw a massive sell-off in the major African markets with markets index performances as follows: Nigeria (- 4.3%), Egypt ( -11.9%) and Kenya (-10.3%). Our fund’s geographic exposure to these countries is; Nigeria (44%), Egypt (26.5%) and Kenya (11%). The MSCI EFM Africa ex ZA index closed the month of June with a loss of 10.7%. MSCI World also lost 2.6% for the month. This downtrend is in line with most emerging markets, as escalating political tensions in Egypt, weak growth numbers from China, resurfacing debt worries in Europe and the overhang of the tapering off of the QE programme by the US Fed are plaguing global markets.
-15%
-10%
-5%
0%
5%
10%
15%
20%
25%
30%
1st Qtr 2013 2nd Qtr 2013 Year to date 12 Months Inception Fund USD-terms 8.69% -3.18% 5.23% 27.15% 3.48% Benchmark 5.46% -5.82% -0.68% 21.09% -1.09% Excess return 3.23% 2.64% 5.90% 6.06% 4.57%

SANLAM UNIVERSAL FUNDS PLC
18
SANLAM AFRICAN FRONTIER MARKETS FUND (CONTINUED) Fund Outlook In Egypt, a political settlement is in the making following the announcement of a transition government after the deposition of Morsi from office. Egypt is expected to finish constitutional amendments by November and we see the country holding presidential election within the first half of 2014 which should see the country moving forward. In Kenya, a gradual recovery in economic activity appears intact following the holding of peaceful elections in March. Although inflation is rising, the trend is unlikely to persuade the Central Bank to begin tightening the policy stance just yet. Most of the pressure on inflation has come from food inflation, mostly on account of unwinding base effects. We remain bullish on Nigeria with valuations that remain attractive amidst strong corporate and country fundamentals. Nigeria’s inflation is coming down and so are rates. This is supportive for consumers and lending in the market and we continue holding some exposure in the banking industry. We will maintain a higher exposure to this geography in the short term and review as the year goes. Investment Managers Sanlam Investment Management (Pty) Limited.

SANLAM UNIVERSAL FUNDS PLC
19
SANLAM GLOBAL BEST IDEAS FUND Investment Objective The investment objective of Sanlam Global Best Ideas Fund (the “Fund”) is to provide above average long-term capital growth by investing in global equities which the Investment Manager has identified as being under valued and as offering above average growth potential. Fund Performance
Note: Fund launched 30 September 2006. Performance figures longer than 12 months are annualised. Figures are quoted gross of fees. The Fund is benchmarked against MSCI World Index. The Fund lost 3.8% during the second quarter, after experiencing a torrid June during which its primarily financial emerging markets investments underperformed significantly and its largest holding, DBA Telecommunications, suffered a meltdown. This is on the back of a disappoining first quarter lagging the benchmark largely due to the negative trend of emerging markets. In particular, the divergence in performance between the Indian and USA markets of more than 10% during the first quarter is the cause of most of the Fund’s underperformance over this three month period. Our positioning favoured India over the USA, because we believe that the market is currently discounting an overly pessimistic view of the prospects of the Indian economy and that shares there are consequently undervalued. This is especially true for the financial sector where most of our exposure resides. Much of the damage to the value of our investments in emerging markets was done by the devaluation of their domestic currencies against the US Dollar as a result of the flight of capital in response to higher yields in the USA and fear induced by the expectation of the phasing out of quantitative easing by the US Federal Reserve. During the quarter our Fund was negatively impacted by the movements of the Indian Rupee (-9%), Russian Rouble (-6%), Thai Baht (-6%) and Turkish Lira (-8%) against the US Dollar. This impact was exacerbated by sharp declines in the prices of the shares, mainly in banks, owned in these countries. Our exposure to emerging markets is predominantly in the financial sector, where we believe that the superior growth and returns are not receiving the recognition that they deserve. The results published continue to be satisfactory and the companies being sold down are growing their net asset value per share and paying dividends confirming that this is a “market sell-down” and generally not company specific.
-20%
-15%
-10%
-5%
0%
5%
10%
15%
20%
25%
1st Qtr 2013 2nd Qtr 2013 Year to date 12 Months Inception Fund USD-terms 2.83% -3.78% -1.06% 7.15% 7.76% Benchmark 7.73% 0.65% 8.43% 18.58% 5.81% Excess return -4.91% -4.43% -9.49% -11.43% 1.95%

SANLAM UNIVERSAL FUNDS PLC
20
SANLAM GLOBAL BEST IDEAS FUND (CONTINUED) Fund Performance (continued) On the positive we are delighted about the Fund’s American shares performance which all outperformed the benchmark significantly. Notable performances were delivered by Berkshire Hathaway (+26%), Cisco Systems (+29%), Hewlett Packard (+45%), Lockheed Martin (+18%), Medtronic (+26%) and Microsoft (+30%). Unfortunately their combined weight in the portfolio was not sufficient to offset the negative effect of our emerging markets exposure and DBA Telecommunications. A well-known trap for portfolio managers to fall into is to get “wedded” to their investment ideas. But the equally damaging trap is to react emotionally and sell “at the bottom”. We therefore visited the region this past quarter to test our view of the outlook for those companies to gain greater clarity and ensure we make objective decisions based on the facts. Fund Outlook The Fund experienced a difficult first half, largely due to its on-going relatively large exposure to emerging markets, particularly in the financial sector, which has detracted from its performance. Whilst the Fund’s developed market exposure, particularly in respect of the United States, has markedly increased during the past year, it remains significantly tilted towards Asian emerging markets. Having been significantly left behind, the valuation of most of these shares now appears ever more compelling, making the argument for a further reduction in the exposure to these markets less obvious. Investment Managers Sanlam Investment Management (Pty) Limited

SANLAM UNIVERSAL FUNDS PLC
21
SANLAM GLOBAL BOND FUND Investment Objective The Sanlam Global Bond Fund (“the Fund”) aims to provide income with the possibility of long-term growth from capital appreciation. Fund Performance
Note: Fund launched 17 August 2004. Performance figures longer than 12 months are annualised. Figures are quoted gross of fees. The Fund is benchmarked against the Barclays Global Aggregate Index. The Fund has delivered a relatively strong performance in 2013 so far. The Fund struggled slightly in the first quarter as it failed to protect capital in a falling market environment and so the Fund under-performed by -0.08%. In contrast, in the second quarter the Fund did exhibit some defensive characteristics, as despite the market decline, the Fund managed to out-perform by +0.52%. As a result for 2013 so far the Fund had out-performed by +0.43%, though this has been in a declining return environment, where the Fund is down -4.40% for 2013 so far. The Fund’s performance over the last twelve months has also seen the Fund deliver strong out-performance of +1.16%. Since inception the Fund remains behind its benchmark though the under-performance now is -0.69%. Fund Outlook The outlook for global bonds is mixed. The continuation of low interest rates globally and monetary stimulus should act as a force to keep bond yields low, but the improving economic environment and slowly emerging central bank rhetoric, primarily from the USA at this time, of an end to the prevailing low interest raw environment, acts as a contrary force, which could see rising yields. If yields do rise, especially in sovereign markets, then the likelihood is that non-sovereign yields will also rise, and hence the outlook for global bonds could be quite bearish and potentially significantly so. In this environment the Fund will continue to seek to out-perform, but the challenge of delivering absolute returns could be substantial. The Fund will still be able to deliver out-performance though the opportunities to do so will depend upon the overall sentiment and direction of global bond markets. Investment Managers BlackRock Investment Management (UK) Limited.
-6%
-4%
-2%
0%
2%
4%
6%
8%
1st Qtr 2013 2nd Qtr 2013 Year to date 12 Months Inception Fund USD-terms -2.18% -2.27% -4.40% -1.02% 3.96% Benchmark -2.10% -2.79% -4.83% -2.18% 4.65% Excess return -0.08% 0.52% 0.43% 1.16% -0.69%

SANLAM UNIVERSAL FUNDS PLC
22
SANLAM GLOBAL FINANCIAL FUND Investment Objective The Sanlam Global Financial Fund (the “Fund”) will be used as an investment vehicle for investors wishing to achieve steady growth in the US Dollar value of investments primarily through global investment in securities of companies of which the principal operations specifically focus on, and derive benefit from or pertain to, the provision of banking, insurance and other financial services. Fund Performance
Note: Fund launched 8 April 2004. Performance figures longer than 12 months are annualised. Figures are quoted gross of fees. The Fund is benchmarked against MSCI World Financial Index. The Fund had a very poor first six months of the year, especially quarter two due to its 50% exposure to emerging markets. Most of the damage was done by the currency falls (Brazilian real and Indian rupee sharp declines). On top of this the Indonesian, Thai, Russian, Korean and Indian bank shares that the Fund owns declined by 10%-20%. This blow was reduced by the developed market investments of the Fund, where most investments were flat or gained up to 10%. India has been our problematic country this year, but the banks (and many industrial companies) have reported satisfactory results this quarter, and it seems as if the economic growth and the market have bottomed. Unless we have a repeat of an emerging market crisis like 1997 the price moves seem overdone. Whilst forecast emerging market growth rates are not as strong as they have been over the past five years, we believe that a repeat of 1997 collapse is unlikely and hence we remain invested in the majority of our holdings except for tactical switches and a complete disinvestment from our Chinese bank holdings. We are slowly increasing the Fund’s investment in Europe, but we remain concerned about the risk of unexpected outcomes in Europe. The criticism could be that the investments in European and especially US banks have been too small (combined investment in US and European banks was 20% of the Fund). However, whilst the US economy has indeed surprised via the speed of the housing recovery and we should have had a larger investment there, we remain cautious about Europe’s outlook and purposely invested only a small percentage.
-20%
-10%
0%
10%
20%
30%
40%
1st Qtr 2013 2nd Qtr 2013 Year to date 12 Months Inception Fund USD-terms 4.18% -4.96% -0.99% 14.52% 11.10% Benchmark 7.43% 1.70% 9.25% 29.00% 0.18% Excess return -3.25% -6.65% -10.24% -14.47% 10.93%

SANLAM UNIVERSAL FUNDS PLC
23
SANLAM GLOBAL FINANCIAL FUND (CONTINUED) Fund Performance (continued) Over the past 14 years our formula of investing in companies when the valuations are low has delivered very good results. Hence, whilst the short-term pain caused by the decline in Indian bank shares hurts, we are excited about the returns they should deliver over the next 12 months. In summary, 2013 has been an unsatisfactory year in terms of investment returns for the Fund and the investor, especially when measured relative to the index. However, we remain confident that the emerging market banks we are invested in will generate better returns on their capital than their developed market counterparts and eventually the market will recognise this, besides, we are not entirely comfortable with the markets recent “risk-on” approach and remain cautious. Fund Outlook Emerging markets were hit hard in quarter two by investors moving funds from emerging markets to developed markets. Whilst the Funds’ investments in developed markets performed well, this was undone by the 45% of the Fund invested in financial services companies in emerging markets. However, these companies are well positioned, and hence are unlikely to be much affected operationally. Their high returns on capital will ensure continued growth in the net asset value per share and should eventually be reflected in share prices. Hence, whilst the immediate outlook ito emerging markets is uncertain, we don’t think it will affect the longer-term outlook of the Fund. Investment Managers Sanlam Investment Management (Pty) Limited

SANLAM UNIVERSAL FUNDS PLC
24
SANLAM GLOBAL PROPERTY FUND Investment Objective The Sanlam Global Property Fund (the “Fund”) aims to provide long-term capital growth. Fund Performance
Note: Fund launched 14 December 2011. Performance figures longer than 12 months are annualised. Figures are quoted gross of fees. The Fund is benchmarked against the EPRA/NAREIT Developed (Gross) Total Index. The Fund has delivered mixed performance over 2013 so far. In the first quarter the Fund performed very well producing a substantial return, which enabled it to out-perform its benchmark by +2.84%. However, in the second quarter, with the deteriorating market conditions the Fund struggled and fell over -5%, whilst also under-performing its benchmark by -1.26%. As a result for 2013 year-to-date the Fund has only risen 3.39%, but the Fund is materially out-performing its benchmark by +1.37%. Additionally, over the last twelve months the Fund has risen by almost 17%, and has out-performed its benchmark by almost +3.3%. Since inception the Fund has risen over 22% and is out-performing its benchmark by +0.71%. Fund Outlook While this is a global listed property fund, the investments it holds are not independent of the broader global equity market. Hence, the performance of this Fund and its benchmark will be driven by a combination of the specific features of the listed property market, and also the behaviour of the wider global equity market. The outlook for the overall equity market is broadly improving, especially as the economic growth in the USA accelerates. Hence this should be a net positive effect. However, for the global listed properties the substantial returns witnessed prior to 2013 are not expected to be repeated in the foreseeable future. Instead, more moderate return levels of high single digits are a more reasonable expectation for the next twelve month. With the anticipated pending rising interest rate environment, property securities will also potentially suffer from being perceived as quasi-fixed income substitutes and this could lead to some headwinds. Investment Managers AllianceBernstein Limited
-10%
-5%
0%
5%
10%
15%
20%
1st Qtr 2013 2nd Qtr 2013 Year to date 12 Months Inception Fund USD-terms 8.95% -5.10% 3.39% 16.77% 22.03% Benchmark 6.11% -3.85% 2.02% 13.50% 21.32% Excess return 2.84% -1.26% 1.37% 3.27% 0.71%

SANLAM UNIVERSAL FUNDS PLC
25
SANLAM STRATEGIC CASH FUND Investment Objective The Sanlam Strategic Cash Fund (“the Fund”) aims to provide a high degree of safety of principal together with an investment return exceeding that available from cash deposits in US Dollar. Fund Performance
Note: Fund launched 5 August 1999. Performance figures longer than 12 months are annualised. Figures are quoted gross of fees. Benchmark until 25 September 2011: Federal Reserve Effective Overnight rate. Benchmark since 25 September 2011: 3 Month USD LIBOR. The Fund has struggled during 2013 so far. The Fund started the year reasonably well producing an absolute return of 0.10%, although this did lead the Fund to lag its benchmark by -0.10% for the first quarter. However, with the change in market conditions in the second quarter, the Fund suffered and was not quite able to produce a positive absolute return, with a decline of -0.01%. This caused the Fund to under-perform by -0.11% over the period. For the year-to-date the Fund now finds itself -0.12% behind its benchmark, though it has produced a positive absolute return. Over the last twelve months the Fund has struggled, though most of this was due to the previous investment manager who ceased to be appointed during December, and so the Fund finds itself -0.63% behind its benchmark. This has also filtered through to the Fund’s since inception numbers where the Fund is -0.77% behind its benchmark.
Fund Outlook There appear to be clear signs emerging that the US economy is recovering, and this has led the US Federal Reserve to start to signal to market that the historically low level of US interest rates is approaching an end, although it is also clear that US interest rates are not about to rise in the short-term. As a result US yield levels, in anticipation of this, are expected to rise, but this is unlikely to be seen in any significant way at the short-end of the US curve during the remainder of 2013, but could well form a key component of the outlook for 2014. Such an environment could make it challenging at the short-end of the bond spectrum, and this could easily impact non-sovereign bonds also, meaning that positive absolute returns for this Fund would require very careful security selection. Investment Managers BlackRock Investment Management UK Limited.
-1.00%
-0.75%
-0.50%
-0.25%
0.00%
0.25%
0.50%
0.75%
1.00%
1st Qtr 2013 2nd Qtr 2013 Year to date 12 Months Inception Fund USD-terms 0.10% -0.01% 0.09% -0.07% -0.09% Benchmark 0.11% 0.10% 0.21% 0.56% 0.68% Excess return -0.01% -0.11% -0.12% -0.63% -0.77%

SANLAM UNIVERSAL FUNDS PLC
26
SANLAM WORLD EQUITY FUND Investment Objective The Sanlam World Equity Fund (the “Fund”) aims to provide above average long-term capital growth by investing primarily in global equities. Fund Performance
Note: The Fund launched 17 August 2004. Performance figures longer than 12 months are annualised. Figures are quoted gross of fees. The Fund is benchmarked against the MSCI World. The Fund’s performance for 2013 so far has been disappointing, though it is showing signs of improvement. In the first quarter of 2013 the Fund had a very disappointing period of performance and failed to keep pace with the market rally, and consequently the Fund under-performed its benchmark by -1.38%. In the second quarter the Fund also struggled, but it did successfully manage to out-perform its benchmark by +0.27%. As a result the Fund finds itself -1.10% behind its benchmark for the first six months of 2013. The Fund is lagging behind its benchmark by an almost identical amount over the last twelve months, although the Fund has delivered some substantial absolute returns over that period. Since inception the Fund continues to lag its benchmark, and it is now -1.16% behind over that period. Fund Outlook The outlook for global equity markets will determine the Fund’s future direction and return profile. While some regional equity markets, and indeed the MSCI World Index, have recently reached all time highs, there still remains scope for further progress, if global economic growth can be achieved. The extent and timing of economic growth will be a significant factor in determining whether equity markets can move forward. And the regional differences are likely to contribute to performance differences in regional equity markets. The Fund will continue to seek to add value from both stock selection and allocation effects and over the long-term expects that these factors will lead to the Fund out-performing relative to its benchmark. In the short-term the immediate direction for the market is unclear, but as the signs of economic growth emerge, it means that it is probably more likely that equity markets will move higher. Investment Managers FOUR Capital Partners Limited Sanlam Investment Management (Pty) Limited Eight Investment Partners (Pty) Limited Centre Asset Management, LLC Sanlam International Investments Limited Alliance Bernstein Limited
-15%
-10%
-5%
0%
5%
10%
15%
20%
1st Qtr 2013 2nd Qtr 2013 Year to date 12 Months Inception Fund USD-terms 6.35% 0.92% 7.33% 17.51% 4.82% Benchmark 7.73% 0.65% 8.43% 18.58% 5.98% Excess return -1.38% 0.27% -1.10% -1.07% -1.16%

SANLAM UNIVERSAL FUNDS PLC
27
SANLAM WORLD EQUITY TRACKER FUND Investment Objective The objective of the Sanlam World Equity Tracker Fund (“the Fund”) is to replicate the performance of world equity markets by tracking the MSCI World Index in US$. Fund Performance
Note: Fund launched 17 August 2004. Performance figures longer than 12 moths are annualised. Figures are quoted gross of fees. The Fund is benchmarked against the MSCI World. The Fund has had slightly disappointing performance in 2013. The Fund performed broadly in line with its benchmark, with a differential of 0.06%. The second quarter saw the Fund perform much the same as the first quarter, and differed to its benchmark by around 0.08%. Due to the performance of the Fund being under-performance in both the first and second quarters the Fund’s performance from the first two quarters of 2013 did not offset, and the Fund consequently finds itself 0.15% away from its benchmark return year-to-date. However, over the last twelve months the Fund is almost perfectly in line with its benchmark. Since inception, the Fund continues to lag relative to its benchmark.
Fund Outlook The outlook for global equity markets will determine the Fund’s future direction and return profile. While some regional equity markets, and indeed the MSCI World Index, have recently reached all time highs, there still remains scope for further progress, if global economic growth can be achieved. The extent and timing of economic growth will be a significant factor in determining whether equity markets can move forward. And the regional differences are likely to contribute to performance differences in regional equity markets. In the short-term the immediate direction for the market is unclear, but as the signs of economic growth emerge, it means that is it probably more likely that equity markets will move higher. The Fund itself will continue with its objective of tracking the performance of the market benchmark over time. The Fund should be able to achieve such an objective over the long-run, regardless of the overall market direction and volatility. Investment Managers Sanlam Investment Management (Pty) Limited.
-10%
-5%
0%
5%
10%
15%
20%
1st Qtr 2013 2nd Qtr 2013 Year to date 12 Months Inception Fund USD-terms 7.67% 0.56% 8.28% 18.56% 5.40% Benchmark 7.73% 0.65% 8.43% 18.58% 5.98% Excess return -0.06% -0.08% -0.15% -0.02% -0.58%

SANLAM UNIVERSAL FUNDS PLC
28
SIIP INDIA OPPORTUNITIES FUND Investment Objective The investment objective of the SIIP India Opportunities Fund (the “Fund”) is to provide long-term capital growth. Fund Performance
Note: Fund launched 13 September 2010. Performance figures shorter than 12 months are annualised. Figures are quoted gross of fees. The Fund is benchmarked against the Bombay Stock Exchange 500 Index. The Fund has produced disappointing performance over 2013 so far. The market conditions over both the first and second quarters have been very difficult with both seeing the market fall in US dollar terms. In the first quarter the Fund under-performed its benchmark by -0.33%, while in the second quarter, market conditions worsened further, and so the market fell even more than in the first quarter, while the Fund itself under-performed by -0.79%. Hence, for 2013 year-to-date the market has fallen by over -13%, while the Fund has declined by -14.14%, and so the Fund is under-performing by just over -1%. However, despite this the Fund is continuing to out-perform over the last twelve months, by +0.82%, and this has just enabled the Fund to produce a positive absolute return. Since inception, both the Fund and benchmark are down in absolute terms, and the Fund still finds itself behind its benchmark by -1.83%.
Fund Outlook The Fund’s performance will primarily be driven by the behaviour of the Indian equity market, which will continued to be determined by both specific domestic and international factors. The outlook for global equity markets is broadly positive: things certainly appear to be improving in the USA, and the situation in Europe looks to be stabilising, but the situation in emerging markets and the Asia Pacific region is less clear. In India the economic growth outlook is disappoint, while the twin deficits are potentially got to lead a sovereign credit rating cut for the country. The Indian rupee also looks set to depreciate further, despite the efforts of the Indian central bank to manage the currency volatility. In this expected future difficult environment the Fund will continue to focus on stock selection, whilst being acutely cognisant of its sector and macro exposures and positioning. Investment Managers Sanlam Investment Management (Pty) Limited.
-20%
-15%
-10%
-5%
0%
5%
10%
15%
20%
1st Qtr 2013 2nd Qtr 2013 Year to date 12 Months Inception Fund USD-terms -6.15% -8.51% -14.14% 0.60% -12.21% Benchmark -5.82% -7.72% -13.09% -0.22% -10.39% Excess return -0.33% -0.79% -1.05% 0.82% -1.83%

SANLAM UNIVERSAL FUNDS PLC
29
SIM GLOBAL EQUITY INCOME FUND Investment Objective The objective of SIM Global Equity Income Fund (the “Fund”) is to generate a growing stream of dividend income for investors through investing in equities, while at the same time pursuing moderate growth in the capital invested. Fund Performance
Note: Fund launched 5 September 2012. Performance figures shorter than 12 months are annualised. Figures are quoted gross of fees. The Fund is benchmarked against the Barclays Global Aggregate Index. The second quarter of 2013 proved to be a difficult one for global equity markets, particularly in the developing world. This is evident when comparing the returns of MSCI World index (0.65%) and the MSCI Emerging Markets index (-9.1%). This is in sharp contrast with the first quarter of 2013 with really good returns from developed markets companies. Speculation regarding the timing of the end of quantitative easing and the first interest rate hike in the USA heralded a move out of high yielding equities and weighed on the performance of the MSCI World High Dividend Yield index (-1.3%) and the fund (-2.0%). The Fund paid its maiden distribution during the quarter. The payment equated to 1.5% of the initial unit price on 6 September 2012 and represents an annualised return of 3.0%. This is lower than the projected forward yield of 4.2% (net of withholding taxes), because the fund missed out on a number of dividends during its first six months as a result of the launch date. Our calculations show that the Fund would have collected dividends representing an additional 0.5% of its value had it been launched in time to qualify for all of the dividends paid by its investee companies during the period. We consequently expect the yield during the second six month period to exceed that of the first. Our reasoning is simple; the prospective dividend yield of a share is simply the dividends expected to be received during the next 12 months divided by the current share price. Similarly, the prospective dividend yield of the Fund is simply the weighted aggregate of the prospective dividend yields of the shares comprising the Fund.
-15%
-10%
-5%
0%
5%
10%
15%
1st Qtr 2013 2nd Qtr 2013 Year to date Inception Fund USD-terms 4.67% -1.67% 2.92% 4.05% Benchmark 8.46% -1.33% 7.03% 10.39% Excess return -3.80% -0.34% -4.11% -6.34%

SANLAM UNIVERSAL FUNDS PLC
30
SIM GLOBAL EQUITY INCOME FUND (CONTINUED) Fund Outlook Based on the consensus dividend expectations for the companies in the Fund, it is projected to achieve a gross yield, calculated on the initial capital value, in the region of 4.6% during the next twelve months. After taking into account the withholding taxes levied on these dividends in the various jurisdictions where the Fund is invested, this yield is expected to be reduced to around 4.2% on a net basis. Given that the dividends declared to date have been in line with expectations, we are reasonably confident that these projections will be met. The corresponding projections for the Fund’s benchmark, the MSCI World High Yield Index, are 4.1% and 3.5% respectively. In an effort to enhance the Fund’s net yield, investments in regions with low dividend taxes have been favoured over those with relatively high taxes. This has resulted in a greater exposure to companies domiciled in Europe and the United Kingdom and a smaller exposure to companies domiciled in the United States when compared to the benchmark. Because the United States market has outperformed European markets during the year to date, the total return of the Fund has lagged that of the benchmark. While it is possible that this trend will continue during the rest of the year, we are confident of achieving our objective of delivering a superior net yield combined with an acceptable level of capital appreciation. Investment Managers Sanlam Investment Management (Pty) Limited

SANLAM UNIVERSAL FUNDS PLC
31
SPI STRATEGIC INVESTMENT GRADE BOND FUND Investment Objective The SPI Strategic Investment Grade Bond Fund (the “Fund”) objective is to provide a total return through generating an income, that may be received monthly, and the potential for capital growth. The Fund mainly invests in investment grade government and corporate bonds, in the UK and overseas. Fund Performance
Note: Fund launched 01 March 2012. Performance figures shorter than 12 months are annualised. Figures are quoted gross of fees. The Fund is benchmarked against the HFRU Hedge Fund Composite Index. The Fund has returned 5.75% over the past 12 months, to the end of June. Over the same period, the IMA £ Strategic Bond Sector returned 8.1%. The FTSE Gilts Index, for comparison purposes, was down 2.4% in the last year. After benefiting earlier in 2013 from local currency emerging market bond exposure, the Fund has recently seen holdings in Brazil, Mexico, Turkey, as well as Australia, contribute significantly to the downside in May and June. In addition the sharp rise in global bond yields, as speculation that Central Bank support may be withdrawn earlier than anticipated, also led to most other areas of the bond market seeing short term price declines. This included corporate bonds and high yield sectors in the UK and overseas. Fund Outlook With the central banks of the UK, Europe and Japan still on a dovish footing, including most recently the Bank of England’s publication of forward interest rate guidance, we expect significant market focus to be on when, and how fast, the Federal Reserve tapers their current purchases of US Treasuries and Mortgages. With yields on 10 year US and UK government bonds around 1% higher than in Q2, we may see support for gilts and corporate bonds in the near term.
-6%
-4%
-2%
0%
2%
4%
6%
8%
10%
1st Qtr 2013 2nd Qtr 2013 Year to date 12 Months Inception Fund GBP-terms 2.75% -4.20% -1.57% 5.75% 6.00% Benchmark 1.63% -1.95% -0.35% 7.02% 5.94% Excess return 1.12% -2.25% -1.22% -1.27% 0.06%

SANLAM UNIVERSAL FUNDS PLC
32
SPI STRATEGIC INVESTMENT GRADE BOND FUND (CONTINUED) Fund Outlook (continued) Forward looking economic indicators finally seem to be improving which, when coupled with expansionary monetary policy, is likely to lead to higher inflation expectations and a steeper yield curve. Risks abound however, with continuing trouble in Europe, a slowdown in China or the failure of Shinzo Abe’s economic agenda in Japan being only some of the possible downside scenarios. Low liquidity in times of market stress and historically high valuations have caused concerns regarding the high yield sector. As such, we have reduced exposure to lower rated corporate bonds, to fund enhanced index-linked gilt exposure while also adding short dated bank bonds that are likely to be held until redeemed by the issuer, where yields have become particularly attractive. Yields on local currency emerging market bonds have climbed significantly since early May. We think that both the bond and the currency side of the potential return equation offer significant potential upside from current levels. Investment Managers Sanlam Private Investments Limited

SANLAM UNIVERSAL FUNDS PLC
33
SANLAM FUND OF ALTERNATIVE UCITS FUND Investment Objective The investment objective of the Sanlam Fund of Alternative UCITS Fund (the “Fund”) is to provide capital growth over the long term. Fund Performance
Note: Fund launched 29 January 2013. Performance figures shorter than 12 months are annualised. Figures are quoted gross of fees. The Fund is benchmarked against the HFRU Hedge Fund Composite Index. The Fund’s performance for 2013 has been in line with the benchmark, but below the investment manager’s expectations, as the Fund under-performed the benchmark by -0.13% during the first half of 2013. The Fund commenced trading at the end of January 2013 and was not fully invested until the middle of March. This caused the Fund to miss out on upside performance during the positive months of February and March. This resulted in the Fund under-performing the benchmark during the relevant part of the first quarter by -1.03%. Once the Fund was fully invested the Fund was able to make up for most of the under-performance during the second quarter, and has ended the period since inception to the end of the first half of 2013 broadly in line with its benchmark. Fund Outlook The investment manager is optimistic on the Fund’s outlook coming into the second half of 2013. The investment manager made further changes to the Fund towards the end of June and in the middle of July, therefore by the end of July the Fund will resemble how it was envisaged to look when it was launched in January 2013. The Fund now consists of twelve underlying managers giving good diversification across regions, strategies and asset classes. While the Fund maintains an equity bias, coming into the second half of 2013 the Fund has decreased the European exposure and increased the US equity exposure. US equity exposure has increased from under 5% in the first quarter, to just below 20%. With the current set of investment managers in the Fund in place, the investment manager does not anticipate any material changes in the near term. The investment manager continues to search through the universe of UCITS Funds in the hope of find managers that offer something unique or that are superior offerings to what is currently in the Fund. Investment Managers Sanlam International Investments Limited
-3%
-2%
-1%
0%
1%
2%
3%
2nd Qtr 2013 Inception Fund USD-terms -1.12% -0.81% Benchmark -1.99% -0.68% Excess return 0.87% -0.13%

SANLAM UNIVERSAL FUNDS PLC
34
SANLAM ACCEL INCOME FUND Investment Objective The investment objective of Sanlam Accel Income Fund (the “Fund”) is to provide income to investors and capital growth over the long term. Fund Performance
Note: Fund launched 8 March 2013. Performance figures shorter than 12 months are annualised. Figures are quoted gross of fees. The Fund is benchmarked against the Income Yield Benchmark Index. It is still early days for the Fund having been launched just a few months ago, and the start-up phase is always difficult with cash flows quite lumpy and able to cause large tracking errors especially in volatile markets. With that in mind we are quite pleased that though the Fund lagged the benchmark in March, it has outperformed since (through the second quarter), and is now only marginally behind benchmark since inception. Fund Outlook There is some concern that rising interest rates will be a drag on the performance of a Fund that has a large bond allocation and stock exposure to the income sector which is often seen the closest equity alternative to bonds. There are ways to moderate the risks though and we are active in managing these. Keeping bond duration down mitigates price risk in fixed income, and in equities we can bias our portfolio towards managers who prefer ‘dividend’ stocks where the promise is for greater dividend growth in future in preference to shares with current high dividends but lower longer term dividend growth rates. Whilst this effectively means reducing the near term potential yield, the aim is to preserve and grow capital slightly more with the aim of protecting value and enhancing income when economic and dividend growth becomes more elusive. Investment Managers Sanlam International Investments Limited
-3%
-2%
-1%
0%
1%
2%
3%
2nd Qtr 2013 Inception Fund GBP-terms -1.87% -1.85% Benchmark -2.09% -1.77% Excess return 0.22% -0.09%

SANLAM UNIVERSAL FUNDS PLC
35
SANLAM NORTH AMERICA EQUITY TRACKER FUND Investment Objective The investment objective of Sanlam North America Equity Tracker Fund (the “Fund”) is to provide capital growth equivalent to that gained from investment in the North American equity markets by tracking the performance of the MSCI North America Index. Fund Performance As the Fund launched on 11 June 2013, a performance report is not presented. Investment Managers Sanlam Investment Management (Pty) Limited
SANLAM UNIVERSAL FUNDS PLC
36
SANLAM UK EQUITY TRACKER FUND Investment Objective The investment objective of Sanlam UK Equity Tracker Fund (the “Fund”) is to provide capital growth equivalent to that gained from investment in the UK equity markets by tracking the performance of the MSCI UK Daily Net Total Return Index. Fund Performance As the Fund launched on 11 June 2013, a performance report is not presented. Investment Managers Sanlam Investment Management (Pty) Limited

SANLAM UNIVERSAL FUNDS PLC
37
SANLAM EUROPE (EX UK) EQUITY FUND Investment Objective The investment objective of Sanlam Europe (Ex UK) Equity Fund (the “Fund”) is to provide capital growth equivalent to that gained from investment in the European equity markets excluding the UK by tracking the performance of the MSCI Europe ex UK Index. Fund Performance As the Fund launched on 11 June 2013, a performance report is not presented. Investment Managers Sanlam Investment Management (Pty) Limited

SANLAM UNIVERSAL FUNDS PLC
38
SANLAM EQUITY ALLOCATION FUND Investment Objective The investment objective of the Sanlam Equity Allocation Fund (the “Fund”) is to provide capital growth over the long-term. Fund Performance As the Fund launched on 25 May 2013, a performance report is not presented. Investment Managers FOUR Capital Partners Limited

SANLAM UNIVERSAL FUNDS PLC
39
SANLAM EMERGING MARKET EQUITY TRACKER FUND Investment Objective The investment objective of the Sanlam Emerging Markets Equity Tracker Fund (the “Fund”) is to provide capital growth equivalent to that gained from investment in the emerging equity markets by tracking the performance of the MSCI Emerging Markets Index. Fund Performance As the Fund launched on 11 June 2013, a performance report is not presented. Investment Managers Sanlam Investment Management (Pty) Limited

SANLAM UNIVERSAL FUNDS PLC
40
STATEMENT OF COMPREHENSIVE INCOME OF THE COMPANY for the six months ended 30 June 2013
Six months ended 30
June 2013 Six months ended 30
June 2012 US$ US$ Investment income Net gains on financial assets and liabilities at fair value through profit or loss – held for trading 69,455,176 156,876,553 Income from stock lending 928,195 1,147,610 Income from financial assets at fair value through profit or loss 63,593,653 56,961,657 Bank interest 59,533 48,684 Other income 152,987 4,415 Net investment income 134,189,544 215,038,919 Operating expenses Management fee (6,921,483) (5,224,373) Custody fees (574,608) (582,800) Other operating expenses (535,218) (423,018) Administration fees (441,635) (162,353) Audit fee (116,495) (119,517) Non Distributing Class Fee (102,524) (88,661) Directors’ fees (27,084) (33,670) Distributing Class Fee (990) (1,079) Performance fee - (1,463,531) Total operating expenses (8,720,037) (8,099,002) Operating profit 125,469,507 206,939,917 Finance costs Distribution to shareholders (4,374,881) (2,228,596) Interest expense (18,341) - Income equalisation (14,958,375) (2,742,541) Total finance costs (19,351,597) (4,971,137) Profit before tax 106,117,910 201,968,780 Withholding tax (9,384,948) (8,618,353) Change in net assets attributable to holders of redeemable participating shares 96,732,962 193,350,427 The attached notes form an integral part of these audited unaudited condensed interim financial statements.

SANLAM UNIVERSAL FUNDS PLC
41
STATEMENTS OF COMPREHENSIVE INCOME OF THE FUNDS for the six months ended 30 June 2013
8IP Asia Equity Opportunities
Fund 8IP Asia Pacific
Equity Fund Centre Global
Equity Fund Grindrod
International Property Fund
P-Solve Inflation Plus
Fund US$ US$ US$ US$ GBP
Investment income Net gains on financial assets and liabilities at fair value through profit or loss – held for trading (2,194,230) (384,862) (236,590) 220,823 2,046,133 Income from stock lending 2,517 2,910 10,182 3,166 2,002 Income from financial assets at fair value through profit or loss 377,990 316,697 466,721 259,382 360,420 Bank interest 55 61 59 118 704 Other income 3,150 3,349 1,450 2,795 4,013 Net investment (deficit)/income (1,810,518) (61,845) 241,822 486,284 2,413,272
Operating expenses Management fee (19,431) (32,334) (173,036) - (17,643) Distributing Class Fee - - - (990) - Non Distributing Class Fee - - - (102,524) - Performance fee - - - - - Administration fees (5,485) (4,847) (9,258) (4,653) (8,793) Audit fee (4,316) (4,316) (4,316) (4,316) (2,554) Directors’ fees (145) (154) (177) (61) (423) Custody fees (9,120) (8,762) (10,951) (1,657) (1,998) Other operating expenses (16,207) (16,330) (9,306) (10,138) (9,743) Total operating expenses (54,704) (66,743) (207,044) (124,339) (41,154)
Operating (loss)/profit (1,865,222) (128,588) 34,778 361,945 2,372,118
Finance costs Distribution to shareholders - - - (664) (1,136,554) Interest expense - - - - - Income equalisation 4,361 (76,563) (4,782) 161,740 12,792
Profit/(loss) before tax (1,860,861) (205,151) 29,996 523,021 1,248,356 Withholding tax (28,515) (20,964) (78,906) (53,274) (16,500) Change in net assets attributable to holders of redeemable participating shares (1,889,376) (226,115) (48,910) 469,747 1,231,856 Distribution per share (in cents/pence) Management fee Class A - - - - 1.50 Management fee Class A (GBP) - - - - - Management fee Class A (EUR) - - - - - Management fee Class A (Income) - - - - - Management fee Class B - - - - 2.60 Management fee Class C - - - - 2.70 Management fee Class C (GBP) - - - - - Management fee Class D - - - - - Management fee Class F - - - - - Management fee Class F (GBP) - - - - - Management fee Class F (EUR) - - - - - Management fee Class P (Accumulation) - - - - - Management fee Class P (Income) - - - - - Distributing Class - - - 0.70 - Gains and losses arise solely from continuing operations. There were no gains or losses other than those reflected above.

SANLAM UNIVERSAL FUNDS PLC
42
STATEMENTS OF COMPREHENSIVE INCOME OF THE FUNDS (CONTINUED) for the six months ended 30 June 2013
Sanlam African Frontier
Markets Fund
Sanlam Global Best Ideas
Fund Sanlam Global
Bond Fund Sanlam Global Financial Fund
Sanlam Global Property Fund
US$ US$ US$ US$ US$ Investment income Net gains on financial assets and liabilities at fair value through profit or loss – held for trading 2,777,993 (6,295,828) (22,340,656) (7,694,330) (4,781,086) Income from stock lending - 149,439 14,353 76,463 27,522 Income from financial assets at fair value through profit or loss 2,103,788 10,746,298 5,523,491 8,464,096 1,895,982 Bank interest 1,582 3,704 3,869 2,067 737 Other income 5,054 18,021 17,293 11,270 5,099 Net investment income/(deficit) 4,888,417 4,621,634 (16,781,650) 859,566 (2,851,746)
Operating expenses Management fee (361,859) (1,402,032) (549,247) (1,457,356) (185,215) Distributing Class Fee - - - - - Non Distributing Class Fee - - - - - Performance fee - - - - - Administration fees (12,682) (73,434) (38,264) (64,159) (12,651) Audit fee (4,316) (8,129) (10,790) (8,129) (4,316) Directors’ fees (311) (3,555) (2,982) (2,239) (507) Custody fees (80,401) (155,201) (7,178) (95,765) (1,658) Other operating expenses (13,384) (74,409) (35,178) (58,148) (15,493) Total operating expenses (472,953) (1,716,760) (643,639) (1,685,796) (219,840)
Operating profit/(loss) 4,415,464 2,904,874 (17,425,289) (826,230) (3,071,586)
Finance costs Distribution to shareholders (6,512) (5,295) - - - Interest expense - - - - - Income equalisation (2,196,547) (2,248,664) (554,948) 225,307 2,554,902
Profit/(loss) before tax 2,212,405 650,915 (17,980,237) (600,923) (516,684) Withholding tax (161,661) (1,504,588) (1) (888,716) (363,121) Change in net assets attributable to holders of redeemable participating shares 2,050,744 (853,673) (17,980,238) (1,489,639) (879,805) Distribution per share (in cents/pence) Management fee Class A - - - - - Management fee Class A (GBP) 11.33 4.22 - - - Management fee Class A (EUR) - - - - - Management fee Class A (Income) - - - - - Management fee Class B - - - - - Management fee Class C - - - - - Management fee Class C (GBP) 11.74 3.17 - - - Management fee Class D - - - - - Management fee Class F - - - - - Management fee Class F (GBP) - - - - - Management fee Class F (EUR) - - - - - Management fee Class G - - - - - Management fee Class P (Accumulation) - - - - - Management fee Class P (Income) - - - - - Distributing Class Fee - - - - - Gains and losses arise solely from continuing operations. There were no gains or losses other than those reflected above.

SANLAM UNIVERSAL FUNDS PLC
43
STATEMENTS OF COMPREHENSIVE INCOME OF THE FUNDS (CONTINUED) for the six months ended 30 June 2013
Sanlam Strategic Cash
Fund Sanlam World
Equity Fund
Sanlam World Equity Tracker
Fund
SIIP India Opportunities
Fund
SIM Global Equity Income
Fund US$ US$ US$ US$ US$
Investment income Net gains on financial assets and liabilities at fair value through profit or loss – held for trading (237,786) 109,985,125 22,586,551 (2,702,958) 165,076 Income from stock lending 160 495,088 114,864 - - Income from financial assets at fair value through profit or loss 271,705 23,462,874 4,741,635 141,130 406,128 Bank interest - 43,684 522 42 110 Other income 2,472 56,652 9,422 3,934 6,666 Net investment income/(deficit) 36,551 134,043,423 27,452,994 (2,557,852) 577,980
Operating expenses Management fee (13,543) (1,619,985) (748,723) (24,812) (62,445) Distributing Class Fee - - - - - Non Distributing Class Fee - - - - - Performance fee - - - - - Administration fees (5,054) (130,481) (43,439) (4,470) (3,114) Audit fee (4,315) (14,387) (7,193) (4,316) (4,316) Directors’ fees (142) (11,988) (2,410) (140) (41) Custody fees (3,499) (158,570) (15,540) (13,635) (2,271) Other operating expenses (9,333) (132,648) (31,984) (22,958) (13,258) Total operating expenses (35,886) (2,068,059) (849,289) (70,331) (85,445)
Operating profit/(loss) 665 131,975,364 26,603,705 (2,628,183) 492,535
Finance costs Distribution to shareholders - - - - (194,293) Interest expense - - - - - Income equalisation 124,515 (12,066,031) (1,308,899) 588 (1,358)
Profit/(loss) before tax 125,180 119,909,333 25,294,806 (2,627,595) 296,884 Withholding tax - (4,970,316) (1,015,103) - (68,947) Change in net assets attributable to holders of redeemable participating shares 125,180 114,939,017 24,279,703 (2,627,595) 227,937 Distribution per share (in cents/pence) Management fee Class A - - - - 0.86 Management fee Class A (GBP) - - - - - Management fee Class A (EUR) - - - - - Management fee Class A (Income) - - - - - Management fee Class B - - - - - Management fee Class C - - - - 1.49 Management fee Class C (GBP) - - - - - Management fee Class D - - - - - Management fee Class F - - - - - Management fee Class F (GBP) - - - - - Management fee Class F (EUR) - - - - - Management fee Class P (Accumulation) - - - - - Management fee Class P (Income) - - - - - Distributing Class Fee - - - - - Gains and losses arise solely from continuing operations. There were no gains or losses other than those reflected above.

SANLAM UNIVERSAL FUNDS PLC
44
STATEMENTS OF COMPREHENSIVE INCOME OF THE FUNDS (CONTINUED) for the six months ended 30 June 2013
SPI Strategic Investment
Grade Bond Fund
Sanlam Fund of Alternative
UCITS Fund
Sanlam Accel Income Fund
Sanlam North America Equity
Tracker Fund
Sanlam UK Equity Tracker
Fund
GBP US$ GBP US$ GBP Investment income Net gains on financial assets and liabilities at fair value through profit or loss – held for trading (2,730,881) (897,806) (302,839) (2,582,926) (1,756,701) Income from stock lending 17,894 - - - - Income from financial assets at fair value through profit or loss 1,797,689 - 11,708 232,118 76,735 Bank interest - 1,016 15 20 1 Other income - - - - - Net investment (deficit)/income (915,298) (896,790) (291,116) (2,350,788) (1,679,965)
Operating expenses Management fee (138,735) - (14,917) - - Distributing Class Fee - - - - - Non Distributing Class Fee - - - - - Performance fee - - - - - Administration fees (1,762) (3,178) (2,158) (1,430) (802) Audit fee (6,384) (3,952) (1,987) (1,763) (968) Directors’ fees (442) (122) (49) (234) (46) Custody fees (77) (1,816) (955) (817) (458) Other operating expenses (15,159) (10,357) (4,670) (5,019) (2,149) Total operating expenses (162,559) (19,425) (24,736) (9,263) (4,423)
Operating (loss)/profit (1,077,857) (916,215) (315,852) (2,360,051) (1,684,388)
Finance costs Distribution to shareholders (1,493,528) - - - - Interest expense (8) - - - - Income equalisation 263,711 80,797 (53,579) - -
(Loss)/profit before tax (2,307,682) (835,418) (369,431) (2,360,051) (1,684,388) Withholding tax - - (782) (85,226) (7,674) Change in net assets attributable to holders of redeemable participating shares (2,307,682) (835,418) (370,213) (2,445,277) (1,692,062) Distribution per share (in cents/pence) Management fee Class A - - - - - Management fee Class A (GBP) - - - - - Management fee Class A (EUR) - - - - - Management fee Class A (Income) 2.11 - - - - Management fee Class B - - - - - Management fee Class C - - - - - Management fee Class C (GBP) - - - - - Management fee Class D - - - - - Management fee Class F - - - - - Management fee Class F (GBP) - - - - - Management fee Class F (EUR) - - - - - Management fee Class P (Accumulation) - - - - - Management fee Class P (Income) 2.54 - - - - Distributing Class Fee - - - - - Gains and losses arise solely from continuing operations. There were no gains or losses other than those reflected above.

SANLAM UNIVERSAL FUNDS PLC
45
STATEMENTS OF COMPREHENSIVE INCOME OF THE FUNDS (CONTINUED) for the six months ended 30 June 2013
Sanlam Europe (ex UK)
Equity Fund
Sanlam Equity Allocation
Fund
Sanlam Emerging
Market Equity Tracker Fund
EUR US$ US$ Investment income Net gains on financial assets and liabilities at fair value through profit or loss – held for trading (3,388,406) (4,203,457) (3,022,930) Income from stock lending - - - Income from financial assets at fair value through profit or loss 140,697 187,753 254,692 Bank interest - 745 Other income -
-
Net investment (deficit) (3,247,709) (4,015,704) (2,767,493)
Operating expenses Management fee - - - Distributing Class Fee - - - Non Distributing Class Fee - - - Performance fee - - - Administration fees (931) (1,217) (1,204) Audit fee (1,148) (1,501) (1,484) Directors’ fees (122) (108) (90) Custody fees (532) (696) (860) Other operating expenses (2,908) (3,712) (3,346) Total operating expenses (5,641) (7,234) (6,984)
Operating (loss) (3,253,350) (4,022,938) (2,774,477)
Finance costs Distribution to shareholders - - - Interest expense (4,727) (12,251) - Income equalisation 79 (6,183) -
(Loss) before tax (3,257,998) (4,041,372) (2,774,477) Withholding tax (35,268) (32,809) (27,914) Change in net assets attributable to holders of redeemable participating shares (3,293,266) (4,074,181) (2,802,391) Distribution per share (in cents/pence) Management fee Class A - - - Management fee Class A (GBP) - - - Management fee Class A (EUR) - - - Management fee Class A (Income) - - - Management fee Class B - - - Management fee Class C - - - Management fee Class C (GBP) - - - Management fee Class D - - - Management fee Class F - - - Management fee Class F (GBP) - - - Management fee Class F (EUR) - - - Management fee Class P (Accumulation) - - - Management fee Class P (Income) - - - Distributing Class Fee - - - Gains and losses arise solely from continuing operations. There were no gains or losses other than those reflected above
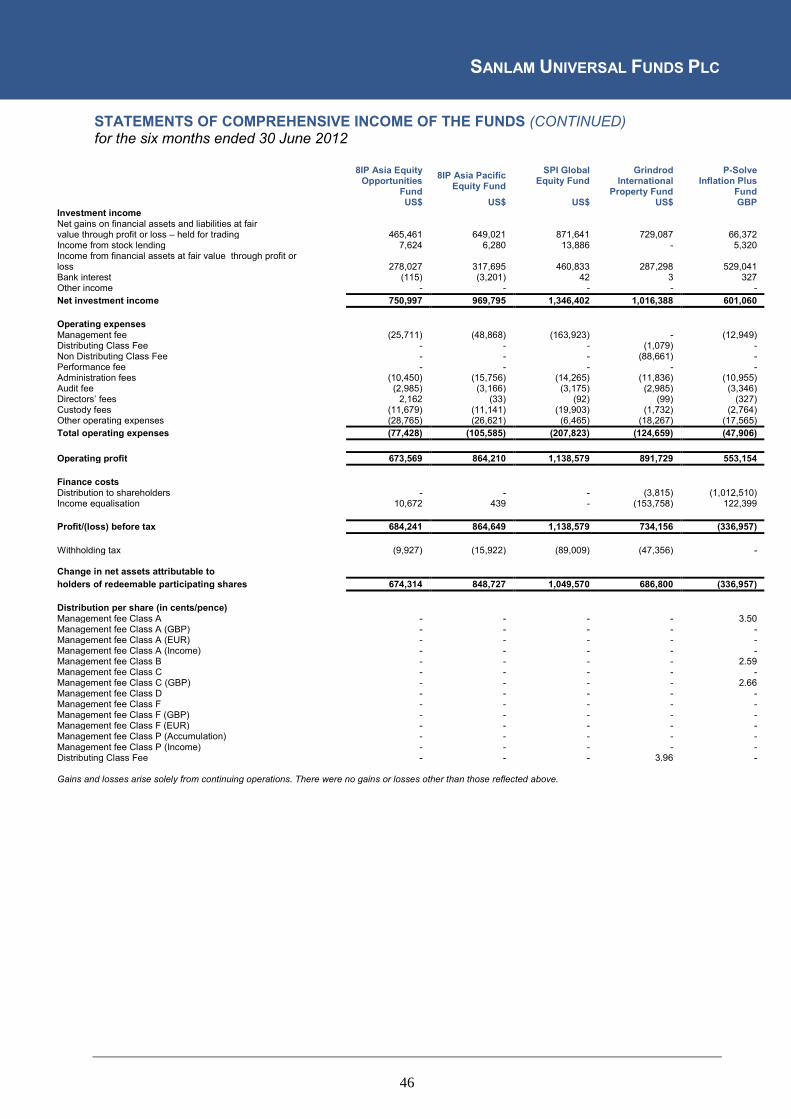
SANLAM UNIVERSAL FUNDS PLC
46
STATEMENTS OF COMPREHENSIVE INCOME OF THE FUNDS (CONTINUED) for the six months ended 30 June 2012
8IP Asia Equity Opportunities
Fund 8IP Asia Pacific
Equity Fund SPI Global
Equity Fund Grindrod
International Property Fund
P-Solve Inflation Plus
Fund US$ US$ US$ US$ GBP
Investment income Net gains on financial assets and liabilities at fair value through profit or loss – held for trading 465,461 649,021 871,641 729,087 66,372 Income from stock lending 7,624 6,280 13,886 - 5,320 Income from financial assets at fair value through profit or loss 278,027 317,695
460,833 287,298 529,041
Bank interest (115) (3,201) 42 3 327 Other income - - - - - Net investment income 750,997 969,795 1,346,402 1,016,388 601,060
Operating expenses Management fee (25,711) (48,868) (163,923) - (12,949) Distributing Class Fee - - - (1,079) - Non Distributing Class Fee - - - (88,661) - Performance fee - - - - - Administration fees (10,450) (15,756) (14,265) (11,836) (10,955) Audit fee (2,985) (3,166) (3,175) (2,985) (3,346) Directors’ fees 2,162 (33) (92) (99) (327) Custody fees (11,679) (11,141) (19,903) (1,732) (2,764) Other operating expenses (28,765) (26,621) (6,465) (18,267) (17,565) Total operating expenses (77,428) (105,585) (207,823) (124,659) (47,906)
Operating profit 673,569 864,210 1,138,579 891,729 553,154
Finance costs Distribution to shareholders - - - (3,815) (1,012,510) Income equalisation 10,672 439 - (153,758) 122,399
Profit/(loss) before tax 684,241 864,649 1,138,579 734,156 (336,957) Withholding tax (9,927) (15,922) (89,009) (47,356) - Change in net assets attributable to holders of redeemable participating shares 674,314 848,727 1,049,570 686,800 (336,957) Distribution per share (in cents/pence) Management fee Class A - - - - 3.50 Management fee Class A (GBP) - - - - - Management fee Class A (EUR) - - - - - Management fee Class A (Income) - - - - - Management fee Class B - - - - 2.59 Management fee Class C - - - - - Management fee Class C (GBP) - - - - 2.66 Management fee Class D - - - - - Management fee Class F - - - - - Management fee Class F (GBP) - - - - - Management fee Class F (EUR) - - - - - Management fee Class P (Accumulation) - - - - - Management fee Class P (Income) - - - - - Distributing Class Fee - - - 3.96 - Gains and losses arise solely from continuing operations. There were no gains or losses other than those reflected above.

SANLAM UNIVERSAL FUNDS PLC
47
STATEMENTS OF COMPREHENSIVE INCOME OF THE FUNDS (CONTINUED) for the six months ended 30 June 2012
Sanlam African Frontier
Markets Fund
Sanlam Global Best Ideas
Fund
Sanlam Universal Bond
Fund Sanlam Global Financial Fund
Sanlam Global Property Fund
US$ US$ US$ US$ US$ Investment income Net gains on financial assets and liabilities at fair value through profit or loss – held for trading 4,421,790 45,519,291 3,132,600 27,610,987 3,135,879 Income from stock lending - 309,123 9,892 133,969 10,793 Income from financial assets at fair value through profit or loss 1,263,033 11,977,352
6,334,063 6,663,688 783,188
Bank interest 249 33,904 3,108 2,158 215 Other income - - 1,204 659 1,331 Net investment income 5,685,072 57,839,670 9,480,867 34,411,461 3,931,406
Operating expenses Management fee (125,880) (1,429,977) (393,183) (1,138,162) (86,134) Distributing Class Fee - - - - - Non Distributing Class Fee - - - - - Performance fee - - - (1,456,332) - Administration fees (18,939) (18,225) (4,276) (9,466) (2,284) Audit fee (3,153) (13,973) (16,536) (7,785) (4,420) Directors’ fees (51) (4,269) (3,994) (1,479) (396) Custody fees (114,621) (51,745) (57,211) (97,135) (13,844) Other operating expenses (18,759) (62,610) (12,634) (45,579) (8,693) Total operating expenses (281,403) (1,580,799) (487,834) (2,755,938) (115,771)
Operating profit 5,403,669 56,258,871 8,993,033 31,655,523 3,815,635
Finance costs Distribution to shareholders - (12,009) - - - Income equalisation - (360,534) - 158,883 107,211
Profit before tax 5,403,669 55,886,328 8,993,033 31,814,406 3,922,846 Withholding tax (82,736) (1,702,497) (254) (846,965) (165,975) Change in net assets attributable to holders of redeemable participating shares 5,320,933 54,183,831 8,992,779 30,967,441 3,756,871 Distribution per share (in cents/pence) Management fee Class A - - - - - Management fee Class A (GBP) - 2.71 - - - Management fee Class A (EUR) - - - - - Management fee Class A (Income) - - - - - Management fee Class B - - - - - Management fee Class C - - - - - Management fee Class C (GBP) - 7.10 - - - Management fee Class D - - - - - Management fee Class F - - - - - Management fee Class F (GBP) - - - - - Management fee Class F (EUR) - - - - - Management fee Class P (Accumulation) - - - - - Management fee Class P (Income) - - - - - Distributing Class Fee - - - - - Gains and losses arise solely from continuing operations. There were no gains or losses other than those reflected above.

SANLAM UNIVERSAL FUNDS PLC
48
STATEMENTS OF COMPREHENSIVE INCOME OF THE FUNDS (CONTINUED) for the six months ended 30 June 2012
Sanlam Strategic Cash
Fund
Sanlam Universal
Equity Fund
Sanlam World Equity Tracker
Fund
SIIP India Opportunities
Fund
Sanlam Principal Monthly Income
Investment Grade Bond
Fund US$ US$ US$ US$ GBP
Investment income Net gains on financial assets and liabilities at fair value through profit or loss – held for trading (163,628) 68,744,236 1,796,590 (396,172) 161,939 Income from stock lending - 512,513 133,940 - 766 Income from financial assets at fair value through profit or loss 233,321 21,607,207
4,794,347 117,878 640,993
Bank interest 86 10,757 1,153 49 (152) Other income 1,149 72 - - - Net investment income/(deficit) 70,928 90,874,785 6,726,030 (278,245) 803,546
Operating expenses
Management fee (53,548) (1,449,267) (250,319) (16,795) (14,089) Distributing Class Fee - - - - - Non Distributing Class Fee - - - - - Performance fee - - - (7,199) - Administration fees (17,674) (6,736) (2,918) (11,800) (295) Audit fee (2,227) (40,664) (8,244) (3,200) (1,099) Directors’ fees (7,420) (15,775) (1,631) (5) (46) Custody fees (2,189) (166,622) (14,204) (16,398) (13) Other operating expenses (25,518) (17,293) (27,825) (21,544) (47,447) Total operating expenses (108,576) (1,696,357) (305,141) (76,941) (62,989)
Operating profit/(loss) (37,648) 89,178,428 6,420,889 (355,186) 740,557
Finance costs Distribution to shareholders - - - - (391,721) Income equalisation (3,492) (495,944) (2,316,624) 77,692 25,409
Profit/(loss) before tax (41,140) 88,682,484 4,104,265 (277,494) 374,245 Withholding tax - (4,559,980) (1,143,582) 45,850 - Change in net assets attributable to holders of redeemable participating shares (41,140) 84,122,504 2,960,683 (231,644) 374,245 Distribution per share (in cents/pence) Management fee Class A - - - - - Management fee Class A (GBP) - - - - - Management fee Class A (EUR) - - - - - Management fee Class A (Income) - - - - 0.02 Management fee Class B - - - - - Management fee Class C - - - - - Management fee Class C (GBP) - - - - - Management fee Class D - - - - - Management fee Class F - - - - - Management fee Class F (GBP) - - - - - Management fee Class F (EUR) - - - - - Management fee Class P (Accumulation) - - - - - Management fee Class P (Income) - - - - 0.95 Distributing Class Fee - - - - - Gains and losses arise solely from continuing operations. There were no gains or losses other than those reflected above.

SANLAM UNIVERSAL FUNDS PLC
49
STATEMENT OF FINANCIAL POSITION OF THE COMPANY as at 30 June 2013
30 June 2013 31 December 2012 US$ US$ Assets Cash and cash equivalents 80,973,899 70,122,816 Margin accounts 929,670 7,214,709 Accrued income 13,612,025 8,338,207 Amounts receivable on sale of securities 55,040,900 63,594,704 Amounts receivable on issue of shares 662,028 800,077 Financial assets at fair value through profit or loss 3,790,982,567 3,602,416,030 Other debtors 312,857 350,691
Total assets 3,942,513,946 3,752,837,234
Liabilities Bank overdraft (1,064,178) (31,667) Margin accounts - (6,355,038) Financial liabilities at fair value through profit or loss (9,376,629) (8,874,780) Accrued expenses (4,571,799) (2,243,440) Administration fees accrued (405,926) (53,575) Amounts payable on purchases of securities (76,621,996) (80,699,998) Amounts payable on repurchases of shares (4,456,491) (1,294,132)
Liabilities (excluding net assets attributable to holders of redeemable participating shares) (96,497,019) (99,552,630)
Net assets attributable to holder of redeemable participating shares 3,846,016,927 3,653,284,604
The unaudited condensed interim financial statements were approved by the Board of Directors on 28 August 2013. The attached notes form an integral part of these audited unaudited condensed interim financial statements.

SANLAM UNIVERSAL FUNDS PLC
50
STATEMENTS OF FINANCIAL POSITION OF THE FUNDS as at 30 June 2013
8IP Asia Equity Opportunities Fund
8IP Asia Pacific Equity Fund
Centre Global Equity Fund
Grindrod International
Property Fund
P-Solve Inflation Plus Fund
US$ US$ US$ US$ GBP Assets Cash and cash equivalents 304,339 170,389 1,375,748 1,436,493 1,490,784 Margin accounts - - - - - Accrued income 152,831 110,445 73,445 47,431 97,193 Amounts receivable on sale of securities - - - - 7 Amounts receivable on issue of shares - - - - 109,704 Other debtors 21,277 20,605 5,014 9,772 6,704 Financial assets at fair value through profit or loss 18,127,399 17,566,425 22,587,186 11,107,734 49,184,689
Total assets 18,605,846 17,867,864 24,041,393 12,601,430 50,889,081
Liabilities Bank overdraft - - - - - Financial liabilities at fair value through profit or loss - - - - - Accrued expenses (65,429) (78,694) (208,888) (132,298) (54,473) Administration fees accrued (4,995) (2,535) (14,901) (4,233) (8,045) Amounts payable on purchases of securities - - - - - Amounts payable on repurchases of shares - - (15,851) (10,232) -
Liabilities (excluding net assets attributable to holders of redeemable participating shares) (70,424) (81,229) (239,640) (146,763) (62,518)
Net assets attributable to holder of redeemable participating shares
18,535,422 17,786,635 23,801,753 12,454,667 50,826,563

SANLAM UNIVERSAL FUNDS PLC
51
STATEMENTS OF FINANCIAL POSITION OF THE FUNDS (CONTINUED) as at 30 June 2013
Sanlam African Frontier Markets Fund
Sanlam Global Best Ideas Fund
Sanlam Global Bond Fund
Sanlam Global Financial Fund
Sanlam Global Property Fund
US$ US$ US$ US$ US$ Assets Cash and cash equivalents 5,511,984 13,180,769 6,788,744 15,967,353 3,480,419 Margin accounts - - 929,670 - - Accrued income 689,028 1,535,506 2,876,094 1,277,317 377,641 Amounts receivable on sale of securities - 24,667,469 21,857,083 1,093,151 3,678,099 Amounts receivable on issue of shares - 107,329 - - - Other debtors 7,820 9,590 3,162 48,734 23,273 Financial assets at fair value through profit or loss 61,676,178 418,190,054 363,350,929 319,890,030 148,107,690 Total assets
67,885,010 457,690,717 395,805,682 338,276,585 155,667,122
Liabilities Bank overdraft - - - - - Financial liabilities at fair value through profit or loss - - (9,091,938) - (284,691) Accrued expenses (496,590) (589,746) (221,460) (409,850) (56,099) Administration fees accrued (7,749) (71,769) (32,161) (51,226) (10,939) Amounts payable on purchases of securities - (20,610,804) (26,590,013) (15,099,708) (3,318,265) Amounts payable on repurchases of shares - - (918,412) (2,931) (315,250)
Liabilities (excluding net assets attributable to holders of redeemable participating shares)
(504,339) (21,272,319) (36,853,984) (15,563,715) (3,985,244)
Net assets attributable to holder of redeemable participating shares
67,380,671 436,418,398 358,951,698 322,712,870 151,681,878

SANLAM UNIVERSAL FUNDS PLC
52
STATEMENTS OF FINANCIAL POSITION OF THE FUNDS (CONTINUED) as at 30 June 2013
Sanlam Strategic Cash Fund
Sanlam World Equity Fund
Sanlam World Equity Tracker Fund
SIIP India Opportunities Fund
SIM Global Equity Income
Fund US$ US$ US$ US$ US$
Assets Cash and cash equivalents - 23,503,596 1,342,658 270,163 516,957 Margin accounts - - - - - Accrued income 209,760 2,637,246 501,337 68,263 70,335 Amounts receivable on sale of securities - 451,593 23,775 243,643 - Amounts receivable on issue of shares - - - - - Other debtors 8,560 14,964 22,444 21,752 14,966 Financial assets at fair value through profit or loss 20,001,487 1,545,591,917 286,201,461 15,744,299 14,849,276
Total assets
20,219,807 1,572,199,316 288,091,675 16,348,120 15,451,534
Liabilities Bank overdraft (281,610) - - - - Financial liabilities at fair value through profit or loss - - - - - Accrued expenses (39,155) (905,205) (837,558) (89,721) (29,627) Administration fees accrued (5,831) (129,097) (40,381) (3,000) (2,177) Amounts payable on purchases of securities - (483,954) - (156,164) - Amounts payable on repurchases of shares (18,992) (2,613,507) (520) (50,000) -
Liabilities (excluding net assets attributable to holders of redeemable participating shares)
(345,588) (4,131,763) (878,459) (298,885) (31,804)
Net assets attributable to holder of redeemable participating shares
19,874,219 1,568,067,553 287,213,216 16,049,235 15,419,730
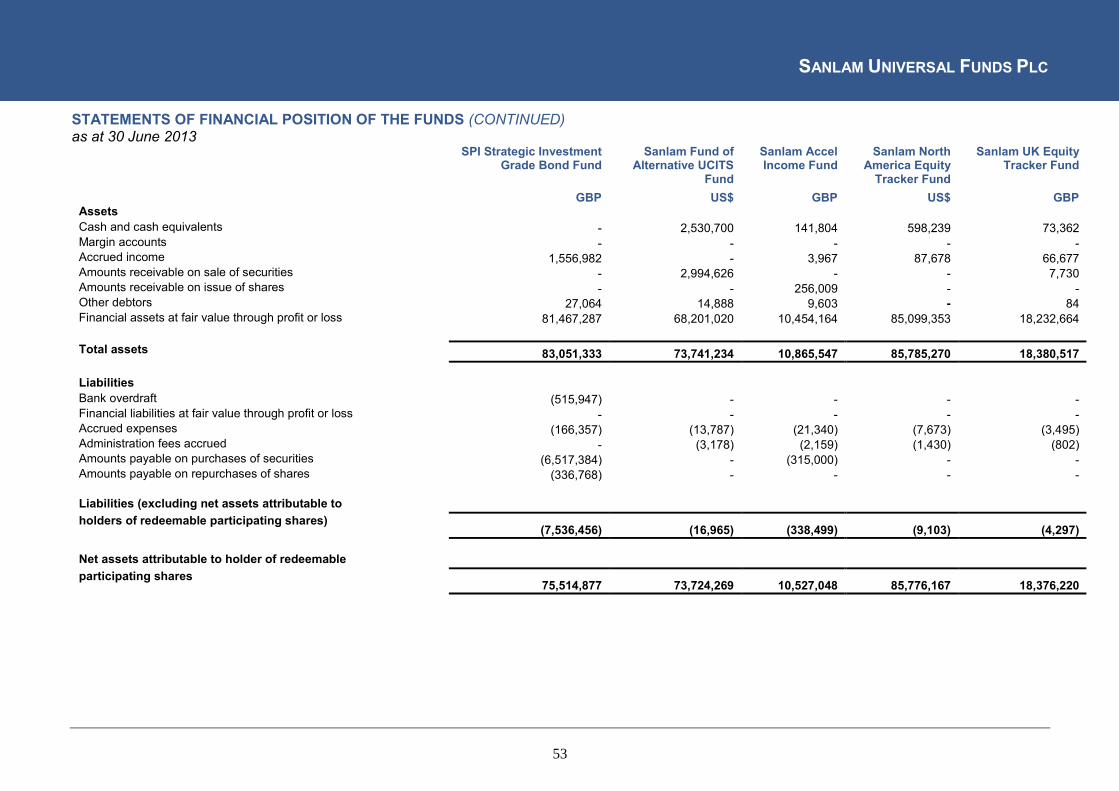
SANLAM UNIVERSAL FUNDS PLC
53
STATEMENTS OF FINANCIAL POSITION OF THE FUNDS (CONTINUED) as at 30 June 2013
SPI Strategic Investment Grade Bond Fund
Sanlam Fund of Alternative UCITS
Fund
Sanlam Accel Income Fund
Sanlam North America Equity
Tracker Fund
Sanlam UK Equity Tracker Fund
GBP US$ GBP US$ GBP Assets Cash and cash equivalents - 2,530,700 141,804 598,239 73,362 Margin accounts - - - - - Accrued income 1,556,982 - 3,967 87,678 66,677 Amounts receivable on sale of securities - 2,994,626 - - 7,730 Amounts receivable on issue of shares - - 256,009 - - Other debtors 27,064 14,888 9,603 - 84 Financial assets at fair value through profit or loss 81,467,287 68,201,020 10,454,164 85,099,353 18,232,664
Total assets 83,051,333 73,741,234 10,865,547 85,785,270 18,380,517
Liabilities Bank overdraft (515,947) - - - - Financial liabilities at fair value through profit or loss - - - - - Accrued expenses (166,357) (13,787) (21,340) (7,673) (3,495) Administration fees accrued - (3,178) (2,159) (1,430) (802) Amounts payable on purchases of securities (6,517,384) - (315,000) - - Amounts payable on repurchases of shares (336,768) - - - -
Liabilities (excluding net assets attributable to holders of redeemable participating shares)
(7,536,456) (16,965) (338,499) (9,103) (4,297)
Net assets attributable to holder of redeemable participating shares
75,514,877 73,724,269 10,527,048 85,776,167 18,376,220

SANLAM UNIVERSAL FUNDS PLC
54
STATEMENTS OF FINANCIAL POSITION OF THE FUNDS (CONTINUED) as at 30 June 2013
Sanlam Europe (ex UK) Equity
Fund Sanlam Equity
Allocation Fund
Sanlam Emerging Market Equity Tracker Fund
EUR US$ US$ Assets Cash and cash equivalents 240,948 904,226 190,359 Margin accounts - - - Accrued income 14,721 78,001 184,393 Amounts receivable on sale of securities - 19,725 - Amounts receivable on issue of shares - - - Other debtors 97 - - Financial assets at fair value through profit or loss 41,447,505 47,297,425 31,830,037
Total assets 41,703,271 48,299,377 32,204,789
Liabilities Bank overdraft - - - Financial liabilities at fair value through profit or loss - - - Accrued expenses (4,561) (5,856) (5,618) Administration fees accrued (931) (1,217) (1,204) Amounts payable on purchases of securities - - - Amounts payable on repurchases of shares - - -
Liabilities (excluding net assets attributable to holders of redeemable participating shares)
(5,492) (7,073) (6,822)
Net assets attributable to holder of redeemable participating shares
41,697,779 48,292,304 32,197,967

SANLAM UNIVERSAL FUNDS PLC
55
STATEMENTS OF FINANCIAL POSITION OF THE FUNDS (CONTINUED) as at 31 December 2012
8IP Asia Equity Opportunities
Fund
8IP Asia Pacific Equity Fund
Centre Global Equity Fund
Grindrod International
Property Fund
P-Solve Inflation Plus Fund
US$ US$ US$ US$ GBP Assets Cash and cash equivalents 304,802 116,523 246,929 811,855 4,417,506 Margin accounts - - - - - Accrued income - 2,229 11,075 39,796 208,322 Amounts receivable on sale of securities - - 49 - - Amounts receivable on issue of shares - - 138,926 - - Other debtors 25,521 27,048 6,116 11,847 7,409 Financial assets at fair value through profit or loss 20,557,344 21,297,983 23,759,552 7,758,308 43,296,819
Total assets 20,887,667 21,443,783 24,162,647 8,621,806 47,930,056 Liabilities Bank overdraft - - - - (19,480) Financial liabilities at fair value through profit or loss - - - - - Accrued expenses (28,813) (32,663) (46,855) (28,866) (29,040) Administration fees accrued (5,289) (3,526) (10,492) (3,645) (6,303) Amounts payable on purchases of securities - (22) - (122) (216) Amounts payable on repurchases of shares - (50,165) - - -
Liabilities (excluding net assets attributable to holders of redeemable participating shares) (34,102) (86,376) (57,347) (32,633) (55,039)
Net assets attributable to holder of redeemable participating shares 20,853,565 21,357,407 24,105,300 8,589,173 47,875,017

SANLAM UNIVERSAL FUNDS PLC
56
STATEMENTS OF FINANCIAL POSITION OF THE FUNDS (CONTINUED) as at 31 December 2012
Sanlam African Frontier
Markets Fund
Sanlam Global Best Ideas
Fund
Sanlam Global Bond Fund
SIM Global Equity Income
Fund
Sanlam Global Financial Fund
Sanlam Global Property Fund
US$ US$ US$ US$ US$ US$ Assets Cash and cash equivalents 5,236,597 9,176,442 14,921,110 514,344 8,003,206 3,254,364 Margin accounts - - 7,214,709 - - - Accrued income 12,258 281,474 3,872,562 57,800 21,750 186,341 Amounts receivable on sale of securities 76 2,276,486 - 553 4,880,650 - Amounts receivable on issue of shares - 38,453 - 135,536 - - Other debtors 9,643 15,635 28,747 18,272 53,600 20,322 Financial assets at fair value through profit or loss 59,521,227 475,456,697 404,194,724 13,584,491 319,837,888 75,299,434
Total assets 64,779,801 487,245,187 430,231,852 14,310,996 332,797,094 78,760,461 Liabilities Margin accounts - - (6,355,038) - - - Financial liabilities at fair value through profit or loss - - (8,841,636) - - (33,144) Accrued expenses (143,111) (416,667) (183,518) (14,962) (299,930) (42,099) Administration fees accrued (2,137) (4,189) - - - (4,442) Amounts payable on purchases of securities - (8,084,925) (11,573,938) - (6,113,612) (970,675) Amounts payable on repurchases of shares (19,349) - (107,238) - - -
Liabilities (excluding net assets attributable to holders of redeemable participating shares) (164,597) (8,505,781) (27,061,368) (14,962)
14,296,034 (6,413,542) (1,050,360)
Net assets attributable to holder of redeemable participating shares 64,615,204 478,739,406 403,170,484 14,296,034 326,383,552 77,710,101

SANLAM UNIVERSAL FUNDS PLC
57
STATEMENTS OF FINANCIAL POSITION OF THE FUNDS (CONTINUED) as at 31 December 2012
Sanlam Strategic Cash Fund
Sanlam World Equity Fund
Sanlam World Equity Tracker
Fund
SIIP India Opportunities
Fund
SPI Strategic Investment Grade
Bond Fund US$ US$ US$ US$ GBP
Assets Cash and cash equivalents 329,581 14,285,558 2,203,388 264,925 2,014,343 Margin accounts - - - - - Accrued income 73,632 1,272,899 305,328 3,867 1,143,613 Amounts receivable on sale of securities - 54,350,715 1,057 10 1,282,967 Amounts receivable on issue of shares - - - - 299,751 Other debtors 6,693 18,821 22,500 26,423 29,203 Financial assets at fair value through profit or loss 13,603,686 1,675,043,714 301,091,029 18,647,633 63,003,837
Total assets 14,013,592 1,744,971,707 303,623,302 18,942,858 67,773,714 Liabilities Bank overdraft - (8) - - - Financial liabilities at fair value through profit or loss - - - - - Accrued expenses (17,761) (674,341) (168,830) (45,039) (32,481) Administration fees accrued (5,996) (1,034) - (2,581) - Amounts payable on purchases of securities - (53,956,353) - - - Amounts payable on repurchases of shares (16,780) (1,040,687) (59,913) - -
Liabilities (excluding net assets attributable to holders of redeemable participating shares) (40,537) (55,672,423) (228,743) (47,620) (32,481)
Net assets attributable to holder of redeemable participating shares 13,973,055 1,689,299,284 303,394,559 18,895,238 67,741,233

SANLAM UNIVERSAL FUNDS PLC
58
STATEMENT OF CHANGES IN NET ASSETS ATTRIBUTABLE TO HOLDERS OF REDEEMABLE PARTICIPATING SHARES OF THE COMPANY for the six months ended 30 June 2013
Six months ended 30 June 2013
Six months ended 30 June 2012
US$ US$ Operating activities Change in net assets attributable to participating shareholders from operations 96,732,962 193,350,427
Capital transactions
Issue of shares during the period 731,528,995 523,571,031 Redemption of shares during the period (620,900,029) (402,033,468)
Net increase in net assets attributable to holders of redeemable participating shares from capital transactions 110,628,966 121,537,563
Net increase in net assets attributable to holders of redeemable participating shares in the period 207,361,928 314,887,990
Net assets attributable to holders of redeemable participating shares at the beginning of the period 3,653,284,604 2,939,350,819 Exchange differences due to presentation of these financial statements in USD
(14,629,605)
139,614
Net assets attributable to holders of redeemable participating shares at the end of the period 3,846,016,927 3,254,378,423
The attached notes form an integral part of these audited unaudited condensed interim financial statements.

SANLAM UNIVERSAL FUNDS PLC
59
STATEMENTS OF CHANGES IN NET ASSETS ATTRIBUTABLE TO PARTICIPATING SHAREHOLDERS OF THE FUNDS for the six months ended 30 June 2013
8IP Asia Equity Opportunities
Fund
8IP Asia Pacific Equity Fund
Centre Global Equity Fund
Grindrod International
Property Fund
P-Solve Inflation Plus Fund
US$ US$ US$ US$ GBP Operating activities Change in net assets attributable to participating shareholders from operations (1,889,376) (226,115) (48,910) 469,747 1,231,856
Capital transactions
Issue of shares during the period 130,670 135,838 1,847,768 4,137,905 1,909,755 Redemption of shares during the period (559,437) (3,480,495) (2,102,405) (742,158) (190,065) Net increase in net assets attributable to holders of redeemable participating shares from capital transactions (428,767) (3,344,657) (254,637) 3,395,747 1,719,690
Net increase in net assets attributable to holders of redeemable participating shares in the period (2,318,143) (3,570,772) (303,547) 3,865,494 2,951,546
Net assets attributable to holders of redeemable participating shares at the beginning of the period 20,853,565 21,357,407 24,105,300 8,589,173 47,875,017 Exchange differences due to presentation of these financial statements in USD
- - - - -
Net assets attributable to holders of redeemable participating shares at the end of the period 18,535,422 17,786,635 23,801,753 12,454,667 50,826,563

SANLAM UNIVERSAL FUNDS PLC
60
STATEMENTS OF CHANGES IN NET ASSETS ATTRIBUTABLE TO PARTICIPATING SHAREHOLDERS OF THE FUNDS (CONTINUED) for the six months ended 30 June 2013
Sanlam African Frontier Markets
Fund
Sanlam Global Best Ideas Fund
Sanlam Global Bond Fund
Sanlam Global Financial Fund
Sanlam Global Property Fund
US$ US$ US$ US$ US$ Operating activities Change in net assets attributable to participating shareholders from operations 2,050,744 (853,673) (17,980,238) (1,489,639) (879,805)
Capital transactions
Issue of shares during the period 28,346,205 7,845,086 44,477,918 21,929,311 104,812,533 Redemption of shares during the period (27,631,482) (49,312,421) (70,716,466) (24,110,354) (29,960,951) Net increase in net assets attributable to holders of redeemable participating shares from capital transactions 714,723 (41,467,335) (26,238,548) (2,181,043) 74,851,582
Net increase in net assets attributable to holders of redeemable participating shares in the period 2,765,467 (42,321,008) (44,218,786) (3,670,682) 73,971,777
Net assets attributable to holders of redeemable participating shares at the beginning of the period 64,615,204 478,739,406 403,170,484 326,383,552 77,710,101 Exchange differences due to presentation of these financial statements in USD
- - - - -
Net assets attributable to holders of redeemable participating shares at the end of the period 67,380,671 436,418,398 358,951,698 322,712,870 151,681,878

SANLAM UNIVERSAL FUNDS PLC
61
STATEMENTS OF CHANGES IN NET ASSETS ATTRIBUTABLE TO PARTICIPATING SHAREHOLDERS OF THE FUNDS (CONTINUED) for the six months ended 30 June 2013
Sanlam Strategic Cash Fund
Sanlam World Equity Fund
Sanlam World Equity Tracker
Fund
SIIP India Opportunities
Fund
SIM Global Equity Income Fund
US$ US$ US$ US$ US$ Operating activities Change in net assets attributable to participating shareholders from operations 125,180 114,939,017 24,279,703 (2,627,595) 227,937
Capital transactions
Issue of shares during the period 7,559,478 61,188,332 39,768,380 58,953 3,468,807 Redemption of shares during the period (1,783,494) (297,359,080) (80,229,426) (277,361) (2,573,048) Net increase in net assets attributable to holders of redeemable participating shares from capital transactions 5,775,984 (236,170,748) (40,461,046) (218,408) 895,759
Net increase in net assets attributable to holders of redeemable participating shares in the period 5,901,164 (121,231,731) (16,181,343) (2,846,003) 1,123,696
Net assets attributable to holders of redeemable participating shares at the beginning of the period 13,973,055 1,689,299,284 303,394,559 18,895,238 14,296,034 Exchange differences due to presentation of these financial statements in USD
- - - - -
Net assets attributable to holders of redeemable
participating shares at the end of the period 19,874,219 1,568,067,553 287,213,216 16,049,235 15,419,730
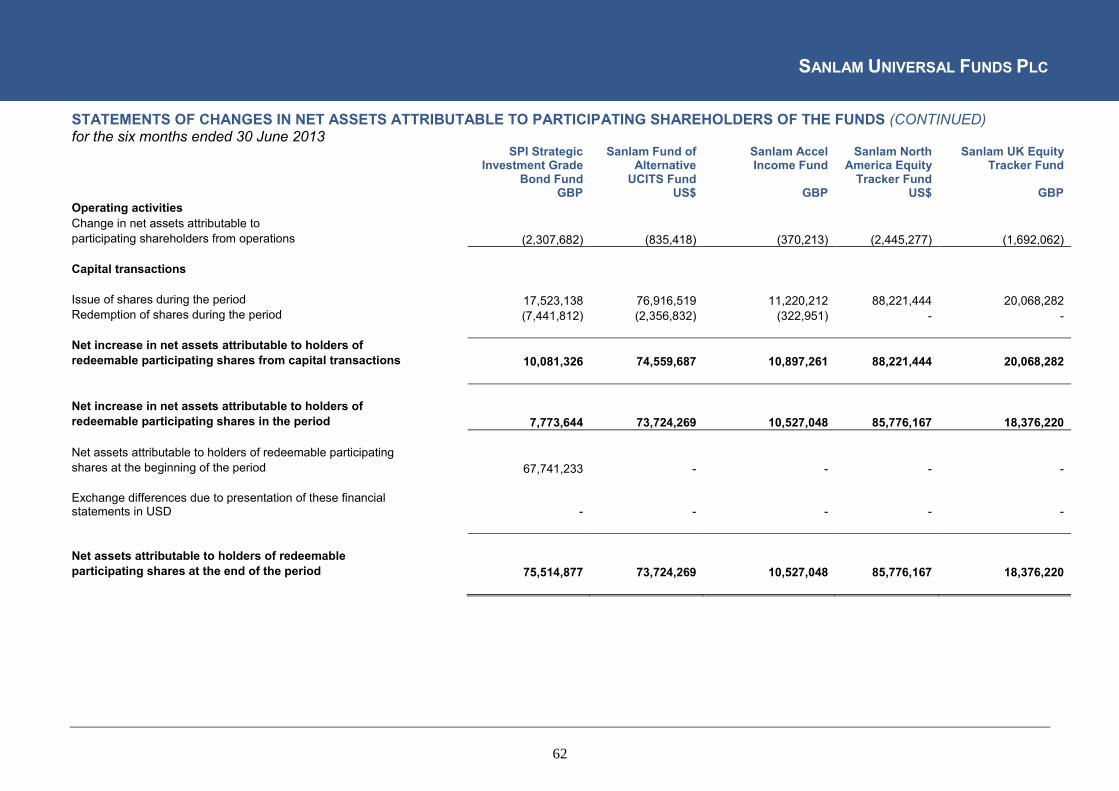
SANLAM UNIVERSAL FUNDS PLC
62
STATEMENTS OF CHANGES IN NET ASSETS ATTRIBUTABLE TO PARTICIPATING SHAREHOLDERS OF THE FUNDS (CONTINUED) for the six months ended 30 June 2013
SPI Strategic Investment Grade
Bond Fund
Sanlam Fund of Alternative
UCITS Fund
Sanlam Accel Income Fund
Sanlam North America Equity
Tracker Fund
Sanlam UK Equity Tracker Fund
GBP US$ GBP US$ GBP Operating activities Change in net assets attributable to participating shareholders from operations (2,307,682) (835,418) (370,213) (2,445,277) (1,692,062)
Capital transactions
Issue of shares during the period 17,523,138 76,916,519 11,220,212 88,221,444 20,068,282 Redemption of shares during the period (7,441,812) (2,356,832) (322,951) - - Net increase in net assets attributable to holders of redeemable participating shares from capital transactions 10,081,326 74,559,687 10,897,261 88,221,444 20,068,282
Net increase in net assets attributable to holders of redeemable participating shares in the period 7,773,644 73,724,269 10,527,048 85,776,167 18,376,220
Net assets attributable to holders of redeemable participating shares at the beginning of the period 67,741,233 - - - - Exchange differences due to presentation of these financial statements in USD
- - - - -
Net assets attributable to holders of redeemable participating shares at the end of the period 75,514,877 73,724,269 10,527,048 85,776,167 18,376,220

SANLAM UNIVERSAL FUNDS PLC
63
STATEMENTS OF CHANGES IN NET ASSETS ATTRIBUTABLE TO PARTICIPATING SHAREHOLDERS OF THE FUNDS (CONTINUED) for the six months ended 30 June 2013
Sanlam Europe (ex UK)
Equity Fund
Sanlam Equity Allocation
Fund
Sanlam Emerging Market Equity Tracker Fund
EUR US$ US$ Operating activities Change in net assets attributable to participating shareholders from operations (3,293,266) (4,074,181) (2,802,391)
Capital transactions
Issue of shares during the period 44,991,045 67,464,402 35,000,358 Redemption of shares during the period - (15,097,917) - Net increase in net assets attributable to holders of redeemable participating shares from capital transactions 44,991,045 52,366,485 35,000,358
Net increase in net assets attributable to holders of redeemable participating shares in the period 41,697,779 48,292,304 32,197,967
Net assets attributable to holders of redeemable participating shares at the beginning of the period - - - Exchange differences due to presentation of these financial statements in USD - - -
Net assets attributable to holders of redeemable participating shares at the end of the period 41,697,779 48,292,304 32,197,967

SANLAM UNIVERSAL FUNDS PLC
64
STATEMENTS OF CHANGES IN NET ASSETS ATTRIBUTABLE TO PARTICIPATING SHAREHOLDERS OF THE FUNDS (CONTINUED) for the six months ended 30 June 2012
8IP Asia Equity Opportunities
Fund
8IP Asia Pacific Equity Fund
SPI Global Equity Fund
Grindrod International
Property Fund
P-Solve Inflation Plus Fund
US$ US$ US$ US$ GBP Operating activities Change in net assets attributable to participating shareholders from operations 674,314 848,727 1,049,570 686,800 (336,957)
Capital transactions
Issue of shares during the period 1,214,730 1,698,134 2,699,328 1,735,371 4,672,415 Redemption of shares during the period (1,852,712) (2,819,790) (2,440,026) (5,407,673) (55,021) Net increase in net assets attributable to holders of redeemable participating shares from capital transactions (637,982) (1,121,656) 259,302 (3,672,302) 4,617,394
Net increase in net assets attributable to holders of redeemable participating shares in the period 36,332 (272,929) 1,308,872 (2,985,502) 4,280,437
Net assets attributable to holders of redeemable participating shares at the beginning of the period 17,977,132 21,840,195 21,380,164 10,375,559 37,856,770 Exchange differences due to presentation of these financial statements in USD
- - - - -
Net assets attributable to holders of redeemable participating shares at the end of the period 18,013,464 21,567,266 22,689,036 7,390,057 42,137,207
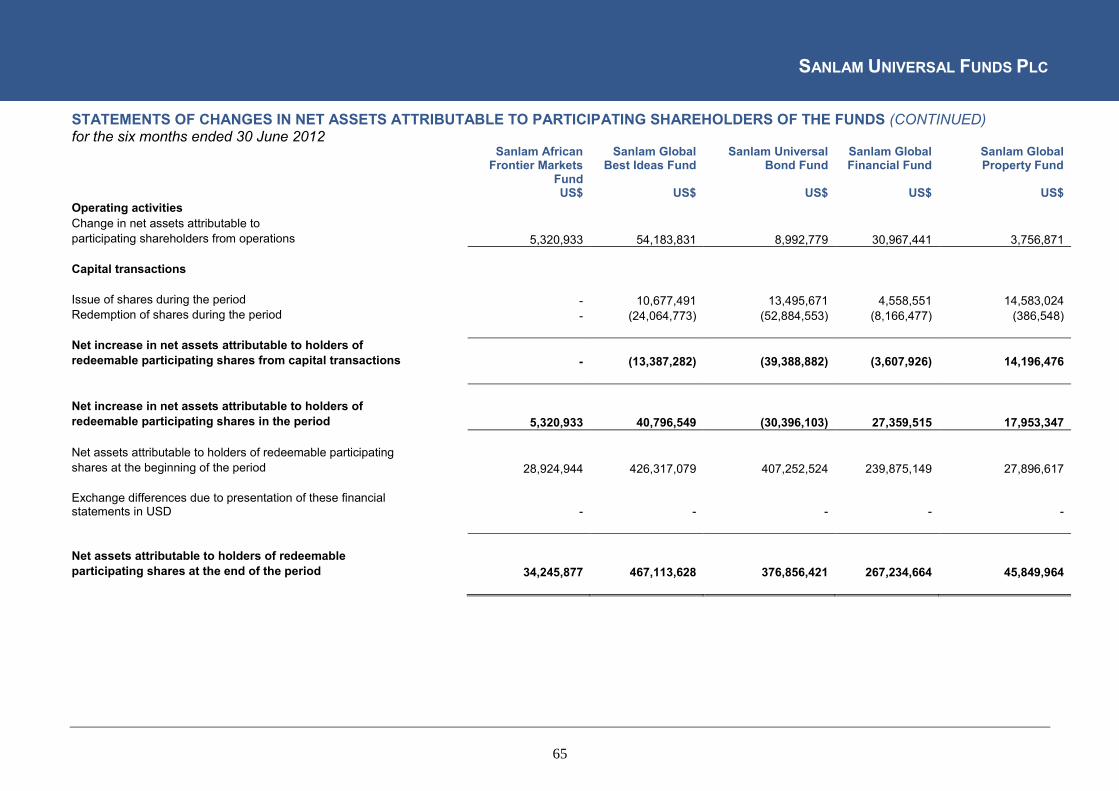
SANLAM UNIVERSAL FUNDS PLC
65
STATEMENTS OF CHANGES IN NET ASSETS ATTRIBUTABLE TO PARTICIPATING SHAREHOLDERS OF THE FUNDS (CONTINUED) for the six months ended 30 June 2012
Sanlam African Frontier Markets
Fund
Sanlam Global Best Ideas Fund
Sanlam Universal Bond Fund
Sanlam Global Financial Fund
Sanlam Global Property Fund
US$ US$ US$ US$ US$ Operating activities Change in net assets attributable to participating shareholders from operations 5,320,933 54,183,831 8,992,779 30,967,441 3,756,871
Capital transactions
Issue of shares during the period - 10,677,491 13,495,671 4,558,551 14,583,024 Redemption of shares during the period - (24,064,773) (52,884,553) (8,166,477) (386,548) Net increase in net assets attributable to holders of redeemable participating shares from capital transactions - (13,387,282) (39,388,882) (3,607,926) 14,196,476
Net increase in net assets attributable to holders of redeemable participating shares in the period 5,320,933 40,796,549 (30,396,103) 27,359,515 17,953,347
Net assets attributable to holders of redeemable participating shares at the beginning of the period 28,924,944 426,317,079 407,252,524 239,875,149 27,896,617 Exchange differences due to presentation of these financial statements in USD
- - - - -
Net assets attributable to holders of redeemable participating shares at the end of the period 34,245,877 467,113,628 376,856,421 267,234,664 45,849,964
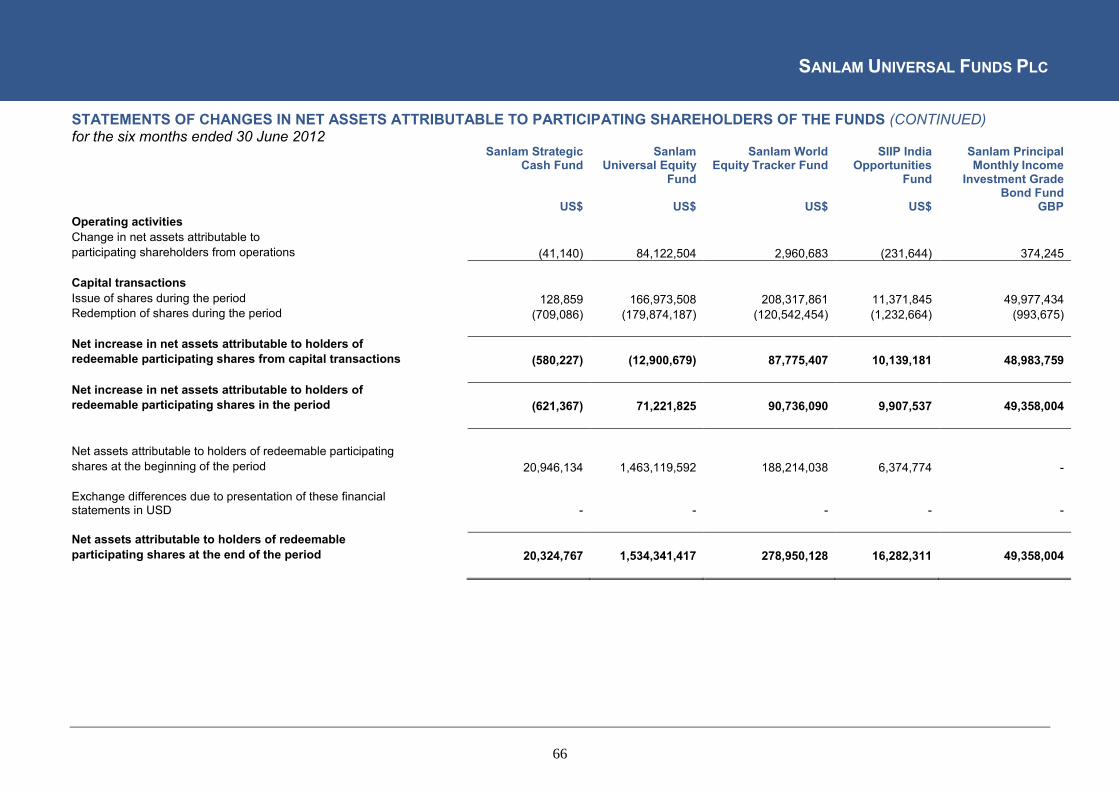
SANLAM UNIVERSAL FUNDS PLC
66
STATEMENTS OF CHANGES IN NET ASSETS ATTRIBUTABLE TO PARTICIPATING SHAREHOLDERS OF THE FUNDS (CONTINUED) for the six months ended 30 June 2012
Sanlam Strategic Cash Fund
Sanlam Universal Equity
Fund
Sanlam World Equity Tracker Fund
SIIP India Opportunities
Fund
Sanlam Principal Monthly Income
Investment Grade Bond Fund
US$ US$ US$ US$ GBP Operating activities Change in net assets attributable to participating shareholders from operations (41,140) 84,122,504 2,960,683 (231,644) 374,245
Capital transactions Issue of shares during the period 128,859 166,973,508 208,317,861 11,371,845 49,977,434 Redemption of shares during the period (709,086) (179,874,187) (120,542,454) (1,232,664) (993,675) Net increase in net assets attributable to holders of redeemable participating shares from capital transactions (580,227) (12,900,679) 87,775,407 10,139,181 48,983,759
Net increase in net assets attributable to holders of redeemable participating shares in the period (621,367) 71,221,825 90,736,090 9,907,537 49,358,004
Net assets attributable to holders of redeemable participating shares at the beginning of the period 20,946,134 1,463,119,592 188,214,038 6,374,774 - Exchange differences due to presentation of these financial statements in USD
- - - - -
Net assets attributable to holders of redeemable participating shares at the end of the period 20,324,767 1,534,341,417 278,950,128 16,282,311 49,358,004

SANLAM UNIVERSAL FUNDS PLC
67
STATEMENT OF CASH FLOWS OF THE COMPANY for the six months ended 30 June 2013 30 June
2013 30 June
2012 US$ US$ Cash flows from operating activities Purchases of financial assets and settlement of financial liabilities (3,239,335,750) (3,232,967,270) Proceeds from sale of investments (including realised gains) 3,114,901,421 3,201,636,667 Dividends received 39,655,713 37,840,845 Interest received 9,024,017 6,996,847 Income from stock lending received 899,701 1,147,567 Other income 179,855 4,415 Operating expenses paid (5,982,343) (8,229,367) Net cash (outflow)/inflow from operating activities (80,657,386) 6,429,704 Cash flows from financing activities Distributions paid to holders of redeemable participating shares (4,195,968) (2,218,501) Proceeds from redeemable participating shares issued 729,084,427 481,319,487 Payments on redemption of redeemable participating shares (617,442,646) (405,515,992) Income equalisation (14,973,540) (2,743,604) Net cash provided by financing activities 92,472,273 70,841,390
Net increase in cash and cash equivalents 11,814,887 77,271,094 Cash and cash equivalents at the start of the period 70,950,820 90,413,185 Exchange losses on cash and cash equivalents (1,926,316) (232,353)
Cash and cash equivalents at the end of the period 80,839,391 167,451,926
The attached notes form an integral part of these audited unaudited condensed interim financial statements.

SANLAM UNIVERSAL FUNDS PLC
68
STATEMENTS OF CASH FLOWS OF THE FUNDS for the six months ended 30 June 2013
8IP Asia Equity Opportunities
Fund
8IP Asia Pacific Equity Fund
Centre Global Equity Fund
Grindrod International
Property Fund
P-Solve Inflation Plus Fund
US$ US$ US$ US$ GBP Cash flows from operating activities Purchases of financial assets and settlement of financial liabilities (5,899,149) (5,275,336) (12,185,589) (3,123,576) (30,953,159) Proceeds from sale of investments (including realised gains) 6,148,437 8,622,373 13,130,667 - 27,114,522 Dividends received 196,644 187,517 325,445 198,473 296,904 Interest received 55 61 59 118 158,849 Income from stock lending received 2,517 2,910 10,182 3,166 2,002 Other income 3,150 3,349 1,450 2,795 4,013 Operating expenses paid (14,138) (15,260) (39,501) (18,244) (13,273) Net cash inflow/(outflow) from operating activities 437,516 3,525,614 1,242,713 (2,937,268) (3,390,142)
Cash flows from financing activities Distributions paid to holders of redeemable participating shares - - - (664) (1,136,554) Proceeds from redeemable participating shares issued 130,670 135,838 1,986,694 4,137,905 1,800,051 Payment on redemption of redeemable participating shares (559,436) (3,530,660) (2,086,554) (731,928) (190,065) Income equalisation 4,361 (76,563) (4,782) 161,740 12,792 Net cash (used in)/provided by financing activities (424,405) (3,471,385) (104,642) 3,567,053 486,224 Net increase/(decrease) in cash and cash equivalents 13,111 54,229 1,138,071 629,785 (2,903,918) Cash and cash equivalents at the start of the period 304,802 116,523 246,929 811,855 4,398,026 Exchange gains/(losses) on cash and cash equivalents (13,574) (363) (9,252) (5,147) (3,324) Cash and cash equivalents at the end of the period 304,339 170,389 1,375,748 1,436,493 1,490,784

SANLAM UNIVERSAL FUNDS PLC
69
STATEMENTS OF CASH FLOWS OF THE FUNDS (CONTINUED) for the six months ended 30 June 2013
Sanlam African Frontier Markets
Fund
Sanlam Global Best Ideas Fund
Sanlam Global Bond Fund
Sanlam Global Financial Fund
Sanlam Global Property Fund
US$ US$ US$ US$ US$ Cash flows from operating activities Purchases of financial assets and settlement of financial liabilities (1,110,164) (143,188,829) (391,508,671) (239,176,273) (129,750,868) Proceeds from sale of investments (including realised gains) 1,754,797 184,437,954 403,826,546 244,387,714 50,790,728 Dividends received 1,265,357 7,987,678 12,133 6,319,814 1,341,561 Interest received 1,582 3,704 6,511,694 2,067 737 Income from stock lending received - 149,439 14,353 76,463 27,522 Other income 5,054 18,021 17,293 11,270 5,099 Operating expenses paid (112,039) (1,470,056) (547,951) (1,519,784) (202,294) Net cash inflow/(outflow) from operating activities 1,804,587 47,937,911 18,325,397 10,101,271 (77,787,515) Cash flows from financing activities Distributions paid to holders of redeemable participating shares (6,512) (5,295) - - - Proceeds from redeemable participating shares issued 28,346,205 7,776,210 44,477,918 21,929,311 104,812,533 Payment on redemption of redeemable participating shares (27,650,831) (49,312,421) (69,905,292) (24,107,424) (29,645,701) Income equalisation (2,196,547) (2,248,664) (554,948) 225,307 2,554,902 Net cash (used in)/provided by financing activities (1,507,685) (43,790,170) (25,982,322) (1,952,806) 77,721,734 Net increase/(decrease) in cash and cash equivalents 296,902 4,147,741 (7,656,925) 8,148,465 (65,781) Cash and cash equivalents at the start of the period 5,236,597 9,176,442 15,780,781 8,003,206 3,254,364 Exchange gains/(losses) on cash and cash equivalents (21,515) (143,414) (405,442) (184,318) 291,836 Cash and cash equivalents at the end of the period 5,511,984 13,180,769 7,718,414 15,967,353 3,480,419

SANLAM UNIVERSAL FUNDS PLC
70
STATEMENTS OF CASH FLOWS OF THE FUNDS (CONTINUED) for the six months ended 30 June 2013
Sanlam Strategic Cash Fund
Sanlam World Equity Fund
Sanlam World Equity Tracker
Fund
SIIP India Opportunities
Fund
SIM Global Equity Income Fund
US$ US$ US$ US$ US$ Cash flows from operating activities Purchases of financial assets and settlement of financial liabilities (37,883,745) (1,035,656,857) (25,792,769) (5,325,200) (5,185,889) Proceeds from sale of investments (including realised gains) 31,248,155 1,275,862,142 63,263,873 5,459,755 4,104,196 Dividends received - 17,128,211 3,530,522 76,733 324,646 Interest received 135,577 43,684 522 42 110 Income from stock lending received 160 495,088 114,864 - - Other income 2,472 56,652 9,422 3,934 6,666 Operating expenses paid (16,524) (1,705,275) (140,124) (20,557) (65,296) Net cash inflow/(outflow) from operating activities (6,513,905) 256,223,645 40,986,310 194,707 (815,567) Cash flows from financing activities Distributions paid to holders of redeemable participating shares - - - - (194,293) Proceeds from redeemable participating shares issued 7,559,478 61,188,332 39,768,381 58,953 3,604,341 Payment on redemption of redeemable participating shares (1,781,279) (295,786,260) (80,288,819) (227,361) (2,573,048) Income equalisation 124,515 (12,066,031) (1,308,899) 588 (1,358) Net cash (used in)/provided by financing activities 5,902,714 (246,663,959) (41,829,337) (167,820) 835,642 Net increase/(decrease) in cash and cash equivalents (611,191) 9,559,686 (843,027) 26,887 20,075 Cash and cash equivalents at the start of the period 329,581 14,285,550 2,203,388 264,925 514,344 Exchange gains/(losses) on cash and cash equivalents - (341,640) (17,703) (21,649) (17,462) Cash and cash equivalents at the end of the period (281,610) 23,503,596 1,342,658 270,163 516,957
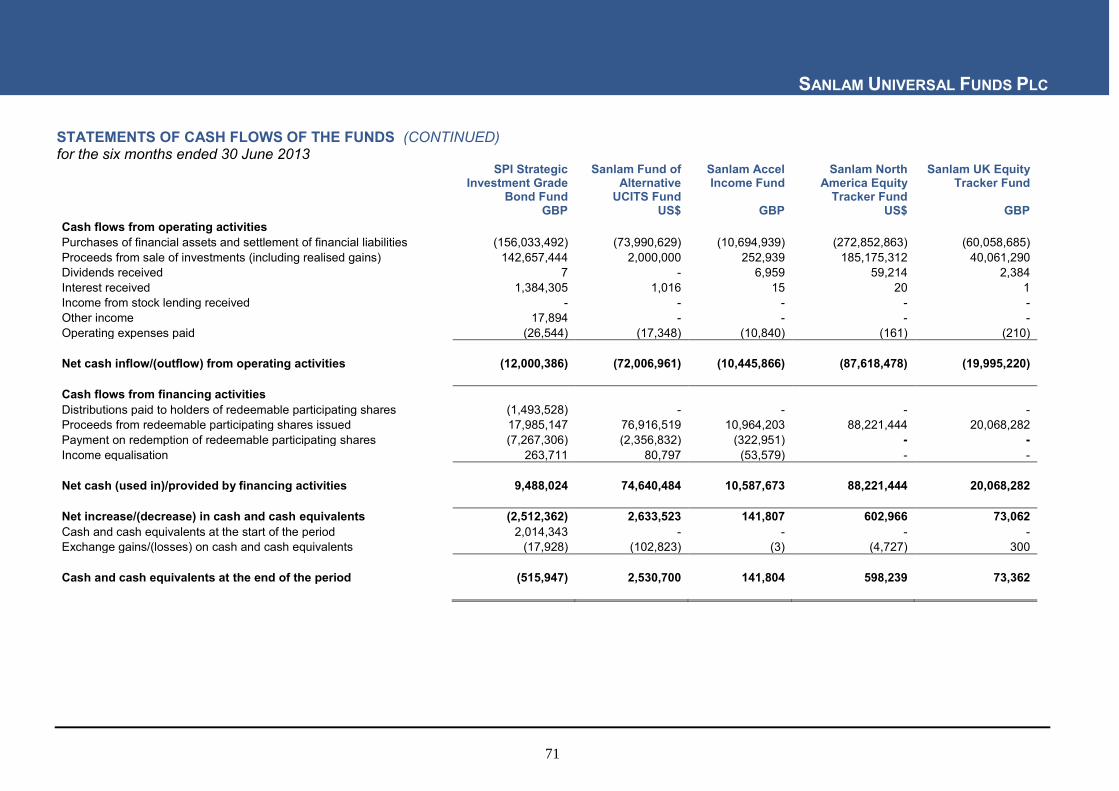
SANLAM UNIVERSAL FUNDS PLC
71
STATEMENTS OF CASH FLOWS OF THE FUNDS (CONTINUED) for the six months ended 30 June 2013
SPI Strategic Investment Grade
Bond Fund
Sanlam Fund of Alternative
UCITS Fund
Sanlam Accel Income Fund
Sanlam North America Equity
Tracker Fund
Sanlam UK Equity Tracker Fund
GBP US$ GBP US$ GBP Cash flows from operating activities Purchases of financial assets and settlement of financial liabilities (156,033,492) (73,990,629) (10,694,939) (272,852,863) (60,058,685) Proceeds from sale of investments (including realised gains) 142,657,444 2,000,000 252,939 185,175,312 40,061,290 Dividends received 7 - 6,959 59,214 2,384 Interest received 1,384,305 1,016 15 20 1 Income from stock lending received - - - - - Other income 17,894 - - - - Operating expenses paid (26,544) (17,348) (10,840) (161) (210) Net cash inflow/(outflow) from operating activities (12,000,386) (72,006,961) (10,445,866) (87,618,478) (19,995,220) Cash flows from financing activities Distributions paid to holders of redeemable participating shares (1,493,528) - - - - Proceeds from redeemable participating shares issued 17,985,147 76,916,519 10,964,203 88,221,444 20,068,282 Payment on redemption of redeemable participating shares (7,267,306) (2,356,832) (322,951) - - Income equalisation 263,711 80,797 (53,579) - - Net cash (used in)/provided by financing activities 9,488,024 74,640,484 10,587,673 88,221,444 20,068,282 Net increase/(decrease) in cash and cash equivalents (2,512,362) 2,633,523 141,807 602,966 73,062 Cash and cash equivalents at the start of the period 2,014,343 - - - - Exchange gains/(losses) on cash and cash equivalents (17,928) (102,823) (3) (4,727) 300 Cash and cash equivalents at the end of the period (515,947) 2,530,700 141,804 598,239 73,362

SANLAM UNIVERSAL FUNDS PLC
72
STATEMENTS OF CASH FLOWS OF THE FUNDS (CONTINUED) for the six months ended 30 June 2013
Sanlam Europe (ex UK)
Equity Fund
Sanlam Equity Allocation Fund
Sanlam Emerging Market Equity Tracker Fund
EUR US$ US$ Cash flows from operating activities Purchases of financial assets and settlement of financial liabilities (134,252,295) (217,083,377) (68,880,811) Proceeds from sale of investments (including realised gains) 89,415,067 165,775,516 34,018,641 Dividends received 90,707 76,942 42,385 Interest received (4,727) (12,251) 745 Income from stock lending received - - - Other income - - - Operating expenses paid (242) (160) (162) Net cash inflow/(outflow) from operating activities (44,751,490) (51,243,330) (34,819,202) Cash flows from financing activities Distributions paid to holders of redeemable participating shares - - - Proceeds from redeemable participating shares issued 44,991,045 67,464,402 35,000,357 Payment on redemption of redeemable participating shares - (15,097,917) - Income equalisation 79 (6,183) - Net cash (used in)/provided by financing activities 44,991,124 52,360,302 35,000,357 Net increase/(decrease) in cash and cash equivalents 239,634 1,116,972 181,155 Cash and cash equivalents at the start of the period - - - Exchange gains/(losses) on cash and cash equivalents 1,314 (212,746) 9,204 Cash and cash equivalents at the end of the period 240,948 904,226 190,359

SANLAM UNIVERSAL FUNDS PLC
73
STATEMENTS OF CASH FLOWS OF THE FUNDS (CONTINUED) for the six months ended 30 June 2012
8IP Asia Equity Opportunities
Fund
8IP Asia Pacific Equity Fund
SPI Global Equity Fund
Grindrod International
Property Fund
P-Solve Inflation Plus Fund
US$ US$ US$ US$ GBP Cash flows from operating activities Purchases of financial assets and settlement of financial liabilities (6,630,691) (9,039,732) (15,515,297) (5,120,259) (16,512,579) Proceeds from sale of investments (including realised gains) 7,078,560 10,411,350 15,132,138 9,934,349 17,367,880 Dividends received 161,192 220,033 351,238 311,648 448,908 Interest received (115) (3,201) 42 3 179,512 Income from stock lending received 7,624 6,280 13,886 - 5,320 Other income - - - - - Operating expenses paid (69,776) (92,944) (212,150) (122,520) (51,128) Net cash inflow/(outflow) from operating activities 546,794 1,501,786 (230,143) 5,003,221 1,437,913 Cash flows from financing activities Distributions paid to holders of redeemable participating shares - - - (3,815) (1,012,510) Proceeds from redeemable participating shares issued 1,214,730 1,698,123 2,699,174 1,735,371 4,672,415 Payment on redemption of redeemable participating shares (1,807,625) (2,819,790) (2,389,372) (5,382,726) (55,021) Income equalisation 10,672 439 - (153,759) 122,399 Net cash (used in)/provided by financing activities (582,223) (1,121,228) 309,802 (3,804,929) 3,727,283 Net increase/(decrease) in cash and cash equivalents (35,429) 380,558 79,659 1,198,292 5,165,196 Cash and cash equivalents at the start of the period 111,401 79,974 105,171 (11,474) 783,987 Exchange gains/(losses) on cash and cash equivalents (96) (14,258) (292) (12,768) 101,991 Cash and cash equivalents at the end of the period 75,876 446,274 184,538 1,174,050 6,051,174

SANLAM UNIVERSAL FUNDS PLC
74
STATEMENTS OF CASH FLOWS OF THE FUNDS (CONTINUED) for the six months ended 30 June 2012
Sanlam African Frontier Markets
Fund
Sanlam Global Best Ideas Fund
Sanlam Universal Bond
Fund
Sanlam Global Financial Fund
Sanlam Global Property Fund
US$ US$ US$ US$ US$ Cash flows from operating activities Purchases of financial assets and settlement of financial liabilities (3,347,343) (127,135,504) (391,227,262) (151,240,861) (24,846,130) Proceeds from sale of investments (including realised gains) 2,761,678 148,088,023 429,683,049 169,050,759 15,291,456 Dividends received 1,116,598 9,633,369 21,441 5,323,586 569,452 Interest received 249 33,904 7,042,952 2,158 215 Income from stock lending received - 309,123 9,892 133,969 10,793 Other income - - 1,204 659 1,331 Operating expenses paid (253,334) (1,652,201) (508,913) (2,850,740) (115,015) Net cash inflow/(outflow) from operating activities 277,848 29,276,714 45,022,363 20,419,530 (9,087,898) Cash flows from financing activities Distributions paid to holders of redeemable participating shares - (12,009) - - - Proceeds from redeemable participating shares issued - 10,677,491 13,495,671 4,558,551 14,583,024 Payment on redemption of redeemable participating shares - (23,854,485) (53,305,691) (6,355,164) (386,548) Income equalisation - (360,534) - 158,883 107,211 Net cash (used in)/provided by financing activities - (13,549,537) (39,810,020) (1,637,730) 14,303,687 Net increase/(decrease) in cash and cash equivalents 277,848 15,727,177 5,212,343 18,781,800 5,215,789 Cash and cash equivalents at the start of the period 1,852,552 15,042,157 2,214,534 1,138,456 561,415 Exchange gains/(losses) on cash and cash equivalents (23,521) (252,263) (429,903) (170,617) (266,249) Cash and cash equivalents at the end of the period 2,106,879 30,517,071 6,996,974 19,749,639 5,510,955

SANLAM UNIVERSAL FUNDS PLC
75
STATEMENTS OF CASH FLOWS OF THE FUNDS (CONTINUED) for the six months ended 30 June 2012
Sanlam Strategic Cash Fund
Sanlam Universal Equity
Fund
Sanlam World Equity Tracker
Fund
SIIP India Opportunities
Fund
Sanlam Principal Monthly Income
Investment Grade Bond Fund
US$ US$ US$ US$ GBP Cash flows from operating activities Purchases of financial assets and settlement of financial liabilities (15,887,163) (2,124,309,931) (227,606,915) (13,745,400) (58,276,885) Proceeds from sale of investments (including realised gains) 19,526,701 2,141,236,437 141,298,897 3,582,696 39,090,460 Dividends received - 15,877,699 3,448,322 102,110 - Interest received 287,941 11,733 1,154 49 (421,917) Income from stock lending received - 512,513 133,940 - 766 Other income 1,149 72 - - - Operating expenses paid (93,816) (1,753,327) (263,653) (64,943) (61,096) Net cash inflow/(outflow) from operating activities 3,834,812 31,575,196 (82,988,255) (10,125,488) (19,668,672) Cash flows from financing activities Distributions paid to holders of redeemable participating shares - - - - (391,721) Proceeds from redeemable participating shares issued 128,859 166,973,508 208,317,861 11,371,845 23,292,183 Payment on redemption of redeemable participating shares (659,388) (183,988,032) (121,689,522) (1,232,664) (993,675) Income equalisation (3,492) (495,944) (2,316,624) 77,592 25,409 Net cash (used in)/provided by financing activities (534,021) (17,510,468) 84,311,715 10,216,773 21,932,196 Net increase/(decrease) in cash and cash equivalents 3,300,791 14,064,728 1,323,460 91,285 2,263,524 Cash and cash equivalents at the start of the period 323,191 65,780,417 1,778,286 191,291 - Exchange gains/(losses) on cash and cash equivalents (56,641) 929,560 (94,370) (39,197) 34,636 Cash and cash equivalents at the end of the period 3,567,341 80,774,705 3,007,376 243,379 2,298,160

SANLAM UNIVERSAL FUNDS PLC
76
SCHEDULE OF INVESTMENTS OF 8IP ASIA EQUITY OPPORTUNITIES FUND as at 30 June 2013 Nominal Security
Classification Fair Value % of
US$ Net Assets
Financial assets at fair value through profit or loss
Equity - 97.8%
Australia - 24.82% 69,474 AMP Ltd
270,216 1.46%
264,252 Atlas Iron Ltd
180,166 0.97% 13,850 Australia and New Zealand Banking Group Ltd
362,252 1.95%
18,319 BHP Billiton Ltd
525,915 2.84% 29,292 Breville Group Ltd
189,257 1.02%
21,045 Lend Lease Corp
160,818 0.87% 10,045 Macquarie Group Lld
384,904 2.08%
18,595 National Australia Bank Ltd
505,079 2.72% 7,953 Rio Tinto Ltd
381,165 2.06%
83,477 TPG Telecom Ltd
268,911 1.45% 22,365 Westpac Banking Corp Ltd
591,106 3.19%
14,285 Woodside Petroleum Ltd
457,690 2.47% 10,735 Woolworths Ltd
322,335 1.74%
Total Australia
4,599,814 24.82%
Bermuda - 0.8% 193,000 Noble Group Ltd
147,607 0.80%
Total Bermuda
147,607 0.80%
Cayman Islands - 4.17% 465,500 KWG Property Holdings Ltd
243,667 1.31%
201,462 Minth Group Ltd
313,250 1.69% 13,603 TPK Holding Co Ltd
217,402 1.17%
Total Cayman Islands
774,319 4.17%
China - 4.37% 664,000 Bank of China Ltd
273,092 1.47%
764,967 Beijing Capital Land Ltd
279,113 1.51% 768,000 Shanghai Electric Group Company Ltd
257,446 1.39%
Total China
809,651 4.37%
Hong Kong - 18.47% 256,000 Agile Properties Holdings Ltd
274,609 1.48%
11,000 Cheung Kong Holdings Ltd
149,197 0.80% 264,000 China Everbright Ltd
347,861 1.88%
220,600 China Insurance International
341,301 1.84% 60,581 China Overseas Land & Investments
158,947 0.86%
1,818,000 China South City Holdings Ltd
407,844 2.20% 370,000 Giordano International Ltd
322,955 1.74%
86,551 Great Eagle Hldg Co
330,863 1.79% 104,000 Hopewell Holdings Ltd
346,613 1.87%
675,000 Industial & Commercial Bank of China
425,563 2.30% 581,000 Yuexiu Real Estate Investment Trust
316,860 1.71%
Total Hong Kong
3,422,613 18.47%
India - 5.65% 27,634 GAIL India Ltd
145,118 0.78%
64,430 Tata Motors Ltd
303,791 1.64% 77,376 Yes Bank Ltd
598,023 3.23%
Total India
1,046,932 5.65%
Indonesia - 3.33% 161,783 Bank Central Asia
162,188 0.88%
790,500 Perusahaan Gas Negara
455,677 2.45% Total Indonesia
617,865 3.33%

SANLAM UNIVERSAL FUNDS PLC
77
SCHEDULE OF INVESTMENTS OF 8IP ASIA EQUITY OPPORTUNITIES FUND (CONTINUED) as at 30 June 2013 Nominal Security
Classification Fair Value % of
US$ Net Assets
South Korea - 15.85% 1,152 Cheil Industries Inc
90,063 0.49%
4,690 GS Engineering & Construction Corp
114,786 0.62% 2,112 Hyundai Motor Co
415,552 2.24%
8,970 Kangwon Land Inc
247,323 1.33% 3,581 LG Corp
198,410 1.07%
4,382 LG Electronics Inc
279,113 1.51% 1,385 NCsoft Corp
195,772 1.06%
808 Samsung Electronics Co Ltd
946,126 5.10% 13,760 Shinhan Financial Group Ltd
451,431 2.43%
Total South Korea
2,938,576 15.85%
Malaysia - 3.2% 151,200 CIMB Group Holdings Berhad
393,641 2.12%
112,700 IJM Corporation Berhad
200,212 1.08% Total Malaysia
593,853 3.20%
Phillippines - 0.95% 2,580 Philippine Long Distance Telephone Co
175,929 0.95%
Total Phillippines
175,929 0.95%
Singapore - 2.68% 239,000 China Minzhong Food Corporation Ltd
196,921 1.06%
54,000 Keppel Land Ltd
142,632 0.77% 10,000 United Overseas Bank Ltd
156,588 0.85%
Total Singapore
496,141 2.68%
Taiwan - 9.91% 401,657 Advanced Semiconductor Energy
336,341 1.81%
56,800 Catcher Technology Co Ltd
295,026 1.59% 366,656 Chinatrust Financial Holding
226,459 1.22%
50,000 Hon Hai Precision Industry
123,194 0.66% 101,725 Pegatron Corp
167,656 0.90%
186,000 Taiwan Semiconductor Manufacturing Company Ltd
687,421 3.73% Total Taiwan
1,836,097 9.91%
Thailand - 3.6% 74,600 Kasikornbank PCL
457,860 2.47%
94,778 PTT Global Chemical PCL
210,142 1.13% Total Thailand
668,002 3.60%
Total Equity
18,127,399 97.80%
Total financial assets at fair value through profit or loss
18,127,399 97.80%
Cash and cash equivalents
304,339 1.64% Other net assets and liabilities
103,684 0.56%
Net assets attributable to holders of redeemable participating shares 18,535,422 100.00%

SANLAM UNIVERSAL FUNDS PLC
78
SCHEDULE OF INVESTMENTS OF 8IP ASIA EQUITY OPPORTUNITIES FUND (CONTINUED) as at 30 June 2013
Summary
Classification Description
Fair Value % of Net Assets
Tranferable securities and money market instruments admitted to
official stock exchange listing or traded on regulated market 18,127,399 97.80%
A Transferabe securities and money market instruments other than
those referred above
- 0.00%
B Collective Investment Schemes
- 0.00% C Financial derivative instruments dealt in on a regulated market - 0.00% D Over the counter financial derivative instrument
- 0.00%
Cash and cash equivalents
304,339 1.64%
Other net assets and liabilities
103,684 0.56%
Net assets attributable to holders of redeemable participating shares 18,535,422 100.00%
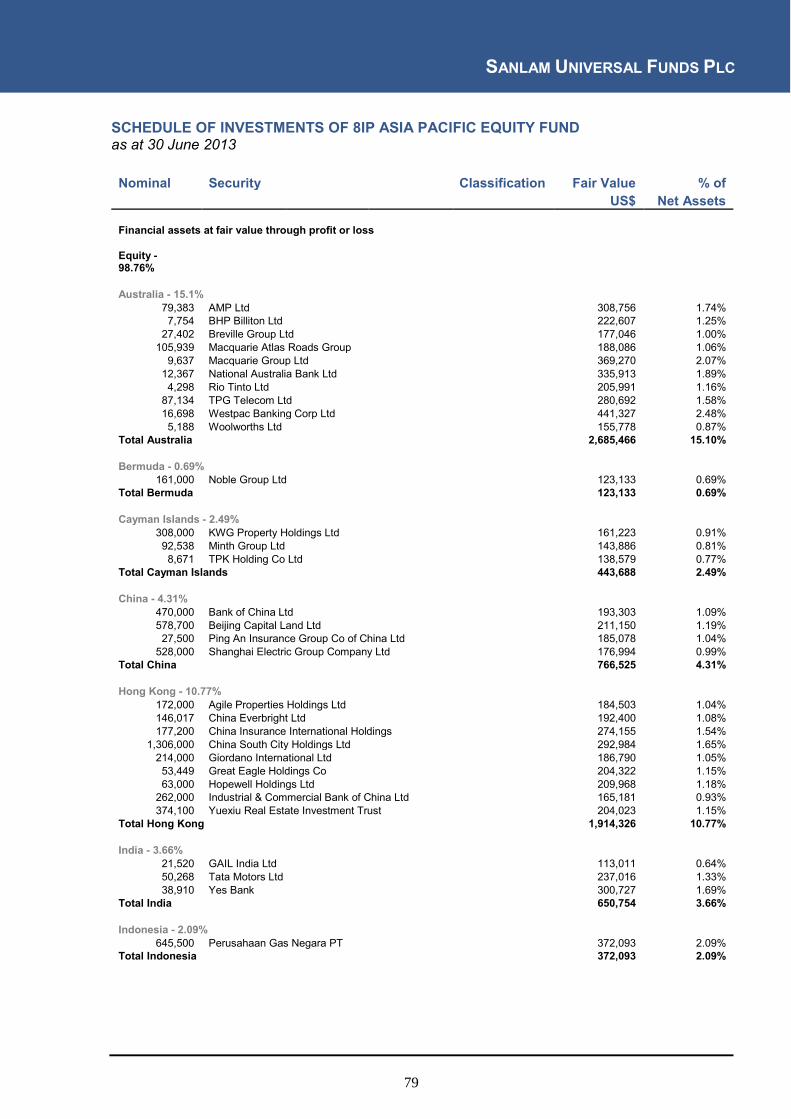
SANLAM UNIVERSAL FUNDS PLC
79
SCHEDULE OF INVESTMENTS OF 8IP ASIA PACIFIC EQUITY FUND as at 30 June 2013 Nominal Security
Classification Fair Value % of
US$ Net Assets
Financial assets at fair value through profit or loss
Equity - 98.76%
Australia - 15.1%
79,383 AMP Ltd
308,756 1.74% 7,754 BHP Billiton Ltd
222,607 1.25%
27,402 Breville Group Ltd
177,046 1.00% 105,939 Macquarie Atlas Roads Group
188,086 1.06%
9,637 Macquarie Group Ltd
369,270 2.07% 12,367 National Australia Bank Ltd
335,913 1.89%
4,298 Rio Tinto Ltd
205,991 1.16% 87,134 TPG Telecom Ltd
280,692 1.58%
16,698 Westpac Banking Corp Ltd
441,327 2.48% 5,188 Woolworths Ltd
155,778 0.87%
Total Australia
2,685,466 15.10%
Bermuda - 0.69% 161,000 Noble Group Ltd
123,133 0.69%
Total Bermuda
123,133 0.69%
Cayman Islands - 2.49% 308,000 KWG Property Holdings Ltd
161,223 0.91%
92,538 Minth Group Ltd
143,886 0.81% 8,671 TPK Holding Co Ltd
138,579 0.77%
Total Cayman Islands
443,688 2.49%
China - 4.31% 470,000 Bank of China Ltd
193,303 1.09%
578,700 Beijing Capital Land Ltd
211,150 1.19% 27,500 Ping An Insurance Group Co of China Ltd
185,078 1.04%
528,000 Shanghai Electric Group Company Ltd
176,994 0.99% Total China
766,525 4.31%
Hong Kong - 10.77% 172,000 Agile Properties Holdings Ltd
184,503 1.04%
146,017 China Everbright Ltd
192,400 1.08% 177,200 China Insurance International Holdings
274,155 1.54%
1,306,000 China South City Holdings Ltd
292,984 1.65% 214,000 Giordano International Ltd
186,790 1.05%
53,449 Great Eagle Holdings Co
204,322 1.15% 63,000 Hopewell Holdings Ltd
209,968 1.18%
262,000 Industrial & Commercial Bank of China Ltd
165,181 0.93% 374,100 Yuexiu Real Estate Investment Trust
204,023 1.15%
Total Hong Kong
1,914,326 10.77%
India - 3.66% 21,520 GAIL India Ltd
113,011 0.64%
50,268 Tata Motors Ltd
237,016 1.33% 38,910 Yes Bank
300,727 1.69%
Total India
650,754 3.66%
Indonesia - 2.09% 645,500 Perusahaan Gas Negara PT
372,093 2.09%
Total Indonesia
372,093 2.09%

SANLAM UNIVERSAL FUNDS PLC
80
SCHEDULE OF INVESTMENTS OF 8IP ASIA PACIFIC EQUITY FUND (CONTINUED) as at 30 June 2013
Nominal Security
Classification Fair Value % of US$ Net Assets
Japan - 39.11% 15,048 Anritsu Corp
178,007 1.00%
10,800 Honda Motor Co
400,664 2.25% 21 Inpex Holdings Inc
87,526 0.49%
64,000 Isuzu Motors Ltd
437,491 2.46% 12,346 Komatsu Ltd
285,003 1.60%
31,859 Marubeni Corp
212,650 1.20% 15,825 Mitsubishi Corp
270,680 1.52%
34,000 Mitsubishi Electric Corp
317,991 1.79% 74,571 Mitsubishi UFJ Holdings Inc
459,453 2.58%
20,538 Mitsui & Co
257,630 1.45% 14,900 Nissan Motor Co Ltd
150,755 0.85%
2,000 Nitto Denko Corp
128,461 0.72% 40,463 Nomura Holdings Inc
297,780 1.67%
23,847 Orix Corp
325,306 1.83% 1,947 Osaka Securities Exchange Co
196,405 1.10%
17,341 SBI Holdings Inc
191,165 1.07% 9,600 Seven & I Holdings
350,347 1.97%
9,000 Softbank Corp
524,615 2.95% 20,600 Sumitomo Corp
256,541 1.44%
18,000 Sumitomo Metal Mining Co
200,423 1.13% 10,329 Sumitomo Mitsui Financial Group
473,140 2.66%
7,200 Takeda Pharmaceutical Co Ltd
324,736 1.83% 2,700 Tokyo Electron Ltd
136,454 0.77%
81,422 Toshiba Corp
391,003 2.20% 1,700 Toyota Motor Co
102,517 0.58%
Total Japan
6,956,743 39.11%
South Korea - 9.25% 3,900 Dongbu Insurance Co Ltd
164,360 0.92%
2,203 GS Engineering & Construction Corp
53,918 0.30% 1,186 Hyundai Motor Co
233,355 1.31%
4,300 LG Electronics Inc
273,890 1.54% 1,317 NCsoft Corp
186,160 1.05%
469 Samsung Electronics Co Ltd
549,175 3.09% 5,640 Shinhan Financial Group Ltd
185,034 1.04%
Total South Korea
1,645,892 9.25%
Malaysia - 1.93% 59,300 CIMB Group Holdings Berhad
154,384 0.87%
106,400 IJM Corporation Berhad
189,020 1.06% Total Malaysia
343,404 1.93%
Phillippines - 0.72% 1,870 Philippine Long Distance Telephone Co
127,515 0.72%
Total Phillippines
127,515 0.72%
Singapore - 0.95% 206,000 China Minzhong Food Corporation Ltd
169,731 0.95%
Total Singapore
169,731 0.95%
Taiwan - 6.49% 150,397 Advanced Semiconductor Energy
125,940 0.71%
73,562 Catcher Technology Co Ltd
382,089 2.15% 36,801 Hon Hai Precision Industry
90,673 0.51%
99,275 Pegatron Corp
163,618 0.92% 105,955 Taiwan Semiconductor Manufacturing Company Ltd 391,590 2.20%
Total Taiwan
1,153,910 6.49%

SANLAM UNIVERSAL FUNDS PLC
81
SCHEDULE OF INVESTMENTS OF 8IP ASIA PACIFIC EQUITY FUND (CONTINUED) as at 30 June 2013
Nominal Security
Classification Fair Value % of US$ Net Assets
Thailand - 1.2%
96,177 PTT Global Chemical PCL
213,245 1.20% Total Thailand
213,245 1.20%
Total Equity
17,566,425 98.76%
Total financial assets at fair value through profit or loss
17,566,425 98.76%
Cash and cash equivalents
170,389 0.96% Other net assets and liabilities
49,821 0.28%
Net assets attributable to holders of redeemable participating shares 17,786,635 100.00%
Summary
Classification Description
Fair Value % of
Net Assets
Tranferable securities and money market instruments admitted to
official stock exchange listing or traded on regulated market 17,566,425 98.76%
A Transferabe securities and money market instruments other than
those referred above
- 0.00%
B Collective Investment Schemes
- 0.00% C Financial derivative instruments dealt in on a regulated market - 0.00% D Over the counter financial derivative instrument
- 0.00%
Cash and cash equivalents
170,389 0.96%
Other net assets and liabilities
49,821 0.28%
Net assets attributable to holders of redeemable participating shares 17,786,635 100.00%

SANLAM UNIVERSAL FUNDS PLC
82
SCHEDULE OF INVESTMENTS OF CENTRE GLOBAL EQUITY FUND as at 30 June 2013
Nominal Security
Classification Fair Value % of US$ Net Assets
Financial assets at fair value through profit or loss
Equity - 94.9%
Australia - 2.77% 6,600 Australia and New Zealand Banking Group Ltd
172,626 0.73%
30,000 Telstra Corp
130,960 0.55%
12,408 BHP Billiton Ltd
356,218 1.49%
Total Australia
659,804 2.77%
Belgium - 1.07% 2,859 Anheuser-Busch InBev SA/NV
254,195 1.07%
Total Belgium
254,195 1.07%
Brazil - 5.14% 19,150 Vale SA
234,605 0.99%
3,500 AmBev
130,901 0.55% 41,450 Petroleo Brasileiro SA
303,741 1.28%
13,500 CCR SA
108,220 0.45% 9,108 Banco Itaú Holding Financiera SA
118,676 0.50%
8,700 Cosan SA Industria e Comercio
170,454 0.72% 14,890 Cia de Saneamento Basico do Estado de Sao Pau
155,846 0.65%
Total Brazil
1,222,443 5.14%
Cayman Islands - 2.16% 13,000 Hengan International Group Company Ltd
141,629 0.60%
3,950 Tencent Holdings Ltd
154,920 0.65% 46,000 Sands China Ltd
216,769 0.91%
Total Cayman Islands
513,318 2.16%
China - 2.39% 55,940 China Petroleum & Chemical Corp
39,379 0.17%
128,400 China Life Insurance Co Ltd
304,603 1.28% 544,400 Bank of China Ltd
223,903 0.94%
Total China
567,885 2.39%
Denmark - 0.52% 2,200 Coloplast AS
123,198 0.52%
Total Denmark
123,198 0.52%
France - 8.17% 2,040 L'Oreal Groupe
334,828 1.41% 1,380 LVMH Moet Hennessy Louis Vuitton SA
223,362 0.94%
1,680 Dassault Systemes SA
205,261 0.86% 2,875 Sanofi SA
297,592 1.25%
2,670 Cie Generale d'Optique Essilor International SA
283,731 1.19% 3,080 BNP Paribas SA
168,075 0.71%
5,563 Total SA
271,243 1.14% 2,130 Groupe Danone SA
159,667 0.67%
Total France
1,943,759 8.17%

SANLAM UNIVERSAL FUNDS PLC
83
SCHEDULE OF INVESTMENTS OF CENTRE GLOBAL EQUITY FUND (CONTINUED) as at 30 June 2013
Nominal Security
Classification Fair Value % of US$ Net Assets
Germany - 9.8% 2,710 Adidas AG
292,914 1.23%
2,861 SAP AG
209,256 0.88% 2,518 Bayer AG
268,200 1.13%
2,686 Basf SE
239,652 1.01% 1,300 Muenchener Rueckversicherungs AG
238,976 1.00%
4,934 Daimler AG
298,176 1.25% 3,781 Siemens AG
381,688 1.60%
810 Linde AG
150,954 0.63% 2,480 Deutsche Bank AG
104,233 0.44%
730 Volswagen AG
147,490 0.63% Total Germany
2,331,539 9.80%
Great Britain - 4.07% 7,300 Diageo Plc
208,160 0.87%
7,000 Imperial Tobacco Group Plc
242,075 1.02% 35,786 HSBC Holdings PLC
370,181 1.56%
2,100 Reckitt Benckiser Group Plc
148,048 0.62% Total Great Britain
968,464 4.07%
Greece - 0.96% 8,680 Coca Cola Hellenic Bottling Company SA A 229,074 0.96%
Total Greece
229,074 0.96%
Hong Kong - 4.87% 33,070 China Mobile Hong Kong Ltd
345,359 1.45%
13,800 Cheung Kong (Holdings) Ltd
187,174 0.79% 201,400 Li & Fung Ltd
276,801 1.16%
113,200 CNOOC Ltd
192,067 0.81% 37,000 AIA Group Ltd
156,706 0.66%
Total Hong Kong
1,158,107 4.87%
India - 1.73% 5,400 HDFC Bank Ltd
195,696 0.82%
7,500 Reliance Industries Ltd
215,925 0.91% Total India
411,621 1.73%
Italy - 2.09% 13,400 Assicurazioni Generali SPA
233,786 0.98%
92,700 Intesa Sanpaolo SPA
148,354 0.62% 2,300 Luxottica Group SPA
116,136 0.49%
Total Italy
498,276 2.09%
Japan - 9.28% 270 Yahoo Japan Corp
132,921 0.56%
38,800 Daiwa Securities Group Inc
325,384 1.37% 800 Fast Retailing Co Ltd
269,405 1.13%
39,800 Mitsubishi UFJ Holdings Inc
245,219 1.03% 8,830 Honda Motor Co Ltd
327,580 1.38%
1,630 Murata Manufacturing Co. Ltd
123,895 0.52% 42,800 Nomura Securities Co. Ltd
314,978 1.32%
7,800 Toyota Motor Corp
470,370 1.97% Total Japan
2,209,752 9.28%
South Korea - 1.38% 280 Samsung Electronics Co Ltd
327,865 1.38%
Total South Korea
327,865 1.38%
Mexico - 1.73% 380,050 America Movil SAB de CV
412,185 1.73%
Total Mexico
412,185 1.73%

SANLAM UNIVERSAL FUNDS PLC
84
SCHEDULE OF INVESTMENTS OF CENTRE GLOBAL EQUITY FUND (CONTINUED) as at 30 June 2013
Nominal Security
Classification Fair Value % of US$ Net Assets
Netherlands - 0.39% 2,340 Unilever NV
92,039 0.39%
Total Netherlands
92,039 0.39%
Russia - 2.61% 4,180 Lukoil OAO
239,932 1.01%
34,470 Gazprom OAO
226,813 0.95% 13,700 Sberbank of Russia
155,594 0.65%
Total Russia
622,339 2.61%
Singapore - 0.54% 39,000 Singapore Technologies Engineering Ltd
128,842 0.54%
Total Singapore
128,842 0.54%
Spain - 2.29% 27,721 Banco Bilbao Vizcaya Argentaria SA
232,270 0.98%
13,788 Telefonica SA
176,473 0.74% 1,100 Inditex SA
135,627 0.57%
Total Spain
544,370 2.29%
Switzerland - 5.49% 540 Syngenta AG
210,932 0.89%
3,300 Novartis AG
234,020 0.98% 1,200 Roche Holding AG
298,034 1.25%
4,980 Nestle SA
326,053 1.37% 2,700 Compagnie Financiere Richemont SA
238,411 1.00%
Total Switzerland
1,307,450 5.49%
Taiwan - 2.1% 17,000 MediaTek Inc
197,260 0.83%
82,100 Taiwan Semiconductor Manufacturing Company LtD
303,426 1.27% Total Taiwan
500,686 2.10%
Turkey - 0.52% 28,200 Turkiye Garanti Bankasi AS
123,060 0.52%
Total Turkey
123,060 0.52%
United States - 22.83% 1,360 International Business Machines Corp
259,910 1.09%
790 Apple Inc
312,903 1.31% 1,250 Berkshire Hathaway Inc.
139,900 0.59%
3,800 JP Morgan Chase & Co
200,602 0.84% 17,300 Cisco Systems Inc
420,563 1.77%
5,360 Coca-Cola Co.
214,990 0.90% 9,000 Bank of America Corp
115,740 0.49%
3,910 Exxon Corp
353,269 1.48% 10,150 General Electric Co.
235,379 0.99%
2,980 Infosys Technologies Ltd
122,746 0.52% 5,000 Intel Corp
121,100 0.51%
2,390 Johnson & Johnson
205,205 0.86% 8,130 Microsoft Corp
280,729 1.18%

SANLAM UNIVERSAL FUNDS PLC
85
SCHEDULE OF INVESTMENTS OF CENTRE GLOBAL EQUITY FUND (CONTINUED) as at 30 June 2013
Nominal Security
Classification Fair Value % of US$ Net Assets
United States - 22.83% (continued)
6,850 Wells Fargo & Co
282,700 1.19% 4,300 Monsanto Co.
424,840 1.78%
6,590 Oracle Corp
202,445 0.85% 6,830 Pfizer Inc
191,308 0.80%
2,380 Procter & Gamble Co.
183,236 0.77% 4,740 Qualcomm Inc
289,567 1.22%
6,790 AT & T Inc
240,366 1.01% 1,860 Chevron Corp
220,112 0.92%
150 Google Inc
132,056 0.55% 500 Mastercard Inc
287,249 1.21%
Total United States
5,436,915 22.83%
Total Equity
22,587,186 94.90%
Total financial assets at fair value through profit or loss
22,587,186 94.90%
Cash and cash equivalents
1,375,748 5.78% Other net assets and liabilities
(161,181) (0.68%)
Net assets attributable to holders of redeemable participating shares 23,801,753 100.00%
Summary
Classification Description
Fair Value % of
Net Assets
Tranferable securities and money market instruments admitted to
official stock exchange listing or traded on regulated market 22,358,112 93.94%
A Transferabe securities and money market instruments other than
those referred above
229,074 0.96%
B Collective Investment Schemes
- 0.00% C Financial derivative instruments dealt in on a regulated market - 0.00% D Over the counter financial derivative instrument
- 0.00%
Cash and cash equivalents
1,375,748 5.78%
Other net assets and liabilities
(161,181) (0.68%)
Net assets attributable to holders of redeemable participating shares 23,801,753 100.00%

SANLAM UNIVERSAL FUNDS PLC
86
SCHEDULE OF INVESTMENTS OF GRINDROD INTERNATIONAL PROPERTY FUND as at 30 June 2013
Nominal Security
Classification Fair Value % of
US$ Net Assets
Financial assets at fair value through profit or loss
Equity - 89.19%
Australia - 10.85% 95,000 Charter Hall Retail REIT
331,244 2.66%
94,366 General Property Group
331,624 2.66% 32,997 Westfield Group
345,461 2.77%
156,403 Growthpoint Properties Australia
343,523 2.76% Total Australia
1,351,852 10.85%
Canada - 5.95% 10,140 Calloway Real Estate Investment Trust
247,132 1.98%
10,910 RioCan Real Estate Investment Trust
261,348 2.10% 7,500 Dundee Real Estate Investment Trust
232,060 1.87%
Total Canada
740,540 5.95%
Isle of Man - 8.4% 139,910 New Europe Property Investment PLC
1,045,869 8.40%
Total Isle of Man
1,045,869 8.40%
France - 3.74% 2,000 Unibail-Rodamco SE
465,419 3.74%
Total France
465,419 3.74%
Singapore - 7.16% 529,100 Fortune REIT
483,654 3.88%
140,000 Capitamall Trust
220,216 1.77% 140,000 CDL Hospitality Trust
187,653 1.51%
Total Singapore
891,523 7.16%
United States - 53.09% 18,100 BioMed Realty Trust Inc
366,163 2.94%
7,026 Digital Realty Trust Inc
428,586 3.44% 16,345 Prologis Inc
616,533 4.95%
35,000 Campus Crest Communities Inc
403,900 3.24% 38,400 Cubesmart
613,632 4.93%
24,200 Duke Realty Corp
377,278 3.03% 33,400 Glimcher Realty Trust
364,728 2.93%
15,100 Healthcare Realty Trust Inc
385,050 3.09% 8,600 Health Care Reit Inc
576,458 4.63%
20,000 Kinco Realty Corp
428,600 3.44% 11,000 Liberty Property Trust
406,560 3.26%
7,000 Macerich Co
426,790 3.43% 8,456 Post Properties Inc
418,487 3.36%
10,000 Realty Income Corp
419,200 3.37% 7,490 Regency Centers Corp
380,566 3.05%
Total United States
6,612,531 53.09%

SANLAM UNIVERSAL FUNDS PLC
87
SCHEDULE OF INVESTMENTS OF GRINDROD INTERNATIONAL PROPERTY FUND (CONTINUED) as at 30 June 2013
Nominal Security
Classification Fair Value % of
US$ Net Assets
Total Equity
11,107,734 89.19%
Total financial assets at fair value through profit or loss
11,107,734 89.19%
Cash and cash equivalents
1,436,493 11.53% Other net assets and liabilities
(89,560) (0.72%)
Net assets attributable to holders of redeemable participating shares 12,454,667 100.00%
Summary
Classification Description
Fair Value % of
Net Assets
Tranferable securities and money market instruments admitted to
official stock exchange listing or traded on regulated market 11,107,734 89.19%
A Transferabe securities and money market instruments other than
those referred above
- 0.00%
B Collective Investment Schemes
- 0.00% C Financial derivative instruments dealt in on a regulated market - 0.00% D Over the counter financial derivative instrument
- 0.00%
Cash and cash equivalents
1,436,493 11.53%
Other net assets and liabilities
(89,560) (0.72%)
Net assets attributable to holders of redeemable participating shares 12,454,667 100.00%

SANLAM UNIVERSAL FUNDS PLC
88
SCHEDULE OF INVESTMENTS OF P-SOLVE INFLATION PLUS FUND as at 30 June 2013 Nominal Security
Classification Fair Value % of
GBP Net Assets
Financial assets at fair value through profit or loss
Exchange Traded Funds - 66.79% 4,943 Finsbury High Income Fund
3,352,002 6.59% 30,101 iShares Core MSCI Emerging Markets ETF
905,788 1.78%
12,091 iShares Barclays Capital Emerging Market Local Govt Bond 695,151 1.37% 104,521 iShares MSCI Europe ex-UK UCITS ETF
1,990,602 3.92%
71,809 iShares MSCI Japan GBP Hedged UCITS ETF
2,842,200 5.59% 62,535 iShares MSCI World Islamic Fund
1,018,382 2.00%
400,032 iShares FTSE 100 UCITS ETF
2,496,200 4.91% 290,625 iShares S&P 500 Index Fund
3,071,906 6.04%
96,905 iShares S&P SmallCap 600 Fund
2,356,730 4.64% 31,758 ETFS Brent 1mth Oil Securities
1,331,922 2.62%
126,728 PowerShares Global Agriculture Fund
982,617 1.93% 84,094 Vanguard Emerging Market ETF
2,138,528 4.21%
143,928 Vanguard FTSE 100 ETF
4,186,866 8.24% 269,003 Vanguard S&P 500 ETF
5,423,100 10.67%
54,679 SPDR S&P 400 US Mid Cap ETF
1,153,277 2.28% Total Exchange Traded Funds
33,945,271 66.79%
Collective Investment Schemes - 22.27%
564,588 First State Investments ICVC
2,386,399 4.70% 118,671 GLG Treasury Plus Fund
1,577,337 3.10%
4,950 IFDC - Japan Dynamic Fund
605,979 1.19% 1,588,396 Institutional Sterling Liquidity Fund - Class A
1,588,396 3.13%
PIMCO Funds Global Investors Series PLC 105,890 Emerging Local Bond Fund Inst Acc GBP
1,884,839 3.71%
204,582 High Yield Bond Fund Inst Acc GBP
3,277,409 6.44% Total Collective Investment Schemes
11,320,359 22.27%
Nominal Security Classification Coupon Maturity Fair Value % of GBP Net Assets
Government Debt - 7.71% 1,684,994 Germany Government Bonds 3.750 04/07/2013 1,444,450 2.84%
2,610,829 United Kingdom Gilt 1.750 07/09/2022 2,474,609 4.87% Total Government Debt
3,919,059 7.71%
Total financial assets at fair value through profit or loss
49,184,689 96.77%
Cash and cash equivalents
1,490,784 2.93% Other net assets and liabilities
151,090 0.30%
Net assets attributable to holders of redeemable participating shares 50,826,563 100.00%

SANLAM UNIVERSAL FUNDS PLC
89
SCHEDULE OF INVESTMENTS OF P-SOLVE INFLATION PLUS FUND (CONTINUED) as at 30 June 2013
Summary
Classification Description
Fair Value % of Net Assets
Tranferable securities and money market instruments admitted to
official stock exchange listing or traded on regulated market 49,184,689 96.77%
A Transferabe securities and money market instruments other than
those referred above
- 0.00%
B Collective Investment Schemes
- 0.00% C Financial derivative instruments dealt in on a regulated market - 0.00% D Over the counter financial derivative instrument
- 0.00%
Cash and cash equivalents
1,490,784 2.93%
Other net assets and liabilities
151,090 0.30%
Net assets attributable to holders of redeemable participating shares 50,826,563 100.00%

SANLAM UNIVERSAL FUNDS PLC
90
SCHEDULE OF INVESTMENTS OF SANLAM AFRICAN FRONTIER MARKETS FUND as at 30 June 2013
Nominal Security
Classification Fair Value % of
US$ Net Assets
Financial assets at fair value through profit or loss
Equity - 91.53%
Botswana - 2.47% 6,228,532 Letshego Holdings Ltd
1,661,038 2.47%
Total Botswana
1,661,038 2.47%
Egypt - 26.69% 279,984 Credit Agricole Egypt
360,513 0.54%
945,727 Commercial International Bank
4,023,654 5.97% 220,043 Egyptian International Pharmaceutical Industries Co
1,324,201 1.97%
429,740 Oriental Weavers Co
1,264,607 1.88% 143,000 Orascom Construction Industries
4,905,103 7.28%
671,073 Telecom Egypt
1,097,315 1.63% 160,500 ElSwedy Cables Holding Co
411,497 0.61%
4,941,862 Orascom Telecom Holdings
2,759,283 4.10% 1,813,556 Talaat Moustafa Group
1,041,012 1.54%
603,834 Juhayna Food Industries
798,151 1.17% Total Egypt
17,985,336 26.69%
Ghana - 1.1% 2,915,000 UT Bank Ltd
743,039 1.10%
Total Ghana
743,039 1.10%
Kenya - 11.23% 1,486,850 Athi River Mining Ltd
1,107,781 1.64%
456,579 Bamburi Cement Co Ltd
1,142,776 1.70% 397,058 East African Breweries Ltd
1,539,235 2.28%
2,961,147 Equity Bank Ltd
1,077,251 1.60% 3,764,428 Kenya Commercial Bank Ltd
1,621,465 2.41%
14,166,087 Safaricom Ltd
1,080,185 1.60% Total Kenya
7,568,693 11.23%
Morocco - 3.16% 26,560 Attijariwafa Bank
1,017,409 1.51%
96,398 Maroc Telecom
1,114,883 1.65% Total Morocco
2,132,292 3.16%
Mauritius - 2.2% 119,908 Mauritius Commercial Bank
717,135 1.06%
23,040,000 State Bank of Mauritius Ltd
763,061 1.14% Total Mauritius
1,480,196 2.20%

SANLAM UNIVERSAL FUNDS PLC
91
SCHEDULE OF INVESTMENTS OF SANLAM AFRICA FRONTIER MARKETS FUND (CONTINUED) as at 30 June 2013
Nominal Security
Classification Fair Value % of
US$ Net Assets
Nigeria - 44.68% 38,841,989 Access Bank Nigeria PLC
2,605,401 3.87%
26,445,534 Guaranty Trust Bank PLC
3,954,624 5.87% 378,403 Guinness Nigeria PLC
584,650 0.87%
150,648 Nestle Foods Nigeria PLC
889,982 1.32% 5,921,271 Nigerian Breweries PLC
5,688,064 8.44%
60,634,724 United Bank for Africa PLC
3,022,408 4.49% 4,528,500 West African Portland Cement Co
2,340,886 3.47%
39,936,399 Zenith Bank Ltd
4,866,097 7.22% 48,959,647 Diamond Bank PLC
1,822,805 2.71%
23,495,904 Dangote Flour Mills PLC
1,337,459 1.98% 27,172,953 FBN Holdings PLC
2,993,208 4.44%
Total Nigeria
30,105,584 44.68%
Total Equity
61,676,178 91.53%
Total financial assets at fair value through profit or loss
61,676,178 91.53%
Cash and cash equivalents
5,511,984 8.18% Other net assets and liabilities
192,509 0.29%
Net assets attributable to holders of redeemable participating shares 67,380,671 100.00%
Summary
Classification Description
Fair Value % of
Net Assets
Tranferable securities and money market instruments admitted to
official stock exchange listing or traded on regulated market 61,676,178 91.53%
A Transferabe securities and money market instruments other than
those referred above
- 0.00%
B Collective Investment Schemes
- 0.00% C Financial derivative instruments dealt in on a regulated market - 0.00% D Over the counter financial derivative instrument
- 0.00%
Cash and cash equivalents
5,511,984 8.18%
Other net assets and liabilities
192,509 0.29%
Net assets attributable to holders of redeemable participating shares 67,380,671 100.00%

SANLAM UNIVERSAL FUNDS PLC
92
SCHEDULE OF INVESTMENTS OF SANLAM GLOBAL BEST IDEAS FUND as at 30 June 2013
Nominal Security
Classification Fair Value % of US$ Net Assets
Financial assets at fair value through profit or loss
Equity - 95.82%
Bermuda - 8.06% 1,175,665 Catlin Group Ltd
8,901,744 2.04%
733,744 Lancashire Holdings Ltd
8,814,276 2.02% 106,520 Renaissancere Holdings Ltd
9,244,871 2.12%
401,000 Tower Group International Ltd
8,224,510 1.88% Total Bermuda
35,185,401 8.06%
Canada - 1.45% 166,500 Potash Corp of Saskatchewan Inc
6,348,645 1.45%
Total Canada
6,348,645 1.45%
Cayman Islands - 3.9% 35,965,574 Chaoda Modern Agricultural Holdings Ltd A 3,825,533 0.88%
46,398,418 DBA Telecommunication Asia Holdings Ltd A 12,143,677 2.78% 2,510,000 Xingda International Holdings Ltd
1,067,920 0.24%
Total Cayman Islands
17,037,130 3.90%
Finland - 1.49% 160,000 Nokiaan Renkaat OYJ
6,512,741 1.49%
Total Finland
6,512,741 1.49%
France - 5.74% 364,449 Scor SE
11,169,898 2.56%
284,800 Total SA
13,886,407 3.18% Total France
25,056,305 5.74%
Great Britain - 11.38% 4,700,000 Accident Exchange Group PLC A - 0.00%
193,500 Bank of Georgia Holdings PLC
4,901,335 1.12% 1,365,000 IG Group Holdings PLC
12,008,191 2.75%
363,348 Imperial Tobacco Group
12,565,349 2.88% 4,017,338 Tesco PLC
20,193,323 4.63%
Total Great Britain
49,668,198 11.38%
Hong Kong - 3.81% 11,152,001 Esprit Holdings Ltd
16,621,172 3.81%
Total Hong Kong
16,621,172 3.81%
India - 6.75% 4,290,000 Andhra Bank
5,896,413 1.35%
2,625,000 Bharat Heavy Electricals Ltd
7,666,883 1.76% 5,113,546 Dena Bank
5,982,660 1.37%
206,500 Jammu & Kashmir Bank Ltd
4,244,395 0.97% 2,354,000 Power Finance Corp
5,685,743 1.30%
Total India
29,476,094 6.75%
Indonesia - 3.73% 12,094,500 Adira Dinamika Multi Finance
10,184,842 2.33%
84,515,000 Bank Bukopin Tbk PT
6,100,331 1.40% Total Indonesia
16,285,173 3.73%
Isreal - 2.14% 945,000 ICL-Israel Chemicals Ltd
9,342,047 2.14%
Total Isreal
9,342,047 2.14%

SANLAM UNIVERSAL FUNDS PLC
93
SCHEDULE OF INVESTMENTS OF SANLAM GLOBAL BEST IDEAS FUND (CONTINUED) as at 30 June 2013
Nominal Security
Classification Fair Value % of US$ Net Assets
South Korea - 8.59% 1,049,900 DGB Financial Group Inc
14,290,835 3.27%
972,730 Korean Reinsurance Co
8,911,826 2.04% 18,500 Samsung Electronics Co Ltd
14,269,510 3.28%
Total South Korea
37,472,171 8.59%
Russia - 1.46% 558,750 Sberbank of Russia ADR
6,364,163 1.46%
Total Russia
6,364,163 1.46%
Thailand - 1.74% 5,762,370 Tisco Financial Group PCL
7,591,811 1.74%
Total Thailand
7,591,811 1.74%
Turkey - 1.23% 5,421,785 Turkiye Sinai Kalkinma Bankasi
5,366,991 1.23%
Total Turkey
5,366,991 1.23%
United States - 34.35% 164,000 American International Group
7,330,800 1.68%
160,650 Berkshire Hathaway Inc
17,979,948 4.12% 82,000 Caterpillar Inc
6,764,180 1.55%
607,000 Cisco Systems Inc
14,756,170 3.38% 111,000 Deere & Co
9,018,750 2.07%
680,300 Hewlett Packard Co
16,871,440 3.87% 215,500 Illinois Tool Works Inc
14,906,135 3.42%
113,000 Lockheed Martin Corp
12,255,980 2.81% 242,000 Medtronic Com
12,455,740 2.85%
813,200 Microsoft Corp
28,079,796 6.43% 108,616 World Acceptance Corp
9,443,073 2.17%
Total United States
149,862,012 34.35%
Total Equity
418,190,054 95.82%
Total financial assets at fair value through profit or loss
418,190,054 95.82%
Cash and cash equivalents
13,180,769 3.02% Other net assets and liabilities
5,047,575 1.16%
Net assets attributable to holders of redeemable participating shares 436,418,398 100.00%
Summary
Classification Description
Fair Value % of
Net Assets
Tranferable securities and money market instruments admitted to
official stock exchange listing or traded on regulated market 402,220,844 92.16%
A Transferabe securities and money market instruments other than
those referred above
15,969,210 3.66%
B Collective Investment Schemes
- 0.00% C Financial derivative instruments dealt in on a regulated market - 0.00% D Over the counter financial derivative instrument
- 0.00%
Cash and cash equivalents
13,180,769 3.02%
Other net assets and liabilities
5,047,575 1.16%
Net assets attributable to holders of redeemable participating shares 436,418,398 100.00%

SANLAM UNIVERSAL FUNDS PLC
94
SCHEDULE OF INVESTMENTS OF SANLAM GLOBAL BOND FUND as at 30 June 2013
Nominal Security Classification Coupon Maturity Fair Value % of US$ Net Assets
Financial assets at fair value through profit or loss
Debt - 95.19%
Australia - 1.88% 185,000 Australia Government Bond 3.000 20/09/2025 218,160 0.06%
1,400,000 Australia Government Bond 4.750 21/04/2027 1,367,457 0.38% 1,030,000 Commonwealth Bank of Australia 5.750 17/12/2013 954,920 0.27% 2,850,000 New South Wales Treasury Corp 2.750 20/11/2025 3,235,495 0.90% 1,000,000 Queensland Treasury Corp 6.000 14/10/2015 979,043 0.27%
Total Australia
6,755,075 1.88%
Belgium - 0.51% 755,000 Belgium Government Bond 2.750 28/03/2016 1,036,751 0.29%
600,000 KBC Bank NV
1.125 11/12/2017 775,663 0.22% Total Belgium
1,812,414 0.51%
Bermuda - 0.41% 800,000 Holcim GB Finance Ltd
8.750 24/04/2017 1,481,147 0.41% Total Bermuda
1,481,147 0.41%
Canada - 3.18% 1,100,000 Canadian Government Bond 4.000 01/06/2041 1,259,489 0.35%
600,000 Copernic Inc
1.177 25/12/2015 784,360 0.22% 1,000,000 Province of Ontario Canada 4.200 08/03/2018 1,028,818 0.29%
700,000 Province of Ontario Canada 6.200 02/06/2031 865,328 0.24% 3,500,000 Province of Quebec Canada 4.250 01/12/2043 3,457,034 0.96% 1,675,000 Province of Quebec Canada 5.000 29/04/2019 2,605,592 0.73% 1,435,000 Transcanada Pipelines Limited 0.750 15/01/2016 1,420,435 0.39%
Total Canada
11,421,056 3.18%
Cayman Islands - 0.94% 2,955,000 Petrobras International Finance Co 3.875 27/01/2016 3,036,706 0.85%
375,000 Saudi Electricity Company 5.060 08/04/2043 341,513 0.09% Total Cayman Islands
3,378,219 0.94%
Denmark - 0.25% 713,000 Dong Energy AS
2.625 19/09/2022 906,869 0.25% Total Denmark
906,869 0.25%
France - 5.94% 900,000 BNP Paribas SA
2.375 14/09/2017 894,420 0.25% 400,000 BPCE SA
4.250 06/02/2023 577,197 0.16%
500,000 BPCE SA
2.750 16/02/2017 688,280 0.19% 445,000 Caisse de Refinancement de l'Habitat SA 3.600 08/03/2024 640,454 0.18% 600,000 Credit Mutuel - CIC Home Loan SFH 4.125 19/01/2024 906,591 0.25% 600,000 EDF SA
5.500 17/10/2041 948,506 0.26%
900,000 EDF SA
4.250 31/12/2049 1,184,321 0.33% 2,697,000 EDF SA
5.250 31/12/2049 2,568,893 0.72%
529,528 FCT GINKGO Sales Finance 1.571 18/07/2038 694,540 0.19% 470,000 France Government Bond OAT 6.000 25/10/2025 826,319 0.23%
1,468,000 France Government Bond OAT 4.500 25/04/2041 2,327,864 0.65% 486,625 Red & Black Auto France 0.976 28/12/2021 634,979 0.18%
1,000,000 Red & Black Auto France 0.911 15/04/2024 1,296,336 0.36%
5,580,000 Societe Financement de l'Economie Francaise 3.375 05/05/2014 5,719,500 1.59%
1,100,000 Societe Generale SFH
1.750 05/03/2020 1,429,843 0.40% Total France
21,338,043 5.94%

SANLAM UNIVERSAL FUNDS PLC
95
SCHEDULE OF INVESTMENTS OF SANLAM GLOBAL BOND FUND (CONTINUED) as at 30 June 2013
Nominal Security Classification Coupon Maturity Fair Value % of US$ Net Assets
Germany - 6.34% 2,575,000 Bayerische Landesbank
1.875 30/06/2014 3,399,690 0.95% 190,000 Deutsche Bank AG
0.960 09/03/2017 236,598 0.07%
816,342 Driver Ten GMBH
0.373 21/03/2019 1,062,295 0.30% 1,600,000 FMS Wertmanagement
1.375 15/01/2020 2,065,003 0.58%
1,080,000 Kreditanstalt fuer Wiederaufbau 0.500 25/07/2016 1,401,880 0.39% 900,000 Kreditanstalt fuer Wiederaufbau 5.500 07/12/2015 1,520,977 0.42% 760,000 Kreditanstalt fuer Wiederaufbau 5.050 04/02/2025 810,770 0.23%
1,275,000 Kreditanstalt fuer Wiederaufbau 2.625 16/08/2019 1,782,713 0.50% 750,000 Kreditanstalt fuer Wiederaufbau 1.250 17/10/2019 967,921 0.27%
1,415,000 Kreditanstalt fuer Wiederaufbau 1.375 21/02/2017 1,883,631 0.52% 1,250,000 Kreditanstalt fuer Wiederaufbau 1.875 13/06/2018 1,162,314 0.32%
500,000 Kreditanstalt fuer Wiederaufbau 1.875 20/03/2019 672,354 0.19% 1,355,000 Kreditanstalt fuer Wiederaufbau 3.750 16/08/2017 1,037,679 0.29% 1,080,000 Kreditanstalt fuer Wiederaufbau 4.125 04/07/2017 1,586,864 0.44%
700,000 Kreditanstalt fuer Wiederaufbau 5.500 08/08/2013 642,249 0.18% 1,110,000 State of Hesse
3.125 13/05/2014 1,479,278 0.41%
600,000 Muenchener Rueckversicherungs AG 6.625 26/05/2042 1,030,093 0.28% Total Germany
22,742,309 6.34%
Great Britain - 4.54% 924,000 Arkle Master Issuer Plc
1.974 17/05/2060 945,971 0.26% 526,768 Asset Backed European Securitisation 0.963 15/06/2019 799,559 0.22% 10,000 Aviva Plc
5.250 02/10/2023 13,054 0.00%
257,540 E-Carat Plc
1.300 18/06/2020 391,533 0.11% 771,273 Fosse Master Issuer Plc
1.904 18/10/2054 1,182,119 0.33%
268,000 GKN Holdings Plc
5.375 19/09/2022 408,484 0.11% 536,000 Hammerson Plc
2.750 26/09/2019 707,977 0.20%
65,561 Headingley RMBS
1.450 11/03/2051 85,403 0.02% 400,000 Legal & General Group Plc 6.385 02/05/2017 617,443 0.17% 447,202 London and Regional Debt Securitisation 4.756 15/10/2014 688,472 0.19% 627,000 Marks & Spencer Plc
5.625 24/03/2014 978,017 0.27%
252,000 Motor Plc
1.286 25/02/2020 252,711 0.07% 1,230,000 Northern Rock Asset Management PLC 5.625 22/06/2017 1,401,979 0.40%
255,566 Turbo Finance Plc
1.893 20/02/2019 389,047 0.11% 3,545,000 United Kingdom Gilt
4.250 07/09/2039 6,103,874 1.71%
85,000 United Kingdom Gilt
4.250 07/12/2040 146,072 0.04% 1,330,000 Vodafone Group Plc
4.375 19/02/2043 1,183,368 0.33%
Total Great Britain
16,295,083 4.54%
India - 0.56% 600,000 Bank of Baroda
5.000 24/08/2016 631,260 0.18%
1,380,000 IDBI Bank Ltd
4.375 26/03/2018 1,360,404 0.38% Total India
1,991,664 0.56%
Indonesia - 0.09% 385,000 Pertamina Persero
5.625 20/05/2043 336,875 0.09% Total Indonesia
336,875 0.09%
Ireland - 1.06% 178,152 Cars Alliance Auto Loans 1.379 25/09/2021 232,554 0.06%
255,000 CRH Finance Ltd
3.125 03/04/2023 325,115 0.09% 624,406 German Residential Asset Note 1.615 20/01/2021 812,287 0.23% 527,634 German Residential Asset Note 1.725 20/01/2021 684,580 0.19% 700,000 Intesa Sanpaolo Bank Ireland PLC 4.000 08/08/2013 913,040 0.25% 660,000 Ireland Government Bonds 3.900 20/03/2023 846,923 0.24%
Total Ireland
3,814,499 1.06%

SANLAM UNIVERSAL FUNDS PLC
96
SCHEDULE OF INVESTMENTS OF SANLAM GLOBAL BOND FUND (CONTINUED) as at 30 June 2013
Nominal Security Classification Coupon Maturity Fair Value % of US$ Net Assets
Italy - 5.64% 100,000 ASSIC GENERALI SPA
7.750 12/12/2042 138,131 0.04%
738,866 AUTO ABS S.R.L.
2.800 27/04/2025 971,892 0.27% 68,556 AUTO ABS S.R.L.
0.347 25/10/2020 89,135 0.02%
1,305,000 Italy Buoni Poliennali Del Tesoro 4.500 01/05/2023 1,699,876 0.47% 635,000 Italy Buoni Poliennali Del Tesoro 4.750 01/09/2028 822,644 0.23% 15,000 Italy Buoni Poliennali Del Tesoro 5.000 01/09/2040 19,493 0.01%
1,600,000 Italy Buoni Poliennali Del Tesoro 4.000 01/02/2017 2,150,494 0.60% 1,220,000 Italy Buoni Poliennali Del Tesoro 3.750 15/04/2016 1,639,990 0.46%
440,000 Italy Buoni Poliennali Del Tesoro 4.750 01/09/2021 596,420 0.17% 425,000 Italy Buoni Poliennali Del Tesoro 5.500 01/11/2022 593,271 0.17%
1,300,000 Italy Buoni Poliennali Del Tesoro 4.750 01/09/2044 1,614,015 0.45% 1,250,000 Intesa Sanpaolo SPA
5.150 16/07/2020 1,659,191 0.46%
585,000 Italy Government Bonds
5.000 01/08/2039 765,360 0.21% 4,520,000 Italy Government Bonds
4.750 01/05/2017 6,210,005 1.73%
500,000 SNAM SPA
3.875 19/03/2018 686,427 0.19% 455,000 Telecom Italia SPA
4.000 21/01/2020 577,150 0.16%
Total Italy
20,233,494 5.64%
Japan - 17.91% 300,000,000 Japanese Government CPI Linked Bond 1.095 10/12/2016 3,237,797 0.90%
704,000,000 Japan Government Bonds 0.100 15/02/2014 7,087,486 1.97% 247,000,000 Japan Government Bonds 1.400 20/03/2020 2,628,649 0.73%
1,220,000,000 Japan Government Bonds 1.100 20/06/2020 12,710,943 3.54% 1,970,000,000 Japan Government Bonds 1.000 20/09/2021 20,240,446 5.64%
693,000,000 Japan Government Bonds 1.800 20/09/2031 7,182,558 2.00% 221,000,000 Japan Government Bonds 2.500 20/09/2037 2,543,959 0.71% 659,000,000 Japan Government Bonds 2.100 20/12/2027 7,378,504 2.06%
1,300,000 Takeda Pharmaceutical Co Ltd 1.625 17/03/2017 1,285,960 0.36% Total Japan
64,296,302 17.91%
South Korea - 1.04% 1,602,192 Korea Development Bank 1.000 22/01/2016 1,574,580 0.44%
1,089,909 Korea Development Bank 1.500 30/05/2018 1,404,811 0.39% 712,090 POSCO
5.250 14/04/2021 757,006 0.21%
Total South Korea
3,736,397 1.04%
Luxembourg - 1% 1,700,753 Bumper 2 SA
1.375 23/02/2023 2,228,449 0.62% 668,291 E-Carat SA
1.371 18/09/2020 875,807 0.24%
373,281 Highway 2012-I BV
1.230 26/03/2024 487,688 0.14% Total Luxembourg
3,591,944 1.00%
Malaysia - 0.21% 735,000 Hong Leong Bank Bhd
3.750 17/03/2016 766,679 0.21% Total Malaysia
766,679 0.21%
Mexico - 0.54% 600,000 America Movil SAB
5.000 16/10/2019 646,710 0.18% 1,040,000 Mexico Government Bonds 2.750 22/04/2023 1,292,293 0.36%
Total Mexico
1,939,003 0.54%
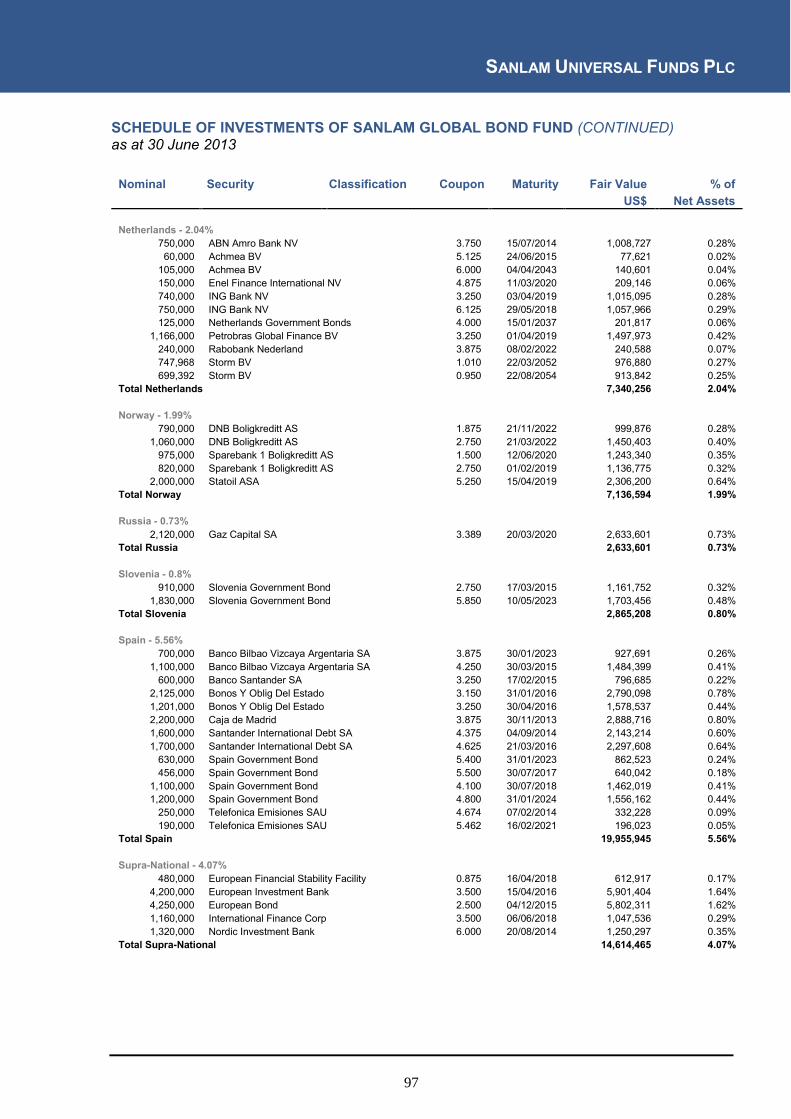
SANLAM UNIVERSAL FUNDS PLC
97
SCHEDULE OF INVESTMENTS OF SANLAM GLOBAL BOND FUND (CONTINUED) as at 30 June 2013
Nominal Security Classification Coupon Maturity Fair Value % of US$ Net Assets
Netherlands - 2.04% 750,000 ABN Amro Bank NV
3.750 15/07/2014 1,008,727 0.28% 60,000 Achmea BV
5.125 24/06/2015 77,621 0.02%
105,000 Achmea BV
6.000 04/04/2043 140,601 0.04% 150,000 Enel Finance International NV 4.875 11/03/2020 209,146 0.06% 740,000 ING Bank NV
3.250 03/04/2019 1,015,095 0.28%
750,000 ING Bank NV
6.125 29/05/2018 1,057,966 0.29% 125,000 Netherlands Government Bonds 4.000 15/01/2037 201,817 0.06%
1,166,000 Petrobras Global Finance BV 3.250 01/04/2019 1,497,973 0.42% 240,000 Rabobank Nederland
3.875 08/02/2022 240,588 0.07%
747,968 Storm BV
1.010 22/03/2052 976,880 0.27% 699,392 Storm BV
0.950 22/08/2054 913,842 0.25%
Total Netherlands
7,340,256 2.04%
Norway - 1.99% 790,000 DNB Boligkreditt AS
1.875 21/11/2022 999,876 0.28% 1,060,000 DNB Boligkreditt AS
2.750 21/03/2022 1,450,403 0.40%
975,000 Sparebank 1 Boligkreditt AS 1.500 12/06/2020 1,243,340 0.35% 820,000 Sparebank 1 Boligkreditt AS 2.750 01/02/2019 1,136,775 0.32%
2,000,000 Statoil ASA
5.250 15/04/2019 2,306,200 0.64% Total Norway
7,136,594 1.99%
Russia - 0.73% 2,120,000 Gaz Capital SA
3.389 20/03/2020 2,633,601 0.73% Total Russia
2,633,601 0.73%
Slovenia - 0.8% 910,000 Slovenia Government Bond 2.750 17/03/2015 1,161,752 0.32%
1,830,000 Slovenia Government Bond 5.850 10/05/2023 1,703,456 0.48% Total Slovenia
2,865,208 0.80%
Spain - 5.56% 700,000 Banco Bilbao Vizcaya Argentaria SA 3.875 30/01/2023 927,691 0.26%
1,100,000 Banco Bilbao Vizcaya Argentaria SA 4.250 30/03/2015 1,484,399 0.41% 600,000 Banco Santander SA
3.250 17/02/2015 796,685 0.22%
2,125,000 Bonos Y Oblig Del Estado 3.150 31/01/2016 2,790,098 0.78% 1,201,000 Bonos Y Oblig Del Estado 3.250 30/04/2016 1,578,537 0.44% 2,200,000 Caja de Madrid
3.875 30/11/2013 2,888,716 0.80%
1,600,000 Santander International Debt SA 4.375 04/09/2014 2,143,214 0.60% 1,700,000 Santander International Debt SA 4.625 21/03/2016 2,297,608 0.64%
630,000 Spain Government Bond
5.400 31/01/2023 862,523 0.24% 456,000 Spain Government Bond
5.500 30/07/2017 640,042 0.18%
1,100,000 Spain Government Bond
4.100 30/07/2018 1,462,019 0.41% 1,200,000 Spain Government Bond
4.800 31/01/2024 1,556,162 0.44%
250,000 Telefonica Emisiones SAU 4.674 07/02/2014 332,228 0.09% 190,000 Telefonica Emisiones SAU 5.462 16/02/2021 196,023 0.05%
Total Spain
19,955,945 5.56%
Supra-National - 4.07% 480,000 European Financial Stability Facility 0.875 16/04/2018 612,917 0.17%
4,200,000 European Investment Bank 3.500 15/04/2016 5,901,404 1.64% 4,250,000 European Bond
2.500 04/12/2015 5,802,311 1.62%
1,160,000 International Finance Corp 3.500 06/06/2018 1,047,536 0.29% 1,320,000 Nordic Investment Bank
6.000 20/08/2014 1,250,297 0.35%
Total Supra-National
14,614,465 4.07%

SANLAM UNIVERSAL FUNDS PLC
98
SCHEDULE OF INVESTMENTS OF SANLAM GLOBAL BOND FUND (CONTINUED) as at 30 June 2013
Nominal Security Classification Coupon Maturity Fair Value % of US$ Net Assets
Sweden - 2.97% 1,165,000 Nordea Bank AB
1.375 12/04/2018 1,497,825 0.42% 377,000 Stadshypotek AB
1.875 02/10/2019 361,279 0.10%
1,801,000 Swedbank Hypotek AB
2.000 31/01/2014 2,365,393 0.66% 895,000 Swedish Covered Bond Corp 3.000 03/02/2015 1,209,332 0.34%
2,475,000 Svensk Exportkredit AB
3.250 16/09/2014 2,560,140 0.71% 1,995,000 Svensk Exportkredit AB
3.625 27/05/2014 2,671,801 0.74%
Total Sweden
10,665,770 2.97%
Switzerland - 0.88% 3,050,000 Credit Suisse/New York
5.500 01/05/2014 3,173,525 0.88% Total Switzerland
3,173,525 0.88%
Turkey - 0.14% 540,000 Turkey Government Bonds 2.803 26/03/2018 514,350 0.14%
Total Turkey
514,350 0.14%
United States - 23.97% 134,000 Altria Group Inc
9.250 06/08/2019 176,599 0.05% 445,000 Altria Group Inc
9.950 10/11/2038 651,369 0.18%
4,070,000 Arkle Master Issuer Plc
1.674 17/05/2060 4,078,348 1.14% - AT&T Inc
4.300 15/12/2042 591 0.00%
1,200,000 BAE Systems Holdings Inc 4.950 01/06/2014 1,242,360 0.35% 585,000 Bank of America Corp
5.625 01/07/2020 645,226 0.18%
490,000 Bank of America Corp
5.700 24/01/2022 542,675 0.15% 1,400,000 Bank of America Corp
0.351 05/02/2014 1,818,071 0.51%
370,000 Boston Scientific Corp
6.250 15/11/2015 400,488 0.11% 3,175,000 California State Bonds
5.250 01/04/2014 3,274,060 0.91%
905,000 Capital One Bank
0.253 15/07/2016 904,659 0.25% 1,200,000 Capital One Bank
3.375 15/02/2023 1,120,080 0.31%
285,000 Citigroup Inc
6.375 12/08/2014 300,832 0.08% 1,600,000 Comcast Corp
6.400 01/03/2040 1,898,240 0.53%
1,520,000 Cox Communications Inc 8.375 01/03/2039 2,050,100 0.57% 500,000 Crown Castle Towers LLC 6.113 15/01/2020 574,524 0.16%
1,403,163 DBUBS Mortgage Trust
3.742 01/06/2017 1,485,445 0.41% 2,560,000 Directv Holdings
1.750 15/01/2018 2,474,156 0.69%
1,150,000 Directv Holdings
5.150 15/03/2042 1,042,820 0.29% 1,200,000 Freddie Mac Pool
4.000 15/08/2039 1,245,609 0.35%
5,598,275 Freddie Mac Pool
4.500 01/01/2040 6,035,028 1.68% 1,710,000 Fannie Mae Pool
4.000 15/08/2039 1,778,200 0.50%
4,594,753 Fannie Mae Pool
5.500 01/04/2034 5,029,464 1.40% 658,798 Fannie Mae Pool
6.000 01/10/2038 716,049 0.20%
702,496 Fannie Mae Pool
6.500 01/10/2038 779,619 0.22% 375,399 Freddie Mac Gold Pool
5.500 01/09/2019 404,942 0.11%
183,611 Freddie Mac Gold Pool
5.500 01/10/2019 198,060 0.06% 499,683 Freddie Mac Gold Pool
5.500 01/09/2034 541,149 0.15%
3,355,027 Fannie Mae Pool
4.000 01/02/2042 3,513,294 0.98% 1,626,118 Fannie Mae Pool
5.000 01/07/2035 1,758,733 0.49%
810,000 Fannie Mae Pool
5.000 15/08/2036 870,940 0.24% 1,185,394 Fannie Mae Pool
5.500 01/09/2034 1,299,858 0.36%
1,522,000 Ford Credit Auto Owner Trust 1.350 15/12/2016 1,533,754 0.43% 1,700,000 Ford Credit Floorplan Master Owner Trust 1.920 15/01/2019 1,729,551 0.48%
950,000 Ford Motor Credit Co LLC 12.000 15/05/2015 1,123,755 0.31% 720,000 Ford Motor Credit Co LLC 6.625 15/08/2017 814,320 0.23%
1,200,000 Ford Motor Credit Co LLC 8.000 15/12/2016 1,406,460 0.39% 102,000 Ford Motor Credit Co LLC 1.150 15/02/2016 102,845 0.03%
2,000,000 Goldman Sachs Group Inc 4.750 15/07/2013 2,002,800 0.56%

SANLAM UNIVERSAL FUNDS PLC
99
SCHEDULE OF INVESTMENTS OF SANLAM GLOBAL BOND FUND (CONTINUED) as at 30 June 2013
Nominal Security Classification Coupon Maturity Fair Value % of US$ Net Assets
United States - 23.97% (continued) 345,000 Goldman Sachs Group Inc 6.150 01/04/2018 389,402 0.11%
1,060,000 Goldman Sachs Group Inc 5.750 24/01/2022 1,160,806 0.32% 3,100,000 Ginnie Mae Pool
0.000 15/07/2034 3,343,641 0.93%
1,033,624 Homes Master Issuer
1.677 15/10/2054 1,040,050 0.29% 1,595,000 International Paper Co
9.375 15/05/2019 2,081,874 0.58%
1,000,000 JPMorgan Chase & Co
3.700 20/01/2015 1,039,550 0.29% 160,000 JPMorgan Chase & Co
4.500 24/01/2022 167,976 0.05%
445,000 Kinder Morgan Energy Partners LP 6.850 15/02/2020 525,167 0.15% 368,000 Kraft Foods Group Inc
6.875 26/01/2039 444,912 0.12%
350,000 MetLife Inc
5.375 09/12/2024 585,174 0.16% 2,460,000 Morgan Stanley & Co.
6.000 13/05/2014 2,558,535 0.71%
515,000 News America Inc
6.400 15/12/2035 566,732 0.16% 1,495,000 Oracle Corp
5.375 15/07/2040 1,650,181 0.46%
1,000,000 PacifiCorp
6.000 15/01/2039 1,205,550 0.34% 900,000 Prudential Financial Inc
3.875 14/01/2015 937,485 0.26%
181,247 Santander Drive Auto Receivables Trust 0.910 15/05/2015 181,427 0.05% 350,000 Santander Drive Auto Receivables Trust 1.080 15/04/2016 351,295 0.10% 240,000 Santander Drive Auto Receivables Trust 1.220 15/12/2015 240,975 0.07% 689,612 SLM Student Loan Trust
1.293 15/08/2023 693,622 0.19%
479,113 SLM Student Loan Trust
1.593 15/08/2025 484,399 0.13% 1,282,631 SLM Student Loan Trust
0.593 25/03/2025 1,274,541 0.36%
2,440,000 SLM Student Loan Trust
1.576 25/01/2018 2,469,147 0.69% 1,340,000 Toyota Motor Credit Corp
1.250 05/10/2017 1,305,026 0.36%
155,000 Valet
1.150 21/09/2015 155,933 0.04% 510,000 Wells Fargo & Co
7.980 31/12/2049 578,850 0.16%
1,000,000 Wells Fargo & Co
3.450 13/02/2023 951,550 0.27% 175,000 Wells Fargo & Co
4.600 01/04/2021 190,566 0.05%
620,000 WM Covered Bond Program 4.375 19/05/2014 833,236 0.23% 1,145,000 CNPC General Capital
3.400 16/04/2023 1,061,415 0.30%
Total United States
86,034,090 23.97%
Total Debt
341,770,876 95.19%
Nominal Security
Classification Fair Value % of
US$ Net Assets
Collective Investment Schemes - 5.35%
19,125,386 Institutional US Dollar Liquidity Fund - Class A B 19,126,935 5.34%
Total Collective Investment Schemes
19,126,935 5.34%

SANLAM UNIVERSAL FUNDS PLC
100
SCHEDULE OF INVESTMENTS OF SANLAM GLOBAL BOND FUND (CONTINUED) as at 30 June 2013
Derivative Financal Instruments
Forward Contracts - 0.44% - Classification D
Buy Buy Sell Sell Maturity Fair Value % of
Currency Amount Currency Amount US$ Net Assets ¹ USD 6,468,354 AUD (6,212,701) 17/07/2013 789,029 0.23% ² USD 36,497,529 EUR (27,950,000) 23/07/2013 160,363 0.04% ³ USD 1,170,645 NZD (1,400,000) 17/07/2013 90,565 0.03% 4 USD 1,821,483 BRL (3,865,733) 24/07/2013 79,333 0.02% 2 USD 2,455,000 JPY (236,882,950) 25/07/2013 69,991 0.02% 2 JPY 189,264,489 USD (1,865,000) 25/07/2013 40,572 0.01% 5 JPY 167,394,150 USD (1,650,000) 25/07/2013 35,375 0.01% 6 USD 545,927 AUD (560,000) 17/07/2013 34,004 0.01% 3 EUR 1,712,023 CHF (2,079,462) 22/07/2013 27,673 0.01% 5 EUR 3,000,000 USD (3,873,240) 23/07/2013 26,993 0.01% 2 USD 1,753,951 INR (104,325,000) 21/08/2013 25,237 0.01% 2 USD 3,955,325 GBP (2,592,466) 21/08/2013 24,591 0.01% 4 USD 7,282,576 JPY (720,898,512) 25/07/2013 24,351 0.01% 2 USD 2,882,103 EUR (2,200,000) 23/07/2013 21,933 0.01% 2 USD 1,184,272 EUR (895,000) 23/07/2013 20,703 0.01% 2 USD 2,407,123 EUR (1,840,000) 23/07/2013 14,980 0.00% 6 EUR 3,585,000 USD (4,647,053) 28/08/2013 14,518 0.00% 7 USD 549,376 CAD (565,000) 17/07/2013 13,975 0.00% 2 USD 619,620 GBP (400,000) 17/07/2013 12,989 0.00% 6 USD 1,871,730 EUR (1,430,000) 23/07/2013 12,619 0.00% 2 USD 1,865,000 JPY (184,255,845) 25/07/2013 9,856 0.00% 2 USD 626,874 EUR (475,000) 23/07/2013 9,337 0.00% 5 USD 365,087 GBP (235,000) 21/08/2013 8,776 0.00% 4 USD 306,741 EUR (230,000) 23/07/2013 7,723 0.00% 4 USD 3,334,070 EUR (2,560,000) 23/07/2013 5,871 0.00% 8 CZK 15,000,432 USD (746,703) 17/07/2013 3,944 0.00% 2 USD 370,272 JPY (36,420,000) 17/07/2013 3,597 0.00% 6 USD 760,765 GBP (500,000) 17/07/2013 2,476 0.00% 6 USD 396,480 GBP (260,000) 17/07/2013 2,170 0.00% 6 USD 1,259,436 JPY (124,925,000) 17/07/2013 1,696 0.00% 2 USD 1,510,953 JPY (150,000,000) 17/07/2013 756 0.00% Total Forward Contracts
1,595,996 0.44%
Nominal Security
Classification Maturity Fair Value % of
US$ Net Assets
Futures Contracts - 0.24% (46) Canada 10 Year Bond Future C 19/09/2013 229,368 0.06%
(4) Euro-Schatz Future
C 06/09/2013 806 0.00% (20) Long Gilt Future
C 26/09/2013 149,553 0.04%
(11) Japan 10 Year Bond Future C 10/09/2013 14,396 0.00% (118) Euro-Bobl Future
C 06/09/2013 134,465 0.04%
(9) Euro-Bund Future
C 06/09/2013 22,595 0.01% (109) US 10Year Note Future
C 19/09/2013 288,465 0.09%
(32) Australia 3 Year Bond Future C 16/09/2013 17,474 0.00% Total Futures Contracts
857,122 0.24%
Total financial assets at fair value through profit or loss
363,350,929 101.21%

SANLAM UNIVERSAL FUNDS PLC
101
SCHEDULE OF INVESTMENTS OF SANLAM GLOBAL BOND FUND (CONTINUED) as at 30 June 2013
Nominal Security
Classification Maturity Fair Value % of
US$ Net Assets
Financial liabilities at fair value through profit or loss
Short Securities - Debt – (1.74%) (6,246,900) Fannie Mae Pool
5.500 15/07/2034 (6,256,800) (1.74%) Total Short Securities – Debt
(6,256,800) (1.74%)
Derivative Financal Instruments
Forward Contracts – (0.54%) – Classification D
Buy Buy Sell Sell Maturity Fair Value % of
Currency Amount Currency Amount US$ Net Assets 3 USD 70,272 JPY (7,000,000) 17/07/2013 (204) 0.00% 3 USD 1,274,908 JPY (126,920,000) 17/07/2013 (2,918) 0.00% 2 JPY 236,871,000 USD (2,388,740) 17/07/2013 (3,930) 0.00% 2 KRW 300,000,000 USD (269,034) 14/08/2013 (8,504) 0.00% 6 AUD 580,000 USD (539,035) 17/07/2013 (8,830) 0.00% 2 DKK 7,402,141 USD (1,302,877) 17/07/2013 (12,570) 0.00% 1 PLN 3,660,857 USD (1,111,884) 17/07/2013 (13,871) 0.00% 6 USD 1,607,600 EUR (1,250,000) 23/07/2013 (17,497) 0.00% 2 USD 7,749,575 EUR (5,975,000) 28/08/2013 (19,709) (0.01%) 2 USD 1,845,000 JPY (185,293,350) 25/07/2013 (20,590) (0.01%) 2 SGD 1,266,000 USD (1,021,551) 17/07/2013 (23,336) (0.01%) 9 EUR 5,000,000 USD (6,524,585) 23/07/2013 (24,197) (0.01%) 6 USD 927,372 JPY (95,000,000) 17/07/2013 (29,085) (0.01%) 2 GBP 600,000 USD (940,195) 17/07/2013 (30,248) (0.01%) 1 NOK 3,843,000 USD (659,710) 17/07/2013 (30,841) (0.01%) 1 BRL 1,683,015 USD (795,000) 24/07/2013 (36,524) (0.01%) 4 GBP 4,693,000 USD (7,155,722) 17/07/2013 (38,425) (0.01%) 2 NZD 665,000 USD (555,689) 17/07/2013 (42,651) (0.01%) 3 CAD 1,347,000 USD (1,320,994) 17/07/2013 (44,560) (0.01%) 2 USD 3,665,820 EUR (2,855,000) 28/08/2013 (46,533) (0.01%) 1 MYR 2,783,000 USD (922,287) 14/08/2013 (48,517) (0.01%) 1 USD 1,765,000 JPY (180,758,062) 25/07/2013 (54,927) (0.02%) 3 CHF 3,347,638 USD (3,603,400) 17/07/2013 (64,969) (0.02%) 6 THB 30,345,000 USD (1,040,370) 17/07/2013 (66,471) (0.02%) 6 BRL 2,182,718 USD (1,065,000) 24/07/2013 (81,326) (0.02%) 6 JPY 235,552,340 USD (2,455,000) 25/07/2013 (83,388) (0.02%) 2 SEK 17,177,298 USD (2,641,008) 17/07/2013 (96,511) (0.03%) 2 KRW 3,929,239,460 USD (3,516,570) 14/08/2013 (104,290) (0.03%) 6 MXN 21,692,000 USD (1,786,148) 17/07/2013 (123,396) (0.03%) 2 INR 104,325,000 USD (1,875,000) 21/08/2013 (146,286) (0.04%) 2 EUR 9,000,000 USD (11,999,277) 23/07/2013 (298,579) (0.08%) 10 JPY 1,008,825,000 USD (10,469,605) 25/07/2013 (312,450) (0.10%) Total Forward Contracts
(1,936,133) (0.54%)

SANLAM UNIVERSAL FUNDS PLC
102
SCHEDULE OF INVESTMENTS OF SANLAM GLOBAL BOND FUND (CONTINUED) as at 30 June 2013
Nominal Security
Classification Maturity Fair Value % of
US$ Net Assets
Futures Contracts – (0.23%) 144 US 5 Year Note Future
C 30/09/2013 (261,776) (0.08%) 99 US 2 Year Note Future
C 30/09/2013 (22,896) (0.01%)
33 Euro Buxl 30 Year Bond Future C 06/09/2013 (84,997) (0.02%) 53 US Long Bond Future
C 19/09/2013 (326,741) (0.09%)
14 US Ultra Bond Future
C 19/09/2013 (11,700) 0.00% 44 Australia 10 Year Bond Future C 16/09/2013 (118,764) (0.03%)
Total Futures Contracts
(826,874) (0.23%)
Interest Rate Swaps – (0.02%) 3,580,000 IRS EUR 0.877%/3ML6
D 10/01/2018 (38,174) (0.01%)
7,100,000 IRS EUR 0.9%/6ML2
D 30/11/2017 (30,396) (0.01%)
(2,020,000) IRS EUR 1.782%/3ML6
D 28/09/2022 (3,561) 0.00% Total Interest Rate Swaps
(72,131) (0.02%)
Total financial liabilities at fair value through profit or loss
(9,091,938) (2.53%)
Cash and cash equivalents
7,718,414 2.15% Other net assets and liabilities
(3,025,707) (0.84%)
Net assets attributable to holders of redeemable participating shares 358,951,698 100.00%
The following institutions act as counterparties to the over the counter derivative financial instruments: 1UBS, 2Deutsche Bank, 3Barclays Bank, 4JP Morgan Chase Bank, 5Goldman Sachs, 6CitiBank, 7Credit Suisse, 8Royal Bank of Scotland, 9BNP Paribas and 10HSBC.
Summary
Classification Description
Fair Value % of Net Assets
Tranferable securities and money market instruments admitted to
official stock exchange listing or traded on regulated market 335,514,074 93.45%
A Transferabe securities and money market instruments other than
those referred above
- 0.00%
B Collective Investment Schemes
19,126,935 5.35% C Financial derivative instruments dealt in on a regulated market 30,248 0.01% D Over the counter financial derivative instrument
(412,266) -0.12%
Cash and cash equivalents
7,718,414 2.15%
Other net assets and liabilities
(3,025,707) -0.84%
Net assets attributable to holders of redeemable participating shares 358,951,698 100.00%

SANLAM UNIVERSAL FUNDS PLC
103
SCHEDULE OF INVESTMENTS OF SANLAM GLOBAL FINANCIAL FUND as at 30 June 2013
Nominal Security
Classification Fair Value % of US$ Net Assets
Financial assets at fair value through profit or loss
Equity - 99.12%
Bermuda - 10.72% 1,208,139 Catlin Group Ltd
9,147,626 2.83%
840,226 Lancashire Holdings Ltd
10,093,417 3.13% 98,190 Renaissancere Holdings Ltd
8,521,910 2.64%
332,532 Tower Group International Ltd
6,820,231 2.12% Total Bermuda
34,583,184 10.72%
Brazil - 0.99% 246,000 Banco Itau Holding Financeira
3,205,353 0.99%
Total Brazil
3,205,353 0.99%
Cayman Islands - 2.45% 4,000,000 DBA Telecommunication Asia
1,046,904 0.32%
279,000 Greenlight Capital Re Ltd
6,843,870 2.13% Total Cayman Islands
7,890,774 2.45%
China - 0.88% 4,000,000 China Construction Bank
2,831,283 0.88%
Total China
2,831,283 0.88%
France - 4.58% 222,575 Scor SE
6,821,640 2.11%
231,920 Societe Generale
7,959,813 2.47% Total France
14,781,453 4.58%
Germany - 2.64% 316,124 ADC African Development Corp
3,534,408 1.10%
518,619 Commerzbank AG
4,516,004 1.40% 41,205 IdB Holdings S.A.
481,582 0.14%
Total Germany
8,531,994 2.64%
Great Britain - 8.68% 2,215,749 Accident Exchange Group PLC
0 0.00%
522,904 Bank of Georgia Holdings PLC
13,245,104 4.10% 1,013,274 Barclays PLC
4,279,480 1.33%
372,000 IG Group Holdings PLC
3,272,562 1.01% 1,264,000 Legal & General Group PLC
3,286,055 1.02%
537,398 Novae Group PLC
3,916,574 1.22% Total Great Britain
27,999,775 8.68%
India - 13.71% 5,103,428 Andhra Bank
7,014,433 2.17%
920,227 Citi Union Bank Ltd
694,104 0.22% 3,680,910 City Union Bank Ltd
3,405,736 1.06%
3,704,282 Dena Bank
4,333,873 1.34% 451,024 Jammu & Kashmir Bank Ltd
9,270,335 2.87%
14,324,097 Manappuram Finance Ltd
2,545,012 0.79% 4,428,500 Power Finance Corp Ltd
10,696,394 3.31%
216,223 Shriram City Union Finance Ltd
3,655,785 1.13% 221,500 Shriram Transport Finance Co Ltd
2,630,266 0.82%
Total India
44,245,938 13.71%
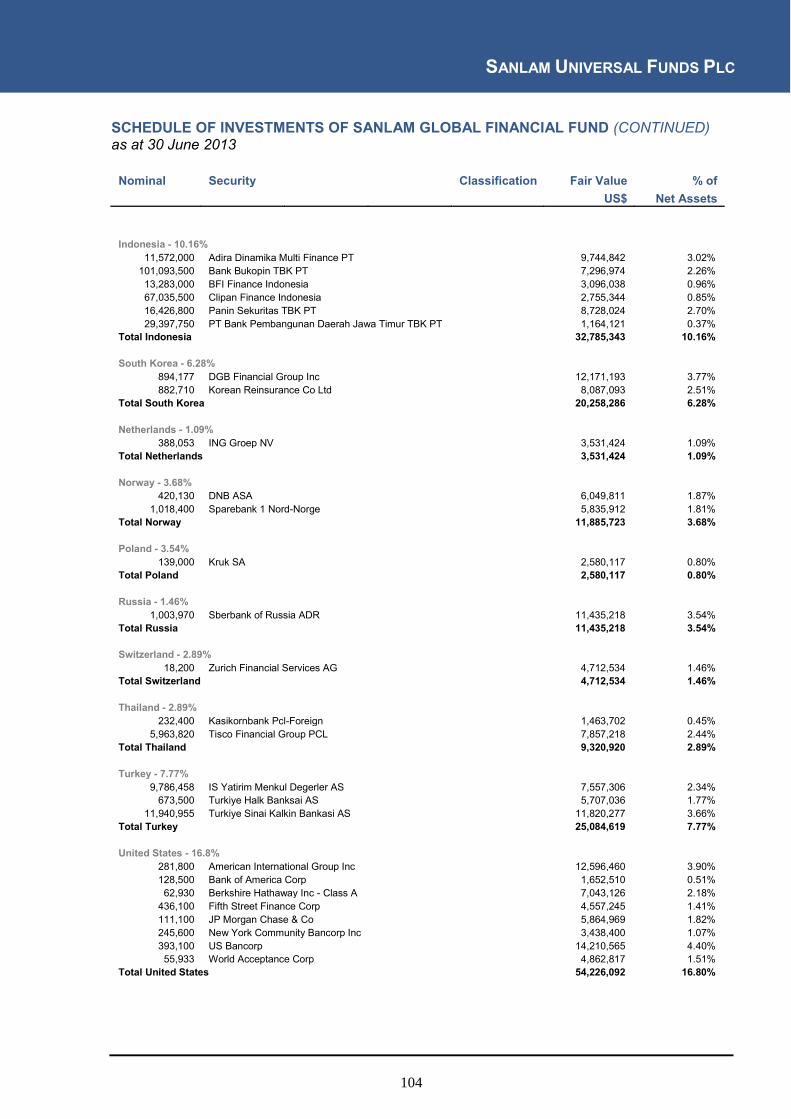
SANLAM UNIVERSAL FUNDS PLC
104
SCHEDULE OF INVESTMENTS OF SANLAM GLOBAL FINANCIAL FUND (CONTINUED) as at 30 June 2013
Nominal Security
Classification Fair Value % of US$ Net Assets
Indonesia - 10.16%
11,572,000 Adira Dinamika Multi Finance PT
9,744,842 3.02% 101,093,500 Bank Bukopin TBK PT
7,296,974 2.26%
13,283,000 BFI Finance Indonesia
3,096,038 0.96% 67,035,500 Clipan Finance Indonesia
2,755,344 0.85%
16,426,800 Panin Sekuritas TBK PT
8,728,024 2.70% 29,397,750 PT Bank Pembangunan Daerah Jawa Timur TBK PT 1,164,121 0.37%
Total Indonesia
32,785,343 10.16%
South Korea - 6.28% 894,177 DGB Financial Group Inc
12,171,193 3.77%
882,710 Korean Reinsurance Co Ltd
8,087,093 2.51% Total South Korea
20,258,286 6.28%
Netherlands - 1.09% 388,053 ING Groep NV
3,531,424 1.09%
Total Netherlands
3,531,424 1.09%
Norway - 3.68% 420,130 DNB ASA
6,049,811 1.87%
1,018,400 Sparebank 1 Nord-Norge
5,835,912 1.81% Total Norway
11,885,723 3.68%
Poland - 3.54% 139,000 Kruk SA
2,580,117 0.80%
Total Poland
2,580,117 0.80%
Russia - 1.46% 1,003,970 Sberbank of Russia ADR
11,435,218 3.54%
Total Russia
11,435,218 3.54%
Switzerland - 2.89% 18,200 Zurich Financial Services AG
4,712,534 1.46%
Total Switzerland
4,712,534 1.46%
Thailand - 2.89% 232,400 Kasikornbank Pcl-Foreign
1,463,702 0.45%
5,963,820 Tisco Financial Group PCL
7,857,218 2.44% Total Thailand
9,320,920 2.89%
Turkey - 7.77% 9,786,458 IS Yatirim Menkul Degerler AS
7,557,306 2.34%
673,500 Turkiye Halk Banksai AS
5,707,036 1.77% 11,940,955 Turkiye Sinai Kalkin Bankasi AS
11,820,277 3.66%
Total Turkey
25,084,619 7.77%
United States - 16.8% 281,800 American International Group Inc
12,596,460 3.90%
128,500 Bank of America Corp
1,652,510 0.51% 62,930 Berkshire Hathaway Inc - Class A
7,043,126 2.18%
436,100 Fifth Street Finance Corp
4,557,245 1.41% 111,100 JP Morgan Chase & Co
5,864,969 1.82%
245,600 New York Community Bancorp Inc
3,438,400 1.07% 393,100 US Bancorp
14,210,565 4.40%
55,933 World Acceptance Corp
4,862,817 1.51% Total United States
54,226,092 16.80%

SANLAM UNIVERSAL FUNDS PLC
105
SCHEDULE OF INVESTMENTS OF SANLAM GLOBAL FINANCIAL FUND (CONTINUED) as at 30 June 2013
Nominal Security
Classification Fair Value % of US$ Net Assets
Total Equity
319,890,030 99.12%
Total financial assets at fair value through profit or loss
319,890,030 99.12%
Cash and cash equivalents
15,967,353 4.95% Other net assets and liabilities
(13,144,513) (4.07%)
Net assets attributable to holders of redeemable participating shares 322,712,870 100.00%
Summary
Classification Description
Fair Value % of
Net Assets
Tranferable securities and money market instruments admitted to
official stock exchange listing or traded on regulated market 314,743,286 97.52%
A Transferabe securities and money market instruments other than
those referred above
5,146,744 1.60%
B Collective Investment Schemes
- 0.00% C Financial derivative instruments dealt in on a regulated market - 0.00% D Over the counter financial derivative instrument
- 0.00%
Cash and cash equivalents
15,967,353 4.95%
Other net assets and liabilities
(13,144,513) -4.07%
Net assets attributable to holders of redeemable participating shares 322,712,870 100.00%
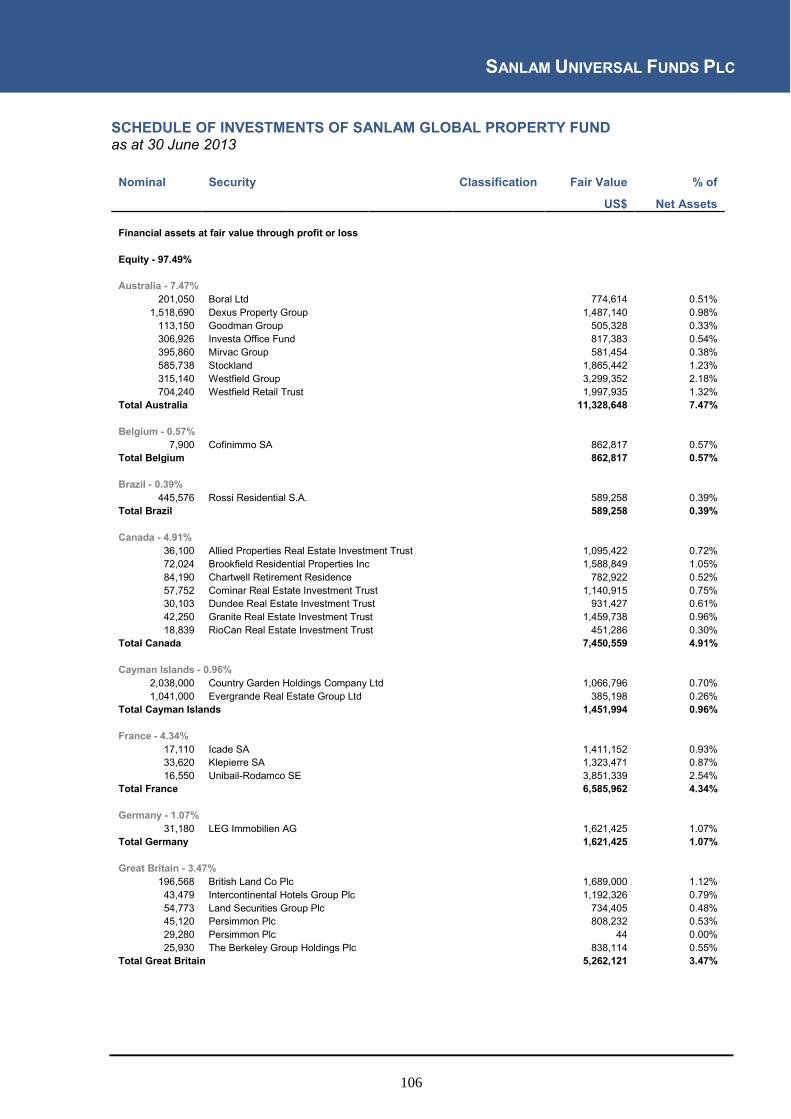
SANLAM UNIVERSAL FUNDS PLC
106
SCHEDULE OF INVESTMENTS OF SANLAM GLOBAL PROPERTY FUND as at 30 June 2013
Nominal Security
Classification Fair Value % of
US$ Net Assets
Financial assets at fair value through profit or loss
Equity - 97.49%
Australia - 7.47% 201,050 Boral Ltd
774,614 0.51%
1,518,690 Dexus Property Group
1,487,140 0.98% 113,150 Goodman Group
505,328 0.33%
306,926 Investa Office Fund
817,383 0.54% 395,860 Mirvac Group
581,454 0.38%
585,738 Stockland
1,865,442 1.23% 315,140 Westfield Group
3,299,352 2.18%
704,240 Westfield Retail Trust
1,997,935 1.32% Total Australia
11,328,648 7.47%
Belgium - 0.57% 7,900 Cofinimmo SA
862,817 0.57%
Total Belgium
862,817 0.57%
Brazil - 0.39% 445,576 Rossi Residential S.A.
589,258 0.39%
Total Brazil
589,258 0.39%
Canada - 4.91% 36,100 Allied Properties Real Estate Investment Trust
1,095,422 0.72%
72,024 Brookfield Residential Properties Inc
1,588,849 1.05% 84,190 Chartwell Retirement Residence
782,922 0.52%
57,752 Cominar Real Estate Investment Trust
1,140,915 0.75% 30,103 Dundee Real Estate Investment Trust
931,427 0.61%
42,250 Granite Real Estate Investment Trust
1,459,738 0.96% 18,839 RioCan Real Estate Investment Trust
451,286 0.30%
Total Canada
7,450,559 4.91%
Cayman Islands - 0.96% 2,038,000 Country Garden Holdings Company Ltd
1,066,796 0.70%
1,041,000 Evergrande Real Estate Group Ltd
385,198 0.26% Total Cayman Islands
1,451,994 0.96%
France - 4.34% 17,110 Icade SA
1,411,152 0.93% 33,620 Klepierre SA
1,323,471 0.87%
16,550 Unibail-Rodamco SE
3,851,339 2.54% Total France
6,585,962 4.34%
Germany - 1.07% 31,180 LEG Immobilien AG
1,621,425 1.07%
Total Germany
1,621,425 1.07%
Great Britain - 3.47% 196,568 British Land Co Plc
1,689,000 1.12%
43,479 Intercontinental Hotels Group Plc
1,192,326 0.79% 54,773 Land Securities Group Plc
734,405 0.48%
45,120 Persimmon Plc
808,232 0.53% 29,280 Persimmon Plc
44 0.00%
25,930 The Berkeley Group Holdings Plc
838,114 0.55% Total Great Britain
5,262,121 3.47%

SANLAM UNIVERSAL FUNDS PLC
107
SCHEDULE OF INVESTMENTS OF SANLAM GLOBAL PROPERTY FUND (CONTINUED) as at 30 June 2013
Nominal Security
Classification Fair Value % of
US$ Net Assets
Hong Kong - 9.54% 55,000 Cheung Kong Holdings Ltd
745,984 0.49%
426,000 China Overseas Land & Investments Ltd
1,117,699 0.74% 411,750 China Vanke Co Ltd
737,903 0.49%
189,462 Great Eagle Holdings Ltd
724,266 0.48% 141,000 Hang Lung Properties Ltd
491,742 0.32%
85,800 Henderson Land Development Co Ltd
512,176 0.34% 222,500 Hopewell Holdings Ltd
741,552 0.49%
213,500 Link Reit
1,050,131 0.69% 1,386,000 New World Development Co Ltd
1,919,192 1.27%
246,000 Sun Hung Kai Properties Ltd
3,174,828 2.09% 303,000 Wharf Holdings Ltd
2,547,072 1.67%
141,000 Wheelock & Co Ltd
707,163 0.47% Total Hong Kong
14,469,708 9.54%
Italy - 0.44% 44,470 Buzzi Unicem SPA
667,166 0.44%
Total Italy
667,166 0.44%
Japan - 13.81% 53,600 Aeon Mall Co Ltd
1,325,835 0.87%
95 Daiwa House REIT Investment Corp
681,919 0.45% 78 Fukuoka REIT Corp
617,215 0.41%
155 Japan Excellent Inc
872,294 0.58% 122 Japan Real Estate Investment Corp
1,359,650 0.90%
504 Japan Retail Fund Investment Corp
1,051,332 0.69% 39,300 JS Group Corp
956,288 0.63%
270 Kenedix Realty Investment Corp
1,073,694 0.71% 85,000 Mitsubishi Estate Co Ltd
2,259,992 1.49%
150,700 Mitsui Fudosan Co Ltd
4,425,570 2.92% 67 Nippon Building Fund Inc
774,348 0.51%
98 Nippon Prologis REIT Inc
851,445 0.56% 1,015 Orix Jreit Inc
1,159,796 0.76%
37,000 Sekisui Chemical Co Ltd
392,238 0.26% 79,000 Sumitomo Realty & Development Co Ltd
3,145,525 2.07%
Total Japan
20,947,141 13.81%
Mexico - 1.6% 312,440 Fibra Uno Administracion SA
1,038,157 0.68%
648,020 Macquarie Mexico Real Estate Management SA de CV 1,387,719 0.92% Total Mexico
2,425,876 1.60%
Netherlands - 0.96% 19,599 Corio NV
778,788 0.51%
16,580 Vastned Retail NV
678,547 0.45% Total Netherlands
1,457,335 0.96%
Singapore - 2.98% 855,000 Capitacommercial Trust
987,602 0.65%
971,000 Mapletree Commercial Trust
907,226 0.60% 1,058,000 Mapletree Logistics Trust
917,606 0.60%
194,000 United Overseas Land Ltd
1,027,896 0.68% 419,000 Wing Tai Holdings Ltd
677,245 0.45%
Total Singapore
4,517,575 2.98%
Thailand - 0.74% 647,000 LPN Development PCL
501,051 0.33%
970,000 Supalai PCL
551,703 0.37% 115,800 Supalai PCL
65,863 0.04%
Total Thailand
1,118,617 0.74%
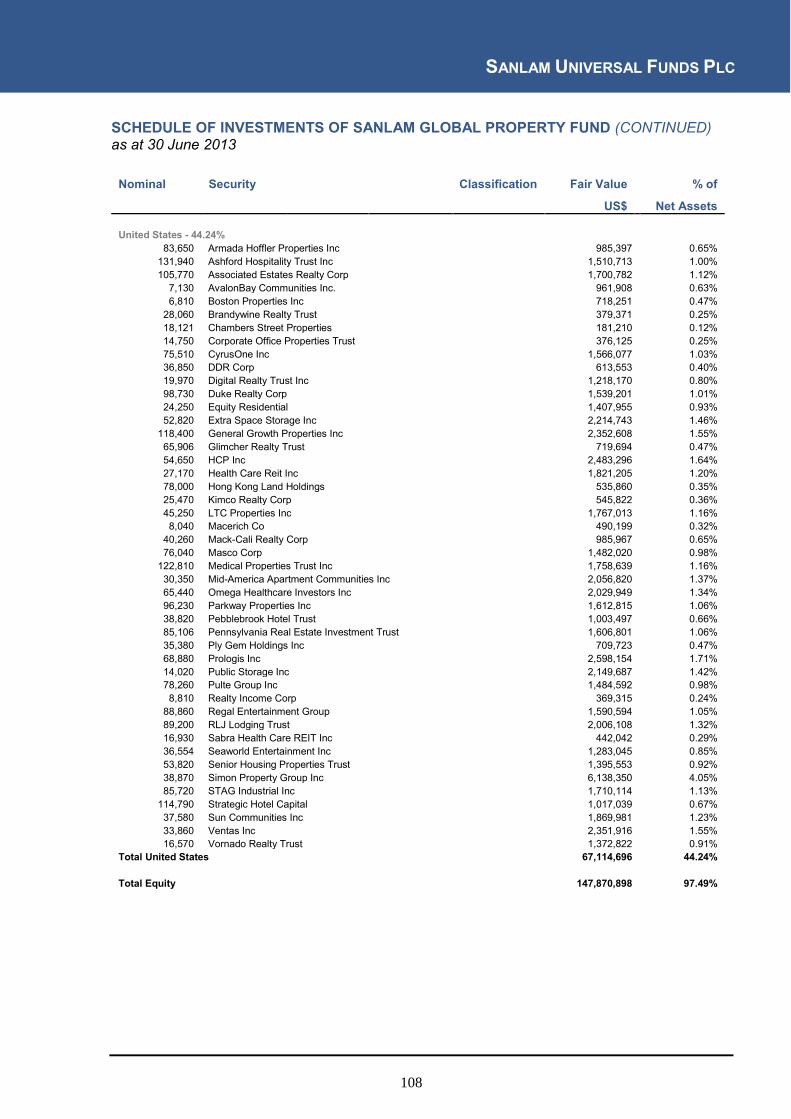
SANLAM UNIVERSAL FUNDS PLC
108
SCHEDULE OF INVESTMENTS OF SANLAM GLOBAL PROPERTY FUND (CONTINUED) as at 30 June 2013
Nominal Security
Classification Fair Value % of
US$ Net Assets
United States - 44.24% 83,650 Armada Hoffler Properties Inc
985,397 0.65%
131,940 Ashford Hospitality Trust Inc
1,510,713 1.00% 105,770 Associated Estates Realty Corp
1,700,782 1.12%
7,130 AvalonBay Communities Inc.
961,908 0.63% 6,810 Boston Properties Inc
718,251 0.47%
28,060 Brandywine Realty Trust
379,371 0.25% 18,121 Chambers Street Properties
181,210 0.12%
14,750 Corporate Office Properties Trust
376,125 0.25% 75,510 CyrusOne Inc
1,566,077 1.03%
36,850 DDR Corp
613,553 0.40% 19,970 Digital Realty Trust Inc
1,218,170 0.80%
98,730 Duke Realty Corp
1,539,201 1.01% 24,250 Equity Residential
1,407,955 0.93%
52,820 Extra Space Storage Inc
2,214,743 1.46% 118,400 General Growth Properties Inc
2,352,608 1.55%
65,906 Glimcher Realty Trust
719,694 0.47% 54,650 HCP Inc
2,483,296 1.64%
27,170 Health Care Reit Inc
1,821,205 1.20% 78,000 Hong Kong Land Holdings
535,860 0.35%
25,470 Kimco Realty Corp
545,822 0.36% 45,250 LTC Properties Inc
1,767,013 1.16%
8,040 Macerich Co
490,199 0.32% 40,260 Mack-Cali Realty Corp
985,967 0.65%
76,040 Masco Corp
1,482,020 0.98% 122,810 Medical Properties Trust Inc
1,758,639 1.16%
30,350 Mid-America Apartment Communities Inc
2,056,820 1.37% 65,440 Omega Healthcare Investors Inc
2,029,949 1.34%
96,230 Parkway Properties Inc
1,612,815 1.06% 38,820 Pebblebrook Hotel Trust
1,003,497 0.66%
85,106 Pennsylvania Real Estate Investment Trust
1,606,801 1.06% 35,380 Ply Gem Holdings Inc
709,723 0.47%
68,880 Prologis Inc
2,598,154 1.71% 14,020 Public Storage Inc
2,149,687 1.42%
78,260 Pulte Group Inc
1,484,592 0.98% 8,810 Realty Income Corp
369,315 0.24%
88,860 Regal Entertainment Group
1,590,594 1.05% 89,200 RLJ Lodging Trust
2,006,108 1.32%
16,930 Sabra Health Care REIT Inc
442,042 0.29% 36,554 Seaworld Entertainment Inc
1,283,045 0.85%
53,820 Senior Housing Properties Trust
1,395,553 0.92% 38,870 Simon Property Group Inc
6,138,350 4.05%
85,720 STAG Industrial Inc
1,710,114 1.13% 114,790 Strategic Hotel Capital
1,017,039 0.67%
37,580 Sun Communities Inc
1,869,981 1.23% 33,860 Ventas Inc
2,351,916 1.55%
16,570 Vornado Realty Trust
1,372,822 0.91% Total United States
67,114,696 44.24%
Total Equity
147,870,898 97.49%

SANLAM UNIVERSAL FUNDS PLC
109
SCHEDULE OF INVESTMENTS OF SANLAM GLOBAL PROPERTY FUND (CONTINUED) as at 30 June 2013
Derivative Financal Instruments
1Forward Contracts - 0.16% - Classification D
Buy Buy Sell Sell Maturity Fair Value % of Currency Amount Currency Amount US$ Net Assets USD 832,868 AUD (862,000) 17/09/2013 48,494 0.03% USD 2,474,372 AUD (2,694,000) 17/09/2013 22,976 0.02% USD 1,106,629 CAD (1,141,000) 17/09/2013 27,064 0.02% USD 1,871,863 CAD (1,950,000) 17/09/2013 26,857 0.02% USD 1,224,778 CAD (1,251,000) 17/09/2013 41,135 0.02% CHF 405,000 USD (415,875) 17/09/2013 12,456 0.01% USD 980,120 CHF (920,000) 17/09/2013 7,121 0.00% USD 1,051,037 EUR (794,000) 17/09/2013 18,501 0.01% GBP 535,000 USD (804,869) 17/09/2013 6,165 0.00% USD 2,357,032 JPY (233,266,000) 17/09/2013 7,779 0.01% USD 633,960 JPY (61,978,000) 17/09/2013 9,771 0.01% USD 2,168,024 SEK (14,599,000) 17/09/2013 8,473 0.01% Total Forward Contracts
236,792 0.16%
Total financial assets at fair value through profit or loss
148,107,690 97.65%
Financial liabilities at fair value through profit or loss
Derivative Financal Instruments
1Forward Contracts – (0.19%) – Classification D
Buy Buy Sell Sell Maturity Fair Value % of Currency Amount Currency Amount US$ Net Assets CAD 746,000 USD (706,925) 17/09/2013 (1,092) 0.00% CHF 515,000 USD (550,519) 17/09/2013 (5,851) 0.00% EUR 1,407,000 USD (1,840,915) 17/09/2013 (11,220) (0.01%) EUR 2,175,000 USD (2,845,763) 17/09/2013 (17,344) (0.01%) USD 789,089 EUR (613,000) 17/09/2013 (8,071) (0.01%) GBP 806,000 USD (1,224,413) 17/09/2013 (2,556) 0.00% JPY 259,018,000 USD (2,750,928) 17/09/2013 (142,323) (0.10%) USD 1,753,854 JPY (179,274,000) 17/09/2013 (51,638) (0.03%) SEK 12,665,000 USD (1,888,738) 17/09/2013 (15,273) (0.01%) SEK 13,568,000 USD (2,020,386) 17/09/2013 (13,345) (0.01%) SEK 4,571,000 USD (692,140) 17/09/2013 (15,978) (0.01%) Total Forward Contracts
(284,691) (0.19%)
Total financial liabilities at fair value through profit or loss
(284,691) (0.19%)
Cash and cash equivalents
3,480,419 2.29% Other net assets and liabilities
378,460 0.25%
Net assets attributable to holders of redeemable participating shares 151,681,878 100.00%
1JP Morgan Chase acts as counterparty to the over the counter derivative financial instruments.

SANLAM UNIVERSAL FUNDS PLC
110
SCHEDULE OF INVESTMENTS OF SANLAM GLOBAL PROPERTY FUND (CONTINUED) as at 30 June 2013
Summary
Classification Description
Fair Value % of Net Assets
Tranferable securities and money market instruments admitted to
official stock exchange listing or traded on regulated market 147,870,898 97.49%
A Transferabe securities and money market instruments other than
those referred above
- 0.00%
B Collective Investment Schemes
- 0.00% C Financial derivative instruments dealt in on a regulated market - 0.00% D Over the counter financial derivative instrument
(47,899) (0.03)%
Cash and cash equivalents
3,480,419 2.29%
Other net assets and liabilities
378,460 0.25%
Net assets attributable to holders of redeemable participating shares 151,681,878 100.00%
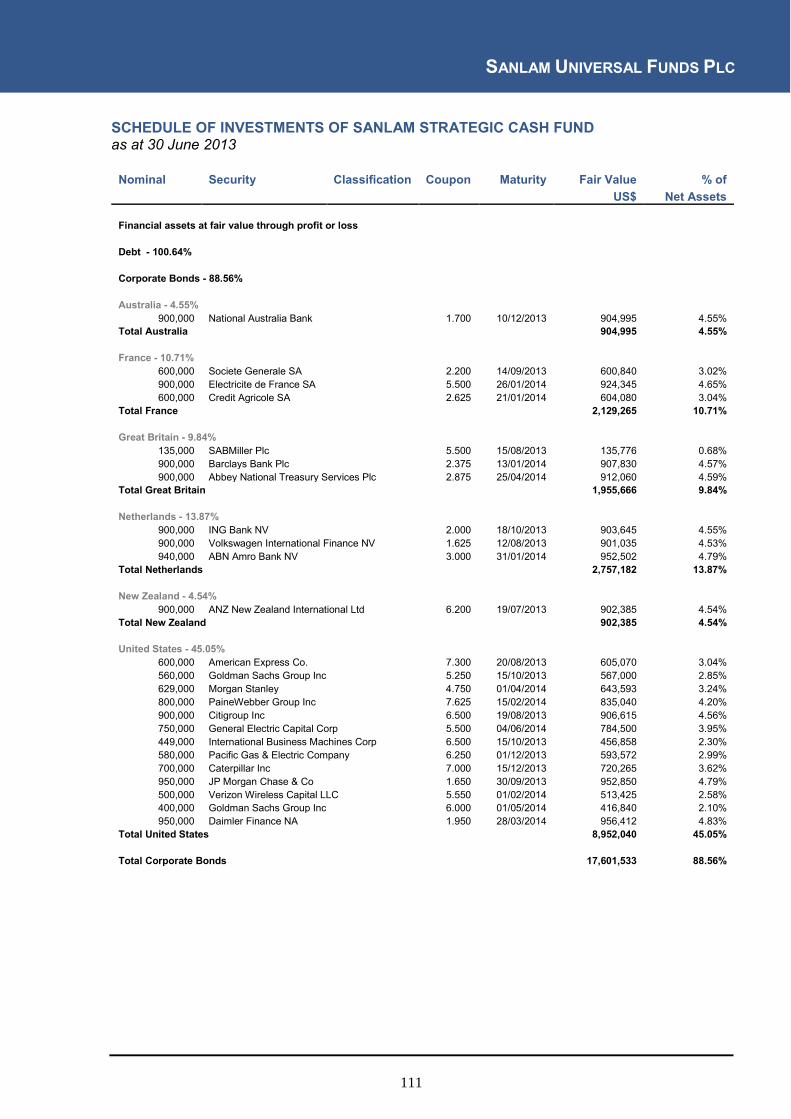
SANLAM UNIVERSAL FUNDS PLC
111
SCHEDULE OF INVESTMENTS OF SANLAM STRATEGIC CASH FUND as at 30 June 2013
Nominal Security Classification Coupon Maturity Fair Value % of US$ Net Assets
Financial assets at fair value through profit or loss
Debt - 100.64%
Corporate Bonds - 88.56%
Australia - 4.55% 900,000 National Australia Bank
1.700 10/12/2013 904,995 4.55% Total Australia
904,995 4.55%
France - 10.71% 600,000 Societe Generale SA
2.200 14/09/2013 600,840 3.02% 900,000 Electricite de France SA
5.500 26/01/2014 924,345 4.65%
600,000 Credit Agricole SA
2.625 21/01/2014 604,080 3.04% Total France
2,129,265 10.71%
Great Britain - 9.84% 135,000 SABMiller Plc
5.500 15/08/2013 135,776 0.68% 900,000 Barclays Bank Plc
2.375 13/01/2014 907,830 4.57%
900,000 Abbey National Treasury Services Plc 2.875 25/04/2014 912,060 4.59% Total Great Britain
1,955,666 9.84%
Netherlands - 13.87% 900,000 ING Bank NV
2.000 18/10/2013 903,645 4.55% 900,000 Volkswagen International Finance NV 1.625 12/08/2013 901,035 4.53% 940,000 ABN Amro Bank NV
3.000 31/01/2014 952,502 4.79%
Total Netherlands
2,757,182 13.87%
New Zealand - 4.54% 900,000 ANZ New Zealand International Ltd 6.200 19/07/2013 902,385 4.54%
Total New Zealand
902,385 4.54%
United States - 45.05% 600,000 American Express Co.
7.300 20/08/2013 605,070 3.04% 560,000 Goldman Sachs Group Inc 5.250 15/10/2013 567,000 2.85% 629,000 Morgan Stanley
4.750 01/04/2014 643,593 3.24%
800,000 PaineWebber Group Inc
7.625 15/02/2014 835,040 4.20% 900,000 Citigroup Inc
6.500 19/08/2013 906,615 4.56%
750,000 General Electric Capital Corp 5.500 04/06/2014 784,500 3.95% 449,000 International Business Machines Corp 6.500 15/10/2013 456,858 2.30% 580,000 Pacific Gas & Electric Company 6.250 01/12/2013 593,572 2.99% 700,000 Caterpillar Inc
7.000 15/12/2013 720,265 3.62%
950,000 JP Morgan Chase & Co
1.650 30/09/2013 952,850 4.79% 500,000 Verizon Wireless Capital LLC 5.550 01/02/2014 513,425 2.58% 400,000 Goldman Sachs Group Inc 6.000 01/05/2014 416,840 2.10% 950,000 Daimler Finance NA
1.950 28/03/2014 956,412 4.83%
Total United States
8,952,040 45.05%
Total Corporate Bonds
17,601,533 88.56%

SANLAM UNIVERSAL FUNDS PLC
112
SCHEDULE OF INVESTMENTS OF SANLAM STRATEGIC CASH FUND (CONTINUED) as at 30 June 2013
Nominal Security Classification Coupon Maturity Fair Value % of US$ Net Assets
Government Bonds - 12.08%
United States - 12.08%
1,000,000 US Treasury Bill
0.000 25/07/2013 1,000,000 5.03% 1,400,000 US Treasury Bill
0.000 29/08/2013 1,399,954 7.05%
Total United States
2,399,954 12.08%
Total Government Bonds
2,399,954 12.08%
Total Debt
20,001,487 100.64%
Total financial assets at fair value through profit or loss
20,001,487 100.64%
Cash and cash equivalents
(281,610) (1.42%) Other net assets and liabilities
154,342 0.78%
Net assets attributable to holders of redeemable participating shares 19,874,219 100.00%
Summary
Classification Description
Fair Value % of
Net Assets
Tranferable securities and money market instruments admitted to
official stock exchange listing or traded on regulated market 20,001,487 100.64%
A Transferabe securities and money market instruments other than
those referred above
- 0.00%
B Collective Investment Schemes
- 0.00% C Financial derivative instruments dealt in on a regulated market - 0.00% D Over the counter financial derivative instrument
- 0.00%
Cash and cash equivalents
(281,610) (1.42)%
Other net assets and liabilities
154,342 0.78%
Net assets attributable to holders of redeemable participating shares 19,874,219 100.00%

SANLAM UNIVERSAL FUNDS PLC
113
SCHEDULE OF INVESTMENTS OF SANLAM WORLD EQUITY FUND as at 30 June 2013
Nominal Security
Classification Fair Value % of
US$ Net Assets
Financial assets at fair value through profit or loss
Equity - 98.57%
Australia - 1.71% 75,106 Amcor Ltd
696,966 0.04%
278,254 AMP Ltd
1,082,255 0.07% 111,500 Australia and New Zealand Banking Group Ltd
2,916,327 0.19%
158,532 BHP Billiton Ltd
4,551,248 0.29% 198,013 Breville Group Ltd
1,279,374 0.08%
29,474 CSL Ltd
1,661,031 0.11% 16,930 Flight Centre Ltd
609,368 0.04%
551,747 Macquarie Atlas Roads Group
979,582 0.06% 73,469 Macquarie Group Ltd
2,815,180 0.18%
49,000 National Australia Bank Ltd
1,330,942 0.08% 554,628 Qantas Airways Ltd
685,227 0.04%
38,317 Rio Tinto Ltd
1,836,425 0.12% 130,000 Telstra Corp
567,493 0.04%
187,000 TPG Telecom Ltd
602,398 0.04% 234,913 Westfield Retail Trust
666,450 0.04%
77,623 Westpac Banking Corp Ltd
2,051,572 0.13% 81,787 Woolworths Ltd
2,455,781 0.16%
Total Australia
26,787,619 1.71%
Belgium - 0.15% 13,066 Anheuser-Busch InBev NV
1,161,705 0.07%
31,890 KBC Bankverzekeringsholding
1,185,925 0.08% Total Belgium
2,347,630 0.15%
Bermuda - 0.43% 18,657 Arch Capital Group Ltd
959,156 0.06%
34,090 Bunge Ltd
2,412,549 0.15% 1,368,000 Noble Group Ltd
1,046,251 0.07%
275,790 North Atlantic Drilling Ltd
2,325,456 0.15% Total Bermuda
6,743,412 0.43%
Brazil - 0.35% 30,162 Banco Itau Holding Financeira
393,008 0.03%
65,790 CCR SA
527,393 0.03% 68,500 Cia de Saneamento Basico do Estado de Sao Pau
716,954 0.05%
16,100 Companhia de Bebidas das Americas
602,146 0.04% 32,170 Cosan SA Industria e Comercio
630,287 0.04%
168,560 Petroleo Brasileiro S.A. - Petrobas
1,235,191 0.08% 106,865 Vale SA
1,309,193 0.08%
Total Brazil
5,414,172 0.35%
Canada - 2.95% 4,589 Agnico-Eagle Mines Ltd
126,155 0.01%
2,596 Agrium Inc
224,385 0.01% 21,846 Bank of Montreal
1,263,253 0.08%
30,531 Bank of Nova Scotia
1,627,124 0.10% 22,324 Barrick Gold Corp
351,292 0.02%
47,640 Brookfield Properties Co
789,860 0.05% 18,058 Cameco Corp
371,636 0.02%
14,276 Canadian Imperial Bank of Commerce
1,010,106 0.06% 14,525 Canadian National Railway Co
1,409,954 0.09%
31,980 Canadian Natural Resources
898,860 0.06% 40,485 Canadian Oil Sands Ltd
747,221 0.05%
7,909 Canadian Pacific Railway Ltd
956,143 0.06%

SANLAM UNIVERSAL FUNDS PLC
114
SCHEDULE OF INVESTMENTS OF SANLAM WORLD EQUITY FUND (CONTINUED) as at 30 June 2013
Nominal Security
Classification Fair Value % of
US$ Net Assets
Canada - 2.95% (continued) 4,193 Catamaran Corp
203,469 0.01%
27,977 Cenovus Energy Inc
795,630 0.05% 24,584 CI Financial Corp
705,430 0.04%
17,764 Crescent Point Energy Corp
600,665 0.04% 1,933,042 Eastern Platinum Ltd
146,595 0.01%
26,020 Eldorado Gold Corp
160,575 0.01% 358,360 Eldorado Gold Corp
2,214,665 0.14%
33,517 Enbridge Inc
1,404,670 0.09% 16,713 Encana Corp
281,851 0.02%
13,795 First Quantum Minerals Ltd
204,002 0.01% 24,110 Fortis Inc
735,710 0.05%
18,809 Goldcorp Inc
465,723 0.03% 99,160 Goldcorp Inc
2,452,227 0.17%
58,789 Husky Energy Inc
1,561,539 0.10% 476,920 Iamgold Corp
2,065,064 0.13%
5,896 ING Canada Inc
331,157 0.02% 31,236 Kinross Gold Corp
159,600 0.01%
598,910 Kinross Gold Corp
3,054,441 0.20% 5,554 Magna International Inc
394,134 0.03%
58,938 Manulife Financial Corp
940,304 0.06% 40,028 Pengrowth Energy Corp
196,175 0.01%
21,114 Penn West Petroleum Ltd
222,168 0.01% 23,320 Potash Corp of Saskatchewan Inc
886,907 0.06%
13,257 Research In Motion Ltd
139,243 0.01% 23,143 Rogers Communications Inc
903,869 0.06%
33,022 Royal Bank of Canada
1,918,275 0.12% 9,314 Shoppers Drug Mart Corp
428,396 0.03%
12,219 Silver Wheaton Corp
238,727 0.02% 13,607 Sun Life Financial Inc
401,799 0.03%
39,534 Suncor Energy Inc
1,161,773 0.07% 290,076 Talisman Energy Inc
3,299,755 0.22%
112,930 Teck Cominco Ltd - Class B
2,413,314 0.15% 13,678 Teck Resources Ltd
291,350 0.02%
35,740 Thomson Reuters Corp
1,164,052 0.07% 10,105 Tim Hortons Inc
544,860 0.03%
20,663 Toronto-Dominion Bank
1,654,568 0.11% 8,202 Transcanada Corp
352,059 0.02%
5,430 Valeant Pharmaceuticals InternationalInc
466,767 0.03% 14,229 Vermilion Energy Inc
693,443 0.04%
21,205 Yamana Gold Inc
201,617 0.01% Total Canada
46,232,557 2.95%
Cayman Islands - 1.07% 550,000 China Shineway Pharmaceutical Group Ltd
875,042 0.06%
73,000 Hengan International Group Compnay Ltd
795,299 0.05% 436,650 HKT Trust and HKT Ltd
418,849 0.03%
370,000 MGM China Holdings Ltd
987,468 0.06% 864,000 Minth Group Ltd
1,343,421 0.09%
8,037,629 Prince Frog International Holdings Ltd
5,554,484 0.34% 220,923 Sands China Ltd
1,041,069 0.07%
6,855 Seagate Technology PLC
307,310 0.02% 43,964 Tencent Holdings Ltd
1,724,278 0.11%
6,925,807 Tiangong International Co Ltd
1,714,441 0.11% 69,939 TPK Holding Co Ltd
1,117,757 0.07%
671,000 Want Want China Holdings Ltd
944,705 0.06% Total Cayman Islands
16,824,123 1.07%

SANLAM UNIVERSAL FUNDS PLC
115
SCHEDULE OF INVESTMENTS OF SANLAM WORLD EQUITY FUND (CONTINUED) as at 30 June 2013
Nominal Security
Classification Fair Value % of
US$ Net Assets
China - 0.55% 5,528,671 Bank of China Ltd
2,273,853 0.15%
1,138,000 Beijing Capital Land Ltd
415,221 0.03% 268,668 China Communications Construction Co Ltd
210,260 0.01%
414,875 China Life Insurance Co Ltd
984,206 0.06% 922,948 China Railway Construction Corp
802,025 0.05%
208,083 China Resources Petroleum Co Ltd
146,481 0.01% 1,183,435 PetroChina Co Ltd
1,258,779 0.08%
190,157 Ping An Insurance Group Co of China Ltd
1,279,776 0.08% 3,616,705 Shanghai Electric Group Company Ltd
1,212,376 0.08%
Total China
8,582,977 0.55%
Denmark - 0.46% 24,752 Coloplast AS
1,386,088 0.09%
182,300 Novozymes AS
5,827,144 0.37% Total Denmark
7,213,232 0.46%
Finland - 0.68% 1,182,800 Nokia OYJ
4,376,298 0.28%
162,300 Sampo OYJ
6,317,293 0.40% Total Finland
10,693,591 0.68%
France - 3.56% 76,300 AtoS SA
5,656,040 0.36%
297,279 BNP Paribas
16,222,421 1.03% 9,119 Cie Generale D'Optique Essilor International SA
969,042 0.06%
10,400 Danone
779,594 0.05% 8,330 Dassault Systemes SA
1,017,750 0.06%
39,900 European Aeronautic Defense and Space Co NV
2,130,127 0.14% 55,210 L'oreal SA
9,061,704 0.58%
5,920 LVMH Moet Hennessy Louis Vuitton SA
958,190 0.06% 19,636 Michelin - Class B
1,753,761 0.11%
27,117 Sanofi
2,806,884 0.18% 174,474 Societe Generale
5,988,187 0.38%
173,032 Total SA
8,436,772 0.55% Total France
55,780,472 3.56%
Germany - 2.18% 10,240 Adidas AG
1,106,804 0.07%
7,357 Basf SE
656,410 0.04% 10,535 Bayer AG
1,122,117 0.07%
18,951 Beiersdorf AG
1,650,698 0.11% 21,700 Bilfinger Berger AG
1,995,937 0.13%
90,304 Daimler AG
5,457,334 0.34% 14,880 Deutsche Bank AG
625,397 0.04%
88,187 Henkel AG & Co KGAA
6,899,727 0.44% 3,300 Linde AG
614,996 0.04%
10,709 Muenchener Rueckversicherungs AG
1,968,607 0.13% 25,114 SAP AG
1,836,861 0.12%
16,839 Siemens AG
1,699,881 0.11% 3,650 Volkswagen AG
737,450 0.05%
40,263 Volkswagen AG
7,846,365 0.49% Total Germany
34,218,584 2.18%

SANLAM UNIVERSAL FUNDS PLC
116
SCHEDULE OF INVESTMENTS OF SANLAM WORLD EQUITY FUND (CONTINUED) as at 30 June 2013
Nominal Security
Classification Fair Value % of
US$ Net Assets
Great Britain - 7.15% 225,469 Aberdeen Asset Management PLC
1,309,109 0.08%
66,100 Amec PLC
1,007,591 0.06% 47,108 Aon PLC
3,031,400 0.19%
96,600 ARM Holdings PLC
1,164,826 0.07% 228,000 Avanti Communications Group PLC
909,510 0.06%
1,069,478 Barclays PLC
4,516,853 0.29% 725,600 BBA Aviation PLC
3,082,672 0.20%
46,400 Betfair Group PLC
599,970 0.04% 332,700 BG Group PLC
5,644,243 0.36%
387,326 BT Group PLC
1,816,490 0.12% 86,300 Cairn Energy PLC
331,299 0.02%
22,500 Croda Internationa PLC
845,328 0.05% 22,286 Diageo PLC
635,487 0.04%
223,800 DS Smith PLC
839,802 0.05% 92,834 Easyjet PLC
1,824,858 0.12%
5,639 Ensco PLC
327,739 0.02% 78,800 Experian Group Ltd
1,366,122 0.09%
220,500 Fenner PLC
1,026,748 0.07% 297,600 G4S PLC
1,039,998 0.07%
1,558,000 Genting Singapore PLC
1,621,509 0.10% 672,200 GKN PLC
3,071,953 0.20%
256,362 GlaxoSmithKline PLC
6,408,078 0.40% 114,450 Hargreaves LansdownPLC
1,541,508 0.10%
177,853 HSBC Holdings PLC
1,839,766 0.12% 291,864 Imperial Tobacco Group PLC
10,093,280 0.64%
292,320 Invensys PLC
1,829,383 0.12% 964,400 ITV PLC
2,049,332 0.13%
591,000 Legal & General Group PLC
1,536,439 0.10% 13,907 Liberty Global PLC
1,030,231 0.07%
938 Liberty Global PLC - Series C
63,681 0.00% 7,326 Mead Johnson Nutrition Co
580,439 0.04%
203,500 Mears Group PLC
1,193,745 0.08% 151,100 Novae Group PLC
1,101,222 0.07%
376,800 Pace PLC
1,382,495 0.09% 246,200 Prudential Corp
4,014,333 0.26%
316,000 Qinetiq PLC
864,650 0.06% 1,219,161 Raven Russia Ltd
1,289,799 0.08%
109,055 Reckitt Benckiser Group PLC
7,688,270 0.48% 137,400 Reed Elsevier PLC
1,556,769 0.10%
56,068 Rightmove PLC
1,772,269 0.11% 95,000 Rio Tinto PLC
3,865,994 0.25%
21,590 Royal Dutch Shell PLC - Class B
716,018 0.05% 93,700 Shire PLC
2,963,211 0.19%
114,200 Standard Chartered PLC
2,471,764 0.16% 139,700 Tullow Oil PLC
2,121,033 0.14%
4,256,103 Vodafone Group PLC
12,126,634 0.76% 53,900 Weir Group PLC
1,758,515 0.11%
242,000 William Hill PLC
1,618,350 0.10% 267,300 Wolfson Microelectronics PLC
642,607 0.04%
Total Great Britain
112,133,322 7.15%
Greece - 0.08% 48,940 Coca Cola Hellenic Bottling Co SA A 1,291,578 0.08%
Total Greece
1,291,578 0.08%

SANLAM UNIVERSAL FUNDS PLC
117
SCHEDULE OF INVESTMENTS OF SANLAM WORLD EQUITY FUND (CONTINUED) as at 30 June 2013
Nominal Security
Classification Fair Value % of
US$ Net Assets
Hong Kong - 1.32% 543,550 Agile Properties Holdings Ltd
583,061 0.04%
457,328 AIA Group Ltd
1,936,931 0.12% 49,500 Cheung Kong Holdings Ltd
671,385 0.04%
117,050 Cheung Kong Infrastructure Holdings
780,213 0.05% 497,208 China Everbright Ltd
655,149 0.04%
233,300 China Insurance International
360,950 0.02% 207,339 China Mobile Hong Kong Ltd
2,165,295 0.15%
606,707 China Overseas Land & Investments Ltd
1,591,822 0.10% 503,212 CNOOC Ltd
853,803 0.05%
1,632,000 Giordano International Ltd
1,424,491 0.09% 277,543 Hong Kong & China Gas Co
678,453 0.04%
333,500 Hopewell Holdings Ltd
1,111,495 0.07% 4,788,688 Industrial & Commerce Bank of China
3,019,092 0.20%
1,062,030 Lenovo Group Ltd
962,594 0.06% 849,200 Li & Fung Ltd
1,167,127 0.07%
628,481 PCCW Ltd
294,137 0.02% 102,623 Power Assets Holdings Ltd
885,160 0.06%
2,877,000 Yuexiu Real Estate Investment Trust
1,569,030 0.10% Total Hong Kong
20,710,188 1.32%
India - 0.35% 203,779 GAIL India Ltd
1,070,130 0.07%
6,350 HDFC Bank Ltd
230,124 0.01% 17,650 Reliance Industries Ltd
508,144 0.03%
306,115 Tata Motors Ltd
1,443,348 0.09% 283,564 Yes Bank Ltd
2,191,608 0.15%
Total India
5,443,354 0.35%
Indonesia - 0.14% 3,885,010 Perusahaan Gas Negara
2,239,479 0.14%
Total Indonesia
2,239,479 0.14%
Ireland - 0.89% 17,421 Accenture PLC
1,253,615 0.08%
135,482 Covidien PLC
8,513,689 0.54% 9,395 Eaton Corp PLC
618,285 0.04%
45,176 Ingersoll-Rand PLC
2,508,172 0.16% 12,215 Paddy Power PLC
1,046,819 0.07%
Total Ireland
13,940,580 0.89%
Italy - 1.21% 104,993 Assicurazioni Generali SpA
1,831,781 0.12%
129,400 Azimut Holding Spa
2,353,492 0.15% 211,454 ENI-Ente Nazionale Idrocarburi SpA
4,337,941 0.28%
1,328,000 HERA SPA
2,515,465 0.16% 4,722,075 Intesa Sanpaolo SpA
7,557,039 0.47%
9,000 Luxottica Group SpA
454,446 0.03% Total Italy
19,050,164 1.21%
Japan - 5.83% 103,900 Aeon Co Ltd
1,361,903 0.09%
111,952 Anritsu Corp
1,324,309 0.08% 212,300 Daiwa Securities Group Inc
1,780,388 0.11%
2,710 Fast Retailing Co Ltd
912,609 0.06% 190,357 Honda Motor Co Ltd
7,061,971 0.45%
352 Inpex Holdings Inc
1,467,110 0.09% 405,280 Isuzu Motors Ltd
2,770,413 0.18%
19,800 Japan Airlines Co Ltd
1,016,611 0.06%

SANLAM UNIVERSAL FUNDS PLC
118
SCHEDULE OF INVESTMENTS OF SANLAM WORLD EQUITY FUND (CONTINUED) as at 30 June 2013
Nominal Security
Classification Fair Value % of
US$ Net Assets
Japan - 5.83% (continued) 49,400 Kao Corp
1,678,496 0.11%
58,604 Komatsu Ltd
1,352,854 0.09% 119,500 Konica Minolta Holdings Inc
901,092 0.06%
127,454 K's Holdings Corp
4,041,882 0.26% 206,574 Marubeni Corp
1,378,824 0.09%
83,375 Mitsubishi Corp
1,426,096 0.09% 241,640 Mitsubishi Electric Corp
2,259,977 0.14%
43,000 Mitsubishi Estate Co Ltd
1,143,290 0.07% 570,061 Mitsubishi UFJ Holdings Inc
3,512,306 0.22%
106,655 Mitsui & Co
1,337,885 0.09% 41,000 Mitsui Fudosan Co Ltd
1,204,037 0.08%
644,136 Mizuho Financial Group Inc
1,335,870 0.09% 135,300 MS&AD Insurance Group Holdings
3,435,282 0.22%
11,240 Murata Manufacturing Co Ltd
854,344 0.05% 179,000 Nippon Express Co
848,777 0.05%
17,200 Nippon Telegraph & Telephone Corp
890,043 0.06% 149,700 Nissan Motor Co Ltd
1,514,633 0.10%
15,500 Nitto Denko Corp
995,570 0.06% 362,396 Nomura Holdings Inc
2,666,984 0.17%
165,550 Orix Corp
2,258,333 0.14% 215,000 Osaka Gas Co
906,926 0.06%
20,600 Otsuka Holdings Co Ltd
679,201 0.04% 166,700 Sankyo Co Ltd
7,862,574 0.50%
68,300 Seven & I Holdings Co Ltd
2,492,575 0.16% 53,392 Softbank Corp
3,112,249 0.20%
147,350 Sumitomo Corp
1,835,014 0.12% 149,330 Sumitomo Metal Mining Co
1,662,730 0.11%
72,385 Sumitomo Mitsui Financial Group Inc
3,315,733 0.21% 35,500 Suzuki Motor Corp
817,361 0.05%
54,200 Takeda Pharmaceutical Co Ltd
2,444,538 0.16% 81,080 THK Co Ltd
1,701,921 0.11%
21,300 Tokyo Electron
1,076,472 0.07% 118,000 Toppan Printing
818,504 0.05%
516,624 Toshiba Corp
2,480,919 0.16% 57,500 Toyota Motor Co
3,467,482 0.21%
1,550 Yahoo Japan Corp
763,063 0.05% 62,700 Yamaha Motor Co Ltd
811,130 0.05%
206,723 Yaskawa Electric Corp
2,511,977 0.16% Total Japan
91,492,258 5.83%
Jersey - 0.26% 7,285 Delphi Automotive PLC
369,277 0.02%
311,300 Glencore International PLC
1,285,004 0.08% 141,514 WPP PLC
2,408,292 0.16%
Total Jersey
4,062,573 0.26%
South Korea - 1.12% 19,091 GS Engineering & Construction Corp
467,247 0.03%
8,597 Hyundai Motor Co
1,691,525 0.11% 5,608 LG Chemicals Ltd
1,237,980 0.08%
8,574 LG Electronics Inc
546,124 0.03% 10,472 NCsoft Corp
1,480,232 0.09%
6,462 Samsung Electronics Co
4,984,301 0.32% 4,584 Samsung Electronics Co Ltd
5,367,625 0.34%
3,559 Samsung Fire & Marine Insurance Co Ltd
723,551 0.05% 33,026 Shinhan Financial Group Ltd
1,083,500 0.07%
Total South Korea
17,582,085 1.12%
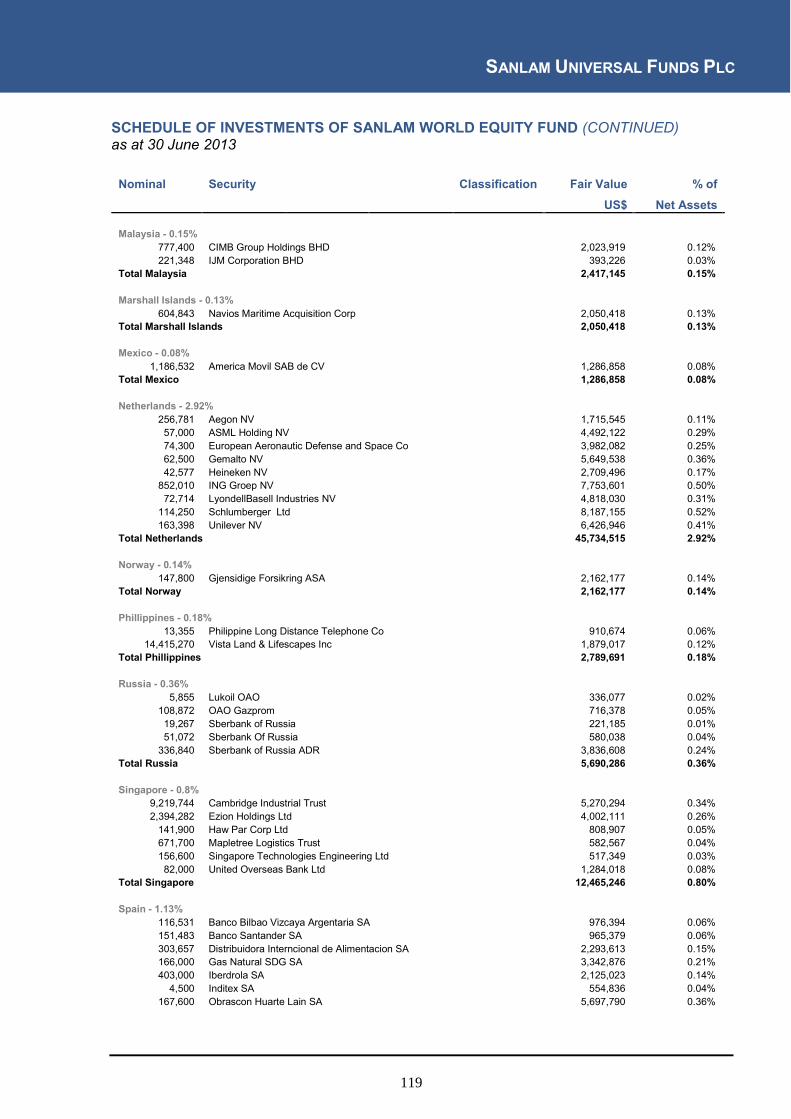
SANLAM UNIVERSAL FUNDS PLC
119
SCHEDULE OF INVESTMENTS OF SANLAM WORLD EQUITY FUND (CONTINUED) as at 30 June 2013
Nominal Security
Classification Fair Value % of
US$ Net Assets
Malaysia - 0.15% 777,400 CIMB Group Holdings BHD
2,023,919 0.12%
221,348 IJM Corporation BHD
393,226 0.03% Total Malaysia
2,417,145 0.15%
Marshall Islands - 0.13% 604,843 Navios Maritime Acquisition Corp
2,050,418 0.13%
Total Marshall Islands
2,050,418 0.13%
Mexico - 0.08% 1,186,532 America Movil SAB de CV
1,286,858 0.08%
Total Mexico
1,286,858 0.08%
Netherlands - 2.92% 256,781 Aegon NV
1,715,545 0.11%
57,000 ASML Holding NV
4,492,122 0.29% 74,300 European Aeronautic Defense and Space Co
3,982,082 0.25%
62,500 Gemalto NV
5,649,538 0.36% 42,577 Heineken NV
2,709,496 0.17%
852,010 ING Groep NV
7,753,601 0.50% 72,714 LyondellBasell Industries NV
4,818,030 0.31%
114,250 Schlumberger Ltd
8,187,155 0.52% 163,398 Unilever NV
6,426,946 0.41%
Total Netherlands
45,734,515 2.92%
Norway - 0.14% 147,800 Gjensidige Forsikring ASA
2,162,177 0.14%
Total Norway
2,162,177 0.14%
Phillippines - 0.18% 13,355 Philippine Long Distance Telephone Co
910,674 0.06%
14,415,270 Vista Land & Lifescapes Inc
1,879,017 0.12% Total Phillippines
2,789,691 0.18%
Russia - 0.36% 5,855 Lukoil OAO
336,077 0.02%
108,872 OAO Gazprom
716,378 0.05% 19,267 Sberbank of Russia
221,185 0.01%
51,072 Sberbank Of Russia
580,038 0.04% 336,840 Sberbank of Russia ADR
3,836,608 0.24%
Total Russia
5,690,286 0.36%
Singapore - 0.8% 9,219,744 Cambridge Industrial Trust
5,270,294 0.34%
2,394,282 Ezion Holdings Ltd
4,002,111 0.26% 141,900 Haw Par Corp Ltd
808,907 0.05%
671,700 Mapletree Logistics Trust
582,567 0.04% 156,600 Singapore Technologies Engineering Ltd
517,349 0.03%
82,000 United Overseas Bank Ltd
1,284,018 0.08% Total Singapore
12,465,246 0.80%
Spain - 1.13% 116,531 Banco Bilbao Vizcaya Argentaria SA
976,394 0.06%
151,483 Banco Santander SA
965,379 0.06% 303,657 Distribuidora Interncional de Alimentacion SA
2,293,613 0.15%
166,000 Gas Natural SDG SA
3,342,876 0.21% 403,000 Iberdrola SA
2,125,023 0.14%
4,500 Inditex SA
554,836 0.04% 167,600 Obrascon Huarte Lain SA
5,697,790 0.36%

SANLAM UNIVERSAL FUNDS PLC
120
SCHEDULE OF INVESTMENTS OF SANLAM WORLD EQUITY FUND (CONTINUED) as at 30 June 2013
Nominal Security
Classification Fair Value % of
US$ Net Assets
Spain - 1.13% (continued) 52,485 Telefonica SA
671,756 0.04%
76,647 Zardoya Otis SA
1,085,135 0.07% Total Spain
17,712,802 1.13%
Sweden - 0.95% 155,100 Electrolux AB - Class B
3,893,358 0.25%
71,100 Getinge AB
2,147,202 0.14% 323,000 Skandinaviska Enskilda Banken SEB
3,068,031 0.20%
21,296 Tyco International Ltd
701,703 0.04% 355,900 Volvo AB
4,735,911 0.30%
25,809 Weatherford International Ltd
353,583 0.02% Total Sweden
14,899,788 0.95%
Switzerland - 3.46% 11,703 ACE Ltd
1,047,184 0.07%
78,000 Adecco SA
4,439,125 0.28% 13,826 Compagnie Financiere Richemont SA
1,220,844 0.08%
17,368 Nestle SA
1,137,125 0.07% 57,396 Novartis AG
4,070,251 0.26%
92,103 Roche Holding AG
22,874,873 1.46% 9,436 Schindler Holding AG
1,312,384 0.08%
1,100 Sika AG
2,843,585 0.18% 15,638 Syngenta AG
6,108,439 0.39%
7,871 TE Connectivity Ltd
358,445 0.02% 522,105 UBS AG
8,872,805 0.57%
Total Switzerland
54,285,060 3.46%
Taiwan - 0.7% 924,548 Advanced Semiconductor Engineering Inc
774,202 0.05%
294,867 Catcher TechnologyCo Ltd
1,531,573 0.10% 2,793,526 Chinatrust Financial Holding Co Ltd
1,725,375 0.11%
205,000 Far Eastone Telecomm Co Ltd
549,461 0.04% 262,079 Hon Hai Precision Industry Co Ltd
645,730 0.04%
72,000 MediaTek Inc
835,453 0.05% 567,167 Pegatron Corp
934,766 0.06%
1,064,978 Taiwan Semiconductor Manufacturing Company Ltd
3,935,958 0.25% Total Taiwan
10,932,518 0.70%
Thailand - 0.07% 518,071 PTT Global Chemical PCL
1,148,679 0.07%
Total Thailand
1,148,679 0.07%
Turkey - 0.03% 118,850 Turkiye Garanti Bankasi AS
518,641 0.03%
Total Turkey
518,641 0.03%
United States - 55.03% 16,053 3M Co
1,755,396 0.11% 90,467 Abbott Laboratories
3,155,489 0.20%
104,386 AbbVie Inc
4,315,317 0.28% 3,049 Actavis Inc
384,845 0.02%
18,448 Adobe Systems Inc
840,491 0.05% 10,071 ADT Corp
401,329 0.03%
115,014 AES Corp
1,379,018 0.09% 13,278 Aetna Inc
843,684 0.05%
13,631 Aflac Inc
792,234 0.05% 14,698 Agilent Technologies Inc
628,486 0.04%
9,570 Air Products & Chemicals Inc
876,325 0.06%

SANLAM UNIVERSAL FUNDS PLC
121
SCHEDULE OF INVESTMENTS OF SANLAM WORLD EQUITY FUND (CONTINUED) as at 30 June 2013
Nominal Security
Classification Fair Value % of
US$ Net Assets
United States - 55.03% (continued) 345,897 Alcoa Inc
2,704,915 0.17% 3,086 Alexion Pharmaceuticals Inc
284,653 0.02%
8,517 Allergan Inc
717,472 0.05% 9,353 Allstate Corp
450,066 0.03%
20,272 Altera Corp
668,773 0.04% 47,961 Altria Group Inc
1,678,155 0.11%
30,193 Amazon.Com Inc
8,384,294 0.53% 10,118 Amerada Hess Corp
672,746 0.04%
37,519 Ameren Corp
1,292,154 0.08% 12,146 American Capital Agency Corp
279,237 0.02%
73,235 American Capital Ltd
927,887 0.06% 22,952 American Express Co
1,715,892 0.11%
138,262 American International Group
6,180,311 0.39% 20,007 American Tower Corp
1,463,912 0.09%
27,253 American Water Works Co Inc
1,123,641 0.07% 10,343 Ameriprise Financial Inc
836,542 0.05%
77,739 Amerisourcebergen Corp
4,340,168 0.28% 82,402 Amgen Corp
8,129,781 0.53%
78,639 Anadarko Petroleum Corp
6,757,449 0.43% 36,730 Analog Devices Inc
1,655,054 0.11%
62,218 Annaly Capital Management Inc
782,080 0.05% 8,140 Apache Corp
682,376 0.04%
54,236 Apple Inc
21,481,795 1.37% 57,800 Applied Material Inc
862,376 0.05%
71,142 Archer-Daniels-Midland Co
2,412,425 0.15% 186,537 Arrow Electronics Inc
7,433,499 0.47%
138,194 AT & T Inc
4,892,068 0.31% 28,500 Autoliv Inc
2,208,746 0.14%
17,180 Automatic Data Processing Inc
1,183,015 0.08% 19,354 Avon Products Inc
407,015 0.03%
14,829 Baker Hughes Inc
684,062 0.04% 1,373,370 Bank of America Corp
17,661,538 1.13%
175,821 Bank Of New York Mellon
4,931,779 0.31% 14,790 Baxter International Inc
1,024,503 0.07%
20,127 BB&T Corp
681,903 0.04% 42,676 Becton Dickinson & Co
4,217,669 0.27%
9,519 Bed Bath & Beyond Inc
674,897 0.04% 79,930 Bemis Company Inc
3,128,460 0.20%
24,786 Berkshire Hathaway Inc
2,774,049 0.18% 31,260 Biogen Idec Inc
6,727,152 0.43%
4,190 Blackrock Inc
1,076,202 0.07% 12,811 BMC Software Inc
578,289 0.04%
15,122 Boeing Co
1,549,098 0.10% 385,048 Boston Scientific Corp
3,569,395 0.23%
38,410 Bristol-Myers Squibb Co
1,716,543 0.11% 108,713 Broadcom Corp
3,670,151 0.23%
5,637 Brown-Forman Corp - Class B
380,779 0.02% 4,430 Cabot Oil & Gas Corp
314,619 0.02%
143,150 Calpine Corp
3,039,075 0.19% 12,108 Cameron International Corp
740,525 0.05%
56,408 Capital One Financial Corp
3,542,986 0.23% 79,262 Cardinal Health Inc
3,741,166 0.24%
5,017 Carmax Inc
231,585 0.01% 10,069 Carnival Corp
345,266 0.02%
14,692 Carter's Inc
1,088,236 0.07% 14,188 Caterpillar Inc
1,170,368 0.07%
34,295 CBOE Holdings Inc
1,599,519 0.10%

SANLAM UNIVERSAL FUNDS PLC
122
SCHEDULE OF INVESTMENTS OF SANLAM WORLD EQUITY FUND (CONTINUED) as at 30 June 2013
Nominal Security
Classification Fair Value % of
US$ Net Assets
United States - 55.03% (continued) 9,483 CBS Corp - Class B
463,434 0.03% 12,026 Celgene Corp
1,405,960 0.09%
13,310 CenturyLink Inc
470,509 0.03% 1,394 CF Industries Holdings Inc
239,071 0.02%
41,073 Charles Schwab Corp
871,980 0.06% 18,480 Chesapeake Energy Corp
376,622 0.02%
70,239 Chevron Corp
8,312,083 0.53% 603 Chipotle Mexican Grill Inc
219,703 0.01%
5,723 Cigna Corp
414,860 0.03% 473,350 Cisco Systems Inc
11,507,139 0.73%
9,762 CIT Group Inc
455,202 0.03% 115,420 Citigroup Inc
5,536,697 0.35%
7,944 Citrix Systems Inc
479,262 0.03% 20,152 Clorox Co
1,675,437 0.11%
9,014 CME Group Inc
684,884 0.04% 10,216 Coach Inc
583,231 0.04%
68,809 Cobalt International Energy Inc
1,828,255 0.12% 329,389 Coca-Cola Co
13,211,793 0.84%
18,926 Coca-Cola Enterprises Inc
665,438 0.04% 9,619 Cognizant Tech Solutions Corp
602,246 0.04%
82,780 Colgate-Palmolive Co
4,742,466 0.30% 120,977 Comcast Corp-Class A
5,066,517 0.32%
34,726 Comcast Corp-Special Class A
1,377,580 0.09% 7,182 Concho Resources Inc
601,277 0.04%
46,387 Conocophillips
2,806,414 0.18% 307,749 Corning Inc
4,379,268 0.28%
11,412 Costco Wholesale Corp
1,261,825 0.08% 3,431 Cree Inc
219,104 0.01%
6,516 Crown Castle Intl Corp
471,693 0.03% 33,466 CSX Corp
776,077 0.05%
8,280 Cummins Inc
898,049 0.06% 30,565 CVS Caremark Corp
1,747,707 0.11%
18,718 Danaher Corp
1,184,849 0.08% 2,422 Davita Inc
292,578 0.02%
12,375 Deere & Co
1,005,469 0.06% 31,049 Dell Inc
414,504 0.03%
130,960 Delta Air Lines Inc
2,450,262 0.16% 10,731 Devon Energy Corp
556,724 0.04%
17,404 Directv
1,072,434 0.07% 29,418 Discover Financial Services
1,401,474 0.09%
4,893 Discovery Communications Inc
340,846 0.02% 6,118 Dollar General Corp
308,531 0.02%
5,162 Dollar Tree Stores Inc
262,436 0.02% 11,696 Dominion Resources Inc
664,567 0.04%
31,060 Dow Chemical Co
999,200 0.06% 24,866 Du Pont De Nemours & Co
1,305,465 0.08%
50,380 Du Pont 'S' Fractional Share
0 0.00% 16,946 Duke Energy Corp
1,143,855 0.07%
129,090 eBay Inc.
6,676,535 0.43% 7,089 Ecolab Inc
603,912 0.04%
45,279 EMC Corp
1,069,490 0.07% 21,784 Emerson Electric Co
1,188,099 0.08%
39,000 Eog Resources Inc
5,135,520 0.33% 1,306 Equinix Inc
241,244 0.02%
18,573 Equity Residential
1,078,348 0.07% 5,241 Estee Lauder Cos Inc
344,701 0.02%
24,898 Exelon Corp
768,850 0.05% 13,629 Expeditors international of washington
518,038 0.03%
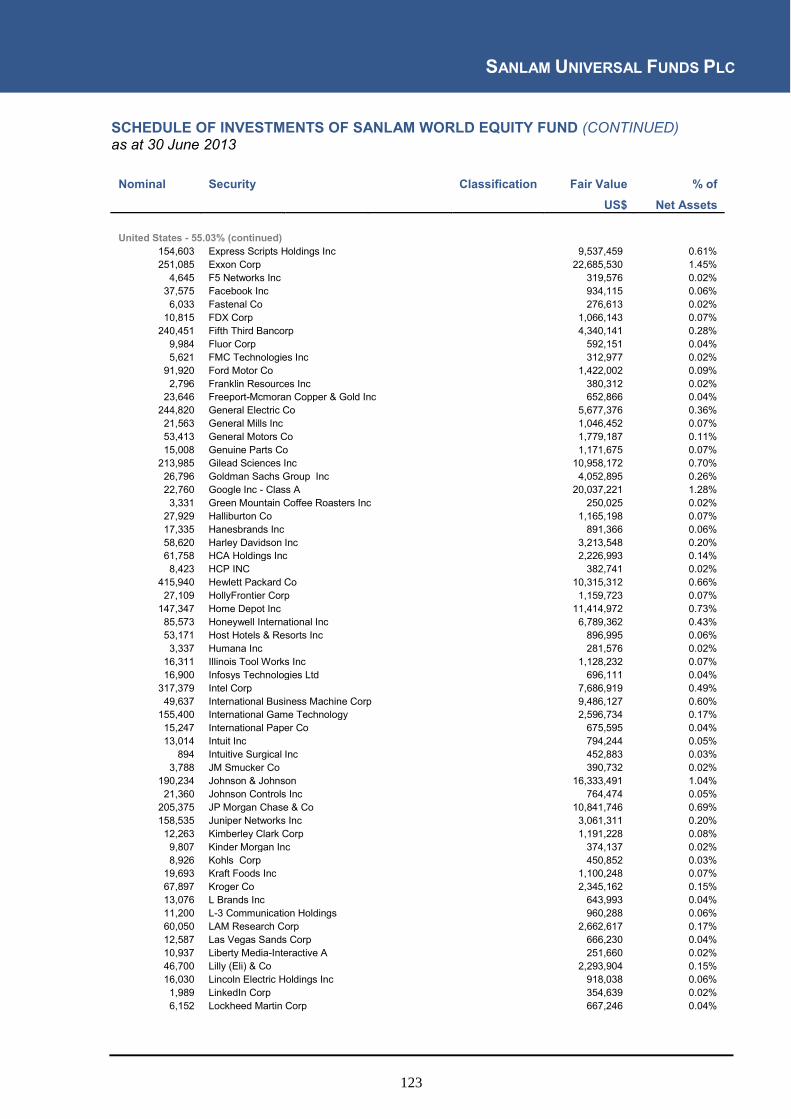
SANLAM UNIVERSAL FUNDS PLC
123
SCHEDULE OF INVESTMENTS OF SANLAM WORLD EQUITY FUND (CONTINUED) as at 30 June 2013
Nominal Security
Classification Fair Value % of
US$ Net Assets
United States - 55.03% (continued) 154,603 Express Scripts Holdings Inc
9,537,459 0.61%
251,085 Exxon Corp
22,685,530 1.45% 4,645 F5 Networks Inc
319,576 0.02%
37,575 Facebook Inc
934,115 0.06% 6,033 Fastenal Co
276,613 0.02%
10,815 FDX Corp
1,066,143 0.07% 240,451 Fifth Third Bancorp
4,340,141 0.28%
9,984 Fluor Corp
592,151 0.04% 5,621 FMC Technologies Inc
312,977 0.02%
91,920 Ford Motor Co
1,422,002 0.09% 2,796 Franklin Resources Inc
380,312 0.02%
23,646 Freeport-Mcmoran Copper & Gold Inc
652,866 0.04% 244,820 General Electric Co
5,677,376 0.36%
21,563 General Mills Inc
1,046,452 0.07% 53,413 General Motors Co
1,779,187 0.11%
15,008 Genuine Parts Co
1,171,675 0.07% 213,985 Gilead Sciences Inc
10,958,172 0.70%
26,796 Goldman Sachs Group Inc
4,052,895 0.26% 22,760 Google Inc - Class A
20,037,221 1.28%
3,331 Green Mountain Coffee Roasters Inc
250,025 0.02% 27,929 Halliburton Co
1,165,198 0.07%
17,335 Hanesbrands Inc
891,366 0.06% 58,620 Harley Davidson Inc
3,213,548 0.20%
61,758 HCA Holdings Inc
2,226,993 0.14% 8,423 HCP INC
382,741 0.02%
415,940 Hewlett Packard Co
10,315,312 0.66% 27,109 HollyFrontier Corp
1,159,723 0.07%
147,347 Home Depot Inc
11,414,972 0.73% 85,573 Honeywell International Inc
6,789,362 0.43%
53,171 Host Hotels & Resorts Inc
896,995 0.06% 3,337 Humana Inc
281,576 0.02%
16,311 Illinois Tool Works Inc
1,128,232 0.07% 16,900 Infosys Technologies Ltd
696,111 0.04%
317,379 Intel Corp
7,686,919 0.49% 49,637 International Business Machine Corp
9,486,127 0.60%
155,400 International Game Technology
2,596,734 0.17% 15,247 International Paper Co
675,595 0.04%
13,014 Intuit Inc
794,244 0.05% 894 Intuitive Surgical Inc
452,883 0.03%
3,788 JM Smucker Co
390,732 0.02% 190,234 Johnson & Johnson
16,333,491 1.04%
21,360 Johnson Controls Inc
764,474 0.05% 205,375 JP Morgan Chase & Co
10,841,746 0.69%
158,535 Juniper Networks Inc
3,061,311 0.20% 12,263 Kimberley Clark Corp
1,191,228 0.08%
9,807 Kinder Morgan Inc
374,137 0.02% 8,926 Kohls Corp
450,852 0.03%
19,693 Kraft Foods Inc
1,100,248 0.07% 67,897 Kroger Co
2,345,162 0.15%
13,076 L Brands Inc
643,993 0.04% 11,200 L-3 Communication Holdings
960,288 0.06%
60,050 LAM Research Corp
2,662,617 0.17% 12,587 Las Vegas Sands Corp
666,230 0.04%
10,937 Liberty Media-Interactive A
251,660 0.02% 46,700 Lilly (Eli) & Co
2,293,904 0.15%
16,030 Lincoln Electric Holdings Inc
918,038 0.06% 1,989 LinkedIn Corp
354,639 0.02%
6,152 Lockheed Martin Corp
667,246 0.04%

SANLAM UNIVERSAL FUNDS PLC
124
SCHEDULE OF INVESTMENTS OF SANLAM WORLD EQUITY FUND (CONTINUED) as at 30 June 2013
Nominal Security
Classification Fair Value % of
US$ Net Assets
United States - 55.03% (continued) 13,002 Lorillard Inc
567,927 0.04% 33,287 Lowes Com
1,361,438 0.09%
3,949 M & T Bank Corp
441,301 0.03% 14,812 Macy's Inc
710,976 0.05%
26,821 Manpower Inc
1,469,791 0.09% 27,265 Marathon Oil Corp
942,824 0.06%
24,353 Marathon Petroleum Corp
1,730,524 0.11% 100,235 Marriott International Inc
4,046,487 0.26%
12,089 Marsh & McLennan Cos
482,593 0.03% 5,355 Mastercard Inc - Class A
3,076,448 0.20%
24,546 Mattel Inc
1,112,179 0.07% 120,497 Maxim Integrated Products Inc
3,347,407 0.21%
21,357 McDonald's Corp
2,114,343 0.13% 10,942 McGraw-Hill Cos Inc
582,005 0.04%
15,042 Mckesson Corp
1,722,309 0.11% 299,115 Medtronic Com
15,395,449 0.98%
301,210 Merck & Co
13,991,205 0.89% 25,037 Metlife Inc
1,145,693 0.07%
911,747 Microsoft Corp
31,482,624 2.01% 40,151 Mondelez International Inc
1,145,508 0.07%
101,146 Monsanto Co
9,993,225 0.64% 3,995 Monster Beverage Corp
242,776 0.02%
4,697 Moody's Corp
286,188 0.02% 35,500 Morgan Stanley
867,265 0.06%
12,553 Motorola Solutions Inc
724,685 0.05% 8,031 Mylan Inc
249,202 0.02%
77,931 National-Oilwell Inc
5,369,446 0.34% 107,869 Netapp Inc
4,075,291 0.26%
1,121 Netflix Inc
236,632 0.02% 13,448 Newmont Mining Corp
402,768 0.03%
42,800 News Corp - C;ass A
1,395,280 0.09% 10,686 NextEra Energy Inc
870,695 0.06%
115,718 Nike Inc
7,368,922 0.47% 8,636 Noble Energy Inc
518,505 0.03%
5,871 Norfolk Southern Corp
426,528 0.03% 33,603 Northeast Utilities
1,411,998 0.09%
29,327 Northrop Grumman Corp
2,428,276 0.15% 86,420 NRG Energy Inc
2,307,414 0.15%
6,030 Nucor Corp
261,220 0.02% 40,707 Nvidia Corp
571,119 0.04%
18,365 Occidental Petroleum Corp
1,638,709 0.10% 13,058 Omnicom Group
820,956 0.05%
527,622 Oracle Corp
16,208,548 1.03% 2,882 O'Reilly Automotive Inc
324,571 0.02%
7,742 Paccar Inc
415,436 0.03% 9,064 Parker Hannifin Corp
864,706 0.06%
20,922 Peabody Energy Corp
306,298 0.02% 41,822 People's United Financial Inc
623,148 0.04%
122,978 Pepsico Inc
10,058,371 0.64% 2,350 Perrigo Co
284,350 0.02%
397,135 Pfizer Inc
11,123,751 0.71% 22,230 PG&E Corp
1,016,578 0.06%
104,439 Philip Morris International
9,046,506 0.58% 17,136 Phillips 66
1,009,482 0.06%
5,500 Pioneer Natural Respurces
796,125 0.05% 12,612 PNC Financial Services Group Inc
919,667 0.06%
2,759 PPG Industries Inc
403,945 0.03% 9,105 Praxair Inc
1,048,532 0.07%

SANLAM UNIVERSAL FUNDS PLC
125
SCHEDULE OF INVESTMENTS OF SANLAM WORLD EQUITY FUND (CONTINUED) as at 30 June 2013
Nominal Security
Classification Fair Value % of
US$ Net Assets
United States - 55.03% (continued) 5,091 Precision Castparts Corp
1,150,617 0.07%
1,355 Priceline.com Inc
1,120,761 0.07% 190,976 Procter & Gamble Co
14,703,242 0.94%
10,283 Prologis Inc
387,875 0.02% 12,858 Prudential Financial Inc
939,020 0.06%
2,647 Public Storage Inc
405,865 0.03% 52,226 Pulte Group Inc
990,727 0.06%
2,205 PVH Corp
275,735 0.02% 204,956 Qualcomm Inc
12,520,762 0.80%
89,650 Quanta Services
2,372,139 0.15% 12,277 Raytheon Co
811,755 0.05%
3,045 Regeneron Pharmaceuticals Inc
684,760 0.04% 31,849 Regions Financial Corp
303,521 0.02%
24,169 Republic Serv Inc
820,296 0.05% 13,260 Rockwell Collins Inc
840,817 0.05%
9,845 Rockwell International Corp
818,513 0.05% 20,500 Salesforce Com Inc
782,690 0.05%
12,333 Sandisk Corp
753,546 0.05% 9,898 Simon Property Group Inc
1,563,092 0.10%
10,092 SLM Corporation Securities
230,703 0.01% 21,768 Southern Co
960,622 0.06%
21,829 Southwestern Energy Co
797,413 0.05% 16,556 Spectra Energy Corp
570,520 0.04%
112,803 Sprint Corp
791,877 0.05% 69,400 ST Jude Medical Inc
3,166,722 0.20%
36,293 Staples Inc
575,607 0.04% 102,384 Starbucks Corp
6,705,128 0.43%
12,686 Starwood Hotels & Resorts Worldwide Inc
801,628 0.05% 15,519 State Street Corp
1,011,994 0.06%
246,515 Steel Dynamics Inc
3,675,539 0.23% 47,143 Stryker Corp
3,049,209 0.19%
11,040 Suntrust Banks Inc
348,533 0.02% 93,261 Symantec Corp
2,095,575 0.13%
24,778 Synopsys Inc
885,814 0.06% 24,252 Sysco Corp
828,448 0.05%
5,243 T Rowe Price Group Inc
383,525 0.02% 46,518 Target Corp
3,203,229 0.20%
4,262 Teradata Corp
214,080 0.01% 14,355 Tesoro Petroleum Corp
751,054 0.05%
27,171 Texas Instruments Inc
947,453 0.06% 5,377 The Mosiac Co
289,336 0.02%
12,614 Thermo Fisher Scientific Inc
1,067,523 0.07% 9,328 Time Warner Cable Inc
1,049,213 0.07%
24,349 Time Warner Inc
1,407,859 0.09% 61,799 TJX Cos Inc
3,093,658 0.20%
89,111 Towers Watson & Co
7,301,755 0.47% 15,661 Travelers Cos Inc
1,251,627 0.08%
73,803 Tupperware Brands Corp
5,733,755 0.37% 57,129 Tyson Foods Inc - Class A
1,467,073 0.09%
30,461 Union Pacific Corp
4,699,523 0.30% 76,577 United Continental Holdings Inc
2,396,094 0.15%
254,570 United Healthcare Corp
16,669,244 1.06% 34,310 United Parcel Service Inc
2,967,129 0.19%
18,119 United Technologies Corp
1,683,980 0.11% 44,140 Unum Group
1,296,392 0.08%
60,530 Urban Outfitters Inc
2,434,517 0.16% 37,935 US Bancorp
1,371,350 0.09%
19,703 Valero Energy Corp
685,073 0.04%

SANLAM UNIVERSAL FUNDS PLC
126
SCHEDULE OF INVESTMENTS OF SANLAM WORLD EQUITY FUND (CONTINUED) as at 30 June 2013
Nominal Security
Classification Fair Value % of
US$ Net Assets
United States - 55.03% (continued) 6,097 Ventas Inc
423,498 0.03% 160,606 VeriFone Holdings Inc
2,699,787 0.17%
4,098 VeriSign Inc
183,017 0.01% 62,321 Verizon Communications Inc
3,137,239 0.20%
2,140 Vertex Pharmaceuticals Inc
170,922 0.01% 128,740 Viacom Inc - Class B
8,760,757 0.56%
53,203 Visa Inc - Class A Shares
9,722,848 0.63% 12,548 Vornado Realty Trust
1,039,602 0.07%
11,331 Vulcan Materials Co.
548,534 0.03% 24,588 Walgreen Co
1,086,790 0.07%
53,599 Wal-Mart Stores Inc
3,992,590 0.25% 115,029 Walt Disney Co
7,264,081 0.46%
29,680 Wellpoint Inc
2,429,011 0.15% 277,457 Wells Fargo & Co
11,450,650 0.73%
77,416 Western Digital Corp
4,806,759 0.31% 18,650 Western Union Co
319,102 0.02%
9,660 Westlake Chemical Corp
931,321 0.06% 1,783 Whirlpool Corp
203,904 0.01%
6,646 Whole Foods Market Inc
342,136 0.02% 24,051 Williams Cos
780,936 0.05%
42,669 Windstream Corp
328,978 0.02% 5,521 Wynn Resorts Ltd
706,688 0.05%
27,487 Xerox Corp
249,307 0.02% 33,593 Yahoo Inc
843,520 0.05%
15,498 Yum Brands Inc
1,074,631 0.07% 54,520 Zimmer Holdings Inc
4,085,729 0.27%
Total United States
862,714,143 55.03%
Total Equity
1,545,591,917 98.57%
Total financial assets at fair value through profit or loss
1,545,591,917 98.57%
Cash and cash equivalents
23,503,596 1.50% Other net assets and liabilities
(1,027,960) (0.07%)
Net assets attributable to holders of redeemable participating shares 1,568,067,553 100.00%
Summary
Classification Description
Fair Value % of Net Assets
Tranferable securities and money market instruments admitted to
official stock exchange listing or traded on regulated market 1,544,300,339 98.49%
A Transferabe securities and money market instruments other than
those referred above
1,291,578 0.08%
B Collective Investment Schemes
- 0.00% C Financial derivative instruments dealt in on a regulated market - 0.00% D Over the counter financial derivative instrument
- 0.00%
Cash and cash equivalents
23,503,596 1.50%
Other net assets and liabilities
(1,027,960) (0.07)%
Net assets attributable to holders of redeemable participating shares 1,568,067,553 100.00%

SANLAM UNIVERSAL FUNDS PLC
127
SCHEDULE OF INVESTMENTS OF SANLAM WORLD EQUITY TRACKER FUND as at 30 June 2013
Nominal Security
Classification Fair Value % of
US$ Net Assets
Financial assets at fair value through profit or loss
Equity - 98.77%
Australia - 3.29% 8,100 Amcor Ltd
75,166 0.03%
31,411 AMP Ltd
122,171 0.04% 20,837 Australia and New Zealand Banking Group Ltd
545,000 0.19%
38,783 BHP Billiton Ltd
1,113,410 0.39% 32,507 Brambles Ltd
277,858 0.10%
16,318 Commonwealth Bank of Australia
1,033,110 0.36% 6,909 Crown Ltd
76,570 0.03%
5,710 CSL Ltd
321,792 0.11% 174,101 Dexus Property Group
170,484 0.06%
26,773 Echo Entertainment Group Ltd
74,975 0.03% 40,665 Insurance Australia Group
202,450 0.07%
26,597 Lend Lease Corp
203,244 0.07% 5,466 Macquarie Group Ltd
209,446 0.07%
66,645 Mirvac Group
97,891 0.03% 26,415 National Australia Bank Ltd
717,486 0.25%
11,624 Newcrest Mining Ltd
104,996 0.04% 8,277 Orica Ltd
156,420 0.05%
7,891 Origin Energy Ltd
90,775 0.03% 11,117 Q.B.E. Insurance Group
153,524 0.05%
5,430 Rio Tinto Ltd
260,244 0.09% 17,817 Santos Ltd
204,308 0.07%
5,029 Sonic Healthcare Ltd
68,161 0.02% 16,356 Suncorp Group Ltd
178,424 0.06%
35,892 Tabcorp Hldgs Ltd
100,184 0.03% 39,612 Telstra Corp
172,920 0.06%
11,657 Toll Holdings Ltd
56,754 0.02% 19,534 Transurban Group
120,847 0.04%
13,207 Wesfarmers Ltd
478,628 0.17% 29,361 Westfield Group
307,394 0.11%
63,870 Westfield Retail Trust
181,200 0.06% 32,098 Westpac Banking Corp Ltd
848,348 0.30%
7,717 Woodside Petroleum Ltd
247,252 0.09% 15,568 Woolworths Ltd
467,453 0.17%
Total Australia
9,438,885 3.29%
Austria - 0.13% 4,472 Erste Group Bank AG
119,213 0.04%
3,650 OMV AG
164,658 0.06% 4,185 Verbund AG
79,380 0.03%
Total Austria
363,251 0.13%
Belgium - 0.38% 670 Ageas
23,496 0.01%
8,180 Anheuser-Busch InBev NV
727,288 0.25% 1,072 Delhaize Group
66,185 0.02%
3,512 Groupe Bruxelles Lambert SA
263,948 0.09% 100 KBC Bankverzekeringsholding
3,719 0.01%
Total Belgium
1,084,636 0.38%

SANLAM UNIVERSAL FUNDS PLC
128
SCHEDULE OF INVESTMENTS OF SANLAM WORLD EQUITY TRACKER FUND (CONTINUED) as at 30 June 2013
Nominal Security
Classification Fair Value % of
US$ Net Assets
Bermuda - 0.3% 1,657 Bunge Ltd
117,266 0.04%
10,490 Invesco Ltd
333,582 0.12% 12,907 Marvell Technology Group Ltd
151,141 0.05%
2,659 Nabors Industries Ltd
40,709 0.01% 5,700 Seadrill Ltd
228,832 0.08%
Total Bermuda
871,530 0.30%
Canada - 4.15% 1,287 Agnico-Eagle Mines Ltd
35,381 0.01%
2,900 Agrium Inc
250,661 0.09% 7,674 Bank of Montreal
443,752 0.15%
9,622 Bank of Nova Scotia
512,796 0.18% 12,600 Barrick Gold Corp
198,275 0.07%
8,678 Brookfield Asset Management Inc
310,957 0.11% 6,232 Cameco Corp
128,255 0.04%
5,253 Canadian Imperial Bank of Commerce
371,679 0.13% 3,840 Canadian National Railway Co
372,752 0.13%
12,126 Canadian Natural Resources Ltd
340,825 0.12% 8,800 Canadian Oil Sands Ltd
162,419 0.06%
3,653 Canadian Pacific Railway Ltd
441,622 0.15% 11,722 Cenovus Energy Inc
333,359 0.12%
9,400 Crescent Point Energy Corp
317,848 0.11% 12,590 Enbridge Inc
527,637 0.18%
8,368 Encana Corp
141,119 0.05% 4,237 Enerplus Corp
62,416 0.02%
7,765 Fortis Inc
236,947 0.08% 10,205 Goldcorp Inc
252,682 0.09%
3,102 Husky Energy Inc
82,395 0.03% 5,527 Imperial Oil Ltd
210,360 0.07%
5,576 ING Canada Inc
313,184 0.11% 13,629 Kinross Gold Corp
69,637 0.02%
1,255 Loblaw Companies Ltd
56,570 0.02% 1,591 Magna International Inc
112,904 0.04%
28,004 Manulife Financial Corp
446,779 0.16% 3,245 Metro Inc
216,805 0.08%
3,546 National Bank Of Canada
252,244 0.09% 6,783 Potash Corp of Saskatchewan Inc
257,971 0.09%
4,450 Research In Motion Ltd (RIM)
46,740 0.02% 8,562 Rogers Communications Inc
334,396 0.12%
13,391 Royal Bank of Canada
777,894 0.27% 11,695 Shaw Communications Inc
279,820 0.10%
5,711 Shoppers Drug Mart Corp
262,677 0.09% 6,475 Silver Wheaton Corp
126,505 0.04%
7,061 Sun Life Financial Inc
208,503 0.07% 18,709 Suncor Energy Inc
549,795 0.19%
675 Talisman Energy Inc
7,678 0.00% 9,564 Teck Resources Ltd
203,719 0.07%
7,952 Telus Corp
231,421 0.08% 5,107 Thomson Reuters Corp
166,151 0.06%
320 Tim Hortons Inc
17,254 0.01% 10,439 Toronto-Dominion Bank
835,892 0.29%
5,543 Transcanada Corp
237,925 0.08% 10,286 Turquoise Hill Resources Ltd
60,844 0.02%
11,277 Yamana Gold Inc
107,222 0.04% Total Canada
11,914,667 4.15%
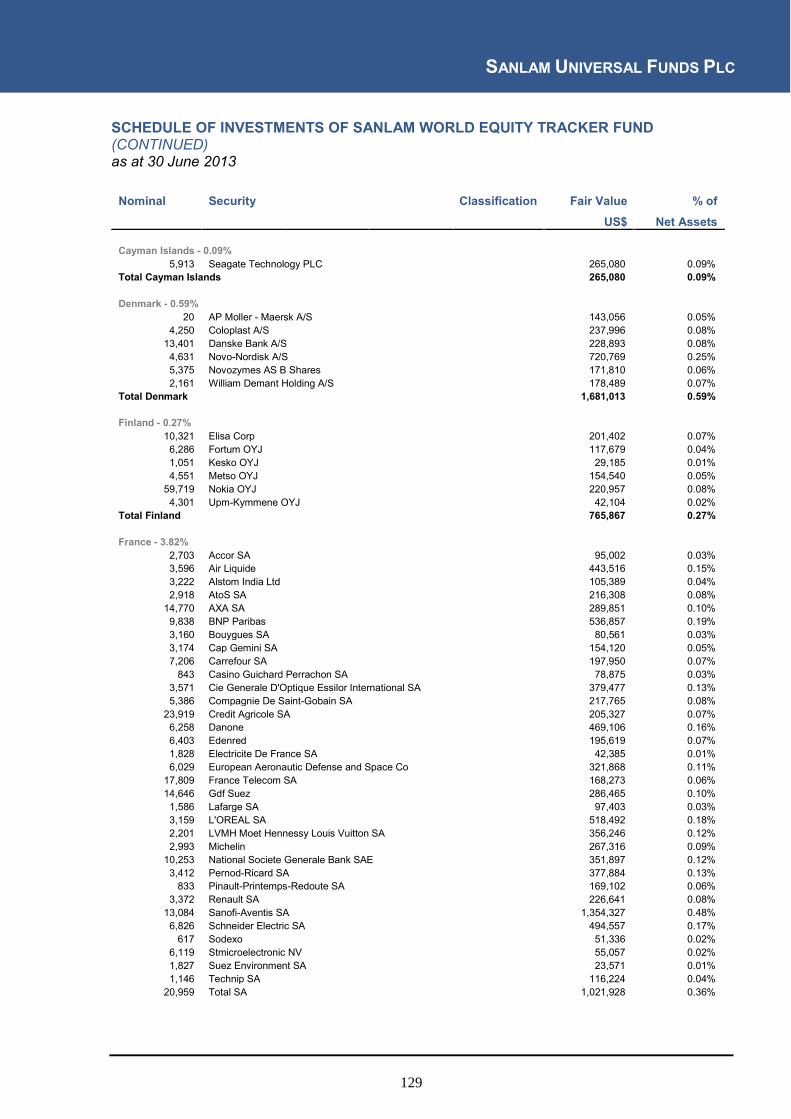
SANLAM UNIVERSAL FUNDS PLC
129
SCHEDULE OF INVESTMENTS OF SANLAM WORLD EQUITY TRACKER FUND (CONTINUED) as at 30 June 2013
Nominal Security
Classification Fair Value % of
US$ Net Assets
Cayman Islands - 0.09% 5,913 Seagate Technology PLC
265,080 0.09%
Total Cayman Islands
265,080 0.09%
Denmark - 0.59% 20 AP Moller - Maersk A/S
143,056 0.05%
4,250 Coloplast A/S
237,996 0.08% 13,401 Danske Bank A/S
228,893 0.08%
4,631 Novo-Nordisk A/S
720,769 0.25% 5,375 Novozymes AS B Shares
171,810 0.06%
2,161 William Demant Holding A/S
178,489 0.07% Total Denmark
1,681,013 0.59%
Finland - 0.27% 10,321 Elisa Corp
201,402 0.07%
6,286 Fortum OYJ
117,679 0.04% 1,051 Kesko OYJ
29,185 0.01%
4,551 Metso OYJ
154,540 0.05% 59,719 Nokia OYJ
220,957 0.08%
4,301 Upm-Kymmene OYJ
42,104 0.02% Total Finland
765,867 0.27%
France - 3.82% 2,703 Accor SA
95,002 0.03%
3,596 Air Liquide
443,516 0.15% 3,222 Alstom India Ltd
105,389 0.04%
2,918 AtoS SA
216,308 0.08% 14,770 AXA SA
289,851 0.10%
9,838 BNP Paribas
536,857 0.19% 3,160 Bouygues SA
80,561 0.03%
3,174 Cap Gemini SA
154,120 0.05% 7,206 Carrefour SA
197,950 0.07%
843 Casino Guichard Perrachon SA
78,875 0.03% 3,571 Cie Generale D'Optique Essilor International SA
379,477 0.13%
5,386 Compagnie De Saint-Gobain SA
217,765 0.08% 23,919 Credit Agricole SA
205,327 0.07%
6,258 Danone
469,106 0.16% 6,403 Edenred
195,619 0.07%
1,828 Electricite De France SA
42,385 0.01% 6,029 European Aeronautic Defense and Space Co
321,868 0.11%
17,809 France Telecom SA
168,273 0.06% 14,646 Gdf Suez
286,465 0.10%
1,586 Lafarge SA
97,403 0.03% 3,159 L'OREAL SA
518,492 0.18%
2,201 LVMH Moet Hennessy Louis Vuitton SA
356,246 0.12% 2,993 Michelin
267,316 0.09%
10,253 National Societe Generale Bank SAE
351,897 0.12% 3,412 Pernod-Ricard SA
377,884 0.13%
833 Pinault-Printemps-Redoute SA
169,102 0.06% 3,372 Renault SA
226,641 0.08%
13,084 Sanofi-Aventis SA
1,354,327 0.48% 6,826 Schneider Electric SA
494,557 0.17%
617 Sodexo
51,336 0.02% 6,119 Stmicroelectronic NV
55,057 0.02%
1,827 Suez Environment SA
23,571 0.01% 1,146 Technip SA
116,224 0.04%
20,959 Total SA
1,021,928 0.36%

SANLAM UNIVERSAL FUNDS PLC
130
SCHEDULE OF INVESTMENTS OF SANLAM WORLD EQUITY TRACKER FUND (CONTINUED) as at 30 June 2013
Nominal Security
Classification Fair Value % of
US$ Net Assets
France - 3.82% (continued) 1,640 Unibail-Rodamco SE
381,643 0.13%
1,808 Vallourec SA
91,375 0.03% 3,690 Veolia Environnement
41,932 0.01%
3,442 Vinci SA
172,525 0.06% 17,216 Vivendi SA
325,653 0.12%
Total France
10,979,823 3.82%
Germany - 3.31% 2,869 Adidas AG
310,100 0.11%
5,327 Allianz SE
777,374 0.27% 9,820 Basf SE
876,166 0.31%
9,778 Bayer AG
1,041,487 0.36% 4,834 Bayerische Motoren Werke AG
422,711 0.15%
4,652 Commerzbank AG
40,508 0.01% 8,115 Daimler AG
490,413 0.17%
9,328 Deutsche Bank AG
392,050 0.14% 484 Deutsche Boerse AG
31,820 0.01%
17,807 Deutsche Post AG
442,050 0.15% 33,390 Deutsche Telekom AG
389,116 0.14%
12,725 E.ON AG
208,609 0.07% 5,800 Henkel AG & Co KGAA
453,790 0.16%
2,302 K+S AG
85,008 0.03% 3,432 Linde AG
639,596 0.22%
1,000 MAN SE
109,074 0.04% 415 Merck KGAA
63,151 0.02%
618 Metro AG
19,503 0.01% 2,411 Muenchener Rueckversicherungs AG
443,208 0.15%
2,046 Porsche AG
158,852 0.06% 3,065 RWE AG
97,704 0.03%
10,024 SAP AG
733,165 0.26% 7,775 Siemens AG
784,879 0.26%
7,649 ThyssenKrupp AG
150,106 0.05% 1,780 Volkswagen AG
359,633 0.13%
Total Germany
9,520,073 3.31%
Great Britain - 8.78% 8,884 3I Group PLC
45,491 0.02%
7,654 Aggreko PLC
190,624 0.07% 13,939 Anglo American PLC
267,659 0.09%
3,333 Aon PLC
214,479 0.07% 13,175 Astrazeneca PLC
622,480 0.22%
34,581 Aviva PLC
178,124 0.06% 121,370 Barclays PLC
512,596 0.18%
30,405 BG Group Plc
515,820 0.18% 25,371 Bhp Billiton Plc
647,263 0.23%
203,582 BP Plc
1,405,744 0.49% 19,055 British Aerospace PLC
110,694 0.04%
20,895 British American Tobacco PLC
1,067,252 0.37% 15,695 British Land Co PLC
134,858 0.05%
14,902 British Sky Broadcast Group PLC
179,014 0.06% 76,664 BT Group PLC
359,541 0.13%
12,306 Capita Group PLC
180,306 0.06% 69,759 Centrica PLC
381,119 0.13%
31,057 Compass Group Plc
395,691 0.14%

SANLAM UNIVERSAL FUNDS PLC
131
SCHEDULE OF INVESTMENTS OF SANLAM WORLD EQUITY TRACKER FUND (CONTINUED) as at 30 June 2013
Nominal Security
Classification Fair Value % of
US$ Net Assets
Great Britain - 8.78% (continued) 28,757 Diageo PLC
820,008 0.29% 11,335 Experian Group Ltd
196,510 0.07%
144,000 Genting Singapore PLC
149,870 0.05% 48,936 GlaxoSmithKline PLC
1,223,214 0.43%
180,873 HSBC Holdings PLC
1,871,005 0.65% 9,736 Imperial Tobacco Group PLC
336,692 0.12%
7,161 Intercontinental Hotels Group PLC
196,376 0.07% 12,550 Invensys PLC
78,540 0.03%
42,419 Kingfisher PLC
220,684 0.08% 22,198 Land Securities Group PLC
297,634 0.10%
95,604 Legal & General Group PLC
248,544 0.09% 3,823 Liberty Global PLC
283,208 0.10%
519 Liberty Global PLC - Series C
35,235 0.01% 585,815 Lloyd Banking Group PLC
561,202 0.20%
1,964 London Stock Exchange Group
39,828 0.01% 1,200 Mead Johnson Nutrition Co
95,076 0.03%
30,399 National Grid PLC
343,966 0.12% 2,449 Next PLC
169,309 0.06%
87,320 Old Mutual PLC
239,325 0.08% 14,936 Pearson PLC
265,282 0.09%
30,660 Prudential Corp
499,917 0.17% 9,693 Reckitt Benckiser Group PLC
683,347 0.24%
31,475 Reed Elsevier PLC
356,618 0.12% 14,769 Rio Tinto PLC
601,020 0.21%
3,576,069 Rolls-Royce Holdings PLC
5,424 0.00% 30,051 Rolls-Royce Holdings PLC
516,879 0.18%
14,230 Royal Bank of Scotland Group
59,031 0.02% 38,944 Royal Dutch Shell PLC - Class A
1,240,443 0.43%
29,482 Royal Dutch Shell PLC - Class B
973,045 0.34% 12,286 Sabmiller PLC
587,466 0.20%
7,285 Scottish & Southern Energy PLC
168,285 0.06% 8,600 Shire PLC
271,970 0.09%
23,313 Smith & Nephew PLC
259,898 0.09% 13,456 Smiths Group PLC
266,957 0.09%
27,280 Standard Chartered PLC
590,453 0.21% 83,878 Tesco PLC
421,616 0.15%
15,608 Tullow Oil PLC
236,973 0.08% 12,470 Unilever PLC
503,491 0.18%
20,605 United Utilities Group PLC
213,769 0.07% 536,419 Vodafone Group PLC
1,528,382 0.52%
40,267 WM Morrison Supermarkets
159,895 0.06% Total Great Britain
25,225,142 8.78%
Greece - 0.01% 4,037 OPAP SA
33,747 0.01%
Total Greece
33,747 0.01%

SANLAM UNIVERSAL FUNDS PLC
132
SCHEDULE OF INVESTMENTS OF SANLAM WORLD EQUITY TRACKER FUND (CONTINUED) as at 30 June 2013
Nominal Security
Classification Fair Value % of
US$ Net Assets
Hong Kong - 1.01% 144,625 AIA Group Ltd
612,533 0.21%
18,601 Bank of East Asia Ltd
67,030 0.02% 46,100 Boc Hong Kong Holdings Ltd
141,756 0.05%
29,300 Cheung Kong Holdings Ltd
397,406 0.14% 25,100 CLP Holdings Ltd
203,067 0.07%
6,700 Hang Seng Bank Ltd
99,081 0.03% 48,535 Hong Kong & China Gas Co Ltd
118,644 0.04%
19,059 Hong Kong Exchanges and Clearing Ltd
287,745 0.11% 35,400 Hutchison Whampoa Ltd
372,202 0.13%
12,000 Power Assets Holdings Ltd
103,504 0.04% 25,242 Sun Hung Kai Properties Ltd
325,768 0.11%
14,500 Swire Pacific Ltd
175,542 0.06% Total Hong Kong
2,904,278 1.01%
Ireland - 0.54% 7,478 Accenture PLC
538,117 0.19%
4,590 Covidien PLC
288,436 0.10% 9,643 CRH PLC
194,941 0.07%
4,734 Eaton Corp PLC
311,545 0.10% 4,073 Ingersoll-Rand PLC
226,132 0.08%
Total Ireland
1,559,171 0.54%
Israel - 0.24% 59,290 Bank Leumi Le-Israel BM
196,678 0.07%
12,775 Teva Pharmaceutical Industries Ltd
496,391 0.17% Total Israel
693,069 0.24%
Italy - 0.74% 8,278 Assicurazioni Generali SpA
144,424 0.05%
12,840 Atlantia SpA
209,159 0.07% 77,468 Enel SpA
242,717 0.08%
32,878 ENI-Ente Nazionale Idrocarburi SpA
674,486 0.24% 11,432 Fiat Industrial SpA
127,295 0.04%
12,300 Fiat SpA
85,870 0.03% 4,512 Finmeccanica SpA
22,572 0.01%
93,023 Intesa Sanpaolo SpA
148,871 0.05% 6,966 Mediobanca SpA
36,225 0.01%
5,777 SAIPEM SpA
93,805 0.03% 42,534 Telecom Italia RNC
23,612 0.01%
149,419 Telecom Italia SpA
103,731 0.04% 40,089 Unicredit SpA
187,520 0.07%
9,524 Unione Di Banche Italiane SCPA
34,446 0.01% Total Italy
2,134,733 0.74%
Japan - 9.01% 5,900 Aeon Co Ltd
77,336 0.03%
4,900 Aisin Seiki Co Ltd
187,209 0.07% 18,000 Ajinomoto Co Inc
263,848 0.09%
6,000 Asahi Chemical Industry and Co Ltd
39,625 0.01% 1,800 Asahi Glass Co Ltd
11,706 0.00%
6,600 Astellas Pharma Inc
358,140 0.12% 22,000 Bank of Yokohama Ltd
113,400 0.04%
6,680 Bridgestone Corp
227,307 0.08% 9,963 Canon Inc
324,477 0.11%
1,700 Central Japan Railway Co
207,601 0.07%

SANLAM UNIVERSAL FUNDS PLC
133
SCHEDULE OF INVESTMENTS OF SANLAM WORLD EQUITY TRACKER FUND (CONTINUED) as at 30 June 2013
Nominal Security
Classification Fair Value % of
US$ Net Assets
Japan - 9.01% (continued) 3,350 Chiba Bank
22,799 0.01%
11,400 Chubu Electric Power Co Inc
161,365 0.06% 39,390 Chuo Mitsui Trust Holdings Inc
183,606 0.06%
3,100 Credit Saison Co Ltd
77,679 0.03% 9,000 Dai Nippon Printing Co Ltd
82,181 0.03%
12,800 Daiichi Sankyo Co
213,398 0.07% 2,000 Daito Trust & Construction Co Ltd
188,261 0.07%
15,000 Daiwa Securities Group Inc
125,793 0.04% 4,730 Denso Corp
222,143 0.08%
3,600 East Japan Railway Co
279,432 0.10% 5,200 Eisai Co Ltd
211,759 0.07%
2,200 Fanuc Ltd
318,494 0.11% 5,000 Fuji Photo Film Co
109,987 0.04%
24,000 Fujitsu Ltd
99,064 0.03% 68,000 Hitachi Ltd
436,082 0.15%
5,500 Hokkaido Electric Power Co Inc
75,083 0.03% 16,500 Honda Motor Co
612,126 0.21%
8,100 Hoya Pentax HD Corp
167,088 0.06% 15,880 Isetan Mitsukoshi Holdings
210,550 0.07%
25,200 Itochu Corp
290,486 0.10% 6,000 Japan Steel Works Ltd
32,981 0.01%
11,400 Japan Tobacco Inc
402,265 0.14% 8,600 JFE Holdings Inc
188,485 0.07%
14,430 Joyo Bank Ltd
78,883 0.03% 48,340 JX Holdings Inc
234,084 0.08%
20,700 Kamigumi Co
166,509 0.06% 11,100 Kansai Electric Power Co
151,867 0.05%
4,000 Kansai Paint Co Ltd
50,982 0.02% 5,751 Kao Corp
195,405 0.07%
5,000 KDDI Corp
259,740 0.09% 24,891 Keikyu Corp
213,502 0.07%
29,000 Keisei Electric Railway Co
271,227 0.09% 584 Keyence Corp
186,083 0.06%
61,000 Kinki Nippon Railway Co Ltd
267,754 0.09% 7,000 Kirin Holdings Company Ltd
109,514 0.04%
33,000 Kobe Steel Ltd
40,864 0.01% 5,500 Komatsu Ltd
126,966 0.04%
6,500 Konica Minolta holdings Inc
49,013 0.02% 25,000 Kubota Corp
364,442 0.13%
7,800 Kurita Water Industries Ltd
164,983 0.06% 2,600 Kyocera Corp
264,371 0.09%
23,000 Marubeni Corp
153,519 0.05% 22,000 Mitsubishi Chemical Holdings Corp
103,212 0.04%
16,300 Mitsubishi Corp
278,805 0.10% 22,500 Mitsubishi Electric Corp
210,435 0.07%
10,950 Mitsubishi Estate Co Ltd
291,140 0.10% 13,000 Mitsubishi Gas Chemical Co Inc
95,409 0.03%
39,700 Mitsubishi Heavy Industries Ltd
220,222 0.08% 12,200 Mitsubishi Tanabe Pharma Corp
157,827 0.05%
137,200 Mitsubishi UFJ Holdings Inc
845,328 0.29% 23,300 Mitsui & Co Ltd
292,276 0.10%
13,100 Mitsui Fudosan Co Ltd
384,705 0.13% 42,000 Mitsui OSK Lines Ltd
163,636 0.06%
283,800 Mizuho Financial Group Inc
588,571 0.20% 11,500 MS&AD Insurance Group Holdings
291,986 0.10%
4,500 Murata Manufacturing Co Ltd
342,042 0.12% 23,000 Nec Corp
50,247 0.02%
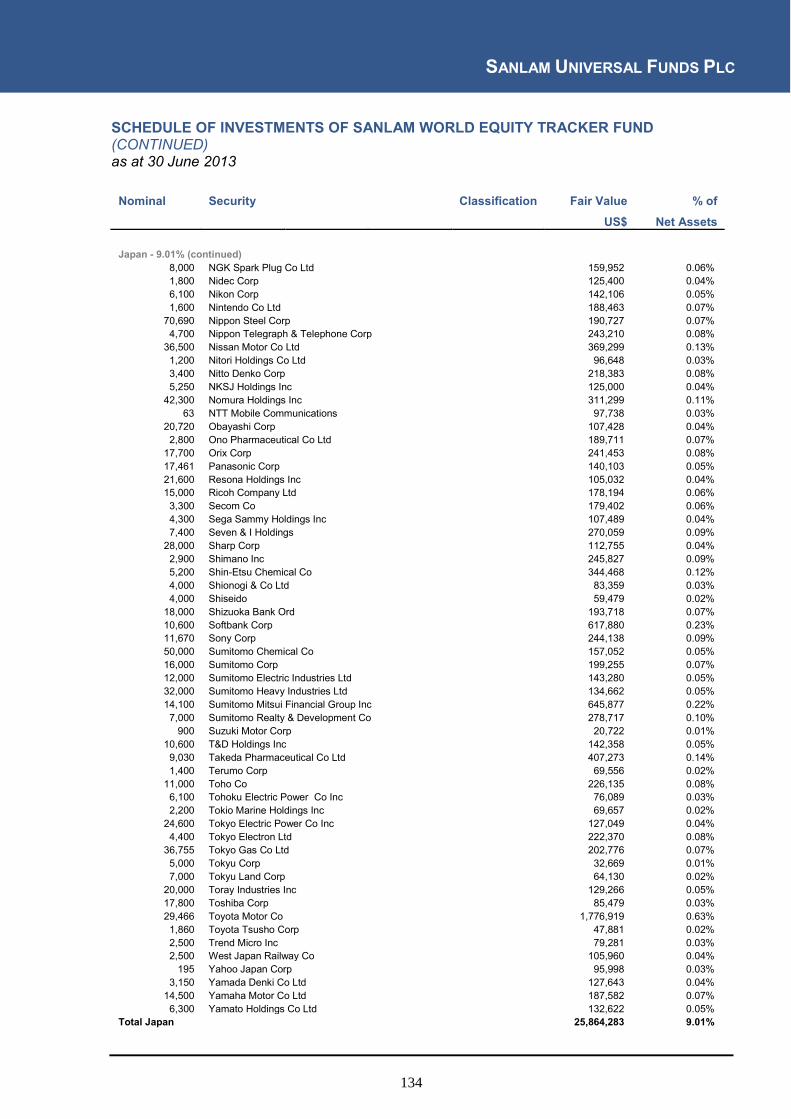
SANLAM UNIVERSAL FUNDS PLC
134
SCHEDULE OF INVESTMENTS OF SANLAM WORLD EQUITY TRACKER FUND (CONTINUED) as at 30 June 2013
Nominal Security
Classification Fair Value % of
US$ Net Assets
Japan - 9.01% (continued) 8,000 NGK Spark Plug Co Ltd
159,952 0.06%
1,800 Nidec Corp
125,400 0.04% 6,100 Nikon Corp
142,106 0.05%
1,600 Nintendo Co Ltd
188,463 0.07% 70,690 Nippon Steel Corp
190,727 0.07%
4,700 Nippon Telegraph & Telephone Corp
243,210 0.08% 36,500 Nissan Motor Co Ltd
369,299 0.13%
1,200 Nitori Holdings Co Ltd
96,648 0.03% 3,400 Nitto Denko Corp
218,383 0.08%
5,250 NKSJ Holdings Inc
125,000 0.04% 42,300 Nomura Holdings Inc
311,299 0.11%
63 NTT Mobile Communications
97,738 0.03% 20,720 Obayashi Corp
107,428 0.04%
2,800 Ono Pharmaceutical Co Ltd
189,711 0.07% 17,700 Orix Corp
241,453 0.08%
17,461 Panasonic Corp
140,103 0.05% 21,600 Resona Holdings Inc
105,032 0.04%
15,000 Ricoh Company Ltd
178,194 0.06% 3,300 Secom Co
179,402 0.06%
4,300 Sega Sammy Holdings Inc
107,489 0.04% 7,400 Seven & I Holdings
270,059 0.09%
28,000 Sharp Corp
112,755 0.04% 2,900 Shimano Inc
245,827 0.09%
5,200 Shin-Etsu Chemical Co
344,468 0.12% 4,000 Shionogi & Co Ltd
83,359 0.03%
4,000 Shiseido
59,479 0.02% 18,000 Shizuoka Bank Ord
193,718 0.07%
10,600 Softbank Corp
617,880 0.23% 11,670 Sony Corp
244,138 0.09%
50,000 Sumitomo Chemical Co
157,052 0.05% 16,000 Sumitomo Corp
199,255 0.07%
12,000 Sumitomo Electric Industries Ltd
143,280 0.05% 32,000 Sumitomo Heavy Industries Ltd
134,662 0.05%
14,100 Sumitomo Mitsui Financial Group Inc
645,877 0.22% 7,000 Sumitomo Realty & Development Co
278,717 0.10%
900 Suzuki Motor Corp
20,722 0.01% 10,600 T&D Holdings Inc
142,358 0.05%
9,030 Takeda Pharmaceutical Co Ltd
407,273 0.14% 1,400 Terumo Corp
69,556 0.02%
11,000 Toho Co
226,135 0.08% 6,100 Tohoku Electric Power Co Inc
76,089 0.03%
2,200 Tokio Marine Holdings Inc
69,657 0.02% 24,600 Tokyo Electric Power Co Inc
127,049 0.04%
4,400 Tokyo Electron Ltd
222,370 0.08% 36,755 Tokyo Gas Co Ltd
202,776 0.07%
5,000 Tokyu Corp
32,669 0.01% 7,000 Tokyu Land Corp
64,130 0.02%
20,000 Toray Industries Inc
129,266 0.05% 17,800 Toshiba Corp
85,479 0.03%
29,466 Toyota Motor Co
1,776,919 0.63% 1,860 Toyota Tsusho Corp
47,881 0.02%
2,500 Trend Micro Inc
79,281 0.03% 2,500 West Japan Railway Co
105,960 0.04%
195 Yahoo Japan Corp
95,998 0.03% 3,150 Yamada Denki Co Ltd
127,643 0.04%
14,500 Yamaha Motor Co Ltd
187,582 0.07% 6,300 Yamato Holdings Co Ltd
132,622 0.05%
Total Japan
25,864,283 9.01%

SANLAM UNIVERSAL FUNDS PLC
135
SCHEDULE OF INVESTMENTS OF SANLAM WORLD EQUITY TRACKER FUND (CONTINUED) as at 30 June 2013
Nominal Security
Classification Fair Value % of
US$ Net Assets
Jersey - 0.3% 87,165 Glencore International PLC
359,805 0.13%
6,373 Wolseley PLC
293,179 0.10% 12,060 WPP PLC
205,238 0.07%
Total Jersey
858,222 0.30%
Luxembourg - 0.06% 15,285 Arcelormittal
170,376 0.06%
Total Luxembourg
170,376 0.06%
Netherlands - 1.38% 39,314 Aegon NV
262,656 0.09%
15,280 Ahold (Kon)
227,154 0.08% 3,166 Akzo Nobel NV
178,283 0.06%
3,637 ASML Holding NV
286,629 0.10% 9,421 De Master Blenders
150,648 0.05%
2,603 Heineken NV
165,649 0.06% 45,647 ING Groep NV
415,404 0.14%
10,011 Koninklijke Philips Electronics NV
272,595 0.09% 926 Randstad Holdings NV
37,921 0.01%
20,717 Reed Elsevier NV
344,745 0.13% 18,138 Royal KPN NV
37,658 0.01%
13,229 Schlumberger Ltd
947,990 0.33% 933 TNT Express NV
6,989 0.00%
16,011 Unilever NV
629,761 0.23% Total Netherlands
3,964,082 1.38%
New Zealand - 0.02% 35,039 Telecom Corp of New Zealand
60,892 0.02%
Total New Zealand
60,892 0.02%
Norway - 0.32% 37,850 Norsk Hydro Asa
150,218 0.05%
25,818 Orkla ASA
210,342 0.07% 11,803 Statoil ASA
242,140 0.08%
15,861 Telenor ASA
312,664 0.12% Total Norway
915,364 0.32%
Portugal - 0.12% 84,304 Energias De Portugal SA
271,259 0.10%
18,142 Portugal Telecom SGPS SA
70,520 0.02% Total Portugal
341,779 0.12%
Singapore - 0.76% 50,850 CapitaLand Limited
123,487 0.04%
17,562 DBS Bank limited
214,627 0.07% 26,291 Flextronics International Ltd
203,492 0.07%
38,400 Keppel Corp Ltd
314,878 0.12% 50,408 Oversea-Chinese Bank Corp Ltd
397,445 0.14%
19,000 Singapore Press Holdings Ltd
62,469 0.02% 125,900 Singapore Telecommunications Ltd
374,236 0.13%
24,725 United Overseas Bank Ltd
387,163 0.13% 42,000 Wilmar International Ltd
104,312 0.04%
Total Singapore
2,182,109 0.76%

SANLAM UNIVERSAL FUNDS PLC
136
SCHEDULE OF INVESTMENTS OF SANLAM WORLD EQUITY TRACKER FUND (CONTINUED) as at 30 June 2013
Nominal Security
Classification Fair Value % of
US$ Net Assets
Spain - 1.02% 996 ACS Actividades De Construccion Y Servicios SA 26,350 0.01%
77,710 Banco Bilbao Viscaya Argentaria SA
651,119 0.23% 8,966 Banco Popular Espanol SA
27,451 0.01%
98,642 Banco Santander SA
628,631 0.21% 3,256 Distribuidora Internacional de Alimentacion SA
24,594 0.01%
49,309 Iberdrola SA
260,007 0.09% 2,967 Inditex SA
365,822 0.13%
1,603 Red Electrica de Espana
88,048 0.03% 12,183 Repsol SA
256,743 0.09%
46,632 Telefonica SA
596,843 0.21% Total Spain
2,925,608 1.02%
Sweden - 1.36% 17,400 Atlas Copco AB
370,772 0.13%
8,120 Getinge AB
245,222 0.09% 12,816 Hennes & Mauritz AB
418,565 0.15%
5,870 Noble Corp
220,595 0.08% 25,892 Nordea Bank AB
287,757 0.09%
16,273 Sandvik AB
193,393 0.07% 20,140 Securitas AB
175,036 0.06%
33,600 Skandinaviska Enskilda Banken AB
319,151 0.11% 9,000 Skanska AB
148,435 0.05%
10,900 SKF AB
253,748 0.09% 7,969 Svenska Handelsbanken AB
317,891 0.10%
985 Swedish Match AB
34,753 0.01% 20,293 Telefonaktiebolaget LM Ericsson
228,388 0.08%
6,954 Teliasonera AB
45,062 0.02% 5,839 Tyco International Ltd
192,395 0.07%
19,966 Volvo AB
265,685 0.09% 13,790 Weatherford International Ltd
188,922 0.07%
Total Sweden
3,905,770 1.36%
Switzerland - 4.11% 27,023 ABB Ltd
585,755 0.20%
3,216 ACE Ltd
287,768 0.10% 5,868 Compagnie Financiere Richemont SA
518,148 0.17%
14,318 Credit Suisse Group AG
379,059 0.13% 1,350 Geberit AG
334,290 0.12%
3,999 Holcim Ltd
278,307 0.10% 3,630 Julius Baer Group Ltd
141,525 0.05%
31,816 Nestle SA
2,083,070 0.73% 22,723 Novartis AG
1,611,407 0.56%
1,401 Pentair Ltd
80,824 0.03% 7,767 Roche Holdings AG
1,929,027 0.67%
2,451 Schindler Holding AG
340,892 0.12% 208 SGS SA
446,028 0.15%
698 Sonova Holdings AG
73,916 0.03% 587 Swatch Group AG
320,735 0.11%
5,591 Swiss RE AG
415,396 0.14% 466 Swisscom AG
203,696 0.07%
1,174 Syngenta AG
458,582 0.16% 4,744 TE Connectivity Ltd
216,042 0.08%
1,711 Transocean Ltd
82,205 0.03% 45,563 UBS AG
774,311 0.27%
957 Zurich Financial Services AG
247,795 0.09% Total Switzerland
11,808,778 4.11%
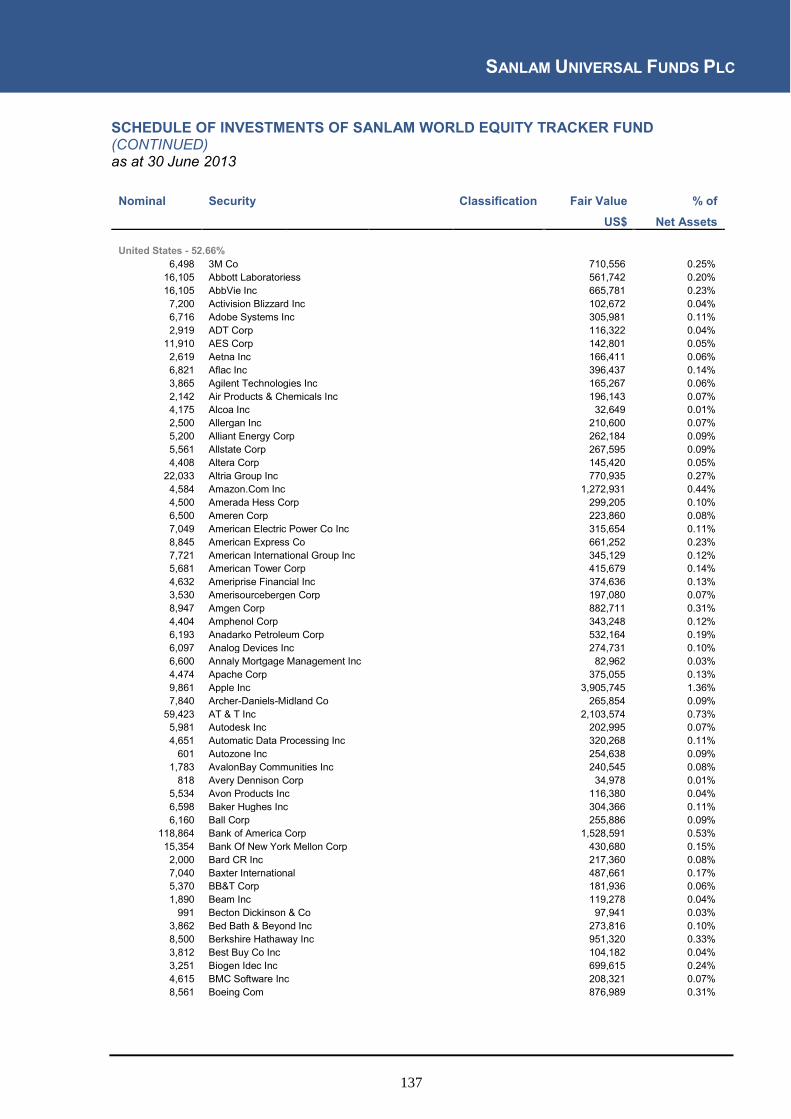
SANLAM UNIVERSAL FUNDS PLC
137
SCHEDULE OF INVESTMENTS OF SANLAM WORLD EQUITY TRACKER FUND (CONTINUED) as at 30 June 2013
Nominal Security
Classification Fair Value % of
US$ Net Assets
United States - 52.66% 6,498 3M Co
710,556 0.25%
16,105 Abbott Laboratoriess
561,742 0.20% 16,105 AbbVie Inc
665,781 0.23%
7,200 Activision Blizzard Inc
102,672 0.04% 6,716 Adobe Systems Inc
305,981 0.11%
2,919 ADT Corp
116,322 0.04% 11,910 AES Corp
142,801 0.05%
2,619 Aetna Inc
166,411 0.06% 6,821 Aflac Inc
396,437 0.14%
3,865 Agilent Technologies Inc
165,267 0.06% 2,142 Air Products & Chemicals Inc
196,143 0.07%
4,175 Alcoa Inc
32,649 0.01% 2,500 Allergan Inc
210,600 0.07%
5,200 Alliant Energy Corp
262,184 0.09% 5,561 Allstate Corp
267,595 0.09%
4,408 Altera Corp
145,420 0.05% 22,033 Altria Group Inc
770,935 0.27%
4,584 Amazon.Com Inc
1,272,931 0.44% 4,500 Amerada Hess Corp
299,205 0.10%
6,500 Ameren Corp
223,860 0.08% 7,049 American Electric Power Co Inc
315,654 0.11%
8,845 American Express Co
661,252 0.23% 7,721 American International Group Inc
345,129 0.12%
5,681 American Tower Corp
415,679 0.14% 4,632 Ameriprise Financial Inc
374,636 0.13%
3,530 Amerisourcebergen Corp
197,080 0.07% 8,947 Amgen Corp
882,711 0.31%
4,404 Amphenol Corp
343,248 0.12% 6,193 Anadarko Petroleum Corp
532,164 0.19%
6,097 Analog Devices Inc
274,731 0.10% 6,600 Annaly Mortgage Management Inc
82,962 0.03%
4,474 Apache Corp
375,055 0.13% 9,861 Apple Inc
3,905,745 1.36%
7,840 Archer-Daniels-Midland Co
265,854 0.09% 59,423 AT & T Inc
2,103,574 0.73%
5,981 Autodesk Inc
202,995 0.07% 4,651 Automatic Data Processing Inc
320,268 0.11%
601 Autozone Inc
254,638 0.09% 1,783 AvalonBay Communities Inc
240,545 0.08%
818 Avery Dennison Corp
34,978 0.01% 5,534 Avon Products Inc
116,380 0.04%
6,598 Baker Hughes Inc
304,366 0.11% 6,160 Ball Corp
255,886 0.09%
118,864 Bank of America Corp
1,528,591 0.53% 15,354 Bank Of New York Mellon Corp
430,680 0.15%
2,000 Bard CR Inc
217,360 0.08% 7,040 Baxter International
487,661 0.17%
5,370 BB&T Corp
181,936 0.06% 1,890 Beam Inc
119,278 0.04%
991 Becton Dickinson & Co
97,941 0.03% 3,862 Bed Bath & Beyond Inc
273,816 0.10%
8,500 Berkshire Hathaway Inc
951,320 0.33% 3,812 Best Buy Co Inc
104,182 0.04%
3,251 Biogen Idec Inc
699,615 0.24% 4,615 BMC Software Inc
208,321 0.07%
8,561 Boeing Com
876,989 0.31%

SANLAM UNIVERSAL FUNDS PLC
138
SCHEDULE OF INVESTMENTS OF SANLAM WORLD EQUITY TRACKER FUND (CONTINUED) as at 30 June 2013
Nominal Security
Classification Fair Value % of
US$ Net Assets
United States - 52.66% (continued) 2,075 Boston Properties Inc
218,850 0.08% 18,228 Boston Scientific Corp
168,974 0.06%
16,567 Bristol-Myrs Squib Co
740,379 0.26% 9,055 Broadcom Corp
305,697 0.11%
3,900 C.H.Robinson Worldwide Inc
219,609 0.08% 5,629 CA Inc
161,158 0.06%
2,186 Cablevision Systems Corp
36,769 0.01% 2,020 Cameron International Corp
123,543 0.04%
4,100 Campbell Soup Co
183,639 0.06% 7,225 Capital One Financial Corp
453,802 0.16%
987 Cardinal Health Inc
46,586 0.02% 2,893 Carefusion Corp
106,607 0.04%
5,261 Carnival Corp
180,400 0.06% 6,443 Caterpillar Inc
531,483 0.19%
7,926 CBS Corp - Class B
387,344 0.13% 4,681 Celgene Corp
547,256 0.19%
12,204 Centerpoint Energy Inc
286,672 0.10% 9,132 CenturyLink Inc
322,816 0.11%
20,291 Charles Schwab Corp
430,778 0.15% 12,733 Chesapeake Energy Corp
259,499 0.09%
20,283 Chevron Corp
2,400,290 0.84% 400 Chipotle Mexican Grill Inc
145,740 0.05%
3,179 Chubb Corp
269,102 0.09% 2,686 Cigna Corp
194,708 0.07%
2,219 Cincinnati Financial Corp
101,852 0.04% 56,353 Cisco Systems Inc
1,369,941 0.48%
28,562 Citigroup Inc
1,370,119 0.48% 22,490 Citizens Communications Co
91,085 0.03%
3,286 Citrix Systems Inc
198,244 0.07% 1,435 Clorox Co
119,306 0.04%
2,235 CME Group Inc
169,815 0.06% 5,103 Coach Inc
291,330 0.10%
42,924 Coca-Cola Co
1,721,682 0.60% 4,836 Cognizant Tech Solutions Corp
302,782 0.11%
10,550 Colgate-Palmolive Co
604,410 0.21% 15,922 Comcast Corp
631,626 0.22%
14,474 Comcast Corp
606,171 0.21% 1,799 Comerica Inc
71,654 0.02%
4,761 Computer Sciences Corp
208,389 0.07% 9,594 Conagra Foods Inc
335,118 0.12%
2,400 Concho Resources Inc
200,928 0.07% 11,420 Conocophillips
690,910 0.24%
5,647 Consol Energy Inc
153,034 0.05% 4,319 Consolidated Edison Inc
251,841 0.09%
3,999 Constellation Brands Inc
208,428 0.07% 7,323 Corning Inc
104,206 0.04%
4,359 Costco Wholesale Corp
481,975 0.17% 5,812 Crown Castle Intl Corp
420,731 0.15%
17,116 CSX Corp
396,920 0.14% 2,700 Cummins Inc
292,842 0.10%
14,628 CVS Caremark Corp
836,429 0.29% 7,392 Danaher Corp
467,914 0.16%
2,181 Darden Restuarants Inc
110,097 0.04% 5,374 Deere & Co
436,638 0.15%
21,175 Dell Inc
282,686 0.10% 3,508 Dentsply International Inc
143,688 0.05%

SANLAM UNIVERSAL FUNDS PLC
139
SCHEDULE OF INVESTMENTS OF SANLAM WORLD EQUITY TRACKER FUND (CONTINUED) as at 30 June 2013
Nominal Security
Classification Fair Value % of
US$ Net Assets
United States - 52.66% (continued) 2,050 Devon Energy Corp
106,354 0.04% 8,018 Directv
494,069 0.17%
5,568 Discover Financial Services
265,260 0.09% 3,200 Dominion Resources Inc
181,824 0.06%
1,964 Dover Corp
152,524 0.05% 13,039 Dow Chemical Co
419,465 0.15%
10,349 DR Horton Inc
220,227 0.08% 5,514 Dr Pepper Snapple Group
253,258 0.09%
3,965 DTE Energy Co
265,695 0.09% 8,121 Duke Energy Corp
548,168 0.19%
13,681 eBay Inc
707,581 0.25% 5,400 Ecolab Inc
460,026 0.16%
2,300 Edison International
110,768 0.04% 9,936 El Du Pont De Nemours & Co
521,640 0.18%
2,546 Electronic Arts Inc
58,482 0.02% 20,868 EMC Corp
492,902 0.17%
7,540 Emerson Electric Co
411,232 0.14% 1,743 Entergy Corp
121,452 0.04%
3,798 Eog Resources Inc
500,121 0.17% 4,020 Equifax Inc
236,899 0.08%
4,817 Equity Residential
279,675 0.10% 3,990 Estee Lauder Cos Inc
262,422 0.09%
3,426 Exelon Corp
105,795 0.04% 2,246 Expeditors International of Washington
85,370 0.03%
9,768 Express Scripts Holdings Inc
602,588 0.21% 46,901 Exxon Corp
4,237,505 1.48%
2,944 Fastenal Co
134,982 0.05% 4,535 Fedex Corp
447,060 0.16%
10,970 Fidelity National Financial In
261,196 0.09% 6,537 Fidelity National Information Services Inc
280,045 0.10%
10,848 Fifth Third Bancorp
195,806 0.07% 5,615 FirstEnergy Corp
209,664 0.07%
1,300 Fiserv Inc
113,633 0.04% 3,928 Fluor Corp
232,970 0.08%
3,900 FMC Technologies Inc
217,152 0.08% 40,415 Ford Motor Co
625,220 0.22%
2,700 Forest Laboraties Inc
110,700 0.04% 2,340 Franklin Resources Inc
318,287 0.11%
9,996 Freeport-Mcmoran Copper & Gold Inc
275,990 0.10% 2,600 Gamestop Corp -Class A
109,278 0.04%
6,590 Gap Inc
275,001 0.10% 2,969 General Dynanics Corp
232,562 0.08%
107,294 General Electric Co
2,488,148 0.87% 12,717 General Growth Properties
252,687 0.09%
8,544 General Mills Inc
414,640 0.14% 12,000 General Motors Co
399,720 0.14%
18,772 Gilead Sciences Inc
961,314 0.33% 4,501 Goldman Sachs Group Inc
680,776 0.24%
2,785 Google Inc
2,451,830 0.85% 640 Grainger (W.W.) Inc.
161,395 0.06%
1,600 Green Mountain Coffee Roasters Inc
120,096 0.04% 2,659 H&R Block Inc
73,787 0.03%
12,420 Halliburton Co
518,162 0.18% 5,000 Harley Davidson Inc
274,100 0.10%
3,309 Hartford Financial Services Group Inc
102,314 0.04% 9,600 HCP INC
436,224 0.15%
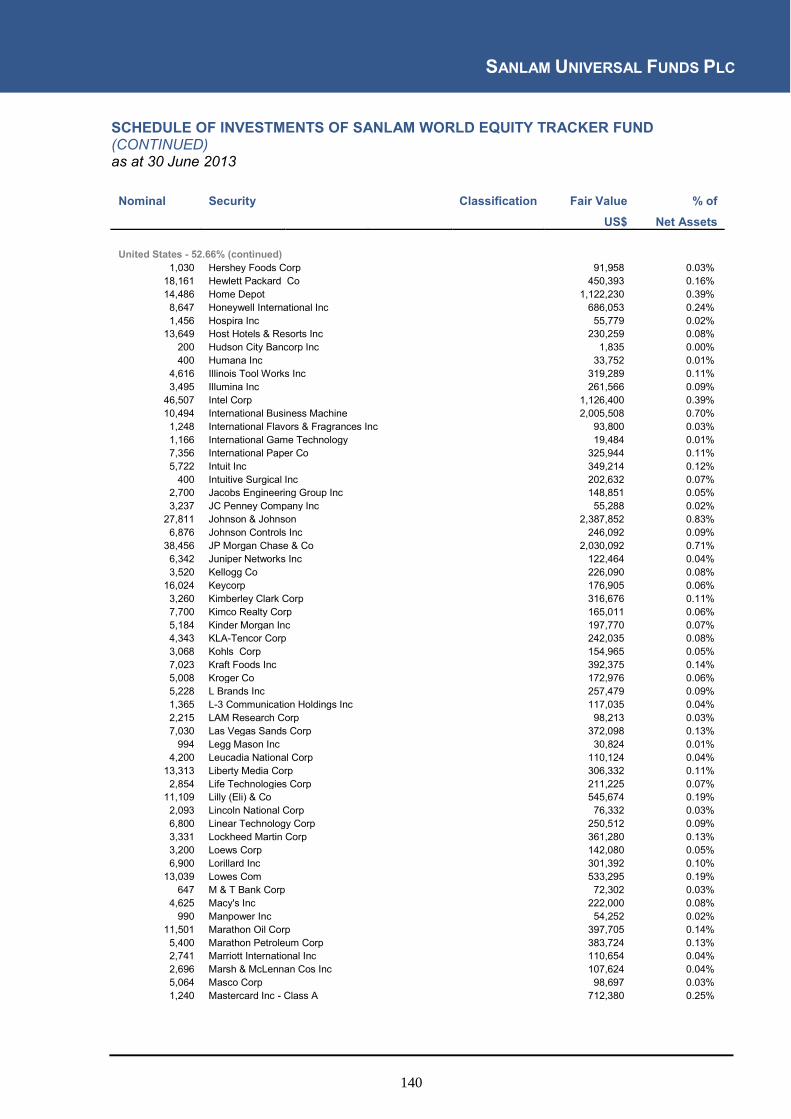
SANLAM UNIVERSAL FUNDS PLC
140
SCHEDULE OF INVESTMENTS OF SANLAM WORLD EQUITY TRACKER FUND (CONTINUED) as at 30 June 2013
Nominal Security
Classification Fair Value % of
US$ Net Assets
United States - 52.66% (continued) 1,030 Hershey Foods Corp
91,958 0.03% 18,161 Hewlett Packard Co
450,393 0.16%
14,486 Home Depot
1,122,230 0.39% 8,647 Honeywell International Inc
686,053 0.24%
1,456 Hospira Inc
55,779 0.02% 13,649 Host Hotels & Resorts Inc
230,259 0.08%
200 Hudson City Bancorp Inc
1,835 0.00% 400 Humana Inc
33,752 0.01%
4,616 Illinois Tool Works Inc
319,289 0.11% 3,495 Illumina Inc
261,566 0.09%
46,507 Intel Corp
1,126,400 0.39% 10,494 International Business Machine
2,005,508 0.70%
1,248 International Flavors & Fragrances Inc
93,800 0.03% 1,166 International Game Technology
19,484 0.01%
7,356 International Paper Co
325,944 0.11% 5,722 Intuit Inc
349,214 0.12%
400 Intuitive Surgical Inc
202,632 0.07% 2,700 Jacobs Engineering Group Inc
148,851 0.05%
3,237 JC Penney Company Inc
55,288 0.02% 27,811 Johnson & Johnson
2,387,852 0.83%
6,876 Johnson Controls Inc
246,092 0.09% 38,456 JP Morgan Chase & Co
2,030,092 0.71%
6,342 Juniper Networks Inc
122,464 0.04% 3,520 Kellogg Co
226,090 0.08%
16,024 Keycorp
176,905 0.06% 3,260 Kimberley Clark Corp
316,676 0.11%
7,700 Kimco Realty Corp
165,011 0.06% 5,184 Kinder Morgan Inc
197,770 0.07%
4,343 KLA-Tencor Corp
242,035 0.08% 3,068 Kohls Corp
154,965 0.05%
7,023 Kraft Foods Inc
392,375 0.14% 5,008 Kroger Co
172,976 0.06%
5,228 L Brands Inc
257,479 0.09% 1,365 L-3 Communication Holdings Inc
117,035 0.04%
2,215 LAM Research Corp
98,213 0.03% 7,030 Las Vegas Sands Corp
372,098 0.13%
994 Legg Mason Inc
30,824 0.01% 4,200 Leucadia National Corp
110,124 0.04%
13,313 Liberty Media Corp
306,332 0.11% 2,854 Life Technologies Corp
211,225 0.07%
11,109 Lilly (Eli) & Co
545,674 0.19% 2,093 Lincoln National Corp
76,332 0.03%
6,800 Linear Technology Corp
250,512 0.09% 3,331 Lockheed Martin Corp
361,280 0.13%
3,200 Loews Corp
142,080 0.05% 6,900 Lorillard Inc
301,392 0.10%
13,039 Lowes Com
533,295 0.19% 647 M & T Bank Corp
72,302 0.03%
4,625 Macy's Inc
222,000 0.08% 990 Manpower Inc
54,252 0.02%
11,501 Marathon Oil Corp
397,705 0.14% 5,400 Marathon Petroleum Corp
383,724 0.13%
2,741 Marriott International Inc
110,654 0.04% 2,696 Marsh & McLennan Cos Inc
107,624 0.04%
5,064 Masco Corp
98,697 0.03% 1,240 Mastercard Inc - Class A
712,380 0.25%

SANLAM UNIVERSAL FUNDS PLC
141
SCHEDULE OF INVESTMENTS OF SANLAM WORLD EQUITY TRACKER FUND (CONTINUED) as at 30 June 2013
Nominal Security
Classification Fair Value % of
US$ Net Assets
United States - 52.66% (continued) 5,875 Mattel Inc
266,196 0.09% 9,486 McDonald's Corp
939,114 0.33%
2,776 McGraw-Hill Cos Inc
147,655 0.05% 2,700 Mckesson Corp
309,150 0.11%
2,197 Meadwestvaco Corp
74,940 0.03% 8,394 Medtronic Inc
432,039 0.15%
34,076 Merck & Co
1,582,830 0.55% 7,711 Metlife Inc
352,855 0.12%
5,806 Microchip Technology Inc
216,274 0.08% 5,663 Micron Technology Inc
81,151 0.03%
78,719 Microsoft Corp
2,718,167 0.95% 1,533 Mohawk Industries Inc
172,447 0.06%
21,071 Mondelez International Inc
601,156 0.21% 5,406 Monsanto Co
534,113 0.19%
3,170 Moody's Corp
193,148 0.07% 15,633 Morgan Stanley & Co
381,914 0.13%
1,971 Motorola Solutions Inc
113,786 0.04% 3,900 Murphy Oil Corp
237,471 0.08%
3,214 National-Oilwell Inc
221,445 0.08% 3,960 Netapp Inc
149,609 0.05%
10,898 Newell Rubbermaid Inc
286,073 0.10% 8,088 Newmont Mining Corp
242,236 0.08%
13,500 News Corp - Class A
440,100 0.15% 7,780 News Corp - Class B
255,340 0.09%
4,866 NextEra Energy Inc
396,482 0.14% 9,982 Nike Inc
635,654 0.22%
6,800 Noble Energy Inc
408,272 0.14% 1,206 Norfolk Southern Corp
87,616 0.03%
970 Northern Trust Corp
56,163 0.02% 4,093 Northrop Grumman Corp
338,900 0.12%
2,800 NRG Energy Inc
74,760 0.03% 6,731 Nucor Corp
291,587 0.10%
12,710 Nvidia Corp
178,321 0.06% 4,415 NYSE Euronext
182,781 0.06%
6,757 Occidental Petroleum Corp
602,927 0.21% 1,622 Omnicom Group
101,975 0.04%
5,800 Oneok Inc
239,598 0.08% 38,576 Oracle Corp
1,185,055 0.41%
1,440 O'Reilly Automotive Inc
162,173 0.06% 6,644 Paccar Inc
356,517 0.12%
3,572 Pall Corp
237,288 0.08% 1,900 Parker Hannifin Corp
181,260 0.06%
1,582 Patterson Cos Inc
59,483 0.02% 6,048 Paychex Inc
220,873 0.08%
3,289 Peabody Energy Corp
48,151 0.02% 14,968 Pepsico Inc
1,224,233 0.43%
2,000 Perrigo Co
242,000 0.08% 81,427 Pfizer Inc
2,280,770 0.79%
5,619 PG&E Corp
256,957 0.09% 17,953 Philip Morris International Inc
1,555,089 0.54%
6,350 Phillips 66
374,079 0.13% 3,774 Pinnacle West Capital Corp
209,344 0.07%
6,214 PNC Financial Services Group Inc
453,125 0.16% 3,013 PPG Industries Inc
441,133 0.15%
7,637 PPL Corp
231,096 0.08% 2,506 Praxair Inc
288,591 0.10%

SANLAM UNIVERSAL FUNDS PLC
142
SCHEDULE OF INVESTMENTS OF SANLAM WORLD EQUITY TRACKER FUND (CONTINUED) as at 30 June 2013
Nominal Security
Classification Fair Value % of
US$ Net Assets
United States - 52.66% (continued) 2,200 Precision Castparts Corp
497,222 0.17% 735 Priceline.com Inc
607,941 0.21%
7,500 Principal Financial Group Inc
280,875 0.10% 26,490 Procter & Gamble Co
2,039,465 0.71%
13,113 Progressive Corp
333,332 0.12% 7,038 Prologis Inc
265,473 0.09%
2,827 Prudential Financial Inc
206,456 0.07% 2,634 Public Service Enterprise Group
86,026 0.03%
1,805 Public Storage Inc
276,761 0.10% 1,988 QEP Resources Inc
55,227 0.02%
17,998 Qualcomm Inc
1,099,498 0.38% 2,090 Quest Diagnostics Inc
126,717 0.04%
29,987 Regions Financial Corp
285,776 0.10% 6,687 Republic Serv Inc
226,957 0.08%
6,045 Robert Half International Inc
200,875 0.07% 1,519 Rockwell Collins
96,320 0.03%
2,042 Rockwell International Corp
169,772 0.06% 1,670 Roper Industries Inc
207,447 0.07%
2,178 Safeway Stores Inc
51,531 0.02% 10,060 Salesforce.Com Inc
384,091 0.13%
4,713 Sandisk Corp
287,964 0.10% 1,915 Sealed Air Corp
45,864 0.02%
684 Sears Holdings Corp
28,783 0.01% 2,868 Sempra Energy
234,488 0.08%
1,234 Sherwin-Williams Co
217,924 0.08% 3,836 Simon Property Group Inc
605,781 0.21%
9,891 SLM Corp
226,108 0.08% 1,640 Southern Co
72,373 0.03%
7,500 Southwestern Energy Co
273,975 0.10% 9,197 Spectra Energy Corp
316,929 0.11%
37,630 Sprint Corp
264,163 0.09% 723 SPX Corp
52,042 0.02%
3,360 ST Jude Medical Inc.
153,317 0.05% 2,872 Stanley Black & Decker Inc
222,006 0.08%
8,947 Staples Inc
141,899 0.05% 7,363 Starbucks Corp
482,203 0.16%
4,769 Starwood Hotels & Resorts Worldwide Inc
301,353 0.10% 3,724 State Street Corp
242,842 0.08%
3,008 Stryker Corp
194,557 0.07% 10,823 Suntrust Banks Inc
341,682 0.12%
6,030 Symantec Corp
135,494 0.05% 8,800 Sysco Corp
300,608 0.10%
4,616 T Rowe Price Group Inc
337,660 0.12% 6,653 Target Corp
458,126 0.15%
7,947 Texas Instruments Inc
277,112 0.10% 5,219 Textron Inc
135,955 0.05%
5,000 The Mosiac Co
269,050 0.09% 4,894 Thermo Fisher Scientific Inc
414,179 0.14%
2,429 Time Warner Cable Inc
273,214 0.10% 9,977 Time Warner Inc
576,870 0.20%
9,636 TJX Cos Inc
482,378 0.17% 4,615 Travelers Cos Inc
368,831 0.13%
1,932 Ultra Petroleum Corp
38,292 0.01% 5,264 Union Pacific Corp
812,130 0.27%
11,631 United Healthcare Corp
761,598 0.26% 7,008 United Parcel Service Inc
606,052 0.21%

SANLAM UNIVERSAL FUNDS PLC
143
SCHEDULE OF INVESTMENTS OF SANLAM WORLD EQUITY TRACKER FUND (CONTINUED) as at 30 June 2013
Nominal Security
Classification Fair Value % of
US$ Net Assets
United States - 52.66% (continued) 7,645 United Technologies Corp
710,526 0.24%
3,968 Unum Group
116,540 0.04% 12,337 US Bancorp
445,983 0.15%
3,538 USD Waste Services
142,688 0.05% 6,438 Valero Energy Corp
223,849 0.08%
3,112 Varian Medical Systems Inc
209,904 0.07% 6,505 Ventas Inc
451,837 0.16%
222 VeriSign Inc
9,915 0.00% 30,057 Verizon Communications Inc
1,513,069 0.52%
1,400 VF Corp
270,284 0.09% 6,630 Viacom Inc - Class B
451,172 0.16%
5,810 Visa INC - Class A Shares
1,061,778 0.36% 240 Vornado Realty Trust
19,884 0.01%
981 Vulcan Materials Co
47,490 0.02% 11,189 Walgreen Co
494,554 0.17%
15,520 Wal-Mart Stores Inc
1,156,085 0.40% 17,972 Walt Disney Co
1,134,932 0.40%
1,208 Waters Corp
120,860 0.04% 4,580 Wellpoint Inc
374,827 0.13%
50,546 Wells Fargo & Co
2,086,033 0.72% 6,995 Western Union Co
119,684 0.04%
10,978 Weyerhaeuser Co
312,763 0.11% 659 Whirlpool Corp
75,363 0.03%
5,950 Whole Foods Market Inc
306,306 0.11% 11,504 Williams Cos Inc
373,535 0.13%
5,400 WR Berkley Corp
220,644 0.08% 3,200 Xcel Energy Inc
90,688 0.03%
15,541 Xerox Corp
140,957 0.05% 4,547 Xilinx Inc
180,107 0.06%
4,849 Xylem Inc
130,632 0.05% 17,831 Yahoo Inc
447,736 0.16%
6,290 Yum Brands Inc
436,149 0.15% 2,784 Zimmer Holdings Inc
208,632 0.07%
Total United States
151,242,448 52.66%
Total Equity
283,674,676 98.77%

SANLAM UNIVERSAL FUNDS PLC
144
SCHEDULE OF INVESTMENTS OF SANLAM WORLD EQUITY TRACKER FUND (CONTINUED) as at 30 June 2013
Nominal Security
Classification Fair Value % of
US$ Net Assets
Exchange Traded Funds - 0.88% 4,057 Ishares MSCI Canada Index Fund
106,091 0.04%
8,614 Ishares S&P 500 Index Fund
1,386,596 0.48% 17,866 Ishares MSCI EAFE Index Fund
1,025,150 0.36%
Total Exchange Traded Funds
2,517,837 0.88%
Rights - 0%
12,183 Repsol SA
A 6,779 0.00% 833 Groupe FNAC RTS
A 2,169 0.00%
Total Rights
8,948 0.00%
Total financial assets at fair value through profit or loss
286,201,461 99.65%
Cash and cash equivalents
1,342,658 0.47% Other net assets and liabilities
(330,903) (0.12%)
Net assets attributable to holders of redeemable participating shares 287,213,216 100.00%
Summary
Classification Description
Fair Value % of
Net Assets
Tranferable securities and money market instruments admitted to
official stock exchange listing or traded on regulated market
286,192,513 99.65%
A Transferabe securities and money market instruments other than
those referred above
8,948 0.00%
B Collective Investment Schemes
- 0.00% C Financial derivative instruments dealt in on a regulated market - 0.00% D Over the counter financial derivative instrument
- 0.00%
Cash and cash equivalents
1,342,658 0.47%
Other net assets and liabilities
(330,903) (0.12)%
Net assets attributable to holders of redeemable participating shares 287,213,216 100.00%

SANLAM UNIVERSAL FUNDS PLC
145
SCHEDULE OF INVESTMENTS OF SIIP INDIA OPPORTUNITIES FUND as at 30 June 2013
Nominal Security
Classification Fair Value % of US$ Net Assets
Financial assets at fair value through profit or loss
Equity - %
India - 98.1% 10,596 Axis Bank Ltd
235,364 1.47%
20,630 Bank of Baroda
198,537 1.24% 11,150 Bata India Ltd
156,083 0.97%
50,840 Berger Paints India Ltd
195,571 1.22% 27,850 Bharat Petroleum Corp Ltd
171,297 1.07%
82,403 Bharti Airtel Ltd
402,968 2.51% 16,250 Cadila Healthcare Ltd
211,038 1.31%
40,518 Coal India Ltd
205,476 1.28% 103,260 Dabur India Ltd
268,968 1.68%
6,338 Dr Reddy's Laboratories Ltd
235,720 1.47% 4,456 Eicher Motors Ltd
244,751 1.53%
31,326 Emami Ltd
252,194 1.57% 668,104 GMR Infrastructure Ltd
197,094 1.23%
9,500 Godrej Consumer Products Ltd
130,398 0.81% 161,673 Gujarat Pipavav Port Inc
127,366 0.79%
46,943 Hathway Cable and Datacom Ltd
217,955 1.36% 16,215 HCL Technololgies Ltd
210,909 1.31%
70,245 HDFC Bank Ltd
788,284 4.91% 44,410 Hindustan Petroluem Corp Ltd
188,404 1.17%
41,356 Housing Development Finance Corp Ltd
609,353 3.80% 45,082 ICICI Bank Ltd
809,111 5.04%
65,152 IL&FS Transportation Networks Ltd
159,331 0.99% 34,017 Info Edge India Ltd
168,374 1.05%
12,251 Infosys Ltd
513,131 3.20% 23,314 ING Vysya Bank Ltd
236,872 1.48%
149,707 ITC Ltd
813,903 5.07% 210,750 Jaiprakash Associates Ltd
189,343 1.18%
79,123 Jyothy Laboratories Ltd
238,854 1.49% 89,555 Karnataka Bank Ltd
168,197 1.05%
278,971 KEC International Ltd
150,334 0.94% 21,706 Larsen & Toubro Ltd
512,234 3.19%
13,720 Lupin Ltd
179,710 1.12% 27,500 Mahindra & Mahindra Financial Services Ltd
120,353 0.75%
59,501 Max India Ltd
199,467 1.24% 99,322 NMDC Ltd
175,553 1.09%
42,544 Oil & Natural Gas Corp Ltd
236,110 1.47% 17,820 Oil India Ltd
171,614 1.07%
4,272 Oracle Financial Services Software Ltd
193,264 1.20% 100,185 PI Industries Ltd
216,457 1.35%
70,919 Reliance Industries Ltd
1,025,389 6.39% 13,950 Shriram Transport Finance Co. Ltd
165,653 1.03%
34,030 Sobha Developers Ltd
200,239 1.25% 8,020 Solar Industries India Ltd
124,797 0.78%
6,349 State Bank of India
207,923 1.30% 9,190 Sun Pharmaceutical Industries Ltd
155,819 0.97%
46,000 Tata Chemicals Ltd
217,085 1.35% 22,850 Tata Consultancy Services Ltd
581,457 3.62%
75,000 Tata Global Beverages Ltd
168,957 1.05% 143,536 Tata Power Company Ltd
207,629 1.29%
12,015 Tech Mahindra Ltd
213,434 1.33% 22,783 Thermax India Ltd
228,441 1.42%
10,000 Torrent Pharmaceuticals Ltd
137,823 0.86%

SANLAM UNIVERSAL FUNDS PLC
146
SCHEDULE OF INVESTMENTS OF SIIP INDIA OPPORTUNITIES FUND (CONTINUED) as at 30 June 2013
Nominal Security
Classification Fair Value % of US$ Net Assets
India - 98.1% (continued)
6,870 Ultratech Cement Ltd
216,141 1.35% 56,309 Union Bank of India
175,883 1.10%
5,130 United Spirits Ltd
186,403 1.16% 6,099 VST Industries Ltd
163,097 1.02%
26,177 Yes Bank Ltd
202,317 1.26% 58,564 Zee Entertainment Enterprises Ltd
231,714 1.44%
21,855 Zydus Wellness Ltd
234,156 1.46% Total
15,744,299 98.10%
Total Equity
15,744,299 98.10%
Total financial assets at fair value through profit or loss
15,744,299 98.10%
Cash and cash equivalents
270,163 1.68% Other net assets and liabilities
34,773 0.22%
Net assets attributable to holders of redeemable participating shares 16,049,235 100.00%
Summary
Classification Description
Fair Value % of
Net Assets
Tranferable securities and money market instruments admitted to
official stock exchange listing or traded on regulated market 15,744,299 98.10%
A Transferabe securities and money market instruments other than
those referred above
- 0.00%
B Collective Investment Schemes
- 0.00% C Financial derivative instruments dealt in on a regulated market - 0.00% D Over the counter financial derivative instrument
- 0.00%
Cash and cash equivalents
270,163 1.68%
Other net assets and liabilities
34,773 0.22%
Net assets attributable to holders of redeemable participating shares 16,049,235 100.00%

SANLAM UNIVERSAL FUNDS PLC
147
SCHEDULE OF INVESTMENTS OF SIM GLOBAL EQUITY INCOME FUND as at 30 June 2013
Nominal Security
Classification Fair Value % of US$ Net Assets
Financial assets at fair value through profit or loss
Equity - 96.3%
Australia - 2.03% 107,762 Tattersall's Ltd
312,625 2.03%
Total Australia
312,625 2.03%
Bermuda - 2.49% 50,727 Catlin Group Ltd
384,088 2.49%
Total Bermuda
384,088 2.49%
Finland - 2.13% 8,075 Nokia Renkaat OYJ
328,690 2.13%
Total Finland
328,690 2.13%
France - 8.93% 5,283 Sanofi SA
546,844 3.55% 8,388 Total SA
408,986 2.65%
13,740 Scor SE
421,113 2.73% Total France
1,376,943 8.93%
Great Britain - 41.86% 27,815 Bhp Billiton Plc
709,614 4.60%
20,830 Imperial Tobacco GroupPlc
720,346 4.67% 187,220 Legal & General Group Plc
486,721 3.16%
58,424 BP Plc
403,421 2.62% 113,302 Tesco Plc
569,517 3.69%
17,186 GlaxoSmithKline Plc
429,585 2.79%
8,007 Astrazeneca Plc
378,307 2.45%
84,529 Sainsbury Plc
455,531 2.95% 60,035 IG Group Holdings Plc
528,140 3.43%
12,531 Royal Dutch Shell Plc
399,861 2.59% 199,485 Vodafone Group Plc
568,379 3.69%
62,552 Amlin Plc
373,149 2.42% 40,093 Micro Focus International Plc
431,761 2.80%
Total Great Britain
6,454,332 41.86%
Israel - 5.01% 78,125 Israel Chemicals Ltd
772,325 5.01%
Total Israel
772,325 5.01%
Netherlands - 2.99% 30,987 Koninklijke Ahold NV
460,656 2.99%
Total Netherlands
460,656 2.99%
Singapore - 5.3% 274,923 Singapore Telecommunications Ltd
817,204 5.30%
Total Singapore
817,204 5.30%
Switzerland - 5.18% 6,811 Novartis AG
483,004 3.13%
1,272 Roche Holding AG
315,916 2.05% Total Switzerland
798,920 5.18%

SANLAM UNIVERSAL FUNDS PLC
148
SCHEDULE OF INVESTMENTS OF SIM GLOBAL EQUITY INCOME FUND (CONTINUED) as at 30 June 2013
Nominal Security
Classification Fair Value % of US$ Net Assets
United States - 20.38% 18,115 Reynolds American Inc
876,224 5.68%
12,493 Lexmark International Inc
381,911 2.48% 6,128 Eli Lilly & Co
301,007 1.95%
4,243 Lockheed Martin Corp
460,196 2.98% 12,978 Philip Morris International Inc
1,124,155 7.29%
Total United States
3,143,493 20.38%
Total Equity
14,849,276 96.30%
Total financial assets at fair value through profit or loss
14,849,276 96.30%
Cash and cash equivalents
516,957 3.35% Other net assets and liabilities
53,497 0.35%
Net assets attributable to holders of redeemable participating shares 15,419,730 100.00%
Summary
Classification Description
Fair Value % of
Net Assets
Tranferable securities and money market instruments admitted to
official stock exchange listing or traded on regulated market 14,849,276 96.30%
A Transferabe securities and money market instruments other than
those referred above
- 0.00%
B Collective Investment Schemes
- 0.00% C Financial derivative instruments dealt in on a regulated market - 0.00% D Over the counter financial derivative instrument
- 0.00%
Cash and cash equivalents
516,957 3.35%
Other net assets and liabilities
53,497 0.35%
Net assets attributable to holders of redeemable participating shares 15,419,730 100.00%

SANLAM UNIVERSAL FUNDS PLC
149
SCHEDULE OF INVESTMENTS OF SPI STRATEGIC INVESTMENT GRADE BOND FUND as at 30 June 2013
Nominal Security Classification Coupon Maturity Fair Value % of
GBP Net Assets
Financial assets at fair value through profit or loss
Debt - 107.88%
Australia - 4.96% 1,500,000 BHP Billiton Finance Ltd
3.250 25/09/2024 1,418,528 1.88% 2,000,000 National Australia Bank Ltd 7.125 12/06/2023 2,328,930 3.08%
Total Australia
3,747,458 4.96%
Bermuda - 1.6% 1,100,000 Fidelity International Ltd
7.125 13/02/2024 1,209,049 1.60% Total Bermuda
1,209,049 1.60%
Brazil - 4.42% 3,800,000 Brazil Government Bond
12.500 05/01/2016 1,243,103 1.65%
7,000,000 Brazil Government Bond
10.000 01/01/2023 2,092,813 2.77% Total Brazil
3,335,916 4.42%
Cayman Islands - 1.41% 1,000,000 Petrobras International Finance Co 6.250 14/12/2026 1,066,275 1.41%
Total Cayman Islands
1,066,275 1.41%
France - 1.77% 1,400,000 Veolia Environnement
4.850 16/04/2049 1,335,432 1.77% Total France
1,335,432 1.77%
Germany - 0.42% 300,000 RWE AG
7.000 31/12/2049 318,902 0.42% Total Germany
318,902 0.42%
Great Britain - 56.56% 29,000 Aviva Plc
9.500 20/06/2016 34,981 0.05% 900,000 BAA SH Plc
7.125 01/03/2017 958,131 1.27%
309,000 British Telecommunications Plc 8.625 26/03/2020 406,871 0.54% 1,200,000 Bupa Finance Plc
5.000 25/04/2023 1,152,228 1.53%
10,000 Compass Group Plc
7.000 08/12/2014 10,835 0.01% 2,600,000 Co-Operative Bank Plc
9.250 28/04/2021 1,900,054 2.52%
700,000 Co-Operative Bank Plc
7.875 19/12/2022 480,690 0.64% 2,200,000 Co-Operative Bank PLC
5.750 02/12/2024 1,433,916 1.90%
900,000 Daily Mail & General Trust Plc 5.750 07/12/2018 965,471 1.28% 1,000,000 Direct Line Insurance Plc 9.250 27/04/2042 1,193,640 1.58%
500,000 ENW Finance Plc
6.125 21/07/2021 588,808 0.78% 1,000,000 Friends Life Group Plc
12.000 21/05/2021 1,260,170 1.67%
1,000,000 GKN Plc
6.750 28/10/2019 1,116,175 1.48% 8,000 Hammerson Plc
6.000 23/02/2026 9,431 0.01%
10,000 HSBC Bank Plc
6.500 07/07/2023 11,671 0.02% 26,000 ILB British Telecom Plc
3.500 25/04/2025 47,126 0.06%
116,000 Land Securities Capital Markets Plc 5.292 28/11/2015 117,131 0.16% 1,197,000 Lloyds TSB Bank Plc
6.625 30/03/2015 1,266,959 1.68%
777,000 National Grid Electricity Transmission Plc 2.983 08/07/2018 1,280,453 1.70% 1,250,000 National Grid Gas Holdings PLC 4.188 14/12/2022 2,467,725 3.27%
52,023 Nats en Route Plc
5.250 31/03/2026 59,004 0.08% 57,000 Pearson Plc
7.000 27/10/2014 61,159 0.08%
11,000 Prudential Plc
6.875 20/01/2023 13,747 0.02% 780,000 Punch Taverns Finance PLlc 6.820 15/07/2020 783,370 1.04% 40,000 Rolls-Royce Plc
7.375 14/06/2016 46,808 0.06%
1,558,000 Royal Bank of Scotland PLC 3.158 01/01/2095 1,014,655 1.34%

SANLAM UNIVERSAL FUNDS PLC
150
SCHEDULE OF INVESTMENTS OF SPI STRATEGIC INVESTMENT GRADE BOND FUND (CONTINUED) as at 30 June 2013
Nominal Security Classification Coupon Maturity Fair Value % of
GBP Net Assets
Great Britain - 56.56% 6,000 Safeway Ltd
6.500 05/08/2014 6,324 0.01% 1,600,000 Scottish Widows Plc
5.500 16/06/2023 1,545,904 2.05%
4,000 Segro Plc
6.250 30/09/2015 4,372 0.01% 70,000 Severn Trent Utilities Finance Plc 5.250 08/12/2014 73,945 0.10%
156,000 SSE PLC
5.875 22/09/2022 185,701 0.25% 1,000,000 SSE PLC
5.452 29/12/2049 1,032,380 1.37%
1,000,000 Tate & Lyle International Finance Plc 6.750 25/11/2019 1,196,190 1.58% 45,000 Tesco Plc
6.000 14/12/2029 51,372 0.07%
1,215,000 Tesco Plc
5.500 13/12/2019 1,383,739 1.83% 2,000,000 United Kingdom Gilt
4.250 07/06/2032 2,295,900 3.04%
2,200,113 United Kingdom Gilt
5.000 07/03/2025 2,724,730 3.61% 21,960 United Kingdom Gilt
5.000 07/09/2014 23,168 0.03%
2,200,000 United Kingdom Gilt
4.250 07/03/2036 2,517,735 3.32% 6,000 United Kingdom Gilt
4.750 07/09/2015 6,569 0.01%
38,085 United Kingdom Gilt
4.750 07/03/2020 45,237 0.06% 1,600,000 United Kingdom Gilt
4.250 07/12/2055 1,853,120 2.45%
43,337 United Kingdom Gilt
4.000 07/09/2016 47,832 0.06% 1,800,000 United Kingdom Gilt
4.250 07/12/2046 2,054,655 2.72%
500,000 United Kingdom Gilt
4.500 07/12/2042 594,675 0.79% 2,000,000 United Kingdom Gilt
4.000 07/03/2022 2,273,200 3.01%
11,000 United Kingdom Gilt
2.250 07/03/2014 11,148 0.01% 2,100,000 United Kingdom Gilt
4.500 07/09/2034 2,484,773 3.28%
1,500,000 United Kingdom Gilt
3.750 22/07/2052 1,560,975 2.06% 47,000 Vodafone Group Plc
5.625 04/12/2025 54,128 0.07%
Total Great Britain
42,708,981 56.56%
Ireland - 3.86% 71,000 GE Capital UK Funding
5.125 03/03/2015 75,540 0.10% 2,184,000 GE Capital UK Funding
5.625 25/04/2019 2,475,466 3.28%
307,000 GE Capital UK Funding
6.750 06/08/2018 364,082 0.48% Total Ireland
2,915,088 3.86%
Italy - 2.36% 700,000 Telecom Italia SPA
6.375 24/06/2019 718,781 0.95%
1,000,000 Telecom Italia SPA
5.625 29/12/2015 1,061,010 1.41% Total Italy
1,779,791 2.36%
Luxembourg - 3.29% 1,300,000 Finmeccanica Finance SA 8.000 16/12/2019 1,423,890 1.89%
1,000,000 Glencore Finance Europe SA 5.500 03/04/2022 1,063,950 1.40% Total Luxembourg
2,487,840 3.29%
Mexico - 4.68% 20,000,000 Mexico Government Bonds 10.000 05/12/2024 1,353,839 1.79%
41,450,000 Mexico Government Bonds 6.500 09/06/2022 2,179,808 2.89% Total Mexico
3,533,647 4.68%
Netherlands - 9.17% 800,000 Deutsche Telekom International Finance BV 6.500 08/04/2022 971,292 1.29%
850,000 Linde Finance BV
8.125 14/07/2066 972,987 1.29% 2,500,000 Petrobras Global Finance BV 5.375 01/10/2029 2,401,750 3.18% 1,200,000 PostNL NV
7.500 14/08/2018 1,367,772 1.81%
122,000 RWE Finance BV
5.625 06/12/2023 140,473 0.19% 983,000 Siemens Financieringsmaatschappij NV 6.124 14/09/2066 1,072,871 1.41%
Total Netherlands
6,927,145 9.17%

SANLAM UNIVERSAL FUNDS PLC
151
SCHEDULE OF INVESTMENTS OF SPI STRATEGIC INVESTMENT GRADE BOND FUND (CONTINUED) as at 30 June 2013
Nominal Security Classification Coupon Maturity Fair Value % of
GBP Net Assets
Spain - 2.53% 900,000 Telefonica Emisiones SAU 5.888 31/01/2014 921,587 1.22%
1,000,000 Telefonica Emisiones SAU 5.289 09/12/2022 986,280 1.31% Total Spain
1,907,867 2.53%
Supra-National - 0.01% 9,000 European Investment Bank 5.375 07/06/2021 10,762 0.01%
Total Supra-National
10,762 0.01%
Turkey - 4.13%
3,500,000 Turkey Government Bond
9.000 08/03/2017 1,232,653 1.63%
3,300,000 Turkey Government Bond
9.500 12/01/2022 1,197,015 1.59%
2,000,000 Turkey Government Bond
8.500 14/09/2022 688,194 0.91%
Total Turkey
3,117,862 4.13%
United States - 6.71% 1,000,000 Goldman Sachs Group Inc 6.125 14/05/2017 1,101,685 1.46%
65,000 HSBC Finance Corp
6.250 19/08/2019 76,687 0.10% 5,000,000 United States Treasury Note/Bond 3.625 15/02/2021 3,876,112 5.13%
8,000 Wal-Mart Stores Inc
5.250 28/09/2035 9,166 0.02% Total United States
5,063,650 6.71%
Total Debt
81,465,665 107.88%
Derivative Financal Instruments
1Forward Contracts - 0% - Classification - D
Buy Buy Sell Sell Maturity Fair Value % of Currency Amount Currency Amount GBP Net Assets USD 73,132 GBP 46,602 19/07/2013 1,622 0.00% Total Forward Contracts
1,622 0.00%
Total financial assets at fair value through profit or loss
81,467,287 107.88%
Cash and cash equivalents
(515,947) (0.68%) Other net assets and liabilities
(5,436,463) (7.20%)
Net assets attributable to holders of redeemable participating shares 75,514,877 100.00%
1JP Morgan Chase acts as counterparty to the over the counter derivative financial instruments.

SANLAM UNIVERSAL FUNDS PLC
152
SCHEDULE OF INVESTMENTS OF SPI STRATEGIC INVESTMENT GRADE BOND FUND (CONTINUED) as at 30 June 2013
Summary
Classification Description
Fair Value % of Net Assets
Tranferable securities and money market instruments admitted to
official stock exchange listing or traded on regulated market 81,465,665 107.88%
A Transferabe securities and money market instruments other than
those referred above
- 0.00%
B Collective Investment Schemes
- 0.00% C Financial derivative instruments dealt in on a regulated market - 0.00% D Over the counter financial derivative instrument
1,622 0.00%
Cash and cash equivalents
(515,947) (0.68)%
Other net assets and liabilities
(5,436,463) (7.20)%
Net assets attributable to holders of redeemable participating shares 75,514,877 100.00%

SANLAM UNIVERSAL FUNDS PLC
153
SCHEDULE OF INVESTMENTS OF SANLAM FUND OF ALTERNATIVE UCITS as at 30 June 2013
Nominal Security
Classification Fair Value % of US$ Net Assets
Financial assets at fair value through profit or loss
Collective Investment Schemes - 92.51% 1,732,550 Cazenove Absolute UK Dynamic Fund B 3,690,833 5.01%
7,198,178 Absolute Insight Emerging Market Debt Fund B 7,871,928 10.68% 67,351 Skyline UCITS Fund
B 8,861,324 12.02%
90,786 GLG Investments VI PLC
B 8,886,132 12.05% 504,024 GAM Star Emerging Market Rates B 5,588,066 7.58% 39,881 Aspect UCITS Funds PLC B 3,712,469 5.04% 4,296 CCP Quantitative UCITS Fund Faraday B 3,825,940 5.19%
1,288,875 Henderson Gartmore Fund United Kingdom Absolute Return Fund B 7,127,478 9.67%
627,903 LO Funds 1798 Europe Equity Long/Short B 6,503,193 8.82% 67,185 Select Equity Long/Short UCITS Sub-Fund B 7,317,192 9.93% 53,074 Swiss Hedge Luxtrade
B 4,816,465 6.52%
Total Collective Investment Schemes
68,201,020 92.51%
Total financial assets at fair value through profit or loss
68,201,020 92.51%
Cash and cash equivalents
2,530,700 3.43% Other net assets and liabilities
2,992,549 4.06%
Net assets attributable to holders of redeemable participating shares 73,724,269 100.00%
Summary
Classification Description
Fair Value % of
Net Assets
Tranferable securities and money market instruments admitted to
official stock exchange listing or traded on regulated market - 0.00%
A Transferabe securities and money market instruments other than
those referred above
- 0.00%
B Collective Investment Schemes
68,201,020 92.51% C Financial derivative instruments dealt in on a regulated market - 0.00% D Over the counter financial derivative instrument
- 0.00%
Cash and cash equivalents
2,530,700 3.43%
Other net assets and liabilities
2,992,549 4.06%
Net assets attributable to holders of redeemable participating shares 73,724,269 100.00%

SANLAM UNIVERSAL FUNDS PLC
154
SCHEDULE OF INVESTMENTS OF SANLAM ACCEL INCOME FUND as at 30 June 2013
Nominal Security
Classification Fair Value % of GBP Net Assets
Financial assets at fair value through profit or loss
Collective Investment Schemes - 99.31% 325,460 Fidelity Institutional Funds ICVC - UK Corporate B 375,255 3.56%
45,860 Henderson UK & Europe Funds - UK Equity Income B 267,916 2.55% 390,117 Henderson UK & Europe Funds - Strategic Bond B 509,103 4.84% 266,299 Trojan Investment Funds - Trojan Income Fund B 396,839 3.76% 253,049 Cazenove Investment Fund Company - UK Equity B 395,945 3.76% 582,077 Cazenove Strategic Bond Fund B 584,464 5.55% 352,752 PFS Chelverton UK Equity Fund B 314,197 2.98% 200,610 Invesco Perpetual UK Invest - High Income Fund B 220,350 2.09%
285,852 Invesco Perpetual Fixed Interest - Corporate Bond Fund B 325,243 3.09%
574,584 M&G Corporate Bond
B 215,354 2.05% 196,036 JPMorgan Fund ICVC - Sterling Corporate Bond B 213,483 2.03% 422,934 PSigma Income Fund
B 345,622 3.28%
239,432 Artemis Income Fund
B 470,053 4.47% 535,783 Artemis Strategic Bond Fund B 279,357 2.65% 887,790 Schroder Income Maximiser Fund B 459,875 4.37% 851,912 Jupiter Strategic Bond - II
B 543,008 5.16%
940,287 Lazard Investment Funds - Global Equity Income B 918,003 8.72% 362,579 Threadneedle Investment Funds - UK Equity Inc B 402,825 3.83% 230,230 Kames ICVC - Sterling Corporate Bond Fund B 230,437 2.19% 551,503 Mellon Investments Funds - Newton Global High B 609,079 5.79% 251,038 Kames ICVC - High Yield Bond Fund B 247,122 2.35%
5,990 Vanguard Investment Series - UK Government Bond B 673,802 6.40% 3,329 Veritas Funds Plc - Global Equity Income Fund B 539,753 5.13%
905,936 SPI Strategic Investment Grade Bond Fund B 917,079 8.70% Total Collective Investment Schemes
10,454,164 99.30%
Total financial assets at fair value through profit or loss
10,454,164 99.30%
Cash and cash equivalents
141,804 1.35% Other net assets and liabilities
(68,920) (0.65%)
Net assets attributable to holders of redeemable participating shares 10,527,048 100.00%
Summary
Classification Description
Fair Value % of
Net Assets
Tranferable securities and money market instruments admitted to
official stock exchange listing or traded on regulated market - 0.00%
A Transferabe securities and money market instruments other than
those referred above
- 0.00%
B Collective Investment Schemes
10,454,164 99.30% C Financial derivative instruments dealt in on a regulated market - 0.00% D Over the counter financial derivative instrument
- 0.00%
Cash and cash equivalents
141,804 1.35%
Other net assets and liabilities
( 68,920) (0.65)%
Net assets attributable to holders of redeemable participating shares 10,527,048 100.00%

SANLAM UNIVERSAL FUNDS PLC
155
SCHEDULE OF INVESTMENTS OF SANLAM NORTH AMERICAN EQUITY TRACKER FUND as at 30 June 2013
Nominal Security
Classification Fair Value % of US$ Net Assets
Financial assets at fair value through profit or loss
Equity - 99.21%
Bermuda - 0.32% 2,858 Marvell Technology Group Ltd
33,467 0.04%
1,724 Arch Capital Group Ltd
88,631 0.10% 942 Bunge Ltd
66,665 0.08%
2,621 Invesco Ltd
83,348 0.10% Total Bermuda
272,111 0.32%
Canada - 7.08% 1,241 Agnico-Eagle Mines Ltd
34,116 0.04%
1,485 Alimentation Couche-Tard Inc
87,842 0.10% 5,812 Barrick Gold Corp
91,458 0.11%
6,260 Talisman Energy Inc
71,211 0.08% 3,642 Bank of Montreal
210,600 0.25%
6,392 Bank of Nova Scotia
340,656 0.40% 1,265 National Bank Of Canada
89,985 0.10%
3,527 Brookfield Asset Manage Inc
126,382 0.15% 11,355 Bombardier Inc
50,376 0.06%
2,900 Research In Motion Ltd
30,460 0.04% 1,479 CGI Group Inc
43,182 0.05%
2,632 Cameco Corp
54,167 0.06% 2,978 Rogers Communications Inc
116,308 0.14%
2,342 Canadian Imperial Bank of Commerce
165,709 0.19% 6,082 Canadian Natural Resources
170,946 0.20%
2,279 Canadian National Railway Co.
221,224 0.26% 900 Agrium Inc
77,791 0.09%
4,765 Yamana Gold Inc
45,306 0.05% 5,241 Eldorado Gold Corp
32,343 0.04%
2,406 Fortis Inc
73,418 0.09% 3,542 First Quantum Minerals Ltd
52,380 0.06%
1,712 Imperial Oil Ltd
65,160 0.08% 4,206 Enbridge Inc
176,270 0.21%
10,415 Manulife Financial Corp
166,162 0.19% 2,127 Pacific Rubiales Energy Corp
37,241 0.04%
1,422 Magna International Inc
100,911 0.12% 3,711 Sun Life Financial Inc
109,582 0.13%
2,022 Husky Energy Inc
53,708 0.06% 3,759 Transcanada Corp
161,349 0.19%
4,662 Goldcorp Inc
115,434 0.13% 4,640 Potash Corp of Saskatchewan Inc
176,469 0.21%
3,034 Power Corporation Of Canada
81,164 0.09% 7,710 Royal Bank of Canada
447,880 0.52%
1,285 SNC Lavalin Group Inc
54,121 0.06% 950 Canadian Pacific Railway Ltd
114,848 0.13%
4,250 Encana Corp
71,673 0.08% 3,417 Shaw Communications Inc
81,757 0.10%
2,084 Shoppers Drug Mart Corp
95,853 0.11% 3,524 Teck Resources Ltd
75,063 0.09%
2,348 Thomson Reuters Corp
76,390 0.09% 4,937 Toronto-Dominion Bank
395,325 0.46%
7,638 Kinross Gold Corp
39,026 0.05% 1,526 ING Direct Canada Inc
85,710 0.10%

SANLAM UNIVERSAL FUNDS PLC
156
SCHEDULE OF INVESTMENTS OF SANLAM NORTH AMERICA EQUITY TRACKER FUND (CONTINUED) as at 30 June 2013
Nominal Security
Classification Fair Value % of US$ Net Assets
Canada - 7.08% (continued)
2,488 Silver Wheaton Corp
48,609 0.06% 1,807 BCE Inc
73,863 0.09%
1,037 Franco-Nevada Corp
37,011 0.04% 8,239 Suncor Energy Inc
242,117 0.28%
1,479 Valeant Pharmaceuticals International Inc
127,136 0.15% 2,307 Pembina Pipeline Corp
70,376 0.08%
1,336 Tim Hortons Inc
72,037 0.08% 4,401 Cenovus Energy Inc
125,159 0.15%
3,647 Penn West Petroleum ltd
38,375 0.04% 2,166 ARC Resources Ltd
56,527 0.07%
3,578 Canadian Oil Sands Ltd
66,038 0.08% 2,767 Crescent Point Energy Corp
93,562 0.11%
1,218 Catamaran Corp
59,105 0.05% Total Canada
6,076,871 7.08%
Cayman Islands - 0.13% 663 Herbalife Ltd
29,928 0.03%
1,880 Seagate Technology PLC
84,280 0.10% Total Cayman Islands
114,208 0.13%
Great Britain - 0.48% 1,327 Ensco PLC
77,125 0.09%
1,141 Mead Johnson Nutrition Co
90,401 0.11% 1,687 Aon PLC
108,558 0.13%
1,590 Liberty Global PLC
117,787 0.14% 258 Liberty Global PLC
17,516 0.01%
Total Great Britain
411,387 0.48%
Ireland - 0.92% 3,372 Accenture PLC
242,649 0.28%
1,509 Willis Group Holdings PLC
61,537 0.07% 2,058 XL Group PLC
62,399 0.07%
1,709 Ingersoll-Rand PLC
94,884 0.11% 2,598 Covidien PLC
163,258 0.19%
2,488 Eaton Corp PLC
163,735 0.20% Total Ireland
788,462 0.92%
Jersey - 0.1% 1,686 Delphi Automotive PLC
85,463 0.10%
Total Jersey
85,463 0.10%
Netherlands - 0.78% 346 Core Laboratories Inc
52,474 0.06%
7,092 Schlumberger Ltd
508,213 0.59% 1,603 LyondellBasell Industries NV
106,215 0.13%
Total Netherlands
666,902 0.78%
Singapore - 0.07% 1,605 Avago Technologies Ltd
59,995 0.07%
Total Singapore
59,995 0.07%
Sweden - 0.26% 4,735 Weatherford International Ltd
64,870 0.08%
3,110 Tyco International Ltd
102,475 0.12% 1,538 Noble Corp
57,798 0.06%
Total Sweden
225,143 0.26%
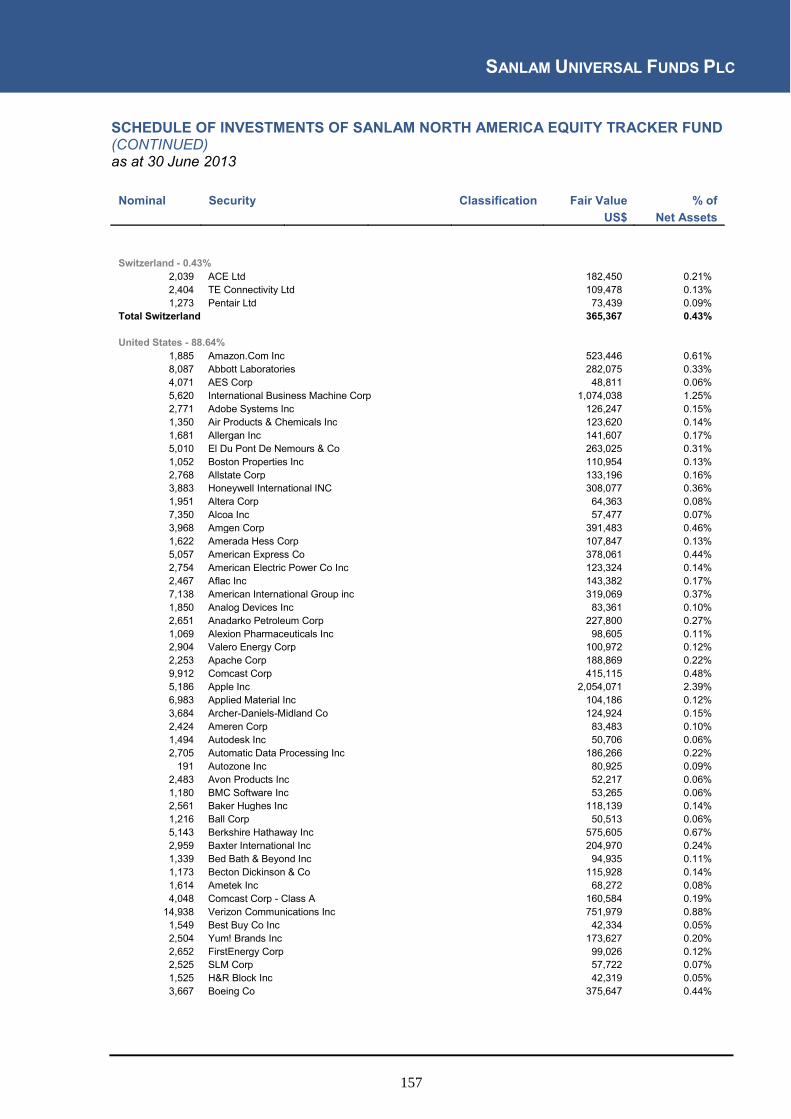
SANLAM UNIVERSAL FUNDS PLC
157
SCHEDULE OF INVESTMENTS OF SANLAM NORTH AMERICA EQUITY TRACKER FUND (CONTINUED) as at 30 June 2013
Nominal Security
Classification Fair Value % of US$ Net Assets
Switzerland - 0.43% 2,039 ACE Ltd
182,450 0.21%
2,404 TE Connectivity Ltd
109,478 0.13% 1,273 Pentair Ltd
73,439 0.09%
Total Switzerland
365,367 0.43%
United States - 88.64% 1,885 Amazon.Com Inc
523,446 0.61%
8,087 Abbott Laboratories
282,075 0.33% 4,071 AES Corp
48,811 0.06%
5,620 International Business Machine Corp
1,074,038 1.25% 2,771 Adobe Systems Inc
126,247 0.15%
1,350 Air Products & Chemicals Inc
123,620 0.14% 1,681 Allergan Inc
141,607 0.17%
5,010 El Du Pont De Nemours & Co
263,025 0.31% 1,052 Boston Properties Inc
110,954 0.13%
2,768 Allstate Corp
133,196 0.16% 3,883 Honeywell International INC
308,077 0.36%
1,951 Altera Corp
64,363 0.08% 7,350 Alcoa Inc
57,477 0.07%
3,968 Amgen Corp
391,483 0.46% 1,622 Amerada Hess Corp
107,847 0.13%
5,057 American Express Co
378,061 0.44% 2,754 American Electric Power Co Inc
123,324 0.14%
2,467 Aflac Inc
143,382 0.17% 7,138 American International Group inc
319,069 0.37%
1,850 Analog Devices Inc
83,361 0.10% 2,651 Anadarko Petroleum Corp
227,800 0.27%
1,069 Alexion Pharmaceuticals Inc
98,605 0.11% 2,904 Valero Energy Corp
100,972 0.12%
2,253 Apache Corp
188,869 0.22% 9,912 Comcast Corp
415,115 0.48%
5,186 Apple Inc
2,054,071 2.39% 6,983 Applied Material Inc
104,186 0.12%
3,684 Archer-Daniels-Midland Co
124,924 0.15% 2,424 Ameren Corp
83,483 0.10%
1,494 Autodesk Inc
50,706 0.06% 2,705 Automatic Data Processing Inc
186,266 0.22%
191 Autozone Inc
80,925 0.09% 2,483 Avon Products Inc
52,217 0.06%
1,180 BMC Software Inc
53,265 0.06% 2,561 Baker Hughes Inc
118,139 0.14%
1,216 Ball Corp
50,513 0.06% 5,143 Berkshire Hathaway Inc
575,605 0.67%
2,959 Baxter International Inc
204,970 0.24% 1,339 Bed Bath & Beyond Inc
94,935 0.11%
1,173 Becton Dickinson & Co
115,928 0.14% 1,614 Ametek Inc
68,272 0.08%
4,048 Comcast Corp - Class A
160,584 0.19% 14,938 Verizon Communications Inc
751,979 0.88%
1,549 Best Buy Co Inc
42,334 0.05% 2,504 Yum! Brands Inc
173,627 0.20%
2,652 FirstEnergy Corp
99,026 0.12% 2,525 SLM Corp
57,722 0.07%
1,525 H&R Block Inc
42,319 0.05% 3,667 Boeing Co
375,647 0.44%

SANLAM UNIVERSAL FUNDS PLC
158
SCHEDULE OF INVESTMENTS OF SANLAM NORTH AMERICA EQUITY TRACKER FUND (CONTINUED) as at 30 June 2013
Nominal Security
Classification Fair Value % of US$ Net Assets
United States - 88.64% (continued)
805 Borgwarner Inc
69,351 0.08% 7,710 Boston Scientific Corp
71,472 0.08%
6,778 Annaly Mortgage Management Inc
85,199 0.10% 1,235 C.H.Robinson Worldwide Inc
69,543 0.08%
8,045 Bristol-Myers Squib
359,531 0.42% 368 Affiliated Managers Group Inc
60,330 0.07%
1,420 ONEOK Inc
58,660 0.07% 781 AvalonBay Communities Inc
105,365 0.12%
1,466 Sempra Energy
119,860 0.14% 1,699 FEDEX Corp
167,487 0.20%
1,066 VeriSign Inc
47,608 0.06% 1,005 Amphenol Corp
78,330 0.09%
1,878 Quanta Services
49,692 0.06% 17,373 Sirius XM Radio Inc
58,200 0.07%
5,444 CSX Corp
126,246 0.15% 1,139 Cabot Oil & Gas Corp
80,892 0.09%
926 Constellation Brands inc
48,263 0.06% 1,970 Cardinal Health Inc
92,984 0.11%
3,553 Caterpillar Inc
293,087 0.34% 2,193 Celgene Corp
256,384 0.30%
1,153 Citrix Systems Inc
69,560 0.08% 3,798 Chesapeake Energy Corp
77,403 0.09%
3,562 CenturyLink Inc
125,917 0.15% 894 Cerner Corp
85,904 0.10%
18,997 JP Morgan Chase & Co
1,002,852 1.17% 1,719 Chubb Corp
145,513 0.17%
1,088 Church&Dwight Co Inc
67,140 0.08% 1,557 Cigna Corp
112,867 0.13%
28,016 Cisco Systems Inc
681,069 0.79% 875 Clorox Co
72,748 0.08%
292 Equinix Inc
53,938 0.06% 20,639 Coca-Cola Co
827,830 0.97%
4,846 Colgate-Palmolive Co
277,627 0.32% 1,497 Marriott International Inc
60,434 0.07%
2,100 NRG Energy Inc
56,070 0.07% 2,340 CA Inc
66,994 0.08%
1,027 Computer Sciences Corp
44,952 0.05% 2,492 Conagra Foods Inc
87,046 0.10%
1,928 Consolidated Edison Inc
112,422 0.13% 1,406 Cameron International Corp
85,991 0.10%
7,874 Corning Inc
112,047 0.13% 661 Cree Inc
42,211 0.05%
2,823 Broadcom Corp
95,304 0.11% 1,018 Cummins Inc
110,412 0.13%
1,821 DR Horton Inc
38,751 0.05% 3,181 Danaher Corp
201,357 0.23%
1,085 Moody's Corp
66,109 0.08% 1,720 Cognizant Technology Solutions Corp
107,689 0.13%
3,359 Target Corp
231,301 0.27% 2,110 Deere & Co
171,438 0.20%
8,265 Dell Inc
110,338 0.13% 7,702 Morgan Stanley
188,160 0.22%
2,190 Republic Serv Inc
74,329 0.09% 8,739 Walt Disney Co
551,868 0.64%
1,343 Dollar Tree Stores Inc
68,278 0.08% 1,099 Dover Corp
85,348 0.10%

SANLAM UNIVERSAL FUNDS PLC
159
SCHEDULE OF INVESTMENTS OF SANLAM NORTH AMERICA EQUITY TRACKER FUND (CONTINUED) as at 30 June 2013
Nominal Security
Classification Fair Value % of US$ Net Assets
United States - 88.64% (continued)
6,259 Dow Chemical Co
201,352 0.23% 1,640 Omnicom Group
103,107 0.12%
1,282 DTE Energy Co
85,907 0.10% 1,645 Crown Castle Intl Corp
119,082 0.14%
6,116 eBay Inc
316,320 0.37% 11,537 EMC Corp/Massachus
272,504 0.32%
54,995 Bank of America Corp
707,236 0.82% 16,004 Citigroup Inc
767,712 0.90%
885 Eastman Chemical Co
61,959 0.07% 1,270 DISH Network Corp
54,000 0.06%
1,615 Ecolab Inc
137,582 0.16% 1,960 Electronic Arts Inc
45,021 0.05%
2,896 Salesforce.com Inc
110,569 0.13% 3,941 Emerson Electric Co
214,942 0.25%
1,303 Entergy Corp
90,793 0.11% 1,460 Eog Resources Inc
192,253 0.22%
2,070 Equity Residential
120,184 0.14% 901 Equitable Resources Inc
71,512 0.08%
1,297 Estee Lauder Cos Inc
85,304 0.10% 1,722 Expditors International of Washington Inc
65,453 0.08%
23,616 Exxon Mobil Corp
2,133,706 2.49% 966 FMC Corporation
58,984 0.07%
2,165 NextEra Energy Inc
176,404 0.21% 721 Family Dollar Stores
44,926 0.05%
1,597 Fastenal Co
73,222 0.09% 5,128 Fifth Third Bancorp
92,560 0.11%
836 M&T Bank Corp
93,423 0.11% 692 TRW Automotive Holdings
45,976 0.05%
966 Fiserv Inc
84,438 0.10% 2,238 Macy's Inc
107,424 0.13%
1,789 Forest Laboratories Inc
73,349 0.09% 803 Franklin Resources Inc
109,224 0.13%
5,207 Freeport-Mcmoran Copper & Gold Inc
143,765 0.17% 1,704 Gap Inc
71,108 0.08%
1,730 General Dynamics Corp
135,511 0.16% 3,540 General Mills Inc
171,796 0.20%
1,137 Genuine Parts Co
88,766 0.10% 8,126 Gilead Sciences Inc
416,132 0.49%
1,286 Mckesson Corp
147,247 0.17% 3,805 Nvidia Corp
53,384 0.06%
54,439 General Electric Co
1,262,440 1.47% 349 WW Grainger Inc.
88,011 0.10%
688 Green Mountain Coffee Roaster
51,641 0.06% 975 Life Technologies Corp
72,160 0.08%
1,733 Nuance Communications Inc
31,853 0.04% 4,848 Halliburton Co
202,259 0.24%
2,254 Goldman Sachs Group Inc
340,918 0.40% 1,425 Harley Davidson Inc
78,119 0.09%
1,531 Consol Energy Inc
41,490 0.05% 737 Henry Schein Inc
70,568 0.08%
2,607 HCP INC
118,462 0.14% 2,677 Denbury Resources Inc
46,366 0.05%
706 Helmerich & Payne Inc
44,090 0.05% 993 Hershey Foods Corp
88,655 0.10%
10,811 Hewlett Packard Co
268,113 0.31% 530 F5 Networks Inc
36,464 0.04%

SANLAM UNIVERSAL FUNDS PLC
160
SCHEDULE OF INVESTMENTS OF SANLAM NORTH AMERICA EQUITY TRACKER FUND (CONTINUED) as at 30 June 2013
Nominal Security
Classification Fair Value % of US$ Net Assets
United States - 88.64% (continued)
1,139 Crown Holdings Inc
46,847 0.05% 2,107 Reynolds American Inc
101,916 0.12%
850 SBA Communications Corp
63,002 0.07% 3,233 Juniper Networks Inc
62,429 0.07%
1,955 Hologic Inc
37,732 0.04% 1,800 Unum Group
52,866 0.06%
7,586 Home Depot Inc
587,687 0.69% 3,191 Centerpoint Energy Inc
74,957 0.09%
1,727 Health Care Reit Inc
115,761 0.13% 911 Humana Inc
76,870 0.09%
1,154 Red Hat Inc
55,184 0.06% 1,312 Biogen Idec Inc
282,342 0.33%
2,273 Illinois Tool Works Inc
157,223 0.18% 1,705 Intuit Inc
104,056 0.12%
26,415 Intel Corp
639,771 0.75% 2,260 International Paper Co
100,141 0.12%
3,038 Interpublic Group Cos. Inc
44,203 0.05% 941 Jacobs Engineering Group Inc
51,877 0.06%
14,063 Johnson & Johnson
1,207,449 1.41% 2,356 Hartford Financial Services Group Inc
72,848 0.08%
3,721 Johnson Controls Inc
133,175 0.16% 1,065 Kla-Tencor Corp
59,352 0.07%
2,253 Devon Energy Corp
116,886 0.14% 1,512 Kellogg Co
97,116 0.11%
6,239 Keycorp
68,879 0.08% 3,381 Kimco Realty Corp
72,455 0.08%
2,072 Kimberly Clark Corp
201,274 0.23% 703 Blackrock Inc
180,566 0.21%
1,420 Kohls Corp
71,724 0.08% 2,616 Kroger Co
90,357 0.11%
1,051 LAM Research Corp
46,601 0.05% 1,031 Akamai Technologies Inc
43,869 0.05%
1,097 Lennar Corp
39,536 0.05% 1,873 Leucadia National Corp
49,110 0.06%
5,327 Lilly (Eli) & Co
261,662 0.31% 1,578 Lincoln National Corp
57,550 0.07%
1,669 Linear Technology Corp
61,486 0.07% 3,871 United Parcel Service Inc
334,764 0.39%
1,922 Agilent Technologies Inc
82,185 0.10% 1,590 Lockheed Martin Corp
172,451 0.20%
2,180 Loews Corp
96,792 0.11% 2,704 Carnival Corp
92,720 0.11%
1,015 Range Resources Corporation
78,480 0.09% 5,820 Lowes Com
238,038 0.28%
3,187 Dominion Resources Inc
181,085 0.21% 990 Macerich Co
60,360 0.07%
2,236 MGM Resorts International
33,048 0.04% 5,189 McDonald's Corp
513,711 0.60%
1,411 McGraw-Hill Cos Inc
75,051 0.09% 726 Manpower Inc
39,785 0.05%
662 Edwards Lifesciences Corp
44,486 0.05% 4,803 Host Hotels & Resorts Inc
81,027 0.09%
3,055 Marsh & McLennan Cos Inc
121,956 0.14% 2,240 Masco Corp
43,658 0.05%
2,324 Mattel Inc
105,300 0.12% 4,465 Metlife Inc
204,318 0.24%

SANLAM UNIVERSAL FUNDS PLC
161
SCHEDULE OF INVESTMENTS OF SANLAM NORTH AMERICA EQUITY TRACKER FUND (CONTINUED) as at 30 June 2013
Nominal Security
Classification Fair Value % of US$ Net Assets
United States - 88.64% (continued)
1,989 Maxim Integrated Products Inc
55,254 0.06% 5,352 Medtronic Inc
275,467 0.32%
2,638 Activision Blizzard Inc
37,618 0.04% 6,288 CVS Caremark Corp
359,548 0.42%
678 Laboratory Corp of Amer Holdings
67,868 0.08% 38,509 Microsoft Corp
1,329,716 1.55%
5,690 Micron Technology Inc
81,538 0.10% 3,449 3M Co
377,148 0.44%
434 Mohawk Industries Inc
48,821 0.06% 591 Kansas City Southern Railway Co
62,622 0.07%
1,166 Murphy Oil Corp
70,998 0.08% 2,391 Mylan Inc
74,193 0.09%
716 Illumina Inc
53,585 0.06% 3,341 Xcel Energy Inc
94,684 0.11%
17,941 Ford Motor Co
277,547 0.32% 2,346 National-Oilwell Inc
161,639 0.19%
2,152 Netapp Inc
81,303 0.09% 1,969 Newell Rubbermaid Inc
51,686 0.06%
2,884 Newmont Mining Corp
86,376 0.10% 3,770 Nike Inc
240,074 0.28%
2,048 Noble Energy Inc
122,962 0.14% 939 Nordstrom Inc
56,284 0.07%
1,723 Norfolk Southern Corp
125,176 0.15% 2,173 Northeast Utilities
91,309 0.11%
1,574 Coach Inc
89,860 0.10% 1,570 Northern Trust Corp
90,903 0.11%
1,490 Northrop Grumman Corp
123,372 0.14% 26,047 Wells Fargo & Co
1,074,960 1.25%
2,014 Nucor Corp
87,246 0.10% 2,821 Monsanto Co
278,715 0.32%
3,067 Capital One Financial Corp
192,638 0.22% 4,233 Occidental Petroleum Corp
377,711 0.44%
730 Oceaneering International Inc
52,706 0.06% 625 Onyx Pharmaceuticals Inc
54,263 0.06%
20,227 Oracle Corp
621,373 0.72% 2,042 Paccar Inc
109,574 0.13%
4,875 Exelon Corp
150,540 0.18% 943 Parker Hannifin Corp
89,962 0.10%
2,446 Paychex Inc
89,328 0.10% 3,562 PPL Corp
107,786 0.13%
7,971 Pepsico Inc
651,948 0.76% 565 Perrigo Co
68,365 0.08%
37,589 Pfizer Inc
1,052,868 1.23% 6,108 Conocophillips
369,534 0.43%
735 Petsmart Inc
49,238 0.06% 2,616 PG&E Corp
119,630 0.14%
739 Pioneer Natural Resources Co
106,970 0.12% 10,422 Altria Group Inc
364,666 0.43%
2,841 PNC Financial Services Group Inc
207,166 0.24% 2,002 Aetna Inc
127,207 0.15%
1,037 Fluor Corp
61,504 0.07% 784 PPG Industries Inc
114,785 0.13%
1,692 Praxair Inc
194,851 0.23% 830 Precision Castparts Corp
187,588 0.22%
2,316 Costco Wholesale Corp
256,080 0.30% 1,534 T Rowe Price Group
112,212 0.13%

SANLAM UNIVERSAL FUNDS PLC
162
SCHEDULE OF INVESTMENTS OF SANLAM NORTH AMERICA EQUITY TRACKER FUND (CONTINUED) as at 30 June 2013
Nominal Security
Classification Fair Value % of US$ Net Assets
United States - 88.64% (continued)
1,093 Quest Diagnostics Inc
66,269 0.08% 13,838 Procter & Gamble Co
1,065,388 1.24%
3,934 Progressive Corp
100,002 0.12% 3,259 Public Service Enterprise Group Inc
106,439 0.12%
2,051 Pultegroup Inc
38,907 0.05% 4,790 New York Community Bancorp
67,060 0.08%
8,870 Qualcomm Inc
541,868 0.63% 1,526 Realty Income Corp
63,970 0.07%
399 Regeneron Pharmaceuticals Inc
89,727 0.10% 9,639 US Bancorp
348,450 0.41%
1,272 Ross Stores Inc
82,438 0.10% 446 Rock-tenn Co
44,546 0.05%
668 Roper Industries Inc
82,979 0.10% 1,912 Peabody Energy Corp
27,992 0.03%
871 Rockwell International Corp
72,415 0.08% 2,056 Raytheon Co
135,943 0.16%
331 Alliance Data Systems Corp
59,921 0.07% 1,396 FMC Technologies Inc
77,729 0.09%
1,369 Sandisk Corp
83,646 0.10% 1,425 Safeway Stores Inc
33,716 0.04%
1,086 Rockwell Collins
68,863 0.08% 1,759 ST Jude Medical Inc.
80,263 0.09%
2,247 Travelers Cos Inc
179,580 0.21% 1,503 Fidelity National Information
64,389 0.08%
15,589 Merck & Co
724,109 0.84% 255 Priceline.com Inc
210,918 0.25%
5,924 Charles Schwab Corp
125,767 0.15% 788 Joy Global Inc
38,242 0.04%
1,107 Zimmer Holdings Inc
82,959 0.10% 1,601 Wellpoint Inc
131,026 0.15%
1,375 Amerisourcebergen Corp
76,766 0.09% 1,824 Principal Financial Group
68,309 0.08%
506 Sherwin-Williams Co
89,360 0.10% 1,024 Sigma-Aldrich
82,289 0.10%
1,651 Simon Property Group Inc
260,726 0.30% 2,477 Prudential Financial Inc
180,895 0.21%
2,076 Southwestern Energy Co
75,836 0.09% 2,021 Edison International
97,331 0.11%
4,657 Southern Co
205,513 0.24% 4,160 BB&T Corp
140,941 0.16%
29,653 AT & T Inc
1,049,716 1.22% 10,218 Chevron Corp
1,209,198 1.41%
4,190 Staples Inc
66,453 0.08% 2,462 State Street Corp
160,547 0.19%
3,963 Starbucks Corp
259,537 0.30% 862 Public Storage Inc
132,170 0.15%
1,732 Stryker Corp
112,026 0.13% 249 Netflix Inc
52,561 0.06%
3,094 Suntrust Banks Inc
97,678 0.11% 4,001 Symantec Corp
89,902 0.10%
3,431 Sysco Corp
117,203 0.14% 226 Intuitive Surgical Inc
114,487 0.13%
5,935 Texas Instruments Inc
206,953 0.24% 1,750 Textron Inc
45,588 0.05%
1,923 Thermo Fisher Scientific Inc
162,743 0.19% 774 Tiffany & Co
56,378 0.07%
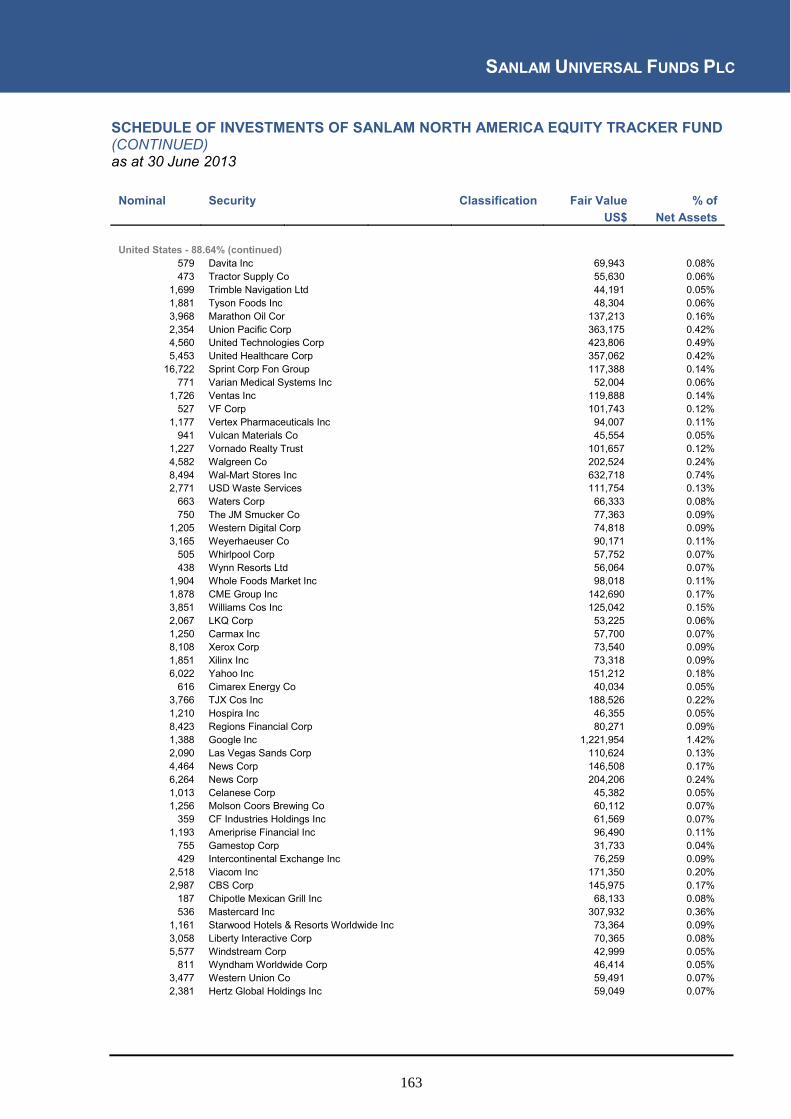
SANLAM UNIVERSAL FUNDS PLC
163
SCHEDULE OF INVESTMENTS OF SANLAM NORTH AMERICA EQUITY TRACKER FUND (CONTINUED) as at 30 June 2013
Nominal Security
Classification Fair Value % of US$ Net Assets
United States - 88.64% (continued)
579 Davita Inc
69,943 0.08% 473 Tractor Supply Co
55,630 0.06%
1,699 Trimble Navigation Ltd
44,191 0.05% 1,881 Tyson Foods Inc
48,304 0.06%
3,968 Marathon Oil Cor
137,213 0.16% 2,354 Union Pacific Corp
363,175 0.42%
4,560 United Technologies Corp
423,806 0.49% 5,453 United Healthcare Corp
357,062 0.42%
16,722 Sprint Corp Fon Group
117,388 0.14% 771 Varian Medical Systems Inc
52,004 0.06%
1,726 Ventas Inc
119,888 0.14% 527 VF Corp
101,743 0.12%
1,177 Vertex Pharmaceuticals Inc
94,007 0.11% 941 Vulcan Materials Co
45,554 0.05%
1,227 Vornado Realty Trust
101,657 0.12% 4,582 Walgreen Co
202,524 0.24%
8,494 Wal-Mart Stores Inc
632,718 0.74% 2,771 USD Waste Services
111,754 0.13%
663 Waters Corp
66,333 0.08% 750 The JM Smucker Co
77,363 0.09%
1,205 Western Digital Corp
74,818 0.09% 3,165 Weyerhaeuser Co
90,171 0.11%
505 Whirlpool Corp
57,752 0.07% 438 Wynn Resorts Ltd
56,064 0.07%
1,904 Whole Foods Market Inc
98,018 0.11% 1,878 CME Group Inc
142,690 0.17%
3,851 Williams Cos Inc
125,042 0.15% 2,067 LKQ Corp
53,225 0.06%
1,250 Carmax Inc
57,700 0.07% 8,108 Xerox Corp
73,540 0.09%
1,851 Xilinx Inc
73,318 0.09% 6,022 Yahoo Inc
151,212 0.18%
616 Cimarex Energy Co
40,034 0.05% 3,766 TJX Cos Inc
188,526 0.22%
1,210 Hospira Inc
46,355 0.05% 8,423 Regions Financial Corp
80,271 0.09%
1,388 Google Inc
1,221,954 1.42% 2,090 Las Vegas Sands Corp
110,624 0.13%
4,464 News Corp
146,508 0.17% 6,264 News Corp
204,206 0.24%
1,013 Celanese Corp
45,382 0.05% 1,256 Molson Coors Brewing Co
60,112 0.07%
359 CF Industries Holdings Inc
61,569 0.07% 1,193 Ameriprise Financial Inc
96,490 0.11%
755 Gamestop Corp
31,733 0.04% 429 Intercontinental Exchange Inc
76,259 0.09%
2,518 Viacom Inc
171,350 0.20% 2,987 CBS Corp
145,975 0.17%
187 Chipotle Mexican Grill Inc
68,133 0.08% 536 Mastercard Inc
307,932 0.36%
1,161 Starwood Hotels & Resorts Worldwide Inc
73,364 0.09% 3,058 Liberty Interactive Corp
70,365 0.08%
5,577 Windstream Corp
42,999 0.05% 811 Wyndham Worldwide Corp
46,414 0.05%
3,477 Western Union Co
59,491 0.07% 2,381 Hertz Global Holdings Inc
59,049 0.07%
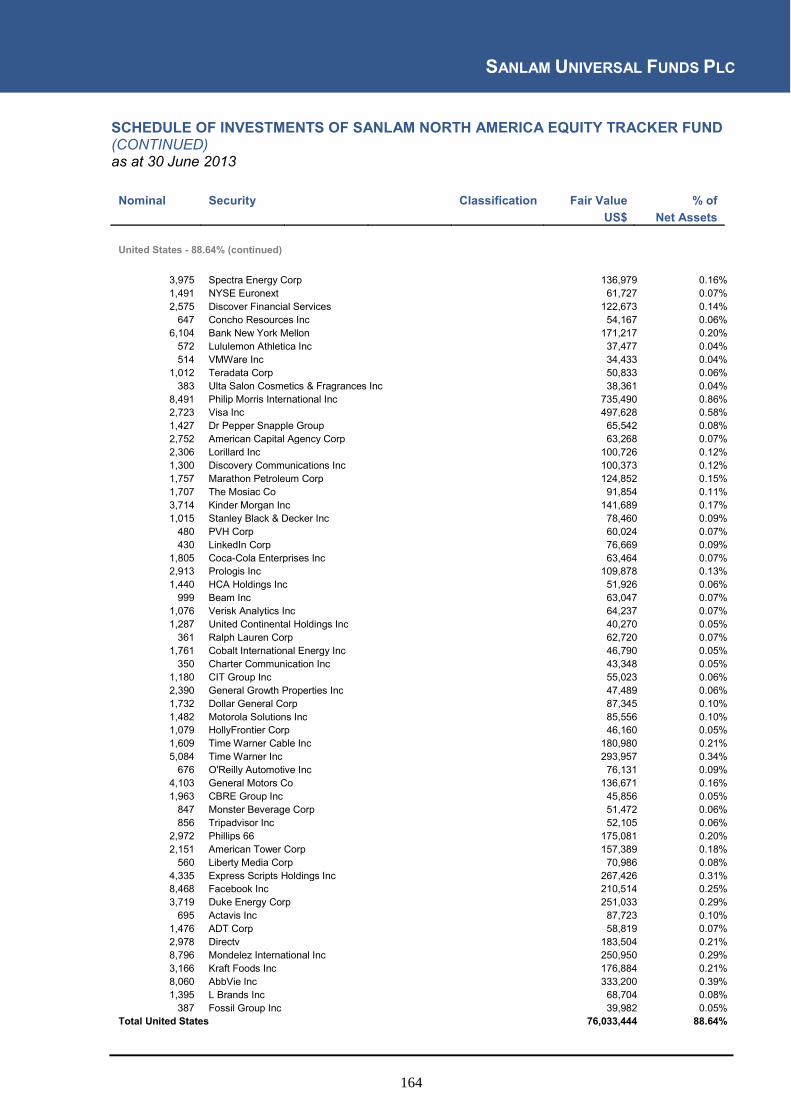
SANLAM UNIVERSAL FUNDS PLC
164
SCHEDULE OF INVESTMENTS OF SANLAM NORTH AMERICA EQUITY TRACKER FUND (CONTINUED) as at 30 June 2013
Nominal Security
Classification Fair Value % of US$ Net Assets
United States - 88.64% (continued)
3,975 Spectra Energy Corp
136,979 0.16%
1,491 NYSE Euronext
61,727 0.07% 2,575 Discover Financial Services
122,673 0.14%
647 Concho Resources Inc
54,167 0.06% 6,104 Bank New York Mellon
171,217 0.20%
572 Lululemon Athletica Inc
37,477 0.04% 514 VMWare Inc
34,433 0.04%
1,012 Teradata Corp
50,833 0.06% 383 Ulta Salon Cosmetics & Fragrances Inc
38,361 0.04%
8,491 Philip Morris International Inc
735,490 0.86% 2,723 Visa Inc
497,628 0.58%
1,427 Dr Pepper Snapple Group
65,542 0.08% 2,752 American Capital Agency Corp
63,268 0.07%
2,306 Lorillard Inc
100,726 0.12% 1,300 Discovery Communications Inc
100,373 0.12%
1,757 Marathon Petroleum Corp
124,852 0.15% 1,707 The Mosiac Co
91,854 0.11%
3,714 Kinder Morgan Inc
141,689 0.17% 1,015 Stanley Black & Decker Inc
78,460 0.09%
480 PVH Corp
60,024 0.07% 430 LinkedIn Corp
76,669 0.09%
1,805 Coca-Cola Enterprises Inc
63,464 0.07% 2,913 Prologis Inc
109,878 0.13%
1,440 HCA Holdings Inc
51,926 0.06% 999 Beam Inc
63,047 0.07%
1,076 Verisk Analytics Inc
64,237 0.07% 1,287 United Continental Holdings Inc
40,270 0.05%
361 Ralph Lauren Corp
62,720 0.07% 1,761 Cobalt International Energy Inc
46,790 0.05%
350 Charter Communication Inc
43,348 0.05% 1,180 CIT Group Inc
55,023 0.06%
2,390 General Growth Properties Inc
47,489 0.06% 1,732 Dollar General Corp
87,345 0.10%
1,482 Motorola Solutions Inc
85,556 0.10% 1,079 HollyFrontier Corp
46,160 0.05%
1,609 Time Warner Cable Inc
180,980 0.21% 5,084 Time Warner Inc
293,957 0.34%
676 O'Reilly Automotive Inc
76,131 0.09% 4,103 General Motors Co
136,671 0.16%
1,963 CBRE Group Inc
45,856 0.05% 847 Monster Beverage Corp
51,472 0.06%
856 Tripadvisor Inc
52,105 0.06% 2,972 Phillips 66
175,081 0.20%
2,151 American Tower Corp
157,389 0.18% 560 Liberty Media Corp
70,986 0.08%
4,335 Express Scripts Holdings Inc
267,426 0.31% 8,468 Facebook Inc
210,514 0.25%
3,719 Duke Energy Corp
251,033 0.29% 695 Actavis Inc
87,723 0.10%
1,476 ADT Corp
58,819 0.07% 2,978 Directv
183,504 0.21%
8,796 Mondelez International Inc
250,950 0.29% 3,166 Kraft Foods Inc
176,884 0.21%
8,060 AbbVie Inc
333,200 0.39% 1,395 L Brands Inc
68,704 0.08%
387 Fossil Group Inc
39,982 0.05% Total United States
76,033,444 88.64%

SANLAM UNIVERSAL FUNDS PLC
165
SCHEDULE OF INVESTMENTS OF SANLAM NORTH AMERICA EQUITY TRACKER FUND (CONTINUED) as at 30 June 2013
Total Equity
85,099,353 99.21%
Total financial assets at fair value through profit or loss
85,099,353 99.21%
Cash and cash equivalents
598,239 0.70% Other net assets and liabilities
78,575 0.09%
Net assets attributable to holders of redeemable participating shares 85,776,167 100.00%
Summary
Classification Description
Fair Value % of Net Assets
Tranferable securities and money market instruments admitted to
official stock exchange listing or traded on regulated market 85,099,353 99.21%
A Transferabe securities and money market instruments other than
those referred above
- 0.00%
B Collective Investment Schemes
- 0.00% C Financial derivative instruments dealt in on a regulated market - 0.00% D Over the counter financial derivative instrument
- 0.00%
Cash and cash equivalents
598,239 0.70%
Other net assets and liabilities
78,575 0.09%
Net assets attributable to holders of redeemable participating shares 85,776,167 100.00%

SANLAM UNIVERSAL FUNDS PLC
166
SCHEDULE OF INVESTMENTS OF SANLAM UK EQUITY TRACKER FUND as at 30 June 2013
Nominal Security
Classification Fair Value % of
GBP Net Assets
Financial assets at fair value through profit or loss
Equity - 99.22%
Great Britain - 95.42% 11,186 Aberdeen Asset Management Plc
42,820 0.23%
3,877 Amec Plc
38,964 0.21% 4,733 Antofagasta Plc
37,627 0.20%
23,961 Bhp Billiton Plc
403,024 2.19% 16,773 ARM Holdings Plc
133,345 0.73%
12,712 British Land Company Plc
72,013 0.39%
12,716 British Sky Broadcasting Group Plc
100,711 0.55%
10,341 Tullow Oil Plc
103,513 0.56% 36,417 Aviva Plc
123,672 0.67%
1,465 Croda International Plc
36,288 0.20% 28,883 Diageo Plc
543,000 2.95%
1,375 Schroders Plc
30,016 0.16% 33,824 British Aerospace Plc
129,546 0.70%
22,394 British American Tobacco Plc
754,118 4.10% 11,321 Hammerson Plc
55,167 0.30%
27,899 Standard Chartered Plc
398,119 2.17% 11,338 Imperial Tobacco Group Plc
258,506 1.41%
3,548 IMI Plc
43,995 0.24% 11,325 Sabmiller PLC
357,021 1.94%
20,099 Compass Group Plc
168,832 0.92% 209,622 HSBC Holdings Plc
1,429,622 7.78%
68,887 Legal & General Group Plc
118,072 0.64% 9,485 Meggitt Plc
49,085 0.27%
27,947 Morrison WM Supermarkets Plc
73,165 0.40% 48,337 RSA Insurance Group Plc
57,521 0.31%
4,048 Associated British Foods Plc
70,233 0.38% 9,150 Pearson Plc
107,147 0.58%
2,100 Persimmon Plc
24,801 0.13% 29,512 Prudential Plc
317,254 1.73%
14,295 Rio Tinto Plc
383,535 2.09% 1,500 Travis Perkins Plc
21,840 0.12%
10,546 Scottish & Southern Energy Plc
160,616 0.87% 6,599 Serco Group Plc
40,683 0.22%
215,269 BP Plc
980,012 5.33% 503,720 Lloyd Banking Group Plc
318,150 1.73%
5,754 Tate & Lyle Plc
47,442 0.26% 38,425 BG Group Plc
429,784 2.34%
92,498 Tesco Plc
306,538 1.67% 10,342 Smith & Nephew Plc
76,014 0.41%
54,783 GlaxoSmithKline Plc
902,824 4.91% 2,510 Weir Group Plc
53,990 0.29%
3,865 Babcock International Group Plc
42,631 0.23% 14,078 Astrazeneca Plc
438,530 2.39%
19,858 GKN Plc
59,832 0.33% 88,136 BT Group Plc
272,517 1.48%
2,607 Carnival Plc
59,700 0.32% 17,388 Marks & Spencer Plc
74,890 0.41%
131,641 Barclays Plc
366,554 1.99% 1,924 Intertek Group Plc
56,239 0.31%
11,600 William Hill Plc
51,144 0.28% 5,166 Burberry Group Plc
69,793 0.38%
9,952 Land Securities Group Plc
87,976 0.48%

SANLAM UNIVERSAL FUNDS PLC
167
SCHEDULE OF INVESTMENTS OF SANLAM UK EQUITY TRACKER FUND (CONTINUED) as at 30 June 2013
Nominal Security
Classification Fair Value % of
GBP Net Assets
Great Britain - 95.42% (continued) 1,758 Next Plc
80,130 0.44%
28,160 Kingfisher Plc
96,589 0.53% 43,692 ITV Plc
61,212 0.33%
14,870 Sainsbury Plc
52,833 0.29% 17,195 G4S PLC
39,617 0.22%
58,143 Centrica Plc
209,431 1.14% 43,366 Royal Dutch Shell Plc - A
910,686 4.96%
30,098 Royal Dutch Shell Plc - B
654,932 3.56% 3,834 Bunzl Plc
49,075 0.27%
14,677 Cobham Plc
38,468 0.21% 41,609 National Grid Plc
310,403 1.69%
5,097 Inmarsat Plc
34,328 0.19% 3,019 Petrofac Ltd
36,168 0.20%
14,442 Unilever Plc
384,446 2.09% 563,336 Vodafone Group Plc
1,058,227 5.76%
26,172 Standard Life Plc
90,477 0.49% 8,020 Investec Plc
33,179 0.18%
11,298 Experian Group Ltd
129,136 0.70% 2,565 Severn Trent Plc
42,682 0.23%
2,040 WHITBREAD Plc
62,342 0.34% 2,798 Hargreaves Lansdown Plc
24,846 0.14%
4,315 Smiths Group Plc
56,440 0.31% 16,048 Anglo American Plc
203,168 1.11%
11,560 3I Group Plc
39,027 0.21% 7,080 Capita Group Plc
68,393 0.37%
7,332 Reckitt Benckiser Group PLC
340,791 1.85% 14,036 Reed Elsevier Plc
104,849 0.57%
6,340 Shire Plc
132,189 0.72% 2,702 Fresnillo Plc
23,832 0.13%
7,614 United Utilities Group Plc
52,080 0.28% 3,304 Aggreko Plc
54,252 0.30%
20,693 Rolls-Royce Holdings PLC
234,659 1.28% 2,436 Johnson Matthey Plc
64,018 0.35%
55,946 Old Mutual PLC
101,094 0.55% 22,713 Royal Bank of Scotland Group Plc
62,120 0.34%
3,264 Intercontinental Hotels Group Plc
59,013 0.32% 13,255 The Sage Group Plc
45,094 0.25%
16,409 Melrose Industries Plc
40,908 0.22% 8,930 Rexam Plc
42,641 0.23%
7,384 Invensys Plc
30,463 0.19% Total Great Britain
17,532,669 95.42%
Guernsey - 0.29% 18,888 Resoution Ltd
53,831 0.29%
Total Guernsey
53,831 0.29%
Jersey - 3.12% 118,189 Glencore International Plc
321,651 1.75%
13,926 WPP Plc
156,250 0.85% 3,157 Wolseley Plc
95,752 0.52%
Total Jersey
573,653 3.12%
Switzerland - 0.16% 1,906 Coca-Cola HBC AG
29,333 0.16%
Total Switzerland
29,333 0.16%

SANLAM UNIVERSAL FUNDS PLC
168
SCHEDULE OF INVESTMENTS OF SANLAM UK EQUITY TRACKER FUND (CONTINUED) as at 30 June 2013
Nominal Security
Classification Fair Value % of
GBP Net Assets
United States - 0.23% 1,057 Randgold Resources Ltd
43,178 0.23%
Total United States
43,178 0.23%
Total Equity
18,232,664 99.22%
Total financial assets at fair value through profit or loss
18,232,664 99.22%
Cash and cash equivalents
73,362 0.40% Other net assets and liabilities
70,194 0.38%
Net assets attributable to holders of redeemable participating shares 18,376,220 100.00%
Summary
Classification Description
Fair Value % of
Net Assets
Tranferable securities and money market instruments admitted to
official stock exchange listing or traded on regulated market 18,232,664 99.22%
A Transferabe securities and money market instruments other than
those referred above
- 0.00%
B Collective Investment Schemes
- 0.00% C Financial derivative instruments dealt in on a regulated market - 0.00% D Over the counter financial derivative instrument
- 0.00%
Cash and cash equivalents
73,362 0.40%
Other net assets and liabilities
70,194 0.38%
Net assets attributable to holders of redeemable participating shares 18,376,220 100.00%

SANLAM UNIVERSAL FUNDS PLC
169
SCHEDULE OF INVESTMENTS OF SANLAM EUROPE (EX UK) EQUITY FUND as at 30 June 2013
Nominal Security
Classification Fair Value % of EUR Net Assets
Financial assets at fair value through profit or loss
Equity - 99.39%
Austria - 0.6% 1,059 Andritz AG
41,751 0.10%
2,653 Erste Group Bank AG
54,400 0.13% 14,925 Immofinanz AG
42,835 0.10%
1,776 OMV AG
61,627 0.15% 1,861 Voestalpine AG
50,489 0.12%
Total Austria
251,102 0.60%
Belgium - 2.73% 2,834 Ageas
76,447 0.18%
9,160 Anheuser-Busch InBev NV
626,452 1.50% 2,473 Belgacom SA
42,622 0.10%
1,169 Delhaize Group
55,516 0.13% 1,465 Groupe Bruxelles Lambert SA
84,692 0.20%
2,610 KBC Bankverzekeringsholding SA
74,659 0.18% 713 Solvay SA
71,799 0.17%
1,410 UCB SA
58,353 0.14% 1,531 Umicore SA
48,885 0.13%
Total Belgium
1,139,425 2.73%
Bermuda - 0.3% 4,048 Seadrill Ltd
125,004 0.30%
Total Bermuda
125,004 0.30%
Denmark - 2.65% 22 AP Moller - MAERSK A/S
113,964 0.27%
1,317 Carlsberg A/S
90,576 0.22% 1,420 Coloplast A/S
61,166 0.15%
8,213 Danske Bank A/S
107,904 0.26% 2,792 DSV A/S
52,290 0.13%
4,613 Novo-Nordisk A/S - Class B
552,260 1.32% 2,831 Novozymes A/S
69,606 0.17%
8,674 TDC A/S
54,003 0.13% Total Denmark
1,101,769 2.65%
Finland - 1.76% 5,275 Fortum Oyj
75,960 0.18%
1,760 Kone OYJ - Class B
107,448 0.26% 1,852 Metso Oyj
48,374 0.12%
42,302 Nokia OYJ
120,391 0.29% 1,531 Nokiaan Renkaat OYJ
47,936 0.11%
5,618 Sampo Oyj
168,203 0.40% 7,600 Stora Enso OYJ
39,140 0.09%
7,381 Upm-Kymmene Oyj
55,579 0.13% 2,109 Wartsila Oyj
70,504 0.18%
Total Finland
733,535 1.76%
France - 21.73% 1,879 Accor SA
50,799 0.12%
3,538 Air Liquide SA
335,650 0.80% 2,473 Alstom SA
62,221 0.15%
714 Arkema
50,358 0.12% 727 AtoS
41,454 0.10%
19,860 AXA SA
299,787 0.72% 11,340 BNP Paribas
475,997 1.14%
2,479 Bouygues SA
48,613 0.12%
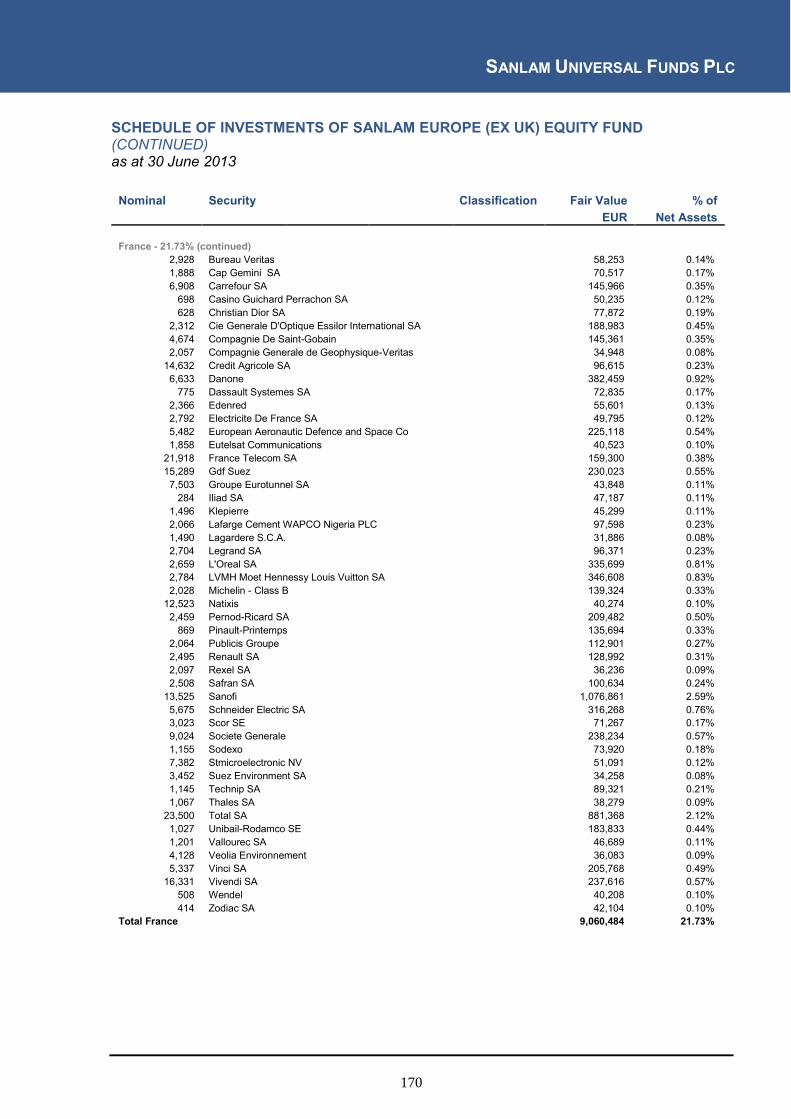
SANLAM UNIVERSAL FUNDS PLC
170
SCHEDULE OF INVESTMENTS OF SANLAM EUROPE (EX UK) EQUITY FUND (CONTINUED) as at 30 June 2013
Nominal Security
Classification Fair Value % of EUR Net Assets
France - 21.73% (continued) 2,928 Bureau Veritas
58,253 0.14%
1,888 Cap Gemini SA
70,517 0.17% 6,908 Carrefour SA
145,966 0.35%
698 Casino Guichard Perrachon SA
50,235 0.12% 628 Christian Dior SA
77,872 0.19%
2,312 Cie Generale D'Optique Essilor International SA
188,983 0.45% 4,674 Compagnie De Saint-Gobain
145,361 0.35%
2,057 Compagnie Generale de Geophysique-Veritas
34,948 0.08% 14,632 Credit Agricole SA
96,615 0.23%
6,633 Danone
382,459 0.92% 775 Dassault Systemes SA
72,835 0.17%
2,366 Edenred
55,601 0.13% 2,792 Electricite De France SA
49,795 0.12%
5,482 European Aeronautic Defence and Space Co
225,118 0.54% 1,858 Eutelsat Communications
40,523 0.10%
21,918 France Telecom SA
159,300 0.38% 15,289 Gdf Suez
230,023 0.55%
7,503 Groupe Eurotunnel SA
43,848 0.11% 284 Iliad SA
47,187 0.11%
1,496 Klepierre
45,299 0.11% 2,066 Lafarge Cement WAPCO Nigeria PLC 97,598 0.23% 1,490 Lagardere S.C.A.
31,886 0.08%
2,704 Legrand SA
96,371 0.23% 2,659 L'Oreal SA
335,699 0.81%
2,784 LVMH Moet Hennessy Louis Vuitton SA
346,608 0.83% 2,028 Michelin - Class B
139,324 0.33%
12,523 Natixis
40,274 0.10% 2,459 Pernod-Ricard SA
209,482 0.50%
869 Pinault-Printemps
135,694 0.33% 2,064 Publicis Groupe
112,901 0.27%
2,495 Renault SA
128,992 0.31% 2,097 Rexel SA
36,236 0.09%
2,508 Safran SA
100,634 0.24% 13,525 Sanofi
1,076,861 2.59%
5,675 Schneider Electric SA
316,268 0.76% 3,023 Scor SE
71,267 0.17%
9,024 Societe Generale
238,234 0.57% 1,155 Sodexo
73,920 0.18%
7,382 Stmicroelectronic NV
51,091 0.12% 3,452 Suez Environment SA
34,258 0.08%
1,145 Technip SA
89,321 0.21% 1,067 Thales SA
38,279 0.09%
23,500 Total SA
881,368 2.12% 1,027 Unibail-Rodamco SE
183,833 0.44%
1,201 Vallourec SA
46,689 0.11% 4,128 Veolia Environnement
36,083 0.09%
5,337 Vinci SA
205,768 0.49% 16,331 Vivendi SA
237,616 0.57%
508 Wendel
40,208 0.10% 414 Zodiac SA
42,104 0.10%
Total France
9,060,484 21.73%

SANLAM UNIVERSAL FUNDS PLC
171
SCHEDULE OF INVESTMENTS OF SANLAM EUROPE (EX UK) EQUITY FUND (CONTINUED) as at 30 June 2013
Nominal Security
Classification Fair Value % of EUR Net Assets
Germany - 20.31%
2,330 Adidas AG
193,716 0.46% 5,043 Allianz SE
566,077 1.36%
10,304 Basf SE
707,164 1.70% 9,330 Bayer AG
764,407 1.83%
4,025 Bayerische Motoren Werke AG
270,734 0.65% 1,265 Beiersdorf AG
84,755 0.20%
619 Brenntag AG
72,733 0.17% 12,221 Commerzbank AG
81,856 0.20%
1,276 Continental AG
131,045 0.31% 10,213 Daimler AG
474,751 1.14%
11,525 Deutsche Bank AG
372,592 0.89% 2,317 Deutsche Boerse AG
117,171 0.28%
9,919 Deutsche Post AG
189,403 0.45% 33,904 Deutsche Telekom AG
303,915 0.73%
20,610 E.ON AG
259,892 0.62% 2,704 Fresenius Medical Care
147,368 0.35%
1,548 Fresenius SE & Co KGAA
146,983 0.35% 2,248 Gea Group AG
61,213 0.15%
898 Hannover Rueckversicherung AG
49,677 0.12% 1,584 Heidelberg-Cement AG
81,845 0.20%
1,540 Henkel AG & Co KGAA
92,680 0.22% 2,029 Henkel AG & Co KGAA
146,595 0.35%
13,610 Infineon Technologies AG
87,512 0.21% 2,219 K+S AG
63,031 0.15%
1,136 Kabel Deutschland Holding AG
95,856 0.23% 928 Lanxess
42,948 0.10%
2,052 Linde AG
294,154 0.71% 3,528 Lufthansa AG
55,019 0.13%
532 MAN SE
44,635 0.11% 767 Merck KGAA
89,777 0.22%
1,582 Metro AG
38,403 0.09% 2,122 Muenchener Rueckversicherungs AG
300,051 0.72%
1,693 Porsche AG
101,108 0.24% 1,256 Prosieben Sat1 Media AG
41,473 0.10%
3,342 Qiagen NV
51,076 0.12% 6,134 RWE AG
150,406 0.36%
10,787 SAP AG
606,877 1.47% 9,507 Siemens AG
738,219 1.78%
4,409 ThyssenKrupp AG
66,554 0.16% 313 Volkswagen AG
46,919 0.11%
1,529 Volkswagen AG
237,622 0.57% Total Germany
8,468,212 20.31%
Ireland - 0.65% 8,249 CRH PLC
128,272 0.31%
5,762 Elan Corp
61,970 0.15% 1,875 Kerry Group
79,500 0.19%
Total Ireland
269,742 0.65%
Italy - 4.41% 13,788 Assicurazioni Generali SpA
185,035 0.44%
4,618 Atlantia SpA
57,864 0.14% 24,915 Enel Green Power SpaA
39,739 0.10%
78,011 Enel SpA
188,007 0.45% 29,057 ENI-Ente Nazionale Idrocarburi SpA
458,519 1.10%
9,768 Fiat Industrial SPA
83,663 0.20%
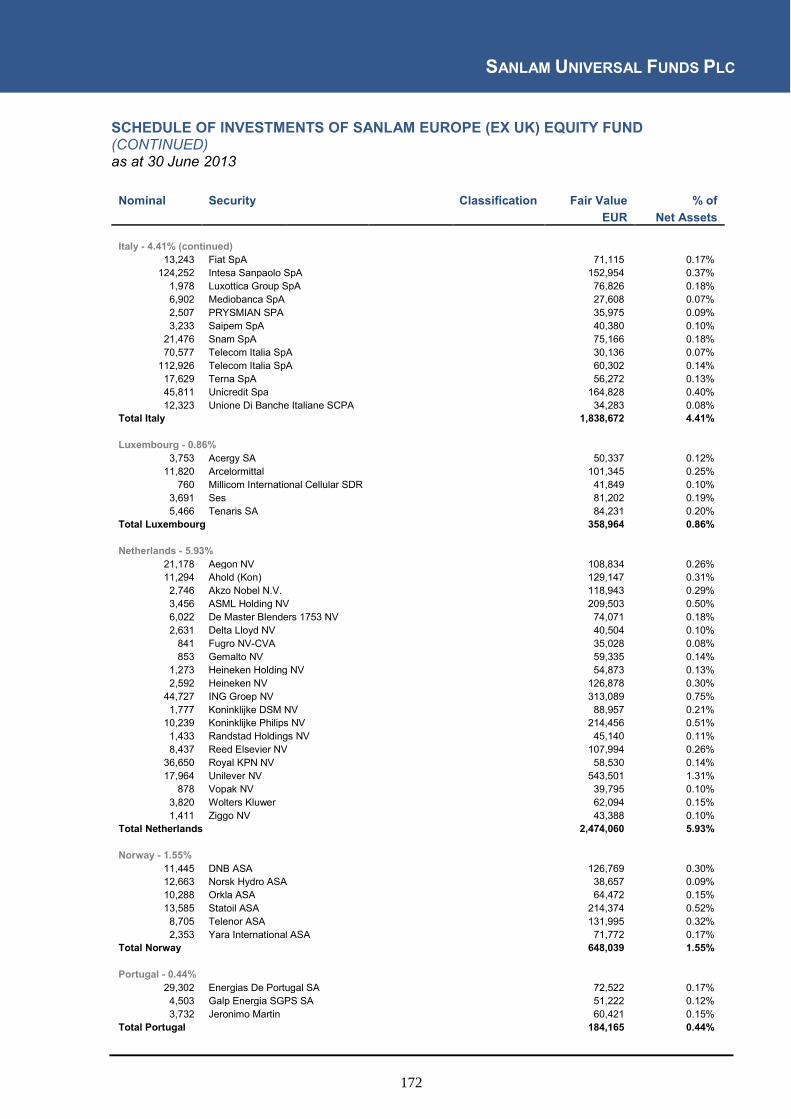
SANLAM UNIVERSAL FUNDS PLC
172
SCHEDULE OF INVESTMENTS OF SANLAM EUROPE (EX UK) EQUITY FUND (CONTINUED) as at 30 June 2013
Nominal Security
Classification Fair Value % of EUR Net Assets
Italy - 4.41% (continued) 13,243 Fiat SpA
71,115 0.17%
124,252 Intesa Sanpaolo SpA
152,954 0.37% 1,978 Luxottica Group SpA
76,826 0.18%
6,902 Mediobanca SpA
27,608 0.07% 2,507 PRYSMIAN SPA
35,975 0.09%
3,233 Saipem SpA
40,380 0.10% 21,476 Snam SpA
75,166 0.18%
70,577 Telecom Italia SpA
30,136 0.07% 112,926 Telecom Italia SpA
60,302 0.14%
17,629 Terna SpA
56,272 0.13% 45,811 Unicredit Spa
164,828 0.40%
12,323 Unione Di Banche Italiane SCPA
34,283 0.08% Total Italy
1,838,672 4.41%
Luxembourg - 0.86% 3,753 Acergy SA
50,337 0.12%
11,820 Arcelormittal
101,345 0.25% 760 Millicom International Cellular SDR
41,849 0.10%
3,691 Ses
81,202 0.19% 5,466 Tenaris SA
84,231 0.20%
Total Luxembourg
358,964 0.86%
Netherlands - 5.93% 21,178 Aegon NV
108,834 0.26%
11,294 Ahold (Kon)
129,147 0.31% 2,746 Akzo Nobel N.V.
118,943 0.29%
3,456 ASML Holding NV
209,503 0.50% 6,022 De Master Blenders 1753 NV
74,071 0.18%
2,631 Delta Lloyd NV
40,504 0.10% 841 Fugro NV-CVA
35,028 0.08%
853 Gemalto NV
59,335 0.14% 1,273 Heineken Holding NV
54,873 0.13%
2,592 Heineken NV
126,878 0.30% 44,727 ING Groep NV
313,089 0.75%
1,777 Koninklijke DSM NV
88,957 0.21% 10,239 Koninklijke Philips NV
214,456 0.51%
1,433 Randstad Holdings NV
45,140 0.11% 8,437 Reed Elsevier NV
107,994 0.26%
36,650 Royal KPN NV
58,530 0.14% 17,964 Unilever NV
543,501 1.31%
878 Vopak NV
39,795 0.10% 3,820 Wolters Kluwer
62,094 0.15%
1,411 Ziggo NV
43,388 0.10% Total Netherlands
2,474,060 5.93%
Norway - 1.55% 11,445 DNB ASA
126,769 0.30%
12,663 Norsk Hydro ASA
38,657 0.09% 10,288 Orkla ASA
64,472 0.15%
13,585 Statoil ASA
214,374 0.52% 8,705 Telenor ASA
131,995 0.32%
2,353 Yara International ASA
71,772 0.17% Total Norway
648,039 1.55%
Portugal - 0.44% 29,302 Energias De Portugal SA
72,522 0.17%
4,503 Galp Energia SGPS SA
51,222 0.12% 3,732 Jeronimo Martin
60,421 0.15%
Total Portugal
184,165 0.44%

SANLAM UNIVERSAL FUNDS PLC
173
SCHEDULE OF INVESTMENTS OF SANLAM EUROPE (EX UK) EQUITY FUND (CONTINUED) as at 30 June 2013
Nominal Security
Classification Fair Value % of EUR Net Assets
Spain - 6.69%
4,838 Abertis Infraestructuras SA
64,829 0.16% 1,835 ACS Actividades Cons Y Serv
37,342 0.09%
3,564 Amadeus IT Holding SA
87,514 0.21% 66,428 Banco Bilbao Viscaya
428,128 1.03%
36,406 Banco De Sabadell SA
46,418 0.11% 13,879 Banco Popular Espanol SA
32,685 0.08%
123,704 Banco Santander SA
606,397 1.45% 4,775 Cintra Concesiones De Infrae
58,637 0.14%
16,497 Criteria Caixacorp SA
38,949 0.09% 7,963 Distribuidora Interncional de Alimentacion SA
46,265 0.11%
2,435 Enagas
46,228 0.11% 4,061 Gas Natural SDG SA
62,905 0.15%
1,820 Grifols SA
51,324 0.12% 54,484 Iberdrola SA
220,987 0.53%
2,569 Inditex SA
243,644 0.58% 12,958 International Consolidated Airlines Group SA
39,988 0.10%
1,283 Red Electrica de Espana
54,207 0.13% 9,505 Repsol SA
154,076 0.37%
47,755 Telefonica SA
470,148 1.13% Total Spain
2,790,671 6.69%
Sweden - 7.17% 3,880 Alfa Laval AB
60,589 0.15%
3,717 Assa Abloy AB
111,341 0.27%
12,117 Atlas Copco AB
198,606 0.48%
3,336 Boliden AB
31,617 0.08% 2,773 Electrolux AB - Classs B
53,543 0.13%
4,571 Elekta AB
53,143 0.13% 2,702 Getinge AB
62,767 0.15%
10,810 Hennes & Mauritz AB
271,566 0.65% 2,747 Hexagon AB-B SHS
56,141 0.13%
5,402 Investor AB-B
111,017 0.27% 2,683 Kinnevik Investment AB-B
52,570 0.13%
2,713 Lundin Petroleum AB
41,128 0.10% 28,909 Nordea Bank AB
247,134 0.59%
11,183 Sandvik AB
102,228 0.25% 3,402 Scania AB-B
52,077 0.12%
15,951 Skandinaviska Enskilda Banken AB
116,543 0.28% 5,240 Skanska AB
66,476 0.16%
4,505 SKF AB
80,670 0.19% 320 Sulzer AG
39,307 0.09%
6,371 Svenska cellulosa AB
122,217 0.29% 5,635 Svenska Handelsbanken AB
172,905 0.41%
9,262 Swedbank AB
162,368 0.39% 2,673 Swedish Match AB
72,543 0.17%
6,063 Tele2 AB
54,422 0.13% 35,675 Telefonaktiebolaget LM Ericsson
308,838 0.74%
25,013 Teliasonera AB
124,676 0.30% 15,998 Volvo AB
163,750 0.39%
Total Sweden
2,990,182 7.17%
Switzerland - 21.61% 24,633 ABB Ltd
410,714 0.98%
1,419 Actelion Ltd
65,637 0.16% 1,668 Adecco SA
73,019 0.18%
1,285 Aryzta AG
55,469 0.13% 773 Baloise Holding AG
57,718 0.14%

SANLAM UNIVERSAL FUNDS PLC
174
SCHEDULE OF INVESTMENTS OF SANLAM EUROPE (EX UK) EQUITY FUND (CONTINUED) as at 30 June 2013
Nominal Security
Classification Fair Value % of EUR Net Assets
Switzerland - 21.61% (continued)
44 Barry Callebaut AG
30,940 0.07% 5,276 Compagnie Financiere Richemont SA
358,350 0.86%
14,785 Credit Suisse Group AG
301,082 0.72% 480 Geberit AG
91,426 0.22%
94 Givaudan
93,151 0.22% 2,584 Holcim Ltd
138,326 0.33%
2,652 Julius Baer Group Ltd
79,531 0.19% 730 Kuehne & Nagel International AG
61,540 0.15%
2 Lindt and Spruengli AG
66,921 0.16% 662 Lonza AG
38,290 0.09%
36,937 Nestle SA
1,860,198 4.46% 25,848 Novartis AG
1,409,957 3.39%
257 Partners Group Holding AG
53,432 0.14% 7,657 Roche Holding AG
1,462,793 3.51%
740 Schindler Holding Part Cert AG
79,167 0.19% 70 SGS SA
115,461 0.28%
28 Sika AG
55,676 0.13% 668 Sonova Holdings AG
54,413 0.13%
312 Swatch Group AG
131,130 0.31% 660 Swatch Group AG
47,752 0.11%
392 Swiss Life Holding AG
48,948 0.12% 1,221 Swiss Prime Site AG
68,936 0.17%
4,219 Swiss RE AG
241,113 0.58% 279 Swisscom AG
93,808 0.22%
1,088 Syngenta AG
326,902 0.78% 4,202 Transocean Ltd
155,289 0.37%
40,594 UBS AG
530,645 1.28% 1,757 Zurich Financial Services AG
349,936 0.84%
Total Switzerland
9,007,670 21.61%
Total Equity
41,441,696 99.39%
Rights - 0.01% 9,505 Repsol SA
A 4,068 0.01%
869 Groupe FNAC RTS
A 1,741 0.00% Total Rights
5,809 0.01%
Total financial assets at fair value through profit or loss
41,447,505 99.40%
Cash and cash equivalents
240,948 0.58% Other net assets and liabilities
9,326 0.02%
Net assets attributable to holders of redeemable participating shares 41,697,779 100.00%

SANLAM UNIVERSAL FUNDS PLC
175
SCHEDULE OF INVESTMENTS OF SANLAM EUROPE (EX UK) EQUITY FUND (CONTINUED) as at 30 June 2013
Summary
Classification Description
Fair Value % of Net Assets
Tranferable securities and money market instruments admitted to
official stock exchange listing or traded on regulated market 41,441,696 99.39%
A Transferabe securities and money market instruments other than
those referred above
5,809 0.01%
B Collective Investment Schemes
- 0.00% C Financial derivative instruments dealt in on a regulated market - 0.00% D Over the counter financial derivative instrument
- 0.00%
Cash and cash equivalents
240,948 0.58%
Other net assets and liabilities
9,326 0.02%
Net assets attributable to holders of redeemable participating shares 41,697,779 100.00%
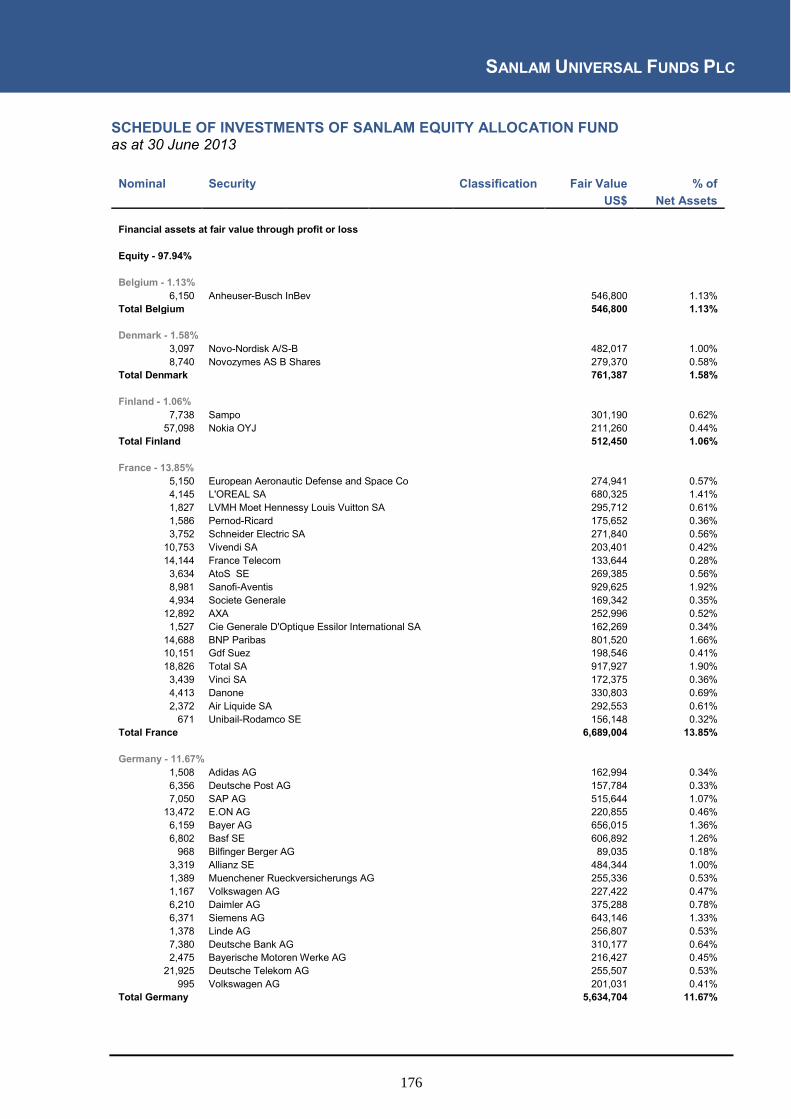
SANLAM UNIVERSAL FUNDS PLC
176
SCHEDULE OF INVESTMENTS OF SANLAM EQUITY ALLOCATION FUND as at 30 June 2013
Nominal Security
Classification Fair Value % of US$ Net Assets
Financial assets at fair value through profit or loss
Equity - 97.94%
Belgium - 1.13% 6,150 Anheuser-Busch InBev
546,800 1.13%
Total Belgium
546,800 1.13%
Denmark - 1.58% 3,097 Novo-Nordisk A/S-B
482,017 1.00%
8,740 Novozymes AS B Shares
279,370 0.58% Total Denmark
761,387 1.58%
Finland - 1.06% 7,738 Sampo
301,190 0.62%
57,098 Nokia OYJ
211,260 0.44% Total Finland
512,450 1.06%
France - 13.85% 5,150 European Aeronautic Defense and Space Co
274,941 0.57%
4,145 L'OREAL SA
680,325 1.41% 1,827 LVMH Moet Hennessy Louis Vuitton SA
295,712 0.61%
1,586 Pernod-Ricard
175,652 0.36% 3,752 Schneider Electric SA
271,840 0.56%
10,753 Vivendi SA
203,401 0.42% 14,144 France Telecom
133,644 0.28%
3,634 AtoS SE
269,385 0.56% 8,981 Sanofi-Aventis
929,625 1.92%
4,934 Societe Generale
169,342 0.35% 12,892 AXA
252,996 0.52%
1,527 Cie Generale D'Optique Essilor International SA
162,269 0.34% 14,688 BNP Paribas
801,520 1.66%
10,151 Gdf Suez
198,546 0.41% 18,826 Total SA
917,927 1.90%
3,439 Vinci SA
172,375 0.36% 4,413 Danone
330,803 0.69%
2,372 Air Liquide SA
292,553 0.61% 671 Unibail-Rodamco SE
156,148 0.32%
Total France
6,689,004 13.85%
Germany - 11.67% 1,508 Adidas AG
162,994 0.34%
6,356 Deutsche Post AG
157,784 0.33% 7,050 SAP AG
515,644 1.07%
13,472 E.ON AG
220,855 0.46% 6,159 Bayer AG
656,015 1.36%
6,802 Basf SE
606,892 1.26% 968 Bilfinger Berger AG
89,035 0.18%
3,319 Allianz SE
484,344 1.00% 1,389 Muenchener Rueckversicherungs AG
255,336 0.53%
1,167 Volkswagen AG
227,422 0.47% 6,210 Daimler AG
375,288 0.78%
6,371 Siemens AG
643,146 1.33% 1,378 Linde AG
256,807 0.53%
7,380 Deutsche Bank AG
310,177 0.64% 2,475 Bayerische Motoren Werke AG
216,427 0.45%
21,925 Deutsche Telekom AG
255,507 0.53% 995 Volkswagen AG
201,031 0.41%
Total Germany
5,634,704 11.67%

SANLAM UNIVERSAL FUNDS PLC
177
SCHEDULE OF INVESTMENTS OF SANLAM EQUITY ALLOCATION FUND (CONTINUED) as at 30 June 2013
Nominal Security
Classification Fair Value % of US$ Net Assets
Great Britain - 34.85% 3,131 AMEC PLC
47,727 0.10%
15,409 Bhp Billiton PLC
393,113 0.81% 15,731 ARM Holdings PLC
189,688 0.39%
6,225 Tullow Oil PLC
94,513 0.20% 1,003 Croda Internationa PLC
37,683 0.08%
19,101 Diageo PLC
544,667 1.13% 22,649 British Aerospace PLC
131,572 0.27%
14,846 British American Tobacco PLC
758,288 1.57% 10,740 Fenner PLC
50,010 0.10%
22,579 Standard Chartered PLC
488,704 1.01% 7,355 Imperial Tobacco Group PLC
254,352 0.53%
7,444 SABmiller PLC
355,941 0.74% 13,138 Compass Group PLC
167,388 0.35%
135,906 HSBC Holdings PLC
1,405,853 2.91% 26,791 Legal & General Group PLC
69,649 0.14%
9,348 Mears Group PLC
54,836 0.11% 17,285 Pace PLC
63,419 0.13%
30,684 Prudential PLC
500,308 1.04% 14,810 Rio Tinto PLC
602,688 1.25%
6,967 Scottish & Southern Energy PLC
160,940 0.33% 141,510 BP PLC
977,134 2.02%
9,973 DS Smith PLC
37,423 0.08% 296,807 Lloyds Banking Group PLC
284,337 0.59%
39,961 BG Group PLC
677,937 1.40% 60,706 Tesco PLC
305,141 0.63%
46,696 GlaxoSmithKline PLC
1,167,223 2.42% 2,504 Weir Group PLC
81,694 0.17%
9,267 Astrazeneca PLC
437,839 0.91% 29,232 GKN PLC
133,590 0.28%
57,389 BT Group PLC
269,144 0.56% 123,682 Barclays PLC
522,361 1.08%
13,539 William Hill PLC
90,541 0.19% 44,547 ITV PLC
94,662 0.20%
14,268 G4S PLC
49,861 0.10% 38,477 Centrica PLC
210,214 0.44%
28,365 Royal Dutch Shell PLC - Class A (GBP)
903,481 1.87% 19,877 Royal Dutch Shell PLC - Class B
656,034 1.36%
27,624 National Grid PLC
312,566 0.65% 10,520 Qinetiq PLC
28,785 0.06%
9,576 Unilever PLC
386,642 0.80% 447,628 Vodafone Group PLC
1,275,397 2.64%
11,227 Experian Group Ltd
194,638 0.40% 31,962 BBA Aviation PLC
135,789 0.28%
12,012 Avanti Communications Group PLC
47,917 0.10% 10,179 Anglo American PLC
195,459 0.40%
2,540 Capita Group PLC
37,216 0.08% 4,783 Reckitt Benckiser Group PLC
337,197 0.70%
6,310 Reed Elsevier PLC
71,494 0.15% 4,180 Shire PLC
132,190 0.27%
4,785 Novae Group PLC
34,873 0.07% 2,288 Betfair Group PLC
29,585 0.06%
14,036 Rolls-Royce Holdings PLC
241,420 0.50% 3,940 Cairn Energy PLC
15,125 0.03%
13,611 Invensys PLC
85,180 0.17% Total Great Britain
16,831,428 34.85%

SANLAM UNIVERSAL FUNDS PLC
178
SCHEDULE OF INVESTMENTS OF SANLAM EQUITY ALLOCATION FUND (CONTINUED) as at 30 June 2013
Nominal Security
Classification Fair Value % of US$ Net Assets
Italy - 2.81%
8,755 Assicurazioni Generali SpA
152,746 0.32% 190,925 Intesa Sanpaolo SpA
305,550 0.63%
50,477 Enel SpA
158,151 0.33% 19,444 ENI-Ente Nazionale Idrocarburi SpA
398,890 0.83%
47,631 HERA SpA
90,221 0.19% 6,304 Azimut Holding SpA
114,655 0.24%
29,298 Unicredit SpA
137,044 0.27% Total Italy
1,357,257 2.81%
Jersey - 1.09% 89,117 Glencore International PLC
367,863 0.76%
9,287 WPP PLC
158,047 0.33% Total Jersey
525,910 1.09%
Netherlands - 4.54% 4,550 European Aeronautic Defense and Space Company
243,856 0.50%
6,869 Koninklijke Philips Electronics NV
187,040 0.39% 38,080 ING Groep NV
346,542 0.72%
19,230 Unilever NV
756,375 1.57% 4,942 ASML Holding NV
389,475 0.81%
2,998 Gemalto NV
271,114 0.55% Total Netherlands
2,194,402 4.54%
Norway - 0.59% 8,930 Statoil ASA
183,200 0.38%
6,943 Gjensidige Forsikring ASA
101,570 0.21% Total Norway
284,770 0.59%
Spain - 4.82% 8,080 Obrascon Huarte Lain SA
274,691 0.57%
42,421 Banco Bilbao Vizcaya Argentaria SA
355,439 0.74% 7,979 Gas Natural SDG SA
160,680 0.33%
6,224 Repsol SA
131,164 0.27% 79,401 Banco Santander SA
506,011 1.05%
31,235 Telefonica SA
399,777 0.83% 1,697 Inditex SA
209,235 0.43%
54,770 Iberdrola SA
288,803 0.60% Total Spain
2,325,800 4.82%
Sweden - 3.67% 15,200 Skandinaviska Enskilda Banken AB
144,378 0.30%
5,978 Swedbank Hypotek AB
136,242 0.28% 19,026 Nordea Bank AB
211,450 0.44%
7,079 Hennes & Mauritz AB
231,197 0.48% 3,657 Svenska Handelsbanken AB
145,881 0.30%
23,574 Telefonaktiebolaget LM Ericsson
265,314 0.55% 3,342 Getinge AB
100,928 0.21%
7,097 Electrolux AB - Class B
178,151 0.37% 26,997 Volvo AB - Class B
359,245 0.74%
Total Sweden
1,772,786 3.67%
Switzerland - 16.07% 1,234 Syngenta AG
482,019 1.00%
47 Sika AG
121,499 0.25% 1,162 Zurich Financial Services AG
300,877 0.62%
17,350 Novartis AG
1,230,379 2.55% 16,473 ABB Ltd
357,072 0.74%
7,399 Roche Holdings AG
1,837,629 3.81% 3,616 Adecco SA
205,793 0.43%

SANLAM UNIVERSAL FUNDS PLC
179
SCHEDULE OF INVESTMENTS OF SANLAM EQUITY ALLOCATION FUND (CONTINUED) as at 30 June 2013
Nominal Security
Classification Fair Value % of US$ Net Assets
Switzerland - 16.07% (continued)
24,951 Nestle SA
1,633,602 3.38% 9,643 Credit Suisse Group AG
255,292 0.53%
40,407 UBS AG
686,688 1.42% 3,520 Compagnie Financiere Richemont SA
310,818 0.64%
2,770 Swiss RE AG
205,803 0.43% 2,758 Transocean Ltd
132,508 0.27%
Total Switzerland
7,759,979 16.07%
United States - 0.21% 1,300 Autoliv Inc
100,748 0.21%
Total United States
100,748 0.21%
Total Equity
47,297,425 97.94%
Total financial assets at fair value through profit or loss
47,297,425 97.94%
Cash and cash equivalents
904,226 1.87% Other net assets and liabilities
90,653 0.19%
Net assets attributable to holders of redeemable participating shares 48,292,304 100.00%
Summary
Classification Description
Fair Value % of
Net Assets
Tranferable securities and money market instruments admitted to
official stock exchange listing or traded on regulated market 47,297,425 97.94%
A Transferabe securities and money market instruments other than
those referred above
- 0.00%
B Collective Investment Schemes
- 0.00% C Financial derivative instruments dealt in on a regulated market - 0.00% D Over the counter financial derivative instrument
- 0.00%
Cash and cash equivalents
904,226 1.87%
Other net assets and liabilities
90,653 0.19%
Net assets attributable to holders of redeemable participating shares 48,292,304 100.00%

SANLAM UNIVERSAL FUNDS PLC
180
SCHEDULE OF INVESTMENTS OF SANLAM EMERGING MARKET EQUITY TRACKER FUND as at 30 June 2013
Nominal Security
Classification Fair Value % of US$ Net Assets
Financial assets at fair value through profit or loss
Equity - 84.45%
Bermuda - 0.61% 24,864 Brilliance China Automotive Holdings Ltd
27,890 0.09%
30,204 China Gas Holdings Ltd
30,881 0.10% 8,259 China Resources Gas Group Ltd
21,297 0.07%
17,544 Cosco Pacific Ltd
22,800 0.07% 8,877 Haier Electronics Group Co Ltd
14,146 0.04%
30,745 Kunlun Energy Company Ltd
54,544 0.17% 16,242 Nine Dragons Paper Holdings Ltd
10,554 0.03%
19,686 Sihuan Pharmaceutical Holdings Group Ltd
12,944 0.04% Total Bermuda
195,056 0.61%
Brazil - 11.21% 1,011 AES Tiete SA
9,652 0.03%
4,378 All America Latina Logistica SA
18,757 0.06% 3,506 Anhanguera Educacional Participacoes SA
20,483 0.06%
1,116 Arteris SA
10,205 0.03% 5,831 Banco Bradesco SA
80,810 0.25%
19,410 Banco Bradesco SA
253,174 0.79% 5,264 Banco Do Brazil SA
52,759 0.16%
1,725 Banco Estado Rio Grande Sul SA
11,820 0.04% 23,106 Banco Itau Holding Financeira SA
301,069 0.94%
7,056 Banco Santander Brasil SA
43,301 0.13% 5,571 BB Seguridade Participacoes SA
44,407 0.14%
16,268 BM&F Bovespa
91,065 0.28% 3,712 BR Malls Participacoes SA
33,590 0.10%
1,820 BR Properties SA
15,661 0.05% 2,151 Bradespar SA
19,679 0.06%
1,507 Braskem SA
11,241 0.03% 8,051 CCR SA
64,539 0.20%
3,155 Centrais Eletricas Brasileiras SA
12,474 0.04% 1,506 CESP - Companhia Energetica de Sao Paulo
13,389 0.04%
1,916 CETIP SA
19,819 0.06% 3,211 Cia Brasileira de Meios de Pagamentos
81,438 0.25%
3,218 Cia de Saneamento Basico do Estado de Sao Paulo
33,681 0.10% 1,306 Companhia Hering
18,514 0.06%
1,114 Companhia Brasileira de Distribuicao Grupo Pao De Acucar 50,251 0.16% 6,889 Companhia de Bebidas das Americas
260,584 0.81%
1,220 Companhia de Bebidas das Americas
45,628 0.14% 605 Companhia de Saneamento de Minas Gerais - Copasa MG 9,864 0.03%
5,018 Companhia Energetica de Minas Gerais
45,248 0.14% 1,013 Companhia Paranaense de Energia-Copel
12,699 0.04%
7,199 Companhia Siderurgica Nacional SA
19,465 0.06% 1,109 Cosan SA Industria e Comercio SA
21,728 0.07%
2,319 CPFL Energia SA
21,751 0.07% 2,897 Cyrela Brazil Realty SA
20,127 0.06%
2,522 Duratex SA
14,643 0.05% 1,512 Ecorodovias Infraestrutura e Logistica SA
10,724 0.03%
2,320 EDP - Energias do Brasil SA
11,905 0.04% 5,124 Embraer SA
47,597 0.15%
2,340 Fibria Celulose SA
26,230 0.08% 7,983 Gerdau SA
45,591 0.14%
3,230 Hypermarcas SA
21,255 0.07% 26,293 Itausa
98,718 0.31%

SANLAM UNIVERSAL FUNDS PLC
181
SCHEDULE OF INVESTMENTS OF SANLAM EMERGING MARKET EQUITY TRACKER FUND (CONTINUED) as at 30 June 2013
Nominal Security
Classification Fair Value % of US$ Net Assets
Brazil - 11.21% (continued)
4,015 JBS SA
11,765 0.04% 4,116 Klabin SA
20,692 0.06%
1,702 Kroton Educacional SA
23,819 0.07% 1,410 Localiza Rent a Car
20,179 0.06%
4,746 Lojas Americanas SA
33,618 0.10% 1,204 Lojas Renner SA
34,871 0.11%
1,934 Marcopolo SA
11,150 0.03% 2,673 Metalurgica Gerdau SA
19,357 0.06%
707 Multiplan Empreendimentos Imobiliarios SA
16,583 0.05% 1,623 Natura Cosmeticos SA
35,062 0.11%
13,168 OGX Petroleo e Gas Participacoes SA
4,711 0.01% 10,078 Oi SA
17,892 0.06%
5,980 Perdigao SA
131,219 0.41% 38,337 Petroleo Brasileiro SA
280,930 0.87%
27,780 Petroleo Brasileiro SA
186,332 0.58% 1,122 Porto Seguro SA
12,043 0.04%
2,242 Qualicorp SA
17,160 0.05% 1,813 Raia Drogasil SA
17,777 0.06%
3,518 Souza Cruz SA
43,640 0.14% 2,709 Telefonica Brasil SA
61,836 0.19%
7,868 Tim Participacoes SA
28,828 0.09% 1,006 Totvs SA
15,942 0.05%
1,507 Tractebel Energia SA
23,663 0.07% 2,940 Ultrapar Participacoes SA
70,730 0.22%
3,587 Usiminas Usi Sd Mg
12,070 0.04% 12,418 Vale SA
163,661 0.51%
18,079 Vale SA
221,484 0.69% 2,020 WEG SA
25,753 0.09%
Total Brazil
3,608,302 11.21%
Cayman Islands - 3.08% 45,725 Belle International Holdings Ltd
62,844 0.20%
6,971 Chailease Holding Co Ltd
16,433 0.05% 11,713 China Mengniu Dairy Co Ltd
41,907 0.13%
20,915 China Shanshui Cement Group Ltd
9,411 0.03% 17,040 China State Construction International Holdings Ltd
26,539 0.08%
41,826 Country Garden Holdings Co Ltd
21,894 0.07% 6,702 ENN Energy Holdings Ltd
35,730 0.11%
65,093 Evergrande Real Estate Group Ltd
24,086 0.07% 77,276 GCL-Poly Energy Holdings Ltd
16,638 0.05%
44,984 Geely Automobile Holdings Ltd
19,487 0.06% 8,191 Golden Eagle Retail Group Ltd
10,941 0.03%
6,287 Greentown China Holdings Ltd
10,278 0.03% 6,920 Hengan International Group Co Ltd
75,390 0.23%
7,468 Kingboard chemical Holdings Ltd
15,386 0.05% 19,193 Lee & Man Paper Manufacturing Ltd
11,432 0.04%
2,058 Mstar Semiconductor Inc
14,801 0.05% 5,300 Shenzhou International Group Holdings Ltd
15,238 0.05%
13,008 Shimao Property Holdings Ltd
25,827 0.08% 37,134 Shui On Land Ltd
10,820 0.03%
26,000 Sino Biopharmaceutical Ltd
16,861 0.05% 19,754 Soho China Ltd
15,714 0.05%
9,450 Tencent Holdings Ltd
370,631 1.15% 1,985 TPK Holding Co Ltd
31,724 0.10%
11,121 Uni-President China Holdings Ltd
11,299 0.04% 56,045 Want Want China Holdings Ltd
78,906 0.25%
Total Cayman Islands
990,217 3.08%
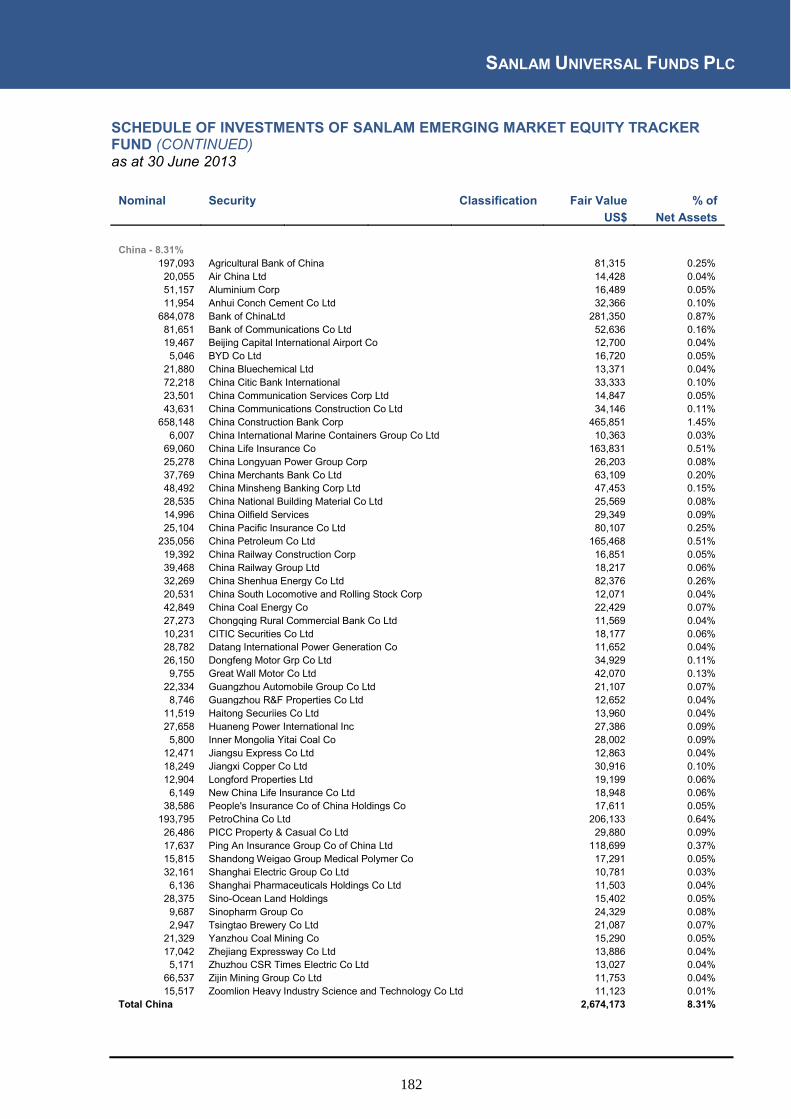
SANLAM UNIVERSAL FUNDS PLC
182
SCHEDULE OF INVESTMENTS OF SANLAM EMERGING MARKET EQUITY TRACKER FUND (CONTINUED) as at 30 June 2013
Nominal Security
Classification Fair Value % of US$ Net Assets
China - 8.31%
197,093 Agricultural Bank of China
81,315 0.25% 20,055 Air China Ltd
14,428 0.04%
51,157 Aluminium Corp
16,489 0.05% 11,954 Anhui Conch Cement Co Ltd
32,366 0.10%
684,078 Bank of ChinaLtd
281,350 0.87% 81,651 Bank of Communications Co Ltd
52,636 0.16%
19,467 Beijing Capital International Airport Co
12,700 0.04% 5,046 BYD Co Ltd
16,720 0.05%
21,880 China Bluechemical Ltd
13,371 0.04% 72,218 China Citic Bank International
33,333 0.10%
23,501 China Communication Services Corp Ltd
14,847 0.05% 43,631 China Communications Construction Co Ltd
34,146 0.11%
658,148 China Construction Bank Corp
465,851 1.45% 6,007 China International Marine Containers Group Co Ltd
10,363 0.03%
69,060 China Life Insurance Co
163,831 0.51% 25,278 China Longyuan Power Group Corp
26,203 0.08%
37,769 China Merchants Bank Co Ltd
63,109 0.20% 48,492 China Minsheng Banking Corp Ltd
47,453 0.15%
28,535 China National Building Material Co Ltd
25,569 0.08% 14,996 China Oilfield Services
29,349 0.09%
25,104 China Pacific Insurance Co Ltd
80,107 0.25% 235,056 China Petroleum Co Ltd
165,468 0.51%
19,392 China Railway Construction Corp
16,851 0.05% 39,468 China Railway Group Ltd
18,217 0.06%
32,269 China Shenhua Energy Co Ltd
82,376 0.26% 20,531 China South Locomotive and Rolling Stock Corp
12,071 0.04%
42,849 China Coal Energy Co
22,429 0.07% 27,273 Chongqing Rural Commercial Bank Co Ltd
11,569 0.04%
10,231 CITIC Securities Co Ltd
18,177 0.06% 28,782 Datang International Power Generation Co
11,652 0.04%
26,150 Dongfeng Motor Grp Co Ltd
34,929 0.11% 9,755 Great Wall Motor Co Ltd
42,070 0.13%
22,334 Guangzhou Automobile Group Co Ltd
21,107 0.07% 8,746 Guangzhou R&F Properties Co Ltd
12,652 0.04%
11,519 Haitong Securiies Co Ltd
13,960 0.04% 27,658 Huaneng Power International Inc
27,386 0.09%
5,800 Inner Mongolia Yitai Coal Co
28,002 0.09% 12,471 Jiangsu Express Co Ltd
12,863 0.04%
18,249 Jiangxi Copper Co Ltd
30,916 0.10% 12,904 Longford Properties Ltd
19,199 0.06%
6,149 New China Life Insurance Co Ltd
18,948 0.06% 38,586 People's Insurance Co of China Holdings Co
17,611 0.05%
193,795 PetroChina Co Ltd
206,133 0.64% 26,486 PICC Property & Casual Co Ltd
29,880 0.09%
17,637 Ping An Insurance Group Co of China Ltd
118,699 0.37% 15,815 Shandong Weigao Group Medical Polymer Co
17,291 0.05%
32,161 Shanghai Electric Group Co Ltd
10,781 0.03% 6,136 Shanghai Pharmaceuticals Holdings Co Ltd
11,503 0.04%
28,375 Sino-Ocean Land Holdings
15,402 0.05% 9,687 Sinopharm Group Co
24,329 0.08%
2,947 Tsingtao Brewery Co Ltd
21,087 0.07% 21,329 Yanzhou Coal Mining Co
15,290 0.05%
17,042 Zhejiang Expressway Co Ltd
13,886 0.04% 5,171 Zhuzhou CSR Times Electric Co Ltd
13,027 0.04%
66,537 Zijin Mining Group Co Ltd
11,753 0.04% 15,517 Zoomlion Heavy Industry Science and Technology Co Ltd 11,123 0.01%
Total China
2,674,173 8.31%

SANLAM UNIVERSAL FUNDS PLC
183
SCHEDULE OF INVESTMENTS OF SANLAM EMERGING MARKET EQUITY TRACKER FUND (CONTINUED) as at 30 June 2013
Nominal Security
Classification Fair Value % of US$ Net Assets Columbia - 1.15%
1,821 Almacenes Exito SA
30,178 0.09% 1,300 Banco Davivienda SA
15,592 0.05%
2,218 Bancolombia SA
30,325 0.09% 3,098 Bancolombia SA
43,319 0.13%
3,698 Cementos Argos SA
15,283 0.05% 799 Corporacion Financiera Colombiana SA
14,896 0.05%
46,717 Ecopetrol SA
98,711 0.31% 2,599 Grupo Argos SA
25,843 0.08%
1,207 Grupo Argos SA
12,064 0.04% 2,699 Grupo De Inversiones Suramericana SA
52,276 0.16%
800 Grupo De Inversiones Suramericana SA
15,719 0.05% 3,898 Interconexion Electrica SA
15,282 0.05%
Total Columbia
369,488 1.15%
Czechoslovakia - 0.28% 1,520 Cez Group
36,432 0.11%
197 Komercni Banka
36,572 0.11% 1,213 Telefonica 02 Czech Republic Co
16,692 0.06%
Total Czechoslovakia
89,696 0.28%
Egypt - 0.25% 5,638 Commercial International Bank
23,987 0.07%
1,102 Orascom Construction Industries SAE
37,800 0.12% 32,994 Orascom Telecom Holdings SAE
18,422 0.06%
Total Egypt
80,209 0.25%
Hong Kong - 6.22% 14,147 Agile Properties Holdings Ltd
15,175 0.05%
5,040 Beijing Enterprises Holdings Ltd
36,291 0.11% 33,872 China Cosco Holdings Co Ltd
14,848 0.05%
10,871 China Everbright Ltd
14,324 0.04% 9,265 China Insurance International Holdings Co Ltd
14,334 0.04%
11,441 China Merchants Holdings International Co Ltd 35,623 0.11% 54,535 China Mobile Hong Kong Ltd
569,523 1.77%
37,532 China Overseas Land & Investments Ltd
98,473 0.31% 17,016 China Resources Energy
40,542 0.13%
11,561 China Resources Enterprise Ltd
36,369 0.11% 18,679 China Resources Land Ltd
51,055 0.16%
130,852 China Telecom Corp Ltd
62,421 0.19% 45,578 China Unicom Hong Kong Ltd
60,526 0.19%
12,300 China Vanke Co Ltd
22,043 0.07% 15,290 Citic Pacific
16,401 0.05%
165,130 CNOOC Ltd
280,177 0.87% 19,008 Fosun International Ltd
13,944 0.04%
33,750 Franshion Properties China Ltd
11,270 0.04% 33,597 Fushan International Energy Group Ltd
13,038 0.04%
24,158 Guangdong Investment Ltd
20,931 0.07% 596,994 Industrial & Commercial Bank of China
376,383 1.17%
55,723 Lenovo Group Ltd
50,506 0.16% 21,990 Poly Hong Kong Investment Ltd
11,879 0.04%
7,449 Shanghai Industrial Holdings Ltd
23,097 0.07% 23,869 Sun Art Retail Group Ltd
34,529 0.11%
19,074 Tingyi (Cayman Island) Holdings Corp
49,676 0.15% 5,077 Weichai Power Co Ltd
14,990 0.05%
55,037 Yuexiu Property Co Ltd
13,979 0.03% Total Hong Kong
2,002,347 6.22%
Hungary - 0.23%
397 Mol Magyar Olaj- es Gazipari R
29,700 0.09% 2,072 OTP Bank Nyrt
43,485 0.14%
Total Hungary
73,185 0.23%
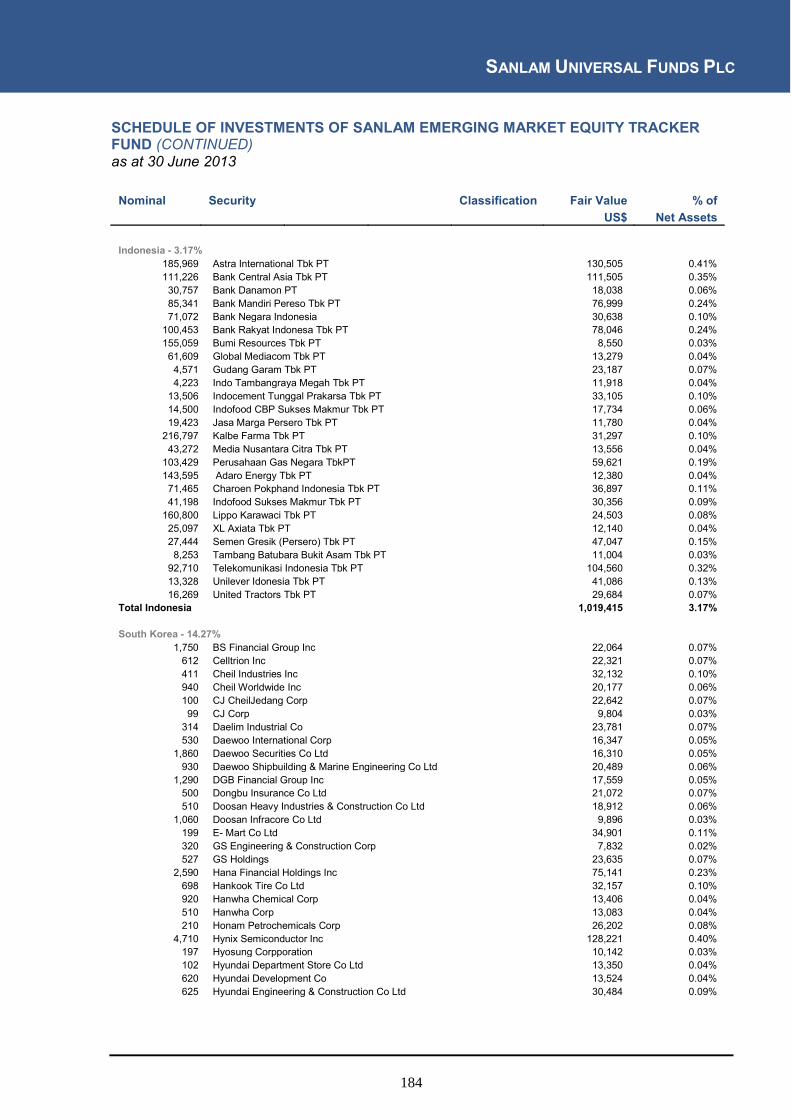
SANLAM UNIVERSAL FUNDS PLC
184
SCHEDULE OF INVESTMENTS OF SANLAM EMERGING MARKET EQUITY TRACKER FUND (CONTINUED) as at 30 June 2013
Nominal Security
Classification Fair Value % of US$ Net Assets
Indonesia - 3.17%
185,969 Astra International Tbk PT
130,505 0.41% 111,226 Bank Central Asia Tbk PT
111,505 0.35%
30,757 Bank Danamon PT
18,038 0.06% 85,341 Bank Mandiri Pereso Tbk PT
76,999 0.24%
71,072 Bank Negara Indonesia
30,638 0.10% 100,453 Bank Rakyat Indonesa Tbk PT
78,046 0.24%
155,059 Bumi Resources Tbk PT
8,550 0.03% 61,609 Global Mediacom Tbk PT
13,279 0.04%
4,571 Gudang Garam Tbk PT
23,187 0.07% 4,223 Indo Tambangraya Megah Tbk PT
11,918 0.04%
13,506 Indocement Tunggal Prakarsa Tbk PT
33,105 0.10% 14,500 Indofood CBP Sukses Makmur Tbk PT
17,734 0.06%
19,423 Jasa Marga Persero Tbk PT
11,780 0.04% 216,797 Kalbe Farma Tbk PT
31,297 0.10%
43,272 Media Nusantara Citra Tbk PT
13,556 0.04% 103,429 Perusahaan Gas Negara TbkPT
59,621 0.19%
143,595 Adaro Energy Tbk PT
12,380 0.04% 71,465 Charoen Pokphand Indonesia Tbk PT
36,897 0.11%
41,198 Indofood Sukses Makmur Tbk PT
30,356 0.09% 160,800 Lippo Karawaci Tbk PT
24,503 0.08%
25,097 XL Axiata Tbk PT
12,140 0.04% 27,444 Semen Gresik (Persero) Tbk PT
47,047 0.15%
8,253 Tambang Batubara Bukit Asam Tbk PT
11,004 0.03% 92,710 Telekomunikasi Indonesia Tbk PT
104,560 0.32%
13,328 Unilever Idonesia Tbk PT
41,086 0.13% 16,269 United Tractors Tbk PT
29,684 0.07%
Total Indonesia
1,019,415 3.17%
South Korea - 14.27% 1,750 BS Financial Group Inc
22,064 0.07%
612 Celltrion Inc
22,321 0.07% 411 Cheil Industries Inc
32,132 0.10%
940 Cheil Worldwide Inc
20,177 0.06% 100 CJ CheilJedang Corp
22,642 0.07%
99 CJ Corp
9,804 0.03% 314 Daelim Industrial Co
23,781 0.07%
530 Daewoo International Corp
16,347 0.05% 1,860 Daewoo Securities Co Ltd
16,310 0.05%
930 Daewoo Shipbuilding & Marine Engineering Co Ltd 20,489 0.06% 1,290 DGB Financial Group Inc
17,559 0.05%
500 Dongbu Insurance Co Ltd
21,072 0.07% 510 Doosan Heavy Industries & Construction Co Ltd 18,912 0.06%
1,060 Doosan Infracore Co Ltd
9,896 0.03% 199 E- Mart Co Ltd
34,901 0.11%
320 GS Engineering & Construction Corp
7,832 0.02% 527 GS Holdings
23,635 0.07%
2,590 Hana Financial Holdings Inc
75,141 0.23% 698 Hankook Tire Co Ltd
32,157 0.10%
920 Hanwha Chemical Corp
13,406 0.04% 510 Hanwha Corp
13,083 0.04%
210 Honam Petrochemicals Corp
26,202 0.08% 4,710 Hynix Semiconductor Inc
128,221 0.40%
197 Hyosung Corpporation
10,142 0.03% 102 Hyundai Department Store Co Ltd
13,350 0.04%
620 Hyundai Development Co
13,524 0.04% 625 Hyundai Engineering & Construction Co Ltd
30,484 0.09%
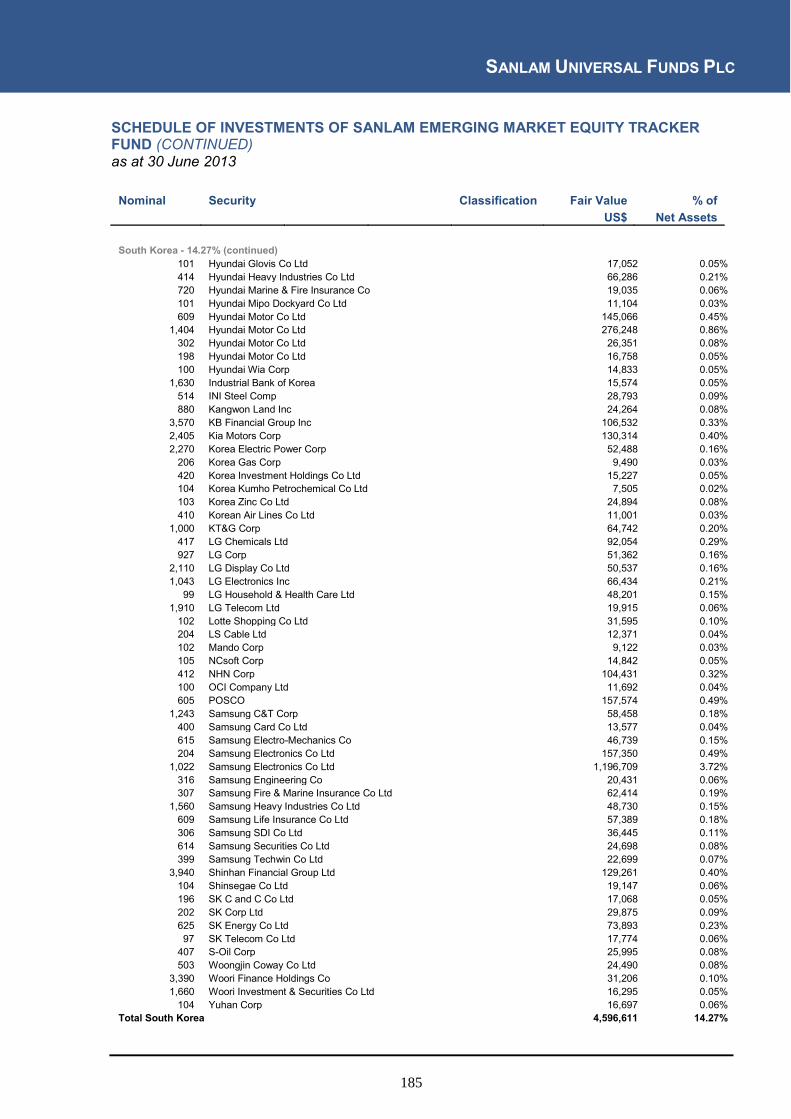
SANLAM UNIVERSAL FUNDS PLC
185
SCHEDULE OF INVESTMENTS OF SANLAM EMERGING MARKET EQUITY TRACKER FUND (CONTINUED) as at 30 June 2013
Nominal Security
Classification Fair Value % of US$ Net Assets
South Korea - 14.27% (continued)
101 Hyundai Glovis Co Ltd
17,052 0.05% 414 Hyundai Heavy Industries Co Ltd
66,286 0.21%
720 Hyundai Marine & Fire Insurance Co
19,035 0.06% 101 Hyundai Mipo Dockyard Co Ltd
11,104 0.03%
609 Hyundai Motor Co Ltd
145,066 0.45% 1,404 Hyundai Motor Co Ltd
276,248 0.86%
302 Hyundai Motor Co Ltd
26,351 0.08% 198 Hyundai Motor Co Ltd
16,758 0.05%
100 Hyundai Wia Corp
14,833 0.05% 1,630 Industrial Bank of Korea
15,574 0.05%
514 INI Steel Comp
28,793 0.09% 880 Kangwon Land Inc
24,264 0.08%
3,570 KB Financial Group Inc
106,532 0.33% 2,405 Kia Motors Corp
130,314 0.40%
2,270 Korea Electric Power Corp
52,488 0.16% 206 Korea Gas Corp
9,490 0.03%
420 Korea Investment Holdings Co Ltd
15,227 0.05% 104 Korea Kumho Petrochemical Co Ltd
7,505 0.02%
103 Korea Zinc Co Ltd
24,894 0.08% 410 Korean Air Lines Co Ltd
11,001 0.03%
1,000 KT&G Corp
64,742 0.20% 417 LG Chemicals Ltd
92,054 0.29%
927 LG Corp
51,362 0.16% 2,110 LG Display Co Ltd
50,537 0.16%
1,043 LG Electronics Inc
66,434 0.21% 99 LG Household & Health Care Ltd
48,201 0.15%
1,910 LG Telecom Ltd
19,915 0.06% 102 Lotte Shopping Co Ltd
31,595 0.10%
204 LS Cable Ltd
12,371 0.04% 102 Mando Corp
9,122 0.03%
105 NCsoft Corp
14,842 0.05% 412 NHN Corp
104,431 0.32%
100 OCI Company Ltd
11,692 0.04% 605 POSCO
157,574 0.49%
1,243 Samsung C&T Corp
58,458 0.18% 400 Samsung Card Co Ltd
13,577 0.04%
615 Samsung Electro-Mechanics Co
46,739 0.15% 204 Samsung Electronics Co Ltd
157,350 0.49%
1,022 Samsung Electronics Co Ltd
1,196,709 3.72% 316 Samsung Engineering Co
20,431 0.06%
307 Samsung Fire & Marine Insurance Co Ltd
62,414 0.19% 1,560 Samsung Heavy Industries Co Ltd
48,730 0.15%
609 Samsung Life Insurance Co Ltd
57,389 0.18% 306 Samsung SDI Co Ltd
36,445 0.11%
614 Samsung Securities Co Ltd
24,698 0.08% 399 Samsung Techwin Co Ltd
22,699 0.07%
3,940 Shinhan Financial Group Ltd
129,261 0.40% 104 Shinsegae Co Ltd
19,147 0.06%
196 SK C and C Co Ltd
17,068 0.05% 202 SK Corp Ltd
29,875 0.09%
625 SK Energy Co Ltd
73,893 0.23% 97 SK Telecom Co Ltd
17,774 0.06%
407 S-Oil Corp
25,995 0.08% 503 Woongjin Coway Co Ltd
24,490 0.08%
3,390 Woori Finance Holdings Co
31,206 0.10% 1,660 Woori Investment & Securities Co Ltd
16,295 0.05%
104 Yuhan Corp
16,697 0.06% Total South Korea
4,596,611 14.27%

SANLAM UNIVERSAL FUNDS PLC
186
SCHEDULE OF INVESTMENTS OF SANLAM EMERGING MARKET EQUITY TRACKER FUND (CONTINUED) as at 30 June 2013
Nominal Security
Classification Fair Value % of US$ Net Assets
Malaysia - 3.91% (continued)
13,100 Airasia Berhad
13,140 0.04% 10,000 Alliance Financial Group Berhad
16,665 0.05%
16,000 AMMB Holding Berhad
36,926 0.11% 24,000 Axiata Group Berhad
50,031 0.16%
1,000 British American Tobacco Berhad
18,740 0.06% 12,200 Bumi Armada Berhad
14,884 0.05%
44,300 CIMB Group Holdings Berhad
115,333 0.36% 28,200 Digi.com Berhad
42,206 0.13%
12,100 Felda Golbal Ventures Holdings Berhad
17,197 0.05% 16,000 Gamuda Berhad
23,846 0.07%
19,300 Genting Berhad
63,354 0.20% 5,100 Hong Leong Bank Berhad
22,290 0.07%
18,900 IHH Healthcare Berhad
23,473 0.07% 12,100 IJM Corporation Berhad
21,496 0.07%
29,900 IOI Corporation Berhad
51,143 0.16% 5,000 Kuala Lumpur Kepong Berhad
34,147 0.11%
4,000 Lafarge Malayan Cement Berhad
12,803 0.04% 38,800 Malayan Banking Berhad
126,877 0.39%
19,900 Maxis Berhad
42,986 0.13% 11,000 MISC Berhad
17,639 0.05%
5,000 Perlis Plantations Group Berhad
22,261 0.07% 26,000 Petronas Chemicals Group Berhad
54,119 0.17%
2,000 Petronas Dagangan Berhad
15,910 0.05% 5,000 Petronas Gas Berhad
32,858 0.10%
10,000 Public Bank Berhad
53,641 0.17% 28,100 Resorts World Berhad
34,370 0.11%
6,000 RHB Capital Berhad
16,281 0.05% 32,700 SapuraKencana Petroleum Berhad
42,052 0.13%
24,900 Sine Darby Berhad
75,004 0.23% 10,000 Telekom Malaysia Berhad
16,979 0.05%
26,000 Tenaga NasionlBerhad
67,771 0.21% 15,400 UEM Land Holdings Berhad
15,108 0.05%
5,000 UMW Holdings Berhad
22,953 0.07% 47,300 YTL Corp Berhad
24,688 0.08%
Total Malaysia
1,259,171 3.91%
Mexico - 5.39% 26,919 Alfa SAB de CV
64,547 0.20%
356,368 America Movil SAB de CV
386,500 1.20% 2,949 Arca Continental SAB de CV
22,470 0.07%
101,617 Cemex SAB de CV
107,323 0.33% 3,877 Coca-Cola Femsa SAB de CV
54,297 0.17%
9,798 Compartamos SAB de CV
16,786 0.05% 3,393 Controladora Comercial Mexican SAB de CV
12,826 0.04%
1,620 El Puerto de Liverpool SAB de CV
18,957 0.06% 17,489 Fomento Economico Mexicano SAB de CV
180,294 0.56%
2,923 Grupo Aeroportuario del Pacifico SAB de CV
14,724 0.05% 1,911 Grupo Aeroportuario del Sureste SAB de CV
21,156 0.07%
14,974 Grupo Bimbo SAB de CV
45,111 0.14% 5,141 Grupo Carso SAB de CV
24,106 0.07%
17,118 Grupo Financiero Banorte SAB de CV
100,802 0.31% 18,234 Grupo Financiero Inbursa
40,055 0.12%
18,396 Grupo Financiero Santander Mexico SAB de CV
52,258 0.16% 35,166 Grupo Mexico SAB de CV
101,165 0.31%
5,907 Grupo Modelo SAB de CV
53,487 0.17% 23,426 Grupo Televisa SAB de CV
116,425 0.36%
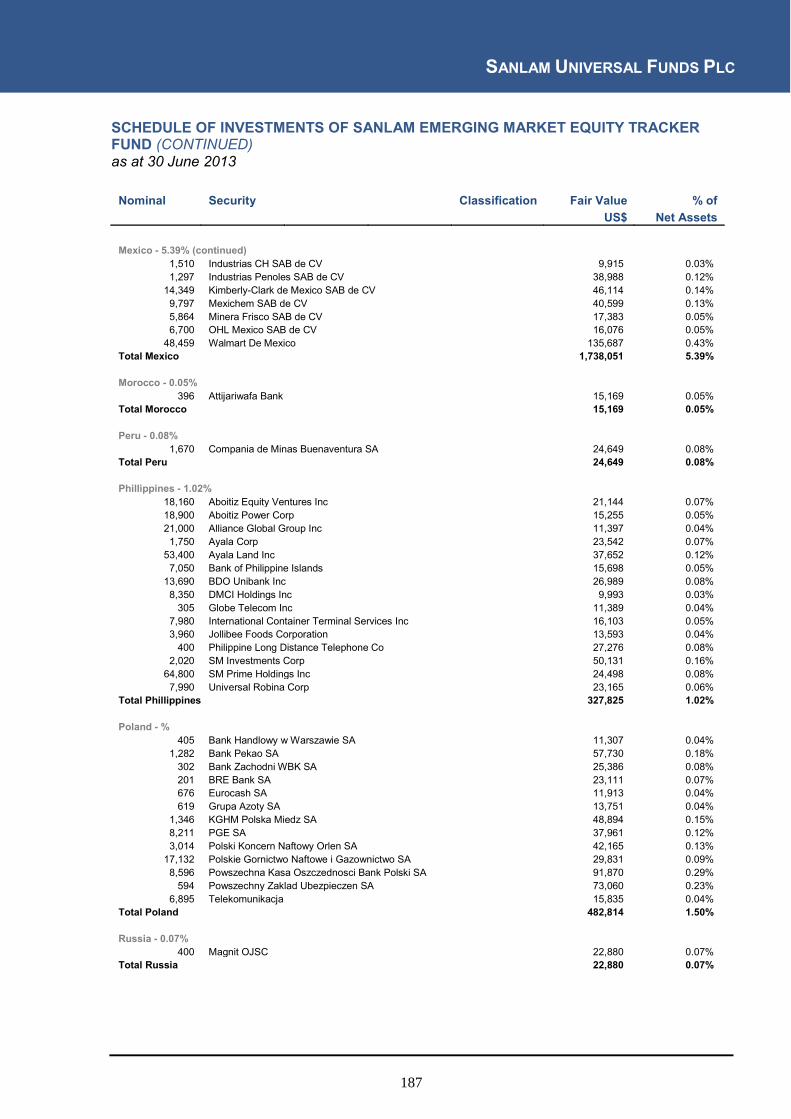
SANLAM UNIVERSAL FUNDS PLC
187
SCHEDULE OF INVESTMENTS OF SANLAM EMERGING MARKET EQUITY TRACKER FUND (CONTINUED) as at 30 June 2013
Nominal Security
Classification Fair Value % of US$ Net Assets
Mexico - 5.39% (continued)
1,510 Industrias CH SAB de CV
9,915 0.03% 1,297 Industrias Penoles SAB de CV
38,988 0.12%
14,349 Kimberly-Clark de Mexico SAB de CV
46,114 0.14% 9,797 Mexichem SAB de CV
40,599 0.13%
5,864 Minera Frisco SAB de CV
17,383 0.05% 6,700 OHL Mexico SAB de CV
16,076 0.05%
48,459 Walmart De Mexico
135,687 0.43% Total Mexico
1,738,051 5.39%
Morocco - 0.05% 396 Attijariwafa Bank
15,169 0.05%
Total Morocco
15,169 0.05%
Peru - 0.08% 1,670 Compania de Minas Buenaventura SA
24,649 0.08%
Total Peru
24,649 0.08%
Phillippines - 1.02% 18,160 Aboitiz Equity Ventures Inc
21,144 0.07%
18,900 Aboitiz Power Corp
15,255 0.05% 21,000 Alliance Global Group Inc
11,397 0.04%
1,750 Ayala Corp
23,542 0.07% 53,400 Ayala Land Inc
37,652 0.12%
7,050 Bank of Philippine Islands
15,698 0.05% 13,690 BDO Unibank Inc
26,989 0.08%
8,350 DMCI Holdings Inc
9,993 0.03% 305 Globe Telecom Inc
11,389 0.04%
7,980 International Container Terminal Services Inc
16,103 0.05% 3,960 Jollibee Foods Corporation
13,593 0.04%
400 Philippine Long Distance Telephone Co
27,276 0.08% 2,020 SM Investments Corp
50,131 0.16%
64,800 SM Prime Holdings Inc
24,498 0.08% 7,990 Universal Robina Corp
23,165 0.06%
Total Phillippines
327,825 1.02%
Poland - % 405 Bank Handlowy w Warszawie SA
11,307 0.04%
1,282 Bank Pekao SA
57,730 0.18% 302 Bank Zachodni WBK SA
25,386 0.08%
201 BRE Bank SA
23,111 0.07% 676 Eurocash SA
11,913 0.04%
619 Grupa Azoty SA
13,751 0.04% 1,346 KGHM Polska Miedz SA
48,894 0.15%
8,211 PGE SA
37,961 0.12% 3,014 Polski Koncern Naftowy Orlen SA
42,165 0.13%
17,132 Polskie Gornictwo Naftowe i Gazownictwo SA
29,831 0.09% 8,596 Powszechna Kasa Oszczednosci Bank Polski SA
91,870 0.29%
594 Powszechny Zaklad Ubezpieczen SA
73,060 0.23% 6,895 Telekomunikacja
15,835 0.04%
Total Poland
482,814 1.50%
Russia - 0.07% 400 Magnit OJSC
22,880 0.07%
Total Russia
22,880 0.07%

SANLAM UNIVERSAL FUNDS PLC
188
SCHEDULE OF INVESTMENTS OF SANLAM EMERGING MARKET EQUITY TRACKER FUND (CONTINUED) as at 30 June 2013
Nominal Security
Classification Fair Value % of US$ Net Assets
South Africa - 6.99%
2,605 ABSA Group Ltd
38,975 0.12% 7,303 African Bank Investments Ltd
12,008 0.04%
1,024 African Rainbow Minerals Ltd
15,451 0.05% 704 Anglo Platinum Ltd
20,924 0.06%
3,417 AngloGold Ashanti Ltd
48,191 0.15% 2,770 Aspen Pharmacare Holdings Ltd
63,371 0.20%
296 Assore Ltd
9,543 0.03% 1,958 Barloworld Ltd
16,078 0.05%
2,698 Bidvest Group Ltd
66,584 0.21% 2,753 Discovery Ltd
23,316 0.07%
1,225 Exxaro Resources Ltd
17,968 0.06% 28,196 FirstRand Ltd
82,184 0.26%
6,486 Gold Fields Ltd
33,177 0.10% 14,877 Growthpoint Properties Ltd
39,555 0.12%
3,497 Harmony Gold Mining Co Ltd
12,596 0.04% 5,133 Impala Platinum Holdings Ltd
48,096 0.15%
1,627 Imperial Holdings Ltd
34,401 0.11% 2,248 Investec Ltd
14,493 0.05%
827 Kumba Iron Ore Ltd
38,378 0.12% 1,001 Liberty Holdings Ltd
12,096 0.04%
8,380 Life Healthcare Group Holdings Ltd
31,661 0.10% 995 Massmart Holdings Ltd
17,974 0.06%
9,237 MMI Holdings Ltd
20,632 0.06% 2,142 Mr Price Group Ltd
29,070 0.09%
15,576 Mtn Group Ltd
288,752 0.90% 3,537 Naspers Ltd
260,142 0.81%
1,811 Nedbank Group Ltd
32,027 0.10% 8,136 Netcare Ltd
18,886 0.06%
4,642 PPC Ltd
13,932 0.04% 25,868 Redefine Properties Ltd
27,339 0.08%
3,881 Remgro Ltd
74,274 0.23% 1,830 Reunert Ltd
12,722 0.04%
6,643 RMB Holdings Ltd
26,370 0.08% 6,221 RMI Holdings Inc
15,795 0.05%
16,015 Sanlam Ltd
74,223 0.23% 5,497 Sappi Ltd
13,513 0.04%
5,094 Sasol Ltd
221,479 0.69% 3,829 Shoprite Holdings Ltd
71,562 0.22%
10,990 Standard Bank Group Ltd
123,437 0.38% 11,234 Steinhoff International Holdings Ltd
27,753 0.09%
1,904 The Foschini Group Ltd
18,943 0.06% 1,682 The Spar Group Ltd
20,334 0.06%
1,535 Tiger Brands Ltd
45,762 0.14% 4,008 Truworths International Ltd
35,111 0.11%
3,483 Vodacom Group Ltd
36,853 0.11% 6,746 Woolworths Holdings Ltd
43,778 0.13%
Total South Africa
2,249,709 6.99%
Taiwan - 11.44% 27,162 Acer Inc
19,444 0.06%
57,314 Advanced Semiconductor Engergy Inc
47,994 0.15% 3,046 Advantech Co Ltd
14,503 0.05%
23,088 Asia Cement Corp
28,366 0.09% 6,018 Asustek Computer Inc
51,696 0.16%
88,165 AU Optronics Corp
31,997 0.10% 6,070 Catcher Technology Co Ltd
31,528 0.10%
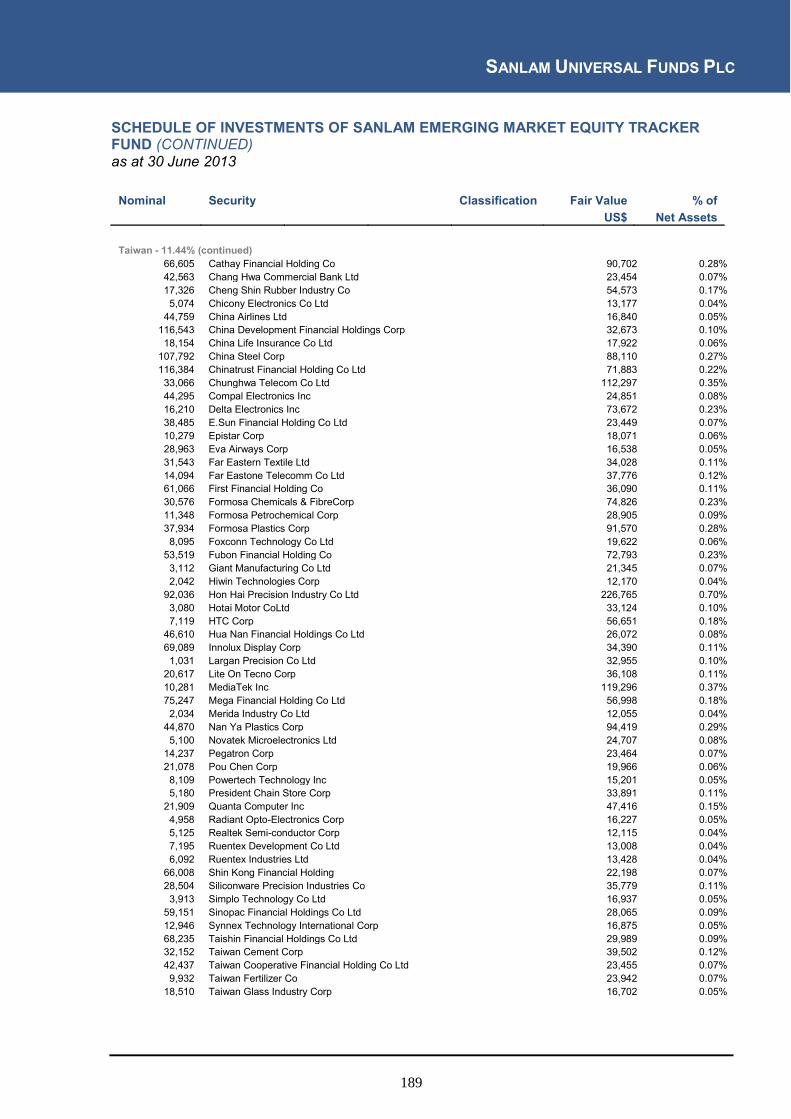
SANLAM UNIVERSAL FUNDS PLC
189
SCHEDULE OF INVESTMENTS OF SANLAM EMERGING MARKET EQUITY TRACKER FUND (CONTINUED) as at 30 June 2013
Nominal Security
Classification Fair Value % of US$ Net Assets
Taiwan - 11.44% (continued)
66,605 Cathay Financial Holding Co
90,702 0.28% 42,563 Chang Hwa Commercial Bank Ltd
23,454 0.07%
17,326 Cheng Shin Rubber Industry Co
54,573 0.17% 5,074 Chicony Electronics Co Ltd
13,177 0.04%
44,759 China Airlines Ltd
16,840 0.05% 116,543 China Development Financial Holdings Corp
32,673 0.10%
18,154 China Life Insurance Co Ltd
17,922 0.06% 107,792 China Steel Corp
88,110 0.27%
116,384 Chinatrust Financial Holding Co Ltd
71,883 0.22% 33,066 Chunghwa Telecom Co Ltd
112,297 0.35%
44,295 Compal Electronics Inc
24,851 0.08% 16,210 Delta Electronics Inc
73,672 0.23%
38,485 E.Sun Financial Holding Co Ltd
23,449 0.07% 10,279 Epistar Corp
18,071 0.06%
28,963 Eva Airways Corp
16,538 0.05% 31,543 Far Eastern Textile Ltd
34,028 0.11%
14,094 Far Eastone Telecomm Co Ltd
37,776 0.12% 61,066 First Financial Holding Co
36,090 0.11%
30,576 Formosa Chemicals & FibreCorp
74,826 0.23% 11,348 Formosa Petrochemical Corp
28,905 0.09%
37,934 Formosa Plastics Corp
91,570 0.28% 8,095 Foxconn Technology Co Ltd
19,622 0.06%
53,519 Fubon Financial Holding Co
72,793 0.23% 3,112 Giant Manufacturing Co Ltd
21,345 0.07%
2,042 Hiwin Technologies Corp
12,170 0.04% 92,036 Hon Hai Precision Industry Co Ltd
226,765 0.70%
3,080 Hotai Motor CoLtd
33,124 0.10% 7,119 HTC Corp
56,651 0.18%
46,610 Hua Nan Financial Holdings Co Ltd
26,072 0.08% 69,089 Innolux Display Corp
34,390 0.11%
1,031 Largan Precision Co Ltd
32,955 0.10% 20,617 Lite On Tecno Corp
36,108 0.11%
10,281 MediaTek Inc
119,296 0.37% 75,247 Mega Financial Holding Co Ltd
56,998 0.18%
2,034 Merida Industry Co Ltd
12,055 0.04% 44,870 Nan Ya Plastics Corp
94,419 0.29%
5,100 Novatek Microelectronics Ltd
24,707 0.08% 14,237 Pegatron Corp
23,464 0.07%
21,078 Pou Chen Corp
19,966 0.06% 8,109 Powertech Technology Inc
15,201 0.05%
5,180 President Chain Store Corp
33,891 0.11% 21,909 Quanta Computer Inc
47,416 0.15%
4,958 Radiant Opto-Electronics Corp
16,227 0.05% 5,125 Realtek Semi-conductor Corp
12,115 0.04%
7,195 Ruentex Development Co Ltd
13,008 0.04% 6,092 Ruentex Industries Ltd
13,428 0.04%
66,008 Shin Kong Financial Holding
22,198 0.07% 28,504 Siliconware Precision Industries Co
35,779 0.11%
3,913 Simplo Technology Co Ltd
16,937 0.05% 59,151 Sinopac Financial Holdings Co Ltd
28,065 0.09%
12,946 Synnex Technology International Corp
16,875 0.05% 68,235 Taishin Financial Holdings Co Ltd
29,989 0.09%
32,152 Taiwan Cement Corp
39,502 0.12% 42,437 Taiwan Cooperative Financial Holding Co Ltd
23,455 0.07%
9,932 Taiwan Fertilizer Co
23,942 0.07% 18,510 Taiwan Glass Industry Corp
16,702 0.05%
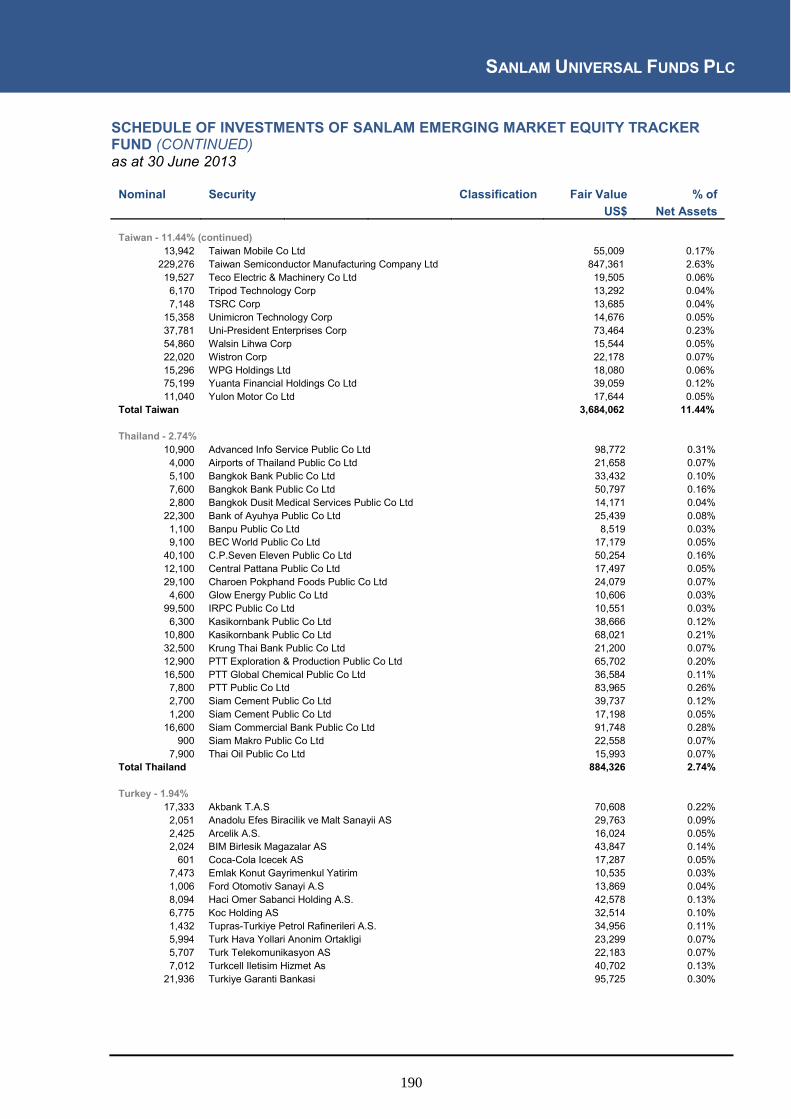
SANLAM UNIVERSAL FUNDS PLC
190
SCHEDULE OF INVESTMENTS OF SANLAM EMERGING MARKET EQUITY TRACKER FUND (CONTINUED) as at 30 June 2013
Nominal Security
Classification Fair Value % of US$ Net Assets
Taiwan - 11.44% (continued)
13,942 Taiwan Mobile Co Ltd
55,009 0.17% 229,276 Taiwan Semiconductor Manufacturing Company Ltd
847,361 2.63%
19,527 Teco Electric & Machinery Co Ltd
19,505 0.06% 6,170 Tripod Technology Corp
13,292 0.04%
7,148 TSRC Corp
13,685 0.04% 15,358 Unimicron Technology Corp
14,676 0.05%
37,781 Uni-President Enterprises Corp
73,464 0.23% 54,860 Walsin Lihwa Corp
15,544 0.05%
22,020 Wistron Corp
22,178 0.07% 15,296 WPG Holdings Ltd
18,080 0.06%
75,199 Yuanta Financial Holdings Co Ltd
39,059 0.12% 11,040 Yulon Motor Co Ltd
17,644 0.05%
Total Taiwan
3,684,062 11.44%
Thailand - 2.74% 10,900 Advanced Info Service Public Co Ltd
98,772 0.31%
4,000 Airports of Thailand Public Co Ltd
21,658 0.07% 5,100 Bangkok Bank Public Co Ltd
33,432 0.10%
7,600 Bangkok Bank Public Co Ltd
50,797 0.16% 2,800 Bangkok Dusit Medical Services Public Co Ltd
14,171 0.04%
22,300 Bank of Ayuhya Public Co Ltd
25,439 0.08% 1,100 Banpu Public Co Ltd
8,519 0.03%
9,100 BEC World Public Co Ltd
17,179 0.05% 40,100 C.P.Seven Eleven Public Co Ltd
50,254 0.16%
12,100 Central Pattana Public Co Ltd
17,497 0.05% 29,100 Charoen Pokphand Foods Public Co Ltd
24,079 0.07%
4,600 Glow Energy Public Co Ltd
10,606 0.03% 99,500 IRPC Public Co Ltd
10,551 0.03%
6,300 Kasikornbank Public Co Ltd
38,666 0.12% 10,800 Kasikornbank Public Co Ltd
68,021 0.21%
32,500 Krung Thai Bank Public Co Ltd
21,200 0.07% 12,900 PTT Exploration & Production Public Co Ltd
65,702 0.20%
16,500 PTT Global Chemical Public Co Ltd
36,584 0.11% 7,800 PTT Public Co Ltd
83,965 0.26%
2,700 Siam Cement Public Co Ltd
39,737 0.12% 1,200 Siam Cement Public Co Ltd
17,198 0.05%
16,600 Siam Commercial Bank Public Co Ltd
91,748 0.28% 900 Siam Makro Public Co Ltd
22,558 0.07%
7,900 Thai Oil Public Co Ltd
15,993 0.07% Total Thailand
884,326 2.74%
Turkey - 1.94% 17,333 Akbank T.A.S
70,608 0.22%
2,051 Anadolu Efes Biracilik ve Malt Sanayii AS
29,763 0.09% 2,425 Arcelik A.S.
16,024 0.05%
2,024 BIM Birlesik Magazalar AS
43,847 0.14% 601 Coca-Cola Icecek AS
17,287 0.05%
7,473 Emlak Konut Gayrimenkul Yatirim
10,535 0.03% 1,006 Ford Otomotiv Sanayi A.S
13,869 0.04%
8,094 Haci Omer Sabanci Holding A.S.
42,578 0.13% 6,775 Koc Holding AS
32,514 0.10%
1,432 Tupras-Turkiye Petrol Rafinerileri A.S.
34,956 0.11% 5,994 Turk Hava Yollari Anonim Ortakligi
23,299 0.07%
5,707 Turk Telekomunikasyon AS
22,183 0.07% 7,012 Turkcell Iletisim Hizmet As
40,702 0.13%
21,936 Turkiye Garanti Bankasi
95,725 0.30%

SANLAM UNIVERSAL FUNDS PLC
191
SCHEDULE OF INVESTMENTS OF SANLAM EMERGING MARKET EQUITY TRACKER FUND (CONTINUED) as at 30 June 2013
Nominal Security
Classification Fair Value % of US$ Net Assets
Turkey - 1.94% (continued)
6,070 TURKIYE HALK BANKASI
51,435 0.16% 15,583 Turkiye IS Bankasi
46,034 0.14%
7,552 Turkiye Vakiflar Bankasi T.A.O
18,826 0.06% 8,490 Yapi Ve Kredi Bankasi
19,316 0.05%
Total Turkey
629,501 1.94%
United States - 0.54% 601 Credicorp
76,904 0.24%
1,427 Southern Copper Corp
39,414 0.12% 120,867 United MicroElectronics Corp
58,358 0.18%
Total United States
174,676 0.54%
Total Equity
27,191,532 84.45%
Exchange Traded Funds - 14.41% 10,900 iShares MSCI Chile Capped Investable Market I
586,311 1.82%
92,365 iShares MSCI India Index Fund
2,168,730 6.74% 98,046 iShares MSCI Russia Capped Index Fund
1,883,464 5.85%
Total Exchange Traded Funds
4,638,505 14.41%
Total financial assets at fair value through profit or loss
31,830,037 98.86%
Cash and cash equivalents
190,359 0.59% Other net assets and liabilities
177,571 0.55%
Net assets attributable to holders of redeemable participating shares 32,197,967 100.00%
Sanlam Emerging Market Equity Tracker Fund
Summary
Classification Description
Fair Value % of Net Assets
Tranferable securities and money market instruments admitted to
official stock exchange listing or traded on regulated market 31,830,037 98.86%
A Transferabe securities and money market instruments other than
those referred above
- 0.00%
B Collective Investment Schemes
- 0.00% C Financial derivative instruments dealt in on a regulated market - 0.00% D Over the counter financial derivative instrument
- 0.00%
Cash and cash equivalents
190,359 0.59%
Other net assets and liabilities
177,571 0.55%
Net assets attributable to holders of redeemable participating shares 32,197,967 100.00%

SANLAM UNIVERSAL FUNDS PLC
192
NOTES TO AND FORMING PART OF THE UNAUDITED CONDENSED INTERIM FINANCIAL STATEMENTS for the six months ended 30 June 2013 1 General – The Company
Sanlam Universal Funds plc (the “Company”) is an investment company with variable capital and was incorporated on 9 June 1997 with registration number 267451 under the laws of Ireland and is authorised in Ireland as an undertaking for collective investment in transferable securities pursuant to the UCITS Regulations. The Company is domiciled in Ireland. At 30 June 2013, the Company comprised twenty three separate investment sub-funds (“Fund(s)”). The Articles of Association of the Company provides segregated liability between the various Funds. A list of Funds active during the period and their status at the period end is set out below: Name Status at 30 June 2013 8IP Asia Equity Opportunities Fund Active 8IP Asia Pacific Equity Fund Active Centre Global Equity Fund Active Grindrod International Property Fund Active P-Solve Inflation Plus Fund Active Sanlam African Frontier Markets Fund Active Sanlam Global Best Ideas Fund Active Sanlam Global Bond Fund Active Sanlam Global Financial Fund Active Sanlam Global Property Fund Active Sanlam Strategic Cash Fund Active Sanlam World Equity Fund Active Sanlam World Equity Tracker Fund Active SIIP India Opportunities Fund Active SIM Global Equity Income Fund Active SPI Strategic Investment Grade Bond Fund Active Sanlam Fund of Alternative UCITS Fund Active – launched on 29 January 2013 Sanlam Accel Income Fund Active – launched on 8 March 2013 Sanlam North America Equity Tracker Fund Active – launched on 11 June 2013 Sanlam UK Equity Tracker Fund Active – launched on 11 June 2013 Sanlam Europe (ex UK) Equity Fund Active – launched on 11 June 2013 Sanlam Equity Allocation Fund Active – launched on 21 May 2013 Sanlam Emerging Market Equity Tracker Fund Active – launched on 11 June 2013 Prices There is a single price for buying, selling and switching Share classes in each Fund. This is represented by the Net Asset Value per Share class of the relevant Fund. In the case of subscriptions, a preliminary charge of up to 5% may be added to the Net Asset Value per share of the classes of certain Funds, as set out in the relevant offering supplements. The Company may waive in whole or in part the preliminary charge. A conversion fee of up to 2% may be charged on applications to convert shares of any class to shares of another class. A repurchase fee of up to 3% may be deducted from the Net Asset Value per share of the classes of certain Funds, as set out in the relevant offering supplements. The Company may waive in whole or in part the repurchase fee.

SANLAM UNIVERSAL FUNDS PLC
193
NOTES TO AND FORMING PART OF THE UNAUDITED CONDENSED INTERIM FINANCIAL STATEMENTS (CONTINUED) for the six months ended 30 June 2013 1 General – The Company (continued)
Dealing The Dealing Day is, except where otherwise clarified in the Prospectus or sub-fund supplement, any day other than Saturday or Sunday on which banks are open for business in Dublin or London. The valuation point is, except where otherwise clarified in the Prospectus or sub-fund supplement, the close of business in each relevant market on the business day immediately preceding a dealing day. Shares Applications for shares must be sent so as to arrive at the Administrator’s office, as detailed below, no later than 4.00pm (Irish time) on the business day preceding the relevant dealing day, or such later time as the Directors may from time to time permit. Applications which are received late, or Funds which are not cleared by the relevant time, will be held over and invested at the next dealing day. Requests for repurchases should be sent so as to arrive at the Administrator’s office by post, facsimile or telex by no later than 4.00pm on the business day preceding the relevant dealing day. As at 30 June 2013, the following Share classes were admitted to the official list of the Irish Stock Exchange. Fund Share Class Launched 8IP Asia Equity Opportunities Fund A 12 October 2010 A (GBP) 16 June 2011 C 11 November 2011 D 12 October 2010 8IP Asia Pacific Equity Fund A 13 September 2010 A (GBP) 16 June 2011 D 18 October 2010 Sanlam World Equity Fund A 17 August 2004 B 17 August 2004 C 17 August 2004 Centre Global Equity Fund A 20 December 2006 B 20 December 2006 C 20 December 2006 Grindrod International Property Fund Distributing 17 November 2010 Non distributing 17 November 2010

SANLAM UNIVERSAL FUNDS PLC
194
NOTES TO AND FORMING PART OF THE UNAUDITED CONDENSED INTERIM FINANCIAL STATEMENTS (CONTINUED) for the six months ended 30 June 2013
1 General – The Company (continued) Shares (continued)
As at 30 June 2013, the following Share classes were admitted to the official list of the Irish Stock Exchange. Fund Share Class Launched P-Solve Inflation Plus Fund A 1 March 2004 B 1 March 2004 Sanlam African Frontier Markets Fund A 5 January 2009 A (GBP) 5 January 2009 C 5 January 2009 C (GBP) 5 January 2009 D 1 March 2010 Sanlam Global Best Ideas Fund A 1 September 2006 A (EUR) 20 January 2011 A (GBP) 20 December 2007 B 1 September 2006 C 1 September 2006 C (GBP) 1 October 2008 D 21 December 2010 F 08 April 2011 F (GBP) 08 April 2011 Sanlam Global Bond Fund A 17 August 2004 B 17 August 2004 C 17 August 2004 Sanlam Global Financial Fund A 17 August 2004 A (EUR) 20 December 2010 A (GBP) 20 December 2007 B 12 April 2004 C 11 November 2009 C (GBP) 03 July 2008 D 07 March 2011 F 08 April 2011 F (GBP) 01 January 2012 Sanlam Global Property Fund A 06 November 2012 B 22 February 2012 C 14 December 2011 E 28 March 2012 Sanlam Strategic Cash Fund A 21 May 2001 B 5 August 1999 F 16 November 2011

SANLAM UNIVERSAL FUNDS PLC
195
NOTES TO AND FORMING PART OF THE UNAUDITED CONDENSED INTERIM FINANCIAL STATEMENTS (CONTINUED) for the six months ended 30 June 2013 1 General – The Company (continued) Shares (continued) Fund Share Class Launched Sanlam World Equity Tracker Fund A 17 August 2004 B 17 August 2004 C 8 December 2011 SIIP India Opportunities Fund A 13 September 2010 A (GBP) 16 June 2011 C 20 March 2012 D 24 October 2010 SIM Global Equity Income Fund A 05 September 2012 C 21 October 2012 E 05 September 2012 I 06 December 2012 SPI Strategic Investment Grade Bond A Income 22 May 2012 Fund A Accumulating 04 July 2012 P Income 01 March 2012 P Accumulating 01 March 2012 Sanlam Fund of Alternative UCITS Fund Class A (GBP) 04 June 2013 Sanlam Accel Income Fund A Net Accumulation 12 March 2013 A Net Income 12 March 2013 Sanlam North America Equity Tracker Fund A 11 June 2013 I 11 June 2013 I (GBP) 11 June 2013 Sanlam UK Equity Tracker Fund A 11 June 2013 C 11 June 2013 I 11 June 2013 I (GBP) 11 June 2013 Sanlam Europe (ex UK) Equity Fund A 11 June 2013 C 11 June 2013 I 11 June 2013 I (GBP) 11 June 2013 Sanlam Emerging Market Equity Tracker Fund A 11 June 2013 B 11 June 2013 I 11 June 2013 I (GBP) 11 June 2013

SANLAM UNIVERSAL FUNDS PLC
196
NOTES TO AND FORMING PART OF THE UNAUDITED CONDENSED INTERIM FINANCIAL STATEMENTS (CONTINUED) for the six months ended 30 June 2013 1 General – The Company (continued)
Minimum Subscription The minimum initial investment for each of the Funds is as follows:
Minimum initial
Fund Share Class investment 8IP Asia Equity Opportunities Fund A US$ 500 A (GBP) GBP£500 B US$500 C US$2,000,000 D US$10,000,000 E None 8IP Asia Pacific Equity Fund A US$ 500 A (GBP) GBP£500 B US$500 C US $2,000,000 D US $ 10,000,000 E None Centre Global Equity Fund A US$5,000 B US$5,000,000 C US$20,000,000 E Class E None Grindrod International Property Fund Distributing US$10,000 Non distributing US$1,000 P-Solve Inflation Plus Fund A (GBP) GBP£1,000 B (GBP) GBP£500,000 C (GBP) GBP £2,500,000 D (GBP) GBP £1,000,000
Sanlam African Frontier Markets Fund A Net Accumulation (GBP)
GBP£1,000
A Net Income (GBP) GBP£1,000

SANLAM UNIVERSAL FUNDS PLC
197
NOTES TO AND FORMING PART OF THE UNAUDITED CONDENSED INTERIM FINANCIAL STATEMENTS (CONTINUED) for the six months ended 30 June 2013 1 General – The Company (continued)
Minimum Subscription (continued)
Minimum initial
Fund Share Class investment
Sanlam Global Best Ideas Fund A US$1,000 A (GBP) GBP£1,000 A (EUR) EUR€1,000 B US$750,000 C US$1,000,000 C (GBP) GBP£5,000,000 D US$10,000,000 E None F US$1,000 F (GBP) GBP£1,000 F (EUR) EUR€1,000
Sanlam Global Bond Fund A US$1,000 B US$750,000 C US$1,000,000 D US$10,000,000 E None Sanlam Global Financial Fund A US$1,000 A (GBP) GBP£1,000 A (EUR) EUR€1,000 B US$1,000,000 E None C (GBP) GBP£5,000,000 C US$5,000,000 D US$1,000 F US$1,000 F (GBP) GBP£1,000 F (EUR) €1,000 Sanlam Global Property Fund A US$1,000 B US$750,000 C US$1,000,000 E None

SANLAM UNIVERSAL FUNDS PLC
198
NOTES TO AND FORMING PART OF THE UNAUDITED CONDENSED INTERIM FINANCIAL STATEMENTS (CONTINUED) for the six months ended 30 June 2013 1 General – The Company (continued)
Minimum Subscription (continued) Minimum initial Fund Share Class investment Sanlam Strategic Cash Fund A US$1,000 B US$1,000,000 E None F US$750,000 Sanlam World Equity Fund A US$1,000 B US$750,000 C US$1,000,000 E None
Sanlam World Equity Tracker Fund A US$1,000 B US$1,000,000 C US$1,000,000 E None I US$10,000,000 I (GBP) GBP£10,000,000 SIIP India Opportunities Fund A US$ 500 A (GBP) GBP£500 B US$500 C US $2,000,000 D US $10,000,000 E None SIM Global Equity Income Fund A US$1,000 B US$10,000,000 C US$15,000,000 A (GBP) GBP£1,000 B (GBP) GBP£10,000,000 I US$1,000 E US$20,000,000 SPI Strategic Investment Grade Bond A Income (GBP) GBP£500 Fund A Accumulation (GBP) GBP£500 P Income (GBP) GBP£10,000,000 P Accumulation (GBP) GBP£10,000,000 P Accumulation US$10,000,000 I Income (GBP) GBP£500,000 I Accumulation (GBP) GBP£500,000 Sanlam Fund of Alternative UCITS Fund Class A (GBP) GBP£1,000 Class A US$1,000 Class E US$10,000,000

SANLAM UNIVERSAL FUNDS PLC
199
NOTES TO AND FORMING PART OF THE UNAUDITED CONDENSED INTERIM FINANCIAL STATEMENTS (CONTINUED) for the six months ended 30 June 2013 1 General – The Company (continued)
Minimum Subscription (continued) Minimum initial Fund Share Class investment Sanlam Accel Income Fund A Net Accumulation GBP£1,000 A Net Income GBP£1,000 Sanlam North America Equity Tracker Fund A US$1,000 B US$10,000,000 C US$1,000,000 E None I US$10,000,000 I (GBP) GBP£10,000,000 Sanlam UK Equity Tracker Fund A US$1,000 B US$10,000,000 C US$1,000,000 E None I US$10,000,000 I (GBP) GBP£10,000,000 E (GBP) None Sanlam Europe (ex UK) Equity Fund A US$1,000 B US$10,000,000 C US$1,000,000 E None I US$10,000,000 I (GBP) GBP£10,000,000 E (GBP) None Sanlam Equity Allocation Fund A US$1,000 B US$750,000 C US$1,000,000 E None Sanlam Emerging Market Equity Tracker Fund A US$1,000 B US$10,000,000 E None I (GBP) US$10,000,000 I (GBP) GBP£10,000,000

SANLAM UNIVERSAL FUNDS PLC
200
NOTES TO AND FORMING PART OF THE UNAUDITED CONDENSED INTERIM FINANCIAL STATEMENTS (CONTINUED) for the six months ended 30 June 2013 1 General – The Company (continued)
Minimum Additional Subscription
There are no minimum additional subscription amounts except for Class A and Class B Shares of the P-Solve Inflation Plus Fund which is GBP 500 and GBP 50,000 respectively, and the Non-distributing Class and Distributing Class of Grindrod International Property Fund is USD 500 and USD 5,000 respectively.
2 Significant accounting policies
The financial statements are prepared in accordance with the Non-UCITS Notices, and IAS 34 Interim Financial Reporting. There have been no changes to the significant accounting policies since the last audited financial statements to 31 December 2012, with the exception of new standards, amendments to published standards and interpretations which are effective for the first time in the current period as set out below. Standards and amendments to existing standards effective 1 January 2013 IFRS 13, Fair value measurement (“IFRS 13”) This standard is effective for annual periods beginning on or after 1 January 2013 and accordingly has been adopted for the first time in the current period. This standard improves consistency and reduces complexity by providing a precise definition of fair value and a single source of fair value measurement and disclosure requirements for use across IFRSs. The requirements do not extend the use of fair value accounting but provide guidance on how it should be applied where its use is already required or permitted by other standards within IFRS.
If an asset or a liability measured at fair value has a bid price and an ask price, the standard requires valuation to be based on a price within the bid-ask spread that is most representative of fair value and allows the use of mid-market pricing or other pricing conventions that are used by market participants as a practical expedient for fair value measurement within a bid-ask spread. On adoption of the standard, the Company changed its valuation inputs for listed financial assets and liabilities to last traded prices to be consistent with the inputs prescribed in the Company’s prospectus for the calculation of its per share trading value for subscriptions and redemptions. The use of last traded prices is recognised as a standard pricing convention within the industry. In the prior year, the Company utilised bid and ask prices for its listed financial assets and liabilities in accordance with IAS 39. As a result of this change, there is no difference at 30 June 2013 between the Net asset value per share for shareholder dealing and the net asset value per share for financial reporting purposes. The differences at 31 December 2012 and 30 June 2012 are reconciled at note 11. The change in valuation inputs is considered to be a change in estimate in accordance with IAS 8.

SANLAM UNIVERSAL FUNDS PLC
201
NOTES TO AND FORMING PART OF THE UNAUDITED CONDENSED INTERIM FINANCIAL STATEMENTS (CONTINUED) for the six months ended 30 June 2013 2 Significant accounting policies (continued)
Standards and amendments to existing standards effective 1 January 2013 (continued) IFRS 7, (Amendment) Financial Instruments: Disclosures (“IFRS 7”) The amendment, issued in December 2011, amended the required disclosures to include information that will enable users of an entity’s financial statements to evaluate the effect or potential effect of netting arrangements, including rights of set-off associated with the entity’s recognised financial assets and recognised financial liabilities, on the entity’s financial position. This change will be applicable for annual periods beginning on or after 1 January 2013. The Directors consider that the adoption of the amendment did not have any impact on the financial position or performance of the Company. No additional disclosures were required as the Company did not set-off any financial assets and liabilities in the current or prior period. Standards effective after 1 January 2013 that have been early adopted by the Fund IFRS 10, Consolidated Financial Statements (“IFRS 10”) The Company has elected to early adopt IFRS 10. IFRS 10 was issued in 12 May 2011 and replaces the previous consolidation requirements in IAS 27 and SIC-12. The standard provides for a single basis for consolidation based on control. It provides detailed guidance on how to apply the control principle in a number of situations, including agency relationships and holdings of potential voting rights. For financial statements prepared in accordance with IFRSs as adopted by the EU, IFRS 10 is effective for annual periods beginning on or after 1 January 2014, with earlier application permitted. The IASB has also issued IFRS 11, IFRS 12 and revised versions of IAS 27 and IAS 28 and these four standards must be applied at the same time as IFRS 10. Further amendments to IFRS 10 were introduced by Investment Entities (Amendments to IFRS 10, IFRS 12 and IAS 27), issued on 31 October 2012 and effective 1 January 2014, subject to endorsement by the EU. This amendment defines an investment entity and sets out an exception to consolidating the subsidiaries of an investment entity. The Directors consider that the Company meets the definition of an investment entity and accordingly is required to value its investments in subsidiaries at fair value and to not consolidate. Adoption of the amendment did not have any impact on the financial position or performance of the Company as the Company did not consolidate under the existing requirements of IAS 27. IAS 32, (Amendment) Financial Instruments: Presentation (“IAS 32”) The amendment, issued in December 2011, clarified the requirements for offsetting financial instruments. The amendment addresses inconsistencies in current practices when applying the offsetting criteria of IAS 32, Financial Instruments, Presentation. The amendment will be applicable for annual periods beginning on or after 1 January 2014 and are required to be applied retrospectively. The Directors consider that the adoption of the amendment did not have any impact on the financial position or performance of the Company.
3 Fair value of financial instruments
During the period ended 30 June 2013, there were no significant transfers between levels of the fair value hierarchy.

SANLAM UNIVERSAL FUNDS PLC
202
NOTES TO AND FORMING PART OF THE UNAUDITED CONDENSED INTERIM FINANCIAL STATEMENTS (CONTINUED) for the six months ended 30 June 2013 4 Exchange rates
The following period ended USD exchange rates have been used in this report: 1 USD = 30 June 2013 31 December 2012 30 June 2012 ARS 4.9170 4.5232 AUD 0.9633 0.9753 BRL 2.0481 2.0182 CAD 0.9957 1.0195 CHF 0.9155 0.9465 CLP 478.3800 502.1600 CNY 6.2350 6.3551 CZK 19.0400 20.1181 DKK 5.6608 5.8587 EGP 6.3666 6.0591 EUR 0.7583 0.7880 GBP 0.6153 0.6375 GHS 1.9045 1.9425 HKD 7.7509 7.7568 HUF 220.9500 225.1200 IDR 9,635.0000 9,403.0000 ILS 3.7312 3.9077 INR 54.8700 55.5250 JPY 86.4600 79.7900 KES 86.1200 84.1000 KRW 1,065.9000 1,142.4800 MAD 8.4639 8.7421 MUR 30.5500 30.6500 MXN 12.9885 13.4251 MYR 3.0567 3.1565 NGN 156.1500 162.6000 NOK 5.5668 5.9438 NZD 1.2125 1.2441 PHP 40.9720 41.9400 PLN 3.0954 3.3373 RUB 30.5500 32.4314 SAR 3.7506 3.7505 SEK 6.5059 6.9036 SGD 1.2215 1.2667 THB 30.6000 31.5800 TND 1.5531 1.5808 TRY 1.7845 1.8086 TWD 29.0680 29.8170 USD 1.0000 1.0000 ZAR 8.4858 8.1802
The following average USD exchange rates have been used in this report: 1 USD = 30 June 2013 31 December 2012 30 June 2012 EUR 0.7789 0.7721 GBP 0.6313 0.6346

SANLAM UNIVERSAL FUNDS PLC
203
NOTES TO AND FORMING PART OF THE UNAUDITED CONDENSED INTERIM FINANCIAL STATEMENTS (CONTINUED) for the six months ended 30 June 2013 5 Related party transactions and significant agreements
All related party transactions have been entered into and conducted under normal market conditions. Significant Agreements Manager The Manager, Sanlam Asset Management (Ireland) Limited (“SAMI”), is a related party to the Company. Pursuant to the Management and Aministration Agreement effective 31 December 2012, SAMI acts as both Manager and Administrator to the Company. SAMI is an ultimate subsidiary Company of Sanlam Limited. Sanlam Life, a fellow subsidiary, is a significant indirect shareholder of the Company. The Manager is entitled to receive a management fee (a percentage of the net assets per annum) from each of the Funds as follows: Fund Share Class Rate of Management fees 8IP Asia Equity Opportunities Fund A 1.50% A (GBP) 1.50% B 1.10% C 0.75% D 0.75% E None 8IP Asia Pacific Equity Fund A 1.50% A (GBP) 1.50% B 1.10% C 0.75% D 0.75% E None Centre Global Equity Fund A 1.50% B 1.00% C 0.75% E None Grindrod International Property Fund Distributing 1.75% Non distributing 1.75% P-Solve Inflation Plus Fund A (GBP) 1.25% B (GBP) 0.60% C (GBP) * D (GBP) 0.35%
Sanlam African Frontier Markets Fund A 1.75% A (GBP) 1.75% C 1.00% C (GBP) 1.00% D 0.75% G 1.50% H None * The Manager is not entitled to receive any fee in respect of Class C Shares, but will agree a separate fee with each holder of Class C Shares to be paid directly by such Shareholder.
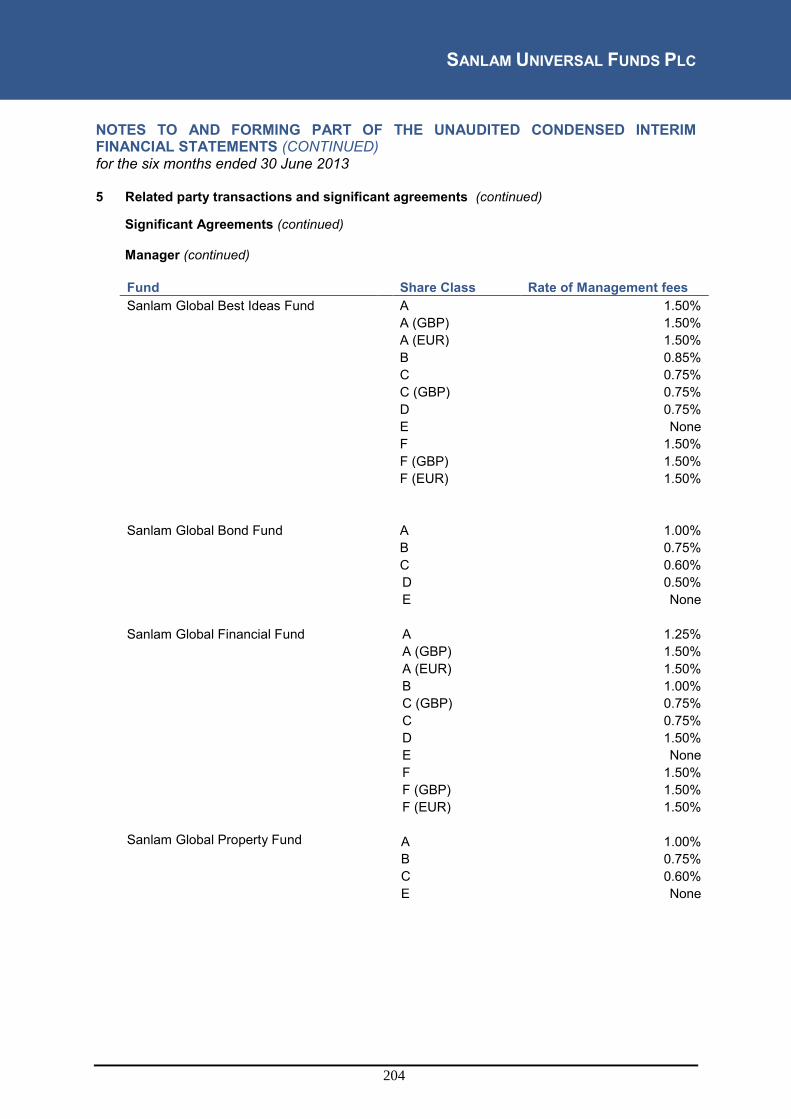
SANLAM UNIVERSAL FUNDS PLC
204
NOTES TO AND FORMING PART OF THE UNAUDITED CONDENSED INTERIM FINANCIAL STATEMENTS (CONTINUED) for the six months ended 30 June 2013 5 Related party transactions and significant agreements (continued)
Significant Agreements (continued) Manager (continued) Fund Share Class Rate of Management fees Sanlam Global Best Ideas Fund A 1.50% A (GBP) 1.50% A (EUR) 1.50% B 0.85% C 0.75% C (GBP) 0.75% D 0.75% E None F 1.50% F (GBP) 1.50% F (EUR) 1.50%
Sanlam Global Bond Fund A 1.00% B 0.75% C 0.60% D 0.50% E None Sanlam Global Financial Fund A 1.25% A (GBP) 1.50% A (EUR) 1.50% B 1.00% C (GBP) 0.75% C 0.75% D 1.50% E None F 1.50% F (GBP) 1.50% F (EUR) 1.50% Sanlam Global Property Fund A 1.00% B 0.75% C 0.60% E None

SANLAM UNIVERSAL FUNDS PLC
205
NOTES TO AND FORMING PART OF THE UNAUDITED CONDENSED INTERIM FINANCIAL STATEMENTS (CONTINUED) for the six months ended 30 June 2013 5 Related party transactions and significant agreements (continued)
Significant Agreements (continued) Manager (continued) Fund Share Class Rate of Management fees Sanlam Strategic Cash Fund A 0.60% B 0.40% E None F 0.75% Sanlam World Equity Fund A 1.50% B 0.85% C 0.75% E None
Sanlam World Equity Tracker Fund A 1.00% B 0.40% C 0.50% E None I 0.30% I (GBP) 0.30% SIIP India Opportunities Fund A 1.50% A (GBP) 1.50% B 1.10% C 0.75% D 0.75% E None SIM Global Equity Income Fund A 1.25% A (GBP) 1.25% B 1.00% B (GBP) 1.00% C 0.75% E None I 1.25% SPI Strategic Investment Grade Bond A Income (GBP) 1.00% Fund A Accumulation (GBP) 1.00% P Income (GBP) 0.15% P Accumulation (GBP) 0.15% P Accumulation 0.15% I Income (GBP) 0.15% I Accumulation (GBP) 0.15% Sanlam Fund of Alternative UCITS Fund A 0.75% A (GBP) 0.75% E None

SANLAM UNIVERSAL FUNDS PLC
206
NOTES TO AND FORMING PART OF THE UNAUDITED CONDENSED INTERIM FINANCIAL STATEMENTS (CONTINUED) for the six months ended 30 June 2013 5 Related party transactions and significant agreements (continued)
Significant Agreements (continued) Manager (continued) Rate of Fund Share Class Management fees Sanlam Accel Income Fund A Net Accumulation 1.00% A Net Income 1.00% Sanlam North America Equity Tracker Fund A 0.50% B 0.40% C 0.75% E None I 0.30% I (GBP) 0.30% Sanlam UK Equity Tracker Fund A 0.50% B 0.40% C 0.75% E None E (GBP) None I 0.30% I (GBP) 0.30% Sanlam Europe (ex UK) Equity Fund A 0.50% B 0.40% C 0.75% E None E (GBP) None I 0.30% I (GBP) 0.30% Sanlam Equity Allocation Fund A 1.00% B 0.85% C 0.75% E None Sanlam Emerging Market Equity Tracker Fund
A
0.75% B 0.60% E None I 0.45% I (GBP) 0.45%

SANLAM UNIVERSAL FUNDS PLC
207
NOTES TO AND FORMING PART OF THE UNAUDITED CONDENSED INTERIM FINANCIAL STATEMENTS (CONTINUED) for the six months ended 30 June 2013 5 Related party transactions and significant agreements (continued)
Significant Agreements (continued) Performance Fee For certain share classes of the 8IP Asia Equity Opportunities Fund, 8IP Asia Pacific Equity Fund, Centre Global Equity Fund, SIIP India Opportunities Fund, Sanlam Global Property Fund, Sanlam Global Financial Fund, Sanlam Global Best Ideas Fund, Sanlam African Frontier Markets Fund, and Sanlam Emerging Market Equity Tracker Fund the Manager shall also be entitled to receive out of the assets of the Funds a performance fee in respect of each performance period. Details of the performance fees applicable are set out in the relevant offering supplements. Administrator SAMI as the Administrator is a related party of the Company. In its role as Administrator, SAMI is entitled to receive out of the assets of each Fund an annual fee ranging from 0.025% - 0.035% of the net assets of the Fund. Certain Funds are also subject to a minimum annual fee and/or additional annual fee ranging from USD 10,000 – 25,000 per annum. Details of the fees applicable to each Fund are set out in the relevant offering supplements. In addition, the Administrator is entitled to receive its reasonable costs and expenses incurred in the performance of its duties as Administrator of the Company. These fees shall accrue and be calculated on each dealing day and shall be payable monthly in arrears. Transfer agency fees are charged at normal commercial rates. Prior to the current reporting period, J.P. Morgan Administration Services (Ireland) Limited acted as administrator to the Company, and was entitled to receive out of the assets of the Fund an annual fee which will not exceed 0.025% of the net assets of the Fund, plus USD 20,000 per annum and USD 20,000 for each additional Investment Manager (where there is more than one Investment Manager) (plus VAT, if any) together with transfer agency fees which will be charged at normal commercial rates and its reasonable costs and expenses incurred by the Administrator in the performance of its duties as Administrator of the Fund. These fees accrued and were calculated on each dealing day and were payable monthly in arrears.
J.P. Morgan remain as the appointed Registrar and Transfer Agent to the Company. Transfer agency fees are charged at normal commercial rates.
Custodian The Custodian is not a related party to the Company or to the Administrator. The Custodian will be entitled to receive from the Company out of the assets of the Fund an annual fee which will not exceed 0.0012% of the net assets of the Fund (plus VAT, if any) subject to certain minimums per Sub-Fund together with reasonable costs and expenses incurred by the Custodian in the performance of its duties as Custodian of the Fund. These fees shall accrue and be calculated on each Dealing Day and shall be payable monthly in arrears. The Custodian shall also be entitled to be reimbursed out of the assets of the Fund all agreed transaction charges (which will be charged at normal commercial rates).
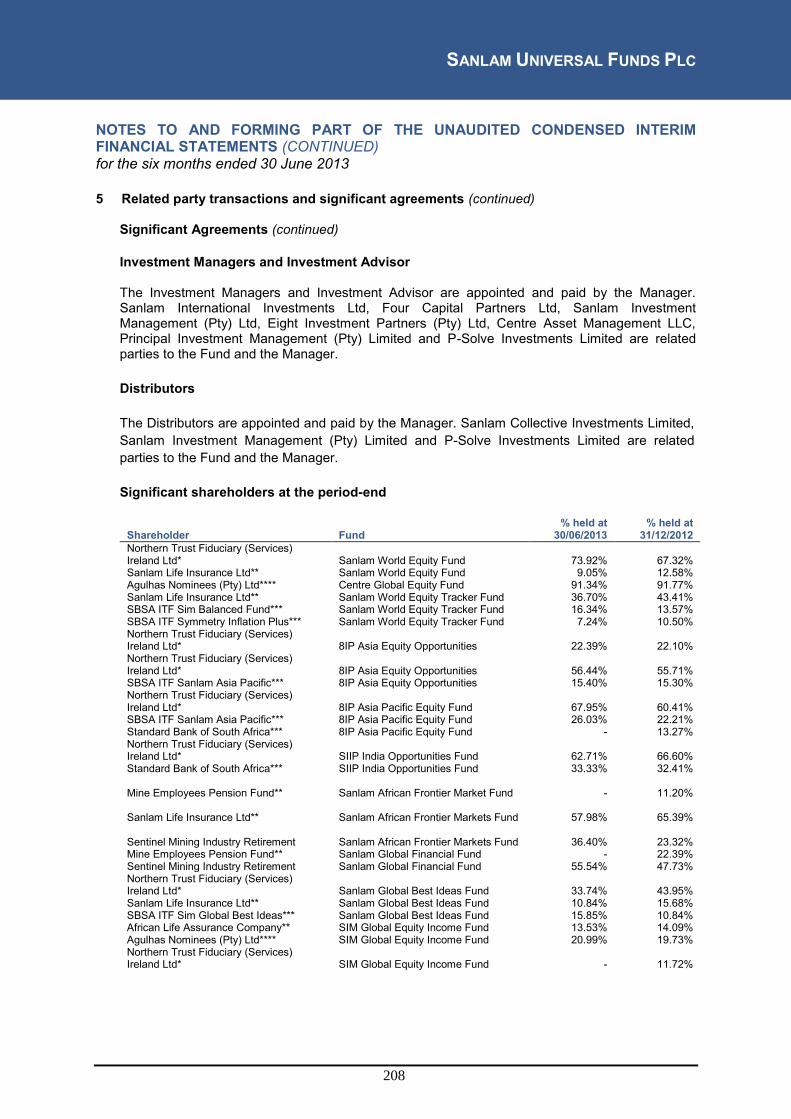
SANLAM UNIVERSAL FUNDS PLC
208
NOTES TO AND FORMING PART OF THE UNAUDITED CONDENSED INTERIM FINANCIAL STATEMENTS (CONTINUED) for the six months ended 30 June 2013 5 Related party transactions and significant agreements (continued)
Significant Agreements (continued) Investment Managers and Investment Advisor The Investment Managers and Investment Advisor are appointed and paid by the Manager. Sanlam International Investments Ltd, Four Capital Partners Ltd, Sanlam Investment Management (Pty) Ltd, Eight Investment Partners (Pty) Ltd, Centre Asset Management LLC, Principal Investment Management (Pty) Limited and P-Solve Investments Limited are related parties to the Fund and the Manager. Distributors The Distributors are appointed and paid by the Manager. Sanlam Collective Investments Limited, Sanlam Investment Management (Pty) Limited and P-Solve Investments Limited are related parties to the Fund and the Manager. Significant shareholders at the period-end
Shareholder Fund % held at
30/06/2013 % held at
31/12/2012 Northern Trust Fiduciary (Services) Ireland Ltd* Sanlam World Equity Fund
73.92% 67.32%
Sanlam Life Insurance Ltd** Sanlam World Equity Fund 9.05% 12.58% Agulhas Nominees (Pty) Ltd**** Centre Global Equity Fund 91.34% 91.77% Sanlam Life Insurance Ltd** Sanlam World Equity Tracker Fund 36.70% 43.41% SBSA ITF Sim Balanced Fund*** Sanlam World Equity Tracker Fund 16.34% 13.57% SBSA ITF Symmetry Inflation Plus*** Sanlam World Equity Tracker Fund 7.24% 10.50% Northern Trust Fiduciary (Services) Ireland Ltd* 8IP Asia Equity Opportunities
22.39% 22.10%
Northern Trust Fiduciary (Services) Ireland Ltd* 8IP Asia Equity Opportunities
56.44% 55.71%
SBSA ITF Sanlam Asia Pacific*** 8IP Asia Equity Opportunities 15.40% 15.30% Northern Trust Fiduciary (Services) Ireland Ltd* 8IP Asia Pacific Equity Fund
67.95% 60.41%
SBSA ITF Sanlam Asia Pacific*** 8IP Asia Pacific Equity Fund 26.03% 22.21% Standard Bank of South Africa*** 8IP Asia Pacific Equity Fund - 13.27% Northern Trust Fiduciary (Services) Ireland Ltd* SIIP India Opportunities Fund
62.71% 66.60%
Standard Bank of South Africa*** SIIP India Opportunities Fund 33.33% 32.41%
Mine Employees Pension Fund** Sanlam African Frontier Market Fund
- 11.20%
Sanlam Life Insurance Ltd** Sanlam African Frontier Markets Fund
57.98% 65.39%
Sentinel Mining Industry Retirement Sanlam African Frontier Markets Fund
36.40% 23.32% Mine Employees Pension Fund** Sanlam Global Financial Fund - 22.39% Sentinel Mining Industry Retirement Sanlam Global Financial Fund 55.54% 47.73% Northern Trust Fiduciary (Services) Ireland Ltd* Sanlam Global Best Ideas Fund
33.74% 43.95%
Sanlam Life Insurance Ltd** Sanlam Global Best Ideas Fund 10.84% 15.68% SBSA ITF Sim Global Best Ideas*** Sanlam Global Best Ideas Fund 15.85% 10.84% African Life Assurance Company** SIM Global Equity Income Fund 13.53% 14.09% Agulhas Nominees (Pty) Ltd**** SIM Global Equity Income Fund 20.99% 19.73% Northern Trust Fiduciary (Services) Ireland Ltd* SIM Global Equity Income Fund
- 11.72%

SANLAM UNIVERSAL FUNDS PLC
209
NOTES TO AND FORMING PART OF THE UNAUDITED CONDENSED INTERIM FINANCIAL STATEMENTS (CONTINUED) for the six months ended 30 June 2013 5 Related party transactions and significant agreements (continued)
Significant shareholders at the period-end (continued)
Shareholder Fund % held at
30/06/2013 % held at
31/12/2012 SBSA ITF Sim Inflation Plus Fund*** SIM Global Equity Income Fund 14.89% 15.52% SBSA ITF Symmetry Inflation Plus*** SIM Global Equity Income Fund 14.38% 14.98% Botswana Insurance Fund Management** Sanlam Global Bond Fund 29.06% 30.21% Northern Trust Fiduciary (Services) Ireland Ltd* Sanlam Global Bond Fund
47.97% 23.18%
Sanlam Life Insurance Ltd** Sanlam Global Bond Fund 11.75% 28.03%
Principal Nominees Ltd**** SPI Strategic Investment Grade Bond Fund
88.50% 93.11%
Northern Trust Fiduciary (Services) Ireland Ltd* Sanlam Global Property Fund
55.23% 17.94%
Sanlam Life Insurance Ltd** Sanlam Global Property Fund 23.49% 49.84% Standard Bank of SA Ltd*** Sanlam Global Property Fund - 21.38%
Agulhas Nominees (Pty) Ltd**** Grindrod International Property Fund
38.46% 49.04%
BNP Paribas Securities Nominees Ltd Grindrod International Property Fund
13.40% 18.44%
Grindrod Pension Fund Grindrod International Property Fund
14.01% - KAS Nominees P-Solve Inflation Plus Fund 87.79% 91.67% Northern Trust Fiduciary (Services) Ireland Ltd* Sanlam Strategic Cash Fund
76.89% 67.28%
Sanlam Collective Investments Scheme**** Sanlam Strategic Cash Fund
11.49% 16.35%
Sanlam Man Global Sanlam Emerging Market Equity Tracker Fund
98.15% -
Chase Nominees Limited Sanlam Equity Allocation Cl E USD Shares
100.55% -
Chase Nominees Limited Sanlam Eur ex UK Equ Tracker
130.37% -
Somers Dublin Ltd Sanlam Fd of Alternative UCITS Fund
26.54% -
Sanlam Life & Pensions Sanlam Fd of Alternative UCITS Fundd
73.16% -
Northern Trust Fiduciary (Services) Ireland Ltd*
Sanlam North America Equity Tracker Fund
100.35% -
Chase Nominees Limited Sanlam UK Equity Tracker
152.49% -
* At 31 December 2012 Northern Trust Fiduciary (Services) Ireland Limited held all of the Class E shares in each of the Funds on behalf of some of the Funds of Sanlam Global Funds plc, Sanlam Qualifying Investor Funds plc and Sanlam Investments and Pensions.
** These significant shareholders are related parties to the Company and the Manager. *** These are investments by South African Unit Trusts. These Unit Trusts are managed by related parties
to the Manager. **** These are nominee accounts managed by the related parties of the Manager.
The Manager may have entered into special fee arrangements and/or rebate agreements with some of the significant shareholders. These rebates are paid from the profits of the manager.

SANLAM UNIVERSAL FUNDS PLC
210
NOTES TO AND FORMING PART OF THE UNAUDITED CONDENSED INTERIM FINANCIAL STATEMENTS (CONTINUED) for the six months ended 30 June 2013 5 Related party transactions and significant agreements (continued)
Management Fees A summary of fees earned by the Manager during the period and outstanding accrued fees as at 30 June 2013 follows:
8IP Asia 8IP Asia Centre Grindrod
Equity Pacific Global International
Opportunities Equity Equity Property
Fund Fund Fund Fund
USD USD USD USD
Fees incurred during the period ended 30/06/2013 Class A Management Fees 7,571 6,747 149,791 102,524
Class A (EUR) Management Fees - - - - Class A (GBP) Management Fees - - - - Class A (Income) Management Fees - - - - Class B Management Fees - - 23,107 990 Class C Management Fees 103 - 138 - Class C (GBP) Management Fees - - - - Class D Management Fees 11,755 25,585 - - Class F (EUR) Management Fees - - - - Class F Management Fees 2 2 - - Class F (EUR) Management Fees - - - - Class F (GBP) Management Fees - - - - Class P Income Management Fees - - - - Class P Accumulating Management Fees - - - - Distributing Class Management Fees - - - - Non-distributing Class Management Fees - - - - Performance Fees - - - -
19,431 32,334 173,036 103,514
Fees accrued at 30/06/2013 Class A Management Fees 7,571 6,747 149,791 102,524 Class A (GBP) Management Fees - - - - Class A (Income) Management Fees - - - - Class B Management Fees - - 23,107 990 Class C Management Fees 103 - 138 - Class C (GBP) Management Fees - - - - Class D Management Fees 11,755 25,585 - - Class F (EUR) Management Fees - - - - Class F Management Fees 2 2 - - Class F (EUR) Management Fees - - - - Class F (GBP) Management Fees - - - - Class P Income Management Fees - - - - Class P Accumulating Management Fees - - - - Distributing Class Management Fees - - - - Non-distributing Class Management Fees - - - - Performance Fees - - - -
19,431 32,334 173,036 103,514

SANLAM UNIVERSAL FUNDS PLC
211
NOTES TO AND FORMING PART OF THE UNAUDITED CONDENSED INTERIM FINANCIAL STATEMENTS (CONTINUED) for the six months ended 30 June 2013
5 Related party transactions and significant agreements (continued)
Management Fees (continued) A summary of fees earned by the Manager during the period and outstanding accrued fees as at 30 June 2013 follows (continued):
Sanlam Sanlam
P-Solve African Global Sanlam
Inflation Frontier Best Global
Plus Markets Ideas Bond
Fund Fund Fund Fund
GBP USD USD USD
Fees incurred during the period ended 30/06/2013 Class A Management Fees 188 19,995 558,559 445
Class A (EUR) Management Fees - - - - Class A (GBP) Management Fees - - - - Class A (Income) Management Fees - - - - Class B Management Fees 17,455 165,758 406,033 28,485 Class C Management Fees - - 335,219 520,317 Class C (GBP) Management Fees - - - - Class D Management Fees - - 219 - Class F (EUR) Management Fees - - - - Class F Management Fees - 212 1,559 - Class F (EUR) Management Fees - - - - Class F (GBP) Management Fees - - - - Class G Management Fees - 175,894 99,829 - Class H Management Fees - - 2 - Class I Management Fees - - 414 - Class J Management Fees - - 205 - Performance Fees - - - -
17,643 361,859 1,402,039 549,247
Fees accrued at 30/06/2013 Class A Management Fees 188 19,995 84,456 73 Class A (GBP) Management Fees - - - - Class A (Income) Management Fees - - - - Class B Management Fees 17,455 165,753 64,101 1,333 Class C Management Fees - - 52,629 85,295 Class C (GBP) Management Fees - - - - Class D Management Fees - - 82 - Class F (EUR) Management Fees - - - - Class F Management Fees - 212 159 - Class F (EUR) Management Fees - - - - Class F (GBP) Management Fees - - - - Class G Management Fees - 175,894 14,476 - Class H Management Fees - - - - Class I Management Fees - - 57 - Class J Management Fees - - 32 - Performance Fees - - - -
17,643 361,859 215,992 86,701
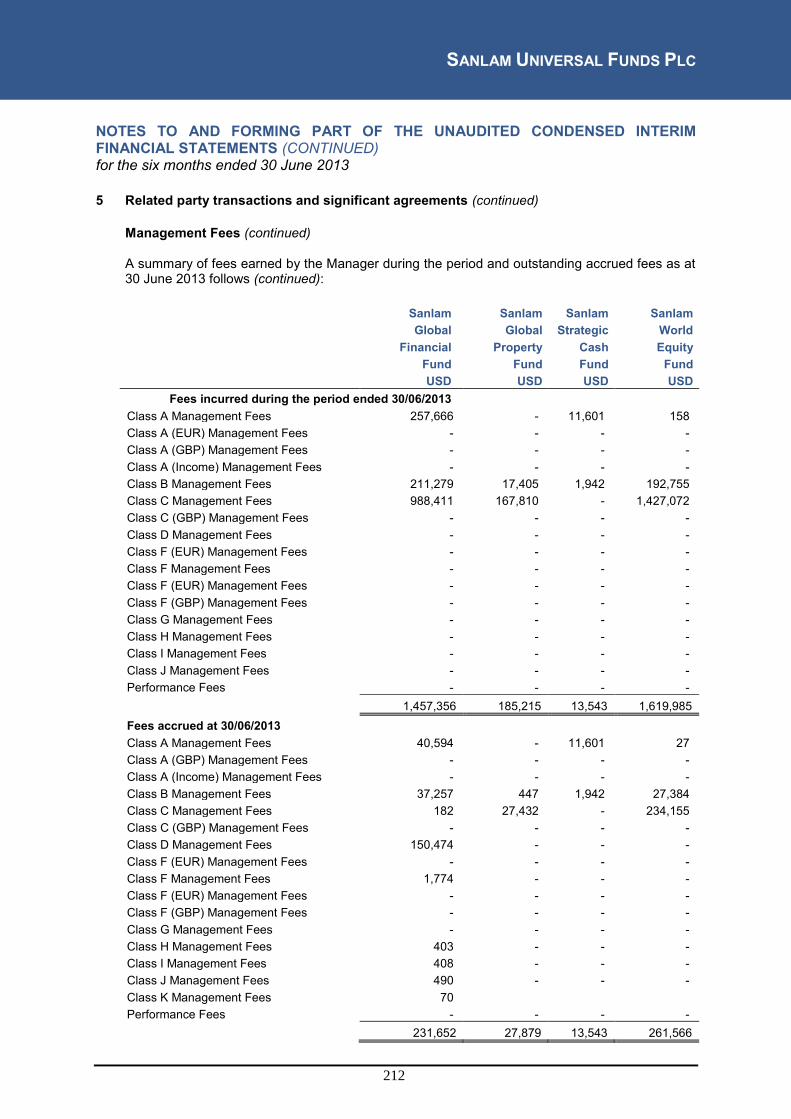
SANLAM UNIVERSAL FUNDS PLC
212
NOTES TO AND FORMING PART OF THE UNAUDITED CONDENSED INTERIM FINANCIAL STATEMENTS (CONTINUED) for the six months ended 30 June 2013 5 Related party transactions and significant agreements (continued)
Management Fees (continued) A summary of fees earned by the Manager during the period and outstanding accrued fees as at 30 June 2013 follows (continued):
Sanlam Sanlam Sanlam Sanlam
Global Global Strategic World
Financial Property Cash Equity
Fund Fund Fund Fund
USD USD USD USD
Fees incurred during the period ended 30/06/2013 Class A Management Fees 257,666 - 11,601 158
Class A (EUR) Management Fees - - - - Class A (GBP) Management Fees - - - - Class A (Income) Management Fees - - - - Class B Management Fees 211,279 17,405 1,942 192,755 Class C Management Fees 988,411 167,810 - 1,427,072 Class C (GBP) Management Fees - - - - Class D Management Fees - - - - Class F (EUR) Management Fees - - - - Class F Management Fees - - - - Class F (EUR) Management Fees - - - - Class F (GBP) Management Fees - - - - Class G Management Fees - - - - Class H Management Fees - - - - Class I Management Fees - - - - Class J Management Fees - - - - Performance Fees - - - -
1,457,356 185,215 13,543 1,619,985
Fees accrued at 30/06/2013 Class A Management Fees 40,594 - 11,601 27 Class A (GBP) Management Fees - - - - Class A (Income) Management Fees - - - - Class B Management Fees 37,257 447 1,942 27,384 Class C Management Fees 182 27,432 - 234,155 Class C (GBP) Management Fees - - - - Class D Management Fees 150,474 - - - Class F (EUR) Management Fees - - - - Class F Management Fees 1,774 - - - Class F (EUR) Management Fees - - - - Class F (GBP) Management Fees - - - - Class G Management Fees - - - - Class H Management Fees 403 - - - Class I Management Fees 408 - - - Class J Management Fees 490 - - - Class K Management Fees 70 Performance Fees - - - -
231,652 27,879 13,543 261,566

SANLAM UNIVERSAL FUNDS PLC
213
NOTES TO AND FORMING PART OF THE UNAUDITED CONDENSED INTERIM FINANCIAL STATEMENTS (CONTINUED) for the six months ended 30 June 2013 5 Related party transactions and significant agreements (continued)
Management Fees (continued) A summary of fees earned by the Manager during the period and outstanding accrued fees as at 30 June 2013 follows (continued):
Sanlam SIIP
SIM Global SPI Strategic
World Equity India Equity Investment
Tracker Opportunities Income Grade Bond
Fund Fund Fund Fund
USD USD USD GBP
Fees incurred during the period ended 30/06/2013 Class A Management Fees 919 1,111 21,863 13
Class A Income Management Fees - - - 12,549 Class A Accumulation Management Fees - - - 5,468 Class B Management Fees 103,174 - - - Class C Management Fees 644,630 23,699 39,579 Class C (GBP) Management Fees - - - - Class D Management Fees - - - - Class F (EUR) Management Fees - - - - Class F Management Fees - 2 - - Class F (EUR) Management Fees - - - - Class F (GBP) Management Fees - - - - Class G Management Fees - - - - Class I Management Fees - - 1,003 - Class P Income Management Fees - - - 101,754 Class P Accumulation Management Fees - - - 18,951 Performance Fees - - - -
748,723 24,812 62,445 138,735
Fees accrued at 30/06/2013 Class A Management Fees 919 1,111 21,863 13 Class A Income Management Fees - - - 12,549 Class A Accumulation Management Fees - - - 5,468 Class B Management Fees 103,174 - - - Class C Management Fees 644,630 23,699 39,579 - Class C (GBP) Management Fees - - - - Class D Management Fees - - - - Class F (EUR) Management Fees - - - - Class F Management Fees - 2 - - Class F (EUR) Management Fees - - - - Class F (GBP) Management Fees - - - - Class G Management Fees - - - - Class I Management Fees - - 1,003 - Class P Income Management Fees - - - 101,754 Class P Accumulation Management Fees - - - 18,951 Performance Fees - - - -
748,723 24,812 62,445 138,735

SANLAM UNIVERSAL FUNDS PLC
214
NOTES TO AND FORMING PART OF THE UNAUDITED CONDENSED INTERIM FINANCIAL STATEMENTS (CONTINUED) for the six months ended 30 June 2013 5 Related party transactions and significant agreements (continued)
Management Fees (continued) A summary of fees earned by the Manager during the period and outstanding accrued fees as at 30 June 2013 follows (continued):
Sanlam Sanlam Sanlam Sanlam
Fund of Accel North America UK Equity Alternative Income Equity Tracker UCITS Fund Fund Tracker Fund Fund
Fees incurred during the period ended 30/06/2013 Class A Management Fees - 13,641 - -
Class A (EUR) Management Fees - - - - Class A (GBP) Management Fees - - - - Class A (Income) Management Fees - - - - Class B Management Fees - 1,276 - - Class C Management Fees - - - - Class C (GBP) Management Fees - - - - Class D Management Fees - - - - Class F (EUR) Management Fees - - - - Class F Management Fees - - - - Class F (EUR) Management Fees - - - - Class F (GBP) Management Fees - - - - Class G Management Fees - - - - Class H Management Fees - - - - Class I Management Fees - - - - Class J Management Fees - - - - Performance Fees - - - -
- 14,917 - -
Fees accrued at 30/06/2013 Class A Management Fees - 13,641 - - Class A (GBP) Management Fees - - - - Class A (Income) Management Fees - - - - Class B Management Fees - 1,276 - - Class C Management Fees - - - - Class C (GBP) Management Fees - - - - Class D Management Fees - - - - Class F (EUR) Management Fees - - - - Class F Management Fees - - - - Class F (EUR) Management Fees - - - - Class F (GBP) Management Fees - - - - Class G Management Fees - - - - Class H Management Fees - - - - Class I Management Fees - - - - Class J Management Fees - - - - Performance Fees - - - -
- 14,917 - -

SANLAM UNIVERSAL FUNDS PLC
215
NOTES TO AND FORMING PART OF THE UNAUDITED CONDENSED INTERIM FINANCIAL STATEMENTS (CONTINUED) for the six months ended 30 June 2013 5 Related party transactions and significant agreements (continued)
Management Fees (continued) A summary of fees earned by the Manager during the period and outstanding accrued fees as at 30 June 2013 follows (continued):
Sanlam Sanlam Sanlam
Europe (ex UK) Equity Emerging Market
Equity Allocation Equity Tracker
Fund Fund Fund
Fees incurred during the period ended 30/06/2013 Class A Management Fees - - -
Class A (EUR) Management Fees - - - Class A (GBP) Management Fees - - - Class A (Income) Management Fees - - - Class B Management Fees - - - Class C Management Fees - - - Class C (GBP) Management Fees - - - Class D Management Fees - - - Class F (EUR) Management Fees - - - Class F Management Fees - - - Class F (EUR) Management Fees - - - Class F (GBP) Management Fees - - - Class G Management Fees - - - Class H Management Fees - - - Class I Management Fees - - - Class J Management Fees - - - Performance Fees - - -
- - -
Fees accrued at 30/06/2013 Class A Management Fees - - - Class A (GBP) Management Fees - - - Class A (Income) Management Fees - - - Class B Management Fees - - - Class C Management Fees - - - Class C (GBP) Management Fees - - - Class D Management Fees - - - Class F (EUR) Management Fees - - - Class F Management Fees - - - Class F (EUR) Management Fees - - - Class F (GBP) Management Fees - - - Class G Management Fees - - - Class H Management Fees - - - Class I Management Fees - - - Class J Management Fees - - - Performance Fees - - -
- - -

SANLAM UNIVERSAL FUNDS PLC
216
NOTES TO AND FORMING PART OF THE UNAUDITED CONDENSED INTERIM FINANCIAL STATEMENTS (CONTINUED) for the six months ended 30 June 2013 5 Related party transactions and significant agreements (continued)
Management Fees (continued) A summary of fees earned by the Manager during the period and outstanding accrued fees as at 30 June 2012 follows (continued):
Sanlam Centre Sanlam 8IP Asia
World Global World Equity Equity
Equity Equity Tracker Opportunities
Fund* Fund** Fund Fund
USD USD USD USD
Fees incurred during the period ended 30/06/2012 Class A Management Fees (108) (143,335) (767) (18,391)
Class A (GBP) Management Fees - - - (1) Class B Management Fees (18,791) (20,588) (98,213) - Class C Management Fees (1,430,368) - (151,339) (130) Class D Management Fees - - - (7,189) Performance Fees - - - -
(1,449,267) (163,923) (250,319) (25,711)
Fees accrued at 30/06/2012 Class A Management Fees (22) (22,332) (108) (2,059)
Class B Management Fees (2,725) (3,135) (15,000) - Class C Management Fees (214,090) - (53,533) (19) Class D Management Fees - - - (1,160) Performance Fees - - - -
(216,837) (25,467) (68,641) (3,238)
* The Sanlam Universal Equity Fund's name was changed to Sanlam World Equity Fund on 9 October 2012. ** The SPI Global Equity Fund's name was changed to Centre Global Equity Fund on 31 August 2012.

SANLAM UNIVERSAL FUNDS PLC
217
NOTES TO AND FORMING PART OF THE UNAUDITED CONDENSED INTERIM FINANCIAL STATEMENTS (CONTINUED) for the six months ended 30 June 2013 5 Related party transactions and significant agreements (continued)
Management Fees (continued) A summary of fees earned by the Manager during the period indicated and outstanding accrued fees as at 30 June 2012 follows (continued):
Sanlam
8IP Asia SIIP African Sanlam
Pacific India Frontier Global
Equity Opportunities Markets Financial
Fund Fund Fund Fund
USD USD USD USD
Fees incurred during the period ended 30/06/2012 Class A Management Fees (6,363) (982) - (227,471)
Class A (EUR) Management Fees - - - (1) Class A (GBP) Management Fees (2) (1) - (5,798) Class B Management Fees - - - (135,397) Class C Management Fees - (14,732) - (1,030) Class C (GBP) Management Fees - - - (295) Class D Management Fees (42,503) (1,080) (125,880) (766,968) Class F (EUR) Management Fees - - - (19) Class F Management Fees - - - (459) Class F (GBP) Management Fees - - - (724) Performance Fees - (7,199) - (1,456,332)
(48,868) (23,994) (125,880) (2,594,494)
Fees accrued at 30/06/2012 Class A Management Fees (975) (157) - (33,825)
Class A (GBP) Management Fees - - - (1,525) Class B Management Fees - - - (22,044) Class C Management Fees - (3,477) - (121,538) Class C (GBP) Management Fees - - - (47) Class D Management Fees (5,896) - (20,845) (176) Class F (EUR) Management Fees - - - (15) Class F Management Fees - - - (32) Class F (GBP) Management Fees - - - (186) Performance Fees - - - -
(6,871) (3,634) (20,845) (179,388)

SANLAM UNIVERSAL FUNDS PLC
218
NOTES TO AND FORMING PART OF THE UNAUDITED CONDENSED INTERIM FINANCIAL STATEMENTS (CONTINUED) for the six months ended 30 June 2013 5 Related party transactions and significant agreements (continued)
Management Fees (continued) The summary of fees earned by the Manager during the period indicated and outstanding accrued fees as at 30 June 2012 follows (continued):
Sanlam Sanlam
SPI Strategic Sanlam
Global Global Investment Global
Best Ideas Bond Grade Bond Property
Fund Fund* Fund** Fund**
USD USD GBP USD
Fees incurred during the period ended 30/06/2012 Class A Management Fees (640,015) (285) - -
Class A (EUR) Management Fees (2) - - - Class A (GBP) Management Fees (5,589) - - - Class A (Income) Management Fees - - (104) - Class B Management Fees (366,124) (72,763) - (831) Class C Management Fees (319,460) (320,135) - (85,303) Class D Management Fees (96,866) - - - Class F Management Fees (847) - - - Class F (GBP) Management Fees (1,074) - - - Class P Income Management Fees - - (11,850) - Class P Accumulating Management Fees - - (2,135) - Performance Fees - - - -
(1,429,977) (393,183) (14,089) (86,134)
Fees accrued at 30/06/2012 Class A Management Fees (98,591) (47) - -
Class A (GBP) Management Fees (645) - - - Class A (Income) Management Fees - - (104) - Class B Management Fees (58,453) (14,144) - (287) Class C Management Fees (49,690) (50,449) - (15,066) Class C (GBP) Management Fees - - - - Class D Management Fees (15,535) - - - Class F Management Fees (109) - - - Class F (GBP) Management Fees (172) - - - Class P Income Management Fees - - (11,850) - Class P Accumulating Management Fees - - (2,135) - Performance Fees - - - -
(223,195) (64,640)
(14,089) (15,353)
* The Sanlam Global Property Fund (formerly Sanlam Universal Bond Fund) commenced operations on 14 December 2011,
therefore no comparative information is available. ** The SPI Strategic Investment Grade Bond Fund (formerly Sanlam Principle Monthly Income Investment Grade Bond Fund)
commenced operation on 01 March 2012; therefore no comparative information is available.

SANLAM UNIVERSAL FUNDS PLC
219
NOTES TO AND FORMING PART OF THE UNAUDITED CONDENSED INTERIM FINANCIAL STATEMENTS (CONTINUED) for the six months ended 30 June 2013 5 Related party transactions and significant agreements (continued)
Management Fees (continued) The summary of fees earned by the Manager during the period indicated and outstanding accrued fees as at 30 June 2012 follows (continued):
Grindrod P-Solve Sanlam
International Inflation Strategic
Property Fund Plus Fund Cash Fund*
USD GBP USD
Fees incurred during the period ended 30/06/2012 Class A Management Fees - (389) (15,073)
Class A (EUR) Management Fees - - - Class A (GBP) Management Fees - - - Class A (Income) Management Fees - - - Class B Management Fees - (12,560) (3,962) Class C Management Fees - - - Class C (GBP) Management Fees - - - Class D Management Fees - - - Class F (EUR) Management Fees - - - Class F Management Fees - - (34,513) Class F (GBP) Management Fees - - - Class P Income Management Fees - - - Class P Accumulating Management Fees - - - Distributing Class Management Fees (1,079) - - Non-distributing Class Management Fees (88,661) - - Performance Fees - - -
(89,740) (12,949) (53,548)
Fees accrued at 30/06/2012 Class A Management Fees - (62) (2,348)
Class A (GBP) Management Fees - - - Class A (Income) Management Fees - - -
Class B Management Fees - (2,211) (565) Class C Management Fees - - - Class C (GBP) Management Fees - - - Class D Management Fees - - - Class F (EUR) Management Fees - - - Class F Management Fees - - (5,689) Class F (GBP) Management Fees - - - Class P Income Management Fees - - - Class P Accumulating Management Fees - - - Distributing Class Management Fees (172) - - Non-distributing Class Management Fees (10,176) - - Performance Fees - - -
(10,348) (2,273) (8,602)
* The Sanlam US Dollar Liquidity Fund's name was changed to Sanlam Strategic Cash Fund on 22 September 2011.

SANLAM UNIVERSAL FUNDS PLC
220
NOTES TO AND FORMING PART OF THE UNAUDITED CONDENSED INTERIM FINANCIAL STATEMENTS (CONTINUED) for the six months ended 30 June 2013 5 Related party transactions and significant agreements (continued)
Some of the Sanlam Universal Funds plc sub-funds operate as master funds to some of the Sanlam Global Funds plc sub-funds. Some of the Sanlam Universal Funds plc sub-funds operate as master funds to some of the Sanlam Qualifying Investors Funds plc sub-funds. Sanlam Investment and Pensions Limited invest in the E classes of the Sanlam Global Bond Fund and the 8IP Asia Equity Opportunities Fund. Related Transactions The following transactions occurred between Sanlam Universal Funds plc, Sanlam Global Funds plc, Sanlam Qualifying Investors Funds plc and Sanlam Investments and Pensions during the period ended 30 June 2013:
Sanlam
Sanlam
Sanlam Europe Sanlam Global World (Ex-UK) Global Property Equity Fund Equity Fund Bond Fund Fund USD USD USD USD Subscriptions: Global Equity Fund - - - - Global Best Ideas Feeder Fund - - - - Global Balanced Fund 310,000 - 1,900,000 1,000,000 Sanlam International Multi-Asset III Fund - - - - Sanlam Accel Income Fund - - - - Sanlam Institutional Bond Fund - - - - Sanlam Institutional Equity Flexible Fund - 57,835,823 - - 310,000 57,835,823 1,900,000 1,000,000
Sanlam
North Sanlam America SPI Strategic Equity Equity Investment Sanlam Allocation Tracker Grade Bond Strategic Fund Fund Fund Cash Fund USD USD USD USD Subscriptions: Global Equity Fund - 88,221,089 - - Global Best Ideas Feeder Fund - - - - Global Balanced Fund - - - 7,650,000 Sanlam International Multi-Asset III Fund - - - - Sanlam Accel Income Fund - - 963,000 - Sanlam Institutional Bond Fund - - - - Sanlam Institutional Equity Flexible Fund 67,464,401 - - - 67,464,401 88,221,089 963,000 7,650,000

SANLAM UNIVERSAL FUNDS PLC
221
NOTES TO AND FORMING PART OF THE UNAUDITED CONDENSED INTERIM FINANCIAL STATEMENTS (CONTINUED) for the six months ended 30 June 2013 5 Related party transactions and significant agreements (continued)
Related Transactions (continued)
Sanlam
Emerging Sanlam Market UK Equity Equity Tracker Tracker Fund Fund USD USD Subscriptions: Global Equity Fund - 35,000,000 Global Best Ideas Feeder Fund - - Global Balanced Fund - - Sanlam International Multi-Asset III Fund - - Sanlam Accel Income Fund - - Sanlam Institutional Bond Fund - - Sanlam Institutional Equity Flexible Fund 30,343,711 - 30,343,711 35,000,000
Sanlam
Sanlam Sanlam Sanlam Global World Global Best Global Property Equity Fund Ideas Fund Bond Fund Fund USD USD USD USD Redemptions: Global Equity Fund 167,740,000 - - - Global Best Ideas Feeder Fund - 20,641,765 - - Global Balanced Fund 9,105,000 - 1,575,000 1,910,000 Sanlam International Multi-Asset I Fund - - 2,279,538 - Sanlam International Multi-Asset II Fund - - 584,628 558,682 Sanlam International Multi-Asset III Fund - - - 907,196 Sanlam Institutional Bond Fund - - 6,508,550 - Sanlam Institutional Equity Flexible Fund - - - - 176,845,000 20,641,765 10,947,716 3,375,878

SANLAM UNIVERSAL FUNDS PLC
222
NOTES TO AND FORMING PART OF THE UNAUDITED CONDENSED INTERIM FINANCIAL STATEMENTS (CONTINUED) for the six months ended 30 June 2013 5 Related party transactions and significant agreements (continued)
Related Transactions (continued)
Sanlam Sanlam SIM Global
Equity World Equity Equity Sanlam Allocation Tracker Income Strategic Fund Fund Fund Cash Fund USD USD USD USD Redemptions: Global Equity Fund - - 1,749,419 - Global Best Ideas Feeder Fund - - - - Global Balanced Fund - - - 1,160,000 Sanlam International Multi-Asset I Fund - - - - Sanlam International Multi-Asset II Fund - 2,143,954 - - Sanlam International Multi-Asset III Fund - 2,026,829 - - Sanlam Institutional Bond Fund - - - - Sanlam Institutional Equity Flexible Fund 15,104,100 - - - 15,104,100 4,170,783 1,749,419 1,160,000

SANLAM UNIVERSAL FUNDS PLC
223
NOTES TO AND FORMING PART OF THE UNAUDITED CONDENSED INTERIM FINANCIAL STATEMENTS (CONTINUED) for the six months ended 30 June 2013 5 Related party transactions and significant agreements (continued)
Related Transactions (continued) The following transactions occurred between Sanlam Universal Funds plc, Sanlam Global Funds plc, Sanlam Qualifying Investors Funds plc and Sanlam Investments and Pensions during the period ended 30 June 2012:
Sanlam
Sanlam World World Equity
8IP Asia Equity
8IP Asia Pacific
Equity Tracker Opportunities Equity Fund Fund Fund Fund USD USD USD USD Subscriptions: Global Equity Fund 80,659,500 76,386,723 194,000 1,584,386 Global Best Ideas Feeder Fund - - - - Global Balanced Fund - - - - Global Bond Fund - - - - Sanlam Investments and Pensions Fund - - - - Total subscriptions: 80,659,500 76,386,723 194,000 1,584,386 SIIP Sanlam Sanlam Sanlam Indian Global Global Global Opportunities Best Ideas Bond Property Fund Fund Fund Fund USD USD USD USD Subscriptions: Global Equity Fund 4,671,000 - - - Global Best Ideas Feeder Fund - 89,056 - - Global Balanced Fund - - - 6,900,000 Global Bond Fund - - - - Sanlam Investments and Pensions Fund - - - - Sanlam Institutional Bond Fund - - 245,000 - - Total subscriptions: 4,671,000 89,056 245,000 6,900,000
8IP Asia Sanlam Sanlam Pacific Global Global Equity Best Ideas Bond Fund Fund Fund USD USD USD Redemptions: Global Equity Fund 713,386 - - Global Best Ideas Feeder Fund - 3,860 - Global Balanced Fund - - 7,200,000 Sanlam Institutional Bond Fund - - 9,260,821 Total redemptions: 713,386 3,860 16,460,821
6 Efficient portfolio management
The Funds may enter into forward foreign currency contracts for efficient portfolio management. Forward foreign currency exchange contracts are used to hedge against anticipated future changes in exchange rates which otherwise might either adversely affect the value of the Fund’s portfolio securities or adversely affect the price of securities which the Funds intend to purchase at a later date. The Funds may also enter into futures contracts for efficient portfolio management. The primary purposes for which the Funds use futures contracts are cash equalisation, hedging and return enhancement. The purpose of cash equalisation is to expose uninvested cash within the Funds to equity market-like returns and ensure that the Funds’ liquid assets are utilised as though invested in the markets.

SANLAM UNIVERSAL FUNDS PLC
224
NOTES TO AND FORMING PART OF THE UNAUDITED CONDENSED INTERIM FINANCIAL STATEMENTS (CONTINUED) for the six months ended 30 June 2013 6 Efficient portfolio management (continued)
Hedging is used by the Funds to limit or control risks, such as adverse movements in exchange rates and interest returns. Return enhancement can be accomplished through the use of futures in the Funds. Interest rate swaps are used for hedging against adverse movements in interest rates. By purchasing certain instruments, the Funds may more effectively achieve the desired portfolio characteristics that assist the Funds in meeting their investment objectives. Details of the net unrealised gain/(loss) on open forward foreign currency exchange contracts, if any, is disclosed in the schedule of investments of each Fund.
7 Soft commissions
During the period Investment Manager and connected persons to the Sanlam Universal Equity Fund have entered into soft commission arrangements with brokers in respect of which certain goods and services used to support the investment decision process were received. The Investment Manager and connected persons do not make direct payment for these services but do transact an agreed amount of business with the brokers on behalf of the Company and commission is paid on these transactions. The goods and services utilised for the Company include computer hardware and software used for economic and political analysis, portfolio analysis including valuation and performance measurement, market analysis, data and quotation services and investment related publications. The Investment Manager considers these arrangements are to the benefit of the Company and has satisfied itself that it obtains best execution on behalf of the Company and the brokerage rates are not in excess of customary institutional full service brokerage rates.
8 Contingent and cross liability of funds The Directors are not aware of any such existing or contingent liability at 30 June 2013. The Company’s amended Articles provide for segregated liability between the various Funds. The Companies Acts of Ireland provide for segregated liability between Funds. These provisions, and the Fund’s application of them may not yet have been fully tested by Irish or foreign courts. Accordingly, while the liabilities of one Fund will not generally impact on or be paid out of the assets of another Fund, it is not entirely free from doubt that the assets of any Fund are protected from the liabilities of other Funds of the Company. As at 30 June 2013, there was no cross liabilities held between the Funds.
9 Stock lending activities The Company has entered into arrangements whereby it transfers securities to a counterparty, in return for which it is agreed that securities of the same kind and amount should be transferred back to the Company at a later date. The arrangement has the substance of a loan of the Company’s securities in return for collateral. The collateral held is in a form required by the Central Bank of Ireland. Stock lending activities are conducted through JP Morgan Bank Plc, London in accordance with the terms of the Stock Lending Agreement, dated 12 March 2004, between the Company, the Manager and JP Morgan Bank Plc. Aggregate income arising from stock lending activities consists of fees charged to counterparty, where the counterparty has provided collateral other than cash, plus net realised income derived from investments of cash collateral less any rebate payable to a counterparty on cash collateral less any commissions or similar transaction costs.

SANLAM UNIVERSAL FUNDS PLC
225
NOTES TO AND FORMING PART OF THE UNAUDITED CONDENSED INTERIM FINANCIAL STATEMENTS (CONTINUED) for the six months ended 30 June 2013
9 Stock lending activities (continued)
The Funds received income as follows under the terms of those agreements for the period ended 30 June 2013:
8IP Asia 8IP Asia Centre P-Solve Sanlam Sanlam
Equity Pacific Global Inflation Global Universal
Opportunities Equity Equity Plus Best Ideas Bond
Fund Fund Fund Fund Fund Fund
USD USD USD GBP USD USD Income 2,084,389 691,805 1,932,759 2,780,939 28,066,901 28,912,469
Sanlam Sanlam Sanlam Sanlam SIM Global SPI Strategic
Global Global World World Equity Equity
Investment Grade
Financial Property Equity Tracker Income Bond
Fund Fund** Fund Fund Fund Fund*
USD USD USD USD USD GBP Income 22,686,778 8,071,034 132,889,344 24,136,746 695,861 5,339,604
Summary of collateral as at 30 June 2013:
8IP Asia 8IP Asia Centre P-Solve
Equity Pacific Global Inflation
Opportunities Equity Equity Plus
Fund Fund Fund Fund
USD USD USD GBP Aggregate value of securities on loan at the period end 263,494 332,702 948,793 1,373,764 Aggregate value of collateral held in respect of the loans 1,820,895 359,103 983,966 1,407,175
Collateral % 691.06% 107.94% 103.71% 102.43%
Sanlam Sanlam Sanlam Sanlam
Global Global Global Global
Best Ideas Bond Financial Property
Fund Fund Fund Fund**
USD USD USD USD Aggregate value of securities on loan at the period end 13,615,571 14,245,441 11,076,244 3,873,411 Aggregate value of collateral held in respect of the loans 14,451,330 14,667,028 11,610,534 4,197,623
Collateral % 106.14% 102.96% 104.82% 108.37%

SANLAM UNIVERSAL FUNDS PLC
226
NOTES TO AND FORMING PART OF THE UNAUDITED CONDENSED INTERIM FINANCIAL STATEMENTS (CONTINUED) for the six months ended 30 June 2013
9 Stock lending activities (continued)
Summary of collateral as at 30 June 2013: (continued)
Sanlam Sanlam SIM Global SPI Strategic
World World Equity Equity Investment Grade
Equity Tracker Income Bond
Fund Fund Fund Fund*
USD USD USD GBP Aggregate value of securities on loan at the period end 64,828,188 9,998,292 339,433 2,605,905 Aggregate value of collateral held in respect of the loans 68,061,156 14,138,453 356,428 2,733,699
Collateral % 104.99% 141.41% 105.01% 104.90%

SANLAM UNIVERSAL FUNDS PLC
227
NOTES TO AND FORMING PART OF THE UNAUDITED CONDENSED INTERIM FINANCIAL STATEMENTS (CONTINUED) for the six months ended 30 June 2013 9 Stock lending activities (continued)
The Funds received income as follows under the terms of those agreements for the period ended 30 June 2012:
Sanlam
Sanlam World
Centre Global
World Equity 8IP Asia Equity 8IP Asia Pacific SIIP India
Equity Equity Tracker Opportunities Equity Opportunities
Fund Fund Fund Fund Fund Fund
USD USD USD USD USD USD
Income 512,513
13,886 133,940 7,624 6,280 -
Sanlam African
Frontier Sanlam Global
Sanlam Global
Best Sanlam
Universal
Sanlam Principle Monthly Income
Investment Grade
Sanlam Global
Markets Financial Ideas Bond Bond Property
Fund Fund Fund Fund Fund Fund
USD USD USD USD GBP USD
Income -
133,969 309,123 9,892 766 10,793
Grindrod P-Solve Sanlam
International Inflation Strategic
Property Plus Cash
Fund Fund Fund
USD GBP USD
Income - 5,320 -
Summary of collateral as at 30 June 2012:
Sanlam
Sanlam Centre World 8IP Asia 8IP Asia
World Global Equity Equity Pacific
Equity Equity Tracker Opportunities Equity
Fund Fund Fund Fund Fund
USD USD USD USD USD
Aggregate value of securities on loan at the period end 91,234,274 1,683,775 18,730,445 821,836 3,250,592 Aggregate value of collateral held in respect of the loans 97,241,206 1,803,504 19,798,982 884,821 3,478,611
Collateral % 106.58% 107.11% 105.70% 107.66% 107.01%

SANLAM UNIVERSAL FUNDS PLC
228
NOTES TO AND FORMING PART OF THE UNAUDITED CONDENSED INTERIM FINANCIAL STATEMENTS (CONTINUED) for the six months ended 30 June 2013
9 Stock lending activities (continued)
Summary of collateral as at 30 June 2012: (continued)
Sanlam
SIIP African Sanlam Sanlam Sanlam
India Frontier Global Global Global
Opportunities Markets Financial Best Ideas Bond
Fund Fund Fund Fund Fund
USD USD USD USD USD
Aggregate value of securities on loan at the period end - - 6,822,217 30,158,703 14,561,979 Aggregate value of collateral held in respect of the loans - - 7,230,613 33,519,722 14,839,898
Collateral % - - 105.99% 111.14% 101.91%
SPI Strategic
Investment Sanlam Grindrod P-Solve Sanlam
Grade Global International Inflation Strategic
Bond Property Property Plus Cash
Fund Fund Fund Fund Fund
GBP USD USD GBP USD
Aggregate value of securities on loan at the period end - 3,534,487 - 231,580 - Aggregate value of collateral held in respect of the loans - 3,749,631 - 432,733 -
Collateral % - 106.09% - 186.86% -

SANLAM UNIVERSAL FUNDS PLC
229
NOTES TO AND FORMING PART OF THE UNAUDITED CONDENSED INTERIM FINANCIAL STATEMENTS (CONTINUED) for the six months ended 30 June 2013
10 Fees of underlying investments
The following tables summarise the investment management fee and incentive fees paid by the Funds in which the Company held investments:
Incentive fees as a %
Investment of Net Asset Gains
Management Fees above the
Period ended 30 June 2013 as a % of Net Assets Benchmarks Absolute Insight Emerging Market Debt Fund 1.00% - Artemis Income Fund 1.50% - Artemis Strategic Bond Fund 1.00% - ASPECT UCITS FUNDS 1.50% - Cazenove Absolute UK Dynamic Fund 1.00% - Cazenove Investment Fund Company - UK Equity 0.75% - Cazenove Strategic Bond Fund 0.50% - CCP Quantitative UCITS Fund Faraday USD Class 2.00% - ETFS Brent 1Mth Oil Security 0.49% - Fidelity Institutional Funds ICVC - UK Corpor 0.35% - Finsbury High Income Fund 1.00% - First State Investments ICVC - Asia Pacific L 0.85% - GAM Star Plc Emerging Market Rates 0.15% - GLG Investments VI PLC - GLG A 2.00% - GLG Treasury Plus Fund 0.25% - Henderson Gartmore Fund United Kingdom Absolu 1.00% - Henderson UK & Europe Funds - Strategic Bond 0.60% - Henderson UK & Europe Funds - UK Equity Incom 0.75% - IFDC - Japan Dynamic Fund 0.44% - Institutional Cash Series Plc - Insti Sterlin 0.00% - Invesco Perpetual Fixed Interest - Corporate 0.75% - Invesco Perpetual UK Invest - High Income Fun 1.00% - iShares Core MSCI Emerging Markets ETF 0.18% - IShares III Plc Barclays Capital Emerging Mar 0.50% - iShares MSCI Europe Ex-UK 0.00% - iShares MSCI Japan Monthly GBP Hedged 0.64% - iShares MSCI World Islamic 0.60% - Ishares PLC-IFTSE 100 0.40% - Ishares S&P 500 Index Fund 0.00% - iShares S&P SmallCap 600 0.14% - JPMorgan Fund ICVC - Sterling Corporate Bond 0.50% - Jupiter Strategic Bond - II 0.50% - Kames ICVC - High Yield Bond Fund 1.00% - Kames ICVC - Sterling Corporate Bond Fund 0.75% - Lazard Investment Funds - Global Equity Incom 0.75% - LO Funds 1798 Europe Equity Long/Short 1.50% - M&G Corporate Bond 0.50% - Mellon Investments Funds - Newton Global High 0.75% - PFS Chelverton UK Equity Fund 0.75% - PIMCO Global Investors 0.89% - Pimco-Hi Yield Bond 0.55% - Powershares Global Fund Agriculture NASDAQ OM 0.75% -

SANLAM UNIVERSAL FUNDS PLC
230
NOTES TO AND FORMING PART OF THE UNAUDITED CONDENSED INTERIM FINANCIAL STATEMENTS (CONTINUED) for the six months ended 30 June 2013
10 Fees of underlying investments (continued)
Incentive fees as a %
Investment of Net Asset Gains
Management Fees above the
Period ended 30 June 2013 as a % of Net Assets Benchmarks PSigma Income Fund 0.75% - Schroder Income Maximiser Fund 0.75% - Select Equity Long/Short UCITS Sub-Fund 1.55% - Skyline UCITS Fund 1.50% - SPDR S&P 400 US Mid Cap ETF 0.30% - SPI Strategic Investment Grade Bond Fund 0.15% - Swiss Hedge Luxtrade 1.65% - Threadneedle Investment Funds - UK Equity Inc 0.75% - Trojan Investment Funds - Trojan Income Fund 1.00% - Vanguard Emerging Market ETF 0.18% - Vanguard FTSE 100 ETF 0.10% - Vanguard Investment Series - UK Government Bo 0.15% - Vanguard S&P 500 ETF 0.09% - Veritas Funds Plc - Global Equity Income Fund 0.75% -
Period ended 30 June 2012:
Investment Management Fees
as a % of Net Assets
Incentive fees as a % of Net Asset Gains
above the benchmarks
Institutional US Dollar Liquidity Fund 0.03% iShares MSCI India 0.99% - iShares MSCI Canada 0.52% - iShares MSCI EAFE Index Fund 0.34% - Alpine Global Premier Properties Fund 1.00% - CBRE Clarion Global Real Estate Income Fund 0.85% - LMP Real Estate Income Fund Inc 0.32% - Neuberger Berman Real Estate Securities Income Fund 0.07% - New Europe Property Investment PLC 1.00% - Nuveen Real Estate Income Fund 0.70% - RMR Real Estate Fund 0.85% - RMR Real Estate Income Fund 0.85% - SPDR S&P 500 ETF Trust 0.10% - Asia Pacific Leaders Fund 0.85% - Global X Uranium 0.69% - iShares Barclays Capital Emerging Market Local Government Bond Fund 0.50% - iShares Markit IBOXX Euro High Yield 0.50% - iShares MSCI World Islamic Fund 0.60% - iShares PLC-FTSE 100 0.40% - iShares S&P 500 Index Fund 0.00% - iShares S&P North American Technology-Multime 0.48% - iShares S&P SmallCap 600 0.00% - PIMCO Emerging Local Bond Fund 0.89% - Powershares Global Fund Agriculture NASDAQ OM 0.75% - Source Physical Markets Gold P-ETC 0.29% - SPDR Barclays Capital High Yield Bond 0.40% - Vanguard Emerging Markets 0.11% -

SANLAM UNIVERSAL FUNDS PLC
231
NOTES TO AND FORMING PART OF THE UNAUDITED CONDENSED INTERIM FINANCIAL STATEMENTS (CONTINUED) for the six months ended 30 June 2013 11 Net asset value per share
8IP Asia Equity Opportunities Fund
Period Ended Year Ended Period Ended 30/06/2013 31/12/2012 30/06/2012 Share class A
Net Asset Value USD 823,721 USD 1,350,491 USD 1,583,482 Number of Shares in Issue 1,089,002 1,608,904 2,106,940
Net asset value per share for financial statement purposes USD 0.7570 USD 0.8394 USD 0.7516 Add: IAS 39 valuation adjustment - USD 0.0018 USD 0.0025 Net asset value per share for shareholder dealing USD 0.7570 USD 0.8412 USD 0.7541
Share class A (GBP) Net Asset Value GBP 79 GBP 82 GBP 76
Number of Shares in Issue 100 100 100
Net asset value per share for financial statement purposes GBP0.7854 GBP 0.8157 GBP 0.7560 Add: IAS 39 valuation adjustment - GBP 0.0018 GBP 0.0026 Net asset value per share for shareholder dealing GBP0.7854 GBP 0.8175 GBP 0.7586
Share class C Net Asset Value USD 25,158 USD 27,813 USD 24,811
Number of Shares in Issue 27,441 27,441 27,441
Net asset value per share for financial statement purposes USD 0.9175 USD 1.0136 USD 0.9041 Add: IAS 39 valuation adjustment - USD 0.0022 USD 0.0031 Net asset value per share for shareholder dealing USD 0.9175 USD 1.0158 USD 0.9072
Share class D Net Asset Value USD 2,890,502 USD 3,178,991 USD 1,923,668
Number of Shares in Issue 3,657,230 3,638,149 2,468,142
Net asset value per share for financial statement purposes USD 0.7909 USD 0.8738 USD 0.7794 Add: IAS 39 valuation adjustment - USD 0.0019 USD 0.0026 Net asset value per share for shareholder dealing USD 0.7909 USD 0.8757 USD 0.7820
Share class E Net Asset Value USD 14,795,922 USD 16,296,137 USD 14,481,384
Number of Shares in Issue 18,505,763 18,505,763 18,505,763
Net asset value per share for financial statement purposes USD 0.8001 USD 0.8806 USD 0.7825 Add: IAS 39 valuation adjustment - USD 0.0019 USD 0.0027 Net asset value per share for shareholder dealing USD 0.8001 USD 0.8825 USD 0.7852

SANLAM UNIVERSAL FUNDS PLC
232
NOTES TO AND FORMING PART OF THE UNAUDITED CONDENSED INTERIM FINANCIAL STATEMENTS (CONTINUED) for the six months ended 30 June 2013 11 Net asset value per share (continued) 8IP Asia Pacific Equity Fund
Period Ended Year Ended Period Ended 30/06/2013 31/12/2012 30/06/2012 Share class A
Net Asset Value USD 850,678 USD 901,380 USD 803,875 Number of Shares in Issue 873,953 907,045 887,094
Net asset value per share for financial statement purposes USD 0.9735 USD 0.9938 USD 0.9062 Add: IAS 39 valuation adjustment - USD 0.0022 USD 0.0029 Net asset value per share for shareholder dealing USD 0.9735 USD 0.9960 USD 0.9091
Share class A (GBP) Net Asset Value GBP 90 GBP 86 GBP 82
Number of Shares in Issue 100 100 100
Net asset value per share for financial statement purposes GBP 0.8995 GBP 0.8596 GBP 0.8152 Add: IAS 39 valuation adjustment - GBP 0.0019 GBP 0.0026 Net asset value per share for shareholder dealing GBP 0.8995 GBP 0.8615 GBP 0.8178
Share class D Net Asset Value USD 4,690,896 USD 8,048,344 USD 9,533,488
Number of Shares in Issue 4,641,340 7,829,104 10,208,005
Net asset value per share for financial statement purposes USD 1.0107 USD 1.0280 USD 0.9339 Add: IAS 39 valuation adjustment - USD 0.0023 USD 0.0030 Net asset value per share for shareholder dealing USD 1.0107 USD 1.0303 USD 0.9369
Share class E Net Asset Value USD 12,244,925 USD 12,407,543 USD 11,229,775
Number of Shares in Issue 13,331,259 13,331,259 13,331,259
Net asset value per share for financial statement purposes USD 0.9185 USD 0.9307 USD 0.8424 Add: IAS 39 valuation adjustment - USD 0.0021 USD 0.0027 Net asset value per share for shareholder dealing USD 0.9185 USD 0.9328 USD 0.8451

SANLAM UNIVERSAL FUNDS PLC
233
NOTES TO AND FORMING PART OF THE UNAUDITED CONDENSED INTERIM FINANCIAL STATEMENTS (CONTINUED) for the six months ended 30 June 2013 11 Net asset value per share (continued)
Centre Global Equity Fund
Period Ended Year Ended Period Ended 30/06/2013 31/12/2012 30/06/2012 Share class A
Net Asset Value USD 19,264,459 USD 19,562,593 USD 18,720,090 Number of Shares in Issue 22,501,120 22,763,652 24,333,715
Net asset value per share for financial statement purposes USD 0.8562 USD 0.8594 USD 0.7693 Add: IAS 39 valuation adjustment - USD 0.0005 USD 0.0012 Net asset value per share for shareholder dealing USD 0.8562 USD 0.8599 USD 0.7705
Share class B Net Asset Value USD 4,501,389 USD 4,506,789 USD 3,968,781
Number of Shares in Issue 5,124,384 5,124,384 5,050,690
Net asset value per share for financial statement purposes USD 0.8785 USD 0.8795 USD 0.7858 Add: IAS 39 valuation adjustment - USD 0.0005 USD 0.0012 Net asset value per share for shareholder dealing USD 0.8785 USD 0.8800 USD 0.7870
Share class C Net Asset Value USD 35,812 USD35,825 USD 82
Number of Shares in Issue 38,863 38,863 100
Net asset value per share for financial statement purposes USD 0.9216 USD 0.9218 USD 0.8218 Add: IAS 39 valuation adjustment - USD 0.0006 USD 0.0013 Net asset value per share for shareholder dealing USD 0.9216 USD 0.9224 USD 0.8231
Share class E Net Asset Value USD 94 USD 93 USD 83
Number of Shares in Issue 100 100 100
Net asset value per share for financial statement purposes USD 0.9355 USD 0.9320 USD 0.8283 Add: IAS 39 valuation adjustment - USD 0.0006 USD 0.0013 Net asset value per share for shareholder dealing USD 0.9355 USD 0.9326 USD 0.8296

SANLAM UNIVERSAL FUNDS PLC
234
NOTES TO AND FORMING PART OF THE UNAUDITED CONDENSED INTERIM FINANCIAL STATEMENTS (CONTINUED) for the six months ended 30 June 2013
11 Net asset value per share (continued)
Grindrod International
Property Fund
Period Ended Year Ended Period Ended
30/06/2013 31/12/2012 30/06/2012 Share class Distributing
Net Asset Value USD 107,769 USD 104,848 USD 96,704 Number of Shares in Issue 95,730 96,497 96,292
Net asset value per share for financial statement purposes USD 1.1259 USD 1.0865 USD 1.0043 Add: IAS 39 valuation adjustment - USD 0.0134 USD 0.0018 Net asset value per share for shareholder dealing USD 1.1259 USD 1.0999 USD 1.0061
Share class Non – Distributing Net Asset Value USD 12,346,897 USD 8,484,325 USD 7,293,353
Number of Shares in Issue 10,467,561 7,493,155 7,048,093
Net asset value per share for financial statement purposes USD 1.1797 USD 1.1323 USD 1.0348 Add: IAS 39 valuation adjustment - USD 0.0139 USD 0.0019 Net asset value per share for shareholder dealing USD 1.1797 USD 1.1462 USD 1.0367

SANLAM UNIVERSAL FUNDS PLC
235
NOTES TO AND FORMING PART OF THE UNAUDITED CONDENSED INTERIM FINANCIAL STATEMENTS (CONTINUED) for the six months ended 30 June 2013
11 Net asset value per share (continued)
P-Solve Inflation
Plus Fund
Period Ended Year Ended Period Ended
30/06/2013 31/12/2012 30/06/2012 Share class A
Net Asset Value GBP 29,980 GBP 28,745 GBP 60,648 Number of Shares in Issue 19,464 19,283 42,167
Net asset value per share for financial statement purposes GBP 1.5396 GBP 1.4907 GBP 1.4383 Add: IAS 39 valuation adjustment - GBP 0.0026 GBP (0.0024) Net asset value per share for shareholder dealing GBP 1.5396 GBP 1.4933 GBP 1.4359
Share class B Net Asset Value GBP 6,153,271 GBP 5,310,857 GBP 4,575,363
Number of Shares in Issue 3,869,265 3,440,360 3,081,939
Net asset value per share for financial statement purposes GBP 1.5895 GBP 1.5437 GBP 1.4846 Add: IAS 39 valuation adjustment - GBP 0.0027 GBP (0.0025) Net asset value per share for shareholder dealing GBP 1.5895 GBP 1.5464 GBP 1.4821 Share class C
Net Asset Value GBP 44,643,308 GBP 42,535,416 GBP 37,501,196 Number of Shares in Issue 38,931,958 38,061,939 34,998,903
Net asset value per share for financial statement purposes GBP 1.1461 GBP 1.1175 GBP 1.0715 Add: IAS 39 valuation adjustment - GBP 0.0020 GBP (0.0018) Net asset value per share for shareholder dealing GBP 1.1461 GBP 1.1195 GBP 1.0697

SANLAM UNIVERSAL FUNDS PLC
236
NOTES TO AND FORMING PART OF THE UNAUDITED CONDENSED INTERIM FINANCIAL STATEMENTS (CONTINUED) for the six months ended 30 June 2013
11 Net asset value per share (continued)
Sanlam African
Frontier Markets Fund
Period Ended Year Ended Period Ended 30/06/2013 31/12/2012 30/06/2012 Share class A
Net Asset Value USD 10,489 USD 23,322,047 USD 92 Number of Shares in Issue 9,019 21,099,125 100
Net asset value per share for financial statement purposes USD 1.1593 USD 1.1054 USD 0.9137 Add: IAS 39 valuation adjustment - USD 0.0126 USD 0.0102 Net asset value per share for shareholder dealing USD 1.1593 USD 1.1180 USD 0.9239
Share class A (GBP) Net Asset Value GBP 60,261 GBP 52,024 GBP 84
Number of Shares in Issue 57,347 52,930 100
Net asset value per share for financial statement purposes GBP 1.0508 GBP 0.9829 GBP 0.8435 Add: IAS 39 valuation adjustment - GBP 0.0113 GBP 0.0093 Net asset value per share for shareholder dealing GBP 1.0508 GBP 0.9942 GBP 0.8528
Share class C Net Asset Value USD 118 USD 111 USD 92
Number of Shares in Issue 100 100 100
Net asset value per share for financial statement purposes USD 1.1805 USD 1.1073 USD 0.9138 Add: IAS 39 valuation adjustment - USD 0.0127 USD 0.0101 Net asset value per share for shareholder dealing USD 1.1805 USD 1.1200 USD 0.9239 Share class C (GBP)
Net Asset Value GBP 112 GBP 98 GBP 84 Number of Shares in Issue 107 100 100
Net asset value per share for financial statement purposes GBP 1.0505 GBP 0.9847 GBP 0.8435 Add: IAS 39 valuation adjustment - GBP 0.0113 GBP 0.0093 Net asset value per share for shareholder dealing GBP 1.0505 GBP 0.9960 GBP 0.8528

SANLAM UNIVERSAL FUNDS PLC
237
NOTES TO AND FORMING PART OF THE UNAUDITED CONDENSED INTERIM FINANCIAL STATEMENTS (CONTINUED) for the six months ended 30 June 2013
11 Net asset value per share (continued)
Sanlam African
Frontier Markets Fund (continued)
Period Ended Year Ended Period Ended 30/06/2013 31/12/2012 30/06/2012 Share class D
Net Asset Value USD 39,240,295 USD 41,208,335 USD 34,245,429 Number of Shares in Issue 35,880,864 39,959,167 39,959,167
Net asset value per share for financial statement purposes USD 1.0937 USD 1.0313 USD 0.8570 Add: IAS 39 valuation adjustment - USD 0.0118 USD 0.0095 Net asset value per share for shareholder dealing USD 1.0937 USD 1.0431 USD 0.8665 Share class G
Net Asset Value USD28,041,017 - - Number of Shares in Issue 28,336,496 - -
Net asset value per share for financial statement purposes USD 0.9896 - - Add: IAS 39 valuation adjustment - - - Net asset value per share for shareholder dealing USD 0.9896 - -

SANLAM UNIVERSAL FUNDS PLC
238
NOTES TO AND FORMING PART OF THE UNAUDITED CONDENSED INTERIM FINANCIAL STATEMENTS (CONTINUED) for the six months ended 30 June 2013
11 Net asset value per share (continued)
Sanlam Global
Best Ideas Fund
Period Ended Year Ended Period Ended
30/06/2013 31/12/2012 30/06/2012 Share class A
Net Asset Value USD 65,924,203 USD 76,473,598 USD 81,184,274 Number of Shares in Issue 37,473,555 43,309,850 49,017,972
Net asset value per share for financial statement purposes USD1.7534 USD 1.7657 USD 1.6562 Add: IAS 39 valuation adjustment - USD 0.0196 USD 0.0047 Net asset value per share for shareholder dealing USD1.7534 USD 1.7853 USD 1.6609 Share class A (EUR)
Net Asset Value EUR 104 EUR 103 EUR 102 Number of Shares in Issue 112 112 111
Net asset value per share for financial statement purposes EUR 0.9310 EUR 0.9281 EUR 0.9098 Add: IAS 39 valuation adjustment - EUR 0.0103 EUR 0.0025 Net asset value per share for shareholder dealing EUR 0.9310 EUR 0.9384 EUR 0.9123
Share class A (GBP)
Net Asset Value GBP 82,970 GBP 141,149 GBP 306,381 Number of Shares in Issue 84,388 150,815 336,854
Net asset value per share for financial statement purposes GBP 0.9832 GBP 0.9359 GBP 0.9095 Add: IAS 39 valuation adjustment - GBP 0.0104 GBP 0.0026 Net asset value per share for shareholder dealing GBP 0.9832 GBP 0.9463 GBP 0.9121
Share class B Net Asset Value USD 88,560,422 USD 91,206,020 USD 85,824,641
Number of Shares in Issue 48,385,842 49,639,915 49,962,964
Net asset value per share for financial statement purposes USD 1.8304 USD 1.8374 USD 1.7178 Add: IAS 39 valuation adjustment - USD 0.0203 USD 0.0049 Net asset value per share for shareholder dealing USD 1.8304 USD 1.8577 USD 1.7227

SANLAM UNIVERSAL FUNDS PLC
239
NOTES TO AND FORMING PART OF THE UNAUDITED CONDENSED INTERIM FINANCIAL STATEMENTS (CONTINUED) for the six months ended 30 June 2013
11 Net asset value per share (continued)
Share class C (GBP) Net Asset Value GBP 78,781 GBP 80,971 GBP 53,760
Number of Shares in Issue 54,471 58,730 40,428
Net asset value per share for financial statement purposes GBP 1.4392 GBP 1.3787 GBP 1.3298 Add: IAS 39 valuation adjustment - GBP 0.0153 GBP 0.0038 Net asset value per share for shareholder dealing GBP 1.4392 GBP 1.3940 GBP 1.3336
Share class D Net Asset Value USD 22,976,553 USD 27,651,348 USD 25,838,710
Number of Shares in Issue 24,103,305 28,911,508 28,911,508
Net asset value per share for financial statement purposes USD 0.9533 USD 0.9564 USD 0.8937 Add: IAS 39 valuation adjustment - USD 0.0106 USD 0.0026 Net asset value per share for shareholder dealing USD 0.9533 USD 0.9670 USD 0.8963
Share class E Net Asset Value USD 175,152,400 USD 194,407,906 USD 190,764,613
Number of Shares in Issue 160,661,902 178,403,740 188,049,011
Net asset value per share for financial statement purposes USD 1.0902 USD 1.0897 USD 1.0144 Add: IAS 39 valuation adjustment - USD 0.0121 USD 0.0029 Net asset value per share for shareholder dealing USD 1.0902 USD 1.1018 USD 1.0173
Sanlam Global
Best Ideas Fund (continued) Period Ended Year Ended Period Ended 30/06/2013 31/12/2012 30/06/2012 Share class C
Net Asset Value USD 83,495,441 USD 88,521,684 USD 82,707,385 Number of Shares in Issue 45,250,709 47,811,643 47,805,253
Net asset value per share for financial statement purposes USD 1.8453 USD 1.8515 USD 1.7301 Add: IAS 39 valuation adjustment - USD 0.0205 USD 0.0049 Net asset value per share for shareholder dealing USD 1.8453 USD 1.8720 USD 1.7350

SANLAM UNIVERSAL FUNDS PLC
240
NOTES TO AND FORMING PART OF THE UNAUDITED CONDENSED INTERIM FINANCIAL STATEMENTS (CONTINUED) for the six months ended 30 June 2013 11 Net asset value per share (continued)
Sanlam Global
Best Ideas Fund (continued)
Period Ended Year Ended Period Ended
30/06/2013 31/12/2012 30/06/2012 Share class F
Net Asset Value USD 44,984 USD 91,186 USD 86,365 Number of Shares in Issue 51,214 101,777 101,777
Net asset value per share for financial statement purposes USD 0.8784 USD 0.8959 USD 0.8486 Add: IAS 39 valuation adjustment - USD 0.0100 USD 0.0024 Net asset value per share for shareholder dealing USD 0.8784 USD 0.9059 USD 0.8510
Share class F (GBP) Net Asset Value GBP 17,158 GBP 16,325 GBP 90,897
Number of Shares in Issue 17,488 17,488 99,388
Net asset value per share for financial statement purposes GBP 0.9811 GBP 0.9336 GBP 0.9146 Add: IAS 39 valuation adjustment - GBP 0.0103 GBP 0.0026 Net asset value per share for shareholder dealing GBP 0.9811 GBP 0.9439 GBP 0.9172

SANLAM UNIVERSAL FUNDS PLC
241
NOTES TO AND FORMING PART OF THE UNAUDITED CONDENSED INTERIM FINANCIAL STATEMENTS (CONTINUED) for the six months ended 30 June 2013 11 Net asset value per share (continued)
Sanlam Global
Bond Fund
Period Ended Year Ended Period Ended 30/06/2013 31/12/2012 30/06/2012 Share class A
Net Asset Value USD 87,138 USD 91,824 USD 57,334 Number of Shares in Issue 65,608 65,835 42,427
Net asset value per share for financial statement purposes USD 1.3282 USD 1.3948 USD 1.3514 Add: IAS 39 valuation adjustment - USD 0.0012 USD 0.0034 Net asset value per share for shareholder dealing USD 1.3282 USD 1.3960 USD 1.3548
Share class B Net Asset Value USD 2,128,836 USD 20,909,855 USD 23,057,994
Number of Shares in Issue 1,597,284 14,957,113 17,043,773
Net asset value per share for financial statement purposes USD 1.3328 USD 1.3980 USD 1.3529 Add: IAS 39 valuation adjustment - USD 0.0012 USD 0.0034 Net asset value per share for shareholder dealing USD 1.3328 USD 1.3992 USD 1.3563
Share class C Net Asset Value USD 170,279,905 USD 154,361,646 USD 102,530,309
Number of Shares in Issue 128,808,399 111,385,857 76,497,610
Net asset value per share for financial statement purposes USD 1.3220 USD 1.3858 USD 1.3403 Add: IAS 39 valuation adjustment - USD 0.0012 USD 0.0034 Net asset value per share for shareholder dealing USD 1.3220 USD 1.3870 USD 1.3437
Share class E Net Asset Value USD 186,455,816 USD 227,807,159 USD 251,210,784
Number of Shares in Issue 135,054,171 157,904,488 180,584,552
Net asset value per share for financial statement purposes USD 1.3806 USD 1.4427 USD 1.3911 Add: IAS 39 valuation adjustment - USD 0.0013 USD 0.0035 Net asset value per share for shareholder dealing USD 1.3806 USD 1.4440 USD 1.3946

SANLAM UNIVERSAL FUNDS PLC
242
NOTES TO AND FORMING PART OF THE UNAUDITED CONDENSED INTERIM FINANCIAL STATEMENTS (CONTINUED) for the six months ended 30 June 2013
11 Net asset value per share (continued)
Sanlam Global Financial Fund
Period Ended Year Ended Period Ended 30/06/2013 31/12/2012 30/06/2012 Share class A
Net Asset Value USD 38,388,302 USD 38,775,949 USD 32,424,199 Number of Shares in Issue 1,547,170 1,550,529 1,487,098
Net asset value per share for financial statement purposes USD 24.8138 USD 25.0082 USD 21.8037 Add: IAS 39 valuation adjustment - USD 0.2055 USD 0.1293 Net asset value per share for shareholder dealing USD 24.8138 USD 25.2137 USD 21.9330
Share class A (EUR) Net Asset Value EUR 106 EUR 106 EUR 97
Number of Shares in Issue 99 99 99
Net asset value per share for financial statement purposes EUR 1.0752 EUR 1.0740 EUR 0.9795 Add: IAS 39 valuation adjustment - EUR 0.0088 EUR 0.0058 Net asset value per share for shareholder dealing EUR 1.0752 EUR 1.0828 EUR 0.9853
Share class A (GBP) Net Asset Value GBP 338,090 GBP 967,866 GBP 824,278
Number of Shares in Issue 266,350 809,648 762,350
Net asset value per share for financial statement purposes GBP 1.2694 GBP 1.1954 GBP 1.0812 Add: IAS 39 valuation adjustment - GBP 0.0098 GBP 0.0064 Net asset value per share for shareholder dealing GBP 1.2694 GBP 1.2052 GBP 1.0876
Share class B Net Asset Value USD 44,103,850 USD 33,055,661 USD 27,868,572
Number of Shares in Issue 1,845,951 1,374,380 1,330,500
Net asset value per share for financial statement purposes USD 23.8937 USD 24.0513 USD 20.9459 Add: IAS 39 valuation adjustment - USD 0.1977 USD 0.1243 Net asset value per share for shareholder dealing USD 23.8937 USD 24.2490 USD 21.0702
Share class C Net Asset Value USD 237,416,462 USD 252,087,834 USD 205,225,127
Number of Shares in Issue 166,846,583 176,204,155 164,940,679
Net asset value per share for financial statement purposes USD 1.4230 USD 1.4307 USD 1.2442 Add: IAS 39 valuation adjustment - USD 0.0117 USD 0.0074 Net asset value per share for shareholder dealing USD 1.4230 USD 1.4424 USD 1.2516

SANLAM UNIVERSAL FUNDS PLC
243
NOTES TO AND FORMING PART OF THE UNAUDITED CONDENSED INTERIM FINANCIAL STATEMENTS (CONTINUED) for the six months ended 30 June 2013
11 Net asset value per share (continued)
Sanlam Global
Financial Fund (continued)
Period Ended Year Ended Period Ended
30/06/2013 31/12/2012 30/06/2012
Share class C (GBP) Net Asset Value GBP 773,299 GBP 71,952 GBP 50,415
Number of Shares in Issue 407,614 40,422 31,421
Net asset value per share for financial statement purposes GBP 1.8971 GBP 1.7800 GBP 1.6045 Add: IAS 39 valuation adjustment - GBP 0.0146 GBP 0.0095 Net asset value per share for shareholder dealing GBP 1.8971 GBP 1.7946 GBP 1.6140 Share class D
Net Asset Value USD 331,842 USD 256,897 USD 148,582 Number of Shares in Issue 313,415 240,442 159,300
Net asset value per share for financial statement purposes USD 1.0588 USD 1.0684 USD 0.9327 Add: IAS 39 valuation adjustment - USD 0.0088 USD 0.0056 Net asset value per share for shareholder dealing USD 1.0588 USD 1.0772 USD 0.9383 Share class E
Net Asset Value USD 113 USD 113 USD 98 Number of Shares in Issue 8 8 8
Net asset value per share for financial statement purposes USD 13.3789 USD 13.3861 USD 11.5917 Add: IAS 39 valuation adjustment - USD 0.1103 USD 0.0686 Net asset value per share for shareholder dealing USD 13.3789 USD 13.4964 USD 11.6603
Share class F Net Asset Value USD 339,658 USD 131,752 USD 25,625
Number of Shares in Issue 337,711 129,365 28,675
Net asset value per share for financial statement purposes USD1.0058 USD 1.0184 USD 0.8936 Add: IAS 39 valuation adjustment - USD 0.0084 USD 0.0054 Net asset value per share for shareholder dealing USD1.0058 USD 1.0268 USD 0.8990
Share class F (EUR) Net Asset Value EUR 42,045 EUR 22,044 EUR 10,542
Number of Shares in Issue 36,653 19,226 10,105
Net asset value per share for financial statement purposes EUR 1.1471 EUR 1.1466 EUR 1.0432 Add: IAS 39 valuation adjustment - EUR 0.0094 EUR 0.0062 Net asset value per share for shareholder dealing EUR 1.1471 EUR 1.1560 EUR 1.0494

SANLAM UNIVERSAL FUNDS PLC
244
NOTES TO AND FORMING PART OF THE UNAUDITED CONDENSED INTERIM FINANCIAL STATEMENTS (CONTINUED) for the six months ended 30 June 2013
11 Net asset value per share (continued) Sanlam Global
Financial Fund (continued)
Period Ended Year Ended Period Ended
30/06/2013 31/12/2012 30/06/2012 Share class F (GBP)
Net Asset Value GBP 258,668 GBP 219,169 GBP 100,019 Number of Shares in Issue 224,284 200,171 100,648 Net asset value per share for financial statement purposes GBP 1.1533 GBP 1.0949 GBP 0.9938 Add: IAS 39 valuation adjustment - GBP 0.0090 GBP 0.0059 Net asset value per share for shareholder dealing GBP 1.1533 GBP 1.1039 GBP 0.9997

SANLAM UNIVERSAL FUNDS PLC
245
NOTES TO AND FORMING PART OF THE UNAUDITED CONDENSED INTERIM FINANCIAL STATEMENTS (CONTINUED) for the six months ended 30 June 2013
11 Net asset value per share (continued)
Sanlam Global Property Fund
Period Ended Year Ended Period Ended
30/06/2013 31/12/2012 30/06/2012 Share class A
Net Asset Value USD 108 USD 104 USD 603,548 Number of Shares in Issue 100 100 605,867
Net asset value per share for financial statement purposes USD 1.0801 USD 1.0435 USD 0.9962 Add: IAS 39 valuation adjustment - USD 0.0016 USD 0.0012 Net asset value per share for shareholder dealing USD 1.0801 USD 1.0451 USD 0.9974
Share class B Net Asset Value USD 750,777 USD 16,893,294 USD 38,138,749
Number of Shares in Issue 649,285 15,072,887 32,852,197
Net asset value per share for financial statement purposes USD 1.1564 USD 1.1208 USD 1.1609 Add: IAS 39 valuation adjustment - USD 0.0016 USD 0.0015 Net asset value per share for shareholder dealing USD 1.1564 USD 1.1224 USD 1.1624 Share class C Net Asset Value USD 65,571,447 USD 46,491,343 USD 7,107,667 Number of Shares in Issue 48,541,320 35,551,943 6,982,952
Net asset value per share for financial statement purposes USD 1.3509 USD 1.3077 USD 1.0179 Add: IAS 39 valuation adjustment - USD 0.0019 USD 0.0012 Net asset value per share for shareholder dealing USD 1.3509 USD 1.3096 USD 1.0191 Share class E Net Asset Value USD 85,359,546 USD 14,325,360 - Number of Shares in Issue 71,708,172 12,462,969 -
Net asset value per share for financial statement purposes USD 1.1094 USD 1.1494 - Add: IAS 39 valuation adjustment - USD 0.0017 - Net asset value per share for shareholder dealing USD 1.1904 USD 1.1511 -

SANLAM UNIVERSAL FUNDS PLC
246
NOTES TO AND FORMING PART OF THE UNAUDITED CONDENSED INTERIM FINANCIAL STATEMENTS (CONTINUED) for the six months ended 30 June 2013
11 Net asset value per share (continued)
Sanlam Strategic
Cash Fund
Period Ended Year Ended Period Ended
30/06/2013 31/12/2012 30/06/2012 Share class A
Net Asset Value USD 3,710,050 USD 4,097,765 USD 4,731,608 Number of Shares in Issue 3,105,070 3,422,120 3,934,618
Net asset value per share for financial statement purposes USD 1.1946 USD 1.1974 USD 1.2026 Add: IAS 39 valuation adjustment - USD (0.0003) USD 0.0001 Net asset value per share for shareholder dealing USD 1.1946 USD 1.1971 USD 1.2027
Share class B Net Asset Value USD 877,230 USD 1,088,624 USD 1,706,916
Number of Shares in Issue 693,393 859,464 1,343,218
Net asset value per share for financial statement purposes USD 1.2649 USD 1.2666 USD 1.2708 Add: IAS 39 valuation adjustment - USD (0.0003) USD 0.0001 Net asset value per share for shareholder dealing USD 1.2649 USD 1.2663 USD 1.2709
Share class E Net Asset Value USD 15,286,841 USD 8,786,567 USD 4,596,345
Number of Shares in Issue 15,306,186 8,805,146 4,600,100
Net asset value per share for financial statement purposes USD 0.9985 USD 0.9979 USD 0.9992 Add: IAS 39 valuation adjustment - USD (0.0003) USD 0.0001 Net asset value per share for shareholder dealing USD 0.9985 USD 0.9976 USD 0.9993 Share class F
Net Asset Value USD 100 USD 99 USD 9,289,898 Number of Shares in Issue 100 100 9,333,750
Net asset value per share for financial statement purposes USD 0.9974 USD 0.9937 USD 0.9953 Add: IAS 39 valuation adjustment - USD (0.0003) USD 0.0001 Net asset value per share for shareholder dealing USD 0.9974 USD 0.9984 USD 0.9954

SANLAM UNIVERSAL FUNDS PLC
247
NOTES TO AND FORMING PART OF THE UNAUDITED CONDENSED INTERIM FINANCIAL STATEMENTS (CONTINUED) for the six months ended 30 June 2013
11 Net asset value per share (continued) Sanlam World
Equity USD Fund
Period Ended Year Ended Period Ended 30/06/2013 31/12/2012 30/06/2012 Share class A
Net Asset Value USD 21,164 USD 19,897 USD 18,344 Number of Shares in Issue 14,792 14,824 14,856
Net asset value per share for financial statement purposes USD 1.4309 USD 1.3422 USD 1.2347 Add: IAS 39 valuation adjustment - USD 0.0008 USD 0.0012 Net asset value per share for shareholder dealing USD 1.4309 USD 1.3430 USD 1.2359
Share class B Net Asset Value USD 37,999,363 USD 44,906,351 USD 4,098,588
Number of Shares in Issue 26,527,210 33,524,261 3,336,927
Net asset value per share for financial statement purposes USD 1.4325 USD 1.3395 USD 1.2283 Add: IAS 39 valuation adjustment - USD 0.0008 USD 0.0011 Net asset value per share for shareholder dealing USD 1.4325 USD 1.3403 USD 1.2294
Share class C Net Asset Value USD 371,019,537 USD 404,765,052 USD 358,351,578
Number of Shares in Issue 256,606,407 299,521,412 289,334,925
Net asset value per share for financial statement purposes USD 1.4459 USD 1.3514 USD 1.2385 Add: IAS 39 valuation adjustment - USD 0.0008 USD 0.0011 Net asset value per share for shareholder dealing USD 1.4459 USD 1.3522 USD 1.2396
Share class E
Net Asset Value USD 1,159,027,490 USD 1,239,607,984 USD 1,171,872,907 Number of Shares in Issue 750,924,152 862,540,370 893,055,823
Net asset value per share for financial statement purposes USD 1.5435 USD 1.4372 USD 1.3122 Add: IAS 39 valuation adjustment - USD 0.0008 USD 0.0012 Net asset value per share for shareholder dealing USD 1.5435 USD 1.4380 USD 1.3134

SANLAM UNIVERSAL FUNDS PLC
248
NOTES TO AND FORMING PART OF THE UNAUDITED CONDENSED INTERIM FINANCIAL STATEMENTS (CONTINUED) for the six months ended 30 June 2013 11 Net asset value per share (continued)
Sanlam World Equity Tracker Fund
Period Ended Year Ended Period Ended 30/06/2013 31/12/2012 30/06/2012 Share class A
Net Asset Value USD 186,213 USD 167,836 USD 135,426 Number of Shares in Issue 122,715 119,233 104,843
Net asset value per share for financial statement purposes USD 1.5175 USD 1.4076 USD 1.2917 Add: IAS 39 valuation adjustment - USD 0.0007 USD 0.0010 Net asset value per share for shareholder dealing USD 1.5175 USD 1.4083 USD 1.2927
Share class B Net Asset Value USD 47,901,858 USD 52,281,141 USD 47,205,050
Number of Shares in Issue 30,984,193 36,563,493 36,085,064
Net asset value per share for financial statement purposes USD 1.5461 USD 1.4299 USD 1.3082 Add: IAS 39 valuation adjustment - USD 0.0007 USD 0.0009 Net asset value per share for shareholder dealing USD 1.5461 USD 1.4306 USD 1.3091
Share class C Net Asset Value USD 239,123,113 USD 247,187,501 USD 137,386,395
Number of Shares in Issue 194,525,268 217,310,093 131,951,791
Net asset value per share for financial statement purposes USD 1.2293 USD 1.1375 USD 1.0412 Add: IAS 39 valuation adjustment - USD 0.0005 USD 0.0008 Net asset value per share for shareholder dealing USD 1.2293 USD 1.1380 USD 1.0420 Share class E
Net Asset Value USD 152 USD 3,758,081 USD 94,223,257 Number of Shares in Issue 101 2,532,784 69,543,924
Net asset value per share for financial statement purposes USD 1.5078 USD 1.4838 USD 1.3549 Add: IAS 39 valuation adjustment - USD 0.0007 USD 0.0010 Net asset value per share for shareholder dealing USD 1.5078 USD 1.4845 USD 1.3559

SANLAM UNIVERSAL FUNDS PLC
249
NOTES TO AND FORMING PART OF THE UNAUDITED CONDENSED INTERIM FINANCIAL STATEMENTS (CONTINUED) for the six months ended 30 June 2013 11 Net asset value per share (continued)
Sanlam World Equity Tracker Fund (continued)
Period Ended Year Ended Period Ended 30/06/2013 31/12/2012 30/06/2012 Share class I
Net Asset Value USD 97 - - Number of Shares in Issue 100 - -
Net asset value per share for financial statement purposes USD 0.9739 - - Add: IAS 39 valuation adjustment - - - Net asset value per share for shareholder dealing USD 0.9739 - -
Share class I (GBP) Net Asset Value GBP 1,176 - -
Number of Shares in Issue 1,247 - -
Net asset value per share for financial statement purposes USD 0.9427 - - Add: IAS 39 valuation adjustment - - - Net asset value per share for shareholder dealing USD 0.9427 - -

SANLAM UNIVERSAL FUNDS PLC
250
NOTES TO AND FORMING PART OF THE UNAUDITED CONDENSED INTERIM FINANCIAL STATEMENTS (CONTINUED) for the six months ended 30 June 2013 11 Net asset value per share (continued)
SIIP India
Opportunities Fund
Period Ended Year Ended Period Ended 30/06/2013 31/12/2012 30/06/2012 Share class A
Net Asset Value USD 132,171 USD 154,769 USD 133,238 Number of Shares in Issue 193,028 193,158 193,288
Net asset value per share for financial statement purposes USD 0.6848 USD 0.8013 USD 0.6893 Add: IAS 39 valuation adjustment - USD 0.0023 USD 0.0015 Net asset value per share for shareholder dealing 0.6848 USD 0.8036 USD 0.6908
Share class A (GBP) Net Asset Value GBP 80 GBP 87 GBP 78
Number of Shares in Issue 100 100 100
Net asset value per share for financial statement purposes GBP 0.7968 GBP 0.8725 GBP 0.7792 Add: IAS 39 valuation adjustment - GBP 0.0025 GBP 0.0017 Net asset value per share for shareholder dealing GBP 0.7968 GBP 0.8750 GBP 0.7809
Share class C Net Asset Value USD 5,523,097 USD 6,669,250 USD 5,841,679
Number of Shares in Issue 6,158,526 6,379,047 6,514,228
Net asset value per share for financial statement purposes USD 0.8969 USD 1.0455 USD 0.8968 Add: IAS 39 valuation adjustment - USD 0.0030 USD 0.0018 Net asset value per share for shareholder dealing USD 0.8969 USD 1.0485 USD 0.8986
Share class D
Net Asset Value USD 73 USD 84 USD 72 Number of Shares in Issue 103 104 104
Net asset value per share for financial statement purposes USD 0.7040 USD 0.8158 USD 0.6943 Add: IAS 39 valuation adjustment - USD 0.0023 USD 0.0015 Net asset value per share for shareholder dealing USD 0.7040 USD 0.8181 USD 0.6958

SANLAM UNIVERSAL FUNDS PLC
251
NOTES TO AND FORMING PART OF THE UNAUDITED CONDENSED INTERIM FINANCIAL STATEMENTS (CONTINUED) for the six months ended 30 June 2013 11 Net asset value per share (continued)
SIIP India Opportunities Fund (continued)
Period Ended Year Ended Period Ended 30/06/2013 31/12/2012 30/06/2012
Share class E Net Asset Value USD 10,393,774 USD 12,070,994 USD 10,307,200
Number of Shares in Issue 13,107,571 13,107,571 13,107,571
Net asset value per share for financial statement purposes USD 0.7930 USD 0.9209 USD 0.7864 Add: IAS 39 valuation adjustment - USD 0.0027 USD 0.0016 Net asset value per share for shareholder dealing USD 0.7930 USD 0.9236 USD 0.7880

SANLAM UNIVERSAL FUNDS PLC
252
NOTES TO AND FORMING PART OF THE UNAUDITED CONDENSED INTERIM FINANCIAL STATEMENTS (CONTINUED) for the six months ended 30 June 2013 11 Net asset value per share (continued)
SIM Global Equity
Income Fund
Period Ended Year Ended Period Ended 30/06/2013 31/12/2012 30/06/2012 Share class A
Net Asset Value USD 4,373,387 USD 2,844,999 - Number of Shares in Issue 4,281,807 2,843,794 -
Net asset value per share for financial statement purposes USD 1.0215 USD 1.0004 - Add: IAS 39 valuation adjustment - USD 0.0066 - Net asset value per share for shareholder dealing USD 1.0215 USD 1.0070 -
Share class C
Net Asset Value USD 10,755,014 USD 9,769,972 - Number of Shares in Issue 10,566,978 9,768,937 -
Net asset value per share for financial statement purposes USD 1.0178 USD 1.0001 - Add: IAS 39 valuation adjustment - USD 0.0066 - Net asset value per share for shareholder dealing USD 1.0178 USD 1.0067 - Share class E
Net Asset Value USD 99 USD 1,680,964 - Number of Shares in Issue 95 1,673,818 -
Net asset value per share for financial statement purposes USD 1.0406 USD 1.0043 - Add: IAS 39 valuation adjustment - USD 0.0066 - Net asset value per share for shareholder dealing USD 1.0406 USD 1.0109 - Share class I
Net Asset Value USD 291,848 USD 99 - Number of Shares in Issue 284,287 100 -
Net asset value per share for financial statement purposes USD 1.0267 USD 0.9950 - Add: IAS 39 valuation adjustment - USD 0.0065 - Net asset value per share for shareholder dealing USD 1.0267 USD 1.0015 -

SANLAM UNIVERSAL FUNDS PLC
253
NOTES TO AND FORMING PART OF THE UNAUDITED CONDENSED INTERIM FINANCIAL STATEMENTS (CONTINUED) for the six months ended 30 June 2013 11 Net asset value per share (continued)
SPI Strategic Investment Grade Bond Fund
Period Ended Year Ended Period Ended 30/06/2013 31/12/2012 30/06/2012
Share class A Accumulating Net Asset Value GBP 1,873,623 GBP 647,159 -
Number of Shares in Issue 1,798,266 611,323 -
Net asset value per share for financial statement purposes GBP 1.0413 GBP 1.0586
-
Add: IAS 39 valuation adjustment - GBP 0.0045 - Net asset value per share for shareholder dealing GBP 1.0413 GBP 1.0631
-
Share class A Income Net Asset Value GBP 2,857,679 GBP 1,777,603 -
Number of Shares in Issue 2,843,017 1,697,475 -
Net asset value per share for financial statement purposes GBP 1.0046 GBP 1.0472
-
Add: IAS 39 valuation adjustment - GBP 0.0045 - Net asset value per share for shareholder dealing GBP 1.0046 GBP 1.0517
-
Share class P Accumulating Net Asset Value GBP 13,487,140 GBP 10,304,705 -
Number of Shares in Issue 12,530,920 9,453,190 -
Net asset value per share for financial statement purposes GBP 1.0756 GBP 1.0901
-
Add: IAS 39 valuation adjustment - GBP 0.0046 - Net asset value per share for shareholder dealing GBP 1.0756 GBP 1.0947
Share class P Income Net Asset Value GBP 57,249,243 GBP 55,011,766 - Number of Shares in Issue 56,520,959 52,324,877 -
Net asset value per share for financial statement purposes GBP 1.0123 GBP 1.0514 - Add: IAS 39 valuation adjustment - GBP 0.0044 - Net asset value per share for shareholder dealing GBP 1.0123 GBP 1.0558 -

SANLAM UNIVERSAL FUNDS PLC
254
NOTES TO AND FORMING PART OF THE UNAUDITED CONDENSED INTERIM FINANCIAL STATEMENTS (CONTINUED) for the six months ended 30 June 2013 11 Net asset value per share (continued)
SPI Strategic Investment Grade Bond Fund (continued)
Period Ended Year Ended Period Ended 30/06/2013 31/12/2012 30/06/2012
Share class P Accumulating (USD) Net Asset Value USD 71,521 - - Number of Shares in Issue 75,500 - -
Net asset value per share for financial statement purposes USD 0.9473 - - Add: IAS 39 valuation adjustment - - - Net asset value per share for shareholder dealing USD 0.9473 - -

SANLAM UNIVERSAL FUNDS PLC
255
NOTES TO AND FORMING PART OF THE UNAUDITED CONDENSED INTERIM FINANCIAL STATEMENTS (CONTINUED) for the six months ended 30 June 2013 11 Net asset value per share (continued)
Sanlam Fund of Alternative
UCITS Fund
Period Ended Year Ended
Period Ended
30/06/2013 31/12/2012 30/06/2012 Share class A (GBP)
Net Asset Value GBP 25,588 - - Number of Shares in Issue 25,648 - -
Net asset value per share for financial statement purposes GBP 0.9977 - - Add: IAS 39 valuation adjustment - - - Net asset value per share for shareholder dealing GBP 0.9977 - - Share class E
Net Asset Value USD 73,685,439 - - Number of Shares in Issue 74,289,880 - -
Net asset value per share for financial statement purposes USD 0.9919 - - Add: IAS 39 valuation adjustment - - - Net asset value per share for shareholder dealing USD 0.9919 - -

SANLAM UNIVERSAL FUNDS PLC
256
NOTES TO AND FORMING PART OF THE UNAUDITED CONDENSED INTERIM FINANCIAL STATEMENTS (CONTINUED) for the six months ended 30 June 2013 11 Net asset value per share (continued)
Sanlam Accel
Income Fund
Period Ended Year Ended
Period Ended
30/06/2013 31/12/2012 30/06/2012 Share class A Net Accumulating
Net Asset Value GBP 1,327,026 - - Number of Shares in Issue 1,363,663 - -
Net asset value per share for financial statement purposes GBP 0.9746 - - Add: IAS 39 valuation adjustment - - - Net asset value per share for shareholder dealing GBP 0.9746 - - Share class A Net Income
Net Asset Value GBP 9,200,022 - - Number of Shares in Issue 9,418,495 - -
Net asset value per share for financial statement purposes GBP 0.9783 - - Add: IAS 39 valuation adjustment - - - Net asset value per share for shareholder dealing GBP 0.9783 - -

SANLAM UNIVERSAL FUNDS PLC
257
NOTES TO AND FORMING PART OF THE UNAUDITED CONDENSED INTERIM FINANCIAL STATEMENTS (CONTINUED) for the six months ended 30 June 2013 11 Net asset value per share (continued)
Sanlam North America
Equity Tracker Fund
Period Ended Year Ended
Period Ended
30/06/2013 31/12/2012 30/06/2012 Share class A
Net Asset Value USD 98 - - Number of Shares in Issue 100 - -
Net asset value per share for financial statement purposes USD 0.9766 - - Add: IAS 39 valuation adjustment - - - Net asset value per share for shareholder dealing USD 0.9766 - -
Share class E
Net Asset Value USD 85,775,819 - - Number of Shares in Issue 88,221,089 - -
Net asset value per share for financial statement purposes USD 0.9723 - - Add: IAS 39 valuation adjustment - - - Net asset value per share for shareholder dealing USD 0.9723 - - Share class I
Net Asset Value USD 98 - - Number of Shares in Issue 100 - -
Net asset value per share for financial statement purposes USD 97.66 - - Add: IAS 39 valuation adjustment - - - Net asset value per share for shareholder dealing USD 97.66 - - Share class I (GBP)
Net Asset Value GBP 100 - - Number of Shares in Issue 100 - -
Net asset value per share for financial statement purposes GBP 1.0042 - - Add: IAS 39 valuation adjustment - - - Net asset value per share for shareholder dealing GBP 1.0042 - -

SANLAM UNIVERSAL FUNDS PLC
258
NOTES TO AND FORMING PART OF THE UNAUDITED CONDENSED INTERIM FINANCIAL STATEMENTS (CONTINUED) for the six months ended 30 June 2013 11 Net asset value per share (continued)
Sanlam UK Equity
Tracker Fund
Period Ended Year Ended
Period Ended
30/06/2013 31/12/2012 30/06/2012 Share class A
Net Asset Value USD 95 - - Number of Shares in Issue 100 - -
Net asset value per share for financial statement purposes USD 0.9465 - - Add: IAS 39 valuation adjustment - - - Net asset value per share for shareholder dealing USD 0.9465 - - Share class E
Net Asset Value USD 27,872,174 - - Number of Shares in Issue 30,389,263 - -
Net asset value per share for financial statement purposes USD 0.9172 - - Add: IAS 39 valuation adjustment - - - Net asset value per share for shareholder dealing USD 0.9172 - - Share class E (GBP)
Net Asset Value GBP 94 - - Number of Shares in Issue 100 - -
Net asset value per share for financial statement purposes GBP 0.9412 - - Add: IAS 39 valuation adjustment - - - Net asset value per share for shareholder dealing GBP 0.9412 - - Share class I
Net Asset Value USD 95 - - Number of Shares in Issue 100 - -
Net asset value per share for financial statement purposes USD 0.9465 - - Add: IAS 39 valuation adjustment - - - Net asset value per share for shareholder dealing USD 0.9465 - -

SANLAM UNIVERSAL FUNDS PLC
259
NOTES TO AND FORMING PART OF THE UNAUDITED CONDENSED INTERIM FINANCIAL STATEMENTS (CONTINUED) for the six months ended 30 June 2013 11 Net asset value per share (continued)
Sanlam UK Equity
Tracker Fund (continued)
Period Ended Year Ended
Period Ended
30/06/2013 31/12/2012 30/06/2012 Share class I (GBP)
Net Asset Value GBP 97 - - Number of Shares in Issue 100 - -
Net asset value per share for financial statement purposes GBP 0.9736 - - Add: IAS 39 valuation adjustment - - - Net asset value per share for shareholder dealing GBP 0.9736 - -

SANLAM UNIVERSAL FUNDS PLC
260
NOTES TO AND FORMING PART OF THE UNAUDITED CONDENSED INTERIM FINANCIAL STATEMENTS (CONTINUED) for the six months ended 30 June 2013 11 Net asset value per share (continued)
Sanlam Europe (ex UK)
Equity Fund
Period Ended Year Ended
Period Ended
30/06/2013 31/12/2012 30/06/2012 Share class A
Net Asset Value USD 95 - - Number of Shares in Issue 100 - -
Net asset value per share for financial statement purposes USD 0.9473 - - Add: IAS 39 valuation adjustment - - - Net asset value per share for shareholder dealing USD 0.9473 - - Share class E
Net Asset Value USD 54,209,186 - - Number of Shares in Issue 57,923,195 - -
Net asset value per share for financial statement purposes USD 0.9359 - - Add: IAS 39 valuation adjustment - - - Net asset value per share for shareholder dealing USD 0.9359 - - Share class E (EUR)
Net Asset Value EUR 95 - - Number of Shares in Issue 100 - -
Net asset value per share for financial statement purposes EUR 0.9461 - - Add: IAS 39 valuation adjustment - - - Net asset value per share for shareholder dealing EUR 0.9461 - - Share class I
Net Asset Value USD 95 - - Number of Shares in Issue 100 - -
Net asset value per share for financial statement purposes USD 0.9473 - - Add: IAS 39 valuation adjustment - - - Net asset value per share for shareholder dealing USD 0.9473 - -

SANLAM UNIVERSAL FUNDS PLC
261
NOTES TO AND FORMING PART OF THE UNAUDITED CONDENSED INTERIM FINANCIAL STATEMENTS (CONTINUED) for the six months ended 30 June 2013 11 Net asset value per share (continued)
Sanlam Europe (ex UK)
Equity Fund (continued)
Period Ended Year Ended
Period Ended
30/06/2013 31/12/2012 30/06/2012 Share class I (GBP)
Net Asset Value GBP 97 - - Number of Shares in Issue 100 - -
Net asset value per share for financial statement purposes GBP 0.9740 - - Add: IAS 39 valuation adjustment - - - Net asset value per share for shareholder dealing GBP 0.9740 - -
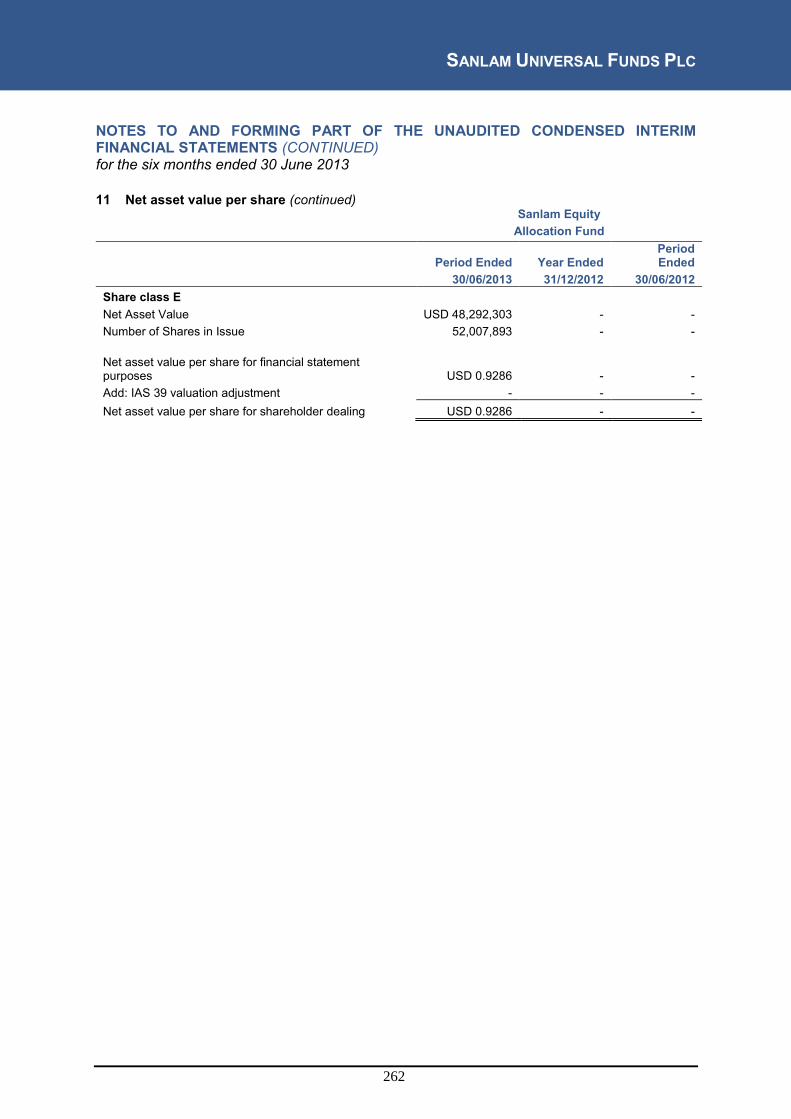
SANLAM UNIVERSAL FUNDS PLC
262
NOTES TO AND FORMING PART OF THE UNAUDITED CONDENSED INTERIM FINANCIAL STATEMENTS (CONTINUED) for the six months ended 30 June 2013 11 Net asset value per share (continued)
Sanlam Equity
Allocation Fund
Period Ended Year Ended
Period Ended
30/06/2013 31/12/2012 30/06/2012 Share class E
Net Asset Value USD 48,292,303 - - Number of Shares in Issue 52,007,893 - -
Net asset value per share for financial statement purposes USD 0.9286 - - Add: IAS 39 valuation adjustment - - - Net asset value per share for shareholder dealing USD 0.9286 - -

SANLAM UNIVERSAL FUNDS PLC
263
NOTES TO AND FORMING PART OF THE UNAUDITED CONDENSED INTERIM FINANCIAL STATEMENTS (CONTINUED) for the six months ended 30 June 2013 11 Net asset value per share (continued)
Sanlam Emerging Market
Equity Tracker Fund
Period Ended Year Ended
Period Ended
30/06/2013 31/12/2012 30/06/2012 Share class B
Net Asset Value USD 97 - - Number of Shares in Issue 100 - -
Net asset value per share for financial statement purposes USD 0.9699 - - Add: IAS 39 valuation adjustment - - - Net asset value per share for shareholder dealing USD 0.9699 - - Share class E
Net Asset Value USD 32,197,624 - - Number of Shares in Issue 35,000,000 - -
Net asset value per share for financial statement purposes USD 0.9200 - - Add: IAS 39 valuation adjustment - - - Net asset value per share for shareholder dealing USD 0.9200 - - Share class I
Net Asset Value USD 97 - - Number of Shares in Issue 100 - -
Net asset value per share for financial statement purposes USD 0.9699 - - Add: IAS 39 valuation adjustment - - - Net asset value per share for shareholder dealing USD 0.9699 - - Share class I (GBP)
Net Asset Value GBP 100 - - Number of Shares in Issue 100 - -
Net asset value per share for financial statement purposes GBP 100 - - Add: IAS 39 valuation adjustment - - - Net asset value per share for shareholder dealing GBP 100 - -

SANLAM UNIVERSAL FUNDS PLC
264
NOTES TO AND FORMING PART OF THE UNAUDITED CONDENSED INTERIM FINANCIAL STATEMENTS (CONTINUED) for the six months ended 30 June 2013 11 Net asset value per share (continued)
Sanlam Strategic
Investment Fund
Period Ended Year Ended
Period Ended
30/06/2013 31/12/2012 30/06/2012 Share class A
Net Asset Value USD 71,579 - - Number of Shares in Issue 75,500 - -
Net asset value per share for financial statement purposes USD 0.9481 - - Add: IAS 39 valuation adjustment - - - Net asset value per share for shareholder dealing USD 0.9481 - -
12 Significant events during the period
J.P. Morgan Administration Services was resigned as administrator and registrar of the Company from 31 December 2012 and Sanlam Asset Management (Ireland) Limited was appointed as Administrator and registrar effective 1 January 2013.
13 Significant events since the end of the period
There were no significant events since the end of the period. 14 Off balance sheet arrangements
The Company was not party to off balance sheet arrangements for twelve months from 01 January 2013 to 30 June 2013.
15 Approval of unaudited condensed interim financial statements
The Financial Statements were approved by the Board of Directors on 28 August 2013.

SANLAM UNIVERSAL FUNDS PLC
265
Purchases and Sales for the period ended 30 June 2013 8IP Asia Equity Opportunities Fund Purchases Cost (USD) (being the largest 20 purchases in the period to 30 June 2013) Minth Group Ltd 349,581
KWG Prop Hold Ltd 339,018
TPG Telecom Ltd 319,569
China South City 300,037
China Insurance Intn 266,261
Beijing Capital Land 258,132
Giordano Intl 236,956
Yuexiu REIT 234,813
IJM Corp Berhad 212,678
Shanghai Elec Group 209,235
Bank of China 209,139
GCL-Poly Energy Hldg 201,440
NCsoft Corp 188,978
Hopewell Holdings 184,057
China Minzhong Food 177,651
Hopewell Holdings 166,171
Agile Properties 160,010
China Insurance Intn 159,840
Atlas Iron Ltd 150,488
Great Eagle 125,888 Sales Proceeds (USD) (being the largest 20 sales in the period to 30 June 2013) PING AN INSURA-H 406,878
AIA Group Ltd 352,702
Yue Yuen Industr Hld 290,603
Yanzhou Coal Mining 273,734
China Const Ba-h 266,923
AIA Group Ltd 263,675
GCL-Poly Energy Hldg 247,317
China Const Ba-h 237,322
China Resources Ent. 233,064
CHEIL INDUS INC 229,943
CNOOC Limited 228,050
TencentHoldingsLtd 214,592
IOI Corporation 210,947
Genting Singapore 205,483
China Mobile (HK) 198,760
SK ENERGY CO 194,210
LGCorp 190,653
PetroChina Co Ltd 184,556
China Overseas Land 183,225
Leighton Hldgs 180,546

SANLAM UNIVERSAL FUNDS PLC
266
Purchases and Sales for the period ended 30 June 2013 (continued) 8IP Asia Pacific Equity Fund Purchases Cost (USD) (being the largest 20 purchases in the period to 30 June 2013) TPG Telecom Ltd 276,472 Shanghai Electric Group 220,952 Bank of China 220,394 China Overseas Land 217,105 China South City 215,538 Yuexiu Reit Mtn Co Ltd 211,671 IJM Corp Berhad 200,793 Macquarie Atlas Roads Group 187,424 Beijing Capital Land Ltd 185,267 NCsoft Corp 179,700 China Insurance International Holdings Co Ltd 176,243 Hopewell Holdings Ltd 175,103 GCL-Poly Energy Holdings Ltd 168,985 Agile Properties Holdings Ltd 167,816 China Minzhong Food Corp Ltd 167,512 Minth Group Ltd 160,621 Osaka Securities Exchange 157,695 China Insurance International Holdings Co Ltd 157,280 KWG Property Holdings Ltd 142,380 Great Eagle Holdings Ltd 133,107 Sales Proceeds (USD) (being the largest 20 sales in the period to 30 June 2013) Mizuho Financial Group 412,810 Orix Corp 274,598 Genting Singapore PLC 222,307 China Construction Bank 222,211 IOI Corp 219,573 Woodside Petroleum Ltd 211,916 Yue Yuen Industrial Holdings Ltd 209,111 Orix Corp 206,436 Nomura Securities Co Ltd 203,299 China Cosco Holdings Co Ltd 202,177 SK Energy Co Ltd 192,378 Cheil Industries Inc 189,848 Kasikornbank PCL 188,399 GCL-Poly Energy Holdings Ltd 187,906 Cnooc Ltd 182,892 Fortescue Metals Group Ltd 179,045 SBI Holdings Inc 177,553 Tencent Holdings Ltd 160,944 AIA Group Ltd 155,703 Yanzhou Coal Mining Co 154,340

SANLAM UNIVERSAL FUNDS PLC
267
Purchases and Sales for the period ended 30 June 2013 (continued) Centre Global Equity Fund Purchases Cost (USD) (being the largest 20 purchases in the period to 30 June 2013) CVS Caremark Corp 418,235 Daiwa 329,985 Nomura Securities Co Ltd 297,244 Muenchener Rueckversicherungs 289,905 Mastercard Inc 262,986 Canon Inc 258,116 Imperial Tobacco Group PLC 256,934 L'oreal 238,585 Reliance Industries Ltd 234,495 Apple Inc 229,017 Cheung Kong Holdings Ltd 227,497 HDFC Bank ADR 224,611 China Shenhua Energy Co Ltd 222,078 Mediatek Inc 207,983 Companhia de Saneamento Basico 201,801 Samsung Electronics Co Ltd 199,339 Cosan SA Industria E Comercio 184,582 Turkiye Garanti Bankasi 172,243 Australia And New Zealand Bank 167,434 Danone 163,975 Sales Proceeds (USD) (being the largest 20 sales in the period to 30 June 2013) CVS Caremark Corp 473,600 Want Want China Holdings Ltd 389,466 Walt Disney Co 358,943 Whole Foods Market Inc 315,682 Home Depot 303,136 CCR SA 286,173 Allianz SE 276,084 Companhia de Saneamento Basico 270,789 Delta Electronics Inc 270,126 Intel Corp 262,350 Apple Inc 251,124 Philip Morris International Inc 243,291 Industrial & Commercial Bank of China 242,340 Banco Santander SA 237,202 Infosys Technologies Ltd 236,224 Statoil ASA 231,071 ASML Holding NV 230,446 Sap AG 229,779 Eni SpA 220,716 Common wealth Bank 220,643

SANLAM UNIVERSAL FUNDS PLC
268
Purchases and Sales for the period ended 30 June 2013 (continued) Grindrod International Property Fund Purchases Cost (USD) (being the largest 20 purchases in the period to 30 June 2013) Prologis Inc 195,823 Cubesmart 172,170 Health Care Reit Inc 167,654 Unibail-Rodamco SE 160,061 Digital Realty Trust Inc 154,242 Post Properties Inc 130,762 Glimcher Realty Trust 129,684 Liberty Property Trust 127,491 BioMedical Realty Trust Inc 120,028 Healthcare Realty Trust Inc 118,292 Glimcher Realty Trust 114,222 Regency Centers Corp 112,898 BioMed Realty Trust 110,541 Duke Realty Corp 109,944 Campus Crest Communities Inc 106,235 Macerich Co 104,897 Realty Income Corp 104,675 Realty Income Corp 103,238 Kimco Realty Corp 103,147 Kimco Realty Corp 99,298

SANLAM UNIVERSAL FUNDS PLC
269
Purchases and Sales for the period ended 30 June 2013 (continued) P-Solve Inflation Plus Fund Purchases Coupon Maturity Cost (USD) (being the largest 20 purchases in the period to 30 June 2013)
Institutional Cash Series
3,083,200 UK Treasury Index Linked Bond 1.75% 07/09/2022 2,529,893 Vanguard S&P 500 ETF
1,406,496
iShares Europe Ex-UK
1,226,646 iShares Europe Ex-UK
1,222,133
ishares PLC-FTSE100
1,220,283 ishares PLC-FTSE101
1,218,687
Vanguard S&P 500 ETF
1,203,705 iShares MSCI Japan Monthly
1,198,281
Vanguard S&P 500 ETF
1,186,337 Vanguard S&P 500 ETF
1,161,125
Vanguard S&P 500 ETF
1,087,578 Vanguard S&P 500 ETF
1,051,240
Vangrd FTSE Emerging Markets EFT
1,030,932 iShares Core MSCI Emerging Markets
1,018,373
IShares IBoxx H/Y Corp Bond
1,016,680 iShares Europe Ex-UK
971,067
Vangruad FTSE 100 ETF
911,046 Vangruad FTSE 100 ETF
908,361
iShares MSCI Japan Monthly
807,363 Sales Coupon Maturity Cost (USD) (being the largest 20 sales in the period to 30 June 2013)
iShares Europe Ex-UK
2,642,683 Vangrd FTSE Emerging Markets EFT
2,458,308
Source Physical Gold P ETC
2,233,611 iShares Markit iBoxx
1,624,683
Institutional Cash Series PLC
1,495,000 iShares S&P North American Natural Resources
1,076,908
Australia Government Bond 5.50% 15/12/2013 1,062,229 Bundesrep Deutschland 3.75% 15/07/2013 1,033,205 IShares IBoxx H/Y Corp Bond
1,015,589
Australia Government Bond 5.50% 15/12/2013 1,012,852 Source Physical Gold P ETC
981,859
Source Physical Gold P ETC
976,214 GLG Treasury Plus Fund
954,751
Pimco-Hi Yield Bond
929,000 RSA 7.50% 15/01/2014 887,463 Pimco-Hi Yield Bond
790,000
Pimco-Hi Yield Bond
559,070 Pimco Global Investment Grade Fund
527,000
iShares iii PLC
487,911 New Zealand Government Bond 6.50% 15/04/2013 477,781

SANLAM UNIVERSAL FUNDS PLC
270
Purchases and Sales for the period ended 30 June 2013 (continued) Sanlam African Frontier Markets Fund Purchases Cost (USD) (being the largest 20 purchases in the period to 30 June 2013) Guinness Nigeria PLC 12,075 United Bank for Africa 347,720 Diamond Bank PLC 157,819 Diamond Bank PLC 244,776 UBA Registrars Ltd 19,558 UBA Capital PLC 56,682 Letshego Holdings Ltd 271,533 Sales Proceeds (USD) (being the largest 20 sales in the period to 30 June 2013) West African Portland Cement Co 272,036 United Bank for Africa 259,327 United Bank for Africa 232,449 FBN Holdings PLC 216,507 United Bank for Africa 165,698 United Bank for Africa 140,000 United Bank for Africa 75,729 United Bank for Africa 75,294 United Bank for Africa 55,100 United Bank for Africa 53,286 UBA Capital PLC 43,367 United Bank for Africa 27,313 United Bank for Africa 24,329 UBA Capital PLC 18,464 UBA Registrars Ltd 11,003 UBA Registrars Ltd 8,592

SANLAM UNIVERSAL FUNDS PLC
271
Purchases and Sales for the period ended 30 June 2013 (continued) Sanlam Global Best Ideas Fund Purchases Cost (USD) (being the largest 20 purchases in the period to 30 June 2013) SPDR Trust Series 1 24,986,822 Caterpillar Inc 11,056,637 Samsung Electronics Co Ltd 9,455,629 Deere & Co 7,448,907 Nokiaan Renkaat OYJ 6,538,476 Sberbank of Russia ADR 5,834,640 Sberbank of Russia ADR 5,726,772 Samsung Electronics Co Ltd 4,616,699 Bank of Georgia 3,569,020 Sberbank of Russia ADR 3,056,573 China Construction Bank 2,947,042 American International Group 2,776,100 ICL-Israel Chemicals Ltd 2,560,752 China Construction Bank 2,529,928 Ing Groep NV 2,493,708 Potash Corp of Saskatchewan 2,468,842 Ing Groep NV 2,457,480 Bank Rakyat Indonesia 2,452,780 American International Group Inc 2,412,097 American International Group Inc 2,270,630 Sales Proceeds (USD) (being the largest 20 sales in the period to 30 June 2013) SPDR Trust Series 1 13,112,100 SPDR Trust Series 1 11,089,761 Ahold (Kon) 9,121,594 China Const Ba-h 7,930,265 Citigroup Inc 7,504,455 Sberbank of Russ GDR 5,771,220 Sberbank of Russ GDR 5,659,848 Ing Groep Nv 5,503,215 Sberbank of Russ ADR 4,864,973 Caterpillar Inc 4,389,520 Sberbank of Russ GDR 4,356,818 Bank Rakyat Indonesa 3,872,580 JP Morgan Chase & Co 3,795,496 Hana Financial 2,805,688 Amlin Plc 2,672,637 Ing Groep Nv 2,613,659 Catlin Group Ltd 2,531,333 Ahold (Kon) 2,514,799 Berkshire Hath-B 2,480,853 Ing Groep Nv 2,282,810

SANLAM UNIVERSAL FUNDS PLC
272
Purchases and Sales for the period ended 30 June 2013 (continued) Sanlam Global Bond Fund Purchases Coupon Maturity Cost (USD) (being the largest 20 purchases in the period to 30 June 2013)
Blackrock Investment Management UK Ltd
12,966,821 Blackrock Investment Management UK Ltd
12,001,622
Blackrock Investment Management UK Ltd
8,132,463 Japan Government Bond 0.10% 15/02/2014 8,024,348 Federal National Mortgage Association 5.50% 15/04/2036 6,285,600 Federal National Mortgage Association 5.50% 15/04/2036 6,266,747 Federal National Mortgage Association 5.50% 15/02/2038 6,256,350 Federal National Mortgage Association 5.50% 15/02/2038 6,256,350 Federal National Mortgage Association 5.50% 15/06/2034 6,249,661 Federal National Mortgage Association 5.50% 01/05/2034 6,215,672 Blackrock Investment Management UK Ltd
6,197,454
Federal National Mortgage Association 5.50% 15/03/2037 6,191,180 Federal National Mortgage Association 5.50% 15/06/2034 6,180,047 Federal National Mortgage Association 5.50% 15/03/2037 6,138,788 Federal National Mortgage Association 5.50% 01/05/2034 6,124,688 Gaz Cap 3.38% 20/03/2020 5,497,281 Blackrock Investment Management UK Ltd
5,496,494
Blackrock Investment Management UK Ltd
4,831,650 Blackrock Investment Management UK Ltd
4,478,611
Buoni 4.75% 01/09/2028 3,671,206 Sales Coupon Maturity Cost (USD) (being the largest 20 sales in the period to 30 June 2013)
Blackrock Investment Management UK Ltd
9,568,567 Blackrock Investment Management UK Ltd
6,597,337
Federal National Mortgage Association 5.50% 15/04/2036 6,285,150 Blackrock Investment Management UK Ltd
6,187,332
Federal National Mortgage Association 5.50% 15/06/2034 6,180,047 Federal National Mortgage Association 5.50% 15/03./2037 6,138,788 Federal National Mortgage Association 5.50% 01/05/2034 6,124,688 Blackrock Investment Management UK Ltd
6,116,217
International Financial Institutions 3.00% 22/04/2014 5,601,837 Blackrock Investment Management UK Ltd
5,159,433
Blackrock Investment Management UK Ltd
4,826,705 KFW Bank 1.88% 16/11/2015 4,583,732 Blackrock Investment Management UK Ltd
3,758,299
Japan Government Bonds 2.10% 20/12/2027 3,680,264 Blackrock Investment Management UK Ltd
3,447,350
Blackrock Investment Management UK Ltd
3,446,699 Government National Mortgage Association 5.00% 15/01/2034 3,377,063 Government National Mortgage Association 5.00% 15/03/2034 3,375,609 Government National Mortgage Association 5.00% 15/03/2034 3,371,492 Government National Mortgage Association 5.00% 15/02/2034 3,370,523

SANLAM UNIVERSAL FUNDS PLC
273
Purchases and Sales for the period ended 30 June 2013 (continued) Sanlam Global Financial Fund Purchases Cost (USD) (being the largest 20 purchases in the period to 30 June 2013) JP Morgan Chase & Co 6,009,083 Commerzbank AG 5,284,406 Ing Groep NV 4,714,188 Sberbank of Russia ADR 4,584,360 Sberbank of Russia ADR 4,335,515 American International Group 3,599,063 Deutsche Bank 3,503,089 Axis Bank Ltd 3,370,305 Banco Itau Holding SA 3,196,489 Zurich Financial Services 3,106,595 Societe Generale 2,988,348 Bank of China 2,821,388 Power Financial Corp 2,773,900 China Construction Bank 2,694,439 Legal & General Group 2,557,509 Sberbank of Russia ADR 2,484,061 Resona Holdings Inc 2,319,982 Commerzbank AG 2,291,766 Commerzbank AG 2,244,500 Barclays PLC 2,241,501 Sales Proceeds (USD) (being the largest 20 sales in the period to 30 June 2013) Deutsche Bank AG 6,509,384 Hana Financial 6,248,513 Legal & General Group 5,840,293 Citigroup Inc 5,766,135 Commerzbank AG 5,474,036 Resona Holdings Inc 5,060,831 Bank Rakyat Indonesia 4,780,586 Bank of China 4,686,509 Sberbank of Russia 4,534,530 Sberbank of Russia 4,284,849 Commerzbank AG 4,012,953 Morgan Stanley 3,985,795 Unicredit Spa 3,831,431 Banco Espirito 3,716,246 Erste Group Bank AG 3,526,741 JP Morgan Chase & Co 3,485,374 Intesa Sanpaolo SPA 3,425,440 Axis Bank Limited 3,384,948 JP Morgan Chase & Co 3,349,520 Hana Financial 3,337,672

SANLAM UNIVERSAL FUNDS PLC
274
Purchases and Sales for the period ended 30 June 2013 (continued) Sanlam Global Property Fund Purchases Cost (USD) (being the largest 20 purchases in the period to 30 June 2013) Mitsubishi Estate Co Ltd 2,537,083 Mitsui Fudosan Co Ltd 2,183,887 Unibail-Rodamco SE 2,098,189 Westfield Group 1,645,468 Sun Hung Kai Properties Ltd 1,561,577 Sumitomo Realty & Development Co 1,479,169 HCP Inc 1,337,578 Health Care Reit Inc 1,312,701 Wharf Holdings Ltd 1,246,852 Ventas Inc 1,245,308 Parkway Properties Ltd 1,176,458 Seaworld Entertainment Inc 1,155,456 Westfield Retail Trust 1,117,200 Simon Property Group Inc 1,071,808 Stockland Trust 1,005,016 Icade 943,353 lEG Immobilien Management GMBH 923,867 British Land Co Ltd 923,865 Prologis Inc 901,146 lEG Immobilien Management GMBH 851,867 Sales Proceeds (USD) (being the largest 20 sales in the period to 30 June 2013) Mitsubishi Estate Co Ltd 1,272,979 West Fraser Timber Co Ltd 1,238,829 Mitsubishi Estate Co Ltd 1,053,954 DDR Corp 812,454 DDR Corp 786,528 Spirit Realty Capital Inc 781,020 General Growth Properites Inc 676,539 NVR Inc 664,809 Chambers Street Properties Inc 631,144 Spirit Realty Capital Inc 616,630 Commonwealth Properites Inc 612,883 Ryman Hospitality Properties Inc 599,899 American Realty Capital Properties Inc 580,710 Global Logistic Properties Ltd 559,658 Simon Property Group 541,086 Swire Properties Ltd 541,078 Sovran Self Storage Inc 539,460 Kerry Properties Ltd 516,232 Parkway Properties Ltd 487,934 Pulte Group Inc 484,130

SANLAM UNIVERSAL FUNDS PLC
275
Purchases and Sales for the period ended 30 June 2013 (continued) Sanlam Strategic Cash Fund Purchases Coupon Maturity Cost (USD) (being the largest 20 purchases in the period to 30 June 2013)
US Department of The Treasury 0.00% 25/07/2013 2,199,966 US Department of The Treasury 0.00% 25/04/2013 1,699,811 US Department of The Treasury 0.00% 27/06/2013 1,699,534 US Department of The Treasury 0.00% 25/07/2013 1,699,412 US Department of The Treasury 0.00% 29/08/2013 1,699,178 US Department of The Treasury 0.00% 26/09/2013 1,699,089 US Department of The Treasury 0.00% 28/03/2013 1,299,898 US Department of The Treasury 0.00% 30/05/2013 1,199,917 US Department of The Treasury 0.00% 27/06/2013 999,994 US Department of The Treasury 0.00% 28/02/2013 999,983 US Department of The Treasury 0.00% 25/04/2013 999,794 Daimler Group 1.95% 28/03/2014 962,075 Deutsche Bank AG London Branch
952,936
Elec & Eltek International Co Ltd 5.50% 26/01/2014 935,235 Citi group 6.50% 19/08/2013 918,414 Abbey National Treasury Services PLC 2.88% 25/04/2014 915,579 ANZ International 6.20% 19/07/2013 911,700 Volkswagen international 1.63% 12/08/2013 903,699 Paine 7.63% 15/02/2014 847,176 US Department of The Treasury 0.00% 25/04/2013 799,894 Sales Coupon Maturity Cost (USD) (being the largest 20 sales in the period to 30 June 2013)
US Department of The Treasury 0.00% 27/06/2013 1,699,793 US Department of The Treasury 0.00% 25/07/2013 1,699,705 US Department of The Treasury 0.00% 26/09/2013 1,699,316 US Department of The Treasury 0.00% 29/08/2013 1,399,660 US Department of The Treasury 0.00% 25/07/2013 1,199,955 US Department of The Treasury 0.00% 07/03/2013 999,947 US Department of The Treasury 0.00% 28/02/2013 699,968 US Department of The Treasury 0.00% 21/03/2013 549,953 US Department of The Treasury 0.00% 27/06/2013 399,985 US Department of The Treasury 0.00% 29/08/2013 299,873

SANLAM UNIVERSAL FUNDS PLC
276
Purchases and Sales for the period ended 30 June 2013 (continued) Sanlam World Equity Fund Purchases Cost (USD) (being the largest 20 purchases in the period to 30 June 2013) Express Scripts Inc 5,188,241 Biogen Idec Inc 4,794,144 Nike Inc 4,543,042 Eog Resources Inc 4,127,789 Gilead Sciences Inc 3,963,219 Express Scripts Inc 3,811,845 Philip Morris Int 3,630,237 CVS Caremark Corp 3,614,639 VeriFone Holdings Inc 3,570,368 Eldorado Gold Corp 3,479,660 Becton Dickinson and Co 3,374,115 Broadcom Corp 3,358,540 Bemis Company Inc 3,341,817 American International Group Inc 3,338,414 Steel Dynamics Inc 3,325,170 Maxim Integrated 3,314,602 NRG Energy Inc 3,299,319 Netapp Inc 3,249,147 AbbVie Inc 3,238,215 Alcoa Inc 3,227,535 Sales Proceeds (USD) (being the largest 20 sales in the period to 30 June 2013) William Hill PLC 4,632,114 Intuit Inc 4,580,896 Cognizant Technology Solutions 4,526,038 Apple Inc 4,478,351 Mastercard Inc 4,435,780 Abbott Laboratories 4,276,922 Want Want China Holdings Ltd 4,138,296 Cintas Corp 4,066,101 Sap AgG 4,003,499 Merck & Co Inc 3,949,637 Omnicom Group 3,843,198 Verizon Commercial 3,840,388 Huntsman Corp 3,686,112 Gilead Sciences Inc 3,663,882 Total System Services Inc 3,627,444 Suncor Energy Inc 3,596,641 Philip Morris International Inc 3,595,677 Robert Half International Inc 3,572,627 Varian Medical Systems Inc 3,513,884 Caterpillar Inc 3,504,753

SANLAM UNIVERSAL FUNDS PLC
277
Purchases and Sales for the period ended 30 June 2013 (continued) Sanlam World Equity Tracker Fund Purchases Cost (USD) (being the largest 20 purchases in the period to 30 June 2013) Ishares S&P 500 Index Fund 2,731,188 Ishares MSCI EAFE Index Fund 2,357,327 Ishares S&P 500 Index Fund 1,533,615 Ishares S&P 500 Index Fund 1,089,675 Ishares S&P 500 Index Fund 957,695 Ishares MSCI EAFE Index Fund 897,420 Ishares S&P 500 Index Fund 862,901 Ishares S&P 500 Index Fund 839,544 Ishares S&P 500 Index Fund 818,726 Ishares MSCI EAFE Index Fund 811,293 Ishares MSCI EAFE Index Fund 810,296 Ishares S&P 500 Index Fund 801,931 Ishares MSCI EAFE Index Fund 678,627 Ishares MSCI EAFE Index Fund 623,797 Ishares MSCI EAFE Index Fund 616,334 Ishares MSCI EAFE Index Fund 612,541 Ishares S&P 500 Index Fund 564,383 Ishares MSCI EAFE Index Fund 549,264 Ishares S&P 500 Index Fund 528,963 Ishares S&P 500 Index Fund 512,769 Sales Proceeds (USD) (being the largest 20 sales in the period to 30 June 2013) Ishares S&P 500 Index Fund 3,423,173 Ishares S&P 500 Index Fund 3,351,467 Ishares S&P 500 Index Fund 3,063,381 Ishares MSCI EAFE Index Fund 3,010,291 Ishares MSCI EAFE Index Fund 2,631,131 Ishares MSCI EAFE Index Fund 2,369,954 Ishares S&P 500 Index Fund 2,131,500 Ishares S&P 500 Index Fund 1,803,559 Ishares MSCI EAFE Index Fund 1,705,685 Ishares MSCI EAFE Index Fund 1,562,050 Ishares MSCI EAFE Index Fund 1,391,655 Ishares MSCI EAFE Index Fund 1,257,914 Ishares S&P 500 Index Fund 1,252,508 Ishares S&P 500 Index Fund 1,070,859 Ishares S&P 500 Index Fund 1,044,016 Ishares MSCI EAFE Index Fund 1,040,995 Ishares S&P 500 Index Fund 981,714 Ishares MSCI EAFE Index Fund 927,732 Ishares S&P 500 Index Fund 879,828 Ishares MSCI EAFE Index Fund 783,930

SANLAM UNIVERSAL FUNDS PLC
278
Purchases and Sales for the period ended 30 June 2013 (continued) SIIP India Opportunities Fund Purchases Cost (USD) (being the largest 20 purchases in the period to 30 June 2013) Dabur India Ltd 197,369 Hindustan Petro Corp 193,571 Jaiprakash Associates Ltd 186,309 Zydus Wellness Ltd 182,590 Shriram Transport Co Ltd 181,783 Cadila Healthcare Ltd 178,802 NTPC Ltd 153,446 Ranbaxy Laboratories Ltd 153,050 United Spirits Ltd 147,965 HCL Technololgies Ltd 147,151 Bata India Ltd 146,991 Bharat Petro Corp 146,461 Oil India Ltd 141,333 Lupin Ltd 138,409 Persistent Systems Ltd 135,686 Godrej Consumer Products Ltd 125,135 Infosys Ltd 123,476 Sun Pharmaceutical Industries Ltd 120,870 Gujarat Pipavav Port Ltd 118,562 Sobha Developers Ltd 110,729 Sales Proceeds (USD) (being the largest 20 sales in the period to 30 June 2013) Bajaj Auto Ltd 297,574 LIC Housing Finance Ltd 243,893 Acc Ltd 236,531 Cummins India Ltd 232,594 Persistent Systems Ltd 228,456 NTPC Ltd 220,767 Crisil Ltd 219,836 TTK Healthcare Ltd 212,641 Tata Motors Ltd 192,630 Tata Steel Ltd 189,353 Britannia Industries Ltd 187,652 Multi Commodity Exchange of India Ltd 184,060 Exide Industries Ltd 177,949 Jubilant Foodworks Ltd 174,439 Ranbaxy Lab Ltd 162,956 Strides Arcolab Ltd 145,425 Divi's Laborator Ltd 139,381 Gujarat Mineral Development Corp 116,567 Gujarat Mineral Development Corp 96,487 Wockhardt Ltd 84,458
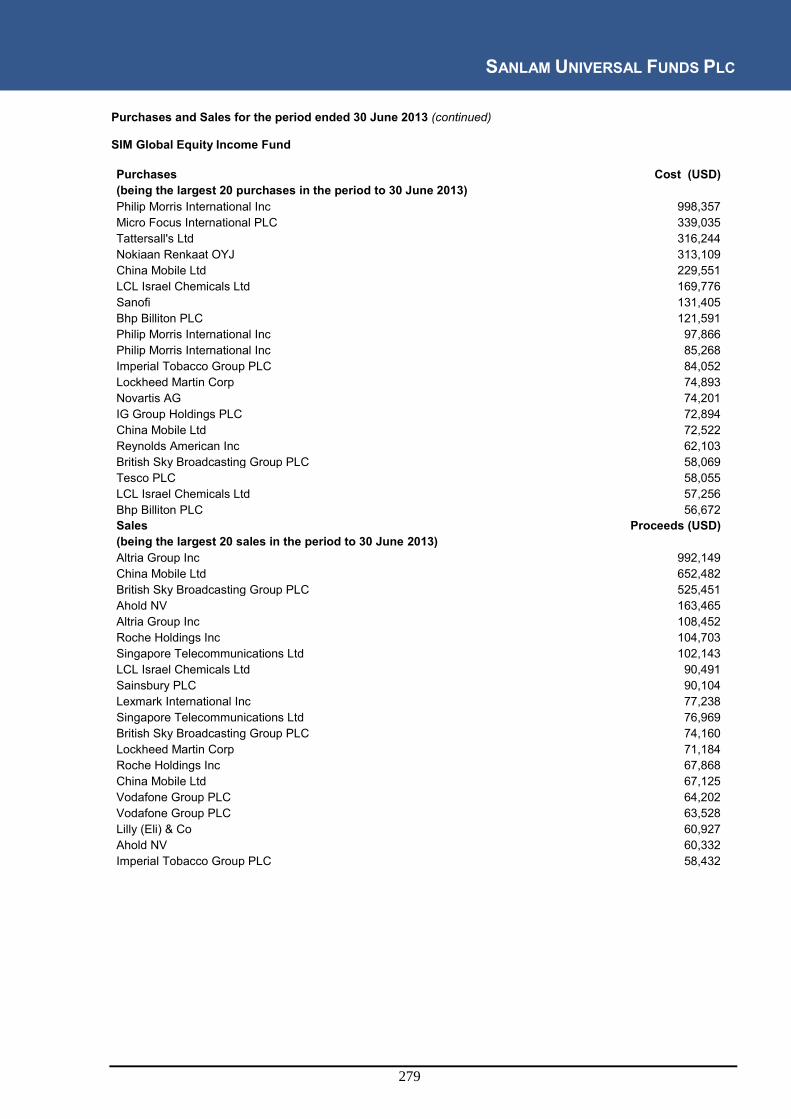
SANLAM UNIVERSAL FUNDS PLC
279
Purchases and Sales for the period ended 30 June 2013 (continued) SIM Global Equity Income Fund Purchases Cost (USD) (being the largest 20 purchases in the period to 30 June 2013) Philip Morris International Inc 998,357 Micro Focus International PLC 339,035 Tattersall's Ltd 316,244 Nokiaan Renkaat OYJ 313,109 China Mobile Ltd 229,551 LCL Israel Chemicals Ltd 169,776 Sanofi 131,405 Bhp Billiton PLC 121,591 Philip Morris International Inc 97,866 Philip Morris International Inc 85,268 Imperial Tobacco Group PLC 84,052 Lockheed Martin Corp 74,893 Novartis AG 74,201 IG Group Holdings PLC 72,894 China Mobile Ltd 72,522 Reynolds American Inc 62,103 British Sky Broadcasting Group PLC 58,069 Tesco PLC 58,055 LCL Israel Chemicals Ltd 57,256 Bhp Billiton PLC 56,672 Sales Proceeds (USD) (being the largest 20 sales in the period to 30 June 2013) Altria Group Inc 992,149 China Mobile Ltd 652,482 British Sky Broadcasting Group PLC 525,451 Ahold NV 163,465 Altria Group Inc 108,452 Roche Holdings Inc 104,703 Singapore Telecommunications Ltd 102,143 LCL Israel Chemicals Ltd 90,491 Sainsbury PLC 90,104 Lexmark International Inc 77,238 Singapore Telecommunications Ltd 76,969 British Sky Broadcasting Group PLC 74,160 Lockheed Martin Corp 71,184 Roche Holdings Inc 67,868 China Mobile Ltd 67,125 Vodafone Group PLC 64,202 Vodafone Group PLC 63,528 Lilly (Eli) & Co 60,927 Ahold NV 60,332 Imperial Tobacco Group PLC 58,432

SANLAM UNIVERSAL FUNDS PLC
280
Purchases and Sales for the period ended 30 June 2013 (continued) SPI Strategic Investment Grade Bond Fund Purchases Coupon Maturity Cost (USD) (being the largest 20 purchases in the period to 30 June 2013)
UK Governement Bond 4.5% 4.50% 4,901,720 US Department of The Treasury 5.00% 07/09/2014 4,800,825 UK Governement Bond 4.5% 4.25% 4,710,560 UK Gilt Index-Linked Stock 2.50% 01/04/2020 3,761,370 US Department of The Treasury 3.60% 15/02/2021 3,612,990 ILB TSY Floating 26/07/2016 3,442,770 ILB TSY Floating 26/07/2016 2,751,280 UK TB 5.00% 07/03/2025 2,738,802 ILB UK Government 22/07/2030 2,662,824 TeleCommunication Systems Inc 4.75% 07/12/2038 2,543,900 TeleCommunication Systems Inc 4.25% 07/03/2036 2,495,218 UK Government Bond 01/03/2020 2,470,580 UK Government Bond 4.50% 07/09/2034 2,461,704 UK Gilt Ind Link 2.50% 01/07/2024 2,444,470 UK Gilt Index-Linked Stock 2.50% 01/04/2020 2,439,593 TeleCommunication Systems Inc 4.25% 01/12/2027 2,428,960 UK Government Bond 2,411,980 UK Governement Bond 4.5% 4.25% 2,374,180 UK TB 4.25% 07/06/2032 2,307,800 GE Cap 5.60% 25/04/2019 2,306,700 Sales Coupon Maturity Cost (USD) (being the largest 20 sales in the period to 30 June 2013)
UK Governement Bond 4.5% 4.50% 4,892,000 UK Governement Bond 4.25% 4.25% 4,695,640 UK Gilt Index-Linked Stock 2.50% 01/04/2020 3,744,000 ILB TSY Floating 26/07/2016 3,433,640 ILB TSY Floating 26/07/2016 2,739,992 ILB UK Government 22/07/2030 2,646,880 UK Government Bond 01/03/2020 2,484,720 TeleCommunication Systems Inc 4.25% 01/12/2027 2,466,040 UK Gilt Index-Linked Stock 2.50% 01/04/2020 2,371,200 US Department of The Treasury 5.00% 07/09/2014 2,345,926 UK Gilt Index-Linked Stock 2.50% 01/07/2024 2,311,323 TeleCommunication Systems Inc 4.00% 07/09/2016 2,242,120 European Investment Bank 3.00% 04/02/2020 2,154,123 UK Governement Bond 4.25% 4.25% 2,028,899 UK Gilt Index-Linked Stock 2.50% 01/04/2020 1,918,050 Queen Tresuryy 6.00% 21/07/2022 1,883,221 USA Treasury 3.63% 01/04/2028 1,846,230 Russia Government Bond 7.85% 10/03/2018 1,822,216 TeleCommunication Systems Inc 4.25% 01/12/2027 1,795,845 UK TB 5.00% 17/03/2025 1,788,318

SANLAM UNIVERSAL FUNDS PLC
281
Purchases and Sales for the period ended 30 June 2013 (continued) Sanlam Fund of Alternative UCITS Fund Purchases Cost (USD) (being the largest 20 purchases in the period to 30 June 2013) Absolute Insight Emerging Market Debt Fund 5,000,000 Select Equity UCITS 5,000,000 Henderson Gartmore Fund 2,750,000 Cazenove Absolute UK Dynamics Fund 2,545,039 Henderson Gartmore Fund 2,500,000 GLG Investments VI PLC 2,500,000 GLG Investments VI PLC 2,500,000 CCP Quantitative Ucits Faraday 2,500,000 Lombard Odier funds 2,500,000 Skyline Ucits Fund 2,470,443 CCP Quant Ucits Faraway 2,055,868 Swiss Hedge Luxtrade 2,020,720 GAM Star Fund PLC 2,000,000 Aspect Ucits Funds 2,000,000 Skyline Ucits Fund 1,971,171 Lombard Odier funds 1,900,000 Skyline Ucits Fund 1,884,375 Henderson Gartmore Fund 1,500,000 Absolute Insight Emerging Market Debt Fund 1,500,000 GLG Investment VI PLC 1,500,000 Sales Proceeds (USD) (being the largest 20 sales in the period to 30 June 2013) Henderson Gartmore Fund 2,000,000 Aspect Ucits Funds 2,000,000 Swiss Hedge Luxtrade 994,626 Aspect Ucits Funds - Aspect Ucits Funds -

SANLAM UNIVERSAL FUNDS PLC
282
Purchases and Sales for the period ended 30 June 2013 (continued) Sanlam Accel Income Fund Purchases Cost (USD) (being the largest 20 purchases in the period to 30 June 2013) Veritas Funds Global Equity Income 250,000 SPI Strategic Investment Grade Bond 200,000 Henderson UK Equity Income Fund 150,000 Henderson UK & Europe Funds - Strategic Bond Fund 150,000 Cazenove UK Equity Income Fund 150,000 Cazenove UK Equity Income Fund 150,000 Cazenove Strategic Bond Fund 150,000 Vanguard UK Government Bond 150,000 Invesco Perp Corp Bond 150,000 SPI Strategic Investment Grade Bond 150,000 Lazard Investment Fund Global Equity Income 150,000 Trojan Investment - Inc Fund 140,000 Trojan Investment - Inc Fund 140,000 Lazard Investment Fund Global Equity Income 140,000 Artemis Income Fund 135,000 Henderson UK & Europe Funds - Strategic Bond Fund 125,000 Veritas Fund Global Equity Income Fund 125,000 Lazard Investment Fund Global Equity Income 125,000 Cazenove Strategic Bond Fund 120,000 Vanguard UK Government Bond 120,000 Sales Proceeds (USD) (being the largest 20 sales in the period to 30 June 2013) Fidelity UK Corp Bond 40,000 Veritas Funds Global Equity Income 97,939 Invesco Perp High Income Fund 40,000 JP Morgan Funds - Global Corp Bond Fund 75,000

SANLAM UNIVERSAL FUNDS PLC
283
Purchases and Sales for the period ended 30 June 2013 (continued) Sanlam North America Equity Tracker Fund Purchases Cost (USD) (being the largest 20 purchases in the period to 30 June 2013) SPDR Trust Series 1 88,221,089 Exxon Corp 2,287,387 Apple Inc 2,280,077 Apple Inc 2,252,145 Exxon Corp 2,191,565 Microsoft Corp 1,427,793 Johnson & Johnson 1,370,690 Google Inc 1,364,676 General Electric Co 1,352,103 Microsoft Corp 1,342,039 Chevron Corp 1,337,119 General Electric Co 1,288,027 Chevron Corp 1,286,855 Johnson & Johnson 1,245,841 Procter & Gamble Co 1,233,597 Google Inc 1,222,596 International Business Machine 1,191,455 Pfizer Inc 1,189,199 International Business Machine 1,172,613 AT & T Inc 1,153,297 Sales Proceeds (USD) (being the largest 20 sales in the period to 30 June 2013) SPDR Trust Series 1 83,059,950 SPDR Trust Series 1 5,631,540 Apple Inc 2,280,077 Exxon Corp 2,191,565 Microsoft Corp 1,342,039 General Electric Co 1,288,027 Chevron Corp 1,286,855 Johnson & Johnson 1,245,841 Google Inc 1,222,596 International Business Machine 1,172,613 AT & T Inc 1,095,382 Procter & Gamble Co 1,090,434 Pfizer Inc 1,081,811 Wells Fargo & Co 1,024,607 JP Morgan Chase & Co 1,007,221 Coca-Cola Co 873,855 Philip Morris International Inc 801,550 Verizon Commercial 777,822 Citigroup Inc 759,815 Bank of America Corp 739,133

SANLAM UNIVERSAL FUNDS PLC
284
Purchases and Sales for the period ended 30 June 2013 (continued) Sanlam UK Equity Tracker Fund Purchases Cost (USD) (being the largest 20 purchases in the period to 30 June 2013) iShares MSCI Europe 20,038,987 HSBC Holdings PLC 1,618,173 HSBC Holdings PLC 1,557,701 Vodafone Group PLC 1,114,635 Vodafone Group PLC 1,113,715 BP PLC 1,046,016 BP PLC 1,038,996 Royal Dutch Shell PLC 986,675 Royal Dutch Shell PLC 977,470 GlaxoSmithKline PLC 976,551 GlaxoSmithKline PLC 976,233 British American Tobacco 847,389 British American Tobacco 844,763 Royal Dutch Shell PLC 707,645 Royal Dutch Shell PLC 699,779 Diageo PLC 599,076 Diageo PLC 591,379 Astrazeneca PLC 495,757 Astrazeneca PLC 493,340 Rio Tinto PLC 492,337 Sales Proceeds (USD) (being the largest 20 sales in the period to 30 June 2013) iShares MSCI Europe 20,235,969 HSBC Holdings PLC 1,557,701 Vodafone Group PLC 1,113,715 BP Plc 1,038,996 Royal Dutch Shell PLC 977,470 GlaxoSmithKline PLC 976,233 British American Tobacco 847,389 Royal Dutch Shell PLC 699,779 Diageo PLC 591,379 Astrazeneca PLC 495,757 Bg Group PLC 468,401 Bhp Billiton PLC 464,484 Rio Tinto PLC 463,616 Standard Chartered PLC 432,435 Barclays PLC 427,965 Unilever PLC 416,363 Sabmiller PLC 396,488 Glencore International PLC 392,328 Reckitt Benckiser 360,808 Tesco PLC 356,117

SANLAM UNIVERSAL FUNDS PLC
285
Purchases and Sales for the period ended 30 June 2013 (continued) Sanlam Europe (ex UK) Equity Purchases Cost (USD) (being the largest 20 purchases in the period to 30 June 2013) iShares MSCI Europe 44,926,867
Nestle Sa-R 1,973,325
Nestle Sa-R 1,927,915
Roche Hldg-Genus 1,570,068
Roche Hldg-Genus 1,541,264
Novartis-Reg Shs 1,510,077
Novartis-Reg Shs 1,470,653
Sanofi-Aventis 1,172,212
Sanofi-Aventis 1,171,771
Total SA 941,645
Total SA 934,600
Bayer AG 807,978
Bayer AG 798,034
Siemens Ag 792,599
Siemens Ag 782,644
Basf SE 777,335
Basf SE 775,891
Banco Santander SA 690,145
Anheuser-Busch InBev 684,985
Anheuser-Busch InBev 680,677 Sales Proceeds (USD) (being the largest 20 sales in the period to 30 June 2013) iShares MSCI Europe 45,037,340
Nestle Sa-R 1,927,915
Roche Hldg-Genus 1,541,264
Novartis-Reg Shs 1,470,653
Sanofi-Aventis 1,172,212
Total SA 941,645
Bayer AG 807,978
Siemens Ag 792,599
Basf SE 775,891
Banco Santander SA 690,145
Anheuser-Busch InBev 684,985
Sap Ag 649,377
Allianz SE 608,186
Novo Nordisk-B 600,314
Unilever NV 589,578
UBS AG-REG 565,119
Eni Spa 535,811
Telefonica SA 527,215
BNP Paribas 522,094
Banco Bilbao Viscaya 486,917
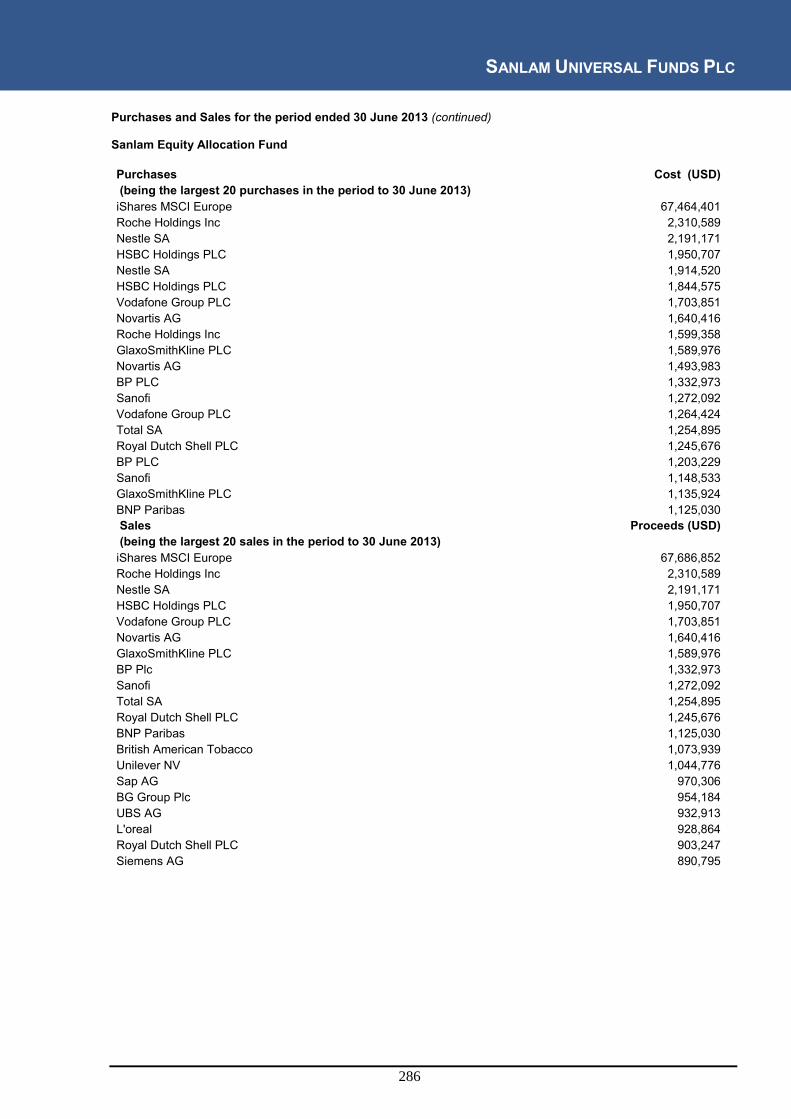
SANLAM UNIVERSAL FUNDS PLC
286
Purchases and Sales for the period ended 30 June 2013 (continued) Sanlam Equity Allocation Fund Purchases Cost (USD) (being the largest 20 purchases in the period to 30 June 2013) iShares MSCI Europe 67,464,401 Roche Holdings Inc 2,310,589 Nestle SA 2,191,171 HSBC Holdings PLC 1,950,707 Nestle SA 1,914,520 HSBC Holdings PLC 1,844,575 Vodafone Group PLC 1,703,851 Novartis AG 1,640,416 Roche Holdings Inc 1,599,358 GlaxoSmithKline PLC 1,589,976 Novartis AG 1,493,983 BP PLC 1,332,973 Sanofi 1,272,092 Vodafone Group PLC 1,264,424 Total SA 1,254,895 Royal Dutch Shell PLC 1,245,676 BP PLC 1,203,229 Sanofi 1,148,533 GlaxoSmithKline PLC 1,135,924 BNP Paribas 1,125,030 Sales Proceeds (USD) (being the largest 20 sales in the period to 30 June 2013) iShares MSCI Europe 67,686,852 Roche Holdings Inc 2,310,589 Nestle SA 2,191,171 HSBC Holdings PLC 1,950,707 Vodafone Group PLC 1,703,851 Novartis AG 1,640,416 GlaxoSmithKline PLC 1,589,976 BP Plc 1,332,973 Sanofi 1,272,092 Total SA 1,254,895 Royal Dutch Shell PLC 1,245,676 BNP Paribas 1,125,030 British American Tobacco 1,073,939 Unilever NV 1,044,776 Sap AG 970,306 BG Group Plc 954,184 UBS AG 932,913 L'oreal 928,864 Royal Dutch Shell PLC 903,247 Siemens AG 890,795
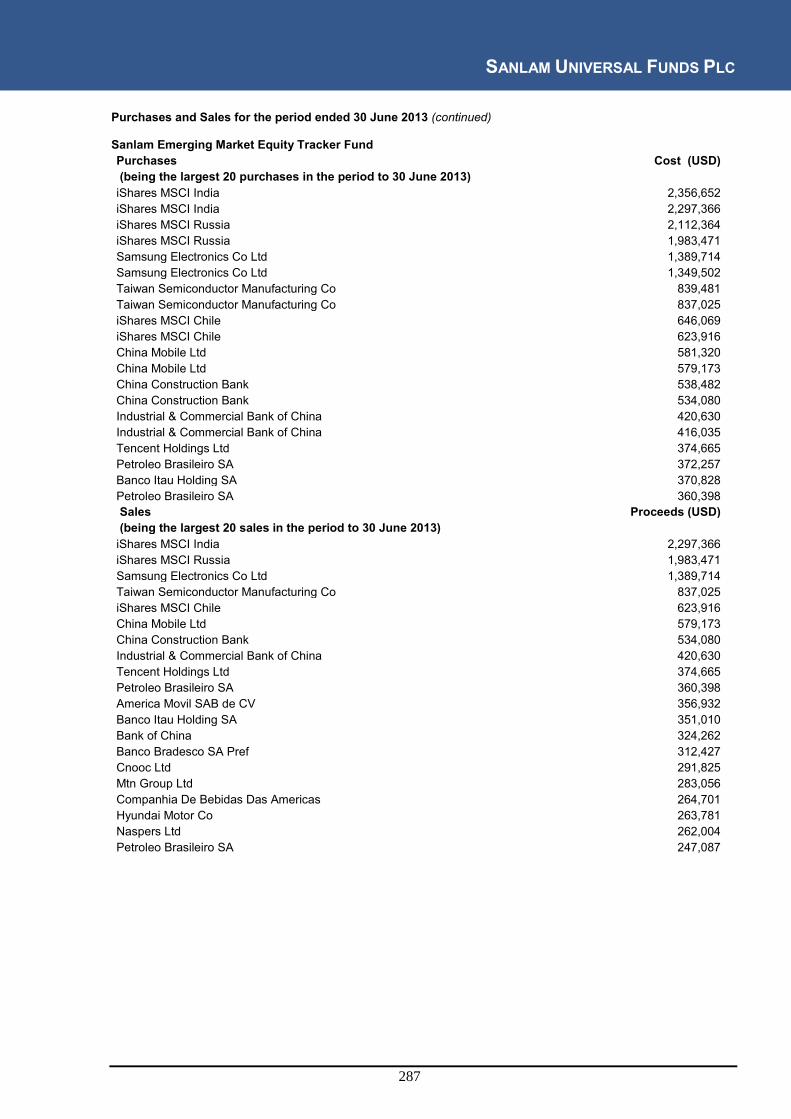
SANLAM UNIVERSAL FUNDS PLC
287
Purchases and Sales for the period ended 30 June 2013 (continued) Sanlam Emerging Market Equity Tracker Fund Purchases Cost (USD) (being the largest 20 purchases in the period to 30 June 2013) iShares MSCI India 2,356,652 iShares MSCI India 2,297,366 iShares MSCI Russia 2,112,364 iShares MSCI Russia 1,983,471 Samsung Electronics Co Ltd 1,389,714 Samsung Electronics Co Ltd 1,349,502 Taiwan Semiconductor Manufacturing Co 839,481 Taiwan Semiconductor Manufacturing Co 837,025 iShares MSCI Chile 646,069 iShares MSCI Chile 623,916 China Mobile Ltd 581,320 China Mobile Ltd 579,173 China Construction Bank 538,482 China Construction Bank 534,080 Industrial & Commercial Bank of China 420,630 Industrial & Commercial Bank of China 416,035 Tencent Holdings Ltd 374,665 Petroleo Brasileiro SA 372,257 Banco Itau Holding SA 370,828 Petroleo Brasileiro SA 360,398 Sales Proceeds (USD) (being the largest 20 sales in the period to 30 June 2013) iShares MSCI India 2,297,366 iShares MSCI Russia 1,983,471 Samsung Electronics Co Ltd 1,389,714 Taiwan Semiconductor Manufacturing Co 837,025 iShares MSCI Chile 623,916 China Mobile Ltd 579,173 China Construction Bank 534,080 Industrial & Commercial Bank of China 420,630 Tencent Holdings Ltd 374,665 Petroleo Brasileiro SA 360,398 America Movil SAB de CV 356,932 Banco Itau Holding SA 351,010 Bank of China 324,262 Banco Bradesco SA Pref 312,427 Cnooc Ltd 291,825 Mtn Group Ltd 283,056 Companhia De Bebidas Das Americas 264,701 Hyundai Motor Co 263,781 Naspers Ltd 262,004 Petroleo Brasileiro SA 247,087

SANLAM UNIVERSAL FUNDS PLC
287
Issued by Sanlam Asset Management (Ireland) Limited Beech Hill House Beech Hill Road Dublin 4 Ireland