
Osterweis Funds Semi Annual Report
71
Semi-Annual Report For the Six Months Ended September 30, 2021 Osterweis Fund Osterweis Strategic Income Fund Osterweis Growth & Income Fund (formerly Osterweis Strategic Investment Fund) Osterweis Emerging Opportunity Fund Osterweis Total Return Fund
-
Upload
khangminh22 -
Category
Documents
-
view
3 -
download
0
Transcript of Osterweis Funds Semi Annual Report

Semi-Annual ReportFor the Six Months Ended September 30, 2021
Osterweis FundOsterweis Strategic Income FundOsterweis Growth & Income Fund
(formerly Osterweis Strategic Investment Fund)Osterweis Emerging Opportunity FundOsterweis Total Return Fund

Past performance is no guarantee of future results. This commentary contains the current opinions of the authors as of the referenced date, which are subjectto change at any time. This commentary has been distributed for informational purposes only and is not a recommendation or offer of any particular security,strategy or investment product. Information contained herein has been obtained from sources believed to be reliable but is not guaranteed.Fund holdings and sector allocations are subject to change at any time and should not be considered a recommendation to buy or sell any security. Current andfuture portfolio holdings are subject to risk. Please refer to the Schedules of Investments for complete fund holdings.No part of this document may be reproduced in any form, or referred to in any other publication, without the express written permission of Osterweis CapitalManagement.The S&P 500 Index is an unmanaged index that is widely regarded as the standard for measuring large-cap U.S. stock market performance. This index includesthe reinvestment of dividends. The index does not incur expenses and is not available for investment.The Bloomberg U.S. Aggregate Bond Index (BC Agg) is an unmanaged index that is widely regarded as a standard for measuring U.S. investment grade bondmarket performance.The 60/40 blend is composed of 60% S&P 500 and 40% BC Agg and assumes monthly rebalancing. The Bloomberg U.S. Aggregate Bond 1-3 Year Index is the1-3 Year segment of the BC Agg.The Bloomberg U.S. Universal Bond Index (BC Univ) is an unmanaged index comprising U.S. dollar-denominated, taxable bonds that are rated investment gradeor below investment grade.The ICE BofA 3-Month Treasury Bill Index is a monthly-rebalanced index that consists of a single Treasury Bill issue that matures closest to, but not beyond,three months.The Russell 2000 Growth Index (Russell 2000G) is a market-capitalization-weighted index representing the small cap growth segment of U.S. equities.These indices reflect the reinvestment of dividends and/or interest income. These indices do not incur expenses and are not available for investment.A mortgage-backed security (MBS) is a type of debt security that is secured by a mortgage or collection of mortgages.An asset-backed security (ABS) is a type of financial investment that is collateralized by an underlying pool of assets-usually ones that generate a cash flow fromdebt, such as loans, leases, credit card balances, or receivables.A collateralized mortgage obligation (CMO) refers to a type of mortgage-backed security that contains a pool of mortgages that are bundled into tranches basedon their risk classifications.All currency figures are shown in USD.Cash flow measures the cash-generating capability of a company and is calculated by adding non-cash charges (e.g., depreciation) and interest expense to pretaxincome.Spread is the difference in yield between a risk-free asset such as a U.S. Treasury bond and another security with the same maturity but of lesser quality.Duration is a commonly used measure of the potential volatility of the price of a debt security, or the aggregate market value of a portfolio of debt securities,prior to maturity. Securities with a longer duration generally have more volatile prices than securities of comparable quality with a shorter duration.A basis point is a unit of measure used in finance to describe the percentage change in the value or rate of a financial instrument. One basis point is equal to1/100th of 1% or 0.01% (0.0001).Investment grade and non-investment grade (high yield) categories are determined by credit ratings from Standard and Poor’s and Moody’s, which are privateindependent rating services that assign grades to bonds to represent their credit quality. The issues are evaluated based on such factors as the bond issuer’sfinancial strength, or its ability to pay a bond’s principal and interest in a timely fashion. Standard and Poor’s ratings are expressed as letters ranging from ‘AAA’,which is the highest grade, to ‘D’, which is the lowest grade. Moody’s ratings are expressed as letters and numbers ranging from ‘Aaa’, which is the highest grade,to ‘C’, which is the lowest grade. A Standard and Poor’s rating of BBB- or higher is considered investment grade. A Moody’s rating of Baa3 or higher is consideredinvestment grade. A Standard and Poor’s rating below BBB- is considered noninvestment grade. A Moody’s rating below Baa3 is considered non-investment grade.The Global Industry Classification Standard (GICS) was developed by and is the exclusive property and a service mark of MSCI Inc. (MSCI) and Standard & Poor’s,a division of The McGraw-Hill Companies, Inc. (S&P) and is licensed for use by Osterweis Capital Management.Neither MSCI, S&P, nor any other party involved in making or compiling the GICS classifications makes any express or implied warranties or representations withrespect to such standard or classification (or the results to be obtained by the use thereof), and all such parties hereby expressly disclaim all warranties oforiginality, accuracy, completeness, merchantability and fitness for a particular purpose with respect to any such standard or classification. Without limiting any ofthe foregoing, in no event shall MSCI, S&P, any of their affiliates or any third party involved in making or compiling the GICS or any GICS classifications have anyliability for any direct, indirect, special, punitive, consequential or any other damages (including lost profits), even if notified of the possibility of such damages.Any ICE index data referenced herein is the property of ICE Data Indices, LLC, its affiliates (“ICE Data”) and/or its Third Party Suppliers and has been licensed for useby Osterweis Capital Management. ICE Data and its Third Party Suppliers accept no liability in connection with its use. See www.osterweis.com/glossary for a fullcopy of the Disclaimer.This document must be preceded or accompanied by a current prospectus. Please refer to the prospectus for important information about the investmentcompany including objectives, risks, charges and expenses.Osterweis Capital Management is the adviser to the Osterweis Funds, which are distributed by Quasar Distributors, LLC. [OSTE-20211111-0372]
Important Notice:
Disclosures
Beginning on January 1, 2021, as permitted by regulations adopted by the Securities and Exchange Commission, paper copies ofthe Funds’ annual and semi-annual shareholder reports are no longer sent by mail, unless you specifically request paper copiesof the reports. Instead, the reports are made available on the Funds’ website at www.osterweis.com/literature, and you will benotified by mail each time a report is posted and provided with a website to access the report. If you already elected to receiveshareholder reports electronically, you will not be affected by this change and you need not take any action.If you would like to receive paper copies and have not done so already, you may elect to receive paper copies of all future reports freeof charge by contacting your financial intermediary or, if you invest directly with the Osterweis Funds, calling (866) 236-0050. Yourelection to receive paper reports will apply to all funds held within your account(s).

1
Letter from the Chief Investment Officers . . . . . . . . . . . . . . . . . . . . . . . . . . . . . . . . . . . . . . . . . . . . . . . . . . . . . . 2Manager Reviews, Fund Overviews and Schedules of InvestmentsOsterweis Fund
Portfolio Managers’ Review . . . . . . . . . . . . . . . . . . . . . . . . . . . . . . . . . . . . . . . . . . . . . . . . . . . . . . . . . . . . . . . . . . 4Fund Overview . . . . . . . . . . . . . . . . . . . . . . . . . . . . . . . . . . . . . . . . . . . . . . . . . . . . . . . . . . . . . . . . . . . . . . . . . . . . . . . 5Schedule of Investments . . . . . . . . . . . . . . . . . . . . . . . . . . . . . . . . . . . . . . . . . . . . . . . . . . . . . . . . . . . . . . . . . . . . . 6
Osterweis Strategic Income FundPortfolio Managers’ Review . . . . . . . . . . . . . . . . . . . . . . . . . . . . . . . . . . . . . . . . . . . . . . . . . . . . . . . . . . . . . . . . . . 8Fund Overview . . . . . . . . . . . . . . . . . . . . . . . . . . . . . . . . . . . . . . . . . . . . . . . . . . . . . . . . . . . . . . . . . . . . . . . . . . . . . . . 9Schedule of Investments . . . . . . . . . . . . . . . . . . . . . . . . . . . . . . . . . . . . . . . . . . . . . . . . . . . . . . . . . . . . . . . . . . . . . 10
Osterweis Growth & Income FundPortfolio Managers’ Review . . . . . . . . . . . . . . . . . . . . . . . . . . . . . . . . . . . . . . . . . . . . . . . . . . . . . . . . . . . . . . . . . . 16Fund Overview . . . . . . . . . . . . . . . . . . . . . . . . . . . . . . . . . . . . . . . . . . . . . . . . . . . . . . . . . . . . . . . . . . . . . . . . . . . . . . . 18Schedule of Investments . . . . . . . . . . . . . . . . . . . . . . . . . . . . . . . . . . . . . . . . . . . . . . . . . . . . . . . . . . . . . . . . . . . . . 19
Osterweis Emerging Opportunity FundPortfolio Managers’ Review . . . . . . . . . . . . . . . . . . . . . . . . . . . . . . . . . . . . . . . . . . . . . . . . . . . . . . . . . . . . . . . . . . 24Fund Overview . . . . . . . . . . . . . . . . . . . . . . . . . . . . . . . . . . . . . . . . . . . . . . . . . . . . . . . . . . . . . . . . . . . . . . . . . . . . . . . 25Schedule of Investments . . . . . . . . . . . . . . . . . . . . . . . . . . . . . . . . . . . . . . . . . . . . . . . . . . . . . . . . . . . . . . . . . . . . . 26
Osterweis Total Return FundPortfolio Managers’ Review . . . . . . . . . . . . . . . . . . . . . . . . . . . . . . . . . . . . . . . . . . . . . . . . . . . . . . . . . . . . . . . . . . 28Fund Overview . . . . . . . . . . . . . . . . . . . . . . . . . . . . . . . . . . . . . . . . . . . . . . . . . . . . . . . . . . . . . . . . . . . . . . . . . . . . . . . 29Schedule of Investments . . . . . . . . . . . . . . . . . . . . . . . . . . . . . . . . . . . . . . . . . . . . . . . . . . . . . . . . . . . . . . . . . . . . . 30
Financial StatementsStatements of Assets and Liabilities . . . . . . . . . . . . . . . . . . . . . . . . . . . . . . . . . . . . . . . . . . . . . . . . . . . . . . . . . . . 36Statements of Operations . . . . . . . . . . . . . . . . . . . . . . . . . . . . . . . . . . . . . . . . . . . . . . . . . . . . . . . . . . . . . . . . . . . . . 37Statements of Changes in Net Assets
Osterweis Fund . . . . . . . . . . . . . . . . . . . . . . . . . . . . . . . . . . . . . . . . . . . . . . . . . . . . . . . . . . . . . . . . . . . . . . . . . . . . . . . 38Osterweis Strategic Income Fund . . . . . . . . . . . . . . . . . . . . . . . . . . . . . . . . . . . . . . . . . . . . . . . . . . . . . . . . . . . . . 39Osterweis Growth & Income Fund . . . . . . . . . . . . . . . . . . . . . . . . . . . . . . . . . . . . . . . . . . . . . . . . . . . . . . . . . . . . 40Osterweis Emerging Opportunity Fund . . . . . . . . . . . . . . . . . . . . . . . . . . . . . . . . . . . . . . . . . . . . . . . . . . . . . . . 41Osterweis Total Return Fund . . . . . . . . . . . . . . . . . . . . . . . . . . . . . . . . . . . . . . . . . . . . . . . . . . . . . . . . . . . . . . . . . 42
Financial HighlightsOsterweis Fund . . . . . . . . . . . . . . . . . . . . . . . . . . . . . . . . . . . . . . . . . . . . . . . . . . . . . . . . . . . . . . . . . . . . . . . . . . . . . . . 43Osterweis Strategic Income Fund . . . . . . . . . . . . . . . . . . . . . . . . . . . . . . . . . . . . . . . . . . . . . . . . . . . . . . . . . . . . . 44Osterweis Growth & Income Fund . . . . . . . . . . . . . . . . . . . . . . . . . . . . . . . . . . . . . . . . . . . . . . . . . . . . . . . . . . . . 45Osterweis Emerging Opportunity Fund . . . . . . . . . . . . . . . . . . . . . . . . . . . . . . . . . . . . . . . . . . . . . . . . . . . . . . . 46Osterweis Total Return Fund . . . . . . . . . . . . . . . . . . . . . . . . . . . . . . . . . . . . . . . . . . . . . . . . . . . . . . . . . . . . . . . . . 47
Notes to Financial Statements . . . . . . . . . . . . . . . . . . . . . . . . . . . . . . . . . . . . . . . . . . . . . . . . . . . . . . . . . . . . . . . . . . . 48Expense Examples . . . . . . . . . . . . . . . . . . . . . . . . . . . . . . . . . . . . . . . . . . . . . . . . . . . . . . . . . . . . . . . . . . . . . . . . . . . . . . . 61Additional Information . . . . . . . . . . . . . . . . . . . . . . . . . . . . . . . . . . . . . . . . . . . . . . . . . . . . . . . . . . . . . . . . . . . . . . . . . . 62Approval of Investment Advisory Agreements . . . . . . . . . . . . . . . . . . . . . . . . . . . . . . . . . . . . . . . . . . . . . . . . . . 63Statement Regarding Liquidity Risk Management Program . . . . . . . . . . . . . . . . . . . . . . . . . . . . . . . . . . . . 67Privacy Notice . . . . . . . . . . . . . . . . . . . . . . . . . . . . . . . . . . . . . . . . . . . . . . . . . . . . . . . . . . . . . . . . . . . . . . . . . . . . . . . . . . . 68
Table of Contents

2
October 15, 2021
The post-pandemic stock market rally finally stalled out during the second fiscal quarter, as investors grappled withseveral significant issues simultaneously, including the Delta surge, decelerating GDP growth, continued supply chainissues, labor shortages, rising inflation, and a potential tightening of the Fed’s monetary policy.
Given all the uncertainty, it is not surprising that the market sputtered – investors are having trouble figuring out whatthe economy will look like when things eventually normalize. While there are many possible scenarios, includingcontinued market volatility, we believe the most likely outcome is favorable – an extended cycle of capital investment thatshould be the impetus for both broadening growth and job creation.
Our bias toward this outlook is based on a few presumptions. The pandemic has laid bare the need for an extendedinvestment cycle. For example, we have witnessed the inherent structural risks associated with global just-in-time supplychains, which are a root cause of the shortages and bottlenecks we are currently facing. We suspect the remedy to this isthe restoring of manufacturing capabilities and supply chains to geographies that are closer to the markets wherecustomers live. The proliferation of omnichannel retail only makes this trend more acute.
We are also seeing signs of energy stress, with demand for energy outstripping supply, resulting in multi-year highprices for crude oil and natural gas. Due to the combination of shareholder demands that traditional energy companies putless money into the ground and return more money to shareholders, along with societal pressures for de-carbonization, wesee the potential for the energy shortage to persist. The need to fill the gap between supply and demand will driveinvestments in alternative sources like wind, hydrogen, and solar.
In addition, everyone in Washington, D.C. seems to agree that infrastructure spending is necessary, which shouldcreate a persistent bid for raw materials such as steel, aggregates, and copper. In combination with reshoring of globalsupply chains to carry more inventory, we will likely see increases in demand for logistics and warehousing.
Another reason we are constructive on the economy is that real wages are rising at a rate we haven’t seen in decades.This is likely due to a constellation of factors that have led to near-term labor shortages: a wave of Covid-induced earlyretirements (2 million above normal), massive labor dislocations created by the pandemic lockdowns, more workerschoosing to stay home due to safety concerns and increased government stimulus, and slowing population growth causedby the tragic decline in life expectancy, lower birth rates, and stagnant immigration rates.
Whether these trends become the impetus for long-term structural inflation or whether they are a short-termanomaly is an open and critical question, as we see both temporary and structural forces at play. For example, on thetemporary side, many of the supply chain issues should be resolved in the next year or so. On the structural side, as notedabove, we think the bottlenecks have laid bare major shortcomings in global supply chains that could lead to permanentchanges and a large investment cycle.
It seems to us that the combination of increased capital investment and rising real wages should result in above-trendgrowth with manageable inflation. Price increases for raw materials should be transitory – there is plenty of capital andtechnology for supply to catch up to demand. Upward wage pressure may persist, but real wages are still below historicallevels, and the recent increase in incomes should be supportive of consumption, which accounts for nearly 70% of U.S. GDP.
In addition, many businesses have done a remarkable job of cutting costs and have positioned themselves to come outof the Covid crisis stronger than they were in 2019. The capital markets have been functioning exceptionally well for thepast 18 months, allowing companies to fund growth and easily refinance debt obligations at attractive rates as they comedue. Management teams are gaining experience and getting comfortable managing disparate organizations whoseemployees have been largely working from home for the last six quarters. So, while tight labor markets and supply chainspresent some near-term challenges, and a Fed taper could trigger some near-term volatility in the markets, corporatebalance sheets are generally in excellent shape and companies seem well-positioned for growth as these temporaryconditions work themselves out over the coming quarters.
Letter from the Chief Investment Officers

3
We invite you to read our Portfolio Managers’ Reviews for more information about each fund’s performance andpositioning. If you would like to receive our quarterly shareholder letters by email, please sign up at www.osterweis.com,email us at [email protected], or call (800) 700-3316.
Sincerely,
Jim Callinan, CFA John Osterweis Larry Cordisco Carl Kaufman Eddy Vataru, CFACIO – Co-CIO – Co-CIO – CIO – CIO –Emerging Growth Core Equity Core Equity Strategic Income Total Return
____________________This commentary contains the current opinions of the authors as of the date above, which are subject to change at any time.This commentary has been distributed for informational purposes only and is not a recommendation or offer of any particularsecurity, strategy or investment product. Information contained herein has been obtained from sources believed to be reliable,but is not guaranteed.
Letter from the Chief Investment Officers

4
Performance Summary
For the period of April 1, 2021 to September 30, 2021, the Osterweis Fund (the “Fund”) generated a total return of5.39% versus 9.18% for the S&P 500. (Please see standardized performance in the table following this review.)
Market Review
Market sentiment gradually shifted during the past six months, as the rally that began in April of 2020 finally loststeam. Stocks continued to perform well through the first fiscal quarter, propelled by enthusiasm for the post-pandemiceconomic reopening. However, investors grew cautious in the second fiscal quarter as they grappled with severalsignificant issues, including the Delta surge, decelerating GDP growth, continued supply chain issues, labor shortages,rising inflation, and a potential tightening of the Fed’s monetary policy.
Portfolio Review
For the six month period ending September 30, 2021, the Fund delivered solid absolute returns but trailed theS&P 500. Our focus on owning quality businesses rather than “hot” recovery stocks impacted our performance, but weexpect these types of companies to come back into favor as the recovery matures and markets normalize.
Security selection had the biggest negative effect on relative performance. Although nearly two-thirds of the stocks inthe portfolio delivered positive absolute returns, several sectors lagged their counterparts in the benchmark, particularlyconsumer discretionary, information technology, and real estate. On the plus side, communication services, health care,and utilities each outperformed.
Sector allocation also was a net drag on relative performance, though less impactful. We were overweight a few sectorsthat underperformed the index and underweight a few sectors that outperformed. The Fund’s small cash position alsodetracted slightly from performance, which is to be expected in a rising market.
Outlook & Portfolio Positioning
Looking ahead, we remain optimistic about the direction of the economy, even though the second fiscal quarter was abit of a slog for the markets. In our view, many of the current headwinds are temporary, and we believe the economy isprimed for an extended cycle of capital investment that should lead to a period of broadening growth and job creation.Given this backdrop, we are looking for opportunities in cyclical stocks, as we expect they will benefit from the likelyincrease in economic activity. Of course, we also remain invested in dominant companies riding durable secular tailwinds,as we continue to believe they will outperform over time.
____________________Mutual fund investing involves risk. Principal loss is possible.
The Osterweis Fund may invest in medium and smaller sized companies, which involve additional risks such as limited liquidity and greatervolatility. The Fund may invest in foreign and emerging market securities, which involve greater volatility and political, economic andcurrency risks and differences in accounting methods. These risks may increase for emerging markets. The Fund may invest in MasterLimited Partnerships, which involve risk related to energy prices, demand and changes in tax code. The Fund may invest in debt securitiesthat are un-rated or rated below investment grade. Lower-rated securities may present an increased possibility of default, price volatility orilliquidity compared to higher-rated securities. Investments in debt securities typically decrease in value when interest rates rise. This risk isusually greater for longer-term debt securities.
Investment performance reflects periods during which fee waivers were in effect. In the absence of such waivers, total return would havebeen reduced.
Osterweis Fund | Portfolio Managers’ Review

5
$0$10,000$20,000$30,000$40,000$50,000$60,000$70,000$80,000$90,000
$100,000$110,000$120,000$130,000$140,000$150,000$160,000$170,000$180,000$190,000
Osterweis Fund $180,133
9/30/0
4
9/30/9
6
9/30/9
8
9/30/0
0
9/30/0
2
9/30/0
6
10/1/9
3
S&P 500 Index $161,128
9/30/9
4
9/30/0
8
9/30/1
0
9/30/1
2
9/30/1
4
9/30/1
6
9/30/1
8
9/30/2
0
9/30/2
1
Average Annual Total ReturnsPeriods Ended September 30, 2021
Six Months Since Inception(Not Annualized) 1 Yr. 3 Yr. 5 Yr. 10 Yr. 15 Yr. (October 1, 1993)
Osterweis Fund 5.39% 24.84% 16.86% 14.20% 12.80% 8.46% 10.88%S&P 500 Index 9.18 30.00 15.99 16.90 16.63 10.37 10.44
Gross/Net Expense Ratio as of 6/30/2021: 0.95%/0.95% 1
1 As of most recent Prospectus dated June 30, 2021. Please see the Fund’s Financial Highlights in this report for the most recent expenseratio. The Adviser has contractually agreed to waive certain fees through June 30, 2022. The net expense ratio is applicable to investors.
The performance data quoted above represents past performance. Past performance does not guarantee futureresults. The investment return and principal value of an investment will fluctuate so that an investor’s shares, whenredeemed, may be worth more or less than their original cost. Current performance of the Fund may be lower orhigher than the performance quoted. Performance data current to the most recent month-end may be obtained bycalling (866) 236-0050.
Growth of $10K (Inception to 9/30/2021)
This chart illustrates the performance of a hypothetical $10,000 investment made onOctober 1, 1993 and is not intended to imply any future performance. The returnsshown do not reflect the deduction of taxes that a shareholder would pay on Funddistributions or the redemption of Fund shares. The returns reflect fee waivers ineffect. In the absence of such waivers, total return would be reduced (See Note 3).The chart assumes reinvestment of capital gains, dividends and return of capital, ifapplicable, for the Fund and dividends for an index.
Sector Allocation (% of Net Assets)
� Information Technology 20.9%� Consumer Discretionary 14.8� Communication Services 13.7� Health Care 12.4� Industrials 9.9� Financials 8.5� Materials 4.3� Real Estate 4.2� Consumer Staples 2.3� Energy 1.7� Utilities 1.3� Cash* 6.0* Cash, cash equivalents and other
assets less liabilities.
Equities are classified by GICS sector. Bonds are classified by bond type.
Osterweis Fund | Fund Overview (Unaudited)
Top Ten Equity Holdings (% of net assets)Alphabet, Inc. – Class C 8.0%Microsoft Corp. 6.0Danaher Corp. 4.2JPMorgan Chase & Co. 4.1Amazon.com, Inc. 3.6Old Dominion Freight Line, Inc. 2.9Visa, Inc. – Class A 2.8Waste Connections, Inc. 2.7T-Mobile US, Inc. 2.7Union Pacific Corp. 2.6
Total 39.6%
Fund holdings are subject to change.

6
The accompanying notes are an integral part of these financial statements.
Osterweis Fund | Schedule of Investments at September 30, 2021 (Unaudited)
Shares ValueCommon Stocks: 94.0%
Aerospace & Defense: 1.7%
95,350 Safran SA – ADR $ 3,021,641____________
Auto Components: 2.4%
28,170 Aptiv PLC 1 4,196,485____________
Banks: 6.5%
22,525 First Republic Bank 4,344,622
44,495 JPMorgan Chase & Co. 7,283,387____________11,628,009____________
Chemicals: 4.3%
16,825 Air Products & Chemicals, Inc. 4,309,051
24,570 International Flavors & Fragrances, Inc. 3,285,500____________
7,594,551____________
Commercial Services & Supplies: 2.7%
38,215 Waste Connections, Inc. 4,812,415____________
Diversified Consumer Services: 1.5%
18,805 Bright Horizons Family Solutions, Inc. 1 2,621,793____________
Electric Utilities: 1.3%
29,447 NextEra Energy, Inc. 2,312,178____________
Equity Real Estate Investment Trusts – REITS: 4.2%
19,795 Crown Castle International Corp. 3,430,870
25,660 PS Business Parks, Inc. 4,021,948____________7,452,818____________
Food & Staples Retailing: 2.3%
52,355 Sysco Corp. 4,109,868____________
Health Care Equipment & Supplies: 8.3%
81,620 Boston Scientific Corp. 1 3,541,492
24,270 Danaher Corp. 7,388,759
9,990 Teleflex, Inc. 3,761,734____________14,691,985____________
Health Care Providers & Services: 2.0%
43,095 CVS Health Corp. 3,657,042____________
Insurance: 2.0%
38,825 The Progressive Corp. 3,509,392____________
Interactive Media & Services: 8.9%
5,374 Alphabet, Inc. – Class C 1 14,323,376
21,705 Snap, Inc. – Class A 1 1,603,348____________15,926,724____________
Shares Value
Internet & Direct Marketing Retail: 4.8%
1,934 Amazon.com, Inc. 1 $ 6,353,267
10,485 Etsy, Inc. 1 2,180,461____________8,533,728____________
IT Services: 4.2%
52,430 LiveRamp Holdings, Inc. 1 2,476,269
22,335 Visa, Inc. – Class A 4,975,121____________7,451,390____________
Media: 2.1%
5,217 Charter Communications, Inc. – Class A 1 3,795,681____________
Multiline Retail: 2.2%
18,730 Dollar General Corp. 3,973,382____________
Oil, Gas & Consumable Fuels: 1.7%
17,785 Pioneer Natural Resources Co. 2,961,380____________
Pharmaceuticals: 2.1%
18,185 Johnson & Johnson 2,936,878
45,550 Nektar Therapeutics 1 818,078____________3,754,956____________
Road & Rail: 5.5%
17,895 Old Dominion Freight Line, Inc. 5,117,612
23,530 Union Pacific Corp. 4,612,115____________9,729,727____________
Semiconductors & Semiconductor Equipment: 7.0%
42,105 Advanced Micro Devices, Inc. 1 4,332,604
27,109 Applied Materials, Inc. 3,489,742
7,445 Monolithic Power Systems, Inc. 3,608,443
6,610 Xilinx, Inc. 998,044____________12,428,833____________
Software: 9.7%
37,795 Microsoft Corp. 10,655,166
11,240 Synopsys, Inc. 1 3,365,368
28,645 Zendesk, Inc. 1 3,333,992____________17,354,526____________
Specialty Retail: 3.9%
11,250 The Home Depot, Inc. 3,692,925
30,710 Ross Stores, Inc. 3,342,783____________7,035,708____________
Wireless Telecommunication Services: 2.7%
37,190 T-Mobile US, Inc. 1 4,751,394____________
Total Common Stocks(Cost $95,925,524) 167,305,606____________

7
The accompanying notes are an integral part of these financial statements.
Osterweis Fund | Schedule of Investments at September 30, 2021 (Unaudited) (Continued)
Shares ValueShort-Term Investments: 4.1%
Money Market Funds: 4.1%
7,356,086 Federated Hermes U.S. Treasury Cash Reserves – Class I , 0.006% 2 $ 7,356,086____________
Total Money Market Funds(Cost $7,356,086) 7,356,086____________
Total Short-Term Investments(Cost $7,356,086) 7,356,086____________
Total Investments in Securities: 98.1%(Cost $103,281,610) 174,661,692
Other Assets in Excess of Liabilities: 1.9% 3,303,702____________Total Net Assets: 100.0% $177,965,394________________________
ADR – American Depositary Receipt1 Non-income producing security.2 Annualized seven-day effective yield as of September 30, 2021.

8
Performance Summary
For the six-month period ending September 30, 2021, the Osterweis Strategic Income Fund (the “Fund”) generated atotal return of 3.64%, outperforming the Bloomberg U.S. Aggregate Bond Index (the “BC Agg”), which returned 1.88% overthe same period. (Please see standardized performance in the table following this review.) The Fund also outperformed theBloomberg U.S. Universal Bond Index (the “BC Univ”), which returned 2.04% over the same period.1
Market Review
Fixed income markets have been relatively calm for the past two fiscal quarters, though investors were grappling withseveral challenging issues during the period, including inflation and the Delta variant. Inflation was particularly top ofmind, as ongoing supply chain disruptions and labor shortages continued to drive prices higher. In mid-June, largely inresponse to inflation, the Fed announced a tentative timeline to taper its bond buying program and possibly raiseshort-term rates, which caused the yield curve to flatten. Long-term Treasuries rallied, as investors expressed confidencethe Fed will be able to contain the problem.
Portfolio Review
For the six months ending September 30, 2021, the Fund outperformed the BC Univ, driven primarily by beneficialsector allocation and secondarily by issue selection. These relative gains were partially offset by duration management.
Sector allocation was the largest contributor to the Fund’s relative results, adding almost 270 basis points. The highyield sector performed well during the period as the macroeconomy continued to recover and borrowers shored up theirbalance sheets. Consequently, our significant overweight to high yield (averaging nearly 75% for the Fund vs. 5% for theindex) was additive to relative performance. Our small allocation to equities, which we acquired through corporateactions, also performed well and provided a boost over the benchmark.
Issue selection also produced a modest contribution to our outperformance during the period, adding over 70 basispoints. The vast majority of the value added came from our high yield bonds, though our investment grade picks also gaveus a further leg up.
During the past two fiscal quarters, longer-term bonds generally fared better as yields rose on the short end anddeclined on the long end. As the Fund continued to focus on shorter-term securities and a more defensive positioncompared to the benchmark, our duration management detracted from relative returns.
Outlook & Portfolio Positioning
We are positioning the Fund cautiously as we expect the combination of the Fed’s tapering program and higherinflation may trigger a modest rate increase that could create near-term volatility throughout the markets. We are alsoholding a healthy cash reserve that allows us to initiate new positions quickly should opportunities present themselves.
____________________Mutual Fund investing involves risk. Principal loss is possible.
The Osterweis Strategic Income Fund may invest in debt securities that are un-rated or rated below investment grade. Lower-ratedsecurities may present an increased possibility of default, price volatility or illiquidity compared to higher-rated securities. The Fund mayinvest in foreign and emerging market securities, which involve greater volatility and political, economic and currency risks and differencesin accounting methods. Investments in debt securities typically decrease in value when interest rates rise. This risk is usually greater forlonger-term debt securities. Small- and mid-capitalization companies tend to have limited liquidity and greater price volatility thanlarge-capitalization companies. Higher turnover rates may result in increased transaction costs, which could impact performance. From timeto time, the Fund may have concentrated positions in one or more sectors subjecting the Fund to sector emphasis risk. The Fund may investin municipal securities which are subject to the risk of default.
1 The Bloomberg U.S. Universal Bond Index is used in the above fixed income analysis as its investment universe more closely resembles thatof the Fund’s fixed income holdings.
Strategic Income Fund | Portfolio Managers’ Review

9
$7,000
$10,000
$13,000
$16,000
$19,000
$22,000
$25,000
$28,000
$31,000
$34,000Osterweis Strategic Income Fund $33,399
9/30/1
8
9/30/0
4
9/30/0
6
9/30/0
8
9/30/1
0
8/30/0
2
Bloomberg U.S. Aggregate Bond Index $21,843
9/30/0
2
9/30/1
2
9/30/1
4
9/30/2
0
9/30/1
6
9/30/2
1
Average Annual Total ReturnsPeriods Ended September 30, 2021
Six Months Since Inception(Not Annualized) 1 Yr. 3 Yr. 5 Yr. 10 Yr. 15 Yr. (August 30, 2002)
Osterweis Strategic Income Fund 3.64% 9.99% 5.23% 5.22% 5.36% 5.85% 6.52%Bloomberg U.S. Aggregate Bond Index 1.88 -0.90 5.36 2.94 3.01 4.17 4.18Gross/Net Expense Ratio as of 3/31/2021: 0.88% 11 As of most recent Prospectus dated June 30, 2021. Please see the Fund’s Financial Highlights in this report for the most recent expense ratio.
The performance data quoted above represents past performance. Past performance does not guarantee futureresults. The investment return and principal value of an investment will fluctuate so that an investor’s shares, whenredeemed, may be worth more or less than their original cost. Current performance of the Fund may be lower orhigher than the performance quoted. Performance data current to the most recent month-end may be obtained bycalling (866) 236-0050.
Growth of $10K (Inception to 9/30/2021)
This chart illustrates the performance of a hypothetical $10,000 investment made onAugust 30, 2002 and is not intended to imply any future performance. The returnsshown do not reflect the deduction of taxes that a shareholder would pay on Funddistributions or the redemption of Fund shares. The chart assumes reinvestment ofcapital gains, dividends and return of capital, if applicable, for the Fund anddividends for an index.
Asset Sector Allocation (% of Net Assets)
� Corporate Bonds 73.7%� Convertible Bonds 6.5� Food & Staples Retailing 2.8� Convertible Preferred Stocks 1.4� Metals & Mining 0.6� Private Mortgage
Backed Obligations 0.3� Warrants 0.0^� Cash* 14.7* Cash, cash equivalents and
other assets less liabilities.^ Does not round to 0.1% or (0.1)%
of net assets.
Equities are classified by GICS sector. Bonds are classified by bond type.
Strategic Income Fund | Fund Overview (Unaudited)
Top Ten Holdings (% of net assets)Southeastern Grocers, Inc. 2.8%Xerox Holdings Corp., 5.000% 1.3Donnelley Financial Solutions, Inc., 8.250% 1.3XPO Logistics, Inc., 6.250% 1.2Michael Baker International LLC, 8.750% 1.2Avation Capital SA, 8.250% 1.2Hecla Mining Co., 7.250% 1.2Tutor Perini Corp., 6.875% 1.2Enova International, Inc., 8.500% 1.1The Goodyear Tire & Rubber Co., 9.500% 1.1
Total 13.6%
Fund holdings are subject to change.

10
The accompanying notes are an integral part of these financial statements.
Shares ValueCommon Stocks: 3.4%
Food & Staples Retailing: 2.8%
7,450,877 Southeastern Grocers, Inc. 1,2 $ 158,331,136
61,582,000 Tops Holding, Litigation Trust Proceeds 1,2,6 46,248_____________
158,377,384_____________
Metals & Mining: 0.6%
823 Real Alloy Holding, Inc. 1,2 32,902,800_____________
Total Common Stocks(Cost $140,360,588) 191,280,184_____________
Convertible Preferred Stocks: 1.4%
Construction & Engineering: 0.2%
7,250 Fluor Corp., 6.500% 7,272,475_____________
Media: 0.2%
196,000 ViacomCBS, Inc., 5.750% 12,804,680_____________
Road & Rail: 1.0%
490,000 Daseke, Inc., 7.625% 1,9 57,199,317_____________
Total Convertible Preferred Stocks(Cost $67,912,000) 77,276,472_____________
PrincipalAmountBonds: 80.5%Corporate Bonds: 73.7%
Air Freight & Logistics: 1.3%
Cargo Aircraft Management, Inc.$ 4,590,000 4.750%, 02/01/2028 4,751,798
XPO Logistics, Inc.64,500,000 6.250%, 05/01/2025 68,088,135_____________
72,839,933_____________
Airlines: 2.2%
American Airlines, Inc.39,066,000 11.750%, 07/15/2025 48,393,007
United Airlines Holdings, Inc.45,074,000 4.250%, 10/01/2022 46,017,73714,896,000 4.875%, 01/15/2025 15,287,020
United Airlines, Inc.5,000,000 4.375%, 04/15/2026 5,137,5005,000,000 4.625%, 04/15/2029 5,173,500_____________
120,008,764_____________Auto Components: 3.1%
American Axle & Manufacturing, Inc.16,600,000 6.250%, 03/15/2026 17,077,25040,000,000 6.875%, 07/01/2028 42,700,000
PrincipalAmount Value
Auto Components: 3.1% (Continued)
The Goodyear Tire & Rubber Co.$53,605,000 9.500%, 05/31/2025 $ 58,898,494
14,500,000 5.000%, 07/15/2029 15,451,925
Real Hero Merger Sub 2, Inc.35,242,000 6.250%, 02/01/2029 36,628,244_____________
170,755,913_____________
Automobiles: 1.4%
Ford Motor Co.9,000,000 9.625%, 04/22/2030 12,771,562
Ford Motor Credit Co. LLC7,925,000 3.278% (3 Month LIBOR
USD + 3.140%), 01/07/2022 3 7,960,02812,051,000 4.250%, 09/20/2022 12,340,22410,000,000 4.687%, 06/09/2025 10,712,500
Volkswagen Group of America Finance LLC
34,000,000 1.063% (3 Month LIBOR USD + 0.940%), 11/12/2021 3 34,035,634_____________
77,819,948_____________
Beverages: 0.4%
Primo Water Holdings, Inc.19,700,000 4.375%, 04/30/2029 19,719,306_____________
Building Products: 2.2%
Builders FirstSource, Inc.16,681,000 6.750%, 06/01/2027 17,702,711
Griffon Corp.45,000,000 5.750%, 03/01/2028 47,306,250
Patrick Industries, Inc.44,500,000 7.500%, 10/15/2027 48,140,768
PGT Innovations, Inc.11,000,000 4.375%, 10/01/2029 11,096,305_____________
124,246,034_____________
Capital Markets: 2.2%
Donnelley Financial Solutions, Inc.70,379,000 8.250%, 10/15/2024 72,352,075
Oppenheimer Holdings, Inc.49,250,000 5.500%, 10/01/2025 51,404,688_____________
123,756,763_____________
Chemicals: 3.1%
Consolidated Energy Finance SA33,852,000 3.866% (3 Month LIBOR
USD + 3.750%), 06/15/2022 3 33,813,69834,500,000 6.875%, 06/15/2025 35,760,97539,500,000 5.625%, 10/15/2028 39,500,000
INEOS Quattro Finance 2 PLC32,914,000 3.375%, 01/15/2026 33,284,282
Strategic Income Fund | Schedule of Investments at September 30, 2021 (Unaudited)

11
The accompanying notes are an integral part of these financial statements.
PrincipalAmount Value
Chemicals: 3.1% (Continued)
Olin Corp.$ 1,750,000 5.500%, 08/15/2022 $ 1,818,127
6,750,000 9.500%, 06/01/2025 8,420,62519,296,000 5.625%, 08/01/2029 21,237,564_____________
173,835,271_____________
Commercial Services & Supplies: 4.0%
The Brink’s Co.10,000,000 5.500%, 07/15/2025 10,467,950
GFL Environmental, Inc.11,100,000 5.125%, 12/15/2026 11,670,09619,750,000 4.750%, 06/15/2029 20,243,750
KAR Auction Services, Inc.54,718,000 5.125%, 06/01/2025 55,401,975
Pitney Bowes, Inc.51,500,000 7.250%, 03/15/2029 54,213,020
Quad/Graphics, Inc.29,258,000 7.000%, 05/01/2022 29,696,870
R.R. Donnelley & Sons Co.13,677,000 7.000%, 02/15/2022 14,005,11128,200,000 6.125%, 11/01/2026 29,433,750_____________
225,132,522_____________
Computers & Peripherals: 3.3%
CPI Acquisition, Inc.51,860,000 8.625%, 03/15/2026 56,332,925
NCR Corp.34,425,000 5.750%, 09/01/2027 36,377,586
5,750,000 5.000%, 10/01/2028 5,882,59510,000,000 5.125%, 04/15/2029 10,325,000
Xerox Holdings Corp.70,000,000 5.000%, 08/15/2025 73,640,000_____________
182,558,106_____________
Construction & Engineering: 5.2%
APi Group DE, Inc.29,750,000 4.125%, 07/15/2029 29,191,592
Global Infrastructure Solutions, Inc.51,157,000 5.625%, 06/01/2029 52,392,442
Great Lakes Dredge & Dock Corp.25,832,000 5.250%, 06/01/2029 26,768,410
Michael Baker International LLC66,404,000 8.750%, 03/01/2023 67,162,666
New Enterprise Stone & Lime Co., Inc.
46,500,000 5.250%, 07/15/2028 47,139,375
Tutor Perini Corp.64,415,000 6.875%, 05/01/2025 65,944,856_____________
288,599,341_____________
PrincipalAmount Value
Construction Materials: 0.1%
Cemex SAB de CV$ 4,750,000 7.375%, 06/05/2027 $ 5,266,563_____________
Consumer Finance: 1.4%
Enova International, Inc.60,000,000 8.500%, 09/01/2024 61,291,500
FirstCash, Inc.15,000,000 4.625%, 09/01/2028 15,581,250_____________
76,872,750_____________
Containers & Packaging: 0.7%
Plastipak Holdings, Inc.36,922,000 6.250%, 10/15/2025 37,625,364_____________
Distributors: 0.7%
American Builders & Contractors Supply Co., Inc.
2,468,000 4.000%, 01/15/2028 2,523,53035,000,000 3.875%, 11/15/2029 34,945,750_____________
37,469,280_____________
Diversified Consumer Services: 0.4%
Carriage Services, Inc.19,500,000 4.250%, 05/15/2029 19,691,100_____________
Diversified Financial Services: 0.8%
Aviation Capital Group LLC5,500,000 5.500%, 12/15/2024 6,165,356
Burford Capital Global Finance LLC38,650,000 6.250%, 04/15/2028 41,010,742_____________
47,176,098_____________
Diversified Telecommunication Services: 2.2%
Level 3 Financing, Inc.44,668,000 4.625%, 09/15/2027 46,010,274
Lumen Technologies, Inc.22,925,000 5.800%, 03/15/2022 23,389,23150,600,000 5.375%, 06/15/2029 51,422,250_____________
120,821,755_____________
Equity Real Estate Investment Trusts – REITS: 0.5%
HAT Holdings I LLC / HAT Holdings II LLC
9,704,000 6.000%, 04/15/2025 10,152,810
Iron Mountain, Inc.20,000,000 4.500%, 02/15/2031 20,311,000_____________
30,463,810_____________
Food & Staples Retailing: 3.6%
C&S Group Enterprises LLC39,500,000 5.000%, 12/15/2028 37,395,045
Strategic Income Fund | Schedule of Investments at September 30, 2021 (Unaudited) (Continued)

12
The accompanying notes are an integral part of these financial statements.
PrincipalAmount Value
Food & Staples Retailing: 3.6% (Continued)
KeHE Distributors LLC / KeHE Finance Corp.
$47,416,000 8.625%, 10/15/2026 $ 51,470,068
Performance Food Group, Inc.19,500,000 4.250%, 08/01/2029 19,573,320
SEG Holding LLC / SEG Finance Corp.15,000,000 5.625%, 10/15/2028 15,656,250
United Natural Foods, Inc.5,000,000 6.750%, 10/15/2028 5,418,750
US Foods, Inc.39,399,000 6.250%, 04/15/2025 41,376,83029,354,000 4.750%, 02/15/2029 30,164,317_____________
201,054,580_____________Food Products: 0.1%
Simmons Foods, Inc. / Simmons5,000,000 4.625%, 03/01/2029 5,043,975_____________
Health Care Providers & Services: 0.7%
AMN Healthcare, Inc.5,000,000 4.625%, 10/01/2027 5,193,750
Owens & Minor, Inc.36,210,000 4.500%, 03/31/2029 36,617,362_____________
41,811,112_____________Hotels, Restaurants & Leisure: 6.0%
Aramark Services, Inc.34,000,000 6.375%, 05/01/2025 35,785,000
Carnival Corp.4,750,000 11.500%, 04/01/2023 5,308,125
23,616,000 7.625%, 03/01/2026 25,239,6009,500,000 5.750%, 03/01/2027 9,820,625
Carrols Restaurant Group, Inc.56,125,000 5.875%, 07/01/2029 52,903,144
GPS Hospitality Holding Co LLC /GPS Finco, Inc.
49,500,000 7.000%, 08/15/2028 49,192,605
International Game Technology PLC5,000,000 4.125%, 04/15/2026 5,203,100
NCL Corp. Ltd.39,750,000 12.250%, 05/15/2024 46,954,68815,510,000 3.625%, 12/15/2024 14,753,887
7,000,000 5.875%, 03/15/2026 7,184,415
Six Flags Entertainment Corp.48,676,000 4.875%, 07/31/2024 49,193,183
Six Flags Theme Parks, Inc.7,500,000 7.000%, 07/01/2025 7,996,875
Travel + Leisure Co.27,111,000 4.250%, 03/01/2022 27,185,284_____________
336,720,531_____________
PrincipalAmount Value
Household Durables: 2.6%
Empire Communities Corp.$47,250,000 7.000%, 12/15/2025 $ 49,435,313
Installed Building Products, Inc.6,750,000 5.750%, 02/01/2028 7,094,891
Mattamy Group Corp.24,500,000 5.250%, 12/15/2027 25,646,110
The New Home Co., Inc.47,308,000 7.250%, 10/15/2025 49,839,924
Taylor Morrison Communities, Inc.9,500,000 5.750%, 01/15/2028 10,594,875_____________
142,611,113_____________
Industrial Conglomerates: 1.2%
Icahn Enterprises L.P. / Icahn Enterprises Finance Corp.
5,635,000 4.750%, 09/15/2024 5,867,4449,783,000 6.375%, 12/15/2025 10,003,117
49,872,000 6.250%, 05/15/2026 52,178,580_____________68,049,141_____________
IT Services: 3.1%
Alliance Data Systems Corp.15,832,000 4.750%, 12/15/2024 16,235,84449,250,000 7.000%, 01/15/2026 52,854,361
KBR, Inc.20,000,000 4.750%, 09/30/2028 20,333,600
MoneyGram International, Inc.36,275,000 5.375%, 08/01/2026 36,864,469
Unisys Corp.44,950,000 6.875%, 11/01/2027 49,168,108_____________
175,456,382_____________
Machinery: 2.8%
Flowserve Corp.9,590,000 4.000%, 11/15/2023 10,174,265
Hillenbrand, Inc.4,000,000 5.750%, 06/15/2025 4,215,000
Wabash National Corp.48,139,000 5.500%, 10/01/2025 48,832,20234,500,000 4.500%, 10/15/2028 34,500,000
Welbilt, Inc.55,002,000 9.500%, 02/15/2024 56,599,808_____________
154,321,275_____________
Media: 1.7%
DIRECTV Holdings LLC / DIRECTV Financing Co., Inc.
29,000,000 5.875%, 08/15/2027 30,305,000
Strategic Income Fund | Schedule of Investments at September 30, 2021 (Unaudited) (Continued)

13
The accompanying notes are an integral part of these financial statements.
PrincipalAmount Value
Media: 1.7% (Continued)
Meredith Corp.$25,000,000 6.500%, 07/01/2025 $ 26,793,000
37,698,000 6.875%, 02/01/2026 38,970,308_____________96,068,308_____________
Metals & Mining: 3.3%
Century Aluminum Co.40,000,000 7.500%, 04/01/2028 42,490,800
Coeur Mining, Inc.56,000,000 5.125%, 02/15/2029 53,843,720
Hecla Mining Co.61,347,000 7.250%, 02/15/2028 66,161,206
Real Alloy Holding, Inc.13,002,247 10.130%, (3 Month LIBOR
USD + 10.000%) Cash or12.130% (3 Month LIBOR USD + 12.000%) PIK, 05/31/2023 1,3 13,002,247
SunCoke Energy, Inc.9,750,000 4.875%, 06/30/2029 9,725,625_____________
185,223,598_____________
Mortgage Real Estate Investment Trusts – REITS: 0.8%
HAT Holdings I LLC / HAT Holdings II LLC
30,000,000 3.375%, 06/15/2026 30,487,500
Starwood Property Trust, Inc.12,416,000 5.000%, 12/15/2021 12,448,592_____________
42,936,092_____________
Oil, Gas & Consumable Fuels: 3.8%
Calumet Specialty Products Partners L.P. / Calumet Finance Corp.
14,518,000 7.625%, 01/15/2022 14,538,54310,000,000 7.750%, 04/15/2023 9,925,00011,792,000 9.250%, 07/15/2024 12,843,90527,525,000 11.000%, 04/15/2025 29,830,219
Genesis Energy L.P. / Genesis Energy Finance Corp.
51,550,000 7.750%, 02/01/2028 51,743,312
Global Partners L.P. / GLP Finance Corp.
30,750,000 7.000%, 08/01/2027 32,138,670
NGL Energy Operating LLC / NGL Energy Finance Corp.
7,500,000 7.500%, 02/01/2026 7,651,313
Renewable Energy Group, Inc.53,601,000 5.875%, 06/01/2028 55,485,075_____________
214,156,037_____________
PrincipalAmount Value
Paper & Forest Products: 0.6%
Resolute Forest Products, Inc.$34,750,000 4.875%, 03/01/2026 $ 35,419,111_____________
Professional Services: 0.2%
Korn Ferry9,600,000 4.625%, 12/15/2027 9,972,000_____________
Specialty Retail: 2.4%
Caleres, Inc.36,385,000 6.250%, 08/15/2023 36,537,271
Ken Garff Automotive LLC49,795,000 4.875%, 09/15/2028 51,251,006
LCM Investments Holdings II LLC17,500,000 4.875%, 05/01/2029 17,978,100
Penske Automotive Group, Inc.19,734,000 3.500%, 09/01/2025 20,326,020
Rent-A-Center, Inc.9,250,000 6.375%, 02/15/2029 9,990,000_____________
136,082,397_____________
Textiles, Apparel & Luxury Goods: 0.3%
The William Carter Co.13,000,000 5.500%, 05/15/2025 13,675,350
3,000,000 5.625%, 03/15/2027 3,120,000_____________16,795,350_____________
Thrifts & Mortgage Finance: 2.7%
Nationstar Mortgage Holdings, Inc.13,250,000 6.000%, 01/15/2027 13,846,25021,275,000 5.500%, 08/15/2028 21,942,078
9,500,000 5.125%, 12/15/2030 9,643,545
PennyMac Financial Services, Inc.56,030,000 5.375%, 10/15/2025 57,694,091
United Wholesale Mortgage LLC18,000,000 5.500%, 11/15/2025 18,167,04029,500,000 5.500%, 04/15/2029 28,684,289_____________
149,977,293_____________
Trading Companies & Distributors: 2.1%
Avation Capital SA78,877,708 8.250% Cash or 9.000% PIK,
10/31/2026 66,780,628
Herc Holdings, Inc.24,500,000 5.500%, 07/15/2027 25,728,430
WESCO Distribution, Inc.15,125,000 7.125%, 06/15/2025 16,200,085
9,750,000 7.250%, 06/15/2028 10,810,313_____________119,519,456_____________
Strategic Income Fund | Schedule of Investments at September 30, 2021 (Unaudited) (Continued)

14
The accompanying notes are an integral part of these financial statements.
PrincipalAmount Value
Transportation Infrastructure: 0.5%
Signature Aviation US Holdings, Inc.$25,600,000 4.000%, 03/01/2028 $ 25,756,672_____________
Total Corporate Bonds(Cost $4,016,849,056) 4,111,633,044_____________
Convertible Bonds: 6.5%
Aerospace & Defense: 0.2%
Parsons Corp.12,500,000 0.250%, 08/15/2025 12,596,837_____________
Airlines: 0.2%
Southwest Airlines Co.7,675,000 1.250%, 05/01/2025 11,493,313_____________
Auto Components: 0.4%
Horizon Global Corp.21,347,000 2.750%, 07/01/2022 20,691,878_____________
Automobiles: 0.3%
Ford Motor Co.14,500,000 N/A%, 03/15/2026 8 15,705,312_____________
Consumer Finance: 0.2%
EZCORP, Inc.9,750,000 2.375%, 05/01/2025 8,970,000_____________
Electronic Equipment,Instruments & Components: 0.3%
OSI Systems, Inc.19,300,000 1.250%, 09/01/2022 20,011,687_____________
Energy Equipment & Services: 0.6%
Newpark Resources, Inc.33,055,000 4.000%, 12/01/2021 32,890,008_____________
Entertainment: 0.2%
Live Nation Entertainment, Inc.8,500,000 2.000%, 02/15/2025 9,783,500_____________
Health Care Equipment & Supplies: 0.8%
CONMED Corp.8,755,000 2.625%, 02/01/2024 13,575,722
Haemonetics Corp.17,750,000 N/A%, 03/01/2026 8 15,395,368
Integra LifeSciences Holdings Corp.13,000,000 0.500%, 08/15/2025 14,345,500_____________
43,316,590_____________
Health Care Technology: 0.1%
Tabula Rasa HealthCare, Inc.8,400,000 1.750%, 02/15/2026 7,072,795_____________
PrincipalAmount Value
Hotels, Restaurants & Leisure: 0.7%
Carnival Corp.$ 8,714,000 5.750%, 04/01/2023 $ 22,582,331
NCL Corp. Ltd.6,835,000 6.000%, 05/15/2024 14,671,327_____________
37,253,658_____________
Internet & Direct Marketing Retail: 0.2%
Etsy, Inc.1,576,000 0.125%, 10/01/2026 3,827,3167,750,000 0.250%, 06/15/2028 8,831,125_____________
12,658,441_____________
IT Services: 0.2%
Euronet Worldwide, Inc.8,680,000 0.750%, 03/15/2049 9,627,587_____________
Machinery: 0.2%
John Bean Technologies Corp.9,450,000 0.250%, 05/15/2026 10,040,625_____________
Pharmaceuticals: 0.2%
Jazz Investments I Ltd.6,000,000 1.500%, 08/15/2024 6,090,0006,650,000 2.000%, 06/15/2026 7,709,844_____________
13,799,844_____________
Semiconductors & Semiconductor Equipment: 0.1%
Rambus, Inc.5,000,000 1.375%, 02/01/2023 6,327,381_____________
Software: 1.3%
Alteryx, Inc.4,647,000 1.000%, 08/01/2026 4,310,092
Box, Inc.5,650,000 N/A%, 01/15/2026 8 6,418,580
Envestnet, Inc.9,490,000 0.750%, 08/15/2025 9,648,950
FireEye, Inc.20,566,000 1.625%, 06/01/2035 20,644,388
Jamf Holding Corp.1,600,000 0.125%, 09/01/2026 1,673,000
Rapid7, Inc.10,000,000 0.250%, 03/15/2027 12,508,986
Tyler Technologies, Inc.6,750,000 0.250%, 03/15/2026 7,418,847
Zendesk, Inc.8,550,000 0.625%, 06/15/2025 10,914,070_____________
73,536,913_____________
Strategic Income Fund | Schedule of Investments at September 30, 2021 (Unaudited) (Continued)

15
The accompanying notes are an integral part of these financial statements.
PrincipalAmount Value
Thrifts & Mortgage Finance: 0.3%
EZCORP, Inc.$16,285,000 2.875%, 07/01/2024 $ 17,007,647_____________
Total Convertible Bonds(Cost $316,150,835) 362,784,016_____________
Private Mortgage Backed Obligations: 0.3%
Diversified Financial Services: 0.3%
HAS Capital Income Opportunity Fund II
21,807,000 8.000%, 12/31/2024 (Cost $21,807,000, Acquisition Dates 06/10/2016, 09/19/2016) 1,5 16,880,297_____________
Total Private Mortgage Backed Obligations(Cost $21,807,000) 16,880,297_____________
Total Bonds(Cost $4,354,806,891) 4,491,297,357_____________
Shares ValueWarrants: 0.0% 7
Trading Companies & Distributors: 0.0% 7
1,601,250 Avation PLC(Expiration Date 10/31/2026, Exercise Price 114.5 GBp) 1,2 $ 914,359_____________
Total Warrants(Cost $—) 914,359_____________
Short-Term Investments: 15.7%
Money Market Funds: 15.7%
438,379,476 Federated Hermes U.S. Treasury Cash Reserves – Class I, 0.006% 4 438,379,476_____________
438,379,475 Morgan Stanley Institutional Liquidity Funds – Treasury Securities Portfolio , 0.010% 4 438,379,475_____________
Total Money Market Funds(Cost $876,758,951) 876,758,951_____________
Total Short-Term Investments(Cost $876,758,951) 876,758,951_____________
Total Investments in Securities: 101.0%(Cost $5,439,838,430) 5,637,527,323
Liabilities in Excess of Other Assets: (1.0)% (56,759,976)_____________Total Net Assets: 100.0% $5,580,767,347__________________________
LIBOR – London Interbank Offered RatePIK – Payment In KindGBp – Great Britain PenceUSD – United States Dollar1 Security is fair valued under the Board of Trustees and is
categorized as a Level 3 security. Significant unobservable inputswere used to determine fair value.
2 Non-income producing security.3 Variable rate security; rate shown is the rate in effect on
September 30, 2021.4 Annualized seven-day effective yield as of September 30, 2021.5 Security considered restricted. As of September 30, 2021, the value
of the restricted securities was $17,146,844 or 0.3% of net assets.6 Not a readily marketable security.7 Does not round to 0.1% or (0.1)%, as applicable.8 Zero coupon security.9 Company is an “affiliated person” of the Fund, as defined in the
Investment Company Act of 1940.
Strategic Income Fund | Schedule of Investments at September 30, 2021 (Unaudited) (Continued)

16
Growth & Income Fund | Portfolio Managers’ Review
Performance Summary
The Osterweis Growth & Income Fund (the “Fund”) generated a total return of 4.76% for the six-month period endingSeptember 30, 2021, trailing its blended benchmark, composed of 60% S&P 500 Index (“S&P 500”) and 40% BloombergU.S. Aggregate Bond Index (“BC Agg”), which returned 6.26% over the same period. (Please see standardized performancein the table following this letter.) The Fund also trailed a blended benchmark composed of 60% S&P 500 and 40%Bloomberg U.S. Universal Bond Index (“BC Univ”), which returned 6.33% over the same period.1
Market Review
Sentiment in the equity markets gradually shifted during the past six months, as the rally that began in April of 2020finally lost steam. Stocks continued to perform well through the first fiscal quarter, propelled by enthusiasm for thepost-pandemic economic reopening. However, investors grew cautious in the second fiscal quarter, as they grappled withseveral significant issues, including the Delta surge, decelerating GDP growth, continued supply chain issues, laborshortages, rising inflation, and a potential tightening of the Fed’s monetary policy.
Fixed income markets were a bit more calm during the past two fiscal quarters, though investors were dealing withmany of the same issues. Inflation was particularly top of mind, as ongoing supply chain disruptions and labor shortagescontinued to drive prices higher. In mid-June, largely in response to inflation, the Fed announced a tentative timeline totaper its bond buying program and possibly raise short-term rates, which caused the yield curve to flatten. Long-termTreasuries rallied, as investors expressed confidence the Fed will be able to contain the problem.
Portfolio Review
During the six-month period ending September 30, 2021, on average 71% of the Fund was allocated to equities, 27% tofixed income, and the rest to cash. We decreased our equity allocation during the period from 71% to 67% while cash rosefrom 1% to 5%. Our fixed income allocation was largely unchanged during the period.
Equities
For the period, our equity positions delivered solid absolute returns but trailed the S&P 500. Our focus on owningquality businesses with the potential to raise dividends rather than “hot” recovery stocks impacted our performance, butwe expect these types of companies to come back into favor as the recovery matures and markets normalize.
Security selection had the biggest negative effect on relative performance. Although nearly two-thirds of the stocks inthe portfolio delivered positive absolute returns, several sectors lagged their counterparts in the equity benchmark,particularly financials, real estate, and consumer discretionary firms. On the plus side, communication services, utilities,and consumer staple firms each outperformed.
Sector allocation also was a net drag on relative performance, though a bit less impactful. We were overweightindustrials, the worst performing sector in the S&P 500, and we were underweight information technology, one of thebetter performers in the index.
Fixed Income
For the period, our fixed income positions outperformed the BC Univ, driven primarily by beneficial sector allocation.High yield bonds performed well during the period as the macroeconomy continued to recover and borrowers shored uptheir balance sheets. Consequently, our significant overweight to high yield (averaging nearly 81% for the Fund’s fixedincome holdings vs. 5% for the BC Univ) was additive to relative performance. Our small allocation to busted convertiblebonds also proved favorable and provided a boost over the fixed income benchmark.
Issue selection also contributed modestly to our outperformance during the period, again due to our high yield bonds,as the combination of our large overweight and favorable picks further lifted the Fund’s results above the index.
____________________1 The Bloomberg U.S. Universal Bond Index is used in the above fixed income analysis as its investment universe more closely resembles that
of the Fund’s fixed income holdings.

17
Growth & Income Fund | Portfolio Managers’ Review
During the past two fiscal quarters, longer-term bonds generally fared better as yields rose on the short end anddeclined on the long end. As we continued to focus the bond portfolio on shorter-term securities and a more defensiveposition compared to the index, our duration management detracted from relative returns.
Outlook & Portfolio Positioning
Looking ahead, we remain optimistic about the direction of the economy, even though the second fiscal quarter was abit of a slog for the markets. In our view, many of the current headwinds are temporary, and we believe the economy isprimed for an extended cycle of capital investment that should lead to a period of broadening growth and job creation.
Given this backdrop, within equities, we are looking for opportunities in cyclical stocks, as we expect they will benefitfrom the likely increase in economic activity. Of course, we also remain invested in dominant companies riding durablesecular tailwinds, as we continue to believe they will outperform over time.
In fixed income, we are positioning the Fund more cautiously as we expect the combination of the Fed’s taperingprogram and higher inflation may trigger a modest rate increase that could create near-term volatility throughout themarkets. We continue to focus on higher quality high yield bonds as we feel they offer favorable risk-adjusted returns.
____________________Mutual Fund investing involves risk. Principal loss is possible.
The Osterweis Growth & Income Fund may invest in small- and mid-capitalization companies, which tend to have limited liquidity andgreater price volatility than large-capitalization companies. The Fund may invest in foreign and emerging market securities, which involvegreater volatility and political, economic and currency risks and differences in accounting methods. These risks may increase for emergingmarkets. The Fund may invest in Master Limited Partnerships, which involve risk related to energy prices, demand and changes in tax code.The Fund may invest in debt securities that are un-rated or rated below investment grade. Lower-rated securities may present an increasedpossibility of default, price volatility or illiquidity compared to higher-rated securities. Investments in debt securities typically decrease invalue when interest rates rise. This risk is usually greater for longer-term debt securities. Higher turnover rates may result in increasedtransaction costs, which could impact performance. From time to time, the Fund may have concentrated positions in one or more sectorssubjecting the Fund to sector emphasis risk. The Fund may also make investments in derivatives that may involve certain costs and riskssuch as liquidity, interest rate, market, credit, management and the risk that a position could not be closed when most advantageous.Leverage may cause the effect of an increase or decrease in the value of the portfolio securities to be magnified and the fund to be morevolatile than if leverage was not used. Investments in preferred securities have an inverse relationship with changes in the prevailinginterest rate. Investments in Asset Backed and Mortgage Backed Securities include additional risks that investors should be aware of such ascredit risk, prepayment risk, possible illiquidity and default, as well as increased susceptibility to adverse economic developments.

18
$7,000$10,000$13,000$16,000$19,000$22,000$25,000$28,000$31,000$34,000$37,000$40,000$43,000$46,000$49,000$52,000$55,000
Osterweis Growth & Income Fund $29,249
S&P 500 Index $51,324
9/30/1
5
9/30/1
1
9/30/1
2
9/30/1
3
9/30/1
4
9/30/1
6
8/31/1
0
Bloomberg U.S. Aggregate Bond Index $14,178
60% S&P/40% BC Agg $31,520
9/30/1
0
9/30/1
7
9/30/1
8
9/30/2
0
9/30/1
9
9/30/2
1
Growth & Income Fund | Fund Overview (Unaudited)
Average Annual Total ReturnsPeriods Ended September 30, 2021
Six Months Since Inception(Not Annualized) 1 Yr. 3 Yr. 5 Yr. 10 Yr. (August 31, 2010)
Osterweis Growth & Income Fund 4.76% 21.58% 12.22% 11.00% 10.78% 10.17%60% S&P 500 Index/40% Bloomberg U.S. Aggregate Bond Index 6.26 16.92 12.10 11.43 11.24 10.91S&P 500 Index 9.18 30.00 15.99 16.90 16.63 15.90Bloomberg U.S. Aggregate Bond Index 1.88 -0.90 5.36 2.94 3.01 3.20Gross/Net Expense Ratio as of 6/30/2021: 0.94% 11 As of most recent Prospectus dated June 30, 2021. Please see the Fund’s Financial Highlights in this report for the most recent expense ratio.
The performance data quoted above represents past performance. Past performance does not guarantee future results.The investment return and principal value of an investment will fluctuate so that an investor’s shares, when redeemed,may be worth more or less than their original cost. Current performance of the Fund may be lower or higher than theperformance quoted. Performance data current to the most recent month-end may be obtained by calling (866) 236-0050.
Growth of $10K (Inception to 9/30/2021)
This chart illustrates the performance of a hypothetical $10,000 investment made onAugust 31, 2010 and is not intended to imply any future performance. The returnsshown do not reflect the deduction of taxes that a shareholder would pay on Funddistributions or the redemption of Fund shares. The returns reflect fee waivers ineffect. In the absence of such waivers, total return would be reduced (See Note 3).The chart assumes reinvestment of capital gains, dividends and return of capital, ifapplicable, for the Fund and dividends for an index.
Asset/Sector Allocation (% of Net Assets)
� Corporate Bonds 22.5%� Information Technology 12.4� Industrials 9.2� Health Care 8.8� Consumer Discretionary 8.2� Communication Services 7.0� Financials 6.7� Convertible Bonds 4.2� Real Estate 4.2� Materials 3.7� Consumer Staples 2.4� Energy 2.3� Utilities 1.6� Convertible Preferred Stocks 1.0� Private Mortgage Backed
Obligations 0.3� Warrants 0.0^� Cash Equivalents 5.5^ Does not round to 0.1% or (0.1)%
of net assets.Equities are classified by GICS sector. Bonds are classified by bond type.
Top Ten Equity Holdings (% of Net Assets)Alphabet, Inc. – Class C 4.8%Microsoft Corp. 4.8JPMorgan Chase & Co. 2.6Danaher Corp. 2.4The Home Depot, Inc. 2.4Chevron Corp. 2.3Waste Connections, Inc. 2.3PS Business Parks, Inc. 2.3Sysco Corp. 2.2Johnson & Johnson 2.2
Total 28.3%
Top Ten Debt Holdings (% of Net Assets)Donnelley Financial Solutions, Inc., 8.250% 0.6%Tutor Perini Corp., 8.250% 0.6%Alliance Data Systems Corp., 7.000% 0.5%Oppenheimer Holdings, Inc., 5.500% 0.5%Carnival Corp., 5.750% 0.4% Ford Motor Co., 9.625% 0.4%Michael Baker International LLC, 8.750% 0.4% R.R. Donnelley & Sons Co., 7.000% 0.4%Rapid7, Inc., 0.250% 0.4%Zendesk, Inc., 0.625% 0.3%
Total 4.5%
Fund holdings are subject to change.

19
The accompanying notes are an integral part of these financial statements.
Shares ValueCommon Stocks: 66.5%
Aerospace & Defense: 3.2%
14,380 L3Harris Technologies, Inc. $ 3,167,051
69,685 Safran SA – ADR 2,208,318____________5,375,369____________
Auto Components: 1.2%
13,625 Aptiv PLC 1 2,029,716____________
Banks: 4.0%
12,045 First Republic Bank 2,323,240
26,925 JPMorgan Chase & Co. 4,407,353____________6,730,593____________
Chemicals: 3.3%
10,865 Air Products & Chemicals, Inc. 2,782,635
20,015 International Flavors & Fragrances, Inc. 2,676,406____________
5,459,041____________Commercial Services & Supplies: 2.3%
30,170 Waste Connections, Inc. 3,799,308____________
Electric Utilities: 1.6%
32,750 NextEra Energy, Inc. 2,571,530____________
Equity Real Estate Investment Trusts – REITS: 4.2%
18,180 Crown Castle International Corp. 3,150,957
23,985 PS Business Parks, Inc. 3,759,409____________6,910,366____________
Food & Staples Retailing: 2.4%
16,993 Southeastern Grocers, Inc. 1,2 361,101
46,660 Sysco Corp. 3,662,810
2,292,000 Tops Holding, Litigation Trust Proceeds 1,2,6 1,722____________
4,025,633____________Health Care Equipment & Supplies: 3.3%
13,365 Danaher Corp. 4,068,841
3,955 Teleflex, Inc. 1,489,255____________5,558,096____________
Health Care Providers & Services: 1.8%
34,700 CVS Health Corp. 2,944,642____________
Insurance: 1.7%
31,440 The Progressive Corp. 2,841,862____________
Interactive Media & Services: 4.8%
3,007 Alphabet, Inc. – Class C 1 8,014,587____________
Internet & Direct Marketing Retail: 1.2%
605 Amazon.com, Inc. 1 1,987,449____________
Shares Value
IT Services: 1.8%
13,720 Visa, Inc. – Class A $ 3,056,130____________
Media: 1.3%
2,971 Charter Communications, Inc. – Class A 1 2,161,581____________
Metals & Mining: 0.4%
17 Real Alloy Holding, Inc. 1,2 661,200____________
Mortgage Real Estate Investment Trusts – REITS: 1.0%
30,375 Hannon Armstrong Sustainable Infrastructure Capital, Inc. 1,624,455____________
Multiline Retail: 1.6%
12,250 Dollar General Corp. 2,598,715____________
Oil, Gas & Consumable Fuels: 2.3%
38,020 Chevron Corp. 3,857,129____________
Pharmaceuticals: 3.7%
22,515 Johnson & Johnson 3,636,173
30,880 Novartis AG – ADR 2,525,366____________6,161,539____________
Road & Rail: 3.7%
9,945 Old Dominion Freight Line, Inc. 2,844,071
16,690 Union Pacific Corp. 3,271,407____________6,115,478____________
Semiconductors & Semiconductor Equipment: 5.4%
18,810 Advanced Micro Devices, Inc. 1 1,935,549
17,455 Analog Devices, Inc. 2,923,364
13,250 Applied Materials, Inc. 1,705,673
3,630 Monolithic Power Systems, Inc. 1,759,388
4,305 Xilinx, Inc. 650,012____________8,973,986____________
Software: 5.2%
28,395 Microsoft Corp. 8,005,118
6,110 Zendesk, Inc. 1 711,143____________8,716,261____________
Specialty Retail: 4.2%
12,035 The Home Depot, Inc. 3,950,609
27,250 Ross Stores, Inc. 2,966,163____________6,916,772____________
Wireless Telecommunication Services: 0.9%
11,640 T-Mobile US, Inc. 1 1,487,126____________
Total Common Stocks(Cost $66,338,007) 110,578,564____________
Growth & Income Fund | Schedule of Investments at September 30, 2021 (Unaudited)

20
The accompanying notes are an integral part of these financial statements.
Shares ValueConvertible Preferred Stocks: 1.0%
Construction & Engineering: 0.1%
250 Fluor Corp., 6.500% $ 250,775____________
Media: 0.2%
4,000 ViacomCBS, Inc., 5.750% 261,320____________
Road & Rail: 0.7%
10,000 Daseke, Inc., 7.625% 1,2,9 1,167,333____________
Total Convertible Preferred Stocks(Cost $1,488,000) 1,679,428____________
Principal AmountBonds: 27.0%Corporate Bonds: 22.5%
Air Freight & Logistics: 0.4%
Cargo Aircraft Management, Inc.$ 124,000 4.750%, 02/01/2028 128,371
XPO Logistics, Inc.500,000 6.250%, 05/01/2025 527,815____________
656,186____________
Auto Components: 1.2%
American Axle & Manufacturing, Inc.400,000 6.250%, 03/15/2026 411,500
The Goodyear Tire & Rubber Co.500,000 9.500%, 05/31/2025 549,375500,000 5.000%, 07/15/2029 532,825
Real Hero Merger Sub 2, Inc.500,000 6.250%, 02/01/2029 519,667____________
2,013,367____________
Automobiles: 0.4%
Ford Motor Co.500,000 9.625%, 04/22/2030 709,531____________
Beverages: 0.2%
Primo Water Holdings, Inc.300,000 4.375%, 04/30/2029 300,294____________
Building Products: 0.3%
Patrick Industries, Inc.500,000 7.500%, 10/15/2027 540,908____________
Capital Markets: 1.1%
Donnelley Financial Solutions, Inc.1,000,000 8.250%, 10/15/2024 1,028,035
Oppenheimer Holdings, Inc.750,000 5.500%, 10/01/2025 782,812____________
1,810,847____________
Principal Amount Value
Chemicals: 0.8%
Consolidated Energy Finance SA$ 327,000 3.866% (3 Month LIBOR
USD + 3.750%), 06/15/2022 3 $ 326,630500,000 5.625%, 10/15/2028 500,000
Olin Corp.250,000 9.500%, 06/01/2025 311,875250,000 5.625%, 08/01/2029 275,155____________
1,413,660____________
Commercial Services & Supplies: 1.7%
GFL Environmental, Inc.220,000 5.125%, 12/15/2026 231,299250,000 4.750%, 06/15/2029 256,250
KAR Auction Services, Inc.500,000 5.125%, 06/01/2025 506,250
Pitney Bowes, Inc.500,000 7.250%, 03/15/2029 526,340
Quad/Graphics, Inc.121,000 7.000%, 05/01/2022 122,815
R.R. Donnelley & Sons Co.676,000 7.000%, 02/15/2022 692,217500,000 6.125%, 11/01/2026 521,875____________
2,857,046____________
Computers & Peripherals: 0.8%
CPI Acquisition, Inc.500,000 8.625%, 03/15/2026 543,125
NCR Corp.450,000 5.750%, 09/01/2027 475,524250,000 5.000%, 10/01/2028 255,765____________
1,274,414____________
Construction & Engineering: 1.9%
Global Infrastructure Solutions, Inc.500,000 5.625%, 06/01/2029 512,075
Great Lakes Dredge & Dock Corp.350,000 5.250%, 06/01/2029 362,687
Michael Baker International LLC700,000 8.750%, 03/01/2023 707,998
New Enterprise Stone & Lime Co., Inc.500,000 5.250%, 07/15/2028 506,875
Tutor Perini Corp.1,000,000 6.875%, 05/01/2025 1,023,750____________
3,113,385____________
Construction Materials: 0.2%
Cemex SAB de CV250,000 7.375%, 06/05/2027 277,187____________
Growth & Income Fund | Schedule of Investments at September 30, 2021 (Unaudited) (Continued)

21
The accompanying notes are an integral part of these financial statements.
Growth & Income Fund | Schedule of Investments at September 30, 2021 (Unaudited) (Continued)
Principal Amount Value
Containers & Packaging: 0.3%
Plastipak Holdings, Inc.$ 500,000 6.250%, 10/15/2025 $ 509,525____________
Distributors: 0.1%
American Builders & Contractors Supply Co., Inc.
139,000 4.000%, 01/15/2028 142,127____________
Diversified Consumer Services: 0.3%
Carriage Services, Inc.500,000 4.250%, 05/15/2029 504,900____________
Diversified Financial Services: 0.2%
Burford Capital Global Finance LLC250,000 6.250%, 04/15/2028 265,270____________
Diversified Telecommunication Services: 0.3%
Lumen Technologies, Inc.500,000 5.375%, 06/15/2029 508,125____________
Food & Staples Retailing: 1.4%
C&S Group Enterprises LLC500,000 5.000%, 12/15/2028 473,355
KeHE Distributors LLC / KeHE Finance Corp.
512,000 8.625%, 10/15/2026 555,776
Performance Food Group, Inc.500,000 4.250%, 08/01/2029 501,880
United Natural Foods, Inc.250,000 6.750%, 10/15/2028 270,938
US Foods, Inc.500,000 4.750%, 02/15/2029 513,802____________
2,315,751____________Health Care Providers & Services: 0.1%
Owens & Minor, Inc.250,000 4.500%, 03/31/2029 252,813____________
Hotels, Restaurants & Leisure: 1.5%
Aramark Services, Inc.450,000 6.375%, 05/01/2025 473,625
Carnival Corp.250,000 11.500%, 04/01/2023 279,375500,000 5.750%, 03/01/2027 516,875
Carrols Restaurant Group, Inc.500,000 5.875%, 07/01/2029 471,297
GPS Hospitality Holding Co. LLC / GPS Finco, Inc.
500,000 7.000%, 08/15/2028 496,895
NCL Corp. Ltd.250,000 12.250%, 05/15/2024 295,313____________
2,533,380____________
Principal Amount Value
Household Durables: 0.8%
Empire Communities Corp.$ 250,000 7.000%, 12/15/2025 $ 261,563
Mattamy Group Corp.500,000 5.250%, 12/15/2027 523,390
The New Home Co., Inc.500,000 7.250%, 10/15/2025 526,760____________
1,311,713____________
Industrial Conglomerates: 0.3%
Icahn Enterprises L.P. / Icahn Enterprises Finance Corp.
500,000 6.250%, 05/15/2026 523,125____________
IT Services: 1.1%
Alliance Data Systems Corp.750,000 7.000%, 01/15/2026 804,889
MoneyGram International, Inc.500,000 5.375%, 08/01/2026 508,125
Unisys Corp.500,000 6.875%, 11/01/2027 546,920____________
1,859,934____________
Machinery: 0.5%
Wabash National Corp.500,000 4.500%, 10/15/2028 500,000
Welbilt, Inc.300,000 9.500%, 02/15/2024 308,715____________
808,715____________
Media: 0.5%
DIRECTV Holdings LLC / DIRECTV Financing Co., Inc.
500,000 5.875%, 08/15/2027 522,500
Meredith Corp.240,000 6.875%, 02/01/2026 248,100____________
770,600____________
Metals & Mining: 1.2%
Century Aluminum Co.500,000 7.500%, 04/01/2028 531,135
Coeur Mining, Inc.500,000 5.125%, 02/15/2029 480,747
Hecla Mining Co.500,000 7.250%, 02/15/2028 539,238
Real Alloy Holding, Inc.220,377 10.130%, (3 Month LIBOR
USD + 10.000%) Cash or 12.130% (3 Month LIBOR USD + 12.000%) PIK, 05/31/2023 2,3 220,377

22
The accompanying notes are an integral part of these financial statements.
Principal Amount Value
Metals & Mining: 1.2% (Continued)
SunCoke Energy, Inc.$ 250,000 4.875%, 06/30/2029 $ 249,375____________
2,020,872____________Oil, Gas & Consumable Fuels: 1.2%
Calumet Specialty Products Partners L.P. / Calumet Finance Corp.
475,000 11.000%, 04/15/2025 514,781
Genesis Energy L.P. / Genesis Energy Finance Corp.
450,000 7.750%, 02/01/2028 451,688
Global Partners L.P. / GLP Finance Corp.
500,000 7.000%, 08/01/2027 522,580
Renewable Energy Group, Inc.500,000 5.875%, 06/01/2028 517,575____________
2,006,624____________Paper & Forest Products: 0.1%
Resolute Forest Products, Inc.250,000 4.875%, 03/01/2026 254,814____________
Professional Services: 0.3%
Korn Ferry500,000 4.625%, 12/15/2027 519,375____________
Specialty Retail: 0.9%
Caleres, Inc.498,000 6.250%, 08/15/2023 500,084
Ken Garff Automotive LLC500,000 4.875%, 09/15/2028 514,620
Rent-A-Center, Inc.500,000 6.375%, 02/15/2029 540,000____________
1,554,704____________Textiles, Apparel & Luxury Goods: 0.2%
The William Carter Co.250,000 5.500%, 05/15/2025 262,988____________
Thrifts & Mortgage Finance: 1.1%
Nationstar Mortgage Holdings, Inc.250,000 6.000%, 01/15/2027 261,250500,000 5.125%, 12/15/2030 507,555
PennyMac Financial Services, Inc.500,000 5.375%, 10/15/2025 514,850
United Wholesale Mortgage LLC500,000 5.500%, 04/15/2029 486,174____________
1,769,829____________Trading Companies & Distributors: 0.9%
Avation Capital SA441,736 8.250% Cash or 9.000%
PIK, 10/31/2026 373,989
Principal Amount Value
Trading Companies & Distributors: 0.9% (Continued)
Herc Holdings, Inc.$ 500,000 5.500%, 07/15/2027 $ 525,070
WESCO Distribution, Inc.250,000 7.125%, 06/15/2025 267,770250,000 7.250%, 06/15/2028 277,188____________
1,444,017____________Transportation Infrastructure: 0.2%
Signature Aviation US Holdings, Inc.400,000 4.000%, 03/01/2028 402,448____________
Total Corporate Bonds(Cost $36,115,491) 37,508,474____________
Convertible Bonds: 4.2%
Airlines: 0.2%
Southwest Airlines Co.200,000 1.250%, 05/01/2025 299,500____________
Auto Components: 0.3%
Horizon Global Corp.480,000 2.750%, 07/01/2022 465,269____________
Automobiles: 0.3%
Ford Motor Co.500,000 N/A%, 03/15/2026 7 541,563____________
Consumer Finance: 0.1%
EZCORP, Inc.250,000 2.375%, 05/01/2025 230,000____________
Electronic Equipment, Instruments & Components: 0.1%
OSI Systems, Inc.230,000 1.250%, 09/01/2022 238,481____________
Energy Equipment & Services: 0.1%
Newpark Resources, Inc.241,000 4.000%, 12/01/2021 239,797____________
Health Care Equipment & Supplies: 0.3%
CONMED Corp.175,000 2.625%, 02/01/2024 271,360
Haemonetics Corp.250,000 N/A%, 03/01/2026 7 216,836____________
488,196____________Hotels, Restaurants & Leisure: 0.7%
Carnival Corp.286,000 5.750%, 04/01/2023 741,169
NCL Corp. Ltd.160,000 6.000%, 05/15/2024 343,440____________
1,084,609____________
Growth & Income Fund | Schedule of Investments at September 30, 2021 (Unaudited) (Continued)

23
The accompanying notes are an integral part of these financial statements.
Principal Amount Value
Internet & Direct Marketing Retail: 0.2%
Etsy, Inc.$ 250,000 0.250%, 06/15/2028 $ 284,875____________
IT Services: 0.3%
Euronet Worldwide, Inc.370,000 0.750%, 03/15/2049 410,393____________
Machinery: 0.2%
John Bean Technologies Corp.250,000 0.250%, 05/15/2026 265,625____________
Pharmaceuticals: 0.2%
Jazz Investments I Ltd.350,000 2.000%, 06/15/2026 405,781____________
Software: 0.9%
Rapid7, Inc.500,000 0.250%, 03/15/2027 625,449
Tyler Technologies, Inc.250,000 0.250%, 03/15/2026 274,772
Zendesk, Inc.450,000 0.625%, 06/15/2025 574,425____________
1,474,646____________
Thrifts & Mortgage Finance: 0.3%
EZCORP, Inc.550,000 2.875%, 07/01/2024 574,406____________
Total Convertible Bonds(Cost $5,745,013) 7,003,141____________
Private Mortgage Backed Obligations: 0.3%
Diversified Financial Services: 0.3%
HAS Capital Income Opportunity Fund II
642,000 8.000%, 12/31/2024 (Cost $642,000 Acquisition Dates 06/10/2016, 09/19/2016) 2,5 496,957____________
Total Private Mortgage Backed Obligations(Cost $642,000) 496,957____________
Total Bonds(Cost $42,502,504) 45,008,572____________
Shares ValueWarrants: 0.0% 8
Trading Companies & Distributors: 0.0% 8
8,750 Avation PLC(Expiration Date 10/31/2026, Exercise Price 114.5 GBp) 1,2 $ 4,997____________
Total Warrants(Cost $—) 4,997____________
Short-Term Investments: 4.7%
Money Market Funds: 4.7%
7,788,571 Federated Hermes U.S. Treasury Cash Reserves – Class I, 0.006% 4 7,788,571____________
Total Money Market Funds(Cost $7,788,571) 7,788,571____________
Total Short-Term Investments(Cost $7,788,571) 7,788,571____________
Total Investments in Securities: 99.2%(Cost $118,117,082) 165,060,132
Other Assets in Excess of Liabilities: 0.8% 1,368,054____________
Total Net Assets: 100.0% $166,428,186________________________
ADR – American Depositary ReceiptLIBOR – London Interbank Offered RatePIK – Payment In KindUSD – United States Dollar1 Non-income producing security.2 Security is fair valued under the Board of Trustees and is
categorized as a Level 3 security. Significant unobservable inputswere used to determine fair value.
3 Variable rate security; rate shown is the rate in effect onSeptember 30, 2021.
4 Annualized seven-day effective yield as of September 30, 2021.5 Security considered restricted. As of September 30, 2021, the
value of the restricted securities was $496,957 or 0.3% of netassets.
6 Not a readily marketable security.7 Zero Coupon Security.8 Does not round to 0.1% or (0.1)%, as applicable.9 Company is an “affiliated person” of the Fund, as defined in the
Investment Company Act of 1940.
Growth & Income Fund | Schedule of Investments at September 30, 2021 (Unaudited) (Continued)

24
Performance Summary
For the period of April 1, 2021 to September 30, 2021, the Osterweis Emerging Opportunity Fund (the “Fund”)generated a total return of 5.90%, outperforming the Russell 2000 Growth Index (the “Russell”), which returned -1.96%over the same period. (Please see standardized performance in the table following this review.)
Market Review
The past six months have been tough for small cap growth stocks, which have largely been an afterthought during thepost-Covid recovery. Instead, investors have been focusing on value stocks, many of which were pushed to the brink duringthe pandemic. In the first fiscal quarter, sectors such as travel & leisure came roaring back as the economy began toreopen. But sentiment changed in the second fiscal quarter, as many of these same companies struggled. Some wereimpacted by the Delta variant, while others had trouble managing ongoing supply chain issues. To compound matters,investors spent much of the quarter grappling with other concerns such as labor shortages, rising inflation, and a potentialtightening of the Fed’s monetary policy.
Portfolio Review
During the past two fiscal quarters, the Fund substantially outperformed the Russell, almost entirely due to our stockselection. Our six largest sectors by weight, representing over 97% of the portfolio, posted positive relative returns versusthe benchmark. The remaining three sectors each delivered negative absolute and relative returns, but they were a smallpart of the portfolio so they had a negligible impact on results. Our top performing sectors – real estate, informationtechnology, financials, and industrials – each delivered double-digit returns during the period.
Sector allocation was also additive to performance, but less so. We were overweight utilities and informationtechnology, two of the top-performing sectors in the Russell. In addition, we were underweight health care, the worstperforming sector in the index.
The Fund maintained an average cash position of nearly 8% during the period. This provides us flexibility to add newnames rapidly when attractive opportunities present themselves and serves as a buffer during periods of volatility.
Outlook & Portfolio Positioning
It appears to us that both the economy and the markets are still trying to find their footing in the aftermath ofCovid-19. It was a disruption of historic proportions, and markets have remained choppy as investors try to figure out whatlies ahead. While we wait for conditions to normalize, we remain focused on finding the most attractive secular growthcompanies in the small cap universe, which we believe will deliver strong performance over the long run.
____________________Mutual Fund investing involves risk. Principal loss is possible.
The Osterweis Emerging Opportunity Fund may invest in unseasoned companies, which involve additional risks such as abrupt or erraticprice movements. The Fund may invest in small and mid-sized companies, which may involve greater volatility than large-sized companies.The Fund may invest in IPOs and unseasoned companies that are in the early stages of their development and may pose more riskcompared to more established companies. The Fund may invest in ETFs, which involve risks that do not apply to conventional Funds. Higherturnover rates may result in increased transaction costs, which could impact performance. From time to time, the Fund may haveconcentrated positions in one or more sectors subjecting the Fund to sector emphasis risk. The Fund may invest in foreign and emergingmarket securities, which involve greater volatility and political, economic and currency risks and differences in accounting methods. Theserisks may increase for emerging markets.
Investment performance reflects periods during which fee waivers were in effect. In the absence of such waivers, total return would havebeen reduced.
Emerging Opportunity Fund | Portfolio Managers’ Review

25
Emerging Opportunity Fund |Fund Overview (Unaudited)
$7,000$10,000$13,000$16,000$19,000$22,000$25,000$28,000$31,000$34,000$37,000$40,000$43,000$46,000$49,000$52,000$55,000
Osterweis Emerging Opportunity Fund $52,365
3/31/1
7
9/30/1
3
3/31/1
4
3/31/1
5
3/31/1
6
10/1/1
2
Russell 2000 Growth Index $32,802
3/31/1
3
3/31/1
8
3/31/1
9
3/31/2
1
9/30/1
4
9/30/1
5
9/30/1
6
9/30/1
8
9/30/1
9
9/30/2
1
3/31/2
0
9/30/2
0
9/31/1
8
Average Annual Total ReturnsPeriods Ended September 30, 2021
Six Months Since Inception(Not Annualized) 1 Yr. 3 Yr. 5 Yr. (October 1, 2012)
Osterweis Emerging Opportunity Fund 5.90% 35.02% 23.11% 26.22% 20.20%Russell 2000 Growth Index -1.96 33.27 11.70 15.34 14.11Gross/Net Expense Ratio as of 3/31/2021: 1.20%/1.11% 11 As of most recent Prospectus dated June 30, 2021. Please see the Fund’s Financial Highlights in this report for the most recent expenseratio. The Adviser has contractually agreed to waive certain fees through June 30, 2022. The net expense ratio is applicable to investors.
The performance data quoted above represents past performance. Past performance does not guarantee futureresults. The investment return and principal value of an investment will fluctuate so that an investor’s shares, whenredeemed, may be worth more or less than their original cost. Current performance of the Fund may be lower orhigher than the performance quoted. Performance data current to the most recent month-end may be obtained bycalling (866) 236-0050. Performance prior to December 1, 2016 is that of another investment vehicle (the “PredecessorFund”) before the commencement of the Fund’s operations. The Predecessor Fund was converted into the Fund onNovember 30, 2016. The Predecessor Fund’s performance shown includes the deduction of the Predecessor Fund’sactual operating expenses. In addition, the Predecessor Fund’s performance shown has been recalculated using themanagement fee that applies to the Fund, which has the effect of reducing the Predecessor Fund’s performance. ThePredecessor Fund was not a registered mutual fund and so was not subject to the same operating expenses orinvestment and tax restrictions as the Fund. If it had been, the Predecessor Fund’s performance may have been lower.Growth of $10K (Inception to 9/30/2021)
This chart illustrates the performance of a hypothetical $10,000 investment made onOctober 1, 2012 and is not intended to imply any future performance. The returnsshown do not reflect the deduction of taxes that a shareholder would pay on Funddistributions or the redemption of Fund shares. The returns reflect fee waivers ineffect. In the absence of such waivers, total return would be reduced (See Note 3).The chart assumes reinvestment of capital gains, dividends and return of capital, ifapplicable, for the Fund and dividends for an index.
Sector Allocation (% of Net Assets)
� Information Technology 27.8%� Health Care 21.8� Consumer Discretionary 19.5� Industrials 9.6� Real Estate 3.5� Financials 2.2� Utilities 2.2� Consumer Staples 1.5� Cash* 11.9* Cash, cash equivalents and
other assets less liabilities.
Equities are classified by GICS sector. Bonds are classified by bond type.
Top Ten Equity Holdings (% of Net Assets)Kornit Digital Ltd. 5.0%Rapid7, Inc. 4.4Floor & Decor Holdings, Inc. – Class A 4.3Insulet Corp. 4.2Brooks Automation, Inc. 3.9Onto Innovation, Inc. 3.8Marriott Vacations Worldwide Corp. 3.8FirstService Corp. 3.5MaxLinear, Inc. 3.2Axon Enterprise, Inc. 3.2
Total 39.3%
Fund holdings are subject to change.

26
The accompanying notes are an integral part of these financial statements.
Emerging Opportunity Fund | Schedule of Investments at September 30, 2021 (Unaudited)
Shares ValueCommon Stocks: 88.1%
Aerospace & Defense: 3.2%
46,445 Axon Enterprise, Inc. 1 $ 8,128,804____________
Biotechnology: 6.6%
48,790 ALX Oncology Holdings, Inc. 1 3,603,631
43,045 Fate Therapeutics, Inc. 1 2,551,277
46,630 Natera, Inc. 1 5,196,447
87,520 Replimune Group, Inc. 1 2,594,093
39,865 Turning Point Therapeutics, Inc. 1 2,648,232____________16,593,680____________
Food Products: 1.5%
26,055 Freshpet, Inc. 1 3,717,788____________
Health Care Equipment & Supplies: 10.3%
81,405 CryoPort, Inc. 1 5,414,246
32,360 Inari Medical, Inc. 1 2,624,396
37,735 Insulet Corp. 1 10,725,419
61,810 Tandem Diabetes Care, Inc. 1 7,378,878____________26,142,939____________
Health Care Providers & Services: 3.9%
134,905 Accolade, Inc. 1 5,688,944
74,645 Progyny, Inc. 1 4,180,120____________9,869,064____________
Health Care Technology: 1.0%
74,853 Certara, Inc. 1 2,477,634____________
Hotels, Restaurants & Leisure: 9.0%
60,880 Marriott Vacations Worldwide Corp. 9,578,251
65,635 Planet Fitness, Inc. – Class A 1 5,155,629
48,995 Wingstop, Inc. 8,031,750____________22,765,630____________
Household Durables: 0.8%
94,320 Vizio Holding Corp. – Class A 1 2,003,357____________
Independent Power & Renewable Electricity Producers: 2.2%
165,535 Sunnova Energy International, Inc. 1 5,452,723____________
Internet & Direct Marketing Retail: 2.4%
15,380 Etsy, Inc. 1 3,198,425
15,730 Fiverr International Ltd. 1 2,873,556____________6,071,981____________
IT Services: 1.6%
74,805 dLocal Ltd. – Class A 1 4,081,361____________
Shares Value
Leisure Products: 2.8%
256,790 Callaway Golf Co. 1 $ 7,095,108____________
Machinery: 5.0%
87,265 Kornit Digital Ltd. 1 12,630,736____________
Professional Services: 1.4%
81,394 Upwork, Inc. 1 3,665,172____________
Real Estate Management & Development: 3.5%
48,935 FirstService Corp. 8,831,789____________
Semiconductors & Semiconductor Equipment: 13.7%
96,270 Brooks Automation, Inc. 9,853,234
87,620 MACOM Technology Solutions Holdings, Inc. 1 5,683,909
165,145 MaxLinear, Inc. 1 8,133,391
134,087 Onto Innovation, Inc. 1 9,687,786
6,550 SiTime Corp. 1 1,337,314____________34,695,634____________
Software: 12.5%
7,510 Alteryx, Inc. – Class A 1 548,981
26,815 Avalara, Inc. 1 4,686,458
83,175 Cerence, Inc. 1 7,993,949
24,460 Everbridge, Inc. 1 3,694,438
22,735 Five9, Inc. 1 3,631,689
99,165 Rapid7, Inc. 1 11,207,628____________31,763,143____________
Specialty Retail: 4.5%
39,580 Brilliant Earth Group, Inc. – Class A 1 530,372
89,610 Floor & Decor Holdings, Inc. – Class A 1 10,823,992____________
11,354,364____________
Thrifts & Mortgage Finance: 2.2%
107,305 Meta Financial Group, Inc. 5,631,366____________
Total Common Stocks(Cost $186,677,316) 222,972,273____________

27
The accompanying notes are an integral part of these financial statements.
Shares ValueShort-Term Investments: 10.9%
Money Market Funds: 10.9%
27,536,426 Federated Hermes U.S. Treasury Cash Reserves – Class I, 0.006% 2 $ 27,536,426____________
Total Money Market Funds(Cost $27,536,426) 27,536,426____________
Total Short-Term Investments(Cost $27,536,426) 27,536,426____________
Total Investments in Securities: 99.0%(Cost $214,213,742) 250,508,699
Other Assets in Excess of Liabilities: 1.0% 2,597,481____________
Total Net Assets: 100.0% $253,106,180________________________
1 Non-income producing security.2 Annualized seven-day effective yield as of September 30, 2021.
Emerging Opportunity Fund | Schedule of Investments at September 30, 2021 (Unaudited) (Continued)

28
Performance Summary
For the six-month period ending September 30, 2021, the Osterweis Total Return Fund (the “Fund”) generated a totalreturn of 0.12%, trailing the Bloomberg U.S. Aggregate Bond Index (the “BC Agg”), which returned 1.88% over the sameperiod. (Please see standardized performance in the table following this review.)
Market Review
Interest rates fell in the first fiscal quarter, reversing some of the selloff observed in the prior quarter. Inflation rosewell above expectations during the period, but investors were more focused on the possibility that earlier-than-expectedremoval of Fed stimulus could potentially stunt the economic recovery – hence the decrease in long-term Treasury yields.The second fiscal quarter was a comparatively quiet period, although inflation continued to rise and the Fed againsuggested it is ready to commence tapering its bond purchase program. Interest rates increased modestly and the yieldcurve flattened slightly as inflation fears weighed most on intermediate maturities. Corporate and mortgage spreadsexhibited little change.
Portfolio Review
During the first fiscal quarter, the Fund underperformed the BC Agg largely due to its lower duration profile. The Fundbenefitted from favorable security selection and an overweight in corporate bonds, a sector that saw spreads narrow11 basis points. Mortgage market returns were mixed as the Fund incurred slight losses on its prepayment exposure in theCMO portion of the portfolio, while recouping this return through owning lower coupon Mortgage-Backed Securities. Wealso altered our sector exposure throughout the quarter based on volatility in mortgage spreads.
During the second fiscal quarter, the Fund lagged the BC Agg due to interest rate hedges and underperformance of theagency MBS portfolio resulting from elevated prepayments. Some of this underperformance was offset by securityselection in corporate bonds, asset backed securities, and TIPS.
Outlook & Portfolio Positioning
Going forward we continue to see inflation as the greatest challenge for the market. While some investors have startedto price inflation risk more in line with our thinking, we still think that prolonged elevated inflation could lead to furtherrepricing. We also believe that the market can withstand a predictable slowing of the pace of Fed purchases, but it maystruggle should the Fed be forced to accelerate their taper to combat inflation. Over the course of the second fiscal quarter,we increased our exposure to ABS and TIPS while keeping corporates and MBS largely unchanged, and we anticipate asimilar stance for the balance of 2021 based upon current valuations.
____________________Mutual fund investing involves risk. Principal loss is possible.
The Osterweis Total Return Fund may invest fixed income securities which are subject to credit, default, extension, interest rate andprepayment risks. It may also make investments in derivatives that may involve certain costs and risks such as liquidity, interest rate, market,credit, management and the risk that a position could not be closed when most advantageous. The Fund may invest in debt securities thatare un-rated or rated below investment grade. Lower-rated securities may present an increased possibility of default, price volatility orilliquidity compared to higher-rated securities. Investments in foreign and emerging market securities involve greater volatility and political,economic and currency risks and differences in accounting methods. These risks may increase for emerging markets. Leverage may cause theeffect of an increase or decrease in the value of the portfolio securities to be magnified and the fund to be more volatile than if leverage wasnot used. Investments in preferred securities have an inverse relationship with changes in the prevailing interest rate. Investments in AssetBacked and Mortgage Backed Securities include additional risks that investors should be aware of such as credit risk, prepayment risk,possible illiquidity and default, as well as increased susceptibility to adverse economic developments. It may also make investments inderivatives that may involve certain costs and risks such as liquidity, interest rate, market, credit, management and the risk that a positioncould not be closed when most advantageous. The Fund may invest in municipal securities which are subject to the risk of default.
Investment performance reflects periods during which fee waivers were in effect. In the absence of such waivers, total return would havebeen reduced.
Total Return Fund | Portfolio Managers’ Review

29
Total Return Fund | Fund Overview (Unaudited)
$9,750$10,000$10,250$10,500$10,750$11,000$11,250$11,500$11,750$12,000$12,250$12,500$12,750$13,000
Osterweis Total Return Fund $11,749
ICE BofA 3 Month Treasury Bill $10,583
6/30/1
8
6/30/1
7
9/30/1
7
12/31/1
7
3/31/1
8
9/30/1
8
12/30/1
6
Bloomberg U.S. Aggregate Bond Index $11,915
Bloomberg U.S. Aggregate 1-3 Year Index $10,998
3/31/1
7
12/31/1
8
3/31/1
9
3/31/2
0
6/30/1
9
9/30/1
9
12/31/1
9
6/30/2
0
9/30/2
0
3/31/2
1
6/30/2
1
9/30/2
1
12/31/2
0
Average Annual Total ReturnsPeriods Ended September 30, 2021
Six Months Since Inception(Not Annualized) 1 Yr. 3 Yr. (December 30, 2016)
Osterweis Total Return Fund 0.12% 0.03% 3.31% 3.45%Bloomberg U.S. Aggregate Bond Index 1.88 -0.90 5.36 3.76Bloomberg U.S. Aggregate Bond 1-3 Year Index 0.14 0.29 2.78 2.02ICE BofA 3-Month Treasury Bill Index 0.01 0.07 1.18 1.20
Gross/Net Expense Ratio as of 3/31/2021: 0.70%/0.70% 1
1 As of most recent Prospectus dated June 30, 2021. Please see the Fund’s Financial Highlights in this report for the most recent expenseratio. The Adviser has contractually agreed to waive certain fees through June 30, 2022. The net expense ratio is applicable to investors.
The performance data quoted above represents past performance. Past performance does not guarantee future results.The investment return and principal value of an investment will fluctuate so that an investor’s shares, when redeemed, maybe worth more or less than their original cost. Current performance of the Fund may be lower or higher than theperformance quoted. Performance data current to the most recent month-end may be obtained by calling (866) 236-0050.
Growth of $10K (Inception to 9/30/2021)
This chart illustrates the performance of a hypothetical $10,000 investment made onDecember 30, 2016 and is not intended to imply any future performance. Thereturns shown do not reflect the deduction of taxes that a shareholder would pay onFund distributions or the redemption of Fund shares. The returns reflect fee waiversin effect. In the absence of such waivers, total return would be reduced (See Note 3).The chart assumes reinvestment of capital gains, dividends and return of capital, ifapplicable, for the Fund and dividends for an index.
Asset Allocation (% of Net Assets)
� Corporate Bonds 37.7%� Mortgage Backed Securities 34.6� Asset Backed Securities 16.6� United States
Government Securities 6.1� Commercial Mortgage
Backed Securities 1.1� Cash* 3.9* Cash, cash equivalents and
other assets less liabilities.
Top Ten Debt Holdings (% of Net Assets)Federal National Mortgage Association
Pool, Series FN FM6816, 2.500% 6.0%Federal National Mortgage Association
Pool, Series FN BT1250, 2.500% 5.5Federal National Mortgage Association
Pool, Series FN CA7747, 3.000% 5.3Federal National Mortgage Association
Pool, Series FN CB1279, 2.500% 2.8United States Treasury Inflation
Indexed Bonds, 0.125% 2.4United States Treasury Inflation
Indexed Bonds, 0.125% 1.8CF Hippolyta LLC,
Series SORT 2021-1A B1, 1.980% 1.6GXO Logistics, Inc., 1.650% 1.3CLI Funding VIII LLC, 1.640% 1.3United States Treasury Inflation
Indexed Bonds, 0.125% 1.2Total 29.2%
Fund holdings are subject to change.

30
The accompanying notes are an integral part of these financial statements.
Principal Amount ValueBonds: 96.1%Corporate Bonds: 37.7%
Aerospace & Defense: 0.5%
Textron, Inc.$ 1,000,000 2.450%, 03/15/2031 $ 1,002,172____________
Air Freight & Logistics: 2.4%
American Airlines 2019-1 Class B Pass Through Trust
858,433 3.850%, 02/15/2028 819,995
British Airways 2021-1 Class A Pass Through Trust
1,200,000 2.900%, 03/15/2035 1,209,548
GXO Logistics, Inc.2,500,000 1.650%, 07/15/2026 2,484,000____________
4,513,543____________
Airlines: 0.9%
Air Canada 2020-2 Class A Pass Through Trust
937,148 5.250%, 04/01/2029 1,013,557
British Airways 2020-1 Class A Pass Through Trust
583,435 4.250%, 11/15/2032 630,850____________1,644,407____________
Automobiles: 1.2%
General Motors Co.1,000,000 6.125%, 10/01/2025 1,171,693
Stellantis Finance US, Inc.1,000,000 1.711%, 01/29/2027 996,796____________
2,168,489____________
Banks: 5.2%
Bank of America Corp.1,500,000 4.250%, 10/22/2026 1,689,065
Barclays PLC1,000,000 1.007% (1 Year CMT
Rate + 0.800%), 12/10/2024 1,10 1,004,804
HSBC Holdings PLC1,000,000 0.976% (SOFR + 0.708%),
05/24/2025 1,10 997,8811,000,000 4.600% (5 Year CMT
Rate + 3.649%), 12/17/2030 1,6,10 1,004,790
JP Morgan Chase & Co.1,000,000 3.599% (3 Month LIBOR
USD + 3.470%), 01/30/2022 1,6 1,005,480
JPMorgan Chase & Co.1,900,000 3.451% (3 Month LIBOR
USD + 3.320%), 01/01/2022 1,6 1,897,088
Principal Amount Value
Banks: 5.2% (Continued)
SVB Financial Group$ 2,000,000 4.000% (5 Year CMT
Rate + 3.202%), 05/15/2026 1,6,10 $ 2,057,500____________9,656,608____________
Biotechnology: 1.1%
Amgen, Inc.2,000,000 1.650%, 08/15/2028 1,964,120____________
Capital Markets: 6.1%
Ares Capital Corp.1,000,000 2.875%, 06/15/2028 1,012,882
Blackstone Private Credit Fund2,000,000 1.750%, 09/15/2024 1,997,743
The Charles Schwab Corp.1,000,000 4.000% (10 Year CMT
Rate + 3.079%), 12/01/2030 1,6,10 1,029,710
Deutsche Bank AG/New York NY1,000,000 3.729% (SOFR + 2.757%),
01/14/2032 1,10 1,032,172
Morgan Stanley2,000,000 4.350%, 09/08/2026 2,258,6682,000,000 2.484% (SOFR + 1.360%),
09/16/2036 1,10 1,956,987
OWL Rock Core Income Corp.1,000,000 3.125%, 09/23/2026 991,900
UBS Group AG1,000,000 1.494% (1 Year CMT
Rate + 0.850%), 08/10/2027 1,10 988,796____________11,268,858____________
Diversified Financial Services: 2.5%
Aviation Capital Group LLC1,000,000 5.500%, 12/15/2024 1,120,9741,000,000 1.950%, 01/30/2026 996,459
500,000 1.950%, 09/20/2026 494,651
Avolon Holdings Funding Ltd.1,000,000 2.125%, 02/21/2026 989,6851,000,000 4.250%, 04/15/2026 1,075,611____________
4,677,380____________Diversified Telecommunication Services: 1.3%
AT&T, Inc.1,000,000 3.500%, 06/01/2041 1,025,916
NTT Finance Corp.1,500,000 1.591%, 04/03/2028 1,484,596____________
2,510,512____________Electric Utilities: 1.9%
NextEra Energy Capital Holdings, Inc.1,500,000 1.900%, 06/15/2028 1,500,573
Total Return Fund | Schedule of Investments at September 30, 2021 (Unaudited)

31
The accompanying notes are an integral part of these financial statements.
Principal Amount Value
Electric Utilities: 1.9% (Continued)
Southern California Edison Co.$ 1,000,000 0.975%, 08/01/2024 $ 1,002,447
The Southern Co.1,000,000 3.750% (5 Year CMT
Rate + 2.915%), 09/15/2051 1,10 1,022,700____________3,525,720____________
Electronic Equipment, Instruments & Components: 0.9%
SYNNEX Corp.1,610,000 1.250%, 08/09/2024 1,610,628____________
Equity Real Estate Investment Trusts – REITS: 1.1%
Boston Properties L.P.1,000,000 2.550%, 04/01/2032 998,132
Vornado Realty L.P.1,000,000 2.150%, 06/01/2026 1,015,858____________
2,013,990____________Hotels, Restaurants & Leisure: 2.4%
Expedia Group, Inc.1,500,000 2.950%, 03/15/2031 1,515,370
Hyatt Hotels Corp.1,000,000 1.100% (SOFR + 1.050%),
10/01/2023 1 1,001,450
Marriott International, Inc.2,000,000 2.850%, 04/15/2031 2,024,934____________
4,541,754____________Industrial Conglomerates: 0.6%
GE Capital International Funding Co. Unlimited Co.
1,000,000 4.418%, 11/15/2035 1,198,809____________
Insurance: 2.2%
Belrose Funding Trust1,000,000 2.330%, 08/15/2030 986,527
Liberty Mutual Group, Inc.1,000,000 4.125% (5 Year CMT
Rate + 3.315%), 12/15/2051 1,10 1,027,637
SBL Holdings, Inc.1,025,000 6.500% (5 Year CMT
Rate + 5.620%), 11/13/2026 1,6,10 1,014,7501,000,000 5.000%, 02/18/2031 1,067,025____________
4,095,939____________Media: 1.6%
Charter Communications Operating LLC / Charter Communications Operating Capital
2,000,000 2.250%, 01/15/2029 1,997,4081,000,000 3.900%, 06/01/2052 993,533____________
2,990,941____________
Principal Amount Value
Oil, Gas & Consumable Fuels: 2.7%
Enbridge, Inc.$ 1,000,000 2.500%, 08/01/2033 $ 1,003,770
Energy Transfer L.P.1,000,000 6.500% (5 Year CMT
Rate + 5.694%), 11/15/2026 1,6,10 1,043,870
Enterprise Products Operating LLC1,000,000 3.300%, 02/15/2053 977,985
Phillips 662,000,000 1.300%, 02/15/2026 1,988,907____________
5,014,532____________Pharmaceuticals: 0.7%
Allergan Finance LLC1,200,000 3.250%, 10/01/2022 1,221,829____________
Specialty Retail: 0.5%
AutoNation, Inc.1,000,000 1.950%, 08/01/2028 986,040____________
Tobacco: 0.6%
BAT Capital Corp.1,000,000 4.390%, 08/15/2037 1,073,618____________
Trading Companies & Distributors: 1.3%
Air Lease Corp.1,000,000 1.875%, 08/15/2026 996,577
Triton Container International Ltd.1,500,000 2.050%, 04/15/2026 1,505,139____________
2,501,716____________
Total Corporate Bonds(Cost $69,207,508) 70,181,605____________
Asset Backed Securities: 16.6%
American Credit Acceptance Receivables Trust 2021-1
1,500,000 1.140%, 03/15/2027 1,501,633
American Credit Acceptance Receivables Trust 2021-2
1,000,000 0.970%, 07/13/2027 1,003,323
Carvana Auto Receivables Trust 2021-N1
1,500,000 1.300%, 01/10/2028 1,508,079
Carvana Auto Receivables Trust 2021-N2
1,000,000 1.270%, 03/10/2028 1,001,083
CF Hippolyta LLCSeries SORT 2020-1 B1
1,073,079 2.280%, 07/15/2060 1,089,861Series SORT 2021-1A B1
2,982,425 1.980%, 03/15/2061 2,993,143
Total Return Fund | Schedule of Investments at September 30, 2021 (Unaudited) (Continued)

32
The accompanying notes are an integral part of these financial statements.
Principal Amount Value
CLI Funding VIII LLC$ 2,354,702 1.640%, 02/18/2046 $ 2,326,307
Credit Acceptance Auto Loan Trust 2021-3
750,000 1.380%, 07/15/2030 749,058
DT Auto Owner Trust 2021-1500,000 0.840%, 10/15/2026 500,513
FCI Funding 2021-1 LLC 2021-1394,711 1.130%, 04/15/2033 395,242
Flagship Credit Auto Trust 2020-4500,000 1.280%, 02/16/2027 504,043
Flagship Credit Auto Trust 2021-21,000,000 1.270%, 06/15/2027 1,000,923
HERO Funding Trust 2021-1859,699 2.240%, 09/20/2051 858,366
Hertz Vehicle Financing III L.P.2,000,000 1.680%, 12/27/2027 2,006,190
MVW 2021-1W LLC460,020 1.440%, 01/22/2041 460,201
NP SPE X L.P. 2021-11,250,000 2.230%, 03/19/2051 1,250,228
OnDeck Asset Securitization Trust III LLC
1,000,000 2.280%, 05/17/2027 1,007,495
Progress Residential 2021-SFR1500,000 1.555%, 04/17/2038 493,506
Santander Drive Auto Receivables Trust 2021-2
1,000,000 1.350%, 07/15/2027 1,004,675
Textainer Marine Containers Ltd.1,986,667 1.940%, 08/20/2046 1,972,477
Thrust Engine Leasing 2021 DAC1,989,945 4.163%, 07/15/2040 1,969,203
Triton Container Finance VIII LLC1,915,000 1.860%, 03/20/2046 1,901,800
TRP – TRIP Rail Master Funding LLC1,982,584 2.150%, 06/19/2051 2,000,506
Westlake Automobile Receivables Trust 2020-1
380,000 2.520%, 04/15/2025 387,809
Westlake Automobile Receivables Trust 2020-3
87,000 1.240%, 11/17/2025 87,744
Westlake Automobile Receivables Trust 2021-2
1,000,000 1.230%, 12/15/2026 999,434____________30,972,842____________
Total Asset Backed Securities(Cost $30,992,162) 30,972,842____________
Principal Amount ValueCommercial Mortgage Backed Securities: 1.1%
BX Commercial Mortgage Trust 2021-VOLTSeries BX 2021-VOLT C
$ 1,000,000 1.200% (1 Month LIBOR USD + 1.100%), 09/15/2036 1 $ 1,003,122
Mortgage TrustSeries LIFE 2021-BMR C
1,000,000 1.184% (1 Month LIBOR USD + 1.100%), 03/15/2038 1 1,002,762____________
2,005,884____________
Total Commercial Mortgage-Backed Securities(Cost $2,000,000) 2,005,884____________
Mortgage Backed Securities: 34.6%
COLT 2021-2 Mortgage Loan Trust – 0: 0.5%
983,507 1.130%, 08/25/2066 983,213____________
COLT Funding LLC: 0.3%486,245 1.513%, 12/25/2064 486,030____________
Federal Home Loan Mortgage Corporation REMICS: 2.7%
Series FHR 2512 SI408,571 7.416% (1 Month LIBOR
USD + 7.500%), 04/15/2024 1,2,8 22,344Series FHR 4048 IK
2,753,660 3.000%, 05/15/2027 2 127,013Series FHR 4093 DS
5,610,581 6.216% (1 Month LIBOR USD + 6.300%), 08/15/2027 1,2,8 619,747
Series FHR 4216 EI3,157,560 3.000%, 06/15/2028 2 207,846
Series FHR 4360 BI1,606,177 2.500%, 11/15/2028 2 62,597
Series FHR 4341 MI1,468,187 4.000%, 11/15/2031 2 132,240
Series FHR 4093 IB1,827,328 4.000%, 08/15/2032 2 191,357
Series FHR 4114 MI2,323,867 3.500%, 10/15/2032 2 236,709
Series FHR 4170 IU3,450,206 3.000%, 02/15/2033 2 305,816
Series FHR 3171 OJ868,228 N/A%, 06/15/2036 3,7 776,268
Series FHR 3824 LS619,942 7.016% (1 Month LIBOR
USD + 7.100%), 08/15/2036 1,2,8 134,942Series FHR 3236 KF
79,161 0.384% (1 Month LIBOR USD + 0.300%), 11/15/2036 1 79,935
Total Return Fund | Schedule of Investments at September 30, 2021 (Unaudited) (Continued)

33
The accompanying notes are an integral part of these financial statements.
Principal Amount Value
Federal Home Loan Mortgage Corporation REMICS: 2.7% (Continued)
Series FHR 3339 JS$ 39,402 42.291% (1 Month LIBOR
USD + 42.835%), 07/15/2037 1,8 $ 84,871Series FHR 3380 FM
181,827 0.674% (1 Month LIBOR USD + 0.590%), 10/15/2037 1 184,971
Series FHR 4121 IM219,441 4.000%, 10/15/2039 2 408
Series FHR 3721 FB142,353 0.584% (1 Month LIBOR
USD + 0.500%), 09/15/2040 1 144,584Series FHR 4105 LS
3,681,737 6.066% (1 Month LIBOR USD + 6.150%), 08/15/2041 1,2,8 315,833
Series FHR 3933 QS2,263,359 5.966% (1 Month LIBOR
USD + 6.050%), 10/15/2041 1,2,8 400,193Series FHR 4340 US
1,398,541 6.516% (1 Month LIBOR USD + 6.600%), 05/15/2042 1,2,8 274,917
Series FHR 4076 LF208,092 0.384% (1 Month LIBOR
USD + 0.300%), 07/15/2042 1 208,440Series FHR 4495 PI
287,948 4.000%, 09/15/2043 2 22,394Series FHR 4313 CS
2,867,014 5.966% (1 Month LIBOR USD + 6.050%), 03/15/2044 1,2,8 491,728
Series FHR 4911 IH1,262,414 4.000%, 04/15/2049 2 77,837____________
5,102,990____________Federal Home Loan Mortgage Corporation Strips: 0.2%
Series FHS 288 IO1,646,116 3.000%, 10/15/2027 2 100,289
Series FHS 272 F2282,994 0.634% (1 Month LIBOR
USD + 0.550%), 08/15/2042 1 289,434____________389,723____________
Federal National Mortgage Association Interest Strips: 0.4%
Pool FNS 419 C13,602,309 2.500%, 09/25/2028 2 209,353
Pool FNS 419 C24,362,686 3.000%, 05/25/2029 2 268,771
Pool FNS 421 C41,879,669 4.500%, 01/25/2030 2 166,135
Pool FNS 421 C3122,647 4.000%, 07/25/2030 2 11,172
Pool FNS 387 7419,232 5.500%, 04/25/2038 2 91,809____________
747,240____________
Principal Amount Value
Federal National Mortgage Association Pool: 21.9%
FN AL2519$ 807,834 4.500%, 07/01/2040 $ 905,438
FN AS5460876,867 3.500%, 07/01/2045 940,337
FN AS65201,114,206 3.500%, 01/01/2046 1,195,873
FN MA31011,084,369 4.500%, 08/01/2047 1,183,068
FN CA77479,211,285 3.000%, 11/01/2050 9,908,458
FN FM681610,823,747 2.500%, 04/01/2051 11,209,246
FN BT12509,946,299 2.500%, 06/01/2051 10,303,925
FN CB12794,965,535 2.500%, 08/01/2051 5,123,188____________
40,769,533____________
Federal National Mortgage Association REMICS: 4.6%
Series FNR 1996-45 SI205,861 7.164% (1 Month LIBOR
USD + 7.250%), 02/25/2024 1,2,8 15,072Series FNR 1997-65 SI
567,779 7.907% (1 Month LIBOR USD + 8.000%), 09/17/2027 1,2,8 77,542
Series FNR 2012-139 DI4,343,610 3.000%, 12/25/2027 2 211,426
Series FNR 2013-29 BI5,114,754 2.500%, 04/25/2028 2 283,510
Series FNR 2015-34 AI1,387,485 4.500%, 06/25/2030 2 29,237
Series FNR 2010-119 PS3,087,667 6.614% (1 Month LIBOR
USD + 6.700%), 09/25/2030 1,2,8 402,764Series FNR 2016-8 CI
7,080,306 3.000%, 03/25/2031 2 516,195Series FNR 2013-51 PI
2,400,564 3.000%, 11/25/2032 2 215,826Series FNR 2014-81 TI
455,252 4.500%, 12/25/2034 2 43,682Series FNR 2016-24 IB
5,095,521 3.500%, 05/25/2036 2 511,129Series FNR 2007-2 FT
226,902 0.336% (1 Month LIBOR USD + 0.250%), 02/25/2037 1 228,723
Series FNR 2016-78 CS3,204,565 6.014% (1 Month LIBOR
USD + 6.100%), 05/25/2039 1,2,8 547,539Series FNR 2012-82 PS
2,612,879 6.014% (1 Month LIBOR USD + 6.100%), 08/25/2041 1,2,8 276,196
Total Return Fund | Schedule of Investments at September 30, 2021 (Unaudited) (Continued)

34
The accompanying notes are an integral part of these financial statements.
Principal Amount Value
Federal National Mortgage Association REMICS: 4.6% (Continued)
Series FNR 2011-100 S$ 4,234,182 6.364% (1 Month LIBOR
USD + 6.450%), 10/25/2041 1,2,8 $ 783,416Series FNR 2012-15 SW
3,860,759 5.864% (1 Month LIBOR USD + 5.950%), 03/25/2042 1,2,8 705,262
Series FNR 2012-79 FM149,205 0.536% (1 Month LIBOR
USD + 0.450%), 07/25/2042 1 150,439Series FNR 2012-128 ST
1,339,587 6.064% (1 Month LIBOR USD + 6.150%), 11/25/2042 1,2,8 301,588
Series FNR 2013-22 TO501,812 N/A%, 03/25/2043 3,7 437,265
Series FNR 2013-20 QS5,317,845 6.064% (1 Month LIBOR
USD + 6.150%), 03/25/2043 1,2,8 1,054,987Series FNR 2014-37 PI
962,371 5.500%, 06/25/2044 2 118,439Series FNR 2014-50 WS
605,603 6.114% (1 Month LIBOR USD + 6.200%), 08/25/2044 1,2,8 99,829
Series FNR 2016-83 BS455,154 6.014% (1 Month LIBOR
USD + 6.100%), 11/25/2046 1,2,8 93,168Series FNR 2018-51 IO
643,617 6.500%, 07/25/2048 2 102,065Series FNR 2019-41 SB
1,549,097 5.964% (1 Month LIBOR USD + 6.050%), 08/25/2049 1,2,8 275,403
Series FNR 2020-88 QI12,119,013 2.000%, 05/25/2050 2 1,110,268____________
8,590,970____________
Goldman Sachs Mortgage-Backed Securities Corp Trust: 0.4%
Series GSMBS 2020-PJ4 A2739,143 3.000%, 01/25/2051 751,654____________
Government National Mortgage Association: 1.0%
Series GNR 2014-74 GI222,111 4.000%, 05/16/2029 2 10,489
Series GNR 2010-47 BX334,710 6.465% (1 Month LIBOR
USD + 6.550%), 08/16/2034 1,2,8 37,373Series GNR 2011-61 WS
3,687,658 6.383% (1 Month LIBOR USD + 6.470%), 02/20/2038 1,2,8 616,903
Series GNR 2010-6 FG137,450 0.685% (1 Month LIBOR
USD + 0.600%), 01/16/2040 1 139,196
Principal Amount Value
Government National Mortgage Association: 1.0% (Continued)
Series GNR 2016-31 CS$ 4,595,975 6.163% (1 Month LIBOR
USD + 6.250%), 07/20/2044 1,2,8 $ 911,683Series GNR 2016-112 WI
5,914,402 1.681% (1 Month LIBOR + 0.430%), 03/20/2045 1,2 163,689____________
1,879,333____________
JP Morgan Mortgage Trust: 0.5%Series JPMMT 2014-IVR3 3A1
448,110 2.466%, 09/25/2044 1 450,127Series JPMMT 2020-7 A3
502,773 3.000%, 01/25/2051 512,948____________963,075____________
Verus Securitization Trust: 0.9%Series 2014-4-0
965,895 1.247%, 07/25/2066 966,307Series 2021-R3-0
786,723 1.380%, 04/25/2064 788,422____________1,754,729____________
Wells Fargo Mortgage Backed Securities Trust: 0.7%
Series WFMBS 2019-4 A1798,500 3.500%, 09/25/2049 99,715
Series WFMBS 2020-3 A3340,765 3.000%, 06/25/2050 342,774
Series WFMBS 2020-4 A1694,832 3.000%, 07/25/2050 709,324____________
1,151,813____________
ZH Trust 2021-1 – 0: 0.5%1,000,000 2.253%, 02/18/2027 1,003,604____________
Total Mortgage Backed Securities(Cost $67,124,348) 64,573,907____________
United States Government Securities: 6.1%
United States Treasury Note/Bond3,156,480 0.125%, 10/15/2025 5,9 $ 3,416,7591,041,000 0.125%, 04/15/2026 5,9 1,127,4782,097,480 0.125%, 01/15/2031 5,9 2,301,6084,074,360 0.125%, 07/15/2031 5,9 4,485,757____________
11,331,602____________
Total United States Government Securities(Cost $11,451,283) 11,331,602____________
Total Bonds(Cost $180,775,301) 179,065,840____________
Total Return Fund | Schedule of Investments at September 30, 2021 (Unaudited) (Continued)

35
The accompanying notes are an integral part of these financial statements.
Principal Amount ValueShort-Term Investments: 5.1%
United States Government Securities: 1.1%
United States Treasury Bill$ 2,000,000 0.088%, 06/16/2022 5,9 $ 1,999,211____________
Total United States Government Securities(Cost $1,998,737) 1,999,211____________
Shares
Money Market Funds: 4.0%
7,403,292 Morgan Stanley Institutional Liquidity Funds – Government Portfolio, 0.026%4 7,403,292____________
Total Money Market Funds(Cost $7,403,292) 7,403,292____________
Total Short-Term Investments(Cost $9,402,029) 9,402,503____________
Total Investments in Securities: 101.2%(Cost $190,177,330) 188,468,343
Liabilities in Excess of Other Assets: (1.2)% (2,209,654)____________
Total Net Assets: 100.0% $186,258,689________________________
CMT – Constant Maturity Treasury RateLIBOR – London Interbank Offered RateSOFR – Secured Overnight Financing RateUSD – United States Dollar1 Variable rate security; rate shown is the rate in effect on
September 30, 2021.2 Interest only security.3 Principal only security.4 Annualized seven-day effective yield as of September 30, 2021.5 Rate represents the yield to maturity from purchase price.6 Perpetual call date security. Date shown is next call date.7 Zero coupon security.8 Inverse floating rate security. Reference interest rates are typically
based on a negative multiplier or slope. Interest rate may also besubject to a ceiling or floor.
9 The security or a portion of the security has been deposited asinitial margin on open futures contracts and another portion isdesignated as collateral for futures contracts. As of September 30,2021, the value of securities designated as collateral was$432,825, or 0.2% of net assets.
10 Fixed-to-variable or fixed-to float bond; rate shown is the rate ineffect on September 30, 2021.
Schedule of Futures Contracts at September 30, 2021 (Unaudited)
The Fund had the following futures contracts outstanding with CreditSuisse:
Short Futures UnrealizedContracts Number of Notional Appreciation Notional
Outstanding Contracts Amount (Depreciation) Value_____________ _________ _______ ____________ _______US Ultra Long
Bond CBT (12/2021) (8) $ (1,529,000) $ 500 $ (1,528,500)
US Long Bond CBT (12/2021) (17) (2,708,313) 1,594 (2,706,719)
US 10 Year Note (12/2021) (35) (4,669,219) 62,891 (4,606,328)
US 10 Year Ultra Future (12/2021) (47) (6,964,445) 137,695 (6,826,750)
US 2 Year Note (12/2021) (90) (19,805,625) 703 (19,804,922)
US 5 Year Note (12/2021) (191) (23,580,270) 136,512 (23,443,758)___________ ________ ___________
$(59,256,872) $339,895 $(58,916,977)___________ ________ ______________________ ________ ___________
CBT – Chicago Board of Trade
Total Return Fund | Schedule of Investments at September 30, 2021 (Unaudited) (Continued)

36
The accompanying notes are an integral part of these financial statements.
Growth & EmergingOsterweis Strategic Income Opportunity Total Return
Fund Income Fund Fund Fund FundASSETSInvestments in unaffiliated securities, at value
(cost $103,281,610, $5,390,838,430, $117,117,082, $214,213,742, and $190,177,330, respectively) . . . . . . . $174,661,692 $5,580,328,006 $163,892,799 $250,508,699 $188,468,343
Investments in affiliated securities, at value (cost $—, $49,000,000, $1,000,000, $—, $—, respectively) . . . . . . — 57,199,317 1,167,333 — —
Cash . . . . . . . . . . . . . . . . . . . . . . . . . . . . . . . . . . . . . . . . . . . — 357,562 6,060 — —Receivables:
Investment securities sold . . . . . . . . . . . . . . . . . . . . . . 3,317,231 1,020,000 2,146,897 2,532,891 —Fund shares sold . . . . . . . . . . . . . . . . . . . . . . . . . . . . . . 16,811 5,847,886 2,904 270,909 232,104Dividends and interest . . . . . . . . . . . . . . . . . . . . . . . . . 143,274 68,355,512 836,665 49,740 883,234Variation margin receivable . . . . . . . . . . . . . . . . . . . . . — — — — 345,656
Prepaid expenses . . . . . . . . . . . . . . . . . . . . . . . . . . . . . . . . . 17,734 69,191 28,563 10,565 11,031____________ _____________ ____________ ____________ ____________Total assets . . . . . . . . . . . . . . . . . . . . . . . . . . . . . . . . . . . 178,156,742 5,713,177,474 168,081,221 253,372,804 189,940,368____________ _____________ ____________ ____________ ____________
LIABILITIESPayables:
Investment securities purchased . . . . . . . . . . . . . . . . . — 126,481,240 1,503,583 — 2,996,700Fund shares redeemed . . . . . . . . . . . . . . . . . . . . . . . . . 35,000 1,764,946 5,000 4,895 143,367Distributions to shareholders . . . . . . . . . . . . . . . . . . . . — — — — 35,212Investment advisory fees, net . . . . . . . . . . . . . . . . . . . 122,494 3,238,774 105,371 202,935 69,944Variation margin able . . . . . . . . . . . . . . . . . . . . . . . . . . — — — — 392,637Administration fees . . . . . . . . . . . . . . . . . . . . . . . . . . . . 4,569 140,618 5,289 5,616 5,618Custody fees . . . . . . . . . . . . . . . . . . . . . . . . . . . . . . . . . . 1,315 39,068 1,010 2,375 2,101Fund accounting fees . . . . . . . . . . . . . . . . . . . . . . . . . . 2,062 94,588 3,114 2,626 4,601Transfer agent fees . . . . . . . . . . . . . . . . . . . . . . . . . . . . 1,782 484,688 5,562 25,574 12,596Trustee fees . . . . . . . . . . . . . . . . . . . . . . . . . . . . . . . . . . 6,362 32,387 6,299 6,683 5,687Audit fees . . . . . . . . . . . . . . . . . . . . . . . . . . . . . . . . . . . . 14,106 14,108 12,809 11,512 10,615Chief Compliance Officer fees . . . . . . . . . . . . . . . . . . . 1,723 1,723 1,723 1,723 1,723
Other accrued expenses . . . . . . . . . . . . . . . . . . . . . . . . . . . 1,935 117,987 3,275 2,685 878____________ _____________ ____________ ____________ ____________Total Liabilities . . . . . . . . . . . . . . . . . . . . . . . . . . . . . . . . 191,348 132,410,127 1,653,035 266,624 3,681,679____________ _____________ ____________ ____________ ____________
NET ASSETS . . . . . . . . . . . . . . . . . . . . . . . . . . . . . . . . . . . . . $177,965,394 $5,580,767,347 $166,428,186 $253,106,180 $186,258,689____________ _____________ ____________ ____________ ________________________ _____________ ____________ ____________ ____________
COMPUTATION OF NET ASSETS:Net assets value (unlimited shares authorized): . . . . . . . . $177,965,394 $5,580,767,347 $166,428,186 $253,106,180 $186,258,689Shares (unlimited number of shares
authorized without par value) . . . . . . . . . . . . . . . . . . . . . 7,913,188 484,133,254 9,038,449 11,958,257 18,326,930____________ _____________ ____________ ____________ ____________Net assets value, offering, and
redemption price per share . . . . . . . . . . . . . . . . . . . . . . . $ 22.49 $ 11.53 $ 18.41 $ 21.17 $ 10.16____________ _____________ ____________ ____________ ________________________ _____________ ____________ ____________ ____________
COMPONENTS OF NET ASSETS:Paid-in capital . . . . . . . . . . . . . . . . . . . . . . . . . . . . . . . . . . . . $ 90,950,550 $5,859,239,528 $110,947,033 $168,543,456 $188,743,529Total distributable (accumulated) earnings (losses) . . . . . 87,014,844 (278,472,181) 55,481,153 84,562,724 (2,484,840)____________ _____________ ____________ ____________ ____________
Net assets . . . . . . . . . . . . . . . . . . . . . . . . . . . . . . . . . . . . $177,965,394 $5,580,767,347 $166,428,186 $253,106,180 $186,258,689____________ _____________ ____________ ____________ ________________________ _____________ ____________ ____________ ____________
Osterweis Funds | Statements of Assets and Liabilities at September 30, 2021 (Unaudited)

37
The accompanying notes are an integral part of these financial statements.
Growth & EmergingOsterweis Strategic Income Opportunity Total Return
Fund Income Fund Fund Fund FundINVESTMENT INCOMEIncome:
Dividends from unaffiliated investments . . . . . . . . . . . . $ 729,172 $ 15,601,052 $ 812,305 $ 115,872 $ —(net of $5,609, $—, $4,473, $2,753, and $—, respectively, in foreign withholding taxes and issuance fees)
Dividends from affiliated investments . . . . . . . . . . . . . . — 1,868,126 38,126 — —Interest . . . . . . . . . . . . . . . . . . . . . . . . . . . . . . . . . . . . . . . 176 121,371,668 1,167,966 657 1,391,875Other income . . . . . . . . . . . . . . . . . . . . . . . . . . . . . . . . . . — 2,242 464 501 —__________ ____________ ___________ ___________ ___________
Total investment income . . . . . . . . . . . . . . . . . . . . . . . . 729,348 138,843,088 2,018,861 117,030 1,391,875__________ ____________ ___________ ___________ ___________
EXPENSESInvestment advisory fees . . . . . . . . . . . . . . . . . . . . . . . . . 788,586 19,112,048 730,219 1,226,952 451,677Administration fees . . . . . . . . . . . . . . . . . . . . . . . . . . . . . 21,474 489,637 20,662 27,462 25,071Sub-transfer agent fees . . . . . . . . . . . . . . . . . . . . . . . . . . 18,777 1,974,920 12,871 71,411 55,028Transfer agent fees . . . . . . . . . . . . . . . . . . . . . . . . . . . . . . 15,139 231,993 13,516 15,016 13,322Audit fees . . . . . . . . . . . . . . . . . . . . . . . . . . . . . . . . . . . . . 14,606 14,608 13,259 11,912 11,016Trustee fees . . . . . . . . . . . . . . . . . . . . . . . . . . . . . . . . . . . . 11,967 61,090 11,855 12,599 11,342Fund accounting fees . . . . . . . . . . . . . . . . . . . . . . . . . . . . 10,644 334,006 16,332 14,650 23,702Registration fees . . . . . . . . . . . . . . . . . . . . . . . . . . . . . . . . 8,247 39,124 14,662 13,326 12,977Chief Compliance Officer fees . . . . . . . . . . . . . . . . . . . . . 5,279 5,279 5,279 5,279 4,793Custody fees . . . . . . . . . . . . . . . . . . . . . . . . . . . . . . . . . . . 4,468 129,998 4,563 7,995 8,194Legal fees . . . . . . . . . . . . . . . . . . . . . . . . . . . . . . . . . . . . . . 4,170 4,201 4,191 4,191 3,680Miscellaneous expense . . . . . . . . . . . . . . . . . . . . . . . . . . 4,126 42,525 4,156 4,343 4,230Reports to shareholders . . . . . . . . . . . . . . . . . . . . . . . . . . 2,842 80,602 1,857 3,181 2,810Insurance expense . . . . . . . . . . . . . . . . . . . . . . . . . . . . . . 2,628 14,773 3,059 3,304 2,474Futures commissions merchant interest expense . . . . . — — — — 352Interest expense . . . . . . . . . . . . . . . . . . . . . . . . . . . . . . . . — — — — 18__________ ____________ ___________ ___________ ___________
Total expenses . . . . . . . . . . . . . . . . . . . . . . . . . . . . . . . . 912,953 22,534,804 856,481 1,421,621 630,686__________ ____________ ___________ ___________ ___________Fees (waived) recouped by the Adviser . . . . . . . . . . (53,592) — — (71,972) —__________ ____________ ___________ ___________ ___________Net expenses . . . . . . . . . . . . . . . . . . . . . . . . . . . . . . . 859,361 22,534,804 856,481 1,349,649 630,686__________ ____________ ___________ ___________ ___________Net investment income (loss) . . . . . . . . . . . . . . . . . (130,013) 116,308,284 1,162,380 (1,232,619) 761,189__________ ____________ ___________ ___________ ___________
REALIZED AND UNREALIZED GAIN (LOSS) ON INVESTMENTSNet realized gain (loss) on:
Unaffiliated investments . . . . . . . . . . . . . . . . . . . . . . . . . 9,437,098 47,953,687 5,749,032 18,704,936 1,583,811Futures contracts . . . . . . . . . . . . . . . . . . . . . . . . . . . . . . . — — — — (2,682,836)
Change in net unrealized appreciation/depreciation on:Unaffiliated investments . . . . . . . . . . . . . . . . . . . . . . . . . (131,915) 25,185,082 639,820 (4,652,551) 960,600Affiliated investments . . . . . . . . . . . . . . . . . . . . . . . . . . . . — (2,289,619) (46,727) — —Futures contracts . . . . . . . . . . . . . . . . . . . . . . . . . . . . . . . — — — — (287,888)__________ ____________ ___________ ___________ ___________
Net realized and unrealized gain (loss) on investments . . . . . . . . . . . . . . . . . . . . . 9,305,183 70,849,150 6,342,125 14,052,385 (426,313)__________ ____________ ___________ ___________ ___________
Net increase (decrease) in net assets resulting from operations . . . . . . . . . . . . . . . . . . . . . . . . $9,175,170 $187,157,434 $ 7,504,505 $12,819,766 $ 334,876__________ ____________ ___________ ___________ _____________________ ____________ ___________ ___________ ___________
Osterweis Funds | Statements of Operations For the Six Months Ended September 30, 2021 (Unaudited)

38
The accompanying notes are an integral part of these financial statements.
Six Months Ended Year EndedSeptember 30, 2021 March 31, 2021__________________ ______________
INCREASE (DECREASE) IN NET ASSETS FROM:OPERATIONS
Net investment income (loss) . . . . . . . . . . . . . . . . . . . . . . . . . . . . . . . . . . . . . . . . . . . . . . . . . . . . . . . $ (130,013) $ 235,939Net realized gain (loss) on investments and distributions . . . . . . . . . . . . . . . . . . . . . . . . . . . . . . . . 9,437,098 10,562,854Change in net unrealized appreciation/depreciation of investments . . . . . . . . . . . . . . . . . . . . . . . (131,915) 47,172,471____________ ____________
Net increase (decrease) in net assets resulting from operations . . . . . . . . . . . . . . . . . . . . . . 9,175,170 57,971,264____________ ____________
DISTRIBUTIONS TO SHAREHOLDERSNet distributions to shareholders . . . . . . . . . . . . . . . . . . . . . . . . . . . . . . . . . . . . . . . . . . . . . . . . . . . — (8,185,457)____________ ____________
CAPITAL SHARE TRANSACTIONSNet increase (decrease) in net assets derived from net change in outstanding shares 1 . . . . . . . (121,924) 8,282,947____________ ____________
Total increase (decrease) in net assets . . . . . . . . . . . . . . . . . . . . . . . . . . . . . . . . . . . . . . . . . . . . 9,053,246 58,068,754____________ ____________
NET ASSETSBeginning of period/year . . . . . . . . . . . . . . . . . . . . . . . . . . . . . . . . . . . . . . . . . . . . . . . . . . . . . . . . . . 168,912,148 110,843,394____________ ____________End of period/year . . . . . . . . . . . . . . . . . . . . . . . . . . . . . . . . . . . . . . . . . . . . . . . . . . . . . . . . . . . . . . . $177,965,394 $168,912,148____________ ________________________ ____________
1 A summary of share transactions is as follows:
Six Months Ended Year EndedSeptember 30, 2021 March 31, 2021__________________________ __________________________
Shares Value Shares Value__________ _________ _________ _________Shares sold . . . . . . . . . . . . . . . . . . . . . . . . . . . . . . . . . . . . . . . . . 223,780 $ 5,039,096 769,170 $14,870,833Shares issued in reinvestment of distributions . . . . . . . . . . . . — — 387,691 7,780,949Shares redeemed . . . . . . . . . . . . . . . . . . . . . . . . . . . . . . . . . . . . (226,927) (5,161,020) (789,699) (14,368,835)________ __________ _________ ___________Net increase (decrease) . . . . . . . . . . . . . . . . . . . . . . . . . . . . . . . (3,147) $ (121,924) 367,162 $ 8,282,947________ __________ _________ ___________________ __________ _________ ___________
Osterweis Fund | Statements of Changes in Net Assets

39
The accompanying notes are an integral part of these financial statements.
Six Months Ended Year EndedSeptember 30, 2021 March 31, 2021__________________ ______________
INCREASE (DECREASE) IN NET ASSETS FROM:OPERATIONS
Net investment income (loss) . . . . . . . . . . . . . . . . . . . . . . . . . . . . . . . . . . . . . . . . . . . . . . . . . . . . . . . $ 116,308,284 $ 189,505,785Net realized gain (loss) on investments and distributions . . . . . . . . . . . . . . . . . . . . . . . . . . . . . . . . 47,953,687 (1,263,626)Change in unrealized appreciation/depreciation on unaffiliated investments . . . . . . . . . . . . . . . 25,185,082 570,798,110Change in unrealized appreciation/depreciation on affiliated investments . . . . . . . . . . . . . . . . . . (2,289,619) —______________ ______________
Net increase (decrease) in net assets resulting from operations . . . . . . . . . . . . . . . . . . . . . . 187,157,434 759,040,269______________ ______________
DISTRIBUTIONS TO SHAREHOLDERSNet distributions to shareholders . . . . . . . . . . . . . . . . . . . . . . . . . . . . . . . . . . . . . . . . . . . . . . . . . . . (118,540,698) (188,057,162)______________ ______________
CAPITAL SHARE TRANSACTIONSNet increase (decrease) in net assets derived from net change in outstanding shares 1 . . . . . . . 308,260,924 637,300,676______________ ______________
Total increase (decrease) in net assets . . . . . . . . . . . . . . . . . . . . . . . . . . . . . . . . . . . . . . . . . . . . 376,877,660 1,208,283,783______________ ______________
NET ASSETSBeginning of period/year . . . . . . . . . . . . . . . . . . . . . . . . . . . . . . . . . . . . . . . . . . . . . . . . . . . . . . . . . . 5,203,889,687 3,995,605,904______________ ______________End of period/year . . . . . . . . . . . . . . . . . . . . . . . . . . . . . . . . . . . . . . . . . . . . . . . . . . . . . . . . . . . . . . . $5,580,767,347 $5,203,889,687______________ ____________________________ ______________
1 A summary of share transactions is as follows:
Six Months Ended Year EndedSeptember 30, 2021 March 31, 2021__________________________ __________________________
Shares Value Shares Value__________ _________ _________ _________Shares sold . . . . . . . . . . . . . . . . . . . . . . . . . . . . . . . . . . . . . . . . . 63,893,114 $ 737,811,084 135,832,063 $ 1,491,508,830Shares issued in reinvestment of distributions . . . . . . . . . . . . 8,989,722 103,786,016 14,755,280 162,788,234Shares redeemed . . . . . . . . . . . . . . . . . . . . . . . . . . . . . . . . . . . . (46,284,963) (533,336,176) (93,945,451) (1,016,996,388)__________ ____________ ___________ ______________Net increase (decrease) . . . . . . . . . . . . . . . . . . . . . . . . . . . . . . . 26,597,873 $ 308,260,924 56,641,892 $ 637,300,676__________ ____________ ___________ ________________________ ____________ ___________ ______________
Strategic Income Fund | Statements of Changes in Net Assets

40
The accompanying notes are an integral part of these financial statements.
Six Months Ended Year EndedSeptember 30, 2021 March 31, 2021__________________ ______________
INCREASE (DECREASE) IN NET ASSETS FROM:OPERATIONS
Net investment income (loss) . . . . . . . . . . . . . . . . . . . . . . . . . . . . . . . . . . . . . . . . . . . . . . . . . . . . . . . . $ 1,162,380 $ 1,931,183Net realized gain (loss) on investments and distributions . . . . . . . . . . . . . . . . . . . . . . . . . . . . . . . . . 5,749,032 8,741,907Change in net unrealized appreciation/depreciation on unaffiliated investments . . . . . . . . . . . . . . 639,820 35,737,880Change in unrealized appreciation/depreciation on affiliated investments . . . . . . . . . . . . . . . . . . . . . . . (46,727) —____________ ____________
Net increase (decrease) in net assets resulting from operations . . . . . . . . . . . . . . . . . . . . . . . 7,504,505 46,410,970____________ ____________
DISTRIBUTIONS TO SHAREHOLDERSNet distributions to shareholders . . . . . . . . . . . . . . . . . . . . . . . . . . . . . . . . . . . . . . . . . . . . . . . . . . . . . (3,905,805) (5,020,422)____________ ____________
CAPITAL SHARE TRANSACTIONSNet increase (decrease) in net assets derived from net change in outstanding shares 1 . . . . . . . . . 5,552,571 5,882,656____________ ____________
Total increase (decrease) in net assets . . . . . . . . . . . . . . . . . . . . . . . . . . . . . . . . . . . . . . . . . . . . . 9,151,271 47,273,204____________ ____________
NET ASSETSBeginning of period/year . . . . . . . . . . . . . . . . . . . . . . . . . . . . . . . . . . . . . . . . . . . . . . . . . . . . . . . . . . . . 157,276,915 110,003,711____________ ____________End of period/year . . . . . . . . . . . . . . . . . . . . . . . . . . . . . . . . . . . . . . . . . . . . . . . . . . . . . . . . . . . . . . . . $166,428,186 $157,276,915____________ ________________________ ____________
1 A summary of share transactions is as follows:
Six Months Ended Year EndedSeptember 30, 2021 March 31, 2021__________________________ __________________________
Shares Value Shares Value__________ _________ _________ _________Shares sold . . . . . . . . . . . . . . . . . . . . . . . . . . . . . . . . . . . . . . . . . 313,960 $ 5,972,975 753,175 $ 12,702,042Shares issued in reinvestment of distributions . . . . . . . . . . . . 154,037 2,911,302 216,644 3,665,617Shares redeemed . . . . . . . . . . . . . . . . . . . . . . . . . . . . . . . . . . . . (176,600) (3,331,706) (672,361) (10,485,003)________ ___________ _________ ____________Net increase (decrease) . . . . . . . . . . . . . . . . . . . . . . . . . . . . . . . 291,397 $ 5,552,571 297,458 $ 5,882,656________ ___________ _________ ____________________ ___________ _________ ____________
Growth & Income Fund | Statements of Changes in Net Assets

41
The accompanying notes are an integral part of these financial statements.
Six Months Ended Year EndedSeptember 30, 2021 March 31, 2021__________________ ______________
INCREASE (DECREASE) IN NET ASSETS FROM:OPERATIONS
Net investment income (loss) . . . . . . . . . . . . . . . . . . . . . . . . . . . . . . . . . . . . . . . . . . . . . . . . . . . . . . . . $ (1,232,619) $ (1,665,148)Net realized gain (loss) on investments and distributions . . . . . . . . . . . . . . . . . . . . . . . . . . . . . . . . . 18,704,936 57,176,496Change in unrealized appreciation/depreciation on investments . . . . . . . . . . . . . . . . . . . . . . . . . . . (4,652,551) 42,588,285____________ ____________
Net increase (decrease) in net assets resulting from operations . . . . . . . . . . . . . . . . . . . . . . . 12,819,766 98,099,633____________ ____________
DISTRIBUTIONS TO SHAREHOLDERSNet distributions to shareholders . . . . . . . . . . . . . . . . . . . . . . . . . . . . . . . . . . . . . . . . . . . . . . . . . . . . . — (20,661,011)____________ ____________
CAPITAL SHARE TRANSACTIONSNet increase (decrease) in net assets derived from net change in outstanding shares 1 . . . . . . . . . 8,571,327 64,056,767____________ ____________
Total increase (decrease) in net assets . . . . . . . . . . . . . . . . . . . . . . . . . . . . . . . . . . . . . . . . . . . . . 21,391,093 141,495,389____________ ____________
NET ASSETSBeginning of period/year . . . . . . . . . . . . . . . . . . . . . . . . . . . . . . . . . . . . . . . . . . . . . . . . . . . . . . . . . . . . 231,715,087 90,219,698____________ ____________End of period/year . . . . . . . . . . . . . . . . . . . . . . . . . . . . . . . . . . . . . . . . . . . . . . . . . . . . . . . . . . . . . . . . $253,106,180 $231,715,087____________ ________________________ ____________
1 A summary of share transactions is as follows:
Six Months Ended Year EndedSeptember 30, 2021 March 31, 2021__________________________ __________________________
Shares Value Shares Value__________ _________ _________ _________Shares sold . . . . . . . . . . . . . . . . . . . . . . . . . . . . . . . . . . . . . . . . . 1,507,455 $ 31,500,707 4,651,315 $ 88,828,433Shares issued in reinvestment of distributions . . . . . . . . . . . . — — 642,334 12,782,445Shares redeemed . . . . . . . . . . . . . . . . . . . . . . . . . . . . . . . . . . . . (1,140,840) (22,929,380) (2,313,252) (37,554,111)_________ ___________ _________ ___________Net increase (decrease) . . . . . . . . . . . . . . . . . . . . . . . . . . . . . . . 366,615 $ 8,571,257 2,980,397 $ 64,056,767_________ ___________ _________ ____________________ ___________ _________ ___________
Emerging Opportunity Fund | Statements of Changes in Net Assets

42
The accompanying notes are an integral part of these financial statements.
Six Months Ended Year EndedSeptember 30, 2021 March 31, 2021__________________ ______________
INCREASE (DECREASE) IN NET ASSETS FROM:OPERATIONS
Net investment income (loss) . . . . . . . . . . . . . . . . . . . . . . . . . . . . . . . . . . . . . . . . . . . . . . . . . . . . . . . . $ 761,189 $ 2,271,509Net realized gain (loss) on investments and futures contracts . . . . . . . . . . . . . . . . . . . . . . . . . . . . . . (1,099,025) 6,194,247Change in net unrealized appreciation/depreciation on investments and futures contracts . . . . . 672,712 (1,504,719)____________ ____________
Net increase (decrease) in net assets resulting from operations . . . . . . . . . . . . . . . . . . . . . . . 334,876 6,961,037____________ ____________
DISTRIBUTIONS TO SHAREHOLDERSNet distributions to shareholders . . . . . . . . . . . . . . . . . . . . . . . . . . . . . . . . . . . . . . . . . . . . . . . . . . . . . (636,048) (6,398,924)____________ ____________
CAPITAL SHARE TRANSACTIONSNet increase (decrease) in net assets derived from net change in outstanding shares 1 . . . . . . . . . (23,520,781) 51,265,652____________ ____________
Total increase (decrease) in net assets . . . . . . . . . . . . . . . . . . . . . . . . . . . . . . . . . . . . . . . . . . . . . (23,821,953) 51,827,765____________ ____________
NET ASSETSBeginning of period/year . . . . . . . . . . . . . . . . . . . . . . . . . . . . . . . . . . . . . . . . . . . . . . . . . . . . . . . . . . . . 210,080,642 158,252,877____________ ____________End of period/year . . . . . . . . . . . . . . . . . . . . . . . . . . . . . . . . . . . . . . . . . . . . . . . . . . . . . . . . . . . . . . . . $186,258,689 $210,080,642____________ ________________________ ____________
1 A summary of share transactions is as follows:
Six Months Ended Year EndedSeptember 30, 2021 March 31, 2021__________________________ __________________________
Shares Value Shares Value__________ _________ _________ _________Shares sold . . . . . . . . . . . . . . . . . . . . . . . . . . . . . . . . . . . . . . . . . 1,896,296 $ 19,368,619 9,805,224 $101,532,320Shares issued in reinvestment of distributions . . . . . . . . . . . . 37,953 387,517 376,805 3,914,132Shares redeemed . . . . . . . . . . . . . . . . . . . . . . . . . . . . . . . . . . . . (4,238,532) (43,276,917) (5,258,112) (54,180,800)__________ ____________ __________ ____________Net increase (decrease) . . . . . . . . . . . . . . . . . . . . . . . . . . . . . . . (2,304,283) $(23,520,781) 4,923,917 $ 51,265,652__________ ____________ __________ ______________________ ____________ __________ ____________
Total Return Fund | Statements of Changes in Net Assets

43
The accompanying notes are an integral part of these financial statements.
For a capital share outstanding throughout each period/year
Six Months Ended
September 30, Year Ended March 31,2021 ______________________________________________________
(Unaudited) 2021 2020 2019 2018 2017____________ _____ _____ _____ _____ _____Net asset value, beginning of period/year . . . . . . . $21.34 $14.68 $16.25 $19.15 $26.07 $25.14_______ _______ _______ _______ _______ _______
INCOME FROM INVESTMENT OPERATIONS:Net investment income (loss) 1 . . . . . . . . . . . . . . . . (0.02) 0.03 0.04 0.08 0.09 0.06Net realized and unrealized
gain (loss) on investments . . . . . . . . . . . . . . . . . . . 1.17 7.75 (0.31) 1.24 1.67 2.70_______ _______ _______ _______ _______ _______Total from investment operations . . . . . . . . . . . . . . 1.15 7.78 (0.27) 1.32 1.76 2.76_______ _______ _______ _______ _______ _______
LESS DISTRIBUTIONS:From net investment income . . . . . . . . . . . . . . . . . . — (0.10) (0.07) (0.76) (1.49) (0.29)From net realized gain . . . . . . . . . . . . . . . . . . . . . . . . — (1.02) (1.23) (3.46) (7.19) (1.54)_______ _______ _______ _______ _______ _______Total distributions . . . . . . . . . . . . . . . . . . . . . . . . . . . — (1.12) (1.30) (4.22) (8.68) (1.83)_______ _______ _______ _______ _______ _______Net asset value, end of period/year . . . . . . . . . . . . $22.49 $21.34 $14.68 $16.25 $19.15 $26.07_______ _______ _______ _______ _______ ______________ _______ _______ _______ _______ _______Total return . . . . . . . . . . . . . . . . . . . . . . . . . . . . . . . . 5.39% 53.48% (2.88)% 9.86% 5.94% 11.33%
SUPPLEMENTAL DATA:Net assets, end of period/year (millions) . . . . . . . . $178.0 $168.9 $110.8 $128.5 $161.8 $244.3Portfolio turnover rate . . . . . . . . . . . . . . . . . . . . . . . 12% 2 37% 35% 43% 47% 50%
RATIOS OF EXPENSES TO AVERAGE NET ASSETS:Before fees/expenses waived or recouped . . . . . . . 1.01% 3 1.19% 1.19% 1.17% 1.14% 1.11%After fees/expenses waived or recouped . . . . . . . . 0.95% 3 0.95% 0.95% 0.95% 1.12% 4 1.11%
RATIOS OF NET INVESTMENT INCOME (LOSS) TO AVERAGE NET ASSETS:Before fees/expenses waived or recouped . . . . . . . (0.20)% 3 (0.08)% (0.02)% 0.21% 0.36% 0.25%After fees/expenses waived or recouped . . . . . . . . (0.14)% 3 0.16% 0.22% 0.43% 0.38% 4 0.25%
1 Calculated based on average shares outstanding.2 Not Annualized.3 Annualized.4 Effective January 1, 2018 the Adviser agreed to contractually limit expenses for the Fund to not exceed 0.95% of average net assets. Prior to
January 1, 2018, Fund expenses were not subject to an expense limitation agreement.
Osterweis Fund | Financial Highlights

44
The accompanying notes are an integral part of these financial statements.
For a capital share outstanding throughout each period/year
Six Months Ended
September 30, Year Ended March 31,2021 ______________________________________________________
(Unaudited) 2021 2020 2019 2018 2017____________ _____ _____ _____ _____ _____Net asset value, beginning of period/year . . . . . . . $11.37 $ 9.97 $11.05 $11.27 $11.26 $10.57_______ _______ _______ _______ _______ _______
INCOME FROM INVESTMENT OPERATIONS:Net investment income (loss) 1 . . . . . . . . . . . . . . . . 0.25 0.45 0.47 0.50 0.51 0.57Net realized and unrealized
gain (loss) on investments . . . . . . . . . . . . . . . . . . . 0.16 1.40 (1.06) (0.21) 0.00 2 0.69_______ _______ _______ _______ _______ _______Total from investment operations . . . . . . . . . . . . . . 0.41 1.85 (0.59) 0.29 0.51 1.26_______ _______ _______ _______ _______ _______
LESS DISTRIBUTIONS:From net investment income . . . . . . . . . . . . . . . . . . (0.25) (0.45) (0.49) (0.51) (0.50) (0.57)_______ _______ _______ _______ _______ _______Total distributions . . . . . . . . . . . . . . . . . . . . . . . . . . . (0.25) (0.45) (0.49) (0.51) (0.50) (0.57)_______ _______ _______ _______ _______ _______Net asset value, end of period/year . . . . . . . . . . . . $11.53 $11.37 $ 9.97 $11.05 $11.27 $11.26_______ _______ _______ _______ _______ ______________ _______ _______ _______ _______ _______Total return . . . . . . . . . . . . . . . . . . . . . . . . . . . . . . . . 3.64% 3 18.73% (5.63)% 2.67% 4.64% 12.18%
SUPPLEMENTAL DATA:Net assets, end of period/year (millions) . . . . . . . . $5,580.8 $5,203.9 $3,995.6 $5,541.4 $6,058.0 $5,414.0Portfolio turnover rate . . . . . . . . . . . . . . . . . . . . . . . 29% 3 60% 40% 46% 53% 37%
RATIO OF EXPENSES TO AVERAGE NET ASSETS:Ratio of expenses to average net assets . . . . . . . . . 0.83% 4 0.86% 0.86% 0.84% 0.84% 0.84%
RATIO OF NET INVESTMENT INCOME (LOSS) TO AVERAGE NET ASSETS:Ratio of net investment income (loss)
to average net assets . . . . . . . . . . . . . . . . . . . . . . . . 4.31% 4 4.14% 4.32% 4.52% 4.49% 5.17%
1 Calculated based on average shares outstanding.2 Does not round to $0.01 or $(0.01), as applicable.3 Not Annualized.4 Annualized.
Strategic Income Fund | Financial Highlights

45
The accompanying notes are an integral part of these financial statements.
For a capital share outstanding throughout each period/year
Six Months Ended
September 30, Year Ended March 31,2021 ______________________________________________________
(Unaudited) 2021 2020 2019 2018 2017____________ _____ _____ _____ _____ _____Net asset value, beginning of period/year . . . . . . . $17.98 $13.02 $14.30 $14.87 $14.77 $13.32_______ _______ _______ _______ _______ _______
INCOME FROM INVESTMENT OPERATIONS:Net investment income (loss) 1 . . . . . . . . . . . . . . . . 0.13 0.23 0.23 0.28 0.39 0.43Net realized and unrealized
gain (loss) on investments . . . . . . . . . . . . . . . . . . . 0.74 5.35 (0.96) 0.44 0.49 1.53_______ _______ _______ _______ _______ _______Total from investment operations . . . . . . . . . . . . . . 0.87 5.58 (0.73) 0.72 0.88 1.96_______ _______ _______ _______ _______ _______
LESS DISTRIBUTIONS:From net investment income . . . . . . . . . . . . . . . . . . (0.44) (0.11) (0.18) (0.37) (0.50) (0.51)From net realized gain . . . . . . . . . . . . . . . . . . . . . . . . — (0.51) (0.37) (0.92) (0.28) —_______ _______ _______ _______ _______ _______Total distributions . . . . . . . . . . . . . . . . . . . . . . . . . . . (0.44) (0.62) (0.55) (1.29) (0.78) (0.51)_______ _______ _______ _______ _______ _______Net asset value, end of period/year . . . . . . . . . . . . $18.41 $17.98 $13.02 $14.30 $14.87 $14.77_______ _______ _______ _______ _______ ______________ _______ _______ _______ _______ _______Total return . . . . . . . . . . . . . . . . . . . . . . . . . . . . . . . . 4.76% 3 43.15% (5.67)% 5.69% 5.86% 14.91%
SUPPLEMENTAL DATA:Net assets, end of period/year (millions) . . . . . . . . $166.4 $157.3 $110.0 $131.7 $178.9 $196.4Portfolio turnover rate . . . . . . . . . . . . . . . . . . . . . . . 10% 3 51% 51% 47% 55% 53%
RATIO OF EXPENSES TO AVERAGE NET ASSETS:Ratio of expenses to average net assets . . . . . . . . . 1.02% 4 1.19% 1.20% 1.19% 1.15% 1.15%
RATIO OF NET INVESTMENT INCOME (LOSS) TO AVERAGE NET ASSETS:Ratio of net investment income (loss)
to average net assets . . . . . . . . . . . . . . . . . . . . . . . . 1.39% 4 1.44% 1.57% 1.91% 2.56% 3.06%
1 Calculated based on average shares outstanding.2 Does not round to $0.01 or $(0.01), as applicable.3 Not Annualized.4 Annualized.
Growth & Income Fund | Financial Highlights

46
The accompanying notes are an integral part of these financial statements.
For a capital share outstanding throughout each period/year
Six Months Ended Period from
September 30, Year Ended March 31,
November 30, 20162021 _________________________________________ through
(Unaudited) 2021 2020 2019 2018 March 31, 2017 1____________ _____ _____ _____ _____ _________________Net asset value, beginning of period/year . . $19.99 $10.48 $12.06 $11.73 $10.62 $10.00______ ______ ______ ______ ______ ______
INCOME FROM INVESTMENT OPERATIONS:Net investment income (loss) 2 . . . . . . . . . . . (0.11) (0.18) (0.10) (0.11) (0.12) (0.05)Net realized and unrealized
gain (loss) on investments . . . . . . . . . . . . . . 1.29 11.81 (0.70) 1.25 3.26 0.67______ ______ ______ ______ ______ ______Total from investment operations . . . . . . . . . 1.18 11.63 (0.80) 1.14 3.14 0.62______ ______ ______ ______ ______ ______
LESS DISTRIBUTIONS:From net realized gain . . . . . . . . . . . . . . . . . . — (2.12) (0.78) (0.81) (2.03) —______ ______ ______ ______ ______ ______Total distributions . . . . . . . . . . . . . . . . . . . . . . — (2.12) (0.78) (0.81) (2.03) —______ ______ ______ ______ ______ ______Net asset value, end of period/year . . . . . . . $21.17 $19.99 $10.48 $12.06 $11.73 $10.62______ ______ ______ ______ ______ ____________ ______ ______ ______ ______ ______Total return . . . . . . . . . . . . . . . . . . . . . . . . . . . 5.90% 3 111.27% (7.60)% 11.12% 31.21% 6.30% 3
SUPPLEMENTAL DATA:Net asset value,
end of period/year (millions) . . . . . . . . . . . . $253.1 $231.7 $90.2 $97.0 $63.4 $43.8Portfolio turnover rate . . . . . . . . . . . . . . . . . . 60% 3 111% 213% 215% 208% 62% 3
RATIOS OF EXPENSES TO AVERAGE NET ASSETS:Before fees/expenses waived or recouped . . 1.16% 4 1.19% 1.24% 1.22% 1.29% 1.60% 4
After fees/expenses waived or recouped . . . 1.10% 4 1.10% 1.13% 6 1.25% 5 1.27% 5 1.50% 4
RATIOS OF NET INVESTMENT INCOME (LOSS) TO AVERAGE NET ASSETS:Before fees/expenses waived or recouped . . (1.06)% 4 (1.08)% (0.88)% (0.88)% (1.04)% (1.48)% 4
After fees/expenses waived or recouped . . . (1.00)% 4 (0.99)% (0.77)% 6 (0.91)% 5 (1.02)% 5 (1.38)% 4
1 Commenced operations on November 30, 2016. Information presented is from the period November 30, 2016 to March 31, 2017.2 Calculated based on average shares outstanding during the period.3 Not Annualized.4 Annualized.5 Effective June 30, 2017 the Adviser agreed to contractually limit expenses for the Fund to not exceed 1.25% of average net assets. Prior to
June 30, 2017, Fund expenses were limited to 1.50% of average net assets.6 Effective June 30, 2019 the Adviser agreed to contractually limit expenses for the Fund to not exceed 1.10% of average net assets. Prior to
June 30, 2017, Fund expenses were limited to 1.25% of average net assets.
Emerging Opportunity Fund | Financial Highlights

47
The accompanying notes are an integral part of these financial statements.
For a capital share outstanding throughout each period/year
Six Months Ended Period from
September 30, Year Ended March 31,
December 30, 20162021 _________________________________________ through
(Unaudited) 2021 2020 2019 2018 March 31, 2017 1____________ _____ _____ _____ _____ _________________Net asset value, beginning of period/year . . $10.18 $10.08 $10.14 $ 9.93 $10.23 $10.00______ ______ ______ ______ ______ ______
INCOME FROM INVESTMENT OPERATIONS:Net investment income (loss) 2 . . . . . . . . . . . 0.04 0.12 0.26 0.33 0.35 0.04Net realized and unrealized
gain (loss) on investments . . . . . . . . . . . . . . (0.03) 0.31 0.01 0.23 (0.26) 0.22______ ______ ______ ______ ______ ______Total from investment operations . . . . . . . . . 0.01 0.43 0.27 0.56 0.09 0.26______ ______ ______ ______ ______ ______
LESS DISTRIBUTIONS:From net investment income . . . . . . . . . . . . . (0.03) (0.14) (0.28) (0.34) (0.35) (0.03)From net realized gain . . . . . . . . . . . . . . . . . . — (0.20) (0.05) (0.01) (0.04) —______ ______ ______ ______ ______ ______Total distributions . . . . . . . . . . . . . . . . . . . . . . (0.03) (0.34) (0.33) (0.35) (0.39) (0.03)______ ______ ______ ______ ______ ______Net asset value, end of period/year . . . . . . . $10.16 $10.18 $10.08 $10.14 $ 9.93 $10.23______ ______ ______ ______ ______ ____________ ______ ______ ______ ______ ______Total return . . . . . . . . . . . . . . . . . . . . . . . . . . . 0.12% 3 4.25% 2.74% 5.78% 0.89% 2.65% 3
SUPPLEMENTAL DATA:Net asset value,
end of period/year (millions) . . . . . . . . . . . . $186.3 $210.1 $158.3 $106.6 $102.2 $46.8Portfolio turnover rate . . . . . . . . . . . . . . . . . . 182% 3 616% 214% 163% 138% 27% 3
Portfolio turnover rate excludingto-be-announced (“TBA”) transactions 5 . . 104% —% —% —% —% —%
RATIOS OF EXPENSES TO AVERAGE NET ASSETS:Before fees/expenses waived or recouped . . 0.63% 4 0.65% 0.66% 0.67% 0.70% 2.55% 4
After fees/expenses waived or recouped . . . 0.63% 4 0.65% 0.66% 0.67% 0.75% 0.75% 4
RATIOS OF NET INVESTMENT INCOME (LOSS) TO AVERAGE NET ASSETS:Before fees/expenses waived or recouped . . 0.76% 4 1.18% 2.51% 3.27% 3.47% (0.30)% 4
After fees/expenses waived or recouped . . . 0.76% 4 1.18% 2.51% 3.26% 3.42% 1.50% 4
1 Commenced operations on December 30, 2016. Information presented is from the period December 30, 2016 to March 31, 2017.2 Calculated based on average shares outstanding during the period.3 Not Annualized.4 Annualized.5 See Note (1.D.) and (1.E.) regarding TBA transactions and mortgage dollar rolls.
Total Return Fund | Financial Highlights

48
Note 1 – Organization
The Osterweis Fund, Osterweis Strategic Income Fund, Osterweis Growth & Income Fund, Osterweis EmergingOpportunity Fund and Osterweis Total Return Fund (each a “Fund”, collectively the “Funds”) are diversified series ofshares of beneficial interest of Professionally Managed Portfolios (the “Trust”), which is registered under the InvestmentCompany Act of 1940, as amended (the “1940 Act”) as an open-end management investment company. The Funds areinvestment companies and accordingly follow the investment company accounting and reporting guidance of theFinancial Accounting Standards Board (FASB) Accounting Standard Codification Topic 946 “Financial Services –Investment Companies.” The Funds commenced operations on October 1, 1993, August 30, 2002, August 31, 2010,November 30, 2016 and December 30, 2016, respectively.
The investment objective of the Osterweis Fund is to attain long-term total returns, which it seeks by investing primarilyin equity securities. The investment objective of the Osterweis Strategic Income Fund is to preserve capital and attainlong-term total returns through a combination of current income and moderate capital appreciation, which it seeks byinvesting primarily in income bearing securities. The investment objective of the Osterweis Growth & Income Fund is toattain long-term total returns and capital preservation, which it seeks by investing in both equity and fixed income securitiesthat the Adviser believes can deliver attractive long-term returns and enhanced capital preservation. The investmentobjective of the Osterweis Emerging Opportunity Fund is to attain long-term capital appreciation. The investment objectiveof the Osterweis Total Return Fund is to preserve capital and attain long-term total returns through a combination of currentincome and moderate capital appreciation. Osterweis Capital Management, Inc. and Osterweis Capital Management, LLCmay be referred to individually or collectively as the “Adviser” or “Advisers” throughout this report.
Note 2 – Significant Accounting Policies
The following is a summary of significant accounting policies consistently followed by the Funds. These policies are inconformity with accounting principles generally accepted in the United States of America (“U.S. GAAP”).
A. Security Valuation. All equity securities, which may include Real Estate Investment Trusts (“REITs”), BusinessDevelopment Companies (“BDCs”) and Master Limited Partnerships (“MLPs”), that are traded on U.S. national orforeign securities exchanges are valued either at the last reported sale price on the exchange on which the securityis principally traded or the exchange’s official closing price. If, on a particular day, an exchange-traded securitydoes not trade, then the mean between the most recent quoted bid and asked prices will be used. All equitysecurities which may include REITs, BDCs and MLPs that are not traded on a listed exchange are valued at the lastsale price in the over-the-counter market. If a non-exchange traded security does not trade on a particular day,then the mean between the last quoted closing bid and asked price will be used.
Debt securities are valued by using the evaluated mean price supplied by an approved independent pricingservice. The independent pricing service may use various valuation methodologies including matrix pricing andother analytical pricing models as well as market transactions and dealer quotations. These models generallyconsider such factors as yields or prices of bonds of comparable quality, type of issue, coupon, maturity, ratingsand general market conditions. In the absence of a price from a pricing service, securities are valued at theirrespective fair values as determined in good faith by the Valuation Committee.
Futures contracts are priced by an approved independent pricing service. Futures contracts are valued at thesettlement price on the exchange on which they are principally traded.
Securities for which quotations are not readily available are valued at their respective fair values as determined ingood faith by the Valuation Committee. When a security is “fair valued,” consideration is given to the facts andcircumstances relevant to the particular situation, including a review of various factors set forth in the pricingprocedures adopted by the Funds’ Board of Trustees (the “Board”). Fair value pricing is an inherently subjectiveprocess, and no single standard exists for determining fair value. Different funds could reasonably arrive atdifferent values for the same security. The use of fair value pricing by a fund may cause the net asset value of itsshares to differ significantly from the net asset value that would be calculated without regard to suchconsiderations.
Osterweis Funds |Notes to Financial Statements at September 30, 2021 (Unaudited)
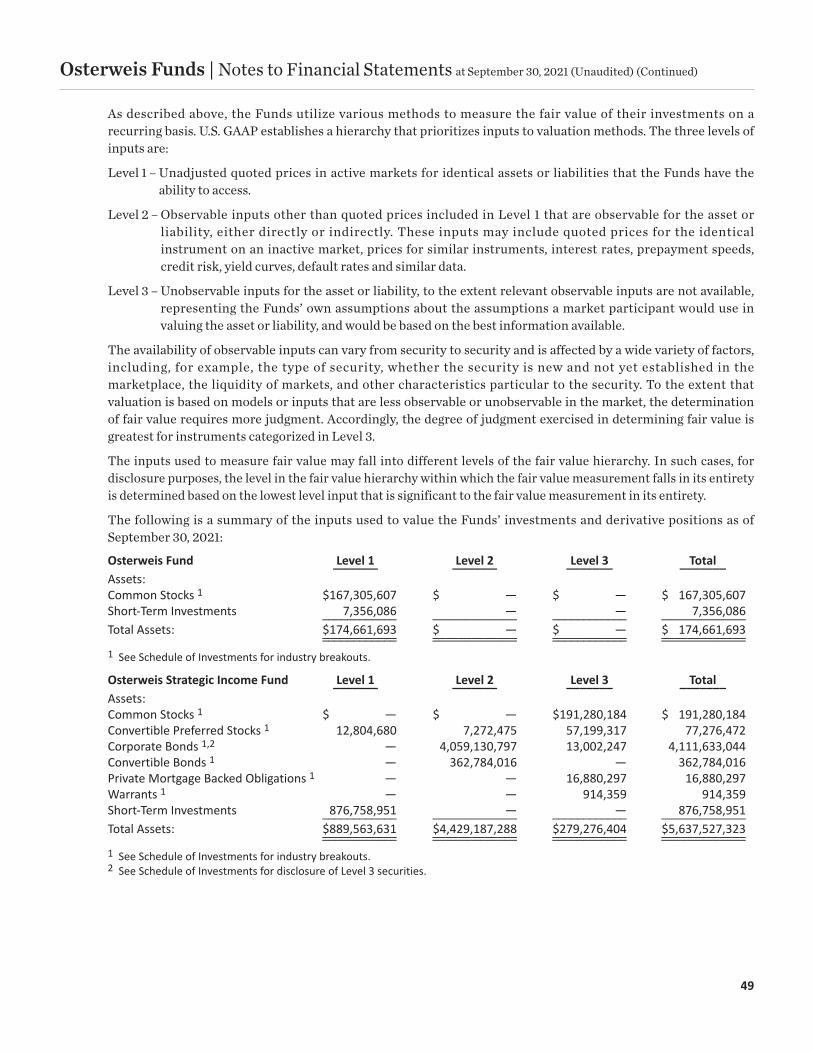
49
As described above, the Funds utilize various methods to measure the fair value of their investments on arecurring basis. U.S. GAAP establishes a hierarchy that prioritizes inputs to valuation methods. The three levels ofinputs are:
Level 1 – Unadjusted quoted prices in active markets for identical assets or liabilities that the Funds have theability to access.
Level 2 – Observable inputs other than quoted prices included in Level 1 that are observable for the asset orliability, either directly or indirectly. These inputs may include quoted prices for the identicalinstrument on an inactive market, prices for similar instruments, interest rates, prepayment speeds,credit risk, yield curves, default rates and similar data.
Level 3 – Unobservable inputs for the asset or liability, to the extent relevant observable inputs are not available,representing the Funds’ own assumptions about the assumptions a market participant would use invaluing the asset or liability, and would be based on the best information available.
The availability of observable inputs can vary from security to security and is affected by a wide variety of factors,including, for example, the type of security, whether the security is new and not yet established in themarketplace, the liquidity of markets, and other characteristics particular to the security. To the extent thatvaluation is based on models or inputs that are less observable or unobservable in the market, the determinationof fair value requires more judgment. Accordingly, the degree of judgment exercised in determining fair value isgreatest for instruments categorized in Level 3.
The inputs used to measure fair value may fall into different levels of the fair value hierarchy. In such cases, fordisclosure purposes, the level in the fair value hierarchy within which the fair value measurement falls in its entiretyis determined based on the lowest level input that is significant to the fair value measurement in its entirety.
The following is a summary of the inputs used to value the Funds’ investments and derivative positions as ofSeptember 30, 2021:
Osterweis Fund Level 1 Level 2 Level 3 Total_______ _______ _______ _______Assets:Common Stocks 1 $167,305,607 $ — $ — $ 167,305,607Short-Term Investments 7,356,086 — — 7,356,086____________ _____________ ____________ _____________Total Assets: $174,661,693 $ — $ — $ 174,661,693____________ _____________ ____________ _________________________ _____________ ____________ _____________1 See Schedule of Investments for industry breakouts.
Osterweis Strategic Income Fund Level 1 Level 2 Level 3 Total_______ _______ _______ _______Assets:Common Stocks 1 $ — $ — $191,280,184 $ 191,280,184Convertible Preferred Stocks 1 12,804,680 7,272,475 57,199,317 77,276,472Corporate Bonds 1,2 — 4,059,130,797 13,002,247 4,111,633,044Convertible Bonds 1 — 362,784,016 — 362,784,016Private Mortgage Backed Obligations 1 — — 16,880,297 16,880,297Warrants 1 — — 914,359 914,359Short-Term Investments 876,758,951 — — 876,758,951____________ _____________ ____________ _____________Total Assets: $889,563,631 $4,429,187,288 $279,276,404 $5,637,527,323____________ _____________ ____________ _________________________ _____________ ____________ _____________1 See Schedule of Investments for industry breakouts.2 See Schedule of Investments for disclosure of Level 3 securities.
Osterweis Funds |Notes to Financial Statements at September 30, 2021 (Unaudited) (Continued)

50
The following is a reconciliation of the Fund’s Level 3 assets for which significant unobservable inputs were usedto determine fair value:
PrivateConvertible Mortgage
Common Preferred Corporate BackedStocks Stocks Bonds Obligations Warrants Total_________ __________ _________ __________ ________ _____
Balance as of March 31, 2021 $134,303,605 $ — $14,343,157 $16,913,269 $848,561 $166,408,592Acquisitions — — — — — —Dispositions (10,468,500) — (1,340,910) — — (11,809,410)Accrued discounts/premiums — — 28,529 — — 28,529Realized gain (loss) 4,455,106 — — — — 4,455,106Change in unrealized
appreciation/depreciation 62,989,973 749,847 (28,529) (32,972) 65,798 63,744,117Transfer in and/or out of Level 3 — 56,449,470 — — — 56,449,470____________ ___________ ___________ ___________ _________ ____________Balance as of September 30, 2021 $191,280,184 $57,199,317 $13,002,247 $16,880,297 $914,359 $279,276,404____________ ___________ ___________ ___________ _________ ________________________ ___________ ___________ ___________ _________ ____________
Change in unrealized appreciation/depreciation for Level 3 investments held at September 30, 2021 $ 62,989,973 $ 749,847 $ (28,529) $ (32,972) $ 65,798 $ 63,744,117____________ ___________ ___________ ___________ _________ ________________________ ___________ ___________ ___________ _________ ____________
Fair Value Type of Security at 9/30/21 Valuation Techniques Unobservable Input Input Value(s)Common Stocks Market Comparable Discount Rate,
Approach EBITDA Multiple 3.0%/5.5xBroker Quotes Market Data $21.25
$191,280,184 Estimated Proceeds Market Data $0.0007514Convertible ConvertiblePreferred Stocks $ 57,199,317 Valuation Model Adjustment to yield 200 bpsCorporate Bonds $ 13,002,247 Issue Price Market Data $100.00Private Mortgage Backed Obligations $ 16,880,297 Discounted Cash Flow Adjustment to yield 344 bpsWarrants $ 914,359 Black Scholes Volatility 45%
Significant increases (decreases) in any of those inputs in isolation would result in a significantly higher (lower)fair value measurement. Increases in the adjustment to yield would decrease price and decreases in theadjustment to yield would increase price.
Transfers out of Level 2 and into Level 3 are due to the security not being priced by a third party.
The Trust’s valuation procedures have been adopted by the Trust’s Board of Trustees, which has established aValuation Committee to oversee valuation techniques. The Board of Trustees ratifies valuation techniques quarterly.
Osterweis Growth & Income Fund Level 1 Level 2 Level 3 Total_______ _______ _______ _______Assets:Common Stocks 1 $109,554,540 $ — $ 1,024,023 $ 110,578,563Convertible Preferred Stocks 1 261,320 250,775 1,167,333 1,679,428Corporate Bonds 1 — 36,788,097 220,377 37,508,474Convertible Bonds 1 — 7,003,141 — 7,003,141Private Mortgage Backed Obligations 1 — — 496,957 496,957Warrants 1 — — 4,997 4,997Short-Term Investments 7,788,571 — — 7,788,571____________ _____________ ____________ _____________Total Assets: $117,604,431 $ 44,042,013 $ 2,913,687 $ 165,060,131____________ _____________ ____________ _________________________ _____________ ____________ _____________1 See Schedule of Investments for industry breakouts.
Osterweis Funds |Notes to Financial Statements at September 30, 2021 (Unaudited) (Continued)

51
The Following is a reconciliation of the Fund’s Level 3 assets for which significant unobservable inputs were usedto determine fair value:
PrivateConvertible Mortgage
Common Preferred Corporate BackedStocks Stocks Bonds Obligations Warrants Total_________ __________ _________ __________ ________ _____
Balance as of March 31, 2021 $ 898,707 $ — $243,104 $497,928 $4,637 $1,644,376Acquisitions — — — — — —Dispositions (31,500) — (22,727) — — (54,227)Accrued discounts/premiums — — 422 — — 422Realized gain (loss) 13,983 — — — — 13,983Change in unrealized
appreciation/depreciation 142,833 15,303 (422) (971) 360 157,102Transfer in and/or out of Level 3 — 1,152,030 — — — 1,152,030__________ __________ ________ ________ ______ __________Balance as of September 30, 2021 $1,024,023 $1,167,333 $220,377 $496,957 $4,997 $2,913,687__________ __________ ________ ________ ______ ____________________ __________ ________ ________ ______ __________
Change in unrealized appreciation/depreciation for Level 3 investments held at September 30, 2021 $ 142,832 $ 15,303 $ (422) $ (971) $ 360 $ 157,102__________ __________ ________ ________ ______ ____________________ __________ ________ ________ ______ __________
Fair Value Type of Security at 9/30/21 Valuation Techniques Unobservable Input Input Value(s)Common Stocks Market Comparable Discount Rate,
Approach EBITDA Multiple 3.0%/5.5xBroker Quotes Market Data $21.25
$1,024,023 Estimated Proceeds Market Data $0.0007514Convertible ConvertiblePreferred Stocks $1,167,333 Valuation Model Adjustment to yield 200 bpsCorporate Bonds $ 220,377 Issue Price Market Data $100.00Private Mortgage Backed Obligations $ 496,957 Discounted Cash Flow Adjustment to yield 344 bpsWarrants $ 4,997 Black Scholes Volatility 45%
Significant increases (decreases) in any of those inputs in isolation would result in a significantly higher (lower)fair value measurement. Increases in the adjustment to yield would decrease price and decreases in theadjustment to yield would increase price.
Transfers out of Level 2 and into Level 3 are due to the security not being priced by a third party.
The Trust’s valuation procedures have been adopted by the Trust’s Board of Trustees, which has established aValuation Committee to oversee valuation techniques. The Board of Trustees ratifies valuation techniques quarterly.
Osterweis Emerging Opportunity Fund Level 1 Level 2 Level 3 Total_______ _______ _______ _______
Assets:Common Stocks 1 $ 222,972,272 $ — $ — $ 222,972,272Short-Term Investments 27,536,426 — — 27,536,426_____________ _____________ ____________ _____________Total Assets: $ 250,508,698 $ — $ — $ 250,508,698_____________ _____________ ____________ __________________________ _____________ ____________ _____________1 See Schedule of Investments for industry breakouts.
Osterweis Funds |Notes to Financial Statements at September 30, 2021 (Unaudited) (Continued)

52
Osterweis Total Return Fund Level 1 Level 2 Level 3 Total_______ _______ _______ _______Assets:Corporate Bonds 1 $ — $ 70,181,605 $ — $ 70,181,605Asset Backed Securities — 30,972,842 — 30,972,842Commercial
Mortgage-Backed Securities — 2,005,884 — 2,005,884Mortgage Backed Securities — 64,573,907 — 64,573,907United States Government Securities 2 — 11,331,602 — 11,331,602Short-Term Investments 7,403,292 1,999,211 — 9,402,503_____________ _____________ ____________ _____________Total Assets: $ 7,403,292 $ 181,065,051 $ — $ 188,468,343_____________ _____________ ____________ __________________________ _____________ ____________ _____________Other Financial Instruments 3:Interest Rate Contracts – Futures $ 339,895 $ — $ — $ 339,895_____________ _____________ ____________ __________________________ _____________ ____________ _____________1 See Schedule of Investments for industry breakouts.2 See schedule of investments for security type breakouts.3 Other Financial Instruments are derivative instruments not reflected in the Schedule of Investments, such as futures contracts,
which are presented at the unrealized appreciation/(depreciation) on the investment.
The Funds have provided additional disclosures below regarding derivatives and hedging activity intending toimprove financial reporting by enabling investors to understand how and why the Funds use futures contracts(a type of derivative), how they are accounted for and how they affect an entity’s results of operations andfinancial position. The Funds may use derivatives for risk management purposes or as part of its investmentstrategies. Derivatives are financial contracts whose values depend on, or are derived from, the value of anunderlying asset, reference rate or index. The Funds may use derivatives to earn income and enhance returns, tohedge or adjust the risk profile of its portfolio, to replace more traditional direct investments and to obtainexposure to otherwise inaccessible markets.
The average notional amount for futures contracts is based on the monthly notional amounts. The notionalamount for futures contracts represents the U.S. dollar value of the contract as of the day of opening thetransaction or latest contract reset date. The Osterweis Total Return Fund’s average notional value of futurescontracts outstanding during the six months ended September 30, 2021, was $59,347,371. The following tablesshow the effects of derivative instruments on the financial statements.
Statements of Assets and Liabilities
Fair values of derivative instruments as of September 30, 2021:
Osterweis Total Return FundAsset Derivatives as of Liability Derivatives as of September 30, 2021 September 30, 2021______________________________ _____________________________
Balance Sheet Balance Sheet Instrument Location Fair Value Location Fair Value__________ ____________ _________ ____________ _________Interest Rate Variation Variation
Contracts – Futures margin receivable $345,656 margin payable $392,637
Statements of Operations
The effect of derivative instruments on the Statements of Operations for the six months ended September 30, 2021:
Osterweis Total Return FundChange in Unrealized
Location of Gain (Loss) Realized Gain Appreciation/Depreciation on Derivatives (Loss) on Derivatives on Derivatives
Instrument Recognized in Income Recognized in Income Recognized in Income__________ __________________ __________________ _______________________Interest Rate Realized and Unrealized
Contracts – Futures Gain (Loss) on Investments $(2,682,836) $(287,888)
Osterweis Funds |Notes to Financial Statements at September 30, 2021 (Unaudited) (Continued)

53
The Osterweis Fund, Osterweis Strategic Income Fund, Osterweis Growth & Income Fund and OsterweisEmerging Opportunity Fund did not have derivatives activity during the six months ended September 30, 2021.
B. Foreign Currency. Foreign currency amounts, other than the cost of investments, are translated into U.S. dollarvalues based upon the spot exchange rate prior to the close of regular trading. The cost of investments istranslated at the rates of exchange prevailing on the dates the portfolio securities were acquired. The Fundsinclude foreign exchange gains and losses from dividends receivable, interest receivable and other foreigncurrency denominated payables and receivables in Change in net unrealized appreciation/depreciation on foreigncurrency translation and Net realized gain (loss) on foreign currency translation. The Funds do not isolate thatportion of realized and unrealized gain (loss) on investments resulting from changes in foreign exchange rates oninvestments from fluctuations arising from changes in the market price of securities for financial reportingpurposes. Fluctuations in foreign exchange rates on investments are thus included in Change in net unrealizedappreciation/depreciation on investments and Net realized gain (loss) on investments.
C. Futures Contracts. Each Fund may purchase or sell futures contracts and options thereon to hedge againstchanges in interest rates, securities (through index futures or options) or currencies. The purchase of futurescontracts may be more efficient or cost-effective than buying the underlying securities or assets. A futurescontract is an agreement that obligates the buyer to buy and the seller to sell a specified quantity of an underlyingasset (or settle for cash the value of a contract based on an underlying asset, rate or index) at a specific price on thecontract maturity date. Upon entering into a futures contract, each Fund is required to pledge to the counterpartyan amount of cash, U.S. Government securities or other high-quality debt securities equal to the minimum “initialmargin” requirements of the exchange or the broker. Pursuant to a contract entered into with a futurescommission merchant, each Fund agrees to receive from or pay to the firm an amount of cash equal to thecumulative daily fluctuation in the value of the contract. Such receipts or payments are known as “variationmargin” and are recorded by the Funds as unrealized gains or losses. When the contract is closed, the Fundsrecord a gain or loss equal to the difference between the value of the contract at the time it was opened and thevalue at the time it was closed. Each Fund will cover its current obligations under futures contracts by thesegregation of liquid assets or by entering into offsetting transactions or owning positions covering its obligations.The Funds’ use of futures contracts may involve risks that are different from, or possibly greater than, the riskassociated with investing directly in securities or other more traditional instruments. These risks include the riskthat the value of the futures contracts may not correlate perfectly, or at all, with the value of the assets, referencerates or indices that they are designed to track. Other risks include: an illiquid secondary market for a particularinstrument and possible exchange-imposed price fluctuation limits, either of which may make it difficult orimpossible to close out a position when desired; the risk that adverse price movements in an instrument can resultin a loss substantially greater than the Funds’ initial investment in that instrument (in some cases, the potentialloss is unlimited); and the risk that a counterparty will not perform its obligations. The Osterweis Total ReturnFund had futures contracts activity during the six months ended September 30, 2021. Realized and unrealizedgains and losses are included in the Statements of Operations. The Osterweis Fund, Osterweis Strategic IncomeFund, Osterweis Growth & Income Fund and Osterweis Emerging Opportunity Fund did not have futurescontracts activity during the six months ended September 30, 2021.
D. To-be-announced (“TBA”) Commitments. Each Fund may enter into TBA purchase commitments. In a TBAtransaction, the TBA unit price and the estimated principal amount are established when a Fund enters into acontract, with the actual principal amount being within a specified range of the estimate. Securities purchased ona TBA basis are not settled until they are delivered to the Fund, which can be 15 to 45 days later. Beginning on thedate the Fund enters into a TBA transaction, cash, U.S. government securities or other liquid securities aresegregated in an amount equal in value to the purchase price of the TBA security. The Funds may enter into TBAsale commitments to hedge their portfolio positions or to sell securities they own under delayed deliveryarrangements. Proceeds of TBA sale commitments are not received until the contractual settlement date.Unsettled TBA sale commitments are valued at current market value of the underlying securities. If the TBA salecommitment is closed through the acquisition of an offsetting purchase commitment, a Fund realizes a gain or
Osterweis Funds |Notes to Financial Statements at September 30, 2021 (Unaudited) (Continued)

54
Osterweis Funds |Notes to Financial Statements at September 30, 2021 (Unaudited) (Continued)
loss on the commitment without regard to any unrealized gain or loss on the underlying security. If a Funddelivers securities under the commitment, the Fund realizes a gain or loss from the sale of the securities basedupon the unit price established at the date the commitment was entered. Transactions in TBAs are accounted foras purchases and sales and may result in an increase to the Fund’s portfolio turnover rate. The Osterweis TotalReturn Fund had TBAs during the six months ended September 30, 2021. The Osterweis Fund, OsterweisStrategic Income Fund, Osterweis Growth & Income Fund and Osterweis Emerging Opportunity Fund did nothave TBA’s during the six months ended September 30, 2021.
Statements of Assets and Liabilities
Fair values of TBA Commitments as of September 30, 2021:
Osterweis Total Return FundAsset TBAs as of Liability TBAs as of
September 30, 2021 September 30, 2021______________________________ ______________________________Balance Sheet Balance Sheet
Instrument Location Fair Value Location Fair Value__________ ___________ _________ ____________ _________TBA Commitments None $ — None $ —
Statements of Operations
The effect of TBA Commitments on the Statements of Operations for the year ended September 30, 2021:
Osterweis Total Return FundChange in Unrealized
Location of Gain Realized Gain Appreciation/Depreciation(Loss) on TBAs (Loss) on TBAs on TBAs
Instrument Recognized in Income Recognized in Income Recognized in Income__________ __________________ __________________ _______________________TBA Commitments Realized and Unrealized
Gain (Loss) on Investments $121,484 $8,400
E. Mortgage Dollar Rolls. The Funds enter into mortgage dollar rolls, typically on a TBA basis. Mortgage dollar rolls areagreements between the Fund and a financial institution where the Fund sells (or buys) mortgage-backed securitiesfor delivery on a specified date and simultaneously contracts to repurchase (or sell) substantially similar (same type,coupon, and maturity) securities at a future date and at a predetermined price. Gains or losses are realized on theinitial sale, and the difference between the repurchase price and the sale price is recorded as an unrealized gain orloss to the Fund upon entering into the mortgage dollar roll. In addition, the Fund may invest the cash proceeds thatare received from the initial sale. During the period between the sale and repurchase, the Fund is not entitled toprincipal and interest paid on the mortgage backed securities. Transactions in mortgage dollar rolls are accountedfor as purchases and sales and may result in an increase to the Fund’s portfolio turnover rate. The risks of mortgagedollar roll transactions include the potential inability of the counterparty to fulfill its obligations.
F. Federal Income Taxes. Each Fund has elected to be taxed as a “regulated investment company” and intends todistribute substantially all taxable income to its shareholders and otherwise comply with the provisions of theInternal Revenue Code applicable to regulated investment companies. Therefore, no provision for federal incometaxes or excise taxes has been made.
In order to avoid imposition of the excise tax applicable to regulated investment companies, each Fund intends todeclare each year as dividends, in each calendar year, at least 98.0% of its net investment income (earned duringthe calendar year) and 98.2% of its net realized capital gains (earned during the twelve months ended October 31)plus undistributed amounts, if any, from prior years.
Net capital losses incurred after October 31, and within the taxable year, are deemed to arise on the first businessday of each Fund’s next taxable year. Net investment losses incurred after December 31, and within the taxableyear, are deemed to arise on the first business day of the Fund’s next taxable year.
As of the most recent fiscal year end March 31, 2021, there were no late-year or post-October losses for the Funds.

55
As of the most recent fiscal year end March 31, 2021, the Funds had the following capital loss carryovers availablefor federal income tax purposes:
Capital Loss Carryovers________________________________________Short-Term Long-Term_____________ _____________
Osterweis Fund $ — $ —Osterweis Strategic Income Fund (8,092,848) (520,504,102)Osterweis Growth & Income Fund — —Osterweis Emerging Opportunity Fund — —Osterweis Total Return Fund — —
As of September 30, 2021, the Funds did not have any tax positions that did not meet the “more likely-than-not”threshold of being sustained by the applicable tax authority. Generally, tax authorities can examine all the taxreturns filed for the last three years. The Funds identify their major tax jurisdictions as U.S. Federal and theCommonwealth of Massachusetts; however, as of September 30, 2021, the Funds are not aware of any tax positionsfor which it is reasonably possible that the total amounts of unrecognized tax benefits will change materially.
G. Security Transactions and Investment Income. Investment securities transactions are accounted for on the tradedate. Gains and losses realized on sales of securities are determined on an identified cost basis.Discounts/premiums on debt securities purchased are accreted/amortized over the life of the respectivesecurities using the effective interest method. Dividend income is recorded on the ex-dividend date. Dividendsreceived from REITs and MLPs are generally comprised of ordinary income, capital gains and may include returnof capital. Interest income is recorded on an accrual basis. Withholding taxes on foreign dividends have beenprovided for in accordance with the Trust’s understanding of the applicable country’s tax rules and rates.
H. Distributions to Shareholders. Distributions to shareholders from net investment income and net realized gains onsecurities for the Osterweis Fund and Osterweis Emerging Opportunity Fund normally are declared and paid onan annual basis. Distributions to shareholders from net investment income for the Osterweis Strategic IncomeFund and Osterweis Growth & Income Fund normally are declared and paid on a quarterly basis, and distributionsto shareholders from net realized gains on securities normally are declared and paid on an annual basis.Distributions to shareholders from net investment income for the Osterweis Total Return Fund normally aredeclared and paid on a monthly basis, and distributions to shareholders from net realized gains on securitiesnormally are declared and paid on an annual basis. Distributions are recorded on the ex-dividend date.
I. Use of Estimates. The preparation of financial statements in conformity with U.S. GAAP requires management tomake estimates and assumptions that affect the reported amounts of assets and liabilities at the date of thefinancial statements and the reported amount of revenue and expenses during the reporting period. Actual resultscould differ from those estimates.
J. Share Valuation. The net asset value (“NAV”) per share of each Fund is calculated by dividing the sum of the valueof the securities held by each Fund, plus cash and other assets, minus all liabilities by the total number of sharesoutstanding for each Fund, rounded to the nearest cent. The Funds’ shares will not be priced on the days on whichthe New York Stock Exchange is closed for trading. The offering and redemption price per share for each Fund isequal to each Fund’s net asset value per share.
K. Guarantees and Indemnifications. In the normal course of business, the Funds enter into contracts with serviceproviders that contain general indemnification clauses. The Funds’ maximum exposure under thesearrangements is unknown as this would involve future claims that may be made against the Funds that have notyet occurred. However, based on experience, the Funds expect the risk of loss to be remote.
L. Illiquid Securities. Pursuant to Rule 22e-4 under the 1940 Act, the Funds have adopted a Board approved liquidityrisk management program that requires, among other things, that the Funds limit their illiquid investments thatare assets to no more than 15% of net assets. An illiquid investment is any security which may not reasonably beexpected to be sold or disposed of in current market conditions in seven calendar days or less without the sale ordisposition significantly changing the market value of the investment.
Osterweis Funds |Notes to Financial Statements at September 30, 2021 (Unaudited) (Continued)

56
M. Offsetting Agreements. The Funds are subject to various netting arrangements, which govern the terms of certaintransactions with counterparties. The arrangements allow the Funds to close out and net their total exposure to acounterparty in the event of a default with respect to all transactions governed under a single agreement with acounterparty. The following table presents derivative financial instruments that are subject to enforceable nettingarrangements, collateral arrangements or other similar agreements as of September 30, 2021:
Osterweis Total Return Fund
Gross Amounts Net Amounts CashOffset in the Presented in Collateral
Gross Statements of the Statements of Financial Pledged NetDescription Amounts Assets and Liabilities Assets and Liabilities Instruments (Received) Amount__________ ________ __________________ __________________ __________ _________ _______AssetsInterest Rate
Contracts – Futures 1 $345,656 $345,656 $ — $ — $ — $ —
LiabilitiesInterest Rate
Contracts – Futures 1 $392,637 $392,637 $ — $ — $ — $46,9811 Counterparty is Credit Suisse.
N. Restricted Cash. Restricted cash represents amounts that are held by third parties under certain of the Fund’sderivative transactions. Such cash is excluded from cash and equivalents in the Statements of Assets and Liabilities.Interest income earned on restricted cash is recorded in other income on the Statements of Operations.
O. Recently Issued Accounting Pronouncements. In March 2020, the FASB issued Accounting Standards Update 2020-04, Reference Rate Reform (Topic 848)-Facilitation of the Effects of Reference Rate Reform on FinancialReporting (“ASU 2020-04”), which provides optional, temporary relief with respect to the financial reporting ofcontracts subject to certain types of modifications due to the planned discontinuation of the London InterbankOffered Rate (“LIBOR”) and other interbank offered rates as of the end of 2021. The temporary relief provided byASU 2020-04 is effective for certain reference rate-related contract modifications that occur during the periodfrom March 12, 2020 through December 31, 2022. Management is evaluating the impact of ASU 2020-04 on thefund’s investments, derivatives, debt and other contracts that will undergo reference rate-related modifications asa result of the reference rate reform.
In October 2020, the Securities and Exchange Commission (the “SEC”) adopted new regulations governing theuse of derivatives by registered investment companies (“Rule 18f-4”). The Fund will be required to comply withRule 18f-4 by August 19, 2022. Once implemented, Rule 18f-4 will impose limits on the amount of derivatives afund can enter into, eliminate the asset segregation framework currently used by funds to comply with Section 18of the 1940 Act, treat derivatives as senior securities and require funds whose use of derivatives is more than alimited specified exposure amount to establish and maintain a comprehensive derivatives risk managementprogram and appoint a derivatives risk manager. The Fund is currently evaluating the impact, if any, of thisprovision.
In October 2020, the SEC adopted new Rule 12d1-4 under the 1940 Act and other regulatory changes which areexpected to be effective on or about January 19, 2022. Those changes are intended to streamline and enhance theregulatory framework for investments by one fund into another fund or “fund-of-funds arrangements”. Theseregulatory changes may limit the Fund’s ability to pursue its principal investment strategies by investing in otherinvestment companies or pooled investment vehicles or to invest in those investment companies or pooledinvestment vehicles it believes are most desirable. The Fund is currently assessing the potential impact of the newrule on the Fund’s financial statements.
In December 2020, the SEC adopted a new rule providing a framework for fund valuation practices (“Rule 2a-5”).Rule 2a-5 establishes requirements for determining fair value in good faith for purposes of the 1940 Act. Rule 2a-5will permit fund boards to designate certain parties to perform fair value determinations, subject to board
Osterweis Funds |Notes to Financial Statements at September 30, 2021 (Unaudited) (Continued)

57
oversight and certain other conditions. Rule 2a-5 also defines when market quotations are “readily available” forpurposes of the 1940 Act and the threshold for determining whether a fund must fair value a security. Inconnection with Rule 2a-5, the SEC also adopted related recordkeeping requirements and is rescinding previouslyissued guidance, including with respect to the role of a board in determining fair value and the accounting andauditing of fund investments. The Fund will be required to comply with the rules by September 8, 2022. The Fundis currently evaluating the impact, if any, of applying this provision.
P. Subsequent Events. In preparing these financial statements, the Funds have evaluated events and transactions forpotential recognition or disclosure through the date the financial statements were issued. The Funds havedetermined that there were no subsequent events that would need to be disclosed in the Funds’ financial statements.
Note 3 – Commitments and Other Related Party Transactions
The Advisers provide the Funds with investment management services under separate Investment AdvisoryAgreements (the “Advisory Agreements”). Under the Advisory Agreements, the Advisers furnish all investment advice,office space, certain administrative services, and most of the personnel needed by each Fund. As compensation for theirservices, the Advisers are entitled to a monthly fee. For the Osterweis Fund, the Adviser is entitled to a monthly fee at anannual rate of 0.75%. Prior to June 30, 2021, Osterweis Fund was entitled to a monthly fee at the annual rate of 1.00% ofthe average daily net assets up to $250 million and 0.75% of the average daily net assets greater than $250 million. For theOsterweis Strategic Income Fund, the Adviser is entitled to a monthly fee at an annual rate of 1.00% of the average dailynet assets up to $250 million, 0.75% of the average daily net assets from $250 million to $2.5 billion, and 0.65% of theaverage daily net assets greater than $2.5 billion. For the Osterweis Growth & Income Fund, the Adviser is entitled to amonthly fee at the annual rate of 0.75%. Prior to June 30, 2021, Osterweis Growth & Income Fund was entitled to amonthly fee at the annual rate of 1.00% for the average daily net assets up to $500 million and 0.75% for the average dailynet assets greater than $500 million. For the Osterweis Emerging Opportunity Fund, the Adviser is entitled to a monthlyfee at an annual rate of 1.00% of the average daily net assets up to $500 million, 0.85% of the average daily net assets from$500 million to $1 billion, and 0.75% of the average daily net assets greater than $1 billion. For the Osterweis Total ReturnFund, the Adviser is entitled to a monthly fee at an annual rate of 0.45% of the average daily net assets. The amount ofinvestment advisory fees incurred by the Funds for the six months ended September 30, 2021 is disclosed in theStatements of Operations. The investment advisory fees incurred are paid monthly to the Adviser, net of any waiver orreimbursement discussed below.
The Adviser has contractually agreed to limit the annual ratio of expenses (Expense Cap) for the Osterweis Fund,Osterweis Emerging Opportunity Fund and Osterweis Total Return Fund by reducing all or a portion of their fees andreimbursing Fund expenses so that each Fund’s ratios of expenses to average net assets will not exceed 0.95%, 1.10% and0.75%, respectively. Each Operating Expenses Limitation Agreement has an indefinite term and may be terminated at anytime, and without payment of any penalty, by the Board, on behalf of the Fund, upon sixty (60) days’ written notice to theAdviser. Any fees waived and/or any Fund expenses absorbed by the Adviser pursuant to an agreed-upon expense cap shallbe reimbursed by the Fund to the Adviser, if so requested by the Adviser, any time before the end of the third yearfollowing the fee waiver and/or expense absorption, provided the aggregate amount of the Fund’s current operatingexpenses for such year does not exceed the lesser expense cap in place at the time of waiver or at the time ofreimbursement. The Fund must pay its current ordinary operating expenses before the Adviser is entitled to anyreimbursements of fees and/or expenses. Any such reimbursement is also contingent upon Board review and approval.Any amount due from the Adviser is paid monthly to the Funds, if applicable. For the six months ended September 30,2021, the Adviser waived $81,223 and recaptured $27,631 in fees in the Osterweis Fund and waived $71,972 in fees in theOsterweis Emerging Opportunity Fund. As of September 30, 2021, the remaining cumulative amount the Adviser may bereimbursed is $876,697 for Osterweis Fund and $340,975 for Osterweis Emerging Opportunity Fund.
The Adviser may recapture a portion of the above no later than the years as stated below:
March 31, 2022 March 31, 2023 March 31, 2024 September 30, 2025 Total_____________ _____________ _____________ _________________ ____Osterweis Fund $137,933 $312,022 $345,519 $81,223 $876,697Osterweis Emerging Opportunity Fund — 122,596 146,407 71,972 340,975
Osterweis Funds |Notes to Financial Statements at September 30, 2021 (Unaudited) (Continued)

58
U.S. Bancorp Fund Services, LLC, doing business as U.S. Bank Global Fund Services (“Fund Services”), acts as theFunds’ administrator, fund accountant and transfer agent. In those capacities Fund Services maintains the Funds’ booksand records, calculates the Funds’ NAV, prepares various federal and state regulatory filings, coordinates the payment offund expenses, reviews expense accruals and prepares materials supplied to the Board. The officers of the Trust and theChief Compliance Officer are also employees of Fund Services. Fees paid by the Funds to Fund Services for these servicesfor the six months ended September 30, 2021, are disclosed in the Statements of Operations.
Quasar Distributors, LLC (the “Distributor”) acts as the Funds’ principal underwriter in a continuous public offeringof the Funds’ shares. U.S. Bank N.A. serves as custodian to the Funds. U.S. Bank N.A. is an affiliate of Fund Services.
The Funds have entered into Sub-Transfer Agent Arrangements (the “Arrangements”). All Arrangements must beapproved by the Board. For the six months ended September 30, 2021, the Sub-Transfer Agent Fees and Transfer AgentFees incurred by the Funds are disclosed in the Statements of Operations.
Note 4 – Purchases and Sales of Securities
For the six months ended September 30, 2021, the cost of purchases and proceeds from sales and maturities ofsecurities, excluding short-term investments, were as follows:
Purchases Sales_________ _____Osterweis Fund $ 20,557,635 $ 26,579,121Osterweis Strategic Income Fund 1,435,826,157 1,377,893,723Osterweis Growth & Income Fund 16,558,537 20,594,203Osterweis Emerging Opportunity Fund 135,224,499 143,605,592Osterweis Total Return Fund 319,895,372 328,967,556
For the six months ended September 30, 2021, the cost of purchases and proceeds from sales and maturities oflong-term U.S. Government securities included above were as follows:
Purchases Sales_________ _____Osterweis Total Return Fund $52,091,871 $59,251,302
The Osterweis Fund, Osterweis Strategic Income Fund, Osterweis Growth & Income Fund and Osterweis EmergingOpportunity Fund did not purchase or sell U.S. Government securities during the six months ended September 30, 2021.
Note 5 – Distributions to Shareholders
The tax character of distributions paid during the six months ended September 30, 2021(estimated), and the yearended March 31, 2021, was as follows:
Ordinary Income_______________________________________September 30, 2021 March 31, 2021_________________ _____________
Osterweis Fund $ — $ 731,863Osterweis Strategic Income Fund 118,540,698 188,057,162Osterweis Growth & Income Fund 3,905,805 945,892Osterweis Emerging Opportunity Fund — 16,776,530Osterweis Total Return Fund 636,048 6,398,924
Long-Term Capital Gains 1_______________________________________September 30, 2021 March 31, 2021_________________ _____________
Osterweis Fund $ — $7,453,594Osterweis Strategic Income Fund — —Osterweis Growth & Income Fund — 4,074,530Osterweis Emerging Opportunity Fund — 3,884,481Osterweis Total Return Fund — —1 Designated as long-term capital gain dividend, pursuant to Internal Revenue Code Section 852(b)(3).
Osterweis Funds |Notes to Financial Statements at September 30, 2021 (Unaudited) (Continued)

59
The cost basis of investments for federal income tax purposes at most recent fiscal year end, March 31, 2021, was as follows:
Growth & EmergingOsterweis Strategic Income Opportunity Total Return
Fund Income Fund Fund Fund Fund____________ _____________ ____________ __________ ___________Cost of investments $97,075,884 $5,006,883,398 $110,579,036 $189,801,555 $247,835,724___________ _____________ ____________ ____________ _______________________ _____________ ____________ ____________ ____________Gross tax unrealized appreciation 72,350,661 228,765,416 47,307,739 50,316,053 1,932,607Gross tax unrealized depreciation (838,664) (58,651,194) (957,782) (9,518,690) (4,622,003)___________ _____________ ____________ ____________ ____________Net tax unrealized
appreciation/depreciation 71,511,997 170,114,222 46,349,957 40,797,363 (2,689,396)___________ _____________ ____________ ____________ ____________Undistributed ordinary income 1,459,601 11,393,811 3,418,331 21,552,756 155,721Undistributed long-term capital gain 4,867,974 — 2,114,165 9,398,432 —___________ _____________ ____________ ____________ ____________Total distributable earnings 6,327,575 11,393,811 5,532,496 30,951,188 155,721___________ _____________ ____________ ____________ ____________Other accumulated gain/(loss) — (528,596,950) — (5,662) 577___________ _____________ ____________ ____________ ____________Total distributable (accumulated)
earnings (losses) $77,839,572 $ (347,088,917) $ 51,882,453 $ 71,742,889 $ (2,533,098)___________ _____________ ____________ ____________ _______________________ _____________ ____________ ____________ ____________
The tax difference between book basis and tax basis unrealized appreciation is attributable primarily to partnershipadjustments and wash sale deferrals.
Note 6 – Investments in Affiliates
Affiliated companies are those that are “affiliated persons” as defined in Section 2(a)(3) of the 1940 Act. They include,among other entities, issuers 5% or more of whose outstanding voting shares are held by the Fund. For the six monthsended September 30, 2021, the Funds had the following transactions with affiliated companies:
Osterweis Strategic Income Fund
AffiliatesShare Change in Balance Value Realized Unrealized Value
Convertible September 30, March 31, Acqui- Dispo- Gain Appreciation/ September 30, DividendPreferred Stocks 2021 2021 sitions sitions (Loss) Depreciation 2021 Income______________ ____________ ________ ______ ______ _______ ____________ ____________ _______Daseke, Inc.,
7.625% 490,000 $59,488,936 $— $— $— $(2,289,619) $57,199,317 $1,868,126
Osterwies Growth & Income FundShare Change in Balance Value Realized Unrealized Value
Convertible September 30, March 31, Acqui- Dispo- Gain Appreciation/ September 30, DividendPreferred Stocks 2021 2021 sitions sitions (Loss) Depreciation 2021 Income______________ ____________ ________ ______ ______ _______ ____________ ____________ _______Daseke, Inc.,
7.625% 10,000 $ 1,214,060 $— $— $— $ (46,727) $ 1,167,333 $ 38,126
Osterweis Funds |Notes to Financial Statements at September 30, 2021 (Unaudited) (Continued)

60
Note 7 – Credit Facility
U.S. Bank N.A. has made available to the Funds credit facilities pursuant to separate Loan and Security Agreements fortemporary or extraordinary purposes. Credit facility details for the six months ended September 30, 2021, are as follows:
Growth & EmergingOsterweis Strategic Income Opportunity Total Return
Fund Income Fund Fund Fund Fund____________ _____________ ____________ __________ ___________Maximum available credit $20,000,000 $300,000,000 $20,000,000 $15,000,000 $13,000,000Largest amount outstanding
on an individual day — — — — 204,000Average balance when in use — — — — 204,000Credit facility outstanding as of
September 30, 2021 — — — — —Average interest rate when in use — — — — 3.25%
Interest expenses for the six months ended September 30, 2021, are disclosed in the Statements of Operations, asapplicable.
Note 8 – Risks Associated with the Discontinuation of the London Interbank Offered Rate (“LIBOR”)
The Funds invest significantly in corporate bonds that have interest rate provisions linked to LIBOR. LIBOR is usedextensively in the U.S. and globally as a “benchmark” or “reference rate” for such loans. It is expected that a number ofprivate-sector banks currently reporting information used to set LIBOR will stop doing so after 2021 when their currentreporting commitment ends, which could either cause LIBOR to stop publication immediately or cause LIBOR’s regulatorto determine that its quality has degraded to the degree that it is no longer representative of its underlying market. Theexpected discontinuation of LIBOR may impact the functioning, liquidity, and value of these.
Note 9 – (COVID-19) Pandemic
The global outbreak of COVID-19 (commonly referred to as “coronavirus”) has disrupted economic markets and theprolonged economic impact is uncertain. The ultimate economic fallout from the pandemic, and the long-term impact oneconomies, markets, industries and individual issuers, are not known. The operational and financial performance of theissuers of securities in which the Funds invest depends on future developments, including the duration and spread of theoutbreak, and such uncertainty may in turn adversely affect the value and liquidity of the Funds’ investments, impair theFunds’ ability to satisfy redemption requests, and negatively impact the Funds’ performance. Please refer to the Funds’prospectus for information regarding the Funds’ principal risks.
Osterweis Funds |Notes to Financial Statements at September 30, 2021 (Unaudited) (Continued)

61
Osterweis Funds | Expense Examples For the Six Months Ended September 30, 2021 (Unaudited)
As a shareholder of the Funds, you incur ongoing costs, including investment advisory fees and other Fund expenses.These examples are intended to help you understand your ongoing costs (in dollars) of investing in the Funds and tocompare these costs with the ongoing costs of investing in other mutual funds. These examples are based on an investmentof $1,000 invested at the beginning of the period and held for the entire period (April 1, 2021– September 30, 2021).
Actual Expenses
The “Actual” line for each of the following tables provides information about actual account values based on actualreturns and actual expenses. Although the Funds charge no sales load or other transaction fees, you will be assessed feesfor outgoing wire transfers, returned checks and stop payment orders at prevailing rates charged by Fund Services, theFunds’ transfer agent. If you request that a redemption be made by wire transfer, the Funds’ transfer agent currentlycharges a $15.00 fee. An Individual Retirement Account will be charged an annual maintenance fee. To the extent theFunds invest in shares of other investment companies as part of their strategies, you will indirectly bear yourproportionate share of any fees and expenses charged by the underlying funds in which the Funds invest in addition to theexpenses of the Funds. Actual expenses of the underlying funds may vary. These expenses are not included in the followingexamples. The following examples include, but are not limited to, investment advisory fees, fund accounting fees, fundadministration fees, custody fees and transfer agent fees. However, the following examples do not include portfolio tradingcommissions and related expenses. You may use the information in this line, together with the amount you invested, toestimate the expenses that you paid over the period. Simply divide your account value by $1,000 (for example, an $8,600account value divided by $1,000 = 8.6), then multiply the result by the number in the first line under the heading titled“Expenses Paid During the Period” to estimate the expenses you paid on your account during this period.
Hypothetical Example for Comparison Purposes
The “Hypothetical” line for each of the following tables provides information about hypothetical account values andhypothetical expenses based on the Funds’ actual expense ratios and an assumed rate of return of 5% per year beforeexpenses, which is not the Funds’ actual return. The hypothetical account values and expenses may not be used to estimatethe actual ending account balance or expenses you paid for the period. You may use this information to compare theongoing costs of investing in the Funds and other funds. To do so, compare this 5% hypothetical example with the 5%hypothetical examples that appear in the shareholder reports of the other funds.
Beginning EndingAccount Value Account Value Expenses Paid
4/1/21 9/30/21 During the Period 1_____________ _____________ _________________Osterweis FundActual $1,000.00 $1,053.90 $4.89Hypothetical (5% annual return before expenses) 1,000.00 1,020.31 4.81
Strategic Income FundActual 1,000.00 1,036.40 4.24Hypothetical (5% annual return before expenses) 1,000.00 1,020.91 4.20
Growth & Income FundActual 1,000.00 1,047.60 5.24Hypothetical (5% annual return before expenses) 1,000.00 1,019.95 5.16
Emerging Opportunity FundActual 1,000.00 1,059.00 5.68Hypothetical (5% annual return before expenses) 1,000.00 1,019.55 5.57
Total Return FundActual 1,000.00 1,001.20 3.16Hypothetical (5% annual return before expenses) 1,000.00 1,021.91 3.191 Expenses are equal to the annualized net expense ratio for the most recent six-month period. The annualized six-month expense ratios for
the Osterweis Fund, Osterweis Strategic Income Fund, Osterweis Growth & Income Fund, Osterweis Emerging Opportunity Fund andOsterweis Total Return Fund were 0.95%, 0.83%, 1.02%, 1.10% and 0.63% (reflecting fee waivers and recoupments in effect), respectively,multiplied by the average account value over the period multiplied by 183/365 (to reflect the one-half year period.)

62
Additional Information
Information About the Portfolio Holdings
The Funds’ quarterly holdings for the most recent fiscal year can be obtained by accessing the Funds’ website atwww.osterweis.com/literature. The Funds file their complete schedule of portfolio holdings with the SEC for the first andthird quarters of each fiscal year as an exhibit to their reports on Form N-PORT. The Funds’ Form N-PORT is available onthe SEC’s website at www.sec.gov. The Fund’s Form N-PORT may also be obtained by calling (866)-236-0050.
The Statement of Additional Information (“SAI”) includes additional information about the Funds’ Trustees and isavailable without charge, upon request, by calling (866) 236-0050. Furthermore, you can obtain the SAI on the SEC’swebsite at www.sec.gov or the Funds’ website at www.osterweis.com.
Information About the Funds Trustees
A description of the policies and procedures that the Funds use to determine how to vote proxies relating to portfoliosecurities is available upon request without charge by calling toll-free at (866) 236-0050 or by accessing the U.S. Securitiesand Exchange Commission’s (SEC) website at www.sec.gov.
Information regarding how the Funds voted proxies relating to portfolio securities during the most recent twelvemonths ended June 30 is available upon request without charge by calling toll-free at (866) 236-0050 or by accessing theSEC’s website at www.sec.gov
Information About Proxy Voting
Each year, you are automatically sent an updated prospectus as well as annual and semi-annual reports for the Funds,if applicable. In an effort to decrease costs, the Funds intend to reduce the number of duplicate prospectuses, proxystatements, and annual and semi-annual reports you receive by sending only one copy of each to those addresses shared bytwo or more accounts and to shareholders we reasonably believe are from the same family or household. Please call theTransfer Agent (or your financial institution) without charge at (866)-236-0050 to request individual copies of thesedocuments. The Funds will begin sending individual copies 30 days after receiving your request. This policy does not applyto account statements.
Householding

63
OSTERWEIS FUNDOSTERWEIS STRATEGIC INCOME FUNDOSTERWEIS GROWTH & INCOME FUND
OSTERWEIS EMERGING OPPORTUNITY FUNDOSTERWEIS TOTAL RETURN FUND
At a meeting held on August 17-18, 20211, the Board (which is comprised of six persons, all of whom are IndependentTrustees as defined under the Investment Company Act) considered and approved the continuance of the InvestmentAdvisory Agreements (the “Advisory Agreements”) between Professionally Managed Portfolios (the “Trust”) and OsterweisCapital Management, Inc. for Osterweis Fund and Osterweis Capital Management, LLC for each of the Osterweis StrategicIncome Fund, the Osterweis Growth & Income Fund, the Osterweis Emerging Opportunity Fund and the Osterweis TotalReturn Fund (each a “Fund,” and together, the “Funds”). Osterweis Capital Management, Inc. and Osterweis CapitalManagement, LLC are referred to individually as an “Adviser” and collectively as the “Advisers” or “Osterweis.” At thismeeting and at a prior meeting held on June 17, 2021, the Board received and reviewed substantial information regardingthe Funds, the Advisers and the services provided by the Advisers to the Funds under the Advisory Agreements. Thisinformation, together with the information provided to the Board throughout the course of the year, formed the primary(but not exclusive) basis for the Board’s determinations. Below is a summary of the factors considered by the Board and theconclusions that formed the basis for the Board’s approval of the continuance of the Advisory Agreements:
1. The nature, extent and quality of the services provided and to be provided by the Advisers under theAdvisory Agreements. The Trustees considered the nature, extent and quality of the Advisers’ overall servicesprovided to the Funds as well as their specific responsibilities in all aspects of day-to-day investment managementof the Funds. The Board considered the qualifications, experience and responsibilities of the portfolio managers,as well as the responsibilities of other key personnel of the Advisers involved in the day-to-day activities of theFunds. The Board also considered the resources and compliance structure of the Advisers, including informationregarding their compliance program, their chief compliance officer and the Advisers’ compliance record, as wellas the Advisers’ cybersecurity program, business continuity plan and risk management process. Additionally, theBoard considered how the Advisers’ business continuity plan has operated during the COVID-19 pandemic. TheBoard also considered the prior relationship between the Advisers and the Trust, as well as the Board’s knowledgeof the Advisers’ operations, and noted that during the course of the prior year they had met with certain personnelof the Advisers by video conference to discuss fund performance and investment outlook, as well as, variousmarketing and compliance topics, including the Advisers’ risk management process. The Board concluded thatthe Advisers had the quality and depth of personnel, resources, investment processes and compliance policies andprocedures essential to performing their duties under the Advisory Agreements, and that they were satisfied withthe nature, overall quality and extent of such management services.
2. The Funds’ historical performance and the overall performance of the Advisers. In assessing the qualityof the portfolio management delivered by the Advisers, the Board reviewed the short-term and long-termperformance of each Fund on both an absolute basis, and in comparison to its peer funds utilizing Morningstarclassifications, appropriate securities market benchmarks and the Advisers’ similarly managed accounts, all forperiods ended March 31, 2021. The Board also considered performance against a smaller group of peers selectedby an independent third-party consultant engaged by the Board to assist it in its 15(c) review (the “Cohort”).While the Board considered both short-term and long-term performance, it placed greater emphasis on longerterm performance. When reviewing each Fund’s performance against its comparative peer group universe, theBoard took into account that the investment objective and strategies of each Fund, as well as its level of risktolerance, may differ significantly from funds in its respective peer universe. When reviewing the Funds’performance against broad market benchmarks, the Board took into account the differences in portfolioconstruction between the Funds and such benchmarks as well as other differences between actively managed
_________________1 Although the Investment Company Act requires that approval of the continuance of the Advisory Agreement be approved by the in-person vote of a
majority of the Independent Trustees, the August 17-18, 2021 meeting was held virtually in reliance on an order issued by the Securities and ExchangeCommission, which provided temporary relief from the in-person meeting requirements in response to the COVID-19 pandemic.
Approval of Investment Advisory Agreements (Unaudited)

64
funds and passive benchmarks, such as objectives and risks. In assessing periods of relative underperformance oroutperformance, the Board took into account that relative performance can be significantly impacted byperformance measurement periods and that some periods of underperformance may be transitory in nature whileothers may reflect more significant underlying issues.
For the Osterweis Fund, the Board noted that the Fund underperformed its peer group median for the one-yearand five-year periods and outperformed for the three-year period. The Board also noted that the Fundoutperformed the average of its Cohort for the one-year and three-year periods and underperformed the averagefor the five-year period. The Board also considered the underperformance of the Fund against its broad-basedsecurities market benchmark for the one-year and five-year periods and outperformance for the three-yearperiod. The Board also considered the Fund’s underperformance compared to the Adviser’s core equity compositefor the one-year period and outperformance for the three-year and five-year periods, noting such differences werenot significant.
For the Osterweis Strategic Income Fund, the Board noted that the Fund underperformed its peer group medianfor the one-year, three year and five-year periods. The Board also noted that the Fund underperformed theaverage of its Cohort for the one-year, three-year and five-year periods. The Board also considered theoutperformance of the Fund against its broad-based securities market benchmark for the one-year, three-year,five-year periods. The Board also considered the Fund’s underperformance compared to the Adviser’s strategicincome composite for the one-year, three-year, and five-year periods, noting such differences were not significant.
For the Osterweis Growth & Income Fund, the Board noted that the Fund had outperformed its peer groupmedian for the one-year, three-year and five-year periods. The Board also noted that the Fund outperformed theaverage of its Cohort for the one-year, three-year and five-year periods. The Board also considered theperformance of the Fund against its broad-based securities market benchmark, noting it outperformed for theone-year, three-year and five-year periods. The Board also considered the Fund’s outperformance compared tothe Adviser’s flexible balanced composite for the one-year, three-year, and five-year periods, noting suchdifferences were not significant.
For the Osterweis Emerging Opportunity Fund, the Board noted that the Fund had outperformed its peer groupmedian for the one-year and three-year periods. The Board also noted that the Fund outperformed the average ofits Cohort for the one-year and three-year periods. The Board also considered the performance of the Fundagainst its broad-based securities market benchmark, noting it outperformed for the one-year and three-yearperiods. The Board also considered the Fund’s outperformance compared to the Adviser’s emerging growthcomposite for the one-year period and underperformance for the three-year period, noting such differences werenot significant.
For the Osterweis Total Return Fund, the Board noted that the Fund had underperformed its peer group medianfor the one-year period and outperformed for the three-year period. The Board also noted that the Fundunderperformed the average of its Cohort for the one-year period and outperformed the average for the three-year period. The Board also considered the performance of the Fund against its broad-based securities marketbenchmark, noting it outperformed for the one-year and three-year periods. The Trustees noted that the Adviserdoes not replicate the Osterweis Total Return Fund’s investment style in separately managed accounts.
3. The costs of the services provided by the Advisers and the structure of the Advisers’ fees under theAdvisory Agreements. In considering the advisory fee and total fees and expenses of each Fund, the Boardreviewed comparisons to the peer funds and similarly managed separate accounts for other types of clientsadvised by the Advisers, as well as all expense waivers and reimbursements. When reviewing fees charged to othersimilarly managed accounts, the Board took into consideration the type of account and the differences in themanagement of that account that might be germane to the difference, if any, in the fees charged to such accounts.
For the Osterweis Fund, the Board noted that the Adviser had contractually agreed to maintain an annual expenseratio of 0.95% (the “Expense Cap”). The Board noted that the Fund’s advisory fee and net expense ratio werehigher than its peer group median and average. The Board noted that the Fund’s net expense ratio was lower than
Approval of Investment Advisory Agreements (Unaudited) (Continued)

65
the average of its Cohort. The Board noted that, after discussions with the Board, the Adviser recentlyimplemented the removal of breakpoints from the advisory fee with all assets being charged an advisory fee of0.75% (previously was 1.00% on the first $250 million and 0.75% thereafter). The Board noted that the feescharged to other similarly managed account clients were higher than, equal to, or lower than those charged to theOsterweis Fund depending on the level of assets. The Board concluded that the fees paid to the Adviser were fairand reasonable in light of the comparative performance and advisory fee information.
For the Osterweis Strategic Income Fund, the Board noted that the Fund’s advisory fee was higher than that of itspeer group median and average. The Board noted the net expense ratio was slightly above the median and belowthe average. The Board noted that the Fund’s net expense ratio was lower than the average of its Cohort. TheBoard considered that the advisory fee included breakpoints in order to share economies of scale with the Fundand that the breakpoints were currently in effect. The Board noted that the fees charged to other similarlymanaged account clients were higher than or equal to those charged to the Osterweis Strategic Income Funddepending on the level of assets. The Board concluded that the fees paid to the Adviser were fair and reasonable inlight of the comparative performance and advisory fee information.
For the Osterweis Growth & Income Fund, the Board noted that the Fund’s advisory fee and net expense ratiowere higher than those of its peer group median and average. The Board noted the Adviser, after discussions withthe Board, recently implemented the removal of breakpoints from the advisory fee with all assets being chargedan advisory fee of 0.75% (previously was 1.00% on the first $500 million and 0.75% thereafter). The Board notedthat the fees charged to other similarly managed account clients were higher than, equal to, or lower than thosecharged to the Osterweis Growth & Income Fund depending on the level of assets. The Board concluded that thefees paid to the Adviser were fair and reasonable in light of the comparative performance and advisory feeinformation.
For the Osterweis Emerging Opportunity Fund, the Board noted that the Adviser had contractually agreed tomaintain an annual expense ratio of 1.10% (the “Expense Cap”). The Board noted that the Fund’s advisory fee washigher than that of its peer group median and average, and the net expense ratio was at the median and below theaverage. The Board noted that the Fund’s net expense ratio was lower than the average of its Cohort. The Boardconsidered that the advisory fee included breakpoints in order to share economies of scale with the Fund,although Fund assets had not yet grown to a point where the breakpoint has been reached. The Board noted thatthe fees charged to other similarly managed account clients were higher than or equal to those charged to theOsterweis Emerging Opportunity Fund depending on the level of assets. The Board concluded that the fees paid tothe Adviser were fair and reasonable in light of the comparative performance and advisory fee information.
For the Osterweis Total Return Fund, the Board noted that the Adviser had contractually agreed to maintain anannual expense ratio of 0.75% (the “Expense Cap”) although the Fund is currently operating below that level. TheBoard noted that the Fund’s advisory fee and net expense ratio were lower than those of its peer group median andaverage. The Board noted that the Fund’s net expense ratio was lower than the average of its Cohort. The Trusteesnoted that the Adviser does not replicate the Osterweis Total Return Fund’s investment style in separatelymanaged accounts. The Board concluded that the fees paid to the Adviser were fair and reasonable in light of thecomparative performance and advisory fee information.
4. Economies of Scale. The Board also considered whether economies of scale were being realized by the Advisersthat should be shared with shareholders. The Board noted that the Advisory Agreements for the OsterweisStrategic Income Fund and Osterweis Emerging Opportunity Fund contain breakpoints in the advisory fee. TheBoard also noted that the Adviser has contractually agreed to reduce its advisory fees or reimburse expenses sothat the Osterweis Fund, Osterweis Emerging Opportunity Fund, and Osterweis Total Return Fund do not exceedtheir respective Expense Cap. The Board noted that at current asset levels, it did not appear that there wereadditional significant economies of scale being realized by the Adviser that should be shared with shareholdersand concluded that it would continue to monitor economies of scale in the future as circumstances changed andassuming asset levels continued to increase.
Approval of Investment Advisory Agreements (Unaudited) (Continued)

66
5. The profits to be realized by the Advisers and their affiliates from their relationship with the Funds.The Board reviewed the Advisers’ financial information and took into account both the direct benefits and theindirect benefits to the Advisers from advising the Funds. The Board considered the profitability to the Advisersfrom their relationship with the Funds and considered any additional material benefits derived by the Advisersfrom their relationship with the Funds, particularly benefits received in exchange for “soft dollars” paid to theAdvisers. After such review, the Board determined that the profitability to the Advisers with respect to theAdvisory Agreements was not excessive, and that the Advisers had maintained adequate financial resources tosupport the services they provide to the Funds.
No single factor was determinative of the Board’s decision to approve the continuance of the Advisory Agreements,but rather the Board based its determination on the total mix of information available to the Trustees. Based on aconsideration of all the factors in their totality, the Board determined that the advisory arrangements with the Advisers,including each Fund’s advisory fee, were fair and reasonable. The Board therefore determined that the continuance of theAdvisory Agreements would be in the best interest of each Fund and its shareholders.
Approval of Investment Advisory Agreements (Unaudited) (Continued)

67
The Funds have adopted a liquidity risk management program (the “program”). The Board has designated the Adviserto serve as the administrator of the program. Personnel of the Adviser conduct the day-to-day operation of the programpursuant to policies and procedures administered by the Adviser.
Under the program, the Adviser manages the Funds’ liquidity risk, which is the risk that the Funds could not meetshareholder redemption requests without significant dilution of remaining shareholders’ interests in the Funds. This riskis managed by monitoring the degree of liquidity of each Funds’ investments, limiting the amount of the Funds’ illiquidinvestments, and utilizing various risk management tools and facilities available to the Funds for meeting shareholderredemptions, among other means. The Adviser’s process of determining the degree of liquidity of the Funds’ investmentsis supported by one or more third-party liquidity assessment vendors.
The Board reviewed a report prepared by the Adviser regarding the operation and effectiveness of the program for theperiod January 1, 2020 through December 31, 2020. No significant liquidity events impacting any of the Funds were notedin the report. In addition, the Adviser provided its assessment that the program had been effective in managing the Funds’liquidity risk.
Statement Regarding Liquidity Risk Management Program (Unaudited)

68
The Funds collect non-public information about you from the following sources:
• Information we receive about you on applications or other forms;
• Information you give us orally; and
• Information about your transactions with us or others.
The Funds do not disclose any non-public personal information about our customers or former customerswithout the customer’s authorization, except as permitted by law or in response to inquiries fromgovernmental authorities. The Funds may share information with affiliated parties and unaffiliated thirdparties with whom we have contracts for servicing the Funds. The Funds will provide unaffiliated third partieswith only the information necessary to carry out their assigned responsibility. The Funds maintain physical,electronic and procedural safeguards to guard your non-public personal information and require third partiesto treat your non-public information with the same high degree of confidentially.
In the event that you hold shares of a Fund through a financial intermediary, including, but not limited to, abroker-dealer, bank or trust company, the privacy policy of your financial intermediary would govern how yournon-public personal information would be shared by those entities with unaffiliated third parties.
Osterweis Funds | Privacy Notice (Unaudited)

AdvisersOSTERWEIS CAPITAL MANAGEMENT, INC.OSTERWEIS CAPITAL MANAGEMENT, LLC
One Maritime Plaza, Suite 800San Francisco, CA 94111
DistributorQUASAR DISTRIBUTORS, LLC
111 East Kilbourn Avenue, Suite 2200Milwaukee, WI 53202
CustodianU.S. BANK N.A.
Custody Operations1555 North RiverCenter Drive, Suite 302
Milwaukee, WI 53212
Transfer Agent, Fund Accountant and Fund AdministratorU.S. BANCORP FUND SERVICES, LLC
615 East Michigan StreetMilwaukee, WI 53202
(866) 236-0050
Independent Registered Public Accounting FirmTAIT, WELLER & BAKER LLP
Two Liberty Place50 South 16th Street, Suite 2900
Philadelphia, PA 19102
Legal CounselSULLIVAN & WORCESTER LLP
1633 Broadway, 32nd FloorNew York, NY 10019
Fund InformationFund Symbol CUSIPOsterweis Fund OSTFX 742935406Osterweis Strategic Income Fund OSTIX 742935489Osterweis Growth & Income Fund OSTVX 74316J771Osterweis Emerging Opportunity Fund OSTGX 74316P744Osterweis Total Return Fund OSTRX 74316P736
OWRPSEMI – 0921